Aberdeen Global Interim Report and Accounts For the six months ended 31 March 2017 R.C.S:B27471

Welcome message from author
This document is posted to help you gain knowledge. Please leave a comment to let me know what you think about it! Share it to your friends and learn new things together.
Transcript

Aberdeen GlobalInterim Report and AccountsFor the six months ended 31 March 2017
R.C.S:B27471

ContentsIncorporation 01
Chairman’s Statement 02
Investment Manager’s Review 03
Net Asset Value History 04
Summary of Historic Information 16
Performance History 18
Aberdeen Global - Combined Statements 23
Asia Pacific Equity 24
Asian Credit Bond 32
Asian Local Currency Short Duration Bond 38
Asian Property Share 45
Asian Smaller Companies 49
Australasian Equity 55
Brazil Bond 59
Brazil Equity 62
China A Share Equity 66
Chinese Equity 70
Eastern European Equity 75
Emerging Markets Corporate Bond 79
Emerging Markets Equity 89
Emerging Markets Infrastructure Equity 96
Emerging Markets Local Currency Bond 103
Emerging Markets Local Currency Corporate Bond 111
Emerging Markets Smaller Companies 116
European Equity 121
European Equity Dividend 126
European Equity (Ex UK) 130
Frontier Markets Bond 134
Frontier Markets Equity 140
German Equity 145
Indian Bond 149
Indian Equity 153
Japanese Equity 157
Japanese Smaller Companies 167
Latin American Equity 174
Multi Asset Growth 178
Multi Asset Income 194
Multi-Manager World Equity 212
North American Equity 215
North American Smaller Companies 219
Responsible World Equity 224
Russian Equity 229
Select Emerging Markets Bond 233
Select Emerging Markets Investment Grade Bond 247
Select Euro High Yield Bond 255
Select Global Credit Bond 267
Select Global Investment Grade Credit Bond 279
Swiss Equity 288
Technology Equity 292
UK Equity 296
World Credit Bond 301
World Equity 311
World Government Bond 316
World Resources Equity 323
World Smaller Companies 328
Notes to the Financial Statements 333
Remuneration 349
Securities Financing Transactions 350
Management and Administration 366
General Information 370
Further Information 371

aberdeen-asset.com 01
Aberdeen Global (“the Company”) was incorporated as a société anonyme, qualifying as a société d’investissement à capital variable on 25 February 1988 for an unlimited period and commenced operations on 26 April 1988. It is registered under number B27471 at the Register of Commerce at the District Court of Luxembourg.
As at 31 March 2017, the Company has issued shares in the following Funds:
Incorporation
Asia Pacific Equity
Asian Credit Bond
Asian Local Currency Short Duration Bond
Asian Property Share
Asian Smaller Companies
Australasian Equity
Brazil Bond
Brazil Equity
China A Share Equity
Chinese Equity
Eastern European Equity
Emerging Markets Corporate Bond
Emerging Markets Equity
Emerging Markets Infrastructure Equity
Emerging Markets Local Currency Bond
Emerging Markets Local Currency Corporate Bond
Emerging Markets Smaller Companies
European Equity
European Equity Dividend
European Equity (Ex UK)
Frontier Markets Bond
Frontier Markets Equity
German Equity
Indian Bond
Indian Equity
Japanese Equity
Japanese Smaller Companies
Latin American Equity
Multi Asset Growth
Multi Asset Income
Multi-Manager World Equity
North American Equity
North American Smaller Companies
Responsible World Equity
Russian Equity
Select Emerging Markets Bond
Select Emerging Markets Investment Grade Bond
Select Euro High Yield Bond
Select Global Credit Bond
Select Global Investment Grade Credit Bond
Swiss Equity
Technology Equity
UK Equity
World Credit Bond
World Equity
World Government Bond
World Resources Equity
World Smaller Companies
The full name of each Fund is constituted by the name of the Company, Aberdeen Global, followed by a hyphen and then the specific name of the Fund. Throughout the Financial Statements, the Funds are referred to by their short names as indicated above.
No subscriptions can be received on the basis of this document. Subscriptions are only valid if made on the basis of the current prospectus or on the Key Investor Information Document, accompanied by a copy of the latest annual report or of the subsequent semi-annual report if it has been published.
Please see the Notes to the Financial Statements for changes during the period.

02 Aberdeen Global
Over the six months to the end of March 2017, the assets of the Company remained stable at US$28.6 billion.
We noted an improving sentiment towards Emerging Markets over the period which resulted in a slowdown in outflows from relevant Funds. The number of Funds in the umbrella remained unchanged at 48 active Funds.
In terms of individual Fund growth and performance, in the Equity Funds, the China A Share Equity Fund continued to grow rapidly in size reaching almost US$600 million by the period end with a strong performance outperforming its relative benchmark. Similarly, the North American Smaller Companies Fund also had successful growth, increasing its assets by US$212 million, which is an increase of 648% over the last 18 months.
There have also been positive developments across the Company’s other asset classes. The Indian Bond Fund almost doubled in size reaching US$153 million, and the two multi asset Funds, which launched relatively recently in 2015 and 2016, are beginning to attract further investment due to good performance since inception.
On 24 March 2017, a notice was sent to Shareholders to explain the latest changes to the Company’s prospectus, which included the possibility to launch several new Funds with innovative strategies. Some of these new Funds will be offered to investors in the second half of the year. One Fund already launched on 2 May 2017 is the Smart Beta Low Volatility Global Equity Income Fund, the first Fund of its type within Aberdeen Global.
CG LittleMay 2017
Chairman’s Statement

aberdeen-asset.com 03
Investment Manager’s Review
Investment reviewGlobal financial markets weathered a volatile six months to end firmer over the period. Sentiment was primarily driven by developments in the West, particularly the US. Uncertainty over the outcome of the US presidential election preoccupied investors at first. A widespread sell-off followed in early November, when results showed Donald Trump had won the election. But equities bounced back quickly, boosted by Trump’s election promises to increase infrastructure spending and work on a fiscal stimulus programme. Markets continued to rally, although initial optimism over Trump’s win was later tempered by concerns over the administration’s ability to achieve its aims. His early moves misfired, with the courts rejecting his orders to tighten immigration from Muslim-majority countries, and the Republicans’ plan to overhaul health care was aborted before it was brought before a vote in Congress.
Against this environment, equities outperformed fixed income instruments. Trump’s election victory sparked a rotation out of bonds and into growth-oriented cyclicals as investors considered the implications of US fiscal policy shifting towards a more reflationary position. US government bonds pulled back sharply, with the 10-year US Treasury yields closing the period at 2.39% as investors started to price in tighter monetary policy and prospects of fiscal stimulus. Core long-term bond yields also rose elsewhere, with German Bund yields ending at around 0.32% amid a pickup economic growth. Meanwhile, government bonds and investment grade credit underperformed high-yield debt amid increased risk appetite.
Equity markets, despite the early jitters, generally benefited from the “Trump trade”. Among the developed markets, US equities rallied to fresh highs on hopes of fiscal stimulus. The dollar also strengthened against most currencies amid expectations of higher US interest rate, although the gains were subsequently pared. In other parts of the developed world, the US election result reflected a broader trend in Europe, where the decline of popular trust in governments and mainstream political parties culminated in drastic political changes, such as the UK’s Brexit vote and Italy’s rejection of a referendum on parliamentary reform. Despite the political uncertainty, European equities held up well, as better economic data overshadowed worries over the rise of populism in several countries. Elsewhere, in Japan, hopes that a softer yen would boost domestic exporters buoyed investor sentiment.
Emerging market equities rose, too, led by Latin America. Increased risk appetite and steadier oil prices buoyed commodity producers. Iron ore climbed on the back of sustained Chinese demand, while OPEC’s agreement with major producers to curb output kept oil prices above US$50 a barrel for the most part, despite persistent concerns of a glut. Optimism over President Michel Temer’s reform agenda also supported Brazil, along with the nation’s emergence from a two-year recession. In emerging Asia, stocks rose amid expectations that the region will benefit from the brightening global economic outlook. Growing evidence of increased trade activity was most evident in export-oriented economies such as South Korea and Taiwan. In India, the ruling party’s resounding state election victory in the country’s largest state Uttar Pradesh boosted investor confidence in Prime Minister Modi’s
ability to carry through with his reform agenda; that outweighed the receding impact of the government’s unexpected move to scrap more than 80% of banknotes in circulation last November.
On monetary policy, central banks generally maintained an accommodative stance. Although the US Federal Reserve followed through with two well-telegraphed rate hikes (in December, and again in March), the European Central Bank extended its bond-buying scheme through 2017, albeit at a smaller magnitude after March. The Bank of Japan also kept its loose policy, as did most of its Asian counterparts.
Outlook Overall, immediate global economic prospects appear upbeat. Higher inflation, healthier manufacturing indicators, stronger activity in the Chinese property market and falling unemployment rates in the developed world are all indicators of an acceleration in economic growth this year. Major central bank policies in Europe and Japan also remain supportive, while China is likely to continue prioritising social and economic stability ahead of a key leadership transition late in the year. However, there are several factors that cloud the outlook, not least in Europe, where key elections are due in France and Germany. Sentiment surrounding Brexit adds to further worries, now that the UK has formally started the process of leaving the European Union, and will be heading to the polls in June. Higher interest rates in the US could also push up the dollar and drain capital from emerging markets. Or Trump might make good on his protectionist campaign pledges. Encouragingly, the corporate sector remains in decent health. Earnings are on the mend, and companies’ continued focus to bolster margins through disciplined cost control should bode well for markets.
Aberdeen International Fund Managers LimitedApril 2017

04 Aberdeen Global
Numbers are shown in USD terms (unless otherwise stated).
FundShare Class
NAV per Share
31.03.17
NAV per Share
30.09.16
NAV per Share
30.09.15
NAV per Share
30.09.14
Ongoing Charges %
As at 31.03.17†
OASE % As at
31.03.17*
Asia Pacific Equity A-1 9.9269 9.2395 8.3543 10.3527 2.02 0.25
A-2 72.1452 67.1490 60.3618 74.1138 2.02 0.25
A(CZK)-2^ 1,125.8200 1,062.4336 - - 2.08 0.31
A(EUR)-1^ 11.2612 - - - 2.16 0.39
A(EUR)-2^ 9.8215 9.2406 8.4043 10.3515 2.08 0.31
B-2 56.5952 52.9393 48.0731 59.6199 3.02 0.25
C-2 15.5076 14.5063 13.1733 16.3376 3.02 0.25
D(GBP)-2 57.7903 51.7778 39.9157 45.7929 2.02 0.25
E(EUR)-2 12.8028 11.3413 10.2641 11.1356 2.02 0.25
I-1 10.4138 9.6546 8.7243 10.8276 1.23 0.21
I-2 78.8512 73.1028 65.1924 79.4157 1.23 0.21
I(EUR)-1^ - 8.6613 7.9198 9.8432 - -
I(EUR)-2^ 11.2935 10.5802 9.5558 11.6720 1.29 0.27
L(SGD)-2 9.9092 8.9996 8.4393 - 2.02 0.25
R(GBP)-2 13.6884 12.2184 9.3473 10.6441 1.27 0.25
S-2 24.6528 22.9649 20.6801 25.4345 2.19 0.25
W-2 11.2943 10.5628 9.5884 - 3.02 0.25
X-1 10.0255 9.2963 8.4024 10.4364 1.27 0.25
X-2 10.6665 9.8907 8.8230 10.7532 1.27 0.25
Y(EUR)-2 12.9908 11.4650 10.2988 11.0912 1.27 0.25
Z-2 10.9822 - - 15.8626 0.23 0.21
Asian Credit BondA A-1 10.4308 10.6525 9.9795 - 1.54 0.34
A-2 10.8664 10.9592 9.9993 - 1.54 0.34
I-1 10.4311 10.6529 9.9795 - 0.90 0.30
I-2 10.9765 11.0349 10.0042 - 0.90 0.30
X-1 10.4311 10.6530 9.9795 - 0.94 0.34
X-2 10.9696 11.0302 10.0039 - 0.94 0.34
Z-2 11.0807 11.1063 10.0088 - 0.30 0.30
Asian Local Currency Short Duration Bond
A-1 3.7914 3.8911 3.7939 4.1806 1.31 0.31
A-2 6.5716 6.6717 6.3707 6.8633 1.31 0.31
A(CHF)-2^ 8.8444 9.0963 8.8706 9.6932 1.45 0.45
A(EUR)-2^ 9.2888 9.5292 9.2177 9.9841 1.42 0.42
D(GBP)-1 10.9459 10.8113 9.0394 9.3069 1.31 0.31
D(GBP)-2 12.6502 12.3610 10.1216 10.1885 1.31 0.31
E(EUR)-2 13.0762 12.6330 12.1445 11.5613 1.31 0.31
I-1 8.9416 9.1752 8.9460 9.8583 0.77 0.27
I-2 10.0668 10.1916 9.6799 10.3718 0.77 0.27
I(EUR)-2^ 9.6088 9.8280 9.4506 10.1782 0.83 0.33
I(GBP)-1^ 8.3246 8.5874 8.4018 9.2394 0.91 0.41
R(GBP)-1 11.0706 10.9347 9.1427 9.4141 0.81 0.31
R(GBP)-2 12.3712 12.0583 9.8264 9.8421 0.81 0.31
X-1 8.6259 8.8508 8.6294 9.5095 0.81 0.31
Net Asset Value History

aberdeen-asset.com 05
FundShare Class
NAV per Share
31.03.17
NAV per Share
30.09.16
NAV per Share
30.09.15
NAV per Share
30.09.14
Ongoing Charges %
As at 31.03.17†
OASE % As at
31.03.17*
X-2 9.6389 9.7598 9.2730 9.9402 0.81 0.31
Y(EUR)-2 11.7466 11.3205 10.8286 10.2573 0.81 0.31
Z-2 10.2324 10.3330 9.7646 10.4106 0.27 0.27
Asian Property Share A-2 18.1410 17.3314 15.8687 19.4070 1.79 0.29
A(EUR)-2^ 8.2107 7.9370 7.3654 9.0355 1.93 0.43
I-2 1,603.1667 1,525.5843 1,385.8576 1,681.4312 1.00 0.25
S-2 17.6258 16.8746 15.5153 19.0547 2.21 0.29
X-2 10.0032 9.5211 8.6519 10.5017 1.04 0.29
Asian Smaller Companies A-2 42.5625 40.6145 37.1956 48.0399 2.02 0.27
D(GBP)-2 33.9845 31.2170 24.5169 29.5860 2.02 0.27
E(EUR)-1 12.1613 11.0453 10.2800 11.8629 2.02 0.27
I-2 46.3121 44.0198 39.9969 51.2501 1.23 0.23
L(SGD)-2 9.7491 9.0774 8.6696 - 2.02 0.27
R(GBP)-2 13.4215 12.2917 9.5958 11.5103 1.42 0.27
X-2 10.4562 9.9480 9.0561 11.6260 1.42 0.27
Y(EUR)-2 12.7430 11.5387 10.5734 11.9948 1.42 0.27
Z-2 21.0497 19.9077 17.9081 22.7174 0.23 0.23
Z(EUR)-2^ 10.7631 10.2836 9.3638 11.9256 0.29 0.29
Australasian Equity A(AUD)-2 38.3662 35.5032 32.1618 31.0859 1.76 0.26
X(AUD)-2 14.8271 13.6697 12.2907 11.7910 1.01 0.26
Brazil Bond A-1 6.7431 6.5080 5.0846 8.3226 1.97 0.47
A-2 131.8317 120.5523 83.4502 125.4456 1.97 0.47
E(EUR)-1 7.9690 7.3176 5.7657 8.3370 1.97 0.47
I-1 12.7505 12.3049 - - 1.43 0.43
I-2 968.2516 882.8913 608.1818 908.6190 1.43 0.43
N(JPY)-1 56,375.8432 48,667.6175 42,970.5446 63,667.1500 0.93 0.43
Brazil Equity A-2 6.3304 5.8255 3.7377 6.8039 2.35 0.60
E(EUR)-2 - - - 9.3510 - -
I-2 7.3364 6.7244 4.2809 7.7309 1.56 0.56
N(JPY)-1 56,716.7541 47,526.3446 36,304.1621 61,367.3528 1.21 0.56
S-2 6.2803 5.7839 3.7175 6.7788 2.52 0.60
China A Share EquityB A-2 9.9699 9.0651 8.8046 - 2.00 0.25
H(EUR)-2 9.9707 8.5950 8.3393 - 1.21 0.21
I-1 9.0280 8.1763 7.9588 - 1.21 0.21
I-2 10.1311 9.1754 8.8422 - 1.21 0.21
Z-1 11.0560 - - - 0.21 0.21
Z-2 10.3392 9.3177 8.8900 - 0.21 0.21
Chinese Equity A-2 24.6040 22.4468 20.7495 23.9918 1.99 0.23
A(EUR)-2^ 9.5311 8.7835 8.2161 9.4967 2.06 0.30
D(GBP)-2 19.6547 17.2612 13.6956 14.7964 1.99 0.23
I-2 26.8423 24.3925 22.3728 25.6657 1.20 0.19
R(GBP)-2 13.6824 11.9714 9.4358 10.1180 1.24 0.23
S-2 21.2125 19.3693 17.9614 20.8040 2.16 0.23
X-2 10.6606 9.6895 8.9067 10.2214 1.24 0.23
Net Asset Value History

06 Aberdeen Global
FundShare Class
NAV per Share
31.03.17
NAV per Share
30.09.16
NAV per Share
30.09.15
NAV per Share
30.09.14
Ongoing Charges %
As at 31.03.17†
OASE % As at
31.03.17*
Y(EUR)-2 - - 10.3962 10.5411 - -
Z-2 15.5806 14.0883 12.8133 14.5520 0.20 0.19
Eastern European Equity A(EUR)-2 103.5881 95.0785 82.3472 91.5161 1.99 0.49
I(EUR)-2 2,360.7240 2,158.3107 1,854.5483 2,044.7157 1.20 0.45
S(EUR)-2 102.2353 94.0329 81.6314 90.8715 2.41 0.49
X(EUR)-2 11.4883 10.5051 9.0302 9.9599 1.24 0.49
Emerging Markets Corporate Bond
A-1 10.3211 10.2665 9.5448 10.3566 1.70 0.20
A-2 13.3341 13.0110 11.6083 12.0616 1.70 0.20
A-3 10.7014 10.6449 - - 1.70 0.20
A(EUR)-2^ 11.2634 11.0942 10.0092 10.4611 1.77 0.27
E(EUR)-1 12.9613 12.2708 11.4853 10.9776 1.70 0.20
I-2 13.5315 13.1690 11.6859 12.0826 1.16 0.16
I(EUR)-2^ 13.5901 13.3522 11.9771 12.4375 1.23 0.23
W-1 10.7088 10.6522 9.9033 - 2.70 0.20
W-2 11.2214 11.0030 9.9141 - 2.70 0.20
X-1 9.7337 9.6822 9.0013 9.7694 1.20 0.20
X-2 11.7921 11.4781 10.1895 10.5329 1.20 0.20
Y(EUR)-1 11.8566 11.2249 10.5050 10.0449 1.20 0.20
Y(EUR)-2 14.3542 13.2978 11.8838 10.8250 1.20 0.20
Z-1 10.4281 10.3729 9.6431 10.3803 0.16 0.16
Emerging Markets Equity A-1 10.0226 9.5681 8.1133 10.1258 2.04 0.32
A-2 65.3639 62.3999 52.7399 65.5894 2.04 0.32
A(CHF)-2^ 12.2088 11.8010 10.1887 12.8433 2.08 0.36
C-2 16.1720 15.5160 13.2480 16.6398 3.04 0.32
D(GBP)-2 52.4955 48.2418 34.9667 40.6320 2.04 0.32
E(EUR)-2 15.8402 14.3923 12.2465 13.4577 2.04 0.32
G-2 9.7815 9.3011 7.7987 9.6224 1.25 0.28
I-1 10.4541 9.9408 8.4255 10.5374 1.25 0.28
I-2 70.9385 67.4557 56.5630 69.7917 1.25 0.28
R(GBP)-2 13.1278 12.0190 8.6462 9.9719 1.29 0.32
S-2 2,264.9015 2,164.0220 1,832.1265 2,282.4024 2.21 0.32
X-1 9.7427 9.2662 7.8541 9.8223 1.29 0.32
X-2 10.2295 9.7292 8.1613 10.0739 1.29 0.32
Y(EUR)-2 12.4608 11.2796 9.5260 10.3905 1.29 0.32
Z-1 10.4840 9.9196 8.3994 - 0.25 0.28
Z-2 17.5391 16.5949 13.7759 16.8285 0.25 0.28
Emerging Markets Infrastructure Equity
A-1 9.2187 8.7597 7.6544 10.3321 2.05 0.30
A-2 8.0532 7.6522 6.6557 8.9459 2.05 0.30
A(CHF)-2^ 7.5535 7.2667 6.4581 8.7603 2.16 0.41
A(EUR)-2^ 7.7475 7.4352 6.5362 8.7883 2.16 0.41
I-2 905.8075 857.2315 739.7913 986.5551 1.26 0.26
I(EUR)-2^ 739.9020 707.4733 618.6759 825.6911 1.36 0.36
N(JPY)-1 67,727.1864 58,147.0197 60,202.6837 74,591.2268 0.78 0.26
Net Asset Value History

aberdeen-asset.com 07
FundShare Class
NAV per Share
31.03.17
NAV per Share
30.09.16
NAV per Share
30.09.15
NAV per Share
30.09.14
Ongoing Charges %
As at 31.03.17†
OASE % As at
31.03.17*
R(GBP)-2 11.7591 10.7261 7.9424 9.8984 1.30 0.30
S-2 7.9677 7.5750 6.5997 8.8853 2.22 0.30
S(EUR)-2^ 7.6628 7.3593 6.4965 8.7556 2.32 0.40
X-2 13.5634 12.8366 - - 1.27 0.27
X(EUR)-2^ 9.7020 9.2817 8.1252 10.8534 1.44 0.44
Y(EUR)-2 11.6494 10.4976 9.1229 10.7534 1.30 0.30
Emerging Markets Local Currency Bond
A-1 6.5894 6.7750 6.1286 8.2914 1.76 0.26
A-2 9.3207 9.3402 8.0289 10.3807 1.76 0.26
A-3 10.4647 10.7596 - - 1.76 0.26
A(EUR)-2^ 7.3423 7.4456 6.4928 8.4643 1.85 0.35
E(EUR)-2 233.5411 222.7376 - - 1.80 0.30
I-2 9.6651 9.6591 8.2580 10.6205 1.22 0.22
X-1 6.5407 6.7250 6.0834 8.2251 1.30 0.30
X-2 8.1826 8.1810 6.9999 9.0031 1.30 0.30
Y(EUR)-2 9.8739 9.3944 - - 1.30 0.30
Z-2 8.9616 8.9117 7.5436 9.6038 0.22 0.22
Emerging Markets Local Currency Corporate BondC
A-2 11.4814 11.0187 - - 1.71 0.20
I-2 11.5669 11.0704 - - 1.16 0.15
X-2 11.5590 11.0656 - - 1.21 0.20
Emerging Markets Smaller Companies
A-2 17.7296 17.7842 15.3444 19.2380 2.06 0.31
D(GBP)-2 14.1405 13.6532 10.1019 11.8339 2.06 0.31
G-2 9.3396 9.3312 7.9876 9.9354 1.27 0.27
I-2 19.2228 19.2060 16.4406 20.4491 1.27 0.27
R(GBP)-2 13.0650 12.5776 9.2504 10.7713 1.46 0.31
X-2 10.1833 10.1839 8.7341 10.8846 1.46 0.31
Y(EUR)-2 12.4038 11.8060 10.1939 11.2260 1.46 0.31
Z-2 21.0153 20.8921 17.7059 21.8042 0.27 0.27
Ethical World EquityD A-2 - - 10.1413 12.4037 - -
H(EUR)-1 - - 8.6916 - - -
X-2 - - 9.9233 12.0808 - -
Y(EUR)-2 - - 11.5862 12.4606 - -
European Equity A(EUR)-2 49.0337 44.6661 43.6649 45.0625 1.71 0.20
I(EUR)-2 1,328.7800 1,205.6858 1,169.3815 1,197.3049 0.92 0.16
S(EUR)-2 406.1370 370.7352 363.9569 377.1805 2.13 0.20
U-2 10.0349 9.6047 9.3275 10.8929 1.71 0.20
X(EUR)-2 13.6068 12.3485 11.9806 12.2713 0.96 0.20
Z(EUR)-2 15.9096 14.3816 13.8429 14.0680 0.17 0.16
European Equity DividendE A(EUR)-1 160.6253 148.0736 147.3177 157.4477 1.72 0.22
A(EUR)-2 205.3418 189.2960 184.8168 193.1659 1.72 0.22
A(CHF)-2^ 174.1502 161.1591 158.9589 168.3901 1.86 0.36
A-2^ 204.9731 187.9165 182.8982 193.2772 1.84 0.34
I(EUR)-2 2,193.1111 2,013.7545 1,950.4138 2,022.4630 0.93 0.18
S(EUR)-2 199.6842 184.4628 180.8382 189.8036 2.14 0.22
X(EUR)-2 13.4102 12.3160 11.9331 12.3781 0.97 0.22
Net Asset Value History

08 Aberdeen Global
FundShare Class
NAV per Share
31.03.17
NAV per Share
30.09.16
NAV per Share
30.09.15
NAV per Share
30.09.14
Ongoing Charges %
As at 31.03.17†
OASE % As at
31.03.17*
European Equity (Ex UK) A(EUR)-2 12.7736 11.8059 11.1798 11.1829 1.86 0.35
D(GBP)-2 10.9177 10.2058 8.2318 8.7020 1.86 0.35
R(GBP)-2 15.0827 14.0463 11.2448 11.7988 1.11 0.35
Z(EUR)-2 9.9751 9.1474 8.5249 - 0.27 0.26
Flexible EquityF A(EUR)-2 - - 111.5583 113.7061 - -
I(EUR)-2 - - 113.4637 115.0651 - -
Frontier Markets Bond A-1 10.1494 10.1082 9.2806 10.5133 1.79 0.29
B-1 5.2952 5.2732 4.8409 5.4852 2.54 0.29
I-1 10.1527 10.1098 9.2828 10.5076 1.25 0.25
I-2 12.8565 12.3610 10.4880 11.0662 1.25 0.25
X-1 - - - 10.4306 - -
X-2 12.6538 12.1691 10.3254 10.9061 1.29 0.29
X(EUR)-2^ 12.2692 11.9431 10.2555 10.8818 1.43 0.43
Z-2 11.2344 10.7476 - - 0.25 0.25
Frontier Markets Equity A-1 12.3278 12.1301 12.4665 15.2550 2.66 0.41
I-2 11.8555 11.6311 11.7467 14.1962 1.87 0.37
Z-2 13.3562 12.9926 12.9275 15.3909 0.37 0.37
German EquityG A(EUR)-1 11.0783 10.6265 - - 1.84 0.34
A(EUR)-2 11.1018 10.6490 - - 1.84 0.34
I(EUR)-2 13.8508 13.2336 11.3473 - 1.05 0.30
Z(EUR)-2 14.0863 13.4084 11.4114 - 0.30 0.30
Indian BondA A-1 10.4660 10.3606 10.1482 - 1.34 0.34
A-2 11.4327 11.0181 10.1812 - 1.34 0.34
E(EUR)-1 11.0291 10.3910 10.2459 - 1.34 0.34
E(EUR)-2 12.0469 11.0496 10.2783 - 1.34 0.34
I-1 10.4668 10.3615 10.1486 - 0.80 0.30
I-2 11.5299 11.0823 10.1849 - 0.80 0.30
I(EUR)-2^ 10.3526 - - - 0.94 0.44
X-2 11.5221 11.0773 10.1844 - 0.84 0.34
Z-1 10.0346 - - - 0.30 0.30
Z-2 11.6206 11.1420 10.1889 - 0.30 0.30
Indian Equity A-2 141.4591 134.0882 123.4471 123.7859 2.12 0.38
D(GBP)-2 113.2842 103.3832 81.6221 76.4734 2.12 0.38
E(EUR)-2 17.6984 15.9670 14.7989 13.1118 2.12 0.38
I-2 154.3258 145.7139 133.0908 132.3965 1.33 0.34
R(GBP)-2 19.3596 17.5994 13.7905 12.8232 1.37 0.38
X-2 15.0843 14.2454 13.0158 12.9531 1.37 0.38
Y(EUR)-2 18.3695 16.5101 15.1885 13.3607 1.37 0.38
Z-1 13.6640 12.8369 11.8423 11.6640 0.33 0.34
Z-2 18.5310 17.4093 15.7406 15.5037 0.33 0.34
Japanese Equity A(JPY)-2 457.2982 423.3736 406.3176 389.7905 1.67 0.18
A(CHF)-2^ 282.8353 263.1557 257.5498 250.4918 1.72 0.23
A(EUR)-1^ 9.9656 - - - 1.71 0.22
Net Asset Value History

aberdeen-asset.com 09
FundShare Class
NAV per Share
31.03.17
NAV per Share
30.09.16
NAV per Share
30.09.15
NAV per Share
30.09.14
Ongoing Charges %
As at 31.03.17†
OASE % As at
31.03.17*
A(EUR)-2^ 12.3163 11.4442 11.1280 10.7423 1.71 0.22
A-2^ 12.6351 11.6685 11.2695 10.8901 1.71 0.22
D(GBP)-2 3.2854 3.2225 2.2425 2.1953 1.67 0.18
E(EUR)-2 10.4666 10.1461 - - 1.67 0.18
I(JPY)-2 101,558.8523 93,655.0538 89,167.2607 84,903.1664 0.88 0.14
I(EUR)-2^ 12.1969 11.2882 10.8793 10.4035 1.02 0.28
I-2^ 13.7231 12.6133 12.0994 11.6165 0.93 0.19
L(SGD)-2 - 10.7387 9.0870 - - -
R(GBP)-2 18.8249 18.3920 12.7030 12.3459 0.92 0.18
R(GBP)-2^ 10.7138 9.8634 9.5174 - 0.98 0.24
S(JPY)-2 25,745.1397 23,886.3016 23,022.3180 22,156.6086 2.09 0.18
S(CHF)-2^ 273.6679 255.2760 251.0583 245.4201 2.23 0.32
S(EUR)-2^ 12.0846 11.2392 10.9685 10.6254 2.16 0.25
U-2 12.8547 13.0969 10.6289 11.1334 1.67 0.18
V-2 10.6067 10.7659 8.6707 - 0.92 0.18
W(JPY)-2 10.5407 9.8058 9.5003 - 2.67 0.18
W-2^ 11.3103 10.4913 - - 2.73 0.24
X(JPY)-2 19.8877 18.3453 17.4746 16.6466 0.92 0.18
X(CHF)-2^ 9.5217 8.8312 8.5733 - 1.02 0.28
X(EUR)-2^ 12.7073 11.7533 11.3319 10.8523 1.02 0.28
X(GBP)-2^ 13.5706 12.4974 12.0864 11.5693 1.06 0.32
X-2^ 9.8038 - - - 0.96 0.22
Y(EUR)-2 17.8592 17.2517 13.9924 12.8593 0.92 0.18
Z(JPY)-2 9,762.2540 - - - 0.13 0.14
Z(GBP)-2^ 10.8526 9.9531 - - 0.19 0.20
Japanese Smaller Companies
A(JPY)-2 1,347.0741 1,217.4772 1,185.2258 1,111.1509 1.68 0.18
A(CHF)-2^ 14.6457 13.3197 13.2132 12.5601 1.82 0.32
A(EUR)-2^ 21.3264 19.3499 19.0628 18.0012 1.73 0.23
A-2^ 16.1741 14.5839 14.2913 13.4949 1.78 0.28
D(GBP)-2 9.6713 9.2586 6.5357 6.2508 1.68 0.18
I(JPY)-2 1,310.8219 1,180.0793 1,139.7474 1,060.1789 0.89 0.14
I(EUR)-2^ 14.4191 13.0306 12.7440 11.8985 0.94 0.19
I-2^ 9.3610 8.3924 8.2540 - 0.95 0.20
L(SGD)-2 11.2649 10.9314 9.3825 - 1.68 0.18
R(GBP)-2 21.9331 20.9191 14.6544 13.9104 0.93 0.18
S(JPY)-2 151,919.4499 137,590.2955 134,505.0153 126,637.0953 2.10 0.18
W(JPY)-2 10.6592 9.6816 9.5196 - 2.68 0.18
W-2^ 11.7220 10.6107 - - 2.74 0.24
X(JPY)-2 23.1651 20.8581 20.1510 18.7517 0.93 0.18
X(CHF)-2^ 9.2807 8.4050 8.2673 - 0.99 0.24
X(EUR)-2^ 14.0031 12.6590 12.4052 11.5845 1.07 0.32
X-2^ 9.9786 - - - 0.99 0.24
Z(JPY)-2 1,291.3453 1,158.1725 - - 0.14 0.14
Z-2^ 11.8135 10.5490 - - 0.20 0.20
Net Asset Value History

10 Aberdeen Global
FundShare Class
NAV per Share
31.03.17
NAV per Share
30.09.16
NAV per Share
30.09.15
NAV per Share
30.09.14
Ongoing Charges %
As at 31.03.17†
OASE % As at
31.03.17*
Latin American Equity A-2 3,532.8032 3,229.9668 2,395.3054 3,850.1975 2.09 0.34
A(EUR)-2^ 7.1507 6.6139 4.9791 8.0516 2.23 0.48
E(EUR)-2 9.3541 8.1403 6.0773 8.6318 2.09 0.34
I-2 4,294.9862 3,911.2450 2,877.5640 4,584.7261 1.30 0.30
S-2 3,491.0473 3,194.5619 2,373.2367 3,821.2475 2.26 0.34
X-2 8.3119 7.5703 5.5716 8.8880 1.34 0.34
Y(EUR)-2 10.1196 8.7726 6.5028 9.1666 1.34 0.34
Z-2 881.2379 798.5146 581.6654 918.3003 0.30 0.30
Multi Asset GrowthH A(EUR)-1 10.7891 10.3369 - - 1.59 0.34
A(EUR)-2 10.8503 10.3956 - - 1.59 0.34
A(SGD)-2^ 10.0789 - - - 1.65 0.40
I(EUR)-2 10.9063 10.4152 - - 0.95 0.30
W(EUR)-2 10.4830 10.0913 - - 2.59 0.34
X(EUR)-2 10.9027 10.4140 - - 0.99 0.34
Z(EUR)-2 10.6187 - - - 0.35 0.30
Z(GBP)-2^ 10.6865 - - - 0.41 0.36
Multi Asset IncomeI A-1 9.9391 9.7749 9.4191 - 1.58 0.34
A-4 10.3780 - - - 1.58 0.34
A(EUR)-1^ 10.2216 10.1386 - - 1.64 0.40
A(EUR)-4^ 10.2950 - - - 1.64 0.40
A(SGD)-1^ 10.0516 - - - 1.64 0.40
E(EUR)-1 10.1563 9.5032 9.2166 - 1.58 0.34
H(EUR)-1 10.2710 9.5826 9.2360 - 0.94 0.30
I-1 10.0570 9.8583 9.4390 - 0.94 0.30
I(EUR)-1^ 10.3138 10.2006 - - 1.00 0.36
I(EUR)-4^ 10.3243 - - - 1.00 0.36
W-1 10.1893 10.0669 - - 2.58 0.34
X-1 10.0497 9.8531 9.4378 - 0.98 0.34
X(EUR)-1^ 10.3064 10.1966 - - 1.04 0.40
Y(EUR)-1 10.2620 9.5760 9.2348 - 0.98 0.34
Z-1 10.3488 10.1140 9.6257 - 0.34 0.30
Multi-Manager World Equity
A(EUR)-2 17.7124 15.7689 14.9643 14.7114 2.52 0.29
I(EUR)-2 18.5548 16.4479 15.4711 15.0559 1.63 0.25
Multi-StrategyF I(EUR)-2 - - 10.2738 10.3814 - -
North American EquityJ A-2 25.4937 23.7036 21.6584 23.1861 1.73 0.23
D(GBP)-2 20.3079 18.1761 14.2423 14.2455 1.73 0.23
I-2 24.3288 22.5316 20.4256 21.6941 0.94 0.19
R(GBP)-2 18.9605 16.9074 13.1497 13.0612 0.98 0.23
X-2 14.7752 13.6885 12.4146 13.1906 0.98 0.23
Z-2 20.1692 18.6095 16.7440 17.6508 0.19 0.19
North American Smaller CompaniesK
A-2 15.0712 14.0049 11.9239 10.7597 1.75 0.25
A(EUR)-2^ 11.5175 10.7765 - - 1.81 0.31
A(SGD)-2^ 9.9959 - - - 1.81 0.31
Net Asset Value History

aberdeen-asset.com 11
FundShare Class
NAV per Share
31.03.17
NAV per Share
30.09.16
NAV per Share
30.09.15
NAV per Share
30.09.14
Ongoing Charges %
As at 31.03.17†
OASE % As at
31.03.17*
I-2 20.4915 18.9660 16.0214 14.3290 0.96 0.21
I(EUR)-2^ 9.7862 - - - 1.02 0.27
W-2 10.9804 10.2498 - - 2.75 0.25
X-2 9.6485 - - - 1.00 0.25
Responsible World Equity A-2 10.9468 10.3511 9.3833 11.4570 1.74 0.24
E(EUR)-2 15.5652 14.0081 12.7833 13.7978 1.74 0.24
I-2 11.3378 10.6915 9.6401 11.7110 1.20 0.20
X-2 11.8523 11.1794 10.0828 12.2540 1.24 0.24
Z-2 - - - 12.4509 - -
Russian Equity A(EUR)-2 9.7146 8.1977 6.4697 7.9347 2.45 0.70
I(EUR)-2 818.5662 688.0363 538.7081 655.4969 1.66 0.66
R(GBP)-2 16.4169 13.9595 - - 1.70 0.70
S(EUR)-2 9.6041 8.1114 6.4126 7.8784 2.62 0.70
X(EUR)-2 11.4316 9.6107 7.5278 9.1629 1.70 0.70
Select Emerging Markets Bond
A-1 17.9004 18.1860 16.3928 18.7999 1.71 0.20
A-2 43.4248 43.0244 36.5546 39.9454 1.71 0.20
A-3 10.6456 10.8155 - - 1.71 0.20
A(CHF)-2^ 135.8108 136.1703 117.7952 130.1349 1.76 0.25
A(CZK)-2^ 104.4565 104.9025 90.6423 99.5249 1.85 0.34
A(EUR)-1^ 8.7186 8.9400 8.1124 9.3392 1.77 0.26
A(EUR)-2^ 138.7223 138.6845 119.1351 130.7213 1.76 0.25
A(GBP)-1^ 13.0680 13.3350 - - 1.77 0.26
A(SGD)-1^ 10.1779 - - - 1.77 0.26
I-1 18.1059 18.3948 16.5786 19.0135 1.17 0.16
I-2 18.2321 18.0154 15.2219 16.5438 1.17 0.16
I(CHF)-1^ 9.4736 9.7321 8.9358 - 1.26 0.25
I(EUR)-1^ 8.8255 9.0477 8.2416 9.4897 1.22 0.21
I(EUR)-2^ - - 8.9664 9.8020 - -
L(SGD)-1 - - 9.4438 - - -
L(SGD)-2 - - 9.7104 - - -
R(GBP)-2 14.2001 13.5094 9.7931 - 1.21 0.20
W-1 10.6160 10.7853 9.7213 - 2.71 0.20
W-2 11.4001 11.3507 9.7378 - 2.71 0.20
X-1 8.9537 9.0965 8.1987 9.4028 1.21 0.20
X-2 11.2266 11.0953 9.3791 10.1968 1.21 0.20
X(EUR)-2^ 11.3693 11.3482 9.6976 10.5867 1.32 0.31
Y(EUR)-1 10.9064 10.5459 9.5692 9.6976 1.21 0.20
Y(EUR)-2 13.6754 12.8631 10.9466 10.5171 1.21 0.20
Z-1 10.0755 - - - 0.17 0.16
Z-2 47.7198 46.9180 39.2485 42.2322 0.17 0.16
Z(EUR)-2^ 11.8136 11.7198 9.9101 10.7125 0.22 0.21
Select Emerging Markets Investment Grade BondL
A-1 10.2509 10.5762 - - 1.76 0.26
A-2 10.6803 10.8683 - - 1.76 0.26
A(EUR)-1^ 10.0645 10.4808 - - 1.82 0.32
Net Asset Value History

12 Aberdeen Global
FundShare Class
NAV per Share
31.03.17
NAV per Share
30.09.16
NAV per Share
30.09.15
NAV per Share
30.09.14
Ongoing Charges %
As at 31.03.17†
OASE % As at
31.03.17*
A(EUR)-2^ 10.4783 10.7663 - - 1.82 0.32
H(EUR)-1 11.0778 10.8749 9.9875 - 1.22 0.22
H(EUR)-2 12.0251 11.6140 10.2913 - 1.22 0.22
I-1 9.6151 9.9175 9.0480 - 1.22 0.22
I-2 10.4370 10.5912 9.3227 - 1.22 0.22
I(EUR)-1^ 9.3976 9.7808 9.0153 - 1.28 0.28
Z-2 10.6808 10.7845 9.3981 - 0.22 0.22
Select Euro High Yield Bond A(EUR)-1 6.1961 6.1428 5.9902 6.1026 1.44 0.19
A(EUR)-2 22.0724 21.3929 19.9638 19.3376 1.44 0.19
A(EUR)-3 10.1863 10.0988 - - 1.44 0.19
A(GBP)-1^ 19.5708 19.3259 18.7111 18.9547 1.50 0.25
A(GBP)-2^ 36.1144 34.8786 32.3306 31.1658 1.50 0.25
A-1^ 10.3589 10.1837 9.8261 9.9674 1.49 0.24
A-2^ 16.5492 15.9105 14.7018 14.1919 1.49 0.24
A-3^ 10.3732 10.1931 - - 1.50 0.25
B(EUR)-1 6.1753 6.1223 5.9705 6.0820 2.44 0.19
D(GBP)-1 5.4123 5.4259 4.5078 4.8561 1.44 0.19
D(GBP)-2^ 14.2561 13.7820 12.7512 12.3820 1.58 0.33
I-1^ 10.1217 9.9434 9.5985 9.7439 0.99 0.29
I(EUR)-2 16.2281 15.6826 14.5486 14.0090 0.85 0.15
R(GBP)-1 11.0154 11.0448 9.1747 9.8836 0.89 0.19
W(EUR)-1 10.2020 10.1143 9.8630 - 2.44 0.19
W(EUR)-2 10.7604 10.4794 9.8764 - 2.44 0.19
W-2^ 10.6764 10.3123 - - 2.50 0.25
X(EUR)-1 10.4541 10.3641 10.1065 10.2964 0.89 0.19
X(EUR)-2 13.4495 12.9998 12.0651 11.6224 0.89 0.19
X-1^ 10.0026 - - - 0.95 0.25
X-2^ 10.0994 - - - 0.95 0.25
Z(EUR)-2 11.0357 10.6278 - - 0.15 0.15
Z(GBP)-2^ 10.7705 10.3284 - - 0.21 0.21
Select Global Credit Bond A(EUR)-1^ - 10.1944 9.7884 - - -
A(EUR)-2^ 10.2331 10.3939 9.7442 - 1.28 0.38
A-2^ 12.6256 12.7086 11.8020 11.9848 1.37 0.47
D(GBP)-1 1.6949 1.7324 1.6501 1.7249 1.23 0.33
D(GBP)-2 12.4196 12.5519 11.6460 11.7884 1.23 0.33
D-1^ 10.4465 10.6281 10.1059 10.5919 1.37 0.47
H(EUR)-2 - 9.7839 10.5912 - - -
R(GBP)-1 10.0929 10.3163 9.8258 10.2718 0.83 0.33
R(GBP)-2 11.6261 11.7265 10.8367 10.9248 0.83 0.33
Z(EUR)-2^ - - - 11.8500 - -
Select Global Investment Grade Credit BondM
A(GBP)-2 2.2244 2.2469 2.1331 2.1142 1.23 0.48
Z(GBP)-2 10.5007 10.5565 9.9271 - 0.28 0.28
Select High Yield BondN D(GBP)-1 - - 0.9649 1.0113 - -
R(GBP)-1 - - 9.3850 9.8360 - -
Net Asset Value History

aberdeen-asset.com 13
FundShare Class
NAV per Share
31.03.17
NAV per Share
30.09.16
NAV per Share
30.09.15
NAV per Share
30.09.14
Ongoing Charges %
As at 31.03.17†
OASE % As at
31.03.17*
Swiss EquityG A(CHF)-2 10.9950 10.0598 - - 1.84 0.34
E(EUR)-2 11.1283 10.0056 - - 1.84 0.34
H(EUR)-2 12.8653 11.5220 10.6233 - 1.05 0.30
I(CHF)-2 11.4501 10.4350 9.6326 - 1.05 0.30
Z(CHF)-2 11.6448 10.5729 9.6870 - 0.30 0.30
Technology Equity A-2 5.1423 4.6816 4.1948 4.4113 1.95 0.20
D(GBP)-2 4.1143 3.6058 2.7706 2.7225 1.95 0.20
I-2 19.2877 17.4689 15.4901 16.1209 0.91 0.16
R(GBP)-2 18.9437 16.5194 12.5667 12.2244 0.95 0.20
S-2 121.9239 111.0964 99.7119 105.0368 2.12 0.20
X-2 14.7542 13.3684 11.8588 12.3489 0.95 0.20
UK Equity A(GBP)-2 23.7193 22.1655 19.4073 20.6019 1.73 0.23
D(GBP)-1 19.6546 18.4285 16.4024 17.7364 1.73 0.23
R(GBP)-1 12.5592 11.7724 10.4749 11.3324 0.98 0.23
X(GBP)-2 13.8537 12.8978 11.2058 11.8098 0.98 0.23
Z(EUR)-2^ 11.0784 10.3264 8.9186 - 0.25 0.25
World Credit BondO A-1 10.2829 10.4921 - - 1.15 0.25
A-2 10.5917 10.6909 - - 1.15 0.25
A(EUR)-1^ 10.0857 10.3910 - - 1.21 0.31
A(EUR)-2^ 10.3781 10.5782 - - 1.21 0.31
D(GBP)-1^ 10.2127 10.4738 - - 1.21 0.31
D(GBP)-2^ 10.5213 10.6760 - - 1.21 0.31
H(EUR)-1 10.3629 10.0636 - - 0.66 0.21
H(EUR)-2 10.7469 10.2994 - - 0.66 0.21
I-1 10.2837 10.4928 - - 0.66 0.21
I-2 10.6636 10.7375 - - 0.66 0.21
R(GBP)-1^ 10.2101 10.4711 - - 0.76 0.31
R(GBP)-2^ 10.5825 10.7143 - - 0.76 0.31
X-1 10.2837 10.4928 - - 0.70 0.25
X-2 10.6578 10.7337 - - 0.70 0.25
Z-2 10.7295 10.7798 - - 0.21 0.21
World Equity A-2 17.8864 16.9803 15.2851 18.6827 1.69 0.19
A(EUR)-2^ - - 8.9166 - - -
C-2 13.9195 13.2804 12.0778 14.9083 2.69 0.19
D(GBP)-1 16.2866 14.8835 11.5452 13.3107 1.69 0.19
D(GBP)-2 14.3027 13.0705 10.0904 11.5241 1.69 0.19
E(EUR)-2 17.1245 15.4733 14.0232 15.1457 1.69 0.19
I-2 12.3004 11.6462 10.4273 12.6769 1.15 0.15
L (SGD)-2 - - 8.7123 - - -
R(GBP)-1 14.0995 12.8527 9.9672 11.5144 1.19 0.19
R(GBP)-2 14.9376 13.6167 10.4588 11.8845 1.19 0.19
X-2 11.6370 11.0198 9.8703 11.9916 1.19 0.19
Y(EUR)-2 14.1733 12.7742 11.5192 12.3789 1.19 0.19
Z-2 20.7987 19.5938 17.3682 20.9037 0.15 0.15
Net Asset Value History
14 Aberdeen Global
FundShare Class
NAV per Share
31.03.17
NAV per Share
30.09.16
NAV per Share
30.09.15
NAV per Share
30.09.14
Ongoing Charges %
As at 31.03.17†
OASE % As at
31.03.17*
World Equity DividendPQ A-1 - - 8.4965 10.9979 - -
E(EUR)-1 - - 10.1984 11.6644 - -
X-1 - - 8.1994 10.5476 - -
Y(EUR)-1 - - 9.5139 10.8854 - -
World Government Bond A-1 9.1491 9.5938 9.1190 9.8198 1.23 0.22
A-2 9.9392 10.3639 9.7403 10.2971 1.23 0.22
E(EUR)-1 11.7715 11.7481 11.2424 10.6979 1.23 0.22
E(EUR)-2 12.5572 12.4620 11.7850 11.0111 1.23 0.22
I-1 9.1428 9.5870 9.1114 9.8130 0.69 0.18
I-2 10.1335 10.5381 9.8450 10.3527 0.69 0.18
World Resources Equity A-2 11.4218 10.5531 9.0566 13.6053 1.72 0.22
A(CHF)-2^ 8.0256 7.5148 6.5879 10.0408 1.80 0.30
A(EUR)-2^ 11.1843 10.4439 9.0898 13.7464 1.82 0.32
E(EUR)-2 10.6855 9.3963 8.1182 10.7758 1.72 0.22
I-2 2,279.1482 2,100.0734 1,792.7259 2,678.6965 1.18 0.18
S-2 11.1056 10.2821 8.8611 13.3677 2.14 0.22
S(EUR)-2^ 10.9044 10.2053 8.9189 13.5558 2.21 0.29
X-2 8.9201 8.2208 7.0195 10.4922 1.22 0.22
Y(EUR)-2 10.8641 9.5299 8.1927 10.8210 1.22 0.22
World Smaller Companies A-2 13.6753 13.4185 11.5202 12.5148 1.80 0.30
E(EUR)-2 15.9091 14.8575 12.8422 12.3249 1.80 0.30
I-2 13.9945 13.6949 11.6942 12.6346 1.26 0.26 † Source: Aberdeen Asset Management. Calculated in accordance with the European Securities and Markets Authority (ESMA) guidelines. The ongoing charges figure (OCF) is the total expenses paid by each share class annualised against its average net asset value. This includes the annual management charge, the other operating expenses and any synthetic element to incorporate the ongoing charges of any underlying collective investments. The OCF can fluctuate as underlying costs change. Where underlying costs have changed, the OCF disclosed in the Key Investor Information Document will be updated to reflect current changes.
* Operating, Administrative and Servicing Expenses (OASE) Gross Rate. ^ Base currency exposure share class. A First net asset value calculated on 1 September 2015. B First net asset value calculated on 16 March 2015. C First net asset value calculated 23 November 2015. D Fund closed on 29 February 2016. E Name changed on 1 January 2014 (formerly named European Equity Income). F Fund closed on 16 December 2015. G First net asset value calculated on 29 December 2014. H First net asset value calculated on 13 June 2016. I First net asset value calculated on 1 June 2015. J Name changed on 1 January 2014 (formerly named American Equity). K Name changed on 1 January 2014 (formerly named American Smaller Companies). L First net asset value calculated on 2 December 2014. M Name changed on 1 November 2013 (formerly Select Sterling Financials Bond). N Fund closed on 22 September 2016. O First net asset value calculated on 9 November 2015. P Name changed on 1 January 2014 (formerly named World Equity Income). Q Fund closed on 22 February 2016.
Net Asset Value History

aberdeen-asset.com 15
Exchange Rates 31.03.17 30.09.16 30.09.15 30.09.14
£ - US$ 1.250450 1.299000 1.514750 1.621150
US$ - AUD 1.310848 1.306774 1.423998 1.142769
£ - € 1.169100 1.155900 1.356999 1.283350
€ - US$ 1.069583 1.123800 1.116250 1.263217
€ - CHF 1.070567 1.089411 1.090715 1.206997
JPY - CHF 0.008982 0.009573 0.008159 0.008710
US$ - JPY 111.430000 101.265012 119.760479 109.695000
Net Asset Value History

16 Aberdeen Global
Summary of Historic Information
Fund Base Currency
Net Asset Value 31.03.17
(‘000)
Net Asset Value 30.09.16
('000)
Net Asset Value 30.09.15
('000)
Net Asset Value 30.09.14
('000)
Asia Pacific Equity US Dollars 3,383,890 3,656,001 5,111,659 8,312,008
Asian Credit BondA US Dollars 29,185 30,021 14,989 -
Asian Local Currency Short Duration Bond US Dollars 172,746 205,083 565,687 728,225
Asian Property Share US Dollars 51,572 49,834 61,002 96,421
Asian Smaller Companies US Dollars 1,811,897 1,986,071 2,113,003 4,362,278
Australasian Equity Australian Dollars 82,678 73,783 65,988 62,950
Brazil Bond US Dollars 36,763 37,692 41,194 61,950
Brazil Equity US Dollars 27,889 22,240 13,031 30,034
China A Share EquityB US Dollars 597,147 294,179 1,839 -
Chinese Equity US Dollars 628,226 623,412 1,023,097 2,389,912
Eastern European Equity Euro 49,946 54,043 49,682 63,213
Emerging Markets Corporate Bond US Dollars 305,277 243,937 243,320 364,241
Emerging Markets Equity US Dollars 6,257,015 6,348,273 5,582,960 8,931,853
Emerging Markets Infrastructure Equity US Dollars 188,723 243,796 216,898 428,236
Emerging Markets Local Currency Bond US Dollars 183,247 183,958 213,088 356,233
Emerging Markets Local Currency Corporate BondC US Dollars 7,597 7,277 - -
Emerging Markets Smaller Companies US Dollars 1,123,282 1,217,309 1,215,400 2,077,908
Ethical World EquityD US Dollars - - 31,496 134,493
European Equity Euro 197,079 199,417 257,253 302,033
European Equity DividendE Euro 67,287 72,266 85,852 142,187
European Equity (Ex UK) Euro 113,457 110,354 55,688 32,216
Flexible EquityF Euro - - 3,694 6,206
Frontier Markets Bond US Dollars 86,308 77,426 96,893 100,845
Frontier Markets Equity US Dollars 197,039 234,907 277,536 317,160
German EquityG Euro 1,816 1,732 1,479 -
Indian BondA US Dollars 153,137 79,859 58,739 -
Indian Equity US Dollars 3,337,188 3,560,312 4,095,942 5,154,344
Japanese Equity Japanese Yen 352,234,034 312,313,293 373,449,600 223,826,017
Japanese Smaller Companies Japanese Yen 80,185,281 72,319,806 115,659,229 101,441,126
Latin American Equity US Dollars 544,611 480,986 229,710 1,305,659
Multi Asset GrowthH Euro 27,258 20,782 - -
Multi Asset IncomeI US Dollars 39,416 27,221 18,881 -
Multi-Manager World Equity Euro 17,872 17,450 18,322 33,855
Multi-StrategyF Euro - - 8,860 8,989
North American EquityJ US Dollars 140,406 132,817 140,176 153,478
North American Smaller CompaniesK US Dollars 464,047 251,447 61,998 53,803
Responsible World Equity US Dollars 8,341 9,147 23,165 154,975
Russian Equity Euro 19,861 17,934 16,099 20,111
Select Emerging Markets Bond US Dollars 1,633,342 1,624,372 1,736,244 2,953,279
Select Emerging Markets Investment Grade BondL US Dollars 93,873 100,724 83,169 -
Select Euro High Yield Bond Euro 1,054,564 999,247 646,174 623,568
Select Global Credit Bond Sterling 45,255 48,249 43,949 52,748
Select Global Investment Grade Credit BondM Sterling 25,657 25,498 23,122 21,983
Select High Yield BondN Sterling - - 37,355 46,854

aberdeen-asset.com 17
Fund Base Currency
Net Asset Value 31.03.17
(‘000)
Net Asset Value 30.09.16
('000)
Net Asset Value 30.09.15
('000)
Net Asset Value 30.09.14
('000)
Swiss EquityG Swiss Franc 1,747 1,590 1,464 -
Technology Equity US Dollars 178,833 169,256 233,962 310,347
UK Equity Sterling 38,604 37,838 36,514 38,616
World Credit BondO US Dollars 9,601 9,917 - -
World Equity US Dollars 645,016 895,316 1,241,429 2,995,325
World Equity DividendPQ US Dollars - - 60,293 76,949
World Government Bond US Dollars 427,356 324,307 250,723 235,041
World Resources Equity US Dollars 111,296 104,789 111,896 197,676
World Smaller Companies US Dollars 23,678 14,457 13,743 18,638
Consolidated Total US Dollars 28,634,577 28,925,762 30,804,381 47,137,596A First net asset value calculated on 1 September 2015.B First net asset value calculated on 16 March 2015.C First net asset value calculated 23 November 2015.D Fund closed on 29 February 2016.E Name changed on 1 January 2014 (formerly named European Equity Income).F Fund closed on 16 December 2015.G First net asset value calculated on 29 December 2014.H First net asset value calculated on 13 June 2016.I First net asset value calculated on 1 June 2015.J Name changed on 1 January 2014 (formerly named American Equity).K Name changed on 1 January 2014 (formerly named American Smaller Companies).L First net asset value calculated on 2 December 2014.M Name changed on 1 November 2013 (formerly Select Sterling Financials Bond).N Fund closed on 22 September 2016.O First net asset value calculated on 9 November 2015.P Name changed on 1 January 2014 (formerly named World Equity Income).Q Fund closed on 22 February 2016.
Summary of Historic Information

18 Aberdeen Global
Performance History
FundBase Currency
31.03.17 %
30.09.16 %
30.09.15 %
30.09.14 %
30.09.13 %
Asia Pacific Equity - A Accumulation Shares USD 7.44 11.32 (18.65) 4.64 2.40
Benchmark: MSCI AC Asia Pacific Ex Japan Index USD 7.35 18.40 (14.23) 6.21 7.40
Asian Credit Bond - A Income SharesA USD (0.88) 9.78 (0.08) - -
Benchmark: JP Morgan Asia Credit Index USD (0.53) 10.55 0.03 - -
Asian Local Currency Short Duration Bond - A Income Shares USD (1.48) 4.77 (7.27) 0.65 (0.87)
Benchmark: iBoxx Asia Ex Japan Sovereign 1-3 years Index USD (1.10) 6.32 (6.76) 2.13 0.82
Asian Property Share - A Accumulation Shares USD 4.76 9.36 (18.37) 0.35 6.13
Benchmark: MSCI AC Asia Pacific Real Estate Index USD (0.20) 17.62 (6.76) (3.70) 16.22
Asian Smaller Companies - A Accumulation Shares USD 4.81 9.13 (22.51) 8.02 10.35
Benchmark: MSCI AC Asia Pacific Ex Japan Small Cap Index USD 4.00 15.44 (13.98) 6.93 8.34
Australasian Equity - A Accumulation Shares AUD 7.96 10.51 3.36 4.81 13.06
Benchmark: Australia Stock Exchange All Ordinaries Index AUD 9.11 14.01 (0.16) 5.89 23.55
Brazil Bond - A Accumulation Shares USD 9.28 44.45 (33.45) (1.51) (4.94)
Benchmark: Brazil CETIP Rate Accumulated Index USD 8.85 39.89 (30.75) 0.25 (2.11)
Brazil Equity - A Accumulation Shares USD 8.60 55.92 (45.10) (11.19) (4.76)
Benchmark: MSCI Brazil 10/40 Index USD 10.77 60.43 (46.92) (3.01) (5.47)
China A Share Equity - A Accumulation SharesB USD 9.96 2.96 (11.95) - -
Benchmark: MSCI China A TR Index USD 0.69 (3.28) (13.20) - -
Chinese Equity - A Accumulation Shares USD 9.59 8.20 (13.52) (1.80) 6.62
Benchmark: MSCI Zhong Hua Index USD 4.47 14.92 (4.46) 5.03 13.22
Eastern European Equity - A Accumulation Shares EUR 9.51 15.89 (10.79) (6.83) 8.55
Benchmark: MSCI Emerging Markets Europe 10/40 NR Index EUR 16.71 8.30 (18.56) (6.97) (1.03)
Emerging Markets Corporate Bond - A Accumulation Shares USD 2.37 12.37 (4.08) 8.15 (0.44)
Benchmark: JP Morgan Corporate EMBI Broad Diversified Index USD 1.62 11.61 (0.38) 8.33 0.26
Emerging Markets Equity - A Accumulation Shares USD 5.26 18.80 (20.18) 1.99 (1.41)
Benchmark: MSCI Emerging Markets Index USD 6.93 17.21 (18.98) 4.66 1.33
Emerging Markets Infrastructure Equity - S Accumulation Shares USD 5.04 14.91 (25.71) 5.81 (3.14)
Benchmark: MSCI EM Infrastructure Index USD 2.78 8.70 (21.26) 8.80 (0.78)
Emerging Markets Local Currency Bond - A Accumulation Shares USD 0.63 16.36 (22.91) (3.13) (7.13)
Benchmark: JP Morgan GBI EM Global Diversified Index USD 0.01 17.06 (19.77) (1.54) (3.74)

aberdeen-asset.com 19
FundBase Currency
31.03.17 %
30.09.16 %
30.09.15 %
30.09.14 %
30.09.13 %
Emerging Markets Local Currency Corporate Bond - A Accumulation SharesC
USD 4.79 9.81 - - -
Benchmark: Bank of America Merrill Lynch Diversified Broad Local Emerging Markets Non-Sovereign Index
USD 2.80 5.62 - - -
Emerging Markets Smaller Companies - A Accumulation Shares USD 0.08 16.50 (20.44) 2.03 7.78
Benchmark: MSCI Global Emerging Markets Small Cap Index USD 6.06 12.95 (14.99) 9.16 5.19
Ethical World Equity - A Accumulation SharesD USD - (3.90) (18.86) 5.50 14.41
Benchmark: FTSE World Index USD - (1.49) (5.79) 12.06 19.38
European Equity - A Accumulation Shares EUR 10.00 1.94 (3.24) 8.02 13.82
Benchmark: FTSE Europe Index EUR 12.54 2.47 3.31 13.83 18.74
European Equity Dividend - A Accumulation SharesE EUR 8.55 2.20 (4.50) 9.77 12.57
Benchmark: MSCI Europe Index EUR 12.66 2.43 3.15 13.98 18.75
European Equity (Ex UK) - A Accumulation Shares EUR 8.64 4.67 0.44 8.02 15.16
Benchmark: FTSE World Europe Ex UK Index EUR 13.91 3.18 4.46 13.94 22.31
Flexible Equity - A Accumulation SharesFG EUR - 0.96 (1.85) 3.84 3.59
Benchmark: Composite Benchmark being 50% EONIA (Euro Overnight Index Average) Index and 50% MSCI World (Hedged EUR) NR Index
EUR - 3.25 (0.50) 7.39 2.38
Dealing days fall on every Wednesday of each calendar month which may cause a timing discrepancy between the performance period for the fund vs the benchmark and the peer group.
Frontier Markets Bond - A Income SharesH USD 3.76 17.14 (6.66) 12.67 0.00
Benchmark: JP Morgan Next Generation Markets Index (NEXGEM) USD 1.89 19.89 (1.84) 17.48 (0.01)
Dealing days fall on every Wednesday of each calendar month which may cause a timing discrepancy between the performance period for the fund vs benchmark and the peer group
Frontier Markets Equity - I Accumulation Shares USD 1.94 (0.59) (17.42) 12.57 19.12
Benchmark: MSCI Frontier Markets Index USD 9.64 1.37 (23.85) 30.49 22.16
Dealing days fall on the Business Day which falls on the first and third Wednesday of each calendar month to 17 June 2015 and thereafter on the 15th (or next business day if this is a weekend) and last business day of each calendar month. This may cause a timing discrepancy between the performance period for the fund vs the benchmark and the peer group
German Equity - A Accumulation SharesI EUR 5.14 5.25 13.66 - -
Benchmark: HDAX TR Index EUR 16.19 (3.76) 0.87 - -
Indian Bond - A Accumulation SharesAJ USD 3.69 8.29 1.80 - -
Benchmark: Markit iBoxx Asia India Index USD 5.27 10.65 1.90 - -
Performance History

20 Aberdeen Global
FundBase Currency
31.03.17 %
30.09.16 %
30.09.15 %
30.09.14 %
30.09.13 %
Indian Equity - A Accumulation Shares USD 5.48 8.69 (0.24) 38.67 (8.68)
Benchmark: MSCI India Index USD 7.77 6.14 (5.90) 37.61 (12.42)
Japanese Equity - A Accumulation Shares JPY 8.01 4.20 4.25 15.83 52.16
Benchmark: Topix (Tokyo First Section) Index JPY 15.60 (4.15) 8.42 13.32 65.04
Japanese Smaller Companies - A Accumulation Shares JPY 10.64 3.02 3.30 7.23 30.03
Benchmark: Russell Nomura Small Cap Index JPY 17.25 0.07 9.78 2.71 28.14
Latin American Equity - A Accumulation Shares USD 10.83 37.92 (39.51) (9.94) (2.64)
Benchmark: MSCI EM Latin America 10/40 NR Index USD 11.07 28.65 (38.65) (1.04) (7.22)
Multi Asset Growth - A Accumulation SharesK EUR 4.53 3.83 - - -
Benchmark: 1 Month Euribor +4.5% Index EUR 2.06 1.13 - - -
Multi Asset Income - A Income SharesL USD 4.15 8.66 (4.58) - -
Benchmark: No official benchmark USD N/A N/A N/A - -
Multi-Manager World Equity - A Accumulation Shares EUR 11.05 8.14 (0.34) 14.06 13.87
Benchmark: MSCI AC World Net Return Index EUR 13.66 11.21 5.63 19.29 11.89
Multi-Strategy - I Accumulation SharesGM EUR - 0.00 (0.76) 0.85 2.70
Benchmark: EONIA (Euro Overnight Index Average) +2.5% Index EUR - 0.39 2.43 2.63 2.37
Dealing days fall on every Wednesday of each calendar month which may cause a timing discrepancy between the performance period for the fund vs benchmark and the peer group
North American Equity - A Accumulation SharesN USD 8.74 10.44 (8.68) 10.61 17.97
Benchmark: S&P 500 Index (1 day lag) USD 11.25 16.71 (2.75) 19.34 19.52
North American Smaller Companies - A Accumulation SharesO USD 8.44 17.82 9.23 9.54 29.50
Benchmark: Russell 2000 Index (1 day lag) USD 12.48 15.96 (1.74) 5.42 29.17
Responsible World Equity - A Accumulation Shares USD 6.24 10.81 (18.86) 8.79 12.38
Benchmark: MSCI World Index USD 8.63 12.02 (4.57) 12.80 20.90
Russian Equity - A Accumulation Shares EUR 18.88 27.59 (19.50) (11.46) 0.82
Benchmark: MSCI Russia 10/40 Index EUR 20.06 25.72 (11.53) (10.90) (4.32)
Select Emerging Markets Bond - A Accumulation Shares USD 1.13 18.22 (9.05) 6.35 (2.90)
Benchmark: JP Morgan EMBI Global Diversified Index USD (0.31) 16.20 (0.62) 9.67 (4.06)
Select Emerging Markets Investment Grade Bond - H Accumulation SharesP
EUR 3.05 14.99 1.73 - -
Benchmark: JP Morgan EMBI Global Diversified Investment Grade Index
EUR 3.17 13.28 7.38 - -
Performance History

aberdeen-asset.com 21
FundBase Currency
31.03.17 %
30.09.16 %
30.09.15 %
30.09.14 %
30.09.13 %
Select Euro High Yield Bond - A Accumulation SharesQ EUR 3.12 7.18 3.06 6.21 12.54
Benchmark: Bank of America Merrill Lynch Euro High Yield Constrained TR Index
EUR 3.54 8.48 0.18 9.94 13.93
Select Global Credit Bond - D Income Shares GBP (1.57) 7.94 (1.06) 7.89 2.84
Benchmark: Barclays Global Aggregate - Credit (Hedged GBP 100%) Index
GBP (1.52) 8.07 1.89 6.94 0.49
Select Global Investment Grade Credit Bond - A Accumulation SharesR
GBP (1.19) 5.42 0.99 4.21 0.40
Benchmark: Barclays Global Aggregate Credit 1-10 years (Hedged GBP) Index
GBP (0.74) 5.58 2.08 5.43 7.60
Select High Yield Bond - D Income SharesST GBP - 18.80 0.87 1.37 17.13
Benchmark: Bank of America Merrill Lynch European Currency High Yield Constrained Index
GBP - 23.78 (3.54) 2.46 17.86
Swiss Equity - I Accumulation SharesI CHF 10.11 7.49 (3.64) - -
Benchmark: Swiss Performance Index TR CHF 8.49 2.34 (2.51) - -
Technology Equity - A Accumulation Shares USD 9.26 13.86 (6.19) 8.82 11.40
Benchmark: Merrill Lynch Technology 100 CR Index USD 12.21 21.29 1.07 15.88 30.02
UK Equity - A Accumulation Shares GBP 7.60 13.95 (6.41) 1.42 17.17
Benchmark: FTSE All-Share Index GBP 8.07 16.82 (2.30) 6.09 18.93
World Credit Bond - A Income SharesU USD (1.22) 7.20 - - -
Benchmark: Barclays Global Aggregate Credit (Hedged USD 100%) Index
USD (1.08) 8.19 - - -
World Equity - A Accumulation Shares USD 5.75 11.55 (18.81) 7.08 11.83
Benchmark: MSCI World Index USD 8.63 12.02 (4.57) 12.80 20.90
World Equity Dividend - E Income SharesV EUR - 1.25 (11.66) 9.94 2.62
Benchmark: MSCI World Index EUR - 0.48 8.00 20.87 14.91
World Government Bond - A Accumulation SharesH USD (4.09) 6.39 (5.35) 2.85 0.01
Benchmark: Barclays Capital Global Treasury Universal GDP weighted by country Index
USD (4.26) 9.30 (5.20) 1.15 0.05
World Resources Equity - A Accumulation Shares USD 9.16 16.57 (34.25) 3.56 (2.46)
Benchmark: S&P Global Natural Resources Index USD 9.81 24.71 (30.76) 3.08 (1.49)
World Smaller Companies - A Accumulation Shares USD 2.52 15.98 (7.95) 3.54 12.28
Benchmark: MSCI World Small Cap Index USD 8.36 14.89 (1.34) 7.01 28.22
Performance History

22 Aberdeen Global
Performance basis is detailed within the Manager’s review.Past performance is no indication of current or future performance. These performance data do not take account of the commissions and costs incurred on the issue and redemption of shares.Performance is calculated at 30 September each year unless otherwise stated.The MSCI information may only be used for your internal use, may not be reproduced or redisseminated in any form and may not be used as a basis for or a component of any financial instruments or products or indices. None of the MSCI information is intended to constitute investment advice or a recommendation to make (or refrain from making) any kind of investment decision and may not be relied on as such. Historical data and analysis should not be taken as an indication or guarantee of any future performance analysis, forecast or prediction.The MSCI information is provided on an “as is” basis and the user of this information assumes the entire risk of any use made of this information. MSCI, each of its affiliates and each other person involved in or related to compiling, computing or creating any MSCI information (collectively, the “MSCI Parties”) expressly disclaims all warranties (including, without limitation, any warranties of originality, accuracy, completeness, timeliness, non-infringement, merchantability and fitness for a particular purpose) with respect to this information.Without limiting any of the foregoing, in no event shall any MSCI Party have any liability for any direct, indirect, special, incidental, punitive, consequential (including, without limitation, lost profits) any other damages. (www.msci.com)
A First net asset value calculated on 1 September 2015.B First net asset value calculated on 16 March 2015.C First net asset value calculated on 23 November 2015.D Fund closed on 29 February 2016. Figures shown for 2016 are from 1 October 2015 to 29 February 2016.E Name changed on 1 January 2014 (formerly named European Equity Income).F First net asset value calculated on 17 June 2013.G Fund closed on 16 December 2015. Figures shown for 2016 are from 1 October 2015 to 16 December 2015.H First net asset value calculated on 25 September 2013.I First net asset value calculated on 29 December 2014.J From 1 September 2015 to 31 March 2016 the benchmark was HSBC Asian Local Bond (ALBI) India Local Currency Government Bond Index and from 1 April 2016 to 31 December 2016 the benchmark was Market iBoxx ALBI India Index.K First net asset value calculated on 13 June 2016.L First net asset value calculated on 1 June 2015.M First net asset value calculated on 31 October 2012.N Name changed on 1 January 2014 (formerly named American Equity). To 30 April 2013 the benchmark was S&P 500 Index.O Name changed on 1 January 2014 (formerly named American Smaller Companies). To 30 April 2013 the benchmark was Russell 2000 Index.P First net asset value calculated on 2 December 2014.Q To 31 March 2014 the benchmark was JP Morgan Euro High Yield Index.R To 31 October 2013 the benchmark was iBoxx Sterling Corporate Financials 1-5 years Index. Changed name from Select Sterling Financials Bond to Select Global Investment Grade Credit Bond effective 1 November 2013.S To 30 April 2013 the benchmark was 70% Merrill Lynch Euro High Yield Constrained Index and 30% Merrill Lynch Sterling High Yield Index.T Fund closed on 22 September 2016. Figures shown for 2016 are from 1 October 2015 to 22 September 2016.U First net asset value calculated on 9 November 2015.V Name changed on 1 January 2014 (formerly named World Equity Income). Fund closed on 22 February 2016. Figures shown for 2016 are from 1 October 2015 to 22 February 2016.
Performance History

aberdeen-asset.com 23
Aberdeen Global - Combined Statements
Statement of Net AssetsAs at 31 March 2017
Notes US$’000
Assets
Investments in securities at market value 2.2 27,904,760
Cash at bank 802,679
Amounts held at futures clearing houses and brokers 1,919
Interest and dividends receivable 130,607
Subscriptions receivable 127,246
Receivable for investments sold 58,506
Unrealised gains on future contracts 2.7 130
Unrealised gains on forward currency exchange contracts 2.6 12,798
Other assets 17,675
Total assets 29,056,320
Liabilities
Bank overdraft 145
Payable for investments purchased 112,794
Taxes and expenses payable 31,295
Redemptions payable 239,568
Unrealised losses on future contracts 2.7 25
Unrealised losses on forward currency exchange contracts 2.6 28,654
Other liabilities 9,262
Total liabilities 421,743
Net assets at the end of the period 28,634,577
Statement of Changes in Net Assets For the period from 1 October 2016 to 31 March 2017
Notes US$’000
Net assets at the beginning of the period 28,925,762
Exchange rate effect on opening net assets (433,093)
Net gains from investments 95,502
Net realised gains 354,652
Net unrealised gains 1,089,844
Proceeds from shares issued 5,804,516
Payments for shares redeemed (7,173,713)
Net equalisation paid 10 (489)
Dividends paid 5 (30,306)
Capacity management charge 15 1,108
Redemption charge 14 767
Unclaimed monies 27
Net assets at the end of the period 28,634,577
Statement of Operations For the period from 1 October 2016 to 31 March 2017
Notes US$’000
Income
Investment income 2.3 274,501
Stocklending income 16 3,324
Bank interest 579
Other income 34
Total income 278,438
Expenses
Management fees 4.2 147,892
Operating, administrative and servicing fees 4.3 35,838
Less: Volume discount applied 4.3 (1,292)
Net operating, administrative and servicing fees 4.3 34,546
Distribution fees 4.1 153
Other operational expenses 286
Bank interest 59
Total expenses 182,936
Net gains from investments 95,502
Realised gains on investments 283,404
Realised gains on future contracts 1,380
Realised gains on forward currency exchange contracts 71,787
Realised currency exchange losses (1,919)
Net realised gains 354,652
Increase in unrealised appreciation on investments 1,096,636
Decrease in unrealised depreciation on future contracts 153
Increase in unrealised depreciation on forward foreign exchange contracts (6,773)
Unrealised currency exchange losses (172)
Net unrealised gains 1,089,844
Net increase in assets as a result of operations 1,539,998
The accompanying notes form an integral part of these financial statements.

24 Aberdeen Global
Asia Pacific EquityFor the six months ended 31 March 2017
Performance For the six months ended 31 March 2017, the value of Asia Pacific Equity – A Accumulation Shares increased by 7.44% compared to an increase of 7.35% in the benchmark, the MSCI AC Asia Pacific Ex-Japan Index.Source: Lipper, Basis: total return, published NAV to NAV, net of annual charges, gross income reinvested, USD.Please see the Performance History section for details on the use of MSCI information.
Please remember that past performance is not a guide to future returns. The price of shares and the revenue from them may fall as well as rise. Investors may not get back the amount originally invested.
Market reviewAsian equity markets overcame a tentative start and ended with healthy gains over the review period. Risk appetite was weak at first, owing to uncertainty over Donald Trump’s surprise US election win, a hard Brexit for the UK and the US Federal Reserve’s (Fed) hint at three more hikes after raising rates. All this deepened concerns over increased volatility across Asian markets, with headwinds also emanating from China. At the start of 2017, a strengthening global economy and expectations of a gradual Fed tightening boosted risk appetite. The Fed maintained a cautious outlook after it tightened policy as widely expected in March. Markets also bounced back swiftly from a late sell-off caused by doubts over Trump’s ability to advance his economic agenda following the failure to overhaul health care.
Portfolio reviewThe Fund’s outperformance was mainly due to positive stock selection in Hong Kong, Australia and Singapore.
In Hong Kong, Jardine Strategic had a good run, driven by its inclusion in the MSCI World Index and expectations that its subsidiaries’ fundamentals will continue to improve. Astra International should benefit from the recovery in Indonesia’s automotive market, while Dairy Farm International has been delivering on margin improvements by closing underperforming stores and increasing its fresh food segment. HSBC was a key beneficiary of rising interest rates, which should be positive for net interest margins. The bank’s sustained share buybacks underscore its commitment to return value to shareholders. The contributions from Jardine Strategic and HSBC more than offset the drag on performance from Swire Pacific’s soft annual results, which were hampered by both its airline subsidiary Cathay Pacific and marine business Swire Pacific Offshore. After a strategic review, management will cut 30% from staff costs at the airline’s Hong Kong headquarters. Despite these current challenges, we think that several key parts of the Swire group remain robust, some of its numbers have stayed resilient and valuations continue to be attractive.
In Australia, miner Rio Tinto benefited from an improving commodity outlook, and announced the disposal of non-core coal assets to further strengthen its balance sheet. Biotech firm CSL upgraded its profit forecast on the back of robust earnings from its immunoglobulin and specialty products. The companies’ positive returns compensated for our lack of exposure to domestic lenders, which performed well. Most Australian lenders operate in a low-growth environment and we prefer banks elsewhere in the region that have more diverse regional exposure and revenue streams, more stable sources of funding, better growth opportunities and attractive valuations.
Meanwhile, shares of our Singapore bank holdings DBS, United Overseas Bank and Oversea-Chinese Banking rebounded, after being weighed down for much of 2016 amid concerns over their exposure to problems in the oil and gas sector. Those worries dissipated late last year after the recovery in the oil price. The lenders also benefited from the recent easing of some property curbs, although the tweaks to seller’s stamp duty and total debt-servicing ratio are unlikely to provide an immediate boost to transaction volumes or prices. Their contributions outweighed the drag on performance from Singapore Telecommunications, which posted a decline in net income, owing to weakness in Australia arising from regulatory changes and stiffer competition.
In significant portfolio activity, we initiated a position in Hindustan Unilever, the Indian subsidiary of Anglo-Dutch consumer goods giant Unilever. Besides having a strong balance sheet, Hindustan Unilever has an unrivalled portfolio of brands, an extensive distribution network nationwide, as well as a long and successful operational track record locally.
We responded to Yum Brands’ restructuring by exiting the holding in favour of its newly-listed China subsidiary, Yum China. This subsidiary is one of the largest restaurant operators on the mainland, running the KFC and Pizza Hut chains. It has a net cash balance sheet and a highly cash generative business, and trades at an attractive valuation.
We also increased our position in the Aberdeen Global – China A Share Equity Fund, which provides diversified exposure to the domestic economy. In South Korea, we continued to build our position in search engine Naver. It posted robust growth, driven by mobile and shopping advertisements. We continue to see good traction in the domestic business as the company leverages its market leadership and extends its lead into e-commerce and search advertising sector. While the results of its mobile messenger subsidiary, Line Corp, were tepid, this was within our expectations. We continue to see this as an added value for Naver, should Line succeed in monetising its regional user base.
OutlookAsia, along with the broader emerging markets, has made stellar gains over the period. Capital is rotating back to the region, partly because valuations in the US appear stretched following Donald Trump’s election victory, and partly owing to expectations that Asia will benefit from the brightening global economic outlook. Exports across the region have bounced, and earnings growth is on the mend, led by some of the worst hit sectors, such as commodities.
But as encouraging as these developments are, caution is merited. Geopolitical risks abound, particularly on the Korean Peninsula. South Korea’s deployment of the US missile defence system has ratcheted tension with China, while North Korea’s nuclear defiance is causing consternation among neighbouring nations. News of the US military strike against Syria also serves as a reminder that many of the simmering crises elsewhere can flare up quickly, with potentially negative impact on financial markets. Meanwhile, a marked improvement in US economic data could prompt the Fed to tighten policy more aggressively than expected. Above all, President Trump’s unpredictable actions will hold sway, with investors focused on his stance on protectionism, and whether the administration can deliver on campaign promises of tax cuts and fiscal stimulus that have

aberdeen-asset.com 25
Asia Pacific EquityFor the six months ended 31 March 2017
supported global equities since November. That said, we are bottom-up investors, whose focus remains on companies. We are confident that the robust fundamentals and the inherent quality of our holdings will stand them in good stead for the challenges over the long run.
Asian Equities Team April 2017

26 Aberdeen Global
Asia Pacific Equity
Statement of Net AssetsAs at 31 March 2017
Notes US$'000AssetsInvestments in securities at market value 2.2 3,317,307 Cash at bank 51,741 Interest and dividends receivable 11,655 Subscriptions receivable 10,330 Receivable for investments sold 1,146 Unrealised gains on forward currency exchange contracts 2.6 499 Other assets 6,712 Total assets 3,399,390 LiabilitiesTaxes and expenses payable 5,337 Redemptions payable 10,163 Total liabilities 15,500 Net assets at the end of the period 3,383,890
Statement of Changes in Net Assets For the period from 1 October 2016 to 31 March 2017
Notes US$'000Net assets at the beginning of the period 3,656,001 Net losses from investments (11,272) Net realised gains 68,377 Net unrealised gains 170,393 Proceeds from shares issued 209,198 Payments for shares redeemed (708,807) Net assets at the end of the period 3,383,890
Statement of Operations For the period from 1 October 2016 to 31 March 2017
Notes US$'000IncomeInvestment income 2.3 19,768 Bank interest 49 Stocklending income 16 29 Total income 19,846 ExpensesManagement fees 4.2 27,097
Operating, administrative and servicing fees 4.3 4,115 Less: Volume discount applied 4.3 (168) Net operating, administrative and servicing fees 4.3 3,947
Distribution fees 4.1 39 Other operational expenses 35 Total expenses 31,118 Net losses from investments (11,272)
Realised gains on investments 72,413 Realised losses on forward currency exchange contracts (3,529) Realised currency exchange losses (507) Net realised gains 68,377
Increase in unrealised appreciation on investments 169,755 Decrease in unrealised depreciation on forward currency exchange contracts 638 Net unrealised gains 170,393 Net increase in assets as a result of operations 227,498

aberdeen-asset.com 27
Asia Pacific Equity
Share Transactions For the period from 1 October 2016 to 31 March 2017
A-1 A-2 A(CZK)-2^ A(EUR)-1^ A(EUR)-2^ B-2Shares outstanding at the beginning of the period 1,076,847 36,833,455 33,262 - 3,629,816 85,535 Shares issued during the period 86,462 1,600,016 5,707 60,000 466,771 - Shares redeemed during the period (126,676) (5,279,233) (1,783) - (1,348,519) (8,653) Shares outstanding at the end of the period 1,036,633 33,154,238 37,186 60,000 2,748,068 76,882 Net asset value per share 9.9269 72.1452 1,125.8200 11.2612 9.8215 56.5952
C-2 D(GBP)-2 E(EUR)-2 I-1 I-2 I(EUR)-I^
Shares outstanding at the beginning of the period 283,031 2,002,146 18,448,340 3,659,961 7,905,758 64,250 Shares issued during the period - 20,940 2,760,571 326,854 566,152 - Shares redeemed during the period (104,797) (263,798) (2,799,558) (2,533,692) (3,215,182) (64,250) Shares outstanding at the end of the period 178,234 1,759,288 18,409,353 1,453,123 5,256,728 - Net asset value per share 15.5076 57.7903 12.8028 10.4138 78.8512 -
I(EUR)-2^ L(SGD) -2 R(GBP)-2 S-2 W-2 X-1Shares outstanding at the beginning of the period 1,280,523 1,020 1,151,838 416,218 790 889,688 Shares issued during the period 183,230 - 216,969 7,319 23,809 69,954 Shares redeemed during the period (587,917) - (154,058) (43,738) (790) (277,392) Shares outstanding at the end of the period 875,836 1,020 1,214,749 379,799 23,809 682,250 Net asset value per share 11.2935 9.9092 13.6884 24.6528 11.2943 10.0255
X-2 Y(EUR)-2 Z-2Shares outstanding at the beginning of the period 7,922,003 895,094 - Shares issued during the period 254,172 50,320 398,437 Shares redeemed during the period (1,312,952) (295,681) - Shares outstanding at the end of the period 6,863,223 649,733 398,437 Net asset value per share 10.6665 12.9908 10.9822
^ Base currency exposure share class.
The accompanying notes form an integral part of these financial statements.

28 Aberdeen Global
Asia Pacific EquityPortfolio StatementAs at 31 March 2017
SecurityNominal/ Quantity
Market Value US$’000
Total Net Assets
%Transferable securities and money market instruments admitted to an official exchange listing or dealt on another regulated market 88.60%Equities 88.60%Australia 2.61%CSL 922,629 88,209 2.61
China 1.80%Anhui Conch Cement∞ 10,420,500 35,432 1.05PetroChina 34,583,710 25,343 0.75
60,775 1.80
Hong Kong 20.40%AIA 17,046,200 107,533 3.18China Mobile 9,595,221 105,040 3.10Dairy Farm International 3,072,163 28,033 0.83Hang Lung 7,666,186 32,824 0.97Hang Lung Properties 12,794,642 33,215 0.98Hong Kong Exchanges & Clearing 2,000,194 50,355 1.49Jardine Matheson∞ 150,000 9,656 0.29Jardine Strategic∞ 4,230,439 177,658 5.24MTR 5,770,993 32,432 0.96Swire Pacific 'B' 52,085,592 90,211 2.67Swire Properties 7,286,532 23,299 0.69
690,256 20.40
India 8.31%Grasim Industries 3,840,050 62,138 1.84Hindustan Unilever 809,355 11,382 0.34Housing Development Finance 4,329,304 100,173 2.95ITC 15,700,000 67,886 2.01Kotak Mahindra Bank 732,599 9,826 0.29New India Investment Trust† 5,402,000 29,823 0.88
281,228 8.31
Indonesia 3.69%Astra International 28,000,000 18,176 0.54Bank Central Asia 59,024,700 73,196 2.16Unilever Indonesia 10,269,536 33,399 0.99
124,771 3.69
Malaysia 2.94%British American Tobacco Malaysia 3,076,920 31,510 0.93CIMB 28,700,845 36,156 1.06Public Bank 7,108,215 31,979 0.95
99,645 2.94

aberdeen-asset.com 29
Asia Pacific Equity
SecurityNominal/ Quantity
Market Value US$’000
Total Net Assets
%Philippines 4.04%Ayala 3,761,000 62,983 1.86Ayala Land 25,329,022 16,785 0.50Bank of the Philippine Islands 28,127,823 56,788 1.68
136,556 4.04
Singapore 17.23%City Developments 14,523,879 105,970 3.13DBS 4,959,645 68,806 2.03Keppel 13,283,700 66,024 1.95Oversea-Chinese Banking 17,083,901 118,780 3.52Singapore Technologies Engineering 26,434,971 70,661 2.09Singapore Telecommunications 42,089,362 117,928 3.48United Overseas Bank 2,198,632 34,782 1.03
582,951 17.23
South Korea 9.01%Amorepacific 39,151 4,192 0.12Amorepacific (PREF) 179,843 26,736 0.79E-Mart 158,748 29,136 0.86Naver 99,276 75,991 2.25Samsung Electronics (PREF) 117,564 168,677 4.99
304,732 9.01
Sri Lanka 1.39%Commercial Bank of Ceylon 11,313,589 9,743 0.29DFCC Bank 12,216,146 9,090 0.27John Keells 31,257,908 28,355 0.83
47,188 1.39
Taiwan 5.03%Taiwan Mobile 13,417,377 49,416 1.46TSMC 19,390,297 120,939 3.57
170,355 5.03
Thailand 2.93%Bangkok Dusit Medical Services (Alien) 7,543,400 4,665 0.14Siam Cement (Alien) 5,998,336 94,437 2.79
99,102 2.93
United Kingdom 8.29%BHP Billiton 3,660,000 56,476 1.67HSBC 8,462,877 68,958 2.04Rio Tinto 2,276,461 91,361 2.70Standard Chartered 6,677,814 63,713 1.88
280,508 8.29
30 Aberdeen Global
Asia Pacific Equity
SecurityNominal/ Quantity
Market Value US$’000
Total Net Assets
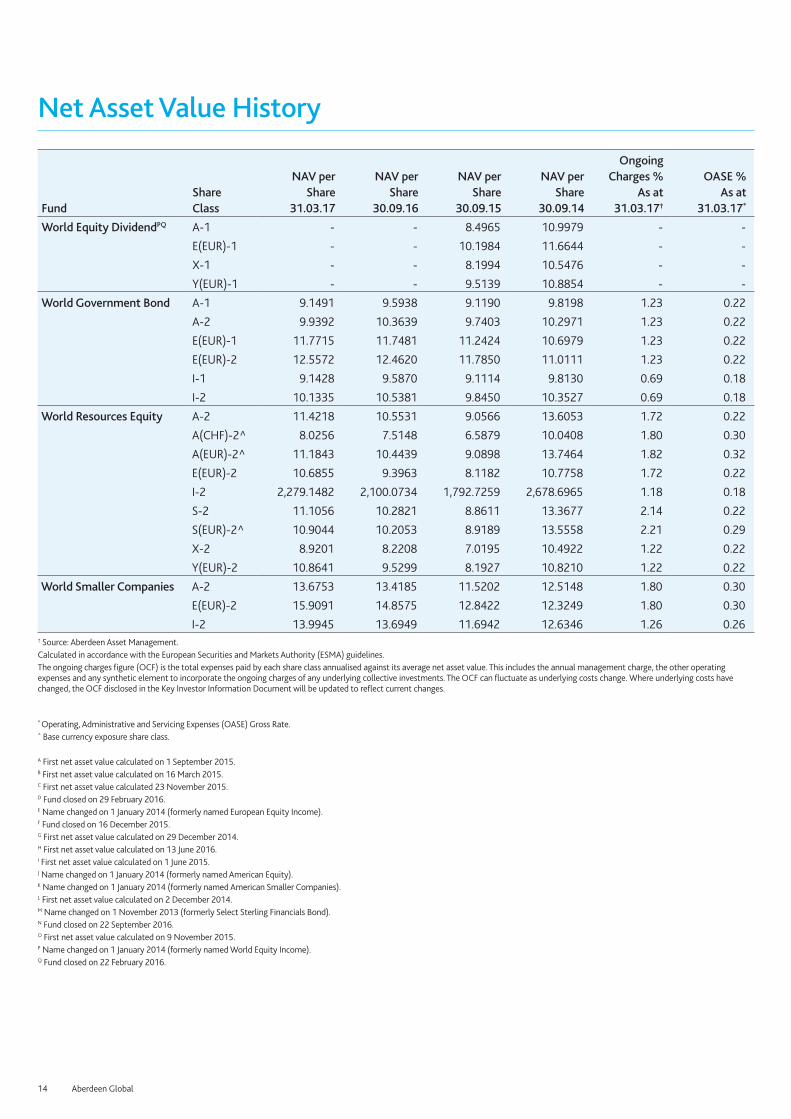
%United States 0.93%Yum China 1,162,297 31,620 0.93
Total Equities 2,997,896 88.60
Total Transferable securities and money market instruments admitted to an official exchange listing or dealt on another regulated market 2,997,896 88.60
Open Ended Investment Funds 9.44%Aberdeen Global - China A Share Equity Fund Z-2† 9,591,257 99,166 2.93Aberdeen Global - Indian Equity Fund Z-2† 11,871,717 220,245 6.51
319,411 9.44
Total Open Ended Investment Funds 319,411 9.44
Derivatives 0.01%
Forward currency exchange contracts 0.01%
Counterparty Buy Sell Settlement Buy Amount Sell Amount
Unrealised Gains/(Losses)
US$’000
Total Net Assets
%BBH USD SGD 03/04/17 616,649 860,010 1 -BBH USD SGD 04/04/17 447,318 624,407 - -BNP Paribas CZK USD 05/04/17 346,307 13,763 - -BNP Paribas CZK USD 15/06/17 38,341,635 1,510,527 23 -BNP Paribas CZK USD 15/06/17 1,099,498 44,456 - -BNP Paribas CZK USD 15/06/17 929,775 37,302 - -BNP Paribas CZK USD 15/06/17 825,867 33,274 - -BNP Paribas CZK USD 15/06/17 399,749 16,130 - -BNP Paribas CZK USD 15/06/17 99,749 3,932 - -BNP Paribas EUR USD 03/04/17 8,450 9,172 - -BNP Paribas EUR USD 06/04/17 7,276 7,771 - -BNP Paribas EUR USD 15/06/17 25,344,959 26,862,539 342 0.01BNP Paribas EUR USD 15/06/17 9,431,574 9,996,309 128 -BNP Paribas EUR USD 15/06/17 858,619 925,998 (4) -BNP Paribas EUR USD 15/06/17 654,370 693,552 9 -BNP Paribas EUR USD 15/06/17 327,059 346,914 4 -BNP Paribas EUR USD 15/06/17 284,121 302,687 2 -BNP Paribas EUR USD 15/06/17 206,565 222,775 (1) -BNP Paribas EUR USD 15/06/17 143,012 153,247 - -BNP Paribas EUR USD 15/06/17 93,886 101,651 (1) -BNP Paribas EUR USD 15/06/17 93,597 102,069 (2) -BNP Paribas EUR USD 15/06/17 93,595 101,588 (1) -BNP Paribas EUR USD 15/06/17 52,895 56,112 1 -BNP Paribas EUR USD 15/06/17 37,460 40,375 - -BNP Paribas EUR USD 15/06/17 22,903 24,797 - -BNP Paribas EUR USD 15/06/17 19,935 21,709 - -BNP Paribas EUR USD 15/06/17 14,239 15,356 - -BNP Paribas EUR USD 15/06/17 4,685 5,070 - -

aberdeen-asset.com 31
Asia Pacific Equity
Counterparty Buy Sell Settlement Buy Amount Sell Amount
Unrealised Gains/(Losses)
US$’000
Total Net Assets
%BNP Paribas EUR USD 15/06/17 3,388 3,651 - -BNP Paribas USD EUR 03/04/17 21,637 19,935 - -BNP Paribas USD EUR 04/04/17 5,054 4,685 - -BNP Paribas USD EUR 05/04/17 3,639 3,388 - -BNP Paribas USD EUR 06/04/17 152,751 143,012 - -BNP Paribas USD EUR 15/06/17 360,703 338,100 (2) -BNP Paribas USD EUR 15/06/17 65,361 61,010 - -BNP Paribas USD EUR 15/06/17 39,698 36,831 - -BNP Paribas USD EUR 15/06/17 16,178 14,939 - -BNP Paribas USD CZK 15/06/17 13,858 346,307 - -BNP Paribas USD EUR 15/06/17 11,921 10,989 - -BNP Paribas USD EUR 15/06/17 11,644 10,752 - -BNP Paribas USD EUR 15/06/17 9,725 8,959 - -BNP Paribas USD EUR 15/06/17 9,358 8,765 - -BNP Paribas USD EUR 15/06/17 9,202 8,450 - -BNP Paribas USD EUR 15/06/17 7,797 7,276 - -BNP Paribas USD EUR 15/06/17 6,650 6,160 - -BNP Paribas USD EUR 15/06/17 4,532 4,208 - -BNP Paribas USD EUR 15/06/17 3,760 3,545 - -BNP Paribas USD EUR 15/06/17 2,582 2,410 - -Unrealised gains on forward currency exchange contracts 499 0.01
Unrealised gains on derivatives 499 0.01
Total investments 3,317,806 98.05Other net assets 66,084 1.95Total net assets 3,383,890 100.00
† Managed by subsidiaries of Aberdeen Asset Management PLC.∞ A portion of this security is on loan at the period end.Currently forward positions are not collateralised.

32 Aberdeen Global
Asian Credit BondFor the six months ended 31 March 2017
PerformanceFor the six months ended 31 March 2017, the value of Asian Credit Bond – A Income Shares decreased by 0.88% compared to a decrease of 0.53% in the benchmark, the JP Morgan Asia Credit Index.Source: Lipper, JP Morgan, Basis: total return, published NAV to NAV, net of annual charges, gross income reinvested, USD.
Please remember that past performance is not a guide to future returns. The price of shares and the revenue from them may fall as well as rise. Investors may not get back the amount originally invested.
Market reviewSpreads in Asian credit markets narrowed over the half-year under review, with the high-yield sector outperforming investment-grade. Sentiment was buttressed by signs of an economic pick-up in China and robust corporate bond demand, which helped spreads in the consumer and industrial sectors outperform. Spreads in the energy sector benefited from the rebound in oil prices. Conversely, the financial sector lagged. Towards the period-end, caution prevailed amid a rising number of lower-quality credits being brought to market and perceptions that valuations had become increasingly stretched.
Meanwhile, events in the US also dominated newsflow, notably Donald Trump’s unexpected election win in the November presidential election. This halted the bull run in US Treasuries as investors considered the possibility that Trump would increase spending and lift inflation. The Federal Reserve hiked rates in December and March, and appeared on course to deliver another two increases later in 2017.
Malaysian credit spreads benefited from the oil price rebound, despite a mixed economic backdrop. Although fourth-quarter GDP growth was driven by healthy consumer spending and private investments in services and manufacturing, overall demand was moderated by lower government expenditure. We think higher-than-expected inflation should rule out rate cuts in the near term. In Indonesia, sentiment was lifted by hopes that reform momentum and infrastructure spending were gathering pace. President Joko Widodo’s signature tax amnesty programme ended, netting 135 trillion rupiah in tax revenues. In India, demonetisation weighed on sentiment at first but companies soon put it behind them as the ruling Bharatiya Janata Party’s victory in several state elections buoyed hopes that reforms would accelerate. The Philippine market also saw spreads tightening, despite concerns over US protectionist policies on the outsourcing sector.
In Thailand, a prolonged period of mourning for the late king pared market gains. Sentiment in China and Hong Kong was bolstered by positive economic and earnings news, even as money-market rates moved sharply higher as authorities attempted to tighten liquidity and encourage deleveraging in the financial sector. Conversely, South Korean credit spreads widened over the quarter as tensions with China escalated and Park Geun-hye was removed as President for alleged corruption.
Portfolio reviewDuring the half-year, we began to reduce the portfolio’s duration on the back of expectations of rising interest rates. In particular, we pared our quasi-sovereign exposure, namely the Indonesian sovereign and quasi-sovereigns such as Perusahaan Penerbit and Pertamina. We rotated into investment-grade industrials, adding names like Malaysia’s
Genting and topping up India’s Reliance. In addition, we added to our financials exposure by increasing the sub-financials weighting with Shinhan Bank and Standard Chartered Bank. In the non-investment grade segment, we initiated a position in Mongolia for its high carry and short-duration profile on the back of improving fundamentals. We also increased our weighting to Chinese industrials with stable credit profiles such as China Water Affairs and 361 Degrees International.
Given our view that valuations in Asian credit continue to be relatively expensive versus its global counterparts, we took the opportunity to add some Middle East exposure, through Kuwait’s Equate Petrochemical and the Oman sovereign new issue.
OutlookDespite the recent rally in rates on the back of geopolitical risks and weaker data from the US, we retain our cautious stance on duration positioning. Asian fundamentals remain strong and a combination of solid macro data and positive technicals should continue to support the asset class. However, we are also mindful that premiums for moving down the credit spectrum have become more unappealing. As such, we prefer to position ourselves in the investment-grade corporate segment, with some exposure to non-investment grade sovereigns and corporates for their short-duration and high-carry profile. The pipeline for new issues has been far more active than anticipated and we do not rule out a period of consolidation in markets before balance is restored. We will continue to find opportunities to switch to better-value credits.
Asian Fixed Income Team April 2017

aberdeen-asset.com 33
Asian Credit Bond
Statement of Net AssetsAs at 31 March 2017
Notes US$'000AssetsInvestments in securities at market value 2.2 28,389 Amounts held at futures clearing houses and brokers 79 Interest receivable 302 Receivable for investments sold 2,048 Total assets 30,818 LiabilitiesBank overdraft 145 Payable for investments purchased 1,391 Taxes and expenses payable 18 Unrealised losses on future contracts 2.7 17 Other liabilities 62 Total liabilities 1,633 Net assets at the end of the period 29,185
Statement of Changes in Net Assets For the period from 1 October 2016 to 31 March 2017
Notes US$'000Net assets at the beginning of the period 30,021 Net gains from investments 487 Net realised gains 129 Net unrealised losses (757) Proceeds from shares issued 206 Payments for shares redeemed (787) Net equalisation paid 10 (2) Dividends paid 5 (112) Net assets at the end of the period 29,185
Statement of Operations For the period from 1 October 2016 to 31 March 2017
Notes US$'000IncomeInvestment income 2.3 595 Bank interest 1 Total income 596 ExpensesManagement fees 4.2 64 Operating, administrative and servicing fees 4.3 45 Total expenses 109 Net gains from investments 487
Realised gains on investments 166 Realised losses on future contracts (37) Net realised gains 129
Decrease in unrealised appreciation on investments (780) Decrease in unrealised depreciation on future contracts 23 Net unrealised losses (757) Net decrease in assets as a result of operations (141)
Share Transactions For the period from 1 October 2016 to 31 March 2017
A-1 A-2 I-1 I-2 X-1 X-2Shares outstanding at the beginning of the period 115,494 107,146 500,000 882,961 100,000 100,000 Shares issued during the period 98 500 - 18,142 - - Shares redeemed during the period (15,592) (1,892) - (55,331) - - Shares outstanding at the end of the period 100,000 105,754 500,000 845,772 100,000 100,000 Net asset value per share 10.4308 10.8664 10.4311 10.9765 10.4311 10.9696
Z-2Shares outstanding at the beginning of the period 934,417 Shares issued during the period - Shares redeemed during the period - Shares outstanding at the end of the period 934,417 Net asset value per share 11.0807
The accompanying notes form an integral part of these financial statements.

34 Aberdeen Global
Asian Credit BondPortfolio StatementAs at 31 March 2017
Security Coupon (%) MaturityNominal/Quantity
Market Value US$’000
Total Net Assets
%Transferable securities and money market instruments admitted to an official exchange listing or dealt on another regulated market 96.30%Bonds 96.30%Corporate Bonds 88.03%Australia 2.07%APT Pipelines 4.2500 15/07/27 60,000 61 0.21SGSP Australia Assets (EMTN) 3.2500 29/07/26 300,000 291 1.00Transurban Finance 3.3750 22/03/27 259,000 251 0.86
603 2.07
China 27.47%Agile 8.3750 18/02/19 200,000 209 0.72Agile Property 9.0000 21/05/20 200,000 220 0.75China Aoyuan Property 6.3500 11/01/20 375,000 388 1.33China Hongqiao 7.6250 26/06/17 200,000 192 0.66China Hongqiao 6.8750 03/05/18 200,000 187 0.64China Railway Resources 3.8500 05/02/23 400,000 411 1.41China Resources Gas (EMTN) 4.5000 05/04/22 200,000 211 0.72CNOOC Finance 2015 USA 3.5000 05/05/25 400,000 397 1.36CNPC General Capital 3.4000 16/04/23 430,000 436 1.50CRCC Yuxiang 3.5000 16/05/23 400,000 404 1.38Franshion Brilliant 3.6000 03/03/22 600,000 595 2.03Future Land Development 5.0000 16/02/20 300,000 302 1.04FUXIANG Investment Management (EMTN) 3.6250 30/11/19 300,000 302 1.03Logan Property 11.2500 04/06/19 200,000 214 0.73Proven Honour Capital 4.1250 19/05/25 500,000 506 1.73Proven Honour Capital 4.1250 06/05/26 350,000 352 1.21Rail Transit International Investment 2.8750 13/05/21 290,000 285 0.98Semiconductor Manufacturing International 4.1250 07/10/19 400,000 411 1.41Sinopec Group Overseas Development 2012 3.9000 17/05/22 400,000 414 1.42Sinopec Group Overseas Development 2015 3.2500 28/04/25 350,000 342 1.17SPIC 3.8750 06/12/26 363,000 372 1.28Times Property 11.4500 05/03/20 200,000 224 0.77Times Property 6.2500 23/01/20 200,000 207 0.71Yestar International 6.9000 15/09/21 210,000 219 0.75361 Degrees International 7.2500 03/06/21 200,000 217 0.74
8,017 27.47
Hong Kong 14.04%Champion (EMTN) 3.7500 17/01/23 400,000 403 1.38China Water Affairs 5.2500 07/02/22 300,000 310 1.06CK Hutchison International 17 2.8750 05/04/22 300,000 300 1.03FPC Treasury 4.5000 16/04/23 300,000 303 1.04HLP Finance (EMTN) 4.7500 25/06/22 400,000 425 1.46Hongkong Electric Finance (EMTN) 2.8750 03/05/26 400,000 382 1.31Hongkong Land Finance Cayman Islands (EMTN) 4.5000 01/06/22 400,000 434 1.49Hutchison Whampoa International 14 3.6250 31/10/24 200,000 205 0.70

aberdeen-asset.com 35
Asian Credit Bond
Security Coupon (%) MaturityNominal/Quantity
Market Value US$’000
Total Net Assets
%ICBCIL Finance (EMTN) 3.0000 05/04/20 600,000 600 2.05Shimao Property 8.3750 10/02/22 300,000 335 1.15Zhejiang Energy Hong Kong 2.3000 30/09/17 400,000 400 1.37
4,097 14.04
India 8.13%Adani Transmission 4.0000 03/08/26 215,000 211 0.72Bharat Petroleum 4.6250 25/10/22 200,000 213 0.73GCX 7.0000 01/08/19 400,000 410 1.40ICICI Bank Dubai (EMTN) 4.0000 18/03/26 400,000 399 1.37Neerg Energy 6.0000 13/02/22 200,000 203 0.70NTPC (EMTN) 4.7500 03/10/22 200,000 214 0.73Reliance USA 5.4000 14/02/22 250,000 273 0.94UPL 3.2500 13/10/21 453,000 449 1.54
2,372 8.13
Indonesia 4.63%Jababeka International 6.5000 05/10/23 200,000 207 0.71MPM Global Pte 6.7500 19/09/19 200,000 209 0.72Pertamina Persero 6.0000 03/05/42 300,000 319 1.08Pratama Agung Pte 6.2500 24/02/20 200,000 209 0.72TBG Global 5.2500 10/02/22 200,000 207 0.71TBG Global 4.6250 03/04/18 200,000 202 0.69
1,353 4.63
Kuwait 1.31%Equate Petrochemical (EMTN) 4.2500 03/11/26 380,000 381 1.31
Malaysia 8.35%CIMB Bank (EMTN) 3.2630 15/03/22 600,000 603 2.06Danga Capital 3.0350 01/03/21 400,000 402 1.38GOHL Capital 4.2500 24/01/27 381,000 385 1.32Malayan Banking VAR 29/10/26 400,000 403 1.38RHB Bank (EMTN) 2.5030 06/10/21 365,000 355 1.22TNB Global Ventures Capital (EMTN) 3.2440 19/10/26 300,000 289 0.99
2,437 8.35
Netherlands 1.41%Samvardhana Motherson Automotive Systems 4.8750 16/12/21 400,000 413 1.41
Philippines 5.30%Energy Development 6.5000 20/01/21 200,000 223 0.76ICTSI Treasury (EMTN) 5.8750 17/09/25 400,000 430 1.47Megaworld 4.2500 17/04/23 500,000 502 1.73Royal Capital (PERP) VAR 29/12/49 400,000 391 1.34
1,546 5.30

36 Aberdeen Global
Asian Credit Bond
Security Coupon (%) MaturityNominal/Quantity
Market Value US$’000
Total Net Assets
%Singapore 4.15%DBS (EMTN) (PERP) VAR 29/12/49 284,000 279 0.96Global Logistic Properties (EMTN) 3.8750 04/06/25 350,000 330 1.13HPHT Finance 15 2.2500 17/03/18 200,000 200 0.69United Overseas Bank (EMTN) VAR 16/09/26 400,000 403 1.37
1,212 4.15
South Korea 4.91%Busan Bank (GMTN) 3.6250 25/07/26 550,000 526 1.81Doosan Power System VAR 03/12/45 200,000 200 0.68Hyundai Capital Services (EMTN) 2.6250 29/09/20 400,000 398 1.36Shinhan Bank 2.8750 28/03/22 310,000 310 1.06
1,434 4.91
Thailand 1.89%Krung Thai Bank Cayman (EMTN) VAR 26/12/24 230,000 239 0.82PTT Global Chemical 4.2500 19/09/22 300,000 314 1.07
553 1.89
United Arab Emirates 1.26%DIB Sukuk 3.6640 14/02/22 368,000 368 1.26
United Kingdom 3.11%HSBC (PERP) VAR 29/12/49 400,000 404 1.39Standard Chartered 3.9500 11/01/23 300,000 301 1.03Standard Chartered 4.0500 12/04/26 200,000 202 0.69
907 3.11
Total Corporate Bonds 25,693 88.03
Government Bonds 8.27%China 0.66%Export-Import Bank of China 2.8750 26/04/26 200,000 192 0.66
Indonesia 5.59%Indonesia (Republic of) 4.3500 08/01/27 384,000 398 1.36Perusahaan Penerbit SBSN Indonesia III 4.3500 10/09/24 500,000 519 1.78Perusahaan Penerbit SBSN Indonesia III 4.5500 29/03/26 300,000 312 1.07Perusahaan Penerbit SBSN Indonesia III 3.4000 29/03/22 200,000 201 0.69Perusahaan Penerbit SBSN Indonesia III 4.1500 29/03/27 200,000 201 0.69
1,631 5.59
Mongolia 0.65%Mongolia (Government of) (EMTN) 5.1250 05/12/22 200,000 189 0.65
Oman 0.72%Oman (Government of) 6.5000 08/03/47 200,000 212 0.72

aberdeen-asset.com 37
Asian Credit Bond
Security Coupon (%) MaturityNominal/Quantity
Market Value US$’000
Total Net Assets
%South Korea 0.65%Korea National Oil 2.6250 14/04/26 200,000 190 0.65
Total Government Bonds 2,414 8.27
Total Bonds 28,107 96.30
Total Transferable securities and money market instruments admitted to an official exchange listing or dealt on another regulated market 28,107 96.30
Other transferable securities and money market instruments 0.97%Bonds 0.97%Corporate Bonds 0.97%Malaysia 0.97%Wakala Global Sukuk 4.6460 06/07/21 260,000 282 0.97
Total Corporate Bonds 282 0.97
Total Bonds 282 0.97
Total Other transferable securities and money market instruments 282 0.97
Derivatives (0.06%)
Future contracts (0.06%)
Future Maturity Notional
Unrealised Gains/(Losses)
US$'000
Total Net Assets
%CBT US Long Bond 21/06/17 16 11 0.04CBT US 10 Year Note 21/06/17 (46) (25) (0.09)CBT US 2 Year Note 30/06/17 34 5 0.02CBT US 5 Year Note 30/06/17 (20) (8) (0.03)Unrealised losses on future contracts (17) (0.06)
Unrealised losses on derivatives (17) (0.06)
Total investments 28,372 97.21Other net assets 813 2.79Total net assets 29,185 100.00

38 Aberdeen Global
Asian Local Currency Short Duration BondFor the six months ended 31 March 2017
Performance For the six months ended 31 March 2017, the value of Asian Local Currency Short Duration Bond – A Income Shares decreased by 1.48%, compared to a decrease of 1.10% in the benchmark, the iBOXX Asia ex Japan Sovereign 1-3 years Index.Source: Lipper, Basis: total return, published NAV to NAV, net of annual charges, gross income reinvested, USD.
Please remember that past performance is not a guide to future returns. The price of shares and the revenue from them may fall as well as rise. Investors may not get back the amount originally invested.
Market review Asian short-duration bonds corrected over the half-year. Events in the US held sway, notably Donald Trump’s unexpected election win in the November presidential election. This halted the global bond market rally as investors considered the possibility that Trump would increase spending and lift inflation. Markets were further pressured by the Federal Reserve’s (Fed) rate hikes in December and its more hawkish outlook for 2017. Subsequently, investors rotated back into bonds when the Trump administration’s isolationist rhetoric sparked concerns that Asian economies would be adversely impacted. The lack of clarity and consistency in US policies, underscored by the failure to overhaul the healthcare system, boosted bond prices but failed to overturn early losses.
Regional currencies declined against the US dollar, led by the 6.5% drop in the ringgit as foreign outflows in Malaysia accelerated. The Philippine peso lost 3.4% amid concerns over the deteriorating balance of payments and fears that adverse US trade policies would hurt the outsourcing sector. The yuan retreated 3% on persistent worries over potential systemic risk in the financial sector. The Singapore dollar, rupiah and won also weakened. Conversely, the baht rose modestly, while the Indian rupee rallied by nearly 3% on the back of robust inflows.
In short-duration regional bonds, Malaysia was the key laggard, with 2-year bond yields rising by around 80 basis points. Outflows were exacerbated by significant amounts of foreign positions and rising inflation that ruled out rate cuts. Chinese short-duration bonds also weakened as money-market rates moved sharply higher after authorities tightened liquidity. Yuan weakness and falling foreign reserves also prompted Beijing to impose more capital controls, which in turn sparked fears over increased scrutiny. Bond yields in South Korea, Singapore, Hong Kong and Taiwan tracked US Treasuries higher. In South Korea, tensions with China escalated, even as Park Geun-hye was removed as President for alleged corruption. Thai yields also trended higher, in the wake of a prolonged period of mourning for the late king. Indonesian bonds pared losses, helped by a rebound in foreign inflows on hopes that reform momentum and infrastructure spending were gathering pace.
India proved the exception. The government’s unexpected decision to replace large rupee denominations resulted in a flood of bank deposits that were channelled into government bonds, fuelling the market rally. Later, the ruling Bharatiya Janata Party’s victory in several state elections consolidated Prime Minister Narendra Modi’s mandate, reigniting hopes that his reforms would accelerate. This masked disappointment over the central bank’s move from an easing to a neutral policy stance.
Portfolio review Our interest rate management contributed to relative performance. This was mainly due to our exposure to Indian and Indonesian bonds. Conversely, our overweight to Chinese onshore bonds detracted. Total currency management was negative, mainly because of the overweight to the ringgit, although hedging effects mitigated losses. On a positive note, the overweight to the Indian rupee and baht, along with the underweight to the won, added to performance.
In portfolio activity, we added to Asian currency risk and rebuilt short US-dollar positions initially. However, as regional currencies strengthened and concerns arose over valuations and potential risks ahead, we reduced the short US-dollar positions. At the same time, a significant amount of exposure was rotated away from more vulnerable currencies into those likely to exhibit better resilience. Specifically, we reduced our exposure to the won and increased the underweight to the ringgit and Singapore dollar. During the review period, we also consistently pared the overweight to Malaysian bonds and India was the prime beneficiary as we substantially increased the bond exposure there. Duration risk declined via reductions in China, Malaysia and Indonesia.
OutlookThe nascent recovery in intra-regional trade has supported growth in Asia and reduced disinflationary pressures, prompting some central banks to reduce expansionary policy support. We have seen Sri Lanka hike rates and India move to a neutral stance. Others may follow suit. In China, we won’t be surprised if short-term rates continue to rise as shadow banking and runaway credit growth remain pressing concerns. However, it is too early to say that the monetary easing cycle in the region has reached an end. Political risks lurk in the background, particularly in North Asia, where relations between China and South Korea continue to be strained. In Europe, we are unlikely to see a tapering in asset purchases or a rate rise this year amid uncertainty ahead of key elections. In the US, the failure in repealing Obamacare throws into doubt Trump’s policy rollout in other areas such as tax reform. As well, concrete details on US fiscal or infrastructure spending remain conspicuously lacking. So the Fed may not be leaping into action even as it stays the course of monetary policy normalisation. We will tread cautiously.
Asian Fixed Income Team April 2017

aberdeen-asset.com 39
Asian Local Currency Short Duration Bond
Statement of Net AssetsAs at 31 March 2017
Notes US$'000AssetsInvestments in securities at market value 2.2 157,412 Cash at bank 17,998 Interest receivable 2,064 Subscriptions receivable 2,985 Receivable for investments sold 18,476 Unrealised gains on forward currency exchange contracts 2.6 111 Other assets 40 Total assets 199,086 LiabilitiesPayable for investments purchased 7,387 Taxes and expenses payable 137 Redemptions payable 18,641 Other liabilities 175 Total liabilities 26,340 Net assets at the end of the period 172,746
Statement of Changes in Net Assets For the period from 1 October 2016 to 31 March 2017
Notes US$'000Net assets at the beginning of the period 205,083 Net gains from investments 2,461 Net realised losses (5,314) Net unrealised losses (1,325) Proceeds from shares issued 17,096 Payments for shares redeemed (44,923) Net equalisation paid 10 (124) Dividends paid 5 (215) Unclaimed monies 7 Net assets at the end of the period 172,746
Statement of Operations For the period from 1 October 2016 to 31 March 2017
Notes US$'000IncomeInvestment income 2.3 3,284 Bank interest 8 Total income 3,292 ExpensesManagement fees 4.2 551 Operating, administrative and servicing fees 4.3 278 Other operational expenses 2 Total expenses 831 Net gains from investments 2,461
Realised losses on investments (4,443) Realised losses on forward currency exchange contracts (550) Realised currency exchange losses (321) Net realised losses (5,314)
Decrease in unrealised appreciation on investments (1,897) Decrease in unrealised depreciation on forward currency exchange contracts 577 Unrealised currency exchange losses (5) Net unrealised losses (1,325) Net decrease in assets as a result of operations (4,178)

40 Aberdeen Global
Asian Local Currency Short Duration Bond
Share Transactions For the period from 1 October 2016 to 31 March 2017
A-1 A-2 A(CHF)-2^ A(EUR)-2^ D(GBP)-1 D(GBP)-2Shares outstanding at the beginning of the period 1,523,875 5,333,762 203,059 453,409 520,391 60,271 Shares issued during the period 27,224 358,821 - 40,090 - - Shares redeemed during the period (241,566) (576,074) (32,834) (71,437) (31,878) (12,512) Shares outstanding at the end of the period 1,309,533 5,116,509 170,225 422,062 488,513 47,759 Net asset value per share 3.7914 6.5716 8.8444 9.2888 10.9459 12.6502
E(EUR)-2 I-1 I-2 I(EUR)-2^ I(GBP)-1^ R(GBP)-1Shares outstanding at the beginning of the period 733,824 44,564 8,642,157 749,913 538,832 41,502 Shares issued during the period 18,124 - 1,334,943 14,083 51,594 382 Shares redeemed during the period (90,678) (11,852) (2,981,302) (696,705) (118) (5,422) Shares outstanding at the end of the period 661,270 32,712 6,995,798 67,291 590,308 36,462 Net asset value per share 13.0762 8.9416 10.0668 9.6088 8.3246 11.0706
R(GBP)-2 X-1 X-2 Y(EUR)-2 Z-2Shares outstanding at the beginning of the period 89,108 31,407 88,752 33,408 3,075,515 Shares issued during the period 4,392 - - - - Shares redeemed during the period (20,558) (11,161) - (21,882) (6,201) Shares outstanding at the end of the period 72,942 20,246 88,752 11,526 3,069,314 Net asset value per share 12.3712 8.6259 9.6389 11.7466 10.2324
^ Base currency exposure share class.
The accompanying notes form an integral part of these financial statements.

aberdeen-asset.com 41
Asian Local Currency Short Duration BondPortfolio StatementAs at 31 March 2017
Security Coupon (%) MaturityNominal/Quantity
Market Value US$’000
Total Net Assets
%Transferable securities and money market instruments admitted to an official exchange listing or dealt on another regulated market 89.83%Bonds 89.83%Corporate Bonds 14.71%India 8.70%NTPC 9.1700 22/09/24 150,000,000 2,515 1.46NTPC 8.1800 31/12/20 150,000,000 2,387 1.38Power Finance 7.5000 17/09/20 300,000,000 4,653 2.68Power Finance 8.8400 04/03/23 50,000,000 822 0.48Rural Electrification 9.2500 25/08/17 250,000,000 3,882 2.25Rural Electrification 9.0600 23/09/17 50,000,000 776 0.45
15,035 8.70
Indonesia 6.01%Lembaga Pembiayaan Ekspor Indonesia 9.5000 13/03/20 127,000,000,000 9,916 5.74Lembaga Pembiayaan Ekspor Indonesia 9.0000 13/03/18 6,000,000,000 458 0.27
10,374 6.01
Total Corporate Bonds 25,409 14.71
Government Bonds 75.12%China 7.60%China (Peoples Republic of) 4.0400 24/04/19 40,000,000 5,929 3.43China (Peoples Republic of) 3.2500 06/09/19 30,000,000 4,381 2.54China (Peoples Republic of) 3.0900 30/05/18 10,000,000 1,455 0.84China (Peoples Republic of) 3.4600 11/07/20 5,000,000 735 0.43China (Peoples Republic of) 3.6400 09/04/25 4,000,000 593 0.34China (Peoples Republic of) 2.8500 28/01/26 300,000 42 0.02
13,135 7.60
India 10.82%India (Government of) 7.7200 25/05/25 585,140,000 9,352 5.41India (Government of) 8.1200 10/12/20 430,000,000 6,944 4.02India (Government of) 7.8000 11/04/21 150,000,000 2,400 1.39
18,696 10.82
Indonesia 1.20%Indonesia (Republic of) - 04/01/18 28,922,000,000 2,079 1.20
Malaysia 5.91%Malaysia (Government of) 3.7590 15/03/19 45,000,000 10,212 5.91
Philippines 2.35%Philippines (Republic of) 4.9500 15/01/21 200,000,000 4,056 2.35
Singapore 4.25%Singapore (Government of) 2.5000 01/06/19 10,000,000 7,339 4.25
42 Aberdeen Global
Asian Local Currency Short Duration Bond
Security Coupon (%) MaturityNominal/Quantity
Market Value US$’000
Total Net Assets
%South Korea 23.22%Korea (Republic of) 2.7500 10/03/18 20,000,000,000 18,098 10.48Korea (Republic of) 1.7500 10/12/18 15,500,000,000 13,905 8.05Korea (Republic of) 2.7500 10/09/17 9,000,000,000 8,096 4.69
40,099 23.22
Sri Lanka 6.29%Sri Lanka (Republic of) 8.0000 15/11/18 650,000,000 4,060 2.35Sri Lanka (Republic of) 10.7500 01/03/21 410,000,000 2,555 1.48Sri Lanka (Republic of) 10.6000 15/09/19 400,000,000 2,544 1.47Sri Lanka (Republic of) 11.4000 01/01/24 275,000,000 1,704 0.99
10,863 6.29
Thailand 13.48%Thailand (Kingdom of) 3.2500 16/06/17 400,000,000 11,683 6.76Thailand (Kingdom of) 3.8750 13/06/19 380,000,000 11,601 6.72
23,284 13.48
Total Government Bonds 129,763 75.12
Total Bonds 155,172 89.83
Total Transferable securities and money market instruments admitted to an official exchange listing or dealt on another regulated market 155,172 89.83
Other transferable securities and money market instruments 1.30%Bonds 1.30%Corporate Bonds 1.30%Malaysia 1.30%Cagamas (MTN) 3.7500 18/10/19 10,000,000 2,240 1.30
Total Corporate Bonds 2,240 1.30
Total Bonds 2,240 1.30
Total Other transferable securities and money market instruments 2,240 1.30

aberdeen-asset.com 43
Asian Local Currency Short Duration BondDerivatives 0.06%
Forward currency exchange contracts 0.06%
Counterparty Buy Sell Settlement Buy Amount Sell Amount
Unrealised Gains/(Losses)
US$’000
Total Net Assets
%BNP Paribas CHF USD 15/06/17 1,556,616 1,543,564 19 0.01BNP Paribas CHF USD 15/06/17 9,115 9,209 - -BNP Paribas CHF USD 15/06/17 7,758 7,933 - -BNP Paribas CHF USD 15/06/17 7,448 7,516 - -BNP Paribas EUR USD 15/06/17 3,897,679 4,131,061 53 0.03BNP Paribas EUR USD 15/06/17 642,318 680,778 9 0.01BNP Paribas EUR USD 15/06/17 21,730 23,436 - -BNP Paribas EUR USD 15/06/17 19,968 21,830 - -BNP Paribas EUR USD 15/06/17 19,690 21,267 - -BNP Paribas EUR USD 15/06/17 3,781 4,078 - -BNP Paribas EUR USD 15/06/17 3,380 3,696 - -BNP Paribas EUR USD 15/06/17 3,305 3,569 - -BNP Paribas GBP USD 15/06/17 4,795,945 5,849,586 157 0.08BNP Paribas GBP USD 15/06/17 85,773 106,819 1 -BNP Paribas GBP USD 15/06/17 43,687 54,181 1 -BNP Paribas GBP USD 15/06/17 25,280 31,876 - -BNP Paribas GBP USD 15/06/17 24,701 30,637 - -BNP Paribas USD GBP 04/04/17 106,633 85,773 (1) -BNP Paribas USD CHF 15/06/17 43,999 43,670 - -BNP Paribas USD GBP 15/06/17 39,404 32,366 (1) -BNP Paribas USD EUR 15/06/17 31,705 29,931 - -BNP Paribas USD CHF 15/06/17 23,145 22,928 - -BNP Paribas USD CHF 15/06/17 13,410 13,533 - -BNP Paribas USD EUR 15/06/17 9,625 9,073 - -BNP Paribas USD EUR 15/06/17 8,758 8,221 - -BNP Paribas USD EUR 15/06/17 4,667 4,406 - -BNP Paribas USD EUR 15/06/17 3,500 3,225 - -Credit Suisse USD PHP 19/05/17 1,500,000 75,840,000 (6) -Credit Suisse USD CNH 19/05/17 1,300,000 8,985,600 (3) -Credit Suisse USD KRW 26/06/17 11,900,000 13,310,150,000 (16) (0.01)Goldman Sachs KRW USD 26/06/17 8,902,400,000 8,000,000 (30) (0.02)Goldman Sachs PHP USD 19/05/17 391,942,200 7,800,000 (19) (0.01)Goldman Sachs SGD USD 16/06/17 14,653,600 10,400,000 92 0.05Goldman Sachs SGD USD 16/06/17 2,261,264 1,600,000 19 0.01Goldman Sachs USD THB 17/05/17 1,600,000 55,136,000 (4) -Goldman Sachs USD THB 17/05/17 1,600,000 56,484,800 (43) (0.02)Goldman Sachs USD PHP 19/05/17 900,000 45,337,500 - -Goldman Sachs USD KRW 26/06/17 19,600,000 22,008,840,000 (104) (0.06)Royal Bank of Canada CNH USD 19/05/17 7,634,091 1,100,000 7 -Standard Chartered USD CNH 19/05/17 4,500,000 31,136,400 (13) (0.01)Standard Chartered USD SGD 16/06/17 3,560,000 4,981,145 (7) -Standard Chartered USD SGD 16/06/17 1,200,000 1,676,443 - -

44 Aberdeen Global
Asian Local Currency Short Duration Bond
Counterparty Buy Sell Settlement Buy Amount Sell Amount
Unrealised Gains/(Losses)
US$’000
Total Net Assets
%Unrealised gains on forward currency exchange contracts 111 0.06
Unrealised gains on derivatives 111 0.06
Total investments 157,523 91.19Other net assets 15,223 8.81Total net assets 172,746 100.00
Currently forward positions are not collateralised.
aberdeen-asset.com 45
Asian Property ShareFor the six months ended 31 March 2017
Performance For the six months ended 31 March 2017, the value of Asian Property Share – A Accumulation shares increased by 4.76% compared to a decrease of 0.20% in the benchmark, the MSCI AC Asia Pacific Real Estate Index.Source: Lipper, Basis: total return, published NAV to NAV, net of annual charges, gross income reinvested, USD.Please see the Performance History section for details on the use of MSCI information.
Please remember that past performance is not a guide to future returns. The price of shares and the revenue from them may fall as well as rise. Investors may not get back the amount originally invested.
Market review Asian property shares ended flat, as early weakness overshadowed the sector’s rebound in the latter half of the review period. Risk appetite was weak at first, owing to uncertainty over Donald Trump’s surprise US election win, a hard Brexit for the UK and the US Federal Reserve’s (Fed) hint at three more hikes after raising rates. All this deepened concerns over increased volatility across Asian markets, with headwinds also emanating from China.
Subsequently, sentiment recovered on the back of a strengthening global economy and expectations of a gradual Fed tightening. The Fed maintained a cautious outlook after it tightened policy as widely expected in March. Markets also bounced back swiftly from a late sell-off caused by doubts over Trump’s ability to advance his economic agenda following the failure to overhaul health care.
Portfolio reviewAt the stock level, Hong Kong conglomerate Jardine Strategic had a good run, driven by its inclusion in the MSCI World Index and expectations that its subsidiaries’ fundamentals, Astra International and Dairy Farm International, will continue to improve. Astra International should benefit from the recovery in Indonesia’s automotive market, while Dairy Farm International has been delivering on margin improvements by closing underperforming stores and increasing its fresh food segment. We trimmed Jardine Strategic on the back of its share price strength.
Singapore property developer Bukit Sembawang and City Developments (CDL) were also among the top contributors to performance. Property stocks in the city state rallied after the government relaxed property curbs for the first time since 2009. We view the changes to the seller’s stamp duty and total debt servicing ratio framework as positive, although these tweaks are unlikely to boost property transactions and prices that significantly for now. We took some profits from Bukit Sembawang, CapitaLand, CDL and Wheelock Properties, which rose following the government’s fine-tuning measures.
Conversely, Philippine developer Ayala Land lagged the local benchmark despite reporting encouraging earnings that were underpinned by stable rental growth and its leasing business. We remain comfortable holding the company, given its robust fundamentals and attractive valuations. In Malaysia, developer YNH Property faced challenging market conditions. The company plans to sell a five-storey hospital in Perak to Pantai Medical Centre (PMC) for M$63 million. The move could be seen as an attempt to pare YNH’s debt and improve future earnings, in light of the challenging market conditions. YNH’s wholly-owned subsidiary YNH Hospitality had earlier entered into discussions with PMC for the proposed disposal of the property. Japanese resort operator ResortTrust declined because of its weaker-than-expected results that were dampened by a higher proportion of deferred sales for resorts to be opened in the future.
Apart from the portfolio transactions mentioned earlier, we also initiated three holdings. Mapletree Commercial Trust is well managed and backed by a strong sponsor in Singapore investment company Temasek Holdings, with a good pipeline of assets and a decent track record of accretive injections into the REIT at an attractive valuation. Hong Kong-listed developer China Resources Land has a substantial land bank, as well as good property development and investment mix, given its superior profitability. BWP Trust is the largest owner of Bunnings Warehouse properties with 80 stores across Australia. BWP’s share price has corrected significantly since mid-2016, after Bunnings Group indicated it would vacate up several BWP properties on lease expiry. BWP is repositioning these properties. We capitalised on the price weakness to initiate a position in BWP because we believe the current valuation has factored in the short-term uncertainty. Over the longer run, we are convinced of BWP’s growth prospects, supported by low debt on its balance sheet.
Against this, we exited Hongkong and Shanghai Hotels, the owner and operator of the Peninsula Hotel brand with other hotel assets across key cities globally. While we recognise the value of its hotel properties, the challenging operating environment has pressured earnings from this business. Hence, we decided to reallocate capital elsewhere. We also sold Shopping Centres Australasia because of a weakening operating environment and on valuation grounds.
Elsewhere, we raised our exposure to Global Logistic Properties on back of its solid business prospect and attractive valuation.
Outlook Asia, along with the broader emerging markets, has made stellar gains over the period. Capital is rotating back to the region, partly because valuations in the US appear stretched following Donald Trump’s election victory, and partly owing to expectations that Asia will benefit from the brightening global economic outlook. Exports across the region have bounced, and earnings growth is on the mend, led by some of the worst hit sectors, such as commodities.
But as encouraging as these developments are, caution is merited. Geopolitical risks abound, particularly on the Korean Peninsula. South Korea’s deployment of the US missile defence system has ratcheted tension with China, while North Korea’s nuclear defiance is causing consternation among neighbouring nations. News of the US military strike against Syria also serves as a reminder that many of the simmering crises elsewhere can flare up quickly, with potentially negative impact on financial markets. Meanwhile, a marked improvement in US economic data could prompt the Fed to tighten policy more aggressively than expected. Above all, President Trump’s unpredictable actions will hold sway, with investors focused on his stance on protectionism, and whether the administration can deliver on campaign promises of tax cuts and fiscal stimulus that have supported global equities since November. That said, we are bottom-up investors, whose focus remains on companies. We are confident that the robust fundamentals and the inherent quality of our holdings will stand them in good stead for the challenges over the long run.
Asian Equities Team April 2017

46 Aberdeen Global
Asian Property Share
Statement of Net AssetsAs at 31 March 2017
Notes US$'000AssetsInvestments in securities at market value 2.2 50,368 Cash at bank 1,295 Interest and dividends receivable 161 Subscriptions receivable 34 Unrealised gains on forward currency exchange contracts 2.6 13 Total assets 51,871 LiabilitiesTaxes and expenses payable 80 Redemptions payable 219 Total liabilities 299 Net assets at the end of the period 51,572
Statement of Changes in Net Assets For the period from 1 October 2016 to 31 March 2017
Notes US$'000Net assets at the beginning of the period 49,834 Net losses from investments (98) Net realised losses (1,167) Net unrealised gains 3,296 Proceeds from shares issued 5,592 Payments for shares redeemed (5,886) Net equalisation received 10 1 Net assets at the end of the period 51,572
Statement of Operations For the period from 1 October 2016 to 31 March 2017
Notes US$'000IncomeInvestment income 2.3 345 Stocklending income 16 2 Total income 347 ExpensesManagement fees 4.2 376 Operating, administrative and servicing fees 4.3 68 Other operational expenses 1 Total expenses 445 Net losses from investments (98)
Realised losses on investments (1,081) Realised losses on forward currency exchange contracts (62) Realised currency exchange losses (24) Net realised losses (1,167)
Decrease in unrealised depreciation on investments 3,279 Decrease in unrealised depreciation on forward currency exchange contracts 16 Unrealised currency exchange gains 1 Net unrealised gains 3,296 Net increase in assets as a result of operations 2,031
Share Transactions For the period from 1 October 2016 to 31 March 2017
A-2 A(EUR)-2^ I-2 S-2 X-2Shares outstanding at the beginning of the period 1,117,409 126,979 3,505 1,364,937 100,379 Shares issued during the period 179,962 6,912 1,395 5,982 7,625 Shares redeemed during the period (176,411) (13,099) (392) (120,215) (17,705) Shares outstanding at the end of the period 1,120,960 120,792 4,508 1,250,704 90,299 Net asset value per share 18.1410 8.2107 1,603.1667 17.6258 10.0032
^ Base currency exposure share class.
The accompanying notes form an integral part of these financial statements.

aberdeen-asset.com 47
Asian Property SharePortfolio StatementAs at 31 March 2017
SecurityNominal/ Quantity
Market Value US$’000
Total Net Assets
%Transferable securities and money market instruments admitted to an official exchange listing or dealt on another regulated market 97.67%Equities 97.67%Australia 6.15%BWP Trust 230,000 502 0.97Scentre (REIT) 404,166 1,329 2.58Westfield (REIT) 198,000 1,339 2.60
3,170 6.15
China 1.87%Anhui Conch Cement 116,500 396 0.77China Resources Land 210,000 568 1.10
964 1.87
Hong Kong 18.58%Hang Lung Properties 581,000 1,508 2.92Hongkong Land 131,000 1,007 1.95Jardine Strategic 57,400 2,411 4.67MTR 208,549 1,172 2.27Shangri-La Asia 702,857 1,022 1.98Swire Properties 770,200 2,462 4.79
9,582 18.58
India 3.03%Grasim Industries (GDR) 96,500 1,561 3.03
Indonesia 2.09%Holcim Indonesia 6,372,000 432 0.84Indocement Tunggal Prakarsa 519,000 647 1.25
1,079 2.09
Japan 19.05%Daibiru Corp 280,500 2,463 4.78Daito Trust Construction Co 2,900 398 0.77East Japan Railway Co 27,600 2,403 4.66Mitsubishi Estate Co 193,000 3,520 6.83Resorttrust Inc 59,000 1,038 2.01
9,822 19.05
Malaysia 5.42%Capitaland Malaysia Mall Trust (REIT) 1,330,000 488 0.95Oriental 522,000 779 1.51SP Setia 547,900 437 0.85SP Setia (PERP) (PREF) 287,462 73 0.14YNH Property 3,000,841 1,018 1.97
2,795 5.42

48 Aberdeen Global
Asian Property Share
SecurityNominal/ Quantity
Market Value US$’000
Total Net Assets
%Philippines 3.60%Ayala Land 2,800,100 1,856 3.60
Singapore 29.47%Bukit Sembawang Estates 350,000 1,519 2.95CapitaLand 588,000 1,530 2.96CDL Hospitality Trusts (REIT) 1,515,000 1,550 3.00City Developments 550,000 4,014 7.77Far East Hospitality Trust (REIT) 1,090,000 470 0.91Global Logistic Properties 750,000 1,495 2.90Keppel (REIT) 1,193,921 895 1.74Mapletree Commercial Trust 230,000 251 0.49Straits Trading Singapore 120,000 193 0.37United Engineers 350,000 715 1.39Wheelock Properties Singapore 1,102,000 1,473 2.86Yanlord Land 846,000 1,097 2.13
15,202 29.47
Thailand 3.84%Central Pattana (Alien) 840,200 1,451 2.81LPN Development∞ 1,500,400 531 1.03
1,982 3.84
United Kingdom 4.57%Millennium & Copthorne Hotels 427,117 2,355 4.57
Total Equities 50,368 97.67
Total Transferable securities and money market instruments admitted to an official exchange listing or dealt on another regulated market 50,368 97.67
Derivatives 0.02%
Forward currency exchange contracts 0.02%
Counterparty Buy Sell Settlement Buy Amount Sell Amount
Unrealised Gains/(Losses)
US$’000
Total Net Assets
%BNP Paribas EUR USD 15/06/17 911,773 966,367 13 0.02BNP Paribas EUR USD 15/06/17 50,000 53,267 - -BNP Paribas EUR USD 15/06/17 19,771 21,181 - -Unrealised gains on forward currency exchange contracts 13 0.02
Unrealised gains on derivatives 13 0.02
Total investments 50,381 97.69Other net assets 1,191 2.31Total net assets 51,572 100.00
∞ A portion of this security is on loan at the period end.Currently forward positions are not collateralised.

aberdeen-asset.com 49
Asian Smaller CompaniesFor the six months ended 31 March 2017
Performance For the six months ended 31 March 2017, the value of Asian Smaller Companies – A Accumulation Shares increased by 4.81% compared to an increase of 4.00% in the benchmark, the MSCI AC Asia Pacific Ex- Japan Small Cap Index.Source: Lipper, Basis: total return, published NAV to NAV, net of annual charges, gross income reinvested, USD. Please see the Performance History section for details on the use of MSCI information.
Please remember that past performance is not a guide to future returns. The price of shares and the revenue from them may fall as well as rise. Investors may not get back the amount originally invested.
Market reviewAsian small-cap equities rose in the review period. Initially, risk appetite was weak owing to uncertainty over Donald Trump’s surprise US election win, a hard Brexit for the UK and the US Federal Reserve’s (Fed) hint at three more hikes after raising rates. All this deepened concerns over increased volatility across Asian markets, with headwinds also emanating from China. At the start of 2017, a strengthening global economy and expectations of a gradual Fed tightening boosted risk appetite. The Fed maintained a cautious outlook after it tightened policy as widely expected in March. Markets also bounced back swiftly from a late sell-off caused by doubts over Trump’s ability to advance his economic agenda following the failure to overhaul health care.
Portfolio reviewAt the stock level, Chinese industrial gas company Yingde Gases was the biggest contributor to performance, as it was the target of a takeover battle. We divested Yingde to private equity firm PAG Capital at HK$6 a share after US-based Air Products and Chemicals withdrew its offer. Yingde’s board had recommended that shareholders accept the PAG offer, while major shareholders indicated they too would tender their stakes, rendering the offer unconditional. More importantly, we agreed with the board that valuations based on PAG’s cash offer were fair, given the company’s financial status and the challenging environment faced by Yingde’s customers, which come primarily from the steel industry. We have been engaging with Yingde for over two years, which culminated in our decision. We are pleased with the outcome, given that we also spoke at length with Yingde to better understand the process of a potential sale and held extensive talks with both factions during the fractious and very public boardroom tussle in recent months.
Similarly, UK-listed MP Evans was a takeover target of KL Kepong, which lifted its share price. While MP Evans successfully fought off the unsolicited approach that undervalued its plantations portfolio in Southeast Asia, the company’s share price ended the period higher, given its clear strategy for growth and disposal of non-core assets to improve returns to shareholders. We had engaged with the boards of both companies during the offer process and were happy to support MP Evans, given its quality assets and longer-term growth potential.
Property names contributed, with Bukit Sembawang Estates and Wheelock Properties in Singapore leading the way after the government marginally eased financing and stamp duty measures. With sales improving from some new launches and valuations remaining attractive, the sector saw a re-rating, particularly among mid-sized companies.
Conversely, Malaysian retail operator Aeon detracted the most, as it faced a tough consumer environment, although its investment in the store network will position it well for a market recovery. Oriental Holdings underperformed its peers. Other laggards included brewer Multi Bintang, which surrendered some gains after prior strength; China’s Green Dragon Gas, as it posted lacklustre results; and Australia’s Healthscope, hurt by negative industry sentiment.
Aside from divesting Yingde Gases, we also exited DBG Financial Group, Far East Hospitality Trust, Giordano, Shopping Centres Australasia, Texwinca and United Malacca.
Against this, we initiated positions in Taiwan FamilyMart, given its wide network and well-recognised brand; Australia’s Blackmores, which delivers good margins from its vitamins business, thanks to its brand portfolio and distribution in Asia; Medy-Tox, a South Korean maker of botulinum toxin, which has a 40% domestic market and is one of eight such manufacturers globally. We also participated in the IPO of Pilipinas Shell Petroleum, given technical backing from its parent and the country’s favourable demographics.
OutlookAsia, along with the broader emerging markets, has made stellar gains in the first quarter. Capital is rotating back to the region, partly because valuations in the US appear stretched following Donald Trump’s election victory, and partly owing to expectations that Asia will benefit from the brightening global economic outlook. Exports across the region have bounced, and earnings growth is on the mend, led by some of the worst hit sectors, such as commodities.
But as encouraging as these developments are, caution is merited. Geopolitical risks abound, particularly on the Korean Peninsula. South Korea’s deployment of the US missile defence system has ratcheted tension with China, while North Korea’s nuclear defiance is causing consternation among neighbouring nations. News of the US military strike against Syria also serves as a reminder that many of the simmering crises elsewhere can flare up quickly, with potentially negative impact on financial markets. Meanwhile, a marked improvement in US economic data could prompt the Fed to tighten policy more aggressively than expected. Above all, President Trump’s unpredictable actions will hold sway, with investors focused on his stance on protectionism, and whether the administration can deliver on campaign promises of tax cuts and fiscal stimulus that have supported global equities since November. That said, we are bottom-up investors, whose focus remains on companies. We are confident that the robust fundamentals and the inherent quality of our holdings will stand them in good stead for the challenges over the long run.
Asian Equities Team April 2017

50 Aberdeen Global
Asian Smaller Companies
Statement of Net AssetsAs at 31 March 2017
Notes US$'000AssetsInvestments in securities at market value 2.2 1,765,487 Cash at bank 55,117 Interest and dividends receivable 7,339 Subscriptions receivable 1,398 Receivable for investments sold 1,237 Unrealised gains on forward currency exchange contracts 2.6 338 Total assets 1,830,916 LiabilitiesPayable for investments purchased 8,750 Taxes and expenses payable 2,292 Redemptions payable 7,977 Total liabilities 19,019 Net assets at the end of the period 1,811,897
Statement of Changes in Net Assets For the period from 1 October 2016 to 31 March 2017
Notes US$'000Net assets at the beginning of the period 1,986,071 Net losses from investments (56) Net realised losses (80,107) Net unrealised gains 158,938 Proceeds from shares issued 142,417 Payments for shares redeemed (395,294) Net equalisation paid 10 (72) Net assets at the end of the period 1,811,897
Statement of Operations For the period from 1 October 2016 to 31 March 2017
Notes US$'000IncomeInvestment income 2.3 13,247 Bank interest 35 Stocklending income 16 538 Total income 13,820 ExpensesManagement fees 4.2 11,510 Operating, administrative and servicing fees 4.3 2,347 Other operational expenses 19 Total expenses 13,876 Net losses from investments (56)
Realised losses on investments (77,409) Realised losses on forward currency exchange contracts (2,003) Realised currency exchange losses (695) Net realised losses (80,107)
Decrease in unrealised depreciation on investments 158,538 Decrease in unrealised depreciation on forward currency exchange contracts 409 Unrealised currency exchange losses (9) Net unrealised gains 158,938 Net increase in assets as a result of operations 78,775
Share Transactions For the period from 1 October 2016 to 31 March 2017
A-2 D(GBP)-2 E(EUR)-1 I-2 L(SGD)-2 R(GBP)-2Shares outstanding at the beginning of the period 24,522,503 4,246,204 2,410,621 8,342,598 1,020 1,166,414 Shares issued during the period 1,160,069 117,671 455,691 1,448,106 - 170,470 Shares redeemed during the period (3,537,147) (283,225) (2,095,022) (4,620,298) - (211,064) Shares outstanding at the end of the period 22,145,425 4,080,650 771,290 5,170,406 1,020 1,125,820 Net asset value per share 42.5625 33.9845 12.1613 46.3121 9.7491 13.4215
X-2 Y(EUR)-2 Z-2 Z(EUR)-2^
Shares outstanding at the beginning of the period 2,240,829 80,630 17,593,187 2,470,000 Shares issued during the period 19,778 17,522 1,003,195 - Shares redeemed during the period (713,312) (50,787) (435,746) - Shares outstanding at the end of the period 1,547,295 47,365 18,160,636 2,470,000 Net asset value per share 10.4562 12.7430 21.0497 10.7631
^ Base currency exposure share class.
The accompanying notes form an integral part of these financial statements.

aberdeen-asset.com 51
Asian Smaller CompaniesPortfolio StatementAs at 31 March 2017
SecurityNominal/ Quantity
Market Value US$’000
Total Net Assets
%Transferable securities and money market instruments admitted to an official exchange listing or dealt on another regulated market 96.93%Equities 96.93%Australia 2.73%ARB∞ 683,051 7,712 0.43Blackmores∞ 107,000 9,191 0.51Cabcharge Australia∞ 5,861,735 13,616 0.75Healthscope 10,930,000 18,928 1.04
49,447 2.73
China 2.73%Asia Satellite Telecommunications 6,271,500 7,727 0.43Beijing Capital International Airport 984,000 1,178 0.07China Conch Venture 7,340,000 14,422 0.80Greka Drilling 5,003,655 192 0.01Tong Ren Tang Technologies 14,600,000 25,982 1.42
49,501 2.73
Hong Kong 11.49%Aeon Credit Service Asia 16,560,000 12,125 0.67Aeon Stores Hong Kong 7,413,000 6,978 0.39Convenience Retail Asia 44,590,000 23,926 1.32Dah Sing Financial 5,808,419 44,227 2.44Green Dragon Gas 4,276,931 5,722 0.32Hong Kong & Shanghai Hotels 7,905,302 9,282 0.51Hong Kong Aircraft Engineering∞ 1,132,000 7,837 0.43Kerry Logistics Network 25,638,500 35,992 1.99Mandarin Oriental International∞ 3,825,000 4,963 0.27Pacific Basin Shipping∞ 137,826,000 29,174 1.61Public Financial 39,604,000 18,320 1.01Towngas China∞ 16,900,000 9,579 0.53
208,125 11.49
India 12.20%Castrol India 3,409,004 22,694 1.25City Union Bank 11,563,883 26,975 1.49CONCOR 1,797,000 35,132 1.93Gujarat Gas 806,740 9,531 0.53Jyothy Laboratories 1,700,573 9,154 0.51Kansai Nerolac Paints 4,693,088 27,572 1.51Mphasis 1,939,800 17,312 0.96Piramal Enterprises 787,391 23,115 1.28Ramco Cements 2,252,340 23,526 1.30Sanofi India 360,163 26,127 1.44
221,138 12.20

52 Aberdeen Global
Asian Smaller Companies
SecurityNominal/ Quantity
Market Value US$’000
Total Net Assets
%Indonesia 11.18%Ace Hardware Indonesia 369,021,800 22,777 1.26AKR Corporindo 72,154,800 33,775 1.85Astra Otoparts 111,810,500 23,284 1.29Bank OCBC NISP 233,116,812 31,839 1.76Bank Permata 255,583,539 12,803 0.71Holcim Indonesia 264,881,500 17,940 0.99Multi Bintang Indonesia 43,168,900 37,984 2.09XL Axiata 96,250,000 22,211 1.23
202,613 11.18
Malaysia 12.64%Aeon 66,823,600 35,861 1.98Alliance Financial 10,506,900 9,663 0.53Batu Kawan 2,051,700 8,971 0.50LPI Capital 4,612,160 17,707 0.98Manulife 2,363,800 1,688 0.09Oriental 26,556,600 39,634 2.18Panasonic Manufacturing Malaysia 2,144,600 16,821 0.93Shangri-La Hotels Malaysia 21,140,500 24,052 1.33SP Setia 20,906,690 16,676 0.92SP Setia (PERP) (PREF) 10,073,118 2,572 0.14Tasek 6,044,760 18,604 1.03United Plantations 4,354,500 28,053 1.55YNH Property 25,834,174 8,756 0.48
229,058 12.64
Netherlands 0.98%ASM International (non-voting) 316,862 17,842 0.98
Philippines 4.26%Asian Terminals 70,841,900 16,802 0.93Cebu 196,895,200 20,130 1.10Jollibee Foods 2,747,490 10,804 0.60Manila Water 28,827,700 17,725 0.98Pilipinas Shell Petroleum 8,158,080 11,772 0.65
77,233 4.26
Singapore 18.26%Bukit Sembawang Estates 13,728,900 59,590 3.30CDL Hospitality Trusts (REIT)∞ 13,570,200 13,888 0.77ComfortDelGro 11,756,600 21,581 1.19Delfi 19,330,400 30,643 1.69FJ Benjamin 3,600,000 148 0.01Hong Leong Finance 5,782,900 11,195 0.62Raffles Medical 33,744,346 34,232 1.89SATS 4,873,000 17,036 0.94SBS Transit 7,326,500 13,449 0.74

aberdeen-asset.com 53
Asian Smaller Companies
SecurityNominal/ Quantity
Market Value US$’000
Total Net Assets
%Straits Trading Singapore∞ 15,833,888 25,440 1.40Venture 3,523,000 28,944 1.60Wheelock Properties Singapore 19,521,400 26,091 1.44Yanlord Land 23,808,200 30,883 1.70Yoma Strategic∞ 38,387,199 17,514 0.97
330,634 18.26
South Korea 3.65%BNK Financial 1,719,454 14,122 0.78Medy-Tox 50,500 20,906 1.15Shinsegae 182,004 31,045 1.72
66,073 3.65
Sri Lanka 2.22%Aitken Spence 20,215,873 7,648 0.42Commercial Bank of Ceylon 9,486,068 8,169 0.45John Keells 26,913,338 24,414 1.35
40,231 2.22
Taiwan 0.82%Taiwan FamilyMart 2,252,000 14,937 0.82
Thailand 7.67%Aeon Thana Sinsap Thailand 6,003,400 17,820 0.98BEC World∞ 30,610,900 15,367 0.85Bumrungrad Hospital (Alien)∞ 2,876,700 15,299 0.84Hana Microelectronics 13,415,800 18,399 1.02Minor International (Alien)∞ 12,361,072 13,265 0.73Minor International (Equity Warrant) 2,278,685 206 0.01Siam City Cement (Alien)∞ 3,247,900 27,978 1.54Thai Reinsurance (Alien) 49,218,030 2,843 0.16Tisco Financial (Alien) 13,365,690 27,859 1.54
139,036 7.67
United Kingdom 5.10%Millennium & Copthorne Hotels 8,061,074 44,453 2.45MP Evans∞ 5,077,550 47,873 2.65
92,326 5.10
United States 1.00%Samsonite International 4,980,300 18,120 1.00
Total Equities 1,756,314 96.93
Total Transferable securities and money market instruments admitted to an official exchange listing or dealt on another regulated market 1,756,314 96.93

54 Aberdeen Global
Asian Smaller Companies
SecurityNominal/ Quantity
Market Value US$’000
Total Net Assets
%Other transferable securities and money market instruments 0.51%Equities 0.51%China 0.51%Han's Laser Technology Industry 2,400,009 9,173 0.51
Total Equities 9,173 0.51
Total Other transferable securities and money market instruments 9,173 0.51
Derivatives 0.02%
Forward currency exchange contracts 0.02%
Counterparty Buy Sell Settlement Buy Amount Sell Amount
Unrealised Gains/(Losses)
US$’000
Total Net Assets
%BBH SGD USD 03/04/17 773,970 554,957 (1) -BBH SGD USD 04/04/17 4,140 2,966 - -BBH SGD USD 05/04/17 21,641 15,485 - -BNP Paribas EUR USD 15/06/17 25,346,212 26,863,867 343 0.02BNP Paribas EUR USD 15/06/17 711,373 767,197 (4) -Unrealised gains on forward currency exchange contracts 338 0.02
Unrealised gains on derivatives 338 0.02
Total investments 1,765,825 97.46Other net assets 46,072 2.54Total net assets 1,811,897 100.00
∞ A portion of this security is on loan at the period end.Currently forward positions are not collateralised.

aberdeen-asset.com 55
Australasian EquityFor the six months ended 31 March 2017
Performance For the six months ended 31 March 2017, the value of Australasian Equity A – Accumulation shares increased by 7.96% compared to an increase of 9.11% in the benchmark, the Australia Stock Exchange All Ordinaries Index.Source: Lipper, Basis: total return, published NAV to NAV, net of annual charges, gross income reinvested, AUD.
Please remember that past performance is not a guide to future returns. The price of shares and the revenue from them may fall as well as rise. Investors may not get back the amount originally invested.
Market reviewAustralian equities rose in the six months under review amid bouts of volatility. Initially, the stock prices were lifted by rising oil and commodity prices. In particular, the mining sector benefited from speculation that demand for resources and energy would rise on the back of Donald Trump’s shock election win in the US and his pledge for a substantial increase in infrastructure spending. Meanwhile, oil prices had rebounded after the Saudi-led deal to cut crude output. Sentiment had also been boosted by positive economic data out of the US, Europe and China. Towards the period end, however, both the energy and mining sectors faced a reversal of fortunes. Risk aversion rose amid a lack of policy details in President Trump’s subsequent speeches, while elevated US oil inventories triggered sharp falls in the oil price.
At home, trade data proved disappointing as exports weakened on declining commodity shipments but imported consumer goods rose substantially. Retail sales grew 0.4%, underpinned by non-discretionary spending, while the consumption of durable goods remained subdued. At the same time, unemployment rose to its highest level since early 2016, as business confidence flagged. In policy news, the central bank held interest rates unchanged at 1.5%, while new macro-prudential rules for mortgage lending were imposed to tame surging home prices that had risen by 7.7% last year.
Portfolio review At the stock level, detracting from performance was private hospital operator Healthscope, which underperformed the market after an unexpected negative trading update. However, its long-term prospects remain robust, as it is the second-largest private hospital operator locally, with structural tailwinds from an aging population and a budget-constrained public system. The company has a significant number of existing developments due over the next few years, which should contribute to earnings. Also costing the Fund was shopping-centre-focused property developer Westfield. Its underperformance mirrored a broad sell-off in REITs amid a reversal in the bond-proxy rally earlier in the period. Nevertheless, Westfield’s long-term prospects remain attractive, given its portfolio of quality assets, high occupancy levels, long-term rental agreements, diversification across geographies and proven management.
Conversely, contributing to relative return was diversified mining services company Incitec Pivot, which saw its shares do well on expectations that a Trump presidency will boost demand for explosives in the US, which would be positive for the company’s coal, quarry and construction businesses. We remain confident of Incitec’s longer-term prospects, given its broad geographical reach and established market share in significant mining geographies, including North America. Also benefiting the Fund was diversified global miner Rio Tinto, which saw its shares buoyed by solid fourth-quarter production results
and maintained its 2017 outlook. The company also grew its managed thermal coal resources in Australia. Separately, Rio will sell its wholly-owned subsidiary Coal & Allied Industries Limited for up to US$2.45 billion. This opportunistic divestment comes at a time of elevated coal prices, and is consistent with the management’s goal of selling non-core assets and recycling cash. We continue to like Rio because of its significant ore reserves, low cost mines, operational discipline and healthy balance sheet. We expect it to go on benefiting from global urbanisation and development trends, driven by emerging market growth.
In key portfolio activity, we introduced Treasury Wine Estates, which has an attractive earnings growth outlook, along with Auckland International Airport (AIA), which has a robust long-term outlook. AIA owns and operates the country’s dominant airport, handling the bulk of international air travel, with a regulated aviation business that is seeing good increases in volumes supported by population and tourism growth. The airport business also generates spin-off revenues and profits from its unregulated retail, car parking, hotel, and property businesses. AIA also owns a large amount of land that represents a large amount of development potential as management executes its Master Plan.
OutlookLooking ahead, some risks to growth are emerging, with credit tightening following bank repricing and local regulators announcing macro-prudential measures on mortgage lending to curb still-rising home prices. Cost pressures are also expected to create a significant drag for both businesses and consumers.
We expect market sentiment to continue to remain weak towards bond-proxy stocks. This has been predominantly driven by a change in views about the US interest rate cycle, with the US Federal Reserve now likely to increase base rates by 75 bps in 2017. We expect the Australian dollar to remain subdued vis-a-vie the US dollar, benefiting our holdings in the export, tourism and healthcare sectors. We envisage political headlines to increasingly influence market volatility, given substantial uncertainty surrounding US policy. For Australia, the biggest concerns will be the potential impact on major trading partner China and commodity prices.
Overall we remain cautiously optimistic about Australia’s economy. We will continue to exploit market volatility, taking the opportunity to either initiate positions we have been closely watching, or add to those quality companies that we already hold (if fundamentals remain unchanged) or shift towards those that exhibit better fundamentals. Our focus remains firmly on cash-generative companies with solid balance sheets, led by prudent management.
Asian Equities Team April 2017
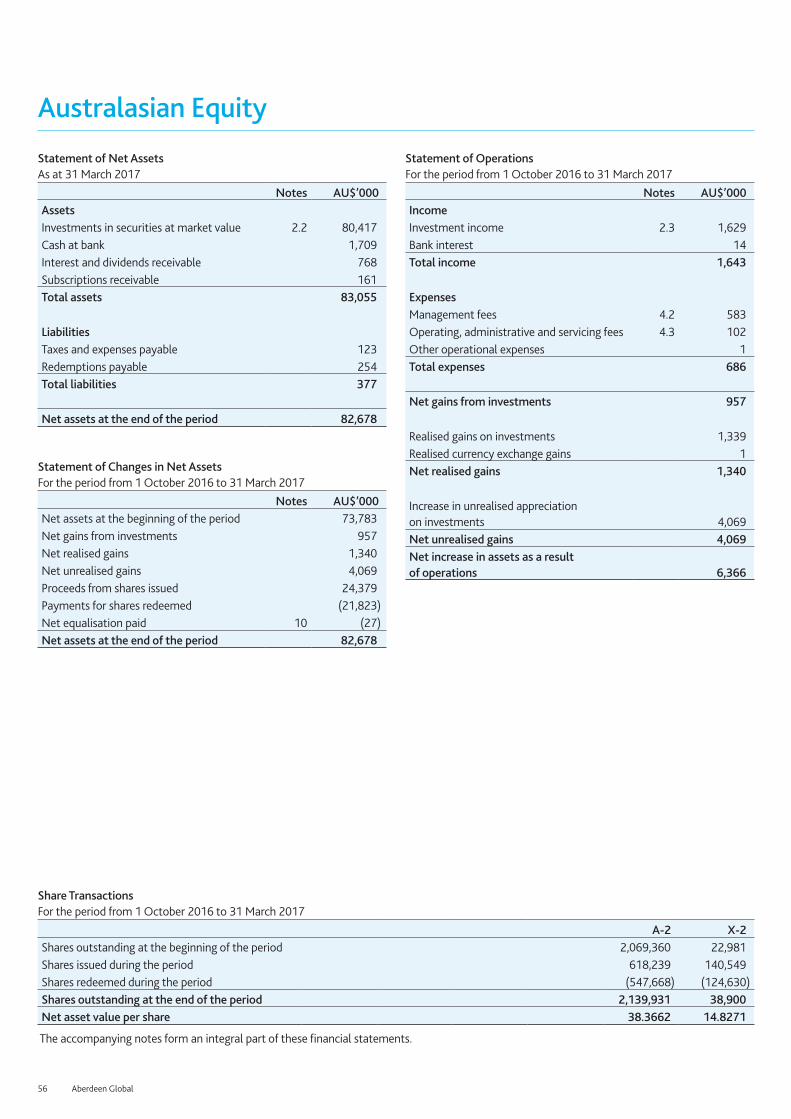
56 Aberdeen Global
Australasian Equity
Statement of Net AssetsAs at 31 March 2017
Notes AU$’000AssetsInvestments in securities at market value 2.2 80,417 Cash at bank 1,709 Interest and dividends receivable 768 Subscriptions receivable 161 Total assets 83,055 LiabilitiesTaxes and expenses payable 123 Redemptions payable 254 Total liabilities 377 Net assets at the end of the period 82,678
Statement of Changes in Net Assets For the period from 1 October 2016 to 31 March 2017
Notes AU$’000Net assets at the beginning of the period 73,783 Net gains from investments 957 Net realised gains 1,340 Net unrealised gains 4,069 Proceeds from shares issued 24,379 Payments for shares redeemed (21,823) Net equalisation paid 10 (27) Net assets at the end of the period 82,678
Statement of Operations For the period from 1 October 2016 to 31 March 2017
Notes AU$’000IncomeInvestment income 2.3 1,629 Bank interest 14 Total income 1,643 ExpensesManagement fees 4.2 583 Operating, administrative and servicing fees 4.3 102 Other operational expenses 1 Total expenses 686 Net gains from investments 957
Realised gains on investments 1,339 Realised currency exchange gains 1 Net realised gains 1,340
Increase in unrealised appreciation on investments 4,069 Net unrealised gains 4,069 Net increase in assets as a result of operations 6,366
Share Transactions For the period from 1 October 2016 to 31 March 2017
A-2 X-2Shares outstanding at the beginning of the period 2,069,360 22,981 Shares issued during the period 618,239 140,549 Shares redeemed during the period (547,668) (124,630) Shares outstanding at the end of the period 2,139,931 38,900 Net asset value per share 38.3662 14.8271
The accompanying notes form an integral part of these financial statements.

aberdeen-asset.com 57
Australasian EquityPortfolio StatementAs at 31 March 2017
SecurityNominal/ Quantity
Market Value AU$’000
Total Net Assets
%Transferable securities and money market instruments admitted to an official exchange listing or dealt on another regulated market 97.27%Equities 97.27%Consumer Discretionary 0.80%Tatts 150,700 664 0.80
Consumer Staples 5.02%Coca-Cola Amatil 145,900 1,579 1.91Treasury Wine Estates 68,800 846 1.02Woolworths 64,900 1,722 2.09
4,147 5.02
Energy 6.92%Caltex Australia 72,300 2,140 2.59Woodside Petroleum 111,500 3,581 4.33
5,721 6.92
Financials 26.85%AMP 472,200 2,448 2.96ASX 86,500 4,372 5.29Australia & New Zealand Banking 103,900 3,314 4.01Commonwealth Bank of Australia 58,600 5,036 6.08Medibank Private 438,500 1,237 1.50Perpetual 23,800 1,236 1.49Westpac Banking 130,200 4,567 5.52
22,210 26.85
Health Care 17.01%Cochlear 22,000 2,980 3.60CSL 39,200 4,913 5.95Fisher & Paykel Healthcare 195,400 1,728 2.09Healthscope 1,252,000 2,842 3.44ResMed (CDI) 172,600 1,598 1.93
14,061 17.01
Industrials 1.96%Auckland International Airport 124,000 770 0.93Brambles 90,900 850 1.03
1,620 1.96
Information Technology 0.55%IRESS 38,900 454 0.55
Materials 17.82%Adelaide Brighton 259,000 1,469 1.78Amcor 214,600 3,244 3.92
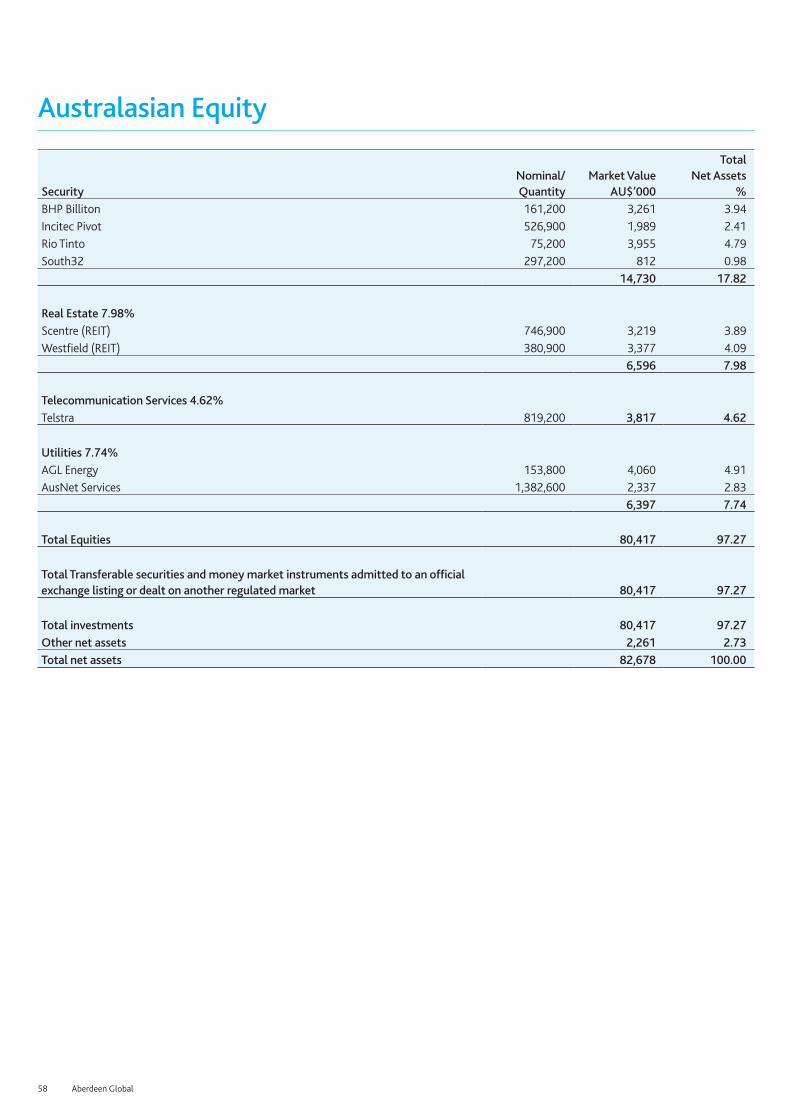
58 Aberdeen Global
Australasian Equity
SecurityNominal/ Quantity
Market Value AU$’000
Total Net Assets
%BHP Billiton 161,200 3,261 3.94Incitec Pivot 526,900 1,989 2.41Rio Tinto 75,200 3,955 4.79South32 297,200 812 0.98
14,730 17.82
Real Estate 7.98%Scentre (REIT) 746,900 3,219 3.89Westfield (REIT) 380,900 3,377 4.09
6,596 7.98
Telecommunication Services 4.62%Telstra 819,200 3,817 4.62
Utilities 7.74%AGL Energy 153,800 4,060 4.91AusNet Services 1,382,600 2,337 2.83
6,397 7.74
Total Equities 80,417 97.27
Total Transferable securities and money market instruments admitted to an official exchange listing or dealt on another regulated market 80,417 97.27
Total investments 80,417 97.27Other net assets 2,261 2.73Total net assets 82,678 100.00

aberdeen-asset.com 59
Brazil BondFor the six months ended 31 March 2017
PerformanceFor the six months ended 31 March 2017, the value of Brazil Bond - A Accumulation Shares increased by 9.28% compared to an increase of 8.85% in the benchmark, the Brazil CETIP Rate Accumulated Index.Source: Lipper, Basis: total return, published NAV to NAV, net of annual charges, gross income reinvested, USD.
Please remember that past performance is not a guide to future returns. The price of shares and the revenue from them may fall as well as rise. Investors may not get back the amount originally invested.
Market review Emerging markets (EM) debt remained defiant over the period. The asset class overcame a shock victory for Donald Trump in the US elections in November, before brushing aside two interest rate hikes from the US Federal Reserve in December and March, respectively. EM debt has benefitted from the synchronised global recovery with both developed and emerging market economies gaining momentum.
There was a sell-off in the immediate aftermath of Trump’s victory as the Republican’s pre-election rhetoric and campaign promises - namely his pledge to boost domestic infrastructure spending and cut taxes in order to boost growth, while also renegotiating or even tearing up existing trade deals - saw US Treasury (UST) yields increase and the US dollar appreciate. This subsequently led to downward pressure on EM debt as the animal spirits were unleashed. Most recently, however, US markets have been more subdued and, with prospects of the so-called reflation trade having diminished, the risk of rising UST yields and a stronger dollar has also declined, which is supportive for the asset class.
Trump withdrew the US from the Trans-Pacific Partnership in January but even that seems to have done little to dampen sentiment. December was the first of four straight months of sustained positive performance as fading external risks and a stabilisation of commodity prices continued to benefit the asset class. Emerging market fundamentals remain strong, with local markets growing particularly attractive over the period.
Brazil’s political landscape has made improvements but a dose of stability is still required; President Temer’s Minister of Government Relations Geddel Viera Lima resigned towards the end of 2016, after being accused of using his influence to gain a building permit for a building in which he owned a stake. Temer has also been implicated in the scandal but seems likely to finish his term given that Congress understands the importance of his reform agenda amid lacklustre growth and continued fiscal stress especially at a state level.
Brazil’s fiscal balance worsened in February with the primary balance recording a deficit equivalent to 2.3% of GDP, which was above consensus expectations. This was driven by growing social security spending which highlights the importance of President Temer’s social security reform in Congress. GDP growth in the last quarter of 2016 was registered at -2.5% year-on-year (y/y), resulting in full year growth of -3.5% y/y. In the central bank’s Focus Survey, economic growth in 2017 is expected to be 0.47% y/y. The quarterly investment report published by the central bank suggested that the pace of cuts would likely increase from 75bps to 100bps. The inflation forecast was reduced to 4.0% at the end of 2017, with 2018’s estimate remaining at 4.5%.
Portfolio review There were no major changes to the Fund’s holdings over the period.
OutlookThe fact that fears of rising UST yields have diminished has clearly been supportive of the asset class. However, even prior to the recent subsidence of UST yields the asset class has been doing well, partly thanks to the resilience of commodity prices. This does point to one of the principle outstanding risks for the asset class, that is a correction in oil and other key commodities (such as the one we are currently witnessing in iron ore), with the most likely trigger being growth disappointment in China. While our outlook for growth in China this year is a fairly sanguine one, we do acknowledge the risk to the asset class that a slowdown in China would pose.
Political volatility is never too far away in emerging markets as recent events in South Africa and April’s constitutional referendum in Turkey can attest. Given the benign backdrop in which the market appears to be operating at the moment, any drop in asset prices caused by negative news flow is swiftly capped by willing buyers. The primary markets continue to be open to issuers on every spectrum of the credit rating scale as investors struggle to reduce healthy cash balances as a result of the consistent inflows that have returned to the asset class this year. The bearish emerging market scenarios which were espoused after Donald Trump’s election have yet to manifest themselves – encouraging market participants to remain invested.
Emerging Market Debt Team April 2017
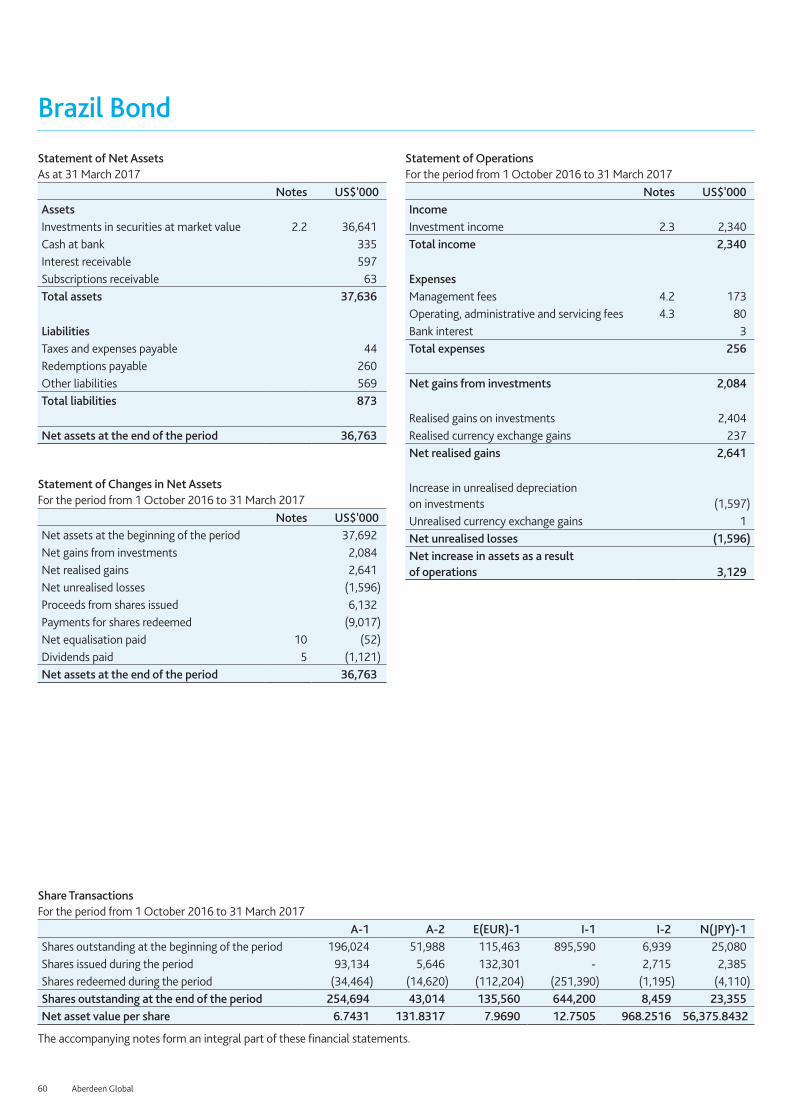
60 Aberdeen Global
Brazil Bond
Statement of Net AssetsAs at 31 March 2017
Notes US$'000AssetsInvestments in securities at market value 2.2 36,641 Cash at bank 335 Interest receivable 597 Subscriptions receivable 63 Total assets 37,636 LiabilitiesTaxes and expenses payable 44 Redemptions payable 260 Other liabilities 569 Total liabilities 873 Net assets at the end of the period 36,763
Statement of Changes in Net Assets For the period from 1 October 2016 to 31 March 2017
Notes US$'000Net assets at the beginning of the period 37,692 Net gains from investments 2,084 Net realised gains 2,641 Net unrealised losses (1,596) Proceeds from shares issued 6,132 Payments for shares redeemed (9,017) Net equalisation paid 10 (52) Dividends paid 5 (1,121) Net assets at the end of the period 36,763
Statement of Operations For the period from 1 October 2016 to 31 March 2017
Notes US$'000IncomeInvestment income 2.3 2,340 Total income 2,340 ExpensesManagement fees 4.2 173 Operating, administrative and servicing fees 4.3 80 Bank interest 3 Total expenses 256 Net gains from investments 2,084
Realised gains on investments 2,404 Realised currency exchange gains 237 Net realised gains 2,641
Increase in unrealised depreciation on investments (1,597) Unrealised currency exchange gains 1 Net unrealised losses (1,596) Net increase in assets as a result of operations 3,129
Share Transactions For the period from 1 October 2016 to 31 March 2017
A-1 A-2 E(EUR)-1 I-1 I-2 N(JPY)-1Shares outstanding at the beginning of the period 196,024 51,988 115,463 895,590 6,939 25,080 Shares issued during the period 93,134 5,646 132,301 - 2,715 2,385 Shares redeemed during the period (34,464) (14,620) (112,204) (251,390) (1,195) (4,110) Shares outstanding at the end of the period 254,694 43,014 135,560 644,200 8,459 23,355 Net asset value per share 6.7431 131.8317 7.9690 12.7505 968.2516 56,375.8432
The accompanying notes form an integral part of these financial statements.

aberdeen-asset.com 61
Brazil BondPortfolio StatementAs at 31 March 2017
Security Coupon (%) MaturityNominal/Quantity
Market Value US$’000
Total Net Assets
%Transferable securities and money market instruments admitted to an official exchange listing or dealt on another regulated market 99.67%Bonds 99.67%Government Bonds 99.67%Brazil 99.67%Brazil (Federal Republic of) - 01/07/18 32,150,000 9,031 24.57Brazil (Federal Republic of) 10.0000 01/01/19 26,000,000 8,257 22.46Brazil (Federal Republic of) 6.0000 15/08/18 7,710,000 7,331 19.94Brazil (Federal Republic of) 10.0000 01/01/18 19,175,000 6,042 16.43Brazil (Federal Republic of) 10.0000 01/01/21 6,620,000 2,040 5.55Brazil (Federal Republic of) 6.0000 15/05/17 270,000 253 0.69Brazil (Federal Republic of) (INDX) 6.0000 15/05/19 3,850,000 3,687 10.03
36,641 99.67
Total Government Bonds 36,641 99.67
Total Bonds 36,641 99.67
Total Transferable securities and money market instruments admitted to an official exchange listing or dealt on another regulated market 36,641 99.67
Total investments 36,641 99.67Other net assets 122 0.33Total net assets 36,763 100.00

62 Aberdeen Global
Brazil EquityFor the six months ended 31 March 2017
Performance For the six months ended 31 March 2017, the value of Brazil Equity - A Accumulation Shares increased by 8.60% compared to an increase of 10.77% in the benchmark, the MSCI Brazil 10/40 Index.Source: Lipper, Basis: total return, published NAV to NAV, net of annual charges, gross income reinvested, USD.Please see the Performance History section for details on the use of MSCI information.
Please remember that past performance is not a guide to future returns. The price of shares and the revenue from them may fall as well as rise. Investors may not get back the amount originally invested.
Market reviewBrazilian equities rose during the six months under review. The US Federal Reserve’s two interest rate hikes were well-flagged, and Brazil benefited from increased risk appetite despite Donald Trump’s presidential election victory. An oil price rebound after major producers agreed to curb output also lifted sentiment.
Economic contraction eased in 2016, with signs of bottoming out. President Michel Temer pressed on with structural reform. The senate passed laws to freeze social spending for 20 years and Temer vetoed a bill offering relief to debt-ridden states, in efforts to tame a budget deficit. These were accompanied by measures to support the ailing economy, such as additional loans for small businesses and tax relief for workers. The declining trajectory of inflation has also allowed the central bank to cut its benchmark Selic rate four times to revive the economy.
Portfolio reviewAt the stock level, Valid Solucoes was a key detractor from relative performance. The payment and mobile solutions company’s earnings were hampered by lower volumes in its Latin American business and the Brazilian real’s appreciation, although this was mitigated by operating efficiency gains and decreased expenses. BRF’s shares fell after an investigation into corruption across the domestic meat sector led some countries to temporarily suspend meat imports from Brazil. Operations at one of BRF’s poultry plants was temporarily suspended. In addition, the company’s fourth-quarter earnings showed it had suffered from weak domestic volumes coupled with margin pressures internationally. Meanwhile, not holding state-owned lender Banco do Brasil also proved costly, as banks continued to outperform the wider market in anticipation of further interest rate cuts. However, the Fund’s holding in Itau Unibanco partly offset this, as the stock also did well during the review period.
Bradespar was a key contributor, as the stock re-rated after the announcement of a transformational restructuring of its primary asset, iron ore miner Vale. Shoemaker Arezzo Industria e Comercio was boosted by good earnings and gains in market share. Meanwhile, not holding Cielo was helpful, as the stock suffered on ongoing uncertainty over the regulatory environment.
In portfolio activity, we introduced market-leading software developer LINX, which focuses on the retail sector. It has a resilient business model, good growth prospects and a robust balance sheet. We sold our rights ahead of Multiplan’s capital raising. We added to Ambev and TOTVS, on attractive valuations. Against this, we trimmed Banco Bradesco and Itau Unibanco, following a recovery in Brazilian banking stocks, as well as Vale, after iron-ore prices rose.
OutlookBrazilian equities could continue to be supported by healthier risk appetite and expectations for improved earnings thanks to both operating and financial leverage as the economy returns to growth. The monetary easing trajectory should also help to reduce the financial burden on companies and consumers. Concerns that Donald Trump’s protectionist stance could hurt global trade appear to be moderating somewhat, as early fears seem overdone. While investors’ sentiment could shift again, we are unfazed by short-term volatility as indiscriminate selling or buying will provide opportunities for us as long-term investors. The Brazilian economy is certainly not out of the woods yet, but the Temer administration continues to push forward with structural reforms that could help improve the business environment. Despite its obvious unpopularity, the proposed changes to the pension scheme would bring the policy in line with much of the developed world, and help the government to improve the country’s finances.
A bottom-up approach to investment means continuously focusing on seeking out and holding companies with solid balance sheets that can withstand near-term challenges. We continue to find appeal in Brazil’s domestic growth story, and there are ample stocks with good fundamentals that are well-positioned to gain from these longer-term trends.
Global Emerging Markets Equity Team April 2017

aberdeen-asset.com 63
Brazil Equity
Statement of Net AssetsAs at 31 March 2017
Notes US$'000AssetsInvestments in securities at market value 2.2 27,334 Cash at bank 570 Interest and dividends receivable 57 Subscriptions receivable 3 Other assets 7 Total assets 27,971 LiabilitiesPayable for investments purchased 13 Taxes and expenses payable 42 Redemptions payable 23 Other liabilities 4 Total liabilities 82 Net assets at the end of the period 27,889
Statement of Changes in Net Assets For the period from 1 October 2016 to 31 March 2017
Notes US$'000Net assets at the beginning of the period 22,240 Net gains from investments 116 Net realised losses (666) Net unrealised gains 2,546 Proceeds from shares issued 13,558 Payments for shares redeemed (9,822) Net equalisation received 10 5 Dividends paid 5 (88) Net assets at the end of the period 27,889
Statement of Operations For the period from 1 October 2016 to 31 March 2017
Notes US$'000IncomeInvestment income 2.3 331 Total income 331 ExpensesManagement fees 4.2 143 Operating, administrative and servicing fees 4.3 72 Total expenses 215 Net gains from investments 116
Realised losses on investments (502) Realised currency exchange losses (164) Net realised losses (666)
Decrease in unrealised depreciation on investments 2,548 Unrealised currency exchange losses (2) Net unrealised gains 2,546 Net increase in assets as a result of operations 1,996
Share Transactions For the period from 1 October 2016 to 31 March 2017
A-2 I-2 N(JPY)-1 S-2Shares outstanding at the beginning of the period 473,876 775,582 25,042 434,243 Shares issued during the period 1,794,358 23,900 4,357 83,792 Shares redeemed during the period (702,692) (107,264) (8,779) (135,105) Shares outstanding at the end of the period 1,565,542 692,218 20,620 382,930 Net asset value per share 6.3304 7.3364 56,716.7541 6.2803
The accompanying notes form an integral part of these financial statements.

64 Aberdeen Global
Brazil EquityPortfolio StatementAs at 31 March 2017
SecurityNominal/ Quantity
Market Value US$’000
Total Net Assets
%Transferable securities and money market instruments admitted to an official exchange listing or dealt on another regulated market 98.01%Equities 98.01%Consumer Discretionary 14.38%Arezzo Industria e Comercio 130,781 1,287 4.61Cia Hering 57,400 324 1.16GAEC Educacao 41,500 174 0.62Lojas Renner 254,000 2,225 7.99
4,010 14.38
Consumer Staples 16.31%Ambev 326,371 1,875 6.72BRF 103,800 1,262 4.53Natura Cosmeticos 65,400 599 2.15Raia Drogasil 43,800 811 2.91
4,547 16.31
Energy 5.01%Ultrapar Participacoes 62,000 1,398 5.01
Financials 25.62%Banco Bradesco 22,200 225 0.81Banco Bradesco (PREF) 221,450 2,257 8.09BM&F Bovespa 222,800 1,354 4.86Itau Unibanco 188,373 2,005 7.19Itausa Investimentos Itau (Interim Line) 6,440 19 0.07Itausa Investimentos Itau (PREF) 427,734 1,283 4.60
7,143 25.62
Health Care 2.72%OdontoPrev 214,000 760 2.72
Industrials 12.15%Localiza Rent a Car 90,150 1,183 4.24Valid Solucoes 88,443 629 2.26WEG 127,800 701 2.51Wilson Sons (BDR) 78,500 875 3.14
3,388 12.15
Information Technology 4.10%LINX 61,604 322 1.16TOTVS 94,100 823 2.94
1,145 4.10
Materials 7.82%Bradespar (PREF) 128,300 884 3.17Vale 138,200 1,298 4.65
2,182 7.82

aberdeen-asset.com 65
Brazil Equity
SecurityNominal/ Quantity
Market Value US$’000
Total Net Assets
%Real Estate 9.90%Iguatemi Empresa de Shopping Centers 134,410 1,389 4.98Multiplan Empreendimentos Imobiliarios 65,616 1,372 4.92
2,761 9.90
Total Equities 27,334 98.01
Total Transferable securities and money market instruments admitted to an official exchange listing or dealt on another regulated market 27,334 98.01
Total investments 27,334 98.01Other net assets 555 1.99Total net assets 27,889 100.00

66 Aberdeen Global
China A Share EquityFor the six months ended 31 March 2017
Performance For the six months ended 31 March 2017, the value of China A Share Equity Fund – A Accumulation shares increased by 9.96%, compared to an increase of 0.69% in the benchmark, the MSCI China A TR Index.Source: Lipper, Basis: total return, published NAV to NAV, net of annual charges, gross income reinvested, USD.Please see the Performance History section for details on the use of MSCI information.
Please remember that past performance is not a guide to future returns. The price of shares and the revenue from them may fall as well as rise. Investors may not get back the amount originally invested.
Market reviewChina’s A-share market closed flat over the review period. Initially, markets succumbed to risk aversion following Donald Trump’s surprise US presidential election win and a US rate hike. A weakening yuan, accelerating capital outflows and tightening regulations overshadowed a stabilising economy. Subsequently, sentiment recovered on positive economic news and receding worries over capital flight. The central bank tightened rates, a marginal tightening in the greater scheme of things but which could signal policymakers’ increasing comfort with the growth trajectory of the economy. Beijing, meanwhile, set its policy goals for 2017, including a GDP growth target of 6.5% and plans to reduce overcapacity in the steel and coal sectors.
Portfolio reviewAt the stock level, video surveillance product maker Hangzhou Hikvision contributed the most to relative performance. The company released solid preliminary full-year results, driven by higher exports. Its foray into robotics also boosted sentiment towards its stock. Another key contributor was China International Travel Service, which won several bids for duty-free shop concessions in airports, including Hong Kong which is one of the busiest in the world, although this may come at the expense of mid-term margins, given that the winning bids included a higher revenue-sharing ratio with the airports. The Fund also benefited from holding auto-glass maker Fuyao Glass Industry, which posted health earnings growth on the back of robust auto sales.
On the other hand, China World Trade Center was the biggest detractor, after it warned that property tax changes would hurt both its operating cash flow and earnings. The lack of exposure to Gree Electric Appliances also hurt performance, as sentiment towards white goods company improved, although our holding in Qingdao Haier, which makes and sells household appliances and consumer electronics products, benefited over a recovery in its aircon business and its smart-TV partnership with Aliababa. Not holding China State Construction Engineering and China United Network Communications also detracted, as both companies outperformed the domestic benchmark.
There were no major portfolio changes over the review period.
OutlookThere are signs of an economic recovery and this has led to rising optimism. Notably, a key manufacturing gauge, the PMI, is hovering around its five-year high. Stability has been achieved through stimulus and government intervention, rather than market forces. Overcapacity remains an issue and industry consolidation is sorely needed. With a key leadership shuffle due at the end of the year, however, it is clear that the government is prioritising growth over reform, most recently announcing an ambitious new economic zone in the Xiongan area of Hebei province that will rival those in Shenzhen and Pudong. That said, the authorities are also concerned over the escalating stresses in the financial system. The country’s top insurance regulator is being investigated for graft, while banks have been warned against speculation that could result in asset bubbles and divert funds away from the more productive parts of the economy. We see Beijing continuing to grapple with supporting growth while averting potential asset bubbles over the coming months. Amid the uncertain backdrop, we are bottom-up investors, whose focus remains on companies. We are confident that the robust fundamentals and the inherent quality of our holdings will stand them in good stead for the challenges over the long run.
Asian Equities Team April 2017

aberdeen-asset.com 67
China A Share Equity
Statement of Net AssetsAs at 31 March 2017
Notes US$'000AssetsInvestments in securities at market value 2.2 537,404 Cash at bank 61,057 Interest and dividends receivable 10 Total assets 598,471 LiabilitiesTaxes and expenses payable 144 Redemptions payable 1,180 Total liabilities 1,324 Net assets at the end of the period 597,147
Statement of Changes in Net Assets For the period from 1 October 2016 to 31 March 2017
Notes US$'000Net assets at the beginning of the period 294,179 Net losses from investments (583) Net realised gains 2,530 Net unrealised gains 55,765 Proceeds from shares issued 272,681 Payments for shares redeemed (27,425) Net assets at the end of the period 597,147
Statement of Operations For the period from 1 October 2016 to 31 March 2017
Notes US$'000IncomeBank interest 39 Stocklending income 16 39 Total income 78 ExpensesManagement fees 4.2 169 Operating, administrative and servicing fees 4.3 488 Other operational expenses 4 Total expenses 661 Net losses from investments (583)
Realised gains on investments 3,453 Realised currency exchange losses (923) Net realised gains 2,530
Increase in unrealised appreciation on investments 55,819 Unrealised currency exchange losses (54) Net unrealised gains 55,765 Net increase in assets as a result of operations 57,712
Share Transactions For the period from 1 October 2016 to 31 March 2017
A-2 H(EUR)-2 I-1 I-2 Z-1 Z-2Shares outstanding at the beginning of the period 1,244,824 833 750 105,818 - 30,255,376 Shares issued during the period 1,197,724 - - 140,427 341,846 27,372,353 Shares redeemed during the period (913) - - (904) - (2,833,954) Shares outstanding at the end of the period 2,441,635 833 750 245,341 341,846 54,793,775 Net asset value per share 9.9699 9.9707 9.0280 10.1311 11.0560 10.3392
The accompanying notes form an integral part of these financial statements.

68 Aberdeen Global
China A Share EquityPortfolio StatementAs at 31 March 2017
SecurityNominal/ Quantity
Market Value US$’000
Total Net Assets
%Transferable securities and money market instruments admitted to an official exchange listing or dealt on another regulated market 90.00%Equities 90.00%Consumer Discretionary 21.62%China CYTS Tours 'A' 7,127,346 22,587 3.78China International Travel Service 'A' 3,742,483 30,822 5.17Fuyao Glass Industry∞ 4,665,600 16,149 2.70Fuyao Glass Industry 1,700,000 5,578 0.93Midea 'A' 3,946,509 19,066 3.20Qingdao Haier 'A' 11,503,259 20,355 3.41SAIC Motor 'A' 3,928,389 14,477 2.43
129,034 21.62
Consumer Staples 8.24%Beijing Yanjing Brewery 'A' 5,314,475 5,780 0.97Kweichow Moutai 'A' 371,610 20,857 3.49Tsingtao Brewery 10,000 46 0.01Yonghui Superstores 'A' 28,235,739 22,546 3.77
49,229 8.24
Energy 3.14%China Oilfield Services 3,004,000 2,886 0.48China Shenhua Energy 273,000 634 0.11PetroChina 20,754,000 15,208 2.55
18,728 3.14
Financials 11.28%Bank of Ningbo 'A' 3,633,438 9,709 1.63China Construction Bank 7,759,000 6,245 1.05China Life Insurance 7,146,000 21,907 3.67China Merchants Bank 8,319,520 23,188 3.88ICBC China 9,623,000 6,296 1.05
67,345 11.28
Health Care 9.92%Beijing Tongrentang 'A' 8,145,937 37,412 6.26China Resources Sanjiu Medical & Pharmaceutical 'A' 5,575,766 21,848 3.66
59,260 9.92
Industrials 16.88%Daqin Railway 'A' 9,711,859 10,681 1.79Han's Laser Technology 5,261,629 20,052 3.36Ningbo Zhoushan Port 'A' 14,456,050 11,535 1.93Shanghai International Airport 'A' 8,657,556 37,675 6.31Shanghai International Port 23,623,188 20,246 3.39Shenzhen Airport 469,848 602 0.10
100,791 16.88

aberdeen-asset.com 69
China A Share Equity
SecurityNominal/ Quantity
Market Value US$’000
Total Net Assets
%Information Technology 6.78%Hangzhou Hikvision Digital Technology 'A' 8,751,767 40,503 6.78
Materials 3.72%Anhui Conch Cement 'A' 7,371,850 22,197 3.72Huaxin Cement 'B' 34,900 27 -
22,224 3.72
Real Estate 7.04%China Vanke 4,980,000 13,473 2.26China World Trade Center 'A' 9,824,332 28,553 4.78
42,026 7.04
Utilities 1.38%Huaneng Power International 12,362,000 8,264 1.38
Total Equities 537,404 90.00
Total Transferable securities and money market instruments admitted to an official exchange listing or dealt on another regulated market 537,404 90.00
Total investments 537,404 90.00Other net assets 59,743 10.00Total net assets 597,147 100.00
∞ A proportion of this security is on loan at the period end.

70 Aberdeen Global
Chinese EquityFor the six months ended 31 March 2017
PerformanceFor the six months ended 31 March 2017, the value of Chinese Equity – A Accumulation Shares increased by 9.59% compared to an increase of 4.47% in the benchmark, the MSCI Zhong Hua Index.Source: Lipper, Basis: total return, published NAV to NAV, net of annual charges, gross income reinvested, USD.Please see the Performance History section for details on the use of MSCI information.
Please remember that past performance is not a guide to future returns. The price of shares and the revenue from them may fall as well as rise. Investors may not get back the amount originally invested.
Market review Equities in China and Hong Kong overcame a jittery start to close higher over the review period. Initially, markets succumbed to risk aversion following Donald Trump’s surprise US presidential election win and a US rate hike. A weakening yuan, accelerating capital outflows and tightening regulations overshadowed a stabilising economy. Subsequently, sentiment recovered on positive economic news and receding worries over capital flight. The mainland economy grew by 6.7% in 2016, with Beijing setting a sensible growth target of 6.5% for 2017. The People’s Bank of China followed the US Federal Reserve and hiked its policy rates to reduce financial risks.
Portfolio review At the stock level, Chinese industrial gas company Yingde Gases was the biggest contributor to performance, as it was the target of a takeover battle. We divested Yingde to private equity firm PAG Capital at HK$6 a share after US-based Air Products and Chemicals withdrew its offer. Yingde’s board had recommended that shareholders accept the PAG offer, while major shareholders indicated they too would tender their stakes, rendering the offer unconditional. More importantly, we agreed with the board that valuations based on PAG’s cash offer were fair, given the company’s financial status and the challenging environment faced by Yingde’s customers, which come primarily from the steel industry. We have been engaging with Yingde for over two years, which culminated in our decision. We are pleased with the outcome, given that we also spoke at length with Yingde to better understand the process of a potential sale and held extensive talks with both factions about their proposals during the fractious and very public boardroom tussle in recent months.
Jardine Strategic also had a good run, driven by its inclusion in the MSCI World Index and expectations that its subsidiaries’ fundamentals will continue to improve. Dairy Farm International has been delivering on margin improvements by closing underperforming stores and increasing its fresh food segment. This offset Swire Pacific’s soft annual results, hampered by its airline subsidiary Cathay Pacific and marine business Swire Pacific Offshore. After a strategic review, management will cut 30% from staff costs at Cathay’s Hong Kong headquarters. Despite these challenges, several key parts of the Swire group remain robust, some of its numbers have stayed resilient and valuations continue to be attractive.
In contrast, Green Dragon Gas detracted the most after it posted lacklustre half-year results. Tong Ren Tang Technologies disappointed, owing to slower-than-expected sales of its Ejiao herb products and higher expenses, while Asia Satellite Telecommunications also lagged the domestic benchmark although we have begun to see its profits stabilise amid reasonable valuations.
Aside from divesting Yingde Gases, we also exited Huaxin Cement and Hung Hing Printing on deteriorating prospects. Against this, we introduced Beijing Capital International Airport, an attractive infrastructure asset in a gateway city, benefiting from being the home base of Air China, and one that is well positioned to gain from an improving traffic mix over time; China Resources Land, a leading mainland property company that is supported by its parent company, low funding cost and land banking discipline; and Kweichow Moutai, which produces and sells baijiu – a distilled Chinese liquor – with strong brand equity.
We responded to Yum Brands’ restructuring by exiting the holding in favour of its newly listed China subsidiary, Yum China. This subsidiary is one of the largest restaurant operators on the mainland, running the KFC and Pizza Hut chains. It has a net cash balance sheet and a highly cash generative business, and it is trading at an attractive valuation.
Outlook There are signs of an economic recovery and this has led to rising optimism. Notably, a key manufacturing gauge, the PMI, is hovering around its five-year high. Stability has been achieved through stimulus and government intervention, rather than market forces. Overcapacity remains an issue and industry consolidation is sorely needed. With a key leadership shuffle due at the end of the year, however, it is clear that the government is prioritising growth over reform, most recently announcing an ambitious new economic zone in the Xiongan area of Hebei province that will rival those in Shenzhen and Pudong. That said, the authorities are also concerned over the escalating stresses in the financial system. The country’s top insurance regulator is being investigated for graft, while banks have been warned against speculation that could result in asset bubbles and divert funds away from the more productive parts of the economy. We see Beijing continuing to grapple with supporting growth while averting potential asset bubbles over the coming months. Amid the uncertain backdrop, we are bottom-up investors, whose focus remains on companies. We are confident that the robust fundamentals and the inherent quality of our holdings will stand them in good stead for the challenges over the long run.
Asian Equities Team April 2017

aberdeen-asset.com 71
Chinese Equity
Statement of Net AssetsAs at 31 March 2017
Notes US$'000AssetsInvestments in securities at market value 2.2 602,340 Cash at bank 27,203 Interest and dividends receivable 1,010 Subscriptions receivable 877 Receivable for investments sold 17 Unrealised gains on forward currency exchange contracts 2.6 228 Total assets 631,675 LiabilitiesTaxes and expenses payable 818 Redemptions payable 2,631 Total liabilities 3,449 Net assets at the end of the period 628,226
Statement of Changes in Net Assets For the period from 1 October 2016 to 31 March 2017
Notes US$'000Net assets at the beginning of the period 623,412 Net losses from investments (2,757) Net realised losses (17,816) Net unrealised gains 75,525 Proceeds from shares issued 66,787 Payments for shares redeemed (116,909) Net equalisation paid 10 (16) Net assets at the end of the period 628,226
Statement of Operations For the period from 1 October 2016 to 31 March 2017
Notes US$'000IncomeInvestment income 2.3 1,717 Bank interest 20 Stocklending income 16 211 Total income 1,948 ExpensesManagement fees 4.2 4,019 Operating, administrative and servicing fees 4.3 680 Other operational expenses 6 Total expenses 4,705 Net losses from investments (2,757)
Realised losses on investments (15,650) Realised losses on forward currency exchange contracts (2,129) Realised currency exchange losses (37) Net realised losses (17,816)
Decrease in unrealised depreciation on investments 75,243 Decrease in unrealised depreciation on forward currency exchange contracts 280 Unrealised currency exchange gains 2 Net unrealised gains 75,525 Net increase in assets as a result of operations 54,952
Share Transactions For the period from 1 October 2016 to 31 March 2017
A-2 A(EUR)-2^ D(GBP)-2 I-2 R(GBP)-2 S-2Shares outstanding at the beginning of the period 18,054,396 2,187,443 808,948 589,495 252,451 369,068 Shares issued during the period 1,659,768 1,175,878 17,869 419,920 21,632 747 Shares redeemed during the period (2,877,970) (1,541,462) (48,081) (323,169) (34,426) (91,968) Shares outstanding at the end of the period 16,836,194 1,821,859 778,736 686,246 239,657 277,847 Net asset value per share 24.6040 9.5311 19.6547 26.8423 13.6824 21.2125
X-2 Z-2Shares outstanding at the beginning of the period 116,631 10,777,315 Shares issued during the period 7,073 412,590 Shares redeemed during the period (2,987) (1,782,412) Shares outstanding at the end of the period 120,717 9,407,493 Net asset value per share 10.6606 15.5806
^ Base Currency Exposure Share Class.
The accompanying notes form an integral part of these financial statements.

72 Aberdeen Global
Chinese EquityPortfolio StatementAs at 31 March 2017
SecurityNominal/ Quantity
Market Value US$’000
Total Net Assets
%Transferable securities and money market instruments admitted to an official exchange listing or dealt on another regulated market 92.54%Equities 92.54%China 23.78%Asia Satellite Telecommunications 8,327,500 10,260 1.63Beijing Capital International Airport 2,670,000 3,197 0.51China Conch Venture 7,526,000 14,788 2.35China International Travel Service 'A' 1,539,979 12,675 2.02China Merchants Bank 3,140,000 8,293 1.32China Resources Land 1,100,000 2,976 0.47CNOOC 10,319,000 12,329 1.96CSPC Pharmaceutical 7,960,000 10,406 1.66Fuyao Glass Industry∞ 4,624,000 16,005 2.55Greka Drilling 5,308,000 204 0.03Hangzhou Hikvision Digital Technology 'A' 2,877,350 13,316 2.12Kweichow Moutai 'A' 123,950 6,960 1.11PetroChina 15,233,800 11,163 1.78Shanghai International Airport 'A' 2,769,896 12,047 1.92Tong Ren Tang Technologies 8,297,000 14,765 2.35
149,384 23.78
Hong Kong 59.09%Aeon Stores Hong Kong 12,753,000 12,004 1.91AIA 5,577,600 35,185 5.60ASM Pacific Technology∞ 810,400 10,996 1.75China Mobile 2,380,500 26,059 4.15Convenience Retail Asia 19,284,000 10,347 1.65Dah Sing Banking 916,959 1,809 0.29Dah Sing Financial 2,340,788 17,824 2.84Dairy Farm International 1,098,000 10,019 1.59Giordano International 22,701,000 12,298 1.96Global Brands 89,412,360 9,492 1.51Green Dragon Gas 3,014,381 4,033 0.64Hang Lung 2,913,000 12,472 1.99Hang Lung Properties 2,210,000 5,737 0.91HKBN 6,580,000 7,345 1.17Hong Kong & China Gas 3,687,820 7,379 1.17Hong Kong & Shanghai Hotels 9,047,413 10,623 1.69Hong Kong Aircraft Engineering 652,400 4,516 0.72Hong Kong Exchanges & Clearing 387,459 9,754 1.55Jardine Strategic 858,781 36,065 5.73Kerry Logistics Network 14,076,000 19,760 3.15MTR 5,758,050 32,360 5.15Pacific Basin Shipping∞ 71,498,000 15,134 2.41Shangri-La Asia 14,826,000 21,557 3.43Swire Pacific 'A' 189,000 1,888 0.30

aberdeen-asset.com 73
Chinese Equity
SecurityNominal/ Quantity
Market Value US$’000
Total Net Assets
%Swire Pacific 'B' 9,309,500 16,124 2.57Swire Properties 4,709,130 15,058 2.40Texwinca 8,050,000 5,423 0.86
371,261 59.09
Singapore 1.24%Yanlord Land 5,999,300 7,782 1.24
United Kingdom 5.61%HSBC 2,563,258 20,886 3.33Standard Chartered∞ 1,502,641 14,352 2.28
35,238 5.61
United States 2.82%Samsonite International 3,436,500 12,503 2.00Yum China 190,500 5,183 0.82
17,686 2.82
Total Equities 581,351 92.54
Total Transferable securities and money market instruments admitted to an official exchange listing or dealt on another regulated market 581,351 92.54
Open Ended Investment Funds 3.34%Aberdeen Global - China A Share Equity Fund Z-2† 2,030,000 20,989 3.34
Total Open Ended Investment Funds 20,989 3.34
Derivatives 0.04%
Forward currency exchange contracts 0.04%
Counterparty Buy Sell Settlement Buy Amount Sell Amount
Unrealised Gains/(Losses)
US$’000
Total Net Assets
%BNP Paribas EUR USD 03/04/17 5,111 5,548 - -BNP Paribas EUR USD 04/04/17 19,069 20,571 - -BNP Paribas EUR USD 15/06/17 16,937,486 17,951,652 230 0.04BNP Paribas EUR USD 15/06/17 343,036 370,171 (2) -BNP Paribas EUR USD 15/06/17 24,294 26,369 - -BNP Paribas EUR USD 15/06/17 12,984 14,017 - -BNP Paribas USD EUR 15/06/17 47,879 44,421 - -BNP Paribas USD EUR 15/06/17 32,650 30,150 - -BNP Paribas USD EUR 15/06/17 32,181 29,878 - -BNP Paribas USD EUR 15/06/17 27,591 25,301 - -BNP Paribas USD EUR 15/06/17 20,637 19,069 - -BNP Paribas USD EUR 15/06/17 12,786 12,054 - -BNP Paribas USD EUR 15/06/17 9,873 9,307 - -BNP Paribas USD EUR 15/06/17 9,574 8,936 - -BNP Paribas USD EUR 15/06/17 5,566 5,111 - -BNP Paribas USD EUR 15/06/17 4,981 4,665 - -

74 Aberdeen Global
Chinese Equity
Counterparty Buy Sell Settlement Buy Amount Sell Amount
Unrealised Gains/(Losses)
US$’000
Total Net Assets
%Unrealised gains on forward currency exchange contracts 228 0.04
Unrealised gains on derivatives 228 0.04
Total investments 602,568 95.92Other net assets 25,658 4.08Total net assets 628,226 100.00
† Managed by subsidiaries of Aberdeen Asset Management PLC.∞ A portion of this security is on loan at the period end.Currently forward positions are not collateralised.

aberdeen-asset.com 75
Eastern European EquityFor the six months ended 31 March 2017
Performance For the six months ended 31 March 2017, the value of Eastern European Equity – A Accumulation Shares increased by 9.51% compared to an increase of 16.71% in the benchmark, the MSCI Emerging Markets Europe 10/40 NR Index. Source: Lipper, Basis: total return, published NAV to NAV, net of annual charges, gross income reinvested, EUR.Please see the Performance History section for details on the use of MSCI information.
Please remember that past performance is not a guide to future returns. The price of shares and the revenue from them may fall as well as rise. Investors may not get back the amount originally invested.
Market reviewEastern European equity markets weathered considerable volatility to post robust gains over the period. Uncertainty over global monetary policies and Donald Trump’s unexpected victory in the US presidential election briefly sidelined investors. But markets continued to rise after that, shrugging off the US Federal Reserve’s much-anticipated interest rate hike, and the prospect of an accelerated pace of tightening.
Poland led the region, driven by good economic growth in the fourth quarter, although concerns over a less business-friendly conservative government surfaced. Russia rallied amid an oil price rebound. Expectations of a brighter outlook, and hopes of warmer relations with the US under the Trump administration bolstered sentiment. Hungary’s return to investment grade credit rating supported the market, thanks to its stable budget and lower gross public debt.
In contrast, Turkey was the main laggard. Political instability caused by, among other things, the fallout from a failed coup last July, hampered tourism – a key source of growth and a source of foreign exchange – and weighed on the currency. Although the economy returned to growth in the fourth quarter of 2016, its annual growth rate slowed sharply. Full-year GDP growth expanded by 2.9%, considerably lower than the 6% growth rate in 2015. The central bank’s decision to keep interest rates unchanged while marginally raising funding costs also disappointed investors who had hoped for a rate hike to support the lira and a clearer signal of the central bank’s independence.
Portfolio reviewThe Fund posted healthy returns despite lagging the benchmark index. In broad terms, the performance reflected the portfolio’s defensive positioning cast against an oil-led rally. While our long-held underweight to the energy sector detracted from performance, the overweight to more defensive sectors, such as consumer staples and financials proved costlier.
At the stock level, a few of our Turkish holdings – Coca Cola Icecek, Akbank and BIM Birlesik Magazalar – detracted owing partly to company-specific issues but mainly as investors reflected fears of an economic slowdown, which proved overdone. In any case, these companies remain well-equipped to weather a tougher economic environment. In Poland, not holding crude oil refiner PKN Orlen and copper producer KGHM Polska Miedz also cost the Fund, as their share prices rallied on the back of the commodity rebound. That said, we do not hold the companies as we have exposure to the sector through other companies such as Lukoil and NOVATEK in Russia.
Slovenian generics drug manufacturer Krka’s performance also disappointed. Although fourth-quarter sales and volumes increased across key markets, profits declined owing to pricing pressure for generics globally and foreign exchange losses. Likewise for food retailers Lenta and Eurocash. Despite being a potential beneficiary of an economic recovery later in the cycle, Lenta failed to keep pace with the rally in cyclicals. Eurocash posted disappointing earnings, owing to higher-than-expected costs and operational losses from new projects.
Nonetheless, there were positive surprises, notably from our Russian holdings. Ongoing operating efficiencies and recovering sales in the US market drove steelmaker Novolipetsk Steel’s share price up by almost 70% over the period. Independent gas producer NOVATEK’s share price rallied on the back of stellar full-year results that were driven by higher global oil prices, production growth and improved margins. Turkish infrastructure company Enka Insaat ve Sanayi also did well. Its earnings surpassed expectations, driven largely by better contribution from the power segment and significant pickup in operating profits.
In key portfolio activity, we initiated two holdings. Russian bourse Moscow Exchange has a dominant market position and exposure to increasing local corporate issuance in both equities and bonds. Turkish software developer Logo Yazilim Sanayi ve Ticaret provides a range of enterprise planning software to small and medium-sized companies, locally and in Romania. The company offers a fast pace of growth and industry-leading profitability. We also added to Lenta on share price weakness and attractive valuation.
Against this, we took advantage of a share price rally to sell Russian food retailer O’Key, after a period of engagement with management and continued disappointment over its lengthy restructuring. In addition, we pared NOVATEK after its strong run, and reduced our position in Krka, given a mixed outlook for the company’s pipeline and tough pricing pressure, particularly in Eastern European markets.
Outlook Eastern European markets are likely to remain supported by healthier risk appetite and expectations for improved earnings. Concerns that the Trump administration’s protectionist stance could hurt global trade appear to be moderating somewhat, as early fears seem overdone. Although investors’ sentiment could shift again, we are unfazed by short-term volatility as indiscriminate selling or buying will provide opportunities for us as long-term investors.
At the corporate level, we remain confident in the quality of our holdings, while our regular engagement with them should help ensure that the interests of both management and shareholders remain aligned. While uncertainties lie ahead, we stand by our prudent bottom-up investment approach, which we believe will help to navigate these headwinds over the long run.
Global Emerging Markets Equity Team April 2017
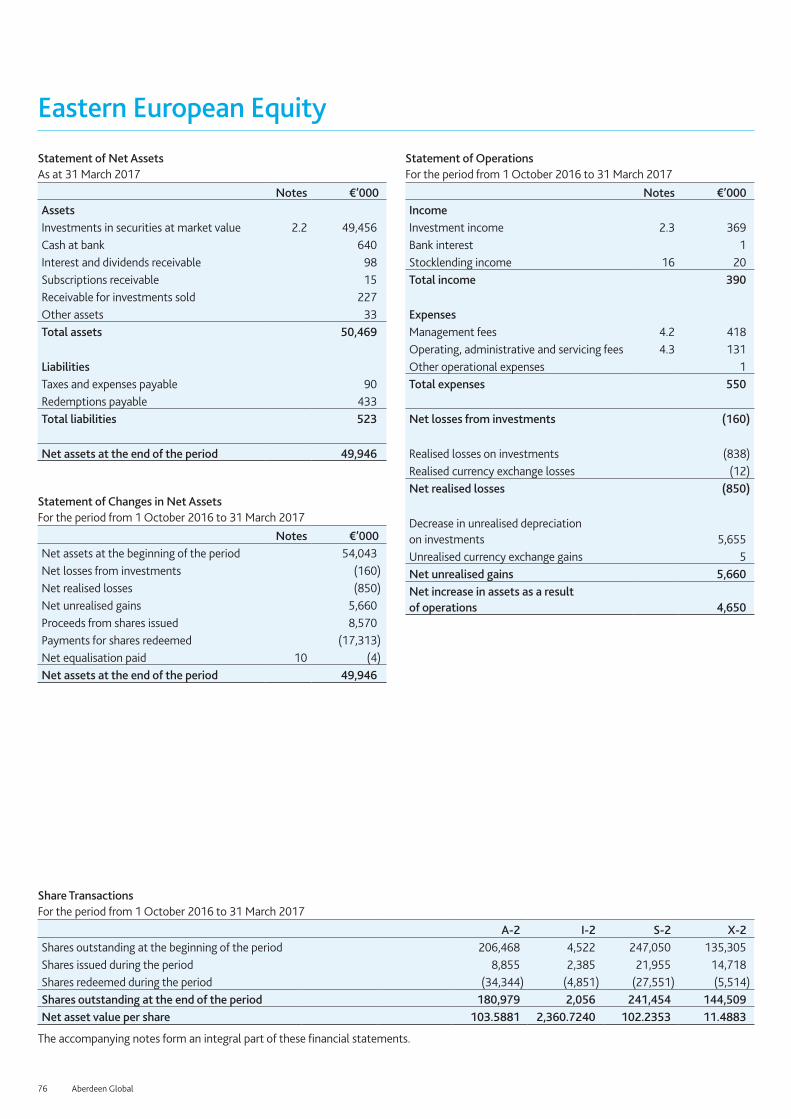
76 Aberdeen Global
Eastern European Equity
Statement of Net AssetsAs at 31 March 2017
Notes €’000AssetsInvestments in securities at market value 2.2 49,456 Cash at bank 640 Interest and dividends receivable 98 Subscriptions receivable 15 Receivable for investments sold 227 Other assets 33 Total assets 50,469 LiabilitiesTaxes and expenses payable 90 Redemptions payable 433 Total liabilities 523 Net assets at the end of the period 49,946
Statement of Changes in Net Assets For the period from 1 October 2016 to 31 March 2017
Notes €’000Net assets at the beginning of the period 54,043 Net losses from investments (160) Net realised losses (850) Net unrealised gains 5,660 Proceeds from shares issued 8,570 Payments for shares redeemed (17,313) Net equalisation paid 10 (4) Net assets at the end of the period 49,946
Statement of Operations For the period from 1 October 2016 to 31 March 2017
Notes €’000IncomeInvestment income 2.3 369 Bank interest 1 Stocklending income 16 20 Total income 390 ExpensesManagement fees 4.2 418 Operating, administrative and servicing fees 4.3 131 Other operational expenses 1 Total expenses 550 Net losses from investments (160)
Realised losses on investments (838) Realised currency exchange losses (12) Net realised losses (850)
Decrease in unrealised depreciation on investments 5,655 Unrealised currency exchange gains 5 Net unrealised gains 5,660 Net increase in assets as a result of operations 4,650
Share Transactions For the period from 1 October 2016 to 31 March 2017
A-2 I-2 S-2 X-2Shares outstanding at the beginning of the period 206,468 4,522 247,050 135,305 Shares issued during the period 8,855 2,385 21,955 14,718 Shares redeemed during the period (34,344) (4,851) (27,551) (5,514) Shares outstanding at the end of the period 180,979 2,056 241,454 144,509 Net asset value per share 103.5881 2,360.7240 102.2353 11.4883
The accompanying notes form an integral part of these financial statements.

aberdeen-asset.com 77
Eastern European EquityPortfolio StatementAs at 31 March 2017
SecurityNominal/ Quantity
Market Value €’000
Total Net Assets
%Transferable securities and money market instruments admitted to an official exchange listing or dealt on another regulated market 99.02%Equities 99.02%Czech Republic 2.59%Komercni Banka 37,000 1,291 2.59
Georgia 1.70%Bank of Georgia 22,600 851 1.70
Greece 1.18%Jumbo 40,400 592 1.18
Hungary 2.80%Gedeon Richter 65,400 1,396 2.80
Poland 5.31%Bank Pekao 45,821 1,430 2.86Eurocash 92,652 698 1.40Orbis 27,327 523 1.05
2,651 5.31
Portugal 4.06%Jeronimo Martins 121,068 2,028 4.06
Romania 3.21%BRD-Groupe Societe Generale 595,709 1,602 3.21
Russian Federation 45.44%Global Ports Investments (GDR) 122,800 419 0.84Lenta (GDR)∞ 187,200 1,187 2.38Lukoil ADR 86,300 4,273 8.55Magnit 30,221 4,656 9.32MD Medical Group Investments (GDR) 237,800 2,290 4.58Mobile Telesystems 163,300 742 1.49Moscow Exchange MICEX-RTS 248,300 463 0.93NOVATEK 181,900 2,124 4.25Novolipetsk Steel 635,800 1,192 2.39Sberbank 1,696,000 4,495 9.00Synergy 89,531 856 1.71
22,697 45.44
Slovenia 1.76%Krka 17,000 881 1.76
Switzerland 3.66%Coca-Cola HBC 75,800 1,826 3.66
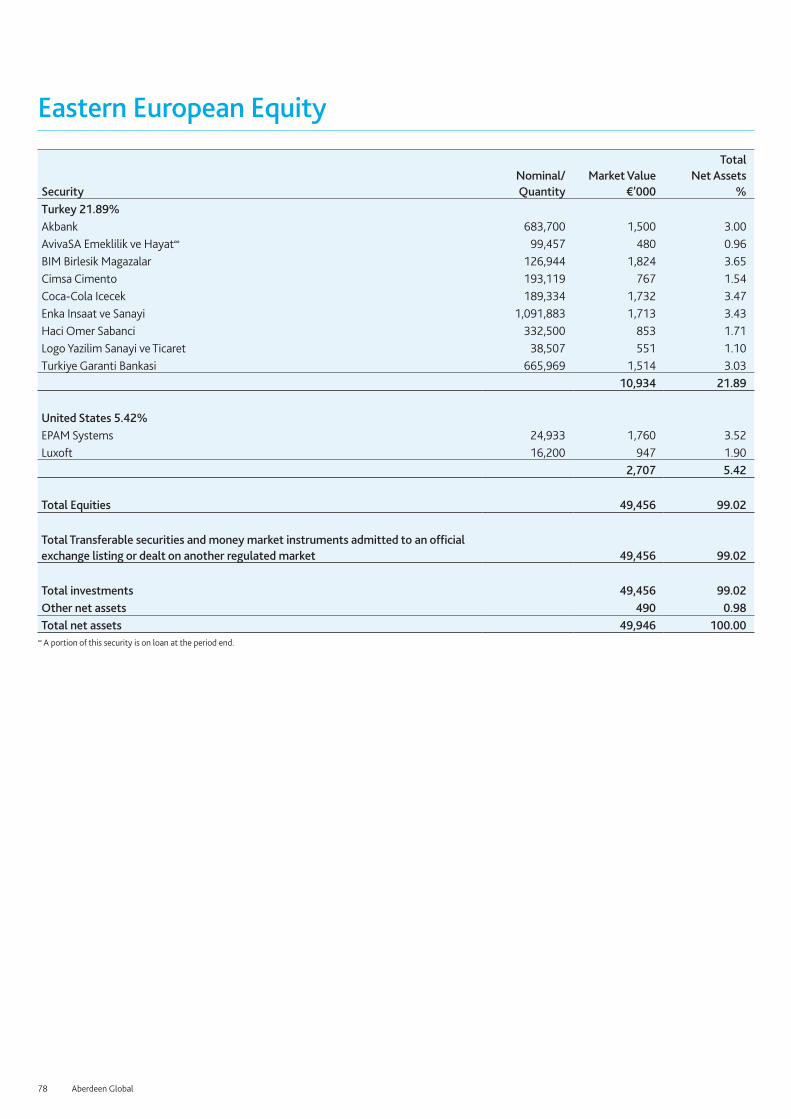
78 Aberdeen Global
Eastern European Equity
SecurityNominal/ Quantity
Market Value €’000
Total Net Assets
%Turkey 21.89%Akbank 683,700 1,500 3.00AvivaSA Emeklilik ve Hayat∞ 99,457 480 0.96BIM Birlesik Magazalar 126,944 1,824 3.65Cimsa Cimento 193,119 767 1.54Coca-Cola Icecek 189,334 1,732 3.47Enka Insaat ve Sanayi 1,091,883 1,713 3.43Haci Omer Sabanci 332,500 853 1.71Logo Yazilim Sanayi ve Ticaret 38,507 551 1.10Turkiye Garanti Bankasi 665,969 1,514 3.03
10,934 21.89
United States 5.42%EPAM Systems 24,933 1,760 3.52Luxoft 16,200 947 1.90
2,707 5.42
Total Equities 49,456 99.02
Total Transferable securities and money market instruments admitted to an official exchange listing or dealt on another regulated market 49,456 99.02
Total investments 49,456 99.02Other net assets 490 0.98Total net assets 49,946 100.00
∞ A portion of this security is on loan at the period end.

aberdeen-asset.com 79
Emerging Markets Corporate BondFor the six months ended 31 March 2017
PerformanceFor the six months ended 31 March 2017, the value of Emerging Markets Corporate Bond – A Accumulation shares increased by 2.37% compared to an increase of 1.62% in the benchmark, the JP Morgan Corporate EMBI Broad Diversified Index.Source: Lipper, JP Morgan, Basis: total return, published NAV to NAV, net of annual charges, gross income reinvested, USD.
Please remember that past performance is not a guide to future returns. The price of shares and the revenue from them may fall as well as rise. Investors may not get back the amount originally invested.
Market reviewEmerging markets (EM) debt remained defiant over the period. The asset class overcame a shock victory for Donald Trump in the US elections in November, before brushing aside two interest rate hikes from the US Federal Reserve in December and March, respectively. EM debt has benefitted from the synchronised global recovery with both developed and emerging market economies gaining momentum.
There was a sell-off in the immediate aftermath of Trump’s victory as the Republican’s pre-election rhetoric and campaign promises - namely his pledge to boost domestic infrastructure spending and cut taxes in order to boost growth, while also renegotiating or even tearing up existing trade deals - saw US Treasury (UST) yields increase and the US dollar appreciate. This subsequently led to downward pressure on EM debt as the animal spirits were unleashed. Most recently, however, US markets have been more subdued and, with prospects of the so-called reflation trade having diminished, the risk of rising UST yields and a stronger dollar has also declined, which is supportive for the asset class.
Trump withdrew the US from the Trans-Pacific Partnership in January but even that seems to have done little to dampen sentiment. December was the first of four straight months of sustained positive performance as fading external risks and a stabilisation of commodity prices continued to benefit the asset class. Emerging market fundamentals remain strong, with local markets growing particularly attractive over the period.
In Brazil, the long awaited leniency agreement between the US, Swiss authorities and construction giant Odebrecht was agreed. Company bonds rallied as much as 20pts on the news, fuelled by the expectation that the company will once again be able to bid on public contracts in Brazil and obtain financing from public entities. MHP bonds had a scare as the European Union (EU) announced the banning of poultry imports from Ukraine due to an outbreak of bird flu in southern regions of the country. There was a quick recovery as the market was comforted by quota limitation for Ukrainian exports into the EU and the fact the production is primarily located away from the Southern regions affected.
Indian energy giant Greenko announced an equity raise of US $155mn from GIC and ADIA, subsequently raising GICs stake in the company to 64%. The merger between First Gulf Bank and National Bank of Abu Dhabi was finally completed in the Middle East, resulting in ‘First Abu Dhabi Bank’, the largest bank in United Arab Emirates with total assets in excess of US $180bn. Mid-March the Brazilian Federal Police launched operation ‘Carne Fraca’ to investigate allegations of bribery of Federak Sanitary Inspectors and illegal sale of meat by several slaughterhouses. On the list targeted included companies including JBS and BRF – two of the biggest meat producers in Brazil. After a sharp sell-off immediately following the revelations, bonds rebounded after the banks were revoked.
Portfolio review The Fund outperformed its benchmark over the period. No exposure to Israel aided performance early on while security selection in South Korea, Thailand and China were positives. Exposure to higher yielding corporates in Mexico such as CEMEX, Grupo Posadas and Elementia performed well after the Peso stabilised and President Trump softened his rhetoric on trade. Commodity-related names in Brazil, notably Petrobras and Vale, also aided performance as commodities rallied.
Conversely, the Fund’s underweight position in Zambia, which rallied following copper price movement, hindered performance. No exposure to financials in Kazakhstan, which outperformed after an important merger was announced between the country’s two largest banks, Halyk and KKB, was also a negative.
OutlookThe fact that fears of rising UST yields have diminished has clearly been supportive of the asset class. However, even prior to the recent subsidence of UST yields the asset class has been doing well, partly thanks to the resilience of commodity prices. This does point to one of the principle outstanding risks for the asset class, that is a correction in oil and other key commodities (such as the one we are currently witnessing in iron ore), with the most likely trigger being growth disappointment in China. While our outlook for growth in China this year is a fairly sanguine one, we do acknowledge the risk to the asset class that a slowdown in China would pose.
Political volatility is never too far away in emerging markets as recent events in South Africa and April’s constitutional referendum in Turkey can attest. Given the benign backdrop in which the market appears to be operating at the moment, any drop in asset prices caused by negative news flow is swiftly capped by willing buyers. The primary markets continue to be open to issuers on every spectrum of the credit rating scale as investors struggle to reduce healthy cash balances as a result of the consistent inflows that have returned to the asset class this year. The bearish emerging market scenarios which were espoused after Donald Trump’s election have yet to manifest themselves – encouraging market participants to remain invested.
Emerging Market Debt Team April 2017

80 Aberdeen Global
Emerging Markets Corporate Bond
Statement of Net AssetsAs at 31 March 2017
Notes US$'000AssetsInvestments in securities at market value 2.2 285,659 Cash at bank 19,758 Interest receivable 4,220 Subscriptions receivable 6,056 Receivable for investments sold 2,655 Unrealised gains on forward currency exchange contracts 2.6 867 Total assets 319,215 LiabilitiesPayable for investments purchased 13,735 Taxes and expenses payable 312 Redemptions payable 2,275 Other liabilities 316 Total liabilities 16,638 Net assets at the end of the period 302,577
Statement of Changes in Net Assets For the period from 1 October 2016 to 31 March 2017
Notes US$'000Net assets at the beginning of the period 243,937 Net gains from investments 5,417 Net realised gains 563 Net unrealised losses (1,757) Proceeds from shares issued 177,928 Payments for shares redeemed (121,862) Net equalisation received 10 116 Dividends paid 5 (1,765) Net assets at the end of the period 302,577
Statement of Operations For the period from 1 October 2016 to 31 March 2017
Notes US$'000IncomeInvestment income 2.3 6,890 Bank interest 3 Stocklending income 16 68 Total income 6,961 ExpensesManagement fees 4.2 1,297 Operating, administrative and servicing fees 4.3 243 Distribution fees 4.1 2 Other operational expenses 2 Total expenses 1,544 Net gains from investments 5,417
Realised gains on investments 4,134 Realised losses on forward currency exchange contracts (3,232) Realised currency exchange losses (339) Net realised gains 563
Decrease in unrealised appreciation on investments (2,705) Decrease in unrealised depreciation on forward currency exchange contracts 935 Unrealised currency exchange gains 13 Net unrealised losses (1,757) Net increase in assets as a result of operations 4,223

aberdeen-asset.com 81
Emerging Markets Corporate Bond
Share Transactions For the period from 1 October 2016 to 31 March 2017
A-1 A-2 A(EUR)-2^ A-3 E(EUR)-1 I-2Shares outstanding at the beginning of the period 1,318,950 3,971,619 72,453 28,014 721,380 4,785,168 Shares issued during the period 1,934,653 1,851,549 124,968 7,308 12,666 5,586,308 Shares redeemed during the period (177,560) (995,578) (568) (9,810) (16,709) (6,073,671) Shares outstanding at the end of the period 3,076,043 4,827,590 196,853 25,512 717,337 4,297,805 Net asset value per share 10.3211 13.3341 11.2634 10.7014 12.9613 13.5315
I(EUR)-2^ W-1 W-2 X-1 X-2 Y(EUR)-1Shares outstanding at the beginning of the period 1,862,169 5,967 5,141 930,624 2,223,475 59,630 Shares issued during the period 3,976,935 39,815 19,430 8,908 40,254 - Shares redeemed during the period (1,108,881) (2,311) (8,778) (697,855) (105,867) - Shares outstanding at the end of the period 4,730,223 43,471 15,793 241,677 2,157,862 59,630 Net asset value per share 13.5901 10.7088 11.2214 9.7337 11.7921 11.8566
Y(EUR)-2 Z-1Shares outstanding at the beginning of the period 63,313 3,881,612 Shares issued during the period - - Shares redeemed during the period (2,000) (351,072) Shares outstanding at the end of the period 61,313 3,530,540 Net asset value per share 14.3542 10.4281
^ Base currency exposure share class.
The accompanying notes form an integral part of these financial statements.

82 Aberdeen Global
Emerging Markets Corporate BondPortfolio StatementAs at 31 March 2017
Security Coupon (%) MaturityNominal/Quantity
Market Value US$’000
Total Net Assets
%Transferable securities and money market instruments admitted to an official exchange listing or dealt on another regulated market 91.59%Bonds 91.59%Corporate Bonds 91.59%Argentina 3.22%Aeropuertos Argentina 2000∞ 6.8750 01/02/27 2,610,000 2,702 0.89Banco de Galicia y Buenos Aires∞ VAR 19/07/26 1,337,000 1,454 0.48Banco Macro VAR 04/11/26 1,390,000 1,394 0.46Cablevision 6.5000 15/06/21 1,279,000 1,351 0.45Genneia 8.7500 20/01/22 1,450,000 1,515 0.50IRSA Propiedades Comerciales 8.7500 23/03/23 1,200,000 1,324 0.44
9,740 3.22
Azerbaijan 0.97%Southern Gas Corridor 6.8750 24/03/26 2,670,000 2,940 0.97
Bangladesh 0.77%Banglalink Digital Communications 8.6250 06/05/19 2,230,000 2,344 0.77
Barbados 0.36%Sagicor Finance 2015 8.8750 11/08/22 960,000 1,085 0.36
Brazil 5.55%JBS Finance 5.7500 15/06/25 1,450,000 1,472 0.49Marfrig 8.0000 08/06/23 1,400,000 1,466 0.48Petrobras Global Finance 8.3750 23/05/21 3,110,000 3,521 1.15Petrobras Global Finance 5.6250 20/05/43 2,690,000 2,233 0.74Petrobras Global Finance 7.3750 17/01/27 1,331,000 1,410 0.47Petrobras Global Finance 6.2500 17/03/24 580,000 596 0.20QGOG Atlantic / Alaskan Rigs 5.2500 30/07/18 233,345 229 0.08QGOG Constellation∞ 6.2500 09/11/19 2,236,000 1,409 0.47Vale Overseas 6.2500 10/08/26 2,700,000 2,940 0.97Vale Overseas 6.8750 21/11/36 1,400,000 1,512 0.50
16,788 5.55
Chile 2.79%Empresa Electrica Angamos 4.8750 25/05/29 2,580,000 2,599 0.86GNL Quintero∞ 4.6340 31/07/29 2,930,000 3,003 0.99Latam Airlines 2015-1 Pass Through Trust A 4.2000 15/08/29 2,847,727 2,837 0.94
8,439 2.79
China 4.26%China Resources Gas (EMTN) 4.5000 05/04/22 2,830,000 2,984 0.99ENN Energy 6.0000 13/05/21 1,503,000 1,660 0.55Future Land Development∞ 5.0000 16/02/20 1,049,000 1,056 0.35Logan Property 11.2500 04/06/19 1,210,000 1,295 0.43Midea Investment Development (EMTN) 2.3750 03/06/19 2,650,000 2,646 0.87

aberdeen-asset.com 83
Emerging Markets Corporate Bond
Security Coupon (%) MaturityNominal/Quantity
Market Value US$’000
Total Net Assets
%Proven Honour Capital 4.1250 19/05/25 2,570,000 2,602 0.86Yestar International 6.9000 15/09/21 610,000 636 0.21
12,879 4.26
Colombia 3.29%Banco de Bogota 6.2500 12/05/26 2,600,000 2,720 0.90Banco GNB Sudameris VAR 03/04/27 4,419,000 4,491 1.49GrupoSura Finance∞ 5.5000 29/04/26 2,590,000 2,736 0.90
9,947 3.29
Democratic Republic of the Congo 0.64%HTA 9.1250 08/03/22 1,963,000 1,948 0.64
Dominican Republic 1.52%AES Andres Dominican Power 7.9500 11/05/26 2,410,000 2,592 0.85Dominican Republic (Mestenio) 8.5000 02/01/20 1,897,275 2,018 0.67
4,610 1.52
El Salvador 1.76%AES El Salvador Trust II 6.7500 28/03/23 2,470,000 2,303 0.76Grupo Unicomer 7.8750 01/04/24 2,870,000 3,014 1.00
5,317 1.76
Georgia 2.21%BGEO 6.0000 26/07/23 2,890,000 2,924 0.97Georgian Oil and Gas 6.7500 26/04/21 752,000 794 0.26Georgian Railway 7.7500 11/07/22 2,670,000 2,954 0.98
6,672 2.21
Guatemala 3.90%Agromercantil Senior Trust 6.2500 10/04/19 1,570,000 1,629 0.54Cementos Progreso Trust 7.1250 06/11/23 2,750,000 2,907 0.95Central American Bottling∞ 5.7500 31/01/27 2,790,000 2,899 0.96Comcel Trust 6.8750 06/02/24 1,890,000 1,969 0.65Industrial Senior Trust 5.5000 01/11/22 2,400,000 2,406 0.80
11,810 3.90
Hong Kong 1.59%Hutchison Whampoa International 12 (PERP) VAR 29/05/49 2,460,000 2,475 0.82Zhejiang Energy Hong Kong 2.3000 30/09/17 2,340,000 2,340 0.77
4,815 1.59
Hungary 0.88%Nitrogenmuvek Vegyipari Zrt 7.8750 21/05/20 2,530,000 2,667 0.88
India 4.61%Adani Transmission 4.0000 03/08/26 1,394,000 1,367 0.45ICICI Bank VAR 30/04/22 5,200,000 5,207 1.72

84 Aberdeen Global
Emerging Markets Corporate Bond
Security Coupon (%) MaturityNominal/Quantity
Market Value US$’000
Total Net Assets
%Neerg Energy 6.0000 13/02/22 1,442,000 1,465 0.48ONGC Videsh 4.6250 15/07/24 2,670,000 2,814 0.93State Bank of India (Dubai) (EMTN) (PERP) VAR 29/09/49 3,030,000 3,103 1.03
13,956 4.61
Indonesia 2.18%Jababeka International 6.5000 05/10/23 2,230,000 2,305 0.76Listrindo Capital 4.9500 14/09/26 1,320,000 1,294 0.43Pertamina Persero (EMTN) 4.3000 20/05/23 2,900,000 2,995 0.99
6,594 2.18
Kazakhstan 1.94%KazMunayGas National 7.0000 05/05/20 1,049,000 1,157 0.38Tengizchevroil Finance International 4.0000 15/08/26 2,480,000 2,382 0.79Zhaikmunai 7.1250 13/11/19 2,390,000 2,339 0.77
5,878 1.94
Kuwait 0.93%Equate Petrochemical (EMTN) 4.2500 03/11/26 2,813,000 2,822 0.93
Malaysia 1.16%Ambank Malaysia (EMTN) 3.1250 03/07/19 1,350,000 1,365 0.45Axiata SPV2 (EMTN) 3.4660 19/11/20 2,097,000 2,155 0.71
3,520 1.16
Mexico 5.43%Alfa 6.8750 25/03/44 1,150,000 1,179 0.39BBVA Bancomer Texas 6.7500 30/09/22 2,270,000 2,548 0.84CEMEX 7.7500 16/04/26 1,240,000 1,398 0.46Elementia 5.5000 15/01/25 1,729,000 1,739 0.57Grupo Financiero Santander Mexico (PERP) VAR 29/12/49 2,350,000 2,502 0.83Grupo Posadas 7.8750 30/06/22 1,540,000 1,602 0.53Trust 1401 6.9500 30/01/44 2,720,000 2,765 0.92Unifin Financiera 7.2500 27/09/23 2,650,000 2,683 0.89
16,416 5.43
Morocco 0.93%OCP 6.8750 25/04/44 2,610,000 2,809 0.93
Netherlands 1.13%GTH Finance 7.2500 26/04/23 1,891,000 2,085 0.69VimpelCom 7.5043 01/03/22 930,000 1,056 0.35Vimpelcom∞ 5.9500 13/02/23 260,000 278 0.09
3,419 1.13
Nigeria 1.89%Access Bank (EMTN) 10.5000 19/10/21 1,380,000 1,440 0.48IHS Netherlands 9.5000 27/10/21 1,350,000 1,392 0.46

aberdeen-asset.com 85
Emerging Markets Corporate Bond
Security Coupon (%) MaturityNominal/Quantity
Market Value US$’000
Total Net Assets
%Zenith Bank (EMTN)∞ 6.2500 22/04/19 2,860,000 2,882 0.95
5,714 1.89
Panama 0.92%Global Bank 4.5000 20/10/21 2,801,000 2,781 0.92
Paraguay 0.49%Banco Regional SAECA 8.1250 24/01/19 1,390,000 1,487 0.49
Peru 3.57%Cia Minera Ares 7.7500 23/01/21 2,010,000 2,166 0.72InRetail Consumer 5.2500 10/10/21 2,830,000 2,914 0.97InRetail Shopping Malls∞ 6.5000 09/07/21 2,646,000 2,820 0.93Southern Copper 6.7500 16/04/40 1,320,000 1,496 0.49Union Andina de Cementos SAA∞ 5.8750 30/10/21 1,340,000 1,397 0.46
10,793 3.57
Philippines 0.84%SM Investment 4.2500 17/10/19 2,460,000 2,546 0.84
Russian Federation 8.28%Alfa Bank (PERP) VAR 29/12/49 2,147,000 2,292 0.76Credit Bank of Moscow VAR 05/10/27 3,000,000 3,058 1.01Evraz 5.3750 20/03/23 2,152,000 2,159 0.71Gazprom∞ 6.5100 07/03/22 2,057,000 2,276 0.75Global Ports Finance 6.8720 25/01/22 2,322,000 2,473 0.82GTLK Europe 5.9500 19/07/21 1,420,000 1,489 0.49Lukoil International Finance 4.5630 24/04/23 2,600,000 2,680 0.89Polyus Gold International 5.2500 07/02/23 2,525,000 2,587 0.85Sberbank of Russia Via SB Capital∞ 6.1250 07/02/22 2,810,000 3,088 1.02Vnesheconombank Via VEB Finance 6.8000 22/11/25 2,650,000 2,968 0.98
25,070 8.28
Singapore 1.43%Global Logistic Properties (EMTN) 3.8750 04/06/25 2,070,000 1,951 0.64United Overseas Bank (EMTN) VAR 19/09/24 2,320,000 2,365 0.79
4,316 1.43
South Africa 2.13%MTN Mauritius Investments 4.7550 11/11/24 3,610,000 3,430 1.13Myriad International 6.0000 18/07/20 1,620,000 1,750 0.58Myriad International 5.5000 21/07/25 1,225,000 1,275 0.42
6,455 2.13
South Korea 1.40%Korea Development Bank 1.5000 22/01/18 1,600,000 1,596 0.53Korea Western Power 2.8750 10/10/18 2,600,000 2,631 0.87
4,227 1.40

86 Aberdeen Global
Emerging Markets Corporate Bond
Security Coupon (%) MaturityNominal/Quantity
Market Value US$’000
Total Net Assets
%Thailand 2.31%Krung Thai Bank Cayman (EMTN) VAR 26/12/24 1,910,000 1,983 0.66PTT Exploration & Production (PERP) VAR 29/12/49 2,520,000 2,583 0.85Siam Commercial Bank (EMTN) 3.5000 07/04/19 2,380,000 2,431 0.80
6,997 2.31
Turkey 6.12%Akbank (EMTN) 5.1250 31/03/25 2,760,000 2,624 0.87TC Ziraat Bankasi (EMTN)∞ 4.7500 29/04/21 2,540,000 2,500 0.83Turk Telekomunikasyon∞ 4.8750 19/06/24 3,180,000 3,070 1.01Turkiye Garanti Bankasi∞ 5.2500 13/09/22 2,950,000 2,942 0.97Turkiye Halk Bankasi∞ 5.0000 13/07/21 1,550,000 1,490 0.49Turkiye Sinai Kalkinma Bankasi VAR 29/03/27 1,500,000 1,530 0.51Turkiye Sise ve Cam Fabrikalari 4.2500 09/05/20 2,280,000 2,277 0.75Yasar 8.8750 06/05/20 2,000,000 2,083 0.69
18,516 6.12
Ukraine 1.74%Kernel∞ 8.7500 31/01/22 907,000 939 0.31MHP∞ 8.2500 02/04/20 2,920,000 2,954 0.98Ukreximbank 9.6250 27/04/22 1,350,000 1,367 0.45
5,260 1.74
United Arab Emirates 7.37%DIB Sukuk∞ 3.6640 14/02/22 2,170,000 2,173 0.72DP World 1.7500 19/06/24 1,200,000 1,231 0.41DP World (EMTN) 6.8500 02/07/37 2,540,000 2,956 0.98ICD Sukuk (EMTN) 5.0000 01/02/27 2,950,000 3,051 1.01Jafz Sukuk 7.0000 19/06/19 1,920,000 2,105 0.70MAF Global Securities (PERP) VAR 29/12/49 2,980,000 2,997 0.99Noor Tier 1 Sukuk (PERP) VAR 29/12/49 2,680,000 2,760 0.91Sukuk Funding No 3∞ 4.3480 03/12/18 2,180,000 2,250 0.74Warba Tier 1 Sukuk (PERP) VAR 29/12/49 2,700,000 2,764 0.91
22,287 7.37
Uruguay 1.08%Arcos Dorados 5.8750 04/04/27 3,232,000 3,266 1.08
Total Corporate Bonds 277,130 91.59
Total Bonds 277,130 91.59
Total Transferable securities and money market instruments admitted to an official exchange listing or dealt on another regulated market 277,130 91.59
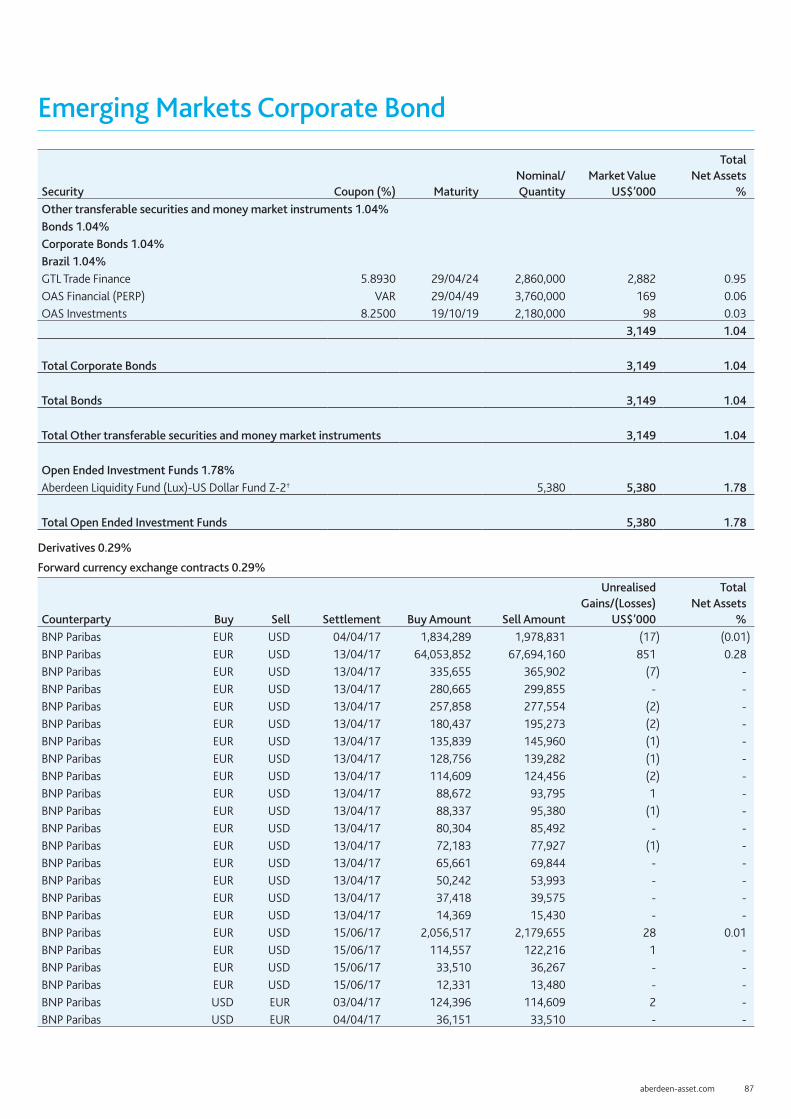
aberdeen-asset.com 87
Emerging Markets Corporate Bond
Security Coupon (%) MaturityNominal/Quantity
Market Value US$’000
Total Net Assets
%Other transferable securities and money market instruments 1.04%Bonds 1.04%Corporate Bonds 1.04%Brazil 1.04%GTL Trade Finance 5.8930 29/04/24 2,860,000 2,882 0.95OAS Financial (PERP) VAR 29/04/49 3,760,000 169 0.06OAS Investments 8.2500 19/10/19 2,180,000 98 0.03
3,149 1.04
Total Corporate Bonds 3,149 1.04
Total Bonds 3,149 1.04
Total Other transferable securities and money market instruments 3,149 1.04
Open Ended Investment Funds 1.78%Aberdeen Liquidity Fund (Lux)-US Dollar Fund Z-2† 5,380 5,380 1.78
Total Open Ended Investment Funds 5,380 1.78
Derivatives 0.29%
Forward currency exchange contracts 0.29%
Counterparty Buy Sell Settlement Buy Amount Sell Amount
Unrealised Gains/(Losses)
US$’000
Total Net Assets
%BNP Paribas EUR USD 04/04/17 1,834,289 1,978,831 (17) (0.01)BNP Paribas EUR USD 13/04/17 64,053,852 67,694,160 851 0.28BNP Paribas EUR USD 13/04/17 335,655 365,902 (7) -BNP Paribas EUR USD 13/04/17 280,665 299,855 - -BNP Paribas EUR USD 13/04/17 257,858 277,554 (2) -BNP Paribas EUR USD 13/04/17 180,437 195,273 (2) -BNP Paribas EUR USD 13/04/17 135,839 145,960 (1) -BNP Paribas EUR USD 13/04/17 128,756 139,282 (1) -BNP Paribas EUR USD 13/04/17 114,609 124,456 (2) -BNP Paribas EUR USD 13/04/17 88,672 93,795 1 -BNP Paribas EUR USD 13/04/17 88,337 95,380 (1) -BNP Paribas EUR USD 13/04/17 80,304 85,492 - -BNP Paribas EUR USD 13/04/17 72,183 77,927 (1) -BNP Paribas EUR USD 13/04/17 65,661 69,844 - -BNP Paribas EUR USD 13/04/17 50,242 53,993 - -BNP Paribas EUR USD 13/04/17 37,418 39,575 - -BNP Paribas EUR USD 13/04/17 14,369 15,430 - -BNP Paribas EUR USD 15/06/17 2,056,517 2,179,655 28 0.01BNP Paribas EUR USD 15/06/17 114,557 122,216 1 -BNP Paribas EUR USD 15/06/17 33,510 36,267 - -BNP Paribas EUR USD 15/06/17 12,331 13,480 - -BNP Paribas USD EUR 03/04/17 124,396 114,609 2 -BNP Paribas USD EUR 04/04/17 36,151 33,510 - -

88 Aberdeen Global
Emerging Markets Corporate Bond
Counterparty Buy Sell Settlement Buy Amount Sell Amount
Unrealised Gains/(Losses)
US$’000
Total Net Assets
%BNP Paribas USD EUR 05/04/17 145,904 135,839 1 -BNP Paribas USD EUR 06/04/17 299,778 280,665 - -BNP Paribas USD EUR 13/04/17 1,979,524 1,834,289 17 0.01BNP Paribas USD EUR 13/04/17 28,253 26,596 - -BNP Paribas USD EUR 13/04/17 26,375 24,688 - -BNP Paribas USD EUR 13/04/17 15,720 14,457 - -BNP Paribas USD EUR 15/06/17 13,869 13,057 - -Unrealised gains on forward currency exchange contracts 867 0.29
Unrealised gains on derivatives 867 0.29
Total investments 286,526 94.70Other net assets 16,051 5.30Total net assets 302,577 100.00
† Managed by subsidiaries of Aberdeen Asset Management PLC.∞ A portion of this security is on loan at the period end.Currently forward positions are not collateralised.

aberdeen-asset.com 89
Emerging Markets EquityFor the six months ended 31 March 2017
Performance For the six months ended 31 March 2017, the value of Emerging Markets Equity – A Accumulation Shares increased by 5.26% compared to an increase of 6.93% in the benchmark, the MSCI Emerging Markets Index.Source: Lipper, Basis: total return, published NAV to NAV, net of annual charges, gross income reinvested, USD.Please see the Performance History section for details on the use of MSCI information.
Please remember that past performance is not a guide to future returns. The price of shares and the revenue from them may fall as well as rise. Investors may not get back the amount originally invested.
Market reviewEmerging market equities closed higher in the six months under review. Sentiment initially weakened after Donald Trump’s election victory, which strengthened the US dollar as well as triggered a rotation out of bonds and bond proxies into low-quality cyclicals as investors considered the implications of US fiscal policy shifting towards a more reflationary position. Subsequently, there was a turnaround as markets were buoyed by expectations that US pro-business policies would improve the global economic outlook. Currencies broadly strengthened relative to the weaker US dollar after the Republican party failed to introduce a new healthcare bill. Oil prices eased but stayed above the US$50 per barrel level over the period. Across markets, Brazil performed well, as the central bank surprised investors by materially cutting interest rates to kickstart the economy amid a more benign inflation environment. Russia was buoyed by stabilising energy prices and a return to growth for the first time in two years. In India, the ruling party’s resounding state election victory in Uttar Pradesh boosted investor confidence in prime minister Modi’s ability to carry through with his reform agenda, which outweighed the receding impact of a shock demonetisation. In contrast, Turkey was among the key laggards, as the lira continued to sell off on political uncertainty and a credit-rating downgrade.
Portfolio reviewAt the stock level, our Philippine holding Ayala Land detracted the most, as investors were cautious about the outlook for its new housing projects. Despite that, the company’s fundamentals remain intact, while valuations are attractive. Another laggard was AIA, as the spill-over effects of tightening regulations in China’s banking sector were felt in Hong Kong, where the insurer weakened on apprehension over the impact of capital controls on sales of life-insurance policies in the mainland. Brazilian food company BRF was pressured by an investigation that led some countries to temporarily suspend Brazilian meat imports. This was further compounded by the company’s soft domestic volumes and margin pressure from overseas.
This was mitigated by the positive contribution from Vale, which surged after the Brazilian miner announced a new shareholder agreement to restructure its share classes, which is a step forward in the company’s corporate governance. South African retailer Truworths also posted solid results despite a challenging operating environment. India’s ITC, meanwhile, benefited from the goods-and-services tax council’s decision to leave rates unchanged for tobacco.
In significant portfolio activity, we initiated positions in Falabella, a diversified retailer with broad regional footprint in Latin America, covering both the more mature Chilean market and neighbouring growth markets; and Shanghai International Airport Co, a leading
airport operator in China with attractive growth prospects. Against this, we sold SABMiller by tendering the shares to AB InBev in a takeover bid; Yum Brands to reinvest the proceeds into the spun-out Yum China, a pure-play restaurant operator in China with a net cash balance sheet; Multiplan’s rights ahead of its upcoming capital raising due to the stock’s relative strength; as well as CIMB and E-mart in view of better opportunities elsewhere.
OutlookLooking ahead, emerging markets are likely to remain supported by healthier risk appetite and expectations for improved earnings. Concerns that Donald Trump’s protectionist stance could hurt global trade appear to be moderating somewhat, as early fears seem overdone. While investors’ sentiment could shift again, we are unfazed by short-term volatility as indiscriminate selling or buying will provide opportunities for us as long-term investors.
In terms of fundamentals, emerging markets’ growth potential remains attractive, supported by favourable demographics and an increasingly affluent middle class. Sensible policymaking and robust balance sheets further strengthen the case that emerging economies are well prepared to weather any major downturn. Stabilising commodity prices should also provide some breathing room for exporters. While a steeper US rate hike and subsequent dollar strength remain key issues to watch, emerging markets are now much better positioned compared to the taper tantrum just a few years ago. We also find comfort from a valuation standpoint: despite the rally, emerging markets are still trading at a healthy discount to their developed counterparts.
Global Emerging Markets Equity Team April 2017
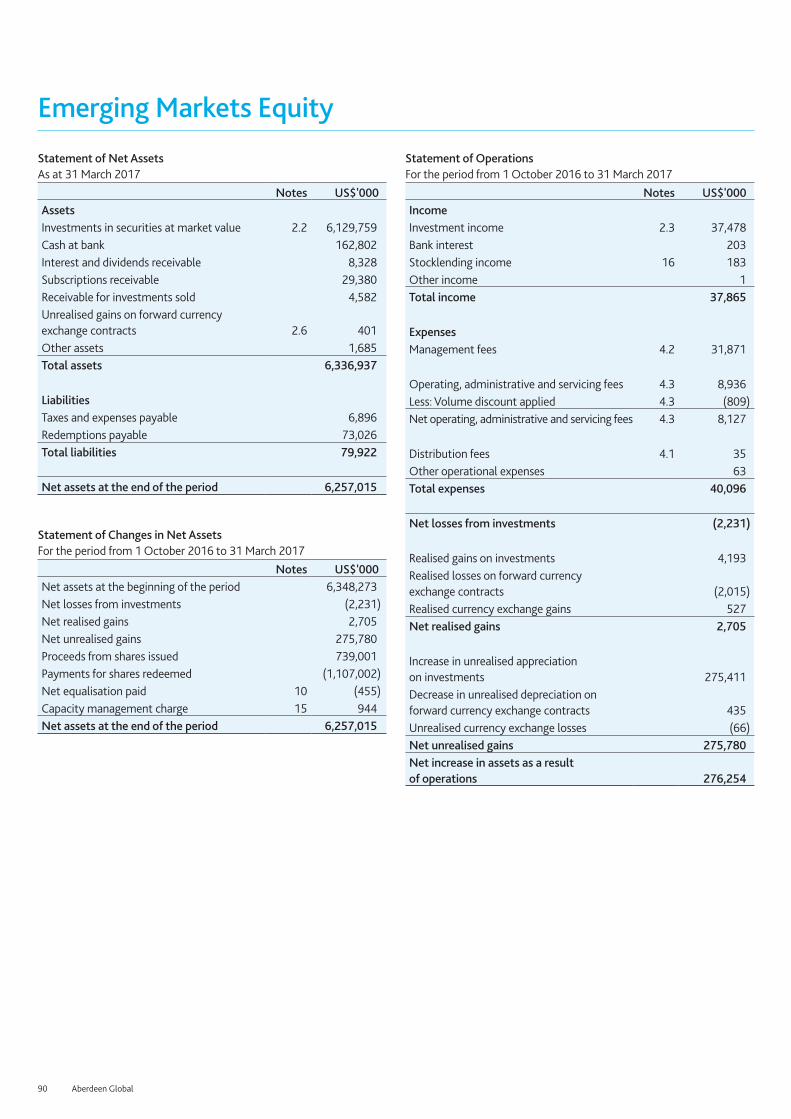
90 Aberdeen Global
Emerging Markets Equity
Statement of Net AssetsAs at 31 March 2017
Notes US$'000AssetsInvestments in securities at market value 2.2 6,129,759 Cash at bank 162,802 Interest and dividends receivable 8,328 Subscriptions receivable 29,380 Receivable for investments sold 4,582 Unrealised gains on forward currency exchange contracts 2.6 401 Other assets 1,685 Total assets 6,336,937 LiabilitiesTaxes and expenses payable 6,896 Redemptions payable 73,026 Total liabilities 79,922 Net assets at the end of the period 6,257,015
Statement of Changes in Net Assets For the period from 1 October 2016 to 31 March 2017
Notes US$'000Net assets at the beginning of the period 6,348,273 Net losses from investments (2,231) Net realised gains 2,705 Net unrealised gains 275,780 Proceeds from shares issued 739,001 Payments for shares redeemed (1,107,002) Net equalisation paid 10 (455) Capacity management charge 15 944 Net assets at the end of the period 6,257,015
Statement of Operations For the period from 1 October 2016 to 31 March 2017
Notes US$'000IncomeInvestment income 2.3 37,478 Bank interest 203 Stocklending income 16 183 Other income 1 Total income 37,865 ExpensesManagement fees 4.2 31,871
Operating, administrative and servicing fees 4.3 8,936 Less: Volume discount applied 4.3 (809) Net operating, administrative and servicing fees 4.3 8,127
Distribution fees 4.1 35 Other operational expenses 63 Total expenses 40,096 Net losses from investments (2,231)
Realised gains on investments 4,193 Realised losses on forward currency exchange contracts (2,015) Realised currency exchange gains 527 Net realised gains 2,705
Increase in unrealised appreciation on investments 275,411 Decrease in unrealised depreciation on forward currency exchange contracts 435 Unrealised currency exchange losses (66) Net unrealised gains 275,780 Net increase in assets as a result of operations 276,254

aberdeen-asset.com 91
Emerging Markets Equity
Share Transactions For the period from 1 October 2016 to 31 March 2017
A-1 A-2 A(CHF)-2^ C-2 D(GBP)-2 E(EUR)-2Shares outstanding at the beginning of the period 3,016,628 29,331,613 3,170,399 498,667 1,587,522 17,815,058 Shares issued during the period 84,379 819,880 138,517 - 10,551 339,894 Shares redeemed during the period (455,974) (4,523,336) (467,715) (82,065) (82,868) (1,415,031) Shares outstanding at the end of the period 2,645,033 25,628,157 2,841,201 416,602 1,515,205 16,739,921 Net asset value per share 10.0226 65.3639 12.2088 16.1720 52.4955 15.8402
G-2 I-1 I-2 R(GBP)-2 S-2 X-1Shares outstanding at the beginning of the period 128,666,547 1,534,867 19,823,379 856,232 7,935 302,224 Shares issued during the period 61,428,077 175,029 258,796 110,681 45 2,966 Shares redeemed during the period (35,814,259) (1,191,926) (3,203,129) (109,786) (523) (38,527) Shares outstanding at the end of the period 154,280,365 517,970 16,879,046 857,127 7,457 266,663 Net asset value per share 9.7815 10.4541 70.9385 13.1278 2,264.9015 9.7427
X-2 Y(EUR)-2 Z-1 Z-2Shares outstanding at the beginning of the period 10,120,186 937,563 6,699,407 78,085,796 Shares issued during the period 265,518 41,611 4,622,319 2,294,729 Shares redeemed during the period (1,020,064) (73,807) (7,023) (14,302,841) Shares outstanding at the end of the period 9,365,640 905,367 11,314,703 66,077,684 Net asset value per share 10.2295 12.4608 10.4840 17.5391
^ Base currency exposure share class.
The accompanying notes form an integral part of these financial statements.

92 Aberdeen Global
Emerging Markets EquityPortfolio StatementAs at 31 March 2017
SecurityNominal/ Quantity
Market Value US$’000
Total Net Assets
%Transferable securities and money market instruments admitted to an official exchange listing or dealt on another regulated market 95.51%Equities 95.51%Argentina 1.30%Tenaris (ADR)∞ 2,373,600 81,047 1.30
Brazil 11.67%Ambev 13,217,000 75,952 1.21Banco Bradesco (ADR) 15,995,643 163,875 2.61BRF 4,871,038 59,244 0.95Lojas Renner 11,543,230 101,128 1.61Multiplan Empreendimentos Imobiliarios 3,945,454 82,527 1.32Ultrapar Participacoes 5,982,066 134,896 2.15Vale (ADR)∞ 7,806,086 74,197 1.19Vale (ADR) (PREF) 4,363,812 39,209 0.63
731,028 11.67
Chile 2.25%Banco Santander Chile (ADR) 3,143,521 78,887 1.26SACI Falabella 7,405,000 61,949 0.99
140,836 2.25
China 0.91%Kweichow Moutai 'A' 550,100 30,935 0.49Shanghai International Airport 5,999,998 26,172 0.42
57,107 0.91
Hong Kong 10.53%AIA 31,532,600 198,917 3.19China Mobile 18,133,603 198,509 3.17Hang Lung 21,981,000 94,115 1.50Hang Lung Properties 11,846,000 30,752 0.49Hong Kong Exchanges & Clearing 2,262,722 56,965 0.91Swire Pacific 'A' 1,155,400 11,544 0.18Swire Pacific 'B' 13,199,000 22,860 0.37Swire Properties 14,089,660 45,053 0.72
658,715 10.53
Hungary 1.16%Gedeon Richter 3,181,416 72,644 1.16
India 16.72%Grasim Industries 4,352,395 70,429 1.13Hero MotoCorp 1,811,247 89,837 1.44Hindustan Unilever 6,883,610 96,801 1.55Housing Development Finance 11,319,834 261,924 4.18

aberdeen-asset.com 93
Emerging Markets Equity
SecurityNominal/ Quantity
Market Value US$’000
Total Net Assets
%ICICI Bank 14,383,000 61,206 0.98Infosys 3,986,325 62,817 1.00ITC 37,741,382 163,191 2.60Kotak Mahindra Bank 2,189,741 29,370 0.47Tata Consultancy Services 2,096,316 78,286 1.25UltraTech Cement 2,172,711 132,835 2.12
1,046,696 16.72
Indonesia 4.63%Astra International 294,491,900 191,164 3.05Bank Central Asia 17,201,900 21,332 0.34Indocement Tunggal Prakarsa 62,142,100 77,471 1.24
289,967 4.63
Malaysia 1.17%Public Bank 16,230,310 73,019 1.17
Mexico 7.34%FEMSA (ADR) 1,990,459 176,295 2.83Grupo Aeroportuario del Sureste (ADR) 524,835 91,017 1.45Grupo Financiero Banorte 28,823,276 164,821 2.63Organizacion Soriana 'B' 11,502,999 26,882 0.43
459,015 7.34
Philippines 3.82%Ayala 1,844,690 30,892 0.49Ayala Land 158,800,800 105,234 1.69Bank of the Philippine Islands 50,883,640 102,731 1.64
238,857 3.82
Poland 1.13%Bank Pekao∞ 2,114,241 70,546 1.13
Portugal 1.15%Jeronimo Martins 4,014,133 71,915 1.15
Russian Federation 4.10%Lukoil ADR∞ 2,325,047 123,123 1.97Magnit 808,073 133,154 2.13
256,277 4.10
South Africa 4.12%BHP Billiton∞ 2,874,135 44,388 0.71Massmart∞ 6,354,186 64,548 1.03MTN∞ 6,356,395 57,846 0.92Truworths International∞ 14,098,599 91,029 1.46
257,811 4.12

94 Aberdeen Global
Emerging Markets Equity
SecurityNominal/ Quantity
Market Value US$’000
Total Net Assets
%South Korea 8.04%Amorepacific 302,733 32,417 0.52Amorepacific (PREF) 162,246 24,120 0.39Naver 178,732 136,810 2.19Samsung Electronics (PREF) 216,000 309,910 4.94
503,257 8.04
Taiwan 4.88%Taiwan Mobile 17,257,211 63,557 1.02TSMC 38,746,559 241,668 3.86
305,225 4.88
Thailand 4.77%Siam Cement (Alien) 9,772,600 153,859 2.46Siam Commercial Bank (Alien)∞ 30,568,200 144,779 2.31
298,638 4.77
Turkey 3.70%Akbank∞ 34,269,501 80,412 1.29BIM Birlesik Magazalar 5,435,104 83,504 1.33Turkiye Garanti Bankasi 27,785,000 67,562 1.08
231,478 3.70
United Kingdom 0.92%Standard Chartered 6,055,209 57,772 0.92
United States 1.20%Yum China 2,751,300 74,849 1.20
Total Equities 5,976,699 95.51
Total Transferable securities and money market instruments admitted to an official exchange listing or dealt on another regulated market 5,976,699 95.51
Other transferable securities and money market instruments nilEquities nilTurkey nilMedya 83,850 - -
Total Equities - -
Total Other transferable securities and money market instruments - -
Open Ended Investment Funds 2.45%Aberdeen Global - China A Share Equity Fund Z-2† 13,087,515 135,315 2.17Aberdeen Global - Indian Equity Fund Z-2† 956,513 17,745 0.28
153,060 2.45
Total Open Ended Investment Funds 153,060 2.45

aberdeen-asset.com 95
Emerging Markets EquityDerivatives 0.01%
Forward currency exchange contracts 0.01%
Counterparty Buy Sell Settlement Buy Amount Sell Amount
Unrealised Gains/(Losses)
US$’000
Total Net Assets
%BNP Paribas CHF USD 03/04/17 82,122 83,296 (1) -BNP Paribas CHF USD 04/04/17 14,393 14,482 - -BNP Paribas CHF USD 15/06/17 33,816,798 33,533,241 405 0.01BNP Paribas CHF USD 15/06/17 887,992 897,120 (6) -BNP Paribas USD CHF 15/06/17 95,874 95,157 - -BNP Paribas USD CHF 15/06/17 83,642 82,122 1 -BNP Paribas USD CHF 15/06/17 68,588 67,834 1 -BNP Paribas USD CHF 15/06/17 39,395 39,679 - -BNP Paribas USD CHF 15/06/17 35,052 34,381 1 -BNP Paribas USD CHF 15/06/17 16,048 15,897 - -BNP Paribas USD CHF 15/06/17 14,543 14,393 - -BNP Paribas USD CHF 15/06/17 12,643 12,689 - -BNP Paribas USD CHF 15/06/17 11,082 11,000 - -BNP Paribas USD CHF 15/06/17 9,874 9,746 - -Unrealised gains on forward currency exchange contracts 401 0.01
Unrealised gains on derivatives 401 0.01
Total investments 6,130,160 97.97Other net assets 126,855 2.03Total net assets 6,257,015 100.00
† Managed by subsidiaries of Aberdeen Asset Management PLC.∞ A portion of this security is on loan at the period end.Currently forward positions are not collateralised.

96 Aberdeen Global
Emerging Markets Infrastructure EquityFor the six months ended 31 March 2017
Performance For the six months ended 31 March 2017, the value of Emerging Markets Infrastructure Equity – S Accumulation Shares increased by 5.04% compared to an increase of 2.78% in the benchmark, the MSCI EM Infrastructure Index.Source: Factset, Lipper, Basis: total return, published NAV to NAV, net of annual charges, gross income reinvested, USD.Please see the Performance History section for details on the use of MSCI information.
Please remember that past performance is not a guide to future returns. The price of shares and the revenue from them may fall as well as rise. Investors may not get back the amount originally invested.
Market reviewThe MSCI EM Infrastructure Index rose over the half year under review, underperforming the broader emerging stockmarket. Sentiment initially weakened after Donald Trump’s election victory, which strengthened the US dollar as well as triggered a rotation out of bonds and bond proxies into low-quality cyclicals as investors considered the implications of US fiscal policy shifting towards a more reflationary position. Subsequently, there was a turnaround on expectations that US pro-business policies would improve the global economy. Currencies broadly strengthened relative to the weaker US dollar after the Republican party failed to introduce a new healthcare bill. Oil prices eased but stayed above the US$50 per barrel level. Across markets, Brazil performed well, as the central bank surprised investors by materially cutting interest rates to kickstart the economy amid more benign inflation. Russia was buoyed by stabilising energy prices and a return to growth for the first time in two years. In India, the ruling party’s resounding state election victory in Uttar Pradesh boosted confidence in prime minister Modi’s ability to carry through with his reform agenda, which outweighed a shock demonetisation. In contrast, Turkey was among the key laggards, as the lira sold off on political uncertainty and a credit-rating downgrade.
Portfolio reviewAsia contributed the most to performance. This was largely driven by the underweight to China, owing to concerns that a depreciating renminbi will trigger capital outflows, and China Mobile, the largest constituent in the benchmark, which lagged. Yingde Gases, meanwhile, was the target of a takeover battle, which buoyed its share price significantly; we divested our holding in March as the company was acquired by private equity firm PAG Asia Capital. Our non-benchmark exposure to Hong Kong was also positive for performance. Pacific Basin Shipping’s share price continued to recover, as business conditions stabilised, while we also benefited from the rally in Hong Kong-based shopping mall operator Hang Lung, with growing exposure to China.
In India, our large overweight contributed positively as the market rebounded from the shock demonetisation, outweighing negative stock selection. Freight operator Container Corp (CONCOR) was a key detractor, as higher cost increases resulted in lower-than-expected earnings. In contrast, cement producer Grasim Industries contributed positively, as shareholders approved increasing the foreign ownership limit from 30% to 45% in an EGM. Gujarat Gas also benefited from positive sentiment over PM Modi’s win in Uttar Pradesh.
In EMEA, the underweight to Russia dragged down performance, as the stockmarket rallied on the back of an economic recovery amid rising oil prices. The lack of exposure to Mobile Telesystems, a Russian telco that we don’t own due to governance concerns, also hurt the Fund.
Latin America also detracted. In Peru, the Fund holds engineering and construction company Grana Y Montero, which is embroiled in a corruption investigation following allegations by former project partner Odebrecht. Grana y Montero has strenuously denied the allegations and launched an internal investigation led by independent lawyers. It has also started to renew its board by adding some well-known independent directors. Stock selection in Brazil was hurt by the lack of exposure to power distribution company Equatorial Energia, as it won contracts to build seven transmission lines. We don’t hold the name because of its low returns. In Mexico, the Fund was hurt by its underweight to telco America Movil, as its share price recovered from prolonged weakness. We do not hold the telco because of concerns over competitive and regulatory pressures within Mexico. More encouragingly, our Argentinian holding, steel pipe producer Tenaris, rallied on the back of a higher Brent oil price.
In portfolio activity, we introduced Aegis Logistics, an Indian company that is a leading provider of logistics services to the oil and gas as well as chemical industries. We like its first-mover advantage in establishing a network of well-located terminals near clients in an industry with high barriers to entry. The company also has an entrepreneurial management team, a strong balance sheet and decent cash flow. Against this, we exited Yingde Gases, as the company was acquired by private equity firm PAG Asia Capital.
OutlookLooking ahead, emerging markets are likely to remain supported by healthier risk appetite and expectations for improved earnings. Concerns that Donald Trump’s protectionist stance could hurt global trade appear to be moderating somewhat, as early fears seem overdone. While investors’ sentiment could shift again, we are unfazed by short-term volatility as indiscriminate selling or buying will provide opportunities for us as long-term investors.
In terms of fundamentals, emerging markets’ growth potential remains attractive, supported by favourable demographics and an increasingly affluent middle class. Sensible policymaking and robust balance sheets further strengthen the case that emerging economies are well prepared to weather any major downturn. Stabilising commodity prices should also provide some breathing room for exporters. While a steeper US rate hike and subsequent dollar strength remain key issues to watch, emerging markets are now much better positioned compared to the taper tantrum just a few years ago. We also find comfort from a valuation standpoint: despite the rally, emerging markets are still trading at a healthy discount to their developed counterparts.
Global Emerging Markets Equity Team April 2017

aberdeen-asset.com 97
Emerging Markets Infrastructure Equity
Statement of Net AssetsAs at 31 March 2017
Notes US$'000AssetsInvestments in securities at market value 2.2 182,810 Cash at bank 5,311 Interest and dividends receivable 266 Subscriptions receivable 443 Unrealised gains on forward currency exchange contracts 2.6 367 Other assets 11 Total assets 189,208 LiabilitiesTaxes and expenses payable 200 Redemptions payable 231 Other liabilities 54 Total liabilities 485 Net assets at the end of the period 188,723
Statement of Changes in Net Assets For the period from 1 October 2016 to 31 March 2017
Notes US$'000Net assets at the beginning of the period 243,796 Net losses from investments (456) Net realised losses (22,132) Net unrealised gains 25,861 Proceeds from shares issued 26,357 Payments for shares redeemed (84,649) Dividends paid 5 (54) Net assets at the end of the period 188,723
Statement of Operations For the period from 1 October 2016 to 31 March 2017
Notes US$'000IncomeInvestment income 2.3 840 Bank interest 5 Stocklending income 16 20 Total income 865 ExpensesManagement fees 4.2 1,037 Operating, administrative and servicing fees 4.3 282 Other operational expenses 2 Total expenses 1,321 Net losses from investments (456)
Realised losses on investments (19,152) Realised losses on forward currency exchange contracts (2,895) Realised currency exchange losses (85) Net realised losses (22,132)
Decrease in unrealised depreciation on investments 25,388 Decrease in unrealised depreciation on forward currency exchange contracts 467 Unrealised currency exchange gains 6 Net unrealised gains 25,861 Net increase in assets as a result of operations 3,273

98 Aberdeen Global
Emerging Markets Infrastructure Equity
Share Transactions For the period from 1 October 2016 to 31 March 2017
A-1 A-2 A(CHF)-2^ A(EUR)-2^ I-2 I(EUR)-2^Shares outstanding at the beginning of the period 29,443 7,158,984 889,942 2,657,471 47,837 10,443 Shares issued during the period 56,290 161,222 10,314 101,664 18,539 5,220 Shares redeemed during the period (5,419) (6,026,405) (182,729) (2,205,819) (5,575) (64) Shares outstanding at the end of the period 80,314 1,293,801 717,527 553,316 60,801 15,599 Net asset value per share 9.2187 8.0532 7.5535 7.7475 905.8075 739.9020
N(JPY)-1 R(GBP)-2 S-2 S(EUR)-2^ X-2 X(EUR)-2^
Shares outstanding at the beginning of the period 138,632 388,048 2,149,083 855,899 800 181,649 Shares issued during the period - 49,202 358,336 84,879 - 2,102 Shares redeemed during the period (12,511) (285,296) (883,762) (150,446) - (35,185) Shares outstanding at the end of the period 126,121 151,954 1,623,657 790,332 800 148,566 Net asset value per share 67,727.1864 11.7591 7.9677 7.6628 13.5634 9.7020
Y(EUR)-2Shares outstanding at the beginning of the period 25,218 Shares issued during the period 9,632 Shares redeemed during the period (11,782) Shares outstanding at the end of the period 23,068 Net asset value per share 11.6494
^ Base currency exposure share class.
The accompanying notes form an integral part of these financial statements.

aberdeen-asset.com 99
Emerging Markets Infrastructure EquityPortfolio StatementAs at 31 March 2017
SecurityNominal/ Quantity
Market Value US$’000
Total Net Assets
%Transferable securities and money market instruments admitted to an official exchange listing or dealt on another regulated market 96.87%Equities 96.87%Argentina 2.42%Tenaris (ADR) 134,000 4,575 2.42
Brazil 12.50%Localiza Rent a Car 189,100 2,482 1.32Multiplan Empreendimentos Imobiliarios 256,900 5,374 2.85Ultrapar Participacoes 337,174 7,602 4.02WEG 464,360 2,546 1.35Wilson Sons (BDR) 500,613 5,582 2.96
23,586 12.50
Chile 6.50%Banmedica 884,500 2,113 1.12Empresa Nacional de Telecomunicaciones 208,968 2,519 1.34Enersis Americas 16,186,656 3,355 1.78Enersis Chile 6,603,406 729 0.39Parque Arauco 1,348,182 3,542 1.87
12,258 6.50
China 2.64%Shanghai International Airport 1,142,046 4,982 2.64
Hong Kong 14.47%China Mobile 746,500 8,171 4.33Hang Lung 1,810,000 7,750 4.11Kerry Logistics Network 2,925,000 4,106 2.18Pacific Basin Shipping 10,000,000 2,117 1.12Swire Pacific 'A' 516,000 5,156 2.73
27,300 14.47
India 15.23%Aegis Logistics 735,000 2,180 1.16Bharti Airtel 508,000 2,726 1.44Bharti Infratel 603,867 3,020 1.60CONCOR 311,382 6,088 3.23Grasim Industries (GDR)∞ 607,000 9,821 5.20Gujarat Gas 349,000 4,123 2.18UltraTech Cement 13,000 795 0.42
28,753 15.23
Indonesia 8.31%AKR Corporindo 7,226,000 3,382 1.79Astra International 10,824,900 7,027 3.72Indocement Tunggal Prakarsa 1,812,000 2,259 1.20

100 Aberdeen Global
Emerging Markets Infrastructure Equity
SecurityNominal/ Quantity
Market Value US$’000
Total Net Assets
%Telekomunikasi Indonesia Persero 9,711,000 3,017 1.60
15,685 8.31
Malaysia 1.93%DiGi.Com 1,500,000 1,737 0.92Lafarge Malaysia 1,260,000 1,906 1.01
3,643 1.93
Mexico 4.12%Grupo Aeroportuario del Sureste (ADR) 44,800 7,769 4.12
Peru 0.52%Grana y Montero (ADR) 313,000 975 0.52
Philippines 4.28%Ayala Land 9,172,800 6,079 3.22Manila Water 3,251,000 1,999 1.06
8,078 4.28
Russian Federation 2.09%Global Ports Investments (GDR)∞ 200,250 731 0.39MD Medical Group Investments (GDR) 312,300 3,217 1.70
3,948 2.09
Singapore 1.05%Keppel∞ 400,000 1,988 1.05
South Africa 5.51%African Oxygen 2,226,945 3,301 1.75MTN∞ 779,746 7,096 3.76
10,397 5.51
Switzerland 1.09%LafargeHolcim 34,745 2,054 1.09
Taiwan 2.41%Taiwan Mobile 1,236,000 4,552 2.41
Thailand 6.65%Advanced Info Service (Alien)∞ 820,200 4,284 2.27Bangkok Dusit Medical Services (Alien) 42,300 26 0.01Electricity Generating (Alien) 429,000 2,665 1.41Siam Cement (Alien) 354,000 5,574 2.96
12,549 6.65
Turkey 5.15%Enka Insaat ve Sanayi 3,034,166 5,091 2.70Haci Omer Sabanci 1,685,750 4,627 2.45
9,718 5.15

aberdeen-asset.com 101
Emerging Markets Infrastructure Equity
SecurityNominal/ Quantity
Market Value US$’000
Total Net Assets
%Total Equities 182,810 96.87
Total Transferable securities and money market instruments admitted to an official exchange listing or dealt on another regulated market 182,810 96.87
Derivatives 0.19%
Forward currency exchange contracts 0.19%
Counterparty Buy Sell Settlement Buy Amount Sell Amount
Unrealised Gains/(Losses)
US$’000
Total Net Assets
%BNP Paribas CHF USD 15/06/17 5,316,414 5,271,836 64 0.03BNP Paribas CHF USD 15/06/17 108,680 110,248 (1) -BNP Paribas CHF USD 15/06/17 5,000 5,043 - -BNP Paribas EUR USD 03/04/17 40,326 43,770 (1) -BNP Paribas EUR USD 03/04/17 14,492 15,729 - -BNP Paribas EUR USD 05/04/17 18,305 19,661 - -BNP Paribas EUR USD 15/06/17 11,226,137 11,898,324 153 0.08BNP Paribas EUR USD 15/06/17 5,870,202 6,221,692 79 0.04BNP Paribas EUR USD 15/06/17 4,191,424 4,442,394 57 0.03BNP Paribas EUR USD 15/06/17 1,401,345 1,485,254 19 0.01BNP Paribas EUR USD 15/06/17 268,309 291,034 (3) -BNP Paribas EUR USD 15/06/17 119,864 129,437 (1) -BNP Paribas EUR USD 15/06/17 83,955 90,660 (1) -BNP Paribas EUR USD 15/06/17 32,174 34,127 - -BNP Paribas EUR USD 15/06/17 29,275 31,613 - -BNP Paribas EUR USD 15/06/17 24,908 27,035 - -BNP Paribas EUR USD 15/06/17 17,500 18,564 - -BNP Paribas EUR USD 15/06/17 15,783 17,039 - -BNP Paribas EUR USD 15/06/17 15,639 16,884 - -BNP Paribas EUR USD 15/06/17 14,250 15,540 - -BNP Paribas EUR USD 15/06/17 11,920 12,645 - -BNP Paribas EUR USD 15/06/17 10,039 10,817 - -BNP Paribas EUR USD 15/06/17 9,305 9,971 - -BNP Paribas EUR USD 15/06/17 9,190 9,950 - -BNP Paribas EUR USD 15/06/17 6,502 6,936 - -BNP Paribas EUR USD 15/06/17 4,278 4,558 - -BNP Paribas EUR USD 15/06/17 3,217 3,465 - -BNP Paribas USD EUR 05/04/17 10,782 10,039 - -BNP Paribas USD CHF 05/04/17 5,022 5,000 - -BNP Paribas USD EUR 06/04/17 9,938 9,305 - -BNP Paribas USD EUR 15/06/17 50,924 47,024 - -BNP Paribas USD EUR 15/06/17 43,916 40,326 1 -BNP Paribas USD CHF 15/06/17 42,533 41,719 1 -BNP Paribas USD CHF 15/06/17 41,674 41,362 - -BNP Paribas USD EUR 15/06/17 27,041 25,089 - -BNP Paribas USD EUR 15/06/17 19,725 18,305 - -BNP Paribas USD EUR 15/06/17 18,368 17,145 - -BNP Paribas USD EUR 15/06/17 15,782 14,492 - -BNP Paribas USD EUR 15/06/17 6,965 6,462 - -

102 Aberdeen Global
Emerging Markets Infrastructure Equity
Counterparty Buy Sell Settlement Buy Amount Sell Amount
Unrealised Gains/(Losses)
US$’000
Total Net Assets
%BNP Paribas USD EUR 15/06/17 2,625 2,407 - -Unrealised gains on forward currency exchange contracts 367 0.19
Unrealised gains on derivatives 367 0.19
Total investments 183,177 97.06Other net assets 5,546 2.94Total net assets 188,723 100.00
∞ A portion of this security is on loan at the period end.Currently forward positions are not collateralised.

aberdeen-asset.com 103
Emerging Markets Local Currency BondFor the six months ended 31 March 2017
Performance For the six months ended 31 March 2017, the value of Emerging Markets Local Currency Bond - A Accumulation Shares increased by 0.63% compared to an increase of 0.01% in the benchmark, the JP Morgan GBI EM Global Diversified Index.Source: Lipper, Basis: total return, published NAV to NAV, net of annual charges, gross income reinvested, USD.
Please remember that past performance is not a guide to future returns. The price of shares and the revenue from them may fall as well as rise. Investors may not get back the amount originally invested.
Market reviewEmerging markets (EM) debt remained defiant over the period. The asset class overcame a shock victory for Donald Trump in the US elections in November, before brushing aside two interest rate hikes from the US Federal Reserve in December and March, respectively. EM debt has benefitted from the synchronised global recovery with both developed and emerging market economies gaining momentum.
There was a sell-off in the immediate aftermath of Trump’s victory as the Republican’s pre-election rhetoric and campaign promises - namely his pledge to boost domestic infrastructure spending and cut taxes in order to boost growth, while also renegotiating or even tearing up existing trade deals - saw US Treasury (UST) yields increase and the US dollar appreciate. This subsequently led to downward pressure on EM debt as the animal spirits were unleashed. Most recently, however, US markets have been more subdued and, with prospects of the so-called reflation trade having diminished, the risk of rising UST yields and a stronger dollar has also declined, which is supportive for the asset class.
Trump withdrew the US from the Trans-Pacific Partnership in January but even that seems to have done little to dampen sentiment. December was the first of four straight months of sustained positive performance as fading external risks and a stabilisation of commodity prices continued to benefit the asset class. Emerging market fundamentals remain strong, with local markets growing particularly attractive over the period.
In local currency debt, the JP Morgan GBI-EM Global Diversified index (unhedged in USD terms) returned 0.01% over the period.
Portfolio reviewOverweight duration in Brazil as well as an off-benchmark allocation to Argentina were positive contributors to the Fund as was currency exposure in Russia and an underweight in Romania. Currency exposure in South Africa and an underweight to Peru detracted from the Fund.
During the period, we reduced our duration underweight in Colombia and reduced duration in Poland and Indonesia, while also initiating an off-benchmark position in Ghana. In currency space, we increased exposure to the Argentine peso and Turkish lira, while also cutting the Fund’s Malaysian ringgit and Indian rupee positioning.
OutlookThe fact that fears of rising UST yields have diminished has clearly been supportive of the asset class. However, even prior to the recent subsidence of UST yields the asset class has been doing well, partly thanks to the resilience of commodity prices. This does point to one of the principle outstanding risks for the asset class, that is a correction in oil and other key commodities (such as the one we are currently witnessing in iron ore), with the most likely trigger being growth disappointment in China. While our outlook for growth in China this year is a fairly sanguine one, we do acknowledge the risk to the asset class that a slowdown in China would pose.
Political volatility is never too far away in emerging markets as recent events in South Africa and April’s constitutional referendum in Turkey can attest. Given the benign backdrop in which the market appears to be operating at the moment, any drop in asset prices caused by negative news flow is swiftly capped by willing buyers. The primary markets continue to be open to issuers on every spectrum of the credit rating scale as investors struggle to reduce healthy cash balances as a result of the consistent inflows that have returned to the asset class this year. The bearish emerging market scenarios which were espoused after Donald Trump’s election have yet to manifest themselves – encouraging market participants to remain invested.
Emerging Market Debt Team April 2017

104 Aberdeen Global
Emerging Markets Local Currency Bond
Statement of Net AssetsAs at 31 March 2017
Notes US$'000AssetsInvestments in securities at market value 2.2 176,160 Cash at bank 2,394 Interest receivable 3,589 Subscriptions receivable 11,588 Unrealised gains on forward currency exchange contracts 2.6 24 Other assets 58 Total assets 193,813 LiabilitiesPayable for investments purchased 8,029 Taxes and expenses payable 130 Redemptions payable 2,280 Other liabilities 127 Total liabilities 10,566 Net assets at the end of the period 183,247
Statement of Changes in Net Assets For the period from 1 October 2016 to 31 March 2017
Notes US$'000Net assets at the beginning of the period 183,958 Net gains from investments 4,853 Net realised losses (9,479) Net unrealised gains 1,721 Proceeds from shares issued 45,468 Payments for shares redeemed (43,176) Net equalisation received 10 51 Dividends paid 5 (149) Net assets at the end of the period 183,247
Statement of Operations For the period from 1 October 2016 to 31 March 2017
Notes US$'000IncomeInvestment income 2.3 5,610 Bank interest 8 Total income 5,618 ExpensesManagement fees 4.2 561 Operating, administrative and servicing fees 4.3 202 Other operational expenses 2 Total expenses 765 Net gains from investments 4,853
Realised losses on investments (7,656) Realised losses on forward currency exchange contracts (1,400) Realised currency exchange losses (423) Net realised losses (9,479)
Decrease in unrealised depreciation on investments 2,160 Decrease in unrealised appreciation on forward currency exchange contracts (428) Unrealised currency exchange losses (11) Net unrealised gains 1,721 Net decrease in assets as a result of operations (2,905)

aberdeen-asset.com 105
Emerging Markets Local Currency Bond
Share Transactions For the period from 1 October 2016 to 31 March 2017
A-1 A-2 A-3 A(EUR)-2^ E(EUR)-2 I-2Shares outstanding at the beginning of the period 732,401 577,328 8,676 3,231,136 63,880 4,718,934 Shares issued during the period 447,540 385,258 7,695 88,240 409 3,278,143 Shares redeemed during the period (485,314) (438,118) (10,677) (446,284) (19,636) (1,035,450) Shares outstanding at the end of the period 694,627 524,468 5,694 2,873,092 44,653 6,961,627 Net asset value per share 6.5894 9.3207 10.4647 7.3423 233.5411 9.6651
X-1 X-2 Y(EUR)-2 Z-2Shares outstanding at the beginning of the period 56,563 45,055 5,859 9,436,224 Shares issued during the period 14,904 17,294 - 777,346 Shares redeemed during the period (7,010) (18,076) - (2,193,372) Shares outstanding at the end of the period 64,457 44,273 5,859 8,020,198 Net asset value per share 6.5407 8.1826 9.8739 8.9616
^ Base currency exposure share class.
The accompanying notes form an integral part of these financial statements.
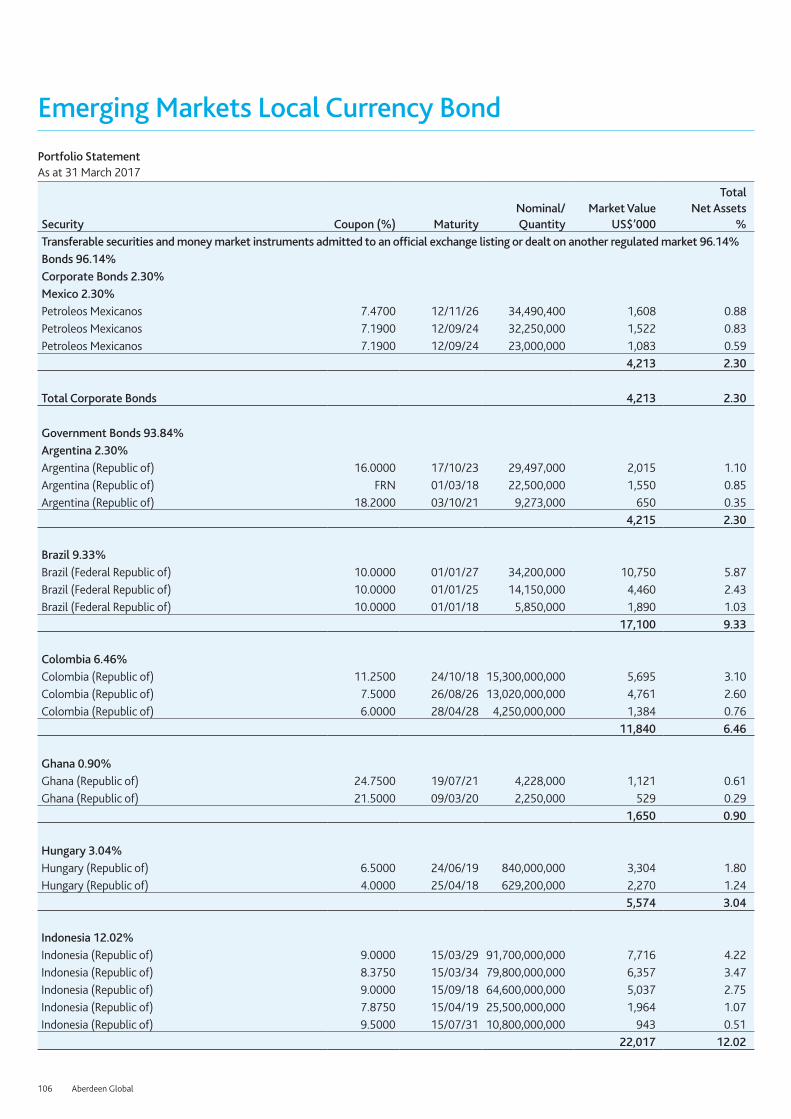
106 Aberdeen Global
Emerging Markets Local Currency BondPortfolio StatementAs at 31 March 2017
Security Coupon (%) MaturityNominal/Quantity
Market Value US$’000
Total Net Assets
%Transferable securities and money market instruments admitted to an official exchange listing or dealt on another regulated market 96.14%Bonds 96.14%Corporate Bonds 2.30%Mexico 2.30%Petroleos Mexicanos 7.4700 12/11/26 34,490,400 1,608 0.88Petroleos Mexicanos 7.1900 12/09/24 32,250,000 1,522 0.83Petroleos Mexicanos 7.1900 12/09/24 23,000,000 1,083 0.59
4,213 2.30
Total Corporate Bonds 4,213 2.30
Government Bonds 93.84%Argentina 2.30%Argentina (Republic of) 16.0000 17/10/23 29,497,000 2,015 1.10Argentina (Republic of) FRN 01/03/18 22,500,000 1,550 0.85Argentina (Republic of) 18.2000 03/10/21 9,273,000 650 0.35
4,215 2.30
Brazil 9.33%Brazil (Federal Republic of) 10.0000 01/01/27 34,200,000 10,750 5.87Brazil (Federal Republic of) 10.0000 01/01/25 14,150,000 4,460 2.43Brazil (Federal Republic of) 10.0000 01/01/18 5,850,000 1,890 1.03
17,100 9.33
Colombia 6.46%Colombia (Republic of) 11.2500 24/10/18 15,300,000,000 5,695 3.10Colombia (Republic of) 7.5000 26/08/26 13,020,000,000 4,761 2.60Colombia (Republic of) 6.0000 28/04/28 4,250,000,000 1,384 0.76
11,840 6.46
Ghana 0.90%Ghana (Republic of) 24.7500 19/07/21 4,228,000 1,121 0.61Ghana (Republic of) 21.5000 09/03/20 2,250,000 529 0.29
1,650 0.90
Hungary 3.04%Hungary (Republic of) 6.5000 24/06/19 840,000,000 3,304 1.80Hungary (Republic of) 4.0000 25/04/18 629,200,000 2,270 1.24
5,574 3.04
Indonesia 12.02%Indonesia (Republic of) 9.0000 15/03/29 91,700,000,000 7,716 4.22Indonesia (Republic of) 8.3750 15/03/34 79,800,000,000 6,357 3.47Indonesia (Republic of) 9.0000 15/09/18 64,600,000,000 5,037 2.75Indonesia (Republic of) 7.8750 15/04/19 25,500,000,000 1,964 1.07Indonesia (Republic of) 9.5000 15/07/31 10,800,000,000 943 0.51
22,017 12.02

aberdeen-asset.com 107
Emerging Markets Local Currency Bond
Security Coupon (%) MaturityNominal/Quantity
Market Value US$’000
Total Net Assets
%Malaysia 7.38%Malaysia (Government of) 4.4980 15/04/30 20,400,000 4,610 2.53Malaysia (Government of) 4.3780 29/11/19 11,814,000 2,718 1.48Malaysia (Government of) 3.5800 28/09/18 9,280,000 2,101 1.15Malaysia (Government of) 4.0480 30/09/21 4,380,000 998 0.54Malaysia (Government of) 4.2320 30/06/31 4,540,000 997 0.54Malaysia (Government of) 4.1810 15/07/24 3,660,000 828 0.45Malaysia (Government of) 3.8000 17/08/23 3,240,000 723 0.39Malaysia (Government of) 4.0120 15/09/17 2,450,000 556 0.30
13,531 7.38
Mexico 8.68%Mexico (Government of) 5.7500 05/03/26 129,050,000 6,280 3.43Mexico (Government of) 7.5000 03/06/27 53,810,000 2,939 1.60Mexico (Government of) 8.0000 11/06/20 48,050,500 2,634 1.44Mexico (Government of) 6.5000 10/06/21 38,460,000 2,012 1.10Mexico (Government of) 8.5000 13/12/18 29,860,000 1,632 0.89Mexico (Government of) 4.5000 22/11/35 1,189,800 409 0.22
15,906 8.68
Peru 1.92%Peru (Republic of) 6.9500 12/08/31 8,970,000 2,971 1.62Peru (Republic of) 6.3500 12/08/28 1,700,000 543 0.30
3,514 1.92
Poland 9.54%Poland (Republic of) 5.2500 25/10/17 37,920,000 9,772 5.33Poland (Republic of) 5.7500 25/10/21 18,350,000 5,229 2.85Poland (Republic of) 2.5000 25/07/27 10,750,000 2,486 1.36
17,487 9.54
Romania 1.75%Romania (Republic of) 5.9000 26/07/17 7,900,000 1,889 1.03Romania (Republic of) 5.6000 28/11/18 5,230,000 1,316 0.72
3,205 1.75
Russian Federation 7.15%Russia (Federation of) 7.0500 19/01/28 506,000,000 8,446 4.62Russia (Federation of) 8.5000 17/09/31 173,110,000 3,214 1.75Russia (Federation of) 7.5000 27/02/19 81,700,000 1,435 0.78
13,095 7.15
South Africa 9.05%South Africa (Republic of) 10.5000 21/12/26 48,800,000 4,019 2.19South Africa (Republic of) 8.7500 28/02/48 42,850,000 2,892 1.58South Africa (Republic of) 6.2500 31/03/36 53,000,000 2,806 1.53South Africa (Republic of) 8.0000 31/01/30 37,400,000 2,528 1.38South Africa (Republic of) 8.5000 31/01/37 37,664,611 2,520 1.38
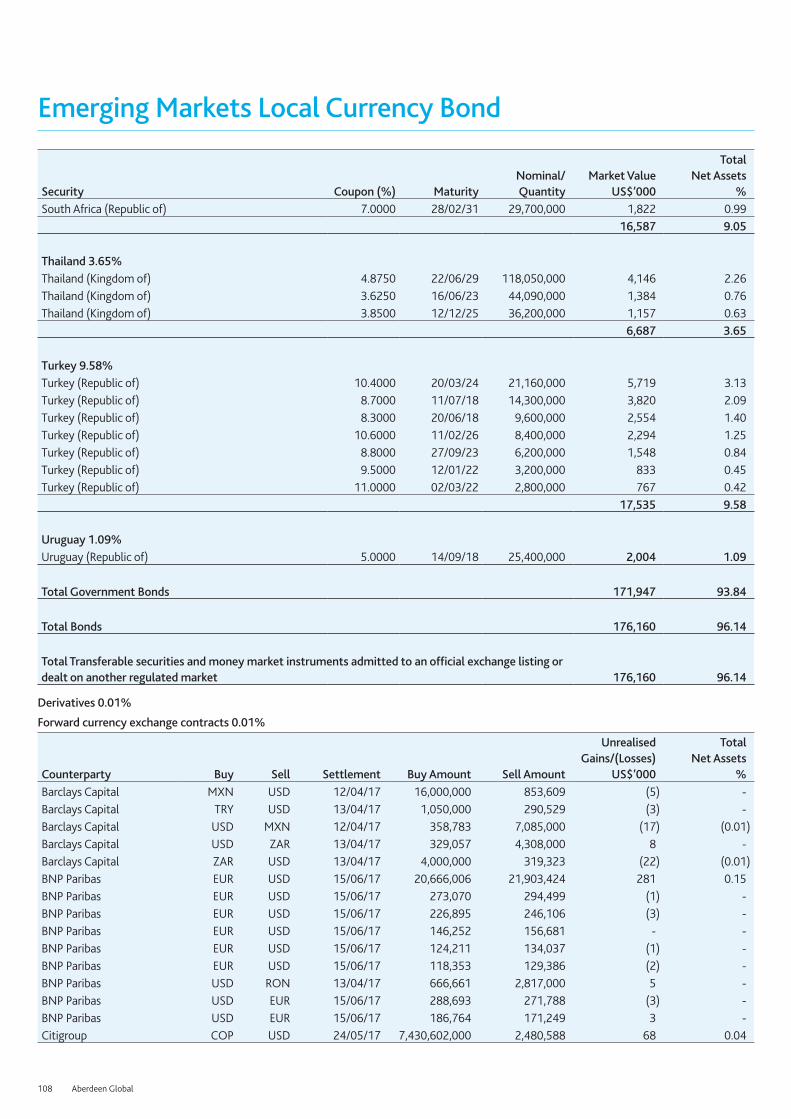
108 Aberdeen Global
Emerging Markets Local Currency Bond
Security Coupon (%) MaturityNominal/Quantity
Market Value US$’000
Total Net Assets
%South Africa (Republic of) 7.0000 28/02/31 29,700,000 1,822 0.99
16,587 9.05
Thailand 3.65%Thailand (Kingdom of) 4.8750 22/06/29 118,050,000 4,146 2.26Thailand (Kingdom of) 3.6250 16/06/23 44,090,000 1,384 0.76Thailand (Kingdom of) 3.8500 12/12/25 36,200,000 1,157 0.63
6,687 3.65
Turkey 9.58%Turkey (Republic of) 10.4000 20/03/24 21,160,000 5,719 3.13Turkey (Republic of) 8.7000 11/07/18 14,300,000 3,820 2.09Turkey (Republic of) 8.3000 20/06/18 9,600,000 2,554 1.40Turkey (Republic of) 10.6000 11/02/26 8,400,000 2,294 1.25Turkey (Republic of) 8.8000 27/09/23 6,200,000 1,548 0.84Turkey (Republic of) 9.5000 12/01/22 3,200,000 833 0.45Turkey (Republic of) 11.0000 02/03/22 2,800,000 767 0.42
17,535 9.58
Uruguay 1.09%Uruguay (Republic of) 5.0000 14/09/18 25,400,000 2,004 1.09
Total Government Bonds 171,947 93.84
Total Bonds 176,160 96.14
Total Transferable securities and money market instruments admitted to an official exchange listing or dealt on another regulated market 176,160 96.14
Derivatives 0.01%
Forward currency exchange contracts 0.01%
Counterparty Buy Sell Settlement Buy Amount Sell Amount
Unrealised Gains/(Losses)
US$’000
Total Net Assets
%Barclays Capital MXN USD 12/04/17 16,000,000 853,609 (5) -Barclays Capital TRY USD 13/04/17 1,050,000 290,529 (3) -Barclays Capital USD MXN 12/04/17 358,783 7,085,000 (17) (0.01)Barclays Capital USD ZAR 13/04/17 329,057 4,308,000 8 -Barclays Capital ZAR USD 13/04/17 4,000,000 319,323 (22) (0.01)BNP Paribas EUR USD 15/06/17 20,666,006 21,903,424 281 0.15BNP Paribas EUR USD 15/06/17 273,070 294,499 (1) -BNP Paribas EUR USD 15/06/17 226,895 246,106 (3) -BNP Paribas EUR USD 15/06/17 146,252 156,681 - -BNP Paribas EUR USD 15/06/17 124,211 134,037 (1) -BNP Paribas EUR USD 15/06/17 118,353 129,386 (2) -BNP Paribas USD RON 13/04/17 666,661 2,817,000 5 -BNP Paribas USD EUR 15/06/17 288,693 271,788 (3) -BNP Paribas USD EUR 15/06/17 186,764 171,249 3 -Citigroup COP USD 24/05/17 7,430,602,000 2,480,588 68 0.04

aberdeen-asset.com 109
Emerging Markets Local Currency Bond
Counterparty Buy Sell Settlement Buy Amount Sell Amount
Unrealised Gains/(Losses)
US$’000
Total Net Assets
%Citigroup HUF USD 13/04/17 410,000,000 1,431,224 (11) (0.01)Citigroup HUF USD 13/04/17 59,613,000 207,554 (1) -Citigroup USD HUF 13/04/17 1,564,014 456,251,000 (17) (0.01)Citigroup USD PLN 13/04/17 657,153 2,663,000 (15) (0.01)Citigroup USD HUF 13/04/17 346,937 100,000,000 - -Citigroup USD RON 13/04/17 340,376 1,445,000 1 -Citigroup USD TRY 13/04/17 259,301 1,000,000 (14) (0.01)Citigroup USD TRY 13/04/17 162,602 599,000 (1) -Citigroup USD COP 24/05/17 1,888,071 5,512,468,000 (3) -Citigroup USD COP 24/05/17 312,608 916,253,000 (2) -Citigroup ZAR USD 13/04/17 6,786,000 498,370 7 -Goldman Sachs BRL USD 24/05/17 12,970,000 4,119,684 (85) (0.05)Goldman Sachs BRL USD 24/05/17 644,000 204,965 (5) -Goldman Sachs PLN USD 13/04/17 3,941,000 954,693 40 0.02Goldman Sachs RON USD 13/04/17 4,262,000 1,005,236 (4) -Goldman Sachs THB USD 12/04/17 22,156,000 629,772 15 0.01Goldman Sachs TRY USD 13/04/17 6,463,000 1,788,892 (20) (0.01)Goldman Sachs USD THB 12/04/17 3,996,141 142,902,000 (162) (0.09)Goldman Sachs USD MXN 12/04/17 151,931 3,295,000 (23) (0.01)Goldman Sachs USD HUF 13/04/17 2,447,533 710,000,000 (12) (0.01)Goldman Sachs USD TRY 13/04/17 210,424 795,000 (7) -Goldman Sachs USD TRY 13/04/17 186,539 700,000 (5) -Goldman Sachs USD THB 24/05/17 628,765 21,942,000 (9) (0.01)Goldman Sachs USD BRL 24/05/17 230,710 743,000 - -Goldman Sachs USD BRL 24/05/17 153,391 493,000 - -HSBC PLN USD 13/04/17 2,100,000 534,994 (5) -HSBC TRY USD 13/04/17 950,000 252,045 8 -HSBC USD IDR 24/05/17 365,387 4,881,573,000 - -JPM Chase BRL USD 13/04/17 1,685,000 538,339 (9) -JPM Chase MXN USD 12/04/17 20,331,000 938,593 139 0.08JPM Chase MXN USD 12/04/17 7,400,000 387,194 5 -JPM Chase MXN USD 12/04/17 5,085,000 259,516 10 0.01JPM Chase PLN USD 13/04/17 3,364,000 827,250 22 0.01JPM Chase PLN USD 13/04/17 885,000 225,140 (2) -JPM Chase USD MXN 12/04/17 1,499,479 32,368,000 (216) (0.12)JPM Chase USD MXN 12/04/17 315,859 6,000,000 (2) -JPM Chase USD ZAR 13/04/17 956,773 12,501,000 26 0.01JPM Chase USD ZAR 13/04/17 191,384 2,644,000 (5) -JPM Chase USD IDR 24/05/17 310,201 4,173,757,000 (2) -JPM Chase ZAR USD 13/04/17 10,400,000 790,493 (16) (0.01)Merrill Lynch MXN USD 12/04/17 7,200,000 357,129 25 0.01Merrill Lynch USD THB 12/04/17 593,465 20,438,000 (1) -Merrill Lynch USD PLN 13/04/17 374,828 1,500,000 (4) -Merrill Lynch USD TRY 13/04/17 82,533 300,000 - -Merrill Lynch USD THB 24/05/17 194,738 6,820,000 (4) -Morgan Stanley EUR USD 13/04/17 465,000 495,330 2 -Morgan Stanley USD ZAR 13/04/17 477,141 6,600,000 (14) (0.01)Morgan Stanley USD COP 24/05/17 217,000 654,254,000 (7) -

110 Aberdeen Global
Emerging Markets Local Currency Bond
Counterparty Buy Sell Settlement Buy Amount Sell Amount
Unrealised Gains/(Losses)
US$’000
Total Net Assets
%Morgan Stanley USD PEN 24/05/17 192,702 639,000 (3) -Royal Bank of Canada MXN USD 12/04/17 9,000,000 433,965 43 0.02Royal Bank of Canada USD TRY 13/04/17 1,208,641 4,400,000 4 -Royal Bank of Canada USD TRY 13/04/17 439,012 1,600,000 1 -Royal Bank of Canada USD TRY 13/04/17 124,763 467,000 (3) -State Street PLN USD 13/04/17 1,200,000 290,599 12 0.01State Street TRY USD 13/04/17 506,000 138,151 - -UBS HUF USD 13/04/17 720,113,000 2,483,814 11 0.01UBS IDR USD 24/05/17 10,067,850,000 747,511 5 -UBS PLN USD 13/04/17 2,450,000 610,066 8 -UBS TRY USD 13/04/17 4,587,000 1,247,821 8 -UBS TRY USD 13/04/17 1,472,000 384,789 18 0.01UBS USD EUR 13/04/17 495,270 465,000 (2) -UBS USD IDR 13/04/17 257,416 3,447,373,000 (1) -UBS USD PEN 24/05/17 845,849 2,771,000 (2) -Unrealised gains on forward currency exchange contracts 24 0.01
Unrealised gains on derivatives 24 0.01
Total investments 176,184 96.15Other net assets 7,063 3.85Total net assets 183,247 100.00
Currently forward positions are not collateralised.

aberdeen-asset.com 111
Emerging Markets Local Currency Corporate BondFor the six months ended 31 March 2017
PerformanceFor the six months ended 31 March 2017, the value of Emerging Markets Local Currency Corporate Bond - A Accumulation Shares increased by 4.79% compared to an increase of 2.80% in the benchmark, the Bank of America Merrill Lynch Diversified Broad Local Emerging Markets Non-Sovereign Index.Source: Lipper, Basis: total return, published NAV to NAV, net of annual charges, gross income reinvested, USD.
Please remember that past performance is not a guide to future returns. The price of shares and the revenue from them may fall as well as rise. Investors may not get back the amount originally invested.
Market reviewEmerging markets (EM) debt remained defiant over the period. The asset class overcame a shock victory for Donald Trump in the US elections in November, before brushing aside two interest rate hikes from the US Federal Reserve in December and March, respectively. EM debt has benefitted from the synchronised global recovery with both developed and emerging market economies gaining momentum.
There was a sell-off in the immediate aftermath of Trump’s victory as the Republican’s pre-election rhetoric and campaign promises - namely his pledge to boost domestic infrastructure spending and cut taxes in order to boost growth, while also renegotiating or even tearing up existing trade deals - saw US Treasury (UST) yields increase and the US dollar appreciate. This subsequently led to downward pressure on EM debt as the animal spirits were unleashed. Most recently, however, US markets have been more subdued and, with prospects of the so-called reflation trade having diminished, the risk of rising UST yields and a stronger dollar has also declined, which is supportive for the asset class.
Trump withdrew the US from the Trans-Pacific Partnership in January but even that seems to have done little to dampen sentiment. December was the first of four straight months of sustained positive performance as fading external risks and a stabilisation of commodity prices continued to benefit the asset class. Emerging market fundamentals remain strong, with local markets growing particularly attractive over the period.
In Brazil, the long awaited leniency agreement between the US, Swiss authorities and construction giant Odebrecht was agreed. Company bonds rallied as much as 20pts on the news, fuelled by the expectation that the company will once again be able to bid on public contracts in Brazil and obtain financing from public entities. MHP bonds had a scare as the European Union (EU) announced the banning of poultry imports from Ukraine due to an outbreak of bird flu in southern regions of the country. There was a quick recovery as the market was comforted by quota limitation for Ukrainian exports into the EU and the fact the production is primarily located away from the Southern regions affected. Indian energy giant Greenko announced an equity raise of US $155mn from GIC and ADIA, subsequently raising GICs stake in the company to 64%.
The merger between First Gulf Bank and National Bank of Abu Dhabi was finally completed in the Middle East, resulting in ‘First Abu Dhabi Bank’, the largest bank in United Arab Emirates (UAE) with total assets in excess of US $180bn. Mid-March the Brazilian Federal Police launched operation ‘Carne Fraca’ to investigate allegations of bribery of Federak Sanitary Inspectors and illegal sale of meat by several slaughterhouses. On the list targeted included companies including JBS and BRF – two of the biggest meat producers in Brazil. After a sharp sell-off immediately following the revelations, bonds rebounded after the banks were revoked.
Portfolio review Over the last six months the EM local corporate market has produced positive returns with the Merrill Lynch benchmark returning 2.80% over the period. The Fund delivered significant outperformance returning 4.79%. Outperformance was driven primarily from FX exposure resulting in a positive 171bps to the total outperformance, namely being overweight the Rouble, and underweight the Mexican Peso and Turkish Lira. The Rouble was a strong performer as oil prices recovered and inflation continued to decline. Bond selection was only a marginal positive contributor to the outperformance. Asset allocation was also a positive contributor to the outperformance. The standout country was the Brazil overweight, driven by the improvement in market driven by investors’ confidence recovering after the Lava Jato scandal.
OutlookThe fact that fears of rising UST yields have diminished has clearly been supportive of the asset class. However, even prior to the recent subsidence of UST yields the asset class has been doing well, partly thanks to the resilience of commodity prices. This does point to one of the principle outstanding risks for the asset class, that is a correction in oil and other key commodities (such as the one we are currently witnessing in iron ore), with the most likely trigger being growth disappointment in China. While our outlook for growth in China this year is a fairly sanguine one, we do acknowledge the risk to the asset class that a slowdown in China would pose.
Political volatility is never too far away in emerging markets as recent events in South Africa and April’s constitutional referendum in Turkey can attest. Given the benign backdrop in which the market appears to be operating at the moment, any drop in asset prices caused by negative news flow is swiftly capped by willing buyers. The primary markets continue to be open to issuers on every spectrum of the credit rating scale as investors struggle to reduce healthy cash balances as a result of the consistent inflows that have returned to the asset class this year. The bearish emerging market scenarios which were espoused after Donald Trump’s election have yet to manifest themselves – encouraging market participants to remain invested.
Emerging Market Debt Team April 2017

112 Aberdeen Global
Emerging Markets Local Currency Corporate Bond
Statement of Net AssetsAs at 31 March 2017
Notes US$'000AssetsInvestments in securities at market value 2.2 7,162 Cash at bank 301 Interest receivable 142 Unrealised gains on forward currency exchange contracts 2.6 1 Other assets 1 Total assets 7,607 LiabilitiesTaxes and expenses payable 8 Other liabilities 2 Total liabilities 10 Net assets at the end of the period 7,597
Statement of Changes in Net Assets For the period from 1 October 2016 to 31 March 2017
Notes US$'000Net assets at the beginning of the period 7,277 Net gains from investments 259 Net realised gains 90 Net unrealised losses (29) Net assets at the end of the period 7,597
Statement of Operations For the period from 1 October 2016 to 31 March 2017
Notes US$'000IncomeInvestment income 2.3 306 Total income 306 ExpensesManagement fees 4.2 41 Operating, administrative and servicing fees 4.3 6 Total expenses 47 Net gains from investments 259
Realised gains on investments 18 Realised gains on forward currency exchange contracts 73 Realised currency exchange losses (1) Net realised gains 90
Decrease in unrealised appreciation on investments (29) Increase in unrealised appreciation on forward currency exchange contracts 1 Unrealised currency exchange losses (1) Net unrealised losses (29) Net increase in assets as a result of operations 320
Share Transactions For the period from 1 October 2016 to 31 March 2017
A-2 I-2 X-2Shares outstanding at the beginning of the period 167,000 324,176 167,000 Shares issued during the period - - - Shares redeemed during the period - - - Shares outstanding at the end of the period 167,000 324,176 167,000 Net asset value per share 11.4814 11.5669 11.5590
The accompanying notes form an integral part of these financial statements.

aberdeen-asset.com 113
Emerging Markets Local Currency Corporate BondPortfolio StatementAs at 31 March 2017
Security Coupon (%) MaturityNominal/Quantity
Market Value US$’000
Total Net Assets
%Transferable securities and money market instruments admitted to an official exchange listing or dealt on another regulated market 83.37%Bonds 83.37%Corporate Bonds 80.50%Brazil 12.57%AmBev International Finance 9.5000 24/07/17 930,000 289 3.81Banco Do Brasil 9.7500 18/07/17 719,000 225 2.97Banco Safra Cayman Islands 10.8750 03/04/17 390,000 123 1.62BRF 7.7500 22/05/18 1,041,000 318 4.17
955 12.57
China 4.82%Eastern Creation II Investment (EMTN) 3.7500 27/06/17 1,280,000 185 2.44Longfor Properties 6.7500 28/05/18 1,220,000 181 2.38
366 4.82
Colombia 3.94%Emgesa 8.7500 25/01/21 405,000,000 143 1.88Findeter 7.8750 12/08/24 470,000,000 156 2.06
299 3.94
India 5.13%Housing Development Finance (EMTN) 7.8750 21/08/19 10,000,000 156 2.06Indiabulls Housing Finance 8.5670 15/10/19 15,000,000 234 3.07
390 5.13
Indonesia 4.81%Indosat 8.6000 02/09/21 1,740,000,000 132 1.73Lembaga Pembiayaan Ekspor Indonesia 9.5000 13/03/20 3,000,000,000 234 3.08
366 4.81
Malaysia 3.77%Cagamas MBS 4.0200 29/05/19 750,000 169 2.23Malaysia Airports Capital Bhd (MTN) 4.6800 16/12/22 510,000 117 1.54
286 3.77
Mexico 10.38%America Movil 6.4500 05/12/22 6,150,000 307 4.05Comision Federal de Electricidad 7.3500 25/11/25 5,350,000 259 3.41Petroleos Mexicanos 7.1900 12/09/24 4,700,000 222 2.92
788 10.38
Russian Federation 14.24%Alfa Bond Issuance (EMTN) 9.2500 16/02/22 10,000,000 178 2.35EvrazHolding Finance 12.6000 23/03/21 9,000,000 175 2.30Federal Grid Finance (EMTN) 8.4460 13/03/19 15,700,000 276 3.62Russian Railways via RZD Capital 9.2000 07/10/23 10,000,000 180 2.37

114 Aberdeen Global
Emerging Markets Local Currency Corporate Bond
Security Coupon (%) MaturityNominal/Quantity
Market Value US$’000
Total Net Assets
%VimpelCom 9.0000 13/02/18 15,445,000 274 3.60
1,083 14.24
Singapore 4.88%Singapore Airlines (MTN) 3.2200 09/07/20 250,000 184 2.42Singapore Technologies Telemedia (MTN) 4.0500 02/12/25 250,000 187 2.46
371 4.88
South Africa 11.15%Development Bank of Southern Africa (MTN) 10.0000 27/02/23 3,000,000 225 2.97Eskom - 31/12/18 2,250,000 140 1.84Eskom (MTN) 7.5000 15/09/33 3,000,000 170 2.23Transnet (MTN) 10.8000 06/11/23 4,000,000 312 4.11
847 11.15
Turkey 4.81%Akbank 7.5000 05/02/18 537,000 142 1.87Turkiye Garanti Bankasi 7.3750 07/03/18 847,000 223 2.94
365 4.81
Total Corporate Bonds 6,116 80.50
Government Bonds 2.87%Peru 2.87%Fondo MIVIVIENDA 7.0000 14/02/24 700,000 218 2.87
Total Government Bonds 218 2.87
Total Bonds 6,334 83.37
Total Transferable securities and money market instruments admitted to an official exchange listing or dealt on another regulated market 6,334 83.37
Other transferable securities and money market instruments 8.31%Bonds 8.31%Corporate Bonds 8.31%Argentina 2.21%YPF Sociedad Anonima (EMTN) FRN 07/07/20 150,000 168 2.21
Malaysia 3.71%CIMB Bank 4.8000 23/12/25 500,000 113 1.48Public Bank (MTN) 4.2800 03/08/22 750,000 169 2.23
282 3.71
Singapore 2.39%SingTel Group Treasury (MTN) 2.7200 03/09/21 250,000 181 2.39
Total Corporate Bonds 631 8.31

aberdeen-asset.com 115
Emerging Markets Local Currency Corporate Bond
Security Coupon (%) MaturityNominal/Quantity
Market Value US$’000
Total Net Assets
%Total Bonds 631 8.31
Total Other transferable securities and money market instruments 631 8.31
Open Ended Investment Funds 2.60%Aberdeen Global - Indian Bond Fund Z-2† 17,000 197 2.60
Total Open Ended Investment Funds 197 2.60
Derivatives 0.01%
Forward currency exchange contracts 0.01%
Counterparty Buy Sell Settlement Buy Amount Sell Amount
Unrealised Gains/(Losses)
US$’000
Total Net Assets
%Citigroup TRY USD 13/04/17 822,000 224,752 - -Citigroup USD ZAR 13/04/17 134,701 1,753,000 4 0.06Goldman Sachs RUB USD 24/05/17 16,972,000 289,674 8 0.10Goldman Sachs TRY USD 13/04/17 115,000 31,567 - -Goldman Sachs USD RUB 24/05/17 224,957 13,124,000 (5) (0.07)HSBC MXN USD 12/04/17 1,427,000 66,100 9 0.13JPM Chase USD MXN 12/04/17 66,273 1,427,000 (9) (0.12)JPM Chase USD TRY 13/04/17 180,113 666,000 (2) (0.03)JPM Chase USD TRY 13/04/17 69,910 271,000 (4) (0.06)Unrealised gains on forward currency exchange contracts 1 0.01
Unrealised gains on derivatives 1 0.01
Total investments 7,163 94.29Other net assets 434 5.71Total net assets 7,597 100.00
† Managed by subsidiaries of Aberdeen Asset Management PLC.Currently forward positions are not collateralised.

116 Aberdeen Global
Emerging Markets Smaller CompaniesFor the six months ended 31 March 2017
Performance For the six months ended 31 March 2017, the value of Emerging Markets Smaller Companies – A Accumulation shares increased by 0.08% compared to an increase of 6.06% in the benchmark, the MSCI Global Emerging Markets Small Cap Index.Source: Lipper, Basis: total return, published NAV to NAV, net of annual charges, gross income reinvested, USD.Please see the Performance History section for details on the use of MSCI information.
Please remember that past performance is not a guide to future returns. The price of shares and the revenue from them may fall as well as rise. Investors may not get back the amount originally invested.
Market reviewEmerging market equities closed higher in the six months under review. Sentiment initially weakened after Donald Trump’s election victory, which strengthened the US dollar as well as triggered a rotation out of bonds and bond proxies into low-quality cyclicals as investors considered the implications of US fiscal policy shifting towards a more reflationary position. Subsequently, there was a turnaround as markets were buoyed by expectations that US pro-business policies would improve the global economic outlook. Currencies broadly strengthened relative to the weaker US dollar after the Republican party failed to introduce a new healthcare bill. Oil prices eased but stayed above the US$50 per barrel level over the period. Across markets, Brazil performed well, as the central bank surprised investors by materially cutting interest rates to kickstart the economy amid a more benign inflation environment. Russia was buoyed by stabilising energy prices and a return to growth for the first time in two years. In India, the ruling party’s resounding state election victory in Uttar Pradesh boosted investor confidence in prime minister Modi’s ability to carry through with his reform agenda, which outweighed the receding impact of a shock demonetisation. In contrast, Turkey was among the key laggards, as the lira continued to sell off on political uncertainty and a credit-rating downgrade.
Portfolio reviewHigher-quality consumer staples and other defensively-positioned companies generally underperformed, while cyclical stocks enjoyed increased momentum on expectations of reflationary policies in the US and continued stimulus in China. This weighed on the Fund’s performance in several markets, including India, Brazil, Mexico, Poland, Philippines and Indonesia, with long-term core holdings such as Grupo Aeroportuario del Centro Norte, Jollibee and AKR Corporindo selling off. Elsewhere, the Fund’s underweight to Taiwan hurt relative performance as the market did well, supported by a firming currency, while our overweight to Turkey detracted as the weakening lira weighed on returns.
At the stock level, Grana y Montero’s shares fell sharply after it became embroiled in a corruption scandal involving former project partner, Odebrecht, over construction contracts undertaken in Peru. Grana strenuously denied the allegations and launched an independently-led internal investigation. It has also moved to refresh its board, appointing a number of additional and highly-regarded outside directors. Holding Eurocash faltered due to continued margin pressure and softness in its cash & carry segment, while in Turkey bottler Coca-Cola Icecek came under pressure from the currency’s slide, as its balance sheet is largely US dollar-funded
Conversely, our underweight to South Korea proved beneficial as the market fell on political instability, as well as the continued de-rating of companies in the biotech industry, a key driver of the South Korean small-cap market last year. At the stock level, Chinese industrial gas company Yingde Gases was the biggest contributor to performance, as it was the target of a takeover battle. We divested Yingde to private equity firm PAG Capital at HK$6 a share after US-based Air Products and Chemicals withdrew its offer. Elsewhere, stock selection in Egypt supported relative returns, with food company Edita performing well amid an improved economic outlook following the pound’s devaluation.
In portfolio activity, we introduced Medy-Tox, a South Korean maker of botulinum toxin, when its valuation turned more reasonable following broader weakness in the health-care sector. The company has a 40% share of the domestic market and is one of eight such manufacturers globally. We also initiated high-quality Turkish software developer Logo on attractive valuations. Meanwhile, we participated in Pilipinas Shell Petroleum’s (Shell Philippines’) initial public offering. Against this, we sold Yingde Gases, as mentioned, as well as Dah Sing Banking Group, O’Key Group and Texwinca to fund better opportunities elsewhere.
OutlookLooking ahead, emerging markets are likely to remain supported by healthier risk appetite and expectations for improved earnings. Concerns that Donald Trump’s protectionist stance could hurt global trade appear to be moderating somewhat, as early fears seem overdone. While investors’ sentiment could shift again, we are unfazed by short-term volatility as indiscriminate selling or buying will provide opportunities for us as long-term investors.
In terms of fundamentals, emerging markets’ growth potential remains attractive, supported by favourable demographics and an increasingly affluent middle class. Sensible policymaking and robust balance sheets further strengthen the case that emerging economies are well prepared to weather any major downturn. Stabilising commodity prices should also provide some breathing room for exporters. While a steeper US rate hike and subsequent dollar strength remain key issues to watch, emerging markets are now much better positioned compared to the taper tantrum just a few years ago. We also find comfort from a valuation standpoint: despite the rally, emerging markets are still trading at a healthy discount to their developed counterparts.
Global Emerging Markets Equity Team April 2017

aberdeen-asset.com 117
Emerging Markets Smaller Companies
Statement of Net AssetsAs at 31 March 2017
Notes US$'000AssetsInvestments in securities at market value 2.2 1,078,924 Cash at bank 48,336 Interest and dividends receivable 2,501 Subscriptions receivable 357 Receivable for investments sold 58 Other assets 25 Total assets 1,130,201 LiabilitiesPayable for investments purchased 3,559 Taxes and expenses payable 1,302 Redemptions payable 2,058 Total liabilities 6,919 Net assets at the end of the period 1,123,282
Statement of Changes in Net Assets For the period from 1 October 2016 to 31 March 2017
Notes US$'000Net assets at the beginning of the period 1,217,309 Net gains from investments 121 Net realised losses (30,208) Net unrealised gains 20,082 Proceeds from shares issued 142,083 Payments for shares redeemed (226,279) Net equalisation received 10 10 Capacity management charge 15 164 Net assets at the end of the period 1,123,282
Statement of Operations For the period from 1 October 2016 to 31 March 2017
Notes US$'000IncomeInvestment income 2.3 7,970 Bank interest 18 Stocklending income 16 82 Total income 8,070 ExpensesManagement fees 4.2 6,341 Operating, administrative and servicing fees 4.3 1,596 Other operational expenses 12 Total expenses 7,949 Net gains from investments 121
Realised losses on investments (30,564) Realised currency exchange gains 356 Net realised losses (30,208)
Decrease in unrealised depreciation on investments 20,049 Unrealised currency exchange gains 33 Net unrealised gains 20,082 Net decrease in assets as a result of operations (10,005)
Share Transactions For the period from 1 October 2016 to 31 March 2017
A-2 D(GBP)-2 G-2 I-2 R(GBP)-2 X-2Shares outstanding at the beginning of the period 18,892,227 5,957,960 23,939,338 19,476,770 407,937 1,968,450 Shares issued during the period 435,978 3,805,305 6,063,865 762,395 26,026 71,397 Shares redeemed during the period (6,842,212) (166,354) (177,517) (5,736,095) (115,279) (339,415) Shares outstanding at the end of the period 12,485,993 9,596,911 29,825,686 14,503,070 318,684 1,700,432 Net asset value per share 17.7296 14.1405 9.3396 19.2228 13.0650 10.1833
Y(EUR)-2 Z-2Shares outstanding at the beginning of the period 62,902 7,211,266 Shares issued during the period - - Shares redeemed during the period (2,810) - Shares outstanding at the end of the period 60,092 7,211,266 Net asset value per share 12.4038 21.0153
The accompanying notes form an integral part of these financial statements.

118 Aberdeen Global
Emerging Markets Smaller CompaniesPortfolio StatementAs at 31 March 2017
SecurityNominal/ Quantity
Market Value US$’000
Total Net Assets
%Transferable securities and money market instruments admitted to an official exchange listing or dealt on another regulated market 96.05%Equities 96.05%Brazil 9.69%Arezzo Industria e Comercio 1,538,417 15,140 1.35Iguatemi Empresa de Shopping Centers 2,620,008 27,059 2.41Localiza Rent a Car 952,875 12,506 1.11OdontoPrev 3,225,153 11,453 1.02TOTVS 1,531,498 13,383 1.19Valid Solucoes 874,012 6,216 0.55Wilson Sons (BDR) 2,070,662 23,088 2.06
108,845 9.69
Chile 3.76%Parque Arauco 13,315,937 34,983 3.11SONDA 4,227,557 7,289 0.65
42,272 3.76
China 1.32%Tong Ren Tang Technologies 8,350,000 14,859 1.32
Egypt 1.56%Edita Food Industries (GDR)∞ 1,353,250 9,460 0.84Juhayna Food Industries 18,050,982 8,100 0.72
17,560 1.56
Hong Kong 2.26%Hong Kong Aircraft Engineering 118,000 817 0.07Pacific Basin Shipping 115,832,000 24,518 2.19
25,335 2.26
India 14.58%Castrol India 1,725,870 11,489 1.02CONCOR 1,282,081 25,065 2.23Godrej Consumer Products 1,553,638 40,198 3.59Kansai Nerolac Paints 3,576,210 21,011 1.87Mphasis 1,507,177 13,451 1.20Piramal Enterprises 784,594 23,033 2.05Ramco Cements 2,817,213 29,426 2.62
163,673 14.58
Indonesia 8.02%Ace Hardware Indonesia 370,093,900 22,844 2.03AKR Corporindo 74,832,900 35,028 3.12Bank OCBC NISP 89,722,543 12,254 1.09Bank Permata 105,130,793 5,266 0.47Holcim Indonesia 208,492,400 14,121 1.26XL Axiata 2,434,100 562 0.05
90,075 8.02

aberdeen-asset.com 119
Emerging Markets Smaller Companies
SecurityNominal/ Quantity
Market Value US$’000
Total Net Assets
%Jordan 1.43%Hikma Pharmaceuticals∞ 646,439 16,013 1.43
Kenya 1.16%East African Breweries 5,928,800 13,073 1.16
Malaysia 5.94%Aeon 38,592,200 20,711 1.84Guinness Anchor 2,184,500 8,851 0.79Oriental 7,050,000 10,522 0.94SP Setia 14,535,751 11,594 1.03SP Setia (PERP) (PREF) 6,520,831 1,665 0.15United Plantations 2,081,400 13,409 1.19
66,752 5.94
Mexico 3.45%Grupo Aeroportuario del Centro Norte (ADR) 896,354 38,718 3.45
Netherlands 1.81%ASM International (non-voting) 361,862 20,376 1.81
Nigeria 1.27%Guinness Nigeria 26,630,835 5,265 0.47Zenith Bank 197,192,066 9,014 0.80
14,279 1.27
Peru 0.62%Grana y Montero (ADR)∞ 2,224,949 6,931 0.62
Philippines 3.82%Jollibee Foods 6,695,830 26,329 2.34Pilipinas Shell Petroleum 11,528,150 16,635 1.48
42,964 3.82
Poland 1.25%Eurocash∞ 1,747,706 14,081 1.25
Romania 1.71%BRD-Groupe Societe Generale 6,682,954 19,217 1.71
Russian Federation 1.82%Synergy 1,995,595 20,419 1.82
Singapore 3.92%Delfi 17,014,400 26,971 2.40Yanlord Land 13,180,200 17,097 1.52
44,068 3.92

120 Aberdeen Global
Emerging Markets Smaller Companies
SecurityNominal/ Quantity
Market Value US$’000
Total Net Assets
%South Africa 6.36%African Oxygen 7,332,411 10,868 0.97City Lodge Hotels 1,193,109 13,432 1.20Clicks∞ 1,929,604 18,437 1.64JSE 1,282,861 12,335 1.10Spar 1,257,554 16,340 1.45
71,412 6.36
South Korea 2.63%BNK Financial 927,196 7,615 0.68Medy-Tox 31,300 12,958 1.15Shinsegae 52,665 8,983 0.80
29,556 2.63
Sri Lanka 2.04%John Keells 25,263,481 22,918 2.04
Taiwan 1.42%Poya International 1,350,000 15,917 1.42
Thailand 4.88%BEC World 17,056,300 8,562 0.76Bumrungrad Hospital (Alien)∞ 1,675,000 8,908 0.79Central Pattana (Alien) 6,909,200 11,938 1.06Hana Microelectronics 8,478,000 11,627 1.04Siam City Cement (Alien) 1,600,700 13,789 1.23
54,824 4.88
Turkey 6.97%Aksigorta 17,199,088 13,059 1.16AvivaSA Emeklilik ve Hayat∞ 1,903,607 9,827 0.87Cimsa Cimento 4,590,522 19,495 1.74Coca-Cola Icecek 2,545,548 24,906 2.22Logo Yazilim Sanayi ve Ticaret∞ 720,903 11,041 0.98
78,328 6.97
United States 2.36%EPAM Systems 350,380 26,459 2.36
Total Equities 1,078,924 96.05
Total Transferable securities and money market instruments admitted to an official exchange listing or dealt on another regulated market 1,078,924 96.05
Total investments 1,078,924 96.05Other net assets 44,358 3.95Total net assets 1,123,282 100.00
∞ A portion of this security is on loan at the period end.

aberdeen-asset.com 121
European EquityFor the six months ended 31 March 2017
Performance reviewFor the six months ended 31 March 2017, the value of European Equity - A Accumulation shares increased by 10.00%, compared to an increase of 12.54% in its benchmark, the FTSE Europe Index.Source: Lipper, Basis: total return, published NAV to NAV, net of annual charges, gross income reinvested, EUR.
Please remember that past performance is not a guide to future returns. The price of shares and the revenue from them may fall as well as rise. Investors may not get back the amount originally invested.
Market reviewPan-European equities rose in the half-year under review, with sentiment buoyed by election results in the Netherlands that were hailed as a rejection of populism, and hopes that US President Donald Trump’s pledge to cut taxes would lift the global economy. Initially, risk appetite had been supported by better-than-expected economic data, rising oil prices on the back of OPEC’s agreement to curb the oil supply. Investors had also cheered the European Central Bank’s unexpected extension of its bond-buying programme till end-2017, albeit with lower monthly asset purchases. Gains were capped somewhat, however, by the US Federal Reserve’s plan to accelerate the pace of interest rate hikes this year after the widely-anticipated quarter-point hike in December, a retreat in the oil price towards the period-end amid rising US shale output, as well as UK Prime Minister Theresa May’s invocation of Article 50 to start divorce negotiations with the European Union.
Portfolio review At the stock level, key detractors included Novo Nordisk, as concerns over pricing pressure continued to weigh on its share price. Lingering weakness in GrandVision’s Italian business and negative earnings revisions dampened its share price, despite fourth-quarter results showing a recovery from weakness in the prior three months. Last, Pearson’s shares suffered following a profit warning and dividend cut, due largely to weaker-than-expected demand for textbooks in US universities.
Mitigating the underperformance was the contribution to relative return from Prudential, which delivered robust growth in its Asian business and is also a beneficiary of rising global interest rates. Also benefiting the Fund was Temenos, which did well on the back of upbeat investor sentiment on potential new contract wins, alongside earnings upgrades. Finally, Swatch recovered somewhat amid signs of improving demand for its watches from the key markets of mainland China and Hong Kong.
In key portfolio activity, we sold Assa Abloy on strength, Linde after its shares rose on the back of a proposed merger with Praxair, and Engie in favour of more attractive opportunities elsewhere. Against this we introduced world-leading hearing-aid retailer Amplifon, with its market leadership providing it cost advantages over its rivals. It also stands to benefit from significant secular tailwinds as the demand for hearing aids is set to grow from a low base. We also initiated a position in well-diversified testing, inspection and certification company SGS, which has a relatively defensive growth profile and a robust balance sheet.
OutlookThe market outlook remains finely balanced: negotiations to leave the EU can begin in earnest now that Article 50 has been triggered, although the outcome of these discussions will take at least two years to be revealed. Meanwhile, the UK government’s call for a snap election in June adds a further layer of uncertainty, sitting alongside other imponderables, including the upcoming French and German elections, the Trump administration’s haphazard policymaking and heightened geopolitical tension with North Korea, Syria and Russia.
However, we continue to believe that the underlying strength of our holdings will outweigh the broader environment in the long term, hence our focus on identifying companies that possess well-diversified earnings streams, superior business models and robust balance sheets, while trading at attractive valuations.
Pan European Equity Team April 2017

122 Aberdeen Global
European Equity
Statement of Net AssetsAs at 31 March 2017
Notes €’000AssetsInvestments in securities at market value 2.2 198,040 Cash at bank 661 Interest and dividends receivable 643 Subscriptions receivable 107 Receivable for investments sold 5 Other assets 73 Total assets 199,529 LiabilitiesTaxes and expenses payable 235 Redemptions payable 2,215 Total liabilities 2,450 Net assets at the end of the period 197,079
Statement of Changes in Net Assets For the period from 1 October 2016 to 31 March 2017
Notes €’000Net assets at the beginning of the period 199,417 Net gains from investments 772 Net realised gains 6,668 Net unrealised gains 10,870 Proceeds from shares issued 9,867 Payments for shares redeemed (30,491) Net equalisation paid 10 (24) Net assets at the end of the period 197,079
Statement of Operations For the period from 1 October 2016 to 31 March 2017
Notes €’000IncomeInvestment income 2.3 2,105 Stocklending income 16 16 Total income 2,121 ExpensesManagement fees 4.2 1,164 Operating, administrative and servicing fees 4.3 183 Other operational expenses 2 Total expenses 1,349 Net gains from investments 772
Realised gains on investments 6,702 Realised currency exchange losses (34) Net realised gains 6,668
Increase in unrealised appreciation on investments 10,872 Unrealised currency exchange losses (2) Net unrealised gains 10,870 Net increase in assets as a result of operations 18,310
Share Transactions For the period from 1 October 2016 to 31 March 2017
A-2 I-2 S-2 U(USD)-2 X-2 Z-2Shares outstanding at the beginning of the period 2,028,513 17,564 115,168 19,878 468,917 2,710,163 Shares issued during the period 120,405 1,347 701 - 21,862 137,361 Shares redeemed during the period (272,049) (8,100) (6,381) (10,127) (3,551) (365,066) Shares outstanding at the end of the period 1,876,869 10,811 109,488 9,751 487,228 2,482,458 Net asset value per share 49.0337 1,328.7800 406.1370 10.0349 13.6068 15.9096
The accompanying notes form an integral part of these financial statements.

aberdeen-asset.com 123
European EquityPortfolio StatementAs at 31 March 2017
SecurityNominal/ Quantity
Market Value €’000
Total Net Assets
%Transferable securities and money market instruments admitted to an official exchange listing or dealt on another regulated market 96.80%Equities 96.80%Austria 2.46%Schoeller-Bleckmann Oilfield Equipment∞ 74,000 4,851 2.46
Denmark 5.14%Novo Nordisk 'B' 208,700 6,742 3.42Novozymes 'B' 91,500 3,397 1.72
10,139 5.14
France 6.30%Edenred 189,900 4,200 2.14Essilor International 36,200 4,122 2.09L'Oreal 22,700 4,088 2.07
12,410 6.30
Germany 4.99%Bayer 46,700 5,034 2.55Henkel 46,000 4,800 2.44
9,834 4.99
Ireland 2.04%Experian 211,100 4,018 2.04
Italy 2.78%Amplifon 273,300 3,090 1.57Brunello Cucinelli 107,000 2,388 1.21
5,478 2.78
Netherlands 7.43%GrandVision 219,000 5,021 2.55Heineken 51,000 4,070 2.06Royal Dutch Shell 'B' 217,500 5,554 2.82
14,645 7.43
Norway 2.00%Kongsberg Gruppen 272,000 3,945 2.00
Spain 2.05%Amadeus IT 85,000 4,042 2.05
Sweden 6.55%Atlas Copco 'B' 141,500 4,219 2.14Ericsson 'B' 539,500 3,383 1.72Nordea Bank 494,500 5,309 2.69
12,911 6.55

124 Aberdeen Global
European Equity
SecurityNominal/ Quantity
Market Value €’000
Total Net Assets
%Switzerland 21.04%LafargeHolcim 55,000 3,040 1.54Nestle 98,000 7,038 3.56Roche 25,200 6,022 3.06Schindler 21,400 3,876 1.97SGS∞ 2,020 4,031 2.05Swatch 83,000 5,413 2.75Temenos 54,800 4,076 2.07UBS 432,500 6,474 3.28VZ 5,800 1,489 0.76
41,459 21.04
United Kingdom 34.02%Aveva 81,500 1,858 0.94BHP Billiton 244,000 3,520 1.79British American Tobacco 134,600 8,340 4.24Compass 229,000 4,032 2.05Croda International 100,000 4,167 2.11GlaxoSmithKline 205,300 3,983 2.02Inmarsat 377,000 3,749 1.90Pearson 382,500 3,052 1.55Prudential 388,000 7,648 3.89Rolls-Royce 546,200 4,815 2.44Schroders (non voting) 148,807 3,833 1.94Spirax-Sarco Engineering 36,000 2,007 1.02Standard Chartered 581,500 5,187 2.63Unilever 149,000 6,862 3.48Weir 178,000 3,989 2.02
67,042 34.02
Total Equities 190,774 96.80
Total Transferable securities and money market instruments admitted to an official exchange listing or dealt on another regulated market 190,774 96.80
Other transferable securities and money market instruments nilEquities nilSpain nilCemex Espana 305 - -
Total Equities - -
Total Other transferable securities and money market instruments - -
Open Ended Investment Funds 3.69%Aberdeen European Smaller Companies Equity Fund Z-Acc† 390,235 7,266 3.69
Total Open Ended Investment Funds 7,266 3.69
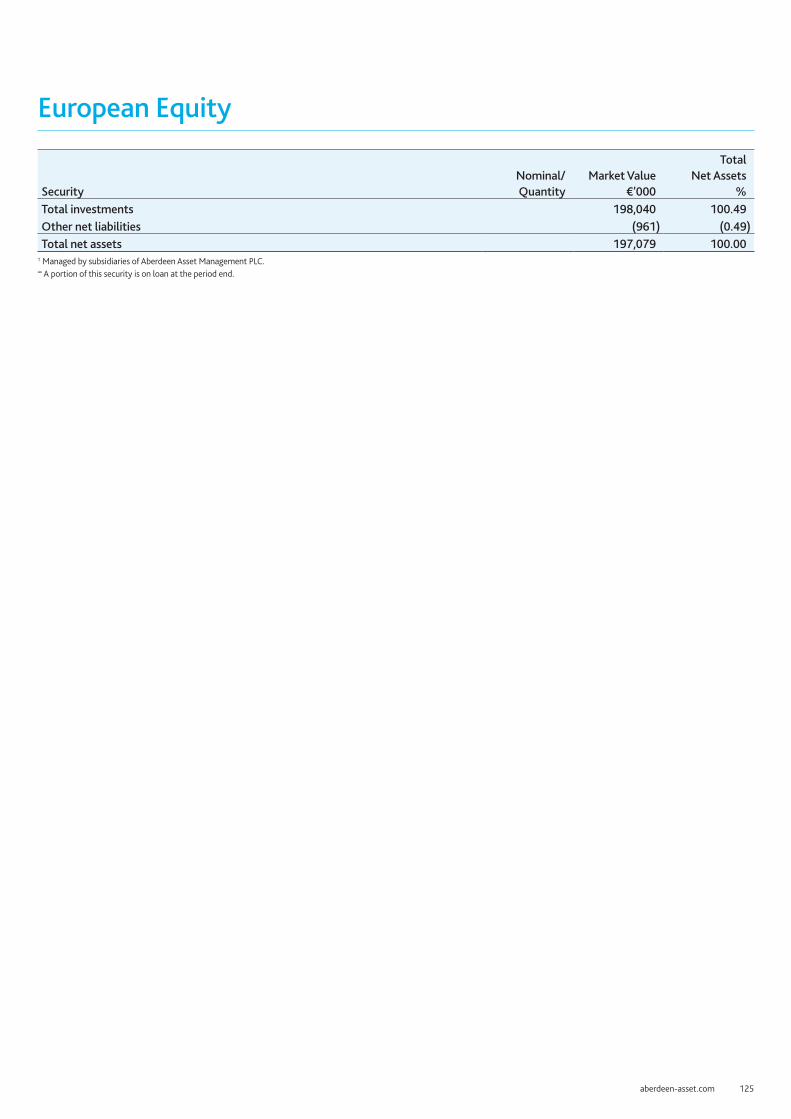
aberdeen-asset.com 125
European Equity
SecurityNominal/ Quantity
Market Value €’000
Total Net Assets
%Total investments 198,040 100.49Other net liabilities (961) (0.49)Total net assets 197,079 100.00
† Managed by subsidiaries of Aberdeen Asset Management PLC.∞ A portion of this security is on loan at the period end.
126 Aberdeen Global
European Equity DividendFor the six months ended 31 March 2017
Performance reviewFor the six months ended 31 March 2017, the value of European Equity Dividend - A Accumulation shares increased by 8.55%, compared to an increase of 12.66% in its benchmark, the MSCI Europe Index.Source: Lipper, Basis: total return, published NAV to NAV, net of annual charges, gross income reinvested, EUR.Please see the Performance History section for details on the use of MSCI information.
Please remember that past performance is not a guide to future returns. The price of shares and the revenue from them may fall as well as rise. Investors may not get back the amount originally invested.
Market reviewEuropean equities rose in the half-year under review, with sentiment buoyed by election results in the Netherlands that were hailed as a rejection of populism, and hopes that US President Donald Trump’s pledge to cut taxes would lift the global economy. Initially, risk appetite had been supported by better-than-expected economic data, rising oil prices on the back of OPEC’s agreement to curb the oil supply. Investors had also cheered the European Central Bank’s unexpected extension of its bond-buying programme till end-2017, albeit with lower monthly asset purchases. Gains were capped somewhat, however, by the US Federal Reserve’s plan to accelerate the pace of interest rate hikes this year after the widely-anticipated quarter-point hike in December, a retreat in the oil price towards the period-end amid rising US shale output, as well as UK Prime Minister Theresa May’s invocation of Article 50 to start divorce negotiations with the European Union.
Portfolio review At the stock level, key detractors included Unibail-Rodamco, which fell alongside its peers in a real estate sector sell-off, with investors spooked by prospects of rising interest rates. Also costing the Fund were Pearson’s shares, which suffered following a profit warning and dividend cut, due largely to weaker-than-expected demand for textbooks in US universities. Last, Engie’s shares were dampened by a lacklustre outlook, falling confidence in management’s ability to implement ambitious restructuring plans and worries over the outcome of the French presidential election.
Conversely, contributors to relative return included Nordea Bank, whose shares rose amid expectations for interest rates increases, as well as progress with cost cutting and strong capital generation, which were well received by investors. Also benefiting the fund was Prudential, which delivered robust growth in its Asian business and is also a beneficiary of rising global interest rates. Finally, Inmarsat did well, adding to Fund performance as it recovered on the back of good full-year results and a positive outlook.
In key portfolio activity, we sold Centrica because of an increasingly challenging external backdrop; and divested Assa Abloy, Engie, Schneider Electric and Syngenta in favour of attractive opportunities elsewhere. Against this, we introduced optical retailer Grandvision at an attractive valuation and given that it remains well-positioned for the longer term; and reinsurer Hannover Re, which offers a more diverse exposure to the Fund and an attractive dividend yield, along with a solid track record of returns. We also initiated holdings in Scandinavian Tobacco because of its valuable portfolio of brands and attractive growth potential, as well as well-diversified testing, inspection and certification company SGS, which has a relatively defensive growth profile and a robust balance sheet.
OutlookThe market outlook remains finely balanced: negotiations to leave the EU can begin in earnest now that Article 50 has been triggered, although the outcome of these discussions will take at least two years to be revealed. Meanwhile, the UK government’s call for a snap election in June adds a further layer of uncertainty, sitting alongside other imponderables, including the upcoming French and German elections, the Trump administration’s haphazard policymaking and heightened geopolitical tension with North Korea, Syria and Russia.
However, we continue to believe that the underlying strength of our holdings will outweigh the broader environment in the long term, hence our focus on identifying companies that possess well-diversified earnings streams, superior business models and robust balance sheets, while trading at attractive valuations.
Pan European Equity Team April 2017

aberdeen-asset.com 127
European Equity Dividend
Statement of Net AssetsAs at 31 March 2017
Notes €’000AssetsInvestments in securities at market value 2.2 69,475 Cash at bank 497 Interest and dividends receivable 398 Subscriptions receivable 36 Other assets 24 Total assets 70,430 LiabilitiesTaxes and expenses payable 105 Redemptions payable 2,978 Unrealised losses on forward currency exchange contracts 2.6 60 Total liabilities 3,143 Net assets at the end of the period 67,287
Statement of Changes in Net Assets For the period from 1 October 2016 to 31 March 2017
Notes €’000Net assets at the beginning of the period 72,266 Net gains from investments 520 Net realised gains 857 Net unrealised gains 4,481 Proceeds from shares issued 1,175 Payments for shares redeemed (11,976) Net equalisation paid 10 (36) Net assets at the end of the period 67,287
Statement of Operations For the period from 1 October 2016 to 31 March 2017
Notes €’000IncomeInvestment income 2.3 1,142 Stocklending income 16 1 Total income 1,143 ExpensesManagement fees 4.2 542 Operating, administrative and servicing fees 4.3 80 Other operational expenses 1 Total expenses 623 Net gains from investments 520
Realised gains on investments 449 Realised gains on forward currency exchange contracts 396 Realised currency exchange gains 12 Net realised gains 857
Increase in unrealised appreciation on investments 4,560 Decrease in unrealised appreciation on forward currency exchange contracts (79) Net unrealised gains 4,481 Net increase in assets as a result of operations 5,858
Share Transactions For the period from 1 October 2016 to 31 March 2017
A-1 A-2 A(CHF)-2^ A(USD)-2^ I-2 S-2Shares outstanding at the beginning of the period 17,705 144,533 28,168 26,602 3,954 137,646 Shares issued during the period 1,802 2,922 6 35 61 768 Shares redeemed during the period (2,686) (21,913) (7,069) (2,353) (1,616) (12,685) Shares outstanding at the end of the period 16,821 125,542 21,105 24,284 2,399 125,729 Net asset value per share 160.6253 205.3418 174.1502 204.9731 2,193.1111 199.6842
X-2Shares outstanding at the beginning of the period 25,671 Shares issued during the period 3,465 Shares redeemed during the period (2,857) Shares outstanding at the end of the period 26,279 Net asset value per share 13.4102
^ Base currency exposure share class.
The accompanying notes form an integral part of these financial statements.

128 Aberdeen Global
European Equity DividendPortfolio StatementAs at 31 March 2017
SecurityNominal/ Quantity
Market Value €’000
Total Net Assets
%Transferable securities and money market instruments admitted to an official exchange listing or dealt on another regulated market 103.25%Equities 103.25%Austria 1.38%Schoeller-Bleckmann Oilfield Equipment 14,200 931 1.38
Denmark 6.50%Novo Nordisk 'B' 62,500 2,019 3.00Novozymes 'B' 34,700 1,288 1.91Scandinavian Tobacco 64,900 1,069 1.59
4,376 6.50
France 8.77%Edenred 81,000 1,791 2.66L'Oreal 4,600 828 1.23TOTAL 28,973 1,373 2.04Unibail-Rodamco (REIT) 8,700 1,907 2.84
5,899 8.77
Germany 3.14%Hannover Re 9,700 1,049 1.56Henkel 10,200 1,064 1.58
2,113 3.14
Ireland 1.68%Experian 59,500 1,132 1.68
Netherlands 5.10%GrandVision 49,500 1,135 1.69Royal Dutch Shell 'B' 90,000 2,298 3.41
3,433 5.10
Norway 1.41%Kongsberg Gruppen 65,500 950 1.41
Sweden 7.90%Atlas Copco 'B' 53,500 1,595 2.37Ericsson 'B' 187,200 1,174 1.74Nordea Bank 237,000 2,545 3.79
5,314 7.90
Switzerland 22.54%LafargeHolcim 13,500 746 1.11Nestle 29,700 2,133 3.17Novartis 20,500 1,424 2.12Roche 9,200 2,199 3.27Schindler 7,700 1,395 2.07SGS 520 1,038 1.54
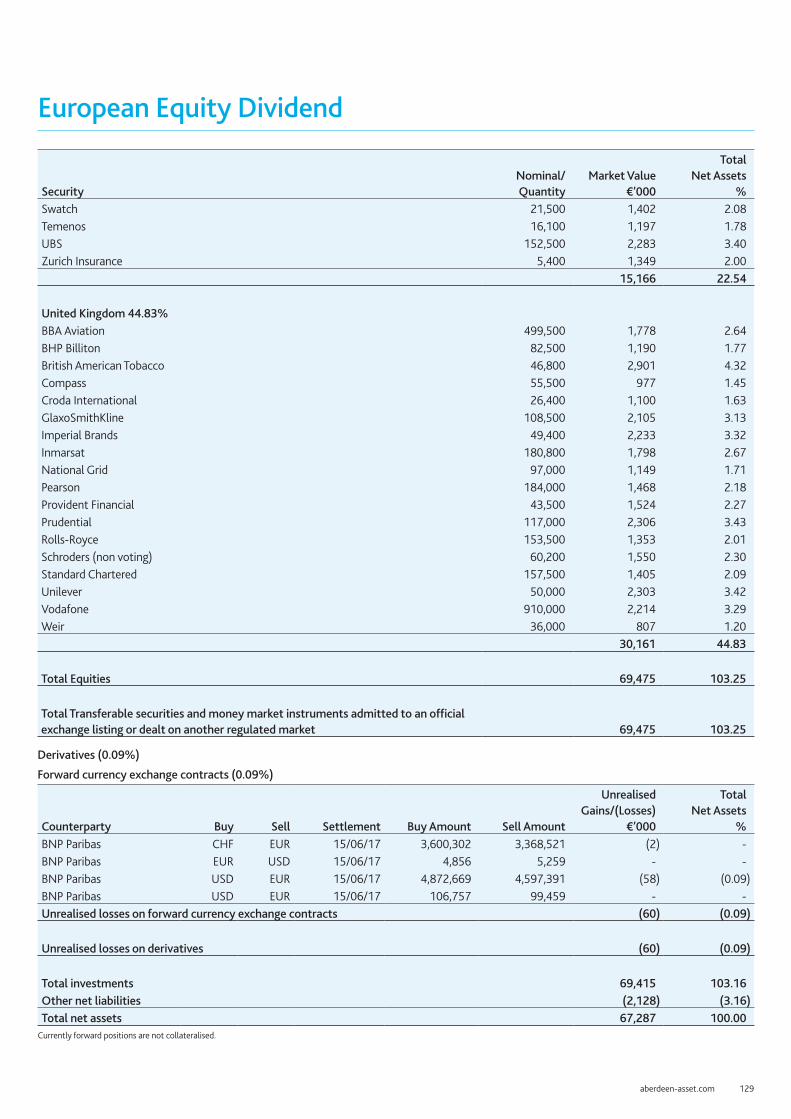
aberdeen-asset.com 129
European Equity Dividend
SecurityNominal/ Quantity
Market Value €’000
Total Net Assets
%Swatch 21,500 1,402 2.08Temenos 16,100 1,197 1.78UBS 152,500 2,283 3.40Zurich Insurance 5,400 1,349 2.00
15,166 22.54
United Kingdom 44.83%BBA Aviation 499,500 1,778 2.64BHP Billiton 82,500 1,190 1.77British American Tobacco 46,800 2,901 4.32Compass 55,500 977 1.45Croda International 26,400 1,100 1.63GlaxoSmithKline 108,500 2,105 3.13Imperial Brands 49,400 2,233 3.32Inmarsat 180,800 1,798 2.67National Grid 97,000 1,149 1.71Pearson 184,000 1,468 2.18Provident Financial 43,500 1,524 2.27Prudential 117,000 2,306 3.43Rolls-Royce 153,500 1,353 2.01Schroders (non voting) 60,200 1,550 2.30Standard Chartered 157,500 1,405 2.09Unilever 50,000 2,303 3.42Vodafone 910,000 2,214 3.29Weir 36,000 807 1.20
30,161 44.83
Total Equities 69,475 103.25
Total Transferable securities and money market instruments admitted to an official exchange listing or dealt on another regulated market 69,475 103.25
Derivatives (0.09%)
Forward currency exchange contracts (0.09%)
Counterparty Buy Sell Settlement Buy Amount Sell Amount
Unrealised Gains/(Losses)
€’000
Total Net Assets
%BNP Paribas CHF EUR 15/06/17 3,600,302 3,368,521 (2) -BNP Paribas EUR USD 15/06/17 4,856 5,259 - -BNP Paribas USD EUR 15/06/17 4,872,669 4,597,391 (58) (0.09)BNP Paribas USD EUR 15/06/17 106,757 99,459 - -Unrealised losses on forward currency exchange contracts (60) (0.09)
Unrealised losses on derivatives (60) (0.09)
Total investments 69,415 103.16Other net liabilities (2,128) (3.16)Total net assets 67,287 100.00
Currently forward positions are not collateralised.

130 Aberdeen Global
European Equity (Ex UK)For the six months ended 31 March 2017
Performance reviewFor six months ended 31 March 2017, the value of European Equity (Ex UK) - A Accumulation shares increased by 8.64%, compared to an increase of 13.91% in its benchmark, the FTSE World Europe ex UK Index.Source: Lipper, Basis: total return, published NAV to NAV, net of annual charges, gross income reinvested, EUR.
Please remember that past performance is not a guide to future returns. The price of shares and the revenue from them may fall as well as rise. Investors may not get back the amount originally invested.
Market reviewEuropean equities rose in the half-year under review, with sentiment buoyed by election results in the Netherlands that were hailed as a rejection of populism, and hopes that US President Donald Trump’s pledge to cut taxes would lift the global economy. Initially, risk appetite had been supported by better-than-expected economic data, rising oil prices on the back of OPEC’s agreement to curb the oil supply. Investors had also cheered the European Central Bank’s unexpected extension of its bond-buying programme till end-2017, albeit with lower monthly asset purchases. Gains were capped somewhat, however, by the US Federal Reserve’s plan to accelerate the pace of interest rate hikes this year after the widely-anticipated quarter-point hike in December, a retreat in the oil price towards the period-end amid rising US shale output, as well as UK Prime Minister Theresa May’s invocation of Article 50 to start divorce negotiations with the European Union.
Portfolio review At the stock level, key detractors included Novo Nordisk, as concerns over pricing pressure continued to weigh on its share price. Also detracting from performance was Koninklijke Vopak, as its shares weakened on the back of softer-than-expected fourth-quarter update, as well as a disappointing forecast for the full-year. Last, lingering weakness in Grandvision’s Italian business and negative earnings revisions dampened its share price, despite fourth-quarter results showing a recovery from weakness in the prior three months.
Conversely, contributors to relative return included Temenos, which did well on the back of upbeat investor sentiment because of potential new contract wins, alongside earnings upgrades, all contributed to Temenos’ good share price performance. Also benefiting the Fund was MTU Aero Engines, as investors responded positively to its solid orders backlog, improvement in the MRO division, as well as positive sales and margin forecasts for the current year. Finally, the lack of exposure to Anheuser-Busch Inbev also proved beneficial as its shares were hampered by weak FY16 numbers that reflected its profitability which was hurt by its Brazilian business, soft pricing and forex headwinds.
In key portfolio activity, we sold Engie in favour of more attractive opportunities elsewhere; Kion because its acquisition of Dematic took it into a new business area and hurt its balance sheet at a time when the demand outlook appears more uncertain; Schneider Electric because of a change in the Fund’s preferred exposure to industrials; and Zurich Insurance, given the continued low interest rate environment. Against this, we introduced Burckhardt Compression and VZ Holdings, given their attractiveness from both quality and valuation perspectives; and world-leading hearing-aid retailer Amplifon, with its market leadership providing it cost advantages over its rivals. It also stands to benefit from significant secular tailwinds as the demand for hearing
aids is set to grow from a low base. We also initiated holdings in optical retailer Grandvision at an attractive valuation and given that it remains well-positioned for the longer term; global brewer Heineken, for its market dominance in many emerging markets and signs of encouraging progress with internal efficiency programmes to aid profitability in slower growth markets, such as Europe; as well as well-diversified testing, inspection and certification company SGS, which has a relatively defensive growth profile and a robust balance sheet.
OutlookThe market outlook remains finely balanced: negotiations to leave the EU can begin in earnest now that Article 50 has been triggered, although the outcome of these discussions will take at least two years to be revealed. Meanwhile, the UK government’s call for a snap election in June adds a further layer of uncertainty, sitting alongside other imponderables, including the upcoming French and German elections, the Trump administration’s haphazard policymaking and heightened geopolitical tension with North Korea, Syria and Russia.
However, we continue to believe that the underlying strength of our holdings will outweigh the broader environment in the long term, hence our focus on identifying companies that possess well-diversified earnings streams, superior business models and robust balance sheets, while trading at attractive valuations.
Pan European Equity Team April 2017

aberdeen-asset.com 131
European Equity (Ex UK)
Statement of Net AssetsAs at 31 March 2017
Notes €’000AssetsInvestments in securities at market value 2.2 117,962 Cash at bank 622 Interest and dividends receivable 198 Subscriptions receivable 4 Other assets 49 Total assets 118,835 LiabilitiesTaxes and expenses payable 132 Redemptions payable 5,246 Total liabilities 5,378 Net assets at the end of the period 113,457
Statement of Changes in Net Assets For the period from 1 October 2016 to 31 March 2017
Notes €’000Net assets at the beginning of the period 110,354 Net gains from investments 164 Net realised gains 2,227 Net unrealised gains 7,232 Proceeds from shares issued 21,700 Payments for shares redeemed (28,196) Net equalisation paid 10 (24) Net assets at the end of the period 113,457
Statement of Operations For the period from 1 October 2016 to 31 March 2017
Notes €’000IncomeInvestment income 2.3 934 Stocklending income 16 19 Total income 953 ExpensesManagement fees 4.2 602 Operating, administrative and servicing fees 4.3 185 Other operational expenses 1 Bank interest 1 Total expenses 789 Net gains from investments 164
Realised gains on investments 2,235 Realised currency exchange losses (8) Net realised gains 2,227
Increase in unrealised appreciation on investments 7,236 Unrealised currency exchange losses (4) Net unrealised gains 7,232 Net increase in assets as a result of operations 9,623
Share Transactions For the period from 1 October 2016 to 31 March 2017
A-2 D(GBP)-2 R(GBP)-2 Z-2Shares outstanding at the beginning of the period 177,685 7,334,447 55,872 2,276,733 Shares issued during the period 314,298 100,787 2,014 1,846,223 Shares redeemed during the period (379,990) (1,430,493) (2,662) (673,549) Shares outstanding at the end of the period 111,993 6,004,741 55,224 3,449,407 Net asset value per share 12.7736 10.9177 15.0827 9.9751
The accompanying notes form an integral part of these financial statements.

132 Aberdeen Global
European Equity (Ex UK)Portfolio StatementAs at 31 March 2017
SecurityNominal/ Quantity
Market Value €’000
Total Net Assets
%Transferable securities and money market instruments admitted to an official exchange listing or dealt on another regulated market 99.77%Equities 99.77%Austria 4.34%Schoeller-Bleckmann Oilfield Equipment 39,900 2,615 2.31Vienna Insurance 101,700 2,304 2.03
4,919 4.34
Denmark 5.81%Novo Nordisk 'B' 141,600 4,575 4.04Novozymes 'B' 54,200 2,012 1.77
6,587 5.81
France 8.55%Dassault Systemes 29,200 2,368 2.09Edenred 117,800 2,605 2.30Essilor International 19,800 2,255 1.99L'Oreal 13,700 2,467 2.17
9,695 8.55
Germany 11.55%Bayer 28,700 3,094 2.73Fuchs Petrolub 50,300 1,988 1.75Henkel 33,400 3,486 3.06Linde 14,300 2,233 1.97MTU Aero Engines 18,900 2,309 2.04
13,110 11.55
Italy 3.58%Amplifon 221,000 2,499 2.20Brunello Cucinelli 70,000 1,562 1.38
4,061 3.58
Netherlands 11.86%Fugro 159,700 2,333 2.06GrandVision 138,200 3,169 2.79Heineken 30,500 2,434 2.15Koninklijke Vopak 49,300 2,013 1.77Royal Dutch Shell 'A' 142,600 3,510 3.09
13,459 11.86
Norway 2.05%Kongsberg Gruppen 160,700 2,331 2.05
Spain 3.29%Amadeus IT 78,600 3,738 3.29

aberdeen-asset.com 133
European Equity (Ex UK)
SecurityNominal/ Quantity
Market Value €’000
Total Net Assets
%Sweden 13.16%Assa Abloy 'B' 124,300 2,396 2.11Atlas Copco 'B' 85,500 2,549 2.25Ericsson 'B' 333,500 2,091 1.84Nordea Bank 269,700 2,895 2.55Svenska Handelsbanken 'A' 201,000 2,590 2.28Swedish Match 78,900 2,412 2.13
14,933 13.16
Switzerland 30.75%Burckhardt Compression 6,400 1,624 1.43Givaudan∞ 900 1,517 1.34LafargeHolcim 43,300 2,393 2.11Nestle 66,800 4,796 4.23Novartis 34,000 2,362 2.08Partners 3,800 1,912 1.69Roche 14,500 3,465 3.05Schindler 12,700 2,300 2.03SGS 1,190 2,375 2.09Swatch 54,400 3,548 3.13Syngenta 2,900 1,194 1.05Temenos 32,000 2,380 2.10UBS 269,700 4,037 3.56VZ 3,800 976 0.86
34,879 30.75
United Kingdom 4.83%Unilever 117,700 5,481 4.83
Total Equities 113,193 99.77
Total Transferable securities and money market instruments admitted to an official exchange listing or dealt on another regulated market 113,193 99.77
Open Ended Investment Funds 4.20%Aberdeen European Smaller Companies Equity Fund Z-Acc† 256,149 4,769 4.20
Total Open Ended Investment Funds 4,769 4.20
Total investments 117,962 103.97Other net liabilities (4,505) (3.97)Total net assets 113,457 100.00
† Managed by subsidiaries of Aberdeen Asset Management PLC.∞ A portion of this security is on loan at the period end.

134 Aberdeen Global
Frontier Markets BondFor the six months ended 31 March 2017
Performance For the six months ended 31 March 2017, the value of Frontier Markets Bond - A Income Shares increased by 3.76% compared to an increase of 1.89% in the benchmark, the JP Morgan Next Generation Markets Index (NEXGEM).Source: Lipper, JP Morgan Basis: total return, published NAV to NAV, net of annual charges, gross income reinvested, USD.
Dealing days fall on every Wednesday of each calendar month which may cause a timing discrepancy between the performance period for the Fund vs benchmark and the peer group.
Please remember that past performance is not a guide to future returns. The price of shares and the revenue from them may fall as well as rise. Investors may not get back the amount originally invested.
Market reviewEmerging markets (EM) debt remained defiant over the period. The asset class overcame a shock victory for Donald Trump in the US elections in November, before brushing aside two interest rate hikes from the US Federal Reserve in December and March, respectively. EM debt has benefitted from the synchronised global recovery with both developed and emerging market economies gaining momentum.
There was a sell-off in the immediate aftermath of Trump’s victory as the Republican’s pre-election rhetoric and campaign promises - namely his pledge to boost domestic infrastructure spending and cut taxes in order to boost growth, while also renegotiating or even tearing up existing trade deals - saw US Treasury (UST) yields increase and the US dollar appreciate. This subsequently led to downward pressure on EM debt as the animal spirits were unleashed. Most recently, however, US markets have been more subdued and, with prospects of the so-called reflation trade having diminished, the risk of rising UST yields and a stronger dollar has also declined, which is supportive for the asset class.
Trump withdrew the US from the Trans-Pacific Partnership in January but even that seems to have done little to dampen sentiment. December was the first of four straight months of sustained positive performance as fading external risks and a stabilisation of commodity prices continued to benefit the asset class. Emerging market fundamentals remain strong, with local markets growing particularly attractive over the period.
The JP Morgan Next Generation Markets index returned 1.89%.
Portfolio review Positioning in Zambia, Mongolia, Ecuador and Gabon USD Eurobonds were positive contributors to the Fund as were local currency positions in the Dominican Republic and Argentina. Hard currency holdings in Kazakhstan, the Ivory Coast and Argentina detracted from the Fund, as did currency exposure in Egypt.
During the period, we participated in new bonds from Suriname, Pakistan, Egypt and Nigeria. We also added a position in Argentine local bonds and reduced our Mongolia exposure after positive performance due to the government discussing a possible program with the International Monetary Fund. We carried out a switch within sub-Saharan Africa, preferring Zambia to Ethiopia, while also increasing exposure to Dominican Republic. We reduced our holding of Ghana hard currency bonds while also increasing our exposure to the Ghanaian local currency market. We increased the Fund’s allocation to
Venezuela via Petroleos de Venezuela, the state-owned oil company. In local currency space, we added a position in Egypt local currency treasury bills after the central bank allowed Egyptian pound to freely float. In corporate space, we bought two new Nigerian issues: Access Bank, a commercial bank, and IHS, a telecommunications company and sold out of Cementos Progreso, a Guatemalan construction company. We added a position in Kernel, a Ukrainian agriculture company.
OutlookThe fact that fears of rising UST yields have diminished has clearly been supportive of the asset class. However, even prior to the recent subsidence of UST yields the asset class has been doing well, partly thanks to the resilience of commodity prices. This does point to one of the principle outstanding risks for the asset class, that is a correction in oil and other key commodities (such as the one we are currently witnessing in iron ore), with the most likely trigger being growth disappointment in China. While our outlook for growth in China this year is a fairly sanguine one, we do acknowledge the risk to the asset class that a slowdown in China would pose.
Political volatility is never too far away in emerging markets as recent events in South Africa and April’s constitutional referendum in Turkey can attest. Given the benign backdrop in which the market appears to be operating at the moment, any drop in asset prices caused by negative news flow is swiftly capped by willing buyers. The primary markets continue to be open to issuers on every spectrum of the credit rating scale as investors struggle to reduce healthy cash balances as a result of the consistent inflows that have returned to the asset class this year. The bearish emerging market scenarios which were espoused after Donald Trump’s election have yet to manifest themselves – encouraging market participants to remain invested.
Emerging Market Debt Team April 2017

aberdeen-asset.com 135
Frontier Markets Bond
Statement of Net AssetsAs at 31 March 2017
Notes US$'000AssetsInvestments in securities at market value 2.2 81,875 Cash at bank 4,720 Interest receivable 1,716 Subscriptions receivable 221 Total assets 88,532 LiabilitiesPayable for investments purchased 1,760 Taxes and expenses payable 102 Redemptions payable 82 Unrealised losses on forward currency exchange contracts 2.6 21 Other liabilities 259 Total liabilities 2,224 Net assets at the end of the period 86,308
Statement of Changes in Net Assets For the period from 1 October 2016 to 31 March 2017
Notes US$'000Net assets at the beginning of the period 77,426 Net gains from investments 2,547 Net realised gains 769 Net unrealised losses (586) Proceeds from shares issued 20,291 Payments for shares redeemed (12,835) Net equalisation received 10 36 Dividends paid 5 (1,340) Net assets at the end of the period 86,308
Statement of Operations For the period from 1 October 2016 to 31 March 2017
Notes US$'000IncomeInvestment income 2.3 3,145 Bank interest 2 Total income 3,147 ExpensesManagement fees 4.2 459 Operating, administrative and servicing fees 4.3 107 Distribution fees 4.1 33 Other operational expenses 1 Total expenses 600 Net gains from investments 2,547
Realised gains on investments 699 Realised gains on forward currency exchange contracts 180 Realised currency exchange losses (110) Net realised gains 769
Increase in unrealised depreciation on investments (441) Decrease in unrealised appreciation on forward currency exchange contracts (138) Unrealised currency exchange losses (7) Net unrealised losses (586) Net increase in assets as a result of operations 2,730
Share Transactions For the period from 1 October 2016 to 31 March 2017
A-1 B-1 I-1 I-2 X-2 X(EUR)-2^
Shares outstanding at the beginning of the period 3,418,590 1,753,717 25,736 1,248,863 1,323,309 117,732 Shares issued during the period 277,204 - 788,056 296,983 94,824 - Shares redeemed during the period (508,201) (110,006) (48) (375,638) (96,484) (111,669) Shares outstanding at the end of the period 3,187,593 1,643,711 813,744 1,170,208 1,321,649 6,063 Net asset value per share 10.1494 5.2952 10.1527 12.8565 12.6538 12.2692
Z-2Shares outstanding at the beginning of the period 22,477 Shares issued during the period 435,978 Shares redeemed during the period (730) Shares outstanding at the end of the period 457,725 Net asset value per share 11.2344
^ Base currency exposure share class.
The accompanying notes form an integral part of these financial statements.

136 Aberdeen Global
Frontier Markets BondPortfolio StatementAs at 31 March 2017
Security Coupon (%) MaturityNominal/Quantity
Market Value US$’000
Total Net Assets
%Transferable securities and money market instruments admitted to an official exchange listing or dealt on another regulated market 90.90%Bonds 90.90%Corporate Bonds 22.11%Angola 0.56%Republic of Angola Via Northern Lights III 7.0000 16/08/19 468,750 485 0.56
Bangladesh 2.92%Banglalink Digital Communications 8.6250 06/05/19 2,400,000 2,523 2.92
Barbados 1.44%Sagicor Finance 2015 8.8750 11/08/22 1,100,000 1,243 1.44
Democratic Republic of the Congo 0.58%HTA 9.1250 08/03/22 504,000 500 0.58
Ecuador 1.27%EP PetroEcuador FRN 24/09/19 1,089,474 1,095 1.27
El Salvador 0.52%Grupo Unicomer 7.8750 01/04/24 426,000 447 0.52
Mongolia 1.58%Trade & Development Bank of Mongolia (EMTN) 9.3750 19/05/20 1,271,000 1,364 1.58
Nigeria 3.80%Access Bank (EMTN) 10.5000 19/10/21 780,000 814 0.94IHS Netherlands 9.5000 27/10/21 340,000 351 0.41Zenith Bank (EMTN) 6.2500 22/04/19 2,100,000 2,116 2.45
3,281 3.80
Sri Lanka 2.50%National Savings Bank 8.8750 18/09/18 2,020,000 2,156 2.50
Ukraine 1.98%Kernel 8.7500 31/01/22 480,000 497 0.58MHP 8.2500 02/04/20 1,200,000 1,214 1.40
1,711 1.98
United Kingdom 1.98%HSBC Bank (EMTN) - 21/09/17 33,550,000 1,707 1.98
United States 2.98%Citigroup Global Markets (EMTN) - 03/07/17 2,400,000 2,572 2.98
Total Corporate Bonds 19,084 22.11
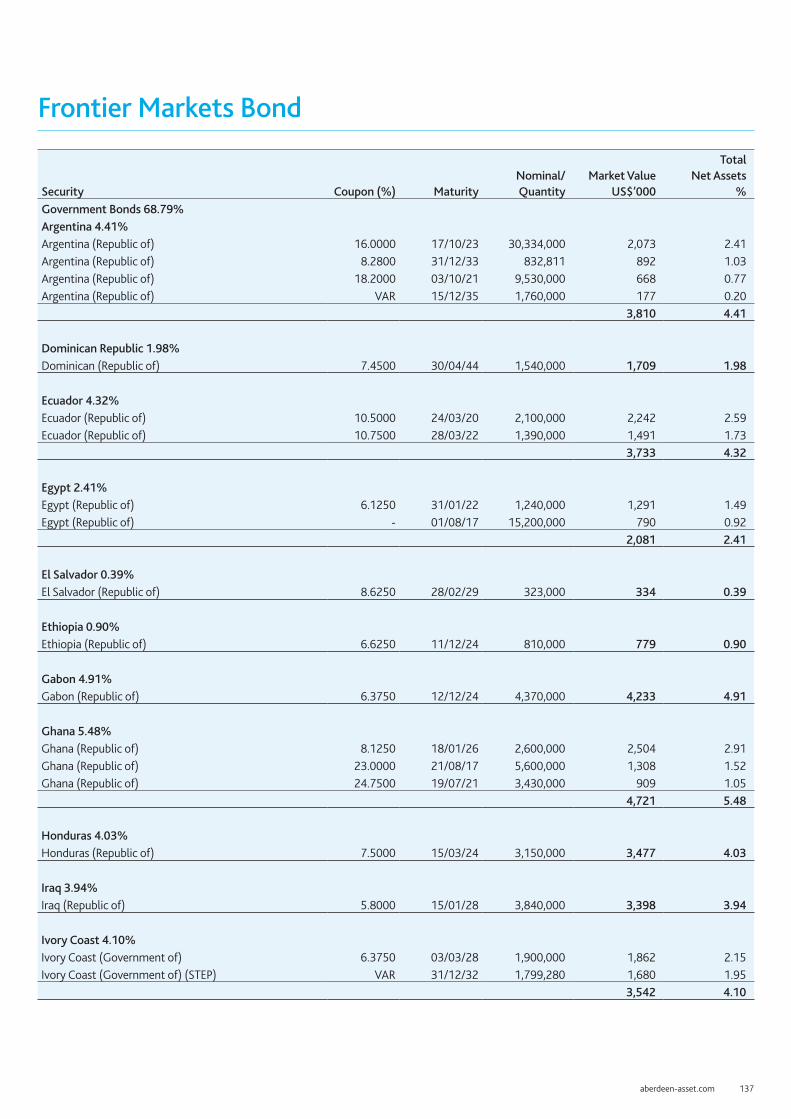
aberdeen-asset.com 137
Frontier Markets Bond
Security Coupon (%) MaturityNominal/Quantity
Market Value US$’000
Total Net Assets
%Government Bonds 68.79%Argentina 4.41%Argentina (Republic of) 16.0000 17/10/23 30,334,000 2,073 2.41Argentina (Republic of) 8.2800 31/12/33 832,811 892 1.03Argentina (Republic of) 18.2000 03/10/21 9,530,000 668 0.77Argentina (Republic of) VAR 15/12/35 1,760,000 177 0.20
3,810 4.41
Dominican Republic 1.98%Dominican (Republic of) 7.4500 30/04/44 1,540,000 1,709 1.98
Ecuador 4.32%Ecuador (Republic of) 10.5000 24/03/20 2,100,000 2,242 2.59Ecuador (Republic of) 10.7500 28/03/22 1,390,000 1,491 1.73
3,733 4.32
Egypt 2.41%Egypt (Republic of) 6.1250 31/01/22 1,240,000 1,291 1.49Egypt (Republic of) - 01/08/17 15,200,000 790 0.92
2,081 2.41
El Salvador 0.39%El Salvador (Republic of) 8.6250 28/02/29 323,000 334 0.39
Ethiopia 0.90%Ethiopia (Republic of) 6.6250 11/12/24 810,000 779 0.90
Gabon 4.91%Gabon (Republic of) 6.3750 12/12/24 4,370,000 4,233 4.91
Ghana 5.48%Ghana (Republic of) 8.1250 18/01/26 2,600,000 2,504 2.91Ghana (Republic of) 23.0000 21/08/17 5,600,000 1,308 1.52Ghana (Republic of) 24.7500 19/07/21 3,430,000 909 1.05
4,721 5.48
Honduras 4.03%Honduras (Republic of) 7.5000 15/03/24 3,150,000 3,477 4.03
Iraq 3.94%Iraq (Republic of) 5.8000 15/01/28 3,840,000 3,398 3.94
Ivory Coast 4.10%Ivory Coast (Government of) 6.3750 03/03/28 1,900,000 1,862 2.15Ivory Coast (Government of) (STEP) VAR 31/12/32 1,799,280 1,680 1.95
3,542 4.10

138 Aberdeen Global
Frontier Markets Bond
Security Coupon (%) MaturityNominal/Quantity
Market Value US$’000
Total Net Assets
%Jamaica 1.41%Jamaica (Government of) 7.6250 09/07/25 1,050,000 1,219 1.41
Kenya 5.31%Kenya (Republic of) 6.8750 24/06/24 2,570,000 2,570 2.98Kenya (Republic of) 11.0000 02/12/24 227,000,000 2,010 2.33
4,580 5.31
Mongolia 2.40%Mongolia (Government of) (EMTN) 10.8750 06/04/21 850,000 982 1.14Mongolia (Government of) (EMTN) 4.1250 05/01/18 870,000 869 1.01Mongolia (Government of) (EMTN) 8.7500 09/03/24 200,000 219 0.25
2,070 2.40
Nigeria 1.00%Nigeria (Federal Republic of) 7.8750 16/02/32 830,000 865 1.00
Pakistan 3.01%Pakistan (Republic of) 8.2500 15/04/24 1,730,000 1,921 2.22Pakistan (Republic of) 5.5000 13/10/21 660,000 679 0.79
2,600 3.01
Rwanda 2.96%Rwanda (Republic of) 6.6250 02/05/23 2,530,000 2,555 2.96
Senegal 2.99%Senegal (Republic of) 6.2500 30/07/24 2,550,000 2,582 2.99
Sri Lanka 2.98%Sri Lanka (Republic of) 8.0000 15/11/18 225,000,000 1,405 1.63Sri Lanka (Republic of) 11.2000 01/09/23 190,000,000 1,168 1.35
2,573 2.98
Suriname 1.09%Suriname (Republic of) 9.2500 26/10/26 940,000 941 1.09
Uganda 1.73%Uganda (Government of) 13.6250 24/09/19 3,135,000,000 833 0.96Uganda (Government of) 20.1250 12/04/17 2,300,000,000 664 0.77
1,497 1.73
Ukraine 0.73%Ukraine (Republic of) VAR 31/05/40 1,728,000 632 0.73
Uruguay 0.99%Uruguay (Republic of) 5.0000 14/09/18 10,800,000 852 0.99

aberdeen-asset.com 139
Frontier Markets Bond
Security Coupon (%) MaturityNominal/Quantity
Market Value US$’000
Total Net Assets
%Venezuela 1.40%Petroleos de Venezuela 6.0000 16/05/24 1,900,000 700 0.81Petroleos de Venezuela 6.0000 15/11/26 1,450,000 511 0.59
1,211 1.40
Zambia 3.92%Zambia (Republic of) 8.9700 30/07/27 3,241,000 3,383 3.92
Total Government Bonds 59,377 68.79
Total Bonds 78,461 90.90
Total Transferable securities and money market instruments admitted to an official exchange listing or dealt on another regulated market 78,461 90.90
Other transferable securities and money market instruments 3.96%Bonds 3.96%Government Bonds 3.96%Dominican Republic 3.96%Dominican (Republic of) 16.0000 10/07/20 75,000,000 1,866 2.17Dominican (Republic of) 11.5000 10/05/24 47,700,000 1,075 1.25Dominican (Republic of) 12.5000 09/02/18 21,600,000 470 0.54
3,411 3.96
Zambia nilZambia (Republic of) 11.0000 27/05/19 30,000 3 -
Total Government Bonds 3,414 3.96
Total Bonds 3,414 3.96
Total Other transferable securities and money market instruments 3,414 3.96
Derivatives (0.02%)
Forward currency exchange contracts (0.02%)
Counterparty Buy Sell Settlement Buy Amount Sell Amount
Unrealised Gains/(Losses)
US$’000
Total Net Assets
%BNP Paribas EUR USD 15/06/17 74,522 78,984 1 -Citigroup USD EUR 13/04/17 919,831 871,000 (13) (0.01)Goldman Sachs EGP USD 24/05/17 13,350,000 740,433 (7) (0.01)HSBC USD EGP 21/09/17 1,602,564 30,000,000 (8) (0.01)Morgan Stanley EUR USD 13/04/17 1,023,000 1,089,095 6 0.01Unrealised losses on forward currency exchange contracts (21) (0.02)
Unrealised losses on derivatives (21) (0.02)
Total investments 81,854 94.84Other net assets 4,454 5.16Total net assets 86,308 100.00
Currently forward positions are not collateralised.

140 Aberdeen Global
Frontier Markets EquityFor the six months ended 31 March 2017
Performance For the six months ended 31 March 2017, the value of Frontier Markets Equity – I Accumulation shares increased by 1.94% compared to an increase of 9.64% in the benchmark, the MSCI Frontier Markets Index.Source: Lipper, Basis: total return, published NAV to NAV, net of annual charges, gross income reinvested, USD.Please see the Performance History section for details on the use of MSCI information.
Dealing days fall on the Business Day which falls on the 15th (or next business day if this is a weekend) and last business day of each calendar month. This may cause a timing discrepancy between the performance period for the Fund vs the benchmark and the peer group.
Please remember that past performance is not a guide to future returns. The price of shares and the revenue from them may fall as well as rise. Investors may not get back the amount originally invested.
Market reviewThe broader Frontier Markets index ended higher in the six months under review, largely due to the uplifting effects of the oil price rally on commodity exporters. At first, investors were circumspect ahead of the US presidential election and markets dropped sharply in the immediate aftermath of Donald Trump’s unexpected victory, with his protectionist tendencies one of the more pressing concerns. Nonetheless, frontier equities were relatively quick to recover, shrugging off the US Federal Reserve’s (Fed) two well-signalled interest rate hikes, as a deal between major oil-producers to cut production sparked a commodity rally. Investor sentiment remained steady as the Fed’s measured projections for future hikes and the fluctuating dollar ensured higher-yielding assets remained in favour.
Across markets, oil exporting nations such as Kuwait, Bahrain and Kazakhstan comfortably outperformed their peers, while Argentine equities also climbed sharply following the government’s successful bids to secure financing from international markets. Conversely, Sri Lanka’s markets wobbled after the central bank hiked interest rates to 8.75% to tame inflationary pressures. Kenyan equities also came under pressure on concerns about the drought’s impact on food inflation, as well as the government cap on bank loan charges, which slowed lending.
Portfolio reviewThe Fund’s lack of exposure to benchmark heavyweight Kuwait weighed heavily on relative performance as its market surged in tandem with the commodity rally. Our underweight to Argentina also detracted as investors continued to reward the government’s reform initiatives, with Moody’s upgrading the country’s outlook from negative to stable, despite the sluggish economy. Non-holding Pampa Energia was particularly strong on news of dramatic electricity price hikes for the first time in several years.
Meanwhile, the overweights to both Kenya and Sri Lanka proved costly. Kenya faced heightened political risk ahead of upcoming presidential elections, while the interest-rate cap on loans, as well as drought conditions, threatened economic growth. Our holding Safaricom, the dominant mobile operator, sold-off as a result, although the business continues to deliver operationally. In Sri Lanka, political paralysis continued to keep investors at bay, with conglomerate John Keells failing to gain traction despite announcing robust results with earnings up 18% compared to a year ago.
Conversely, stock selection proved supportive, particularly in Pakistan where holdings Shell, Linde, Jubilee Life and Habib Bank were all buoyed by the positive growth outlook, as well as the potential for a buyout in Linde’s case. Elsewhere, Thailand-based Mega Lifesciences rose on expectations of continued robust sales growth for its branded nutritional and pharmaceutical products across several Asian frontier markets.
During the period, we initiated Vietnamese electronics retailer Mobile World, which has decent exposure to domestic consumption in an underpenetrated market, as well as attractively-valued Pakistani cement company Maple Leaf, for its considerable growth potential. We also introduced: Kenya-based Equity Bank, the local market leader in small to medium business banking; Square Pharmaceuticals, Bangladesh’s largest generic drug maker; Globant, an Argentinian digital software developer with a good global reputation; Sri Lanka-based Hemas, a family-controlled conglomerate and domestic market leader in hair oils, baby care and branded drug distribution; and Olympic Industries, which owns Bangladesh’s best-selling biscuit brand. Against this, we sold DFCC Bank to fund better opportunities elsewhere and PZ Cussons due to a deteriorating outlook.
OutlookGlobally, investors continue to be preoccupied by developments in the West, the US in particular. Certainly, any suggestion of tighter monetary policy from the Fed, or restrictions on trade, seems to provoke a flurry of capital outflows from higher-risk assets in the developing world. However, the constituents of frontier market indices are a discrete bunch, with starkly different economic drivers and political backdrops. So, what matters to one could be irrelevant to another and this makes for uncorrelated performance; something that is unlikely to change.
Overall, we are encouraged by reform efforts across the asset class, particularly in terms of currency liberalisation. Despite the inevitable short-term pain, we believe this is necessary to fully unleash economic potential, which we are beginning to see in Egypt, for example. Nigeria’s beleaguered economy would also have much to gain if only the authorities would step aside completely and allow the naira to freely find its equilibrium. Meanwhile, we continue to see tremendous long-term potential among individual frontier markets. Many have large and youthful populations, as well as significant natural resources. Furthermore, they are home to a variety of well-run companies trading at attractive valuations.
Global Emerging Markets Equity Team April 2017

aberdeen-asset.com 141
Frontier Markets Equity
Statement of Net AssetsAs at 31 March 2017
Notes US$'000AssetsInvestments in securities at market value 2.2 194,805 Cash at bank 3,215 Interest and dividends receivable 1,098 Receivable for investments sold 831 Other assets 65 Total assets 200,014 LiabilitiesTaxes and expenses payable 166 Redemptions payable 931 Other liabilities 1,878 Total liabilities 2,975 Net assets at the end of the period 197,039
Statement of Changes in Net Assets For the period from 1 October 2016 to 31 March 2017
Notes US$'000Net assets at the beginning of the period 234,907 Net gains from investments 913 Net realised losses (2,103) Net unrealised gains 2,948 Proceeds from shares issued 55,695 Payments for shares redeemed (96,154) Net equalisation received 10 66 Redemption charge 14 767 Net assets at the end of the period 197,039
Statement of Operations For the period from 1 October 2016 to 31 March 2017
Notes US$'000IncomeInvestment income 2.3 2,319 Bank interest 1 Stocklending income 16 63 Total income 2,383 ExpensesManagement fees 4.2 1,074 Operating, administrative and servicing fees 4.3 393 Other operational expenses 3 Total expenses 1,470 Net gains from investments 913
Realised losses on investments (1,922) Realised currency exchange losses (181) Net realised losses (2,103)
Decrease in unrealised depreciation on investments 2,935 Unrealised currency exchange gains 13 Net unrealised gains 2,948 Net increase in assets as a result of operations 1,758
Share Transactions For the period from 1 October 2016 to 31 March 2017
A-1 I-2 Z-2Shares outstanding at the beginning of the period 336,539 15,238,480 4,124,242 Shares issued during the period 1,172 - 4,440,647 Shares redeemed during the period - (8,618,634) - Shares outstanding at the end of the period 337,711 6,619,846 8,564,889 Net asset value per share 12.3278 11.8555 13.3562
The accompanying notes form an integral part of these financial statements.

142 Aberdeen Global
Frontier Markets EquityPortfolio StatementAs at 31 March 2017
SecurityNominal/ Quantity
Market Value US$’000
Total Net Assets
%Transferable securities and money market instruments admitted to an official exchange listing or dealt on another regulated market 97.69%Equities 97.69%Argentina 0.76%Tenaris (ADR) 44,100 1,506 0.76
Bangladesh 6.45%British American Tobacco Bangladesh 142,000 4,301 2.18Grameenphone 1,145,228 4,742 2.42Olympic Industries 250,000 896 0.45Square Pharmaceuticals 798,513 2,766 1.40
12,705 6.45
Egypt 4.87%Commercial International Bank Egypt 1,012,625 4,235 2.15Edita Food Industries (GDR) 336,314 2,351 1.19Juhayna Food Industries 6,720,221 3,016 1.53
9,602 4.87
Georgia 2.96%Bank of Georgia 144,801 5,834 2.96
Ghana 2.02%Fan Milk 1,524,638 3,983 2.02
Jordan 2.54%Hikma Pharmaceuticals∞ 201,974 5,003 2.54
Kenya 11.98%Bamburi Cement 1,638,700 2,626 1.33British American Tobacco Kenya 323,973 2,672 1.36East African Breweries 1,833,700 4,043 2.05Equity 7,532,400 2,414 1.23Safaricom 50,485,000 8,828 4.48Wpp Scangroup 16,527,200 3,010 1.53
23,593 11.98
Lebanon 1.36%BLOM Bank (GDR) 211,511 2,686 1.36
Morocco 1.55%Maroc Telecom 224,278 3,057 1.55
Nigeria 7.15%Guaranty Trust Bank 48,352,511 3,933 2.00Guinness Nigeria 6,707,901 1,326 0.67Nestle Nigeria 1,142,752 2,834 1.44

aberdeen-asset.com 143
Frontier Markets Equity
SecurityNominal/ Quantity
Market Value US$’000
Total Net Assets
%Nigerian Breweries 5,332,333 2,235 1.13Zenith Bank 82,334,099 3,764 1.91
14,092 7.15
Oman 0.85%Bank Muscat 1,688,990 1,680 0.85
Pakistan 12.23%Engro Foods 450,000 697 0.35Habib Bank 2,982,400 7,639 3.89Jubilee Life Insurance 405,515 2,659 1.35Linde Pakistan 684,643 1,911 0.97Maple Leaf Cement Factory 2,553,000 3,024 1.53Packages 389,000 3,222 1.64Shell Pakistan 793,000 4,935 2.50
24,087 12.23
Panama 2.44%Copa 'A' 42,800 4,806 2.44
Romania 3.40%BRD-Groupe Societe Generale 2,327,781 6,694 3.40
Singapore 2.27%Yoma Strategic∞ 9,785,812 4,465 2.27
Slovenia 1.38%Krka 49,245 2,728 1.38
South Africa 2.76%MTN 598,526 5,447 2.76
Sri Lanka 8.41%Aitken Spence 3,013,214 1,140 0.58Chevron Lubricants Lanka 2,304,390 2,590 1.31Commercial Bank of Ceylon 3,095,526 2,665 1.35Hemas 2,728,000 1,954 0.99John Keells 9,064,213 8,222 4.18
16,571 8.41
Tanzania 1.44%Tanzania Breweries 523,000 2,844 1.44
Thailand 1.91%Mega LifeSciences (Alien) 4,849,000 3,757 1.91
Turkey 2.90%Coca-Cola Icecek 584,451 5,718 2.90

144 Aberdeen Global
Frontier Markets Equity
SecurityNominal/ Quantity
Market Value US$’000
Total Net Assets
%United States 6.12%EPAM Systems 85,800 6,479 3.29Globant 66,886 2,434 1.24Pricesmart 34,100 3,141 1.59
12,054 6.12
Vietnam 9.94%FPT 1,670,000 3,477 1.77Mobile World Investment 400,000 2,961 1.50Vietnam Dairy Products 2,083,726 13,127 6.67
19,565 9.94
Total Equities 192,477 97.69
Total Transferable securities and money market instruments admitted to an official exchange listing or dealt on another regulated market 192,477 97.69
Other transferable securities and money market instruments 1.18%Equities 1.18%Oman 1.18%Shell Oman Marketing 461,314 2,328 1.18
Total Equities 2,328 1.18
Total Other transferable securities and money market instruments 2,328 1.18
Total investments 194,805 98.87Other net assets 2,234 1.13Total net assets 197,039 100.00
∞ A portion of this security is on loan at the period end.

aberdeen-asset.com 145
German EquityFor the six months ended 31 March 2017
Performance For the six months ended 31 March 2017, the value of German Equity - A Accumulation shares increased by 5.14% compared to an increase of 16.19% in the benchmark, the HDAX TR Index.Source: Lipper, Basis: total return, published NAV to NAV, net of annual charges, gross income reinvested, EUR.
Please remember that past performance is not a guide to future returns. The price of shares and the revenue from them may fall as well as rise. Investors may not get back the amount originally invested.
Market reviewGerman equities rose in the six months under review, with sentiment buoyed by election results in the Netherlands that were hailed as a rejection of populism, and hopes that US President Donald Trump’s pledge to cut taxes would lift the global economy. Initially, risk appetite had been supported by better-than-expected economic data, rising oil prices on the back of OPEC’s agreement to curb the oil supply. Investors had also cheered the European Central Bank’s unexpected extension of its bond-buying programme till end-2017, albeit with lower monthly asset purchases. Gains were capped somewhat, however, by the US Federal Reserve’s plan to accelerate the pace of interest rate hikes this year after the widely-anticipated quarter-point hike in December, a retreat in the oil price towards the period-end amid rising US shale output, as well as UK Prime Minister Theresa May’s invocation of Article 50 to start divorce negotiations with the European Union.
In economic news, domestic manufacturing growth led private sector activity in the Eurozone, which rose to a six-year high in March. This in turn, lifted German business sentiment which approached its highest in almost six years, even as unemployment fell to a new low. Meanwhile, the construction sector mounted a broad-based rebound in February after being hampered by cold weather earlier on. Inflation is estimated to have accelerated by a more-than-expected 2.2% in February, led by energy and food price increases.
Portfolio reviewAt the stock level, key detractors included Aurelius, whose shares were dampened by a research report from short-selling outfit Gotham City, which dented investor confidence. Also costing the Fund was the lack of exposure to Allianz, which saw its shares buoyed by rising bond yields and expectation for further interest rate hikes in the developed world. Last, GEA’s shares were hurt by its latest results that showed continued weakness in demand from its dairy customers, with both a decline in new orders and cancellations of existing ones.
Conversely, contributors to relative return included MTU Aero Engines, as investors responded positively to its solid orders backlog, improvement in the MRO division, as well as positive sales and margin forecasts for the current year. Not holding global retailer Steinhoff International contributed to performance: in the wake of a strong run, its shares were dampened by concerns over the price it paid for recent acquisitions. Similarly, a lack of exposure to Fresenius contributed to performance as its shares, which had benefited from a strong run previously, failed to keep pace with a fast-rising market over the quarter.
In key portfolio activity, we introduced world-leading gas springs maker and supplier for the automotive and industrial sectors, Stabilus, based on its attractive niches and underpinned by supportive long-term market dynamics. We also initiated a position in reinsurer Hannover Rueck, which diversifies exposure in the Fund and offers an attractive dividend yield, along with a solid track record of returns.
Outlook The market outlook remains finely balanced: UK negotiations to leave the EU can begin in earnest now that Article 50 has been triggered, although the outcome of these discussions will take at least two years to be revealed. Meanwhile, the UK government’s call for a snap election in June adds a further layer of uncertainty, sitting alongside other imponderables, including the upcoming French and German elections, the Trump administration’s haphazard policymaking and heightened geopolitical tension with North Korea, Syria and Russia.
However, we continue to believe that the underlying strength of our holdings will outweigh the broader environment in the long term, hence our focus on identifying companies that possess well-diversified earnings streams, superior business models and robust balance sheets, while trading at attractive valuations.
Pan European Equity Team April 2017

146 Aberdeen Global
German Equity
Statement of Net AssetsAs at 31 March 2017
Notes €’000AssetsInvestments in securities at market value 2.2 1,801 Cash at bank 13 Interest and dividends receivable 1 Other assets 2 Total assets 1,817 LiabilitiesTaxes and expenses payable 1 Total liabilities 1 Net assets at the end of the period 1,816
Statement of Changes in Net Assets For the period from 1 October 2016 to 31 March 2017
Notes €’000Net assets at the beginning of the period 1,732 Net losses from investments (6) Net realised gains 26 Net unrealised gains 64 Net assets at the end of the period 1,816
Statement of Operations For the period from 1 October 2016 to 31 March 2017
Notes €’000ExpensesManagement fees 4.2 3 Operating, administrative and servicing fees 4.3 3 Total expenses 6 Net losses from investments (6)
Realised gains on investments 26 Net realised gains 26
Increase in unrealised appreciation on investments 64 Net unrealised gains 64 Net increase in assets as a result of operations 84
Share Transactions For the period from 1 October 2016 to 31 March 2017
A-1 A-2 I-2 Z-2Shares outstanding at the beginning of the period 710 710 65,000 63,857 Shares issued during the period - - - - Shares redeemed during the period - - - - Shares outstanding at the end of the period 710 710 65,000 63,857 Net asset value per share 11.0783 11.1018 13.8508 14.0863
The accompanying notes form an integral part of these financial statements.

aberdeen-asset.com 147
German EquityPortfolio StatementAs at 31 March 2017
SecurityNominal/ Quantity
Market Value €’000
Total Net Assets
%Transferable securities and money market instruments admitted to an official exchange listing or dealt on another regulated market 99.18%Equities 99.18%Consumer Discretionary 11.95%BMW 215 18 1.00BMW (PREF) 255 19 1.05CTS Eventim 1,547 55 3.03Daimler 513 36 1.97Fielmann 673 49 2.70TAKKT 1,820 40 2.20
217 11.95
Consumer Staples 8.92%Beiersdorf 400 35 1.93Henkel 870 91 5.01KWS Saat 125 36 1.98
162 8.92
Financials 6.88%Aurelius 865 35 1.93Grenkeleasing 328 53 2.92Hannover Re 338 37 2.03
125 6.88
Health Care 18.17%Bayer 1,045 113 6.22CompuGroup Medical 1,275 53 2.92Fresenius Medical Care 681 54 2.97Gerresheimer 670 50 2.75Sartorius (PREF) 728 60 3.31
330 18.17
Industrials 22.14%Bertrandt 540 49 2.71Brenntag 1,060 56 3.07GEA 1,070 43 2.36KION 900 55 3.03MTU Aero Engines 605 75 4.13Rational 58 25 1.39Siemens 480 62 3.40Stabilus 616 37 2.05
402 22.14
Information Technology 13.67%CANCOM 733 39 2.14GFT Technologies 1,977 35 1.94Nemetschek 825 46 2.54

148 Aberdeen Global
German Equity
SecurityNominal/ Quantity
Market Value €’000
Total Net Assets
%SAP 820 76 4.18XING 271 52 2.87
248 13.67
Materials 11.45%BASF 580 54 2.97Fuchs Petrolub 1,410 55 3.03Linde 322 50 2.76Symrise 780 49 2.69
208 11.45
Real Estate 6.00%Deutsche Wohnen 2,000 61 3.36LEG Immobilien 620 48 2.64
109 6.00
Total Equities 1,801 99.18
Total Transferable securities and money market instruments admitted to an official exchange listing or dealt on another regulated market 1,801 99.18
Total investments 1,801 99.18Other net assets 15 0.82Total net assets 1,816 100.00

aberdeen-asset.com 149
Indian Bond For the six months ended 31 March 2017
Performance For the six months ended 31 March 2017, the value of the Indian Bond – A Accumulation shares increased by 3.69% compared to an increase of 5.27% in the benchmark, Markit iBoxx Asia India Index.Source: Lipper, Basis: total return, published NAV to NAV, net of annual charges, gross income reinvested, USD.
Please remember that past performance is not a guide to future returns. The price of shares and the revenue from them may fall as well as rise. Investors may not get back the amount originally invested.
Market reviewIndian bonds bucked the regional downtrend to end mostly firmer in the first quarter. The government’s unexpected decision to replace large rupee denominations resulted in a flood of bank deposits that were channelled into government bonds, fuelling the market rally. The ruling Bharatiya Janata Party’s subsequent victory in several state elections consolidated Prime Minister Narendra Modi’s mandate, reigniting hopes that his reforms would accelerate. This masked disappointment over the central bank’s move from an easing bias to a neutral policy stance. The new budget had little impact on sentiment but investors drew comfort from efforts to balance fiscal prudence with support for key sectors like agriculture and infrastructure.
The government bond yield curve ended mixed, with short-dated yields outperforming the long end. The 2-year bond yield fell by around 25 basis points (bps), the 10-year yield retreated by 14 bps, while longer-dated yields trended higher. Corporate bond spreads also outperformed in the shorter tenures, where primary issues saw good demand. Three months on, most companies appeared to have put the demonetisation behind them and are now bracing for the July rollout of the goods-and-services tax, which will unify disparate duties into one single tax. This should provide a fillip to sectors such as logistics, warehousing and transportation. Meanwhile, the rupee also proved the exception among regional currencies, rallying nearly 3% against the US dollar amid robust inflows.
Portfolio review Early in the review period, the outperformance of government bonds at the longer end of the curve prompted us to reduce our exposure and rotate into quasi-sovereign and corporate bonds. This lowered the Fund’s government bond exposure to 50%, which we maintained for the remainder of the review period. Subsequently, the exposure to quasi-sovereign bonds was reduced, while corporate debt exposure rose via increased allocation to issuers such as Housing Development Finance Corp, Axis Bank, ICICI, Reliance and the financing entities of Indiabulls. The duration of the Fund increased to about 6.8 years.
OutlookThe resounding vote of confidence for Prime Minister Modi after the recent state elections places him in a good position to continue rolling out reforms that we hope will become institutionalised. Increased agriculture and infrastructure spending proposed in the budget should also give bond investors more options. The local market’s recent strength may have pushed up valuations so we would not be surprised if there was a correction. There may also be some short-term disruption when GST is implemented but most corporates are optimistic that it will help smoothen their operations and cut costs in the long term. We remain sanguine about the market’s potential. It is relatively insulated from global risks. Yields remain among the most attractive in emerging bond markets, and while the Indian central bank has moved to a neutral policy stance, it is too early to call an end to monetary easing. We will seek to add to favoured positions when opportunities arise.
Asian Fixed Income Team April 2017

150 Aberdeen Global
Indian Bond
Statement of Net AssetsAs at 31 March 2017
Notes US$'000AssetsInvestments in securities at market value 2.2 144,757 Cash at bank 3,373 Interest receivable 4,218 Subscriptions receivable 546 Unrealised gains on forward currency exchange contracts 2.6 555 Total assets 153,449 LiabilitiesTaxes and expenses payable 56 Redemptions payable 88 Other liabilities 168 Total liabilities 312 Net assets at the end of the period 153,137
Statement of Changes in Net Assets For the period from 1 October 2016 to 31 March 2017
Notes US$'000Net assets at the beginning of the period 79,859 Net gains from investments 3,233 Net realised gains 128 Net unrealised gains 2,473 Proceeds from shares issued 78,591 Payments for shares redeemed (10,978) Net equalisation received 10 156 Dividends paid 5 (325) Net assets at the end of the period 153,137
Statement of Operations For the period from 1 October 2016 to 31 March 2017
Notes US$'000IncomeInvestment income 2.3 3,453 Bank interest 1 Total income 3,454 ExpensesManagement fees 4.2 67 Operating, administrative and servicing fees 4.3 153 Other operational expenses 1 Total expenses 221 Net gains from investments 3,233
Realised gains on investments 340 Realised losses on forward currency exchange contracts (54) Realised currency exchange losses (158) Net realised gains 128
Increase in unrealised appreciation on investments 1,889 Decrease in unrealised depreciation on forward currency exchange contracts 584 Net unrealised gains 2,473 Net increase in assets as a result of operations 5,834
Share Transactions For the period from 1 October 2016 to 31 March 2017
A-1 A-2 E(EUR)-1 E(EUR)-2 I-1 I-2Shares outstanding at the beginning of the period 57,916 61,514 70,489 710 429,537 448,957 Shares issued during the period 101,779 117,733 79,891 4,245 62,855 2,030,228 Shares redeemed during the period (800) (3) - - (429,717) (199,213) Shares outstanding at the end of the period 158,895 179,244 150,380 4,955 62,675 2,279,972 Net asset value per share 10.4660 11.4327 11.0291 12.0469 10.4668 11.5299
I(EUR)-2^ X-2 Z-1 Z-2Shares outstanding at the beginning of the period - 25,889 - 6,106,316 Shares issued during the period 582,697 825,734 2,529,187 1,082,393 Shares redeemed during the period - - (650) (389,947) Shares outstanding at the end of the period 582,697 851,623 2,528,537 6,798,762 Net asset value per share 10.3526 11.5221 10.0346 11.6206
^ Base currency exposure share class.
The accompanying notes form an integral part of these financial statements.

aberdeen-asset.com 151
Indian Bond Portfolio StatementAs at 31 March 2017
Security Coupon (%) MaturityNominal/Quantity
Market Value US$’000
Total Net Assets
%Transferable securities and money market instruments admitted to an official exchange listing or dealt on another regulated market 94.53%Bonds 94.53%Corporate Bonds 42.70%India 42.70%Axis Bank 7.6000 20/10/23 250,000,000 3,824 2.50Axis Bank 8.8500 05/12/24 200,000,000 3,258 2.13GAIL India 8.3000 23/02/22 50,000,000 804 0.52HDFC Bank 7.9500 21/09/26 400,000,000 6,233 4.07Housing Development Finance 8.4300 04/03/25 200,000,000 3,149 2.06Housing Development Finance 7.9000 24/08/26 200,000,000 3,061 2.00ICICI Bank 7.6000 07/10/23 250,000,000 3,837 2.51ICICI Bank 9.2500 04/09/24 200,000,000 3,374 2.20Indiabulls Housing Finance 8.9000 26/09/21 300,000,000 4,652 3.04Indian Railway Finance 8.7900 04/05/30 100,000,000 1,704 1.11National Bank for Agriculture and Rural Development 7.2000 21/10/31 100,000,000 1,541 1.01NHPC 8.2400 27/06/31 150,000,000 2,436 1.59NHPC 8.5400 26/11/23 50,000,000 811 0.53NTPC 8.1000 27/05/31 150,000,000 2,391 1.56NTPC 9.1700 22/09/24 100,000,000 1,676 1.09Power Finance 8.3900 19/04/25 200,000,000 3,190 2.08Power Finance 7.6300 14/08/26 200,000,000 3,092 2.02Power Grid of India 9.3000 04/09/29 250,000,000 4,353 2.84Reliance Jio Infocomm 8.9500 04/10/20 400,000,000 6,431 4.20Rural Electrification 8.2700 06/02/25 350,000,000 5,575 3.64
65,392 42.70
Total Corporate Bonds 65,392 42.70
Government Bonds 51.83%India 51.83%Export-Import Bank of India 8.1100 11/07/31 150,000,000 2,383 1.56Export-Import Bank of India 8.1500 21/01/30 50,000,000 798 0.52Export-Import Bank of India 8.2500 23/06/31 100,000,000 1,585 1.04India (Government of) 8.4000 28/07/24 645,260,000 10,712 6.99India (Government of) 7.8800 19/03/30 640,000,000 10,297 6.72India (Government of) 7.7300 19/12/34 560,000,000 8,903 5.81India (Government of) 8.6000 02/06/28 450,000,000 7,586 4.95India (Government of) 7.3500 22/06/24 450,000,000 7,053 4.61India (Government of) 8.3300 07/06/36 400,000,000 6,718 4.39India (Government of) 8.3000 02/07/40 380,000,000 6,367 4.16India (Government of) 8.1700 01/12/44 380,000,000 6,278 4.10India (Government of) 8.2400 10/11/33 340,000,000 5,636 3.68India (Government of) 8.1300 22/06/45 200,750,000 3,320 2.17India (Government of) 8.2700 09/06/20 107,100,000 1,729 1.13
79,365 51.83

152 Aberdeen Global
Indian Bond
Security Coupon (%) MaturityNominal/Quantity
Market Value US$’000
Total Net Assets
%Total Government Bonds 79,365 51.83
Total Bonds 144,757 94.53
Total Transferable securities and money market instruments admitted to an official exchange listing or dealt on another regulated market 144,757 94.53
Derivatives 0.36%
Forward currency exchange contracts 0.36%
Counterparty Buy Sell Settlement Buy Amount Sell Amount
Unrealised Gains/(Losses)
US$’000
Total Net Assets
%BNP Paribas EUR USD 15/06/17 5,000,000 5,303,530 64 0.04BNP Paribas EUR USD 15/06/17 600,000 635,926 8 0.01BNP Paribas EUR USD 15/06/17 200,000 213,537 1 -BNP Paribas EUR USD 15/06/17 116,798 126,891 (2) -BNP Paribas INR USD 28/04/17 503,262,000 7,300,000 448 0.28BNP Paribas INR USD 28/04/17 93,919,000 1,400,000 46 0.03BNP Paribas INR USD 28/04/17 34,530,000 500,000 32 0.02BNP Paribas USD INR 28/04/17 4,600,000 312,731,000 (214) (0.14)BNP Paribas USD INR 28/04/17 2,900,000 195,228,000 (106) (0.07)Credit Suisse INR USD 28/04/17 1,207,620,000 18,000,000 591 0.38Credit Suisse INR USD 28/04/17 121,410,000 1,800,000 69 0.05Credit Suisse INR USD 28/04/17 33,617,500 500,000 18 0.01Credit Suisse USD INR 28/04/17 4,700,000 308,226,000 (45) (0.03)Credit Suisse USD INR 28/04/17 1,300,000 87,613,500 (49) (0.03)Merrill Lynch INR USD 28/04/17 61,959,870 900,000 54 0.04Royal Bank of Canada INR USD 28/04/17 46,235,000 700,000 12 0.01Royal Bank of Canada USD INR 28/04/17 2,900,000 192,821,000 (68) (0.04)Standard Chartered INR USD 28/04/17 485,810,000 7,400,000 79 0.05Standard Chartered INR USD 28/04/17 150,634,000 2,200,000 119 0.08Standard Chartered INR USD 28/04/17 85,371,000 1,300,000 14 0.01Standard Chartered INR USD 28/04/17 67,220,000 1,000,000 35 0.02Standard Chartered INR USD 28/04/17 62,010,000 900,000 55 0.04Standard Chartered INR USD 28/04/17 40,746,000 600,000 27 0.02Standard Chartered USD INR 28/04/17 8,100,000 542,943,000 (259) (0.18)Standard Chartered USD INR 28/04/17 4,800,000 313,536,000 (27) (0.02)Standard Chartered USD INR 28/04/17 3,400,000 223,550,000 (42) (0.03)Standard Chartered USD INR 28/04/17 2,200,000 150,194,000 (112) (0.07)Standard Chartered USD INR 28/04/17 2,100,000 140,679,000 (66) (0.04)Standard Chartered USD INR 28/04/17 2,000,000 130,210,000 (5) -Standard Chartered USD INR 28/04/17 1,800,000 121,950,000 (77) (0.05)Standard Chartered USD INR 28/04/17 1,000,000 67,880,000 (45) (0.03)Unrealised gains on forward currency exchange contracts 555 0.36
Unrealised gains on derivatives 555 0.36
Total investments 145,312 94.89Other net assets 7,825 5.11Total net assets 153,137 100.00
Currently forward positions are not collateralised.

aberdeen-asset.com 153
Indian EquityFor the six months ended 31 March 2017
Performance For the six months ended 31 March 2017, the value of Indian Equity – A Accumulation shares increased by 5.48% compared to an increase of 7.77% in the benchmark, the MSCI India Index.Source: Lipper, Basis: total return, published NAV to NAV, net of annual charges, gross income reinvested, USD.Please see the Performance History section for details on the use of MSCI information.
Please remember that past performance is not a guide to future returns. The price of shares and the revenue from them may fall as well as rise. Investors may not get back the amount originally invested.
Market reviewIndian equities rose during the half-year under review. At first, sentiment was dented by Prime Minister Narendra Modi’s unexpected announcement of the demonetisation of existing 500- and 1,000-rupee notes. The policy targeted corruption and vote-buying in the lead-up to key state elections. Although there was initial public backlash, the cash crunch began to recede quickly. December-quarter GDP figures fell by less than anticipated, and fourth-quarter results revealed that most of our holdings held up relatively well during the transition. India’s newly-instated monetary policy committee cut the benchmark repurchase rate at its inaugural meeting by 25 basis points to 6.25%, as inflation continued to ease on the back of falling food prices. It later moved from an easing bias to a neutral stance, anticipating that growth may accelerate in 2018. Towards the period-end, sentiment was lifted by the ruling Bharatiya Janata Party’s victory in the most-populous state of Uttar Pradesh. We think this will allow Modi to pursue his reform agenda and anti-corruption policies with added impetus, especially if he is returned to power for a second term in 2019.
Portfolio review Our materials sector exposure in cement and paints companies proved costly, as it was one of the sectors most affected by demonetisation because it is largely cash-based. The crunch resulted in short-term supply-chain tightness. As a fair number of real estate transactions were funded by ‘black money’, demonetisation meant a slowdown in property purchases. However, materials industry pricing remained relatively stable and volumes have been picking up. At the stock level, our holdings Ambuja Cements, ACC and Asian Paints underperformed. Not holding Vedanta detracted, as the metals and mining firm’s shares rose in tandem with commodity prices.
Energy was one of the best-performing sectors, buoyed by higher oil prices, so our lack of exposure to companies such as energy heavyweight Reliance Industries cost us.
Stock selection in industrials detracted. In particular, CONCOR continued to be weighed down by a subdued trade environment and ongoing tariff pressures from Indian Railways, which hampered earnings.
Consumer discretionary was another sector disproportionately hurt by demonetisation, as consumers delayed purchasing big-ticket items such as two- and four-wheelers. Hero MotoCorp underperformed, with sales volumes declining by 15% in November, largely in line with its peers. Our underweight to this sector mitigated losses, as the lack of exposure to automakers Tata Motors and Mahindra & Mahindra benefited the Fund.
Gujarat Gas was a key contributor to performance. It was aided by a pick-up in volumes, as gas is competitively priced with other alternatives. The utilities company has also effectively managed costs. Stock selection in health care was another positive. In particular, our lack of exposure to Dr Reddy’s Laboratories benefited the Fund, as the stock was dampened by US regulatory investigations into price collusion.
Among financials, HDFC Bank and Kotak Mahindra Bank both gained from demonetisation, posting solid income growth driven largely by net interest income. Not holding Axis Bank was another contributor, as the stock fell after reporting a sharp increase in provisions for bad loans.
During the period, we took advantage of the market sell-off after demonetisation to add to some quality holdings at attractive valuations. These included domestic market-leading decorative paintmaker Asian Paints and mortgage lender HDFC Bank, given its good asset quality. We also added to Bharti Infratel and Sun Pharmaceutical, on attractive valuations. Against this, we took profits from Bosch and Piramal Enterprises, on relative share price strength. We trimmed ACC, Godrej Consumer Products and Lupin, in view of more attractive opportunities. Finally, we trimmed our position in ICICI Bank, taking profits from its resilient share price as we rebalance the portfolio to selectively position for a credit recovery while reducing the risk of exposure to stress in the banking system as a whole.
OutlookAs global growth remains on an unsteady unpredictable path, the Indian market continues to be one of the best places to pick stocks. It offers a diverse range of companies with good fundamentals that can take advantage of the untapped growth potential of a vast market. Having won four out of five state elections in the most recent round, Prime Minister Modi now has a stronger mandate to enact further reforms. While there may be some short-term disruption when GST is implemented, most corporates are optimistic that it will help smoothen their operations and cut costs in the long term. Meanwhile, with the impact of demonetisation receding, all eyes are now on an expected recovery in spending and investment, which could ultimately boost earnings growth and improve topline performance for corporates.
Asian Equities Team April 2017

154 Aberdeen Global
Indian Equity
Statement of Net AssetsAs at 31 March 2017
Notes US$'000AssetsInvestments in securities at market value 2.2 3,310,306 Cash at bank 28,333 Interest and dividends receivable 2,207 Subscriptions receivable 5,075 Receivable for investments sold 6,328 Other assets 8,398 Total assets 3,360,647 LiabilitiesTaxes and expenses payable 1,845 Redemptions payable 21,614 Total liabilities 23,459 Net assets at the end of the period 3,337,188
Statement of Changes in Net Assets For the period from 1 October 2016 to 31 March 2017
Notes US$'000Net assets at the beginning of the period 3,560,312 Net gains from investments 3,156 Net realised gains 184,786 Net unrealised gains 9,558 Proceeds from shares issued 435,428 Payments for shares redeemed (856,016) Net equalisation paid 10 (36) Net assets at the end of the period 3,337,188
Statement of Operations For the period from 1 October 2016 to 31 March 2017
Notes US$'000IncomeInvestment income 2.3 15,048 Bank interest 43 Total income 15,091 ExpensesManagement fees 4.2 6,507
Operating, administrative and servicing fees 4.3 5,554 Less: Volume discount applied 4.3 (159) Net operating, administrative and servicing fees 4.3 5,395
Other operational expenses 33 Total expenses 11,935 Net gains from investments 3,156
Realised gains on investments 182,984 Realised currency exchange gains 1,802 Net realised gains 184,786
Increase in unrealised appreciation on investments 9,644 Unrealised currency exchange losses (86) Net unrealised gains 9,558 Net increase in assets as a result of operations 197,500
Share Transactions For the period from 1 October 2016 to 31 March 2017
A-2 D(GBP)-2 E(EUR)-2 I-2 R(GBP)-2 X-2Shares outstanding at the beginning of the period 3,985,799 2,392,308 633,650 1,919,601 1,999,003 658,450 Shares issued during the period 631,681 105,899 123,116 201,763 976,863 48,016 Shares redeemed during the period (759,990) (1,912,470) (195,231) (933,448) (1,099,461) (106,587) Shares outstanding at the end of the period 3,857,490 585,737 561,535 1,187,916 1,876,405 599,879 Net asset value per share 141.4591 113.2842 17.6984 154.3258 19.3596 15.0843
Y(EUR)-2 Z-1 Z-2Shares outstanding at the beginning of the period 10,732 752,353 134,902,848 Shares issued during the period 3,319 138,342 16,938,736 Shares redeemed during the period (5,233) (46,044) (19,717,264) Shares outstanding at the end of the period 8,818 844,651 132,124,320 Net asset value per share 18.3695 13.6640 18.5310
The accompanying notes form an integral part of these financial statements.
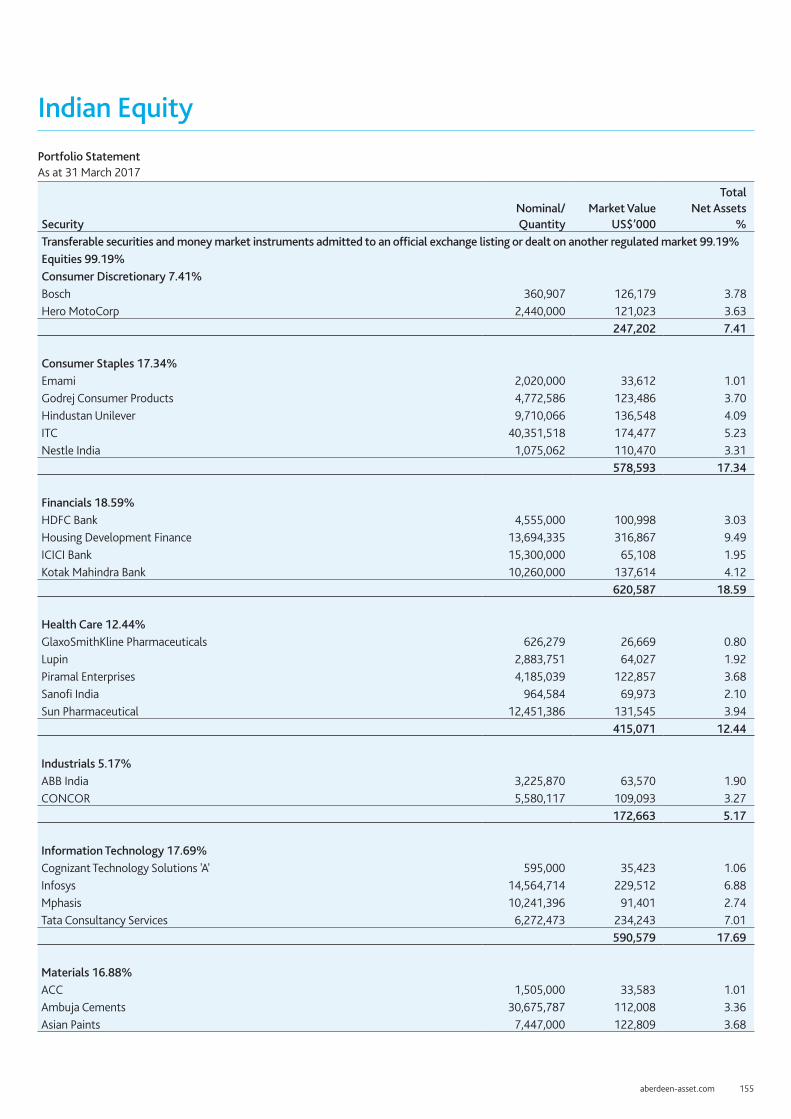
aberdeen-asset.com 155
Indian EquityPortfolio StatementAs at 31 March 2017
SecurityNominal/ Quantity
Market Value US$’000
Total Net Assets
%Transferable securities and money market instruments admitted to an official exchange listing or dealt on another regulated market 99.19%Equities 99.19%Consumer Discretionary 7.41%Bosch 360,907 126,179 3.78Hero MotoCorp 2,440,000 121,023 3.63
247,202 7.41
Consumer Staples 17.34%Emami 2,020,000 33,612 1.01Godrej Consumer Products 4,772,586 123,486 3.70Hindustan Unilever 9,710,066 136,548 4.09ITC 40,351,518 174,477 5.23Nestle India 1,075,062 110,470 3.31
578,593 17.34
Financials 18.59%HDFC Bank 4,555,000 100,998 3.03Housing Development Finance 13,694,335 316,867 9.49ICICI Bank 15,300,000 65,108 1.95Kotak Mahindra Bank 10,260,000 137,614 4.12
620,587 18.59
Health Care 12.44%GlaxoSmithKline Pharmaceuticals 626,279 26,669 0.80Lupin 2,883,751 64,027 1.92Piramal Enterprises 4,185,039 122,857 3.68Sanofi India 964,584 69,973 2.10Sun Pharmaceutical 12,451,386 131,545 3.94
415,071 12.44
Industrials 5.17%ABB India 3,225,870 63,570 1.90CONCOR 5,580,117 109,093 3.27
172,663 5.17
Information Technology 17.69%Cognizant Technology Solutions 'A' 595,000 35,423 1.06Infosys 14,564,714 229,512 6.88Mphasis 10,241,396 91,401 2.74Tata Consultancy Services 6,272,473 234,243 7.01
590,579 17.69
Materials 16.88%ACC 1,505,000 33,583 1.01Ambuja Cements 30,675,787 112,008 3.36Asian Paints 7,447,000 122,809 3.68

156 Aberdeen Global
Indian Equity
SecurityNominal/ Quantity
Market Value US$’000
Total Net Assets
%Castrol India 5,340,000 35,549 1.07Grasim Industries 14,778,034 239,132 7.16UltraTech Cement 330,060 20,179 0.60
563,260 16.88
Telecommunication Services 1.96%Bharti Airtel 4,570,000 24,525 0.73Bharti Infratel 8,166,561 40,845 1.23
65,370 1.96
Utilities 1.71%Gujarat Gas 4,822,972 56,981 1.71
Total Equities 3,310,306 99.19
Total Transferable securities and money market instruments admitted to an official exchange listing or dealt on another regulated market 3,310,306 99.19
Total investments 3,310,306 99.19Other net assets 26,882 0.81Total net assets 3,337,188 100.00

aberdeen-asset.com 157
Japanese EquityFor the six months ended 31 March 2017
Performance For the six months ended 31 March 2017, the value of Japanese Equity - A Accumulation shares increased by 8.01%, compared to an increase of 15.60% in the benchmark, the Topix (Tokyo First Section) Index.Source: Lipper, Basis: total return, published NAV to NAV, net of annual charges, gross income reinvested, JPY.
Please remember that past performance is not a guide to future returns. The price of shares and the revenue from them may fall as well as rise. Investors may not get back the amount originally invested.
Market reviewJapanese equities rose in the half year under review, with sentiment buoyed by hopes that US President Donald Trump would deliver on his pro-business agenda but this was dented somewhat by his failure to repeal Obamacare. The yen also strengthened because of its safe-haven appeal, hurting export sector stocks. Initially, anxiety over likely policy tightening by the US Federal Reserve, and UK prime minister Theresa May’s plan to begin Brexit negotiations by March had affected sentiment. However, risk aversion eased as investors grew hopeful that Donald Trump’s shock-election win would herald a rosier business backdrop.
At home, the Bank of Japan left interest rates unchanged at -0.1%, and maintained its 80 trillion yen asset-purchase programme. Corporate earnings dominated newsflow and the domestic economy managed to string together four quarters of expansion for the first time in over three years. Consumer prices rose for a second month, led by higher oil prices, but wage growth stayed sluggish despite unemployment slipping to its lowest level since 1994.
In politics, Prime Minister Shinzo Abe’s popularity dipped following allegations of impropriety surrounding a questionable land deal, although recent polls suggest he still commanded solid support.
Portfolio reviewAt the stock level, detractors included Japan Tobacco, as its share price was weighed down by worries that its market share was being eroded by competitors’ new offerings in the rapidly expanding e-cigarettes segment. Nevertheless, the company retains the lion’s share in terms of overall domestic cigarette sales. It also aims to start selling its version of electronic cigarettes across Japan soon. At the same time, retail conglomerate Seven & i continued to face rising wage costs and a struggling department-store business. But the company’s long-term fundamentals remain solid. Finally, KDDI Corp detracted amid a global sell-off in the telecommunication sector. However, we see no fundamental changes in KDDI’s business, such as the competitive environment with other domestic mobile operators.
In contrast, contributing to relative performance was Shin-Etsu, with its shares rallying on speculation that demand for its polyvinyl chloride products would improve on potentially higher infrastructure spending in the US, while tighter market conditions raised the prospect of better pricing for its semiconductor wafer products. Meanwhile, increased capital expenditure from automobile companies helped support Fanuc. Last, Yahoo Japan’s shares rose on the back of better results helped by advertising and e-commerce businesses.
In key portfolio activity, we sold both Canon and Unicharm on concerns over their deteriorating business prospects. Against this, we introduced Shionogi, a drugmaker with an edge in infectious diseases such as HIV. We like the management for its focus, as well as the diversified pipelines for both existing and new drugs, with no concerns over expiring patents in the near term.
OutlookLooking ahead, the Japanese stockmarket seems likely to face further volatility, especially among the more export-dependent companies on the back of the yen’s recent strengthening against the US dollar. Confidence in the Trump administration’s ability to enact tax reform was significantly handicapped by his failure to overhaul healthcare. This was despite his seemingly more pragmatic approach to international affairs, particularly his tougher stance on both Syria and North Korea. Further afield, elections in Europe and the start of Brexit negotiations have also added to market uncertainty.
That said, as bottom-up investors, our focus is very much on the fundamentals of the companies we invest in. And despite the macroeconomic challenges, the fundamentals of these businesses remain firm, with progress toward their longer-term goals. We believe that these companies will retain or improve on their inherent qualities, which will stand them in good stead over the long run.
Asian Equities Team April 2017

158 Aberdeen Global
Japanese Equity
Statement of Net AssetsAs at 31 March 2017
Notes JP¥’000AssetsInvestments in securities at market value 2.2 349,775,585 Cash at bank 3,352,143 Interest and dividends receivable 2,437,203 Subscriptions receivable 2,888,808 Total assets 358,453,739 LiabilitiesTaxes and expenses payable 411,355 Redemptions payable 3,180,043 Unrealised losses on forward currency exchange contracts 2.6 2,628,307 Total liabilities 6,219,705 Net assets at the end of the period 352,234,034
Statement of Changes in Net Assets For the period from 1 October 2016 to 31 March 2017
Notes JP¥’000Net assets at the beginning of the period 312,313,293 Net gains from investments 769,463 Net realised gains 19,006,632 Net unrealised gains 16,935,304 Proceeds from shares issued 123,783,798 Payments for shares redeemed (120,571,616) Net equalisation paid 10 (2,840) Net assets at the end of the period 352,234,034
Statement of Operations For the period from 1 October 2016 to 31 March 2017
Notes JP¥’000IncomeInvestment income 2.3 3,061,320 Stocklending income 16 38,285 Total income 3,099,605 ExpensesManagement fees 4.2 2,013,643
Operating, administrative and servicing fees 4.3 326,467 Less: Volume discount applied 4.3 (17,435) Net operating, administrative and servicing fees 4.3 309,032
Distribution fees 4.1 464 Other operational expenses 3,642 Bank interest 3,361 Total expenses 2,330,142 Net gains from investments 769,463
Realised gains on investments 7,070,250 Realised gains on forward currency exchange contracts 11,874,066 Realised currency exchange gains 62,316 Net realised gains 19,006,632
Increase in unrealised appreciation on investments 18,932,629 Increase in unrealised depreciation on forward currency exchange contracts (1,994,695) Unrealised currency exchange losses (2,630) Net unrealised gains 16,935,304 Net increase in assets as a result of operations 36,711,399

aberdeen-asset.com 159
Japanese Equity
Share Transactions For the period from 1 October 2016 to 31 March 2017
A-2 A(CHF)-2^ A(EUR)1^ A(EUR)-2^ A(USD)-2^ D(GBP)-2Shares outstanding at the beginning of the period 113,450,965 193,798 - 46,729,748 31,821,390 16,502,517 Shares issued during the period 42,865,051 30,638 84,800 12,299,688 16,973,853 8,448,488 Shares redeemed during the period (39,264,481) (22,250) - (10,567,232) (14,020,190) (6,430,503) Shares outstanding at the end of the period 117,051,535 202,186 84,800 48,462,204 34,775,053 18,520,502 Net asset value per share 457.2982 282.8353 9.9656 12.3163 12.6351 3.2854
E(EUR)-2 I-2 I(EUR)-2^ I(USD)-2^ L(SGD)-2 R(GBP)-2Shares outstanding at the beginning of the period 600 1,109,064 7,440,147 16,276,787 49,962 62,954 Shares issued during the period 235,703 376,925 4,560,033 5,785,077 - 83,644 Shares redeemed during the period (3,436) (383,712) (6,138,705) (1,986,988) (49,962) (12,895) Shares outstanding at the end of the period 232,867 1,102,277 5,861,475 20,074,876 - 133,703 Net asset value per share 10.4666 101,558.8523 12.1969 13.7231 - 18.8249
R(GBP)-2^ S-2 S(CHF)-2^ S(EUR)-2^ U(USD)-2 V(USD)-2Shares outstanding at the beginning of the period 1,313,995 46,077 29,358 1,458,123 4,061,014 976,004 Shares issued during the period 179,515 33,065 67 224,327 186,810 328,277 Shares redeemed during the period (63,931) (27,804) (4,862) (380,802) (3,231,459) (949,184) Shares outstanding at the end of the period 1,429,579 51,338 24,563 1,301,648 1,016,365 355,097 Net asset value per share 10.7138 25,745.1397 273.6679 12.0846 12.8547 10.6067
W-2 W(USD)-2^ X-2 X(CHF)-2^ X(EUR)-2^ X(GBP)-2^
Shares outstanding at the beginning of the period 100,000 71,000 94,883,193 585,195 1,447,076 1,431,959 Shares issued during the period 344,131 1,779 5,013,660 50,129 148,331 786,526 Shares redeemed during the period - - (87,144,246) (240,770) (1,352,534) (1,148,252) Shares outstanding at the end of the period 444,131 72,779 12,752,607 394,554 242,873 1,070,233 Net asset value per share 10.5407 11.3103 19.8877 9.5217 12.7073 13.5706
X(USD)-2^ Y(EUR)-2 Z-2 Z(GBP)-2^
Shares outstanding at the beginning of the period - 209,482 - 97,305 Shares issued during the period 168,851 82,158 71 99,239 Shares redeemed during the period (63,500) (51,094) - (120,700) Shares outstanding at the end of the period 105,351 240,546 71 75,844 Net asset value per share 9.8038 17.8592 9,762.2540 10.8526
^ Base currency exposure share class.
The accompanying notes form an integral part of these financial statements.

160 Aberdeen Global
Japanese EquityPortfolio StatementAs at 31 March 2017
SecurityNominal/ Quantity
Market Value JP¥’000
Total Net Assets
%Transferable securities and money market instruments admitted to an official exchange listing or dealt on another regulated market 99.31%Equities 99.31%Basic Materials 9.22%Kansai Paint Co∞ 1,855,000 4,383,365 1.24Nippon Paint Holdings Co 1,582,100 6,130,638 1.74Shin-Etsu Chemical Co 2,277,600 21,972,007 6.24
32,486,010 9.22
Consumer Goods 27.76%Aisin Seiki Co 323,700 1,770,639 0.50Asics Corp 2,086,400 3,732,570 1.06Calbee Inc∞ 1,935,900 7,351,580 2.09Denso Corp 1,086,200 5,322,380 1.51Honda Motor Co 2,537,500 8,510,775 2.42Japan Tobacco Inc 4,810,700 17,414,734 4.95Makita Corp∞ 2,787,800 10,872,420 3.09Mandom Corp 840,900 4,397,907 1.25Pigeon Corp 3,100,400 11,029,673 3.13Rinnai Corp 493,900 4,375,954 1.24Sekisui House 1,891,800 3,465,305 0.98Shimano Inc 517,600 8,411,000 2.39Toyota Motor Corp 1,832,700 11,080,504 3.15
97,735,441 27.76
Consumer Services 9.82%East Japan Railway Co 1,418,300 13,759,637 3.91Seven & i Holdings Co 3,943,020 17,205,368 4.88USS Co∞ 1,945,100 3,611,078 1.03
34,576,083 9.82
Financials 13.43%AEON Financial Service Co∞ 3,225,500 6,770,325 1.92Concordia Financial∞ 7,552,700 3,895,683 1.11Daito Trust Construction Co∞ 683,100 10,456,552 2.96Japan Exchange Group Inc 4,502,600 7,138,872 2.03Mitsubishi Estate Co 4,511,000 9,166,352 2.60Suruga Bank 4,218,900 9,893,321 2.81
47,321,105 13.43
Health Care 9.80%Astellas Pharma Inc 4,685,600 6,877,289 1.95Chugai Pharmaceutical Co 2,622,200 10,036,471 2.85Shionogi & Co 661,500 3,806,933 1.08Sysmex Corp 2,046,660 13,814,954 3.92
34,535,647 9.80

aberdeen-asset.com 161
Japanese Equity
SecurityNominal/ Quantity
Market Value JP¥’000
Total Net Assets
%Industrials 19.84%Amada Co∞ 11,242,500 14,300,460 4.06Daikin Industries Ltd∞ 1,016,400 11,376,057 3.23FANUC Corp 636,600 14,546,310 4.13Keyence Corp 367,376 16,388,643 4.65Nabtesco Corp 4,497,500 13,269,874 3.77
69,881,344 19.84
Technology 4.81%SCSK Corp 1,399,800 6,190,616 1.76Yahoo Japan Corp∞ 20,915,100 10,750,361 3.05
16,940,977 4.81
Telecommunications 4.63%KDDI Corp 5,572,300 16,298,978 4.63
Total Equities 349,775,585 99.31
Total Transferable securities and money market instruments admitted to an official exchange listing or dealt on another regulated market 349,775,585 99.31
Derivatives (0.75%)
Forward currency exchange contracts (0.75%)
Counterparty Buy Sell Settlement Buy Amount Sell Amount
Unrealised Gains/(Losses)
JP¥’000
Total Net Assets
%BNP Paribas CHF JPY 03/04/17 36,280 4,067,934 (29) -BNP Paribas CHF JPY 04/04/17 19,351 2,161,037 (7) -BNP Paribas CHF JPY 04/04/17 12,647 1,412,300 (4) -BNP Paribas CHF JPY 05/04/17 57,726 6,444,174 (18) -BNP Paribas CHF JPY 06/04/17 33,631 3,758,167 (14) -BNP Paribas CHF JPY 06/04/17 16,826 1,880,207 (7) -BNP Paribas CHF JPY 15/06/17 58,281,147 6,559,140,970 (60,427) (0.02)BNP Paribas CHF JPY 15/06/17 7,519,753 846,296,357 (7,797) -BNP Paribas CHF JPY 15/06/17 4,216,821 474,574,141 (4,372) -BNP Paribas CHF JPY 15/06/17 707,233 80,143,756 (1,283) -BNP Paribas CHF JPY 15/06/17 55,027 6,283,032 (147) -BNP Paribas CHF JPY 15/06/17 11,396 1,277,228 (6) -BNP Paribas CHF JPY 15/06/17 7,070 801,138 (13) -BNP Paribas EUR JPY 03/04/17 32,327 3,878,629 (26) -BNP Paribas EUR JPY 04/04/17 1,796,411 215,085,315 (982) -BNP Paribas EUR JPY 04/04/17 194,527 23,290,860 (106) -BNP Paribas EUR JPY 04/04/17 9,312 1,110,337 (1) -BNP Paribas EUR JPY 05/04/17 5,543,374 661,712,538 (1,033) -BNP Paribas EUR JPY 05/04/17 6,103 729,511 (2) -BNP Paribas EUR JPY 06/04/17 216,436 25,852,310 (57) -BNP Paribas EUR JPY 06/04/17 41,748 4,986,598 (11) -BNP Paribas EUR JPY 13/04/17 577,299,195 69,443,897,424 (636,234) (0.18)BNP Paribas EUR JPY 13/04/17 82,364,072 9,907,656,615 (90,772) (0.03)

162 Aberdeen Global
Japanese Equity
Counterparty Buy Sell Settlement Buy Amount Sell Amount
Unrealised Gains/(Losses)
JP¥’000
Total Net Assets
%BNP Paribas EUR JPY 13/04/17 8,515,349 1,025,372,367 (10,437) -BNP Paribas EUR JPY 13/04/17 7,966,776 955,318,390 (5,767) -BNP Paribas EUR JPY 13/04/17 6,316,150 775,345,280 (22,530) (0.01)BNP Paribas EUR JPY 13/04/17 4,963,658 592,947,680 (1,335) -BNP Paribas EUR JPY 13/04/17 4,735,402 568,176,232 (3,769) -BNP Paribas EUR JPY 13/04/17 2,294,360 278,448,350 (4,986) -BNP Paribas EUR JPY 13/04/17 1,967,934 240,717,527 (6,162) -BNP Paribas EUR JPY 13/04/17 1,945,815 236,112,807 (4,193) -BNP Paribas EUR JPY 13/04/17 1,848,061 225,985,004 (5,717) -BNP Paribas EUR JPY 13/04/17 1,620,166 197,001,853 (3,896) -BNP Paribas EUR JPY 13/04/17 1,504,435 183,098,820 (3,787) -BNP Paribas EUR JPY 13/04/17 1,237,056 148,445,526 (1,002) -BNP Paribas EUR JPY 13/04/17 1,222,504 148,058,100 (2,349) -BNP Paribas EUR JPY 13/04/17 835,740 102,296,634 (2,686) -BNP Paribas EUR JPY 13/04/17 802,894 96,320,894 (625) -BNP Paribas EUR JPY 13/04/17 608,447 72,967,776 (448) -BNP Paribas EUR JPY 13/04/17 586,914 70,065,239 (112) -BNP Paribas EUR JPY 13/04/17 477,207 57,173,432 (296) -BNP Paribas EUR JPY 13/04/17 246,115 29,515,263 (181) -BNP Paribas EUR JPY 13/04/17 225,538 27,082,284 (201) -BNP Paribas EUR JPY 13/04/17 184,334 22,413,854 (443) -BNP Paribas EUR JPY 13/04/17 69,196 8,271,770 (24) -BNP Paribas EUR JPY 13/04/17 22,267 2,673,735 (20) -BNP Paribas EUR JPY 13/04/17 21,653 2,648,627 (68) -BNP Paribas EUR JPY 13/04/17 14,748 1,768,216 (10) -BNP Paribas EUR JPY 13/04/17 8,747 1,069,060 (27) -BNP Paribas EUR JPY 13/04/17 6,867 822,698 (4) -BNP Paribas EUR JPY 13/04/17 5,736 702,670 (19) -BNP Paribas EUR JPY 13/04/17 3,654 442,856 (7) -BNP Paribas EUR JPY 15/06/17 16,124,443 1,940,109,075 (17,101) -BNP Paribas EUR JPY 15/06/17 8,213,679 988,278,097 (8,711) -BNP Paribas EUR JPY 15/06/17 644,876 77,592,081 (684) -BNP Paribas EUR JPY 15/06/17 355,848 43,206,996 (768) -BNP Paribas EUR JPY 15/06/17 207,220 25,233,224 (520) -BNP Paribas EUR JPY 15/06/17 184,886 22,615,720 (566) -BNP Paribas EUR JPY 15/06/17 104,845 12,767,032 (263) -BNP Paribas EUR JPY 15/06/17 71,914 8,712,200 (136) -BNP Paribas EUR JPY 15/06/17 51,196 6,138,278 (33) -BNP Paribas EUR JPY 15/06/17 16,659 2,019,800 (33) -BNP Paribas EUR JPY 15/06/17 15,781 1,921,621 (40) -BNP Paribas EUR JPY 15/06/17 15,382 1,883,319 (49) -BNP Paribas EUR JPY 15/06/17 15,108 1,833,949 (32) -BNP Paribas EUR JPY 15/06/17 14,606 1,793,552 (52) -BNP Paribas EUR JPY 15/06/17 9,539 1,145,996 (8) -BNP Paribas EUR JPY 15/06/17 4,619 556,468 (6) -BNP Paribas EUR JPY 15/06/17 2,670 324,191 (6) -BNP Paribas EUR JPY 15/06/17 2,551 310,634 (6) -BNP Paribas GBP JPY 03/04/17 28,805 3,998,018 16 -

aberdeen-asset.com 163
Japanese Equity
Counterparty Buy Sell Settlement Buy Amount Sell Amount
Unrealised Gains/(Losses)
JP¥’000
Total Net Assets
%BNP Paribas GBP JPY 06/04/17 1,400,000 194,967,640 105 -BNP Paribas GBP JPY 15/06/17 16,265,311 2,252,524,381 11,298 -BNP Paribas GBP JPY 15/06/17 14,575,493 2,018,507,594 10,124 -BNP Paribas GBP JPY 15/06/17 1,060,000 147,452,678 79 -BNP Paribas GBP JPY 15/06/17 839,379 116,242,593 583 -BNP Paribas GBP JPY 15/06/17 41,362 5,701,021 56 -BNP Paribas GBP JPY 15/06/17 30,819 4,269,704 20 -BNP Paribas GBP JPY 15/06/17 5,698 793,004 - -BNP Paribas JPY EUR 03/04/17 148,422,146 1,237,056 985 -BNP Paribas JPY EUR 03/04/17 1,768,032 14,748 10 -BNP Paribas JPY GBP 04/04/17 5,706,737 41,362 (57) -BNP Paribas JPY USD 04/04/17 998,865 9,000 (4) -BNP Paribas JPY USD 05/04/17 71,214,063 640,760 (186) -BNP Paribas JPY EUR 05/04/17 70,059,956 586,914 109 -BNP Paribas JPY USD 05/04/17 46,955,501 422,490 (123) -BNP Paribas JPY EUR 05/04/17 8,270,877 69,196 24 -BNP Paribas JPY USD 05/04/17 571,986 5,117 2 -BNP Paribas JPY EUR 06/04/17 592,886,131 4,963,658 1,299 -BNP Paribas JPY USD 06/04/17 508,004,605 4,542,447 1,840 -BNP Paribas JPY EUR 13/04/17 1,352,526,983 11,255,750 10,966 -BNP Paribas JPY USD 13/04/17 934,827,450 8,422,696 (3,293) -BNP Paribas JPY EUR 13/04/17 899,482,870 7,485,816 7,257 -BNP Paribas JPY EUR 13/04/17 661,762,428 5,543,374 1,054 -BNP Paribas JPY USD 13/04/17 612,343,212 5,553,972 (6,259) -BNP Paribas JPY EUR 13/04/17 602,614,351 5,046,206 1,163 -BNP Paribas JPY USD 13/04/17 570,827,063 5,132,935 (880) -BNP Paribas JPY EUR 13/04/17 551,233,945 4,625,040 (19) -BNP Paribas JPY USD 13/04/17 411,085,008 3,695,296 (497) -BNP Paribas JPY USD 13/04/17 376,866,980 3,383,317 33 -BNP Paribas JPY EUR 13/04/17 215,087,830 1,796,411 976 -BNP Paribas JPY EUR 13/04/17 193,554,471 1,623,988 (7) -BNP Paribas JPY EUR 13/04/17 178,681,755 1,467,631 3,756 -BNP Paribas JPY EUR 13/04/17 149,778,525 1,243,857 1,525 -BNP Paribas JPY USD 13/04/17 135,414,773 1,220,169 (488) -BNP Paribas JPY USD 13/04/17 99,698,339 902,406 (812) -BNP Paribas JPY USD 13/04/17 73,775,729 651,612 1,199 -BNP Paribas JPY EUR 13/04/17 59,143,269 483,187 1,553 -BNP Paribas JPY USD 13/04/17 50,241,027 452,871 (200) -BNP Paribas JPY USD 13/04/17 27,051,244 239,560 369 -BNP Paribas JPY EUR 13/04/17 25,854,993 216,436 58 -BNP Paribas JPY EUR 13/04/17 23,291,132 194,527 106 -BNP Paribas JPY USD 13/04/17 22,746,543 205,102 (98) -BNP Paribas JPY USD 13/04/17 18,649,960 163,804 405 -BNP Paribas JPY EUR 13/04/17 15,188,815 125,153 272 -BNP Paribas JPY EUR 13/04/17 13,915,110 114,294 293 -BNP Paribas JPY EUR 13/04/17 13,172,362 108,231 272 -BNP Paribas JPY EUR 13/04/17 10,189,404 83,971 181 -BNP Paribas JPY USD 13/04/17 9,617,628 86,015 37 -

164 Aberdeen Global
Japanese Equity
Counterparty Buy Sell Settlement Buy Amount Sell Amount
Unrealised Gains/(Losses)
JP¥’000
Total Net Assets
%BNP Paribas JPY USD 13/04/17 8,329,186 72,741 227 -BNP Paribas JPY EUR 13/04/17 5,963,503 49,240 95 -BNP Paribas JPY EUR 13/04/17 3,020,973 24,925 50 -BNP Paribas JPY EUR 13/04/17 2,405,755 20,053 16 -BNP Paribas JPY USD 13/04/17 2,054,848 18,498 (5) -BNP Paribas JPY EUR 13/04/17 1,110,417 9,312 1 -BNP Paribas JPY USD 13/04/17 1,022,012 8,898 31 -BNP Paribas JPY EUR 13/04/17 929,762 7,607 23 -BNP Paribas JPY EUR 13/04/17 829,314 6,900 7 -BNP Paribas JPY EUR 13/04/17 729,589 6,103 2 -BNP Paribas JPY EUR 13/04/17 715,419 5,873 15 -BNP Paribas JPY EUR 13/04/17 516,462 4,257 9 -BNP Paribas JPY USD 13/04/17 439,392 3,840 12 -BNP Paribas JPY USD 13/04/17 426,071 3,836 (1) -BNP Paribas JPY USD 13/04/17 367,329 3,334 (4) -BNP Paribas JPY EUR 13/04/17 347,299 2,897 2 -BNP Paribas JPY USD 13/04/17 241,854 2,179 (1) -BNP Paribas JPY EUR 15/06/17 660,311,701 5,482,928 6,415 -BNP Paribas JPY GBP 15/06/17 194,762,400 1,400,000 (91) -BNP Paribas JPY CHF 15/06/17 135,559,924 1,205,841 1,101 -BNP Paribas JPY CHF 15/06/17 63,307,902 554,456 1,483 -BNP Paribas JPY GBP 15/06/17 44,634,558 320,356 47 -BNP Paribas JPY EUR 15/06/17 38,821,830 322,928 309 -BNP Paribas JPY CHF 15/06/17 19,141,048 167,750 436 -BNP Paribas JPY CHF 15/06/17 18,409,327 161,768 371 -BNP Paribas JPY CHF 15/06/17 16,195,590 144,064 132 -BNP Paribas JPY CHF 15/06/17 16,014,161 142,888 81 -BNP Paribas JPY CHF 15/06/17 15,276,135 134,573 270 -BNP Paribas JPY EUR 15/06/17 15,010,203 124,638 146 -BNP Paribas JPY EUR 15/06/17 14,542,752 120,259 201 -BNP Paribas JPY CHF 15/06/17 8,885,785 79,041 72 -BNP Paribas JPY CHF 15/06/17 8,425,954 74,018 173 -BNP Paribas JPY CHF 15/06/17 7,885,923 70,363 40 -BNP Paribas JPY GBP 15/06/17 7,785,399 55,783 22 -BNP Paribas JPY EUR 15/06/17 7,161,423 58,995 126 -BNP Paribas JPY CHF 15/06/17 6,453,317 57,726 16 -BNP Paribas JPY EUR 15/06/17 6,093,206 50,093 119 -BNP Paribas JPY CHF 15/06/17 5,889,076 52,497 35 -BNP Paribas JPY CHF 15/06/17 5,423,427 48,353 32 -BNP Paribas JPY EUR 15/06/17 4,989,612 41,748 11 -BNP Paribas JPY CHF 15/06/17 4,073,332 36,280 28 -BNP Paribas JPY GBP 15/06/17 3,993,066 28,805 (16) -BNP Paribas JPY EUR 15/06/17 3,880,245 32,327 25 -BNP Paribas JPY CHF 15/06/17 3,763,353 33,631 13 -BNP Paribas JPY CHF 15/06/17 3,069,356 26,983 61 -BNP Paribas JPY EUR 15/06/17 3,006,200 24,570 76 -BNP Paribas JPY USD 15/06/17 2,438,141 21,990 (5) -BNP Paribas JPY CHF 15/06/17 2,163,744 19,351 6 -

aberdeen-asset.com 165
Japanese Equity
Counterparty Buy Sell Settlement Buy Amount Sell Amount
Unrealised Gains/(Losses)
JP¥’000
Total Net Assets
%BNP Paribas JPY EUR 15/06/17 2,161,737 18,017 13 -BNP Paribas JPY USD 15/06/17 2,018,111 18,201 (4) -BNP Paribas JPY EUR 15/06/17 1,955,996 15,976 51 -BNP Paribas JPY CHF 15/06/17 1,882,802 16,826 7 -BNP Paribas JPY CHF 15/06/17 1,414,069 12,647 4 -BNP Paribas JPY EUR 15/06/17 1,394,213 11,508 22 -BNP Paribas JPY CHF 15/06/17 1,031,160 9,193 6 -BNP Paribas JPY GBP 15/06/17 792,726 5,699 - -BNP Paribas JPY EUR 15/06/17 722,594 6,027 4 -BNP Paribas JPY GBP 15/06/17 700,758 5,008 4 -BNP Paribas JPY EUR 15/06/17 575,684 4,706 14 -BNP Paribas JPY EUR 15/06/17 434,339 3,619 3 -BNP Paribas JPY EUR 15/06/17 409,055 3,363 8 -BNP Paribas JPY CHF 15/06/17 391,729 3,461 6 -BNP Paribas JPY CHF 15/06/17 375,288 3,329 4 -BNP Paribas JPY CHF 15/06/17 300,042 2,636 6 -BNP Paribas USD JPY 03/04/17 902,406 99,756,454 799 -BNP Paribas USD JPY 03/04/17 18,498 2,055,749 5 -BNP Paribas USD JPY 04/04/17 452,871 50,261,859 202 -BNP Paribas USD JPY 04/04/17 3,836 426,206 1 -BNP Paribas USD JPY 06/04/17 86,015 9,619,503 (35) -BNP Paribas USD JPY 13/04/17 442,121,469 50,311,301,003 (1,067,767) (0.31)BNP Paribas USD JPY 13/04/17 279,380,380 31,792,146,253 (674,731) (0.19)BNP Paribas USD JPY 13/04/17 5,880,640 648,381,165 6,605 -BNP Paribas USD JPY 13/04/17 5,452,537 626,404,392 (19,100) (0.01)BNP Paribas USD JPY 13/04/17 4,542,447 507,905,580 (1,967) -BNP Paribas USD JPY 13/04/17 3,489,276 387,190,633 1,445 -BNP Paribas USD JPY 13/04/17 1,418,415 156,434,867 1,548 -BNP Paribas USD JPY 13/04/17 1,092,424 123,163,425 (1,489) -BNP Paribas USD JPY 13/04/17 1,063,160 122,514,297 (4,099) -BNP Paribas USD JPY 13/04/17 791,700 90,139,277 (1,960) -BNP Paribas USD JPY 13/04/17 734,193 82,574,007 (800) -BNP Paribas USD JPY 13/04/17 691,505 76,690,131 330 -BNP Paribas USD JPY 13/04/17 640,760 71,200,415 167 -BNP Paribas USD JPY 13/04/17 500,900 56,473,068 (683) -BNP Paribas USD JPY 13/04/17 500,328 57,271,450 (1,545) -BNP Paribas USD JPY 13/04/17 442,833 50,690,061 (1,367) -BNP Paribas USD JPY 13/04/17 422,490 46,946,502 110 -BNP Paribas USD JPY 13/04/17 333,460 38,181,932 (1,041) -BNP Paribas USD JPY 13/04/17 313,657 36,027,490 (1,092) -BNP Paribas USD JPY 13/04/17 211,500 23,472,333 85 -BNP Paribas USD JPY 13/04/17 205,841 23,305,365 (379) -BNP Paribas USD JPY 13/04/17 198,061 22,365,087 (305) -BNP Paribas USD JPY 13/04/17 178,722 20,464,380 (558) -BNP Paribas USD JPY 13/04/17 123,965 13,786,025 21 -BNP Paribas USD JPY 13/04/17 102,580 11,385,287 40 -BNP Paribas USD JPY 13/04/17 33,201 3,801,631 (104) -BNP Paribas USD JPY 13/04/17 9,000 998,451 4 -

166 Aberdeen Global
Japanese Equity
Counterparty Buy Sell Settlement Buy Amount Sell Amount
Unrealised Gains/(Losses)
JP¥’000
Total Net Assets
%BNP Paribas USD JPY 13/04/17 5,117 571,857 (2) -BNP Paribas USD JPY 13/04/17 4,039 448,035 2 -BNP Paribas USD JPY 15/06/17 1,008,881 114,507,172 (2,417) -BNP Paribas USD JPY 15/06/17 825,616 93,706,725 (1,978) -BNP Paribas USD JPY 15/06/17 27,960 3,204,009 (98) -BNP Paribas USD JPY 15/06/17 25,000 2,854,338 (77) -BNP Paribas USD JPY 15/06/17 22,470 2,574,947 (78) -Unrealised losses on forward currency exchange contracts (2,628,307) (0.75)
Unrealised losses on derivatives (2,628,307) (0.75)
Total investments 347,147,278 98.56Other net assets 5,086,756 1.44Total net assets 352,234,034 100.00
∞ A portion of this security is on loan at the period end.Currently forward positions are not collateralised.

aberdeen-asset.com 167
Japanese Smaller CompaniesFor the six months ended 31 March 2017
Performance For the six months ended 31 March 2017, the value of Japanese Smaller Companies - A Accumulation shares increased by 10.64%, compared to an increase of 17.25% in the benchmark, the Russell Nomura Small Cap Index.Source: Lipper, Basis: total return, published NAV to NAV, net of annual charges, gross income reinvested, JPY.
Please remember that past performance is not a guide to future returns. The price of shares and the revenue from them may fall as well as rise. Investors may not get back the amount originally invested.
Market reviewJapanese small-cap equities rose in the half year under review, with sentiment buoyed by hopes that US President Donald Trump would deliver on his pro-business agenda but this was dented somewhat by his failure to repeal Obamacare. The yen also strengthened because of its safe-haven appeal, hurting export sector stocks. Initially, anxiety over likely policy tightening by the US Federal Reserve, and UK prime minister Theresa May’s plan to begin Brexit negotiations by March had affected sentiment. However, risk aversion eased as investors grew hopeful that Donald Trump’s shock-election win would herald a rosier business backdrop.
At home, the Bank of Japan left interest rates unchanged at -0.1%, and maintained its 80 trillion yen asset-purchase programme. Corporate earnings dominated newsflow and the domestic economy managed to string together four quarters of expansion for the first time in over three years. Consumer prices rose for a second month, led by higher oil prices, but wage growth stayed sluggish despite unemployment slipping to its lowest level since 1994.
In politics, Prime Minister Shinzo Abe’s popularity dipped following allegations of impropriety surrounding a questionable land deal, although recent polls suggest he still commanded solid support.
Portfolio reviewAt the stock level, detractors included ResortTrust, which saw its share price hurt by weaker-than-expected results that were dampened by a higher proportion of deferred sales for resorts to be opened in the future. Also costing the Fund was San-A on the back of lacklustre sales numbers due to a warm winter. Last, Sysmex Corp detracted because |of concerns over its weaker business outlook in China. We remain positive about the company’s prospects, backed by its technological competitiveness and recurring revenue generation from the sale of its reagents.
In contrast, contributing to relative performance was a lack of exposure to Hitachi Koki. We had divested our stake in the company after it became the target of a takeover bid that was triggered by Hitachi’s sale of its controlling stake to private equity group KKR. While we believe the bid was below the fair value of the business, our opposition to the bid was rebuffed by the company’s board, leaving us with little choice but to tender our shares. That said, we believe our return from this investment has been more than satisfactory. Also benefiting the Fund was a non-benchmark exposure to Heian Ceremony. The stock outperformed on good results, raising its forecast for a second time in a year, on higher utilisation of its ceremonial facilities. Finally, a non-benchmark exposure to Amada also proved beneficial as the company’s competitiveness and profitability was expected to get a boost from a weaker yen.
In key portfolio activity, we tendered our stake in Hitachi Koki after it received a takeover bid from a private equity firm. Against this, we introduced Daiwa Industries, a domestically-focused commercial fridge maker, which has a relatively good market position among standalone restaurants through its direct sales approach. We like the company’s stable cash flow, backed by customers’ replacement demand and after-sales service revenues.
OutlookLooking ahead, the Japanese stockmarket seems likely to face further volatility, especially among the more export-dependent companies on the back of the yen’s recent strengthening against the US dollar. Confidence in the Trump administration’s ability to enact tax reform was significantly handicapped by his failure to overhaul healthcare. This was despite his seemingly more pragmatic approach to international affairs, particularly his tougher stance on both Syria and North Korea. Further afield, elections in Europe and the start of Brexit negotiations have also added to market uncertainty.
That said, as bottom-up investors, our focus is very much on the fundamentals of the companies we invest in. And despite the macroeconomic challenges, the fundamentals of these businesses remain firm, with progress toward their longer-term goals. We believe that these companies will retain or improve on their inherent qualities, which will stand them in good stead over the long run.
Asian Equities Team April 2017
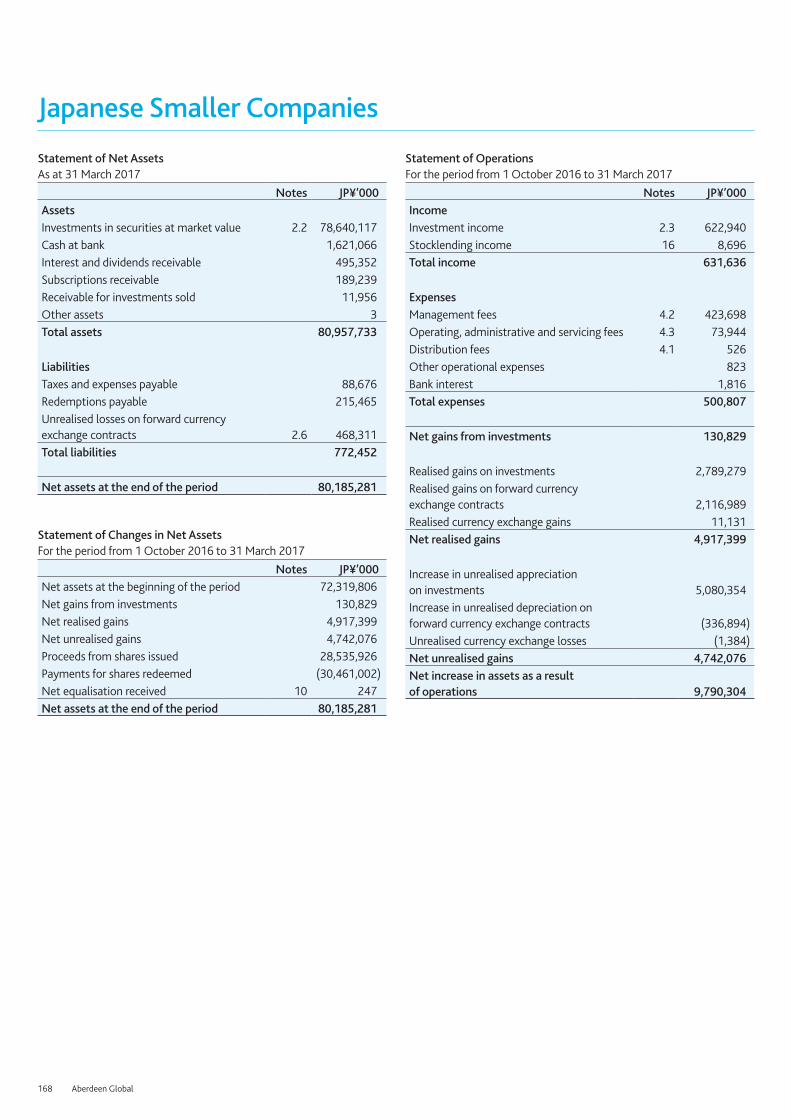
168 Aberdeen Global
Japanese Smaller Companies
Statement of Net AssetsAs at 31 March 2017
Notes JP¥’000AssetsInvestments in securities at market value 2.2 78,640,117 Cash at bank 1,621,066 Interest and dividends receivable 495,352 Subscriptions receivable 189,239 Receivable for investments sold 11,956 Other assets 3 Total assets 80,957,733 LiabilitiesTaxes and expenses payable 88,676 Redemptions payable 215,465 Unrealised losses on forward currency exchange contracts 2.6 468,311 Total liabilities 772,452 Net assets at the end of the period 80,185,281
Statement of Changes in Net Assets For the period from 1 October 2016 to 31 March 2017
Notes JP¥’000Net assets at the beginning of the period 72,319,806 Net gains from investments 130,829 Net realised gains 4,917,399 Net unrealised gains 4,742,076 Proceeds from shares issued 28,535,926 Payments for shares redeemed (30,461,002) Net equalisation received 10 247 Net assets at the end of the period 80,185,281
Statement of Operations For the period from 1 October 2016 to 31 March 2017
Notes JP¥’000IncomeInvestment income 2.3 622,940 Stocklending income 16 8,696 Total income 631,636 ExpensesManagement fees 4.2 423,698 Operating, administrative and servicing fees 4.3 73,944 Distribution fees 4.1 526 Other operational expenses 823 Bank interest 1,816 Total expenses 500,807 Net gains from investments 130,829
Realised gains on investments 2,789,279 Realised gains on forward currency exchange contracts 2,116,989 Realised currency exchange gains 11,131 Net realised gains 4,917,399
Increase in unrealised appreciation on investments 5,080,354 Increase in unrealised depreciation on forward currency exchange contracts (336,894) Unrealised currency exchange losses (1,384) Net unrealised gains 4,742,076 Net increase in assets as a result of operations 9,790,304

aberdeen-asset.com 169
Japanese Smaller Companies
Share Transactions For the period from 1 October 2016 to 31 March 2017
A-2 A(CHF)-2^ A(EUR)-2^ A(USD)-2^ D(GBP)-2 I-2Shares outstanding at the beginning of the period 8,828,450 89,894 3,142,774 4,635,774 4,306,376 18,970,276 Shares issued during the period 3,581,365 900 724,499 1,471,914 2,506,305 9,015,905 Shares redeemed during the period (4,340,377) (5,350) (558,563) (2,563,535) (2,617,790) (10,499,368) Shares outstanding at the end of the period 8,069,438 85,444 3,308,710 3,544,153 4,194,891 17,486,813 Net asset value per share 1,347.0741 14.6457 21.3264 16.1741 9.6713 1,310.8219
I(EUR)-2^ I(USD)-2^ L(SGD)-2 R(GBP)-2 S-2 W-2Shares outstanding at the beginning of the period 11,629,340 101,401 1,020 147,507 6,871 1,333,944 Shares issued during the period 1,986,441 990,200 - 49,489 1,153 604,953 Shares redeemed during the period (1,076,329) - - (45,614) (1,576) (100,000) Shares outstanding at the end of the period 12,539,452 1,091,601 1,020 151,382 6,448 1,838,897 Net asset value per share 14.4191 9.3610 11.2649 21.9331 151,919.4499 10.6592
W(USD)-2^ X-2 X(CHF)-2^ X(EUR)-2^ X(USD)-2^ Z-2Shares outstanding at the beginning of the period 71,000 6,350,198 90,476 177,655 - 629,896 Shares issued during the period - 707,057 - 43,604 63,750 - Shares redeemed during the period - (959,663) - (14,099) - (1,000) Shares outstanding at the end of the period 71,000 6,097,592 90,476 207,160 63,750 628,896 Net asset value per share 11.7220 23.1651 9.2807 14.0031 9.9786 1,291.3453
Z(USD)-2^
Shares outstanding at the beginning of the period 73,278 Shares issued during the period - Shares redeemed during the period - Shares outstanding at the end of the period 73,278 Net asset value per share 11.8135
^ Base currency exposure share class.
The accompanying notes form an integral part of these financial statements.

170 Aberdeen Global
Japanese Smaller CompaniesPortfolio StatementAs at 31 March 2017
SecurityNominal/ Quantity
Market Value JP¥’000
Total Net Assets
%Transferable securities and money market instruments admitted to an official exchange listing or dealt on another regulated market 98.07%Equities 98.07%Basic Materials 7.49%Kansai Paint Co 1,240,500 2,931,302 3.66Nippon Paint Holdings Co 794,200 3,077,525 3.83
6,008,827 7.49
Consumer Goods 25.33%Asics Corp 866,300 1,549,811 1.93Calbee Inc∞ 933,000 3,543,067 4.42Descente 905,200 1,196,222 1.49Mandom Corp 747,700 3,910,470 4.87Milbon Co 103,000 578,345 0.72Musashi Seimitsu Industry Co 988,000 2,813,824 3.51Pigeon Corp 927,800 3,300,649 4.12Pilot Corp 277,400 1,264,944 1.58Tamron Co 1,069,400 2,154,841 2.69
20,312,173 25.33
Consumer Services 16.78%Ain Holdings Inc 158,900 1,193,339 1.49Resorttrust Inc∞ 1,641,040 3,218,079 4.01San-A Co 820,900 4,145,545 5.17Sky Perfect JSAT Holdings∞ 2,812,000 1,321,640 1.65USS Co 1,926,100 3,575,805 4.46
13,454,408 16.78
Financials 6.05%Daibiru Corp 3,017,600 2,952,721 3.69Kabu.com Securities 5,229,800 1,895,803 2.36
4,848,524 6.05
Health Care 12.43%Asahi Intecc Co 558,400 2,585,392 3.22BML 582,600 1,429,992 1.78EPS Corp 1,079,800 1,690,427 2.11Mani Inc 637,700 1,672,049 2.09Sysmex Corp 383,500 2,588,625 3.23
9,966,485 12.43
Industrials 23.42%Aeon Delight Co 819,200 2,867,200 3.58Amada Co 2,917,000 3,710,425 4.62Daiwa Industries 792,800 918,855 1.15Harmonic Drive Systems Inc∞ 112,400 395,086 0.49Heian Ceremony Service Co∞ 1,311,000 1,287,402 1.61

aberdeen-asset.com 171
Japanese Smaller Companies
SecurityNominal/ Quantity
Market Value JP¥’000
Total Net Assets
%Intage Inc 949,900 1,918,798 2.39Nabtesco Corp 1,248,900 3,684,879 4.59Naigai Trans Line 120,000 133,920 0.17Optex Co 210,300 638,261 0.80SK Kaken Co 63,000 686,700 0.86TKP Corp 600 7,770 0.01Wellnet Corporation 715,900 971,834 1.21Yushin Precision Equipment Co∞ 533,200 1,559,343 1.94
18,780,473 23.42
Technology 1.99%Canon Electronics Inc 882,400 1,595,379 1.99
Telecommunications 4.09%Okinawa Cellular Telephone Co∞ 911,200 3,278,042 4.09
Utilities 0.49%Shizuoka Gas Co 523,900 395,806 0.49
Total Equities 78,640,117 98.07
Total Transferable securities and money market instruments admitted to an official exchange listing or dealt on another regulated market 78,640,117 98.07
Derivatives (0.58%)
Forward currency exchange contracts (0.58%)
Counterparty Buy Sell Settlement Buy Amount Sell Amount
Unrealised Gains/(Losses)
JP¥’000
Total Net Assets
%BNP Paribas CHF JPY 15/06/17 1,251,613 140,860,370 (1,298) -BNP Paribas CHF JPY 15/06/17 855,761 96,310,001 (887) -BNP Paribas CHF JPY 15/06/17 31,421 3,583,410 (80) -BNP Paribas EUR JPY 03/04/17 27,408 3,288,367 (22) -BNP Paribas EUR JPY 06/04/17 12,662 1,512,457 (3) -BNP Paribas EUR JPY 13/04/17 182,805,576 21,989,865,537 (201,467) (0.25)BNP Paribas EUR JPY 13/04/17 73,200,861 8,805,404,791 (80,673) (0.10)BNP Paribas EUR JPY 13/04/17 1,851,942 227,337,033 (6,606) (0.01)BNP Paribas EUR JPY 13/04/17 279,011 33,330,080 (75) -BNP Paribas EUR JPY 13/04/17 263,377 31,959,191 (568) -BNP Paribas EUR JPY 13/04/17 237,288 29,025,009 (743) -BNP Paribas EUR JPY 13/04/17 197,620 23,699,502 (145) -BNP Paribas EUR JPY 13/04/17 190,271 22,832,365 (154) -BNP Paribas EUR JPY 13/04/17 163,271 19,660,241 (200) -BNP Paribas EUR JPY 13/04/17 147,836 17,648,489 (28) -BNP Paribas EUR JPY 13/04/17 140,728 17,111,667 (338) -BNP Paribas EUR JPY 13/04/17 111,540 13,579,829 (285) -BNP Paribas EUR JPY 13/04/17 107,643 12,913,669 (84) -BNP Paribas EUR JPY 13/04/17 96,552 11,717,779 (210) -BNP Paribas EUR JPY 13/04/17 91,450 11,193,687 (294) -

172 Aberdeen Global
Japanese Smaller Companies
Counterparty Buy Sell Settlement Buy Amount Sell Amount
Unrealised Gains/(Losses)
JP¥’000
Total Net Assets
%BNP Paribas EUR JPY 13/04/17 86,189 10,539,403 (267) -BNP Paribas EUR JPY 13/04/17 51,842 6,309,450 (130) -BNP Paribas EUR JPY 13/04/17 41,000 4,909,036 (22) -BNP Paribas EUR JPY 13/04/17 24,162 2,909,495 (30) -BNP Paribas EUR JPY 13/04/17 11,948 1,432,398 (8) -BNP Paribas EUR JPY 13/04/17 11,420 1,363,338 (2) -BNP Paribas EUR JPY 13/04/17 11,181 1,338,731 (6) -BNP Paribas EUR JPY 13/04/17 10,350 1,241,254 (8) -BNP Paribas EUR JPY 13/04/17 5,717 692,398 (11) -BNP Paribas EUR JPY 13/04/17 5,360 643,601 (5) -BNP Paribas EUR JPY 13/04/17 3,007 359,167 (1) -BNP Paribas EUR JPY 13/04/17 2,727 326,899 (2) -BNP Paribas EUR JPY 15/06/17 2,864,980 344,717,306 (3,039) -BNP Paribas EUR JPY 15/06/17 76,540 9,398,578 (270) -BNP Paribas EUR JPY 15/06/17 52,000 6,313,824 (112) -BNP Paribas EUR JPY 15/06/17 11,121 1,336,125 (10) -BNP Paribas JPY EUR 03/04/17 22,828,768 190,271 152 -BNP Paribas JPY USD 03/04/17 1,821,097 16,474 (15) -BNP Paribas JPY EUR 03/04/17 326,864 2,727 2 -BNP Paribas JPY EUR 04/04/17 4,908,979 41,000 22 -BNP Paribas JPY EUR 04/04/17 1,338,715 11,181 6 -BNP Paribas JPY EUR 05/04/17 17,647,158 147,836 28 -BNP Paribas JPY EUR 05/04/17 1,363,235 11,420 2 -BNP Paribas JPY USD 05/04/17 325,014 2,907 1 -BNP Paribas JPY EUR 06/04/17 33,326,620 279,011 73 -BNP Paribas JPY EUR 06/04/17 359,129 3,007 1 -BNP Paribas JPY EUR 13/04/17 206,413,513 1,717,846 1,665 -BNP Paribas JPY EUR 13/04/17 129,128,793 1,077,793 668 -BNP Paribas JPY EUR 13/04/17 86,878,394 723,514 644 -BNP Paribas JPY EUR 13/04/17 56,958,547 475,413 295 -BNP Paribas JPY EUR 13/04/17 43,263,286 356,481 775 -BNP Paribas JPY EUR 13/04/17 31,187,941 257,021 554 -BNP Paribas JPY EUR 13/04/17 14,645,127 119,647 384 -BNP Paribas JPY EUR 13/04/17 13,570,136 111,460 285 -BNP Paribas JPY EUR 13/04/17 7,176,123 58,667 184 -BNP Paribas JPY EUR 13/04/17 6,975,155 57,593 111 -BNP Paribas JPY EUR 13/04/17 3,288,885 27,408 22 -BNP Paribas JPY EUR 13/04/17 2,692,720 22,445 17 -BNP Paribas JPY EUR 13/04/17 2,452,099 20,166 48 -BNP Paribas JPY EUR 13/04/17 2,033,558 16,630 51 -BNP Paribas JPY EUR 13/04/17 1,883,550 15,476 39 -BNP Paribas JPY EUR 13/04/17 293,815 2,445 2 -BNP Paribas JPY USD 15/06/17 154,128,448 1,401,220 (1,553) -BNP Paribas JPY USD 15/06/17 92,602,005 808,469 2,778 -BNP Paribas JPY USD 15/06/17 29,225,265 264,208 (129) -BNP Paribas JPY USD 15/06/17 25,604,104 230,980 (59) -BNP Paribas JPY USD 15/06/17 18,433,719 160,385 614 -BNP Paribas JPY USD 15/06/17 13,207,523 116,326 283 -

aberdeen-asset.com 173
Japanese Smaller Companies
Counterparty Buy Sell Settlement Buy Amount Sell Amount
Unrealised Gains/(Losses)
JP¥’000
Total Net Assets
%BNP Paribas JPY USD 15/06/17 8,743,316 78,961 (30) -BNP Paribas JPY USD 15/06/17 8,735,064 76,507 235 -BNP Paribas JPY EUR 15/06/17 8,219,655 68,373 65 -BNP Paribas JPY USD 15/06/17 7,120,361 62,353 193 -BNP Paribas JPY CHF 15/06/17 3,338,457 29,696 27 -BNP Paribas JPY USD 15/06/17 2,858,478 25,378 39 -BNP Paribas JPY USD 15/06/17 2,715,843 24,348 11 -BNP Paribas JPY USD 15/06/17 2,255,383 20,504 (23) -BNP Paribas JPY USD 15/06/17 1,966,653 17,414 32 -BNP Paribas JPY CHF 15/06/17 1,943,844 17,422 1 -BNP Paribas JPY USD 15/06/17 1,604,694 14,441 - -BNP Paribas JPY EUR 15/06/17 1,513,371 12,662 3 -BNP Paribas JPY USD 15/06/17 1,189,531 10,813 (12) -BNP Paribas JPY EUR 15/06/17 1,061,594 8,846 7 -BNP Paribas JPY USD 15/06/17 588,692 5,320 (2) -BNP Paribas JPY EUR 15/06/17 438,053 3,654 2 -BNP Paribas JPY EUR 15/06/17 392,837 3,225 8 -BNP Paribas JPY USD 15/06/17 263,953 2,402 (3) -BNP Paribas USD JPY 04/04/17 5,320 590,388 2 -BNP Paribas USD JPY 05/04/17 230,980 25,671,065 67 -BNP Paribas USD JPY 06/04/17 24,348 2,722,968 (10) -BNP Paribas USD JPY 15/06/17 58,835,708 6,677,805,753 (140,928) (0.18)BNP Paribas USD JPY 15/06/17 9,654,603 1,095,789,668 (23,125) (0.03)BNP Paribas USD JPY 15/06/17 1,830,162 209,725,056 (6,387) (0.01)BNP Paribas USD JPY 15/06/17 880,742 99,963,560 (2,110) -BNP Paribas USD JPY 15/06/17 833,417 94,592,167 (1,996) -BNP Paribas USD JPY 15/06/17 700,159 79,939,554 (2,149) -BNP Paribas USD JPY 15/06/17 635,000 72,071,992 (1,521) -BNP Paribas USD JPY 15/06/17 107,356 12,074,069 (146) -BNP Paribas USD JPY 15/06/17 78,744 8,993,947 (245) -BNP Paribas USD JPY 15/06/17 50,625 5,680,225 (56) -BNP Paribas USD JPY 15/06/17 43,006 4,771,640 7 -BNP Paribas USD JPY 15/06/17 24,645 2,824,106 (86) -BNP Paribas USD JPY 15/06/17 17,446 1,999,255 (61) -BNP Paribas USD JPY 15/06/17 16,474 1,816,111 14 -BNP Paribas USD JPY 15/06/17 2,907 324,209 (1) -Unrealised losses on forward currency exchange contracts (468,311) (0.58)
Unrealised losses on derivatives (468,311) (0.58)
Total investments 78,171,806 97.49Other net assets 2,013,475 2.51Total net assets 80,185,281 100.00
∞ A portion of this security is on loan at the period end.Currently forward positions are not collateralised.

174 Aberdeen Global
Latin American EquityFor the six months ended 31 March 2017
Performance For the six months ended 31 March 2017, the value of Latin American Equity - A Accumulation Shares increased by 10.83% compared to an increase of 11.07% in the benchmark, the MSCI EM Latin America 10/40 NR Index.Source: Lipper, Basis: total return, published NAV to NAV, net of annual charges, gross income reinvested, USD.Please see the Performance History section for details on the use of MSCI information.
Please remember that past performance is not a guide to future returns. The price of shares and the revenue from them may fall as well as rise. Investors may not get back the amount originally invested.
Market ReviewLatin American equities rose during the six months under review, outperforming the broader emerging markets. The US Federal Reserve’s two interest rate hikes were well-flagged, and the region benefited from increased risk appetite despite Donald Trump’s presidential election victory. An oil price rebound after major producers agreed to curb output also lifted sentiment.
Brazil’s economic contraction eased in 2016, with signs of bottoming out. President Michel Temer pressed on with structural reform. The senate passed laws to freeze social spending for 20 years and Temer vetoed a bill offering relief to debt-ridden states, in efforts to tame a budget deficit. These were accompanied by measures to support the ailing economy, such as additional loans for small businesses and tax relief for workers. The declining trajectory of inflation has also allowed the central bank to cut its benchmark Selic rate four times to revive the economy.
Chile cut rates for the first time since 2014, as economic growth faltered and inflation fell to its lowest in three years. The Chilean and Peruvian stockmarkets rose as commodities, particularly copper, rebounded after the US election. In Mexico, concerns over trade relations with the US, its biggest partner, began to dissipate towards the period-end, and after the central bank raised rates to help support the currency.
Portfolio Review Grana y Montero and BRF were the key detractors from relative performance. Grana y Montero became embroiled in a corruption investigation in Peru following allegations by former project partner Odebrecht. Grana y Montero strenuously denied the allegation and launched an internal investigation led by independent lawyers. It also began a board renewal process to add some well-known independent directors. Separately, BRF’s shares fell after an investigation into corruption across the domestic meat sector led some countries to temporarily suspend meat imports from Brazil. Operations at one of BRF’s poultry plants was temporarily suspended. In addition, the company’s fourth-quarter earnings showed it had suffered from weak domestic volumes coupled with margin pressures internationally.
Not holding state-owned lender Banco do Brasil also proved costly, as banks continued to outperform the wider market in anticipation of further interest rate cuts. However, the Fund’s holding in Itau Unibanco partly offset this, as the stock also did well during the review period.
Bradespar was another key contributor, as the stock re-rated after the announcement of a transformational restructuring of its primary asset, iron ore miner Vale. Shoemaker Arezzo Industria e Comercio was boosted by good earnings and gains in market share. Meanwhile, not holding Cielo was helpful, as the stock suffered on ongoing uncertainty over the regulatory environment.
In portfolio activity, we initiated a position in LINX, a retail-oriented software provider that was trading at attractive valuations. Against this, we sold our rights ahead of Multiplan’s capital raising. We added to Ambev, Grupo Aeroportuario del Centro Norte and TOTVS, on attractive valuations, and FEMSA, following a sell-off in Mexican stocks. Against this, we trimmed Tenaris following a solid rebound in its share price on the back of higher oil prices, Banco Bradesco, following a recovery in Brazilian banking stocks, and Vale, after iron-ore prices rose. We also trimmed Arezzo, on the back of share price strength.
OutlookLatin American equities are likely to remain supported by healthier risk appetite and expectations for improved earnings. Concerns that Donald Trump’s protectionist stance could hurt global trade appear to be moderating somewhat, as early fears seem overdone. While investors’ sentiment could shift again, we are unfazed by short-term volatility as indiscriminate selling or buying will provide opportunities for us as long-term investors.
The Brazilian economy is certainly not out of the woods yet, but the Temer administration continues to push forward with structural reforms that could help improve the business environment. Despite its obvious unpopularity, the proposed changes to the pension scheme would bring the policy in line with much of the developed world, and help the government to improve the country’s finances. Meanwhile, Mexico is taking a more proactive stance in renegotiating the terms of NAFTA. Risk perception around US trade and tax policy towards Mexico is becoming less negative. In Chile, the upcoming presidential election may be an opportunity for renewal as potential candidates begin to step forward.
A bottom-up approach to investment means continuously focusing on seeking out and holding companies with solid balance sheets that can withstand near-term challenges. We continue to find appeal in Latin America’s domestic growth stories, and there are ample stocks with good fundamentals that are well-positioned to gain from these longer-term trends.
Global Emerging Markets Equity Team April 2017

aberdeen-asset.com 175
Latin American Equity
Statement of Net AssetsAs at 31 March 2017
Notes US$'000AssetsInvestments in securities at market value 2.2 539,765 Cash at bank 7,706 Interest and dividends receivable 724 Subscriptions receivable 2,341 Unrealised gains on forward currency exchange contracts 2.6 39 Total assets 550,575 LiabilitiesTaxes and expenses payable 656 Redemptions payable 5,308 Total liabilities 5,964 Net assets at the end of the period 544,611
Statement of Changes in Net Assets For the period from 1 October 2016 to 31 March 2017
Notes US$'000Net assets at the beginning of the period 480,986 Net gains from investments 2,747 Net realised losses (2,353) Net unrealised gains 52,246 Proceeds from shares issued 324,105 Payments for shares redeemed (312,910) Net equalisation paid 10 (210) Net assets at the end of the period 544,611
Statement of Operations For the period from 1 October 2016 to 31 March 2017
Notes US$'000IncomeInvestment income 2.3 6,544 Bank interest 7 Stocklending income 16 10 Total income 6,561 ExpensesManagement fees 4.2 3,000 Operating, administrative and servicing fees 4.3 809 Other operational expenses 5 Total expenses 3,814 Net gains from investments 2,747
Realised losses on investments (1,699) Realised losses on forward currency exchange contracts (170) Realised currency exchange losses (484) Net realised losses (2,353)
Decrease in unrealised depreciation on investments 52,194 Decrease in unrealised depreciation on forward currency exchange contracts 55 Unrealised currency exchange losses (3) Net unrealised gains 52,246 Net increase in assets as a result of operations 52,640
Share Transactions For the period from 1 October 2016 to 31 March 2017
A-2 A(EUR)-2^ E(EUR)-2 I-2 S-2 X-2Shares outstanding at the beginning of the period 26,851 394,761 1,550,338 88,788 7,537 133,664 Shares issued during the period 22,362 363,487 1,542,116 50,664 1,816 4,279,253 Shares redeemed during the period (31,360) (391,199) (2,257,906) (41,789) (4,623) (944,610) Shares outstanding at the end of the period 17,853 367,049 834,548 97,663 4,730 3,468,307 Net asset value per share 3,532.8032 7.1507 9.3541 4,294.9862 3,491.0473 8.3119
Y(EUR)-2 Z-2Shares outstanding at the beginning of the period 305,655 2,213 Shares issued during the period 37,824 224 Shares redeemed during the period (9,257) (207) Shares outstanding at the end of the period 334,222 2,230 Net asset value per share 10.1196 881.2379
^ Base currency exposure share class.
The accompanying notes form an integral part of these financial statements.

176 Aberdeen Global
Latin American EquityPortfolio StatementAs at 31 March 2017
SecurityNominal/ Quantity
Market Value US$’000
Total Net Assets
%Transferable securities and money market instruments admitted to an official exchange listing or dealt on another regulated market 99.11%Equities 99.11%Argentina 2.23%Tenaris (ADR)∞ 356,081 12,158 2.23
Brazil 60.17%Ambev 4,433,833 25,479 4.68Arezzo Industria e Comercio 1,380,363 13,584 2.49Banco Bradesco 503,000 5,089 0.93Banco Bradesco (PREF) 3,897,250 39,739 7.30BM&F Bovespa 1,958,750 11,904 2.19Bradespar (PREF) 968,228 6,671 1.22BRF 1,213,450 14,759 2.71Cia Hering 791,150 4,460 0.82Iguatemi Empresa de Shopping Centers 649,950 6,713 1.23Itau Unibanco 4,143,469 44,090 8.11LINX 1,058,000 5,535 1.02Localiza Rent a Car 761,900 10,000 1.84Lojas Renner 3,129,850 27,420 5.03Multiplan Empreendimentos Imobiliarios 1,075,972 22,506 4.13Natura Cosmeticos 703,668 6,441 1.18OdontoPrev 2,022,650 7,183 1.32TOTVS 906,555 7,922 1.45Ultrapar Participacoes 924,714 20,852 3.83Vale 2,014,500 18,924 3.47Vale (ADR) 301,500 2,866 0.53Vale (ADR) (PREF) 148,562 1,335 0.25Valid Solucoes 660,518 4,698 0.86WEG 1,866,620 10,233 1.88Wilson Sons (BDR) 830,751 9,263 1.70
327,666 60.17
Chile 11.07%Banco Santander Chile (ADR) 667,021 16,739 3.07Embotelladora Andina 'A' (PREF) 4,456,361 16,844 3.10Parque Arauco 3,836,895 10,080 1.85SACI Falabella 1,986,190 16,616 3.05
60,279 11.07
Colombia 1.78%Bancolombia 1,067,600 9,699 1.78
Mexico 22.11%Arca Continental 1,641,300 11,324 2.08FEMSA (ADR) 265,902 23,551 4.32Grupo Aeroportuario del Centro Norte (ADR) 264,572 11,428 2.10Grupo Aeroportuario del Sureste (ADR) 76,800 13,319 2.45

aberdeen-asset.com 177
Latin American Equity
SecurityNominal/ Quantity
Market Value US$’000
Total Net Assets
%Grupo Financiero Banorte 3,899,550 22,299 4.09Grupo Financiero Santander Mexico 4,052,700 7,274 1.34Grupo Lala 3,621,675 6,525 1.20Kimberly-Clark de Mexico 3,162,064 6,821 1.25Organizacion Soriana 'B' 699,816 1,635 0.30Wal-Mart de Mexico 7,081,400 16,237 2.98
120,413 22.11
Peru 1.75%Cementos Pacasmayo 3,256,166 7,163 1.31Fossal 826,532 114 0.02Grana y Montero (ADR) 729,581 2,273 0.42
9,550 1.75
Total Equities 539,765 99.11
Total Transferable securities and money market instruments admitted to an official exchange listing or dealt on another regulated market 539,765 99.11
Derivatives 0.01%
Forward currency exchange contracts 0.01%
Counterparty Buy Sell Settlement Buy Amount Sell Amount
Unrealised Gains/(Losses)
US$’000
Total Net Assets
%BNP Paribas EUR USD 15/06/17 2,825,349 2,994,522 38 0.01BNP Paribas EUR USD 15/06/17 101,254 109,199 (1) -BNP Paribas EUR USD 15/06/17 61,428 66,175 - -BNP Paribas EUR USD 15/06/17 4,746 5,151 - -BNP Paribas EUR USD 15/06/17 3,995 4,325 - -BNP Paribas EUR USD 15/06/17 2,263 2,425 - -BNP Paribas USD EUR 06/04/17 2,417 2,263 - -BNP Paribas USD EUR 15/06/17 163,752 152,033 1 -BNP Paribas USD EUR 15/06/17 86,752 81,672 (1) -BNP Paribas USD EUR 15/06/17 72,037 66,520 1 -BNP Paribas USD EUR 15/06/17 12,773 11,964 - -BNP Paribas USD EUR 15/06/17 7,781 7,335 - -BNP Paribas USD EUR 15/06/17 7,142 6,704 - -BNP Paribas USD EUR 15/06/17 4,835 4,466 - -BNP Paribas USD EUR 15/06/17 3,778 3,465 - -BNP Paribas USD EUR 15/06/17 3,703 3,436 - -Goldman Sachs USD EUR 03/04/17 110,066 101,986 1 -JPM Chase USD EUR 04/04/17 21,948 20,436 - -Royal Bank of Canada USD EUR 05/04/17 35,052 32,831 - -Unrealised gains on forward currency exchange contracts 39 0.01
Unrealised gains on derivatives 39 0.01
Total investments 539,804 99.12Other net assets 4,807 0.88Total net assets 544,611 100.00
∞ A portion of this security is on loan at the period end.Currently forward positions are not collateralised.

178 Aberdeen Global
Multi Asset Growth For the six months ended 31 March 2017
Performance For the six months ended 31 March 2017, the value of Multi Asset Growth – A Accumulation Shares increased by 4.53% compared to an increase of 2.06% in the benchmark, 1 Month Euribor +4.5% Index.Source: Lipper, Basis: total return, published NAV to NAV, net of annual charges, gross income reinvested, EUR.
Please remember that past performance is not a guide to future returns. The price of shares and the revenue from them may fall as well as rise. Investors may not get back the amount originally invested.
Market reviewMost global equity markets rose over the six months under review, with the best gains in Japan, where the stock market climbed sharply in the latter months of 2016, largely on hopes that yen weakness would boost the profits of the country’s exporters particularly within Asia. Economic data showing that the Chinese economy remained more robust than expected also helped buoy sentiment and boosted regional markets. European equities also performed well, with economic data underpinning investor confidence despite prevailing political uncertainty. In the US, investors appeared optimistic that President Donald Trump’s promises to reduce taxes, increase infrastructure spending and slash regulation would boost economic growth; the stock market hit record levels in November. However, investors became slightly more circumspect in the last few weeks of the reporting period due to the content of some of the new administration’s executive orders.
The global high-yield segment performed well, generating a positive return and high-income yield over the period. This was in contrast to investment-grade credit and government bonds. Emerging-market debt experienced a sell-off in November, perpetrated by Trump’s election. However, this largely reversed in early 2017, with the asset class producing a small negative return over the reporting period.
Some cash flow-generative assets, including real assets such as infrastructure and aircraft leasing, produced good levels of income and positive total returns over the period.
Portfolio reviewThe main asset allocation change over the six months was an increase in our local-currency emerging-market debt weighting. We believe that the medium and long-term prospects for growth in emerging economies are significantly greater than those of developed economies, and this should boost returns in emerging-market bonds through real currency appreciation. This was predominantly funded by a reduction in low volatility equities. There was also a slight decrease in our exposure to high yield.
In absolute return, we allocated to an alternative risk premia strategy. The strategy provides exposure to a broad collection of diversifying risk premia indices across equities, fixed income, currencies and commodities. The underlying indices are provided by Goldman Sachs and the asset allocation between the indices is managed by Aberdeen’s highly experienced hedge fund team.
In asset-backed securities, we invested in the Prytania Diversified Asset-Backed Securities Fund. This is a fund established for our Diversified Multi-Asset portfolios that invests in a diversified portfolio of asset-backed securities. We also added positions in several loan funds that invest in the more junior segments of collateralised loan obligations and offer attractive risk-return profiles.
In special opportunities, we continued to add positions that offer attractive potential returns which are generally uncorrelated with wider financial markets. We also took a strategic stake in the Aberdeen Diversified Income and Growth Trust (ADIG). As a closed-end fund, ADIG is able to invest in a number of illiquid specialist alternative assets that cannot be incorporated into a diversified growth fund and as such has a higher expected return for a similar level of risk.
OutlookIn the shorter term, we are positive on the outlook for equities and other risk assets. Growth appears to be improving, in particular in the US, and this has the potential to be boosted at the margin by modest fiscal stimulus from President Trump. Central bank policy remains supportive in Europe and Japan, and in China we believe the government will continue to prioritise growth over the necessary rebalancing of the economy in the near term.
This positive base case is somewhat countered by greater uncertainty. In the US, the policies of a Trump-led administration are still unclear, given differences in opinion over free trade and fiscal stimulus. In Europe, uncertainty comes largely from the Brexit negotiations and rising populist political pressures. In China, levels of credit growth are unsustainable but it is unclear when this issue might be addressed. This potentially has significant knock-on effects on other emerging markets.
Both the challenging long-term investment environment and the heightened near-term risks highlight the importance of having a diversified portfolio. We continue to see attractions in a range of asset classes with different return drivers and hence are not excessively exposed to equity markets or any other asset class.
Diversified Multi-Asset Team April 2017

aberdeen-asset.com 179
Multi Asset Growth
Statement of Net AssetsAs at 31 March 2017
Notes €’000AssetsInvestments in securities at market value 2.2 24,914 Cash at bank 2,252 Amounts held at futures clearing houses and brokers 20 Interest and dividends receivable 182 Subscriptions receivable 93 Receivable for investments sold 1,730 Unrealised gains on future contracts 2.7 52 Other assets 1 Total assets 29,244 LiabilitiesPayable for investments purchased 1,859 Taxes and expenses payable 20 Unrealised losses on forward currency exchange contracts 2.6 107 Total liabilities 1,986 Net assets at the end of the period 27,258
Statement of Changes in Net Assets For the period from 1 October 2016 to 31 March 2017
Notes €’000Net assets at the beginning of the period 20,782 Net gains from investments 285 Net realised gains 94 Net unrealised gains 655 Proceeds from shares issued 13,772 Payments for shares redeemed (8,368) Net equalisation received 10 38 Net assets at the end of the period 27,258
Statement of Operations For the period from 1 October 2016 to 31 March 2017
Notes €’000IncomeInvestment income 2.3 412 Total income 412 ExpensesManagement fees 4.2 89 Operating, administrative and servicing fees 4.3 37 Bank interest 1 Total expenses 127 Net gains from investments 285
Realised gains on investments 300 Realised gains on future contracts 47 Realised losses on forward currency exchange contracts (238) Realised currency exchange losses (15) Net realised gains 94
Increase in unrealised appreciation on investments 906 Decrease in unrealised depreciation on future contracts 59 Decrease in unrealised appreciation on forward currency exchange contracts (309) Unrealised currency exchange losses (1) Net unrealised gains 655 Net increase in assets as a result of operations 1,034

180 Aberdeen Global
Multi Asset Growth
Share Transactions For the period from 1 October 2016 to 31 March 2017
A-1 A-2 A(SGD)-2^ I-2 W-2 X-2Shares outstanding at the beginning of the period 500,087 499,417 - 500,000 600 500,000 Shares issued during the period 16,531 72,335 90,000 473,287 22,081 1,186 Shares redeemed during the period (159,345) (499,549) - (58,077) - - Shares outstanding at the end of the period 357,273 72,203 90,000 915,210 22,681 501,186 Net asset value per share 10.7891 10.8503 10.0789 10.9063 10.4830 10.9027
Z-2 Z(GBP)-2^
Shares outstanding at the beginning of the period - - Shares issued during the period 616,737 50,398 Shares redeemed during the period (80,000) - Shares outstanding at the end of the period 536,737 50,398 Net asset value per share 10.6187 10.6865
^ Base currency exposure share class.
The accompanying notes form an integral part of these financial statements.

aberdeen-asset.com 181
Multi Asset Growth Portfolio StatementAs at 31 March 2017
SecurityNominal/Quantity
Market Value €’000
Total Net Assets
%Transferable securities and money market instruments admitted to an official exchange listing or dealt on another regulated market 79.95%Bonds 24.26%Corporate Bonds 8.69%Brazil 0.24%JBS Finance 5.7500 15/06/25 30,000 28 0.10Petrobras Global Finance 5.3750 27/01/21 39,000 38 0.14
66 0.24
Canada 0.20%Gateway Casinos & Entertainment 8.2500 01/03/24 27,000 26 0.10Kissner 8.3750 01/12/22 7,000 7 0.02MEG Energy 7.0000 31/03/24 17,000 14 0.05MEG Energy 6.5000 15/01/25 4,000 4 0.01Telesat 8.8750 15/11/24 5,000 5 0.02
56 0.20
Mexico 0.59%Petroleos Mexicanos 7.1900 12/09/24 3,635,000 160 0.59
Peru 0.10%InRetail Consumer 5.2500 10/10/21 27,000 26 0.10
Spain 0.37%Obrascon Huarte Lain (EMTN) 7.6250 15/03/20 100,000 99 0.37
United Kingdom 0.05%Royal Bank of Scotland (PERP) VAR 29/08/49 12,000 13 0.05
United States 7.14%Airxcel 8.5000 15/02/22 11,000 11 0.04Albertsons 5.7500 15/03/25 25,000 23 0.08American Axle & Manufacturing 6.2500 01/04/25 7,000 7 0.02AmeriGas Finance 5.8750 20/08/26 15,000 14 0.05Avis Budget Car Rental 5.2500 15/03/25 38,000 33 0.12Bank of America (PERP) VAR 29/09/49 35,000 34 0.13Blue Racer Midstream Finance 6.1250 15/11/22 37,000 35 0.13Boyd Gaming 6.3750 01/04/26 13,000 13 0.05CalAtlantic 5.8750 15/11/24 13,000 13 0.05Callon Petroleum 6.1250 01/10/24 3,000 3 0.01Carrizo Oil & Gas 6.2500 15/04/23 15,000 14 0.05CCO Capital 5.7500 15/02/26 33,000 32 0.12Cengage Learning 9.5000 15/06/24 41,000 34 0.13CenturyLink 7.5000 01/04/24 40,000 40 0.15Cenveo 6.0000 01/08/19 15,000 12 0.04Change Healthcare Finance 5.7500 01/03/25 9,000 9 0.03Cheniere Corpus Christi 5.8750 31/03/25 25,000 24 0.09
MaturityCoupon (%)

182 Aberdeen Global
Multi Asset Growth
SecurityNominal/Quantity
Market Value €’000
Total Net Assets
%Citgo 10.7500 15/02/20 22,000 22 0.08Cogent Communications 5.3750 01/03/22 10,000 10 0.04Continental Resources 3.8000 01/06/24 31,000 27 0.10Dana Financing Luxembourg 6.5000 01/06/26 34,000 33 0.12DISH DBS 5.8750 15/11/24 37,000 36 0.13Dynegy 7.6250 01/11/24 10,000 9 0.03EMI Music Publishing 7.6250 15/06/24 43,000 44 0.16Endo Finance 5.7500 15/01/22 30,000 26 0.09Equinix 5.3750 01/04/23 13,000 13 0.05First Data 7.0000 01/12/23 41,000 41 0.15Florida East Coast 9.7500 01/05/20 10,000 10 0.04Fresh Market 9.7500 01/05/23 33,000 25 0.09Frontier Communications 6.8750 15/01/25 40,000 31 0.11Gardner Denver 6.8750 15/08/21 35,000 34 0.12GCP Applied Technologies 9.5000 01/02/23 15,000 16 0.06Goldman Sachs (PERP) VAR 29/12/49 27,000 26 0.09Hardwoods Acquisition 7.5000 01/08/21 10,000 8 0.03HCA 7.5000 15/02/22 33,000 35 0.13HD Supply 5.7500 15/04/24 33,000 33 0.12Herc Rentals 7.7500 01/06/24 13,000 13 0.05Hilcorp Energy Finance I 5.7500 01/10/25 10,000 9 0.03JC Penney 5.8750 01/07/23 24,000 22 0.08KB Home 7.0000 15/12/21 23,000 24 0.09Landry's 6.7500 15/10/24 74,000 72 0.25Level 3 Financing 5.2500 15/03/26 23,000 22 0.08Manitowoc Foodservice 9.5000 15/02/24 30,000 32 0.12MGM Resorts International 4.6250 01/09/26 24,000 22 0.08Morgan Stanley (PERP) VAR 29/12/49 42,000 40 0.15Nationstar Mortgage 6.5000 01/06/22 14,000 13 0.05NCR 5.0000 15/07/22 36,000 34 0.13Neiman Marcus 8.0000 15/10/21 13,000 7 0.03New Enterprise Stone & Lime 10.1250 01/04/22 5,000 5 0.02NewStar Financial 7.2500 01/05/20 32,000 31 0.11Oasis Petroleum 6.8750 15/03/22 41,000 39 0.14Park-Ohio Industries 8.1250 01/04/21 57,000 55 0.20PDC Energy 6.1250 15/09/24 10,000 10 0.04Post 5.0000 15/08/26 30,000 27 0.10Rite Aid 6.1250 01/04/23 58,000 54 0.20Sabine Pass Liquefaction 5.6250 01/03/25 34,000 35 0.13Scientific Games International 7.0000 01/01/22 35,000 35 0.13Sealed Air 5.5000 15/09/25 14,000 14 0.05Service International 5.3750 15/05/24 14,000 14 0.05Sinclair Television 5.8750 15/03/26 34,000 33 0.12Sprint 7.8750 15/09/23 39,000 40 0.15Summit Materials Finance 6.1250 15/07/23 34,000 33 0.12Sunoco Finance 6.2500 15/04/21 44,000 42 0.15Tenet Healthcare 8.1250 01/04/22 47,000 46 0.17TerraForm Power Operating 5.8750 01/02/23 33,000 32 0.12
MaturityCoupon (%)

aberdeen-asset.com 183
Multi Asset Growth
SecurityNominal/Quantity
Market Value €’000
Total Net Assets
%T-Mobile USA 6.0000 15/04/24 28,000 28 0.10United Rentals North America 6.1250 15/06/23 22,000 22 0.08Valeant Pharmaceuticals 7.5000 15/07/21 37,000 30 0.11Valvoline Finco Two 5.5000 15/07/24 10,000 10 0.04Whiting Petroleum 5.0000 15/03/19 35,000 33 0.12WMG Acquisition 5.6250 15/04/22 36,000 35 0.13WR Grace & Co-Conn 5.1250 01/10/21 19,000 19 0.07XPO Logistics 6.1250 01/09/23 33,000 32 0.12Zayo Capital 6.0000 01/04/23 54,000 54 0.20
1,948 7.14
Total Corporate Bonds 2,368 8.69
Government Bonds 15.57%Argentina 0.30%Argentina (Republic of) 16.0000 17/10/23 1,285,000 83 0.30
Brazil 1.98%Brazil (Federal Republic of) 10.0000 01/01/27 1,395,000 410 1.51Brazil (Federal Republic of) 10.0000 01/01/25 300,000 91 0.33Brazil (Federal Republic of) 6.0000 15/05/45 40,000 39 0.14
540 1.98
Colombia 0.80%Colombia (Republic of) 7.0000 04/05/22 416,000,000 139 0.51Colombia (Republic of) 7.5000 26/08/26 228,600,000 78 0.29
217 0.80
Ghana 0.16%Ghana (Republic of) 24.7500 19/07/21 180,000 45 0.16
Indonesia 2.00%Indonesia (Republic of) 9.0000 15/03/29 4,050,000,000 319 1.17Indonesia (Republic of) 9.0000 15/09/18 1,789,000,000 130 0.48Indonesia (Republic of) 8.3750 15/03/34 1,282,000,000 95 0.35
544 2.00
Malaysia 1.47%Malaysia (Government of) 4.3780 29/11/19 892,000 192 0.70Malaysia (Government of) 4.4980 15/04/30 525,000 111 0.41Malaysia (Government of) 4.0480 30/09/21 460,000 98 0.36
401 1.47
Mexico 1.23%Mexico (Government of) 8.0000 11/06/20 3,519,200 181 0.66Mexico (Government of) 7.7500 13/11/42 1,740,000 89 0.33Mexico (Government of) 6.5000 09/06/22 1,330,000 65 0.24
335 1.23
MaturityCoupon (%)

184 Aberdeen Global
Multi Asset Growth
SecurityNominal/Quantity
Market Value €’000
Total Net Assets
%Peru 0.41%Peru (Republic of) 6.9500 12/08/31 365,000 113 0.41
Poland 1.29%Poland (Republic of) 5.7500 25/10/21 625,000 166 0.62Poland (Republic of) 1.5000 25/04/20 620,000 143 0.52Poland (Republic of) 5.7500 25/04/29 145,000 42 0.15
351 1.29
Russian Federation 2.00%Russia (Federation of) 7.0500 19/01/28 23,204,000 361 1.33Russia (Federation of) 7.5000 27/02/19 11,083,000 182 0.67
543 2.00
South Africa 1.71%South Africa (Republic of) 10.5000 21/12/26 3,465,000 267 0.98South Africa (Republic of) 6.2500 31/03/36 4,040,000 200 0.73
467 1.71
Turkey 1.97%Turkey (Republic of) 10.7000 17/02/21 1,580,000 403 1.47Turkey (Republic of) 10.6000 11/02/26 530,000 135 0.50
538 1.97
Uruguay 0.25%Uruguay (Republic of) 5.0000 14/09/18 913,149 67 0.25
Total Government Bonds 4,244 15.57
Total Bonds 6,612 24.26
Equities 55.69%Australia 0.92%AGL Energy 2,122 40 0.15Ansell 913 16 0.06CIMIC 632 16 0.06Cochlear 224 22 0.08Fortescue Metals 9,088 39 0.14Lendlease 2,940 33 0.12Metcash 9,590 17 0.06Qantas Airways 5,991 17 0.06Seven West Media 28,054 16 0.06Sonic Healthcare 1,104 17 0.06Vicinity Centres (REIT) 8,889 18 0.07
251 0.92
Belgium 0.05%Bpost 657 14 0.05
MaturityCoupon (%)

aberdeen-asset.com 185
Multi Asset Growth
SecurityNominal/Quantity
Market Value €’000
Total Net Assets
%Bermuda 2.09%Blue Capital Global Reinsurance Fund 461,112 453 1.66Blue Capital Reinsurance 6,545 118 0.43
571 2.09
Canada 0.86%Bank of Montreal 408 28 0.10Canadian Imperial Bank of Commerce 253 20 0.07CGI 'A' 900 40 0.15George Weston 242 20 0.07Loblaw 1,231 63 0.24Metro 660 19 0.07RioCan (REIT) 1,200 22 0.08Saputo 682 22 0.08
234 0.86
China 0.06%FIH Mobile 45,000 16 0.06
Czech Republic 0.12%MONETA Money Bank 4,657 15 0.05O2 Czech Republic 1,589 16 0.07
31 0.12
Denmark 0.34%H Lundbeck 393 17 0.06ISS 1,024 36 0.13Novo Nordisk 'B' 1,255 41 0.15
94 0.34
Finland 0.16%UPM-Kymmene 1,963 43 0.16
France 0.63%Atos 500 58 0.22Ingenico 219 19 0.07Peugeot 2,220 42 0.15Thales 580 53 0.19
172 0.63
Germany 0.30%Covestro 287 21 0.08Deutsche Lufthansa 1,343 20 0.07MAN 219 22 0.08Uniper 1,223 19 0.07
82 0.30

186 Aberdeen Global
Multi Asset Growth
SecurityNominal/Quantity
Market Value €’000
Total Net Assets
%Guernsey 12.31%Amedeo Air Four Plus 168,993 206 0.76Bluefield Solar Income Fund 211,192 275 1.01Doric Nimrod Air Three 74,726 90 0.33DP Aircraft 213,659 210 0.77John Laing Infrastructure Fund 83,759 131 0.48NB Global Floating Rate Income Fund 1,188,710 1,354 4.96NextEnergy Solar Fund 160,685 208 0.76Renewables Infrastructure 344,242 433 1.59SQN Asset Finance Income Fund 23,953 30 0.11TwentyFour Income Fund 300,757 419 1.54
3,356 12.31
Hong Kong 1.09%CLP 4,500 45 0.16Hongkong Land 3,200 23 0.08Huabao International 35,000 19 0.07Jardine Matheson 500 30 0.11Jardine Strategic 1,100 43 0.16NWS 9,000 15 0.06PCCW 26,000 14 0.05Power Assets 4,000 32 0.12WH 27,000 22 0.08Wheelock 5,000 37 0.14Yue Yuen Industrial 4,500 17 0.06
297 1.09
Hungary 0.11%Gedeon Richter 726 15 0.06Magyar Telekom 8,917 14 0.05
29 0.11
Israel 0.11%Azrieli 327 16 0.06Strauss 936 15 0.05
31 0.11
Japan 3.68%Adastria Co 500 12 0.04Amada Co 2,200 23 0.09Aozora Bank 5,000 17 0.06Astellas Pharma Inc 3,800 47 0.17Azbil Corp 500 16 0.06Canon Marketing Japan Inc 900 17 0.06Chubu Electric Power Co 1,400 18 0.06Coca-Cola West Co 500 15 0.06COLOPL 1,800 16 0.06Comsys Holdings Corp 800 13 0.05

aberdeen-asset.com 187
Multi Asset Growth
SecurityNominal/Quantity
Market Value €’000
Total Net Assets
%Daiichi Sankyo Co 1,900 40 0.15Daito Trust Construction Co 400 51 0.19Fuji Heavy Industries 1,700 58 0.20Gree 2,700 16 0.06Heiwa Corp 600 14 0.05Idemitsu Kosan Co 600 19 0.07Kajima Corp 5,000 30 0.11Kandenko Co 2,000 17 0.06Konami Holdings Corp 500 20 0.07Maeda Road Construction Co 1,000 17 0.06Maruichi Steel Tube 500 13 0.05Matsumotokiyoshi Holdings Co 300 13 0.05Megmilk Snow Brand Co 600 15 0.06Meiji Holdings Co 500 39 0.14Mitsubishi Gas Chemical 800 16 0.06Mitsubishi Shokuhin Co 500 14 0.05NH Foods 1,000 25 0.09Nichirei Corp 700 16 0.06Nippo Corp 1,000 18 0.07NTT 1,000 40 0.15NTT Data Corp 300 13 0.05Obayashi Corp 3,700 32 0.12Osaka Gas Co 6,000 21 0.08SCREEN Holdings Co 300 21 0.08Sega Sammy Holdings 1,200 15 0.06Sumitomo Corp 6,100 76 0.27Sumitomo Osaka Cement Co 4,000 16 0.06Sundrug Co 400 13 0.05Taisei Corp 6,000 41 0.15TIS Corp 700 17 0.06Toppan Forms Co 1,500 14 0.05Toyota Boshoku Corp 600 13 0.05Yamada Denki Co 2,700 13 0.05Yamato Kogyo Co 500 12 0.04
1,002 3.68
Malaysia 0.17%AirAsia 25,600 17 0.06Tenaga Nasional 9,700 28 0.11
45 0.17
Mexico 0.11%Gentera 10,600 16 0.06Industrias CH 2,400 13 0.05
29 0.11
Netherlands 0.30%Gemalto 324 17 0.06Koninklijke Ahold Delhaize 3,220 65 0.24
82 0.30

188 Aberdeen Global
Multi Asset Growth
SecurityNominal/Quantity
Market Value €’000
Total Net Assets
%New Zealand 0.08%Fisher & Paykel Healthcare 3,512 22 0.08
Poland 0.06%Asseco Poland 1,177 15 0.06
Singapore 0.17%HPH 34,900 14 0.05Venture 2,100 16 0.06Yanlord Land 14,700 18 0.06
48 0.17
South Africa 0.12%Harmony Gold Mining 6,765 16 0.06Kumba Iron Ore 1,290 18 0.06
34 0.12
South Korea 2.24%BGF Retail 188 16 0.06Hyundai Marine & Fire Insurance 473 14 0.05Hyundai Mobis 342 69 0.25Kangwon Land 634 20 0.07Kia Motors 1,361 42 0.15Korea Electric Power 1,376 53 0.20KT&G 455 37 0.14LG Electronics 580 33 0.12LG Uplus 1,403 17 0.06LS 268 14 0.05Nongshim 50 13 0.05POSCO 384 94 0.35Samsung Electronics 51 88 0.32Samsung Fire & Marine Insurance 102 23 0.08SK Innovation 326 45 0.17S-1 178 13 0.05Woori Bank 1,743 19 0.07
610 2.24
Spain 0.56%Aena 355 53 0.20Amadeus IT 1,056 50 0.18Avangrid 300 12 0.04Endesa 998 22 0.08Iberdrola 90 1 -Mediaset Espana Comunicacion 1,360 16 0.06
154 0.56
Sweden 0.13%Electrolux 'B' 660 17 0.06ICA 603 20 0.07
37 0.13
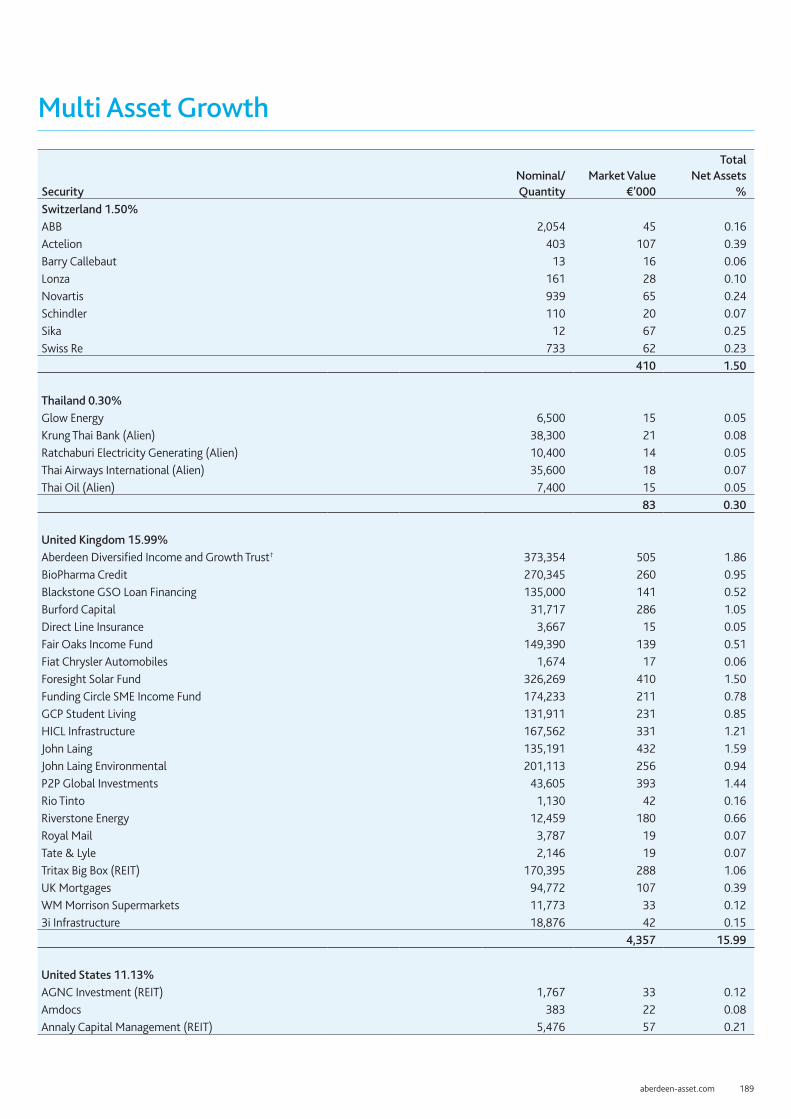
aberdeen-asset.com 189
Multi Asset Growth
SecurityNominal/Quantity
Market Value €’000
Total Net Assets
%Switzerland 1.50%ABB 2,054 45 0.16Actelion 403 107 0.39Barry Callebaut 13 16 0.06Lonza 161 28 0.10Novartis 939 65 0.24Schindler 110 20 0.07Sika 12 67 0.25Swiss Re 733 62 0.23
410 1.50
Thailand 0.30%Glow Energy 6,500 15 0.05Krung Thai Bank (Alien) 38,300 21 0.08Ratchaburi Electricity Generating (Alien) 10,400 14 0.05Thai Airways International (Alien) 35,600 18 0.07Thai Oil (Alien) 7,400 15 0.05
83 0.30
United Kingdom 15.99%Aberdeen Diversified Income and Growth Trust† 373,354 505 1.86BioPharma Credit 270,345 260 0.95Blackstone GSO Loan Financing 135,000 141 0.52Burford Capital 31,717 286 1.05Direct Line Insurance 3,667 15 0.05Fair Oaks Income Fund 149,390 139 0.51Fiat Chrysler Automobiles 1,674 17 0.06Foresight Solar Fund 326,269 410 1.50Funding Circle SME Income Fund 174,233 211 0.78GCP Student Living 131,911 231 0.85HICL Infrastructure 167,562 331 1.21John Laing 135,191 432 1.59John Laing Environmental 201,113 256 0.94P2P Global Investments 43,605 393 1.44Rio Tinto 1,130 42 0.16Riverstone Energy 12,459 180 0.66Royal Mail 3,787 19 0.07Tate & Lyle 2,146 19 0.07Tritax Big Box (REIT) 170,395 288 1.06UK Mortgages 94,772 107 0.39WM Morrison Supermarkets 11,773 33 0.123i Infrastructure 18,876 42 0.15
4,357 15.99
United States 11.13%AGNC Investment (REIT) 1,767 33 0.12Amdocs 383 22 0.08Annaly Capital Management (REIT) 5,476 57 0.21
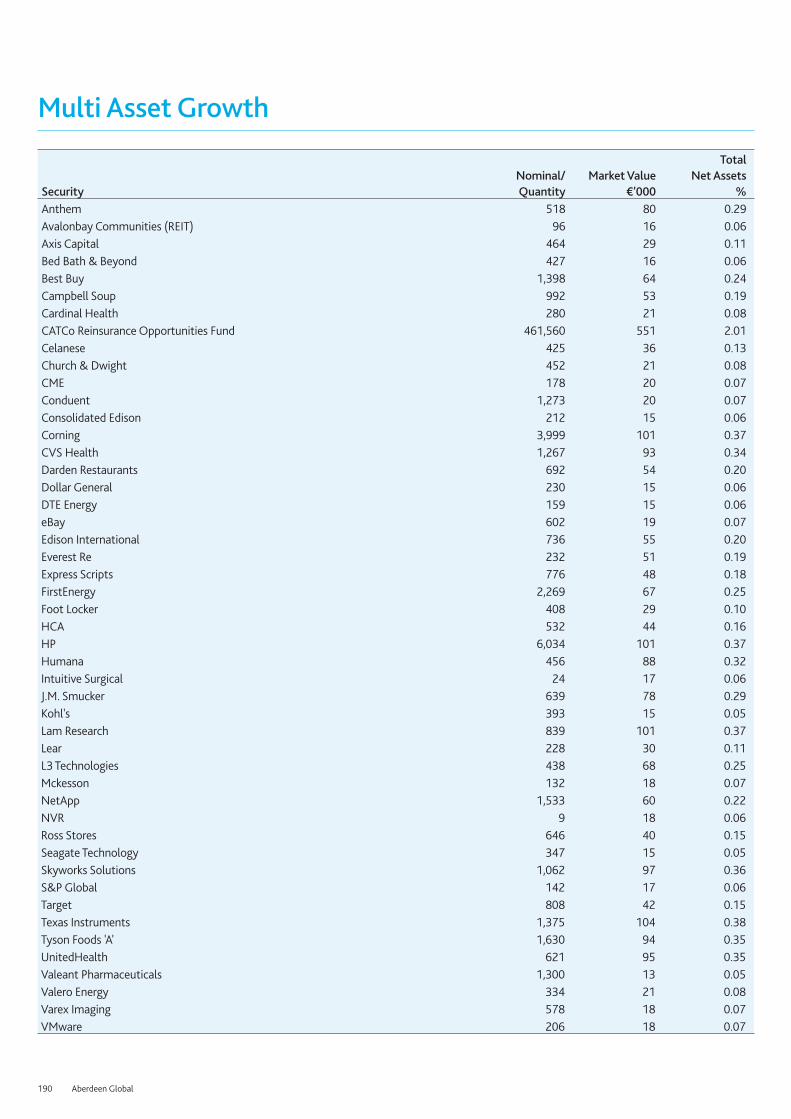
190 Aberdeen Global
Multi Asset Growth
SecurityNominal/Quantity
Market Value €’000
Total Net Assets
%Anthem 518 80 0.29Avalonbay Communities (REIT) 96 16 0.06Axis Capital 464 29 0.11Bed Bath & Beyond 427 16 0.06Best Buy 1,398 64 0.24Campbell Soup 992 53 0.19Cardinal Health 280 21 0.08CATCo Reinsurance Opportunities Fund 461,560 551 2.01Celanese 425 36 0.13Church & Dwight 452 21 0.08CME 178 20 0.07Conduent 1,273 20 0.07Consolidated Edison 212 15 0.06Corning 3,999 101 0.37CVS Health 1,267 93 0.34Darden Restaurants 692 54 0.20Dollar General 230 15 0.06DTE Energy 159 15 0.06eBay 602 19 0.07Edison International 736 55 0.20Everest Re 232 51 0.19Express Scripts 776 48 0.18FirstEnergy 2,269 67 0.25Foot Locker 408 29 0.10HCA 532 44 0.16HP 6,034 101 0.37Humana 456 88 0.32Intuitive Surgical 24 17 0.06J.M. Smucker 639 78 0.29Kohl's 393 15 0.05Lam Research 839 101 0.37Lear 228 30 0.11L3 Technologies 438 68 0.25Mckesson 132 18 0.07NetApp 1,533 60 0.22NVR 9 18 0.06Ross Stores 646 40 0.15Seagate Technology 347 15 0.05Skyworks Solutions 1,062 97 0.36S&P Global 142 17 0.06Target 808 42 0.15Texas Instruments 1,375 104 0.38Tyson Foods 'A' 1,630 94 0.35UnitedHealth 621 95 0.35Valeant Pharmaceuticals 1,300 13 0.05Valero Energy 334 21 0.08Varex Imaging 578 18 0.07VMware 206 18 0.07
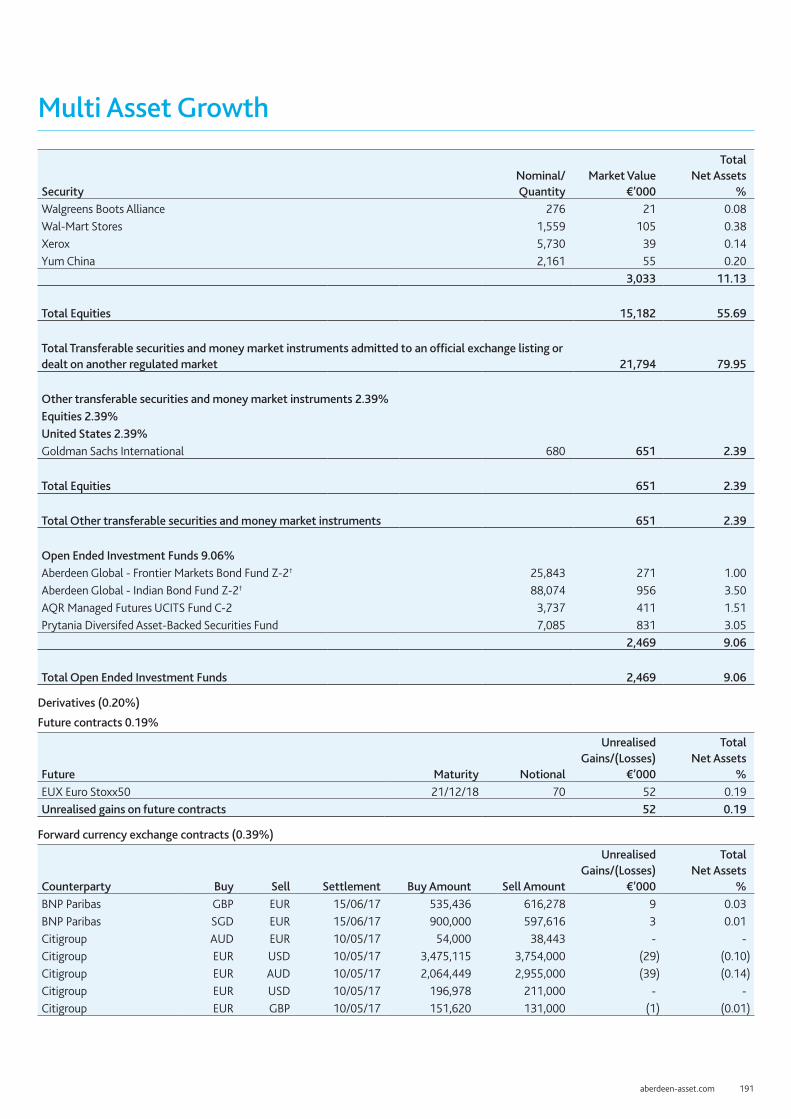
aberdeen-asset.com 191
Multi Asset Growth
SecurityNominal/Quantity
Market Value €’000
Total Net Assets
%Walgreens Boots Alliance 276 21 0.08Wal-Mart Stores 1,559 105 0.38Xerox 5,730 39 0.14Yum China 2,161 55 0.20
3,033 11.13
Total Equities 15,182 55.69
Total Transferable securities and money market instruments admitted to an official exchange listing or dealt on another regulated market 21,794 79.95
Other transferable securities and money market instruments 2.39%Equities 2.39%United States 2.39%Goldman Sachs International 680 651 2.39
Total Equities 651 2.39
Total Other transferable securities and money market instruments 651 2.39
Open Ended Investment Funds 9.06%Aberdeen Global - Frontier Markets Bond Fund Z-2† 25,843 271 1.00Aberdeen Global - Indian Bond Fund Z-2† 88,074 956 3.50AQR Managed Futures UCITS Fund C-2 3,737 411 1.51Prytania Diversifed Asset-Backed Securities Fund 7,085 831 3.05
2,469 9.06
Total Open Ended Investment Funds 2,469 9.06
Derivatives (0.20%)
Future contracts 0.19%
Future Maturity Notional
Unrealised Gains/(Losses)
€’000
Total Net Assets
%EUX Euro Stoxx50 21/12/18 70 52 0.19Unrealised gains on future contracts 52 0.19
Forward currency exchange contracts (0.39%)
Counterparty Buy Sell Settlement Buy Amount Sell Amount
Unrealised Gains/(Losses)
€’000
Total Net Assets
%BNP Paribas GBP EUR 15/06/17 535,436 616,278 9 0.03BNP Paribas SGD EUR 15/06/17 900,000 597,616 3 0.01Citigroup AUD EUR 10/05/17 54,000 38,443 - -Citigroup EUR USD 10/05/17 3,475,115 3,754,000 (29) (0.10)Citigroup EUR AUD 10/05/17 2,064,449 2,955,000 (39) (0.14)Citigroup EUR USD 10/05/17 196,978 211,000 - -Citigroup EUR GBP 10/05/17 151,620 131,000 (1) (0.01)

192 Aberdeen Global
Multi Asset Growth
Counterparty Buy Sell Settlement Buy Amount Sell Amount
Unrealised Gains/(Losses)
€’000
Total Net Assets
%Citigroup EUR GBP 10/05/17 144,672 125,000 (1) -Citigroup EUR GBP 10/05/17 69,916 61,000 (1) -Citigroup EUR USD 10/05/17 35,089 38,000 - -Citigroup EUR USD 10/05/17 31,251 33,000 - -Citigroup EUR GBP 10/05/17 17,258 15,000 - -Citigroup GBP EUR 10/05/17 56,000 64,314 1 -Citigroup GBP EUR 10/05/17 27,000 31,008 1 -Citigroup JPY EUR 10/05/17 20,045,000 165,082 3 0.01Citigroup USD EUR 10/05/17 52,000 49,005 - -Citigroup USD EUR 10/05/17 30,000 27,865 - -Goldman Sachs EUR GBP 10/05/17 3,785,493 3,227,000 16 0.06Goldman Sachs EUR JPY 10/05/17 2,185,591 267,076,000 (56) (0.19)Goldman Sachs EUR USD 10/05/17 465,586 502,000 (3) (0.01)Goldman Sachs EUR JPY 10/05/17 292,356 35,480,000 (5) (0.02)Goldman Sachs EUR AUD 10/05/17 210,738 298,000 (1) -Goldman Sachs EUR GBP 10/05/17 143,221 123,000 - -Goldman Sachs EUR USD 10/05/17 125,940 133,000 2 0.01Goldman Sachs EUR USD 10/05/17 106,860 116,000 (1) (0.01)Goldman Sachs EUR USD 10/05/17 106,713 113,000 1 -Goldman Sachs EUR GBP 10/05/17 82,377 72,000 (2) (0.01)Goldman Sachs EUR USD 10/05/17 71,963 77,000 - -Goldman Sachs EUR GBP 10/05/17 56,062 49,000 (1) -Goldman Sachs EUR USD 10/05/17 49,037 52,000 1 -Goldman Sachs EUR GBP 10/05/17 45,004 39,000 (1) -Goldman Sachs EUR USD 10/05/17 39,703 43,000 - -Goldman Sachs EUR GBP 10/05/17 38,927 34,000 (1) -Goldman Sachs EUR AUD 10/05/17 24,530 34,000 - -Goldman Sachs EUR USD 10/05/17 16,921 18,000 - -Goldman Sachs EUR JPY 10/05/17 14,481 1,750,000 - -Goldman Sachs EUR USD 10/05/17 13,220 14,000 - -Goldman Sachs GBP EUR 10/05/17 25,000 29,283 - -Goldman Sachs GBP EUR 10/05/17 21,000 24,615 - -Goldman Sachs USD EUR 10/05/17 25,000 23,073 - -Goldman Sachs USD EUR 10/05/17 24,000 22,514 - -Goldman Sachs USD EUR 10/05/17 20,000 18,474 - -Goldman Sachs USD EUR 10/05/17 15,000 14,109 - -HSBC EUR USD 10/05/17 3,475,015 3,754,000 (29) (0.11)HSBC EUR USD 10/05/17 448,324 474,000 6 0.02HSBC EUR GBP 10/05/17 433,661 371,000 - -HSBC EUR GBP 10/05/17 397,031 345,000 (6) (0.02)HSBC EUR GBP 10/05/17 280,136 242,000 (3) (0.01)HSBC EUR GBP 10/05/17 252,844 218,000 (2) (0.01)HSBC EUR USD 10/05/17 226,643 240,000 3 0.01HSBC EUR JPY 10/05/17 103,840 12,482,000 (1) -HSBC EUR USD 10/05/17 89,086 94,000 1 -HSBC EUR GBP 10/05/17 69,015 60,000 (1) -HSBC EUR USD 10/05/17 46,289 49,000 1 -HSBC EUR GBP 10/05/17 41,015 36,000 (1) -

aberdeen-asset.com 193
Multi Asset Growth
Counterparty Buy Sell Settlement Buy Amount Sell Amount
Unrealised Gains/(Losses)
€’000
Total Net Assets
%HSBC EUR GBP 10/05/17 28,801 25,000 - -HSBC EUR USD 10/05/17 13,206 14,000 - -HSBC GBP EUR 10/05/17 214,000 246,267 4 0.01HSBC GBP EUR 10/05/17 18,000 21,150 - -HSBC JPY EUR 10/05/17 1,568,000 12,796 - -HSBC USD EUR 10/05/17 745,000 692,317 3 0.01HSBC USD EUR 10/05/17 532,000 494,632 2 0.01HSBC USD EUR 10/05/17 259,000 240,803 1 -HSBC USD EUR 10/05/17 68,000 63,213 - -HSBC USD EUR 10/05/17 42,000 38,764 - -Merrill Lynch EUR USD 10/05/17 244,295 266,000 (4) (0.01)Merrill Lynch EUR USD 10/05/17 27,331 29,000 - -Merrill Lynch GBP EUR 10/05/17 178,000 207,397 1 -Royal Bank of Canada EUR GBP 10/05/17 3,785,551 3,228,000 15 0.05Royal Bank of Canada EUR AUD 10/05/17 326,581 458,000 1 -Royal Bank of Canada EUR USD 10/05/17 226,997 240,000 3 0.01Royal Bank of Canada EUR USD 10/05/17 183,214 194,000 2 0.01Royal Bank of Canada EUR USD 10/05/17 43,357 46,000 - -Royal Bank of Canada EUR GBP 10/05/17 30,022 26,000 - -Royal Bank of Canada EUR GBP 10/05/17 14,946 13,000 - -Royal Bank of Canada GBP EUR 10/05/17 20,000 22,933 - -Royal Bank of Canada GBP EUR 10/05/17 19,000 21,984 - -Royal Bank of Canada GBP EUR 10/05/17 9,000 10,414 - -Royal Bank of Canada JPY EUR 10/05/17 10,493,000 86,466 2 0.01Royal Bank of Canada USD EUR 10/05/17 31,000 28,624 - -Unrealised losses on forward currency exchange contracts (107) (0.39)
Unrealised losses on derivatives (55) (0.20)
Total investments 24,859 91.20Other net assets 2,399 8.80Total net assets 27,258 100.00
† Managed by subsidiaries of Aberdeen Asset Management PLC.Currently forward positions are not collateralised.

194 Aberdeen Global
Multi Asset Income For the six months ended 31 March 2017
Performance For the six months ended 31 March 2017, the value of Multi Asset Income – A Income shares increased by 4.15%. The Fund does not have an official benchmark.Source: Lipper, Basis: total return, published NAV to NAV, net of annual charges, gross income reinvested, USD.
Please remember that past performance is not a guide to future returns. The price of shares and the revenue from them may fall as well as rise. Investors may not get back the amount originally invested.
Market reviewMost global equity markets rose over the six months under review, with the best gains in Japan, where the stock market climbed sharply in the latter months of 2016, largely on hopes that yen weakness would boost the profits of the country’s exporters particularly within Asia. Economic data showing that the Chinese economy remained more robust than expected also helped buoy sentiment and boosted regional markets. European equities also performed well, with economic data underpinning investor confidence despite prevailing political uncertainty. In the US, investors appeared optimistic that President Donald Trump’s promises to reduce taxes, increase infrastructure spending and slash regulation would boost economic growth; the stock market hit record levels in November. However, investors became slightly more circumspect in the last few weeks of the reporting period due to the content of some of the new administration’s executive orders.
The global high-yield segment performed well, generating a positive return and high-income yield over the period. This was in contrast to investment-grade credit and government bonds. Emerging-market debt experienced a sell-off in November, perpetrated by Trump’s election. However, this largely reversed in early 2017, with the asset class producing a small negative return over the reporting period.
Some cash flow-generative assets, including real assets such as infrastructure and aircraft leasing, produced good levels of income and positive total returns over the period.
Portfolio reviewThe main asset allocation change over the six months was an increase in our local-currency emerging-market debt weighting. We believe that the medium and long-term prospects for growth in emerging economies are significantly greater than those of developed economies, and this should boost returns in emerging-market bonds through real currency appreciation.
We sold out of our holdings in investment-grade bonds, given low prospective returns and better opportunities elsewhere. We also reduced our property (REITs) exposure, reflecting a view that emerging-market bonds offer better return prospects and greater diversification.
In absolute return, we allocated to an alternative risk premia strategy. The strategy provides exposure to a broad collection of diversifying risk premia indices across equities, fixed income, currencies and commodities. The underlying indices are provided by Goldman Sachs and the asset allocation between the indices is managed by Aberdeen’s highly experienced hedge fund team.
In asset-backed securities, we invested in the Prytania Diversified Asset-Backed Securities Fund. This is a fund established for our Diversified Multi-Asset portfolios that invests in a diversified portfolio of asset-backed securities. We also added positions in several loan funds that invest in the more junior segments of collateralised loan obligations and offer attractive risk-return profiles.
In special opportunities, we continued to add positions that offer attractive potential returns which are generally uncorrelated with wider financial markets. We also took a strategic stake in the Aberdeen Diversified Income and Growth Trust (ADIG). As a closed-end fund, ADIG is able to invest in a number of illiquid specialist alternative assets that cannot be incorporated into a diversified growth fund and as such has a higher expected return for a similar level of risk.
OutlookIn the shorter term, we are positive on the outlook for equities and other risk assets. Growth appears to be improving, in particular in the US, and this has the potential to be boosted at the margin by modest fiscal stimulus from President Trump. Central bank policy remains supportive in Europe and Japan, and in China we believe the government will continue to prioritise growth over the necessary rebalancing of the economy in the near term.
This positive base case is somewhat countered by greater uncertainty. In the US, the policies of a Trump-led administration are still unclear, given differences in opinion over free trade and fiscal stimulus. In Europe, uncertainty comes largely from the Brexit negotiations and rising populist political pressures. In China, levels of credit growth are unsustainable but it is unclear when this issue might be addressed. This potentially has significant knock-on effects on other emerging markets.
Both the challenging long-term investment environment and the heightened near-term risks highlight the importance of having a diversified portfolio. We continue to see attractions in a range of asset classes with different return drivers and hence are not excessively exposed to equity markets or any other asset class.
Diversified Multi-Asset Team April 2017

aberdeen-asset.com 195
Multi Asset Income
Statement of Net AssetsAs at 31 March 2017
Notes US$'000AssetsInvestments in securities at market value 2.2 36,430 Cash at bank 2,804 Interest and dividends receivable 290 Subscriptions receivable 453 Receivable for investments sold 3,145 Other assets 7 Total assets 43,129 LiabilitiesPayable for investments purchased 3,145 Taxes and expenses payable 31 Redemptions payable 55 Unrealised losses on forward currency exchange contracts 2.6 340 Other liabilities 142 Total liabilities 3,713 Net assets at the end of the period 39,416
Statement of Changes in Net Assets For the period from 1 October 2016 to 31 March 2017
Notes US$'000Net assets at the beginning of the period 27,221 Net gains from investments 591 Net realised gains 429 Net unrealised gains 268 Proceeds from shares issued 20,456 Payments for shares redeemed (8,815) Net equalisation received 10 17 Dividends paid 5 (751) Net assets at the end of the period 39,416
Statement of Operations For the period from 1 October 2016 to 31 March 2017
Notes US$'000IncomeInvestment income 2.3 743 Bank interest 1 Stocklending income 16 1 Total income 745 ExpensesManagement fees 4.2 98 Operating, administrative and servicing fees 4.3 54 Distribution fees 4.1 2 Total expenses 154 Net gains from investments 591
Realised losses on investments (146) Realised losses on future contracts (18) Realised gains on forward currency exchange contracts 609 Realised currency exchange losses (16) Net realised gains 429
Increase in unrealised appreciation on investments 613 Decrease in unrealised depreciation on future contracts 8 Increase in unrealised depreciation on forward currency exchange contracts (337) Unrealised currency exchange losses (16) Net unrealised gains 268 Net increase in assets as a result of operations 1,288

196 Aberdeen Global
Multi Asset Income
Share Transactions For the period from 1 October 2016 to 31 March 2017
A-1 A(EUR)-1^ A(SGD)-1^ A-4 A(EUR)-4^ E(EUR)-1Shares outstanding at the beginning of the period 203,151 99,198 - - - 5,497 Shares issued during the period 76,926 193,411 89,599 11,956 95,212 584,047 Shares redeemed during the period (226,808) (69,847) - (80) (2,217) (59,707) Shares outstanding at the end of the period 53,269 222,762 89,599 11,876 92,995 529,837 Net asset value per share 9.9391 10.2216 10.0516 10.3780 10.2950 10.1563
H(EUR)-1 I-1 I(EUR)-1^ I(EUR)-4^ W-1 X-1Shares outstanding at the beginning of the period 993 1,357,211 119,737 - 650 200,000 Shares issued during the period - 208,630 203,386 58,062 110,769 - Shares redeemed during the period - (431,549) (81,518) - - - Shares outstanding at the end of the period 993 1,134,292 241,605 58,062 111,419 200,000 Net asset value per share 10.2710 10.0570 10.3138 10.3243 10.1893 10.0497
X(EUR)-1^ Y(EUR)-1 Z-1Shares outstanding at the beginning of the period 69,000 989 643,184 Shares issued during the period - - 348,479 Shares redeemed during the period - - - Shares outstanding at the end of the period 69,000 989 991,663 Net asset value per share 10.3064 10.2620 10.3488
^ Base currency exposure share class.
The accompanying notes form an integral part of these financial statements.

aberdeen-asset.com 197
Multi Asset Income Portfolio StatementAs at 31 March 2017
Security Coupon (%) MaturityNominal/Quantity
Market Value US$’000
Total Net Assets
%Transferable securities and money market instruments admitted to an official exchange listing or dealt on another regulated market 81.29%Equities 55.59%Australia 0.70%AGL Energy 1,576 32 0.08Ansell 1,488 27 0.07CIMIC 969 27 0.07CSR 6,364 22 0.06Fortescue Metals 13,086 62 0.15Lendlease 2,300 27 0.07Medibank Private 12,055 26 0.07Metcash 12,361 23 0.06Seven West Media 46,027 28 0.07
274 0.70
Belgium 0.23%Ageas 1,630 64 0.16Bpost 1,208 28 0.07
92 0.23
Bermuda 2.05%Blue Capital Global Reinsurance Fund 487,824 512 1.30Blue Capital Reinsurance 13,959 270 0.68RenaissanceRe 178 26 0.07
808 2.05
Brazil 0.33%Braskem (PREF) 2,500 25 0.06Cia de Gas de Sao Paulo 'A' (PREF) 1,750 26 0.07Multiplus 2,400 27 0.07Smiles 1,300 26 0.07Suzano Papel e Celulose (PREF) 6,100 25 0.06
129 0.33
Canada 0.19%George Weston 273 24 0.06Imperial Oil 764 23 0.06Industrivarden 'A' 1,188 28 0.07
75 0.19
China 0.12%Uni-President China 33,000 23 0.06Yangzijiang Shipbuilding 31,800 26 0.06
49 0.12
Czech Republic 0.13%MONETA Money Bank 7,336 25 0.06O2 Czech Republic 2,444 27 0.07
52 0.13

198 Aberdeen Global
Multi Asset Income
Security Coupon (%) MaturityNominal/Quantity
Market Value US$’000
Total Net Assets
%Denmark 0.22%H Lundbeck 610 28 0.07ISS 1,505 57 0.15
85 0.22
Finland 0.32%Neste 722 28 0.07UPM-Kymmene 4,148 98 0.25
126 0.32
France 0.77%Atos 231 29 0.07Eutelsat Communications 1,283 29 0.07ICADE (REIT) 920 67 0.17Klepierre (REIT) 2,760 107 0.28Peugeot 1,814 37 0.09Renault 400 35 0.09
304 0.77
Germany 0.60%Covestro 511 39 0.10Deutsche Lufthansa 1,765 29 0.07Evonik Industries 1,253 41 0.10Hochtief 141 23 0.06Muenchener Rueckver 394 78 0.20Uniper 1,681 28 0.07
238 0.60
Greece 0.07%Motor Oil (Hellas) 1,684 29 0.07
Guernsey 12.16%Amedeo Air Four Plus 329,017 429 1.09Bluefield Solar Income Fund 274,321 382 0.97Doric Nimrod Air Three 71,434 92 0.23DP Aircraft 199,615 210 0.53John Laing Infrastructure Fund 119,022 199 0.51NB Global Floating Rate Income Fund 1,580,332 1,926 4.89NextEnergy Solar Fund 204,486 283 0.72Renewables Infrastructure 527,326 709 1.80SQN Asset Finance Income Fund 33,358 44 0.11TwentyFour Income Fund 345,473 515 1.31
4,789 12.16
Hong Kong 1.79%BOC Hong Kong 29,500 121 0.31CLP 12,500 130 0.33Hopewell Highway Infrastructure 37,000 20 0.05

aberdeen-asset.com 199
Multi Asset Income
Security Coupon (%) MaturityNominal/Quantity
Market Value US$’000
Total Net Assets
%Jardine Strategic 600 25 0.06Kowloon Development 27,000 28 0.07Li & Fung 62,000 27 0.07Lifestyle International 15,000 20 0.05NWS 13,000 24 0.06PCCW 37,000 22 0.06Power Assets 10,000 86 0.22Television Broadcasts 6,100 25 0.06Texwinca 32,000 22 0.05WH 62,000 53 0.14Wheelock 7,000 55 0.14Xinyi Glass 26,000 23 0.06Yue Yuen Industrial 6,000 24 0.06
705 1.79
Hungary 0.11%Magyar Telekom 11,833 20 0.05MOL Hungarian Oil & Gas 371 25 0.06
45 0.11
Israel 0.07%Strauss 1,614 28 0.07
Italy 0.12%Atlantia 1,900 49 0.12
Japan 2.93%Adastria Co 900 22 0.06Amada Co 2,500 29 0.07Canon Marketing Japan Inc 1,400 28 0.07Chubu Electric Power Co 3,600 48 0.12Coca-Cola West Co 700 23 0.06Daito Trust Construction Co 300 41 0.10FamilyMart Holdings Co 500 30 0.08Fuji Heavy Industries 3,400 124 0.32Gree 3,300 21 0.05Heiwa Corp 800 20 0.05ITOCHU Corporation 10,300 145 0.37Kajima Corp 3,000 20 0.05Konami Holdings Corp 700 30 0.08Maeda Road Construction Co 1,000 18 0.04Matsumotokiyoshi Holdings Co 500 24 0.06Mitsubishi Gas Chemical 1,500 31 0.08Mitsubishi Shokuhin Co 800 25 0.06Mitsui Chemicals 5,000 25 0.06NEC Corp 11,000 26 0.07Nichirei Corp 1,000 25 0.06Nippo Corp 1,000 19 0.05

200 Aberdeen Global
Multi Asset Income
Security Coupon (%) MaturityNominal/Quantity
Market Value US$’000
Total Net Assets
%NTT 1,900 81 0.21Obayashi Corp 2,700 25 0.06Okuma Corp 2,000 21 0.05SCREEN Holdings Co 400 29 0.07Sojitz Corp 8,800 22 0.06Sumitomo Corp 8,300 112 0.28Sundrug Co 800 27 0.07Taisei Corp 3,000 22 0.06Toppan Forms Co 2,400 23 0.06Yamato Kogyo Co 800 21 0.05
1,157 2.93
Malaysia 0.27%AirAsia 35,800 25 0.06Malayan Banking 40,700 82 0.21
107 0.27
Mexico 0.07%Concentradora Fibra Danhos (REIT) 16,600 27 0.07
Netherlands 0.60%Boskalis Westminster 553 19 0.05Koninklijke Ahold Delhaize 6,792 146 0.36Konninklijke 24,217 73 0.19
238 0.60
New Zealand 0.12%Air New Zealand 18,119 31 0.08Warehouse 10,857 18 0.04
49 0.12
Norway 0.11%Marine Harvest 2,898 44 0.11
Poland 0.06%Asseco Poland 1,710 23 0.06
Singapore 0.50%BOC Aviation 5,000 27 0.07CapitaLand Mall Trust (REIT) 16,800 24 0.06HPH 64,800 27 0.07Oversea-Chinese Banking 9,100 63 0.16Venture 3,400 28 0.07Yanlord Land 22,400 29 0.07
198 0.50
South Korea 0.88%Hyundai Mobis 125 27 0.07Kia Motors 945 31 0.08

aberdeen-asset.com 201
Multi Asset Income
Security Coupon (%) MaturityNominal/Quantity
Market Value US$’000
Total Net Assets
%Korea Electric Power 1,155 48 0.12KT&G 297 26 0.07LG Uplus 2,258 29 0.07Nongshim 88 24 0.06POSCO 274 70 0.18Samsung Electronics (PREF) 18 26 0.07SK Innovation 245 37 0.09SK Telecom 120 27 0.07
345 0.88
Spain 0.74%ACS Actividades 1,421 48 0.12Aena 503 80 0.20Endesa 2,454 58 0.15Iberdrola 11,554 83 0.21Mediaset Espana Comunicacion 1,878 24 0.06
293 0.74
Sweden 0.29%Electrolux 'B' 953 27 0.07ICA 759 26 0.07Industrivarden 'C' 1,275 28 0.07Wihlborgs Fastigheter 1,830 34 0.08
115 0.29
Switzerland 0.71%ABB 3,425 80 0.20Actelion 112 32 0.08PSP Swiss Property 862 78 0.20Sika 5 30 0.08Swiss Re 674 61 0.15
281 0.71
Taiwan 0.89%Cathay Real Estate Development 37,000 26 0.07China Motor 27,000 25 0.06Formosa Petrochemical 6,000 21 0.05Foxconn Technology 9,090 28 0.07Hon Hai Precision Industry 30,000 90 0.23Lite-On Technology 15,074 26 0.07Pegatron 16,000 47 0.12Quanta Computer 12,000 24 0.06Synnex Technology International 24,000 26 0.07Uni-President Enterprises 19,000 36 0.09
349 0.89
Thailand 0.33%Electricity Generating (Alien) 4,400 27 0.07Glow Energy 11,200 27 0.07

202 Aberdeen Global
Multi Asset Income
Security Coupon (%) MaturityNominal/Quantity
Market Value US$’000
Total Net Assets
%Intouch (Alien) 16,500 27 0.07Ratchaburi Electricity Generating (Alien) 16,900 25 0.06Thai Oil (Alien) 11,300 25 0.06
131 0.33
United Kingdom 13.82%Aberdeen Diversified Income and Growth Trust† 477,761 689 1.76Bellway 975 33 0.08BioPharma Credit 346,263 356 0.90Blackstone GSO Loan Financing 170,000 190 0.48Direct Line Insurance 10,649 46 0.12Fair Oaks Income Fund 186,939 186 0.47Foresight Solar Fund 434,238 584 1.48Funding Circle SME Income Fund 251,680 327 0.83GCP Student Living 161,865 304 0.77Hansteen (REIT) 62,000 93 0.24HICL Infrastructure 213,128 450 1.14HSBC 17,045 139 0.35John Laing 172,712 589 1.50John Laing Environmental 182,934 249 0.63P2P Global Investments 54,140 521 1.32Rio Tinto 1,138 46 0.12Tate & Lyle 3,717 36 0.09Tritax Big Box (REIT) 192,620 348 0.88UK Mortgages 112,906 137 0.35WM Morrison Supermarkets 17,981 54 0.143i 2,901 27 0.073i Infrastructure 17,269 41 0.10
5,445 13.82
United States 13.29%AGNC Investment (REIT) 2,762 55 0.14Ally Financial 1,137 23 0.06Annaly Capital Management (REIT) 8,127 90 0.23Anthem 182 30 0.08AT&T 1,602 67 0.17Baxter International 521 27 0.07Bed Bath & Beyond 629 25 0.06Best Buy 1,979 97 0.25CA 2,574 82 0.21CATCo Reinsurance Opportunities Fund 475,167 605 1.53CATCo Reinsurance Opportunities Fund 251,826 254 0.65Celanese 287 26 0.07CenturyLink 4,473 105 0.27Cincinnati Financial 462 33 0.08Cisco Systems 3,003 101 0.26CME 208 25 0.06CNA Financial 579 26 0.06

aberdeen-asset.com 203
Multi Asset Income
Security Coupon (%) MaturityNominal/Quantity
Market Value US$’000
Total Net Assets
%Conduent 1,573 26 0.07Consolidated Edison 1,989 154 0.39Corning 954 26 0.07CVS Health 776 61 0.15Darden Restaurants 1,003 84 0.21Delta Air Lines 765 35 0.09DTE Energy 775 79 0.20Duke Energy 1,745 143 0.36Edison International 1,108 88 0.22Entergy 643 49 0.12Equity Residential (REIT) 1,489 93 0.23Everest Re 113 26 0.07Express Scripts 377 25 0.06FirstEnergy 1,891 60 0.15Ford Motor 10,388 121 0.31Garmin 445 23 0.06Gilead Sciences 740 50 0.13HCP (REIT) 2,037 64 0.16HP 8,644 155 0.39Humana 126 26 0.07Ingersoll-Rand 546 44 0.11J.M. Smucker 920 121 0.31Juniper Networks 856 24 0.06KLA-Tencor 1,216 116 0.29Kohl's 1,361 54 0.14Lam Research 215 28 0.07Lear 179 25 0.06L3 Technologies 160 26 0.07Macerich (REIT) 1,049 68 0.17Maxim Integrated Products 565 25 0.06Mckesson 159 24 0.06MDU Resources 820 22 0.06NCR 592 27 0.07NetApp 2,236 94 0.24Public Service Enterprise 1,752 78 0.20Quality Care Properties (REIT) 1,356 26 0.06Ross Stores 384 25 0.06Seagate Technology 556 26 0.06Skyworks Solutions 313 31 0.08Synopsys 392 28 0.07Sysco 1,633 85 0.22Target 2,025 112 0.28Texas Instruments 1,109 89 0.23TransDigm 393 87 0.22Tyson Foods 'A' 386 24 0.06UnitedHealth 142 23 0.06Valero Energy 2,210 146 0.37Varex Imaging 788 26 0.07

204 Aberdeen Global
Multi Asset Income
Security Coupon (%) MaturityNominal/Quantity
Market Value US$’000
Total Net Assets
%Verizon Communications 2,892 141 0.36VMware 291 27 0.07Wal-Mart Stores 2,166 156 0.40Waste Management 1,025 75 0.19Welltower (REIT) 2,198 156 0.39Western Union 1,892 39 0.10Xerox 7,867 58 0.15Yum China 815 22 0.06
5,237 13.29
Total Equities 21,916 55.59
Bonds 25.70%Corporate Bonds 8.62%Brazil 0.21%JBS USA Finance 5.7500 15/06/25 30,000 30 0.08Petrobras Global Finance 5.3750 27/01/21 52,000 54 0.13
84 0.21
Canada 0.22%Gateway Casinos & Entertainment 8.2500 01/03/24 43,000 44 0.11MEG Energy 7.0000 31/03/24 29,000 26 0.07MEG Energy 6.5000 15/01/25 7,000 7 0.02Telesat 8.8750 15/11/24 8,000 9 0.02
86 0.22
Mexico 0.65%Petroleos Mexicanos 7.1900 12/09/24 5,400,000 254 0.65
Peru 0.09%InRetail Consumer 5.2500 10/10/21 35,000 36 0.09
Spain 0.27%Obrascon Huarte Lain (EMTN) 7.6250 15/03/20 100,000 106 0.27
United Kingdom 0.42%PGH Capital 6.6250 18/12/25 100,000 136 0.34Royal Bank of Scotland (PERP) VAR 29/08/49 25,000 30 0.08
166 0.42
United States 6.76%ABC Supply 5.7500 15/12/23 27,000 28 0.07Airxcel 8.5000 15/02/22 20,000 21 0.05Albertsons 5.7500 15/03/25 43,000 42 0.11Alliance Data Systems 5.8750 01/11/21 25,000 26 0.07American Axle & Manufacturing 6.2500 01/04/25 10,000 10 0.03Avis Budget Car Rental 5.5000 01/04/23 34,000 33 0.08Bank of America (PERP) VAR 29/09/49 40,000 42 0.11

aberdeen-asset.com 205
Multi Asset Income
Security Coupon (%) MaturityNominal/Quantity
Market Value US$’000
Total Net Assets
%Blue Racer Finance 6.1250 15/11/22 20,000 20 0.05Blue Racer Midstream Finance 6.1250 15/11/22 34,000 35 0.09Boyd Gaming 6.3750 01/04/26 20,000 21 0.05Carrizo Oil & Gas 6.2500 15/04/23 20,000 20 0.05CCO Capital 5.7500 15/02/26 55,000 58 0.15CCOs Capital 5.5000 01/05/26 5,000 5 0.01Cengage Learning 9.5000 15/06/24 37,000 33 0.08Centene 6.1250 15/02/24 37,000 40 0.10CenturyLink 7.5000 01/04/24 35,000 37 0.09Cenveo 6.0000 01/08/19 20,000 17 0.04Change Healthcare Finance 5.7500 01/03/25 16,000 16 0.04Cheniere Corpus Christi 5.8750 31/03/25 40,000 42 0.11Citgo 10.7500 15/02/20 41,000 44 0.11Cogent Communications 5.3750 01/03/22 20,000 21 0.05Continental Resources 3.8000 01/06/24 46,000 43 0.11Dana Financing Luxembourg 6.5000 01/06/26 30,000 31 0.08DISH DBS 5.8750 15/11/24 40,000 42 0.11Dollar Tree 5.7500 01/03/23 35,000 37 0.10Dynegy 7.6250 01/11/24 22,000 21 0.05EMI Music Publishing 7.6250 15/06/24 40,000 44 0.11Endo Finance 5.7500 15/01/22 35,000 32 0.08Equinix 5.3750 01/04/23 20,000 21 0.05First Data 7.0000 01/12/23 60,000 66 0.17Fresh Market 9.7500 01/05/23 38,000 31 0.08Frontier Communications 6.8750 15/01/25 47,000 39 0.10Gardner Denver 6.8750 15/08/21 60,000 63 0.17Goldman Sachs (PERP) VAR 29/12/49 39,000 40 0.10HCA 7.5000 15/02/22 42,000 48 0.12HD Supply 5.7500 15/04/24 41,000 43 0.11Hilcorp Energy Finance I 5.7500 01/10/25 20,000 19 0.05JC Penney 5.8750 01/07/23 42,000 42 0.11KB Home 7.0000 15/12/21 35,000 39 0.10Kratos Defense & Security Solutions 7.0000 15/05/19 25,000 25 0.06Landry's 6.7500 15/10/24 70,000 74 0.19Level 3 Financing 5.3750 01/05/25 40,000 41 0.10Manitowoc Foodservice 9.5000 15/02/24 38,000 44 0.11MGM Resorts International 4.6250 01/09/26 26,000 25 0.06Morgan Stanley (PERP) VAR 29/12/49 35,000 36 0.09Nationstar Mortgage 6.5000 01/07/21 20,000 20 0.05NCR 6.3750 15/12/23 40,000 42 0.11Neiman Marcus 8.0000 15/10/21 15,000 9 0.02New Enterprise Stone & Lime 10.1250 01/04/22 9,000 10 0.02NewStar Financial 7.2500 01/05/20 25,000 26 0.06NRG Energy 7.2500 15/05/26 13,000 13 0.03Oasis Petroleum 6.8750 15/03/22 22,000 23 0.06Oasis Petroleum 6.8750 15/01/23 21,000 21 0.05Owens-Brockway Glass Container 5.0000 15/01/22 30,000 31 0.08Park-Ohio Industries 8.1250 01/04/21 62,000 65 0.17

206 Aberdeen Global
Multi Asset Income
Security Coupon (%) MaturityNominal/Quantity
Market Value US$’000
Total Net Assets
%PDC Energy 6.1250 15/09/24 15,000 15 0.04Post 5.0000 15/08/26 42,000 40 0.10QVC 4.4500 15/02/25 10,000 10 0.02QVC 4.3750 15/03/23 5,000 5 0.01Rite Aid 6.1250 01/04/23 50,000 50 0.13Sabine Pass Liquefaction 5.6250 01/03/25 40,000 43 0.11Scientific Games International 7.0000 01/01/22 45,000 48 0.12Service International 5.3750 15/05/24 21,000 22 0.06Sinclair Television 5.8750 15/03/26 40,000 41 0.10Springs Industries 6.2500 01/06/21 44,000 45 0.12Sprint 7.8750 15/09/23 38,000 42 0.11Summit Materials Finance 6.1250 15/07/23 42,000 43 0.11Sunoco Finance 6.2500 15/04/21 47,000 48 0.12Tenet Healthcare 8.1250 01/04/22 55,000 58 0.15TerraForm Power Operating 5.8750 01/02/23 46,000 48 0.12T-Mobile USA 6.0000 15/04/24 36,000 38 0.10United Continental 6.0000 01/12/20 20,000 21 0.05United Rentals North America 6.1250 15/06/23 12,000 13 0.03Valeant Pharmaceuticals 7.5000 15/07/21 35,000 31 0.08Valeant Pharmaceuticals 5.8750 15/05/23 13,000 10 0.03Vector 6.1250 01/02/25 20,000 20 0.05Whiting Petroleum 5.0000 15/03/19 45,000 45 0.11WMG Acquisition 5.6250 15/04/22 46,000 48 0.12WR Grace & Co-Conn 5.1250 01/10/21 6,000 6 0.02XPO Logistics 6.1250 01/09/23 38,000 40 0.10Zayo Capital 6.0000 01/04/23 17,000 18 0.05
2,665 6.76
Total Corporate Bonds 3,397 8.62
Government Bonds 17.08%Argentina 0.32%Argentina (Republic of) 16.0000 17/10/23 1,850,000 127 0.32
Brazil 2.17%Brazil (Federal Republic of) 10.0000 01/01/25 1,320,000 420 1.06Brazil (Federal Republic of) 10.0000 01/01/27 1,155,000 363 0.92Brazil (Federal Republic of) 6.0000 15/05/45 70,000 73 0.19
856 2.17
Colombia 0.88%Colombia (Republic of) 7.0000 04/05/22 538,000,000 192 0.49Colombia (Republic of) 7.5000 26/08/26 420,000,000 154 0.39
346 0.88
Ghana 0.17%Ghana (Republic of) 24.7500 19/07/21 260,000 69 0.17

aberdeen-asset.com 207
Multi Asset Income
Security Coupon (%) MaturityNominal/Quantity
Market Value US$’000
Total Net Assets
%Indonesia 2.21%Indonesia (Republic of) 9.0000 15/03/29 6,130,000,000 517 1.32Indonesia (Republic of) 9.0000 15/09/18 2,630,000,000 205 0.52Indonesia (Republic of) 8.3750 15/03/34 1,820,000,000 145 0.37
867 2.21
Malaysia 1.60%Malaysia (Government of) 4.0480 30/09/21 1,378,000 313 0.79Malaysia (Government of) 4.4980 15/04/30 778,000 176 0.45Malaysia (Government of) 4.3780 29/11/19 620,000 143 0.36
632 1.60
Mexico 1.35%Mexico (Government of) 6.5000 09/06/22 6,050,700 315 0.80Mexico (Government of) 7.7500 13/11/42 2,590,000 142 0.36Mexico (Government of) 8.0000 11/06/20 1,380,000 76 0.19
533 1.35
Peru 0.45%Peru (Republic of) 6.9500 12/08/31 530,000 176 0.45
Poland 1.41%Poland (Republic of) 5.7500 25/10/21 1,060,000 302 0.77Poland (Republic of) 1.5000 25/04/20 750,000 185 0.47Poland (Republic of) 5.7500 25/04/29 221,000 68 0.17
555 1.41
Russian Federation 2.19%Russia (Federation of) 7.0500 19/01/28 34,480,000 576 1.46Russia (Federation of) 7.5000 27/02/19 16,470,000 289 0.73
865 2.19
South Africa 1.90%South Africa (Republic of) 10.5000 21/12/26 5,315,000 437 1.11South Africa (Republic of) 6.2500 31/03/36 5,850,000 310 0.79
747 1.90
Turkey 2.17%Turkey (Republic of) 10.7000 17/02/21 2,350,000 640 1.63Turkey (Republic of) 10.6000 11/02/26 786,000 215 0.54
855 2.17
Uruguay 0.26%Uruguay (Republic of) 5.0000 14/09/18 1,321,385 104 0.26
Total Government Bonds 6,732 17.08
Total Bonds 10,129 25.70

208 Aberdeen Global
Multi Asset Income
Security Coupon (%) MaturityNominal/Quantity
Market Value US$’000
Total Net Assets
%Total Transferable securities and money market instruments admitted to an official exchange listing or dealt on another regulated market 32,045 81.29
Other transferable securities and money market instruments 2.65%Equities 2.65%United States 2.65%Goldman Sachs International 1,020 1,044 2.65
Total Equities 1,044 2.65
Bonds nilCorporate Bonds nilUnited States nilMomentive Performance 8.8750 15/10/20 16,000 - -
Total Corporate Bonds - -
Total Bonds - -
Total Other transferable securities and money market instruments 1,044 2.65
Open Ended Investment Funds 8.48%Aberdeen Global - Frontier Markets Bond Fund I-1† 36,593 373 0.95Aberdeen Global - Indian Bond Fund Z-1† 150,055 1,513 3.84Prytania Diversifed Asset-Backed Securities Fund 11,599 1,455 3.69
3,341 8.48
Total Open Ended Investment Funds 3,341 8.48
Derivatives (0.86%)
Forward currency exchange contracts (0.86%)
Counterparty Buy Sell Settlement Buy Amount Sell Amount
Unrealised Gains/(Losses)
US$’000
Total Net Assets
%Barclays Capital EUR USD 13/04/17 26,000 28,000 - -Barclays Capital GBP USD 13/04/17 15,000 18,748 - -Barclays Capital USD GBP 13/04/17 105,774 84,000 1 -Barclays Capital USD JPY 13/04/17 56,651 6,401,000 (1) -BNP Paribas EUR USD 06/04/17 3,996 4,268 - -BNP Paribas EUR USD 15/06/17 2,490,712 2,639,848 34 0.09BNP Paribas EUR USD 15/06/17 2,090,890 2,216,087 28 0.07BNP Paribas EUR USD 15/06/17 866,873 918,779 12 0.03BNP Paribas EUR USD 15/06/17 710,840 753,403 10 0.02BNP Paribas EUR USD 15/06/17 595,240 630,881 8 0.02BNP Paribas EUR USD 15/06/17 60,231 65,024 - -BNP Paribas EUR USD 15/06/17 44,087 47,071 - -BNP Paribas EUR USD 15/06/17 35,350 38,347 - -BNP Paribas EUR USD 15/06/17 26,843 28,476 - -

aberdeen-asset.com 209
Multi Asset Income
Counterparty Buy Sell Settlement Buy Amount Sell Amount
Unrealised Gains/(Losses)
US$’000
Total Net Assets
%BNP Paribas EUR USD 15/06/17 20,427 21,762 - -BNP Paribas EUR USD 15/06/17 18,422 19,543 - -BNP Paribas EUR USD 15/06/17 13,726 14,709 - -BNP Paribas EUR USD 15/06/17 13,158 14,241 - -BNP Paribas EUR USD 15/06/17 12,389 13,382 - -BNP Paribas EUR USD 15/06/17 11,936 12,858 - -BNP Paribas EUR USD 15/06/17 10,740 11,568 - -BNP Paribas EUR USD 15/06/17 9,969 10,793 - -BNP Paribas EUR USD 15/06/17 8,207 8,949 - -BNP Paribas EUR USD 15/06/17 5,139 5,565 - -BNP Paribas EUR USD 15/06/17 5,019 5,434 - -BNP Paribas EUR USD 15/06/17 4,993 5,388 - -BNP Paribas EUR USD 15/06/17 4,228 4,554 - -BNP Paribas EUR USD 15/06/17 3,500 3,750 - -BNP Paribas EUR USD 15/06/17 3,444 3,716 - -BNP Paribas GBP USD 13/04/17 279,000 344,734 4 0.01BNP Paribas GBP USD 13/04/17 131,000 161,077 3 0.01BNP Paribas SGD USD 15/06/17 895,985 634,672 7 0.02BNP Paribas SGD USD 15/06/17 5,422 3,889 - -BNP Paribas USD EUR 04/04/17 333,792 310,782 1 -BNP Paribas USD EUR 04/04/17 14,195 13,158 - -BNP Paribas USD EUR 06/04/17 14,661 13,726 - -BNP Paribas USD EUR 13/04/17 703,806 668,000 (11) (0.03)BNP Paribas USD EUR 13/04/17 359,438 335,000 1 -BNP Paribas USD AUD 13/04/17 267,601 349,000 1 -BNP Paribas USD GBP 13/04/17 182,778 149,000 (4) (0.01)BNP Paribas USD EUR 15/06/17 18,034 17,025 - -BNP Paribas USD EUR 15/06/17 16,489 15,566 - -BNP Paribas USD EUR 15/06/17 5,142 4,841 - -BNP Paribas USD EUR 15/06/17 5,083 4,798 - -BNP Paribas USD EUR 15/06/17 4,282 3,996 - -BNP Paribas USD EUR 15/06/17 3,782 3,561 - -Citigroup EUR USD 13/04/17 414,000 444,947 (2) -Citigroup EUR USD 13/04/17 44,000 47,300 - -Citigroup EUR USD 13/04/17 21,000 22,147 - -Citigroup GBP USD 13/04/17 127,000 155,428 3 0.01Citigroup GBP USD 13/04/17 103,000 127,619 1 -Citigroup USD GBP 13/04/17 9,572,744 7,759,000 (133) (0.34)Citigroup USD AUD 13/04/17 309,359 406,000 - -Citigroup USD GBP 13/04/17 271,226 217,000 - -Citigroup USD GBP 13/04/17 86,585 71,000 (2) (0.01)Citigroup USD EUR 13/04/17 68,000 63,000 1 -Goldman Sachs EUR USD 13/04/17 25,000 26,717 - -Goldman Sachs GBP USD 13/04/17 96,000 119,890 - -Goldman Sachs GBP USD 13/04/17 30,000 37,332 - -Goldman Sachs GBP USD 13/04/17 27,000 33,713 - -Goldman Sachs GBP USD 13/04/17 19,000 23,412 - -Goldman Sachs GBP USD 13/04/17 15,000 18,137 1 -

210 Aberdeen Global
Multi Asset Income
Counterparty Buy Sell Settlement Buy Amount Sell Amount
Unrealised Gains/(Losses)
US$’000
Total Net Assets
%Goldman Sachs JPY USD 13/04/17 4,871,000 43,132 1 -Goldman Sachs USD EUR 13/04/17 2,979,128 2,824,000 (43) (0.11)Goldman Sachs USD GBP 13/04/17 666,422 537,000 (5) (0.01)Goldman Sachs USD GBP 13/04/17 367,391 294,000 - -Goldman Sachs USD GBP 13/04/17 245,339 199,000 (4) (0.01)Goldman Sachs USD GBP 13/04/17 61,180 50,000 (1) -Goldman Sachs USD GBP 13/04/17 61,110 49,000 - -Goldman Sachs USD GBP 13/04/17 56,286 46,000 (1) -Goldman Sachs USD GBP 13/04/17 52,341 43,000 (1) -Goldman Sachs USD GBP 13/04/17 27,109 22,000 - -HSBC AUD USD 13/04/17 29,000 21,847 - -HSBC GBP USD 13/04/17 14,000 17,283 - -HSBC JPY USD 13/04/17 10,847,000 96,765 1 -HSBC USD JPY 13/04/17 2,401,428 278,619,000 (101) (0.25)HSBC USD GBP 13/04/17 766,042 612,000 1 -HSBC USD GBP 13/04/17 124,801 100,000 - -HSBC USD GBP 13/04/17 117,531 95,000 (1) -HSBC USD GBP 13/04/17 54,648 45,000 (2) -HSBC USD EUR 13/04/17 47,021 44,000 - -HSBC USD JPY 13/04/17 42,396 4,714,000 - -HSBC USD GBP 13/04/17 37,419 30,000 - -HSBC USD EUR 13/04/17 25,860 24,000 - -JPM Chase GBP USD 13/04/17 39,000 48,189 1 -JPM Chase JPY USD 13/04/17 2,123,000 18,789 - -JPM Chase USD AUD 13/04/17 2,727,555 3,749,000 (133) (0.33)JPM Chase USD GBP 13/04/17 402,787 322,000 - -JPM Chase USD GBP 13/04/17 221,058 176,000 1 -Morgan Stanley EUR USD 13/04/17 483,000 515,838 1 -Morgan Stanley GBP USD 13/04/17 34,000 41,445 1 -Morgan Stanley JPY USD 13/04/17 2,594,000 23,336 - -Morgan Stanley USD EUR 13/04/17 389,306 360,000 4 0.01Morgan Stanley USD AUD 13/04/17 314,365 433,000 (16) (0.04)Morgan Stanley USD JPY 13/04/17 269,106 29,950,000 - -Morgan Stanley USD EUR 13/04/17 182,891 173,000 (2) (0.01)Morgan Stanley USD JPY 13/04/17 176,787 19,730,000 - -Morgan Stanley USD GBP 13/04/17 130,263 107,000 (4) (0.01)Morgan Stanley USD GBP 13/04/17 106,762 87,000 (2) (0.01)Royal Bank of Canada AUD USD 13/04/17 34,000 25,925 - -Royal Bank of Canada GBP USD 13/04/17 473,000 588,655 3 0.01Royal Bank of Canada GBP USD 13/04/17 34,000 41,337 1 -Royal Bank of Canada GBP USD 13/04/17 18,000 22,770 - -Royal Bank of Canada USD GBP 13/04/17 317,232 255,000 (2) -Royal Bank of Canada USD GBP 13/04/17 219,034 176,000 (1) -Royal Bank of Canada USD GBP 13/04/17 41,241 33,000 - -Royal Bank of Canada USD GBP 13/04/17 30,464 25,000 (1) -State Street GBP USD 13/04/17 255,000 316,049 3 0.01State Street USD GBP 13/04/17 89,269 72,000 (1) -State Street USD JPY 13/04/17 52,043 5,836,000 - -

aberdeen-asset.com 211
Multi Asset Income
Counterparty Buy Sell Settlement Buy Amount Sell Amount
Unrealised Gains/(Losses)
US$’000
Total Net Assets
%State Street USD AUD 13/04/17 18,264 24,000 - -Unrealised losses on forward currency exchange contracts (340) (0.86)
Unrealised losses on derivatives (340) (0.86)
Total investments 36,090 91.56Other net assets 3,326 8.44Total net assets 39,416 100.00
† Managed by subsidiaries of Aberdeen Asset Management PLC.Currently forward positions are not collateralised.

212 Aberdeen Global
Multi-Manager World EquityFor the six months ended 31 March 2017
Performance For the six months ended 31 March 2017, the value of Multi-Manager World Equity – A Accumulation shares increased by 11.05% compared to an increase of 13.66% in the benchmark, the MSCI AC World Net Return Index.Source: Lipper, Basis: total return, published NAV to NAV, net of annual charges, gross income reinvested, EUR.Please see the Performance History section for details on the use of MSCI information.
Please remember that past performance is not a guide to future returns. The price of shares and the revenue from them may fall as well as rise. Investors may not get back the amount originally invested.
Market reviewMost global equity markets rose over the six months under review, with low-to-mid double-digit returns. The main focus for US investors was the presidential election. Once uncertainty was out of the way, markets surged, with the S&P 500 Index ending the period 15.7% higher. Investors appeared optimistic that Donald Trump’s promises to reduce taxes, increase infrastructure spending and slash regulation would boost economic growth, and this propelled US stock markets to record levels in November. However, the mood became more circumspect following the new administration’s executive orders. There were worries that economically beneficial elements of the president’s policies would be overshadowed by the chaotic implementation of populist measures, such as the attempt to ban travel to the US from seven predominantly Muslim countries. Investors were also concerned with the outlook for interest rates. In March, the US Federal Reserve announced its much anticipated third interest rate rise in two years, raising the borrowing cost to 1% on the back of strength in the US jobs market, improved economic growth and rising inflation.
European equities were also positive, with the FTSE World Europe (Ex-UK) Index rising over 14%. Economic data underpinned investor confidence. Germany was the world’s fastest-growing developed economy, with GDP increasing by 1.9% over 2016, while the Eurozone’s jobless rate in February fell to the lowest level since May 2009. This helped investors overcome concerns about the rise of anti-globalisation parties in several countries. The UK was one of the weaker markets. Nevertheless, it rose 9%, with the market continuously hitting all-time highs. The economy is growing reasonably well and investors responded positively despite bouts of uncertainty regarding the UK’s pending departure from the EU.
Japan performed well in the latter months of 2016, largely on hopes that yen weakness would boost the profits of its exporters, particularly within Asia. In other parts of Asia outside of Japan, economic data showing a robust Chinese economy helped buoy sentiment, boosting stock markets by 12.8%.
Emerging markets elsewhere also did well, rising by 12%. This was largely driven by Latin America, which continued to recover and was up more than 16% over the period.
Portfolio reviewWhile the portfolio posted good returns over the period, it lagged the benchmark. In the US, we saw decent returns from our managers, with Artemis, Edgewood and Legg Mason rising over 16%. We are pleased with the 13% return of the Findlay Park fund because the manager held about 15% of the portfolio in cash due to his cautious
approach. Returns from 11% to 15% from our four European managers were also good, with Verrazzano the best performer due in part to its financials exposure. Overall, the best returns in the portfolio came from our Japanese managers. Man GLG was the standout performer, rising 24% on the back of its large-company, value-focused style of investment. Pictet, which has a growth focus, returned 18%. Morant Wright, which has a value bias but tends to invest in mid and smaller-sized companies, contributed 13%. Returns from our two Asian managers were respectable and in line with their benchmark.
The two emerging-market managers both posted low double-digit returns but lagged their respective benchmarks. In the case of Old Mutual, this was due to its growth focus. For Findlay Park Latin America, the overweight to Mexico detracted. Over in the UK, the Majedie fund outperformed the FTSE All Share benchmark by 3%. However, the JO Hambro fund returned 3.8% due to its 25% cash weighting and focus on high-quality companies, which have struggled in the current market environment.
OutlookA synchronised recovery in corporate earnings should continue to support global equity markets. The return of inflation and hopes of regulatory easing within the financial sector, coupled with further innovation in technology, are all contributing to strong earnings forecasts.
Sentiment in Europe remains positive despite political hurdles ahead and company profits are catching up with those of US companies. Progress is being made in some of the region’s struggling economies, such as Greece, and we forecast GDP growth of 1.4% this year, with a further expansion of 1.6% in 2018.
We are also sanguine about Japan, which should continue to benefit from ongoing economic stimulus measures. Within the boardrooms of many Japanese companies, there is an increasing focus on investors. Management teams are more approachable than they used to be, and a more investor-friendly approach is being reflected in higher dividend pay-outs and a focus on boosting share prices.
In the US, valuations are beginning to look fairly rich, and uncertainty is building over Donald Trump’s ability to push various reforms through Congress. Although US companies will benefit from further economic growth, we think there are better opportunities available elsewhere.
Multi Manager Team April 2017

aberdeen-asset.com 213
Multi-Manager World Equity
Statement of Net AssetsAs at 31 March 2017
Notes €’000AssetsInvestments in securities at market value 2.2 17,455 Cash at bank 119 Interest and dividends receivable 14 Subscriptions receivable 472 Other assets 18 Total assets 18,078 LiabilitiesTaxes and expenses payable 26 Redemptions payable 180 Total liabilities 206 Net assets at the end of the period 17,872
Statement of Changes in Net Assets For the period from 1 October 2016 to 31 March 2017
Notes €’000Net assets at the beginning of the period 17,450 Net losses from investments (63) Net realised gains 1,099 Net unrealised gains 1,050 Proceeds from shares issued 6,539 Payments for shares redeemed (8,203) Net assets at the end of the period 17,872
Statement of Operations For the period from 1 October 2016 to 31 March 2017
Notes €’000IncomeInvestment income 2.3 49 Other income 31 Total income 80 ExpensesManagement fees 4.2 117 Operating, administrative and servicing fees 4.3 26 Total expenses 143 Net losses from investments (63)
Realised gains on investments 1,115 Realised currency exchange losses (16) Net realised gains 1,099
Increase in unrealised appreciation on investments 1,049 Unrealised currency exchange gains 1 Net unrealised gains 1,050 Net increase in assets as a result of operations 2,086
Share Transactions For the period from 1 October 2016 to 31 March 2017
A-2 I-2Shares outstanding at the beginning of the period 1,040,437 63,418 Shares issued during the period 194,154 184,678 Shares redeemed during the period (276,128) (199,856) Shares outstanding at the end of the period 958,463 48,240 Net asset value per share 17.7124 18.5548
The accompanying notes form an integral part of these financial statements.

214 Aberdeen Global
Multi-Manager World EquityPortfolio StatementAs at 31 March 2017
SecurityNominal/ Quantity
Market Value €’000
Total Net Assets
%Open Ended Investment Funds 97.67%Asia Pacific 6.75%BlackRock Global Funds - Asian Growth Leaders 41,687 672 3.76Schroder Asian Alpha Plus Fund 363,325 534 2.99
1,206 6.75
Emerging Markets 6.86%Findlay Park Latin American Fund 24,482 352 1.97Old Mutual Global Emerging Markets Fund 49,896 875 4.89
1,227 6.86
Europe 16.60%BlackRock European Dynamic Fund 511,181 875 4.91Henderson European Focus Fund 290,489 699 3.91JO Hambro Continental European Fund 180,817 868 4.85Verrazzano Capital European Advantage Fund 3,421 524 2.93
2,966 16.60
Global 0.91%iShares III Core MSCI World UCITS 3,700 163 0.91
Japan 8.46%Capita Financial Morant Wright Nippon Yield Fund 170,737 676 3.78MAN GLG Japan CoreAlpha Equity Fund 1,816 325 1.82Pictet Japan Equity Opportunities Fund 6,791 511 2.86
1,512 8.46
North America 52.31%Artemis US Extended Alpha Fund 820,425 1,681 9.42Delaware Investments US Large Cap Value Fund 60,498 1,397 7.81Edgewood L Select - US Select Growth Fund 330 1,592 8.91Findlay Park American Fund 19,325 1,679 9.39Hermes US SMID Equity Fund 476,180 1,407 7.87Legg Mason US Equity Fund 628,804 1,592 8.91
9,348 52.31
United Kingdom 5.78%JO Hambro UK Opportunities Fund 156,445 482 2.70Majedie UK Equity Fund 270,065 551 3.08
1,033 5.78
Total Open Ended Investment Funds 17,455 97.67
Total investments 17,455 97.67Other net assets 417 2.33Total net assets 17,872 100.00

aberdeen-asset.com 215
North American EquityFor the six months ended 31 March 2017
Performance For the six months ended 31 March 2017, the value of North American Equity – A Accumulation shares increased by 8.74% compared to an increase of 11.25% in the benchmark, the S&P 500 Index (1 day lag). Source: Lipper, basis: total return, published NAV to NAV, net of annual charges, gross income reinvested, USD.
Please remember that past performance is not a guide to future returns. The price of shares and the revenue from them may fall as well as rise. Investors may not get back the amount originally invested.
Market reviewUS equities recorded robust gains in the six-month review period, despite numerous periods of uncertainty surrounding the policies of newly-elected president Trump and his administration. All of the gains during the period occurred following the November 2016 presidential election. One of Trump’s first official executive actions was to reopen negotiations on the construction of the controversial Keystone XL and Dakota Access oil pipelines, reversing the Obama administration’s rejection of the projects. Meanwhile, the leaders of the Republican-controlled House of Representatives introduced a proposal to replace the Affordable Care Act. However, the House was unable to reach consensus, as the opposition Democratic party and both the moderate and conservative factions of the majority Republican party objected to different provisions of the plan. Consequently, the bill was withdrawn before it was put to a vote. On the monetary policy front, the US Federal Reserve (Fed) hiked its benchmark interest rate by 25 basis points twice over the period, once in December 2016 and again in March 2017.
Portfolio reviewStock selection in the materials sector and an underweight to information technology detracted the most from relative performance. The most notable individual stock detractors were retail drugstore operator and pharmacy benefits manager (PBM) CVS Health Corp and convenience-store operator Casey’s General Stores, while the lack of exposure to Apple also proved costly. While CVS posted relatively positive results for its 2016 fiscal year, management lowered its earnings guidance for 2017 amid increasing competition for its PBM business. Casey’s General Stores reported generally disappointing results for its fiscal 2017 third quarter, due to reduced customer traffic and lower operating margins as rising wholesale costs weighed on fuel margins per gallon. While we acknowledge Apple’s innovations, we historically have had issues with the lack of visibility into its business and its high dependence on a single product.
Conversely, the Fund benefited from stock selection in the industrials and information technology sectors. M&T Bank Corp was the key stock-level contributor. The financial services company’s shares rose alongside its banking sector peers amid interest rate hikes, which boost banks’ net interest margins. The company was further buoyed by healthy loan growth for its 2016 fiscal year, which it believed would continue in 2017. Holding Charles Schwab also did well, with the financial services firm’s results bolstered by healthy year-over-year growth in net interest revenue and administrative fees. Elsewhere, industrial machinery manufacturer Deere & Co benefited from year-over-year revenue and earnings growth in its fiscal 2017 first quarter, while management anticipated continued decent demand for equipment over the coming year.
Outlook One quarter in and 2017 is playing out much as we expected. At the beginning of the year, we sounded a cautious note around the speed with which specific proposals were implemented, as we believed there was a likelihood of partisan and even in-party disagreements in what has increasingly become a very charged political climate. Therefore, we expected volatility as we moved through the year and as specific policies took shape. This proved prescient, as evidenced by the recent failure of President Trump’s healthcare bill. While we think that a healthcare compromise ultimately may be reached, we would not be surprised to see similar consternation and delay regarding tax reform. This arguably would have a greater effect on markets given that, in isolation, lower tax rates would have a more significant impact on earnings growth and cash-flow expansion for most companies than healthcare reform.
Economic data was generally positive and the Fed has signalled a more optimistic outlook, as well as what appeared to be a more convincing commitment to rate normalisation. However, US GDP growth remains somewhat sluggish and, in our view, first-quarter estimates will likely come in below 2%, and remain there for the full year. From an industry perspective, we are increasingly cautious about certain segments of the consumer discretionary sector. Challenges from e-commerce and shifting consumer preferences have had a profoundly negative impact on traditional “brick and mortar” retailers and we believe that companies may see margin pressure as business models adapt.
North American Equity Team April 2017

216 Aberdeen Global
North American Equity
Statement of Net AssetsAs at 31 March 2017
Notes US$'000AssetsInvestments in securities at market value 2.2 139,432 Cash at bank 2,857 Interest and dividends receivable 121 Subscriptions receivable 1,082 Total assets 143,492 LiabilitiesPayable for investments purchased 973 Taxes and expenses payable 201 Redemptions payable 1,912 Total liabilities 3,086 Net assets at the end of the period 140,406
Statement of Changes in Net Assets For the period from 1 October 2016 to 31 March 2017
Notes US$'000Net assets at the beginning of the period 132,817 Net losses from investments (203) Net realised gains 6,091 Net unrealised gains 4,779 Proceeds from shares issued 71,727 Payments for shares redeemed (74,804) Net equalisation paid 10 (1) Net assets at the end of the period 140,406
Statement of Operations For the period from 1 October 2016 to 31 March 2017
Notes US$'000IncomeInvestment income 2.3 947 Bank interest 3 Stocklending income 16 (8) Total income 942 ExpensesManagement fees 4.2 984 Operating, administrative and servicing fees 4.3 159 Other operational expenses 2 Total expenses 1,145 Net losses from investments (203)
Realised gains on investments 6,082 Realised currency exchange gains 9 Net realised gains 6,091
Increase in unrealised appreciation on investments 4,779 Net unrealised gains 4,779 Net increase in assets as a result of operations 10,667
Share Transactions For the period from 1 October 2016 to 31 March 2017
A-2 D(GBP)-2 I-2 R(GBP)-2 X-2 Z-2Shares outstanding at the beginning of the period 5,139,847 25,534 200,283 37,755 49,521 234,378 Shares issued during the period 2,336,150 1,778 57,685 285,816 514,596 24,488 Shares redeemed during the period (2,515,014) (1,289) (67,754) (181,306) (514,512) (33,853) Shares outstanding at the end of the period 4,960,983 26,023 190,214 142,265 49,605 225,013 Net asset value per share 25.4937 20.3079 24.3288 18.9605 14.7752 20.1692
The accompanying notes form an integral part of these financial statements.
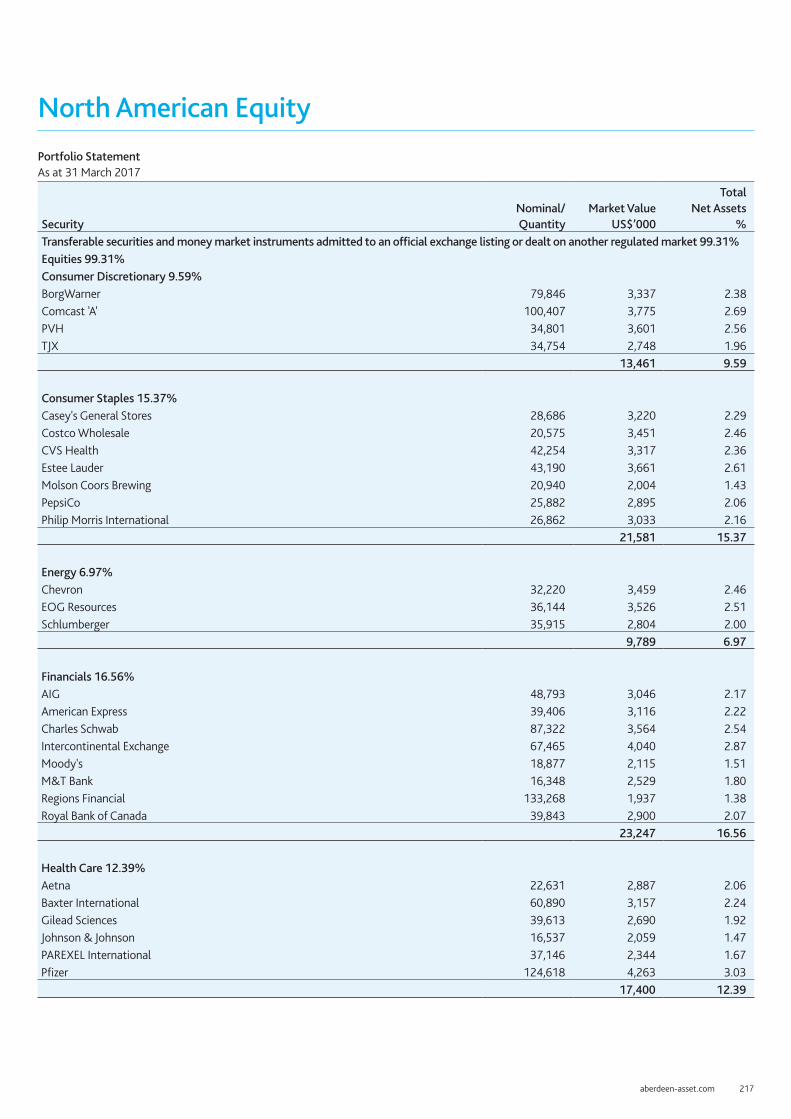
aberdeen-asset.com 217
North American EquityPortfolio StatementAs at 31 March 2017
SecurityNominal/ Quantity
Market Value US$’000
Total Net Assets
%Transferable securities and money market instruments admitted to an official exchange listing or dealt on another regulated market 99.31%Equities 99.31%Consumer Discretionary 9.59%BorgWarner 79,846 3,337 2.38Comcast 'A' 100,407 3,775 2.69PVH 34,801 3,601 2.56TJX 34,754 2,748 1.96
13,461 9.59
Consumer Staples 15.37%Casey's General Stores 28,686 3,220 2.29Costco Wholesale 20,575 3,451 2.46CVS Health 42,254 3,317 2.36Estee Lauder 43,190 3,661 2.61Molson Coors Brewing 20,940 2,004 1.43PepsiCo 25,882 2,895 2.06Philip Morris International 26,862 3,033 2.16
21,581 15.37
Energy 6.97%Chevron 32,220 3,459 2.46EOG Resources 36,144 3,526 2.51Schlumberger 35,915 2,804 2.00
9,789 6.97
Financials 16.56%AIG 48,793 3,046 2.17American Express 39,406 3,116 2.22Charles Schwab 87,322 3,564 2.54Intercontinental Exchange 67,465 4,040 2.87Moody's 18,877 2,115 1.51M&T Bank 16,348 2,529 1.80Regions Financial 133,268 1,937 1.38Royal Bank of Canada 39,843 2,900 2.07
23,247 16.56
Health Care 12.39%Aetna 22,631 2,887 2.06Baxter International 60,890 3,157 2.24Gilead Sciences 39,613 2,690 1.92Johnson & Johnson 16,537 2,059 1.47PAREXEL International 37,146 2,344 1.67Pfizer 124,618 4,263 3.03
17,400 12.39

218 Aberdeen Global
North American Equity
SecurityNominal/ Quantity
Market Value US$’000
Total Net Assets
%Industrials 11.19%Canadian National Railway 39,751 2,939 2.09Deere & Co 19,005 2,069 1.47Equifax 22,750 3,112 2.23Lockheed Martin 7,923 2,121 1.51Rockwell Automation 18,601 2,896 2.06Verisk Analytics 31,696 2,571 1.83
15,708 11.19
Information Technology 15.85%Alliance Data Systems 11,563 2,879 2.05Alphabet 3,205 2,718 1.94Cognizant Technology Solutions 'A' 48,677 2,898 2.06Oracle 118,017 5,265 3.75Texas Instruments 43,111 3,473 2.47Visa 'A' 56,477 5,020 3.58
22,253 15.85
Materials 9.55%Ecolab 22,342 2,800 1.98International Flavors & Fragrances 20,847 2,763 1.97Monsanto 23,515 2,662 1.90Potash Corp of Saskatchewan 141,857 2,424 1.73Praxair 23,312 2,765 1.97
13,414 9.55
Telecommunication Services 1.84%TELUS 59,845 1,937 1.38TELUS 19,782 642 0.46
2,579 1.84
Total Equities 139,432 99.31
Total Transferable securities and money market instruments admitted to an official exchange listing or dealt on another regulated market 139,432 99.31
Total investments 139,432 99.31Other net assets 974 0.69Total net assets 140,406 100.00

aberdeen-asset.com 219
North American Smaller CompaniesFor the six months ended 31 March 2017
Performance For the six months ended 31 March 2017, the value of North American Smaller Companies Fund – A Accumulation shares increased by 8.44% compared to an increase of 12.48% in the benchmark, the Russell 2000 Index (1 day lag).Source: Lipper, basis: total return, published NAV to NAV, net of annual charges, gross income reinvested, USD.
Please remember that past performance is not a guide to future returns. The price of shares and the revenue from them may fall as well as rise. Investors may not get back the amount originally invested.
Market reviewUS equities recorded robust gains in the six-month review period, despite numerous periods of uncertainty surrounding the policies of newly-elected president Trump and his administration. All of the gains during the period occurred following the November 2016 presidential election. All 11 sectors within the Russell 2000 Index, the US small-cap company benchmark, garnered positive returns for the period, led by financials and materials. Conversely, telecommunication services and real estate stocks saw more modest gains and were the most notable market laggards.
One of Trump’s first official executive actions was to reopen negotiations on the construction of the controversial Keystone XL and Dakota Access oil pipelines, reversing the Obama administration’s rejection of the projects. Meanwhile, the leaders of the Republican-controlled House of Representatives introduced a proposal to replace the Affordable Care Act. However, the House was unable to reach consensus, as the opposition Democratic party and both the moderate and conservative factions of the majority Republican party objected to different provisions of the plan. Consequently, the bill was withdrawn before it was put to a vote. On the monetary policy front, the US Federal Reserve hiked its benchmark interest rate by 25 basis points twice over the period, once in December 2016 and again in March 2017.
Portfolio reviewThe Fund underperformed the benchmark over the reporting period, as management’s investment style faced headwinds from the market’s continued focus on lower-quality stocks. Periodically over the past year, the market has appeared to reward companies with lower returns on equity and weaker balance sheets, for example, as well as firms with higher valuations. In such periods where momentum drives markets or valuations detach from fundamentals, the Fund most likely will struggle to outperform.
Meanwhile, at the stock level, holding retailer G-III Apparel underperformed after issuing a lower earnings outlook for its 2018 fiscal year due to delayed revenue and earnings contributions from its recently acquired Donna Karan business. Sporting goods chain Hibbett Sports also weighed on performance; however, we exited the relatively small position in March 2017, as we believed management was lagging in regard to investing in e-commerce, while competitive pressures would continue to intensify. Research organization PAREXEL International’s results for the first two quarters of its 2017 fiscal year were hampered by higher-than-expected contract cancellations, project delays, and continued slow backlog conversion.
On the positive side, holding Bank of the Ozarks contributed to performance as the Arkansas-based lender continued to benefit from effective cost controls, and improvement in credit quality and net interest margins. We sold our holding in December 2016 after the company’s market capitalisation expanded to the extent it no longer met the Fund’s investment parameters. Shares of Globus Medical performed well over the period, as the medical device maker stabilised its salesforce turnover issues that were a hindrance in 2016, leading to improved revenue expectations. Finally, financial services company WSFS Financial’s operating results were bolstered by healthy broad-based organic loan growth and a significant increase in fee revenue.
Outlook ReviewOne quarter in and 2017 is playing out much as we expected. At the beginning of the year, we noted that, while many of President Trump’s proposed pro-growth policies would benefit small-cap companies given their domestic focus, we were cautious around the speed with which specific proposals were implemented, as we anticipated some partisan bickering in what has increasingly become a very charged political climate. Therefore, we expected volatility as we moved through the year and as specific policies took shape. This proved prescient, as evidenced by the recent failure of President Trump’s healthcare bill. While we think that a healthcare compromise ultimately may be reached, we would not be surprised to see similar consternation and delay regarding tax reform. This arguably would have a greater effect on markets given that lower tax rates would have a more significant impact on earnings growth for most companies than healthcare reform. Across the broader small-cap market, we think fundamentals remain solid, with companies continuing to deliver positive sales and earnings growth, albeit at lower rates than in the past few years. Given the underperformance of small-cap stocks relative to their large-cap counterparts during the first quarter of 2017, the small-cap premium to large caps has compressed to below historical levels.
North American Equity Team April 2017
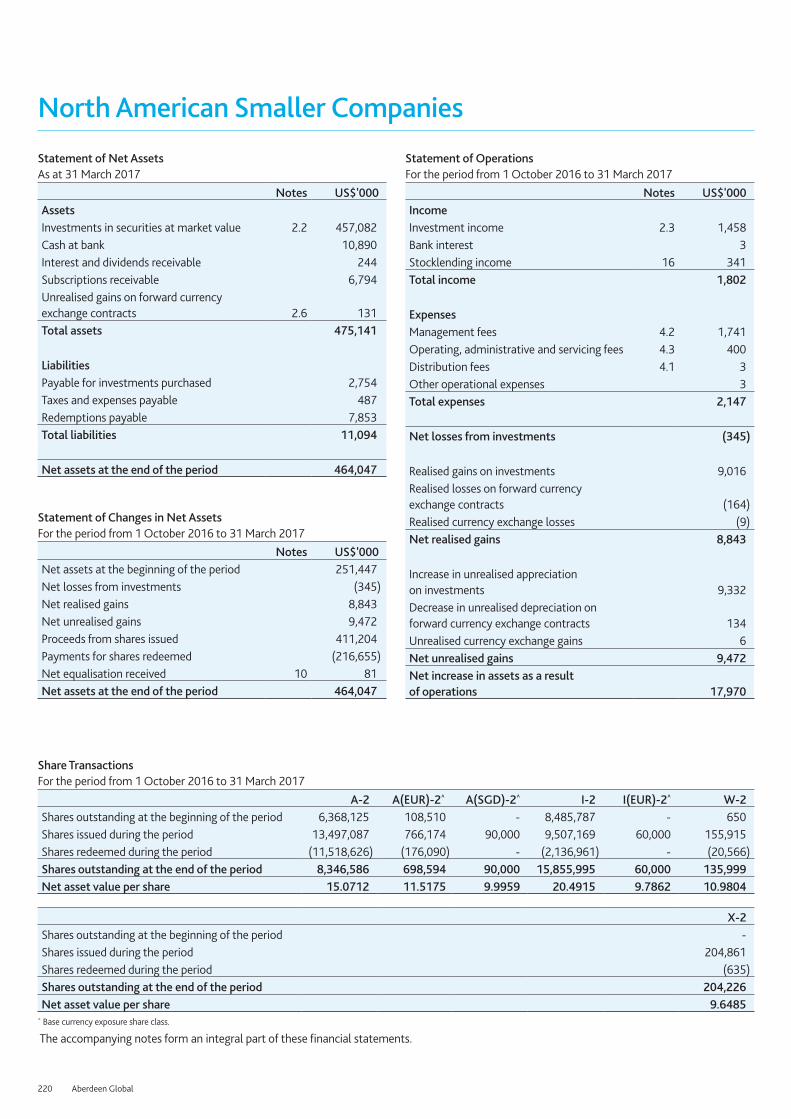
220 Aberdeen Global
North American Smaller Companies
Statement of Net AssetsAs at 31 March 2017
Notes US$'000AssetsInvestments in securities at market value 2.2 457,082 Cash at bank 10,890 Interest and dividends receivable 244 Subscriptions receivable 6,794 Unrealised gains on forward currency exchange contracts 2.6 131 Total assets 475,141 LiabilitiesPayable for investments purchased 2,754 Taxes and expenses payable 487 Redemptions payable 7,853 Total liabilities 11,094 Net assets at the end of the period 464,047
Statement of Changes in Net Assets For the period from 1 October 2016 to 31 March 2017
Notes US$'000Net assets at the beginning of the period 251,447 Net losses from investments (345) Net realised gains 8,843 Net unrealised gains 9,472 Proceeds from shares issued 411,204 Payments for shares redeemed (216,655) Net equalisation received 10 81 Net assets at the end of the period 464,047
Statement of Operations For the period from 1 October 2016 to 31 March 2017
Notes US$'000IncomeInvestment income 2.3 1,458 Bank interest 3 Stocklending income 16 341 Total income 1,802 ExpensesManagement fees 4.2 1,741 Operating, administrative and servicing fees 4.3 400 Distribution fees 4.1 3 Other operational expenses 3 Total expenses 2,147 Net losses from investments (345)
Realised gains on investments 9,016 Realised losses on forward currency exchange contracts (164) Realised currency exchange losses (9) Net realised gains 8,843
Increase in unrealised appreciation on investments 9,332 Decrease in unrealised depreciation on forward currency exchange contracts 134 Unrealised currency exchange gains 6 Net unrealised gains 9,472 Net increase in assets as a result of operations 17,970
Share Transactions For the period from 1 October 2016 to 31 March 2017
A-2 A(EUR)-2^ A(SGD)-2^ I-2 I(EUR)-2^ W-2Shares outstanding at the beginning of the period 6,368,125 108,510 - 8,485,787 - 650 Shares issued during the period 13,497,087 766,174 90,000 9,507,169 60,000 155,915 Shares redeemed during the period (11,518,626) (176,090) - (2,136,961) - (20,566) Shares outstanding at the end of the period 8,346,586 698,594 90,000 15,855,995 60,000 135,999 Net asset value per share 15.0712 11.5175 9.9959 20.4915 9.7862 10.9804
X-2Shares outstanding at the beginning of the period - Shares issued during the period 204,861 Shares redeemed during the period (635) Shares outstanding at the end of the period 204,226 Net asset value per share 9.6485
^ Base currency exposure share class.
The accompanying notes form an integral part of these financial statements.

aberdeen-asset.com 221
North American Smaller CompaniesPortfolio StatementAs at 31 March 2017
SecurityNominal/ Quantity
Market Value US$’000
Total Net Assets
%Transferable securities and money market instruments admitted to an official exchange listing or dealt on another regulated market 98.50%Equities 98.50%Consumer Discretionary 11.57%Core-Mark 330,267 10,299 2.22Culp 261,651 8,150 1.76Fox Factory 288,519 8,273 1.78G-III Apparel 365,660 8,002 1.72La Quinta 562,915 7,605 1.64LCI Industries 68,078 6,796 1.46Pool 38,411 4,582 0.99
53,707 11.57
Consumer Staples 5.38%Cal-Maine Foods∞ 307,104 11,309 2.43J&J Snack Foods 45,389 6,153 1.33WD-40 69,061 7,521 1.62
24,983 5.38
Energy 2.26%Forum Energy Technologies 508,315 10,509 2.26
Financials 15.00%AMERISAFE 140,104 9,089 1.96Boston Private Financial 665,422 10,896 2.35Canadian Western Bank∞ 531,468 11,748 2.53Glacier Bancorp 338,612 11,491 2.48Univest Corp of Pennsylvania 345,480 8,957 1.93Wisdomtree Investments∞ 557,428 5,053 1.09WSFS Financial 268,769 12,343 2.66
69,577 15.00
Health Care 9.59%Emergent BioSolutions 329,109 9,552 2.06Globus Medical 312,551 9,256 1.99PAREXEL International 134,900 8,513 1.83Prestige Brands 167,686 9,313 2.01US Physical Therapy 120,775 7,884 1.70
44,518 9.59
Industrials 22.05%ABM Industries 228,654 9,968 2.15Actuant 'A' 357,084 9,400 2.03Beacon Roofing Supply 325,252 15,987 3.44Curtiss-Wright 98,669 9,001 1.94Gibraltar Industries 224,914 9,261 2.00

222 Aberdeen Global
North American Smaller Companies
SecurityNominal/ Quantity
Market Value US$’000
Total Net Assets
%Heartland Express 375,293 7,523 1.62Multi-Color 158,751 11,267 2.43RBC Bearings 103,111 10,012 2.16Ritchie Brothers Auctioneers 332,560 10,940 2.36US Ecology 190,745 8,932 1.92
102,291 22.05
Information Technology 16.28%Ellie Mae 57,677 5,784 1.25EXLService 231,428 10,956 2.36Fair Isaac 105,526 13,603 2.94Insight Enterprises 195,253 8,022 1.73Littelfuse 72,366 11,575 2.49Manhattan Associates 141,052 7,344 1.58OSI Systems 126,591 9,239 1.99Pegasystems 204,805 8,986 1.94
75,509 16.28
Materials 9.79%Compass Minerals International 92,649 6,289 1.36Kaiser Aluminium 134,855 10,771 2.32Quaker Chemical 77,160 10,158 2.19Sensient Technologies 136,151 10,789 2.32Silgan 125,409 7,442 1.60
45,449 9.79
Real Estate 3.67%Healthcare Realty Trust (REIT) 299,637 9,737 2.10Marcus & Millichap 296,610 7,289 1.57
17,026 3.67
Telecommunication Services 2.91%Shenandoah Telecommunications 482,171 13,513 2.91
Total Equities 457,082 98.50
Total Transferable securities and money market instruments admitted to an official exchange listing or dealt on another regulated market 457,082 98.50

aberdeen-asset.com 223
North American Smaller CompaniesDerivatives 0.03%
Forward currency exchange contracts 0.03%
Counterparty Buy Sell Settlement Buy Amount Sell Amount
Unrealised Gains/(Losses)
US$’000
Total Net Assets
%BNP Paribas EUR USD 03/04/17 458,605 497,770 (7) -BNP Paribas EUR USD 06/04/17 7,412 7,917 - -BNP Paribas EUR USD 15/06/17 8,627,012 9,143,572 116 0.03BNP Paribas EUR USD 15/06/17 600,000 635,926 8 -BNP Paribas EUR USD 15/06/17 167,929 181,107 (1) -BNP Paribas EUR USD 15/06/17 109,566 118,579 (1) -BNP Paribas EUR USD 15/06/17 72,040 78,147 (1) -BNP Paribas EUR USD 15/06/17 32,157 34,653 - -BNP Paribas EUR USD 15/06/17 30,000 32,139 - -BNP Paribas EUR USD 15/06/17 8,947 9,689 - -BNP Paribas EUR USD 15/06/17 3,688 3,972 - -BNP Paribas EUR USD 15/06/17 2,854 3,089 - -BNP Paribas SGD USD 15/06/17 900,000 637,516 7 -BNP Paribas USD EUR 03/04/17 3,079 2,854 - -BNP Paribas USD EUR 04/04/17 118,200 109,566 1 -BNP Paribas USD EUR 05/04/17 34,540 32,157 - -BNP Paribas USD EUR 15/06/17 499,428 458,605 7 -BNP Paribas USD EUR 15/06/17 236,042 217,266 3 -BNP Paribas USD EUR 15/06/17 235,523 219,807 - -BNP Paribas USD EUR 15/06/17 182,021 170,857 (1) -BNP Paribas USD EUR 15/06/17 55,062 51,003 - -BNP Paribas USD EUR 15/06/17 13,188 12,450 - -BNP Paribas USD EUR 15/06/17 12,856 11,880 - -BNP Paribas USD SGD 15/06/17 12,616 17,556 - -BNP Paribas USD EUR 15/06/17 8,461 7,925 - -BNP Paribas USD EUR 15/06/17 7,942 7,412 - -BNP Paribas USD EUR 15/06/17 3,164 2,965 - -Unrealised gains on forward currency exchange contracts 131 0.03
Unrealised gains on derivatives 131 0.03
Total investments 457,213 98.53Other net assets 6,834 1.47Total net assets 464,047 100.00
∞ A portion of this security is on loan at the period end.Currently forward positions are not collateralised.

224 Aberdeen Global
Responsible World EquityFor the six months ended 31 March 2017
Performance For the six months ended 31 March 2017, the value of Responsible World Equity - A Accumulation shares increased by 6.24%, compared to an increase of 8.63% in the benchmark, the MSCI World Index.Source: Lipper, Basis: total return, published NAV to NAV, net of annual charges, gross income reinvested, USD.Please see the Performance History section for details on the use of MSCI information.
Please remember that past performance is not a guide to future returns. The price of shares and the revenue from them may fall as well as rise. Investors may not get back the amount originally invested.
Market reviewGlobal equities rose during the six months under review. Initial uncertainty over the US elections gave way to bullishness after Donald Trump’s shock victory. Several major indices reached record highs and the US dollar rallied, on speculation over potential fiscal stimulus from the incoming Trump administration. Risk appetite for emerging markets was also renewed. However, the ‘Trump trade’ tapered off somewhat by the end of the review period, over concerns that political wrangling would hamstring US policymakers, particularly after the failed bill to overhaul healthcare. On the back of firmer economic data, the US Federal Reserve (Fed) raised rates twice, in December and in March.
Elsewhere, sentiment was lifted by the European Central Bank’s decision to extend its bond-buying scheme through 2017, albeit at a smaller magnitude after March. Early on, markets were rattled by UK prime minister Theresa May’s announcement of a hard deadline to begin formal negotiations to exit the EU, which sent sterling tumbling to a 31-year low. Article 50 was triggered near the period-end. Oil prices were volatile, on ongoing oversupply worries.
Portfolio review Stock selection in health care was a key detractor, with the sector coming under more intense regulatory scrutiny. Perrigo was hampered by guidance revisions and caution over the execution of its restructuring strategy. Meanwhile, retail pharmacy CVS Health suffered as increased competition from rival Walgreens Boots Alliance is expected to affect its 2017 profit margins. Elsewhere, Novartis declined in line with the wider health care sector owing to continued uncertainty surrounding US drug prices.
The overweight to the UK proved costly, as the market lagged the broader rally in global stocks on the back of uncertainty over how the Brexit process would unfold. At the stock level, Vodafone’s results were dampened by impairments against its Indian business as a result of intensifying competition.
Conversely, Shin-Etsu Chemical was a key contributor to performance, after its core PVC business posted healthy results. Checkpoint Software climbed after its quarterly profits beat estimates, as recurring revenues rose on the back of an increase in subscription sales.
Elsewhere, M&T Bank rode the extended post-election rally in the broader US financial sector, which rose on speculation that a Trump presidency would be inflationary and lead to higher Fed benchmark rates. Market sentiment was also buoyed by hopes of less stringent regulatory oversight. The lender also increased its prime lending rate after the Fed’s December rate hike, raising expectations for a boost in interest income.
In portfolio activity, we introduced Ultrapar, a well-managed and attractively-valued Brazilian chemicals and fuel distribution company. We also initiated a position in Indian mortgage lender Housing Development Finance, which enjoys attractive secular growth.
OutlookMarkets appear to be recalibrating as the Trump trade loses steam, and his presidency becomes more benign than initially anticipated. However, there seems to be plenty of optimism that his promised tax cuts will materialise. Meanwhile, all eyes are on the consequences of unfolding political events in Europe, including a possible second Scottish referendum on independence and the start of Brexit negotiations. In Asia, rising exports signal renewed momentum for economic growth, but key risks such as China’s debt situation remain. We continue to navigate these uncertainties through our stock-focused investment process, picking and holding companies that have proven track records and robust balance sheets to maximise growth.
Global Equity Team April 2017

aberdeen-asset.com 225
Responsible World Equity
Statement of Net AssetsAs at 31 March 2017
Notes US$'000AssetsInvestments in securities at market value 2.2 8,142 Cash at bank 189 Interest and dividends receivable 18 Subscriptions receivable 8 Other assets 1 Total assets 8,358 LiabilitiesTaxes and expenses payable 12 Redemptions payable 5 Total liabilities 17 Net assets at the end of the period 8,341
Statement of Changes in Net Assets For the period from 1 October 2016 to 31 March 2017
Notes US$'000Net assets at the beginning of the period 9,147 Net losses from investments (2) Net realised gains 229 Net unrealised gains 208 Proceeds from shares issued 770 Payments for shares redeemed (2,011) Net assets at the end of the period 8,341
Statement of Operations For the period from 1 October 2016 to 31 March 2017
Notes US$'000IncomeInvestment income 2.3 69 Total income 69 ExpensesManagement fees 4.2 61 Operating, administrative and servicing fees 4.3 10 Total expenses 71 Net losses from investments (2)
Realised gains on investments 226 Realised currency exchange gains 3 Net realised gains 229
Increase in unrealised appreciation on investments 208 Net unrealised gains 208 Net increase in assets as a result of operations 435
Share Transactions For the period from 1 October 2016 to 31 March 2017
A-2 E(EUR)-2 I-2 X-2Shares outstanding at the beginning of the period 749,555 4,762 72,920 47,755 Shares issued during the period 26,017 333 44,949 580 Shares redeemed during the period (78,048) - (112,459) (1,145) Shares outstanding at the end of the period 697,524 5,095 5,410 47,190 Net asset value per share 10.9468 15.5652 11.3378 11.8523
The accompanying notes form an integral part of these financial statements.

226 Aberdeen Global
Responsible World EquityPortfolio StatementAs at 31 March 2017
SecurityNominal/ Quantity
Market Value US$’000
Total Net Assets
%Transferable securities and money market instruments admitted to an official exchange listing or dealt on another regulated market 97.62%Equities 97.62%Argentina 1.35%Tenaris (ADR) 3,300 113 1.35
Brazil 2.98%Banco Bradesco (ADR) 15,750 161 1.93Ultrapar Participacoes (ADR) 3,850 88 1.05
249 2.98
Canada 1.34%Potash Corp of Saskatchewan 6,540 112 1.34
Germany 4.03%Fresenius Medical Care 2,000 169 2.03Henkel (non voting) (PREF) 1,300 167 2.00
336 4.03
Hong Kong 6.46%AIA 26,100 165 1.97Jardine Matheson 2,600 167 2.01MTR 16,000 90 1.08Swire Pacific 'A' 11,700 117 1.40
539 6.46
India 1.68%Housing Development Finance 6,050 140 1.68
Ireland 1.49%Experian 6,100 124 1.49
Israel 2.07%Check Point Software Technologies 1,680 172 2.07
Japan 9.48%Daito Trust Construction Co 900 124 1.48FANUC Corp 600 123 1.48Keyence Corp 300 120 1.44Mitsubishi Estate Co 4,300 78 0.94Shimano Inc 700 102 1.22Shin-Etsu Chemical Co 2,800 243 2.92
790 9.48
Netherlands 1.34%Royal Dutch Shell 'B' 4,090 112 1.34

aberdeen-asset.com 227
Responsible World Equity
SecurityNominal/ Quantity
Market Value US$’000
Total Net Assets
%Philippines 0.84%Ayala Land 106,300 70 0.84
Singapore 1.09%City Developments 12,500 91 1.09
South Africa 1.45%MTN 13,320 121 1.45
South Korea 1.99%Samsung Electronics (GDR) (PREF) 230 166 1.99
Sweden 1.61%Atlas Copco 'A' 3,800 135 1.61
Switzerland 9.33%Nestle 2,200 169 2.03Novartis 3,930 292 3.50Roche 1,240 317 3.80
778 9.33
Taiwan 3.09%TSMC (ADR) 7,850 258 3.09
Thailand 1.50%Kasikornbank (Alien) 22,700 125 1.50
United Kingdom 7.20%BHP Billiton 4,600 71 0.85Standard Chartered 12,700 121 1.45Vodafone 79,300 207 2.47Whitbread 4,090 202 2.43
601 7.20
United States 37.30%Amdocs 2,600 159 1.90Casey's General Stores 1,000 112 1.35Cisco Systems 2,450 83 0.99Cognizant Technology Solutions 'A' 2,720 162 1.94Comcast 'A' 4,300 162 1.94CVS Health 2,050 161 1.93EOG Resources 2,800 273 3.28Intercontinental Exchange 2,000 120 1.44Johnson & Johnson 1,450 181 2.16Jones Lang LaSalle 1,160 129 1.55M&T Bank 1,250 193 2.32Oracle 5,070 226 2.71PepsiCo 1,200 134 1.61

228 Aberdeen Global
Responsible World Equity
SecurityNominal/ Quantity
Market Value US$’000
Total Net Assets
%Perrigo 2,082 138 1.66Praxair 1,300 154 1.85Samsonite International 41,600 151 1.81Schlumberger 1,950 152 1.83TJX 2,050 162 1.94Visa 'A' 2,900 258 3.09
3,110 37.30
Total Equities 8,142 97.62
Total Transferable securities and money market instruments admitted to an official exchange listing or dealt on another regulated market 8,142 97.62
Total investments 8,142 97.62Other net assets 199 2.38Total net assets 8,341 100.00

aberdeen-asset.com 229
Russian EquityFor the six months ended 31 March 2017
Performance For the six months ended 31 March 2017, the value of Russian Equity – A Accumulation Shares increased by 18.88% compared to an increase of 20.06% in the benchmark, the MSCI Russia 10/40 Index.Source: Lipper, Basis: total return, published NAV to NAV, net of annual charges, gross income reinvested, EUR.Please see the Performance History section for details on the use of MSCI information.
Please remember that past performance is not a guide to future returns. The price of shares and the revenue from them may fall as well as rise. Investors may not get back the amount originally invested.
Market reviewRussian equity markets posted robust gains over the period, boosted by the uplifting effects of a commodity rally. Uncertainty over global monetary policies and Donald Trump’s unexpected victory in the US presidential election briefly sidelined investors. But markets continued to rise after that. A deal between major oil-producers to cut production sparked an oil price hike, helping markets shrug off the US Federal Reserve’s much-anticipated interest rate hike, and the prospect of an accelerated pace of tightening. Expectations of a brighter outlook, and hopes of warmer relations with the US under the Trump administration further bolstered sentiment. The economy returned to growth in the fourth quarter, its first expansion in two years, party aided by capital expenditure. Meanwhile, the central bank unexpectedly cut interest rates by 0.25% in March, the first cut in seven months, in response to a faster than expected slowdown in inflation.
Portfolio review Positive stock selection aided the Fund’s performance.
Our holdings in the materials sector were among the key contributors to performance. Steel producers Magnitogorsk Iron & Steel Works and Novolipetsk rallied, as both companies continued to improve profitability through internal efficiencies. They also benefited from the sectoral tailwind of supply rationalisation among Chinese mills. We trimmed Magnitogorsk on share price strength over the period.
For consumer staples, positive stock selection – notably food retailers Magnit, O’Key and X5 Retail – mitigated the drag on performance from our overweight to the sector, which lagged the broader market. X5 Retail, in particular, continued to enjoy robust performance, with solid revenue and profit growth in the fourth quarter, helped by a remarkable performance at its Pyaterochka outlets and increased customer traffic. Magnit is still on track to achieve earlier-issued earnings guidance, although its results were slightly below expectations. Profitability remains at the core of management’s strategy and further closures of unprofitable stores are expected. The retailer is also seeing encouraging results from remodelled stores.
Against this, the lack of exposure to utilities pared overall returns, as companies there rallied amid the promise of higher dividend payouts. We find companies in the utility sector lack regulatory visibility, and the industry is characterised by a lack of pricing power, hence have no exposure there. Our non-benchmark exposure to IT names, via local internet search engine Yandex and software developer EPAM Systems also pared overall returns. Belarussian software developer EPAM Systems’ results were robust, but its modestly lowered
forecast for enterprise spending prompted investors to seek better returns elsewhere. Yandex lagged despite reporting healthy quarterly earnings. Likewise, our significant underweight to energy also cost the fund, given the oil price rally over the period.
Besides trimming Magnitogorsk as mentioned above, we also top-sliced Enka Insaat ve Sanayi following its strong relative performance, and added to Magnit on share price weakness.
Outlook The economy has emerged from the recession, but the challenge now is for recovery to gain traction. Consumer demand remains subdued and the outlook for oil is mixed. Oil prices have come under renewed pressure from rising US shale production, despite several major oil producers reaching an initial agreement to extend output cuts.
On a brighter note, concerns that the Trump administration’s protectionist stance could hurt global trade appear to be moderating somewhat, as early fears seem overdone. Russia, along with the broader emerging markets have rallied on the back of expectations for pro-business policies in the US and an improving global economic outlook; they are likely to remain supported by healthier risk appetite and expectations for improved earnings. Although investors’ sentiment could shift again, we are unfazed by short-term volatility as indiscriminate selling or buying will provide opportunities for us as long-term investors.
At the corporate level, we remain confident in the quality of our holdings, while our regular engagement with them should help ensure that the interests of both management and shareholders remain aligned. While uncertainties lie ahead, we stand by our prudent bottom-up investment approach, which we believe will help to navigate these headwinds over the long run.
Global Emerging Markets Equity Team April 2017

230 Aberdeen Global
Russian Equity
Statement of Net AssetsAs at 31 March 2017
Notes €’000AssetsInvestments in securities at market value 2.2 19,675 Cash at bank 229 Interest and dividends receivable 9 Subscriptions receivable 82 Receivable for investments sold 11 Other assets 4 Total assets 20,010 LiabilitiesTaxes and expenses payable 41 Redemptions payable 108 Total liabilities 149 Net assets at the end of the period 19,861
Statement of Changes in Net Assets For the period from 1 October 2016 to 31 March 2017
Notes €’000Net assets at the beginning of the period 17,934 Net losses from investments (64) Net realised gains 257 Net unrealised gains 2,922 Proceeds from shares issued 7,463 Payments for shares redeemed (8,649) Net equalisation paid 10 (2) Net assets at the end of the period 19,861
Statement of Operations For the period from 1 October 2016 to 31 March 2017
Notes €’000IncomeInvestment income 2.3 155 Stocklending income 16 13 Total income 168 ExpensesManagement fees 4.2 164 Operating, administrative and servicing fees 4.3 68 Total expenses 232 Net losses from investments (64)
Realised gains on investments 252 Realised currency exchange gains 5 Net realised gains 257
Decrease in unrealised depreciation on investments 2,921 Unrealised currency exchange gains 1 Net unrealised gains 2,922 Net increase in assets as a result of operations 3,115
Share Transactions For the period from 1 October 2016 to 31 March 2017
A-2 I-2 R(GBP)-2 S-2 X-2Shares outstanding at the beginning of the period 694,259 4,994 500 1,017,200 56,982 Shares issued during the period 135,303 5,785 - 175,262 1,207 Shares redeemed during the period (182,789) (6,610) - (198,452) (4,935) Shares outstanding at the end of the period 646,773 4,169 500 994,010 53,254 Net asset value per share 9.7146 818.5662 16.4169 9.6041 11.4316
The accompanying notes form an integral part of these financial statements.

aberdeen-asset.com 231
Russian EquityPortfolio StatementAs at 31 March 2017
SecurityNominal/ Quantity
Market Value €’000
Total Net Assets
%Transferable securities and money market instruments admitted to an official exchange listing or dealt on another regulated market 99.07%Equities 99.07%Consumer Staples 23.89%Anadolu Efes Biracilik Ve Malt Sanayii 63,905 325 1.64Lenta (GDR)∞ 146,900 930 4.69Magnit 12,200 1,879 9.46O'Key (GDR) 145,200 280 1.41Synergy 66,682 638 3.21X5 Retail (GDR) 22,005 692 3.48
4,744 23.89
Energy 16.35%Lukoil 33,823 1,681 8.46NOVATEK 134,200 1,567 7.89
3,248 16.35
Financials 18.61%Bank of Georgia 25,500 961 4.84Moscow Exchange MICEX-RTS 415,400 775 3.90Sberbank 739,434 1,960 9.87
3,696 18.61
Health Care 7.66%Georgia Healthcare 141,000 605 3.05MD Medical Group Investments (GDR) 95,093 916 4.61
1,521 7.66
Industrials 4.43%Enka Insaat ve Sanayi 330,949 519 2.61Global Ports Investments (GDR) 105,971 362 1.82
881 4.43
Information Technology 15.48%EPAM Systems 13,413 947 4.77Luxoft 16,600 970 4.89QIWI (ADR) 25,300 406 2.04Yandex 'A' 36,600 751 3.78
3,074 15.48
Materials 6.78%Magnitogorsk Iron & Steel Works (GDR) 65,700 521 2.62Novolipetsk Steel 440,600 826 4.16
1,347 6.78

232 Aberdeen Global
Russian Equity
SecurityNominal/ Quantity
Market Value €’000
Total Net Assets
%Real Estate 2.25%Raven Russia 694,125 446 2.25
Telecommunication Services 3.62%Mobile Telesystems 158,050 718 3.62
Total Equities 19,675 99.07
Total Transferable securities and money market instruments admitted to an official exchange listing or dealt on another regulated market 19,675 99.07
Total investments 19,675 99.07Other net assets 186 0.93Total net assets 19,861 100.00
∞ A portion of this security is on loan at the period end.

aberdeen-asset.com 233
Select Emerging Markets BondFor the six months ended 31 March 2017
Performance For the six months ended 31 March 2017, the value of Select Emerging Markets Bond - A Accumulation Shares increased by 1.13% compared to a decrease of 0.31% in the benchmark, the JP Morgan EMBI Global Diversified Index.Source: Lipper, Basis: total return, published NAV to NAV, net of annual charges, gross income reinvested, USD.
Please remember that past performance is not a guide to future returns. The price of shares and the revenue from them may fall as well as rise. Investors may not get back the amount originally invested.
Market review Emerging markets (EM) debt remained defiant over the period. The asset class overcame a shock victory for Donald Trump in the US elections in November, before brushing aside two interest rate hikes from the US Federal Reserve in December and March, respectively. EM debt has benefitted from the synchronised global recovery with both developed and emerging market economies gaining momentum.
There was a sell-off in the immediate aftermath of Trump’s victory as the Republican’s pre-election rhetoric and campaign promises - namely his pledge to boost domestic infrastructure spending and cut taxes in order to boost growth, while also renegotiating or even tearing up existing trade deals - saw US Treasury (UST) yields increase and the US dollar appreciate. This subsequently led to downward pressure on EM debt as the animal spirits were unleashed. Most recently, however, US markets have been more subdued and, with prospects of the so-called reflation trade having diminished, the risk of rising UST yields and a stronger dollar has also declined, which is supportive for the asset class.
Trump withdrew the US from the Trans-Pacific Partnership in January but even that seems to have done little to dampen sentiment. December was the first of four straight months of sustained positive performance as fading external risks and a stabilisation of commodity prices continued to benefit the asset class. Emerging market fundamentals remain strong, with local markets growing particularly attractive over the period.
JP Morgan EMBI Global Diversified index returned -0.31% while the benchmark spread narrowed 26bps to +310bps over US Treasuries.
Portfolio review The Fund’s local currency exposure in Brazil and Russia were both positive contributors to performance as were underweights to the Philippines and Peru and an overweight position in Ghana. Underweights in Lebanon and Sri Lanka detracted from performance as did overweights in Argentina and Venezuela.
During the period, we participated in new bonds from Pakistan, Egypt, Ecuador, Nigeria, Oman and Argentina. We reduced our exposure to Ecuador and Kenya in the run up to US elections and also topped up our exposure to Bahrain. We reduced exposure to certain frontier markets including Suriname, Angola, Ethiopia and Ghana, while also reducing duration in Petroleos Mexicanos, the Mexican state-owned oil company. We carried out a switch from Eskom, South Africa’s quasi-sovereign energy company into the sovereign, as a risk reduction trade on the back of heightened political volatility. In corporate space,
we switched from Myriad into MTN, a South African telecom company. In terms of local markets, we added a position in Argentine local bonds and reduced our positioning in Malaysia and Uruguay. We increased duration in Mexico on attractive yield differentials. We trimmed duration in Brazil and Russia, both of which have performed well in 2017, and topped up our position to Turkey. In currency space, we added exposure to the Turkish lira.
OutlookThe fact that fears of rising UST yields have diminished has clearly been supportive of the asset class. However, even prior to the recent subsidence of UST yields the asset class has been doing well, partly thanks to the resilience of commodity prices. This does point to one of the principle outstanding risks for the asset class, that is a correction in oil and other key commodities (such as the one we are currently witnessing in iron ore), with the most likely trigger being growth disappointment in China. While our outlook for growth in China this year is a fairly sanguine one, we do acknowledge the risk to the asset class that a slowdown in China would pose.
Political volatility is never too far away in emerging markets as recent events in South Africa and April’s constitutional referendum in Turkey can attest. Given the benign backdrop in which the market appears to be operating at the moment, any drop in asset prices caused by negative news flow is swiftly capped by willing buyers. The primary markets continue to be open to issuers on every spectrum of the credit rating scale as investors struggle to reduce healthy cash balances as a result of the consistent inflows that have returned to the asset class this year. The bearish emerging market scenarios which were espoused after Donald Trump’s election have yet to manifest themselves – encouraging market participants to remain invested.
Emerging Market Debt Team April 2017

234 Aberdeen Global
Select Emerging Markets Bond
Statement of Net AssetsAs at 31 March 2017
Notes US$'000AssetsInvestments in securities at market value 2.2 1,509,964 Cash at bank 123,975 Interest receivable 23,571 Subscriptions receivable 9,423 Receivable for investments sold 11,864 Unrealised gains on forward currency exchange contracts 2.6 5,575 Total assets 1,684,372 LiabilitiesPayable for investments purchased 41,559 Taxes and expenses payable 1,763 Redemptions payable 4,910 Other liabilities 2,798 Total liabilities 51,030 Net assets at the end of the period 1,633,342
Statement of Changes in Net Assets For the period from 1 October 2016 to 31 March 2017
Notes US$'000Net assets at the beginning of the period 1,624,372 Net gains from investments 41,045 Net realised losses (20,761) Net unrealised losses (32,609) Proceeds from shares issued 439,975 Payments for shares redeemed (407,558) Net equalisation paid 10 (3) Dividends paid 5 (11,125) Unclaimed monies 6 Net assets at the end of the period 1,633,342
Statement of Operations For the period from 1 October 2016 to 31 March 2017
Notes US$'000IncomeInvestment income 2.3 50,579 Bank interest 73 Stocklending income 16 472 Total income 51,124 ExpensesManagement fees 4.2 8,534 Operating, administrative and servicing fees 4.3 1,520 Distribution fees 4.1 9 Other operational expenses 16 Total expenses 10,079 Net gains from investments 41,045
Realised gains on investments 13,822 Realised losses on forward currency exchange contracts (33,908) Realised currency exchange losses (675) Net realised losses (20,761)
Decrease in unrealised appreciation on investments (39,817) Decrease in unrealised depreciation on forward currency exchange contracts 7,319 Unrealised currency exchange losses (111) Net unrealised losses (32,609) Net decrease in assets as a result of operations (12,325)

aberdeen-asset.com 235
Select Emerging Markets Bond
Share Transactions For the period from 1 October 2016 to 31 March 2017
A-1 A-2 A-3 A(CHF)-2^ A(CZK)-2^ A(EUR)-1^
Shares outstanding at the beginning of the period 10,595,547 11,047,660 99,409 93,508 98,215 2,485,682 Shares issued during the period 1,631,604 3,532,908 229,247 5,534 - 991,461 Shares redeemed during the period (1,386,165) (3,394,672) (70,685) (10,260) (37,222) (424,986) Shares outstanding at the end of the period 10,840,986 11,185,896 257,971 88,782 60,993 3,052,157 Net asset value per share 17.9004 43.4248 10.6456 135.8108 104.4565 8.7186
A(EUR)-2^ A(GBP)-1^ A(SGD)-1^ I-1 I-2 I(CHF)-1^
Shares outstanding at the beginning of the period 783,207 1,546,128 - 574,122 15,553,872 9,101,445 Shares issued during the period 115,225 194,929 90,000 178,000 8,589,581 - Shares redeemed during the period (193,290) (188,059) - (190,844) (7,646,877) - Shares outstanding at the end of the period 705,142 1,552,998 90,000 561,278 16,496,576 9,101,445 Net asset value per share 138.7223 13.0680 10.1779 18.1059 18.2321 9.4736
I(EUR)-1^ R(GBP)-2 W-1 W-2 X-1 X-2Shares outstanding at the beginning of the period 10,357,228 679,487 107,774 11,658 241,176 2,717,051 Shares issued during the period 6,433,686 177,123 48,253 40,251 48,303 168,606 Shares redeemed during the period (6,283,686) (62,673) (1,263) (5,732) (15,970) (320,697) Shares outstanding at the end of the period 10,507,228 793,937 154,764 46,177 273,509 2,564,960 Net asset value per share 8.8255 14.2001 10.6160 11.4001 8.9537 11.2266
X(EUR)-2^ Y(EUR)-1 Y(EUR)-2 Z-1 Z-2 Z(EUR)-2^
Shares outstanding at the beginning of the period 792,992 105,033 257,976 - 2,607,534 7,400,000 Shares issued during the period 244,803 12,911 279,039 650 - - Shares redeemed during the period (280,594) (21,676) (17,921) - (5,517) - Shares outstanding at the end of the period 757,201 96,268 519,094 650 2,602,017 7,400,000 Net asset value per share 11.3693 10.9064 13.6754 10.0755 47.7198 11.8136
^ Base currency exposure share class.
The accompanying notes form an integral part of these financial statements.
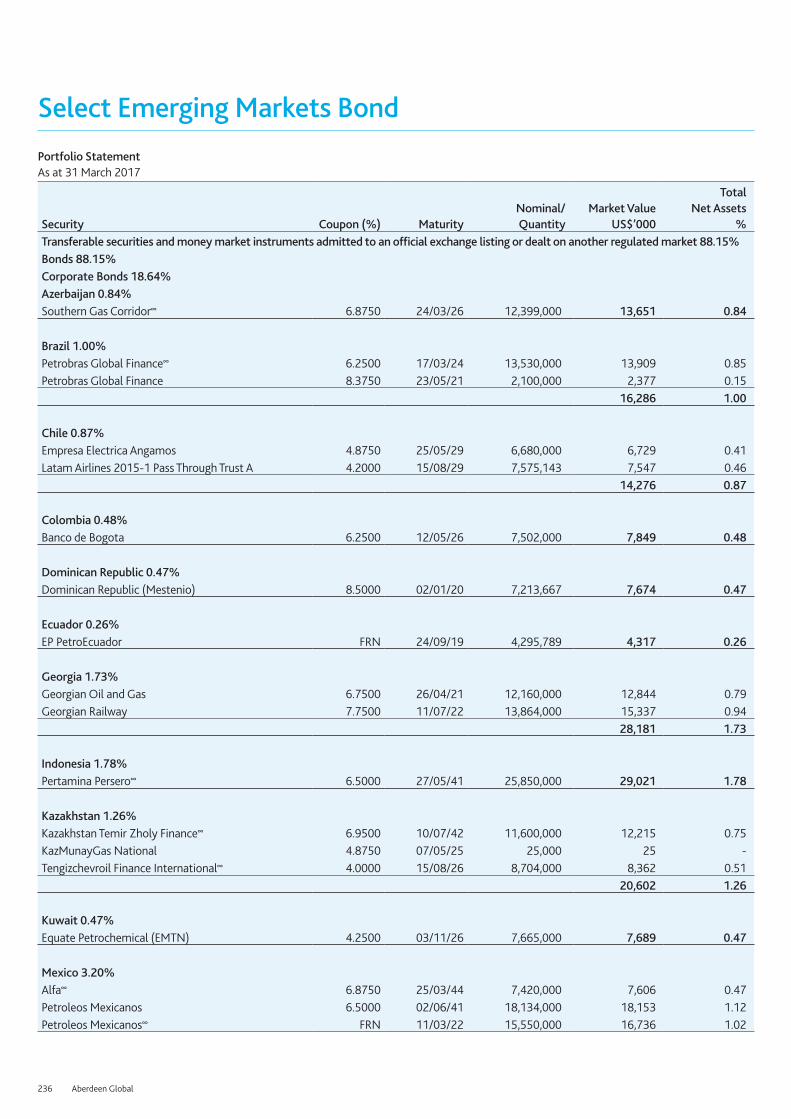
236 Aberdeen Global
Select Emerging Markets BondPortfolio StatementAs at 31 March 2017
Security Coupon (%) MaturityNominal/Quantity
Market Value US$’000
Total Net Assets
%Transferable securities and money market instruments admitted to an official exchange listing or dealt on another regulated market 88.15%Bonds 88.15%Corporate Bonds 18.64%Azerbaijan 0.84%Southern Gas Corridor∞ 6.8750 24/03/26 12,399,000 13,651 0.84
Brazil 1.00%Petrobras Global Finance∞ 6.2500 17/03/24 13,530,000 13,909 0.85Petrobras Global Finance 8.3750 23/05/21 2,100,000 2,377 0.15
16,286 1.00
Chile 0.87%Empresa Electrica Angamos 4.8750 25/05/29 6,680,000 6,729 0.41Latam Airlines 2015-1 Pass Through Trust A 4.2000 15/08/29 7,575,143 7,547 0.46
14,276 0.87
Colombia 0.48%Banco de Bogota 6.2500 12/05/26 7,502,000 7,849 0.48
Dominican Republic 0.47%Dominican Republic (Mestenio) 8.5000 02/01/20 7,213,667 7,674 0.47
Ecuador 0.26%EP PetroEcuador FRN 24/09/19 4,295,789 4,317 0.26
Georgia 1.73%Georgian Oil and Gas 6.7500 26/04/21 12,160,000 12,844 0.79Georgian Railway 7.7500 11/07/22 13,864,000 15,337 0.94
28,181 1.73
Indonesia 1.78%Pertamina Persero∞ 6.5000 27/05/41 25,850,000 29,021 1.78
Kazakhstan 1.26%Kazakhstan Temir Zholy Finance∞ 6.9500 10/07/42 11,600,000 12,215 0.75KazMunayGas National 4.8750 07/05/25 25,000 25 -Tengizchevroil Finance International∞ 4.0000 15/08/26 8,704,000 8,362 0.51
20,602 1.26
Kuwait 0.47%Equate Petrochemical (EMTN) 4.2500 03/11/26 7,665,000 7,689 0.47
Mexico 3.20%Alfa∞ 6.8750 25/03/44 7,420,000 7,606 0.47Petroleos Mexicanos 6.5000 02/06/41 18,134,000 18,153 1.12Petroleos Mexicanos∞ FRN 11/03/22 15,550,000 16,736 1.02

aberdeen-asset.com 237
Select Emerging Markets Bond
Security Coupon (%) MaturityNominal/Quantity
Market Value US$’000
Total Net Assets
%Petroleos Mexicanos 6.6250 15/06/38 9,432,000 9,644 0.59
52,139 3.20
Morocco 0.42%OCP 6.8750 25/04/44 6,350,000 6,834 0.42
Nigeria 0.22%Zenith Bank (EMTN) 6.2500 22/04/19 3,570,000 3,597 0.22
Panama 0.46%Global Bank 4.5000 20/10/21 6,807,000 6,759 0.41Global Bank 4.5000 20/10/21 770,000 765 0.05
7,524 0.46
Russian Federation 2.11%Gazprom∞ 4.3750 19/09/22 7,270,000 7,357 0.45Gazprom 9.2500 23/04/19 5,952,000 6,681 0.41GTLK Europe 5.9500 19/07/21 6,880,000 7,215 0.44VimpelCom∞ 7.7480 02/02/21 6,190,000 7,010 0.43Vnesheconombank Via VEB Finance∞ 6.8000 22/11/25 5,600,000 6,272 0.38
34,535 2.11
South Africa 0.64%Eskom 6.7500 06/08/23 2,822,000 2,864 0.18MTN Mauritius Investments 6.5000 13/10/26 7,440,000 7,626 0.46
10,490 0.64
Sri Lanka 0.24%National Savings Bank 8.8750 18/09/18 3,700,000 3,950 0.24
Supranational 0.87%European Bank for Reconstruction & Development (EMTN) 5.7500 19/03/18 920,000,000 14,207 0.87
Turkey 0.37%Hazine Mustesarligi Varlik Kiralama 5.0040 06/04/23 6,098,000 6,098 0.37
United Arab Emirates 0.95%DP World (EMTN)∞ 6.8500 02/07/37 6,540,000 7,611 0.47ICD Sukuk (EMTN) 5.0000 01/02/27 7,650,000 7,914 0.48
15,525 0.95
Total Corporate Bonds 304,445 18.64
Government Bonds 69.51%Argentina 6.95%Argentina (Republic of)∞ 7.5000 22/04/26 31,000,000 33,014 2.03Argentina (Republic of) 8.2800 31/12/33 19,743,181 21,149 1.29Argentina (Republic of) 5.6250 26/01/22 15,836,000 16,252 0.99

238 Aberdeen Global
Select Emerging Markets Bond
Security Coupon (%) MaturityNominal/Quantity
Market Value US$’000
Total Net Assets
%Argentina (Republic of) 16.0000 17/10/23 185,801,000 12,696 0.78Argentina (Republic of) 7.8200 31/12/33 5,954,401 6,687 0.41Argentina (Republic of)∞ 7.1250 06/07/36 5,638,000 5,474 0.34Argentina (Republic of) 2.5000 31/12/38 7,944,053 5,025 0.31Argentina (Republic of) VAR 15/12/35 38,250,000 3,844 0.24Argentina (Republic of) (SINK) 7.8200 31/12/33 8,066,720 9,146 0.56
113,287 6.95
Armenia 0.45%Armenia (Republic of)∞ 6.0000 30/09/20 3,604,000 3,788 0.23Armenia (Republic of)∞ 7.1500 26/03/25 3,373,000 3,622 0.22
7,410 0.45
Bahrain 1.46%Bahrain (Kingdom of) 7.0000 12/10/28 22,850,000 23,878 1.46
Brazil 3.82%Brazil (Federal Republic of) 10.0000 01/01/27 66,060,000 20,776 1.28Brazil (Federal Republic of) 4.8750 22/01/21 8,200,000 8,647 0.53Brazil (Federal Republic of) 10.0000 01/01/25 27,087,000 8,538 0.52Brazil (Federal Republic of) 10.0000 01/01/23 25,760,000 8,135 0.50Brazil (Federal Republic of) 6.0000 15/08/50 7,700,000 8,060 0.49Caixa Economica Federal 4.2500 13/05/19 7,957,000 8,139 0.50
62,295 3.82
Croatia 0.92%Croatia (Republic of)∞ 6.0000 26/01/24 7,050,000 7,826 0.48Croatia (Republic of)∞ 5.5000 04/04/23 6,629,000 7,159 0.44
14,985 0.92
Dominican Republic 3.36%Dominican (Republic of)∞ 7.4500 30/04/44 25,210,000 27,983 1.71Dominican (Republic of) 6.8500 27/01/45 16,300,000 16,952 1.04Dominican (Republic of) 5.8750 18/04/24 8,950,000 9,420 0.58Dominican (Republic of) 7.5000 06/05/21 480,000 532 0.03
54,887 3.36
Ecuador 1.14%Ecuador (Republic of) 10.7500 28/03/22 10,487,000 11,248 0.69Ecuador (Republic of) 9.6500 13/12/26 7,067,000 7,314 0.45
18,562 1.14
Egypt 0.55%Egypt (Republic of) 6.1250 31/01/22 8,662,000 9,014 0.55
El Salvador 1.55%El Salvador (Republic of) 6.3750 18/01/27 17,157,000 15,441 0.94El Salvador (Republic of) 7.6500 15/06/35 6,450,000 6,047 0.37

aberdeen-asset.com 239
Select Emerging Markets Bond
Security Coupon (%) MaturityNominal/Quantity
Market Value US$’000
Total Net Assets
%El Salvador (Republic of) 8.6250 28/02/29 2,508,000 2,591 0.16El Salvador (Republic of) 5.8750 30/01/25 1,420,000 1,273 0.08
25,352 1.55
Ethiopia 1.14%Ethiopia (Republic of) 6.6250 11/12/24 19,450,000 18,696 1.14
Gabon 1.45%Gabon (Republic of) 6.3750 12/12/24 19,718,445 19,102 1.17Gabon (Republic of) 6.9500 16/06/25 4,727,000 4,615 0.28
23,717 1.45
Georgia 0.43%Georgia (Republic of) 6.8750 12/04/21 6,330,000 7,020 0.43
Ghana 1.99%Ghana (Republic of) 8.1250 18/01/26 29,040,000 27,951 1.72Ghana (Republic of) 10.7500 14/10/30 2,960,000 3,471 0.21Ghana (Republic of)∞ 7.8750 07/08/23 1,080,000 1,049 0.06
32,471 1.99
Guatemala 0.43%Guatemala (Republic of) 4.8750 13/02/28 6,872,000 7,027 0.43
Honduras 1.39%Honduras (Republic of) 7.5000 15/03/24 16,526,000 18,240 1.12Honduras (Republic of) 6.2500 19/01/27 4,350,000 4,413 0.27
22,653 1.39
Hungary 0.52%Hungary (Republic of) 6.3750 29/03/21 7,550,000 8,517 0.52
Indonesia 3.74%Indonesia (Republic of) 8.3750 15/03/34 225,470,000,000 17,961 1.10Indonesia (Republic of) (EMTN) 5.8750 15/01/24 19,240,000 21,873 1.34Lembaga Pembiayaan Ekspor Indonesia (EMTN) 3.8750 06/04/24 3,759,000 3,766 0.23Perusahaan Penerbit SBSN Indonesia III∞ 4.3500 10/09/24 9,130,000 9,472 0.58Perusahaan Penerbit SBSN Indonesia III 3.4000 29/03/22 7,952,000 8,000 0.49
61,072 3.74
Iraq 0.47%Iraq (Republic of) 5.8000 15/01/28 8,650,000 7,655 0.47
Ivory Coast 1.53%Ivory Coast (Government of) 6.3750 03/03/28 15,579,000 15,268 0.93Ivory Coast (Government of) (STEP) VAR 31/12/32 10,422,300 9,733 0.60
25,001 1.53

240 Aberdeen Global
Select Emerging Markets Bond
Security Coupon (%) MaturityNominal/Quantity
Market Value US$’000
Total Net Assets
%Jordan 0.41%Jordan (Kingdom of) 5.7500 31/01/27 6,896,000 6,766 0.41
Kenya 0.55%Kenya (Republic of) 6.8750 24/06/24 8,996,000 8,996 0.55
Mexico 2.96%Mexico (Government of) 6.0500 11/01/40 16,940,000 19,438 1.18Mexico (Government of) 5.5500 21/01/45 11,600,000 12,571 0.77Mexico (Government of) 8.5000 31/05/29 199,100,000 11,686 0.72Mexico (Government of) 8.5000 13/12/18 86,000,000 4,700 0.29
48,395 2.96
Mongolia 0.68%Mongolia (Government of) (EMTN)∞ 10.8750 06/04/21 6,100,000 7,050 0.43Mongolia (Government of) (EMTN) 4.1250 05/01/18 4,100,000 4,094 0.25
11,144 0.68
Morocco 1.03%Morocco (Government of) 4.2500 11/12/22 16,168,000 16,799 1.03
Namibia 0.27%Namibia (Government of)∞ 5.2500 29/10/25 4,382,000 4,431 0.27
Nigeria 0.33%Nigeria (Federal Republic of) 7.8750 16/02/32 5,219,000 5,441 0.33
Oman 1.02%Oman (Government of)∞ 6.5000 08/03/47 15,800,000 16,709 1.02
Pakistan 0.10%Pakistan (Republic of) 8.2500 15/04/24 1,454,000 1,614 0.10
Panama 0.16%Panama (Republic of) 5.2000 30/01/20 2,463,000 2,672 0.16
Paraguay 2.06%Paraguay (Republic of)∞ 6.1000 11/08/44 23,260,000 24,888 1.52Paraguay (Republic of) 5.0000 15/04/26 7,310,000 7,639 0.47Paraguay (Republic of) 4.7000 27/03/27 1,154,000 1,177 0.07
33,704 2.06
Russian Federation 0.97%Russia (Federation of) 8.5000 17/09/31 857,000,000 15,910 0.97
Rwanda 0.97%Rwanda (Republic of) 6.6250 02/05/23 15,650,000 15,807 0.97

aberdeen-asset.com 241
Select Emerging Markets Bond
Security Coupon (%) MaturityNominal/Quantity
Market Value US$’000
Total Net Assets
%Senegal 1.20%Senegal (Republic of)∞ 6.2500 30/07/24 14,800,000 14,985 0.92Senegal (Republic of) 8.7500 13/05/21 4,060,000 4,621 0.28
19,606 1.20
Serbia 2.45%Serbia (Republic of)∞ 7.2500 28/09/21 35,100,000 40,067 2.45
South Africa 1.17%South Africa (Republic of) 5.8750 30/05/22 12,861,000 14,083 0.86South Africa (Republic of) 4.6650 17/01/24 5,026,000 5,101 0.31
19,184 1.17
Suriname 0.48%Suriname (Republic of)∞ 9.2500 26/10/26 7,760,000 7,770 0.48
Tanzania 0.38%Tanzania (Republic of) FRN 09/03/20 5,873,333 6,211 0.38
Tunisia 1.26%Banque Centrale de Tunisie 5.7500 30/01/25 21,304,000 20,532 1.26
Turkey 6.97%Turkey (Republic of) 4.8750 09/10/26 24,950,000 24,045 1.47Turkey (Republic of) 5.7500 22/03/24 21,255,000 22,105 1.35Turkey (Republic of)∞ 6.0000 25/03/27 19,700,000 20,505 1.26Turkey (Republic of) 7.3750 05/02/25 17,910,000 20,305 1.24Turkey (Republic of) 11.0000 02/03/22 61,900,000 16,947 1.04Turkey (Republic of) 4.8750 16/04/43 6,960,000 5,989 0.37Turkey (Republic of) 6.2500 26/09/22 3,599,000 3,851 0.24
113,747 6.97
Ukraine 4.65%Ukraine (Republic of) 7.7500 01/09/24 18,682,000 17,532 1.08Ukraine (Republic of) 7.7500 01/09/21 14,550,000 14,361 0.88Ukraine (Republic of)∞ VAR 31/05/40 36,628,000 13,388 0.82Ukraine (Republic of) 7.7500 01/09/26 12,700,000 11,690 0.72Ukraine (Republic of) 7.7500 01/09/25 10,450,000 9,699 0.59Ukraine (Republic of) 7.7500 01/09/20 9,170,000 9,175 0.56
75,845 4.65
United Arab Emirates 0.49%Dubai (Government of) (EMTN) 5.2500 30/01/43 8,280,000 8,052 0.49
Uruguay 3.22%Uruguay (Republic of)∞ 5.1000 18/06/50 31,497,000 30,474 1.87Uruguay (Republic of) 5.0000 14/09/18 168,543,648 13,299 0.81Uruguay (Republic of) 4.3750 27/10/27 8,480,000 8,872 0.54
52,645 3.22

242 Aberdeen Global
Select Emerging Markets Bond
Security Coupon (%) MaturityNominal/Quantity
Market Value US$’000
Total Net Assets
%Venezuela 2.32%Petroleos de Venezuela 6.0000 16/05/24 33,600,000 12,382 0.76Petroleos de Venezuela 6.0000 15/11/26 23,600,000 8,321 0.51Venezuela (Republic of) 7.7500 13/10/19 29,500,000 17,110 1.05
37,813 2.32
Zambia 0.12%Zambia (Republic of) 8.9700 30/07/27 1,928,000 2,012 0.12
Total Government Bonds 1,135,371 69.51
Total Bonds 1,439,816 88.15
Total Transferable securities and money market instruments admitted to an official exchange listing or dealt on another regulated market 1,439,816 88.15
Other transferable securities and money market instruments 1.13%Bonds 1.13%Corporate Bonds 1.13%Brazil 0.04%OAS Investments 8.2500 19/10/19 14,310,000 644 0.04
Mexico 1.09%Petroleos Mexicanos 6.8750 04/08/26 16,000,000 17,800 1.09
Total Corporate Bonds 18,444 1.13
Total Bonds 18,444 1.13
Total Other transferable securities and money market instruments 18,444 1.13
Open Ended Investment Funds 3.17%Aberdeen Global - Emerging Markets Corporate Bond Fund Z-1† 3,530,540 36,978 2.27Aberdeen Global - Indian Bond Fund Z-2† 1,268,267 14,726 0.90
51,704 3.17
Total Open Ended Investment Funds 51,704 3.17

aberdeen-asset.com 243
Select Emerging Markets BondDerivatives 0.34%
Forward currency exchange contracts 0.34%
Counterparty Buy Sell Settlement Buy Amount Sell Amount
Unrealised Gains/(Losses)
US$’000
Total Net Assets
%Barclays Capital USD INR 24/05/17 12,811,844 865,376,000 (479) (0.03)BNP Paribas CHF USD 06/04/17 50,692 50,652 - -BNP Paribas CHF USD 13/04/17 85,839,529 84,806,753 1,008 0.06BNP Paribas CHF USD 13/04/17 682,490 685,233 (3) -BNP Paribas CHF USD 13/04/17 500,696 507,139 (7) -BNP Paribas CHF USD 13/04/17 494,747 497,027 (2) -BNP Paribas CHF USD 15/06/17 11,736,808 11,638,394 141 0.01BNP Paribas CHF USD 15/06/17 286,904 284,851 3 -BNP Paribas CHF USD 15/06/17 93,942 94,673 - -BNP Paribas CHF USD 15/06/17 69,054 70,200 (1) -BNP Paribas CHF USD 15/06/17 67,050 67,605 - -BNP Paribas CHF USD 15/06/17 54,046 54,607 - -BNP Paribas CHF USD 15/06/17 11,465 11,424 - -BNP Paribas CHF USD 15/06/17 4,110 4,145 - -BNP Paribas CHF USD 15/06/17 2,903 2,926 - -BNP Paribas CZK USD 03/04/17 511,720 20,555 - -BNP Paribas CZK USD 15/06/17 7,354,688 289,749 4 -BNP Paribas CZK USD 15/06/17 65,957 2,686 - -BNP Paribas CZK USD 15/06/17 55,209 2,215 - -BNP Paribas EUR USD 04/04/17 53,925 58,174 - -BNP Paribas EUR USD 05/04/17 96,599 103,757 - -BNP Paribas EUR USD 06/04/17 57,148 61,039 - -BNP Paribas EUR USD 13/04/17 97,079,988 102,597,237 1,288 0.07BNP Paribas EUR USD 13/04/17 92,292,099 97,537,244 1,224 0.08BNP Paribas EUR USD 13/04/17 86,622,985 91,545,942 1,149 0.07BNP Paribas EUR USD 13/04/17 760,084 817,778 (4) -BNP Paribas EUR USD 13/04/17 734,137 789,861 (4) -BNP Paribas EUR USD 13/04/17 705,002 758,514 (4) -BNP Paribas EUR USD 13/04/17 559,188 605,760 (7) -BNP Paribas EUR USD 13/04/17 549,650 590,435 (2) -BNP Paribas EUR USD 13/04/17 540,404 585,411 (7) -BNP Paribas EUR USD 13/04/17 533,936 573,555 (2) -BNP Paribas EUR USD 13/04/17 520,277 558,882 (2) -BNP Paribas EUR USD 13/04/17 518,805 562,014 (7) -BNP Paribas EUR USD 13/04/17 144,519 156,040 (1) -BNP Paribas EUR USD 13/04/17 101,913 108,878 - -BNP Paribas EUR USD 13/04/17 75,217 79,562 1 -BNP Paribas EUR USD 13/04/17 70,494 76,551 (1) -BNP Paribas EUR USD 13/04/17 37,789 40,797 - -BNP Paribas EUR USD 13/04/17 35,038 37,654 - -BNP Paribas EUR USD 13/04/17 29,617 31,880 - -BNP Paribas EUR USD 13/04/17 12,594 13,629 - -BNP Paribas EUR USD 13/04/17 10,548 11,383 - -BNP Paribas EUR USD 13/04/17 3,526 3,814 - -BNP Paribas EUR USD 15/06/17 25,706,873 27,246,123 348 0.02BNP Paribas EUR USD 15/06/17 7,478,639 7,926,438 101 0.01

244 Aberdeen Global
Select Emerging Markets Bond
Counterparty Buy Sell Settlement Buy Amount Sell Amount
Unrealised Gains/(Losses)
US$’000
Total Net Assets
%BNP Paribas EUR USD 15/06/17 1,142,933 1,212,315 15 -BNP Paribas EUR USD 15/06/17 267,125 287,715 (1) -BNP Paribas EUR USD 15/06/17 249,786 270,445 (2) -BNP Paribas EUR USD 15/06/17 202,999 219,057 (1) -BNP Paribas EUR USD 15/06/17 184,372 196,420 1 -BNP Paribas EUR USD 15/06/17 151,397 164,480 (2) -BNP Paribas EUR USD 15/06/17 147,953 159,387 (1) -BNP Paribas EUR USD 15/06/17 98,914 105,993 - -BNP Paribas EUR USD 15/06/17 73,548 78,793 - -BNP Paribas EUR USD 15/06/17 68,114 73,502 - -BNP Paribas EUR USD 15/06/17 50,558 54,465 - -BNP Paribas EUR USD 15/06/17 50,143 54,477 (1) -BNP Paribas EUR USD 15/06/17 30,591 32,448 - -BNP Paribas EUR USD 15/06/17 11,994 12,795 - -BNP Paribas EUR USD 15/06/17 7,967 8,537 - -BNP Paribas EUR USD 15/06/17 7,340 7,910 - -BNP Paribas EUR USD 15/06/17 4,948 5,370 - -BNP Paribas EUR USD 15/06/17 3,722 4,019 - -BNP Paribas GBP USD 06/04/17 14,312 17,822 - -BNP Paribas GBP USD 15/06/17 20,199,069 24,636,683 667 0.04BNP Paribas GBP USD 15/06/17 159,121 197,334 2 -BNP Paribas GBP USD 15/06/17 115,883 144,777 - -BNP Paribas GBP USD 15/06/17 112,947 141,375 - -BNP Paribas GBP USD 15/06/17 40,400 50,401 - -BNP Paribas GBP USD 15/06/17 24,430 30,592 - -BNP Paribas GBP USD 15/06/17 16,429 20,460 - -BNP Paribas GBP USD 15/06/17 13,740 17,140 - -BNP Paribas GBP USD 15/06/17 13,000 16,284 - -BNP Paribas GBP USD 15/06/17 11,705 14,246 - -BNP Paribas GBP USD 15/06/17 9,828 12,360 - -BNP Paribas GBP USD 15/06/17 5,042 6,359 - -BNP Paribas GBP USD 15/06/17 4,644 5,722 - -BNP Paribas GBP USD 15/06/17 4,000 4,995 - -BNP Paribas GBP USD 15/06/17 1,983 2,415 - -BNP Paribas SGD USD 15/06/17 900,000 637,516 7 -BNP Paribas SGD USD 15/06/17 8,068 5,761 - -BNP Paribas SGD USD 15/06/17 5,281 3,782 - -BNP Paribas SGD USD 15/06/17 5,101 3,663 - -BNP Paribas USD EUR 03/04/17 76,514 70,494 1 -BNP Paribas USD GBP 03/04/17 12,339 9,828 - -BNP Paribas USD CHF 04/04/17 54,377 54,046 - -BNP Paribas USD GBP 04/04/17 20,425 16,429 - -BNP Paribas USD EUR 04/04/17 11,379 10,548 - -BNP Paribas USD GBP 05/04/17 50,318 40,400 - -BNP Paribas USD EUR 05/04/17 7,884 7,340 - -BNP Paribas USD CHF 05/04/17 4,128 4,110 - -BNP Paribas USD EUR 06/04/17 105,650 98,914 - -BNP Paribas USD EUR 06/04/17 8,510 7,967 - -

aberdeen-asset.com 245
Select Emerging Markets Bond
Counterparty Buy Sell Settlement Buy Amount Sell Amount
Unrealised Gains/(Losses)
US$’000
Total Net Assets
%BNP Paribas USD EUR 13/04/17 965,233 903,364 (1) -BNP Paribas USD EUR 13/04/17 961,959 900,300 (1) -BNP Paribas USD CHF 13/04/17 868,469 875,930 (7) -BNP Paribas USD EUR 13/04/17 649,124 607,517 (1) -BNP Paribas USD EUR 13/04/17 526,056 496,672 (5) -BNP Paribas USD EUR 13/04/17 177,995 167,194 (1) -BNP Paribas USD EUR 13/04/17 111,156 104,638 (1) -BNP Paribas USD EUR 13/04/17 103,796 96,599 - -BNP Paribas USD EUR 13/04/17 61,055 57,148 - -BNP Paribas USD EUR 13/04/17 36,773 34,570 - -BNP Paribas USD EUR 13/04/17 29,639 27,602 - -BNP Paribas USD EUR 13/04/17 3,914 3,600 - -BNP Paribas USD GBP 15/06/17 265,454 217,855 (7) -BNP Paribas USD EUR 15/06/17 177,053 166,685 (2) -BNP Paribas USD EUR 15/06/17 173,372 161,803 - -BNP Paribas USD GBP 15/06/17 143,303 117,274 (4) -BNP Paribas USD CHF 15/06/17 108,323 109,319 (1) -BNP Paribas USD EUR 15/06/17 91,195 84,069 1 -BNP Paribas USD CHF 15/06/17 74,959 75,334 (1) -BNP Paribas USD EUR 15/06/17 73,749 69,430 (1) -BNP Paribas USD EUR 15/06/17 66,547 61,347 1 -BNP Paribas USD EUR 15/06/17 58,361 53,925 - -BNP Paribas USD EUR 15/06/17 57,498 53,661 - -BNP Paribas USD CHF 15/06/17 50,853 50,692 - -BNP Paribas USD CHF 15/06/17 41,750 41,291 - -BNP Paribas USD EUR 15/06/17 40,114 37,157 - -BNP Paribas USD CHF 15/06/17 28,918 29,011 - -BNP Paribas USD CZK 15/06/17 20,685 511,720 - -BNP Paribas USD CZK 15/06/17 20,144 504,290 - -BNP Paribas USD GBP 15/06/17 17,850 14,312 - -BNP Paribas USD GBP 15/06/17 13,199 10,839 - -BNP Paribas USD EUR 15/06/17 11,323 10,505 - -BNP Paribas USD GBP 15/06/17 9,528 7,777 - -BNP Paribas USD EUR 15/06/17 4,340 4,008 - -BNP Paribas USD CZK 15/06/17 3,636 91,613 - -BNP Paribas USD GBP 15/06/17 3,264 2,635 - -BNP Paribas USD CHF 15/06/17 2,823 2,790 - -BNP Paribas USD CZK 15/06/17 2,678 68,178 - -BNP Paribas USD GBP 15/06/17 2,413 1,944 - -BNP Paribas USD CHF 15/06/17 2,286 2,307 - -Citigroup USD EUR 13/04/17 13,970,657 13,229,000 (186) (0.01)Goldman Sachs BRL USD 13/04/17 12,970,000 4,068,764 6 -Goldman Sachs USD BRL 24/05/17 24,166,693 76,084,000 498 0.03Morgan Stanley IDR USD 24/05/17 203,722,691,000 15,240,719 (9) -UBS USD IDR 24/05/17 17,436,061 234,837,594,000 (122) (0.01)

246 Aberdeen Global
Select Emerging Markets Bond
Counterparty Buy Sell Settlement Buy Amount Sell Amount
Unrealised Gains/(Losses)
US$’000
Total Net Assets
%Unrealised gains on forward currency exchange contracts 5,575 0.34
Unrealised gains on derivatives 5,575 0.34
Total investments 1,515,539 92.79Other net assets 117,803 7.21Total net assets 1,633,342 100.00
† Managed by subsidiaries of Aberdeen Asset Management PLC.∞ A portion of this security is on loan at the period end.Currently forward positions are not collateralised.

aberdeen-asset.com 247
Select Emerging Markets Investment Grade BondFor the six months ended 31 March 2017
Performance For the six months ended 31 March 2017, the value of Select Emerging Markets Investment Grade Bond - H Accumulation Shares increased by 3.05% compared to an increase of 3.17% in the benchmark, the JP Morgan EMBI Global Diversified Investment Grade Index.Source: Lipper, JP Morgan. Basis: total return, NAV to NAV, net of annual charges, gross income reinvested, EUR.
Please remember that past performance is not a guide to future returns. The price of shares and the revenue from them may fall as well as rise. Investors may not get back the amount originally invested.
Market review Emerging markets (EM) debt remained defiant over the period. The asset class overcame a shock victory for Donald Trump in the US elections in November, before brushing aside two interest rate hikes from the US Federal Reserve in December and March, respectively. EM debt has benefitted from the synchronised global recovery with both developed and emerging market economies gaining momentum.
There was a sell-off in the immediate aftermath of Trump’s victory as the Republican’s pre-election rhetoric and campaign promises - namely his pledge to boost domestic infrastructure spending and cut taxes in order to boost growth, while also renegotiating or even tearing up existing trade deals - saw US Treasury (UST) yields increase and the US dollar appreciate. This subsequently led to downward pressure on EM debt as the animal spirits were unleashed. Most recently, however, US markets have been more subdued and, with prospects of the so-called reflation trade having diminished, the risk of rising UST yields and a stronger dollar has also declined, which is supportive for the asset class.
Trump withdrew the US from the Trans-Pacific Partnership in January but even that seems to have done little to dampen sentiment. December was the first of four straight months of sustained positive performance as fading external risks and a stabilisation of commodity prices continued to benefit the asset class. Emerging market fundamentals remain strong, with local markets growing particularly attractive over the period.
The JP Morgan EMBI Global Diversified Investment Grade index returned 3.17% while the benchmark spread narrowed by 31bps to +179bps over US Treasuries.
Portfolio reviewBond selection in Mexico was the key contributor to performance as were overweight positions in Brazil, Russia and an underweight to the Philippines. Underweight positions in Malaysia and Romania detracted from performance as did a holding in long duration Uruguayan bonds.
During the period, we participated in the inaugural Eurobond from Saudi Arabia, a new floating-rate note from Petroleos Mexicanos, Mexico’s state-owned oil company, and a new 30 year bond in Oman, which was funded via a sale of long-end Kazakhstan Temir Zholy bonds, the state railway company. We participated in a new sukuk issue from Indonesia and sold a Peruvian quasi-sovereign financial, Corporacion Financiera. We reduced our Turkey position as the country was removed from the benchmark as it now has sub-investment grade credit ratings from two of the three main agencies, and increased exposure to Hungary. In local currency space, we reduced exposure to Malaysia and Uruguay and topped up our position in Indonesia. We reintroduced a position in Russia, preferring to take an unhedged position.
OutlookThe fact that fears of rising UST yields have diminished has clearly been supportive of the asset class. However, even prior to the recent subsidence of UST yields the asset class has been doing well, partly thanks to the resilience of commodity prices. This does point to one of the principle outstanding risks for the asset class, that is a correction in oil and other key commodities (such as the one we are currently witnessing in iron ore), with the most likely trigger being growth disappointment in China. While our outlook for growth in China this year is a fairly sanguine one, we do acknowledge the risk to the asset class that a slowdown in China would pose.
Political volatility is never too far away in emerging markets as recent events in South Africa and April’s constitutional referendum in Turkey can attest. Given the benign backdrop in which the market appears to be operating at the moment, any drop in asset prices caused by negative news flow is swiftly capped by willing buyers. The primary markets continue to be open to issuers on every spectrum of the credit rating scale as investors struggle to reduce healthy cash balances as a result of the consistent inflows that have returned to the asset class this year. The bearish emerging market scenarios which were espoused after Donald Trump’s election have yet to manifest themselves – encouraging market participants to remain invested.
Emerging Market Debt Team April 2017

248 Aberdeen Global
Select Emerging Markets Investment Grade Bond
Statement of Net AssetsAs at 31 March 2017
Notes US$'000AssetsInvestments in securities at market value 2.2 87,291 Cash at bank 4,896 Interest receivable 1,191 Unrealised gains on forward currency exchange contracts 2.6 835 Total assets 94,213 LiabilitiesTaxes and expenses payable 102 Other liabilities 238 Total liabilities 340 Net assets at the end of the period 93,873
Statement of Changes in Net Assets For the period from 1 October 2016 to 31 March 2017
Notes US$'000Net assets at the beginning of the period 100,724 Net gains from investments 1,475 Net realised losses (5,762) Net unrealised losses (1,490) Proceeds from shares issued 3,229 Payments for shares redeemed (3,214) Net equalisation received 10 2 Dividends paid 5 (1,091) Net assets at the end of the period 93,873
Statement of Operations For the period from 1 October 2016 to 31 March 2017
Notes US$'000IncomeInvestment income 2.3 2,070 Bank interest 5 Total income 2,075 ExpensesManagement fees 4.2 475 Operating, administrative and servicing fees 4.3 124 Other operational expenses 1 Total expenses 600 Net gains from investments 1,475
Realised losses on investments (441) Realised losses on forward currency exchange contracts (5,276) Realised currency exchange losses (45) Net realised losses (5,762)
Decrease in unrealised appreciation on investments (2,511) Decrease in unrealised depreciation on forward currency exchange contracts 1,021 Net unrealised losses (1,490) Net decrease in assets as a result of operations (5,777)
Share Transactions For the period from 1 October 2016 to 31 March 2017
A-1 A(EUR)-1^ A-2 A(EUR)-2^ H(EUR)-1 H(EUR)-2Shares outstanding at the beginning of the period 220,790 71,000 790 278,000 640 1,683,000 Shares issued during the period 220,000 - - - - - Shares redeemed during the period (320,000) - - - - - Shares outstanding at the end of the period 120,790 71,000 790 278,000 640 1,683,000 Net asset value per share 10.2509 10.0645 10.6803 10.4783 11.0778 12.0251
I-1 I(EUR)-1^ I-2 Z-2Shares outstanding at the beginning of the period 800 6,566,865 800 800 Shares issued during the period - 105,509 - - Shares redeemed during the period - - - - Shares outstanding at the end of the period 800 6,672,374 800 800 Net asset value per share 9.6151 9.3976 10.4370 10.6808
^ Base currency exposure share class.
The accompanying notes form an integral part of these financial statements.

aberdeen-asset.com 249
Select Emerging Markets Investment Grade BondPortfolio StatementAs at 31 March 2017
Security Coupon (%) MaturityNominal/Quantity
Market Value US$’000
Total Net Assets
%Transferable securities and money market instruments admitted to an official exchange listing or dealt on another regulated market 91.95%Bonds 91.95%Corporate Bonds 33.16%Brazil 1.04%Petrobras Global Finance 8.3750 23/05/21 860,000 974 1.04
Chile 1.50%Empresa Electrica Angamos 4.8750 25/05/29 450,000 453 0.48Inversiones CMPC 4.3750 15/05/23 460,000 472 0.50Latam Airlines 2015-1 Pass Through Trust A 4.2000 15/08/29 488,719 487 0.52
1,412 1.50
China 4.83%China Railway Resources 3.8500 05/02/23 690,000 709 0.75China Resources Gas (EMTN) 4.5000 05/04/22 500,000 527 0.56CNOOC Curtis Funding No 1 4.5000 03/10/23 844,000 897 0.96CNOOC Nexen Finance 2014 ULC 4.2500 30/04/24 850,000 887 0.95ENN Energy 6.0000 13/05/21 400,000 442 0.47Sinopec Group Overseas Development 2014 4.3750 10/04/24 1,010,000 1,068 1.14
4,530 4.83
Colombia 1.03%Banco de Bogota 6.2500 12/05/26 448,000 469 0.50GrupoSura Finance 5.5000 29/04/26 470,000 496 0.53
965 1.03
India 1.47%ICICI Bank Dubai (EMTN) 4.0000 18/03/26 500,000 499 0.53Indian Railway Finance 3.9170 26/02/19 860,000 884 0.94
1,383 1.47
Indonesia 3.69%Pertamina Persero 6.5000 27/05/41 2,070,000 2,324 2.47Pertamina Persero 6.0000 03/05/42 590,000 627 0.67Pertamina Persero (EMTN) 6.4500 30/05/44 454,000 514 0.55
3,465 3.69
Kazakhstan 4.48%Kazakhstan Temir Zholy Finance 6.9500 10/07/42 2,420,000 2,548 2.72KazMunayGas National 7.0000 05/05/20 700,000 772 0.82KazMunayGas National (EMTN) 9.1250 02/07/18 360,000 388 0.41Tengizchevroil Finance International 4.0000 15/08/26 517,000 497 0.53
4,205 4.48
Kuwait 0.53%Equate Petrochemical (EMTN) 4.2500 03/11/26 500,000 502 0.53

250 Aberdeen Global
Select Emerging Markets Investment Grade Bond
Security Coupon (%) MaturityNominal/Quantity
Market Value US$’000
Total Net Assets
%Malaysia 3.27%Danga Capital 3.0350 01/03/21 1,000,000 1,005 1.07Petronas Capital 7.8750 22/05/22 1,680,000 2,063 2.20
3,068 3.27
Mexico 4.61%Alfa 6.8750 25/03/44 460,000 472 0.50BBVA Bancomer Texas 6.7500 30/09/22 430,000 482 0.51Petroleos Mexicanos 6.5000 02/06/41 2,894,000 2,896 3.10Petroleos Mexicanos FRN 11/03/22 234,000 252 0.27Petroleos Mexicanos 5.6250 23/01/46 170,000 153 0.16Petroleos Mexicanos 6.3750 23/01/45 70,000 69 0.07
4,324 4.61
Morocco 1.01%OCP 6.8750 25/04/44 880,000 947 1.01
Panama 0.53%Global Bank 4.5000 20/10/21 500,000 497 0.53
Peru 0.57%Southern Copper 5.8750 23/04/45 512,000 533 0.57
Russian Federation 1.01%Vnesheconombank Via VEB Finance 6.8000 22/11/25 850,000 952 1.01
South Africa 0.53%MTN Mauritius Investments 6.5000 13/10/26 486,000 498 0.53
Turkey 0.52%Turk Telekomunikasyon 4.8750 19/06/24 510,000 492 0.52
United Arab Emirates 2.54%Abu Dhabi National Energy 3.6250 12/01/23 460,000 463 0.49ADCB Finance Cayman (EMTN) 4.5000 06/03/23 420,000 434 0.46DP World (EMTN) 6.8500 02/07/37 430,000 500 0.53ICD Sukuk (EMTN) 5.0000 01/02/27 260,000 269 0.29RAK Capital (EMTN) 3.0940 31/03/25 730,000 715 0.77
2,381 2.54
Total Corporate Bonds 31,128 33.16
Government Bonds 58.79%Bahrain 0.55%Bahrain (Kingdom of) 7.0000 12/10/28 490,000 512 0.55
Brazil 1.38%Brazil (Federal Republic of) 10.0000 01/01/23 4,110,000 1,298 1.38

aberdeen-asset.com 251
Select Emerging Markets Investment Grade Bond
Security Coupon (%) MaturityNominal/Quantity
Market Value US$’000
Total Net Assets
%Chile 1.42%Chile (Republic of) 2.2500 30/10/22 1,360,000 1,337 1.42
Colombia 3.36%Colombia (Republic of) 7.3750 18/03/19 1,930,000 2,132 2.28Colombia (Republic of) 7.3750 18/09/37 790,000 1,018 1.08
3,150 3.36
Hungary 4.83%Hungary (Republic of) 5.3750 21/02/23 3,080,000 3,403 3.62Hungary (Republic of) 4.1250 19/02/18 1,110,000 1,135 1.21
4,538 4.83
Indonesia 6.33%Indonesia (Republic of) 8.3750 15/03/34 13,000,000,000 1,036 1.10Indonesia (Republic of) (EMTN) 5.8750 15/01/24 2,450,000 2,785 2.98Perusahaan Penerbit SBSN Indonesia III 4.3500 10/09/24 1,850,000 1,919 2.04Perusahaan Penerbit SBSN Indonesia III 3.4000 29/03/22 200,000 201 0.21
5,941 6.33
Kazakhstan 1.74%Kazakhstan Government International Bond 3.8750 14/10/24 1,620,000 1,636 1.74
Lithuania 0.34%Lithuania (Republic of) 6.1250 09/03/21 280,000 317 0.34
Mexico 6.86%Mexico (Government of) 4.0000 02/10/23 2,360,000 2,439 2.61Mexico (Government of) 6.0500 11/01/40 2,000,000 2,295 2.44Mexico (Government of) 5.5500 21/01/45 650,000 704 0.75Mexico (Government of) 8.5000 31/05/29 8,830,000 518 0.55Mexico (Government of) 8.5000 13/12/18 8,740,000 478 0.51
6,434 6.86
Morocco 2.19%Morocco (Government of) 4.2500 11/12/22 1,980,000 2,057 2.19
Namibia 0.49%Namibia (Government of) 5.2500 29/10/25 455,000 460 0.49
Oman 1.08%Oman (Government of) 6.5000 08/03/47 962,000 1,017 1.08
Panama 3.00%Panama (Republic of) 6.7000 26/01/36 900,000 1,138 1.21Panama (Republic of) 3.7500 16/03/25 1,110,000 1,138 1.21Panama (Republic of) 3.8750 17/03/28 530,000 540 0.58
2,816 3.00

252 Aberdeen Global
Select Emerging Markets Investment Grade Bond
Security Coupon (%) MaturityNominal/Quantity
Market Value US$’000
Total Net Assets
%Peru 2.10%Peru (Republic of) 6.5500 14/03/37 920,000 1,192 1.27Peru (Republic of) 5.6250 18/11/50 650,000 778 0.83
1,970 2.10
Philippines 2.14%Philippines (Republic of) 8.3750 17/06/19 930,000 1,063 1.14Philippines (Republic of) 7.7500 14/01/31 660,000 942 1.00
2,005 2.14
Poland 3.28%Poland (Republic of) 5.1250 21/04/21 1,760,000 1,930 2.06Poland (Republic of) 3.2500 06/04/26 880,000 875 0.93Poland (Republic of) 3.0000 17/03/23 270,000 270 0.29
3,075 3.28
Qatar 0.95%Qatar (State of) 2.3750 02/06/21 900,000 892 0.95
Romania 3.32%Romania (Republic of) (EMTN) 6.1250 22/01/44 1,580,000 1,951 2.08Romania (Republic of) (EMTN) 6.7500 07/02/22 1,000,000 1,162 1.24
3,113 3.32
Russian Federation 0.76%Russia (Federation of) 8.5000 17/09/31 38,560,000 716 0.76
Saudi Arabia 1.04%Saudi Arabia (Government of) (EMTN) 3.2500 26/10/26 1,000,000 974 1.04
South Africa 1.88%South Africa (Republic of) 4.8750 14/04/26 1,750,000 1,768 1.88
Turkey 1.50%Turkey (Republic of) 4.8750 09/10/26 980,000 944 1.00Turkey (Republic of) 5.7500 22/03/24 450,000 468 0.50
1,412 1.50
United Arab Emirates 1.50%Dubai (Government of) (EMTN) 5.2500 30/01/43 500,000 486 0.52Sharjah Sukuk 3.7640 17/09/24 890,000 920 0.98
1,406 1.50
Uruguay 6.75%Uruguay (Republic of) 5.1000 18/06/50 3,680,000 3,561 3.79Uruguay (Republic of) 7.8750 15/01/33 1,340,000 1,762 1.88Uruguay (Republic of) 4.3750 27/10/27 620,000 649 0.69Uruguay (Republic of) 5.0000 14/09/18 4,661,241 368 0.39
6,340 6.75

aberdeen-asset.com 253
Select Emerging Markets Investment Grade Bond
Security Coupon (%) MaturityNominal/Quantity
Market Value US$’000
Total Net Assets
%Total Government Bonds 55,184 58.79
Total Bonds 86,312 91.95
Total Transferable securities and money market instruments admitted to an official exchange listing or dealt on another regulated market 86,312 91.95
Other transferable securities and money market instruments 1.04%Bonds 1.04%Corporate Bonds 1.04%Mexico 1.04%Petroleos Mexicanos 6.8750 04/08/26 880,000 979 1.04
Total Corporate Bonds 979 1.04
Total Bonds 979 1.04
Total Other transferable securities and money market instruments 979 1.04
Derivatives 0.89%
Forward currency exchange contracts 0.89%
Counterparty Buy Sell Settlement Buy Amount Sell Amount
Unrealised Gains/(Losses)
US$’000
Total Net Assets
%BNP Paribas EUR USD 13/04/17 62,083,553 65,611,886 824 0.87BNP Paribas EUR USD 13/04/17 360,728 390,106 (4) -BNP Paribas EUR USD 13/04/17 328,515 353,767 (2) -BNP Paribas EUR USD 13/04/17 326,736 351,346 (2) -BNP Paribas EUR USD 13/04/17 326,637 351,603 (2) -BNP Paribas EUR USD 13/04/17 164,006 176,574 (1) -BNP Paribas EUR USD 15/06/17 2,880,452 3,052,924 39 0.03BNP Paribas EUR USD 15/06/17 708,228 750,634 10 0.01BNP Paribas EUR USD 15/06/17 16,501 17,897 - -BNP Paribas EUR USD 15/06/17 15,097 16,281 - -BNP Paribas EUR USD 15/06/17 15,056 16,262 - -BNP Paribas EUR USD 15/06/17 14,880 16,063 - -BNP Paribas EUR USD 15/06/17 4,056 4,399 - -BNP Paribas EUR USD 15/06/17 3,711 4,002 - -BNP Paribas EUR USD 15/06/17 3,701 3,997 - -BNP Paribas EUR USD 15/06/17 3,657 3,948 - -BNP Paribas USD EUR 13/04/17 411,558 388,570 (4) -BNP Paribas USD EUR 13/04/17 391,605 367,674 (2) -BNP Paribas USD EUR 15/06/17 22,996 21,649 - -BNP Paribas USD EUR 15/06/17 18,469 17,289 - -BNP Paribas USD EUR 15/06/17 5,895 5,550 - -BNP Paribas USD EUR 15/06/17 4,540 4,250 - -Citigroup USD HUF 13/04/17 453,917 133,487,000 (9) (0.01)Citigroup USD COP 24/05/17 527,125 1,539,010,000 (1) -Goldman Sachs BRL USD 24/05/17 252,000 80,043 (2) -

254 Aberdeen Global
Select Emerging Markets Investment Grade Bond
Counterparty Buy Sell Settlement Buy Amount Sell Amount
Unrealised Gains/(Losses)
US$’000
Total Net Assets
%Morgan Stanley IDR USD 24/05/17 14,709,883,000 1,100,463 (1) -UBS USD IDR 24/05/17 1,194,095 16,082,671,000 (8) (0.01)Unrealised gains on forward currency exchange contracts 835 0.89
Unrealised gains on derivatives 835 0.89
Total investments 88,126 93.88Other net assets 5,747 6.12Total net assets 93,873 100.00
Currently forward positions are not collateralised.

aberdeen-asset.com 255
Select Euro High Yield BondFor the six months ended 31 March 2017
PerformanceFor the six months ended 31 March 2017, the value of Select Euro High Yield Bond - A Accumulation shares increased by 3.12% compared to an increase of 3.54% in the benchmark, the Bank of America Merrill Lynch Euro High Yield Constrained TR Index.Source: JP Morgan, Lipper, Basis: total return, published NAV to NAV, net of annual charges, gross income reinvested, EUR.
Please remember that past performance is not a guide to future returns. The price of shares and the revenue from them may fall as well as rise. Investors may not get back the amount originally invested.
Market reviewThe Bank of America Merrill Lynch Euro High Yield Constrained Index posted a positive return of 3.54% for six months to end March 2017. Political risk remained an important driver of markets, with the election of Donald Trump catching most pollsters and forecasters by surprise. There was a spike in volatility levels on the back of Trump’s election win, although the market rebounded in December and remained bullish into January and February. This was all the more impressive given the negative outcome from the Italian referendum, a “soft tapering” from the European Central Bank (ECB), and a second post crisis interest rate hike from the Federal Reserve (Fed) in December.
A sharp fall in oil supply, Theresa May’s decision to trigger Article 50, further tapering from the ECB and a hike from the Fed in March saw sentiment become much more muted. Concerns around the political calendar remain heightened, although they were somewhat tempered by the Dutch election result where Prime Minister Mark Rutte was victorious over populist Geert Wilders. The Eurozone’s PMI ended the period strong at 56.2, with the manufacturing and services indicators also increasing.
Portfolio reviewThe biggest positive and negative drivers of return were stock specific rather than macro. Stressed holdings in Brighthouse (retail), Obrascon and Aldesa (both construction) performed very strongly whilst positions in Valeant (pharmaceuticals) and Agrokor (retail) suffered. Our holding in Agrokor was particularly frustrating given the company appears likely to file for bankruptcy protection; especially given our bond was due to mature in August 2017. Although we had become increasingly cautious on the credit over the last couple of years, and had meaningfully reduced exposure as a result, we felt the company had ample liquidity to remain solvent until the end of 2017. Unfortunately, supplier panic resulted in a liquidity crunch which ultimately caused our bonds to fall sixty points in the last month of the period.
OutlookWe remain sanguine about the outlook for defaults rates in Europe which should remain around 2% for the next twelve months. The economic data is improving, which should translate into better corporate fundamentals whilst the ECB remain both accommodative and market friendly. Importantly, capital is readily available and the cost of debt is extremely low by historic standards both of which underpin the low default environment.
Euro High Yield Team April 2017

256 Aberdeen Global
Select Euro High Yield Bond
Statement of Net AssetsAs at 31 March 2017
Notes €’000AssetsInvestments in securities at market value 2.2 1,032,150 Cash at bank 31,009 Interest receivable 16,967 Subscriptions receivable 5,944 Total assets 1,086,070 LiabilitiesPayable for investments purchased 14,876 Taxes and expenses payable 1,124 Redemptions payable 13,735 Unrealised losses on forward currency exchange contracts 2.6 111 Other liabilities 1,660 Total liabilities 31,506 Net assets at the end of the period 1,054,564
Statement of Changes in Net Assets For the period from 1 October 2016 to 31 March 2017
Notes €’000Net assets at the beginning of the period 999,247 Net gains from investments 24,101 Net realised gains 414 Net unrealised gains 21,410 Proceeds from shares issued 294,956 Payments for shares redeemed (274,684) Net equalisation paid 10 (49) Dividends paid 5 (10,843) Unclaimed monies 12 Net assets at the end of the period 1,054,564
Statement of Operations For the period from 1 October 2016 to 31 March 2017
Notes €’000IncomeInvestment income 2.3 29,824 Stocklending income 16 683 Total income 30,507 ExpensesManagement fees 4.2 5,375 Operating, administrative and servicing fees 4.3 998 Distribution fees 4.1 15 Other operational expenses 11 Bank interest 7 Total expenses 6,406 Net gains from investments 24,101
Realised losses on investments (9,167) Realised gains on forward currency exchange contracts 10,226 Realised currency exchange losses (645) Net realised gains 414
Decrease in unrealised depreciation on investments 23,321 Decrease in unrealised appreciation on forward currency exchange contracts (2,052) Unrealised currency exchange gains 141 Net unrealised gains 21,410 Net increase in assets as a result of operations 45,925

aberdeen-asset.com 257
Select Euro High Yield Bond
Share Transactions For the period from 1 October 2016 to 31 March 2017
A-1 A(GBP)-1^ A(USD)-1^ A-2 A(GBP)-2^ A(USD)-2^
Shares outstanding at the beginning of the period 30,982,912 4,898,894 11,964,145 6,090,169 104,865 5,546,553 Shares issued during the period 3,746,689 264,059 727,491 2,862,803 5,919 3,675,660 Shares redeemed during the period (4,011,701) (591,855) (2,120,905) (1,360,132) (13,208) (4,710,402) Shares outstanding at the end of the period 30,717,900 4,571,098 10,570,731 7,592,840 97,576 4,511,811 Net asset value per share 6.1961 19.5708 10.3589 22.0724 36.1144 16.5492
A-3 A(USD)-3^ B-1 D(GBP)-1 D(GBP)-2^ I(USD)-1^
Shares outstanding at the beginning of the period 624,534 74,438 294,773 3,575,338 1,878 951,209 Shares issued during the period 116,110 15,763 - 171,831 - 2,409,117 Shares redeemed during the period (171,564) (26,694) (20,710) (411,800) - (2,333,732) Shares outstanding at the end of the period 569,080 63,507 274,063 3,335,369 1,878 1,026,594 Net asset value per share 10.1863 10.3732 6.1753 5.4123 14.2561 10.1217
I-2 R(GBP)-1 W-1 W-2 W(USD)-2^ X-1Shares outstanding at the beginning of the period 19,901,947 1,574,836 3,675 5,282 71,000 310,086 Shares issued during the period 5,099,138 584,356 58,670 69,459 6,992 357,376 Shares redeemed during the period (4,973,415) (554,595) (710) (1,625) - (41,911) Shares outstanding at the end of the period 20,027,670 1,604,597 61,635 73,116 77,992 625,551 Net asset value per share 16.2281 11.0154 10.2020 10.7604 10.6764 10.4541
X(USD)-1^ X-2 X(USD)-2^ Z-2 Z(GBP)-2^
Shares outstanding at the beginning of the period - 122,605 - 612 50,000 Shares issued during the period 63,510 5,488 2,166,677 - 57,543 Shares redeemed during the period - (45,344) - - (90,813) Shares outstanding at the end of the period 63,510 82,749 2,166,677 612 16,730 Net asset value per share 10.0026 13.4495 10.0994 11.0357 10.7705
^ Base currency exposure share class.
The accompanying notes form an integral part of these financial statements.

258 Aberdeen Global
Select Euro High Yield BondPortfolio StatementAs at 31 March 2017
Security Coupon (%) MaturityNominal/Quantity
Market Value €’000
Total Net Assets
%Transferable securities and money market instruments admitted to an official exchange listing or dealt on another regulated market 91.30%Bonds 91.30%Corporate Bonds 91.30%Austria 0.23%Wienerberger (PERP) VAR 29/12/49 2,220,000 2,384 0.23
Belgium 1.30%KBC (PERP) VAR 29/03/49 10,425,000 10,624 1.01Solvay Finance (PERP) VAR 29/12/49 2,769,000 3,034 0.29
13,658 1.30
Canada 1.14%Cott Finance (EMTN) 5.5000 01/07/24 8,216,000 8,684 0.82Entertainment One 6.8750 15/12/22 2,627,000 3,364 0.32
12,048 1.14
Denmark 0.45%Nassa Topco 2.8750 06/04/24 4,628,000 4,697 0.45
France 11.85%Albea Beauty (EMTN) 8.7500 01/11/19 9,860,000 10,337 0.98BiSoho∞ 5.8750 01/05/23 2,973,000 3,194 0.30Cerba European Lab 7.0000 01/02/20 8,170,000 8,354 0.79Electricite de France (EMTN) (PERP) VAR 29/12/49 11,800,000 12,126 1.15Financiere Quick∞ FRN 15/10/19 4,262,065 3,964 0.38Holding Medi-Partenaires 7.0000 15/05/20 9,590,000 10,015 0.95HomeVi 6.8750 15/08/21 11,246,000 11,825 1.12Lion/Seneca France 2 7.8750 15/04/19 5,180,000 5,163 0.49Loxam 4.2500 15/04/24 1,930,000 1,966 0.19NewCo Sab MidCo 5.3750 15/04/25 3,334,000 3,351 0.32Novafives∞ 4.5000 30/06/21 8,000,000 7,964 0.76Novafives∞ FRN 30/06/20 2,000,000 1,984 0.19Novalis∞ 3.0000 30/04/22 4,017,000 4,134 0.39Numericable 5.6250 15/05/24 14,317,000 15,231 1.43Numericable 5.3750 15/05/22 7,500,000 7,833 0.74Paprec∞ 5.2500 01/04/22 3,300,000 3,458 0.33Paprec∞ 7.3750 01/04/23 2,933,000 3,125 0.30Paprec∞ 5.2500 01/04/22 2,151,000 2,250 0.21THOM Europe 7.3750 15/07/19 3,675,000 3,816 0.363AB Optique Developpement 5.6250 15/04/19 4,890,000 4,950 0.47
125,040 11.85
Germany 8.87%ALBA 8.0000 15/05/18 14,410,000 14,449 1.36HP Pelzer 4.1250 01/04/24 5,000,000 5,041 0.48PrestigeBidCo 6.2500 15/12/23 5,802,000 6,138 0.58

aberdeen-asset.com 259
Select Euro High Yield Bond
Security Coupon (%) MaturityNominal/Quantity
Market Value €’000
Total Net Assets
%Rapid 6.6250 15/11/20 13,112,000 13,503 1.28Safari Verwaltungs 8.2500 15/02/21 8,192,083 8,542 0.81Techem (EMTN)∞ 6.1250 01/10/19 9,050,000 9,363 0.89Techem Energy Metering Service (EMTN) 7.8750 01/10/20 4,800,000 5,009 0.48Trionista Holdco 5.0000 30/04/20 3,600,000 3,671 0.35Trionista TopCo 6.8750 30/04/21 11,600,000 12,093 1.15Unitymedia Hessen 4.6250 15/02/26 10,554,000 11,314 1.07WEPA Hygieneprodukte∞ 3.7500 15/05/24 3,629,000 3,773 0.36Xefin Lux (EMTN) FRN 01/06/19 620,000 623 0.06
93,519 8.87
Greece 0.49%Intralot Capital Luxembourg∞ 6.7500 15/09/21 5,074,000 5,217 0.49
Ireland 1.01%Ardagh Packaging Finance 6.7500 15/05/24 5,946,000 6,515 0.62Ardagh Packaging Finance 4.2500 15/01/22 876,623 904 0.09Smurfit Kappa Acquisitions∞ 2.3750 01/02/24 3,167,000 3,199 0.30
10,618 1.01
Italy 3.48%Bormioli Rocco∞ 10.0000 01/08/18 10,090,000 10,457 0.99Gamenet 6.0000 15/08/21 2,298,000 2,403 0.23Snaitech∞ 6.3750 07/11/21 1,215,000 1,288 0.12Wind Acquisition Finance 7.0000 23/04/21 21,715,000 22,548 2.14
36,696 3.48
Jersey 0.98%Nemean Bondco∞ 7.3750 01/02/24 8,900,000 10,369 0.98
Luxembourg 9.53%Altice 7.2500 15/05/22 22,385,000 23,716 2.25Altice∞ 6.2500 15/02/25 5,410,000 5,774 0.55Cerberus Nightingale 1 8.2500 01/02/20 4,000,000 4,092 0.39DEA Finance 7.5000 15/10/22 8,417,000 8,933 0.85Galapagos∞ 5.3750 15/06/21 5,705,000 5,728 0.54Galapagos∞ FRN 15/06/21 3,447,000 3,402 0.32Garfunkelux Holdco 3∞ 7.5000 01/08/22 5,500,000 5,917 0.56Garfunkelux Holdco 3∞ 8.5000 01/11/22 850,000 1,058 0.10INEOS 5.3750 01/08/24 8,415,000 8,729 0.83Intralot Capital Luxembourg∞ 6.0000 15/05/21 3,780,000 3,799 0.36Monitchem HoldCo 2 6.8750 15/06/22 2,600,000 2,545 0.24Picard Bondco 7.7500 01/02/20 2,080,000 2,188 0.21Play Topco 5.3750 15/09/22 3,092,000 3,091 0.29SES (PERP) VAR 29/12/49 3,039,000 3,179 0.30SIG Combibloc 7.7500 15/02/23 5,560,000 5,950 0.56Telenet Finance VI Luxembourg∞ 4.8750 15/07/27 11,520,000 12,394 1.18
100,495 9.53

260 Aberdeen Global
Select Euro High Yield Bond
Security Coupon (%) MaturityNominal/Quantity
Market Value €’000
Total Net Assets
%Netherlands 7.40%InterXion 6.0000 15/07/20 5,794,000 6,065 0.58LGE HoldCo VI∞ 7.1250 15/05/24 14,740,000 16,610 1.58Lincoln Finance 6.8750 15/04/21 14,699,000 15,756 1.49Nyrstar Netherlands (EMTN)∞ 6.8750 15/03/24 2,931,000 2,941 0.28United Group 7.8750 15/11/20 15,366,000 16,027 1.52UPC 6.7500 15/03/23 8,890,000 9,610 0.91UPCB Finance IV∞ 4.0000 15/01/27 1,172,000 1,198 0.11Ziggo Secured Finance∞ 4.2500 15/01/27 9,410,000 9,835 0.93
78,042 7.40
South Africa 0.82%Sappi Papier 3.3750 01/04/22 8,398,000 8,665 0.82
Spain 7.49%Aldesa Financial Services (EMTN) 7.2500 01/04/21 2,730,000 2,193 0.21Befesa Zinc (EMTN) 8.8750 15/05/18 18,220,000 18,502 1.74Cirsa Funding Luxembourg 5.8750 15/05/23 5,349,000 5,640 0.53Cirsa Funding Luxembourg 5.7500 15/05/21 1,378,000 1,470 0.14Codere Finance 2 Luxembourg 6.7500 01/11/21 7,077,000 7,137 0.68Empark Funding FRN 15/12/19 900,000 907 0.09Obrascon Huarte Lain 4.7500 15/03/22 13,340,000 11,450 1.09Obrascon Huarte Lain 5.5000 15/03/23 8,320,000 7,161 0.68PortAventura Entertainment Barcelona 7.2500 01/12/20 12,436,000 12,926 1.22PortAventura Entertainment Barcelona FRN 01/12/19 3,500,000 3,533 0.34Telefonica Europe (PERP) VAR 29/11/49 6,400,000 8,067 0.77
78,986 7.49
Switzerland 2.02%Credit Suisse Guernsey (PERP) VAR 15/05/49 5,381,000 5,012 0.48Dufry Finance 4.5000 01/08/23 4,885,000 5,245 0.50Dufry Finance (EMTN) 4.5000 15/07/22 275,000 288 0.03Selecta 6.5000 15/06/20 10,975,000 10,772 1.01
21,317 2.02
United Kingdom 27.13%Alliance Automotive Finance∞ 6.2500 01/12/21 3,770,000 4,008 0.38Alliance Automotive Finance FRN 01/12/21 2,640,000 2,676 0.25Amigo Luxembourg∞ 7.6250 15/01/24 1,703,000 2,050 0.19Annington Finance No 5 (PIK) 13.0000 15/01/23 11,948,775 16,186 1.54Arrow Global Finance∞ 5.1250 15/09/24 3,765,000 4,576 0.43Bank of Scotland Capital Funding (PERP) VAR 29/03/49 2,031,000 2,731 0.26Barclays (PERP) VAR 29/12/49 5,550,000 5,654 0.54Barclays (PERP) VAR 29/12/49 2,361,000 2,868 0.27Boparan Finance (EMTN)∞ 4.3750 15/07/21 13,050,000 13,035 1.24Brighthouse (EMTN)∞ 7.8750 15/05/18 6,250,000 5,401 0.51Cabot Financial Luxembourg (EMTN) 8.3750 01/08/20 3,732,000 4,645 0.44Corral Petroleum 11.7500 15/05/21 7,780,000 8,171 0.77

aberdeen-asset.com 261
Select Euro High Yield Bond
Security Coupon (%) MaturityNominal/Quantity
Market Value €’000
Total Net Assets
%CYBG VAR 09/02/26 2,875,000 3,322 0.32CYBG (PERP) VAR 29/12/49 5,400,000 6,125 0.58Fiat Chrysler Automobiles (EMTN) 3.7500 29/03/24 9,087,000 9,547 0.91Fiat Chrysler Finance Europe (EMTN)∞ 4.7500 15/07/22 4,500,000 4,972 0.47Fiat Chrysler Finance Europe (EMTN)∞ 4.7500 22/03/21 4,500,000 4,968 0.47Fiat Chrysler Finance Europe (EMTN) 6.6250 15/03/18 3,000,000 3,174 0.30Galaxy Bidco FRN 15/11/19 1,160,000 1,364 0.13Galaxy Finco 7.8750 15/11/21 8,770,000 10,475 0.99Jaguar Land Rover Automotive∞ 5.0000 15/02/22 6,350,000 8,144 0.77Keystone Financing 9.5000 15/10/19 4,495,000 5,530 0.52Ladbrokes∞ 5.1250 08/09/23 9,340,000 10,877 1.03Lloyds Bank (EMTN) (PERP)∞ VAR 29/01/49 1,500,000 3,191 0.30Lloyds Banking (PERP) VAR 27/06/49 10,000,000 10,504 1.00Lloyds Banking (PERP) VAR 29/12/49 8,244,000 9,886 0.94Marlin Intermediate (EMTN) 10.5000 01/08/20 2,500,000 3,178 0.30Matalan Finance 6.8750 01/06/19 9,675,000 9,617 0.91Mizzen Bondco 7.0000 01/05/21 10,644,280 13,050 1.24Moto Finance 4.5000 01/10/22 6,490,000 7,616 0.72Moy Park Bondco 6.2500 29/05/21 5,697,000 6,892 0.65Nationwide Building Society (EMTN) (PERP) VAR 11/03/49 3,500,000 4,170 0.40New Look Secured Issuer∞ 6.5000 01/07/22 2,728,000 2,812 0.27Paragon VAR 09/09/26 3,097,000 3,813 0.36PGH Capital 6.6250 18/12/25 5,359,000 6,841 0.65PGH Capital 5.7500 07/07/21 3,050,000 4,006 0.38PGH Capital (EMTN) 4.1250 20/07/22 3,924,000 4,648 0.44PizzaExpress Financing 2∞ 6.6250 01/08/21 1,571,000 1,890 0.18Stonegate Pub Financing 5.7500 15/04/19 6,154,000 7,310 0.69Stonegate Pub Financing 4.8750 15/03/22 5,441,000 6,402 0.61TES Finance∞ 6.7500 15/07/20 4,975,000 5,133 0.49TES Finance FRN 15/07/20 1,600,000 1,590 0.15Thomas Cook∞ 6.2500 15/06/22 2,644,000 2,846 0.27Travis Perkins 4.5000 07/09/23 4,420,000 5,278 0.50TVL Finance 8.5000 15/05/23 3,987,000 5,128 0.49Virgin Media Finance (EMTN)∞ 4.5000 15/01/25 5,344,000 5,536 0.52Virgin Media Secured Finance 5.0000 15/04/27 1,550,000 1,833 0.17Voyage Care Bondco 6.5000 01/08/18 2,789,000 3,312 0.31William Hill∞ 4.8750 07/09/23 4,424,000 5,405 0.51Worldpay Finance 3.7500 15/11/22 3,590,000 3,864 0.37
286,250 27.13
United States 7.11%Alliance Data Systems 5.2500 15/11/23 12,219,000 12,820 1.22AMC Entertainment 6.3750 15/11/24 3,305,000 4,111 0.39Avis Budget Finance∞ 4.5000 15/05/25 8,344,000 8,146 0.77Axalta Coating Systems 4.2500 15/08/24 1,582,000 1,690 0.16Crown European 3.3750 15/05/25 8,475,000 8,615 0.82International Game Technology 4.7500 15/02/23 3,140,000 3,393 0.32Kloeckner Pentaplast of America 7.1250 01/11/20 9,287,000 9,655 0.92

262 Aberdeen Global
Select Euro High Yield Bond
Security Coupon (%) MaturityNominal/Quantity
Market Value €’000
Total Net Assets
%Silgan∞ 3.2500 15/03/25 4,795,000 4,787 0.45Trinseo Materials Operating 6.3750 01/05/22 5,345,000 5,715 0.54Valeant Pharmaceuticals 4.5000 15/05/23 18,345,000 13,550 1.29WMG Acquisition 4.1250 01/11/24 2,362,000 2,460 0.23
74,942 7.11
Total Corporate Bonds 962,943 91.30
Total Bonds 962,943 91.30
Total Transferable securities and money market instruments admitted to an official exchange listing or dealt on another regulated market 962,943 91.30
Other transferable securities and money market instruments 4.30%Equities 0.05%Jersey nilReal Estate Opportunities 350,908 - -
United Kingdom 0.05%Ceva Newco 2,743 516 0.05
Total Equities 516 0.05
Bonds 4.25%Corporate Bonds 4.25%Croatia 0.40%Agrokor FRN 08/08/17 12,000,000 4,200 0.40
Czech Republic nilSazka (STEP) 9.0000 12/07/21 10,566,043 11 -
Italy nilParmalat Capital Finance (PERP) 9.3750 29/12/49 3,614,664 - -
Luxembourg 1.26%ARD Finance (PIK)∞ 6.6250 15/09/23 12,835,000 13,290 1.26Hellas Telecommunications III 8.5000 15/10/13 5,599,045 - -
13,290 1.26
Netherlands 0.18%REA Finance 9.5000 31/12/17 1,595,000 1,874 0.18
United Kingdom 1.35%Cammell Laird 12.0000 15/10/10 1,080,000 - -TalkTalk Telecom 5.3750 15/01/22 6,285,000 7,513 0.71Virgin Media Finance 6.3750 15/10/24 5,350,000 6,711 0.64
14,224 1.35

aberdeen-asset.com 263
Select Euro High Yield Bond
Security Coupon (%) MaturityNominal/Quantity
Market Value €’000
Total Net Assets
%United States 1.06%Adient Global 3.5000 15/08/24 4,949,000 4,993 0.47AMC Entertainment 6.3750 15/11/24 4,987,000 6,206 0.59
11,199 1.06
Total Corporate Bonds 44,798 4.25
Corporate Convertible Bonds nilUnited Kingdom nilScotia 8.5000 26/03/02 1,624,000 - -
Total Corporate Convertible Bonds - -
Total Bonds 44,798 4.25
Total Other transferable securities and money market instruments 45,314 4.30
Open Ended Investment Funds 2.27%Aberdeen Liquidity Fund (Lux)-Euro Fund Z-3† 23,893 23,893 2.27
Total Open Ended Investment Funds 23,893 2.27
Derivatives (0.01%)
Forward currency exchange contracts (0.01%)
Counterparty Buy Sell Settlement Buy Amount Sell Amount
Unrealised Gains/(Losses)
€’000
Total Net Assets
%BNP Paribas EUR GBP 03/04/17 4,597 3,975 - -BNP Paribas EUR USD 04/04/17 27,416 29,576 - -BNP Paribas EUR USD 04/04/17 4,588 4,950 - -BNP Paribas EUR GBP 04/04/17 2,681 2,326 - -BNP Paribas EUR GBP 05/04/17 152,498 131,514 (1) -BNP Paribas EUR USD 05/04/17 39,157 42,059 - -BNP Paribas EUR USD 06/04/17 1,221,501 1,304,685 2 -BNP Paribas EUR USD 13/04/17 3,292,186 3,482,382 38 -BNP Paribas EUR USD 13/04/17 2,027,850 2,194,592 (23) -BNP Paribas EUR USD 13/04/17 1,426,747 1,515,622 10 -BNP Paribas EUR USD 13/04/17 1,175,237 1,251,163 6 -BNP Paribas EUR USD 13/04/17 777,935 831,105 1 -BNP Paribas EUR USD 13/04/17 598,732 650,175 (9) -BNP Paribas EUR USD 13/04/17 598,116 647,016 (7) -BNP Paribas EUR GBP 13/04/17 519,271 452,468 (10) -BNP Paribas EUR USD 13/04/17 454,840 486,795 - -BNP Paribas EUR USD 13/04/17 361,258 382,086 4 -BNP Paribas EUR GBP 13/04/17 316,199 275,688 (6) -BNP Paribas EUR USD 13/04/17 291,650 314,902 (3) -BNP Paribas EUR USD 13/04/17 264,048 282,102 - -BNP Paribas EUR USD 13/04/17 246,975 266,530 (2) -

264 Aberdeen Global
Select Euro High Yield Bond
Counterparty Buy Sell Settlement Buy Amount Sell Amount
Unrealised Gains/(Losses)
€’000
Total Net Assets
%BNP Paribas EUR GBP 13/04/17 221,745 190,224 (1) -BNP Paribas EUR GBP 13/04/17 184,266 159,736 (2) -BNP Paribas EUR USD 13/04/17 173,606 186,424 (1) -BNP Paribas EUR USD 13/04/17 173,344 187,140 (2) -BNP Paribas EUR USD 13/04/17 154,327 166,610 (1) -BNP Paribas EUR USD 13/04/17 121,839 131,857 (1) -BNP Paribas EUR USD 13/04/17 116,259 124,939 - -BNP Paribas EUR USD 13/04/17 94,832 101,313 - -BNP Paribas EUR GBP 13/04/17 94,368 80,953 - -BNP Paribas EUR GBP 13/04/17 76,291 66,618 (2) -BNP Paribas EUR GBP 13/04/17 51,529 45,206 (1) -BNP Paribas EUR USD 13/04/17 34,749 36,913 - -BNP Paribas EUR GBP 13/04/17 33,953 29,467 - -BNP Paribas EUR GBP 13/04/17 32,568 28,427 (1) -BNP Paribas EUR USD 13/04/17 31,269 33,956 - -BNP Paribas EUR GBP 13/04/17 27,203 23,258 - -BNP Paribas EUR USD 13/04/17 25,309 27,520 - -BNP Paribas EUR GBP 13/04/17 20,010 17,388 - -BNP Paribas EUR GBP 13/04/17 18,849 16,452 - -BNP Paribas EUR USD 13/04/17 14,629 15,800 - -BNP Paribas EUR USD 13/04/17 10,312 11,081 - -BNP Paribas EUR USD 13/04/17 9,703 10,264 - -BNP Paribas EUR GBP 13/04/17 4,487 3,872 - -BNP Paribas EUR GBP 13/04/17 3,900 3,421 - -BNP Paribas EUR GBP 13/04/17 3,654 3,172 - -BNP Paribas EUR USD 13/04/17 3,009 3,272 - -BNP Paribas EUR USD 10/05/17 471,666 505,000 - -BNP Paribas EUR GBP 15/06/17 405,123 348,052 (1) -BNP Paribas EUR USD 15/06/17 156,616 166,123 2 -BNP Paribas EUR USD 15/06/17 116,923 125,502 - -BNP Paribas EUR USD 15/06/17 92,400 100,042 (1) -BNP Paribas EUR USD 15/06/17 7,022 7,617 - -BNP Paribas EUR USD 15/06/17 5,209 5,591 - -BNP Paribas GBP EUR 06/04/17 348,052 405,797 1 -BNP Paribas GBP EUR 06/04/17 190,224 221,784 1 -BNP Paribas GBP EUR 06/04/17 80,953 94,384 - -BNP Paribas GBP EUR 13/04/17 90,824,577 104,694,988 1,464 0.14BNP Paribas GBP EUR 13/04/17 3,646,115 4,202,937 59 0.01BNP Paribas GBP EUR 13/04/17 131,514 152,479 1 -BNP Paribas GBP EUR 13/04/17 65,891 76,164 1 -BNP Paribas GBP EUR 13/04/17 43,607 50,523 - -BNP Paribas GBP EUR 13/04/17 29,128 33,326 1 -BNP Paribas GBP EUR 13/04/17 26,227 30,199 - -BNP Paribas GBP EUR 13/04/17 18,974 21,816 - -BNP Paribas GBP EUR 13/04/17 16,296 18,872 - -BNP Paribas GBP EUR 13/04/17 4,424 5,091 - -BNP Paribas GBP EUR 13/04/17 3,975 4,597 - -BNP Paribas GBP EUR 13/04/17 2,466 2,839 - -

aberdeen-asset.com 265
Select Euro High Yield Bond
Counterparty Buy Sell Settlement Buy Amount Sell Amount
Unrealised Gains/(Losses)
€’000
Total Net Assets
%BNP Paribas GBP EUR 13/04/17 2,460 2,838 - -BNP Paribas GBP EUR 13/04/17 2,326 2,680 - -BNP Paribas GBP EUR 15/06/17 528,484 608,277 8 -BNP Paribas GBP EUR 15/06/17 26,426 30,415 - -BNP Paribas USD EUR 03/04/17 650,175 599,019 9 -BNP Paribas USD EUR 03/04/17 33,956 31,284 - -BNP Paribas USD EUR 04/04/17 266,530 247,061 2 -BNP Paribas USD EUR 05/04/17 11,081 10,316 - -BNP Paribas USD EUR 06/04/17 282,102 264,115 - -BNP Paribas USD EUR 13/04/17 112,789,980 106,724,607 (1,323) (0.13)BNP Paribas USD EUR 13/04/17 77,314,189 73,156,555 (907) (0.09)BNP Paribas USD EUR 13/04/17 2,719,912 2,532,901 9 -BNP Paribas USD EUR 13/04/17 1,312,248 1,232,615 (6) -BNP Paribas USD EUR 13/04/17 1,304,685 1,221,189 (2) -BNP Paribas USD EUR 13/04/17 670,056 629,924 (4) -BNP Paribas USD EUR 13/04/17 577,671 535,017 5 -BNP Paribas USD EUR 13/04/17 442,863 412,098 2 -BNP Paribas USD EUR 13/04/17 436,391 401,330 6 -BNP Paribas USD EUR 13/04/17 381,311 352,596 4 -BNP Paribas USD EUR 13/04/17 75,779 70,385 - -BNP Paribas USD EUR 13/04/17 71,769 66,345 1 -BNP Paribas USD EUR 13/04/17 64,068 59,522 - -BNP Paribas USD EUR 13/04/17 42,059 39,142 - -BNP Paribas USD EUR 13/04/17 39,671 37,509 - -BNP Paribas USD EUR 13/04/17 29,576 27,406 - -BNP Paribas USD EUR 13/04/17 6,904 6,495 - -BNP Paribas USD EUR 13/04/17 2,749 2,541 - -BNP Paribas USD EUR 13/04/17 2,363 2,195 - -BNP Paribas USD EUR 15/06/17 21,895,297 20,658,338 (261) (0.02)BNP Paribas USD EUR 15/06/17 10,714,990 10,109,654 (127) (0.01)BNP Paribas USD EUR 15/06/17 760,561 717,593 (9) -BNP Paribas USD EUR 15/06/17 660,398 623,089 (8) -BNP Paribas USD EUR 15/06/17 641,992 605,723 (8) -BNP Paribas USD EUR 15/06/17 146,762 138,550 (2) -BNP Paribas USD EUR 15/06/17 75,000 70,708 (1) -BNP Paribas USD EUR 15/06/17 17,952 16,851 - -BNP Paribas USD EUR 15/06/17 17,771 16,457 - -BNP Paribas USD EUR 15/06/17 12,100 11,208 - -BNP Paribas USD EUR 15/06/17 10,444 9,675 - -BNP Paribas USD EUR 15/06/17 10,000 9,213 - -BNP Paribas USD EUR 15/06/17 7,800 7,242 - -BNP Paribas USD EUR 15/06/17 4,978 4,699 - -BNP Paribas USD EUR 15/06/17 4,950 4,574 - -Citigroup EUR GBP 10/05/17 143,117,414 122,073,000 523 0.05JPM Chase EUR GBP 10/05/17 143,107,014 122,072,000 512 0.05JPM Chase EUR USD 10/05/17 5,921,391 6,418,000 (69) (0.01)Merrill Lynch GBP EUR 10/05/17 1,050,000 1,204,713 22 -Merrill Lynch USD EUR 10/05/17 1,000,000 936,088 (3) -

266 Aberdeen Global
Select Euro High Yield Bond
Counterparty Buy Sell Settlement Buy Amount Sell Amount
Unrealised Gains/(Losses)
€’000
Total Net Assets
%Unrealised losses on forward currency exchange contracts (111) (0.01)
Unrealised losses on derivatives (111) (0.01)
Total investments 1,032,039 97.86Other net assets 22,525 2.14Total net assets 1,054,564 100.00
† Managed by subsidiaries of Aberdeen Asset Management PLC.∞ A portion of this security is on loan at the period end.Currently forward positions are not collateralised.

aberdeen-asset.com 267
Select Global Credit BondFor the six months ended 31 March 2017
Performance For the year six months ended 31 March 2017, the value of Select Global Credit Bond - D Income shares decreased by 1.57% compared to a decrease of 1.52% in the benchmark, the Barclays Global Aggregate Credit (Hedged GBP 100%) Index.Source: Lipper, Basis: total return, published NAV to NAV, net of annual charges, gross income reinvested, GBP.
Please remember that past performance is not a guide to future returns. The price of shares and the revenue from them may fall as well as rise. Investors may not get back the amount originally invested.
Market reviewThe past six months have been marked by volatility and political upheaval. Donald Trump won the US presidential election in November, while in Europe, a surge in popularity for populist Eurosceptic parties ahead of upcoming elections also prompted concerns over the future of the European Union (EU). Notably in December, Matteo Renzi lost the Italian constitutional reform referendum and announced his resignation as Italy’s Prime Minister, being replaced by Paulo Gentiloni. In the Dutch election, Prime Minister Mark Rutte’s VVD remained the largest party despite losing some seats, and the anti-immigration PVV performed worse than expected. During March, UK Prime Minister Theresa May triggered Article 50, starting the clock on Britain’s exit from the EU. Against this backdrop, global economic activity showed signs of a pick-up, particularly in the US, Eurozone and China. This improvement raised expectations of a gradual removal of central banks’ accommodative monetary policy.
The US Federal Reserve raised interest rates in December and March by 25 bps at a time, taking the range to 0.75 – 1.0 by the end of the period. Meanwhile in Europe, the European Central Bank (ECB) tapered its asset purchases but extended its monetary stimulus programme to the end of 2017. President of the ECB, Mario Draghi, delivered an upbeat assessment of the economic outlook and noted that growth forecasts in 2017 and 2018 had been revised upwards and downside risks were diminishing. In Japan, there were some signs of inflation. These were welcomed by the Bank of Japan, which has been trying to ward off deflation for years. Nonetheless, economic stimulus measures are likely to be kept in place.
Yields began to drift higher as global economic data showed signs of a cyclical upswing. US rates moved sharply higher in November, following the surprise victory of Donald Trump at the US election. In the aftermath, markets began to price in fiscal stimulus in the form of tax cuts and increased infrastructure spending, which would lead to higher nominal growth and a sharper path of interest rates. US yields reached a high of 2.62% over the review period; while positive economic activity in Europe and hawkish rhetoric from the ECB helped push bund yields to a high of 0.49%.
US Treasuries and German bunds closed the period at 2.39% and 0.37% respectively. France and peripheral spreads widened amid political concerns surrounding Italian referendum and latterly the French elections where Marine Le Pen of far-right Front National was polling favourably.
In currencies, the US dollar outperformed as markets began to price Trump induced reflation. The yen broadly weakened as interest rate differentials following the Bank of Japan’s yield curve control policy prompted the currency to depreciate. Tumbling oil prices also weighed on commodity-linked currencies, particularly the Norwegian krone.
Portfolio reviewPerformance was driven by financials; specifically senior/subordinated bank exposure which we continue to like given the industry’s heightened regulation and capital requirements. Energy rallied after OPEC’s November meeting and helped drive performance. Media & Telecommunications, having struggled early in the period, was positive in the latter stages. We favour the sector for its robust cash flows and exposure to the global economy. Conversely, transport and capital goods detracted from performance.
In the primary market, we added a UK bank, a Dutch bank and a German automaker which we felt were attractively priced relative to peers. In the secondary market, we increased our positioning in basic industrials, adding high conviction names that offered good relative value. Active credit risk was reduced, and we rotated some of our dollar exposure into sterling and euro credits. Finally, we added a US insurer that has simplified its business with continued deleveraging.
OutlookAt the end of March 2017, credit spreads in all the major markets were trading towards fair value. The asset class is appropriately priced for the prevailing macroeconomic conditions, in our opinion, and we currently have a modest overweight to risk. We see the global economy as fundamentally improving, albeit with material risks still apparent (e.g., the ability or inability of President Trump to enact his policies, and European politics, especially this year’s election cycle). Overall, we have increased the diversification within our funds and, as a result, have spread our modest overweight across many sectors. For example, we like senior bank exposure, especially given the heightened regulation and capital requirements within the industry. Subordinated insurance remains a modest overweight based on stock selection (i.e., we continue to favour national champions and insurers with strong processes) and relatively cheap valuations. We favour the telecom, media, and technology sector for its robust cash flows and exposure to positive momentum in the global economy. Also, we have invested in non-cyclical consumer companies (e.g., pharmaceuticals) where we believe sufficient insulation exists to protect investors if the credit cycle were to deteriorate. Generally, we remain underweight government-related entities like agencies and supranationals given their richness.
In summary, we expect 2017 to be a year in which politics drive volatility and remain mindful that any pick-up in volatility will generate investment opportunities. Accordingly, the portfolio has been positioned with room to add risk opportunistically.
Global Credit Team April 2017

268 Aberdeen Global
Select Global Credit Bond
Statement of Net AssetsAs at 31 March 2017
Notes £’000AssetsInvestments in securities at market value 2.2 43,677 Cash at bank 816 Amounts held at futures clearing houses and brokers 90 Interest receivable 522 Subscriptions receivable 199 Receivable for investments sold 3,107 Unrealised gains on future contracts 2.7 10 Unrealised gains on forward currency exchange contracts 2.6 404 Other assets 6 Total assets 48,831 LiabilitiesPayable for investments purchased 521 Taxes and expenses payable 48 Redemptions payable 2,603 Other liabilities 404 Total liabilities 3,576 Net assets at the end of the period 45,255
Statement of Changes in Net Assets For the period from 1 October 2016 to 31 March 2017
Notes £’000Net assets at the beginning of the period 48,249 Net gains from investments 591 Net realised gains 64 Net unrealised losses (1,024) Proceeds from shares issued 8,612 Payments for shares redeemed (10,764) Net equalisation paid 10 (69) Dividends paid 5 (404) Net assets at the end of the period 45,255
Statement of Operations For the period from 1 October 2016 to 31 March 2017
Notes £’000IncomeInvestment income 2.3 886 Bank interest 1 Total income 887 ExpensesManagement fees 4.2 205 Operating, administrative and servicing fees 4.3 90 Other operational expenses 1 Total expenses 296 Net gains from investments 591
Realised gains on investments 2,393 Realised losses on future contracts (109) Realised losses on forward currency exchange contracts (2,269) Realised currency exchange gains 49 Net realised gains 64
Decrease in unrealised appreciation on investments (2,212) Decrease in unrealised depreciation on future contracts 10 Decrease in unrealised depreciation on forward currency exchange contracts 1,189 Unrealised currency exchange losses (11) Net unrealised losses (1,024) Net decrease in assets as a result of operations (369)

aberdeen-asset.com 269
Select Global Credit Bond
Share Transactions For the period from 1 October 2016 to 31 March 2017
A(EUR)-1^ A(EUR)-2^ A(USD)-2^ D-1 D(USD)-1^ D-2Shares outstanding at the beginning of the period 71,000 706,127 298,805 15,316,733 506,593 11,346 Shares issued during the period - 31,942 - 439,629 4,209 - Shares redeemed during the period (71,000) (18,933) (35,162) (1,245,898) (36,314) - Shares outstanding at the end of the period - 719,136 263,643 14,510,464 474,488 11,346 Net asset value per share - 10.2331 12.6256 1.6949 10.4465 12.4196
H(EUR)-2 R-1 R-2Shares outstanding at the beginning of the period 630 589,330 123,111 Shares issued during the period - 124,593 541,971 Shares redeemed during the period (630) (107,245) (538,042) Shares outstanding at the end of the period - 606,678 127,040 Net asset value per share - 10.0929 11.6261
^ Base currency exposure share class.
The accompanying notes form an integral part of these financial statements.

270 Aberdeen Global
Select Global Credit BondPortfolio StatementAs at 31 March 2017
Security Coupon (%) MaturityNominal/Quantity
Market Value £’000
Total Net Assets
%Transferable securities and money market instruments admitted to an official exchange listing or dealt on another regulated market 91.99%Bonds 91.99%Asset Backed Bonds / Mortgage Backed Bonds 2.63%United Kingdom 1.74%Annington Finance No 4 - 07/12/22 600,000 541 1.20Paragon Mortgages No 8 FRN 15/04/44 296,516 245 0.54
786 1.74
United States 0.89%First Horizon Alternative Mortgage Securities Trust 2005-FA2 FRN 25/04/35 126,865 85 0.19GreenPoint Mortgage Loan Trust 2004-1 FRN 25/10/34 146,972 105 0.23Merrill Lynch Mortgage Investors Trust MLMI Series 2005-A5 FRN 25/06/35 134,289 105 0.23RALI Series 2006-QS1 Trust 5.7500 25/01/36 148,423 109 0.24
404 0.89
Total Asset Backed Bonds / Mortgage Backed Bonds 1,190 2.63
Corporate Bonds 86.71%Australia 3.91%APT Pipelines 4.2000 23/03/25 320,000 262 0.58APT Pipelines (EMTN) 2.0000 22/03/27 300,000 259 0.57Australia & New Zealand Banking 4.5000 19/03/24 380,000 316 0.69BHP Billiton Finance VAR 22/04/76 215,000 202 0.45QBE Insurance 2.4000 01/05/18 265,000 212 0.47Suncorp Metway 2.3500 27/04/20 300,000 238 0.53Telstra 3.1250 07/04/25 350,000 279 0.62
1,768 3.91
Belgium 0.66%Anheuser-Busch InBev (EMTN) 2.7500 17/03/36 170,000 156 0.34Anheuser-Busch InBev Finance 4.9000 01/02/46 165,000 143 0.32
299 0.66
Brazil 0.70%Petrobras Global Finance 4.8750 07/03/18 250,000 221 0.48QGOG Atlantic / Alaskan Rigs 5.2500 30/07/18 123,900 97 0.22
318 0.70
Canada 2.15%Canadian Natural Resources 3.9000 01/02/25 330,000 266 0.59Canadian Pacific Railway 4.8000 01/08/45 139,000 121 0.27Glencore Canada Financial (EMTN) 7.3750 27/05/20 400,000 467 1.03TransCanada PipeLines VAR 15/05/67 160,000 120 0.26
974 2.15

aberdeen-asset.com 271
Select Global Credit Bond
Security Coupon (%) MaturityNominal/Quantity
Market Value £’000
Total Net Assets
%China 1.64%CNOOC Curtis Funding No 1 4.5000 03/10/23 300,000 255 0.56CNPC General Capital 2.7500 14/05/19 320,000 258 0.58Industrial & Commercial Bank of China/New York 2.4520 20/10/21 290,000 228 0.50
741 1.64
France 6.12%AXA (EMTN) (PERP) VAR 31/12/49 200,000 178 0.39Banque Federative du Credit Mutuel (EMTN) 2.0000 12/04/19 326,000 259 0.57BNP Paribas (EMTN) 3.8000 10/01/24 313,000 249 0.55BPCE (MTN) 2.7500 02/12/21 285,000 226 0.50Cap Gemini 2.5000 01/07/23 200,000 187 0.41CNP Assurances VAR 30/09/41 200,000 227 0.50Credit Agricole Assurances (PERP) VAR 31/10/49 200,000 174 0.39Credit Agricole (EMTN) 2.3750 01/07/21 269,000 211 0.47RCI Banque (EMTN) 1.3750 17/11/20 130,000 115 0.25Societe Generale (PERP) VAR 29/09/49 450,000 457 1.02TDF Infrastructure 2.5000 07/04/26 200,000 177 0.39Teleperformance 1.5000 03/04/24 100,000 85 0.19TOTAL (EMTN) (PERP) VAR 29/12/49 260,000 223 0.49
2,768 6.12
Germany 3.55%Allianz VAR 06/07/47 300,000 267 0.59Deutsche Telekom International Finance 2.8200 19/01/22 450,000 358 0.79Deutsche Telekom International Finance (EMTN) 1.5000 03/04/28 185,000 158 0.35Muenchener Rueckversicherungs-Gesellschaft in Muenchen VAR 21/06/28 200,000 215 0.47PrestigeBidCo 6.2500 15/12/23 100,000 90 0.20Safari Verwaltungs 8.2500 15/02/21 85,816 77 0.17Volkswagen International Finance 1.1250 02/10/23 200,000 172 0.38Vonovia Finance (PERP) VAR 29/12/49 300,000 270 0.60
1,607 3.55
Hong Kong 0.58%Hutchison Whampoa Europe Finance 13 (PERP) VAR 29/05/49 300,000 264 0.58
India 3.20%GCX 7.0000 01/08/19 320,000 262 0.58HDFC Bank (EMTN) 3.0000 06/03/18 250,000 201 0.45ICICI Bank Dubai (EMTN) 3.5000 18/03/20 360,000 293 0.65Indian Railway Finance 3.9170 26/02/19 300,000 247 0.54NTPC (EMTN) 5.6250 14/07/21 300,000 264 0.58ONGC Videsh 2.7500 15/07/21 200,000 182 0.40
1,449 3.20
Israel 0.31%Teva Pharmaceutical Finance Netherlands III 3.1500 01/10/26 191,000 141 0.31

272 Aberdeen Global
Select Global Credit Bond
Security Coupon (%) MaturityNominal/Quantity
Market Value £’000
Total Net Assets
%Italy 1.03%Enel VAR 24/09/73 200,000 184 0.41Italgas (EMTN) 1.6250 19/01/27 200,000 172 0.38Italgas (EMTN) 0.5000 19/01/22 130,000 111 0.24
467 1.03
Mexico 0.79%America Movil VAR 06/09/73 100,000 108 0.24Petroleos Mexicanos 5.5000 21/01/21 293,000 248 0.55
356 0.79
Netherlands 4.11%ABN AMRO Bank (EMTN) VAR 18/01/28 300,000 273 0.60ABN AMRO Bank (PERP) VAR 29/12/49 300,000 266 0.59Cooperatieve Rabobank (PERP) VAR 29/12/49 260,000 244 0.54ING Groep 3.9500 29/03/27 225,000 181 0.40Koninklijke (PERP) VAR 14/09/49 550,000 504 1.11LGE HoldCo VI 7.1250 15/05/24 160,000 154 0.34TenneT (PERP) VAR 29/12/49 280,000 239 0.53
1,861 4.11
New Zealand 0.22%Chorus (EMTN) 1.1250 18/10/23 114,000 98 0.22
Russian Federation 0.36%Lukoil International Finance 4.5630 24/04/23 200,000 165 0.36
Spain 1.15%Gas Natural Fenosa Finance (EMTN) 1.3750 19/01/27 300,000 254 0.56Metrovacesa (EMTN) 2.3750 23/05/22 300,000 267 0.59
521 1.15
Sweden 1.14%Svenska Handelsbanken (MTN) 2.4500 30/03/21 307,000 245 0.54Volvo Treasury VAR 10/06/75 300,000 269 0.60
514 1.14
Switzerland 0.59%Credit Suisse Sydney (MTN) 3.5000 29/04/20 430,000 265 0.59
Thailand 0.54%Thai Oil 3.6250 23/01/23 300,000 245 0.54
Turkey 0.52%Turkiye Garanti Bankasi 5.8750 16/03/23 290,000 235 0.52
United Arab Emirates 0.50%National Bank of Abu Dhabi (EMTN) 3.0000 30/03/22 280,000 224 0.50

aberdeen-asset.com 273
Select Global Credit Bond
Security Coupon (%) MaturityNominal/Quantity
Market Value £’000
Total Net Assets
%United Kingdom 12.36%Aviva (EMTN) VAR 05/07/43 240,000 243 0.54Barclays 3.6840 10/01/23 287,000 231 0.51Barclays Bank 7.6250 21/11/22 200,000 175 0.39Barclays Bank (EMTN) 1.8750 08/12/23 382,000 334 0.74CYBG VAR 09/02/26 264,000 261 0.58HBOS Capital Funding (PERP) VAR 29/11/49 230,000 244 0.54HSBC VAR 13/03/23 586,000 473 1.03HSBC (EMTN) VAR 18/10/22 100,000 102 0.23Jaguar Land Rover Automotive 5.0000 15/02/22 330,000 362 0.80Lloyds Banking 3.7500 11/01/27 200,000 158 0.35Marks & Spencer (EMTN) 3.0000 08/12/23 120,000 122 0.27Paragon VAR 09/09/26 100,000 105 0.23PGH Capital 5.7500 07/07/21 400,000 449 0.98Royal Bank of Scotland (EMTN) 6.6250 17/09/18 250,000 270 0.60Royal Bank of Scotland (EMTN) 2.5000 22/03/23 200,000 177 0.39Santander UK 5.0000 07/11/23 320,000 268 0.59Smiths (EMTN) 2.0000 23/02/27 100,000 87 0.19SSE (PERP) VAR 29/12/49 150,000 153 0.34SSE (PERP) VAR 29/12/49 100,000 85 0.19Stagecoach 4.0000 29/09/25 190,000 209 0.46Standard Chartered (EMTN) 2.1000 19/08/19 237,000 188 0.42Standard Life (EMTN) VAR 04/12/42 140,000 153 0.34Tesco Property Finance 3 5.7440 13/04/40 127,196 134 0.30Western Power Distribution 3.6250 06/11/23 200,000 217 0.48Whitbread 3.3750 16/10/25 118,000 126 0.28WPP Finance Deutschland (EMTN) 1.6250 23/03/30 320,000 267 0.59
5,593 12.36
United States 40.58%AbbVie 4.4500 14/05/46 242,000 185 0.41AbbVie 2.1250 17/11/28 200,000 176 0.39Amgen 2.2500 19/08/23 396,000 303 0.67Amgen 4.4000 01/05/45 98,000 76 0.17Apple 3.4500 09/02/45 320,000 229 0.51Apple 3.0000 09/02/24 240,000 194 0.43AT&T 5.2500 01/03/37 454,000 371 0.82AT&T 3.2000 01/03/22 385,000 311 0.69AutoNation 4.5000 01/10/25 240,000 199 0.44Bank of America (MTN) 3.2480 21/10/27 290,000 221 0.49Bank of America (MTN) 2.5030 21/10/22 166,000 130 0.29Broadcom Cayman Finance 3.8750 15/01/27 320,000 258 0.57Broadcom Cayman Finance 3.0000 15/01/22 320,000 256 0.57Buckeye 3.9500 01/12/26 314,000 246 0.54Burlington Northern Santa Fe 4.7000 01/09/45 227,000 198 0.44Citigroup 2.3500 02/08/21 620,000 489 1.08Citigroup 3.3900 18/11/21 410,000 258 0.57Columbia Pipeline 2.4500 01/06/18 148,000 119 0.26

274 Aberdeen Global
Select Global Credit Bond
Security Coupon (%) MaturityNominal/Quantity
Market Value £’000
Total Net Assets
%Comcast 6.9500 15/08/37 330,000 355 0.78Crown Castle International 2.2500 01/09/21 207,000 161 0.36CSC 10.8750 15/10/25 200,000 193 0.43CVS Health 3.5000 20/07/22 209,000 172 0.38Delta Air Lines 3.6250 15/03/22 197,000 161 0.36Dominion Resources VAR 01/07/19 420,000 341 0.75Duke Energy 2.6500 01/09/26 182,000 136 0.30Energy Transfer Partners 5.2000 01/02/22 270,000 232 0.51Energy Transfer Partners 4.2000 15/04/27 167,000 132 0.29Exelon 3.4970 01/06/22 245,000 198 0.44FedEx 4.5500 01/04/46 302,000 242 0.54Ford Motor Credit 5.7500 01/02/21 500,000 441 0.97Ford Motor Credit 1.8970 12/08/19 200,000 159 0.35General Motors Financial 4.0000 06/10/26 408,000 322 0.71Georgia-Pacific 5.4000 01/11/20 400,000 352 0.78Goldman Sachs 3.7500 22/05/25 565,000 458 1.01Goldman Sachs 3.0000 26/04/22 463,000 372 0.82Harley-Davidson 4.6250 28/07/45 270,000 219 0.48Harley-Davidson 3.5000 28/07/25 181,000 147 0.33Hartford Financial Services 6.6250 30/03/40 217,000 221 0.49HollyFrontier 5.8750 01/04/26 315,000 268 0.59HSBC Finance 6.6760 15/01/21 560,000 506 1.11Intel 4.9000 29/07/45 85,000 76 0.17International Paper 5.1500 15/05/46 124,000 104 0.23JPMorgan Chase 3.1250 23/01/25 525,000 413 0.91JPMorgan Chase 3.6250 01/12/27 277,000 215 0.48JPMorgan Chase (PERP) VAR 29/12/49 310,000 251 0.55Kinder Morgan 5.5500 01/06/45 130,000 107 0.24Kraft Heinz Foods 3.5000 15/07/22 259,000 212 0.47Kraft Heinz Foods 6.7500 15/03/32 99,000 97 0.21Kroger 3.8750 15/10/46 154,000 111 0.25Legg Mason 5.6250 15/01/44 150,000 123 0.27Marathon Oil 5.2000 01/06/45 115,000 91 0.20Marathon Petroleum 4.7500 15/09/44 240,000 174 0.38Microsoft 2.8750 06/02/24 210,000 169 0.37Mondelez International 2.3750 06/03/35 100,000 82 0.18Mondelez International Netherlands 2.0000 28/10/21 201,000 155 0.34Morgan Stanley 3.7000 23/10/24 260,000 211 0.47Morgan Stanley (MTN) 2.6250 17/11/21 349,000 278 0.61MPLX 4.8750 01/06/25 170,000 143 0.32MPLX 5.2000 01/03/47 74,000 60 0.13Mylan 2.2500 22/11/24 210,000 185 0.41Mylan 3.0000 15/12/18 133,000 108 0.24Mylan 5.2500 15/06/46 120,000 99 0.22Mylan 1.2500 23/11/20 100,000 88 0.19Oracle 4.0000 15/07/46 324,000 248 0.55Penske Truck Leasing 3.3750 01/02/22 414,000 336 0.74Perrigo Finance 3.5000 15/12/21 400,000 325 0.72
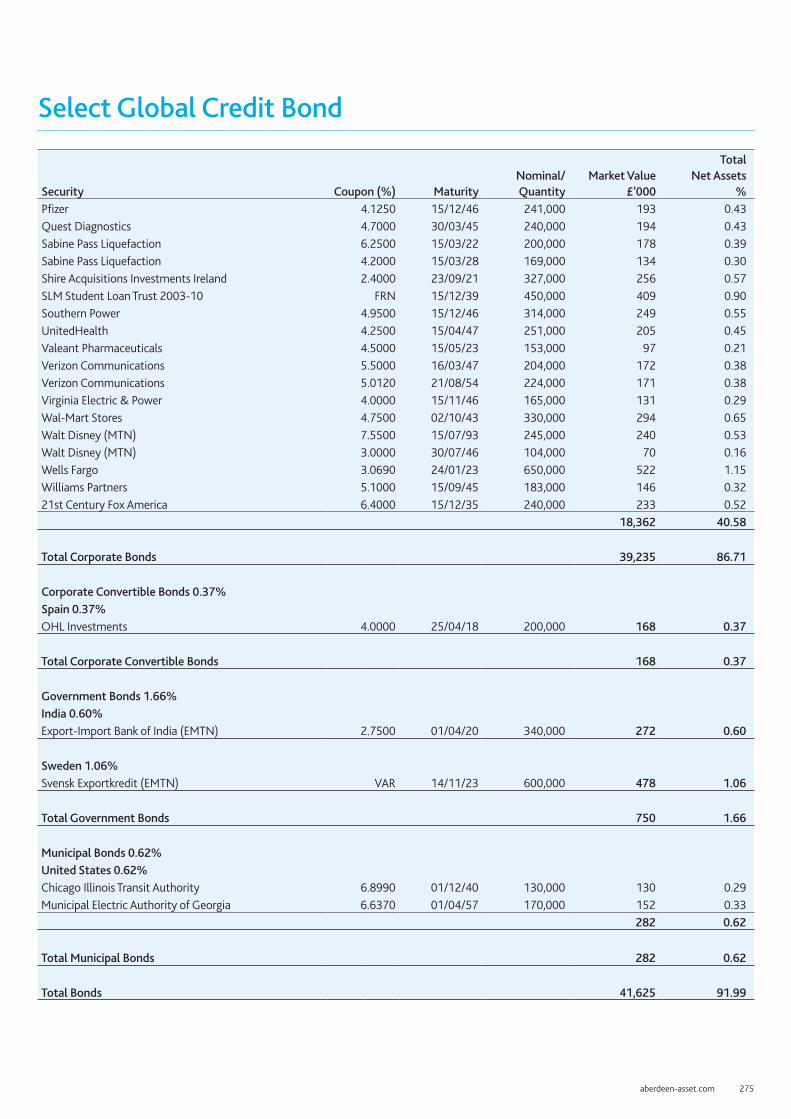
aberdeen-asset.com 275
Select Global Credit Bond
Security Coupon (%) MaturityNominal/Quantity
Market Value £’000
Total Net Assets
%Pfizer 4.1250 15/12/46 241,000 193 0.43Quest Diagnostics 4.7000 30/03/45 240,000 194 0.43Sabine Pass Liquefaction 6.2500 15/03/22 200,000 178 0.39Sabine Pass Liquefaction 4.2000 15/03/28 169,000 134 0.30Shire Acquisitions Investments Ireland 2.4000 23/09/21 327,000 256 0.57SLM Student Loan Trust 2003-10 FRN 15/12/39 450,000 409 0.90Southern Power 4.9500 15/12/46 314,000 249 0.55UnitedHealth 4.2500 15/04/47 251,000 205 0.45Valeant Pharmaceuticals 4.5000 15/05/23 153,000 97 0.21Verizon Communications 5.5000 16/03/47 204,000 172 0.38Verizon Communications 5.0120 21/08/54 224,000 171 0.38Virginia Electric & Power 4.0000 15/11/46 165,000 131 0.29Wal-Mart Stores 4.7500 02/10/43 330,000 294 0.65Walt Disney (MTN) 7.5500 15/07/93 245,000 240 0.53Walt Disney (MTN) 3.0000 30/07/46 104,000 70 0.16Wells Fargo 3.0690 24/01/23 650,000 522 1.15Williams Partners 5.1000 15/09/45 183,000 146 0.3221st Century Fox America 6.4000 15/12/35 240,000 233 0.52
18,362 40.58
Total Corporate Bonds 39,235 86.71
Corporate Convertible Bonds 0.37%Spain 0.37%OHL Investments 4.0000 25/04/18 200,000 168 0.37
Total Corporate Convertible Bonds 168 0.37
Government Bonds 1.66%India 0.60%Export-Import Bank of India (EMTN) 2.7500 01/04/20 340,000 272 0.60
Sweden 1.06%Svensk Exportkredit (EMTN) VAR 14/11/23 600,000 478 1.06
Total Government Bonds 750 1.66
Municipal Bonds 0.62%United States 0.62%Chicago Illinois Transit Authority 6.8990 01/12/40 130,000 130 0.29Municipal Electric Authority of Georgia 6.6370 01/04/57 170,000 152 0.33
282 0.62
Total Municipal Bonds 282 0.62
Total Bonds 41,625 91.99

276 Aberdeen Global
Select Global Credit Bond
Security Coupon (%) MaturityNominal/Quantity
Market Value £’000
Total Net Assets
%Total Transferable securities and money market instruments admitted to an official exchange listing or dealt on another regulated market 41,625 91.99
Other transferable securities and money market instruments 4.53%Bonds 4.53%Asset Backed Bonds / Mortgage Backed Bonds 1.96%United States 1.96%Bear Stearns ARM Trust 2007-4 VAR 25/06/47 220,137 163 0.36STARM Mortgage Loan Trust 2007-2 FRN 25/04/37 271,354 186 0.41WaMu Mortgage Pass-Through Certificates Series 2006-AR12 Trust FRN 25/10/36 295,474 202 0.45WaMu Mortgage Pass-Through Certificates Series 2006-AR18 Trust FRN 25/01/37 282,209 202 0.45WaMu Mortgage Pass-Through Certificates Series 2007-HY7 Trust FRN 25/07/37 181,076 133 0.29
886 1.96
Total Asset Backed Bonds / Mortgage Backed Bonds 886 1.96
Corporate Bonds 2.03%Australia 0.17%Suncorp-Metway (EMTN) 2.1000 03/05/19 97,000 77 0.17
Hong Kong 0.48%Green Dragon Gas 10.0000 20/11/17 300,000 218 0.48
Netherlands 0.67%ABN AMRO Bank (MTN) 3.2500 09/04/20 490,000 301 0.67
South Africa 0.27%Sappi Papier 7.5000 15/06/32 155,000 123 0.27
Sweden 0.44%Skandinaviska Enskilda Banken 2.6250 17/11/20 250,000 201 0.44
Total Corporate Bonds 920 2.03
Government Bonds 0.54%South Korea 0.54%Export-Import Bank of Korea (MTN) 4.2500 21/05/20 390,000 246 0.54
Total Government Bonds 246 0.54
Total Bonds 2,052 4.53
Total Other transferable securities and money market instruments 2,052 4.53

aberdeen-asset.com 277
Select Global Credit BondDerivatives 0.91%
Future contracts 0.02%
Future Maturity Notional
Unrealised Gains/(Losses)
£’000
Total Net Assets
%CBT US Long Bond 21/06/17 6 2 -CBT US Ultra Bond 21/06/17 12 4 0.01CBT US 10 Year Note 21/06/17 (12) (9) (0.03)CBT US 10 Year Ultra 21/06/17 4 4 0.01CBT US 2 Year Note 30/06/17 20 3 0.01CBT US 5 Year Note 30/06/17 (82) 5 0.01EUX Euro Bobl 08/06/17 7 (2) -EUX Euro Boxl 30 Year Bond 08/06/17 1 1 -EUX Euro Bund 08/06/17 4 - -EUX Euro Schatz 08/06/17 10 - -ICE Long Gilt 28/06/17 2 - -MSE Canada 10 Year Bond 21/06/17 6 3 0.01SFE Australia 3 Year Bond 15/06/17 (3) (1) -SGX 10 Year Mini JGB 12/06/17 3 - -Unrealised gains on future contracts 10 0.02
Forward currency exchange contracts 0.89%
Counterparty Buy Sell Settlement Buy Amount Sell Amount
Unrealised Gains/(Losses)
£’000
Total Net Assets
%Barclays Capital GBP USD 10/04/17 43,248 54,000 - -Barclays Capital USD GBP 10/04/17 67,000 53,826 - -BNP Paribas EUR GBP 15/06/17 7,333,678 6,371,653 (88) (0.19)BNP Paribas EUR GBP 15/06/17 45,586 39,364 - -BNP Paribas GBP AUD 10/04/17 795,754 1,287,000 11 0.02BNP Paribas GBP CAD 10/04/17 236,708 389,000 3 0.01BNP Paribas GBP CHF 10/04/17 190,753 236,000 2 -BNP Paribas GBP USD 10/04/17 183,773 230,000 - -BNP Paribas GBP USD 10/04/17 76,624 96,000 - -BNP Paribas GBP EUR 15/06/17 41,815 47,933 1 -BNP Paribas GBP USD 15/06/17 29,892 36,423 1 -BNP Paribas GBP USD 15/06/17 15,488 18,872 - -BNP Paribas USD GBP 10/04/17 174,000 142,826 (4) (0.01)BNP Paribas USD GBP 15/06/17 4,996,603 4,096,604 (108) (0.24)BNP Paribas USD GBP 15/06/17 3,314,591 2,717,559 (72) (0.16)BNP Paribas USD GBP 15/06/17 29,152 23,344 - -BNP Paribas USD GBP 15/06/17 27,338 21,767 - -BNP Paribas USD GBP 15/06/17 19,370 15,511 - -BNP Paribas USD GBP 15/06/17 18,164 14,463 - -Citigroup EUR GBP 10/04/17 55,000 47,694 (1) -Citigroup GBP EUR 10/04/17 9,623,914 11,142,000 92 0.20Citigroup GBP USD 10/04/17 225,520 280,000 2 -Citigroup GBP USD 10/04/17 166,889 204,000 4 0.01Citigroup GBP USD 10/04/17 80,950 101,000 - -Citigroup USD GBP 10/04/17 549,000 451,482 (13) (0.03)Citigroup USD GBP 10/04/17 122,000 100,096 (3) (0.01)

278 Aberdeen Global
Select Global Credit Bond
Counterparty Buy Sell Settlement Buy Amount Sell Amount
Unrealised Gains/(Losses)
£’000
Total Net Assets
%Goldman Sachs GBP USD 10/04/17 7,752,456 9,513,000 146 0.32Goldman Sachs GBP EUR 10/04/17 85,774 99,000 1 -Goldman Sachs GBP USD 10/04/17 67,675 85,000 - -Goldman Sachs GBP USD 10/04/17 57,786 72,000 - -Goldman Sachs GBP EUR 10/04/17 43,300 50,000 1 -HSBC GBP USD 10/04/17 7,752,936 9,513,000 147 0.33HSBC GBP USD 10/04/17 7,752,936 9,513,000 147 0.33JPM Chase CHF GBP 10/04/17 236,000 191,831 (3) (0.01)JPM Chase EUR GBP 10/04/17 549,000 471,186 (2) -JPM Chase USD GBP 10/04/17 141,000 114,951 (2) -Merrill Lynch GBP USD 10/04/17 214,129 268,000 - -Merrill Lynch GBP USD 10/04/17 147,196 182,000 2 -Merrill Lynch USD GBP 10/04/17 424,000 347,613 (9) (0.02)Morgan Stanley EUR GBP 10/04/17 66,000 57,614 (1) -Royal Bank of Canada GBP EUR 10/04/17 43,419 50,000 1 -State Street GBP USD 10/04/17 7,752,810 9,512,000 148 0.34UBS GBP EUR 10/04/17 285,334 331,000 2 -UBS GBP EUR 10/04/17 60,697 70,000 1 -UBS USD GBP 10/04/17 76,000 62,088 (1) -UBS USD GBP 10/04/17 67,000 53,178 - -UBS USD GBP 10/04/17 53,000 43,588 (1) -Unrealised gains on forward currency exchange contracts 404 0.89
Unrealised gains on derivatives 414 0.91
Total investments 44,091 97.43Other net assets 1,164 2.57Total net assets 45,255 100.00
Currently forward positions are not collateralised.
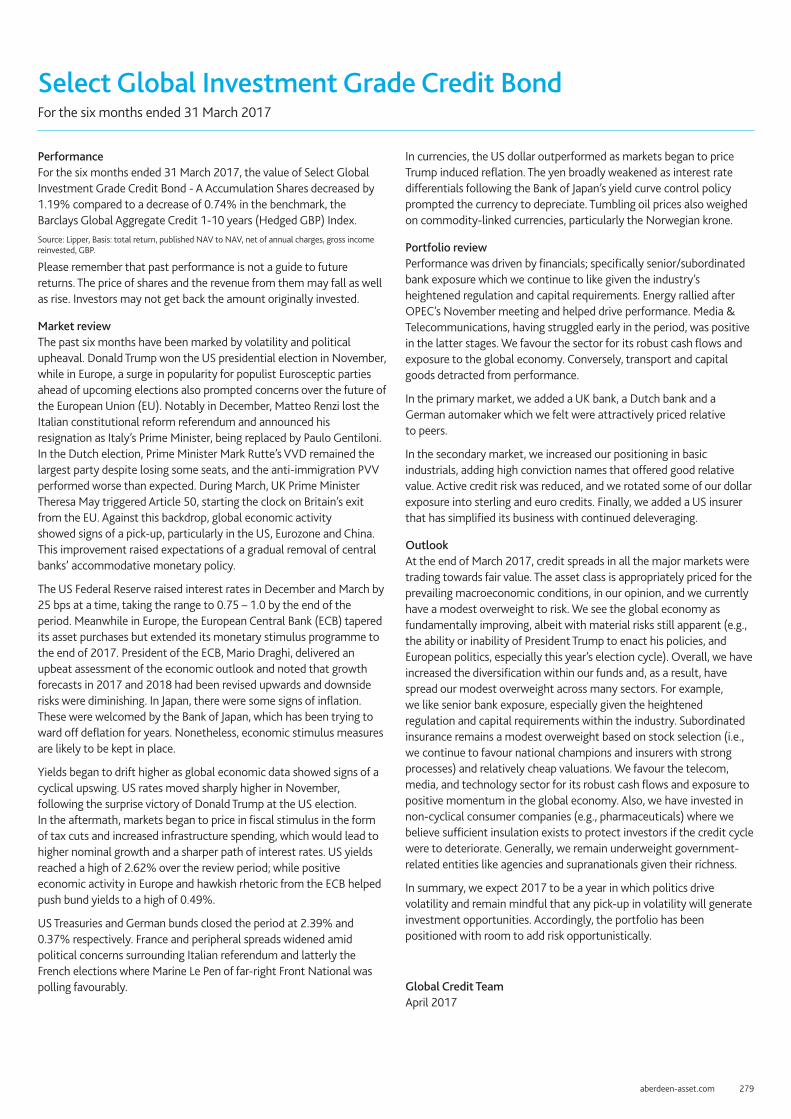
aberdeen-asset.com 279
Select Global Investment Grade Credit BondFor the six months ended 31 March 2017
Performance For the six months ended 31 March 2017, the value of Select Global Investment Grade Credit Bond - A Accumulation Shares decreased by 1.19% compared to a decrease of 0.74% in the benchmark, the Barclays Global Aggregate Credit 1-10 years (Hedged GBP) Index.Source: Lipper, Basis: total return, published NAV to NAV, net of annual charges, gross income reinvested, GBP.
Please remember that past performance is not a guide to future returns. The price of shares and the revenue from them may fall as well as rise. Investors may not get back the amount originally invested.
Market reviewThe past six months have been marked by volatility and political upheaval. Donald Trump won the US presidential election in November, while in Europe, a surge in popularity for populist Eurosceptic parties ahead of upcoming elections also prompted concerns over the future of the European Union (EU). Notably in December, Matteo Renzi lost the Italian constitutional reform referendum and announced his resignation as Italy’s Prime Minister, being replaced by Paulo Gentiloni. In the Dutch election, Prime Minister Mark Rutte’s VVD remained the largest party despite losing some seats, and the anti-immigration PVV performed worse than expected. During March, UK Prime Minister Theresa May triggered Article 50, starting the clock on Britain’s exit from the EU. Against this backdrop, global economic activity showed signs of a pick-up, particularly in the US, Eurozone and China. This improvement raised expectations of a gradual removal of central banks’ accommodative monetary policy.
The US Federal Reserve raised interest rates in December and March by 25 bps at a time, taking the range to 0.75 – 1.0 by the end of the period. Meanwhile in Europe, the European Central Bank (ECB) tapered its asset purchases but extended its monetary stimulus programme to the end of 2017. President of the ECB, Mario Draghi, delivered an upbeat assessment of the economic outlook and noted that growth forecasts in 2017 and 2018 had been revised upwards and downside risks were diminishing. In Japan, there were some signs of inflation. These were welcomed by the Bank of Japan, which has been trying to ward off deflation for years. Nonetheless, economic stimulus measures are likely to be kept in place.
Yields began to drift higher as global economic data showed signs of a cyclical upswing. US rates moved sharply higher in November, following the surprise victory of Donald Trump at the US election. In the aftermath, markets began to price in fiscal stimulus in the form of tax cuts and increased infrastructure spending, which would lead to higher nominal growth and a sharper path of interest rates. US yields reached a high of 2.62% over the review period; while positive economic activity in Europe and hawkish rhetoric from the ECB helped push bund yields to a high of 0.49%.
US Treasuries and German bunds closed the period at 2.39% and 0.37% respectively. France and peripheral spreads widened amid political concerns surrounding Italian referendum and latterly the French elections where Marine Le Pen of far-right Front National was polling favourably.
In currencies, the US dollar outperformed as markets began to price Trump induced reflation. The yen broadly weakened as interest rate differentials following the Bank of Japan’s yield curve control policy prompted the currency to depreciate. Tumbling oil prices also weighed on commodity-linked currencies, particularly the Norwegian krone.
Portfolio reviewPerformance was driven by financials; specifically senior/subordinated bank exposure which we continue to like given the industry’s heightened regulation and capital requirements. Energy rallied after OPEC’s November meeting and helped drive performance. Media & Telecommunications, having struggled early in the period, was positive in the latter stages. We favour the sector for its robust cash flows and exposure to the global economy. Conversely, transport and capital goods detracted from performance.
In the primary market, we added a UK bank, a Dutch bank and a German automaker which we felt were attractively priced relative to peers.
In the secondary market, we increased our positioning in basic industrials, adding high conviction names that offered good relative value. Active credit risk was reduced, and we rotated some of our dollar exposure into sterling and euro credits. Finally, we added a US insurer that has simplified its business with continued deleveraging.
OutlookAt the end of March 2017, credit spreads in all the major markets were trading towards fair value. The asset class is appropriately priced for the prevailing macroeconomic conditions, in our opinion, and we currently have a modest overweight to risk. We see the global economy as fundamentally improving, albeit with material risks still apparent (e.g., the ability or inability of President Trump to enact his policies, and European politics, especially this year’s election cycle). Overall, we have increased the diversification within our funds and, as a result, have spread our modest overweight across many sectors. For example, we like senior bank exposure, especially given the heightened regulation and capital requirements within the industry. Subordinated insurance remains a modest overweight based on stock selection (i.e., we continue to favour national champions and insurers with strong processes) and relatively cheap valuations. We favour the telecom, media, and technology sector for its robust cash flows and exposure to positive momentum in the global economy. Also, we have invested in non-cyclical consumer companies (e.g., pharmaceuticals) where we believe sufficient insulation exists to protect investors if the credit cycle were to deteriorate. Generally, we remain underweight government-related entities like agencies and supranationals given their richness.
In summary, we expect 2017 to be a year in which politics drive volatility and remain mindful that any pick-up in volatility will generate investment opportunities. Accordingly, the portfolio has been positioned with room to add risk opportunistically.
Global Credit Team April 2017

280 Aberdeen Global
Select Global Investment Grade Credit Bond
Statement of Net AssetsAs at 31 March 2017
Notes £’000AssetsInvestments in securities at market value 2.2 24,762 Cash at bank 511 Amounts held at futures clearing houses and brokers 110 Interest receivable 216 Unrealised gains on forward currency exchange contracts 2.6 419 Total assets 26,018 LiabilitiesPayable for investments purchased 319 Taxes and expenses payable 22 Redemptions payable 14 Unrealised losses on future contracts 2.7 6 Total liabilities 361 Net assets at the end of the period 25,657
Statement of Changes in Net Assets For the period from 1 October 2016 to 31 March 2017
Notes £’000Net assets at the beginning of the period 25,498 Net gains from investments 241 Net realised losses (678) Net unrealised gains 223 Proceeds from shares issued 2,427 Payments for shares redeemed (2,059) Net equalisation received 10 5 Net assets at the end of the period 25,657
Statement of Operations For the period from 1 October 2016 to 31 March 2017
Notes £’000IncomeInvestment income 2.3 375 Total income 375 ExpensesManagement fees 4.2 78 Operating, administrative and servicing fees 4.3 56 Total expenses 134 Net gains from investments 241
Realised gains on investments 1,216 Realised gains on future contracts 46 Realised losses on forward currency exchange contracts (1,919) Realised currency exchange losses (21) Net realised losses (678)
Decrease in unrealised appreciation on investments (820) Decrease in unrealised appreciation on future contracts (13) Decrease in unrealised depreciation on forward currency exchange contracts 1,055 Unrealised currency exchange gains 1 Net unrealised gains 223 Net decrease in assets as a result of operations (214)
Share Transactions For the period from 1 October 2016 to 31 March 2017
A-2 Z-2Shares outstanding at the beginning of the period 9,771,233 335,633 Shares issued during the period 221,535 187,753 Shares redeemed during the period (929,265) - Shares outstanding at the end of the period 9,063,503 523,386 Net asset value per share 2.2244 10.5007
The accompanying notes form an integral part of these financial statements.

aberdeen-asset.com 281
Select Global Investment Grade Credit BondPortfolio StatementAs at 31 March 2017
Security Coupon (%) MaturityNominal/Quantity
Market Value £’000
Total Net Assets
%Transferable securities and money market instruments admitted to an official exchange listing or dealt on another regulated market 94.75%Bonds 94.75%Asset Backed 0.98%United States 0.98%SBA Tower Trust 2.9330 15/12/17 315,000 252 0.98
Total Asset Backed 252 0.98
Corporate Bonds 91.79%Australia 5.11%APT Pipelines 4.2000 23/03/25 150,000 123 0.48Australia & New Zealand Banking 4.5000 19/03/24 200,000 166 0.65BHP Billiton Finance VAR 22/04/76 115,000 108 0.42National Australia Bank 2.2500 16/03/21 350,000 278 1.08QBE Insurance 2.4000 01/05/18 320,000 257 1.00Suncorp Metway 2.3500 27/04/20 200,000 159 0.62Telstra 3.1250 07/04/25 277,000 221 0.86
1,312 5.11
Belgium 0.69%Anheuser-Busch InBev Worldwide 7.7500 15/01/19 200,000 176 0.69
Canada 1.46%Canadian Natural Resources 3.9000 01/02/25 115,000 93 0.36Canadian Pacific Railway 3.7000 01/02/26 230,000 189 0.74Toyota Credit Canada 1.8000 19/02/20 48,000 29 0.11TransCanada PipeLines VAR 15/05/67 85,000 64 0.25
375 1.46
China 3.18%CNOOC Curtis Funding No 1 4.5000 03/10/23 300,000 255 0.99CNPC General Capital 2.7500 14/05/19 200,000 162 0.63Industrial & Commercial Bank of China/New York 2.4520 20/10/21 300,000 235 0.92Sinopec Group Overseas Development 2015 2.5000 28/04/20 205,000 163 0.64
815 3.18
Denmark 0.31%Danske Bank (EMTN) VAR 29/09/21 75,000 79 0.31
France 5.43%Banque Federative du Credit Mutuel (EMTN) 2.0000 12/04/19 200,000 159 0.62BNP Paribas (EMTN) 0.5000 01/06/22 250,000 214 0.84BPCE (MTN) 2.7500 02/12/21 250,000 198 0.77CNP Assurances VAR 30/09/41 100,000 114 0.44Credit Agricole 1.0000 16/09/24 300,000 258 1.01

282 Aberdeen Global
Select Global Investment Grade Credit Bond
Security Coupon (%) MaturityNominal/Quantity
Market Value £’000
Total Net Assets
%Credit Agricole Assurances (PERP) VAR 31/10/49 100,000 87 0.34Engie (PERP) VAR 10/01/49 100,000 104 0.41TDF Infrastructure 2.5000 07/04/26 100,000 88 0.34Teleperformance 1.5000 03/04/24 100,000 85 0.33TOTAL (EMTN) (PERP) VAR 29/12/49 100,000 86 0.33
1,393 5.43
Germany 2.46%Deutsche Telekom International Finance 2.8200 19/01/22 225,000 179 0.70Volkswagen International Finance 0.5000 30/03/21 100,000 86 0.33Volkswagen Leasing (EMTN) 2.6250 15/01/24 200,000 187 0.73Vonovia Finance (PERP) VAR 29/12/49 200,000 180 0.70
632 2.46
Hong Kong 0.53%Hutchison Whampoa Europe Finance 13 (PERP) VAR 29/05/49 154,000 136 0.53
India 2.94%HDFC Bank (EMTN) 3.0000 06/03/18 200,000 161 0.63ICICI Bank Dubai (EMTN) 3.5000 18/03/20 200,000 163 0.63Indian Railway Finance 3.9170 26/02/19 200,000 164 0.64NTPC (EMTN) 5.6250 14/07/21 200,000 176 0.69ONGC Videsh 2.7500 15/07/21 100,000 91 0.35
755 2.94
Israel 0.48%Teva Pharmaceutical Finance Netherlands III 2.2000 21/07/21 161,000 124 0.48
Italy 1.39%Enel VAR 24/09/73 200,000 185 0.72Italgas (EMTN) 1.6250 19/01/27 100,000 86 0.34Italgas (EMTN) 0.5000 19/01/22 100,000 85 0.33
356 1.39
Japan 1.07%Mizuho Financial 2.2730 13/09/21 350,000 274 1.07
Mexico 0.52%Petroleos Mexicanos 5.5000 21/01/21 158,000 134 0.52
Netherlands 4.94%ABN AMRO Bank (EMTN) VAR 18/01/28 100,000 91 0.36Cooperatieve Rabobank (PERP) VAR 29/12/49 265,000 248 0.97ING Bank (EMTN) 2.3000 22/03/19 370,000 298 1.15ING Groep 3.1500 29/03/22 357,000 287 1.11Rabobank Nederland (EMTN) 4.2500 13/10/21 340,000 217 0.85TenneT (PERP) VAR 29/12/49 150,000 128 0.50
1,269 4.94

aberdeen-asset.com 283
Select Global Investment Grade Credit Bond
Security Coupon (%) MaturityNominal/Quantity
Market Value £’000
Total Net Assets
%New Zealand 1.18%BNZ International Funding 2.3500 04/03/19 270,000 217 0.85Chorus (EMTN) 1.1250 18/10/23 100,000 86 0.33
303 1.18
Russian Federation 0.64%Lukoil International Finance 4.5630 24/04/23 200,000 165 0.64
Spain 1.35%Gas Natural Fenosa Finance (EMTN) 1.3750 19/01/27 200,000 169 0.66Metrovacesa (EMTN) 2.3750 23/05/22 200,000 179 0.69
348 1.35
Sweden 0.78%Svenska Handelsbanken (MTN) 2.4500 30/03/21 250,000 200 0.78
Switzerland 1.72%Credit Suisse Sydney (MTN) 3.5000 29/04/20 400,000 247 0.97UBS Funding Jersey 2.9500 24/09/20 240,000 193 0.75
440 1.72
Thailand 0.64%Thai Oil 3.6250 23/01/23 200,000 163 0.64
United Arab Emirates 0.62%National Bank of Abu Dhabi (EMTN) 3.0000 30/03/22 200,000 160 0.62
United Kingdom 9.07%Aviva (EMTN) VAR 05/07/43 120,000 122 0.47Barclays Bank 7.6250 21/11/22 200,000 175 0.68Barclays Bank (EMTN) 1.8750 08/12/23 182,000 159 0.62CYBG VAR 09/02/26 140,000 138 0.54Experian Finance (EMTN) 3.5000 15/10/21 100,000 110 0.43HBOS Capital Funding (PERP) VAR 29/11/49 60,000 64 0.25HSBC VAR 13/03/23 318,000 255 1.01Lloyds Banking 3.7500 11/01/27 200,000 158 0.61National Grid Gas Finance (EMTN) 1.1250 22/09/21 100,000 100 0.39PGH Capital 5.7500 07/07/21 100,000 112 0.44Royal Bank of Scotland (EMTN) 2.5000 22/03/23 120,000 106 0.41Santander UK 5.0000 07/11/23 210,000 176 0.68SSE (PERP) VAR 29/12/49 110,000 112 0.44Standard Chartered (EMTN) 2.1000 19/08/19 200,000 159 0.62Standard Life (EMTN) VAR 04/12/42 120,000 131 0.51Western Power Distribution 3.6250 06/11/23 130,000 141 0.55Whitbread 3.3750 16/10/25 100,000 107 0.42
2,325 9.07

284 Aberdeen Global
Select Global Investment Grade Credit Bond
Security Coupon (%) MaturityNominal/Quantity
Market Value £’000
Total Net Assets
%United States 45.28%AbbVie 1.3750 17/05/24 290,000 251 0.98ACMP Finance 4.8750 15/03/24 170,000 140 0.55American Express 2.6500 02/12/22 230,000 182 0.71Amgen 2.2500 19/08/23 284,000 217 0.85Apple 2.2500 23/02/21 205,000 165 0.64Apple 3.0000 09/02/24 119,000 96 0.37AT&T 3.2000 01/03/22 191,000 154 0.60AT&T 2.8000 17/02/21 175,000 140 0.55AutoNation 5.5000 01/02/20 104,000 89 0.35Bank of America (MTN) 2.5030 21/10/22 177,000 138 0.54Broadcom Cayman Finance 3.8750 15/01/27 160,000 129 0.50Broadcom Cayman Finance 3.0000 15/01/22 160,000 128 0.50Buckeye 3.9500 01/12/26 71,000 56 0.22CBS 2.3000 15/08/19 150,000 120 0.47Chevron 2.8950 03/03/24 190,000 152 0.59Citigroup 2.3500 02/08/21 340,000 268 1.04Citigroup 3.3900 18/11/21 300,000 189 0.74Columbia Pipeline 2.4500 01/06/18 90,000 72 0.28Crown Castle International 2.2500 01/09/21 113,000 88 0.34CVS Health 4.0000 05/12/23 325,000 273 1.07Delta Air Lines 3.6250 15/03/22 106,000 87 0.34Diamond 1 Finance / Diamond 2 Finance 3.4800 01/06/19 132,000 108 0.42Dominion Resources 5.2000 15/08/19 210,000 180 0.70Duke Energy 2.6500 01/09/26 98,000 73 0.29Electronic Arts 3.7000 01/03/21 350,000 292 1.13Energy Transfer Partners 5.2000 01/02/22 140,000 120 0.47Energy Transfer Partners 4.2000 15/04/27 80,000 63 0.25Exelon 3.4970 01/06/22 131,000 106 0.41Express Scripts 2.2500 15/06/19 330,000 264 1.03Ford Motor Credit 5.7500 01/02/21 230,000 203 0.79General Motors Financial 4.0000 06/10/26 167,000 132 0.51General Motors Financial 4.3750 25/09/21 150,000 126 0.49Georgia-Pacific 5.4000 01/11/20 358,000 316 1.22Goldman Sachs 3.7500 22/05/25 256,000 208 0.81Goldman Sachs 3.0000 26/04/22 229,000 184 0.72Harley-Davidson 3.5000 28/07/25 150,000 122 0.48Hartford Financial Services 5.1250 15/04/22 267,000 236 0.92HSBC Finance 6.6760 15/01/21 270,000 244 0.95JPMorgan Chase 2.5500 01/03/21 155,000 124 0.48JPMorgan Chase 3.6250 01/12/27 132,000 103 0.40JPMorgan Chase (PERP) VAR 29/12/49 168,000 136 0.53Kinder Morgan Energy 3.5000 01/03/21 195,000 159 0.62Kraft Heinz Foods 3.5000 15/07/22 103,000 84 0.33Laboratory of America 3.6000 01/02/25 197,000 156 0.61Marathon Oil 3.8500 01/06/25 85,000 67 0.26Metropolitan Life Global Funding I (MTN) 4.7500 17/09/21 340,000 219 0.85Microsoft 2.8750 06/02/24 104,000 84 0.33

aberdeen-asset.com 285
Select Global Investment Grade Credit Bond
Security Coupon (%) MaturityNominal/Quantity
Market Value £’000
Total Net Assets
%Mondelez International Netherlands 2.0000 28/10/21 258,000 199 0.77Morgan Stanley 3.7000 23/10/24 135,000 110 0.43Morgan Stanley (MTN) 2.6250 17/11/21 180,000 143 0.56MPLX 4.8750 01/06/25 85,000 71 0.28Mylan 2.2500 22/11/24 100,000 88 0.34Mylan 3.0000 15/12/18 104,000 84 0.33NextEra Energy Capital 6.0000 01/03/19 325,000 279 1.09Oncor Electric Delivery 7.0000 01/09/22 224,000 216 0.84Oracle 1.9000 15/09/21 330,000 259 1.01Penske Truck Leasing 3.3750 01/02/22 244,000 198 0.77Perrigo Finance 3.5000 15/12/21 400,000 326 1.26Phillips 66 3.5500 01/10/26 310,000 237 0.92Premier Health 2.9110 15/11/26 207,000 152 0.59Quest Diagnostics 3.5000 30/03/25 322,000 255 1.00Ryder System (MTN) 2.5500 01/06/19 83,000 67 0.26Ryder System (MTN) 2.2500 01/09/21 62,000 49 0.19Sabine Pass Liquefaction 4.2000 15/03/28 72,000 57 0.22Shire Acquisitions Investments Ireland 2.4000 23/09/21 174,000 136 0.53Southern Power 1.9500 15/12/19 236,000 187 0.73Time Warner 4.7500 29/03/21 200,000 172 0.67Toyota Motor Credit 1.9000 08/04/21 214,000 169 0.66Verizon Communications 4.5000 15/09/20 240,000 204 0.80Verizon Communications 4.1250 16/03/27 160,000 130 0.51Walt Disney (MTN) 7.5500 15/07/93 136,000 133 0.52Wells Fargo 3.0690 24/01/23 322,000 259 1.01Wells Fargo (MTN) 4.1000 03/06/26 24,000 20 0.0821st Century Fox America 6.9000 01/03/19 200,000 174 0.68
11,617 45.28
Total Corporate Bonds 23,551 91.79
Government Bonds 1.98%India 0.62%Export-Import Bank of India (EMTN) 2.7500 01/04/20 200,000 160 0.62
Sweden 1.25%Svensk Exportkredit (EMTN) VAR 14/11/23 400,000 319 1.25
United States 0.11%Bay Area California Toll Authority 6.7930 01/04/30 30,000 29 0.11
Total Government Bonds 508 1.98
Total Bonds 24,311 94.75
Total Transferable securities and money market instruments admitted to an official exchange listing or dealt on another regulated market 24,311 94.75

286 Aberdeen Global
Select Global Investment Grade Credit Bond
Security Coupon (%) MaturityNominal/Quantity
Market Value £’000
Total Net Assets
%Other transferable securities and money market instruments 1.76%Bonds 1.76%Corporate Bonds 1.24%Netherlands 0.05%ABN AMRO Bank (MTN) 3.2500 09/04/20 20,000 12 0.05
Sweden 1.19%Skandinaviska Enskilda Banken 2.6250 17/11/20 380,000 306 1.19
Total Corporate Bonds 318 1.24
Government Bonds 0.52%South Korea 0.52%Export-Import Bank of Korea (MTN) 4.2500 21/05/20 210,000 133 0.52
Total Government Bonds 133 0.52
Total Bonds 451 1.76
Total Other transferable securities and money market instruments 451 1.76
Derivatives 1.61%
Future contracts (0.02%)
Future Maturity Notional
Unrealised Gains/(Losses)
£’000
Total Net Assets
%CBT US Ultra Bond 21/06/17 4 - -CBT US 10 Year Note 21/06/17 (9) (12) (0.04)CBT US 10 Year Ultra 21/06/17 6 11 0.04CBT US 2 Year Note 30/06/17 3 - -CBT US 5 Year Note 30/06/17 (57) 3 0.01EUX Euro Bobl 08/06/17 10 (3) (0.01)EUX Euro Bund 08/06/17 5 1 -EUX Euro Schatz 08/06/17 14 (1) -ICE Long Gilt 28/06/17 (1) (3) (0.01)MSE Canada 10 Year Bond 21/06/17 2 1 -SFE Australia 10 Year Bond 15/06/17 (2) (3) (0.01)SGX 10 Year Mini JGB 12/06/17 2 - -Unrealised losses on future contracts (6) (0.02)

aberdeen-asset.com 287
Select Global Investment Grade Credit BondForward currency exchange contracts 1.63%
Counterparty Buy Sell Settlement Buy Amount Sell Amount
Unrealised Gains/(Losses)
£’000
Total Net Assets
%Barclays Capital GBP EUR 10/04/17 86,453 100,000 1 -Barclays Capital GBP EUR 10/04/17 23,207 27,000 - -BNP Paribas GBP USD 10/04/17 94,284 118,000 - -BNP Paribas GBP USD 10/04/17 25,541 32,000 - -BNP Paribas USD GBP 10/04/17 53,000 43,504 (1) -Citigroup EUR GBP 10/04/17 18,000 15,609 - -Citigroup GBP EUR 10/04/17 3,125,915 3,619,000 30 0.12Citigroup GBP AUD 10/04/17 908,729 1,469,000 13 0.05Citigroup GBP USD 10/04/17 279,785 342,000 6 0.02Citigroup GBP CAD 10/04/17 208,785 343,000 3 0.01Citigroup GBP USD 10/04/17 168,583 211,000 - -Citigroup GBP USD 10/04/17 161,086 200,000 1 -Citigroup USD GBP 10/04/17 363,000 288,146 2 0.01Citigroup USD GBP 10/04/17 38,000 31,177 (1) -Goldman Sachs EUR GBP 03/04/17 87,449 75,758 (1) -Goldman Sachs GBP USD 10/04/17 4,970,275 6,099,000 94 0.37Goldman Sachs GBP EUR 10/04/17 75,377 87,000 1 -Goldman Sachs GBP USD 10/04/17 33,709 42,000 - -Goldman Sachs GBP USD 10/04/17 17,756 22,000 - -Goldman Sachs USD GBP 10/04/17 117,000 95,371 (2) (0.01)HSBC GBP USD 10/04/17 4,970,583 6,099,000 94 0.37JPM Chase GBP USD 10/04/17 4,971,288 6,099,000 94 0.36JPM Chase USD GBP 10/04/17 255,000 208,346 (4) (0.02)Merrill Lynch AUD GBP 10/04/17 133,000 81,557 - -Merrill Lynch GBP USD 10/04/17 48,526 60,000 1 -Merrill Lynch USD GBP 10/04/17 333,000 269,060 (3) (0.01)Morgan Stanley EUR GBP 10/04/17 38,000 33,172 (1) -Royal Bank of Canada GBP EUR 10/04/17 20,841 24,000 - -State Street GBP USD 10/04/17 4,971,025 6,099,000 94 0.37UBS EUR GBP 10/04/17 202,000 174,858 (2) (0.01)UBS EUR GBP 10/04/17 21,000 18,148 - -UBS GBP USD 10/04/17 86,594 106,000 2 0.01UBS GBP EUR 10/04/17 15,708 18,000 - -UBS USD GBP 10/04/17 104,000 85,530 (2) (0.01)Unrealised gains on forward currency exchange contracts 419 1.63
Unrealised gains on derivatives 413 1.61
Total investments 25,175 98.12Other net assets 482 1.88Total net assets 25,657 100.00
Currently forward positions are not collateralised.

288 Aberdeen Global
Swiss EquityFor the six months ended 31 March 2017
Performance For the six months ended 31 March 2017, the value of Swiss Equity - I Accumulation shares increased by 10.11% compared to an increase of 8.49% in the benchmark, the Swiss Performance Index TR.Source: Lipper, Basis: total return, published NAV to NAV, net of annual charges, gross income reinvested, CHF.
Please remember that past performance is not a guide to future returns. The price of shares and the revenue from them may fall as well as rise. Investors may not get back the amount originally invested.
Market reviewSwiss equities rose in the six months under review, with sentiment buoyed by election results in the Netherlands that were hailed as a rejection of populism, and hopes that US President Donald Trump’s pledge to cut taxes would lift the global economy. Initially, risk appetite had been supported by better-than-expected economic data, rising oil prices on the back of OPEC’s agreement to curb the oil supply. Investors had also cheered the European Central Bank’s unexpected extension of its bond-buying programme till end-2017, albeit with lower monthly asset purchases. Gains were capped somewhat, however, by the US Federal Reserve’s plan to accelerate the pace of interest rate hikes this year after the widely-anticipated quarter-point hike in December, a retreat in the oil price towards the period-end amid rising US shale output, as well as UK Prime Minister Theresa May’s invocation of Article 50 to start divorce negotiations with the European Union.
In economic news, fourth-quarter GDP grew by a less-than-expected 0.1% because lacklustre investment and foreign demand counterbalanced domestic consumption, with both household spending and government expenditure positive. Notably, exports contracted to their worst level in three years. On a positive note, manufacturing activity expanded in February at the fastest pace in almost six years, helped by underlying demand. This in turn, significantly boosted employment data. Also, private consumption is poised to expand as households’ expectations are considerably rosier. This is despite a fall in new car registrations and a decline in domestic tourism.
Portfolio reviewAt the stock level, contributors to relative return included an underweight to Nestle, which benefited the Fund as its shares lagged the market’s climb, due to weaker volume growth in the most recent period. Also contributing to performance was Temenos, which saw its shares buoyed by upbeat investor sentiment over potential new contract wins, alongside earnings upgrades. Last, an underweight to Novartis also proved beneficial as its shares were outpaced by the broader market, dampened by weakness within its Alcon division, while increased competition in generics weighed on the company’s profitability.
Conversely, key detractors included a lack of exposure to Actelion, which detracted after its shares rose on the back of its acquisition by Johnson & Johnson, which was done at a significant premium to its share price. Also costing the Fund was PSP Swiss Property, as our real estate holdings were hurt in the sell-off in the sector because investors were spooked by the prospects of rising interest rates. Finally, despite progress in improving its services offered, Burckhardt Compression’s results and share price remained pressured by continued weakness for new equipment in key markets.
In key portfolio activity, we introduced Tecan, a market-leading provider of laboratory automation systems, services and consumables for life sciences and diagnostics industries. We believe it has good prospects which are supported by significant levels of recurring revenue and a net cash balance sheet. We also initiated a holding in high-quality chocolatier Lindt & Spruengli, believing its stable, healthy earnings justified its valuation.
Outlook The market outlook remains finely balanced: UK negotiations to leave the EU can begin in earnest now that Article 50 has been triggered, although the outcome of these discussions will take at least two years to be revealed. Meanwhile, the UK government’s call for a snap election in June adds a further layer of uncertainty, sitting alongside other imponderables, including the upcoming French and German elections, the Trump administration’s haphazard policymaking and heightened geopolitical tension with North Korea, Syria and Russia.
However, we continue to believe that the underlying strength of our holdings will outweigh the broader environment in the long term, hence our focus on identifying companies that possess well-diversified earnings streams, superior business models and robust balance sheets, while trading at attractive valuations.
Pan European Equity Team April 2017

aberdeen-asset.com 289
Swiss Equity
Statement of Net AssetsAs at 31 March 2017
Notes CHF’000AssetsInvestments in securities at market value 2.2 1,730 Cash at bank 16 Interest and dividends receivable 2 Total assets 1,748 LiabilitiesTaxes and expenses payable 1 Total liabilities 1 Net assets at the end of the period 1,747
Statement of Changes in Net Assets For the period from 1 October 2016 to 31 March 2017
Notes CHF’000Net assets at the beginning of the period 1,590 Net gains from investments 8 Net realised gains 27 Net unrealised gains 122 Net assets at the end of the period 1,747
Statement of Operations For the period from 1 October 2016 to 31 March 2017
Notes CHF’000IncomeInvestment income 2.3 15 Total income 15 ExpensesManagement fees 4.2 4 Operating, administrative and servicing fees 4.3 3 Total expenses 7 Net gains from investments 8
Realised gains on investments 27 Net realised gains 27
Decrease in unrealised depreciation on investments 122 Net unrealised gains 122 Net increase in assets as a result of operations 157
Share Transactions For the period from 1 October 2016 to 31 March 2017
A-2 E(EUR)-2 H(EUR)-2 I-2 Z-2Shares outstanding at the beginning of the period 770 710 42,379 50,000 49,257 Shares issued during the period - - - - - Shares redeemed during the period - - - - - Shares outstanding at the end of the period 770 710 42,379 50,000 49,257 Net asset value per share 10.9950 11.1283 12.8653 11.4501 11.6448
The accompanying notes form an integral part of these financial statements.
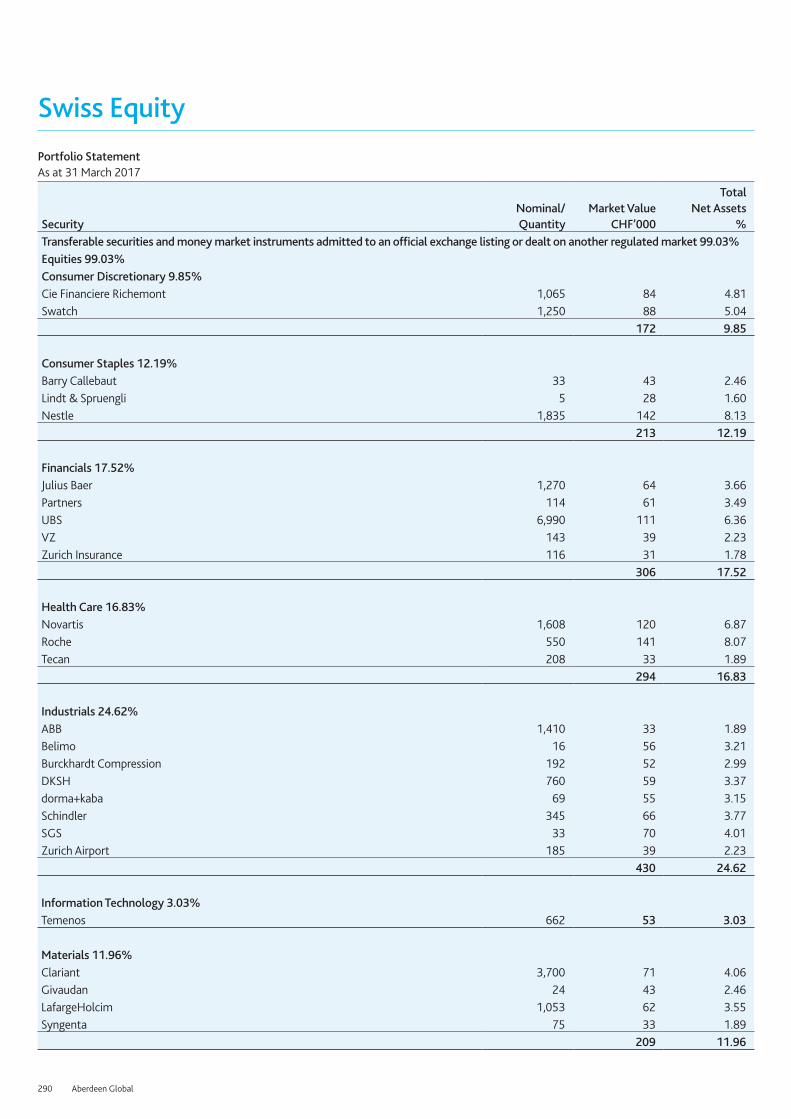
290 Aberdeen Global
Swiss EquityPortfolio StatementAs at 31 March 2017
SecurityNominal/ Quantity
Market Value CHF’000
Total Net Assets
%Transferable securities and money market instruments admitted to an official exchange listing or dealt on another regulated market 99.03%Equities 99.03%Consumer Discretionary 9.85%Cie Financiere Richemont 1,065 84 4.81Swatch 1,250 88 5.04
172 9.85
Consumer Staples 12.19%Barry Callebaut 33 43 2.46Lindt & Spruengli 5 28 1.60Nestle 1,835 142 8.13
213 12.19
Financials 17.52%Julius Baer 1,270 64 3.66Partners 114 61 3.49UBS 6,990 111 6.36VZ 143 39 2.23Zurich Insurance 116 31 1.78
306 17.52
Health Care 16.83%Novartis 1,608 120 6.87Roche 550 141 8.07Tecan 208 33 1.89
294 16.83
Industrials 24.62%ABB 1,410 33 1.89Belimo 16 56 3.21Burckhardt Compression 192 52 2.99DKSH 760 59 3.37dorma+kaba 69 55 3.15Schindler 345 66 3.77SGS 33 70 4.01Zurich Airport 185 39 2.23
430 24.62
Information Technology 3.03%Temenos 662 53 3.03
Materials 11.96%Clariant 3,700 71 4.06Givaudan 24 43 2.46LafargeHolcim 1,053 62 3.55Syngenta 75 33 1.89
209 11.96

aberdeen-asset.com 291
Swiss Equity
SecurityNominal/ Quantity
Market Value CHF’000
Total Net Assets
%Real Estate 3.03%PSP Swiss Property 578 53 3.03
Total Equities 1,730 99.03
Total Transferable securities and money market instruments admitted to an official exchange listing or dealt on another regulated market 1,730 99.03
Total investments 1,730 99.03Other net assets 17 0.97Total net assets 1,747 100.00

292 Aberdeen Global
Technology EquityFor the six months ended 31 March 2017
Performance For the six months ended 31 March 2017, the value of Technology Equity - A Accumulation shares increased by 9.26% compared to an increase of 12.21% in the benchmark, the Merrill Lynch Technology 100 CR Index.Source: Lipper, Basis: total return, published NAV to NAV, net of annual charges, gross income reinvested, USD.
Please remember that past performance is not a guide to future returns. The price of shares and the revenue from them may fall as well as rise. Investors may not get back the amount originally invested.
Market reviewTech stocks rose in the six-month review period. Investors were relatively cautious early on, given uncertainty around global monetary policy and the outcome of the US presidential election. In the immediate aftermath of Donald Trump’s surprise victory, many tech-sector heavyweights with multinational platforms, including Facebook, Alphabet and Amazon, came under pressure in light of the new president’s protectionist position on global trade. The dollar’s rapid ascent also weighed on sentiment, given so many tech firms derive the bulk of their income from abroad. However, the sector returned to favour in the first quarter of 2017 as the US dollar weakened and investors began to focus on upbeat earnings from the likes of Facebook, Apple and Amazon. Despite the Trump administration’s failure to navigate its healthcare reforms through the House of Representatives, equities continued to climb, particularly in the US, on hopes that Trump would press ahead with his promised growth-boosting policies; chiefly tax cuts.
Portfolio review Asset allocation was a key detractor from relative performance, with the portfolio’s underweight to the semiconductor sector hurting returns, given the improving industry outlook. The non-benchmark exposure to mobile telecommunications was negative, largely due to holding Vodafone, which remained weak on concerns over increased competition in India. Meanwhile, Brazilian-listed management-software and solutions business Totvs underperformed amid uncertainty over the policy direction of the newly-elected president Trump and the implications for emerging markets. In addition, not holding graphics-processing unit designer Nvidia proved costly, as the stock rallied on speculation of improved demand from the promising autonomous car market.
Conversely, Israel-based cyber security business Checkpoint Software lifted returns, as it posted better-than-expected earnings during the period. Cognizant Technology also outperformed, benefiting from a brighter outlook for US financials, due to speculation of greater fiscal stimulus from the Trump administration and the prospect of further US interest rate hikes. Elsewhere, the portfolio’s underweight to specialised consumer services added to relative performance as the sector sold off during the period.
In portfolio activity, we initiated a position in South Korean search portal Naver, given its established market position and good growth opportunities, as well as Manhattan Associates, a supply-chain software provider with attractive fundamentals. We also topped up Visa, FICO (Fair Isaac), Inmarsat, Vodafone and EPAM Systems, as well as Alphabet and Naver, given their market-leading status and prospects for growth.
To fund these opportunities we sold Taiwan Mobile. We also exited Verizon following a run-up in in its share price, to reduce the portfolio’s exposure to the telecommunications sector and trimmed Singapore Telecommunications, Telus, Cisco and Check Point Software.
OutlookTechnology sector stocks have climbed steadily since the beginning of the year and should remain resilient in the short term if firms deliver the hardy first-quarter earnings markets are expecting. Certainly, the semi-conductor industry anticipates decent growth this year after sales of semiconductors reached a record high in 2016. More broadly, global markets remain largely optimistic, with investors quick to move on from the Trump administration’s high-profile policy failures to refocus on the more favourable prospect of tax reform. Meanwhile, growth indicators in the US and across several emerging markets, particularly in Asia, suggest economic conditions are improving, albeit at an often measured pace. There are plenty of risks to keep investors on their toes though, amid political wrangling in Europe, Brexit negotiations and Trump’s willingness to pick fights with notoriously prickly global leaders.
As always, we remain true to our disciplined investment process, aiming to identify conservatively-managed, robustly-financed businesses with high levels of cash generation. While we may sometimes lag both the benchmark and a number of our peers in this environment, we take comfort in our ability to outperform over market cycles and the proven benefits of having a truly diversified portfolio of stocks.
Global Equity Team April 2017

aberdeen-asset.com 293
Technology Equity
Statement of Net AssetsAs at 31 March 2017
Notes US$'000AssetsInvestments in securities at market value 2.2 171,566 Cash at bank 8,095 Interest and dividends receivable 104 Subscriptions receivable 392 Other assets 278 Total assets 180,435 LiabilitiesPayable for investments purchased 604 Taxes and expenses payable 281 Redemptions payable 717 Total liabilities 1,602 Net assets at the end of the period 178,833
Statement of Changes in Net Assets For the period from 1 October 2016 to 31 March 2017
Notes US$'000Net assets at the beginning of the period 169,256 Net losses from investments (733) Net realised gains 8,603 Net unrealised gains 8,505 Proceeds from shares issued 33,781 Payments for shares redeemed (40,582) Net equalisation received 10 3 Net assets at the end of the period 178,833
Statement of Operations For the period from 1 October 2016 to 31 March 2017
Notes US$'000IncomeInvestment income 2.3 849 Stocklending income 16 4 Bank interest 2 Total income 855 ExpensesManagement fees 4.2 1,419 Operating, administrative and servicing fees 4.3 167 Other operational expenses 2 Total expenses 1,588 Net losses from investments (733)
Realised gains on investments 8,582 Realised currency exchange gains 21 Net realised gains 8,603
Increase in unrealised appreciation on investments 8,506 Unrealised currency exchange losses (1) Net unrealised gains 8,505 Net increase in assets as a result of operations 16,375
Share Transactions For the period from 1 October 2016 to 31 March 2017
A-2 D(GBP)-2 I-2 R(GBP)-2 S-2 X-2Shares outstanding at the beginning of the period 26,946,953 1,759,513 752,698 78,256 175,481 40,050 Shares issued during the period 3,849,611 30,562 595,961 39,960 6,617 189,358 Shares redeemed during the period (4,684,051) (135,386) (681,216) (13,488) (17,455) (187,737) Shares outstanding at the end of the period 26,112,513 1,654,689 667,443 104,728 164,643 41,671 Net asset value per share 5.1423 4.1143 19.2877 18.9437 121.9239 14.7542
The accompanying notes form an integral part of these financial statements.

294 Aberdeen Global
Technology EquityPortfolio StatementAs at 31 March 2017
SecurityNominal/ Quantity
Market Value US$’000
Total Net Assets
%Transferable securities and money market instruments admitted to an official exchange listing or dealt on another regulated market 95.94%Equities 95.94%Brazil 1.96%TOTVS 400,800 3,502 1.96
Canada 0.95%TELUS 52,700 1,706 0.95
France 2.42%Dassault Systemes 49,900 4,329 2.42
Germany 1.00%SAP (ADR)∞ 18,200 1,786 1.00
Ireland 2.95%Experian 259,300 5,279 2.95
Israel 7.43%Check Point Software Technologies 129,400 13,285 7.43
Japan 7.95%FANUC Corp 31,100 6,377 3.57Keyence Corp 19,600 7,847 4.38
14,224 7.95
Singapore 1.52%Singapore Telecommunications 971,300 2,721 1.52
South Africa 1.81%MTN∞ 354,800 3,229 1.81
South Korea 7.91%Naver 7,200 5,511 3.08Samsung Electronics (GDR) (PREF)∞ 11,990 8,639 4.83
14,150 7.91
Switzerland 1.49%Temenos 33,500 2,665 1.49
Taiwan 6.45%TSMC (ADR) 351,000 11,529 6.45
United Kingdom 7.60%Aveva 182,000 4,438 2.47Inmarsat 364,100 3,872 2.17
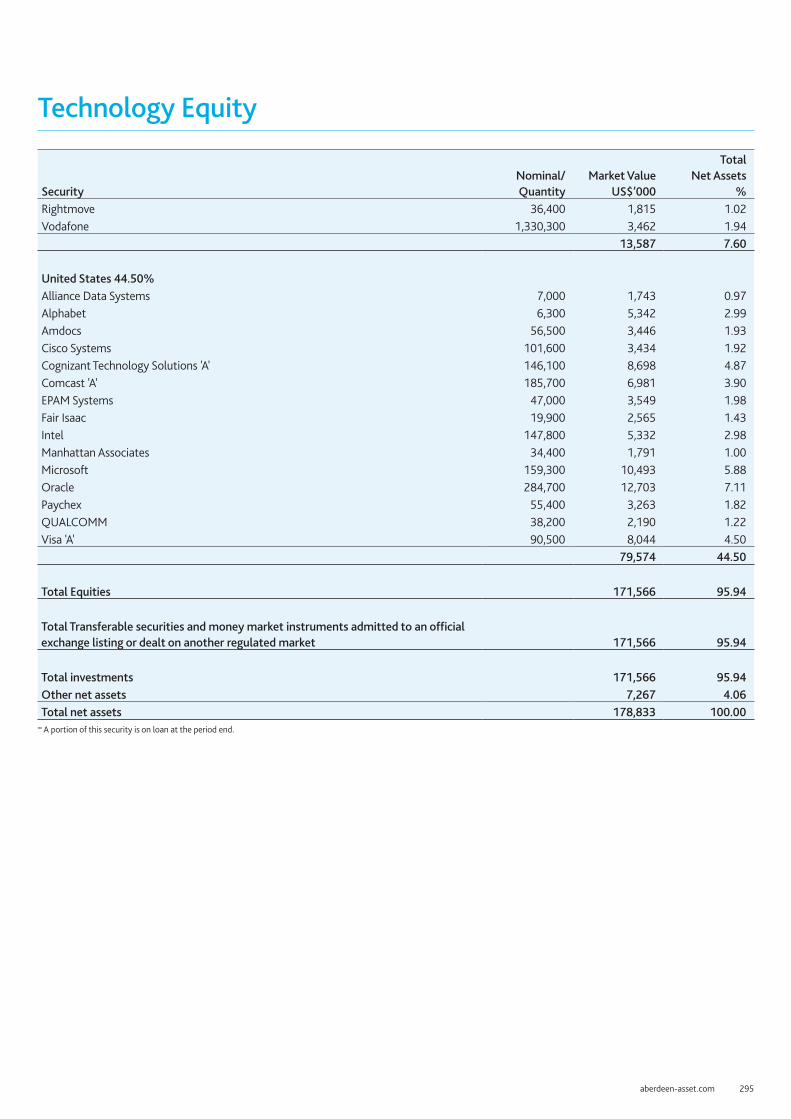
aberdeen-asset.com 295
Technology Equity
SecurityNominal/ Quantity
Market Value US$’000
Total Net Assets
%Rightmove 36,400 1,815 1.02Vodafone 1,330,300 3,462 1.94
13,587 7.60
United States 44.50%Alliance Data Systems 7,000 1,743 0.97Alphabet 6,300 5,342 2.99Amdocs 56,500 3,446 1.93Cisco Systems 101,600 3,434 1.92Cognizant Technology Solutions 'A' 146,100 8,698 4.87Comcast 'A' 185,700 6,981 3.90EPAM Systems 47,000 3,549 1.98Fair Isaac 19,900 2,565 1.43Intel 147,800 5,332 2.98Manhattan Associates 34,400 1,791 1.00Microsoft 159,300 10,493 5.88Oracle 284,700 12,703 7.11Paychex 55,400 3,263 1.82QUALCOMM 38,200 2,190 1.22Visa 'A' 90,500 8,044 4.50
79,574 44.50
Total Equities 171,566 95.94
Total Transferable securities and money market instruments admitted to an official exchange listing or dealt on another regulated market 171,566 95.94
Total investments 171,566 95.94Other net assets 7,267 4.06Total net assets 178,833 100.00
∞ A portion of this security is on loan at the period end.

296 Aberdeen Global
UK EquityFor the six months ended 31 March 2017
Performance For the six months ended 31 March 2017, the value of UK Equity - A Accumulation shares increased by 7.60% compared to an increase of 8.07% in its benchmark, the FTSE All-Share Index.Source: Lipper, Basis: total return, published NAV to NAV, net of annual charges, gross income reinvested, GBP.
Please remember that past performance is not a guide to future returns. The price of shares and the revenue from them may fall as well as rise. Investors may not get back the amount originally invested.
Market reviewEuropean equities rose in the half-year under review, with sentiment buoyed by election results in the Netherlands that were hailed as a rejection of populism, and hopes that US President Donald Trump’s pledge to cut taxes would lift the global economy. Initially, risk appetite had been supported by better-than-expected economic data, rising oil prices on the back of OPEC’s agreement to curb the oil supply. Investors had also cheered the European Central Bank’s unexpected extension of its bond-buying programme till end-2017, albeit with lower monthly asset purchases. Gains were capped somewhat, however, by the US Federal Reserve’s plan to accelerate the pace of interest rate hikes this year after the widely-anticipated quarter-point hike in December, a retreat in the oil price towards the period-end amid rising US shale output, as well as UK Prime Minister Theresa May’s invocation of Article 50 to start divorce negotiations with the European Union.
Portfolio review At the stock level, key detractors included Sage Group which gave some back of its recent performance after a very strong run and some investors were disappointed by the weakness in its US payments business. Our lack of exposure to Glencore also proved costly as we saw further recovery in commodity-related stocks. Last, Dignity’s share price was hurt by increased competition, which saw it lower its medium-term growth targets.
Conversely, contributors to relative return included Prudential, which delivered robust growth in its Asian business and is also a beneficiary of rising global interest rates. Also benefiting the Fund was our lack of exposure to BT Group, which suffered after it issued profit warning, alongside the discovery of ‘improper accounting practices’ in its Italian business. Finally, Inchcape added to relative returns, with encouraging data on new car sales and the completed acquisition in Latin America were well received by investors.
In key portfolio activity, we exited GKN and reallocated capital elsewhere. Against this, we introduced mid-sized drugmaker BTG, for its compelling medium-term growth opportunities; aviation services company BBA Aviation, recognising its dominance in light of recent market consolidation; and data and information provider Euromoney, taking advantage of the attractive valuation and liquidity from the stake reduction by its majority shareholder. We also initiated holdings in financial services group Provident Financial, given its competitive advantage, solid balance sheet and attractive valuation; as well as multi-national spirits company Diageo, with an unrivalled portfolio of brands across geographies and price points. It enjoys a particularly good position in Scottish whisky, where it commands pricing power and as a result, generates good margins and returns.
OutlookThe market outlook remains finely balanced: negotiations to leave the EU can begin in earnest now that Article 50 has been triggered, although the outcome of these discussions will take at least two years to be revealed. Meanwhile, the UK government’s call for a snap election in June adds a further layer of uncertainty, sitting alongside other imponderables, including the upcoming French and German elections, the Trump administration’s haphazard policymaking and heightened geopolitical tension with North Korea, Syria and Russia.
However, we continue to believe that the underlying strength of our holdings will outweigh the broader environment in the long term, hence our focus on identifying companies that possess well-diversified earnings streams, superior business models and robust balance sheets, while trading at attractive valuations.
Pan European Equity Team April 2017

aberdeen-asset.com 297
UK Equity
Statement of Net AssetsAs at 31 March 2017
Notes £’000AssetsInvestments in securities at market value 2.2 37,700 Cash at bank 1,022 Interest and dividends receivable 218 Subscriptions receivable 125 Receivable for investments sold 13 Other assets 48 Total assets 39,126 LiabilitiesPayable for investments purchased 14 Taxes and expenses payable 41 Redemptions payable 269 Unrealised losses on forward currency exchange contracts 2.6 165 Other liabilities 33 Total liabilities 522 Net assets at the end of the period 38,604
Statement of Changes in Net Assets For the period from 1 October 2016 to 31 March 2017
Notes £’000Net assets at the beginning of the period 37,838 Net gains from investments 225 Net realised gains 851 Net unrealised gains 1,397 Proceeds from shares issued 1,850 Payments for shares redeemed (3,522) Net equalisation paid 10 (3) Dividends paid 5 (33) Unclaimed monies 1 Net assets at the end of the period 38,604
Statement of Operations For the period from 1 October 2016 to 31 March 2017
Notes £’000IncomeInvestment income 2.3 456 Total income 456 ExpensesManagement fees 4.2 186 Operating, administrative and servicing fees 4.3 45 Total expenses 231 Net gains from investments 225
Realised gains on investments 543 Realised gains on forward currency exchange contracts 309 Realised currency exchange losses (1) Net realised gains 851
Increase in unrealised appreciation on investments 1,844 Decrease in unrealised appreciation on forward currency exchange contracts (447) Net unrealised gains 1,397 Net increase in assets as a result of operations 2,473
Share Transactions For the period from 1 October 2016 to 31 March 2017
A-2 D-1 R-1 X-2 Z(EUR)-2^
Shares outstanding at the beginning of the period 810,607 312,421 126,056 37,028 1,360,185 Shares issued during the period 39,812 34,393 1,136 628 31,334 Shares redeemed during the period (85,949) (11,754) (11,521) (342) (134,041) Shares outstanding at the end of the period 764,470 335,060 115,671 37,314 1,257,478 Net asset value per share 23.7193 19.6546 12.5592 13.8537 11.0784
^ Base currency exposure share class.
The accompanying notes form an integral part of these financial statements.

298 Aberdeen Global
UK EquityPortfolio StatementAs at 31 March 2017
SecurityNominal/ Quantity
Market Value £’000
Total Net Assets
%Transferable securities and money market instruments admitted to an official exchange listing or dealt on another regulated market 93.52%Equities 93.52%Basic Materials 7.78%BHP Billiton 68,300 843 2.18Croda International 32,500 1,158 3.00Elementis 135,700 392 1.02Rio Tinto 19,000 610 1.58
3,003 7.78
Consumer Goods 13.63%Associated British Foods 17,000 443 1.15British American Tobacco 30,400 1,611 4.17Diageo 33,700 770 1.99Imperial Brands 20,300 785 2.03Unilever 42,000 1,654 4.29
5,263 13.63
Consumer Services 13.47%Compass 87,000 1,310 3.40Dignity 27,500 654 1.69Euromoney Institutional Investor 48,461 515 1.33Inchcape 105,000 884 2.29Pearson 92,500 631 1.64Tesco 227,500 422 1.09Whitbread 19,800 784 2.03
5,200 13.47
Financials 12.84%HSBC 118,693 773 2.00Provident Financial 20,000 599 1.55Prudential 89,500 1,509 3.92Schroders (non voting) 43,674 962 2.49Standard Chartered 145,900 1,113 2.88
4,956 12.84
Health Care 7.11%AstraZeneca 22,000 1,081 2.80BTG 98,296 577 1.49GlaxoSmithKline 65,500 1,086 2.82
2,744 7.11
Industrials 24.08%Aggreko 55,500 490 1.27BBA Aviation 192,700 587 1.52Bunzl 25,200 585 1.51Capita 75,000 423 1.10

aberdeen-asset.com 299
UK Equity
SecurityNominal/ Quantity
Market Value £’000
Total Net Assets
%Essentra 111,000 583 1.51Experian 73,000 1,189 3.07Intertek 21,000 826 2.14Rolls-Royce 144,000 1,086 2.81Rotork 282,500 687 1.78RPC 65,250 510 1.32Spirax-Sarco Engineering 17,000 811 2.10Ultra Electronics 35,522 736 1.91Weir 41,000 786 2.04
9,299 24.08
Oil & Gas 4.94%John Wood Group 85,400 649 1.68Royal Dutch Shell 'B' 57,500 1,257 3.26
1,906 4.94
Technology 5.28%Aveva 45,000 878 2.27Sage 184,000 1,160 3.01
2,038 5.28
Telecommunications 4.39%Inmarsat 125,093 1,063 2.76Vodafone 303,000 631 1.63
1,694 4.39
Total Equities 36,103 93.52
Total Transferable securities and money market instruments admitted to an official exchange listing or dealt on another regulated market 36,103 93.52
Open Ended Investment Funds 4.14%Aberdeen UK Smaller Companies Equity Fund Z-Acc† 414,053 1,597 4.14
Total Open Ended Investment Funds 1,597 4.14

300 Aberdeen Global
UK EquityDerivatives (0.43%)
Forward currency exchange contracts (0.43%)
Counterparty Buy Sell Settlement Buy Amount Sell Amount
Unrealised Gains/(Losses)
£’000
Total Net Assets
%BNP Paribas EUR GBP 15/06/17 13,769,061 11,962,850 (165) (0.43)BNP Paribas EUR GBP 15/06/17 310,767 270,367 (4) (0.01)BNP Paribas GBP EUR 15/06/17 265,349 305,319 4 0.01Unrealised losses on forward currency exchange contracts (165) (0.43)
Unrealised losses on derivatives (165) (0.43)
Total investments 37,535 97.23Other net assets 1,069 2.77Total net assets 38,604 100.00
† Managed by subsidiaries of Aberdeen Asset Management PLC.Currently forward positions are not collateralised.

aberdeen-asset.com 301
World Credit BondFor the six months ended 31 March 2017
Performance For the six months ended 31 March 2017, the value of World Credit Bond - A Income shares decreased by 1.22% compared to a decrease of 1.08% in the benchmark, the Barclays Capital Global Aggregate Credit (Hedged USD 100%) Index.Source: Lipper, Basis: total return, published NAV to NAV, net of annual charges, gross income reinvested, USD.
Please remember that past performance is not a guide to future returns. The price of shares and the revenue from them may fall as well as rise. Investors may not get back the amount originally invested.
Market reviewThe past six months have been marked by volatility and political upheaval. Donald Trump won the US presidential election in November, while in Europe, a surge in popularity for populist Eurosceptic parties ahead of upcoming elections also prompted concerns over the future of the European Union (EU). Notably in December, Matteo Renzi lost the Italian constitutional reform referendum and announced his resignation as Italy’s Prime Minister, being replaced by Paulo Gentiloni. In the Dutch election, Prime Minister Mark Rutte’s VVD remained the largest party despite losing some seats, and the anti-immigration PVV performed worse than expected. During March, UK Prime Minister Theresa May triggered Article 50, starting the clock on Britain’s exit from the EU. Against this backdrop, global economic activity showed signs of a pick-up, particularly in the US, Eurozone and China. This improvement raised expectations of a gradual removal of central banks’ accommodative monetary policy.
The US Federal Reserve raised interest rates in December and March by 25 bps at a time, taking the range to 0.75% - 1.0% by the end of the period. Meanwhile in Europe, the European Central Bank (ECB) tapered its asset purchases but extended its monetary stimulus programme to the end of 2017. President of the ECB, Mario Draghi, delivered an upbeat assessment of the economic outlook and noted that growth forecasts in 2017 and 2018 had been revised upwards and downside risks were diminishing. In Japan, there were some signs of inflation. These were welcomed by the Bank of Japan, which has been trying to ward off deflation for years. Nonetheless, economic stimulus measures are likely to be kept in place.
Yields began to drift higher as global economic data showed signs of a cyclical upswing. US rates moved sharply higher in November, following the surprise victory of Donald Trump at the US election. In the aftermath, markets began to price in fiscal stimulus in the form of tax cuts and increased infrastructure spending, which would lead to higher nominal growth and a sharper path of interest rates. US yields reached a high of 2.62% over the review period; while positive economic activity in Europe and hawkish rhetoric from the ECB helped push bund yields to a high of 0.49%.
US Treasuries and German bunds closed the period at 2.39% and 0.37% respectively. Peripheral spreads widened amid political concerns surrounding Italian referendum and latterly the French elections where Marine Le Pen of far-right Front National was polling favourably.
In currencies, the US dollar outperformed as markets began to price in Trump induced reflation. The yen broadly weakened as interest rate differentials following the Bank of Japan’s yield curve control policy prompted the currency to depreciate. Tumbling oil prices also weighed on commodity-linked currencies, particularly the Norwegian krone.
Portfolio reviewIn the financial sector positions in banking performed particularly well. Given the industry’s heightened regulation and capital requirements we continue to favour senior/subordinated bank exposure. The Fund also generated strong returns from insurance; this was due to stock selection (i.e., we continue to favour national champions and insurers with strong processes) and relatively attractive valuations. Away from financials, utilities, energy and consumer cyclicals performed well. Transport credits detracted slightly form overall returns.
Towards the end of the period we added HSBC and Dutch bank ING Group which issued a senior HoldCo at attractive price levels. We continue to think senior USD denominated bank issuance comes with a compelling premium. Currently these transactions price in the final maturity of the bond structure. However, we consider it highly likely that these bonds will be called which will deliver excess yield to the Fund and potential capital gains over the life of the bond.
In the secondary market the general theme towards the end of the period was taking profits and reducing specific risk exposures. Credit risk came down over the period.
OutlookAs at the end of the first quarter of 2017, credit spreads in all the major markets are trading towards fair value. The asset class is appropriately priced for the prevailing macroeconomic conditions, in our opinion, and we currently have a modest risk positioning in credit relative to the global corporate bond market. We see the global economy as fundamentally improving, albeit with material risks still apparent (e.g., the ability or inability of President Trump to enact his policies, and European politics, especially this year’s election cycle). Overall, we have increased the diversification within our funds and, as a result, have spread our modest overweight across many sectors. For example, we like senior bank exposure, especially given the heightened regulation and capital requirements within the industry. Subordinated insurance remains a modest overweight based on stock selection (i.e., we continue to favour national champions and insurers with strong processes) and relatively cheap valuations. We favour the telecom, media, and technology sector for its robust cash flows and exposure to positive momentum in the global economy. Also, we have invested in non-cyclical consumer companies (e.g., pharmaceuticals) where we believe sufficient insulation exists to protect investors if the credit cycle were to deteriorate.
In summary, we expect 2017 to be a year in which politics drive volatility and remain mindful that any pick-up in volatility will generate investment opportunities. Accordingly, the portfolio has been positioned with room to add risk opportunistically.
Global Credit Team April 2017

302 Aberdeen Global
World Credit BondWorld Credit Bond
Statement of Net AssetsAs at 31 March 2017
Notes US$'000AssetsInvestments in securities at market value 2.2 9,257 Cash at bank 324 Amounts held at futures clearing houses and brokers 36 Interest receivable 112 Unrealised gains on future contracts 2.7 4 Unrealised gains on forward currency exchange contracts 2.6 43 Total assets 9,776 LiabilitiesPayable for investments purchased 144 Taxes and expenses payable 7 Other liabilities 24 Total liabilities 175 Net assets at the end of the period 9,601
Statement of Changes in Net Assets For the period from 1 October 2016 to 31 March 2017
Notes US$'000Net assets at the beginning of the period 9,917 Net gains from investments 118 Net realised losses (237) Net unrealised losses (173) Dividends paid 5 (24) Net assets at the end of the period 9,601
Statement of Operations For the period from 1 October 2016 to 31 March 2017
Notes US$'000IncomeInvestment income 2.3 158 Total income 158 ExpensesManagement fees 4.2 28 Operating, administrative and servicing fees 4.3 12 Total expenses 40 Net gains from investments 118
Realised losses on investments (68) Realised losses on future contracts (48) Realised losses on forward currency exchange contracts (107) Realised currency exchange losses (14) Net realised losses (237)
Decrease in unrealised appreciation on investments (304) Decrease in unrealised depreciation on future contracts 5 Decrease in unrealised depreciation on forward currency exchange contracts 125 Unrealised currency exchange gains 1 Net unrealised losses (173) Net decrease in assets as a result of operations (292)

aberdeen-asset.com 303
World Credit Bond
Share Transactions For the period from 1 October 2016 to 31 March 2017
A-1 A-2 A(EUR)-1^ A(EUR)-2^ D(GBP)-1^ D(GBP)-2^
Shares outstanding at the beginning of the period 800 800 70,000 70,000 52,597 52,597 Shares issued during the period - - - - - - Shares redeemed during the period - - - - - - Shares outstanding at the end of the period 800 800 70,000 70,000 52,597 52,597 Net asset value per share 10.2829 10.5917 10.0857 10.3781 10.2127 10.5213
H(EUR)-1 H(EUR)-2 I-1 I-2 R(GBP)-1^ R(GBP)-2^
Shares outstanding at the beginning of the period 700 1,270 800 493,712 52,597 52,597 Shares issued during the period - - - - - - Shares redeemed during the period - - - - - - Shares outstanding at the end of the period 700 1,270 800 493,712 52,597 52,597 Net asset value per share 10.3629 10.7469 10.2837 10.6636 10.2101 10.5825
X-1 X-2 Z-2Shares outstanding at the beginning of the period 800 800 800 Shares issued during the period - - - Shares redeemed during the period - - - Shares outstanding at the end of the period 800 800 800 Net asset value per share 10.2837 10.6578 10.7295
^ Base currency exposure share class.
The accompanying notes form an integral part of these financial statements.

304 Aberdeen Global
World Credit BondWorld Credit BondPortfolio StatementAs at 31 March 2017
Security Coupon (%) MaturityNominal/Quantity
Market Value US$’000
Total Net Assets
%Transferable securities and money market instruments admitted to an official exchange listing or dealt on another regulated market 95.35%Bonds 95.35%Asset Backed Bonds / Mortgage Backed Bonds 0.47%United Kingdom 0.47%Paragon Mortgages No 8 FRN 15/04/44 43,393 45 0.47
Total Asset Backed Bonds / Mortgage Backed Bonds 45 0.47
Corporate Bonds 92.01%Australia 3.07%APT Pipelines 4.2000 23/03/25 100,000 102 1.07BHP Billiton Finance VAR 22/04/76 100,000 118 1.22Telstra 3.1250 07/04/25 75,000 75 0.78
295 3.07
Belgium 1.07%Anheuser-Busch InBev (EMTN) 2.7500 17/03/36 30,000 34 0.36Anheuser-Busch InBev Finance 3.6500 01/02/26 41,000 42 0.43Anheuser-Busch InBev Finance 4.9000 01/02/46 25,000 27 0.28
103 1.07
Brazil 1.57%Petrobras Global Finance 4.8750 07/03/18 100,000 110 1.15QGOG Atlantic / Alaskan Rigs 5.2500 30/07/18 41,300 41 0.42
151 1.57
Canada 1.72%Bank of Montreal (MTN) 1.5000 18/07/19 63,000 63 0.65Canadian Natural Resources 3.9000 01/02/25 50,000 50 0.53Canadian Pacific Railway 4.8000 01/08/45 26,000 28 0.29TransCanada PipeLines VAR 15/05/67 26,000 24 0.25
165 1.72
France 5.74%AXA (PERP) VAR 29/12/49 100,000 101 1.05BNP Paribas (EMTN) 0.5000 01/06/22 100,000 107 1.12Credit Agricole 1.0000 16/09/24 100,000 107 1.12Credit Agricole Assurances (PERP) VAR 31/10/49 100,000 109 1.14Societe Generale (PERP) VAR 29/09/49 100,000 127 1.31
551 5.74
Germany 2.56%Deutsche Telekom International Finance (EMTN) 1.5000 03/04/28 30,000 32 0.33KFW 2.5000 20/11/24 100,000 101 1.05Vonovia Finance (PERP) VAR 29/12/49 100,000 113 1.18
246 2.56

aberdeen-asset.com 305
World Credit Bond
Security Coupon (%) MaturityNominal/Quantity
Market Value US$’000
Total Net Assets
%Hong Kong 1.15%Hutchison Whampoa Europe Finance 13 (PERP) VAR 29/05/49 100,000 110 1.15
India 1.18%ONGC Videsh 2.7500 15/07/21 100,000 114 1.18
Israel 0.29%Teva Pharmaceutical Finance Netherlands III 3.1500 01/10/26 30,000 28 0.29
Italy 1.20%Enel VAR 10/01/74 100,000 116 1.20
Japan 1.13%Bank of Tokyo-Mitsubishi (EMTN) 0.8750 11/03/22 100,000 109 1.13
Mexico 0.53%Petroleos Mexicanos 5.5000 21/01/21 48,000 51 0.53
Netherlands 6.83%ABN AMRO Bank (EMTN) VAR 18/01/28 100,000 114 1.19Cooperatieve Rabobank (PERP) VAR 29/12/49 75,000 88 0.92Koninklijke (PERP) VAR 14/09/49 100,000 115 1.19LGE HoldCo VI 7.1250 15/05/24 100,000 120 1.25Rabobank Nederland VAR 26/05/26 100,000 112 1.17TenneT (PERP) VAR 29/12/49 100,000 107 1.11
656 6.83
Russian Federation 1.18%Lukoil International Finance 6.6560 07/06/22 100,000 113 1.18
Spain 3.22%Gas Natural Fenosa Finance (EMTN) 1.3750 19/01/27 100,000 106 1.10Metrovacesa (EMTN) 2.3750 23/05/22 100,000 111 1.16Obrascon Huarte Lain 5.5000 15/03/23 100,000 92 0.96
309 3.22
Switzerland 2.32%Credit Suisse Sydney (MTN) 3.5000 29/04/20 200,000 155 1.61Glencore Finance Europe (EMTN) 6.5000 27/02/19 50,000 68 0.71
223 2.32
United Arab Emirates 2.09%National Bank of Abu Dhabi (EMTN) 3.0000 30/03/22 200,000 200 2.09
United Kingdom 9.21%Aviva (PERP) VAR 29/11/49 40,000 54 0.57Barclays Bank (EMTN) 1.8750 08/12/23 100,000 109 1.14Barclays Bank (EMTN) VAR 16/01/23 50,000 65 0.67

306 Aberdeen Global
World Credit Bond
Security Coupon (%) MaturityNominal/Quantity
Market Value US$’000
Total Net Assets
%HBOS Capital Funding (PERP) VAR 29/11/49 40,000 53 0.55Jaguar Land Rover Automotive 5.0000 15/02/22 100,000 137 1.43PGH Capital 5.7500 07/07/21 100,000 141 1.46Royal Bank of Scotland (PERP) VAR 29/08/49 60,000 82 0.86SSE (PERP) VAR 29/12/49 100,000 107 1.11Western Power Distribution 3.6250 06/11/23 100,000 136 1.42
884 9.21
United States 45.95%AbbVie 2.1250 17/11/28 100,000 109 1.15AbbVie 4.4500 14/05/46 36,000 34 0.36American Honda Finance (MTN) 1.2000 12/07/19 49,000 48 0.50Amgen 2.2500 19/08/23 69,000 66 0.69Amgen 4.4000 01/05/45 17,000 17 0.17Apple 3.4500 09/02/45 70,000 63 0.65Apple 2.2500 23/02/21 54,000 54 0.56Apple 3.0000 09/02/24 35,000 35 0.37AT&T 5.2500 01/03/37 66,000 67 0.70AT&T 3.2000 01/03/22 56,000 57 0.59AutoNation 4.5000 01/10/25 40,000 41 0.43Bank of America (MTN) 3.2480 21/10/27 50,000 48 0.50Bank of America (MTN) 2.5030 21/10/22 29,000 28 0.29Broadcom Cayman Finance 3.8750 15/01/27 50,000 50 0.52Broadcom Cayman Finance 3.0000 15/01/22 50,000 50 0.52Buckeye 3.9500 01/12/26 49,000 48 0.50Burlington Northern Santa Fe 4.7000 01/09/45 30,000 33 0.34Citigroup 2.3500 02/08/21 100,000 99 1.03Citigroup 3.3900 18/11/21 100,000 79 0.82Columbia Pipeline 2.4500 01/06/18 100,000 100 1.05Comcast 6.9500 15/08/37 60,000 81 0.84Crown Castle International 2.2500 01/09/21 33,000 32 0.33Delta Air Lines 3.6250 15/03/22 33,000 34 0.35Dominion Resources VAR 01/07/19 64,000 65 0.68Duke Energy 2.6500 01/09/26 30,000 28 0.29Electronic Arts 3.7000 01/03/21 95,000 99 1.03Energy Transfer Partners 5.2000 01/02/22 50,000 54 0.56Energy Transfer Partners 4.2000 15/04/27 25,000 25 0.26Exelon 3.4970 01/06/22 37,000 37 0.39FedEx 4.5500 01/04/46 45,000 45 0.47General Motors Financial 4.0000 06/10/26 66,000 65 0.68Georgia-Pacific 5.4000 01/11/20 80,000 88 0.92Goldman Sachs 3.7500 22/05/25 95,000 96 1.00Goldman Sachs 3.0000 26/04/22 68,000 68 0.71Harley-Davidson 3.5000 28/07/25 35,000 36 0.37Harley-Davidson 4.6250 28/07/45 30,000 30 0.32Hartford Financial Services 6.6250 30/03/40 34,000 43 0.45HollyFrontier 5.8750 01/04/26 45,000 48 0.50HSBC Finance 6.6760 15/01/21 80,000 91 0.94
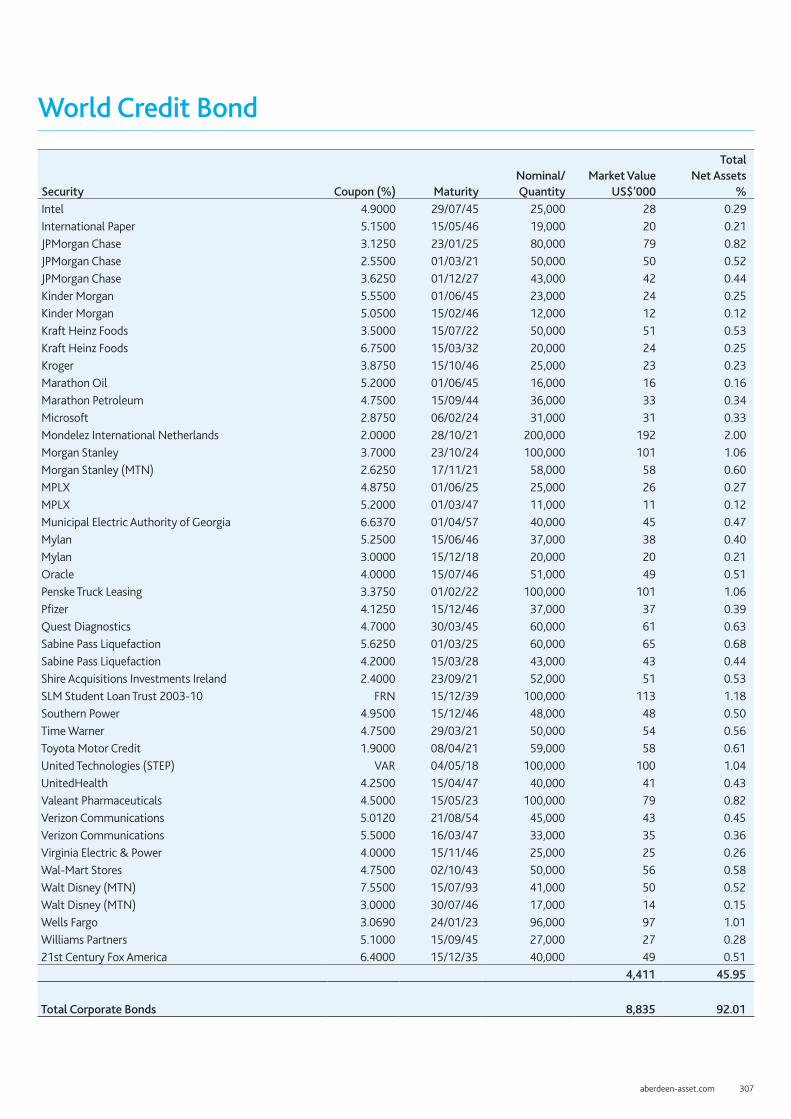
aberdeen-asset.com 307
World Credit Bond
Security Coupon (%) MaturityNominal/Quantity
Market Value US$’000
Total Net Assets
%Intel 4.9000 29/07/45 25,000 28 0.29International Paper 5.1500 15/05/46 19,000 20 0.21JPMorgan Chase 3.1250 23/01/25 80,000 79 0.82JPMorgan Chase 2.5500 01/03/21 50,000 50 0.52JPMorgan Chase 3.6250 01/12/27 43,000 42 0.44Kinder Morgan 5.5500 01/06/45 23,000 24 0.25Kinder Morgan 5.0500 15/02/46 12,000 12 0.12Kraft Heinz Foods 3.5000 15/07/22 50,000 51 0.53Kraft Heinz Foods 6.7500 15/03/32 20,000 24 0.25Kroger 3.8750 15/10/46 25,000 23 0.23Marathon Oil 5.2000 01/06/45 16,000 16 0.16Marathon Petroleum 4.7500 15/09/44 36,000 33 0.34Microsoft 2.8750 06/02/24 31,000 31 0.33Mondelez International Netherlands 2.0000 28/10/21 200,000 192 2.00Morgan Stanley 3.7000 23/10/24 100,000 101 1.06Morgan Stanley (MTN) 2.6250 17/11/21 58,000 58 0.60MPLX 4.8750 01/06/25 25,000 26 0.27MPLX 5.2000 01/03/47 11,000 11 0.12Municipal Electric Authority of Georgia 6.6370 01/04/57 40,000 45 0.47Mylan 5.2500 15/06/46 37,000 38 0.40Mylan 3.0000 15/12/18 20,000 20 0.21Oracle 4.0000 15/07/46 51,000 49 0.51Penske Truck Leasing 3.3750 01/02/22 100,000 101 1.06Pfizer 4.1250 15/12/46 37,000 37 0.39Quest Diagnostics 4.7000 30/03/45 60,000 61 0.63Sabine Pass Liquefaction 5.6250 01/03/25 60,000 65 0.68Sabine Pass Liquefaction 4.2000 15/03/28 43,000 43 0.44Shire Acquisitions Investments Ireland 2.4000 23/09/21 52,000 51 0.53SLM Student Loan Trust 2003-10 FRN 15/12/39 100,000 113 1.18Southern Power 4.9500 15/12/46 48,000 48 0.50Time Warner 4.7500 29/03/21 50,000 54 0.56Toyota Motor Credit 1.9000 08/04/21 59,000 58 0.61United Technologies (STEP) VAR 04/05/18 100,000 100 1.04UnitedHealth 4.2500 15/04/47 40,000 41 0.43Valeant Pharmaceuticals 4.5000 15/05/23 100,000 79 0.82Verizon Communications 5.0120 21/08/54 45,000 43 0.45Verizon Communications 5.5000 16/03/47 33,000 35 0.36Virginia Electric & Power 4.0000 15/11/46 25,000 25 0.26Wal-Mart Stores 4.7500 02/10/43 50,000 56 0.58Walt Disney (MTN) 7.5500 15/07/93 41,000 50 0.52Walt Disney (MTN) 3.0000 30/07/46 17,000 14 0.15Wells Fargo 3.0690 24/01/23 96,000 97 1.01Williams Partners 5.1000 15/09/45 27,000 27 0.2821st Century Fox America 6.4000 15/12/35 40,000 49 0.51
4,411 45.95
Total Corporate Bonds 8,835 92.01

308 Aberdeen Global
World Credit Bond
Security Coupon (%) MaturityNominal/Quantity
Market Value US$’000
Total Net Assets
%Government Bonds 2.74%Japan 0.46%Japan (Government of) 2.1000 20/06/29 4,000,000 44 0.46
Sweden 2.08%Svensk Exportkredit (EMTN) VAR 14/11/23 200,000 200 2.08
United Kingdom 0.20%UK Treasury 4.7500 07/12/38 10,000 19 0.20
Total Government Bonds 263 2.74
Municipal Bonds 0.13%United States 0.13%Chicago Illinois Transit Authority 6.8990 01/12/40 10,000 12 0.13
Total Municipal Bonds 12 0.13
Total Bonds 9,155 95.35
Total Transferable securities and money market instruments admitted to an official exchange listing or dealt on another regulated market 9,155 95.35
Other transferable securities and money market instruments 1.07%Bonds 1.07%Corporate Bonds 1.07%Australia 0.50%Suncorp-Metway (EMTN) 2.1000 03/05/19 48,000 48 0.50
South Africa 0.57%Sappi Papier 7.5000 15/06/32 55,000 54 0.57
Total Corporate Bonds 102 1.07
Total Bonds 102 1.07
Total Other transferable securities and money market instruments 102 1.07

aberdeen-asset.com 309
World Credit BondDerivatives 0.49%
Future contracts 0.04%
Future Maturity Notional
Unrealised Gains/(Losses)
US$'000
Total Net Assets
%CBT US Long Bond 21/06/17 1 - 0.01CBT US Ultra Bond 21/06/17 2 - -CBT US 10 Year Note 21/06/17 1 - -CBT US 5 Year Note 30/06/17 (11) 1 0.01EUX Euro Bobl 08/06/17 (1) - -EUX Euro Bund 08/06/17 1 2 0.01EUX Euro Schatz 08/06/17 (1) - -ICE Long Gilt 28/06/17 1 - -MSE Canada 10 Year Bond 21/06/17 1 1 0.01Unrealised gains on future contracts 4 0.04
Forward currency exchange contracts 0.45%
Counterparty Buy Sell Settlement Buy Amount Sell Amount
Unrealised Gains/(Losses)
US$’000
Total Net Assets
%Barclays Capital EUR USD 10/04/17 106,000 113,998 (1) (0.01)Barclays Capital EUR USD 10/04/17 54,000 58,265 - (0.01)Barclays Capital EUR USD 10/04/17 5,000 5,293 - -Barclays Capital GBP USD 10/04/17 14,000 17,523 - -BNP Paribas EUR USD 15/06/17 724,919 768,325 10 0.10BNP Paribas EUR USD 15/06/17 711,987 754,619 10 0.10BNP Paribas EUR USD 15/06/17 4,044 4,421 - -BNP Paribas EUR USD 15/06/17 3,972 4,342 - -BNP Paribas EUR USD 15/06/17 3,656 3,949 - -BNP Paribas EUR USD 15/06/17 3,591 3,878 - -BNP Paribas GBP USD 15/06/17 557,099 679,490 18 0.19BNP Paribas GBP USD 15/06/17 554,091 675,822 18 0.19BNP Paribas GBP USD 15/06/17 544,340 663,928 18 0.19BNP Paribas GBP USD 15/06/17 543,483 662,883 18 0.19BNP Paribas GBP USD 15/06/17 3,144 3,965 - -BNP Paribas GBP USD 15/06/17 3,079 3,883 - -BNP Paribas GBP USD 15/06/17 3,072 3,874 - -BNP Paribas GBP USD 15/06/17 3,021 3,809 - -BNP Paribas GBP USD 15/06/17 2,864 3,553 - -BNP Paribas GBP USD 15/06/17 2,799 3,471 - -BNP Paribas GBP USD 15/06/17 2,782 3,450 - -BNP Paribas GBP USD 15/06/17 2,728 3,384 - -BNP Paribas USD GBP 15/06/17 6,074 4,988 - -BNP Paribas USD GBP 15/06/17 6,032 4,953 - -BNP Paribas USD GBP 15/06/17 5,958 4,892 - -BNP Paribas USD GBP 15/06/17 5,893 4,839 - -BNP Paribas USD EUR 15/06/17 5,745 5,424 - -BNP Paribas USD EUR 15/06/17 5,643 5,327 - -BNP Paribas USD EUR 15/06/17 4,658 4,347 - -BNP Paribas USD EUR 15/06/17 4,575 4,270 - -BNP Paribas USD GBP 15/06/17 4,087 3,354 - -BNP Paribas USD GBP 15/06/17 4,081 3,349 - -

310 Aberdeen Global
World Credit Bond
Counterparty Buy Sell Settlement Buy Amount Sell Amount
Unrealised Gains/(Losses)
US$’000
Total Net Assets
%BNP Paribas USD GBP 15/06/17 4,003 3,285 - -BNP Paribas USD GBP 15/06/17 3,993 3,277 - -Citigroup EUR USD 10/04/17 9,000 9,615 - -Citigroup USD GBP 10/04/17 956,916 780,000 (20) (0.19)Citigroup USD EUR 10/04/17 9,614 9,000 - -Goldman Sachs USD EUR 10/04/17 1,434,566 1,354,000 (14) (0.15)Goldman Sachs USD EUR 10/04/17 8,610 8,000 - -Goldman Sachs USD EUR 10/04/17 7,520 7,000 - -Goldman Sachs USD GBP 10/04/17 6,213 5,000 - -Goldman Sachs USD EUR 10/04/17 4,307 4,000 - -HSBC USD EUR 10/04/17 1,433,677 1,353,000 (14) (0.15)JPM Chase USD AUD 10/04/17 145,677 192,000 (1) (0.01)Merrill Lynch EUR USD 10/04/17 20,000 21,457 - -Merrill Lynch GBP USD 10/04/17 67,000 83,749 - -Morgan Stanley EUR USD 10/04/17 7,000 7,398 - -Morgan Stanley USD JPY 10/04/17 40,549 4,500,000 - -UBS EUR USD 10/04/17 128,000 136,296 1 0.01UBS EUR USD 10/04/17 5,000 5,281 - -UBS USD CAD 10/04/17 71,677 96,000 - -Unrealised gains on forward currency exchange contracts 43 0.45
Unrealised gains on derivatives 47 0.49
Total investments 9,304 96.91Other net assets 297 3.09Total net assets 9,601 100.00
Currently forward positions are not collateralised.

aberdeen-asset.com 311
World EquityFor the six months ended 31 March 2017
Performance For the six months ended 31 March 2017, the value of World Equity – A Accumulation shares increased by 5.75% compared to an increase of 8.63% in the benchmark, the MSCI World Index.Source: Lipper, Basis: total return, published NAV to NAV, net of annual charges, gross income reinvested, USD. Please see the Performance History section for details on the use of MSCI information.
Please remember that past performance is not a guide to future returns. The price of shares and the revenue from them may fall as well as rise. Investors may not get back the amount originally invested.
Market reviewGlobal equities rose during the six months under review. Initial uncertainty over the US elections gave way to bullishness after Donald Trump’s shock victory. Several major indices reached record highs and the US dollar rallied, on speculation over potential fiscal stimulus from the incoming Trump administration. Risk appetite for emerging markets was also renewed. However, the ‘Trump trade’ tapered off somewhat by the end of the review period, over concerns that political wrangling would hamstring US policymakers, particularly after the failed bill to overhaul healthcare. On the back of firmer economic data, the US Federal Reserve (Fed) raised rates twice, in December and in March.
Elsewhere, sentiment was lifted by the European Central Bank’s decision to extend its bond-buying scheme through 2017, albeit at a smaller magnitude after March. Early on, markets were rattled by UK prime minister Theresa May’s announcement of a hard deadline to begin formal negotiations to exit the EU, which sent sterling tumbling to a 31-year low. Article 50 was triggered near the period-end. Oil prices were volatile, on ongoing oversupply worries.
Portfolio review The overall contribution from Japan was negative. Our holding Japan Tobacco was the biggest detractor, hurt by strong competition from Philip Morris with regard to heat-no-burn products in Japan. Daito Trust Construction’s shares fell on concerns about the company’s earnings release, due to a trend of declining orders for rental apartments.
Stock selection in health care was a negative, with the sector coming under more intense regulatory scrutiny. Perrigo was hampered by guidance revisions and caution over the execution of its restructuring strategy. Meanwhile, retail pharmacy CVS Health suffered as increased competition from rival Walgreens Boots Alliance is expected to affect its 2017 profit margins. Elsewhere, Novartis declined in line with the wider health care sector owing to continued uncertainty surrounding US drug prices.
The overweight to the UK detracted, as the market lagged the broader rally in global stocks on the back of uncertainty over how the Brexit process would unfold. At the stock level, Vodafone’s results were dampened by impairments against its Indian business as a result of intensifying competition.
Conversely, M&T Bank rode the extended post-election rally in the broader US financial sector, which rose on speculation that a Trump presidency would be inflationary and lead to higher Fed benchmark rates. Market sentiment was also buoyed by hopes of less stringent regulatory oversight. The lender also increased its prime lending rate after the Fed’s December rate hike, raising expectations for a boost in interest income.
Elsewhere, Shin-Etsu Chemical was a key contributor, after its core PVC business posted healthy results. Checkpoint Software climbed after its quarterly profits beat estimates, as recurring revenues rose on the back of an increase in subscription sales.
There were no new stock introductions or exits during the interim period.
OutlookMarkets appear to be recalibrating as the Trump trade loses steam, and his presidency becomes more benign than initially anticipated. However, there seems to be plenty of optimism that his promised tax cuts will materialise. Meanwhile, all eyes are on the consequences of unfolding political events in Europe, including a possible second Scottish referendum on independence and the start of Brexit negotiations. In Asia, rising exports signal renewed momentum for economic growth, but key risks such as China’s debt situation remain. We continue to navigate these uncertainties through our stock-focused investment process, picking and holding companies that have proven track records and robust balance sheets to maximise growth.
Global Equity Team April 2017

312 Aberdeen Global
World Equity
Statement of Net AssetsAs at 31 March 2017
Notes US$'000AssetsInvestments in securities at market value 2.2 638,183 Cash at bank 17,532 Interest and dividends receivable 1,835 Subscriptions receivable 1,439 Other assets 62 Total assets 659,051 LiabilitiesTaxes and expenses payable 744 Redemptions payable 13,291 Total liabilities 14,035 Net assets at the end of the period 645,016
Statement of Changes in Net Assets For the period from 1 October 2016 to 31 March 2017
Notes US$'000Net assets at the beginning of the period 895,316 Net gains from investments 2,058 Net realised gains 55,368 Net unrealised losses (19,004) Proceeds from shares issued 65,741 Payments for shares redeemed (354,176) Net equalisation paid 10 (287) Net assets at the end of the period 645,016
Statement of Operations For the period from 1 October 2016 to 31 March 2017
Notes US$'000IncomeInvestment income 2.3 6,959 Bank interest 25 Stocklending income 16 31 Total income 7,015 ExpensesManagement fees 4.2 4,236 Operating, administrative and servicing fees 4.3 708 Distribution fees 4.1 5 Other operational expenses 8 Total expenses 4,957 Net gains from investments 2,058
Realised gains on investments 55,288 Realised currency exchange gains 80 Net realised gains 55,368
Decrease in unrealised appreciation on investments (19,003) Unrealised currency exchange losses (1) Net unrealised losses (19,004) Net increase in assets as a result of operations 38,422
Share Transactions For the period from 1 October 2016 to 31 March 2017
A-2 C-2 D(GBP)-1 D(GBP)-2 E(EUR)-2 I-2Shares outstanding at the beginning of the period 28,679,451 77,467 25,149 2,012,868 3,624,738 6,053,336 Shares issued during the period 2,263,957 - - 11,557 202,932 47,023 Shares redeemed during the period (11,279,284) (19,215) (1,143) (316,385) (2,190,067) (4,154,576) Shares outstanding at the end of the period 19,664,124 58,252 24,006 1,708,040 1,637,603 1,945,783 Net asset value per share 17.8864 13.9195 16.2866 14.3027 17.1245 12.3004
R(GBP)-1 R(GBP)-2 X-2 Y(EUR)-2 Z-2Shares outstanding at the beginning of the period 70,537 490,485 1,071,380 393,941 10,809,328 Shares issued during the period 667 7,729 5,860 21,311 1,125,201 Shares redeemed during the period (32,435) (75,796) (90,116) (107,748) (3,145,693) Shares outstanding at the end of the period 38,769 422,418 987,124 307,504 8,788,836 Net asset value per share 14.0995 14.9376 11.6370 14.1733 20.7987
The accompanying notes form an integral part of these financial statements.

aberdeen-asset.com 313
World EquityPortfolio StatementAs at 31 March 2017
SecurityNominal/ Quantity
Market Value US$’000
Total Net Assets
%Transferable securities and money market instruments admitted to an official exchange listing or dealt on another regulated market 98.94%Equities 98.94%Argentina 1.65%Tenaris (ADR) 311,800 10,646 1.65
Brazil 2.21%Banco Bradesco (ADR) 1,392,530 14,266 2.21
Canada 1.53%Potash Corp of Saskatchewan 578,400 9,897 1.53
Germany 4.10%Fresenius Medical Care 158,400 13,389 2.08Henkel (non voting) (PREF) 101,300 13,029 2.02
26,418 4.10
Hong Kong 5.51%AIA 2,034,500 12,835 1.99Jardine Matheson 147,600 9,502 1.47MTR 1,178,400 6,622 1.03Swire Pacific 'A' 655,900 6,553 1.02
35,512 5.51
India 3.08%Housing Development Finance 440,800 10,199 1.58ITC 2,232,900 9,655 1.50
19,854 3.08
Ireland 1.53%Experian 485,600 9,886 1.53
Israel 2.07%Check Point Software Technologies 129,900 13,337 2.07
Japan 9.98%Daito Trust Construction Co 69,800 9,589 1.49FANUC Corp 47,900 9,822 1.52Japan Tobacco Inc 476,500 15,480 2.40Keyence Corp 24,400 9,768 1.51Shin-Etsu Chemical Co 227,400 19,687 3.06
64,346 9.98
Mexico 2.01%FEMSA (ADR) 146,200 12,949 2.01

314 Aberdeen Global
World Equity
SecurityNominal/ Quantity
Market Value US$’000
Total Net Assets
%Netherlands 1.51%Royal Dutch Shell 'B' 357,200 9,757 1.51
Singapore 0.99%City Developments 878,900 6,413 0.99
South Africa 0.92%MTN 652,000 5,933 0.92
South Korea 2.49%Samsung Electronics (PREF) 11,200 16,069 2.49
Sweden 1.57%Atlas Copco 'A' 286,400 10,153 1.57
Switzerland 9.17%Nestle 169,300 13,003 2.02Novartis 306,800 22,797 3.53Roche 91,300 23,338 3.62
59,138 9.17
Taiwan 2.97%TSMC 3,074,038 19,173 2.97
Thailand 1.51%Kasikornbank (Alien)∞ 1,765,600 9,737 1.51
United Kingdom 10.74%BHP Billiton 410,100 6,328 0.98British American Tobacco 202,900 13,447 2.08Rolls-Royce 1,014,900 9,569 1.48Standard Chartered 1,079,400 10,298 1.60Vodafone 6,278,500 16,338 2.54Whitbread 268,948 13,311 2.06
69,291 10.74
United States 33.40%Amdocs 158,300 9,656 1.50Cognizant Technology Solutions 'A' 168,400 10,026 1.55Comcast 'A' 354,400 13,324 2.07CVS Health 167,150 13,120 2.03EOG Resources 208,500 20,340 3.15Intercontinental Exchange 164,100 9,825 1.52Johnson & Johnson 103,200 12,851 1.99M&T Bank 105,900 16,383 2.54Oracle 424,500 18,939 2.94PepsiCo 117,550 13,149 2.04Perrigo 177,050 11,753 1.82

aberdeen-asset.com 315
World Equity
SecurityNominal/ Quantity
Market Value US$’000
Total Net Assets
%Philip Morris International 115,800 13,076 2.03Praxair 112,300 13,320 2.07Schlumberger 125,200 9,775 1.52TJX 126,200 9,979 1.55Visa 'A' 223,800 19,892 3.08
215,408 33.40
Total Equities 638,183 98.94
Total Transferable securities and money market instruments admitted to an official exchange listing or dealt on another regulated market 638,183 98.94
Total investments 638,183 98.94Other net assets 6,833 1.06Total net assets 645,016 100.00
∞ A portion of this security is on loan at the period end.

316 Aberdeen Global
World Government BondFor the six months ended 31 March 2017
Performance For the six months ended 31 March 2017, the value of World Government Bond - A Accumulation shares decreased by 4.09% compared to a decrease of 4.26% in the benchmark, the Barclays Capital Global Treasury Universal GDP weighted by country Index.Source: Lipper, Basis: total return, published NAV to NAV, net of annual charges, gross income reinvested, USD.
Please remember that past performance is not a guide to future returns. The price of shares and the revenue from them may fall as well as rise. Investors may not get back the amount originally invested.
Market reviewThe past six months have been marked by volatility and political upheaval. Donald Trump won the US presidential election in November, while in Europe, a surge in popularity for populist Eurosceptic parties ahead of upcoming elections also prompted concerns over the future of the European Union (EU). During March, UK Prime Minister Theresa May triggered Article 50, starting the clock on Britain’s exit from the EU. Against this backdrop, global economic activity showed signs of a pick-up, particularly in the US, Eurozone and China. This improvement raised expectations of a gradual removal of central banks’ accommodative monetary policy. The US Federal Reserve (Fed) raised interest rates in December and March. Meanwhile in Europe, the European Central Bank (ECB) tapered its asset purchases but extended its monetary stimulus programme to the end of 2017.
Yields began to drift higher as global economic data showed signs of a cyclical upswing. US rates moved sharply higher in November, following the surprise victory of Donald Trump at the US election. In the aftermath, markets began to price in fiscal stimulus in the form of tax cuts and increased infrastructure spending, which would lead to higher nominal growth and a sharper path of interest rates. US yields reached a high of 2.62% over the review period; while positive economic activity in Europe and hawkish rhetoric from the ECB helped push bund yields to a high of 0.49%.
US Treasuries and German bunds closed the period at 2.39% and 0.37% respectively. France and peripheral spreads widened amid political concerns surrounding Italian referendum and latterly the French elections where Marine Le Pen of far-right Front National was polling favourably.
In currencies, the US dollar outperformed driven as markets began to price Trump induced reflation. The yen broadly weakened as interest rate differentials following the Bank of Japan’s yield curve control policy prompted the currency to depreciate. Tumbling oil prices also weighed on commodity-linked currencies, particularly the Norwegian krone.
Portfolio reviewThe portfolio outperformed relative to the benchmark. Currency returns positively contributed driven by the portfolio’s overweight position in the US dollar, particularly versus emerging markets, as Donald Trump’s surprise election victory stoked expectations of greater fiscal easing, higher nominal growth and therefore a sharper path of interest rates. These gains were partially offset by a short Korean won and Japanese yen position which detracted. Elsewhere, a long Russian rouble and short Egyptian pound position added value.
In government bonds, a long US versus Germany spread detracted from returns early on as Treasury yields moved higher. The portfolio benefited from a short Italy versus Germany spread amid political uncertainties following the December referendum. Profits were booked on this position in February. Allocation to India via the Aberdeen Global Indian Bond Fund also made a positive contribution.
Overall, the portfolio remains positioned for higher yields, wider European peripheral spreads and a stronger US dollar.
OutlookIt is still not clear which of Trump’s campaign themes will characterise his government, although early indications are that he is leaning more protectionist than hoped. Fiscal easing, largely through tax cuts and possibly infrastructure spending, should boost demand in the short to medium term. However, it is unclear whether he will be able to push these changes through Congress. With the economy close to full employment it is likely the Fed will need to offset some of the fiscal easing with further monetary tightening. If Trump pursues a protectionist agenda, the US will suffer a supply shock, which will make the growth/inflation trade off less favourable. European political risk will remain a big concern, with a series of important elections over the next year. Accelerating headline inflation in the Eurozone is putting pressure on the ECB to gradually withdraw stimulus. In the UK, sentiment surrounding Brexit negotiations will tend to overshadow other economic news.
Global Macro Team April 2017

aberdeen-asset.com 317
World Government Bond
Statement of Net AssetsAs at 31 March 2017
Notes US$'000AssetsInvestments in securities at market value 2.2 383,543 Cash at bank 38,650 Amounts held at futures clearing houses and brokers 1,533 Interest receivable 2,376 Subscriptions receivable 33 Unrealised gains on future contracts 2.7 58 Unrealised gains on forward currency exchange contracts 2.6 1,491 Total assets 427,684 LiabilitiesTaxes and expenses payable 246 Redemptions payable 72 Other liabilities 10 Total liabilities 328 Net assets at the end of the period 427,356
Statement of Changes in Net Assets For the period from 1 October 2016 to 31 March 2017
Notes US$'000Net assets at the beginning of the period 324,307 Net gains from investments 3,043 Net realised losses (10,802) Net unrealised losses (1,657) Proceeds from shares issued 137,143 Payments for shares redeemed (25,152) Net equalisation received 10 476 Dividends paid 5 (2) Net assets at the end of the period 427,356
Statement of Operations For the period from 1 October 2016 to 31 March 2017
Notes US$'000IncomeInvestment income 2.3 4,275 Bank interest 7 Total income 4,282 ExpensesManagement fees 4.2 911 Operating, administrative and servicing fees 4.3 325 Other operational expenses 3 Total expenses 1,239 Net gains from investments 3,043
Realised losses on investments (10,902) Realised gains on future contracts 1,512 Realised losses on forward currency exchange contracts (1,812) Realised currency exchange gains 400 Net realised losses (10,802)
Decrease in unrealised appreciation on investments (3,863) Increase in unrealised appreciation on future contracts 58 Decrease in unrealised depreciation on forward currency exchange contracts 2,125 Unrealised currency exchange gains 23 Net unrealised losses (1,657) Net decrease in assets as a result of operations (9,416)
Share Transactions For the period from 1 October 2016 to 31 March 2017
A-1 A-2 E(EUR)-1 E(EUR)-2 I-1 I-2Shares outstanding at the beginning of the period 843 70,808 28,385 148,394 840 30,470,734 Shares issued during the period - 28,318 841 63,121 - 13,795,908 Shares redeemed during the period - (12,846) (3,759) (42,400) - (2,435,935) Shares outstanding at the end of the period 843 86,280 25,467 169,115 840 41,830,707 Net asset value per share 9.1491 9.9392 11.7715 12.5572 9.1428 10.1335
The accompanying notes form an integral part of these financial statements.

318 Aberdeen Global
World Government BondPortfolio StatementAs at 31 March 2017
Security Coupon (%) MaturityNominal/Quantity
Market Value US$’000
Total Net Assets
%Transferable securities and money market instruments admitted to an official exchange listing or dealt on another regulated market 85.92%Bonds 85.92%Corporate Bonds 6.50%China 1.08%Sinopec Group Overseas Development 2014 4.3750 10/04/24 4,360,000 4,612 1.08
Germany 3.41%KFW (EMTN) 4.2500 20/03/18 100,000,000 14,585 3.41
Supranational 2.01%Asian Development Bank (EMTN) 3.2000 10/11/19 60,000,000 8,579 2.01
Total Corporate Bonds 27,776 6.50
Government Bonds 79.42%Australia 3.14%Australia (Commonwealth of) 1.7500 21/11/20 17,750,000 13,412 3.14
Belgium 0.90%Belgium (Kingdom of) 2.2500 22/06/23 3,166,000 3,851 0.90
Brazil 3.21%Brazil (Federal Republic of) - 01/07/18 48,845,000 13,721 3.21
Canada 1.13%Canada (Government of) 5.0000 01/06/37 4,487,000 4,839 1.13
France 3.25%France (Government of) - 25/05/20 6,471,000 6,985 1.64France (Government of) 1.5000 25/05/31 3,356,000 3,647 0.85France (Government of) 3.2500 25/05/45 1,440,000 1,962 0.46France (Government of) 0.5000 25/05/25 1,230,000 1,296 0.30
13,890 3.25
Germany 8.75%Germany (Federal Republic of)∞ 0.2500 16/10/20 14,034,000 15,468 3.62Germany (Federal Republic of) 0.5000 15/02/25 11,880,000 13,202 3.09Germany (Federal Republic of) 2.5000 15/08/46 3,443,000 4,961 1.16Germany (Federal Republic of) 5.5000 04/01/31 2,119,000 3,752 0.88
37,383 8.75
Indonesia 1.83%Indonesia (Republic of) 8.3750 15/03/24 97,084,000,000 7,830 1.83
Ireland 0.19%Ireland (Republic of) 1.0000 15/05/26 764,000 818 0.19

aberdeen-asset.com 319
World Government Bond
Security Coupon (%) MaturityNominal/Quantity
Market Value US$’000
Total Net Assets
%Italy 2.98%Italy (Republic of) 0.7000 01/05/20 6,411,000 6,919 1.62Italy (Republic of) 2.0000 01/12/25 4,097,000 4,374 1.02Italy (Republic of) 5.7500 01/02/33 600,000 890 0.21Italy (Republic of) 2.7000 01/03/47 560,000 537 0.13
12,720 2.98
Japan 3.81%Japan (Government of) 2.4000 20/03/37 596,550,000 7,115 1.67Japan (Government of) 2.1000 20/06/29 607,050,000 6,713 1.57Japan (Government of) 1.5000 20/03/45 230,950,000 2,436 0.57
16,264 3.81
Mexico 1.62%Mexico (Government of) 5.7500 05/03/26 142,593,000 6,940 1.62
Netherlands 1.28%Netherlands (Kingdom of) 1.7500 15/07/23 4,574,000 5,455 1.28
New Zealand 3.81%New Zealand (Government of) 6.0000 15/05/21 20,475,000 16,274 3.81
Peru 0.15%Peru (Republic of) 6.9500 12/08/31 1,900,000 629 0.15
Poland 0.44%Poland (Republic of) 2.5000 25/07/26 8,073,000 1,899 0.44
Russian Federation 1.56%Russia (Federation of) 7.0500 19/01/28 400,000,000 6,677 1.56
South Korea 1.07%Korea (Republic of) 2.7500 10/09/19 5,000,000,000 4,589 1.07
Spain 1.71%Spain (Kingdom of) 1.6000 30/04/25 5,133,000 5,626 1.32Spain (Kingdom of) 4.0000 30/04/20 1,001,000 1,203 0.28Spain (Kingdom of) 5.1500 31/10/44 310,000 478 0.11
7,307 1.71
Sweden 0.50%Sweden (Kingdom of) 3.5000 30/03/39 13,940,000 2,129 0.50
United Kingdom 8.06%UK Treasury 4.2500 07/12/46 3,638,000 7,195 1.68UK Treasury 4.2500 07/06/32 2,540,000 4,370 1.02UK Treasury 2.0000 22/07/20 3,065,000 4,057 0.95United Kingdom Government International Bond 2.7000 21/10/17 130,000,000 18,819 4.41
34,441 8.06

320 Aberdeen Global
World Government Bond
Security Coupon (%) MaturityNominal/Quantity
Market Value US$’000
Total Net Assets
%United States 30.03%US Treasury 0.8750 15/10/18 38,737,000 38,561 9.02US Treasury 1.3750 30/04/21 36,611,000 36,001 8.42US Treasury - 13/04/17 13,108,000 13,105 3.07US Treasury 2.1250 15/05/25 11,970,000 11,792 2.76US Treasury 2.5000 15/02/45 12,208,500 10,973 2.57US Treasury 2.0000 15/08/25 7,437,500 7,244 1.70US Treasury 0.7500 31/12/17 5,971,000 5,959 1.39US Treasury 3.8750 15/08/40 3,237,000 3,743 0.88US Treasury 5.2500 15/11/28 734,000 938 0.22
128,316 30.03
Total Government Bonds 339,384 79.42
Total Bonds 367,160 85.92
Total Transferable securities and money market instruments admitted to an official exchange listing or dealt on another regulated market 367,160 85.92
Open Ended Investment Funds 3.83%Aberdeen Global - Indian Bond Fund Z-2† 1,411,000 16,383 3.83
Total Open Ended Investment Funds 16,383 3.83
Derivatives 0.36%
Future contracts 0.01%
Future Maturity Notional
Unrealised Gains/(Losses)
US$’000
Total Net Assets
%CBT US Ultra Bond 21/06/17 43 5 -CBT US 5 Year Note 30/06/17 (245) 48 0.01EUX Euro Bund 08/06/17 84 20 -EUX Euro-BTP 08/06/17 (121) (17) -EUX Euro-OAT 08/06/17 (86) 40 0.01ICE Long Gilt 28/06/17 (76) (108) (0.03)MSE Canada 10 Year Bond 21/06/17 138 70 0.02Unrealised gains on future contracts 58 0.01

aberdeen-asset.com 321
World Government BondForward currency exchange contracts 0.35%
Counterparty Buy Sell Settlement Buy Amount Sell Amount
Unrealised Gains/(Losses)
US$’000
Total Net Assets
%Barclays Capital EUR HUF 13/04/17 15,192,008 4,683,298,000 32 0.01Barclays Capital GBP USD 13/04/17 1,386,000 1,709,879 24 0.01Barclays Capital JPY USD 13/04/17 374,629,000 3,227,741 136 0.03Barclays Capital JPY USD 13/04/17 238,090,000 2,109,184 28 0.01Barclays Capital TRY USD 13/04/17 13,076,000 3,507,666 72 0.02BNP Paribas CHF USD 13/04/17 3,694,000 3,637,252 56 0.01Citigroup AUD USD 13/04/17 35,974,000 26,351,315 1,087 0.26Citigroup COP USD 24/05/17 6,192,931,000 2,121,136 3 -Citigroup EUR USD 13/04/17 308,000 333,294 (4) -Citigroup NOK USD 12/04/17 19,428,000 2,264,429 (2) -Citigroup USD CNH 13/04/17 41,082,988 287,129,000 (660) (0.15)Citigroup USD EUR 13/04/17 1,468,242 1,379,000 (7) -Citigroup USD KRW 24/05/17 2,573,055 2,928,523,000 (48) (0.01)Goldman Sachs MXN USD 12/04/17 98,540,000 4,561,868 662 0.15Goldman Sachs NGN USD 24/05/17 878,303,000 2,598,530 271 0.06Goldman Sachs TRY USD 13/04/17 14,553,000 3,928,635 55 0.01Goldman Sachs USD AUD 13/04/17 38,870,041 53,423,000 (1,878) (0.43)Goldman Sachs USD JPY 13/04/17 563,578 63,890,000 (10) -Goldman Sachs USD BRL 24/05/17 76,232 240,000 2 -HSBC EUR USD 13/04/17 8,351,000 9,010,495 (74) (0.02)HSBC EUR JPY 13/04/17 7,913,000 948,835,960 (51) (0.01)HSBC ILS USD 13/04/17 6,389,000 1,662,481 98 0.02HSBC JPY EUR 13/04/17 972,300,371 7,946,000 226 0.05HSBC RON USD 12/04/17 4,206,000 983,541 5 -HSBC USD EUR 13/04/17 11,993,796 11,115,000 100 0.02HSBC USD EUR 13/04/17 8,508,584 7,922,000 31 0.01HSBC USD CNH 13/04/17 8,336,405 57,442,000 (15) -JPM Chase AUD USD 13/04/17 5,509,000 4,216,991 (15) -JPM Chase CAD USD 13/04/17 11,575,000 8,562,106 119 0.03JPM Chase CNY USD 24/05/17 5,802,000 835,121 3 -JPM Chase EUR SEK 13/04/17 13,681,196 130,102,000 61 0.01JPM Chase MXN USD 12/04/17 50,525,000 2,345,109 333 0.08JPM Chase MXN USD 12/04/17 4,145,000 216,135 4 -JPM Chase SEK USD 13/04/17 141,518,000 15,670,214 188 0.04JPM Chase USD MXN 12/04/17 4,199,471 84,689,000 (290) (0.07)JPM Chase USD MXN 12/04/17 1,238,932 26,516,000 (167) (0.04)JPM Chase USD EUR 13/04/17 25,242,178 23,930,000 (366) (0.09)JPM Chase USD TRY 13/04/17 2,987,087 11,032,000 (33) (0.01)JPM Chase USD GBP 13/04/17 1,459,675 1,159,000 10 -Merrill Lynch NOK USD 12/04/17 3,877,000 465,535 (14) -Merrill Lynch PLN USD 13/04/17 2,400,000 589,306 16 -Merrill Lynch USD MXN 12/04/17 1,116,954 22,176,000 (59) (0.01)Merrill Lynch USD CAD 13/04/17 586,889 770,000 9 -Morgan Stanley CNY USD 24/05/17 450,498,000 65,030,386 84 0.02Morgan Stanley EUR USD 13/04/17 1,386,000 1,473,605 10 -Morgan Stanley JPY USD 13/04/17 48,080,000 420,086 12 -Morgan Stanley KRW USD 24/05/17 7,454,995,000 6,606,110 66 0.02
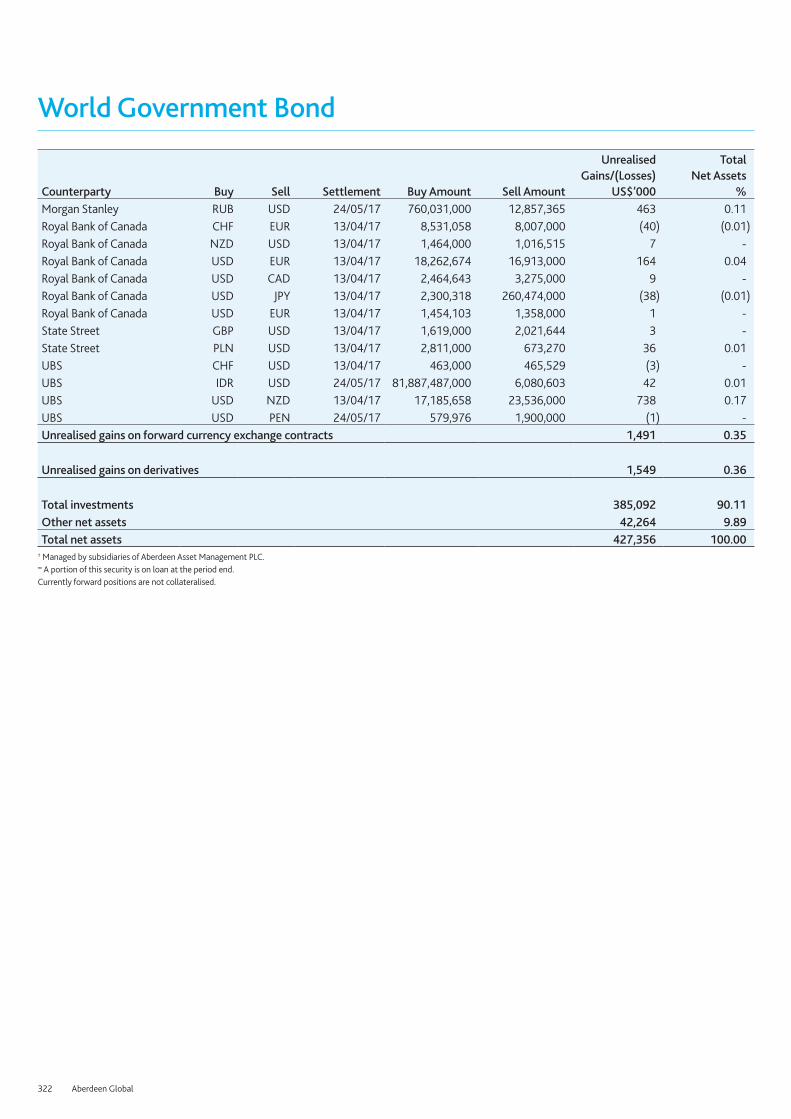
322 Aberdeen Global
World Government Bond
Counterparty Buy Sell Settlement Buy Amount Sell Amount
Unrealised Gains/(Losses)
US$’000
Total Net Assets
%Morgan Stanley RUB USD 24/05/17 760,031,000 12,857,365 463 0.11Royal Bank of Canada CHF EUR 13/04/17 8,531,058 8,007,000 (40) (0.01)Royal Bank of Canada NZD USD 13/04/17 1,464,000 1,016,515 7 -Royal Bank of Canada USD EUR 13/04/17 18,262,674 16,913,000 164 0.04Royal Bank of Canada USD CAD 13/04/17 2,464,643 3,275,000 9 -Royal Bank of Canada USD JPY 13/04/17 2,300,318 260,474,000 (38) (0.01)Royal Bank of Canada USD EUR 13/04/17 1,454,103 1,358,000 1 -State Street GBP USD 13/04/17 1,619,000 2,021,644 3 -State Street PLN USD 13/04/17 2,811,000 673,270 36 0.01UBS CHF USD 13/04/17 463,000 465,529 (3) -UBS IDR USD 24/05/17 81,887,487,000 6,080,603 42 0.01UBS USD NZD 13/04/17 17,185,658 23,536,000 738 0.17UBS USD PEN 24/05/17 579,976 1,900,000 (1) -Unrealised gains on forward currency exchange contracts 1,491 0.35
Unrealised gains on derivatives 1,549 0.36
Total investments 385,092 90.11Other net assets 42,264 9.89Total net assets 427,356 100.00
† Managed by subsidiaries of Aberdeen Asset Management PLC.∞ A portion of this security is on loan at the period end.Currently forward positions are not collateralised.

aberdeen-asset.com 323
World Resources EquityFor the six months ended 31 March 2017
Performance For the six months ended 31 March 2017, the value of World Resources Equity – A Accumulation shares increased by 9.16% compared to an increase of 9.81% in the benchmark, the S&P Global Natural Resources Index.Source: Lipper, Basis: total return, published NAV to NAV, net of annual charges, gross income reinvested, USD.
Please remember that past performance is not a guide to future returns. The price of shares and the revenue from them may fall as well as rise. Investors may not get back the amount originally invested.
Market reviewGlobal resources stocks shrugged off a weak start to end firmer over the review period, buoyed by healthy investor appetite for riskier assets, such as mining and energy stocks. Notably, iron ore prices climbed on the back of sustained Chinese demand. Oil and gold prices, however, were volatile. Oil prices retreated initially on doubts over OPEC’s ability to curb production. While prices subsequently recovered after the cartel agreed with major oil producers to trim output, fresh concerns over rising shale inventory levels in the US eroded gains. Meanwhile, gold prices rebounded from their early losses in the second half of the review period amid uncertainty over US President Donald Trump’s policies and upcoming European elections. But the late gains were insufficient to offset early weakness.
Portfolio reviewThe Fund posted healthy returns despite lagging the benchmark index.
At the stock level, Goldcorp, EOG Resources and Praxair detracted from performance. Despite reporting moderately positive first-quarter earnings, Goldcorp’s shares lagged towards the period-end in the wake of declining gold prices. EOG Resources came under pressure, as the sharp rebound in oil prices in 2016 faltered lately, amid worries of an oversupplied market, especially given the pricing disruption caused by low-cost US shale. Meanwhile, Praxair remained volatile as investors assessed the impact of its proposed merger with German rival Linde, which has seen two senior executive departures.
Conversely, Vale surged after the Brazilian miner announced a new shareholder agreement to restructure its share classes, which is a step forward for the company’s attempt to improve corporate governance. Shin-Etsu Chemical’s shares rallied on speculation that demand for its polyvinyl chloride products would improve on potentially higher infrastructure spending in the US, while tighter market conditions raised the prospect of better pricing for its semiconductor wafer products. Rio Tinto benefited from solid results, with both cost cuts and more disciplined capital spending boosting underlying earnings.
During the period, we initiated two cement holdings: Indocement Tunggal Prakarsa, an Indonesian cement company that boasts an efficient operating model, and UltraTech Cement, a low-cost Indian producer with long-term growth drivers. We also topped up Bayer, Brenntag and KWS Saat on recent weakness.
Conversely, we sold Givaudan in view of better opportunities elsewhere, and Deere & Co, following a price rally that reflected its full valuation. We also exited Eni given our preference for other exploration and production businesses. Elsewhere, we trimmed EOG Resources, Rio Tinto and Vale on price strength.
OutlookThe period under review has been good for the resources sector: some commodity prices have risen and their prospects are brighter than they were a year ago. This has improved investor sentiment, with some resources companies chalking up stellar gains. Healthier risk appetite and expectations for improved earnings may remain supportive of the sector. Concerns that Donald Trump’s protectionist stance could hurt global trade appear to be moderating somewhat, as early fears seem overdone. Meanwhile, political uncertainty, with a series of key elections due in France, Germany and the UK may continue to underpin gold prices. The outlook for oil, however, is mixed. Oil prices have come under renewed pressure from rising US shale production, while it remains unclear if OPEC would succeed in persuading member nations to extend their joint effort to curb supply.
Although investors’ sentiment could shift again, we are unfazed by short-term volatility as indiscriminate selling or buying will provide opportunities for us as long-term investors. We continue to navigate these uncertainties through our stock-focused investment process, picking and holding companies that have proven track records and robust balance sheets to maximise growth.
Global Equity Team April 2017

324 Aberdeen Global
World Resources Equity
Statement of Net AssetsAs at 31 March 2017
Notes US$'000AssetsInvestments in securities at market value 2.2 107,869 Cash at bank 2,974 Interest and dividends receivable 619 Subscriptions receivable 545 Unrealised gains on forward currency exchange contracts 2.6 251 Other assets 33 Total assets 112,291 LiabilitiesTaxes and expenses payable 185 Redemptions payable 810 Total liabilities 995 Net assets at the end of the period 111,296
Statement of Changes in Net Assets For the period from 1 October 2016 to 31 March 2017
Notes US$'000Net assets at the beginning of the period 104,789 Net gains from investments 118 Net realised losses (6,392) Net unrealised gains 12,889 Proceeds from shares issued 41,627 Payments for shares redeemed (41,719) Net equalisation paid 10 (16) Net assets at the end of the period 111,296
Statement of Operations For the period from 1 October 2016 to 31 March 2017
Notes US$'000IncomeInvestment income 2.3 1,173 Bank interest 3 Stocklending income 16 12 Total income 1,188 ExpensesManagement fees 4.2 936 Operating, administrative and servicing fees 4.3 133 Other operational expenses 1 Total expenses 1,070 Net gains from investments 118
Realised losses on investments (4,747) Realised losses on forward currency exchange contracts (1,584) Realised currency exchange losses (61) Net realised losses (6,392)
Decrease in unrealised depreciation on investments 12,594 Decrease in unrealised depreciation on forward currency exchange contracts 296 Unrealised currency exchange losses (1) Net unrealised gains 12,889 Net increase in assets as a result of operations 6,615
Share Transactions For the period from 1 October 2016 to 31 March 2017
A-2 A(CHF)-2^ A(EUR)-2^ E(EUR)-2 I-2 S-2Shares outstanding at the beginning of the period 2,427,399 1,157,403 346,955 1,014,225 2,165 3,801,482 Shares issued during the period 2,015,264 17,095 606,099 235,405 2,224 124,706 Shares redeemed during the period (1,449,429) (83,193) (907,151) (411,022) (2,194) (282,999) Shares outstanding at the end of the period 2,993,234 1,091,305 45,903 838,608 2,195 3,643,189 Net asset value per share 11.4218 8.0256 11.1843 10.6855 2,279.1482 11.1056
S(EUR)-2^ X-2 Y(EUR)-2Shares outstanding at the beginning of the period 919,707 148,572 1,378 Shares issued during the period 172,878 60,655 100 Shares redeemed during the period (137,543) (28,288) (844) Shares outstanding at the end of the period 955,042 180,939 634 Net asset value per share 10.9044 8.9201 10.8641
^ Base currency exposure share class.
The accompanying notes form an integral part of these financial statements.

aberdeen-asset.com 325
World Resources EquityPortfolio StatementAs at 31 March 2017
SecurityNominal/ Quantity
Market Value US$’000
Total Net Assets
%Transferable securities and money market instruments admitted to an official exchange listing or dealt on another regulated market 96.92%Equities 96.92%Argentina 4.29%Tenaris (ADR) 139,700 4,770 4.29
Brazil 7.12%Vale (ADR) 347,100 3,299 2.96Wilson Sons (BDR) 414,800 4,625 4.16
7,924 7.12
Canada 10.14%Goldcorp 443,600 6,452 5.80Potash Corp of Saskatchewan 282,900 4,833 4.34
11,285 10.14
Chile 3.08%Sociedad Quimica y Minera de Chile (ADR) (PREF) 99,600 3,424 3.08
Denmark 2.01%Novozymes 'B' 56,400 2,239 2.01
France 2.97%TOTAL 65,300 3,310 2.97
Germany 12.20%BASF 13,500 1,340 1.20Bayer 28,700 3,309 2.97Brenntag 29,400 1,653 1.49Fuchs Petrolub 39,600 1,674 1.50KWS Saat 5,300 1,647 1.48Linde 23,700 3,958 3.56
13,581 12.20
India 1.04%UltraTech Cement 18,900 1,156 1.04
Indonesia 1.59%Indocement Tunggal Prakarsa 1,420,800 1,771 1.59
Israel 1.99%Frutarom 39,600 2,209 1.99
Japan 4.56%Shin-Etsu Chemical Co 58,600 5,073 4.56

326 Aberdeen Global
World Resources Equity
SecurityNominal/ Quantity
Market Value US$’000
Total Net Assets
%Jersey 2.06%Randgold Resources 26,300 2,291 2.06
Netherlands 5.99%Koninklijke Vopak 25,300 1,105 0.99Royal Dutch Shell 'B' 203,800 5,567 5.00
6,672 5.99
United Kingdom 14.15%BHP Billiton 392,300 6,053 5.44John Wood Group 239,500 2,278 2.05Rio Tinto 155,800 6,253 5.61Weir 48,800 1,170 1.05
15,754 14.15
United States 23.73%Chevron 34,700 3,725 3.35EOG Resources 80,900 7,892 7.08Monsanto 38,400 4,347 3.91Praxair 46,800 5,551 4.99Schlumberger 62,700 4,895 4.40
26,410 23.73
Total Equities 107,869 96.92
Total Transferable securities and money market instruments admitted to an official exchange listing or dealt on another regulated market 107,869 96.92
Derivatives 0.23%
Forward currency exchange contracts 0.23%
Counterparty Buy Sell Settlement Buy Amount Sell Amount
Unrealised Gains/(Losses)
US$’000
Total Net Assets
%BNP Paribas CHF USD 15/06/17 8,965,324 8,890,149 107 0.09BNP Paribas CHF USD 15/06/17 328,734 332,113 (2) -BNP Paribas CHF USD 15/06/17 3,442 3,471 - -BNP Paribas EUR USD 06/04/17 93,323 99,678 - -BNP Paribas EUR USD 15/06/17 10,759,876 11,404,145 145 0.12BNP Paribas EUR USD 15/06/17 6,661,004 7,059,845 89 0.08BNP Paribas EUR USD 15/06/17 391,685 422,422 (2) -BNP Paribas EUR USD 15/06/17 198,072 213,835 (1) -BNP Paribas EUR USD 15/06/17 26,506 28,094 - -BNP Paribas USD CHF 05/04/17 3,457 3,442 - -BNP Paribas USD EUR 15/06/17 5,953,519 5,612,789 (71) (0.06)BNP Paribas USD EUR 15/06/17 546,911 512,639 (3) -BNP Paribas USD EUR 15/06/17 258,336 243,882 (3) -BNP Paribas USD EUR 15/06/17 228,908 214,397 (1) -BNP Paribas USD EUR 15/06/17 227,747 214,410 (2) -

aberdeen-asset.com 327
World Resources Equity
Counterparty Buy Sell Settlement Buy Amount Sell Amount
Unrealised Gains/(Losses)
US$’000
Total Net Assets
%BNP Paribas USD CHF 15/06/17 190,021 191,764 (2) -BNP Paribas USD CHF 15/06/17 177,289 178,919 (2) -BNP Paribas USD EUR 15/06/17 100,001 93,323 - -BNP Paribas USD EUR 15/06/17 49,849 47,060 (1) -BNP Paribas USD CHF 15/06/17 32,687 32,922 - -BNP Paribas USD EUR 15/06/17 22,192 20,715 - -BNP Paribas USD CHF 15/06/17 21,251 20,844 - -BNP Paribas USD CHF 15/06/17 20,194 20,043 - -BNP Paribas USD EUR 15/06/17 17,366 16,040 - -BNP Paribas USD EUR 15/06/17 15,128 14,260 - -BNP Paribas USD EUR 15/06/17 14,380 13,557 - -BNP Paribas USD CHF 15/06/17 12,843 12,690 - -BNP Paribas USD EUR 15/06/17 12,119 11,376 - -BNP Paribas USD CHF 15/06/17 10,179 10,103 - -BNP Paribas USD CHF 15/06/17 9,106 9,173 - -BNP Paribas USD EUR 15/06/17 9,062 8,368 - -BNP Paribas USD EUR 15/06/17 5,951 5,610 - -BNP Paribas USD CHF 15/06/17 3,470 3,444 - -BNP Paribas USD EUR 15/06/17 3,409 3,126 - -Unrealised gains on forward currency exchange contracts 251 0.23
Unrealised gains on derivatives 251 0.23
Total investments 108,120 97.15Other net assets 3,176 2.85Total net assets 111,296 100.00
Currently forward positions are not collateralised.

328 Aberdeen Global
World Smaller CompaniesFor the six months ended 31 March 2017
Performance For the six months ended 31 March 2017, the value of World Smaller Companies – A Accumulation shares increased by 2.52% compared to an increase of 8.36% in the benchmark, the MSCI World Small Cap Index.Source: Lipper, Basis: total return, published NAV to NAV, net of annual charges, gross income reinvested, USD.Please see the Performance History section for details on the use of MSCI information.
Please remember that past performance is not a guide to future returns. The price of shares and the revenue from them may fall as well as rise. Investors may not get back the amount originally invested.
Market reviewGlobal small-cap equities rose during the six months under review, broadly in line with their large-cap counterparts. Initial uncertainty over the US elections gave way to bullishness after Donald Trump’s shock victory. Several major indices reached record highs and the US dollar rallied, on speculation over potential fiscal stimulus from the incoming Trump administration. Risk appetite for emerging markets was also renewed. However, the ‘Trump trade’ tapered off somewhat by the end of the review period, over concerns that political wrangling would hamstring US policymakers, particularly after the failed bill to overhaul healthcare. On the back of firmer economic data, the US Federal Reserve raised rates twice, in December and in March.
Elsewhere, sentiment was lifted by the European Central Bank’s decision to extend its bond-buying scheme through 2017, albeit at a smaller magnitude after March. Early on, markets were rattled by UK prime minister Theresa May’s announcement of a hard deadline to begin formal negotiations to exit the EU, which sent sterling tumbling to a 31-year low. Article 50 was triggered near the period-end. Oil prices were volatile, on ongoing oversupply worries.
Portfolio review At the stock level, Japanese haematology instrumentation company Sysmex was a key detractor. Its shares fell after results showed a one-off slowdown in earnings due to the yen’s appreciation and higher expenses despite sales remaining firm on a local-currency basis. Auto spare-parts manufacturer ARB Corp reported a reasonable set of interim results, with both sales and underlying earnings growth of 6%, but failed to meet the market’s expectations or to match its own robust performance from previous periods. On a positive note, demand for the company’s products remains healthy. Meanwhile, Parexel’s results for the first two quarters of its 2017 fiscal year were hampered by higher-than-expected contract cancellations, project delays, and continued slow backlog conversion.
Conversely, RBC Bearings was among the top contributors, boosted by healthy profits in both its aerospace and industrial segments, which offset a modest decline in operating margins. Similarly, Arezzo released healthy 2016 fourth-quarter results and gained market share. Meanwhile, shares of Globus Medical performed well over the period, as the medical device maker stabilised its salesforce turnover issues that were a hindrance in 2016, leading to improved revenue expectations.
In portfolio activity, we introduced Manhattan Associates, a supply-chain software provider with attractive fundamentals, on recent weakness. We also initiated a position in BIM, a market leading Turkish hard discount retailer. Against this, we sold Close Brothers Group, as the company faces increased competition within its high-margin specialist lending business.
OutlookMarkets appear to be recalibrating as the Trump trade loses steam, and his presidency becomes more benign than initially anticipated. However, there seems to be plenty of optimism that his promised tax cuts will materialise. Meanwhile, all eyes are on the consequences of unfolding political events in Europe, including a possible second Scottish referendum on independence and the start of Brexit negotiations. In Asia, rising exports signal renewed momentum for economic growth, but key risks such as China’s debt situation remain. We continue to navigate these uncertainties through our stock-focused investment process, picking and holding companies that have proven track records and robust balance sheets to maximise growth.
Global Equity Team April 2017
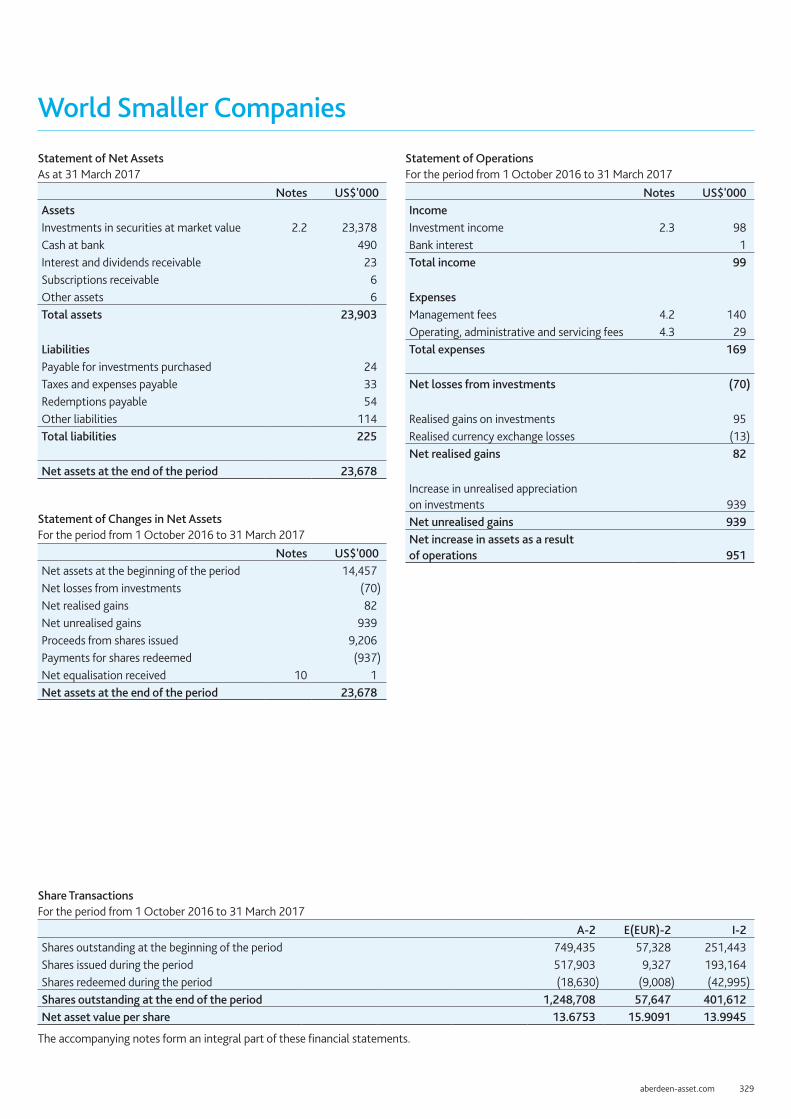
aberdeen-asset.com 329
World Smaller Companies
Statement of Net AssetsAs at 31 March 2017
Notes US$'000AssetsInvestments in securities at market value 2.2 23,378 Cash at bank 490 Interest and dividends receivable 23 Subscriptions receivable 6 Other assets 6 Total assets 23,903 LiabilitiesPayable for investments purchased 24 Taxes and expenses payable 33 Redemptions payable 54 Other liabilities 114 Total liabilities 225 Net assets at the end of the period 23,678
Statement of Changes in Net Assets For the period from 1 October 2016 to 31 March 2017
Notes US$'000Net assets at the beginning of the period 14,457 Net losses from investments (70) Net realised gains 82 Net unrealised gains 939 Proceeds from shares issued 9,206 Payments for shares redeemed (937) Net equalisation received 10 1 Net assets at the end of the period 23,678
Statement of Operations For the period from 1 October 2016 to 31 March 2017
Notes US$'000IncomeInvestment income 2.3 98 Bank interest 1 Total income 99 ExpensesManagement fees 4.2 140 Operating, administrative and servicing fees 4.3 29 Total expenses 169 Net losses from investments (70)
Realised gains on investments 95 Realised currency exchange losses (13) Net realised gains 82
Increase in unrealised appreciation on investments 939 Net unrealised gains 939 Net increase in assets as a result of operations 951
Share Transactions For the period from 1 October 2016 to 31 March 2017
A-2 E(EUR)-2 I-2Shares outstanding at the beginning of the period 749,435 57,328 251,443 Shares issued during the period 517,903 9,327 193,164 Shares redeemed during the period (18,630) (9,008) (42,995) Shares outstanding at the end of the period 1,248,708 57,647 401,612 Net asset value per share 13.6753 15.9091 13.9945
The accompanying notes form an integral part of these financial statements.

330 Aberdeen Global
World Smaller CompaniesPortfolio StatementAs at 31 March 2017
SecurityNominal/ Quantity
Market Value US$’000
Total Net Assets
%Transferable securities and money market instruments admitted to an official exchange listing or dealt on another regulated market 98.73%Equities 98.73%Australia 1.50%ARB 31,500 356 1.50
Brazil 8.03%Arezzo Industria e Comercio 46,700 460 1.94Iguatemi Empresa de Shopping Centers 58,300 601 2.54OdontoPrev 126,500 449 1.90Wilson Sons (BDR) 35,026 391 1.65
1,901 8.03
Canada 1.44%Canadian Western Bank∞ 15,400 340 1.44
Chile 6.68%Embotelladora Andina 'A' (PREF) 176,600 667 2.82Parque Arauco 183,300 482 2.03Vina Concha y Toro 257,000 432 1.83
1,581 6.68
China 0.51%Asia Satellite Telecommunications 98,500 121 0.51
Germany 5.99%Fielmann 3,240 251 1.06Fuchs Petrolub 11,400 481 2.04KWS Saat 1,090 339 1.43Symrise 5,200 347 1.46
1,418 5.99
Hong Kong 2.60%Kerry Logistics Network 439,000 616 2.60
Indonesia 1.61%Ace Hardware Indonesia 6,191,600 382 1.61
Israel 1.86%Frutarom 7,900 441 1.86
Japan 7.98%Asahi Intecc Co 9,700 403 1.70Calbee Inc 13,200 451 1.90Nabtesco Corp 12,700 336 1.42Resorttrust Inc 21,900 385 1.63Sysmex Corp 5,200 315 1.33
1,890 7.98

aberdeen-asset.com 331
World Smaller Companies
SecurityNominal/ Quantity
Market Value US$’000
Total Net Assets
%Malaysia 1.38%Carlsberg Brewery Malaysia 96,100 326 1.38
Mexico 2.06%Grupo Aeroportuario del Sureste 28,300 488 2.06
New Zealand 1.45%Auckland International Airport 72,500 343 1.45
Singapore 2.21%Raffles Medical 516,166 524 2.21
South Africa 2.48%Clicks 61,500 588 2.48
Spain 1.99%Viscofan 9,100 472 1.99
Switzerland 6.55%Barry Callebaut 400 523 2.21dorma+kaba 840 670 2.83Temenos 4,500 358 1.51
1,551 6.55
Thailand 1.71%Tesco Lotus Retail Growth Freehold & Leasehold Property Fund 820,100 405 1.71
Turkey 0.99%BIM Birlesik Magazalar 15,300 235 0.99
United Kingdom 20.23%Aveva 18,900 461 1.95Croda International 5,418 241 1.02Dechra Pharmaceuticals 16,792 351 1.48Dignity 10,600 315 1.33Fuller Smith & Turner 25,794 322 1.36John Wood Group 42,400 403 1.70Millennium & Copthorne Hotels 57,600 318 1.34Rathbone Brothers 9,100 273 1.15Rotork 136,100 414 1.75Spirax-Sarco Engineering 4,100 244 1.03Ultra Electronics 23,900 620 2.63Victrex 20,000 475 2.01Weir 14,600 350 1.48
4,787 20.23

332 Aberdeen Global
World Smaller Companies
SecurityNominal/ Quantity
Market Value US$’000
Total Net Assets
%United States 19.48%Casey's General Stores 5,300 595 2.51EPAM Systems 6,900 521 2.20Fair Isaac 3,800 490 2.07Globus Medical 14,900 441 1.86Jones Lang LaSalle 5,400 602 2.54Manhattan Associates 4,400 229 0.97PAREXEL International 7,600 480 2.03RBC Bearings 6,400 621 2.62Samsonite International 174,300 634 2.68
4,613 19.48
Total Equities 23,378 98.73
Total Transferable securities and money market instruments admitted to an official exchange listing or dealt on another regulated market 23,378 98.73
Total investments 23,378 98.73Other net assets 300 1.27Total net assets 23,678 100.00
∞ A portion of this security is on loan at the period end.
aberdeen-asset.com 333
Notes to the Financial Statements1 PRESENTATION OF THE FINANCIAL STATEMENTS
1.1 GeneralAberdeen Global (“The Company”) was incorporated under the laws of the Grand Duchy of Luxembourg on 25 February 1988 as a société anonyme and qualifies as an open-ended société d’investissement à capital variable (a “SICAV”) with UCITS status (an Undertaking for Collective Investment in Transferable Securities as defined in the European Union Directive 2009/65/EEC of 13 July 2009). The Company comprises various classes of shares, each relating to a separate portfolio (a “Fund”) consisting of securities, mutual funds, derivatives, cash and other sundry assets and liabilities.
The Company is authorised as a UCITS under part I of the law dated of 17 December 2010 on undertakings for collective investment, as amended.
At 31 March 2017, the Company comprises 48 separate active funds, providing shareholders with opportunities for investment in a wide variety of markets, securities and currencies.
1.2 Aberdeen Global Indian Equity Limited (“The Subsidiary”)Indian Equity makes almost all of its investments in India through a wholly owned subsidiary, Aberdeen Global Indian Equity Limited (formerly named Aberdeen Global Indian Equity (Mauritius) Limited), a company incorporated in Mauritius. Transactions involving both the Company and its Subsidiary are accounted for in accordance with their economic substance and accordingly these financial statements reflect the activities of Indian Equity and of its Subsidiary as if all the activities had been undertaken by Indian Equity. On 30 May 2015, the tax residency of the subsidiary changed from Mauritius to Singapore.
1.3 Presentation of financial statementsThe accompanying financial statements present the assets and liabilities of the individual Funds and of the Company taken as a whole. The financial statements of each individual Fund are expressed in the currency designated in the Prospectus for that particular Fund and the combined financial statements of the Company are expressed in United States Dollars (“US$”). The financial statements have been prepared in accordance with the format prescribed by the Luxembourg authorities for Luxembourg investment companies.
As the financial statements are produced at a valuation point that is different from the daily dealing Net Asset Values (NAVs) calculated on 31 March 2017 (except in the case of Brazil Bond, Brazil Equity and Emerging Markets Infrastructure Equity, which are valued at 23.59 (Luxembourg time)), the NAVs shown throughout the report may differ from those advertised on 31 March 2017 for dealing in these Funds. Those NAVs may include dividend declarations effective for the distribution on 31 March 2017 and certain accounting adjustments relating to the period ended 31 March 2017.
In the case of Frontier Markets Equity which is valued on the 15th day of each month and last business day of each month at 13.00 (Luxembourg time) and in the case of Frontier Markets Bond which is valued each Wednesday at 13.00 (Luxembourg time), a special NAV was calculated as at 31 March 2017 for financial statements purposes.
The combined statements were calculated on the basis of aggregation of individual Funds statements with no elimination of cross-investments if any. As of 31 March 2017, the cross-investments within the Fund represent US$ 564,942,000.
2 ACCOUNTING POLICIES
2.1 Accounting conventionThe financial statements have been prepared under the historical cost convention modified by the revaluation of investments.
2.2 Assets and portfolio securities valuationThe market value of investments has been calculated using the last available prices at close of business on 31 March 2017 quoted on stock exchanges or over-the-counter market or any other organised market on which these investments are traded or admitted for trading.
If such prices are not representative of their fair value, all such securities and all other permitted assets will be valued at their fair value at which it is expected they may be resold as determined in good faith by or under the direction of the Directors.
Mortgage and other asset backed securities are independently priced using appropriate models (FT-IDC evaluated prices) and certain corporate bonds may be valued using indicative broker quotes.
Security Acronyms:
CLN Credit Linked Note DIP Default In Possession
EMTN Euro Medium Term Note FRN Floating Rate Note
GMTN Global Medium Term Note INDX Index Linked
PERP Perpetual PIK Payment In Kind
PREF Preference Bond VAR Variable Rate Note
SINK Sinking Bond

334 Aberdeen Global
2.3 Income Interest is accrued on a day-to-day basis. In the case of debt securities issued at a discount or premium to maturity value, the total income arising on such securities, taking into account the amortisation of such discount or premium on an effective interest rate basis, is spread over the life of the security.
Interest income on bonds may be received either in cash or as a Payment in Kind (“PIK”). Where a PIK bond settles physically (either because it matures or it pays interest) the interest income is recognised as the lower of the market value and the nominal value of the settlement. In the event where there is no physical settlement, the factor change on that holding is recognised as interest income in the Statement of Operations at the point when the factor change occurs.
Dividends are accounted for on an ex-dividend basis. Interest and dividend income are stated net of irrecoverable withholding taxes, if any.
Securities lending commission is accounted for on an accruals basis.
2.4 Foreign exchangeThe cost of investments, income and expenses in currencies other than the Funds’ relevant reporting currency have been recorded at the rate of exchange ruling at the time of the transaction. The market value of the investments and other assets and liabilities in currencies other than the relevant reporting currency has been converted at the rates of exchange ruling at 31 March 2017.
Realised and unrealised exchange differences on the revaluation of foreign currencies are taken to the Statement of Operations.
2.5 Realised gains and losses on investmentsA realised investment gain or loss is the difference between the historical average cost of the investment and the sale proceeds.
2.6 Forward currency exchange contractsUnsettled forward currency contracts are valued using forward rates of exchange applicable at the balance sheet date for the remaining period until maturity. All unrealised gains and losses are recognised in the Statement of Operations. Currently forward positions are not collateralised.
2.7 Futures contractsFutures contracts are valued at the exchange quoted price at close of business on 31 March 2017. Initial margin deposits are made in cash upon entering into futures contracts. During the period the future contract is open, changes in the value of the contract are recognised as unrealised gains and losses by marking to market on a daily basis to reflect the market value of the contract at the end of each day’s trading.
Variation margin payments are made or received, depending upon whether unrealised losses or gains are incurred. Variation margin payments are recorded in the futures margin account in the Statement of Net Assets and related movements on unrealised results are recorded in the Statement of Operations. When the contract is closed, the Fund records a realised gain or loss equal to the difference between the proceeds from (or cost of) the closing transaction and the opening transaction.
3 SHARE CLASS INFORMATION
3.1 GeneralWithin each Fund, the Company is entitled to create different share classes. These are distinguished by their distribution policy or by any other criteria stipulated by the Directors. Classes suffixed with a ‘1’ are Distribution shares, classes suffixed with a ‘2’ are Accumulation shares, classes suffixed with a ‘3’ are accelerated Distribution shares and classes suffixed with a ‘4’ are alternative income frequency Shares. Base currency exposure share classes may be available. Please refer to the Prospectus for further details. For a list of current live shareclasses please visit aberdeen-asset.com
The Funds are valued at 13:00 hours Luxembourg time on each Dealing Day, with the exception of Brazil Bond, Brazil Equity and Emerging Markets Infrastructure Equity which are valued at 23:59 hours Luxembourg time on each Dealing Day.
Investors should note that the Dealing Days in respect of Frontier Markets Equity shall be on the Business Day which falls on the 15th day of each month and the last Business Day of the month, other than days during a period of suspension of dealing in Shares in that Fund. The Dealing Days in respect of Frontier Markets Bond shall be on each Business Day which is a Wednesday other than days during a period of suspension of dealing in Shares. If such Dealing Days are not a Business Day in Luxembourg, the Dealing Day will be the Business Day immediately following such day.
3.2 UK Reporting Fund RegimeUK Reporting Fund Regime Status is granted prospectively by the UK taxation authorities. It is the intention of the Board of Directors to continue to comply with the requirements of the Reporting Fund Regime for D, I, G, R and Z shares.
Equalisation applies only to shares purchased during the distribution period (Group 2 shares). It is the average amount of income included in the purchase price of Group 2 shares.
Notes to the Financial Statements

aberdeen-asset.com 335
Annually and within six months of the year end, the Manager will publish the UK Reporting Regime Report to investors for all share classes granted reporting fund status on its website (aberdeen-asset.com).
The UK Reporting Regime Report to investors for each share class can also be requested in writing by contacting Aberdeen Global Services S.A. at the Shareholder Service Centre as detailed on the back cover of this Report.
3.3 SwitchesThe following information applies to all Funds, except if an exchange (or switch) request involves exchanging within, into or out of Emerging Markets Infrastructure Equity, Frontier Markets Bond, Frontier Markets Equity, Brazil Bond or Brazil Equity.
Shares in one Fund may be exchanged or switched into Shares of the same or a different Class in another Fund or of a different Class in the same Fund, subject to the qualifications for investment being met, on any Dealing Day for the relevant Funds. Shares in the same Class may be switched between Accumulation and Distribution shares within the same Class. Investors may switch either a specific number of Shares or Shares of a specified value.
For full details on switching contact the Global Distributor, UK Distributor, Transfer Agent or [email protected]
3.4 Dilution adjustmentFrequent subscriptions and redemptions can potentially have a dilutive effect on the Fund’s NAV per share and be detrimental to the long term investors as a result of the transaction costs that are incurred by the Fund in relation to the trades undertaken by the Investment Manager.
The Board of Directors’ current policy through delegation to the Investment Managers’ Investor Protection Committee (“IPC”) is normally to impose a dilution adjustment to the NAV of each Class of Shares. A dilution rate is applied whenever net subscriptions or redemptions exceed a certain threshold determined by the Board of Directors (having considered prevailing market conditions).
The dilution adjustment will be recorded in the relevant Fund’s NAV and becomes part of the Fund’s relevant dealing NAV.
The dilution adjustment is a percentage adjustment applied to each share class in a Fund on a dealing day determined on the basis of estimates of any dealing charges (including commission and/or other costs) and/or any bid/offer spread that the Board of Directors believes are appropriate to take into account in respect of that Fund. Such dealing charges will reflect costs and liabilities not included in the calculation of the NAV of the relevant class.
The net asset values as at 31 March 2017 disclosed in this report do not include any dilution adjustments and hence may differ from those published on 31 March 2017 for dealing into the Funds.
4 EXPENSES
4.1 Distribution feesClass B, Class C and Class W shares are subject to an annual distributor fee of 1% except for Class B of Frontier Markets Bond for which a distributor fee of 0.75% is applied. These fees are accrued daily and paid monthly in arrears.
4.2 Management feesAberdeen International Fund Managers Limited (the “Investment Manager”) is entitled to receive investment management fees calculated on the Net Asset Value of the Funds, accrued daily. The investment management fee paid by Indian Equity is split between Aberdeen International Fund Managers Limited and Aberdeen Asset Managers Asia Limited.
Where a Fund invests in an open-ended collective investment which is operated or managed by the Investment Manager or an associate of the Investment Manager, no additional annual management charge will be incurred by the Fund on such an investment.
The following management fee rates were applicable as at 31 March 2017:
Class of Shares (%)Fund Name A,B,C,D,E,L,U,W G,H,I,N R,V,X,Y S
Asia Pacific Equity 1.75 1.00 1.00 1.92
Asian Credit Bond 1.20 0.60 0.60 1.92
Asian Local Currency Short Duration Bond 1.00 0.50 0.50 1.92
Asian Property Share 1.50 0.75 0.75 1.92
Asian Smaller Companies 1.75 1.00 1.15 1.92
Australasian Equity 1.50 0.75 0.75 1.92
Brazil BondA 1.50 1.00 1.00 1.92
Brazil EquityB 1.75 1.00 1.00 1.92
Notes to the Financial Statements

336 Aberdeen Global
Class of Shares (%)Fund Name A,B,C,D,E,L,U,W G,H,I,N R,V,X,Y S
China A Share Equity 1.75 1.00 1.00 1.92
Chinese Equity 1.75 1.00 1.00 1.92
Eastern European Equity 1.50 0.75 0.75 1.92
Emerging Markets Corporate Bond 1.50 1.00 1.00 1.92
Emerging Markets Equity 1.75 1.00 1.00 1.92
Emerging Markets Infrastructure EquityC 1.75 1.00 1.00 1.92
Emerging Markets Local Currency Bond 1.50 1.00 1.00 1.92
Emerging Markets Local Currency Corporate Bond 1.50 1.00 1.00 1.92
Emerging Markets Smaller Companies 1.75 1.00 1.15 1.92
European Equity 1.50 0.75 0.75 1.92
European Equity Dividend 1.50 0.75 0.75 1.92
European Equity (Ex UK) 1.50 0.75 0.75 1.92
Frontier Markets Bond 1.50 1.00 1.00 2.00
Frontier Markets Equity 2.25 1.50 1.50 2.50
German Equity 1.50 0.75 0.75 1.92
Indian Bond 1.00 0.50 0.50 1.92
Indian Equity 1.75 1.00 1.00 1.92
Japanese Equity 1.50 0.75 0.75 1.92
Japanese Smaller Companies 1.50 0.75 0.75 1.92
Latin American Equity 1.75 1.00 1.00 1.92
Multi Asset Growth 1.20 0.60 0.60 1.92
Multi Asset Income 1.20 0.60 0.60 1.92
Multi-Manager World Equity 1.35 0.50 0.50 1.92
North American Equity 1.50 0.75 0.75 1.92
North American Smaller Companies 1.50 0.75 0.75 1.92
Responsible World Equity 1.50 1.00 1.00 1.92
Russian Equity 1.75 1.00 1.00 1.92
Select Emerging Markets Bond 1.50 1.00 1.00 1.92
Select Emerging Markets Investment Grade Bond 1.50 1.00 1.00 1.92
Select Euro High Yield Bond 1.25 0.70 0.70 1.92
Select Global Credit Bond 0.90 0.40 0.50 1.92
Select Global Investment Grade Credit Bond 0.75 0.50 0.50 1.92
Swiss Equity 1.50 0.75 0.75 1.92
Technology Equity 1.75 0.75 0.75 1.92
UK Equity 1.50 0.75 0.75 1.92
World Credit Bond 0.90 0.45 0.45 1.92
World Equity 1.50 1.00 1.00 1.92
World Government Bond 1.00 0.50 0.50 1.92
World Resources Equity 1.50 1.00 1.00 1.92
World Smaller Companies 1.50 1.00 1.00 1.92 A The management charge for Class N Shares of Brazil Bond is 0.50% instead of 1.00%.B The management charge for Class N Shares of Brazil Equity is 0.65% instead of 1.00%.C The management charge for Class N Shares of Emerging Markets Infrastructure Equity is 0.52% instead of 1.00%.All other Class N Shares have the same management charge as Class I Shares of the relevant Fund.Class Z shares are not subject to any investment management fee charge.
Notes to the Financial Statements

aberdeen-asset.com 337
4.3 Operating, Administrative and Servicing ExpensesOrdinary operating expenses incurred by Aberdeen Global will generally be paid out of the assets of the relevant Fund. To seek to protect the Shareholders from fluctuations in these expenses, the yearly total amount of these expenses to be borne by each Share Class (the “Operating, Administrative and Servicing Expenses”), is fixed at a maximum level of 0.60% of the Net Asset Value in respect of all Share Classes (except for Brazil Bond, Brazil Equity, Russian Equity and Eastern European Equity where the corresponding maximum is 0.80%, and except Base Currency Exposure Share Classes in respect of which a fee of up to 0.10% may be charged in addition by the Investment Manager for providing currency exposure services). The level of effective Operating, Administrative and Servicing Expenses below these maximum levels may vary at the Board of Directors’discretion, as agreed with the Management Company, and different rates may apply across the Funds and Share Classes. The Board of Directors may amend the maximum fixed level of the Operating, Administrative and Servicing Expenses applicable to each Share Class at any time at their discretion upon prior notice to relevant Shareholders.
In order to pass on economies of scales achieved by those Funds reaching significant levels of assets, the following discounts to the Operating, Administrative and Servicing Expenses will be applied:
In respect of all Share Classes of a Fund reaching a level of assets of at least (USD or the equivalent in another currency):
Discount to be applied to the Operating, Administrative and Servicing Expenses (per annum):
Below 2,000,000,000 0.00%
2,000,000,000 0.01%
4,000,000,000 0.02%
6,000,000,000 0.03%
8,000,000,000 0.04%
10,000,000,000 0.05%
Provided the relevant level of asset value is reached by a Fund on the last Business Day of each month, the relevant discount will apply and be paid to that Fund in relation to that month.
Operating, Administrative and Servicing Expenses (OASE) are paid through a bank account (“the OASE account”) opened at the Fund’s Depositary Bank in the Fund’s name. Each sub-fund pays its fixed OASE to the OASE account which in turn is used to pay actual invoices. The balance of the OASE account is not reflected in the daily NAV of the Fund or in the financial statements.
Full details can be found in the Prospectus.
5 DIVIDENDS (DISTRIBUTION CLASS)The Directors declared monthly dividends for the Funds as listed below, for the period 1 October 2016 to 31 March 2017 to all shareholders on record on the last day of the relevant month (expressed in USD unless otherwise stated).
Emerging Markets Corporate Bond
Date A-1 A-3 E(EUR)-1 W-1 X-1 Y(EUR)-1 Z-1
October 2016 0.032591 0.033830 0.039871 0.025183 0.034720 0.041364 0.046483
November 2016 0.032924 0.034022 0.041593 0.026002 0.034881 0.042866 0.046157
December 2016 0.032071 0.033180 0.040753 0.024332 0.034201 0.042236 0.045610
January 2017 0.034958 0.036024 0.043443 0.027453 0.037021 0.044635 0.048732
February 2017 0.031860 0.033021 0.040254 0.024951 0.033754 0.041379 0.044441
March 2017 0.031605 0.032674 0.039652 0.023912 0.033894 0.041296 0.045527
Emerging Markets Local Currency Bond
Date A-1 A-3 X-1
October 2016 0.027633 0.043770 0.029952
November 2016 0.019569 0.030816 0.021779
December 2016 0.028354 0.044872 0.030600
January 2017 0.028785 0.046073 0.031131
February 2017 0.028056 0.044485 0.030116
March 2017 0.033403 0.052717 0.035689
Notes to the Financial Statements

338 Aberdeen Global
Frontier Markets Bond
Date A-1 B-1 I-1
October 2016 0.051048 0.023236 0.055534
November 2016 0.048487 0.022073 0.052157
December 2016 0.049627 0.022640 0.054215
January 2017 0.065048 0.030673 0.070136
February 2017 0.056693 0.026542 0.060935
March 2017 0.053542 0.024537 0.058727
Indian Bond
Date A-1 E(EUR)-1 I-1 Z-1
October 2016 0.045466 0.046717 0.050345 -
November 2016 0.039294 0.041745 0.043855 0.046173
December 2016 0.045405 0.048507 0.050130 0.052270
January 2017 0.045862 0.047801 0.050632 0.052627
February 2017 0.048822 0.051499 0.052865 0.054353
March 2017 0.051850 0.055026 0.056488 0.058371
Multi Asset Income
Date A-1 A(EUR)-1 A(SGD)-1 E(EUR)-1 H(EUR)-1 I-1
October 2016 0.036490 0.037789 - 0.036375 0.036693 0.036822
November 2016 0.036122 0.037374 - 0.037211 0.037554 0.036469
December 2016 0.036732 0.037948 - 0.038057 0.038428 0.037106
January 2017 0.036645 0.037781 - 0.037056 0.037437 0.037038
February 2017 0.037254 0.038371 - 0.038318 0.038731 0.037676
March 2017 0.037411 0.038475 0.037835 0.038229 0.038661 0.037855
Date I(EUR)-1 W-1 X-1 X(EUR)-1 Y(EUR)-1 Z-1
October 2016 0.038036 0.037549 0.036801 0.038019 0.036666 0.037796
November 2016 0.037634 0.037138 0.036447 0.037616 0.037526 0.037453
December 2016 0.038224 0.037744 0.037082 0.038204 0.038398 0.038126
January 2017 0.038078 0.037623 0.037013 0.038057 0.037406 0.038075
February 2017 0.038696 0.038224 0.037650 0.038671 0.038698 0.038749
March 2017 0.038822 0.038353 0.037828 0.038794 0.038627 0.038954
Select Emerging Markets Bond
Date A-1 A(EUR)-1 A(GBP)-1 A(SGD)-1 A-3 I-1
October 2016 0.080889 0.039472 0.059389 - 0.048305 0.090214
November 2016 0.071293 0.035194 0.051417 - 0.042517 0.079996
December 2016 0.067019 0.032445 0.048993 - 0.039848 0.075726
January 2017 0.074959 0.035555 0.053050 - 0.044652 0.083938
February 2017 0.075262 0.036382 0.054555 - 0.044838 0.083513
March 2017 0.072458 0.034875 0.051582 0.022147 0.043372 0.081619
Notes to the Financial Statements

aberdeen-asset.com 339
Date I(CHF)-1 I(EUR)-1 W-1 X-1 Y(EUR)-1 Z-1
October 2016 0.047079 0.044232 0.038862 0.044323 0.052715 -
November 2016 0.042499 0.039634 0.034279 0.039268 0.048268 -
December 2016 0.039106 0.036396 0.031163 0.037178 0.046052 -
January 2017 0.042396 0.040296 0.035661 0.041204 0.049687 -
February 2017 0.043185 0.040540 0.036568 0.041025 0.050395 0.054143
March 2017 0.041974 0.039379 0.034062 0.040029 0.048800 0.053936
Select Emerging Markets Investment Grade Bond
Date A-1 A(EUR)-1 H(EUR)-1 I-1 I(EUR)-1
October 2016 0.025255 0.024676 0.031717 0.028156 0.027545
November 2016 0.021324 0.021761 0.028863 0.024873 0.024535
December 2016 0.026015 0.022832 0.030810 0.026423 0.025501
January 2017 0.022793 0.021361 0.029080 0.025548 0.024107
February 2017 0.023452 0.022663 0.030079 0.025927 0.025037
March 2017 0.020791 0.019853 0.027509 0.023850 0.022816
Select Euro High Yield Bond
Date A-1 A(EUR)-1 A(GBP)-1 A-3 A(EUR)-3 B(EUR)-1
October 2016 0.034625 0.021167 0.066401 0.034598 0.034980 0.015968
November 2016 0.046483 0.028797 0.087756 0.046457 0.047364 0.023659
December 2016 0.038305 0.023302 0.073138 0.038201 0.038301 0.017954
January 2017 0.036402 0.021784 0.067442 0.036433 0.035966 0.016433
February 2017 0.038866 0.023617 0.073545 0.038822 0.038783 0.018737
March 2017 0.035505 0.021592 0.066036 0.035472 0.035080 0.016133
Date D(GBP)-1 I-1 R(GBP)-1 W(EUR)-1 X-1 X(EUR)-1
October 2016 0.018351 0.038081 0.044321 0.026450 - 0.040640
November 2016 0.024977 0.050082 0.055726 0.039603 - 0.053310
December 2016 0.020301 0.041684 0.046472 0.030251 - 0.044048
January 2017 0.019107 0.039482 0.044091 0.027481 0.004777 0.041676
February 2017 0.020722 0.041889 0.046724 0.031211 0.041693 0.044361
March 2017 0.019795 0.039040 0.044047 0.026881 0.038930 0.041287
The Directors declared quarterly dividends for the Funds as listed below, for the period 1 October 2016 to 31 March 2017 to all shareholders on record on the last day of the relevant quarter (expressed in USD unless otherwise stated).
Asian Credit Bond
Date A-1 I-1 X-1
December 2016 0.062160 0.079090 0.078032
March 2017 0.068004 0.084509 0.083487
Asian Local Currency Short Duration Bond
Date A-1 D(GBP)-1 I-1 I(GBP)-1 R(GBP)-1 X-1
December 2016 0.020025 0.057534 0.058646 0.052173 0.072329 0.055710
March 2017 0.020597 0.059461 0.060368 0.052944 0.073693 0.057383
Notes to the Financial Statements

340 Aberdeen Global
Brazil Bond
Date A-1 E(EUR)-1 I-1 N(JPY)-1
December 2016 0.176904 0.213640 0.352360 1,210.304721
March 2017 0.185261 0.218966 0.367990 1,209.298266
Brazil Equity
Date N(JPY)-1
December 2016 374.686628
March 2017 23.564706
Emerging Markets Infrastructure Equity
Date A-1 N(JPY)-1
December 2016 - -
March 2017 - 47.652923
The Directors declared six-monthly dividends for the Funds as listed below, for the period 1 October 2016 to 31 March 2017 to all shareholders on record on the last day of March 2017 (expressed in USD unless otherwise stated).
Select Global Credit Bond
Date D-1 D(GBP)-1 R(GBP)-1
March 2017 0.111683 0.019255 0.135071
UK Equity
Date D(GBP)-1 R(GBP)-1
March 2017 0.068231 0.087645
World Credit Bond
Date A-1 A(EUR)-1 D(GBP)-1 H(EUR)-1 I-1 R(GBP)-1 X-1
March 2017 0.111753 0.107243 0.107087 0.137929 0.136932 0.130025 0.134914
World Government Bond
Date A-1 E(EUR)-1 I-1
March 2017 0.051548 0.066354 0.076120
6 DIRECTORS’ INTERESTSNone of the Directors were materially interested in any contracts of significance subsisting with the Company either during the period or at 31 March 2017.
None of the Directors have service contracts with the Company.
7 CHANGES IN INVESTMENT PORTFOLIOThe schedule of changes in the investment portfolio is available on request from the Registered Office in Luxembourg and from the local agents listed under Management and Administration and in the Prospectus.
8 TRANSACTIONS WITH CONNECTED PERSONSTransactions with connected persons outlined in the previous notes (4.2 and 4.3) have been entered into in the ordinary course of business and on normal commercial terms.
As at 31 March 2017, other Aberdeen Funds/Trusts and mandates managed by Aberdeen Asset Management PLC held investments in the Company valued at US$6,501,053,398.
Notes to the Financial Statements

aberdeen-asset.com 341
9 SOFT COMMISSION/COMMISSION SHARINGThe Investment Manager has entered into soft commission/commission sharing arrangements with brokers in respect of which certain goods and services used to support investment decision making were received. The Investment Manager does not make direct payment for these services but transacts an agreed amount of business with the brokers on behalf of the Company and commission is paid on these transactions. The goods and services utilised for the Fund include research and advisory services; economic and political analysis, portfolio analysis including valuation and performance measurement, market analysis data and quotation services; computer hardware and software incidental to the above goods and services and investment related publications.
10 EQUALISATION ON THE ISSUE AND REDEMPTION OF SHARESEqualisation is operated in connection with the issue and redemption of shares. It represents the income element included in the price for the issue and redemption of shares.
11 OVERDRAFT FACILITYThe Company has a US$50 million intra-day uncommitted unsecured credit line facility with Bank of America to finance short-term timing differences arising from subscriptions and redemptions. Any liability arising on this account will be recoverable from subscribers to the Company and is therefore not reflected in the financial statements of the Company.
12 PROVISIONS FOR TAXES
Chinese TaxesThere is currently uncertainty as to whether the People’s Republic of China (PRC) tax authorities will impose a capital gains tax on realised gains from dealing in fixed income securities as well as in domestic shares. In light of this uncertainty and in line with current market practice, the Fund provides for a 10% contingency on realised gains from disposing or holding fixed income securities as well as domestic shares for the period between 17 November 2009, and 16 November 2014 as the Fund may be subject to withholding and other taxes imposed in the PRC. The PRC tax authorities have clarified that income tax and other tax categories are payable on capital gains arising from securities trading of QFIIs on or after 17 November 2014. Any unclaimed provisions or over provision made on realised gains may later be released to form part of the relevant Fund’s assets. Any changes to the market practice or interpretation or clarification of PRC tax rules may impact this provision and may result in this provision being higher or lower than required, or deemed not to be required. The Board of Directors therefore reserves the right to amend its practice in this regard and/or this policy without prior notice at any time.
The following provisions have been recorded in the other liabilities caption of the financial statements:
Fund Name Currency Provision for Realised Gain on CNY holdings
Asian Local Currency Short Duration Bond USD 3,427
South Korean TaxesKorea Treasury bond and monetary stabilization bond sale transactions settling on or after 1 January 2011 are subject to a statutory tax rate of 22% of the capital gain.
The following provisions have been recorded in the other liabilities caption of the financial statements:
Fund Name Currency Provision for Realised Gain on KRW holdings
World Government Bond USD 7,903
Indonesian TaxesIndonesian Corporate and Government bonds issued in the domestic market, and Indonesian Corporate bonds issued in foreign markets, are subject to 20% of capital gains tax.
The following provisions have been recorded in the other liabilities caption of the financial statements:
Fund Name Currency Provision for Realised Gain on Indonesian holdings
Asian Credit Bond USD 4,604
Asian Local Currency Short Duration Bond USD 62,127
Emerging Markets Corporate Bond USD 14,898
Emerging Markets Local Currency Bond USD 101,782
Emerging Markets Local Currency Corporate Bond USD 1,427
Select Emerging Markets Bond USD 832,214
Select Emerging Markets Investment Grade Bond GBP 70,920
Notes to the Financial Statements

342 Aberdeen Global
Bangladesh TaxesCapital Gains on sale proceeds from Bangladesh listed shares are generally taxed at 15%.
The following provisions have been recorded in the other liabilities caption of the financial statements:
Fund Name Currency Provision for Realised Gain on Kenyan holdings
Frontier Markets Equity USD 321,932
Ghana TaxesPursuant to domestic law Capital Gains from the realization of capital assets or liabilities, including corporate bonds, are taxed at the general income rate, which is 25%.
The following provisions have been recorded in the other liabilities caption of the financial statements:
Fund Name Currency Provision for Realised Gain on Kenyan holdings
Frontier Markets Equity USD 436,939
Pakistan TaxesPursuant to domestic law, capital gains are subject to tax at rates between 0% - 18%, which vary according to the holding period of the investment. These rates are on the assumption that capital gains are derived from listed shares.
The following provisions have been recorded in the other liabilities caption of the financial statements:
Fund Name Currency Provision for Realised Gain on Kenyan holdings
Frontier Markets Equity USD 1,118,971
13 TRANSACTION CHARGESFor the year ended 31 March 2017, the Funds incurred transaction costs which have been defined as commissions and tax relating to purchase or sale of transferable securities, money market instruments, derivatives or other eligible assets as follows:
Fund CurrencyCommissions
‘000Taxes
‘000Total ‘000
Asia Pacific Equity USD 721 393 1,114
Asian Credit Bond USD - - -
Asian Local Currency Short Duration Bond USD 11 - 11
Asian Property USD 5 3 8
Asian Smaller Companies USD 741 331 1,072
Australasian Equity AUD 10 - 10
Brazil Bond USD - - -
Brazil Equity USD 13 - 13
China A Share Equity USD 361 58 419
Chinese Equity USD 91 97 188
Eastern European Equity EUR 12 - 12
Emerging Markets Corporate Bond USD - - -
Emerging Markets Equity USD 1,592 480 2,072
Emerging Markets Infrastructure Equity USD 60 32 92
Emerging Markets Local Currency Bond USD - - -
Emerging Markets Local Currency Corporate Bond USD - - -
Emerging Markets Smaller Companies USD 368 117 485
European Equity EUR 44 15 59
European Equity (Ex UK) EUR 27 - 27
European Equity Dividend EUR 9 8 17
Frontier Markets Bond USD - - -
Frontier Markets Equity USD 274 42 316
Notes to the Financial Statements

aberdeen-asset.com 343
Fund CurrencyCommissions
‘000Taxes
‘000Total ‘000
German Equity EUR - - -
Indian Bond USD - - -
Indian Equity USD 436 555 991
Japanese Equity JPY 57,647 - 57,647
Japanese Smaller Companies JPY 12,401 - 12,401
Latin American Equity USD 298 7 305
Multi Asset Growth EUR 7 5 12
Multi Asset Income USD 10 12 22
Multi-Manager World Equity EUR 3 - 3
North American Equity USD 35 - 35
North American Smaller Companies USD 132 - 132
Responsible World Equity USD 1 1 2
Russian Equity EUR 4 1 5
Select Emerging Markets Bond USD - - -
Select Emerging Markets Investment Grade Bond USD - - -
Select Euro High Yield Bond EUR - - -
Select Global Credit Bond GBP 1 - 1
Select Global Investment Grade Credit Bond GBP 1 - 1
Select High Yield Bond GBP - - -
Swiss Equity CHF - - -
Technology Equity USD 15 16 31
UK Equity GBP 3 18 21
World Credit Bond USD - - -
World Equity USD 160 115 275
World Government Bond USD - - -
World Resources Equity USD 23 18 41
World Smaller Companies USD 6 11 17
14 REDEMPTION CHARGEThe proceeds of any redemption of Shares in Frontier Markets Equity by a Shareholder during the first full three years after purchase will be reduced in accordance with the following percentage scale. This represents a reducing redemption charge liability for Shareholders in Frontier Markets Equity and is calculated in the manner which results in the lowest possible charge on the assumption that the first shares acquired by the Shareholder are the first shares sold by that Shareholder. The redemption charge is collected for the benefit of the Fund and shall not be payable to the Global Distributor or any other party. The scale is as follows:
Year of Redemption Redemption Charge as a Percentage of Share Price
Within 1 full year of purchase 5.0%
After 1 full year but within 2 full years of purchase 3.0%
After 2 full years but within 3 full years of purchase 1.0%
After 3 full years of purchase None
15 CAPACITY MANAGEMENT CHARGEDue to very strong net inflows into Emerging Markets Equity and Emerging Markets Smaller Companies, the Board has decided to implement mandatory initial charges (maximum 6.38%; it was decided to set the initial charge rate at 2.00%) for all new subscriptions into Class A, Class D, Class E, Class I, Class R, Class S, Class U, Class X and Class Y Shares of the Funds with effect from 11 March 2013. The initial charge is collected for the benefit of the relevant Fund and shall not be payable to the Global Distributor or any other party.
Notes to the Financial Statements

344 Aberdeen Global
16 SECURITIES LENDINGThe Company has entered into a securities lending program for a number of equity and fixed income Funds. In return for making securities available for loan throughout the period, the Funds participating in the programs received fees which are reflected in the Financial Statements of each participating Fund under the “Stocklending income” caption. The company has appointed Securities Finance Trust Company (the operating arm of eSec Lending) as agent for the equity and fixed income lending program. As remuneration for this agency role, Securities Finance Trust Company receives 20% of the fees from the securities lending program and the Company received 80% of the fees.
Collateralisation in the form of Government Bonds must be with a minimum issuer rating of AA (S&P rating) or Aa3 (Moody’s rating) at a minimum of 102 -105 % (Min. 102% bond loan v. Sovereign bond Collateral, Min. 105% equity loan v. Sovereign Bond Collateral minimum margins). With respect to a government issuer that is rated by both Moody’s and S&P, the lower of those two ratings shall apply.
The following countries may be accepted as collateral:
Australia, Austria, Belgium, Canada, Denmark, Finland, France, Germany, Japan, Luxembourg, Netherlands, New Zealand, Norway, Sweden, Switzerland, United Kingdom & United States.
Collateralisation in the form of Equities must be from the listed equities from the following indices overleaf, provided that no single issuer shall represent more than 10% of Equity collateral on a ‘’per Approved Borrower’’ basis: 108% minimum margin. Borrowers’ own stock is not acceptable.
Index Country
S&P 500 United States
FTSE 100 United Kingdom
CAC 40 France
DAX Germany
S&P/TSX 60 Canada
AEX Netherlands
BEL 20 Belgium
OMX Stockholm 30 Sweden
OMX Copenhagen 20 Denmark
OMX Helsinki 25 Finland
Swiss Market Switzerland
S&P/ASX 200 Australia
NIKKEI 225 Japan
ATX Austria
FTSE MIB Italy
OBX Norway
IBEX 35 Spain
The amount of securities on loan and collateral value at 31 March 2017 are:
FundAmount on Loan
US$ CounterpartyCollateral Value
US$ Type of Collateral
Asia Pacific Equity 52,500,000 Barclays Capital Securities Limited 56,700,004 Equity
13,589,422 BNP Paribas Arbitrage (Paris) 14,849,341 Equity/Government Bond
7,968,952 Deutsche Bank AG (London Branch) 8,773,276 Equity
9,618,000 Goldman Sachs International 10,476,000 Equity
5,322,557 Macquarie Bank Limited (UK) 5,882,553 Equity
5,523,414 Merrill Lynch International 5,917,109 Equity/Government Bond
Asian Property Share 220,815 Credit Suisse Securities (Europe) Limited 329,973 Equity/Government Bond
Notes to the Financial Statements
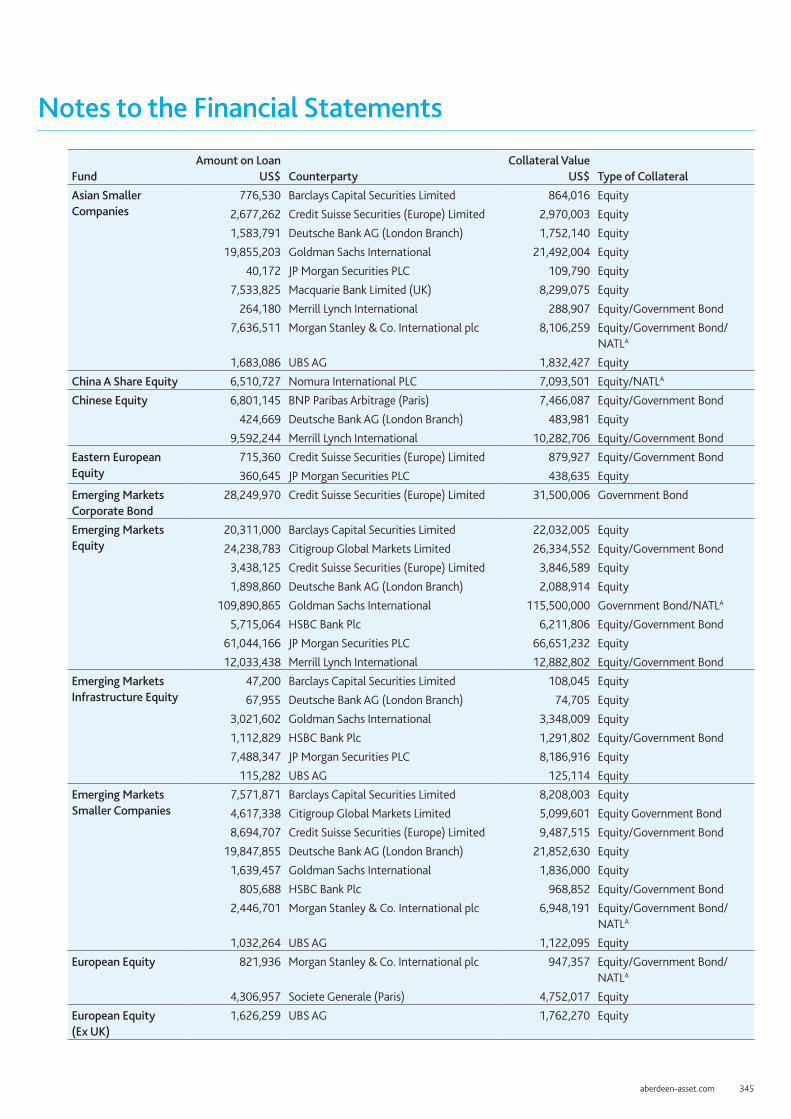
aberdeen-asset.com 345
FundAmount on Loan
US$ CounterpartyCollateral Value
US$ Type of Collateral
Asian Smaller Companies
776,530 Barclays Capital Securities Limited 864,016 Equity
2,677,262 Credit Suisse Securities (Europe) Limited 2,970,003 Equity
1,583,791 Deutsche Bank AG (London Branch) 1,752,140 Equity
19,855,203 Goldman Sachs International 21,492,004 Equity
40,172 JP Morgan Securities PLC 109,790 Equity
7,533,825 Macquarie Bank Limited (UK) 8,299,075 Equity
264,180 Merrill Lynch International 288,907 Equity/Government Bond
7,636,511 Morgan Stanley & Co. International plc 8,106,259 Equity/Government Bond/NATLA
1,683,086 UBS AG 1,832,427 Equity
China A Share Equity 6,510,727 Nomura International PLC 7,093,501 Equity/NATLA
Chinese Equity 6,801,145 BNP Paribas Arbitrage (Paris) 7,466,087 Equity/Government Bond
424,669 Deutsche Bank AG (London Branch) 483,981 Equity
9,592,244 Merrill Lynch International 10,282,706 Equity/Government Bond
Eastern European Equity
715,360 Credit Suisse Securities (Europe) Limited 879,927 Equity/Government Bond
360,645 JP Morgan Securities PLC 438,635 Equity
Emerging Markets Corporate Bond
28,249,970 Credit Suisse Securities (Europe) Limited 31,500,006 Government Bond
Emerging Markets Equity
20,311,000 Barclays Capital Securities Limited 22,032,005 Equity
24,238,783 Citigroup Global Markets Limited 26,334,552 Equity/Government Bond
3,438,125 Credit Suisse Securities (Europe) Limited 3,846,589 Equity
1,898,860 Deutsche Bank AG (London Branch) 2,088,914 Equity
109,890,865 Goldman Sachs International 115,500,000 Government Bond/NATLA
5,715,064 HSBC Bank Plc 6,211,806 Equity/Government Bond
61,044,166 JP Morgan Securities PLC 66,651,232 Equity
12,033,438 Merrill Lynch International 12,882,802 Equity/Government Bond
Emerging Markets Infrastructure Equity
47,200 Barclays Capital Securities Limited 108,045 Equity
67,955 Deutsche Bank AG (London Branch) 74,705 Equity
3,021,602 Goldman Sachs International 3,348,009 Equity
1,112,829 HSBC Bank Plc 1,291,802 Equity/Government Bond
7,488,347 JP Morgan Securities PLC 8,186,916 Equity
115,282 UBS AG 125,114 Equity
Emerging Markets Smaller Companies
7,571,871 Barclays Capital Securities Limited 8,208,003 Equity
4,617,338 Citigroup Global Markets Limited 5,099,601 Equity Government Bond
8,694,707 Credit Suisse Securities (Europe) Limited 9,487,515 Equity/Government Bond
19,847,855 Deutsche Bank AG (London Branch) 21,852,630 Equity
1,639,457 Goldman Sachs International 1,836,000 Equity
805,688 HSBC Bank Plc 968,852 Equity/Government Bond
2,446,701 Morgan Stanley & Co. International plc 6,948,191 Equity/Government Bond/NATLA
1,032,264 UBS AG 1,122,095 Equity
European Equity 821,936 Morgan Stanley & Co. International plc 947,357 Equity/Government Bond/NATLA
4,306,957 Societe Generale (Paris) 4,752,017 Equity
European Equity (Ex UK)
1,626,259 UBS AG 1,762,270 Equity
Notes to the Financial Statements

346 Aberdeen Global
FundAmount on Loan
US$ CounterpartyCollateral Value
US$ Type of Collateral
Frontier Markets Equity
5,069,006 Credit Suisse Securities (Europe) Limited 5,609,520 Equity/Government Bond
818,508 Morgan Stanley & Co. International plc 947,369 Equity/Government Bond/NATLA
959,197 UBS AG 1,042,931 Equity
Japanese Equity 21,576,127 Barclays Capital Securities Limited 23,328,000 Equity
44,798,059 BNP Paribas Arbitrage (Paris) 48,707,063 Equity/Government Bond
29,260,769 Credit Suisse Securities (Europe) Limited 31,878,681 Equity/Government Bond
283,470,476 Goldman Sachs International 306,288,004 Equity
32,654,374 Macquarie Bank Limited (UK) 35,546,645 Equity
48,166,818 Morgan Stanley & Co. International plc 50,743,804 Equity/Government Bond/NATLA
Japanese Smaller Companies
17,229,301 Barclays Capital Securities Limited 18,684,005 Equity
48,512,082 Credit Suisse Securities (Europe) Limited 52,645,799 Equity/Government Bond
129,089 Morgan Stanley & Co. International plc 210,410 Equity/Government Bond/NATLA
- UBS AG 970,818 Equity
Latin American Equity 2,961,720 Goldman Sachs International 3,240,009 Equity
North American Smaller Companies
10,635,484 Citigroup Global Markets Limited 11,580,334 Equity/Government Bond
16,121,625 Deutsche Bank AG (London Branch) 17,734,226 Equity
Russian Equity 782,680 Credit Suisse Securities (Europe) Limited 880,002 Equity
Select Emerging Markets Bond
170,057,360 Credit Suisse Securities (Europe) Limited 185,535,023 Government Bond
Select Euro High Yield Bond
126,666,288 Credit Suisse Securities (Europe) Limited 134,400,020 Government Bond
Technology Equity 1,772,171 Citigroup Global Markets Limited 1,948,326 Equity/Government Bond
3,771,367 JP Morgan Securities PLC 4,161,940 Equity
World Equity 4,572,669 Goldman Sachs International 4,968,002 Equity
World Government Bond
5,536,789 Bank of Nova Scotia 6,300,444 Government Bond
World Smaller Companies
218,942 Citigroup Global Markets Limited 323,513 Equity/Government Bond
A National Bonds of a Sovereign Nation.
For the period ended 31 March 2017 revenues arising from securities lending are as follows in the Fund currency:
Fund
Total gross amount of securities lending income
'000
Direct and indirect costs and fees deducted from
gross income '000
Total net amount of securities lending income
'000
Asia Pacific Equity 36 7 29
Asian Property Share 3 1 2
Asian Smaller Companies 673 135 538
China A Share Equity 49 10 39
Chinese Equity 264 53 211
Eastern European Equity 25 5 20
Emerging Markets Corporate Bond 85 17 68
Emerging Markets Equity 229 46 183
Emerging Markets Infrastructure Equity 25 5 20
Notes to the Financial Statements

aberdeen-asset.com 347
Fund
Total gross amount of securities lending income
'000
Direct and indirect costs and fees deducted from
gross income '000
Total net amount of securities lending income
'000
Emerging Markets Smaller Companies 103 21 82
European Equity 20 4 16
European Equity (Ex UK) 24 5 19
European Equity Dividend 1 - 1
Frontier Markets Equity 79 16 63
Japanese Equity 47,856 9,571 38,285
Japanese Smaller Companies 10,870 2,174 8,696
Latin American Equity 13 3 10
Multi Asset Income 1 - 1
North American Equity (10) (2) (8)
North American Smaller Companies 426 85 341
Russian Equity 16 3 13
Select Emerging Markets Bond 590 118 472
Select Euro High Yield Bond 854 171 683
Technology Equity 5 1 4
World Equity 39 8 31
World Government BondA - - -
World Resources Equity 15 3 12
World Smaller CompaniesB - - -A The unrounded gross return was $433 and the direct operational costs and fees incurred for securities lending for the six months to 31 March 2017 was $86.B The unrounded gross return was $235 and the direct operational costs and fees incurred for securities lending for the six months to 31 March 2017 was $47.
17 WITHHOLDING TAX RECLAIMSWithholding tax reclaims have been filed in respect of the withholding tax applied on dividends received during the recent years.
The decision for claiming is taken by the Board of Directors based on the analysis of costs to be borne and maximum potential amount refunded. The costs for pursuing the reclaims are borne only by the Funds potentially entitled to the refunds and recorded under Operational Expenses.
It is not possible to assess the likelihood of success of these reclaiming actions. Consequently no receivables with respect to the potential refunded amounts are booked until they are virtually certain.
Any proceeds received from these reclaiming actions will be booked in the respective Fund’s net asset values.
18 FUTURE EXPOSURE The following Funds have open future contracts with total commitments as follows:
Fund Currency Fund Exposure '000
Asian Credit Bond USD 1,689
Multi Asset Growth EUR 834
Select Global Credit Bond GBP 554
Select Global Investment Grade Credit Bond GBP 1,329
World Credit Bond USD 524
World Government Bond USD 35,788
Notes to the Financial Statements
348 Aberdeen Global
19 SINGAPORE SUBSIDIARYThe subsidiary in Singapore was incorporated as a limited company on 11 January 2013 with one issued share of USD 1 held by the Company. Its sole director was Hugh Young (also a director of the Company). Since incorporation it did not have any assets or liabilities and was a non-trading entity.
On 9 November 2016, a publication was made in the Government Gazette of Singapore to strike the company off the register if no objection was received within a 2 month period. Consequently the company was struck off the register on 9 January 2017.
20 CORPORATE GOVERNANCEThe Board has adopted the Principles of the ALFI Code of Conduct dated June 2013 (“the Code”), which sets out a framework of high level principles and best practice recommendations for the governance of Luxembourg investment funds.
The Board considers that it has been in compliance with the Principles of the Code in all material respects for the period ended 31 March 2017.
The Board meets regularly to consider the activities of the Company and receives reports on various activities, including compliance controls and risk management.
The Board of Directors has established an Audit Committee which is charged with reviewing the annual accounts and the external audit process (including the appointment and remuneration of the external Auditor, subject to Shareholders approval), and reviewing and monitoring internal audit matters.
The Board of Directors has also established a Risk Committee which has oversight of the Risk Management Framework of the Company and specifically the effectiveness of risk management, governance and compliance activity.
The collective remuneration of the Board of Directors charged to the Company amounts to US$90,915 for the period ended 31 March 2017.
Notes to the Financial Statements

aberdeen-asset.com 349
The Management Company has approved and adopted a UCITS V Remuneration Policy Statement in conjunction with the remuneration policy of the Aberdeen Asset Management group of companies. In accordance with the European Securities and Markets Authority (ESMA) Guidelines, the UCITS V Remuneration requirements will come into effect on 1 January 2017 following the first full performance period, accordingly there is no remuneration disclosures for this accounting period.
Remuneration

350 Aberdeen Global
Securities Financing TransactionsThe Company engages in Securities Financing Transactions (SFTs) (as defined in Article 3 of Regulation (EU) 2015/2365, SFTs include repurchase transactions, securities or commodities lending and securities or commodities borrowing, buy-sell back transactions or sell-buy back transactions and margin lending transactions). In accordance with Article 13 of the Regulation, the Company’s involvement in and exposures related to securities lending for the accounting period are detailed below:
As at 31 March 2017
Absolute value of assets engaged in SFTs
Market value of securities on loan
$’000 % of lendable assets% of assets under
management
Asia Pacific Equity 94,522 2.85 2.79
Asian Property Share 221 0.44 0.43
Asian Smaller Companies 42,051 2.38 2.32
China A Share Equity 6,511 1.21 1.09
Chinese Equity 16,818 2.79 2.68
Eastern European Equity 1,076 2.03 2.01
Emerging Markets Corporate Bond 28,250 9.86 9.34
Emerging Markets Equity 238,570 3.89 3.81
Emerging Markets Infrastructure Equity 11,853 6.47 6.28
Emerging Markets Smaller Companies 46,656 4.32 4.15
European Equity 5,129 2.42 2.43
European Equity (Ex UK) 1,626 1.29 1.34
Frontier Markets Equity 6,847 3.51 3.47
Japanese Equity 459,927 14.76 14.55
Japanese Smaller Companies 65,870 9.39 9.15
Latin American Equity 2,962 0.55 0.54
North American Smaller Companies 26,757 5.85 5.77
Russian Equity 783 3.72 3.69
Select Emerging Markets Bond 170,057 11.22 10.41
Select Euro High Yield Bond 126,666 11.47 11.23
Technology Equity 5,544 3.23 3.10
World Equity 4,573 0.72 0.71
World Government Bond 5,537 1.44 1.30
World Smaller Companies 219 0.94 0.92

aberdeen-asset.com 351
Top ten collateral issuers
Issuers
Market value of collateral
received $’000 Issuers
Market value of collateral
received $’000 Issuers
Market value of collateral
received $’000
Asia Pacific Equity Chinese Equity Emerging Markets Infrastructure Equity
RSA Insurance 5,581 US Treasury 3,363 Danone 1,068
Paddy Power Betfair 5,250 Reynolds American 961 Legrand Promesses 806
Mylan 5,250 Visa 'A' 961 L'Oreal 780
Shire 5,250 Sherwin-Williams 961 UK Treasury 440
Carnival (London Listed) 5,250 Starbucks 961 Banco BPM 409
CRH 5,250 Raytheon 961 KBC Bankverzekerings 408
Microsoft 5,250 Facebook 'A' 958 Prysmian 406
Syngenta 5,248 Deutsche Boerse (Tender) 734 Snam 404
InterContinental Hotels 4,832 LafargeHolcim 734 Telstra 403
International Consolidated Airlines 4,243 Experian 731 Aurizon Holdings 394
Asian Property Share Eastern European Equity Emerging Markets Smaller Companies
Australian Pharmaceutical Industries 16 Snam 63 US Treasury 2,515
Concordia Financial 16 Unipol Gruppo Finanziario 62 France (Government of) 2,310
Mitsui 16 Asahi Group Holdings 46 Germany (Federal Republic of) 2,137
Ferrovial 16 JFE Holdings 43 Sumitomo Realty & Development 1,504
Canon Inc 16 Australian Pharmaceutical Industries 43 Microsoft 1,239
Indra Sistemas 16 Mazda Motor Corp 43 Toshiba 1,091
Komatsu 16 Softbank Group 42 Osaka Gas Co 1,083
Kansai Electric Power Co 16 Hitachi Construction Machinery 42 Konica Minolta 1,073
JFE Holdings 15 Komatsu 42 Daiichi Sankyo Co 1,072
Sumitomo Mitsui Financial 15 Kansai Electric Power Co 42 Mitsui Chemicals 1,072
Asian Smaller Companies Emerging Markets Corporate Bond European Equity
France (Government of) 2,695 US Treasury 11,025 Wolseley 440
Germany (Federal Republic of) 2,695 UK Treasury 11,024 Schneider Electric 440
US Treasury 2,045 Canada (Government of) 4,383 Orange 440
Abbott Laboratories 1,990 Switzerland (Confederation of ) 3,360 InterContinental Hotels 440
Ameriprise Financial 1,990 Germany (Federal Republic of) 1,708 Siemens 440
Berkshire Hathaway 'B' 1,990 National Grid 440
Aetna 1,990 LVMH Moët Hennessy Louis Vuitton 440
Coca-Cola 1,990 Persimmon 440
Danone 1,990 Adecco 440
Safran 1,990 RSA Insurance 440
China A Share Equity Emerging Markets Equity European Equity (Ex UK)
France (Government of) 1,794 US Treasury 43,206 ABB 163
Medtronic 660 France (Government of) 39,413 Adecco 163
DCC 660 Germany (Federal Republic of) 38,914 Swiss Re 163
Seagate Technology 660 British Sky Broadcasting 8,617 Cie Financiere Richemont 163
Allegion 652 LafargeHolcim 6,599 Zurich Insurance 163
International Consolidated Airlines 386 Danone 5,410 Nestle 163
Pulte 379 Reynolds American 4,821 Roche 163
Celgene 377 Paddy Power Betfair 4,664 Syngenta 162
Bluescope Steel 330 Boliden 3,852 Julius Baer 137
WorleyParsons 330 Facebook 'A' 3,827 Aperam 81
Securities Financing Transactions

352 Aberdeen Global
Issuers
Market value of collateral
received $’000 Issuers
Market value of collateral
received $’000 Issuers
Market value of collateral
received $’000
Frontier Markets Equity Latin American Equity Select Emerging Markets Bond
Germany (Federal Republic of) 315 BB & T 300 US Treasury 64,937
France (Government of) 315 Berkshire Hathaway 'B' 300 UK Treasury 64,937
Challenger 280 AIG 300 Canada (Government of) 48,599
TDK 279 Danone 300 Germany (Federal Republic of) 4,327
Mazda Motor Corp 279 MetLife 300 Switzerland (Confederation of ) 2,277
JFE Holdings 276 Kering 300 France (Government of) 458
NTT Data Corp 275 Charles Schwab 300
Canon Inc 274 Marathon Petroleum 300
Mitsubishi Estate Co 274 Safran 300
Mitsui 274 Schneider Electric 300
Japanese Equity North American Smaller Companies Select Euro High Yield Bond
Kering 29,723 Mitsubishi 1,113 UK Treasury 47,040
Safran 29,428 Imperial Brands 1,112 US Treasury 47,040
Alphabet 28,630 London Stock Exchange 1,111 Canada (Government of) 29,501
Aetna 28,360 Paddy Power Betfair 1,106 Switzerland (Confederation of ) 5,901
The Walt Disney Company 28,360 AXA 988 Germany (Federal Republic of) 4,879
Danone 28,360 Unilever 886 Netherlands (Kingdom of) 39
Facebook 'A' 28,360 Mazda Motor Corp 886 Enel 207
Rockwell Automation 28,360 Osaka Gas Co 886 Banco BPM 207
Germany (Federal Republic of) 18,599 Toshiba 885 Ferrovial 205
France (Government of) 17,958 Kajima Corp 881 Finecobank 204
Japanese Smaller Companies Russian Equity Technology Equity
UK Treasury 7,903 East Japan Railway Co 44 Imperial Brands 572
Ingersoll-Rand 4,353 Salvatore Ferragamo 44 Anglo American 286
US Treasury 3,800 Red Electrica 44 Babcock International 234
London Stock Exchange 3,697 Panasonic 43 Cofinimmo 209
Novartis 3,161 Taiyo Yuden 43 Telstra 209
Allstate 2,821 Alps Electric 43 Viscofan 208
Konecranes 2,673 Finecobank 43 Enel 207
East Japan Railway Co 2,334 Fujitsu 43 Banco BPM 207
Cellnex Telecom 1,948 Svenska Cellulosa 'B' 43 Ferrovial 205
Agnico Eagle Mines 1,888 Softbank Group 42 Finecobank 204
Securities Financing Transactions

aberdeen-asset.com 353
Issuers
Market value of collateral
received $’000 Issuers
Market value of collateral
received $’000 Issuers
Market value of collateral
received $’000
World Equity World Government Bond World Smaller Companies
Capital One Financial 460 UK Treasury 2,205 Germany (Federal Republic of) 35
Vivendi 460 France (Government of) 2,205 Imperial Brands 32
Peugeot 460 Germany (Federal Republic of) 1,881 Schneider Electric 32
Danone 460 Canada (Government of) 9 Cooper 32
Chesapeake Energy 460 Paddy Power Betfair 32
Electronic Arts 460 France (Government of) 31
Marathon Petroleum 460 Syngenta 25
Safran 460 Red Electrica 16
Alphabet 459 Banco Bilbao Vizcaya Argentaria 16
Aetna 406 Gas Natural 15
Securities Financing Transactions

354 Aberdeen Global
Top ten counterparties per type of SFT
Counterparty
Market value of securities
on loan $’000 Counterparty
Market value of securities
on loan $’000 Counterparty
Market value of securities
on loan $’000
Asia Pacific Equity Emerging Markets Equity Japanese Equity
Barclays Capital Securities Limited 52,500 Goldman Sachs International 109,890 Goldman Sachs International 283,471
BNP Paribas Arbitrage (Paris) 13,589 JP Morgan Securities PLC 61,044 Morgan Stanley & Co. International plc 48,167
Goldman Sachs International 9,618 Citigroup Global Markets Limited 24,239 BNP Paribas Arbitrage (Paris) 44,798
Deutsche Bank AG (London Branch) 7,969 Barclays Capital Securities Limited 20,312 Macquarie Bank Limited (UK) 32,655
Merrill Lynch International 5,523 Merrill Lynch International 12,033 Credit Suisse Securities (Europe) Limited 29,260
Macquarie Bank Limited (UK) 5,323 HSBC Bank Plc 5,715 Barclays Capital Securities Limited 21,576
Credit Suisse Securities (Europe) Limited 3,438
Asian Property Share Deutsche Bank AG (London Branch) 1,899 Japanese Smaller Companies
Credit Suisse Securities (Europe) Limited 221 Credit Suisse Securities (Europe) Limited 48,512
Emerging Markets Infrastructure Equity Barclays Capital Securities Limited 17,229
JP Morgan Securities PLC 7,488 Morgan Stanley & Co. International plc 129
Asian Smaller Companies Goldman Sachs International 3,022
Goldman Sachs International 19,855 HSBC Bank Plc 1,113 Latin American Equity
Morgan Stanley & Co. International plc 7,637 UBS AG 115 Goldman Sachs International 2,962
Macquarie Bank Limited (UK) 7,534 Deutsche Bank AG (London Branch) 68
Credit Suisse Securities (Europe) Limited 2,677 Barclays Capital Securities Limited 47 North American Smaller Companies
UBS AG 1,683 Deutsche Bank AG (London Branch) 16,122
Deutsche Bank AG (London Branch) 1,584 Emerging Markets Smaller Companies Citigroup Global Markets Limited 10,635
Barclays Capital Securities Limited 777 Deutsche Bank AG (London Branch) 19,848
Merrill Lynch International 264 Credit Suisse Securities (Europe) Limited 8,695 Russian Equity
JP Morgan Securities PLC 40 Barclays Capital Securities Limited 7,572 Credit Suisse Securities (Europe) Limited 783
Citigroup Global Markets Limited 4,617
China A Share Equity Morgan Stanley & Co. International plc 2,447 Select Emerging Markets Bond
Nomura International PLC 6,511 Goldman Sachs International 1,639 Credit Suisse Securities (Europe) Limited 170,057
UBS AG 1,032
Chinese Equity HSBC Bank Plc 806 Select Euro High Yield Bond
Merrill Lynch International 9,592 Credit Suisse Securities (Europe) Limited 126,666
BNP Paribas Arbitrage (Paris) 6,801 European Equity
Deutsche Bank AG (London Branch) 425 Societe Generale (Paris) 4,307 Technology Equity
Morgan Stanley & Co. International plc 822 JP Morgan Securities PLC 3,771
Eastern European Equity Citigroup Global Markets Limited 1,773
Credit Suisse Securities (Europe) Limited 715 European Equity (Ex UK)
JP Morgan Securities PLC 361 UBS AG 1,626 World Equity
Goldman Sachs International 4,573
Emerging Markets Corporate Bond Frontier Markets Equity
Credit Suisse Securities (Europe) Limited 28,250 Credit Suisse Securities (Europe) Limited 5,069 World Government Bond
UBS AG 959 Bank of Nova Scotia 5,537
Morgan Stanley & Co. International plc 819
World Smaller Companies
Citigroup Global Markets Limited 219
Securities Financing Transactions

aberdeen-asset.com 355
Counterparty
Countries of counterparty establishment Type Quality
Collateral currency
Settlement and clearing Custodian
Market value of
collateral received
$’000
Asia Pacific Equity
Barclays Capital Securities Limited United Kingdom Equity Main market listing CHF Tri-party BNY Mellon 5,248
Barclays Capital Securities Limited United Kingdom Equity Main market listing EUR Tri-party BNY Mellon 33,049
Barclays Capital Securities Limited United Kingdom Equity Main market listing GBP Tri-party BNY Mellon 5,250
Barclays Capital Securities Limited United Kingdom Equity Main market listing USD Tri-party BNY Mellon 13,153
BNP Paribas Arbitrage (Paris) France Equity Main market listing EUR Tri-party JP Morgan 9,048
BNP Paribas Arbitrage (Paris) France Equity Main market listing JPY Tri-party JP Morgan 2,957
BNP Paribas Arbitrage (Paris) France Equity Main market listing USD Tri-party JP Morgan 2,801
BNP Paribas Arbitrage (Paris) France Government bond Investment grade EUR Tri-party JP Morgan 43
Deutsche Bank AG (London Branch) Germany Equity Main market listing EUR Tri-party JP Morgan 18
Deutsche Bank AG (London Branch) Germany Equity Main market listing JPY Tri-party JP Morgan 8,755
Goldman Sachs International United States Equity Main market listing EUR Tri-party BNY Mellon 1,940
Goldman Sachs International United States Equity Main market listing USD Tri-party BNY Mellon 8,536
Macquarie Bank Limited (UK) United Kingdom Equity Main market listing AUD Tri-party JP Morgan 590
Macquarie Bank Limited (UK) United Kingdom Equity Main market listing EUR Tri-party JP Morgan 5,293
Merrill Lynch International United States Equity Main market listing USD Tri-party BNY Mellon 3,982
Merrill Lynch International United States Government bond Investment grade USD Tri-party BNY Mellon 1,935
Asian Property Share
Credit Suisse Securities (Europe) Limited Switzerland Equity Main market listing AUD Tri-party JP Morgan 16
Credit Suisse Securities (Europe) Limited Switzerland Equity Main market listing CHF Tri-party JP Morgan 3
Credit Suisse Securities (Europe) Limited Switzerland Equity Main market listing EUR Tri-party JP Morgan 45
Credit Suisse Securities (Europe) Limited Switzerland Equity Main market listing JPY Tri-party JP Morgan 265
Credit Suisse Securities (Europe) Limited Switzerland Government bond Investment grade USD Tri-party JP Morgan 1
Asian Smaller Companies
Barclays Capital Securities Limited United Kingdom Equity Main market listing CHF Tri-party BNY Mellon 77
Barclays Capital Securities Limited United Kingdom Equity Main market listing EUR Tri-party BNY Mellon 412
Barclays Capital Securities Limited United Kingdom Equity Main market listing GBP Tri-party BNY Mellon 80
Barclays Capital Securities Limited United Kingdom Equity Main market listing USD Tri-party BNY Mellon 295
Credit Suisse Securities (Europe) Limited Switzerland Equity Main market listing AUD Tri-party JP Morgan 30
Credit Suisse Securities (Europe) Limited Switzerland Equity Main market listing EUR Tri-party JP Morgan 1,101
Credit Suisse Securities (Europe) Limited Switzerland Equity Main market listing JPY Tri-party JP Morgan 1,690
Credit Suisse Securities (Europe) Limited Switzerland Equity Main market listing USD Tri-party JP Morgan 149
Deutsche Bank AG (London Branch) Germany Equity Main market listing EUR Tri-party JP Morgan 9
Deutsche Bank AG (London Branch) Germany Equity Main market listing JPY Tri-party JP Morgan 1,504
Deutsche Bank AG (London Branch) Germany Equity Main market listing USD Tri-party JP Morgan 239
Goldman Sachs International United States Equity Main market listing EUR Tri-party BNY Mellon 3,980
Goldman Sachs International United States Equity Main market listing USD Tri-party BNY Mellon 17,512
JP Morgan Securities PLC United States Equity Main market listing AUD Tri-party JP Morgan 11
Securities Financing Transactions

356 Aberdeen Global
Counterparty
Countries of counterparty establishment Type Quality
Collateral currency
Settlement and clearing Custodian
Market value of
collateral received
$’000
JP Morgan Securities PLC United States Equity Main market listing CHF Tri-party JP Morgan 11
JP Morgan Securities PLC United States Equity Main market listing EUR Tri-party JP Morgan 56
JP Morgan Securities PLC United States Equity Main market listing JPY Tri-party JP Morgan 26
JP Morgan Securities PLC United States Equity Main market listing NZD Tri-party JP Morgan -
JP Morgan Securities PLC United States Equity Main market listing USD Tri-party JP Morgan 6
Macquarie Bank Limited (UK) United Kingdom Equity Main market listing AUD Tri-party JP Morgan 607
Macquarie Bank Limited (UK) United Kingdom Equity Main market listing EUR Tri-party JP Morgan 7,692
Merrill Lynch International United States Equity Main market listing USD Tri-party BNY Mellon 195
Merrill Lynch International United States Government bond Investment grade USD Tri-party BNY Mellon 94
Morgan Stanley & Co. International plc France Equity Main market listing EUR Tri-party BNY Mellon 765
Morgan Stanley & Co. International plc France Government bond Investment grade USD Tri-party BNY Mellon 1,951
Morgan Stanley & Co. International plc France NATLA Investment grade EUR Tri-party BNY Mellon 5,390
UBS AG Switzerland Equity Main market listing AUD Tri-party BNY Mellon 84
UBS AG Switzerland Equity Main market listing CHF Tri-party BNY Mellon 1,579
UBS AG Switzerland Equity Main market listing EUR Tri-party BNY Mellon 169
China A Share Equity
Nomura International PLC Japan Equity Main market listing AUD Tri-party BNY Mellon 660
Nomura International PLC Japan Equity Main market listing EUR Tri-party BNY Mellon 3,290
Nomura International PLC Japan Equity Main market listing USD Tri-party BNY Mellon 1,350
Nomura International PLC Japan NATLA Investment grade EUR Tri-party BNY Mellon 1,794
Chinese Equity
BNP Paribas Arbitrage (Paris) France Equity Main market listing CHF Tri-party JP Morgan 2,175
BNP Paribas Arbitrage (Paris) France Equity Main market listing EUR Tri-party JP Morgan 5,231
BNP Paribas Arbitrage (Paris) France Government bond Investment grade EUR Tri-party JP Morgan 60
Deutsche Bank AG (London Branch) Germany Equity Main market listing EUR Tri-party JP Morgan 4
Deutsche Bank AG (London Branch) Germany Equity Main market listing JPY Tri-party JP Morgan 480
Merrill Lynch International United States Equity Main market listing USD Tri-party BNY Mellon 6,919
Merrill Lynch International United States Government bond Investment grade USD Tri-party BNY Mellon 3,364
Eastern European Equity
Credit Suisse Securities (Europe) Limited Switzerland Equity Main market listing AUD Tri-party JP Morgan 79
Credit Suisse Securities (Europe) Limited Switzerland Equity Main market listing CHF Tri-party JP Morgan 8
Credit Suisse Securities (Europe) Limited Switzerland Equity Main market listing EUR Tri-party JP Morgan 166
Credit Suisse Securities (Europe) Limited Switzerland Equity Main market listing JPY Tri-party JP Morgan 625
Credit Suisse Securities (Europe) Limited Switzerland Government bond Investment grade USD Tri-party JP Morgan 2
JP Morgan Securities PLC United States Equity Main market listing AUD Tri-party JP Morgan 39
JP Morgan Securities PLC United States Equity Main market listing CHF Tri-party JP Morgan 1
JP Morgan Securities PLC United States Equity Main market listing EUR Tri-party JP Morgan 279
Securities Financing Transactions

aberdeen-asset.com 357
Counterparty
Countries of counterparty establishment Type Quality
Collateral currency
Settlement and clearing Custodian
Market value of
collateral received
$’000
JP Morgan Securities PLC United States Equity Main market listing JPY Tri-party JP Morgan 93
JP Morgan Securities PLC United States Equity Main market listing NZD Tri-party JP Morgan 1
JP Morgan Securities PLC United States Equity Main market listing USD Tri-party JP Morgan 25
Emerging Markets Corporate Bond
Credit Suisse Securities (Europe) Limited Switzerland Government bond Investment grade CAD Tri-party JP Morgan 4,383
Credit Suisse Securities (Europe) Limited Switzerland Government bond Investment grade CHF Tri-party JP Morgan 3,360
Credit Suisse Securities (Europe) Limited Switzerland Government bond Investment grade EUR Tri-party JP Morgan 1,708
Credit Suisse Securities (Europe) Limited Switzerland Government bond Investment grade GBP Tri-party JP Morgan 11,024
Credit Suisse Securities (Europe) Limited Switzerland Government bond Investment grade USD Tri-party JP Morgan 11,025
Emerging Markets Equity
Barclays Capital Securities Limited United Kingdom Equity Main market listing CHF Tri-party BNY Mellon 2,037
Barclays Capital Securities Limited United Kingdom Equity Main market listing EUR Tri-party BNY Mellon 10,200
Barclays Capital Securities Limited United Kingdom Equity Main market listing GBP Tri-party BNY Mellon 2,040
Barclays Capital Securities Limited United Kingdom Equity Main market listing USD Tri-party BNY Mellon 7,755
Citigroup Global Markets Limited United States Equity Main market listing CHF Tri-party JP Morgan 3,786
Citigroup Global Markets Limited United States Equity Main market listing EUR Tri-party JP Morgan 8,118
Citigroup Global Markets Limited United States Equity Main market listing JPY Tri-party JP Morgan 5,300
Citigroup Global Markets Limited United States Equity Main market listing USD Tri-party JP Morgan 8,162
Citigroup Global Markets Limited United States Government bond Investment grade EUR Tri-party JP Morgan 467
Citigroup Global Markets Limited United States Government bond Investment grade GBP Tri-party JP Morgan 9
Citigroup Global Markets Limited United States Government bond Investment grade USD Tri-party JP Morgan 492
Credit Suisse Securities (Europe) Limited Switzerland Equity Main market listing CHF Tri-party JP Morgan 186
Credit Suisse Securities (Europe) Limited Switzerland Equity Main market listing EUR Tri-party JP Morgan 1,596
Credit Suisse Securities (Europe) Limited Switzerland Equity Main market listing JPY Tri-party JP Morgan 2,065
Deutsche Bank AG (London Branch) Germany Equity Main market listing EUR Tri-party JP Morgan 27
Deutsche Bank AG (London Branch) Germany Equity Main market listing JPY Tri-party JP Morgan 2,062
Goldman Sachs International United States Government bond Investment grade USD Tri-party BNY Mellon 38,500
Goldman Sachs International United States NATLA Investment grade EUR Tri-party BNY Mellon 76,947
Goldman Sachs International United States NATLA Investment grade GBP Tri-party BNY Mellon 53
HSBC Bank Plc United Kingdom Equity Main market listing EUR Tri-party JP Morgan 3,166
HSBC Bank Plc United Kingdom Government bond Investment grade EUR Tri-party JP Morgan 913
HSBC Bank Plc United Kingdom Government bond Investment grade GBP Tri-party JP Morgan 2,132
HSBC Bank Plc United Kingdom Government bond Investment grade SEK Tri-party JP Morgan 1
JP Morgan Securities PLC United States Equity Main market listing AUD Tri-party JP Morgan 3,527
JP Morgan Securities PLC United States Equity Main market listing CHF Tri-party JP Morgan 15,997
JP Morgan Securities PLC United States Equity Main market listing EUR Tri-party JP Morgan 32,211
JP Morgan Securities PLC United States Equity Main market listing GBP Tri-party JP Morgan 86
JP Morgan Securities PLC United States Equity Main market listing JPY Tri-party JP Morgan 7,617
Securities Financing Transactions

358 Aberdeen Global
Counterparty
Countries of counterparty establishment Type Quality
Collateral currency
Settlement and clearing Custodian
Market value of
collateral received
$’000
JP Morgan Securities PLC United States Equity Main market listing NZD Tri-party JP Morgan 8
JP Morgan Securities PLC United States Equity Main market listing USD Tri-party JP Morgan 7,205
Merrill Lynch International United States Equity Main market listing USD Tri-party BNY Mellon 8,669
Merrill Lynch International United States Government bond Investment grade USD Tri-party BNY Mellon 4,214
Emerging Markets Infrastructure Equity
Barclays Capital Securities Limited United Kingdom Equity Main market listing CAD Tri-party BNY Mellon 1
Barclays Capital Securities Limited United Kingdom Equity Main market listing CHF Tri-party BNY Mellon 7
Barclays Capital Securities Limited United Kingdom Equity Main market listing DKK Tri-party BNY Mellon 1
Barclays Capital Securities Limited United Kingdom Equity Main market listing EUR Tri-party BNY Mellon 60
Barclays Capital Securities Limited United Kingdom Equity Main market listing GBP Tri-party BNY Mellon 10
Barclays Capital Securities Limited United Kingdom Equity Main market listing SEK Tri-party BNY Mellon 1
Barclays Capital Securities Limited United Kingdom Equity Main market listing USD Tri-party BNY Mellon 28
Deutsche Bank AG (London Branch) Germany Equity Main market listing EUR Tri-party JP Morgan 1
Deutsche Bank AG (London Branch) Germany Equity Main market listing JPY Tri-party JP Morgan 61
Deutsche Bank AG (London Branch) Germany Equity Main market listing USD Tri-party JP Morgan 13
Goldman Sachs International United States Equity Main market listing EUR Tri-party BNY Mellon 681
Goldman Sachs International United States Equity Main market listing USD Tri-party BNY Mellon 2,667
HSBC Bank Plc United Kingdom Equity Main market listing EUR Tri-party JP Morgan 851
HSBC Bank Plc United Kingdom Government bond Investment grade GBP Tri-party JP Morgan 440
HSBC Bank Plc United Kingdom Government bond Investment grade SEK Tri-party JP Morgan 1
JP Morgan Securities PLC United States Equity Main market listing AUD Tri-party JP Morgan 1,075
JP Morgan Securities PLC United States Equity Main market listing CHF Tri-party JP Morgan 387
JP Morgan Securities PLC United States Equity Main market listing EUR Tri-party JP Morgan 6,338
JP Morgan Securities PLC United States Equity Main market listing JPY Tri-party JP Morgan 186
JP Morgan Securities PLC United States Equity Main market listing NZD Tri-party JP Morgan 17
JP Morgan Securities PLC United States Equity Main market listing USD Tri-party JP Morgan 184
UBS AG Switzerland Equity Main market listing AUD Tri-party BNY Mellon 6
UBS AG Switzerland Equity Main market listing CHF Tri-party BNY Mellon 97
UBS AG Switzerland Equity Main market listing EUR Tri-party BNY Mellon 17
UBS AG Switzerland Equity Main market listing SEK Tri-party BNY Mellon 5
Emerging Markets Smaller Companies
Barclays Capital Securities Limited United Kingdom Equity Main market listing CHF Tri-party BNY Mellon 1,174
Barclays Capital Securities Limited United Kingdom Equity Main market listing EUR Tri-party BNY Mellon 3,680
Barclays Capital Securities Limited United Kingdom Equity Main market listing GBP Tri-party BNY Mellon 760
Barclays Capital Securities Limited United Kingdom Equity Main market listing USD Tri-party BNY Mellon 2,594
Citigroup Global Markets Limited United States Equity Main market listing CHF Tri-party JP Morgan 249
Citigroup Global Markets Limited United States Equity Main market listing EUR Tri-party JP Morgan 3,195
Citigroup Global Markets Limited United States Equity Main market listing JPY Tri-party JP Morgan 703
Securities Financing Transactions

aberdeen-asset.com 359
Counterparty
Countries of counterparty establishment Type Quality
Collateral currency
Settlement and clearing Custodian
Market value of
collateral received
$’000
Citigroup Global Markets Limited United States Equity Main market listing USD Tri-party JP Morgan 454
Citigroup Global Markets Limited United States Government bond Investment grade EUR Tri-party JP Morgan 463
Citigroup Global Markets Limited United States Government bond Investment grade USD Tri-party JP Morgan 36
Credit Suisse Securities (Europe) Limited Switzerland Equity Main market listing AUD Tri-party JP Morgan 153
Credit Suisse Securities (Europe) Limited Switzerland Equity Main market listing CAD Tri-party JP Morgan 96
Credit Suisse Securities (Europe) Limited Switzerland Equity Main market listing EUR Tri-party JP Morgan 2,235
Credit Suisse Securities (Europe) Limited Switzerland Equity Main market listing JPY Tri-party JP Morgan 3,722
Credit Suisse Securities (Europe) Limited Switzerland Equity Main market listing USD Tri-party JP Morgan 3,064
Credit Suisse Securities (Europe) Limited Switzerland Government bond Investment grade GBP Tri-party JP Morgan 48
Credit Suisse Securities (Europe) Limited Switzerland Government bond Investment grade USD Tri-party JP Morgan 170
Deutsche Bank AG (London Branch) Germany Equity Main market listing EUR Tri-party JP Morgan 405
Deutsche Bank AG (London Branch) Germany Equity Main market listing JPY Tri-party JP Morgan 21,447
Goldman Sachs International United States Equity Main market listing EUR Tri-party BNY Mellon 339
Goldman Sachs International United States Equity Main market listing USD Tri-party BNY Mellon 1,497
HSBC Bank Plc United Kingdom Equity Main market listing EUR Tri-party JP Morgan 638
HSBC Bank Plc United Kingdom Government bond Investment grade GBP Tri-party JP Morgan 331
Morgan Stanley & Co. International plc France Equity Main market listing EUR Tri-party BNY Mellon 655
Morgan Stanley & Co. International plc France Government bond Investment grade USD Tri-party BNY Mellon 2,309
Morgan Stanley & Co. International plc France NATLA Investment grade EUR Tri-party BNY Mellon 3,984
UBS AG Switzerland Equity Main market listing AUD Tri-party BNY Mellon 51
UBS AG Switzerland Equity Main market listing CHF Tri-party BNY Mellon 930
UBS AG Switzerland Equity Main market listing EUR Tri-party BNY Mellon 103
UBS AG Switzerland Equity Main market listing SEK Tri-party BNY Mellon 38
European Equity
Morgan Stanley & Co. International plc France Equity Main market listing EUR Tri-party BNY Mellon 85
Morgan Stanley & Co. International plc France Government bond Investment grade USD Tri-party BNY Mellon 315
Morgan Stanley & Co. International plc France NATLA Investment grade EUR Tri-party BNY Mellon 547
Societe Generale (Paris) United States Equity Main market listing CHF Tri-party BNY Mellon 440
Societe Generale (Paris) United States Equity Main market listing EUR Tri-party BNY Mellon 3,872
Societe Generale (Paris) United States Equity Main market listing GBP Tri-party BNY Mellon 440
European Equity (Ex UK)
UBS AG Switzerland Equity Main market listing AUD Tri-party BNY Mellon 81
UBS AG Switzerland Equity Main market listing CHF Tri-party BNY Mellon 1,438
UBS AG Switzerland Equity Main market listing EUR Tri-party BNY Mellon 162
UBS AG Switzerland Equity Main market listing SEK Tri-party BNY Mellon 81
Frontier Markets Equity
Credit Suisse Securities (Europe) Limited Switzerland Equity Main market listing AUD Tri-party JP Morgan 766
Securities Financing Transactions

360 Aberdeen Global
Counterparty
Countries of counterparty establishment Type Quality
Collateral currency
Settlement and clearing Custodian
Market value of
collateral received
$’000
Credit Suisse Securities (Europe) Limited Switzerland Equity Main market listing CHF Tri-party JP Morgan 54
Credit Suisse Securities (Europe) Limited Switzerland Equity Main market listing EUR Tri-party JP Morgan 55
Credit Suisse Securities (Europe) Limited Switzerland Equity Main market listing JPY Tri-party JP Morgan 4,724
Credit Suisse Securities (Europe) Limited Switzerland Government bond Investment grade USD Tri-party JP Morgan 10
Morgan Stanley & Co. International plc France Equity Main market listing EUR Tri-party BNY Mellon 85
Morgan Stanley & Co. International plc France Government bond Investment grade USD Tri-party BNY Mellon 233
Morgan Stanley & Co. International plc France NATLA Investment grade EUR Tri-party BNY Mellon 629
UBS AG Switzerland Equity Main market listing AUD Tri-party BNY Mellon 48
UBS AG Switzerland Equity Main market listing CHF Tri-party BNY Mellon 851
UBS AG Switzerland Equity Main market listing EUR Tri-party BNY Mellon 144
Japanese Equity
Barclays Capital Securities Limited United Kingdom Equity Main market listing CHF Tri-party BNY Mellon 2,157
Barclays Capital Securities Limited United Kingdom Equity Main market listing EUR Tri-party BNY Mellon 6,877
Barclays Capital Securities Limited United Kingdom Equity Main market listing GBP Tri-party BNY Mellon 2,160
Barclays Capital Securities Limited United Kingdom Equity Main market listing USD Tri-party BNY Mellon 12,134
BNP Paribas Arbitrage (Paris) France Equity Main market listing CHF Tri-party JP Morgan 7,149
BNP Paribas Arbitrage (Paris) France Equity Main market listing EUR Tri-party JP Morgan 30,292
BNP Paribas Arbitrage (Paris) France Equity Main market listing JPY Tri-party JP Morgan 6,532
BNP Paribas Arbitrage (Paris) France Government bond Investment grade EUR Tri-party JP Morgan 1,729
BNP Paribas Arbitrage (Paris) France Government bond Investment grade SEK Tri-party JP Morgan 3,005
Credit Suisse Securities (Europe) Limited Switzerland Equity Main market listing AUD Tri-party JP Morgan 5,231
Credit Suisse Securities (Europe) Limited Switzerland Equity Main market listing CAD Tri-party JP Morgan 1,525
Credit Suisse Securities (Europe) Limited Switzerland Equity Main market listing CHF Tri-party JP Morgan 3,305
Credit Suisse Securities (Europe) Limited Switzerland Equity Main market listing EUR Tri-party JP Morgan 11,180
Credit Suisse Securities (Europe) Limited Switzerland Equity Main market listing JPY Tri-party JP Morgan 6,754
Credit Suisse Securities (Europe) Limited Switzerland Government bond Investment grade EUR Tri-party JP Morgan 1,088
Credit Suisse Securities (Europe) Limited Switzerland Government bond Investment grade GBP Tri-party JP Morgan 1,698
Credit Suisse Securities (Europe) Limited Switzerland Government bond Investment grade USD Tri-party JP Morgan 1,098
Goldman Sachs International United States Equity Main market listing CHF Tri-party BNY Mellon 2,090
Goldman Sachs International United States Equity Main market listing EUR Tri-party BNY Mellon 112,347
Goldman Sachs International United States Equity Main market listing USD Tri-party BNY Mellon 191,851
Macquarie Bank Limited (UK) United Kingdom Equity Main market listing AUD Tri-party JP Morgan 50
Macquarie Bank Limited (UK) United Kingdom Equity Main market listing EUR Tri-party JP Morgan 31,091
Macquarie Bank Limited (UK) United Kingdom Equity Main market listing JPY Tri-party JP Morgan 4,405
Morgan Stanley & Co. International plc France Equity Main market listing EUR Tri-party BNY Mellon 4,815
Morgan Stanley & Co. International plc France Government bond Investment grade USD Tri-party BNY Mellon 12,189
Morgan Stanley & Co. International plc France NATLA Investment grade EUR Tri-party BNY Mellon 33,740
Securities Financing Transactions

aberdeen-asset.com 361
Counterparty
Countries of counterparty establishment Type Quality
Collateral currency
Settlement and clearing Custodian
Market value of
collateral received
$’000
Japanese Smaller Companies
Barclays Capital Securities Limited United Kingdom Equity Main market listing CHF Tri-party BNY Mellon 173
Barclays Capital Securities Limited United Kingdom Equity Main market listing EUR Tri-party BNY Mellon 6,919
Barclays Capital Securities Limited United Kingdom Equity Main market listing USD Tri-party BNY Mellon 11,592
Credit Suisse Securities (Europe) Limited Switzerland Equity Main market listing AUD Tri-party JP Morgan 6,365
Credit Suisse Securities (Europe) Limited Switzerland Equity Main market listing CAD Tri-party JP Morgan 3,735
Credit Suisse Securities (Europe) Limited Switzerland Equity Main market listing CHF Tri-party JP Morgan 3,161
Credit Suisse Securities (Europe) Limited Switzerland Equity Main market listing EUR Tri-party JP Morgan 17,503
Credit Suisse Securities (Europe) Limited Switzerland Equity Main market listing JPY Tri-party JP Morgan 7,413
Credit Suisse Securities (Europe) Limited Switzerland Equity Main market listing USD Tri-party JP Morgan 2,821
Credit Suisse Securities (Europe) Limited Switzerland Government bond Investment grade GBP Tri-party JP Morgan 7,903
Credit Suisse Securities (Europe) Limited Switzerland Government bond Investment grade USD Tri-party JP Morgan 3,745
Morgan Stanley & Co. International plc France Equity Main market listing EUR Tri-party BNY Mellon 15
Morgan Stanley & Co. International plc France Government bond Investment grade USD Tri-party BNY Mellon 55
Morgan Stanley & Co. International plc France NATLA Investment grade EUR Tri-party BNY Mellon 140
UBS AG Switzerland Equity Main market listing AUD Tri-party BNY Mellon 45
UBS AG Switzerland Equity Main market listing CHF Tri-party BNY Mellon 792
UBS AG Switzerland Equity Main market listing EUR Tri-party BNY Mellon 134
Latin American Equity
Goldman Sachs International United States Equity Main market listing EUR Tri-party BNY Mellon 1,200
Goldman Sachs International United States Equity Main market listing USD Tri-party BNY Mellon 2,040
North American Smaller Companies
Citigroup Global Markets Limited United States Equity Main market listing EUR Tri-party JP Morgan 7,452
Citigroup Global Markets Limited United States Equity Main market listing JPY Tri-party JP Morgan 2,339
Citigroup Global Markets Limited United States Equity Main market listing USD Tri-party JP Morgan 562
Citigroup Global Markets Limited United States Government bond Investment grade EUR Tri-party JP Morgan 662
Citigroup Global Markets Limited United States Government bond Investment grade USD Tri-party JP Morgan 565
Deutsche Bank AG (London Branch) Germany Equity Main market listing EUR Tri-party JP Morgan 222
Deutsche Bank AG (London Branch) Germany Equity Main market listing JPY Tri-party JP Morgan 17,512
Russian Equity
Credit Suisse Securities (Europe) Limited Switzerland Equity Main market listing CHF Tri-party JP Morgan 43
Credit Suisse Securities (Europe) Limited Switzerland Equity Main market listing EUR Tri-party JP Morgan 148
Credit Suisse Securities (Europe) Limited Switzerland Equity Main market listing JPY Tri-party JP Morgan 689
Select Emerging Markets Bond
Credit Suisse Securities (Europe) Limited Switzerland Government bond Investment grade CAD Tri-party JP Morgan 48,598
Credit Suisse Securities (Europe) Limited Switzerland Government bond Investment grade CHF Tri-party JP Morgan 2,278
Securities Financing Transactions

362 Aberdeen Global
Counterparty
Countries of counterparty establishment Type Quality
Collateral currency
Settlement and clearing Custodian
Market value of
collateral received
$’000
Credit Suisse Securities (Europe) Limited Switzerland Government bond Investment grade EUR Tri-party JP Morgan 4,785
Credit Suisse Securities (Europe) Limited Switzerland Government bond Investment grade GBP Tri-party JP Morgan 64,937
Credit Suisse Securities (Europe) Limited Switzerland Government bond Investment grade USD Tri-party JP Morgan 64,937
Select Euro High Yield Bond
Credit Suisse Securities (Europe) Limited Switzerland Government bond Investment grade CAD Tri-party JP Morgan 29,502
Credit Suisse Securities (Europe) Limited Switzerland Government bond Investment grade CHF Tri-party JP Morgan 5,901
Credit Suisse Securities (Europe) Limited Switzerland Government bond Investment grade EUR Tri-party JP Morgan 4,917
Credit Suisse Securities (Europe) Limited Switzerland Government bond Investment grade GBP Tri-party JP Morgan 47,040
Credit Suisse Securities (Europe) Limited Switzerland Government bond Investment grade USD Tri-party JP Morgan 47,040
Technology Equity
Citigroup Global Markets Limited United States Equity Main market listing EUR Tri-party JP Morgan 1,425
Citigroup Global Markets Limited United States Equity Main market listing JPY Tri-party JP Morgan 190
Citigroup Global Markets Limited United States Equity Main market listing USD Tri-party JP Morgan 211
Citigroup Global Markets Limited United States Government bond Investment grade EUR Tri-party JP Morgan 98
Citigroup Global Markets Limited United States Government bond Investment grade USD Tri-party JP Morgan 24
JP Morgan Securities PLC United States Equity Main market listing AUD Tri-party JP Morgan 418
JP Morgan Securities PLC United States Equity Main market listing CHF Tri-party JP Morgan 45
JP Morgan Securities PLC United States Equity Main market listing EUR Tri-party JP Morgan 3,356
JP Morgan Securities PLC United States Equity Main market listing GBP Tri-party JP Morgan 69
JP Morgan Securities PLC United States Equity Main market listing JPY Tri-party JP Morgan 267
JP Morgan Securities PLC United States Equity Main market listing NZD Tri-party JP Morgan 7
World Equity
Goldman Sachs International United States Equity Main market listing EUR Tri-party BNY Mellon 1,840
Goldman Sachs International United States Equity Main market listing USD Tri-party BNY Mellon 3,128
World Government Bond
Bank of Nova Scotia Canada Government bond Investment grade CAD Tri-party JP Morgan 9
Bank of Nova Scotia Canada Government bond Investment grade EUR Tri-party JP Morgan 4,086
Bank of Nova Scotia Canada Government bond Investment grade GBP Tri-party JP Morgan 2,205
World Smaller Companies
Citigroup Global Markets Limited United States Equity Main market listing CHF Tri-party JP Morgan 25
Citigroup Global Markets Limited United States Equity Main market listing EUR Tri-party JP Morgan 145
Citigroup Global Markets Limited United States Equity Main market listing JPY Tri-party JP Morgan 37
Citigroup Global Markets Limited United States Equity Main market listing USD Tri-party JP Morgan 47
Citigroup Global Markets Limited United States Government bond Investment grade EUR Tri-party JP Morgan 66
Citigroup Global Markets Limited United States Government bond Investment grade USD Tri-party JP Morgan 4A National Bonds of a Sovereign Nation.Two custodians are used to hold the collateral.
Securities Financing Transactions

aberdeen-asset.com 363
Securities Financing Transactions
Maturity Tenor of Collateral (remaining period to maturity)
Less than one day
$’000
One day to one week
$’000
One week to one month
$’000
One to three months
$’000
Three months to
one year $’000
Above one year
$’000
Open maturity
$’000Total
$’000
Asia Pacific Equity - - - - - 1,979 100,619 102,598
Asian Property Share - - - - - 1 329 330
Asian Smaller Companies - - - - 2,695 4,740 38,280 45,715
China A Share Equity - - - - - 1,794 5,300 7,094
Chinese Equity - - - - - 3,423 14,810 18,233
Eastern European Equity - - - - - 2 1,316 1,318
Emerging Markets Corporate Bond - 938 - - 6,185 24,377 - 31,500
Emerging Markets Equity - - 31 913 - 122,783 131,821 255,548
Emerging Markets Infrastructure Equity - - - - - 441 12,694 13,135
Emerging Markets Smaller Companies - - 12 - 1,674 5,654 48,183 55,523
European Equity - - - - - 863 4,836 5,699
European Equity (Ex UK) - - - - - - 1,762 1,762
Frontier Markets Equity - - - - - 873 6,727 7,600
Japanese Equity - - - - - 54,546 441,946 496,492
Japanese Smaller Companies - - 70 56 - 11,718 60,667 72,511
Latin American Equity - - - - - - 3,240 3,240
North American Smaller Companies - - 662 - - 565 28,087 29,314
Russian Equity - - - - - - 880 880
Select Emerging Markets Bond - 4,327 - 6,337 56,283 118,588 - 185,535
Select Euro High Yield Bond - 4,879 - - 20,702 108,819 - 134,400
Technology Equity - - 93 - - 29 5,988 6,110
World Equity - - - - - - 4,968 4,968
World Government Bond - - - - - 6,300 - 6,300
World Smaller Companies - - 14 - - 56 254 324

364 Aberdeen Global
Securities Financing Transactions
Maturity Tenor of securities on loan (remaining period to maturity)
Less than one day
$’000
One day to one week
$’000
One week to one month
$’000
One to three months
$’000
Three months to
one year $’000
Above one year
$’000
Open maturity
$’000Total
$’000
Asia Pacific Equity - - - - - - 94,522 94,522
Asian Property Share - - - - - - 221 221
Asian Smaller Companies - - - - - - 42,051 42,051
China A Share Equity - - - - - - 6,511 6,511
Chinese Equity - - - - - - 16,818 16,818
Eastern European Equity - - - - - - 1,076 1,076
Emerging Markets Corporate Bond - - - - - 28,250 - 28,250
Emerging Markets Equity - - - - - - 238,570 238,570
Emerging Markets Infrastructure Equity - - - - - - 11,853 11,853
Emerging Markets Smaller Companies - - - - - - 46,656 46,656
European Equity - - - - - - 5,129 5,129
European Equity (Ex UK) - - - - - - 1,626 1,626
Frontier Markets Equity - - - - - - 6,847 6,847
Japanese Equity - - - - - - 459,927 459,927
Japanese Smaller Companies - - - - - - 65,870 65,870
Latin American Equity - - - - - - 2,962 2,962
North American Smaller Companies - - - - - - 26,757 26,757
Russian Equity - - - - - - 783 783
Select Emerging Markets Bond - - - - - 170,057 - 170,057
Select Euro High Yield Bond - - - - - 123,443 3,223 126,666
Technology Equity - - - - - - 5,544 5,544
World Equity - - - - - - 4,573 4,573
World Government Bond - - - - - 5,537 - 5,537
World Smaller Companies - - - - - - 219 219
The Fund does not engage in any re-use of collateral.
Lending and collateral transactions are on an open basis and can be reclaimed on demand.

aberdeen-asset.com 365
Securities Financing TransactionsFor the period ended 31 March 2017
Return and cost per type of SFT
Total gross amount of securities
lending income
Direct costs deducted by securities
lending agent
Net amount of securities
lending income
Return of the securities lending
agent %
Return of the fund %
Asia Pacific Equity 36 7 29 25.00 100.00
Asian Property Share 3 1 2 25.00 100.00
Asian Smaller Companies 673 135 538 25.00 100.00
China A Share Equity 49 10 39 25.00 100.00
Chinese Equity 264 53 211 25.00 100.00
Eastern European Equity 25 5 20 25.00 100.00
Emerging Markets Corporate Bond 85 17 68 25.00 100.00
Emerging Markets Equity 229 46 183 25.00 100.00
Emerging Markets Infrastructure Equity 25 5 20 25.00 100.00
Emerging Markets Smaller Companies 103 21 82 25.00 100.00
European Equity 20 4 16 25.00 100.00
European Equity (Ex UK) 24 5 19 25.00 100.00
European Equity Dividend 1 - 1 25.00 100.00
Frontier Markets Equity 79 16 63 25.00 100.00
Japanese Equity 47,856 9,571 38,285 25.00 100.00
Japanese Smaller Companies 10,870 2,174 8,696 25.00 100.00
Latin American Equity 13 3 10 25.00 100.00
Multi Asset Income 1 - 1 25.00 100.00
North American Equity (10) (2) (8) 25.00 100.00
North American Smaller Companies 426 85 341 25.00 100.00
Russian Equity 16 3 13 25.00 100.00
Select Emerging Markets Bond 590 118 472 25.00 100.00
Select Euro High Yield Bond 854 171 683 25.00 100.00
Technology Equity 5 1 4 25.00 100.00
World Equity 39 8 31 25.00 100.00
World Government BondA - - - 25.00 100.00
World Resources Equity 15 3 12 25.00 100.00
World Smaller CompaniesB - - - 25.00 100.00
The income and costs above are stated in sub fund currency.A The unrounded gross return was $433 and the direct operational costs and fees incurred for securities lending for the six months to 31 March 2017 was $86.B The unrounded gross return was $235 and the direct operational costs and fees incurred for securities lending for the six months to 31 March 2017 was $47.

366 Aberdeen Global
Management and AdministrationInvestment Advisers Aberdeen Asset Managers Limited10 Queen’s Terrace Aberdeen AB10 1YG United Kingdom. Authorised and regulated by the Financial Conduct Authority in the United Kingdom.
Aberdeen Asset Management Asia Limited, (AAM Asia)21 Church Street, #01-01 Capital Square Two, Singapore 049480Regulated by the Monetary Authority of Singapore.
Aberdeen Asset Management Inc., (AAM Inc)1735 Market Street, 32nd Floor, Philadelphia, PA1903Regulated by the Securities and Exchange Commission in the United States.
Fund Managed by:
Asia Pacific Equity Fund AAM Asia
Asian Credit Bond Fund AAM Asia and AAM Inc
Asian Local Currency Short Duration Bond Fund AAM Asia
Asian Property Share Fund AAM Asia
Asian Smaller Companies Fund AAM Asia
Australasian Equity Fund AAM Asia
Brazil Bond Fund AAM Limited
Brazil Equity Fund AAM Limited
China A Share Equity Fund AAM Limited and AAM Asia
Chinese Equity Fund AAM Limited and AAM Asia
Eastern European Equity Fund AAM Limited
Emerging Markets Corporate Bond Fund AAM Limited and AAM Asia
Emerging Markets Equity Fund AAM Limited and AAM Asia
Emerging Markets Infrastructure Equity Fund AAM Limited and AAM Asia
Emerging Markets Local Currency Bond Fund AAM Limited
Emerging Markets Local Currency Corporate Bond AAM Limited
Emerging Markets Smaller Companies Fund AAM Limited and AAM Asia
European Equity Fund AAM Limited
European Equity Dividend Fund AAM Limited
European Equity (Ex UK) Fund AAM Limited
Frontier Markets Bond Fund AAM Limited and AAM Asia
Frontier Markets Equity Fund AAM Limited and AAM Asia
German Equity Fund AAM Limited
Indian Bond Fund AAM Asia
Indian Equity Fund AAM Asia
Japanese Equity Fund AAM Asia
Japanese Smaller Companies Fund AAM Asia
Latin American Equity Fund AAM Limited
Multi Asset Growth AAM Limited, AAM Inc and AAM Asia
Multi Asset Income Fund AAM Limited, AAM Inc and AAM Asia
Multi-Manager World Equity Fund AAM Limited
North American Equity Fund AAM Inc
North American Smaller Companies Fund AAM Inc
Responsible World Equity Fund AAM Limited
Russian Equity Fund AAM Limited
Select Emerging Markets Bond Fund AAM Limited
Select Emerging Markets Investment Grade Bond Fund AAM Limited
Select Euro High Yield Bond Fund AAM Limited
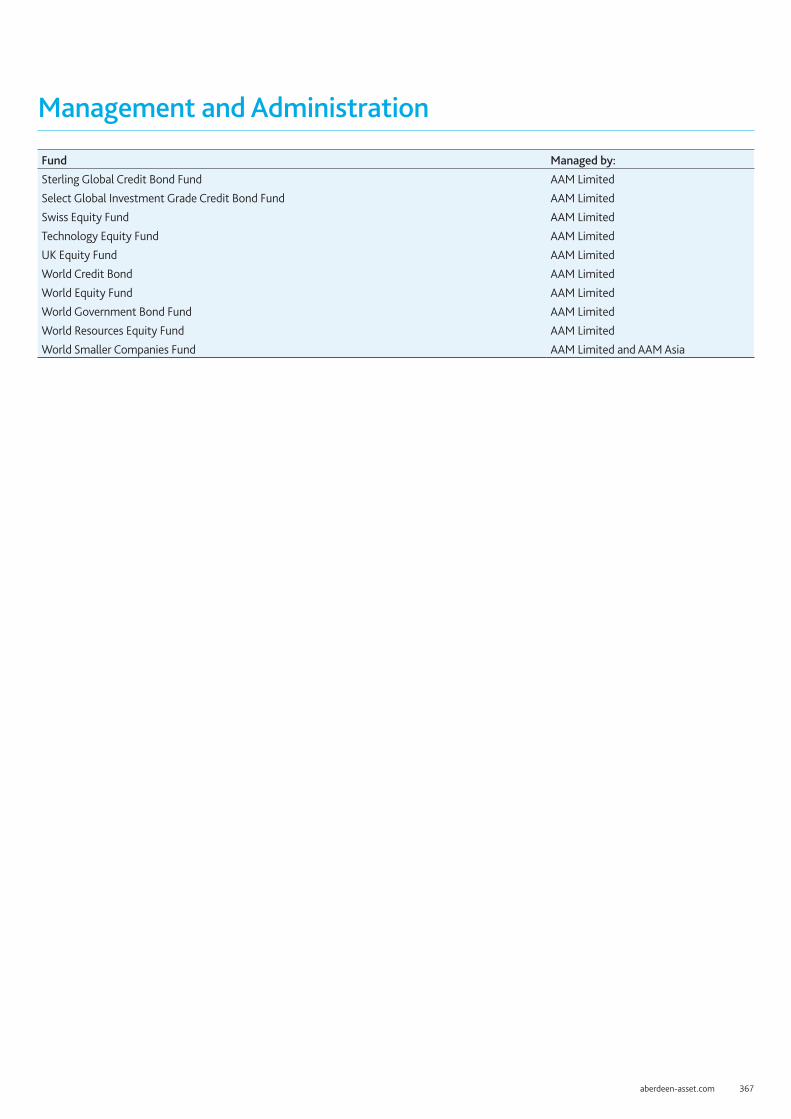
aberdeen-asset.com 367
Fund Managed by:
Sterling Global Credit Bond Fund AAM Limited
Select Global Investment Grade Credit Bond Fund AAM Limited
Swiss Equity Fund AAM Limited
Technology Equity Fund AAM Limited
UK Equity Fund AAM Limited
World Credit Bond AAM Limited
World Equity Fund AAM Limited
World Government Bond Fund AAM Limited
World Resources Equity Fund AAM Limited
World Smaller Companies Fund AAM Limited and AAM Asia
Management and Administration

368 Aberdeen Global
Chairman
Directors
Christopher G LittleAberdeen Global 35a, avenue John F. KennedyL-1855LuxembourgGrand Duchy of Luxembourg
Hugh YoungAberdeen Asset Management Asia Limited21 Church Street, #01–01 Capital Square TwoSingapore 049480
Martin J Gilbert Aberdeen Asset Managers Limited10 Queen’s TerraceAberdeen AB10 1YGUnited Kingdom
Gary MarshallAberdeen Asset Management Plc 40 Princes Street Edinburgh EH2 2BY
Bob Hutcheson Aberdeen Global 35a, avenue John F. KennedyL-1855LuxembourgGrand Duchy of Luxembourg
Soraya HashimzaiAberdeen Global Services S.A.35a, avenue John F. KennedyL-1855LuxembourgGrand Duchy of Luxembourg
Lynn BirdsongAberdeen Global35a, avenue John F. KennedyL-1855LuxembourgGrand Duchy of Luxembourg
Ian MacdonaldAberdeen Asset Management Asia Limited21 Church Street, #01–01 Capital Square TwoSingapore 049480
Roger BarkerAberdeen Global35a, avenue John F. KennedyL-1855LuxembourgGrand Duchy of Luxembourg
Cross TradeThe Manager / Investment Advisor may, as appropriate, make sales and purchases of assets of the Portfolio to or from its Associates or other clients in the same manner as if the other party were at arms length with the Client or Manager / Investment Advisor.
Management and Administration

aberdeen-asset.com 369
Registered Office Aberdeen Global, 35a, avenue John F. Kennedy L-1855 Luxembourg, Grand Duchy of Luxembourg
Management Company also acting as Domiciliary, Registrar, Transfer Agent and Listing Agent.Aberdeen Global Services S.A, 35a, avenue John F. Kennedy L-1855 Luxembourg, Grand Duchy of Luxembourg
Administrator and Depositary Bank.BNP Paribas Securities Services Luxembourg Branch, 60, avenue John F. Kennedy L-1855 Luxembourg, Grand Duchy of Luxembourg
Paying AgentState Street Bank Luxembourg S.C.A., 49 Avenue JF Kennedy, L-1855 Luxembourg, Grand Duchy of Luxembourg
Investment Manager & Global Distributor Aberdeen International Fund Managers Limited, Suites 1601 and 1609-1610 Chater House 8 Connaught Road Central Hong Kong
UK DistributorAberdeen Asset Managers Limited, 10 Queen’s Terrace, Aberdeen, AB10 1YG, United Kingdom
Auditor KPMG Luxembourg Société coopérative, 39, Avenue John F. Kennedy, L–1855 Luxembourg, Grand Duchy of Luxembourg
Legal Advisors to the CompanyElvinger Hoss & Prussen, 2 Place Winston Churchill, L–1340, Luxembourg, Grand Duchy of Luxembourg
German Paying AgentMarcard, Stein & Co AG, Ballindamm 36, D-20095 Hamburg, Germany
Austrian Paying and Information Agent Raiffeisen Bank International, Am Stadtpark 9, A-1030 Vienna, Austria
Swedish Paying Agent Skandinaviska Enskilda Banken AB, Rissneleden 110, SE-106 40 Stockholm, Sweden
Irish Facilities Agent Aberdeen Fund Management Ireland Limited, 78 Sir John Rogerson’s Quay, Dublin 2, Ireland
Swiss Paying Agent and RepresentativeBNP Paribas Securities Services, Paris, succursale de Zurich Selnaustrasse 16, CH-8002 Zurich, Switzerland.
Financial and Centralising Correspondent Agent in France BNP Paribas Securities Services, 3 rue d’Antin, 75002 Paris, France
Spanish DistributorAllfunds Bank SA, Calle Estafeta 6, Complejo Plaza de la Fuente, Edificio 3 (La Moraleja), C.P. 28109, Alcobendas, Madrid, Spain
Italian Paying AgentsBNP Paribas Securities Services, Via Ansperto no. 5, 20123, Milan, Italy
State Street Bank International GmbH, Succursale Italia Aporti 10, 20125, Milan, Italy
Allfunds Bank S.A., Italian branch Via Santa Margherita 7 20121 Milan, Italy
Société Générale Securities Services S.p.AVia Benigno Crespi 19A - MAC 2 20159 Milan, Italy
Banca Sella Holdings S.p.A., Piazza Gaudenzio Sella, 1 13900, Biella, Italy
Liechtenstein Paying AgentLGT Bank in Liechtenstein AG, Herrengasse 12, FL-9490 Vaduz, Liechtenstein.
Financial agent in BelgiumBNP Paribas Securities Services acting from its Brussels branch at Bld Louis Schmidt, 2, 1040 Brussels
Danish Paying Agent and RepresentativeNordea Bank Denmark, Strandgate 3, DK-0900 Copenhagen, Denmark
Management and Administration

370 Aberdeen Global
General InformationFurther Information on Aberdeen Global can be obtained from:
Aberdeen Asset Managers Limited Aberdeen International Fund Managers Limited(UK Distributor) (Global Distributor and Investment Manager)10 Queen’s Terrace Suites 1601 and 1609-1610,Aberdeen Chater House, 8 Connaught RoadAB10 1YG Central, Hong KongUnited Kingdom Telephone: +852 2103 4700aberdeen-asset.com Fax: +852 2103 4788
Additional information for investors in GermanyMarcard Stein & Co AG, Ballindamm 36, D-20095 Hamburg, has undertaken the function of Paying and Information Agent for the Company in the Federal Republic of Germany (the “German Paying and Information Agent”).
Applications for the subscriptions, redemptions, and conversion of shares may be sent to the German Paying and Information Agent.
All payments to investors, including redemption proceeds and potential distributions, may, upon request, be paid through the German Paying and Information Agent.
The full prospectus, Key Investor Information Documents (“KIIDs”), the Articles of Incorporation of the Company and the annual and semi-annual reports may be obtained, free of charge, at the office of the German Paying and Information Agent during normal opening hours. The statement of changes in the composition of the investment portfolio is also free of charge upon request at the office of the German Paying and Information Agent available.
Issue, redemption and conversion prices of the shares, and any other information to the shareholders, are also available from the German Paying and Information Agent.
Issue, redemption and conversion prices of the shares will also be available at aberdeen-asset.com and at the offices of the Transfer Agent. Any notices to the shareholders will be published on aberdeen-asset.de.
In March 2013, the German government agreed new legislation that required the calculation of daily Aktiengewinn II(AGII) figures for corporate investors in addition to the Aktiengewinn I (AGI) figures that are currently produced. These have been produced daily from the 1st July 2013 for each shareclass and are released as part of the daily price file distributed by the Funds administrator BNP Paribas Luxembourg.
For the period 1 March to 28 June 2013, the German tax authorities have confirmed that the AGII figures may be retrospectively calculated due to the short-time period allowed to the Fund Industry to develop and implement the new AGII calculations. The AGII figures for this period have been calculated and can be found on the Managers website at the following address: aberdeen-asset.de
Supplementary information for investors in SwitzerlandConditions for shares marketed in Switzerland or from a base in Switzerland.
For shares marketed in Switzerland or from a base in Switzerland, the following is applicable in addition to the Prospectus and the Key Investor Information Documents (“KIIDs”) conditions:
Swiss Representative and Paying Agent: BNP Paribas Securities Services, Paris, Succursale de ZurichSelnaustrasse 16CH-8002 ZurichSwitzerland
Place of distribution for relevant documentsThe constitution documents, Prospectus, KIID’s, articles of association, the annual and half-yearly reports and a schedule of purchases and sales for the Fund can be obtained free of charge from the representative’s Zurich branch.
Publicationsa. Required publications concerning foreign collective investments are published by the Swiss representative in the Swiss Official Gazette of
Commerce and on the electronic platform of fundinfo AG Zurich (www.fundinfo.com).
b. The Share issue price together with the redemption price and the Net Asset Value with indication of “commissions not included” are published when subscriptions and redemptions occur. Prices are published every working day on the electronic platform of fundinfo AG Zurich (www.fundinfo.com).
c. All Shareholder notices will be published on the electronic platform of fundinfo AG Zurich (www.fundinfo.com).

aberdeen-asset.com 371
Further InformationAberdeen GlobalAberdeen Global is an open-ended investment company incorporated with limited liability under the laws of the Grand Duchy of Luxembourg and organised as a société d’investissement à capital variable (a “SICAV”) with UCITS status (an Undertaking for Collective Investment in Transferable Securities as defined in the European Union Directive 2014/91/EU of 23 July 2014.
Aberdeen Global aims to provide investors with a broad international range of diversified actively-managed Funds. There are 48 active subfunds in total, each with its own specific investment objectives and individual portfolios, offering investors the opportunity of exposure to selected areas or to conveniently build a diversified global stock and bond portfolio to meet specific investment goals. The overall strategy of Aberdeen Global and the separate subfunds is to seek diversification through investment primarily in transferable securities.
Aberdeen Asset Management PLCAberdeen Asset Management PLC is an international investment management group, managing assets for both institutions and private investors from offices around the world. “Our goal is to deliver superior fund performance across diverse asset classes in which we believe we have a sustainable competitive edge. Listed on the London Stock Exchange, we manage fixed income and equities (quoted and private) in segregated, closed and open-ended pooled structures.
Over three decades we have expanded through a combination of organic growth and acquisition, first in the UK, then by seeking selectively to manage and (or) market funds in countries in which we already invest. We operate flat management structures to facilitate local decision-making, underpinned by clear lines of control and central reporting.
Our investment style is driven by fundamental analysis, with an emphasis on active management and team decision-making supported by strong process disciplines.
Aberdeen Asset Management PLC is a pure asset manager, without the distractions of other financial services activities, we are able to concentrate all our resources on our core business. We believe this is key to our performance. Assets are only managed for third parties, not our own balance sheet, which helps reduce conflicts of interest.
We dislike unnecessary obscurity and complexity so our investment processes strive to be simple and clear. We aim to seek out investments that display those qualities too. Finally, we focus on taking a long-term view of our investments.
Our business is predominantly the active management of financial assets, using first-hand research to make our investment decisions. Active investment spans equities, fixed income securities and property, sharing resources and a common investment approach. We have also developed a solutions business that can blend our abilities across different asset classes to provide tailored investment outcomes to meet specific client needs. This can incorporate skills in both quantitative equities and alternatives.
Our investment expertise is delivered through both segregated and pooled products – allowing us to serve a range of clients from institutions to private investors.”

121027405 03/17
Shareholder Service CentreAberdeen Global Services S.A,c/o State Street Bank Luxembourg S.C.A.49, Avenue J. F. KennedyL-1855 LuxembourgGrand Duchy of Luxembourg
For more information on Aberdeen Global, please contact:Tel +44 1224 425255 (UK Shareholders)Tel +352 46 40 10 820 (Outside UK)Fax +352 245 29 056
Aberdeen Asset Managers Limited(UK Distributor)10 Queen’s Terrace, AberdeenAB10 1YGAuthorised and regulated by The Financial Conduct Authority in the United KingdomMember of the Aberdeen Asset Management Group of Companies
Aberdeen Asset Management Asia Limited21 Church Street, #01-01 Capital Square Two, Singapore 049480Regulated by The Monetary Authority of SingaporeMember of the Aberdeen Asset ManagementGroup of Companies
Aberdeen International Fund Managers Limited (Global Distributor and Investment Manager)Suites 1601 and 1609-1610, Chater House, 8 Connaught Road Central, Hong KongTel +852 2103 4700Fax +852 2103 4788Regulated by The Securities and FuturesCommission of Hong KongMember of the Aberdeen Asset Management Group of Companies
Related Documents


![The Aberdeen Democrat. (Aberdeen, S.D.), 1905-03-17, [p ].](https://static.cupdf.com/doc/110x72/616d0ff553a9be267648fc3d/the-aberdeen-democrat-aberdeen-sd-1905-03-17-p-.jpg)