European Quarterly 9M 2008 A Lost Year December 2008

Welcome message from author
This document is posted to help you gain knowledge. Please leave a comment to let me know what you think about it! Share it to your friends and learn new things together.
Transcript

European Quarterly 9M 2008 A Lost Year December 2008


Aon Benfield
1 December 2008
European Quarterly
9M 2008 A Lost Year
Aon Benfield Research
Lewis Phillips T: +44 (0)20 7522 8207 F: +44 (0)20 7816 1600 E: [email protected]
Aon Benfield Research T: +44 (0)20 7522 4125 F: +44 (0)20 7816 1600 E: [email protected]
Benfield Group Limited trading as Aon Benfield ׀ Benfield Group Limited is a wholly owned subsidiary of Aon Corporation
www.aonbenfield.com
© Benfield Group Limited (for itself and on behalf of each company within its group of companies) (Trading as Aon Benfield) Aon Benfield reserves all rights to the content of this document. This document is provided exclusively for the use of the directors and employees of the organisation to which it was originally delivered. Copies may be made by that organisation for its own internal purposes, but no part of this document may be made available to any third party without both (i) Aon Benfield’s prior written consent and (ii) that third party having first signed a “recipient of report” letter in a form acceptable to Aon Benfield. Aon Benfield will accept no liability to any third party to whom this document is disclosed whether in compliance with the preceding sentence or otherwise. This document does not constitute any form of legal, accounting, taxation regulatory or actuarial advice. Without prejudice to the generality of the preceding sentence this document does not constitute an opinion of reserving levels or accounting treatment. The recipient acknowledges that in preparing this document Aon Benfield may have based analysis on data provided by the recipient and/or from third party sources. This data may have been subjected to mathematical and/or empirical analysis and modelling. Aon Benfield has not verified, and accepts no responsibility for, the accuracy or completeness of any such data. In addition, the recipient acknowledges that any form of mathematical and/or empirical analysis and modelling (including that used in the preparation of this document) may produce results which differ from actual events or losses. Where this document includes a recommendation or an assessment of risk, the recipient acknowledges that such recommendation or assessment of risk is an expression of Aon Benfield’s opinion only and not a statement of fact. Any decision to rely upon any such recommendation or assessment will be solely at the risk of the recipient, for which Aon Benfield accepts no liability, and the recipient acknowledges that this document does not replace the need for the recipient to make its own assessment. Aon Benfield will not be liable, in any event, for any special, indirect or consequential loss or damage of any kind (including, but not limited to, loss of profit and business interruption) arising from any use of the information contained in this document. Benfield Limited is authorised and regulated by the Financial Services Authority under the reference number 311884.

CONTENTS
Chapter page
A lost year 3
Premium income 4 Premiums 4 Pricing trends 5
Earnings 7 Major losses 7 Combined ratios 8 Investment income 9 Earnings 10
Balance sheet 13 Investments 13 Capital 15
Financial strength ratings 16
Appendix 17 Exchange rates 17 Equity markets 18 Bond yields 18 Corporate bonds 19 Reporting dates 19

European Quarterly 9M 2008 A Lost Year
PAGE 3
A lost year
A lost year Hannover Re summed up the European reinsurers’ results, describing 2008 as a lost year. While it suffered disproportionately at the nine month stage compared with its peers, Hannover Re’s bullish outlook for the reinsurance industry for 2009 was shared by all.
Reigning in Sliding premium rates, disciplined underwriting and adverse exchange rates were common themes at reporting dates throughout the year. All contributed to a decline in premium income for the European reinsurers. Aggregate gross written premiums for non-life reinsurance fell 2% to EUR26.2bn.
The big one Hurricane Ike punched above its weight, with insured losses now expected to be in the region of USD20bn, to rank third among all time storm losses. Following on from a first half with an above average major loss burden, the aggregate combined ratio rose 4.0pp to 100.0%, driving down underwriting profits.
Financial hurricanes Storms were not confined to the meteorological variety, as the third quarter witnessed extreme turbulence in the financial markets. Reinsurers suffered large realised and unrealised losses on equities and corporate bonds. Lower interest rates put pressure on ordinary investment income. Profits fell sharply.
Caution on capital The former emphasis on surplus capital and capital management evaporated. In the face of an expected upturn in the demand for reinsurance, the major reinsurers are looking to conserve capital to be able to respond to clients’ needs. Capital repatriated to shareholders was nevertheless a significant feature in the 18% reduction in the aggregate capitalisation of the European reinsurers.
Ratings reprieve The European reinsurers have so far escaped ratings downgrades. However, Standard & Poor’s sounded a warning that it considered the previous capital cushion was depleted and warned that it expected the current unfavourable market conditions to translate into what it termed substantial price rises at 1 January 2009 renewals.

European Quarterly 9M 2008 A Lost Year
PAGE 4
Premium income
Continuing price erosion was a feature of the first three quarters of 2008, leading to lower premium income for the European reinsurers. It was widely anticipated that the slide in pricing would be arrested, if not reversed, given the impact of storm losses and the financial market turmoil since the middle of the year and that top lines would benefit from the recent strengthening of the US dollar.
Premiums The European reinsurance groups have a mixed business profile. The contribution of non-life reinsurance to total gross premiums ranged from 93% to 37%, as shown in Chart 1. The “Other” segment for Munich Re comprises its substantial primary insurance businesses.
62%
37%
93%
55% 55%
0%
20%
40%
60%
80%
100%
Hannover Re Munich Re Paris Re SCOR Swiss Re
Non-life Reinsurance Life & Health Reinsurance Other
The development of reinsurance premium income is shown in Table 1. On a constant exchange rate basis, premiums were mostly down, reflecting both continued rate erosion and turning down of business which fell below price hurdles. Hannover Re showed the largest reduction in nominal terms, but reported that the underlying fall at constant exchange rates was 1.7%, reflecting also a withdrawal from specialty business.1 Munich Re’s premiums increased very slightly as acquisitions (principally The Midland Company in the USA which was consolidated from 1 April 2008, adding EUR344mn) compensated for adverse exchange rates. Premiums grew 9.0% at constant exchange rates.2
Reporting in US dollars, Paris Re was the exception, benefiting from the weakness of that currency for most of the period. At constant exchange rates, its premium income declined by 3.3%.3
1 Hannover Re Interim Report 3/2008 2 Munich Re Interim Report 3/2008 3 Paris Re, press release and conference call, 13 November 2008
Chart 1
Business mix
Company information, Benfield Research

European Quarterly 9M 2008 A Lost Year
PAGE 5
SCOR has presented pro-forma comparative figures for 2007 with Converium consolidated as if the acquisition had completed on 1 January 2007. On this basis, its premium income declined 4% in nominal terms but rose 1.8% at constant exchange rates.4 Swiss Re mentioned a cautious approach to underwriting and higher client retentions in recent renewals as the reasons for its top line contraction.5 In aggregate, gross written premiums declined 2% to EUR26.2bn.6
9M 2007 9M 2008 Change
Hannover Re EUR mn 4,102 3,792 -8%
Munich Re EUR mn 10,945 10,960 0%
Paris Re USD mn 1,327 1,342 1%
SCOR EUR mn 2,469 2,371 -4%
Swiss Re CHF mn 13,691 13,196 -4%
Broadly similar trends were evident in net written premiums, although Hannover Re and Paris Re increased net retentions. The impact of the 20% quota share with Berkshire Hathaway is evident at Swiss Re, which resulted in a 18% fall. In aggregate, net written premiums fell 7% to EUR22.3bn and net earned premiums were down 12% to EUR22.7bn.
9M 2007 9M 2008 Change
Hannover Re EUR mn 3,442 3,352 -3%
Munich Re EUR mn 10,101 9,772 -3%
Paris Re USD mn 1,014 1,127 11%
SCOR EUR mn 2,257 2,188 -3%
Swiss Re CHF mn 12,286 10,084 -18%
Pricing trends Hannover Re noted that softening tendencies were still evident in some major markets but in most cases it could obtain prices which were commensurate with risks accepted. It reported that it had increased its involvement in North American casualty business where it had obtained rate increases running into “double digits in some subsegments” reversing several years of rate reductions. Other growth areas for Hannover Re, where it saw better pricing, included German business, worldwide credit and surety and agricultural.
Munich Re reported a continuing decline in prices at the 1 July renewals in the USA, Australia and Latin America, commenting that there was considerable variation between markets and lines of business. The company said it will maintain its policy of switching out of unprofitable business segments in favour of those offering risk-adequate price levels.
4 SCOR, press release and conference call presentation, 14 November 2008 5 Swiss Re, conference call, 4 November 2008 6 Premiums for Paris Re and Swiss Re converted to euros at period-average exchange rates
Table 1
Non-life reinsurance gross written premiums
Company information, Aon Benfield Research
Table 2
Net written premiums
Company information, Aon Benfield Research
European Quarterly 9M 2008 A Lost Year
PAGE 6
Looking forward, the consensus view was that a combination of catastrophe losses in the third quarter, the turbulence in the financial markets and dislocations among primary insurers such as AIG was likely to boost the demand for reinsurance. This was expected to cause prices at least to stabilise, if not increase, at 1 January 2009 renewals. Munich Re saw more opportunities to implement differential pricing based on the strength of its balance sheet. CEO Jacques Aigrain said Swiss Re was in a “position to benefit from the current market developments”.7 The strengthening of the US dollar against the euro will also have a positive impact on premium income for all except Paris Re (which reports in dollars).
Hannover Re’s CEO Willhelm Zeller described 2008 as “a lost year”. With disarming frankness, he admitted that at the nine month stage “we failed each and every target”.8 Nevertheless, he remained bullish on the prospects for 2009 and beyond, noting that the capital constraints faced by cedants were likely to increase demand for reinsurance. The group assumed that “the soft market has bottomed out” and did not expect further softening of reinsurance terms and conditions.
7 Swiss Re, press release, 4 November 2008 8 Hannover Re conference call 5 November 2008

European Quarterly 9M 2008 A Lost Year
PAGE 7
Earnings
Earnings were impacted by higher catastrophe losses, notably from Hurricane Ike, which followed a first half with above average losses. The weighted average combined ratio for the group rose 4.0pp to 100.0%. Dislocation in the financial markets generated substantial realised and unrealised investment losses, driving profits sharply down.
Major losses Earlier this year, reinsurers appeared to have been “waiting for the big one”. Hurricane Gustav caused extensive damage in the Caribbean and other areas, before hitting the US mainland on 1 September. Insured losses are estimated by the major modelling agencies to be around the USD5bn mark. Hurricane Ike was initially on a direct line for Miami but then changed course to make US landfall in Texas. Although only a Category 2 storm (as determined by the windspeed), its high integrated kinetic energy and large windfield caused damage more closely associated by the modelling agencies with a Category 4 storm. Initial insured loss estimates from the agencies proved to be too low and more recently figures in the USD20bn range have become commonplace. Chart 2 shows the average of top end estimates for hurricane Ike from AIR, EQECAT and RMS and compares it with the ten most costly insured losses. Hurricane Ike looks set to rank third among storm losses, behind Hurricane Andrew and Hurricane Katrina. Early estimates from reinsurers have also had to be revised upwards as the full extent of claims has become apparent. The third quarter did indeed deliver the anticipated big one.
68.5
23.7
22.0
19.6
17.5
14.1
13.3
10.7
8.8
8.6
7.7
0 10 20 30 40 50 60 70 80
Hurricane Katrina
Hurricane Andrew
Terror Attack on WTC
Northridge Earthquake
Hurricane Ike
Hurricane Ivan
Hurricane Wilma
Hurricane Rita
Hurricane Charley
Typhoon Mirelle/No 19
Hurricane Hugo
USDbn
Values are at 2007 prices, except for Hurricane Ike
Other major losses in the quarter were hail losses in Germany and the Eurotunnel fire. Coming on top of an already above average level of major losses at the half year, losses year to date have been significantly higher than in the prior-year period. The trend has continued through the fourth quarter with events such as rainstorms in Queensland and wildfires in California which have caused an estimated USD600-800mn in insured losses.9
9 AIR Worldwide, 26 November 2008
Chart 2
Hurricane Ike vs. most costly insured losses 1997-2007
Swiss Re sigma 1/2008 Modelling agencies Aon Benfield Research

European Quarterly 9M 2008 A Lost Year
PAGE 8
Chart 3 shows Hurricane Ike losses in absolute terms (before tax) and as a proportion of shareholders’ funds at 30 June 2008. Hannover Re and Paris Re had significantly the highest proportionate loss on this measure.
221
300
13062
330
0
100
200
300
400
Hannover Re Munich Re Paris Re SCOR Swiss Re
Rep
ort
ing
curr
ency
0%
1%
2%
3%
4%
5%
6%
7%
Hurricane Ike loss (mn) % 30 June 2008 SHF (RH scale)
Table 3 shows the major losses incurred in the third quarter and nine months periods, together with the impact of the nine month losses on the combined ratio.
3Q 2008 9M 2008
9M 2008 loss ratio impact p.p.
Hannover Re EUR mn 315 445 14.3%
Munich Re EUR mn 441 1,218 12.5%
Paris Re USD mn 128 142 15.4%
SCOR EUR mn 113 200 9.4%
Swiss Re CHF mn 385 677 6.3%
Combined ratios Table 4 shows nine month combined ratios for group companies’ P&C reinsurance segment.10 Reflecting the burden of higher catastrophe losses, they were higher across the board than during the prior period when catastrophe losses were below average. The weighted average combined ratio for the group was four percentage points (pp) higher at 100.0%.11 Swiss Re figures are for its traditional business only. Its combined ratio was noticeably the lowest. Paris Re had the highest combined ratio and the highest expense ratio.
10 For consistency, Aon Benfield calculates combined ratios as the sum of net claims incurred and expenses to net premiums earned, all as recorded in the technical accounts. In some cases, the resulting ratios differ from those published by companies, where different calculation bases have been used or adjustments have been made to the figures shown in the income statements. 11 Weighted by net earned premiums, converted to euros at period average exchange rates.
Chart 3
Hurricane Ike losses
Company information, Aon Benfield Research
Table 3
Major losses
Company information, Aon Benfield Research

European Quarterly 9M 2008 A Lost Year
PAGE 9
Reserve development had only a limited net impact on results. Swiss Re again reported approximately CHF100mn of adverse development on its Workers’ Compensation business in the third quarter and added a similar amount in Credit & Surety in anticipation of higher claims in Europe. Together, these amounted to 1.2pp on the loss ratio which was broadly offset by net favourable development in several lines during the first half. For the first time, Hannover Re reported EUR77mn of net reserve releases, benefiting the loss ratio by 2.6pp. SCOR had 0.6pp of reserve releases on Aviation in the first quarter and commutation profits equivalent to 0.7pp in the third quarter, giving a 0.4pp boost to the 9M combined ratio.
Combined ratio 9M 2007
Combined ratio 9M 2008
Loss ratio 9M 2008
Expense ratio 9M 2008
Hannover Re 101.5% 104.2% 78.0% 26.3%
Munich Re 98.2% 100.6% 71.8% 28.8%
Paris Re 93.4% 106.7% 76.1% 30.6%
SCOR 98.6% 99.6% 71.5% 28.2%
Swiss Re 90.5% 96.4% 67.7% 28.6%
Weighted avge 96.0% 100.0% 71.7% 28.3%
Investment income Table 5 shows ordinary investment income, excluding capital gains and losses, across all business segments. The effect of lower interest rates during the year is evident in the fall in the investment return. Average invested assets were higher year-on-year for Hannover Re, Paris Re and SCOR, which helped keep up investment income. Average investments fell at Munich Re and Swiss Re, contributing to the fall in investment income.
Investment income Return on avge inv assets
9M 2007 9M 2008 9M 2007 9M 2008
Hannover Re EUR mn 768 760 3.6% 3.4%
Munich Re EUR mn 5,751 5,091 4.3% 3.9%
Paris Re USD mn 178 184 4.6% 4.5%
SCOR EUR mn 537 546 n.a. 3.8%
Swiss Re CHF mn 7,718 6,312 4.2% 3.6%
Note: SCOR 9M 2007 includes Converium pro-forma for nine months
The turbulence in the financial markets took its toll on all the group companies, in the form of realised and unrealised capital losses on investments. Equity holdings were significantly impaired, and corporate bonds were marked down as spreads over government bonds widened. Unrealised capital gains on government bond holdings caused by lower interest rates could not compensate. The net contribution from capital gains and losses, including investment write-downs, is shown in Table 6.
Table 4
Combined ratios
Company information, Aon Benfield Research
Table 5
Ordinary investment income
Company information, Aon Benfield Research

European Quarterly 9M 2008 A Lost Year
PAGE 10
9M 2007 9M 2008
Hannover Re EUR mn 88 -389
Munich Re EUR mn 1,885 -1,154
Paris Re USD mn 6 1
SCOR EUR mn 96 -101
Swiss Re CHF mn 833 -6,102
Swiss Re suffered substantially the largest losses. Its net CHF6.1bn charge was largely explained by CHF7.6bn in realised and unrealised gains on trading securities and CHF0.7bn of other than temporary impairments. Realised gains and losses on bonds and equities broadly balanced. There were net positives of CHF1.3bn gains on other investments and CHF1.0bn of foreign exchange gains. CHF3.6bn of the total CHF6.1bn of losses occurred within the Admin Re segment of the Life and Health division and was largely attributable to life policyholders.
Munich Re reported a net EUR1.2bn of capital losses, which included EUR2.3bn of investment write-downs, mostly on equities. These were partly offset by EUR1.1bn of realised gains, mostly on derivative financial products used to hedge the equity portfolio. Some EUR1.1bn of write-offs occurred in the primary life insurance segment. While these gains would normally be substantially for the account of life policyholders, in German life insurance contracts, losses are normally borne by shareholders.
Hannover Re incurred EUR443mn of investment impairment charges, mostly relating to equities. SCOR reported asset impairments of EUR127mn, partly offset by EUR62mn of realised gains. Impairments were relatively modest for Paris Re at USD21mn, largely offset by realised gains on the sale of its entire equity portfolio in the first half of the year.
Earnings Chart 4 shows the divisional contribution to pre-tax profits. Segmental results reflect differences in reporting as well as the allocation of investment income and central costs. Higher combined ratios negatively impacted the contribution from P&C reinsurance, with worse investment results comprising the majority of the remaining difference. The operating loss in Hannover Re’s P&C reinsurance segment includes investment losses on equities, which were allocated to this segment. Hannover Re recorded its first ever loss for the nine month period.
Swiss Re’s P&C segment income halved to CHF2.2bn as underwriting income fell, and because of a CHF1.2bn swing in capital gains to a loss of CHF0.9bn. Life results were negatively impacted by investment losses and a spike in mortality losses.
Paris Re’s results were again distorted by the accounting treatment relating to amortisation of intangibles associated with the purchase of AXA Re’s business. It reported after tax operating income of USD97mn for 9M 2008 compared with USD204mn in the prior year period.12
12 Paris Re’s operating income excludes amortisation of intangibles, foreign exchange differences, capital gains and certain other impairment charges
Table 6
Capital gains/losses
Company information, Aon Benfield Research

European Quarterly 9M 2008 A Lost Year
PAGE 11
Paris Re
11
86
-200-150-100-50
050
100150200250300
9M 2007 9M 2008
USD
mn
P&C RI Other Total pre-tax profit
Hannover Re
-25
620
-200
-100
0
100
200
300
400
500
600
700
9M 2007 9M 2008
EUR
mn
P&C Life & Health Other Total pre-tax profit
Munich Re
3,742
2,162
-1,000
0
1,000
2,000
3,000
4,000
5,000
9M 2007 9M 2008EU
Rm
n
P&C Reinsurance Life & Health ReinsPrimary Ins and other Finance etcTotal pre-tax profit
SCOR
271
455
-100
0
100
200
300
400
500
600
9M 2007 9M 2008
EUR
mn
Non-life reinsurance Life reinsuranceFinance / other Total pre-tax profit
Swiss Re
890
4,923
-10,000
-5,000
0
5,000
10,000
15,000
9M 2007 9M 2008
CH
Fmn
P&C Life & Health Fin Services
Centre/other Total pre-tax profit
Chart 4
Divisional contribution to pre-tax profits
Company information, Aon Benfield Research

European Quarterly 9M 2008 A Lost Year
PAGE 12
Table 7 shows the development of net income, which was similarly down in all cases. SCOR benefited from a EUR12mn tax credit compared with a more normal EUR98mn charge in the prior year period. In contrast, Hannover Re’s tax charge was EUR114mn, despite a pre-tax loss, because capital losses on disposals and write-downs of equities are not tax-deductible under German law.
9M 2007 9M 2008 Change
Hannover Re EUR mn 654 -140 n.a.
Munich Re EUR mn 3,348 1,418 -58%
Paris Re USD mn 93 2 -98%
SCOR EUR mn 356 283 -21%
Swiss Re CHF mn 3,992 884 -78%
Table 7
Net income
Company information, Aon Benfield Research

European Quarterly 9M 2008 A Lost Year
PAGE 13
Balance sheet
Balance sheets suffered from the weakness in financial markets, especially during the third quarter, reducing the value of investment portfolios and weakening capitalisation. Despite still retaining substantial excess capital, Swiss Re has suspended its share buy-back programme in response to market conditions.
Investments Table 8 shows the movement in total invested assets at each company during the year. Swiss Re reported the largest fall, which it attributed to the combined effects of the weakening of the US dollar against the Swiss franc and, especially in the third quarter, the decline in market values. Despite currency effects and the financial market turmoil, Hannover Re’s total investments grew by 4%, driven by strong cash flow.
31 Dec 2007 30 Sept 2008 Change
Hannover Re EUR mn 29,042 30,142 4%
Munich Re EUR mn 176,481 172,148 -2%
Paris Re USD mn 5,608 5,307 -5%
SCOR EUR mn 19,093 19,175 0%
Swiss Re CHF mn 255,687 214,285 -16%
The composition of invested assets is shown in Chart 5. Figures presented are gross of any hedging. Funds withheld remains a significant component for Hannover Re, Paris Re and SCOR. Equity exposures fell as a result of market value declines and disposals. The vast majority of the CHF17bn equities on Swiss Re’s balance sheet were for the account of life policyholders. Net of hedging, its own account global equity portfolio was close to zero at the end of the period. Hannover Re reported that it had disposed of its remaining equity holdings during October 2008.
0%
20%
40%
60%
80%
100%
Hannover Re Munich Re Paris Re SCOR Swiss Re
Bonds Equities Cash Funds withheld Other
Table 8
Invested assets at 30 September 2008
Company information, Aon Benfield Research
Chart 5
Composition of invested assets
Company information, Aon Benfield Research
European Quarterly 9M 2008 A Lost Year
PAGE 14
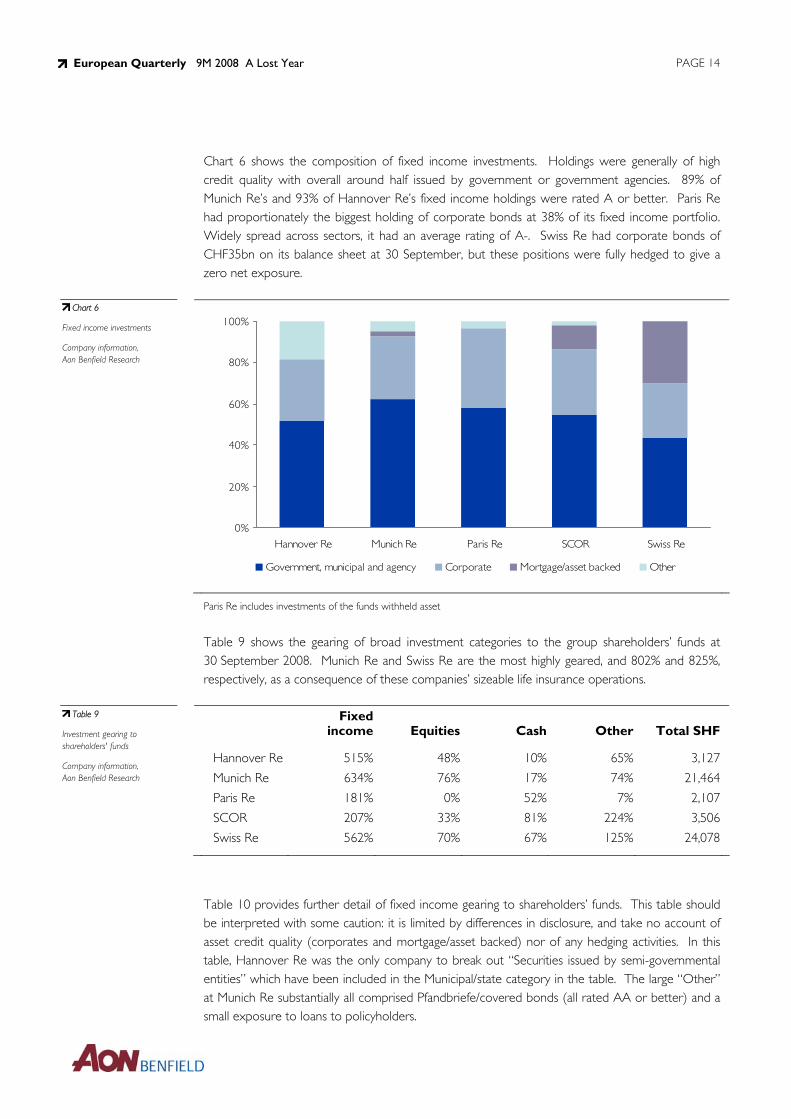
Chart 6 shows the composition of fixed income investments. Holdings were generally of high credit quality with overall around half issued by government or government agencies. 89% of Munich Re’s and 93% of Hannover Re’s fixed income holdings were rated A or better. Paris Re had proportionately the biggest holding of corporate bonds at 38% of its fixed income portfolio. Widely spread across sectors, it had an average rating of A-. Swiss Re had corporate bonds of CHF35bn on its balance sheet at 30 September, but these positions were fully hedged to give a zero net exposure.
0%
20%
40%
60%
80%
100%
Hannover Re Munich Re Paris Re SCOR Swiss Re
Government, municipal and agency Corporate Mortgage/asset backed Other
Paris Re includes investments of the funds withheld asset
Table 9 shows the gearing of broad investment categories to the group shareholders’ funds at 30 September 2008. Munich Re and Swiss Re are the most highly geared, and 802% and 825%, respectively, as a consequence of these companies’ sizeable life insurance operations.
Fixed
income Equities Cash Other Total SHF
Hannover Re 515% 48% 10% 65% 3,127
Munich Re 634% 76% 17% 74% 21,464
Paris Re 181% 0% 52% 7% 2,107
SCOR 207% 33% 81% 224% 3,506
Swiss Re 562% 70% 67% 125% 24,078
Table 10 provides further detail of fixed income gearing to shareholders’ funds. This table should be interpreted with some caution: it is limited by differences in disclosure, and take no account of asset credit quality (corporates and mortgage/asset backed) nor of any hedging activities. In this table, Hannover Re was the only company to break out “Securities issued by semi-governmental entities” which have been included in the Municipal/state category in the table. The large “Other” at Munich Re substantially all comprised Pfandbriefe/covered bonds (all rated AA or better) and a small exposure to loans to policyholders.
Chart 6
Fixed income investments
Company information, Aon Benfield Research
Table 9
Investment gearing to shareholders' funds
Company information, Aon Benfield Research

European Quarterly 9M 2008 A Lost Year
PAGE 15
Government and agencies Corporate
Municipal/ state other
Mortgage/ asset backed Other
Hannover Re 130% 154% 135% 96% 0%
Munich Re 273% 133% 0% 31% 197%
Paris Re 107% 72% 0% 6% 3%
SCOR 111% 65% 0% 27% 4%
Swiss Re 245% 147% 1% 170% 0%
Capital Table 11 shows how shareholders’ funds at each company has declined during the first nine months of 2008. A major factor has been the reduction in unrealised gains on investments as stock markets have fallen and credit spreads widened on corporate bonds. Munich Re, Paris Re and Swiss Re were all active in returning capital to shareholders through share repurchase and dividend payments. Earlier in the year, SCOR issued EUR20mn in new equity in connection with the squeeze-out of the residual minority in Converium. This was partly offset by a EUR8mn purchase of treasury shares. The strengthening of the US dollar in the third quarter meant the impact of adverse foreign exchange movements was lessened from the position at 30 June 2008. Converted where necessary to euros, the group’s aggregate capitalisation fell 17% to EUR44.7bn.13
Swiss Re said it still had over CHF5bn of excess capital over the AA level, but in the light of market conditions it was suspending its share buy-back programme for the time being. Of a total CHF7.75bn, the programme was 51% complete at the end of October 2008.
mn Hannover Re
EUR Munich Re
EUR Paris Re
USD SCOR
EUR Swiss Re
CHF
31 December 2007 3,922 25,458 2,474 3,629 31,867
Capital increase 0 -1,373 -391 12 -1,467
Net profit -140 1,418 2 283 884
Dividends paid etc -319 -1,184 0 -143 -1,331
FX changes 8 207 28 -7 -878
Change in unrealised gains -313 -2,963 -23 -267 -5,162
Other -31 -99 18 -2 165
Total changes -795 -3,994 -367 -124 -7,789
30 September 2008 3,127 21,464 2,107 3,505 24,078
Change -20% -16% -15% -3% -24%
13 Paris Re and Swiss Re converted to euros at exchange rates on the balance sheet date
Table 10
Fixed income gearing to shareholders' funds
Company information, Aon Benfield Research
Table 11
Change in shareholders' funds
Company information, Aon Benfield Research

European Quarterly 9M 2008 A Lost Year
PAGE 16
Financial strength ratings
Ratings of the European group have not altered despite the financial market turbulence, but S&P has warned that it considers the capital cushion to be depleted.
Despite the financial market turbulence, and weaker than expected results, there have been no recent rating actions to affect the European group. Commenting on the global reinsurance sector, Standard & Poor’s observed that much of the previously available capital cushion to current ratings had been eroded by the shocks of the past year to both sides of the balance sheet. The agency said it had altered its expectations for the sector to recognise a somewhat depleted capital base, lower investment returns and a “spike” in the cost of capital, all of which it expects to constrain reinsurers’ financial flexibility. It expects these to translate into what it termed substantial (risk-adjusted) price increases at the forthcoming January renewal. Absent such increases, S&P warned that it might change its outlook on the sector from stable to negative and take negative rating action on those companies deemed most exposed.14
Table 12 shows the financial strength ratings of the principal operating entities of the ABEQ group as at 28 November 2008.
Standard & Poor’s FSR Outlook
A.M. Best FSR Outlook
Fitch FSR Outlook
Moody’s FSR Outlook
Hannover Re AA- Stable A Positive A+ Positive NR -
Munich Re AA- Stable A+ Stable AA- Stable Aa3 Stable
Paris Re A- Stable A- Positive NR - NR -
SCOR A- Positive A- Stable A Stable A3 Rev pos
Swiss Re AA- Stable A+ Stable NR - Aa2 Negative
14 Standard & Poor’s, press release, 25 November 2008
Table 12
Financial strength ratings
Standard & Poor's, A.M. Best, Fitch Ratings, Moody’s

European Quarterly 9M 2008 A Lost Year
PAGE 17
Appendix
Exchange rates Chart 7 shows the evolution of the US dollar/euro exchange rate over the period 2004 to end September 2008. The daily average rate (used for the translation of income statement items) for 9M 2008 was 0.658, 11.6% lower than the 0.744 average rate for 9M 2007. The dollar weakened appreciably against the euro through the first quarter of 2008 then stabilised during the second quarter before rallying strongly in the third to end the period down just 0.2%. Nominal growth rates for the those companies reporting in European currencies with significant US dollar denominated business continued to be depressed.
0.60
0.65
0.70
0.75
0.80
0.85
Jan 04 Jul 04 Jan 05 Jul 05 Jan 06 Jul 06 Jan 07 Jul 07 Jan 08 Jul 08
Chart 7
USD/EUR exchange rate
Bloomberg

European Quarterly 9M 2008 A Lost Year
PAGE 18
Equity markets Chart 8 shows movements in major equity market indices, rebased to January 2001 = 100. Markets weakened during the first quarter of 2008. A modest rally was short-lived, as further weakness set in from mid-May and markets fell sharply. European markets, measured by the FTSE 100 and the Eurotop 100, ended the period down 18.0% and 25.9%, respectively, while the US market, measured by the S&P 500 index, fell 21.4%.
40
50
60
70
80
90
100
110
120
130
Jan 01 Jan 02 Jan 03 Jan 04 Jan 05 Jan 06 Jan 07 Jan 08
S&P 500 FTSE 100 Eurotop 100
Jan 2001 = 100
Bond yields Chart 9 shows the yield on selected 5-year government bonds. Yields continued their downward trend in the first quarter of 2008, before reaching an inflection point in March. Thereafter, yields firmed during the second quarter before falling sharply in the third in response to central government interest rate cuts and other fiscal stimuli. Yields ended the nine month period down 0.81pp at 4.49% in the UK, down 0.22pp to 3.96% in the Eurozone and down by 1.63 at 3.01% in the USA. Average yields fell by 0.08pp in the UK, 0.22pp in the Eurozone and 0.44pp in the US.
2.0%
2.5%
3.0%
3.5%
4.0%
4.5%
5.0%
5.5%
6.0%
Jan 01 Jan 02 Jan 03 Jan 04 Jan 05 Jan 06 Jan 07 Jan 08
UK Eurozone USA
Chart 8
Equity markets
Bloomberg
Chart 9
5-year government bond yields
Bloomberg
European Quarterly 9M 2008 A Lost Year
PAGE 19
Falling bond yields have mixed implications for reinsurers. While they benefit from the higher market value of bond holdings with a beneficial effect on capitalisation and solvency, there is a reduction in income on reinvestment and new cash flow.
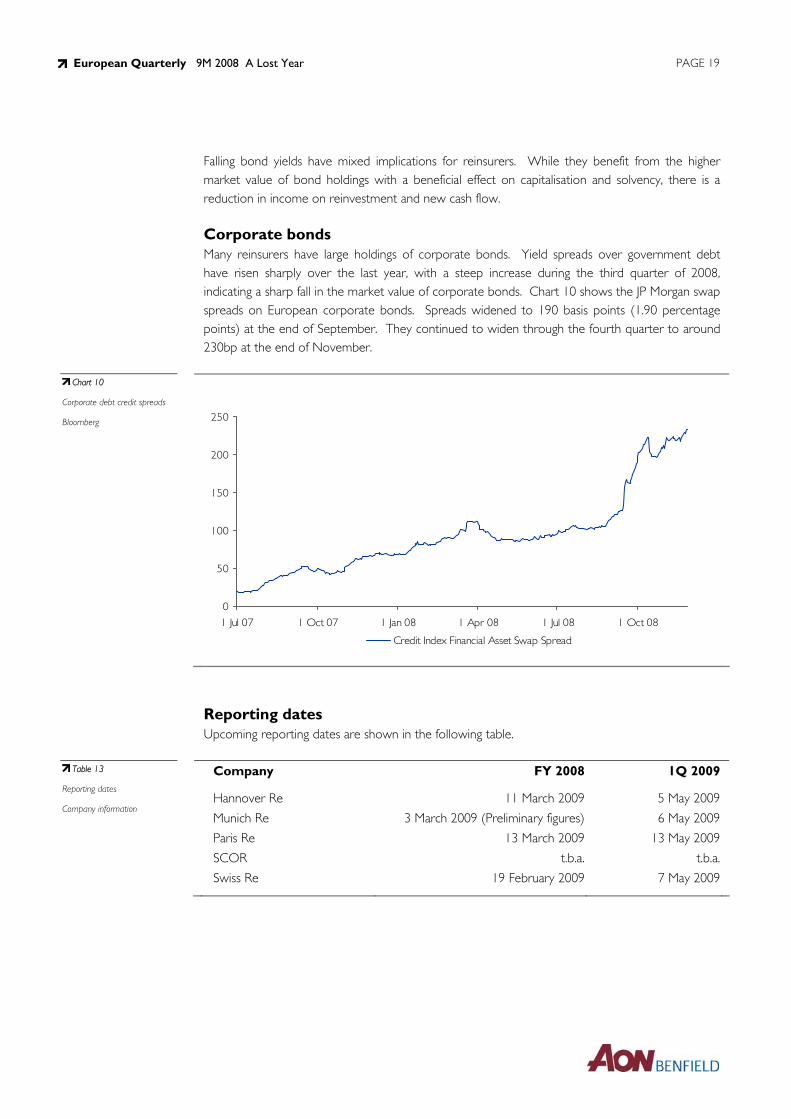
Corporate bonds Many reinsurers have large holdings of corporate bonds. Yield spreads over government debt have risen sharply over the last year, with a steep increase during the third quarter of 2008, indicating a sharp fall in the market value of corporate bonds. Chart 10 shows the JP Morgan swap spreads on European corporate bonds. Spreads widened to 190 basis points (1.90 percentage points) at the end of September. They continued to widen through the fourth quarter to around 230bp at the end of November.
0
50
100
150
200
250
1 Jul 07 1 Oct 07 1 Jan 08 1 Apr 08 1 Jul 08 1 Oct 08
Credit Index Financial Asset Swap Spread
Reporting dates Upcoming reporting dates are shown in the following table.
Company FY 2008 1Q 2009
Hannover Re 11 March 2009 5 May 2009
Munich Re 3 March 2009 (Preliminary figures) 6 May 2009
Paris Re 13 March 2009 13 May 2009
SCOR t.b.a. t.b.a.
Swiss Re 19 February 2009 7 May 2009
Chart 10
Corporate debt credit spreads
Bloomberg
Table 13
Reporting dates
Company information

Aon Benfield Research
Aon Benfield Research Aon Benfield Research publications are available on request from [email protected]. Recent titles are listed below.
Bermuda Quarterly December 2008 9M 2008 Bittersweet
Benfield European Quarterly October 2008 1H 2008 Challenging Times
Benfield Bermuda Quarterly September 2008 1H 2008 The Inevitable
Lloyd’s Update July 2008 Reformation
Benfield Bermuda Quarterly June 2008 1Q 2008 Take the Strain
Benfield European Quarterly April 2008 FY 2007 Waiting Game
Benfield Bermuda Quarterly March 2008 FY 2007 Balancing Act
Global Reinsurance Market Review January 2008 Changing the Game
Benfield European Quarterly November 2007 9M 2007 Out with the Old
Benfield Bermuda Quarterly November 2007 9M 2007 Return of Capital
Related Documents