ABBEY WARD 0 to 4 5 to 7 8 to 9 10 to 14 15 16 to 17 18 to 19 20 to 24 25 to 29 30 to 44 45 to 59 60 to 64 65 to 74 75 to 84 85 to 89 90 and Over 0 500 1,000 1,500 2,000 2,500 3,000 3,500 4,000 Age Structure 2011 2001 10,323 Population has increased by 8% 34.7 Average age has fallen from 35.6 3,506 Largest population of 30-44 year olds in the borough Stephen Hammond (CON) Wimbledon Andrew Judge (LAB) Member of Parliament Councillors Diane Neil Mills (CON) Henry Nelless (CON) Top 5 Countries of Birth England South Africa Poland India Ireland 74.1 People per 10,000m 2 increased from 68.4 74% hite population has increased by 2% 26% AME population has increased by 22% Owned Outright Owned with a Mortgage/Loan Shared Ownership Social Rented Private Rented 0.0% 10.0% 20.0% 30.0% 40.0% 19.3% 29.2% 0.7% 14.1% 35.7% 22.1% 36.4% 0.3% 15.3% 25.9% House Ownership 2011 v 2001 2011 2001 81% Economically Active proportion has increas by 5% 19% Economically Inactive proportion has decreas by 16% No Qualifications 10% 1+ GCSE (any grade) 7% 5+ GCSE (Grades A-C) 8% Apprenticeship 1% 2+ A-Levels 9% First/Higher Degree 55% Other Qualifications 10% Highest Level of Qualifications Ethnic Group Employmen t Top 3 Occupations Business, Research and Administrative Professionals Sales, Marketing and Related Associate Professionals Information Technology and Telecommunication s Professionals Colliers Wood Wimbledon Raynes Park Morden Mitcham Christia n 52% Buddhist 1% Hindu 4% Jewish 0% Muslim 7% Sikh 0% Any Other Religion 1% No Religion 27% Religion Not Stated 8% Religious Beliefs

ABBEY WARD 10,323 Population has increased by 8% 34.7 Average age has fallen from 35.6 3,506 Largest population of 30-44 year olds in the borough Stephen.
Dec 30, 2015
Welcome message from author
This document is posted to help you gain knowledge. Please leave a comment to let me know what you think about it! Share it to your friends and learn new things together.
Transcript
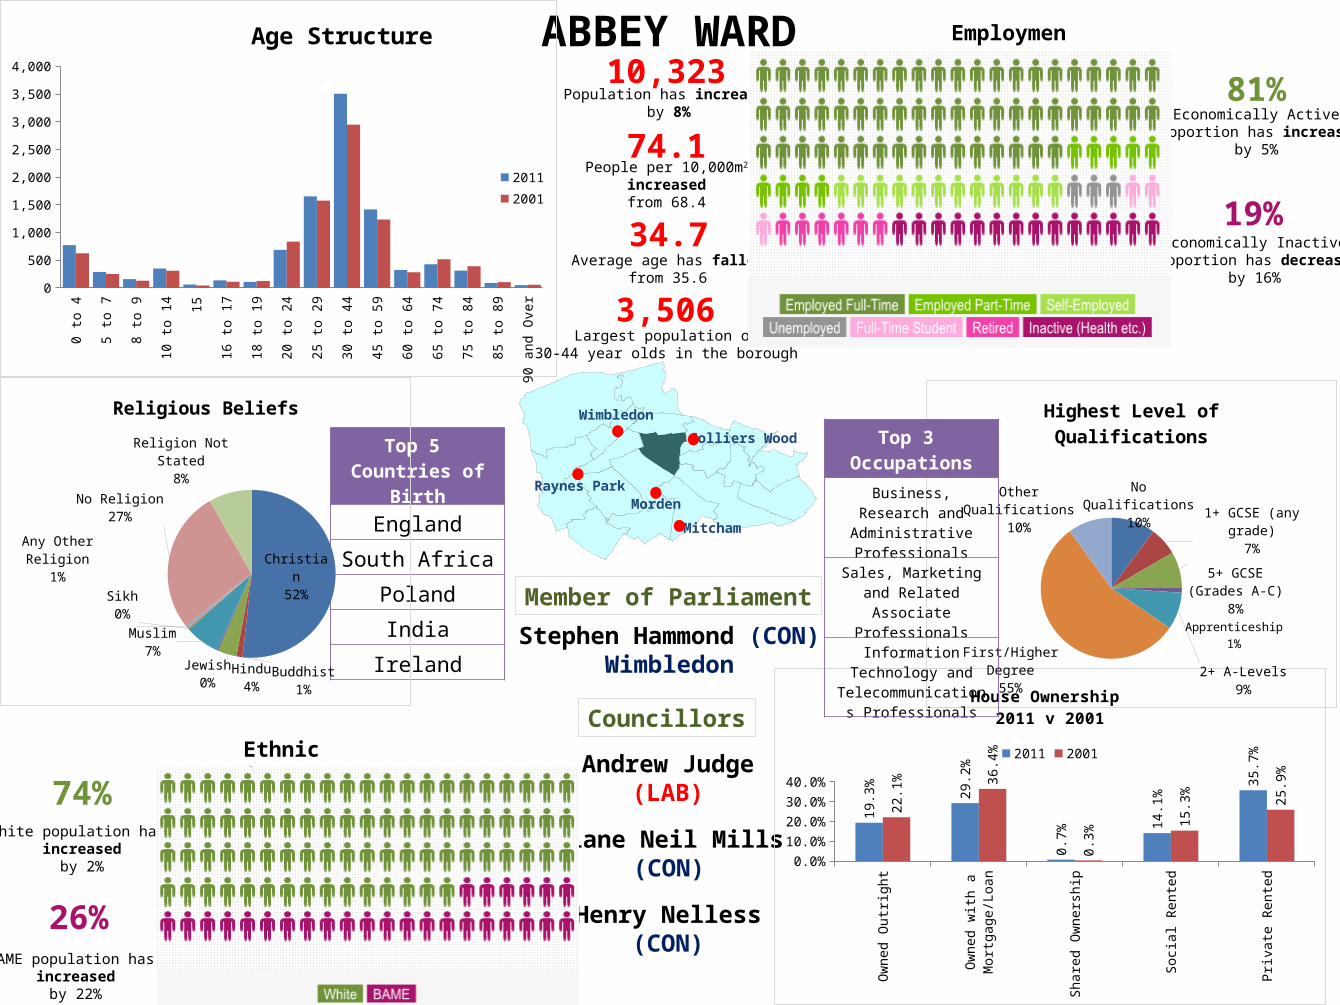
ABBEY WARD0
to 4
5 to
7
8 to
9
10 to
14 15
16 to
17
18 to
19
20 to
24
25 to
29
30 to
44
45 to
59
60 to
64
65 to
74
75 to
84
85 to
89
90 a
nd O
ver
0
500
1,000
1,500
2,000
2,500
3,000
3,500
4,000
Age Structure
20112001
10,323Population has increased
by 8%
34.7Average age has fallen
from 35.6
3,506Largest population of
30-44 year olds in the borough
Stephen Hammond (CON)Wimbledon
Andrew Judge(LAB)
Member of Parliament
Councillors
Diane Neil Mills(CON)
Henry Nelless(CON)
Top 5 Countries of Birth
England
South Africa
Poland
India
Ireland
74.1People per 10,000m2
increasedfrom 68.4
74%White population has
increasedby 2%
26%BAME population has
increasedby 22%
Ow
ned
Out
right
Ow
ned
with
a M
ortg
age/
Loan
Shar
ed O
wne
rshi
p
Socia
l Ren
ted
Priv
ate
Rent
ed
0.0%10.0%20.0%30.0%40.0%
19.3
% 29.2
%
0.7%
14.1
%
35.7
%
22.1
% 36.4
%
0.3%
15.3
% 25.9
%
House Ownership 2011 v 2001
2011 2001
81%Economically Active
proportion has increasedby 5%
19%Economically Inactive
proportion has decreasedby 16%
No Qualifications10% 1+ GCSE (any
grade)7%
5+ GCSE (Grades A-C)
8%
Apprenticeship1%
2+ A-Levels9%
First/Higher Degree
55%
Other Qualifications10%
Highest Level of Qualifications
Ethnic Group
Employment
Top 3 Occupations
Business, Research and Administrative Professionals
Sales, Marketing and Related Associate
Professionals
Information Technology and Telecommunications
Professionals
Colliers Wood
Wimbledon
Raynes ParkMorden
Mitcham
Christian52%
Buddhist1%
Hindu4%
Jewish0%
Muslim7%
Sikh0%
Any Other Re-ligion
1%
No Religion27%
Religion Not Stated8%
Religious Beliefs
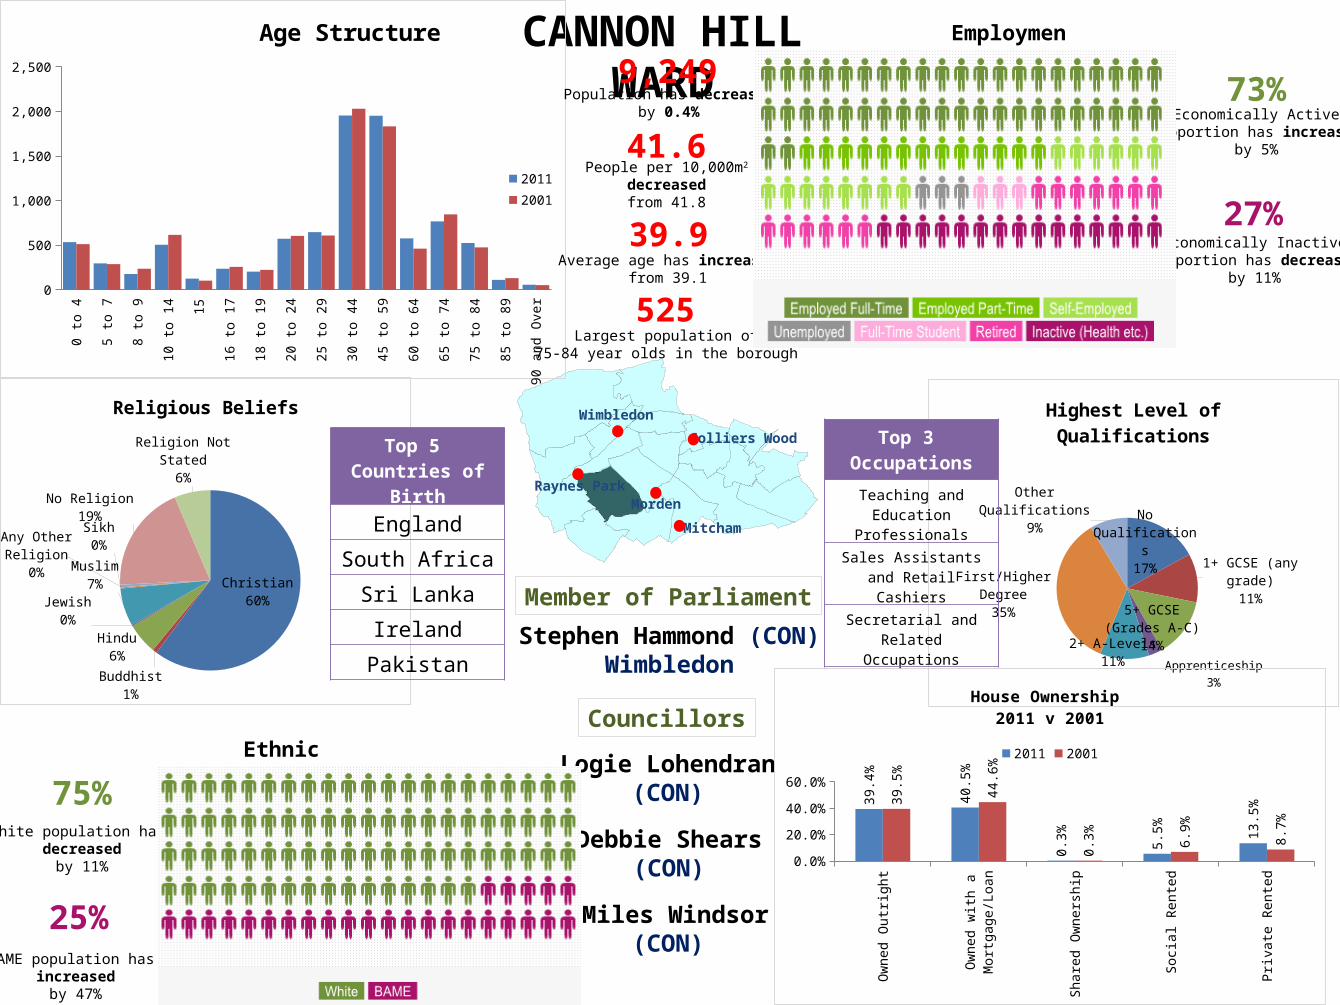
CANNON HILL WARD
Stephen Hammond (CON)Wimbledon
Logie Lohendran(CON)
Member of Parliament
Councillors
Debbie Shears(CON)
Miles Windsor(CON)
0 to
4
5 to
7
8 to
9
10 to
14 15
16 to
17
18 to
19
20 to
24
25 to
29
30 to
44
45 to
59
60 to
64
65 to
74
75 to
84
85 to
89
90 a
nd O
ver
0
500
1,000
1,500
2,000
2,500
Age Structure
20112001
Christian60%
Buddhist1%
Hindu6%
Jewish0%
Muslim7%
Sikh0%
Any Other Religion
0% No Religion19%
Religion Not Stated6%
Religious Beliefs
Colliers Wood
Wimbledon
Raynes ParkMorden
Mitcham
Top 5 Countries of Birth
England
South Africa
Sri Lanka
Ireland
Pakistan
9,249Population has decreased
by 0.4%
39.9Average age has increased
from 39.1
525Largest population of
75-84 year olds in the borough
41.6People per 10,000m2
decreasedfrom 41.8
75%White population has
decreasedby 11%
25%BAME population has
increasedby 47%
No Qualifica-tions17%
1+ GCSE (any grade)11%
5+ GCSE (Grades A-C)
14%
Apprenticeship3%
2+ A-Levels11%
First/Higher Degree
35%
Other Qualifications9%
Highest Level of Qualifications
Ow
ned
Out
right
Ow
ned
with
a M
ortg
age/
Loan
Shar
ed O
wne
rshi
p
Socia
l Ren
ted
Priv
ate
Rent
ed
0.0%10.0%20.0%30.0%40.0%50.0%
39.4
%
40.5
%
0.3% 5.
5% 13.5
%
39.5
%
44.6
%
0.3% 6.
9% 8.7%
House Ownership 2011 v 2001
2011 2001
Top 3 Occupations
Teaching and Education Professionals
Sales Assistants and Retail Cashiers
Secretarial and Related Occupations
Ethnic Group
Employment
73%Economically Active
proportion has increasedby 5%
27%Economically Inactive
proportion has decreasedby 11%

COLLIERS WOOD WARD
Siobhain McDonagh (LAB)Mitcham and Morden
Laxmi Attawar(LAB)
Member of Parliament
Councillors
Nick Draper(LAB)
CarolineCooper-Marbiah
(LAB)
0 to
4
5 to
7
8 to
9
10 to
14 15
16 to
17
18 to
19
20 to
24
25 to
29
30 to
44
45 to
59
60 to
64
65 to
74
75 to
84
85 to
89
90 a
nd O
ver
0
500
1,000
1,500
2,000
2,500
3,000
3,500
4,000
Age Structure
20112001
Christian50%
Buddhist1%
Hindu7%
Jewish0%
Muslim11%
Sikh0%
Any Other Re-ligion
0%
No Religion23%
Religion Not Stated7%
Religious Beliefs
Colliers Wood
Wimbledon
Raynes ParkMorden
Mitcham
Top 5 Countries of Birth
England
Poland
Sri Lanka
South Africa
India
10,712Population has increased
by 15%
34.6Average age has decreased
from 34.9
1003Largest population of
20-24 year olds in the borough
96.4People per 10,000m2
increasedfrom 83.6
60%White population has
increasedby 6%
40%BAME population has
increasedby 33%
No Qualifications13%
1+ GCSE (any grade)
9%
5+ GCSE (Grades A-C)11%
Apprenticeship1%
2+ A-Levels10%
First/Higher Degree
43%
Other Qualifications12%
Highest Level of Qualifications
Ow
ned
Out
right
Ow
ned
with
a M
ortg
age/
Loan
Shar
ed O
wne
rshi
p
Socia
l Ren
ted
Priv
ate
Rent
ed
0.0%10.0%20.0%30.0%40.0%50.0%
17.0
% 31.7
%
1.1%
12.5
%
36.8
%
18.3
%
41.5
%
0.8%
14.6
% 24.9
%
House Ownership 2011 v 2001
2011 2001
Top 3 Occupations
Information Technology and Telecommunications
Professionals
Teaching and Educational Professionals
Business, Research and Administrative Professionals
Ethnic Group
Employment
78%Economically Active
proportion has increasedby 6%
22%Economically Inactive
proportion has decreasedby 17%

CRICKET GREEN WARD
Member of Parliament
Siobhan McDonagh (LAB)Mitcham and Morden
Russell Makin (LAB)
Councillors
Ian Munn (LAB)
Judy Saunders(LAB)
0 to
4
5 to
7
8 to
9
10 to
14 15
16 to
17
18 to
19
20 to
24
25 to
29
30 to
44
45 to
59
60 to
64
65 to
74
75 to
84
85 to
89
90 a
nd O
ver
0
500
1,000
1,500
2,000
2,500
3,000
Age Structure
20112001
Christian56%
Buddhist1%
Hindu7%
Jewish0%
Muslim11%
Sikh0%
Any Other Re-ligion
0% No Religion18%
Religion Not Stated7%
Religious Beliefs
Colliers Wood
Wimbledon
Raynes ParkMorden
Mitcham
Top 5 Countries of Birth
England
Sri Lanka
Poland
Ghana
Pakistan
11,474Population has increased
by 11%
34.7Average age has decreased
from 35.0
175Largest population of
15 year olds in the borough
38.3People per 10,000m2
increasedfrom 34.6
53%White population has
decreasedby 15%
47%BAME population has
increasedby 59%
No Qualifications24%
1+ GCSE (any grade)15%
5+ GCSE (Grades A-C)14%
Apprenticeship2%
2+ A-Levels10%
First/Higher Degree
23%
Other Qualifications12%
Highest Level of Qualifications
Ow
ned
Out
right
Ow
ned
with
a M
ortg
age/
Loan
Shar
ed O
wne
rshi
p
Socia
l Ren
ted
Priv
ate
Rent
ed
0.0%10.0%20.0%30.0%40.0%
15.7
% 26.0
%
1.6%
36.9
%
18.4
%
17.1
% 32.8
%
0.7%
37.4
%
12.1
%
House Ownership 2011 v 2001
2011 2001
Top 3 Occupations
Sales Assistants and Retail Cashiers
Elementary Cleaning Occupations
Caring Personal Services
Ethnic Group
Employment
70%Economically Active
proportion has increasedby 6%
30%Economically Inactive
proportion has decreasedby 12%
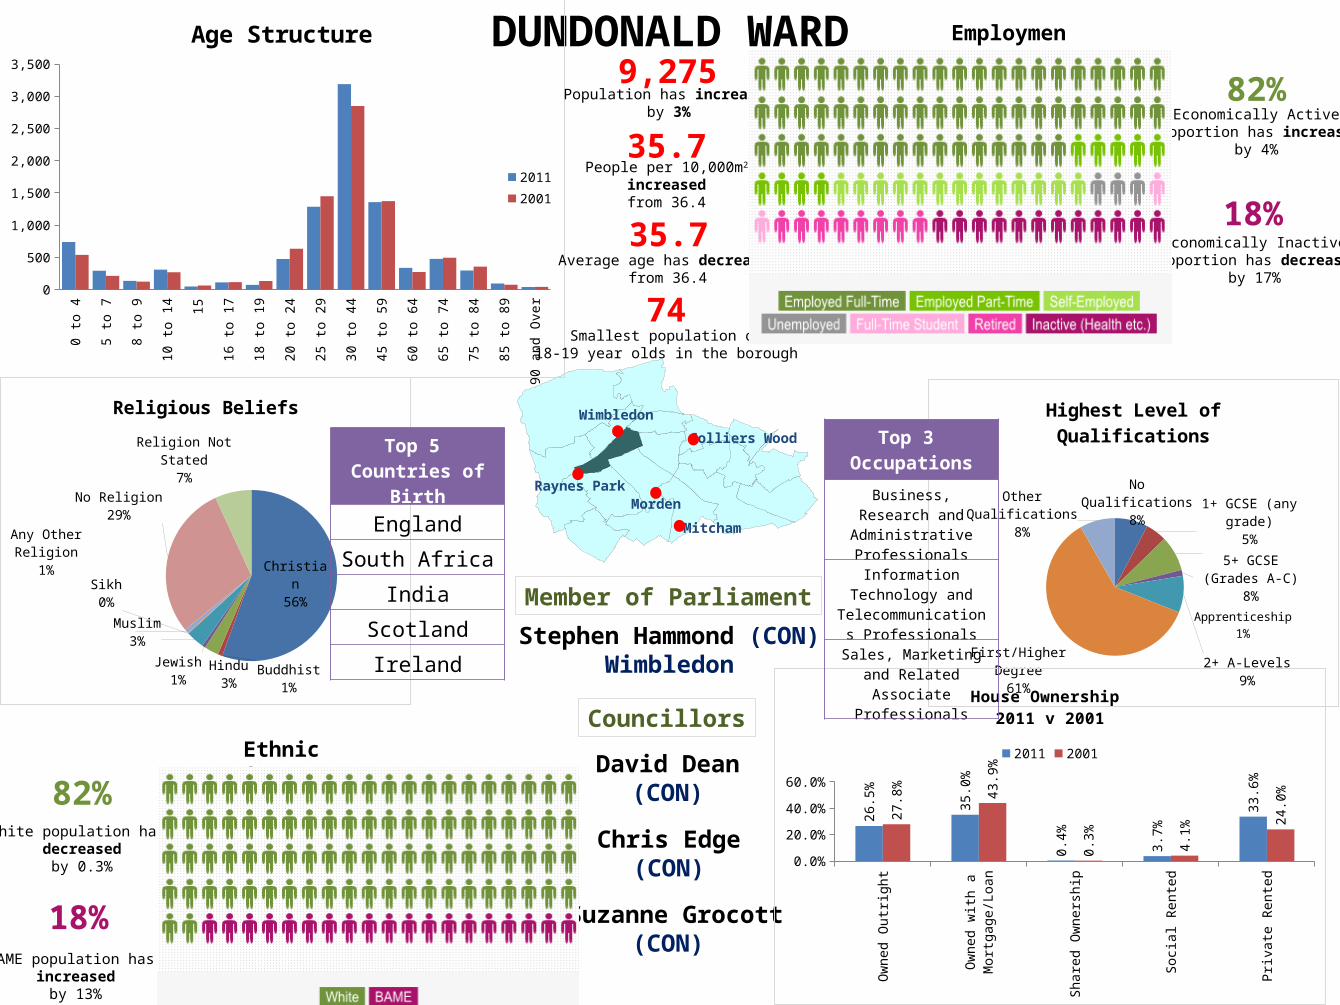
DUNDONALD WARD
Stephen Hammond (CON)Wimbledon
David Dean(CON)
Member of Parliament
Councillors
Chris Edge(CON)
Suzanne Grocott(CON)
0 to
4
5 to
7
8 to
9
10 to
14 15
16 to
17
18 to
19
20 to
24
25 to
29
30 to
44
45 to
59
60 to
64
65 to
74
75 to
84
85 to
89
90 a
nd O
ver
0
500
1,000
1,500
2,000
2,500
3,000
3,500
Age Structure
20112001
Christian56%
Buddhist1%
Hindu3%
Jewish1%
Muslim3%
Sikh0%
Any Other Re-ligion
1%
No Religion29%
Religion Not Stated7%
Religious Beliefs
Colliers Wood
Wimbledon
Raynes ParkMorden
Mitcham
Top 5 Countries of Birth
England
South Africa
India
Scotland
Ireland
9,275Population has increased
by 3%
35.7Average age has decreased
from 36.4
74Smallest population of
18-19 year olds in the borough
35.7People per 10,000m2
increasedfrom 36.4
82%White population has
decreasedby 0.3%
18%BAME population has
increasedby 13%
No Qualifications8%
1+ GCSE (any grade)
5%5+ GCSE
(Grades A-C)8%
Apprenticeship1%
2+ A-Levels9%
First/Higher Degree
61%
Other Qualifications8%
Highest Level of Qualifications
Ow
ned
Out
right
Ow
ned
with
a M
ortg
age/
Loan
Shar
ed O
wne
rshi
p
Socia
l Ren
ted
Priv
ate
Rent
ed
0.0%10.0%20.0%30.0%40.0%50.0%
26.5
%
35.0
%
0.4% 3.7%
33.6
%
27.8
% 43.9
%
0.3% 4.
1%
24.0
%
House Ownership 2011 v 2001
2011 2001
Top 3 Occupations
Business, Research and Administrative Professionals
Information Technology and Telecommunications
Professionals
Sales, Marketing and Related Associate
Professionals
Ethnic Group
Employment
82%Economically Active
proportion has increasedby 4%
18%Economically Inactive
proportion has decreasedby 17%
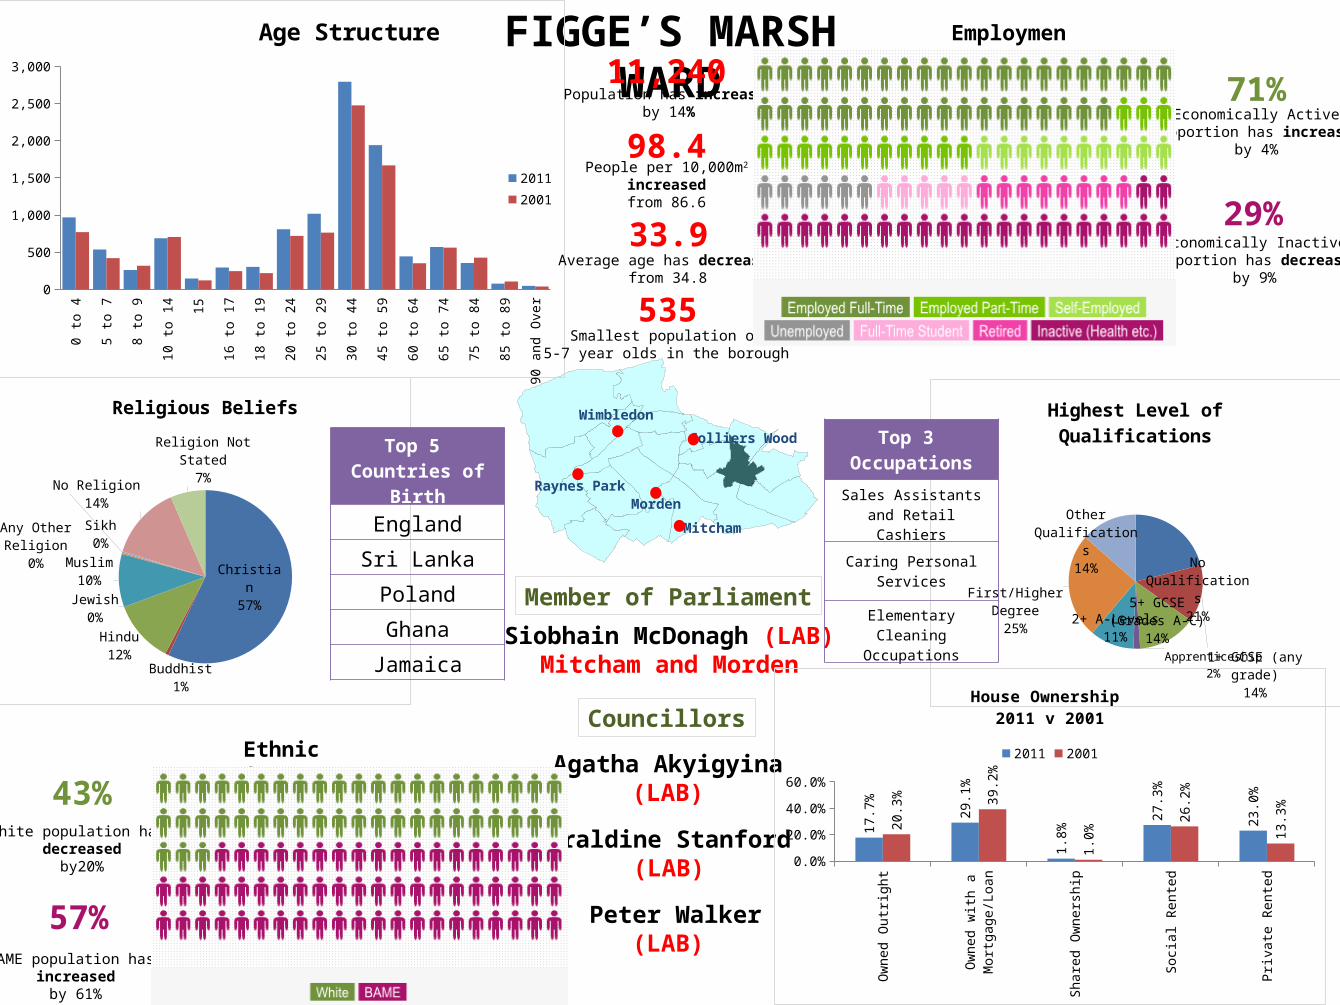
FIGGE’S MARSH WARD
Siobhain McDonagh (LAB)Mitcham and Morden
Agatha Akyigyina(LAB)
Member of Parliament
Councillors
Geraldine Stanford (LAB)
Peter Walker(LAB)
0 to
4
5 to
7
8 to
9
10 to
14 15
16 to
17
18 to
19
20 to
24
25 to
29
30 to
44
45 to
59
60 to
64
65 to
74
75 to
84
85 to
89
90 a
nd O
ver
0
500
1,000
1,500
2,000
2,500
3,000
Age Structure
20112001
Christian57%
Buddhist1%
Hindu12%
Jewish0%
Muslim10%
Sikh0%
Any Other Re-ligion
0% No Religion14%
Religion Not Stated7%
Religious Beliefs
Colliers Wood
Wimbledon
Raynes ParkMorden
Mitcham
Top 5 Countries of Birth
England
Sri Lanka
Poland
Ghana
Jamaica
11,240Population has increased
by 14%
33.9Average age has decreased
from 34.8
535Smallest population of
5-7 year olds in the borough
98.4People per 10,000m2
increasedfrom 86.6
43%White population has
decreasedby20%
57%BAME population has
increasedby 61%
No Qualifications21%
1+ GCSE (any grade)14%
5+ GCSE (Grades A-C)14%
Apprenticeship2%
2+ A-Levels11%
First/Higher Degree
25%
Other Qualifica-tions14%
Highest Level of Qualifications
Ow
ned
Out
right
Ow
ned
with
a M
ortg
age/
Loan
Shar
ed O
wne
rshi
p
Socia
l Ren
ted
Priv
ate
Rent
ed
0.0%10.0%20.0%30.0%40.0%50.0%
17.7
% 29.1
%
1.8%
27.3
%
23.0
%
20.3
% 39.2
%
1.0%
26.2
%
13.3
%
House Ownership 2011 v 2001
2011 2001
Top 3 Occupations
Sales Assistants and Retail Cashiers
Caring Personal Services
Elementary Cleaning Occupations
Ethnic Group
Employment
71%Economically Active
proportion has increasedby 4%
29%Economically Inactive
proportion has decreasedby 9%
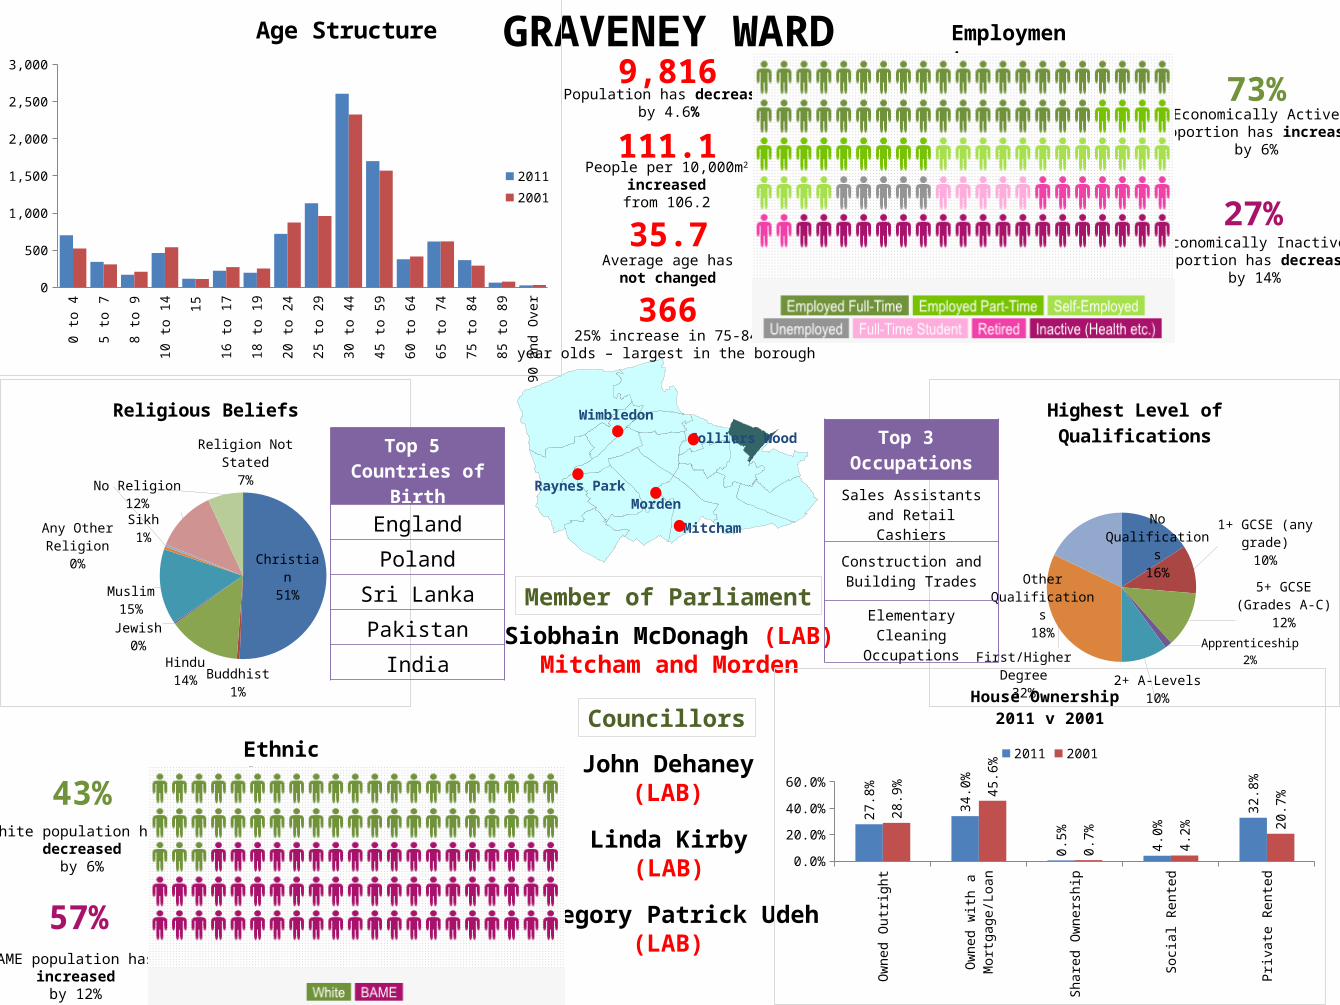
GRAVENEY WARD
Siobhain McDonagh (LAB)Mitcham and Morden
John Dehaney(LAB)
Member of Parliament
Councillors
Linda Kirby(LAB)
Gregory Patrick Udeh(LAB)
0 to
4
5 to
7
8 to
9
10 to
14 15
16 to
17
18 to
19
20 to
24
25 to
29
30 to
44
45 to
59
60 to
64
65 to
74
75 to
84
85 to
89
90 a
nd O
ver
0
500
1,000
1,500
2,000
2,500
3,000
Age Structure
20112001
Christian51%
Buddhist1%
Hindu14%
Jewish0%
Muslim15%
Sikh1%
Any Other Re-ligion
0% No Religion12%
Religion Not Stated7%
Religious Beliefs
Colliers Wood
Wimbledon
Raynes ParkMorden
Mitcham
Top 5 Countries of Birth
England
Poland
Sri Lanka
Pakistan
India
9,816Population has decreased
by 4.6%
35.7Average age has
not changed
36625% increase in 75-84
year olds – largest in the borough
111.1People per 10,000m2
increasedfrom 106.2
43%White population has
decreasedby 6%
57%BAME population has
increasedby 12%
No Qualifica-tions16%
1+ GCSE (any grade)10%
5+ GCSE (Grades A-C)12%
Apprenticeship2%
2+ A-Levels10%
First/Higher Degree
32%
Other Qualifica-tions18%
Highest Level of Qualifications
Ow
ned
Out
right
Ow
ned
with
a M
ortg
age/
Loan
Shar
ed O
wne
rshi
p
Socia
l Ren
ted
Priv
ate
Rent
ed
0.0%10.0%20.0%30.0%40.0%50.0%
27.8
%
34.0
%
0.5% 4.0%
32.8
%
28.9
% 45.6
%
0.7% 4.2%
20.7
%
House Ownership 2011 v 2001
2011 2001
Top 3 Occupations
Sales Assistants and Retail Cashiers
Construction and Building Trades
Elementary Cleaning Occupations
Ethnic Group
Employment
73%Economically Active
proportion has increasedby 6%
27%Economically Inactive
proportion has decreasedby 14%

HILLSIDE WARD
Stephen Hammond (CON)Wimbledon
Suzanne Evans(UKIP)
Member of Parliament
Councillors
David Simpson(CON)
David Williams(CON)
0 to
4
5 to
7
8 to
9
10 to
14 15
16 to
17
18 to
19
20 to
24
25 to
29
30 to
44
45 to
59
60 to
64
65 to
74
75 to
84
85 to
89
90 a
nd O
ver
0
500
1,000
1,500
2,000
2,500
3,000
3,500
Age Structure
20112001
Christian56%
Buddhist1%
Hindu3%
Jewish1%
Muslim4%
Sikh0%
Any Other Re-ligion
0%
No Religion27%
Religion Not Stated8%
Religious Beliefs
Colliers Wood
Wimbledon
Raynes ParkMorden
Mitcham
Top 5 Countries of Birth
England
South Africa
India
Scotland
Ireland
8,977Population has decreased
by 1.1%
38.7Average age has increased
from 38.5
265Smallest population of
10-14 year olds in the borough
75.8People per 10,000m2
decreasedfrom 76.6
79%White population has
decreasedby 8%
21%BAME population has
increasedby 24%
No Qualifications6%
1+ GCSE (any grade)
4%
5+ GCSE (Grades A-C)
7%Appren-ticeship
1%
2+ A-Levels8%
First/Higher Degree
65%
Other Qualifications9%
Highest Level of Qualifications
Ow
ned
Out
right
Ow
ned
with
a M
ortg
age/
Loan
Shar
ed O
wne
rshi
p
Socia
l Ren
ted
Priv
ate
Rent
ed
0.0%10.0%20.0%30.0%40.0%50.0%
26.3
%
23.8
%
0.3% 9.
9%
38.4
%
27.5
%
31.9
%
0.3% 9.
5%
30.8
%
House Ownership 2011 v 2001
2011 2001
Top 3 Occupations
Business, Research and Administrative Professionals
Business, Finance and Related Associate
Professionals
Functional Managers and Directors
Ethnic Group
Employment
79%Economically Active
proportion has increasedby 5%
21%Economically Inactive
proportion has decreasedby 14%

LAVENDER FIELDS WARD
Siobhain McDonagh (LAB)Mitcham and Morden
Mark Allison(LAB)
Member of Parliament
Councillors
Mark Betteridge(LAB)
Edith Joan Macauley(LAB)
0 to
4
5 to
7
8 to
9
10 to
14 15
16 to
17
18 to
19
20 to
24
25 to
29
30 to
44
45 to
59
60 to
64
65 to
74
75 to
84
85 to
89
90 a
nd O
ver
0
500
1,000
1,500
2,000
2,500
3,000
3,500
Age Structure
20112001
Christian53%
Buddhist1%
Hindu10%
Jewish0%
Muslim10%
Sikh0%
Any Other Re-ligion
0% No Religion19%
Religion Not Stated7%
Religious Beliefs
Colliers Wood
Wimbledon
Raynes ParkMorden
Mitcham
Top 5 Countries of Birth
England
Poland
Sri Lanka
India
Pakistan
10,273Population has increased
by 7%
33.3Average age has increased
from 32.8 –lowest mean age
306Smallest population of
75+ year olds in the borough
87.1People per 10,000m2
increasedfrom 81.5
54%White population has
decreasedby 16%
46%BAME population has
increasedby 47%
No Qualifications18%
1+ GCSE (any grade)11%
5+ GCSE (Grades A-C)12%
Apprenticeship2%
2+ A-Levels10%
First/Higher Degree
33%
Other Qualifica-tions15%
Highest Level of Qualifications
Ow
ned
Out
right
Ow
ned
with
a M
ortg
age/
Loan
Shar
ed O
wne
rshi
p
Socia
l Ren
ted
Priv
ate
Rent
ed
0.0%10.0%20.0%30.0%40.0%50.0%
14.8
% 32.8
%
1.0%
20.4
%
30.0
%
16.2
%
44.9
%
0.8%
20.3
%
17.9
%
House Ownership 2011 v 2001
2011 2001
Top 3 Occupations
Sales Assistants and Retail Cashiers
Elementary Cleaning Occupations
Construction and Building Trades
Ethnic Group
Employment
76%Economically Active
proportion has increasedby 4%
27%Economically Inactive
proportion has decreasedby 9%
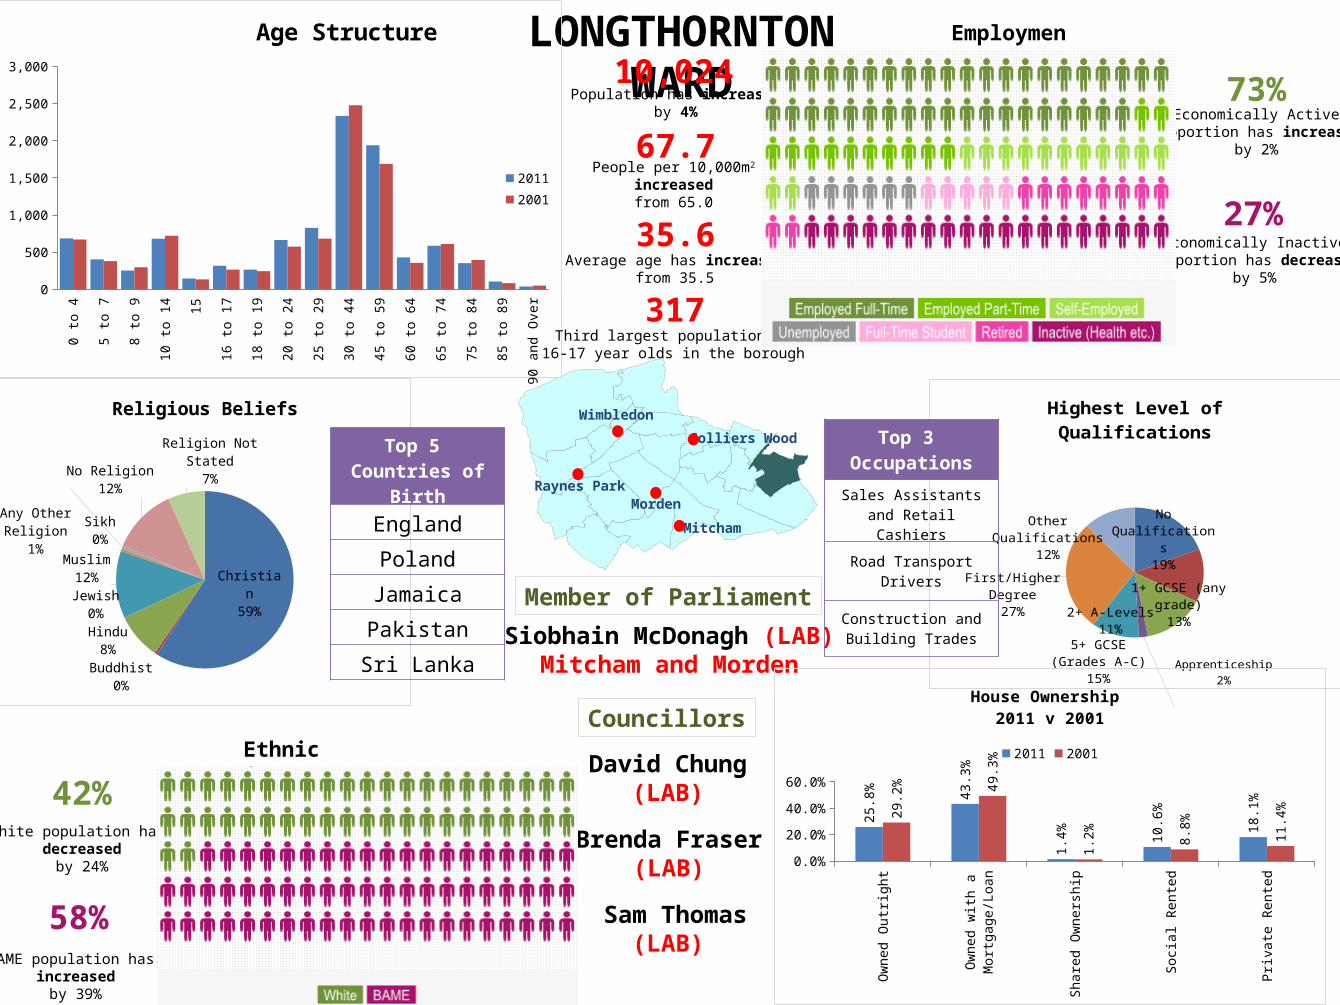
LONGTHORNTON WARD
Siobhain McDonagh (LAB)Mitcham and Morden
David Chung(LAB)
Member of Parliament
Councillors
Brenda Fraser(LAB)
Sam Thomas(LAB)
0 to
4
5 to
7
8 to
9
10 to
14 15
16 to
17
18 to
19
20 to
24
25 to
29
30 to
44
45 to
59
60 to
64
65 to
74
75 to
84
85 to
89
90 a
nd O
ver
0
500
1,000
1,500
2,000
2,500
3,000
Age Structure
20112001
Christian59%
Buddhist0%
Hindu8%
Jewish0%
Muslim12%
Sikh0%
Any Other Religion
1% No Religion12%
Religion Not Stated7%
Religious Beliefs
Colliers Wood
Wimbledon
Raynes ParkMorden
Mitcham
Top 5 Countries of Birth
England
Poland
Jamaica
Pakistan
Sri Lanka
10,024Population has increased
by 4%
35.6Average age has increased
from 35.5
317Third largest population of
16-17 year olds in the borough
67.7People per 10,000m2
increasedfrom 65.0
42%White population has
decreasedby 24%
58%BAME population has
increasedby 39%
No Qualifications19%
1+ GCSE (any grade)13%
5+ GCSE (Grades A-C)15%
Apprenticeship2%
2+ A-Levels11%
First/Higher Degree
27%
Other Qualifications12%
Highest Level of Qualifications
Ow
ned
Out
right
Ow
ned
with
a M
ortg
age/
Loan
Shar
ed O
wne
rshi
p
Socia
l Ren
ted
Priv
ate
Rent
ed
0.0%10.0%20.0%30.0%40.0%50.0%60.0%
25.8
% 43.3
%
1.4% 10
.6%
18.1
%
29.2
% 49.3
%
1.2% 8.
8% 11.4
%
House Ownership 2011 v 2001
2011 2001
Top 3 Occupations
Sales Assistants and Retail Cashiers
Road Transport Drivers
Construction and Building Trades
Ethnic Group
Employment
73%Economically Active
proportion has increasedby 2%
27%Economically Inactive
proportion has decreasedby 5%
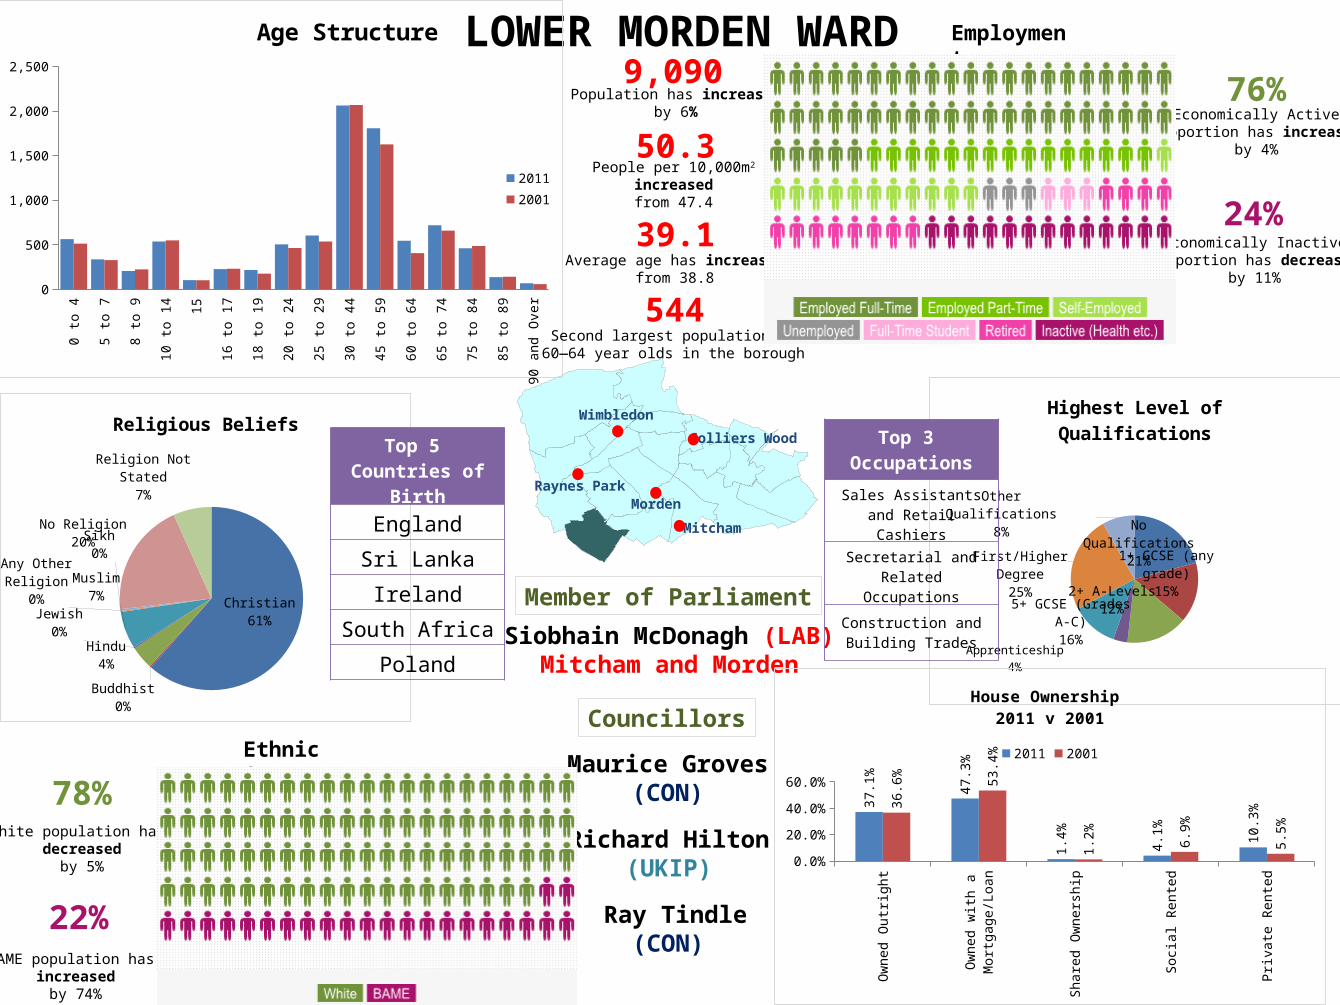
LOWER MORDEN WARD
Siobhain McDonagh (LAB)Mitcham and Morden
Maurice Groves(CON)
Member of Parliament
Councillors
Richard Hilton(UKIP)
Ray Tindle(CON)
0 to
4
5 to
7
8 to
9
10 to
14 15
16 to
17
18 to
19
20 to
24
25 to
29
30 to
44
45 to
59
60 to
64
65 to
74
75 to
84
85 to
89
90 a
nd O
ver
0
500
1,000
1,500
2,000
2,500
Age Structure
20112001
Christian61%
Buddhist0%
Hindu4%
Jewish0%
Muslim7%
Sikh0%
Any Other Religion
0%
No Religion20%
Religion Not Stated7%
Religious BeliefsColliers Wood
Wimbledon
Raynes ParkMorden
Mitcham
Top 5 Countries of Birth
England
Sri Lanka
Ireland
South Africa
Poland
9,090Population has increased
by 6%
39.1Average age has increased
from 38.8
544Second largest population of
60—64 year olds in the borough
50.3People per 10,000m2
increasedfrom 47.4
78%White population has
decreasedby 5%
22%BAME population has
increasedby 74%
No Qualifications21%
1+ GCSE (any grade)15%
5+ GCSE (Grades A-C)16%
Apprenticeship4%
2+ A-Levels12%
First/Higher Degree
25%
Other Qualifications8%
Highest Level of Qualifications
Ow
ned
Out
right
Ow
ned
with
a M
ortg
age/
Loan
Shar
ed O
wne
rshi
p
Socia
l Ren
ted
Priv
ate
Rent
ed
0.0%10.0%20.0%30.0%40.0%50.0%60.0%
37.1
%
47.3
%
1.4% 4.1% 10
.3%
36.6
% 53.4
%
1.2% 6.
9%
5.5%
House Ownership 2011 v 2001
2011 2001
Top 3 Occupations
Sales Assistants and Retail Cashiers
Secretarial and Related Occupations
Construction and Building Trades
Ethnic Group
Employment
76%Economically Active
proportion has increasedby 4%
24%Economically Inactive
proportion has decreasedby 11%
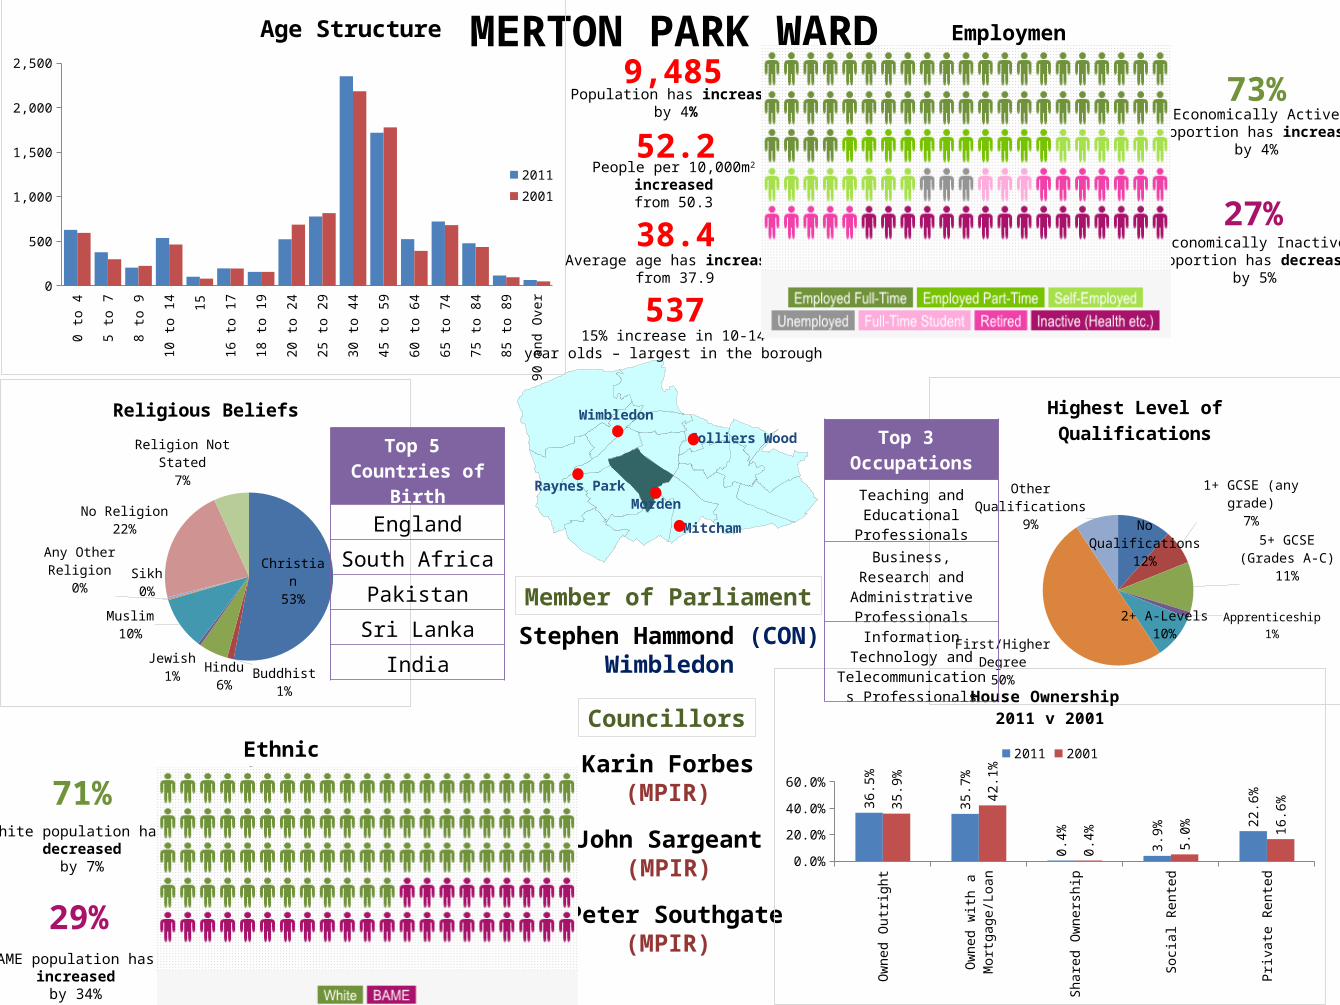
MERTON PARK WARD
Stephen Hammond (CON)Wimbledon
Karin Forbes(MPIR)
Member of Parliament
Councillors
John Sargeant(MPIR)
Peter Southgate(MPIR)
0 to
4
5 to
7
8 to
9
10 to
14 15
16 to
17
18 to
19
20 to
24
25 to
29
30 to
44
45 to
59
60 to
64
65 to
74
75 to
84
85 to
89
90 a
nd O
ver
0
500
1,000
1,500
2,000
2,500
Age Structure
20112001
Christian53%
Buddhist1%
Hindu6%
Jewish1%
Muslim10%
Sikh0%
Any Other Re-ligion
0%
No Religion22%
Religion Not Stated7%
Religious Beliefs
Colliers Wood
Wimbledon
Raynes ParkMorden
Mitcham
Top 5 Countries of Birth
England
South Africa
Pakistan
Sri Lanka
India
9,485Population has increased
by 4%
38.4Average age has increased
from 37.9
53715% increase in 10-14
year olds – largest in the borough
52.2People per 10,000m2
increasedfrom 50.3
71%White population has
decreasedby 7%
29%BAME population has
increasedby 34%
No Qualifications12%
1+ GCSE (any grade)
7%
5+ GCSE (Grades A-C)11%
Apprenticeship1%
2+ A-Levels10%
First/Higher Degree
50%
Other Qualifications9%
Highest Level of Qualifications
Ow
ned
Out
right
Ow
ned
with
a M
ortg
age/
Loan
Shar
ed O
wne
rshi
p
Socia
l Ren
ted
Priv
ate
Rent
ed
0.0%10.0%20.0%30.0%40.0%50.0%
36.5
%
35.7
%
0.4% 3.9%
22.6
%35.9
%
42.1
%
0.4% 5.
0%
16.6
%
House Ownership 2011 v 2001
2011 2001
Top 3 Occupations
Teaching and Educational Professionals
Business, Research and Administrative Professionals
Information Technology and Telecommunications
Professionals
Ethnic Group
Employment
73%Economically Active
proportion has increasedby 4%
27%Economically Inactive
proportion has decreasedby 5%
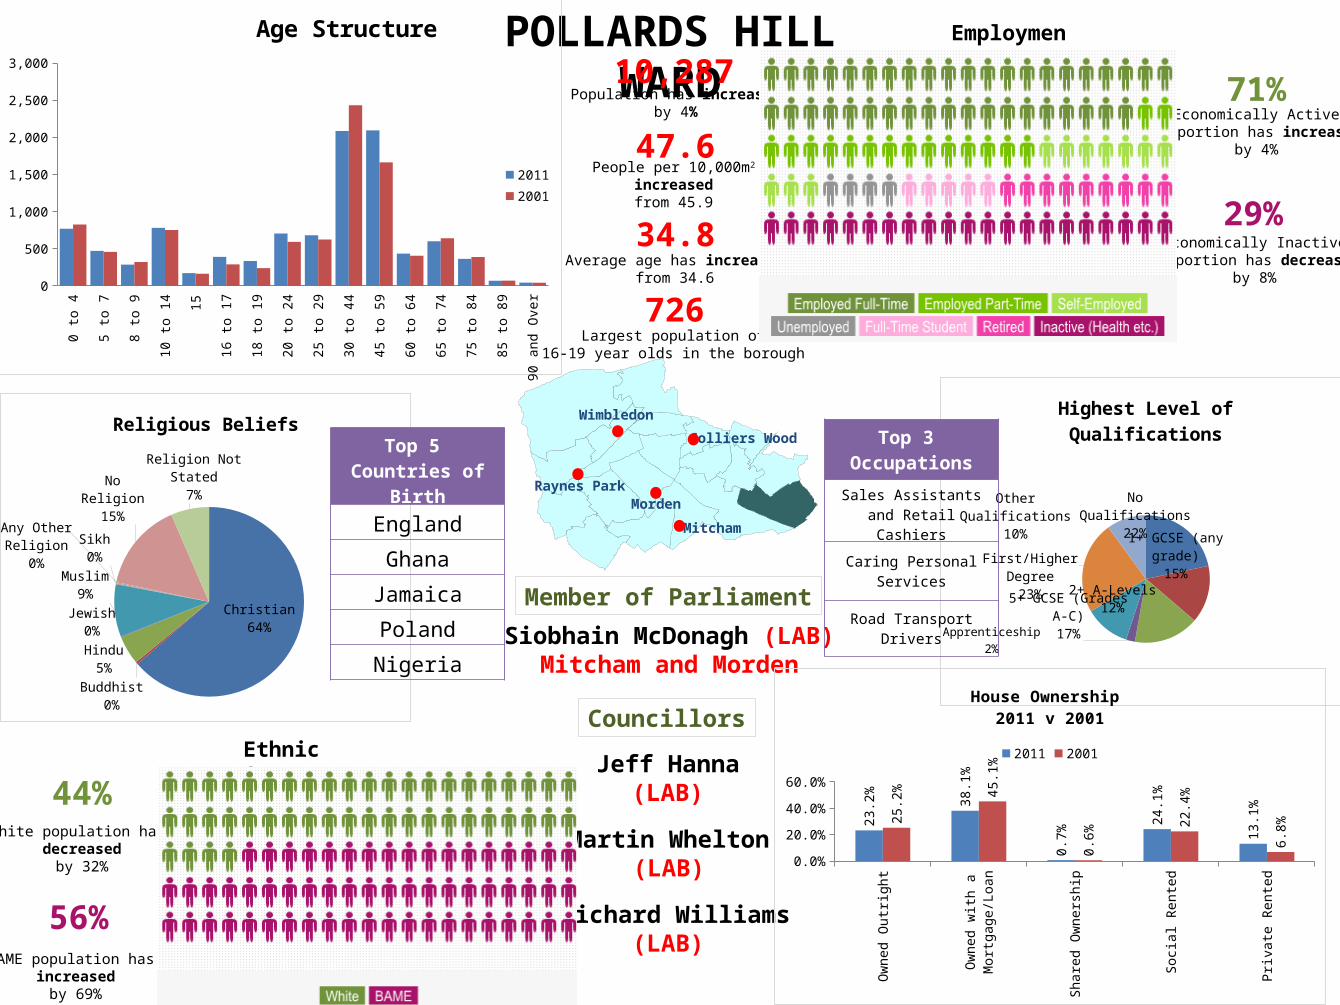
POLLARDS HILL WARD
Siobhain McDonagh (LAB)Mitcham and Morden
Jeff Hanna(LAB)
Member of Parliament
Councillors
Martin Whelton(LAB)
Richard Williams(LAB)
0 to
4
5 to
7
8 to
9
10 to
14 15
16 to
17
18 to
19
20 to
24
25 to
29
30 to
44
45 to
59
60 to
64
65 to
74
75 to
84
85 to
89
90 a
nd O
ver
0
500
1,000
1,500
2,000
2,500
3,000
Age Structure
20112001
Christian64%
Buddhist0%
Hindu5%
Jewish0%
Muslim9%
Sikh0%
Any Other Religion
0%
No Religion15%
Religion Not Stated7%
Religious BeliefsColliers Wood
Wimbledon
Raynes ParkMorden
Mitcham
Top 5 Countries of Birth
England
Ghana
Jamaica
Poland
Nigeria
10,287Population has increased
by 4%
34.8Average age has increased
from 34.6
726Largest population of
16-19 year olds in the borough
47.6People per 10,000m2
increasedfrom 45.9
44%White population has
decreasedby 32%
56%BAME population has
increasedby 69%
No Qualifications22%
1+ GCSE (any grade)15%
5+ GCSE (Grades A-C)17%
Apprenticeship2%
2+ A-Levels12%
First/Higher Degree
23%
Other Qualifications10%
Highest Level of Qualifications
Ow
ned
Out
right
Ow
ned
with
a M
ortg
age/
Loan
Shar
ed O
wne
rshi
p
Socia
l Ren
ted
Priv
ate
Rent
ed
0.0%10.0%20.0%30.0%40.0%50.0%
23.2
% 38.1
%
0.7%
24.1
%
13.1
%25.2
%
45.1
%
0.6%
22.4
%
6.8%
House Ownership 2011 v 2001
2011 2001
Top 3 Occupations
Sales Assistants and Retail Cashiers
Caring Personal Services
Road Transport Drivers
Ethnic Group
Employment
71%Economically Active
proportion has increasedby 4%
29%Economically Inactive
proportion has decreasedby 8%
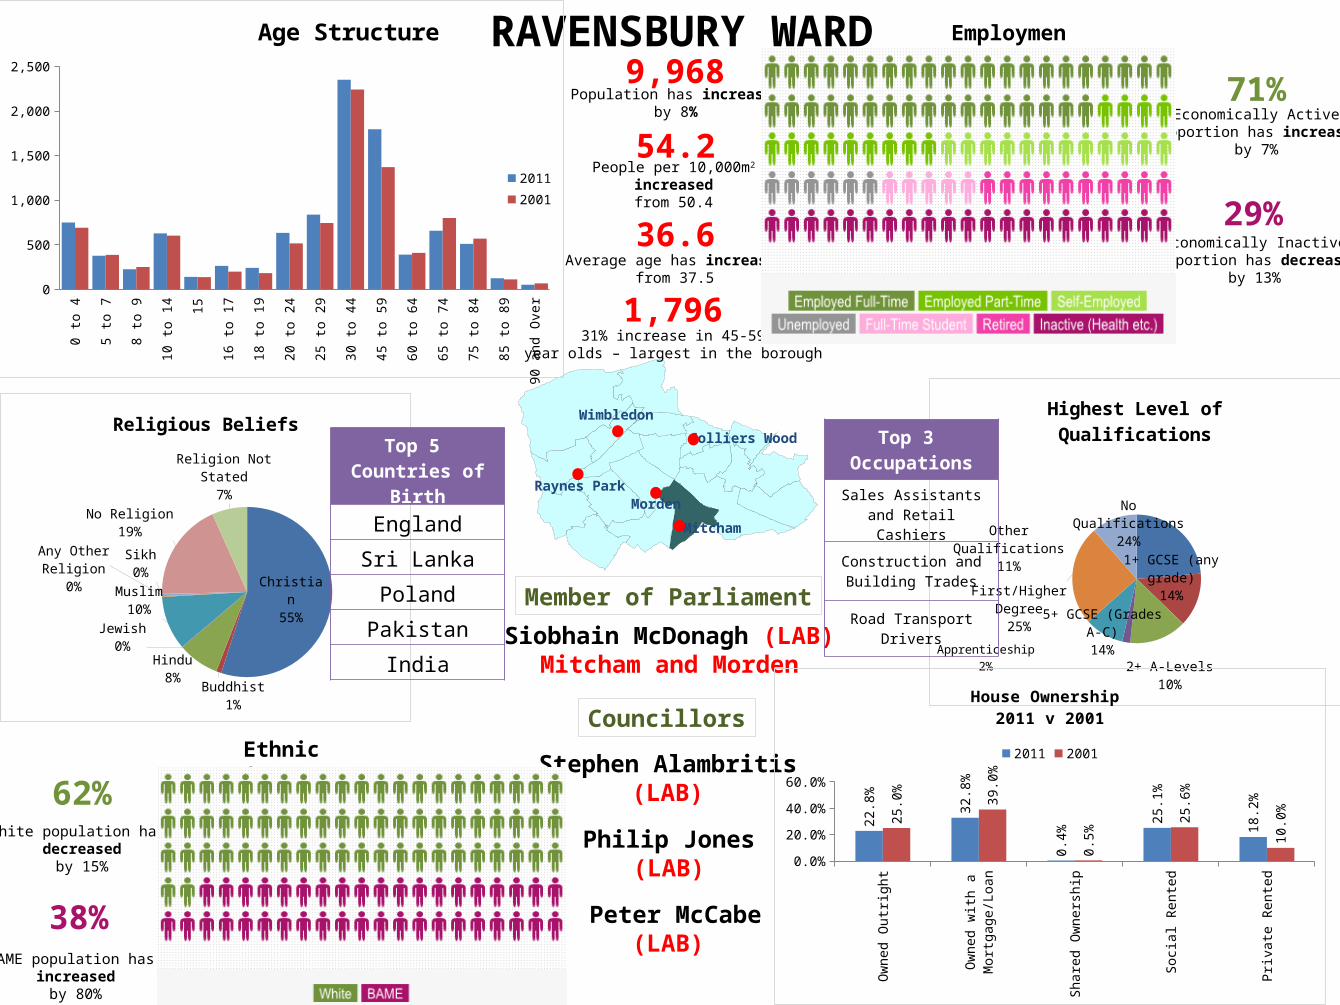
RAVENSBURY WARD
Siobhain McDonagh (LAB)Mitcham and Morden
Stephen Alambritis(LAB)
Member of Parliament
Councillors
Philip Jones(LAB)
Peter McCabe(LAB)
0 to
4
5 to
7
8 to
9
10 to
14 15
16 to
17
18 to
19
20 to
24
25 to
29
30 to
44
45 to
59
60 to
64
65 to
74
75 to
84
85 to
89
90 a
nd O
ver
0
500
1,000
1,500
2,000
2,500
Age Structure
20112001
Christian55%
Buddhist1%
Hindu8%
Jewish0%
Muslim10%
Sikh0%
Any Other Re-ligion
0% No Religion19%
Religion Not Stated7%
Religious BeliefsColliers Wood
Wimbledon
Raynes ParkMorden
Mitcham
Top 5 Countries of Birth
England
Sri Lanka
Poland
Pakistan
India
9,968Population has increased
by 8%
36.6Average age has increased
from 37.5
1,79631% increase in 45-59
year olds – largest in the borough
54.2People per 10,000m2
increasedfrom 50.4
62%White population has
decreasedby 15%
38%BAME population has
increasedby 80%
No Qualifications24%
1+ GCSE (any grade)14%
5+ GCSE (Grades A-C)14%
Apprenticeship2%
2+ A-Levels10%
First/Higher Degree
25%
Other Qualifications11%
Highest Level of Qualifications
Ow
ned
Out
right
Ow
ned
with
a M
ortg
age/
Loan
Shar
ed O
wne
rshi
p
Socia
l Ren
ted
Priv
ate
Rent
ed
0.0%10.0%20.0%30.0%40.0%50.0%
22.8
% 32.8
%
0.4%
25.1
%
18.2
%
25.0
% 39.0
%
0.5%
25.6
%
10.0
%
House Ownership 2011 v 2001
2011 2001
Top 3 Occupations
Sales Assistants and Retail Cashiers
Construction and Building Trades
Road Transport Drivers
Ethnic Group
Employment
71%Economically Active
proportion has increasedby 7%
29%Economically Inactive
proportion has decreasedby 13%
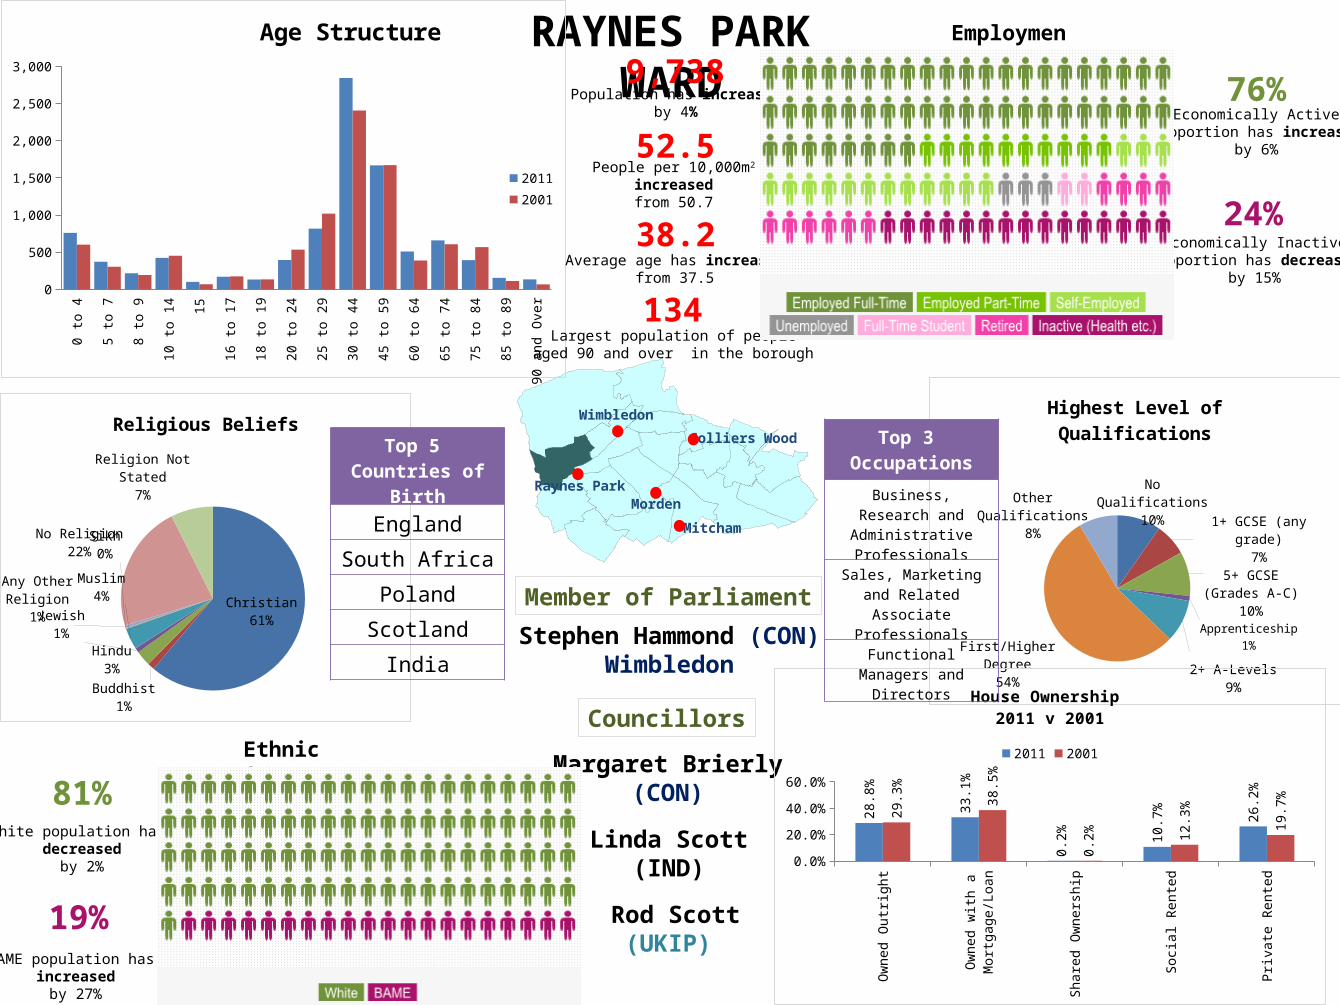
RAYNES PARK WARD
Stephen Hammond (CON)Wimbledon
Margaret Brierly(CON)
Member of Parliament
Councillors
Linda Scott(IND)
Rod Scott(UKIP)
0 to
4
5 to
7
8 to
9
10 to
14 15
16 to
17
18 to
19
20 to
24
25 to
29
30 to
44
45 to
59
60 to
64
65 to
74
75 to
84
85 to
89
90 a
nd O
ver
0
500
1,000
1,500
2,000
2,500
3,000
Age Structure
20112001
Christian61%
Buddhist1%
Hindu3%
Jewish1%
Muslim4%
Sikh0%
Any Other Religion
1%
No Religion22%
Religion Not Stated7%
Religious BeliefsColliers Wood
Wimbledon
Raynes ParkMorden
Mitcham
Top 5 Countries of Birth
England
South Africa
Poland
Scotland
India
9,738Population has increased
by 4%
38.2Average age has increased
from 37.5
134Largest population of people
aged 90 and over in the borough
52.5People per 10,000m2
increasedfrom 50.7
81%White population has
decreasedby 2%
19%BAME population has
increasedby 27%
No Qualifications10% 1+ GCSE (any
grade)7%
5+ GCSE (Grades A-C)10%
Apprenticeship1%
2+ A-Levels9%
First/Higher Degree
54%
Other Qualifications8%
Highest Level of Qualifications
Ow
ned
Out
right
Ow
ned
with
a M
ortg
age/
Loan
Shar
ed O
wne
rshi
p
Socia
l Ren
ted
Priv
ate
Rent
ed
0.0%10.0%20.0%30.0%40.0%50.0%
28.8
%
33.1
%
0.2% 10
.7% 26
.2%
29.3
%
38.5
%
0.2%
12.3
%
19.7
%
House Ownership 2011 v 2001
2011 2001
Top 3 Occupations
Business, Research and Administrative Professionals
Sales, Marketing and Related Associate
Professionals
Functional Managers and Directors
Ethnic Group
Employment
76%Economically Active
proportion has increasedby 6%
24%Economically Inactive
proportion has decreasedby 15%
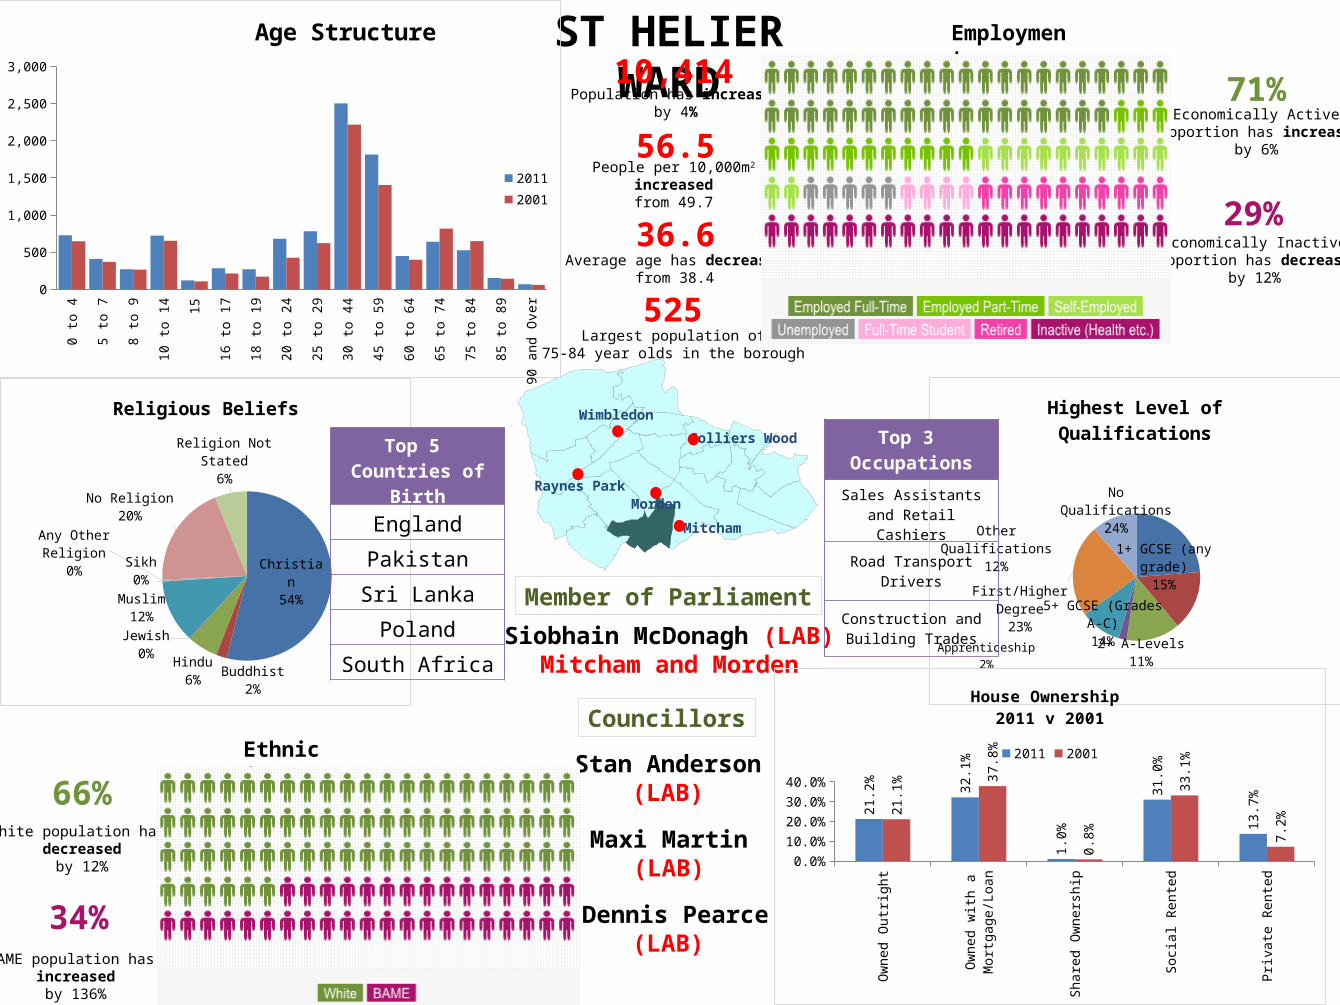
ST HELIER WARD
Siobhain McDonagh (LAB)Mitcham and Morden
Stan Anderson(LAB)
Member of Parliament
Councillors
Maxi Martin(LAB)
Dennis Pearce(LAB)
0 to
4
5 to
7
8 to
9
10 to
14 15
16 to
17
18 to
19
20 to
24
25 to
29
30 to
44
45 to
59
60 to
64
65 to
74
75 to
84
85 to
89
90 a
nd O
ver
0
500
1,000
1,500
2,000
2,500
3,000
Age Structure
20112001
Christian54%
Buddhist2%
Hindu6%
Jewish0%
Muslim12%
Sikh0%
Any Other Re-ligion
0% No Religion20%
Religion Not Stated6%
Religious Beliefs
Colliers Wood
Wimbledon
Raynes ParkMorden
Mitcham
Top 5 Countries of Birth
England
Pakistan
Sri Lanka
Poland
South Africa
10,414Population has increased
by 4%
36.6Average age has decreased
from 38.4
525Largest population of
75-84 year olds in the borough
56.5People per 10,000m2
increasedfrom 49.7
66%White population has
decreasedby 12%
34%BAME population has
increasedby 136%
No Qualifications24%
1+ GCSE (any grade)15%
5+ GCSE (Grades A-C)14%
Apprenticeship2%
2+ A-Levels11%
First/Higher Degree
23%
Other Qualifications12%
Highest Level of Qualifications
Ow
ned
Out
right
Ow
ned
with
a M
ortg
age/
Loan
Shar
ed O
wne
rshi
p
Socia
l Ren
ted
Priv
ate
Rent
ed
0.0%10.0%20.0%30.0%40.0%
21.2
% 32.1
%
1.0%
31.0
%
13.7
%
21.1
%
37.8
%
0.8%
33.1
%
7.2%
House Ownership 2011 v 2001
2011 2001
Top 3 Occupations
Sales Assistants and Retail Cashiers
Road Transport Drivers
Construction and Building Trades
Ethnic Group
Employment
71%Economically Active
proportion has increasedby 6%
29%Economically Inactive
proportion has decreasedby 12%

TRINITY WARD
Stephen Hammond (CON)Wimbledon
James Holmes(CON)
Member of Parliament
Councillors
Krystal Miller(CON)
Simon Withey(CON)
0 to
4
5 to
7
8 to
9
10 to
14 15
16 to
17
18 to
19
20 to
24
25 to
29
30 to
44
45 to
59
60 to
64
65 to
74
75 to
84
85 to
89
90 a
nd O
ver
0
500
1,000
1,500
2,000
2,500
3,000
3,500
4,000
Age Structure
20112001
Christian53%
Buddhist1%
Hindu3%
Jewish1%
Muslim4%
Sikh0%
Any Other Re-ligion
0%
No Religion30%
Religion Not Stated8%
Religious Beliefs
Colliers Wood
Wimbledon
Raynes ParkMorden
Mitcham
Top 5 Countries of Birth
England
South Africa
India
Poland
Ireland
9,798Population has increased
by 11%
34.7Average age has increased
from 33.6
1,350Smallest population of
45-59 year olds in the borough
91.2People per 10,000m2
increasedfrom 82.2
78%White population has
increasedby 3%
22%BAME population has
increasedby 44%
No Qualifications9% 1+ GCSE (any
grade)6%5+ GCSE
(Grades A-C)8%
Apprenticeship1%
2+ A-Levels8%
First/Higher Degree
60%
Other Qualifications8%
Highest Level of Qualifications
Ow
ned
Out
right
Ow
ned
with
a M
ortg
age/
Loan
Shar
ed O
wne
rshi
p
Socia
l Ren
ted
Priv
ate
Rent
ed
0.0%10.0%20.0%30.0%40.0%50.0%
19.6
% 33.3
%
1.0% 11
.8%
33.4
%
22.2
% 41.5
%
1.3% 11
.5% 23
.5%
House Ownership 2011 v 2001
2011 2001
Top 3 Occupations
Business, Research and Administrative Professionals
Information Technology and Telecommunications
Professionals
Construction and Building Sales, Marketing and
Related Associate Professionals
Ethnic Group
Employment
82%Economically Active
proportion has increasedby 4%
19%Economically Inactive
proportion has decreasedby 14%
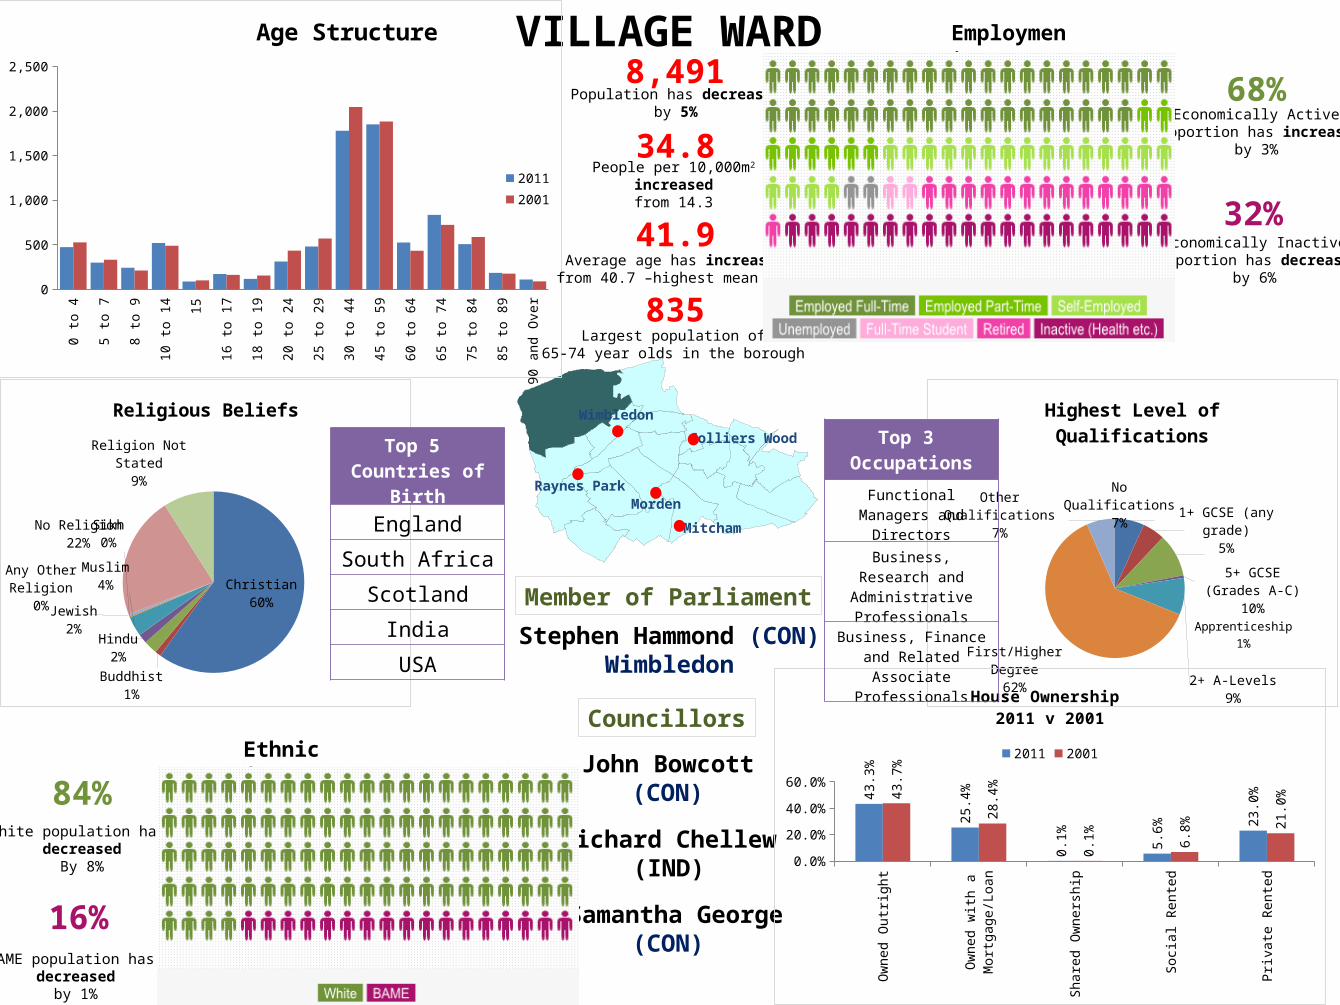
VILLAGE WARD
Stephen Hammond (CON)Wimbledon
John Bowcott(CON)
Member of Parliament
Councillors
Richard Chellew(IND)
Samantha George(CON)
0 to
4
5 to
7
8 to
9
10 to
14 15
16 to
17
18 to
19
20 to
24
25 to
29
30 to
44
45 to
59
60 to
64
65 to
74
75 to
84
85 to
89
90 a
nd O
ver
0
500
1,000
1,500
2,000
2,500
Age Structure
20112001
Christian60%
Buddhist1%
Hindu2%
Jewish2%
Muslim4%
Sikh0%
Any Other Religion
0%
No Religion22%
Religion Not Stated9%
Religious Beliefs
Colliers Wood
Wimbledon
Raynes ParkMorden
Mitcham
Top 5 Countries of Birth
England
South Africa
Scotland
India
USA
8,491Population has decreased
by 5%
41.9Average age has increased
from 40.7 –highest mean age
835Largest population of
65-74 year olds in the borough
34.8People per 10,000m2
increasedfrom 14.3
84%White population has
decreasedBy 8%
16%BAME population has
decreasedby 1%
No Qualifications7%
1+ GCSE (any grade)
5%5+ GCSE
(Grades A-C)10%
Apprenticeship1%
2+ A-Levels9%
First/Higher Degree
62%
Other Qualifications7%
Highest Level of Qualifications
Ow
ned
Out
right
Ow
ned
with
a M
ortg
age/
Loan
Shar
ed O
wne
rshi
p
Socia
l Ren
ted
Priv
ate
Rent
ed
0.0%10.0%20.0%30.0%40.0%50.0% 43
.3%
25.4
%
0.1% 5.
6%
23.0
%
43.7
%
28.4
%
0.1% 6.
8%
21.0
%
House Ownership 2011 v 2001
2011 2001
Top 3 Occupations
Functional Managers and Directors
Business, Research and Administrative Professionals
Business, Finance and Related Associate
Professionals
Ethnic Group
Employment
68%Economically Active
proportion has increasedby 3%
32%Economically Inactive
proportion has decreasedby 6%

WEST BARNES WARD
Stephen Hammond (CON)Wimbledon
Ian Dysart(LIB DEM)
Member of Parliament
Councillors
Mary-Jane Jeanes(LIB DEM)
Gilli Lewis-Lavender(CON)
0 to
4
5 to
7
8 to
9
10 to
14 15
16 to
17
18 to
19
20 to
24
25 to
29
30 to
44
45 to
59
60 to
64
65 to
74
75 to
84
85 to
89
90 a
nd O
ver
0
500
1,000
1,500
2,000
2,500
3,000
Age Structure
20112001
Christian59%
Buddhist1%
Hindu8%
Jewish0%
Muslim6%
Sikh0%
Any Other Religion
0% No Religion18%
Religion Not Stated6%
Religious BeliefsColliers Wood
Wimbledon
Raynes ParkMorden
Mitcham
Top 5 Countries of Birth
England
Sri Lanka
South Africa
India
Poland
9,862Population has increased
by 3%
37.6Average age has increased
from 37.1
6846% increase in 90+ year
olds – second largest in the borough
50.5People per 10,000m2
increasedfrom 49.0
71%White population has
decreasedby 8%
29%BAME population has
increasedby 34%
No Qualifica-tions14% 1+ GCSE (any
grade)9%
5+ GCSE (Grades A-C)
13%
Apprenticeship2%
2+ A-Levels11%
First/Higher Degree
42%
Other Qualifications9%
Highest Level of Qualifications
Ow
ned
Out
right
Ow
ned
with
a M
ortg
age/
Loan
Shar
ed O
wne
rshi
p
Socia
l Ren
ted
Priv
ate
Rent
ed
0.0%10.0%20.0%30.0%40.0%50.0%60.0%
34.1
%
42.2
%
0.8% 5.2% 16
.9%33
.5% 49
.7%
0.3% 5.
9% 10.6
%
House Ownership 2011 v 2001
2011 2001
Top 3 Occupations
Teaching and Educational Professionals
Sales Assistants and Retail Cashiers
Business, Research and Administrative Professionals
Ethnic Group
Employment
76%Economically Active
proportion has increasedby 3%
25%Economically Inactive
proportion has decreasedby 8%
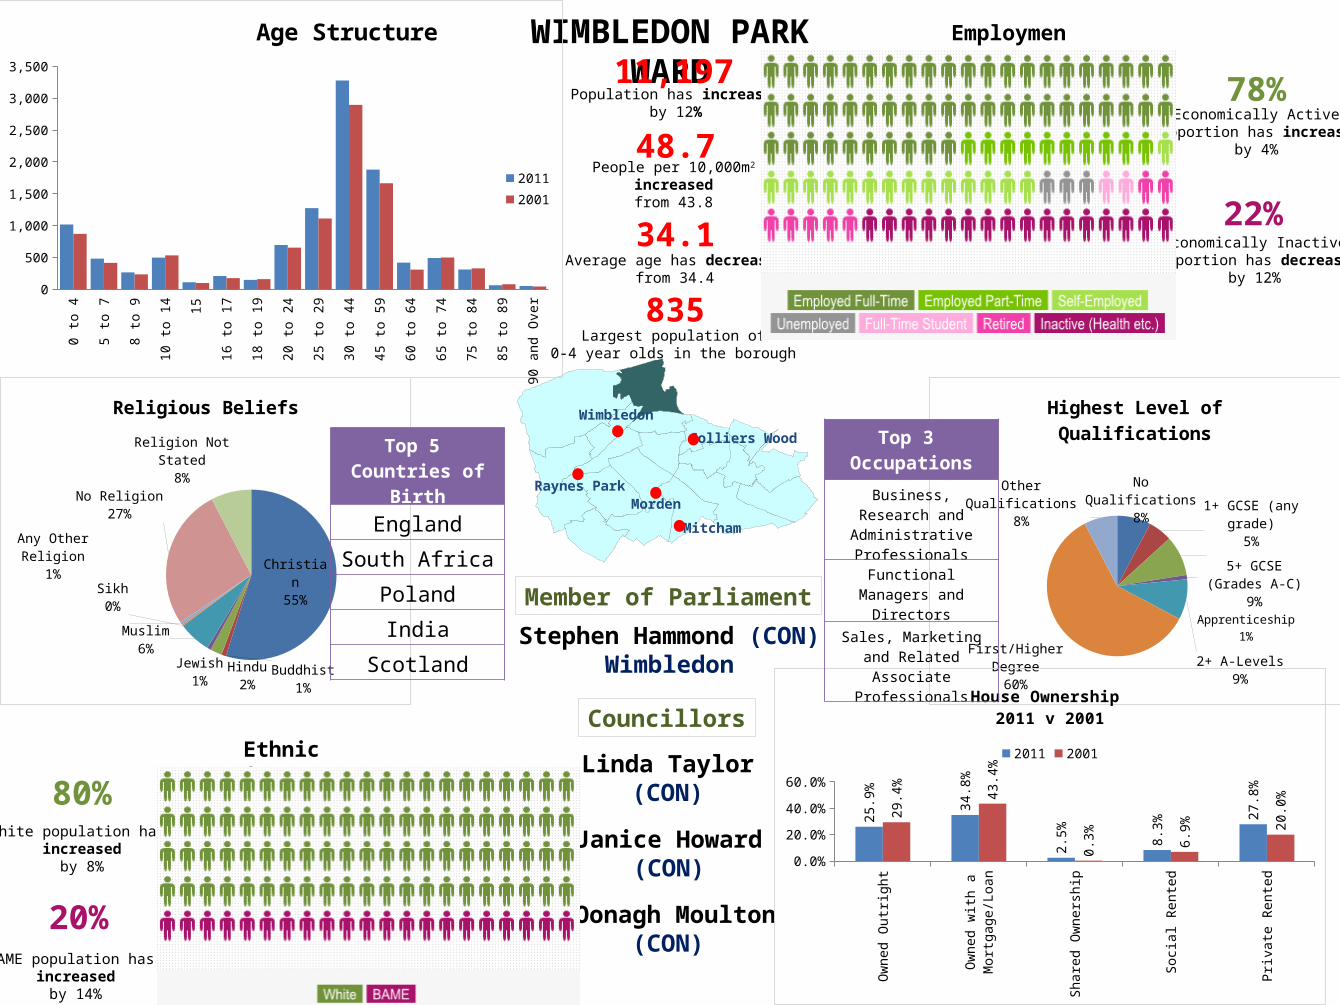
WIMBLEDON PARK WARD
Stephen Hammond (CON)Wimbledon
Linda Taylor(CON)
Member of Parliament
Councillors
Janice Howard(CON)
Oonagh Moulton(CON)
0 to
4
5 to
7
8 to
9
10 to
14 15
16 to
17
18 to
19
20 to
24
25 to
29
30 to
44
45 to
59
60 to
64
65 to
74
75 to
84
85 to
89
90 a
nd O
ver
0
500
1,000
1,500
2,000
2,500
3,000
3,500
Age Structure
20112001
Christian55%
Buddhist1%
Hindu2%
Jewish1%
Muslim6%
Sikh0%
Any Other Re-ligion
1%
No Religion27%
Religion Not Stated8%
Religious Beliefs
Colliers Wood
Wimbledon
Raynes ParkMorden
Mitcham
Top 5 Countries of Birth
England
South Africa
Poland
India
Scotland
11,197Population has increased
by 12%
34.1Average age has decreased
from 34.4
835Largest population of
0-4 year olds in the borough
48.7People per 10,000m2
increasedfrom 43.8
80%White population has
increasedby 8%
20%BAME population has
increasedby 14%
No Qualifications8%
1+ GCSE (any grade)
5%5+ GCSE
(Grades A-C)9%
Apprenticeship1%
2+ A-Levels9%
First/Higher Degree
60%
Other Qualifications8%
Highest Level of Qualifications
Ow
ned
Out
right
Ow
ned
with
a M
ortg
age/
Loan
Shar
ed O
wne
rshi
p
Socia
l Ren
ted
Priv
ate
Rent
ed
0.0%10.0%20.0%30.0%40.0%50.0%
25.9
%
34.8
%
2.5% 8.
3%
27.8
%
29.4
% 43.4
%
0.3% 6.
9%
20.0
%
House Ownership 2011 v 2001
2011 2001
Top 3 Occupations
Business, Research and Administrative Professionals
Functional Managers and Directors
Sales, Marketing and Related Associate
Professionals
Ethnic Group
Employment
78%Economically Active
proportion has increasedby 4%
22%Economically Inactive
proportion has decreasedby 12%
Related Documents