ABB Q4 and full-year 2011 results Joe Hogan, CEO Michel Demaré, CFO Zurich, February 16, 2012

Welcome message from author
This document is posted to help you gain knowledge. Please leave a comment to let me know what you think about it! Share it to your friends and learn new things together.
Transcript

ABB Q4 and full-year 2011 resultsJoe Hogan, CEOMichel Demaré, CFO
Zurich, February 16, 2012

Safe-harbor statement
This presentation includes forward-looking information and statements including statements concerningthe outlook for our businesses. These statements are based on current expectations, estimates andprojections about the factors that may affect our future performance, including global economic conditions,and the economic conditions of the regions and industries that are major markets for ABB Ltd. Theseexpectations, estimates and projections are generally identifiable by statements containing words such as“expects,” “believes,” “estimates,” “targets,” “plans” or similar expressions. However, there are many risksand uncertainties, many of which are beyond our control, that could cause our actual results to differmaterially from the forward-looking information and statements made in this press release and which couldaffect our ability to achieve any or all of our stated targets. The important factors that could cause suchdifferences include, among others, business risks related to the economic environment, costs associatedwith compliance activities, the amount of revenues we are able to generate from backlog and ordersreceived, raw materials prices, market acceptance of new products and services, changes ingovernmental regulations and currency exchange rates and such other factors as may be discussed fromtime to time in ABB Ltd’s filings with the U.S. Securities and Exchange Commission, including its AnnualReports on Form 20-F. Although ABB Ltd believes that its expectations reflected in any such forward-looking statement are based upon reasonable assumptions, it can give no assurance that thoseexpectations will be achieved.
10 February 2012 | Slide 2

ABB reports robust performance in a challenging year
Joe Hogan
10 February 2012 | Slide 3

2011: Successful focus on growth and costsStrong balance sheet, value creating acquisitions, higher investments
§ Growth driven by megatrends, strong demand for energy efficiency, power infrastructure§ Double-digit order and revenue growth, improved operating margin§ Profitable growth in Robotics business and Power Systems§ Discipline: exceeded annual cost target of $1bn § Focused acquisitions to support profitable growth§ Successful integration of Baldor and other acquisitions, new joint ventures in China§ Investments: accelerated spending on research and development, capital expenditure, new ventures§ Maintained best-in-class balance sheet, higher dividend through the cycle
§ Growth driven by megatrends, strong demand for energy efficiency, power infrastructure§ Double-digit order and revenue growth, improved operating margin§ Profitable growth in Robotics business and Power Systems§ Discipline: exceeded annual cost target of $1bn § Focused acquisitions to support profitable growth§ Successful integration of Baldor and other acquisitions, new joint ventures in China§ Investments: accelerated spending on research and development, capital expenditure, new ventures§ Maintained best-in-class balance sheet, higher dividend through the cycle
10 February 2012 | Slide 4
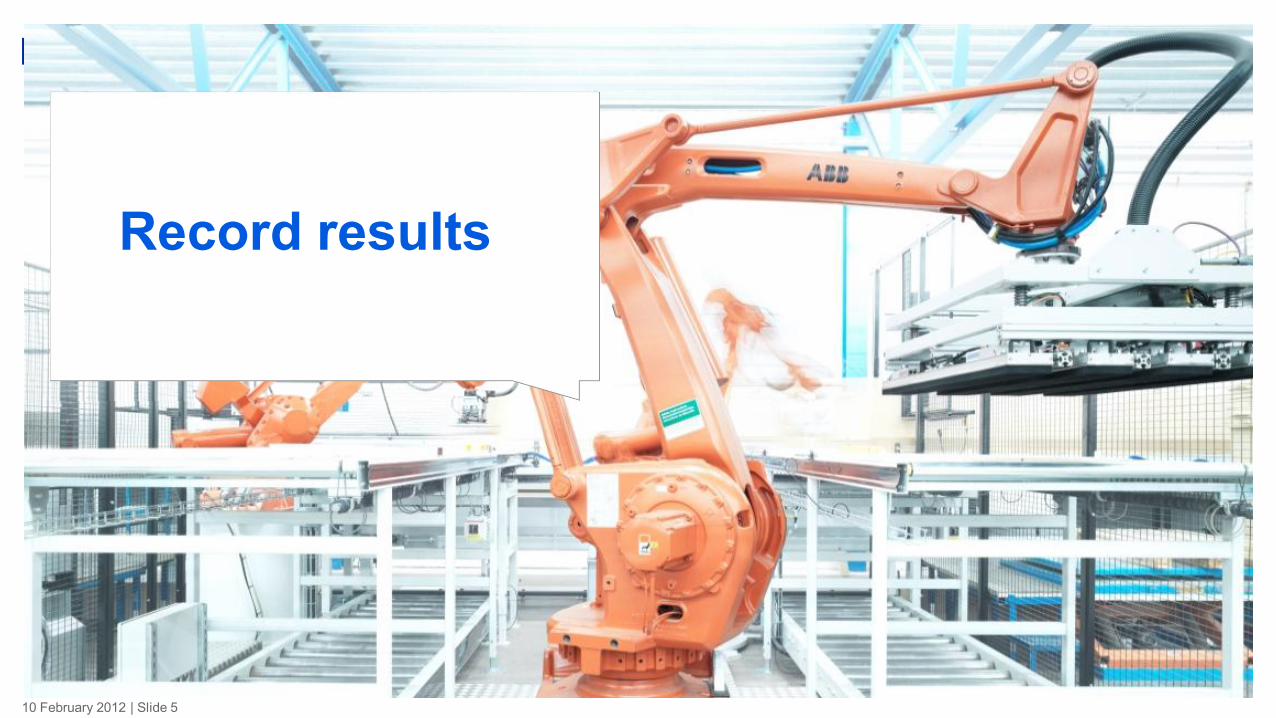
Picture for robotics
Record results
10 February 2012 | Slide 5
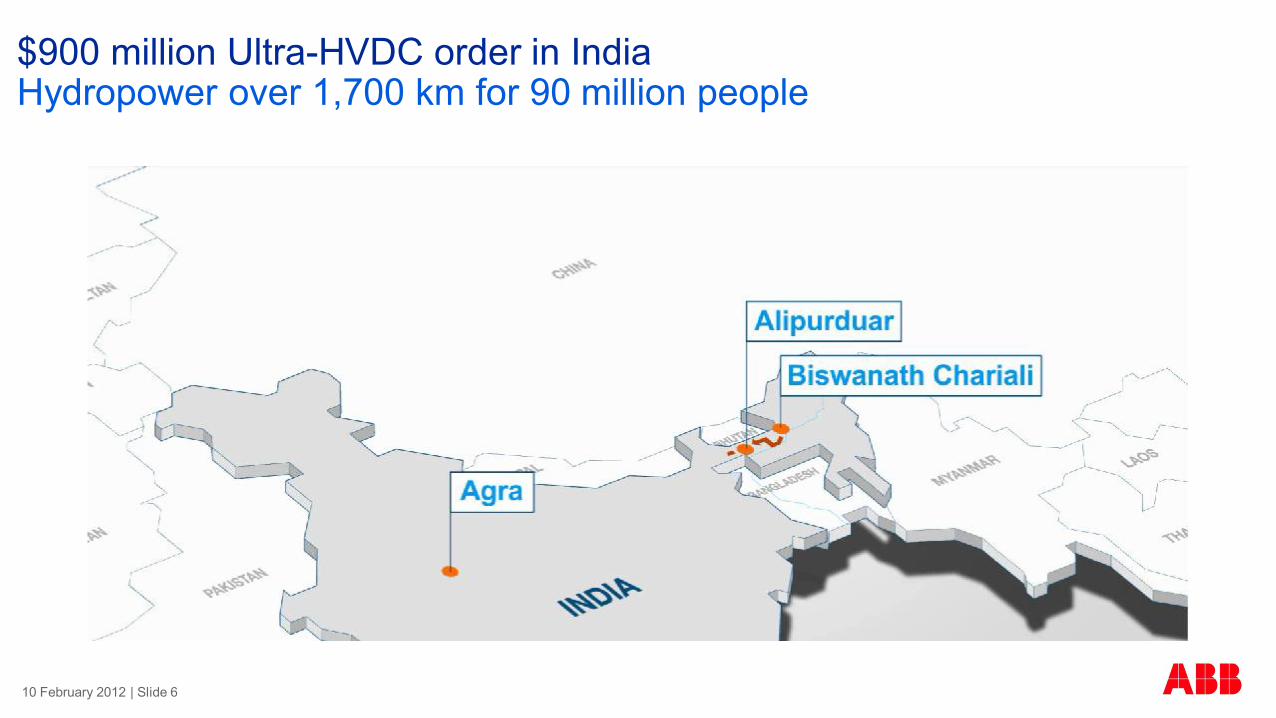
$900 million Ultra-HVDC order in India Hydropower over 1,700 km for 90 million people
10 February 2012 | Slide 6

Full-year 2011: record orders and revenuesStrong cash flow performance, redeployed in acquisitions and dividends
§ $40 bn orders for first time ever, record revenues
§ Solid delivery against growth profitability targets
§ Cost savings >$1 bn offset price pressure,
§ Funded additional $385 mln of selling and R&D
§ Acquired companies with strong revenue, earnings and cash generation contributions
§ Net income up $600 mln, EPS $1.38 per share
§ Strong Q4 cash flow performance
§ CROI at 14%, initial impact of Baldor acquisition
§ 8% increase in dividend proposed to CHF 0.65
1 In local currencies
YTD PerformanceUS$ millions unless otherwise stated
change vs 2010
Orders 40,210 +18%1
(organic. +11%)
Revenues 37,990 +15%1
(organic +9%)
Operational EBITDA 6,014 +25%
Operational EBITDA % 15.8% +0.5 percentage points
Net Income 3,168 + 24%
EPS (basic) 1.38 +23%
Dividend per share(CHF, proposed)
0.65 +8%
Cash from operations 3,612 -14%
Cash return on invested capital 14% -7 percentage
points
10 February 2012 | Slide 7
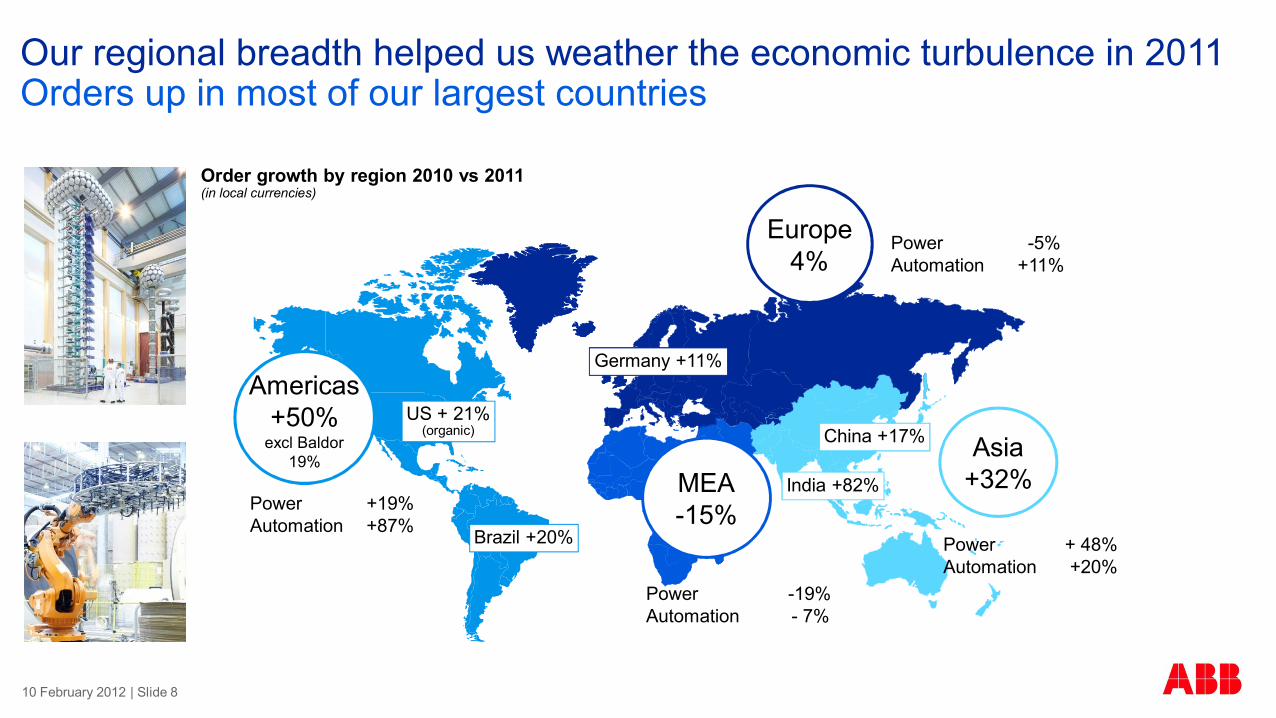
Power +19%Automation +87%
Power -5%Automation +11%
Power + 48%Automation +20%
Power -19%Automation - 7%
Order growth by region 2010 vs 2011(in local currencies)
Americas+50%
excl Baldor19%
Europe4%
Asia+32%MEA
-15%
Our regional breadth helped us weather the economic turbulence in 2011 Orders up in most of our largest countries
Germany +11%
US + 21%(organic)
Brazil +20%
China +17%
India +82%
10 February 2012 | Slide 8
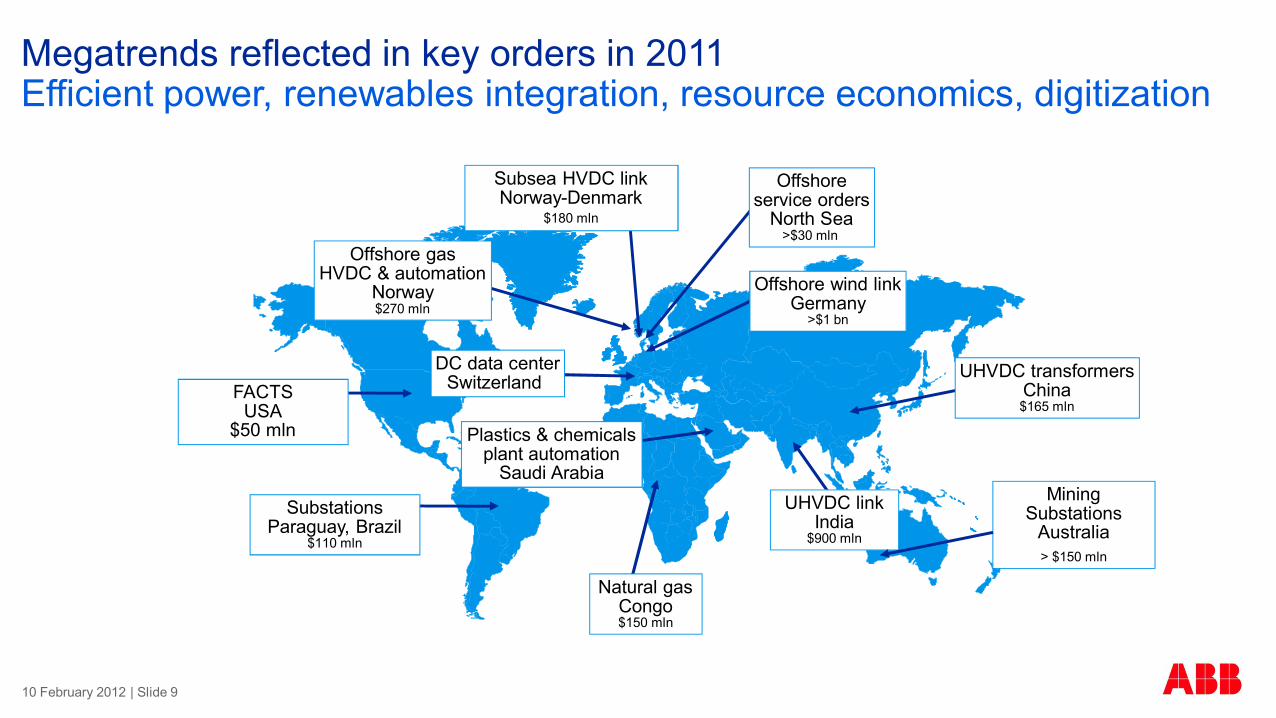
Megatrends reflected in key orders in 2011 Efficient power, renewables integration, resource economics, digitization
Offshore wind linkGermany
>$1 bn
Subsea HVDC link Norway-Denmark
$180 mln
UHVDC linkIndia
$900 mln
Offshoreservice orders
North Sea>$30 mln
UHVDC transformersChina$165 mln
Offshore gasHVDC & automation
Norway$270 mln
Plastics & chemicals plant automation
Saudi Arabia
Natural gasCongo$150 mln
SubstationsParaguay, Brazil
$110 mln
DC data centerSwitzerland FACTS
USA$50 mln
Mining Substations
Australia> $150 mln
10 February 2012 | Slide 9
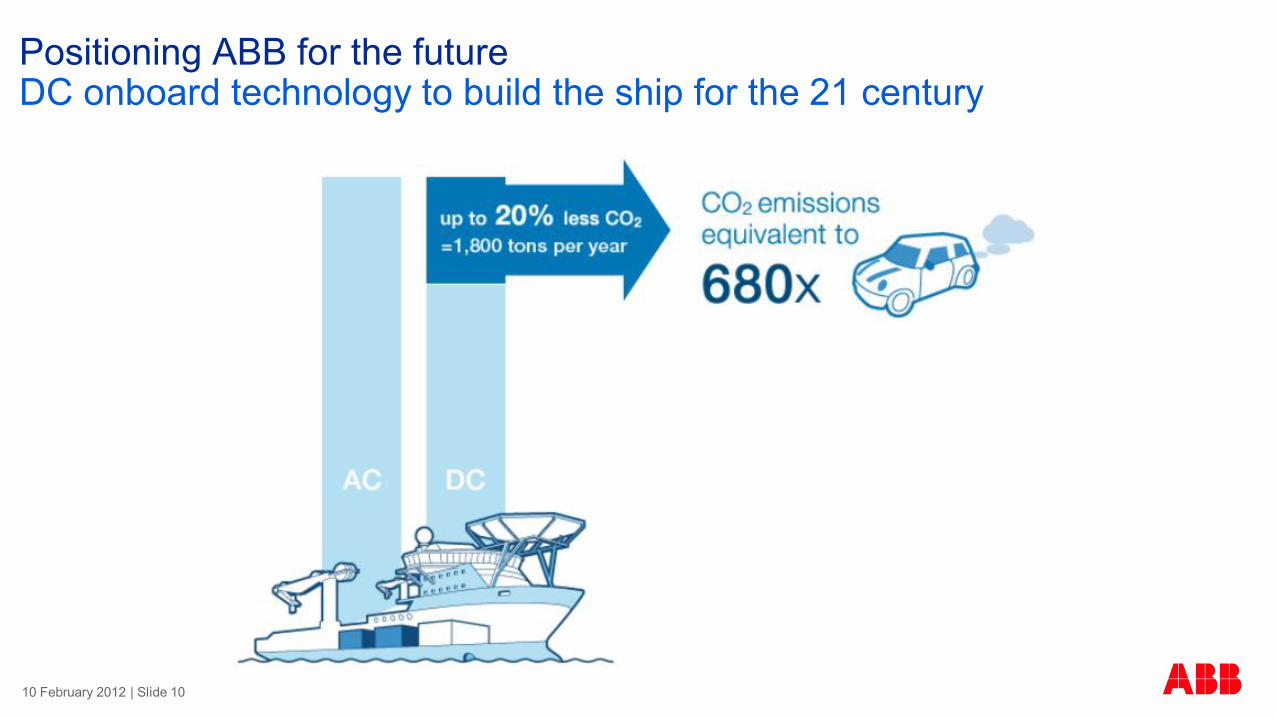
Positioning ABB for the futureDC onboard technology to build the ship for the 21 century
10 February 2012 | Slide 10

Exceeded 2011 cost savings targetSavings continued to outpace negative market impacts
Approx. share of savings by category 2011Percent
Sourcing
Global footprint
Operational Excellence
$1.1 bn
Approx. share of savings by division 2011Percent
$1.1 bnPP
DM
PS
LP
PA
Indirect Sourcing
§ $1.1 bn savings 2011 offset >$970 mln of price pressure
§ Operational excellence measures continue to gain traction
§ Focus in power pays off with sector-leading profitability despite challenging price environment
10 February 2012 | Slide 11

§ Cash returns at or above WACC within 3 years§ NPV positive (DCF at WACC + internal hurdles)§ Conservative net debt/EBITDA and gearing ratios – maintain single A credit rating
Critical gap Baldor Mincom Epyon Lorentzen & Wettre Trasfor Envitech Powercorp Newave* T&B*
Geographic ü ü ü ü üProduct/ service/solution ü ü ü ü ü ü ü ü üIndustry/market ü ü ü ü ü ü ü ü ü
§ All transactions in line with stated acquisition strategy§ Balancing integration challenges across divisions and geography
Disciplined approach
Financial criteria
$5 billion invested in strategic acquisitions in 2011ABB continued to fill strategic white spots
* Transactions expected to be closed in 2012
10 February 2012 | Slide 12
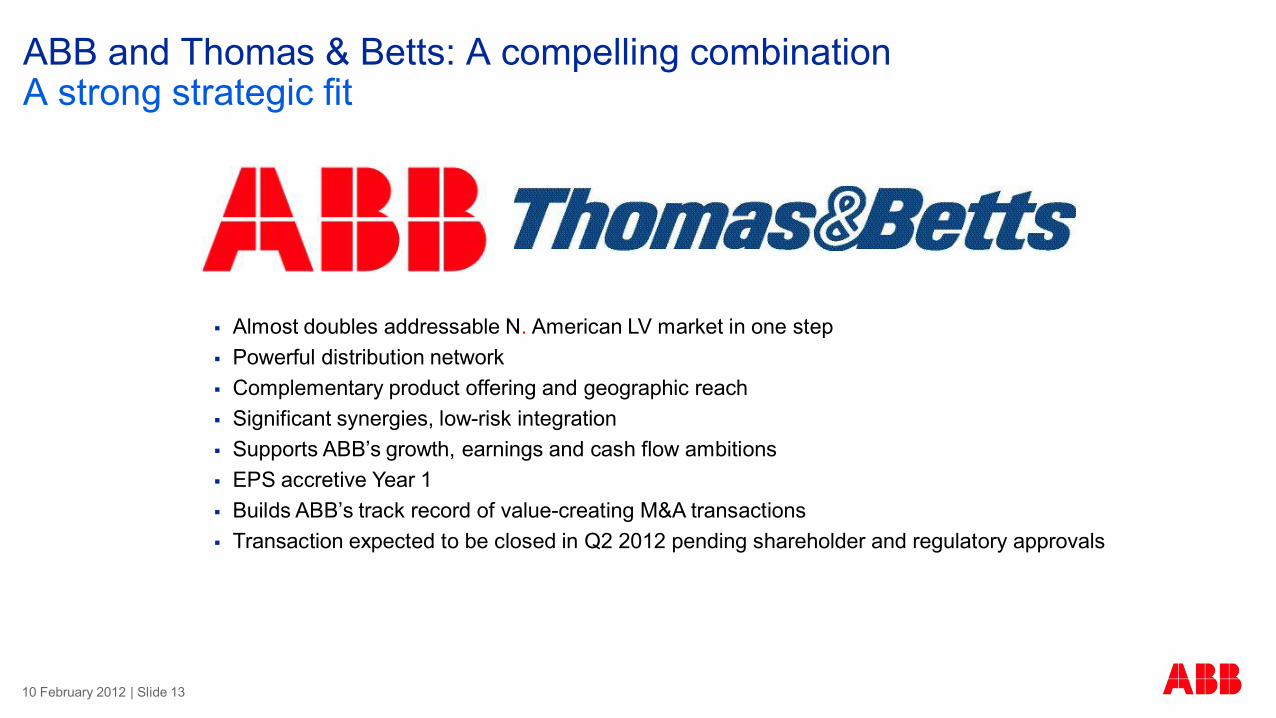
ABB and Thomas & Betts: A compelling combinationA strong strategic fit
§ Almost doubles addressable N. American LV market in one step§ Powerful distribution network§ Complementary product offering and geographic reach§ Significant synergies, low-risk integration§ Supports ABB’s growth, earnings and cash flow ambitions§ EPS accretive Year 1§ Builds ABB’s track record of value-creating M&A transactions§ Transaction expected to be closed in Q2 2012 pending shareholder and regulatory approvals
10 February 2012 | Slide 13
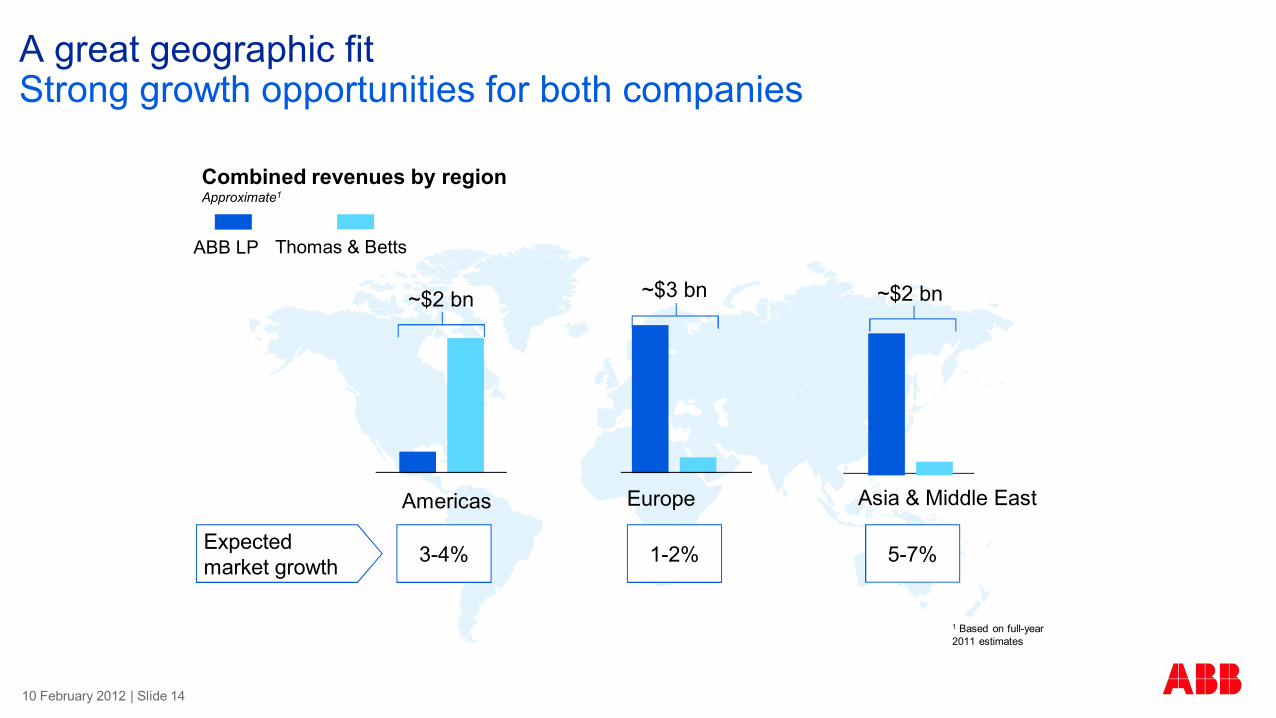
A great geographic fitStrong growth opportunities for both companies
10 February 2012 | Slide 14
Combined revenues by regionApproximate1
Americas Europe Asia & Middle East
~$2 bn ~$3 bn ~$2 bn
1 Based on full-year 2011 estimates
ABB LP Thomas & Betts
3-4% 1-2% 5-7%Expected market growth
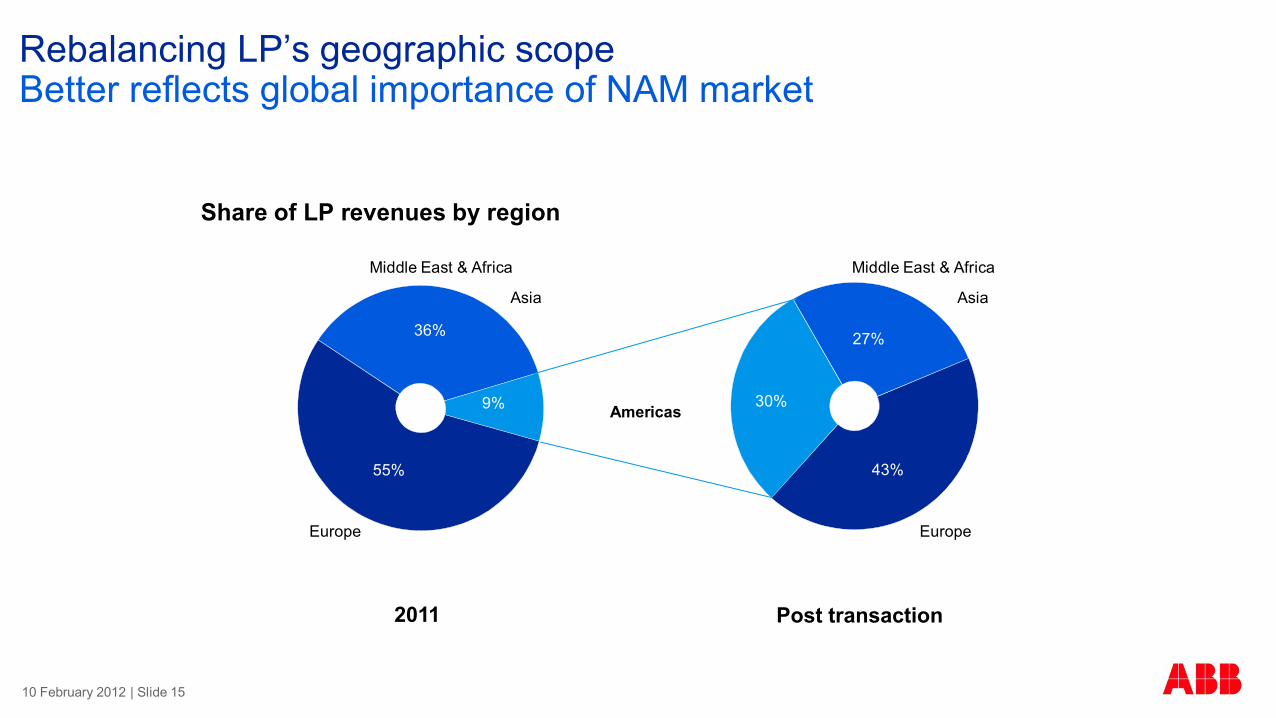
Rebalancing LP’s geographic scopeBetter reflects global importance of NAM market
Share of LP revenues by region
10 February 2012 | Slide 15
36%
9%
55% 43%
30%
27%
Post transaction2011
Americas
Middle East & Africa
Europe Europe
Middle East & Africa
Asia Asia
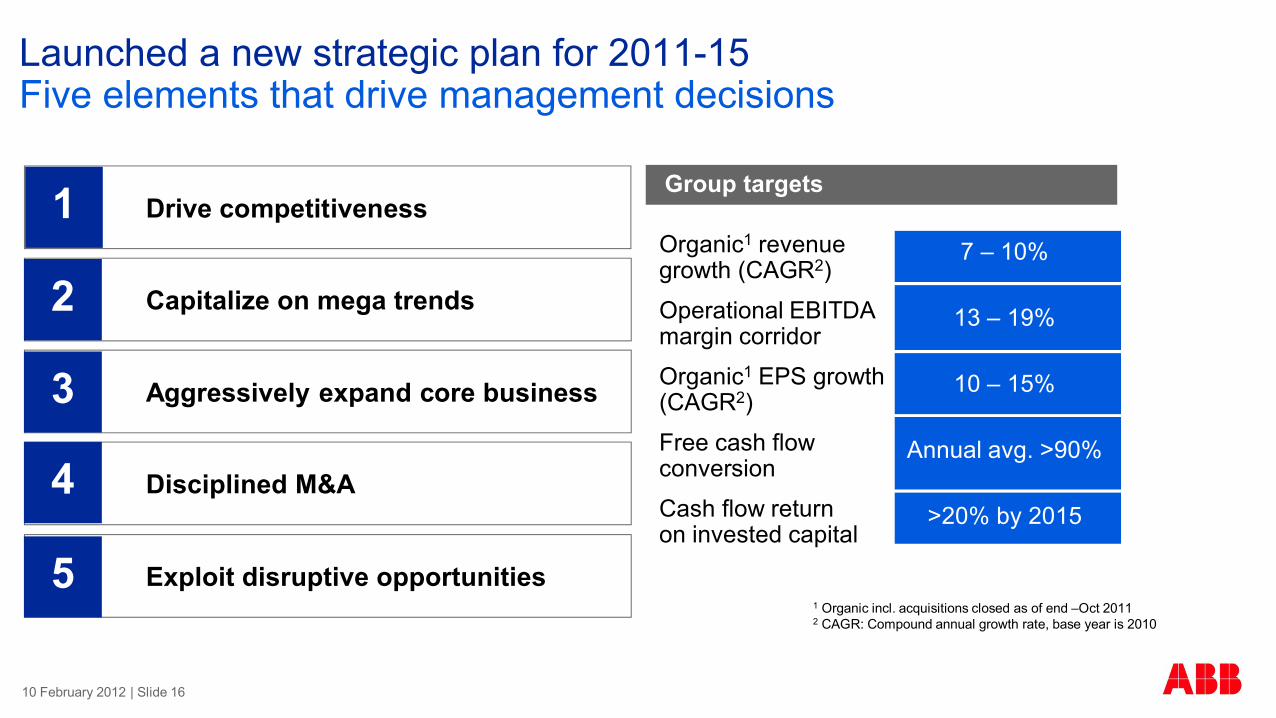
Launched a new strategic plan for 2011-15Five elements that drive management decisions
Drive competitiveness1
Capitalize on mega trends
Aggressively expand core business
Disciplined M&A
Exploit disruptive opportunities
2
3
4
5
7 – 10%
13 – 19%
10 – 15%
Annual avg. >90%
>20% by 2015
Organic1 revenue growth (CAGR2)
Operational EBITDA margin corridor
Organic1 EPS growth (CAGR2)
Free cash flow conversion
Cash flow return on invested capital
Group targets
1 Organic incl. acquisitions closed as of end –Oct 20112 CAGR: Compound annual growth rate, base year is 2010
10 February 2012 | Slide 16
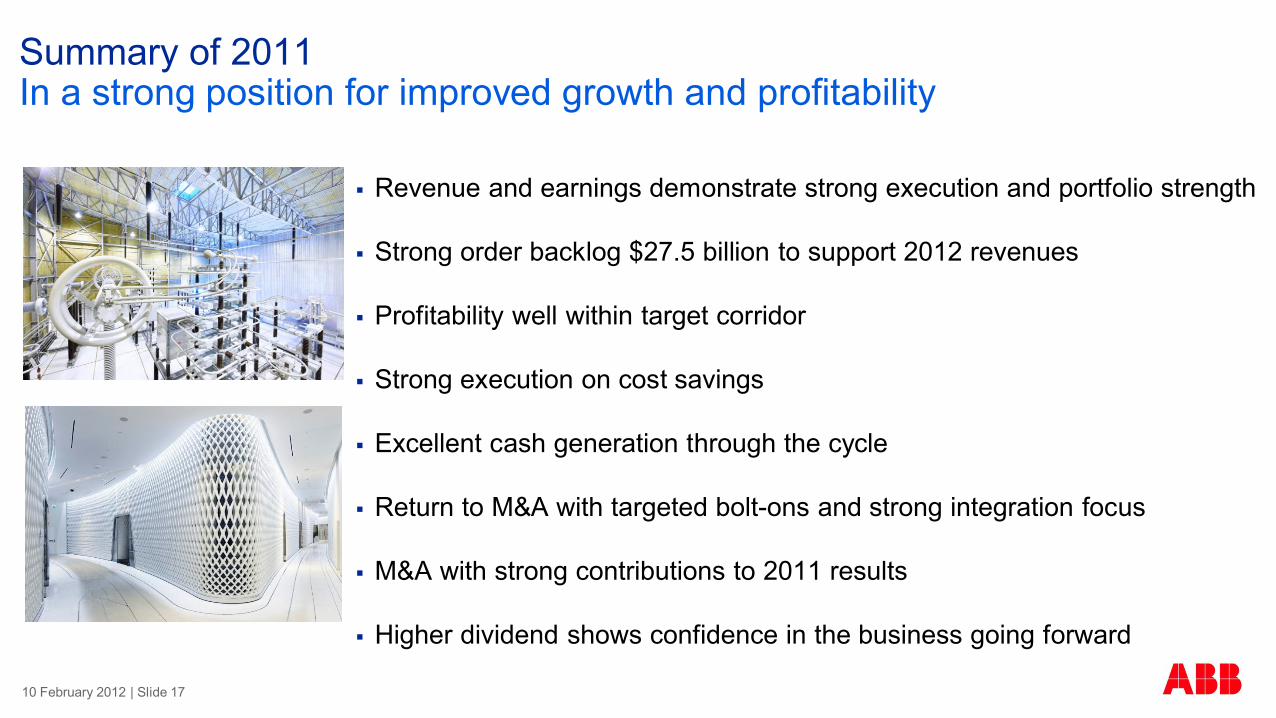
Summary of 2011In a strong position for improved growth and profitability
§ Revenue and earnings demonstrate strong execution and portfolio strength
§ Strong order backlog $27.5 billion to support 2012 revenues
§ Profitability well within target corridor
§ Strong execution on cost savings
§ Excellent cash generation through the cycle
§ Return to M&A with targeted bolt-ons and strong integration focus
§ M&A with strong contributions to 2011 results
§ Higher dividend shows confidence in the business going forward
10 February 2012 | Slide 17
Q4 resultsSolid top and bottom line growth along with strong cash flow generation
10 February 2012 | Slide 18

Q4: Solid top and bottom line in a challenging marketStrong cash flow generation and reduction in net working capital
Q4 PerformanceUS$ millions unless otherwise stated
change vs 2010
Orders 10,160 +17%1
(organic 10%)
Revenues 10,571 +16%1
(organic 10%)
Operational EBITDA 1,568 +18%
Operational EBITDA % 14.8% +0.4 percentage points
Net Income 830 +19%
Cash Flow from Operations 1,674 - 5%
§ Good order growth in N. America and emerging markets
§ South Europe weaker on market uncertainty
§ Orders and revenues up in all divisions
§ Service orders and revenues up faster than Group
§ Operational EBITDA up ~$250 mln
§ Divisional margins impacted by business mix and price
§ Cost savings remain key to maintaining margins
§ Strong cash generation near last year’s record
§ NWC reduced by $1 bn vs Q3 2011
1 In local currencies
10 February 2012 | Slide 19
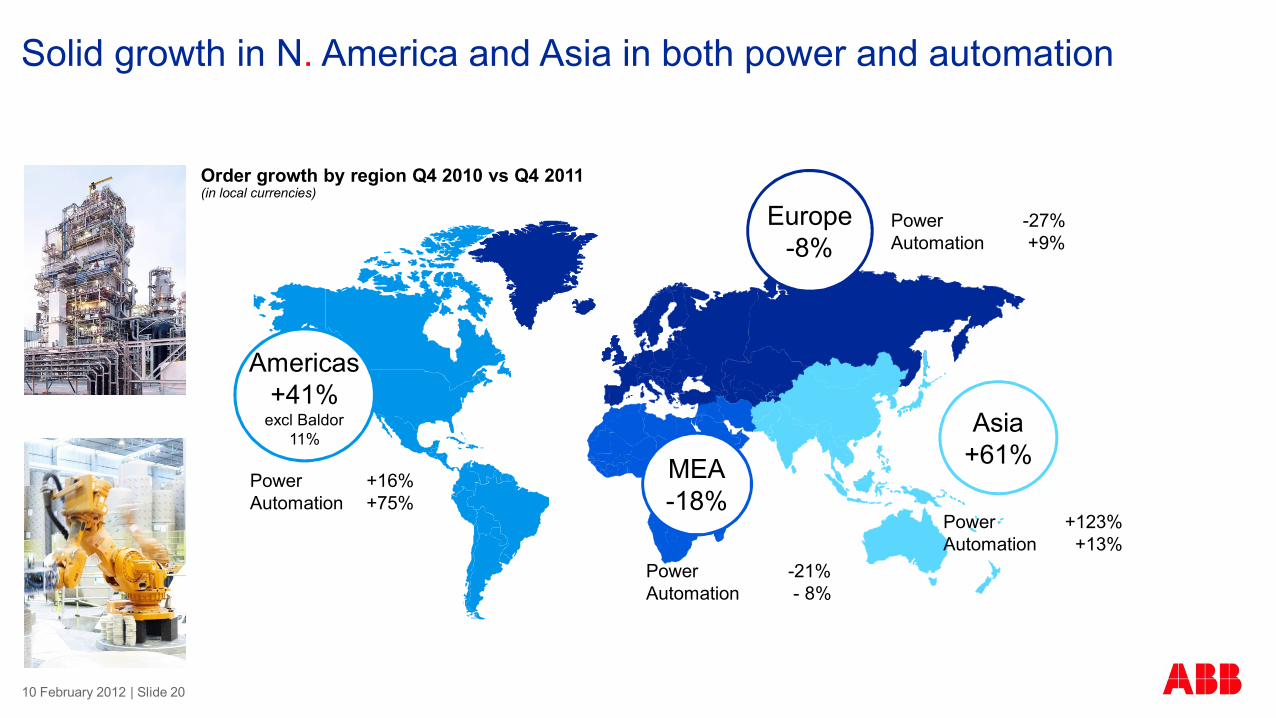
Power +16%Automation +75%
Power -27%Automation +9%
Power +123%Automation +13%
Power -21%Automation - 8%
Order growth by region Q4 2010 vs Q4 2011(in local currencies)
Americas+41%
excl Baldor11%
Europe-8%
Asia+61%MEA
-18%
Solid growth in N. America and Asia in both power and automation
10 February 2012 | Slide 20

Most large markets performed wellGeographic scope continues to pay off
Order growth by selected country Q4 2011 vs Q4 2010(in local currencies)
India >4x
Brazil -8%
U.S. +81%(25% excl. Baldor)
China +6%
Germany +4%
Power -36%Automation +76%
Power +5%Automation +3%
Power -4%Automation +15%
Power $900-millHVDC order
Automation -18%
Power +37%Automation +145%
Saudi Arabia +17%
Power +16%Automation +30%
10 February 2012 | Slide 21

Financial reviewStrong balance sheet supports successful business execution
Michel Demaré
10 February 2012 | Slide 22

percentage change in local currencies vs same period in 2010 except operational EBITDA percentage change in US$
OrdersΔ vs Q4 10
RevenuesΔ vs Q4 10
Op.EBITDAΔ vs Q4 10
Op. EBITDA margin
Δ vs Q410(percentage points)
Power Products +8% +6% -13% 14.8% -3.2%
Power Systems +21% +17% +245% 9.9% +6.6%
Discrete Automation and Motion +49% +44% +37% 17.4% -0.8%
Low-Voltage Products +6% +7% +2% 19.0% -1.1%
Process Automation +7% +10% -7% 11.8% -2.0%
ABB Group +17% +16% +18% 14.8% +0.4%
Continued growth across all divisions in Q4 Improved PS results compensate mix and price pressure in other divisions
Growth continues
Led by systems business
Large orders, strong backlog
Strong order backlog
Pricing, tougher compsQ4 2010 charges, Q4 2011 claims management
11% organicMainly unfavorable business mix, eg, systems vs product revenues
10 February 2012 | Slide 23
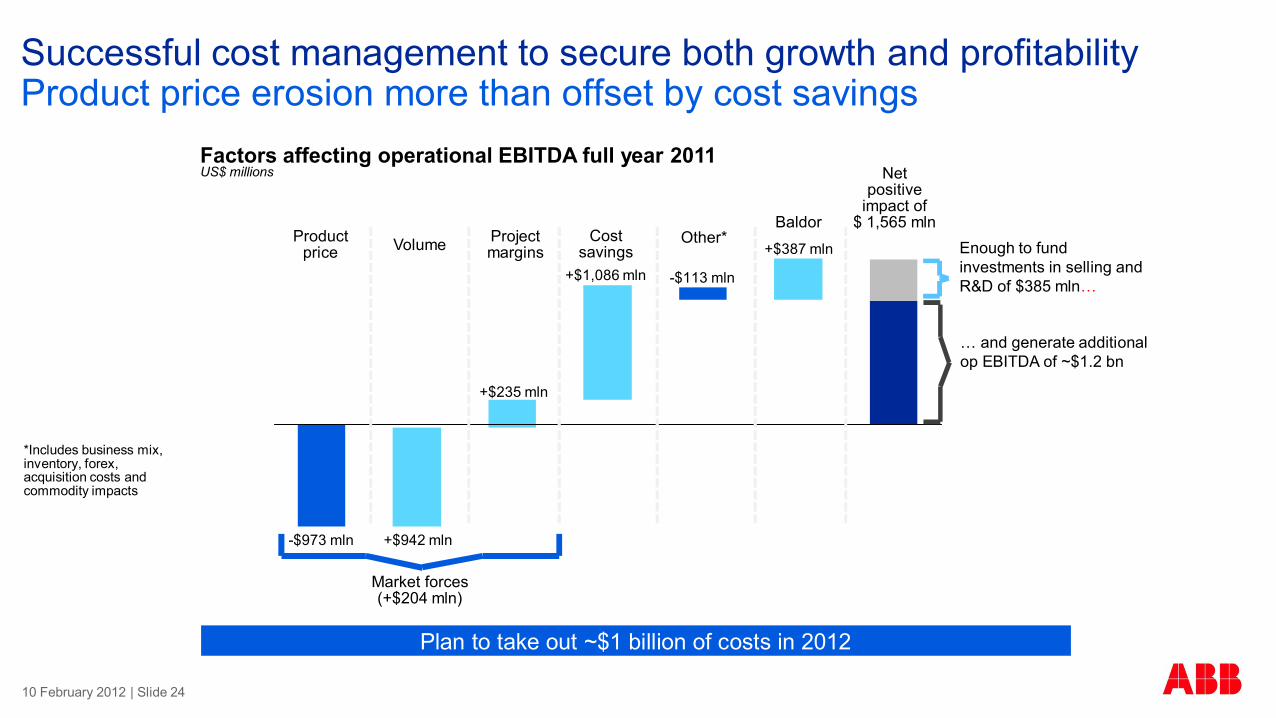
Successful cost management to secure both growth and profitability Product price erosion more than offset by cost savings
Enough to fund investments in selling and R&D of $385 mln…
… and generate additional op EBITDA of ~$1.2 bn
Net positive
impact of $ 1,565 mln
Product price
Project marginsVolume Cost
savings
Factors affecting operational EBITDA full year 2011US$ millions
Market forces(+$204 mln)
Plan to take out ~$1 billion of costs in 2012
*Includes business mix, inventory, forex, acquisition costs and commodity impacts
-$973 mln +$942 mln
+$235 mln
+$1,086 mln
Other*+$387 mln
Baldor
-$113 mln
10 February 2012 | Slide 24
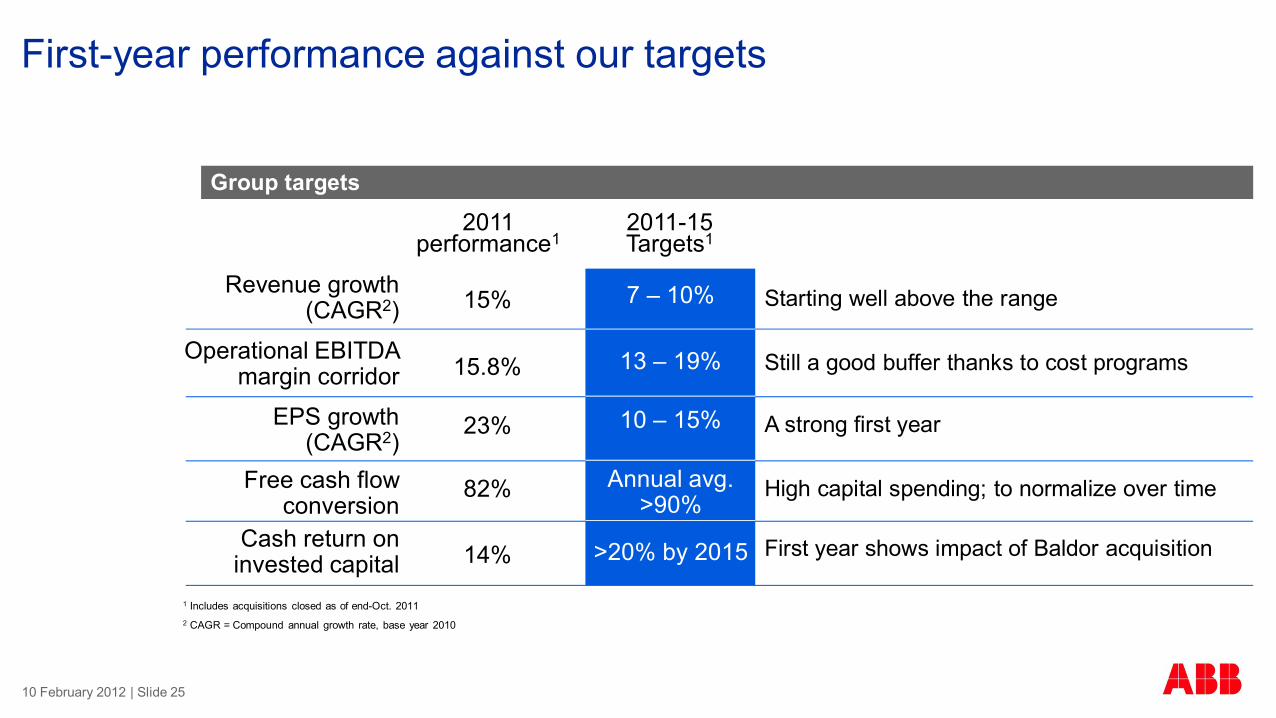
First-year performance against our targets
1 Includes acquisitions closed as of end-Oct. 20112 CAGR = Compound annual growth rate, base year 2010
Starting well above the range 7 – 10%
13 – 19%
10 – 15%
Annual avg.>90%
>20% by 2015
Group targets
Revenue growth (CAGR2)
Operational EBITDA margin corridor
EPS growth (CAGR2)
Free cash flow conversion
Cash return oninvested capital
15%
15.8%
23%
82%
14%
2011performance1
2011-15Targets1
Still a good buffer thanks to cost programs
A strong first year
High capital spending; to normalize over time
First year shows impact of Baldor acquisition
10 February 2012 | Slide 25
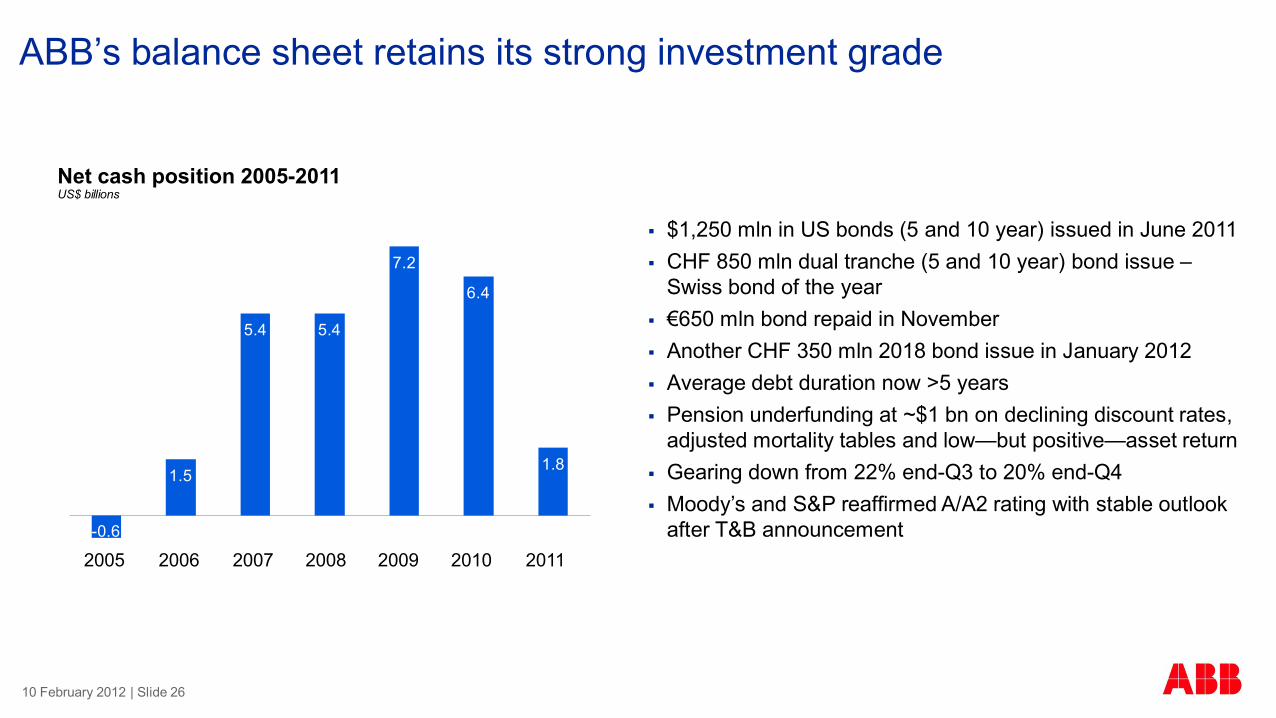
ABB’s balance sheet retains its strong investment grade
Net cash position 2005-2011US$ billions
§ $1,250 mln in US bonds (5 and 10 year) issued in June 2011§ CHF 850 mln dual tranche (5 and 10 year) bond issue –
Swiss bond of the year§ €650 mln bond repaid in November§ Another CHF 350 mln 2018 bond issue in January 2012§ Average debt duration now >5 years§ Pension underfunding at ~$1 bn on declining discount rates,
adjusted mortality tables and low—but positive—asset return§ Gearing down from 22% end-Q3 to 20% end-Q4§ Moody’s and S&P reaffirmed A/A2 rating with stable outlook
after T&B announcement
1.5
5.4 5.4
7.2
6.4
1.8
-0.6
2005 2006 2007 2008 2009 2010 2011
10 February 2012 | Slide 26

0.12
0.24
0.48 0.48
0.600.51
2005 2006 2007 2008 2009 2010 2011
Increased dividend for 2011: CHF 0.65 per share vs 0.60 in 2010Equivalent to 47% payout ratio, 3.3% yield
§ 8% dividend increase vs 2010
§ Shareholders to benefit from higher earnings
§ Payment from capital contribution reserve retains Swiss tax benefits
§ CHF 5.3 bn available for 2011 and future tax-free dividends
§ Needs AGM approval, dividend payment early May
Dividend payout 2005-2011CHF per share
A steadily rising, sustainable annual dividend throughout the business cycleDividend policy
0.65
10 February 2012 | Slide 27

Summary and outlookIn a good position for profitable growth in uncertain times
Joe Hogan
10 February 2012 | Slide 28
DC to become key technology for ABB
10 February 2012 | Slide 29

2009 2010 2011 2015F
Technology to remain a key focus in 2012Localized R&D to cut time-to-market; new products for new markets
§ R&D where the customers are:Faster to market, better match to customer needs
50%
27%26%25%
R&D employees in emerging markets% total R&D employees
Annual R&D spend as % of sales
EV fast-charger
GIS type ELK-14
2009 2010 2011 2015F
4.0%3.6%3.4%3.3%
Emerging markets
§ Target R&D spend 4% of revenues by 2015—key to sustained competitiveness
Examples of new products launched in 2011
§ Space saver for high-voltage substations
§ Highly modular, easy to customize
§ Operating in Europe and Asia§ Full charge <30 mins.§ Software connectivity to grid
§ New generation DCS upgrade for installed base
§ Widely used in power and water applications
Symphony DCS
Door entry systems§ Residential/commercial,
indoor/outdoor§ Modular design for network
configuration
10 February 2012 | Slide 30

Organic growth initiatives boost top line growthContinued cost-out focus for 2012 at 3-5% of cost of sales
Organic growth initiatives
§ Accelerate execution on software and service
§ Focus on key growth areas eg, smart grid, rail, data centers, mobility
§ Lead in grid expansion through HVDC, FACTS
§ Disruptive technologies to open new markets, eg, direct current applications
§ Leverage core technologies for new products, eg, inverters and drives, power DCS
Supply Chain ManagementLeverage volumes, boost supply chain competences
Operational ExcellenceQuality improvements, on-time delivery
Global FootprintOptimize geographic footprint
50%
45%
5%
Cost savings
10 February 2012 | Slide 31
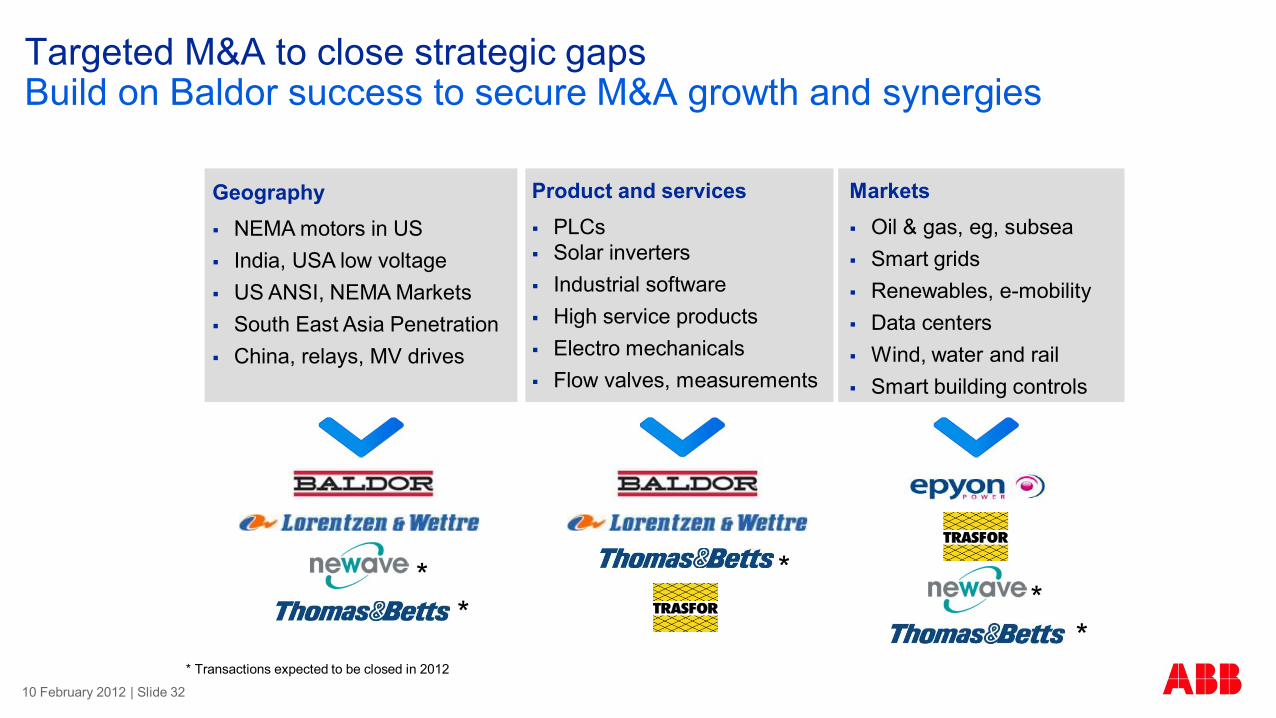
Targeted M&A to close strategic gaps Build on Baldor success to secure M&A growth and synergies
Markets§ Oil & gas, eg, subsea§ Smart grids§ Renewables, e-mobility§ Data centers § Wind, water and rail§ Smart building controls
Product and services§ PLCs§ Solar inverters§ Industrial software§ High service products§ Electro mechanicals§ Flow valves, measurements
Geography§ NEMA motors in US § India, USA low voltage § US ANSI, NEMA Markets§ South East Asia Penetration§ China, relays, MV drives
* Transactions expected to be closed in 2012
**
***
10 February 2012 | Slide 32

Outlook for 2012Mixed view short term, ample profitable growth opportunities for FY 2012
Long-term market outlook remains positive§ Continued investments in grid efficiency and industrial productivity
Short-term market view mixed§ Uncertainty in Europe, but signs of recovery in NAM, China focus on growth
Management expectations on results§ Early-cycle growth at low single digits
§ Price pressure expected to continue in parts of power (as previously guided)
§ Business mix expected to weigh on Q1 margins
§ Management focus on driving cost and productivity improvements to continue
§ Backlog, power distribution, oil & gas, emerging markets support profitable growth in 2012
Driving the business for both cost and growth
10 February 2012 | Slide 33
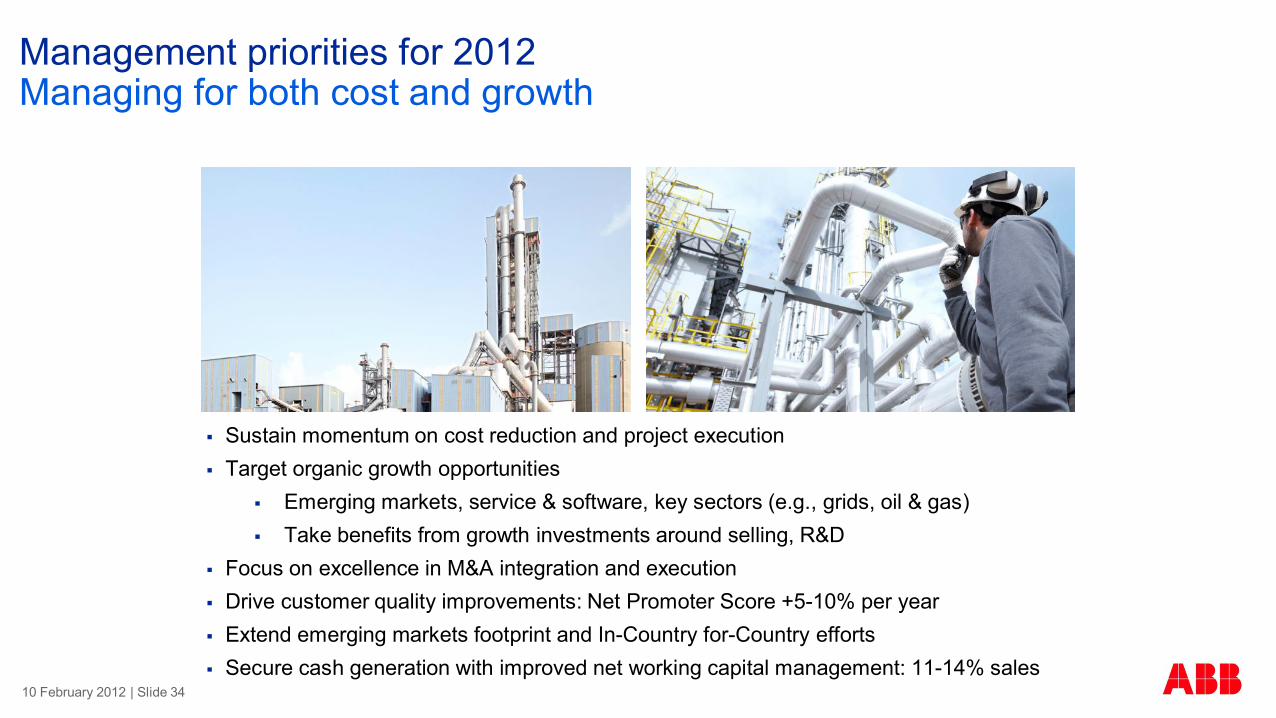
Management priorities for 2012Managing for both cost and growth
§ Sustain momentum on cost reduction and project execution§ Target organic growth opportunities
§ Emerging markets, service & software, key sectors (e.g., grids, oil & gas)§ Take benefits from growth investments around selling, R&D
§ Focus on excellence in M&A integration and execution§ Drive customer quality improvements: Net Promoter Score +5-10% per year§ Extend emerging markets footprint and In-Country for-Country efforts§ Secure cash generation with improved net working capital management: 11-14% sales
10 February 2012 | Slide 34
Related Documents