Ab initio modelling and experimental studies of order-disorder, hydration, and ionic conductivity of fluorite related oxides Liv-Elisif Queseth Kalland Dissertation for the degree of Philosophiae Doctor Department of Chemistry Faculty of Mathematics and Natural Sciences UNIVERSITY OF OSLO October 2020

Welcome message from author
This document is posted to help you gain knowledge. Please leave a comment to let me know what you think about it! Share it to your friends and learn new things together.
Transcript
Ab initio modelling and experimental studies of order-disorder,
hydration, and ionic conductivity of fluorite related oxides
Liv-Elisif Queseth Kalland
Dissertation for the degree of Philosophiae Doctor
Department of Chemistry Faculty of Mathematics and Natural Sciences
UNIVERSITY OF OSLO
October 2020
© Liv-Elisif Queseth Kalland, 2020 Series of dissertations submitted to the Faculty of Mathematics and Natural Sciences, University of Oslo No. 2348 ISSN 1501-7710 All rights reserved. No part of this publication may be reproduced or transmitted, in any form or by any means, without permission. Cover: Hanne Baadsgaard Utigard. Print production: Reprosentralen, University of Oslo.
i
Preface This thesis and dissertation represents part of the requirements for the degree of
Philosophiae Doctor (Ph.D.) at the Department of Chemistry, Faculty of Mathematics and
Natural Sciences, University of Oslo. The doctoral scholarship has been funded by the
Norwegian Ministry of Education and Research, and the work carried out at the group for
Solid State Electrochemistry (FASE) under the supervision of Prof. Truls E. Norby, Doctor
Chris E. Mohn and Prof. Reidar Haugsrud.
Discussion and collaboration motivates me as it brings inspiration and new ideas, and I am
utterly grateful to my three supervisors, for always having their door open for a short
discussion and taking the time to listen and respond. This also goes to Andreas, Tor, Anna
M., Einar, Ragnar, Shiyang, Matthias, the physicists and all others in the group, who never
turned me down when I asked for a five minute discussion, on life or my research results,
and offered me their reflections. You all inspired me, and created an encouraging work
environment.
In addition, I want to express my gratitude to Chris Knee, for sharing his knowledge and
introducing me to other peers, like Prof. Stephen Hull. Together they gave me important
perspectives to guide me in my search for order within disorder on the boundary between
short and long range order. I also want to acknowledge M. Sc. Jakob Kyrklund for the initial
preparation of samples. I want to thank Prof. Saiful Islam for welcoming me to the
University of Bath and teaching the theory and practical aspects of GULP. I am also grateful
to Post doc Sandeep Gorantla and Prof. Anette Gunnæs from structure physics section at
UiO, who took the time to perform HR-TEM investigations with me.
My family, friends, Xuemei and many from the group have offered comfort when needed,
and I am grateful for the endless support. My current workplace, also deserve my gratitude
for their flexibility and cheering the last years. Finally, I would especially like to thank my
partner Kristian for being so patient and helping me through this long lasting period of
finishing the thesis.
Liv-Elisif Queseth Kalland
Oslo, October 2020

ii
iii
Summary In this thesis we investigate the structure of La28-xW4+xO54+δ (x = 0, 1) and La2-xNdxCe2O7
(x = 0, 0.5, 1, 1.5 and 2) and the ionic conductivity and hydration, which are defect related
properties of La2-xNdxCe2O7. The underlying goal is to strengthen the understanding of
oxides with fluorite related structure, with respect to the main energetic contributions to
transport properties and the hydration thermodynamics.
La2Ce2O7 has previously been shown to exhibit pure ionic conductivity with contribution
of proton conductivity at low temperatures, and La28-xW4+xO54+δ show high proton
conductivity at intermediate to high temperatures. However, the classic hydration model on
the average structure determined by diffraction has failed to provide reasonable
explanations for the observed water uptake and conductivity. By combining first principles
calculations and a number of experimental techniques, we show how the local structure
defines frameworks for the defect chemistry, and provide models that can rationalize the
experimentally obtained results.
In the two first manuscripts/papers we have conducted a structural investigation of the two
defective fluorites La2Ce2O7 and Nd2Ce2O7 and their intermediate phases when replacing
La with Nd. In Paper I, “C-type related order in the defective fluorites La2Ce2O7 and
Nd2Ce2O7 studied by neutron scattering and ab initio MD simulations”, we focus on the
average crystal structure and identify a compatible local structure. We perform X-ray and
total scattering neutron powder diffraction and the diffraction data is analysed using
Rietveld and reversed Monte Carlo method (RMC). We further construct atomic distribution
functions from ab initio molecular dynamics (MD) results for different configurations to
compare with the functions obtained by neutron total scattering. We find that La2Ce2O7 is
best refined as a disordered fluorite, but due to increasing intensity of additional C-type
supercell peaks in the powder neutron diffraction (PND) data with increasing x in
La2-xNdxCe2O7, the Nd-containing compounds were best fitted using a combination of
oxygen deficient fluorite and oxygen excess C-type structures. Ab initio molecular
dynamics results confirm that oxygen vacancy order comparable to that in the C-type
structure, is a plausible ordering scheme explaining the observed long range order. The
results from MD modelling suggest that C-type related ordering might also be found in
La2Ce2O7, which is supported by the PND data. The Rietveld refinements indicate that the
C-type superlattice peaks stem from domains with long range vacancy ordering. Further
iv
evidence for this is given using HR-TEM (high resolution transmission electron
microscopy).
In Paper II, “First principles calculations on order and disorder in La2Ce2O7 and Nd2Ce2O7”,
we explore the local structure by comparison of a large number of configurations in the
static limit, and from Born-Oppenheimer Molecular dynamics calculation using density
functional theory (DFT). C-type related ordering of the oxygen vacancies reduce the energy
for both compounds, and the ordering is largely independent of how the cations are arranged
in the configuration. The ordering is identified by a high fractions of <210> vacancy pairs
which is optimized when combining <110> and <111> vacancy pairs in ordered patterns.
As discussed in this thesis long range ordering results in even distribution of vacancies,
ensuring a relatively cubic oxygen sublattice and cation coordination numbers between 6
and 8.
Computationally we find C-type related ordering to be favourable for both La2Ce2O7 and
Nd2Ce2O7, but experiments show significant differences in the extent of ordering. To
resolve this apparent contradiction, the summarizing discussion proposes that the
vibrational and configurational entropy contributions in the Gibbs energy of the systems be
different based on different lattice constant for the two compounds. Stabilization of disorder
to quite low temperatures could rationalize the observed extent of ordering, and the degree
of ordering is expected to increase with decreasing temperatures. We further support this
by analysing the temperature dependence of the activation energy of oxide ion conductivity
in the summarizing discussion. Partial vacancy order and disorder at diffraction
temperatures, is proposed explained due to equilibrium concentrations of ordered vacancies
or frozen-in disorder due to kinetic limitations.
In Paper III, “Structure, hydration, and proton conductivity in 50% La and Nd doped CeO2
– La2Ce2O7 and Nd2Ce2O7 – and their solid solutions”, we use TG-DSC and electrical
conductivity measurements to investigate the hydration properties and the proton
conductivity of La2-xNdxCe2O7. The high amount of vacancies leads to a potential of 1 mol
H2O uptake per mole La2-xNdxCe2O7. However, we find the hydration is strongly limited
with respect to the expected potential, even in 1 atm of water. The limited water uptake is
explained by two models. First we identify long range ordering of vacancies to restrict the
effective concentration of available, or “free”, vacancies that can be hydrated in order to
explain the evolving decrease in water uptake with increasing Nd3+ content. Secondly, we
propose a model for the disordered domains of La2-xNdxCe2O7, where protons associate to
the statistical number of fully acceptor-coordinated oxide ions, due to the higher basicity of
La3+ and Nd3+ compared to Ce4+. The basicity of La and Nd thus enables hydration in the
heavily doped ceria, and in the summarizing discussion we further argue that proton
trapping is the main contribution to the hydration enthalpy. As such, the trapping also
v
impose a site restriction for protons, creating a limitation on the maximum amount of
hydration. This second model obtains a good fit to the mainly disordered La2Ce2O7.
In Paper IV, “Local Structure of Proton-Conducting Lanthanum Tungstate La28-xW4+xO54+δ:
a Combined Density Functional Theory and Pair Distribution Function Study”, we present
the local nature of the most stable compounds within the cubic fluorite structure. We use
classical force field calculations and first principles to study the local structure. Similar to
the method used in the first paper, we compare pair distribution functions based on first
principles calculations and from total scattering neutron diffraction.
The computational study of La28-xW4+xO54+δ for x = 0 and 1, shows that strongly bonded and
regular WO6 polyhedra result in strong local ordering of two vacancies coordinating
tungsten. This results in only a small part of the vacancies to be considered as charged
defects available for diffusion and hydration. We further establish that the excess tungsten
in La27W5O55.5 will be situated on the La site that shares oxide ions with the cations on the
W specific site. As such, the additional WO6 polyhedra are corner sharing with the WO6
polyhedra in W sites. The reduced vacancy concentration resulting from W self-doping
limits the effective concentration of free vacancies, and the additional WO6 polyhedra
influence the direction of the two connected tungsten polyhedra, limiting the rotation and
transport of oxygen. The structural model of La28-xW4+xO54+δ is used to explain experimental
observations from literature.
In the discussion of this thesis, the modelled and observed vacancy ordering is connected
to the observation of defect related properties. Similarities and differences between the
studied compounds are highlighted, and from this, possible trends describing how structural
properties, ionic conductivity and hydration change for the compounds are identified.

vi
vii
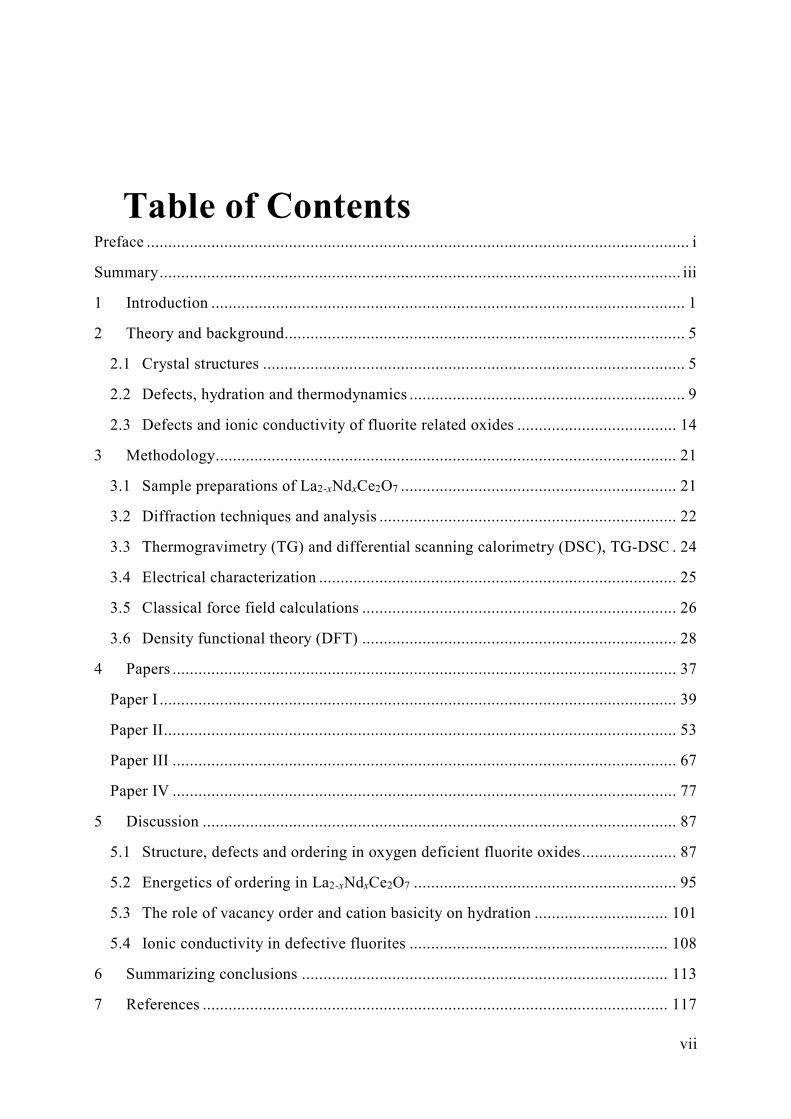
Table of Contents Preface .............................................................................................................................. i
Summary ......................................................................................................................... iii
1 Introduction .............................................................................................................. 1
2 Theory and background ............................................................................................. 5
2.1 Crystal structures .................................................................................................. 5
2.2 Defects, hydration and thermodynamics ................................................................ 9
2.3 Defects and ionic conductivity of fluorite related oxides ..................................... 14
3 Methodology ........................................................................................................... 21
3.1 Sample preparations of La2-xNdxCe2O7 ................................................................ 21
3.2 Diffraction techniques and analysis ..................................................................... 22
3.3 Thermogravimetry (TG) and differential scanning calorimetry (DSC), TG-DSC . 24
3.4 Electrical characterization ................................................................................... 25
3.5 Classical force field calculations ......................................................................... 26
3.6 Density functional theory (DFT) ......................................................................... 28
4 Papers ..................................................................................................................... 37
Paper I ........................................................................................................................ 39
Paper II ....................................................................................................................... 53
Paper III ..................................................................................................................... 67
Paper IV ..................................................................................................................... 77
5 Discussion .............................................................................................................. 87
5.1 Structure, defects and ordering in oxygen deficient fluorite oxides ...................... 87
5.2 Energetics of ordering in La2-xNdxCe2O7 ............................................................. 95
5.3 The role of vacancy order and cation basicity on hydration ............................... 101
5.4 Ionic conductivity in defective fluorites ............................................................ 108
6 Summarizing conclusions ..................................................................................... 113
7 References ............................................................................................................ 117

viii
1
1 Introduction
“The more I learn, the more I realize how much I don't know.”
― Albert Einstein
Over the last decade, proton conducting oxides have gained massive interest as promising
candidates for next-generation materials in electrochemical devices for energy conversion
and storage [1, 2]. These materials exhibit properties that could drastically reduce cost and
increase durability in several electrochemical applications important for the hydrogen
economy. Hydrogen will play a key role in developing a carbon neutral and carbon negative
society. Hydrogen can function as a fuel for the transport sector, either as pure H2 or though
hydrogen carriers such as ammonia or liquid organic hydrogen carriers (LOHC). Energy
conversion of electricity into hydrogen, and vice versa, can contribute with flexibility in
renewable energy production to manage large peak variations. Hydrogen is also an
important factor for upgrading bio-oils or CO2 into hydrocarbons, necessary in order to
produce fuels or other carbon-containing products such as plastics. Green carbon from
biomass and CO2 extracted from the atmosphere or from large point sources of emission
(carbon capture and usage) are needed in order to mitigate the use of fossil factors to the
petrochemical industry.
Proton conducting oxides can be used for a variety of electrochemical devices: proton
ceramic fuel cells (PCFCs) for converting hydrogen to electricity, proton ceramic
electrolysis cells (PCECs) for hydrogen production, ammonia synthesis or even co-
conversion of CO2 and H2O, reversible protonic ceramic electrochemical cells (RePCEC)
for energy conversion and grid-scale storage and protonic ceramic electrochemical reactors
(PCERs) for natural gas upgrading [1-3].
Proton conducting oxides that conduct electrons or oxide ions as well as protons are called
mixed conductors. Mixed conductors are applicable for electrodes in SOFCs[4], and mixed
electronic-protonic conductors can be used as hydrogen gas separation membranes in
addition to being candidates for PCFC electrodes [5]. Triple conducting oxides (electrons,
oxide ions and protons) can function as cathode material for dual-ion SOFCs [6].
2
Hydrogen is the energy carrier with the highest energy density, and can be converted to
electricity in a fuel cell without CO2 emission. Fuel cells are classified according to the
types of electrolytes and their major ionic charge carriers. In solid oxide fuel cells (SOFC)
oxide ions or protons are transported through an oxide electrolyte due to a chemical
potential gradient and an electric current is drawn over the cell. State-of-the-art oxide ion
conductors offer the best ionic conductivities at high temperatures. However, proton
conductors have higher ionic conductivity at low and intermediate temperatures. Today’s
proton exchange membrane (or polymer electrolyte membrane, PEM) fuel cells are
commercialized for use in fuel cell electrical vehicles and small scale electricity generation
from hydrogen. The PEM electrolyte, however, need high purity H2 fuel to avoid fast
degradation of the electrolyte. Proton conducting oxides, on the other hand, tolerate coking
and contaminants better, making them more durable as well as suitable for different types
of hydrogen-containing fuels [1-3]. Proton conducting ceramics also obtain higher
efficiency in reversible electrochemical cells. In order for proton ceramic fuel cells to reach
commercialization the large scale production methods must be developed in order to reduce
the cost of production, and more efficient electrode materials must be developed [1].
The state-of-the-art proton conductors known today are doped ABO3 perovskites with Ba
for the A site and Ce and-or Zr for the B site nominally [1-3, 7-9]. These materials absorb
protons through a hydration reaction creating hydroxide defects. This is an exothermic
reaction that creates a limitation to the temperature range in which protons will be present,
due to dehydration [7]. Doping (usually acceptor doping) of these materials can in most
cases increase the concentration of vacancies, and subsequently protons upon hydration.
Zirconia and ceria based oxides but with the fluorite structure, yield state-of-the-art solid
oxide ion conductors such as yttria stabilized zirconia (YSZ) and Gadolinium doped ceria
(GDC) [10, 11]. High oxide ion diffusion upon doping with alkaline earth oxides or rare
earth oxides is enabled by their high tolerance for disorder. Doped ceria and YSZ exhibit
high oxide ion conductivity but show no or little proton conductivity in the bulk, only
surface proton conductivity at room temperatures [12, 13]. However, heavily La doped ceria
(i.e. La2Ce2O7) has shown significant bulk proton conductivity at low to intermediate
temperatures making it an interesting proton ceramic conductor [14-16]. La6WO12 is
another fluorite derived compound that has harvested interest due to its relatively high and
predominate proton conductivity at intermediate to high temperatures, in addition to its
mixed electronic-protonic conductor properties [17-19].
Status and motivation
In the search for new oxide materials for electrochemical devices we encounter different
challenges in understanding the underlying principles of the materials chemistry. For some
oxides, more basic properties like crystal structure and atomic ordering are also not yet
3
determined. These properties are closely related to the defect chemistry of oxides.
Understanding the defect structure and investigating thermodynamic equilibria between
different defects in proton conducting oxides, are important to gain knowledge that can be
used to further improve material properties such as ionic conduction through doping and
specialized synthesis methods.
The main goal of the work presented in this thesis is to strengthen the understanding of
fluorite related oxides that can be considered highly oxygen deficient with respect to the
perfect fluorite structure. The structure and defect structure are keys to the properties of
oxides. The structures of some fluorite related oxides exhibiting oxide ion and proton
conductivity, La6WO12 (or in reality La28-xW4+xO54+δ with 0.74 ≤ x ≤ 1.08) and Ln2Ce2O7
(Ln = La and/or Nd) are the focus. The compounds cannot be described by means of the
average structure models available in the current literature, particularly for the oxygen
environment and a disordered oxygen sublattice. The compounds possess cubic fluorite
derived structures which are highly oxygen deficient with respect to the fluorite structure
(i.e. high oxygen vacancy concentration). The understanding of when the compound
exhibits defects in the dilute regime, defect association or short or long range order, is
important to understanding the physical properties of the compound such as hydration, ionic
conductivity and phase stability. Through experimental and computational methods we
investigate the structure, hydration and ionic conductivity of these compounds.
La2Ce2O7 and Nd2Ce2O7
Conductivity measurements on La2Ce2O7 [14-16] indicate pure ionic conductivity. The
oxide ion conductivity is high at elevated temperatures, almost comparable to the state-of-
the-art oxide ion conductors YSZ and GDC, and proton conductivity is found at lower
temperatures. This raises the question of why La2Ce2O7 shows significant proton
conductivity when moderately doped ceria does not. The question further leads to the
question of whether La2Ce2O7 (and Nd2Ce2O7) is best described as heavily doped ceria, a
solid solution or an oxide with its own perfect crystal structure. Additional acceptor doping
of La2Ce2O7 with calcium, decreases the conductivity. Self-compensation with over-
stoichiometry of cerium is suggested to be the reason, together with precipitation of La2O3
[20]. Another possible explanation is trapping of oxygen vacancies by the acceptor dopants
or ordering of vacancies. Earlier studies on the related compound Nd2Ce2O7, which has
somewhat lower ionic conductivity than La2Ce2O7, show indications of some long range
ordering of vacancies in otherwise disordered fluorite structure [21-24]. However, the
physical origin of the supercell diffraction peaks in Nd2Ce2O7 is yet not fully understood.
For La2Ce2O7, however the debate has been whether pyrochlore structured La2Ce2O7 will
be formed [25, 26], or whether it will be a disordered fluorite [14, 27, 28]. It follows that
4
these two compounds are on the stability border between the pyrochlore, disordered fluorite
and C-type structure.
Density functional theory (DFT) is an ab initio or first-principles, computational method
which provides a powerful tool for determining the structural energy landscape. In this work,
computational as well as experimental structure investigations will be presented, aiming to
determine the order and disorder within the crystal structure. Ionic conductivity and
hydration of the oxides are studied experimentally and correlated to the information on the
atomic structure. The combined data is used to develop a full structural model that can
explain the observed properties of La2-xNdxCe2O7 (with x = 0, 0.5, 1, 1.5, and 2).
Crystal structure refinement of La6WO12
As previously mentioned, La6WO12 exhibits high temperature proton conductivity. The
crystal structure and stability range of lanthanum tungstate has been investigated with
neutron diffraction prior to this work revealing the true stoichiometry to be La28-xW4+xO54+δ
(with 0.74 ≤ x ≤ 1.08), within a cubic fluorite related structure [29]. The findings, however,
leave some questions regarding the defect chemistry as to where the excess tungsten resides
and why the hydration conductivity properties were limited with respect to the refined
structure, which predicted about 1 out of 6 oxygen positions to be vacant [17, 30]. Through
classical force field calculations with empirical pair potentials, we further investigate the
crystal structure of La28-xW4+xO54+δ. Computational studies using simple atomistic
calculations of the lattice energy have lower computational costs compared to first-
principles techniques such as DFT. This opens up the possibility of studying large systems
in the search for superstructures and good sampling of different structural configurations.
The results form the basis for further and more accurate DFT-calculations in this study,
which in turn are compared with neutron total scattering and the resulting pair distribution
function. By altering the configurations we can also interpret facets of the experimentally
obtained diffraction data.
5
2 Theory and background
“If I have seen further it is by standing on the shoulders of Giants.”
― Isaac Newton
In this chapter, some of the basic principles and underlying theory of this work will be
described together with literature relevant for this thesis. In addition, some connections to
general methods will be drawn.
2.1 Crystal structures
In the work with crystalline materials and their material properties, it is alpha and omega to
know and understand the crystal structure and the thermodynamics, since all physical and
chemical properties can be understood through their thermodynamic states and equilibria.
Therefore we will start with looking at the theory of perfect crystals and some relevant
crystal structures for this work.
Perfect crystals and the ground state
A perfect crystal has perfect ordering of atoms in the lattice of the atoms and perfect
translational symmetry (and of course no defects). If a crystal is perfect, the crystal (i.e.
physical system) is in its one unique state (i.e. crystal structure) where it has the lowest
possible energy. This is called the ground state and the third law of thermodynamics reveals
that it will have zero entropy, S, at absolute zero degrees (0 K). If the system is not able to
reach this equilibrium at 0 K, it will be frozen-in at another state or in other words a meta-
stable structure. If there are several degenerate (i.e. having the same energy) states, the
system has configurational entropy, and in principle, it is possible to have degenerate
ground states, but this is rare for binary and ternary oxide compounds when looking only at
the atomic structure. In this work a certain atomic structure or arrangement of the atoms in
a crystal, is often referred to as a configuration. The system gains configurational entropy
when other configurations are accessible due to available energy through increased
temperature. In addition to the configurational entropy, crystalline compounds gain
vibrational entropy when the temperature increases. The energy is related to the oscillating
vibrations of atoms, which increase with temperature.
6
It is the ground state of a compound that atomistic simulation techniques are searching for
when relaxing an atomic structure during energy minimization, either they are potential
based models, simulating the potentials between atoms based on empirical values, or first
principles calculations like DFT solving the Schrödinger equation including electrons using
a functional of the electron density. Most atomistic simulation techniques entail iterative
operations where the energy of the crystal (or molecule for non-crystalline materials) is
calculated for a trial configuration. Then atoms are moved in small steps in different
directions to see if the forces acting on the atoms or the total energy can be minimized. The
energy gradients due to forces acting on the atoms tell the program where to continue its
search for the configuration with a global minimum energy which is the ground state. If the
computational method also calculates the electronic structure, the electron energy is
minimized for each atomic step. The calculated energy for the resulting atomic (and
electronic) structure is called the total energy. From the total energy, the change in enthalpy
∆H of reactions can also be calculated assuming constant pressure. For example, the
formation enthalpy of an oxide can be found from the difference between the energy for the
oxide and the energy of the constituents in their ground state (more about this later in
Chapter 3 Methodology).
During synthesis crystals can get kinetically hindered from reaching the ground state
structure when cooled down. The crystals are then frozen-in, in a meta-stable state. In a
similar manner the infinite crystal simulated can be stuck in local minima. Therefore one
has to search between in principle all possible structure candidates in some manner to be
sure to succeed in reaching the global minimum. However, this would in turn demand
significantly more computational effort and create a much more time-demanding
calculation.
The atomic structure of the perfect crystal, the “ground state” or lowest energy configuration,
is a central topic in this work defining properties we are interested in and serving as a
starting point for calculations of defects. Before we look at relevant defects we will
introduce the fluorite structure and superstructures of fluorites relevant for this work.
Crystal structure and the fluorite structure
Crystal structures describe the atom arrangements, and the smallest repeating pattern
repeated infinitely in all directions is called the unit cell. The lattice constants describe the
length and angles of the axis in the unit cell and the space group identifies the symmetry
operations of the unit cell. The atomic positions are expressed in fractional coordinates
within this cell, and due to symmetry, the sites in the unit cell are repeated according to the
space group. These distinct sites are then reported using Wykoff sites. This type of structural
information is the input and output for atomistic simulation techniques. There are several
other ways of classifying a crystal structure than the space group, e.g. crystal families,
7
crystal systems and lattice systems. They all give a good impression of the lattice parameters,
however space group is the classification scheme with most detailed information about the
symmetry between the atomic positions.
The perfect fluorite structure is the basis of all the modelling of structure in this work, and
CeO2 is an example of a compound that exhibits this structure. The perfect fluorite structure
has the space group Fm-3m and two Wyckoff sites 4a (0, 0, 0) and 8c (¼, ¼, ¼) for the
cations and anions, respectively, which are fully occupied in CeO2. Z = 4, meaning there
are 4 formula units in the unit cell. The Bravais lattice and crystal family/lattice system for
the fluorite structure is face-centred cubic. The term cubic, tells us the lattice parameter
angles are all 90˚. The lattice parameters are a, b, and c = 5.4625 Å.
The lanthanides (Ln: La, […], Lu) and the rare earths (which in addition to Ln also include
Y and Sc) with oxidation state 3+, adopt the A-type, B-type or C-type sesquioxides structure.
Sesqui is latin and means 1.5 times referring to the 3:2 ratio of oxygen to cations. The binary
oxides of the bigger rare earths such as La crystallize in the A-type crystal structure, and
for the medium sized lanthanide the B-type will be found. The C-type structure is most
stable for the sesquioxides formed by Gd and smaller rare earths. The A- B- and C-type are
actually not closely related structurally, as they are hexagonal, monoclinic and cubic
respectively. The C-type structure is, however, related to the perfect fluorite structure, it is
a so-called super structure of fluorite.
Super structures of Fluorite; C-type and pyrochlore structure
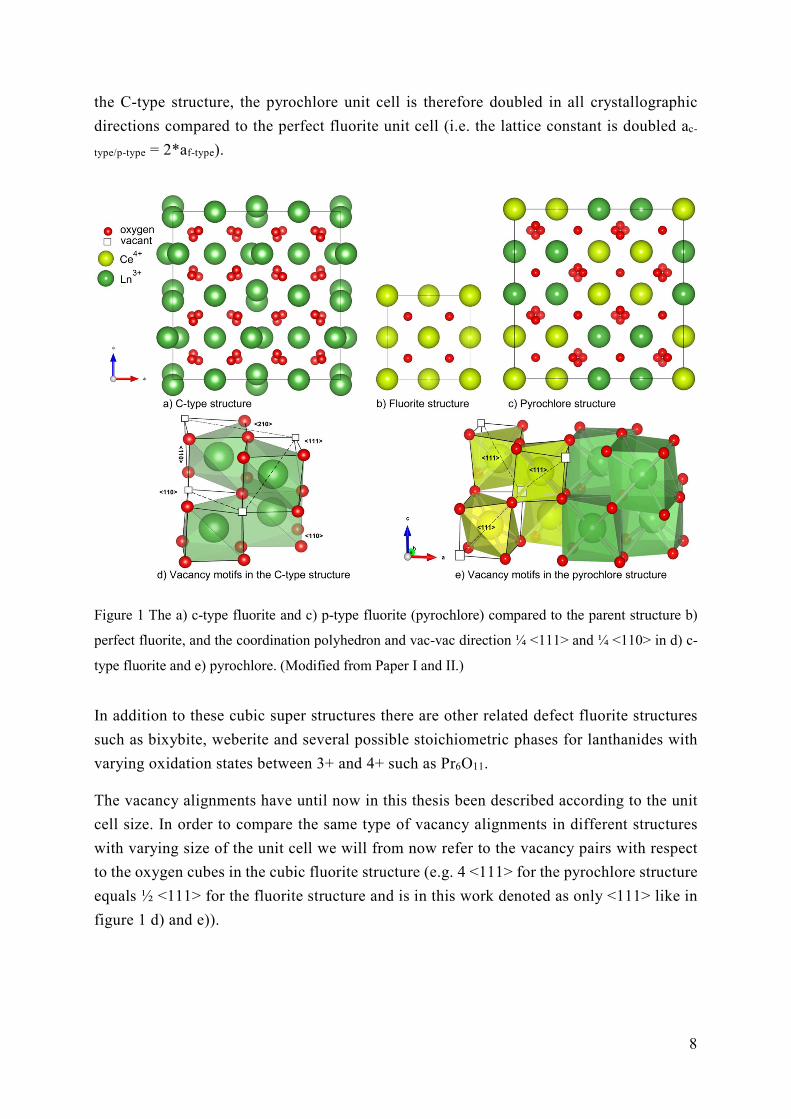
There are several super structures that are derived from the perfect fluorite (see Figure 1 a-
c). The cubic C-type structure (Ln2O3, space group Ia-3) has a higher symmetry, compared
to the parent cubic perfect fluorite structure (see Figure 1 a)). Due to the lower oxygen
stoichiometry in the c-type fluorite and the small cations favouring a 6-fold coordination,
the parent 4a and 8c sites are split into two Wyckoff sites with the cations occupying 8b and
24d and the oxide ions occupying only 48e and not 16c. The unit cell is doubled in all
directions correspondingly. The oxygen atoms, or rather the vacant sites, form a
symmetrical pattern with ¼ <111> and ¼ <110> direction between the vacant 16c sites
around the two cation sites 8b and 24d respectively (see Figure 2 d). Further, the next closest
vacant site will have a ¼ <210> direction in this symmetry.
The pyrochlore structure, (A2B2O7, space group Fd-3m), is also derived from the fluorite
structure (see Figure 1c). Due to size mismatch and charge difference, the trivalent and
tetravalent cation order into the different 16d and 16c sites. In addition the oxygen sublattice
splits into the positions 8b, 48f and 8a, where the latter is vacant resulting in an 8-fold
coordination of the trivalent A-cation and 6-fold coordination of the smaller tetravalent B-
cation with the vacant oxygen sites aligned in the ¼ <111> direction (see Figure 1 e). Like
8
the C-type structure, the pyrochlore unit cell is therefore doubled in all crystallographic
directions compared to the perfect fluorite unit cell (i.e. the lattice constant is doubled ac-
type/p-type = 2*af-type).
Figure 1 The a) c-type fluorite and c) p-type fluorite (pyrochlore) compared to the parent structure b)
perfect fluorite, and the coordination polyhedron and vac-vac direction ¼ <111> and ¼ <110> in d) c-
type fluorite and e) pyrochlore. (Modified from Paper I and II.)
In addition to these cubic super structures there are other related defect fluorite structures
such as bixybite, weberite and several possible stoichiometric phases for lanthanides with
varying oxidation states between 3+ and 4+ such as Pr6O11.
The vacancy alignments have until now in this thesis been described according to the unit
cell size. In order to compare the same type of vacancy alignments in different structures
with varying size of the unit cell we will from now refer to the vacancy pairs with respect
to the oxygen cubes in the cubic fluorite structure (e.g. 4 <111> for the pyrochlore structure
equals ½ <111> for the fluorite structure and is in this work denoted as only <111> like in
figure 1 d) and e)).
9
2.2 Defects, hydration and thermodynamics
It is the point defects in the crystal structure that enable physical properties such as ionic
and electronic conductivity, as well as hydration. The presence of oxygen vacancies in an
oxide, for instance, usually enables oxide ion conductivity as well as hydration and
subsequently proton conductivity. Understanding the defect chemistry of oxides is therefore
important in this thesis.
Defects in oxides in fluorite related oxides
Defects form intrinsically, extrinsically, or they are incorporated into the structure by
adding dopants or contamination. Intrinsic defects occur in charge compensating pairs as
they involve the constituents present in the perfect crystal only and the compound remains
stoichiometric. An example is anti-Frenkel defects often formed in pyrochlore structured
oxides [27, 28, 31, 32], where an oxide ion swaps site to a nominally unoccupied Wykoff
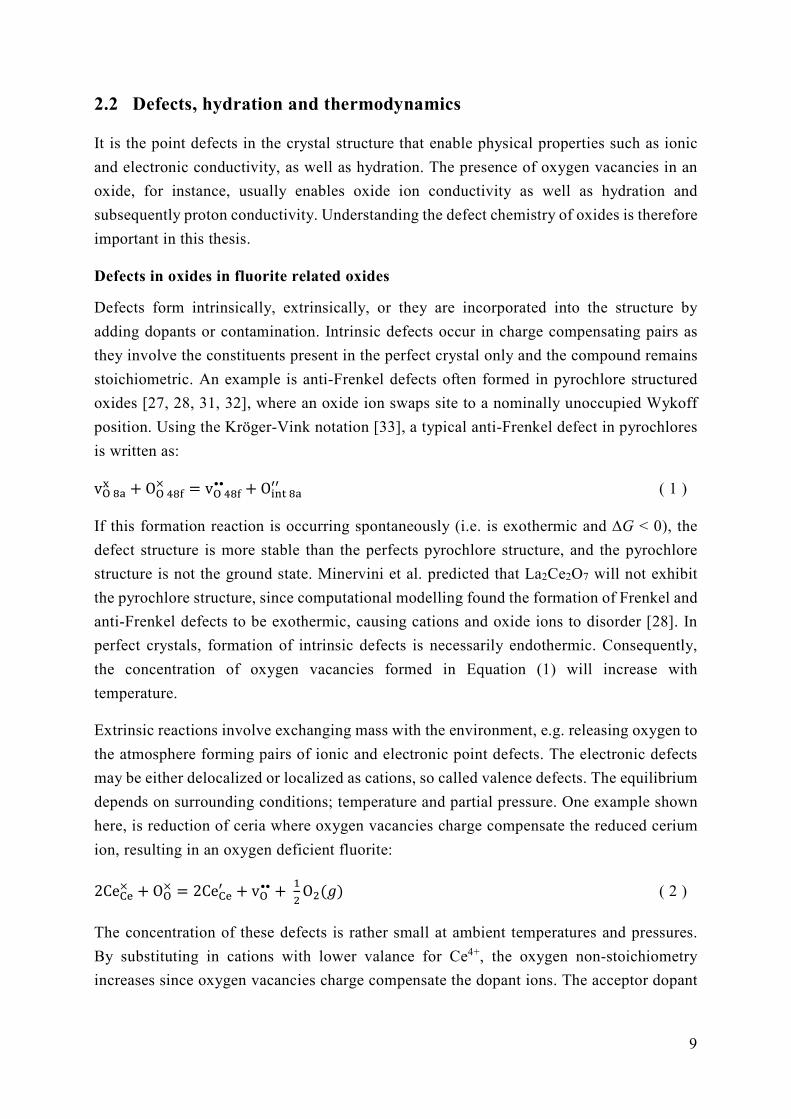
position. Using the Kröger-Vink notation [33], a typical anti-Frenkel defect in pyrochlores
is written as:
v + O × = v
•• + O ( 1 )
If this formation reaction is occurring spontaneously (i.e. is exothermic and ∆G < 0), the
defect structure is more stable than the perfects pyrochlore structure, and the pyrochlore
structure is not the ground state. Minervini et al. predicted that La2Ce2O7 will not exhibit
the pyrochlore structure, since computational modelling found the formation of Frenkel and
anti-Frenkel defects to be exothermic, causing cations and oxide ions to disorder [28]. In
perfect crystals, formation of intrinsic defects is necessarily endothermic. Consequently,
the concentration of oxygen vacancies formed in Equation (1) will increase with
temperature.
Extrinsic reactions involve exchanging mass with the environment, e.g. releasing oxygen to
the atmosphere forming pairs of ionic and electronic point defects. The electronic defects
may be either delocalized or localized as cations, so called valence defects. The equilibrium
depends on surrounding conditions; temperature and partial pressure. One example shown
here, is reduction of ceria where oxygen vacancies charge compensate the reduced cerium
ion, resulting in an oxygen deficient fluorite:
2Ce× + O× = 2Ce + v•• + O (𝑔) ( 2 )
The concentration of these defects is rather small at ambient temperatures and pressures.
By substituting in cations with lower valance for Ce4+, the oxygen non-stoichiometry
increases since oxygen vacancies charge compensate the dopant ions. The acceptor dopant
10
concentration will be constant provided that the concentration is below the solubility limit
or frozen-in.
In the present work concerning La2Ce2O7 and Nd2Ce2O7 one may choose to regard these
compounds as ceria substituted by trivalent lanthanides, i.e. as 50% acceptor doped ceria
(Ce1-xLnxO2-0.5x in the general form), in the Kröger-Vink notation:
𝐿𝑛 O = 2𝐿𝑛 + 3O× + v•• ( 3 )
If a cation is substituted with a higher valent cation, the oxide is donor doped, and oxygen
interstitials can be formed to charge compensate as they will have effectively negative
charge. Self-donor doping occurs in another of the materials represented in this work,
La28-xW4+xO54+δ:
WO = W••• + O× + O ( 4 )
where the material is most stable at 0.74 ≤ x ≤ 1.08 [30].
Defect thermodynamics
Defect formation and the thermodynamics of non-stoichiometric phases are analysed using
the mass action law on quasi-chemical reactions like in Equation 1-4 and their quasi-
chemical equilibrium constant, K. When writing defect equation one must take into account
the three rules demanding conservation of mass, charge and site ratio. For the anti-Frenkel
(AF) reaction in Equation ( 1 ) we can write the equilibrium constant as:
𝐾𝐴𝐹 =[vO 48f
•• ] Oint 8a′′
vO 8ax OO 48f
× = exp −∆𝐴𝐹𝐻°
𝑅𝑇exp
∆𝐴𝐹𝑆°
𝑅 ( 5 )
By using the electroneutrality condition [v •• ] = [O ], and assuming that the fractions
[v ] and [O × ] are approximately 1 (low defect concentration), we see that the
concentration of vacancies is dependent on the temperature through the enthalpy of defect
formation:
[vO 48f•• ] = exp −
∆𝐻°𝐴𝐹
2𝑅𝑇exp
∆𝑆°𝐴𝐹
2𝑅 ( 6 )
Another relevant defect equilibrium for this work is hydration of oxygen vacancies forming
two hydroxide defects:
H O( ) + O× + v•• = 2OH• ( 7 )
The equilibrium constant can be expressed as:
𝐾 = exp −∆ °
exp∆ °
=[ • ]
•• × , ( 8 )
11
showing the relationship between the enthalpy and entropy of hydration, ∆𝐻° and
∆𝑆° , the temperature T and the activity of the participating species, here given by the
mole fraction of the species [OH• ] [v••] and [O×] as well as the partial pressure of water,
𝑝 /bar. By rearranging these equations we can find how the defect concentrations depend
on the partial pressure of water or temperature.
If the vacancies involved in the reaction Equation ( 7 ), are introduced due to acceptor
doping such as in Equation ( 3 ), then the electroneutrality condition reads:
[𝐿𝑛 ] = 2 [v••] + [OH• ]. These equations can be used to fit the concentration of the
species, and therefore also the enthalpy and the entropy included in the hydration reaction,
to measured water uptake from thermogravimetry measurements (TG). The
electroneutrality conditions for the dominating defects can reduce the number of unknowns
when solving these equations by fitting the variables to experimentally measured water
uptake.
Protons are usually present in most oxides in hydrogenous atmospheres and can at times
also dominate the material properties [34]. Hydration of most oxides usually yield an
exothermic hydration reaction, although, in some oxides, like CeO2, the hydration is
theoretically found to be endothermic [35]. Since the hydration enthalpy is determined by
change in energy between the dehydrated and hydrated state, it depends on the energy of
the defects on the two sides of the equation. To illustrate that hydration constitutes both
protonation of the oxide ions and filling of oxygen vacancies, we can split the hydration
reaction into two reactions accordingly:
𝐻 𝑂( ) + 2 O× = 2 OH• + 2 e + 𝑂 ( ) ( 9 )
v•• + 2 e + 𝑂 ( ) = O× ( 10 )
The two partial reactions can contribute differently to the total hydration enthalpy.
Increasingly exothermic hydration enthalpies have for pyrochlores and sesquioxides been
correlated with increasing stability of the oxide [32, 36]. This can be explained by the high
energy needed to create vacancies in the more stable oxides, which means that more energy
is released when the vacancies are filled during hydration. For the perovskite BaCeO3, it
has been proposed that filling of vacancies give a much lower energy contribution to the
hydration enthalpy than the protonation of oxide ions [37]. Another work on BaCeO3 show
the importance of the dopant choice due to the interaction between dopants and vacancies
or protons [38]. For doped oxides the dopant can affect the stability of the proton by for
12
example influencing the charge density on the neighbouring oxide ions, further altering the
potential bond strength to the proton. In a recent computational work a new correlation
model explaining hydration enthalpies in oxides is presented. They find that both the
affinity (of the oxide ion) for protons and the hydroxide affinity (filling a vacancy in an
oxide with OH-) is correlated with the ionization potential of the oxide but with opposite
trends. The proton affinity increases with decreasing ionization potential (the energy
difference between the valence band maximum, usually from the oxygen, and the vacuum
level) [39].
Hydration in fluorite derived structures containing rare-earth oxides
In order to predict the hydration enthalpy for the rare earth containing fluorite related oxides
studied in this work, it is useful to understand the correlation between the materials
chemistry and the hydration thermodynamic of other related oxides. As mentioned
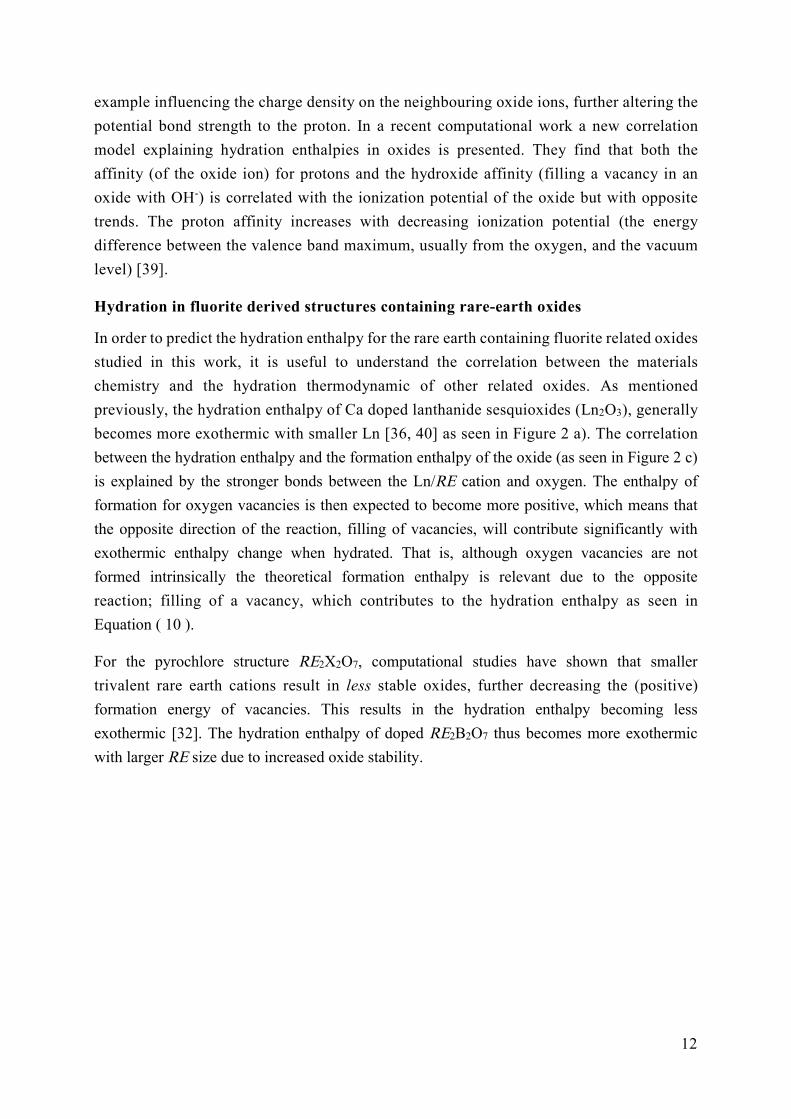
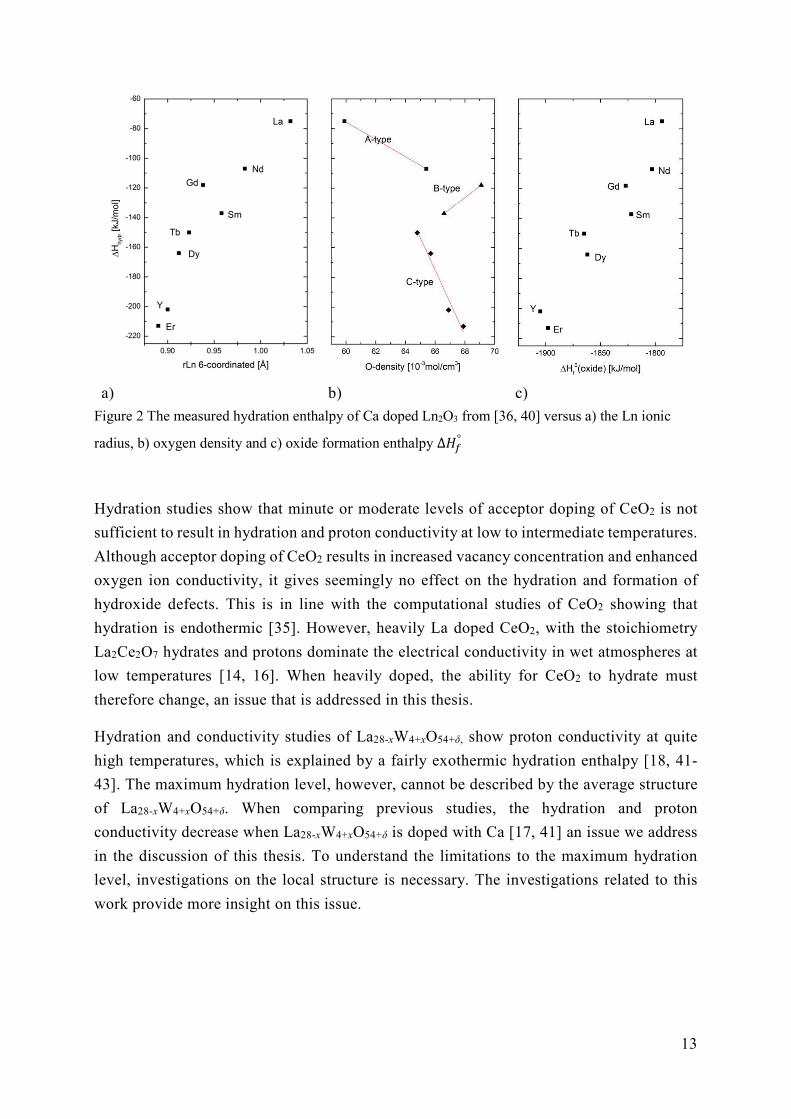
previously, the hydration enthalpy of Ca doped lanthanide sesquioxides (Ln2O3), generally
becomes more exothermic with smaller Ln [36, 40] as seen in Figure 2 a). The correlation
between the hydration enthalpy and the formation enthalpy of the oxide (as seen in Figure 2 c)
is explained by the stronger bonds between the Ln/RE cation and oxygen. The enthalpy of
formation for oxygen vacancies is then expected to become more positive, which means that
the opposite direction of the reaction, filling of vacancies, will contribute significantly with
exothermic enthalpy change when hydrated. That is, although oxygen vacancies are not
formed intrinsically the theoretical formation enthalpy is relevant due to the opposite
reaction; filling of a vacancy, which contributes to the hydration enthalpy as seen in
Equation ( 10 ).
For the pyrochlore structure RE2X2O7, computational studies have shown that smaller
trivalent rare earth cations result in less stable oxides, further decreasing the (positive)
formation energy of vacancies. This results in the hydration enthalpy becoming less
exothermic [32]. The hydration enthalpy of doped RE2B2O7 thus becomes more exothermic
with larger RE size due to increased oxide stability.
13
a) b) c)
Figure 2 The measured hydration enthalpy of Ca doped Ln2O3 from [36, 40] versus a) the Ln ionic
radius, b) oxygen density and c) oxide formation enthalpy ∆𝐻°
Hydration studies show that minute or moderate levels of acceptor doping of CeO2 is not
sufficient to result in hydration and proton conductivity at low to intermediate temperatures.
Although acceptor doping of CeO2 results in increased vacancy concentration and enhanced
oxygen ion conductivity, it gives seemingly no effect on the hydration and formation of
hydroxide defects. This is in line with the computational studies of CeO2 showing that
hydration is endothermic [35]. However, heavily La doped CeO2, with the stoichiometry
La2Ce2O7 hydrates and protons dominate the electrical conductivity in wet atmospheres at
low temperatures [14, 16]. When heavily doped, the ability for CeO2 to hydrate must
therefore change, an issue that is addressed in this thesis.
Hydration and conductivity studies of La28-xW4+xO54+δ, show proton conductivity at quite
high temperatures, which is explained by a fairly exothermic hydration enthalpy [18, 41-
43]. The maximum hydration level, however, cannot be described by the average structure
of La28-xW4+xO54+δ. When comparing previous studies, the hydration and proton
conductivity decrease when La28-xW4+xO54+δ is doped with Ca [17, 41] an issue we address
in the discussion of this thesis. To understand the limitations to the maximum hydration
level, investigations on the local structure is necessary. The investigations related to this
work provide more insight on this issue.
14
2.3 Defects and ionic conductivity of fluorite related oxides
The conductivity, 𝜎 , of a species i, can be described:
𝜎 = 𝑧 𝑒𝑐 𝑢 , ( 11 )
Where 𝑧 is the charge of the species, e the elementary charge, the concentration 𝑐 and the
mobility 𝑢 of the species i. When several charge carriers are present, the total conductivity
is the sum of the partial conductivities:
𝜎 = Σ 𝜎 ( 12 )
The random diffusion coefficient in a cubic sublattice can be expressed by the jump
frequency, Γ, for the jump distance s:
𝐷 = 𝑠 Γ ( 13 )
The jumping frequency, Γ, is dependent on the frequency of jumps with sufficient energy
and the number of sites the species can jump to. The number of sites is expressed by the
number of nearest sites times the concentration of vacant sites, if the diffusion occurs
through the vacancy mechanism. For oxide ion diffusion we can find the concentration of
vacancies through the formation reaction. For example, the concentration of vacancies
created through the anti-Frenkel defect in Equation ( 1 ), can be expressed through the
equilibrium constant shown in Equation ( 5 ). Both the migration jump and the creation of
vacancies are activated processes and the energy needed to perform a successful jump,
Δ𝐻 , , and creating a vacancy, Δ𝐻 ( ), thus constitute the activation energy for
oxide ion diffusion through the vacancy diffusion mechanism. The diffusion coefficient for
oxide ions can be generally expressed as:
𝐷 = 𝐷 , exp , = 𝐷 , exp , ( ) ( 14 )
If the vacancies are created through the anti-Frenkel reaction, the relation in Equation ( 5 )
can be used to write the diffusion coefficient more specifically, as:
𝐷 = 𝐷 , exp , = 𝐷 , exp , )
( 15 )
If the vacancy concentration is defined by the dopant concentration and therefore constant,
𝐸 , represents Δ𝐻 , only. Using the Nernst-Einstein relationship, we can combine
Equation (11) with Equation (13) if we assume that random diffusion 𝐷 of a species can
be related to the conductivity (i.e. 𝐷 , = 𝐷 ):
𝐷 = 𝑢 = 𝜎
( 16 )
15
From Equation ( 16 ) we see that the temperature dependence for 𝜎 𝑇 will be the same as
the temperature dependence of 𝐷 , and we can express the 𝜎 𝑇 as:
𝜎 𝑇 = 𝐴 exp , = 𝐴 exp , ( ), ( 17 )
and the pre-exponential can be written as:
𝐴 = 𝐷 ,
( 18 )
The 𝑐 can for most cases be considered essentially constant since the relative
concentration change will be insignificant unless the vacancy concentration is close to the
concentration of oxide ions in the compound.
If we plot experimentally obtained conductivity in an Arrhenius plot 𝜎 𝑇 vs 1/T, we can find
the value for the activation energy E , from the slope. If the curve has distinctly different
activation energies at different temperatures it can be due to for example change in the
activity of the constituents or changes in the mobility parameters. Distinctly different
mobility can be connected to a phase transition, or associated species becoming fully
dissociated (going from higher activation energy at lower temperatures to a region with
lower activation energy at higher temperatures). In some cases the temperature can be too
low to activate a process (e.g. intrinsic formation of vacancies) and the activation energy of
this process will then only contribute at higher temperatures. This will result in the
activation energy becoming higher at higher temperatures due to an additional contribution
(e.g. from the activation of vacancy formation).
Proton transport is assumed to be faster than transport of oxide ions since they are smaller.
The activated jumping mechanism that normally lies behind proton transport in oxide proton
conductors, called the Grotthus-mechanism [34, 44] has in general a lower activation energy
than oxide ions diffusion through the vacancy mechanism. The Grotthus-mechanism is an
interstitial diffusion mechanism and then the number of potential sites the proton can jump
to is not dependent on the concentration of any defect. The activation energy for diffusion
therefore only contains the enthalpy of mobility Δ𝐻 , :
𝜎 𝑇 = 𝐴 exp( )
= 𝐴 exp,( )
= 𝐷
exp,( ) ( 19 )
The enthalpy of mobility contains potential trapping or association between protons and for
example a dopant, creating a higher jumping barrier to escape the trap. The enthalpy of
mobility can therefore be expressed as the sum of Δ𝐻 , , + Δ𝐻 , being the
inherent enthalpy for jumping as a free and untrapped proton, and the trapping enthalpy. As
seen in Equation ( 19 ), the concentration of protons is a factor in the conductivity which
16
depends on temperature through the hydration enthalpy, as seen in Equation ( 8 ). If the
concentration of protons is not constant for the temperature range where conductivity is
measured, this will influence the apparent activation energy of proton conductivity.
Defect association and oxide ion conductivity in doped ceria
Some of the best oxide ion conductors known are acceptor doped ceria and zirconia with
the fluorite structure such as Yttrium stabilized zirconia (YSZ) and Gadolinium doped ceria
(GDC) [11]. The presence of oxygen vacancies is necessary in order to allow for the vacancy
diffusion mechanism, and the effects of the properties of the dopant on the conductivity
have been investigated for many decades. Size and concentration of the dopant in doped
ceria, influence the oxide ion/vacancy diffusion, as we now will see.
Trivalent rare earth acceptor dopants and the charge compensation vacancies formed in
ceria, interact even for dilute dopant concentrations (i.e. < ~1%) [45-47]. Several studies
have shown how the binding energy between the acceptor and oxygen vacancy depends on
the size of the rare earth dopant. Gerhardt- Anderson et al., reported that the ionic
conductivity was highest and activation energy lowest for dopants with the most similar
size compared to the ceria cation, which is Gd3+ for the rare earths (8-fold coordinated Ce4+
compared with 6-fold coordinated Gd3+) [46]. This trend was later supported by Butler et
al. using theoretical methods (Mott-Littleton ionic models) [48]. They argued that for
cations smaller than Gd3+ (in this case Sc3+ and Y3+) the association energies were due to
electrostatic forces between dopant and vacancy. For the larger cations (La3+ and Gd3+) the
association energy was due to reduction of strain in the crystal structure initially caused by
the size mismatch between the dopant and Ce. Atomistic simulation done by Minervini et
al. [49] elucidated the trend observed related to the size of the RE dopant. They show that
for smaller cations (than Gd3+) the highest binding energy is obtained when the vacancy is
on a 1st neighbour site of the dopant, and the binding energy decreases when the cation size
increases (towards Gd). For the cations larger than Gd, the binding energy is highest when
the vacancy is situated as a 2nd nearest neighbour to the dopant, and the energy decreases
with decreasing RE+3 size (towards Gd). This means Gd3+ is the crossover point between
the two trends which indicate whether vacancies prefer to be 1st or 2nd nearest neighbour to
the dopant. It further explains that Gd3+ gives the minimum binding energy between dopants
and the oxygen vacancies.
Wang et al. developed a model that connects the association energy between dopants and
vacancies to the variation in activation energy measured for different dopant. They found
that for Y2O3 dopant concentrations up to ~4%, the Arrhenius representation for the
conductivity deviates from linearity. This was interpreted to reflect the association energy
contributing to the effective activation energy for oxide ion conductivity at the lower
temperatures of the conductivity measurements (i.e. EA = Hmob + Hassociation) [45]. As the
17
temperature increase the system changes into a state where all vacancies are unassociated
and activation energy only depends on the mobility of the free vacancies yielding lower
effective activation energy. (i.e. EA = Hmob). They further observed that the activation energy
decreased with increasing dopant concentration up to ~4%, which they explain by
fluctuating electrostatic fields between the dopant and the vacancies. The vacancies will be
drawn towards new favourable locations close to a dopant, effectively reducing the enthalpy
of association as the number of dopants increases. As the concentration increases above 4%
Y2O3, the effective activation energy for conductivity increases rapidly which they suggest
stems from deep traps of vacancies due to more than one Y3+ dopants in nearest or next
nearest neighbouring site of the vacancies. The traps increase in strength and concentration
with increasing yttria content. These observations and models were further shown to also
apply for other rare earth dopants in a study on defect association and percolation by Faber
et al. [47]. In the mentioned work, the conductivity maximum and activation energy
minimum were for samples of ceria doped with 1-4% RE2O3 (RE = La, Nd, Gd, Y, Yb), and
Gd exhibited the lowest activation energy for concentrations above 3%. The trends in
association between vacancies and dopants depending on dopant size is supported by a more
recent theoretical study of rare earth doped ceria [50], further emphasizing how similar size
of the dopant and Ce is beneficial.
The studies mentioned above show that acceptor doping CeO2 more than 10-15% REO3/2
(when translated to Y3+ doping), does not result in increased conductivity due to trapping
of the vacancies by dopants. We will continue to look into the vacancy interactions when
ceria is heavily doped or reduced.
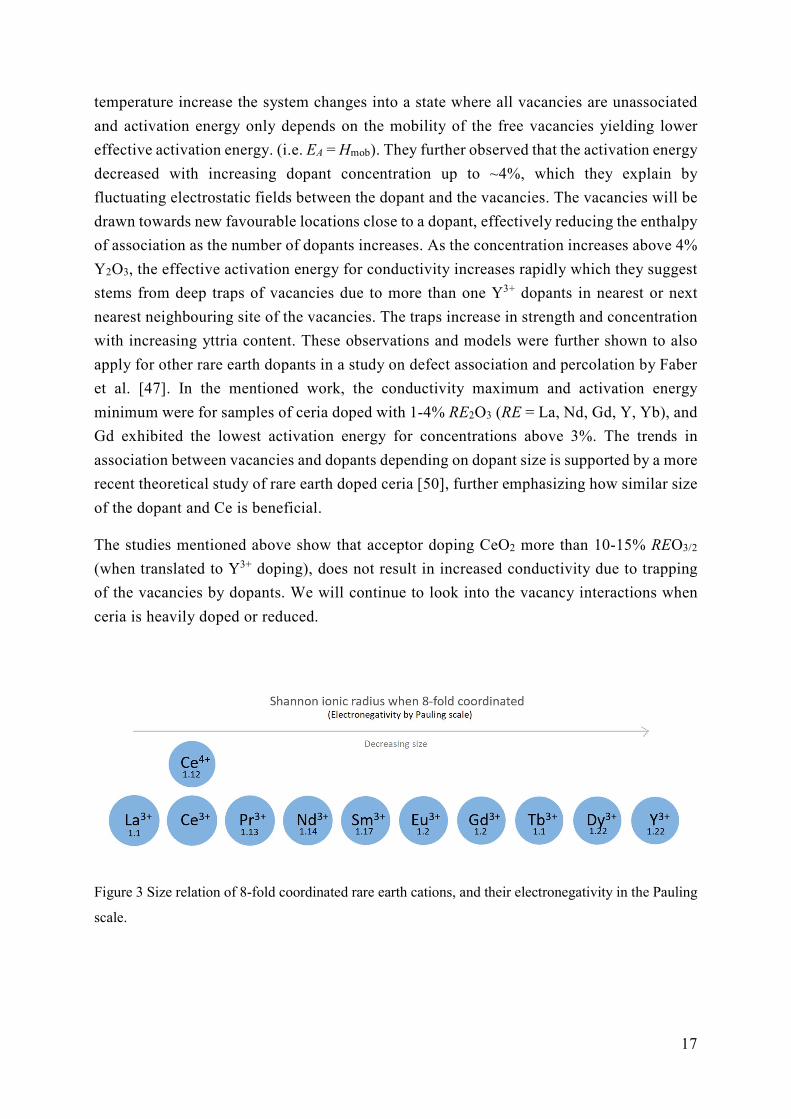
Figure 3 Size relation of 8-fold coordinated rare earth cations, and their electronegativity in the Pauling
scale.
18
Order and disorder in fluorite related structures
When the concentration of dopants and/or oxygen vacancies increases, the increasing
interactions result in short or even long range order. When ceria becomes sufficiently
oxygen deficient due to reduction (as described in Equation 2) vacancies pair up with a ½
<111> alignment between them, as shown for CeO2-δ when δ > 0.3 by Hull et al. [51]. The
short range ordering of the vacancies starts to occur when CeO2-δ is closing up to the
stoichiometry for the ordered structure of Ce7O12, and the vacancy ordering is similar.
Ce7O12 is the first ordered phase stable at high temperatures when CeO2-δ is reduced, and
the structure is described in the work of Ray et al. [52]. The vacancy ordering in ceria can
therefore be seen as a seed of the transition to a fully ordered phase. The same type of
vacancy ordering has been found for YSZ [53].
The type of vacancy ordering found in ceria has been found to be important for most fluorite
related structures. As Rossell and Scott underlined, all superstructures of the fluorite
structure were commonly believed to always exhibit vacancy ordering in <111> vacancy-
vacancy pair (i.e. third next nearest ordering of vacancies) through a cube with a cation
giving the cation a octahedral coordination [54]. A relevant example is the pyrochlore
structure which can be described as <111> vacancy-vacancy pairs linked in zig-zag lines.
Rossell and Scott also conclude that for the ordered superstructures of fluorites, no
vacancies are situated closer than in the <111> alignment, except for in the C-type
superstructure where the vacancies also are aligned in <110> direction [54]. This exception
proves important for the ordering we discover for 50% doped ceria in this work.
When fluorite oxides such as CeO2, are heavily doped with rare earth sesquioxides, the
association between dopants and vacancies plays a role in the ordering into fluorite super
structures. For dopant concentrations above 25% there are in principle no configurations
where vacancies can be further away than as 3rd nearest and 2nd nearest neighbour to the
dopant. The work by Minervini et al. also find that 𝐿𝑛 − v•• − 𝐿𝑛 trimers is likely to
form when concentration of dopants is above a few percent [49]. When CeO2 is doped with
lanthanides, the smallest ion present generally prefers lower coordination, as described
earlier, and this preference as well as the trimers described above, can be accommodated in
the ordered structure of pyrochlore when CeO2 is doped with 50% LnO1.5 of the larger
lanthanides, such as LaO1.5. Thus the <111> vac-vac preference of reduced ceria as well as
the structural relaxation when dopants larger than Ce4+ have vacancies as second nearest
neighbour, predicts of the pyrochlore structure for La2Ce2O7 and Nd2Ce2O7.
However, most studies on La2Ce2O7 do not find evidence of the pyrochlore structure [14,
21, 27, 31]. La2Ce2O7 is rather found to be a disordered fluorite, although there are studies
advocating the pyrochlore structure [25]. According to a model from Minervini et al., the
cation radius ratio, rA3+/rB4+, of a A2B2O7 pyrochlore must be above 1.4 in order to form a
19
stable pyrochlore structured oxide, if not disordering will be favourable [28]. Both
La2Ce2O7 and Nd2Ce2O7, are as such outside the pyrochlore stability range, whereas
La2Zr2O7 with a smaller B-cation, will order in the pyrochlore structure. As predicted,
Nd2Ce2O7 is also not exhibiting the pyrochlore structure, instead evidence of C-type
ordering has been indicated [21-24, 55].
C-type ordering severely decreases the conductivity as observed by Yamamura et al. for
heavily doped ceria [21]. They find that the conductivity decreases with smaller Ln in
Ln2Ce2O7 and Gd is no longer the best dopant when the goal is to obtain the highest oxide
ion conductivity due to C-type ordering. This is supported by the findings of Ou et al. when
using HR-TEM. Diffuse scattering, additional to the fluorite Bragg peaks, show that
formation of microdomains with order have an opposite trend correlated to dopant size than
acceptor-dopant association (i.e. rare earth more similar to Ce form microdomains to a
stronger degree [56]. A relevant study on the origin of partial vacancy ordering related to
the C-type structure, is from Withers et al., where the compositional study of (CeO2)1-
x(YO1.5)x using HR-TEM, shows evidence of C-type related vacancy ordering in
microdomains for the ~50 YO1.5 doped CeO2. They further find that when there is a dual
phase region between 60% and 75% YO1.5, and above this concentration the sample obtains
an oxygen excess C-type structure [57]. Some studies on Ln2Ce2O7 compounds with Ln =
Sm, Gd and smaller, have found ordering in hybrid structures between fluorite and C-type,
and biphasic structure models where Ln cluster in regions with coordination numbers closer
to the C-type structure [58, 59]. Biphasic models can be explained by the acceptor-vacancy
association previously described for Gd and the smaller Ln cations, where the Ln3+ prefer
vacancies being in a nearest neighbour position due to its smaller ionic size than the 8-fold
coordinated Ce4+. That is, the smallest cation is 6-fold coordinated. The local structure is
then similar to that of the C-type structured Ln2O3.

20
21
3 Methodology “Science is what scientist do, and there are as many scientific methods as there are
individual scientists.”
― Percy Williams Bridgman
In this chapter we will briefly go through the theory and practical implementation of some
experimental techniques and computational approaches relevant for the work in this thesis.
We will also elaborate on some methods and less conventional choices made in this work,
and on specific challenges with some of the approaches. The most important computational
and experimental details for our work are presented in the papers.
3.1 Sample preparations of La2-xNdxCe2O7
Solid state reaction
In paper I we describe the sample preparation of the powders used for structural analysis of
La2-xNdxCe2O7 where x = 0, 0.5, 1, 1.5 and 2. The powder samples were prepared using
solid state reaction with heating and regrinding steps, and sintered in pellets and re-grinded
several times. These powders are further used for TG-DSC measurements presented in paper
III. Numerous and long sintering processes are advantageous in that the chance of full
reaction increases. Conversely, preparing dense samples for electrical characterization of
the resulting powders gets more difficult, since the “reactivity” of the powder becomes very
low. The pellet samples made for electrical characterization were prepared by pressing the
powder into pellets, followed by sintering at 1400 ºC. After sintering, the samples exhibited
a relative density of approximately 60%. As we shall see, this high porosity decreases the
total conductivity. However, the temperature dependencies remain comparable with those
measured in previous works, and the value of running experiments on the same samples that
are subjected to in-depth structural analysis is considered greater than the disadvantages of
a porous sample.
22
Electron microscopy
The grain size and morphology of the powders and pellets were analysed using scanning
electron microscopy, (SEM, Quanta 200F), before and after measurements. The samples
only showed small and expected changes after measurements, such as a small degree of
sintering and the formation of some impurities on the surface due to the platinum electrodes.
Semi-quantitative analysis of the composition of the samples was performed using the
EDAX system integrated in the SEM using EDS-detector (energy dispersive spectroscopy).
To further study the origin of supercell lattice peaks found by diffraction methods, we
studied a sample of Nd2Ce2O7 using high resolution transmission electron microscopy (HR-
TEM, JEOL2100F) to perform selected area diffraction (SAED). The observed extra
satellite reflections are used to take dark field images in order to indicate the presence of
domains with supercell reflections. We also performed energy dispersive X-ray analysis
using the JEOL, for areas in the prepared sample in order to ensure that we were not looking
at any impurities and that the stoichiometry between Nd and Ce does not deviate
significantly from the Nd2Ce2O7 compound.
3.2 Diffraction techniques and analysis
Powder X-ray diffraction (XRD) and Neutron powder diffraction (NPD) are widely used to
investigate the long range structure of solid crystalline materials. X-rays and neutrons are
scattered by the electrons and atoms nucleus respectively, giving rise to diffraction patterns
according to the crystal structure of a crystalline material. The diffraction patterns are a
product of symmetries resulting from repeating atomic arrangements constituting the long
range order of atoms.
The X-rays in powder XRD, interacts with the electron cloud of the atoms in the crystal,
and the scattering cross-section increases with the atomic number Z of atoms. For neutron
diffraction the scattering length and the amount of incoherent and coherent scattering vary
for all elements, and have no systematic trend, as is the case for X-ray scattering. This
means that NPD is more suitable for detecting some light elements, such as hydrogen and
oxygen, depending on the scattering length. Two elements with similar electron cloud may
also have significantly different scattering cross-sections for neutrons
The X-rays may be absorbed and usual wavelengths give penetration depths in the
micrometre range. During diffraction, neutrons interact weakly with most elements and are
not absorbed, and typical penetration depths are in the millimetre range. This means that
the neutron beam allows us to investigate the crystal structure in the internal region of both
small and big samples.
23
The crystal structure can be solved by Rietveld [60] analysis of diffraction patterns obtained
from XRD or NPD, and the Rietveld refinements describe the average long range structure
of the sample investigated. In addition to a Rietveld refinement offering positions,
symmetry and cell size, total scattering experiments can provide the pair distribution
function, also called the radial distribution function, between atoms in the sample.
In Paper I neutron total scattering has been performed on the samples of La2-xNdxCe2O7 by
applying several detector banks covering a wide range of scattering vector Q (where Q
2/d and d is the interplanar spacing). (The reader is referred to Paper I for more practical
details of the scattering experiments and analysis methods.)
G(r) and analysis
After combining and normalizing the results to a total scattering structure factor, S(Q), we
obtain the corresponding total radial distribution function, G(r), through Fourier
transformation. G(r) can be written as:
23
00
1 sin4π d
2
QrG r Q S Q Q
Qr
, ( 20 )
where 0 is the average atom number density in atoms Å3 (for details, see Keen [61]).
G(r) is a distribution function describing the distribution of bond lengths for all atoms. Since
the total distribution function G(r) also can be expressed in terms of the individual partial
radial distribution functions between pair of atoms, gij(r), we can compare the distribution
function obtained from a modelled structure configuration tot the total G(r):
, 1
2
1
n
i ji j iji j
n
iii
c c b b g r
G rc b
, ( 21 )
where n is the number of ionic species, and the function is weighted by the concentrations
of the two species, ci and cj, and their coherent bound neutron scattering lengths, ib and jb .
The partial radial distribution function can then be written as:
2
1
4ij
ijj
n rg r
r r
, ( 22 )
with nij(r) equal to the number of atoms of type j located at a distance between r and r r
from an atom of type i and j is the number density of atoms of type j, given by j cj0.
24
Long range structure is the result of local structure and the two properties are linked as seen
by the partial and total radial distribution functions above. Although diffraction methods do
not offer explicit pictures of the local structure through refinements, the total distribution
function from total scattering creates a frame that the local structure must fit into.
One way of analysing the radial distribution function in order to look for possible local
structure is Reversed Monte Carlo modelling RMC, implemented in the RMCProfile
software [62]. RMC probes for the atomic configurations giving the individual partial
distribution functions, gij(r), which together result in the G(r) that best fits the
experimentally obtained G(r). RMC simultaneously probes both the long range and short
range structural properties within the user defined limitations such as possible lattice sites
and properties of the ions. Structure configurations found by DFT can also be compared
with the total radial distribution function, a topic we will come back to in Section 3.6.
3.3 Thermogravimetry (TG) and differential scanning calorimetry
(DSC), TG-DSC
Combined thermogravimetry and differential scanning calorimetry, TG-DSC, allows us to
simultaneously measure the mass change and heat flow occurring as a response on changes
in temperature (or partial pressure when connected to a flowmeter or similar). Conceptually,
TG can be thought of as a scale that measures mass change of the sample while the
temperature is changed over time using a heating element. DSC enables measurements of
the heat exchange occurring during for example a hydration process, by measuring the
voltage needed to sustain the same temperature for a reference crucible as for the crucible
containing the sample. When combined we obtain energy released or captured during the
weight change. When connected to a wetting stage or water vapour generator, TG-DSC can
be used to investigate hydration processes. The TG gives data on the water uptake, and the
hydration enthalpy can be found by dividing the total heat exchange by the number of moles
of water incorporated.
The DSC signal exhibits a baseline shift during the hydration process leading to a potentially
significant source of uncertainty. It has previously been proposed that the shift in the heat
exchange signal is due to a change in the thermal conductivity of the sample when hydrated
[63]. To take into account the baseline shift we have used a sigmoidal shape during the
integration of the DSC data. By changing the limits of the integral and accounting for small
changes in the measured mass, we obtain a statistical mean value and standard deviation of
the hydration enthalpy, as reported in Paper III.
25
In the preparations for the TG-DSC measurements on La2-xNdxCe2O7 we found that the
resulting signals from water uptake become more significant when changing the conditions
from dry to wet atmosphere with ~1 atm of water vapor, compared to the uptake found in
atmospheres with a partial water vapour pressure of 0.025 atm, as obtained by a typical
wetting stage.
3.4 Electrical characterization
In this work, electrical characterization of samples of the La2-xNdxCe2O7 series is performed
as a function of temperature and partial pressure of oxygen or water (pO2 and pH2O). The
conductivity was measured under controlled atmosphere and temperature using a
ProboStatTM (NorECs, Norway) measurement cell, coupled with a furnace with temperature
controller, and a gas-mixer [64].
By using a 2-point 4-wire setup and an impedance analyser (Solartron 1260), both constant
frequency measurements at 10 kHz and impedance sweeps in the frequency range 0.5 -
106 Hz, are performed. Prior to all impedance measurements the samples are equilibrated
with the surrounding gas at each temperature. When the conductivity is measured while
ramping the temperature down to room temperature, the ramping rate is slow in order to
allow the sample to reach equilibrium.
The conductivity of a sample depends both on the bulk and grain boundary conductivity.
The grain boundary capacitance in oxides is often 1-2 orders of magnitude higher than the
bulk capacitance. Impedance spectra plotted in a Nyquist plot, where the real and imaginary
part of the impedance are plotted over frequency, may result in one or two semicircles
depending on the impedance and characteristic frequency of bulk and grain boundary. The
impedance spectra collected for the La2-xNdxCe2O7 samples display two semicircles at lower
temperatures, which can be fitted by a series of two parallel circuits comprising a resistor
and a capacitive constant phase element (RQ) (i.e. resulting series (R1Q1)(R2Q2) for the bulk
and grain boundary). For more details on impedance spectroscopy or the Brick Layer Model,
the reader is referred to for example Irvine et al. [65] or Haile et al. [66]. The first semicircle
given by the highest frequencies is considered as bulk due to the capacitance found to be
around 10-12 - 10-11 F for all samples. For the second element, the capacitance is only 1-2
magnitudes greater and the resistance is low compared to bulk (R1 > R2), which usually
indicates a grain boundary contribution. A potential third semi-circle would be the result of
the electrode process. At higher temperatures the two semicircles become indistinguishable,
and by assuming that the bulk resistance exceeds the resistance of the grain boundary we
can ascribe the remaining semicircle to bulk.
26
The conductivity measured at 10 kHz represents the bulk well at most temperatures in the
temperature window of these measurements. This can be seen by identifying where the
10 kHz point is located within the bulk semicircle, and checking that the real part of the
admittance at 10 kHz equals that of the main part of the bulk semicircle. For instance, at
temperatures below 400°C, the admittance will be higher compared to the admittance of the
first circuit element when the 10 kHz point is approaching the origin. This is due to the
effect of short circuiting of the capacitance part of the equivalent circuit. At high
temperatures above 800 °C, only the electrode contribution is visible in the impedance
spectra, and the measured conductivity will be lower than the bulk conductivity when the
10 kHz point includes resistance from the electrode contribution.
In Paper III, and for the additional conductivity data presented in Chapter 6 Discussion, the
constant frequency data at 10 kHz is presented, but due to the limitations just explained we
correct the data for the highest and lowest temperatures by analysing the impedance spectra
to obtain the bulk conductivity.
The samples analysed are quite porous, and the deviation in conductivity predicted due to
low density may not necessarily be directly proportional to relative density when the
porosity is high [67]. Therefore, the conductivity data are only corrected for thickness of
the sample and the electrode area, and not for porosity. However, the densities for all the
samples are relatively similar, and close to 60%. Therefore, the total conductivities
measured are expected to be suitable for comparison between the samples. Furthermore, we
do not expect the porosity to affect the temperature dependence used to investigate the
activation energies, since the porosity usually has a stronger influence on the low frequency
semicircle. That is, using the Brick Layer Model on the impedance data for porous samples
mainly affects the deconvolution of the grain boundary [68, 69].
3.5 Classical force field calculations
Classical force field calculations are a rather simple atomistic simulation technique different
from DFT, which simulates the forces between ions based on typical simple “pair potentials”
to describe interactions between atoms. The potentials are described in mathematical terms,
numerical or analytical as a function of particle coordinates. It is an empirical method and
the reliability depends on how well the potentials describe the modelled system. The main
advantage is low computational cost giving the possibility of studying large systems or
numerous configurations quickly, compared to simulation techniques using electron density
or atomic orbitals which demand more computational effort.
27
GULP estimates the lattice energy as the sum of short and long term interactions between
ions. A general expression for the lattice energy of a static lattice:
𝐸 = ∑ + ∑ Ф 𝑟 + ∑ Ф 𝑟 + … ( 23 )
where i, j, k, etc. denote different atoms, 𝑞 and r their charge and interatomic separation.
The first term is the sum of Coulomb interactions between pairs of atoms i and j describing
the local environment. The second term is the two-body, central-force part of the short range
interactions between pairs of atoms and is the dominant part of the short range energy of
the system. The third term is the same for three-body interactions, which gives little
contribution to the lattice energy, but is significant when calculating vibrational properties.
For ionic materials, the interactions between pairs of atoms can be assumed to dominate the
total energy so that all interactions between a higher number of atoms can be considered
negligible [70].
The interatomic potentials frequently used are the Buckingham potential (other popular ones
are Morse potentials, especially in oxides with hydrogen defects present). The Buckingham
potential includes an exponential repulsion term and an attractive 1/r6 term:
Ф 𝑟 = 𝐴 𝑒 − ( 24 )
Ionic polarization can in addition be described with the shell model, first developed nu Dick
and Overhauser [71]. In the shell model polarizable valence shell electrons are represented
by a mass-less shell connected to the core by a harmonic spring. The model provides more
accurate values for elastic and dielectric properties, which is valuable when modelling
defects since the response of the surrounding crystal is largely elastic and dielectric when a
defect is included.
There are mainly three types of properties that can be studied; structural, physical and defect
properties. The method iteratively calculates forces between all ions and relaxes the
structure in order to minimize the energy, and can thus be used to predict the crystal
structure and rearrangements around structural and point defects. Both bulk and surface can
be studied with this technique. When modelling the energy in the system and interactions
between the ions, the physical properties of a system, such as dielectric and elastic constants
and phonon dispersion curves can be calculated at the same time. Comparing the results to
experimental results, can be a good reference point to whether a as the potentials used are
adequate.
In Paper IV we use configurations found using GULP, general utility lattice program [72],
as a first approximation to determine which type of site the excess W is located on in the
structure of La28-xW4+xO54+δ (i.e. if W prefer a interstitial site or if it substitutes La). We
28
know the stability range of x in La28-xW4+xO54+δ and the average crystal structure from the
work of Margasó et al. [30].
In this work we have used a combination of Buckingham potentials and shell models giving
a coupling between polarization and short-range repulsion. As the first adequate parameters
for the potentials of La, W and O, in La28-xW4+xO54+δ, we use the potentials earlier used for
Bi2WO6 [73] and Sc2(WO4)3 [74]. We performed calculations on numerous different
configurations for La28-xW4+xO54+δ where x = 0 and 1. We could rule out configurations that
have phonon modes with negative frequencies, since these configurations are dynamically
instable. Finally we selected a set of promising configurations based on final structural
parameters and phonon calculations which we investigated further using DFT.
3.6 Density functional theory (DFT)
Density functional theory is an approach that aims to solve the many particle, time
independent Schrödinger equation, and find the total energy of a system using first
principles calculations. The foundation of DFT is the Hohenberg-Kohn theorems [75] which
state that the electron density 𝑛(𝒓) of a system with interacting particles in an external
potential 𝑉 (𝐫), can be used as a variable to find the non-degenerate ground state of the
system and all related physical properties. They further state that there is a universal
electron density functional 𝐹 [𝑛(𝒓)] independent of the external potential, which together
with the energy from the external potential give an energy functional of the system, 𝐸[𝑛(𝒓)]:
𝐸[𝑛(𝒓)] = 𝐹 [𝑛(𝒓)] + ∫ 𝑛(𝒓) 𝑉 (𝐫)d𝐫 ( 25 )
When the electron density is minimized to the ground state electron density, 𝑛 (𝒓), the
energy functional gives the ground state energy of the system.
Kohn and Sham [76] further developed a practical scheme for solving for the ground state,
given by the universal functional, by expressing the electron density as a set of non-
interacting particle orbitals. For this system the kinetic energy of non-interacting electrons
𝑇 [𝑛(𝒓)] and the Coulombic electron-electron interactions 𝐽 [𝑛(𝒓)] of the electron density
functional 𝐹 [𝑛(𝒓)] can be found without any approximations. The non-classical
electron-electron interactions that are unknown and not possible to solve exactly, are left in
the Exchange-correlation functional 𝐸 [𝑛(𝒓)]:
𝐸[𝑛(𝒓)] = 𝑇 [𝑛(𝒓)] + 𝐽 [𝑛(𝒓)] + 𝐸 [𝑛(𝒓)] + ∫ 𝑛(𝒓) 𝑉 (𝐫)d𝐫 ( 26 )
The electron exchange can be solved by the Hartee-Fock approximation, but the
approximation does not include the electron correlation. Thus only the exchange-correlation
29
functional in equation ( 26 ) cannot be solved exactly. The development of DFT has since
then mostly been on optimising the exchange correlation functional, and there now exist
several approaches.
First principles calculations have in the last decade become a powerful tool for investigating
the energetics of structures and defects of solid state oxides. The development of exchange
correlation functionals and implementations in calculations packages such as the Vienna
Ab-initio simulation package (VASP [77]) utilized in this work, have accelerated
simultaneously with the increasing computational resources available worldwide.
In this thesis we have performed structural optimisations and MD simulations on
configurationally disordered La2Ce2O7, Nd2Ce2O7 and La28-xW4+xO54+δ (for x = 0, 1).
Structural optimisations of many possible structural candidates which also represent local
snapshot of bulk in the disordered state are performed. Our main objective of the structural
optimisations has been to search for the lowest energy configurations of these disordered
compounds, as well as to look at their local structure and how the different arrangements of
cations and oxygen/vacancies are arranged energetically. For systems with unknown
ordering and possible high degree of disorder, the search for representative configurations
demands testing of numerous configurations including predictions of possible favourable
configurations based on iterative procedure as well as trial and error. Atomistic calculations
using classical potentials are less computationally demanding and can be used for an initial
search for favourable configurations, which we have done for the La28-xW4+xO54+δ system.
Ab inito molecular dynamics simulations also contribute in the search for favourable
configurations by quenching configurations along the trajectory. In this section we will
briefly go through the chosen approaches and parameters in this work.
Exchange correlation functional
The approximation first proposed to the exchange correlation functional is the simple local
density approximation (LDA) [76]. In LDA the electron density is described as a uniform
electron gas at a given point in order to calculate the exchange correlation energy. In other
words, the density depends only on the value of the electronic density at each point in space.
The approximation is in general in good agreement with experiment for many properties of
many compounds. For the crystal structure the deviation in cell parameters and equilibrium
volumes are a few per cent away from those found experimentally. That is, LDA is known
to often over-estimate the binding energies resulting in too small lattice parameters.
The generalized gradient approximation, GGA, is in general, an improvement over LDA,
the gradient of the electron density is included to estimate the exchange correlation energy.
This can better describe systems with less homogenous electron density. There exist both
semi-empirical and ab initio derived GGA functionals and for calculations on crystal
30
structures the PW91 [78] and PBE [79] functional is most often used. In contrast to LDA,
GGA is often found to overestimate the lattice constants. GGA also usually underestimates
the bandgap significantly. However, in this work the main interest is not the band structure
but the structure (i.e. how the ions arrange themselves locally), and therefore we have used
the GGA-PBE functional [79]. We do carry out some test calculations where an additional
Hubbard type +U correction term is included to check if the structure is sensitive to such
correlations. The empirical +U term uses orbital dependent interactions to describe the
strong in-site Coulomb interaction of localized electrons which may occur for d- and f-
electrons.
Practical implementation of DFT
Two popular methods for describing the electron density; are the linear combination of
atomic orbitals, LCAO, and plane waves, PW. Linearized augmented plane waves, LAPW,
is a combination of the two methods. LCAO gives a good approximation to molecular
orbitals and is therefore mostly used to study molecules. Plane-waves methods are mostly
used for crystalline inorganic materials, because they are easy to implement and demand a
smaller set of functions, which results in fast energy convergence. VASP, uses plane-waves
as basis set, and a particular efficient implementation in VASP is the Projected Augmented
Wave method, PAW[80], which is a generalization of the LAWP method and the use of
pseudoptensials. In PAW, pseudopotentials are used to describe a simplified potential
around the atomic core where the core electrons are described by the frozen-core
approximation. In the frozen-core approximation only the outer electrons, such as the
valence electrons, are included in solving the Kohn-Sham equations. The PAW method
further includes a projection of the pseudopotentials into an all-electron wave function
which gives a smooth plane-wave function throughout the system.
In order to reduce the computational effort needed to reach a satisfactory energy
convergence, the plane-wave expansion can be limited to a maximum kinetic energy, Ecut.
Additional simplifications can be made based on the similarity of wave functions close to
each other in the Brillouin zone, and the system can be evaluated at a finite number of at k-
points, instead of at an infinite number. The number of k-points needed in each orthogonal
direction, the k-point density, is dependent on the cell size and a suitable k-point density
that balance cost and accuracy can be found by analysing the convergence of the energy
(and other properties) with number of k-points used.
Chosen ensembles and limitations
For structural relaxation in the static limit we can choose to relax the atomic positions by
setting the volume constant (consistent with an MD carried out in the NVT ensamble) or to
relax also the lattice constants as for constant pressure (in line with the use of NPT ensamble
31
in MD). Allowing for full relaxation of the structure, lattice parameters, cell volume, basic
atomic positions, is preferred when searching for the ground state configuration. However,
in many cases comparison of configurations and analysis of oxygen ordering in the oxygen
sublattice is simplified by keeping the volume fixed (cubic) during the structural
optimizations. We find that the relative order of the different configurations for La2Ce2O7
and Nd2Ce2O7 does not change when we carry out a full structural optimisation allowing
both the cell volume and the cell shape to relax compared to if the volume is kept fixed The
experimentally observed cubic lattice parameters with relatively sharp peaks in XRD and
NPD support the idea that we can fix the cubic cell volume during the structural
optimisations.
The cation and oxygen sites in the pyrochlore and C-type structure are quite comparable to
the sites in the perfect fluorite as seen in Figure 1 a-c, the main difference is shifts of the
sites and lower oxygen stoichiometry for pyrochlore and C-type structures. The alignments
and ordering of the vacancies (vac-vac configurations) in the oxygen lattice are easily
analysed by dividing the unit cell into boxes around the initial (oxygen) 8c sites in the
perfect fluorite and identifying whether there is an oxygen atom there or not. We then
identify the space group symmetry, the coordination numbers and the bond lengths of this
configuration using PLATON [81]. The distance and direction between the vacancies are
categorized with reference to the perfect fluorite. The notation representing the types of
alignments between pairs of vacancies is <100>, <110>, <111>, <200> and so forth and
refers to the distance and direction of a cube of oxygen positions with a cation site in the
cube centre (e.g. a <111> vacancy pair will create an octahedron instead of a cube). Note,
that since the counting method searches for vacant neighbours from each vacant cube, every
pair will be counted twice.
DFT and thermodynamics
DFT calculations, as well as other atomistic simulation techniques, can be used to estimate
the Gibbs energy of formation for defects and oxides [82-84] through the relationship to the
equilibrium constant for the formation reaction, K (e.g. Equation ( 8 ) for the hydration
reaction). That is, if we disregard the temperature dependent contributions and thermal
expansion, the Gibbs energy for the defect formation, ∆G , can be found by:
∆G = E − E − ∑ ∆𝑛 𝜇 + 𝑞 (𝜖 + ∆𝜖) ( 27 )
where E and E is the total electronic energy of the defective and perfect supercell
describing the energy difference with and without a defect, as described by Oba et al. [85].
The two latter contributions arise from species being incorporated or extracted during the
defect reaction, where ∆𝑛 is the change in number of species i with the chemical potential
32
𝜇 , 𝑞 is the effective charge of the defect and 𝜖 the Fermi level. ∆𝜖 is the shift in core
potential in the defective cell compared to the perfect one [86]. If relaxations are carried
out within the static limit, the entropy of the reaction is not included and the energy
difference represents the enthalpy of formation. In order to calculate the hydration enthalpy
in an acceptor doped oxide with a perfect structure we first determine the most favourable
position of a charge compensating vacancy and proton. The most favourable defect position
is assumed to be dominating and the energy of the cell containing a proton and a cell
containing an oxygen vacancy can be used for the calculation of the hydration enthalpy. For
the hydration reaction the chemical potential of water can be expressed as the total
electronic energy of the pure phase; 𝜇° = E . Defect-defect interactions should be
accounted for since the charged defect is periodically repeated in all directions.
This method is a valuable way of investigating the thermodynamics of defects formation in
the dilute limit for a compound that initially has a perfect crystal structure. However, the
oxygen deficient and disordered fluorites studied here, impose more challenges in the
evaluation of the Gibbs energy. First, for these compounds the concentration of vacant
oxygen sites in the fluorite structure is very high and we cannot simplify by assuming an
isolated oxygen defect approximation. Vacancies co-exist in the supercell and this
influences the structural relaxation and charge distribution and, hence, the total energy.
Second, the effective charge of the vacancies is defined according to the perfect reference
structure. Finding a perfect crystal structure can prove difficult and for these disordered
fluorite compounds there are most likely several possible configurations that can co-exist
in the relevant temperature regime for hydration. Using only the single most energetically
favourable configuration we have been able to find from DFT, might be severely misleading
unless we know for a fact that it represents the ground state. For La28-xW4+xO54+δ the
complex structure forces us to use the “perfect structure” of La28W4O54 which is not stable,
as the starting point for describing the defects caused by self-doping, resulting in oxide ions
and vacancies with a charge less than +2 as described in the publication of Erdal et al. [41].
For these disordered systems one should calculate the energy of all possible configurations
before and after hydration in order to determine the statistical hydration enthalpy. Including
(configurational and vibrational) entropy would be even more challenging. This is in
practice an enormous job when using DFT and has not been feasible within this study.
In this thesis we have done preliminary calculations in a number of supercell configurations
with different oxygen and cation sublattices to illustrate the effects of vacancy ordering on
the hydration properties in La2Ce2O7 and Nd2Ce2O7. We place two protons and one oxide
ion into the crystal structure, which is the equivalent of hydration filling 12.5% of the
vacancies. This also results in a neutral supercell and since electrons are not involved in the
defect reaction, the bandgap and chemical potential of electrons need not be considered. In
33
order to predict favourable initial positions for the protons (distance and direction from
adjacent oxygen) we used results from previous studies done on La2Ce2O7 in the pyrochlore
structure [32] and we avoid to position the protons in the vicinity of each other. Note that
we have not performed tests to find converged calculations parameters and the results are
thus preliminary giving us a first indication of trends and correlations, and are not meant to
provide exact hydration enthalpies.
MD calculations using DFT
Ab-initio Born-Oppenheimer molecular dynamics follow the ionic motions by iteratively
minimizing the electronic energy at each atomic step. The Born-Oppenheimer
approximation assumes that the motion of the atomic nuclei and electrons can be treated
separately due to the high difference in mass between the electrons and the nuclei. That is
the electrons see the nuclei as stationary. Consequently the electrons will almost
instantaneously respond to the forces and movement of the nuclei. The atomic movement is
described by Nosé dynamics in a given ensemble [87, 88], for example the NVT ensemble,
by adding a thermostat to the system.
Self-diffusion for mobile species can then be analysed based on the calculated jumping rate
and jump distance in the MD calculations. Using MD-DFT calculations is mainly done for
oxygen and protons as the system can be regarded as melted if also the cations start diffusing.
Generating PDF from DFT modelling:
Structure configurations obtained from DFT modelling can be used to provide atomic
positions needed to calculate the pair distribution function (PDF), which is comparable to
the total radial distribution function G(r) found from total scattering experiments. All the
separation lengths between pairs of atoms in the configuration result in the partial radial
distribution function gij(r). By further applying the correct scattering lengths and
concentrations we obtain the resulting G(r) which can be used for comparison to the G(r)
from total neutron scattering.
DFT results of static relaxations (0 K) will result in peaks that will represent static pictures
of atoms with no dynamical displacement from the origin of the position and become quite
sharp with only static displacement contributing to any distribution of atomic positions.
Only static disorder in the configuration will provide a distribution in the partial radial
distribution function, creating less sharp peaks. The experimental results, on the other hand,
reflect the conditions used during the scattering experiment at room temperature or similar.
At these temperatures the atoms vibrate around their ground position creating a distribution
around the position related to the oscillation. A generalized difference is illustrated in Figure
4.
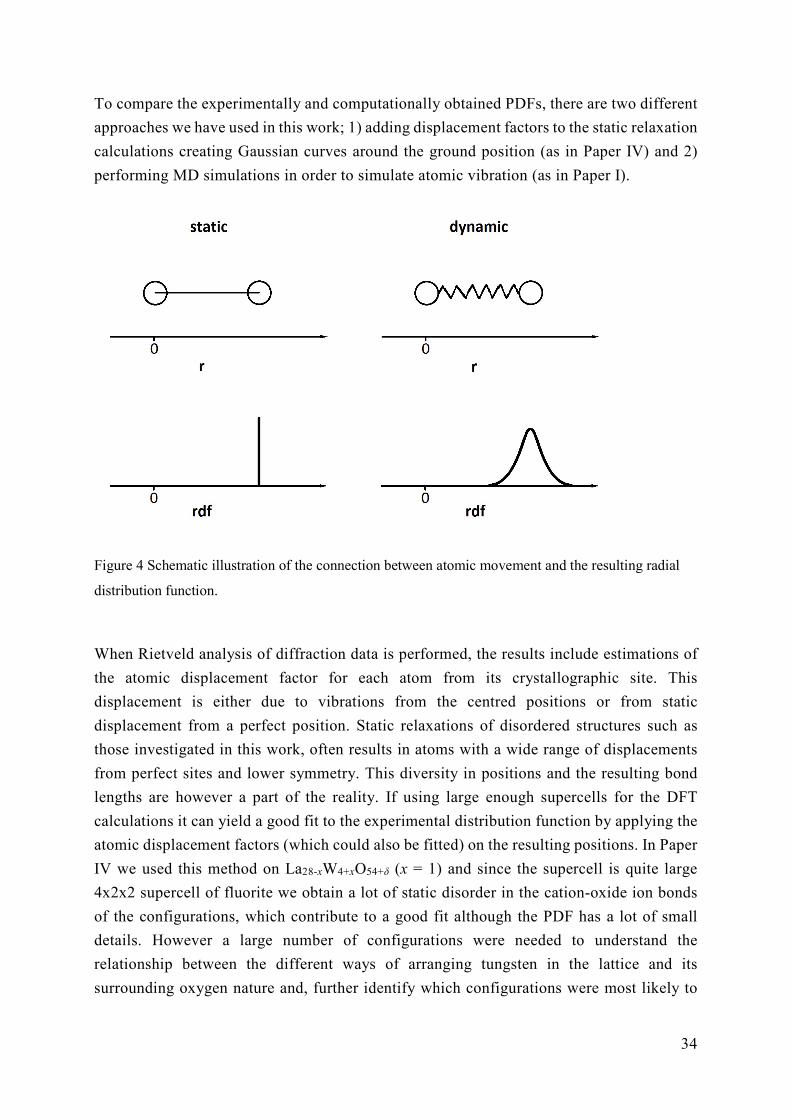
34
To compare the experimentally and computationally obtained PDFs, there are two different
approaches we have used in this work; 1) adding displacement factors to the static relaxation
calculations creating Gaussian curves around the ground position (as in Paper IV) and 2)
performing MD simulations in order to simulate atomic vibration (as in Paper I).
Figure 4 Schematic illustration of the connection between atomic movement and the resulting radial
distribution function.
When Rietveld analysis of diffraction data is performed, the results include estimations of
the atomic displacement factor for each atom from its crystallographic site. This
displacement is either due to vibrations from the centred positions or from static
displacement from a perfect position. Static relaxations of disordered structures such as
those investigated in this work, often results in atoms with a wide range of displacements
from perfect sites and lower symmetry. This diversity in positions and the resulting bond
lengths are however a part of the reality. If using large enough supercells for the DFT
calculations it can yield a good fit to the experimental distribution function by applying the
atomic displacement factors (which could also be fitted) on the resulting positions. In Paper
IV we used this method on La28-xW4+xO54+δ (x = 1) and since the supercell is quite large
4x2x2 supercell of fluorite we obtain a lot of static disorder in the cation-oxide ion bonds
of the configurations, which contribute to a good fit although the PDF has a lot of small
details. However a large number of configurations were needed to understand the
relationship between the different ways of arranging tungsten in the lattice and its
surrounding oxygen nature and, further identify which configurations were most likely to
35
present in the oxide based on the comparison to the experimentally obtained distribution
function.
In Paper I we use MD modelling of chosen structure configurations to obtain comparable
distribution functions, a method used with success in previous works [89]. During the MD
simulations atoms vibrate as they do at finite temperatures. The temperature used for the
thermostat in the MD calculations should be comparable to the experimental one. Then the
PDF obtained is based on both static displacements due to relaxation of the atomic positions
as well as dynamic due to vibrations, and the result is only based on ab initio, or first
principles, calculations.
The two approaches presented are useful methods to validate that PDFs from optimized
configurations are consistent with the average structure in G(r) obtained by diffraction, and
it further allows us to investigate indirectly how different local structures affect the average
structure. Although the diffraction data may be unable to provide all details about the local
structure, the average structure information obtained from diffraction acts as a frame to
which the local structure models must fit. If there is a large mismatch between the obtained
PDFs it is evident that the modelled structure configuration is not the dominating structure
in the investigated sample.

37
4 Papers
I. C-type related order in the defective fluorites La2Ce2O7 and Nd2Ce2O7 studied by neutron scattering and ab initio MD simulations L-E. Kalland, S. T. Norberg, J. Kyrklund, S. Hull, S. G. Eriksson, T. Norby, C. E. Mohn and C. S. Knee, Physical Chemistry Chemical Physics, 2016, 18, 24070-24080
II. First principles calculations on order and disorder in La2Ce2O7 and Nd2Ce2O7
L-E. Kalland and C. E. Mohn, Physical Chemistry Chemical Physics, 2020, 22, 13930-13941
III. Structure, hydration, and proton conductivity in 50% La and Nd doped CeO2 –
La2Ce2O7 and Nd2Ce2O7 – and their solid solutions L-E. Kalland, A. Løken, T. S. Bjørheim, R. Haugsrud and T. Norby, Solid State Ionics, 2020, 354, 115401-115408
IV. Local Structure of Proton-Conducting Lanthanum Tungstate La28-xW4+xO54+δ: a
Combined Density Functional Theory and Pair Distribution Function Study L-E. Kalland, A. Magraso, A. Mancini, C. Tealdi, and L. Malavasi, Chemistry of Materials, 2013, 25 2378-2384
The work has also contributed to the following publications:
Defect structure and its nomenclature for mixed conducting lanthanum tungstates La28-xW4+xO54+3x/2 S. Erdal, L-E. Kalland, R. Hancke, J. Polfus, R. Haugsrud and T. Norby Int. J. Hydrogen Energy, 2012, 37(9) 8051-8055.
Complete structural model for lanthanum tungstate: a chemically stable hightemperature proton conductor by means of intrinsic defects A. Magraso, J. M. Polfus, C. Frontera, J. Canales-Vazquez, L.E. Kalland, C. H. Hervoches, S. Erdal, R Hancke, M. S. Islam, T. Norby, R. Haugsrud, Journal of Materials Chemistry, 2012, 22 1762-1764

38
39
Paper I C-type related order in the defective fluorites La2Ce2O7 and Nd2Ce2O7 studied by
neutron scattering and ab initio MD simulations
L-E. Kalland, S. T. Norberg, J. Kyrklund, S. Hull, S. G. Eriksson, T. Norby, C. E. Mohn and C. S. Knee, Physical Chemistry Chemical Physics, 2016, 18, 24070-24080 DOI: 10.1039/c6cp04708d

40
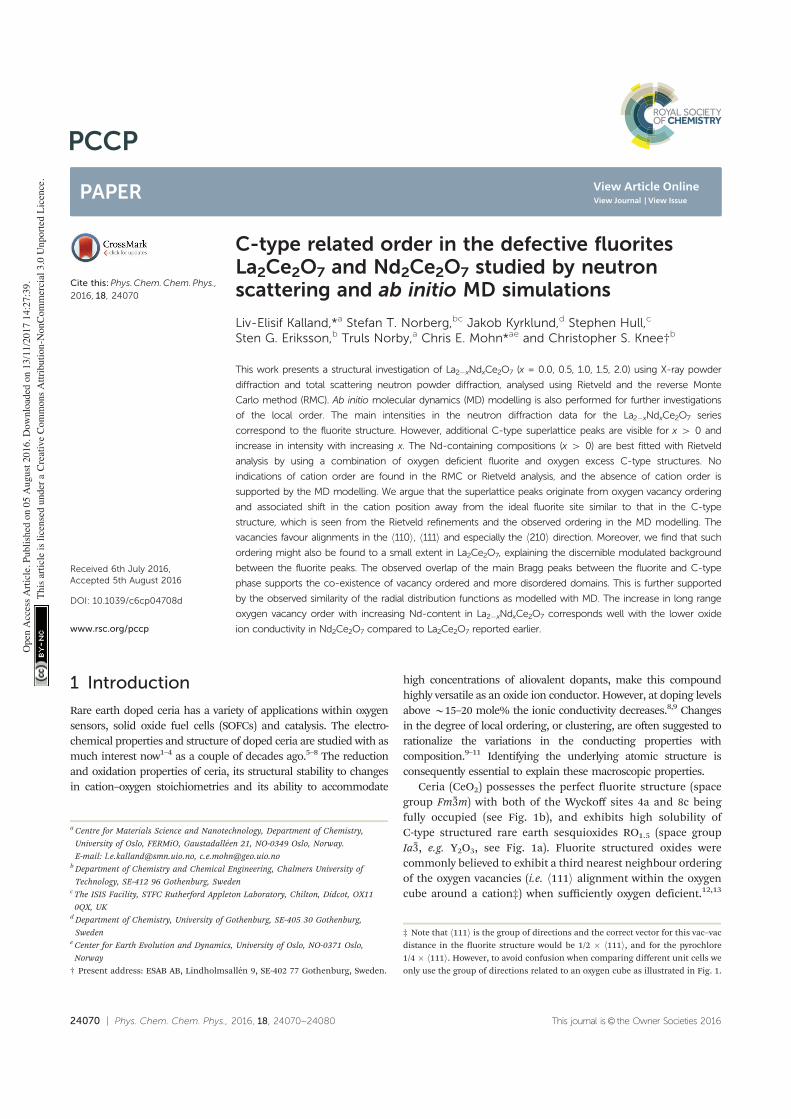
24070 | Phys. Chem. Chem. Phys., 2016, 18, 24070--24080 This journal is© the Owner Societies 2016
Cite this:Phys.Chem.Chem.Phys.,
2016, 18, 24070
C-type related order in the defective fluoritesLa2Ce2O7 and Nd2Ce2O7 studied by neutronscattering and ab initio MD simulations
Liv-Elisif Kalland,*a Stefan T. Norberg,bc Jakob Kyrklund,d Stephen Hull,c
Sten G. Eriksson,b Truls Norby,a Chris E. Mohn*ae and Christopher S. Knee†b
This work presents a structural investigation of La2�xNdxCe2O7 (x = 0.0, 0.5, 1.0, 1.5, 2.0) using X-ray powder
diffraction and total scattering neutron powder diffraction, analysed using Rietveld and the reverse Monte
Carlo method (RMC). Ab initio molecular dynamics (MD) modelling is also performed for further investigations
of the local order. The main intensities in the neutron diffraction data for the La2�xNdxCe2O7 series
correspond to the fluorite structure. However, additional C-type superlattice peaks are visible for x 4 0 and
increase in intensity with increasing x. The Nd-containing compositions (x 4 0) are best fitted with Rietveld
analysis by using a combination of oxygen deficient fluorite and oxygen excess C-type structures. No
indications of cation order are found in the RMC or Rietveld analysis, and the absence of cation order is
supported by the MD modelling. We argue that the superlattice peaks originate from oxygen vacancy ordering
and associated shift in the cation position away from the ideal fluorite site similar to that in the C-type
structure, which is seen from the Rietveld refinements and the observed ordering in the MD modelling. The
vacancies favour alignments in the h110i, h111i and especially the h210i direction. Moreover, we find that such
ordering might also be found to a small extent in La2Ce2O7, explaining the discernible modulated background
between the fluorite peaks. The observed overlap of the main Bragg peaks between the fluorite and C-type
phase supports the co-existence of vacancy ordered and more disordered domains. This is further supported
by the observed similarity of the radial distribution functions as modelled with MD. The increase in long range
oxygen vacancy order with increasing Nd-content in La2�xNdxCe2O7 corresponds well with the lower oxide
ion conductivity in Nd2Ce2O7 compared to La2Ce2O7 reported earlier.
1 Introduction
Rare earth doped ceria has a variety of applications within oxygensensors, solid oxide fuel cells (SOFCs) and catalysis. The electro-chemical properties and structure of doped ceria are studied with asmuch interest now1–4 as a couple of decades ago.5–8 The reductionand oxidation properties of ceria, its structural stability to changesin cation–oxygen stoichiometries and its ability to accommodate
high concentrations of aliovalent dopants, make this compoundhighly versatile as an oxide ion conductor. However, at doping levelsabove B15–20 mole% the ionic conductivity decreases.8,9 Changesin the degree of local ordering, or clustering, are often suggested torationalize the variations in the conducting properties withcomposition.9–11 Identifying the underlying atomic structure isconsequently essential to explain these macroscopic properties.
Ceria (CeO2) possesses the perfect fluorite structure (spacegroup Fm%3m) with both of the Wyckoff sites 4a and 8c beingfully occupied (see Fig. 1b), and exhibits high solubility ofC-type structured rare earth sesquioxides RO1.5 (space groupIa%3, e.g. Y2O3, see Fig. 1a). Fluorite structured oxides werecommonly believed to exhibit a third nearest neighbour orderingof the oxygen vacancies (i.e. h111i alignment within the oxygencube around a cation‡) when sufficiently oxygen deficient.12,13
a Centre for Materials Science and Nanotechnology, Department of Chemistry,
University of Oslo, FERMiO, Gaustadalleen 21, NO-0349 Oslo, Norway.
E-mail: [email protected], [email protected] Department of Chemistry and Chemical Engineering, Chalmers University of
Technology, SE-412 96 Gothenburg, Swedenc The ISIS Facility, STFC Rutherford Appleton Laboratory, Chilton, Didcot, OX11
0QX, UKd Department of Chemistry, University of Gothenburg, SE-405 30 Gothenburg,
Swedene Center for Earth Evolution and Dynamics, University of Oslo, NO-0371 Oslo,
Norway
† Present address: ESAB AB, Lindholmsallen 9, SE-402 77 Gothenburg, Sweden.
Received 6th July 2016,Accepted 5th August 2016
DOI: 10.1039/c6cp04708d
www.rsc.org/pccp
‡ Note that h111i is the group of directions and the correct vector for this vac–vacdistance in the fluorite structure would be 1/2 � h111i, and for the pyrochlore1/4 � h111i. However, to avoid confusion when comparing different unit cells weonly use the group of directions related to an oxygen cube as illustrated in Fig. 1.
PCCP
PAPER
Ope
n A
cces
s A
rtic
le. P
ublis
hed
on 0
5 A
ugus
t 201
6. D
ownl
oade
d on
13/
11/2
017
14:2
7:39
. T
his
artic
le is
lice
nsed
und
er a
Cre
ativ
e C
omm
ons
Attr
ibut
ion-
Non
Com
mer
cial
3.0
Unp
orte
d L
icen
ce.
View Article OnlineView Journal | View Issue
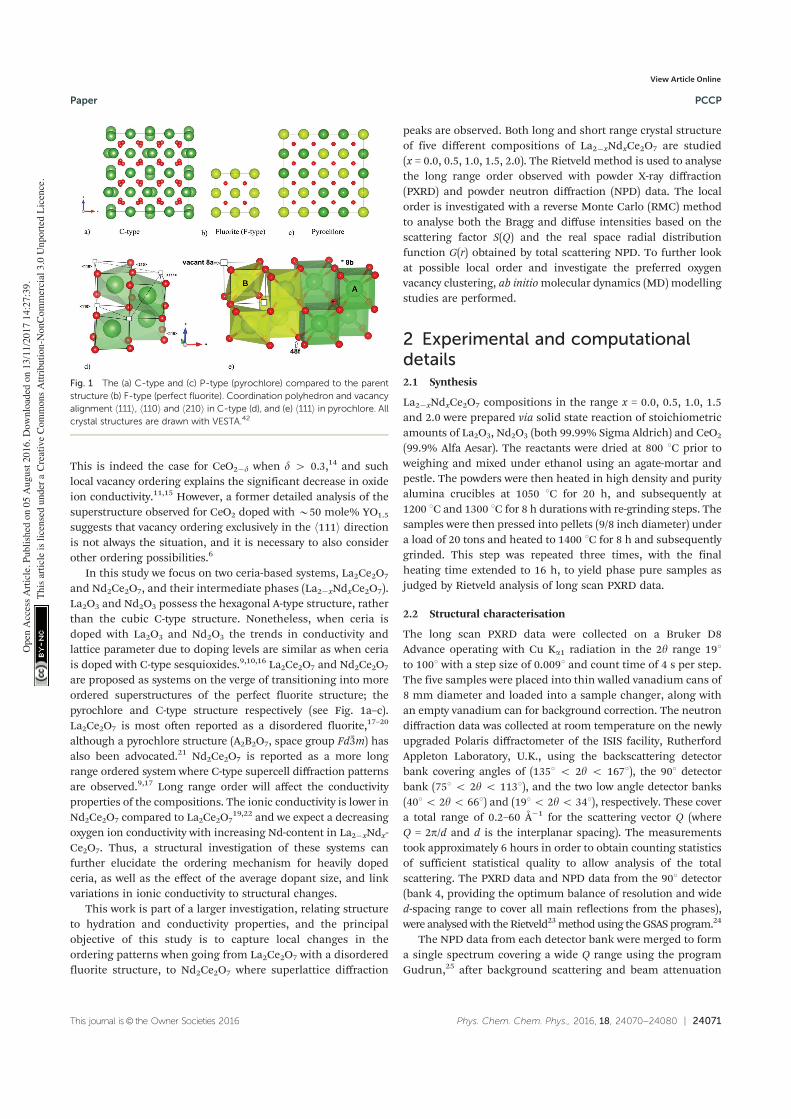
This journal is© the Owner Societies 2016 Phys. Chem. Chem. Phys., 2016, 18, 24070--24080 | 24071
This is indeed the case for CeO2�d when d 4 0.3,14 and suchlocal vacancy ordering explains the significant decrease in oxideion conductivity.11,15 However, a former detailed analysis of thesuperstructure observed for CeO2 doped with B50 mole% YO1.5
suggests that vacancy ordering exclusively in the h111i directionis not always the situation, and it is necessary to also considerother ordering possibilities.6
In this study we focus on two ceria-based systems, La2Ce2O7
and Nd2Ce2O7, and their intermediate phases (La2�xNdxCe2O7).La2O3 and Nd2O3 possess the hexagonal A-type structure, ratherthan the cubic C-type structure. Nonetheless, when ceria isdoped with La2O3 and Nd2O3 the trends in conductivity andlattice parameter due to doping levels are similar as when ceriais doped with C-type sesquioxides.9,10,16 La2Ce2O7 and Nd2Ce2O7
are proposed as systems on the verge of transitioning into moreordered superstructures of the perfect fluorite structure; thepyrochlore and C-type structure respectively (see Fig. 1a–c).La2Ce2O7 is most often reported as a disordered fluorite,17–20
although a pyrochlore structure (A2B2O7, space group Fd%3m) hasalso been advocated.21 Nd2Ce2O7 is reported as a more longrange ordered system where C-type supercell diffraction patternsare observed.9,17 Long range order will affect the conductivityproperties of the compositions. The ionic conductivity is lower inNd2Ce2O7 compared to La2Ce2O7
19,22 and we expect a decreasingoxygen ion conductivity with increasing Nd-content in La2�xNdx-Ce2O7. Thus, a structural investigation of these systems canfurther elucidate the ordering mechanism for heavily dopedceria, as well as the effect of the average dopant size, and linkvariations in ionic conductivity to structural changes.
This work is part of a larger investigation, relating structureto hydration and conductivity properties, and the principalobjective of this study is to capture local changes in theordering patterns when going from La2Ce2O7 with a disorderedfluorite structure, to Nd2Ce2O7 where superlattice diffraction
peaks are observed. Both long and short range crystal structureof five different compositions of La2�xNdxCe2O7 are studied(x = 0.0, 0.5, 1.0, 1.5, 2.0). The Rietveld method is used to analysethe long range order observed with powder X-ray diffraction(PXRD) and powder neutron diffraction (NPD) data. The localorder is investigated with a reverse Monte Carlo (RMC) methodto analyse both the Bragg and diffuse intensities based on thescattering factor S(Q) and the real space radial distributionfunction G(r) obtained by total scattering NPD. To further lookat possible local order and investigate the preferred oxygenvacancy clustering, ab initiomolecular dynamics (MD) modellingstudies are performed.
2 Experimental and computationaldetails2.1 Synthesis
La2�xNdxCe2O7 compositions in the range x = 0.0, 0.5, 1.0, 1.5and 2.0 were prepared via solid state reaction of stoichiometricamounts of La2O3, Nd2O3 (both 99.99% Sigma Aldrich) and CeO2
(99.9% Alfa Aesar). The reactants were dried at 800 1C prior toweighing and mixed under ethanol using an agate-mortar andpestle. The powders were then heated in high density and purityalumina crucibles at 1050 1C for 20 h, and subsequently at1200 1C and 1300 1C for 8 h durations with re-grinding steps. Thesamples were then pressed into pellets (9/8 inch diameter) undera load of 20 tons and heated to 1400 1C for 8 h and subsequentlygrinded. This step was repeated three times, with the finalheating time extended to 16 h, to yield phase pure samples asjudged by Rietveld analysis of long scan PXRD data.
2.2 Structural characterisation
The long scan PXRD data were collected on a Bruker D8Advance operating with Cu Ka1 radiation in the 2y range 191to 1001 with a step size of 0.0091 and count time of 4 s per step.The five samples were placed into thin walled vanadium cans of8 mm diameter and loaded into a sample changer, along withan empty vanadium can for background correction. The neutrondiffraction data was collected at room temperature on the newlyupgraded Polaris diffractometer of the ISIS facility, RutherfordAppleton Laboratory, U.K., using the backscattering detectorbank covering angles of (1351 o 2y o 1671), the 901 detectorbank (751 o 2y o 1131), and the two low angle detector banks(401o 2yo 661) and (191o 2yo 341), respectively. These covera total range of 0.2–60 Å�1 for the scattering vector Q (whereQ = 2p/d and d is the interplanar spacing). The measurementstook approximately 6 hours in order to obtain counting statisticsof sufficient statistical quality to allow analysis of the totalscattering. The PXRD data and NPD data from the 901 detector(bank 4, providing the optimum balance of resolution and wided-spacing range to cover all main reflections from the phases),were analysedwith the Rietveld23method using theGSAS program.24
The NPD data from each detector bank were merged to forma single spectrum covering a wide Q range using the programGudrun,25 after background scattering and beam attenuation
Fig. 1 The (a) C-type and (c) P-type (pyrochlore) compared to the parentstructure (b) F-type (perfect fluorite). Coordination polyhedron and vacancyalignment h111i, h110i and h210i in C-type (d), and (e) h111i in pyrochlore. Allcrystal structures are drawn with VESTA.42
Paper PCCP
Ope
n A
cces
s A
rtic
le. P
ublis
hed
on 0
5 A
ugus
t 201
6. D
ownl
oade
d on
13/
11/2
017
14:2
7:39
. T
his
artic
le is
lice
nsed
und
er a
Cre
ativ
e C
omm
ons
Attr
ibut
ion-
Non
Com
mer
cial
3.0
Unp
orte
d L
icen
ce.
View Article Online
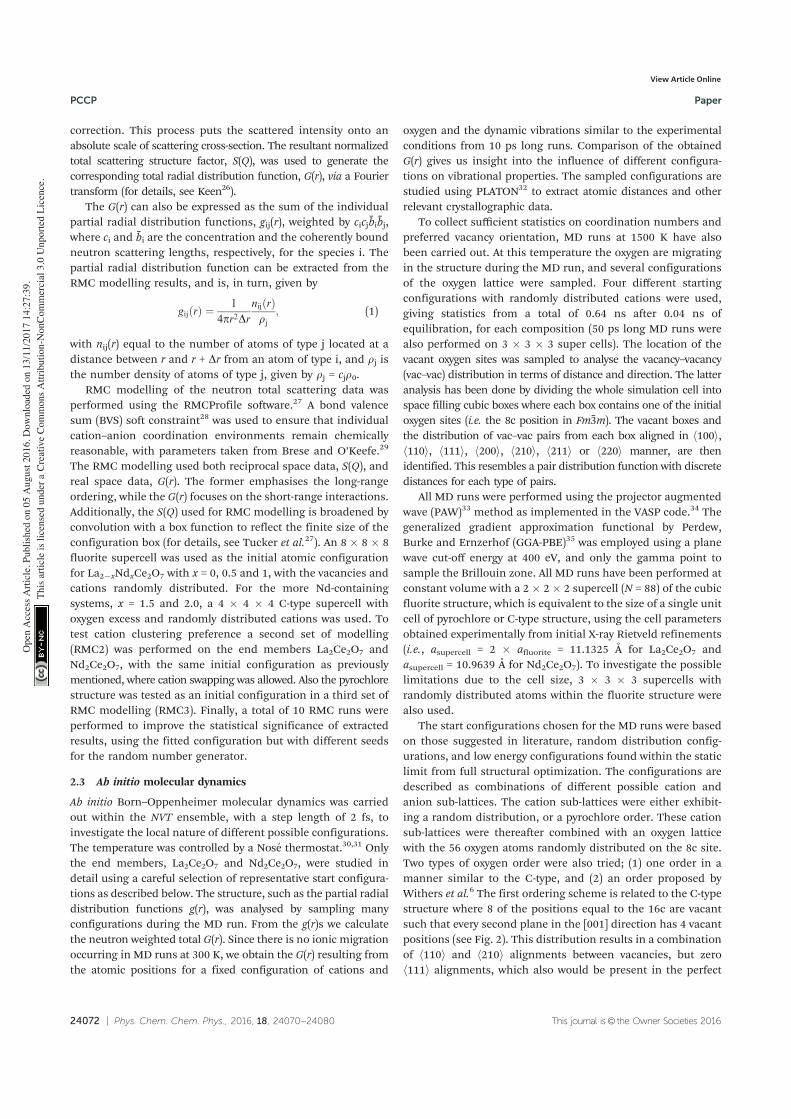
24072 | Phys. Chem. Chem. Phys., 2016, 18, 24070--24080 This journal is© the Owner Societies 2016
correction. This process puts the scattered intensity onto anabsolute scale of scattering cross-section. The resultant normalizedtotal scattering structure factor, S(Q), was used to generate thecorresponding total radial distribution function, G(r), via a Fouriertransform (for details, see Keen26).
The G(r) can also be expressed as the sum of the individualpartial radial distribution functions, gij(r), weighted by cicj%bi%bj,where ci and %bi are the concentration and the coherently boundneutron scattering lengths, respectively, for the species i. Thepartial radial distribution function can be extracted from theRMC modelling results, and is, in turn, given by
gijðrÞ ¼ 1
4pr2DrnijðrÞrj
; (1)
with nij(r) equal to the number of atoms of type j located at adistance between r and r + Dr from an atom of type i, and rj isthe number density of atoms of type j, given by rj = cjr0.
RMC modelling of the neutron total scattering data wasperformed using the RMCProfile software.27 A bond valencesum (BVS) soft constraint28 was used to ensure that individualcation–anion coordination environments remain chemicallyreasonable, with parameters taken from Brese and O’Keefe.29
The RMC modelling used both reciprocal space data, S(Q), andreal space data, G(r). The former emphasises the long-rangeordering, while the G(r) focuses on the short-range interactions.Additionally, the S(Q) used for RMC modelling is broadened byconvolution with a box function to reflect the finite size of theconfiguration box (for details, see Tucker et al.27). An 8 � 8 � 8fluorite supercell was used as the initial atomic configurationfor La2�xNdxCe2O7 with x = 0, 0.5 and 1, with the vacancies andcations randomly distributed. For the more Nd-containingsystems, x = 1.5 and 2.0, a 4 � 4 � 4 C-type supercell withoxygen excess and randomly distributed cations was used. Totest cation clustering preference a second set of modelling(RMC2) was performed on the end members La2Ce2O7 andNd2Ce2O7, with the same initial configuration as previouslymentioned, where cation swapping was allowed. Also the pyrochlorestructure was tested as an initial configuration in a third set ofRMC modelling (RMC3). Finally, a total of 10 RMC runs wereperformed to improve the statistical significance of extractedresults, using the fitted configuration but with different seedsfor the random number generator.
2.3 Ab initio molecular dynamics
Ab initio Born–Oppenheimer molecular dynamics was carriedout within the NVT ensemble, with a step length of 2 fs, toinvestigate the local nature of different possible configurations.The temperature was controlled by a Nose thermostat.30,31 Onlythe end members, La2Ce2O7 and Nd2Ce2O7, were studied indetail using a careful selection of representative start configura-tions as described below. The structure, such as the partial radialdistribution functions g(r), was analysed by sampling manyconfigurations during the MD run. From the g(r)s we calculatethe neutron weighted total G(r). Since there is no ionic migrationoccurring in MD runs at 300 K, we obtain the G(r) resulting fromthe atomic positions for a fixed configuration of cations and
oxygen and the dynamic vibrations similar to the experimentalconditions from 10 ps long runs. Comparison of the obtainedG(r) gives us insight into the influence of different configura-tions on vibrational properties. The sampled configurations arestudied using PLATON32 to extract atomic distances and otherrelevant crystallographic data.
To collect sufficient statistics on coordination numbers andpreferred vacancy orientation, MD runs at 1500 K have alsobeen carried out. At this temperature the oxygen are migratingin the structure during the MD run, and several configurationsof the oxygen lattice were sampled. Four different startingconfigurations with randomly distributed cations were used,giving statistics from a total of 0.64 ns after 0.04 ns ofequilibration, for each composition (50 ps long MD runs werealso performed on 3 � 3 � 3 super cells). The location of thevacant oxygen sites was sampled to analyse the vacancy–vacancy(vac–vac) distribution in terms of distance and direction. The latteranalysis has been done by dividing the whole simulation cell intospace filling cubic boxes where each box contains one of the initialoxygen sites (i.e. the 8c position in Fm%3m). The vacant boxes andthe distribution of vac–vac pairs from each box aligned in h100i,h110i, h111i, h200i, h210i, h211i or h220i manner, are thenidentified. This resembles a pair distribution function with discretedistances for each type of pairs.
All MD runs were performed using the projector augmentedwave (PAW)33 method as implemented in the VASP code.34 Thegeneralized gradient approximation functional by Perdew,Burke and Ernzerhof (GGA-PBE)35 was employed using a planewave cut-off energy at 400 eV, and only the gamma point tosample the Brillouin zone. All MD runs have been performed atconstant volume with a 2 � 2 � 2 supercell (N = 88) of the cubicfluorite structure, which is equivalent to the size of a single unitcell of pyrochlore or C-type structure, using the cell parametersobtained experimentally from initial X-ray Rietveld refinements(i.e., asupercell = 2 � afluorite = 11.1325 Å for La2Ce2O7 andasupercell = 10.9639 Å for Nd2Ce2O7). To investigate the possiblelimitations due to the cell size, 3 � 3 � 3 supercells withrandomly distributed atoms within the fluorite structure werealso used.
The start configurations chosen for the MD runs were basedon those suggested in literature, random distribution config-urations, and low energy configurations found within the staticlimit from full structural optimization. The configurations aredescribed as combinations of different possible cation andanion sub-lattices. The cation sub-lattices were either exhibit-ing a random distribution, or a pyrochlore order. These cationsub-lattices were thereafter combined with an oxygen latticewith the 56 oxygen atoms randomly distributed on the 8c site.Two types of oxygen order were also tried; (1) one order in amanner similar to the C-type, and (2) an order proposed byWithers et al.6 The first ordering scheme is related to the C-typestructure where 8 of the positions equal to the 16c are vacantsuch that every second plane in the [001] direction has 4 vacantpositions (see Fig. 2). This distribution results in a combinationof h110i and h210i alignments between vacancies, but zeroh111i alignments, which also would be present in the perfect
PCCP Paper
Ope
n A
cces
s A
rtic
le. P
ublis
hed
on 0
5 A
ugus
t 201
6. D
ownl
oade
d on
13/
11/2
017
14:2
7:39
. T
his
artic
le is
lice
nsed
und
er a
Cre
ativ
e C
omm
ons
Attr
ibut
ion-
Non
Com
mer
cial
3.0
Unp
orte
d L
icen
ce.
View Article Online
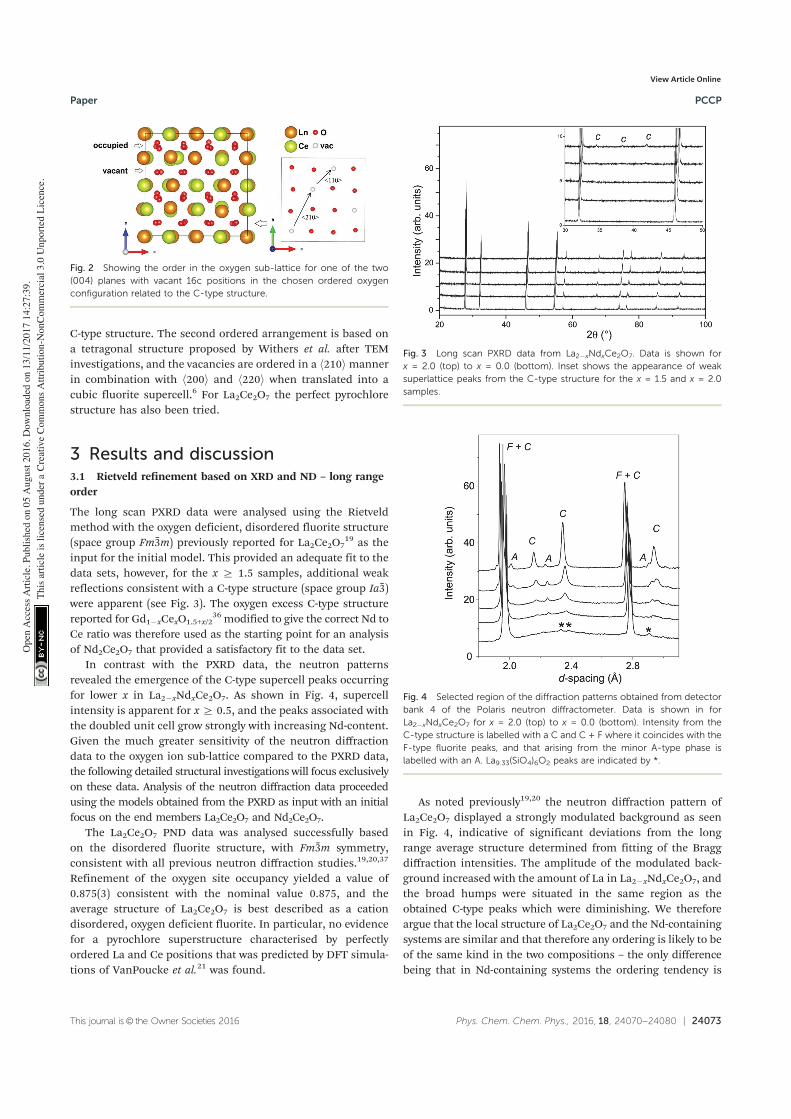
This journal is© the Owner Societies 2016 Phys. Chem. Chem. Phys., 2016, 18, 24070--24080 | 24073
C-type structure. The second ordered arrangement is based ona tetragonal structure proposed by Withers et al. after TEMinvestigations, and the vacancies are ordered in a h210imannerin combination with h200i and h220i when translated into acubic fluorite supercell.6 For La2Ce2O7 the perfect pyrochlorestructure has also been tried.
3 Results and discussion3.1 Rietveld refinement based on XRD and ND – long rangeorder
The long scan PXRD data were analysed using the Rietveldmethod with the oxygen deficient, disordered fluorite structure(space group Fm%3m) previously reported for La2Ce2O7
19 as theinput for the initial model. This provided an adequate fit to thedata sets, however, for the x Z 1.5 samples, additional weakreflections consistent with a C-type structure (space group Ia%3)were apparent (see Fig. 3). The oxygen excess C-type structurereported for Gd1�xCexO1.5+x/2
36 modified to give the correct Nd toCe ratio was therefore used as the starting point for an analysisof Nd2Ce2O7 that provided a satisfactory fit to the data set.
In contrast with the PXRD data, the neutron patternsrevealed the emergence of the C-type supercell peaks occurringfor lower x in La2�xNdxCe2O7. As shown in Fig. 4, supercellintensity is apparent for x Z 0.5, and the peaks associated withthe doubled unit cell grow strongly with increasing Nd-content.Given the much greater sensitivity of the neutron diffractiondata to the oxygen ion sub-lattice compared to the PXRD data,the following detailed structural investigations will focus exclusivelyon these data. Analysis of the neutron diffraction data proceededusing the models obtained from the PXRD as input with an initialfocus on the end members La2Ce2O7 and Nd2Ce2O7.
The La2Ce2O7 PND data was analysed successfully basedon the disordered fluorite structure, with Fm%3m symmetry,consistent with all previous neutron diffraction studies.19,20,37
Refinement of the oxygen site occupancy yielded a value of0.875(3) consistent with the nominal value 0.875, and theaverage structure of La2Ce2O7 is best described as a cationdisordered, oxygen deficient fluorite. In particular, no evidencefor a pyrochlore superstructure characterised by perfectlyordered La and Ce positions that was predicted by DFT simula-tions of VanPoucke et al.21 was found.
As noted previously19,20 the neutron diffraction pattern ofLa2Ce2O7 displayed a strongly modulated background as seenin Fig. 4, indicative of significant deviations from the longrange average structure determined from fitting of the Braggdiffraction intensities. The amplitude of the modulated back-ground increased with the amount of La in La2�xNdxCe2O7, andthe broad humps were situated in the same region as theobtained C-type peaks which were diminishing. We thereforeargue that the local structure of La2Ce2O7 and the Nd-containingsystems are similar and that therefore any ordering is likely to beof the same kind in the two compositions – the only differencebeing that in Nd-containing systems the ordering tendency is
Fig. 2 Showing the order in the oxygen sub-lattice for one of the two(004) planes with vacant 16c positions in the chosen ordered oxygenconfiguration related to the C-type structure.
Fig. 3 Long scan PXRD data from La2�xNdxCe2O7. Data is shown forx = 2.0 (top) to x = 0.0 (bottom). Inset shows the appearance of weaksuperlattice peaks from the C-type structure for the x = 1.5 and x = 2.0samples.
Fig. 4 Selected region of the diffraction patterns obtained from detectorbank 4 of the Polaris neutron diffractometer. Data is shown in forLa2�xNdxCe2O7 for x = 2.0 (top) to x = 0.0 (bottom). Intensity from theC-type structure is labelled with a C and C + F where it coincides with theF-type fluorite peaks, and that arising from the minor A-type phase islabelled with an A. La9.33(SiO4)6O2 peaks are indicated by *.
Paper PCCP
Ope
n A
cces
s A
rtic
le. P
ublis
hed
on 0
5 A
ugus
t 201
6. D
ownl
oade
d on
13/
11/2
017
14:2
7:39
. T
his
artic
le is
lice
nsed
und
er a
Cre
ativ
e C
omm
ons
Attr
ibut
ion-
Non
Com
mer
cial
3.0
Unp
orte
d L
icen
ce.
View Article Online
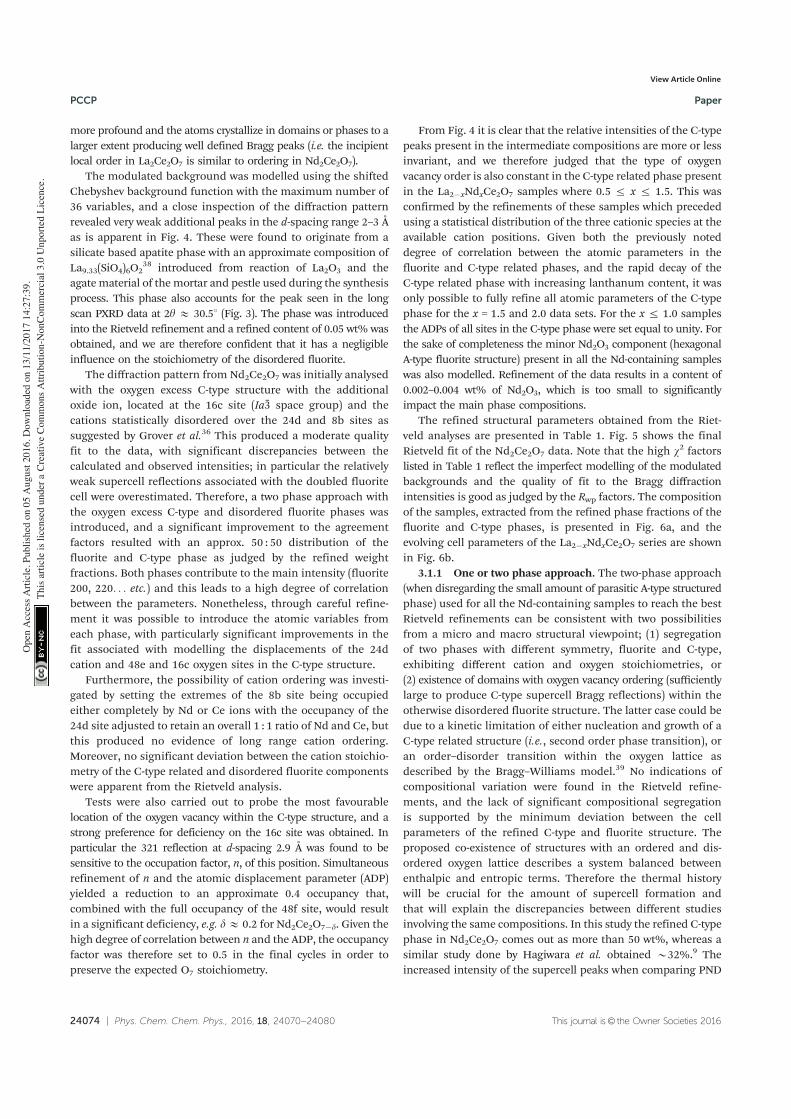
24074 | Phys. Chem. Chem. Phys., 2016, 18, 24070--24080 This journal is© the Owner Societies 2016
more profound and the atoms crystallize in domains or phases to alarger extent producing well defined Bragg peaks (i.e. the incipientlocal order in La2Ce2O7 is similar to ordering in Nd2Ce2O7).
The modulated background was modelled using the shiftedChebyshev background function with the maximum number of36 variables, and a close inspection of the diffraction patternrevealed very weak additional peaks in the d-spacing range 2–3 Åas is apparent in Fig. 4. These were found to originate from asilicate based apatite phase with an approximate composition ofLa9.33(SiO4)6O2
38 introduced from reaction of La2O3 and theagatematerial of the mortar and pestle used during the synthesisprocess. This phase also accounts for the peak seen in the longscan PXRD data at 2y E 30.51 (Fig. 3). The phase was introducedinto the Rietveld refinement and a refined content of 0.05 wt% wasobtained, and we are therefore confident that it has a negligibleinfluence on the stoichiometry of the disordered fluorite.
The diffraction pattern from Nd2Ce2O7 was initially analysedwith the oxygen excess C-type structure with the additionaloxide ion, located at the 16c site (Ia%3 space group) and thecations statistically disordered over the 24d and 8b sites assuggested by Grover et al.36 This produced a moderate qualityfit to the data, with significant discrepancies between thecalculated and observed intensities; in particular the relativelyweak supercell reflections associated with the doubled fluoritecell were overestimated. Therefore, a two phase approach withthe oxygen excess C-type and disordered fluorite phases wasintroduced, and a significant improvement to the agreementfactors resulted with an approx. 50 : 50 distribution of thefluorite and C-type phase as judged by the refined weightfractions. Both phases contribute to the main intensity (fluorite200, 220. . . etc.) and this leads to a high degree of correlationbetween the parameters. Nonetheless, through careful refine-ment it was possible to introduce the atomic variables fromeach phase, with particularly significant improvements in thefit associated with modelling the displacements of the 24dcation and 48e and 16c oxygen sites in the C-type structure.
Furthermore, the possibility of cation ordering was investi-gated by setting the extremes of the 8b site being occupiedeither completely by Nd or Ce ions with the occupancy of the24d site adjusted to retain an overall 1 : 1 ratio of Nd and Ce, butthis produced no evidence of long range cation ordering.Moreover, no significant deviation between the cation stoichio-metry of the C-type related and disordered fluorite componentswere apparent from the Rietveld analysis.
Tests were also carried out to probe the most favourablelocation of the oxygen vacancy within the C-type structure, and astrong preference for deficiency on the 16c site was obtained. Inparticular the 321 reflection at d-spacing 2.9 Å was found to besensitive to the occupation factor, n, of this position. Simultaneousrefinement of n and the atomic displacement parameter (ADP)yielded a reduction to an approximate 0.4 occupancy that,combined with the full occupancy of the 48f site, would resultin a significant deficiency, e.g. dE 0.2 for Nd2Ce2O7�d. Given thehigh degree of correlation between n and the ADP, the occupancyfactor was therefore set to 0.5 in the final cycles in order topreserve the expected O7 stoichiometry.
From Fig. 4 it is clear that the relative intensities of the C-typepeaks present in the intermediate compositions are more or lessinvariant, and we therefore judged that the type of oxygenvacancy order is also constant in the C-type related phase presentin the La2�xNdxCe2O7 samples where 0.5 r x r 1.5. This wasconfirmed by the refinements of these samples which precededusing a statistical distribution of the three cationic species at theavailable cation positions. Given both the previously noteddegree of correlation between the atomic parameters in thefluorite and C-type related phases, and the rapid decay of theC-type related phase with increasing lanthanum content, it wasonly possible to fully refine all atomic parameters of the C-typephase for the x = 1.5 and 2.0 data sets. For the x r 1.0 samplesthe ADPs of all sites in the C-type phase were set equal to unity. Forthe sake of completeness the minor Nd2O3 component (hexagonalA-type fluorite structure) present in all the Nd-containing sampleswas also modelled. Refinement of the data results in a content of0.002–0.004 wt% of Nd2O3, which is too small to significantlyimpact the main phase compositions.
The refined structural parameters obtained from the Riet-veld analyses are presented in Table 1. Fig. 5 shows the finalRietveld fit of the Nd2Ce2O7 data. Note that the high w2 factorslisted in Table 1 reflect the imperfect modelling of the modulatedbackgrounds and the quality of fit to the Bragg diffractionintensities is good as judged by the Rwp factors. The compositionof the samples, extracted from the refined phase fractions of thefluorite and C-type phases, is presented in Fig. 6a, and theevolving cell parameters of the La2�xNdxCe2O7 series are shownin Fig. 6b.
3.1.1 One or two phase approach. The two-phase approach(when disregarding the small amount of parasitic A-type structuredphase) used for all the Nd-containing samples to reach the bestRietveld refinements can be consistent with two possibilitiesfrom a micro and macro structural viewpoint; (1) segregationof two phases with different symmetry, fluorite and C-type,exhibiting different cation and oxygen stoichiometries, or(2) existence of domains with oxygen vacancy ordering (sufficientlylarge to produce C-type supercell Bragg reflections) within theotherwise disordered fluorite structure. The latter case could bedue to a kinetic limitation of either nucleation and growth of aC-type related structure (i.e., second order phase transition), oran order–disorder transition within the oxygen lattice asdescribed by the Bragg–Williams model.39 No indications ofcompositional variation were found in the Rietveld refine-ments, and the lack of significant compositional segregationis supported by the minimum deviation between the cellparameters of the refined C-type and fluorite structure. Theproposed co-existence of structures with an ordered and dis-ordered oxygen lattice describes a system balanced betweenenthalpic and entropic terms. Therefore the thermal historywill be crucial for the amount of supercell formation andthat will explain the discrepancies between different studiesinvolving the same compositions. In this study the refined C-typephase in Nd2Ce2O7 comes out as more than 50 wt%, whereas asimilar study done by Hagiwara et al. obtained B32%.9 Theincreased intensity of the supercell peaks when comparing PND
PCCP Paper
Ope
n A
cces
s A
rtic
le. P
ublis
hed
on 0
5 A
ugus
t 201
6. D
ownl
oade
d on
13/
11/2
017
14:2
7:39
. T
his
artic
le is
lice
nsed
und
er a
Cre
ativ
e C
omm
ons
Attr
ibut
ion-
Non
Com
mer
cial
3.0
Unp
orte
d L
icen
ce.
View Article Online
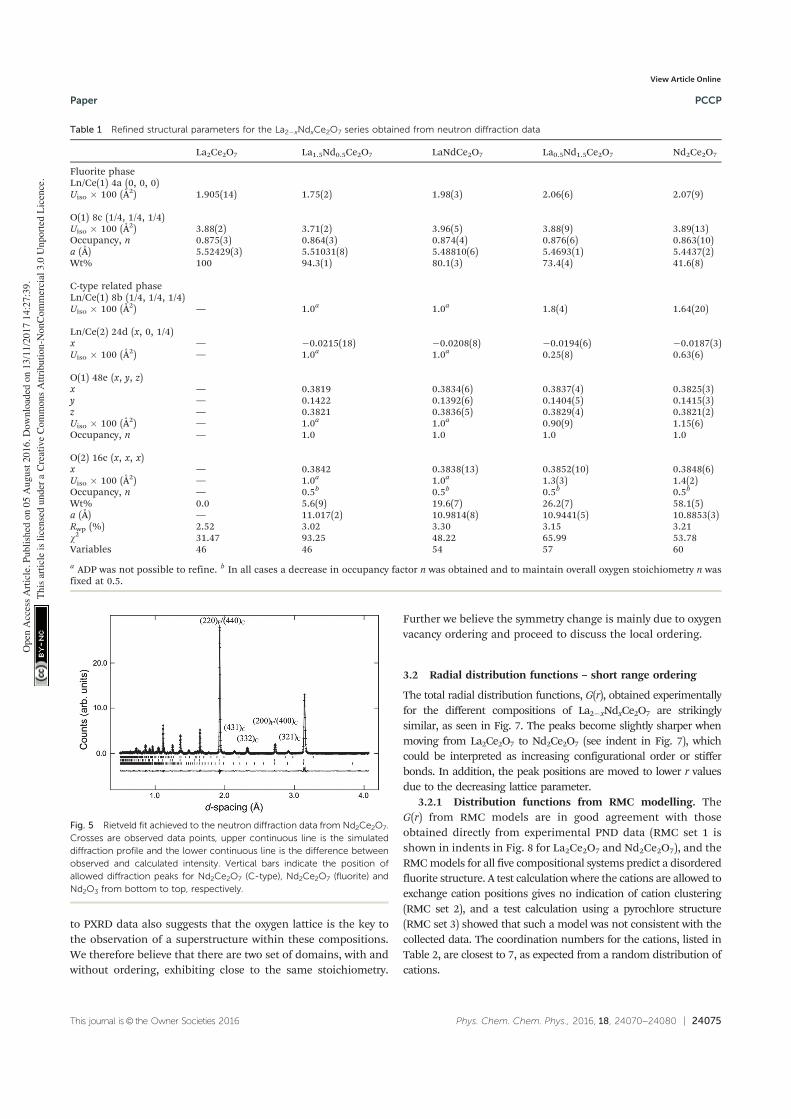
This journal is© the Owner Societies 2016 Phys. Chem. Chem. Phys., 2016, 18, 24070--24080 | 24075
to PXRD data also suggests that the oxygen lattice is the key tothe observation of a superstructure within these compositions.We therefore believe that there are two set of domains, with andwithout ordering, exhibiting close to the same stoichiometry.
Further we believe the symmetry change is mainly due to oxygenvacancy ordering and proceed to discuss the local ordering.
3.2 Radial distribution functions – short range ordering
The total radial distribution functions, G(r), obtained experimentallyfor the different compositions of La2�xNdxCe2O7 are strikinglysimilar, as seen in Fig. 7. The peaks become slightly sharper whenmoving from La2Ce2O7 to Nd2Ce2O7 (see indent in Fig. 7), whichcould be interpreted as increasing configurational order or stifferbonds. In addition, the peak positions are moved to lower r valuesdue to the decreasing lattice parameter.
3.2.1 Distribution functions from RMC modelling. TheG(r) from RMC models are in good agreement with thoseobtained directly from experimental PND data (RMC set 1 isshown in indents in Fig. 8 for La2Ce2O7 and Nd2Ce2O7), and theRMCmodels for all five compositional systems predict a disorderedfluorite structure. A test calculation where the cations are allowed toexchange cation positions gives no indication of cation clustering(RMC set 2), and a test calculation using a pyrochlore structure(RMC set 3) showed that such a model was not consistent with thecollected data. The coordination numbers for the cations, listed inTable 2, are closest to 7, as expected from a random distribution ofcations.
Table 1 Refined structural parameters for the La2�xNdxCe2O7 series obtained from neutron diffraction data
La2Ce2O7 La1.5Nd0.5Ce2O7 LaNdCe2O7 La0.5Nd1.5Ce2O7 Nd2Ce2O7
Fluorite phaseLn/Ce(1) 4a (0, 0, 0)Uiso � 100 (Å2) 1.905(14) 1.75(2) 1.98(3) 2.06(6) 2.07(9)
O(1) 8c (1/4, 1/4, 1/4)Uiso � 100 (Å2) 3.88(2) 3.71(2) 3.96(5) 3.88(9) 3.89(13)Occupancy, n 0.875(3) 0.864(3) 0.874(4) 0.876(6) 0.863(10)a (Å) 5.52429(3) 5.51031(8) 5.48810(6) 5.4693(1) 5.4437(2)Wt% 100 94.3(1) 80.1(3) 73.4(4) 41.6(8)
C-type related phaseLn/Ce(1) 8b (1/4, 1/4, 1/4)Uiso � 100 (Å2) — 1.0a 1.0a 1.8(4) 1.64(20)
Ln/Ce(2) 24d (x, 0, 1/4)x — �0.0215(18) �0.0208(8) �0.0194(6) �0.0187(3)Uiso � 100 (Å2) — 1.0a 1.0a 0.25(8) 0.63(6)
O(1) 48e (x, y, z)x — 0.3819 0.3834(6) 0.3837(4) 0.3825(3)y — 0.1422 0.1392(6) 0.1404(5) 0.1415(3)z — 0.3821 0.3836(5) 0.3829(4) 0.3821(2)Uiso � 100 (Å2) — 1.0a 1.0a 0.90(9) 1.15(6)Occupancy, n — 1.0 1.0 1.0 1.0
O(2) 16c (x, x, x)x — 0.3842 0.3838(13) 0.3852(10) 0.3848(6)Uiso � 100 (Å2) — 1.0a 1.0a 1.3(3) 1.4(2)Occupancy, n — 0.5b 0.5b 0.5b 0.5b
Wt% 0.0 5.6(9) 19.6(7) 26.2(7) 58.1(5)a (Å) — 11.017(2) 10.9814(8) 10.9441(5) 10.8853(3)Rwp (%) 2.52 3.02 3.30 3.15 3.21w2 31.47 93.25 48.22 65.99 53.78Variables 46 46 54 57 60
a ADP was not possible to refine. b In all cases a decrease in occupancy factor n was obtained and to maintain overall oxygen stoichiometry n wasfixed at 0.5.
Fig. 5 Rietveld fit achieved to the neutron diffraction data from Nd2Ce2O7.Crosses are observed data points, upper continuous line is the simulateddiffraction profile and the lower continuous line is the difference betweenobserved and calculated intensity. Vertical bars indicate the position ofallowed diffraction peaks for Nd2Ce2O7 (C-type), Nd2Ce2O7 (fluorite) andNd2O3 from bottom to top, respectively.
Paper PCCP
Ope
n A
cces
s A
rtic
le. P
ublis
hed
on 0
5 A
ugus
t 201
6. D
ownl
oade
d on
13/
11/2
017
14:2
7:39
. T
his
artic
le is
lice
nsed
und
er a
Cre
ativ
e C
omm
ons
Attr
ibut
ion-
Non
Com
mer
cial
3.0
Unp
orte
d L
icen
ce.
View Article Online
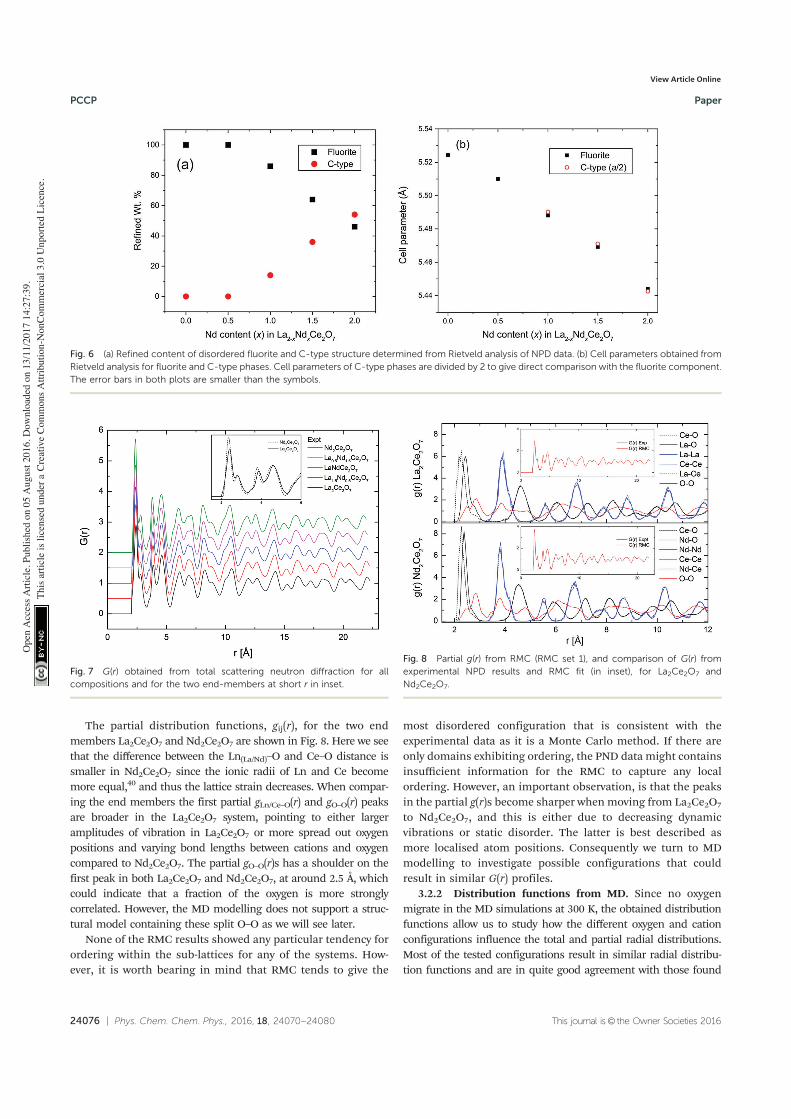
24076 | Phys. Chem. Chem. Phys., 2016, 18, 24070--24080 This journal is© the Owner Societies 2016
The partial distribution functions, gij(r), for the two endmembers La2Ce2O7 and Nd2Ce2O7 are shown in Fig. 8. Here we seethat the difference between the Ln(La/Nd)–O and Ce–O distance issmaller in Nd2Ce2O7 since the ionic radii of Ln and Ce becomemore equal,40 and thus the lattice strain decreases. When compar-ing the end members the first partial gLn/Ce–O(r) and gO–O(r) peaksare broader in the La2Ce2O7 system, pointing to either largeramplitudes of vibration in La2Ce2O7 or more spread out oxygenpositions and varying bond lengths between cations and oxygencompared to Nd2Ce2O7. The partial gO–O(r)s has a shoulder on thefirst peak in both La2Ce2O7 and Nd2Ce2O7, at around 2.5 Å, whichcould indicate that a fraction of the oxygen is more stronglycorrelated. However, the MD modelling does not support a struc-tural model containing these split O–O as we will see later.
None of the RMC results showed any particular tendency forordering within the sub-lattices for any of the systems. How-ever, it is worth bearing in mind that RMC tends to give the
most disordered configuration that is consistent with theexperimental data as it is a Monte Carlo method. If there areonly domains exhibiting ordering, the PND data might containsinsufficient information for the RMC to capture any localordering. However, an important observation, is that the peaksin the partial g(r)s become sharper when moving from La2Ce2O7
to Nd2Ce2O7, and this is either due to decreasing dynamicvibrations or static disorder. The latter is best described asmore localised atom positions. Consequently we turn to MDmodelling to investigate possible configurations that couldresult in similar G(r) profiles.
3.2.2 Distribution functions from MD. Since no oxygenmigrate in the MD simulations at 300 K, the obtained distributionfunctions allow us to study how the different oxygen and cationconfigurations influence the total and partial radial distributions.Most of the tested configurations result in similar radial distribu-tion functions and are in quite good agreement with those found
Fig. 6 (a) Refined content of disordered fluorite and C-type structure determined from Rietveld analysis of NPD data. (b) Cell parameters obtained fromRietveld analysis for fluorite and C-type phases. Cell parameters of C-type phases are divided by 2 to give direct comparison with the fluorite component.The error bars in both plots are smaller than the symbols.
Fig. 7 G(r) obtained from total scattering neutron diffraction for allcompositions and for the two end-members at short r in inset.
Fig. 8 Partial g(r) from RMC (RMC set 1), and comparison of G(r) fromexperimental NPD results and RMC fit (in inset), for La2Ce2O7 andNd2Ce2O7.
PCCP Paper
Ope
n A
cces
s A
rtic
le. P
ublis
hed
on 0
5 A
ugus
t 201
6. D
ownl
oade
d on
13/
11/2
017
14:2
7:39
. T
his
artic
le is
lice
nsed
und
er a
Cre
ativ
e C
omm
ons
Attr
ibut
ion-
Non
Com
mer
cial
3.0
Unp
orte
d L
icen
ce.
View Article Online
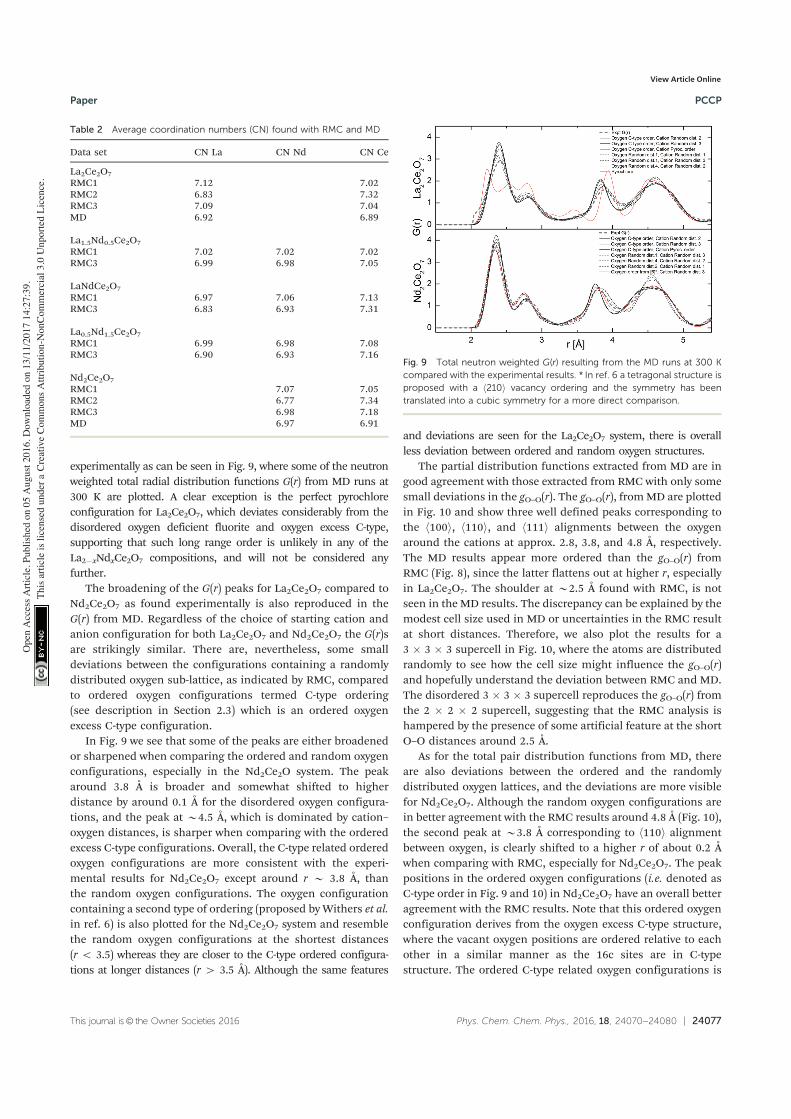
This journal is© the Owner Societies 2016 Phys. Chem. Chem. Phys., 2016, 18, 24070--24080 | 24077
experimentally as can be seen in Fig. 9, where some of the neutronweighted total radial distribution functions G(r) from MD runs at300 K are plotted. A clear exception is the perfect pyrochloreconfiguration for La2Ce2O7, which deviates considerably from thedisordered oxygen deficient fluorite and oxygen excess C-type,supporting that such long range order is unlikely in any of theLa2�xNdxCe2O7 compositions, and will not be considered anyfurther.
The broadening of the G(r) peaks for La2Ce2O7 compared toNd2Ce2O7 as found experimentally is also reproduced in theG(r) from MD. Regardless of the choice of starting cation andanion configuration for both La2Ce2O7 and Nd2Ce2O7 the G(r)sare strikingly similar. There are, nevertheless, some smalldeviations between the configurations containing a randomlydistributed oxygen sub-lattice, as indicated by RMC, comparedto ordered oxygen configurations termed C-type ordering(see description in Section 2.3) which is an ordered oxygenexcess C-type configuration.
In Fig. 9 we see that some of the peaks are either broadenedor sharpened when comparing the ordered and random oxygenconfigurations, especially in the Nd2Ce2O system. The peakaround 3.8 Å is broader and somewhat shifted to higherdistance by around 0.1 Å for the disordered oxygen configura-tions, and the peak at B4.5 Å, which is dominated by cation–oxygen distances, is sharper when comparing with the orderedexcess C-type configurations. Overall, the C-type related orderedoxygen configurations are more consistent with the experi-mental results for Nd2Ce2O7 except around r B 3.8 Å, thanthe random oxygen configurations. The oxygen configurationcontaining a second type of ordering (proposed by Withers et al.in ref. 6) is also plotted for the Nd2Ce2O7 system and resemblethe random oxygen configurations at the shortest distances(r o 3.5) whereas they are closer to the C-type ordered configura-tions at longer distances (r 4 3.5 Å). Although the same features
and deviations are seen for the La2Ce2O7 system, there is overallless deviation between ordered and random oxygen structures.
The partial distribution functions extracted from MD are ingood agreement with those extracted from RMC with only somesmall deviations in the gO–O(r). The gO–O(r), fromMD are plottedin Fig. 10 and show three well defined peaks corresponding tothe h100i, h110i, and h111i alignments between the oxygenaround the cations at approx. 2.8, 3.8, and 4.8 Å, respectively.The MD results appear more ordered than the gO–O(r) fromRMC (Fig. 8), since the latter flattens out at higher r, especiallyin La2Ce2O7. The shoulder at B2.5 Å found with RMC, is notseen in the MD results. The discrepancy can be explained by themodest cell size used in MD or uncertainties in the RMC resultat short distances. Therefore, we also plot the results for a3 � 3 � 3 supercell in Fig. 10, where the atoms are distributedrandomly to see how the cell size might influence the gO–O(r)and hopefully understand the deviation between RMC and MD.The disordered 3 � 3 � 3 supercell reproduces the gO–O(r) fromthe 2 � 2 � 2 supercell, suggesting that the RMC analysis ishampered by the presence of some artificial feature at the shortO–O distances around 2.5 Å.
As for the total pair distribution functions from MD, thereare also deviations between the ordered and the randomlydistributed oxygen lattices, and the deviations are more visiblefor Nd2Ce2O7. Although the random oxygen configurations arein better agreement with the RMC results around 4.8 Å (Fig. 10),the second peak at B3.8 Å corresponding to h110i alignmentbetween oxygen, is clearly shifted to a higher r of about 0.2 Åwhen comparing with RMC, especially for Nd2Ce2O7. The peakpositions in the ordered oxygen configurations (i.e. denoted asC-type order in Fig. 9 and 10) in Nd2Ce2O7 have an overall betteragreement with the RMC results. Note that this ordered oxygenconfiguration derives from the oxygen excess C-type structure,where the vacant oxygen positions are ordered relative to eachother in a similar manner as the 16c sites are in C-typestructure. The ordered C-type related oxygen configurations is
Table 2 Average coordination numbers (CN) found with RMC and MD
Data set CN La CN Nd CN Ce
La2Ce2O7
RMC1 7.12 7.02RMC2 6.83 7.32RMC3 7.09 7.04MD 6.92 6.89
La1.5Nd0.5Ce2O7
RMC1 7.02 7.02 7.02RMC3 6.99 6.98 7.05
LaNdCe2O7
RMC1 6.97 7.06 7.13RMC3 6.83 6.93 7.31
La0.5Nd1.5Ce2O7RMC1 6.99 6.98 7.08RMC3 6.90 6.93 7.16
Nd2Ce2O7
RMC1 7.07 7.05RMC2 6.77 7.34RMC3 6.98 7.18MD 6.97 6.91
Fig. 9 Total neutron weighted G(r) resulting from the MD runs at 300 Kcompared with the experimental results. * In ref. 6 a tetragonal structure isproposed with a h210i vacancy ordering and the symmetry has beentranslated into a cubic symmetry for a more direct comparison.
Paper PCCP
Ope
n A
cces
s A
rtic
le. P
ublis
hed
on 0
5 A
ugus
t 201
6. D
ownl
oade
d on
13/
11/2
017
14:2
7:39
. T
his
artic
le is
lice
nsed
und
er a
Cre
ativ
e C
omm
ons
Attr
ibut
ion-
Non
Com
mer
cial
3.0
Unp
orte
d L
icen
ce.
View Article Online
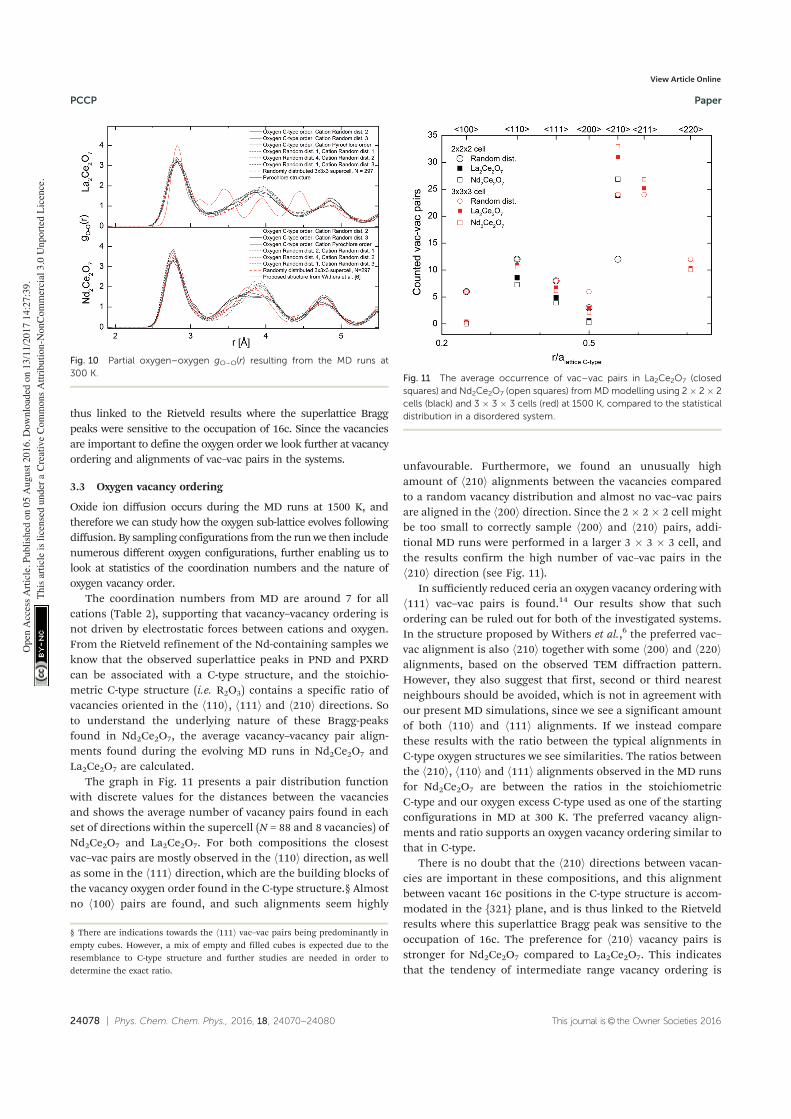
24078 | Phys. Chem. Chem. Phys., 2016, 18, 24070--24080 This journal is© the Owner Societies 2016
thus linked to the Rietveld results where the superlattice Braggpeaks were sensitive to the occupation of 16c. Since the vacanciesare important to define the oxygen order we look further at vacancyordering and alignments of vac–vac pairs in the systems.
3.3 Oxygen vacancy ordering
Oxide ion diffusion occurs during the MD runs at 1500 K, andtherefore we can study how the oxygen sub-lattice evolves followingdiffusion. By sampling configurations from the runwe then includenumerous different oxygen configurations, further enabling us tolook at statistics of the coordination numbers and the nature ofoxygen vacancy order.
The coordination numbers from MD are around 7 for allcations (Table 2), supporting that vacancy–vacancy ordering isnot driven by electrostatic forces between cations and oxygen.From the Rietveld refinement of the Nd-containing samples weknow that the observed superlattice peaks in PND and PXRDcan be associated with a C-type structure, and the stoichio-metric C-type structure (i.e. R2O3) contains a specific ratio ofvacancies oriented in the h110i, h111i and h210i directions. Soto understand the underlying nature of these Bragg-peaksfound in Nd2Ce2O7, the average vacancy–vacancy pair align-ments found during the evolving MD runs in Nd2Ce2O7 andLa2Ce2O7 are calculated.
The graph in Fig. 11 presents a pair distribution functionwith discrete values for the distances between the vacanciesand shows the average number of vacancy pairs found in eachset of directions within the supercell (N = 88 and 8 vacancies) ofNd2Ce2O7 and La2Ce2O7. For both compositions the closestvac–vac pairs are mostly observed in the h110i direction, as wellas some in the h111i direction, which are the building blocks ofthe vacancy oxygen order found in the C-type structure.§ Almostno h100i pairs are found, and such alignments seem highly
unfavourable. Furthermore, we found an unusually highamount of h210i alignments between the vacancies comparedto a random vacancy distribution and almost no vac–vac pairsare aligned in the h200i direction. Since the 2 � 2� 2 cell mightbe too small to correctly sample h200i and h210i pairs, addi-tional MD runs were performed in a larger 3 � 3 � 3 cell, andthe results confirm the high number of vac–vac pairs in theh210i direction (see Fig. 11).
In sufficiently reduced ceria an oxygen vacancy ordering withh111i vac–vac pairs is found.14 Our results show that suchordering can be ruled out for both of the investigated systems.In the structure proposed by Withers et al.,6 the preferred vac–vac alignment is also h210i together with some h200i and h220ialignments, based on the observed TEM diffraction pattern.However, they also suggest that first, second or third nearestneighbours should be avoided, which is not in agreement withour present MD simulations, since we see a significant amountof both h110i and h111i alignments. If we instead comparethese results with the ratio between the typical alignments inC-type oxygen structures we see similarities. The ratios betweenthe h210i, h110i and h111i alignments observed in the MD runsfor Nd2Ce2O7 are between the ratios in the stoichiometricC-type and our oxygen excess C-type used as one of the startingconfigurations in MD at 300 K. The preferred vacancy align-ments and ratio supports an oxygen vacancy ordering similar tothat in C-type.
There is no doubt that the h210i directions between vacan-cies are important in these compositions, and this alignmentbetween vacant 16c positions in the C-type structure is accom-modated in the {321} plane, and is thus linked to the Rietveldresults where this superlattice Bragg peak was sensitive to theoccupation of 16c. The preference for h210i vacancy pairs isstronger for Nd2Ce2O7 compared to La2Ce2O7. This indicatesthat the tendency of intermediate range vacancy ordering is
Fig. 10 Partial oxygen–oxygen gO–O(r) resulting from the MD runs at300 K. Fig. 11 The average occurrence of vac–vac pairs in La2Ce2O7 (closed
squares) and Nd2Ce2O7 (open squares) from MDmodelling using 2 � 2 � 2cells (black) and 3 � 3 � 3 cells (red) at 1500 K, compared to the statisticaldistribution in a disordered system.
§ There are indications towards the h111i vac–vac pairs being predominantly inempty cubes. However, a mix of empty and filled cubes is expected due to theresemblance to C-type structure and further studies are needed in order todetermine the exact ratio.
PCCP Paper
Ope
n A
cces
s A
rtic
le. P
ublis
hed
on 0
5 A
ugus
t 201
6. D
ownl
oade
d on
13/
11/2
017
14:2
7:39
. T
his
artic
le is
lice
nsed
und
er a
Cre
ativ
e C
omm
ons
Attr
ibut
ion-
Non
Com
mer
cial
3.0
Unp
orte
d L
icen
ce.
View Article Online
This journal is© the Owner Societies 2016 Phys. Chem. Chem. Phys., 2016, 18, 24070--24080 | 24079
stronger in Nd2Ce2O7, although La2Ce2O7 probably exhibitssimilar ordering to a small extent.
3.4 Summarizing discussion
The Rietveld refinements of the La2�xNdxCe2O7 series showthat La2Ce2O7 exhibits a disordered oxygen deficient fluoritestructure whereas additional super lattice peaks are apparentfor the Nd-containing compositions. Therefore the best refine-ments for the Nd-containing compositions were reached with atwo phase approach combining a C-type related structure withan oxygen deficient fluorite structure. Moreover, the Rietveldanalysis revealed that the oxygen vacancies tend to be localisedon the 16c site of the C-type structure, indicating that it can beviewed as an oxygen excess C-type phase. The increased inten-sity of the super-lattice peaks extracted from the PND datacompared to the PXRD data indicates that oxygen order is theorigin of the observed C-type supercell peaks. We find noevidence of cation order but the refinements show a small shiftin one of the cation sites away from the perfect fluorite structurefor the C-type related phase. The MD and RMC results are ingood agreement and support the lack of cation clustering. Bothtechniques give an average coordination number around 7 for allcations in contrast to earlier suggested models.2,3 Therefore, wetrust that the observed supercell peaks appear mainly due tosymmetry changes arising from oxygen vacancy ordering.
The observed vacancy ordering is described by vacanciesaligning in the h210i direction combined with h110i and someh111i alignments, and can thus be termed an oxygen excessC-type structure where the remaining vacancies favour the 16cposition. Such an order gives rise to symmetry planes equal tothose in the C-type structure and can explain the superlatticepeaks. Locally the h110i and h111i alignments of the vacanciesinduce small shifts in the cation position away from the perfectfluorite site for the 24d site as it is in the C-type structure. Thisshift in position will contribute to the additional superlatticepeaks as supported by the Rietveld refinements.
The significant diffuse scattering observed for La2Ce2O7
indicates that the local structure deviates from the averagefluorite structure, and the background modulation is alsoconsistent with the C-type peak positions suggesting that thereis some short range order similar to that of the Nd-containingsamples. MDmodelling of La2Ce2O7 supports this claim showing atendency towards vacancy ordering.
Based on the diffraction data it is apparent that the amount,or degree, of long range order existing in La2�xNdxCe2O7
increases with the Nd-content. In La2�xNdxCe2O7 the latticeparameter decreases with Nd-content (see Fig. 6b), as expected,since the cation radius of Nd+3 is smaller than La+3. The develop-ment is, however, not linear, and the additional size reduction islikely to occur due to the increase in long range order, which is inagreement with earlier studies on Ce1�xNdxO2�d.
9,16
Some short range oxygen vacancy order seems to be pre-ferred in both La2Ce2O7 and Nd2Ce2O7, but for long range orderto appear, the building blocks of h110i and h111i alignmentsbetween the vacancies, further creating a high number of h210ialignments, must expand over several unit cells. The driving
force towards long range order in La2�xNdxCe2O7 is most likely dueto structural relaxation based on vacancy interactions and changesin cation size, since the coordination numbers and vacancy con-centrations are equal for all the compositions in the La2�xNdxCe2O7
series. The decreasing cell size and free volume with increasingNd-content could impose greater electrostatic forces between thevacancies, and oxide ions, making it more favourable for them toorder. Structural relaxation in terms of long range ordering couldalso be facilitated by more similar ionic radius for the involvedcations (i.e. Nd+3 more similar to Ce+4 than La+3). In La2Ce2O7, onthe other hand, the strain caused by larger differences in cation sizewithin the disordered cation lattice, obstructs the prevalence oflong range order. This is consistent with the findings of Yamamuraet al. in an earlier study of Ln2Ce2O7 (Ln = La, Nd, Sm, Eu, Gd, Y,Yb).17 They concluded that the ionic radius ratio r(Ln3+)/r(Ce4+),using the 8-fold coordinated Shannon radii,40 must be smaller than1.17 for the C-type phase to be stabilized. This leaves La2Ce2O7
outside the stability range. This correlation is also found in thework of Ou et al. in similar compositions.41
The two phase approach used in the Rietveld refinementsdoes not contradict the existence of grains containing domainsof vacancy ordering, and the refined unit cell parameters ofthe two phases are indeed almost identical (i.e. afluorite E 1/2 �ac-type). Also the G(r)s extracted from ordered and randomoxygen configurations are quite similar, indicating that theycould co-exist without considerable lattice mismatch. We there-fore conclude that the samples of La2�xNdxCe2O7 exhibit crystal-line grains with the fluorite structure and the presence of anionordered domains of increasing extent with the Nd-content and itis supported by findings in Y2Ce2O7 by Withers et al.6
Vacancy ordering ultimately lowers the oxide ion conductiv-ity. When a long range ordered sub-lattice is energeticallyfavourable, the activation energy for an oxygen jump is higherthan in a totally disordered lattice, as it can be compared to theformation of an anti-Frenkel defect. Oxygen transport might evendepend on collective movements. If the more local forces are thedominating factor for the ordering, the oxygen (or vacancy) can beeffectively trapped. In these compositions it is natural to assumethat any oxygen movement inducing a vac–vac alignment in theh100i would have a high activation barrier, leading to a lowernumber of possible sites the oxygen (or vacancy) can jump to.
4 Conclusions
The La2�xNdxCe2O7 series predominantly exhibits a disorderedfluorite structure with increasing intensity of additional C-typesupercell peaks in the PND data with increasing x. Rietveldrefinements show that the Nd-containing (x 4 0) compositionswere best fitted using a combination of oxygen deficient fluoriteand oxygen excess C-type structure, whereas La2Ce2O7 was bestrefined as a disordered fluorite. The diffraction data andRietveld refinements indicate that superlattice peaks stem fromdomains with vacancy ordering and associated shifts in thecation position away from the perfect fluorite structure, whichis related to the C-type structure. Ab initio molecular dynamics
Paper PCCP
Ope
n A
cces
s A
rtic
le. P
ublis
hed
on 0
5 A
ugus
t 201
6. D
ownl
oade
d on
13/
11/2
017
14:2
7:39
. T
his
artic
le is
lice
nsed
und
er a
Cre
ativ
e C
omm
ons
Attr
ibut
ion-
Non
Com
mer
cial
3.0
Unp
orte
d L
icen
ce.
View Article Online
24080 | Phys. Chem. Chem. Phys., 2016, 18, 24070--24080 This journal is© the Owner Societies 2016
results confirm that oxygen vacancy order comparable to that inthe C-type structure, is a plausible ordering scheme explainingthe change in long range order and the observed C-type Braggpeaks. The oxygen vacancies prefer alignments in the h210idirection in combination with the h110i and h111i direction.The PND data and MD suggest that C-type related orderingmight also be found in La2Ce2O7. The radial distribution func-tions extracted from PND, RMC and MD is in good agreement,and show that oxygen ordered and disordered configurationscan co-exist. The results show how these compositions are at theborder between different structures where the stability is sofinely balanced between enthalpic and entropic contributions,order and disorder. The extent of long range order graduallyincreases as the average cation size decreases with Nd-substitution. Finally, greater vacancy ordering can explain thelow oxide ion conductivity in Nd2Ce2O7 compared to La2Ce2O7.
Acknowledgements
The authors gratefully acknowledge UNINETT Sigma2 – theNational Infrastructure for High Performance Computing andData Storage in Norway, for providing computational resourcesfor the MDmodelling. The UK Science and Technology FacilitiesCouncil is thanked for allocating neutron beamtime at the ISISfacility, Rutherford Appleton Laboratory, U.K.
References
1 J. P. Allen, P. R. Keating, D. O. Scanlon and G. W. Watson,Doping CeO2 with trivalent cations: defect structures andreducibility, American Chemical Society, 2013, p. ENFL-418.
2 M. Coduri, M. Brunelli, M. Scavini, M. Allieta, P. Masala,L. Capogna, H. E. Fischer and C. Ferrero, Z. Kristallogr.,2012, 227, 272–279.
3 D. E. P. Vanpoucke, P. Bultinck, S. Cottenier, V. Van Speybroeckand I. Van Driessche, J. Mater. Chem. A, 2014, 2, 13723–13737.
4 L. Pino, A. Vita, M. Lagana and V. Recupero, Appl. Catal., B,2014, 148–149, 91–105.
5 H. L. Tuller and A. S. Nowick, J. Electrochem. Soc., 1975, 122,255–259.
6 R. L. Withers, J. G. Thompson, N. Gabbitas, L. R. Wallenbergand T. R. Welberry, J. Solid State Chem., 1995, 120, 290–298.
7 T.KudoandH.Obayashi, J. Electrochem.Soc., 1975,122, 142–147.8 H. Yahiro, Y. Eguchi, K. Eguchi and H. Arai, J. Appl. Electrochem.,
1988, 18, 527–531.9 T. Hagiwara, Z. Kyo, A. Manabe, H. Yamamura and K. Nomura,
J. Ceram. Soc. Jpn., 2009, 117, 1306–1310.10 J. Faber, C. Geoffroy, A. Roux, A. Sylvestre and P. Abelard,
Appl. Phys. A: Solids Surf., 1989, 49, 225–232.11 H. L. Tuller and A. S. Norwick, J. Electrochem. Soc., 1979, 126,
209–217.12 H. J. Rossell and H. G. Scott, J. Phys. (Paris), Colloq., 1977,
38(Colloq C-7), 28–31.13 T. R. Welberry, B. D. Butler, J. G. Thompson and R. L.
Withers, J. Solid State Chem., 1993, 106, 461–475.
14 S. Hull, S. T. Norberg, I. Ahmed, S. G. Eriksson, D. Marrocchelliand P. A. Madden, J. Solid State Chem., 2009, 182, 2815–2821.
15 M. Mogensen, T. Lindegaard, U. R. Hansen and G. Mogensen,J. Electrochem. Soc., 1994, 141, 2122–2128.
16 L. Li, R. Kasse, S. Phadke, W. Qiu, A. Huq and J. C. Nino,Solid State Ionics, 2012, 221, 15–21.
17 H. Yamamura, H. Nishino, K. Kakinuma and K. Nomura,J. Ceram. Soc. Jpn., 2003, 111, 902–906.
18 H. Yamamura, H. Nishino and K. Kakinuma, J. Ceram. Soc.Jpn., 2004, 112, 553–558.
19 V. Besikiotis, C. S. Knee, I. Ahmed, R. Haugsrud andT. Norby, Solid State Ionics, 2012, 228, 1–7.
20 E. Reynolds, P. E. R. Blanchard, Q. Zhou, B. J. Kennedy,Z. Zhang and L.-Y. Jang, Phys. Rev. B: Condens. Matter Mater.Phys., 2012, 85, 132101.
21 D. E. P. Vanpoucke, P. Bultinck, S. Cottenier, V. Van Speybroeckand I. Van Driessche, Phys. Rev. B: Condens. Matter Mater. Phys.,2011, 84, 054110.
22 S. Cheng, Master thesis, University of Oslo, 2012.23 H. Rietveld, J. Appl. Crystallogr., 1969, 2, 65–71.24 A. C. Larson and R. B. Von Dreele, General Structure Analysis
System (GSAS), Los Alamos National Laboratory Report, 1994,LAUR 86-748.
25 A. K. Soper, Gudrun, http://www.isis.stfc.ac.uk/instruments/sandals/data-analysis/gudrun8864.html.
26 D. Keen, J. Appl. Crystallogr., 2001, 34, 172–177.27 M. G. Tucker, D. A. Keen, M. T. Dove, A. L. Goodwin and
Q. Hui, J. Phys.: Condens. Matter, 2007, 19, 335218.28 S. T. Norberg, M. G. Tucker and S. Hull, J. Appl. Crystallogr.,
2009, 42, 179–184.29 N. E. Brese and M. O’Keeffe, Acta Crystallogr., Sect. B: Struct.
Sci., 1991, 47, 192–197.30 S. Nose, J. Chem. Phys., 1984, 81, 511–519.31 G. Kresse and J. Hafner, Phys. Rev. B: Condens. Matter Mater.
Phys., 1993, 48, 13115–13118.32 A. Spek, Acta Crystallogr., Sect. D: Biol. Crystallogr., 2009, 65,
148–155.33 P. E. Blochl, C. J. Forst and J. Schimpl, Bull. Mater. Sci., 2003,
26, 33–41.34 G. Kresse and J. Furthmueller, Phys. Rev. B: Condens. Matter
Mater. Phys., 1996, 54, 11169–11186.35 J. P. Perdew, K. Burke and M. Ernzerhof, Phys. Rev. Lett.,
1996, 77, 3865–3868.36 V. Grover and A. K. Tyagi, J. Solid State Chem., 2004, 177,
4197–4204.37 F. Brisse and O. Knop, Can. J. Chem., 1967, 45, 609–614.38 J. E. H. Sansom, J. R. Tolchard, P. R. Slater and M. S. Islam,
Solid State Ionics, 2004, 167, 17–22.39 W. L. Bragg and E. J. Williams, Proc. R. Soc. London, Ser. A,
1934, 145, 699–730.40 R. Shannon, Acta Crystallogr., Sect. A: Cryst. Phys., Diffr.,
Theor. Gen. Crystallogr., 1976, 32, 751–767.41 D. R. Ou, T. Mori, F. Ye, T. Kobayashi, J. Zou, G. Auchterlonie
and J. Drennan, Appl. Phys. Lett., 2006, 89, 171911.42 K.MommaandF. Izumi, J. Appl. Crystallogr., 2011,44, 1272–1276.
PCCP Paper
Ope
n A
cces
s A
rtic
le. P
ublis
hed
on 0
5 A
ugus
t 201
6. D
ownl
oade
d on
13/
11/2
017
14:2
7:39
. T
his
artic
le is
lice
nsed
und
er a
Cre
ativ
e C
omm
ons
Attr
ibut
ion-
Non
Com
mer
cial
3.0
Unp
orte
d L
icen
ce.
View Article Online

52
53
Paper II First principles calculations on order and disorder in La2Ce2O7 and Nd2Ce2O7
L-E. Kalland and C. E. Mohn, Physical Chemistry Chemical Physics, 2020, 22, 13930-13941
DOI: 10.1039/d0cp00921k

54
13930 | Phys. Chem. Chem. Phys., 2020, 22, 13930--13941 This journal is©the Owner Societies 2020
Cite this:Phys.Chem.Chem.Phys.,
2020, 22, 13930
First principles calculations on order and disorderin La2Ce2O7 and Nd2Ce2O7†
Liv-Elisif Kalland a and Chris E. Mohnb
In this paper, we highlight the connection between the local structure and collective dynamics of the
defective fluorites La2Ce2O7 and Nd2Ce2O7. The local and average structure is explored by investigating
a large number of different structural models and snapshots from Born–Oppenheimer Molecular
dynamics calculations. Both compounds show a strong preference for local oxygen vacancy order
similar to that found in the C-type structure. This suggests that previous studies, where Nd2Ce2O7 and
La2Ce2O7 are viewed as disordered defective fluorites, or as a pyrochlore for the latter, did not capture
the nature of local order in the disordered phase. We observe more collective chains of migrating
oxygen in Nd2Ce2O7 – a manifestation of a stronger preference for a dynamic local oxygen vacancy
order – than in La2Ce2O7. The stronger preference for h210i vacancy–vacancy alignments can explain
why long range ordering is identified by distinct C-type like superlattice peaks in neutron diffraction
patterns for Nd2Ce2O7 whereas they appear to be almost invisible in La2Ce2O7.
1. Introduction
The local structure of a disordered oxide is of key importance inorder to understand many of its chemical and physical properties,such as ionic conductivity and hydration. Popular structuralmodels, however, often assume that the structure of a crystallinedisordered material can be represented by an ‘‘average’’ modelwhere the disordered ions are distributed randomly over asublattice. Although such models are useful as a starting pointfor many properties, they do not capture changes in theenvironment a diffusing ion will experience as it jumps fromone position to another one. Such changes in the local structureare therefore essential to understanding diffusion processes indisordered oxides.1,2 Many A2B2O7 compounds, where A is atrivalent lanthanide and B is a tetravalent cation, are conveni-ently classified as fully ordered perfect pyrochlore structures oras oxygen deficient disordered flourites (see Fig. 1(c) and (a),respectively). Minervini et al.3 suggested that a tolerance factor,R = rA/rB (rA is the ionic radius for an 8-fold coordinatedtrivalent A cation and rB is the ionic radius for a 6-foldcoordinated tetravalent B cation), can be used to predict whetheran A2B2O7 compound should be classified as a perfect pyrochlorestructure (R 4 1.4) or if it will be disordered (and hence beclassified as a disordered fluorite). La2Ce2O7, for example, has
attracted considerable interest since it displays both high oxygen ionand proton conductivity,4,5 but its crystal structure is poorly under-stood. Since the tolerance factor for La2Ce2O7 is 1.33,which is slightlyless than 1.4, one would expect that it displays a disordered (oxygendeficient) fluorite structure. Although Vanpoucke et al.6 suggestedthat La2Ce2O7 exhibits an ordered pyrochlore structure,6 most workssupport this prediction4,7–9 and the relatively high oxygen conduc-tivity of ‘‘undoped’’ La2Ce2O7 also suggests that it has a highlydisordered oxygen structure.
Oxygen disordered oxides often display high oxygen ionconductivity, and it is therefore interesting to see how theirstructure changes when incorporating a smaller lanthanidecation and how in turn these structural changes affect ionicconductivity. The tolerance factor decreases to about 1.22 whenLa3+ is replaced with Nd3+ and this suggests that Nd2Ce2O7 is adisordered fluorite as well (all Ln2Ce2O7 compounds are actu-ally predicted to be disordered fluorites). However, this predic-tion contradicts several X-ray studies where the presence ofweak superlattice peaks indicates structural deviation fromthe fluorite structure.7 Neutron diffraction studies confirmedthis and observed distinct Bragg peaks for Nd2Ce2O7, whichindicates long range crystalline order.10,11 The peak positionsare consistent with the C-type structure (see Fig. 1d) whichcould possibly be explained by the presence of strong butpartial oxygen vacancy interactions as suggested for heavilyyttria doped ceria.12,13 Long range oxygen order is thusobserved once La3+ is substituted by Nd3+ in La2�xNdxCe2O7,but interestingly, notable modulations of the background scat-tering between the fluorite peaks of La2Ce2O7 are found in thesame region as the superlattice Bragg peaks were found for
a Department of Chemistry, Centre for Materials Science and Nanotechnology,
University of Oslo, FERMiO, Gaustadalleen 21, Norway.
E-mail: [email protected] Centre for Earth Evolution and Dynamics, Department of Geosciences,
University of Oslo, Norway
† Electronic supplementary information (ESI) available. See DOI: 10.1039/d0cp00921k
Received 18th February 2020,Accepted 7th May 2020
DOI: 10.1039/d0cp00921k
rsc.li/pccp
PCCP
PAPER
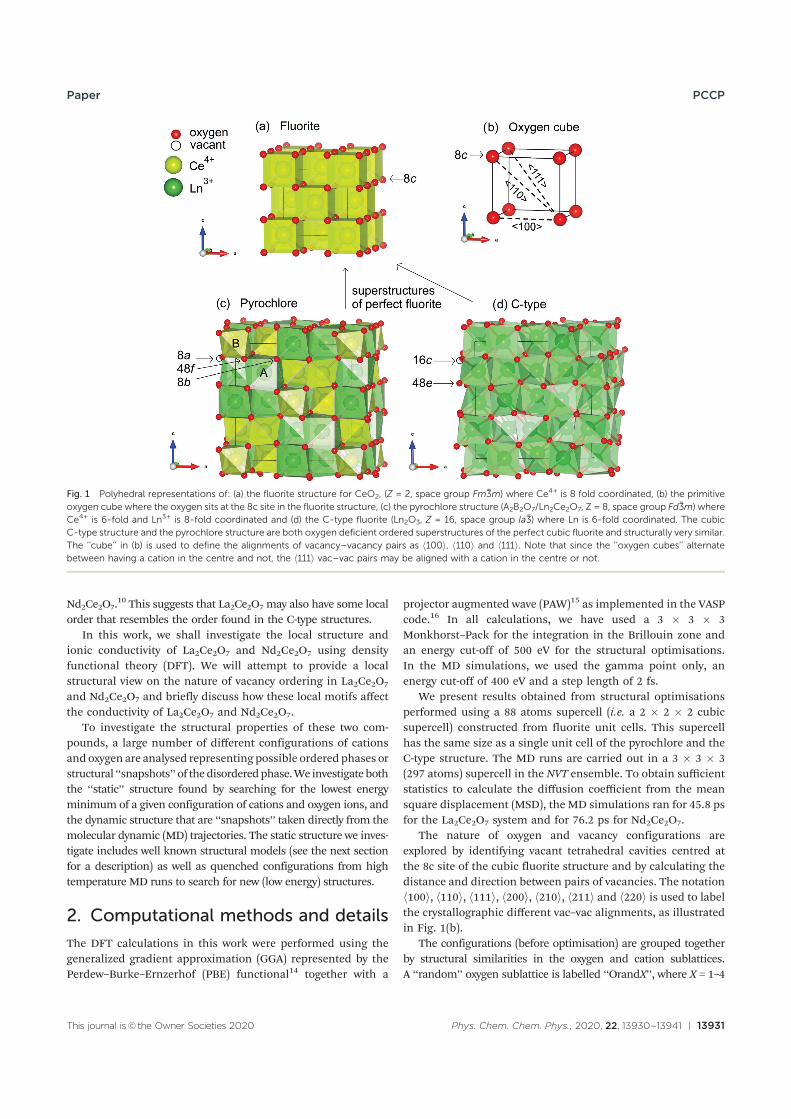
This journal is©the Owner Societies 2020 Phys. Chem. Chem. Phys., 2020, 22, 13930--13941 | 13931
Nd2Ce2O7.10 This suggests that La2Ce2O7 may also have some local
order that resembles the order found in the C-type structures.In this work, we shall investigate the local structure and
ionic conductivity of La2Ce2O7 and Nd2Ce2O7 using densityfunctional theory (DFT). We will attempt to provide a localstructural view on the nature of vacancy ordering in La2Ce2O7
and Nd2Ce2O7 and briefly discuss how these local motifs affectthe conductivity of La2Ce2O7 and Nd2Ce2O7.
To investigate the structural properties of these two com-pounds, a large number of different configurations of cationsandoxygen are analysed representing possible ordered phases orstructural ‘‘snapshots’’ of thedisorderedphase.We investigateboththe ‘‘static’’ structure found by searching for the lowest energyminimum of a given configuration of cations and oxygen ions, andthe dynamic structure that are ‘‘snapshots’’ taken directly from themolecular dynamic (MD) trajectories. The static structure we inves-tigate includes well known structural models (see the next sectionfor a description) as well as quenched configurations from hightemperature MD runs to search for new (low energy) structures.
2. Computational methods and details
The DFT calculations in this work were performed using thegeneralized gradient approximation (GGA) represented by thePerdew–Burke–Ernzerhof (PBE) functional14 together with a
projector augmented wave (PAW)15 as implemented in the VASPcode.16 In all calculations, we have used a 3 � 3 � 3Monkhorst–Pack for the integration in the Brillouin zone andan energy cut-off of 500 eV for the structural optimisations.In the MD simulations, we used the gamma point only, anenergy cut-off of 400 eV and a step length of 2 fs.
We present results obtained from structural optimisationsperformed using a 88 atoms supercell (i.e. a 2 � 2 � 2 cubicsupercell) constructed from fluorite unit cells. This supercellhas the same size as a single unit cell of the pyrochlore and theC-type structure. The MD runs are carried out in a 3 � 3 � 3(297 atoms) supercell in the NVT ensemble. To obtain sufficientstatistics to calculate the diffusion coefficient from the meansquare displacement (MSD), the MD simulations ran for 45.8 psfor the La2Ce2O7 system and for 76.2 ps for Nd2Ce2O7.
The nature of oxygen and vacancy configurations areexplored by identifying vacant tetrahedral cavities centred atthe 8c site of the cubic fluorite structure and by calculating thedistance and direction between pairs of vacancies. The notationh100i, h110i, h111i, h200i, h210i, h211i and h220i is used to labelthe crystallographic different vac–vac alignments, as illustratedin Fig. 1(b).
The configurations (before optimisation) are grouped togetherby structural similarities in the oxygen and cation sublattices.A ‘‘random’’ oxygen sublattice is labelled ‘‘OrandX’’, where X = 1–4
Fig. 1 Polyhedral representations of: (a) the fluorite structure for CeO2, (Z = 2, space group Fm %3m) where Ce4+ is 8 fold coordinated, (b) the primitiveoxygen cube where the oxygen sits at the 8c site in the fluorite structure, (c) the pyrochlore structure (A2B2O7/Ln2Ce2O7, Z = 8, space group Fd %3m) whereCe4+ is 6-fold and Ln3+ is 8-fold coordinated and (d) the C-type fluorite (Ln2O3, Z = 16, space group Ia %3) where Ln is 6-fold coordinated. The cubicC-type structure and the pyrochlore structure are both oxygen deficient ordered superstructures of the perfect cubic fluorite and structurally very similar.The ‘‘cube’’ in (b) is used to define the alignments of vacancy–vacancy pairs as h100i, h110i and h111i. Note that since the ‘‘oxygen cubes’’ alternatebetween having a cation in the centre and not, the h111i vac–vac pairs may be aligned with a cation in the centre or not.
Paper PCCP
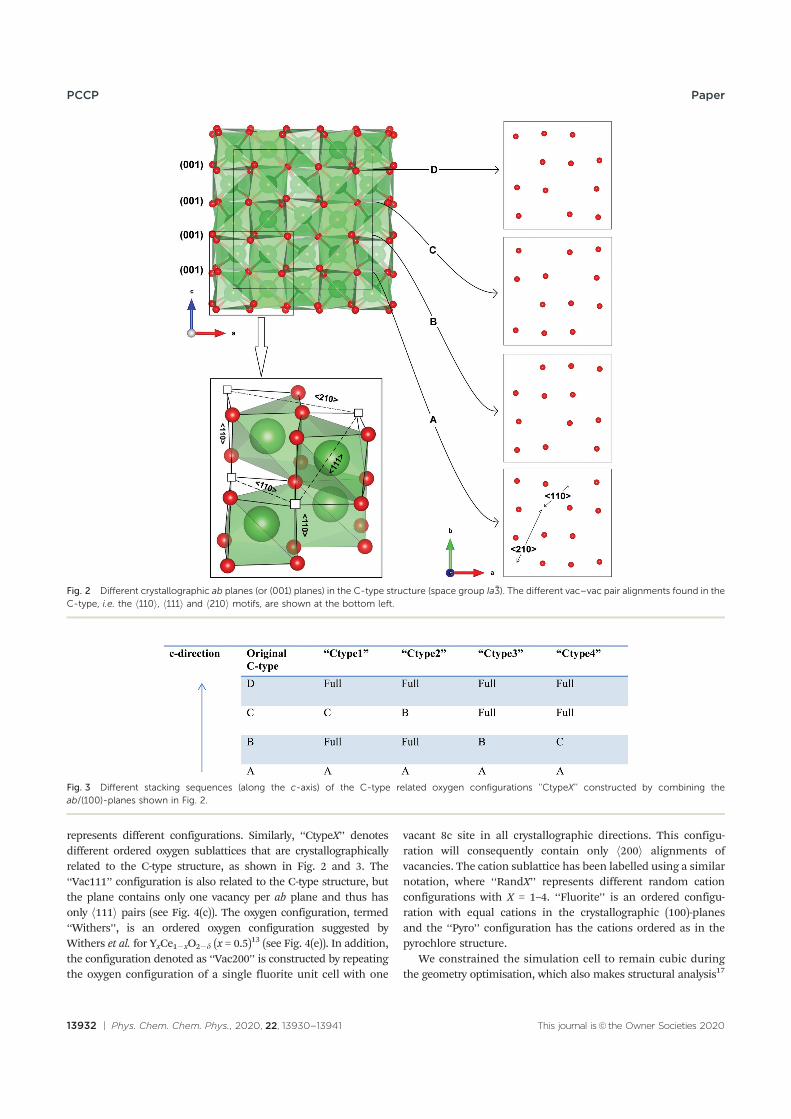
13932 | Phys. Chem. Chem. Phys., 2020, 22, 13930--13941 This journal is©the Owner Societies 2020
represents different configurations. Similarly, ‘‘CtypeX’’ denotesdifferent ordered oxygen sublattices that are crystallographicallyrelated to the C-type structure, as shown in Fig. 2 and 3. The‘‘Vac111’’ configuration is also related to the C-type structure, butthe plane contains only one vacancy per ab plane and thus hasonly h111i pairs (see Fig. 4(c)). The oxygen configuration, termed‘‘Withers’’, is an ordered oxygen configuration suggested byWithers et al. for YxCe1�xO2�d (x = 0.5)
13 (see Fig. 4(e)). In addition,the configuration denoted as ‘‘Vac200’’ is constructed by repeatingthe oxygen configuration of a single fluorite unit cell with one
vacant 8c site in all crystallographic directions. This configu-ration will consequently contain only h200i alignments ofvacancies. The cation sublattice has been labelled using a similarnotation, where ‘‘RandX’’ represents different random cationconfigurations with X = 1–4. ‘‘Fluorite’’ is an ordered configu-ration with equal cations in the crystallographic (100)-planesand the ‘‘Pyro’’ configuration has the cations ordered as in thepyrochlore structure.
We constrained the simulation cell to remain cubic duringthe geometry optimisation, which also makes structural analysis17
Fig. 2 Different crystallographic ab planes (or (001) planes) in the C-type structure (space group Ia %3). The different vac–vac pair alignments found in theC-type, i.e. the h110i, h111i and h210i motifs, are shown at the bottom left.
Fig. 3 Different stacking sequences (along the c-axis) of the C-type related oxygen configurations ‘‘CtypeX’’ constructed by combining theab/(100)-planes shown in Fig. 2.
PCCP Paper
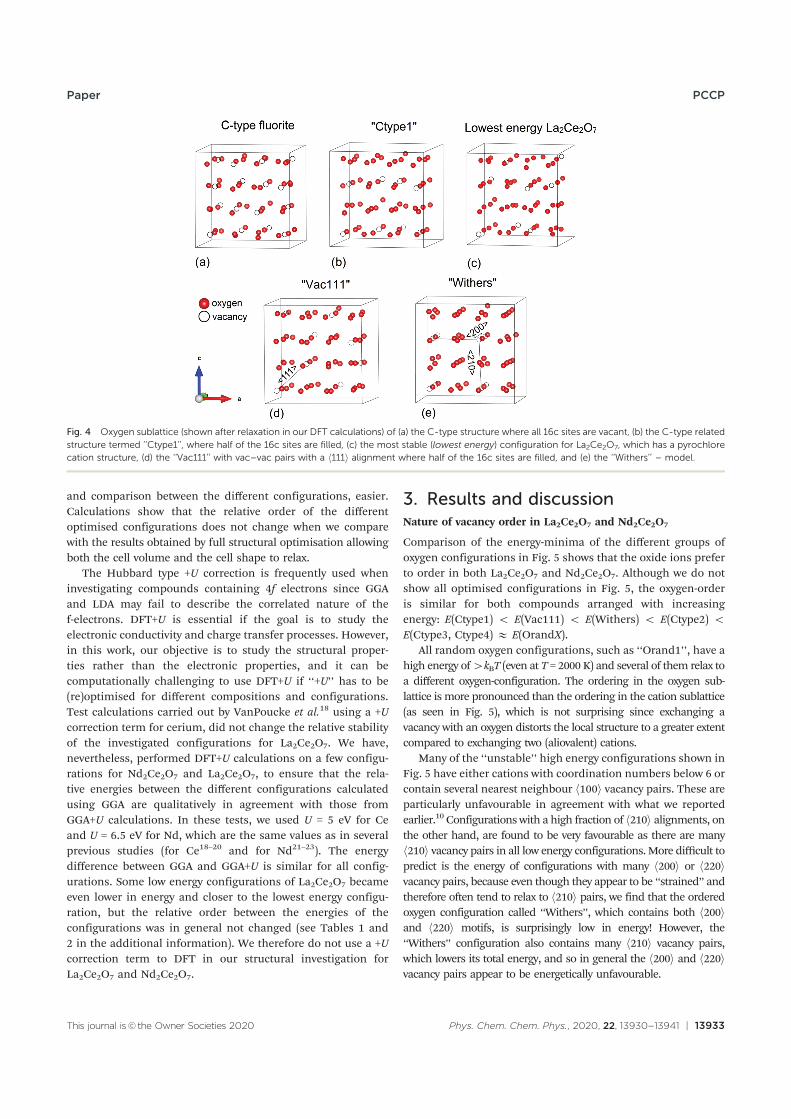
This journal is©the Owner Societies 2020 Phys. Chem. Chem. Phys., 2020, 22, 13930--13941 | 13933
and comparison between the different configurations, easier.Calculations show that the relative order of the differentoptimised configurations does not change when we comparewith the results obtained by full structural optimisation allowingboth the cell volume and the cell shape to relax.
The Hubbard type +U correction is frequently used wheninvestigating compounds containing 4f electrons since GGAand LDA may fail to describe the correlated nature of thef-electrons. DFT+U is essential if the goal is to study theelectronic conductivity and charge transfer processes. However,in this work, our objective is to study the structural proper-ties rather than the electronic properties, and it can becomputationally challenging to use DFT+U if ‘‘+U’’ has to be(re)optimised for different compositions and configurations.Test calculations carried out by VanPoucke et al.18 using a +Ucorrection term for cerium, did not change the relative stabilityof the investigated configurations for La2Ce2O7. We have,nevertheless, performed DFT+U calculations on a few configu-rations for Nd2Ce2O7 and La2Ce2O7, to ensure that the rela-tive energies between the different configurations calculatedusing GGA are qualitatively in agreement with those fromGGA+U calculations. In these tests, we used U = 5 eV for Ceand U = 6.5 eV for Nd, which are the same values as in severalprevious studies (for Ce18–20 and for Nd21–23). The energydifference between GGA and GGA+U is similar for all config-urations. Some low energy configurations of La2Ce2O7 becameeven lower in energy and closer to the lowest energy configu-ration, but the relative order between the energies of theconfigurations was in general not changed (see Tables 1 and2 in the additional information). We therefore do not use a +Ucorrection term to DFT in our structural investigation forLa2Ce2O7 and Nd2Ce2O7.
3. Results and discussionNature of vacancy order in La2Ce2O7 and Nd2Ce2O7
Comparison of the energy-minima of the different groups ofoxygen configurations in Fig. 5 shows that the oxide ions preferto order in both La2Ce2O7 and Nd2Ce2O7. Although we do notshow all optimised configurations in Fig. 5, the oxygen-orderis similar for both compounds arranged with increasingenergy: E(Ctype1) o E(Vac111) o E(Withers) o E(Ctype2) oE(Ctype3, Ctype4) E E(OrandX).
All random oxygen configurations, such as ‘‘Orand1’’, have ahigh energy of4kBT (even at T = 2000 K) and several of them relax toa different oxygen-configuration. The ordering in the oxygen sub-lattice is more pronounced than the ordering in the cation sublattice(as seen in Fig. 5), which is not surprising since exchanging avacancy with an oxygen distorts the local structure to a greater extentcompared to exchanging two (aliovalent) cations.
Many of the ‘‘unstable’’ high energy configurations shown inFig. 5 have either cations with coordination numbers below 6 orcontain several nearest neighbour h100i vacancy pairs. These areparticularly unfavourable in agreement with what we reportedearlier.10 Configurations with a high fraction of h210i alignments, onthe other hand, are found to be very favourable as there are manyh210i vacancy pairs in all low energy configurations.More difficult topredict is the energy of configurations with many h200i or h220ivacancy pairs, because even though they appear to be ‘‘strained’’ andtherefore often tend to relax to h210i pairs, we find that the orderedoxygen configuration called ‘‘Withers’’, which contains both h200iand h220i motifs, is surprisingly low in energy! However, the‘‘Withers’’ configuration also contains many h210i vacancy pairs,which lowers its total energy, and so in general the h200i and h220ivacancy pairs appear to be energetically unfavourable.
Fig. 4 Oxygen sublattice (shown after relaxation in our DFT calculations) of (a) the C-type structure where all 16c sites are vacant, (b) the C-type relatedstructure termed ‘‘Ctype1’’, where half of the 16c sites are filled, (c) the most stable (lowest energy) configuration for La2Ce2O7, which has a pyrochlorecation structure, (d) the ‘‘Vac111’’ with vac–vac pairs with a h111i alignment where half of the 16c sites are filled, and (e) the ‘‘Withers’’ – model.
Paper PCCP
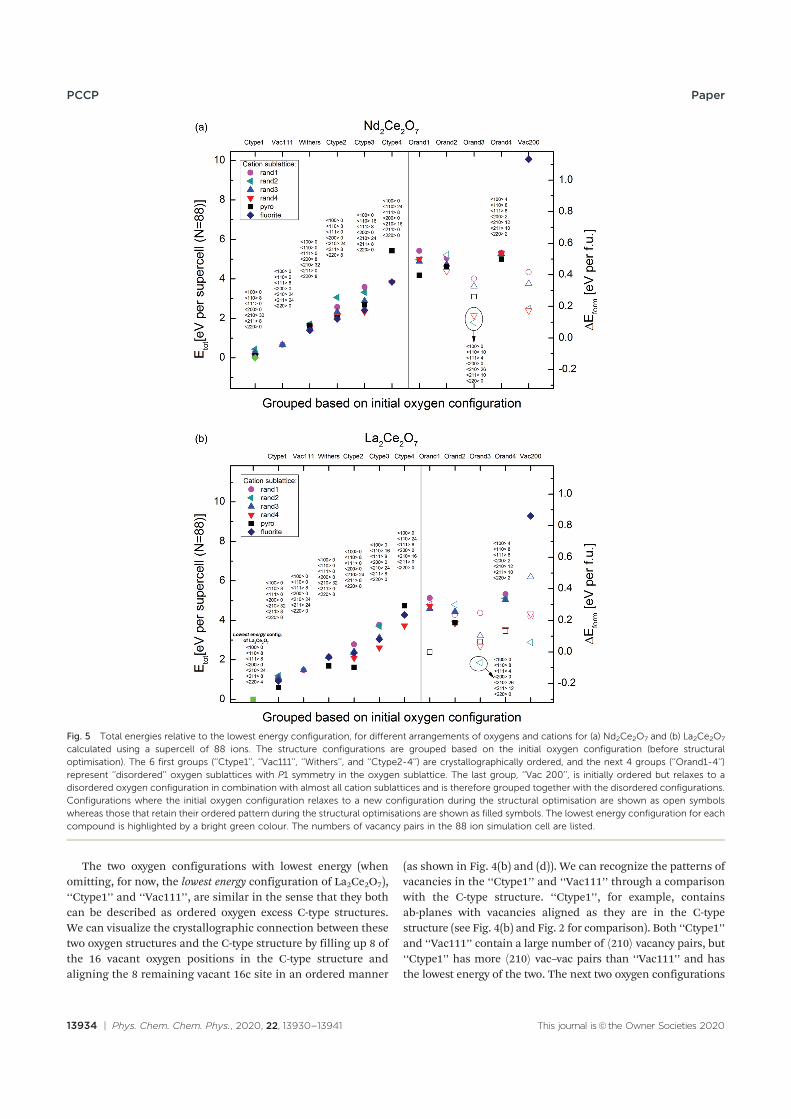
13934 | Phys. Chem. Chem. Phys., 2020, 22, 13930--13941 This journal is©the Owner Societies 2020
The two oxygen configurations with lowest energy (whenomitting, for now, the lowest energy configuration of La2Ce2O7),‘‘Ctype1’’ and ‘‘Vac111’’, are similar in the sense that they bothcan be described as ordered oxygen excess C-type structures.We can visualize the crystallographic connection between thesetwo oxygen structures and the C-type structure by filling up 8 ofthe 16 vacant oxygen positions in the C-type structure andaligning the 8 remaining vacant 16c site in an ordered manner
(as shown in Fig. 4(b) and (d)). We can recognize the patterns ofvacancies in the ‘‘Ctype1’’ and ‘‘Vac111’’ through a comparisonwith the C-type structure. ‘‘Ctype1’’, for example, containsab-planes with vacancies aligned as they are in the C-typestructure (see Fig. 4(b) and Fig. 2 for comparison). Both ‘‘Ctype1’’and ‘‘Vac111’’ contain a large number of h210i vacancy pairs, but‘‘Ctype1’’ has more h210i vac–vac pairs than ‘‘Vac111’’ and hasthe lowest energy of the two. The next two oxygen configurations
Fig. 5 Total energies relative to the lowest energy configuration, for different arrangements of oxygens and cations for (a) Nd2Ce2O7 and (b) La2Ce2O7
calculated using a supercell of 88 ions. The structure configurations are grouped based on the initial oxygen configuration (before structuraloptimisation). The 6 first groups (‘‘Ctype1’’, ‘‘Vac111’’, ‘‘Withers’’, and ‘‘Ctype2-4’’) are crystallographically ordered, and the next 4 groups (‘‘Orand1-4’’)represent ‘‘disordered’’ oxygen sublattices with P1 symmetry in the oxygen sublattice. The last group, ‘‘Vac 200’’, is initially ordered but relaxes to adisordered oxygen configuration in combination with almost all cation sublattices and is therefore grouped together with the disordered configurations.Configurations where the initial oxygen configuration relaxes to a new configuration during the structural optimisation are shown as open symbolswhereas those that retain their ordered pattern during the structural optimisations are shown as filled symbols. The lowest energy configuration for eachcompound is highlighted by a bright green colour. The numbers of vacancy pairs in the 88 ion simulation cell are listed.
PCCP Paper
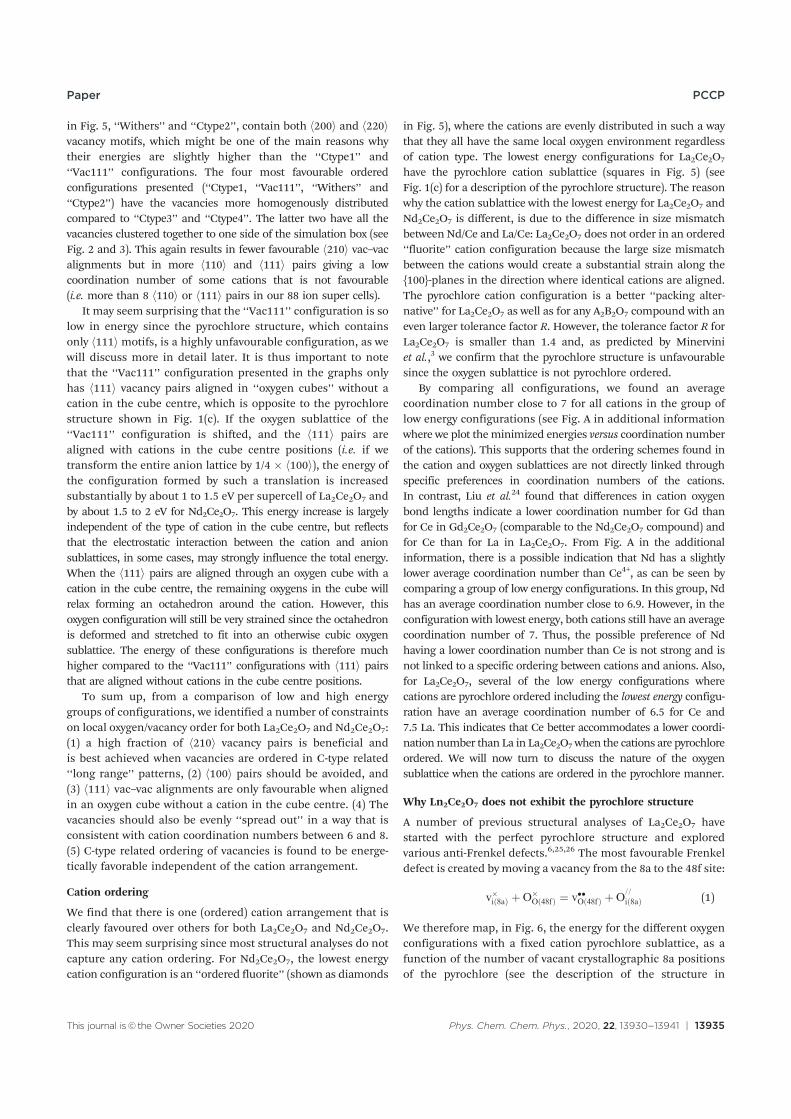
This journal is©the Owner Societies 2020 Phys. Chem. Chem. Phys., 2020, 22, 13930--13941 | 13935
in Fig. 5, ‘‘Withers’’ and ‘‘Ctype2’’, contain both h200i and h220ivacancy motifs, which might be one of the main reasons whytheir energies are slightly higher than the ‘‘Ctype1’’ and‘‘Vac111’’ configurations. The four most favourable orderedconfigurations presented (‘‘Ctype1, ‘‘Vac111’’, ‘‘Withers’’ and‘‘Ctype2’’) have the vacancies more homogenously distributedcompared to ‘‘Ctype3’’ and ‘‘Ctype4’’. The latter two have all thevacancies clustered together to one side of the simulation box (seeFig. 2 and 3). This again results in fewer favourable h210i vac–vacalignments but in more h110i and h111i pairs giving a lowcoordination number of some cations that is not favourable(i.e. more than 8 h110i or h111i pairs in our 88 ion super cells).
It may seem surprising that the ‘‘Vac111’’ configuration is solow in energy since the pyrochlore structure, which containsonly h111i motifs, is a highly unfavourable configuration, as wewill discuss more in detail later. It is thus important to notethat the ‘‘Vac111’’ configuration presented in the graphs onlyhas h111i vacancy pairs aligned in ‘‘oxygen cubes’’ without acation in the cube centre, which is opposite to the pyrochlorestructure shown in Fig. 1(c). If the oxygen sublattice of the‘‘Vac111’’ configuration is shifted, and the h111i pairs arealigned with cations in the cube centre positions (i.e. if wetransform the entire anion lattice by 1/4 � h100i), the energy ofthe configuration formed by such a translation is increasedsubstantially by about 1 to 1.5 eV per supercell of La2Ce2O7 andby about 1.5 to 2 eV for Nd2Ce2O7. This energy increase is largelyindependent of the type of cation in the cube centre, but reflectsthat the electrostatic interaction between the cation and anionsublattices, in some cases, may strongly influence the total energy.When the h111i pairs are aligned through an oxygen cube with acation in the cube centre, the remaining oxygens in the cube willrelax forming an octahedron around the cation. However, thisoxygen configuration will still be very strained since the octahedronis deformed and stretched to fit into an otherwise cubic oxygensublattice. The energy of these configurations is therefore muchhigher compared to the ‘‘Vac111’’ configurations with h111i pairsthat are aligned without cations in the cube centre positions.
To sum up, from a comparison of low and high energygroups of configurations, we identified a number of constraintson local oxygen/vacancy order for both La2Ce2O7 and Nd2Ce2O7:(1) a high fraction of h210i vacancy pairs is beneficial andis best achieved when vacancies are ordered in C-type related‘‘long range’’ patterns, (2) h100i pairs should be avoided, and(3) h111i vac–vac alignments are only favourable when alignedin an oxygen cube without a cation in the cube centre. (4) Thevacancies should also be evenly ‘‘spread out’’ in a way that isconsistent with cation coordination numbers between 6 and 8.(5) C-type related ordering of vacancies is found to be energe-tically favorable independent of the cation arrangement.
Cation ordering
We find that there is one (ordered) cation arrangement that isclearly favoured over others for both La2Ce2O7 and Nd2Ce2O7.This may seem surprising since most structural analyses do notcapture any cation ordering. For Nd2Ce2O7, the lowest energycation configuration is an ‘‘ordered fluorite’’ (shown as diamonds
in Fig. 5), where the cations are evenly distributed in such a waythat they all have the same local oxygen environment regardlessof cation type. The lowest energy configurations for La2Ce2O7
have the pyrochlore cation sublattice (squares in Fig. 5) (seeFig. 1(c) for a description of the pyrochlore structure). The reasonwhy the cation sublattice with the lowest energy for La2Ce2O7 andNd2Ce2O7 is different, is due to the difference in size mismatchbetween Nd/Ce and La/Ce: La2Ce2O7 does not order in an ordered‘‘fluorite’’ cation configuration because the large size mismatchbetween the cations would create a substantial strain along the{100}-planes in the direction where identical cations are aligned.The pyrochlore cation configuration is a better ‘‘packing alter-native’’ for La2Ce2O7 as well as for any A2B2O7 compound with aneven larger tolerance factor R. However, the tolerance factor R forLa2Ce2O7 is smaller than 1.4 and, as predicted by Minerviniet al.,3 we confirm that the pyrochlore structure is unfavourablesince the oxygen sublattice is not pyrochlore ordered.
By comparing all configurations, we found an averagecoordination number close to 7 for all cations in the group oflow energy configurations (see Fig. A in additional informationwhere we plot the minimized energies versus coordination numberof the cations). This supports that the ordering schemes found inthe cation and oxygen sublattices are not directly linked throughspecific preferences in coordination numbers of the cations.In contrast, Liu et al.24 found that differences in cation oxygenbond lengths indicate a lower coordination number for Gd thanfor Ce in Gd2Ce2O7 (comparable to the Nd2Ce2O7 compound) andfor Ce than for La in La2Ce2O7. From Fig. A in the additionalinformation, there is a possible indication that Nd has a slightlylower average coordination number than Ce4+, as can be seen bycomparing a group of low energy configurations. In this group, Ndhas an average coordination number close to 6.9. However, in theconfiguration with lowest energy, both cations still have an averagecoordination number of 7. Thus, the possible preference of Ndhaving a lower coordination number than Ce is not strong and isnot linked to a specific ordering between cations and anions. Also,for La2Ce2O7, several of the low energy configurations wherecations are pyrochlore ordered including the lowest energy configu-ration have an average coordination number of 6.5 for Ce and7.5 La. This indicates that Ce better accommodates a lower coordi-nation number than La in La2Ce2O7 when the cations are pyrochloreordered. We will now turn to discuss the nature of the oxygensublattice when the cations are ordered in the pyrochlore manner.
Why Ln2Ce2O7 does not exhibit the pyrochlore structure
A number of previous structural analyses of La2Ce2O7 havestarted with the perfect pyrochlore structure and exploredvarious anti-Frenkel defects.6,25,26 The most favourable Frenkeldefect is created by moving a vacancy from the 8a to the 48f site:
v�ið8aÞ þO�Oð48fÞ ¼ v��Oð48fÞ þO
==
ið8aÞ (1)
We therefore map, in Fig. 6, the energy for the different oxygenconfigurations with a fixed cation pyrochlore sublattice, as afunction of the number of vacant crystallographic 8a positionsof the pyrochlore (see the description of the structure in
Paper PCCP
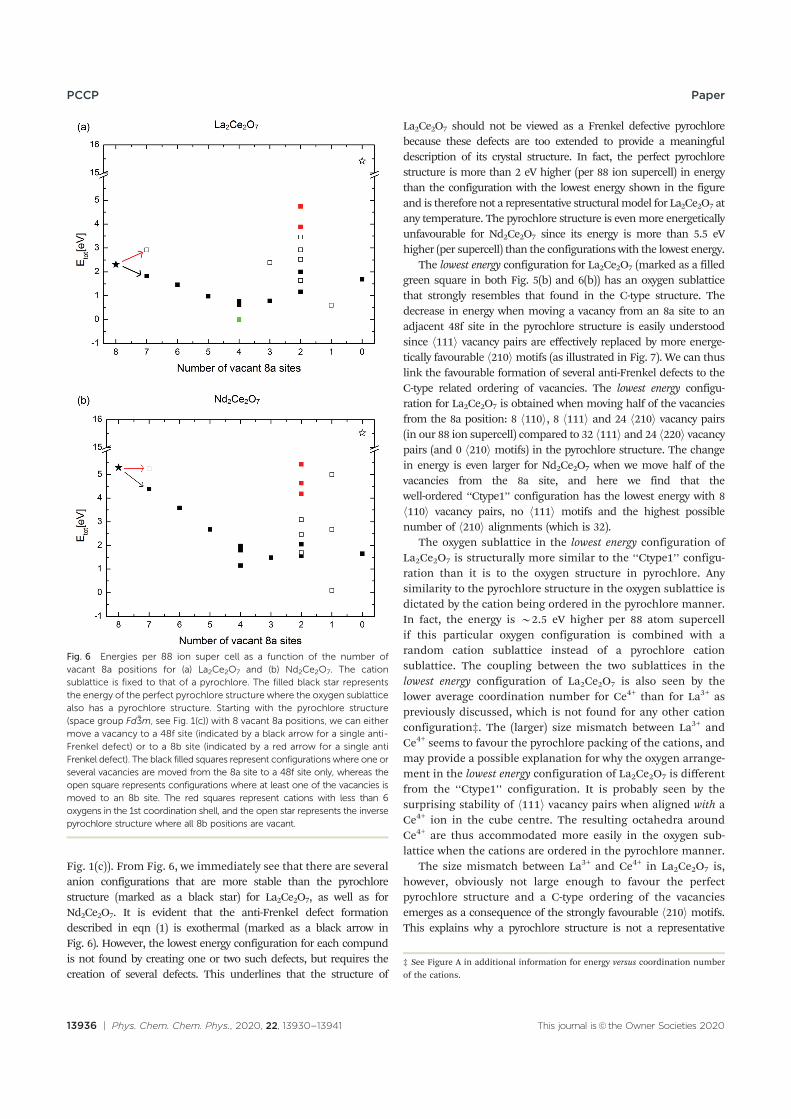
13936 | Phys. Chem. Chem. Phys., 2020, 22, 13930--13941 This journal is©the Owner Societies 2020
Fig. 1(c)). From Fig. 6, we immediately see that there are severalanion configurations that are more stable than the pyrochlorestructure (marked as a black star) for La2Ce2O7, as well as forNd2Ce2O7. It is evident that the anti-Frenkel defect formationdescribed in eqn (1) is exothermal (marked as a black arrow inFig. 6). However, the lowest energy configuration for each compundis not found by creating one or two such defects, but requires thecreation of several defects. This underlines that the structure of
La2Ce2O7 should not be viewed as a Frenkel defective pyrochlorebecause these defects are too extended to provide a meaningfuldescription of its crystal structure. In fact, the perfect pyrochlorestructure is more than 2 eV higher (per 88 ion supercell) in energythan the configuration with the lowest energy shown in the figureand is therefore not a representative structuralmodel for La2Ce2O7 atany temperature. The pyrochlore structure is evenmore energeticallyunfavourable for Nd2Ce2O7 since its energy is more than 5.5 eVhigher (per supercell) than the configurations with the lowest energy.
The lowest energy configuration for La2Ce2O7 (marked as a filledgreen square in both Fig. 5(b) and 6(b)) has an oxygen sublatticethat strongly resembles that found in the C-type structure. Thedecrease in energy when moving a vacancy from an 8a site to anadjacent 48f site in the pyrochlore structure is easily understoodsince h111i vacancy pairs are effectively replaced by more energe-tically favourable h210imotifs (as illustrated in Fig. 7). We can thuslink the favourable formation of several anti-Frenkel defects to theC-type related ordering of vacancies. The lowest energy configu-ration for La2Ce2O7 is obtained when moving half of the vacanciesfrom the 8a position: 8 h110i, 8 h111i and 24 h210i vacancy pairs(in our 88 ion supercell) compared to 32 h111i and 24 h220i vacancypairs (and 0 h210i motifs) in the pyrochlore structure. The changein energy is even larger for Nd2Ce2O7 when we move half of thevacancies from the 8a site, and here we find that thewell-ordered ‘‘Ctype1’’ configuration has the lowest energy with 8h110i vacancy pairs, no h111i motifs and the highest possiblenumber of h210i alignments (which is 32).
The oxygen sublattice in the lowest energy configuration ofLa2Ce2O7 is structurally more similar to the ‘‘Ctype1’’ configu-ration than it is to the oxygen structure in pyrochlore. Anysimilarity to the pyrochlore structure in the oxygen sublattice isdictated by the cation being ordered in the pyrochlore manner.In fact, the energy is B2.5 eV higher per 88 atom supercellif this particular oxygen configuration is combined with arandom cation sublattice instead of a pyrochlore cationsublattice. The coupling between the two sublattices in thelowest energy configuration of La2Ce2O7 is also seen by thelower average coordination number for Ce4+ than for La3+ aspreviously discussed, which is not found for any other cationconfiguration‡. The (larger) size mismatch between La3+ andCe4+ seems to favour the pyrochlore packing of the cations, andmay provide a possible explanation for why the oxygen arrange-ment in the lowest energy configuration of La2Ce2O7 is differentfrom the ‘‘Ctype1’’ configuration. It is probably seen by thesurprising stability of h111i vacancy pairs when aligned with aCe4+ ion in the cube centre. The resulting octahedra aroundCe4+ are thus accommodated more easily in the oxygen sub-lattice when the cations are ordered in the pyrochlore manner.
The size mismatch between La3+ and Ce4+ in La2Ce2O7 is,however, obviously not large enough to favour the perfectpyrochlore structure and a C-type ordering of the vacanciesemerges as a consequence of the strongly favourable h210i motifs.This explains why a pyrochlore structure is not a representative
Fig. 6 Energies per 88 ion super cell as a function of the number ofvacant 8a positions for (a) La2Ce2O7 and (b) Nd2Ce2O7. The cationsublattice is fixed to that of a pyrochlore. The filled black star representsthe energy of the perfect pyrochlore structure where the oxygen sublatticealso has a pyrochlore structure. Starting with the pyrochlore structure(space group Fd %3m, see Fig. 1(c)) with 8 vacant 8a positions, we can eithermove a vacancy to a 48f site (indicated by a black arrow for a single anti-Frenkel defect) or to a 8b site (indicated by a red arrow for a single antiFrenkel defect). The black filled squares represent configurations where one orseveral vacancies are moved from the 8a site to a 48f site only, whereas theopen square represents configurations where at least one of the vacancies ismoved to an 8b site. The red squares represent cations with less than 6oxygens in the 1st coordination shell, and the open star represents the inversepyrochlore structure where all 8b positions are vacant.
‡ See Figure A in additional information for energy versus coordination numberof the cations.
PCCP Paper
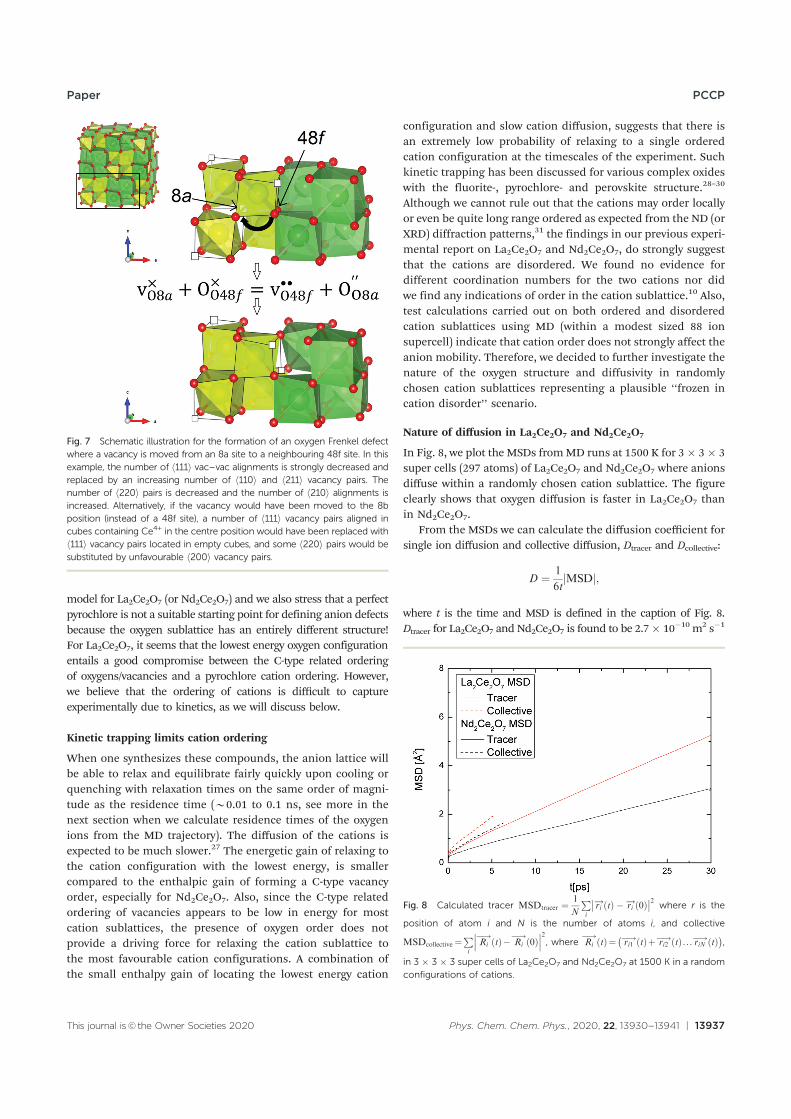
This journal is©the Owner Societies 2020 Phys. Chem. Chem. Phys., 2020, 22, 13930--13941 | 13937
model for La2Ce2O7 (or Nd2Ce2O7) and we also stress that a perfectpyrochlore is not a suitable starting point for defining anion defectsbecause the oxygen sublattice has an entirely different structure!For La2Ce2O7, it seems that the lowest energy oxygen configurationentails a good compromise between the C-type related orderingof oxygens/vacancies and a pyrochlore cation ordering. However,we believe that the ordering of cations is difficult to captureexperimentally due to kinetics, as we will discuss below.
Kinetic trapping limits cation ordering
When one synthesizes these compounds, the anion lattice willbe able to relax and equilibrate fairly quickly upon cooling orquenching with relaxation times on the same order of magni-tude as the residence time (B0.01 to 0.1 ns, see more in thenext section when we calculate residence times of the oxygenions from the MD trajectory). The diffusion of the cations isexpected to be much slower.27 The energetic gain of relaxing tothe cation configuration with the lowest energy, is smallercompared to the enthalpic gain of forming a C-type vacancyorder, especially for Nd2Ce2O7. Also, since the C-type relatedordering of vacancies appears to be low in energy for mostcation sublattices, the presence of oxygen order does notprovide a driving force for relaxing the cation sublattice tothe most favourable cation configurations. A combination ofthe small enthalpy gain of locating the lowest energy cation
configuration and slow cation diffusion, suggests that there isan extremely low probability of relaxing to a single orderedcation configuration at the timescales of the experiment. Suchkinetic trapping has been discussed for various complex oxideswith the fluorite-, pyrochlore- and perovskite structure.28–30
Although we cannot rule out that the cations may order locallyor even be quite long range ordered as expected from the ND (orXRD) diffraction patterns,31 the findings in our previous experi-mental report on La2Ce2O7 and Nd2Ce2O7, do strongly suggestthat the cations are disordered. We found no evidence fordifferent coordination numbers for the two cations nor didwe find any indications of order in the cation sublattice.10 Also,test calculations carried out on both ordered and disorderedcation sublattices using MD (within a modest sized 88 ionsupercell) indicate that cation order does not strongly affect theanion mobility. Therefore, we decided to further investigate thenature of the oxygen structure and diffusivity in randomlychosen cation sublattices representing a plausible ‘‘frozen incation disorder’’ scenario.
Nature of diffusion in La2Ce2O7 and Nd2Ce2O7
In Fig. 8, we plot the MSDs fromMD runs at 1500 K for 3 � 3� 3super cells (297 atoms) of La2Ce2O7 and Nd2Ce2O7 where anionsdiffuse within a randomly chosen cation sublattice. The figureclearly shows that oxygen diffusion is faster in La2Ce2O7 thanin Nd2Ce2O7.
From the MSDs we can calculate the diffusion coefficient forsingle ion diffusion and collective diffusion, Dtracer and Dcollective:
D ¼ 1
6tMSDj j;
where t is the time and MSD is defined in the caption of Fig. 8.Dtracer for La2Ce2O7 and Nd2Ce2O7 is found to be 2.7� 10�10 m2 s�1
Fig. 7 Schematic illustration for the formation of an oxygen Frenkel defectwhere a vacancy is moved from an 8a site to a neighbouring 48f site. In thisexample, the number of h111i vac–vac alignments is strongly decreased andreplaced by an increasing number of h110i and h211i vacancy pairs. Thenumber of h220i pairs is decreased and the number of h210i alignments isincreased. Alternatively, if the vacancy would have been moved to the 8bposition (instead of a 48f site), a number of h111i vacancy pairs aligned incubes containing Ce4+ in the centre position would have been replaced withh111i vacancy pairs located in empty cubes, and some h220i pairs would besubstituted by unfavourable h200i vacancy pairs.
Fig. 8 Calculated tracer MSDtracer ¼ 1
N
Pi
ri! tð Þ � ri
! 0ð Þ�� ��2 where r is the
position of atom i and N is the number of atoms i, and collective
MSDcollective ¼Pi
Ri�!
tð Þ� Ri�!
0ð Þ���
���2, where Ri�!
tð Þ¼ ri1�! tð Þþ ri2
�! tð Þ . .. riN�! tð Þ� �,
in 3 � 3 � 3 super cells of La2Ce2O7 and Nd2Ce2O7 at 1500 K in a randomconfigurations of cations.
Paper PCCP
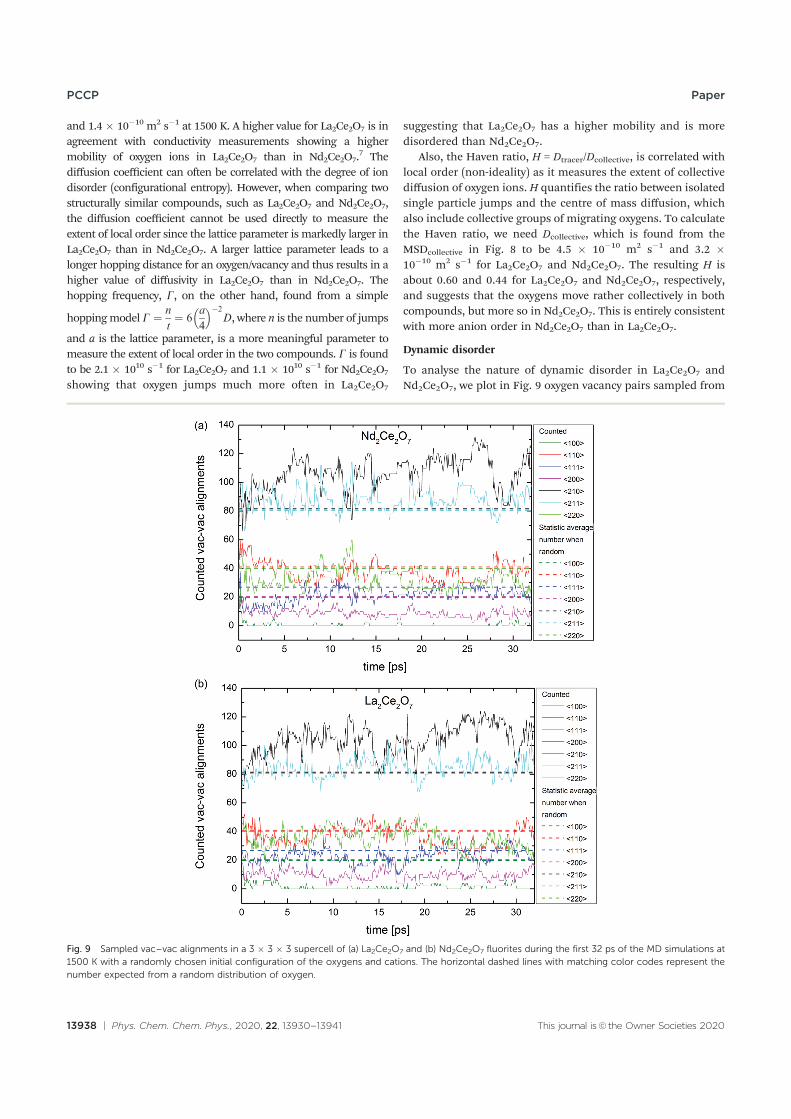
13938 | Phys. Chem. Chem. Phys., 2020, 22, 13930--13941 This journal is©the Owner Societies 2020
and 1.4� 10�10 m2 s�1 at 1500 K. A higher value for La2Ce2O7 is inagreement with conductivity measurements showing a highermobility of oxygen ions in La2Ce2O7 than in Nd2Ce2O7.
7 Thediffusion coefficient can often be correlated with the degree of iondisorder (configurational entropy). However, when comparing twostructurally similar compounds, such as La2Ce2O7 and Nd2Ce2O7,the diffusion coefficient cannot be used directly to measure theextent of local order since the lattice parameter is markedly larger inLa2Ce2O7 than in Nd2Ce2O7. A larger lattice parameter leads to alonger hopping distance for an oxygen/vacancy and thus results in ahigher value of diffusivity in La2Ce2O7 than in Nd2Ce2O7. Thehopping frequency, G, on the other hand, found from a simple
hoppingmodelG ¼ n
t¼ 6
a
4
� ��2
D, where n is the number of jumps
and a is the lattice parameter, is a more meaningful parameter tomeasure the extent of local order in the two compounds. G is foundto be 2.1 � 1010 s�1 for La2Ce2O7 and 1.1 � 1010 s�1 for Nd2Ce2O7
showing that oxygen jumps much more often in La2Ce2O7
suggesting that La2Ce2O7 has a higher mobility and is moredisordered than Nd2Ce2O7.
Also, the Haven ratio, H = Dtracer/Dcollective, is correlated withlocal order (non-ideality) as it measures the extent of collectivediffusion of oxygen ions. H quantifies the ratio between isolatedsingle particle jumps and the centre of mass diffusion, whichalso include collective groups of migrating oxygens. To calculatethe Haven ratio, we need Dcollective, which is found from theMSDcollective in Fig. 8 to be 4.5 � 10�10 m2 s�1 and 3.2 �10�10 m2 s�1 for La2Ce2O7 and Nd2Ce2O7. The resulting H isabout 0.60 and 0.44 for La2Ce2O7 and Nd2Ce2O7, respectively,and suggests that the oxygens move rather collectively in bothcompounds, but more so in Nd2Ce2O7. This is entirely consistentwith more anion order in Nd2Ce2O7 than in La2Ce2O7.
Dynamic disorder
To analyse the nature of dynamic disorder in La2Ce2O7 andNd2Ce2O7, we plot in Fig. 9 oxygen vacancy pairs sampled from
Fig. 9 Sampled vac–vac alignments in a 3 � 3 � 3 supercell of (a) La2Ce2O7 and (b) Nd2Ce2O7 fluorites during the first 32 ps of the MD simulations at1500 K with a randomly chosen initial configuration of the oxygens and cations. The horizontal dashed lines with matching color codes represent thenumber expected from a random distribution of oxygen.
PCCP Paper
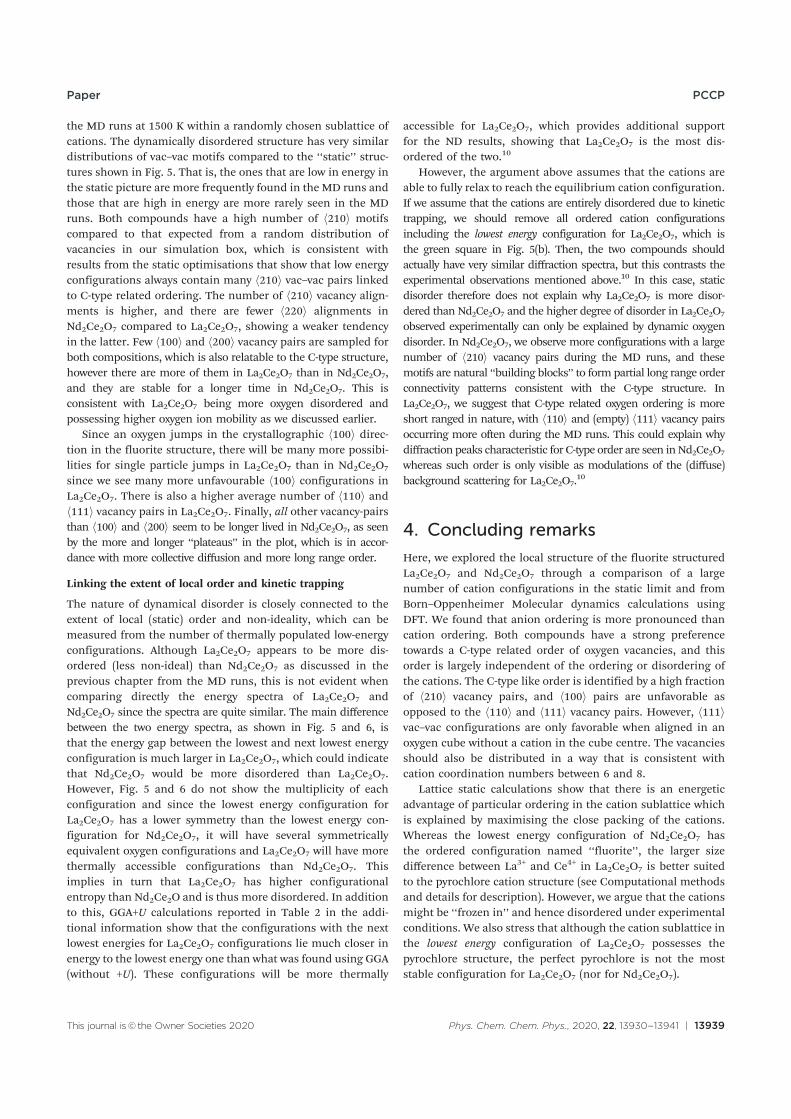
This journal is©the Owner Societies 2020 Phys. Chem. Chem. Phys., 2020, 22, 13930--13941 | 13939
the MD runs at 1500 K within a randomly chosen sublattice ofcations. The dynamically disordered structure has very similardistributions of vac–vac motifs compared to the ‘‘static’’ struc-tures shown in Fig. 5. That is, the ones that are low in energy inthe static picture are more frequently found in the MD runs andthose that are high in energy are more rarely seen in the MDruns. Both compounds have a high number of h210i motifscompared to that expected from a random distribution ofvacancies in our simulation box, which is consistent withresults from the static optimisations that show that low energyconfigurations always contain many h210i vac–vac pairs linkedto C-type related ordering. The number of h210i vacancy align-ments is higher, and there are fewer h220i alignments inNd2Ce2O7 compared to La2Ce2O7, showing a weaker tendencyin the latter. Few h100i and h200i vacancy pairs are sampled forboth compositions, which is also relatable to the C-type structure,however there are more of them in La2Ce2O7 than in Nd2Ce2O7,and they are stable for a longer time in Nd2Ce2O7. This isconsistent with La2Ce2O7 being more oxygen disordered andpossessing higher oxygen ion mobility as we discussed earlier.
Since an oxygen jumps in the crystallographic h100i direc-tion in the fluorite structure, there will be many more possibi-lities for single particle jumps in La2Ce2O7 than in Nd2Ce2O7
since we see many more unfavourable h100i configurations inLa2Ce2O7. There is also a higher average number of h110i andh111i vacancy pairs in La2Ce2O7. Finally, all other vacancy-pairsthan h100i and h200i seem to be longer lived in Nd2Ce2O7, as seenby the more and longer ‘‘plateaus’’ in the plot, which is in accor-dance with more collective diffusion and more long range order.
Linking the extent of local order and kinetic trapping
The nature of dynamical disorder is closely connected to theextent of local (static) order and non-ideality, which can bemeasured from the number of thermally populated low-energyconfigurations. Although La2Ce2O7 appears to be more dis-ordered (less non-ideal) than Nd2Ce2O7 as discussed in theprevious chapter from the MD runs, this is not evident whencomparing directly the energy spectra of La2Ce2O7 andNd2Ce2O7 since the spectra are quite similar. The main differencebetween the two energy spectra, as shown in Fig. 5 and 6, isthat the energy gap between the lowest and next lowest energyconfiguration is much larger in La2Ce2O7, which could indicatethat Nd2Ce2O7 would be more disordered than La2Ce2O7.However, Fig. 5 and 6 do not show the multiplicity of eachconfiguration and since the lowest energy configuration forLa2Ce2O7 has a lower symmetry than the lowest energy con-figuration for Nd2Ce2O7, it will have several symmetricallyequivalent oxygen configurations and La2Ce2O7 will have morethermally accessible configurations than Nd2Ce2O7. Thisimplies in turn that La2Ce2O7 has higher configurationalentropy than Nd2Ce2O and is thus more disordered. In additionto this, GGA+U calculations reported in Table 2 in the addi-tional information show that the configurations with the nextlowest energies for La2Ce2O7 configurations lie much closer inenergy to the lowest energy one than what was found using GGA(without +U). These configurations will be more thermally
accessible for La2Ce2O7, which provides additional supportfor the ND results, showing that La2Ce2O7 is the most dis-ordered of the two.10
However, the argument above assumes that the cations areable to fully relax to reach the equilibrium cation configuration.If we assume that the cations are entirely disordered due to kinetictrapping, we should remove all ordered cation configurationsincluding the lowest energy configuration for La2Ce2O7, which isthe green square in Fig. 5(b). Then, the two compounds shouldactually have very similar diffraction spectra, but this contrasts theexperimental observations mentioned above.10 In this case, staticdisorder therefore does not explain why La2Ce2O7 is more disor-dered than Nd2Ce2O7 and the higher degree of disorder in La2Ce2O7
observed experimentally can only be explained by dynamic oxygendisorder. In Nd2Ce2O7, we observe more configurations with a largenumber of h210i vacancy pairs during the MD runs, and thesemotifs are natural ‘‘building blocks’’ to form partial long range orderconnectivity patterns consistent with the C-type structure. InLa2Ce2O7, we suggest that C-type related oxygen ordering is moreshort ranged in nature, with h110i and (empty) h111i vacancy pairsoccurring more often during the MD runs. This could explain whydiffraction peaks characteristic for C-type order are seen inNd2Ce2O7
whereas such order is only visible as modulations of the (diffuse)background scattering for La2Ce2O7.
10
4. Concluding remarks
Here, we explored the local structure of the fluorite structuredLa2Ce2O7 and Nd2Ce2O7 through a comparison of a largenumber of cation configurations in the static limit and fromBorn–Oppenheimer Molecular dynamics calculations usingDFT. We found that anion ordering is more pronounced thancation ordering. Both compounds have a strong preferencetowards a C-type related order of oxygen vacancies, and thisorder is largely independent of the ordering or disordering ofthe cations. The C-type like order is identified by a high fractionof h210i vacancy pairs, and h100i pairs are unfavorable asopposed to the h110i and h111i vacancy pairs. However, h111ivac–vac configurations are only favorable when aligned in anoxygen cube without a cation in the cube centre. The vacanciesshould also be distributed in a way that is consistent withcation coordination numbers between 6 and 8.
Lattice static calculations show that there is an energeticadvantage of particular ordering in the cation sublattice whichis explained by maximising the close packing of the cations.Whereas the lowest energy configuration of Nd2Ce2O7 hasthe ordered configuration named ‘‘fluorite’’, the larger sizedifference between La3+ and Ce4+ in La2Ce2O7 is better suitedto the pyrochlore cation structure (see Computational methodsand details for description). However, we argue that the cationsmight be ‘‘frozen in’’ and hence disordered under experimentalconditions. We also stress that although the cation sublattice inthe lowest energy configuration of La2Ce2O7 possesses thepyrochlore structure, the perfect pyrochlore is not the moststable configuration for La2Ce2O7 (nor for Nd2Ce2O7).
Paper PCCP
13940 | Phys. Chem. Chem. Phys., 2020, 22, 13930--13941 This journal is©the Owner Societies 2020
Both long range and short range vacancy interactions willinfluence the properties such as conductivity, and the nature ofoxygen diffusion is here studied within a random cation sub-lattice based on our assumption of a ‘‘frozen in’’ disorderedcation sublattice. La2Ce2O7 is here found to have higher oxygendiffusion than Nd2Ce2O7. Collective chains are more dominantin Nd2Ce2O7 than in La2Ce2O7 with Haven ratios – whichmeasure the single particle to collective diffusion – of about0.44 and 0.60, respectively. A lower Haven ratio is consistentwith stronger order in the former.
Our present results show that previous computationalmodels where La2Ce2O7 has been viewed as a pyrochlore withone or two Frenkel defects, are not representative structuralmodels of this compound. On the other hand, when modellingLa2Ce2O7 or Nd2Ce2O7 as a disordered fluorite with a randomdistribution of vacancies, one ignores the fact that thesecompounds have a preference towards (local or long range)C-type related order of the oxygen sublattice. C-type oxygenorder is found to be more dominant in Nd2Ce2O7 than inLa2Ce2O7, and the observed higher amount of h210i vacancypairs in the former suggests that the stacking of ‘‘Ctype1’’ (andother low energy) configurations forms more long range orderin Nd2Ce2O7 than in La2Ce2O7.
Conflicts of interest
There are no conflicts of interest to declare.
Acknowledgements
The authors gratefully knowledge the Norwegian Metacentrefor Computational Science (Notur) for providing computationalresources under the project number nn4604k and nn2916k.This work was partly supported by the Research Council ofNorway through its Centres of Excellence funding schemeproject 223272.
References
1 C. E. Mohn, et al., Order in the disordered state: localstructural entities in the fast ion conductor Ba2In2O5,J. Solid State Chem., 2005, 178(1), 346–355.
2 C. E. Mohn, N. L. Allan and S. Stolen, Sr and Ga substitutedBa2In2O5. Linking ionic conductivity and the potentialenergy surface, Solid State Ionics, 2006, 177(3–4), 223–228.
3 L. Minervini, R. W. Grimes and K. E. Sickafus, Disorderin Pyrochlore Oxides, J. Am. Ceram. Soc., 2000, 83(8),1873–1878.
4 V. Besikiotis, et al., Crystal structure, hydration and ionicconductivity of the inherently oxygen-deficient La2Ce2O7,Solid State Ionics, 2012, 228, 1–7.
5 W. Sun, S. Fang, L. Yan and W. Liu, Investigation on ProtonConductivity of La2Ce2O7 in Wet Atmosphere: Dependenceon Water Vapor Partial Pressure, Fuel Cells, 2012, 12(3),457–463, DOI: 10.1002/fuce.201100175.
6 D. E. P. Vanpoucke, et al., Density functional theory study ofLa2Ce2O7: Disordered fluorite versus pyrochlore structure,Phys. Rev. B: Condens. Matter Mater. Phys., 2011, 84(5), 054110.
7 H. Yamamura, et al., Crystal Phase and Electrical Conductivityin the Pyrochlore-Type Composition Systems, Ln2Ce2O7
(Ln = La, Nd, Sm, Eu, Gd, Y and Yb), J. Ceram. Soc. Jpn.,2003, 111(1300), 902–906.
8 H. Yamamura, H. Nishino and K. Kakinuma, Ac Conductivityfor Eu2Zr2O7 and La2Ce2O7 with Pyrochlore-Type Composition,J. Ceram. Soc. Jpn., 2004, 112(1310), 553–558.
9 E. Reynolds, et al., Structural and spectroscopic studies ofLa2Ce2O7: Disordered fluorite versus pyrochlore structure,Phys. Rev. B: Condens. Matter Mater. Phys., 2012, 85(13),132101.
10 L.-E. Kalland, et al., C-type related order in the defectivefluorites La2Ce2O7 and Nd2Ce2O7 studied by neutron scat-tering and ab initio MD simulations, Phys. Chem. Chem.Phys., 2016, 18(34), 24070–24080.
11 T. Hagiwara, et al., Formation of C-type rare earth structuresin the Ce1�xNdxO2�d system: a factor in the decrease in oxide-ion conductivity, J. Ceram. Soc. Jpn., 2009, 117, 1306–1310.
12 D. R. Ou, et al., Oxygen vacancy ordering in heavily rare-earth-doped ceria, Appl. Phys. Lett., 2006, 89(17), 171911.
13 R. L. Withers, et al., Microdomains, Solid Solutions andthe ‘‘Defect Fluorite’’ to C-Type Sesquioxide Transition inCeO2-RO1.5 and ZrO2-RO1.5 Systems, J. Solid State Chem.,1995, 120(2), 290–298.
14 J. P. Perdew, K. Burke and M. Ernzerhof, GeneralizedGradient Approximation Made Simple, Phys. Rev. Lett.,1996, 77(18), 3865–3868.
15 P. E. Blochl, C. J. Forst and J. Schimpl, Projector augmentedwave method: ab initio molecular dynamics with full wavefunctions, Bull. Mater. Sci., 2003, 26, 33–41.
16 G. Kresse and J. Furthmueller, Efficient iterative schemesfor ab initio total-energy calculations using a plane-wavebasis set, Phys. Rev. B: Condens. Matter Mater. Phys., 1996,54, 11169–11186.
17 A. Spek, Structure validation in chemical crystallography, ActaCrystallogr., Sect. D: Biol. Crystallogr., 2009, 65(2), 148–155.
18 D. E. P. Vanpoucke, et al., Aliovalent doping of CeO2: DFTstudy of oxidation state and vacancy effects, J. Mater.Chem. A, 2014, 2(33), 13723–13737.
19 T. Zacherle, et al., Ab initio analysis of the defect structureof ceria, Phys. Rev. B: Condens. Matter Mater. Phys., 2013,87(13), 134104.
20 M. Nolan, et al., Density functional theory studies of thestructure and electronic structure of pure and defective lowindex surfaces of ceria, Surf. Sci., 2005, 576(1), 217–229.
21 J. K. Lang, Y. Baer and P. A. Cox, Study of the 4f and valenceband density of states in rare-earth metals. II. Experimentand results, J. Phys. F: Met. Phys., 1981, 11(1), 121–138.
22 F. Chen, et al., Structure and luminescence properties of a Nd3+
doped Bi4Ge3O12 scintillation crystal: new insights from acomprehensive study, J. Mater. Chem. C, 2017, 5(12), 3079–3087.
23 J. Feng, et al., Electronic structure, mechanical propertiesand thermal conductivity of Ln2Zr2O7 (Ln = La, Pr, Nd,
PCCP Paper
This journal is©the Owner Societies 2020 Phys. Chem. Chem. Phys., 2020, 22, 13930--13941 | 13941
Sm, Eu and Gd) pyrochlore, Acta Mater., 2011, 59(4),1742–1760.
24 X. Liu, et al., Local structural changes in Ce1�xLnxO2�d
(Ln = La, Gd) solid electrolytes, Solid State Ionics, 2020, 347,115213.
25 Q. Zhang, et al., Structural Stability of La2Ce2O7 as a ProtonConductor: A First-Principles Study, J. Phys. Chem. C, 2013,117(40), 20379–20386.
26 T. S. Bjørheim, V. Besikiotis and R. Haugsrud, Hydrationthermodynamics of pyrochlore structured oxides from TGand first principles calculations, Dalton Trans., 2012, 41(43),13343–13351.
27 M. Martin, Diffusion in Oxides, in Diffusion in CondensedMatter: Methods, Materials, Models, ed. P. Heitjans and
J. Karger, 2005, Springer Berlin Heidelberg, Berlin, Heidelberg,pp. 209–247.
28 A. S. Nowick, 3 – Atom Transport in Oxides of the FluoriteStructure, in Diffusion in Crystalline Solids, ed. G. E. Murchand A. S. Nowick, 1984, Academic Press, pp. 143–188.
29 Y. Liu, R. L. Withers and L. Noren, The pyrochlore to ‘defectfluorite’ transition in the Y2(ZryTi1�y)2O7 system and itsunderlying crystal chemistry, J. Solid State Chem., 2004,177(12), 4404–4412.
30 S. Svarcova, et al., Structural instability of cubic perovskiteBaxSr1�xCo1�yFeyO3�d, Solid State Ionics, 2008, 178(35), 1787–1791.
31 F. Brisse and O. Knop, Pyrochlores. II. An investigation ofLa2Ce2O7 by neutron diffraction, Can. J. Chem., 1967, 45(6),609–614.
Paper PCCP
67
Paper III Structure, hydration, and proton conductivity in 50% La and Nd doped CeO2 – La2Ce2O7 and Nd2Ce2O7 – and their solid solutions
L-E. Kalland, A. Løken, T. S. Bjørheim, R. Haugsrud and T. Norby, Solid State Ionics, 2020, 354, 115401-115408
DOI: 10.1016/j.ssi.2020.115401

68
Contents lists available at ScienceDirect
Solid State Ionics
journal homepage: www.elsevier.com/locate/ssi
Structure, hydration, and proton conductivity in 50% La and Nd doped CeO2
– La2Ce2O7 and Nd2Ce2O7 – and their solid solutions
Liv-Elisif Kallanda,⁎, Andreas Løkena,b, Tor S. Bjørheima, Reidar Haugsruda, Truls Norbya
a Centre for Materials Science and Nanotechnology, Department of Chemistry, University of Oslo, FERMiO, Gaustadalléen 21, NO-0349 Oslo, Norwayb Jotun Performance Coatings, Jotun A/S, NO-3202 Sandefjord, Norway1
A R T I C L E I N F O
Keywords:
TG-DSC
C-type structure
Fluorite structure
Hydration
Proton conductivity
Vacancy ordering
A B S T R A C T
We have measured water uptake and hydration enthalpy in 50% La and Nd doped CeO2, also to be taken as
compositions in the series La2−xNdxCe2O7 (x=0.0, 0.5, 1.0 and 2.0) using combined thermogravimetry (TG)
and differential scanning calorimetry (DSC), TG-DSC. The TG-DSC data unambiguously yield standard molar
hydration enthalpies of ~−74 kJ/mol independent of water uptake. The interpretation of the TG results,
however, does not fit a classical model of hydration of all oxygen vacancies. Instead, the hydration appears to be
limited to a small fraction of the free vacancies. Hydration further decreases as the Nd content (x) and long-range
order increases and regions of disorder decrease. We propose a new model explaining why hydration occurs only
in a small fraction of the nominally free vacancies: The higher basicity of La/Nd compared to Ce promotes
protonation at oxide ion sites with high coordination to La/Nd, and the observed water uptake and modelling
suggests that mainly oxide ions fully coordinated to 4 La/Nd neighbours become protonated. The statistical
variation of coordination around oxygen sites in a disordered fluorite oxide creates a limited number of such
oxide ions sites which results in limited hydration. The model matches well the experimental results and DFT
calculations of proton trapping at the fully La-coordinated sites for 50% La-doped CeO2, and also rationalizes
conductivity data.
1. Introduction
Ln2Ce2O7 with Ln=La or other large lanthanides is sometimes re-
ferred to as 50% lanthanide-doped ceria since the structure remains
related to the cubic ceria parent structure [1–3]. Adhering to the
Kröger-Vink notation, the doping reaction can then be written as:
= + +×Ln LnO 2 3O v2 3 Ce O O
••(1)
This results in 1 oxygen vacancy per formula unit Ln2Ce2O7. The
structure may as such potentially incorporate one molecule of water,
i.e., two protons, per vacancy if the material is fully hydrated:
+ + =×H O O v 2OH2 (g) O O
••O•
(2)
In support of this, La2Ce2O7, which exhibits oxide ion conductivity in
the dry state, has been reported to hydrate and exhibit proton conduction in
the presence of water vapour [2]. From reaction (2) it is evident that a
lower stability (higher energy) of the oxygen vacancy, or a higher stability
(lower energy) of the hydroxide species, will result in more favourable
hydration thermodynamics [4,5]. Hydration enthalpies in oxides can range
from endothermic values such as in undoped ceria [6] to highly exothermic
for a wide range of oxides including rare earth sesquioxides [7,8], pyro-
chlores [9], and perovskites [10,11].
High concentrations of defects, for instance by high doping levels,
can induce a number of defect-defect interactions, and corresponding
associates will affect the concentrations of free defects, the degree of
hydration, and the apparent mobility of defects. These can comprise
vacancy-vacancy pairs, vacancy-dopant pairs, vacancy-double dopant
clusters, proton-dopant pairs and clusters, and long-range order of va-
cancies and dopant-vacancy constellations. Accordingly, lanthanide-
doped ceria (Ln-CeO2) shows a steep decrease in the oxide ion con-
ductivity when doping levels increase above 10–20mol% [1,3,12,13].
While ceria with moderate acceptor doping levels exhibits negligible
protonation and bulk proton conductivity [5], ceria heavily doped with
some large lanthanides, such as 50% La-doping corresponding to
La2Ce2O7, can be hydrated and shows significant proton conductivity at
lower temperatures in wet atmospheres [2,14]. This we may qualita-
tively attribute to the higher basicity of the large lanthanides, notably
La and Nd, relative to that of Ce.
https://doi.org/10.1016/j.ssi.2020.115401
Received 19 December 2019; Received in revised form 18 June 2020; Accepted 29 June 2020
⁎ Corresponding author.
E-mail address: [email protected] (L.-E. Kalland).1 Current affiliation.
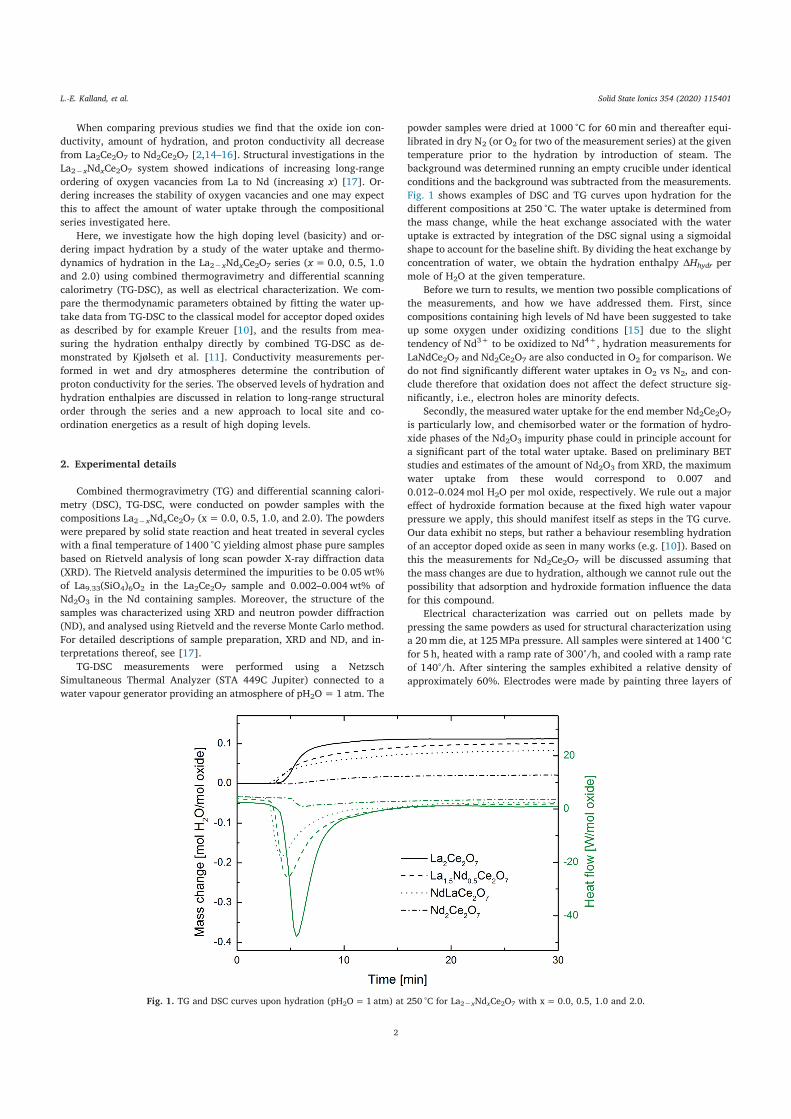
When comparing previous studies we find that the oxide ion con-
ductivity, amount of hydration, and proton conductivity all decrease
from La2Ce2O7 to Nd2Ce2O7 [2,14–16]. Structural investigations in the
La2−xNdxCe2O7 system showed indications of increasing long-range
ordering of oxygen vacancies from La to Nd (increasing x) [17]. Or-
dering increases the stability of oxygen vacancies and one may expect
this to affect the amount of water uptake through the compositional
series investigated here.
Here, we investigate how the high doping level (basicity) and or-
dering impact hydration by a study of the water uptake and thermo-
dynamics of hydration in the La2−xNdxCe2O7 series (x=0.0, 0.5, 1.0
and 2.0) using combined thermogravimetry and differential scanning
calorimetry (TG-DSC), as well as electrical characterization. We com-
pare the thermodynamic parameters obtained by fitting the water up-
take data from TG-DSC to the classical model for acceptor doped oxides
as described by for example Kreuer [10], and the results from mea-
suring the hydration enthalpy directly by combined TG-DSC as de-
monstrated by Kjølseth et al. [11]. Conductivity measurements per-
formed in wet and dry atmospheres determine the contribution of
proton conductivity for the series. The observed levels of hydration and
hydration enthalpies are discussed in relation to long-range structural
order through the series and a new approach to local site and co-
ordination energetics as a result of high doping levels.
2. Experimental details
Combined thermogravimetry (TG) and differential scanning calori-
metry (DSC), TG-DSC, were conducted on powder samples with the
compositions La2−xNdxCe2O7 (x=0.0, 0.5, 1.0, and 2.0). The powders
were prepared by solid state reaction and heat treated in several cycles
with a final temperature of 1400 °C yielding almost phase pure samples
based on Rietveld analysis of long scan powder X-ray diffraction data
(XRD). The Rietveld analysis determined the impurities to be 0.05 wt%
of La9.33(SiO4)6O2 in the La2Ce2O7 sample and 0.002–0.004wt% of
Nd2O3 in the Nd containing samples. Moreover, the structure of the
samples was characterized using XRD and neutron powder diffraction
(ND), and analysed using Rietveld and the reverse Monte Carlo method.
For detailed descriptions of sample preparation, XRD and ND, and in-
terpretations thereof, see [17].
TG-DSC measurements were performed using a Netzsch
Simultaneous Thermal Analyzer (STA 449C Jupiter) connected to a
water vapour generator providing an atmosphere of pH2O=1 atm. The
powder samples were dried at 1000 °C for 60min and thereafter equi-
librated in dry N2 (or O2 for two of the measurement series) at the given
temperature prior to the hydration by introduction of steam. The
background was determined running an empty crucible under identical
conditions and the background was subtracted from the measurements.
Fig. 1 shows examples of DSC and TG curves upon hydration for the
different compositions at 250 °C. The water uptake is determined from
the mass change, while the heat exchange associated with the water
uptake is extracted by integration of the DSC signal using a sigmoidal
shape to account for the baseline shift. By dividing the heat exchange by
concentration of water, we obtain the hydration enthalpy ΔHhydr per
mole of H2O at the given temperature.
Before we turn to results, we mention two possible complications of
the measurements, and how we have addressed them. First, since
compositions containing high levels of Nd have been suggested to take
up some oxygen under oxidizing conditions [15] due to the slight
tendency of Nd3+ to be oxidized to Nd4+, hydration measurements for
LaNdCe2O7 and Nd2Ce2O7 are also conducted in O2 for comparison. We
do not find significantly different water uptakes in O2 vs N2, and con-
clude therefore that oxidation does not affect the defect structure sig-
nificantly, i.e., electron holes are minority defects.
Secondly, the measured water uptake for the end member Nd2Ce2O7
is particularly low, and chemisorbed water or the formation of hydro-
xide phases of the Nd2O3 impurity phase could in principle account for
a significant part of the total water uptake. Based on preliminary BET
studies and estimates of the amount of Nd2O3 from XRD, the maximum
water uptake from these would correspond to 0.007 and
0.012–0.024mol H2O per mol oxide, respectively. We rule out a major
effect of hydroxide formation because at the fixed high water vapour
pressure we apply, this should manifest itself as steps in the TG curve.
Our data exhibit no steps, but rather a behaviour resembling hydration
of an acceptor doped oxide as seen in many works (e.g. [10]). Based on
this the measurements for Nd2Ce2O7 will be discussed assuming that
the mass changes are due to hydration, although we cannot rule out the
possibility that adsorption and hydroxide formation influence the data
for this compound.
Electrical characterization was carried out on pellets made by
pressing the same powders as used for structural characterization using
a 20mm die, at 125MPa pressure. All samples were sintered at 1400 °C
for 5 h, heated with a ramp rate of 300°/h, and cooled with a ramp rate
of 140°/h. After sintering the samples exhibited a relative density of
approximately 60%. Electrodes were made by painting three layers of
Fig. 1. TG and DSC curves upon hydration (pH2O=1 atm) at 250 °C for La2−xNdxCe2O7 with x= 0.0, 0.5, 1.0 and 2.0.
L.-E. Kalland, et al.
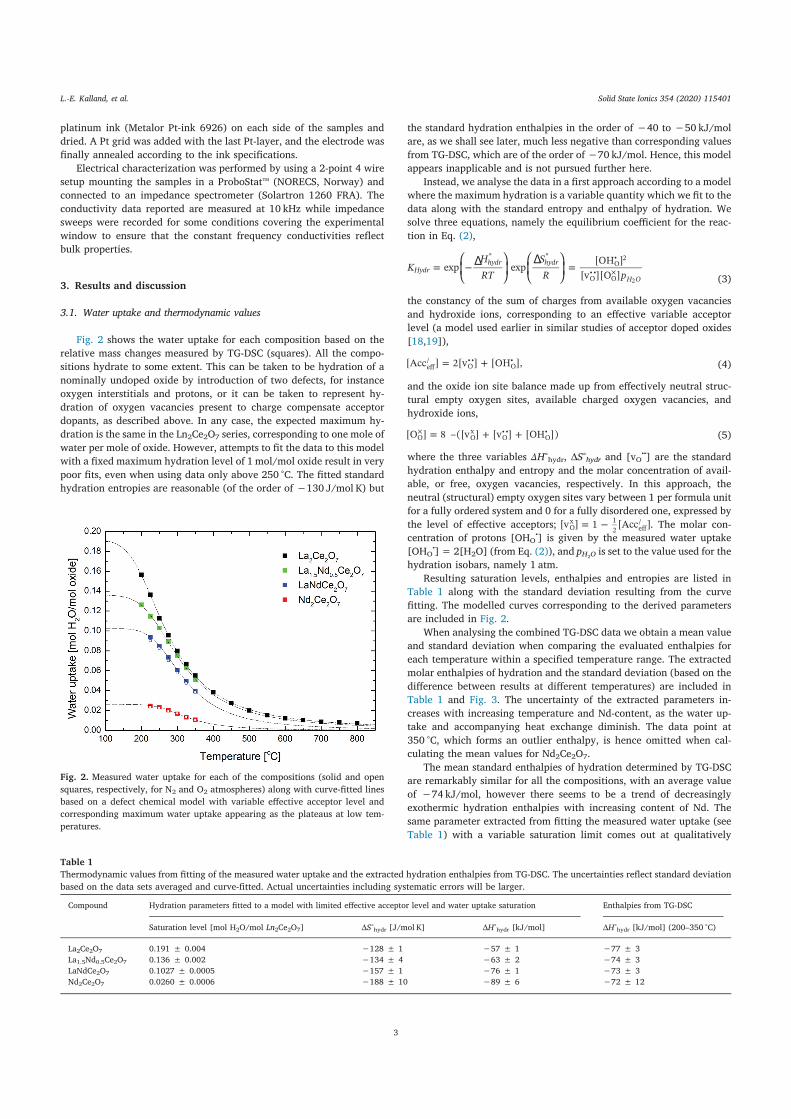
platinum ink (Metalor Pt-ink 6926) on each side of the samples and
dried. A Pt grid was added with the last Pt-layer, and the electrode was
finally annealed according to the ink specifications.
Electrical characterization was performed by using a 2-point 4 wire
setup mounting the samples in a ProboStat™ (NORECS, Norway) and
connected to an impedance spectrometer (Solartron 1260 FRA). The
conductivity data reported are measured at 10 kHz while impedance
sweeps were recorded for some conditions covering the experimental
window to ensure that the constant frequency conductivities reflect
bulk properties.
3. Results and discussion
3.1. Water uptake and thermodynamic values
Fig. 2 shows the water uptake for each composition based on the
relative mass changes measured by TG-DSC (squares). All the compo-
sitions hydrate to some extent. This can be taken to be hydration of a
nominally undoped oxide by introduction of two defects, for instance
oxygen interstitials and protons, or it can be taken to represent hy-
dration of oxygen vacancies present to charge compensate acceptor
dopants, as described above. In any case, the expected maximum hy-
dration is the same in the Ln2Ce2O7 series, corresponding to one mole of
water per mole of oxide. However, attempts to fit the data to this model
with a fixed maximum hydration level of 1mol/mol oxide result in very
poor fits, even when using data only above 250 °C. The fitted standard
hydration entropies are reasonable (of the order of −130 J/mol K) but
the standard hydration enthalpies in the order of −40 to −50 kJ/mol
are, as we shall see later, much less negative than corresponding values
from TG-DSC, which are of the order of −70 kJ/mol. Hence, this model
appears inapplicable and is not pursued further here.
Instead, we analyse the data in a first approach according to a model
where the maximum hydration is a variable quantity which we fit to the
data along with the standard entropy and enthalpy of hydration. We
solve three equations, namely the equilibrium coefficient for the reac-
tion in Eq. (2),
= =
° °
×K
HRT
SR p
exp exp [OH ][v ][O ]Hydr
hydr hydr
H O
O• 2
O••
O 2 (3)
the constancy of the sum of charges from available oxygen vacancies
and hydroxide ions, corresponding to an effective variable acceptor
level (a model used earlier in similar studies of acceptor doped oxides
[18,19]),
= +[Acc ] 2[v ] [OH ],eff/
O••
O•
(4)
and the oxide ion site balance made up from effectively neutral struc-
tural empty oxygen sites, available charged oxygen vacancies, and
hydroxide ions,
= + +×[O ] 8 –([v ] [v ] [OH ])O O
xO••
O•
(5)
where the three variables ΔH°hydr, ΔS°hydr and [vO••] are the standard
hydration enthalpy and entropy and the molar concentration of avail-
able, or free, oxygen vacancies, respectively. In this approach, the
neutral (structural) empty oxygen sites vary between 1 per formula unit
for a fully ordered system and 0 for a fully disordered one, expressed by
the level of effective acceptors; =[v ] 1 [Acc ]Ox 1
2 eff/ . The molar con-
centration of protons [OHO•] is given by the measured water uptake
[OHO•]= 2[H2O] (from Eq. (2)), and pH2O
is set to the value used for the
hydration isobars, namely 1 atm.
Resulting saturation levels, enthalpies and entropies are listed in
Table 1 along with the standard deviation resulting from the curve
fitting. The modelled curves corresponding to the derived parameters
are included in Fig. 2.
When analysing the combined TG-DSC data we obtain a mean value
and standard deviation when comparing the evaluated enthalpies for
each temperature within a specified temperature range. The extracted
molar enthalpies of hydration and the standard deviation (based on the
difference between results at different temperatures) are included in
Table 1 and Fig. 3. The uncertainty of the extracted parameters in-
creases with increasing temperature and Nd-content, as the water up-
take and accompanying heat exchange diminish. The data point at
350 °C, which forms an outlier enthalpy, is hence omitted when cal-
culating the mean values for Nd2Ce2O7.
The mean standard enthalpies of hydration determined by TG-DSC
are remarkably similar for all the compositions, with an average value
of −74 kJ/mol, however there seems to be a trend of decreasingly
exothermic hydration enthalpies with increasing content of Nd. The
same parameter extracted from fitting the measured water uptake (see
Table 1) with a variable saturation limit comes out at qualitatively
Fig. 2. Measured water uptake for each of the compositions (solid and open
squares, respectively, for N2 and O2 atmospheres) along with curve-fitted lines
based on a defect chemical model with variable effective acceptor level and
corresponding maximum water uptake appearing as the plateaus at low tem-
peratures.
Table 1
Thermodynamic values from fitting of the measured water uptake and the extracted hydration enthalpies from TG-DSC. The uncertainties reflect standard deviation
based on the data sets averaged and curve-fitted. Actual uncertainties including systematic errors will be larger.
Compound Hydration parameters fitted to a model with limited effective acceptor level and water uptake saturation Enthalpies from TG-DSC
Saturation level [mol H2O/mol Ln2Ce2O7] ΔS°hydr [J/mol K] ΔH°hydr [kJ/mol] ΔH°hydr [kJ/mol] (200–350 °C)
La2Ce2O7 0.191 ± 0.004 −128 ± 1 −57 ± 1 −77 ± 3
La1.5Nd0.5Ce2O7 0.136 ± 0.002 −134 ± 4 −63 ± 2 −74 ± 3
LaNdCe2O7 0.1027 ± 0.0005 −157 ± 1 −76 ± 1 −73 ± 3
Nd2Ce2O7 0.0260 ± 0.0006 −188 ± 10 −89 ± 6 −72 ± 12
L.-E. Kalland, et al.
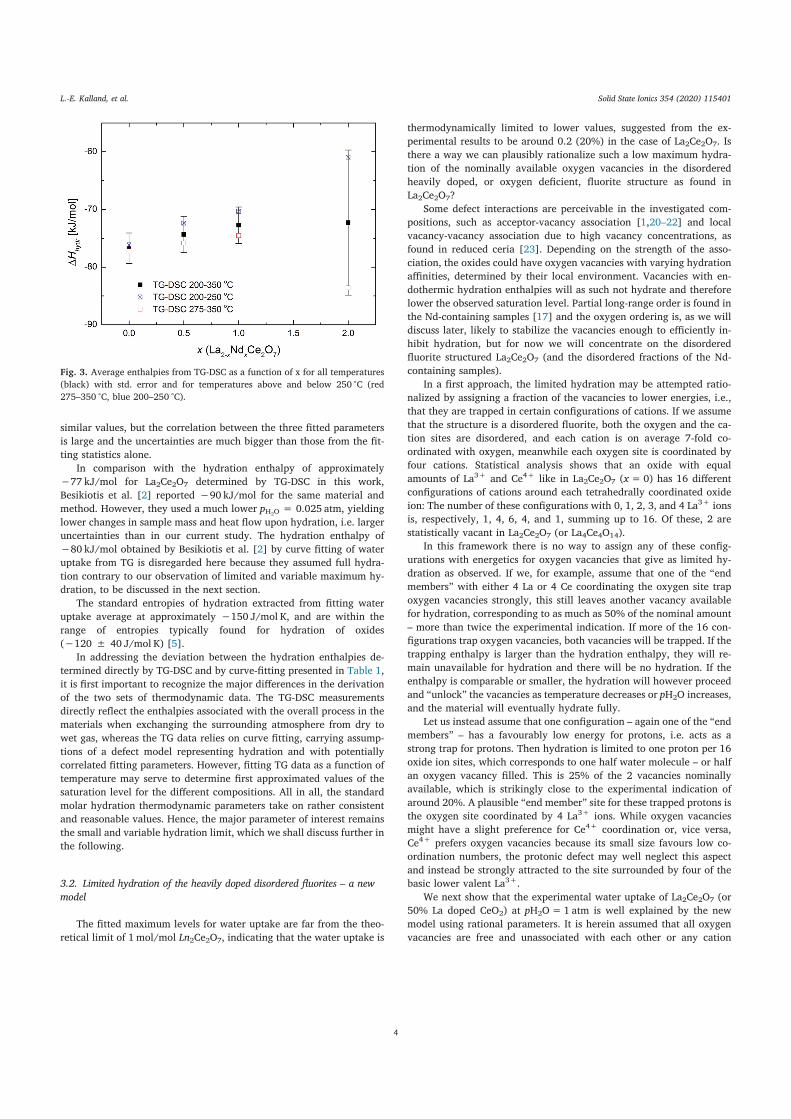
similar values, but the correlation between the three fitted parameters
is large and the uncertainties are much bigger than those from the fit-
ting statistics alone.
In comparison with the hydration enthalpy of approximately
−77 kJ/mol for La2Ce2O7 determined by TG-DSC in this work,
Besikiotis et al. [2] reported −90 kJ/mol for the same material and
method. However, they used a much lower pH2O= 0.025 atm, yielding
lower changes in sample mass and heat flow upon hydration, i.e. larger
uncertainties than in our current study. The hydration enthalpy of
−80 kJ/mol obtained by Besikiotis et al. [2] by curve fitting of water
uptake from TG is disregarded here because they assumed full hydra-
tion contrary to our observation of limited and variable maximum hy-
dration, to be discussed in the next section.
The standard entropies of hydration extracted from fitting water
uptake average at approximately −150 J/mol K, and are within the
range of entropies typically found for hydration of oxides
(−120 ± 40 J/mol K) [5].
In addressing the deviation between the hydration enthalpies de-
termined directly by TG-DSC and by curve-fitting presented in Table 1,
it is first important to recognize the major differences in the derivation
of the two sets of thermodynamic data. The TG-DSC measurements
directly reflect the enthalpies associated with the overall process in the
materials when exchanging the surrounding atmosphere from dry to
wet gas, whereas the TG data relies on curve fitting, carrying assump-
tions of a defect model representing hydration and with potentially
correlated fitting parameters. However, fitting TG data as a function of
temperature may serve to determine first approximated values of the
saturation level for the different compositions. All in all, the standard
molar hydration thermodynamic parameters take on rather consistent
and reasonable values. Hence, the major parameter of interest remains
the small and variable hydration limit, which we shall discuss further in
the following.
3.2. Limited hydration of the heavily doped disordered fluorites – a new
model
The fitted maximum levels for water uptake are far from the theo-
retical limit of 1mol/mol Ln2Ce2O7, indicating that the water uptake is
thermodynamically limited to lower values, suggested from the ex-
perimental results to be around 0.2 (20%) in the case of La2Ce2O7. Is
there a way we can plausibly rationalize such a low maximum hydra-
tion of the nominally available oxygen vacancies in the disordered
heavily doped, or oxygen deficient, fluorite structure as found in
La2Ce2O7?
Some defect interactions are perceivable in the investigated com-
positions, such as acceptor-vacancy association [1,20–22] and local
vacancy-vacancy association due to high vacancy concentrations, as
found in reduced ceria [23]. Depending on the strength of the asso-
ciation, the oxides could have oxygen vacancies with varying hydration
affinities, determined by their local environment. Vacancies with en-
dothermic hydration enthalpies will as such not hydrate and therefore
lower the observed saturation level. Partial long-range order is found in
the Nd-containing samples [17] and the oxygen ordering is, as we will
discuss later, likely to stabilize the vacancies enough to efficiently in-
hibit hydration, but for now we will concentrate on the disordered
fluorite structured La2Ce2O7 (and the disordered fractions of the Nd-
containing samples).
In a first approach, the limited hydration may be attempted ratio-
nalized by assigning a fraction of the vacancies to lower energies, i.e.,
that they are trapped in certain configurations of cations. If we assume
that the structure is a disordered fluorite, both the oxygen and the ca-
tion sites are disordered, and each cation is on average 7-fold co-
ordinated with oxygen, meanwhile each oxygen site is coordinated by
four cations. Statistical analysis shows that an oxide with equal
amounts of La3+ and Ce4+ like in La2Ce2O7 (x=0) has 16 different
configurations of cations around each tetrahedrally coordinated oxide
ion: The number of these configurations with 0, 1, 2, 3, and 4 La3+ ions
is, respectively, 1, 4, 6, 4, and 1, summing up to 16. Of these, 2 are
statistically vacant in La2Ce2O7 (or La4Ce4O14).
In this framework there is no way to assign any of these config-
urations with energetics for oxygen vacancies that give as limited hy-
dration as observed. If we, for example, assume that one of the “end
members” with either 4 La or 4 Ce coordinating the oxygen site trap
oxygen vacancies strongly, this still leaves another vacancy available
for hydration, corresponding to as much as 50% of the nominal amount
– more than twice the experimental indication. If more of the 16 con-
figurations trap oxygen vacancies, both vacancies will be trapped. If the
trapping enthalpy is larger than the hydration enthalpy, they will re-
main unavailable for hydration and there will be no hydration. If the
enthalpy is comparable or smaller, the hydration will however proceed
and “unlock” the vacancies as temperature decreases or pH2O increases,
and the material will eventually hydrate fully.
Let us instead assume that one configuration – again one of the “end
members” – has a favourably low energy for protons, i.e. acts as a
strong trap for protons. Then hydration is limited to one proton per 16
oxide ion sites, which corresponds to one half water molecule – or half
an oxygen vacancy filled. This is 25% of the 2 vacancies nominally
available, which is strikingly close to the experimental indication of
around 20%. A plausible “end member” site for these trapped protons is
the oxygen site coordinated by 4 La3+ ions. While oxygen vacancies
might have a slight preference for Ce4+ coordination or, vice versa,
Ce4+ prefers oxygen vacancies because its small size favours low co-
ordination numbers, the protonic defect may well neglect this aspect
and instead be strongly attracted to the site surrounded by four of the
basic lower valent La3+.
We next show that the experimental water uptake of La2Ce2O7 (or
50% La doped CeO2) at pH2O=1 atm is well explained by the new
model using rational parameters. It is herein assumed that all oxygen
vacancies are free and unassociated with each other or any cation
Fig. 3. Average enthalpies from TG-DSC as a function of x for all temperatures
(black) with std. error and for temperatures above and below 250 °C (red
275–350 °C, blue 200–250 °C).
L.-E. Kalland, et al.
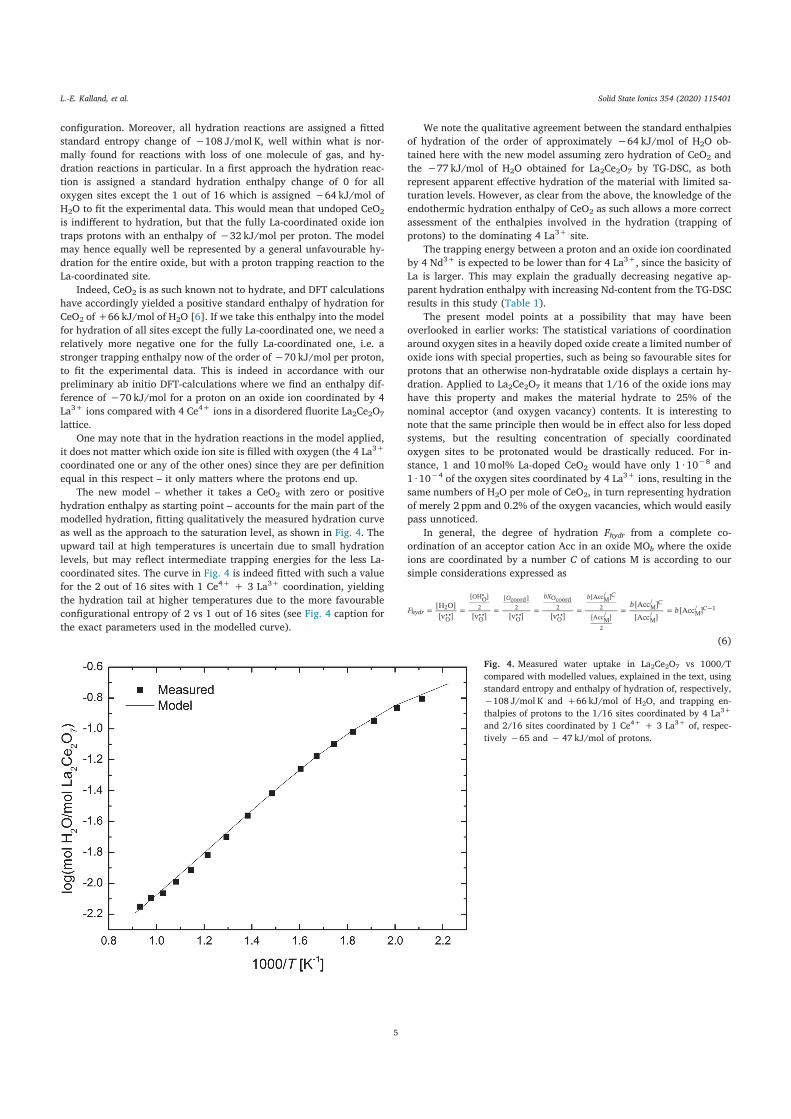
configuration. Moreover, all hydration reactions are assigned a fitted
standard entropy change of −108 J/mol K, well within what is nor-
mally found for reactions with loss of one molecule of gas, and hy-
dration reactions in particular. In a first approach the hydration reac-
tion is assigned a standard hydration enthalpy change of 0 for all
oxygen sites except the 1 out of 16 which is assigned −64 kJ/mol of
H2O to fit the experimental data. This would mean that undoped CeO2
is indifferent to hydration, but that the fully La-coordinated oxide ion
traps protons with an enthalpy of −32 kJ/mol per proton. The model
may hence equally well be represented by a general unfavourable hy-
dration for the entire oxide, but with a proton trapping reaction to the
La-coordinated site.
Indeed, CeO2 is as such known not to hydrate, and DFT calculations
have accordingly yielded a positive standard enthalpy of hydration for
CeO2 of +66 kJ/mol of H2O [6]. If we take this enthalpy into the model
for hydration of all sites except the fully La-coordinated one, we need a
relatively more negative one for the fully La-coordinated one, i.e. a
stronger trapping enthalpy now of the order of −70 kJ/mol per proton,
to fit the experimental data. This is indeed in accordance with our
preliminary ab initio DFT-calculations where we find an enthalpy dif-
ference of −70 kJ/mol for a proton on an oxide ion coordinated by 4
La3+ ions compared with 4 Ce4+ ions in a disordered fluorite La2Ce2O7
lattice.
One may note that in the hydration reactions in the model applied,
it does not matter which oxide ion site is filled with oxygen (the 4 La3+
coordinated one or any of the other ones) since they are per definition
equal in this respect – it only matters where the protons end up.
The new model – whether it takes a CeO2 with zero or positive
hydration enthalpy as starting point – accounts for the main part of the
modelled hydration, fitting qualitatively the measured hydration curve
as well as the approach to the saturation level, as shown in Fig. 4. The
upward tail at high temperatures is uncertain due to small hydration
levels, but may reflect intermediate trapping energies for the less La-
coordinated sites. The curve in Fig. 4 is indeed fitted with such a value
for the 2 out of 16 sites with 1 Ce4+ + 3 La3+ coordination, yielding
the hydration tail at higher temperatures due to the more favourable
configurational entropy of 2 vs 1 out of 16 sites (see Fig. 4 caption for
the exact parameters used in the modelled curve).
We note the qualitative agreement between the standard enthalpies
of hydration of the order of approximately −64 kJ/mol of H2O ob-
tained here with the new model assuming zero hydration of CeO2 and
the −77 kJ/mol of H2O obtained for La2Ce2O7 by TG-DSC, as both
represent apparent effective hydration of the material with limited sa-
turation levels. However, as clear from the above, the knowledge of the
endothermic hydration enthalpy of CeO2 as such allows a more correct
assessment of the enthalpies involved in the hydration (trapping of
protons) to the dominating 4 La3+ site.
The trapping energy between a proton and an oxide ion coordinated
by 4 Nd3+ is expected to be lower than for 4 La3+, since the basicity of
La is larger. This may explain the gradually decreasing negative ap-
parent hydration enthalpy with increasing Nd-content from the TG-DSC
results in this study (Table 1).
The present model points at a possibility that may have been
overlooked in earlier works: The statistical variations of coordination
around oxygen sites in a heavily doped oxide create a limited number of
oxide ions with special properties, such as being so favourable sites for
protons that an otherwise non-hydratable oxide displays a certain hy-
dration. Applied to La2Ce2O7 it means that 1/16 of the oxide ions may
have this property and makes the material hydrate to 25% of the
nominal acceptor (and oxygen vacancy) contents. It is interesting to
note that the same principle then would be in effect also for less doped
systems, but the resulting concentration of specially coordinated
oxygen sites to be protonated would be drastically reduced. For in-
stance, 1 and 10mol% La-doped CeO2 would have only 1 · 10−8 and
1 · 10−4 of the oxygen sites coordinated by 4 La3+ ions, resulting in the
same numbers of H2O per mole of CeO2, in turn representing hydration
of merely 2 ppm and 0.2% of the oxygen vacancies, which would easily
pass unnoticed.
In general, the degree of hydration Fhydr from a complete co-
ordination of an acceptor cation Acc in an oxide MOb where the oxide
ions are coordinated by a number C of cations M is according to our
simple considerations expressed as
= = = = = = =Fb
b[H O][v ] [v ] [v ] [v ]
[Acc ][Acc ]
[Acc ]hydr
O bX b CC
C2
O••
[OHO• ]2
O••
[ coord]2
O••
Ocoord2
O••
[AccM/ ]2
[AccM/ ]
2
M/
M/ M
/ 1
(6)
Fig. 4. Measured water uptake in La2Ce2O7 vs 1000/T
compared with modelled values, explained in the text, using
standard entropy and enthalpy of hydration of, respectively,
−108 J/mol K and +66 kJ/mol of H2O, and trapping en-
thalpies of protons to the 1/16 sites coordinated by 4 La3+
and 2/16 sites coordinated by 1 Ce4+ + 3 La3+ of, respec-
tively −65 and −47 kJ/mol of protons.
L.-E. Kalland, et al.
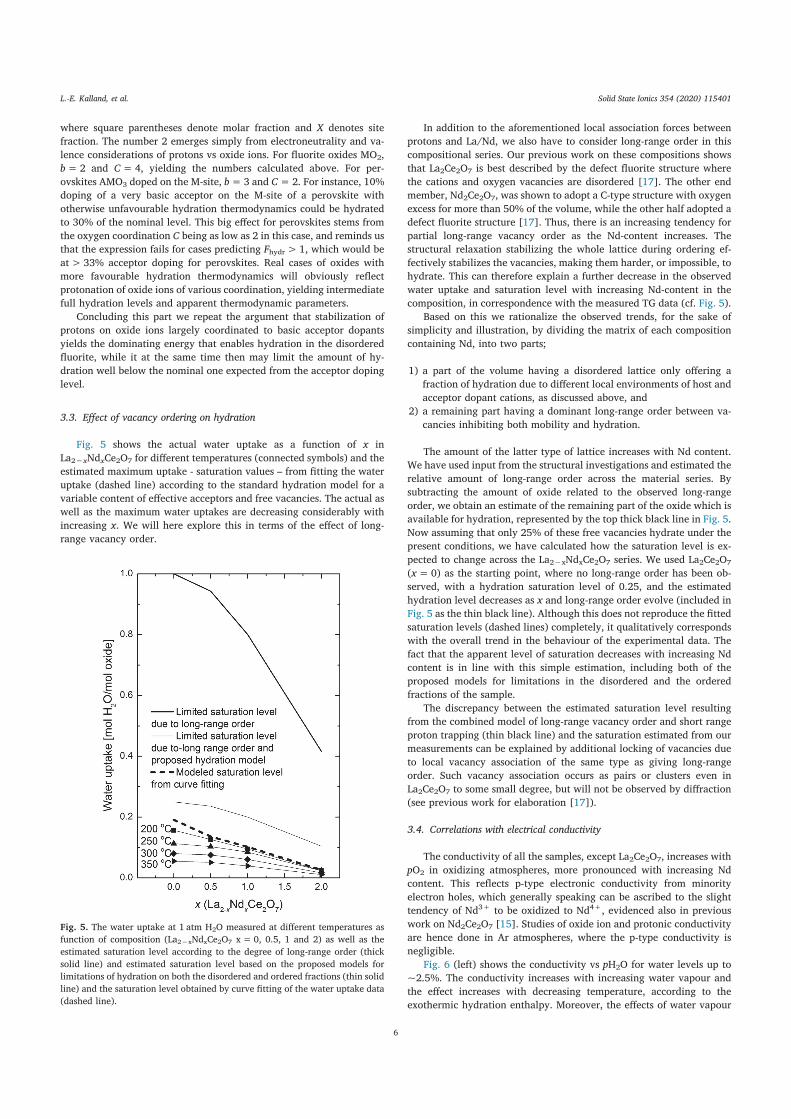
where square parentheses denote molar fraction and X denotes site
fraction. The number 2 emerges simply from electroneutrality and va-
lence considerations of protons vs oxide ions. For fluorite oxides MO2,
b=2 and C=4, yielding the numbers calculated above. For per-
ovskites AMO3 doped on the M-site, b=3 and C=2. For instance, 10%
doping of a very basic acceptor on the M-site of a perovskite with
otherwise unfavourable hydration thermodynamics could be hydrated
to 30% of the nominal level. This big effect for perovskites stems from
the oxygen coordination C being as low as 2 in this case, and reminds us
that the expression fails for cases predicting Fhydr> 1, which would be
at> 33% acceptor doping for perovskites. Real cases of oxides with
more favourable hydration thermodynamics will obviously reflect
protonation of oxide ions of various coordination, yielding intermediate
full hydration levels and apparent thermodynamic parameters.
Concluding this part we repeat the argument that stabilization of
protons on oxide ions largely coordinated to basic acceptor dopants
yields the dominating energy that enables hydration in the disordered
fluorite, while it at the same time then may limit the amount of hy-
dration well below the nominal one expected from the acceptor doping
level.
3.3. Effect of vacancy ordering on hydration
Fig. 5 shows the actual water uptake as a function of x in
La2−xNdxCe2O7 for different temperatures (connected symbols) and the
estimated maximum uptake - saturation values – from fitting the water
uptake (dashed line) according to the standard hydration model for a
variable content of effective acceptors and free vacancies. The actual as
well as the maximum water uptakes are decreasing considerably with
increasing x. We will here explore this in terms of the effect of long-
range vacancy order.
In addition to the aforementioned local association forces between
protons and La/Nd, we also have to consider long-range order in this
compositional series. Our previous work on these compositions shows
that La2Ce2O7 is best described by the defect fluorite structure where
the cations and oxygen vacancies are disordered [17]. The other end
member, Nd2Ce2O7, was shown to adopt a C-type structure with oxygen
excess for more than 50% of the volume, while the other half adopted a
defect fluorite structure [17]. Thus, there is an increasing tendency for
partial long-range vacancy order as the Nd-content increases. The
structural relaxation stabilizing the whole lattice during ordering ef-
fectively stabilizes the vacancies, making them harder, or impossible, to
hydrate. This can therefore explain a further decrease in the observed
water uptake and saturation level with increasing Nd-content in the
composition, in correspondence with the measured TG data (cf. Fig. 5).
Based on this we rationalize the observed trends, for the sake of
simplicity and illustration, by dividing the matrix of each composition
containing Nd, into two parts;
1) a part of the volume having a disordered lattice only offering a
fraction of hydration due to different local environments of host and
acceptor dopant cations, as discussed above, and
2) a remaining part having a dominant long-range order between va-
cancies inhibiting both mobility and hydration.
The amount of the latter type of lattice increases with Nd content.
We have used input from the structural investigations and estimated the
relative amount of long-range order across the material series. By
subtracting the amount of oxide related to the observed long-range
order, we obtain an estimate of the remaining part of the oxide which is
available for hydration, represented by the top thick black line in Fig. 5.
Now assuming that only 25% of these free vacancies hydrate under the
present conditions, we have calculated how the saturation level is ex-
pected to change across the La2−xNdxCe2O7 series. We used La2Ce2O7
(x=0) as the starting point, where no long-range order has been ob-
served, with a hydration saturation level of 0.25, and the estimated
hydration level decreases as x and long-range order evolve (included in
Fig. 5 as the thin black line). Although this does not reproduce the fitted
saturation levels (dashed lines) completely, it qualitatively corresponds
with the overall trend in the behaviour of the experimental data. The
fact that the apparent level of saturation decreases with increasing Nd
content is in line with this simple estimation, including both of the
proposed models for limitations in the disordered and the ordered
fractions of the sample.
The discrepancy between the estimated saturation level resulting
from the combined model of long-range vacancy order and short range
proton trapping (thin black line) and the saturation estimated from our
measurements can be explained by additional locking of vacancies due
to local vacancy association of the same type as giving long-range
order. Such vacancy association occurs as pairs or clusters even in
La2Ce2O7 to some small degree, but will not be observed by diffraction
(see previous work for elaboration [17]).
3.4. Correlations with electrical conductivity
The conductivity of all the samples, except La2Ce2O7, increases with
pO2 in oxidizing atmospheres, more pronounced with increasing Nd
content. This reflects p-type electronic conductivity from minority
electron holes, which generally speaking can be ascribed to the slight
tendency of Nd3+ to be oxidized to Nd4+, evidenced also in previous
work on Nd2Ce2O7 [15]. Studies of oxide ion and protonic conductivity
are hence done in Ar atmospheres, where the p-type conductivity is
negligible.
Fig. 6 (left) shows the conductivity vs pH2O for water levels up to
~2.5%. The conductivity increases with increasing water vapour and
the effect increases with decreasing temperature, according to the
exothermic hydration enthalpy. Moreover, the effects of water vapour
Fig. 5. The water uptake at 1 atm H2O measured at different temperatures as
function of composition (La2−xNdxCe2O7 x= 0, 0.5, 1 and 2) as well as the
estimated saturation level according to the degree of long-range order (thick
solid line) and estimated saturation level based on the proposed models for
limitations of hydration on both the disordered and ordered fractions (thin solid
line) and the saturation level obtained by curve fitting of the water uptake data
(dashed line).
L.-E. Kalland, et al.
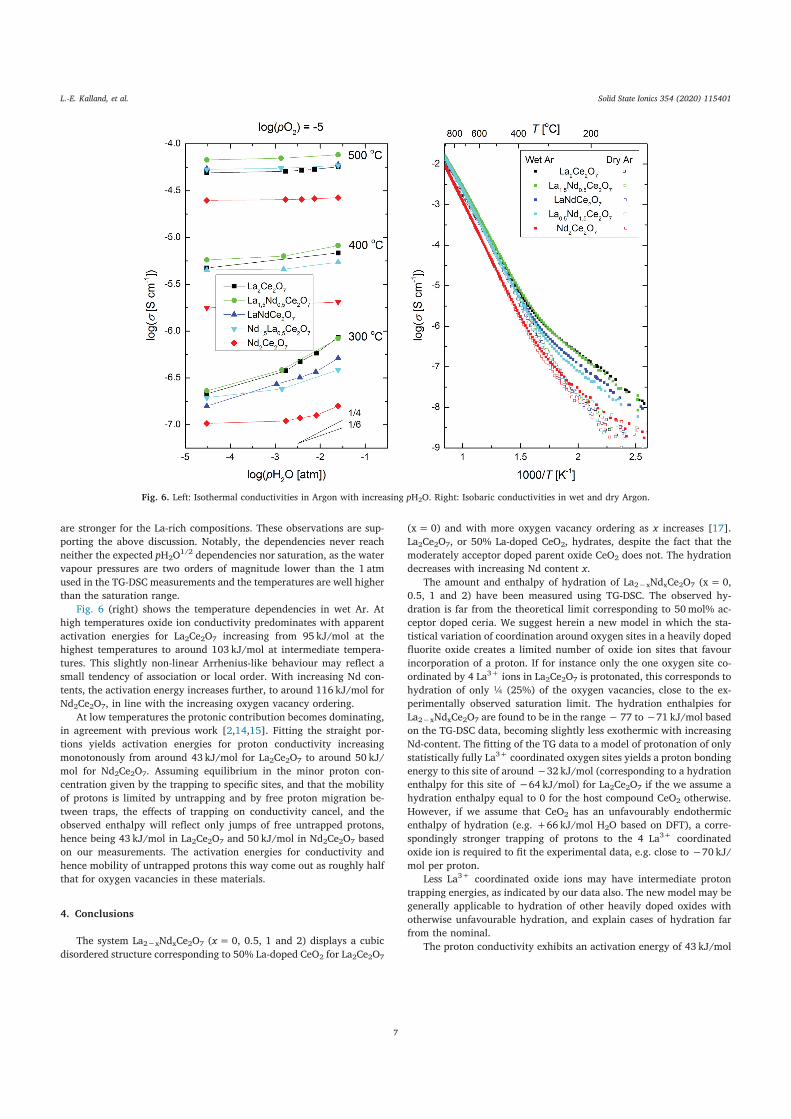
are stronger for the La-rich compositions. These observations are sup-
porting the above discussion. Notably, the dependencies never reach
neither the expected pH2O1/2 dependencies nor saturation, as the water
vapour pressures are two orders of magnitude lower than the 1 atm
used in the TG-DSC measurements and the temperatures are well higher
than the saturation range.
Fig. 6 (right) shows the temperature dependencies in wet Ar. At
high temperatures oxide ion conductivity predominates with apparent
activation energies for La2Ce2O7 increasing from 95 kJ/mol at the
highest temperatures to around 103 kJ/mol at intermediate tempera-
tures. This slightly non-linear Arrhenius-like behaviour may reflect a
small tendency of association or local order. With increasing Nd con-
tents, the activation energy increases further, to around 116 kJ/mol for
Nd2Ce2O7, in line with the increasing oxygen vacancy ordering.
At low temperatures the protonic contribution becomes dominating,
in agreement with previous work [2,14,15]. Fitting the straight por-
tions yields activation energies for proton conductivity increasing
monotonously from around 43 kJ/mol for La2Ce2O7 to around 50 kJ/
mol for Nd2Ce2O7. Assuming equilibrium in the minor proton con-
centration given by the trapping to specific sites, and that the mobility
of protons is limited by untrapping and by free proton migration be-
tween traps, the effects of trapping on conductivity cancel, and the
observed enthalpy will reflect only jumps of free untrapped protons,
hence being 43 kJ/mol in La2Ce2O7 and 50 kJ/mol in Nd2Ce2O7 based
on our measurements. The activation energies for conductivity and
hence mobility of untrapped protons this way come out as roughly half
that for oxygen vacancies in these materials.
4. Conclusions
The system La2−xNdxCe2O7 (x=0, 0.5, 1 and 2) displays a cubic
disordered structure corresponding to 50% La-doped CeO2 for La2Ce2O7
(x= 0) and with more oxygen vacancy ordering as x increases [17].
La2Ce2O7, or 50% La-doped CeO2, hydrates, despite the fact that the
moderately acceptor doped parent oxide CeO2 does not. The hydration
decreases with increasing Nd content x.
The amount and enthalpy of hydration of La2−xNdxCe2O7 (x=0,
0.5, 1 and 2) have been measured using TG-DSC. The observed hy-
dration is far from the theoretical limit corresponding to 50mol% ac-
ceptor doped ceria. We suggest herein a new model in which the sta-
tistical variation of coordination around oxygen sites in a heavily doped
fluorite oxide creates a limited number of oxide ion sites that favour
incorporation of a proton. If for instance only the one oxygen site co-
ordinated by 4 La3+ ions in La2Ce2O7 is protonated, this corresponds to
hydration of only ¼ (25%) of the oxygen vacancies, close to the ex-
perimentally observed saturation limit. The hydration enthalpies for
La2−xNdxCe2O7 are found to be in the range −77 to −71 kJ/mol based
on the TG-DSC data, becoming slightly less exothermic with increasing
Nd-content. The fitting of the TG data to a model of protonation of only
statistically fully La3+ coordinated oxygen sites yields a proton bonding
energy to this site of around −32 kJ/mol (corresponding to a hydration
enthalpy for this site of −64 kJ/mol) for La2Ce2O7 if the we assume a
hydration enthalpy equal to 0 for the host compound CeO2 otherwise.
However, if we assume that CeO2 has an unfavourably endothermic
enthalpy of hydration (e.g. +66 kJ/mol H2O based on DFT), a corre-
spondingly stronger trapping of protons to the 4 La3+ coordinated
oxide ion is required to fit the experimental data, e.g. close to −70 kJ/
mol per proton.
Less La3+ coordinated oxide ions may have intermediate proton
trapping energies, as indicated by our data also. The new model may be
generally applicable to hydration of other heavily doped oxides with
otherwise unfavourable hydration, and explain cases of hydration far
from the nominal.
The proton conductivity exhibits an activation energy of 43 kJ/mol
Fig. 6. Left: Isothermal conductivities in Argon with increasing pH2O. Right: Isobaric conductivities in wet and dry Argon.
L.-E. Kalland, et al.
for La2Ce2O7 increasing to 50 kJ/mol for Nd2Ce2O7 under conditions
with minority proton concentrations, which then corresponds to the
activation energy for mobility of free untrapped protons.
The observed decrease in water uptake with increasing Nd content x
is interpreted to reflect an increasing tendency to long-range order that
inhibits hydration of an increasing fraction of the vacancies.
Credit author statement
Liv-Elisif Kalland: Conceptualization, Methodology, Formal
Analysis, Investigation, Writing - Original Draft, Writing –Review &
Editing
Andreas Løken: Methodology, Formal Analysis, Writing – Review &
Editing
Tor Bjørheim: Methodology, Formal Analysis, Writing – Review &
Editing
Reidar Haugsrud: Conceptualization, Writing – Review & Editing,
Supervision
Truls Norby: Conceptualization, Methodology, Writing - Original
Draft (minor parts), Writing – Review & Editing, Supervision.
Declaration of competing interest
The authors declare that they have no known competing financial
interests or personal relationships that could have appeared to influ-
ence the work reported in this paper.
Acknowledgements
The computations were performed on resources provided by
UNINETT Sigma2 – the National Infrastructure for High Performance
Computing and Data Storage in Norway.
References
[1] D.Y. Wang, D.S. Park, J. Griffith, A.S. Nowick, Solid State Ionics 2 (2) (1981) 95.
[2] V. Besikiotis, C.S. Knee, I. Ahmed, R. Haugsrud, T. Norby, Solid State Ionics 228
(2012) 1.
[3] T. Hagiwara, Z. Kyo, A. Manabe, H. Yamamura, K. Nomura, J. Ceram, Soc. Jpn. 117
(Dec.) (2009) 1306.
[4] T.S. Bjørheim, A. Løken, R. Haugsrud, J. Mater. Chem. A 4 (16) (2016) 5917.
[5] T. Norby, M. Wideroe, R. Gloeckner, Y. Larring, Dalton Trans. (2004) 3012.
[6] T. Zacherle, A. Schriever, R.A. De Souza, M. Martin, Phys. Rev. B 87 (13) (2013)
134104.
[7] R. Haugsrud, Y. Larring, T. Norby, Solid State Ionics 176 (39–40) (2005) 2957.
[8] Y. Larring, T. Norby, Solid State Ionics 97 (1–4) (1997) 523.
[9] T.S. Bjørheim, V. Besikiotis, R. Haugsrud, Dalton Trans. 41 (43) (2012) 13343.
[10] K.D. Kreuer, Annu. Rev. Mater. Res. 33 (2003) 333.
[11] C. Kjølseth, L.-Y. Wang, R. Haugsrud, T. Norby, Solid State Ionics 181 (39) (2010)
1740.
[12] J. Faber, C. Geoffroy, A. Roux, A. Sylvestre, P. Abélard, Appl. Phys. A Solids Surf. 49
(3) (1989) 225.
[13] H. Yahiro, Y. Eguchi, K. Eguchi, H. Arai, J. Appl. Electrochem. 18 (4) (1988) 527.
[14] W. Sun, S. Fang, L. Yan, W. Liu, Fuel Cells 12 (3) (2012) 457.
[15] S. Cheng. Master thesis, Department of Physics, University of Oslo, Oslo (2012).
[16] Z.G. Liu, J.H. Ouyang, K.N. Sun, Fuel Cells 11 (2) (2011) 153.
[17] L.-E. Kalland, S.T. Norberg, J. Kyrklund, S. Hull, S.G. Eriksson, T. Norby, C.E. Mohn,
C.S. Knee, Phys. Chem. Chem. Phys. 18 (34) (2016) 24070.
[18] A. Løken, T.S. Bjørheim, R. Haugsrud, J. Mater. Chem. A 3 (46) (2015) 23289.
[19] K.D. Kreuer, S. Adams, W. Münch, A. Fuchs, U. Klock, J. Maier, Solid State Ionics
145 (1) (2001) 295.
[20] V. Butler, C.R.A. Catlow, B.E.F. Fender, J.H. Harding, Solid State Ionics 8 (2) (1983)
109.
[21] L. Minervini, M.O. Zacate, R.W. Grimes, Solid State Ionics 116 (3–4) (1999) 339.
[22] R. Gerhardt-Anderson, A.S. Nowick, Solid State Ionics 5 (1981) 547.
[23] S. Hull, S.T. Norberg, I. Ahmed, S.G. Eriksson, D. Marrocchelli, P.A. Madden, J.
Solid State Chem. 182 (10) (2009) 2815.
L.-E. Kalland, et al.

86
87
5 Discussion “Research is to see what everybody else has seen, and to think what nobody else has
thought.”
– Albert Szent-Györgyi
La28-xW4+xO54+δ and La2-xNdxCe2O7 crystallize in cubic, fluorite derived structures and are
highly oxygen deficient with respect to the perfect fluorite. The nature and degree of oxygen
vacancy ordering is intimately connected to the vacancy related materials properties. The
size, valence and electronegativity of ions, together with the crystal structure, define the
bond length between cations and anions, and the resulting size of the fluorite derived unit
cell. The bond length also indicates the effective basicity of the cations (or cat-O complexes)
which play an important role for the conductivity and hydration of the oxides. The aim in
this discussion is to identify trends that describe and explain the change in defect related
properties, correlated to oxygen vacancy ordering, as well as cation-oxygen bond lengths.
In the discussion and summarizing conclusions, we will refer to the La2-xNdxCe2O7 series
studied in Papers I-III without including (x = 0, 0.5, 1, 1.5 and 2). For discussion of general
properties and trends for compounds containing also other lanthanide cations (Ln) we
sometimes use Ln2Ce2O7. LaWO will be used as a general expression for La28-xW4+xO54+δ
compositions within the range of stable ratios of La/W 5.3-5.7 [30, 90, 91], and we further
include the La/W ratio when referring to a compound with specific stoichiometries (e.g.
LaWO54 for the La/W ratio of 5.4). The term vacancy will refer to an oxygen vacancy
unless stated otherwise.
5.1 Structure, defects and ordering in oxygen deficient fluorite oxides
The diffraction studies do not provide a perfect crystal structure, and none of these
compounds is therefore completely ordered. The average structure obtained from Rietveld
refinements - containing partial occupancy, and displacement factors - cannot determine all
details of the local structure. Thus, the compounds cannot be described fully by means of
average structure models when the goal is to understand their conductivity and hydration
88
properties. It is important to understand the local oxygen environment to be able to define
the defect chemistry and reactions occurring. Therefore, we use computational modelling
of the structure and compare with diffraction results to look at possible local structures in
the materials that are consistent with the average structure models. We will in this section
investigate how local structure of LaWO and La2-xNdxCe2O7 influences the materials
properties such as oxide ion conductivity and hydration which depend on oxygen vacancies.
In the LaWO-compositions studied, we find that the local oxygen structure differs strongly
around W and La due to the large difference in cation size and electronegativity. Although
all oxide ions are positioned close to the original fluorite oxygen positions (i.e. at the 8c
Wyckoff position of the space group Fm-3m), W forms strongly bonded and regular WO6
octahedra, contrary to La which has a distorted cubic coordination of oxides with
coordination number between 6 and 8. In La2-xNdxCe2O7, the cations are more similar in
size and electronegativity, and the oxygen structure around the cations are almost identical,
but with a varying degree of long range ordering of the vacancies. There are several
similarities in the crystal structure of LaWO and La2-xNdxCe2O7, but also important
differences in their local structure. By comparing these, we find trends in the coordination
polyhedra of cations and local vacancy ordering related to the size of the cations, and ratio
of electronegativity or size between the cations, in the structure.
The compounds studied can also be viewed as doped systems, e.g. Ln2Ce2O7 (Ln = La and/or
Nd) could be written as Ce1-xLnxO2-0.5*x and LaWO as La28-xW4+xO54+3/2*x [91]. These oxides
have large amounts of vacant oxygen sites corresponding to 12.5% empty sites relative to
the perfect fluorite structure (8c Wyckoff position of space group Fm-3m) for Ln2Ce2O7
and LaWO has even more vacant sites. In both materials classes, the relatively high
concentration of vacancies is far from the dilute limit, and interactions between them must
be expected. For LaWO, the majority of the vacant sites are not considered as charged
vacancies, since they are part of a strong local order around W.
Local structure and oxygen defects in LaWO
The average defective fluorite structure previously determined for LaWO with only one
partially occupied oxygen position [30] does not describe the local oxygen sublattice in a
way consistent with the observed proton uptake [41]. Our GULP and DFT study of LaWO
with excess W ([91] and Paper III), however, solved the apparent limitation on hydration: W
ions always obtain octahedral oxygen coordination and the W-O bonds are shorter and more
regular (i.e. more strong and more covalent) than the La-O bonds. Since only 6 out of 8
nominal oxygen positions coordinating each W cation are occupied in order to obtain 6-fold
octahedral coordination, tungsten strongly “trap”, or lock, two vacancies. For La28W4O54
(LaWO70), 54 of the 64 oxygen positions in the parent fluorite structure are occupied and
89
8 of the vacancies are trapped around the four W cations. The remaining 2 vacancies are
disordered and available for hydration. The local nature of WO6 is the basis of the defect
nomenclature proposed by Erdal et al., which defines the site restrictions and allows us to
describe the concentration of “free” and charged vacancies without additional aliovalent
doping [41]. The strong preference of tungsten for a specific coordination thus limits the
number of available or free vacancies, but it also dictates site restrictions that have to be
followed when W is substituting La.
For lower and stable La/W ratios, we find in Paper IV that the additional W in LaWO54
substitute for La and act as donors by substituting for La located at the La2 site in the fluorite
lattice (which is one of two La sites, La1 and La2). This structural model for the excess W
has been further validated for LaWO56 [92]. As we now will see, the local oxygen structure
around the cations in LaWO is also the key to explain the La/W ratio stability range. In
LaWO54, one La2 substituted by W results in filling 1.5 vacant oxygen sites, leaving only
half a vacancy available for hydration. The connectivity between the WO6 and La2Ox
coordination complexes makes it possible to substitute one La2 with W because the
resulting two WO6 octahedra will be sharing the 2 «trapped» vacancies. In this way, the
average coordination number of La increases while W keeps its preferred octahedral
coordination. Any further W substitution of La is restricted due to the lack of vacant oxygen
positions available to be filled with new oxide ions. The instability of additional W
substitution is encountered experimentally by the observed phase segregation when La/W
< 5.3 [30]. These site restrictions make substitution of the La1 position with W unfavourable
since La1 does not have any connectivity to W. The resulting configuration is forced to
incorporate some oxygen in interstitial positions, consequently yielding a heavily distorted
oxygen structure locally. The material is also not stable when La/W > 5.7 [30] supporting
the idea that the stoichiometry of La28W4O54 results in an unfavourably high vacancy
concentration, since it results in heavy under-coordination of La. The effective coordination
number of La becomes lower due to the strong W-O bonds to the oxygen shared with La2,
making La2 even more vulnerable to under-coordination. This shows how the nature of the
W-O bonds and W coordination number, explain the stability range of LaWO.
Partial C-type diffraction peaks due to ordered domains in La2-xNdxCe2O7
NPD and XRD of the La2-xNdxCe2O7 series give distinct Bragg peaks corresponding to the
simpler fluorite structure but there are super lattice reflections in the Nd containing samples
which indicates some long range order not captured in the simple fluorite structure. The
additional diffuse and broadened Bragg peaks, however, have low intensity and correspond
to only some of the peaks found in the C-type structure of RE2O3. They became more intense
and sharper with increasing Nd-content in La2-xNdxCe2O7. Rietveld refinements show that
a combination of the disordered oxygen deficient fluorite structure and an oxygen excess
90
C-type structure is a good average model for the Nd containing samples of La2-xNdxCe2O7.
50% statistical occupation of the 16c site of space group Ia-3 for the fraction fitted to the
C-type structure, suggests that the partial long range ordering within the fluorite structure
is related to the oxygen positions in this structure.
The most probable source of the super lattice diffraction peaks is formation of domains with
long range ordering of vacancies and size effects from the domains could then explain the
broadened superlattice reflections. To investigate this further, we looked for domains with
vacancy order in the La2-xNdxCe2O7 samples using HR-TEM, inspired by the work of
Withers et al. [57]. Compared to the simple fluorite structure the electron diffraction
patterns revealed extra satellite reflections as seen in the inset of Figure 5. The satellites
around the 220 diffraction spot indicate the presence of domains as previously shown for
Ce1-xYxO2-0.5x (x = ~0.5) by Withers et al. [57]. Figure 5 shows dark field (DF) images
obtained from two regions along the edge of a crystal oriented close to the [-111] zone axis.
The main reflection 220 (consistent with both disordered fluorite structure and C-type
supercell structure as 220 and 440 respectively), has high intensity and it is hard to
distinguish any features within the corresponding dark field image. However, both the
satellites (indexed as 220 + 0 ½ ½ and 220 + -½ 0 ½ with respect to a simple fluorite cell)
show clear intensity variations within their dark field discs as seen in Figure 5. This is a
clear indication of domains with sizes of a few 10ths of nm and, hence, the presence of
nanodomains.
Nanodomains with distorted fluorite structure have similarly been identified in La and Sm
doped ceria by HR-TEM [93]. These nanodomains most likely contain C-type related
vacancy order but not the C-type structure itself, which has a different stoichiometry,
namely RE2O3. The nature of the C-type related vacancy ordering is thoroughly discussed
based on DFT calculations in Paper II, and will be further addressed in the next section.
C-type related vacancy ordering has also been proposed for LaWO57 as a possible origin
of diffuse scattering indicative of long range ordering [91]. The amount of vacancies
increases with increasing La/W ratio in LaWO, which can lead to more vacancy ordering.
This is further supported by the observation of superstructures with HR-TEM in samples
where the more reducible Mo substitute W, and is believed to stem from oxygen vacancies
ordering as the amount increase upon increasing substitution [94].
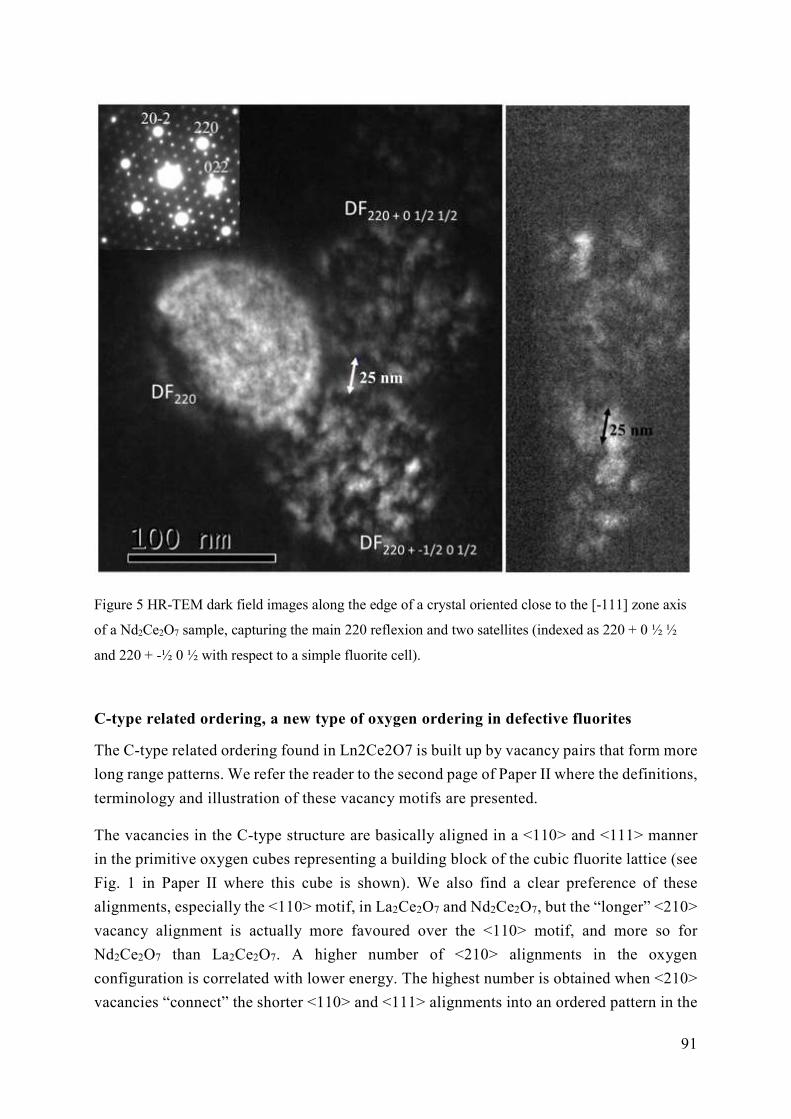
91
Figure 5 HR-TEM dark field images along the edge of a crystal oriented close to the [-111] zone axis
of a Nd2Ce2O7 sample, capturing the main 220 reflexion and two satellites (indexed as 220 + 0 ½ ½
and 220 + -½ 0 ½ with respect to a simple fluorite cell).
C-type related ordering, a new type of oxygen ordering in defective fluorites
The C-type related ordering found in Ln2Ce2O7 is built up by vacancy pairs that form more
long range patterns. We refer the reader to the second page of Paper II where the definitions,
terminology and illustration of these vacancy motifs are presented.
The vacancies in the C-type structure are basically aligned in a <110> and <111> manner
in the primitive oxygen cubes representing a building block of the cubic fluorite lattice (see
Fig. 1 in Paper II where this cube is shown). We also find a clear preference of these
alignments, especially the <110> motif, in La2Ce2O7 and Nd2Ce2O7, but the “longer” <210>
vacancy alignment is actually more favoured over the <110> motif, and more so for
Nd2Ce2O7 than La2Ce2O7. A higher number of <210> alignments in the oxygen
configuration is correlated with lower energy. The highest number is obtained when <210>
vacancies “connect” the shorter <110> and <111> alignments into an ordered pattern in the
92
same manner as for the C-type structure (see Fig. 2 in Paper II). There are some small
differences in the nature of the local ordering between La2Ce2O7 and Nd2Ce2O7 which is
correlated to the cation radius and radius ratio rLn3+/rCe4+ although both compounds have
a preference for C-type related ordering according to our DFT results. In La2Ce2O7 the
shorter vacancy pairs, <110> and <111>, occur slightly more frequently during an MD run,
which could be related to the observation of less long range order in La2Ce2O7 than in
Nd2Ce2O7. Also, the oxygen sublattice of the lowest energy configuration in La2Ce2O7 is
only partly ordered in the C-type manner even though all vacancy pairs are aligned in
favourable <110>, <111> and <210> configurations. Since the cations in this configuration
are ordered in the pyrochlore manner, the effect of the size difference between the two
cations seems to be emphasized resulting in the smaller Ce4+ being coordinated in
octahedrons (<111> vacancy alignment) more frequently than when the cations are
organized in other ordered or disordered configurations. This illustrates that La2Ce2O7 is
closer to, but still far from, the pyrochlore stability range than Nd2Ce2O7, according to the
prediction model from Minervini et al. [28], which states that the cation radius ratio,
rA3+/rB4+, of a A2B2O7 pyrochlore must be above 1.4 in order to form a stable pyrochlore
structured oxide.
Configurations where all vacancies are ordered in the C-type related manner are more
favourable than the random oxygen configurations, independent of the cation arrangements.
This indicates that the vacancy ordering is not driven by strong differences in size and
electronegativity between the cation types contrary to the cation-anion ordering in the
pyrochlore and perovskite structures. In La2Ce2O7 and Nd2Ce2O7 the cations are much more
similar and comparable to the situation in C-type structured Ln2O3, where the oxygen
ordering is the result of the densest and most symmetric ionic arrangement possible of Ln
and O. This also takes into account the coordination based on stoichiometry. We find
evidence that the reasons for long range ordering in Ln2Ce2O7 could be similar.
When relaxing all cell parameters in Nd2Ce2O7 during DFT optimizations the volume
obtained for C-type related ordered configurations is slightly smaller than for disordered
configurations, indicating that these ordering patterns allow for a better close packing and
denser structure. The more disordered configurations thus have more free volume which
enhances ionic conductivity, but gives a higher (less negative) lattice energy, making
disorder less energetically favourable than long range order. When comparing La2Ce2O7
and Nd2Ce2O7, the latter has the smaller lattice constant due to the smaller cation size and
shorter Cat-O bonds. Since we observe more long range vacancy ordering in Nd2Ce2O7 than
in La2Ce2O7, we may speculate whether ordering - giving denser arrangements of the ions
and vacancies - is more important for Nd2Ce2O7 than for La2Ce2O7 due to the smaller unit
cell volume. The authors of a previous study of the disorder-order transition in the NdO1.5-
93
CeO2 system also suggest that the structural relaxation due to oxygen vacancy ordering
could be facilitated by the similar ionic radii of the cations (i.e. Nd+3 more similar to Ce+4
than La+3) and the decreasing unit cell volume with increasing Nd-content [23]. Another
recent work also proposes a maximum value for the size mismatch in order to obtain C-type
ordering intergrown with disordered fluorite structure [58].
Based on the local structure of the low energy oxygen configurations, we can identify some
structural constraints we believe rationalize why ordering and higher symmetry give a
decrease in the lattice energy. Some ordered oxygen configurations can ensure uniform
distribution of vacancies in the lattice and similar average coordination number for the
cations throughout the whole lattice, better than random configurations. The fact that the
<100> vacancy alignments, which are not a part of the favourable vacancy ordering patterns,
are highly unfavourable can be explained by electrostatic repulsion, but equally well by the
fact that the highly distorted coordination sphere created by aligning the vacancies as
nearest neighbours do not “enclose” the cation in a satisfactory way. Heavy under-
coordination of cations is also unfavourable for both La/Nd2Ce2O7 and LaWO, and large
differences in coordination numbers creates heavily distorted coordination polyhedrons.
These could induce additional strain in the lattice [95, 96], which is avoided when the
vacancies are ordered with a fairly even distribution.
Although the local oxygen structure around the La cations in LaWO regarding vacancy
alignments was not studied extensively in our computational work in Paper IV, it is
interesting to revisit the DFT findings in the attempt to identify any similarities with
La2-xNdxCe2O7. When looking at low energy configurations for LaWO54, it becomes clear
that the <100> configurations of vacancy pairs around the 6-fold coordinated La2 are
unfavourable, which is the same as found for La2Ce2O7 and Nd2Ce2O7. We further find
some indications that the <110> alignments of vacancy pairs in a cube around La are found
more frequently than <111> vacancy pairs. The volume of the polyhedron formed when the
vacancies are aligned as third nearest neighbours, i.e. in the <111> pairs, seems to be smaller
and with slightly shorter La-O bonds than when vacancies pairs are <110> aligned. Shorter
La-O bonds could be considered favourable since heavy under coordination of La is not
favourable. However, such a coordination polyhedron seems to give less flexibility and
contributes to a less cubic lattice, as is also seen in La2Ce2O7 and Nd2Ce2O7. There could
be similarities to Ln2Ce2O7 also regarding long range order of vacancies in LaWO; C-type
related ordering was also mentioned as a possible origin of diffuse scattering indicative of
some type of oxygen vacancy ordering observed for a LaWO57 [91].
In reduced ceria and also in many complex fluorites containing trivalent rare earths, the
most frequently observed short range vacancy ordering is the <111> alignment of vacancies
around a cation resulting in an octahedral oxygen coordination around the cation [51, 54].
94
The C-type related ordering, which contains a high fraction of <110> and <210> vacancy
alignments is thus a new structural model describing vacancy ordering in oxygen deficient
fluorites which is different to what has previously been suggested for most oxygen deficient
cubic fluorites (except C-type structured Ln2O3, itself). It is possible that local and long
range order related to the C-type structure could be recognized in other complex fluorite
structures where trivalent Lanthanides are one of the cation constituents.
Effect of cation size on local oxygen structure
From the optimised low energy configurations from DFT calculations, we see a trend in the
local oxygen structure correlated to the ionic radii of the cations or more specifically the
Cat-O bond length:
La-OLaWO > La-OLCO > Nd-ONCO > Ce-ONCO ~ Ce-OLCO > W-OLaWO
Increasing bond length
The smallest cation W obtains more covalent strong bonds creating well defined local order,
whereas the largest cation La, allows for more disorder in the surrounding oxygen lattice.
The La-O bond is longer in LaWO than in La2Ce2O7 due to the strong W-O bonds, pulling
the oxygen away from La, thus stretching the La-O bonds. The local structure of oxygen
around La in LaWO is, accordingly, more distorted and the oxide ions are generally
displaced further away from the initial 16c oxygen positions (or refined as 16e for LaWO)
than in La2Ce2O7. When the ratio between the radii of the cations is increased, it emphasizes
the effect on the local oxygen structure which has been correlated to the size, for both the
smaller and larger cation. This is also seen in the difference between the coordination of Ce
in La2Ce2O7 and Nd2Ce2O7, where the Ce4+ cation is more frequently octahedrally
coordinated in La2Ce2O7 than in Nd2Ce2O7.
By correlating local vacancy order around a cation to its size we then find that <111>
ordering of vacancies is preferred for the smaller cations with higher electronegativity,
giving less polar and ionic bonds. The <111> vacancy alignments are found in heavily
oxygen deficient ZrO2-x and CeO2-x as well as for the smaller cation in the pyrochlore
structures. The C-type related vacancy ordering is seen in fluorite derived cubic structures
where there are larger cations with low electronegativity, such as Lanthanides (seen that the
cations have similar size if there are more than one type). All in all, we can conclude that
local vacancy ordering around cations in cubic fluorites can be correlated to the cation size
and electronegativity.
95
5.2 Energetics of ordering in La2-xNdxCe2O7
In Paper II we find that the C-type related ordering of oxygen vacancies gives an enthalpy
gain for both La2Ce2O7 and Nd2Ce2O7 compared to other types of ordered and randomly
generated configurations. Long range order is only observed for the Nd containing samples
of the La2-xNdxCe2O7 series and such long range order is found in certain domains in the
sample. These observations leave us with two questions that are yet not thoroughly
answered: Why do we only observe partial long range ordering of vacancies if this type of
ordering is energetically favourable? Why do we experimentally observe more disorder in
La2Ce2O7 than in Nd2Ce2O7?
Entropy of disorder
We attempt to answer the first of these questions in Paper II by sketching out two possible
explanations by comparing of the optimised energies for different configurations calculated
using DFT. One possible explanation is that the two lowest energy configurations of
La2Ce2O7 have lower symmetry than those of the “Ctype1” configuration, thereby having a
higher degeneracy and are thus representing a more disordered system. However, these low
energy configurations have an ordered cation sublattice and we argue that ordered cation
configurations are unlikely to exist in the characterized samples. Firstly, the structure
analysis in Paper I using ND gives no evidence of cation order. Secondly, there is a strong
possibility that the cation lattice of La2Ce2O7 and Nd2Ce2O7 contains frozen-in disorder at
room temperature where the diffraction studies are performed. If we do not take cation
ordered configurations into consideration, the energy difference between vacancy
disordered and ordered configurations is lower for La2Ce2O7 than for Nd2Ce2O7. On the
other hand, many vacancy disordered configurations are not thermally available if we only
look at the enthalpies from DFT. This suggests that a comparison of enthalpies between the
different configurations only, does not give us the complete explanation to what we observe
experimentally. We also need to consider entropy contributions to the Gibbs energy.
The Gibbs energy (including also entropy) of the systems we observe experimentally is thus
important and although further studies are required to determine exact values of entropy
contributions to these structures, we still can make some assumptions.
Vibrational entropy could contribute differently to the Gibbs energy for the two compounds.
In general when increasing the volume and bond lengths the vibrational entropy
contribution to the free energy increases, comparing identical atomic arrangements. Both
compounds will most likely be stabilized as disordered fluorites at sufficiently high
temperatures. However, a larger vibrational entropy of La2Ce2O7 due to its larger lattice
constants could stabilize more disordered oxygen configurations to lower temperatures for
La2Ce2O7 than for Nd2Ce2O7. That is the configurational and vibrational entropies couples.
96
In the MD calculations we indeed find that dynamic disorder contributes to a higher degree
of oxygen disorder in La2Ce2O7 than in Nd2Ce2O7.
Since the more disordered compounds usually have a higher configurational entropy
contribution than ordered ones, the enthalpy difference between ordered and disordered
configurations is likely to be smaller than what is apparent solely from DFT results. There
might be more ways to organize the vacancies locally for La2Ce2O7 than explored in our
small 88 ion cell in Paper II (i.e. the <111> vacancy pairs less unfavourable when
coordinating Ce4+). That is, there could be more configurations close in energy to the lowest
energy configuration than we have found during our calculations. More configurations close
in energy indicate higher configurational entropy and would indicate that La2Ce2O7 is more
disordered at lower temperature than Nd2Ce2O7.
Since long range order is favourable only at sufficiently low temperatures, low mobility
could result in frozen-in disorder, as thoroughly discussed in Paper II. The thermal history
of La2-xNdxCe2O7 samples is therefore crucial for the degree of ordering present at low
temperatures. Thermal history is also important for the LaWO system where higher oxygen
deficiency related to higher La content (LaWO56 and LaWO57) is only stabilized at higher
temperatures and the stoichiometry is frozen-in if cooled sufficiently fast to low
temperatures [90].
Enthalpy of disordering
In this section we will sketch out a simplified model that can describe the order-disorder
transition in a defect chemical manner which can help us connect the activation energy of
oxide ion conductivity to the observed ordering of vacancies. The fact that we observe that
the amount of domains with vacancy order increases with x in La2-xNdxCe2O7, could be an
indication of an equilibrium reaction between disordered vacancies and vacancies that are
ordered, either in clusters with intermediate range or in nanodomains with long range order.
We have seen no evidence of an abrupt phase transition and instead we expect a
development of ordering with decreasing temperature. This can be linked to the C-type
related ordering found from DFT calculations consisting of distinct vac-vac alignments, e.g.
<110> and <210> building blocks which align to form (C-type related) ordered clusters and
domains That is, we expect the disorder-order reaction to start with the formation of vacancy
pairs, before more vacancies collectively combine to first form clusters, followed by (more)
long range ordered patterns. This process is comparable to the association-dissociation
process between defects forming and dissolving dimers, trimers and larger clusters, and a
proposed disordering reaction equation could be:
(v v )•••• = v••, ( 28 )
97
where the reactant is ordered pairs of vacancies and the product two disordered vacancies.
More generally for larger clusters and domains the reaction could be written as:
(𝑛v ) (••) = v•• ( 29 )
Since it will require energy to disorder vacancies with strong interaction, the enthalpy part,
Δ𝐻 , of the change in Gibbs energy, ΔG, for the disordering reaction is naturally
endothermic. The concentration of disordered vacancies will increase with temperature
depending on the enthalpy through the expression for the equilibrium constant, 𝐾 :
𝐾 = 𝐾 , exp = [ ••]
•• / ( 30 )
This “equilibrium reaction-model” is also able to rationalize the presence of some short to
intermediate range order in La2Ce2O7 at low temperatures (i.e. room temp) as proposed in
Paper II based on DFT results and the modulations observed in the diffraction patterns in
Paper I. As a part of the equilibrium model, one should also expect the presence of some
short range order, in addition to domains with long range order also in the Nd containing
compositions of La2-xNdxCe2O7.
Based on the ordering observed of vacancies through La2-xNdxCe2O7 we expect that
Δ𝐻 increases with increasing x. The long range ordered vacancies are stabilized so
much that they become immobile. This is supported by the observation of reduced
conductivity through reduced fraction of contributing vacancies due to ordering in
nanodomains [93]. Short range order, such as pairs and clusters, has weaker interactions but
can also influence the stability and concentration and mobility of vacancies at low
temperatures. Although, Δ𝐻 in the case of long range order is expected to be
significantly higher than the energy needed to disorder short range ordered vacancies, we
use the same term for simplicity. We do not aim to provide exact values, but use the enthalpy
term to illustrate how it contributes to the activation energy of conductivity.
Only vacancies that are mobile can contribute to vacancy conductivity, or put differently,
an oxide ion can only jump to a vacant position if the vacancy is considered disordered and
available for an oxide ion to jump to. The concentration of available and disordered
vacancies is temperature dependent and can be derived by using Equation ( 30 ). However,
in order to simplify the expression we will consider the two limiting situations; where all
vacancies are ordered and where all vacancies are disordered. We use the electroneutrality
condition:
[Ln ] = [𝑛v ••] + 2[v••] ( 31 )
98
in order to relate the concentration of vacancies to the concentration of dopants. If we
assume that almost all vacancies will be ordered at sufficiently low temperature, then:
[Ln ] = [𝑛v ••] ( 32 )
By expressing the concentration of 𝑛v •• in terms of the constant dopant concentration and
inserting in to Equation ( 30 ) we obtain:
[vO••] = 𝑛/2 LnCe
′ 1/𝑛𝐾0,𝑑𝑖𝑠𝑜𝑟𝑑𝑒𝑟 exp
−Δ𝐻𝑑𝑖𝑠𝑜𝑟𝑑𝑒𝑟
𝑅𝑇 ( 33 )
The Δ𝐻 will therefore contribute to the activation energy, EA, for oxide ion
conductivity in La2-xNd2Ce2O7, in addition to the enthalpy of mobility, ΔHmob, which is the
enthalpy needed for a oxide ion jump in the case of disassociated or disordered vacancies:
𝐸 = Δ𝐻 + Δ𝐻 .
However if all vacancies are disordered, the concentration is constant for the given
temperature range (i.e. all vacancies are disordered) and then 𝐸 is reduced to only ΔHmob.
(This is also the case if the temperature is too low to activate disordering which results in
the fraction of vacancies being ordered remains constant.) For the transition between these
two situations, the expression for the vacancy concentration cannot be simplified and will
be a quadratic expression. In order to keep the connection between ordering/disordering and
the activation energy simple, we will none-the-less describe the apparent activation energy
as the sum of Δ𝐻 and Δ𝐻 for the temperature regions where 𝐸 is not solely
determined by Δ𝐻 .
The correlation between vacancy-vacancy interaction and conductivity is similar to those
previously used for acceptor-vacancy associations in the dilute limit, e.g. in doped ceria
where they see variations in 𝐸 with temperature [45-47]. In our work on La2-xNdxCe2O7,
we also see some variation in 𝐸 with temperature, which may reflect effects of ordering,
and the difference in Δ𝐻 for the different compositions is reflected in the
conductivity data for the La2-xNdxCe2O7 samples. Figure 6 presents the isobaric
conductivities in dry argon in an Arrhenius representation (Paper III) for the two end
members La2Ce2O7 and Nd2Ce2O7. The fitted activation energies and pre-exponentials for
the La2-xNdxCe2O7 samples are listed in Table 1 and included for the end members in Figure
6. Table 1 and Figure 6 show that the apparent 𝐸 for La2Ce2O7 decreases with increasing
temperature, and even more than listed here, to 95 kJ/mol at the highest temperatures (as
mentioned in Paper III). By contrast, 𝐸 for Nd2Ce2O7 apparently increases with increasing
temperature within the temperature window of our conductivity measurements.
The change in the apparent activation energy of the conductivity for the La rich
compositions (i.e. La2-xNdxCe2O7 with x = 0, 0.5 and 1), going from higher to lower values
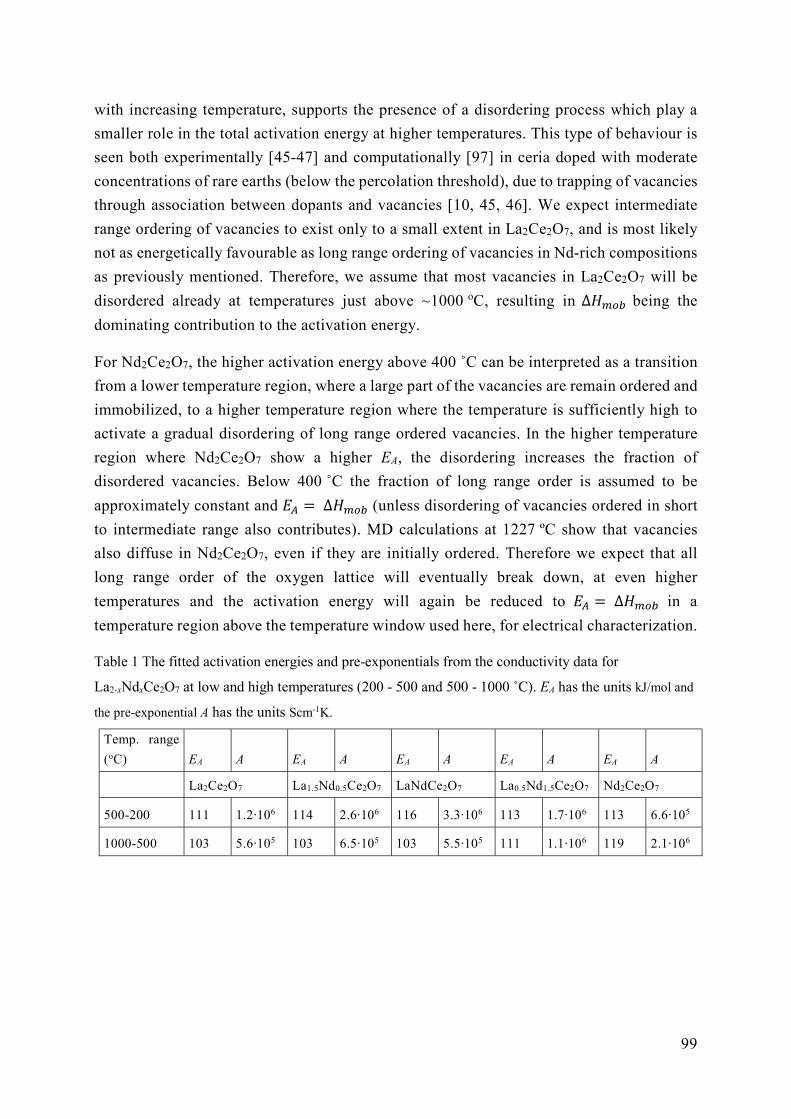
99
with increasing temperature, supports the presence of a disordering process which play a
smaller role in the total activation energy at higher temperatures. This type of behaviour is
seen both experimentally [45-47] and computationally [97] in ceria doped with moderate
concentrations of rare earths (below the percolation threshold), due to trapping of vacancies
through association between dopants and vacancies [10, 45, 46]. We expect intermediate
range ordering of vacancies to exist only to a small extent in La2Ce2O7, and is most likely
not as energetically favourable as long range ordering of vacancies in Nd-rich compositions
as previously mentioned. Therefore, we assume that most vacancies in La2Ce2O7 will be
disordered already at temperatures just above ~1000 oC, resulting in Δ𝐻 being the
dominating contribution to the activation energy.
For Nd2Ce2O7, the higher activation energy above 400 ˚C can be interpreted as a transition
from a lower temperature region, where a large part of the vacancies are remain ordered and
immobilized, to a higher temperature region where the temperature is sufficiently high to
activate a gradual disordering of long range ordered vacancies. In the higher temperature
region where Nd2Ce2O7 show a higher EA, the disordering increases the fraction of
disordered vacancies. Below 400 ˚C the fraction of long range order is assumed to be
approximately constant and 𝐸 = Δ𝐻 (unless disordering of vacancies ordered in short
to intermediate range also contributes). MD calculations at 1227 ºC show that vacancies
also diffuse in Nd2Ce2O7, even if they are initially ordered. Therefore we expect that all
long range order of the oxygen lattice will eventually break down, at even higher
temperatures and the activation energy will again be reduced to 𝐸 = Δ𝐻 in a
temperature region above the temperature window used here, for electrical characterization.
Table 1 The fitted activation energies and pre-exponentials from the conductivity data for
La2-xNdxCe2O7 at low and high temperatures (200 - 500 and 500 - 1000 ˚C). EA has the units kJ/mol and
the pre-exponential A has the units Scm-1K.
Temp. range
(oC) EA A EA A EA A EA A EA A
La2Ce2O7 La1.5Nd0.5Ce2O7 LaNdCe2O7 La0.5Nd1.5Ce2O7 Nd2Ce2O7
500-200 111 1.2∙106 114 2.6∙106 116 3.3∙106 113 1.7∙106 113 6.6∙105
1000-500 103 5.6∙105 103 6.5∙105 103 5.5∙105 111 1.1∙106 119 2.1∙106
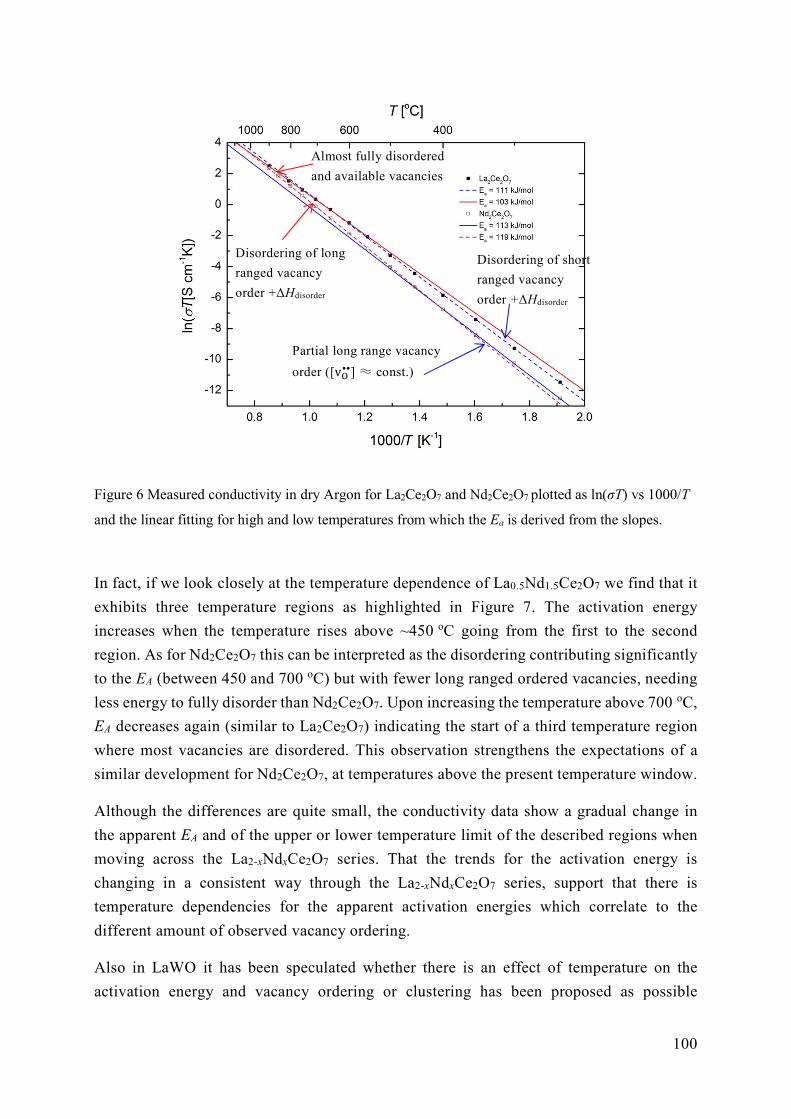
100
Figure 6 Measured conductivity in dry Argon for La2Ce2O7 and Nd2Ce2O7 plotted as ln(σT) vs 1000/T
and the linear fitting for high and low temperatures from which the Ea is derived from the slopes.
In fact, if we look closely at the temperature dependence of La0.5Nd1.5Ce2O7 we find that it
exhibits three temperature regions as highlighted in Figure 7. The activation energy
increases when the temperature rises above ~450 oC going from the first to the second
region. As for Nd2Ce2O7 this can be interpreted as the disordering contributing significantly
to the EA (between 450 and 700 oC) but with fewer long ranged ordered vacancies, needing
less energy to fully disorder than Nd2Ce2O7. Upon increasing the temperature above 700 oC,
EA decreases again (similar to La2Ce2O7) indicating the start of a third temperature region
where most vacancies are disordered. This observation strengthens the expectations of a
similar development for Nd2Ce2O7, at temperatures above the present temperature window.
Although the differences are quite small, the conductivity data show a gradual change in
the apparent EA and of the upper or lower temperature limit of the described regions when
moving across the La2-xNdxCe2O7 series. That the trends for the activation energy is
changing in a consistent way through the La2-xNdxCe2O7 series, support that there is
temperature dependencies for the apparent activation energies which correlate to the
different amount of observed vacancy ordering.
Also in LaWO it has been speculated whether there is an effect of temperature on the
activation energy and vacancy ordering or clustering has been proposed as possible
Partial long range vacancy
order ([v••] ≈ const.)
Disordering of short
ranged vacancy
order +ΔHdisorder
Disordering of long
ranged vacancy
order +ΔHdisorder
Almost fully disordered
and available vacancies
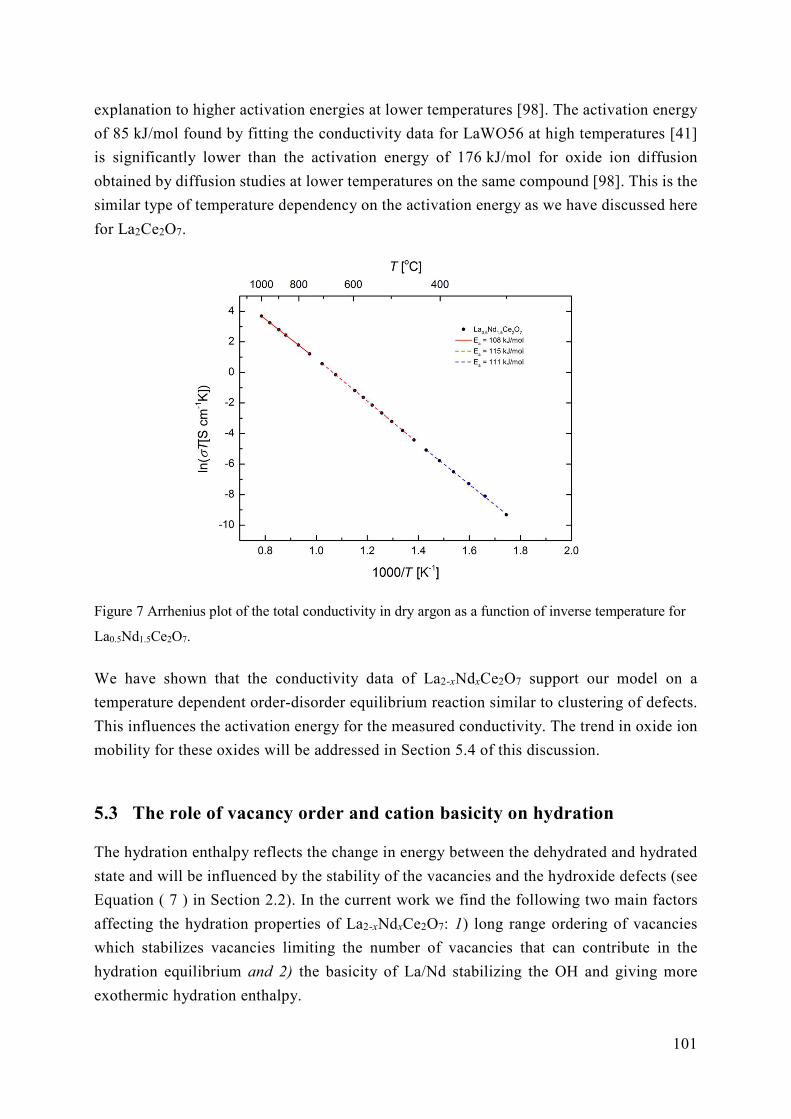
101
explanation to higher activation energies at lower temperatures [98]. The activation energy
of 85 kJ/mol found by fitting the conductivity data for LaWO56 at high temperatures [41]
is significantly lower than the activation energy of 176 kJ/mol for oxide ion diffusion
obtained by diffusion studies at lower temperatures on the same compound [98]. This is the
similar type of temperature dependency on the activation energy as we have discussed here
for La2Ce2O7.
Figure 7 Arrhenius plot of the total conductivity in dry argon as a function of inverse temperature for
La0.5Nd1.5Ce2O7.
We have shown that the conductivity data of La2-xNdxCe2O7 support our model on a
temperature dependent order-disorder equilibrium reaction similar to clustering of defects.
This influences the activation energy for the measured conductivity. The trend in oxide ion
mobility for these oxides will be addressed in Section 5.4 of this discussion.
5.3 The role of vacancy order and cation basicity on hydration
The hydration enthalpy reflects the change in energy between the dehydrated and hydrated
state and will be influenced by the stability of the vacancies and the hydroxide defects (see
Equation ( 7 ) in Section 2.2). In the current work we find the following two main factors
affecting the hydration properties of La2-xNdxCe2O7: 1) long range ordering of vacancies
which stabilizes vacancies limiting the number of vacancies that can contribute in the
hydration equilibrium and 2) the basicity of La/Nd stabilizing the OH and giving more
exothermic hydration enthalpy.
102
Vacancy ordering limiting hydration
Our preliminary DFT results suggest that long range ordering of vacancies in La2-xNdxCe2O7
stabilizes vacancies to such a degree that the amount of vacancies available for hydration is
reduced at low temperatures. Strong stabilization of vacancies through long range ordering
is supported by the negative formation energy of the oxides found with DFT when
configured with the C-type related vacancy order (“Ctype1”) for La2Ce2O7 and Nd2Ce2O7.
Using DFT we estimate how the energy changes for a supercell by incorporating both one
proton and one hydroxide defect at expected favourable positions in initially ordered and
disordered configurations (additional details on the method are presented in Section 3.6).
Although these preliminary test calculations cannot be used to accurately predict the
hydration enthalpy, they will still point out some important observations. The first
observation is that only when we allow the protons and oxide ions to relocate and relax after
incorporation, using MD simulations, it results in hydrated configurations giving
exothermic hydration enthalpies (see Figure 8). When able to relax through MD, the
vacancies tend to order in C-type related manner like in the dehydrated configurations,
reducing the total energy of the system. The results in Figure 8 show that the total energy
varies significantly depending on the ordering of the oxygen sublattice both before and after
hydration. The energy difference between disorder and ordered oxygen configurations is
larger than the energy difference between dehydrated and hydrated state.
From these simulations, it is important to recognize that we have not found any hydrated
configuration for any of the compounds studied that can provide exothermic hydration
enthalpy when compared to the energy of the dehydrated “Ctype1” structure. Consequently,
vacancies that are part of long range ordered domains with C-type related order do not
hydrate. We may conclude that only the disordered vacancies in La2-xNdxCe2O7 contribute
to the effective vacancy concentration possible to hydrate.
The maximum hydration levels found for La2-xNdxCe2O7 are, however, not limited by long
range vacancy ordering alone. Our model where hydration of the disordered vacancies is
driven and limited by proton trapping on La/Nd coordinated oxide ions, gives a reasonable
fit to the maximum hydration relative to the amount of disordered domains (presented in
Paper III and to be discussed shortly). However, there is still a small deviation between the
maximum hydration based on these two models and the observed maximum hydration levels.
This additional limitation in the hydration level at low temperatures could be explained by
the presence of short range vacancy order in La2-xNd2Ce2O7 in the domains that are
otherwise considered disordered. Evolving short to intermediate range ordering as the
temperature decreases, may give a slight decrease of the concentration of disordered
vacancies as the hydration enthalpy changes to less exothermic values.
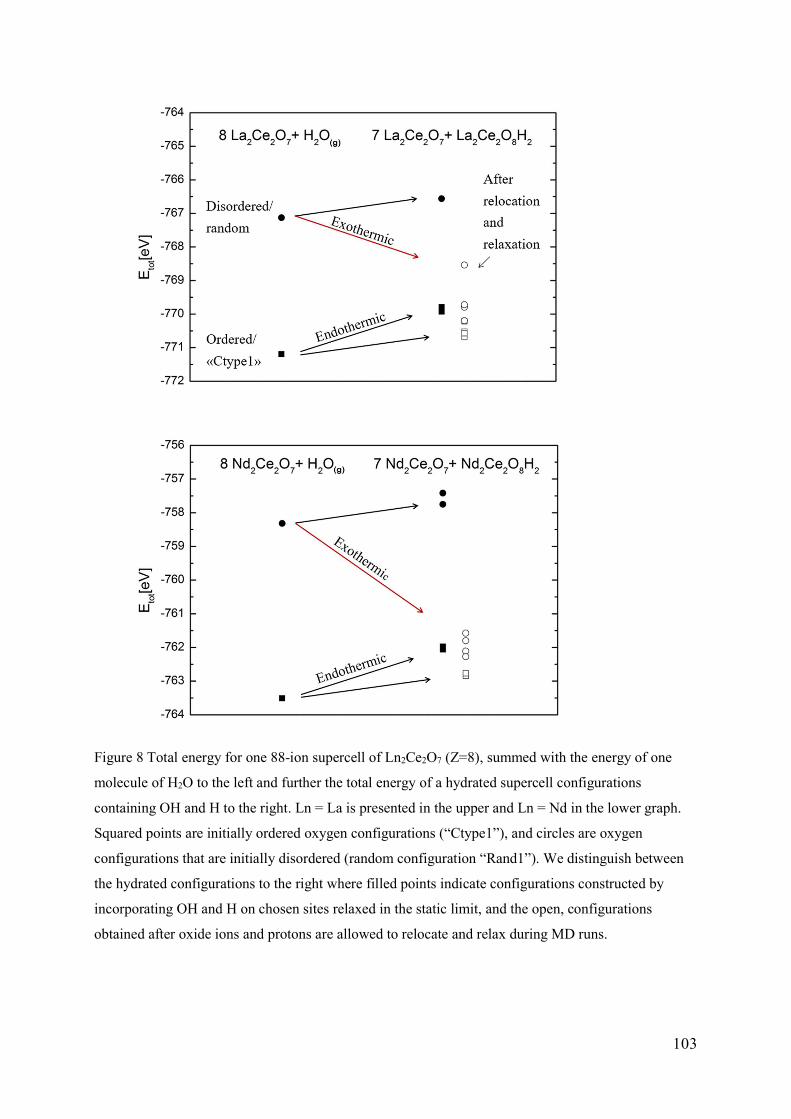
103
Figure 8 Total energy for one 88-ion supercell of Ln2Ce2O7 (Z=8), summed with the energy of one
molecule of H2O to the left and further the total energy of a hydrated supercell configurations
containing OH and H to the right. Ln = La is presented in the upper and Ln = Nd in the lower graph.
Squared points are initially ordered oxygen configurations (“Ctype1”), and circles are oxygen
configurations that are initially disordered (random configuration “Rand1”). We distinguish between
the hydrated configurations to the right where filled points indicate configurations constructed by
incorporating OH and H on chosen sites relaxed in the static limit, and the open, configurations
obtained after oxide ions and protons are allowed to relocate and relax during MD runs.
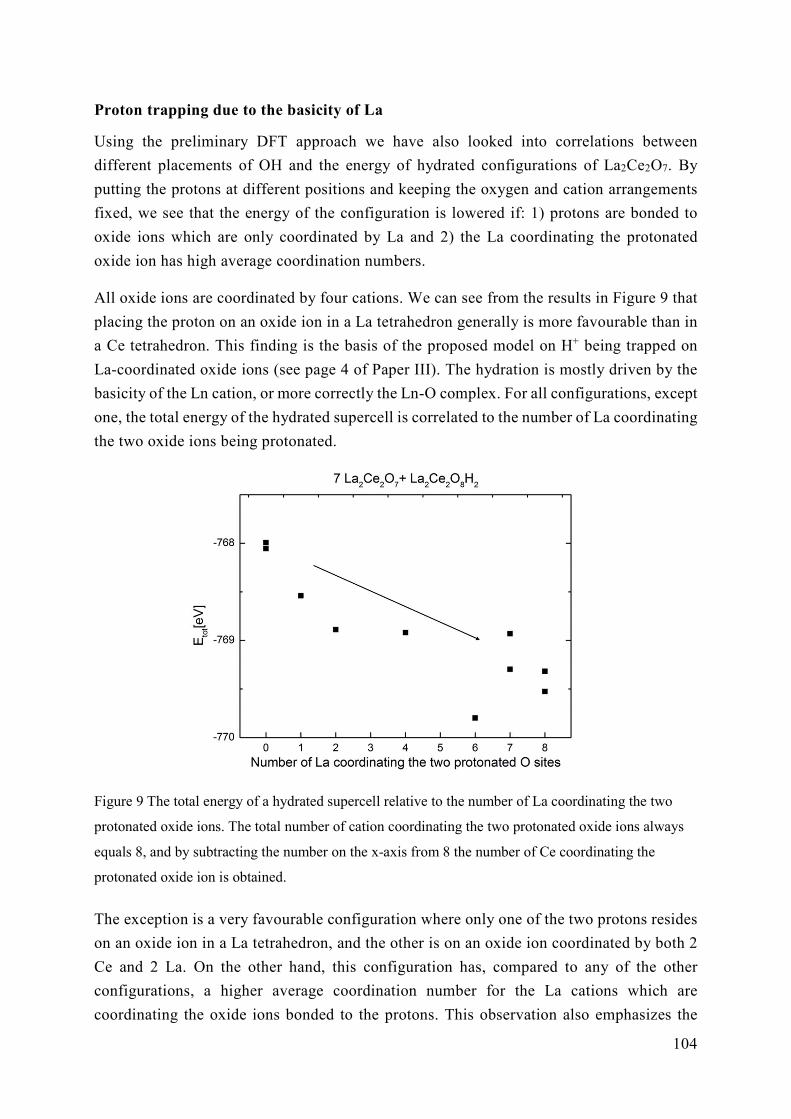
104
Proton trapping due to the basicity of La
Using the preliminary DFT approach we have also looked into correlations between
different placements of OH and the energy of hydrated configurations of La2Ce2O7. By
putting the protons at different positions and keeping the oxygen and cation arrangements
fixed, we see that the energy of the configuration is lowered if: 1) protons are bonded to
oxide ions which are only coordinated by La and 2) the La coordinating the protonated
oxide ion has high average coordination numbers.
All oxide ions are coordinated by four cations. We can see from the results in Figure 9 that
placing the proton on an oxide ion in a La tetrahedron generally is more favourable than in
a Ce tetrahedron. This finding is the basis of the proposed model on H+ being trapped on
La-coordinated oxide ions (see page 4 of Paper III). The hydration is mostly driven by the
basicity of the Ln cation, or more correctly the Ln-O complex. For all configurations, except
one, the total energy of the hydrated supercell is correlated to the number of La coordinating
the two oxide ions being protonated.
Figure 9 The total energy of a hydrated supercell relative to the number of La coordinating the two
protonated oxide ions. The total number of cation coordinating the two protonated oxide ions always
equals 8, and by subtracting the number on the x-axis from 8 the number of Ce coordinating the
protonated oxide ion is obtained.
The exception is a very favourable configuration where only one of the two protons resides
on an oxide ion in a La tetrahedron, and the other is on an oxide ion coordinated by both 2
Ce and 2 La. On the other hand, this configuration has, compared to any of the other
configurations, a higher average coordination number for the La cations which are
coordinating the oxide ions bonded to the protons. This observation also emphasizes the
105
importance of the effective basicity of the La-O: A higher oxygen coordination of the cation
leads to weaker La-O bonds resulting in the complex becoming more basic.
Basicity of cations as key role in hydration
In LaWO and La2-xNd2Ce2O7 we have until now concluded that only disordered vacancies
contribute to the hydration process. As we have seen strong local vacancy order around W
in LaWO, limits the concentration of vacancies available for hydration, whereas in
La2-xNdxCe2O7 the long range ordering of vacancies in domains does the same. DFT
calculations also show that it is the oxide ions coordinated to the more basic cation La that
will be bonded to protons in disordered La2Ce2O7. Also in LaWO, we find from DFT that
protons prefer to reside on oxide ions coordinated by the less acidic La cation, as we have
commented on in a previous work [41]. The limited hydration in disordered La2Ce2O7 seen
in Paper III, called for an alternative model to the classic model where oxides are hydrated
through hydration of existing vacancies and the concentration of vacancies determines the
maximum hydration level. Therefore, we proposed a model where only statistically fully
La3+ coordinated oxide ions are protonated (see page 4 of Paper III). That is, the basicity of
La3+ enables the hydration in La2Ce2O7 but also creates a site restriction for protons limiting
the hydration. We assume that Nd ions in the disordered domains of Nd2Ce2O7 plays the
same role, although they have lower basicity. We will now assess this hydration model and
how it is connected to observed trends in the hydration enthalpy of different relevant groups
of oxides.
The hydration enthalpy of sesquioxides and pyrochlore structured oxides, has opposite
correlations with Ln size as we now will see. For the sesquioxides (Ln2O3), Nd2O3 has
smaller cation radius and lattice parameters and displays a more exothermic hydration
enthalpy than La2O3 (-107 kJ/mol and -75 kJ/mol respectively [99]). For all the A-type and
C-type sesquioxides the hydration enthalpy becomes more exothermic with smaller Ln
cation sizes [36]. The hydration enthalpy of doped Ln2B2O7 with the pyrochlore structure,
shows the opposite trend than the sesquioxides with respect to the size correlation; the
hydration enthalpy becomes less exothermic with smaller Ln size [32].
However, the stability of the pyrochlores increases with the larger rLn3+/rB4+ [32], and for
the sesquioxides the stability of the oxide increases with decreasing size [36]. Consequently,
there is a correlation between the hydration enthalpy and the stability of the oxides for both
oxide systems, which is rationalized by relating the oxides stability and the energy needed
to form oxygen vacancies. Oxygen vacancies become more difficult to form the more stable
the oxide is, resulting in less stable vacancies. Filling of vacancies then contributes
significantly to exothermic enthalpy change when the oxide is hydrated. For all moderately
doped oxides with high formation enthalpy for oxygen vacancies, it is likely that filling of
106
vacancies will contribute significantly, and the stability of introduced vacancies will explain
trends of changing hydration enthalpy within a class of oxides.
For La2-xNdxCe2O7, however, the correlation between oxide stability and hydration enthalpy
fails to predict how the enthalpy of hydration will change through the series. First, if we
consider La2-xNdxCe2O7 to be 50% Ln doped CeO2, the stability of the undoped oxide is the
same for all compositions. The total energy of the doped oxide, La2-xNdxCe2O7, should
rather represent the stability of vacancies. Then the DFT results imply a more exothermic
hydration enthalpy for Nd2Ce2O7 since La2Ce2O7 is found to be more stable than Nd2Ce2O7
(see Paper II). This is not the case since the hydration enthalpy is found to be less exothermic
when La is substituted by the smaller Nd cation. Although the concentration of vacancies
is highly limited by vacancy ordering, the relative stability of the disordered oxygen lattice
can thus not rationalize the trend for the value of hydration enthalpy observed in Ln2Ce2O7.
Instead, we can correlate the hydration enthalpy in Ln2Ce2O7 to the basicity of Ln3+ and the
resulting bond length between Ln and oxide ions. Generally, a more basic oxide dissolves
water more easily, and the basicity is a good correlation factor when looking at formation
of oxyhydroxides from sesquioxides which happens more readily for the bigger La and Nd
than for the smaller Ln cations in the period [100]. The sesquioxides on the other hand
becomes less ionic and basic with decreasing Ln-O bond length [100], which notably is an
argument for the hydration enthalpy of doped sesquioxides being dominated by the stability
of the charge compensating vacancies, not basicity. Since basicity may rationalize how the
hydration enthalpy changes in the La2-xNdxCe2O7 series, we should try to understand any
similarities to the formation of oxyhydroxides from sesquioxides, although we do not form
Ln(OH)3 in our La2-xNdxCe2O7 samples.
Formation of La(OH)3 and Nd(OH)3 from Ln2O3 with the A-type hexagonal structure
includes a phase transition as there are no obvious empty oxygen sites in the (undoped and
perfect) hexagonal structure for interstitial OH groups. But, if Ln2O3 is in the C-type
structure there will be room for some interstitial hydroxide groups on the empty 16c
positions of the cubic fluorite. Interestingly, a study from Nagao et al. has shown that the
crystal structure of Nd2O3 affects the hydration mechanisms, and C-type structured Nd2O3
has a higher reactivity towards water than A-type structured. Actually the C-type structure
hydrates first to NdOOH which is structurally related to the C-type structure, before further
transitioning to Nd(OH)3 [100]. This would correspond to the incorporation of water as
described in our hydration model where H+ associates to O connected to Ln3+ only, within
the Ln2Ce2O7 matrix. The filling of a vacant position (whether it is considered to create an
interstitial or fill a vacancy) could be merely exothermic or even endothermic as long as the
H+ trapping provides sufficient enthalpy gain to the hydration process. There are thus
structural similarities between the C-type sesquioxides and their hydrated forms LnOOH.
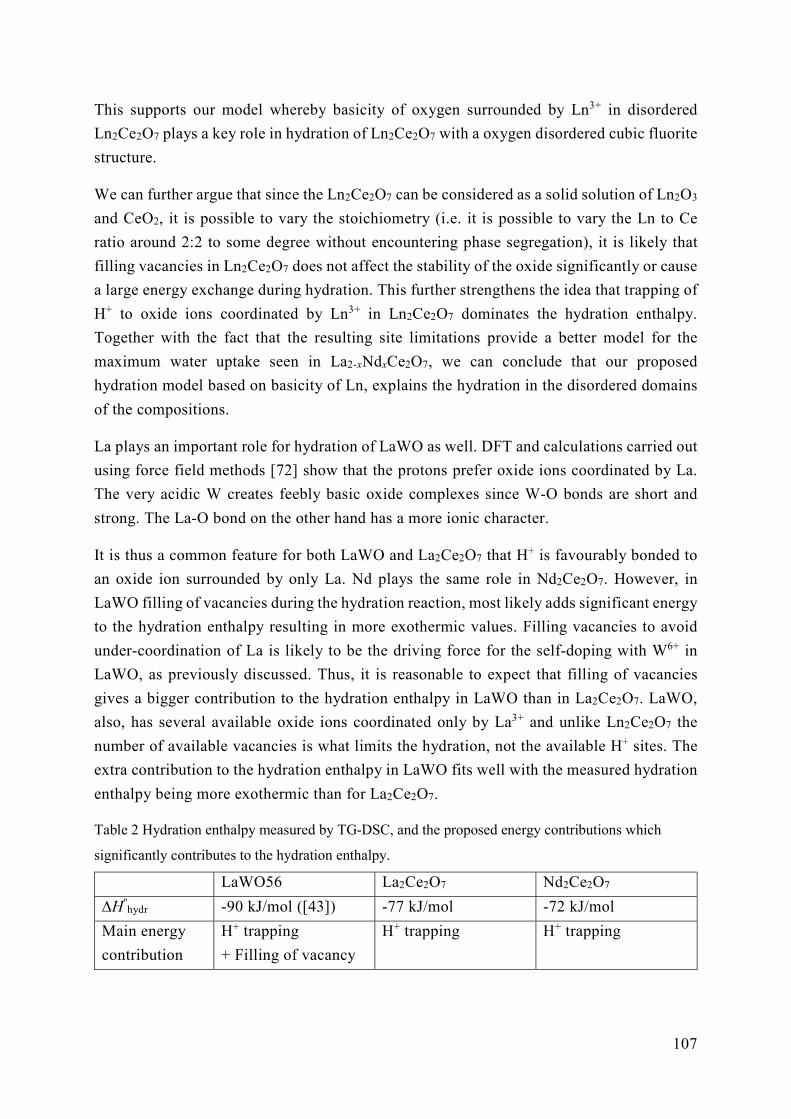
107
This supports our model whereby basicity of oxygen surrounded by Ln3+ in disordered
Ln2Ce2O7 plays a key role in hydration of Ln2Ce2O7 with a oxygen disordered cubic fluorite
structure.
We can further argue that since the Ln2Ce2O7 can be considered as a solid solution of Ln2O3
and CeO2, it is possible to vary the stoichiometry (i.e. it is possible to vary the Ln to Ce
ratio around 2:2 to some degree without encountering phase segregation), it is likely that
filling vacancies in Ln2Ce2O7 does not affect the stability of the oxide significantly or cause
a large energy exchange during hydration. This further strengthens the idea that trapping of
H+ to oxide ions coordinated by Ln3+ in Ln2Ce2O7 dominates the hydration enthalpy.
Together with the fact that the resulting site limitations provide a better model for the
maximum water uptake seen in La2-xNdxCe2O7, we can conclude that our proposed
hydration model based on basicity of Ln, explains the hydration in the disordered domains
of the compositions.
La plays an important role for hydration of LaWO as well. DFT and calculations carried out
using force field methods [72] show that the protons prefer oxide ions coordinated by La.
The very acidic W creates feebly basic oxide complexes since W-O bonds are short and
strong. The La-O bond on the other hand has a more ionic character.
It is thus a common feature for both LaWO and La2Ce2O7 that H+ is favourably bonded to
an oxide ion surrounded by only La. Nd plays the same role in Nd2Ce2O7. However, in
LaWO filling of vacancies during the hydration reaction, most likely adds significant energy
to the hydration enthalpy resulting in more exothermic values. Filling vacancies to avoid
under-coordination of La is likely to be the driving force for the self-doping with W6+ in
LaWO, as previously discussed. Thus, it is reasonable to expect that filling of vacancies
gives a bigger contribution to the hydration enthalpy in LaWO than in La2Ce2O7. LaWO,
also, has several available oxide ions coordinated only by La3+ and unlike Ln2Ce2O7 the
number of available vacancies is what limits the hydration, not the available H+ sites. The
extra contribution to the hydration enthalpy in LaWO fits well with the measured hydration
enthalpy being more exothermic than for La2Ce2O7.
Table 2 Hydration enthalpy measured by TG-DSC, and the proposed energy contributions which
significantly contributes to the hydration enthalpy.
LaWO56 La2Ce2O7 Nd2Ce2O7
∆Hºhydr -90 kJ/mol ([43]) -77 kJ/mol -72 kJ/mol
Main energy
contribution
H+ trapping
+ Filling of vacancy
H+ trapping H+ trapping
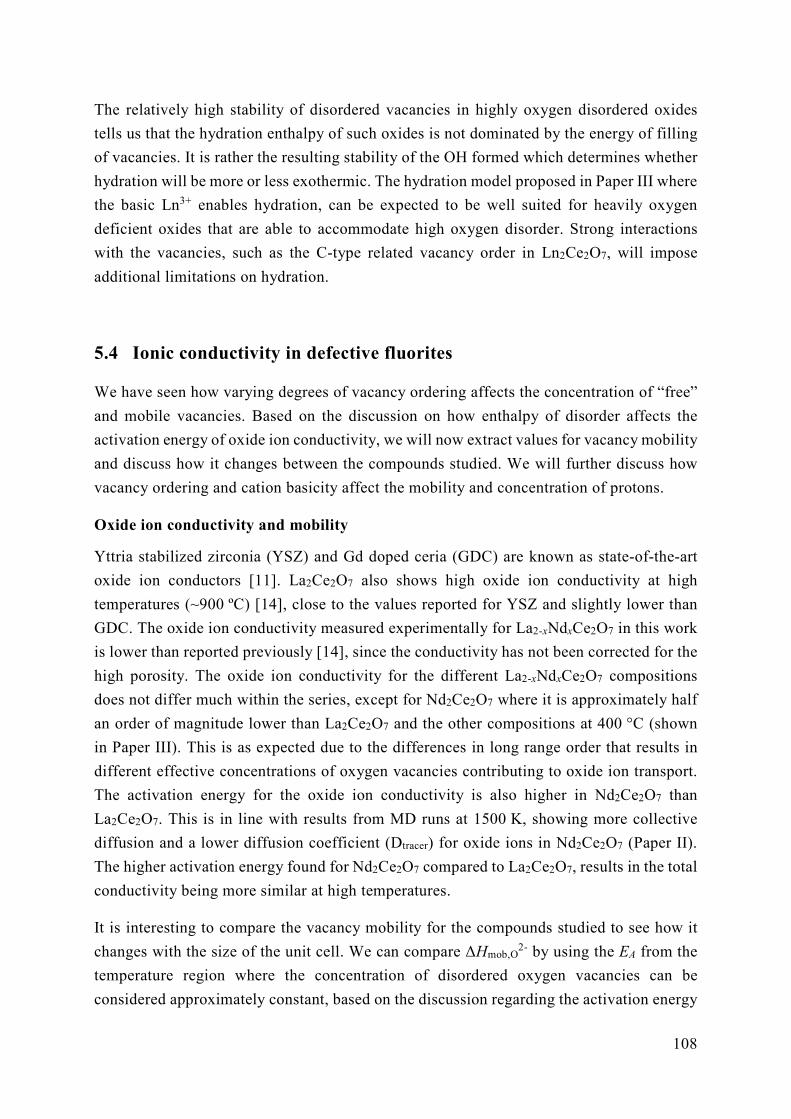
108
The relatively high stability of disordered vacancies in highly oxygen disordered oxides
tells us that the hydration enthalpy of such oxides is not dominated by the energy of filling
of vacancies. It is rather the resulting stability of the OH formed which determines whether
hydration will be more or less exothermic. The hydration model proposed in Paper III where
the basic Ln3+ enables hydration, can be expected to be well suited for heavily oxygen
deficient oxides that are able to accommodate high oxygen disorder. Strong interactions
with the vacancies, such as the C-type related vacancy order in Ln2Ce2O7, will impose
additional limitations on hydration.
5.4 Ionic conductivity in defective fluorites
We have seen how varying degrees of vacancy ordering affects the concentration of “free”
and mobile vacancies. Based on the discussion on how enthalpy of disorder affects the
activation energy of oxide ion conductivity, we will now extract values for vacancy mobility
and discuss how it changes between the compounds studied. We will further discuss how
vacancy ordering and cation basicity affect the mobility and concentration of protons.
Oxide ion conductivity and mobility
Yttria stabilized zirconia (YSZ) and Gd doped ceria (GDC) are known as state-of-the-art
oxide ion conductors [11]. La2Ce2O7 also shows high oxide ion conductivity at high
temperatures (~900 ºC) [14], close to the values reported for YSZ and slightly lower than
GDC. The oxide ion conductivity measured experimentally for La2-xNdxCe2O7 in this work
is lower than reported previously [14], since the conductivity has not been corrected for the
high porosity. The oxide ion conductivity for the different La2-xNdxCe2O7 compositions
does not differ much within the series, except for Nd2Ce2O7 where it is approximately half
an order of magnitude lower than La2Ce2O7 and the other compositions at 400 °C (shown
in Paper III). This is as expected due to the differences in long range order that results in
different effective concentrations of oxygen vacancies contributing to oxide ion transport.
The activation energy for the oxide ion conductivity is also higher in Nd2Ce2O7 than
La2Ce2O7. This is in line with results from MD runs at 1500 K, showing more collective
diffusion and a lower diffusion coefficient (Dtracer) for oxide ions in Nd2Ce2O7 (Paper II).
The higher activation energy found for Nd2Ce2O7 compared to La2Ce2O7, results in the total
conductivity being more similar at high temperatures.
It is interesting to compare the vacancy mobility for the compounds studied to see how it
changes with the size of the unit cell. We can compare ΔHmob,O2- by using the EA from the
temperature region where the concentration of disordered oxygen vacancies can be
considered approximately constant, based on the discussion regarding the activation energy
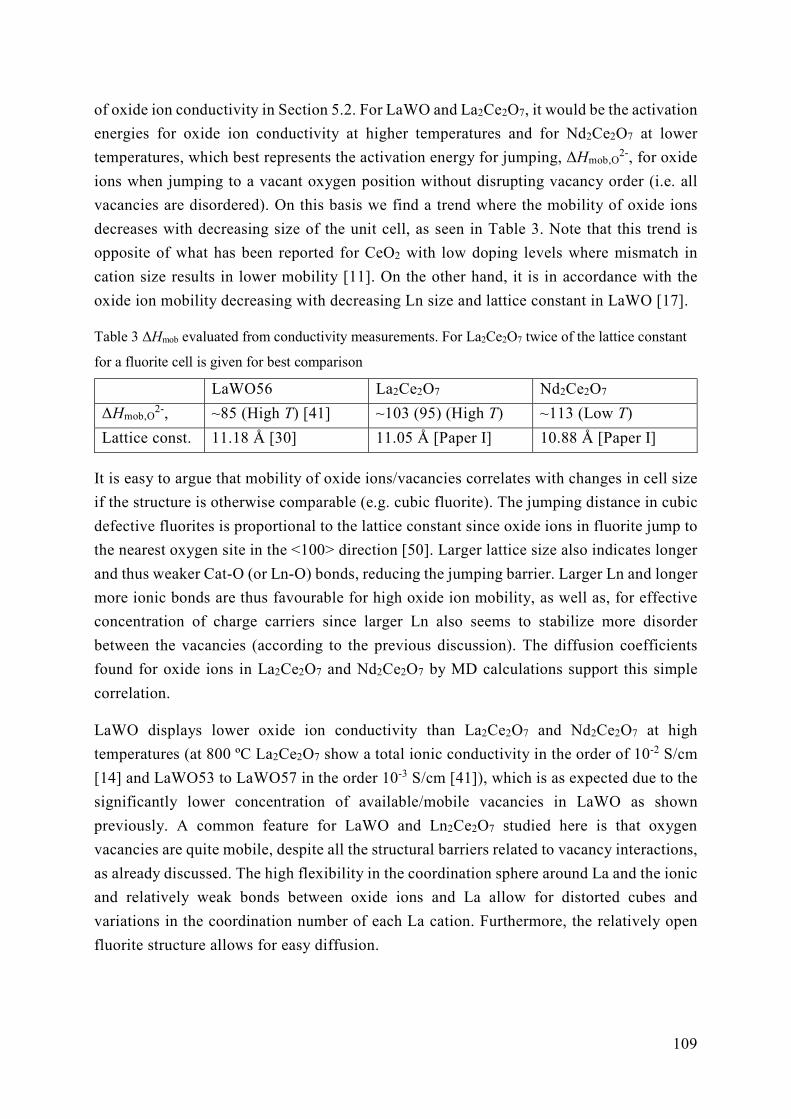
109
of oxide ion conductivity in Section 5.2. For LaWO and La2Ce2O7, it would be the activation
energies for oxide ion conductivity at higher temperatures and for Nd2Ce2O7 at lower
temperatures, which best represents the activation energy for jumping, ΔHmob,O2-, for oxide
ions when jumping to a vacant oxygen position without disrupting vacancy order (i.e. all
vacancies are disordered). On this basis we find a trend where the mobility of oxide ions
decreases with decreasing size of the unit cell, as seen in Table 3. Note that this trend is
opposite of what has been reported for CeO2 with low doping levels where mismatch in
cation size results in lower mobility [11]. On the other hand, it is in accordance with the
oxide ion mobility decreasing with decreasing Ln size and lattice constant in LaWO [17].
Table 3 ΔHmob evaluated from conductivity measurements. For La2Ce2O7 twice of the lattice constant
for a fluorite cell is given for best comparison
LaWO56 La2Ce2O7 Nd2Ce2O7
ΔHmob,O2-, ~85 (High T) [41] ~103 (95) (High T) ~113 (Low T)
Lattice const. 11.18 Å [30] 11.05 Å [Paper I] 10.88 Å [Paper I]
It is easy to argue that mobility of oxide ions/vacancies correlates with changes in cell size
if the structure is otherwise comparable (e.g. cubic fluorite). The jumping distance in cubic
defective fluorites is proportional to the lattice constant since oxide ions in fluorite jump to
the nearest oxygen site in the <100> direction [50]. Larger lattice size also indicates longer
and thus weaker Cat-O (or Ln-O) bonds, reducing the jumping barrier. Larger Ln and longer
more ionic bonds are thus favourable for high oxide ion mobility, as well as, for effective
concentration of charge carriers since larger Ln also seems to stabilize more disorder
between the vacancies (according to the previous discussion). The diffusion coefficients
found for oxide ions in La2Ce2O7 and Nd2Ce2O7 by MD calculations support this simple
correlation.
LaWO displays lower oxide ion conductivity than La2Ce2O7 and Nd2Ce2O7 at high
temperatures (at 800 ºC La2Ce2O7 show a total ionic conductivity in the order of 10-2 S/cm
[14] and LaWO53 to LaWO57 in the order 10-3 S/cm [41]), which is as expected due to the
significantly lower concentration of available/mobile vacancies in LaWO as shown
previously. A common feature for LaWO and Ln2Ce2O7 studied here is that oxygen
vacancies are quite mobile, despite all the structural barriers related to vacancy interactions,
as already discussed. The high flexibility in the coordination sphere around La and the ionic
and relatively weak bonds between oxide ions and La allow for distorted cubes and
variations in the coordination number of each La cation. Furthermore, the relatively open
fluorite structure allows for easy diffusion.
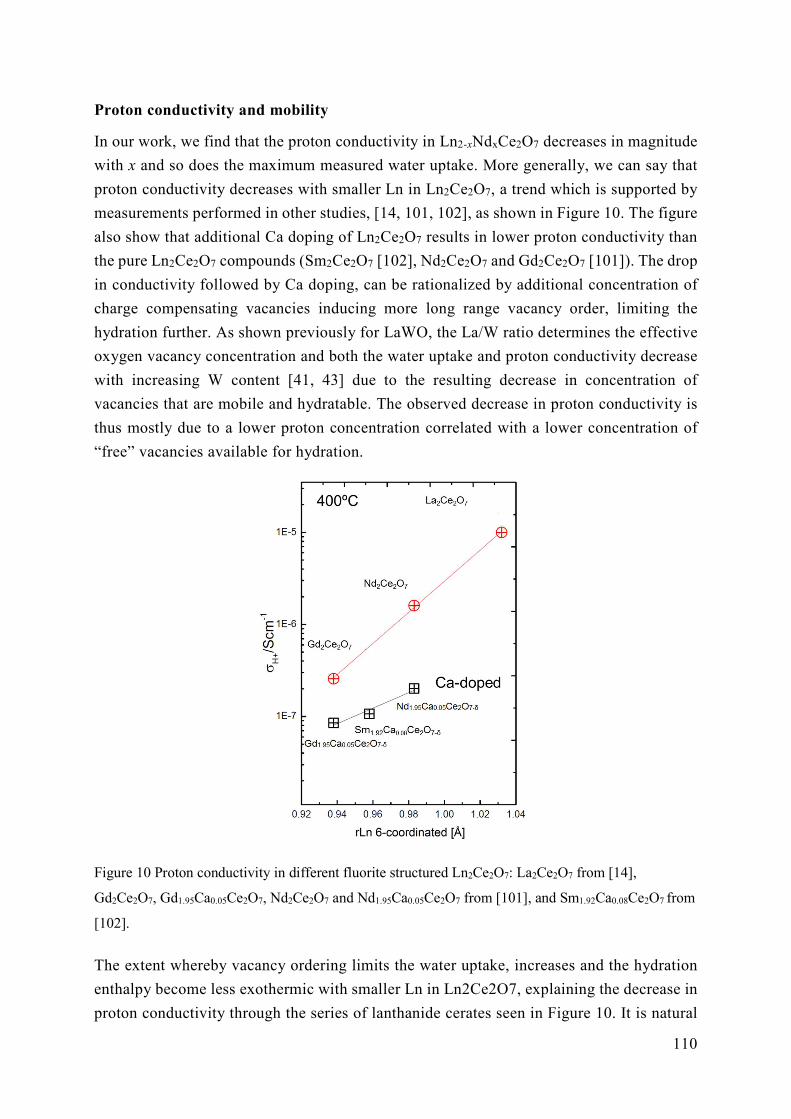
110
Proton conductivity and mobility
In our work, we find that the proton conductivity in Ln2-xNdxCe2O7 decreases in magnitude
with x and so does the maximum measured water uptake. More generally, we can say that
proton conductivity decreases with smaller Ln in Ln2Ce2O7, a trend which is supported by
measurements performed in other studies, [14, 101, 102], as shown in Figure 10. The figure
also show that additional Ca doping of Ln2Ce2O7 results in lower proton conductivity than
the pure Ln2Ce2O7 compounds (Sm2Ce2O7 [102], Nd2Ce2O7 and Gd2Ce2O7 [101]). The drop
in conductivity followed by Ca doping, can be rationalized by additional concentration of
charge compensating vacancies inducing more long range vacancy order, limiting the
hydration further. As shown previously for LaWO, the La/W ratio determines the effective
oxygen vacancy concentration and both the water uptake and proton conductivity decrease
with increasing W content [41, 43] due to the resulting decrease in concentration of
vacancies that are mobile and hydratable. The observed decrease in proton conductivity is
thus mostly due to a lower proton concentration correlated with a lower concentration of
“free” vacancies available for hydration.
Figure 10 Proton conductivity in different fluorite structured Ln2Ce2O7: La2Ce2O7 from [14],
Gd2Ce2O7, Gd1.95Ca0.05Ce2O7, Nd2Ce2O7 and Nd1.95Ca0.05Ce2O7 from [101], and Sm1.92Ca0.08Ce2O7 from
[102].
The extent whereby vacancy ordering limits the water uptake, increases and the hydration
enthalpy become less exothermic with smaller Ln in Ln2Ce2O7, explaining the decrease in
proton conductivity through the series of lanthanide cerates seen in Figure 10. It is natural
111
to expect a trend where the proton mobility increases with Ln-O bond length and lattice
constants, identical to what we found for the oxygen mobility for LaWO and La2-xNdxCe2O7.
The apparent activation energies determined by the σT vs 1/T Arrhenius plot of the proton
conductivity in La2-xNdxCe2O7, do in fact increase with the content of the smaller Nd, from
~43 kJ/mol for La2Ce2O7 to around ~50 kJ/mol for Nd2Ce2O7. However, if we compare the
activation energy for proton conductivity in LaWO with La2Ce2O7 and Nd2Ce2O7 it does
not correlated with decreasing lattice size (EA for proton diffusion studied in LaWO56 is
found to be 63 kJ/mol [98] and EA from conductivity measurements is found to be
~60 kJ/mol [41]). The activation energy of proton diffusion is expected to be higher in
LaWO than in La2Ce2O7, since the proton conductivity of LaWO is higher at 200 °C while
at the same time the proton concentration is found to be lower than in La2Ce2O7. This
indicates that the apparent activation energy for La2-xNdxCe2O7 extracted from conductivity
measurements contains additional contributions.
At the temperatures where proton conductivity is measured in La2-xNd2Ce2O7, the
concentration of protons is indeed not constant but rather decreasing with increasing
temperature, according to TG-DSC measurements (Paper III). The apparent activation
energy for the measured proton conductivity will thus include an energy contribution from
formation of protons since the conductivity is proportional to the proton concentration (see
Equation ( 19 )). For La2-xNd2Ce2O7 we propose that the hydration enthalpy is dominated
by the energy gain of trapping H+ on oxide ions coordinated by La and Nd in Nd2Ce2O7 (see
Paper III). As discussed in Section 5.3 we assume that filling vacancies does not contribute
significantly to the hydration enthalpy. The hydration enthalpy can then be considered as
the enthalpy of formation for 2 protons which contributes to the apparent activation energy
Eapparent(H+
). Consequently, there is an additional (negative) energy contribution to the
apparent activation energy besides the enthalpy of mobility of protons, which can be derived
from the hydration enthalpy:
Eapparent(H+
) = ΔH°hydr/2 + EA(H+
) = ΔH°hydr/2 + ΔHmob(H+
) ( 34 )
where the latter is the activation energy for proton mobility. Eapparent= 43 kJ/mol and ΔH°hydr
= -77 kJ/mol, results in EA(H+
) = ΔHmob(H+
) = 81.5 kJ/mol for La2Ce2O7. Similarly, we obtain
EA(H+
) = ΔHmob(H+
) = 85.5 kJ/mol for Nd2Ce2O7 where ΔH°hydr= 71 kJ/mol and Eapparent=
50 kJ/mol.
The hydration model for La2-xNdxCe2O7, also suggests that the same energy term can be
interpreted as trapping energy of two protons (i.e. ΔHH+
trap = - ΔH°hydr/2). Thus, we can
make a rough estimate of the enthalpy of mobility for untrapped protons ΔHmob(freeH+
) by
solving this equation:
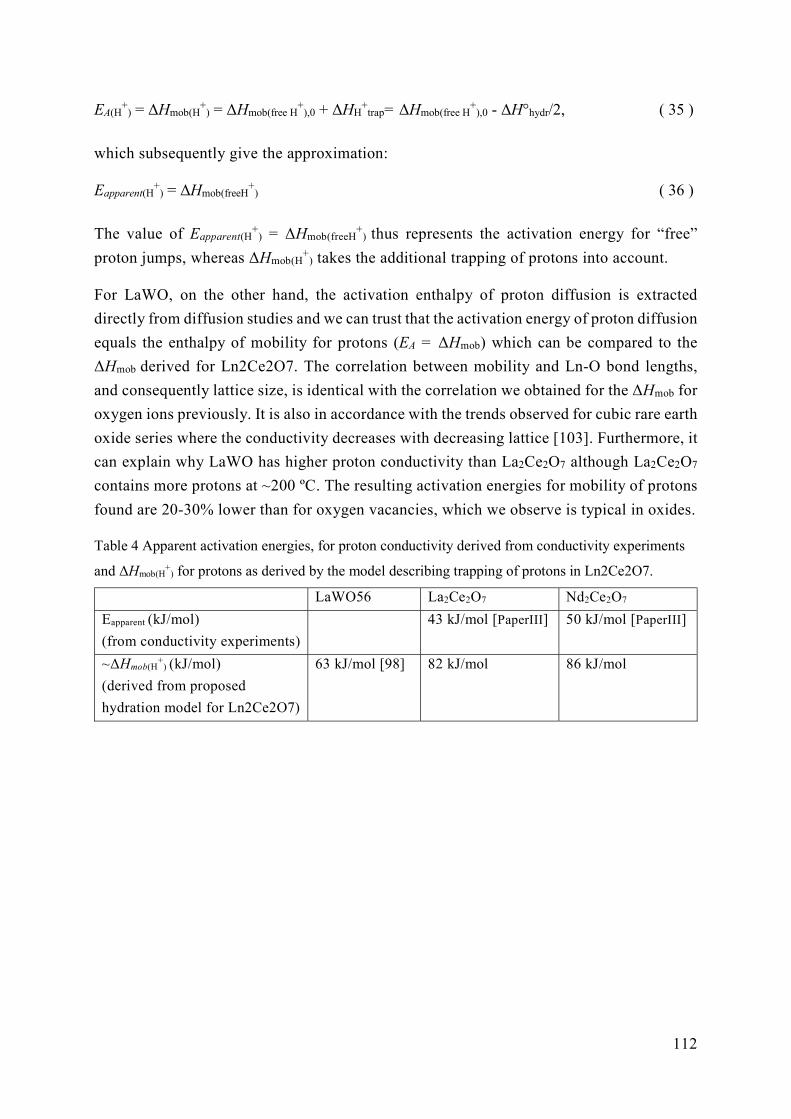
112
EA(H+
) = ΔHmob(H+
) = ΔHmob(free H+
),0 + ΔHH+
trap= ΔHmob(free H+
),0 - ΔH°hydr/2, ( 35 )
which subsequently give the approximation:
Eapparent(H+
) = ΔHmob(freeH+
) ( 36 )
The value of Eapparent(H+
) = ΔHmob(freeH+
) thus represents the activation energy for “free”
proton jumps, whereas ΔHmob(H+
) takes the additional trapping of protons into account.
For LaWO, on the other hand, the activation enthalpy of proton diffusion is extracted
directly from diffusion studies and we can trust that the activation energy of proton diffusion
equals the enthalpy of mobility for protons (EA = ΔHmob) which can be compared to the
ΔHmob derived for Ln2Ce2O7. The correlation between mobility and Ln-O bond lengths,
and consequently lattice size, is identical with the correlation we obtained for the ΔHmob for
oxygen ions previously. It is also in accordance with the trends observed for cubic rare earth
oxide series where the conductivity decreases with decreasing lattice [103]. Furthermore, it
can explain why LaWO has higher proton conductivity than La2Ce2O7 although La2Ce2O7
contains more protons at ~200 ºC. The resulting activation energies for mobility of protons
found are 20-30% lower than for oxygen vacancies, which we observe is typical in oxides.
Table 4 Apparent activation energies, for proton conductivity derived from conductivity experiments
and ΔHmob(H+
) for protons as derived by the model describing trapping of protons in Ln2Ce2O7.
LaWO56 La2Ce2O7 Nd2Ce2O7
Eapparent (kJ/mol)
(from conductivity experiments)
43 kJ/mol [PaperIII] 50 kJ/mol [PaperIII]
~ΔHmob(H+
) (kJ/mol)
(derived from proposed
hydration model for Ln2Ce2O7)
63 kJ/mol [98] 82 kJ/mol 86 kJ/mol
113
6 Summarizing conclusions
“Nothing in life is to be feared, it is only to be understood.”
– Marie Curie
In this work we have investigated the relationship between local and average structure in
LaWO and La2-xNdxCe2O7 in order to explain their defect related properties - oxide ion
conductivity, hydration and proton conductivity. LaWO and La2-xNdxCe2O7 crystallize in
cubic, fluorite derived structures, which are highly oxygen deficient with respect to the
perfect fluorite. The local atomic structure in these oxides cannot be determined by average
structure models without losing essential information needed to determine the defect
situation. Combining computational and experimental methods provides complementary
information about the structure in complex oxides, and is valuable in order to understand
both local and average structure in fluorite related oxides.
In LaWO, strong covalent bonds between W and O, result in strong local ordering of
vacancies around W. This limits the effective concentration of vacancies that are available
for diffusion and hydration. In La2-xNdxCe2O7 the high number of vacancies results in partial
long range vacancy ordering in a C-type related manner for the Nd containing samples.
Rietveld refinements of total scattering neutron diffraction on La2-xNdxCe2O7 reveal that
La2Ce2O7 is best described as a disordered fluorite, whereas long range vacancy order
evolves in the system with increasing Nd content. We find evidence of nanodomains with
long range ordering in Nd2Ce2O7 using HR-TEM. This corresponds perfectly with a model
combining oxygen excess C-type and oxygen deficient fluorite structures giving the best fit
in the Rietveld refinements. We therefore conclude that La2-xNdxCe2O7 compounds where
x > 0 consists of two types of domains at low temperatures, where vacancies are disordered
in one and long range ordered in the other.
DFT calculations show that the C-type related ordering is favourable for both La2Ce2O7 and
Nd2Ce2O7 and are a way of ordering vacancies in oxygen deficient, cubic fluorites not
previously described. C-type related vacancy ordering is a good way to order vacancies for
oxygen deficient fluorites with cations of relatively large size and low electronegativity
such as Ln cations (given that different cations have similar size). However, in LaWO,
114
where the cations have different sizes, the long La-O bonds enable disorder in and distortion
of the oxygen lattice surrounding La. The long La-O bond and slightly larger difference in
cation sizes, also enable more disorder in La2Ce2O7 compared to Nd2Ce2O7. The local
structure of short or long ranged vacancy ordering in cubic fluorites can thus be correlated
with the size and electronegativity of the cations, the resulting lattice volume and whether
the cations have equal sizes or not.
The enthalpy gain of long range ordering in Nd2Ce2O7 is slightly higher than in La2Ce2O7,
which is correlated with the smaller lattice constants and shorter Cat-O bonds of the former.
This is rationalized by C-type related vacancy ordering enabling a better close packing for
the oxides with smaller cations and cell volume. Dynamic oxygen disorder is more
significant for La2Ce2O7 than Nd2Ce2O7, and is an important explanation for the disorder
observed in La2Ce2O7. Configurational and vibrational entropy contribute to the difference
in the extent of vacancy ordering between La2Ce2O7 and Nd2Ce2O7, resulting in disorder
being stabilized to lower temperatures in La2Ce2O7 than for Nd2Ce2O7.
The apparent activation energies for oxide ion conductivity in La2-xNdxCe2O7 which are
found to change with temperature can be explained by the additional contribution from the
enthalpy of disorder. We find that an equilibrium between order and disorder can be
rationalized, where the degree of ordering increases with decreasing temperature for
La2-xNdxCe2O7. The enthalpy of disordering will influence the effective concentration of
disordered vacancies available for oxide ion diffusion and hydration. At room temperatures
and below there may be kinetic limitations to the ordering, hindering the whole sample from
becoming fully ordered and creating frozen-in disorder.
From the experimental TG-DSC results, we find that the water uptake in La2-xNdxCe2O7 is
strongly limited being always less than 1 mol vacancy per formula unit, and increasingly so
with increasing x. Based on the measurements and DFT computations we show that there
are two important factors influencing the hydration reaction in La2-xNdxCe2O7: 1) vacancy
ordering and 2) basicity of the Ln cation. The first factor limits the effective concentration
of vacancies, whereas the second influences the mobility of free vacancies and the hydration
enthalpy through the strength of H+ trapping/LnO-H bonds.
In La2-xNdxCe2O7, long range order limits the hydration by stabilizing the oxygen vacancies
and making them unfavourable to hydrate. For the hydration of the oxygen disordered
domains of La2-xNdxCe2O7, the dominating energy contribution to the hydration enthalpy is
trapping of H+ on oxide ions coordinated by the more basic Ln, supported by DFT results.
This hydration model imposes a site limitation for H+ that fits well to the measured water
uptake in the disordered La2Ce2O7. The general trend for the hydration enthalpy of
Ln2Ce2O7 is that it becomes less exothermic with smaller Ln and shorter Ln-O bonds due
to lower basicity. In LaWO the hydration enthalpy is more exothermic and filling of
115
vacancies is assumed to contribute significantly to the hydration enthalpy. Also, it is the
number of available vacancies that imposes the hydration limit for LaWO, not the possible
proton sites.
Our hydration model for La2Ce2O7, is a good model for oxides that tolerate a high number
of vacancies due to doping by basic acceptors (large cations such as La). The model is
relevant for all oxides where vacancies are stabilized in a disordered lattice, since the
importance of H+ trapping to basic Ln-O complexes increases when filling vacancies
contributes less to the hydration enthalpy.
The mobility for untrapped vacancies and protons increases with increasing fluorite lattice
constants and Ln-O bonds. Accordingly, the mobility decreases in the order: LaWO >
La2Ce2O7 > Nd2Ce2O7.
The high proton mobility of LaWO is due to the large cell volume and the percolating
diffusion pathway between favourable proton sites. LaWO exhibits relatively high
exothermic hydration enthalpy and proton mobility, making it a good proton conductor. The
low concentration of mobile vacancies and the site restrictions reducing the possible sites
to jump to, result in a lower oxide ion conductivity of LaWO than of La2Ce2O7, even though
the energy needed for vacancies to jump is lower.
In La2Ce2O7 the relatively high stability of disordered oxygen vacancies offers a high
effective concentration of vacancies yielding high oxide ion conductivity. However, the
hydration enthalpy is less exothermic than for LaWO, and the hydration is strongly limited
due to site restrictions for H+. Consequently, La2Ce2O7 only exhibits a minor contribution
from protons to the total conductivity.
The concentration of free and disordered vacancies is strongly reduced with the Nd content
in La2-xNdxCe2O7 due to long range ordering of vacancies. Together with lower mobility,
the reduced effective concentration of vacancies lowers the oxygen ion conductivity and
limits the hydration compared to La2Ce2O7, making Nd2Ce2O7 both a poor oxide ion and
proton conductor.
The findings in this thesis have led to general trends and insights which contribute to the
understanding of defect related properties of oxides containing lanthanides in cubic fluorite
related structures with oxygen disorder.

116
117
7 References [1] C. Duan, J. Huang, N. Sullivan, R. O'Hayre, Applied Physics Reviews 7 (2020) (1)
011314.
[2] J. Kim, S. Sengodan, S. Kim, O. Kwon, Y. Bu, G. Kim, Renewable and Sustainable
Energy Reviews 109 (2019) 606.
[3] H.-I. Ji, J.-H. Lee, J.-W. Son, K.J. Yoon, S. Yang, B.-K. Kim, Journal of the Korean
Ceramic Society 57 (2020) (5) 480.
[4] L. Yang, S. Wang, K. Blinn, M. Liu, Z. Liu, Z. Cheng, M. Liu, Science 326 (2009)
(5949) 126.
[5] Y. Larring, T. Norby, Solid State Ionics 136-137 (2000) (2) 139.
[6] C. Zhou, J. Sunarso, Y. Song, J. Dai, J. Zhang, B. Gu, W. Zhou, Z. Shao, Journal of
Materials Chemistry A 7 (2019) (21) 13265.
[7] T. Norby, Solid State Ionics 125 (1999) (1-4) 1.
[8] S. Choi, C.J. Kucharczyk, Y. Liang, X. Zhang, I. Takeuchi, H.-I. Ji, S.M. Haile,
Nature Energy 3 (2018) (3) 202.
[9] C. Duan, R.J. Kee, H. Zhu, C. Karakaya, Y. Chen, S. Ricote, A. Jarry, E.J. Crumlin,
D. Hook, R. Braun, N.P. Sullivan, R. O’Hayre, Nature 557 (2018) (7704) 217.
[10] N. Jaiswal, K. Tanwar, R. Suman, D. Kumar, S. Upadhyay, O. Parkash, Journal of
Alloys and Compounds 781 (2019) 984.
[11] S.J. Skinner, J.A. Kilner, Materials Today 6 (2003) (3) 30.
[12] C. Tandé, D. Pérez-Coll, G.C. Mather, Journal of Materials Chemistry 22 (2012)
(22) 11208.
[13] D. Nishioka, T. Tsuchiya, W. Namiki, M. Takayanagi, K. Kawamura, T. Fujita, R.
Yukawa, K. Horiba, H. Kumigashira, T. Higuchi, Nanoscale Research Letters 15 (2020) (1)
42.
[14] V. Besikiotis, C.S. Knee, I. Ahmed, R. Haugsrud, T. Norby, Solid State Ionics 228
(2012) 1.
[15] Z. Zhu, B. Liu, J. Shen, Y. Lou, Y. Ji, Journal of Alloys and Compounds 659 (2016)
232.
[16] W. Sun, S. Fang, L. Yan, W. Liu, Fuel Cells 12 (2012) (3) 457.
[17] R. Haugsrud, Solid State Ionics 178 (2007) (7-10) 555.
[18] R. Haugsrud, C. Kjølseth, J. Phys Chem Solids 69 (2008) (7) 1758.
[19] T. Shimura, S. Fujimoto, H. Iwahara, Solid State Ionics 143 (2001) (1) 117.
118
[20] V. Besikiotis, S. Ricote, M.H. Jensen, T. Norby, R. Haugsrud, Solid State Ionics 229
(2012) 26.
[21] H. Yamamura, H. Nishino, K. Kakinuma, K. Nomura, Journal of the Ceramic
Society of Japan 111 (2003) (1300) 902.
[22] T. Hagiwara, Z. Kyo, A. Manabe, H. Yamamura, K. Nomura, J. Ceram. Soc. Jpn.
117 (2009) (Dec.) 1306.
[23] L. Li, R. Kasse, S. Phadke, W. Qiu, A. Huq, J.C. Nino, Solid State Ionics 221 (2012)
15.
[24] V. Grover, S.V. Chavan, P. Sengupta, A.K. Tyagi, Journal of the European Ceramic
Society 30 (2010) (15) 3137.
[25] D.E.P. Vanpoucke, P. Bultinck, S. Cottenier, V. Van Speybroeck, I. Van Driessche,
Physical Review B 84 (2011) (5) 054110.
[26] D.E.P. Vanpoucke, P. Bultinck, S. Cottenier, V. Van Speybroeck, I. Van Driessche,
Journal of Materials Chemistry A 2 (2014) (33) 13723.
[27] E. Reynolds, P.E.R. Blanchard, Q. Zhou, B.J. Kennedy, Z. Zhang, L.-Y. Jang,
Physical Review B 85 (2012) (13) 132101.
[28] L. Minervini, R.W. Grimes, K.E. Sickafus, Journal of the American Ceramic Society
83 (2000) (8) 1873.
[29] A. Magraso, C. Frontera, D. Marrero-Lopez, P. Nunez, Dalton Transactions (2009)
(46) 10273.
[30] A. Magraso, C. Frontera, D. Marrero-Lopez, P. Nunez, Dalton Trans. (2009) (46)
10273.
[31] Q. Zhang, X. Zheng, J. Jiang, W. Liu, The Journal of Physical Chemistry C 117
(2013) (40) 20379.
[32] T.S. Bjørheim, V. Besikiotis, R. Haugsrud, Dalton Trans. 41 (2012) (43) 13343.
[33] F.A. Kröger, H.J. Vink, Journal of Physics and Chemistry of Solids 5 (1958) (3) 208.
[34] T. Norby, M. Wideroe, R. Gloeckner, Y. Larring, Dalton Trans. (2004) (Copyright
(C) 2011 American Chemical Society (ACS). All Rights Reserved.) 3012.
[35] T. Zacherle, A. Schriever, R.A. De Souza, M. Martin, Physical Review B 87 (2013)
(13) 134104.
[36] Y. Larring, T. Norby, Solid State Ionics 97 (1997) (1–4) 523.
[37] K.D. Kreuer, T. Dippel, Y.M. Baikov, J. Maier, Solid State Ionics 86-88 (1996) 613.
[38] A. Løken, T.S. Bjørheim, R. Haugsrud, Journal of Materials Chemistry A 3 (2015)
(46) 23289.
[39] T.S. Bjørheim, M.F. Hoedl, R. Merkle, E.A. Kotomin, J. Maier, The Journal of
Physical Chemistry C 124 (2020) (2) 1277.
[40] R. Haugsrud, Y. Larring, T. Norby, Solid State Ionics 176 (2005) (39–40) 2957.
[41] S. Erdal, L.-E. Kalland, R. Hancke, J. Polfus, R. Haugsrud, T. Norby, A. Magraso,
Int. J. Hydrogen Energy 37 (2012) (9) 8051.
119
[42] R. Hancke, Z. Li, R. Haugsrud, International Journal of Hydrogen Energy 37 (2012)
(9) 8043.
[43] R. Hancke, A. Magrasó, T. Norby, R. Haugsrud, Solid State Ionics 231 (2013) (0)
25.
[44] H. Iwahara, H. Uchida, N. Maeda, Journal of Power Sources 7 (1982) (3) 293.
[45] D.Y. Wang, D.S. Park, J. Griffith, A.S. Nowick, Solid State Ionics 2 (1981) (2) 95.
[46] R. Gerhardt-Anderson, A.S. Nowick, Solid State Ionics 5 (1981) 547.
[47] J. Faber, C. Geoffroy, A. Roux, A. Sylvestre, P. Abélard, Applied Physics A Solids
and Surfaces 49 (1989) (3) 225.
[48] V. Butler, C.R.A. Catlow, B.E.F. Fender, J.H. Harding, Solid State Ionics 8 (1983)
(2) 109.
[49] L. Minervini, M.O. Zacate, R.W. Grimes, Solid State Ionics 116 (1999) (3–4) 339.
[50] J. Koettgen, S. Grieshammer, P. Hein, B.O.H. Grope, M. Nakayama, M. Martin,
Physical Chemistry Chemical Physics 20 (2018) (21) 14291.
[51] S. Hull, S.T. Norberg, I. Ahmed, S.G. Eriksson, D. Marrocchelli, P.A. Madden, J.
Solid State Chem. 182 (2009) (10) 2815.
[52] S.P. Ray, D.E. Cox, Journal of Solid State Chemistry 15 (1975) (4) 333.
[53] T.R. Welberry, B.D. Butler, J.G. Thompson, R.L. Withers, Journal of Solid State
Chemistry 106 (1993) (2) 461.
[54] H.J. Rossell, H.G. Scott, J Phys (Paris) Colloq 38 Colloq C-7 (1977) (12) c7. 28.
[55] Z.G. Liu, J.H. Ouyang, K.N. Sun, Fuel Cells 11 (2011) (2) 153.
[56] D.R. Ou, T. Mori, F. Ye, T. Kobayashi, J. Zou, G. Auchterlonie, J. Drennan, Appl.
Phys. Lett. 89 (2006) (17) 171911/1.
[57] R.L. Withers, J.G. Thompson, N. Gabbitas, L.R. Wallenberg, T.R. Welberry,
Journal of Solid State Chemistry 120 (1995) (2) 290.
[58] C. Artini, M.M. Carnasciali, J.R. Plaisier, G.A. Costa, M. Pani, Solid State Ionics
311 (2017) 90.
[59] C. Artini, G.A. Costa, M. Pani, A. Lausi, J. Plaisier, Journal of Solid State Chemistry
190 (2012) 24.
[60] H. Rietveld, Journal of Applied Crystallography 2 (1969) (2) 65.
[61] D. Keen, Journal of Applied Crystallography 34 (2001) (2) 172.
[62] M.G. Tucker, D.A. Keen, M.T. Dove, A.L. Goodwin, Q. Hui, Journal of Physics:
Condensed Matter 19 (2007) (33) 335218.
[63] C. Kjølseth, L.-Y. Wang, R. Haugsrud, T. Norby, Solid State Ionics 181 (2010) (39)
1740.
[64] NorECs, ProboStatTM.
[65] J.T.S. Irvine, D.C. Sinclair, A.R. West, Advanced Materials 2 (1990) (3) 132.
[66] S.M. Haile, D.L. West, J. Campbell, Journal of Materials Research 13 (1998) (6)
1576.
120
[67] J. Mizusaki, K. Waragai, S. Tsuchiya, H. Tagawa, Y. Arai, Y. Kuwayama, Journal
of the American Ceramic Society 79 (1996) (1) 109.
[68] J. Fleig, Solid State Ionics 131 (2000) (1) 117.
[69] J. Fleig, J. Maier, Journal of the American Ceramic Society 82 (1999) (12) 3485.
[70] J.H. Harding, Reports on Progress in Physics 53 (1990) (11) 1403.
[71] B.G. Dick, A.W. Overhauser, Physical Review 112 (1958) (1) 90.
[72] J.D. Gale, Journal of the Chemical Society, Faraday Transactions 93 (1997) (4) 629.
[73] M.S. Islam, S. Lazure, R.-n. Vannier, G. Nowogrocki, G. Mairesse, J. Mater. Chem.
8 (1998) (3) 655.
[74] D.J. Driscoll, M.S. Islam, P.R. Slater, Solid State Ionics 176 (2005) (5-6) 539.
[75] P. Hohenberg, W. Kohn, Physical Review 136 (1964) (3B) B864.
[76] W. Kohn, L.J. Sham, Physical Review 140 (1965) (4A) A1133.
[77] G. Kresse, J. Furthmueller, Phys. Rev. B: Condens. Matter 54 (1996) 11169.
[78] Y. Wang, J.P. Perdew, Physical Review B 44 (1991) (24) 13298.
[79] J.P. Perdew, K. Burke, M. Ernzerhof, Physical Review Letters 77 (1996) (18) 3865.
[80] P.E. Blöchl, Physical Review B 50 (1994) (24) 17953.
[81] A. Spek, Acta Crystallographica Section D 65 (2009) (2) 148.
[82] D. Alfè, G.A. de Wijs, G. Kresse, M.J. Gillan, International Journal of Quantum
Chemistry 77 (2000) (5) 871.
[83] P.G. Sundell, M.E. Björketun, G. Wahnström, Physical Review B 73 (2006) (10)
104112.
[84] C. Freysoldt, B. Grabowski, T. Hickel, J. Neugebauer, G. Kresse, A. Janotti, C.G.
Van de Walle, Reviews of modern physics 86 (2014) (1) 253.
[85] F. Oba, M. Choi, A. Togo, I. Tanaka, Science and Technology of Advanced Materials
12 (2011) (3) 034302.
[86] S. Lany, A. Zunger, Physical Review B 78 (2008) (23) 235104.
[87] G. Kresse, J. Hafner, Phys. Rev. B: Condens. Matter 48 (1993) 13115.
[88] S. Nosé, The Journal of Chemical Physics 81 (1984) (1) 511.
[89] Y. Choi, D.S. Mebane, M.C. Lin, M. Liu, Chem. Mater. 19 (2007) (Copyright (C)
2011 American Chemical Society (ACS). All Rights Reserved.) 1690.
[90] A. Magrasó, R. Haugsrud, Journal of Materials Chemistry A 2 (2014) (32) 12630.
[91] A. Magraso, J.M. Polfus, C. Frontera, J. Canales-Vazquez, L.-E. Kalland, C.H.
Hervoches, S. Erdal, R. Hancke, M.S. Islam, T. Norby, R. Haugsrud, J. Mater. Chem. 22
(2012) 1762.
[92] A. Magrasó, C.H. Hervoches, I. Ahmed, S. Hull, J. Nordström, A.W.B. Skilbred, R.
Haugsrud, Journal of Materials Chemistry A 1 (2013) (11) 3774.
[93] T. Mori, J. Drennan, J.-H. Lee, J.-G. Li, T. Ikegami, Solid State Ionics 154-155 (2002)
461.
121
[94] M. Amsif, A. Magrasó, D. Marrero-López, J.C. Ruiz-Morales, J. Canales-Vázquez,
P. Núñez, Chemistry of Materials 24 (2012) (20) 3868.
[95] C.E. Mohn, N.L. Allan, C.L. Freeman, P. Ravindran, S. Stolen, J. Solid State Chem.
178 (2005) (1) 346.
[96] E. Bakken, N.L. Allan, T.H.K. Barron, C.E. Mohn, I.T. Todorov, S. Stølen, Physical
Chemistry Chemical Physics 5 (2003) (11) 2237.
[97] A. Tarancón, A. Morata, F. Peiró, G. Dezanneau, Fuel Cells 11 (2011) (1) 26.
[98] R. Hancke, PCCP. Physical chemistry chemical physics 14 (2012) (40) 13971.
[99] T. Norby, O. Dyrlie, P. Kofstad, Solid State Ionics 53-56 (1992) 446.
[100] M. Nagao, H. Hamano, K. Hirata, R. Kumashiro, Y. Kuroda, Langmuir 19 (2003)
(22) 9201.
[101] S. Cheng, Master thesis, Department of Physics, University of Oslo, Oslo (2012).
[102] K.E.J. Eurenius, E. Ahlberg, C.S. Knee, Dalton Transactions 40 (2011) (15) 3946.
[103] T. Norby, O. Dyrlie, P. Kofstad, Journal of the American Ceramic Society 75 (1992)
(5) 1176.

122
Related Documents