1 Aashish Phansalkar & Lizy K. John Performance Prediction Using Program Similarity The University of Texas at The University of Texas at Austin Austin

Aashish Phansalkar & Lizy K. John
Feb 09, 2016
Performance Prediction Using Program Similarity. Aashish Phansalkar & Lizy K. John. The University of Texas at Austin. Outline. Motivation and Objectives Methodology Experimental results Conclusion Future work. Motivation (1): Simulation is costly. - PowerPoint PPT Presentation
Welcome message from author
This document is posted to help you gain knowledge. Please leave a comment to let me know what you think about it! Share it to your friends and learn new things together.
Transcript

1
Aashish Phansalkar&
Lizy K. John
Performance Prediction Using Program Similarity
The University of Texas at AustinThe University of Texas at Austin

2
Outline Motivation and Objectives
Methodology
Experimental results
Conclusion
Future work

3
Motivation (1): Simulation is costly
A computer architect or a designer has to simulate multiple customer applications
Simulations take very long due to the complexity of modern microprocessor designs

4
Motivation(2): Making a decision based on benchmark
scores
Customers often use benchmarks to make a decision about buying computer systems
The application program they use often, may not be a part of the benchmark suite
Customers can use benchmarks as representatives of their application programs
Predict performance of their application based on the already available performance data of benchmarks

5
Objective
A quantitative method to estimate performance without running cycle accurate simulation
Use the knowledge of similarity between a customer’s application program and known benchmark programs to develop a quantitative approach to predict performance

6
Outline Motivation and Objectives
Methodology
Experimental results
Conclusion
Future work
7
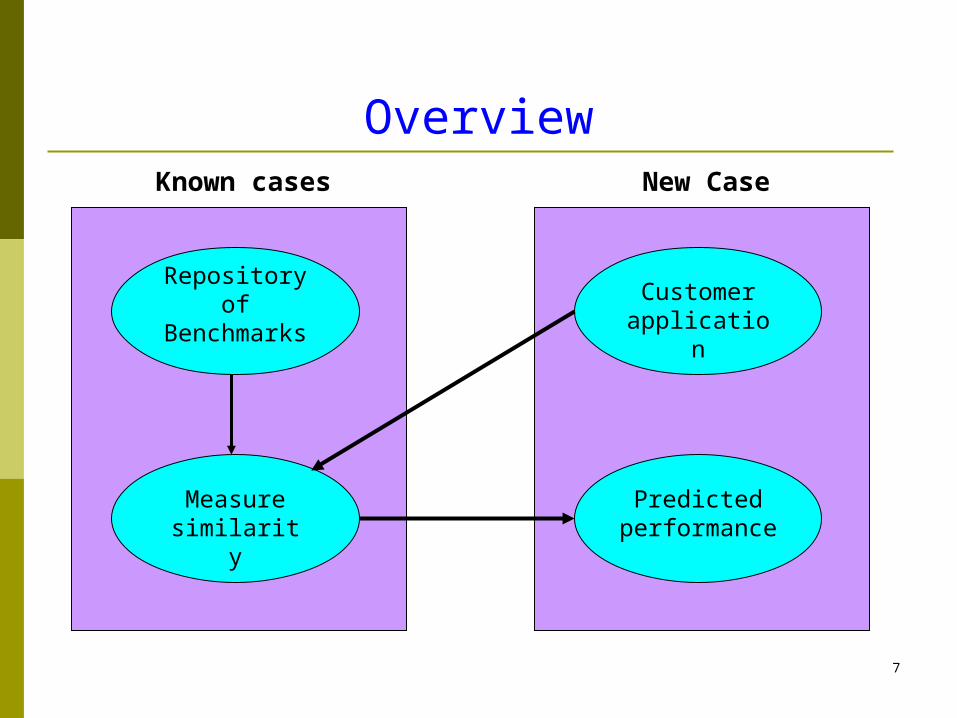
Overview
Customer application
Repository of
Benchmarks
Measure similarity
Predicted performance
New CaseKnown cases

8
Program characterization Instruction mix
Percentage of different types of instructions e.g. percentage of memory references, percentage of branch
instructions
Control Flow % Taken branches % Forward branches % Forward taken branches Basic Block Size (Number of instructions between two branches)
Register Dependency Distance Data and instruction temporal locality of program
Data and instruction spatial locality of program
9
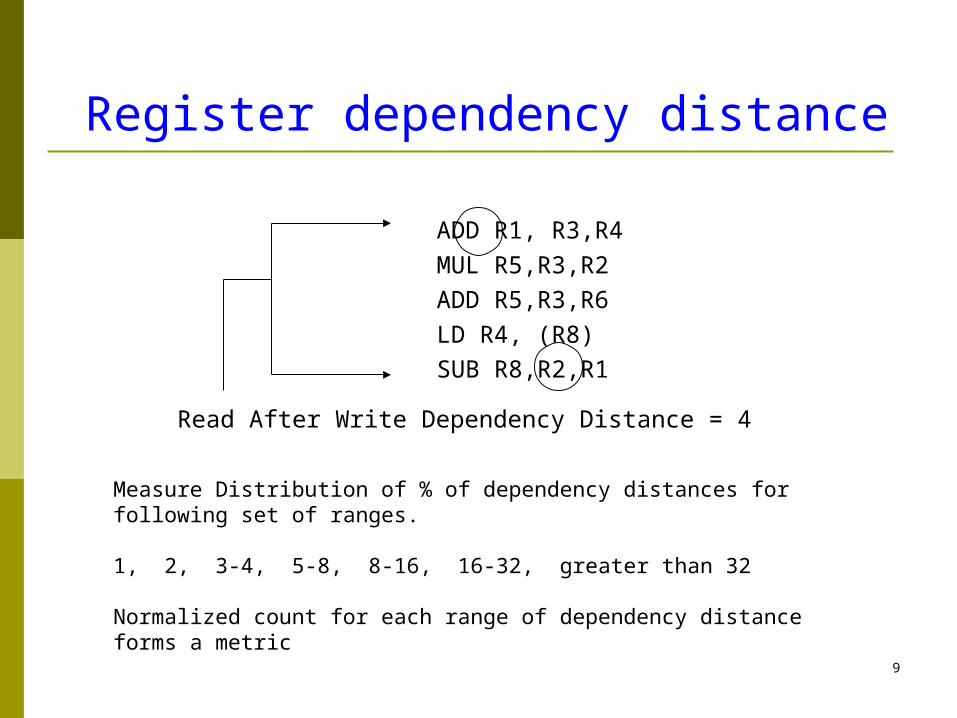
ADD R1, R3,R4MUL R5,R3,R2ADD R5,R3,R6LD R4, (R8)SUB R8,R2,R1
Read After Write Dependency Distance = 4
Measure Distribution of % of dependency distances for following set of ranges.
1, 2, 3-4, 5-8, 8-16, 16-32, greater than 32
Normalized count for each range of dependency distance forms a metric
Register dependency distance

10
Memory reuse distance 2004, 2008, 4008, 2000, 1080,2004,4008
Reuse Distance = 4 Reuse Distance = 3
Data and instruction temporal locality
Computing reuse distance for a trace of byte addresses is very computation and space intensive
Reuse distance for a block of 16, 64, 256, 4096 bytes
Temporal locality metrics (tlocality) = Wt. average reuse distance

11
Data and instruction spatial locality Spatial locality metrics are derived from the temporal locality metrics
As the block size increases, programs with good spatial locality will show lower values for tlocality for higher block sizes
Spatial Locality = tlocality64 / tlocality16 tlocality256 / tlocality16
tlocality4096 / tlocality16
12
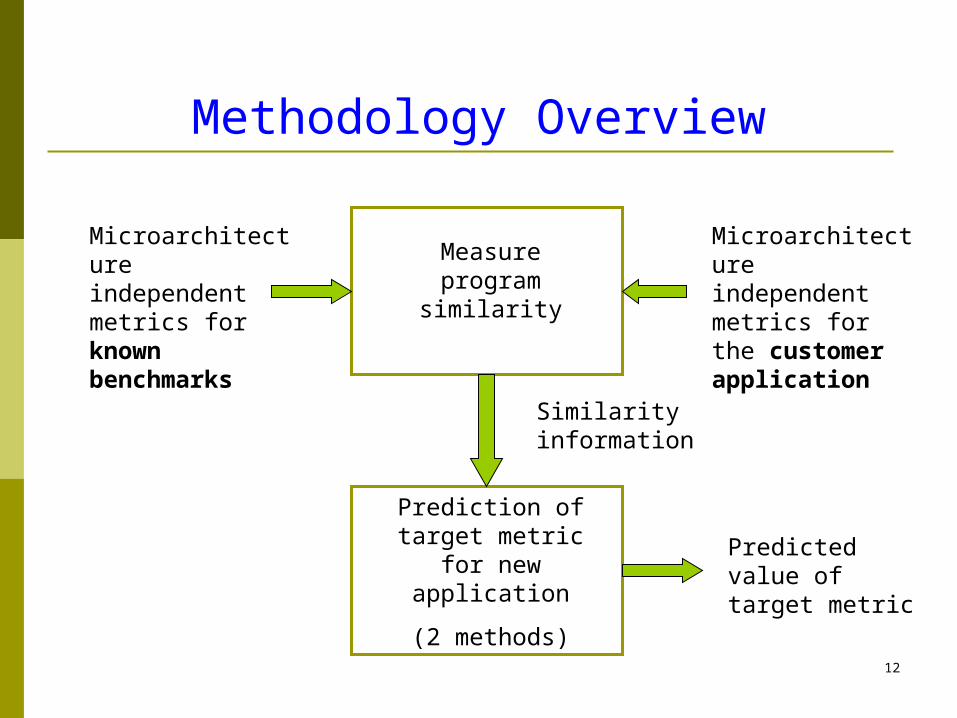
Methodology Overview
Microarchitecture independent metrics for known benchmarks
Microarchitecture independent metrics for the customer application
Measure program similarity
Prediction of target metric
for new application(2 methods)
Similarity information
Predicted value of target metric
13
Measuring Similarity (1)
Distance between two programs in the workload space is the measure of their similarity
We assume that similarity between two programs is inversely proportional to the Euclidean distance between them

14
Measuring similarity (2)
The workload space is made of many workload characteristics and so its dimensionality is very high
Inherent characteristics are highly correlated Euclidean distance measured using these characteristics will be
biased The correlated variables will add twice to the distance as the
independent variables
Use Principal Components Analysis (PCA)
15
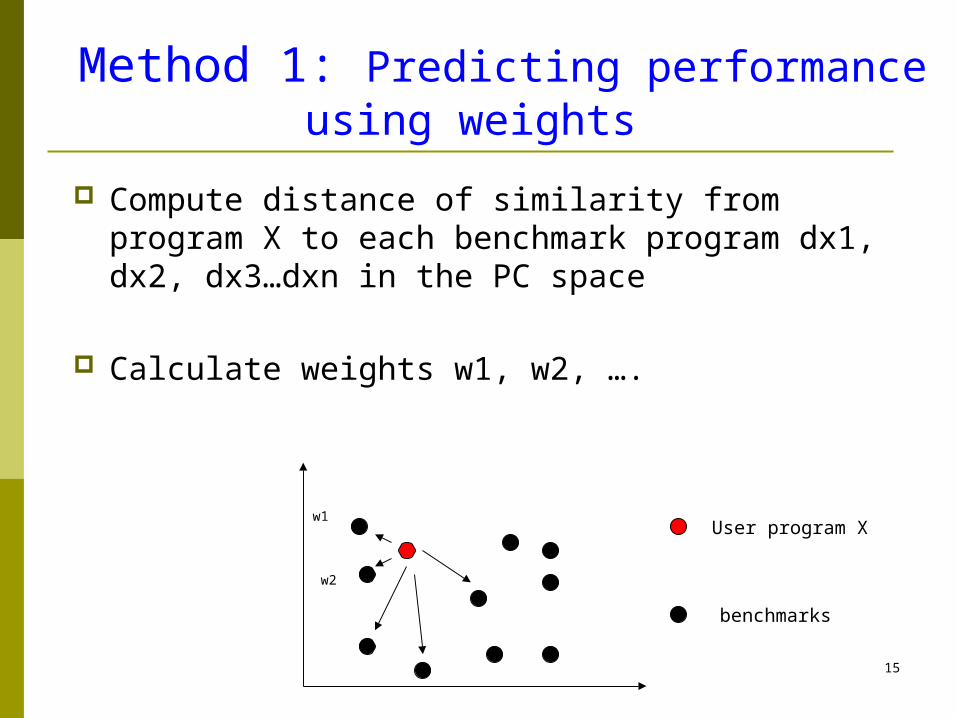
Method 1: Predicting performance using weights
Compute distance of similarity from program X to each benchmark program dx1, dx2, dx3…dxn in the PC space
Calculate weights w1, w2, ….
w1
w2
User program X
benchmarks

16
Method 2: Predicting performance using clustering
Measure all the inherent characteristics for the benchmarks and user program X
Cluster all the programs based on the inherent characteristics and find optimal clusters
User program X
benchmarks

17
Outline Motivation and Objectives
Methodology
Experimental results
Conclusion
Future work

18
Experiments Used integer programs from SPEC CPU2000 suite
to demonstrate the use of Method 1 and Method 2 described
Prediction of speedup Used all the workload characteristics to form the workload space
Prediction of cache miss-rates Used only the data locality characteristics to form the workload space
19
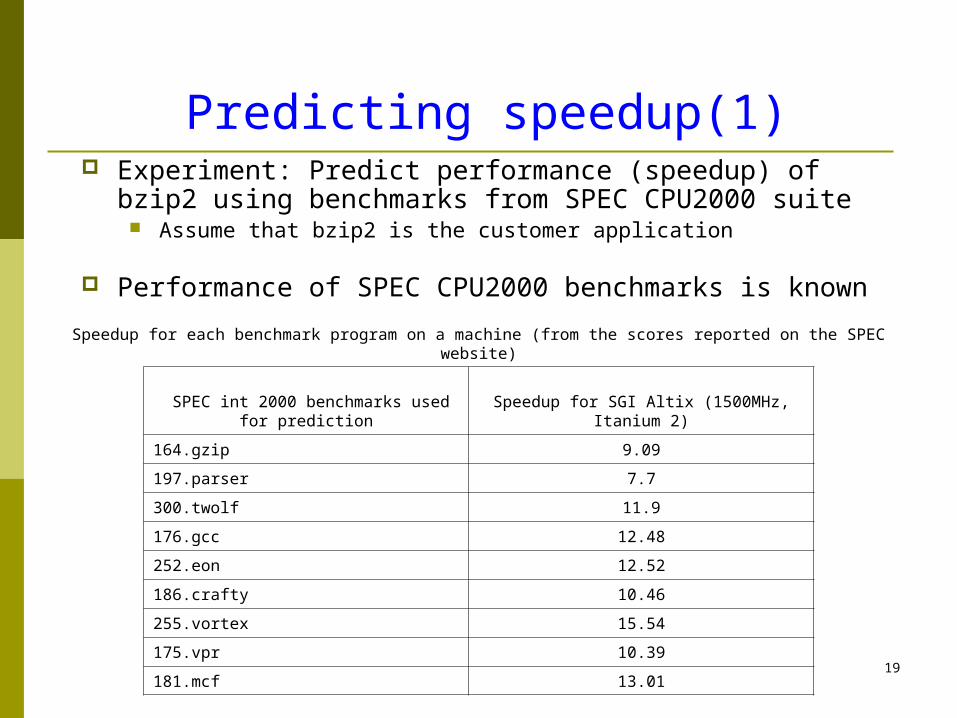
Experiment: Predict performance (speedup) of bzip2
using benchmarks from SPEC CPU2000 suite Assume that bzip2 is the customer application
Performance of SPEC CPU2000 benchmarks is known
Predicting speedup(1)
SPEC int 2000 benchmarks used for prediction Speedup for SGI Altix (1500MHz, Itanium 2)
164.gzip 9.09
197.parser 7.7
300.twolf 11.9
176.gcc 12.48
252.eon 12.52
186.crafty 10.46
255.vortex 15.54
175.vpr 10.39
181.mcf 13.01
Speedup for each benchmark program on a machine (from the scores reported on the SPEC website)
20
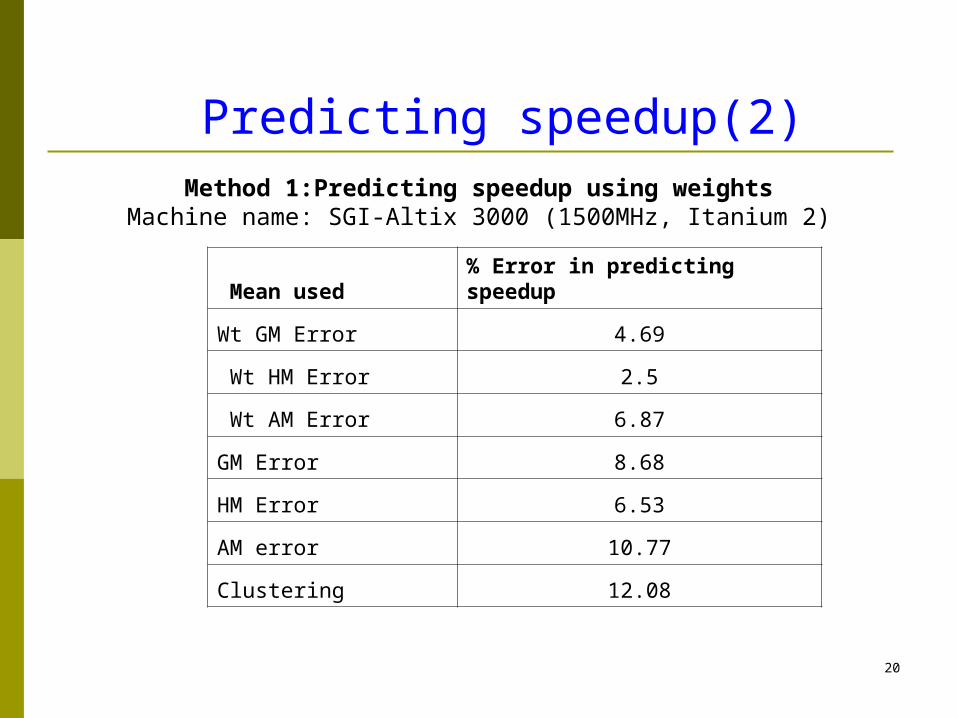
Predicting speedup(2)
Mean used % Error in predicting speedup
Wt GM Error 4.69
Wt HM Error 2.5
Wt AM Error 6.87
GM Error 8.68
HM Error 6.53
AM error 10.77
Clustering 12.08
Method 1:Predicting speedup using weightsMachine name: SGI-Altix 3000 (1500MHz, Itanium 2)

21
Predicting speedup (3)
Statistics
% Error in predicted speedup
usingweighted GM
% Error in predicted speedup
using weighted HM
% Error in predicted speedup
using weighted AM
% Error in predicted speedup
using GM
Average 14.37 11.31 18.05 16.41
Lower CI(95%) 13.72 10.74 17.30 15.73
Upper CI(95%) 15.02 11.89 18.80 17.09
Method 1: Predicting speedup using weightsFor 50 different machines the error in predicted speedup
22
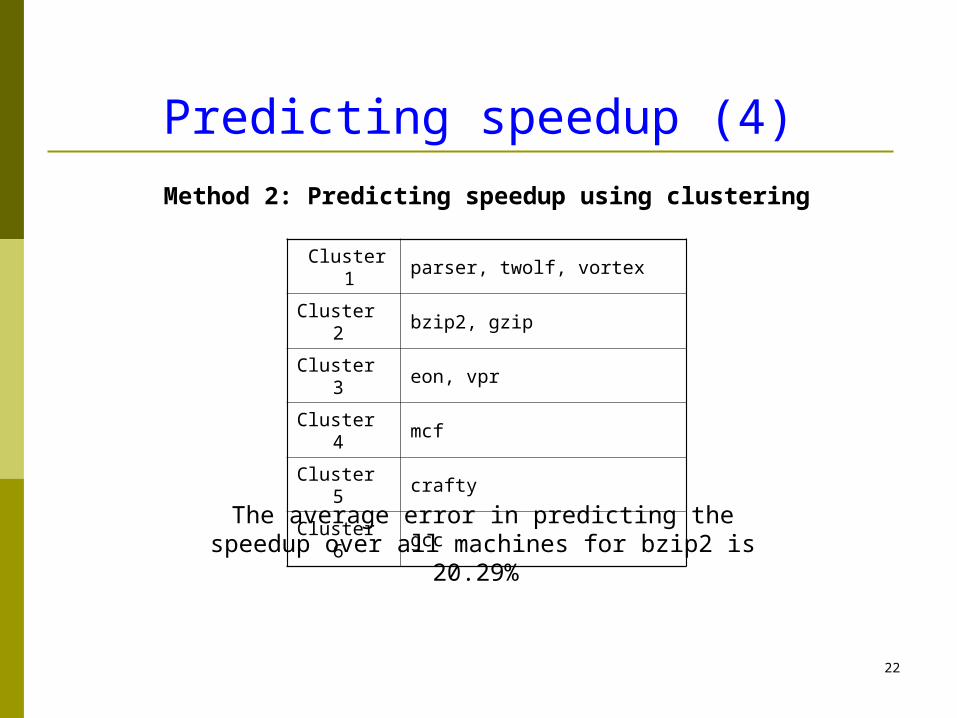
Predicting speedup (4)
Cluster 1 parser, twolf, vortex
Cluster 2 bzip2, gzip
Cluster 3 eon, vpr
Cluster 4 mcf
Cluster 5 crafty
Cluster 6 gcc
Method 2: Predicting speedup using clustering
The average error in predicting the speedup over all machines for bzip2 is 20.29%
23
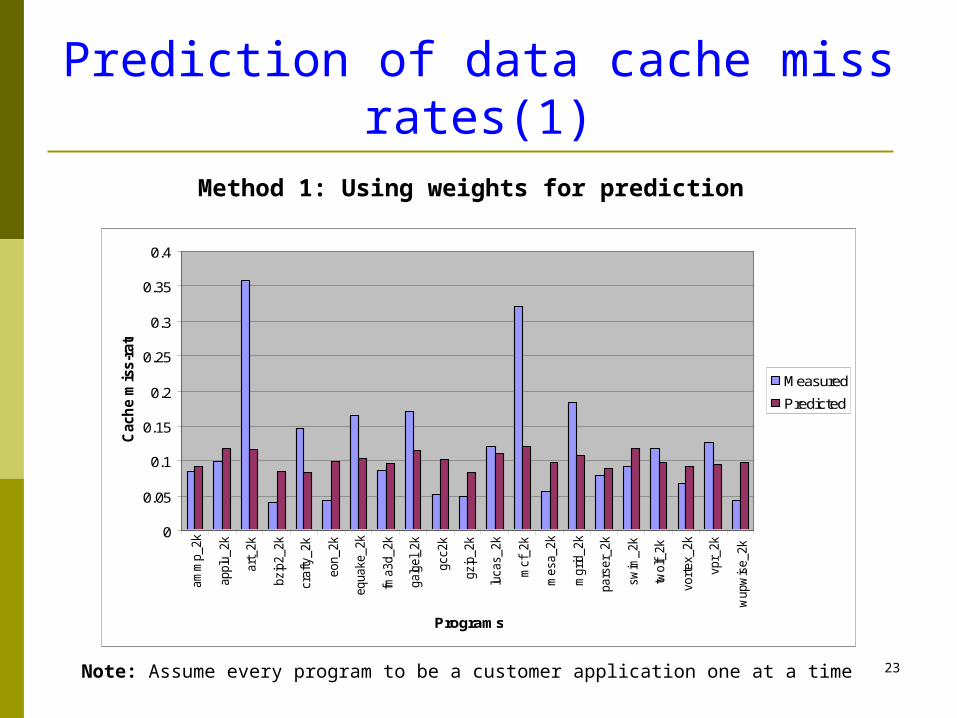
Prediction of data cache miss rates(1)
0
0.05
0.1
0.15
0.2
0.25
0.3
0.35
0.4
amm
p_2k
appl
u_2k
art_
2k
bzip
2_2k
craf
ty_2
k
eon_
2k
equa
ke_2
k
fma3
d_2k
galg
el_2
k
gcc2
k
gzip
_2k
luca
s_2k
mcf
_2k
mes
a_2k
mgr
id_2
k
pars
er_2
k
swim
_2k
twol
f_2k
vorte
x_2k
vpr_
2k
wup
wis
e_2k
Programs
Cach
e m
iss-
rate
MeasuredPredicted
Method 1: Using weights for prediction
Note: Assume every program to be a customer application one at a time
24
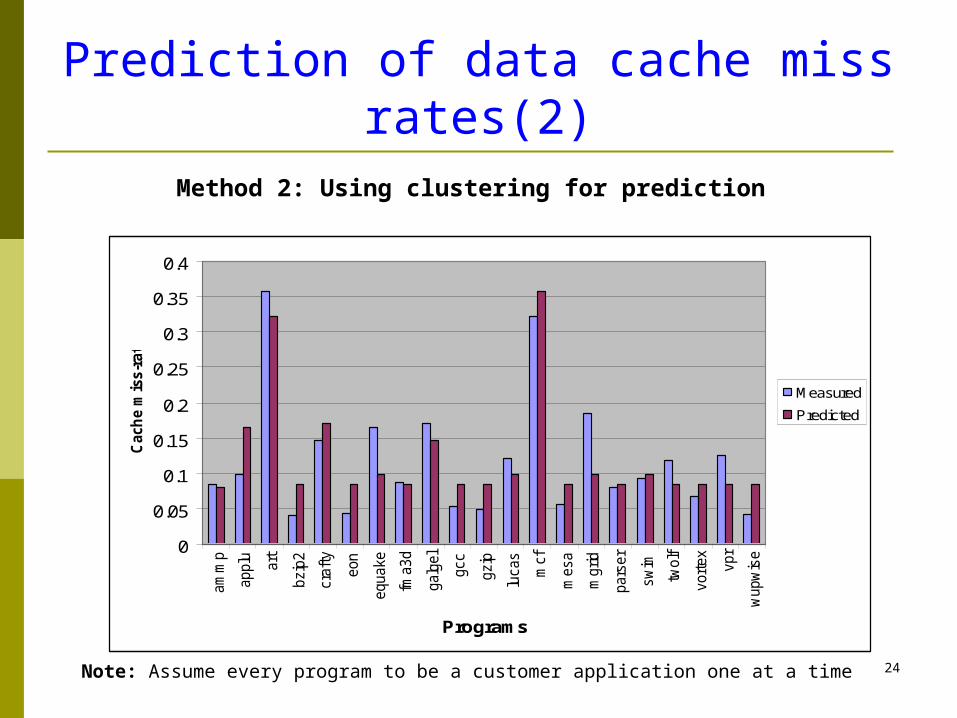
Prediction of data cache miss rates(2)
Method 2: Using clustering for prediction
0
0.05
0.1
0.15
0.2
0.25
0.3
0.35
0.4
amm
p
appl
u
art
bzip
2
craf
ty
eon
equa
ke
fma3
d
galg
el
gcc
gzip
luca
s
mcf
mes
a
mgr
id
pars
er
swim
twol
f
vorte
x
vpr
wup
wis
e
Programs
Cach
e m
iss-
rate
Measured
Predicted
Note: Assume every program to be a customer application one at a time

25
Outline Motivation and Objectives
Methodology
Experimental results
Conclusion
Future work
26
Conclusion Demonstrated two simple methods to predict
performance
Used SPEC CPU2000 as an example to predict performance.
The accuracy of prediction depends on two factors:
How well the workload characteristics correlate to performance Is there a program similar to the customer application in the
repository of known programs

27
Future Work
Two main items on the TO DO list:
To add more programs to the repository and validate the results
To calibrate the measure of similarity (distance) in workload space to the error in the target metric space.

28
Thank you !!
Related Documents