AAMP Training Materials Module 4.4: Winners & Losers from Regional Trade Nicholas Minot (IFPRI) [email protected]

AAMP Training Materials Module 4.4: Winners & Losers from Regional Trade Nicholas Minot (IFPRI) [email protected].
Dec 15, 2015
Welcome message from author
This document is posted to help you gain knowledge. Please leave a comment to let me know what you think about it! Share it to your friends and learn new things together.
Transcript

AAMP Training MaterialsModule 4.4: Winners & Losers from
Regional TradeNicholas Minot (IFPRI)
Objectives
• Understand welfare impact of trade– Identify types of gains from trade– Learn how to measure welfare impact of trade– Address myths about trade
• Examine effects of trade restrictions– Who gains & who loses from trade restrictions– Highlight politics of trade restrictions
• Explore policies to compensate for losses

Module Contents
• Objectives• Types of gains from trade• Myths about trade• Measuring welfare impact of trade• Exercises• Conclusions

What are gains from trade?
• Gains from trade refer to the benefits gained by a group of people from exchanging goods and services with other groups of people
• Usually we think of gains from trade from countries trading with each other, but there are also gains from districts, villages, or even households trading with each other
• The term “gains from trade” does not mean that everyone in the group gains…– It means that benefits > losses
Why are there gains from trade?
Four types of gains from trade:
1. Comparative advantage
2. Competition
3. Economies of scale
4. Dynamic gains from trade
1. Comparative Advantage
• Definition: Each country can produce some goods at relatively lower cost than other goods
• A country will export goods it can produce at relatively lower cost and import goods that cost relatively more to produce

1. Comparative advantage (cont.)
Example• Bolivia is a high-cost producer• Argentina has an absolute advantage in everything• What can Bolivia export?
Argentina BoliviaCost in days of Labor
Potatoes 10 10
Beef 15 30
Soap 12 18
Beer 22 66
Shirts 18 45
Radios 25 75

1. Comparative advantage (cont.)
Example (continued)• Argentina will export beer and radios (goods for which it
has the largest cost advantage)• Bolivia will export potatoes and soap (goods which it
produces least inefficiently)
Argentina Bolivia RatioCost in days of Labor
Potatoes 10 10 1.0
Beef 15 30 2.0
Soap 12 18 1.5
Beer 22 66 3.0
Shirts 18 45 2.5
Radios 25 75 3.0

2. Increased competition
• Without trade, some companies dominate their industry, so they can act as monopolists and charge higher prices
• With trade, companies have to compete with imports and offer prices close to costs
• Usually does not apply to crop production because many small farmers keep prices competitive
• May apply to agricultural inputs (seeds, fertilizer, chemicals, etc) and agricultural machinery
• Often applies to manufacturing, particularly in countries with a small market

3. Economies of scale
• Many goods have “economies of scale” in production– Definition: Economies of scale : the per-unit cost declines as the
volume of production increases– Common among manufactured goods (e.g. cars) – But less common among agricultural commodities
• If the domestic market is small and there is no trade, the costs of production will be high
• In this case, trade allows a larger market, higher production, and lower costs

B2 P2P1B1
Cost per unit
Radios
3. Economies of scale - exampleWithout trade, Paraguay produces P1 radios, Bolivia produces B1 radios. Costs are high.
With trade, Paraguay produces P2 radios for both countries at lower cost. Bolivia stops producing radios, importing instead
Cost of producing radios declines (red arrow)
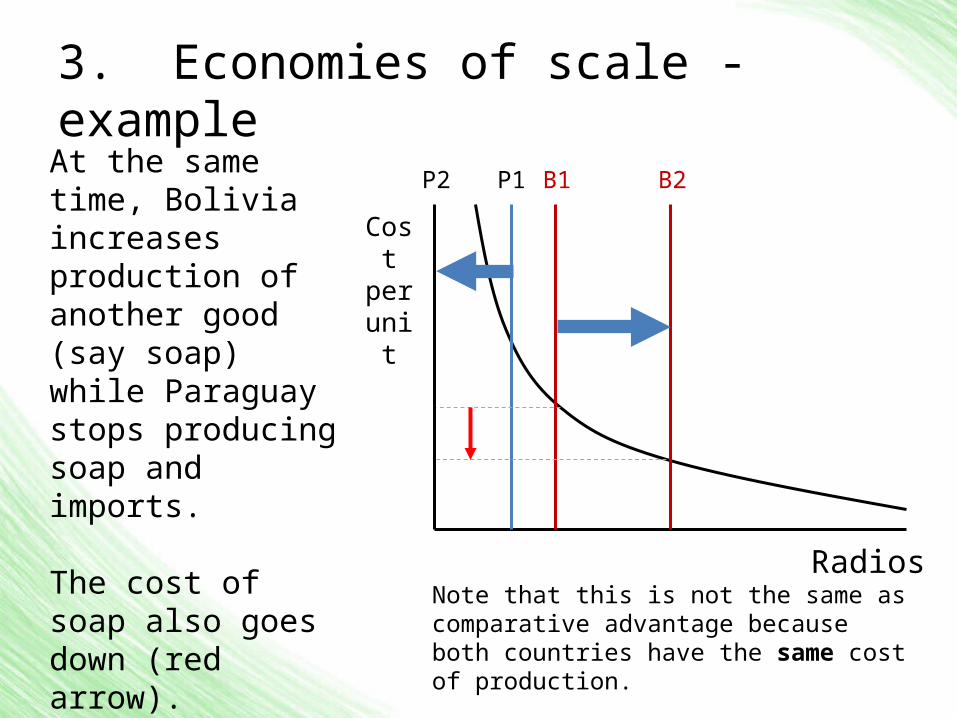
3. Economies of scale - exampleAt the same time, Bolivia increases production of another good (say soap) while Paraguay stops producing soap and imports.
The cost of soap also goes down (red arrow).
P2 B2B1P1
Cost per unit
RadiosNote that this is not the same as comparative advantage because both countries have the same cost of production.

4. Dynamic gains from trade
• Static gains mean that trade gives a one-time increase in income (GDP)
• Dynamic gains means that trade increases the rate of growth in income (GDP)
• Why does trade create dynamic gains?– Competition spurs innovation and investment– Trade introduces new technology and inputs– Open trade policy increases investment, particularly foreign
investment• Open trade policy is a signal of a good investment climate
• Allows foreign companies to invest while catering to home consumers

4. Dynamic gains from trade - examples
• North Korea vs South Korea– North Korea has followed extreme self-sufficiency policy but
economic growth is stagnant– South Korea has followed more open trade policy and has been
one of the Asian Tigers, with rapid growth
• Studies of determinants of economic growth show:– Landlocked countries have less trade and slower growth than
countries with coast – Countries with open trade policies have higher growth rates on
average

Three common trade myths
1. “When two countries trade, one country wins and the other loses.”
2. “Some countries are so inefficient, they don’t have a comparative advantage in anything”
3. “The country should promote exports and reduce imports”

Myth #1: “When two countries trade, one country wins and the other loses”• Trade is not a zero-sum game• Both countries generally benefit from trade, though the
benefits may not be equal, and there are winners and losers in each country
• Example: If Uganda exports maize to Kenya, both countries gain overall, but:– Some Ugandan maize producers and Kenyan maize consumers
gain– Some Ugandan maize consumers and some Kenyan maize
producers lose

Myth #2: “Some countries are so inefficient, they don’t have a comparative advantage in anything”• Some countries may not have an absolute advantage in
anything– Like Bolivia the example earlier
• Every country has a comparative advantage in something– Although it may be difficult to predict ahead of time
Myth #3: “The country should promote exports and reduce imports”• Mercantilist philosophy (1500s): Maximize exports and
minimize imports– This is a flawed philosophy
• The only reason to export is to be able to pay for imports, either now or later
• Exports help the economy via job creation• Imports help the economy by lowering cost and
increasing variety of inputs for producers and goods for consumers

Measuring the static gains from trade
• Three scenarios
1. Exports vs. Autarky
2. Imports vs. Autarky
3. Removing import barriers
Autarky (definition): Self-sufficiency, or a situation in which there is not international trade

Gains from trade: Exports vs. Autarky
• Export price is higher than autarky price
• Producer benefit from the higher price = blue + green
• Consumer loss from higher price = blue
• Net gain = green
Trade vs. Autarky in Exports
Price
Demand
Supply
Quantity
WorldPrice
AutarkyPrice

Gains from trade: Imports vs. Autarky
• Import price is lower than autarky price
• Consumer benefit from lower price = blue + green
• Producer loss from lower price = blue
• Net gain = green
Price
Demand
Supply
Quantity
ImportPrice
AutarkyPrice
Trade vs. Autarky for Imports
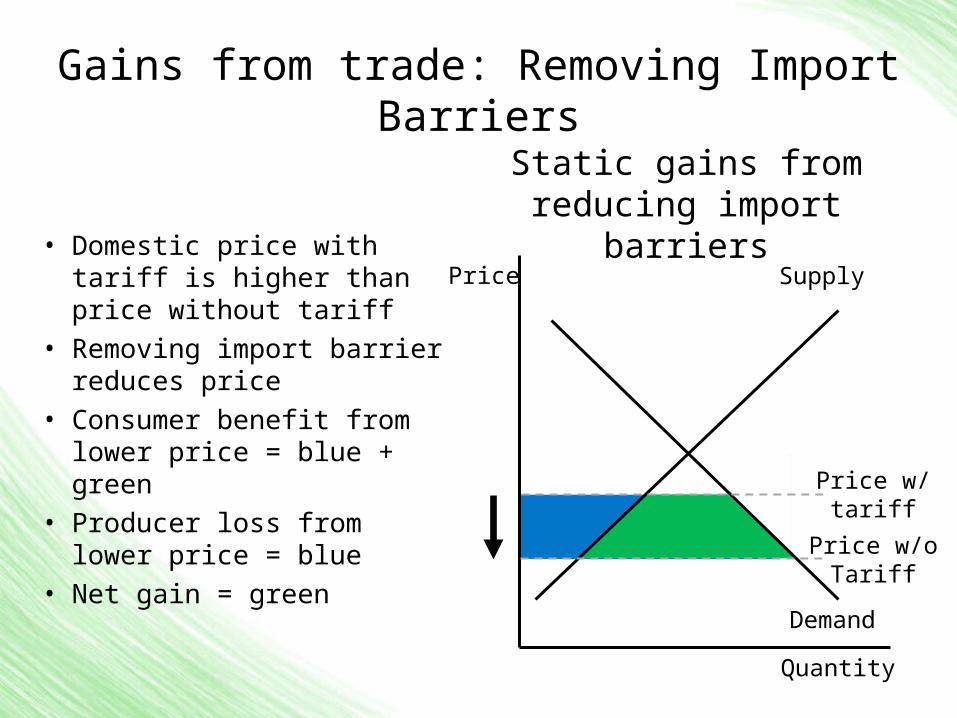
Gains from trade: Removing Import Barriers
• Domestic price with tariff is higher than price without tariff
• Removing import barrier reduces price
• Consumer benefit from lower price = blue + green
• Producer loss from lower price = blue
• Net gain = green
Price
Demand
Supply
Quantity
Price w/oTariff
Price w/tariff
Static gains from reducing import barriers

Measuring static gains from trade
Information needed to calculate static benefits of eliminating an import tariff
(green area)
•Current level of imports with tariff (Mt)•Current price with tariff (Pt)•What price would be with no tariff (Pn)•What imports would be with no tariff (Mn)
• Net benefit = green area =
0.5 x (Mt + Mn) x (Pt – Pn)
Pt
Pn
Mn
Price
Quantity
Mt

Example: Measuring Static Gains from Trade
Wheat import tariffs in Kenya
Net benefit = Area = 0.5 x (Mt + Mn) x (Pt – Pn) = 0.5 x (600 + 845) x (430 – 270)
= 725 thousand tons x $160/ton = $116 Million
$430
$270845 thousand tons
293 360 960 1138Price
Quantity

How big are gains from trade?
• Static gains from trade– Most studies of trade liberalization show gains of 1 – 6% of
GDP, depending on how restrictive trade policy was before liberalization.
• Dynamic gains from trade– Harder to measure, but generally much larger– Wacziarg and Welch (2008)
• Econometric study of dozens of countries from 1950 – 1998
• Trade liberalization increased trade/GDP ratio 5 – 10 pct points
• Trade liberalization increases GDP growth rate 1.5 to 2 pct points
• Over 10 years, this represents a GDP that is 22% higher
Why do governments impose trade restrictions?
• Political influence of producers– Producers are usually larger, better informed and better
organized than consumers
• Infant industry argument– Problem of infants who never grow up
• Concern about impact on poverty– If producers are poorer than consumers
• Dependence on tariff revenue• Cost of transition

Why do governments impose trade restrictions?
In most cases, political influence of producers:

Ameliorating negative effects of trade
• Who is hurt by removing trade barriers– Removing export restrictions raises domestic price,
benefiting producers but hurting consumers– Removing import restrictions lowers domestic price,
benefiting consumers but hurting producers
• Compensation - Some governments try to compensate or assist those hurt by removing trade barriers– Tax relief– Retraining – Assistance to regions hard-hit by trade reform– Safety-net programs (for poor in general)

Exercises – How to use
• Open Excel Workbook “Module 4.4 gains_from_trade” • Yellow areas can be changed by user• Green areas give results and should not be changed by
user • Graph shows results
– Solid lines are “before” change– Dashed lines are “after” change
• Two worksheets– First represents an imported good– Second represents an exported good

Exercise 1 – Higher world prices & imports
• Open worksheet “Ex1 – Import gains” • Simulate 10% increase in import price by inserting
“10” in yellow cell next to “Pct increase in import price” (D16)
• What happens to production? Consumption? Imports?• Why does the higher price cause these three effects?• What is the impact on consumer welfare?• What is the impact on producer welfare?• What is the net impact on producers and consumers?• Return import price to original value (10 0)

Exercise 2 – Import tariffs
• Simulate a 10% import tariff by inserting “10” in yellow cell next to “New import tariff” (D19)
• What happens to production? Consumption? Imports?• What is the net impact on producers and consumers?• What is the tariff revenue generated by the tariff? • How is this result different than a 10% increase in import
price? • Return tariff to original value (10 0)
Exercise 3 - Self-sufficiency via tariffs
• Increase the tariff rate (D19) in intervals until you reach self-sufficiency (no imports)
• How high does the tariff have to be in order to achieve self-sufficiency?
• After reaching self-sufficiency, what is the net effect on producers and consumers?
• After reaching self-sufficiency, what is the tariff revenue? Why?
• Write down the tariff revenue for tariff rates of 10%, 15%, 20%, 30%, and 40%.
• Why does the tariff revenue rise and then fall as tariff rate increases?

Exercise 4 – Self-sufficiency via productivity
• Increase productivity (D18) in intervals until you reach self-sufficiency (no imports)
• How high much does productivity have to increase to achieve self-sufficiency?
• What is the effect of productivity growth on prices?• Why is this?• [Note that in this spreadsheet, the welfare impact
measures do not work for changes in productivity]
Exercise 5 – Export taxes
• Open worksheet “Ex2 – Export Gains”• Increase the new export tax (D19) at 5% intervals• What export tax yields the highest tax revenue?• What is the effect of that tax on producers, consumers
and net effect? • What export tax would result in stopping exports
completely?

Exercise 6 – Productivity and exports
• Increase productivity (D18) by 35%• What is the effect on domestic prices?• Why?• What is the effect on consumption? • Why?• What is the effect on exports?

Conclusions
• Every country can benefit from trade through– Comparative advantage– Increased competition– Economies of scale– Dynamic gains from trade
• Trade creates a net benefit over autarky– Consumers win if imports reduce the price of goods– Producers win if exports increase the price of their produce

Conclusions
• However, not everyone gains from trade– Producers of import-competing goods lose from trade– Consumers of exportable goods lose from trade
• Gains and losses can be estimated– Requires information on production, consumption, trade, prices,
and price elasticities
• Potential negative effects of trade can be moderated by– Training programs for displaced workers– Safety net programs that help poor households– Regional development programs that assist regions adversely
affected.
Related Documents


