SCHOOL OF COMPUTING AND INFORMATICS A BUSINESS INTELLIGENCE SYSTEM TO SUPPORT CRIME MANAGEMENT IN LAW ENFORCEMENT AGENCIES: A CASE OF UGANDA POLICE FORCE BY AHISHAKIYE EMMANUEL P52/85886/2016 Supervisor Dr. Elisha T. O. Opiyo A RESEARCH PROJECT REPORT SUBMITTED IN PARTIAL FULFILLMENT FOR THE REQUIREMENTS OF THE AWARD OF DEGREE OF MASTER OF SCIENCE IN COMPUTATIONAL INTELLIGENCE, SCHOOL OF COMPUTING AND INFORMATICS, UNIVERSITY OF NAIROBI NOVEMBER, 2017

Welcome message from author
This document is posted to help you gain knowledge. Please leave a comment to let me know what you think about it! Share it to your friends and learn new things together.
Transcript

SCHOOL OF COMPUTING AND INFORMATICS
A BUSINESS INTELLIGENCE SYSTEM TO SUPPORT CRIME MAN AGEMENT IN
LAW ENFORCEMENT AGENCIES: A CASE OF UGANDA POLICE F ORCE
BY
AHISHAKIYE EMMANUEL
P52/85886/2016
Supervisor
Dr. Elisha T. O. Opiyo
A RESEARCH PROJECT REPORT SUBMITTED IN PARTIAL FULF ILLMENT FOR
THE REQUIREMENTS OF THE AWARD OF DEGREE OF MASTER O F SCIENCE IN
COMPUTATIONAL INTELLIGENCE, SCHOOL OF COMPUTING AND
INFORMATICS, UNIVERSITY OF NAIROBI
NOVEMBER, 2017

ii
DECLARATION
Researcher’s Declaration
This project report is my original work and has not been presented in any other institution for the purpose
of an academic award.
SIGNATURE: ____________________ Date: ____________________
AHISHAKIYE Emmanuel
Registration Number: P52/85886/2016
Supervisor’s Approval
This project report has been submitted in partial fulfillment of the requirements for the Degree of Master
of Science in Computational Intelligence of the University of Nairobi with my approval as the University
Supervisor.
SIGNATURE: ____________________ Date: ____________________
Dr. Elisha T. O. Opiyo
School of Computing and Informatics
University of Nairobi

iii
DEDICATION
To KAAD - the sponsors of my masters, my family, my supervisor, my lecturers and colleagues, I wish to
appreciate your valuable support and contribution you accorded me throughout the whole process, from
the project initiation till completion.
Thank you and May God the almighty bless you all.

iv
ACKNOWLEDGEMENT
I wish to thank God for having given me strength and guidance in this project. Special thanks to my
supervisor Dr Opiyo and University of Nairobi staff especially those at school of computing and
informatics for their great support and good relation throughout the time I was a student of this university.
Contribution from friends and colleagues towards this project is highly appreciated. Lastly to Mr. Ariho
Paulino for the inspiration and the spirit of hard work you planted in me.
Thank you all.

v
TABLE OF CONTENTS
DECLARATION .................................................................................................................................... ii
DEDICATION ....................................................................................................................................... iii
ACKNOWLEDGEMENT ...................................................................................................................... iv
LIST OF TABLES ............................................................................................................................... viii
LIST OF FIGURES ................................................................................................................................ ix
PUBLICATIONS .................................................................................................................................... x
ABSTRACT ........................................................................................................................................... xi
CHAPTER ONE: INTRODUCTION ...................................................................................................... 1
1.1 Background to the Study ................................................................................................................ 1
1.2 Problem Statement ......................................................................................................................... 3
1.3 Objectives of the study ................................................................................................................... 3
1.3.1 General Objective of the study ................................................................................................ 3
1.3.2 Specific Objectives of the study............................................................................................... 4
1.4 The Significance of the study ......................................................................................................... 4
1.5 Scope of the study .......................................................................................................................... 4
1.6 Definition of Key Terms ................................................................................................................ 4
CHAPTER TWO: LITERATURE REVIEW ........................................................................................... 6
2.1 Introduction ................................................................................................................................... 6
2.2 Introduction to Business Intelligence (BI) ...................................................................................... 6
2.3 Reasons for Business Intelligence .................................................................................................. 7
2.4 Business Intelligence Cycle............................................................................................................ 7
2.5 Business Intelligence Tools ............................................................................................................ 8
2.6.1 Selected Open source business intelligence tools ..................................................................... 8
2.6.1.10 Summary of open source BI systems ...................................................................................... 9
2.7 Big Data and Hadoop ..................................................................................................................... 9
2.8 Comparison of BI systems and conventional systems ................................................................... 11
2.9 Crime Management in Uganda ..................................................................................................... 11
2.9.1 Investigated Crimes in Uganda .................................................................................................. 12
2.9.2 Performance of Uganda Police Force in crime management ...................................................... 13
2.10 Fighting crime with big data analytics ........................................................................................ 13
2.11 BI Predictive Classification Models ........................................................................................... 13
2.12 Review of Existing Crime Management Systems ....................................................................... 15
2.13 Gaps to be filled ......................................................................................................................... 15
2.14 Conceptual Design ..................................................................................................................... 16

vi
CHAPTER THREE: METHODOLOGY ............................................................................................... 17
3.1 Overview ..................................................................................................................................... 17
3.2 Research Design .......................................................................................................................... 17
3.3 Software construction .................................................................................................................. 17
3.3.1 Requirements Analysis .......................................................................................................... 17
3.3.2 The study population ............................................................................................................. 18
3.3.3 The developed system design ................................................................................................ 18
3.3.4 System Implementation ......................................................................................................... 18
3.4 Performance Analysis of predictive algorithms on crime prediction .............................................. 20
3.4.1 Classification Algorithms to be used...................................................................................... 20
3.4.2 Sources of Data and the Modeling Tool ................................................................................. 20
CHAPTER FOUR: SYSTEM ANALYSIS, DESIGN AND IMPLEMENTATION ................................ 21
4.1 Introduction ................................................................................................................................. 21
4.2 Analysis of the Current Information Systems used by Uganda Police ........................................... 21
4.3 Feasibility Study .......................................................................................................................... 21
4.3.1 Technical Feasibility ............................................................................................................. 21
4.3.2 Economic Feasibility ............................................................................................................. 22
4.3.3 Strategic Feasibility ............................................................................................................... 22
4.4 Requirements statement ............................................................................................................... 22
4.5 System design .............................................................................................................................. 22
4.5.1 The Components of the Designed System .............................................................................. 23
4.6 System Implementation ................................................................................................................ 24
4.6.1 System User Interaction ........................................................................................................ 24
4.6.2 Starting the Hadoop Cluster................................................................................................... 24
4.6.3 User Login ............................................................................................................................ 25
4.6.4 System Configuration ............................................................................................................ 25
4.6.5 Main System Links ............................................................................................................... 26
4.6.6 The data warehouse ............................................................................................................... 26
4.6.7 Loading data into the Hadoop system .................................................................................... 27
4.6.8 The Meta store manager ........................................................................................................ 28
4.6.9 Reports ................................................................................................................................. 28
4.6.10 The HiveQL ........................................................................................................................ 29
4.6.11 Analytics on crime data in the crime management data warehouse ....................................... 29
4.6.12 Benchmarking the developed system with other State-of-Art Open Source BI Systems ............ 30
CHAPTER FIVE: RESULTS AND DISCUSSIONS ............................................................................. 32

vii
5.1 Introduction ................................................................................................................................. 32
5.2 Presentation of Results based on the Research Objectives ............................................................ 32
5.2.1 Evaluation of the open source BI tools used in this study ....................................................... 32
5.2.2 Performance Analysis of BI algorithms on Crime Prediction ................................................. 34
5.3 Comparison of the developed system with other Open Source BI Systems.................................... 36
5.4 Hadoop Framework Opportunities in BI ....................................................................................... 36
5.5 Big Data Analytics in Police to Curb Crimes ................................................................................ 37
5.6 Data Analysis using R Software ................................................................................................... 37
5.7 Hadoop and python ...................................................................................................................... 37
CHAPTER SIX: CONCLUSIONS AND RECOMMENDATIONS ....................................................... 38
6.1 Conclusions ................................................................................................................................. 38
6.2 Challenges and Limitations .......................................................................................................... 38
6.3 Contributions of the study ...................................................................................................... 39
6.4 Recommendations........................................................................................................................ 39
REFERENCES...................................................................................................................................... 40

viii
LIST OF TABLES
Table 1: Investigated Crimes from 2011 to 2014 ................................................................................ 12
Table 2: Description of Selected BI Classification Algorithms ........................................................... 14
Table 3: Technical feasibility ............................................................................................................. 21
Table 4: Comparison of the developed system with Other State-of-Art Systems ................................. 30
Table 5: Open Source Business Intelligence Platforms Features ......................................................... 33
Table 6: Comparison of the algorithms on training crime data ............................................................ 34
Table 7: Comparison of the algorithms on testing and validation crime data ....................................... 34
Table 8: Comparison of the algorithms on training crime data from UPF ........................................... 35
Table 9: Comparison of the algorithms on testing and validation crime data from UPF ...................... 35

ix
LIST OF FIGURES
Figure 1: Development of Business Intelligence Systems. Source: (Olszak & Ziemba, 2007) ............... 7
Figure 2: The Business Intelligence Cycle. SOURCE: Thomas (2001) ................................................. 8
Figure 3: Crime category (‘000s): source: UBOS report 2015 ............................................................ 12
Figure 4: The conceptual design of a proposed system ....................................................................... 16
Figure 5: Extreme Programming Implementation Process .................................................................. 17
Figure 6: Starting the Hadoop Cluster ................................................................................................ 18
Figure 7: Eclipse IDE Setup ............................................................................................................... 19
Figure 8: The system design of a proposed system ............................................................................. 23
Figure 9: Starting the Hadoop Cluster ................................................................................................ 24
Figure 10: The authentication of the system ....................................................................................... 25
Figure 11: system configuration ......................................................................................................... 25
Figure 12: System main links and table creation ................................................................................. 26
Figure 13: The data warehouse .......................................................................................................... 27
Figure 14: The loaded crime data in Hadoop system .......................................................................... 27
Figure 15: The Metastore manager ..................................................................................................... 28
Figure 16: Information Reports .......................................................................................................... 28
Figure 17: The HiveQL for Generating Reports ................................................................................. 29
Figure 18: The bar chart visualization ................................................................................................ 29

x
PUBLICATIONS
Some ideas, Figures and Tables of this research have previously appeared in the following journals:
1. Emmanuel Ahishakiye, Elisha Opiyo Omulo, Danison Taremwa and Ivan Niyonzima (May, 2017).
Crime prediction using Decision Tree (J48) classification algorithm. In International Journal of
Computer and Information Technology. Url: www.ijcit.com
2. Emmanuel Ahishakiye, Elisha Opiyo Omulo, Danison Taremwa and Ruth Wario (April, 2017).
Comparative Analysis of Open source Business Intelligence Tools for Crime Data Analytics. In
International Journal of latest research in Engineering and Technology (IJLRET). (ISSN: 2454-5031).
Url: www.ijlret.com
3. Emmanuel Ahishakiye, Elisha Opiyo Omulo, Ruth Wario and Ivan Niyonzima (March, 2017). A
Performance Analysis of Business Intelligence Techniques on Crime Prediction. In International Journal
of Computer and Information Technology (ISSN: 2279 – 0764). Volume 06– Issue 02, March 2017. Url:
www.ijcit.com

xi
ABSTRACT
Police data is continuing to grow at a high rate and it will be doubling every two years; police uses only
17% of its crime data in crime management today (Xerox, 2013). Nicole’s study of 2012 concluded that
Law Enforcement Agencies are data rich but information poor and Uganda Police Force (UPF) is not an
exceptional. Jacob et al. (2015) revealed Uganda Police Crime Case Management System support police
officers in the management of crime cases, storage and retrieval of complainants’ and offenders’
information as well as to follow up the case status and keep track of information concerning crime cases
in the Uganda Police Force. Also (Oludele et al. 2015) revealed that A Real-Time Crime Records
Management System for National Security Agencies is an efficient and effective data analysis tool for
improving the operations of the law enforcement agencies. Anil et al. (2013) argued that Crime
Automation and Reporting System would allow the reporting of crimes 24/7 by the victims and witnesses.
Jimoh et al. (2014) argued that a scalable Online Crime Reporting System would help the police to timely
get the information about criminals and their mode of operation and also allows crime reporting with
anonymity. Developing a low cost Business Intelligence system for crime data analytics requires low cost
development tools and this is where open source business intelligence tools come to a play. Therefore
there was a need to identify an efficient and effective open source business intelligence tool for the
implementation of a Business Intelligence System for crime data analytics. Five Open Source BI tools i.e.
Apache Hadoop, Jaspersoft, Pentaho, SpagoBI and vanilla were considered. Apache Hadoop is
recommended by this research for crime data analytics because it has capabilities which are not found to
other open source tools. Also a BI system was developed using Hadoop ecosystem, the system allows
structured, semi structured and unstructured data, audios and videos for crime data analytics. Also the
system is fault tolerant, easy to use and is economically feasible and it will therefore act as a reference
point by the law enforcement agencies during the implementation of BI and Crime analytics systems.
Also four different classification algorithms that is; decision tree (J48), Naïve Bayes, Multilayer
Perceptron and Support Vector Machine were compared to find the most effective algorithm for crime
prediction. The study used classification models generated using Waikato Environment for Knowledge
Analysis (WEKA). The study revealed that the average accuracy of J48, Naïve bayes, Multilayer
Perceptron and Support Vector Machine (SMO) is approximately 100%, 89.7989%, 100% and 92.6724%,
respectively for both training and test data. Also the execution time in seconds of J48, Naïve bayes,
Multilayer Perceptron and SVO is 0.06, 0.14, 9.26 and 0.66 respectively using windows7 32 bit. Hence,
Decision Tree (J48) out performed Naïve bayes, Multilayer Perceptron and Support Vector Machine
(SMO) algorithms, and manifested higher performance though J48 had little execution time as compared
to Multilayer Perceptron. The researcher recommends that this project would further be developed by
incorporating real-time Business Intelligence. This implies that, Hadoop should be connected to the
information systems and also social media to stream live content and update dashboards in near real-time.

1
CHAPTER ONE: INTRODUCTION 1.1 Background to the Study
In the developing world, the daily activities of humans’ social, political and economic life makes it vital
and easy to encounter the phenomenon of crime. Crime is an unnecessary evil in the society and for any
economic, social and political activities to run smoothly, crime offences must be completely eliminated
from the society and therefore knowledge of crime analysis is required. According to (Jack, 2016), 90%
of the data that exists in the world today has been created over the last two years alone and crime data is
not exceptional as it also comes in many formats (e.g., videos, images, audios, satellite data, and sensor
data). Intelligently analyzed data can assist decision makers to make actionable data driven decisions and
therefore it is a valuable resource in the era of big data. It can lead to new insights and, in commercial
settings, to competitive advantages.
Law enforcement has always relied on intelligence information enhanced by analysis to combat all crime
and identify threats; however, the information is often narrowly focused and inconsistently updated or
shared. The rise of digital technologies has made possible more powerful methods for collecting,
analyzing and sharing information and has fostered the development of Intelligence-Led Policing. Global
business data is becoming an essential component for Law Enforcement and Intelligence Agencies which
increasingly rely on Intelligence-Led Policing (ILP) strategies. Commercial business data can help law
enforcement uncover money laundering schemes, financial fraud, illegal business fronts, and a variety of
other criminal activities. Global business data assists law enforcement in proactively assessing and
monitoring threats and exposing businesses and executives that are involved in nefarious activity (Dun
and Bradstreet, 2012). According to (OSAC Report, 2017), crimes in Uganda can occur anywhere at any
time. The report shows that there was an increase of crime activity in the central region of Kampala and
the northern region specifically Gulu and lira. These included both serious and moderate crimes and there
was moderate cybercrime.
The proliferation of modern and complex information communication technology (ICT) including the
borderless connectivity of the World Wide Web (www) have significantly altered the way nation states
deals with their security, political, economic and social issues. While the western and developed countries
have taken advantage of developments in the ICT to improve on their legal and institutional arrangements
in crime detection and prevention, Africa have grossly lagged behind and have not leveraged on these 21st
century tool in addressing its myriad of security and other challenges (International Report 2010).
Understandably, this climate of insecurity and criminality is now a feature of our modern world, for two
main reasons, first, because of the lowering of economic and political barriers and secondly because of
the advancement in communications and commerce. Insecurity and criminality generally, is the darker
side of our contemporary world as science and ICT have provided the convenience and anonymity with
which crimes may be committed (Etheridge, 2010).

2
According to (Adeola et al. 2014), crime prevention promotes community safety and contributes to the
sustainable development of countries. Well planned crime prevention improves the quality of life of all
citizens and it has long-term benefits associated with reduced costs in connection to the formal criminal
justice system, as well as other social costs that result from crime like the facilitation of law enforcement
agencies. Crime prevention practices offers opportunities for a humane and more cost-effective approach
to the problems of crime and the key benefit of applying business intelligence in crime Prevention and
management is that often there are multiple complex factors which influence crimes to be committed and
Business intelligence tools enables us to analyze those complex factors forexample historical crime data
sets and identifying the combination of factors which are most closely correlated with the past crimes and
build a business intelligence model which can assist crime analysts and law enforcement decision makers
to make data driven actionable decisions which would in turn lead to crime reduction.
Insecurity and criminality generally, is the darker side of our contemporary world as science and
Information Communications Technology (ICT) have provided the convenience and anonymity with
which crimes may be committed (Etheridge, 2010). The birth and growth of crime in a community is
based on many characteristics related to the community and society. These characteristics are - different
races in a society , different income groups, different age groups, family structure (single, divorced,
married, number of kids), level of education, the locality where people live, number of police officers
allocated to a locality, number of employed and unemployed people and etc (Iqbal et al. 2013). In modern
businesses, increasing standards, automation, and technologies have led to vast amounts of data becoming
available. Data warehouse technologies have set up repositories to store this data. Improved Extract,
transform, load (ETL) and even recently Enterprise Application Integration tools have increased the
speedy collecting of data. OLAP reporting technologies have allowed faster generation of new reports
which analyze the data. Business intelligence has now become the art of sifting through large amounts of
data, extracting pertinent information, and turning that information into knowledge upon which actions
can be taken (Ranjan, 2009). The benefits of having a Business Intelligence system cannot be
overemphasized; Law enforcement agencies being one of the organizations also require such systems.
Today more and more organizations are turning towards Business Intelligence for making better business
decisions.
The data for business intelligence system can be obtained from past records which constitute historical
data or data directly obtained from the systems on real time basis. During the invent of business
intelligence system, the main users used to be IT professionals who used very complex queries to
manipulate data from the source to generate final meaningful reports. However, due to advancement the
business intelligence front, better, faster, user friendly and easier to use applications have been developed
and increasingly the users of this technologies have become business executives and finance practitioners.

3
According to (Daniel, 2014), 63% of the prospective buyers of BI software are business professionals as
opposed to a mere 37% IT professionals (Ipomai, 2016).
1.2 Problem Statement
An issue of concern in Law Enforcement Agencies across the world is crime management and public
security. Police data is continuing to grow at a high rate and it will be doubling every two years; police
uses only 17% of its crime data in crime management today (Xerox, 2013). Nicole’s study of 2012
concluded that Law Enforcement Agencies are data rich but information poor and Uganda Police Force
(UPF) is not an exceptional. UPF is facing problems in regards to access to valuable, correct, timely, and
actionable information for effective crime management. UPF Crime Case management system supports
police officers in the management of crime cases, storage and retrieval of complainants’ and offenders’
information as well as to follow up the case status and keep track of information concerning crime cases
in the Uganda Police Force (Jacob et al. 2015). Data stored and generated from the crime case
management system is basically structured data but police has access to other kinds of data which are
unstructured in nature forexample from emails, social media, and intelligence reports and therefore
consolidating this data to one system is a problem. UPF needs to optimize resources, foresee new
opportunities and seize them; report accurate information and in best way possible to government,
sponsors and the public and also to answer critical questions like what time and location is crime likely to
happen amongst others. To successfully address this problem, there should be effective quick responses
requiring access to timely, accurate and actionable data and this call for police Business Intelligence
System. Law enforcement agencies especially Police need to be given better access to data that will drive
actionable data driven intelligence decisions and concentrate on investigating crimes on the front line
rather than dealing with time-consuming administrative tasks behind the scenes like generating reports
and crime patterns. Crime data analytics has the potential to enable the police to achieve a truly
preventative approach towards crime prevention and management but has not been exploited by law
enforcement agencies in Uganda. Also a well developed state-of-the-art business intelligence and data
analytics system can enable law enforcement agencies to stay focused on the mission and make more
informed decisions fed by complete, accurate and up-to-date data possible but such systems are lacking in
law enforcement agencies especially with Uganda Police Force.
1.3 Objectives of the study
1.3.1 General Objective of the study
The main aim of conducting this project was to develop a Business Intelligence system for Law
Enforcement Agencies in Uganda using open source tools taking a case of Uganda Police Force.

4
1.3.2 Specific Objectives of the study
i. To investigate appropriate open source tools for the implementation of Business Intelligence
systems.
ii. To investigate the appropriate BI algorithms for crime prediction.
iii. To design the relevant BI system components to support in crime management in law
enforcement agencies.
iv. To develop the BI system to support in crime management in law enforcement agencies.
v. To perform analytics pertaining crime data in law enforcement agencies in Uganda.
1.4 The Significance of the study
Through the process of business intelligence, Law Enforcement Agencies can leverage or understand the
hidden information in its data, uncovering associations, patterns, and trends that can lead to improving
security and reduce crimes. In the execution of this project, the following was beneficial both to the
developers and scholars in the BI community: The study revealed the current tools and approaches
towards implementing Business Intelligence systems, the study will act as a reference point for the
implementation of Business Intelligence projects and it also added to the knowledge base, the different
techniques and methods of developing optimal Business Intelligence Systems for Law Enforcement
Agencies. The study also opened new insights of research areas that can improve BI implementation in
organizations.
1.5 Scope of the study
This project was intended to develop a Business Intelligence system based on the typical business
processes of the Uganda Police Force. The main idea of the project was crime management using
business intelligence system. The information generated after implementing business intelligence can be
helpful for both the police, policy makers, neighborhood watch as well as the general public.
1.6 Definition of Key Terms
Some terms had been used to clearly bring out the topic of this research and were elaborated as follows:
• Business intelligence: Business intelligence, or BI, is an umbrella term that refers to a variety of
software applications used to analyze an organization’s raw data. BI as a discipline is made up of
several related activities, including data mining, online analytical processing, querying and
reporting.
• Business intelligence systems: These are systems that process, store and provide useful
information to users who need it and when they need it.

5
• Business intelligence tool: This is defined as a type of application software designed to retrieve,
analyze, transform and report data for business intelligence. The tool can be used for querying
and reporting, online analytical processing (OLAP), data mining, or dash-boarding, among others.
• Crime: This refers to a behavior disorder that is an integrated result of social, economical and
environmental factors. Crimes are a social nuisance and cost our society dearly in several ways.
• Law: This refers to a system of rules that are enforced through social institutions to govern
behavior. Laws can be made by a collective legislature or by a single legislator, resulting in
statutes, by the executive through decrees and regulations, or by judges through binding
precedent, normally in common law jurisdictions.
• Law Enforcement: This refers to any system by which some members of society act in an
organized manner to enforce the law by discovering, deterring, rehabilitating, or punishing people
who violate the rules and norms governing that society.
• Law Enforcement Agencies (LEA): This refers to any agency which enforces the law. This
may be a special, local, or state police, federal agencies such as the Federal Bureau of
Investigation (FBI) or the Drug Enforcement Administration (DEA).
• Performance: This refers to an action or process of carrying out or accomplishing an action,
task, or function.

6
CHAPTER TWO: LITERATURE REVIEW
2.1 Introduction
This section surveyed the past studies on BI in general, Hadoop BI methodologies/implementation
frameworks, open source BI tools, advanced data mining techniques that are used in crime prediction and
the BI implementation approach (conceptual framework) proposed in this project.
2.2 Introduction to Business Intelligence (BI)
Business Intelligence is defined as a set of tools and techniques for the acquisition and transformation of
raw data into meaningful and useful information for data driven decision making (Turner, 2016). Turban
et al. (2011) noted that Business Intelligence rose from Decision Support Systems. Also (Turban et al.
2011) further noted that the term Business Intelligence has its roots in (MIS) Management Information
Systems of the 1970s and (EIS) Executive Information Systems of the 1980s. Also (Negash, 2004) stated
that by 2005 Business Intelligence systems had analytical support functions and artificial intelligence by
2005. Business intelligence systems are capable of handling large amounts of data in all formats
(structured, semi structured and unstructured) forexample video, audio, image, satellite data, sensor data
and BI systems helps to create new strategic business opportunities and actionable decision making. The
goal of BI is to allow for the easy interpretation of these large volumes of data. Also (Rud and Olivia,
2009) stated that Analytics and Business Intelligence helps to identify new opportunities from the data
and their successful implementation can provide decision makers with long term stability and competitive
advantage.
According to (Negash, 2004), research about Business Intelligence Systems is limited although they have
been widely used in businesses. Also (Olszak and Ziemba, 2007) stated that Business Intelligence
Systems support decision making at all levels of the organization’s management and therefore it’s very
important to understand their value. Due to significant changes in information technology, existing
information systems have not met decision maker’s expectations such as monitoring competition and
making decisions under time pressure (Olszak and Ziemba, 2007). Also (Power, 2001) stated that in order
for organizations to quickly react quickly to changes that take place on the market, they should make use
of over increasing data and therefore need systems that can handle and make use of such data.
Understanding business intelligence systems in an organization is very important because it makes it easy
for data analysts to transform data into information, then into knowledge and finally knowledge helps
organizations decision makers to make data driven decisions.
The figure 1 below shows how Business Intelligence Systems evolved from the already existing
convolutional information systems. BI systems have a central data repository called Data warehouse
which stores data from all the departments in the organization and also from external sources and it’s on

7
this data where variety of operations are done like drill up, drill down, Data mining, online analytical
processing (OLAP), standard and adhoc queries, multivariate and multidimensional data analysis. All
these operations help decision makers at different levels to make quick data driven decisions.
Figure 1: Development of Business Intelligence Systems. Source: (Olszak & Ziemba, 2007)
2.3 Reasons for Business Intelligence
In this era of Big Data, Business Intelligence Systems are very important because they help decision
makers make data driven decisions under time pressure and monitor competition (Ranjan, 2004).
By utilizing past data, accurate forecasts about future trends or economic conditions is easy and possible
using Business Intelligence Systems. Improvement of timeliness and quality of information is the ultimate
goal of BI systems. Vitt et al. (2002) noted that BI Systems enables organizations to make faster better
decisions, generate information from large volumes of raw data and they also provide an effective
approach to management. Business Intelligence tools and techniques also help organizations in making
better and faster decisions (Pirttimaki and Hannula, 2003).
2.4 Business Intelligence Cycle
The first phase of Business Intelligence process is planning; in this phase decision makers’ needs are
clearly identified. This phase allows decision makers to iron out their business needs from their related
problems, questions and prevailing working conditions. This is followed by data collection which is the
second phase in BI cycle, Data is gathered from the organization’s internal sources or external or both
sources, which can be primary or secondary (Pirttimaki, 2007). The collected data is entered in data
warehouse (Watson and Wixom, 2007). The third phase is Analysis and production phase where data is
analyzed carefully by employing analytic methods and tools. The result of this phase is actionable

8
information which enables strategic decisions to be taken. Another phase is the Dissemination phase
which enables the knowledge and intelligence that was generated from the Analysis and production phase
to be made available using reports, newsletter, internal databases or intranet (Pirttimaki, 2007), which is
understandable for actionable decisions by decision makers (Thomas, 2001). This cycle continue again as
the need arise. There are four major groups of human resource that are required at each stage of Business
Intelligence cycle that are critical for the process, these are; library-acquire, organize and store
information; collectors-gather intelligence for analyst; analyst-perform analysis; and users-make use of
discovered knowledge and intelligence (Herring, 1996). The figure2 shows the BI cycle.
Figure 2: The Business Intelligence Cycle. SOURCE: Thomas (2001)
2.5 Business Intelligence Tools
Golfareli’s research of 2009 suggests that closed and commercial tools were dominating the BI market
with only limited adoption of open source tools. However there has been an increasing use of open source
tools to develop Business Intelligence Systems and also (Wise, 2012) noted that open source Business
Intelligence tools have more benefits over traditional commercial software ranging from offering lower
initial costs to more flexible support and integration options.
2.6.1 Selected Open source business intelligence tools
2.6.1.1 Apache Hadoop
According to (Apache Hadoop, 2017), Apache Hadoop is scalable, reliable and distributed computing
software. It has a library framework that allows distributed processing of large data sets across clusters of
computers using simple programming models. Apache Hadoop was designed to scale up from single
servers to thousands of machines each providing local storage and computation. The software framework

9
was designed to detect and handle failures at the application layer thereby if an individual cluster machine
or server fails, the system continues to work and the data on the failed cluster is not lost since Hadoop
replicates the data and distributes it to three different clusters on the distributed system.
2.6.1.3 JasperReport
According to (Jaspersoft, 2017), Jaspersoft has both open source and commercial versions. It is the most
popular and widely used open source BI tool. Their feature which includes ETL, OLAP and server
components makes it easier to integrate Jaspersoft with the already existing IT systems of organizations.
Jaspersoft runs on Windows, Linux, and Mac; it’s also supported by wiki, excellent documentation and
additional resources.
2.6.1.4 Pentaho
According to (Pentaho, 2017), Pentaho is an open source BI tool with several features ranging from
reporting to data mining and it also contains the Pentaho BI Server. Pentaho has support from many
community resources such as documentation, wiki, and others. It also runs on (JEE) Java Enterprise
Edition and it can be used on Windows, Linux, and Mac.
2.6.1.5 SpagoBI
According to (SpagoBI, 2017), SpagoBI has the capability to integrate with other tools like KeyRock
identity manager, Orion Context Broker, and CKAN. SpagoBI also has features which include reporting,
charts, cockpits, data-mining, ETL.
2.6.1.10 Summary of open source BI systems
The researcher after analyzing variety of open source Business Intelligence and reporting tools, he noted
that majority of the open source BI tools have rich features which can be customized for enterprise use.
The researcher further noted that BI systems developers should also make a thorough comparison of the
open source tools so that they can make a best choice of the tool that best suits their needs.
2.7 Big Data and Hadoop
Devakunchari’s 2014 study (as cited in Rohan et al. 2015) suggests the widespread usage of the Hadoop
MapReduce framework by businesses and others needing mediums to precisely organize sets of data.
Hadoop MapReduce is a software framework which allows users to easily script applications which
process massive datasets in parallel. It utilizes two main functions: map and reduce. The map functions
apply functions to datasets, consequently producing further lists containing its output results. Reduce
accepts big data and outputs a single value. Functions used conjoined with the reduce function must have
the ability to combine two pieces of data into one, then insert another piece of data, combining, and

10
repeating until there is only one value. To optimize the Hadoop experience, technologies such as Apache
Mahout, Pig, Hive, and Sqoop have been developed in recent decades. These tools are targeted for
specific purposes and may work conjoined with one another to ease the workings of Hadoop. These
technologies have the ability to aid distributed data processing, commonly needed in the techsavvy world
(Rohan et al. 2015).
Krishnan (2015) contends to the primary purposes of establishing distributed data processing. This
purpose is to copy the database management system in a master slave configuration and process the data
across the multiple instances. As Hadoop is a platform for storing big data, it does not allow the transfer
of other smaller and unstructured data that could play vital role in the process of analyzing the
information for necessary purposes (Yang et al. 2015). Consequently, in order to transfer the data between
the Hadoop system and RDBMS, Sqoop has been developed as a junction which, stated by Krishnan, was
one of the primary design goals of Sqoop when it was first introduced (Krishnan, 2015).While Sqoop is a
significant tool regarding the management of Big Data, many other tools have been developed which are
necessary for the smooth functionality of Hadoop (Rohan et al.2015).
a. Mahout
Mahout is a component of apache Hadoop that is used for machine learning functions. It carries out three
machine learning techniques which include recommendations, classification, and clustering. Using
recommendation, the user utilizes the already stored past information and the public information to
determine the likelihood of a user liking something. Using classification, the known data is used to
determine which category that new data will belong. It uses the already existing groups to sort the new
data into the existing categories. Also mahout is used to implement clustering technique that sorts data
into groups that didn’t previously exist. This technique is very important especially when no category of
data existed before where the new data can belong (Rohan et al.2015).
b. Pig
Initially Pig was developed to analyze large datasets in timely and efficient manner. This component
includes Pig Latin which is a programming language that runs data through transformations, loads the
data from HDFS and stores or dumps the data. Using this component, big datum can be analyzed that
efficiently utilizes high level languages than writing MapReduce functions (Rohan et al.2015).
c. Hive
Hive is a component of apache Hadoop that has the ability of distributed storage. It uses HiveQL which
allows the user to query large datasets. It provides different types of storage and reduced semantic check
time. Other components of Hive include metadata storage, indexing and compression of data stored in

11
Hadoop. It also utilizes MapReduce programs to use custom mappers and reducers which helps to easily
direct the software without HiveQL (Rohan et al. 2015).
d. Spark
This is a component of apache Hadoop that allows users to perform analytics on large datasets on
clustered computers. It can process data from different sources including HDFS, SQL and Hive. It has its
own memory storage that enables it to enhance performance as long as the data being analyzed can fit in
that memory otherwise it uses computer’s storage. It has a fault tolerance system RDD (Resilient
Distributed Datasets), is much more efficient than MapReduce method of copying every single bit of
information because it only restores the part that was lost, freeing up a significant amount of memory and
therefore it provides more efficient and faster framework than MapReduce (Rohan et al. 2015).
2.8 Comparison of BI systems and conventional systems
According to (Laudon and Laudon, 2000), information systems depending on which level of the
organization they serve; the first level of the organization is operational level which is comprised of
mainly OLTP (online transactional processing systems) supports the activities that are performed at this
level like material flow, payroll processing and processing of orders in an organization. Knowledge work
systems are used at the knowledge level which ensures the knowledge is created and integrated into the
organization. The MIS (Management information systems) supports the managers with reports,
performance management and historical records. Also DSS (Decision support systems) supports
managers to make decisions very fast. The ESS (executive support systems) is used at the strategic level
to support senior managers to make long term decisions. According to (Datta and Thomas, 1999; Power,
2002; Ponniah, 2001), information systems takes two forms which are OLAP (online analytical
processing) and OLTP (online transactional processing) systems. According to (Turban et al. 2007) online
transactional processing systems focuses on repetitive and routine activities by processing large number
of transactions while online analytical processing systems provide managers and executives with decision
support. According to (Gray, 2003; Olszak and Ziemba, 2006), Business Intelligence Systems provides
multivariate analysis, multidimensional data presentation and they have central repository of data called
Data Warehouse. Also according to (Olszak and Ziemba, 2003), Business Intelligence Systems supports
decision making at all the levels of the organization and various stake holders.
2.9 Crime Management in Uganda
According to the 2015 report from Uganda bureau of statistics (UBOS), crimes in Uganda have been
increasing every year. From the same report, it shows that crimes in Uganda increases every each year
and the year 2017 registered a tremendous increase in number of crimes including women killings,
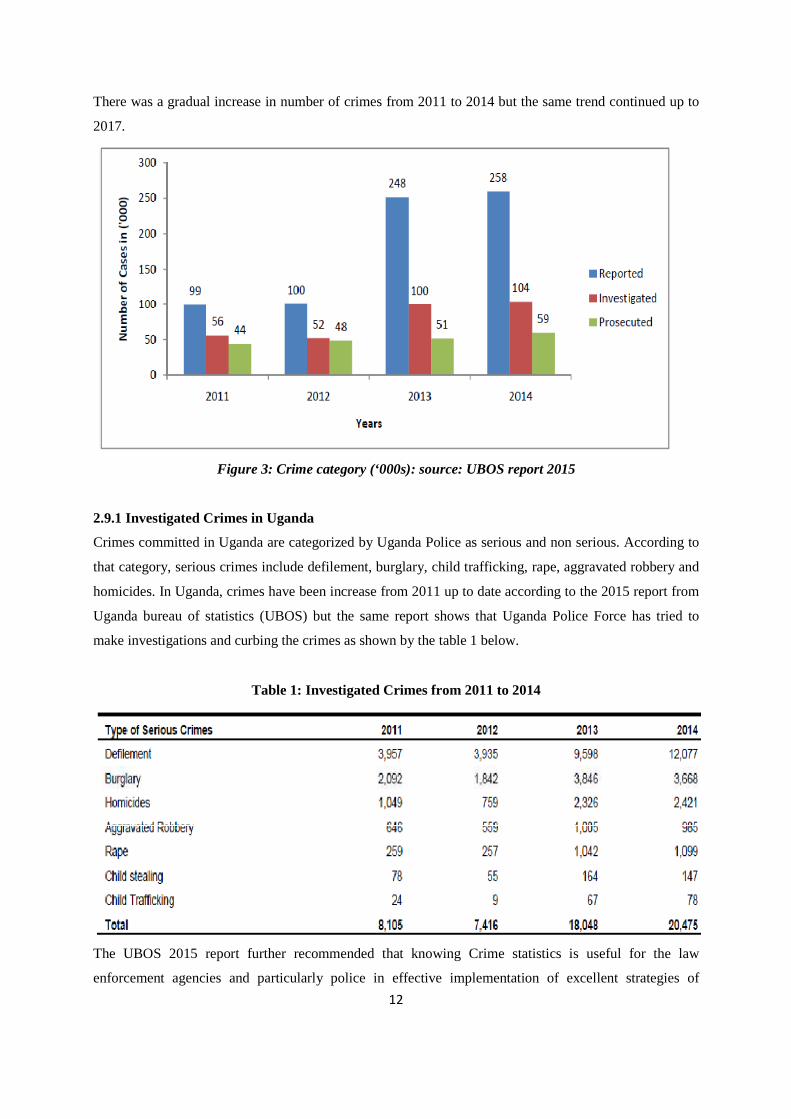
robbery and others. The Figure 3 below shows the crimes that were reported, investigated and prosecuted.
12
There was a gradual increase in number of crimes from 2011 to 2014 but the same trend continued up to
2017.
Figure 3: Crime category (‘000s): source: UBOS report 2015
2.9.1 Investigated Crimes in Uganda
Crimes committed in Uganda are categorized by Uganda Police as serious and non serious. According to
that category, serious crimes include defilement, burglary, child trafficking, rape, aggravated robbery and
homicides. In Uganda, crimes have been increase from 2011 up to date according to the 2015 report from
Uganda bureau of statistics (UBOS) but the same report shows that Uganda Police Force has tried to
make investigations and curbing the crimes as shown by the table 1 below.
Table 1: Investigated Crimes from 2011 to 2014
The UBOS 2015 report further recommended that knowing Crime statistics is useful for the law
enforcement agencies and particularly police in effective implementation of excellent strategies of

13
fighting crimes. The researcher therefore suggests that implementation of a business intelligence system
to support crime management would be the best option since the system has features like dashboard
which provides insights and actionable information about the situation at hand, data analysis and data
visualization like plots, charts and graphs.
2.9.2 Performance of Uganda Police Force in crime management
According to Ugandan news paper report (daily monitor, Sunday march 19 2017), Uganda Police Force
(UPF) failed to investigate in four years over 4000 murder cases only. The news paper further reported
that only 2 percent of murder cases were fully investigated and disposed of in the last five years. The
researcher also found out that it was not only murder cases which were not fully investigated to the
maximum but also other serious crimes. The researcher found out that the low performance on
investigations, disposing of and preventing crimes was attributed to several factors which include low
technology, lack of expertise and understaffing. The researcher therefore believes that a business
intelligence system to support crime management is among the required resources by the police to curb
the ever increasing crime in the country because it will assist the police to make proactive decisions very
fast and provide the necessary reports to the management and sponsors on time.
2.10 Fighting crime with big data analytics
According to (Sergio, 2015), big data analytics can help law enforcement agencies especially police to
keep their communities safe by proactively fighting the crimes before they happen. By analyzing data
from police reports, live camera feeds and other sources can help the police to anticipate, predict and
prevent crimes. Crime data analytics can help police to identify crime patterns and proactively prevent
crimes from happening; this also helps to effectively respond to crimes once they occur. In this era of big
data, police has overwhelmingly amount of information from past police reports to security cameras to
social media to bystander’s cell phones; Once police applies analytics to this crime data, it gets sense out
of the data which can help them to make fast timely decisions and thereby proactively preventing crimes
from happening or effectively respond to the crimes that had already occurred (Sergio, 2015).
2.11 BI Predictive Classification Models
Predictive modeling uses the data sets that one has collected so as to derive a mathematical model which
will be used to predict outcomes of crime detection. The main goal of a predictive model is that it should
be very accurate in its results as they are used in decision making for potential users. Predictive models
can be built using different approaches which (Frank, 2011) defines some of them as stated below.

14
Table 2: Description of Selected BI Classification Algorithms
Algorithm Description
J48 This is a BI Predictive Model generates decision tree using C4.5
algorithm which an extension of ID3 algorithm and is used for
classification.
Multilayered Perceptron Frank (1961) defined a Multilayer Perceptron (MLP) as a feed forward
artificial neural network model that uses back propagation which is a
supervised learning technique and it consists of large number of
neurons joined together in a pattern of connections. Cybenko (1989)
noted that multilayer Perceptron is considered a deep neural network
because it consists of three or more layers of nonlinearly-activating
nodes.
Naïve Bayes Rennie et al. (2003) defined Naïve Bayes as a supervised probabilistic
classifier that uses statistical method for classification and it uses Bayes'
theorem with strong independence assumptions between the features.
Also (Rennie et al. 2003) further noted that the algorithm is competitive
than advanced methods when appropriate preprocessing is done.
Support vector machines This BI predictive algorithm is also called Support Vector Networks.
SVM analyzes data by using supervised learning models for regression
and classification analysis. Given a set of training examples, each
marked as belonging to one or the other of two categories, an SVM
training algorithm builds a model that assigns new examples to one
category or the other, making it a non-probabilistic binary linear
classifier.
2.11.1 Performance analysis of classification algorithms on crime prediction
Iqbal et al. (2013) did a comparative analysis of decision tree and Naïve Bayes algorithms on crime data
and found out that the accuracy of decision tree and Naïve Bayes algorithms was 83.9519% and
70.8124% respectively and concluded that decision tree performs better than Naïve Bayes in crime
predictions. Ahishakiye et al. (2017) also did a performance analysis of BI techniques on crime prediction
using four classification algorithms in their study i.e. decision tree (J48), Naïve Bayes, Multilayer
Perceptron and support vector machine and found that the accuracy was 100%, 89.9425%, 100% and
93.6782% respectively with execution time of 0.06sec, 0.14sec, 9.26sec and 0.66sec respectively and

15
hence they concluded that decision tree out performed Naïve Bayes, Multilayer Perceptron and support
vector machine both in accuracy and little time of execution.
2.12 Review of Existing Crime Management Systems
Jacob et al. (2015) revealed Uganda Police Crime Case Management System support police officers in the
management of crime cases, storage and retrieval of complainants’ and offenders’ information as well as
to follow up the case status and keep track of information concerning crime cases in the Uganda Police
Force. The system captures police constable, detective, OC CIID and administrator’s details, stores
captured complaints/data and enables users to manipulate it, Enables users to search for crime cases by
use of station dairy number (unique identification numbers allocated to cases). Entered data is validated
and constables are able to categorize crime cases as they are reported in and allow cross referencing of
cases and criminal records (Jacob et al. 2015). Also (Oludele et al. 2015) stated that A Real-Time Crime
Records Management System for National Security Agencies is an efficient and effective data analysis
tool for improving the operations of the law enforcement agencies. Anil et al. (2013) argued that Crime
Automation and Reporting System would allow the reporting of crimes 24/7 by the victims and witnesses.
Due to improved technology in 21st century, integrating mobiles with the police systems would allow easy
reporting of crimes, and enables easy accessibility of crime information to police during its investigations
(Aanchal et al. 2015). Jimoh et al. (2014) argued that a scalable Online Crime Reporting System would
help the police to timely get the information about criminals and their mode of operation and also allows
crime reporting with anonymity.
2.13 Gaps to be filled
Despite the fact that Business Intelligence Systems have a vital role in crime management, such systems
have not been utilized in Law Enforcement Agencies especially the Uganda Police. Most of the
information systems used in law enforcements agencies are just a collection of crime data with CRUD
(create, read, update and delete) operations. Existing crime management systems are used to collect and
manage crime data but the data in those systems have not been utilized. There is a need for data in these
systems to be used in operations like data mining, crime predictions, online analysis (OLAP), and
generation of visualizations (graphs, charts and maps) and these can be achieved by developing a
Business Intelligence System. This study presents a BI project to generate predictive model for crime
prediction and crime data management and construct a BI prototype for predicting the likelihood of crime
happening. BI improves decisions by supplying timely, accurate, valuable, and actionable insights. BI
solutions are the answer to achieving comprehensive analytics and enabling decision makers to make data
driven decisions.

16
2.14 Conceptual Design
The researcher critically analyzed the already existing information systems to support crime management
in Law Enforcement Agencies, after the analysis he identified the need to have a Business Intelligence
System at Uganda Police. Developing a prototype for the system was pioneered by identifying the
Business Intelligence Maturity level of the already existing system at UPF and followed clear guidelines
as suggested by researchers (Chamoni and Gluchowski, 2004) (Williams, 2004b). Then the researcher
designed a model that would extract crime data from the already existing system, data from police
archives and from external sources using ETL (Extract, Transform and Load). The extracted data is
subjected to removing outliers, filling the missing data, Smoothening the data and resolving the
inconsistence and then stored at the central data repository called the Data Warehouse. Different
operations can then be performed on the data in the central repository including generation of reports
using standard and adhoc queries, OLAP operations, Data Mining, multidimensional visualizations and
analysis as illustrated in the figure 4 below.
Figure 4: The conceptual design of a proposed system

17
CHAPTER THREE: METHODOLOGY
3.1 Overview
This describes the step by step methods that the researcher used in the execution of this project. It
includes the how the researcher did the analysis, design, implementation and testing of the BI prototype.
3.2 Research Design
The description of research design, selected programming language and other resources that were used in
the implementation of this project is explained here. This contains a summary of the complete research
process that was used in this study. The researcher used extreme programming (XP), and all its processes
were followed as shown in figure 6. It started with requirements analysis which includes feasibility study
(this involved interviews and observation), then followed by software design. The BI system was
developed using Hadoop ecosystem and after development phase, crime data analytics was performed to
find the effectiveness of the system.
3.3 Software construction
Extreme Programming (XP) was selected for the prototype’s implementation. The methodology improves
the quality and responsiveness of the software by rapidly changing the requirements of the customer.
The researcher used all the phases of XP shown in the figure 6 below as explained after the diagram.
Figure 5: Extreme Programming Implementation Process
3.3.1 Requirements Analysis
The researcher physically visited Uganda police force (UPF) ICT head office to find out the system
requirements to assist in developing an effective BI system that can improve law enforcement agencies’
performance on effective crime management. The researcher used interviews and observation at the UPF
ICT facility headquarters to identify the requirements and the necessary features to include in the
prototype.

18
3.3.2 The study population
This research involved 40 respondents from the Uganda Police Force (UPF). They included the ICT
police staff officers and the police management. The chosen respondents were selected because some
were the management of the police facility and the rest were the ICT officers whom the researcher
thought that they were relevant to this research study.
3.3.3 The developed system design
The researcher designed the proposed system to exploit the weaknesses of the current system in use. The
design also considered extracting and loading data from the existing system and from external sources
like social media, intelligence reports to the BI data warehouse where different processes and operations
were performed on the data like generation of dashboards, online data analysis (data visualization),
generation of standard and adhoc reports and also data mining operations. The design of the developed
prototype is shown by figure 8 in chapter four.
3.3.4 System Implementation
Once the data warehouse was modeled, implementation proceeded. This mainly, consisted of setting up of
host machine (single-node cluster), Hadoop installation and configuration, setting up of programming
environment, data warehouse development and dashboard creation.
3.3.4.1 Setting up of the Host Machine
The initial step of the implementation is to set up the host machine. The project used Microsoft Windows
7 64 bit operating system on a core i7 processor with 8GB of RAM. The machine BIOS setup was
configured to activate virtualization technology. This followed with an installation of virtual machine
(VM) called Oracle’s Virtual Box on top of Windows 7 operating system. It is this Virtual Box where the
Hadoop cluster was to be configured.
Figure 6: Starting the Hadoop Cluster

19
3.3.4.2 Configuration of Java Environment
Java IDE (Integrated Development Environment) is essential to be integrated into the developed BI
system because it is used in writing map reduce programs for processing large chunks of data. Apache
Maven will be used as the project management tool for building the source codes and other project
artifacts. The IDE enables testing of MapReduce jobs and also non-Hadoop Java programs.
Figure 7: Eclipse IDE Setup
3.3.4.3 Data Warehouse Development
The data warehouse was created using Hue. Sample data was generated with help of existing data at the
Uganda Police Force. This is due to confidentially of the data, avoiding using live data. Data was
transferred to Hive data warehouse using Hive Table MetaStores. Pig scripts were also written for some
extraction, transformation and loading procedures. Hadoop User Experience (HUE) was configured and
used to develop web portal for accessing the data warehouse.
3.3.4.4 Data Visualization and Dashboard Development
Different dashboards were created using Apache Solr and Cloudera Search. Analysis of data was carried
out to generate the required reports and also answer business questions and appropriate dashboards
generated using Apache Solr. Hive queries were also used to analyze and visualize data and also generate
the required reports.
3.3.4.5 Data Analysis
The developed prototype was integrated with R statistical analysis software to assist in advanced crime
data analytics. Also a feature of the system called HUE has a sub feature called HIVE which allows
generation of reports by executing HIVE Queries, generation of different types of charts including pie
charts, bar and line graphs and also allows visualizations of data with geo-coordinate locations.

20
3.4 Performance Analysis of predictive algorithms on crime prediction
The performance analysis was done in this study to find the most effective and appropriate classification
algorithm for crime prediction. This is because the system was connected with R packages and crime
predictions would be done when need arises.
3.4.1 Classification Algorithms to be used
The BI Predictive algorithms used in this study are the Naïve Bayes, J48, Multilayer Perceptron and
Support Vector Machine (SVM). All the algorithms are used for classification and they were of interest to
the researcher during this study because he wanted to indentify the most appropriate BI classification
algorithm for crime prediction.
3.4.2 Sources of Data and the Modeling Tool
The crime data was obtained from two sources. The primary data was obtained from UPF and the
secondary data was obtained from UCI machine learning repository website under Crime and
Communities dataset. The researcher partitioned the crime data in the ration of 70%:30% for training and
testing respectively. The researcher also used WEKA (Waikato Environment for Knowledge Analysis)
for modeling which is a popular open source machine learning tool that includes visualization, predictive
and data analysis techniques easy to use graphical user interfaces.

21
CHAPTER FOUR: SYSTEM ANALYSIS, DESIGN AND IMPLEMENT ATION
4.1 Introduction
This section discussed weakness and strength of the current systems, analysis and detailed design issues,
design requirements and system functionalities are all discussed within this chapter. It addresses the
requirements that were necessary for the effective functioning of the system, tools that were used and how
the system was developed.
4.2 Analysis of the Current Information Systems used by Uganda Police
The researcher analyzed carefully the existing system used in crime management in Uganda and the
following are its weaknesses; Crime data duplication, Also the system has poor security features and as
result unauthorized persons can be able to access crime data. Most of the crime data is recorded on papers
and this risks being damaged by rodents, bulky to store, difficult in information retrieval and also crime
information can easily be misplaced. Furthermore, the data being corrected is not being utilized where in
this era of big data, operations like crime data mining, crime predictions and discovery of crime patterns
from the available crime data. If the available crime data is utilized, actionable decisions can be taken and
this can result into reduction in crimes. Also the available crime records management systems are suitable
for structured data, in this error of big data, semi structured and unstructured data are also available and
the existing systems cannot handle such data. More so when analytics is required, the crime data is
extracted from the crime database and then loaded to excel for possible analytics, these results into time
wastage in performing the required analytics and also rendering crime information vulnerable to
insecurity.
4.3 Feasibility Study
4.3.1 Technical Feasibility
The researcher together with the ICT technical staff carried out the technical feasibility and it was clear
that the project was feasible with minimum risk as outlined below.
Table 3: Technical feasibility
Technology required Current availability Risk Action Hadoop ecosystem Available (Open source) None N/A Application server Available None N/A Data analysis programs Available (R) None N/A Access to available crime data
Available on authorization Denial of authorization
Seek authorization
Cluster machines Available May not be enough Purchasing un expensive cluster computers
Technical manpower Available Not enough To be trained

22
4.3.2 Economic Feasibility
In terms of cost implications, there was no significant cost since all the technologies required were open
source. The only cost would result during the project phase where the BI developer need to be paid salary
for which in this case is a non factor given the nature of the project. Furthermore, although there was no
cost in terms of salary, there was an identified opportunity cost since the time spent on the project in
terms of man hours could have been used in other activities.
4.3.3 Strategic Feasibility
Because crime data is in different formats; structured, semi-structured and unstructured, it was discovered
that the proposed system was suitable for all the above data formats. Therefore the developed system was
suitable for the growing challenge of crime big data analytics and it was of strategic importance in this era
of big data and therefore the system was at spotlight in helping decision makers generate insights from the
data very fast and with ease for data driven decision making.
4.4 Requirements statement
The target users of this system are Law Enforcement Agencies, Specifically the Uganda Police force.
The proposed system architecture is comprised of a data warehouse from which different operations are
performed on the stored data. The operations that are performed include data mining using R or python
programming languages, creation of dashboards using Cloudera search and SOLR, online analysis (Data
visualization), standard and adhoc reports using Hive Query Language (HiveQL). All these operations
help to generate insights from the data which assists in decision making.
4.5 System design
The researcher designed the system to exploit the weaknesses of the current system in use. The design
also considered extracting and loading data from the existing system and from external sources like social
media, intelligence reports to the BI data warehouse where different processes and operations will be
performed on the data like generation of dashboards, online data analysis (data visualization), generation
of standard and adhoc reports and also data mining operations.

23
Figure 8: The system design of a proposed system
4.5.1 The Components of the Designed System
The developed prototype allows data acquisition from the already existing system in use and also from
external data sources using ETL operations. Another component is called Data Warehouse where data
extracted from different sources is stored. The data warehouse in Hadoop was implemented using Hive
and once data is in the central repository, different operations can be done like generation of reports using
both standard and adhoc queries, data visualization using graphs, charts and maps. Also the designed
system has a data analysis feature which is a component that is executed using R software that was
integrated with the system.

24
4.6 System Implementation
The following section discussed how the system was developed in Apache Hadoop and its functionality
and capability. Apache Hadoop is a distributed computing open source Business Intelligence tool for
storing and processing huge datasets of any format distributed across different clusters. Apache Hadoop
using its MapReduce framework breaks up the huge data and distributes it to distributed clusters for
concurrent data analysis. Apache Hadoop platform is fault tolerant in that if an individual cluster machine
or server fails, the system continues to work and the data on the failed cluster is not lost since Hadoop
replicates the data and distributes it to three different clusters on the distributed system. Apache Hadoop
is designed to scale up from single servers to thousands of machines, each offering local computation and
storage. With Big Data being used extensively to leverage analytics for gaining meaningful insights,
Apache Hadoop is the solution for processing big data which comes in different formats including text,
video, audio, satellite data, sensor data where the data is not structured. It can also process semi structured
and structured data. Apache Hadoop architecture consists of various Hadoop components and
technologies that provide capabilities in solving complex business problems.
4.6.1 System User Interaction
This part describes how a user can extract data from different sources into a data warehouse and perform
complex analytics.
4.6.2 Starting the Hadoop Cluster
In order to start the Hadoop cluster, open the Virtual Box application, then start Cloudera Virtual Machine
(VM) already installed. Remember you can save state of your VM.
Figure 9: Starting the Hadoop Cluster

25
4.6.3 User Login
When the system is accessed remotely through the host machine, then login will be required. Otherwise, a
user is logged in automatically when the cluster is started. The system can be accessed using the
following links:
i. Virtual Machine: http://quickstart.cloudera:8888/
ii. Host Machine: http://localhost:8888/
Figure 10: The authentication of the system
4.6.4 System Configuration
Once you log in, if you are super user, then you will be directed to system configuration setup page. In
case of any errors, then this page will always raise flags.
Figure 11: system configuration

26
4.6.5 Main System Links
The main system links are:
i. User Profile: This links to profile of currently logged in user and also user management panel.
ii. Job Browser: This provides access to management of MapReduce jobs.
iii. File Browser: This enables access to HDFS; allowing uploading, deleting, renaming, moving,
and copying of files and folders, amongst others.
iv. Security: This enables assignment of roles and privileges to users of the system.
v. Workflows: This link provides access to Hadoop workflows, for example Pig jobs.
vi. ETL: Enables the extraction transformation and loading of data into the data warehouse. Tools
adopted include Metastore Tables and Sqoop Transfer.
vii. Data Warehouse: This links to data warehouse of the system. Apache Hive and Impala have
been used to implement the data warehouse. Queries on Hive are executed using MapReduce
while Impala has in-built query engine.
viii. Dashboards: This is where users can access various dashboards. Users can also create new
dashboards based on the business answers they may be seeking.
Figure 12: System main links and table creation
4.6.6 The data warehouse
In Apache Hadoop, you can create as many data warehouses as the organization may need. In this
research, crime management data warehouse was created which houses all the crime data. This data ware
house contains tables which contains crime information. The analytics are performed on the tables
available in the data warehouse.

27
Figure 13: The data warehouse
4.6.7 Loading data into the Hadoop system
Crime data can be loaded into the HDFS either from the crime management systems directly using Sqoop
or data loaded as files (CSV files. Excel files, text files). After this data is loaded into HDFS, it can then
be loaded to Hive where the columns containing information in the files or from the databases turned into
tables like in SQL and different operations can then be performed in hive using HiveQL which are more
like SQL statements in relational databases.
Figure 14: The loaded crime data in Hadoop system

28
4.6.8 The Meta store manager
This is a functionality of the system that manages the information stored. Using this functionality, you
can manage the data warehouse and the tables in it. Also the list of the tables in the active data warehouse
is displayed on the left end of the Metastore manager, when you select one of the displayed tables, its
relevant information is displayed like when it was created, the file size and its location. Also the file can
be downloaded.
Figure 15: The Metastore manager
4.6.9 Reports
Using HiveQL which are more like SQL of the relational databases, the information in the crime
management data warehouse is queried and the required information is extracted in form of reports which
can be analyzed directly, printed or saved in HDFS for later use.
Figure 16: Information Reports

29
4.6.10 The HiveQL
This is SQL like commands that are used to extract required information in form of reports from crime
management data warehouse. HiveQL was developed such that professionals in the field who use SQL on
their every day job does not get difficulties when using Hadoop. These commands are used in Hive which
is obtained when Hue is launched. The figure below demonstrates the use of HiveQL in Hadoop.
Figure 17: The HiveQL for Generating Reports
4.6.11 Analytics on crime data in the crime management data warehouse
Different visualizations are very easy to obtain using the data in the crime management data warehouse
by just a click. The data visualizations which can be obtained from the crime management data warehouse
include bar charts, line plots, pie charts, maps. All these can be obtained depending on the needs of
decision makers.
Figure 18: The bar chart visualization

30
4.6.12 Benchmarking the developed system with other State-of-Art Open Source BI Systems
The seven (7) most common open source BI platforms are Actuate, JasperSoft, OpenBI, Palo, Pentaho,
SpagoBI and Vanilla (Bernardino & Figueiredo, 2014). In this section a comparison is carried to
benchmark the system with some of the state-of-art BI platforms. Bernardino & Tereso (2012)
(Bernardino & Figueiredo, 2014), Jorge (2011) and (Victor et al. 2011) used the following features to
compare open source and commercial BI tools, and hence what was used in the benchmarking.
Table 4: Comparison of the developed system with Other State-of-Art Systems
Features Developed system Jaspersoft Pentaho SpagoBI Vanilla
Reports yes yes yes yes yes
Graphics yes yes yes yes yes
Dashboards yes yes yes yes yes
OLAP yes yes yes yes yes
ETL yes yes yes yes yes
Data mining yes yes yes yes yes
KPIs yes No yes yes yes
Data export yes yes yes yes yes
GEO/GIS yes yes yes yes No
Adhoc queries yes yes yes yes yes
Linux yes yes yes yes yes
Windows yes yes yes yes yes
Unix yes No yes yes yes
Mac yes yes yes yes yes
Java yes yes yes yes No
Distributed storage & Processing
yes No No No No
Fault tolerance yes No No No No
Scalability yes No No No No
The system was developed using Apache Hadoop and inherited all the features of the platform as
discussed in section 5.2.1 in chapter five. Apart from the above features, this system was customized to be
used in a law enforcement agencies setup with major data warehouse schema already done. It was

31
intended to be used in by police with less modifications or configurations. This system took into
consideration the nature of data sizes and with Hadoop HDFS, it is believed that the system if
implemented on physical server clusters may perform better without any hardware issues. Running on
MapReduce ensures fault-free operations.

32
CHAPTER FIVE: RESULTS AND DISCUSSIONS
5.1 Introduction
This chapter discussed the results of the research study based on the research objectives in chapter one.
Also the comparison of the developed system with the already existing Business Intelligence Tools open
source tools was done.
5.2 Presentation of Results based on the Research Objectives
As discussed in chapter one, the following section discussed the results of the research objectives in
chronological order.
5.2.1 Evaluation of the open source BI tools used in this study
The researcher did an evaluation of the most appropriate open source business intelligence tool for the
implementation of the proposed system. The result of the evaluation is shown in table 1 below.
5.2.1.1 Criteria used for evaluation
The criteria used for the comparative study of the selected BI tools are the features they have that enable
them to perform the business intelligence tasks. Each of the open source BI tool was studied to determine
the most tool for crime data analytics. This criteria used have been used by other researchers (Bernardino
& Figueiredo, 2014), Jorge (2011), (Victor et al., 2011) and the features considered took into account the
available crime data which is in different formats (structured, semi structured and unstructured crime
data). The following are the Business Intelligence Indicators/ Features that were considered in this study.
• Reports
• Dashboards
• OLAP – Online Analytical Processing
• ETL – Extraction, transformation and loading
• Data Mining
• KPIs – Key Performance Indicators
• GEO/ GIS – Geo Information System
• Ad-Hoc Queries
• Linux
• Windows
• Unix
• Mac
• Java
• Distributed storage & Processing
• Fault tolerance
• Scalability

33
Based on the above Business Intelligence Indicators, the researcher made a comparison of five open
source BI tools (Apache Hadoop, Jaspersoft, Pentaho, SpagoBI and Vanilla) to determine the appropriate
tool for the implementation of a low cost BI system for Law Enforcement Agencies. Apache Hadoop had
more features as compared to Jaspersoft, Pentaho, SpagoBI and Vanilla as shown in table 4 below.
Therefore the researcher identified Apache Hadoop as the most appropriate open source BI tool to be used
in this study for the implementation of a Business Intelligence System to support crime management in
law enforcement agencies.
Table 5: Open Source Business Intelligence Platforms Features
Features Apache Hadoop Jaspersoft Pentaho SpagoBI Vanilla
Reports � � � � �
Graphics � � � � �
Dashboards � � � � �
OLAP � � � � �
ETL � � � � �
Data mining � x � � �
KPIs � x � � �
Data export � � � � �
GEO/GIS � � � � x
Adhoc queries � � � � �
Linux � � � � �
Windows � � � � �
Unix � x � � �
Mac � � � � �
Java � � � � x
Distributed storage & Processing
� x x x x
Fault tolerance � x x x x
Scalability � x x x x
5.2.1.2 How this study will help BI system developers and consumers
This study will act as a guide to both the big data system developers and consumers as it will act as a road
map in selection of the best and most efficient open source BI tool for crime data analytics. The selection
of the tool to use will depend on the problem at hand to be solved but the researchers believe that this

34
study will help the developers and consumers in making their decisions on which open source BI tool to
use in their data analytics.
5.2.2 Performance Analysis of BI algorithms on Crime Prediction
The second objective was to investigate the appropriate BI algorithm for crime prediction. The researcher
considered classification algorithms which include J48, Naïve Bayes, Multilayer Perceptron and SVM.
The researcher used data from two data sources; the primary data was got from Uganda Police and the
secondary data was got from UCI machine learning website. The researcher then carried out a
performance analysis of the above algorithms and then the accuracy of the algorithms was compared
based on the two data sources as explained in the following sections.
5.2.2.1 Performance Analysis of BI Algorithms using crime data from UCI machine learning
repository website
The researcher used WEKA machine learning tool. The researchers then applied 10 folds cross validation
on the crime data set identified above and the average accuracy of J48, Naïve Bayes, Multilayer
Perceptron and SVM was 100%, 89.7989%, 98.5632% and 92.6724%, respectively. Also the average
execution time of the algorithms was 0.06, 0.14, 9.26 and 0.66 seconds for J48, Naïve Bayes, Multilayer
Perceptron and SVM respectively.
Table 6: Comparison of the algorithms on training crime data
Algorithm Execution time in seconds using windows 7 32 bit
Accuracy Incorrectly classified instances
Precision Recall F measure
J48 0.06sec 100% 0% 100% 100% 100%
Naïve Bayes 0.14sec 89.9425% 10.0575% 90.4% 89.9% 90.1%
Multilayer Perceptron
9.26sec 100% 0% 100% 100% 100%
SVM 0.66sec 93.6782% 6.3218% 93.5% 93.7% 93.4%
Table 7: Comparison of the algorithms on testing and validation crime data
Algorithm Execution time in seconds
Accuracy
Incorrectly classified instances
Precision Recall F measure
J48 0.1sec 100% 0% 100% 100% 100%
Naïve Bayes 0.103sec 89.6104% 10.3896% 89.4% 89.6% 89.3%
Multilayer Perceptron
9.21sec 100% 0% 100% 100% 100%
SVM 0.28sec 92.2078% 7.7922% 91.9% 92.2% 92.8%

35
Based on the above results from tables 6 & 7, J48 and Multilayer Perceptron have the best accuracy,
precision, recall and F measure of 100% but the execution time of J48 and Multilayer Perceptron are 0.1
and 9.21 seconds respectively. This means that J48 can predict accurately crime data within a shortest
time period than Multilayer Perceptron. Also Support Vector Machine is the third in this comparison. It
has the accuracy of approximately 92% which can produce relatively very good results when dealing with
crime prediction. Naïve Bayes has relatively good accuracy when compared to Support Vector Machine
but it executes in relatively little time when compared with Support Vector Machine. Therefore when one
requires very good accurate predictions, decision tree (J48) and Multilayer Perceptron are the best options
but when the execution time is a factor to consider also, then decision tree (J48) can work best. In
conclusion, the researcher noted that J48 performance is better than all other algorithms.
5.2.2.2 Performance Evaluation of BI Algorithms using crime data from Uganda Police Force
The researcher used WEKA machine learning tool. The researchers then applied 10 folds cross validation
on the crime data set identified above and the average accuracy of J48, Naïve Bayes, Multilayer
Perceptron and SVM was 96%, 88.9425%, 97.2% and 92.6782%, respectively. Also the average
execution time of the algorithms was 2.06, 2.14, 12.26 and 3.66 seconds for J48, Naïve Bayes, Multilayer
Perceptron and SVM respectively.
Table 8: Comparison of the algorithms on training crime data from UPF
Algorithm Execution time in seconds using windows 7 32 bit
Accuracy
Incorrectly classified instances
Precision Recall F measure
J48 2.06sec 96% 4% 96.1% 96.5% 96.6%
Naïve Bayes 2.14sec 88.9425% 9.0575% 89.4% 88.9% 89.1%
Multilayer Perceptron
12.26sec 97.2% 2.8% 97.4% 97.8% 97.3%
SVM 3.66sec 92.6782% 6.3218% 92.5% 92.7% 92.4%
Table 9: Comparison of the algorithms on testing and validation crime data from UPF
Algorithm Execution time in seconds
Accuracy
Incorrectly classified instances
Precision Recall F measure
J48 2.1sec 96.3% 3.7% 96.1% 96.03% 96.3%
Naïve Bayes 2.103sec 88.6104% 9.3896% 88.4% 88.6% 88.3%
Multilayer Perceptron
12.21sec 97% 3% 96.8% 97% 97.2%
SVM 3.28sec 91.2078% 8.7922% 90.9% 91.2% 91.8%
Based on the above results from tables 8 & 9, Multilayer Perceptron performed better with good results
(high accuracy) as compared to J48, Naïve Bayes and SVM though it takes long time to execute as

36
compared to the rest. J84 has also a very good accuracy level performance after Multilayer Perceptron
and with minimum execution time as compared to all the three. SVM had the third best accuracy
performance and the last was Naïve Bayes.
5.2.2.3 Comparison of the Results of Crime Data for UCL Dataset and UPF Dataset
According to the results from tables 6, 7, 8 & 9; J48 and Multilayer Perceptron algorithms dominated
with very good accuracy level. In general accuracy, Multilayer Perceptron performed better than J48 for
both datasets from UCI machine learning repository website and from Uganda Police crime data. On
execution time, J48 Algorithm has a very short execution time as compared to Multilayer Perceptron,
Naïve Bayes and SVM. Support Vector Machine had the third best performance in both accuracy and
execution time. Lastly, Naïve Bayes had the least performance accuracy though with minimum execution
time as compared to Multilayer Perceptron. Therefore based on this study, the researcher recommends
both J48 and Multilayer Perceptron algorithms for crime prediction. Multilayer Perceptron had the highest
accuracy than J48 and the later also had very low execution time.
5.3 Comparison of the developed system with other Open Source BI Systems
The third and fourth was to design and develop a business intelligence system to support crime
management for law enforcement agencies. The system was implemented as described in section 4.6 in
chapter four. A comparison of the developed system and the other existing state of art was done in
section 4.12 of chapter four. Apart from the features discussed in section 4.12, the developed system was
customized to be used in a law enforcement agencies setup with major data warehouse schema already
done. It was intended to be used in by police with less modifications or configurations. This system took
into consideration the nature of data sizes and with Hadoop HDFS, it is believed that the system if
implemented on physical server clusters may perform better without any hardware issues. Running on
MapReduce ensures fault-free operations.
5.4 Hadoop Framework Opportunities in BI
Hadoop framework has shown great opportunity for the development and implementation of low cost BI
systems. This is because of the power to store and manipulate large datasets on commodity servers.
Hadoop is mainly composed of two components; they are Hadoop File System (HDFS) and MapReduce.
HDFS enables the storage of larger data sets than normal file systems can handle. This is achieved by
breaking down the large data into smaller units on a set of nodes. MapReduce allows the manipulation of
data on each node and consequently the overall job. The programming model of MapReduce has opened
up opportunities for other Hadoop projects which makes easy development of Hadoop systems. They
provide tools that can be plugged into various processes required in the implementation of Hadoop BI
systems.

37
5.5 Big Data Analytics in Police to Curb Crimes
The researcher noted from literature that crime data in police agencies is increasing and also the presence
of big data in the other sectors of the economy, law enforcement agencies especially police in Uganda
have not been left out. Increased use of information systems, social media and other unstructured data in
the law enforcement agencies, has resulted into the phenomenon of “Big Data”. The term “Big Data” is
described by the 4Vs; Volume, Velocity, Variety and Veracity; meaning data that is huge, growing fast, in
all sorts of formats, and which is uncertain. Analytics around this kind of data is seen to pick momentum.
Possible analytics around big data in the law enforcement agencies is distribution of crime in given period
of time to determine pattern, crime prediction.
5.6 Data Analysis using R Software
R statistical software was integrated to Hadoop to achieve the transfer of data stored in the Hadoop cluster
to R environment for analysis. Once data is in the R working space, several statistical analyses can be
carried out. With the various integration options available as discussed above, R computational
capabilities are brought right into Hadoop. Although Hadoop has analytics capabilities, R being a mature
open source statistical software, has natural ways of data analysis. R has inbuilt algorithms for data
mining and prediction.
5.7 Hadoop and python
Even though the Hadoop framework is written in java, programs for Hadoop are not necessarily coded in
java but can also be developed in other languages like python or C++. Python language can be used to
develop map reduce programs which are the key in the utilization of data in HDFS. Therefore the
developed system allows the users to perform crime data analysis and write map reduce programs using
python.

38
CHAPTER SIX: CONCLUSIONS AND RECOMMENDATIONS
6.1 Conclusions
It has been shown that Hadoop provides a great opportunity to developers who aspire to implement
solutions dealing with large amounts of data typically termed as “Big Data”. Law enforcement agencies
should take a lead to incorporate this low-cost technology into their information systems so as to able to
take advantage of Business Intelligence. R is also powerful and can work well with Hadoop to analyze
data for further insights. Developers can take advantage of these open source tools especially Hadoop
framework and implement sophisticated solutions that can improve organization’s performance.
However, Hadoop technology is still developing and more research is required to make it mature for
development of enterprise systems. The challenge faced in this project was that Hadoop framework has a
long learning curve and most developers in organizations especially in Law enforcement agencies may
find it a bit challenging to incorporate it in their projects.
Based on the findings of this study, the study concluded that in adoption of a technology, key decision
maker characteristics, user characteristics and environmental characteristics were very essential
components for adoption of BI. User characteristics such as users’ education level and computer literacy
determined the speed of adoption of a technology. On the other hand, environmental characteristics such
as competitive pressure also influence the level of adoption of innovation. The intensity of competition in
a market affects firm incentives to improve in all aspects hence the need for technological adoption.
Finally, key decision makers of the organization make the final decision on whether to adopt a technology
or not. Therefore, decision makers’ level of computer education and innovativeness plays a key role in
adoption of a technology.
The researchers recommended Apache Hadoop for the development of a BI System to support crime
management because it has some functionalities which are not found to other open source tools which
includes but not limited to distributed storage and processing of big data sets, Ability to store and process
huge amounts of any kind of data quickly, fast computing power, Fault tolerance, Flexibility (processes
structured, semi structured and un structured data) and Scalability which are key to handle the ever
increasing data which is in different forms (structured, semi structured and unstructured data). Hadoop
represent an increasingly important approach for data-intensive computing.
6.2 Challenges and Limitations
The following challenges were faced in the research project:
1. Data complexity – Use of data obtained online provided a great challenge as it included a lot of
information including irrelevant columns, thus requiring time to cleanup and contextualize the data to the
local scenarios.

39
2. Time - the time available to conduct this research was constrained by its due date. More time would
have been needed to expand the prototype with additional functionality that would demonstrate the power
of analytics and BI, allowing for the inclusion of some of the requirements noted in the survey.
6.3 Contributions of the study
The study helped the researcher to identify the most appropriate open source BI tool suitable for the
development and implementation of a low cost BI system not only for law enforcement agencies
especially police but also to other sectors like health, education, finance. The researcher noted that
Hadoop framework as the most appropriate tool for the development and implementation of the BI
System to support crime management in law enforcement agencies and crime data mining due to its
robustness, fault tolerance, easy to use, ability to work with other data analysis tools like R and Python
programming languages (Chapter five sections 5.2.1 – 5.2.1.2, 5.6, 5.7). The study also helped to identify
the most appropriate BI classification prediction algorithm for crime predictions. Decision tree (J48)
algorithm was considered the best classification algorithm for crime prediction after a performance
analysis was done on Naïve Bayes, Support vector Machine, ANN (Multilayer Perceptron) and Decision
tree (J48). It was found out that both Decision tree (J48) and ANN (Multilayer Perceptron) had the same
best accuracy but Decision tree (J48) has the shortest execution time, hence this research considered
Decision tree (J48) as the best algorithm (Chapter five sections 5.2.2 – 5.2.2.3, tables 6, 7, 8 & 9). Finally,
this study acts as the benchmark for the implementation of business intelligence systems for law
enforcement agencies especially the police. As different crime activities are on increase and with a lot of
data in different formats (images, audio, structured, unstructured and semi structured), law enforcement
agencies need to counteract such challenges and this research acts as a reference.
6.4 Recommendations
The researcher recommends that this project would further be developed by incorporating real-time
Business Intelligence. This implies that, Hadoop should be connected to the information systems and also
social media to stream live content and update dashboards in near real-time. Other Hadoop projects like
Apache Flume are heading in this direction. Developers can take advantage of social media unstructured
content and aggregate to structured data of information systems so as to improve analytics in the Law
Enforcement Agencies.

40
REFERENCES
Aanchal D., Aniruddha K., Ketaki K., Vrushali C. and Sneha T., (2015). Crime Area Detection
and Criminal Data Record. Aanchal Dabhere et al, / (IJCSIT) International Journal of Computer
Science and Information Technologies, Vol. 6 (1), 510-513.
Adeola S. O, Falaki S. O, and Olabode O., (2014). E-neighborhood Management Architecture for
Crime Detection and Control in Nigeria; Science and Technology 2014, 4(2): 17-21 DOI:
10.5923/j.scit.20140402.02. Ann Long more Etheridge (2010). April 2014].
Andrew M., Paul I. M., Catherine N., Sandy S. T., Edward K. K. and Amos N. (2013).
Requirements engineering for the uganda police force crime records management system.
Requirements Engineering Conference (RE), 2013 21st IEEE International.
Anil J., Neeta G., Pooja L., Shikha S. and Ramesh S., (2013). Crime Automation & Reporting
System. International Journal of Science and Modern Engineering (IJISME) ISSN: 2319 -
6386,Volume -1, Issue-11.
Berk, R., Sherman, L., Barnes, G., Kurtz, E., Ahlman, L. (2009): Forecasting murder within a
population of probationers and parolees: a high stakes application of statistical learning. Journal of the
Royal Statistical Society: Series A (Statistics in Society) 172(1) (2009) 191-211
Bernardino, J., & Tereso, M. (2013). Business Intelligence Tools. Computational Intelligence and
Decision Making , 267-276.
Bernardino, L. J., & Figueiredo, A. (2014). A comparative analysis of open source business
intelligence platforms. Information Systems and Design of Communication (pp. 86-92). ACM.
Berson A., Smith S., and Thearling K., (2002) ‘Building Data Mining Applications for CRM’,
Tata McGraw Hill.
Boba, Rachel (2005). Crime Analysis and Crime Mapping. Sage Publications. pp. 5–6.
Bond, C. (1996), “The nature of general police work”, Criminal Justice Commission Research
Paper Series, vol. 3, no. 2.
Bourne, D. (1998), “Performance or conformance?”, Police Review, vol. 106, no. 5468, pp. 22–4.
Brantingham, P. L. (2011). “Computational Criminology,” Keynote Address to the European
Intelligence and Security Informatics
Bruni, Margherita (2011). "5 Steps To Agile BI", Informationweek.com, June 13, 2011.
Chamoni, P., & Gluchowski, P. (2004). Integration trends in business intelligence systems - An
empirical study based on the business intelligence maturity model. Wirtschaftsinformatik, 46(2), 119-
128.
Chaudhary, S. (2004). Management factors for strategic BI success. In Business intelligence in
digital economy. Opportunities, limitations and risks. IDEA Group Publishing.
Chen, H. (2006). Intelligence and Security Informatics for International Security: Information
Sharing and Data Mining, New York: Springer.

41
Chen, H., Reid, E., Sinai, J., Silke, A., and Ganor, B. (eds.). (2008). Terrorism Informatics:
Knowledge Management and Data
Chen, H; Chung, W; Xu, JJ; Wang, G; Qin, Y; Chau, M. (2004).Crime data mining: A general
framework and some examples. Computer, 2004, v. 37 n. 4, p. 50-56, ©2004 IEEE.
Cherrett, M. (1993). “Performance indicators: Better accountability implies clearer measures of
performance”, Policing, vol. 9, no. 1, pp. 40–53.
Chuah, M.-H., & Wong, K.-L. (2013). The Implementation of Enterprise Business: Case Study
Approach. Journal of Southeast Asian Research, 15.
Clarke, R (ed) (1997). Situational Crime Prevention: Successful Case Studies (2nd ed.) Harrow
and Heston, New York, 1997, ISBN 978-0911577389.
Curt Hall. (1999). ‘Data Warehousing for Business Intelligence’. Retrieved 20 March 1999, from
http://www.cutter.com/itreports/RP68E.pdf.
Cybenko, G. (1989). Approximation by superpositions of a sigmoidal function Mathematics of
Control, Signals, and Systems, 2(4), 303–314.
Cynthia R. (2013). "Predictive Policing: Using Machine Learning to Detect Patterns of Crime".
Wired. Retrieved 11 July 2016.
Daily monitor, Sunday march 19, (2017). Security must resolve mystery of killer gangs.
http://www.monitor.co.ug/OpEd/Editorial/Security-killer--gangs--Andrew-Felix-Kaweesi/689360-
3854506-q7ntoj/index.html
Datta, A, Thomas, H, (1999), 'The cube data model: a conceptual model and algebra for on-line
analytical processing in data warehouses', Decision Support Systems, vol. 27, no. 3, pp. 289-301.
Department of Treasury and Finance South Australia (1997), Guidelines for Costing Outputs:
Edition 1, Government of South Australia, Adelaide.
Devakunchari R. and Valliyammai C. (2016). International Conference on Communication,
Media, Technology and Design 27 - 29 May 2016 Zagreb – Croatia.
Dun & Bradstreet, Business Intelligence (1995): A Critical Data Layer for Intelligence-Led
Policing From Big Data to Big Impact. MIS Quarterly Vol. 36 No. 4, pp. 1165-1188/December 2012
from Reports of Large Cash Transactions,” AI Magazine, vol.16, no. 4, 1995, pp. 21-39.
Edwards, C. (1999), Changing Policing Theories: For 21st Century Societies, The Federation
Press, Sydney.
Fraser, P., Moultrie, J., Gregory, M. (2001): The Use of Maturity Models/Grids as a Tool in
Assessing Product Development Capability. In Proceedings of IEMC 2002, Cambridge, UK, pp.
244-249 (2002)
Gangadharan.G.R. and Swamy, N., Sundaravalli. (2004) ‘Business Intelligence Systems: Design
and Implementation Strategies’, Proceedings of 26http://ieeexplore.ieee.org/
xpls/abs_all.jsp?arnumber=1372391. International Conference on Information Technology Interfaces,

42
Cavtat, Croatia. www.gartner.com. Retrieved July 31, 2013, from www.gartner.com:
www.gatner.com/newsroom/id/1526414
Golfarelli Matteo, Rizzi Stefano and Cella Luris. (2004) ‘Beyond Data Warehousing: What’s next
in Business Intelligence?’ Proceedings of DOLAP-04, Washington, DC, USA. Retrieved May 17
2006 from www.acm.org
Gray, P (2003), 'Business Intelligence: A New Name or the Future of DSS', in DSS in the
Uncertainty of the Internet Age, eds. T Bui, H Sroka, S Stanek & J Gołuchowski, University of
Economics, Katowice.
H. Kargupta, K. Liu, and J. Ryan (2003), “Privacy-Sensitive Distributed Data Mining from Multi-
Party Data,” Proc. 1st NSF/NIJ Symp. Intelligence and Security Informatics, LNCS 2665, Springer-
Verlag, 2003, pp. 336-342.
Herring, J. P. (1996). "Creating The Intelligence System That Produces Analytical Intelligence."
The Art and Science of Business Intelligence Analysis: 53.
Hugh J. Watson and Barbara H. Wixom, (2007). The Current State of Business Intelligence.
https://www.researchgate.net/profile/Hugh_Watson3/publication/2961945_The_Current_State_of_Bu
siness_Intelligence/links/5767e62b08aeb4b9980b0097/The-Current-State-of-Business-
Intelligence.pdf. Retrieved 24 April 2016.
Ian H. Witten and Eibe Frank, (2005); Data Mining Practical Machine Learning Tools and
Techniques, Second Edition
Inmon, W.H. (1999) ‘Building the Operational Data Store’, Wiley Publishers-New York, 2nd
edition.
Iqbal et al, (2013) ‘An Experimental Study of Classification Algorithms for Crime prediction.
Indian Journal of Science and Technology.
Irena H. R. (2010). Overview of Business Intelligence Maturity Models. Management, Vol. 15,
2010, 1, pp. 47-67
J. Han and M. Kamber, Data Mining (2011): Concepts and Techniques, Morgan Kaufmann.
Jack Loechner (2017). mp_research, https://www.mediapost.com/publications/article/291358/90-
of-todays-data-created-in-two-years.html. Retrieved on 24th august 2017.
Jacob S., Azizi R., Mark M., Fatina N. and Mercy A. (2015), Uganda police force crime case
management system. IT Innovation/Project for College of Computing and Information Sciences
Makerere University Connect 2015. UPFCCMS PROJECT EXHIBITION As From 26-27th March
2015. A must attend exhibition. BIS 14-9 Copy Right Reserved.
Jaspersoft (2017), “Jaspersoft”, http://www.jaspersoft.com/. Retrieved on 24th August 2017.
Jayanthi Ranjan; Business Intelligence (2009): Concepts, Components, Techniques And Benefits;
© 2005 - 2009 JATIT; Journal of Theoretical and Applied Information Technology

43
Jimoh, K.T. Ojulari, & O.A. Enikuomehin (2014). scalable Online Crime Reporting System.
http://www.ajocict.net/uploads/V7N1P2-2014_AJOCICT_-_Paper_2.pdf. Retrieved 24 June 2017.
Joel Rubin (2010). "Stopping crime before it starts". The Los Angeles Times. Retrieved 19
December 2013.
Jon M. B., (2016); Using Business Intelligence Tools to Pursue Identity Thieves; INFSY 556
Jorge Bernardino (2011). Open Source Business Intelligence Platforms for Engineering
Education. 1st world engineering education flash week, Lisbon 2011.
K. Krishnan, "Introducing Big Data Technologies Data Warehousing in the Age of Big Data
Chapter 4", Sciencedirect.com, 2016. [Online]. Available:
http://www.sciencedirect.com/science/article/pii/B9780124058910000040.
K. Z. Hussain, M. Durairaj and G. R. J. Farzana (2012), “Application of Data Mining Techniques
for Analyzing Violent Criminal Behavior by Simulation Model”, International Journal of Computer
Science and Information Technology & Security (IJCSITS), ISSN: 2249-9555 Vol. 2, No. 1, 2012.
K.V.S.N JAWAHAR BABU; Business Intelligence: Concepts, Components, Techniques and
Benefits.
Kernochan, Wayne (2011). "What Agile Business Intelligence Really Means", IT Business Edge,
April 7, 2011".
Keyvanpour, M.R., Javideh, M. and Ebrahimi, M.R. (2010) Detecting and investigating crime by
means of data mining: a general crime matching framework, Procedia Computer Science, World
Conference on Information Technology, Elsvier B.V., Vol. 3, Pp. 872-830.
Laudon, K & Laudon, J (2000), Management Information Systems: Organization and Technology
in the Networked Enterprise, Prentice Hall, Upper Saddle River, NJ.
Lawrence M. and Natarajan M. (2015). Using Machine Learning Algorithms to Analyze Crime
Data. Machine Learning and Applications: An International Journal (MLAIJ) Vol.2, No.1, March
2015:
Luhn, HP (1958), 'A Business Intelligence System', IBM Journal of Research and Development,
vol. 2, no. 4, pp. 314-319.
Malathi A., Santhosh B.S, (2011). Algorithmic Crime Prediction Model Based on the Analysis of
Crime Clusters; Global Journal of Computer Science and Technology; Volume 11 Issue 11 Version
1.0 July 2011.
Martin Z´avodn´(2013). Methodology Framework for Analysis and Design of Business
Intelligence Systems. Applied Mathematical Sciences, Vol. 7, 2013, no. 31, 1523 – 1528. HIKARI
Ltd, www.m-hikari.com
Matteo Golfarelli. Open Source BI Platforms: a Functional and Architectural Comparison. DEIS,
University of Bologna, Viale Risorgimento 2, Bologna, Italy.

44
McCallum, Andrew; Nigam, Kamal (1998). A comparison of event models for Naive Bayes text
classification (PDF). AAAI-98 workshop on learning for text Mining for Homeland Security, New
York: Springer.
Najjar, L. (2002). The Impact of Information Quality and Ergonomics on Service Quality in the
Banking Industry. University of Nebraska, Lincoln.
Narasimha M., Susheela D., V. (2011). Pattern Recognition: An Algorithmic Approach.
ISBN 0857294946.
Nath, S. (2007) Crime data mining, Advances and innovations in systems, K. Elleithy (ed.),
Computing Sciences and Software Engineering, Pp. 405-409.
Negash, S. (2004). Business intelligence. Communications of the Association for Information
Syst., 13: 177-195.
Nicole Hemsoth (2012). How BI is Becoming Crime’s Biggest Enemy. Retrieved on 16th March
2017.
Olszak, C & Ziemba, E (2006). 'Business Intelligence Systems in the Holistic Infrastructure
Development Supporting Decision-Making in Organization’s, Interdisciplinary Journal of
Information, Knowledge, and Management, vol. 1, pp. 47-58.
Olszak, C & Ziemba, E (2007). 'Approach to Building and Implementing Business Intelligence
Systems', Interdisciplinary Journal of Information, Knowledge, and Management, vol. 2, pp. 135-148.
Olszak, CM & Ziemba, E (2003). 'Business Intelligence as a Key to Management of an
Enterprise', Proceedings of Informing Science and IT Education, 2003.
Oludele A., Onuiri E. E., Olaore Ol. A., Sowunmi O. O., Ugo-Ezeaba A. A. (2015), A Real-Time
Crime Records Management System For National Security Agencies. European Journal of Computer
Science and Information Technology Vol.3, No.2, pp.1-12, May 2015
OSAC Report (2017). https://www.osac.gov/pages/ContentReportDetails.aspx?cid=21789.
Retrieved on 20th March 2017.
Pentaho (2017), “Pentaho Open Source BI”, Janeiro, http://www.pentaho.org/.Retrieved 2017-03-
25.
Pirttimäki, V. (2007). "Business intelligence as a managerial tool in large Finnish companies."
Tampereen teknillinen yliopisto. Julkaisu-Tampere University of Technology. Publication; 646.
Pirttimaki, V. and M. Hannula, (2003). Process Models of Business Intelligence. Proceedings of
the Frontiers of E-Business Research Conference. Cityoffset Oy, Tampere, Finland, pp: 250-260.
Ponniah, P (2001). Data Warehousing Fundamentals, Wiley-Interscience, New York, USA.
Power, DJ (2002). Decisions Support Systems: Concepts and Resources for Managers, Quorum
Books, Westport, CT.
Prabowo H.Y. (2011). Building our defence against credit card fraud: a strategic review, Journal
of Money Laundering Control, Vol 14(4) p 371–86, 2011

45
Quinlan, J. R., (1986). Induction of Decision Trees. Machine Learning 1: 81-106, Kluwer
Academic Publishers
R. G. Jimoh, K.T. Ojulari, & O.A. Enikuomehin (2014). A Scalable Online Crime Reporting
System Afr J. of Comp & ICTs. Vol 7, No. 1. Pp11-20, 2014.
Ranjan, J. (2009). “Business Intelligence: Concepts, Components, Techniques and Benefits”,
Journal of Theoretical and Applied Information Technology, 9(1). 60-70.
Revatthy K., and J. Satheesh K., (2012). SURVEY OF DATA MINING TECHNIQUES ON
CRIME DATA ANALYSIS. International Journal of Data Mining Techniques and Applications. Vol
01, Issue 02, December 2012. ISSN: 2278-2419.
Rienks R. (2015). "Predictive Policing: Taking a chance for a safer future.". The Role of Crime
Forecasting in Law Enforcement Operations
Robert Ipomai (2016). Adoption of Business Intelligence Solutions: A Case Of Kenyan Insurance
Industry. November 2016
Rohan Sidhu, Deanna Chea, Rachita Dhakal, Annie Hur and Mark Zhang (2015). Implementation
of Hadoop and Sqoop for Big Data Organization
Rud, Olivia (2009). Business Intelligence Success Factors: Tools for Aligning Your Business in
the Global Economy. Hoboken, N.J: Wiley & Sons. ISBN 978-0-470-39240-9.)
S. Kotsiantis, D. Kanellopoulos, P. Pintelas (2006). "Data Preprocessing for Supervised
Learning", International Journal of Computer Science, 2006, Vol 1 N. 2, pp 111–117.
S. Yang, C. Tu and J. Lin, "Design Issue and Performance Analysis of Data Migration Tool in a
CloudBased Environment", Presented at Proceedings of the 4th International Conference on
Salaun, Y., & Flores, K. (2001). Information quality: Meeting the needs of the consumer.
International Journal of Information Management, 21(1), 21-37.
Satish Gopalani and Rohan Arora (2015). Comparing Apache Spark and Map Reduce with
Performance Analysis using K-Means, International Journal of Computer Applications.
Sergio Ortega Cruz (2015). Fighting crime with big data analytics.
https://enterprise.microsoft.com/en-us/articles/industries/government/state-and-local/fighting-crime-
with-big-data-analytics/. Retrieved 24 June 2017.
Simpson, J.A., Weiner, E.S.C. (1989): The Oxford English Dictionary, 2 ed., Oxford, UK:
Oxford University Press (1989)
SpagoBI (2017), “Spago Business Intelligence”, http://www.spagoworld.org/.Retrieved 2017-03-
25.
Thomas Jr, J. H. (2001). "Business Intelligence–Why." eAI Journal, July: 47-49.
Thomsen, E. 2003, “BI’s Promised Land”, Intelligent Enterprise, vol. 6, no. 4, pp. 21-25.

46
Tong Wang, Cynthia Rudin, Daniel Wagner and Rich Sevieri, “Learning to Detect Patterns of
Crime”, Massachusetts Institute of Technology, Cambridge, MA 02139, USA , Cambridge Police
Department, Cambridge, MA 02139, USA.
Turban, E, Sharda, R, Aronson, J & King, D (2007), Business Intelligence, Prentice Hall; 1
edition, New Jersey.
Turban, E., R. Sharda and D. Delen, (2011). Decision Support Systems and Intelligent Systems.
9th Edn., Prentice Hall International, New York, pp: 2.
Turner, Dawn M. (2016). "What is Venture Management?". www.VentureSkies.com.
VentureSkies. Retrieved 24 February 2016.
UCI MachineLearning Repository (2017). Available from:
http://archive.ics.uci.edu/ml/datasets.html
Umair S., Muhammad S., Amna U., Aniqa M., Abdul B.S., and Sheikh K. R., (2015); Application
of Machine learning Algorithms in Crime Classification and Classification Rule Mining. Research
Journal of Recent Sciences; ISSN 2277-2502; Vol. 4(3), 106-114, March (2015)
Vanilla (2017), “True Open Source BI Platform”, http://vanilla-bi.com/.Retrieved 2017-03-25.
Victor M. P., Azeem M., Ali S., and Malka N. H., (2011). Pentaho and Jaspersoft: A Comparative
Study of Business Intelligence Open Source Tools Processing Big Data to Evaluate Performances.
(IJACSA) International Journal of Advanced Computer Science and Applications, Vol. 7, No. 10,
2016
Vitt, E., M. Luckevich and S. Misner, (2002). Business Intelligence: Making Better Decisions
Faster. Microsoft Press, Redmond, Washington.
William, Y (2008). Critical Success Factors for Implementation of Business Intelligence Systems
in Engineering Asset Management Organisations. August 2008.
"Welcome to Apache Hadoop!". hadoop.apache.org. Retrieved 2017-03-25.
Williams, N. et al. (2003), ‘BI Maturity and ROI: How Does Your Organization Measure Up?’,
viewed on 19. April 2017, http://www.decisionpath.com:8180/docs_downloads/TDWI%20Flash%20-
%20BI%20Maturity%20and%20ROI%20110703.pdf
Williams, S. (2004b). Delivering strategic business value. Strategic Finance, 86(2), 40-48.
Williams, S. Delivering strategic business value. Strategic Finance, 86(2), 40-48, (2004b).
Xerox (2013). https://www.xerox.com/annualreport/2013/assets/xerox-oar-2013-full.pdf.
Retrieved on 12th March 2017.
Related Documents