Welcome message from author
This document is posted to help you gain knowledge. Please leave a comment to let me know what you think about it! Share it to your friends and learn new things together.
Transcript


Population and Globalization
Preface
A7: Shigeyuki�, Sumner J. L6 CGD>M�� and Andrew M6HDC���
The connections between population and globalization are pervasive and important.
International labor migration provides a paradigmatic example of such connections, but
the links between demography and globalization are broader and deeper than this
example might suggest. The major components of demographic change�fertility, mor-
tality, and migration�have been greatly influenced by global forces throughout history.
In some instances, such as with the spread of the HIV/AIDS epidemic, globalization has
abetted tragedy. In other instances, such as with the improvements of reproductive
health services, immunization programs, and many other public health measures, globa-
lization has facilitated rapid improvements in the human condition in both rich and poor
countries.
Conversely, the pace and nature of globalization have also been influenced by
demographic change. Demographic divergence between the developing and the devel-
oped worlds has provided an important incentive for trade, foreign investment, and
international capital flows. As populations age during the coming decades and as the
demographic center of gravity shifts increasingly toward Asia and the developing world,
these changes will continue to influence globalization.
This special volume of Southeast Asian Studies addresses these and other issues.
Most of the articles are drawn from the ���� IUSSP Regional Population Conference,
Southeast Asia’s Population in a Changing Asian Context, held in Bangkok, Thailand,
June �����, ����. The conference was a collaborative effort of the International Union for
the Scientific Study of Population and the College of Population Studies, Chulalongkorn
University.
The first article, “Population and Globalization,” by Sumner J. La Croix, Andrew
* ����� Center for Southeast Asian Studies, Kyoto University, e-mail: abe�cseas.kyoto-u.ac.jp
** Department of Economics, University of Hawaii, Honolulu, HI �����, U. S. A. ; Economics,East-West Center, ���� East-West Road, Honolulu, HI �����, U. S. A., e-mail: lacroix�hawaii.edu
*** Department of Economics, University of Hawaii, Honolulu, HI �����, U. S. A. ; Populationand Health Studies, East-West Center, ���� East-West Road, Honolulu, HI �����, U. S. A.,e-mail: amason�hawaii.edu
Southeast Asian Studies, Vol. ��, No. �, December ����
235
Mason, and Abe Shigeyuki, can be regarded as a position paper for this special issue. It
discusses how globalization has affected demographic trends on the one hand and how
demographic trends have affected globalization on the other. The authors focus on
developments over the past ��� years and emphasize “economic globalization” �the
integration of product, capital, and labor markets and the rapid diffusion of technology
and information across borders. On the basis of their review of demographic trends over
that extended period of time, they conclude that the global demographic transition is still
incomplete. Continuation of the mortality revolution in the developing world will likely
depend to a considerable extent on the ability of developing countries to put institutions
in place that facilitate the transmission and acceptance of public health knowledge and
new medical practices. The adoption of social institutions that facilitate information
transmission and allow adaptation to changing circumstances is the critical element. The
vital task for any society is to get the institutions right. Otherwise, globalization and
demography can interact to produce large populations living in poverty.
Matthew Higgins and Jeffrey G. Williamson contributed the second article, “Explain-
ing Inequality the World Round: Cohort Size, Kuznets Curves, and Openness.” It is an
empirical analysis of relationships between inequality, development, and demography.
The authors explore three hypotheses regarding sources of inequality: ( � ) the effect of
demographic conditions (cohort size), ( � ) the effect of development (Kuznets Curve), and
( � ) the effect of globalization (degree of openness in trade and migration). Using
Deininger and Squire’s inequality database, they have tested these hypotheses while
allowing for the effects of other variables suggested by the literature.
The empirical results provide strong support for demographic effects on inequality
the world round: large mature working-age cohorts are associated with lower aggregate
inequality, and large young-adult cohorts are associated with higher aggregate inequal-
ity. In addition, the analysis reports strong evidence that inequality follows the Kuznets’
inverted-U pattern, tending to rise as low-income countries grow, and tending to fall as
medium-income countries grow. It should be stressed that this work differs from most
previous studies of the Kuznets hypothesis, as it examines the inequality-development
relationship conditional on other variables. Finally, the authors extend their analysis to
clarify its implications for the recent debate about rising wage inequality in the United
States and other OECD economies in the ����s. They find little support for the hypothesis
that a policy commitment to globalization has an impact on inequality.
Thus the first two articles discuss general issues. The following four articles deal
with more country- or region-specific and issue-oriented analyses, or case studies. The
first of these is “Employment Transitions in an Era of Change in Thailand,” by Soumya
Alva and Barbara Entwisle. This article considers the implications of globalization in
Thailand from a rural perspective by examining both the direct impact on employment
of rural residents who migrate to urban areas and the indirect impact on rural residents
through the experiences of urban migrants. Within this framework, they consider
������� ��� �
236
whether men and women have similar migration and associated employment outcomes,
and whether those outcomes vary by changes in the individual’s stage in the life course.
They discuss the factors influencing some individuals to remain employed in Nang Rong,
while others migrate, either permanently or temporarily, to urban areas. They compare
categories based on sector of employment, including individuals not employed, to exam-
ine these questions. Their research reveals some interesting patterns, such as the
growing trend of nonagricultural employment in both urban and rural areas, which
validates their hypothesis that recent macroeconomic changes in Thailand have penetra-
ted rural areas as well as urban ones. They provide further confirmation for the trends
revealed by the cohort analysis mentioned above.
Tsuya Noriko O. and Napaporn Chayovan’s article, “The Economic Crisis and Desires
for Children and Marriage in Thailand,” examines the relationships between young Thai
women’s and men’s experiences of economic difficulties due to the economic crisis and
their desires for marriage and children. They use data from a recent national survey on
the economic crisis and demographic and family dynamics. This study shows that the
experiences of economic hardships due to the crisis were widespread among Thai women
and men in their ��s and ��s, although there were considerable gender, regional, and
urban-rural differences in the extent of such hardships. The multivariate analyses reveal
that the effects of the crisis on desires for children and marriage were diverse and
indirect. The authors found that husbands’ hardship reduced the desired fertility of
married women aged �����. In other words, a husband’s employment is a major factor in
determining a woman’s perception of the financial feasibility of having children. This
finding leads to their assertion that the crisis, if prolonged, may result in lower marital
fertility in Thailand. Marriage desires of young unmarried women aged ����� have been
dampened not by their own hardships but by their mothers’ economic difficulties. This
suggests that the widely documented close emotional ties between mothers and daugh-
ters in Thailand may have played a role in their marriage and fertility decisions.
In his article, “Unauthorized Migrants as Global Workers in the ASEAN Region,”
Graziano Battistella reports that, although globalization is an inevitable process and
widespread, labor is not free to move where productivity is highest. Unauthorized
migration has been found in all countries, however. This article explores three migration
subsystems in the Asian region characterized by various types of population flows. The
loci of the three migration subsystems are the Malay Peninsula (including Singapore), the
Brunei-Indonesia-Malaysia-Philippines East ASEAN Growth Area (BIMP-EAGA), and the
Northern ASEAN countries. The article first examines the current trends in migration
flows. It then examines the characteristics of unauthorized migration and the signifi-
cance of these characteristics for regional relations. Finally, the article explores the
following questions: Is the large unauthorized migration in the region a consequence of
the characteristics of the regional process adopted in ASEAN? Is unauthorized migration
the result of increasing globalization or does it depend on other factors? Are migration
A7: S., S. J. L6 CGD>M and A. M6HDC : Preface
237
policies consistent with regional and globalization policies?
Battistella reaches the following conclusions. On the one hand, migrants are a
by-product of globalization, which disrupts national labor markets and redirects workers
to internationalized labor markets; on the other hand, migrants are excluded from the
benefits of globalization, as they are not free to move where productivity is higher.
Unauthorized migration can be considered to be the response of workers to the regula-
tion of manpower, which during the process of globalization remains strictly local. The
ultimate solution, deregulating migration in favor of the free circulation of labor, may
appear utopian now. But the economic integration envisaged in ASEAN cannot be
successful until migrant labor is factored into it.
Ching-lung Tsay concentrates upon a more specific migration problem in his article,
“Labor Migration and Regional Changes in East Asia: Outflows of Thai Workers to
Taiwan.” Since the early ����s the migration of workers across borders has become an
increasingly controversial issue. In fact, Japan, the Asian NIEs (South Korea, Taiwan,
Hong Kong, Singapore) and Malaysia and Thailand have begun to absorb growing
numbers of workers from other countries at earlier stages of demographic and economic
transitions. This article investigates the existing migration systems between Thailand
and the destination countries in East Asia. The focus is upon the migrant flows to
Taiwan before and after the legalization of labor importation there in the early ����s.
The labor market segments into which Thai workers were recruited are identified and
their earnings as well as working and living conditions in Taiwan are explored. The
research also specifies the costs and benefits of labor exports for Thailand, since this issue
appears to be particularly crucial in light of the ���� economic crisis. On the one hand, it
has to be expected that the prospects of working abroad may not be so promising now
that the Asian economies are slowing down. On the other hand, the Thai government is
interested in sending more laborers overseas in response to economic pressures at home.
This research has important policy implications for both Thailand and Taiwan.
The last section of this issue consists of a report of the panel at the final plenary
session of the ���� IUSSP Regional Population Conference on Southeast Asia’s Popula-
tion in a Changing Asian Context. It summarizes a discussion entitled “Does Globaliza-
tion Adversely Affect Population and Poverty? The Views of Five Panelists.” The panel
provides a concluding general discussion that addresses the effects of globalization on
population and poverty. Richard Leete of the United Nations Population Fund (UNFPA)
organized and chaired the session. Two panel members, Andrew Mason and Simeen
Mahmud, agreed to stimulate debate by presenting the case that globalization was not
adversely affecting population and poverty. The other two panelists, Ogawa Naohiro and
Rafiqul Huda Chaudhury, presented the case that globalization was adversely affecting
population and poverty. Each of the panel members was asked to summarize the views
presented at the forum. We hope that readers will find the panel discussion provocative
and interesting.
������� ��� ��
238

Finally, we would like to express our appreciation to the members of the Interna-
tional Organizing Committee and its chair, Mercedes Concepcion, to the National Organ-
izing Committee, and to the conference coordinator, Pivan Prachuabmoh. We would also
like to acknowledge the financial support of the Globalization Research Center of the
University of Hawaii and the East-West Center. Special thanks go to Ms. Sandra Ward
for her superb editorial work. Lan Chen and Ann Takeyasu, both of the East-West
Center, provided outstanding editorial assistance, and Neil Jamieson, at the Center for
Southeast Asian Studies, assisted greatly in editing this issue.
A7: S., S. J. L6 CGD>M and A. M6HDC : Preface
239
Population and Globalization�
Sumner J. L6 CGD>M��, Andrew M6HDC��� and A7: Shigeyuki�
Abstract
We consider how globalization has affected demographic trends and how demographic
trends have affected globalization. We focus on developments over the last ��� years and
emphasize “economic globalization”�the integration of product, capital, and labor markets
and the rapid diffusion of technology and information across borders. We begin by
relating a brief history of economic globalization since ���� and then identify demographic
trends that may have significant effects on economic globalization. We consider how
globalization has affected demographic trends and then discuss how demographic trends
have affected globalization. We conclude by reflecting on how our analysis is affected by
the increased pace of globalization over the last �� years.
Keywords: globalization, population, trade, saving, international capital flows, investment,
development
Globalization is not new, and neither is its interaction with demographic trends.
Alexander the Great’s conquest of the Middle East instilled Greek culture in a vast
population ranging from North Africa to India; and Roman, Chinese, and Mayan empires
brought dominant languages and new immigrants to conquered regions. The movement
of goods along the thousands of miles of the Silk Road trade route raised wages and
wealth in both China and Europe in the Middle Ages without inducing major flows of
population from one region to another; at the same time it facilitated the transmission of
the Black Plague from Mongolia to Europe. The global diffusion of vaccines preventing
* The authors thank Widyanti Soetjipto, Kim Jonghyuk, and Phyllis Tabusa for their assis-tance with this article. They also thank the University of Hawaii Globalization ResearchCenter for its generous financial assistance with the project.
** Department of Economics, University of Hawaii, Honolulu, HI �����, U. S. A.; Economics,East-West Center, ���� East-West Road, Honolulu, HI �����, U. S. A. e-mail: lacroix�hawaii.edu
*** Department of Economics, University of Hawaii, Honolulu, HI �����, U. S. A.; Population andHealth Studies, East-West Center, ���� East-West Road, Honolulu, HI �����, U. S. A. e-mail:amason�hawaii.edu
� ����� Center for Southeast Asian Studies, Kyoto University, e-mail: abe�cseas.kyoto-u.ac.jp
Southeast Asian Studies, Vol. ��, No. , December ����
240
polio, smallpox, and measles reduced death rates dramatically in developed countries
after ���� and in developing countries after ����. In contrast with continued increases in
life expectancy in Asia, the Americas, and Western Europe, life expectancy has collapsed
in sub-Saharan Africa, Russia, Central Asia, and Eastern Europe since ����. The globali-
zation of war over the last ��� years has entailed the temporary migration of millions of
soldiers and the often more permanent migration of millions of refugees. Changing
population age structures induced global flows of capital in both the nineteenth and
twentieth centuries, while international immigration was a critical cause of relative and
absolute factor price convergence across Europe and the Americas. And the large
increase in world population over the last �� years may be at least in part responsible for
the recent surge in inventions that have markedly reduced computing and communica-
tion costs and, consequently, set off the most recent surge in globalization.
Our goal in this article is to consider how globalization has affected demographic
trends and how demographic trends have affected globalization. Our survey of these
issues is far from comprehensive, as we focus on developments over the last ��� years and
emphasize economic aspects of globalization. The economic perspective is an important
distinguishing feature of this article, entailing a narrow view of globalization that
focuses on the integration of product, capital, and labor markets and the rapid diffusion
of technology and information across borders. Demographers have spent considerable
effort analyzing how global forces have affected demographic trends�that is, how the
rapid international diffusion of birth control technology has reduced birth rates, how the
international diffusion of public health measures has reduced death rates, and how
changing relative wages have affected female labor force participation and marriage
rates. Less attention has been paid to how demographic trends have affected globaliza-
tion. Does a growing population necessarily lead to more integrated labor or product
markets or to increased international diffusion of technologies? Does an aging popula-
tion necessarily lead to increased international capital flows, or instead to increased
xenophobia and increasingly closed markets?
We begin in Section I by considering why narratives of globalization differ so
markedly depending on the perspectives of those telling the story. Section II relates a
brief history of economic globalization since ����. Section III focuses on identifying
demographic trends that may have significant effects on economic globalization. Section
IV considers how globalization has affected demographic trends, whereas Section V
considers how demographic trends have affected globalization. We conclude, in Section
VI, by reflecting on how our analysis is affected by the increased pace of globalization
over the last �� years.
S. J. L6 CGD>M, A. M6HDC and A7: S. : Population and Globalization
241
I Globalization and Population: Perspectives and Prelude
Stories of globalization are widely contested. Some analysts view globalization as a
process by which the powerful exploit the weak in increasingly remote areas of the globe;
others view it as a process by which all countries increase their wealth. Both views have
an element of truth and depend on the perspective of the analyst. Advantages in
armaments and opponents’ susceptibility to disease allowed a few European countries
and their offshoots to colonize societies throughout Africa, the Americas, Europe, Asia,
Australasia, and the Pacific between ���� and ����.�) In contrast, others emphasize how
international flows of capital, labor, intermediate goods, and final goods in the nineteenth
and twentieth centuries led to absolute factor price convergence across rich and poor
countries whereas restrictions on those flows led to divergence. Similar contrasts can be
drawn on numerous issues�for example, the spread of disease by global conquest, trade,
and tourism versus the spread of vaccines by international agencies; and the develop-
ment of virtual communities of dispersed ethnic groups versus the reduction in cultural
variety induced by mass consumption of a hegemonic culture. Much of the debate can be
traced back to whether the analyst believes in the enlightenment concept of progress or
instead believes that unintended consequences of new production and organization
technologies often have pernicious indirect effects that outweigh the direct gains accru-
ing to societies with high levels of market integration, information flows, and technolog-
ical innovation.
The contested-stories analogy carries over to the field of population. Debate has
raged over the effects of a growing global population on the environment, resources,
income, innovation, and social relations. Some demographers and economists have
focused on how increasing global population could exhaust resources, alter the climate in
life-threatening ways, and increase congestion costs to unacceptable levels. Others have
focused on how larger global populations could generate new waves of innovation with
the potential to offset most of the costs described above. Some analysts draw from both
of the above perspectives while emphasizing that individual decisions concerning mar-
riage, labor force participation, children, medical care, and education are made on the
basis of private costs and benefits that frequently diverge from social costs and benefits
and, therefore, result in outcomes that are often inefficient.
� � Our dating of “world wars” should be revised. A redating would show five world wars overthe last ��� years rather than two. In this scheme the first world war was the war betweenBritain and France, known in the United States as the French-Indian War, which wasfought over five continents between ���� and ����. The second world war consisted of theseveral Napoleonic Wars (��������) that were fought over five continents and generatedSouth America’s independence revolutions. World Wars I and II (now III and IV) were, ofcourse, followed by the Cold War (World War V).
������� ���
242
The interaction between population and globalization clearly goes back to prehistor-
ical periods when early human beings slowly migrated from Africa to distant land areas
across the globe. One can, however, date an acceleration of the interaction at ����. The
arrival of European explorers in the Americas and their conquest of the Inca and Mayan
empires set off an unprecedented wave of depopulation among Native Americans due to
the spread of smallpox, measles, mumps, and other diseases to which Native Americans
had little immunity.�) Disease and the enslavement of conquered populations by the
Portuguese and Spanish reduced the Native American population by roughly �� percent
during the sixteenth and seventeenth centuries. Similar demographic catastrophes
would be repeated with Aborigines in Australia and Pacific Islanders in the eighteenth
and nineteenth centuries after contact with Europeans.�) The depopulation of the
Americas and Australia was one of the factors that led to the enslavement and forced
migration of �����million Africans from the ����s through ���� and voluntary immigra-
tion of �� million people between ���� and ���� from land-poor, labor-abundant Europe.�)
European susceptibility to tropical diseases limited settler immigration to Africa to the
Northern and Southern extremes, but colonization of tropical Africa was eventually
completed in the late nineteenth century [Curtin ����]. World population growth,
proceeding at low but positive levels since roughly ����, received a jolt with the
agricultural revolutions of the seventeenth and eighteenth centuries. The improved
nutrition, reduced mortality rates, and increasing population growth rates in Western
Europe set the stage for the beginning of the demographic transitions (see Section III
below), the signal demographic phenomena of the last ��� years.
II Economic Globalization since ����
Although globalization trends have had enormous effects on demographic trends since
����, we focus on globalization since ���� because its ebbs and flows over the last ���years provide key insights into our current situation. We subdivide the ��������� period
into three periods based on divergent trends in economic globalization: Globalization in
a Colonial World (���������), Retreat from Globalization (�������), and Globalization in a
Postcolonial World (�����present).
� � See Bentley and Ziegler [����] for an overview of the conquest of the Americas and popula-tion decline there.
� � See Butlin [����] for a discussion of Aboriginal population decline and Bushnell [����] for areview of the controversy over the extent of the decline in Hawaiian population afterEuropean contact.
� � See Baines [����] for an overview of nineteenth-century European migration to the Ameri-cas and Hatton and Williamson [����] for a more in-depth analysis of the causes of immigra-tion and the effects on sending and receiving economies. See Fogel [����] for a comprehen-sive discussion of the introduction of slavery to the Americas.
S. J. L6 CGD>M, A. M6HDC and A7: S. : Population and Globalization
243
Extent of Globalization in 1850
At the beginning of the first period (����), market integration across Europe and across
the globe was limited, and information and technology diffused slowly. Tariffs were high
in most industrialized countries, and the effect was to limit international trade flows.
Capital markets were growing in importance, yet were still undeveloped, trading few
financial instruments and with listings for only the largest railroads, banks, trading
companies, and utilities. Their limited development meant that capital flows across
national borders constituted a large portion of investment for only a small number of
countries. Foreign direct investment was extremely limited. Immigration from Europe
to the Americas and Australasia had been slowly increasing, but the flows were still small
proportions of the growing European populations. There are many well-known cases of
rapid technology diffusion across national boundaries during this period�for example,
Samuel Slater’s transfer of cotton-spinning technology from England to Rhode Island in
�����but, as a rule, technology diffused with long and variable delays. In sum, both
dimensions of economic globalization, international market integration and information
and technology diffusion, were extremely limited.
Globalization in a Colonial World: 1850�1914
During this first period (���������), economic globalization proceeded at a rapid pace,
leading to an unprecedented degree of capital, labor, and product market integration by
the end of the century. The most important force behind the globalization push in this
period was the reduction in land- and sea-transport costs, with the largest absolute
reductions coming in land transport and the largest percentage reductions in sea trans-
port [O’Rourke and Williamson ����: Ch. � ]. The opening of the Suez and Panama canals
during this period also helped to reduce transcontinental price gaps. The lower transpor-
tation costs led to a surge in international trade, which in turn produced a convergence
in the Anglo-American prices of important products such as wheat (from a �� percent
gap in Chicago-Liverpool prices in ���� to a �� percent gap by ����), meat (from more
than a ��� percent gap in Cincinnati-London prices in ���� to a ��� percent gap by ����),iron bars (from a �� percent gap in London-Philadelphia prices in ���� to a �� percent
gap by ����), copper (from a ��� percent gap in London-Philadelphia prices in ���� to
roughly no gap by ����), coal, tin, wool, and coffee [Harley ����]. Declining transportation
costs massively reduced price gaps between Europe and Asia on cotton, jute, and rice
(from a �� percent price gap between London and Rangoon in ���� to a � percent gap in
����) [O’Rourke and Williamson ����: Ch. � ; see also Williamson ����]. Great Britain’s
��� repeal of its Corn Laws, which had imposed tariffs on grain imports, and the ���Cobden-Chevalier treaty between Great Britain and France, reducing tariffs substantially
and providing for most-favored-nation treatment, led the way to a series of treaties
liberalizing trade in Europe.
With tariffs and transport costs declining and the gold standard reducing exchange-
������� ��� ��
244
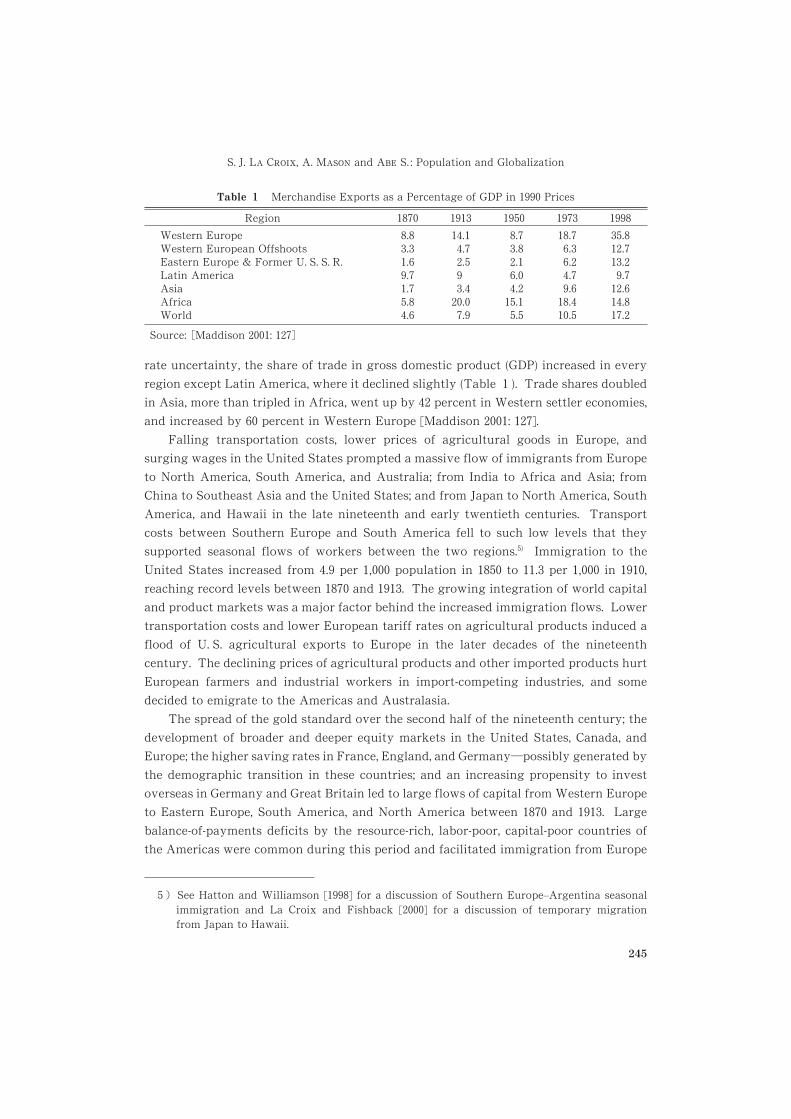
rate uncertainty, the share of trade in gross domestic product (GDP) increased in every
region except Latin America, where it declined slightly (Table � ). Trade shares doubled
in Asia, more than tripled in Africa, went up by �� percent in Western settler economies,
and increased by �� percent in Western Europe [Maddison ����: ���].
Falling transportation costs, lower prices of agricultural goods in Europe, and
surging wages in the United States prompted a massive flow of immigrants from Europe
to North America, South America, and Australia; from India to Africa and Asia; from
China to Southeast Asia and the United States; and from Japan to North America, South
America, and Hawaii in the late nineteenth and early twentieth centuries. Transport
costs between Southern Europe and South America fell to such low levels that they
supported seasonal flows of workers between the two regions.�) Immigration to the
United States increased from �� per ���� population in ���� to ���� per ���� in ���,reaching record levels between ���� and ���. The growing integration of world capital
and product markets was a major factor behind the increased immigration flows. Lower
transportation costs and lower European tariff rates on agricultural products induced a
flood of U. S. agricultural exports to Europe in the later decades of the nineteenth
century. The declining prices of agricultural products and other imported products hurt
European farmers and industrial workers in import-competing industries, and some
decided to emigrate to the Americas and Australasia.
The spread of the gold standard over the second half of the nineteenth century; the
development of broader and deeper equity markets in the United States, Canada, and
Europe; the higher saving rates in France, England, and Germany�possibly generated by
the demographic transition in these countries; and an increasing propensity to invest
overseas in Germany and Great Britain led to large flows of capital from Western Europe
to Eastern Europe, South America, and North America between ���� and ���. Large
balance-of-payments deficits by the resource-rich, labor-poor, capital-poor countries of
the Americas were common during this period and facilitated immigration from Europe
� � See Hatton and Williamson [��] for a discussion of Southern Europe+Argentina seasonalimmigration and La Croix and Fishback [����] for a discussion of temporary migrationfrom Japan to Hawaii.
Table � Merchandise Exports as a Percentage of GDP in �� Prices
Region ���� ��� ��� ��� ��Western EuropeWestern European OffshootsEastern Europe & Former U. S. S. R.Latin AmericaAsiaAfricaWorld
��������������������
�������������������
����������������������
�����������������������
��������������������������
Source: �Maddison ����: ����
S. J. L6 CGD>M, A. M6HDC and A7: S. : Population and Globalization
245
to the Americas by ensuring that new immigrants would be equipped with new capital.�)
Retreat from Globalization: 1914�45
A backlash against economic globalization began to emerge near the end of the first
period [Williamson ����]. The United States restricted immigration from Asia with the
Chinese Exclusion Act (����) and the Gentlemen’s Agreement with Japan (����). In
reaction to the flood of American agricultural products entering Europe in the ����s,
Germany, Sweden, France, and many other European countries began to re-impose tariffs
on grain imports and raw materials in the late ����s and early ����s. Only Great Britain,
Denmark, the Netherlands, and some countries (e. g., Japan) and colonies with gunboat-
imposed trade policies retained relatively liberal trade policies.
The beginning of the second period was marked by a shattering global war,
World War I, which brought economic globalization to a halt and set in motion
forces that would ultimately reverse virtually all of the labor, capital, and product
market integration achieved in the earlier Globalization Period. Newly created states
in Europe produced refugee flows and fragile, short-lived democracies [Mazower ����].
Most industrialized countries left the gold standard during World War I and did not
resume the standard again until the ����s [Feinstein, Temin and Toniolo ����]. With
the notable exception of Great Britain, most countries did not resume the gold
standard at the previous parity, thereby impairing investor confidence that foreign
investments were not subject to severe exchange-rate risk.�) Britain’s large wartime
borrowings converted it from a net creditor to a net debtor and diminished its role
as the main international financier. The United States, now a net creditor nation, was
unable to replace the British flows because it did not have the requisite institutional
infrastructure or depth of knowledge to undertake large-scale international lending.
International capital flows to South America and Asia resumed at much lower levels after
World War I (��� percent rather than � percent), declined during the ����s, and
descended to very low levels in the ����s (���� percent), as international financial
and domestic banking crises slowly unraveled the gold standard during the Great
� � O’Rourke and Williamson [����: �������] find that a large proportion of the catch-up andfalling-behind of countries in Europe and the European periphery during the ��������period was due to labor migration and capital flows. Trade played a surprisingly small rolein their convergence with or divergence from the GDP leaders.
� � See Eichengreen [����]. Most countries involved in World War I financed part of theirwartime expenditures and postwar expenditures with inflationary finance. To resume thegold standard at “parity”�the same exchange rate between the currency and gold whenthey left the gold standard, a country would have to be subjected to a difficult period ofdeflation. Given the expanded franchise and the weak condition of political parties in newEuropean democracies, few governments could choose this course.
������� �� �
246
Depression.�)
Immigration from Europe to the United States was almost totally curtailed during
World War I and World War II and was severely restricted in the interwar period by
national legislation (���� and ����) that restricted annual immigration to just ������people from outside the Americas and mandated that �� percent of immigrants be from
Great Britain and percent from Germany.�) The redrawing of European borders at the
���� Paris Conference stimulated large migration flows in Central and Eastern Europe.
European countries responded by imposing immigration restrictions in the ����s and
���s, with only France remaining open to Eastern European migrants.
Higher tariffs were imposed throughout the industrialized world in the ����s and
���s, with the U. S. passage of the Smoot-Hawley tariff in ��� provoking retaliatory
responses in France, Great Britain, Germany, and most other industrialized countries.
France, England, the United States, and Germany responded to the disintegration of the
world financial and trading systems by forming regional trading blocs with colonial and
regional partners during the ���s. Although economics historians have debated
whether the collapse of world trade during the ���s was due to higher tariffs or the
collapse of the world monetary system, the segmentation of national capital, labor, and
product markets is widely accepted. The drastic decline in the share of trade in GDP
during this period provides graphic evidence (Table � ). Increasing transportation costs
also played a significant role in reducing the share of trade in GDP during the ����s and
���s [Estevadeoral, Frantz and Taylor ����].
Other trends affecting economic globalization during this period of retreat were
more positive. The expansion of the telephone network, the rapid adoption of the radio,
the spread of the newsreel in theaters, and the expansion of higher-education institutions
facilitated a more rapid dissemination of technologies and information. Expenditures on
research and development declined during the Great Depression of the ���s in Europe
and the United States, but a large flow of new public health, medical, and nutritional
technologies was still generated.
World War II provides a fourth example of global war. Capital was destroyed
throughout the world; weapons of mass destruction were used on civilian populations in
Asia and Europe; regional transportation networks and mobile extermination facilities
reduced Hitler’s costs of decimating Europe’s Jewish population; and roughly �����million people lost their lives through wartime combat, genocide, or famine. Two world
wars in combination with the interwar depression left national factor and product
markets operating virtually in isolation at the end of World War II. The international
monetary system was in shambles; tariffs were high in virtually every countryÜa
� � See Eichengreen [����] for a full discussion of these issues. See Obstfeld and Taylor [����]for data on capital flows between ���� and ����.
� � The ���� legislation reduced the annual flow to ������ people. By comparison, annualimmigration to the United States in ���� had been ������� people.
S. J. L6 CGD>M, A. M6HDC and A7: S. : Population and Globalization
247
hangover from the ����s; and voluntary immigration was severely restricted, while
post-war refugee flows numbered in the tens of millions in Japan, China, Korea, Europe,
India, and Pakistan.
Globalization in a Post-Colonial World: 1945�Present
The flawed revival of the gold standard after World War I severely limited international
capital flows, and after World War II countries acted to replace the gold standard with
the Bretton Woods Agreement. Retaining fixed exchange rates and the veneer of a tie
with gold, the new financial system allowed countries to implement exchange-rate
controls that limited international capital flows. The dollar was linked to gold whereas
other currencies were linked to the dollar. Most European currencies became convertible
on the current account (but not on the capital account) only in ����, and binding capital
controls remained in place in the United States, Europe, Japan, and most of the develop-
ing world through the mid-����s. As a result, capital flows stagnated at only � percent
of GDP for �� of the world’s industrialized countries over the ������� period [Obstfeld and
Taylor ����]. With the United States leading the way in the ���s, Japan and the
European countries began to remove capital controls in the ����s, with the trend
accelerating in the ����s. Developing countries, under pressure from the International
Monetary Fund, began the process of removing capital controls in the ����s and ����s.��)
The gradual restoration of integrated product markets in manufactured goods was
accomplished over a ��-year period by gradual tariff reductions under the General
Agreement on Tariffs and Trade (GATT)�now the World Trade Organization (WTO)�as well as by unilateral tariff reductions. Limited progress in trade in services has been
made over the last �� years, and the ���� Uruguay Round Agreement specified a
back-loaded dismantling of the Multifibre Agreement, an elaborate maze of quotas on
textiles manufactured in low- and middle-income countries. Trade in agricultural prod-
ucts is still heavily protected by most industrialized countries, with elaborate systems of
tariffs and quotas in place and complex political obstacles blocking future reform. The
asymmetric liberalization of trade in manufactures relative to agriculture and textiles
has hurt income growth in developing countries specializing in such labor- and land-
intensive products. Despite the asymmetric liberalization, Sachs and Warner [����] find
that countries that liberalized trade in the post�World War II period experienced higher
than average GDP growth. Incomes in poor countries with liberal trade policies generally
converged with those in rich countries. This contrasts with results from the overall
sample of countries in which incomes of poor and rich countries diverged over the course
of the three globalization periods [Pritchett ����].��)
��� Some economists blame the removal of capital controls in Asian countries for the Asianfinancial crisis in the late ����s. See, e. g., Bhagwati [���].
��� Poor countries with poor data are excluded from such cross-country studies, often biasingthe results. See Frankel and Romer [����] for additional supporting arguments andRodríguez and Rodrik [���] for contrary views.
������� ��� �
248
Immigration, a major contributor to GDP convergence in the ��������� period, has
increased gradually in the post�World War II period and has served as an attenuating
force on the demographic transition. Immigration can, for example, dampen population
growth or the swings in age structure that occur during the transition. Sending
populations are often those that are growing rapidly with heavy concentrations at young
ages. Receiving countries are often those that are experiencing slower population
growth and aging populations. Immigrants are frequently young workers who have
children or begin families once they have relocated. The high rate of immigration into
the United States over the last three decades is one of the key reasons why the U. S. age
structure is expected to stay much younger than Japan’s.
Between ���� and ����, immigration to the United States was very limited and
restricted to European countries. Legislative reforms in ���� opened the door to larger
immigrant flows from a broader mix of countries.��) U. S. immigration flows are currently
about the same as in the early twentieth century, but have a smaller impact on the U. S.
economy and on sending economies because the U. S. population has almost tripled,
growing from �� million in ���� to �� million in ����, and world population has more
than tripled, increasing from �� billion in ���� to ��� billion in ����. Some countries
sending migrants to the larger U. S. economy have experienced significant reductions in
their workforces in recent years.
Migration flows have also had large implications for other sending and receiving
countries. Ethnic German populations migrated to West Germany after World War II and
after the fall of the Berlin Wall. Repatriation of colonial populations after World War II,
and refugees from civil wars generated large refugee flows in central Africa, Venezuela
(from Colombia), Pakistan and Iran (from Afghanistan), Taiwan (from China), Korea (from
North to South), and Vietnam. Temporary and permanent immigration within Europe
and to Europe�from Africa, Asia, and Turkey�after World War II markedly increased
the share of migrants in the labor forces of Switzerland (�� percent), Luxembourg (��percent), Belgium ( � percent), Germany ( � percent), and Austria ( � percent); whereas
inter-Asian migration has led to large shares of migrant workers in the labor forces of
Hong Kong ( � percent), Malaysia (�� percent), and Singapore (�� percent). Since the mid-
����s, Europe has tightened regulations with respect to refugees, making it more difficult
for them to enter and settle. Many of the small oil economies of the Middle East,
including Saudi Arabia and Kuwait, have large percentages of migrant workers in their
labor forces, many of them from Asian countries. And Israel’s population has swelled as
a result of migration from the Middle East and countries in the former Soviet Union.
Communication and transportation costs have continued to decline since World War
II. The digitization of information and the expanding use of the Internet to distribute
information have led to large declines in the cost of gathering information. The
��� Our discussion of immigration relies heavily on Martin and Widgren [����].
S. J. L6 CGD>M, A. M6HDC and A7: S. : Population and Globalization
249
introduction and improvement of the jumbo jet and the continued standardization of sea
and rail container shipment have combined to reduce the costs of transporting people
and goods. As in the earlier two periods, continuing improvements in transportation and
communication costs have the potential to diffuse information more rapidly and to
increase life expectancy, via improvements in public health, nutrition, and medical
treatment. The proliferation of nonprofit and intergovernmental organizations dedicated
to improving economic, social, environmental, and demographic conditions in developing
countries has also helped to speed the pace of globalization.
III Demographic Transitions
The demographic transition is a singular historical period during which mortality and
fertility rates decline from high to low levels in a particular country or region. The broad
outlines of the transition are similar in countries around the world, but the pace and
timing of the transition have varied considerably. In this section we describe this
important demographic phenomenon, emphasizing three demographic variables that
bear most directly on globalization: the size of national populations, their rates of growth,
and their age structures. We then discuss the ways in which globalization has influenced
the transition through its affects on fertility, mortality, and immigration.
The transition began earliest in Europe and in former European-settler colonies.
Death rates began to decline in some European populations in the mid- or late-����s.
Fertility declined with a substantial lag in some cases and with a very short lag in others.
The transition from high to low fertility took nearly ��� years in France but roughly ���years in the United States.
The transition began later elsewhere, and the changes were often much more rapid
once they began to occur. Mortality decline in Africa and Asia (Japan aside) was
concentrated in the twentieth century, with substantial advances occurring both before
and after World War II. Life expectancy in India was only �� years at the beginning of
the twentieth century, and life expectancy in China was only �� years in �������[Maddison ����: ��]. The total fertility rate did not drop below five births per woman in
Japan until the ����s, and in other Asian countries fertility decline did not begin until the
����s or later. As a result, Asia and the rest of the developing world experienced rapid
population growth in the decades after World War II and consequently rapid changes in
their age structure. The United States and many other countries in the West experienced
a post�World War II baby boom, which produced large swings in age structure that are
in some respects similar to the swings in age structure produced by the demographic
transition in Asia. The baby boom in the West resulted from rising birth rates, whereas
the “baby boom” in the developing world resulted from declining infant and child
mortality rates.
������� ��� ��
250
Perhaps the most striking aspect of the demographic transition is the enormous
gap in life expectancy that emerged between Japan and the West on the one hand and the
rest of the world on the other. By ���� a substantial gap in life expectancy at birth of ��years had already emerged. By ���� the gap had increased to �� years as essentially all
of the gains in life expectancy were confined to Japan and the West. Between ���� and
���� life expectancy improved significantly throughout the world, but the gap in life
expectancy continued to rise, reaching �� years in ����. Only in the second half of the
twentieth century was there any convergence, with the gap declining to �� years in
����.��)
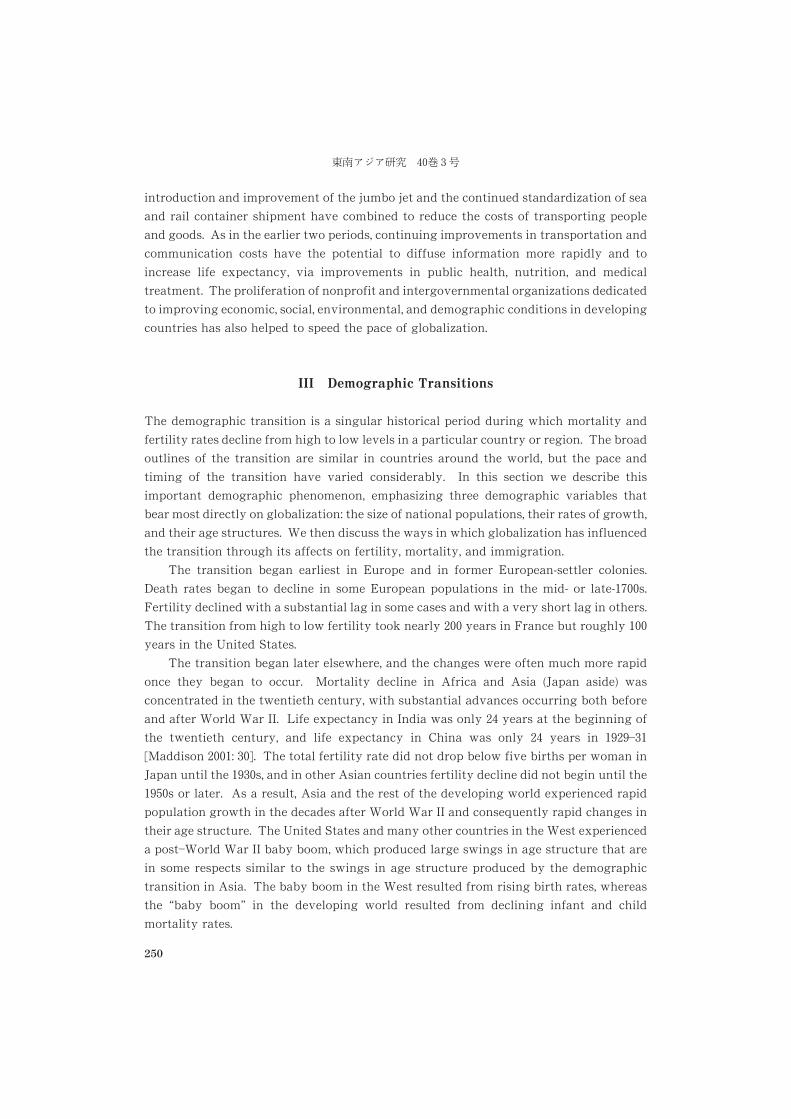
Of course, averages sometimes hide important details. The gains in life expectancy
outside the West would have been much greater had it not been for the devastating
impact of the HIV/AIDS epidemic in sub-Saharan Africa and deteriorating conditions in
Russia and some other Eastern European and Central Asian republics (see Fig. � ).
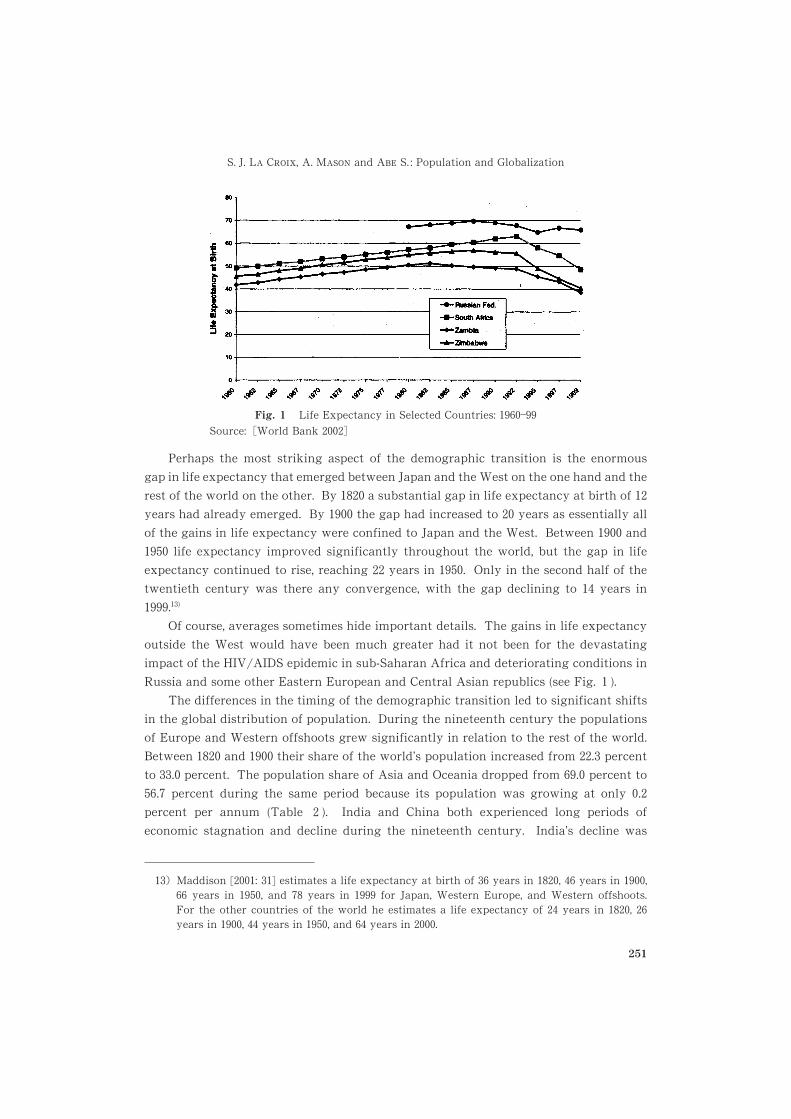
The differences in the timing of the demographic transition led to significant shifts
in the global distribution of population. During the nineteenth century the populations
of Europe and Western offshoots grew significantly in relation to the rest of the world.
Between ���� and ���� their share of the world’s population increased from ��� percent
to ��� percent. The population share of Asia and Oceania dropped from �� percent to
�� percent during the same period because its population was growing at only ��percent per annum (Table � ). India and China both experienced long periods of
economic stagnation and decline during the nineteenth century. India’s decline was
��� Maddison [����: ��] estimates a life expectancy at birth of � years in ����, � years in ����, years in ����, and �� years in ���� for Japan, Western Europe, and Western offshoots.For the other countries of the world he estimates a life expectancy of �� years in ����, �years in ����, �� years in ����, and � years in ����.
Fig. � Life Expectancy in Selected Countries: ������Source: �World Bank �����
S. J. L6 CGD>M, A. M6HDC and A7: S. : Population and Globalization
251
coupled with severe famines toward the end of that century.
During the twentieth century, population growth rates increased to high levels in
Latin America, Asia, Oceania, and Africa, reversing the global shift in population shares.
The share of Europe and its former European-settler countries declined to only ����percent of the global population by the year ����, less than its share in ����. Latin
America’s share more than doubled, and Africa’s share almost doubled.
The shift is even more dramatic if we look at the growth in population. Between ����and ����, ��� percent of the world’s population growth occurred in Europe and Western
offshoots. Between ��� and ����, however, only ���� percent occurred in that region.
United Nations projections imply that the center of gravity of the global population
will shift toward Africa during the coming decades. By ��� Africa’s share of the world
Table � Population of Major Regions of the World, ��������
YearWesternEurope
(�)
WesternOffshoots
( � )
SouthernEurope
( � )
EasternEurope
( � )
LatinAmerica
(��)
Asia &Oceania
(�)
Africa(�)
World(���)
Population (thousands at mid-year)
����������������������
��������������������������������
��������������������������������
������������������������������
�����������������������������������
��������������������������������
���������������������������������������
����������������������������������
����������������������������������������������
Percentage distribution
����������������������
����������������
�������������
����������������
������������������
����������������
�������������������
��������������������
������������������������������
Annual rate of growth for interval (percentage)
������������������������������������������
��������������
� ����
�������������������
���������������
��������������
� ���
������������������
�������������������
������������������
����������������
Increase of population as a percentage of total
������������������������������������������
��������������
� ���
��������������
�����������
�����������
� ���
��������������
����������������
�������������
���������������
Sources: Figures for ���� and ��� are from United Nations ������; figures for �������� are fromMaddison ������. Regional classifications follow Maddison ������.
Note: Numbers in parentheses under the headings refer to the number of countries in eachgrouping.
������ �� �
252
population will increase to almost �� percent as compared with only � percent in ����and � percent in ����. Population growth will by no means be confined to Africa,
however. The combined population of Asia and Oceania is projected to increase by ���billion and that of Latin America by almost �� billion by ���.
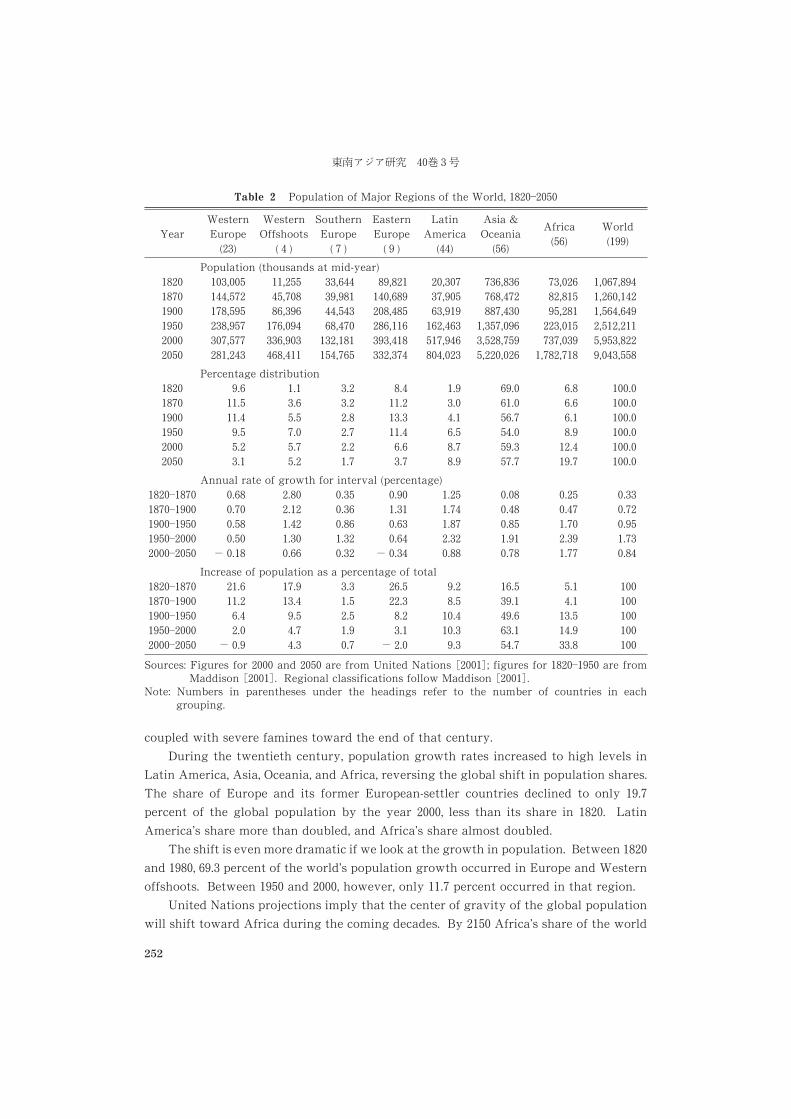
Changes in population size and growth rates provide an incomplete picture of the
demographic transition because there are also important changes in age structure. The
limited data that are available indicate that changes in age structure have been very
different in Japan and the West than in the rest of world (Fig. � ). Beginning in ��� the
dependency ratio varied from about �� to ��� in Western European countries (France,
Italy, Spain, Sweden, and England and Wales). The United States had a much higher
dependency ratio in ���, over ���, due to its much higher birth rate, but by ���� its
dependency ratio had fallen within the range found among Western European countries.
The overall trend was downward until ���, when the dependency ratio was close to ��for all of these countries. The post�World War II baby boom, which occurred throughout
the West and was most pronounced in the United States, produced a correspondingly
large, but temporary, increase in the dependency ratio. Currently, the dependency ratio
in the Western countries varies within a relatively narrow band near levels observed in
���.
Fig. � Age Structure, Selected Countries, ��������Sources: Available from the authors.Notes: The depecdency ratio is the young population (����)�the old population (�
�or ���, depending on data availability) divided by the working-agepopulation. Russia (�) consists of former non-Russian members of theSoviet Republic. Data for Japan prior to ���� include honseki.
S. J. L6 CGD>M, A. M6HDC and A7: S. : Population and Globalization
253
Japan’s experience is somewhat distinctive. Its dependency ratio increased fairly
substantially between ���� and ����, when the first population census was conducted.��)
Between ���� and the early ����s its dependency ratio was significantly higher than
ratios found in the West. Japan experienced a precipitous decline in childbearing during
the ����s, however, and its fertility rates in recent years are among the lowest in the
world. As a consequence, its dependency ratio dropped to a level similar to values found
in Western countries in ���� and later.
The most noteworthy feature of Fig. � is the distinctive trend found in the develop-
ing countries. The dependency ratios for India and the Philippines were somewhat
higher than in the West around ����. Taiwan’s dependency ratio was less than � in ����.But the precipitous decline in infant and child mortality and the continuation of high
levels of fertility produced an enormous increase in the dependency ratio and the
emergence of a huge gap that reached its peak around ����.During the last few decades, the gap in the dependency ratios has begun to disappear
as birth rates have dropped throughout the world. Taiwan and Thailand have already
achieved low dependency ratios, and in countries where fertility has declined more
slowly, the gap between the West and the developing world had become much smaller by
���� than it was in ����.If we were to trace out the changes in dependency ratios over the next �� years, we
would likely find that the positions of the developing world and the West would be
reversed. As populations begin to age, the dependency ratio will rise precipitously. This
will happen first in the West, producing dependency ratios that are substantially higher
than today’s and higher than those found in Latin America or Asia’s developing coun-
tries.
IV The Impact of Globalization on Population
The impact of globalization on population is both direct and indirect. Globalization has
influenced the speed of development, serving as an impetus for faster growth in some
countries and retarding growth in others. Increasing factor, product, and capital-market
integration allowed GDP to increase in Europe and North America at a faster rate than it
would have otherwise. In the long run, all groups gained from the market integration,
but some groups gained more than others. In the short-to-medium run, some groups may
have lost because of competition from other countries’ imports. The pace of develop-
ment, in turn, has influenced nutritional levels, economic structure and urbanization,
levels of literacy, opportunities for women, and other social and economic conditions that
��� Data for ���� to ���� are based on Japan’s household registration system. See Taeuber[����] for a detailed discussion of these data and their consistency with population censusdata.
������� ��� �
254
influence fertility, mortality, and migration.
Globalization can also have a potent direct influence on population. Perhaps most
obvious is the influence on migration of policies toward the international flow of
refugees, workers, and their families. The forces of globalization have also directly
influenced fertility and mortality. In some instances globalization has been an important
positive force, particularly with respect to the globalization of health care. The most
notable example of a negative impact is probably the effect of globalization on the spread
of disease.
It is beyond our grasp to offer definitive evidence or firm conclusions about the
importance of globalization on the important demographic processes described above.
Our effort here will be more suggestive in that we hope to identify potentially important
ways in which globalization has influenced population.
Divergence in the Demographic Transition
We hypothesize that market integration was an important factor driving the demo-
graphic transition in Europe and North America in the nineteenth century. Increases in
life expectancy, in particular, were driven by more rapid development and by the
international diffusion and implementation of public health knowledge, nutritional prac-
tices, vaccines, and birth control practices [Fogel ����]. The speed of diffusion increased
with globalization, as transportation and communication costs declined throughout its
first period (���������), with the telegraph in wide use and, later, telephone networks
rapidly expanding. Globalization also led to higher incomes in most countries, thereby
allowing new and old practices to be implemented more broadly and deeply. Record
population growth rates in Europe and North America were the result.
Why were the enormous gains in life expectancy achieved in the West and, to some
extent, in Japan not shared by the rest of the world? Three factors seem to be important,
all of which are related either directly or indirectly to the globalization processes that
existed at the time. First, living standards improved much more rapidly in Japan and in
the West than in the rest of the world. Maddison [����: ���] estimates that per capita
income grew four times as fast in Japan and the West as in other countries between ����and ����. Second, new public health developments and new knowledge about the causes,
prevention, and treatment of disease did not diffuse quickly and without cost throughout
the world. Third, globalization directly raised death rates in many countries by exposing
populations to pathogens for which they had developed no immunities. Europe itself
experienced devastating contact with the plague. But other populations in Latin Amer-
ica and the Pacific suffered enormously from their contacts with the West. Japan, on the
other hand, enjoyed a higher life expectancy than other Asian countries in part because
of its isolation. As compared with China, Japan experienced less devastation from war or
disease introduced by outside forces [ibid.].
During the interwar period, globalization and de-globalization trends pulled in
S. J. L6 CGD>M, A. M6HDC and A7: S. : Population and Globalization
255
opposite directions, accelerating the demographic transition in the West. On the one
hand, the disintegration of international capital, labor, and product markets reduced or
slowed national incomes significantly during the ����s and thereby reduced the demand
for children and consequently lowering birth rates. On the other hand, continuing
advances in communication technology and networks facilitated the rapid diffusion of
the new and old stock of public health information and technologies, thereby increasing
life expectancy. Sweden provides a good example of a country in which incomes fell in
the first half of the ����s, communication networks expanded during the interwar period,
and World War II generated few wartime casualties. Swedish life expectancy continued
its secular rise throughout the ������� period, while the downward trend in Swedish
birth rates accelerated in the low-growth interwar period, only to stage a momentary
recovery when Sweden mounted a vigorous economic recovery in the late ����s [ibid.: ��].
Demographic Convergence
The re-emergence of globalization after the end of World War II was accompanied by
convergence in birth and death rates. What is the connection, if any, between the two
events? Some countries, particularly in East Asia, achieved extraordinarily rapid eco-
nomic growth and rapid demographic change. Japan and Singapore now rank number
one and two in the world in life expectancy. South Korea, Taiwan, Thailand, Hong Kong,
and Singapore all have fertility rates lower than in the United States. The evidence is
quite clear that these Asian countries owe a large part of their development to their
success at integrating themselves into the global economy and that their rapid economic
growth accelerated their demographic transitions.
A more widespread phenomenon, however, is the delinking of demography and
development. Relatively poor countries have now achieved relatively high life ex-
pectancies and low or moderate birth rates. The demographic gap between the rich and
the poor has declined much more rapidly than the economic gap.
What accounts for this phenomenon? We believe that an important cause is the
successful globalization of the health sector. Communication costs have become so small
that many people in even the most isolated areas are exposed to new ideas that allow
them to achieve better health and to regulate their childbearing. The reduction in
transportation costs have also facilitated efforts to increase the supplies of drugs and
other medical commodities to populations that were previously isolated.
Complementing these changes, and possibly more important, has been the develop-
ment of global institutions committed to improving health and reproductive health care
throughout the world. Prior to ����, the effort to improve health in the developing world
was the province of underfunded missionaries, a few private foundations, and the nascent
efforts of the League of Nations. Large-scale efforts by national, multinational, and
private nonprofit organizations became an important force only after World War II.
Foreign aid from the United States under the aegis of the Marshall Plan sped the recovery
������� ��� ��
256
of Europe and, to a lesser extent, of Japan, South Korea, and Taiwan. Development
assistance from Japan, Western Europe, and the United States to poor countries peaked
in the ����s and has declined as a percentage of GDP in the United States over the last ��years and in Japan in the last � years. Aid from donor countries has been particularly
important for some developing countries. For example, donor aid funded roughly ��percent of the health-care expenditures of sub-Saharan Africa countries (not including
South Africa) in ����.Aid efforts by international organizations have complemented national bilateral
programs. The World Health Organization played an important role in introducing
environmental sanitation measures; providing essential drugs; vaccinating children in
the developing world against such infectious diseases as tetanus, diphtheria, measles,
tuberculosis, polio, and whooping cough; and eradicating such diseases as smallpox. The
World Bank, the United Nations Children’s Fund, Project Hope, Oxfam, and the United
Nations Development Programme have all played significant roles in upgrading health
care in developing countries and spreading the revolution in death and birth rates to poor
and middle-income countries. Relief organizations including the U. S. Agency for Inter-
national Development, CARE International, the International Red Cross, Medecins Sans
Frontieres, the Food and Agriculture Organization, the World Food Programme, and the
UN High Commissioner for Refugees have all been instrumental in reducing mortality
from disasters and wars.
The Post�World War II Baby Boom
Completion of the demographic transition in the West was interrupted by the post�World
War II baby boom. In Europe, North America, and Oceania, birth rates rose to levels more
than sufficient to replace lost wartime fertility. Japan experienced a substantial, but
short-lived, increase in birth rates in the early ����s. Economists disagree about why the
baby boom occurred, and the role that globalization processes played depends very much
on which theory is accepted.
The Chicago school emphasizes the competing effects of income on the ability to
afford children and the value of women’s time on the affordability of children [Becker
����; Becker and Lewis ����; Willis ���]. Butz and Ward [����] argue that fertility
increased after the war because rising income led to an increased demand for children.
Although the wages of women and, hence, the opportunity costs of childbearing were
also rising, the effects were muted because many women were not part of the labor force.
Rising wages did draw women into the labor force during the ����s and early ����s.
Thus, increased female labor force participation and rising wages combined to increase
the “price” of children and led to declining fertility in the mid-����s in the United States.
If this explanation of the baby boom is correct, re-globalization played only an
indirect role by stimulating simultaneous economic recovery from the global war throu-
ghout the West. Aid provided to Europe by the United States under the aegis of the
S. J. L6 CGD>M, A. M6HDC and A7: S. : Population and Globalization
257
Marshall Plan was a critical factor in Europe’s fast recovery and could be identified as a
global force inducing higher birth rates in Europe. Similar global forces, however, were
not present in the United States and could not have caused the U. S. baby boom.
Easterlin [����] offers an alternative view in which globalization forces played a
much more direct role. (See also Easterlin, Wachter, and Wachter [����].) Prior to ����,fluctuations in the U. S. economy produced fluctuations in immigration rates. The entry
of workers ebbed and flowed depending on domestic economic conditions. When the
United States and other countries closed their borders to immigrants after World War I,
economic fluctuations produced a fertility swing rather than an immigration swing.
Thus fertility declined to low levels during the Depression. Economic recovery after
World War II increased the demand for workers at the same time that an unusually small
cohort�those born during the Depression�was entering the work force. This led to a
rapid increase in wages and rising fertility. Two forces led to the subsequent baby bust.
The first was the endogenous cycle generated by successive generations of large and
small cohorts. Baby boomers began to enter the labor force in record numbers, depress-
ing wages and their own fertility. The second was that, with re-globalization after World
War II, immigration became an important attenuating force so that economic cycles were
once again absorbed by immigration as well as by fertility.
Twenty-First Century Mortality Disasters
The mortality revolution has been disrupted in sub-Saharan Africa and Asia by the
spread of HIV, the human immunodeficiency virus that causes AIDS (acquired im-
munodeficiency syndrome) and in Russia by the collapse of life expectancy. Both
phenomena may be due to failed globalization. In sub-Saharan Africa, HIV has been
spread by the regionalization of labor markets, refugees fleeing civil wars, and rural
residents escaping drought by migrating to cities. Traditional social norms giving men
greater power than women in determining sexual practices have combined with migra-
tory labor patterns to produce a situation particularly conducive to spreading HIV
[Kauffman and Volks ����]. Public health systems in sub-Saharan countries have
generally failed to communicate information to citizens or to persuade them of its
validity. This situation stands in stark contrast to that in Thailand, where campaigns by
public health authorities have been successful in markedly reducing infection rates since
the mid-����s.
The decline in life expectancy in Russia stems from increasing rates of alcohol
consumption, rising suicide rates, declining levels of medical care, and increasing public
health hazards. Most explanations of this deterioration in mortality rates trace back to
Russia’s decline as a superpower and, more importantly, to its sharp decline in living
standards. The fall in Russia’s income could be attributed to its de-globalization�manifested in falling international trade�after the dismantling of the communist bloc in
���� and to its failed attempts at economic reform and integration into the global
economy.
������� ��� �
258
V The Impact of Population on Globalization
Historically, population growth has served as an impetus for exploration and coloniza-
tion. This is true to some extent in the case of European colonization of the Americas and
Oceania, where colonization involved substantial emigration. In both cases, colonization
may have served as an outlet from Malthusian pressures in Europe. The same cannot,
however, be said of European conquests in Asia and Africa, because they did not lead to
substantial emigration. We hypothesize that there are two ways in which population
factors may have influenced colonization. First, in the sixteenth and seventeenth
centuries European population growth led to increased shortages in agricultural land and
provided the impetus for migration to and exploitation of the land-rich, labor-poor
Americas, which had undergone depopulation through contact with Europeans. Second,
larger populations�and economies�gave European countries the power and wealth
needed to mount expeditions and to secure military conquests. How population influ-
ences war and security remains a controversial topic, however, about which no strong
consensus has emerged [Angell ����; Simon ����; Cashman ����: Ch. � ].
In recent years, population has influenced globalization via two channels: by in-
fluencing relative factor endowments and by influencing the national distribution of
global income [Helpman and Krugman ����]. Our analysis emphasizes the first channel
and pays particular attention to how this channel has led to the rapid development of
East Asian countries over the last �� years [Mason ����].
Trade, foreign investment, and immigration are influenced by a variety of forces,
with one of the most important being differences in factor endowments�of labor,
physical capital, and human capital. Countries with a limited supply of one of these
important economic resources gain by “cooperating” with countries with an abundant
supply of the same resource. The cooperation can take several forms. The factors
themselves can be exchanged, with the labor-abundant economy exchanging labor for
capital. Or the countries can specialize in the production of final goods and services and
engage in trade. Thus the economies with abundant labor produce labor-intensive goods,
and the economies with abundant capital produce capital-intensive goods. Through this
specialization, production costs can be minimized and higher standards of living attained.
Important intercountry differences exist in factor endowments, and sometimes rapid
changes occur. For example, capital per worker was much greater in the United States in
���� than in Japan, Taiwan, South Korea, or Thailand. But between ���� and the early
����s, high rates of investment in those countries allowed them to greatly reduce the gap
and, in the case of Japan, eliminate it altogether (Fig. � ).
There is a striking relationship between demographic variables and factor endow-
ments. Countries with early and fast demographic transitions are relatively well en-
S. J. L6 CGD>M, A. M6HDC and A7: S. : Population and Globalization
259
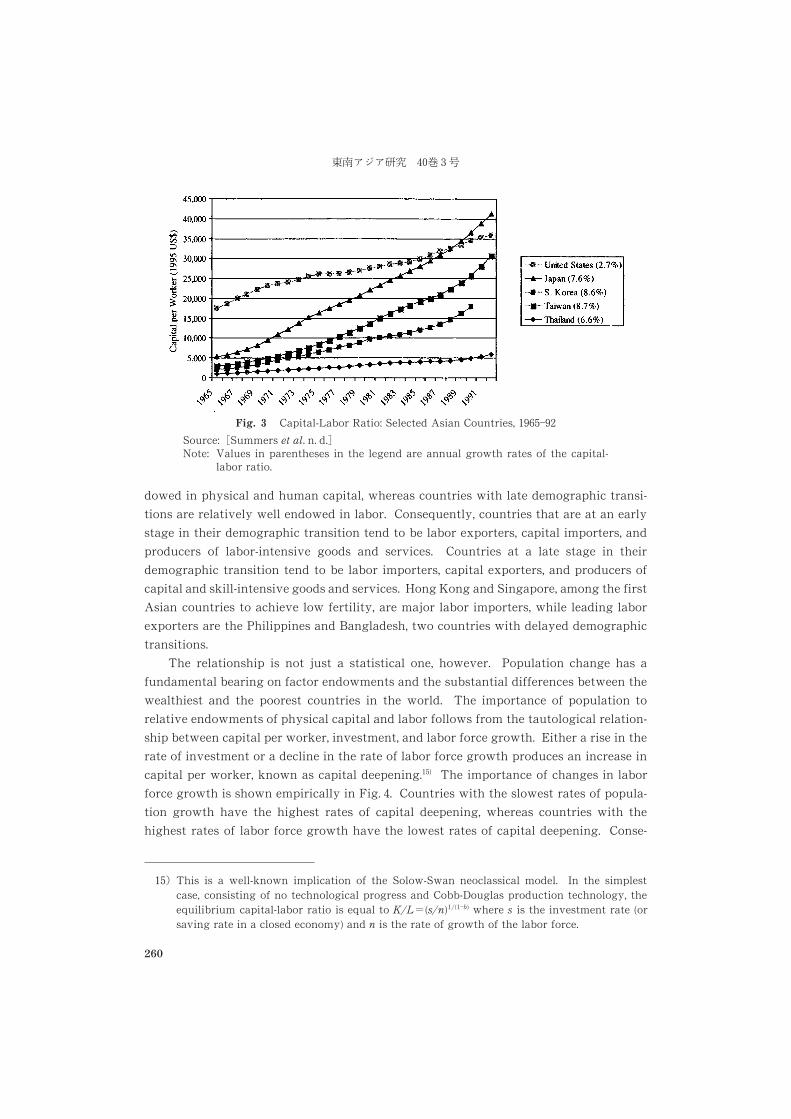
dowed in physical and human capital, whereas countries with late demographic transi-
tions are relatively well endowed in labor. Consequently, countries that are at an early
stage in their demographic transition tend to be labor exporters, capital importers, and
producers of labor-intensive goods and services. Countries at a late stage in their
demographic transition tend to be labor importers, capital exporters, and producers of
capital and skill-intensive goods and services. Hong Kong and Singapore, among the first
Asian countries to achieve low fertility, are major labor importers, while leading labor
exporters are the Philippines and Bangladesh, two countries with delayed demographic
transitions.
The relationship is not just a statistical one, however. Population change has a
fundamental bearing on factor endowments and the substantial differences between the
wealthiest and the poorest countries in the world. The importance of population to
relative endowments of physical capital and labor follows from the tautological relation-
ship between capital per worker, investment, and labor force growth. Either a rise in the
rate of investment or a decline in the rate of labor force growth produces an increase in
capital per worker, known as capital deepening.��) The importance of changes in labor
force growth is shown empirically in Fig. �. Countries with the slowest rates of popula-
tion growth have the highest rates of capital deepening, whereas countries with the
highest rates of labor force growth have the lowest rates of capital deepening. Conse-
��� This is a well-known implication of the Solow-Swan neoclassical model. In the simplestcase, consisting of no technological progress and Cobb-Douglas production technology, theequilibrium capital-labor ratio is equal to K/L�(s/n)1/(1�b) where s is the investment rate (orsaving rate in a closed economy) and n is the rate of growth of the labor force.
Fig. � Capital-Labor Ratio: Selected Asian Countries, �������Source: �Summers et al. n. d.�Note: Values in parentheses in the legend are annual growth rates of the capital-
labor ratio.
����� ��� ��
260
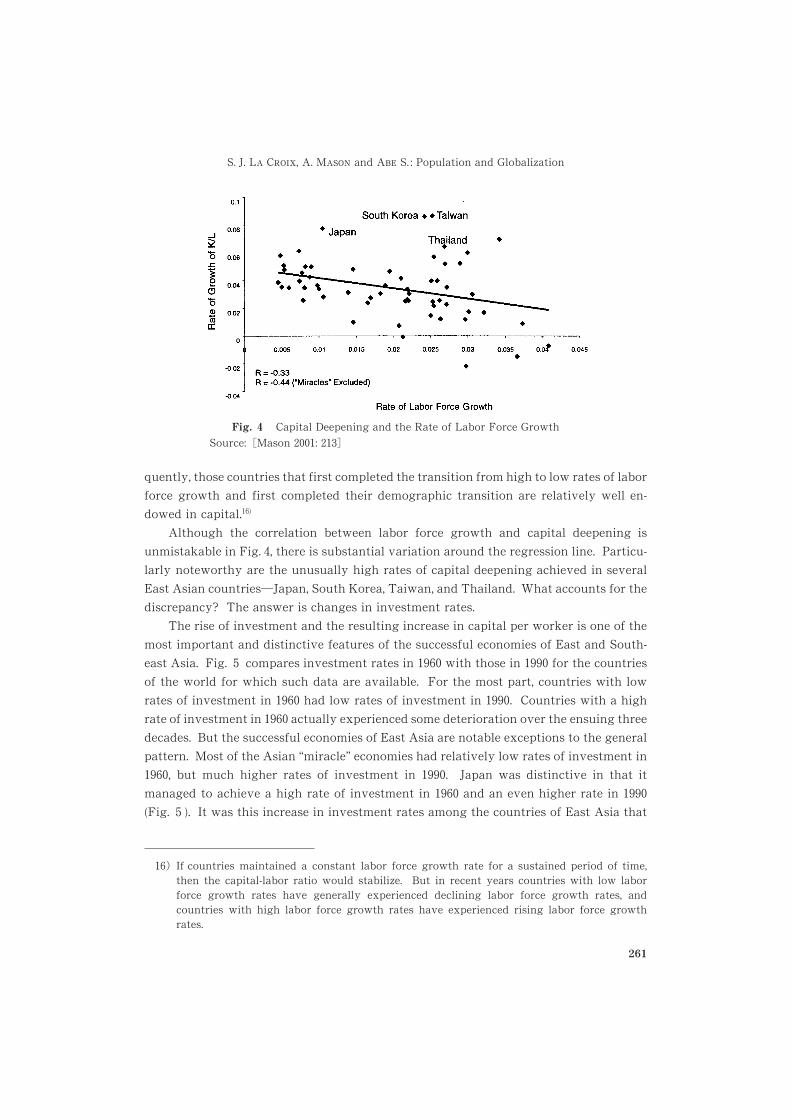
quently, those countries that first completed the transition from high to low rates of labor
force growth and first completed their demographic transition are relatively well en-
dowed in capital.��)
Although the correlation between labor force growth and capital deepening is
unmistakable in Fig. �, there is substantial variation around the regression line. Particu-
larly noteworthy are the unusually high rates of capital deepening achieved in several
East Asian countries�Japan, South Korea, Taiwan, and Thailand. What accounts for the
discrepancy? The answer is changes in investment rates.
The rise of investment and the resulting increase in capital per worker is one of the
most important and distinctive features of the successful economies of East and South-
east Asia. Fig. � compares investment rates in ���� with those in ���� for the countries
of the world for which such data are available. For the most part, countries with low
rates of investment in ���� had low rates of investment in ����. Countries with a high
rate of investment in ���� actually experienced some deterioration over the ensuing three
decades. But the successful economies of East Asia are notable exceptions to the general
pattern. Most of the Asian “miracle” economies had relatively low rates of investment in
����, but much higher rates of investment in ����. Japan was distinctive in that it
managed to achieve a high rate of investment in ���� and an even higher rate in ����(Fig. � ). It was this increase in investment rates among the countries of East Asia that
��� If countries maintained a constant labor force growth rate for a sustained period of time,then the capital-labor ratio would stabilize. But in recent years countries with low laborforce growth rates have generally experienced declining labor force growth rates, andcountries with high labor force growth rates have experienced rising labor force growthrates.
Fig. � Capital Deepening and the Rate of Labor Force Growth
Source: �Mason ����: ����
S. J. L6 CGD>M, A. M6HDC and A7: S. : Population and Globalization
261
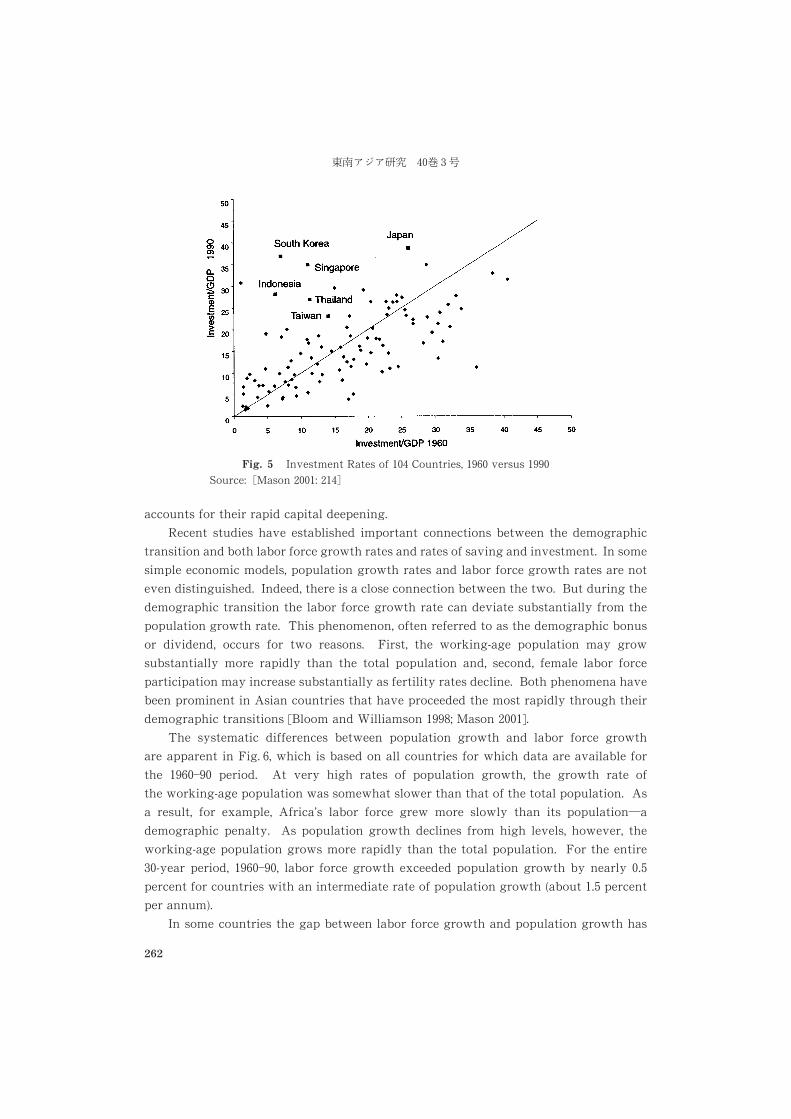
accounts for their rapid capital deepening.
Recent studies have established important connections between the demographic
transition and both labor force growth rates and rates of saving and investment. In some
simple economic models, population growth rates and labor force growth rates are not
even distinguished. Indeed, there is a close connection between the two. But during the
demographic transition the labor force growth rate can deviate substantially from the
population growth rate. This phenomenon, often referred to as the demographic bonus
or dividend, occurs for two reasons. First, the working-age population may grow
substantially more rapidly than the total population and, second, female labor force
participation may increase substantially as fertility rates decline. Both phenomena have
been prominent in Asian countries that have proceeded the most rapidly through their
demographic transitions [Bloom and Williamson ����; Mason ����].
The systematic differences between population growth and labor force growth
are apparent in Fig. �, which is based on all countries for which data are available for
the ������� period. At very high rates of population growth, the growth rate of
the working-age population was somewhat slower than that of the total population. As
a result, for example, Africa’s labor force grew more slowly than its population�a
demographic penalty. As population growth declines from high levels, however, the
working-age population grows more rapidly than the total population. For the entire
��-year period, �������, labor force growth exceeded population growth by nearly ��percent for countries with an intermediate rate of population growth (about �� percent
per annum).
In some countries the gap between labor force growth and population growth has
Fig. � Investment Rates of �� Countries, ���� versus ����Source: �Mason ����: ���
������� � �
262
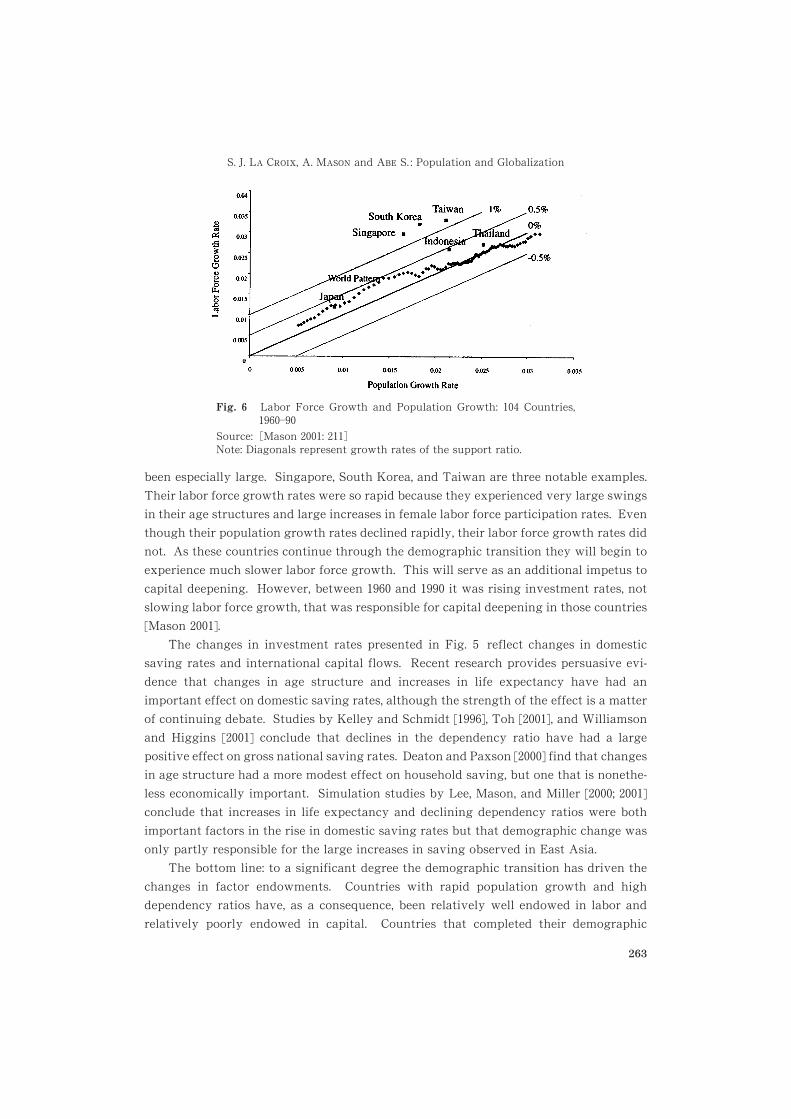
been especially large. Singapore, South Korea, and Taiwan are three notable examples.
Their labor force growth rates were so rapid because they experienced very large swings
in their age structures and large increases in female labor force participation rates. Even
though their population growth rates declined rapidly, their labor force growth rates did
not. As these countries continue through the demographic transition they will begin to
experience much slower labor force growth. This will serve as an additional impetus to
capital deepening. However, between ���� and ���� it was rising investment rates, not
slowing labor force growth, that was responsible for capital deepening in those countries
[Mason ����].
The changes in investment rates presented in Fig. � reflect changes in domestic
saving rates and international capital flows. Recent research provides persuasive evi-
dence that changes in age structure and increases in life expectancy have had an
important effect on domestic saving rates, although the strength of the effect is a matter
of continuing debate. Studies by Kelley and Schmidt [����], Toh [����], and Williamson
and Higgins [����] conclude that declines in the dependency ratio have had a large
positive effect on gross national saving rates. Deaton and Paxson [����] find that changes
in age structure had a more modest effect on household saving, but one that is nonethe-
less economically important. Simulation studies by Lee, Mason, and Miller [����; ����]conclude that increases in life expectancy and declining dependency ratios were both
important factors in the rise in domestic saving rates but that demographic change was
only partly responsible for the large increases in saving observed in East Asia.
The bottom line: to a significant degree the demographic transition has driven the
changes in factor endowments. Countries with rapid population growth and high
dependency ratios have, as a consequence, been relatively well endowed in labor and
relatively poorly endowed in capital. Countries that completed their demographic
Fig. � Labor Force Growth and Population Growth: ��� Countries,�������
Source: �Mason ����: ����Note: Diagonals represent growth rates of the support ratio.
S. J. L6 CGD>M, A. M6HDC and A7: S. : Population and Globalization
263
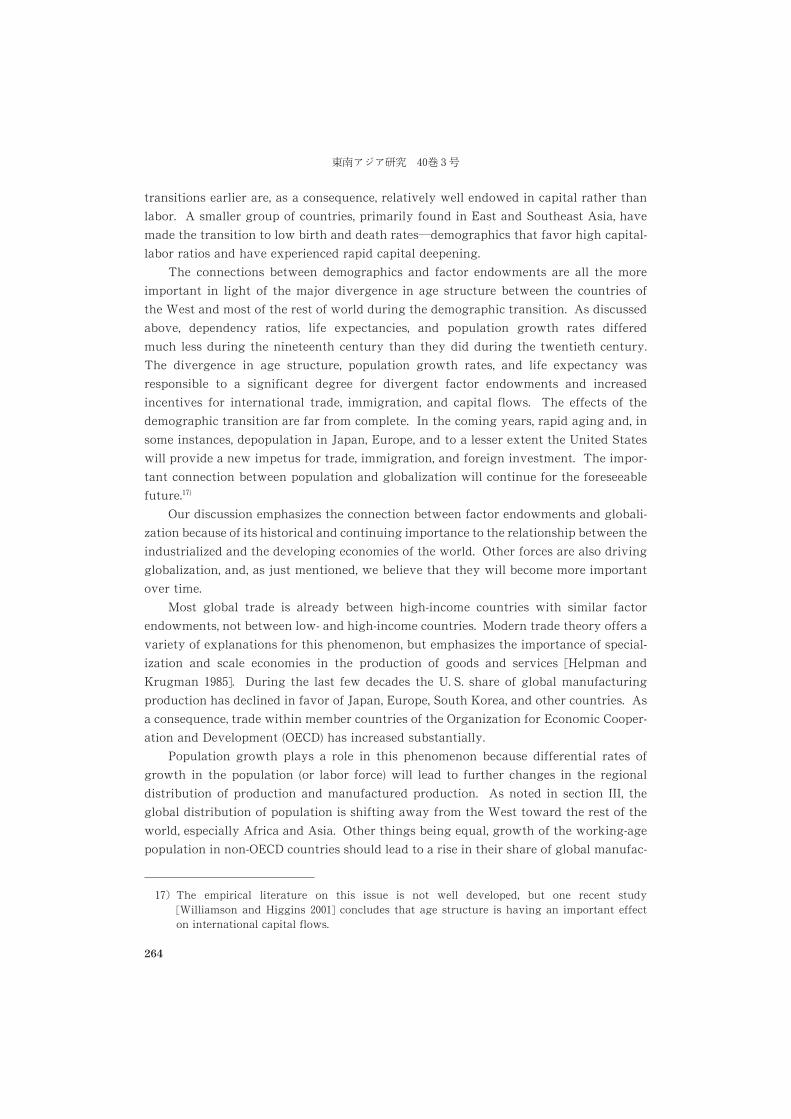
transitions earlier are, as a consequence, relatively well endowed in capital rather than
labor. A smaller group of countries, primarily found in East and Southeast Asia, have
made the transition to low birth and death rates�demographics that favor high capital-
labor ratios and have experienced rapid capital deepening.
The connections between demographics and factor endowments are all the more
important in light of the major divergence in age structure between the countries of
the West and most of the rest of world during the demographic transition. As discussed
above, dependency ratios, life expectancies, and population growth rates differed
much less during the nineteenth century than they did during the twentieth century.
The divergence in age structure, population growth rates, and life expectancy was
responsible to a significant degree for divergent factor endowments and increased
incentives for international trade, immigration, and capital flows. The effects of the
demographic transition are far from complete. In the coming years, rapid aging and, in
some instances, depopulation in Japan, Europe, and to a lesser extent the United States
will provide a new impetus for trade, immigration, and foreign investment. The impor-
tant connection between population and globalization will continue for the foreseeable
future.��)
Our discussion emphasizes the connection between factor endowments and globali-
zation because of its historical and continuing importance to the relationship between the
industrialized and the developing economies of the world. Other forces are also driving
globalization, and, as just mentioned, we believe that they will become more important
over time.
Most global trade is already between high-income countries with similar factor
endowments, not between low- and high-income countries. Modern trade theory offers a
variety of explanations for this phenomenon, but emphasizes the importance of special-
ization and scale economies in the production of goods and services [Helpman and
Krugman ����]. During the last few decades the U. S. share of global manufacturing
production has declined in favor of Japan, Europe, South Korea, and other countries. As
a consequence, trade within member countries of the Organization for Economic Cooper-
ation and Development (OECD) has increased substantially.
Population growth plays a role in this phenomenon because differential rates of
growth in the population (or labor force) will lead to further changes in the regional
distribution of production and manufactured production. As noted in section III, the
global distribution of population is shifting away from the West toward the rest of the
world, especially Africa and Asia. Other things being equal, growth of the working-age
population in non-OECD countries should lead to a rise in their share of global manufac-
��� The empirical literature on this issue is not well developed, but one recent study[Williamson and Higgins ����] concludes that age structure is having an important effecton international capital flows.
������� ���
264
turing production. This in turn should lead to a rise in OECD imports from non-OECD
countries and to a decline in trade within OECD (as a fraction of OECD production).
It is unclear whether the shift in the global distribution of manufacturing will
produce a substantial increase in global trade or merely influence the trade patterns by
shifting trade from within OECD to between OECD and non-OECD countries. Bergoeing
and Kehoe [����] argue that changes in the regional distribution of production cannot
account for the rapid rise in global trade in recent years.
VI Conclusion
The global demographic transition is still incomplete. African nations and some Asian
nations are still in early stages of the transition. As their transitions proceed, the
potential for changes in trade patterns, capital flows, and immigration looms large. At
the same time, the revolution in life expectancy is likely to continue in the developed
world unless it is disrupted by widespread use of weapons of mass destruction or the
emergence and spread of new infectious diseases. Whether the mortality revolution
continues in the developing world is likely to depend upon whether developing countries
are able to put institutions in place that facilitate the transmission and acceptance of
public health knowledge and new medical practices.
The adoption of social institutions that facilitate information transmission and allow
adaptation to changing circumstances is surely the critical element for any society, as
efficient institutions will also generate strong economic growth. Globalization and
demography are likely to generate a virtuous circle of benefits only when attention is
paid to the underlying institutions through which they are filtered. Without well-
functioning political and economic institutions, globalization can be dysfunctional for
any society. Filtered through a system of incentives that does not reflect social costs or
benefits, globalization and demography can interact to produce large populations living
in poverty. In sum, the critical task for any society is to get the institutions right.
References
Angell, Sir Norman. ����. Raw Materials, Population Pressure, and War. World Affairs Books, No. ��.Boston: World Peace Foundation.
Baines, Dudley. ����. Emigration from Europe, 1815�1930. Cambridge: Cambridge University Press.Becker, Gary S. ����. An Economic Analysis of Fertility. In Demographic and Economic Change in
Developed Countries, pp. �������. Universities-National Bureau Conference Series, No. ��. Prince-ton, NJ: Princeton University Press.
Becker, Gary S.; and Lewis, H. Gregg. ����. Interaction between Quantity and Quality of Children.Journal of Political Economy � (March/April): S����S�.
Bentley, Jerry H.; and Ziegler, Herbert F. ����. Traditions and Encounters: A Global Perspective on thePast. New York: McGraw-Hill.
Bergoeing, Raphael; and Kehoe, Timothy J. ����. Trade Theory and Trade Facts. Research Depart-
S. J. L6 CGD>M, A. M6HDC and A7: S. : Population and Globalization
265
ment Staff Report No. ���, November ����. Minneapolis, MN: Federal Reserve Bank of Minneap-olis.
Bhagwati, Jagdish. ����. The Wind of the Hundred Days. Cambridge, MA: MIT Press.Bloom, David E.; and Williamson, Jeffrey G. ����. Demographic Transitions and Economic Miracles
in Emerging Asia. World Bank Economic Review �� ( � ): ������.Bushnell, Andrew F. ����. The “Horror” Reconsidered: An Evaluation of the Historical Evidence for
Population Decline in Hawai’i, �������. Pacific Studies � (September): ������.Butlin, N. G. ����. Our Original Aggression: Aboriginal Populations of Southeastern Australia, 1788�
1850. Boston and Sydney: G. Allen & Unwin.Butz, William P.; and Ward, Michael P. ���. The Emergency of Countercyclical U. S. Fertility.
American Economic Review � (June): �������.Cashman, Greg. ����. What Causes War?: An Introduction to Theories of International Conflict. New
York: Lexington Books.Curtin, Phillip D. ����. Death by Migration: Europe’s Encounters with the Tropical World in the
Nineteenth Century. New York: Cambridge University Press.Deaton, Angus; and Paxson, Christina. ����. Growth, Demographic Structure, and National Saving
in Taiwan. In Population and Economic Change in East Asia, edited by C. Y. Cyrus Chu andRonald Lee. A special supplement to Population and Development Review �: ������.
Easterlin, Richard A. ���. Population, Labor Force, and Long Swings in Economic Growth: TheAmerican Experience. New York: Columbia University Press.
Easterlin, Richard A.; Wachter, Michael L.; and Wachter, Susan M. ���. The Changing Impact ofPopulation Swings on the American Economy. Proceedings of the American Philosophical Society
��� ( � ) (June): �������.Eichengreen, Barry. ���. Golden Fetters: The Gold Standard and the Great Depression. New York:
Oxford University Press.����. ����. Globalizing Capital: A History of the International Monetary System. Rev. ed. Princeton,
NJ: Princeton University Press.Estevadeoral, Antoni; Frantz, Brian; and Taylor, Alan M. ����. The Rise and Fall of World Trade,
��������. Working Paper, Department of Economics, University of California, Davis.Feinstein, Charles H.; Temin, Peter; and Toniolo, Gianni. ���. The European Economy between the
Wars. New York: Oxford University Press.Fogel, Robert W. ����. Without Consent or Contract: The Rise and Fall of American Slavery. New York:
Norton.����. ����. Second Thoughts on the European Escape from Hunger: Famine, Chronic Malnutri-
tion, and Mortality Rates. In Nutrition and Poverty, edited by S. R. Osmani. Oxford: ClarendonPress.
Frankel, Jeffrey; and Romer, David. ����. Does Trade Cause Growth? American Economic Review ��:������.
Harley, C. Knick. ����. Transportation, the World Wheat Trade, and the Kuznets Cycle: ���������.Explorations in Economic History �: �������.
Hatton, Timothy J.; and Williamson, Jeffrey G. ����. The Age of Mass Migration: An EconomicAnalysis. New York: Oxford University Press.
Helpman, Elhanan; and Krugman, Paul. ����. Market Structure and Foreign Trade. Cambridge: MITPress.
Kauffman, Kyle D.; and Volks, Cal. ����. AIDS in South Africa: The Social Expression of a Pandemic.Cape Town: University of Cape Town Press. forthcoming
Kelley, Allen C.; and Schmidt, R. M. ���. Saving, Dependency, and Development. Journal ofPopulation Economics � ( � ): �����.
La Croix, Sumner J.; and Fishback, Price. ����. Migration, Labor Market Dynamics, and WageDifferentials in Hawaii’s Sugar Industry. Advances in Agricultural Economic History � (January):
������� ��� ��
266
�����.Lee, Ronald D.; Mason, Andrew; and Miller, Timothy. ����. Life Cycle Saving and the Demographic
Transition: The Case of Taiwan. In Population and Economic Change in East Asia, edited by C.Y. Cyrus Chu and Ronald Lee. A special supplement to Population and Development Review ��:�������.
����. ����. Saving, Wealth, and the Demographic Transition in East Asia. In Population Changeand Economic Development in East Asia: Challenges Met, Opportunities Seized, edited by AndrewMason, pp. ����. Stanford, CA: Stanford University Press.
Maddison, Angus. ����. The World Economy: A Millennial Perspective. Paris: OECD.Martin, Philip; and Widgren, Jonas. ����. International Migration: Facing the Challenge. Population
Bulletin � (March): ����.Mason, Andrew. ����. Population, Capital, and Labor. In Population Change and Economic Develop-
ment in East Asia: Challenges Met, Opportunities Seized, edited by Andrew Mason, pp. ������.Stanford, CA: Stanford University Press.
Mazower, Mark. ����. Dark Continent: Europe’s 20th Century. New York: Knopf.Obstfeld, Maurice; and Taylor, Alan. ���. The Great Depression as a Watershed: International
Capital Mobility in the Long Run. In The Defining Moment: The Great Depression and theAmerican Economy in the Twentieth Century, edited by Michael D. Bordo, Claudia D. Goldin, andEugene N. White. Chicago, IL: University of Chicago Press.
O’Rourke, Kevin H.; and Williamson, Jeffrey G. ����. Globalization and History: The Evolution of aNineteenth Century Atlantic Economy. Cambridge and London: MIT Press.
Pritchett, Lant. ����. Divergence, Big Time. Journal of Economic Perspectives �� (September): ����.Rodríguez, Francisco C.; and Rodrik, Dani. ����. Trade Policy and Economic Growth: A Skeptic’s
Guide to the Cross-National Evidence. In NBER Macroeconomics Annual ,***, edited by BenBernanke and Kenneth S. Rogoff, pp. ������. Cambridge, MA: MIT Press for the NationalBureau of Economic Research.
Sachs, Jeffrey D.; and Warner, Andrew M. ���. Economic Reform and the Process of GlobalIntegration. Brookings Papers on Economic Activity No. � : ����.
Simon, Julian L. ���. Lebenstraum: Paradoxically, Population Growth May Eventually End Wars.Journal of Conflict Resolution �� ( � ): ������.
Summers, R.; Heston, A.; Aten, B.; and Nuxoll, D. n. d. Penn World Tables, Mark 5.6a. Available ondiskette from the National Bureau of Economic Research, Cambridge, MA.
Taueber, Irene B. ��. The Population of Japan. Princeton, NJ: Princeton University Press.Toh, Mun-Heng. ����. Savings, Capital Formation, and Economic Growth in Singapore. In Popula-
tion Change and Economic Development in East Asia: Challenges Met, Opportunities Seized, editedby Andrew Mason, pp. ����. Stanford, CA: Stanford University Press.
United Nations. ����. World Population Prospects, the 2001 Revision. New York: UN.Williamson, Jeffrey G. ���. Globalization, Labor Markets, and Policy Backlash in the Past. Journal
of Economic Perspectives �� ( � ): ����.����. ����. Land, Labor, and Globalization in the Third World, ��������. Journal of Economic
History �� (March): �.Williamson, Jeffrey G.; and Higgins, Matthew. ����. The Accumulation and Demography Connection
in East Asia. In Population Change and Economic Development in East Asia: Challenges Met,Opportunities Seized, edited by Andrew Mason, pp. ������. Stanford, CA: Stanford UniversityPress.
Willis, Robert J. ����. A New Approach to the Economic Theory of Fertility Behavior. Journal ofPolitical Economy (March-April): S���S��.
World Bank. ����. Key Indicators, 2002: CD-ROM Version. Washington, D. C.: World Bank.
S. J. L6 CGD>M, A. M6HDC and A7: S. : Population and Globalization
267
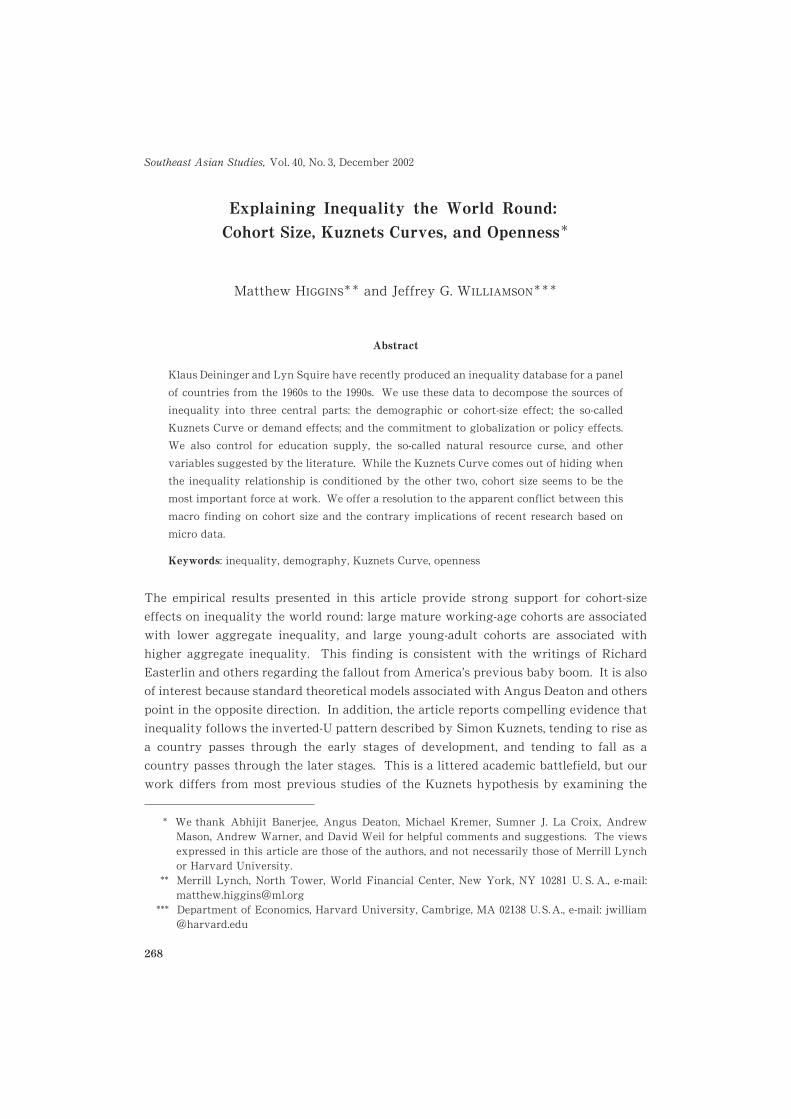
Explaining Inequality the World Round:
Cohort Size, Kuznets Curves, and Openness�
Matthew H><<>CH�� and Jeffrey G. W>AA>6BHDC���
Abstract
Klaus Deininger and Lyn Squire have recently produced an inequality database for a panel
of countries from the ����s to the ����s. We use these data to decompose the sources of
inequality into three central parts: the demographic or cohort-size effect; the so-called
Kuznets Curve or demand effects; and the commitment to globalization or policy effects.
We also control for education supply, the so-called natural resource curse, and other
variables suggested by the literature. While the Kuznets Curve comes out of hiding when
the inequality relationship is conditioned by the other two, cohort size seems to be the
most important force at work. We offer a resolution to the apparent conflict between this
macro finding on cohort size and the contrary implications of recent research based on
micro data.
Keywords: inequality, demography, Kuznets Curve, openness
The empirical results presented in this article provide strong support for cohort-size
effects on inequality the world round: large mature working-age cohorts are associated
with lower aggregate inequality, and large young-adult cohorts are associated with
higher aggregate inequality. This finding is consistent with the writings of Richard
Easterlin and others regarding the fallout from America’s previous baby boom. It is also
of interest because standard theoretical models associated with Angus Deaton and others
point in the opposite direction. In addition, the article reports compelling evidence that
inequality follows the inverted-U pattern described by Simon Kuznets, tending to rise as
a country passes through the early stages of development, and tending to fall as a
country passes through the later stages. This is a littered academic battlefield, but our
work differs from most previous studies of the Kuznets hypothesis by examining the
* We thank Abhijit Banerjee, Angus Deaton, Michael Kremer, Sumner J. La Croix, AndrewMason, Andrew Warner, and David Weil for helpful comments and suggestions. The viewsexpressed in this article are those of the authors, and not necessarily those of Merrill Lynchor Harvard University.
** Merrill Lynch, North Tower, World Financial Center, New York, NY ����� U. S. A., e-mail:matthew.higgins�ml.org
*** Department of Economics, Harvard University, Cambrige, MA ����� U. S. A., e-mail: jwilliam�harvard.edu
Southeast Asian Studies, Vol. ��, No. �, December ����
268
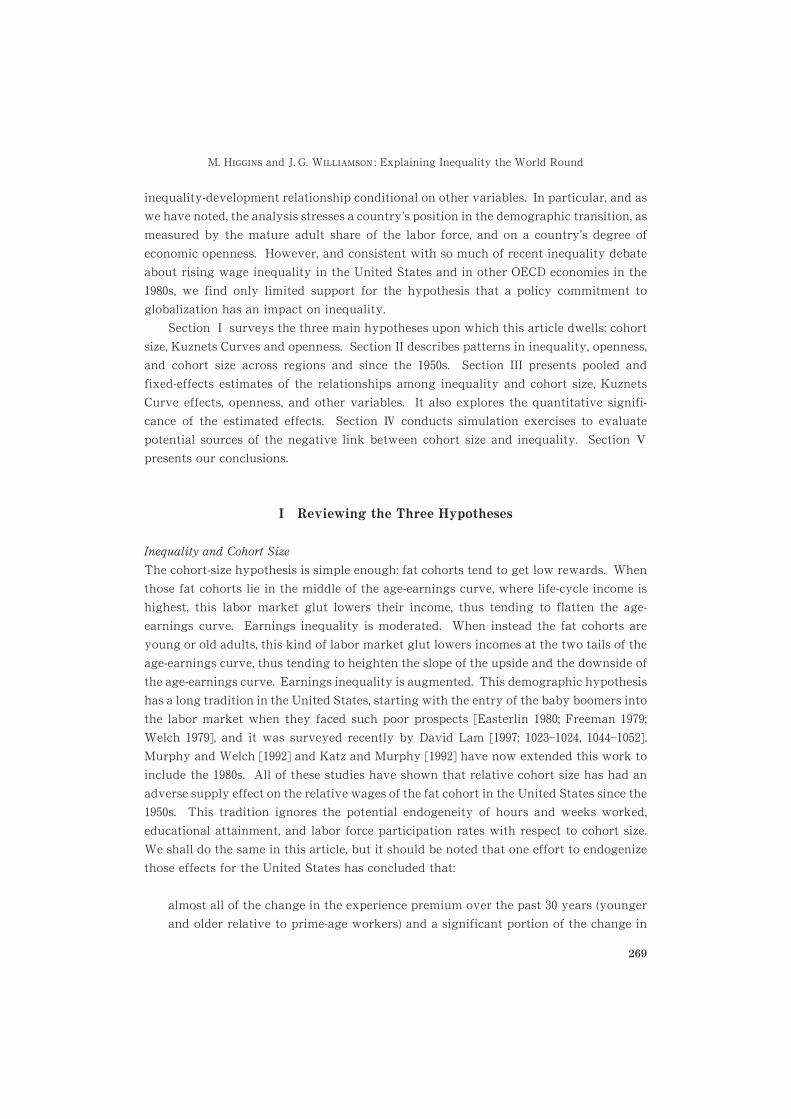
inequality-development relationship conditional on other variables. In particular, and as
we have noted, the analysis stresses a country’s position in the demographic transition, as
measured by the mature adult share of the labor force, and on a country’s degree of
economic openness. However, and consistent with so much of recent inequality debate
about rising wage inequality in the United States and in other OECD economies in the
����s, we find only limited support for the hypothesis that a policy commitment to
globalization has an impact on inequality.
Section� surveys the three main hypotheses upon which this article dwells: cohort
size, Kuznets Curves and openness. Section II describes patterns in inequality, openness,
and cohort size across regions and since the ����s. Section III presents pooled and
fixed-effects estimates of the relationships among inequality and cohort size, Kuznets
Curve effects, openness, and other variables. It also explores the quantitative signifi-
cance of the estimated effects. Section � conducts simulation exercises to evaluate
potential sources of the negative link between cohort size and inequality. Section �presents our conclusions.
I Reviewing the Three Hypotheses
Inequality and Cohort Size
The cohort-size hypothesis is simple enough: fat cohorts tend to get low rewards. When
those fat cohorts lie in the middle of the age-earnings curve, where life-cycle income is
highest, this labor market glut lowers their income, thus tending to flatten the age-
earnings curve. Earnings inequality is moderated. When instead the fat cohorts are
young or old adults, this kind of labor market glut lowers incomes at the two tails of the
age-earnings curve, thus tending to heighten the slope of the upside and the downside of
the age-earnings curve. Earnings inequality is augmented. This demographic hypothesis
has a long tradition in the United States, starting with the entry of the baby boomers into
the labor market when they faced such poor prospects [Easterlin ����; Freeman ����;Welch ����], and it was surveyed recently by David Lam [����: ��������, �������].
Murphy and Welch [����] and Katz and Murphy [����] have now extended this work to
include the ����s. All of these studies have shown that relative cohort size has had an
adverse supply effect on the relative wages of the fat cohort in the United States since the
����s. This tradition ignores the potential endogeneity of hours and weeks worked,
educational attainment, and labor force participation rates with respect to cohort size.
We shall do the same in this article, but it should be noted that one effort to endogenize
those effects for the United States has concluded that:
almost all of the change in the experience premium over the past �� years (younger
and older relative to prime-age workers) and a significant portion of the change in
M. H><<>CH and J. G. W>AA>6BHDC : Explaining Inequality the World Round
269
the college wage premium can be explained solely as a function of changing age
structure. [Macunovich ����: ���]
If the cohort-size hypothesis helps explain U. S. postwar experience with wage
inequality, it might do even better worldwide. After all, there is far greater variance in
the age distribution of populations between regions and countries than there has been
over time in the United States. Furthermore, the post+World War II demographic
transition in the Third World has generated much more dramatic changes in relative
cohort size than did the baby boom in the OECD countries. The higher demographic
variance between countries at any point in time versus within countries over time can
also be illustrated by a pair of summary statistics from the data set used in this analysis.
Define the variable MATURE as the proportion of the adult population (taken to be
persons in the age range �����) who are ����. When the standard deviation of MATURE
is calculated between countries in the sample, we get a figure, ��, that far exceeds the
standard deviation over time within countries for the sample, ���. Thus the variance in
cohort size across countries and regions is more than nine times the variance for
countries over time.
All of this suggests that cohort size is likely to matter in explaining inequality the
world around since the ���s, fat young-adult cohorts creating inequality whereas fat
prime-age cohorts doing just the opposite. Interestingly, a recent and influential paper by
Deaton and Paxson [����] identifies forces linking faster population growth (and thus fat
young and thin prime-age cohorts) with reduced inequality. The resolution of the
apparent conflict is, we think, straightforward, but is reserved for section �.
Two caveats are in order before we proceed. First, we have relied on the micro-
economics literature on cohort size to motivate the discussion of demographic effects on
inequality. This literature assumes that cohort-size effects reflect the competitive
market-clearing equilibrium, driven by imperfect substitutability in production between
workers of different experience levels. We are unable to test this assumption, and the
validity of our empirical results does not rest on it. It is also possible, for example, that
more mature workers are better at “gaming” the economic system, and thus in extracting
rents from other age groups. Cohort-size effects on income require only that the total
income accruing to a cohort rises less than proportionately with cohort size, whatever the
causal mechanism. Second, as a related matter, the micro-cohort-size literature focuses on
earnings; the international macro-inequality data pertain to total income, and sometimes
consumption. We know of no way to address this mismatch without abandoning the
attempt to link international demographic variation with international variation in
inequality. Given the much greater demographic variation in the international data, we
hold that this would be throwing out the baby with the bathwater. In effect, we assume
that what holds true for earnings holds true for income as well. The true links between
demography and income inequality are no doubt more complex, depending on the links
������� �� ��
270
among demography, savings rates, the transmission of wealth across generations, and the
mean and variability of returns to accumulated assets.
Inequality and Openness
After ���� and especially in the ����s, the United States experienced a dismal real wage
performance for the less skilled, due mostly to declining productivity growth coupled
with increasing wage inequality between skills.�) The ratio of weekly wages of the top
decile to the bottom decile increased from ��� in ��� to � in ���� [Kosters ���; Freeman
����]. This inequality was manifested primarily by an increasing wage premium for
workers with advanced schooling and age-related skills. While the same inequality
trends were apparent elsewhere in the OECD countries in the ����s, the increase was
typically far smaller [Kosters ���]. Most of the current debate has focused on explaining
these inequality facts, and it started with the observation that rising inequality coincided
with rising globalization in the form of rising trade and immigration. The latter
underwent rising rates and a decline in “quality” [Borjas ���]. Trade shares in the United
States increased from �� percent of GNP in ���� to �� percent in ���� [Lawrence and
Slaughter ����], while World Bank figures document that the share of output exported
from low-income countries rose from � percent in ��� to �� percent in ���� [Richardson
����: �]. These inequality developments also coincided with a shift in U. S. spending
patterns, which resulted in large trade deficits. Thus economists have quite naturally
explored the linkages between trade and immigration on the one hand and wage
inequality on the other.
The standard Heckscher-Ohlin two-factor, two-good trade model makes un-
ambiguous predictions. Every country exports those products that use intensively
abundant and cheap factors of production. Thus a trade boom induced by either
declining tariffs or transport costs will cause exports and the demand for the cheap factor
to boom too. Globalization in poor countries should favor unskilled labor and disfavor
skilled labor; globalization in rich countries should favor skilled labor and disfavor
unskilled labor. Lawrence and Slaughter [����] used the standard Heckscher-Ohlin trade
model to explore wage inequality and concluded that there is little evidence to support it.
Instead, they concluded that technological change was the more important source of
rising wage inequality. Hot debate ensued.
This strand of the debate stressed the evolution of labor demand by skill, ignoring
the potential influence of supply. Borjas [���] and his collaborators [Borjas, Freeman
and Katz ����] took a different approach, emphasizing instead how trade and immigra-
tion served to augment the U. S. labor supply. In order to do this, they first estimated the
implicit labor supply embodied in trade flows. Imports embody labor, thus serving to
augment effective domestic labor supply. Likewise, exports imply a decrease in the
� � This subsection is taken from Williamson [����: �������].
M. H><<>CH and J. G. W>AA>6BHDC : Explaining Inequality the World Round
271
effective domestic labor supply. In this way, the huge U. S. trade deficit of the ����simplied a ��� percent increase in the U. S. labor supply; and, since most of the imports
were in goods, which used unskilled labor relatively intensively, it also implied an
increasing ratio of unskilled- to skilled-effective labor supplies. In addition, there was a
shift from the ����s to the ����s in the national origin of immigrants: an increasing
proportion was from less developed areas (e. g., Mexico and Asia) and thus less skilled.
This in turn meant that a far higher fraction of immigrants were relatively unskilled just
when there were more of them.
These shifts in relative supply gave economists the desired qualitative result�wage
inequality between skill types. The quantitative result, at least in Borjas’s hands, also
seemed big. Borjas estimated that �� to �� percent of the wage decline of high school grad-
uates in relation to that of college graduates was due to trade and immigration. He also
estimated that � to �� percent of the decline in the relative wage of high school dropouts
vis-à-vis all other workers was due to these same globalization forces, one-third of which
was due to trade and two-thirds to immigration. Migration was the more important
globalization force producing U. S. inequality trends in the ����s, according to Borjas.
Thus far, the discussion has focused mainly on the United States, perhaps because
this is where rising inequality and immigration have been greatest. But the question is
not simply why the United States and even Europe experienced a depressed relative
demand for low-skilled labor in the ����s and ����s [Freeman ����: ��], but whether the
same factors were stimulating the relative demand for low-skill labor in the poor Third
World. This is where Wood [���: Ch. � ; ����] entered the debate. Wood was one of the
first economists to examine systematically inequality trends across rich industrial coun-
tries in the North and poor developing countries in the South.
Basing his results on insights derived from classical Heckscher-Ohlin theory ex-
tended by Stolper-Samuelson (hereafter cited as SS), Wood [���] concluded that trade
globalization could account for rising inequality in the rich North and falling inequality
in the poor South. Wood’s research has been met with stiff critical resistance. Since his
book appeared, we have learned more about the inequality and globalization connection
in the Third World. The standard SS prediction is that unskilled labor-abundant poor
countries should undergo egalitarian trends in the face of globalization forces, unless
those forces are overwhelmed by industrial revolutionary labor-saving events on the
upswing of the Kuznets Curve [Kuznets ����], or by young-adult gluts generated by the
demographic transition [Bloom and Williamson ����; ����]. A recent review by Davis
[����] reports the contrary, and a study by Robbins [����] of seven countries in Latin
America and East Asia shows that wage inequality typically did not fall after trade
liberalization, but rather rose.�) This apparent anomaly has been strengthened by other
� � An even more recent survey by Lindert and Williamson [����] suggests some reasons why theSS result was not forthcoming at the time Robbins was writing but now is [Robertson ����].
������� ��
272
studies, some of which have been rediscovered since Wood’s book appeared. Of course,
none of these studies is very attentive to the simultaneous role of emigration from these
developing countries.
As detailed below, we have designed our empirical specification with an eye to the
possibility of nonstandard SS effects. Here Davis’s study is of particular interest. Davis
shows that, given partial specialization, the textbook SS propositions linking external
prices hold only within a given cone of specialization. For example, Mexico might be the
capital-rich country within its cone, even if it is capital-poor in relation to the United
States. The rough empirical analogue of this observation is that greater openness may
raise the returns to capital or skilled labor (and thus raise inequality) only for the poorest
countries, and may lower the returns to capital or skilled labor only for the richest
countries. As a result, we interact our measures of openness with dummy variables
capturing the top and bottom thirds of the world’s national income distribution.
As with our discussion of demographic effects, two caveats are in order before we
proceed. First, the standard SS predictions can fail for reasons other than partial
specialization. The possible violation of these standard assumptions should be kept in
mind in interpreting our empirical results. Second, the SS predictions apply to relative
factor rewards, e. g., capital versus labor or skilled versus unskilled labor. Relative factor
rewards have a clear intuitive connection with aggregate inequality measures, but the
actual correspondence between factor rewards and inequality is no doubt fairly rough.
Strong versus Weak Versions of the Kuznets Curve Hypothesis
Simon Kuznets [����] noted that inequality had declined in several nations across the
mid-twentieth century, and supposed that it probably had risen earlier. Furthermore,
Kuznets thought it was demand-side forces that could explain his curve: that is, techno-
logical and structural change tended to favor the demand for capital and skills, while
saving on unskilled labor. These laborsaving conditions eventually moderated as the
rate of technological change (catching up) and the rate of structural change (urbanization
and industrialization) both slowed down. Eventually, the laborsaving stopped, and other,
more egalitarian forces were allowed to have their impact. This is what might be called
the strong version of the Kuznets Curve hypothesis, that income inequality first rises and
then declines with development. The strong version of the hypothesis is strong because
it is unconditioned by any other effects. Factor demand does it all.
The weak version of the Kuznets Curve hypothesis is more sophisticated. It argues
that these demand forces can be offset or reinforced by any other forces if they are
sufficiently powerful. The forces of a demographic transition at home may glut the labor
market with the young and impecunious early in development, reinforcing the rise in
inequality. Or emigration to labor-scarce OECD or oil-rich economies may have the
opposite effect, making the young and impecunious who stay home scarcer (while the old
receive remittances). It depends on the size of the demographic transition and whether
M. H><<>CH and J. G. W>AA>6BHDC : Explaining Inequality the World Round
273
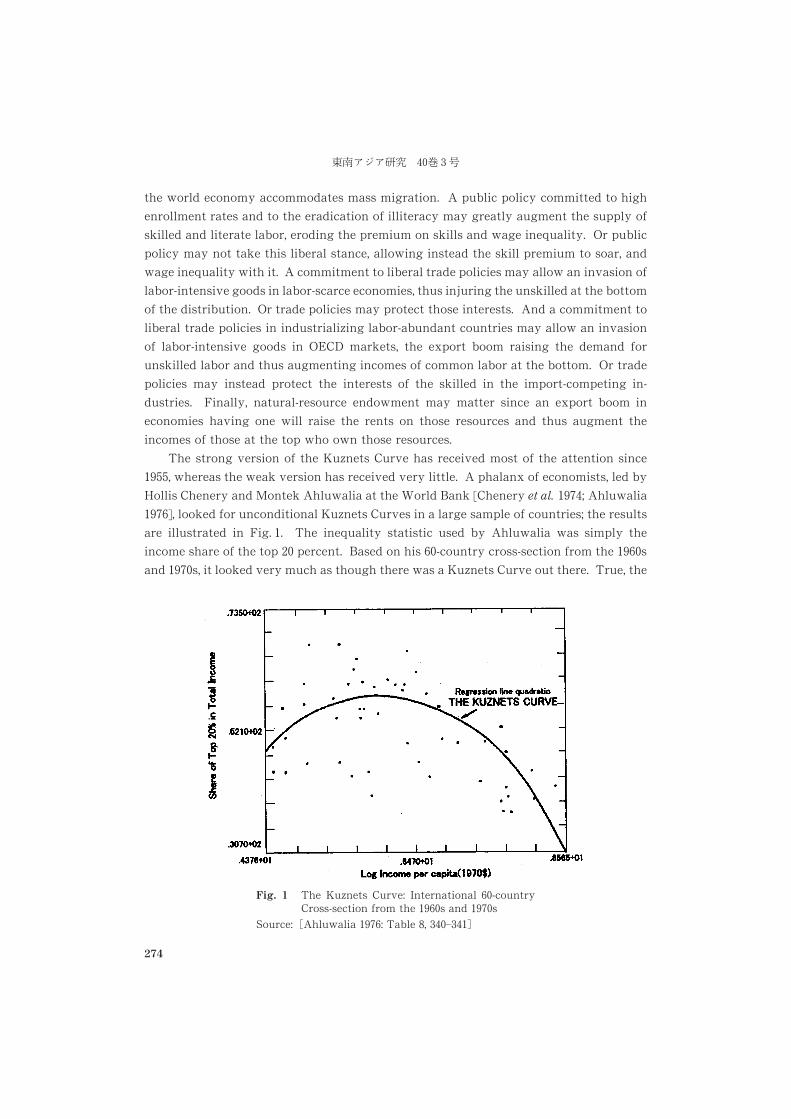
the world economy accommodates mass migration. A public policy committed to high
enrollment rates and to the eradication of illiteracy may greatly augment the supply of
skilled and literate labor, eroding the premium on skills and wage inequality. Or public
policy may not take this liberal stance, allowing instead the skill premium to soar, and
wage inequality with it. A commitment to liberal trade policies may allow an invasion of
labor-intensive goods in labor-scarce economies, thus injuring the unskilled at the bottom
of the distribution. Or trade policies may protect those interests. And a commitment to
liberal trade policies in industrializing labor-abundant countries may allow an invasion
of labor-intensive goods in OECD markets, the export boom raising the demand for
unskilled labor and thus augmenting incomes of common labor at the bottom. Or trade
policies may instead protect the interests of the skilled in the import-competing in-
dustries. Finally, natural-resource endowment may matter since an export boom in
economies having one will raise the rents on those resources and thus augment the
incomes of those at the top who own those resources.
The strong version of the Kuznets Curve has received most of the attention since
����, whereas the weak version has received very little. A phalanx of economists, led by
Hollis Chenery and Montek Ahluwalia at the World Bank [Chenery et al. ����; Ahluwalia
����], looked for unconditional Kuznets Curves in a large sample of countries; the results
are illustrated in Fig. �. The inequality statistic used by Ahluwalia was simply the
income share of the top �� percent. Based on his ��-country cross-section from the ����sand ����s, it looked very much as though there was a Kuznets Curve out there. True, the
Fig. � The Kuznets Curve: International ��-countryCross-section from the ����s and ����s
Source: �Ahluwalia ����: Table , ������
������� ��
274
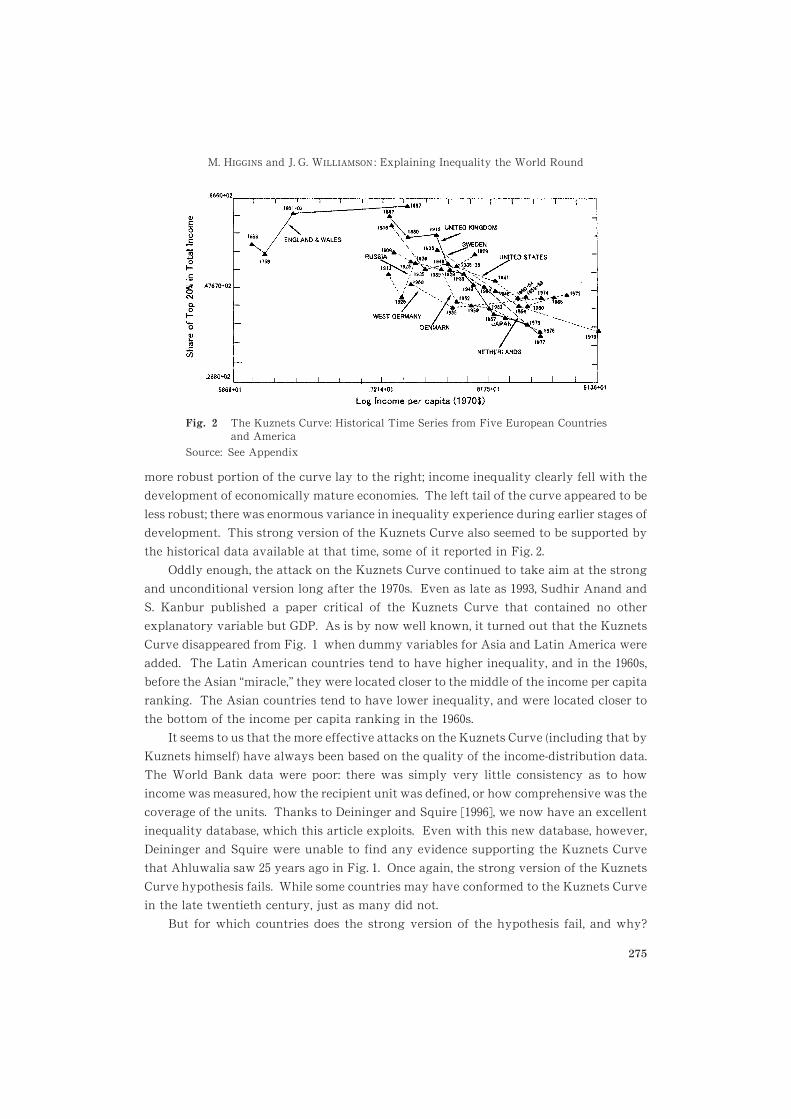
more robust portion of the curve lay to the right; income inequality clearly fell with the
development of economically mature economies. The left tail of the curve appeared to be
less robust; there was enormous variance in inequality experience during earlier stages of
development. This strong version of the Kuznets Curve also seemed to be supported by
the historical data available at that time, some of it reported in Fig. �.Oddly enough, the attack on the Kuznets Curve continued to take aim at the strong
and unconditional version long after the ����s. Even as late as ����, Sudhir Anand and
S. Kanbur published a paper critical of the Kuznets Curve that contained no other
explanatory variable but GDP. As is by now well known, it turned out that the Kuznets
Curve disappeared from Fig. � when dummy variables for Asia and Latin America were
added. The Latin American countries tend to have higher inequality, and in the ����s,
before the Asian “miracle,” they were located closer to the middle of the income per capita
ranking. The Asian countries tend to have lower inequality, and were located closer to
the bottom of the income per capita ranking in the ����s.
It seems to us that the more effective attacks on the Kuznets Curve (including that by
Kuznets himself) have always been based on the quality of the income-distribution data.
The World Bank data were poor: there was simply very little consistency as to how
income was measured, how the recipient unit was defined, or how comprehensive was the
coverage of the units. Thanks to Deininger and Squire [����], we now have an excellent
inequality database, which this article exploits. Even with this new database, however,
Deininger and Squire were unable to find any evidence supporting the Kuznets Curve
that Ahluwalia saw �� years ago in Fig. �. Once again, the strong version of the Kuznets
Curve hypothesis fails. While some countries may have conformed to the Kuznets Curve
in the late twentieth century, just as many did not.
But for which countries does the strong version of the hypothesis fail, and why?
Fig. � The Kuznets Curve: Historical Time Series from Five European Countriesand America
Source: See Appendix
M. H><<>CH and J. G. W>AA>6BHDC : Explaining Inequality the World Round
275
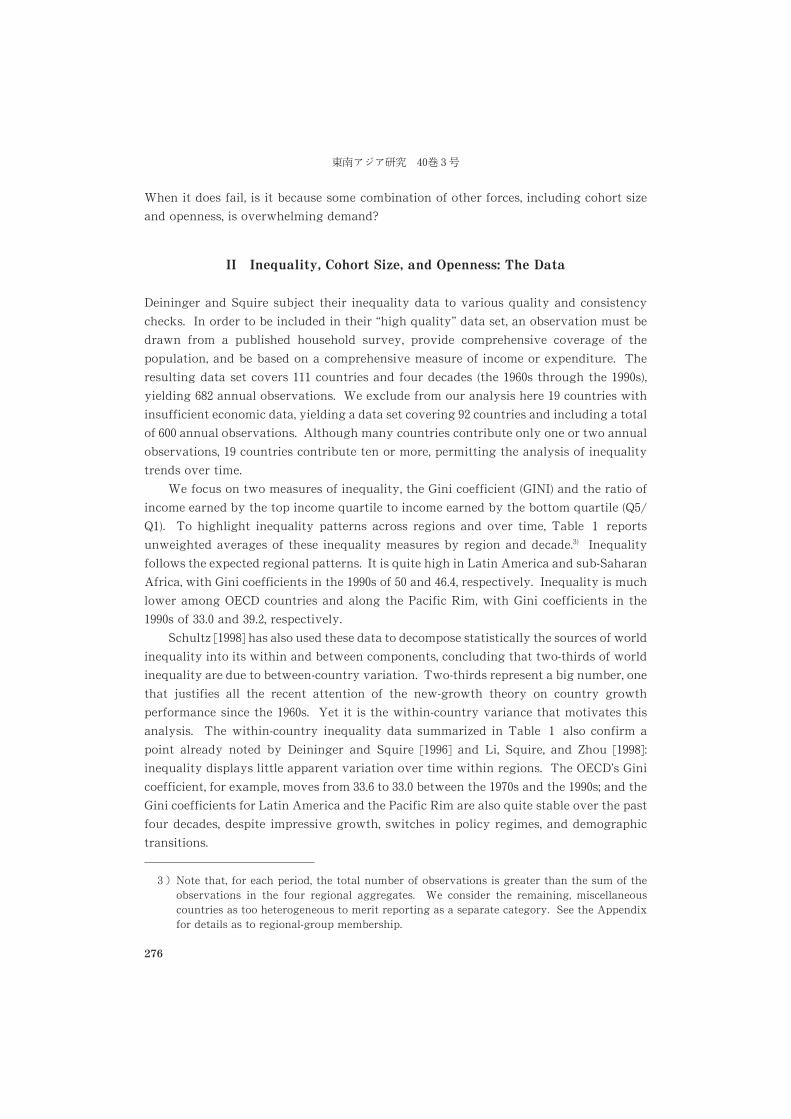
When it does fail, is it because some combination of other forces, including cohort size
and openness, is overwhelming demand?
II Inequality, Cohort Size, and Openness: The Data
Deininger and Squire subject their inequality data to various quality and consistency
checks. In order to be included in their “high quality” data set, an observation must be
drawn from a published household survey, provide comprehensive coverage of the
population, and be based on a comprehensive measure of income or expenditure. The
resulting data set covers ��� countries and four decades (the ����s through the ����s),
yielding ��� annual observations. We exclude from our analysis here �� countries with
insufficient economic data, yielding a data set covering �� countries and including a total
of ��� annual observations. Although many countries contribute only one or two annual
observations, �� countries contribute ten or more, permitting the analysis of inequality
trends over time.
We focus on two measures of inequality, the Gini coefficient (GINI) and the ratio of
income earned by the top income quartile to income earned by the bottom quartile (Q�/Q�). To highlight inequality patterns across regions and over time, Table � reports
unweighted averages of these inequality measures by region and decade.�) Inequality
follows the expected regional patterns. It is quite high in Latin America and sub-Saharan
Africa, with Gini coefficients in the ����s of �� and �, respectively. Inequality is much
lower among OECD countries and along the Pacific Rim, with Gini coefficients in the
����s of ��� and ���, respectively.
Schultz [����] has also used these data to decompose statistically the sources of world
inequality into its within and between components, concluding that two-thirds of world
inequality are due to between-country variation. Two-thirds represent a big number, one
that justifies all the recent attention of the new-growth theory on country growth
performance since the ����s. Yet it is the within-country variance that motivates this
analysis. The within-country inequality data summarized in Table � also confirm a
point already noted by Deininger and Squire [����] and Li, Squire, and Zhou [����]:
inequality displays little apparent variation over time within regions. The OECD’s Gini
coefficient, for example, moves from ��� to ��� between the ����s and the ����s; and the
Gini coefficients for Latin America and the Pacific Rim are also quite stable over the past
four decades, despite impressive growth, switches in policy regimes, and demographic
transitions.
� � Note that, for each period, the total number of observations is greater than the sum of theobservations in the four regional aggregates. We consider the remaining, miscellaneouscountries as too heterogeneous to merit reporting as a separate category. See the Appendixfor details as to regional-group membership.
������� �� �
276
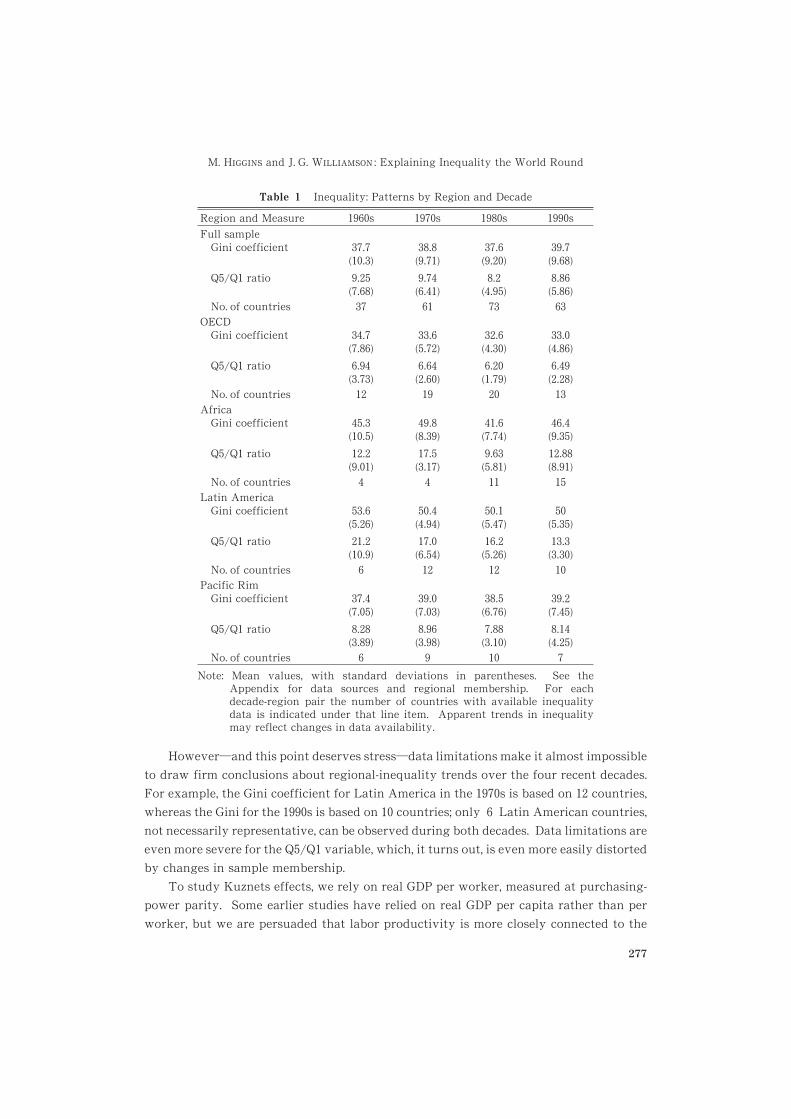
However�and this point deserves stress�data limitations make it almost impossible
to draw firm conclusions about regional-inequality trends over the four recent decades.
For example, the Gini coefficient for Latin America in the ����s is based on �� countries,
whereas the Gini for the ����s is based on �� countries; only � Latin American countries,
not necessarily representative, can be observed during both decades. Data limitations are
even more severe for the Q�/Q� variable, which, it turns out, is even more easily distorted
by changes in sample membership.
To study Kuznets effects, we rely on real GDP per worker, measured at purchasing-
power parity. Some earlier studies have relied on real GDP per capita rather than per
worker, but we are persuaded that labor productivity is more closely connected to the
Table � Inequality: Patterns by Region and Decade
Region and Measure ����s ����s ����s ����sFull sample
Gini coefficient ��(��)
��(���)
��(���)
��(���)
Q�/Q� ratio ���(���)
���(���)
��(���)
���(���)
No. of countries � �� � �OECD
Gini coefficient ��(���)
�(���)
��(��)
�(���)
Q�/Q� ratio ���(�)
���(���)
���(���)
���(���)
No. of countries �� �� �� �Africa
Gini coefficient ��(���)
���(��)
���(���)
���(��)
Q�/Q� ratio ���(���)
���(��)
��(���)
����(���)
No. of countries � � �� ��Latin America
Gini coefficient ��(���)
���(���)
���(���)
��(��)
Q�/Q� ratio ���(���)
���(���)
���(���)
�(�)
No. of countries � �� �� ��Pacific Rim
Gini coefficient ��(���)
��(��)
��(���)
��(���)
Q�/Q� ratio ���(��)
���(��)
���(��)
���(���)
No. of countries � � �� �Note: Mean values, with standard deviations in parentheses. See the
Appendix for data sources and regional membership. For eachdecade-region pair the number of countries with available inequalitydata is indicated under that line item. Apparent trends in inequalitymay reflect changes in data availability.
M. H><<>CH and J. G. W>AA>6BHDC : Explaining Inequality the World Round
277
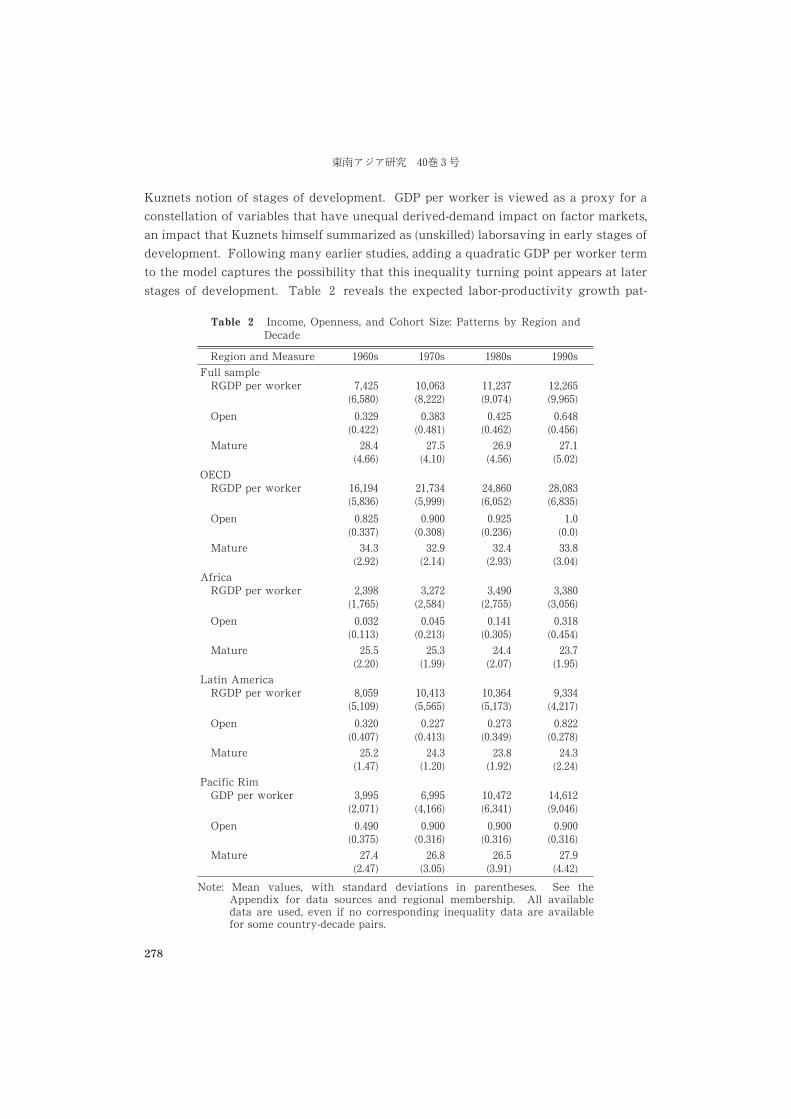
Kuznets notion of stages of development. GDP per worker is viewed as a proxy for a
constellation of variables that have unequal derived-demand impact on factor markets,
an impact that Kuznets himself summarized as (unskilled) laborsaving in early stages of
development. Following many earlier studies, adding a quadratic GDP per worker term
to the model captures the possibility that this inequality turning point appears at later
stages of development. Table � reveals the expected labor-productivity growth pat-
Table � Income, Openness, and Cohort Size: Patterns by Region andDecade
Region and Measure ����s ����s ����s ����sFull sample
RGDP per worker ���(����)
������(�����)
������(����)
�����(����)
Open �����(����)
�����(����)
���(����)
����(���)
Mature ���(���)
���(���)
����(��)
����(���)
OECDRGDP per worker �����
(����)�����(����)
�����(����)
������(����)
Open ����(�����)
�����(�����)
����(�����)
���(���)
Mature ���(����)
����(���)
���(����)
����(���)
AfricaRGDP per worker �����
(����)�����
(���)����
(���)�����
(����)Open �����
(�����)���
(�����)����
(����)�����
(��)Mature ��
(����)���
(����)��
(����)����
(���)Latin America
RGDP per worker ����(����)
�����(��)
�����(����)
����(����)
Open �����(����)
�����(����)
�����(����)
�����(�����)
Mature ���(���)
���(����)
����(����)
���(���)
Pacific RimGDP per worker ����
(�����)����
(����)�����(����)
�����(����)
Open ����(����)
�����(�����)
�����(�����)
�����(�����)
Mature ���(���)
����(���)
���(����)
����(��)
Note: Mean values, with standard deviations in parentheses. See theAppendix for data sources and regional membership. All availabledata are used, even if no corresponding inequality data are availablefor some country-decade pairs.
������� �� ��
278
terns: real GDP per worker grows rapidly along the Pacific Rim, grows moderately in the
OECD economies, and stagnates in sub-Saharan Africa and Latin America.
Our openness measure comes from Sachs and Warner [����], who classify an econ-
omy as closed (dummy� � ) if it is characterized by any of the following four conditions:
( � ) a black market premium of �� percent or more for foreign exchange, ( � ) an export-
marketing board that appropriates most foreign-exchange earnings, ( � ) a socialist eco-
nomic system, or ( � ) extensive nontariff barriers on imports of intermediate and capital
goods. The black market premium is generally the most decisive criterion of the four, by
itself identifying the vast majority of countries considered closed. According to the
Sachs-Warner index, the OECD region has been quite open since the ����s. The Pacific
Rim became open in the ���s. Latin America waited until the first half of the ����s to
make a significant switch toward economic openness, whereas sub-Saharan Africa still
remains closed. Since there is no generally accepted metric for assessing a country’s
degree of economic openness [Anderson and Neary ����; Rodriguez and Rodrik ����], we
experiment with alternative measures of openness to test the robustness of our results
based on the Sachs-Warner index.
To capture the effects of cohort size, we rely on the fraction of the labor force in its
peak earning years (MATURE). Because data concerning age-specific labor force partic-
ipation rates are unavailable, we approximate this by the fraction of the adult population
aged �����. This cohort size measure has been relatively stable within regions over the
past three decades, but it varies substantially across regions, standing far higher in the
developed world than elsewhere (Table � ). Evidently the mature adult share of the labor
force rises substantially only during later stages of the demographic transition.
III Empirical Results
Our benchmark empirical model treats the data as decadal averages by country, follow-
ing Deininger and Squire [���]. We first estimate the standard unconditional Kuznets
Curve, with only real output per worker and its square as explanatory variables. We then
add measures of openness and cohort size to the conditional Kuznets Curve. To assess
the robustness of our results, we consider the stability of the estimated relationships over
time, add to the model several additional variables identified in the literature as potential
inequality determinants, experiment with alternative measures of economic openness,
and explore alternative demographic variables for which our cohort size measure might
act as a proxy. Our results provide considerable support for the hypotheses that
inequality follows an inverted U as an economy’s aggregate labor productivity rises, and
that inequality falls as an economy’s population matures. We find only limited support,
however, for the hypothesis that economic openness brings increased inequality. Cohort
size has a consistent and powerful effect throughout.
M. H><<>CH and J. G. W>AA>6BHDC : Explaining Inequality the World Round
279
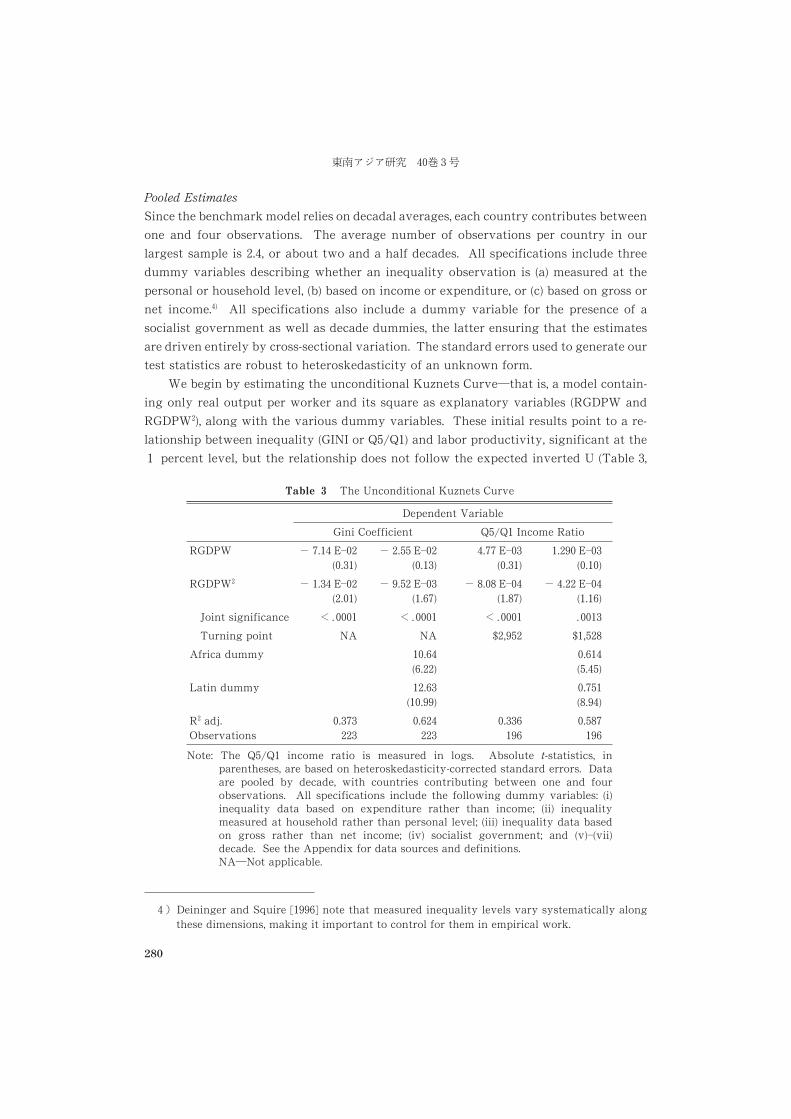
Pooled Estimates
Since the benchmark model relies on decadal averages, each country contributes between
one and four observations. The average number of observations per country in our
largest sample is ���, or about two and a half decades. All specifications include three
dummy variables describing whether an inequality observation is (a) measured at the
personal or household level, (b) based on income or expenditure, or (c) based on gross or
net income.�) All specifications also include a dummy variable for the presence of a
socialist government as well as decade dummies, the latter ensuring that the estimates
are driven entirely by cross-sectional variation. The standard errors used to generate our
test statistics are robust to heteroskedasticity of an unknown form.
We begin by estimating the unconditional Kuznets Curve�that is, a model contain-
ing only real output per worker and its square as explanatory variables (RGDPW and
RGDPW�), along with the various dummy variables. These initial results point to a re-
lationship between inequality (GINI or Q�/Q�) and labor productivity, significant at the
� percent level, but the relationship does not follow the expected inverted U (Table �,
� � Deininger and Squire [����] note that measured inequality levels vary systematically alongthese dimensions, making it important to control for them in empirical work.
Table � The Unconditional Kuznets Curve
Dependent Variable
Gini Coefficient Q�/Q� Income Ratio
RGDPW � ��� E��(���)
� ���� E��(���)
�� E��(���)
���� E��(��)
RGDPW� � ���� E��(���)
� ���� E��(���)
� ��� E��(���)
� ���� E��(����)
Joint significance ��� ��� ��� ���Turning point NA NA $����� $�����
Africa dummy ����(����)
����(����)
Latin dummy �����(����)
���(����)
R� adj.Observations
������
�������
�������
������
Note: The Q�/Q� income ratio is measured in logs. Absolute t-statistics, inparentheses, are based on heteroskedasticity-corrected standard errors. Dataare pooled by decade, with countries contributing between one and fourobservations. All specifications include the following dummy variables: (i)inequality data based on expenditure rather than income; (ii) inequalitymeasured at household rather than personal level; (iii) inequality data basedon gross rather than net income; (iv) socialist government; and (v)�(vii)decade. See the Appendix for data sources and definitions.NA�Not applicable.
������ � ��
280
columns � and � ). The estimated coefficients in GINI for RGDPW and RGDPW� are both
negative, implying that inequality declines monotonically with the level of economic
development. When inequality is measured instead by Q�/Q�, the inverted U does
appear, but the individual coefficients are very imprecisely estimated, reflecting a high
degree of collinearity between the two variables. Much the same holds true when the
model is estimated for the four decades in our sample (not reported): for both the GINI and
Q�/Q� variables, RGDPW and RGDPW� are always jointly significant at the � percent
level, but the estimated sign pattern is often perverse. Adding regional dummy variables
for sub-Saharan Africa and Latin America changes these results but little (columns �and � ).
It is, of course, possible that the inverted U posited by Kuznets is masked by other
forces, such as cohort size and economic openness. After all, economic relationships are
seldom expected to hold unless other relevant influences are controlled.�) In this spirit, we
add to the model the measures of openness and cohort size discussed earlier, and when we
do so the Kuznets Curve emerges (Table �, columns � and �, � and � ). RGDPW and
RGDPW� are jointly and individually significant at the � percent level, and they display
the expected sign pattern. It is worth noting, however, that the estimated inequality
turning point is quite high, at about $������ evaluated at purchasing-power parity in ���prices.) For comparison, as of ����, real output per worker stood at $���� in the United
States, $����� in South Korea, and $��� in Thailand. According to Kuznets, the
transition from a traditional, agricultural economy to a modern, industrial economy
should be essentially complete at the estimated turning point, or at least the economy
should undergo a pronounced slowdown in the rate of structural change at the turning
point. Thus it is difficult to interpret these results in the manner Kuznets would have
preferred, as showing the path of inequality over the course of the agricultural-industrial
transition.
Next, note that Table � reports emphatic support for a link between cohort size and
aggregate inequality. The estimated coefficient for MATURE is negative and easily
statistically significant at the � percent level for both the GINI and Q�/Q� variables,
indicating that a more experienced labor force is associated with reduced inequality,
regardless of schooling levels or its distribution. The estimated quantitative impact is
also large. According to the estimated coefficients, a one-standard deviation increase in
� � The distinction between unconditional and conditional convergence in country incomelevels provides an apt analogy [Williamson ���]. Numerous studies fail to find support forunconditional convergence, but they do find powerful evidence of convergence after controll-ing for determinants of steady-state income levels.
� Recall that these estimates are based on output per worker, which is generally about twiceas high as output per capita. Also, developing country productivity levels evaluated atpurchasing power parity are often more than twice as high as productivity levels evaluatedat current prices and exchange rates [Summers and Heston ����].
M. H><<>CH and J. G. W>AA>6BHDC : Explaining Inequality the World Round
281
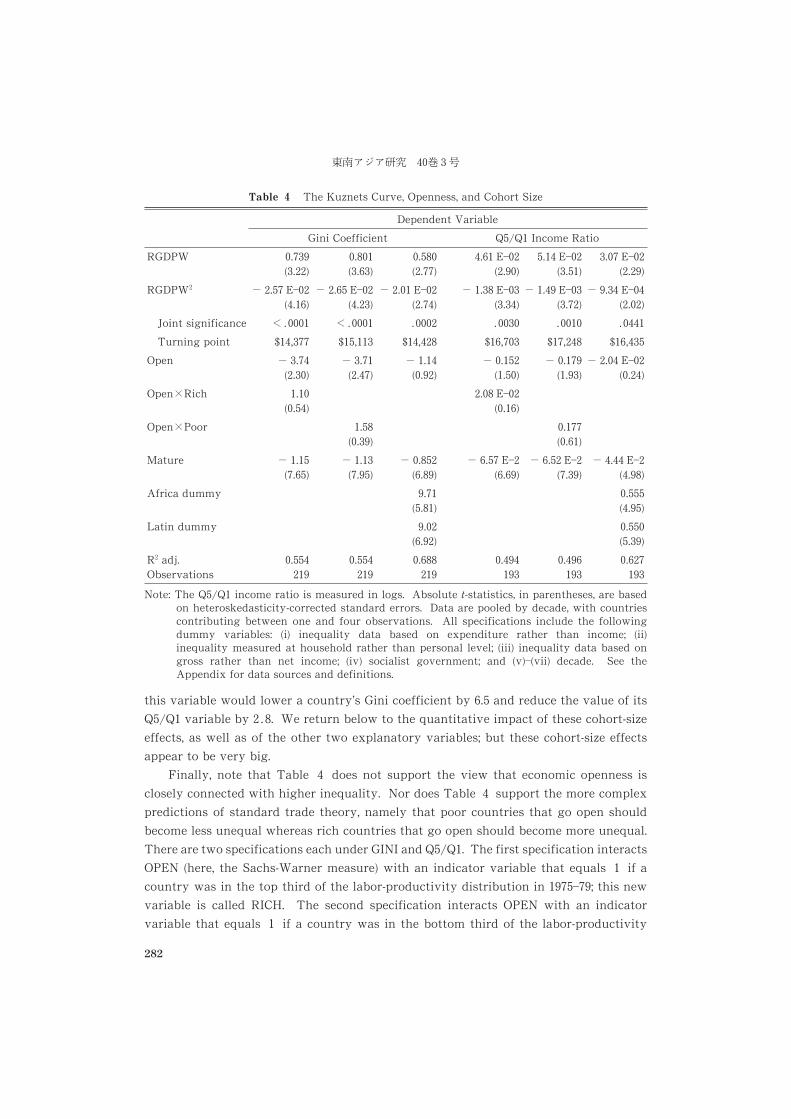
this variable would lower a country’s Gini coefficient by ��� and reduce the value of its
Q�/Q� variable by ���. We return below to the quantitative impact of these cohort-size
effects, as well as of the other two explanatory variables; but these cohort-size effects
appear to be very big.
Finally, note that Table � does not support the view that economic openness is
closely connected with higher inequality. Nor does Table � support the more complex
predictions of standard trade theory, namely that poor countries that go open should
become less unequal whereas rich countries that go open should become more unequal.
There are two specifications each under GINI and Q�/Q�. The first specification interacts
OPEN (here, the Sachs-Warner measure) with an indicator variable that equals � if a
country was in the top third of the labor-productivity distribution in �����; this new
variable is called RICH. The second specification interacts OPEN with an indicator
variable that equals � if a country was in the bottom third of the labor-productivity
Table � The Kuznets Curve, Openness, and Cohort Size
Dependent Variable
Gini Coefficient Q�/Q� Income Ratio
RGDPW ���(����)
���(����)
���(��)
���� E��(���)
���� E��(����)
�� E��(����)
RGDPW� � ��� E��(����)
� ���� E��(����)
� ��� E��(���)
� ���� E��(����)
� ���� E��(���)
� ���� E��(���)
Joint significance ��� ��� �� �� �� ����Turning point $���� $������ $������ $���� $����� $������
Open � ���(���)
� ���(���)
� ����(���)
� ����(���)
� ���(����)
� ��� E��(���)
Open�Rich ���(���)
��� E��(���)
Open�Poor ����(���)
��(���)
Mature � ����(���)
� ����(���)
� ����(����)
� ��� E��(����)
� ���� E��(���)
� ���� E��(����)
Africa dummy ���(����)
����(����)
Latin dummy ���(����)
���(����)
R� adj.Observations
�������
�������
�������
�������
�������
������
Note: The Q�/Q� income ratio is measured in logs. Absolute t-statistics, in parentheses, are basedon heteroskedasticity-corrected standard errors. Data are pooled by decade, with countriescontributing between one and four observations. All specifications include the followingdummy variables: (i) inequality data based on expenditure rather than income; (ii)inequality measured at household rather than personal level; (iii) inequality data based ongross rather than net income; (iv) socialist government; and (v)�(vii) decade. See theAppendix for data sources and definitions.
������ � ��
282
distribution in �������; this new variable is called POOR. As Table � shows, OPEN �RICH and OPEN� POOR are always small and insignificant, indicating that the impact
of openness (as measured here) does not vary with income, productivity, or human-
capital endowment. Standard Stolper-Samuelson trade theory does not survive in these
data.
As noted earlier, the theoretical predictions of standard trade rest on several ancil-
lary assumptions; the failure of our empirical results to support those predictions may
mean that one or more of the assumptions are violated. Perhaps more important, our
tests may simply lack statistical power against the null hypothesis that inequality is
unrelated to openness. Remember, we interact the Sachs-Warner openness measure with
a dummy variable that selects members of (depending on the specification) the top or the
bottom third of the world-income distribution. It turns out that, by this measure, almost
all countries in the top third of the world income distribution are rated as open, and
almost all countries in the bottom third as closed. Because the available data may not
permit a sharp test of the hypothesis that the openness-inequality relationship should
vary with the level of development�and in light of the negative openness results
reported above�the remainder of this article treats the openness-inequality relationship
as independent of the level of development.
Turning to the direct effect of openness, the coefficient on the Sachs-Warner variable
is negative and statistically significant at the � percent level for the GINI variable
(columns � and � ), and negative but significant at the �� percent level in only one of the
two specifications for the Q�/Q� variable. According to these estimated coefficients, an
economy rated as fully open (dummy� � ) would have a Gini coefficient of �� below that
of an economy rated as fully closed (dummy� � ). Given that the cross-country standard
deviation for Gini coefficients is close to ��, the maximum quantitative impact of ��does not appear to be very large (and only � percent of the Latin American Gini in the
����s). Similarly, according to the estimated coefficients, the Q�/Q� variable is only ��percent higher for a closed than for an open economy, a reduction of only about ��percent evaluated at the sample average for the ����s.�)
Checking Robustness
To evaluate the robustness of these results, we experiment with a number of alternative
specifications. We begin by adding dummy variables for sub-Saharan Africa and Latin
America to control for unobserved factors peculiar to these regions (Table �, columns �and ).�) Now how do our three main hypotheses perform? First, and most important,
� � The cross-country standard deviation is close to ��.� � We experimented with adding additional regional dummies for OECD and Pacific Rim eco-
nomies. These dummy variables were statistically insignificant, and coefficient estimatesfor other variables remained essentially unchanged.
M. H><<>CH and J. G. W>AA>6BHDC : Explaining Inequality the World Round
283
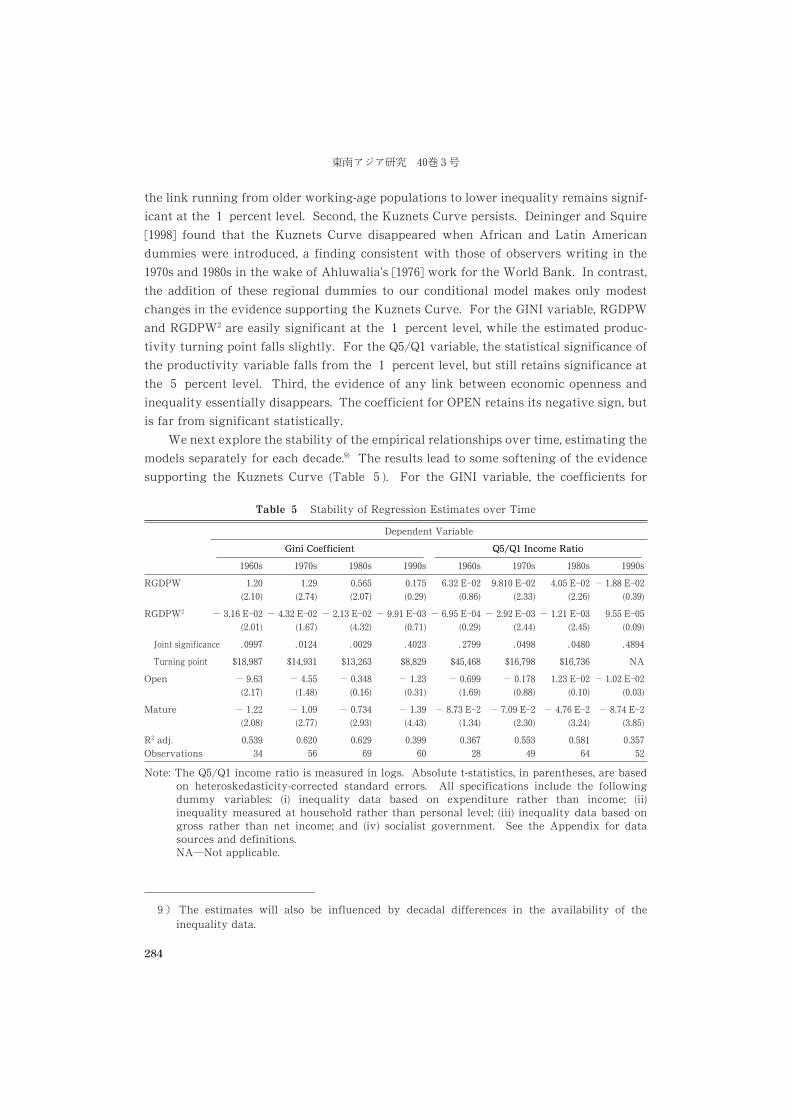
the link running from older working-age populations to lower inequality remains signif-
icant at the � percent level. Second, the Kuznets Curve persists. Deininger and Squire
[����] found that the Kuznets Curve disappeared when African and Latin American
dummies were introduced, a finding consistent with those of observers writing in the
����s and ����s in the wake of Ahluwalia’s [����] work for the World Bank. In contrast,
the addition of these regional dummies to our conditional model makes only modest
changes in the evidence supporting the Kuznets Curve. For the GINI variable, RGDPW
and RGDPW� are easily significant at the � percent level, while the estimated produc-
tivity turning point falls slightly. For the Q�/Q� variable, the statistical significance of
the productivity variable falls from the � percent level, but still retains significance at
the � percent level. Third, the evidence of any link between economic openness and
inequality essentially disappears. The coefficient for OPEN retains its negative sign, but
is far from significant statistically.
We next explore the stability of the empirical relationships over time, estimating the
models separately for each decade.�) The results lead to some softening of the evidence
supporting the Kuznets Curve (Table � ). For the GINI variable, the coefficients for
� � The estimates will also be influenced by decadal differences in the availability of theinequality data.
Table � Stability of Regression Estimates over Time
Dependent Variable
Gini CoefficientGini Coefficient Q�/Q� Income RatioQ�/Q� Income Ratio
����s ����s ����s ����s ����s ����s ����s ����s
RGDPW ���(���)
���(��)
����(���)
����(���)
��� E���(���)
���� E���(���)
�� E���(���)
� ��� E���(���)
RGDPW� � ��� E���(���)
� �� E���(���)
� ��� E���(��)
� ��� E���(���)
� ��� E��(���)
� ��� E���(�)
� ��� E���(��)
��� E���(���)
Joint significance ���� ��� ���� ��� ���� ��� ��� ��
Turning point $������ $����� $������ $����� $���� $������ $������ NA
Open � ���(���)
� ��(��)
� ���(���)
� ���(���)
� ����(���)
� ����(���)
��� E���(���)
� ��� E���(���)
Mature � ���(���)
� ���(���)
� ���(���)
� ���(�)
� ��� E��(��)
� ��� E��(���)
� �� E��(��)
� �� E��(���)
R� adj.
Observations
�����
������
������
������
������
�����
�����
������
Note: The Q�/Q� income ratio is measured in logs. Absolute t-statistics, in parentheses, are basedon heteroskedasticity-corrected standard errors. All specifications include the followingdummy variables: (i) inequality data based on expenditure rather than income; (ii)inequality measured at household rather than personal level; (iii) inequality data based ongross rather than net income; and (iv) socialist government. See the Appendix for datasources and definitions.NA�Not applicable.
������� � �
284
RGDPW and RGDPW� are of the expected signs and jointly statistically significant at or
close to the � percent level for the ����s and ����s; they are also significant at the ��percent level for the ����s. However, there is no evidence of a Kuznets Curve in the ����s.
Similarly, for the Q�/Q� variable, coefficients for RGDPW and RGDPW� are of the
expected signs and jointly statistically significant at the � percent level for the ����s and
����s; but they switch signs and fall well short of statistical significance for the ����s. In
short, it seems wise to be tentative even about the emergence of a conditional Kuznets
Curve in these data. After all, while the poor results for the ����s may reflect the small
sample size (in particular, there are few inequality observations for Africa or Latin
America), the results for the ����s are just plain negative.
Splitting the sample by decade tends to increase the already strong support for
cohort-size effects on inequality. The MATURE variable attains � percent significance
levels in all cases but one�for the Q�/Q� variable in the ����s, a period for which the
sample size is small. In contrast, the Sachs-Warner openness measure�treated here as
the simple additive variable OPEN because Table rejected complex interactions�attains a conventional statistical significance level for only one specification, that for the
GINI variable in the ����s.
The extensive theoretical and empirical literature on inequality has identified many
other potentially important inequality determinants. We further examine the robustness
of our empirical results by adding a number of these other determinants to our bench-
mark equations (Table � ). Bourguignon and Morrisson [����] focus on the role of relative
labor productivity in agriculture and nonagriculture to capture Kuznets’s notion that the
differential development of these sectors plays a key role in explaining inequality. These
authors also include arable land per capita to capture a potential link between natural
resource endowment and inequality, and the secondary-school enrollment ratio to cap-
ture the intuitive notion that broader access to education reduces inequality.
Table � confirms the importance of the Bourguignon-Morrisson agricultural varia-
bles in explaining inequality. The productivity ratio between industry and agriculture is
statistically significant at the � percent level, bigger productivity gaps contributing to
greater inequality. The estimated coefficient implies that a reduction in the productivity
ratio from �� to �� (the values, respectively, for Peru and the United States in the early
����s) would lower a country’s Gini coefficient by ��, compared with a cross-sectional
standard deviation of about ��. Similarly, a more abundant agricultural endowment is
associated with higher inequality, supporting the view that abundant resources can be a
social “curse” as well as a drag on growth [Sachs and Warner ����].��) The secondary-
��� We experimented by measuring natural resource abundance as the share of natural re-source exports in GDP, rather than as agricultural land per capita. The alternative variablewas statistically insignificant. Natural resource exports include fuels, minerals, and prima-ry agricultural products.
M. H><<>CH and J. G. W>AA>6BHDC : Explaining Inequality the World Round
285
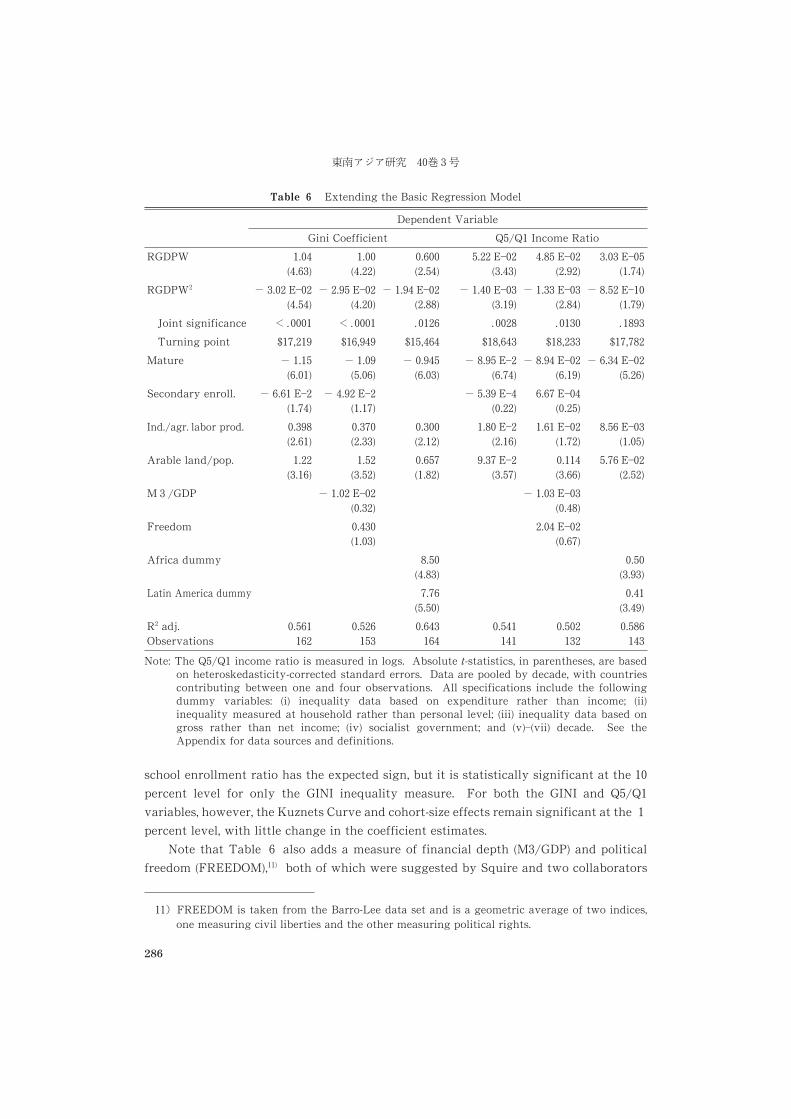
school enrollment ratio has the expected sign, but it is statistically significant at the ��percent level for only the GINI inequality measure. For both the GINI and Q�/Q�variables, however, the Kuznets Curve and cohort-size effects remain significant at the �percent level, with little change in the coefficient estimates.
Note that Table � also adds a measure of financial depth (M�/GDP) and political
freedom (FREEDOM),��) both of which were suggested by Squire and two collaborators
��� FREEDOM is taken from the Barro-Lee data set and is a geometric average of two indices,one measuring civil liberties and the other measuring political rights.
Table � Extending the Basic Regression Model
Dependent Variable
Gini Coefficient Q�/Q� Income Ratio
RGDPW ����(����)
����(����)
�����(����)
���� E���(����)
��� E���(���)
���� E���(����)
RGDPW� � ���� E���(����)
� ��� E���(����)
� ��� E���(��)
� ���� E���(���)
� ���� E���(���)
� ��� E���(���)
Joint significance ������ ������ ����� ���� ����� ���Turning point $����� $���� $������ $����� $����� $�����
Mature � ����(����)
� ���(����)
� ����(����)
� �� E��(����)
� �� E���(���)
� ���� E���(����)
Secondary enroll. � ���� E��(����)
� ��� E��(����)
� ��� E��(����)
���� E���(����)
Ind./agr. labor prod. ���(����)
�����(����)
�����(����)
��� E��(����)
���� E���(����)
��� E���(����)
Arable land/pop. ����(����)
����(����)
�����(���)
��� E��(����)
�����(����)
���� E���(����)
M � /GDP � ���� E���(����)
� ���� E���(���)
Freedom �����(����)
���� E���(����)
Africa dummy ���(���)
����(���)
Latin America dummy ����(����)
����(���)
R� adj.Observations
��������
��������
��������
��������
��������
�������
Note: The Q�/Q� income ratio is measured in logs. Absolute t-statistics, in parentheses, are basedon heteroskedasticity-corrected standard errors. Data are pooled by decade, with countriescontributing between one and four observations. All specifications include the followingdummy variables: (i) inequality data based on expenditure rather than income; (ii)inequality measured at household rather than personal level; (iii) inequality data based ongross rather than net income; (iv) socialist government; and (v)�(vii) decade. See theAppendix for data sources and definitions.
������ �� ��
286
[Li, Squire and Zhou ����]. Regarding the former, some inequality theories argue that
countries with poorly developed financial systems will have higher inequality because
the poor, lacking collateral, will be unable to make profitable investments. In any case,
neither variable is significant in our data. A final specification drops variables that are
insignificant at the �� percent level and adds dummy variables for Latin America and
Africa, with little effect on the results.
The largely negative results described above concerning the relationship between
inequality and economic openness could reflect the choice of a poor or misleading index
of the latter. Similarly, the positive results concerning the relationship between inequal-
ity and our measure of cohort size could reflect a proxy relationship between this
variable and some relevant, omitted demographic variable. To explore these possibilities,
we experimented with several alternative measures of openness and added several
alternative demographic variables to the model.
As alternative measures of openness, we used measures of the presence of capital
controls,��) quantitative and tariff restrictions on imports, the share of imports plus
exports in GDP, and the portion of this variable orthogonal to variables designed to
capture a country’s “natural” level of openness: the logs of country size, population, per
capita income, per capita crude proven oil reserves, the average distance from trading
partners, and two dummy variables describing, respectively, whether a country is an
island or is landlocked.��) None of the alternative openness measures was significant at
the �� percent level when used in place of the Sachs-Warner OPEN index.��) The cross-
country data, it appears, do not support the hypothesis that more open economies will
suffer from higher inequality. It should be stressed, however, that the evidence support-
��� The IMF records four policies restricting capital flows: ( � ) separate exchange rates forcapital-account transactions, ( � ) payment restrictions for current transactions, ( � ) paymentrestrictions for capital transactions, and ( � ) mandatory surrender of export proceeds. Foreach of the four possible restrictions, we define a dummy variable equal to � when therestriction is in place, and � otherwise. We then take the sum of the four dummy varia-bles as our measure of the presence of capital controls. We thank Leonardo Bartolini andAlan Drazen for providing a tabulation of the IMF data.
��� Exports plus imports as a share of GDP are often used as a measure of openness�indeed,Summers and Heston [����] simply label the variable as OPEN�although it has no clearconnection with openness in an economically relevant sense. Standard trade models implythat a country’s product and factor prices may be determined entirely in the world marketeven with a low trade share, or diverge substantially from their free-trade values even witha high trade share. Moreover, country size and population size explain much of the varia-tion in the trade/GDP ratio, although these variables should be unrelated to a country’strade policy. We take the residual of OPEN from the variables listed in the text as a crudeattempt to capture the variation in the trade/GDP ratio potentially explained by economicpolicy.
��� For brevity, we do not report those results here. The specifications correspond to Table �,columns � and �, but with only a simple, non-interacted measure of openness.
M. H><<>CH and J. G. W>AA>6BHDC : Explaining Inequality the World Round
287
ing a Kuznets Curve was unaffected during these experiments, remaining significant at
the � percent level for both the Q�/Q� and GINI variables. The same held true for the
cohort-size impact on inequality.
To check the robustness of the cohort-size effect and our choice of MATURE, we
added the following demographic variables to the model, one at a time: the total fertility
rate, the population growth rate, the labor force growth rate, the infant mortality rate,
and life expectancy at birth. Our preferred cohort-size measure, of course, depends on the
behavior of age-specific fertility and mortality rates over several previous decades. Even
so, MATURE could serve as an excellent point-in-time proxy for such demographic
variables: for the ������� period, the cross-country correlation of MATURE with labor
force growth and the total fertility rate is � ���� and � ����, respectively. This point is
important because some models of fertility choice imply that fertility will fall as income
inequality declines [Perotti ���]. According to this reasoning, the negative estimated
coefficient for MATURE could be capturing the endogenous response of fertility to
inequality, rather than a cohort-size effect, as we have inferred.
Our robustness tests suggest that our inference is correct: our principal cohort-size
findings are unaffected by adding the alternative demographic variables to the model. Of
the new variables, the total fertility rate and life expectancy at birth are statistically
significant at the � percent level, but only when the model does not include dummy
variables for sub-Saharan Africa and Latin America.��) In contrast, MATURE is always
statistically significant at the � percent level, with little change in the estimated
coefficient. RGDPW and RGDPW remain jointly significant at the � percent level, with
little change in the estimated inequality turning point.
The results described above provide emphatic support for the link between inequal-
ity and cohort size. They also offer strong, even if not unequivocal, support for a Kuznets
Curve. Even so, our empirical models are not without their flaws. First, the estimates
suffer from possible simultaneity bias, as is true of most other work in this area. The
dearth of variables correlated with the relevant explanatory variables, and clearly
uncorrelated with disturbances to inequality, makes it difficult to address this issue in a
satisfactory way. Equally important, the estimates are likely to suffer from omitted-
variable bias. Our strategy has been to address this issue by testing the robustness of our
principal results to the inclusion of other variables identified in the literature as potential
inequality determinants.�)
��� Again, for brevity, we do not report these results here. The specifications correspond toTable �, columns � and �, but with only a simple, non-interacted measure of openness, andincluding both MATURE and the alternative demographic variable.
�� An alternative strategy, explored in Higgins and Williamson [����], is to rely on a fixed-effects model by adding country-specific dummy variables to the regression specification.A fixed-effects estimator eliminates bias arising from unobserved country-specific character-istics that (a) affect inequality and (b) are correlated with included explanatory variables.�
������� �� �
288
Quantitative Implications
Tables � and � explore the impact on inequality of demand (proxied by the Kuznets
Curve), openness, and cohort size. The figures in Table � show how inequality would be
affected were the regional values of the three explanatory variables replaced by OECD
values (columns � and � ) or by Pacific Rim values (columns � and � ). The biggest
effects coming from this exercise are those associated with cohort size. Compared with
the OECD economies, both Africa and Latin America had much greater inequality, the
Gini coefficient being ���� points higher in the ���s in Africa and �� points higher in
Latin America (see Table � ). Table � shows that if Africa had the same demographic
mix as the OECD, inequality (measured by the Gini coefficient) would have been lower by
��� points, cohort size accounting for almost two-thirds of the difference between the
two regions. If Latin America had the same demographic mix as the OECD, inequality
would have been lower by ��� points, cohort size accounting for almost half of the
difference between the two regions. Compared with the Pacific Rim countries, inequality
(again measured by the Gini coefficient) in Africa and Latin America in the ���s was
much higher, bigger by ��� points in Africa and by ��� points in Latin America (Table � ).
Table � shows that if Africa had the same demographic mix as the Pacific Rim,
inequality would have been lower by ���� points, cohort size accounting for about half of
the difference between the two regions. If Latin America had the same demographic mix
as the Pacific Rim, inequality would have been lower by ��� points, cohort size account-
ing for almost a third of the difference between the two regions.
Openness (OPEN) also helps account for the inequality differences between regions in
�The authors’ results, based on annual data, support the presence of a conditional KuznetsCurve, as well as a strong negative link between inequality and the MATURE cohort share.However, there is good reason to take these results with a grain of salt. First, the fixed-effect procedure removes the dominant cross-sectional variation from the data: the authorsfind that more than �� percent of the variation in inequality and the principal explanatoryvariables is across countries, rather than within countries over time. Thus, any reductionin estimation bias comes at a substantial potential cost in estimation efficiency. Second,the regression residuals displayed significant serial correlation, implying that the estimatedstandard errors are biased (or worse yet, that relevant, serially dependent explanatoryvariables have been omitted from the model, leaving both coefficient and standard-errorestimates biased [Davidson and MacKinnon ����: ��]). However, extant techniques for con-trolling for serial dependence require a fairly large number of consecutive observations�astandard that the available inequality data do not accommodate. In our data set, only �countries have as many as � adjacent annual observations for inequality and the relevantmacroeconomic variables. Judson and Owen [����] show that lagged dependent-variablemodels with fixed effects are subject to substantial bias even with as many as � time-series observations. Similarly, the panel data estimators proposed by Anderson and Hsiao[����] and Arellano and Bond [����] instrument for the lagged dependent variable usingdeeper lags; while the panel-data estimator proposed by Arellano and Bover [����] trans-forms the data into deviations from forward-looking means. These estimators are alsoinfeasible given an unbalanced panel with few complete consecutive observations.
M. H><<>CH and J. G. W>AA>6BHDC : Explaining Inequality the World Round
289
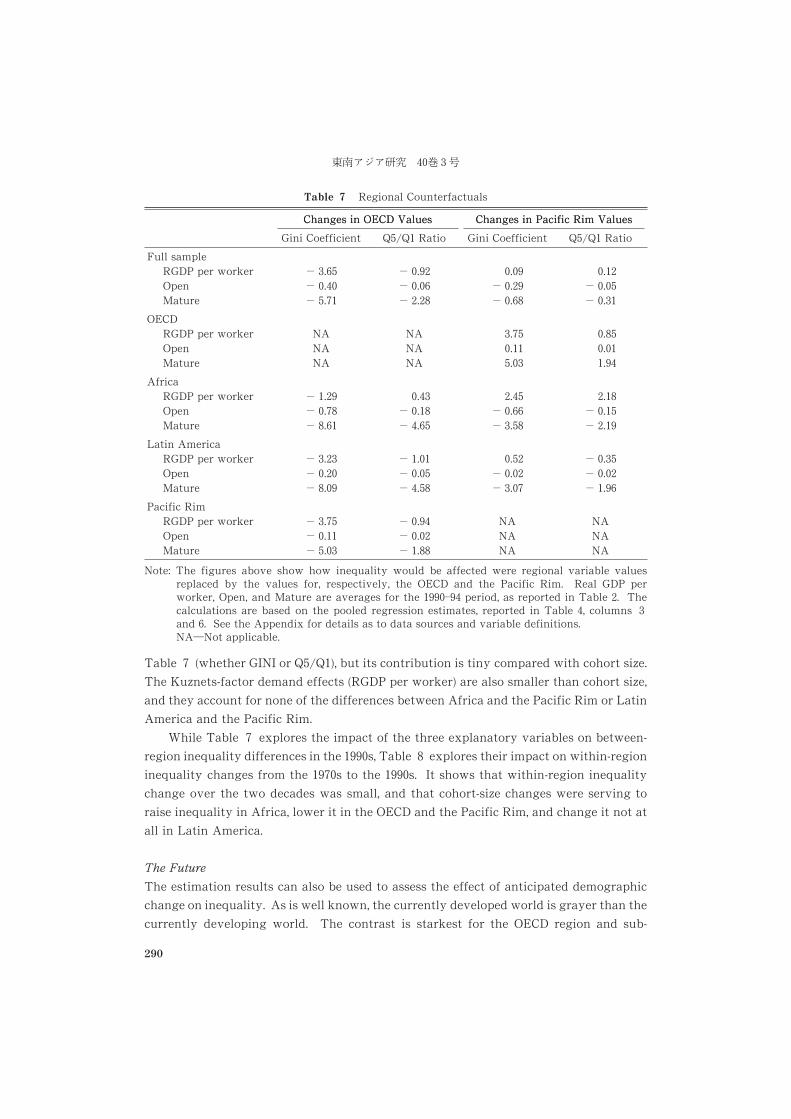
Table � (whether GINI or Q�/Q�), but its contribution is tiny compared with cohort size.
The Kuznets-factor demand effects (RGDP per worker) are also smaller than cohort size,
and they account for none of the differences between Africa and the Pacific Rim or Latin
America and the Pacific Rim.
While Table � explores the impact of the three explanatory variables on between-
region inequality differences in the ����s, Table � explores their impact on within-region
inequality changes from the ����s to the ����s. It shows that within-region inequality
change over the two decades was small, and that cohort-size changes were serving to
raise inequality in Africa, lower it in the OECD and the Pacific Rim, and change it not at
all in Latin America.
The Future
The estimation results can also be used to assess the effect of anticipated demographic
change on inequality. As is well known, the currently developed world is grayer than the
currently developing world. The contrast is starkest for the OECD region and sub-
Table � Regional Counterfactuals
Changes in OECD ValuesChanges in OECD Values Changes in Pacific Rim ValuesChanges in Pacific Rim Values
Gini Coefficient Q�/Q� Ratio Gini Coefficient Q�/Q� Ratio
Full sampleRGDP per workerOpenMature
� ���� ���� ����
� ����� ���� ����
����� ����� ���
����� ����� ����
OECDRGDP per workerOpenMature
NANANA
NANANA
������������
�����������
AfricaRGDP per workerOpenMature
� ����� ����� ���
���� ����� ��
���� ��� ����
����� ����� ����
Latin AmericaRGDP per workerOpenMature
� ����� ����� ����
� ����� ����� ���
����� ����� ����
� ����� ����� ���
Pacific RimRGDP per workerOpenMature
� ����� ����� ����
� ���� ����� ����
NANANA
NANANA
Note: The figures above show how inequality would be affected were regional variable valuesreplaced by the values for, respectively, the OECD and the Pacific Rim. Real GDP perworker, Open, and Mature are averages for the ������ period, as reported in Table �. Thecalculations are based on the pooled regression estimates, reported in Table , columns �and . See the Appendix for details as to data sources and variable definitions.NA�Not applicable.
������� �� �
290
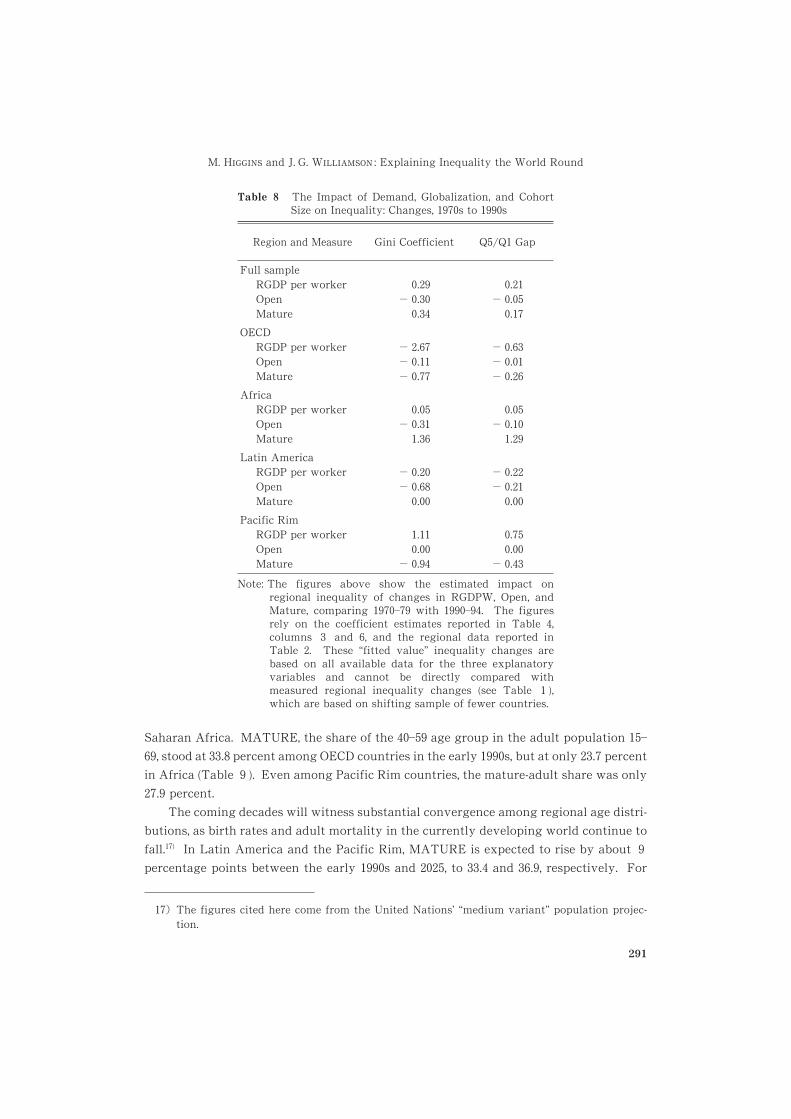
Saharan Africa. MATURE, the share of the ����� age group in the adult population �����, stood at ��� percent among OECD countries in the early ����s, but at only ��� percent
in Africa (Table � ). Even among Pacific Rim countries, the mature-adult share was only
��� percent.
The coming decades will witness substantial convergence among regional age distri-
butions, as birth rates and adult mortality in the currently developing world continue to
fall.��) In Latin America and the Pacific Rim, MATURE is expected to rise by about �percentage points between the early ����s and ��, to ���� and ����, respectively. For
��� The figures cited here come from the United Nations’ “medium variant” population projec-tion.
Table � The Impact of Demand, Globalization, and CohortSize on Inequality: Changes, ����s to ����s
Region and Measure Gini Coefficient Q�/Q� Gap
Full sampleRGDP per workerOpenMature
���� ��������
���� ��������
OECDRGDP per workerOpenMature
� ���� ����� ����
� ����� ����� ���
AfricaRGDP per workerOpenMature
����� ��������
����� �������
Latin AmericaRGDP per workerOpenMature
� ���� �������
� ��� �������
Pacific RimRGDP per workerOpenMature
��������
� ����
��������
� ����
Note: The figures above show the estimated impact onregional inequality of changes in RGDPW, Open, andMature, comparing ������� with �������. The figuresrely on the coefficient estimates reported in Table �,columns � and �, and the regional data reported inTable . These “fitted value” inequality changes arebased on all available data for the three explanatoryvariables and cannot be directly compared withmeasured regional inequality changes (see Table � ),which are based on shifting sample of fewer countries.
M. H><<>CH and J. G. W>AA>6BHDC : Explaining Inequality the World Round
291
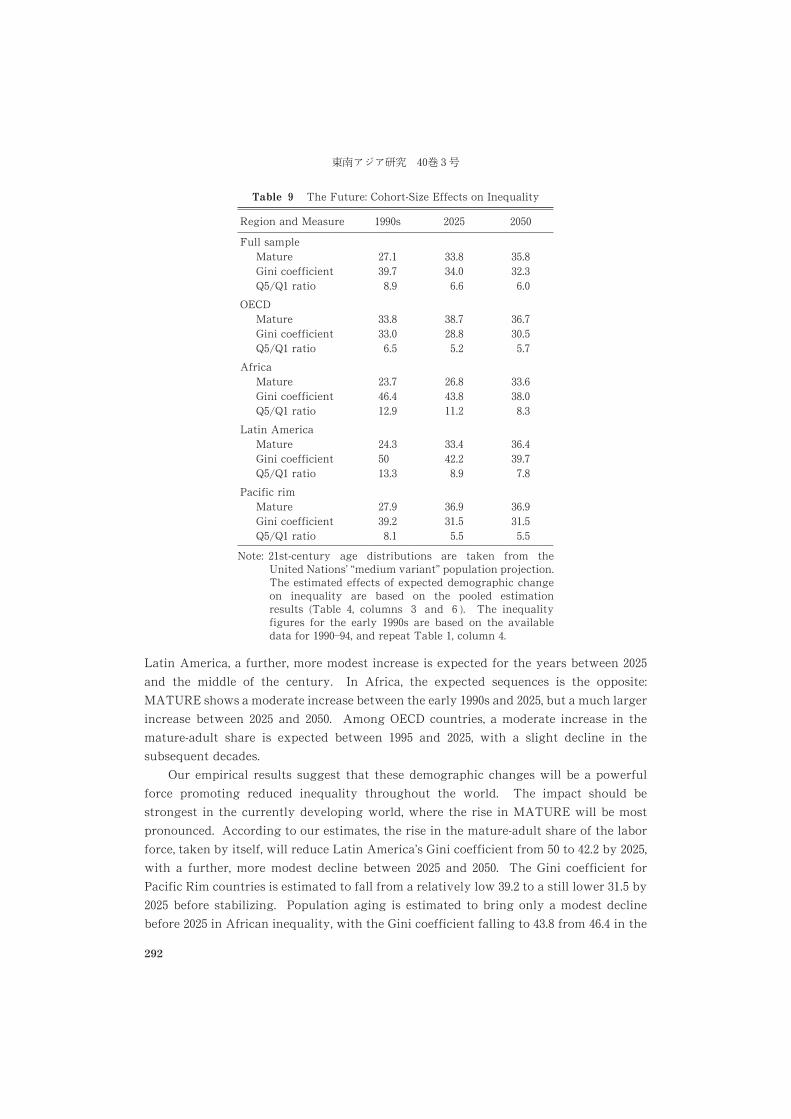
Latin America, a further, more modest increase is expected for the years between ����and the middle of the century. In Africa, the expected sequences is the opposite:
MATURE shows a moderate increase between the early ����s and ����, but a much larger
increase between ���� and ����. Among OECD countries, a moderate increase in the
mature-adult share is expected between ���� and ����, with a slight decline in the
subsequent decades.
Our empirical results suggest that these demographic changes will be a powerful
force promoting reduced inequality throughout the world. The impact should be
strongest in the currently developing world, where the rise in MATURE will be most
pronounced. According to our estimates, the rise in the mature-adult share of the labor
force, taken by itself, will reduce Latin America’s Gini coefficient from �� to ���� by ����,with a further, more modest decline between ���� and ����. The Gini coefficient for
Pacific Rim countries is estimated to fall from a relatively low ���� to a still lower ���� by
���� before stabilizing. Population aging is estimated to bring only a modest decline
before ���� in African inequality, with the Gini coefficient falling to ��� from ��� in the
Table � The Future: Cohort-Size Effects on Inequality
Region and Measure ����s ���� ����
Full sampleMatureGini coefficientQ�/Q� ratio
����������
��������
���������
OECDMatureGini coefficientQ�/Q� ratio
���������
��������
����������
AfricaMatureGini coefficientQ�/Q� ratio
�����������
���������
��������
Latin AmericaMatureGini coefficientQ�/Q� ratio
����������
����������
���������
Pacific rimMatureGini coefficientQ�/Q� ratio
����������
����������
����������
Note: ��st-century age distributions are taken from theUnited Nations’ “medium variant” population projection.The estimated effects of expected demographic changeon inequality are based on the pooled estimationresults (Table �, columns � and ). The inequalityfigures for the early ����s are based on the availabledata for �������, and repeat Table �, column �.
������� ��� ��
292
early ����s. However, the rapid rise in MATURE during ������� would push the region’s
Gini coefficient down to ����. The OECD, for its part, would see a moderate decline in
inequality until ����, followed by a modest rise. Note that these demographic changes
would leave inequality in Latin America and Africa well above OECD or Pacific Rim
levels, although the gap would be reduced.
Before concluding this section, it is worth emphasizing the obvious: this analysis
considers only the potential effect of demography on inequality. It ignores the many
other factors that drive it.
IV Explaining Cohort-Size Effects on Inequality
This section attempts to place the cohort-size effects estimated above in context, by
drawing on earlier theoretical and empirical work linking demographic variables and
inequality. We find that our estimated cohort-size effects are roughly twice as large as
typical estimates from the U. S. micro literature.
The effect of steady-state changes in population growth on aggregate inequality can
be broken down into three channels. First, slower population growth increases the share
of older, high-earning workers at the expense of younger, low-earning workers. Thus the
contribution of age structure to aggregate inequality is altered, even without any change
in the age-earnings profile. Deaton and Paxson [���] show that slower steady-state
population growth raises aggregate earnings inequality, so long as the age-earnings
profile slopes upward throughout the lifecycle.��) Second, different age groups may be
characterized by different inequality levels. Deaton and Paxson [���; ���] present
evidence that income inequality has tended to increase with age for several countries
examined.��) Slower population growth, by raising the average age of the population,
should raise aggregate inequality through this channel. Finally, slower population
growth tilts the population age distribution toward older, more experienced cohorts,
possibly reducing the experience premium, and lowering aggregate inequality. As noted
above, the consistent empirical finding is that smaller youth cohorts enjoy higher mean
earnings, although estimates of the magnitude of this effect vary widely.
The first two channels identified above work through changes in the relative
population weights of age groups that differ in the mean or variance of earnings, treating
the age-income profile as fixed (in both first and second moments). There is no attempt
��� The effect of slower population growth on inequality, operating through this channel, isambiguous if labor earnings tend to decline during the final years of working life. Theambiguity is compounded if labor force participation declines for older adults.
��� The authors present evidence that within-cohort inequality in consumption, income, andearnings has tended to rise with age in the United States, the United Kingdom, Taiwan, andThailand.
M. H><<>CH and J. G. W>AA>6BHDC : Explaining Inequality the World Round
293
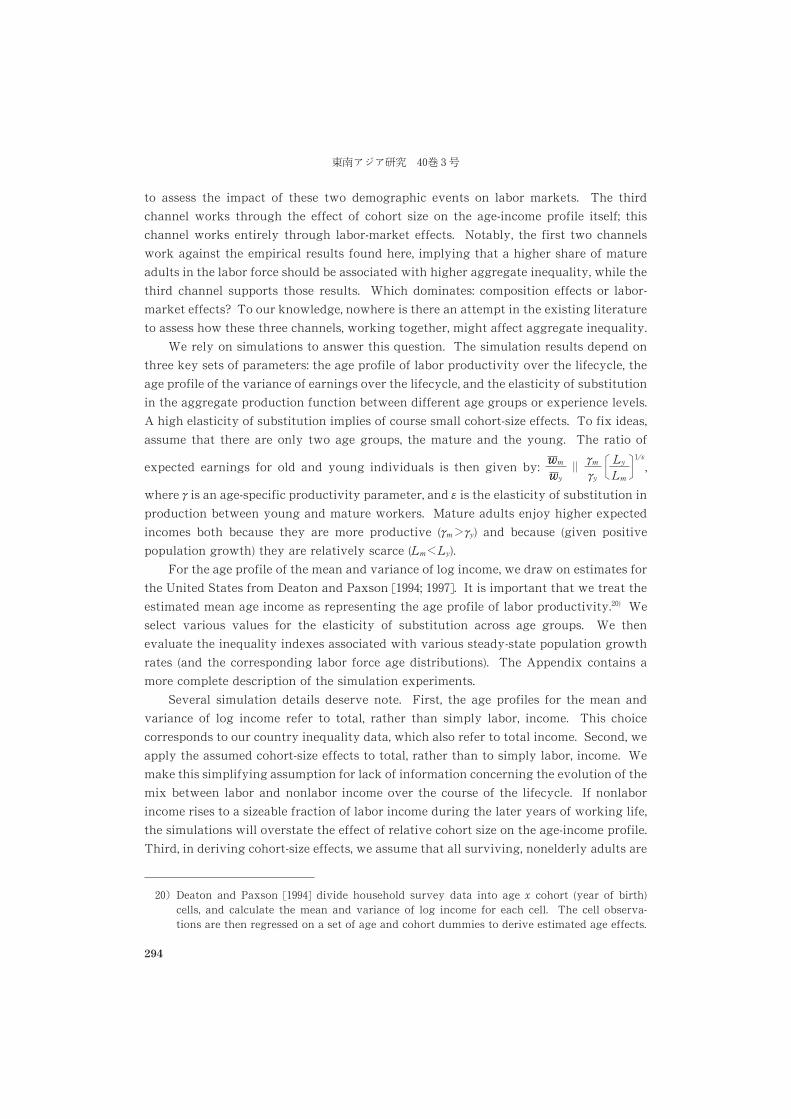
to assess the impact of these two demographic events on labor markets. The third
channel works through the effect of cohort size on the age-income profile itself; this
channel works entirely through labor-market effects. Notably, the first two channels
work against the empirical results found here, implying that a higher share of mature
adults in the labor force should be associated with higher aggregate inequality, while the
third channel supports those results. Which dominates: composition effects or labor-
market effects? To our knowledge, nowhere is there an attempt in the existing literature
to assess how these three channels, working together, might affect aggregate inequality.
We rely on simulations to answer this question. The simulation results depend on
three key sets of parameters: the age profile of labor productivity over the lifecycle, the
age profile of the variance of earnings over the lifecycle, and the elasticity of substitution
in the aggregate production function between different age groups or experience levels.
A high elasticity of substitution implies of course small cohort-size effects. To fix ideas,
assume that there are only two age groups, the mature and the young. The ratio of
expected earnings for old and young individuals is then given by:wwm
wwy� gm
gy
���
Ly
Lm
���
�/e
,
where g is an age-specific productivity parameter, and e is the elasticity of substitution in
production between young and mature workers. Mature adults enjoy higher expected
incomes both because they are more productive (gm�gy) and because (given positive
population growth) they are relatively scarce (Lm�Ly).
For the age profile of the mean and variance of log income, we draw on estimates for
the United States from Deaton and Paxson [����; ����]. It is important that we treat the
estimated mean age income as representing the age profile of labor productivity.��) We
select various values for the elasticity of substitution across age groups. We then
evaluate the inequality indexes associated with various steady-state population growth
rates (and the corresponding labor force age distributions). The Appendix contains a
more complete description of the simulation experiments.
Several simulation details deserve note. First, the age profiles for the mean and
variance of log income refer to total, rather than simply labor, income. This choice
corresponds to our country inequality data, which also refer to total income. Second, we
apply the assumed cohort-size effects to total, rather than to simply labor, income. We
make this simplifying assumption for lack of information concerning the evolution of the
mix between labor and nonlabor income over the course of the lifecycle. If nonlabor
income rises to a sizeable fraction of labor income during the later years of working life,
the simulations will overstate the effect of relative cohort size on the age-income profile.
Third, in deriving cohort-size effects, we assume that all surviving, nonelderly adults are
��� Deaton and Paxson [����] divide household survey data into age x cohort (year of birth)cells, and calculate the mean and variance of log income for each cell. The cell observa-tions are then regressed on a set of age and cohort dummies to derive estimated age effects.
����� ��� ��
294
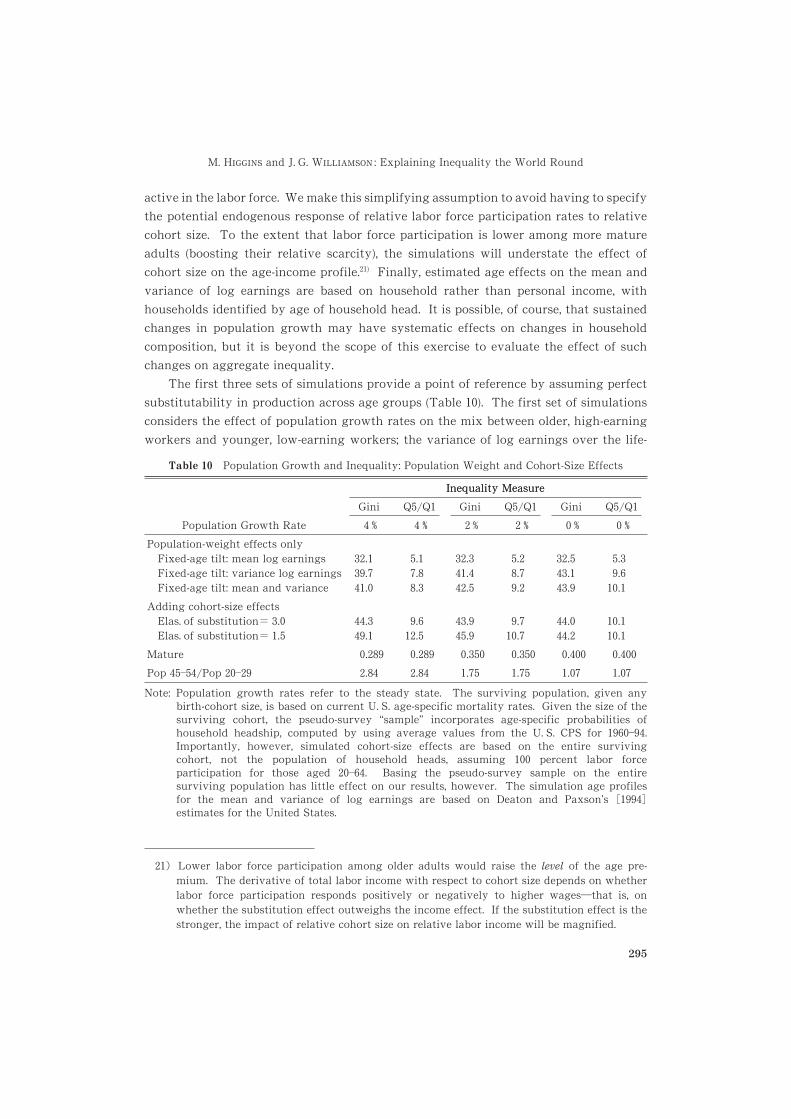
active in the labor force. We make this simplifying assumption to avoid having to specify
the potential endogenous response of relative labor force participation rates to relative
cohort size. To the extent that labor force participation is lower among more mature
adults (boosting their relative scarcity), the simulations will understate the effect of
cohort size on the age-income profile.��) Finally, estimated age effects on the mean and
variance of log earnings are based on household rather than personal income, with
households identified by age of household head. It is possible, of course, that sustained
changes in population growth may have systematic effects on changes in household
composition, but it is beyond the scope of this exercise to evaluate the effect of such
changes on aggregate inequality.
The first three sets of simulations provide a point of reference by assuming perfect
substitutability in production across age groups (Table ��). The first set of simulations
considers the effect of population growth rates on the mix between older, high-earning
workers and younger, low-earning workers; the variance of log earnings over the life-
��� Lower labor force participation among older adults would raise the level of the age pre-mium. The derivative of total labor income with respect to cohort size depends on whetherlabor force participation responds positively or negatively to higher wages�that is, onwhether the substitution effect outweighs the income effect. If the substitution effect is thestronger, the impact of relative cohort size on relative labor income will be magnified.
Table �� Population Growth and Inequality: Population Weight and Cohort-Size Effects
Population Growth Rate
Inequality MeasureInequality Measure
Gini Q�/Q� Gini Q�/Q� Gini Q�/Q�� � � � � � � � � � � �
Population-weight effects onlyFixed-age tilt: mean log earningsFixed-age tilt: variance log earningsFixed-age tilt: mean and variance
�����������
������
������������
�������
������������
����������
Adding cohort-size effectsElas. of substitution� ���Elas. of substitution� ���
��������
�������
��������
�����
��������
��������
Mature ���� ���� ����� ����� ����� �����Pop �����/Pop ����� ��� ��� ��� ��� ��� ���
Note: Population growth rates refer to the steady state. The surviving population, given anybirth-cohort size, is based on current U. S. age-specific mortality rates. Given the size of thesurviving cohort, the pseudo-survey “sample” incorporates age-specific probabilities ofhousehold headship, computed by using average values from the U. S. CPS for �������.Importantly, however, simulated cohort-size effects are based on the entire survivingcohort, not the population of household heads, assuming ��� percent labor forceparticipation for those aged �����. Basing the pseudo-survey sample on the entiresurviving population has little effect on our results, however. The simulation age profilesfor the mean and variance of log earnings are based on Deaton and Paxson’s ������estimates for the United States.
M. H><<>CH and J. G. W>AA>6BHDC : Explaining Inequality the World Round
295
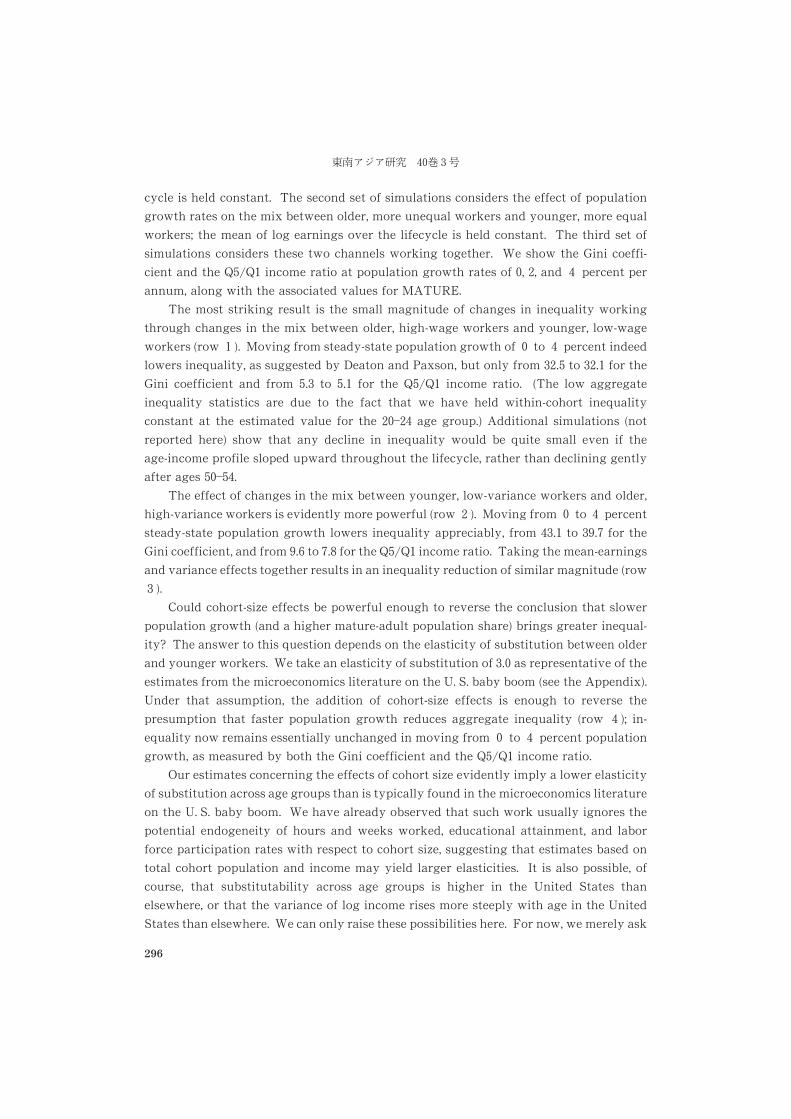
cycle is held constant. The second set of simulations considers the effect of population
growth rates on the mix between older, more unequal workers and younger, more equal
workers; the mean of log earnings over the lifecycle is held constant. The third set of
simulations considers these two channels working together. We show the Gini coeffi-
cient and the Q�/Q� income ratio at population growth rates of �, �, and � percent per
annum, along with the associated values for MATURE.
The most striking result is the small magnitude of changes in inequality working
through changes in the mix between older, high-wage workers and younger, low-wage
workers (row � ). Moving from steady-state population growth of � to � percent indeed
lowers inequality, as suggested by Deaton and Paxson, but only from ���� to ���� for the
Gini coefficient and from ��� to ��� for the Q�/Q� income ratio. (The low aggregate
inequality statistics are due to the fact that we have held within-cohort inequality
constant at the estimated value for the ����� age group.) Additional simulations (not
reported here) show that any decline in inequality would be quite small even if the
age-income profile sloped upward throughout the lifecycle, rather than declining gently
after ages �����.The effect of changes in the mix between younger, low-variance workers and older,
high-variance workers is evidently more powerful (row � ). Moving from � to � percent
steady-state population growth lowers inequality appreciably, from ���� to ��� for the
Gini coefficient, and from �� to �� for the Q�/Q� income ratio. Taking the mean-earnings
and variance effects together results in an inequality reduction of similar magnitude (row
� ).
Could cohort-size effects be powerful enough to reverse the conclusion that slower
population growth (and a higher mature-adult population share) brings greater inequal-
ity? The answer to this question depends on the elasticity of substitution between older
and younger workers. We take an elasticity of substitution of ��� as representative of the
estimates from the microeconomics literature on the U. S. baby boom (see the Appendix).
Under that assumption, the addition of cohort-size effects is enough to reverse the
presumption that faster population growth reduces aggregate inequality (row � ); in-
equality now remains essentially unchanged in moving from � to � percent population
growth, as measured by both the Gini coefficient and the Q�/Q� income ratio.
Our estimates concerning the effects of cohort size evidently imply a lower elasticity
of substitution across age groups than is typically found in the microeconomics literature
on the U. S. baby boom. We have already observed that such work usually ignores the
potential endogeneity of hours and weeks worked, educational attainment, and labor
force participation rates with respect to cohort size, suggesting that estimates based on
total cohort population and income may yield larger elasticities. It is also possible, of
course, that substitutability across age groups is higher in the United States than
elsewhere, or that the variance of log income rises more steeply with age in the United
States than elsewhere. We can only raise these possibilities here. For now, we merely ask
������� ��� ��
296
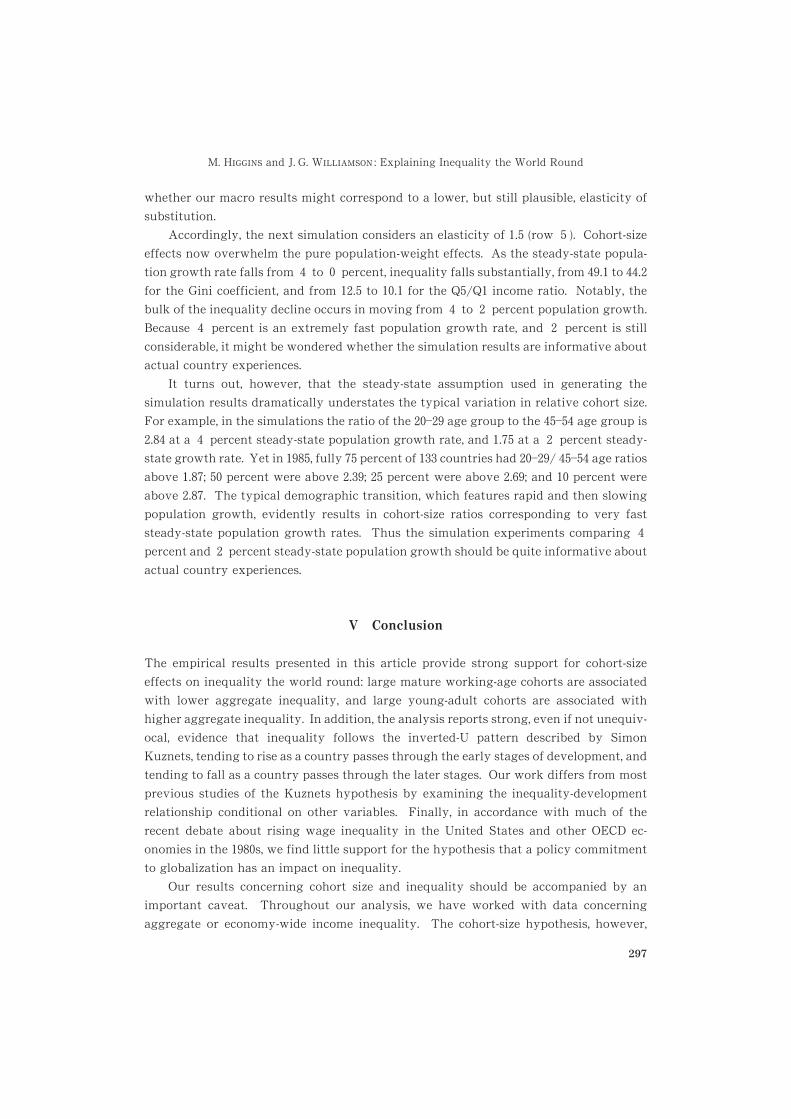
whether our macro results might correspond to a lower, but still plausible, elasticity of
substitution.
Accordingly, the next simulation considers an elasticity of ��� (row � ). Cohort-size
effects now overwhelm the pure population-weight effects. As the steady-state popula-
tion growth rate falls from � to � percent, inequality falls substantially, from ���� to ����for the Gini coefficient, and from ���� to ���� for the Q�/Q� income ratio. Notably, the
bulk of the inequality decline occurs in moving from � to � percent population growth.
Because � percent is an extremely fast population growth rate, and � percent is still
considerable, it might be wondered whether the simulation results are informative about
actual country experiences.
It turns out, however, that the steady-state assumption used in generating the
simulation results dramatically understates the typical variation in relative cohort size.
For example, in the simulations the ratio of the ����� age group to the ����� age group is
���� at a � percent steady-state population growth rate, and ��� at a � percent steady-
state growth rate. Yet in ����, fully � percent of � countries had �����/ ����� age ratios
above ���; �� percent were above ���; �� percent were above ����; and �� percent were
above ���. The typical demographic transition, which features rapid and then slowing
population growth, evidently results in cohort-size ratios corresponding to very fast
steady-state population growth rates. Thus the simulation experiments comparing �percent and � percent steady-state population growth should be quite informative about
actual country experiences.
V Conclusion
The empirical results presented in this article provide strong support for cohort-size
effects on inequality the world round: large mature working-age cohorts are associated
with lower aggregate inequality, and large young-adult cohorts are associated with
higher aggregate inequality. In addition, the analysis reports strong, even if not unequiv-
ocal, evidence that inequality follows the inverted-U pattern described by Simon
Kuznets, tending to rise as a country passes through the early stages of development, and
tending to fall as a country passes through the later stages. Our work differs from most
previous studies of the Kuznets hypothesis by examining the inequality-development
relationship conditional on other variables. Finally, in accordance with much of the
recent debate about rising wage inequality in the United States and other OECD ec-
onomies in the ����s, we find little support for the hypothesis that a policy commitment
to globalization has an impact on inequality.
Our results concerning cohort size and inequality should be accompanied by an
important caveat. Throughout our analysis, we have worked with data concerning
aggregate or economy-wide income inequality. The cohort-size hypothesis, however,
M. H><<>CH and J. G. W>AA>6BHDC : Explaining Inequality the World Round
297
concerns the relationship between relative size and the slope of the age-earnings profile.
Aggregate inequality data can provide only an indirect window on such cohort-size
effects. A definitive analysis of cohort-size effects awaits the development of internation-
ally comparable data concerning age-earnings profiles.
References
Ahluwalia, M. ����. Inequality, Poverty and Development. Journal of Development Economics � :
�������.Anand, S.; and Kanbur, S. ����. Inequality and Development: A Critique. Journal of Development
Economics ��: �����.Anderson, J. E.; and Neary, J. P. ����. Measuring the Restrictiveness of Trade Policy. The World Bank
Economic Review : ������.Anderson, T. W.; and Hsiao, C. ���. Estimation of Dynamic Models with Error Components. Journal
of the American Statistical Association ��: �����.Arellano, M.; and Bond, S. ����. Some Tests of Specification for Panel Data: Monte Carlo Evidence
and an Application to Employment Data. Review of Economic Studies : �������.Arellano, M.; and Bover, O. ���. Another Look at the Instrumental Variable Estimation of Error-
Components Models. Journal of Econometrics �: ����.Barro, R.; and Lee, J-W. ����. Data Set for a Panel of 138 Countries. Available from the National
Bureau of Economic Research at http: //www.nber.org/pub/barro.lee/ziphttp: //www.nber.org/pub/barro.lee/zipBloom, D.; and Williamson, J. G. ����. Demographic Change and Human Resource Development. In
Emerging Asia: Change and Challenges, Ch. �. Manila: Asian Development Bank.����. ���. Demographic Transitions and Economic Miracles in Emerging Asia. World Bank
Economic Review ��: �����.Borjas, G. ����. The Economics of Immigration. Journal of Economic Literature ��: ���������.Borjas, G.; Freeman, R.; and Katz, L. ����. On the Labor Market Impacts of Immigration and Trade.
In Immigration and the Work Force: Economic Consequences for the United States and Source Areas,edited by G. Borjas and R. B. Freeman. Chicago: University of Chicago Press.
Bourguignon, F.; and Morrisson, C. ���. Inequality and Development: The Role of Dualism. Journalof Development Economics � ( � ): �����.
Chenery, H. B.; Ahluwalia, M. S.; Bell, C. L. G.; Duloy, J. H.; and Jolly, R. ����. Redistribution withGrowth. London: Oxford University Press.
Davidson, Russell; and MacKinnon, James G. ����. Estimation and Inference in Econometrics. Oxford:Oxford University Press.
Davis, D. R. ����. Trade Liberalization and Income Distribution. NBER Working Paper No. ���(August). Cambridge, MA: National Bureau of Economic Research.
Deaton, A. S.; and Paxson, C. H. ����. Intertemporal Choice and Inequality. Journal of PoliticalEconomy ��� ( � ): �������.
����. ����. The Effects of Economic and Population Growth on National Saving and Inequality.Demography �� ( � ): ������.
Deininger, K.; and Squire, L. ����. A New Data Set Measuring Income Inequality. World BankEconomic Review ��: ����.
����. ���. New Ways of Looking at Old Issues: Inequality and Growth. Journal of DevelopmentEconomics � ( � ): ����.
Easterlin, R. A. ���. Birth and Fortune: The Impact of Numbers on Personal Welfare. New York: BasicBooks.
Freeman, R. B. ����. The Effects of Demographic Factors on Age-Earnings Profiles. Journal ofHuman Resources ��: �����.
����. ���. Are Your Wages Set in Beijing? Journal of Economic Perspectives � : ����.
������� ��� ��
298
Gastil, R.; and Wright, L. ���� �. Freedom in the World. Westport, CT: Greenwood Publishing Group.Higgins, M.; and Williamson, J. G. ����. Explaining Inequality the World Round: Cohort Size, Kuznets
Curves and Openness. NBER Working Paper No. ���� (June). Cambridge, MA: National Bureau ofEconomic Research.
Judson, R.; and Owen, A. ����. Estimating Dynamic Panel Data Models: A Practical Guide forMacroeconomists. Federal Reserve Board Finance and Economics Discussion Series. Washing-ton, D. C. (Mimeographed)
Katz, L.; and Murphy, K. ����. Changes in Relative Wages, ���������: Supply and Demand Factors.Quarterly Journal of Economics ��: ����.
Kosters, M. H. ����. An Overview of Changing Wage Patterns in the Labor Market. In Trade andWages: Leveling Wages Down? edited by J. Bhagwati and M. H. Kosters. Washington, D. C.: AEIPress.
Kuznets, S. ��. Economic Growth and Income Inequality. American Economic Review �: ����.Lam, David. ����. Demographic Variables and Income Inequality. In Handbook of Population and
Family Economics, edited by Mark R. Rosenzweig and Oded Stark, pp. �����. Amsterdam:Elsevier Science B. V.
Lawrence, L.; and Slaughter, M. ����. International Trade and American Wages in the ���s: GiantSucking Sound or Small Hiccup? Brookings Papers on Economic Activity, Microeconomics � :
�������.Li, H.; Squire, L.; and Zhou, H. ����. Explaining International and Intertemporal Variations in Income
Inequality. Economic Journal ��: �����.Lindert, P. H.; and Williamson, J. G. ��. Does Globalization Make the World More Unequal? In
Globalization in Historical Perspective, edited by M. Bordo, A. M. Taylor, and J. G. Williamson.Chicago: University of Chicago Press.
Macunovich, D. J. ����. Relative Cohort Size and Inequality in the United States. American EconomicReview ��: ������.
����. ����. The Fortune of One’s Birth: Relative Cohort Size and the Youth Labor Market in theU. S. Journal of Population Economics ��: ������.
Murphy, K.; and Welch, F. ����. The Structure of Wages. Quarterly Journal of Economics ��: ������.Perotti, R. ����. Growth, Income Distribution and Democracy. Journal of Economic Growth � : �������.
Richardson, J. D. ���. Income Inequality and Trade: How to Think, What to Conclude. Journal ofEconomic Perspectives � : ���.
Robbins, D. ����. Trade, Trade Liberalization and Inequality in Latin America and East Asia:Synthesis of Seven Countries. Harvard Institute for International Development, Cambridge,MA. (Mimeographed)
Robertson, R. ��. Relative Prices and Wage Inequality: Evidence from Mexico. Unpublished paper(October). Macalester College, St. Paul, MN. �p.
Rodriguez, F.; and Rodrik, D. ��. Trade Policy and Economic Growth: A Skeptic’s Guide to theCross-National Evidence. In NBER Macroeconomics Annual 2000, Vol. �, edited by B. S.Bernanke and K. Rogoff, pp. ������. Cambridge, MA: MIT Press.
Sachs, J.; and Warner, A. ���. Economic Reform and the Process of Global Integration. BrookingsPapers on Economic Activity � : ����.
Schultz, T. P. ����. Inequality in the Distribution of Personal Income in the World: How It IsChanging and Why. Journal of Population Economics ��: ������.
Summers, R.; and Heston, A. ����. The Penn World Table (Mark ): An Expanded Set of Interna-tional Comparisons, �������. Quarterly Journal of Economics ��: �������.
����. ���. Penn World Table (Mark 5.6). Available on diskette from the National Bureau ofEconomic Research, Cambridge, MA.
United Nations, Department of International Economic and Social Affairs. ����a. Age and Sex
M. H><<>CH and J. G. W>AA>6BHDC : Explaining Inequality the World Round
299
Quinquennial, 1950�2050. New York: United Nations.����. ����b. Demographic Indicators, +3/*�,*/*. New York: United Nations.Welch, F. ����. Effects of Cohort Size on Earnings: The Baby Boom Babies Financial Bust. Journal
of Political Economy ��: S���S��.Williamson, J. G. ����. Globalization and Inequality, Past and Present. World Bank Research Observer
�� ( � ): �������.����. ����. Growth, Distribution, and Demography: Some Lessons from History. Explorations in
Economic History �� ( � ): ������.Wood, A. ���. North-South Trade, Employment and Inequality: Changing Fortunes in a Skill-Driven
World. Oxford: Clarendon Press.����. ����. How Trade Hurt Unskilled Workers. Journal of Economic Perspectives � : ����.World Bank. ����. World Development Indicators: 1998. CD-ROM. Washington, D. C.
Appendix
Data SourcesInequality data come from Deininger and Squire [����]. The data can be downloaded from the WorldBank web site: http: //www.worldbank.org/growth/dddeisqu.htmhttp: //www.worldbank.org/growth/dddeisqu.htm. Demographic data are takenfrom the United Nations diskettes Age and Sex Quinquennial, 1950�2050 [����a] and DemographicIndicators, 1950�2050 [����b]. Data documenting real output per worker and exports plus importsas a share of GDP come from the data diskette Penn World Tables (Mark 5.6), available from theNational Bureau of Economic Research (NBER) in Cambridge, MA. Our principal measure ofopenness comes from Sachs and Warner [����]. Data concerning the incidence of capital controlswere developed by the International Monetary Fund, compiled by Leonardo Bartolini and AlanDrazen, and obtained from those authors via personal communication. Data concerning politicalrights and civil liberties were taken from Barro and Lee [���]. The complete Barro-Lee data set isavailable from the NBER web site at http: //www.nber.org/pub/barro.lee/ziphttp: //www.nber.org/pub/barro.lee/zip. The original sourceof the political rights and civil liberties data is Gastil and Wright [�����]. All other data come fromthe World Bank’s [����] CD-ROM World Development Indicators: 1998.
Regional AggregatesSub-Saharan AfricaSub-Saharan Africa: Botswana, Cameroon, Central African Republic, Cote D’Ivoire, Gabon, Ghana,
Guinea-Bissau, Kenya, Lesotho, Madagascar, Mauritania, Mauritius, Niger, Nigeria, Rwanda,Senegal, Sierra Leone, South Africa, Tanzania, Uganda, Zambia, Zimbabwe.
Latin AmericaLatin America: Bolivia, Brazil, Chile, Columbia, Costa Rica, Dominican Republic, Ecuador, ElSalvador, Guatemala, Honduras, Mexico, Nicaragua, Panama, Peru, Puerto Rico, Venezuela.
OECDOECD: Australia, Belgium, Canada, Denmark, Finland, France, Germany, Greece, Ireland, Italy,Japan, Luxembourg, Netherlands, New Zealand, Norway, Portugal, Spain, Sweden, Turkey,United Kingdom, United States.
Pacific RimPacific Rim: China, Hong Kong, Indonesia, Japan, South Korea, Malaysia, Philippines, Singapore,Taiwan, Thailand.
OtherOther: Algeria, Bangladesh, Barbados, Bulgaria, Czechoslovakia, Egypt, Fiji, Guyana, Hungary,India, Iran, Jamaica, Jordan, Laos, Morocco, Nepal, Pakistan, Poland, Romania, Soviet Union,Sri Lanka, Trinidad and Tobago, Tunisia, Yugoslavia.
Simulation DetailsThe simulation experiments concern a population ranging in age from � to ��. The parametersdescribing the age profile for the mean and variance of log income are taken from Deaton andPaxson’s [���; ����] estimates for the United States. The parameters are taken from [���: Table � ],and from various graphs in [���; ����] via visual approximation. Deaton and Paxson’s estimates are
������� � ��
300
quite similar to our own estimates using the Current Population Survey (CPS) data for the UnitedStates. As noted in the text, we use the estimated age profile of mean log income as a baseline; andthen alter this profile to reflect different experimental assumptions about the age distribution of thelabor force and the elasticity of substitution in production between different age groups. The keyexception here is that we assume that persons aged ����� are no longer in the labor force. For thisage group, we begin with a mean log income for ��-year-olds and adjust it downward using theappropriate age factors estimated by Deaton and Paxson.
An assumed steady-state population growth rate fixes the population age distribution at zeromortality. We then apply a Metropolitan Life Insurance Company mortality table to find thesurviving population for each age group. Finally, we calculate age-specific probabilities of house-hold headship using the CPS data for the United States and apply these probabilities to thesurviving population to generate experimental survey samples. (Note that this procedure affects thenumber of observations by age group, not the total population by age group; the latter is relevant forassessing cohort-size effects.) We adopt this procedure because the Deininger-Squire data setgenerally reports inequality at the household level rather than the individual level. Sampling theentire surviving population has little effect on our results.
The final simulation experiment relies on an age-year rather than an age-cohort model to assessthe age profile of the variance of log income. We begin by estimating age-year and age-cohortmodels for the variance of log income using the ������� CPS data for the United States. We breakage groups and cohorts into five-year periods. As noted earlier, our estimates for the age-cohortmodel appear very close to those reported by Deaton and Paxson [����; ����]. To ensure com-parability with the earlier experiments, we then adjust the Deaton-Paxson age effects to reflect thedifference we find in age effects from the age-year and age-cohort models.
Cohort Effects in the Micro LiteratureFinis Welch [����], in a seminal study on the subject, takes as his measure of cohort size thepercentage of all workers belonging to a given age x education group. For new entrants to the laborforce, he finds that the elasticity of annual earnings with respect to cohort size ranges from �. ��� forhigh school dropouts to �. ��� for college graduates [ibid.: Table �, S��]. He finds, however, that theeffects of cohort size diminish over the lifecycle: the permanent effect for high school dropouts is infact the smallest, at �. ���; the effect for high school graduates (with no college) is the smallest, at� ��.
Welch’s estimates do not correspond directly with the elasticity of substitution framework usedin the simulations. In particular, the dependent variable is actual rather than relative wages.Moreover, in assessing the elasticity of substitution across age groups, we must remember that anincrease in the young-adult age share implies a decrease in other age shares. We proceed as followsto translate Welch’s results into our framework. First, we calculate the labor force age sharesassociated with population growth of �, �, �, �, and � percent per annum, focusing on the ����� and
����� age groups. For simplicity, we assume zero mortality and ��� percent labor force participation.At successive population growth rates (and the associated labor force shares) we apply the averageentry elasticity across education classes to the wages of the ����� age group, and the averagepermanent elasticity across age groups to the wages of the ����� age group. We then compare thechange in the log wage gap with the change in the log labor force ratio to calculate implicitelasticities of substitution. The implicit elasticities range from ��, in moving from � to � percentpopulation growth, to ��, in moving from � to � percent population growth.
Murphy and Welch [����] estimate elasticities of complementarity across various age andeducation groups. Using these estimates, the authors assess the labor-market effects of increasingthe relative size of younger cohorts by �� percent. They find that the wages of younger high schoolgraduates would fall by � percent relative to older graduates, implying an elasticity of substitutionof ��. They also find that the wages of younger college graduates would fall by between � and ��
M. H><<>CH and J. G. W>AA>6BHDC : Explaining Inequality the World Round
301
percent relative to older graduates, implying an elasticity of substitution of between ��� and ���.Katz and Murphy [����] directly estimate the effect of changes in relative cohort size (measured
by hours worked) and relative hourly wages. Aggregating across education categories, the authorsfind an elasticity of substitution of ��� [ibid.: ��, footnote ��].
Macunovich [���; ����] relies on the gross fertility rate during a cohort’s year of birth as ameasure of cohort size. (The gross fertility rate is the number of births per female population aged
����.) This measure has no natural interpretation in terms of relative steady-state cohort size. Withmortality held constant, a high steady-state gross fertility rate implies a high steady-state popula-tion growth rate, making older workers relatively scarce. Yet the gross fertility rate at birth wouldbe the same for both older and younger workers. As a result, we are unable to interpretMacunovich’s estimates in an elasticity-of-substitution framework. It should be noted, however, thather estimates imply quite large cohort-size effects.
������� ��� ��
302
Employment Transitions in an Era of Change in Thailand�
Soumya AAK6�� and Barbara ECIL>HA:��
Abstract
The last three decades offer much evidence of greater access to new avenues of employ-
ment with globalization and rapid economic development in Southeast Asia, including a
trend toward employment-related migration out of rural areas. This article considers the
implications of globalization in Thailand from a rural perspective by examining the direct
impact on employment of rural residents who migrate to urban areas, and the indirect
impact on rural residents through the experiences of urban migrants. Within this frame-
work, we consider whether men and women have similar migration and associated
employment outcomes, and whether those outcomes vary by changes in the individual’s
stage in the life course. We use data for working-age individuals from Nang Rong District
in Thailand in ����, ����, and ���� to determine general employment trends in rural and
urban Thailand. An associated analysis follows a single cohort of individuals aged ����years in ���� to examine changes in their employment patterns in subsequent years, ����and ����. We discuss the factors influencing some individuals to remain employed in Nang
Rong, while others migrate, either permanently or temporarily, to urban areas. We
compare categories of sector of employment, including individuals not employed, to
examine these questions.
Keywords: globalization, employment, labor force, migration, rural-urban, gender differ-
ences, developing countries, Thailand
Globalization and Employment
Until recently Thailand was a predominantly agricultural economy. Even now, ��
* We gratefully acknowledge support received from the National Institute of Child Healthand Human Development (R�� HD ���; R�� HD �����); the Population Council (a postdoc-toral fellowship to Soumya Alva); and the Carolina Population Center. We thank JeffreyEdmeades, Aree Jampaklay, Kammi Schmeer, Amy Weinberg, Andrew Mason, and SumnerJ. La Croix for their comments. Rick O’Hara provided valuable assistance with the dataand programming.
** Carolina Population Center, University of North Carolina, Chapel Hill, CB� ����, UniversitySquare, ��� West Franklin St., Chapel Hill, NC ��������, U. S. A. Their e-mail addresses aree-mail: salva�unc.edu and entwisle�unc.edu, respectively.
Southeast Asian Studies, Vol. ��, No. �, December ����
303
percent of the population lives in rural areas. Over the past three decades, however,
Thailand became a fast-growing, industrializing economy [Phananiramai ����: ���]. Only
half of the labor force is now engaged in agriculture [World Bank n. d. (a)] as compared
with more than �� percent in ���� [Phananiramai ����: ���]. Agriculture as a share of
gross domestic product has also decreased, contributing only a little more than �� percent
by ����. Industry, especially manufacturing, has increased its share to �� percent, with
services holding steady at about �� percent of GDP. Average annual growth rates have
varied, but they reached levels as high as � percent in the period �����, sufficient to
absorb a rapidly growing labor force [Mason and Campbell ���: ��]. Growth rates in
manufacturing have been particularly notable, reaching levels of �� percent per annum in
the period ������ and �� percent in ���� [World Bank n. d. (b)]. The average annual rate
of industrial growth peaked in the late ���s as a result [Galenson ����: � ].
These dramatic changes in the structure of Thailand’s economy have occurred in the
context, and in many ways as a consequence, of globalization. Globalization refers to the
process by which economic, financial, technical, and cultural transactions between
different countries and communities throughout the world become increasingly inter-
connected [Pearson ����: ��]. The increasing integration of the world economy has had
consequences for patterns and trends in employment within countries. In Thailand the
growth in the manufacturing sector was (and is) tied directly to large increases in foreign
investment and the growth of export-based manufacturing industry [Kurian ����: ��], in
addition to government policies to promote this sector [Rigg and Nattapoolwat ����: ���].
Globalization has resulted in the movement of production activity from more to less
developed countries, consolidating an international division of labor that takes advan-
tage of cheap labor in the latter. Though not new [Moghadam ����: �; also see
Dickinson ����: ���], globalization has gained unprecedented impetus since the ����s[Beneria et al. ����: vii; Moghadam ����: �].
The impact of globalization on employment has been well documented. Job creation
associated with this trend involves manufacturing activities as a result of direct foreign
investment and particularly through the creation of export-processing zones [Pearson
����: ��; Rama ����: ��; Standing ���: ���]. Trade-related employment in the service
sector such as tourism, finance, and information processing is also evident [Pearson ����:��; United Nations ����: ��]. In Thailand, for instance, tourism has become an important
provider of foreign exchange [Bell ���]. The impact of these trends is most evident in
urban areas�not surprisingly, as urban centers are foci of production activity and the
provision of services, catering to both domestic and foreign markets. Accordingly, the
literature linking globalization, international trade, and other economic changes with
employment patterns and trends within countries has a distinct urban bias.
Although the economic forces associated with globalization have their most obvious
impact in the major urban areas of developing countries, it is also important to consider
their impact on marginal populations, especially on people living in the rural areas of
������� ��� �
304
developing countries. Only a few authors have done this [e. g., Rigg and Nattapoolwat
����: ���]. Globalization is implicated in the commercialization of agriculture and a shift
to the production of more profitable cash crops in conjunction with Thailand’s emphasis
on economic development through export promotion, starting around ���� [Charoenloet
����: ��]. For instance, the cultivation of cassava as a cash crop in Thailand began in
direct response to a demand for this product in Europe, where it is used as a supplement
to cattle feed, and a change in European Economic Commission (EEC) import regulations
that made it possible for Thai farmers to respond to this demand. Economic forces may
operate “at a distance,” as in the cassava example, or they may intrude directly into the
rural economy. Some farmers in Thailand have subcontracted their family plots to
multinational corporations in order to produce cash crops or raise shrimp under contract
to those companies [Rigg and Nattapoolwat ����: ���; Stephens ����]. With the commer-
cialization of agriculture, some household members in rural Thailand also diversified into
employment as brokers and traders [Ayuwat ����: �]. Globalization may not always
serve to increase economic opportunities in rural areas, however. Some argue that the
opening of urban markets to cheaper agricultural imports and the removal of agricul-
tural subsidies result in the loss of employment among small-scale farmers [United
Nations ����: ].
In this study, we focus on economic change in the context of globalization in
Thailand, emphasizing the growth of economic and employment opportunities. We
further elaborate the consequences of globalization for rural populations, with particular
reference to the situation in Thailand and especially the role that migration plays.
Indeed, migration is part and parcel of the globalization process. Communities have
become increasingly interconnected within as well as between countries. The economic,
financial, technical, and cultural transactions that link communities together [see
Pearson ����: ��] involve the movement of people as well as flows of money, goods,
information, and ideas. When migrants cross international borders, their role in the
globalization process is clear [Massey et al. ���: ���]. The same processes that give rise
to international migration of labor from less to more developed countries motivate
rural-to-urban migration of labor within developing countries [VanWey ����]. In Thai-
land, as in many countries, the establishment and growth of manufacturing concerns in
and around urban centers is associated with employment-related migration from rural
areas. The seasonal nature of agriculture in Thailand is also responsible for considerable
movement of individuals back to rural areas as well as between rural areas.
By migrating to urban areas, the rural population may participate directly in the
growth of employment in manufacturing associated with foreign investment and export-
oriented industry, and with the growth in construction and services that may accompany
it. In turn, these migrants affect the rural economy in several ways. Migrants may send
remittances to their households of origin, thus improving the quality of life in rural areas
and possibly also providing the capital to create or expand household businesses [Guest
S. AAK6 and B. ECIL>HA: : Employment Transitions in an Era of Change in Thailand
305
����: ���]. They may return and bring with them a taste for an urban lifestyle, an
unwillingness to work in agriculture, the skills to obtain some other kind of employment
outside of agriculture, or the wherewithal to build some kind of nonagricultural concern.
These migration-related consequences of globalization for the rural population are in
addition to the effects on agriculture that are generally the focus in the literature (for an
exception, see Rigg and Nattapoolwat [����: ���]). Our study of the patterns and trends
in employment in rural areas and of migration by rural migrants to urban areas thus fills
a gap in the literature on globalization and employment.
Although our main interest is in general patterns and trends, similarities and
differences in the experiences of men and women are also of interest. In an economy
known for its high rate of female labor force participation [Sussangkorn and
Chalamwong ����: ��], the growth of economic opportunities outside of agriculture has
encouraged the movement of women as well as men. In contrast to other developing
countries, where men typically constitute a major part of the migrant labor force, in
Thailand both men and women have been important. Women typically comprise the
majority of the labor force in the new labor-intensive manufacturing sectors of develop-
ing countries that produce goods for the global economy [Rama ����: ��; Standing ���:���]. This has been true in the case of Thailand, where, in ���, female workers exceeded
male workers in the manufacturing, commerce, and service sectors [Phananiramai ����:��].
The Example of Nang Rong
Our study is set in Nang Rong, a rural district in the Northeast Region of Thailand
(Map �). The Northeast, one of the country’s poorest regions, is a major supplier of
migrants to the urban areas of Thailand, especially Bangkok and the Eastern Seaboard.
According to the National Migration Survey, a significant proportion of the migrants to
Bangkok comes from the Northeast [Guest ����: ��; Guest et al. ����: ��]. Many of them
are temporary migrants and are registered in their region of origin [Chamratrithirong
et al. ���: ��]. According to other observers [Chalamwong ���: ��; Krongkaew ���: ],
migration in Thailand is more permanent. Migrants tend to stay year-round in urban
areas, although without severing their ties with the rural households. Such employment-
based migration provides rural households with more wage-employment opportunities to
supplement their earnings through seasonal migration. Alongside a greater demand for
labor in urban centers in recent decades, the development of better transportation and
infrastructure has facilitated the corresponding increase in the level of employment-
based migration. Although employment in urban areas in the global era has been
characterized negatively as “flexible,” “casual,” and “informal,” with a low wage potential,
for residents of rural villages it offers a better wage than can be earned locally, along with
the opportunity and access to an urban lifestyle.
������� ��� ��
306
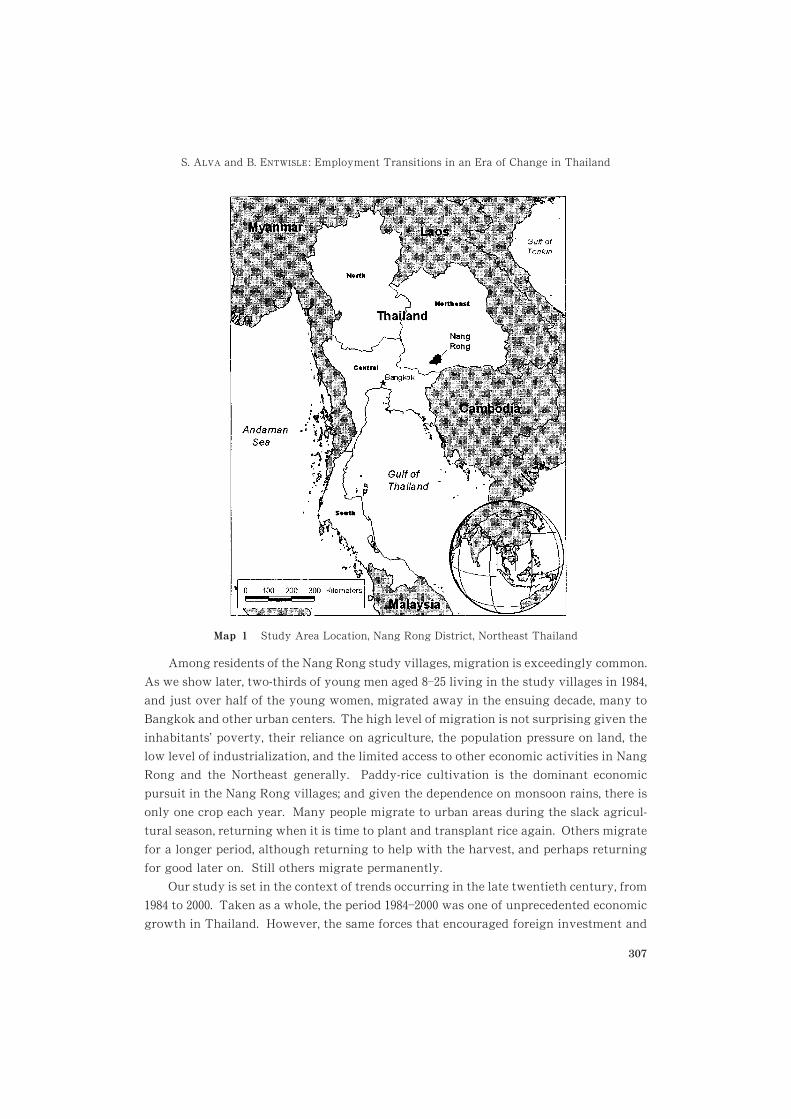
Among residents of the Nang Rong study villages, migration is exceedingly common.
As we show later, two-thirds of young men aged ���� living in the study villages in ����,and just over half of the young women, migrated away in the ensuing decade, many to
Bangkok and other urban centers. The high level of migration is not surprising given the
inhabitants’ poverty, their reliance on agriculture, the population pressure on land, the
low level of industrialization, and the limited access to other economic activities in Nang
Rong and the Northeast generally. Paddy-rice cultivation is the dominant economic
pursuit in the Nang Rong villages; and given the dependence on monsoon rains, there is
only one crop each year. Many people migrate to urban areas during the slack agricul-
tural season, returning when it is time to plant and transplant rice again. Others migrate
for a longer period, although returning to help with the harvest, and perhaps returning
for good later on. Still others migrate permanently.
Our study is set in the context of trends occurring in the late twentieth century, from
���� to ����. Taken as a whole, the period ��������� was one of unprecedented economic
growth in Thailand. However, the same forces that encouraged foreign investment and
Map � Study Area Location, Nang Rong District, Northeast Thailand
S. AAK6 and B. ECIL>HA: : Employment Transitions in an Era of Change in Thailand
307
created a global market for Thailand’s industry also exposed the country to external
influences and global crises. The consequences were especially evident in the financial
crisis of ����, which resulted in job losses in the urban areas and return migration to rural
areas. There have been mixed reports on the impact of the ���� crisis in rural areas.
Some observers assert that the impact was decidedly negative [e. g., Chalamwong ����:���; Phongpaichit and Baker ����: ���]. Others argue that there was only a short-term
impact [e. g., Rigg and Nattapoolwat ����: ���]. National data show that the growth of
investment was positive in all years between ��� and ���� except for ���� and ����, and
likewise, the growth of exports was positive in all years between ��� and ���� except for
����, ����, and ���� [World Bank n. d. (b)]. The economy had recovered to some extent by
����, the end point of our own study.
We use data from a set of surveys conducted by the Institute for Population and
Social Research (IPSR), Mahidol University, and the Carolina Population Center, Univer-
sity of North Carolina�Chapel Hill, known collectively as the C-Bird Evaluation Program�Carolina Population Center (CEP-CPC) surveys, to analyze the employment picture in
���, ���, and ���� for residents of rural Nang Rong, and in ��� and ���� to analyze the
employment situation of rural-to-urban migrants. We investigate employment patterns
from several perspectives. First, we consider trends in the employment of men and
women in rural Nang Rong villages during �������� and in the employment of migrants
from these villages to Bangkok and other urban destinations during ��������. In
particular, we are interested in whether, and to what extent, employment in agriculture
declined in rural Nang Rong during the period, and whether nonagricultural activity
increased. Were changes in the economic activities of migrants from Nang Rong to urban
areas also evident during the period? We focus too on youth to examine whether their
employment behavior changed in this evolving economic scenario, especially with re-
spect to their transition from school to work. Second, we consider the aggregate and
individual employment experiences of a cohort of young people aged ���� years in ���as they aged over the ��-year period through the year ����. We examine the changes in
their migration and employment activities over their life course, focusing on the traject-
ories of young men versus young women. We touch on the effects of the ���� economic
crisis in our analysis of the �������� data; but we do not attempt a full assessment of the
���� crisis and its consequences for employment, which would require more detailed data
than we report here.
The remainder of the article is organized as follows. The next section describes the
data, measures, and analytic approach in greater detail. The following section documents
employment trends over the �������� period for men and women of prime working age,
first for residents of rural Nang Rong villages and then for migrants to urban areas. After
that, we shift to a cohort perspective, taking advantage of the longitudinal strength of
the data set to study change over the life course. The article concludes with a discussion
of the trends shown in each part of the analysis, relating them to the context of
globalization in which they occurred.
������� �� �
308
Data and Method
In the changing context of economic opportunities in Thailand, we examine employment
patterns of men and women from a rural perspective. We analyze data from the Nang
Rong CEP-CPC surveys. (For a more detailed description of the surveys, see http: //www.http: //www.
cpc.unc.edu/projects/nangrongcpc.unc.edu/projects/nangrong) The surveys are both prospective and retrospective,
include migrants from Nang Rong to Bangkok and selected other urban areas, and cover
a crucial period in the recent history of the country. With these data, it is possible to
examine not only employment trends over the period, but also the experiences of a
particular cohort of individuals as they move through their life course. The experiences
of migrants can be compared with those of return migrants and nonmigrants. Migration
is defined in the survey as a move lasting at least two months. As the first study to
document employment trends with the Nang Rong CEP-CPC data, this article focuses on
a description of major trends, the role of migration, and gender differences in employ-
ment patterns.
The Nang Rong CEP-CPC surveys began in ����. The first surveys were fielded in ��study villages in that year. Data were collected on all persons in all households in the ��study villages. Likewise, in ���� and ����, data were again collected on all persons in all
households in the �� villages (including those affected by administrative splits).�) The
���� and ���� data cover persons who may have migrated into the study villages as well
as those ���� residents still (or perhaps again) residing in those villages. We use the data
from the ����, ����, and ���� cross-sections to describe employment patterns at each of
these dates and, more specifically, to document whether a shift out of agriculture
occurred among rural residents. We focus on men and women aged �����; but for
information about trends in the timing of labor force entry, we also look at patterns
among youth aged ����. Occupational data were collected for all household members
aged �� and older.
In addition to surveying all residents of the �� study villages at each date, the
CEP-CPC surveys followed up all the original ���� residents in ���� and ����, and all the
���� residents in ����. As part of the ���� survey, an annual life history was collected for
those aged �����, and in ���� for those aged �����. The life history provides retrospective
information about migration experience and allows us to distinguish rural residents who
migrated and returned from those who never migrated (since age ��, when the life history
starts). Further, in ���� and ����, in a subset of �� villages, we followed out-migrants to
� � Between ���� and ����, the original �� villages split administratively�into villages in
���� and into �� villages in ����. All persons and all households in all descendant villagesare included in the ���� and ���� data collections. For ease of exposition, we refer simplyto the �� study villages.
S. AAK6 and B. ECIL>HA: : Employment Transitions in an Era of Change in Thailand
309
select urban destinations: Bangkok, the Eastern Seaboard, Korat (a regional city), and
Buriram (the provincial city).�) For ���� and ����, it is thus possible to examine the
employment patterns of Nang Rong migrants who lived in urban areas. Here is where we
might expect to see some effects of the ���� financial crisis. The longitudinal design of
the CEP-CPC surveys enables us also to examine the employment patterns of a cohort of
young persons in ���� as they migrated or not, returned or not, in the context of dramatic
macroeconomic changes over the ��������� period.
Measuring Employment
The key variable of interest in our descriptive analysis is the primary occupation of the
individuals, recorded in the household roster of the Nang Rong household and migrant
follow-up surveys. Although some of Thailand’s working-age population has a second-
ary occupation, as is the case in many developing countries, we restrict our analysis to
the primary occupation in order to focus on the productive activity to which individuals
allocate most of their time. To be consistent with the rural context of the data collection,
we did not use formal definitions of the labor force or of employment. The International
Labour Organization (ILO) uses the term “labor force” as a formal concept to identify
persons who are working (employed), or are without work but have looked for work
during a specified reference period (unemployed). Such concepts do not apply well in
agricultural settings, where seasonal unemployment is common. It is not our goal to
describe patterns of seasonal unemployment, but rather to capture broad trends over
time. In Nang Rong, the household surveys were fielded during the agricultural slack
season�deliberately, so that people had time to participate. Thus, we were interested in
people’s usual occupation, not whether they were in fact working at the time of the
survey. In addition, we were interested in unpaid as well as paid work. Rural Nang Rong
is composed largely of small farmers, who work first for subsistence and then sell the
surplus. Formal definitions of the labor force and employment, which do not always
include unpaid family members working on family farms or in family businesses, may
distort gender patterns of employment, especially in rural areas [Beneria ����: ��; Dixon
����: ��]. Thus, while broad and including a subjective element (i. e., respondents decide
what constitutes an occupation), our measure of employment fits with the reality of the
setting we are trying to describe.
We use information on primary occupation to classify employment into categories.
All respondents aged �� years or over provided information on their primary occupation.
As Nang Rong is a poor district where agriculture or related activities are the predomi-
� � In ����, the migrant follow-up included a rural as well as an urban component. Migrants toother villages in Nang Rong (including nonstudy villages) were followed up in ����. We donot use the rural migrant data in this analysis.
������� ���
310
nant occupation, our interest lies in examining a move away from agriculture, with an
expectation that nonagricultural opportunities increased in recent years. Therefore, at
the first stage of this analysis, we broadly define employment sector on the basis of
whether or not an individual is employed in agriculture (or related activities such as
animal husbandry), in nonagricultural activities, or in no occupation. Individuals classi-
fied as not employed are those in school, in college, or undergoing vocational training;
housewives or stay-at-home fathers; or those who have no job or occupation (who may or
may not be seeking a job). All of these are individuals of working age with the potential
to be employed.
We also examine primary employment in nonagricultural activities in more detail.
This examination includes observing what individuals do when employed outside of
agriculture. Furthermore, we are interested in examining patterns of movement between
these nonagricultural sectors over time among rural residents (nonmigrants and return
migrants) and among rural-to-urban migrants. We classify all nonagricultural activities
as skilled or unskilled blue-collar work that involves any production activity; employ-
ment in the service sector; and government, professional, and other activities. We use
this classification for two reasons. First, the literature on globalization and employment
focuses primarily on the growth of the manufacturing and service sectors. It also alludes
to a gender bias in employment in these sectors. Although globalization initially creates
opportunities for unskilled and semi-skilled labor, especially for young women, a transi-
tion occurs in later years, when the development of industry creates a market for the
service sector resulting in higher employment in service-sector work [Pearson ����: ��].
Second, a simple descriptive analysis of the Nang Rong data confirms that these sectors
are the most important (details not shown). In particular, employment in factories or in
construction labor is the most important blue-collar work activity in our data. Employ-
ment as traders, food-service providers, commercial transport drivers, and domestic
workers are the most important service activities in our data.
Analysis Samples
Our analysis of employment capitalizes on the information available in the Nang
Rong CEP-CPC data. The analysis involves two steps. The first uses the data as a
time-series of cross-sections to study trends; the second uses the data to follow the
experiences of a cohort over time. Fig. � illustrates how the two samples overlap in the
analysis.
The cross-sectional analysis represented by the solid gray bars in the figure is
restricted to men and women of prime working age (����� years) at three time points:
����, ����, and ����. The data for employment patterns in Nang Rong refer to residents
of all �� villages. There were ���� such individuals in ����, � in ����, and ���� in ����.The respondents in each of the time periods are not necessarily the same because of aging
S. AAK6 and B. ECIL>HA: : Employment Transitions in an Era of Change in Thailand
311
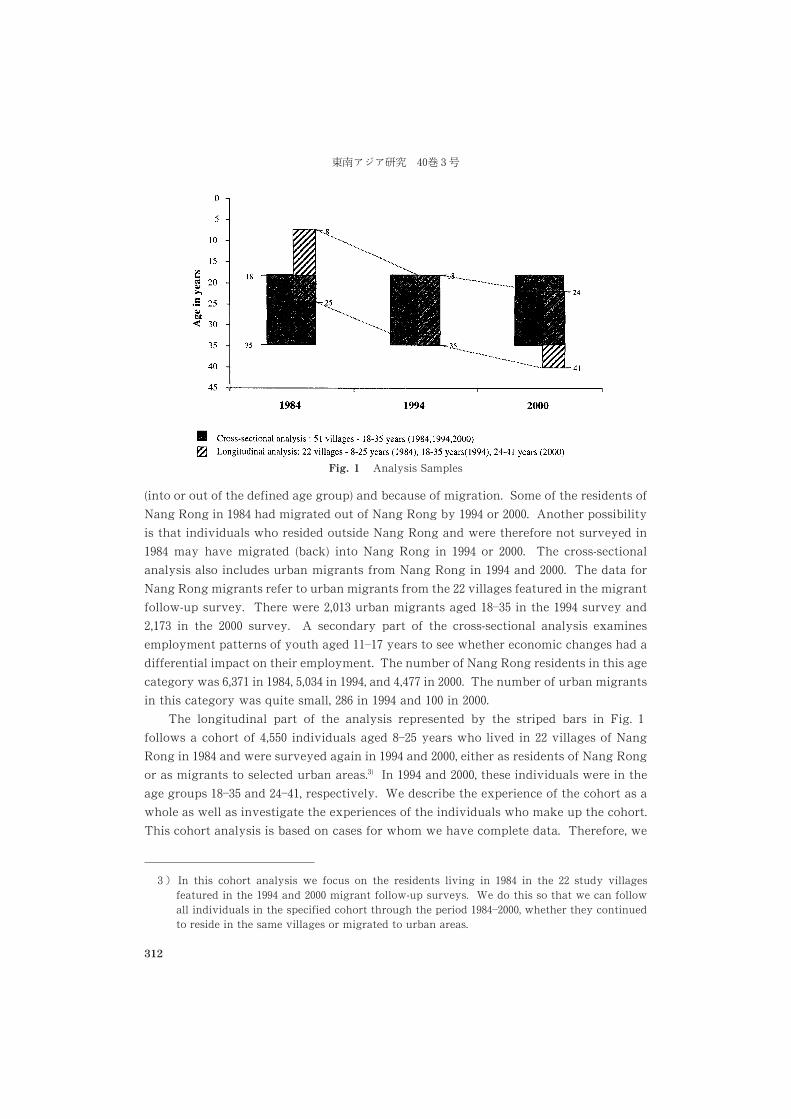
(into or out of the defined age group) and because of migration. Some of the residents of
Nang Rong in ���� had migrated out of Nang Rong by ���� or ����. Another possibility
is that individuals who resided outside Nang Rong and were therefore not surveyed in
���� may have migrated (back) into Nang Rong in ���� or ����. The cross-sectional
analysis also includes urban migrants from Nang Rong in ���� and ����. The data for
Nang Rong migrants refer to urban migrants from the �� villages featured in the migrant
follow-up survey. There were ����� urban migrants aged ���� in the ���� survey and
���� in the ���� survey. A secondary part of the cross-sectional analysis examines
employment patterns of youth aged ���� years to see whether economic changes had a
differential impact on their employment. The number of Nang Rong residents in this age
category was ���� in ����, ���� in ����, and ��� in ����. The number of urban migrants
in this category was quite small, ��� in ���� and ��� in ����.The longitudinal part of the analysis represented by the striped bars in Fig. �
follows a cohort of ��� individuals aged ��� years who lived in �� villages of Nang
Rong in ���� and were surveyed again in ���� and ����, either as residents of Nang Rong
or as migrants to selected urban areas.�) In ���� and ����, these individuals were in the
age groups ���� and �����, respectively. We describe the experience of the cohort as a
whole as well as investigate the experiences of the individuals who make up the cohort.
This cohort analysis is based on cases for whom we have complete data. Therefore, we
� � In this cohort analysis we focus on the residents living in ���� in the �� study villagesfeatured in the ���� and ���� migrant follow-up surveys. We do this so that we can followall individuals in the specified cohort through the period ���������, whether they continuedto reside in the same villages or migrated to urban areas.
Fig. � Analysis Samples
������� ��� �
312
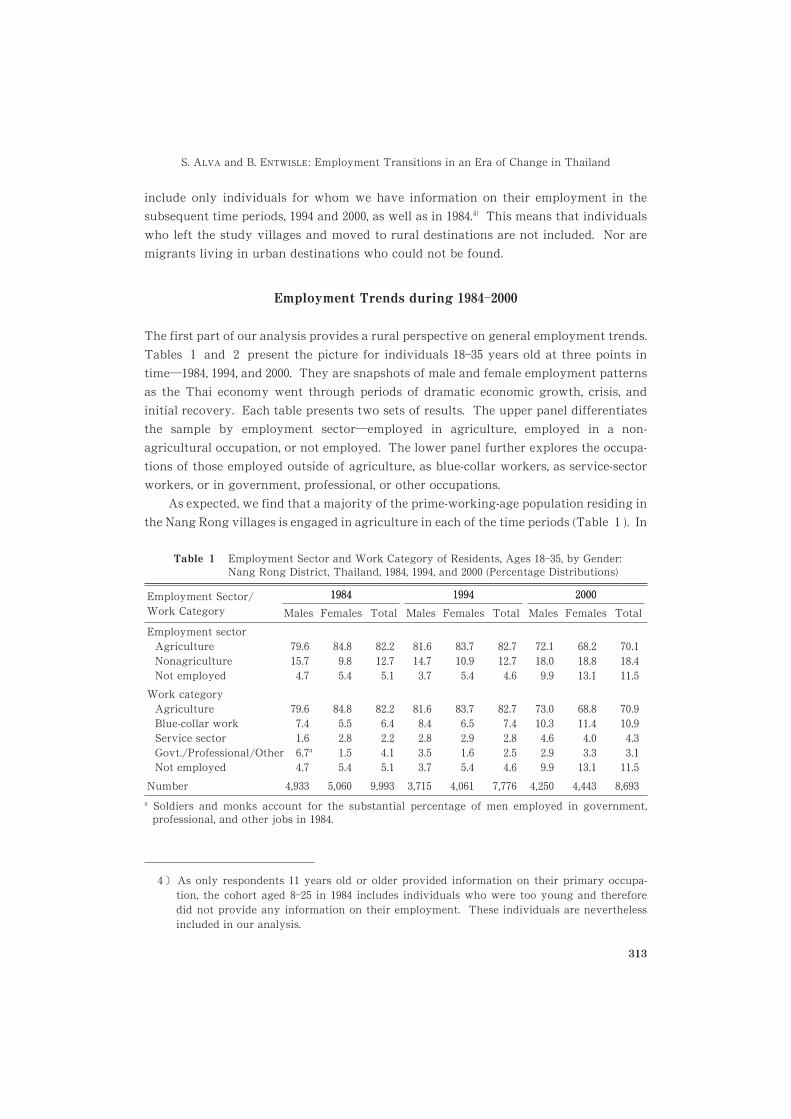
include only individuals for whom we have information on their employment in the
subsequent time periods, ���� and ����, as well as in ����.�) This means that individuals
who left the study villages and moved to rural destinations are not included. Nor are
migrants living in urban destinations who could not be found.
Employment Trends during ���������
The first part of our analysis provides a rural perspective on general employment trends.
Tables � and � present the picture for individuals ����� years old at three points in
time�����, ����, and ����. They are snapshots of male and female employment patterns
as the Thai economy went through periods of dramatic economic growth, crisis, and
initial recovery. Each table presents two sets of results. The upper panel differentiates
the sample by employment sector�employed in agriculture, employed in a non-
agricultural occupation, or not employed. The lower panel further explores the occupa-
tions of those employed outside of agriculture, as blue-collar workers, as service-sector
workers, or in government, professional, or other occupations.
As expected, we find that a majority of the prime-working-age population residing in
the Nang Rong villages is engaged in agriculture in each of the time periods (Table � ). In
� � As only respondents �� years old or older provided information on their primary occupa-tion, the cohort aged ���� in ���� includes individuals who were too young and thereforedid not provide any information on their employment. These individuals are neverthelessincluded in our analysis.
Table � Employment Sector and Work Category of Residents, Ages �����, by Gender:Nang Rong District, Thailand, ����, ����, and ���� (Percentage Distributions)
Employment Sector/Work Category
�������� �������� ��������Males Females Total Males Females Total Males Females Total
Employment sectorAgricultureNonagricultureNot employed
�����
�������
�������
������
�������
������
�������
���������
��������
Work categoryAgricultureBlue-collar workService sectorGovt./Professional/OtherNot employed
������a
�
�����������
�����������
����������
����������
���������
�����������
�������������
������������
Number ����� ����� ����� ���� ����� �� ����� ����� �����a Soldiers and monks account for the substantial percentage of men employed in government,
professional, and other jobs in ����.
S. AAK6 and B. ECIL>HA: : Employment Transitions in an Era of Change in Thailand
313
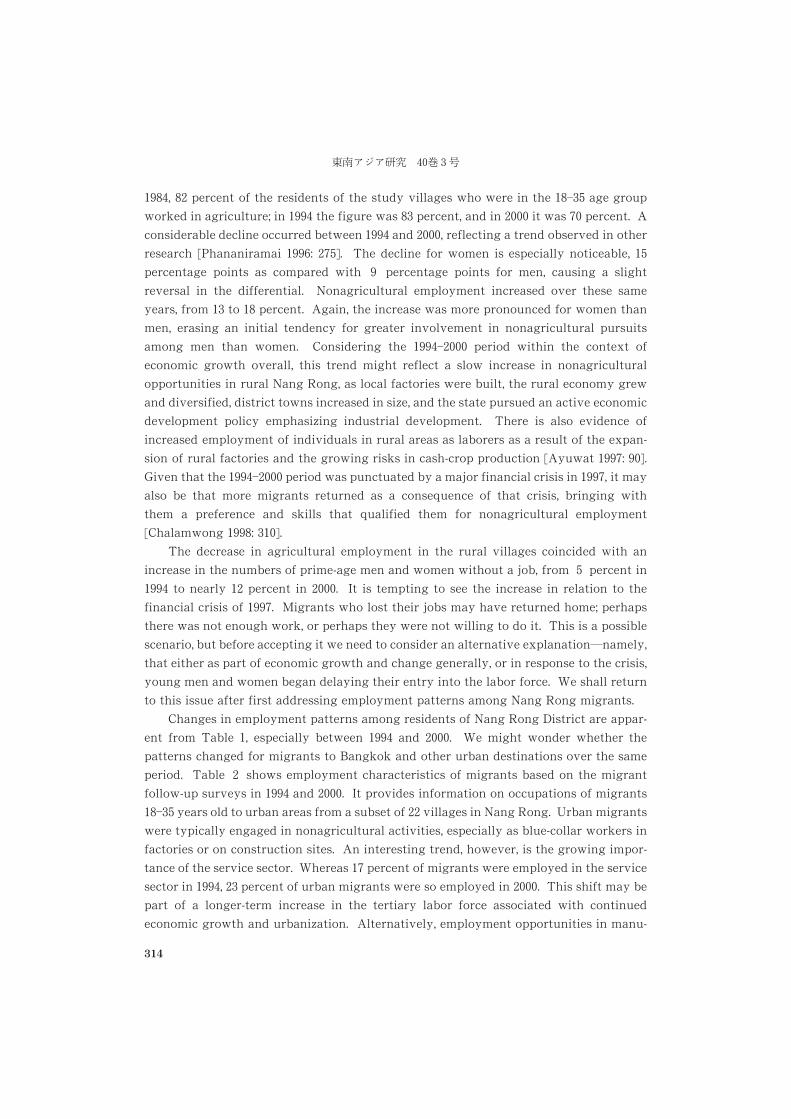
����, �� percent of the residents of the study villages who were in the ����� age group
worked in agriculture; in ���� the figure was �� percent, and in ���� it was � percent. A
considerable decline occurred between ���� and ����, reflecting a trend observed in other
research [Phananiramai ���: ��]. The decline for women is especially noticeable, ��percentage points as compared with � percentage points for men, causing a slight
reversal in the differential. Nonagricultural employment increased over these same
years, from �� to �� percent. Again, the increase was more pronounced for women than
men, erasing an initial tendency for greater involvement in nonagricultural pursuits
among men than women. Considering the ��������� period within the context of
economic growth overall, this trend might reflect a slow increase in nonagricultural
opportunities in rural Nang Rong, as local factories were built, the rural economy grew
and diversified, district towns increased in size, and the state pursued an active economic
development policy emphasizing industrial development. There is also evidence of
increased employment of individuals in rural areas as laborers as a result of the expan-
sion of rural factories and the growing risks in cash-crop production [Ayuwat ���: ��].
Given that the ��������� period was punctuated by a major financial crisis in ���, it may
also be that more migrants returned as a consequence of that crisis, bringing with
them a preference and skills that qualified them for nonagricultural employment
[Chalamwong ����: ���].
The decrease in agricultural employment in the rural villages coincided with an
increase in the numbers of prime-age men and women without a job, from � percent in
���� to nearly �� percent in ����. It is tempting to see the increase in relation to the
financial crisis of ���. Migrants who lost their jobs may have returned home; perhaps
there was not enough work, or perhaps they were not willing to do it. This is a possible
scenario, but before accepting it we need to consider an alternative explanation�namely,
that either as part of economic growth and change generally, or in response to the crisis,
young men and women began delaying their entry into the labor force. We shall return
to this issue after first addressing employment patterns among Nang Rong migrants.
Changes in employment patterns among residents of Nang Rong District are appar-
ent from Table �, especially between ���� and ����. We might wonder whether the
patterns changed for migrants to Bangkok and other urban destinations over the same
period. Table � shows employment characteristics of migrants based on the migrant
follow-up surveys in ���� and ����. It provides information on occupations of migrants
����� years old to urban areas from a subset of �� villages in Nang Rong. Urban migrants
were typically engaged in nonagricultural activities, especially as blue-collar workers in
factories or on construction sites. An interesting trend, however, is the growing impor-
tance of the service sector. Whereas � percent of migrants were employed in the service
sector in ����, �� percent of urban migrants were so employed in ����. This shift may be
part of a longer-term increase in the tertiary labor force associated with continued
economic growth and urbanization. Alternatively, employment opportunities in manu-
������� ��� ��
314
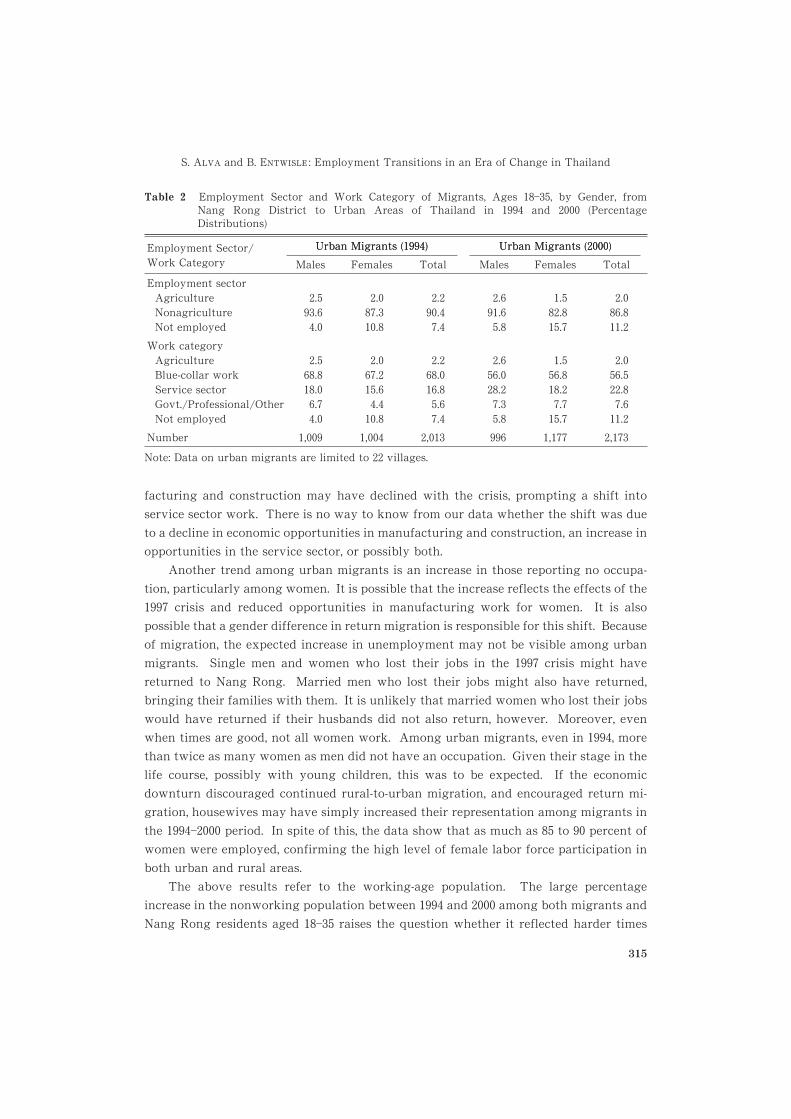
facturing and construction may have declined with the crisis, prompting a shift into
service sector work. There is no way to know from our data whether the shift was due
to a decline in economic opportunities in manufacturing and construction, an increase in
opportunities in the service sector, or possibly both.
Another trend among urban migrants is an increase in those reporting no occupa-
tion, particularly among women. It is possible that the increase reflects the effects of the
���� crisis and reduced opportunities in manufacturing work for women. It is also
possible that a gender difference in return migration is responsible for this shift. Because
of migration, the expected increase in unemployment may not be visible among urban
migrants. Single men and women who lost their jobs in the ���� crisis might have
returned to Nang Rong. Married men who lost their jobs might also have returned,
bringing their families with them. It is unlikely that married women who lost their jobs
would have returned if their husbands did not also return, however. Moreover, even
when times are good, not all women work. Among urban migrants, even in ����, more
than twice as many women as men did not have an occupation. Given their stage in the
life course, possibly with young children, this was to be expected. If the economic
downturn discouraged continued rural-to-urban migration, and encouraged return mi-
gration, housewives may have simply increased their representation among migrants in
the ��������� period. In spite of this, the data show that as much as �� to �� percent of
women were employed, confirming the high level of female labor force participation in
both urban and rural areas.
The above results refer to the working-age population. The large percentage
increase in the nonworking population between ���� and ���� among both migrants and
Nang Rong residents aged ���� raises the question whether it reflected harder times
Table � Employment Sector and Work Category of Migrants, Ages ����, by Gender, fromNang Rong District to Urban Areas of Thailand in ���� and ���� (PercentageDistributions)
Employment Sector/Work Category
Urban Migrants (����)Urban Migrants (����) Urban Migrants (����)Urban Migrants (����)Males Females Total Males Females Total
Employment sectorAgricultureNonagricultureNot employed
������
�������
�������
�������
��������
��������
Work categoryAgricultureBlue-collar workService sectorGovt./Professional/OtherNot employed
������������
�������������
������������
�����������
�������������
�������������
Number ����� ����� ���� ��� ����� ����
Note: Data on urban migrants are limited to �� villages.
S. AAK6 and B. ECIL>HA: : Employment Transitions in an Era of Change in Thailand
315
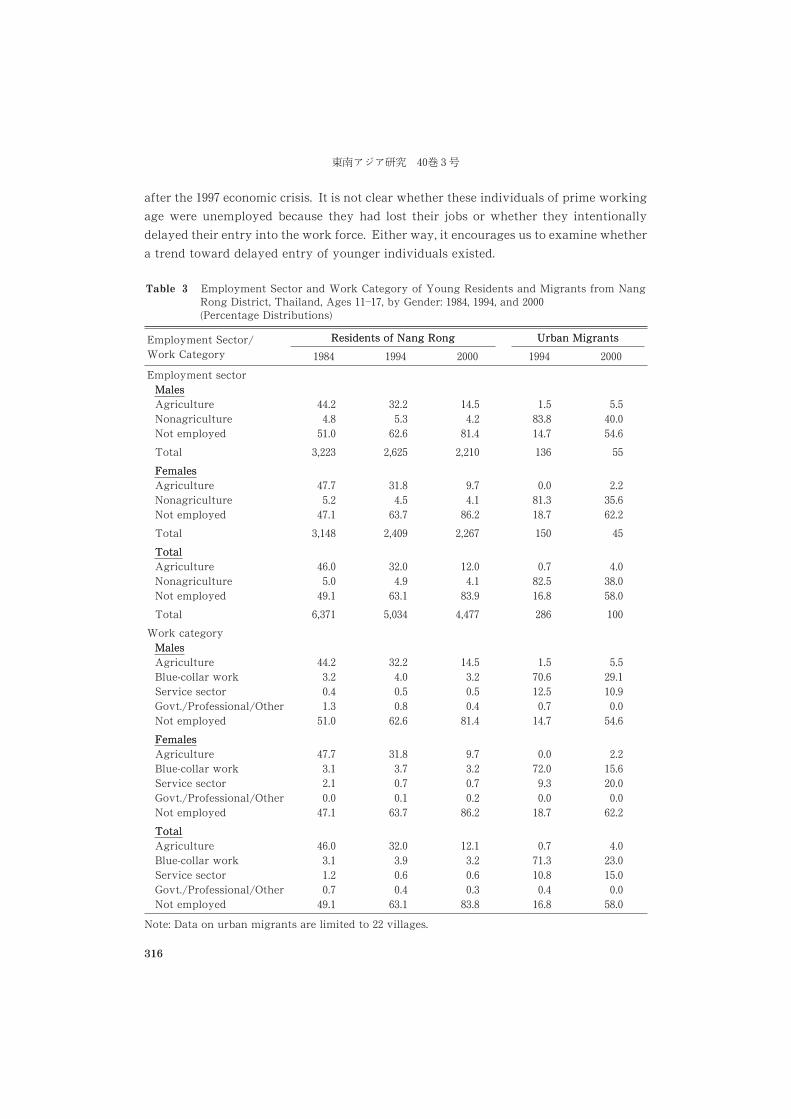
after the ���� economic crisis. It is not clear whether these individuals of prime working
age were unemployed because they had lost their jobs or whether they intentionally
delayed their entry into the work force. Either way, it encourages us to examine whether
a trend toward delayed entry of younger individuals existed.
Table � Employment Sector and Work Category of Young Residents and Migrants from NangRong District, Thailand, Ages �����, by Gender: ����, ����, and ����(Percentage Distributions)
Employment Sector/Work Category
Residents of Nang RongResidents of Nang Rong Urban MigrantsUrban Migrants
���� ���� ���� ���� ����Employment sector
MalesMalesAgricultureNonagricultureNot employed
����������
��������
����������
���������
��������
Total ��� ���� ����� �� FemalesFemalesAgricultureNonagricultureNot employed
����������
��������
����������
����������
���������
Total ���� ����� ����� �� �TotalTotalAgricultureNonagricultureNot employed
����������
���������
����������
����������
���������
Total ���� ��� ����� ��� ���Work category
MalesMalesAgricultureBlue-collar workService sectorGovt./Professional/OtherNot employed
��������������
���������������
��������������
����������������
���������������
FemalesFemalesAgricultureBlue-collar workService sectorGovt./Professional/OtherNot employed
����������������
��������������
���������������
����������������
�����������������
TotalTotalAgricultureBlue-collar workService sectorGovt./Professional/OtherNot employed
����������������
��������������
��������������
�����������������
���������������
Note: Data on urban migrants are limited to �� villages.
������� ��� �
316
Table �, which compares the employment outcomes in ����, ����, and ���� of male
and female youth ����� years old residing in Nang Rong as well as migrants in urban
centers, indicates a large decrease in the economic activity of youth in both areas over
time. Whereas � percent of youth in Nang Rong were employed in ����, only �� percent
were employed in ���� and only � percent were employed in ����. This decrease in
gainful activity corresponds to increased schooling. Although a substantial percentage
of youth aged ����� not employed was reported to be in school in ����, the percentage
was almost � percent in ���� and ���� (data not shown). There is no way to determine
whether those in school were there as a matter of choice or because lean times limited
their opportunity in the labor force. That the trend for increasing education among
youth was well established before the ���� crisis suggests that choice played at least
some role. The patterns among youth in Nang Rong correspond with other national
data. )
The decrease in the work activity of youth was even more substantial among
migrants, although our sample is small. In ����, most migrant youth were in the labor
force, mainly in manufacturing and construction. This is not surprising given that
much of the migration to urban centers in Thailand has been employment-driven
[Phongpaichit ����: ���]. It appears that in the period of growing economic opportunities
during the early ����s, the labor force attracted a large proportion of youth in urban
areas. One study found that migrants to Bangkok generally had higher levels of
employment than did nonmigrants in Bangkok [Guest ���: ���]. Like older individuals,
most of them worked as factory or construction workers. Young migrant females did
even better than males in the urban labor force. However, the scenario appears to have
changed by ����; a significant percentage dropped out of the labor force. Table � shows
that � percent of migrant youth in the ����� age group were not employed in ����;almost all of them reported that they were still in school. We interpret this change in part
as a trend toward delayed labor-force entry that is typically associated with economic
development, and in part as a reaction to the economic crisis. The decline was most
evident in agriculture in the rural areas and in factory and construction work among
urban migrants.
Life-Course Transitions in Employment
The next part of the analysis follows a single cohort of ��� individuals through the
period of interest, ���������. The results are based on employment outcomes in ����, ����,and ���� for individuals aged ��� in ���� and at that time residing in the �� Nang Rong
� Data from the World Bank corroborate the increasing levels of education in Thailand.Between ���� and ����, the gross enrollment ratio at the secondary level increased from ��to � percent in Thailand [World Bank n. d. (c)].
S. AAK6 and B. ECIL>HA: : Employment Transitions in an Era of Change in Thailand
317
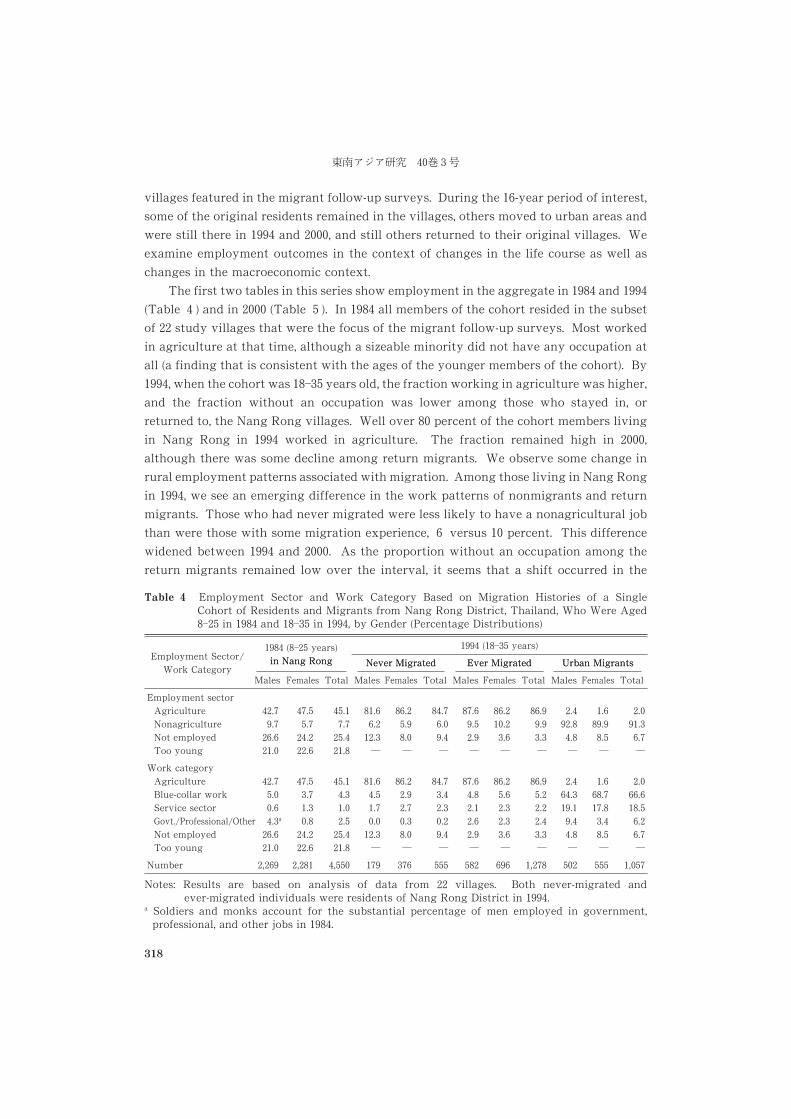
villages featured in the migrant follow-up surveys. During the ��-year period of interest,
some of the original residents remained in the villages, others moved to urban areas and
were still there in ���� and ����, and still others returned to their original villages. We
examine employment outcomes in the context of changes in the life course as well as
changes in the macroeconomic context.
The first two tables in this series show employment in the aggregate in ���� and ����(Table � ) and in ���� (Table � ). In ���� all members of the cohort resided in the subset
of �� study villages that were the focus of the migrant follow-up surveys. Most worked
in agriculture at that time, although a sizeable minority did not have any occupation at
all (a finding that is consistent with the ages of the younger members of the cohort). By
����, when the cohort was ���� years old, the fraction working in agriculture was higher,
and the fraction without an occupation was lower among those who stayed in, or
returned to, the Nang Rong villages. Well over �� percent of the cohort members living
in Nang Rong in ���� worked in agriculture. The fraction remained high in ����,although there was some decline among return migrants. We observe some change in
rural employment patterns associated with migration. Among those living in Nang Rong
in ����, we see an emerging difference in the work patterns of nonmigrants and return
migrants. Those who had never migrated were less likely to have a nonagricultural job
than were those with some migration experience, � versus �� percent. This difference
widened between ���� and ����. As the proportion without an occupation among the
return migrants remained low over the interval, it seems that a shift occurred in the
Table � Employment Sector and Work Category Based on Migration Histories of a SingleCohort of Residents and Migrants from Nang Rong District, Thailand, Who Were Aged���� in ���� and ���� in ����, by Gender (Percentage Distributions)
Employment Sector/
Work Category
���� (���� years)
in Nang Rongin Nang Rong
���� (���� years)
Never MigratedNever Migrated Ever MigratedEver Migrated Urban MigrantsUrban Migrants
Males Females Total Males Females Total Males Females Total Males Females Total
Employment sector
Agriculture
Nonagriculture
Not employed
Too young
�����������
�����������
�����������
��������
��������
��������
��������
��������
������
��������
��������
�������
Work category
Agriculture
Blue-collar work
Service sector
Govt./Professional/Other
Not employed
Too young
��������a
������
�������������
��������������
������������
�����������
����������
������������
���������
����������
������������
������������
�������������
Number ����� ����� ����� ��� �� ��� ��� ��� ����� ��� ��� �����
Notes: Results are based on analysis of data from �� villages. Both never-migrated andever-migrated individuals were residents of Nang Rong District in ����.
a Soldiers and monks account for the substantial percentage of men employed in government,professional, and other jobs in ����.
������� ��� �
318
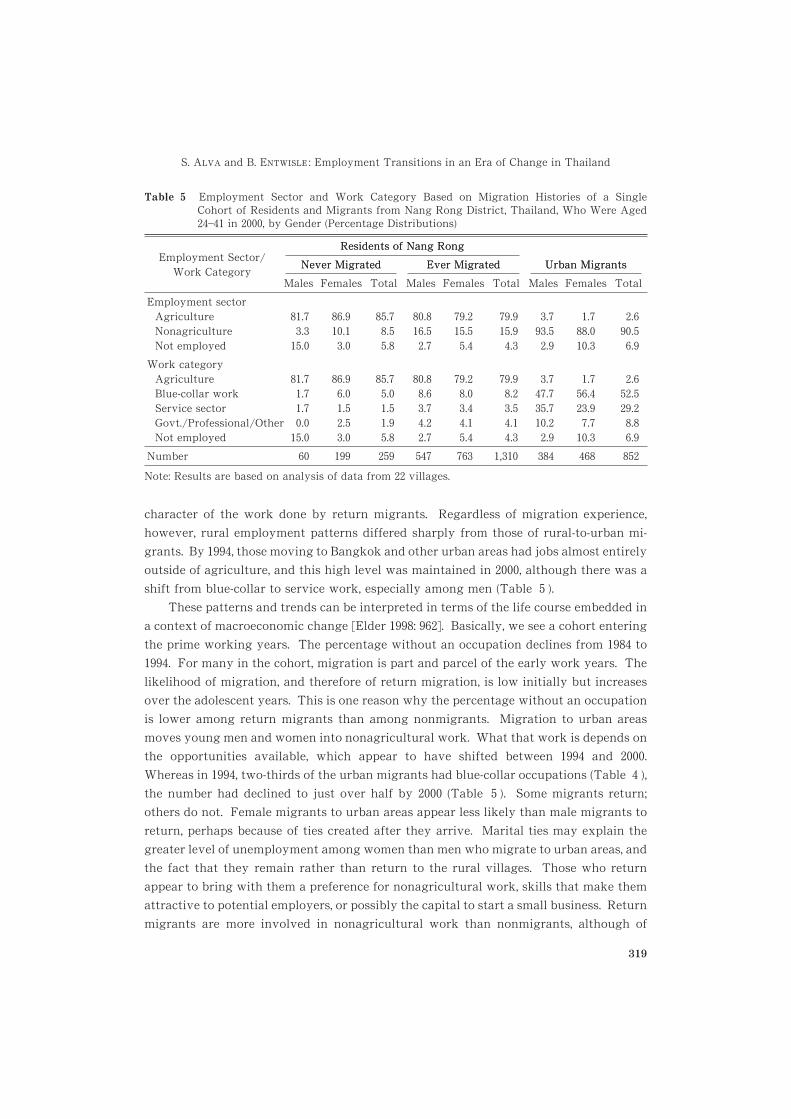
character of the work done by return migrants. Regardless of migration experience,
however, rural employment patterns differed sharply from those of rural-to-urban mi-
grants. By ����, those moving to Bangkok and other urban areas had jobs almost entirely
outside of agriculture, and this high level was maintained in ����, although there was a
shift from blue-collar to service work, especially among men (Table � ).
These patterns and trends can be interpreted in terms of the life course embedded in
a context of macroeconomic change [Elder ����: ���]. Basically, we see a cohort entering
the prime working years. The percentage without an occupation declines from ���� to
����. For many in the cohort, migration is part and parcel of the early work years. The
likelihood of migration, and therefore of return migration, is low initially but increases
over the adolescent years. This is one reason why the percentage without an occupation
is lower among return migrants than among nonmigrants. Migration to urban areas
moves young men and women into nonagricultural work. What that work is depends on
the opportunities available, which appear to have shifted between ���� and ����.Whereas in ����, two-thirds of the urban migrants had blue-collar occupations (Table � ),
the number had declined to just over half by ���� (Table � ). Some migrants return;
others do not. Female migrants to urban areas appear less likely than male migrants to
return, perhaps because of ties created after they arrive. Marital ties may explain the
greater level of unemployment among women than men who migrate to urban areas, and
the fact that they remain rather than return to the rural villages. Those who return
appear to bring with them a preference for nonagricultural work, skills that make them
attractive to potential employers, or possibly the capital to start a small business. Return
migrants are more involved in nonagricultural work than nonmigrants, although of
Table � Employment Sector and Work Category Based on Migration Histories of a SingleCohort of Residents and Migrants from Nang Rong District, Thailand, Who Were Aged����� in ����, by Gender (Percentage Distributions)
Employment Sector/Work Category
Residents of Nang RongResidents of Nang Rong
Urban MigrantsUrban MigrantsNever MigratedNever Migrated Ever MigratedEver Migrated
Males Females Total Males Females Total Males Females Total
Employment sectorAgricultureNonagricultureNot employed
�������
��������
������
�������
�������
�������
������
�������
�������
Work categoryAgricultureBlue-collar workService sectorGovt./Professional/OtherNot employed
���������
�����������
����������
���������
����������
����������
���������
����������
������������
Number �� ��� ��� �� �� ����� ��� ��� ���
Note: Results are based on analysis of data from �� villages.
S. AAK6 and B. ECIL>HA: : Employment Transitions in an Era of Change in Thailand
319
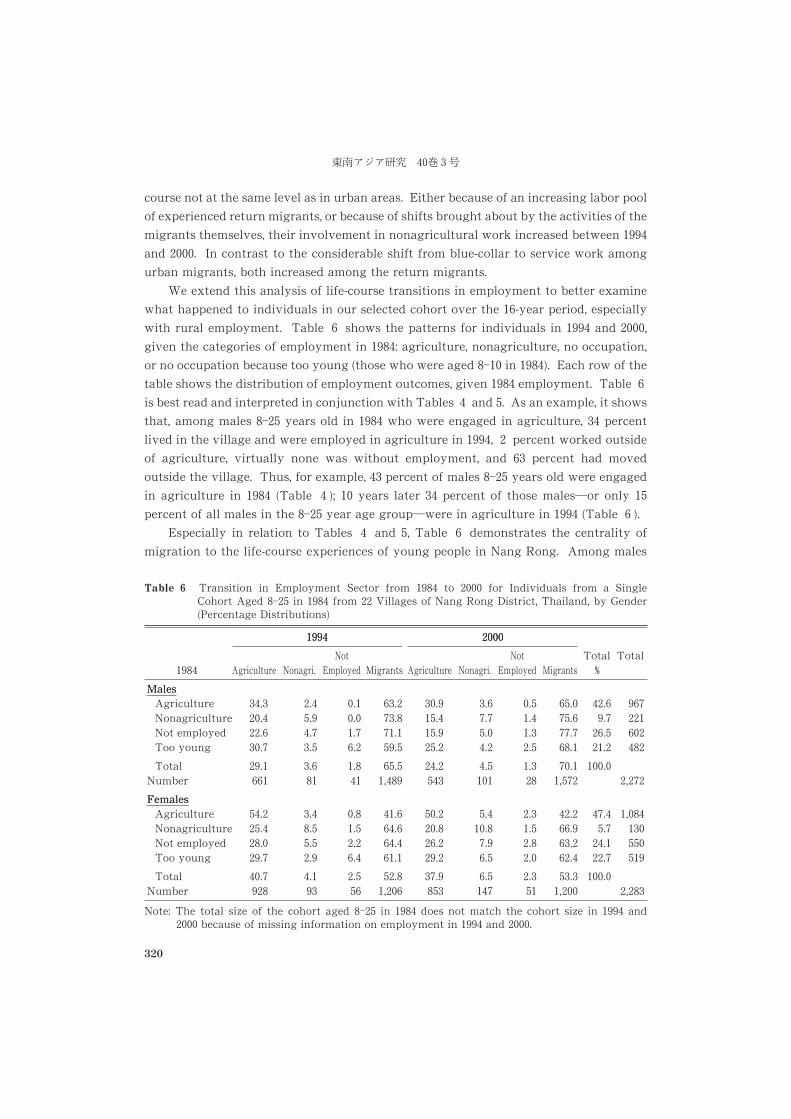
course not at the same level as in urban areas. Either because of an increasing labor pool
of experienced return migrants, or because of shifts brought about by the activities of the
migrants themselves, their involvement in nonagricultural work increased between ����and ����. In contrast to the considerable shift from blue-collar to service work among
urban migrants, both increased among the return migrants.
We extend this analysis of life-course transitions in employment to better examine
what happened to individuals in our selected cohort over the ��-year period, especially
with rural employment. Table � shows the patterns for individuals in ���� and ����,given the categories of employment in ����: agriculture, nonagriculture, no occupation,
or no occupation because too young (those who were aged ���� in ����). Each row of the
table shows the distribution of employment outcomes, given ���� employment. Table �is best read and interpreted in conjunction with Tables � and �. As an example, it shows
that, among males ���� years old in ���� who were engaged in agriculture, � percent
lived in the village and were employed in agriculture in ����, � percent worked outside
of agriculture, virtually none was without employment, and � percent had moved
outside the village. Thus, for example, � percent of males ���� years old were engaged
in agriculture in ���� (Table � ); �� years later � percent of those males�or only ��percent of all males in the ���� year age group�were in agriculture in ���� (Table � ).
Especially in relation to Tables � and �, Table � demonstrates the centrality of
migration to the life-course experiences of young people in Nang Rong. Among males
Table � Transition in Employment Sector from ���� to ���� for Individuals from a SingleCohort Aged ���� in ���� from �� Villages of Nang Rong District, Thailand, by Gender(Percentage Distributions)
����
�������� ��������Total�
TotalAgriculture Nonagri.
NotEmployed Migrants Agriculture Nonagri.
NotEmployed Migrants
MalesMalesAgricultureNonagricultureNot employedToo young
���������
�������
��������
����������
�����������
�������
�������
������������
�����������
������������
TotalNumber
������
���
����
��������
�����
�����
���
��������
���������
FemalesFemalesAgricultureNonagricultureNot employedToo young
������������
�������
��������
������������
������������
���������
�������
�����������
�����������
�������������
TotalNumber
������
���
����
��������
����
�����
���
������
��������
Note: The total size of the cohort aged ���� in ���� does not match the cohort size in ���� and���� because of missing information on employment in ���� and ����.
������� ��� �
320
���� years old in ����, �� percent had moved away by ����, and � percent had moved
away by �. The fraction is a little lower (� percent in ���� and �), but still
substantial for young women. Although a greater number of young men than young
women left their villages, as indicated by Table �, slightly more young women were
found and interviewed in urban destinations. As we discuss more fully below, young
men have less to keep them in the village than young women, and so they leave, some of
them going to urban places but others going to other rural places. Although women are
less likely to leave, those who do are more likely to move to major urban destinations and
not return [Entwisle and VanWey �].
Table � confirms the movement toward nonagricultural employment in the rural
areas. In Tables � and � we saw an increasing trend in this direction over the life
course, particularly among return migrants. In Table � we see that young people with
a nonagricultural job in ���� were slightly more likely than others to hold such a job in
���� and �, but what is striking is the extent to which this is not the case. Among
young men with a nonagricultural job in ����, � percent had one in ���� and � percent
had one in �. Certainly, this is not a picture of strong job continuity. The same is true
for young women. If anything, young persons having a nonagricultural job in ���� were
more likely than others to leave the village. Turning it around, Nang Rong residents with
nonagricultural jobs in ���� and � were as likely or more likely to have held an
agricultural as a nonagricultural job in ����. Putting this together with our interpreta-
tion of Tables � and �, it seems that migration has an important influence on the
preferences and skills for nonagricultural work. This conclusion is speculative, but
migration appears to mitigate the impact of initial differences in skills and preferences.
Table � also reveals an important gender difference in employment trajectories. For
both young men and young women, agriculture was the most likely occupation in ����according to Table �: � percent among males and �� percent among females ���� years
old. Table � shows that in ���� and � the young women were more likely than the
young men to be engaged in agriculture, but what follows from that involvement differs
sharply by gender. More than half of the young women in agriculture in ���� were still
in agriculture a decade later, whereas this was true of only a third of the young men. The
different trajectories are possibly due to differences in the demand for male and female
labor in places of destination, perhaps in conjunction with efforts to control the move-
ments of young women more than young men. It is possible that despite the socioeco-
nomic changes in Thailand, women are still trying to perform the traditional roles
expected of them, including the role of caregiver to elderly parents [Curran ����: �]. At
the same time, out-migration is common for both genders, and similarities are more
striking than differences in the employment of urban migrants. It is possible that
agricultural employment has a different significance for young men and young women in
rural villages of Thailand. Although there are exceptions, the traditional pattern is for
daughters to inherit family land, and for the youngest also to inherit the parental home
S. AAK6 and B. ECIL>HA: : Employment Transitions in an Era of Change in Thailand
321
[Foster ����: ��; Richter and Podhisita ����: �]. Perhaps for young women, agricultural
employment is a step in this direction. Interestingly, the migration propensities of young
women not initially in agriculture resemble those of young men.
Discussion
In this study we have examined employment trends of young men and women in
Thailand using data from ���� to ����, a period of increasing globalization, export-
oriented development, and unprecedented economic growth in Thailand despite the ����financial crisis. Globalization has economic, financial, technical, and cultural implica-
tions. Thailand has witnessed changes in all these areas. Our analysis has focused
primarily on economic growth and its consequences for economic opportunities and
employment outcomes.
We examined changes in occupations among residents of rural Thailand, including
those employed in rural areas or as temporary or permanent migrants to urban centers.
Given the strong ties�financial as well as social and cultural�that urban migrants have
to their households of origin in rural areas, we believe that changes in rural areas are
closely connected to the economic changes occurring in urban areas. This is particularly
true in poor, primarily agricultural rural areas such as Nang Rong District, areas that
otherwise offer little opportunity for employment outside of agriculture, especially in the
dry season. We have further conceptualized employment and migration as varying
according to the stage of an individual’s life course. Using the Nang Rong CEP-CPC data,
we have relied on this connection between rural and urban areas in examining employ-
ment trends over an extended period of time, based on individuals’ past migration history
as well as the stage in their life course, all situated in a context of increasing economic
opportunities.
Our research reveals some interesting patterns. Most apparent is the growing trend
of nonagricultural employment in urban and rural areas, validating the hypothesis that
the macroeconomic changes in Thailand have permeated to rural areas as well. An
increasing percentage of men and women are employed as skilled or unskilled labor in
factories, rice mills, and construction work. Therefore, a trend toward the diversification
of household activities outside of agriculture is taking place, even in Nang Rong,
although it is slow and delayed or even small, as compared with what urban migrants do.
The largest increase in nonagricultural activity is evident between ���� and ����,indicating possibly a lag in the impact of growing opportunities on poor rural areas such
as Nang Rong.
Migrants, both urban and rural, are likely players in this process, as an examination
of past migration patterns of individuals in rural areas indicates. With poverty and
population pressures on land in rural areas, both seasonal and permanent migration from
������� ��� �
322
rural areas has increased. The development of transport and infrastructural facilities in
rural Thailand in conjunction with the country’s overall focus on economic development
has facilitated this movement. Individuals who have had the opportunity to migrate in
the past are more likely to move into nonagricultural employment, especially in factories
or even as construction labor, even when they return to rural areas. Given the drudgery
of agricultural work, they now have an added incentive to move into nonagricultural
activities, which are becoming increasingly available, particularly in small towns adjoin-
ing rural areas. Equally likely is the possibility that the remittances of urban migrants
have led to a slow transformation of rural areas, creating new employment opportunities
there. A change is evident in urban areas as well. Especially in the late ����s, there was
a trend toward greater employment in the service sector as manufacturing activities led
to the need for better services. This change, though small, is evident in rural Nang Rong
too and is significant, given that our conservative definition of employment in the service
sector includes only employment as traders, food-service workers, transportation work-
ers, and domestic workers.
These trends are further confirmed in our cohort analysis, which follows a single
cohort of individuals aged ���� from ���� to ����. They also display gender differences
in the patterns of movement from rural Nang Rong to urban areas. Much of the
globalization and migration literature on Thailand and other Southeast Asian countries
alludes to the large role played by youth, particularly women, in the growth of labor-
intensive industries and the service sector. This is evident in Nang Rong as well. Both
women and men play a part in the migration process, but with gender differences. While
all young men have a tendency to migrate to urban areas, only some women do, mainly
those women who previously engaged in some nonagricultural activity. It appears,
therefore, that those young women who have stronger ties to land remain in their
villages, while a majority of men seek out new opportunities in urban and other rural
areas. But patterns of return migration are also interesting, again with distinct gender
differences. They tend to be small, even between ���� and ����, despite reports in other
research of high rates of return migration after the ���� financial crisis. Whereas men
maintain ties to their households of origin and are likely to return, it is the opposite case
with women.
Throughout this study, we have made references to the ���� financial crisis in our
discussions of changing employment and migration patterns, levels of unemployment,
and a possible delay in the entry to work among youth. We intend to be cautious in
assessing its impact, however. As others have indicated [e. g., Rigg and Nattapoolwat
����: ��], the effects of the crisis may have been immediate but without creating a major
dent in the high growth levels in Thailand over the long term (see Chalamwong [����:���] for a contrasting view). It is also difficult to assess the impact on the rest of the
economy. Most analyses, for example of the impact of the crisis in Indonesia, are based
on aggregate statistics and so do not always present a true picture of the changes over
S. AAK6 and B. ECIL>HA: : Employment Transitions in an Era of Change in Thailand
323
time [Aslanbeigui and Summerfield ����: ��; Frankenberg, Thomas, and Beegle ����: ��].
Even in Thailand, our analysis of the situation between ���� and ���� possibly misses
some subtle short-term changes that occurred during that period. It is possible that high
levels of unemployment after the crisis reflected only job turnovers rather than longer
stints of unemployment. Other researchers have shown that return migration as a result
of the economic crisis in Thailand was not permanent [TDRI ����: ��]. We have found
that the levels of unemployment were consistently low at all three time points, including
����, except possibly among adolescents and youth who were still in school. A deeper
analysis of the retrospective employment-history data for individuals from Nang Rong,
which we will undertake in a subsequent study, is required to explore this subject more
thoroughly.
References
Aslanbeigui, Nahid; and Summerfield, Gale. ����. The Asian Crisis, Gender, and the InternationalFinancial Architecture. Feminist Economics ( � ): ������.
Ayuwat, Dusadee. ���. The Change of Occupations of the Rural Population in Northeast Thailand.In Research Papers on Interrelationships between Population Growth in Developing Countries andGlobal Environment, Vol. II. Research Series No. ���, pp. �����. Tokyo: National Institute ofPopulation and Social Security Research, Ministry of Health and Welfare.
Bell, Peter. ����. Gender and Economic Development in Thailand. In Gender and Development inSoutheast Asia, edited by Penny Van Esterik and John Van Esterik, pp. ����. Proceedings of theTwentieth Meetings of the Canadian Council for Southeast Asian Studies, York University,October �����, ����.
Beneria, Lourdes. ����. Conceptualizing the Labor Force: The Underestimation of Women’s Econom-ic Activities. Journal of Development Studies � ( � ): �����.
Beneria, Lourdes; Floro, Maria; Grown, Caren; and MacDonald, Martha. ����. Introduction: Globaliza-tion and Gender. Feminist Economics ( � ): vii�xviii.
Chalamwong, Yongyuth. ����. The Impact of the Crisis on Migration in Thailand. Asian and PacificMigration Journal (���): ������.
Chamratrithirong, Aphichat; Archavanitkul, Kritaya; Richter, Kerry; Guest, Philip; Thongthai,Varachai; Boonchalaksi, Wathinee; Piriyathamwong, Nittaya; and Vong-Ek, Panee. ����.National Migration Survey of Thailand. Bangkok: Institute for Population and Social Research,Mahidol University.
Charoenloet, Voravidh. ����. Population and Industrial Development. Journal of Population andSocial Studies � (���): �����.
Curran, Sara R. ����. Gender Roles and Migration: “Good Sons” vs. Daughters in Rural Thailand.Working Paper No. �����. Seattle: Seattle Population Research Center, University of Washing-ton.
Dickinson, Tony D. ���. Selective Globalization: The Relocation of Industrial Production and theShaping of Women’s Work. Research in the Sociology of Work : �������.
Dixon, Ruth. ����. Women in Agriculture: Counting the Labor Force in Developing Countries.Population and Development Review � ( � ): �����.
Elder, Glen H. Jr. ����. The Life Course and Human Development. In Handbook of Child Psychology,Vol. 1: Theoretical Models of Human Development, edited by R. M. Lerner, pp. �������. New York:Wiley.
Entwisle, Barbara; and VanWey, Leah K. ����. The Holding Power of Land: Gender Differences inRural-Urban Migration in Nang Rong, Thailand. Paper presented at the Annual Meetings of the
������� ��� ��
324
Population Association of America, Los Angeles, CA.Foster, Brian. ����. Family Structure and the Generation of Thai Social Exchange Networks. In
Households: Comparative and Historical Studies of the Domestic Group, edited by Robert McC.Netting, Richard R. Wilk, and Eric J. Arnould, pp. ������. Berkeley: University of CaliforniaPress.
Frankenberg, Elizabeth; Thomas, Duncan; and Beegle, Kathleen. ����. The Real Costs of Indonesia’sEconomic Crisis: Preliminary Findings from the Indonesia Family Life Surveys. Labor andPopulation Program Working Paper Series, �����. Santa Monica, CA: RAND.
Galenson, Walter. ����. Labour and Economic Growth in Five Asian Countries: South Korea, Malaysia,Taiwan, Thailand, and the Philippines. New York: Praeger.
Guest, Philip. ����. Assessing the Consequences of Internal Migration: Methodological Issues and aCase Study on Thailand Based on Longitudinal Household Survey Data. In Migration, Urbani-zation, and Development: New Directions and Issues, edited by Richard E. Bilsborrow, pp. �����.Proceedings of the Symposium on Internal Migration and Urbanization in Developing Count-ries, January �����, ����, New York. New York: United Nations Population Fund and KluwerAcademic Publishers.
Guest, Philip; Chamratrithirong, Aphichat; Archavanitkul, Kritaya; Piriyathamwong, Nittaya; andRichter, Kerry. ����. Internal Migration in Thailand. Asian and Pacific Migration Journal ( � ):
������.Krongkaew, Medhi. ����. Contributions of Agriculture to Industrialization. In Thailand’s Industrial-
ization and Its Consequences, edited by Medhi Krongkaew, pp. ���. New York: St. Martin’sPress.
Kurian, Rachel. ����. Women’s Work in Changing Labor Markets: The Case of Thailand in the ����s.In Women, Globalization and Fragmentation in the Developing World, edited by Haleh Afshar andStephanie Barrientos, pp. ������. New York: St. Martin’s Press.
Mason, Andrew; and Campbell, Burnham O. ���. Demographic Change and the Thai Economy: AnOverview. In The Economic Impact of Demographic Change in Thailand, 1980�2015: An Applica-tion of the HOMES Household Forecasting Model, edited by Burnham O. Campbell, AndrewMason, and Ernesto M. Pernia, pp. ����. Honolulu: University of Hawaii Press for the East-WestCenter and the Asian Development Bank.
Massey, Douglas S.; Arango, Joaquin; Hugo, Graeme; Kouaouci, Ali; Pellegrino, Adela.; and Taylor, J.Edward. ���. Theories of International Migration: A Review and Appraisal. Population andDevelopment Review �� ( ): ������.
Moghadam, Valentine. ����. Gender and Globalization: Female Labor and Women’s Mobilization.Journal of World-Systems Research V( � ): ����.
Pearson, Ruth. ����. Moving the Goalposts: Gender and Globalization in the Twenty-first Century.Gender and Development � ( � ): �����.
Phananiramai, Mathana. ����. Changes in Women’s Economic Role in Thailand. In Women andIndustrialization in Asia, edited by Susan Horton, pp. �����. London and New York: Routledge.
Phongpaichit, Pasuk. ���. The Labour Market Aspects of Female Migration to Bangkok. In InternalMigration of Women in Developing Countries, pp. ������. Proceedings of the United NationsExpert Meeting on the Feminization of Internal Migration, Aguascalientes, Mexico, October
�����, ����. New York: United Nations.Phongpaichit, Pasuk; and Baker, Chris. ����. Thailand’s Crisis. Chiang Mai: Institute of Southeast
Asian Studies and Nordic Institute of Asian Studies.Rama, Martin. ����. Globalization and Workers in Developing Countries. Washington, D. C.: The World
Bank.Richter, Kerry; and Podhisita, Chai. ����. Thai Family Demography: A Review and Research
Prospects. Journal of Population and Social Studies (���): ����.Rigg, Jonathan; and Nattapoolwat, Sakunee. ����. Embracing the Global in Thailand: Activism and
S. AAK6 and B. ECIL>HA: : Employment Transitions in an Era of Change in Thailand
325
Pragmatism in an Era of Deagrarianization. World Development �� ( � ): �������.Standing, Guy. ����. Global Feminisation through Flexible Labour. World Development � ( ):
�������.Stephens, Alexandra. ����. Gender Issues in Agricultural and Rural Development Policy in Asia and
the Pacific. In Gender Issues in Agricultural and Rural Development Policy in Asia and the Pacific.Bangkok: FAO/RAPA.
Sussangkorn, Chalongphob; and Chalamwong, Yongyuth. ����. Thailand: Development Strategiesand Their Impacts on Labor Markets and Migration. In Development Strategy, Employment andMigration: Country Experiences, edited by David O’Connor and Leila Farsakh, pp. ������. Paris:Development Centre Seminars, Organisation for Economic Co-operation and Development.
Thailand Development Research Institute (TDRI). ����. Social Impact Assessment: Synthesis Report.Bangkok: Thailand Development Research Institute Foundation. �p.
United Nations. ����. +333 World Survey on the Role of Women in Development: Globalization, Genderand Work. Division for the Advancement of Women, Department of Economic and SocialAffairs. New York: United Nations. �p.
VanWey, Leah K. ����. A Comparative Study of Migration in Mexico and Thailand. Ph. D.dissertation, University of North Carolina, Chapel Hill.
World Bank. n. d. (a). http: //worldbank.org/data/wdi ����/pdfs/tab �http: //worldbank.org/data/wdi ����/pdfs/tab � .pdf.pdf����. n. d. (b). http: //worldbank.org/data/countrydata/aag/thahttp: //worldbank.org/data/countrydata/aag/tha aag.pdfaag.pdf����. n. d. (c). http: //devdata.worldbank.org/hnpstats/Dcselection.asphttp: //devdata.worldbank.org/hnpstats/Dcselection.asp
������� ��� �
326
The Economic Crisis and Desires for Children
and Marriage in Thailand�
THJN6 Noriko O.�� and Napaporn C=6NDK6C���
Abstract
This study examines the relationships between young Thai women’s and men’s experi-
ences of economic difficulties due to the economic crisis and their desires for marriage and
children, using data from a recent national survey on the economic crisis and demographic
and family dynamics. The study found that the experiences of economic hardships due to
the crisis were widespread among Thai women and men in their ��s and ��s, although
there were considerable gender, regional, and urban-rural differences in the extent of
experiencing such hardships. Our multivariate analyses reveal that the effects of the crisis
on desires for children and marriage were diverse and indirect. Desired fertility of married
women aged ����� was reduced, not by their own experiences of economic hardships, but
by their husbands’. This implies that the husband’s employment is a major factor in
determining a woman’s perception of the financial feasibility of having children and
suggests that, if prolonged, the crisis could lead to lower marital fertility in Thailand.
Marriage desires of young unmarried women aged ����� were dampened, not by their own
hardships, but their mothers’ economic difficulties, hinting that the widely documented
close emotional ties between mothers and daughters in Thailand may have played a role.
Keywords: the economic crisis, Thailand, desired fertility, marriage desires
The Asian economic crisis began in Thailand in June ���� with the near-collapse of its
financial markets [Bhaopichitr ����; Facts on Life News Services ���]. In the late ���sand early ����s the country had experienced remarkable economic growth, transforming
itself into an Asian “economic miracle” [Ito ���; Lee and Rhee ����]. This miracle was
enhanced primarily through the globalization of Thailand’s financial markets, interna-
* We thank Sumner J. La Croix, Andrew Mason, and Srawooth Paitoonpong for helpfulcomments. This study is supported by funding from the COE Project on the Asian Finan-cial Crisis and Its Macroeconomic Response at Keio University, and also by a Grant-in-Aidfor Specially Promoted Research from the Japanese Ministry of Education, Culture, Sports,Science, and Technology.
** ����� Faculty of Economics, Keio University, ������� Mita, Minato-ku, Tokyo ������,Japan, e-mail: tsuya�econ.keio.ac.jp
*** College of Population Studies, Chulalongkorn University, Bangkok �����, Thailand, e-mail:cnapapor�chula.ac.th
Southeast Asian Studies, Vol. ��, No. �, December ����
327
tional trades, and direct foreign investments [Jansen ����; ����]. Thailand needed foreign
capital because its domestic savings were not great enough to finance the high level of
investment necessary for rapid growth.�) During the early ����s the dependency on
foreign capital continued to grow while the government failed to develop a system for
sound macroeconomic management of domestic and international financial markets
[Jansen ����; Kaosa-ard et al. ����]. Consequently, the private sector went on a borrowing
spree, which resulted in a skyrocketing foreign debt and a burgeoning current account
deficit. This in turn caused a massive exodus of foreign capital, culminating in the
financial meltdown during the summer of ���� [Bello ����]. Showing what the vulnera-
bility to variations in foreign-capital inflows and outflows can do to a society, Thailand’s
economic crisis represents an extreme consequence of the malcontents of globalization.
After five years the Thai economy and society are still not out of the devastating
effects of the crisis [The Economist ����]. Those effects continue to ripple throughout the
country, creating many economic and social problems, including lower wages and
salaries, higher living expenses, upsurges in unemployment, and increases in the number
of school dropouts [Kaosa-ard et al. ����]. Macroeconomic stress of this magnitude must
also have demographic and family consequences. Assessing the effects of economic
downturn on fertility and mortality in developing countries in the ����s, Mason [����]found that, although the evidence was mixed, the adverse effects of a major and
prolonged economic slump on childbearing and survival were not widespread. Compar-
atively little, however, is known about the demographic effects of an abrupt economic
bust after a prolonged boom. It is therefore of interest to study the demographic and
family impacts of the Thai crisis because the crisis also occurred in other parts of Asia,
and its effects will likely continue to shape the demographic landscape of the region as a
whole for some time. Examining how the crisis has influenced families and households,
we can also develop a fuller picture of the far-reaching outcome of economic globaliza-
tion.
Using data drawn from the ���� National Survey on the Economic Crisis, Demo-
graphic Dynamics, and Family (hereafter referred to as the ECODDF), this study exam-
ines the relationships between young Thai women’s and men’s experiences of economic
difficulties due to the economic crisis and their desires for marriage and children. We
begin by describing the data and measurements employed by the study. Next we look at
the degrees and patterns of experiences of economic hardship due to the economic crisis
for women and men separately. We then examine the patterns of our two dependent
variables�fertility desires among currently married women and men aged ����� and
marriage desires among never-married women and men aged ����. Turning to multi-
� � According to Jansen [����], its dependency on external capital did not begin in the late ����s;rather, the dependency had been a long-standing characteristic of Thai economic develop-ment.
������� �� �
328
variate analyses of desires for children and marriage, we first look at the results of a
logistic regression analysis of the effects on women’s and men’s fertility desires of their
experiences of economic hardship related to the economic crisis. We then examine the
results of the logistic regression analysis of the effects of economic hardship on desires
for marriage among young single women and men. The article concludes with a
summary of the findings and a discussion of their implications.
Few comprehensive studies have been made of the sociodemographic impacts of
Asia’s economic crisis, with the notable exceptions of the Indonesia Family Life Surveys,
a collaborative project conducted by the RAND Corporation, the University of California
at Los Angeles, and the Demographic Institute of the University of Indonesia [e. g.,
Frankenberg, Thomas and Beegle ����] and a case study of Thailand’s economic crisis
and reproductive health conducted by the College of Population Studies at Chulalong-
korn University [Chayovan, Peracca and Ruffolo ����]. Admittedly, unlike the Indonesia
Family Life Surveys, the ECODDF is not a longitudinal survey covering the period prior
to the economic crisis. Nonetheless, it provides a unique opportunity to examine the
multidimensional consequences of the economic crisis for people and families in Thai-
land. Through this study, we seek to shed light on the paths through which the crisis
influenced individuals’ attitudes and perceptions about marriage and the family.
Data and Measurements
Data
The data for this study are drawn mainly from the ECODDF, the first national family
survey covering both women and men of all marital statuses throughout the reproduc-
tive age range in Thailand. The survey was intended to collect nationally representative
data on a variety of issues pertaining to economic conditions, demographic situations,
and family life in Thailand, including experiences and attitudes related to the economic
crisis, fertility and other life histories, reproductive health and family planning, family
activities, and attitudes toward marriage and the family, as well as the demographic and
socioeconomic backgrounds of respondents, their spouses, and other family members.
The ECODDF was also intended to parallel the ���� National Survey on Family and
Economic Conditions in Japan. Conducted during March�June and October ���� by the
College of Population Studies (CPS) at Chulalongkorn University in Bangkok, the survey
was designed by a research team from Keio University in Tokyo and the CPS.
The ECODDF was based on a national, stratified multistage probability sample of the
Thai population, in which ����� urban and ����� rural households were randomly selected,
with the ���� population census used as the sampling frame. Stratifying Thailand into
five regional strata�the North, Northeast, Central Region (excluding Bangkok), South,
and Bangkok Metropolis, the CPS randomly selected �� provinces by probability propor-
THJN6 N. O. and N. C=6NDK6C : The Economic Crisis and Desires for Children and Marriage
329
tional to population size, except for Bangkok, which was self-representative. Then,
dividing the sample provinces into two substrata�municipal (urban) and nonmunicipal
(rural) areas�the researchers selected a total urban sample of ����� households (�����households in the provincial cities and towns and ����� households in Bangkok) and a
total rural sample of ����� households, using multistage systematic or simple random-
sampling methods. From these sample households, ����� eligible persons������ women
and ��� men of all marital statuses between the ages of � and ���were selected, with
twice as many women as men being sampled (i. e., women were double-sampled). Among
those sampled individuals, face-to-face interviews were successfully conducted with ���women and ���� men, a response rate of approximately �� percent.
Our study has two dependent variables, desired fertility and desires about marriage,
and therefore uses two subsamples of the ECODDF.�) The analysis of desired fertility
focuses on currently married women and men aged ��� who had been married for at
least four years�that is, to those who were married when the economic crisis began.
This restriction to couples married for at least four years led us to choose age � instead
of age �� as the lower age limit so that we would minimize a possible bias due to the
inclusion of outliers who had married at very young ages.
We imposed the upper age limit of � mainly to minimize the bias that would be
introduced by including women and, to a lesser extent, men who were not at risk of
childbearing. Women’s physiological ability to bear children drops precipitously in their
��s with the onset of menopause, and for those older women (and for men whose wives
are also likely to be of similar ages) a question about desired fertility would in many cases
be irrelevant.) Our data therefore include ��� currently married women and ���currently married men aged ��� who had been married for four or more years.
Our analysis of marriage desires focuses on never-married women and men aged
����. We again imposed the lower age limit of �� because the question about experiences
of economic hardship due to the economic crisis pertains to the four-year period prior to
the ���� survey. If we had included respondents in their upper teens at the time of the
survey, this might have biased the results because of the inclusion of a small minority
who started working in their early teens and therefore had a low level of education. We
chose the upper age limit of � for the analysis of marriage desires because including
another type of outlier, unmarried persons at older ages, would distort the results. In our
data the proportion never-married was ���� percent for women aged ���� and ��� percent
for women aged ���; the corresponding proportions for men aged ���� and ��� were
� � The cleaning of the survey data is still ongoing, and therefore the results of the analysesreported here are preliminary.
� It was possible to set (and we considered setting) higher upper age limits for men, or to usethe wife’s age instead of the man’s own age. We decided against doing so primarilybecause having different age limits for the two sexes would unduly complicate the analysis.
������� ���
330
���� percent and ���� percent.�) The sample of single respondents included ���women and
��� men aged �����.
Dependent Variables
As we have already mentioned, the two dependent variables we examine in this study are
desired fertility and desires about marriage. Desired fertility is measured by a dichoto-
mous variable indicating whether or not a married woman or man wants to have more
children. The ECODDF asked respondents, “Do you want to have more children?” Three
precoded responses were Yes, Uncertain, and No. As we shall see later, only a small
percentage of the respondents gave an uncertain response. Therefore, in our measure of
desired fertility, we scored the responses as � for a positive answer and � for a negative
or indefinite answer.
We measured marriage desires by a variable indicating whether or not a never-
married woman or man wanted to marry someday.) Five precoded responses to this
question were Definitely yes, Yes, Uncertain, Probably not, and Definitely not. As we
shall see, only a small proportion gave a negative answer (Probably not or Definitely not).
We therefore coded our measure of marriage desires as � if a respondent chose Definitely
yes or Yes, and � if otherwise.
Independent Variables
In the multivariate analyses of desires for children and marriage, we estimate by logistic
regression the likelihood of wanting to have more children or wanting to marry, using as
the independent variables the economic hardships due to the economic crisis experienced
by respondents themselves or by their family members. To measure such experiences,
the ECODDF asked respondents:
Since the economic crisis, have you and other people you know experienced any such
� � Alternatively, we could have used different upper age limits for women and men, namelyage � for women and �� for men. We decided against doing so in part because the resultswere not notably different, and also because we wanted to keep our results as simple andstraightforward as possible.
� The ECODDF also asked all those who did not indicate that they definitely did not want tomarry someday how soon they would like to marry. Using this variable, we constructedvariables indicating whether or not respondents wanted to marry within three years or fiveyears, respectively. However, these additional analyses did not yield significantly differentresults. Furthermore, a considerable proportion (around �� percent of both women andmen) indicated that they were not sure about when they would like to marry; and evenamong those who indicated a specific time frame, �� percent of women and �� percent ofmen answered that they would like to marry in ten or more years, a response we consid-ered to be too vague to be realistic. Consequently, we decided not to use this variable asour dependent variable.
THJN6 N. O. and N. C=6NDK6C : The Economic Crisis and Desires for Children and Marriage
331
economic problems as: unable to find a job; losing a job or [being] laid off; demotion,
cut in work hours or salary/wage cut; forced transfer of position or office; forced
early retirement; failure or deterioration of [your] own business; drop in the prices of
products/produce; or abrupt increases in costs of living/necessary capital invest-
ments?
The “other people you know” included the respondent’s spouse, brothers, sisters,
father, mother, other male or female relatives, male or female friends, and male or female
co-workers. About each of these categories of people whom the respondents knew, the
above question was asked, and their responses were precoded as Yes or No.�) We scored
responses as � for Yes and � for No.
In our analysis of desired fertility among the currently married sample, we use two
dichotomous variables as the independent variables: whether or not the respondent or
the respondent’s spouse had experienced any economic crisis-related hardships. In the
analysis of marriage desires among single women and men, the independent variables are
three dichotomous variables indicating whether or not the respondent him- or herself, the
respondent’s father, or the respondent’s mother had experienced at least one of the
above-mentioned economic hardships due to the economic crisis. Thus our measures of
experiences of crisis-related hardship of the spouse or parents are based on proxy reports
from respondents, whereas the reports of economic hardship experienced by the respond-
ents themselves are, of course, self-reports.
Control Variables
Our analysis of desired fertility has four groups of control variables: ( � ) basic demo-
graphic characteristics including age, region, urban versus rural residence, and number
of living children; ( � ) characteristics of marriage as measured by the age difference
between spouses, and whether the current marriage was the first or not; ( � ) basic
socioeconomic characteristics, including the respondent’s own and the spouse’s education
and the couple’s income; and ( � ) household structure as measured by coresidence with
the respondent’s own parents or spouse’s parents.
Our multivariate analysis controls for the respondent’s number of living children
because desired fertility (wanting to have more children or not) is very much a function
of a couple’s existing family size. As we shall show later, because the relationship
between the number of living children and desired fertility is in general linear, we specify
this covariate as a continuous variable. The respondent’s age is included in the model
because, even after we control for family size, desired fertility is, to an extent, a function
� � For the categories of people other than themselves, we provided a response category of“not applicable” so that we could identify respondents who did not have a spouse, parent,sibling, other relative, friend, or co-worker.
������� ��� �
332
of age. Our preliminary analysis indicated that the effects of age on desired fertility was
not always linear, and so we specified age as a categorical variable consisting of three
five-year age groups.
Although the Thai population is relatively homogeneous, there are clear demograph-
ic, socioeconomic, and cultural differentials by region [Knodel, Chamratrithirong and
Debavalya ����]. Evidence also suggests that the effects of the economic crisis have
varied among regions, with the Northeast having been affected most seriously [Thailand,
NSO ����; ����a; ����b]. Our model therefore includes a categorical variable that
accounts for the five major regions of Thailand�North, Northeast, Central, South, and
Bangkok Metropolis. The model also controls for possible urban/rural differences in
desired fertility by including a dichotomous variable indicating whether a respondent
resided in an urban (municipal) area or not.
Our analysis of desired fertility takes into consideration characteristics of marriage.
Those characteristics include age differences between the husband and wife and whether
the current marriage is the first marriage or a remarriage. (We did not include age at
marriage or duration of marriage in the model primarily because marriage duration and
age at marriage are known to have a fairly strong multicolinearity with the number of
children already born.) The age difference between spouses reflects both norms and the
status relationship between husband and wife. Previous studies indicate that in contem-
porary Thailand the average age difference between spouses is small (three to four years),
with women being much more likely to marry older men than younger men [Limanonda
����; Prachuabmoh et al. ����]. Given a possible curvilinearity of the effect of the age
difference between spouses, our model specifies this variable as a categorical variable
consisting of five categories: husband is younger than the wife; both spouses are of the
same age; husband is older by one or two years; husband is older by three to five years;
and husband is older by six or more years.
Marital separation, dissolution, and remarriage are not unusual among Thais
[Knodel, Chamratrithirong and Debavalya ����: ��; Limanonda ����]. To control for the
possible effects of the number of times a respondent had married, our model includes a
dichotomous variable indicating whether current marriage was the first marriage or not.
Around � percent of married women and men included in the analysis of desired fertility
reported that they had been married more than once.
Our model controls for basic socioeconomic characteristics of spouses by including
the number of years of education of the wife and husband and also the couple’s income.
Because our preliminary analysis did not clearly indicate curvilinearity or a threshold in
the effects of the wife’s or husband’s education on desired fertility, we introduce these
covariates as continuous variables. The mean number of years of education was �� years
for married women included in the analysis and �� years for their husbands, whereas it
was �� years for married men and �� years for their wives.
As another indicator of the economic status of couples and households, the model
THJN6 N. O. and N. C=6NDK6C : The Economic Crisis and Desires for Children and Marriage
333
includes the couple’s average monthly income for the period from April ���� to the time
of the interview.�) Because there were a considerable number of missing cases for couple’s
income (�� percent of the women and �� percent of the men), the model includes a
dichotomous variable indicating whether the couple’s income information was missing or
not. By including this variable, we minimize a possible estimation bias resulting from the
exclusion of a large number of cases from the analysis.
Our model for the analysis of desired fertility controls for household structure by
accounting for the respondent’s coresidence with his or her own parents or the spouse’s
parents. We measure coresidence with parents or parents-in-law by using four dichoto-
mous variables: coresidence with the respondent’s own father, own mother, spouse’s
father (father-in-law), and spouse’s mother (mother-in-law). Although considerable
urban/rural and regional differences are known to exist in Thailand, living with the
wife’s parents after marriage (postnuptial matrilocal coresidence) has traditionally been
more prevalent than patrilocal coresidence [Limanonda ����; Podhisita ����]. As ex-
pected, we found matrilocal coresidence to be more prevalent than patrilocal coresidence
among both wives and husbands in our study: �� percent of the wives indicated that they
lived with their own parents, whereas only � percent of the wives reported living with
their spouse’s parents. Similarly, �� percent of the husbands indicated that they lived
with their wife’s parents, whereas the proportion of husbands who reported living with
their own parents was �� percent. Few individuals (only four wives and no husbands)
reported living with both sets of parents.
Our analysis of marriage desires has four groups of control variables: ( � ) basic
demographic traits including age, region, and urban/rural residence; ( � ) basic socioeco-
nomic characteristics including years of education and respondent’s own income; ( � )
household economic status as measured by parents’ home ownership; and ( � ) household
structure measured by coresidence with parents.
Our multivariate model for the analysis of marriage desires controls for respondents’
basic demographic traits such as age, region, and urban/rural residence. A desire to
marry is a function of age. Because our preliminary analysis indicated that the relation-
� � We attempted to use the respondent’s own income and the spouse’s income, rather thancouple’s income, but decided not to use them primarily because a considerable proportionof married women and men included in the analysis of desired fertility were self-employedor working in agriculture. For those wives and husbands, it would be difficult to assesstheir income separately. We also tried using such indicators of household living standardsas housing quality and ownership of durable consumer goods. We decided against usingthem primarily because they are influenced by region, urban/rural residence, and occupa-tion/industry of the couples. We attempted to include respondents’ and spouses’ occupa-tions in the model but decided not to use them in part because a considerable proportion ofrespondents and their spouses held more than one occupation, or their occupation hadchanged or was temporary, and also because occupation was found to be correlated withcouples’ income.
������� ��� �
334
ship between age and marriage desire was not necessarily linear, we specified age as a
categorical variable consisting of three five-year age groups. We specified region and
urban/rural residence in the same ways as in the analysis of desired fertility of married
women and men.
As in the analysis of desired fertility, the model accounts for two basic socioeconomic
characteristics, years of education and income. Years of education are measured by a
continuous variable. Interestingly, in our data the mean number of years of education
was higher (���� years) for never-married women aged ����� than for never-married men
in the same age group (���� years). This suggests that as their age goes up, single women
become increasingly more selective about marriage in the sense that highly educated
women are more likely to stay single than are their less educated counterparts. We
measured respondents’ own income by a continuous variable indicating the average
monthly income for the period from April ���� to the month of the survey.�)
To measure the household economic status of young, never-married women and men
independently of their own economic situations, we used parents’ home ownership,
primarily because the ECODDF did not collect information on parents’ income (nor on the
income of coresiding siblings). Although information on household income was availa-
ble, we found that respondents’ own income and their household income were associated
because household income included the respondents’ income. This was especially the
case for single men whose household income was low.�) Approximately � percent of the
parents of our respondent single women owned the home in which they resided; the
corresponding proportion for our respondent single men was percent. Parental home
ownership was strongly associated with their ownership of the land on which the
residential home was located: roughly � percent of the parents of young single women
and men who owned their home also owned the land.
Our model for the analysis of marriage desires includes coresidence with
respondents’ own parents. This covariate is specified as a categorical variable consisting
of four categories: living with both parents, living with the father only, living with the
mother only, and not living with parents. We introduced this specification in part
because, as mentioned earlier, marital separation and dissolution are not unusual in
Thailand, and also because marriage desires of the young, unmarried Thais may differ
according to whether they live with both parents or with a single parent. Among
� � We also tried to include respondents’ occupations in the model but decided not to includethem for most of the same reasons that we did not include them in the model for marriedrespondents.
� � We considered using some other indicators of household living standard such as ownershipof durable consumer goods. But we decided not to employ that variable because suchownership was highly correlated with respondents’ own income. This was so probablybecause respondents themselves had purchased some durable household goods, such as atelevision set, mobile phone, automobile, motorcycle, or computer.
THJN6 N. O. and N. C=6NDK6C : The Economic Crisis and Desires for Children and Marriage
335
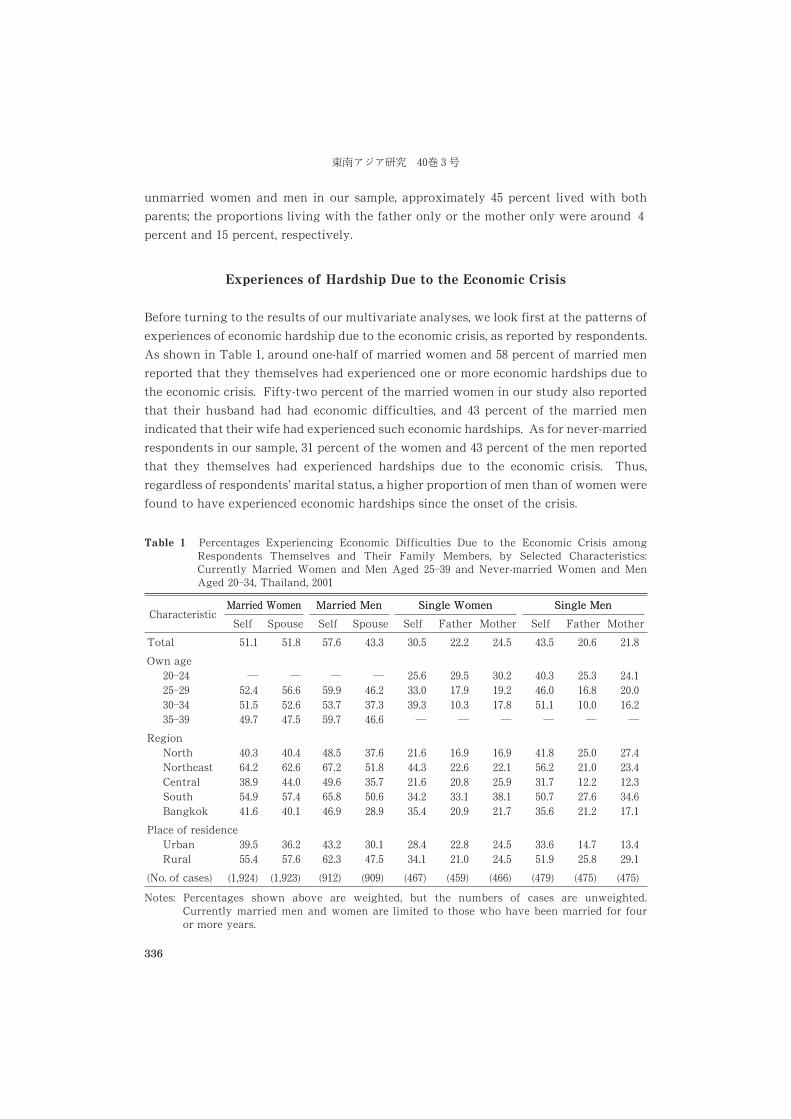
unmarried women and men in our sample, approximately �� percent lived with both
parents; the proportions living with the father only or the mother only were around �percent and �� percent, respectively.
Experiences of Hardship Due to the Economic Crisis
Before turning to the results of our multivariate analyses, we look first at the patterns of
experiences of economic hardship due to the economic crisis, as reported by respondents.
As shown in Table �, around one-half of married women and �� percent of married men
reported that they themselves had experienced one or more economic hardships due to
the economic crisis. Fifty-two percent of the married women in our study also reported
that their husband had had economic difficulties, and �� percent of the married men
indicated that their wife had experienced such economic hardships. As for never-married
respondents in our sample, �� percent of the women and �� percent of the men reported
that they themselves had experienced hardships due to the economic crisis. Thus,
regardless of respondents’ marital status, a higher proportion of men than of women were
found to have experienced economic hardships since the onset of the crisis.
Table � Percentages Experiencing Economic Difficulties Due to the Economic Crisis amongRespondents Themselves and Their Family Members, by Selected Characteristics:Currently Married Women and Men Aged ����� and Never-married Women and MenAged �����, Thailand, ����
CharacteristicMarried WomenMarried Women Married MenMarried Men Single WomenSingle Women Single MenSingle Men
Self Spouse Self Spouse Self Father Mother Self Father Mother
Total ��� ��� �� ��� ��� ��� ��� ��� ��� ���Own age
��������������������
���������
���������
��������
���������
����������
���������
���������
����������
����������
����������
RegionNorthNortheastCentralSouthBangkok
���������������
��������������
��������������
�������������
���������������
���������������
��������������
�������������
��������������
�������������
Place of residenceUrbanRural
������
�����
������
�����
������
������
������
������
�����
������
(No. of cases) (�����) (�����) (���) (���) (��) (���) (���) (��) (��) (��)
Notes: Percentages shown above are weighted, but the numbers of cases are unweighted.Currently married men and women are limited to those who have been married for fouror more years.
������� ��� ��
336
Considerably higher proportions of married men and women than of unmarried men
and women reported having experienced economic hardships. This was probably be-
cause our subsample of currently married respondents, being slightly older, tended to
have been in the labor force longer than their never-married counterparts and therefore
had been exposed longer to the risk of experiencing hardships related to the economic
crisis. It may also be the case that marriage leads men and women to shoulder major
economic responsibilities, thus exposing married individuals to a higher risk of ex-
periencing economic hardships.
We found notable age patterns in reported experiences of economic hardships due to
the crisis. Table � shows that the proportion of married women (and of their spouses)
experiencing economic difficulties tends to decrease at higher ages, whereas for married
men and their spouses the relationship between age and experiences of crisis-related
hardships is U-shaped. On the other hand, the proportion of never-married women and
men experiencing economic hardships increases almost linearly as their age increases.
Regardless of single respondents’ sex, the proportion of parents (both father and mother)
reported to have experienced such economic difficulties tends to decrease as the age of
respondents (and therefore their parents) goes up.
From Table � we can also see large regional differentials in the proportion ex-
periencing economic hardships since the economic crisis began, with notably higher
proportions of women and men in the Northeast and the South reporting such dif-
ficulties. Proportionately more residents in rural areas than in urban areas also reported
economic hardships due to the crisis. This finding is contrary to evidence given by
earlier reports that were published shortly after the economic crisis began in Thailand,
according to which urban areas suffered higher unemployment and other forms of
economic downturn than rural areas [Daorueng ����; Sugisaki ����]. The crisis may have
hit urban areas harder initially because in Thailand it started with the meltdown of the
financial sector, resulting in the collapse of scores of financial houses and the closure of
factories that were concentrated in urban areas. Our finding suggests that economic
hardship subsequently spread to rural areas, causing greater labor uncertainty and
restlessness there. The higher level of economic hardship in rural areas may also be due
in part to the fact that the government’s labor and social welfare offices earlier supported
the return of unemployed urban workers to their hometowns and villages to ease urban
joblessness [Daorueng ����].
Our multivariate analysis indicates that the Northeast and the South continue to
have greater economic hardship than other regions (data not shown). Urban areas also
continue to have significantly lower levels of hardship related to the crisis than do rural
areas. The analysis indicates that men and women in primary industries and women in
service industries have a significantly greater likelihood of experiencing economic
hardship than do those in other sectors of the economy. This finding suggests not only
that persons in primary and service industries have been more vulnerable to economic
THJN6 N. O. and N. C=6NDK6C : The Economic Crisis and Desires for Children and Marriage
337
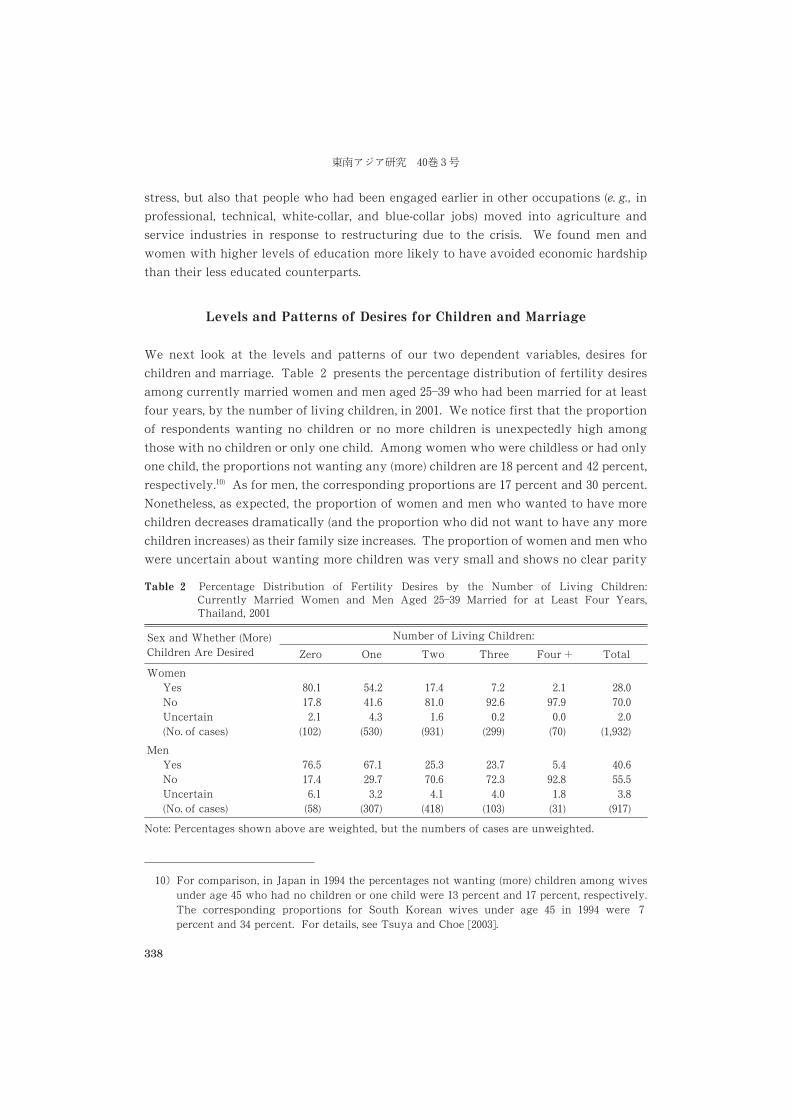
stress, but also that people who had been engaged earlier in other occupations (e. g., in
professional, technical, white-collar, and blue-collar jobs) moved into agriculture and
service industries in response to restructuring due to the crisis. We found men and
women with higher levels of education more likely to have avoided economic hardship
than their less educated counterparts.
Levels and Patterns of Desires for Children and Marriage
We next look at the levels and patterns of our two dependent variables, desires for
children and marriage. Table � presents the percentage distribution of fertility desires
among currently married women and men aged ����� who had been married for at least
four years, by the number of living children, in ����. We notice first that the proportion
of respondents wanting no children or no more children is unexpectedly high among
those with no children or only one child. Among women who were childless or had only
one child, the proportions not wanting any (more) children are �� percent and �� percent,
respectively.��) As for men, the corresponding proportions are � percent and �� percent.
Nonetheless, as expected, the proportion of women and men who wanted to have more
children decreases dramatically (and the proportion who did not want to have any more
children increases) as their family size increases. The proportion of women and men who
were uncertain about wanting more children was very small and shows no clear parity
��� For comparison, in Japan in ���� the percentages not wanting (more) children among wivesunder age �� who had no children or one child were �� percent and � percent, respectively.The corresponding proportions for South Korean wives under age �� in ���� were percent and �� percent. For details, see Tsuya and Choe [����].
Table � Percentage Distribution of Fertility Desires by the Number of Living Children:Currently Married Women and Men Aged ����� Married for at Least Four Years,Thailand, ����
Sex and Whether (More)Children Are Desired
Number of Living Children:
Zero One Two Three Four� Total
WomenYesNoUncertain(No. of cases)
�������
(���)
��������
(���)
�������
(���)
������
(���)
������
(�)
�������
(�����)Men
YesNoUncertain(No. of cases)
������
(��)
������
(��)
�������
(���)
������
(���)
�������
(��)
��������
(��)
Note: Percentages shown above are weighted, but the numbers of cases are unweighted.
������� �� �
338
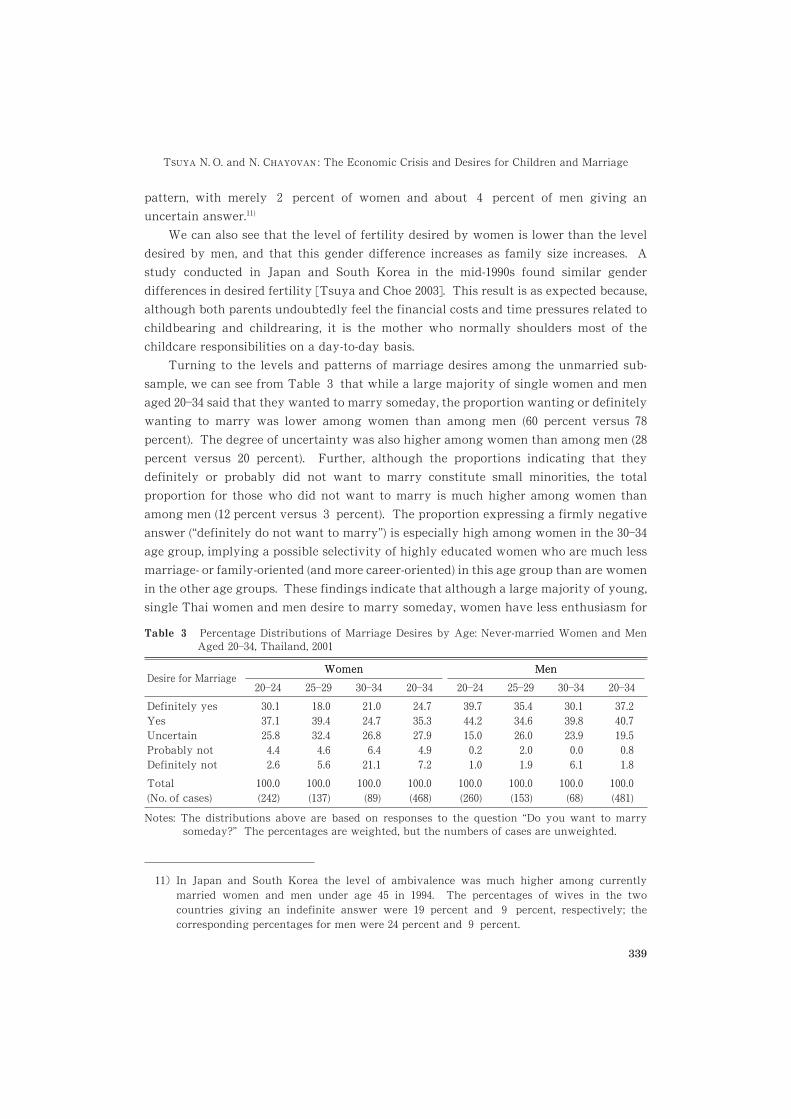
pattern, with merely � percent of women and about � percent of men giving an
uncertain answer.��)
We can also see that the level of fertility desired by women is lower than the level
desired by men, and that this gender difference increases as family size increases. A
study conducted in Japan and South Korea in the mid-����s found similar gender
differences in desired fertility [Tsuya and Choe ����]. This result is as expected because,
although both parents undoubtedly feel the financial costs and time pressures related to
childbearing and childrearing, it is the mother who normally shoulders most of the
childcare responsibilities on a day-to-day basis.
Turning to the levels and patterns of marriage desires among the unmarried sub-
sample, we can see from Table � that while a large majority of single women and men
aged ����� said that they wanted to marry someday, the proportion wanting or definitely
wanting to marry was lower among women than among men (�� percent versus �percent). The degree of uncertainty was also higher among women than among men (�percent versus �� percent). Further, although the proportions indicating that they
definitely or probably did not want to marry constitute small minorities, the total
proportion for those who did not want to marry is much higher among women than
among men (�� percent versus � percent). The proportion expressing a firmly negative
answer (“definitely do not want to marry”) is especially high among women in the �����age group, implying a possible selectivity of highly educated women who are much less
marriage- or family-oriented (and more career-oriented) in this age group than are women
in the other age groups. These findings indicate that although a large majority of young,
single Thai women and men desire to marry someday, women have less enthusiasm for
��� In Japan and South Korea the level of ambivalence was much higher among currentlymarried women and men under age � in ����. The percentages of wives in the twocountries giving an indefinite answer were �� percent and � percent, respectively; thecorresponding percentages for men were �� percent and � percent.
Table � Percentage Distributions of Marriage Desires by Age: Never-married Women and MenAged �����, Thailand, ����
Desire for MarriageWomenWomen MenMen
����� ���� ����� ����� ����� ���� ����� �����Definitely yesYesUncertainProbably notDefinitely not
����������������
����������������
������������������
�����������������
�����������������
�����������������
�����������������
���������������
Total(No. of cases)
�����(���)
�����(���)
�����(�)
�����(��)
�����(���)
�����(��)
�����(�)
�����(��)
Notes: The distributions above are based on responses to the question “Do you want to marrysomeday?” The percentages are weighted, but the numbers of cases are unweighted.
THJN6 N. O. and N. C=6NDK6C : The Economic Crisis and Desires for Children and Marriage
339
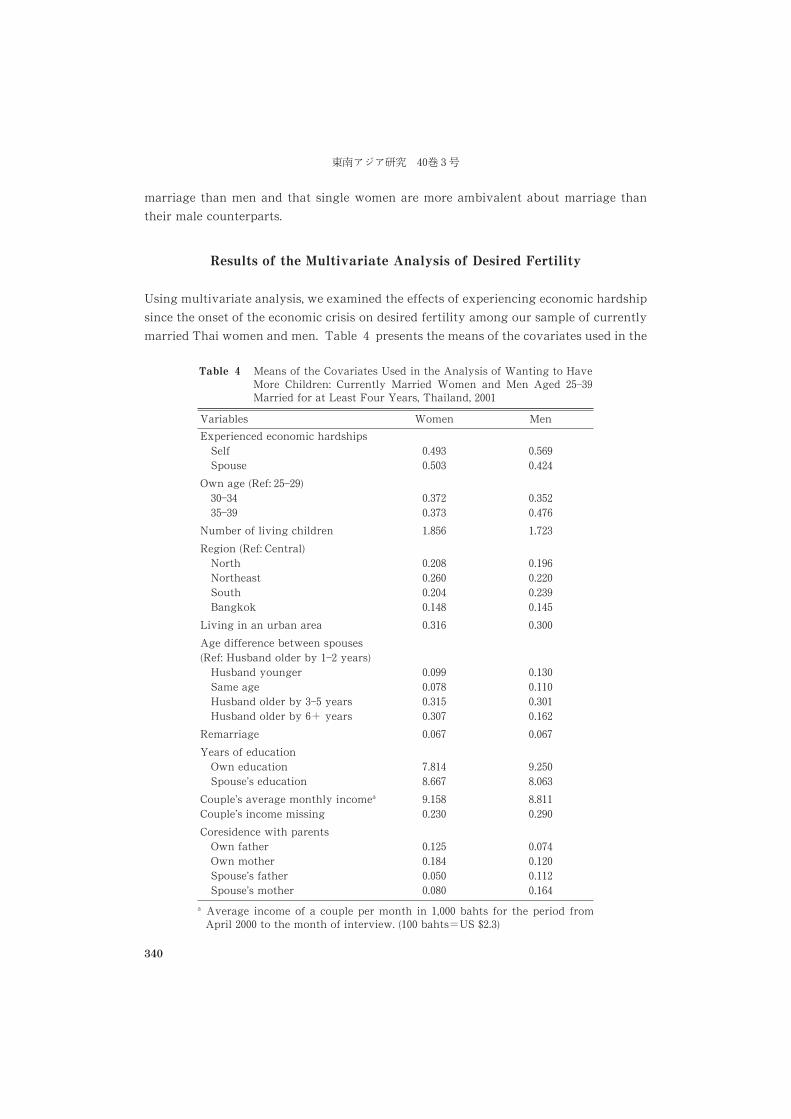
marriage than men and that single women are more ambivalent about marriage than
their male counterparts.
Results of the Multivariate Analysis of Desired Fertility
Using multivariate analysis, we examined the effects of experiencing economic hardship
since the onset of the economic crisis on desired fertility among our sample of currently
married Thai women and men. Table � presents the means of the covariates used in the
Table � Means of the Covariates Used in the Analysis of Wanting to HaveMore Children: Currently Married Women and Men Aged �����Married for at Least Four Years, Thailand, ����
Variables Women Men
Experienced economic hardshipsSelfSpouse
����������
���������
Own age (Ref: �����)����������
��������
��������
Number of living children ���� ����Region (Ref: Central)
NorthNortheastSouthBangkok
�������������������
�������������������
Living in an urban area ���� �����Age difference between spouses(Ref: Husband older by ��� years)
Husband youngerSame ageHusband older by ��� yearsHusband older by � years
������������������
�������������������
Remarriage ��� ���Years of education
Own educationSpouse’s education
������
���������
Couple’s average monthly incomea
Couple’s income missing����������
����������
Coresidence with parentsOwn fatherOwn motherSpouse’s fatherSpouse’s mother
��������������������
������������������
a Average income of a couple per month in ����� bahts for the period fromApril ���� to the month of interview. (��� bahts�US $���)
������� �� �
340
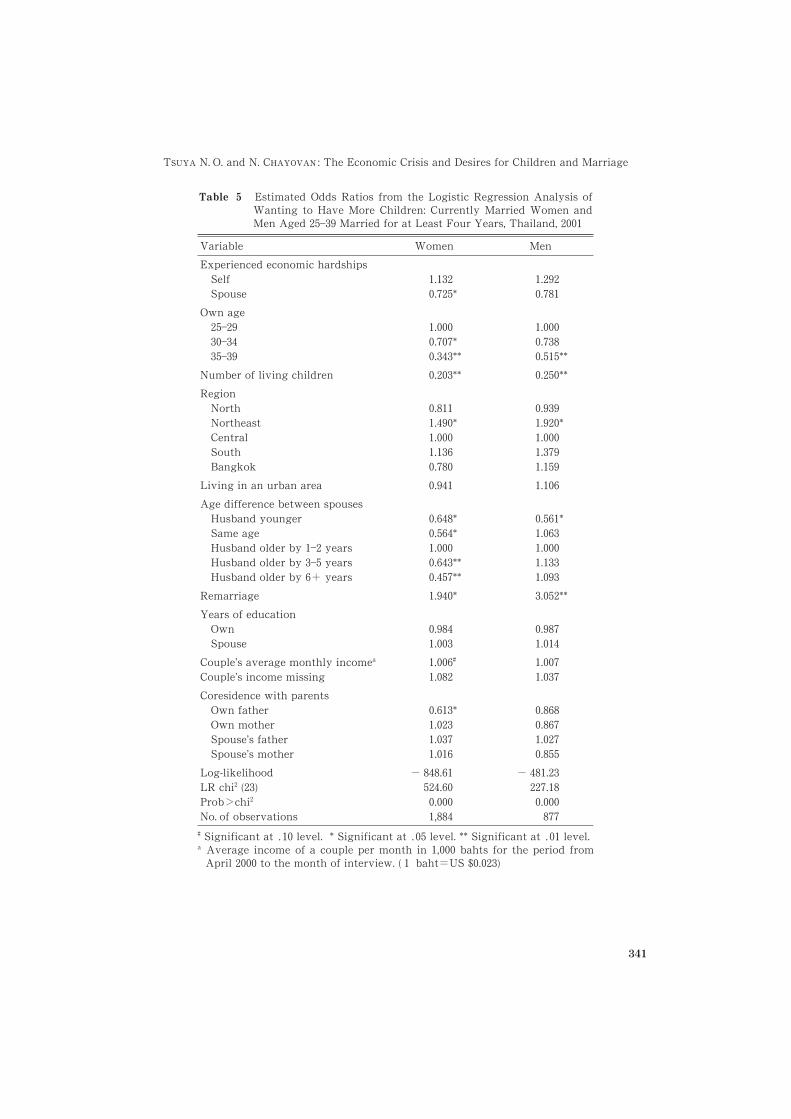
Table � Estimated Odds Ratios from the Logistic Regression Analysis ofWanting to Have More Children: Currently Married Women andMen Aged ����� Married for at Least Four Years, Thailand, ����
Variable Women Men
Experienced economic hardshipsSelfSpouse
����������*
���������
Own age
��������������
����������*����**
��������������**
Number of living children �����** �����**
RegionNorthNortheastCentralSouthBangkok
��������*��������������
����������*���������������
Living in an urban area ���� �����Age difference between spouses
Husband youngerSame ageHusband older by ��� yearsHusband older by ��� yearsHusband older by �� years
���*����*���������**
����**
�����*��������������������
Remarriage ����* �����**
Years of educationOwnSpouse
��������
��������
Couple’s average monthly incomea
Couple’s income missing����������
����������
Coresidence with parentsOwn fatherOwn motherSpouse’s fatherSpouse’s mother
�����*���������������
����������������
Log-likelihoodLR chi� (��)Prob�chi�
No. of observations
� ���������������
� ����������������
� Significant at ��� level. * Significant at ��� level. ** Significant at ��� level.a Average income of a couple per month in ����� bahts for the period from
April ���� to the month of interview. ( � baht�US $�����)
THJN6 N. O. and N. C=6NDK6C : The Economic Crisis and Desires for Children and Marriage
341
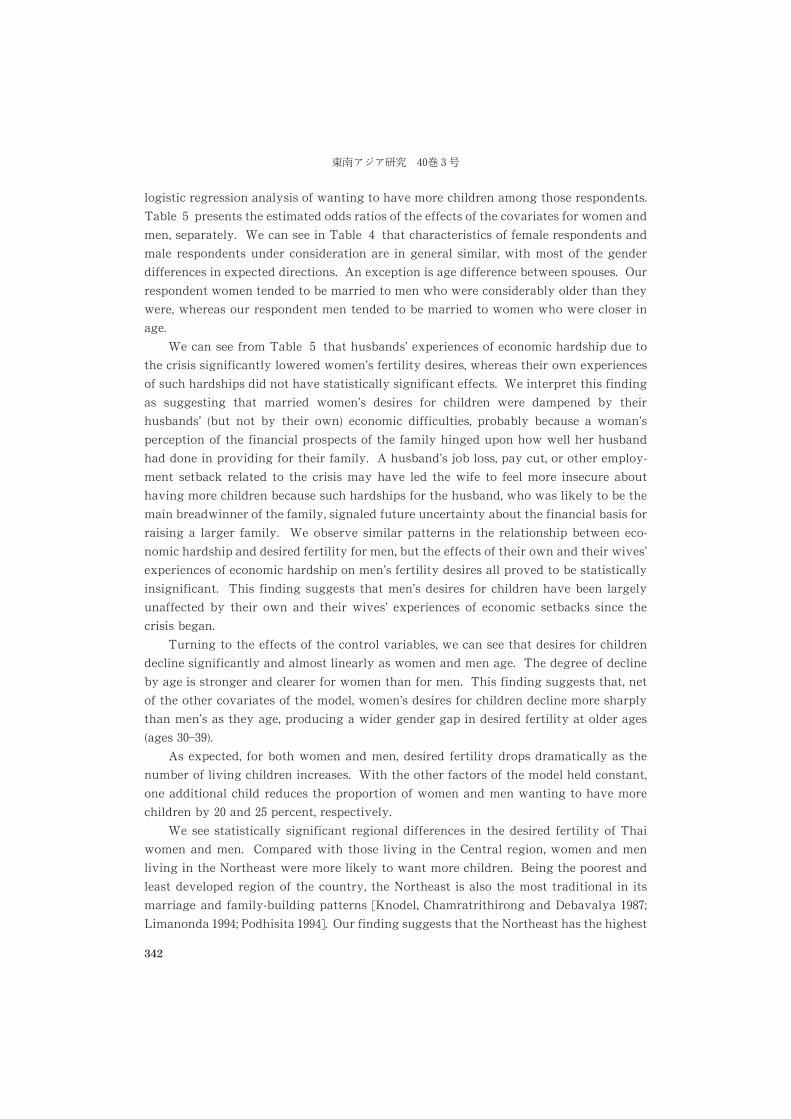
logistic regression analysis of wanting to have more children among those respondents.
Table � presents the estimated odds ratios of the effects of the covariates for women and
men, separately. We can see in Table � that characteristics of female respondents and
male respondents under consideration are in general similar, with most of the gender
differences in expected directions. An exception is age difference between spouses. Our
respondent women tended to be married to men who were considerably older than they
were, whereas our respondent men tended to be married to women who were closer in
age.
We can see from Table � that husbands’ experiences of economic hardship due to
the crisis significantly lowered women’s fertility desires, whereas their own experiences
of such hardships did not have statistically significant effects. We interpret this finding
as suggesting that married women’s desires for children were dampened by their
husbands’ (but not by their own) economic difficulties, probably because a woman’s
perception of the financial prospects of the family hinged upon how well her husband
had done in providing for their family. A husband’s job loss, pay cut, or other employ-
ment setback related to the crisis may have led the wife to feel more insecure about
having more children because such hardships for the husband, who was likely to be the
main breadwinner of the family, signaled future uncertainty about the financial basis for
raising a larger family. We observe similar patterns in the relationship between eco-
nomic hardship and desired fertility for men, but the effects of their own and their wives’
experiences of economic hardship on men’s fertility desires all proved to be statistically
insignificant. This finding suggests that men’s desires for children have been largely
unaffected by their own and their wives’ experiences of economic setbacks since the
crisis began.
Turning to the effects of the control variables, we can see that desires for children
decline significantly and almost linearly as women and men age. The degree of decline
by age is stronger and clearer for women than for men. This finding suggests that, net
of the other covariates of the model, women’s desires for children decline more sharply
than men’s as they age, producing a wider gender gap in desired fertility at older ages
(ages �����).As expected, for both women and men, desired fertility drops dramatically as the
number of living children increases. With the other factors of the model held constant,
one additional child reduces the proportion of women and men wanting to have more
children by �� and �� percent, respectively.
We see statistically significant regional differences in the desired fertility of Thai
women and men. Compared with those living in the Central region, women and men
living in the Northeast were more likely to want more children. Being the poorest and
least developed region of the country, the Northeast is also the most traditional in its
marriage and family-building patterns [Knodel, Chamratrithirong and Debavalya ���;Limanonda ����; Podhisita ����]. Our finding suggests that the Northeast has the highest
������� ��� ��
342
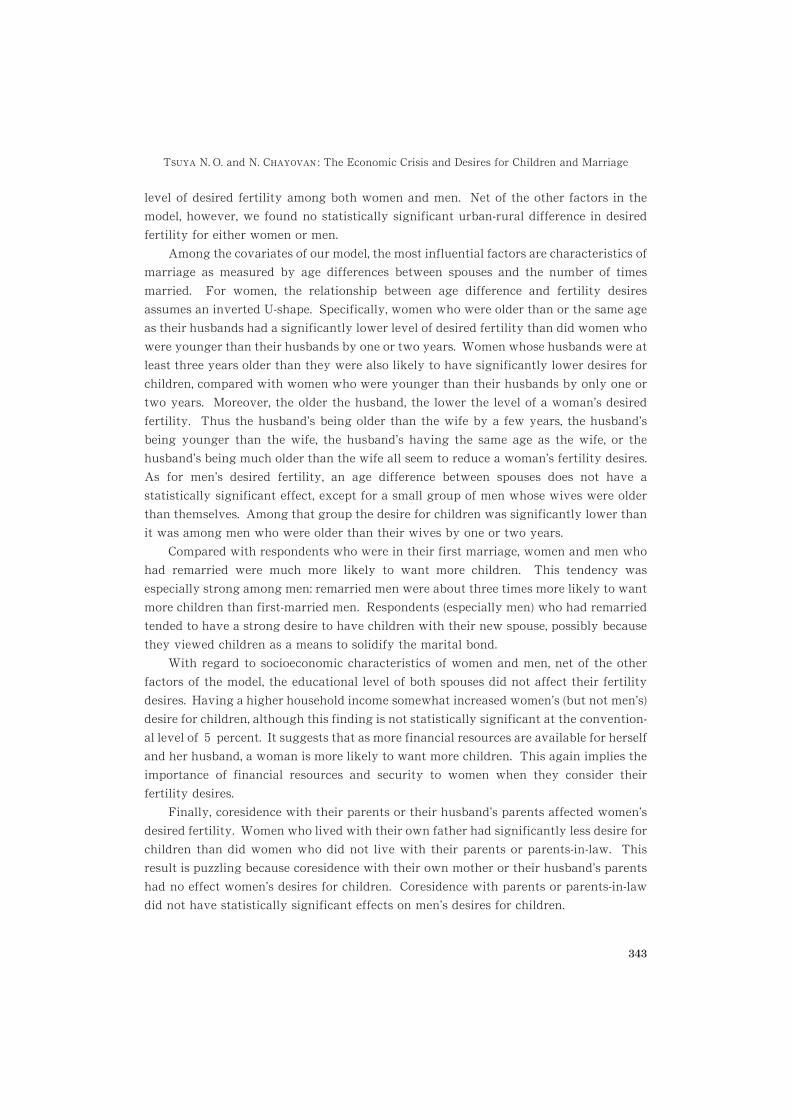
level of desired fertility among both women and men. Net of the other factors in the
model, however, we found no statistically significant urban-rural difference in desired
fertility for either women or men.
Among the covariates of our model, the most influential factors are characteristics of
marriage as measured by age differences between spouses and the number of times
married. For women, the relationship between age difference and fertility desires
assumes an inverted U-shape. Specifically, women who were older than or the same age
as their husbands had a significantly lower level of desired fertility than did women who
were younger than their husbands by one or two years. Women whose husbands were at
least three years older than they were also likely to have significantly lower desires for
children, compared with women who were younger than their husbands by only one or
two years. Moreover, the older the husband, the lower the level of a woman’s desired
fertility. Thus the husband’s being older than the wife by a few years, the husband’s
being younger than the wife, the husband’s having the same age as the wife, or the
husband’s being much older than the wife all seem to reduce a woman’s fertility desires.
As for men’s desired fertility, an age difference between spouses does not have a
statistically significant effect, except for a small group of men whose wives were older
than themselves. Among that group the desire for children was significantly lower than
it was among men who were older than their wives by one or two years.
Compared with respondents who were in their first marriage, women and men who
had remarried were much more likely to want more children. This tendency was
especially strong among men: remarried men were about three times more likely to want
more children than first-married men. Respondents (especially men) who had remarried
tended to have a strong desire to have children with their new spouse, possibly because
they viewed children as a means to solidify the marital bond.
With regard to socioeconomic characteristics of women and men, net of the other
factors of the model, the educational level of both spouses did not affect their fertility
desires. Having a higher household income somewhat increased women’s (but not men’s)
desire for children, although this finding is not statistically significant at the convention-
al level of � percent. It suggests that as more financial resources are available for herself
and her husband, a woman is more likely to want more children. This again implies the
importance of financial resources and security to women when they consider their
fertility desires.
Finally, coresidence with their parents or their husband’s parents affected women’s
desired fertility. Women who lived with their own father had significantly less desire for
children than did women who did not live with their parents or parents-in-law. This
result is puzzling because coresidence with their own mother or their husband’s parents
had no effect women’s desires for children. Coresidence with parents or parents-in-law
did not have statistically significant effects on men’s desires for children.
THJN6 N. O. and N. C=6NDK6C : The Economic Crisis and Desires for Children and Marriage
343
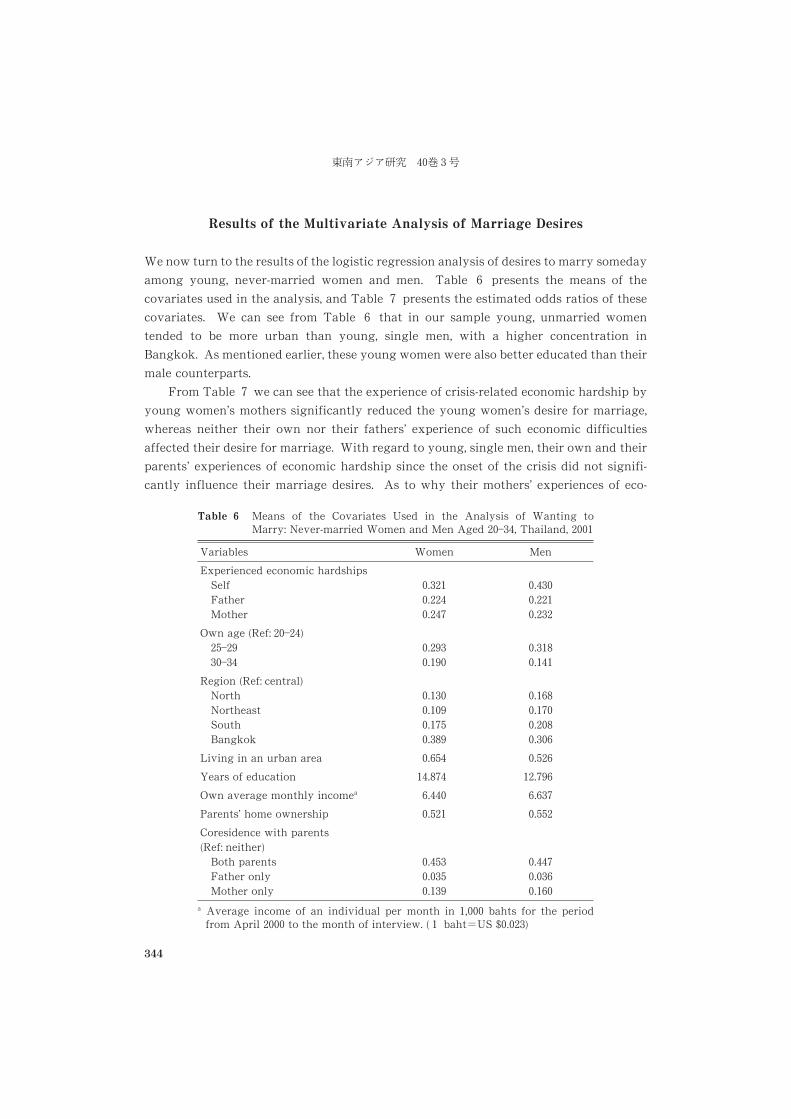
Results of the Multivariate Analysis of Marriage Desires
We now turn to the results of the logistic regression analysis of desires to marry someday
among young, never-married women and men. Table � presents the means of the
covariates used in the analysis, and Table � presents the estimated odds ratios of these
covariates. We can see from Table � that in our sample young, unmarried women
tended to be more urban than young, single men, with a higher concentration in
Bangkok. As mentioned earlier, these young women were also better educated than their
male counterparts.
From Table � we can see that the experience of crisis-related economic hardship by
young women’s mothers significantly reduced the young women’s desire for marriage,
whereas neither their own nor their fathers’ experience of such economic difficulties
affected their desire for marriage. With regard to young, single men, their own and their
parents’ experiences of economic hardship since the onset of the crisis did not signifi-
cantly influence their marriage desires. As to why their mothers’ experiences of eco-
Table � Means of the Covariates Used in the Analysis of Wanting toMarry: Never-married Women and Men Aged �����, Thailand, ����
Variables Women Men
Experienced economic hardshipsSelfFatherMother
���������������
���������������
Own age (Ref: �����)��������
��������
����������
Region (Ref: central)NorthNortheastSouthBangkok
�����������������
��������������������
Living in an urban area ���� ����Years of education ������ �����Own average monthly incomea ����� �����Parents’ home ownership ���� ���Coresidence with parents(Ref: neither)
Both parentsFather onlyMother only
������������
���������������
a Average income of an individual per month in ����� bahts for the periodfrom April ���� to the month of interview. ( � baht�US $�����)
������� ��� �
344
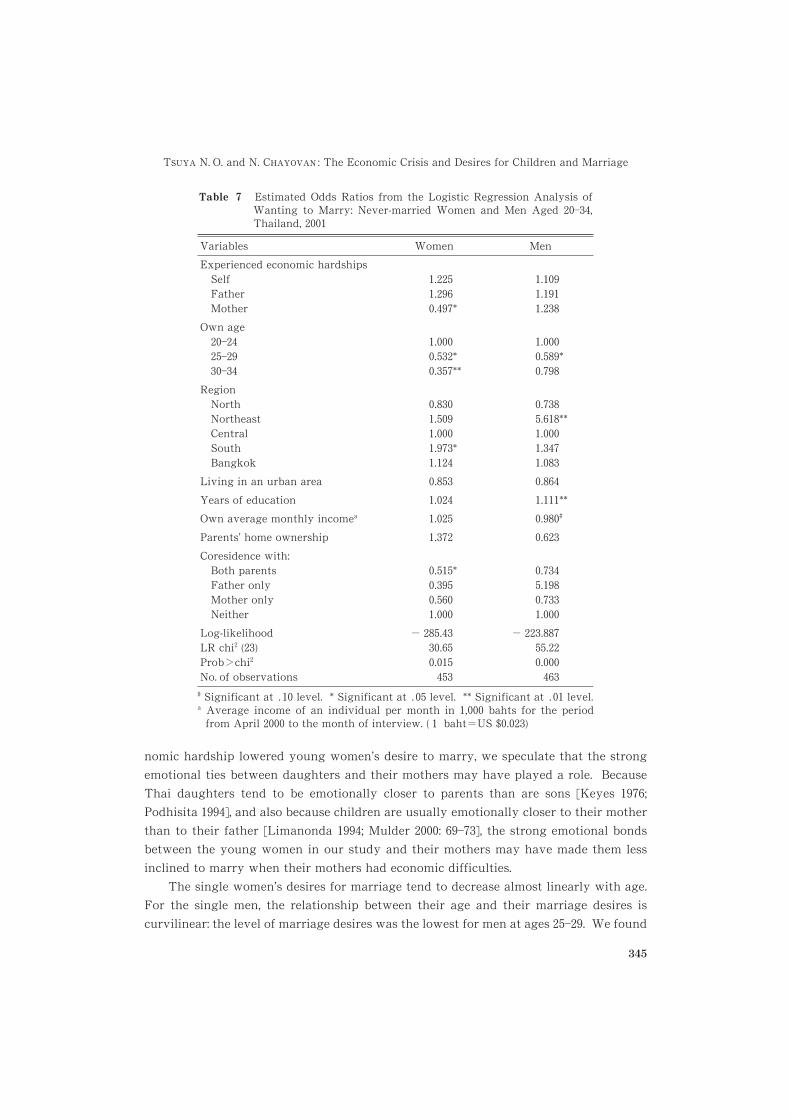
nomic hardship lowered young women’s desire to marry, we speculate that the strong
emotional ties between daughters and their mothers may have played a role. Because
Thai daughters tend to be emotionally closer to parents than are sons [Keyes ����;Podhisita ����], and also because children are usually emotionally closer to their mother
than to their father [Limanonda ����; Mulder ����: �����], the strong emotional bonds
between the young women in our study and their mothers may have made them less
inclined to marry when their mothers had economic difficulties.
The single women’s desires for marriage tend to decrease almost linearly with age.
For the single men, the relationship between their age and their marriage desires is
curvilinear: the level of marriage desires was the lowest for men at ages ����. We found
Table � Estimated Odds Ratios from the Logistic Regression Analysis ofWanting to Marry: Never-married Women and Men Aged �����,Thailand, ����
Variables Women Men
Experienced economic hardshipsSelfFatherMother
�����������*
������������
Own age
��������������
�������*���**
�������*����
RegionNorthNortheastCentralSouthBangkok
���������������*����
�������**
������������
Living in an urban area ��� ����Years of education ���� ����**
Own average monthly incomea ��� �����
Parents’ home ownership ���� ����Coresidence with:
Both parentsFather onlyMother onlyNeither
��*����������
���������������
Log-likelihoodLR chi� (��)Prob�chi�
No. of observations
� ������������
� ���������������
� Significant at �� level. * Significant at � level. ** Significant at �� level.a Average income of an individual per month in ����� bahts for the period
from April ���� to the month of interview. ( � baht�US $����)
THJN6 N. O. and N. C=6NDK6C : The Economic Crisis and Desires for Children and Marriage
345
significant regional differences in marriage desires of single women and men. Compared
with women living in the Central region, women in the South were more likely to want
to marry someday. Compared with men in the Central region, men residing in the
Northeast were much more likely to want to marry. We found no statistically significant
urban-rural differences in the level of marriage desires, however.
Socioeconomic traits of single men influenced their desires for marriage. On the one
hand, education had a strongly positive and significant effect: a one-year increase in
education raised the proportion of single men who wanted to marry someday by ��percent. On the other, higher income tended to reduce men’s marriage desires, although
this result is not statistically significant at the conventional level of � percent. By
contrast, education and income did not significantly affect women’s desire for marriage.
Nor did the economic status of their parents, as measured by parents’ ownership of the
home, affect women’s (or men’s) marriage desires.
Coresidence with parents influenced women’s desire to marry in the sense that
women who lived with both parents were significantly less likely to want to marry than
were women who did not live with their parents. Interestingly, women living with their
father but not with their mother were also less likely to want to marry. In contrast, men
who lived with their father but not with their mother tended to have much stronger
marriage desires than did men who were not living with their parents. These results are
not statistically significant because the proportions of women and men living with only
their father were very small (around � percent). Nonetheless, women living with only
their father were less likely to want to marry, probably because they played the role of
homemaker, taking care of the father and other family members. In contrast, young men
living with only their father had strong desires for marriage, probably because they felt
acutely the inconveniences caused by the absence of the mother, who would normally
shoulder household tasks and care for the father and other family members.
Summary and Discussion
This study has found that the effects of the economic crisis as measured by experiences
of economic hardship among Thai women and men in their ��s and ��s have been
pervasive, with more than one-half of the married women and men surveyed reporting
such experiences. Even among the young, single respondents, the effects of the economic
crisis have been substantial: nearly half of the single men and �� percent of the single
women surveyed reported having experienced economic hardships since the crisis began.
We also found gender, regional, and urban-rural differences in the effects of the crisis. A
higher percentage of men than of women reported experiencing economic hardship. The
percentages of women and men who experienced economic difficulties were notably
higher in the Northeast and the South than in other regions. For both sexes the
������� ��� ��
346
proportion experiencing such difficulties was higher among rural residents than among
those living in urban areas.
Judging from the relatively high proportions of married women and men with no
children or only one child who did not want to have any children or more children, the
level of desired fertility in Thailand today is not high. Nonetheless, for both men and
women, we found the level of desired fertility to decrease drastically as the number of
children they already had increased. Women’s desired fertility was lower than men’s, and
the gender difference in desired fertility was greater at older ages. It is mostly the woman
who shoulders major responsibilities for raising children, and the costs and pressures
associated with childrearing tend to increase as family size becomes larger. This in turn
results in an increasing gender gap in desires for children among women and men with
larger families.
Although a large majority of young, unmarried women and men expressed the desire
to marry someday, our study reveals a large gender difference in the desire for marriage,
women expressing less interest than men. Moreover, the level of ambivalence toward
marriage was higher among single women than among single men.
Our multivariate analysis of desired fertility suggests that the economic crisis has
negatively affected women’s fertility desires through their husbands’ economic dif-
ficulties, those difficulties including a job loss, pay cut, or other employment-related
setback. This finding in turn implies that the husband’s employment is a major factor in
determining a woman’s perception of the financial feasibility of having children and
suggests that, if prolonged, the crisis could lead to lower marital fertility in Thailand.
Not only do such demographic factors as age, number of living children, and region
affect fertility desires, but also characteristics of the marriage as measured by the age
difference between spouses and the number of times married have strong effects on the
fertility desires of both sexes. We found that although couples’ socioeconomic character-
istics did not exert strong effects on desired fertility, a higher income tended to increase
women’s (but not men’s) desire for children. This again seems to indicate the enhancing
effect of a couple’s financial security on women’s desired fertility.
The crisis may have also dampened the marriage desires of young, single women by
causing economic hardships for their mothers. Our multivariate analysis shows that
having a mother who experienced economic hardship due to the crisis significantly
reduced the marriage desires of young, unmarried women. Though we are not certain
why their mothers’ economic setbacks negatively affected women’s desires for marriage,
the widely documented close emotional ties between mothers and daughters in Thailand
may have played a role.
Our study suggests that the paths through which the economic crisis has affected
desires for children and marriage are diverse and indirect. By implication, to account
fully for its sociodemographic effects on family formation and family planning, it is
necessary to take into consideration the economic and demographic situations of not
THJN6 N. O. and N. C=6NDK6C : The Economic Crisis and Desires for Children and Marriage
347
only individual women and men but also their family members, including their parents
and, if married, the spouse and his or her parents.
We are not certain whether the identified effects of the crisis on desires for children
and marriage among Thai women and men are short-term responses, or more or less
irrevocable. Mason [����] suggests that the effects of economic downturns on the
demand for children tended to be temporary and procyclical in developing countries at
late stages of demographic transition in the ����s. According to recent reports on the
economic conditions in Thailand [e. g., Kaosa-ard et al. ����; The Economist ����], the Thai
economy is on the way to recovery. If Mason’s suggestion applies to the recent and more
acute crisis in Thailand, once the economy recovers, women’s and men’s desires for
marriage and children may also bounce back. We cannot ignore the possibility, however,
that once having experienced such a shock, young Thais may have undergone changes in
their desires for children and marriage that are likely to linger long after the recovery.
More studies are needed to explain the magnitudes and the mechanisms of the demo-
graphic effects produced by the economic crisis in Thailand and elsewhere in Asia.
References
Bello, Walden. ����. Globalization in Crisis: The End of a “Miracle.” Multinational Monitor (February).http: //www/globalpolicy.org/globaliz/econ/globcris.htmhttp: //www/globalpolicy.org/globaliz/econ/globcris.htm
Bhaopichitr, Kirida. ����. Thailand’s Road to Economic Crisis. The Nation (Bangkok), December.http: //www.hartford-hwp.com/archives/��/��.htmlhttp: //www.hartford-hwp.com/archives/��/��.html
Chayovan, Napaporn; Peracca, Sara; and Ruffolo, Vipan Prachuabmoh. ����. Thailand’s EconomicCrisis and Reproductive Health: A Case Study of Bangkok, Any Tong and Sri Saket. Bangkok:College of Population Studies, Chulalongkorn University.
Daorueng, Prangtrip. ����. Crisis Promises More Pain for Workers. InterPress Third World NewsAgency (IPS), December �. http: //www/hartford-hwp.com/archives/��/���htmlhttp: //www/hartford-hwp.com/archives/��/���html
Facts on Life News Services. ����. Issues and Controversies: Asia’s Economic Crisis. March ��.http: //www.facts.com/icof/i ���.htmhttp: //www.facts.com/icof/i ���.htm
Frankenberg, Elizabeth; Thomas, Duncan; and Beegle, Kathleen. ����. The Real Costs of Indonesia’sEconomic Crisis: Preliminary Findings from the Indonesian Family Life Surveys. Labor andPopulation Program Working Paper Series, No. �����. Santa Monica, CA: RAND.
Ito, Takatoshi. ����. The Development of the Thailand Currency Crisis: A Chronological Review.Kaigai-Toshi Kenkyusho Ho [Journal of Research Institute for International Investment andDevelopment] �� ( � / ��): ���.
Jansen, Karel. ����. External Finance in Thailand’s Development: An Interpretation of Thailand’sGrowth Boom. London: Macmillan.
����. ����. Thailand, Financial Crisis and Monetary Policy. Journal of the Asia Pacific Economy
( � ): �������.Kaosa-ard, Mingsarn; Yusanas, C.; Plangpraphan, J.; Charoenpiew, P.; Wijukprasert, P.; Meethom, P.;
Leangcharoen, P.; Jarungrattanapong, R.; Saae Hae, S.; Jitsuchon, S.; Rungjan, S.; Keawmesri T.;and Uparasit, U. ����. Social Impact Assessment: Synthesis Report. Bangkok: Thailand Develop-ment Research Institute.
Keyes, Charles F. ���. In Search of Land: Village Formation in the Central Chi River Valley,Northeast Thailand. Contributions to Asian Studies � : ���.
Knodel, John; Chamratrithirong, Apichat; and Debavalya, Nibhon. ����. Thailand’s ReproductiveRevolution: Rapid Fertility Decline in a Third World Setting. Madison: University of Wisconsin
������� ��� �
348
Press.Lee, Jong-Wha; and Rhee, Changyong. ����. Social Impacts of the Asian Crisis: Policy Challenges and
Lessons. Occasional Paper ��. New York: United Nations Development Programme, HumanDevelopment Report Office. http: //hdr.undp.org/docs/publications/occasionalhttp: //hdr.undp.org/docs/publications/occasional papers/oc��a.papers/oc��a.htmhtm
Limanonda, Bhassorn. ����. Family Formation in Rural Thailand: Evidence from the ������� Familyand Household Survey. In Tradition and Change in the Asian Family, edited by Lee-Jay Cho andMoto Yada, pp. �������. Honolulu: East-West Center.
Mason, Andrew. ����. The Response of Fertility and Mortality to Economic Crisis and StructuralAdjustment Policy during the ����s: A Review. In Demographic Responses to Economic Adjust-ment in Latin America, edited by George Tapinos, Andrew Mason, and Jorge Bravo, pp. �����.Oxford: Clarendon Press.
Mulder, Niels. ����. Inside Thai Society: Religion, Everyday Life, Change. Chiang Mai: SilkwormBooks.
Podhisita, Chai. ����. Coresidence and the Transition to Adulthood in the Rural Thai Family. InTradition and Change in the Asian Family, edited by Lee-Jay Cho and Moto Yada, pp. ������.Honolulu: East-West Center.
Prachuabmoh, Visid; Knodel, John; Prasitrathsin, Suchart; and Debavalya, Nibhon. ����. The Ruraland Urban Population of Thailand: Comparative Profiles. Institute of Population Studies, Chula-longkorn University Research Report No. �. Bangkok: Thai Watana Panich Press.
Sugisaki, Shigemitsu. ����. Economic Crisis and Recovery in Asia and Its Implications for theInternational Financial System. Paper presented at the Meeting on Development Cooperation:Responding to the Asia Crisis, sponsored by the International Monetary Fund, Sydney, March .
Thailand, National Statistics Office (NSO). ����. The Report of the Labor Force Survey: Round 2�May+331. Bangkok: National Statistics Office, Office of Prime Minister.
����. ����a. The Report of the Labor Force Survey: Round 2�May 2000. Bangkok: NationalStatistics Office, Office of Prime Minister.
����. ����b. The Report of the Labor Force Survey: Round 3�August 2000. Bangkok: NationalStatistics Office, Office of Prime Minister.
The Economist. ����. Special Report�East Asian Economies: The Lost (Half) Decade. July .Tsuya, Noriko O.; and Choe, Minja Kim. ����. Investments in Children’s Education, Desired Fertility,
and Women’s Employment. Chapter in Marriage, Work, and Family Life in ComparativePerspective: Japan, South Korea, and the United States, edited by Noriko O. Tsuya and Larry L.Bumpass. Honolulu: University of Hawaii Press (forthcoming).
THJN6 N. O. and N. C=6NDK6C : The Economic Crisis and Desires for Children and Marriage
349
Unauthorized Migrants as Global Workers
in the ASEAN Region
Graziano B6II>HI:AA6�
Abstract
Globalization is a social phenomenon that by definition does not admit limitations. How-
ever, of the various factors of production, labor is not free to move where productivity is
highest. The traditional reasons limiting the movement of labor (political, economic, social
and cultural) have been reinforced by current discussions that link migration and terror-
ism. Thus, it is foreseeable that migration policies will become more restrictive in the near
future.
However, regardless of policies or sometimes in response to them, unauthorized
migration has developed in all countries. Is unauthorized migration the expression of the
globalization of foreign work? Is it a response to the futile attempts to limit the overreach-
ing power of globalization?
This paper will explore the significance of unauthorized migration as an outcome of
globalization by analyzing migration flows in Southeast Asia. There are currently three
migration subsystems in the region characterized by various types of population flows.
The paper will first examine the current trends of such flows. It will then examine the
characteristics of unauthorized migration and their significance for regional relations. It
will finally consider the following questions: Is the large unauthorized migration in the
region a consequence of the characteristics of the regional process adopted in ASEAN? Is
unauthorized migration the result of increasing globalization or does it depend on other
factors? Are migration policies consistent with regional and globalization policies?
Keywords: unauthorized migration, migration policies, globalization, ASEAN
In November ����Malaysia vowed to reduce unauthorized migration, exercizing tougher
control on the entry of migrants in its territory and repatriating those present with
unauthorized status. Although Malaysia had embarked on many such operations in the
past, this one smacked of unusual determination and resolve. Even if ������� irregular
workers had been repatriated in ����, as reported by the Immigration Department, �������unauthorized Indonesians were still said to remain in the country, ������� in Peninsular
Malaysia and ������� in Sabah [AMN, �� November ����]. The government’s intention to
* Scalabrini International Migration Institute, Via Calandrelli ��, ����� Rome, Italy, e-mail:graziano�simi����.org
Southeast Asian Studies, Vol. ��, No. �, December ����
350
repatriate ������ Indonesians a month led to riots among migrants detained in the Pekan
Nenas detention centre and the subsequent deportation of most of them. A similar move
of massive repatriation was announced in Sabah on February ��, ����, to tackle the
estimated ������� unauthorized migrants who had remained after the regularization of
���� or who had since failed to renew their permits [AMN, � February ����]. The
announcement was followed by quick action targeting the demolition of squatter shan-
ties and the repatriation of Filipinos and Indonesians.
On the other frontier, the one between Thailand and Burma, government action has
proceeded with similar determination. After the registration of some ������ migrants in
September ����, perhaps �������mostly Burmese migrants are still considered to be in the
country in an unauthorized status. A four-month crackdown on unauthorized migrants
in major cities of nine provinces was announced in February, to last until June �� [AMN,
�� February ����]. Burma agreed to cooperate in the process, taking repatriated workers
in the Myawaddy holding centre just across the border from Thailand’s Tak Province.
These references to current migration issues in two of the three most important
countries of destination within the ASEAN region are sufficient to indicate how relevant
unauthorized migration has become to government policies in the region. The signifi-
cance of this phenomenon and of the policies toward it deserve special attention because
it is occurring in the most successful regional experiment in Asia. Three questions need
to be addressed: Is the large unauthorized migration in the region a consequence of the
characteristics of the regional process adopted in ASEAN? Is unauthorized migration the
result of increasing globalization, or does it depend on other factors? Are migration
policies consistent with regional and globalization policies?
To answer these questions this article will first analyse migration flows within the
ASEAN region by examining three distinct migration subsystems. It will then examine
the dynamics of unauthorized migration in each of the three subsystems. Finally it will
discuss the three questions raised above.
Migration within the ASEAN Region
If migration within the ASEAN region is examined from a continental perspective, it
appears to constitute one fairly coherent migration system. A system can be understood
as comprising a group of countries with one, or more than one, core country, which
functions as a destination, and others as periphery countries from which migrants
originate. Because of differences in demographic, economic, social, and political contexts
(see selected indicators in Table � ), which serve as a premise to the population move-
ment, and because of specific linkages of various kinds (historical, cultural, technolog-
ical), which function as triggers to the actual movement, migration has taken place and
continues to take place reinforced by feedback and adjustments, and by the facilitative
G. B6II>HI:AA6 : Unauthorized Migrants as Global Workers in the ASEAN Region
351
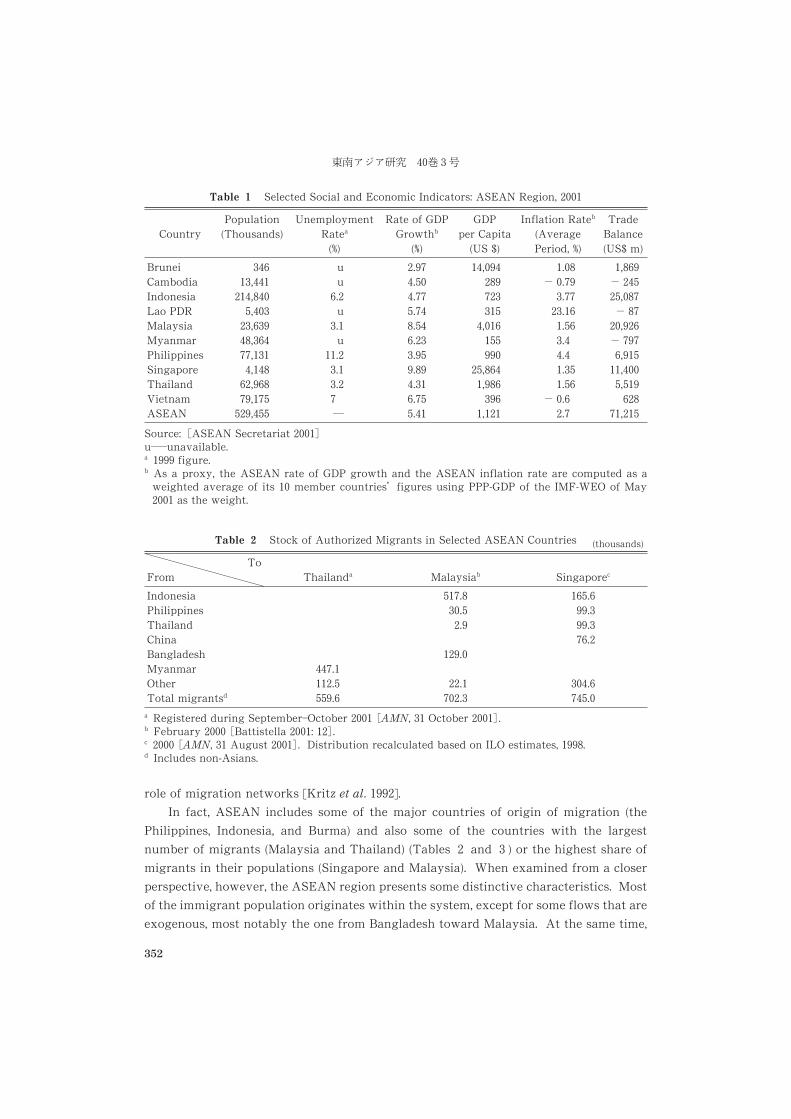
role of migration networks [Kritz et al. ����].
In fact, ASEAN includes some of the major countries of origin of migration (the
Philippines, Indonesia, and Burma) and also some of the countries with the largest
number of migrants (Malaysia and Thailand) (Tables � and � ) or the highest share of
migrants in their populations (Singapore and Malaysia). When examined from a closer
perspective, however, the ASEAN region presents some distinctive characteristics. Most
of the immigrant population originates within the system, except for some flows that are
exogenous, most notably the one from Bangladesh toward Malaysia. At the same time,
Table � Stock of Authorized Migrants in Selected ASEAN Countries (thousands)
ToFrom Thailanda Malaysiab Singaporec
IndonesiaPhilippinesThailandChinaBangladeshMyanmarOtherTotal migrantsd
��������������
�����������
�����
���������
��������������
���������
a Registered during September�October ���� �AMN, �� October �����.b February ���� �Battistella ����: ���.c ���� �AMN, �� August �����. Distribution recalculated based on ILO estimates, ���.d Includes non-Asians.
Table � Selected Social and Economic Indicators: ASEAN Region, ����
CountryPopulation
(Thousands)Unemployment
Ratea
(�)
Rate of GDPGrowthb
(�)
GDPper Capita
(US $)
Inflation Rateb
(AveragePeriod, �)
TradeBalance(US$ m)
BruneiCambodiaIndonesiaLao PDRMalaysiaMyanmarPhilippinesSingaporeThailandVietnamASEAN
������������������������������������������������������
uu
��u
���u
������������
����������������������������������������
������������������������
��������������
���� ����������������������������
� �����
���� ��������� ������� �������������������
������
Source: �ASEAN Secretariat �����u��unavailable.a ���� figure.b As a proxy, the ASEAN rate of GDP growth and the ASEAN inflation rate are computed as a
weighted average of its �� member countries� figures using PPP-GDP of the IMF-WEO of May���� as the weight.
����� ��� ��
352
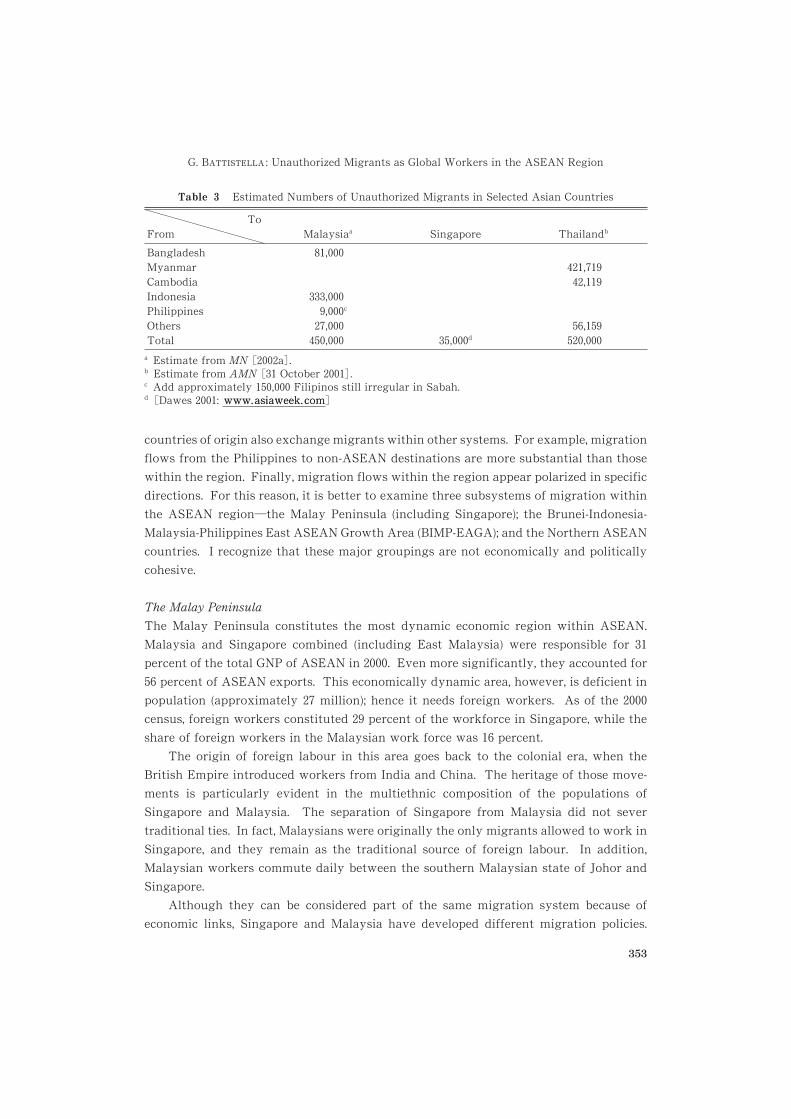
countries of origin also exchange migrants within other systems. For example, migration
flows from the Philippines to non-ASEAN destinations are more substantial than those
within the region. Finally, migration flows within the region appear polarized in specific
directions. For this reason, it is better to examine three subsystems of migration within
the ASEAN region�the Malay Peninsula (including Singapore); the Brunei-Indonesia-
Malaysia-Philippines East ASEAN Growth Area (BIMP-EAGA); and the Northern ASEAN
countries. I recognize that these major groupings are not economically and politically
cohesive.
The Malay Peninsula
The Malay Peninsula constitutes the most dynamic economic region within ASEAN.
Malaysia and Singapore combined (including East Malaysia) were responsible for ��percent of the total GNP of ASEAN in ����. Even more significantly, they accounted for
�� percent of ASEAN exports. This economically dynamic area, however, is deficient in
population (approximately �� million); hence it needs foreign workers. As of the ����census, foreign workers constituted �� percent of the workforce in Singapore, while the
share of foreign workers in the Malaysian work force was �� percent.
The origin of foreign labour in this area goes back to the colonial era, when the
British Empire introduced workers from India and China. The heritage of those move-
ments is particularly evident in the multiethnic composition of the populations of
Singapore and Malaysia. The separation of Singapore from Malaysia did not sever
traditional ties. In fact, Malaysians were originally the only migrants allowed to work in
Singapore, and they remain as the traditional source of foreign labour. In addition,
Malaysian workers commute daily between the southern Malaysian state of Johor and
Singapore.
Although they can be considered part of the same migration system because of
economic links, Singapore and Malaysia have developed different migration policies.
Table � Estimated Numbers of Unauthorized Migrants in Selected Asian Countries
ToFrom Malaysiaa Singapore Thailandb
BangladeshMyanmarCambodiaIndonesiaPhilippinesOthersTotal
����
����������c
����������� �����d
�����������
�����������
a Estimate from MN �����a�.b Estimate from AMN ��� October �����.c Add approximately ������ Filipinos still irregular in Sabah.d �Dawes ����: www. asiaweek. comwww. asiaweek. com�
G. B6II>HI:AA6 : Unauthorized Migrants as Global Workers in the ASEAN Region
353
The differences reflect different initial conditions as well as differences in the pace of
absorbing the local workforce.
Singapore early factored migration into the growth process of its economy. It
adopted a different treatment for professionals and highly skilled workers from that for
unskilled migrants. Although it encouraged the contribution of professionals, offering
them incentives to remain in Singapore and acquire permanent residence, it discouraged
the migration of unskilled workers. Control policies were aimed not just at making
migrant labour precarious (through lack of long-term residence possibilities) but also at
profiting from it by collecting a levy imposed on employers who hired foreign workers.
When it became apparent that the demand for migrant labour was increasing, because
migrants performed jobs that local workers shunned and that could not be eliminated
through automation, the government adopted policies that discouraged an increasing
dependency ratio [Wong ����].
Accurate data on the number and origin of migrants in Singapore are not available.
Newspapers have reported that in a population of ��� million people the number of
foreigners has reached ���� [AMN, �� August �], of whom perhaps �� are
migrants. Women domestic workers constitute an important component (perhaps one
fifth) of the foreign workforce and come mostly from the Philippines (three quarters),
Indonesia, and Sri Lanka [Yeoh et al. ����: ���]. Migrants are also widely employed in
construction; most come from Thailand, Bangladesh, and India.
Singapore’s migration policy is often characterized as pragmatic, aimed at maximiz-
ing the contribution of foreign workers and minimizing social costs. Social costs are
minimized, as mentioned earlier, by discouraging the hiring of unskilled workers, while
encouraging highly skilled workers, particularly in the area of the new economy, to settle
in Singapore. Social costs are also minimized by discouraging unskilled migrants from
remaining in Singapore or even intermarrying with the local population. The pragma-
tism of Singapore’s policy was particularly evident during the economic crisis of ����,when the government encouraged employers to retain workers not on the basis of
nationality, but rather productivity. Measures against unauthorized migration are
severe, including caning for those caught violating immigration policies. Punishment is
meted not just for hiring unauthorized migrants; providing lodging to unauthorized
migrants also constitutes an offence punishable by imprisonment and fines.
Immigration to Malaysia originated in the ���s, as local workers moved out of
agriculture and construction to better-paying jobs. Migrants came mostly from Indone-
sia and settled in Malaysia under a laissez-faire policy. The Malaysian govenment began
to control the movement of foreign workers with the ���� Medan Pact with Indonesia,
which was followed by similar agreements with the Philippines, Bangladesh, and Thai-
land. The state took a more proactive role in the ���s, particularly with the intention to
reduce the large number of unauthorized migrants. Nevertheless, various amnesties and
repatriations did not substantially modify the situation. Perhaps the largest reduction of
������� �� ��
354
foreign labour took place in ����, in reaction to the financial crisis, but the current
repatriation of Indonesians indicates it was an unfinished job. Overall, Malaysian
migration policy can be considered flexible and aimed at promoting growth and upgrad-
ing industry [Kanapathy ����]. Like Singapore, Malaysia does not make public its data
on migration. Recent newspaper reports indicate the number of registered foreign
workers in Malaysia to be �������, of whom ������ are Indonesians, ������� Bangladeshis,
����� Nepalese, ������ Filipinos, ���� Burmese, ���� Thais, ����� Pakistanis, and the rest
from other countries. In addition, approximately ������ are considered unauthorized
migrants, most of them from Indonesia and Bangladesh. Occupations are clustered by
ethnic origin. Thus Indonesians are predominantly in plantation work and construction,
Bangladeshis in manufacturing and services, and Filipinos in services.
Malaysia’s frequent policy changes make it difficult to have an overall grasp of the
current system. For instance, hiring for specific occupations has been restricted and
relaxed at various times, as has been the hiring of particular ethnic groups. The hiring
of Filipinos was suspended in October ����, but was lifted in January ���� after Indone-
sians were placed at the bottom of the list following their involvement in riots [AMN, ��January ����]. Like Singapore, Malaysia encourages the hiring of professionals; in
February, the hiring of foreign doctors was approved. It also aims at reducing the
number of unauthorized migrants, an objective it has pursued during the past �� years
with limited results.
In addition to the Philippines and Thailand, which send large numbers of migrants to
Singapore, the major sources of migration to this subsystem are Indonesia and Bangla-
desh, two highly populated countries with social and economic conditions that fuel
instability. Ethnic clashes and independence movements in Indonesia have subsided
under President Megawati, but their underlying causes have not found a solution.
Formal labour migration from Indonesia, which experienced a large transfer of popula-
tion within its own territory through the government’s programme of transmigrasi,
started in the ����s and consisted mostly of domestic workers heading for the Middle
East, Malaysia, and Singapore. Preceding and overshadowing the formal programme,
however, has been the unauthorized movement of migrants who enter Peninsular Malay-
sia by crossing the Straits of Malacca. Religious, linguistic, and cultural proximity have
facilitated this unauthorized transfer to Malaysia. Intermediaries (illegal recruiters,
travel agents, and transport operators) play a prominent role. Several agreements and
regularizations have not succeeded in bringing order to a movement that is based on
marked demographic and economic disparities between the two countries, with their
close borders and well-established migration networks. In recent years, however, Indone-
sia has also developed significant migration flows toward other destinations. About
����� Indonesians, mostly domestic workers, are in Hong Kong, and ������ are in Taiwan,
working in domestic and care services and also in manufacturing.
Bangladesh also sends most of its migrant labour force to other destinations, partic-
G. B6II>HI:AA6 : Unauthorized Migrants as Global Workers in the ASEAN Region
355
ularly the Middle East; and an unspecified number of Bangladeshis, perhaps �������, have
moved to the Indian state of Assam. Nonetheless, ties established through migration
flows will ensure that Bangladesh remains an important source of migrant labour in
Peninsular Malaysia. At the same time, an increasing diversification of origins is
expected, particularly after the recent action taken by the Malaysian government to
reduce the number of unauthorized Indonesians and to relegate them to the bottom of the
hiring list (domestic workers excluded). As soon as this happened, India and Nepal
moved to secure a niche in that labour market. Malaysia’s Human Resource Ministry has
expressed the intention to source workers from Vietnam, particularly in the construction
and plantation sectors [AMN, �� March ����].
The BIMP-EAGA Subregion
Because of its location, its history, and the configuration of its economy, East Malaysia
has developed autonomous immigration procedures. On the one hand, the two states,
Sabah in particular, have become the destinations of migrants mainly from the Philip-
pines and Indonesia. On the other, the Sultanate of Brunei, with its high standard of
living, due to the export of oil, also attracts migrants. Therefore, this region can be
considered a separate migration subsystem within the ASEAN region. The boundaries of
this subsystem coincide with the Brunei-Indonesia-Malaysia-Philippines East ASEAN
Growth Area commonly referred to as BIMP-EAGA.
Established in ����, BIMP-EAGA covers the sultanate of Brunei, East Malaysia
(Sabah, Sarawak, and Labuan), Mindanao and Palawan in the Philippines, and ��provinces in the Indonesian islands of Kalimantan, Sulawesi, Maluku, and Irian Jaya. It
is a vast region of ���� million square kilometres and a population of approximately ��million. The intention in establishing the growth area was to take advantage of the
opportunities it provides and create incentives for the economic growth of the least
developed areas in each nation (except for Brunei). Natural resources (forests, oil, gas, and
water) are plentiful; and agriculture specializes in coconut and corn in Mindanao, rubber
in Indonesia, and oil palm in Indonesia and Malaysia. Industrialization in the region at
large is below the level of the respective countries, however, and wages (except in East
Kalimantan) are also lower than national wages. Complementarities are not significant
enough to suggest a spectacular increase of intraregional trade; but there are possibilities,
particularly in tourism and labour complementarities, as well as in attracting more
foreign direct investment.
Since its establishment, BIMP-EAGA set up air and sea linkages to facilitate transpor-
tation and communication, though the private sector did not respond as expected to the
idea. BIMP-EAGA seems to be having a second life since President Arroyo revived the
attention of the other partners in ����. Regardless of the success of the growth area,
however, the region has developed migratory flows that respond not only to economic
but also to historical factors.
������� ��� �
356
Sabah has long been part of a geopolitical zone with linkages to both Malaysia and
the Philippines. It remains a source of territorial dispute between the two countries,
although the Philippines’ recent establishment of a de facto consulate in Kota Kinabalu
indicates that the Philippines may consider the possibility of obtaining sovereignty over
Sabah as remote. Population movement to Sabah (also to Sarawak) from Western
Mindanao in the Philippines and from Kalimantan in Indonesia began in precolonial
times, and the state boundaries established by colonial powers had limited impact. The
importation of labour during British colonial rule and the arrival of Filipinos seeking
refuge during the conflict in Mindanao in the ����s reinforced the migrant population,
which has now reached about ������� and is managed by the autonomous State Immigra-
tion Department. As in Peninsular Malaysia, efforts in Sabah and Sarawak to bring
unauthorized migration under control have met with little success. The largest operation
was the regularization programme implemented in ����, which registered ����� mi-
grants, including ����� Indonesians and ����� Filipinos [Kurus ���: �]. Malaysian
authorities estimated that approximately ����� failed to register. Some ������� un-
authorized migrants are said to remain in the state, and a new crackdown was launched
on February �. Toward the end of March, ����� migrants were deported from Sabah, of
whom ��� were Filipinos, ���� were Indonesians, and �� were of other nationalities.
Migrants in Sabah are involved in the same sectors (forestry, plantation, construc-
tion, manufacturing, and domestic service) as those in Peninsular Malaysia. But the level
of settlement is higher because nearly ������ Indonesians and Filipinos live with their
dependents. In addition to employment in sectors traditionally associated with migrants,
they are also involved in various aspects of the informal economy.
Similar to the economies of the Gulf countries, which depend largely on oil exports,
the economy of Brunei relies heavily on foreign labour. In �� immigrants already
represented �� percent of the labour force in the private sector. Government efforts to
reduce foreign labour have not been very successful [Mani ����]. Accurate figures on the
number and origin of migrants are not available, but Indonesians number perhaps �����,and other migrants come from the Philippines and the neighbouring Malaysian states.
Besides Indonesia, the other major country of origin for this subsystem is the
Philippines. In fact, the Philippines is the country with the largest and most developed
overseas labour programme in Asia. Even so, the ASEAN region does not constitute a
major destination for Filipino migrants. As shown in Table �, only � percent of all
Filipino workers were deployed to ASEAN countries in ���. The highest number of
Filipino migrants within ASEAN is in Sabah, but it is a migration flow that developed
largely outside the formal system of recruitment and deployment. Filipinos in Sabah
include those who fled to Sabah in the early ����s and obtained refugee status. In April
���, there were ������ Filipino refugees in the state living in �� settlements, with �����children studying in local primary and secondary schools [AMN, �� April ���]. Their
refugee status was revoked in July, but they were allowed to remain provided they could
G. B6II>HI:AA6 : Unauthorized Migrants as Global Workers in the ASEAN Region
357
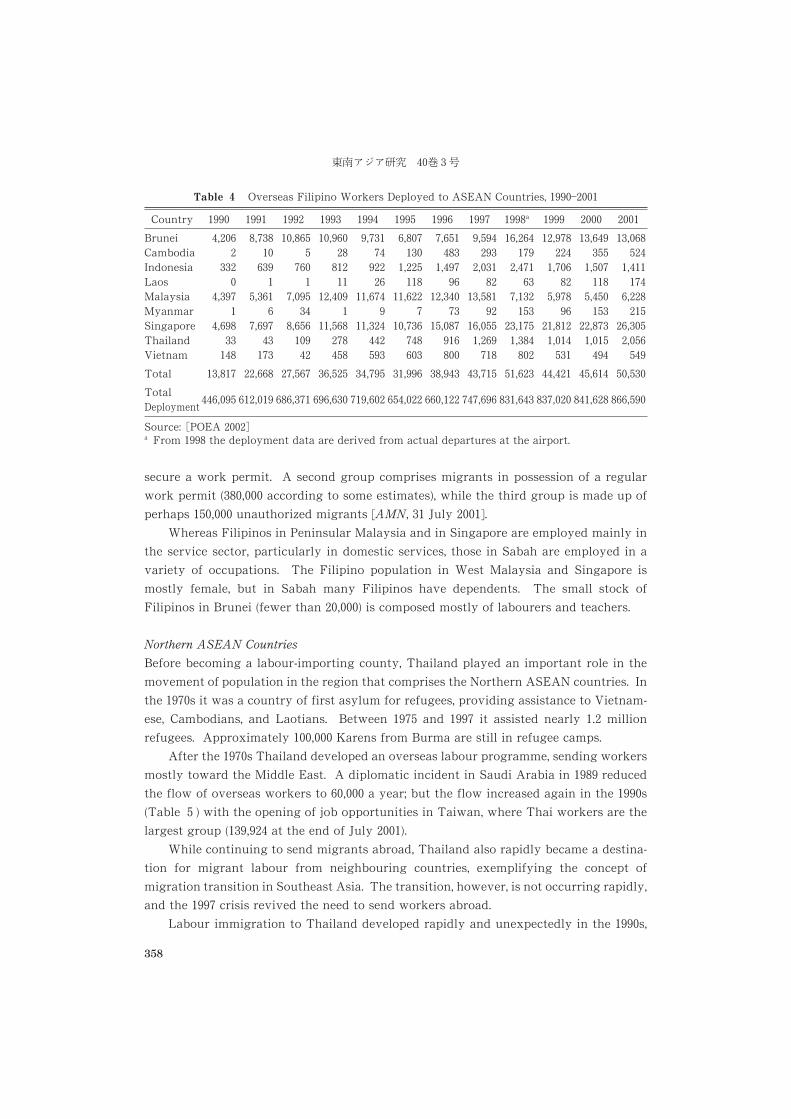
secure a work permit. A second group comprises migrants in possession of a regular
work permit (������� according to some estimates), while the third group is made up of
perhaps ������� unauthorized migrants [AMN, �� July ����].
Whereas Filipinos in Peninsular Malaysia and in Singapore are employed mainly in
the service sector, particularly in domestic services, those in Sabah are employed in a
variety of occupations. The Filipino population in West Malaysia and Singapore is
mostly female, but in Sabah many Filipinos have dependents. The small stock of
Filipinos in Brunei (fewer than ������) is composed mostly of labourers and teachers.
Northern ASEAN Countries
Before becoming a labour-importing county, Thailand played an important role in the
movement of population in the region that comprises the Northern ASEAN countries. In
the ���s it was a country of first asylum for refugees, providing assistance to Vietnam-
ese, Cambodians, and Laotians. Between ��� and ��� it assisted nearly �� million
refugees. Approximately ������� Karens from Burma are still in refugee camps.
After the ���s Thailand developed an overseas labour programme, sending workers
mostly toward the Middle East. A diplomatic incident in Saudi Arabia in ���� reduced
the flow of overseas workers to ������ a year; but the flow increased again in the ����s(Table � ) with the opening of job opportunities in Taiwan, where Thai workers are the
largest group (������� at the end of July ����).While continuing to send migrants abroad, Thailand also rapidly became a destina-
tion for migrant labour from neighbouring countries, exemplifying the concept of
migration transition in Southeast Asia. The transition, however, is not occurring rapidly,
and the ��� crisis revived the need to send workers abroad.
Labour immigration to Thailand developed rapidly and unexpectedly in the ����s,
Table � Overseas Filipino Workers Deployed to ASEAN Countries, ���������
Country ���� ���� ���� ���� ���� ���� ���� ��� ����a ���� ���� ����BruneiCambodiaIndonesiaLaosMalaysiaMyanmarSingaporeThailandVietnam
����������
�����
����������
����������
������
�������
����������
������
����������
�������������
�������
�����������
����������
������
������������
���������������
������
����������
�������������
�������
�����������
���������������
��������
�������������
��������������
�������
�������������
��������������
������
��������������
������������������������
�������������
������������������������
��������������
Total ����� ������ ���� ������ ����� ������ ������ ����� ������ ������ ������ ������TotalDeployment
������� ������� ������ ������� ������ ������� ������� ����� ������� ������ ������� �������
Source: �POEA �����a From ���� the deployment data are derived from actual departures at the airport.
������� �� �
358
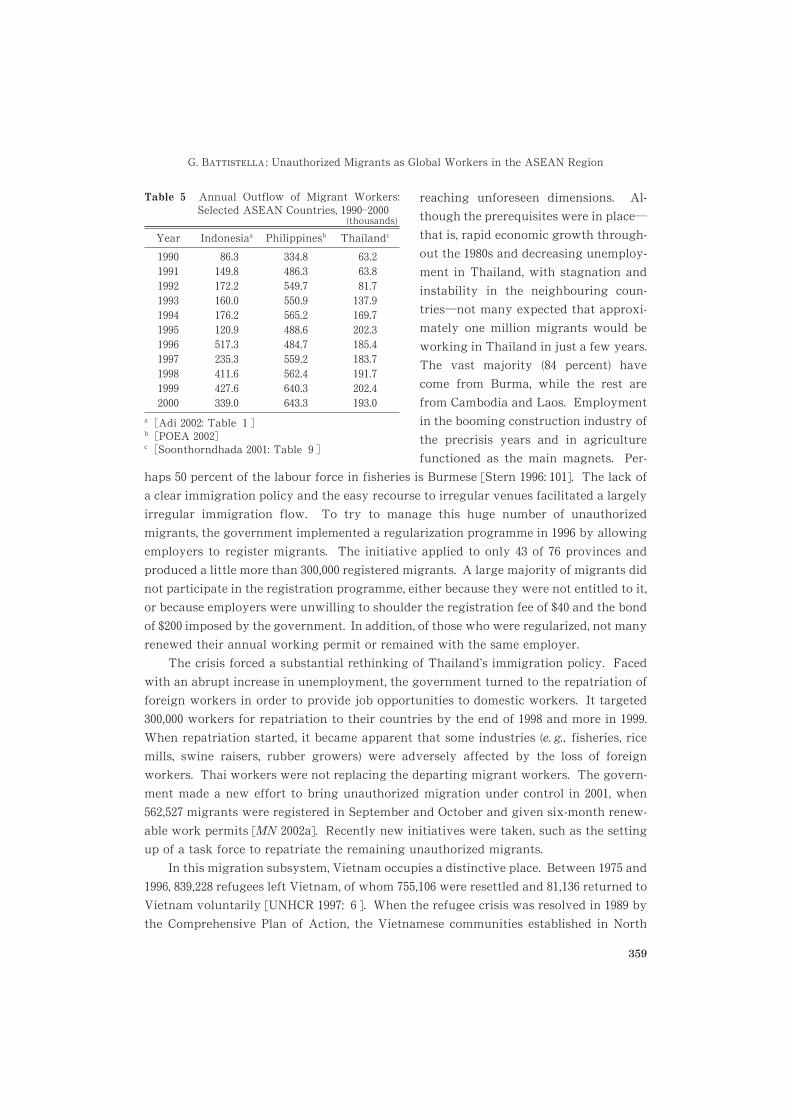
reaching unforeseen dimensions. Al-
though the prerequisites were in place�that is, rapid economic growth through-
out the ����s and decreasing unemploy-
ment in Thailand, with stagnation and
instability in the neighbouring coun-
tries�not many expected that approxi-
mately one million migrants would be
working in Thailand in just a few years.
The vast majority (�� percent) have
come from Burma, while the rest are
from Cambodia and Laos. Employment
in the booming construction industry of
the precrisis years and in agriculture
functioned as the main magnets. Per-
haps �� percent of the labour force in fisheries is Burmese [Stern ����: ���]. The lack of
a clear immigration policy and the easy recourse to irregular venues facilitated a largely
irregular immigration flow. To try to manage this huge number of unauthorized
migrants, the government implemented a regularization programme in ���� by allowing
employers to register migrants. The initiative applied to only �� of � provinces and
produced a little more than ������ registered migrants. A large majority of migrants did
not participate in the registration programme, either because they were not entitled to it,
or because employers were unwilling to shoulder the registration fee of $�� and the bond
of $��� imposed by the government. In addition, of those who were regularized, not many
renewed their annual working permit or remained with the same employer.
The crisis forced a substantial rethinking of Thailand’s immigration policy. Faced
with an abrupt increase in unemployment, the government turned to the repatriation of
foreign workers in order to provide job opportunities to domestic workers. It targeted
������ workers for repatriation to their countries by the end of ���� and more in ����.When repatriation started, it became apparent that some industries (e. g., fisheries, rice
mills, swine raisers, rubber growers) were adversely affected by the loss of foreign
workers. Thai workers were not replacing the departing migrant workers. The govern-
ment made a new effort to bring unauthorized migration under control in ����, when
����� migrants were registered in September and October and given six-month renew-
able work permits [MN ����a]. Recently new initiatives were taken, such as the setting
up of a task force to repatriate the remaining unauthorized migrants.
In this migration subsystem, Vietnam occupies a distinctive place. Between ��� and
����, ������ refugees left Vietnam, of whom ����� were resettled and ����� returned to
Vietnam voluntarily [UNHCR ���: � ]. When the refugee crisis was resolved in ���� by
the Comprehensive Plan of Action, the Vietnamese communities established in North
Table � Annual Outflow of Migrant Workers:Selected ASEAN Countries, ���������
(thousands)
Year Indonesiaa Philippinesb Thailandc
�������������������������������������������
��������������������������������������������������
�����������������������������������������������������
�����������������������������������������������
a �Adi ����: Table � �b �POEA �����c �Soonthorndhada ����: Table � �
G. B6II>HI:AA6 : Unauthorized Migrants as Global Workers in the ASEAN Region
359
America and Australia induced additional migration for family reunification. Between
���� and ���� another stream of Vietnamese migrants moved to countries of the Soviet
bloc for work. More recently, an agreement signed with Taiwan in May ���� has
provided an important destination for overseas labour. At the end of July ����, there
were ������ Vietnamese in Taiwan’s manufacturing sector and care services.
The description of labour mobility in the region, clustered around three subsystems,
presents several common aspects. First, the absolute number of migrants is not a huge
figure compared with the total population of the region (less than � percent). In fact, the
total number of migrants in the three subsystems can be estimated at �� million (Tables
� and � ), not considering the foreigners in the countries of origin, who do not constitute
a large number. It is necessary to cite estimates since the available data are not reliable.
In addition, the number of unauthorized migrants is not easily ascertained. Thus
migration does not constitute in itself a phenomenon of alarming proportions. Second, in
the receiving countries, the relative importance of migrant labour varies considerably.
Foreign labour constitutes �� percent of the labour force in Singapore, �� percent in
Malaysia, and � percent in Thailand. Although such numbers do not present a problem
to an economy or society in times of prosperity, they become an issue in times of crisis.
Third, the number of unauthorized migrants in the region is absolutely disproportionate,
constituting perhaps � percent of the total number of migrants. This indicates that
policies are most likely not in step with the needs of the economy or, to put it in different
terms, that the demand for migrant labour (and conversely, the pressure to migrate) are
larger than what policies intend to accommodate. A better understanding of un-
authorized migration in the region requires a further examination of its dynamics.
The Dynamics of Unauthorized Migration within the ASEAN Region
Unauthorized migration, as briefly described in the three migration subsystems, is not
purely the result of a demand for labour from labour-scarce economies, matched by
available manpower from countries with a high level of unemployment, that cannot be
addressed by adequate policy measures. A variety of other aspects must also be
considered to understand the extraordinary development of unauthorized migration
within ASEAN.
First is the geographic aspect. Geographic contiguity between Indonesia and Malay-
sia, between Burma and Thailand, and between western Mindanao and Sabah provides
opportunities for border crossing to people who cannot or do not know how to follow
formal procedures. In this respect, most unauthorized migration within ASEAN is of the
border-crossing type, unlike that in other areas, such as East Asia, where it consists
mostly of unauthorized stay after legal entry. Obviously, the possibility to cross borders
depends on the control that is exercized. Control measures are limited where borders are
������� �� ��
360
very long or traditionally porous.
Second is the historical aspect. In the development of Asian states, the jurisdiction
over peripheral areas, often forested and mountainous, shifted according to whichever
state was strongest; such areas sometimes straddled two or several states. The move-
ment of population in the areas followed dynamics that were not determined by political
sovereignty. The establishment of clearer borders by colonial powers led people to
discover that movement within traditional economic areas entailed crossing interna-
tional borders [IOM ����].
Third is the importance of intermediaries. Migration traditionally relies on social
networks to provide the necessary information to facilitate departure, entry, and inser-
tion in the country of destination. In the case of unauthorized migration, such networks
are essential and offer a vast typology. Often intermediation for unauthorized migration
combines and colludes with the formal labour-recruiting system put in place in Asian
countries to facilitate the expansion of the overseas labour programmes.
Considering these aspects, which are not unique or clearly specific to the ASEAN
case, it seems advisable to go beyond the macro perspective to acquire a better under-
standing of the dynamics of unauthorized migration. To explore the phenomenon within
specific contexts, in ���� several of my colleagues and I conducted a four-country study
of the experience of unauthorized migrants. The study covered two countries of origin,
Indonesia and the Philippines, and two countries of destination, Malaysia and Thailand.
Some of the results from the study are relevant to the current discussion.
At the core of unauthorized migration from Indonesia is the migrants’ need for
information. The need covers the whole migration process, from its origin at the village
to employment in Malaysia. In most cases��� percent in the sample interviewed by Adi
[����]�migrants obtain information through friends and relatives. Often, friends and
relatives can also provide assistance, particularly in the final stage of the process,
securing employment and perhaps a place to stay. Professional intermediaries, called
tekong, also play a crucial role. Sometimes their role is limited to taking the prospective
migrant to a recruiting agent, sometimes it involves financing the cost of migration
(which the migrant must repay twice over), and sometimes it covers the whole process.
The tekong is often a former migrant who has established a network of contacts in
Malaysia, knows how to obtain documentation, and accompanies the migrant to the
employer in Malaysia. The picture that emerges from the Indonesia-Malaysia flow is one
of a migration system in which social networks play a decisive role. Intermediaries offer
services throughout the migration process, but relatives and friends are more trusted
because they can provide assistance while the migrant is abroad.
Unauthorized migration from the Philippines to ASEAN destinations is primarily to
Sabah. Filipino migration to Sabah is organized around two major routes. The unofficial
one, known as the Southern backdoor, originates from the small islands of the Sulu
Archipelago, and is part of traditional trading that goes back to time immemorial.
G. B6II>HI:AA6 : Unauthorized Migrants as Global Workers in the ASEAN Region
361
Another unofficial route to Sabah originates from Palawan. People involved in the
trading do not consider going to Sabah as going to a foreign country. Perhaps �� percent
of residents in Tawi-Tawi have relatives in Sabah [Battistella et al. ����: ��]. Travelling
in small vessels, migrants go to Sabah for various reasons�to look for a job, to visit
relatives, or to buy goods for training. As there is no immigration office in the small
islands, the movement is outside the official system. The official route entails passing
through immigration requirements in Zamboanga City, which is far away and impracti-
cal to reach. The second route transports migrants by way of a ferry from Zamboanga
City to Sandakan, Sabah. The ferry service was established in ���� as part of the
BIMP-EAGA accord. It is the legal gateway to Sabah, as passengers must travel with
documents. This does not imply that unauthorized migration does not occur, since
documents are sometimes forged and passengers may enter Sabah as visitors and then
remain beyond the period of stay allowed them and find work. Smugglers use this route
to traffic women to Sabah and Labuan to work as prostitutes.
A different dynamic of unauthorized migration from the Philippines to ASEAN
countries involves migrants, mostly domestic workers, in Singapore. Little information
is available on the volume of unauthorized migration to Singapore, except for the
increasing number of migrants arrested and repatriated (����� in ����, ���� in ����) and
the fact that many unauthorized migrants are employed in the construction sector.
However, Filipinos can be considered unauthorized migrants not so much for breaking
Singapore law as for not complying with Philippine regulations. Most Filipinos in
Singapore�� out of �� according to some estimates [Yeoh et al. ����: ��]�have entered
Singapore with a tourist visa and been employed through a preapproved work permit
arranged by the employment agency. Leaving as tourists to find employment as
migrants is considered unauthorized migration in the Philippines because the migrants
circumvent the process requiring the submission of a standard labour contract, passing
physical tests, attending predeparture seminars, and contributing to the welfare fund.
Measures in the Philippines against unauthorized migration have been directed
mostly against illegal recruitment. The Migrant Workers and Overseas Filipinos Act of
���� contains detailed provisions defining illegal recruitment, which can be committed
also by a licensed agency, and harsh penalties for violators. Nevertheless, the law has not
succeeded in eliminating illegal recruitment because the demand for migration remains
strong. Many cases are settled outside of court, and perpetrators are allowed to continue
operating.
From the perspective of the country of destination, unauthorized migration is a
parallel system that continues to function alongside the formal system of foreign-labour
recruitment. The formal system is the typical procurement of labour for employers who
use the services of local employment agencies, which are in contact with recruitment
agencies in the country of origin. Unauthorized migration instead consists in entry to
Malaysia through the intermediation of tekongs and, more commonly, of friends and
������� ��� �
362
relatives, and the procurement of employment on site. Interestingly, Wong and Afrizal
[����] have compared this system to the arrival of Chinese workers in Malaya during the
nineteenth century. Whereas Indian labourers obtained assisted passage from rubber
companies, Chinese workers paid their way and consequently entered a much more open
labour market. “One consequence was that the Chinese labour was highly mobile,
moving constantly in search of higher wages and better working conditions, whilst
Indian labour was confined to the low-wage plantation economy” [ibid.: ���].
The results of the study in both pairs of countries emphasized the prevalent role of
social networks in unauthorized migration�with intermediaries having a say in it,
benefiting from it, and sometimes victimizing their clients. That role has significance for
policies to control unauthorized migration. Furthermore, the historical parallel with
earlier experiences of foreign labour in Malaysia show that some dynamics have the
possibility to prosper. Consequently, “the current system of migrant labour regulation,
namely the establishment of a rigid system of migrant labour recruitment on the one
hand, and the criminalization of informal channels of recruitment on the other, is
unrealistic, counter-productive and damaging” [ibid.: ���].
Research in Thailand by Amarapibal et al. [����] has shed light on another aspect of
the dynamics of unauthorized migration. I have already indicated that migration to
Thailand increased dramatically in the ����s, coinciding with growing development,
particularly before the ���� crisis, as well as with difficult conditions in the military
regime of Burma. In ���� Thailand changed its migration policy from a laissez-faire
approach to requiring registration, allowing � provinces to hire migrants from neigh-
bouring Burma, Cambodia, and Laos. New requirements were introduced in the years
following the crisis, for the purpose of reducing the number of migrants and providing
employment opportunities to Thais. A quota system was adopted, and registrations for
the year ���� were allocated, based on employers who had registered workers in ����.This system was criticized for being shortsighted and limited; dependents were not
included, and it did not provide adequate protection to workers. The number of
registered migrants (usually fewer than ������) perhaps never surpassed �� percent of
the migrant population.
Unauthorized migration to Thailand, however, presents a variety of situations.
According to Amarapibal and her colleagues, the low-income border province of Tak has
a migrant population of perhaps �����, mostly Burmese, largely employed in factories,
which were relocated along the border precisely to take advantage of low-cost migrant
labour. Unlike single migrants employed in factories, migrants with families work in
agricultural jobs. Ninety percent of the migrants interviewed crossed from Burma
without much recruitment assistance, and most found jobs by themselves or with the
help of relatives. The same percentage of migrants interviewed had relatives in the
province. Most maintained ties with families in Burma; �� percent sent remittances
regularly and �� percent visited their families once a year. Only �� percent knew of the
G. B6II>HI:AA6 : Unauthorized Migrants as Global Workers in the ASEAN Region
363
registration process, and even fewer were aware that the employer was responsible to
pay the registration fees.
The coastal province of Samutsakhon, south of Bangkok, presents a different scena-
rio. Samutsakhon has the fifth highest income among the �� provinces in Thailand.
Migrants, who numbered ������ in , form �� percent of the province’s population.
Ninety percent of them are below � years of age, and most are from Burma; of these, ��percent are Mon, � percent are Burmese, and �� percent are Karen. Sixty percent are
married. Family members accompany most migrants, although not all migrants bring
their children with them.
Unlike the group in the border province of Tak, �� percent of migrants in Samutsa-
khon sought the assistance of recruiting agents, while the rest relied on relatives and
friends. In most cases the migrants contacted agents or their social networks in Burma
before starting the migration process. Thai agents were used only for crossing and
transportation. More than �� percent did not cross the border at a checkpoint. Those
who did so had border passes, which allow for only a short stay and in specific areas. The
migrants obtained employment through friends or agents, or by themselves almost in
equal proportion. They found employment in fishing and fish processing, which are the
main industries of the province. Awareness of registration and its benefits is greater in
Samutsakhon than in Tak, but the rate of registration is far from satisfactory. Migrants
have grown sceptical of the system because registration costs, which should be borne by
the employers, are passed on to the workers. Some migrants find little advantage in
registering, claiming harassment by enforcers who extort money from them. Examining
the correlation between registration and other variables, Amarapibal et al. [ibid.: ��]found that only a few were significant. Women were more likely to be registered than
men (�� percent versus �� percent); those employed in industries were more likely to be
registered than those in the agricultural sector and fishing. Knowledge of the system or
the rights of workers did not have much effect on registration.
The registration process that took place in �, although insufficient to cover the
whole migrant population, appears to have been a temporary measure pointing toward a
more comprehensive change of the migration policy. The benefits of the recent approach
is that it was not limited to specific occupations or specific provinces, thus discarding the
quota system, which relied heavily on the ties between local businesses or politicians and
central authorities. “It provides a system of health and welfare support; it can assist
greatly in reducing corruption; it can provide a more secure environment for a greater
number of people” [ibid.: �].
Unauthorized migration in Thailand has acquired the characteristics of a flow
sustained by some local industries that have organized to take advantage of migrant
labour to the point that there is no substitution for it. In fact, even during the region’s
economic crisis unemployed Thai workers did not want to replace migrants in jobs that
paid low salaries and had low prestige. Employers can take advantage of the precarious
������� �� ��
364
situation of unauthorized migrant labour by not providing social benefits and often by
paying below-minimum wages. In this situation it is not surprising that control policies,
which simply aim to reduce irregular migration by repatriating migrants, have been
highly ineffective because the demand for migrant labour is embedded in the system.
Migrants are widely available and capable of entering the system through well-organized
social networks, and officials can also benefit through extortions.
The exploration in this section of the dynamics of unauthorized migration within the
ASEAN region has revealed the existence of two major systems. One derives from the
shifting of borders between contiguous countries, with a long tradition that predates the
current political borders drawn by colonial powers. The other is the result of develop-
ment in sectors that require menial, dirty, unskilled jobs, or jobs with little social prestige.
The availability of foreign workers for such jobs, which are normally shunned by most
local populations, allows those sectors to maximize profits by employing underpaid
foreign labour rather than modernizing those sectors. The involvement of social net-
works and recruitment agencies is essential for unauthorized migration to continue.
Unauthorized Migration and Policies within ASEAN Countries
Having described migration within the ASEAN region as organized into three distinct
subsystems, and having explored the dynamics of unauthorized migration, it is now
possible for me to attempt to address the questions posed at the beginning of the article.
It is an initial exploration, as appropriate data would be needed for more conclusive
answers.
Migration and the Regional Process of ASEAN
ASEAN was established in ����, during the cold war. It is no surprise that its charter did
not consider the movement of labour. In fact, of the three objectives set forth for the
association, the predominant one was promoting regional peace and stability. Initiatives
toward economic cooperation were taken, but not with a vision of an integrated regional
economy. This occurred in ����, at the Fourth Summit in Singapore, when strong
American leadership toward economic liberalization affected the international climate.
The ASEAN Free Trade Area (AFTA) was created with the primary objective of facilitat-
ing trade among the member countries by lowering tariffs to a ��� percent range by ����.The date was later advanced to ��� and then again, in spite of the financial crisis, to ����.Thus, for the original six member countries of ASEAN, AFTA is already a fact. Neverthe-
less, the circulation of labour remains a subject on which the association does not want
to engage; and since the tragedy of September ��, governments have become less
interested in multilateral approaches to the subject.
The reasons for avoiding discussing migration are various and understandable.
G. B6II>HI:AA6 : Unauthorized Migrants as Global Workers in the ASEAN Region
365
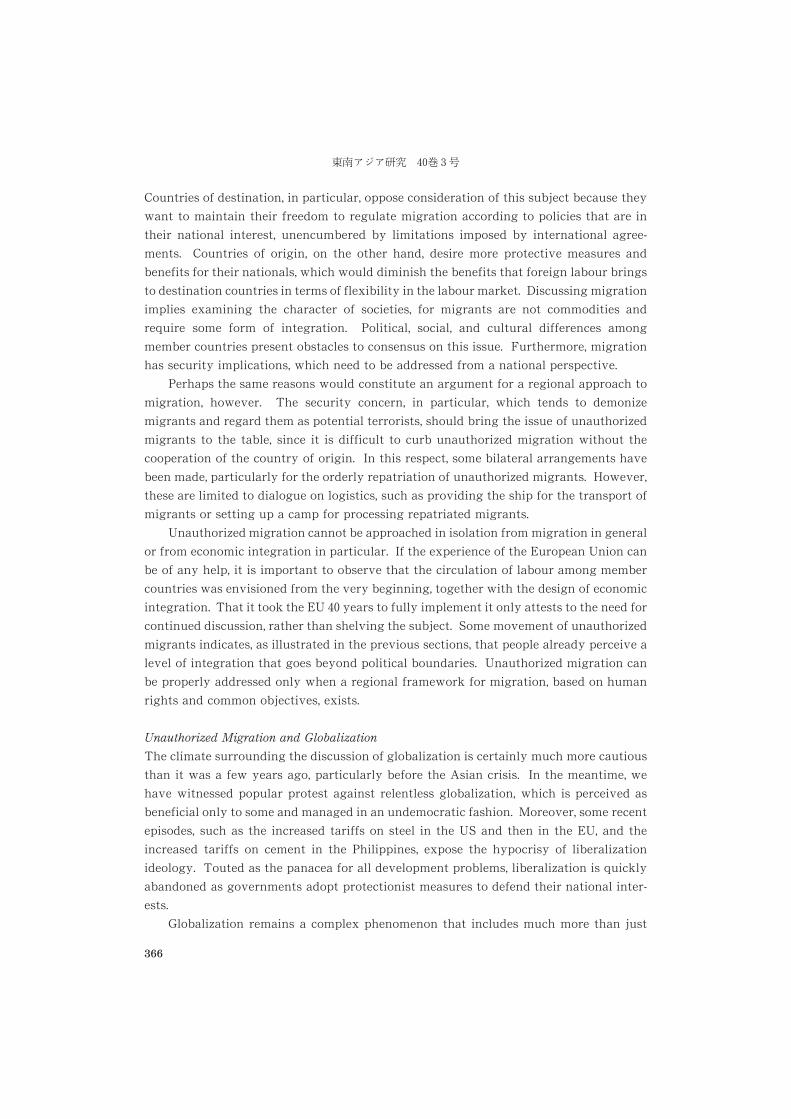
Countries of destination, in particular, oppose consideration of this subject because they
want to maintain their freedom to regulate migration according to policies that are in
their national interest, unencumbered by limitations imposed by international agree-
ments. Countries of origin, on the other hand, desire more protective measures and
benefits for their nationals, which would diminish the benefits that foreign labour brings
to destination countries in terms of flexibility in the labour market. Discussing migration
implies examining the character of societies, for migrants are not commodities and
require some form of integration. Political, social, and cultural differences among
member countries present obstacles to consensus on this issue. Furthermore, migration
has security implications, which need to be addressed from a national perspective.
Perhaps the same reasons would constitute an argument for a regional approach to
migration, however. The security concern, in particular, which tends to demonize
migrants and regard them as potential terrorists, should bring the issue of unauthorized
migrants to the table, since it is difficult to curb unauthorized migration without the
cooperation of the country of origin. In this respect, some bilateral arrangements have
been made, particularly for the orderly repatriation of unauthorized migrants. However,
these are limited to dialogue on logistics, such as providing the ship for the transport of
migrants or setting up a camp for processing repatriated migrants.
Unauthorized migration cannot be approached in isolation from migration in general
or from economic integration in particular. If the experience of the European Union can
be of any help, it is important to observe that the circulation of labour among member
countries was envisioned from the very beginning, together with the design of economic
integration. That it took the EU �� years to fully implement it only attests to the need for
continued discussion, rather than shelving the subject. Some movement of unauthorized
migrants indicates, as illustrated in the previous sections, that people already perceive a
level of integration that goes beyond political boundaries. Unauthorized migration can
be properly addressed only when a regional framework for migration, based on human
rights and common objectives, exists.
Unauthorized Migration and Globalization
The climate surrounding the discussion of globalization is certainly much more cautious
than it was a few years ago, particularly before the Asian crisis. In the meantime, we
have witnessed popular protest against relentless globalization, which is perceived as
beneficial only to some and managed in an undemocratic fashion. Moreover, some recent
episodes, such as the increased tariffs on steel in the US and then in the EU, and the
increased tariffs on cement in the Philippines, expose the hypocrisy of liberalization
ideology. Touted as the panacea for all development problems, liberalization is quickly
abandoned as governments adopt protectionist measures to defend their national inter-
ests.
Globalization remains a complex phenomenon that includes much more than just
������� ��� ��
366
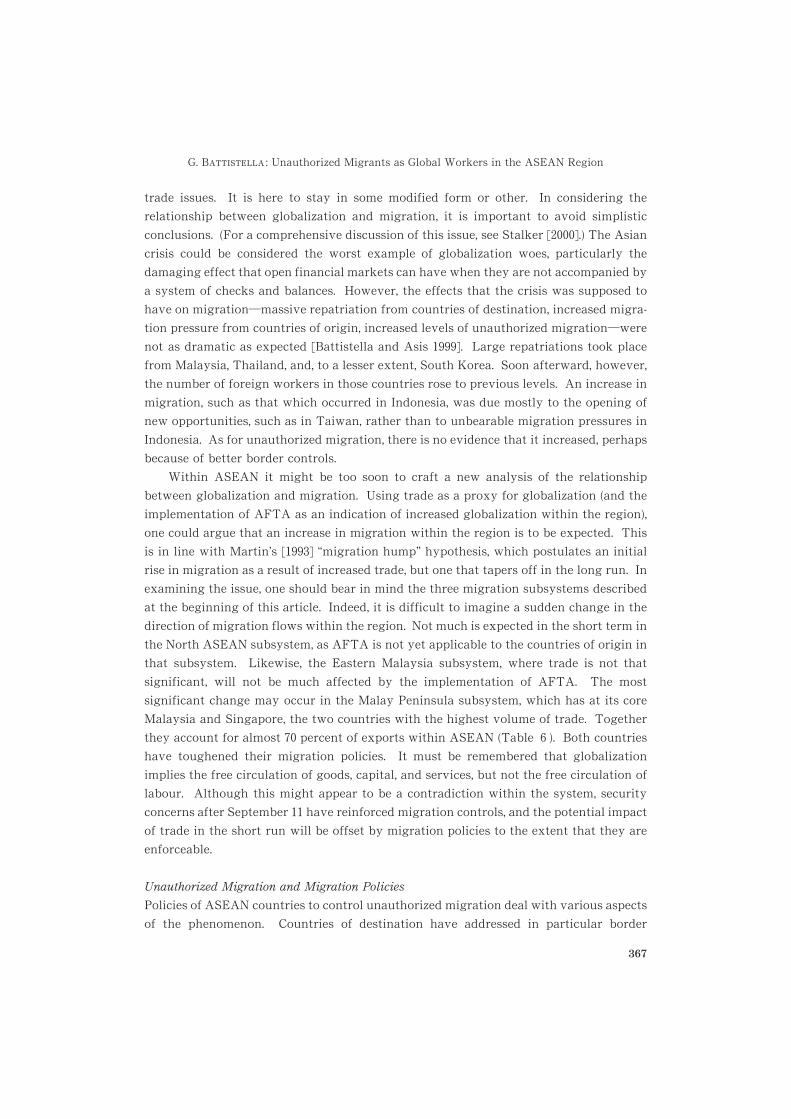
trade issues. It is here to stay in some modified form or other. In considering the
relationship between globalization and migration, it is important to avoid simplistic
conclusions. (For a comprehensive discussion of this issue, see Stalker [����].) The Asian
crisis could be considered the worst example of globalization woes, particularly the
damaging effect that open financial markets can have when they are not accompanied by
a system of checks and balances. However, the effects that the crisis was supposed to
have on migration�massive repatriation from countries of destination, increased migra-
tion pressure from countries of origin, increased levels of unauthorized migration�were
not as dramatic as expected [Battistella and Asis ����]. Large repatriations took place
from Malaysia, Thailand, and, to a lesser extent, South Korea. Soon afterward, however,
the number of foreign workers in those countries rose to previous levels. An increase in
migration, such as that which occurred in Indonesia, was due mostly to the opening of
new opportunities, such as in Taiwan, rather than to unbearable migration pressures in
Indonesia. As for unauthorized migration, there is no evidence that it increased, perhaps
because of better border controls.
Within ASEAN it might be too soon to craft a new analysis of the relationship
between globalization and migration. Using trade as a proxy for globalization (and the
implementation of AFTA as an indication of increased globalization within the region),
one could argue that an increase in migration within the region is to be expected. This
is in line with Martin’s [����] “migration hump” hypothesis, which postulates an initial
rise in migration as a result of increased trade, but one that tapers off in the long run. In
examining the issue, one should bear in mind the three migration subsystems described
at the beginning of this article. Indeed, it is difficult to imagine a sudden change in the
direction of migration flows within the region. Not much is expected in the short term in
the North ASEAN subsystem, as AFTA is not yet applicable to the countries of origin in
that subsystem. Likewise, the Eastern Malaysia subsystem, where trade is not that
significant, will not be much affected by the implementation of AFTA. The most
significant change may occur in the Malay Peninsula subsystem, which has at its core
Malaysia and Singapore, the two countries with the highest volume of trade. Together
they account for almost �� percent of exports within ASEAN (Table � ). Both countries
have toughened their migration policies. It must be remembered that globalization
implies the free circulation of goods, capital, and services, but not the free circulation of
labour. Although this might appear to be a contradiction within the system, security
concerns after September �� have reinforced migration controls, and the potential impact
of trade in the short run will be offset by migration policies to the extent that they are
enforceable.
Unauthorized Migration and Migration Policies
Policies of ASEAN countries to control unauthorized migration deal with various aspects
of the phenomenon. Countries of destination have addressed in particular border
G. B6II>HI:AA6 : Unauthorized Migrants as Global Workers in the ASEAN Region
367
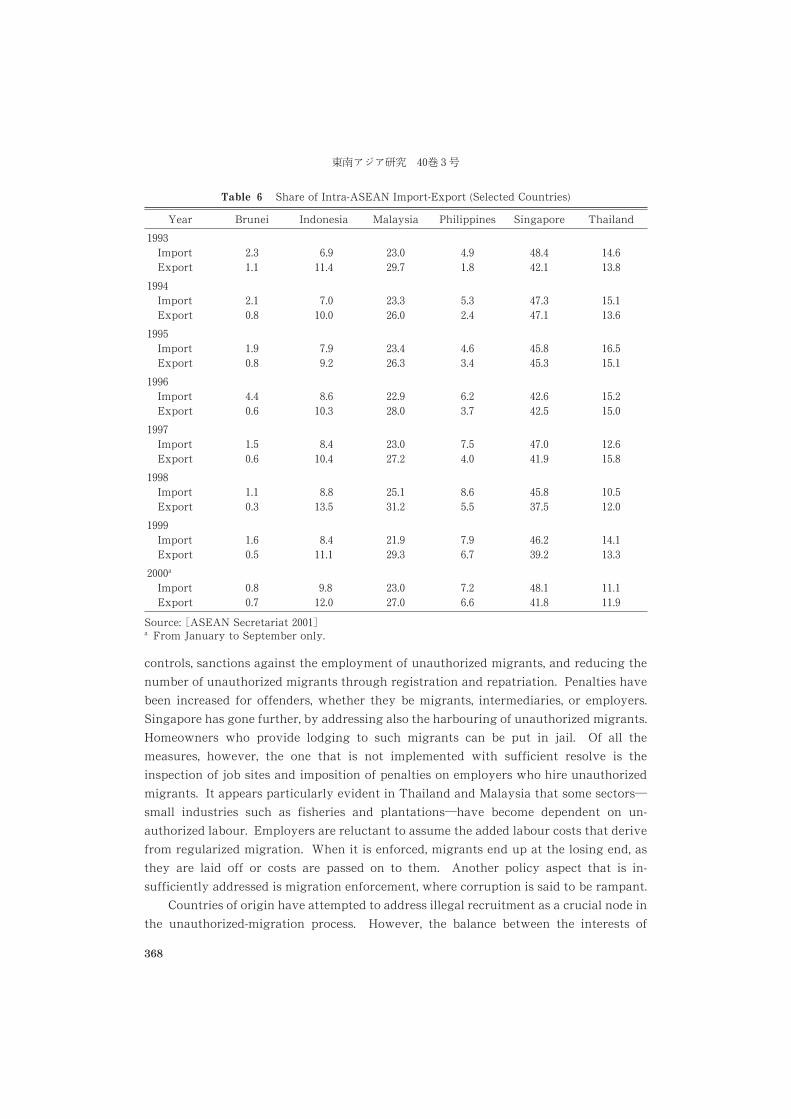
controls, sanctions against the employment of unauthorized migrants, and reducing the
number of unauthorized migrants through registration and repatriation. Penalties have
been increased for offenders, whether they be migrants, intermediaries, or employers.
Singapore has gone further, by addressing also the harbouring of unauthorized migrants.
Homeowners who provide lodging to such migrants can be put in jail. Of all the
measures, however, the one that is not implemented with sufficient resolve is the
inspection of job sites and imposition of penalties on employers who hire unauthorized
migrants. It appears particularly evident in Thailand and Malaysia that some sectors�small industries such as fisheries and plantations�have become dependent on un-
authorized labour. Employers are reluctant to assume the added labour costs that derive
from regularized migration. When it is enforced, migrants end up at the losing end, as
they are laid off or costs are passed on to them. Another policy aspect that is in-
sufficiently addressed is migration enforcement, where corruption is said to be rampant.
Countries of origin have attempted to address illegal recruitment as a crucial node in
the unauthorized-migration process. However, the balance between the interests of
Table � Share of Intra-ASEAN Import-Export (Selected Countries)
Year Brunei Indonesia Malaysia Philippines Singapore Thailand
����ImportExport
������
�������
�������
�����
�������
�������
����ImportExport
�����
������
��������
������
������
��������
����ImportExport
�����
�����
��������
������
�������
��������
����ImportExport
������
������
�������
�����
��������
��������
���ImportExport
������
������
�������
�����
�������
�������
���ImportExport
������
�����
��������
�����
������
��������
����ImportExport
������
������
��������
����
��������
��������
����a
ImportExport
����
������
�������
�����
������
��������
Source: �ASEAN Secretariat �����a From January to September only.
������� �� �
368
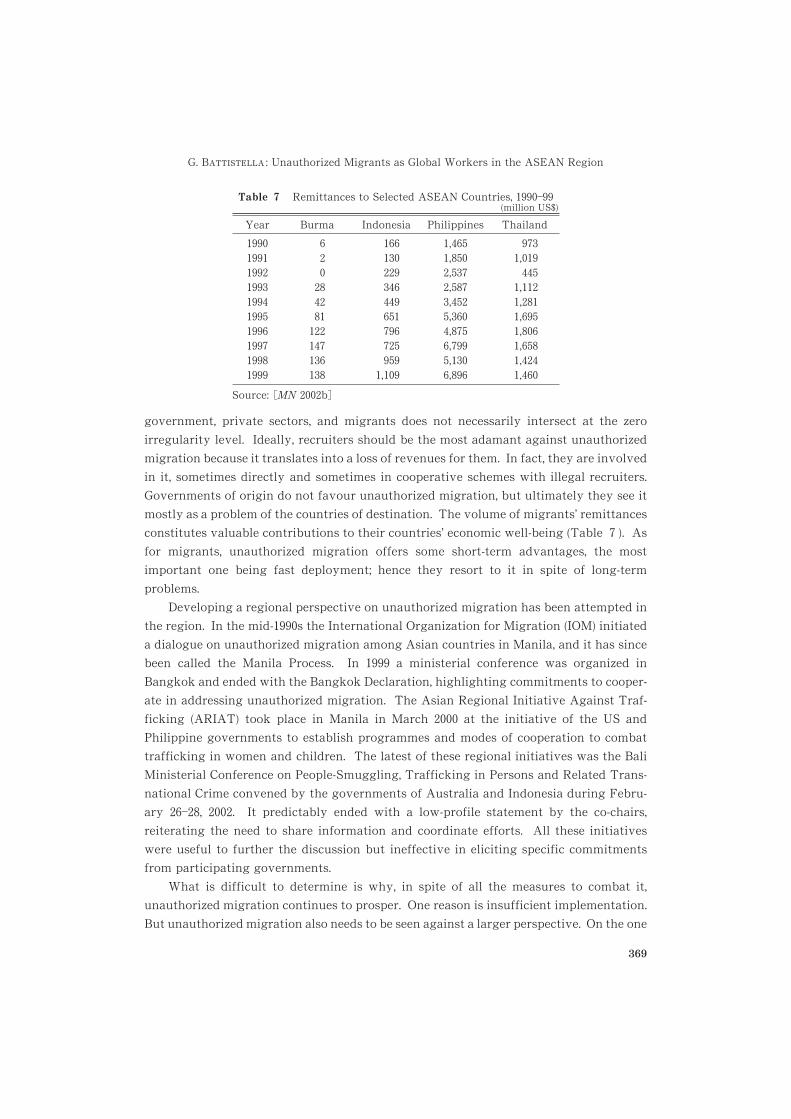
government, private sectors, and migrants does not necessarily intersect at the zero
irregularity level. Ideally, recruiters should be the most adamant against unauthorized
migration because it translates into a loss of revenues for them. In fact, they are involved
in it, sometimes directly and sometimes in cooperative schemes with illegal recruiters.
Governments of origin do not favour unauthorized migration, but ultimately they see it
mostly as a problem of the countries of destination. The volume of migrants’ remittances
constitutes valuable contributions to their countries’ economic well-being (Table � ). As
for migrants, unauthorized migration offers some short-term advantages, the most
important one being fast deployment; hence they resort to it in spite of long-term
problems.
Developing a regional perspective on unauthorized migration has been attempted in
the region. In the mid-����s the International Organization for Migration (IOM) initiated
a dialogue on unauthorized migration among Asian countries in Manila, and it has since
been called the Manila Process. In ���� a ministerial conference was organized in
Bangkok and ended with the Bangkok Declaration, highlighting commitments to cooper-
ate in addressing unauthorized migration. The Asian Regional Initiative Against Traf-
ficking (ARIAT) took place in Manila in March ���� at the initiative of the US and
Philippine governments to establish programmes and modes of cooperation to combat
trafficking in women and children. The latest of these regional initiatives was the Bali
Ministerial Conference on People-Smuggling, Trafficking in Persons and Related Trans-
national Crime convened by the governments of Australia and Indonesia during Febru-
ary �����, ����. It predictably ended with a low-profile statement by the co-chairs,
reiterating the need to share information and coordinate efforts. All these initiatives
were useful to further the discussion but ineffective in eliciting specific commitments
from participating governments.
What is difficult to determine is why, in spite of all the measures to combat it,
unauthorized migration continues to prosper. One reason is insufficient implementation.
But unauthorized migration also needs to be seen against a larger perspective. On the one
Table � Remittances to Selected ASEAN Countries, �������(million US$)
Year Burma Indonesia Philippines Thailand
��������������������������������������
�������������������
��������������������������
���������������������������������������
��������������������������������������
Source: �MN ����b�
G. B6II>HI:AA6 : Unauthorized Migrants as Global Workers in the ASEAN Region
369
hand, migrants are a by-product of globalization, which disrupts national labour markets
and redirects workers to internationalized labour markets; on the other, migrants are
excluded from the benefits of globalization, as they are not free to move where productiv-
ity is higher. Unauthorized migration can be considered to be the response of workers to
regulations of manpower, which during the process of globalization remain strictly local.
The ultimate solution, deregulating migration in favour of the free circulation of labour,
may appear utopian now. But the economic integration envisaged in ASEAN cannot be
successful until migrant labour is factored into it.
References
Adi, R. ����. Irregular Migration from Indonesia. In Unauthorized Migration in Southeast Asia. Areport submitted to the Ford Foundation, edited by G. Battistella and M. M. B. Asis, pp. ������.Quezon City: Scalabrini Migration Center.
Amarapibal, A.; Beesey, A.; and Gemershausen, A. ����. Irregular Migration into Thailand. InUnauthorized Migration in Southeast Asia. A report submitted to the Ford Foundation, edited byG. Battistella and M. M. B. Asis, pp. �������. Quezon City: Scalabrini Migration Center.
ASEAN Secretariat. ����. ASCU Database, Jakarta. www.aseansec.orgwww.aseansec.org, last updated on May ��, ����.Asian Migration News (AMN). ���������. Various issues. www.smc.org.ph/amnews/amnews.htmwww.smc.org.ph/amnews/amnews.htmBattistella, G. ����. Migration ���� in Asia: A Year in Review. Asian Migrant �� ( � ): ����.Battistella, G.; and Asis, M. M. B. �. The Crisis and Migration in Asia. Quezon City: Scalabrini
Migration Center.Battistella, G.; Asis, M. M. B.; and Abubakar, C. ��. Migration from the Philippines to Malaysia: An
Exploratory Study. Manila: International Organisation for Migration.Dawes, J. ����. Beware the Alien Invasion. Asiaweek, �� September ����.International Organisation for Migration (IOM). �. Overview of the Current Situation of Irregular
or Undocumented Migration in the East and Southeast Asian Region: The Need for a PolicyResponse Framework. Paper presented at the International Symposium on Migration “TowardRegional Cooperation on Irregular/Undocumented Migration,” April �����, �, Bangkok.
Kanapathy, V. ����. International Migration and Labor Market Adjustments in Malaysia: The Roleof Foreign Labor Management Policies. Asian and Pacific Migration Journal �� (���): ������.
Kritz, M. M.; Lin L. L.; and Zlotnik, H. ��. International Migration Systems: A Global Approach.Oxford: Clarendon Press.
Kurus, B. �. Migrant Labor: The Sabah Experience. Asian and Pacific Migration Journal � (���):�����.
Mani, A. ��. Migration in Brunei Darussalam. In Crossing Borders: Transmigration in Asia Pacific,edited by J. H. Ong, K. B. Chan, and S. B. Chew, pp. �������. Singapore: Prentice Hall.
Martin, P. L. ��. Trade and Migration: NAFTA and Agriculture. Washington, D. C.: Institute forInternational Economics.
Migration News (MN). ����a. Vol. , No. �. http://migration.ucdavis.eduhttp://migration.ucdavis.edu����. ����b. Data. http://migration.ucdavis.eduhttp://migration.ucdavis.edu, accessed March ����.Philippine Overseas Employment Administration (POEA). ����. http://www.poea.gov.ph/html/http://www.poea.gov.ph/html/
statistics.htmlstatistics.html, updated July ����.Soonthorndhada, K. ����. Changes in the Labor Market and International Migration since the
Economic Crisis in Thailand. Asian and Pacific Migration Journal �� (���): ������.Stalker, P. ����. Workers without Frontiers: The Impact of Globalization on International Migration.
Boulder, CO: Lynne Rienner Publishers.Stern, A. ��. Thailand’s Illegal Labour Migrants. Asian Migrant ( � ): ���.
������� ��� ��
370
United Nations High Commissioner for Refugees (UNHCR). ����. The Indo-Chinese Exodus and theCPA. Geneva, ��p.
Yeoh, B. S. A.; Huang, S.; and Gonzalez, J. III. ����. Migrant Female Domestic Workers: Debatingthe Economic, Social and Political Impacts in Singapore. International Migration Review �� ( � ):
�������.Wong, D. ����. Transience and Settlement: Singapore’s Foreign Labor Policy. Asian and Pacific
Migration Journal � ( � ): �������.Wong, D.; and Afrizal, Teuku. ��. Migran Gelap. Indonesian Migrants into Malaysia’s Shadow
Economy. In Unauthorized Migration in Southeast Asia. A report submitted to the FordFoundation, edited by G. Battistella and M. M. B. Asis, pp. �������. Quezon City: ScalabriniMigration Center.
G. B6II>HI:AA6 : Unauthorized Migrants as Global Workers in the ASEAN Region
371
Labor Migration and Regional Changes in East Asia:
Outflows of Thai Workers to Taiwan�
Ching-lung TH6N��
Abstract
The Thai economy grew dramatically in the past few decades, particularly between ����and ����. During that period Thailand ceased to be solely a labor-exporting society and
became one that both sends workers abroad and receives foreign labor. At present the
number of foreign professionals working in the kingdom exceeds �������. The stock of
workers from neighboring countries was nearly � million before the ���� economic crisis.
On the contrary, Thai laborers started moving overseas in the early ����s to work in the
Gulf region. The direction of labor flow gradually shifted to East Asia, as Japan and the
NIEs began having labor shortages in the ����s. In light of the Thai experience, the link
between international labor migration and regional economic changes becomes an intri-
guing topic for research. This article investigates the migration systems that exist
between Thailand and the destination countries in East Asia. It focuses on the migrant
flows to Taiwan before and after the legalization of labor importation in the early ����s,
identifying the labor market segments into which Thai workers have been recruited. The
main concern is the consequences of the labor movements on individual workers, in
particular their earnings and their working and living conditions in Taiwan. The analysis
also addresses key policy implications for both Thailand and Taiwan, which are closely
linked not only by labor movement but also by trade and direct investment.
Keywords: international labor migration, regional economic changes, East Asian develop-
ment, Thailand, Taiwan
* The first draft of this article was presented at the International Workshop on LabourMigration and Socio-Economic Change in Southeast and East Asia, organized by the NordicInstitute of Asian Studies and held at Lund, Sweden, in May ����. A revised version wasread at the ���� IUSSP Regional Population Conference: Southeast Asia’s Population in aChanging Asian Context, held in Bangkok, Thailand, in June ����. The original manuscriptwas written while the author was a visiting fellow at the Demography Program of Austra-lian National University, from September ���� to March ����, with an award (���� F) fromthe National Science Council of Taiwan. This article also represents an outcome of theTaiwanese Migration Research Network, which the Chiang Ching Kuo Foundation for Inter-national Scholarly Exchange established with a grant. Support from all these institutionsis deeply appreciated. Additionally, the author was grateful to Lillian Tee for researchassistance.
** The Institute of Economics, Academia Sinica, Nankang, Taipei �����, Taiwan, e-mail:ctsay�econ.sinica.edu.tw
Southeast Asian Studies, Vol. �, No. , December ����
372
The movement of workers is a natural response to differences in labor conditions
between markets. In other words, labor migration is a mechanism for adjusting the
supply of and demand for labor across economic sectors and geographic divisions. The
international migration of workers is distinct in its interaction with boarder controls,
institutional arrangements, and cultural differences between countries. In addition to
economic elements, many noneconomic factors influence the cross-border mobility of
human resources. Compared with internal migration, the market-adjustment mechanism
is often more limited at the cross-national level of worker flows.
Political, social, and economic conditions in the sending and receiving countries
affect the international migration of workers. International relations and regional
interactions further influence the mobility of manpower. The study of cross-country
labor migration should assume a broad, regional perspective when considering political,
economic, and cultural conditions. Its focus should not be limited to the labor-sending
and labor-receiving countries only.
In the past two decades, Japan and the Asian NIEs of Taiwan, South Korea, Singa-
pore, and Hong Kong experienced rapid economic development and demographic transi-
tions. As a result, they all entered a stage of labor shortages and sharp increases in the
cost of producing labor-intensive goods. Reinforced by currency appreciation, the new
situation induced significant labor flows in East and Southeast Asia. According to
estimates by the ILO [����: ���], the volume reached ��� million people in ����.Between the early ���s and the mid-���s, Southeast Asian nations enjoyed signifi-
cant economic growth. Thailand, Malaysia, the Philippines, and Indonesia became
known as the Four Asian Little Tigers. Since mid-����, however, those countries have
been seriously hit by the region-wide financial crisis and have experienced periods of
negative growth. Japan and the NIEs have also been affected by the turmoil. Whether
these regional economic dynamics have had strong impacts on international labor
migration is a question that deserves attention.
Thailand has a long history of exporting labor. In the early years, beginning in the
���s, most Thai workers headed for the oil-rich countries of the Middle East. More
recently the major labor flows from Thailand have been re-directed to the East Asian
countries of Japan, Taiwan, Singapore, and Malaysia. Since the early ���s, Thailand has
also become a receiving country for workers from less developed neighboring countries
such as Myanmar, Cambodia, and Laos. This unique status makes Thailand an interest-
ing case for the study of international labor migration. For Taiwan, Thailand is the
largest supply country of foreign contract workers, accounting for about half the total.
Among the destination countries of Thai laborers, Taiwan receives the biggest share,
from one-third to one-half. At the same time, Thailand and Taiwan have close linkages
through trade and foreign direct investment. For these reasons, this article investigates
the relationship between labor migration and structural changes in East Asia by examin-
ing the outflows of Thai workers to Taiwan.
C. -l. TH6N : Labor Migration and Regional Changes in East Asia
373
Background and Changes in Labor Outflows
With an area about �� times larger than Taiwan, Thailand in ���� had a population of
�� million and a labor force of �� million. In the earlier stages of development, from the
����s to the ����s, Thailand had a very low unemployment rate of ��� percent.�) In those
years, slightly more than half of the employed were engaged in the agricultural sector.
Agricultural activities are seasonal, however, and therefore a substantial number of
laborers have traditionally been underemployed in rural Thailand. Furthermore, the
average educational level of the Thai working population is low. More than �� percent
has received no more than six years of basic schooling. Most workers can do only manual
work, for which there is a limited demand. As a result, labor underutilization has been a
common problem in the kingdom, especially in rural areas.
Because job opportunities were limited and wage levels low in the past, many Thais
lived in poverty. The Thai National Statistical Office [Sussangkarn ���: ���, Table � ]
estimates that almost �� percent of the population lived under the poverty line in the
early ����s. The proportion of Thais who were poor decreased to �� percent in the late
����s and to one-third in the mid-���s, remaining at that level or slightly lower through-
out the ����s. With rapid economic growth in the early ����s, however, the proportion of
Thais who were poor slid from � percent in ���� to �� percent in ���� [Soonthorndhada
����: ���, Table � ]. The high poverty rate in the ����s and ���s, especially in rural
Thailand, created strong pressure for young adults to work overseas. The employment
opportunities and higher wages in the Gulf and other overseas countries were the main
pull factors.
Most of the Thai workers who began moving overseas for employment in the ���sheaded for the Middle East, especially to Saudi Arabia. It was rumored that by the mid-
����s some ������� Thais were working in the Gulf region, but this number has not been
confirmed by official records. According to the register at the Thai Ministry of Labor and
Social Welfare, ������Thais went to work overseas in ���� (Table � ). The great majority
of them (� percent) landed in the Middle East and North Africa. The major host country
was Saudi Arabia (nearly �� percent), followed by Libya (nearly �� percent), Iraq, and
Qatar (not shown in Table � ). In ���� the registered number of Thai migrant workers
going to the Middle East and North Africa was �����, just � percent of the ���� figure.
Its share in the total volume of Thai workers abroad, however, declined significantly,
from � to � percent. In the same period, the share of Thai workers going to ASEAN
countries and East Asia increased substantially, from � percent to � percent.
� � As a result of the ��� financial crisis, the unemployment rate jumped from ��� percent in
������ to �� percent in �������.
������� ��� �
374
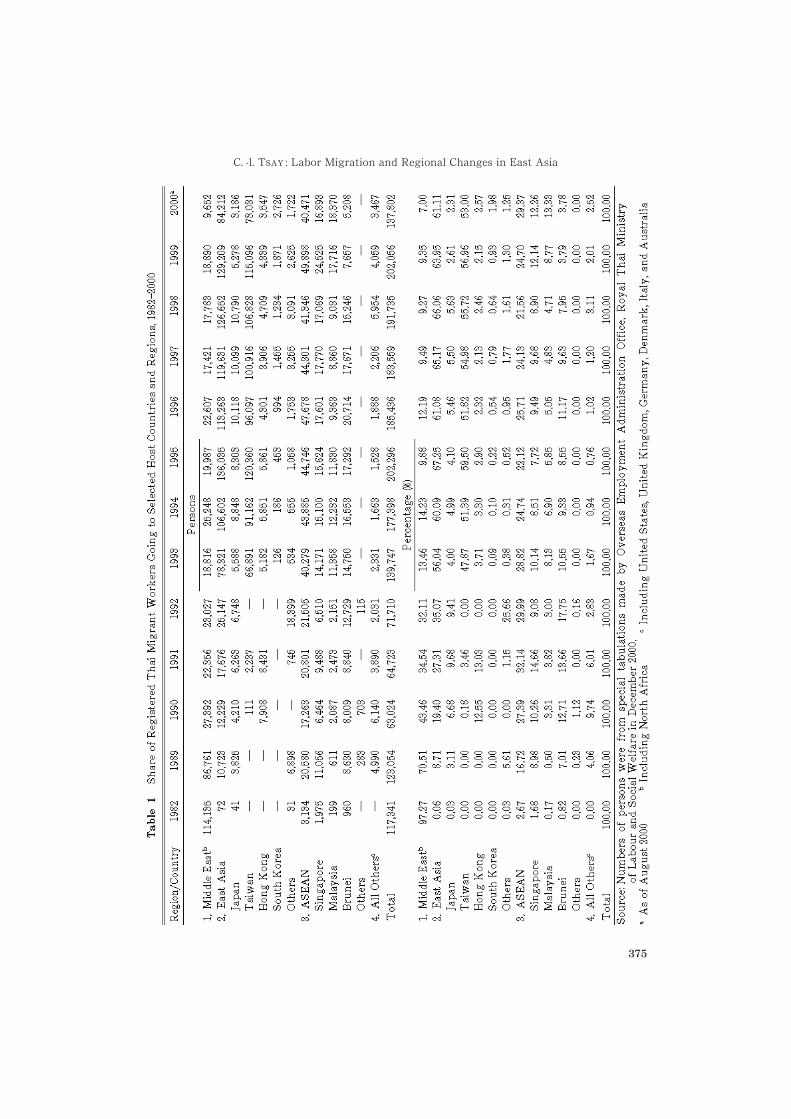
C. -l. TH6N : Labor Migration and Regional Changes in East Asia
375
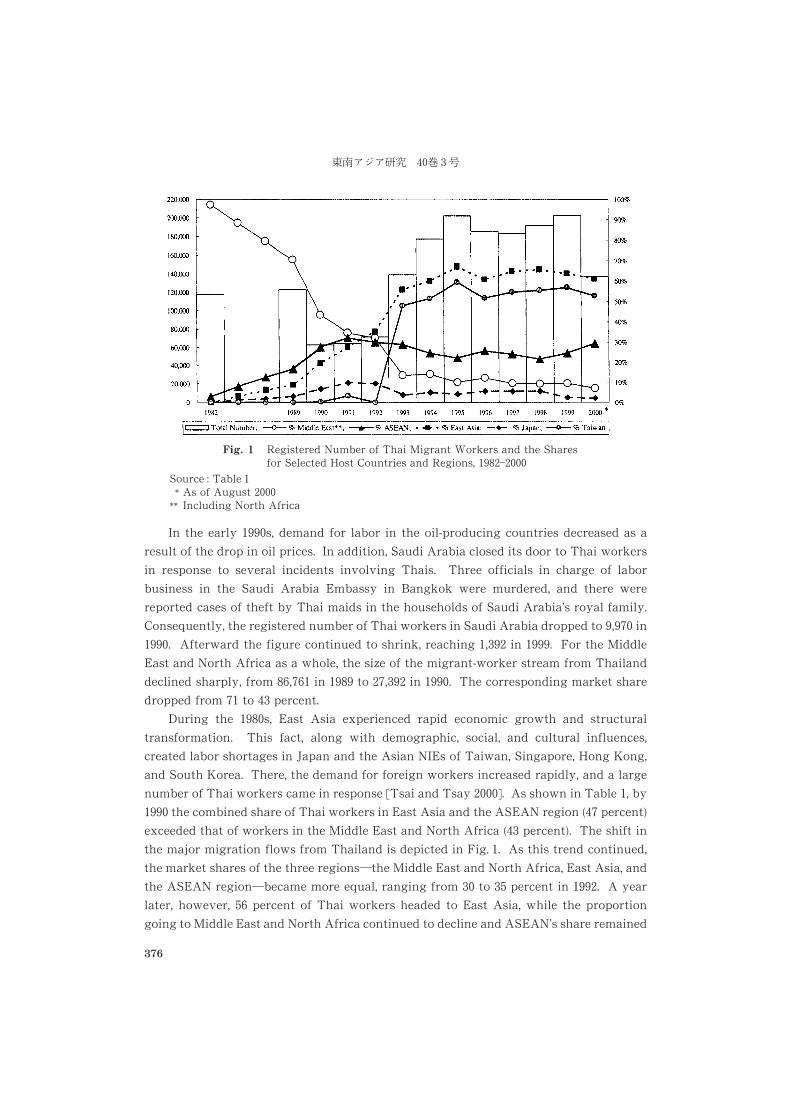
In the early ����s, demand for labor in the oil-producing countries decreased as a
result of the drop in oil prices. In addition, Saudi Arabia closed its door to Thai workers
in response to several incidents involving Thais. Three officials in charge of labor
business in the Saudi Arabia Embassy in Bangkok were murdered, and there were
reported cases of theft by Thai maids in the households of Saudi Arabia’s royal family.
Consequently, the registered number of Thai workers in Saudi Arabia dropped to ����� in
����. Afterward the figure continued to shrink, reaching ����� in ����. For the Middle
East and North Africa as a whole, the size of the migrant-worker stream from Thailand
declined sharply, from ���� in ���� to ������ in ����. The corresponding market share
dropped from �� to � percent.
During the ����s, East Asia experienced rapid economic growth and structural
transformation. This fact, along with demographic, social, and cultural influences,
created labor shortages in Japan and the Asian NIEs of Taiwan, Singapore, Hong Kong,
and South Korea. There, the demand for foreign workers increased rapidly, and a large
number of Thai workers came in response [Tsai and Tsay ����]. As shown in Table �, by
���� the combined share of Thai workers in East Asia and the ASEAN region (� percent)
exceeded that of workers in the Middle East and North Africa (� percent). The shift in
the major migration flows from Thailand is depicted in Fig. �. As this trend continued,
the market shares of the three regions�the Middle East and North Africa, East Asia, and
the ASEAN region�became more equal, ranging from �� to �� percent in ����. A year
later, however, � percent of Thai workers headed to East Asia, while the proportion
going to Middle East and North Africa continued to decline and ASEAN’s share remained
Fig. � Registered Number of Thai Migrant Workers and the Sharesfor Selected Host Countries and Regions, ���������
Source : Table �* As of August ����
** Including North Africa
������� �� ��
376
roughly the same. Between ���� and ���� the East Asian countries hosted �� percent or
more of the registered Thai workers in the world. Among them, Taiwan played a key role
in the shift of direction in Thai labor migration. As I have shown elsewhere [Tsay ����b;
Tsay and Lin ����], Taiwan started to officially import contract workers from Thailand,
the Philippines, Indonesia, and Malaysia in ����.Generally speaking, Taiwanese employers like to hire Thai migrant workers because
they are diligent, cooperative, and friendly. Since Taiwan legalized labor importation in
the ����s, Thailand has been the most important source country of contract workers in
Taiwan. For migrant Thai workers, Taiwan replaced Saudi Arabia as the favored host
nation. According to Taiwanese records [Taiwan, Council of Labour Affairs ����: ���,Table ����], the market share of Thais was �� percent in ����, with ������ workers.
During ��������� the number fluctuated between ����� and ������ while the share
declined constantly from � to �� percent. Besides Taiwan, other recent destinations of
Thai workers have included Singapore, Malaysia, Brunei, Hong Kong, Japan, and South
Korea (Table � ); but the volume of legally imported Thai migrant workers to each of
these countries is far smaller than that to Taiwan. It is evident that the market for
foreign contract workers in Taiwan has played an important role in the process of labor
exportation from Thailand.
Recent Developments in Labor Migration
Destinations and Volumes
Thailand registered an average annual rate of economic growth at percent or higher
during �������. The records of ��� percent during ������� and ��� percent during �������are most remarkable [Chalamwong ����: ���; Sussangkarn and Chalamwong ����: �����].
The kingdom has been recognized as a newly industrialized country (NIC). Nonetheless,
the rapid development of the past �� years did not spread evenly across national
subdivisions and over economic sectors. The manufacturing industry, especially
medium- and high-technology manufacturing, has been concentrated in and around the
capital city of Bangkok. The wage gap that existed between Bangkok and other
changwats (provinces) widened substantially in the ����s. Economic development has
benefited mostly the well educated, by providing them with opportunities for increased
earnings and other kinds of income. The improvement in earnings has been much slower
for workers with little education [Sussangkarn ����].
As a result of these factors, the rural-urban income difference has increased. GNP per
capita in Bangkok was ��� times that of other parts of the kingdom in ����. The
corresponding figures for ���� and ���� were ��� and ���. Low-income Thai workers,
especially the rural workforce and the less educated, have thus been motivated to search
for overseas jobs promising higher pay. Working abroad is a goal for many who want to
C. -l. TH6N : Labor Migration and Regional Changes in East Asia
377
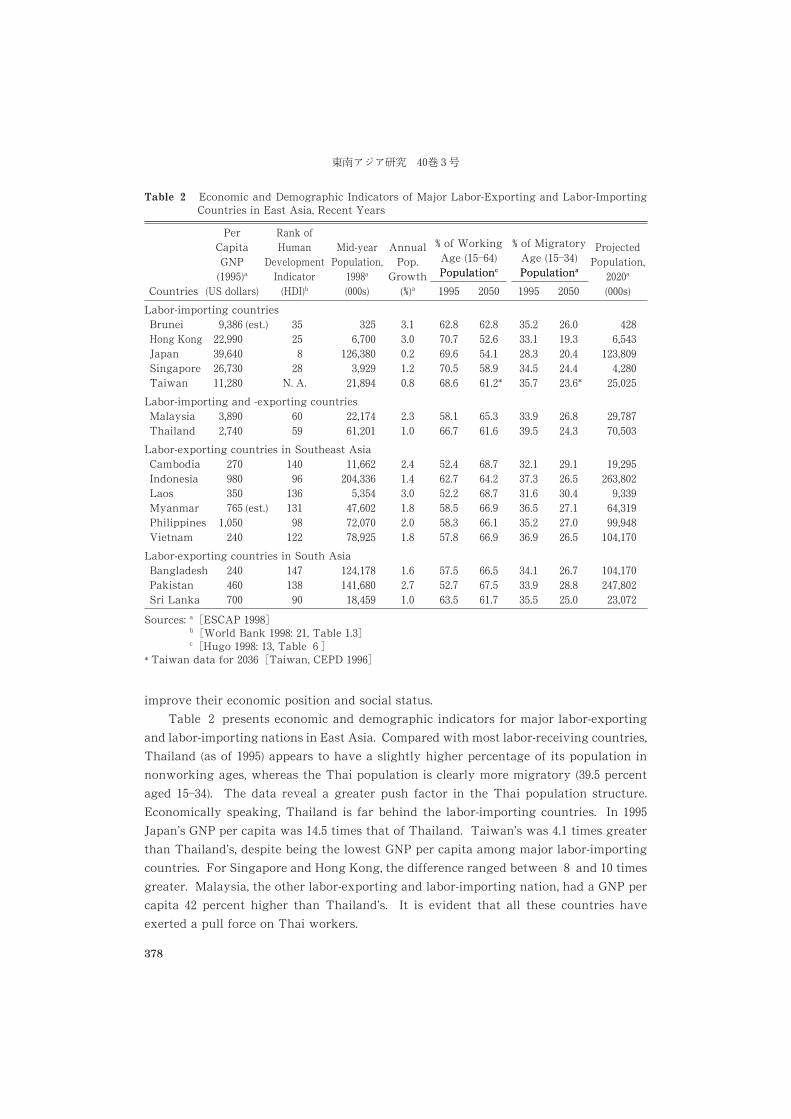
improve their economic position and social status.
Table � presents economic and demographic indicators for major labor-exporting
and labor-importing nations in East Asia. Compared with most labor-receiving countries,
Thailand (as of ����) appears to have a slightly higher percentage of its population in
nonworking ages, whereas the Thai population is clearly more migratory (���� percent
aged �����). The data reveal a greater push factor in the Thai population structure.
Economically speaking, Thailand is far behind the labor-importing countries. In ����Japan’s GNP per capita was ���� times that of Thailand. Taiwan’s was ��� times greater
than Thailand’s, despite being the lowest GNP per capita among major labor-importing
countries. For Singapore and Hong Kong, the difference ranged between � and � times
greater. Malaysia, the other labor-exporting and labor-importing nation, had a GNP per
capita �� percent higher than Thailand’s. It is evident that all these countries have
exerted a pull force on Thai workers.
Table � Economic and Demographic Indicators of Major Labor-Exporting and Labor-ImportingCountries in East Asia, Recent Years
Countries
PerCapita
GNP(����)a
(US dollars)
Rank ofHuman
DevelopmentIndicator
(HDI)b
Mid-yearPopulation,
����a
(s)
AnnualPop.
Growth(�)a
� of WorkingAge (����)PopulationcPopulationc
� of MigratoryAge (�����)PopulationaPopulationa
ProjectedPopulation,
��a
(s)���� �� ���� ��Labor-importing countries
BruneiHong KongJapanSingaporeTaiwan
���� (est.)
������������������
�������
N. A.
���������������������
������������
�������������
�����������������*
��������������������
����������������*
����������������������
Labor-importing and -exporting countriesMalaysiaThailand
��������
��
����������
�����
������
�����
��������
�������
����������
Labor-exporting countries in Southeast AsiaCambodiaIndonesiaLaosMyanmarPhilippinesVietnam
�������� (est.)
�����
�������������
����������������������������
����������������
�����������������������
���������������
���������������������
��������������������
��������������������������������
Labor-exporting countries in South AsiaBangladeshPakistanSri Lanka
����
�������
������������������
�������
�����������
��������
������������
����������
����������������
Sources: a �ESCAP �����b �World Bank ����: ��, Table �.��c �Hugo ����: ��, Table �
* Taiwan data for �� �Taiwan, CEPD ����
������� � �
378
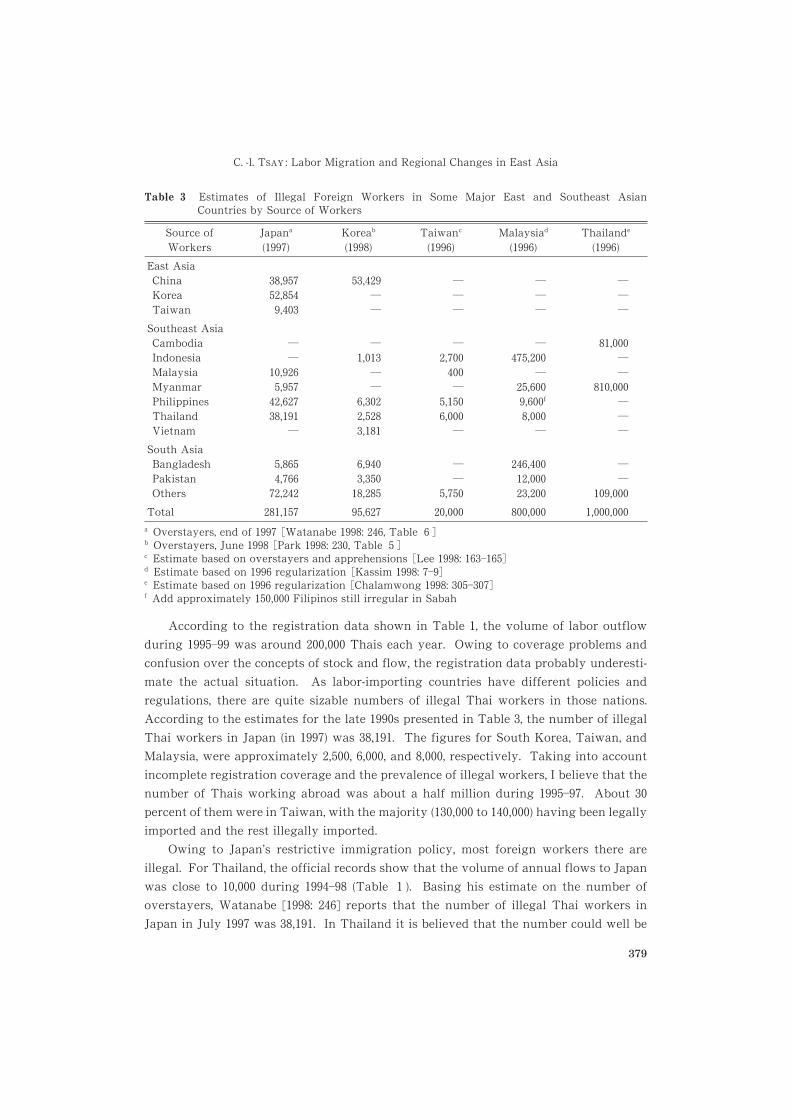
According to the registration data shown in Table �, the volume of labor outflow
during ������� was around ������� Thais each year. Owing to coverage problems and
confusion over the concepts of stock and flow, the registration data probably underesti-
mate the actual situation. As labor-importing countries have different policies and
regulations, there are quite sizable numbers of illegal Thai workers in those nations.
According to the estimates for the late ����s presented in Table �, the number of illegal
Thai workers in Japan (in ����) was �����. The figures for South Korea, Taiwan, and
Malaysia, were approximately �����, ����, and ����, respectively. Taking into account
incomplete registration coverage and the prevalence of illegal workers, I believe that the
number of Thais working abroad was about a half million during �������. About ��percent of them were in Taiwan, with the majority (������� to �������) having been legally
imported and the rest illegally imported.
Owing to Japan’s restrictive immigration policy, most foreign workers there are
illegal. For Thailand, the official records show that the volume of annual flows to Japan
was close to ������ during ������ (Table � ). Basing his estimate on the number of
overstayers, Watanabe [���: ��] reports that the number of illegal Thai workers in
Japan in July ���� was �����. In Thailand it is believed that the number could well be
Table � Estimates of Illegal Foreign Workers in Some Major East and Southeast AsianCountries by Source of Workers
Source ofWorkers
Japana
(����)Koreab
(���)Taiwanc
(���)Malaysiad
(���)Thailande
(���)East Asia
ChinaKoreaTaiwan
���������������
��������
���
���
���
Southeast AsiaCambodiaIndonesiaMalaysiaMyanmarPhilippinesThailandVietnam
��
���������������������
��������
������������
����������
����������
��������
����������f
�����
�������
���������
South AsiaBangladeshPakistanOthers
������������
�������������
��
�����
������������������
��
�������Total ������ ����� ������ ������ ���������
a Overstayers, end of ���� �Watanabe ���: ��, Table �b Overstayers, June ��� �Park ���: ���, Table � �c Estimate based on overstayers and apprehensions �Lee ���: ������d Estimate based on ��� regularization �Kassim ���: ����e Estimate based on ��� regularization �Chalamwong ���: ��������f Add approximately ������� Filipinos still irregular in Sabah
C. -l. TH6N : Labor Migration and Regional Changes in East Asia
379
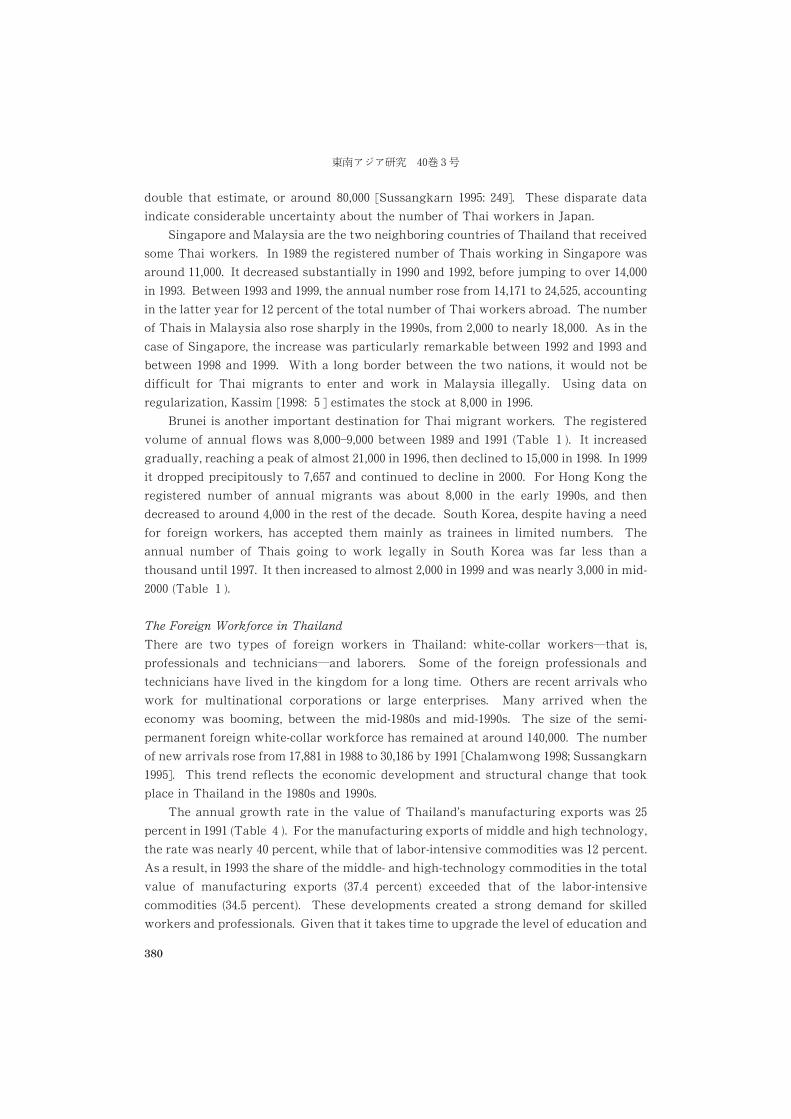
double that estimate, or around ������ [Sussangkarn ����: ���]. These disparate data
indicate considerable uncertainty about the number of Thai workers in Japan.
Singapore and Malaysia are the two neighboring countries of Thailand that received
some Thai workers. In ���� the registered number of Thais working in Singapore was
around ������. It decreased substantially in ���� and ����, before jumping to over ������in ���. Between ��� and ����, the annual number rose from ����� to ������, accounting
in the latter year for �� percent of the total number of Thai workers abroad. The number
of Thais in Malaysia also rose sharply in the ����s, from ����� to nearly ������. As in the
case of Singapore, the increase was particularly remarkable between ���� and ��� and
between ���� and ����. With a long border between the two nations, it would not be
difficult for Thai migrants to enter and work in Malaysia illegally. Using data on
regularization, Kassim [����: � ] estimates the stock at ����� in ����.Brunei is another important destination for Thai migrant workers. The registered
volume of annual flows was ����������� between ���� and ���� (Table � ). It increased
gradually, reaching a peak of almost ������ in ����, then declined to ������ in ����. In ����it dropped precipitously to ��� and continued to decline in ����. For Hong Kong the
registered number of annual migrants was about ����� in the early ����s, and then
decreased to around ����� in the rest of the decade. South Korea, despite having a need
for foreign workers, has accepted them mainly as trainees in limited numbers. The
annual number of Thais going to work legally in South Korea was far less than a
thousand until ���. It then increased to almost ����� in ���� and was nearly ���� in mid-
���� (Table � ).
The Foreign Workforce in Thailand
There are two types of foreign workers in Thailand: white-collar workers�that is,
professionals and technicians�and laborers. Some of the foreign professionals and
technicians have lived in the kingdom for a long time. Others are recent arrivals who
work for multinational corporations or large enterprises. Many arrived when the
economy was booming, between the mid-����s and mid-����s. The size of the semi-
permanent foreign white-collar workforce has remained at around �������. The number
of new arrivals rose from ����� in ���� to ����� by ���� [Chalamwong ����; Sussangkarn
����]. This trend reflects the economic development and structural change that took
place in Thailand in the ����s and ����s.
The annual growth rate in the value of Thailand’s manufacturing exports was ��percent in ���� (Table � ). For the manufacturing exports of middle and high technology,
the rate was nearly �� percent, while that of labor-intensive commodities was �� percent.
As a result, in ��� the share of the middle- and high-technology commodities in the total
value of manufacturing exports (�� percent) exceeded that of the labor-intensive
commodities (��� percent). These developments created a strong demand for skilled
workers and professionals. Given that it takes time to upgrade the level of education and
������� ��� �
380
training of a labor force, it is not surprising that Thailand began to experience a serious
manpower shortage at higher skill levels. The situation was particularly acute in the
fields of scientific and industrial research and development, and in business management.
Economic development and structural change in Thailand have also attracted huge
numbers of foreign workers from neighboring countries, mainly Myanmar, Cambodia,
and Laos. As shown in Table �, those three countries are far behind Thailand in their
economic development. Demographically, they all reveal a high potential for labor
out-migration. The foreign workers, some of whom are refugees, initially scatter along
the border and then spread into the interior of the kingdom. The best-known place for
foreign workers is Changwat Ranong on the Burmese border. Most of them work in
agriculture, construction, cottage industries, small manufacturing, and personal services.
A majority of them enter Thailand illegally and remain in Thailand without legalizing
their status.
The population of undocumented foreign workers is believed to be quite large. Stern
[����: ���] estimates it at ������� to ������� in the early ����s. Chalamwong [���: ���]estimates the number for ���, the year before the ���� financial crisis, at � million. Of
those, ������ were from Myanmar, ����� from Cambodia, and ������� from Laos and
other South Asian countries (Table � ). The International Labour Organization [���: ��]reports that the financial crisis reduced the number of foreign workers in Thailand by
������ in the second half of ���.
Table � Value of Manufacturing Exports from Thailand, Selected Years, �����Unit: Million Baht
Type of Export Commodities ��� ���� ���� ���a
Labor-intensive commoditiesExport valueAnnual growth (�)
��������
�����������
����������
�����������
Middle-/high-technology commoditiesExport valueAnnual growth (�)
������
����������
����������
����������
OthersExport valueAnnual growth (�)
���������
������������
������������
������������
TotalExport valueAnnual growth (�)
��������
���������
����������
��������������
Percentage distributionLabor-intensive commoditiesMiddle-/high-technology commoditiesOthers
��������������
������������
��������������
�����������
Total ������ ������ ������ ������
Source: �Thailand, Bank of Thailand ������: Tables �, � �a Estimate based on the average growth rate for �������
C. -l. TH6N : Labor Migration and Regional Changes in East Asia
381
Labor Importation Policies � )
The world has acknowledged East Asia’s success in the ����s and ����s in managing the
region’s national economies to achieve rapid economic growth. Now most of the Asian
nations face a new challenge: managing migration. There are about � million foreign
workers in the major labor-importing countries of East and Southeast Asia�Japan,
Taiwan, South Korea, Hong Kong, Singapore, Brunei, Malaysia, and Thailand. Most of
them come from the five main exporting nations of the region�Indonesia, the Philip-
pines, China, Thailand, and Malaysia. Will the Asian nations provide the world with
another “miracle” in the management of labor migration? Abella [����] notes that the
process through which Asian nations opened their doors to foreign workers was very
similar to that of Western Europe and North America. When countries found themselves
short of labor in particular sectors after domestic reservoirs of flexible labor were
exhausted, they permitted or tolerated the entry of foreign workers.
Asia may have simply delayed rather than avoided the dilemmas associated with
importing foreign workers. The countries now importing foreign workers can be ranked
along a policy spectrum ranging from denial to management. At the denial end of the
spectrum are Japan and South Korea, whose immigration laws do not permit the
importation of unskilled foreign workers. There, unskilled foreign workers are students,
trainees, or illegal workers. At the other end of the spectrum, Singapore has announced
that it considers foreign workers to be an instrument of economic policymaking. Foreign
workers are to be imported when needed, charged significant fees that increase govern-
ment revenues, and sent home when they are not needed.
In between those extremes are countries such as Taiwan and Hong Kong, which
recognize the need for guest workers. Their policies, however, zigzag as they are tugged
first by labor-short employers to permit more foreign workers to enter, or to let those
already there stay longer, and then persuaded by unions and other critics of foreign
workers to reduce their number or to tighten restrictions on them. Malaysia and
Thailand represent special cases of countries that both import and export labor. Both
countries’ workers seek high-wage jobs abroad, but the number of workers from poorer
countries seeking to enter these fast-growing economies is rising sharply. Both countries
have long borders with less affluent neighbors, making it impossible for them to keep out
unskilled foreign workers without great effort.
The sending countries of the Philippines, Indonesia, and China have announced that
exporting labor is a crucial part of their economic development plans for the next decade.
All three countries would like to upgrade their labor exports by exporting higher-wage
skilled labor rather than unskilled workers, and to better protect unskilled workers
� � This subsection draws heavily on Martin, Mason, and Tsay [����: �������]. More recentdiscussions can be found in Athukorala and Manning [����], Kimura and Hayase [����],Hayase and Tsay [����], and Stahl [����].
������� �� �
382
abroad. Nevertheless, it is hard to see how they can achieve this goal, given that other
labor-exporting countries are eagerly competing to supply workers to the international
labor market.
East Asian nations have credibility in economic policymaking. But the new chal-
lenge of managing migration is an area in which they have little credibility. A growing
gap exists between policies that prohibit the importation of unskilled foreign workers
and the reality that such workers comprise over � percent of their workforces. Similarly,
in labor-exporting nations, governments have little credibility when they promise to
prevent the exploitation of migrants but allow migrants to be exploited by recruitment
agents at home and employers abroad.
Three general trends in Asian labor migration affect prospects for labor-exporting
nations. First, it appears that the “need” for additional skilled and unskilled laborers will
persist throughout the region. Second, labor-short nations such as South Korea and
Japan may try to hire foreign workers as trainees, both to avoid acknowledging their
own dependence on foreign workers and to pay migrant workers lower wages. Third,
migrant workers seem to be staying abroad much longer, demonstrating the axiom that
there is nothing more permanent than temporary workers.
The Financial Crisis
In July ���� the Asian financial crisis started in Thailand. Spreading rapidly into most
East and Southeast Asian countries, it was called the dom yam kuong � ) Disease. The
extent of a financial crisis can be expressed by the misery index, which is the percentage
sum of currency devaluation and decline in stock prices. The upper panel of Table �shows that, in both June+December ���� and June �����June ����, South Korea, Indonesia,
Malaysia, and Thailand were the four most affected countries. The data further indicate
a recovery period in ���� for the heavily affected economies of South Korea and
Indonesia, while Taiwan and the Philippines did not perform as well. Indonesia, South
Korea, Thailand, and the Philippines were hit by an economic downturn again in ����.From mid-���� to the end of ����, Singapore, Hong Kong, and Japan suffered less in the
crisis than the other economies.
Because of the crisis the Thai economy grew at � � percent in ���� and at � ��percent in ����; it did not register positive growth (of � percent) until ����[Soonthorndhada ����: ����]. Compared with other countries in the region, the economic
performance of Thailand was unsatisfactory from June ���� to December ����. Unem-
ployment increased from ������� in August ���� (��� percentage rate) to ��� million
jobless and an unemployment rate of �� percent in August ����. In the year from mid-
���� to mid-����, about ������� workers were laid off by ����� enterprises. As economic
conditions deteriorated, the unemployment rate surged to �� percent and the number of
� � Dom yam kuong (spicy and sour prawn soup) is a popular and well-known Thai dish.
C. -l. TH6N : Labor Migration and Regional Changes in East Asia
383
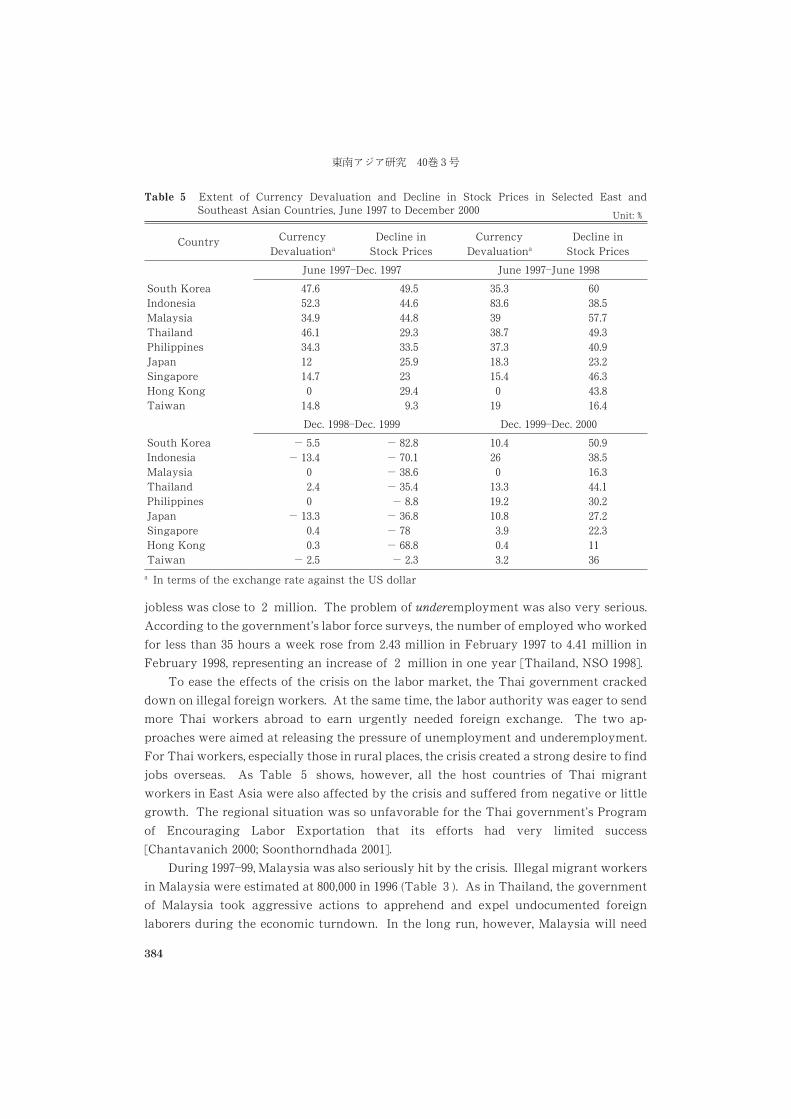
jobless was close to � million. The problem of underemployment was also very serious.
According to the government’s labor force surveys, the number of employed who worked
for less than �� hours a week rose from ���� million in February ���� to ���� million in
February ���, representing an increase of � million in one year [Thailand, NSO ���].
To ease the effects of the crisis on the labor market, the Thai government cracked
down on illegal foreign workers. At the same time, the labor authority was eager to send
more Thai workers abroad to earn urgently needed foreign exchange. The two ap-
proaches were aimed at releasing the pressure of unemployment and underemployment.
For Thai workers, especially those in rural places, the crisis created a strong desire to find
jobs overseas. As Table � shows, however, all the host countries of Thai migrant
workers in East Asia were also affected by the crisis and suffered from negative or little
growth. The regional situation was so unfavorable for the Thai government’s Program
of Encouraging Labor Exportation that its efforts had very limited success
[Chantavanich �; Soonthorndhada ��].
During �������, Malaysia was also seriously hit by the crisis. Illegal migrant workers
in Malaysia were estimated at � in ���� (Table � ). As in Thailand, the government
of Malaysia took aggressive actions to apprehend and expel undocumented foreign
laborers during the economic turndown. In the long run, however, Malaysia will need
Table � Extent of Currency Devaluation and Decline in Stock Prices in Selected East andSoutheast Asian Countries, June ���� to December � Unit: �
Country CurrencyDevaluationa
Decline inStock Prices
CurrencyDevaluationa
Decline inStock Prices
June �����Dec. ���� June �����June ���South KoreaIndonesiaMalaysiaThailandPhilippinesJapanSingaporeHong KongTaiwan
�����������������������������
��������������������������������
�������������������������
������������������������������
Dec. ����Dec. ���� Dec. �����Dec. �South KoreaIndonesiaMalaysiaThailandPhilippinesJapanSingaporeHong KongTaiwan
� ���� �������
� ��������
� ���
� ��� ���� ���� ����� �� ���� �� ��� ���
�����������������������
�����������������������������
a In terms of the exchange rate against the US dollar
������� �� �
384
workers from abroad after the crisis ends [Kassim ����; Pillai ����]. In Singapore the
volume of foreign workers to be accepted by the government will continue to be
determined by the economic benefits of guest workers and the social costs associated
with their presence.
In Japan, where the policy has been to deny the entry of unskilled workers from
abroad, foreigners are permitted to work as trainees at discounted wage rates [Abella and
Mori ����; Athukorala and Manning ����: �����; Oishi ����; Okunishi ����]. Despite the
strict regulations, substantial numbers of irregular foreigners have been working il-
legally in Japan. The estimated number for ���� was �������. About � percent of them
are Thais (Table ). It is believed that some of the illegal foreign workers in Japan are
trainees who left their original employers to take higher paying jobs elsewhere in the
country. According to Watanabe [����], the recent decline in the illegal workforce was
due mainly to tighter immigration control rather than the effects of the economic crisis.
The wages of foreign workers, however, especially of illegal ones, were affected by the
crisis.
The crisis affected Taiwan less than other countries in East and Southeast Asia
except in ���� (Table � ). Taiwan’s liberal policy of labor importation has exerted a
strong pull force on foreign workers, particularly Thais. In ���� the performance of the
Taiwan economy was the poorest among the East and Southeast Asian countries, partly
because of the earthquake that struck the country in September of that year. The
economic position of Taiwan improved only moderately in ����. However, the stock of
contract workers increased from ������� at the end of ���� to ����� in January ����.Given the existing economic conditions and trends, the Taiwanese manufacturing indus-
try will continue to demand foreign workers. For some time the demand could be
particularly strong for low-skilled laborers in that sector.
As a result of industrial restructuring in Taiwan, the demand for labor is expected to
shift to highly skilled professionals [Lee ����]. With the relocation of traditional
manufacturing overseas, the demand for low-skilled workers will eventually decline
relative to the demand for highly skilled workers. At the same time, the demand for
health care and household services will continue to grow as the Taiwanese population
ages and living arrangements change. This pattern has been observed in the most recent
statistics [Tsay and Lin ����]. In response to the ������� crisis, Taiwan initiated the
Program of Enlarging Domestic Demand. A major portion of the program concentrates
on the construction of public infrastructure, an activity employing large numbers of
relatively low-skilled workers. The demand for such workers increased with the need for
reconstruction projects after the earthquake in September ����. As pointed out earlier,
Thailand supplies more than �� percent of the imported construction workers in Taiwan.
Unfortunately, the continued economic downturn in �������, with a record-high unem-
ployment rate of � percent, has forced Taiwan to review its labor importation policy. It
recently decided to keep the number of foreign contract workers under ������.
C. -l. TH6N : Labor Migration and Regional Changes in East Asia
385
Foreign Workers in Taiwan
Labor Importation
The inflows of migrant workers to Taiwan became significant in the mid-����s, when a
sizable number of laborers from Southeast Asian and other countries were observed in
the manufacturing and construction industries and in the household sector [Tsay ����;����a; ����c]. Almost all of them entered as tourists and then overstayed their visas and
illegally engaged in paid employment. According to my own estimate, the illegal foreign
workforce stood at more than ������ by the end of ���� [Tsay ����: ��]. Some estimates,
however, place the number as high as ������� clandestine migrant workers [ibid.: ����].
The existence of a very large number of undocumented foreigners working in the
country presented major challenges for officials charged with their management and
deportation. Concurrently, there was a general acceptance of the need to augment the
labor supply. The authorities were pressured to grant special permissions allowing the
importation of contract laborers to expedite several major public construction projects
and to alleviate labor shortages in local manufacturing firms; and in ���� Taiwan
officially opened its labor market to foreign workers without having a solid legal ground.
Two waves of contract laborers came to Taiwan in late ���� and ���� to meet the need of
the construction industries involved in key national development projects and to supple-
ment the shortages of manufacturing labor; but strictly speaking, the importation of
those workers was unlawful. In May ���� the government promulgated the Employment
Services Act to provide a legal basis for labor importation.
Although the history of legal importation of foreign workers to Taiwan goes back
only a decade, the liberalization process was quite rapid, resulting in a huge surge of
contract workers from the four designated source countries: Indonesia, Malaysia, the
Philippines, and Thailand. Vietnam was added to the list of labor-providing countries in
����. The total volume of imported workers jumped from ����� in ����, to ����� in ����,to almost ������� in ����, and then to ������� in ����. The sharp increase was due to both
the expansion of the importation schemes and the rise in the number of workers imported
for existing schemes [Tsay ����].
Between the end of ���� and January ����, the number of imported laborers con-
tinued to grow, rising from ������� to �������, a � percent increase. Table reveals that
Thailand has been the biggest supplier of import labor, followed by the Philippines and
Indonesia. At the end of January ����, Thai workers (������) accounted for �� percent of
the total ������� contract laborers, while the share of Filipinos and Indonesians was ��and �� percent, respectively. The number of Malaysian workers, never very large, has
become neglible in recent years. In contrast, Vietnamese workers have just entered the
������� ��� ��
386
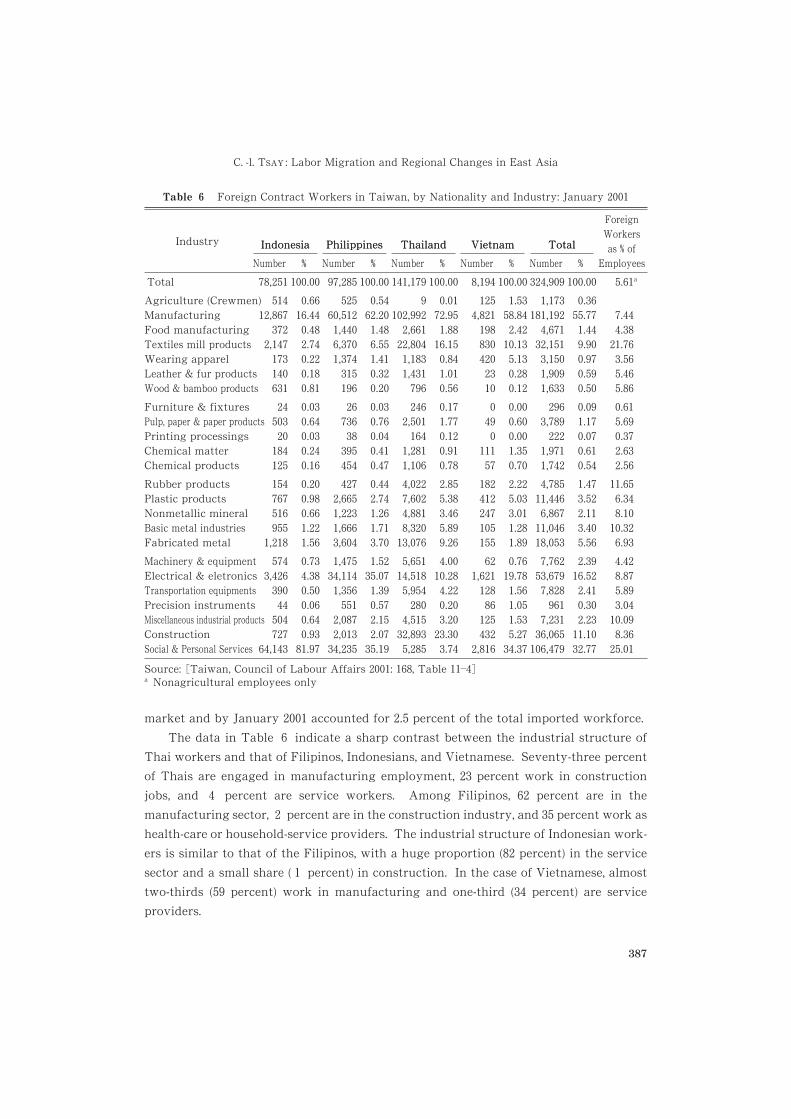
market and by January ���� accounted for ��� percent of the total imported workforce.
The data in Table � indicate a sharp contrast between the industrial structure of
Thai workers and that of Filipinos, Indonesians, and Vietnamese. Seventy-three percent
of Thais are engaged in manufacturing employment, �� percent work in construction
jobs, and � percent are service workers. Among Filipinos, �� percent are in the
manufacturing sector, � percent are in the construction industry, and �� percent work as
health-care or household-service providers. The industrial structure of Indonesian work-
ers is similar to that of the Filipinos, with a huge proportion (� percent) in the service
sector and a small share ( � percent) in construction. In the case of Vietnamese, almost
two-thirds (� percent) work in manufacturing and one-third (�� percent) are service
providers.
Table � Foreign Contract Workers in Taiwan, by Nationality and Industry: January ����
Industry IndonesiaIndonesia PhilippinesPhilippines ThailandThailand VietnamVietnam TotalTotal
ForeignWorkers
as � ofEmployeesNumber � Number � Number � Number � Number �
Total ����� ������ ���� ������ ������ ������ ��� ������ ����� ������ ����a
Agriculture (Crewmen)ManufacturingFood manufacturingTextiles mill productsWearing apparelLeather & fur productsWood & bamboo products
�������������������������
��������������������������
�����������������������������
����������������������������
��������������������������
��������������������������
�����������������
���������������������������
����������������������������������
�������������������������
�����������������������
Furniture & fixturesPulp, paper & paper productsPrinting processingsChemical matterChemical products
������������
��������������������
�����������
��������������������
��������������������
������������������
��������
��������������������
�����������������
�������������������
�������������������
Rubber productsPlastic productsNonmetallic mineralBasic metal industriesFabricated metal
���������������
������������������
�����������������������
��������������������
�����������������������
���������������
��������������
�����������������
�������������������������
��������������������
��������������������
Machinery & equipmentElectrical & eletronicsTransportation equipmentsPrecision instrumentsMiscellaneous industrial productsConstructionSocial & Personal Services
������������������
������
�������������������������
����������������������������������
����������������������������
�����������������������������
�����������������������������
��������������������
����������������������������
��������������������������������
������������������������������
������������������������
Source: �Taiwan, Council of Labour Affairs ����: ��, Table �����a Nonagricultural employees only
C. -l. TH6N : Labor Migration and Regional Changes in East Asia
387
A closer look at Table � suggests that contract workers are segregated by national-
ity. Among the ������ contract workers employed by the construction sector, �� percent
are Thais. The share of Filipinos, Indonesians, and Vietnamese is only � percent, �percent, and � percent, respectively. On the contrary, the great majority of the �����imported service workers are Indonesians (�� percent) and Filipinos (�� percent). For
manufacturing employment, the market share is � percent for Thais, �� percent for
Filipinos, percent for Indonesians, and � percent for Vietnamese. Thai laborers are
fairly widely distributed across the manufacturing industries, with some concentration
in textiles, electrical and electronics industries, fabricated metals, and basic metals. For
the Filipinos, �� percent of the manufacturing workers (or �� percent of the total) are in
the electrical and electronics industry, followed by �� percent in the textile industry
(which accounts for percent of the total). The Vietnamese tend to be concentrated in
electrical and electronics industries and in textiles. Although Indonesians are less evenly
distributed in the manufacturing industries than Thais, their distribution is less concen-
trated than that of Filipinos.
In sum, irregular migrant workers emerged in the labor market of Taiwan in the mid-
����s. In late ���� the market was opened for the first time to contract laborers from
Southeast Asia, although the legal basis for importing workers was not provided until
the Employment Services Act was promulgated in May ����. After that, the industrial
coverage of importation schemes expanded and the number of contract workers in-
creased rapidly. Virtually all industries in the manufacturing and construction sectors,
as well as households in need of services found it easy to qualify for permits to use
workers from abroad. In just a decade the number of foreign workers rose to the current
level of about �������. The rapid increase in the number of care providers in recent years
has been particularly remarkable.
After the legalization of labor importation and the subsequent sharp increase in the
volume of foreign workers, the labor market in Taiwan changed significantly. Over the
past few years the unemployment rate has shot up and the length of unemployment
prolonged. Concurrently the growth rate of wages has slowed. All these changes
occurred about two years after the rapid expansion in labor-importation schemes. It is
thus reasonable to hypothesize that foreign workers have had some negative effects on
the employment prospects of local workers. Recent analyses based on survey data [Tsay
and Lin ����] support this hypothesis, at least in part.
Thai Contract Workers
Taiwan is the major destination of Thai nationals working abroad, accounting for nearly
one-third of the total. In Taiwan, Thai contract workers represent half of the whole
imported labor force. For both the sending and receiving countries, it is important to
understand the migration outcomes of Thai workers. The main reason given by Thais for
moving to work in Taiwan is the pursuit of higher pay. Therefore in ���� I conducted a
������� �� ��
388
survey of Thai migrant workers in Taiwan � ) to gain a better understanding of their
working and living conditions. In addition, my staff and I used the survey data to
compare their situation with that of Thai workers in Japan, Singapore, and Malaysia
[Chantavanich et al. ����].
A total of ��� Thai workers in Taiwan were successfully interviewed using “snow-
ball” sampling method [Tsay and Lin ����]. The study examined the characteristics of
Thai migrant workers in two major industries: manufacturing and construction. The
survey data indicate that all Thai workers were under age ��, but construction workers
were on average older than manufacturing workers. The general level of educational
attainment was limited. The majority (�� percent) of all workers had received no more
than a primary education. The level was especially low among construction workers.
Almost all Thai workers had not participated in any skill-training programs before
coming to Taiwan. Most of them had no prior experience of working in another country.
Most of the workers were not household heads, a finding that indicates they were
probably not the only breadwinner in the family. This was particularly true among
construction workers. With regard to household income, the largest group (� percent)
earned less than ����� baht per month, followed by those earning ����������� baht (�percent). (In ����, one US dollar was equivalent to ��� Thai baht.) A strong rural and
agricultural background characterizes Thai workers in Taiwan. Some of them may be
underemployed or even unemployed. We found that more than half of the respondents
were hesitant to reveal their individual income, and reported ones indicated a low level,
averaging about ��� baht per month.
As contract workers, most Thai migrants (�� percent) had been in Taiwan for less
than a year. Their travel and job arrangements were all made by recruiters in Thailand.
They were well informed about the working and living conditions in Taiwan. But the
amount of money they paid to work in Taiwan was extremely high in relation to their
potential wage rate in Thailand. Over �� percent of the respondents had paid more than
����� baht, �� percent had paid more than ������ baht, and �� percent had paid ������������ baht. The cost of migration is substantially higher for construction workers than
for those in the manufacturing sector. Just to pay back the migration cost, the Thai
workers would have to work for at least half a year without spending any income.
Almost all the Thai workers took on debt to migrate. They were financed mostly by
private lenders or through informal channels. The high interest rates charged by the
private lending agencies in the underground market may explain part of the high
� � The ���� Survey of Thai Migrant Workers in Taiwan was a component of the ResearchProject on Thai Migrant Workers in East and Southeast Asia, coordinated by the AsianResearch Center for Migration (ARCM) at Chulalongkorn University in Bangkok[Chantavanich et al. ����]. The fieldwork supervisor of the survey was SamarnLaodumrongchai of ARCM. His successful conduct of the interviews is greatly appreciated.
C. -l. TH6N : Labor Migration and Regional Changes in East Asia
389
migration cost. It is likely that the migrant workers did not have the required guarantee
to apply for loans from the formal financial institutions. One way to address this problem
is to involve Thai authorities in charge of labor exportation. The Thai government
should be able to act as a guarantee to the banks for the migrant workers so that they can
obtain credit loans at the market rate. Without having to pay the high interest rates of
the underground market, the cost to migrants could be substantially reduced.
Most Thai workers in Taiwan are satisfied with their migration outcomes, as
evidenced by respondents’ indications of job fit and higher incomes. All the Thai
contract workers we surveyed were paid more than the minimum wage (NT$ ������ a
month) in Taiwan, which was equivalent to US$ ��� in ����. Most of them earned more
than this level by working overtime. Median earnings were close to NT$ ������ a month,
remarkably higher than their income in Thailand. Construction workers earned more
than their manufacturing counterparts by taking on more overtime work. Probably as a
result of differences in the nature of their work, construction workers reported far less
satisfaction with their jobs than manufacturing workers when asked whether their job
expectations had been realized.
Almost all the Thai workers (�� percent) were satisfied with their earnings in Taiwan,
though the proportion was higher in the construction group than in the manufacturing
category. The construction workers earned more than the manufacturing workers on
average; even so, far fewer of them said they were highly satisfied with their income.
Most construction workers ( percent), however, indicated that they were paid fairly for
their work. These findings reflect the hardship of construction work and the large
amount of overtime worked in the industry. Compared with construction workers, larger
percentages of manufacturing workers were both highly satisfied with their earnings
and dissatisfied with their earnings. This finding is probably related to the relative ease
of manufacturing work and reduced opportunities to work overtime for extra income in
that industry.
Thai workers reported some problems in their workplace in Taiwan. The construc-
tion workers experienced more difficulties with their job and workplace than did manu-
facturing workers and they also had more health problems. More than half of the
construction workers claimed that their health had deteriorated, whereas the figure for
the manufacturing workers was only � percent. The most serious problem of the Thai
workers as a whole was loneliness. Their social isolation represents a serious psychic cost
of migrating to work in Taiwan. The mental health of Thai workers deserves more
attention from labor management.
In sum, the migration outcomes of Thai workers in Taiwan are generally satisfac-
tory. Of course, there are some problems with the work, the workplace, and the living
environment. The problems are particularly serious among the construction workers,
even though their earnings are higher than those of manufacturing workers. The violent
conflicts that recently broke out between Thai and Filipino workers at a major construc-
������� ��� �
390
tion site in central Taiwan indicate a need to address foreign workers’ concerns. More
efforts should be made by employers, recruiters, the governments, and the workers
themselves to avoid similar tragedies in the future.
Summary and Conclusion
International labor migration is an adjustment mechanism for responding to differences
in labor market conditions among countries. Noneconomic factors such as international
relations and regional conditions also spur cross-border movement. The study of
international labor migration should not be limited to the economic and labor market
considerations in the sending and receiving countries. Migration systems need to be
understood in a regional perspective. In addition to economic elements, research should
consider the social and cultural background of migrants and the receiving areas, and the
policies and regulations affecting foreign workers.
Because of internal economic, social, and demographic factors, Thais have a long
history of working abroad. In the ����s and ����s, most Thai migrants sought employ-
ment in the Middle East. Between the late ����s and early ����s, East Asia, including the
ASEAN countries, replaced the Gulf Area as the major destination of Thai workers. The
shift in migration direction was due mainly to the decline in oil prices but also in part to
noneconomic factors. At the same time, Japan, the Asian NIEs (Singapore, Hong Kong,
Taiwan, and South Korea), Malaysia, and Brunei began having labor shortages because of
their rapid economic growth and demographic transition. The problem was particularly
serious in industries requiring low-skilled laborers and jobs entailing hardship. Cur-
rently about half a million Thais are working in those countries. At least half of them are
working there illegally. This situation represents a great challenge to the host govern-
ments in managing migrant workers and protecting their rights. It is also a sensitive
issue in international relations that deserves more concern and understanding.
In the one and a half decades before the ���� financial crisis, rapid growth of the Thai
economy resulted in a significant shortage of skilled manpower. The number of foreign
professionals working in the kingdom rose to more than �������, and the stock of
undocumented migrant workers approached � million. Most of them came from the less
developed neighboring countries of Myanmar, Cambodia, and Laos. During that period,
Thailand changed from a labor-exporting country to one both sending workers abroad
and receiving foreign workers. The Thai experience illustrates the link between labor
migration and regional changes, presenting challenges for research and policy formula-
tion.
The effects of the ���� financial crisis have been tremendous throughout the region.
An immediate response by Thailand was to expel illegal foreign workers and to encour-
age more Thais to work abroad. In practice the two strategies were difficult to imple-
C. -l. TH6N : Labor Migration and Regional Changes in East Asia
391
ment. In the long run the East Asian labor-importing countries will continue to demand
foreign workers for various economic, social, and demographic reasons. The temporary
migration of workers is likely to become a permanent phenomenon in East and Southeast
Asia, as in other parts of the world.
The available data indicate that between one-third and one-half of all Thai workers
abroad are in Taiwan, and Thai migrant workers account for almost half of the total labor
imported to Taiwan. Among them, �� percent are engaged in manufacturing employ-
ment and �� percent in construction. More than �� percent of foreign workers in the
construction industry of Taiwan are Thais. Thus the labor migration from Thailand to
Taiwan represents a close relationship between the two countries. Survey results
reported here indicate that the migration outcomes of Thai workers in Taiwan are
generally satisfactory with respect to income gains and working and living conditions.
Not surprisingly, respondents identified problems related to their work, the workplace,
and their living environments. Given the socioeconomic conditions and regional factors,
Thai labor migration to Taiwan will continue to be beneficial to both countries and to the
individual workers and their families.
References
Abella, Manolo I. ����. Asian Labour Migration: Past, Present, and Future. ASEAN EconomicBulletin �� ( � ): �������.
Abella, Manolo; and Mori, Hiromi. ���. Structural Change and Labour Migration in East Asia. InDevelopment Strategy, Employment and Migration: Country Experiences, edited by David O’Connorand Leila Farsakh, pp. ����. Paris: OECD Development Centre.
Athukorala, Prema-chandra; and Manning, Chris. ����. Structural Change and International Migrationin East Asia. New York: Oxford University Press.
Chalamwong, Yongyuth. ����. The Impact of the Crisis on Migration in Thailand. Asian and PacificMigration Journal � (���): �������.
Chantavanich, Supang. ����. Labour Migration from Thailand: A Lack of Policy in Human ResourceDevelopment. In Proceedings of the APEC-HRD Workshop on International Migration and Struc-tural Change in APEC Member Economies, edited by Michio Kimura and Yasuko Hayase, pp.
������. Chiba, Japan: Institute of Developing Economies, JETRO.Chantavanich, Supang; Germershausen, Andreas; Ito, Chiaki; Laodumrongchai, Samarn; Chotipa-
nich, Jiraporn; and Pranchason, Sajin, eds. ����. Thai Migrant Workers in East and SoutheastAsia: Conditions in Destination Countries. Bangkok: Asian Research Center for Migration(ARCM), Institute of Asian Studies, Chulalongkorn University.
Economic and Social Commission for Asia and the Pacific (ESCAP). ����. +332 Population Data Sheet.Bangkok: ESCAP.
Hayase, Yasuko; and Tsay, Ching-lung, eds. ����. Proceedings of the APEC-HRD Workshop onInternational Migration and Structural Change in APEC Member Economies. Chiba, Japan: Insti-tute of Developing Economies, JETRO.
Hugo, Graeme. ����. The Demographic Underpinnings of Current and Future International Migra-tion in Asia. Asian and Pacific Migration Journal � ( � ): ����.
International Labour Organization (ILO). ����. The Social Impact of the Asian Financial Crisis.Technical report for discussion at the High-Level Tripartite Meeting on Social Responses to theFinancial Crisis in East and South-East Asian Countries. Bangkok, ���� April ����.
������� �� ��
392
Kassim, Azizah. ����. The Case of a New Receiving Country in the Developing World: Malaysia.Paper prepared for Technical Symposium on International Migration and Development, ��June�� July ����, The Hague, Netherlands.
Kimura, Michio; and Hayase, Yasuko, eds. ����. Proceedings of the APEC-HRD Workshop on Interna-tional Migration and Structural Change in APEC Member Economies. Chiba, Japan: Institute ofDeveloping Economies, JETRO.
Lee, Joseph S. ����. The Impact of the Asian Financial Crisis on Foreign Workers in Taiwan. Asianand Pacific Migration Journal � (���): �����.
Martin, Philip L.; Mason, Andrew; and Tsay, Ching-lung, eds. ���. Labour Migration in Asia. SpecialIssue of ASEAN Economic Bulletin �� ( � ).
Oishi, Nana. ���. Training or Employment? Japanese Immigration Policy in Dilemma. Asian andPacific Migration Journal � (���): �����.
Okunishi, Yoshio. ���. Japan. ASEAN Economic Bulletin �� ( � ): ������.Park, Young-Bum. ����. The Financial Crisis and Foreign Workers in Korea. Asian and Pacific
Migration Journal � (���): �������.Pillai, Patrick. ����. The Impact of the Crisis on Migrant Labor in Malaysia: Policy Implications.
Asian and Pacific Migration Journal � (���): �����.Soonthorndhada, Kusol. ����. Changes in the Labour Market and International Migration since the
Economic Crisis in Thailand. In Proceedings of the APEC-HRD Workshop on InternationalMigration and Structural Change in APEC Member Economies, edited by Yasuko Hayase andChing-lung Tsay, pp. ������. Chiba, Japan: Institute of Developing Economies, JETRO.
Stahl, C. W. ����. International Labour Migration in East Asia: Trends and Policy Issues. Paperprepared for APMRN Symposium on New Trends in Asia Pacific Migration and the Conse-quences for Japan, ����� September ����, held by Waseda University, Tokyo.
Stern, Aaron. ����. Quantitative International Migration Data for Thailand: An Overview. Asian andPacific Migration Journal ( � ): ������.
Sussangkarn, Chalongphob. ���. Labour Market Adjustments and Migration in Thailand. ASEANEconomic Bulletin �� ( � ): ������.
Sussangkarn, Chalongphob; and Chalamwong, Yongyuth. ���. Thailand: Development Strategiesand Their Impacts on Labour Markets and Migration. In Development Strategy, Employment andMigration: Country Experiences, edited by J. Edward Taylor, pp. �����. Paris: Organization forEconomic Co-operation and Development; Washington, D. C.: OECD Publications and Informa-tion Centre.
Taiwan, Council for Economic Planning and Development (CEPD). ���. Projections of the Populationof Taiwan: +33/ to ,*-0. Taipei, Taiwan: CEPD.
Taiwan, Council of Labour Affairs. ����. Monthly Bulletin of Labour Statistics, No. ���.Thailand, Bank of Thailand. Various years. Annual Report of the Bank of Thailand. Bangkok,
Thailand.Thailand, National Statistical Office (NSO). ����. Labour Force Survey. Bangkok: National Statistical
Office, Office of the Prime Minister.Tsai, Pan-long; and Tsay, Ching-lung. ����. Economic Development, Foreign Direct Investment and
International Labor Migration: The Experiences of Japan, Taiwan and Thailand. Paper preparedfor the Symposium on Experiences and Challenges of Economic Development in Southeast andEast Asia, ����� October ����, held by the Institute of Economics, Academia Sinica, IEAS, Taipei.
Tsay, Ching-lung. ����. Clandestine Labor Migration to Taiwan. Asian and Pacific Migration Journal
� (���): ���.����. ����. Industrial Restructuring and International Competition in Taiwan. Environment and
Planning A. � ( � ): �������.����. ���a. Data on International Migration from Taiwan. Asian and Pacific Migration Journal
� ( � ): �����.
C. -l. TH6N : Labor Migration and Regional Changes in East Asia
393
����. ����b. Taiwan: Labour Importer. ASEAN Economic Bulletin �� ( � ): �������.����. ����c. Taiwan: Labour Shortage. In Asian NIEs and the Global Economy: Industrial
Restructuring and Corporate Strategy in the 1990s, edited by Gordon Clark and Won Bae Kim,pp. �������. Baltimore: The Johns Hopkins University Press.
����. ����. Trends and Characteristics of Migration Flows to Taiwan. In Proceedings of theAPEC-HRD Workshop on International Migration and Structural Change in APEC Member Econo-mies, edited by Yasuko Hayase and Ching-lung Tsay, pp. �������. Chiba, Japan: Institute ofDeveloping Economies, JETRO.
Tsay, Ching-lung; and Lin, Ji-ping. ����. Working and Living Conditions of Thai Contract Workersin Taiwan: A Study on Individual Outcomes of Labour Migration. Paper prepared for the �ndInternational Workshop on Thai Migrant Workers in Southeast and East Asia, ���� November
����, held by Chulalongkorn University, Bangkok.����. ����. Labour Importation and Unemployment of Local Workers in Taiwan. Asian and
Pacific Migration Journal �� (��): ������.Watanabe, Susumu. ���. The Economic Crisis and Migrant Workers in Japan. Asian and Pacific
Migration Journal � (���): ������.World Bank. ���. Human Development Report. New York: Oxford University Press for the World
Bank.
������� �� ��
394
Does Globalization Adversely Affect
Population and Poverty?
The Views of Five Panelists
The final plenary session of the ���� IUSSP Regional Population Conference on Southeast
Asia’s Population in a Changing Asian Context addressed the effects of globalization on
population and poverty. Richard Leete of the United Nations Population Fund (UNFPA)
organized and chaired the session. Two panel members, Andrew Mason and Simeen
Mahmud, agreed to stimulate debate by presenting the case that globalization was not
adversely affecting population and poverty. The other two panelists, Ogawa Naohiro and
Rafiqul Huda Chaudhury, presented the case that globalization was adversely affecting
population and poverty. Each of the panel members was asked to summarize the views
presented at the forum.
Does Globalization Adversely Affect
Population and Poverty?
Richard L::I:�
Globalization, the growing integration and interdependence of economies and societies,
excites great emotions and has become a force triggering massive international demon-
strations�in Seattle, in Doha, in Rome, and just about anywhere that the G� and Bretton
Woods Institutions’ leaders meet. Paradoxically, both those who advocate more globali-
zation and the anti-globalization campaigners contend that their route is the road that
leads to poverty eradication.
On the one side, those subscribing to the Washington Consensus argue that globali-
zation improves living standards and reduces poverty through employment growth
stimulated by increased trade and capital flows, the sharing of ideas, and the extension of
democratic institutions. Macroeconomic stability, low inflation, and fiscal discipline are
seen as imperatives for sustained economic growth and sustainable development. Globa-
lization is perceived as the means for achieving international-development goals and for
* Population and Development Branch, Technical Support Division, United Nations Popula-tion Fund, ��� East ��nd St., New York, NY �����, U. S. A., e-mail: leete�unfpa.org
Southeast Asian Studies, Vol. ��, No. �, December ����
395
creating a more inclusive and equitable global economy.
On the other side, the anti-globalization lobby argues that much of the world,
especially the poorest countries, has been largely excluded from its benefits. Private
investment flows are targeted to a minority of developing countries, bypassing poor
countries because of their low human capital and perceived limited investment opportu-
nities. The gap between rich and poor has tended to widen, inequalities have risen, debt
has mounted�promised debt relief under the enhanced Heavily Indebted Poor Country
initiative has been slow in coming�and trade subsidies, especially for agricultural
produce, disproportionately benefit the North. Current levels of Official Development
Assistance, less than ��� percent of annual GDP overall, are (for most Northern countries)
far below the target of ��� percent that developed countries are committed to meeting�and for the United States, which has the world’s biggest economy, just ��� percent of GDP.
There is fear of instability in the international economic and financial system, with
large transnational companies often lacking social accountability and sometimes even
appearing more powerful than governments of developing countries. Capital flows move
swiftly, and as the Asian financial and economic crisis of the late ����s showed, huge
amounts can be moved at times of perceived macroeconomic instability. These massive
outflows can seriously reverse development gains carefully built up over decades, as was
the case in Indonesia, for example [UNFPA and ANU ����]. And at times of financial and
economic crisis, it is the social sectors that tend to be most affected, their effects being felt
disproportionately by the poor, especially women and children.
Then there is a further fear of loss of cultural diversity. Globalization is viewed as
leading to cultural homogeneity, or Westernization. Increasing interaction and integra-
tion across borders diminish differences between nations, causing global norms, ideas,
and practices to dilute local cultures. The spread of factors influencing culture is
unbalanced and heavily weighted in one direction, from rich countries to poor ones. A
contrary view is that a new heterogeneity and diversity stems from globalization, with
the interaction between different societies leading to new mixtures of cultures and
integration.
Globalization processes can be seen as national responses to internationally dictated
economic prescriptions�reductions in state spending, decreased subsidies, increases in
privatization, and so on. Further they can be seen as international responses, such as the
cross-border movement of goods, services, capital, information, and investment. Or they
can be viewed as a combination of both.
However globalization is viewed, the reality of widespread poverty continues to
linger. The HIV/AIDS pandemic is devastating economies, communities, and individual
families, especially in the poorest countries; and it is widening inequalities within
countries. More than ��� billion people live on less than $� a day, a similar number lack
access to safe water, and more than � billion lack access to improved sanitation [IMF
et al. ����]. Some ��million children under age die each year. About one child in three
������� �� ��
396
living in developing countries does not complete primary schooling. Approximately ���million couples who want to space the births of their children or stop having children are
not using contraception. Gender equality and women’s empowerment remain distant
targets in much of the world.
Poverty is multidimensional, as reflected in the international development goals and
especially the Millennium Development Goals (MDGs) [UN ����]. Without a more
equitable distribution of the benefits of globalization both within and between countries,
it is unlikely that the development goals will be achieved by the target date of ����. We
need in particular to monitor the MDGs targets that relate to international governance so
as to determine to what extent developed countries can be counted as true partners in
supporting the aspirations of the poorest countries to lift the curtain of poverty that
undermines human dignity. As we move forward in the first decade of this new
millennium, progress toward achieving the international-development goals, including
the MDGs, can be used as a yardstick for measuring the effectiveness of globalization.
Globalization has direct effects on demographic processes. Those include move-
ments of people within and across national borders, health and fertility outcomes, and
changes in age structure. Over the next �� years more than � billion persons will be
added to the global total of ��� billion, and almost all of them will be net additions to the
world’s poorest countries. Urban populations will grow rapidly, posing challenges to
sustainable development. The attainment of universal access to reproductive health�that is, to gender-sensitive information and services�is crucial for achieving the develop-
ment goals. Access to reproductive-health services not only is directly related to health,
social, and economic outcomes; it also enables individuals, particularly women, to exer-
cise choice and opens opportunities.
In sum, macroeconomic policies will need to be more carefully blended with social
policies and protection measures to ensure that market forces do not neglect the needs of
the poorest, and that poverty and inequality are not perpetuated. Put another way,
globalization needs to be humanely managed and regulated. And there is a need for more
developed countries to support the provision of global public goods and thereby contrib-
ute to national poverty-reduction strategies.
References
United Nations Population Fund (UNFPA); and The Australian National University (ANU). ����.Southeast Asian Populations in Crisis: Challenges to the Implementation of the ICPD Programme ofAction. New York: UNFPA. ��p.
International Monetary Fund (IMF); Organisation for Economic Cooperation and Development(OECD); United Nations (UN); and World Bank Group (WB). ����. A Better World for All: Progresstowards the International Development Goals, 2000. Washington, D. C. ��p.
United Nations (UN). ����. Road Map toward the Implementation of the United Nations MillenniumDeclaration. Report of the Secretary-General, September. New York: United Nations. �������(E) ������.
Does Globalization Adversely Affect Population and Poverty?
397
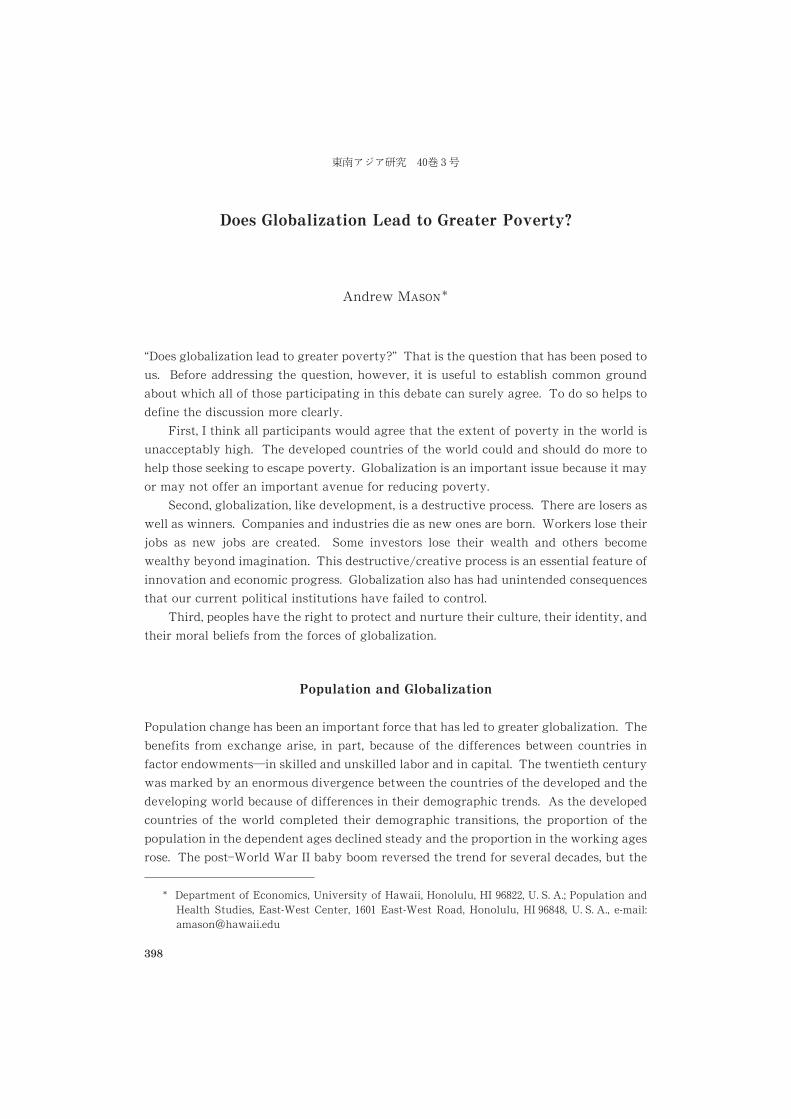
Does Globalization Lead to Greater Poverty?
Andrew M6HDC�
“Does globalization lead to greater poverty?” That is the question that has been posed to
us. Before addressing the question, however, it is useful to establish common ground
about which all of those participating in this debate can surely agree. To do so helps to
define the discussion more clearly.
First, I think all participants would agree that the extent of poverty in the world is
unacceptably high. The developed countries of the world could and should do more to
help those seeking to escape poverty. Globalization is an important issue because it may
or may not offer an important avenue for reducing poverty.
Second, globalization, like development, is a destructive process. There are losers as
well as winners. Companies and industries die as new ones are born. Workers lose their
jobs as new jobs are created. Some investors lose their wealth and others become
wealthy beyond imagination. This destructive/creative process is an essential feature of
innovation and economic progress. Globalization also has had unintended consequences
that our current political institutions have failed to control.
Third, peoples have the right to protect and nurture their culture, their identity, and
their moral beliefs from the forces of globalization.
Population and Globalization
Population change has been an important force that has led to greater globalization. The
benefits from exchange arise, in part, because of the differences between countries in
factor endowments�in skilled and unskilled labor and in capital. The twentieth century
was marked by an enormous divergence between the countries of the developed and the
developing world because of differences in their demographic trends. As the developed
countries of the world completed their demographic transitions, the proportion of the
population in the dependent ages declined steady and the proportion in the working ages
rose. The post�World War II baby boom reversed the trend for several decades, but the
* Department of Economics, University of Hawaii, Honolulu, HI �����, U. S. A.; Population andHealth Studies, East-West Center, ���� East-West Road, Honolulu, HI �����, U. S. A., e-mail:amason�hawaii.edu
������� ��� �
398
rise was relatively modest as compared with the long-term secular trend.
In the developing world, if the eight countries for which we have data are represent-
ative, the dependency ratio was roughly ����� percent higher in the late nineteenth and
early twentieth centuries. Between ���� and ����, however, the average dependency ratio
for the eight developing countries shown in Fig. � increased very rapidly, producing an
enormous dependency-ratio differential between the developing and the developed coun-
tries. Since that time, however, the dependency ratio has dropped very rapidly in many
developing countries, and by ���� the gap between the developing and the developed
world was not very different from what it was in ����. Taiwan is shown separately in
Fig. � to illustrate an important point. In a number of East and Southeast Asian
countries, fertility decline has been especially rapid, yielding an even greater swing in the
dependency ratio. The proportion of Taiwan’s population in the working ages is now
smaller than the average for the seven developed countries shown in Fig. �.Because of these demographic changes some countries have experienced rapid labor
force growth and others have experienced labor shortages. The demographic changes
have also led to high saving rates in some countries and low saving rates in others.
Globalization has allowed countries to respond to their own demographic conditions by
engaging in trade, foreign investment, and international labor migration with countries
experiencing complementary demographic conditions [Mason ����; La Croix, Mason and
Abe ����]. The large demographic differences among countries have been an important
force behind the increased integration of global markets.
Why does globalization benefit poor countries? There are three important ways that
globalization benefits poor countries and the poor who live in those countries.
The first way is by creating jobs. In the most successful countries of Asia, employ-
ment increased more rapidly than the working-age population. Moreover, labor produc-
tivity and wages grew very rapidly. How was this accomplished? Through effective
Fig. � Age Structure: Developed and Developing Countries
Note: For sources and details see La Croix, Mason, and Abe in this issue.
Does Globalization Adversely Affect Population and Poverty?
399
participation in the global economy. In the successful Asian countries exports grew
rapidly. When saving rates were low, those countries imported and effectively used
foreign capital to start new businesses. Their workers found jobs in the Middle East.
Second, globalization improves the value of and the incentives to develop new ideas.
Innovation is the lifeblood of development and poverty reduction. Ideas about how to
improve a product, combat a disease, or produce at lower cost all help the poor.
Third, globalization facilitates the diversification of risk. This benefit will become
increasingly important as countries age and their larger elderly populations depend on
personal savings and public and private pensions for their material needs. The integra-
tion of national capital markets will allow greater protection from investment risk.
Those of us who live in the United States will be able to invest in Thailand and other
countries likely to achieve high rates of economic growth in the coming decades. Those
living in Thailand will be better able to hedge their bets by spreading their savings
around the world.
Although I have emphasized the potential value of globalization, it is important to
acknowledge that we have not yet achieved the idealized global economy. The United
States and other countries in the West, for example, protect their agricultural industries
much to the detriment of many developing countries [La Croix, Mason and Abe ����].
The national and international institutions that currently regulate globalization pro-
cesses are inadequate in many respects.
I have offered no empirical support of the proposition that globalization leads to a
reduction in poverty, but a simple exercise is compelling. Make two lists, one of the Asian
countries that have actively participated in the global economy and the other of the
countries that have not. Those with a global orientation would surely include South
Korea, post-reform China, Taiwan, Hong Kong, Singapore, and Thailand. Those without
a global orientation would surely include North Korea, pre-reform China, Cambodia, and
Pakistan. The results speak for themselves.
The solution to poverty is not to retreat from globalization. The poor of Asia will
gain when globalization includes those groups and countries still left on the sidelines.
References
La Croix, Sumner J.; Mason, Andrew; and Abe, Shigeyuki. ����. Population and Globalization.Southeast Asian Studies �� ( � ), edited by Shigeyuki Abe, Sumner J. La Croix, and AndrewMason.
Mason, Andrew. ����. Population and Economic Growth in East Asia. In Population Change andEconomic Development in East Asia: Challenges Met, Opportunities Seized, edited by AndrewMason, pp. ����. Stanford, CA: Stanford University Press.
������� ��� ��
400
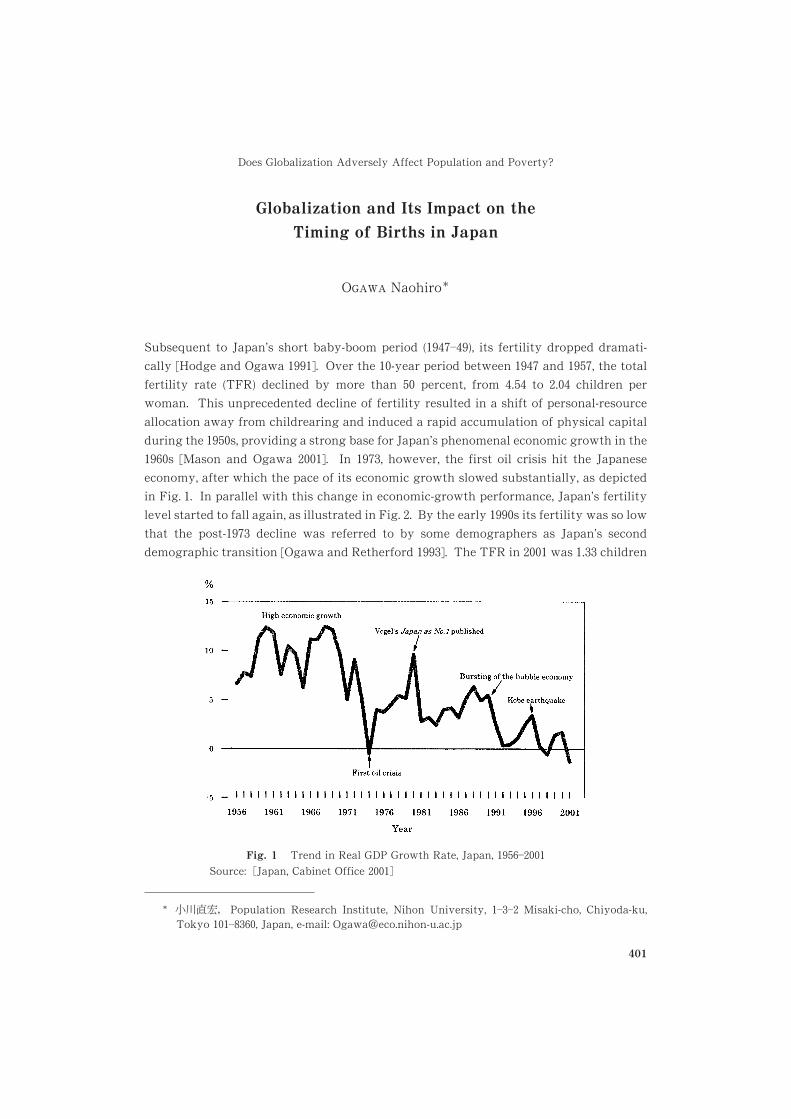
Globalization and Its Impact on the
Timing of Births in Japan
O<6L6 Naohiro�
Subsequent to Japan’s short baby-boom period (�������), its fertility dropped dramati-
cally [Hodge and Ogawa ����]. Over the ��-year period between ���� and ����, the total
fertility rate (TFR) declined by more than �� percent, from ���� to ���� children per
woman. This unprecedented decline of fertility resulted in a shift of personal-resource
allocation away from childrearing and induced a rapid accumulation of physical capital
during the ����s, providing a strong base for Japan’s phenomenal economic growth in the
���s [Mason and Ogawa ����]. In ���, however, the first oil crisis hit the Japanese
economy, after which the pace of its economic growth slowed substantially, as depicted
in Fig. �. In parallel with this change in economic-growth performance, Japan’s fertility
level started to fall again, as illustrated in Fig. �. By the early ����s its fertility was so low
that the post-��� decline was referred to by some demographers as Japan’s second
demographic transition [Ogawa and Retherford ���]. The TFR in ���� was �� children
* ����� Population Research Institute, Nihon University, ���� Misaki-cho, Chiyoda-ku,Tokyo ������, Japan, e-mail: Ogawa�eco.nihon-u.ac.jp
Fig. � Trend in Real GDP Growth Rate, Japan, ��������Source: �Japan, Cabinet Office �����
Does Globalization Adversely Affect Population and Poverty?
401
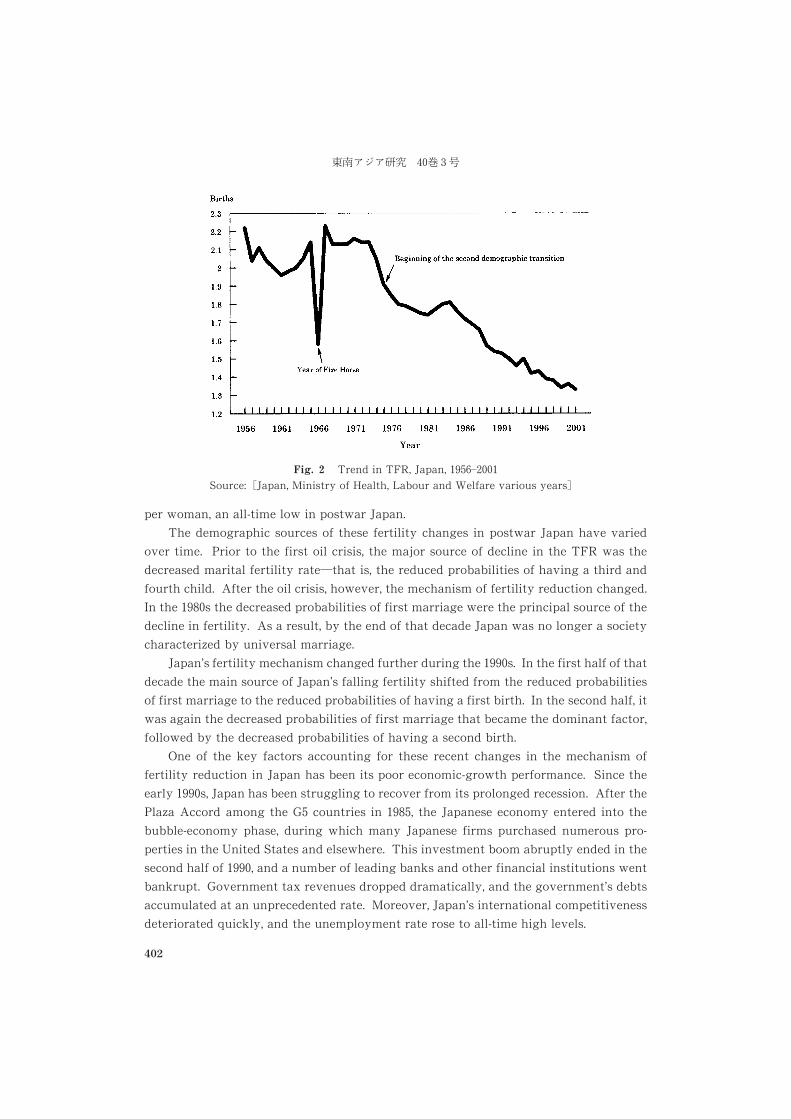
per woman, an all-time low in postwar Japan.
The demographic sources of these fertility changes in postwar Japan have varied
over time. Prior to the first oil crisis, the major source of decline in the TFR was the
decreased marital fertility rate�that is, the reduced probabilities of having a third and
fourth child. After the oil crisis, however, the mechanism of fertility reduction changed.
In the ����s the decreased probabilities of first marriage were the principal source of the
decline in fertility. As a result, by the end of that decade Japan was no longer a society
characterized by universal marriage.
Japan’s fertility mechanism changed further during the ����s. In the first half of that
decade the main source of Japan’s falling fertility shifted from the reduced probabilities
of first marriage to the reduced probabilities of having a first birth. In the second half, it
was again the decreased probabilities of first marriage that became the dominant factor,
followed by the decreased probabilities of having a second birth.
One of the key factors accounting for these recent changes in the mechanism of
fertility reduction in Japan has been its poor economic-growth performance. Since the
early ����s, Japan has been struggling to recover from its prolonged recession. After the
Plaza Accord among the G� countries in ����, the Japanese economy entered into the
bubble-economy phase, during which many Japanese firms purchased numerous pro-
perties in the United States and elsewhere. This investment boom abruptly ended in the
second half of ����, and a number of leading banks and other financial institutions went
bankrupt. Government tax revenues dropped dramatically, and the government’s debts
accumulated at an unprecedented rate. Moreover, Japan’s international competitiveness
deteriorated quickly, and the unemployment rate rose to all-time high levels.
Fig. � Trend in TFR, Japan, ���������Source: �Japan, Ministry of Health, Labour and Welfare various years�
������� ��
402
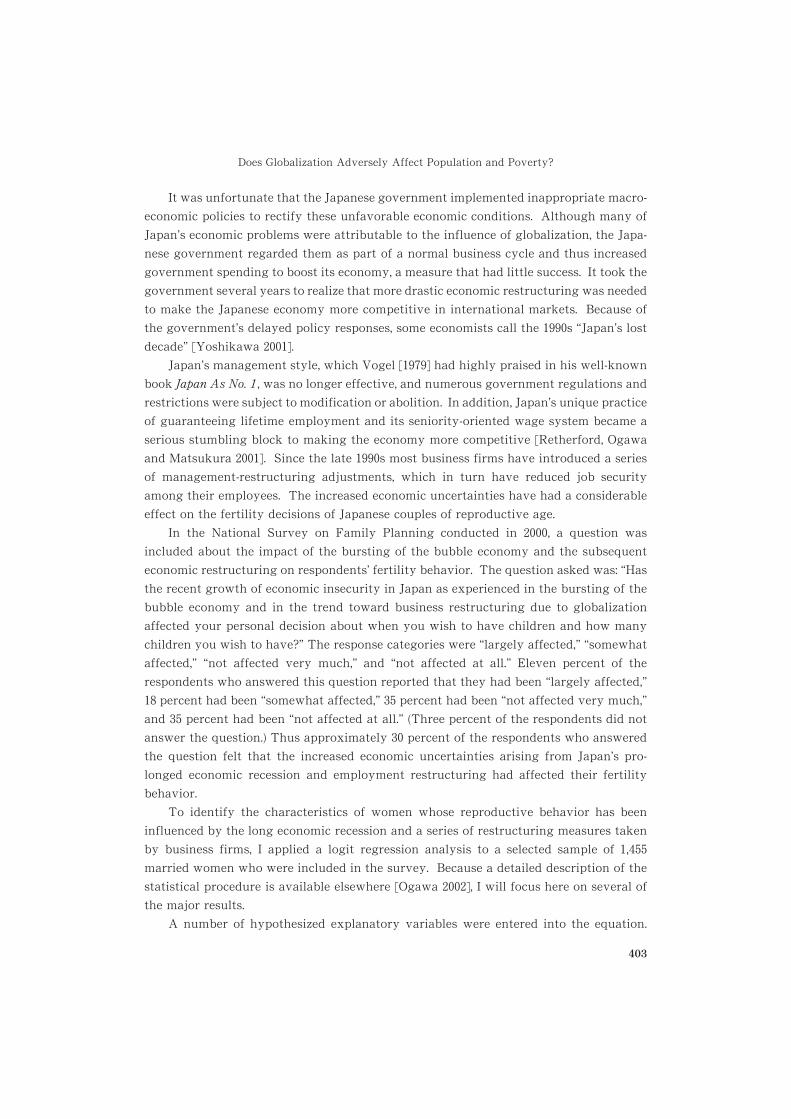
It was unfortunate that the Japanese government implemented inappropriate macro-
economic policies to rectify these unfavorable economic conditions. Although many of
Japan’s economic problems were attributable to the influence of globalization, the Japa-
nese government regarded them as part of a normal business cycle and thus increased
government spending to boost its economy, a measure that had little success. It took the
government several years to realize that more drastic economic restructuring was needed
to make the Japanese economy more competitive in international markets. Because of
the government’s delayed policy responses, some economists call the ����s “Japan’s lost
decade” [Yoshikawa ����].
Japan’s management style, which Vogel [����] had highly praised in his well-known
book Japan As No. 1, was no longer effective, and numerous government regulations and
restrictions were subject to modification or abolition. In addition, Japan’s unique practice
of guaranteeing lifetime employment and its seniority-oriented wage system became a
serious stumbling block to making the economy more competitive [Retherford, Ogawa
and Matsukura ����]. Since the late ����s most business firms have introduced a series
of management-restructuring adjustments, which in turn have reduced job security
among their employees. The increased economic uncertainties have had a considerable
effect on the fertility decisions of Japanese couples of reproductive age.
In the National Survey on Family Planning conducted in ����, a question was
included about the impact of the bursting of the bubble economy and the subsequent
economic restructuring on respondents’ fertility behavior. The question asked was: “Has
the recent growth of economic insecurity in Japan as experienced in the bursting of the
bubble economy and in the trend toward business restructuring due to globalization
affected your personal decision about when you wish to have children and how many
children you wish to have?” The response categories were “largely affected,” “somewhat
affected,” “not affected very much,” and “not affected at all.” Eleven percent of the
respondents who answered this question reported that they had been “largely affected,”
�� percent had been “somewhat affected,” �� percent had been “not affected very much,”
and �� percent had been “not affected at all.” (Three percent of the respondents did not
answer the question.) Thus approximately �� percent of the respondents who answered
the question felt that the increased economic uncertainties arising from Japan’s pro-
longed economic recession and employment restructuring had affected their fertility
behavior.
To identify the characteristics of women whose reproductive behavior has been
influenced by the long economic recession and a series of restructuring measures taken
by business firms, I applied a logit regression analysis to a selected sample of ���married women who were included in the survey. Because a detailed description of the
statistical procedure is available elsewhere [Ogawa ����], I will focus here on several of
the major results.
A number of hypothesized explanatory variables were entered into the equation.
Does Globalization Adversely Affect Population and Poverty?
403
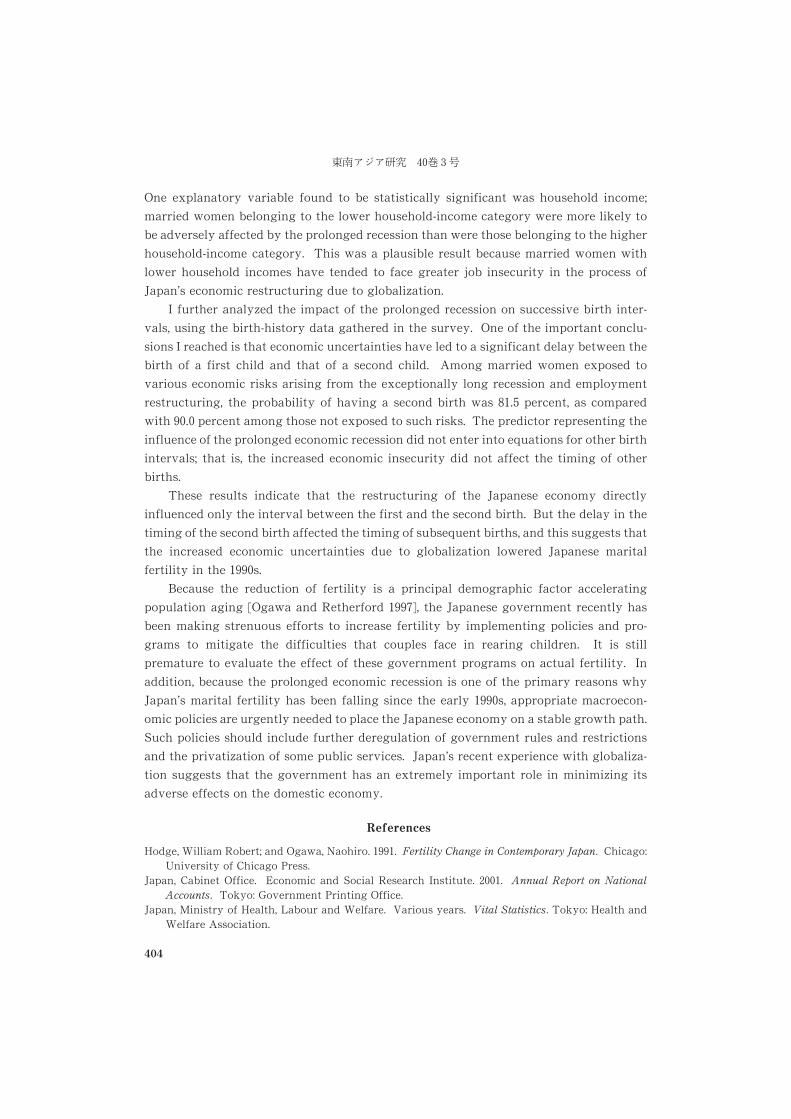
One explanatory variable found to be statistically significant was household income;
married women belonging to the lower household-income category were more likely to
be adversely affected by the prolonged recession than were those belonging to the higher
household-income category. This was a plausible result because married women with
lower household incomes have tended to face greater job insecurity in the process of
Japan’s economic restructuring due to globalization.
I further analyzed the impact of the prolonged recession on successive birth inter-
vals, using the birth-history data gathered in the survey. One of the important conclu-
sions I reached is that economic uncertainties have led to a significant delay between the
birth of a first child and that of a second child. Among married women exposed to
various economic risks arising from the exceptionally long recession and employment
restructuring, the probability of having a second birth was ���� percent, as compared
with ���� percent among those not exposed to such risks. The predictor representing the
influence of the prolonged economic recession did not enter into equations for other birth
intervals; that is, the increased economic insecurity did not affect the timing of other
births.
These results indicate that the restructuring of the Japanese economy directly
influenced only the interval between the first and the second birth. But the delay in the
timing of the second birth affected the timing of subsequent births, and this suggests that
the increased economic uncertainties due to globalization lowered Japanese marital
fertility in the ����s.
Because the reduction of fertility is a principal demographic factor accelerating
population aging [Ogawa and Retherford ����], the Japanese government recently has
been making strenuous efforts to increase fertility by implementing policies and pro-
grams to mitigate the difficulties that couples face in rearing children. It is still
premature to evaluate the effect of these government programs on actual fertility. In
addition, because the prolonged economic recession is one of the primary reasons why
Japan’s marital fertility has been falling since the early ����s, appropriate macroecon-
omic policies are urgently needed to place the Japanese economy on a stable growth path.
Such policies should include further deregulation of government rules and restrictions
and the privatization of some public services. Japan’s recent experience with globaliza-
tion suggests that the government has an extremely important role in minimizing its
adverse effects on the domestic economy.
References
Hodge, William Robert; and Ogawa, Naohiro. ����. Fertility Change in Contemporary Japan. Chicago:University of Chicago Press.
Japan, Cabinet Office. Economic and Social Research Institute. ����. Annual Report on NationalAccounts. Tokyo: Government Printing Office.
Japan, Ministry of Health, Labour and Welfare. Various years. Vital Statistics. Tokyo: Health andWelfare Association.
������� �� �
404
Mason, Andrew; and Ogawa, Naohiro. ����. Population, Labor Force, Saving, and Japan’s Future. InJapan’s New Economy: Continuity and Change in the Twenty-First Century, edited by MagnusBlomstrom, Byron Gangnes, and Sumner J. La Croix, pp. �����. Oxford: Oxford University Press.
Ogawa, Naohiro. ����. Japan’s Changing Fertility Mechanism and Its Policy Responses. Journal ofPopulation Research. forthcoming
Ogawa, Naohiro; and Retherford, Robert D. ����. The Resumption of Fertility Decline in Japan:
�������. Population and Development Review �� ( � ): �������.����. ����. Shifting Costs of Caring for the Elderly Back to Families in Japan. Population and
Development Review �� ( � ): ����.Retherford, Robert D.; Ogawa, Naohiro; and Matsukura, Rikiya. ����. Late Marriage and Less
Marriage. Population and Development Review �� ( � ): ����.Vogel, Ezra. ����. Japan As No. 1: Lessons for America. Cambridge: Harvard University Press.Yoshikawa, Hiroshi. ����. Japan’s Lost Decade. Tokyo: International House of Japan.
Is Globalization Adversely Affecting
Population and Poverty?
Simeen M6=BJ9�
Ours is a continuously globalizing world in the sense that the nations of the world are
becoming more and more interconnected every day. During the last two decades both
the pace and complexity of this ongoing phenomenon have reached unprecedented
proportions. However, the degree of integration into the global economy and its impact
have varied among countries, which are highly differentiated by whether they are in the
North or the South, by the nature of the goods and services they produce and trade, by
the level of human development of their populations, by their policies for social pro-
visioning and protection, and by the degree of stability and maturity of their financial
sectors, which in turn are influenced in large measure by the extent of each country’s
integration into the global information and communications network.
For developing countries generally, globalization has meant, among other things,
increased exports from the South to the North, the increased flow of capital in the other
direction, and the increased movement of skilled labor from labor-surplus countries
of the South to the newly industrialized countries. Because these processes affect
markets and institutions, they undoubtedly have enormous potential effects on a
country’s population and on people’s livelihoods. It is not surprising, therefore, that
* Bangladesh Institute of Development Studies, E-�� Agargaon Sher-e-Bangla Nagar, G. P. O.Box ���, Dhaka ����, Bangladesh, e-mail: simeen�sdnbd.org
Does Globalization Adversely Affect Population and Poverty?
405
the weak and vulnerable groups within a country’s population are more likely to be
adversely affected, at least in the transitional period, than other groups. In addition,
given that labor markets and other institutions are governed by norms and rules
reflecting a society’s gender relationships and stereotypes, these processes will affect
women and men differently, women being more likely than men to be adversely affected.
The question “Is globalization adversely affecting population and poverty?” therefore
deserves a thoughtful response.
There are two direct ways in which globalization processes affect people’s livelihoods
in developing countries, both of which have poverty and gender consequences. The first
is by causing quantitative and qualitative changes in people’s labor market participation,
and the second is by requiring governments to curtail their own responsibility for public
social and human-development provisioning.
The most visible change in the labor market induced by the globalization phenome-
non is the “feminization” of the labor market�that is, a more than proportionate increase
in the female share of the labor force, particularly paid employment in manufacturing
industries. In Asia the evidence indicates that feminization of the labor force has taken
place “via worsening income distribution and increased openness of adjusting econ-
omies” [Ozler ����: ���]. Whereas the increased labor market availability of women has
been due in some cases to worsening real incomes during the period of structural
adjustment,�) in other cases it has been due to new economic opportunities and new
modes of production that actually favored women because of low labor costs. Women
have been considered more suited than men to work under the new conditions because
they are seen as subsidiary wage earners, not requiring the regular jobs and stable
incomes that men need. Female labor is also considered more suited to the flexible and
informal new modes of production�for example, outsourcing, contract labor, casual and
part-time labor, and home-based work, which allow easy entry and exit. These kinds of
jobs allow the combination of reproductive work, considered to be primarily women’s
responsibility, and productive work.
Who has gained from this expansion of women’s paid employment because of
adjustment and trade reforms?
Governments have gained because a country’s participation in export trade is
influenced positively not only by the availability of “cheap” female labor but also by the
attributes of women workers not captured by typical measures of skill, such as the
willingness to work under flexible, informal, and diverse labor conditions, conditions
under which men are generally unlikely to work. Firms and employers have gained by
remaining competitive in the international market, their competitiveness made possible
� � In Bangladesh real wages declined in ����, three years after the initiation of the adjustmentprogram, and fluctuated afterward, especially in agriculture and construction, and to alesser extent in manufacturing [CIRDAP ����].
������� ��� �
406
by the low costs of hiring women under the new modes of production. The comparative
advantage of “cheap” labor (by which I mean not only low wages but also all other
conditions of labor that contribute to low labor costs) has meant that employers have
gained access to the reserve female workforce, placing them in jobs in agriculture,
service, and construction that men have traditionally done and in new kinds of jobs in
manufacturing.
For families, the balance of gains and losses is not yet fully played out, since there is
consumption gain offset by some welfare loss. On the one hand, there is immediate
welfare loss for all family members, but particularly for dependents, due to the reduced
supply of women’s care-giving labor that is not compensated by an increased supply
of men’s care-giving labor. In all countries of the South women still undertake most
of the work in the reproductive economy�that is, labor that provides for the care of
dependents (children, elderly, and the ill) and for the sustenance of not-so-dependent
adults, on a daily and intergenerational basis. Hence, changes in the supply of female
labor for productive work is bound to have implications for the supply of labor for
reproductive and care-giving work. Unfortunately, macroeconomics generally takes
the reproductive economy for granted, assuming that it can continue to function ad-
equately no matter how much its relation to the productive economy is disrupted. In
other words, it assumes that an unlimited supply of female labor exists for reproductive
or care-giving work. In Bangladesh, garment factory workers are usually unmarried
daughters who migrate to cities for employment, reducing the amount of care-giving
labor available to their rural households. Women workers with small children also
reduce their care-giving time and rely upon childcare of lower quality (grandparents,
siblings, paid help, neighbors).
On the other hand, families also gain because women’s earnings supplement
household income, often raising not only the quantity of consumption but also the
quality because women spend a higher proportion of their income than men do on food,
housing, clothing, education, and health care. Within families men gain because
women share the work of income earning to meet the family’s consumption needs, often
allowing men to migrate to urban areas and get better jobs, to go to college, to obtain
higher-skills training, or to go abroad for more remunerative employment. In Bangla-
desh, garment factory workers remit a part of their earnings to their natal families, help
pay for the schooling of siblings, and save for their own marriage dowries. Their
remittances not only are poverty reducing but also enhance human development and
human capabilities.
Women have gained jobs, but whether this has been to their advantage or disadvan-
tage is difficult to assess because an expansion in paid employment has both positive
and negative dimensions. Women have to pay for the burden of additional work through
health costs and reduced leisure time since there is no change in the gender division
of labor in the reproductive economy. Women may also be losing out in the work
Does Globalization Adversely Affect Population and Poverty?
407
place by being stuck in employment that has poorer returns, fewer prospects for upward
mobility, and worse working conditions than those of male employment. Female
employment is also riskier, being directly linked to swings in international demand
and dependent upon how much individual countries can remain internationally compet-
itive. There is also the risk of losing the “female” advantage and being replaced by men
in more highly skilled jobs, a reversal that is already seen in many countries, including
Bangladesh, where men are taking up the more skilled and more remunerative work in
knitwear factories.
Nevertheless, although the deregulation of labor permitting flexible modes of pro-
duction, easy entry and exit, and low labor costs has meant that jobs available to women
have less favorable terms than jobs available to men, it has also meant that more jobs are
available in situations where women are forced to seek paid work. Moreover, the
conditions of work in the new factory jobs, both wages and working conditions, compare
favorably with the conditions of work in jobs that women otherwise engage in, such as
domestic service, construction work, or agricultural wage work. The expansion of jobs
for women and the better working conditions in export manufacturing industries act as
a leverage for improved working conditions in other sectors, particularly the informal
sector. In Bangladesh, since the establishment of the export-oriented ready-made gar-
ment factories, which hire large numbers of unskilled women, there has been a scarcity
of female labor for service and domestic work, a factor responsible for pushing up the
wages of maids and service workers.
Although the number of factory jobs is insufficient to employ all women seeking
paid work, they do represent expanded opportunity in a context of limited choice and
raise women’s hopes of getting a job because of the ease of entrance and the mobility
between factories. In that respect they contribute to the increasing value of daughters to
parents, a positive change indicated by parents’ increased willingness to invest in the
education and health of daughters as well. In Bangladesh, for example, the gender gap in
primary school enrollment is closed (and maybe even reversed), and the gender gap in
child mortality and nutrition is considerably reduced, a fact not readily accounted for by
either economic or demographic explanations. Furthermore, in patriarchal societies like
Bangladesh, these jobs have contributed to the creation of norms that are beneficial to
women and society, such as young women working for pay, women delaying marriage in
favor of employment, and women living on their own and moving visibly in the public
domain.
Finally, the expansion of women’s paid work, especially in the modern sectors, can
contribute to more egalitarian gender relationships and a reduction in gender inequalities
because of the links between women’s empowerment and their decision-making role in
the family, their mobility in the public domain, and the re-evaluation of women’s work.
The link is not automatic, however; rather, it depends on the extent to which women have
control over their earnings and have a say in how to spend them. Evidence suggests that
������� ��� ��
408
women do retain control over part of their earnings and spend it on themselves, although
the major portion is spent on family consumption. Women workers report gaining a
feeling of independence and seem to enjoy greater self-esteem and social prestige. They
also report being more valued by their family members, although the lack of sharing of
reproductive and caring work by men suggests that gender relationships in the family
have not altered much. However, among women employed in export-oriented manufac-
turing industries the age at marriage has gone up, and those women enjoy greatly
increased access to the public domain, and to services and information, which indicates
an improvement in their absolute status in society.
For developing countries globalization has tremendously increased opportunities in
the world’s markets, but the extent to which gains in economic growth have been
translated into improvements in human development and to poverty reduction depends
more upon individual countries than upon the processes of global integration per se
[UNDP ����]. Some countries, like Malaysia and South Korea, were able to manage
increased trade and economic growth to produce significantly reduced poverty levels
and increased human-development levels, whereas others, like Pakistan, were unable to
translate high rates of growth in exports to visible improvement in human development.
Clearly, an individual country’s ability to transform the gains from globalization into real
gains for its people depends upon how comprehensive and pro-poor its adjustment
packages have been at the national level.
It is not surprising that in the face of shrinking government resources and donor aid,
public systems of social provisioning and protection have been, in many cases, downsized
or even dismantled. In Asia generally the adverse effects of cutbacks in government
spending have not been very severe because adjustment packages accompanying trade
liberalization have tended to be sensitive to the need to increase income transfers to the
poor by subsidizing health and education services and by providing safety nets for the
very poor. Evidence of this can be seen in the “Asian Tigers’” enormous and rapid strides
in human development and poverty reduction during the decade prior to the financial
meltdown in ���� and their relatively quick recovery to pre-crisis levels despite the
severe human cost of the crisis.
Moreover, although health and education subsidies often end up favoring the rich,
they do reduce overall inequality in income because private spending is more unequal
than public spending. For example, in ���� the Bangladesh government spent �� percent
of all government expenditure on education and ��� percent on health. Government
subsidies were greater for education, and some of the expenditure components in both
health (essential-services package) and education (primary education) were strongly
pro-poor. Bangladesh also has one of the world’s largest programs of targeted food
transfers, and it has been described as reasonably pro-poor.
In conclusion, the extreme vulnerability of people and the helplessness of national
governments in the face of volatile financial markets cannot be glossed over. Southern-
Does Globalization Adversely Affect Population and Poverty?
409
country governments should prepare to address new sources of vulnerability that are not
directly linked to financial markets but rather to the fact that workers in geographically
dispersed and economically diverse locations have come into direct competition with
one another. The question of ethics in international trade has cropped up, and the
issue of “fair” rather than “free” trade is becoming more relevant for countries of
the South and for poor workers within those countries. Recent attempts to include a
social clause in international trade agreements (for example, linking labor and en-
vironmental standards to exports from developing countries) should be tackled by
governments in such a way that these international pressures result in improved work-
ing conditions for their workers rather than in the loss of employment for millions of
poor workers, most of whom are women who have a very weak bargaining position
vis-à-vis their employers.
References
Centre on Integrated Rural Development for Asia and the Pacific (CIRDAP). ����. StructuralAdjustment Policy and Labour Market in Bangladesh. Monitoring Adjustment and Poverty FocusStudy. Dhaka: CIRDAP. ���p.
Ozler, S. ����. Globalization, Employment and Gender. In Background Papers, Vol. �, HumanDevelopment Report 1999, pp. �������. New York and Oxford: Oxford University Press for theUnited Nations Development Programme.
United Nations Development Programme (UNDP). ����. Human Development Report +333. New Yorkand Oxford: Oxford University Press for the UNDP. ���p.
Does Globalization Adversely Affect
Poverty and Population?
Rafiqul Huda C=6J9=JGN�
I would argue that the globalization process, including structural-adjustment programs,
which aim to accelerate economic growth through improved macroeconomic perform-
ance, fiscal discipline, greater reliance on private markets, and trade liberalization, may
adversely affect poverty and a country’s population dynamics (e. g., fertility, mortality,
nuptiality, migration), at least in the short run. Structural adjustment includes the
liberalization of markets and wages; it also includes demand-contraction policies, such as
* Population Policies and Development Strategies, UNFPA Technical Services Team forSouth and West Asia, P. O. Box ���� Kathmandu, Nepal, e-mail: chaudhury�unfpa.org.np
������� ��� �
410
cutbacks in public expenditures, the imposition of service charges, and exchange-rate
devaluation�all of which are likely to erode household income and thereby increase
poverty, lowering the quality of life, health, and education.
Liberalized market policies, such as the privatization of industries, which leads to the
retrenchment of workers and unemployment, and the withdrawal of food subsidies,
may also erode household income and consequently give rise to poverty. The wage-
liberalization process may lead to the stagnation or decline of the real wage rate and
thereby accentuate poverty.
Governments devalue their exchange rates to reduce trade deficits. Exchange-rate
devaluation boosts exports by making foreign goods expensive and local goods cheaper;
but among the imported goods that become more expensive are medicines, medical
equipment, and fuel. Increases in the price of imported life-saving drugs and medical
technologies can adversely affect the demand and quality of health services. Increases in
fuel prices often lead to higher prices for food and other commodities by affecting
transportation costs, and those higher prices negatively affect household income and
weaken demand for health and education services.
Demand-contraction policies such as cutbacks in public expenditure in social sectors,
particularly on health and education, are often introduced to reduce budget deficits.
They negatively affect the accessibility and quality of those services and have a detri-
mental affect on the health and education outcomes of a population, particularly the
poor.
Service charges, often imposed as a cost-recovery measure to compensate for the
cutbacks in expenditures on public health and education, may lead to a reduction in
household income, particularly for the poor, and their ability to pay for those services.
This in turn will adversely affect their health and education. Ill health and poor
education will further increase the vulnerability of the poor.
Since structural-adjustment programs emphasize economic growth and are geared
toward allocating more resources to the productive sector, the health, education, and
social services sectors receive smaller allocations or investments, and that may adversely
affect both the coverage and quality of these services.
Overall, the negative impact of structural adjustment is likely to be especially severe
in situations where social safety nets are inadequate to protect the poor and vulnerable
groups (e. g., children, women, particularly female-headed households, the elderly)
against its immediate adverse affects during the transition period. Fig. � shows the
pathways through which each of these features of structural adjustment may adversely
affect household income and the quality of life, particularly health and education.
Does Globalization Adversely Affect Population and Poverty?
411
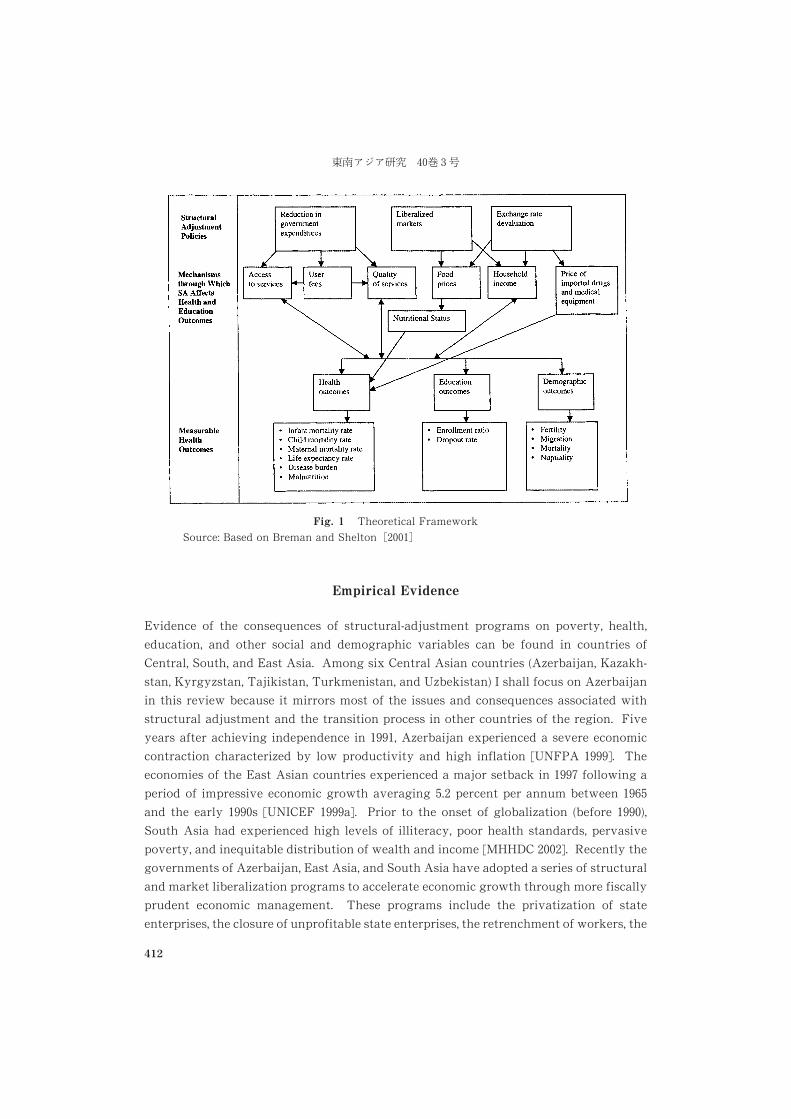
Empirical Evidence
Evidence of the consequences of structural-adjustment programs on poverty, health,
education, and other social and demographic variables can be found in countries of
Central, South, and East Asia. Among six Central Asian countries (Azerbaijan, Kazakh-
stan, Kyrgyzstan, Tajikistan, Turkmenistan, and Uzbekistan) I shall focus on Azerbaijan
in this review because it mirrors most of the issues and consequences associated with
structural adjustment and the transition process in other countries of the region. Five
years after achieving independence in ����, Azerbaijan experienced a severe economic
contraction characterized by low productivity and high inflation [UNFPA ����]. The
economies of the East Asian countries experienced a major setback in ���� following a
period of impressive economic growth averaging ��� percent per annum between ����and the early ����s [UNICEF ����a]. Prior to the onset of globalization (before ����),South Asia had experienced high levels of illiteracy, poor health standards, pervasive
poverty, and inequitable distribution of wealth and income [MHHDC ����]. Recently the
governments of Azerbaijan, East Asia, and South Asia have adopted a series of structural
and market liberalization programs to accelerate economic growth through more fiscally
prudent economic management. These programs include the privatization of state
enterprises, the closure of unprofitable state enterprises, the retrenchment of workers, the
Fig. � Theoretical Framework
Source: Based on Breman and Shelton ������
������� �
412
devaluation of national currencies, the relaxation of controls over capital flow, tariff
reductions, cutbacks of public provisioning in the social sector, the withdrawal of state
subsidies for health and education, and the imposition of service charges for health care
and education. Structural-adjustment and liberalization programs have been in effect in
Azerbaijan and South Asia since ����, but most countries in Central and South Asia have
not moved toward full-phase market liberalization. East Asian countries, on the other
hand, have been implementing mixed liberal economic policies (via a confluence of
public-sector and private market-driven development) over the past �� years, and by the
early ����s they had achieved full-phase market liberalization. The impact of globaliza-
tion, in particular of structural-adjustment programs, on population and poverty can be
measured by comparing the situation in the pre-globalization period with that in the
post-globalization period.
Economic, Social, and Demographic Consequences
of the Globalization Process
Economic Consequences
In Azerbaijan the closure of a number of unprofitable state enterprises and the retrench-
ment of workers led to an unprecedented increase in unemployment, from nearly full
employment before independence in ���� to �� percent unemployment of the labor force
in ���� [UNFPA ����: � ]. In East Asia the unemployment rate skyrocketed with the
closure of large numbers of private enterprises and the widespread retrenchment of
workers. The rate doubled in Thailand and Hong Kong and increased more than
threefold in South Korea between ���� and ����. Malaysia and Indonesia were hit even
harder. Some � million people were unemployed in Thailand, South Korea, and
Indonesia, roughly �� percent of those countries’ work force [UNICEF ����a: �]. In South
Asia the privatization of state-owned enterprises also led to retrenchment of workers.
For example, in Bangladesh ������workers lost their jobs through retrenchment between
���� and ����. In India ������� workers lost their jobs owing to the privatization of state
enterprises. In Pakistan the annual compound growth rate of overall employment
declined from �� percent in the pre-privatization period to ��� percent in the post-
privatization period [SAAT ����: Tables �.�, �.�, Fig. �.�].
Loss of income, due largely to the loss of jobs and price hikes, led to increased
poverty. In Azerbaijan the incidence of poverty, measured by whether annual household
expenditure on food fell below the cost of minimal consumption, increased during the
����s, reaching its highest level, �� percent, in ����. Real wages, measured as the ratio of
the average wage to the cost of a basic consumer basket, dropped from �� percent in ����to �� percent in ���� [UNFPA ����: � ]. An estimated �� percent of Indonesia’s population,
�� percent of South Korea’s, and �� percent of Thailand’s were poor in ���� [UNICEF ����a:
Does Globalization Adversely Affect Population and Poverty?
413
��]. The incidence of poverty, defined as the proportion of a population having an income
below $� per day, increased in three out of five South Asian countries for which data are
available during two consecutive periods, ������� and ������� [MHHDC ����: ��,Fig. �.�].
With the increase in poverty, income distribution also worsened. In Azerbaijan it
worsened in the ����s, with the richest �� percent of the population accounting for ��percent of the national income and the poorest �� percent accounting for only � percent
[UNFPA ����: � ]. Income distribution among various economic groups also worsened in
South Asia. Between ��� and ���� the richest �� percent of the region’s population
received between �� and � percent of total income, while the poorest �� percent received
less than �� percent of the total income [MHHDC ����: ��, Table �.�]. The benefits of
economic growth in general tend to be limited to a small minority of educated, urban
denizens. In East Asia the widening of the income gap has been dramatic; and basic
human development�education, public health, and gender development�have suffered
deeply from mounting pressures stemming from increased unemployment and the
retrenchment of the public sector [UNICEF ����a; ����b].
Social Consequences
In ��� government expenditures on public health and education, as a percentage of GDP,
were less than half of the ���� level in Azerbaijan [UNFPA ����: �����]. This has
adversely affected the health, nutrition, and educational status of the population. For
example, in Azerbaijan more births have been taking place at home because many
couples cannot afford to pay health-facility fees. As many as one-third of all children
under age � were found to have been born at home in ���, compared with nearly ���percent of deliveries taking place at health facilities in ���� [ibid.: ��]. This increase in
home deliveries has had a serious effect on the maternal mortality rate, which increased
from � per ������� live births in ���� to �� per ������� live births in ���. Mortality rates
among infants and children under age � also increased during the first � to � years
following independence. Life expectancy at birth declined by � years, from � years in
���� to � years in ����. Structural adjustment has also taken its toll in the education
sector in Azerbaijan. Enrollment in education institutions declined by �� percent
between ����/�� and ����/� [ibid.: ��].
Drastic reductions in the budget allocations for health and education in East Asia
have reduced the accessibility and quality of those services. The reductions are reflected
in the closure of health facilities and in increased school-dropout rates in various
countries. For example, half of the health facilities in one part of Greater Jakarta were
reported to have been closed. The number of Indonesian children dropping out of
primary and junior-secondary schools during ���� were �� and ��� million respectively,
twice the levels in ��� [UNICEF ����a: ��].
Public expenditures on health and education, as a percentage of GDP, decreased in
������� ��� ��
414
almost all South Asian countries during �������, declining to levels lower than those in
the pre-globalization period. These reductions have had negative health and education
outcomes. For example, the progress made since ���� in improving life expectancy and
adult literacy and in reducing maternal and child mortality slowed in ���� and ����/��following structural adjustment, owing to cutbacks in public-sector employment and
service delivery. Moreover, the region experienced more cases of infectious diseases such
as tuberculosis and malaria. The emergence of HIV/AIDS put a further strain on the
health care system, which was already squeezed by the decrease in public spending
[MHHDC ����].
The Demographic Response
Here I focus on demographic responses to structural-adjustment programs in Azerbaijan
because comparable data for other countries were unavailable at the time I prepared this
report. Economic hardships triggered various demographic responses to meet the
challenges stemming from structural-adjustment programs in Azerbaijan. These include:
declining fertility, a declining marriage rate, and an increasing divorce rate and net
exodus of population. The total fertility rate declined from ��� children per woman in
���� to ��� in ����. The proportion of women who had never married rose by � percent,
from �� percent in ���� to � percent in ����. The mean age at marriage for females
increased by three years, from ��� years in ���� to ��� years in ����. Reduced job
opportunities, created by the closure of unprofitable government enterprises and low
domestic wages, encouraged young, qualified persons to seek employment outside the
country. The annual net flow of emigrants from Azerbaijan grew by ��� percent, from
��,��� persons per year during the ������� decade to ������ persons per year during
������� [UNFPA ����: ����].
Conclusion
Evidence from various countries in Central, South, and East Asia with different economic
histories and at different stages of economic liberalization indicates that globalization, in
particular structural-adjustment and market-liberalization programs such as the privati-
zation of state enterprises, retrenchment of workers, and cutbacks in public expenditures
on the social sector, have exacerbated poverty and inequality and have negatively
affected health and education outcomes, at least during the transition period. So far
globalization has not helped these Asian countries to break free of the vicious cycle of
poverty, unemployment, illiteracy, and poor health. Instead, market liberalization and
reductions in public investment in social services have intensified the plight of the poor
and exacerbated income polarization. In order for the poor to benefit from market-driven
development in an increasingly integrated world economy, there is a critical need to
Does Globalization Adversely Affect Population and Poverty?
415
bolster the capacity of national and international institutions to provide inclusive social
safety nets, investments in human capital, reductions in economic volatility, and the
management of global public goods.
References
Breman, Anna; and Shelton, Carolyn. ����. Structural Adjustment and Health: A Literature Reviewof the Debate, Its Role-players and Presented Empirical Evidence. Paper No. WG � : � (draft fordiscussion only). Geneva, WHO: Commission on Macroeconomics and Health.
Mahbubul Haq Human Development Center (MHHDC). ����. Human Development in South Asia,2001. Karachi: Oxford University Press.
South Asia Multidisciplinary Advisory Team (SAAT). ����. Privatization in South Asia: MinimizingNegative Social Affects through Restructuring. New Delhi: International Labour Organization.
United Nations Children’s Fund (UNICEF), Regional Office for South Asia. ����a. EconomicLiberalization and the Situation of Children and Women in South Asia: An Initial Assessment.Kathmandu.
����. ����b. Liberalization, Globalization and Their Social Impacts: Background and Asian Perspec-tives. An Annotated Bibliography, Report No. ��, Kathmandu.
United Nations Population Fund (UNFPA), Country Support Team for Central and South Asia. ����.Population and Reproductive Health Country Profiles [for Central Asia]. Kathmandu.
������� ��� ��
416

Related Documents