1 A.4 Evaluation of Distortion and Residual Stresses during Heat Treatment of Aluminum Alloys Report 09-1 Research Team: Makhlouf M. Makhlouf, Professor (508) 831 5647 [email protected] Chang-Kai Wu (Lance), M.S. Student (508) 831 6157 [email protected] Focus Group Members: Geoffrey Sigworth Fred Major Andrew Borland Ray Donahue Paul Crepreau (Qigui Wang) PROJECT STATEMENT Objectives The objective of this project is to develop and verify a computer simulation software and strategy that enables the prediction of the effects of heat treatment on cast aluminum alloy components. The simulation should accurately predict dimensional changes and distortion, and residual stresses. Strategy The project is divided into three major tasks as follows: Task 1 aims to develop the data necessary for the model. Task 2 aims to model the heat treatment response of a cast aluminum alloy component. Task 3 aims to verify the model predictions against measured data. PROJECT TASKS Task 1: Generate Input Data for the Model Sub-Task 1.1: Determine the heat transfer coefficient Probes are machined from cast A356 alloy in order to use them in measuring the heat transfer coefficient during quenching. The probes are quenched in the CHTE quenching system, and the heat transfer coefficient is calculated from the time temperature data. Heat transfer coefficients for different quenching velocities are generated. Surface roughness measurements were

Welcome message from author
This document is posted to help you gain knowledge. Please leave a comment to let me know what you think about it! Share it to your friends and learn new things together.
Transcript

1
A.4 Evaluation of Distortion and Residual Stresses during Heat Treatment of Aluminum Alloys
Report 09-1
Research Team: Makhlouf M. Makhlouf, Professor (508) 831 5647 [email protected] Chang-Kai Wu (Lance), M.S. Student (508) 831 6157 [email protected] Focus Group Members: Geoffrey Sigworth Fred Major Andrew Borland Ray Donahue Paul Crepreau (Qigui Wang)
PROJECT STATEMENT
Objectives
The objective of this project is to develop and verify a computer simulation software and strategy that enables the prediction of the effects of heat treatment on cast aluminum alloy components. The simulation should accurately predict dimensional changes and distortion, and residual stresses.
Strategy
The project is divided into three major tasks as follows:
Task 1 aims to develop the data necessary for the model. Task 2 aims to model the heat treatment response of a cast aluminum alloy component. Task 3 aims to verify the model predictions against measured data.
PROJECT TASKS
Task 1: Generate Input Data for the Model
Sub-Task 1.1: Determine the heat transfer coefficient
Probes are machined from cast A356 alloy in order to use them in measuring the heat transfer coefficient during quenching.
The probes are quenched in the CHTE quenching system, and the heat transfer coefficient is calculated from the time temperature data. Heat transfer coefficients for different quenching velocities are generated. Surface roughness measurements were

2
performed on the probes and the modeled part to ensure that both had the same surface roughness.
1 Cast A356 parts Machine the quench probes Measure the surface roughness of probes and cast components Perform quenching experiments Calculate heat transfer coefficients
Sub-Task 1.2: Measure the room temperature supersaturated mechanical properties of the alloy
The supersaturated mechanical properties of the alloy were measured at room temperature for three different strain rates. Solutionized and quenched ASTM standard specimens were used. Measurements were performed on an Instron Universal Testing machine.
Equipment setup Perform room temperature measurements
Sub-Task 1.3: Obtain the elevated temperature supersaturated mechanical properties of the alloy
The supersaturated mechanical properties of the alloy were obtained at a series of temperatures from [10, 11].
Subtask 1.4: Obtain the temperature-dependent physical properties of the alloy
Much of the thermal data for A356 alloy may be obtained by JMat Pro Software.
Task 2: Model the Response of a Cast Aluminum Alloy Component
Sub-Task 2.1: Design and manufacture the test component
Design the part Manufacture the part
Sub-Task 2.2: Model the heat treatment process
A quenching simulation is performed using the ABAQUS model and depicting the heat treatment behavior of the part. The simulation results are compared to measured distortion and residual stresses in the part caused by heat treatment.
Preliminary modeling (learning curve)
1 ≡ Performed work

3
Mesh development Heat transfer simulations (user-subroutine development) Thermal-stress simulations
Task 3: Verify the Model Predictions
Measurements were performed on the cast parts in order to characterize the effect of heat treatment.
Measure distortion and dimensional changes Measure residual stresses
ACHIEVEMENTS TO DATE
– See Appendix A
– One paper has been submitted for the TMS 2009 Annual Meeting. The title is “Prediction of Residual Stresses Caused by Heat Treating Cast Aluminum Alloy”.
CHANGES IN PROJECT STATEMENT
None
WORK PLANNED BEFORE THE NEXT ACRC MEETING
None
PROJECT DELIVERABLES
The deliverable from the project is a tested and validated software and strategy for predicting the effect of heat treatment on the characteristics of cast aluminum alloy components.
An equally important deliverable from the project is an assessment of the significance of metallurgical effects, e.g. solution and precipitation of alloying elements, on distortion and residual stresses in components cast from commercial Al-Si alloys.
PROJECT SCHEDULE
The project is completed and a final report is attached as Appendix A.

4
APPENDIX A
Final Report

5

6
ABSTRACT
The objective of this research was to develop and verify a mathematical model that
enables the prediction of the effects of heat treatment on cast aluminum alloy
components. The model, which uses the commercially available software (ABAQUS),
predicts dimensional changes, distortion, and residual stresses in heat treated
components.
An extensive database is developed for an example aluminum alloy (A356) and
includes the mechanical, physical, and thermal properties of the alloy all as functions
of temperature. The database is obtained through calculations and measurements
made on A356 alloy specimens. In addition, boundary conditions – in the form of heat
transfer coefficients for each of the heat treatment steps - are obtained from
measurements performed with a special quenching system developed at the Center for
Heat Treating Excellence at WPI.
The database and boundary conditions were used in the software to predict the
dimensional changes, distortions, and residual stresses that develop in a commercial
A356 cast component that is subjected to a standard commercial heat treating cycle.
In order to verify the accuracy of the software predictions, the predictions were
compared to their measured counterparts, where dimensional changes and distortion
were measured with a coordinate measuring machine, and residual stresses were
measured with x-ray diffraction.

7
TABLE OF CONTENTS
ABSTRACT...................................................................................................................6
ACKNOWLEDGEMENTS.........................................Error! Bookmark not defined.
1. Introduction................................................................................................................7
2. Methodology ............................................................................................................10
Selection of the Programming Code ....................................................................10
1. Thermal Analysis Module......................................................................11
2. Stress Analysis Module..........................................................................13
3. Materials and Procedures.........................................................................................14
Materials ..............................................................................................................14
Generation of Physical Properties........................................................................17
Measurement of the Quenching Heat Transfer Coefficient.........................18
Measurement of Surface Roughness............................................................23
Generation of Mechanical Properties...................................................................25
4. Model Construction .................................................................................................28
The Modeled Part.................................................................................................28
Mesh Development ..............................................................................................29
5. Computer Simulations .....................................................................................35
The Thermal Module ...........................................................................................35
The Stress Module ...............................................................................................39
5. Verification of the Model Predictions......................................................................42
Measurement of Residual Stresses.......................................................................42
Measurement of Dimensional Changes and Distortion .......................................47
6. Summary and Conclusions ......................................................................................52
7. References................................................................................................................54

5
LIST OF FIGURES
Figure 1. Solution procedures for the ABAQUS model. ........................................ 11
Figure 2. Cast A356.2 standard tensile bar. ............................................................ 15
Figure 3. Microstructure of as-cast A356 alloy. ..................................................... 16
Figure 4. Microstructure of solutionized A356 alloy.............................................. 16
Figure 5. Calculated thermal conductivity as a function of temperature. ............... 18
Figure 6. Quenching probe system. ........................................................................ 20
Figure 7.Quench probe-coupling-connecting rod assembly. .................................. 20
Figure 8. Measured cooling curves for A 356 alloy. .............................................. 22
Figure 9. Calculated cooling rate vs. temperature for A356 alloy.......................... 22
Figure 10. Calculated quenching heat transfer coefficient curves for A356 alloy. 23
Figure 11.Measured surface roughness for (a) the cast part, and (b) the probe...... 24
Figure 12. Surface roughness comparison for A 356 alloy. ................................... 24
Figure 13. True stress-strain curves for water-quenched and slow-cooled samples at
strain rates = 0.0083/s, 0.00083/s and 0.000083/s. ......................................... 26
Figure 14. True stress-strain curves for supersaturated alloy at elevated temperature
for strain rates = 0.001/s and 0.1/s. [10] ......................................................... 27
Figure 15: The modeled part................................................................................... 28
Figure 16. Large mesh. ........................................................................................... 30
Figure 17. Medium mesh. ....................................................................................... 30
Figure 18. Small mesh ............................................................................................ 31
Figure 19. Location of node selected for mesh development. ................................ 32
Figure 20. Cooling curves at the selected point obtained by simulation with
different mesh densities. ................................................................................. 32
Figure 21. Cooling rates at the selected node obtained by simulation with different
mesh densities. ................................................................................................ 33
Figure 22. Computational time for the different mesh densities. ........................... 33
Figure 23. Refined mesh. ........................................................................................ 34
Figure 24. Schematic representation of the directions in which the parts were
quenched. ........................................................................................................ 35

6
Figure 25. Thermal prediction for vertical quenching after immersion step. ......... 38
Figure 26. Thermal prediction for horizontal quenching after immersion step...... 38
Figure 27. Thermal-stress prediction for vertical quenching after quenching step. 40
Figure 28. Thermal-stress prediction for vertical quenching after quenching step. 40
Figure 29. Thermal-stress prediction for horizontal quenching after quenching step.
......................................................................................................................... 41
Figure 30. Thermal-stress prediction for horizontal quenching after quenching step.
......................................................................................................................... 41
Figure 31. Picture of the cast part. .......................................................................... 42
Figure 32. A schematic representation of a surface under plain stress. [14] .......... 44
Figure 33. Diffractometer and location on the part where residual stresses were
measured. ........................................................................................................ 45
Figure 34. Diffraction pattern showing the angular range selected. ....................... 45
Figure 35. Change in d-spacing with sin2ψ for the vertically quenched part. ........ 46
Figure 36. Change in d-spacing with sin2ψ for the horizontally quenched part. ... 46
Figure 37. Measured vs. Predicted residual stresses in MPa. ................................. 47
Figure 38. The path of CMM measurements. ......................................................... 48
Figure 39. Measurements of the inner hole of the part (vertical quenching) for (a)
CMM measurement vs. model prediction, (b) model prediction in different
units................................................................................................................. 49
Figure 40. True stress-strain curves for supersaturated and naturally aged A356
alloy................................................................................................................. 51
LIST OF TABLES
Table 1: Composition of A356.2 ............................................................................................ 14
Table 2. Data generated by JMatPro Software. ...................................................................... 17

7
1. Introduction
The mechanical properties of aluminum alloy castings can be greatly improved by a
precipitation hardening heat treatment. Typically, this heat treatment consists of three steps:
(1) solutionizing, (2) quenching, and (3) aging; and is performed by first heating the casting
to and maintaining it at a temperature that is a few degrees lower than the solidus temperature
of the alloy in order to form a single-phase solid solution. The casting is then rapidly
quenched in a cold (or warm) fluid in order to form a supersaturated non-equilibrium solid
solution. The casting is then aged by reheating it to a temperature that allows the controlled
nucleation and growth of strengthening precipitate(s) to occur thereby increasing the alloy’s
yield strength [1].
Aluminum alloy cast components experience considerable changes during heat treatment.
These include changes in mechanical properties, in dimensions, in magnitude and sense of
residual stresses, and in metallurgical phase composition. Residual stresses often adversely
affect the mechanical properties of the cast component. They are caused by differing rates of
cooling during quenching and depend on the differential rate of cooling, section thickness,
and material strength. In addition to the completely reversible changes that are caused by
thermal expansion and contraction, metallic components experience permanent dimensional
changes during heat treatment. These permanent changes can be classified into three main
groups based on their origin. These are (1) Dimensional changes with mechanical origins
which include dimensional changes caused by stresses developed by external forces,

8
dimensional changes arising from thermally induced stresses, and dimensional changes
caused by relaxation of residual stresses. (2) Dimensional changes due to quenching which
are dimensional changes that occur during quenching or that result from stresses induced by
quenching. (3) Dimensional changes with metallurgical origins which include dimensional
changes caused by re-crystallization, solution and precipitation of alloying elements, and
phase transformations.
Since most of the quality assurances criteria that cast components have to meet include
prescribed minimum mechanical properties and compliance with dimensional tolerances, it is
necessary for casters to be able to accurately predict these changes in order to take
appropriate measures to insure the production of parts that meet the required specifications.
Satisfactory response to heat treatment is often gauged by the ability of the component to be
heat treated to a desired microstructure, hardness and strength level without undergoing
cracking, distortion or excessive dimensional changes. Most of the products manufactured
today are designed using sophisticated computer models and finite element analysis (FEA).
These models are built on sound physical concepts and mathematical equations. Several
commercially available software packages are capable of predicting the heat treatment
response of wrought steels [2, 3]. One good example is DANTE [4], a subroutine that has an
extensive material database and is used with ABAQUS2 for heat treatment and cooling
process simulations of steels. However, none of the commercially available software
packages is able to accurately predict the response of cast aluminum alloy components to
heat treatment.
2ABAQUES is marketed by Slovia, Inc. Rhode Island, USA.

9
This work focused on developing a computer model for predicting (1) residual stresses, (2)
dimensional changes that have mechanical origins. Dimensional changes that have
metallurgical origins are not addressed here and will be the subject of future work.
The objective of this work is to develop and verify a mathematical model that enables the
prediction of residual stresses caused by heat treating cast aluminum alloy components. The
model is based on the commercially available software ABAQUS. This software can perform
all the required simulations provided that the necessary material properties are made
available to it. These include thermal properties, such as the coefficient of thermal expansion,
the specific heat, etc., and mechanical properties, such as the modulus of elasticity, the yield
strength, etc., all as functions of temperature. Consequently, the first Task in the project
focused on generating the necessary database. The database was obtained by calculations and
measurements made on A356 alloy specimens using a modified Instron tensile testing
machine. In addition, boundary conditions – in the form of heat transfer coefficients for each
of the heat treatment steps - were obtained from measurements performed with a special
quenching system. Once, this was accomplished, the second Task in the project commenced
and focused on developing the model and using the software, database, and boundary
conditions to predict the response of a commercial A356 cast component to a standard
commercial heat treating cycle. In the third Task, the predicted responses were compared to
experimentally measured responses.

10
2. Methodology
Selection of the Programming Code
Among the many finite element codes that are commercially available today, ABAQUS
enables a wide range of linear and nonlinear engineering simulations to be performed
efficiently, and therefore it is widely used. Because of its popularity and its ability to perform
the required simulations accurately and efficiently, ABAQUS was selected for this project. It
is a general purpose finite element code with the capability for sequentially coupled thermal
and stress analysis to simulate solid material heat conduction/convection with general
temperature-dependent conductivity, internal energy, and radiation boundary conditions.
Moreover, ABAQUS has the special feature of allowing the user to prescribe user-defined
material properties and analysis parameters that can vary with time and/or temperature.
These user subroutines are written in the FORTRAN language and are compiled before the
model is run. For example, in this work, this aspect of ABAQUS was used in the thermal
analysis module to specify the direction and velocity of quenching and also in prescribing the
quenching heat transfer coefficient as a function of temperature.
For predicting the response of the casting to quenching, ABAQUS performs two separate
simulations in sequence. First, it performs a heat transfer analysis for quenching that
produces the temperature profile in the part as it cools down from the solutionizing
temperature. Next, it performs a mechanical simulation that calculates the evolution of

11
stresses and the final distortion in the part. In each step, different initial conditions, boundary
conditions and material properties are used. The flow chart shown in Figure 1 illustrates the
simulation procedure which involves the following simulation steps:
Figure 1. Solution procedures for the ABAQUS model.
1. Thermal Analysis Module
Heat transfer across the metal/fluid interface is a most significant aspect of the heat treatment
processes because it controls the cooling rate which in turn determines the distribution and

12
severity of residual stress created in the casting. The heat treatment process consists of
several steps, each of which imposes different boundary conditions on the model. Pre-heat
treatment machining processes may induce residual stresses in castings. However, during
solutionizing, these stresses are removed and it is assumed that the casting enters the
quenching fluid in a stress-free condition.
Therefore, at time t=0, the casting is assumed to be at equilibrium at room temperature. It is
then homogenized at an elevated temperature for a prescribed time. After homogenization, it
is exposed to room temperature and then it is quenched. It is necessary to characterize the
heat transfer coefficient from the surfaces of the casting to the environment during these
steps.
During the process of dipping the casting into the quenching medium, the casting becomes
partially covered with the fluid, and as the casting moves deeper into the fluid, more of its
surface becomes covered with the fluid. Regions on the casting’s surface that are in the fluid
lose heat at a different rate than regions that are in the air.
Accordingly, the heat transfer coefficient must be varied on the surface of the part as it is
continuously submerged into the fluid. The rate of heat loss due to convection qc is
determined from Eq. (1):
where (1)
In Eq. (1), hw and ha are the convective heat transfer coefficients from the casting surface to
water, and from the casting surface to air, respectively. T is the surface temperature, and T∞ is
the ambient temperature. The exponent, a, has a value of zero for forced convection (in our

13
case), and a value of 0.25 for free convection.
2. Stress Analysis Module
In the thermal analysis module, the temperature is the unknown variable. In the stress
analysis module, the displacement and stress are the unknown variables. The thermal fields
affect the mechanical fields through thermal expansion and temperature-dependent material
properties. The relationship is given by Eq. (2).
(2)
In Eq. (2), α(θ) is the coefficient of thermal expansion, θ is the current temperature, θI is the
initial temperature and θ0 is the reference temperature for the expansion coefficient. At this
temperature the thermal expansion is assumed to be zero [5].
In order to perform stress analysis based on the transient temperature distribution predicted
by the thermal module it assumed that all the residual stresses that were introduced into the
casting during its manufacturing have been removed during solutionizing. An elastic-plastic
analysis is therefore performed in order to account for material yielding as the casting is
cooled from high solutionizing temperature where the mechanical properties of the alloy are
severely diminished.
The stress analysis module uses the same time increment that is used in the thermal module,
but if desired, the time increment can be refined to enhance the accuracy of the stress
analysis.

14
3. Materials and Procedures
Materials
Aluminum casting alloy A356.2 with the chemical composition shown in Table 1 was used
to develop and demonstrate the procedure for obtaining the necessary database and modeling
the response of aluminum alloy cast components to heat treatment. Because it is heat
treatable and precipitate hardenable, and because it has excellent castability, good corrosion
resistance and good machinability, this alloy is used extensively in many applications
including military and aerospace applications.
Table 1: Composition of A356.2
Si Fe Cu Ti Mg Others
7.25 0.08 0.005 0.27 0.27 < 0.002
Procedures
Aluminum A356.2 standard tensile bars similar to that shown in Figure 2 were cast in a steel
mold. The mold was preheated to 427°C (800°F) in a GECO BHT30 furnace. About 40 lbs
of A356.2 ingot were melted in a MELLEN CC12 resistance furnace and cast into the
pre-heated steel mold. A 0.2%wt of TiB (5Ti: 1B) grain refiner was added to the melt. Prior

15
to casting, the melt was degassed for about 40 minutes with a rotary impeller and Argon gas
[6, 7]. While degassing, the melt temperature was maintained at 750°C (1382°F). The melt
was poured at 800°C (1472°F).
Microstructures of as-cast and solutionized specimens taken from the tensile bars are shown
in Figure 3Figure 4, respectively. For the solutionized condition, specimens were held at
538°C (1000°F) and then rapidly quenched in room temperature water. The Si particles were
spheroidized and coarsened after this homogenization treatment.
Figure 2. Cast A356.2 standard tensile bar.

16
Figure 3. Microstructure of as-cast A356 alloy.
Figure 4. Microstructure of solutionized A356 alloy.

17
Generation of Physical Properties
The necessary database for ABAQUS contains the density specific heat and thermal
conductivity of the alloy. These properties can be generated by JMatPro software3, which is a
powerful software that calculates properties of multi component alloys. The data used in this
work is shown in Table 2. Data generated by JMatPro Software.
Table 2. Data generated by JMatPro Software.
Property Temperature: 25°C – 538°C (Linear)
Specific Heat (T) 886 – 1300 (J.Kg-1°C-1)
Density (T) 2674 – 2576 (Kg.m-3)
Expansion Coefficient (T) 21.13 – 26.2 (10-6 °C-1)
Poisson’s Ratio (T) 0.330 – 0.359
Thermal conductivity at elevated temperature was calculated from electrical resistivity
measurements and the Wiedemann-Franz law which states that the ratio of electronic
contribution to thermal conductivity (k) of a metal is proportional to temperature as shown in
Eq. (3). The calculated thermal conductivity as a function of temperature is shown in Figure
5.
3JMat Pro is marketed by Thermotech Sente Software.

18
(3)
(4)
Figure 5. Calculated thermal conductivity as a function of temperature.
Measurement of the Quenching Heat Transfer Coefficient
The quenching heat transfer coefficient is used by the thermal module in ABAQUS to
compute the heat that is transferred out of the part during quenching. The heat transfer
coefficient is measured with the apparatus shown in Figure 6 [8]. The measurement involves
quenching a heated cylindrical probe that is machined from a cast piece of A356.2 alloy and

19
equipped with a thermocouple connected to a fast data acquisition system into the quenching
medium and acquiring the temperature-time profile. The probe dimensions are chosen such
that the Biot number for the quenching process is <0.1. This insures that significant thermal
gradients will not be present in the radial direction in the probe. Accordingly, a simple heat
balance analysis (usually referred to as a lumped parameter analysis) can be performed on the
system (probe + quenching medium) to yield the heat transfer coefficient. Since the Bi < 0.1,
the error associated with the calculation of the heat transfer coefficient is less than 5%. For
this work, a small cylindrical probe with dimension of 0.374” (9.5 mm) in diameter and
1.496” (38mm) long shown schematically in Figure 7, was cast from a standard A356.2 alloy.
A hole was drilled down to the geometrical center of this probe and a thermocouple was
inserted for measuring the time-temperature data. Graphite powder was packed into the hole
before the thermocouple was inserted in order to ensure intimate contact between the probe
and the thermocouple. The probe was heated to the solutionizing temperature and held at that
temperature for 12 hours in order to ensure homogenization. Subsequently, the probe was
quenched in water that was maintained at room temperature. While quenching, the
temperature of the probe was acquired as a function of time using a fast data acquisition
system at a scan rate of 1000 scans/sec. A quench tank with two liters of water was used and
the probe was immersed completely in the water. The temperature of the water before and
after quenching remained constant at 17°C (63°F). A heat balance applied to the probe results
in Eq. (5), which was used to calculate the heat transfer coefficient at the surface of the
probe.

20
Figure 6. Quenching probe system.
Figure 7.Quench probe-coupling-connecting rod assembly.
Water

21
(5)
In Eq. (5), h is the heat transfer coefficient at the surface of the probe, ρ, V, Cp and As are the
density, volume, specific heat, and surface area of the probe, respectively. Ts is the
temperature at the surface of the probe, which, due to the geometry of the probe, is
approximately equal to the measured temperature at the center of the probe. Tf is the bulk
temperature of the quenching medium. The derivative of temperature with respect to time in
Eq. (5) is calculated from the measured temperature vs. time data.
The quenching heat transfer coefficient was measured for quenching at 2 different velocities,
namely 1,000 and 1,200 mm/s. The maximum heat transfer coefficient was found to shift to
lower temperature as the quenching velocity increased. The reason for this behavior is not
clear. The measured cooling curves are shown in Figure 8, and the calculated cooling rate
vs. temperature at different quench velocities are shown in Figure 9. The quenching heat
transfer coefficients for the different quenching velocities are shown in Figure 10.

22
Figure 8. Measured cooling curves for A 356 alloy.
Figure 9. Calculated cooling rate vs. temperature for A356 alloy.

23
Figure 10. Calculated quenching heat transfer coefficient curves for A356 alloy.
Measurement of Surface Roughness
In order to guarantee a similar surface micro-profile for the quenching probe and the modeled
component, surface roughness measurements were performed on the quenching probes and
the part to be modeled. Measurements were made with a UBM Laser Microscope4 and the
results are shown in Figure 11Figure 12. Surface roughness measurements show that the
superficial roughness is 0.501 µm Sa (mean superficial micro-profile amplitude) for the part
and 0.398 µm Sa for the quenching probe. Muojekwu, et al. [9] have shown that such
difference in surface roughness has negligible effect on the magnitude of the quenching heat
transfer coefficient.
4 Received from Solarius Development Inc.

24
(a) (b)
Figure 11.Measured surface roughness for (a) the cast part, and (b) the probe.
Figure 12. Surface roughness comparison for A 356 alloy.
Sa=0.398µmSq=0.496µmSp=1.9µmSv=1.5µmSt=3.4µmSsk=0.187 Sku=2.79 Sz=2.36µm
Sa=0.501µmSq=0.711µmSp=2.2µmSv=4.1µmSt=6.3µmSsk=-1.39 Sku=7.31 Sz=5.36µm

25
Generation of Mechanical Properties
The required mechanical properties are the Young’s modulus, Poisson’s ratio and the
stress-strain curve (including working hardening) over the entire heat treatment temperature
range. Stress-strain curves are obtained by measurements. This information is needed by the
stress analysis module to compute the stresses that develop in the part during heat treatment.
The thermal-stress and distortion develop in the first few seconds after quenching, while the
material is still a supersaturated solid solution, and before any precipitation has occurred.
Therefore, the properties of the supersaturated solid solution must be used. In order to
demonstrate the difference between the mechanical properties of the supersaturated solid
solution and the equilibrium casting, the following were used in tensile tests: (1) Specimens
that were solutionized at 538°C (1000°F) and then rapidly quenched in room temperature
water, and (2) Specimens that were solutionized at 538°C (1000°F) and then furnace-cooled
to room temperature.
An Instron universal testing machine5 was used for measuring the room temperature
mechanical properties. The elastic modulus, yield stress, and plastic strain of the alloy were
calculated from these measurements. Sufficient measurements were made in order to obtain
accurate representation of these properties. The resulting room temperature stress-strain
curves under several strain rates are shown in Figure 13. Water quenched tensile bars show
higher ultimate tensile stress and yield stress, and lower Elastic modulus. The Figure shows
that the yield strength of this alloy increases as the strain rate decreases.
5 Instron Worldwide Headquarters, 825 University Ave, Norwood, MA 02062-2643, USA

26
The mechanical properties of A356 alloy at elevated temperature were obtained from Maijer,
et al. [10]. These measurements were performed on samples that were previously heated and
quenched. The samples were re-heated in a Gleeble to 540°C (1004°F) for 30 seconds in
order to create a supersaturated solid solution, and then they were cooled at a rate of 5°C /s
by water cooled platens. Measurements were performed when the desired temperature was
attained. The stress-strain curves are shown in Figure 14. The Figure shows that above 300°C
(572°F), the strength increases as the strain rate increases. However, below 300°C (572°F),
the opposite is true and the strength decreases as the strain rate increases. This may be
because Mg-Si particles form in this temperature range and affect the strength of the alloy.
[11, 12]
Figure 13. True stress-strain curves for water-quenched and slow-cooled samples at strain
rates = 0.0083/s, 0.00083/s and 0.000083/s.
Tru
e St
ress
(MPa
)
True Strain (%)

27
Figure 14. True stress-strain curves for supersaturated alloy at elevated temperature for strain
rates = 0.001/s and 0.1/s. [10]

28
4. Model Construction
The Modeled Part
The part shown in Figure 15 was chosen to demonstrate the model and verify the accuracy of
its prediction. This design contains both thick and thin wall sections, and its symmetrical
shape reduces both quenching and measuring difficulties. The distortion and residual stresses
are expected to be concentrated in the thin wall section.
Figure 15: The modeled part6.
6 Courtesy of Montupet S.A., 60180 Nogent Sur Oise, France.

29
Mesh Development
The part geometry shown in Figure 15 was meshed by the ABAQUS pre-processor. Three
different mesh sizes were used: large, medium, and small. All three meshes were generated
with built-in curvature control and a deviation factor as shown in Figure 16Figure 17 Figure
18. The sensitivity of the simulation to the nodal spacing is an important aspect of any
numerical simulation and the results of the finite element simulation will depend on the
design of the mesh. In general, as the spacing between nodes is made smaller, the solution
becomes more accurate. However, this increase in accuracy will be accompanied by a
substantial increase in computing time. Therefore, the mesh must to be small enough to
produce reasonable values for the force and displacement, but large enough to perform the
calculation in acceptable time. The heat transfer module was used to assess the effect of mesh
density on model predictions. Specifically, quenching the part vertically with a velocity of
1000 mm/s was modeled using the three mesh sizes.

30
Figure 16. Large mesh.
Figure 17. Medium mesh.

31
Figure 18. Small mesh
The results are shown for the node marked in red in Figure 19 because this node is the most
sensitive node to mesh refinement since it is located in the thickest section of the part. The
model-predicted cooling curves at this point are presented in Figure 20 and the cooling rates
during quenching are shown in Figure 21. The maximum temperature at the highest cooling
rate as predicted by the large mesh is 271.4℃(520°F), the medium mesh predicted 291.9℃
(557°F) and the small mesh predicted 295.5℃ (564°F). The difference in maximum cooling
rate as predicted by the small and large meshes is 1.76% and the difference in maximum
cooling rate as predicted by the small and medium meshes is less than 0.289 %. Figure 22
shows the computing time for the three simulations. It is believed that the medium mesh
provides a good balance between prediction accuracy and computing time. With the medium
mesh the geometry contains 11,835 hexahedral elements and 14,510 nodes.

32
Figure 19. Location of node selected for mesh development.
Figure 20. Cooling curves at the selected point obtained by simulation with different mesh
densities.

33
Figure 21. Cooling rates at the selected node obtained by simulation with different mesh
densities.
Figure 22. Computational time for the different mesh densities.

34
Because the thinner sections of the geometry are more sensitive than the thicker sections to
temperature and stress, the graded mesh geometry, which is shown in Figure 23 and is based
on the medium mesh, was used. In this mesh design, the mesh density is increased in the thin
sections of the geometry. The DC3D8 element is used in the heat transfer simulation. This is
an eight-node continuum-diffusive linear three dimensional brick element. On the other hand,
the C3D8R element is used in the stress module. This is an eight-node linear reduced
integration three dimensional brick continuum element with hourglass control.
Figure 23. Refined mesh.

35
5. Computer Simulations
The Thermal Module
As shown schematically in Figure 24, two heat transfer simulations were performed on the
meshed geometry. In the first simulation, the part is vertically quenched into the water tank.
In the second simulation, the part is horizontally quenched into the water tank.
Figure 24. Schematic representation of the directions in which the parts were quenched.

36
The following sequence was used to model the heat treatment of the part: Furnace heating to
538°C (1000°F), followed by a dwell in room temperature air for 6 seconds, followed by
immersion into the quench tank with a velocity of 1000 mm/s, followed by quenching in
water to room temperature. The initial conditions used for the thermal module included the
temperature of the part before heat-treating (room temperature in this case), and the mode of
heat treatment. The boundary conditions used to represent each of the steps of the heat
treatment process were as follows:
− For the furnace-heating step: A convective boundary condition was used at all surfaces of
the part by providing the rough heat transfer coefficient (50 W/m2)for heating the part in
the furnace up to the homogenization temperature of 538°C (1000°F).
− For the dwell step: A convective boundary condition was used at all surfaces of the part
by providing the air heat transfer coefficient (200 W/m2). The ambient temperature was
room temperature.
− For the immersion step: The direction and velocity of immersing the part into the quench
tank were defined. This step is important in order to capture the temperature gradient
along the immersion length of the part. In this demonstration, the part was immersed
along (1) its length and (2) its thickness with a velocity of 1000 mm/s, and the process
time for this step was 0.128 second for the vertical quenching and 0.018 second for the
horizontal quenching. A convective boundary condition at all surfaces of the part was
used by providing either the measured heat transfer coefficient for quenching the part in
water or air heat transfer coefficient, depending on node location at processing time. This
feature was specified via a user-developed subroutine.

37
− For the quenching step: A convective boundary condition at all surfaces of the part was
used also by providing the measured heat transfer coefficient for quenching the part in
water from the inherited temperature down to room temperature.
Vertical Immersion – In this simulation, the time for complete immersion is 0.128 s and this
time span resulted in a maximum temperature difference of 18.7°C (65.7°F) between the
bottom surface of the part (the surface that contacted the water first) and the top surface of
the part (the surface that contacted the water last). The resulting temperature distribution is
shown in
Figure 25.
Horizontal Immersion – In this simulation, the time for complete immersion is 0.018542 s
and this time span resulted in a maximum temperature difference of 16°C (60.8°F) between
the bottom surface of the part and the top surface of the part. This is a more uniform
temperature distribution, compared to the other quenching direction. The resulting
temperature distribution is shown in Figure 26.

38
Figure 25. Thermal prediction for vertical quenching after immersion step.
Figure 26. Thermal prediction for horizontal quenching after immersion step.

39
The Stress Module
The stress module calculates the residual stresses and distortion cause by the quench process.
The analysis begins with the part in a stress-free state. However, if a known initial stress state
existed, the appropriate values could be used. The deformation and stress developed in the
casting during quenching depends on the rate of quenching. Therefore, the transient
temperature history at each node during heat treatment is obtained from the heat transfer
analysis. The finite element mesh and time increment which are used in the thermal module
must be used in the stress module.
Nodal constraints are required in order to prevent rigid body displacement and rotation. This
requirement applies to all the process steps, and is defined in the model input file. Referring
to the 3-D geometry, 3 nodes at the center of the top face were constrained from moving. The
quench-induced deformation and the quench-induced residual stress for both quenching
directions are shown in
Figure 27Figure 29, respectively. For better visualization, the distortion results are shown
magnified in Figure 28 and Figure 30.

40
Figure 27. Thermal-stress prediction for vertical quenching after quenching step.
Figure 28. Thermal-stress prediction for vertical quenching after quenching step.

41
Figure 29. Thermal-stress prediction for horizontal quenching after quenching step.
Figure 30. Thermal-stress prediction for horizontal quenching after quenching step.

42
5. Verification of the Model Predictions
The model predictions were verified by comparing them to measurements of corresponding parameters for parts made using processing conditions similar to those used in the simulation. The capabilities of the model are demonstrated using the part shown in Figure 317. The castings were heat treated following the same procedure used in the
simulation. Several repetitions were made for both vertical quenching and horizontal
quenching in order ensure that the measurements are statistically valid.
Figure 31. Picture of the cast part.
Measurement of Residual Stresses
The standard x-ray diffraction method for measuring residual stresses in metallic components
7 Courtesy of Montupet S.A., 60180 Nogent Sur Oise, France.

43
was used. In this method, line shifts due to a uniform strain in the component are measured
and then the stresses in the component are determined by a calculation involving the elastic
constants of the material. Figure 32 is a schematic representation of a surface under a plain
stress condition. By knowing the strain free inter planar spacing d and do, the modulus of
elasticity in a specific crystal direction, E, and Poisson’s ratio in that crystal direction, ν, the
two components of the biaxial principle stress can be obtained from Eq. (6) [13-15].
(6)
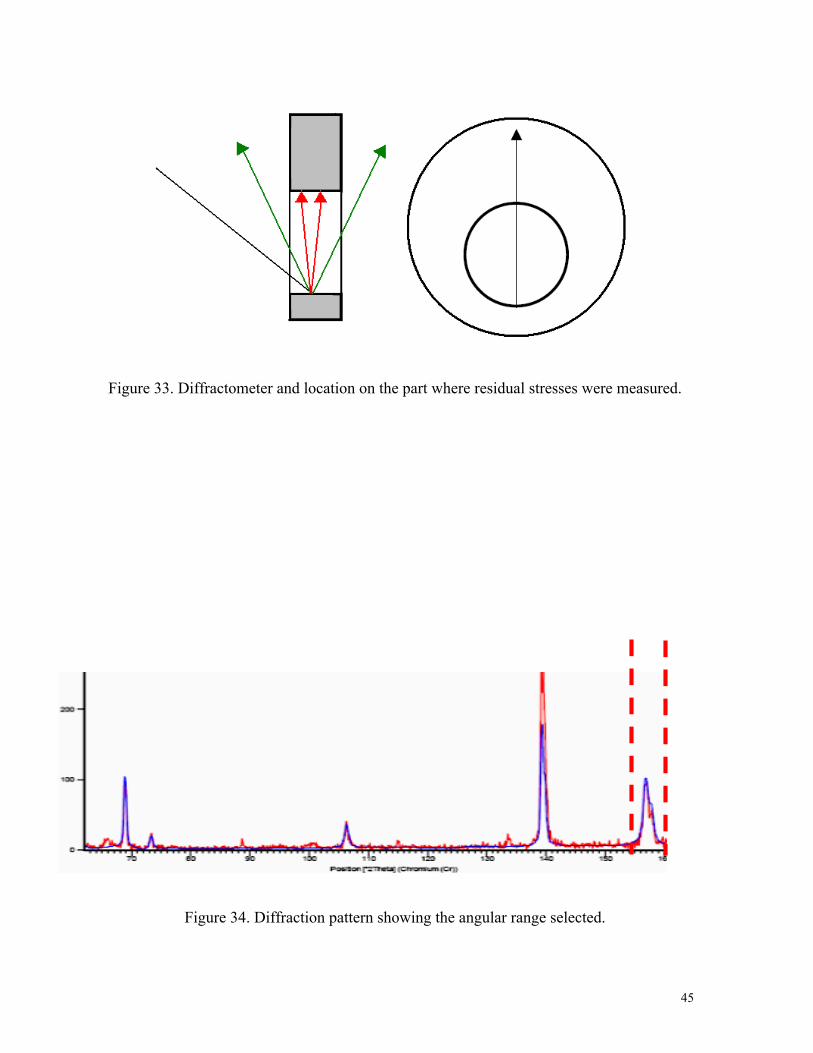
Measurements were made in an x-ray diffractometer equipped with a stress analysis module8.
The residual stresses were measured at the inner face of the hole in the thinnest section since
this location is expected to have the highest magnitude of residual stress. The part is
measured at the inside round surface where the maximum residual stresses occur. This
restricts the X-ray beam path as shown in Figure 33. The upper part of the ring will block
some of the X-ray beam diffraction angles. Similarly, due to restrictions imposed by the part
geometry, bi-axial stress analysis is difficult. Therefore, uni-axial residual stresses analysis is
applied, which is the standard method for measuring large samples [15]. Figure 34 shows the
peak (~157°) and angular range that was used for residual stresses analysis.
Residual stress measurements on vertically and horizontally quenched parts are shown in
Figure 35 Figure 36. A comparison between the measured and model- predicted magnitude
of residual stress in the part is shown in Figure 37. It is clear that there is very good
8 Model X’Pert Pro Diffractometer manufactured by PANalytical, Inc., Natick, MA, USA.

44
agreement between the measured and the model-predicted residual stresses and that
quenching the part vertically creates more residual stresses in the part than quenching it
horizontally. The residual stress measurements at maximum location are well matched to
x-ray measurements. The accuracy is 94.2% for the vertically quenched part and 99% for the
horizontally quenched part.
Figure 32. A schematic representation of a surface under plain stress. [14]
45
Figure 33. Diffractometer and location on the part where residual stresses were measured.
Figure 34. Diffraction pattern showing the angular range selected.

46
Figure 35. Change in d-spacing with sin2ψ for the vertically quenched part.
Figure 36. Change in d-spacing with sin2ψ for the horizontally quenched part.

47
Figure 37. Measured vs. Predicted residual stresses in MPa.
Measurement of Dimensional Changes and Distortion
A Starrett coordinate measuring machine (CMM) was used to measure the dimensional
changes and distortion caused by the heat treatment process. Sufficient measurements were
made in order to obtain accurate representation of the part before and after heat treatment. In
order to characterize the amount of distortion in the parts after heat treatment, a fixture was
made to hold the rings at the same location in the CMM. The fixture was made out of an
aluminum block with standard pins that fit the holes in the part to hold it in a vertical position
with the thinnest section of the part pointing up. The middle circular hole is measured before
and after heat treatment at locations around the periphery in 10° increments, started from the
thickest section, as shown in Figure 38.

48
The CMM measurements were converted into a plot of angular radius change. Measured and
model-predicted results are shown in Figure 39. There is good agreement between the
measured and model-predicted distortion profiles. However, there is significant discrepancy
in the magnitude of the distortion. Better temperature-dependent mechanical properties data
is needed in order to improve the ability of the model to predict the magnitude of the
distortion.
Figure 38. The path of CMM measurements.

49
(a)
(b)
Figure 39. Measurements of the inner hole of the part (vertical quenching) for (a) CMM
measurement vs. model prediction, (b) model prediction in different units.

50
The distortion measurements show that the model correctly predicts the location where the
maximum distortion occurs, but the predicted distortion is consistently lower in magnitude
than the measured distortion.
The in predicting the magnitude of distortion is attributed to the inaccuracy of the mechanical
properties used in the stress module. It is believed that the tensile test bars used to measure
the room and elevated temperature mechanical properties naturally aged during the
measurements. This was particularly true in measurements performed at low strain rates and
resulted in incorrect (higher) strength values for the supersaturated solid solution. It has been
shown [16, 17] that independent self-clusters of Mg and Si atoms form in A356 alloy when it
is held even for a relatively short time in the temperature range between -30℃ (-22°F) and
70℃ (158°F). The formation of these clusters is accompanied by an increase in hardness
(VHN) from 53 to 68 after 1 hour of natural aging [18].
In order to further prove this concept, two specimens were tested: (1) One specimen was
tested right after it was quenched, and (2) one specimen that was tested after being kept at
room temperature for four hours after quenching. The results are shown in Figure 40. It is
important to notice that the quenched A356 alloy is highly unstable and easily forms
precipitates, even when held at room temperature. This experiment illustrates how easily
supersaturated A356 alloy could naturally age. More accurate model predictions of
deformation are believed to be attainable with a data base that accurately reflects the
mechanical properties of the supersaturated alloy without natural aging effects.

51
Figure 40. True stress-strain curves for supersaturated and naturally aged A356 alloy.

52
6. Summary and Conclusions
• A finite element model has been developed based on the commercially available software,
ABAQUS (version 6.7.1) to predict the response of aluminum alloy castings to heat
treatment. The model predicts the magnitude and sense of residual stresses and the
magnitude and profile of distortion caused by the quenching step.
• The model was used to simulate the response of a commercially produced part to the
standard T6 heat treatment. Residual stresses and distortion were measured on heat
treated parts and compared to the computer predictions. Residual stress was measured
with the standard x-ray method and distortion was measured with a coordinate measuring
machine.
• The subroutine specially developed for this work allows the user of the model to define
the quenching direction and quenching velocity.
• It was found that:
– The predicted residual stresses are in good agreement with measurements.
– Although the model correctly predicts the location of maximum distortion,
predicted distortion magnitudes are significantly lower than the measured
ones. It is believed that improved predictions are possible with a more

53
accurate mechanical properties data base.

54
7. References
[1] Emadi D, Whiting, L.V., Sahoo, M., Sokolowski, J.H., Burke, P., and Hart, M. Optimal heat
treatment of A356.2 alloy. Light Metals 2003:983.
[2] D.J. Bammann MLC, and G.C. Johnson. Modeling Large Deformation and Failure in
Manufacturing Processes. Proceedings of the Nineteenth International Congress on Theoretical
and Applied Mechanics 1996:359.
[3] Virendra S. Warke JY, Mohamed Maniruzzaman, Makhlouf M. Makhlouf, and Richard D.
Sisson, Jr. Modeling the Heat Treatment of Powder Metallurgy Steels. Proceedings of the 2004
International Conference On Powder Metallurgy and Particulate Materials, part-1,. Chicago,
IL, 2004. p.39.
[4] DANTE users mannual. Deformation Control Technology, Inc., 2003.
[5] Hibbitn KaS, Inc. Heat Transfer and Thermal-Stress Analysis with ABAQUS Training.
2002.
[6] V. S. Warke GTaMMM. Mathematical Modeling and Computer Simulation of Molten
Metal Cleansing by the Rotating Impeller Degasser: Part I. Fluid Flow. J. Mater.
Process. Tech. 2005;168:112.
[7] V.S. Warke SS, and M.M. Makhlouf. Mathematical Modeling and Computer
Simulation of Molten Metal Cleansing by the Rotating Impeller Degasser: Part II.
Removal of Hydrogen Gas and Solid Particles. J. Mater. Process. Tech. 2005. ;vol.
168:pp. 119.
[8] M. Maniruzzaman JCC, C. McGee, S. Ma and R.D. Sisson, Jr. CHTE Quench Probe System

55
- a new quenchant characterization system. the 5th International Conference on
Frontiers of Design and Manufacturing, ICFDM. Dalian, China, 2002
[9] C.A. Muojekwu IVSaJKB. Casting-chill Interface Heat Transfer during Solidification of an
Aluminum Alloy. Metall. Mater. Trans 1995;26:361.
[10] C.M. Estey SLC, D.M. Maijer & C. Hermesmann. Constitutive Behavior of A356
During The Quenching Operation. Mater. Sci. Eng 2004;A 383:245.
[11] Meckin UFKaH. Physics and Phenomenology of Strain. Hardening: The FCC Case.
Prog. Mater. Sci. 2003;48:171.
[12] P. Li DMM, T.C. Lindley, and P.D. Lee. Simulating the Residual Stress in an A356
Automotive Wheel and its Impact on Fatigue Life. Metallurgical and Materials
Transactions B 2007;38A:505.
[13] Stock BDCaSR. Elements of X-Ray Diffraction: Princeton Hall Publications, 2004.
[14] Prevey PS. A method of Determining Elastic Constants in Selected Crystallographic direction
for X-Ray diffraction residual stress measurement. Advances in X-Ray Analysis 1977;20:345.
[15] Guley V. Residual stress and retained austenite X-Ray diffraction measurements on ball
bearings. PANalytical Co., 2003.
[16] C.D. Marioara SJA, J. Jansen and H. W. Zandbergen. The influence of temperature and
storage time at RT on nucleation of the β" phase in a 6082 Al-Mg-Si alloy. Acta
Materialia 2003;51:789.
[17] G. A. Edwards KS, G. L. Dunlp and M. J. Couper. The precipitation sequences in
Al-Mg-Si alloys. Acta Materialia 1998;46:3983.
[18] H. Moller GG, W. E. Stumpf Investigation of the T4 and T6 Heat Treatment Cycles
of Semi-Solid Processed Aluminium Alloy A356 The Open Materials Science Journal

56
2008;2:11.
Related Documents