A3: Contaminant Reduction, Life Cycle Impacts, and Life Cycle Costs of Ion Exchange Treatment and Regeneration Treavor Boyer and Alysse Ness, University of Florida Jane Zhang, University of South Florida

Welcome message from author
This document is posted to help you gain knowledge. Please leave a comment to let me know what you think about it! Share it to your friends and learn new things together.
Transcript
A3: Contaminant Reduction, Life Cycle Impacts, and Life Cycle Costs of Ion
Exchange Treatment and Regeneration Treavor Boyer and Alysse Ness, University of Florida
Jane Zhang, University of South Florida
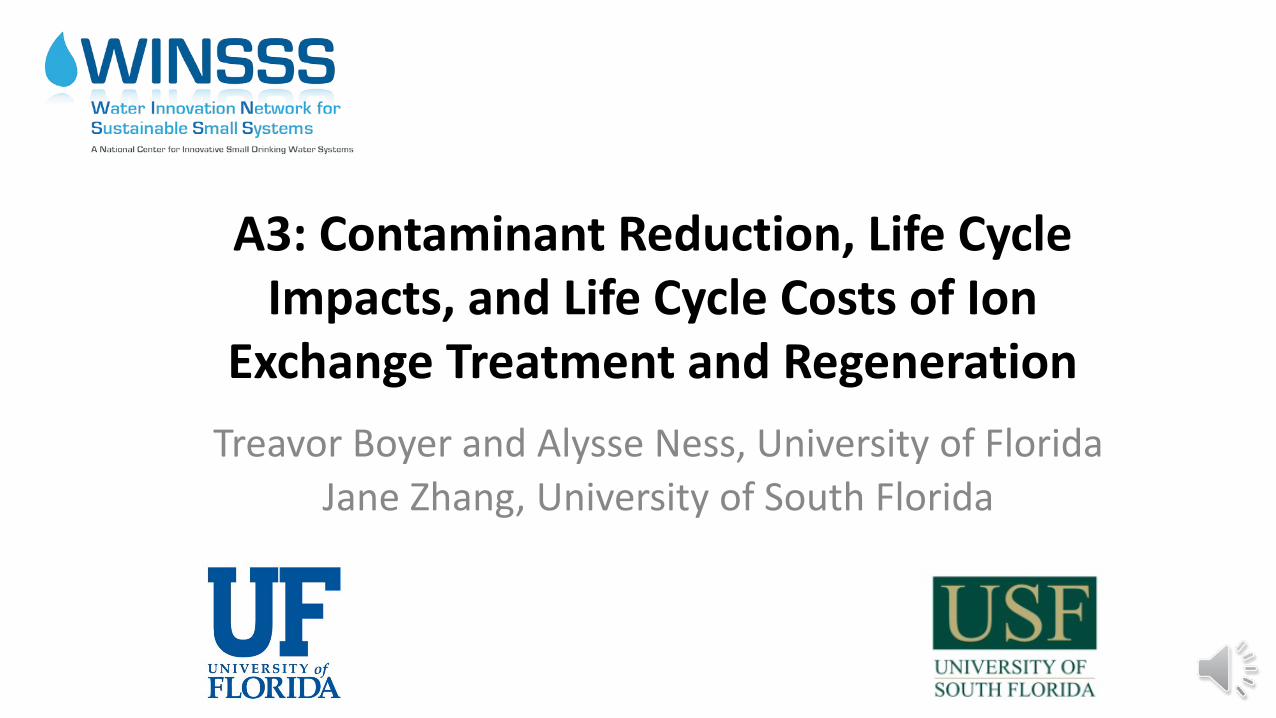
Introduction • Brief Description: Create a more sustainable approach to ion
exchange treatment and regeneration through the coupling of: • Ion exchange pilot plant study, • Ion exchange process models, • Life cycle assessment (LCA), • Life cycle cost analysis (LCCA), and • Integrated decision-support tool.
• Anticipated target utility characteristics: All utilities could benefit. • Emphasis on small systems that treat groundwater or surface
water high in DOC, bromide, nitrate, and/or hardness.
• Continuum of technology development:
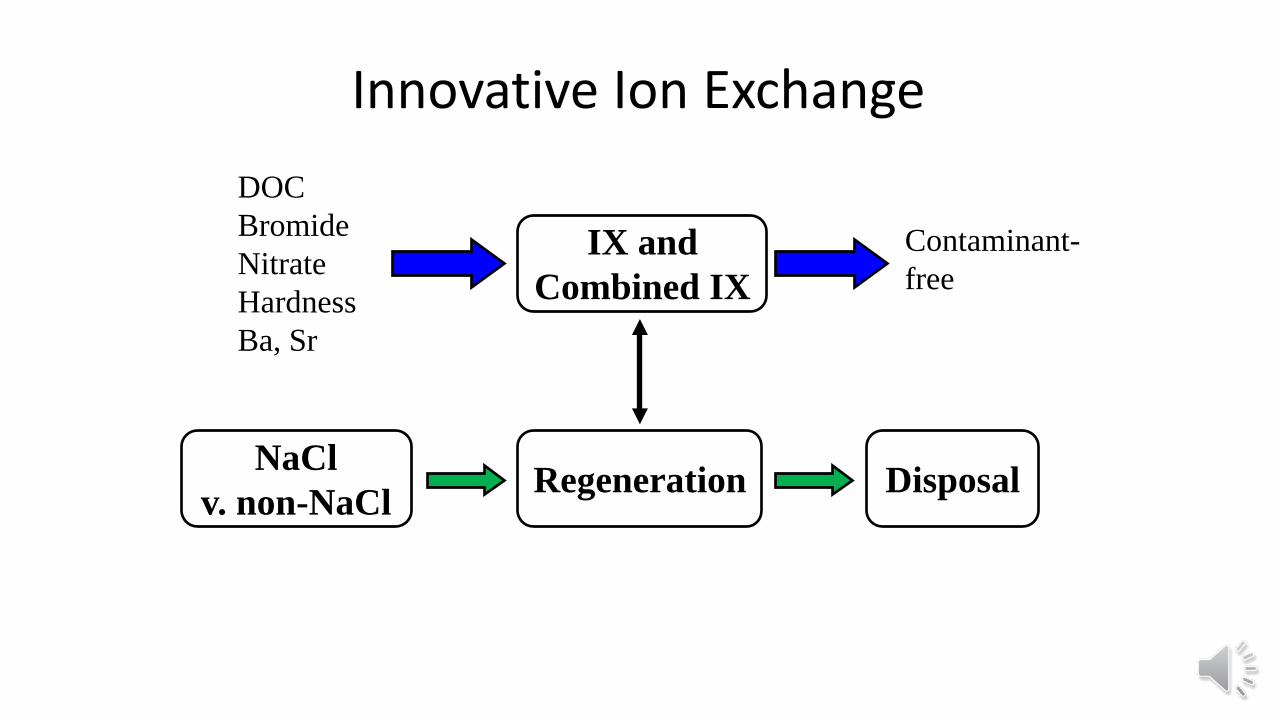
Innovative Ion Exchange
IX and Combined IX
Regeneration Disposal NaCl v. non-NaCl
DOC Bromide Nitrate Hardness Ba, Sr
Contaminant-free
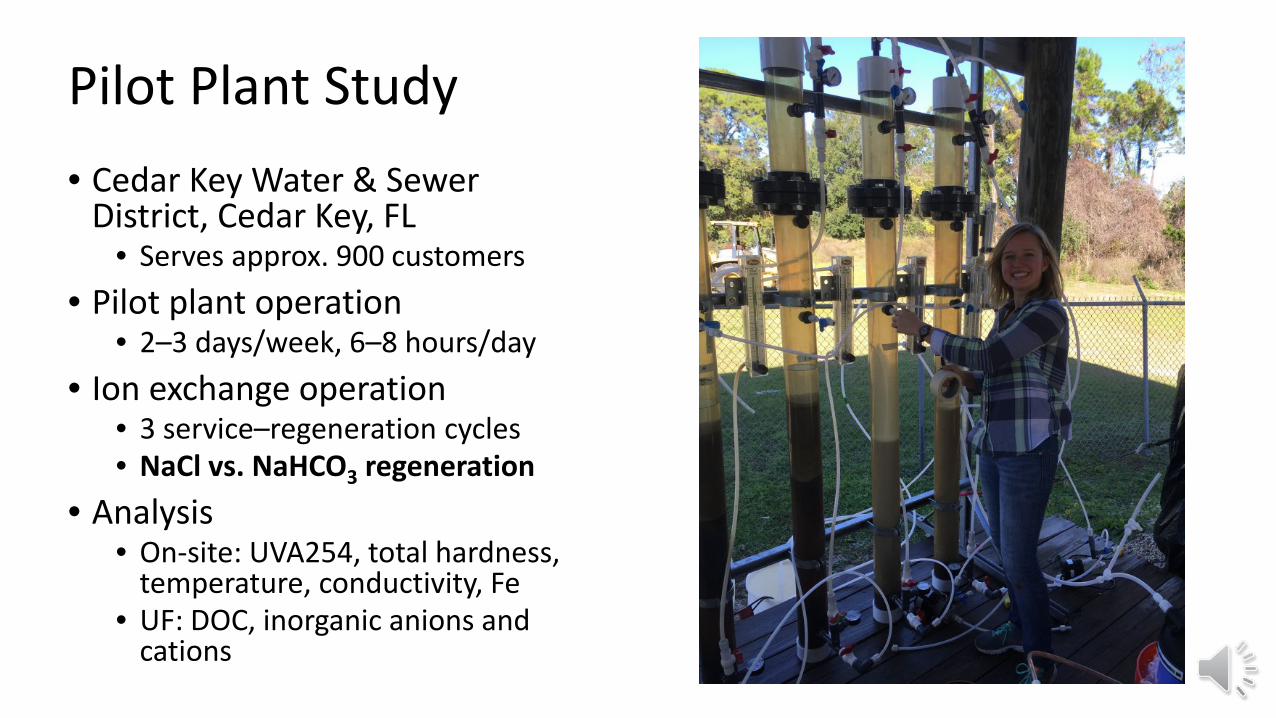
Pilot Plant Study • Cedar Key Water & Sewer
District, Cedar Key, FL • Serves approx. 900 customers
• Pilot plant operation • 2–3 days/week, 6–8 hours/day
• Ion exchange operation • 3 service–regeneration cycles • NaCl vs. NaHCO3 regeneration
• Analysis • On-site: UVA254, total hardness,
temperature, conductivity, Fe • UF: DOC, inorganic anions and
cations
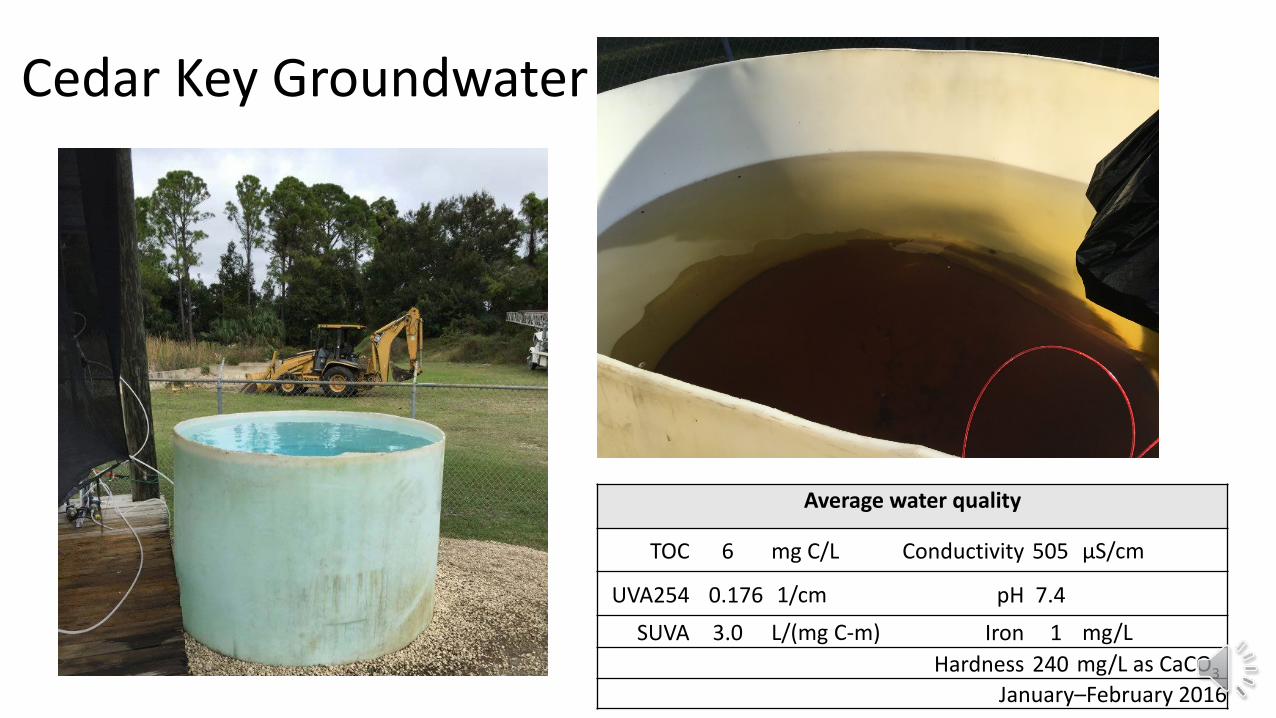
Cedar Key Groundwater
Average water quality
TOC 6 mg C/L Conductivity 505 µS/cm
UVA254 0.176 1/cm pH 7.4 SUVA 3.0 L/(mg C-m) Iron 1 mg/L
Hardness 240 mg/L as CaCO3 January–February 2016
Cedar Key Groundwater
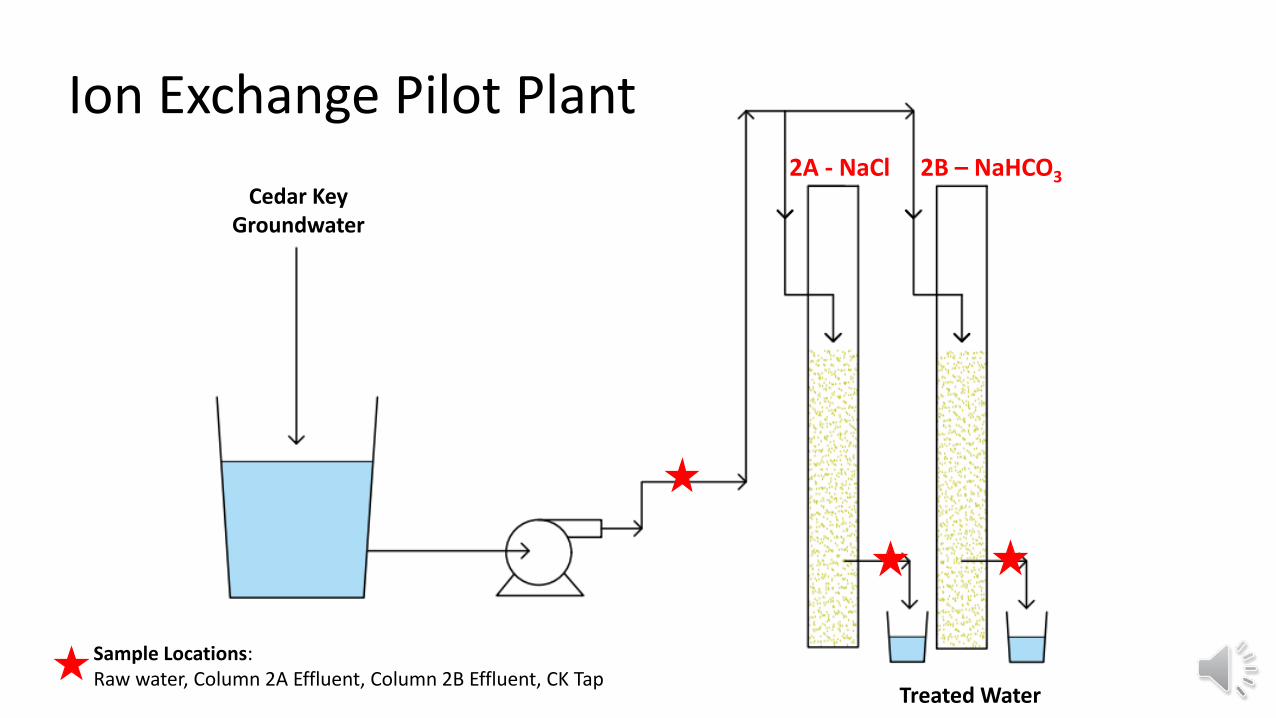
Ion Exchange Pilot Plant 2A - NaCl 2B – NaHCO3
Treated Water
Sample Locations: Raw water, Column 2A Effluent, Column 2B Effluent, CK Tap

Sampling
Sample Locations: 1. Column Influent 2. Column 2A Effluent 3. Column 2B Effluent 4. Cedar Key Tap Water
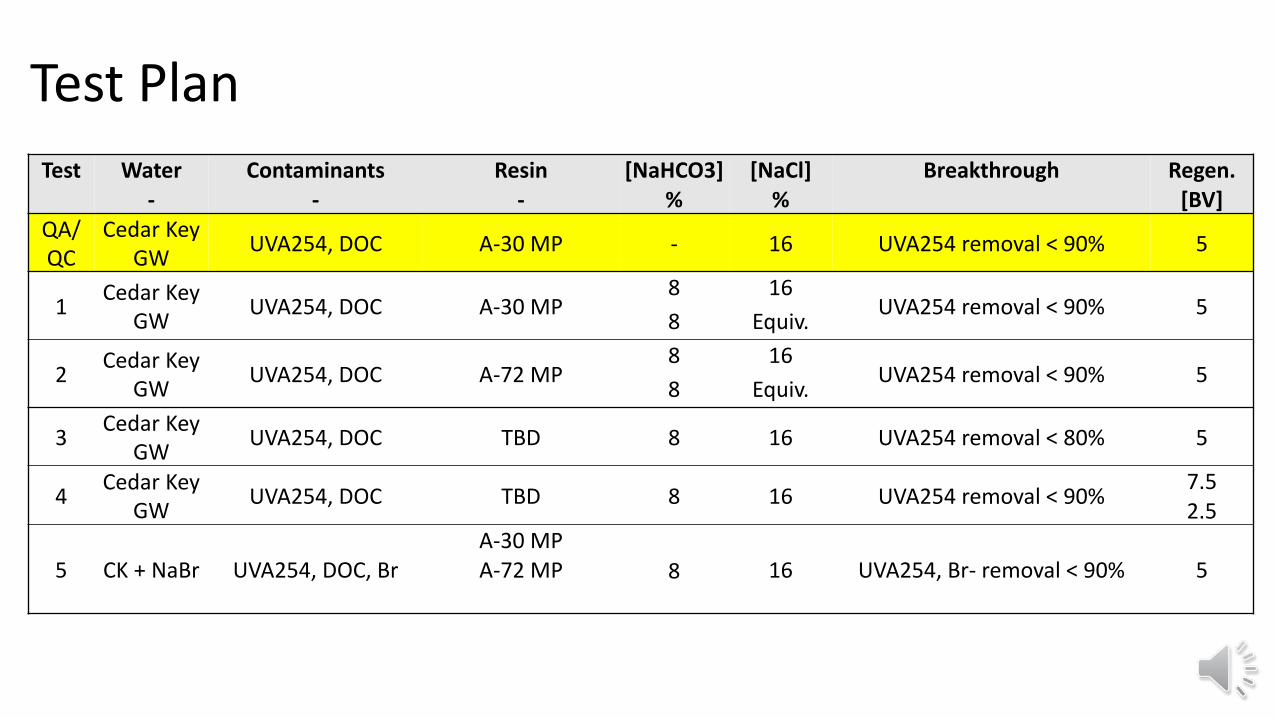
Test Plan Test Water Contaminants Resin [NaHCO3] [NaCl] Breakthrough Regen.
- - - % % [BV] QA/ QC
Cedar Key GW UVA254, DOC A-30 MP - 16 UVA254 removal < 90% 5
1 Cedar Key GW UVA254, DOC A-30 MP
8 16 UVA254 removal < 90% 5 8 Equiv.
2 Cedar Key GW UVA254, DOC A-72 MP
8 16 UVA254 removal < 90% 5 8 Equiv.
3 Cedar Key GW UVA254, DOC TBD 8 16 UVA254 removal < 80% 5
4 Cedar Key GW UVA254, DOC TBD 8 16 UVA254 removal < 90% 7.5
2.5
5 CK + NaBr UVA254, DOC, Br A-30 MP
8
16 UVA254, Br- removal < 90% 5 A-72 MP
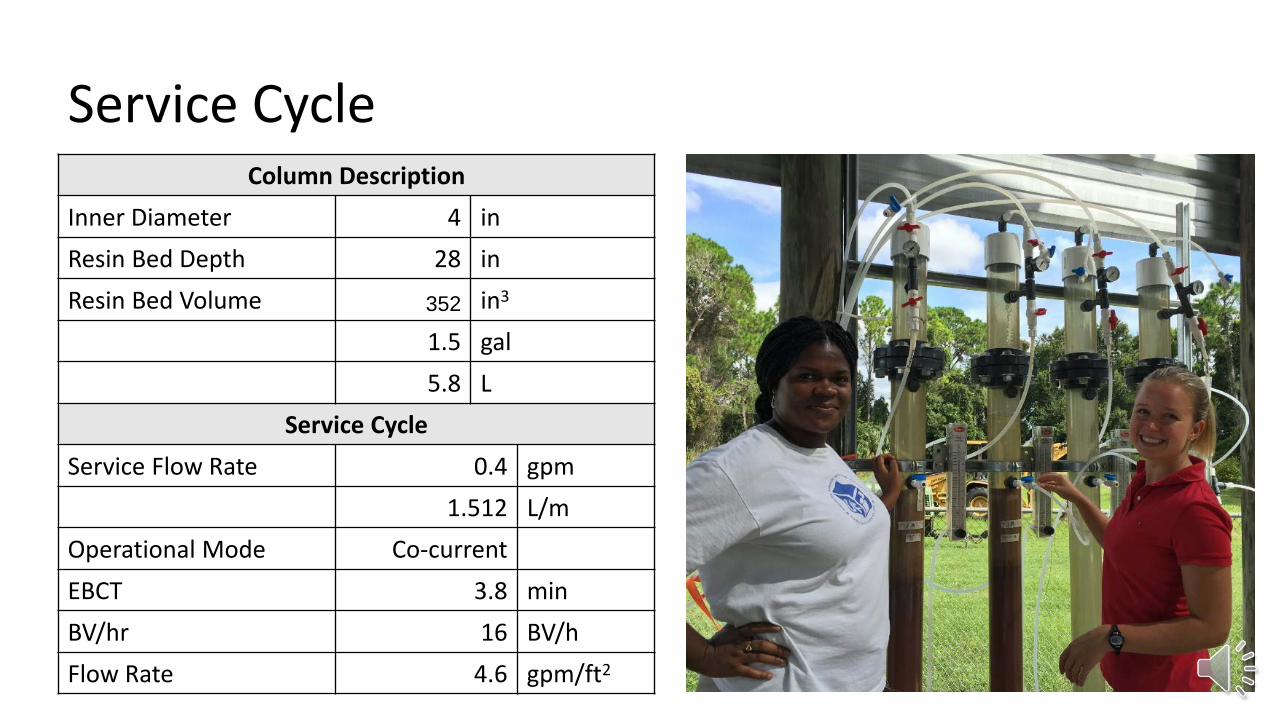
Service Cycle Column Description
Inner Diameter 4 in Resin Bed Depth 28 in Resin Bed Volume 352 in3
1.5 gal 5.8 L
Service Cycle Service Flow Rate 0.4 gpm 1.512 L/m Operational Mode Co-current EBCT 3.8 min BV/hr 16 BV/h Flow Rate 4.6 gpm/ft2
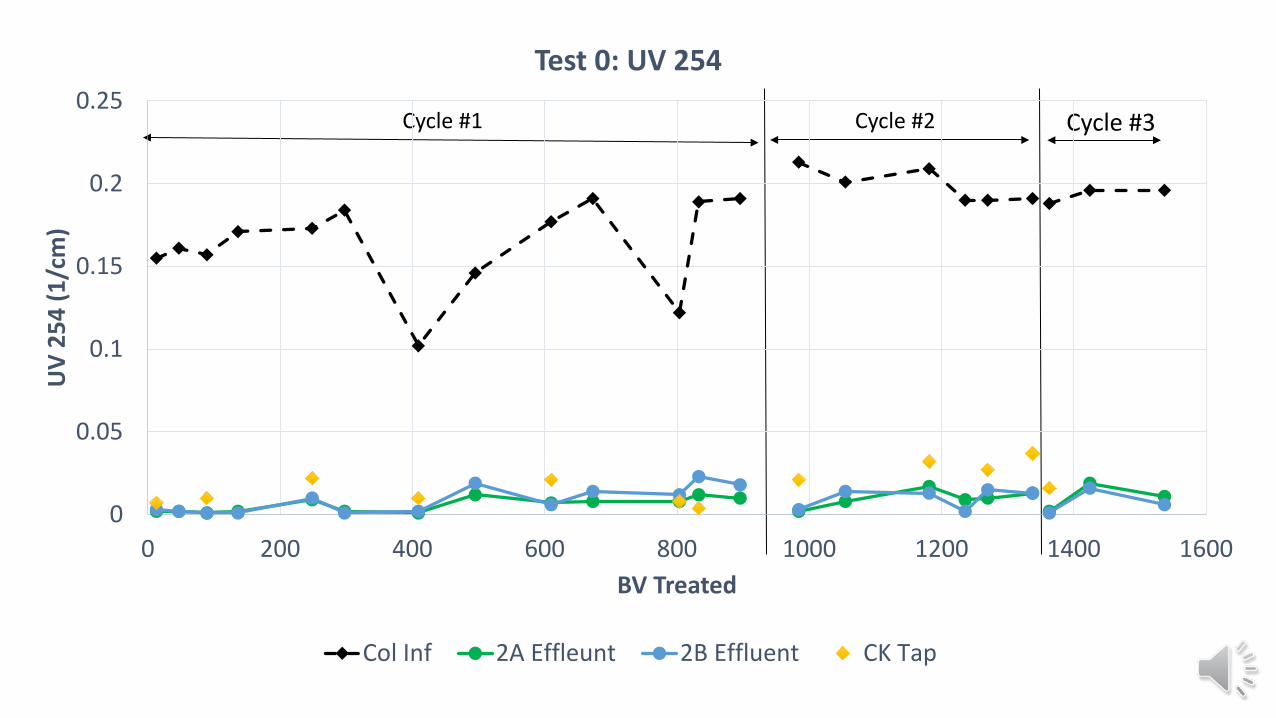
Cycle #1 Cycle #3 Cycle #2
0
0.05
0.1
0.15
0.2
0.25
0 200 400 600 800 1000 1200 1400 1600
UV
254
(1/c
m)
BV Treated
Test 0: UV 254
Col Inf 2A Effleunt 2B Effluent CK Tap
0
1
2
3
4
5
6
7
8
9
0 200 400 600 800 1000 1200 1400 1600
DOC
(mg/
L)
BV Treated
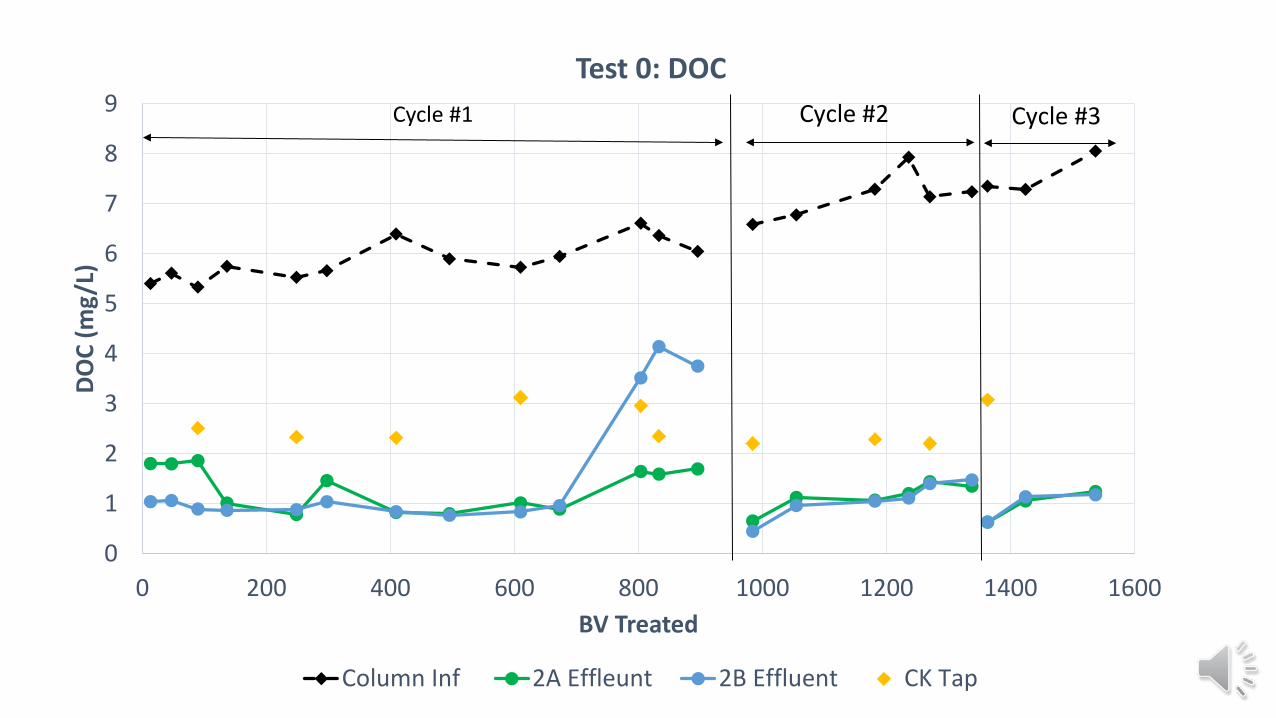
Test 0: DOC
Column Inf 2A Effleunt 2B Effluent CK Tap
Cycle #2 Cycle #3 Cycle #1
0
0.5
1
1.5
2
2.5
3
3.5
4
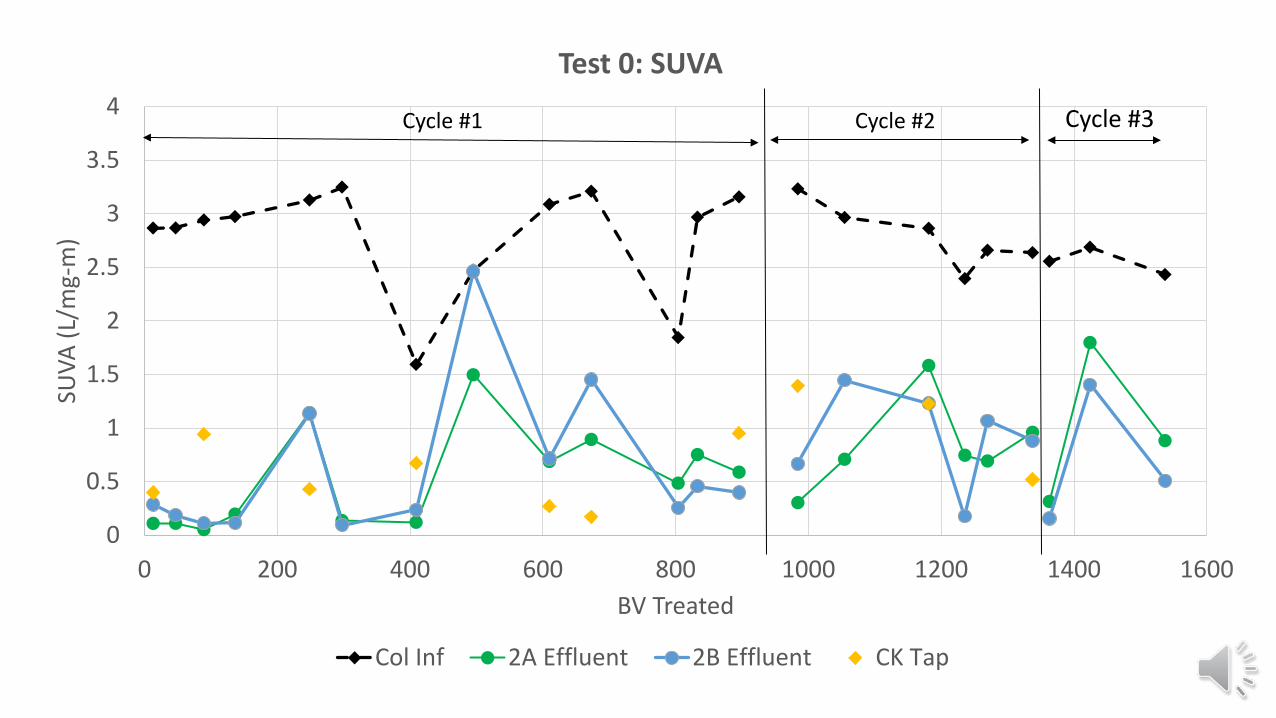
0 200 400 600 800 1000 1200 1400 1600
SUVA
(L/m
g-m
)
BV Treated
Test 0: SUVA
Col Inf 2A Effluent 2B Effluent CK Tap
Cycle #1 Cycle #3 Cycle #2
Cycle #1 Cycle #3 Cycle #2
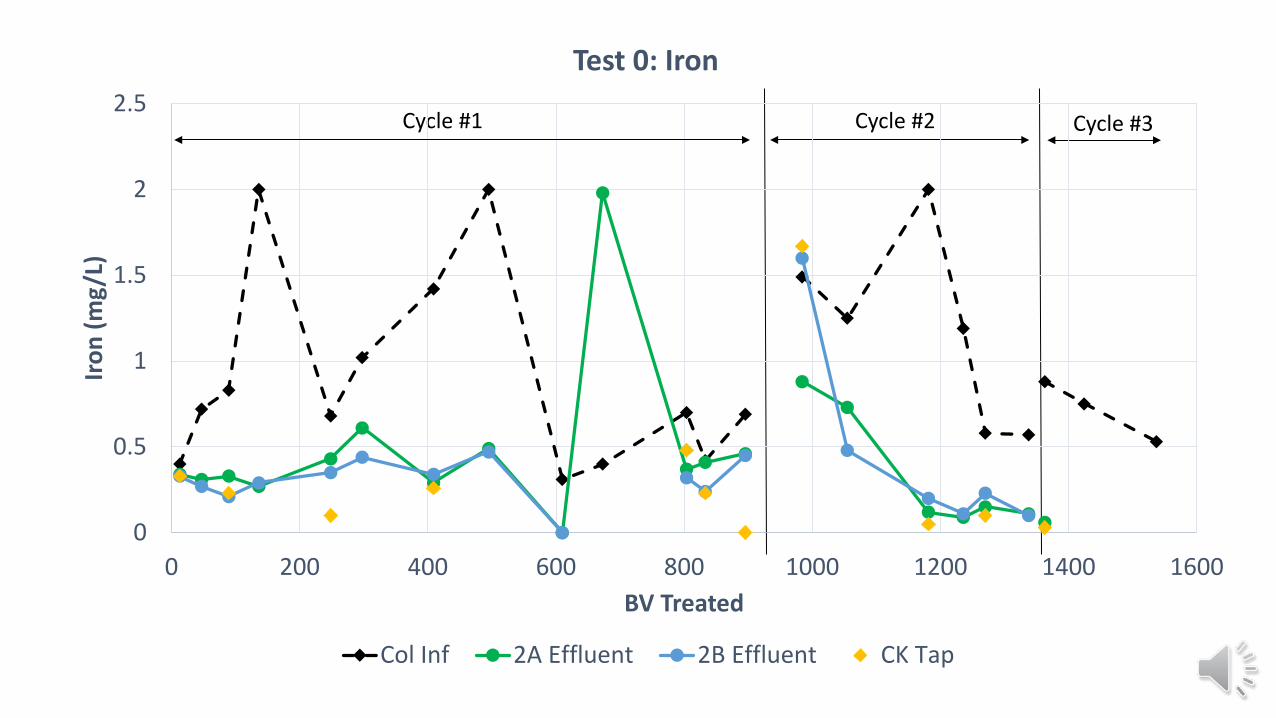
0
0.5
1
1.5
2
2.5
0 200 400 600 800 1000 1200 1400 1600
Iron
(mg/
L)
BV Treated
Test 0: Iron
Col Inf 2A Effluent 2B Effluent CK Tap
Cycle #1 Cycle #3 Cycle #2
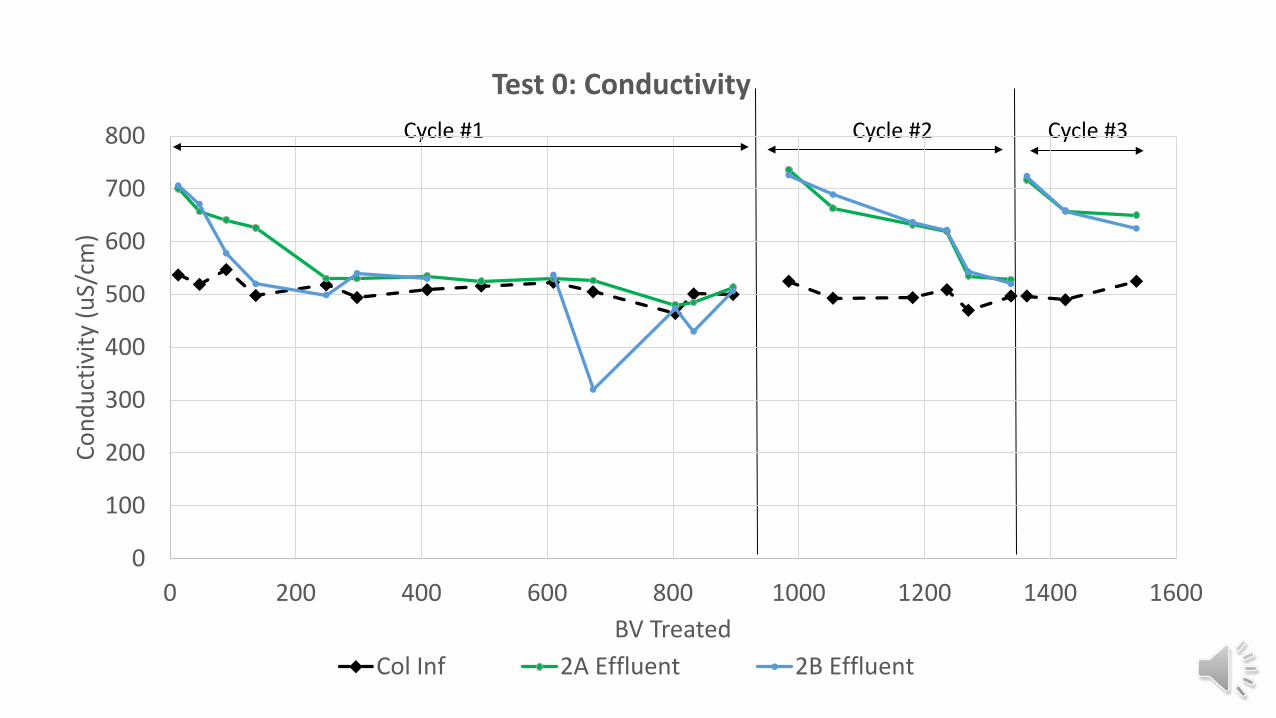
0
100
200
300
400
500
600
700
800
0 200 400 600 800 1000 1200 1400 1600
Cond
uctiv
ity (u
S/cm
)
BV Treated
Test 0: Conductivity
Col Inf 2A Effluent 2B Effluent
Cycle #1 Cycle #3 Cycle #2
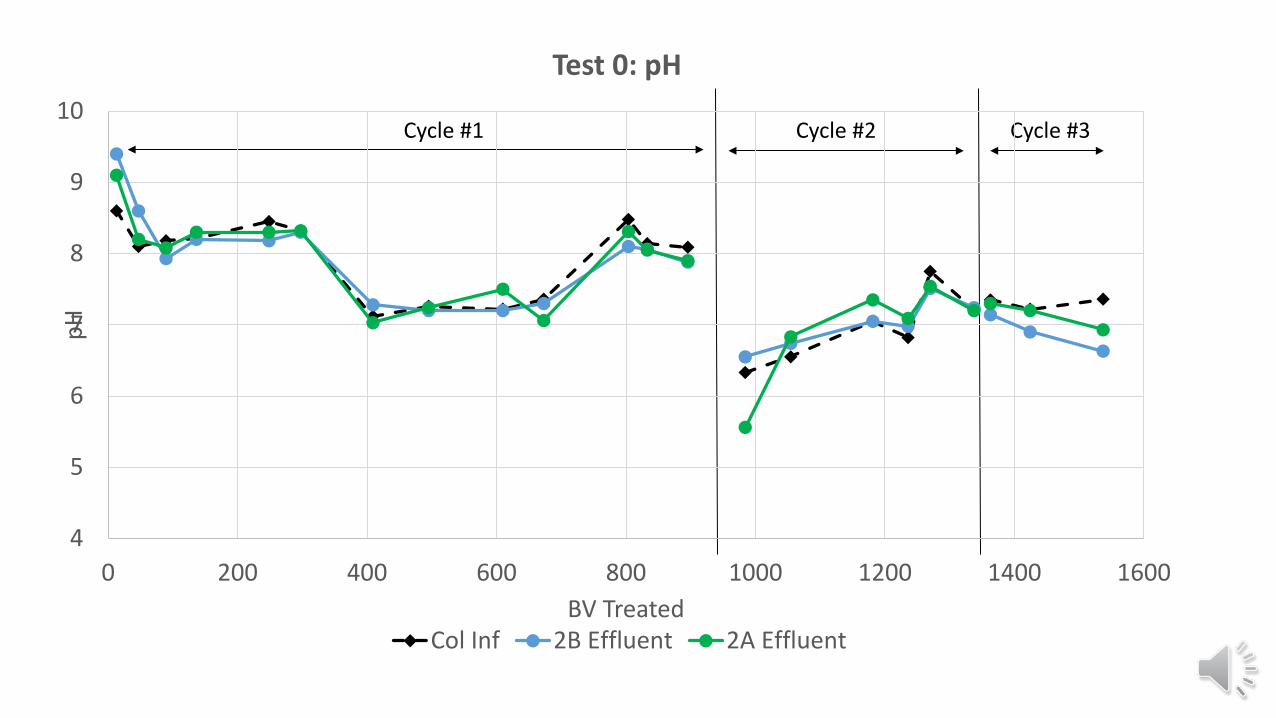
4
5
6
7
8
9
10
0 200 400 600 800 1000 1200 1400 1600
pH
BV Treated
Test 0: pH
Col Inf 2B Effluent 2A Effluent
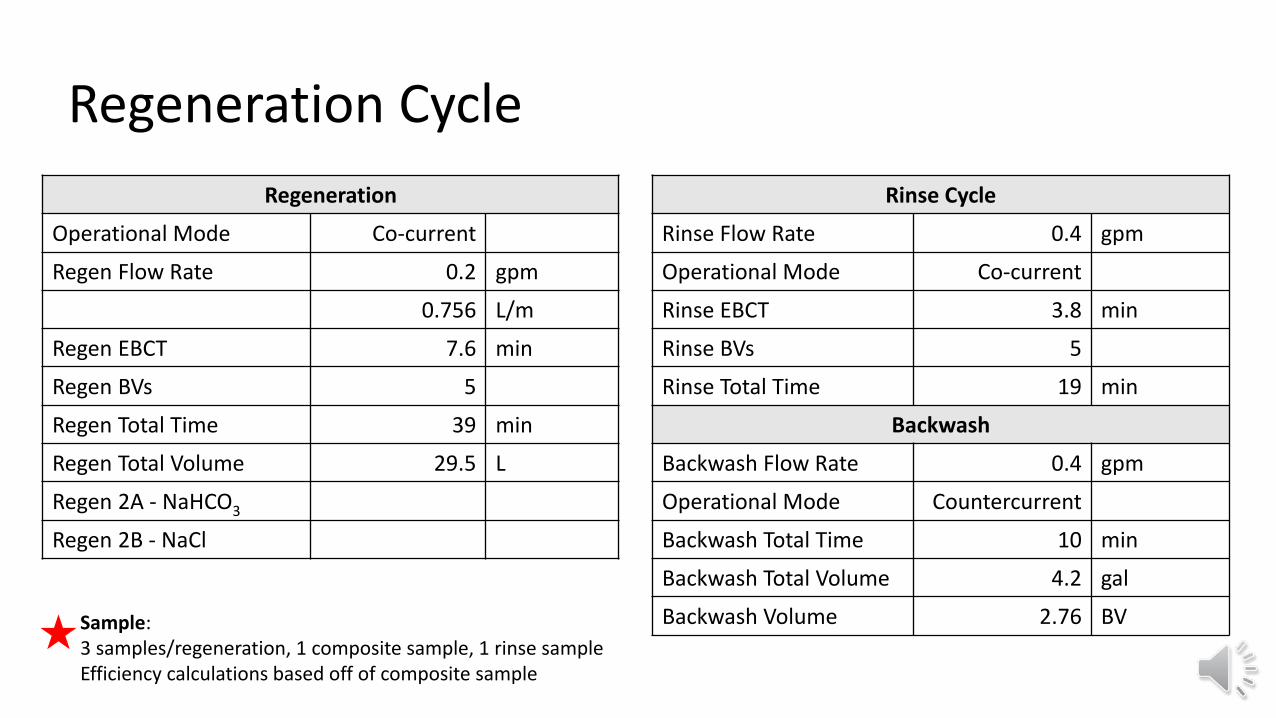
Regeneration Cycle Regeneration
Operational Mode Co-current
Regen Flow Rate 0.2 gpm
0.756 L/m
Regen EBCT 7.6 min
Regen BVs 5
Regen Total Time 39 min
Regen Total Volume 29.5 L
Regen 2A - NaHCO3
Regen 2B - NaCl
Rinse Cycle
Rinse Flow Rate 0.4 gpm
Operational Mode Co-current
Rinse EBCT 3.8 min
Rinse BVs 5
Rinse Total Time 19 min
Backwash
Backwash Flow Rate 0.4 gpm
Operational Mode Countercurrent
Backwash Total Time 10 min
Backwash Total Volume 4.2 gal
Backwash Volume 2.76 BV Sample: 3 samples/regeneration, 1 composite sample, 1 rinse sample Efficiency calculations based off of composite sample
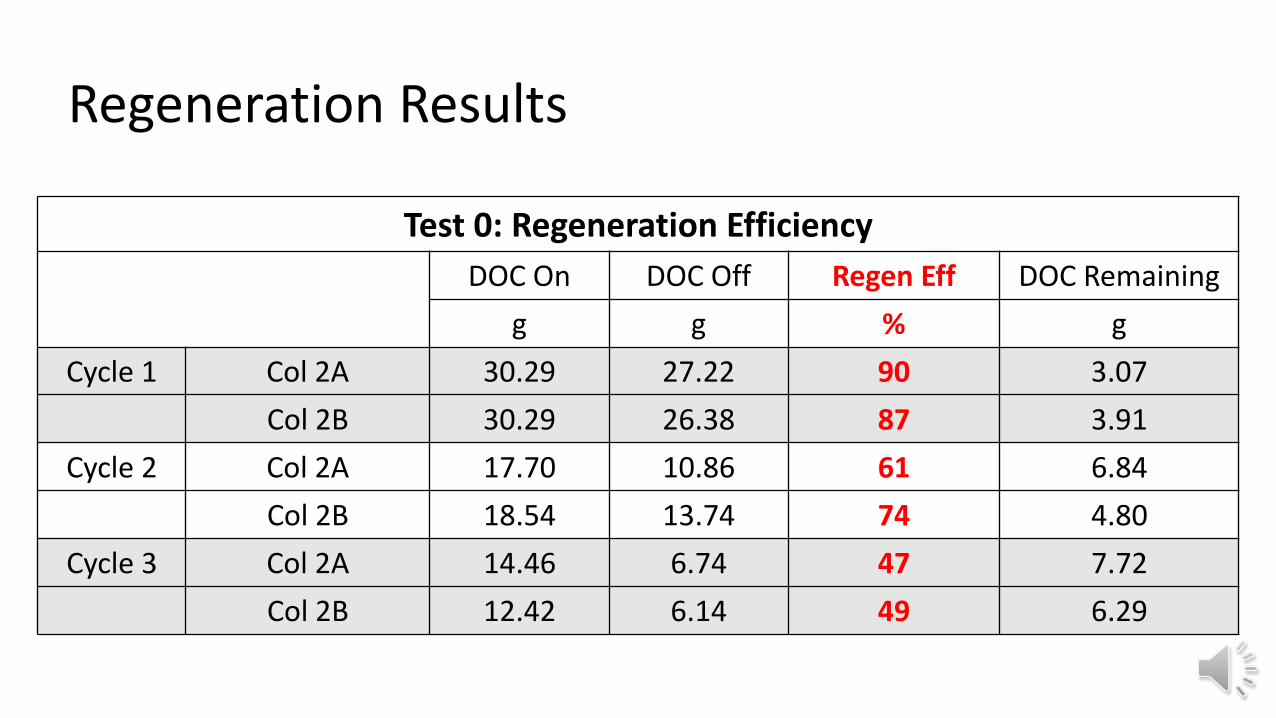
Regeneration Results
Test 0: Regeneration Efficiency DOC On DOC Off Regen Eff DOC Remaining
g g % g Cycle 1 Col 2A 30.29 27.22 90 3.07
Col 2B 30.29 26.38 87 3.91 Cycle 2 Col 2A 17.70 10.86 61 6.84
Col 2B 18.54 13.74 74 4.80 Cycle 3 Col 2A 14.46 6.74 47 7.72
Col 2B 12.42 6.14 49 6.29

Modeling Framework
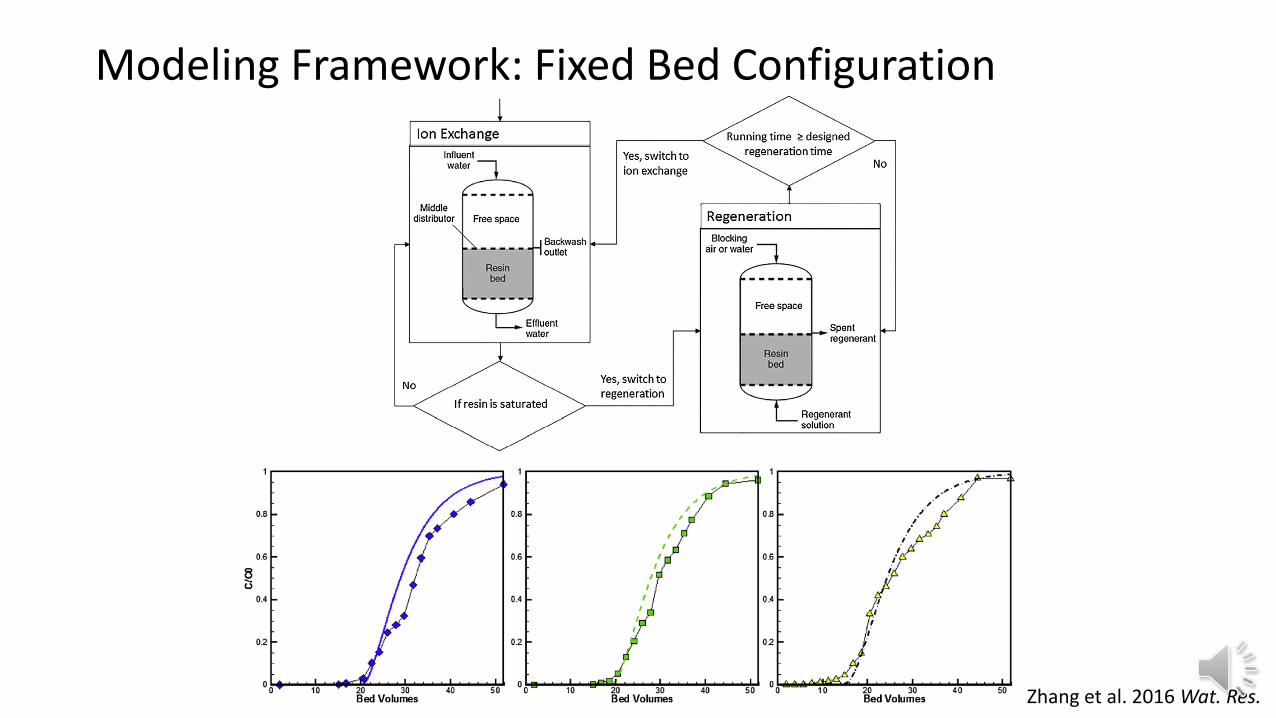
Modeling Framework: Fixed Bed Configuration
Zhang et al. 2016 Wat. Res.
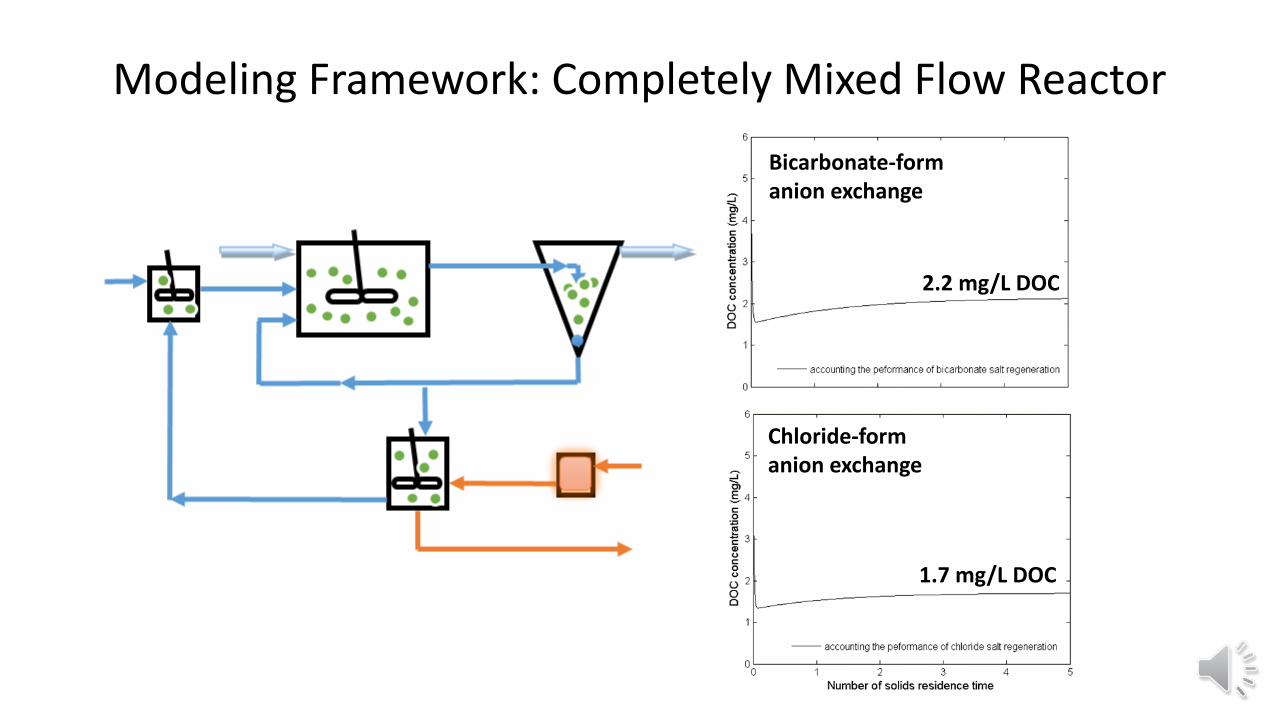
Modeling Framework: Completely Mixed Flow Reactor
Bicarbonate-form anion exchange
Chloride-form anion exchange
2.2 mg/L DOC
1.7 mg/L DOC
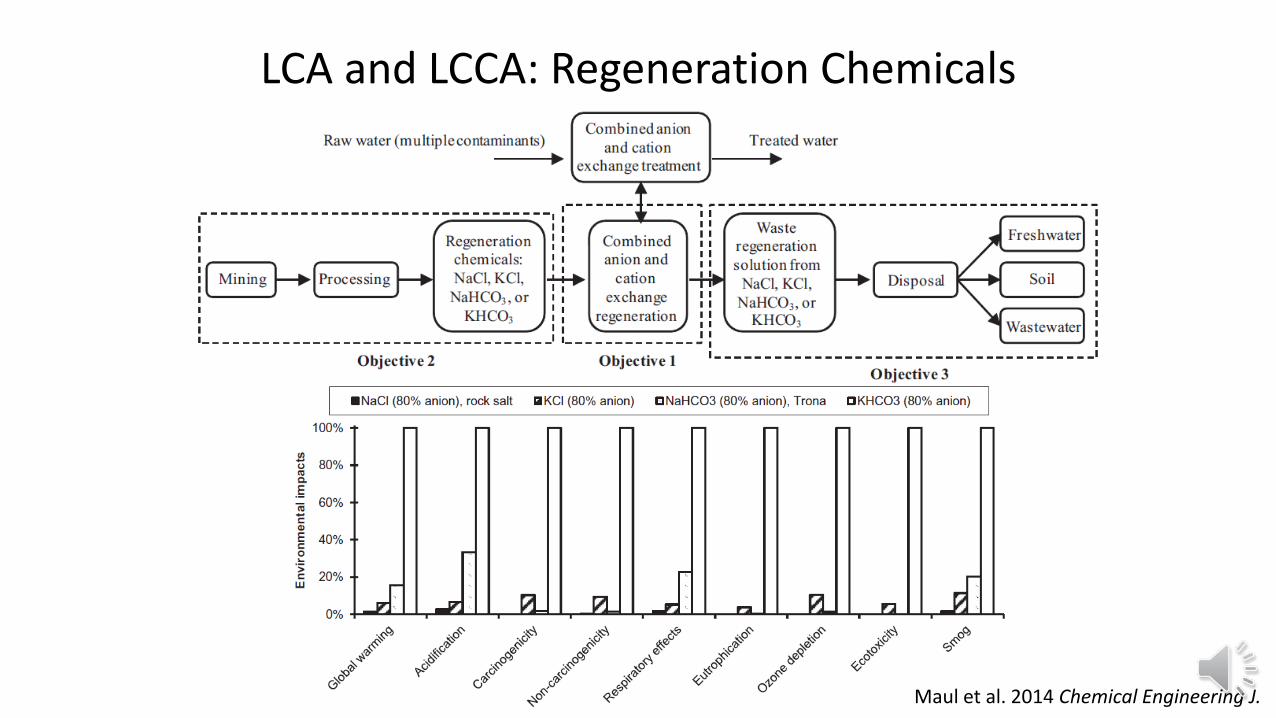
LCA and LCCA: Regeneration Chemicals
Maul et al. 2014 Chemical Engineering J.

LCA and LCCA: Reactor Configuration
Amini et al. 2015 J. of Cleaner Production
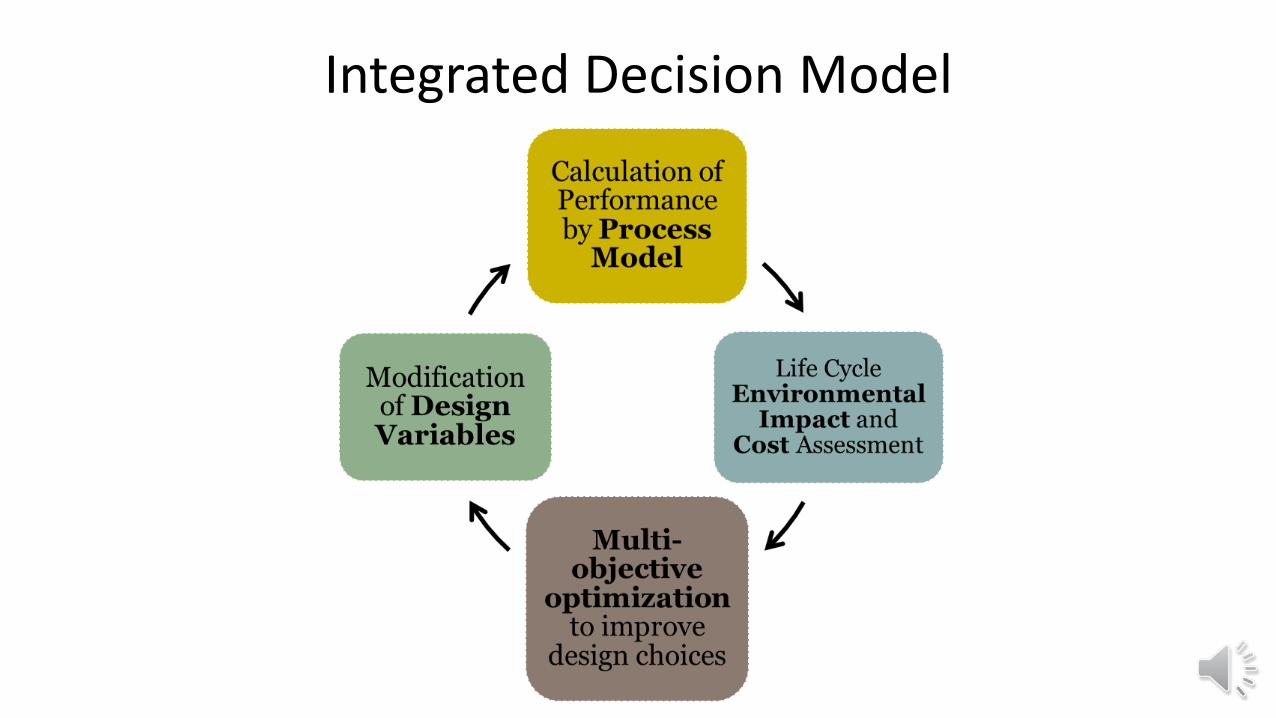
Integrated Decision Model
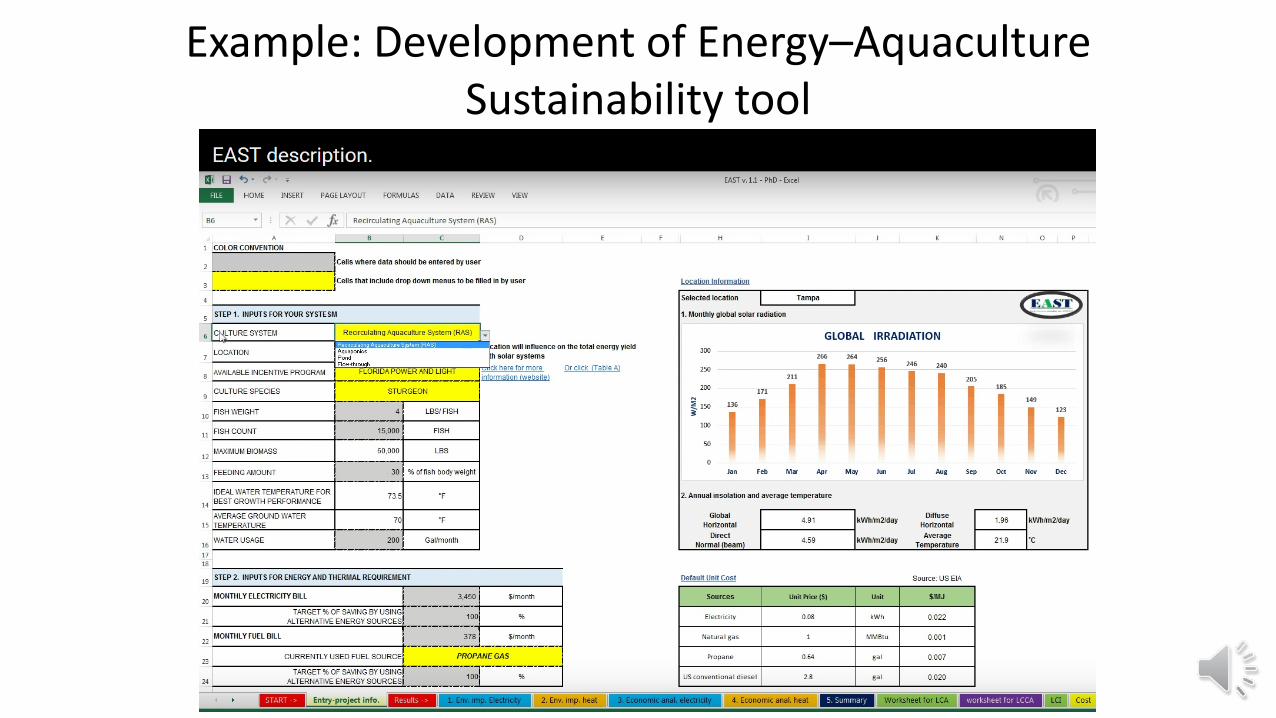
Example: Development of Energy–Aquaculture Sustainability tool
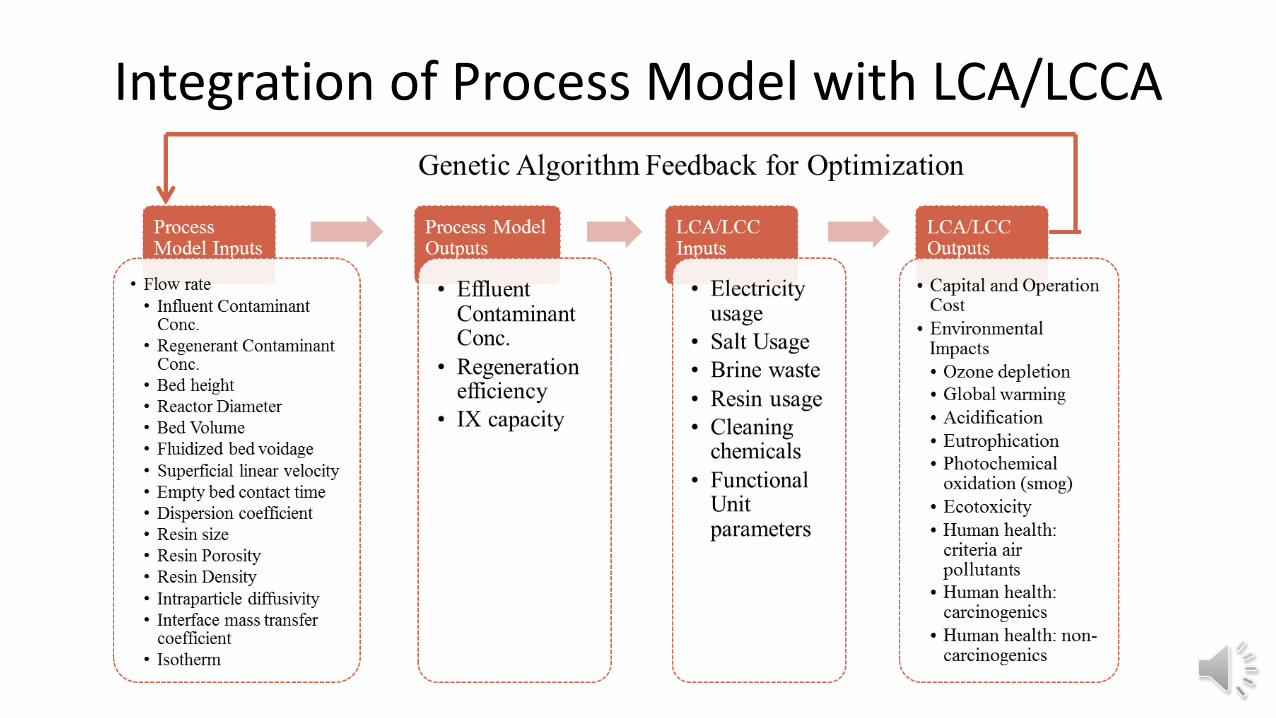
Integration of Process Model with LCA/LCCA
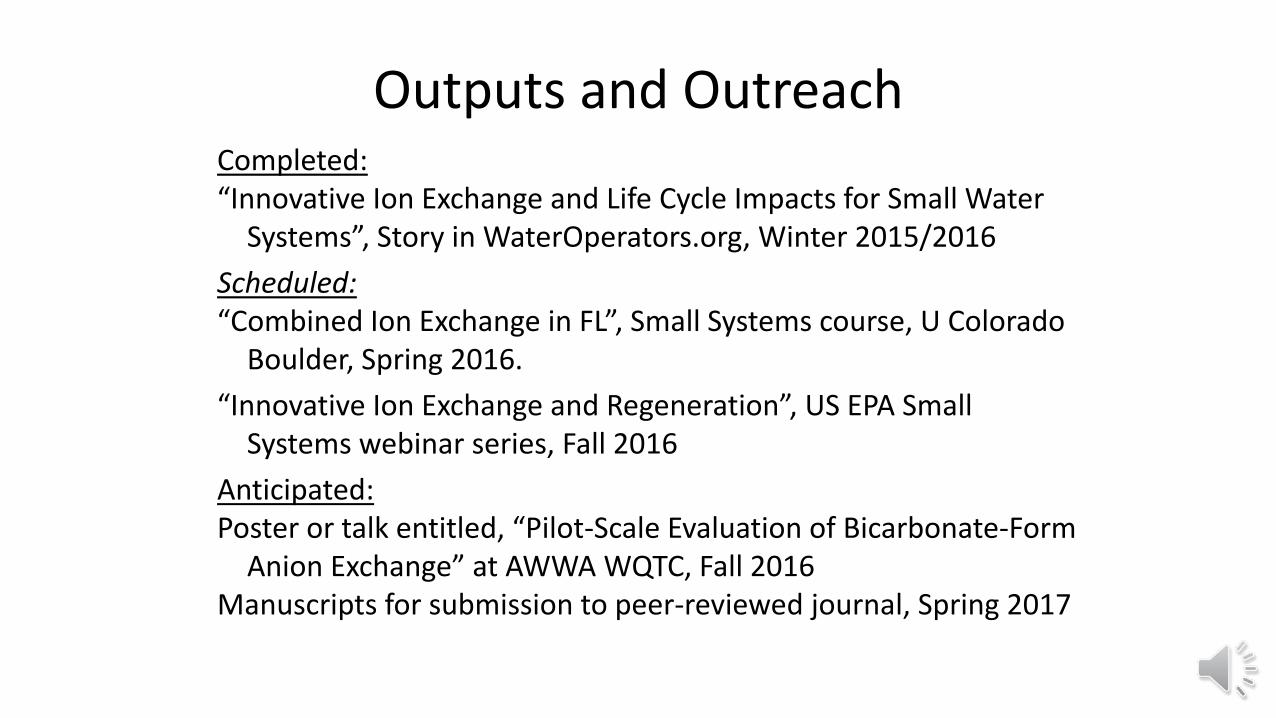
Outputs and Outreach Completed: “Innovative Ion Exchange and Life Cycle Impacts for Small Water
Systems”, Story in WaterOperators.org, Winter 2015/2016 Scheduled: “Combined Ion Exchange in FL”, Small Systems course, U Colorado
Boulder, Spring 2016. “Innovative Ion Exchange and Regeneration”, US EPA Small
Systems webinar series, Fall 2016 Anticipated: Poster or talk entitled, “Pilot-Scale Evaluation of Bicarbonate-Form
Anion Exchange” at AWWA WQTC, Fall 2016 Manuscripts for submission to peer-reviewed journal, Spring 2017
Related Documents