ASEE 2014 Zone I Conference, April 3-5, 2014, University of Bridgeport, Bridgpeort, CT, USA. A Wireless Sensor Network for Environmental Monitoring of Greenhouse Gases Ashenafi Lambebo Department of Electrical and Computer Engineering University of the District of Columbia 4200 Connecticut Ave N.W., Building 42 Washington DC, 20008 [email protected] Sasan Haghani Department of Electrical and Computer Engineering University of the District of Columbia 4200 Connecticut Ave N.W., Building 42 Washington DC, 20008 [email protected] Abstract—The rapid development and miniaturization of sensor devices, and the recent advances in wireless communication and networking technologies, are allowing scientists and engineers to develop networks of small sensors that can be used to continuously monitor the health and stability of the environment we live in. Wireless Sensor Networks (WSNs) consist of a number of spatially distributed sensors with computing, processing and communication capabilities that can continuously sense and transmit data to a base station, where data can be processed and observed in real time. This project provides a detailed study and implementation of a WSN for real time and continuous environmental monitoring of greenhouse gases. A tree-topology WSN consisting of two sensor nodes and a base station was successfully built and tested using open source and inexpensive hardware to measure the concentration level of several greenhouse gases. The sensor nodes consisted of carbon monoxide sensor, a carbon dioxide sensor, a methane sensor, a temperature sensor, a GPS module and a ZigBee wireless transmitter packaged together. The GPS module was added to give information about the location of the sensors. The base stations consisted of an Arduino Uno micro-controller and a ZigBee receiver that can collect data from the various sensors and submit to a sink base station where data can be stored and processed. A website was developed where the captured data can be continuously monitored and displayed in real time. Keywords—Environmental Monitoring, IEEE 802.15., Wireless Sensor Networks, Wi-Fi, ZigBee Communication. I. INTRODUCTION Pressing consequences of climate change such as global warming, the melting of glaciers, and recent frequent storm incidents have prompted the emergence of technology-driven improvements of the current environmental monitoring systems. For instance, recent advances in electronics have enabled the development of low power sensors that can be used to continuously monitor the environment [1-[7]. A wireless sensor network (WSN) generally consists of a large number of low-cost and low-power multifunctional sensor nodes that are deployed in a region of interest. In WSN, the nodes communicate wirelessly over short distances and are capable of organizing themselves in an autonomous multi-hop mesh network [1]. A WSN can be generally described as a network of nodes that cooperatively sense and may control the environment enabling interaction between persons or computers and the surrounding environment A typical sensor node in a WSN consists of a wireless communication unit, a microprocessor, a data acquisition unit, memory unit, and sensor boards. The microprocessor and the memory unit control how often the sensor measurements are taken or transmitted. The measurements can be taken in fixed time intervals or based on an event driven model [2]. The data collected by the sensors is then sent to a base station where the data can be stored for analysis and processing. The application of WSN for environmental monitoring has been studied in the literature. For example, in [8], WSNs were used to gather forest temperature data and the amount of rainfall. In [9], MasliNET, a multimodal environmental monitoring system built for microclimate and pest monitoring in olive groves, was introduced. In this paper, we present the implementation and testing of a real time environmental monitoring system using wireless sensor networks, capable of measuring temperature and greenhouse gas concentration levels including CO, CO 2 and CH 4 levels. The network consists of two nodes and a base station. A ZigBee wireless communication module [10], based on IEEE 802.15.4, is used as the wireless communication unit in the sensor nodes. ZigBee is selected as it is a low-cost and low-power wireless communication protocol and it has been shown to be a viable technology for sensor applications [3]. These wireless modules are easy to configure and suitable for point-to-point, multipoint and convertible to a mesh network [3]. The captured data is made available to the user through a graphic application programming interface (API). The designed network is suitable for the monitoring of temperature and greenhouse gases in warehouses and factory settings. The rest of this paper is organized as follows. In Section II, we present the wireless sensor network architecture, including details on the transmitter and the receiving node structures. The data visualization and experimental results are presented in Section III. Finally, the conclusions are given in Section IV.

Welcome message from author
This document is posted to help you gain knowledge. Please leave a comment to let me know what you think about it! Share it to your friends and learn new things together.
Transcript

ASEE 2014 Zone I Conference, April 3-5, 2014, University of Bridgeport, Bridgpeort, CT, USA.
A Wireless Sensor Network for Environmental Monitoring of Greenhouse Gases
Ashenafi Lambebo Department of Electrical and Computer Engineering
University of the District of Columbia 4200 Connecticut Ave N.W., Building 42
Washington DC, 20008 [email protected]
Sasan Haghani Department of Electrical and Computer Engineering
University of the District of Columbia 4200 Connecticut Ave N.W., Building 42
Washington DC, 20008 [email protected]
Abstract—The rapid development and miniaturization of sensor devices, and the recent advances in wireless communication and networking technologies, are allowing scientists and engineers to develop networks of small sensors that can be used to continuously monitor the health and stability of the environment we live in. Wireless Sensor Networks (WSNs) consist of a number of spatially distributed sensors with computing, processing and communication capabilities that can continuously sense and transmit data to a base station, where data can be processed and observed in real time. This project provides a detailed study and implementation of a WSN for real time and continuous environmental monitoring of greenhouse gases. A tree-topology WSN consisting of two sensor nodes and a base station was successfully built and tested using open source and inexpensive hardware to measure the concentration level of several greenhouse gases. The sensor nodes consisted of carbon monoxide sensor, a carbon dioxide sensor, a methane sensor, a temperature sensor, a GPS module and a ZigBee wireless transmitter packaged together. The GPS module was added to give information about the location of the sensors. The base stations consisted of an Arduino Uno micro-controller and a ZigBee receiver that can collect data from the various sensors and submit to a sink base station where data can be stored and processed. A website was developed where the captured data can be continuously monitored and displayed in real time.
Keywords—Environmental Monitoring, IEEE 802.15., Wireless Sensor Networks, Wi-Fi, ZigBee Communication.
I. INTRODUCTION Pressing consequences of climate change such as global
warming, the melting of glaciers, and recent frequent storm incidents have prompted the emergence of technology-driven improvements of the current environmental monitoring systems. For instance, recent advances in electronics have enabled the development of low power sensors that can be used to continuously monitor the environment [1-[7].
A wireless sensor network (WSN) generally consists of a large number of low-cost and low-power multifunctional sensor nodes that are deployed in a region of interest. In WSN, the nodes communicate wirelessly over short distances and are capable of organizing themselves in an autonomous multi-hop mesh network [1]. A WSN can be generally described as a
network of nodes that cooperatively sense and may control the environment enabling interaction between persons or computers and the surrounding environment
A typical sensor node in a WSN consists of a wireless communication unit, a microprocessor, a data acquisition unit, memory unit, and sensor boards. The microprocessor and the memory unit control how often the sensor measurements are taken or transmitted. The measurements can be taken in fixed time intervals or based on an event driven model [2]. The data collected by the sensors is then sent to a base station where the data can be stored for analysis and processing.
The application of WSN for environmental monitoring has been studied in the literature. For example, in [8], WSNs were used to gather forest temperature data and the amount of rainfall. In [9], MasliNET, a multimodal environmental monitoring system built for microclimate and pest monitoring in olive groves, was introduced. In this paper, we present the implementation and testing of a real time environmental monitoring system using wireless sensor networks, capable of measuring temperature and greenhouse gas concentration levels including CO, CO2 and CH4 levels. The network consists of two nodes and a base station. A ZigBee wireless communication module [10], based on IEEE 802.15.4, is used as the wireless communication unit in the sensor nodes. ZigBee is selected as it is a low-cost and low-power wireless communication protocol and it has been shown to be a viable technology for sensor applications [3]. These wireless modules are easy to configure and suitable for point-to-point, multipoint and convertible to a mesh network [3]. The captured data is made available to the user through a graphic application programming interface (API). The designed network is suitable for the monitoring of temperature and greenhouse gases in warehouses and factory settings.
The rest of this paper is organized as follows. In Section II, we present the wireless sensor network architecture, including details on the transmitter and the receiving node structures. The data visualization and experimental results are presented in Section III. Finally, the conclusions are given in Section IV.

II. NETWORK ARCHITECTURE The Wireless Sensor Network (WSN) was implemented
using a tree topology in beacon mode (data being sent continuously without interruption) where sensors collect data and send it to the base station which is the task manager of the network. The proposed WSN architecture is shown in Fig. 1. Two individual environmental sensor nodes serving as transmitters have been designed to collect, process, and transmit the gas concentration levels, temperature, and the sensor’s location signals in real time. The system operates within a range of 100m from the base station and is suitable for monitoring the concentration of greenhouse gases inside industrial buildings and warehouses.
The base station, which is the network coordinator, manages the activities of individual nodes by periodically requesting data. In addition to data integration and analysis, the base station also relays processed data to display devices and PDAs. The base station is equipped with an Arduino Uno Microcontroller for system coordination, a receiving ZigBee module and a Wi-Fi___33 module for wireless communication and data transmission over the 802.11b/g wireless networks, which make it possible to access the collected data via the Internet. In addition, the captured data is inserted into a MySQL database where a webpage with a graphing application programming interface (API) is used to display the data.
Fig. 1: Network architecture
A. Transmitter Node To achieve a power efficient network, open source and
low-power consumption hardware were used to implement the transmitter. The structure of the transmitting nodes and the final product are shown in Fig. 2(a) and Fig. 2(b), respectively. Each transmitting node consists of one off-the shelf XBee wireless module, greenhouse gas sensors, temperature sensor, and a GPS module. The XBee wireless module operates on the 802.15.4 protocol [3] at a frequency of 2.4GHz with a power output of 1mW and a data transmission rate of 250kbps, which ensures the wireless nature of the network. The sensors consist of a carbon monoxide (CO)
sensor with a power consumption of <350mw at 5V, with 17mm of diameter, a carbon dioxide (CO2) sensor with a current consumption of <200mA at 5V with a diameter of 15mm and a methane sensor (CH4) with a power consumption <750mw at 5V and a 16mm of diameter. The gas sensors collect data from the monitored environment. A TMP36 analog temperature sensor with a voltage output of 1.75V at 125°C is used to monitor the temperature. A GTPA013 ultimate GPS module with a -165dBm sensitivity and only 20mA current draw is added to the transmitter node. This determines the location of the sensor node at all time. Each transmitting node is powered up using a 9V battery and the data collected is wirelessly sent to the base station for processing, display, and storage. To program the Arduino controller in the transmitter node, the Arduino open source environment was used where the C++ programming language was utilized. For each sensor, using the data sheets provided by the manufacturer, a distinct code and library was implemented. The function of the transmitter node is summarized below:
• Collect continuous and real time sensor data from
each sensor. • Process the inputs from each sensor using the
corresponding sensor code. • Transmit the processed data to the base station
periodically for further analysis and display.
Fig. 2(a): Structure of transmitter node.
Fig. 2(b): The constructed transmitter node.
B. Base Station The base station was constructed using open source and
low-power consumption hardware. The structure of the base station and the constructed base station are shown in Fig. 3(a) and Fig. 3(b), respectively. An XBee wireless module, operating on the IEEE 802.15.4 protocol at a frequency of 2.4GHz and a power output of 1mW was used as the wireless module. To allow wireless relay of data over the Internet one WRL-09954 WiFly shield is used that allows connection to 802.11b/g wireless networks (Wi-Fi) network. The tasks of the base station are given below:
• To coordinate the two transmitting nodes by sending periodic data requests.
• To receive environmental data from all transmitting nodes in real time.
• To relay the received data to display devices for a remote visualization.
Fig. 3: The constructed receiver node (base station).
III. DATA VISUALIZATION AND EXPERIMENTAL RESULTS The receiver node was designed with a capability to
communicate with the local network (Wi-Fi). A website was developed to graphically display the environmental data as it is continuously supplied by the sensor nodes. This database-driven and user friendly website was implemented with HTML code, PHP server script and MySQL database tools. As shown in Fig. 4, the designed website has the option to select between two sensors. The drop-down option for each sensor gives the user the flexibility to easily switch between greenhouse gases such as CO2, CO, and CH4. For each sensor, the concentration of the greenhouse gases as a function of time can be displayed. As it can be seen from the Fig. 5, the location of the sensor node is given on the top right hand side of the page where the latitude and longitude of the sensor location is displayed. Real time and continuous data is updated periodically and can be accessed by refreshing the website. Depending on the application and the user preference, the sensor frequency of data measurement can be modified. The sensor data is periodically taken and streamed in to the database and the website displays a continuous graph based on the collected data. For example Fig. 4 shows the screenshot of the website graphically displaying the CO2 level (PPM), as the sensor takes measurements every 30 minutes for over 12 hours.
Fig. 4: Graphic display of sensor data on a website.
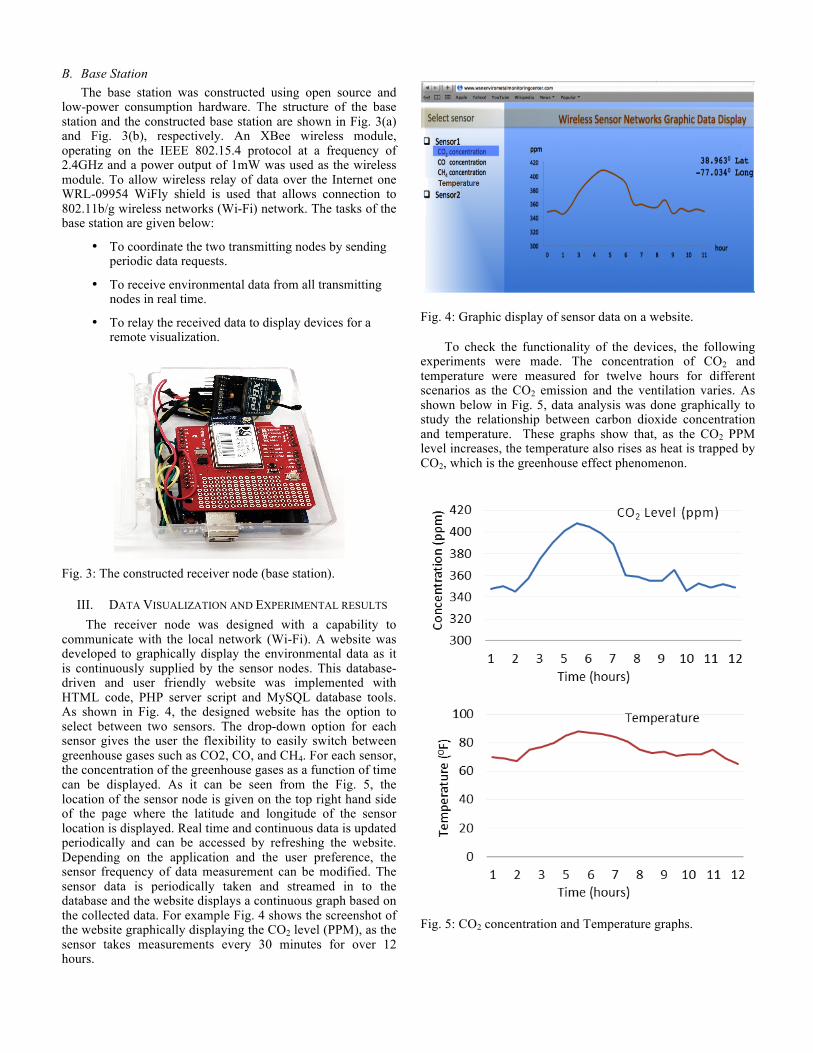
To check the functionality of the devices, the following experiments were made. The concentration of CO2 and temperature were measured for twelve hours for different scenarios as the CO2 emission and the ventilation varies. As shown below in Fig. 5, data analysis was done graphically to study the relationship between carbon dioxide concentration and temperature. These graphs show that, as the CO2 PPM level increases, the temperature also rises as heat is trapped by CO2, which is the greenhouse effect phenomenon.
Fig. 5: CO2 concentration and Temperature graphs.

IV. CONCLUSION AND FUTUR WORK A wireless sensor network for environmental monitoring of
greenhouse gases and temperature was built and successfully tested in real time where data was successfully captured and displayed on a website. The captured data is made available to the user through a graphing application programming interface (API). The network works within the range of 100 meters for optimum performance.
Future enhancements to safeguard the data, including the data encryption are under investigation. The communication between the transmitter and the base station is crucial to collect the data without any interruption. Currently, the base station is powered up using a USB cable that connects to a computer, but the transmitter nodes use 9V batteries to operate. The use of batteries in the transmitting nodes requires maintenance of these nodes on a periodic basis. In the next phase of the project, the use of renewable energy sources such as radio frequency (RF) harvesting and solar energy will be studied.
ACKNOWLEDGMENT This study was supported by the NSF/HBCU-UP Program
HRD 0928444
REFERENCES [1] J. Yang and X. Li, “Design and implementation of low-power wireless
sensor networks for environmental monitoring”, Proc. of IEEE International Conference on Wireless Communications, Networking and Information Security, Beijing, China, June 2010, pp. 593-597.
[2] N. Giannopoulos, C. Giannopoulos, A. Kameas “Design Guidelines for Building a Wireless Sensor Network for Environmental Monitoring” Proc. of 2009 Panhellenic Conference on Informatics, Corfu Greek, September 2009, pp. 148-152.
[3] F. Cuomo S. Della Luna, U. Monaco, U, and T. Melodia “Routing in ZigBee: Benefits from Exploiting the IEEE 802.15.4 Association Tree”, Proc. of IEEE International Conference on Communications, Glasgow, Scotland, June 2007, pp. 3271-3276.
[4] K. Lu, Y. Qian, D. Rodriguez, W. Rivera, and M. Rodriguez “Wireless Sensor Networks for Environmental Monitoring Applications: A Design Framework”, in Proc. IEEE Global Communications Conference, Washington, DC, November 2007, pp. 1108-1112.
[5] B. Pekoslawski, et. al. "Autonomous wireless sensor network for greenhouse environmental conditions monitoring", Proc. of the 20th International Conference on Mixed Design of Integrated Circuits and Systems, Gydnia, Poland, June 2013, pp. 503-507.
[6] Guillermo Barrenetxea, Franc¸ois Ingelrest, Gunnar Schaefer, and Martin Vetterli. “Wirless Sensor Network for Environmantal Monitoring : The SesnsorScope Experience”, Proc. of 2008 International Zurich Seminar on Communications, Zurich, Switzerland, March 2009, pp. 98-101.
[7] I. Akyildiz, W. Su, Y. Sankarasubramaniam, and E. Cayirci, “Wireless sensor networks: A survey,” Computer Networks, vol. 38, pp. 393–422, 2002.
[8] ZigBee Specification, ZigBee Alliance Std. 2005 [online]. Available at : http://www.zigbee.com
[9] Mittal. Ruchi and Bhatia. M.P.S “Wireless Sensor Networks for Monitoring the Environmental Activities” Computational Intelligence and Computing Research (ICCIC), IEEE International Conference, Coimbatore, India, December 2010, pp.1-5.
[10] Jelicic. Vana, Razov Tomislav. Oletic, Kur. Marijan, and Bilas Vedran “MasliNET: A Wrielsess Sensor Network based Environmental Monitoring System” MIPRO, Proceedings of the 34th International Convention, Opatija, Croatia, May 2011, pp. 150-155.
Related Documents