A WIRELESS ELECTROCARDIOGRAM SYSTEM A Design Project Report Presented to the Engineering Division of the Graduate School of Cornell University in Partial Fulfillment of the Requirements for the Degree of Master of Engineering (Electrical) by Mathew David Melnyk & Joshua Marc Silbermann Project Advisor: Dr. Bruce Land Degree Date: May 2004

Welcome message from author
This document is posted to help you gain knowledge. Please leave a comment to let me know what you think about it! Share it to your friends and learn new things together.
Transcript

A WIRELESS ELECTROCARDIOGRAM SYSTEM
A Design Project Report
Presented to the Engineering Division of the Graduate School
of Cornell University
in Partial Fulfillment of the Requirements for the Degree of
Master of Engineering (Electrical)
by
Mathew David Melnyk
&
Joshua Marc Silbermann
Project Advisor: Dr. Bruce Land
Degree Date: May 2004

Abstract
Master of Electrical and Computer Engineering Program
Cornell University
Design Project Report
Project Title: A Wireless Electrocardiogram System
Authors: Joshua Marc Silbermann and Matthew David Melnyk
Abstract: A wireless electrocardiogram system was designed for instructional purposes
in a Cornell undergraduate class in Neurobiology and Behavior. Using a series of filters,
amplifiers, and voltage-to-frequency conversion, a small voltage signal detected on a
human subject is transmitted to receiving circuitry using FM band frequencies. A
receiver unit uses frequency-to-voltage conversion that recovers the signal, which is
again conditioned so that it is of suitable amplitude. An Atmel Mega32 microcontroller
is used to create a scrolling oscilloscope out of a television screen. This television
oscilloscope accurately displays the received signal in an aesthetically pleasing manner.
In addition, by serially transferring the EKG data into MATLAB, several analysis tools
check the wave for basic characteristics. The goal of this project is to create a reliable,
safe, low-cost, low-power electrocardiogram system that will demonstrate a variety of
circuit techniques to undergraduate students.
Report Approved by
Project Advisor: ________________________________________ Date:____________
ii
Executive Summary
For an undergraduate class in circuits and systems, a variety of techniques and
circuit topologies should be demonstrated. Often times, designing and constructing a
practical electrical system provides a more interesting, effective means of demonstrating
the course material. An electrocardiogram system is comprised of a variety of analog
circuits and has very practical applications. If this system is to be used in a classroom
setting, it must be reliable, low-cost, low power, and easily moved. This report outlines
the design of such a system that meets these requirements.
This system has three main components; a transmitter component, a receiving
component, and a scrolling oscilloscope. The transmitter detects the small voltage signal
from the human body and uses filters, amplifiers, and voltage-to-frequency conversion to
condition the signal for a FM transmitter microchip. This chip broadcasts the signal at
FM frequencies.
The receiving component reconstructs the signal. Circuitry used here includes
peak detectors, comparators, and frequency-to-voltage converters. The recovered signal
can then be used by the scrolling oscilloscope circuitry. An Atmel Mega32
microprocessor creates an NTSC raster for a television screen, accurately displaying the
received signal representing the contractions and relaxations of the human heart.
MATLAB code has been written to analyze the data from the receiver, and monitor that it
within a reasonable limit.
After several design iterations and many hours spent debugging and refining our
circuits, we have successfully implemented a system that meets the stated goals. The
transmitted and received electrocardiogram signal matches textbook examples. The
voltage amplitudes of these signals are suitable for inspection and further analytic
analysis by software programs. The reception range is currently about 30 feet, and may
be increased by adding more efficient antennas. A MATLAB program has also been
developed to graph the EKG wave and perform some basic diagnostics on the signal. We
have a system that will be extremely useful in illustrating a variety of electrical concepts
in a laboratory environment.
iii

Division of Labor
This Master of Engineering Design Project was the work of two people, Joshua
Silbermann and Matthew Melnyk. Their technical interests are shared, and both students
expressed an interest in working as part of a small team to produce a larger, working
system. Matthew and Joshua met with Professor Bruce Land to discuss possible joint
projects. After some discussion, the design project was chosen to be a wireless EKG
system. Matthew and Joshua had several meetings with Professor Land in order to more
fully develop the project, and ensure that the workload would be suitable for two people.
After these meetings, with Professor Land’s approval, they began work. The paragraphs
that follow will document each individual’s specific contributions to this joint design
project.
Both students began by working on the transmitter unit, although different parts.
Joshua began by designing the transmitter amplifiers and researching the best methods
for the radio frequency circuitry. Matthew worked on the transmitter filter circuitry, the
voltage-to-frequency conversion, and researching the best method for a power supply.
Each student performed their own tasks for this module, and when design work had been
completed, they reviewed each other’s work. Their work was combined into one piece of
circuitry, and both worked on bread boarding the initial design. Once the circuit was
assembled, both students worked to debug the circuitry. There were many issues to
resolve, and both students contributed to this troubleshooting phase of the design.
Once the transmitter had been completed, Matthew began to work on the printed
circuit board layout for the transmitter, while Joshua began to design the receiver
circuitry. Once the PCB had been laid out, Matthew met with Joshua to discuss his
progress and design work. There were several problems with the receiver circuitry. Both
students discussed the problems and possible solutions. An agreement on the general
strategy was reached, and Joshua began to work on the frequency-to-voltage circuitry and
Matthew worked on the peak detection and the comparator. Once both students had
completed the design work, they again met to discuss their methods and jointly bread
boarded the circuit. They dealt with debugging together.
iv

As Joshua began to layout the receiver PCB, Matthew began to examine C code
to transform a television into a scrolling oscilloscope. Once Joshua had completed his
task, he began to work on the MATLAB Data acquisition software. Each student worked
primarily on their respective software tasks, however at times they offered assistance to
one another.
Overall system testing was performed as a team, as was final validation. Both
students contributed to the final design report, each focusing on writing the parts for their
respective design responsibilities. After the writing of each section, the other team
member would review the work, and make any necessary corrections. Some sections
were written together, such as the executive summary, some of the appendices, and the
abstract. Both Matthew and Joshua were pleased with their own and each other’s efforts
on this design project. Each had a significant role in the successful completion of this
design project.
v

Table of Contents
Introduction……………………………………………………………………………..1
Background……………………………………………………………………………..3
Design Requirements…………………………………………………………………...6
Design Alternatives…………………………………………………………………….8
Design Implementation……………………………………………………………..…11
The Transmitter…………………………………………………………...…..17
The Receiver……………………………………………………………..……23
Scrolling Television EKG Display………………………………….…..……..26
MATLAB Data Analysis……………………………………………..………..31
Printed Circuit Board Design……………………………………..……….…35
Results…………………………………………………………………..………….…38
Transmitter Results………………………………………………………...…38
Receiver Results…………………………………………………………..…..39
Scrolling Display Results………………………………………………...…...39
MATLAB Data Analysis Results………………………………………..…….41
Parts Listing and Price Estimate……………………………………..………48
Conclusion……………………………………………………………………………49
Acknowledgements………………………………………………………..………….51
References……….………………………………………………………...………….51
Appendix I: Final Circuit Schematics…………………………………..…………….52
Appendix II: Pictures of EKG Transmitter and Receiver Circuitry …..……………..54
Appendix III: Comprehensive Instruction Manuel for EKG System ….…………….58
Appendix IV: CodeVision C Code for Scrolling Oscilloscope…………………..…..61
Appendix V: MATLAB Script for EKG Data Analysis …………………………..…75
Appendix VI: PCB Layout Files…………………………………………………..….83
vi

Table of Figures & Tables
Table 1: Electrocardiogram Basic Characteristics…………………………………………3
Figure 1: An Electrocardiogram Waveform………………………………………………4
Table 2: Nominal EKG Parameters………………………………………………………5
Figure 2: (ER) view of general system requirements……………………………………..12
Figure 3: Element relationship (ER) view of general EKG system functions………………12
Figure 4: N2 Diagram of general EKG system functions…………………………………12
Figure 5: (ER) view of system…………………………………………………………..12
Figure 6: Functional Hierarchy of General System Functions……………………………..13
Figure 7: Left Section of Figure 6……………………………………………………….13
Figure 8: Middle section of Figure 6…………………………………………………...…13
Figure 9: Right section of figure 6……………………………………………………….13
Figure 10: Physical Hierarchy of Wireless EKG System………………………………….14
Figure 11: Left section of figure 10………………………………………………………14
Figure 12: Middle section of figure 10…………………………………………………...14
Figure 13: Right section of figure 10……………………………………………………..14
Figure 14: Traceability Hierarchy of General Requirements……………………………....15
Figure 15: Left section of figure 14………………………………………………………15
Figure 16: Middle section of figure 14………………………………………………...…15
Figure 17: Right section of figure 14…………………………………………………......15
Figure 18: Traceability Hierarchy for MEng Proposal……………………………...……..16
Figure 19: Left portion of figure 18………………………………………………………16
Figure 20: Right portion of figure 18……………………………………………………..16
Table 3: Push Button Functions for EKGSCOPE ………………………………………..29
Figure 21: Circuit for Data Input into STK-500 (adapted from ECE 476 website) …….…...30
Figure 22: Circuit for STK-500 output to TV (from ECE 476 website) ……………………30
Figure 23: Sample Control Chart…………………………………………………………31
Figure 24: EKG Waveform from receiver shown on a standard oscilloscope……………….39
Figure 25: EKG Waveform from receiver shown on our scrolling display………………….41
Figure 26: Suite of Figures Characterizing BPM (group size = 3) …………………………42
Figure 27: Second Suite of Figures Characterizing BPM (group size = 3) …………………43
vii

Figure 28: Suite of Figures Characterizing QRS-interval (group size = 3) …………………44
Figure 29: Second Suite of Figures Characterizing QRS-interval (group size = 3) …………44
Figure 30: Close-up view of EKG Waveform…………………………………………….45
Figure 31: Illustration of beat frequency concept [Kostic (1999)] …………………………45
Figure 32: Final transmitter schematic……………………………………………………52
Figure 33: Final receiver schematic…………………………………………………………...53
Figure 34: Final transmitter circuit on proto-board………………………………………..54
Figure 35: Final transmitter circuit on a PCB (1.9” x 2.5”) ……………………………….54
Figure 36: Final transmitter circuit on PCB plus battery (3.8” x 2.5”) …………………….55
Figure 37: Underside of final transmitter PCB (1.9” x 2.5”) ……………………………...55
Figure 38: Final receiver circuit on proto-board………………………………………..…56
Figure 39: Final receiver circuit on a PCB (1.9” x 2.5”)……………………………………..56
Figure 40: Underside of final receiver PCB (1.9” x 2.5”)……………………………………57
Figure 41: Radio and receiver PCB……………………………………………………57
Figure 42: PCB Layout of Transmitter……………………………………………………….83
Figure 43: PCB Layout of Receiver………………………………………………………….83
viii

Introduction
Motivation
Professor Land indicated to us that there was a need of a design project that would
be used in an undergraduate class that would teach a variety of electrical concepts,
including analog circuits and microcontroller design. Further, the class is to be taught to
students who have an interest in biology. The students in the class would build this
project, and the various circuits involved with the project would be used as illustrative
examples. An electrocardiogram (EKG) system meets the description above. It involves
a variety circuits and theories. The system that is described in the report that follows is
intended to meet this need.
Disclaimer
The electrocardiogram system described in this report is not intended to diagnose
or treat any health problem or disease. This EKG device should not be used in place of a
call or visit to a medical or health professional. See your health professional for specific
medical advice and assistance. This report is made available with the understanding that
the authors are not engaged in administering any medical or health professional services.
Overview of System Operation
This system is comprised of three main components; the transmitter, the receiver,
and the scrolling oscilloscope. Three electrodes are placed on the subject’s skin. One
lead is used as a positive, one as a negative, and the third as a ground reference. The
positive and negative signals are fed into a differential amplifier, then a series of filters
and amplifiers. The ground reference provided by the third electrode is connected to the
transmitter circuit’s ground. Once the signal has been appropriately conditioned, a
voltage-to-frequency (V-to-F) converter transforms the signal into a fixed amplitude
square wave train of varying frequency. This signal is then sent to a radio frequency
(RF) microchip that transmits the signal at a user-selectable FM band frequency.
1

Any FM radio can be tuned to the broadcasting frequency and receive the signal.
A listener can then hear the heartbeat. The higher the pitch of the signal, the higher the
voltage level to which it corresponds. There is also a receiving unit that can recover the
broadcast signal. It is composed of an FM radio receiver that outputs the signal to the
receiving circuitry via the headphone jack. The signal is then sent to a comparator that
generates a fixed amplitude square wave train of varying frequency. A frequency-to-
voltage (F-to-V) microchip takes this signal as an input and converts the frequency of the
signal back into a corresponding voltage level. This signal is amplified and then sent to
the scrolling oscilloscope (“scope”).
At the heart of the scope module is an Atmel Mega32 that is used to read in the
signal voltage and generate an NTSC compliant signal that controls a television screen.
The screen then displays the EKG waveform as a scrolling signal. There is a pulse
detector that flashes each time a R-wave peak is detected. A beats-per-minute (BPM)
calculation is also performed and displayed in the lower left corner. The scope supports
several different voltages scales and two scroll rates. The user can select which scale
displays the signal in the most desirable fashion. There is also a run/stop button, which
enables the user to freeze the screen, parse the signal with a cursor, and restart the
scrolling.
As the EKG data is sampled by the Mega32 for output to the screen, the data is
also serially transferred by the microcontroller into a serial connection opened directly
through MATLAB. Now that the data is stored in a MATLAB vector, it can be analyzed
for many of the basic characteristics listed in the background section of this report. A
MATLAB m-file has been written to parse the EKG data for basic metrics including
beats per minute (BPM) and the QRS-interval time. Warm-up data is taken first to create
distributions from which confidence intervals are constructed. These intervals are then
applied to real time data and are used to flag the user for values that may be out of the
valid range.
The above description is intended to provide a general understanding about how
this EKG system was designed. In the pages that follow, more detailed information will
be provided.
2

Background
The idea of the EKG has been around since 1887, yet it remains one of the most
important indicators of proper heart functioning today. The EKG is a non-invasive
technique, meaning that this signal can be measured without entering the body at all.
Electrodes are placed on the user’s skin to detect the bioelectric potentials given off by
the heart that reach the skin’s surface. This section is adapted from [Cromwell et. al.
(1980)].
The four heart chambers, the left and right atria (upper chambers) and the left and
right ventricles (lower chambers) work in a controlled manner to manage blood flow to
and from the lungs and into the circulatory system. There are specific timing constraints
to ensure proper operation of the heart. For instance, both atria work in synchronicity as
well as both ventricles. These electrical timing signals originate at a location on the heart
called the pacemaker, or sinoatrial node. The pacemaker node produces signals that are
at regular intervals. The regular signals the pacemaker produces are passed through delay
channels that ensure different heart sections will fire at the proper time. As different heart
cells are excited by this signals they become depolarized and display what is known as
action potentials. An action potential is a change in the cell’s chemical balance and can
be translated into a voltage equal to roughly 20mV.
The cyclic changes in the heart cell’s polarization are what produce the standard
EKG wave, shown below in figure 1. Note the letters which are the names given to
different wave sections. The flat section that comes before the P-wave is called the
baseline. The following table highlights EKG sections and what they indicate:
Section of Electrocardiogram Source
P-Wave Atrial Excitation
QRS-Complex Atria repolarization + Ventricle depolarization
T- Wave Ventricle repolarization
P-Q Interval Excitation timing delay
Table 1: Electrocardiogram Basic Characteristics
3

Figure 1: An Electrocardiogram Waveform
There are many methodologies for hooking-up a subject for an EKG study. As
many as 12 electrodes could be hooked up to a candidate to offer the examiner a wide
selection of waveforms, each highlighting various heart characteristics better than others.
However as few as three electrodes (the number used in our system) can still record a
typical EKG waveform. One electrode serves as the ground reference and the other two
serve to measure the heart’s electrical activity. We have chosen to use disposable skin
electrodes for our system, although other types of electrodes are sometimes used in
practice. It is important that the ground electrode be away from the heart, away from a
lot of muscle activity. We have found the forearm to be a good location for this, although
often the right leg is used for grounding. As for the other two electrodes, we have found
good locations to be under the left breast and under the right section of the rib cage. The
waveform noise level and clarity is very sensitive to the placement of these electrodes
and they need to be adjusted, as in commercial equipment, to find the optimal location.
The EKG wave serves as an excellent tool for heart analysis. As mentioned
before, the EKG wave has been studied over the years to yield nominal values of both
individual wave amplitudes and time intervals between waves. A summary of these
values is shown in table 2.
4

EKG Wave Amplitude EKG Interval Duration
P 0.25 mV P-R 0.12 - 0.20 sec
R 1.60 mV Q-T 0.35 – 0.44 sec
Q 25% of R S-T 0.05 – 0.15 sec
T 0.1-0.5 mV Q-R-S 0.09 sec
Table 2: Nominal EKG Parameters
By comparing a given EKG wave’s parameters against these nominal values, insight can
be found into potential problems. Our system is able to take an EKG waveform from a
user and wirelessly transmit it to a receiving unit where the wave can both be viewed on a
television monitor as well as analyzed in MATLAB for some of these basic
characteristics. The results portion of this paper will detail some of the specific data we
were able to render from the system and how this data maps to the nominal values
discussed in this section.
5

Design requirements
Because this system is to be used on humans and because it is to be used in a class
laboratory environment, there are a variety of requirements that are placed upon this
system. Some of these requirements originated with our advisor and others we imposed
upon our system:
First, the transmitter shall be independent of all off-the-wall voltages. The
transmitter component is directly hooked up to the human subject. For safety reasons,
this person should not in any way be in contact with the high voltages and currents that
are associated with wall sockets.
The transmitter and receiver components shall not exceed fifty dollars in price.
Price must be kept relatively low since this project is to be replicated numerous times in
the lab. In order to remain a practical solution, this system cannot be expensive. Note
that the scope component is not included in this cost requirement. This is because it will
require the use of a television set and an Atmel evaluation board, which is obviously
more expensive. However, one small television set could be shared among many people,
which would still keep the combined costs low. Also, the undergraduate course ECE 476
also has a large number of evaluation boards and small television screens so these items
do not necessarily need to be purchased.
The transmitter shall broadcast at frequencies ranging between 88MHz and
108MHz (FM) or 560kHz to1800kHz (AM). In order to be received by a commercial
radio, the broadcast signal must be within this range.
The transmitter and receiver shall be low-power circuits that should not draw
more than 10mA each. This requirement is partially for safety reasons and partially
because the circuits should be able to run off of a battery power source for a lengthy
amount of time (roughly 50 hours).
The system shall be portable and easily fit in the space of a typical lab station.
Again, this project is to be used in a classroom setting and there are space limitations. To
6

be a useful solution, the system needs to be compact. In addition, portability is a
necessary requirement for a practical application of this system.
The scope component must output a signal that complies with the NTSC standard.
This standard is used to generate pictures on American television screens. In order to
display artifact free images, the signal must meet a very specific set of guidelines.
The system shall be accompanied by a design description and a discussion of the
theories and considerations necessary to implement the system. If the system is to be
duplicated and/or extended by others, they should be able to refer to a document for
reference. This project report should meet this requirement.
7

Design Alternatives
Our design requirements were fairly specific about several key design choices.
There were some design choices that we did have to consider, and weigh alternatives
against one another.
One of the first major choices that we had to make was how to deal with the
transmitter. We could either attempt to build a transmitter ourselves, or use an IC that
would handle most of the transmission. If we were to build a transmitter, it could have
cut down on costs since an IC would not need to be purchased. Given our background
and the complexity of building an FM transmitter, the transmitter constructed would have
been AM. It would also make our design less dependant on ICs and use more analog
circuitry. It would significantly increase the scope and complexity of this circuit. It
would take up less space on our PCB, which would make our unit more compact.
Ultimately we decided to use the FM transmitter IC for several reasons. First, we
were concerned that we would not be able to build a transmitter that would be able to
accurately transmit the EKG signal. The variations in voltage levels are not that large,
and we were concerned that some of the waveform detail would be lost. Second, after
some design work, it was clear that this project already touched upon many topics in
electrical engineering. Students analyzing this system in their class might not have the
necessary background to analyze and design RF circuitry. We felt that including too
much RF design in addition to all of the other design work involved with this system
would make this project beyond the analytical capabilities of undergraduates. Further,
after analyzing how an FM transmitter IC would work, we discovered that there is still a
large amount of supporting circuitry that must be built. There are several considerations
that must be made, and several RF considerations still must be addressed, even when
using the IC.
There were more choices that had to be made about the transmitter. We could
either set the transmission frequency at some fixed value, or we could allow it to be
selected by the user. Obviously it would make for a more versatile system if this
frequency could be selected. If the frequency could be changed, the user could find an
FM frequency that was not being used by a neighboring radio station. By fixing the
8

broadcast frequency at some available value, we would run the risk of receiving
interference from a station. If the weather changed or if the system was used in a
different location, it could pick up on interference that was not present at the time of
design. However, by allowing the transmission frequency to vary, we would have to
include additional circuitry on the transmitter. Undoubtedly the receiver circuitry would
increase in complexity as well. The added circuitry would increase cost, physical size of
the circuit, and raise complexity.
We decided to allow the user to select the transmission frequency because it
would be too inconvenient to continually have to change circuit components to select a
different broadcast frequency. We determined that the added circuitry would not
consume too much power or physical area. At the end of our design process, if we did
not meet the power and physical area specifications, we would have reconsidered this
design choice first.
There are a variety of ways to use electrodes to monitor the heart signal of a
human. Many electrodes can be used that increase the sensitivity of the EKG system as
well as allow it to be more versatile in the different wave characteristics is can detect. If
we used more than three connections (considered the minimum) we could possibly get
better results and observe a wider range of EKG characteristics. By doing this however,
we would increase the complexity of the system. In addition we would increase the
complexity to hook up and use our EKG.
We ultimately decided to use only three electrodes. This choice was made
primarily because of the added complexity of hooking the system up to a person. There
is a lot of science and skill associated with the proper placement of EKG electrodes.
Being untrained in this area (and assuming that most system users, students, would also
be untrained) we did not feel that added electrodes would significantly enhance our
results, since human error in placement would probably degrade any added benefit. Also,
students would not require the finer details of an EKG wave, so long as the basic
characteristics were present.
Initially, we chose not to include any EKG analysis tools at all. After nearing the
end of the design process however, we decided that adding this functionality would round
out our system, and provide an interesting way of verifying our results. When
9

implementing our EKG analysis tools, we thought of two unique ways of examining our
collected data. We could either use a PC-based software program (such as MATLAB), or
use an Atmel Mega32. If we used MATLAB, we would be able to take advantage of its
ability to read in serial data and analyze it. We could also opt to use some extended
software packages that rely on MATLAB, such as Simulink. Using Simulink would
enable real time data analysis and offer a wider range of analysis tools. MATLAB is
more programmer friendly and powerful than anything we could accomplish using the
Mega32. Both the MATLAB and Simulink options require the use of a PC equipped
with the MATLAB software package. By using the Mega32, we would divorce ourselves
from this requirement. However, the EKG analysis would not be as in depth due to the
lack of processing power.
We decided to use the MATLAB software package, since this project is designed
for use at Cornell, where nearly every engineering PC has the software loaded on it. In
addition, we felt that student would be exposed to programming the Mega32 when
working with the scrolling oscilloscope, and including MATLAB would enhance the
overall design experience. MATLAB also gives the user access to a wide range of
statistical packages that might be useful for future additions.
10

Design Implementation Systems Engineering Description
The CORE software package is a utility that helps classify a system by grouping
characteristics of the system into classes and then establishing relationships between
them. By creating these relationships, one can keep track of all necessary functions, the
components that are responsible for those functions, the physical connections between
components, etc. This is known as traceability and can be applied to physical hierarchies,
functional hierarchies, requirement flow-downs, and others. By exploring these
relationships, we were better able to organize requirements, clarify our design ideas, and
determine potential problems before we even began building our system.
Using CORE, we created a map of our EKG system. One nice feature of CORE
is the script function that the program can run on loaded databases. Of particular interest
is the script known as System Description Document (SDD). This script takes the
information in the database and prepares a report that summarizes many of the links in
the database. These links are presented in both a textual display and a graphical display.
The SDD script that is included with the trial version of CORE seems to leave out
physical hierarchy descriptions, but these can be easily supplemented by building the
charts in CORE and copying them into the prepared report. We generated an SDD,
which is a very lengthy document. Here, we have included highlights from this
document showing key diagrams that characterize our system.
11

Figure 2: (ER) view of general system requirements
Figure 3: Element relationship (E
R) view of general EKG system functions
Figure 4: N2 Diagram of general EKG system function
em
s
Figure 5: (ER) view of syst
12

Figure 6: Functional Hierarchy of General System Functions
Figure 7: Left Section of Figure 6
Figure 8: Middle section of Figure 6
Figure 9: Right section of figure 6
13

Figure 10: Physical Hierarchy of Wireless EKG System
Figure 11: Left section of figure 10
Figure 12: Middle section of figure 10
Figure 13: Right section of figure 10
14

Figure 14: Traceability Hierarchy of General Requirements
Figure 15: Left section of figure 14
Figure 16: Middle section of figure 14
Figure 17: Right section of figure 14
15

Figure 18: Traceability Hierarchy for MEng Proposal
Figure 19: Left portion of figure 18
Figure 20: Right portion of figure 18
16

The Transmitter
The transmitter component takes in three signals from the user, a positive, a
negative, and a ground. Electrodes placed on the user’s skin detect these signals. The
transmitter conditions the signal for a V-to-F converter using amplifiers, filters, and a
summing amp. Once the V-to-F conversion has occurred, the signal is attenuated so it
can be used in the RF circuitry to transmit at FM frequencies. Because of the modularity
of the transmitter, this unit can be broken down into smaller sub-components: the gain
circuitry, filter circuitry, the summing amplifier, V-to-F converter, and the RF circuitry.
Each sub-component will be discussed below along with a description of the problems
that arose, and the solutions that we found to correct them.
The Gain Circuitry
Vpp of the EKG signal in from the user is about 1.6 mV. This is clearly a very
low-level signal, which is unusable at its current amplitude. We added several gain
stages to boost this Vpp up to fully utilize our rail levels (set to –4.5V, 4.5V by our power
supply, to be discussed later). Because of the initial low level of the signal, noise was a
serious issue. White noise alone was enough to distort any input signal that we received
from the user. Examining the input signals directly with a scope, the signal would look
indistinguishable from the scope readout with nothing connected up to its probes.
Because of this problem we used a differential amplifier, allowing us to effectively ignore
the common signal between the positive and negative leads from the user (the common
signal being the white noise). We used a Burr-Brown INA121 low-power
instrumentation amplifier. The gain for this stage was set to ten by a resistor (5.55k), and
the output was single-ended.
More gain was necessary, so we decided to use Linear Technology’s LT1079
operational amplifier package, which is designed with the intention of being used in
instrumentation circuitry. Before amplifying the signal further, we decided to use a
simple RC high-pass filter to block any DC bias that the signal was riding on. The DC
level of the signal tended to fluctuate and caused difficulty in subsequent circuit stages.
The time constant for this filter was set to pass very low frequencies (on the order of 1
17

Hz) without attenuation. This is the lowest frequency contribution of the EKG frequency
spectrum. We used two stages for amplification, one stage with a gain of approximately
100, and the other with a gain of approximately 6.
We had initially designed these gain stages to set the signal up to maximum and
minimum voltages of ±4.5 V (the rail voltages). Upon completing the circuitry for this
transmitter component, we found that at the input to the V-to-F converter the signal was
clipping at the top and bottom rail. After consulting the datasheet and experimenting on
our own, we determined that the maximum voltage should be less than 4V, and minimum
voltage should be greater than –4V. We lowered the gain of one stage to be 5, while the
others were left at 10 and 100. Throughout our design process, we constantly had to
adjust the gains of the amplifiers in this stage of the circuit. As a general rule, we did not
allow the gain of one stage to exceed 100, because of the gain bandwidth product
restrictions on the op-amp. Eventually, for reasons to be discussed in subsequent
sections, we were able to completely eliminate one of these stages.
Filter Circuitry
Aside from the RC high-pass, several other filter stages were necessary in order to
ensure that the signal was as noiseless as possible. Despite having the differential
amplifier, we still had concerns about noise. A notch filter to eliminate 60-Hz noise
seemed like an effective method to filter out noise from lighting and other off-the-wall
appliances. There was no gain associated with this stage of the transmitter.
In our background research on the origins of the EKG signal and some of its
characteristics, we found that almost all of the signal’s frequency content was below 200
Hz. For this reason, we decided to use another low-pass filter to attenuate frequencies
higher than this value. We used a Butterworth filter because it provides the flattest
frequency response across the pass-band. By using some other filter topology, such as a
Chebyshev filter, we would be attenuating some frequencies of our signal due to the
ripple in the low-pass band. Although other filters have steeper responses than the
Butterworth (that is they attenuate frequencies outside of the pass-band more quickly) we
decided that this was not as important as keeping the pass-band response as flat as
possible. We decided to use an active Butterworth filter, utilizing another op-amp on the
18

LTC1079 (each package includes four op-amps). We could have constructed the filter
using only passive elements, however we already had the LT1079 present in the circuitry
and there was no reason not to use it for this filter. Also a butterworth filter made out of
only passive components would consume much more physical area. We made this stage
of the circuit non-inverting, with a small gain of 1.1.
The Summing Amplifier
This is the final stage before the V-to-F converter. We initially did not plan on
including this stage, but it was determined that the V-to-F integrated circuit chip would
not accept negative voltages as input. After our AC coupling capacitor included in the
amplification stage, the EKG signal was centered on 0V DC, and does contain some
negative voltages. We did not want to lose this signal content, since we wanted to
reproduce the input signal as exactly as possible. We therefore had to include an offset
on the signal so that it never went below 0V. Since the EKG signal can spike below the
baseline voltage, we decided to set this nominal level to 2V DC, effectively centering our
signal to the middle of ground and the positive voltage rail.
We quickly realized that this would require us to decrease the gain significantly,
since we can now only support a maximum voltage swing from 0 to 4 V. We went back
and reassessed our gain circuitry. We found that we could actually completely eliminate
one stage, and only use two gain stages (plus the slight gain in our Butterworth filter).
By eliminating one amplifying stage, we were able to keep the total number of needed
LTC1079 op-amps to 4. This will fit all on one package. Keeping the IC count as low as
possible for our circuit would ensure that the minimum amount of power was used, and it
would also decrease the physical area needed for circuit layout when we designed the
printed circuit board (PCB). The INA121 was left with a gain of 10. One amplifying
stage of the LTC1079 was eliminated, and the other was left at 90. This left us with a
total gain of 900, which would give us a signal Vpp of 1.45V. The notch filter slightly
attenuates this Vpp, lowering it to 1.25V. With the summing amp centering the signal at
about 2V DC, our total swing was 1.6V to 2.8V. Note that negative spike of the EKG is
about .4V less than the positive EKG spike. The observed Vpp at TH1 off of the PCB is
slightly less than 1V peak to peak. This is because there is a filter at the input to pin
19

seven of the V-to-F, which slightly attenuates our signal. This signal voltage of about
1Vpp is acceptable, and appears very similar to textbook examples of EKG waveforms.
Note that the voltage levels above are examples only, and will vary depending on the
placement of electrodes.
We initially used a resistive voltage divider to get 2V from our 4.5V supply.
After having some difficulty getting a non-inverting summing amplifier to function
properly, we changed it to inverting. We also ensured that one other stage of the circuit
was inverting so that the final signal was non-inverted. The notch filter was an inverting
stage that would meet this requirement. Changing the summing amplifier to an inverting
one required us to sum the signal with a –2V level. This value was obtained using a
resistive voltage divider with the –4.5V rail.
At the end of the amplifying, filtering, and summing stages, we had taken the
noisy, small signal detected by the electrodes placed on the human subject and turned it
into a clean signal whose amplitude was usable by the V-to-F circuitry.
The Voltage-to-frequency Converter
The purpose of this stage of the circuit was to take the voltage level of the EKG
signal and convert it to a corresponding frequency level. The output of this stage is a 0-
4V square wave train whose frequency varies according to the amplitude of the EKG
signal incident on the input. This stage required a great deal of fine-tuning. The output
frequency of the train corresponds to the audio frequency that will be heard when the
signal is broadcast over FM band. Thus we had to ensure the pulse train was within the
range of 20Hz to 20kHz. Furthermore, we wanted to ensure that the audio signal heard
was of a pleasing tone, and that the frequency range of the wave train was high enough so
that there would be a notable change in tone as the EKG signal changed in voltage level.
We used a National LM231 V-to-F IC for this circuitry.
There was some documentation in the datasheet about how to construct the
circuit. Especially helpful was an equation given to set the output frequency, given an
input voltage level and the value of several passive components.
20

The equation wasttL
Sinout CRR
RV
Vf 1
09.2××= where RS, RL, Rt, and Ct are referenced in the
schematic in Appendix I as R20, R19, R21, and C10 respectively. We selected these
values so that, given our range of Vin levels, we would produce a frequency that could be
heard by the human ear. Because our Vin was never zero volts, some tone was always
heard. Thus for small values of Vin a low frequency tone will be heard, while larger Vin
amplitudes lead to higher tones. Our low Vin is about 1.6V and our upper Vin is about
2.5V. Given these values, the frequency range is approximately 780Hz to 1230Hz.
RF Circuitry
At the heart of this circuitry is a Maxim 2606 RF Transmitter chip. This chip
takes a small AC signal in, and modulates it for FM transmission. The output of the chip
goes to a small wire antenna. There were initially two potentiometers in this circuit, one
to control the amplitude of the AC signal (thus the volume of the received signal), one to
control the broadcast frequency. The chip has an integrated varactor, which controls the
broadcast frequency. As the potentiometer alters the DC voltage level, the varactor
changes capacitance values that, combined with an inductor, allow the broadcast
frequency to be selected. The AC signal input to pin 3 on the 2606 was the information
to be broadcast. The DC level on pin 3 sets the broadcasting frequency.
Upon experimentation with the volume potentiometer, we decided to remove it
from the circuit. Since the volume could be controlled from the receiver and the
potentiometer would take up a sizeable amount of area on the PCB, we reasoned that the
pot was unnecessary.
Because of the fast switching nature of the output from this IC, we isolated it as
much as possible from the other transmission circuitry. We did not want this high-
frequency signal to couple back into our circuit. This led us to keep this circuitry as far
removed on the breadboard as was possible. During PCB layout, we took special
considerations to ensure that this circuitry would not interfere with operation (to be
discussed in PCB section of the report).
The 2606 was also very sensitive to the proximity of the antenna and inductor.
We found that if this distance was too great, it would interfere with the circuit’s
21

operation. We soldered the 2606 onto a small external PCB and placed the antenna and
inductor on the board as close as possible to the IC. This greatly improved the range of
broadcasting frequencies and transmission strength.
Because we had limited access to inductor values, we had to wrap our own.
Using 20 gauge wire (approximately), we used to formula:
L(uH) = d * n / ( 18d+40l )2 2 d = Coil diameter(in), n = Number of turns, l = Coil length (in)
to determine the inductance value of our wound coil. This process was an iterative one,
as we continued to fine-tune our inductance value until we came across one that would
allow us to broadcast at a desired range of FM frequencies. Our final inductor was
approximately 280nH.
Final Remarks
There were two major issues we experienced in addition to the ones listed above.
First, we found that our power rails were very noisy. Most of this noise was high
frequency, and we assumed that some of the high frequency signal from the RF IC was
coupling back into our power supply. We added several decoupling capacitors from
power to ground to help filter out this noise. These additions resolved the problem.
There were also a variety of inexplicable problems that occurred halfway through
the design process. On one particular day we would have part of the circuit operating
correctly, only to leave the lab and come back the next day to find that the circuit no
longer functioned. We also had problems that would inexplicably occur and then
disappear from one minute to the next. After many hours of debugging we began to
suspect the protoboard. We decided to switch to a different protoboard and see if the
problem still occurred. Our suspicions were confirmed as these odd problems no longer
occurred. We never had any more trouble of this kind, even on our transmitter PCB.
The Split Power Supply
We wanted our system to be small and portable. Connecting to a large variable
power supply was not an attractive design decision. We decided to use a battery-based
power supply. However, because of the use of op-amps, we needed both a positive and a
negative rail. Each rail needed to be approximately 5V in magnitude. We decided to use
22

a split power supply circuit. Because values of ±5 V were needed, we decided to use a
nine-volt battery. This circuit would output three different signals to be used by the
transmitter. The positive terminal of the battery would become the 4.5V rail while the
negative terminal would become the –4.5V rail. This supply uses one op-amp, whose
output is the ground reference from the circuit. Essentially the voltage provided by the
battery was divided by two (4.5V), and then used as the ground reference for each battery
terminal.
The Receiver
Once we had successfully designed the transmitter, we began work on the
receiver component. This unit was designed to receive the transmitted signal using a
radio receiver, and then convert the modulating frequency of the signal back to a voltage.
The received signal should be an accurate reconstruction of the transmitted signal. The
signal should be appropriately amplified so that the television oscilloscope can use it and
displayed in an accurate, meaningful manner. We had several initial ideas about how to
achieve these goals. Once we implemented our design however, we found some
unexpected problems and had to completely redesign the circuitry to address these issues.
Our final circuit had little in common with our initial design. This section of the report
will outline our initial design work, the problems that we encountered, and our solutions
to them.
Initial Design
We initially planned on using the signal from the headphone jack of the radio
receiver and sending it directly to the F-to-V converter. Afterwards, we expected that
some amplification and filtering would be necessary. We started by setting up the F-to-V
circuitry and observing the output so that we would have some idea of how noisy the
signal was and how much it would have to be amplified. Once we had this circuit built
and began testing, we quickly realized that all of the capacitance values in the F-to-V
circuitry would have to be fine tuned to pass the signal without distorting it. This was
particularly important at the output, where the capacitance value had to be increased to 1
µF so as not to attenuate the signal. After some alterations were made, we did in fact get
23

a very small amplitude signal out. It was very noisy however, and the signal was on the
order of 50mV peak-to-peak. We added several amplifiers and filters, hoping to see an
improvement. There was some, although it was impossible to filter out all of the noise.
There were also some distortions to the signal itself that were not associated with noise.
There were added voltage peaks that seemed to suggest the F-to-V was detecting some
high frequency components of the signal and translating them to a high voltage level.
After fully implementing our initial design, we had a very rough signal that did not look
very similar to our original EKG waveform.
We checked our input signal to the F-to-V and were surprised at what we saw.
We were expecting an approximate square wave train coming out of our radio receiver.
Instead we found very sharp spikes in the voltage. Instead of a square wave train, we had
a signal that much more closely resembled an impulse train. The F-to-V called for a
nearly ideal square-wave train input, so we immediately knew that this was one source of
our problems.
Receiver Revised
We had to come up with a way to turn the pulse signal from our radio receiver
into a square wave train. We thought that a comparator would be the appropriate
solution. When we hooked up an LT1079 op-amp to perform this function, we were
unable to get any sort of an output. We found the reason for this to be that the 1079 was
in fact too slow to handle the quick timing associated with the impulse train. We had to
switch ICs to one that could handle the quicker signal speed. We decided upon an
NTE834 IC. Once we had switched over to this faster operational amplifier, a square
wave was generated from the non-ideal radio receiver signal. At first, we believed the
problem to be solved. Soon after we realized the addition of the comparator had
improved the problem, but there were still some remaining issues to be solved.
A 2V reference signal had been used for the comparator. For input signals less
than this value, the comparator would pull its output to ground. For values above this,
the output would rail out. This 2V comparison value was the middle of the high and low
voltage level of the input impulse. However, if the volume was changed on the radio
receiver, a different user was hooked up to the circuit, or a different radio was used, this
24

2V value may no longer be the center of the impulse. Thus the circuit we had constructed
was entirely dependant upon reconstructing the exact situation we set up in the lab while
designing. We wanted this circuit to be as robust as possible, so we had to come up with
a way to address the issue of varying amplitude on the input impulse.
Final receiver circuitry
A peak detector is used to determine the maximum value of the impulse input.
This level replaces the 2V comparison value discussed above. This peak value is divided
by two using a resistive voltage divider and used by our comparator to generate a square
wave output. Once one particular peak value was detected, a smaller peak could never
register because there was no path for current to drain and subsequently allow for a lower
peak voltage level. To resolve this, we added a 1M “bleeder” resistor to ground in the
peak detector circuitry. Now, should the voltage level of the peak decrease, current can
slowly drain through this resistor and allow a smaller peak value to be detected. The
exact radio receiver used and its volume level no longer matters. Whatever the signal is,
our comparator will find half of the peak amplitude and create a square pulse train that
accurately represents the frequencies received from the radio.
Using the faster op-amp for the comparator, and using the peak detector combined
with the voltage divider, we had solved the issues that had confronted us with our
previous design. With the new square wave train as input, the F-to-V produced a much
cleaner, higher amplitude output. We fine-tuned some of the RC values at the output so
as to not to unnecessarily attenuate our signal. With the new circuitry in place, our
recovered EKG signal looked identical in shape to the one that was broadcast. Since the
amplitude was still a little low, we used an op-amp to increase the signal magnitude. An
extra shunt resistor to ground was needed between the coupling capacitor and the non-
inverting terminal for proper functioning. This resistor provides a ground path for the
operational amplifier, which is absent because of the insulating capacitor. The ground
path provides the small amount of current needed to run the operational amplifier
properly. The signal still seemed to have some high frequency components that were
making it unnecessarily noisy. We added in a capacitor to short all of the higher
frequency signals to ground.
25

We had successfully designed a receiver that recovered our broadcast signal. The
circuit, like the transmitter, uses a 9-volt battery split power supply. Our scrolling
oscilloscope uses the signal output from this component.
Scrolling Television EKG Display In order to round out the EKG system, we wanted to display the EKG wave on a
monitor. However, we did not want there to be a particular dedicated display system
since that would defeat the purpose of the portability and “anytime” usage of the device.
Having utilized microcontroller based television display techniques in the past, we knew
that it was possible to generate NTSC raster from an Atmel controller. It therefore
seemed feasible that the on-board analog-to-digital converter (ADC) could sample the
relatively low frequency heart signal and then write that data to the monitor. This way
not only would the transmitter and receiver be portable, but so would the display system
as any television monitor with a video-in connection could be used to show the scrolling
EKG data.
Professor Bruce Land had already created an television based oscilloscope that
would read in a fixed number of data points through the ADC, store them into a buffer
and then blast them out screen [TV Oscilloscope, Circuit Cellar Magazine #161, pp 20-
25, Dec 2003]. This created a refresh type effect on screen roughly every couple
seconds. It was decided that the code for this TV scope could be modified to generate a
scrolling effect. A full listing of our code can be found in Appendix IV.
The original code samples an ADC channel at video rate (15.75 kHz) and displays
a voltage trace as 128 dots across the screen. Professor Land has adjusted the horizontal
synch pulse time to be 63.625 µs in order to make each frame exactly 1/60 of a second.
None of these timing constraints needed to be changed in order to create the scrolling
display. The basic mentality behind converting the scope into an EKG display was that
because of the slow speed of the EKG wave, that data sampled over one frame would
essentially be the same data value. This assumption holds only because typical EKG
rhythms have such a slow period of about 2-3 seconds, so if one were to sample that
wave every 1/60 of a second (the NTSC frame rate) it is likely that there would be more
then enough data to highlight the general features of the EKG wave. Hence instead of
26

sampling a screen’s worth of data and then blasting it to the screen all at once, each frame
that is repainted to the screen adds one new point to the right hand side of the screen and
shifts the other 127 pieces of data in the 128 point screen to the left.
The ADC is still read out in the synch generation interrupt except now all except
the last data point taken are essentially ignored. The variable “ADnow” holds the most
recent data point. The rest of the code for the EKG monitor executes in the vertical
blanking interval (when the electron beam makes its way back to the upper left of the
screen), where Professor Land left space for additional calculation and data manipulation.
A vector “Adout” holds the 128 data points that occupy the width of the screen. Once the
vertical blanking interval is reached, the data in that vector is scrolled, moving all points
one index to the left and filling the right-most void with the information in ADnow. Also
at this point, the data in ADnow is sent to COM1 for collection by the MATLAB data
collection and analysis code, which will be discussed next. The refreshed ADout array is
then parsed, fitting each point to the proper location on the screen based on its ADC
value and the current voltage scale on the screen. This constructs the data raster to be
displayed on the next frame.
Next, there is code for a visual pulse indicator and for calculating the user’s heart
rate in beats per minute (BPM). The pulse indicator is a flashing box on the screen that
blinks every time the user’s R-wave is detected. It was recognized that the R-Wave has a
much larger amplitude then any of the other portions of the EKG wave, so by monitoring
the newest addition to the ADout vector (ADout[127]) and seeing if it is exceeding a
certain amplitude threshold the pulse indicator knows when to flash. It is important that
this threshold be adjustable since different users will produce R-waves with slightly
different amplitudes. To do this, we created dual roles for push buttons 7 and 6 on the
STK-500 board. When the waveform is stopped on the screen, push buttons 6 and 7 still
have the same effect they did in the previous code, namely moving a cursor right and left
along the wave and displaying the time and amplitude coordinates on the screen.
However, now when the waveform is in motion on the screen, push buttons 7 and 6
respectively raise and lower the “pulse threshold”. The right hand corner of the screen
keeps track of the current threshold setting in ADC units. The trigger level is restricted to
the range of 0 to 255. The typical setting for measuring human EKG waves is around
27

167. The operator can fine-tune this setting so that the pulse indicator is flashing in
proper relationship to the R-waves entering from the right side of the screen.
To calculate the user’s heart rate, the same initial information is used regarding
whether ADout[127] is greater than the threshold voltage setting. That is why the pulse
indicator and heart rate calculation are together in the same conditional statement. Once
the program finds that index 127 of ADout contains an R peak, it begins a search to the
left finding where the next R peak is. It does this again by finding the first data point that
exceeds the threshold voltage setting. Because there could be a cluster of two or three
points that reside above the threshold setting, a search offset of seven data points is hard
coded to avoid counting the same R peak and registering an erroneously high pulse rate.
This is the explanation for why the search begins at index 120 rather then 126. This
search offset could be adjusted if needed but it has worked well in the lab.
At this point, the heart rate is simply the index of the next closest R peak to the
left of the one residing at index 127. To convert this to a beats per minute value and
recognizing the subsequent points are spaced 1/60 of a second apart, the following
formula is applied:
60))127(016.0(
1×
−× BPM
Because the human heart rate does tend to jump around quite a bit, some
averaging was also coded in to help prevent the BPM display on the monitor from
jumping around too much. To do this, the three most recent BPM calculations are held as
variables at all times and the three are averaged together to arrive at the value that is
displayed on the screen.
All of the above calculations done in the vertical blanking interval were initiated
by an R-wave detected at the right hand side of the screen. If there is no R-wave detected
than no new BPM calculations are performed. Also, all of the screen pixels that make up
the pulse indicator are set to black. This creates the flashing effect.
While Professor Land’s button state machine is used as before, not all of the
buttons have the same function as they did before the code modification. Below is a brief
summary of what function the push buttons on the STK-500 serve for the EKGSCOPE:
28

Push Button Number EKGSCOPE Function
1 Cursor Adjustment (Right) AND Threshold Adjustment (Up)
2 Cursor Adjustment (Left) AND Threshold Adjustment (Down)
3 No Function
4 Voltage Scale Adjustment
5 Fast / Slow Rate Adjustment
6 No Function
7 No Function
8 Waveform Run / Stop
Table 3: Push Button Functions for EKGSCOPE
Push buttons 1 and 2 have already been discussed while push buttons 4 and 8
have not had their original functionality altered. Push button 5 has the new task of
toggling between a full speed rate and a half speed rate. It does this by simply toggling a
variable named “rate” between 1 and 2. A running counter is then checked as to whether
it is divisible by “rate” and if it is, the scrolling loop that controls ADout is entered at the
start of the vertical blanking interval. Obviously, if “rate” is set to one, the loop is always
entered and the screen scrolls at the maximum frame rate. That means that a point on the
right hand side of the screen takes 128601× = 2.13 seconds to get across. By pressing
button 5, the scrolling loop is entered only half as much as it was before. This cuts the
scrolling rate in half, meaning that points now take roughly 4.27 seconds to move across
the screen. The only caveat to this is that in order to accommodate the half-speed rate
while maintaining real time data, every other data point is now thrown out slightly
impairing the resolution of the displayed waveform. This corresponds to sampling the
EKG waveform roughly once every 1/30 of a second. An indicator of “FULL” or
“HALF” at the bottom of the screen lets the user know what the current setting is.
Hooking up the EKGSCOPE to the receiving unit is very simple and requires only
the following circuitry shown in figure 21. This circuit simply scrubs off any DC from
29

the incoming waveform and centers the AC portion midway between the usable range of
the ADC. Note the Vref is being generated by the REF pin on PORT E since it changes
for certain voltage range settings of the screen. To hook up the television to the STK-500
simply follow the circuit in figure 22. The ground connection should be made to the
outer conductor of the RCA cable while the “To TV” connection can be made to the
center conductor. This circuit combines the sync information with the video information
and sends it out to the video input on the television.
100 nF
Figure 21: Circuit for Data Input into STK-500 (adapted from ECE 476 website)
.
Figure 22: Circuit for STK-500 output to TV (from ECE 476 website)
30

MATLAB Data Analysis
To further complement the EKG system, it seemed appropriate to add some data
analysis into the mix. Not only could a user see his/her heart wave travel across a
television monitor, but also using any PC with MATLAB installed they could also more
closely inspect that data and extract some of the basic EKG parameters. To accomplish
this required finding an easy way to transfer data into a MATLAB environment and then
writing some macros to analyze the EKG waveforms.
We wanted to approach this analysis from a process control perspective. In
general, process control mentality provides basic approaches to help determine whether a
given process’s mean and/or variability are in control (i.e. within acceptable tolerances).
Often constructing what are known as control charts does this. The control charts are
meant to monitor major deviations from a target mean (X-bar chart) as well as excess
variability around the target specification (Range or R chart). An example of a control
chart is shown below in figure 23:
Figure 23: Sample Control Chart
The upper and lower dotted green lines are known respectively as the upper
control limit (UCL) and the lower control limit (LCL). These control limits are generated
by monitoring the process when it is assumed to be in control, collecting and grouping
data, and finally generating some basic statistics out of this data. For instance, on an X-
bar chart an estimator for the mean is calculated and the UCL and LCL are generated as
31

the 99.7% confidence interval (3 standard deviations on either side assuming normality)
about the mean. The basic methodology that follows relies on the assumption that the
random variables being analyzed are of the following nature:
y = µ + ε where ε ~ N(0, σ2)
The random variable y is itself assumed to be normal so to facilitate the creation of the
chosen confidence intervals as seen in the next section. It will be assumed for now that
the variables being tracked are normally distributed, however in the results discussion
this issue will be addressed further and it will be shown that indeed that they are not all
randomly distributed.
Based on the above discussion, there are six steps to creating a control chart and
each one of these steps will be evident in the MATLAB script that analyzes the EGK
waveform [adapted from Jackson].
Step 1) Data collection from a process assumed to be in control
Step 2) Grouping of Data Elements
Step 3) Process Mean and Variability Estimation
Step 4) Establishing Control Limits
Step 5) Confirmation that Previous Process was in Control
Step 6) Plot Subsequent Data on Chart and Monitor for Out-of-Control Tendencies
As mentioned in the previous section, each time that a new data point is brought
into the ADout array, it is also sent to COM1 for serial transfer into MATLAB. Using
the SERIAL command in MATLAB, we were able to open a direct serial connection into
the program rather then going through an intermediary program such as HyperTerminal,
which was our original thought. Besides configuring the serial port that is being used and
the baud rate, we have configured the input buffer size and the timeout length. The input
buffer size will determine the maximum amount of data that can be taken in at a time.
This includes how much data could be taken in the initial collection before the control
limits are calculated as well as how much could be taken in during monitoring before the
32

screen is refreshed. This will be shown to be an important parameter since the more total
data points the user has to work with the more they might be able to make use of the
central limit theorem in case of a non-normal random variable. The timeout length
should simply be set high enough that all data can be taken in the span of it.
The first thing the software does is collect initial EKG data from the user based on
the parameters of the “fread” command, which reads in a given number of binary pieces
of information (maximum is input buffer size). This stream of ADC values is stored
directly in a vector and can be immediately worked with in MATLAB. The user is asked
which of two parameters they would like to track, heart rate (BPM) or QRS-interval
length. Depending on which parameter is chosen, the software will parse the initial data
set and extract the information.
If heart rate is chosen, the software creates a vector of intervals between detected
R-wave peaks. The peaks are located in the same way that they are located with the
scrolling display, by simply looking for values above a certain threshold. This variable
“threshold” is set in the code and should be adjusted on a person-by-person basis. The
software finds the intervals between the peaks and converts these intervals to seconds as
before. It then looks for noticeable outliers by sorting out values that are out of a certain
range, which is also adjustable. These outliers were mainly due to the occasional time
where two data points were collected near the same peak. This creates the illusion of a
falsely high BPM that is then weeded out. Due to the sampling rate of the system, this
does not happen all the time. All possible BPM calculations are made and stored in a
vector.
For QRS-interval extraction, finding the R-wave peaks, the intervals between the
peaks and basic error correction are performed in the same fashion as for BPM. The
technique for finding the QRS-intervals is similar to the way one might find them by eye.
The most noticeable feature of the EKG waveform are the R-wave peaks, which is why
they are located first. Next there is a two-step procedure for finding each interval.
Beginning at the peak, a backwards-in-time search is performed until the amplitude is
within a close distance away from the baseline value (indicating the start of the Q-wave).
This baseline value tends to be around 126, but depending on the baseline for a given
user the value of the search parameter (now set to 130) can be changed. Once this lower
33

time mark is found, it is saved. Next the search is reset to the time of the peak. Now a
forward-in-time search is performed to find the end of the S-wave. The criteria for
location the end of the S-wave is that the value is within a given distance from the
baseline but on a positive slope. This means that the baseline is passed once on the way
down from the peak and then located on the way up. This upper time mark minus the
lower time mark indicates the QRS interval. This interval is converted into seconds and
stored in a vector. This analysis is performed for all peaks.
It should be noted that a function called Delmat was used to remove an item from
a vector and automatically resize it. This command was written by B. Rasmus Anthin
Copyright (c) 2003-09-24.
After the initial data set is parsed for the appropriate parameters, that vector of
parameters (either BPM values or QRS-intervals) needs to be grouped for control limit
calculations. The user is prompted to enter this group size and is given the total number
of parameters extracted. It is preferable that the number of parameters be divisible by the
group size however if it is not, one group will simply be smaller than the rest. The larger
the group size the better since the application of the central limit theorem will help
enforce normality.
The program will then compute group mean and range for each set of data. After
that, a mean of those means (grand mean) and a mean of those ranges (mean range) are
calculated. The grand mean will serve as centerline of the x-bar chart and the mean range
will serve as the centerline of the range chart. To estimate the corresponding standard
deviations the following formulas from process control are used:
σ for x-bar chart = 2
_d
rangemean
σ for range chart = 2
_3d
rangemeand ×
Note that d2 and d3 are pre-computed factors for creating control charts and are based on
the group size (Montgomery). A look-up table of these values is referenced in the code.
34

Once all of these values are calculated, a 99.7% confidence interval is constructed on
both charts in the following manner:
(grand mean) ± size group
chart)bar -for x ()3( σ× x-bar chart
(mean range) ± (3)*(σ for range chart) range chart
These control limits are then applied to the charts. At this point, the program
begins taking in new data, the amount of which is set by new “fread” commands. Also,
the number of data sets to be monitored is established by a while loop conditional
statement that can be changed by the user. As the program takes in new data sets from
the user, depending on which variable is being tracked, it will extract the new parameters,
regroup them, create new group means and ranges and then refresh the plots with this
new data. Note that the control limits will remain fixed through this process. One item
of note is a 1ms pause in between subsequent plots. This was found to be necessary to
create the desired refresh effect. Without this line, the plot window only displays the
final data set and remains blank for the ones in between.
The results of these basic data analysis tools can be found in the results section.
Sample plots are given there as well as general descriptions of how the algorithms
appeared to work. Finally, a small piece of code has been left commented out toward the
beginning of the main code (see Appendix V) that can be used specifically for the
purpose of recording data. This code will simply read in a set number of data elements
and store them in an array. This is handy for gathering data for testing new EKG
waveform analysis algorithms that could be added at a later date.
Printed Circuit Board Design
We did not want our circuits to be on breadboards once our design work was
complete. We both wanted the design experience of laying out a PCB. So after the
transmitter circuitry was designed and tested, we used the software provided by
ExpressPCB to design a circuit board for the transmitter. Once the receiving circuitry
was completed, we designed another PCB. The following section will outline the
35

considerations and steps that we took while laying out our designs. The full printed
circuit boards we designed on were 3.8” x 2.5”, however our circuits only occupied 1.9”
x 2.5” so that we could fit two circuits on every one board.
The Transmitter PCB
The first consideration made was the placement of the split power supply and the
RF circuitry. As mentioned in previous sections, we wanted to isolate the RF circuit as
much as possible from the rest of the design, especially the power supply. For this
reason, the split supply was placed in one corner of the board while the RF circuitry was
placed in the opposite corner. Space was left between the RF circuitry and other circuits
so that the RF pickup would be at a minimum.
Another noise reduction technique that was utilized was ground plane shielding.
The bottom layer of the PCB was almost entirely devoted to ground connections. Instead
of running ground traces around the circuit, large sections of metal were used to supply
ground. In fact, as much of the bottom layer of the PCB was shielded by ground
connections as possible. This was done to shield the supply and other circuit components
from the RF transmission signals.
All power traces were laid slightly thicker than normal traces. This was done so
that they were easily identifiable and also to ensure that appropriate levels of current
could flow through them without generating heat. Power connections were made as
directly as possible, without snaking around components. This was to minimize the area
that would be susceptible to noise pickup. Also, decoupling capacitors were spaced
throughout the power traces to eliminate noise on the supply lines. Just like the power
traces, ground traces were also slightly wider. These traces, and all others were laid out
in straight lines whenever possible. When a corner had to be made, it was not done using
90-degree angles, but rather with two 45-degree angles. This was to avoid any
fabrication errors when the boards were created.
Many other smaller considerations were also made during this layout process
including the following: labeling each IC with a unique number, spacing all components
so that there would be enough room to solder them, including several test holes for
debugging purposes (holes provided for ground, positive and negative rails, and the
36

signal before the V-to-F conversion), and adding a power switch in the circuit. The
transmitter layout schematic can be found in Appendix VI.
The Receiver PCB
The signal in from the radio receiver was isolated from the rest of the circuitry.
Many of the same considerations were made for this PCB as were made for the
transmitter PCB. Just like the transmitter PCB, a split rail supply was used to provide
power. Connections were provided for the output of the signal to the television
oscilloscope. The receiver layout schematic can be found in Appendix VI.
37

Results
With the design complete and described in the pages above, we can now analyze
the results and examine some key characteristics of the design. This section will
highlight the performance specifications of our design. Pictures of the circuitry and
waveforms can be found in Appendix II.
Power consumption can be measured for both the receiver and transmitter by
examining the current drawn from each nine volt supply and using P=IV where V is 9
volts. The transmitter draws 7.6mA, corresponding to 68.4 mW. The receiver draws
5.9mA amps, corresponding to 53.1mW. In our design we tried to limit the use of ICs so
that we could keep the power consumption as low as possible for each component. It is
estimated that a 9V battery has a capacity of 500mAh. This will provide the transmitter
with an operating life of 500mAh/7.6mA = 65.8 hours, and the receiver with an estimated
operating time of 84.5 hours. Note this satisfies the original operating time requirement.
Transmitter Results
The transmitter converts an EKG signal to a frequency varying square wave train
of 4V. The broadcast frequency of the transmitter can be changed by varying the
resistance of the potentiometer. Transmission frequencies can range from 94MHz to
108MHz. The effective range of this transmitter varies depending on the number of
obstructions in the path from transmitter to receiver. It can range anywhere from a
several feet if there are many thick walls between the transmitter and receiver, up to 50
feet if there is a clear line of sight. Note that this fifty-foot range was achieved with a
very primitive wire antenna. The receiver used also did not have any antenna. If a more
efficient antenna was used, and/or a receiving antenna was used the transmission range
would likely increase significantly. The FM band is also very crowded with radio
stations, and interference with these signals tends to cut down on the transmission range.
It should be noted that the electrodes are very sensitive to movement and in order to
receive a good EKG signal, the user must remain as still as possible. When an FM
receiver outputs the EKG signal through its speakers, the frequency of the tone ranges
from 780Hz to 1230Hz.
38

Receiver Results
The receiver component can use any FM radio receiver’s output. All that is
required is a headphone jack to provide the input to the circuit. There is minimum level
of the AC pulse train that the input must have in order for the receiver to properly
function. This value is 1.0Vpp. The receiver outputs the recovered EKG signal, which is
about 1.0Vpp. This signal can be examined either with a commercial oscilloscope, or it
may be examined by using our scrolling display system. Figure 24 below shows the
signal on a commercial oscilloscope:
Figure 24: EKG Waveform from receiver shown on a standard oscilloscope
Scrolling Display Results (EKGSCOPE)
The television oscilloscope uses the output of the receiver component as an input.
It displays the signal on any television, using RCA cables as an interface between the
Atmel Mega32 and the television. The scroll rate of the data across the television may be
changed by the user. The choices are a fast rate of 2.13 seconds per screen or half this
rate at 4.26 seconds per screen. At the slower rate, because the software ignores every
other point, the resolution is not as good as the full rate. This can be especially
problematic since we are only sampling a few points on the sharp R-wave and these
39

points are occasionally missed at the half-speed rate. It is suggested that the display be
used at the full-speed rate in order to see the best resolution. However, if data is being
taken into MATLAB where all of the data will be captured anyway, there may be some
interest in this slower speed. Figure 25 below shows the waveform on our scrolling TV
display.
As designed, the user can set the voltage threshold for R-wave detection via the
push buttons on the STK-500. The current threshold value is displayed in the lower right
hand portion of the screen. The averaged heart rate in beats per minute is shown in the
lower left of the screen. The averaging does help prevent this number from jumping
around as much as it did with no averaging at all, however occasionally spikes are seen in
this readout. A suggestion would be to use this value as well as the BPM data that can be
attained through MATLAB together to get a good tracking of the user’s heart rate.
One minor defect with the display system is some mild tearing of the screen when
the buttons are pushed. This does not always happen, but when it does it simply causes
some artifacts to appear along either the top or bottom of the screen. These artifacts
however do not interfere with any of the data being displayed so they were not
considered a major problem. They most likely result from too much time being spent in
the vertical blanking interval section, which is throwing off some of the precise
synchronization timing necessary for the electron gun. Code refinements could likely be
made to get rid of these effects, such as reducing some of the C code into assembly
language.
40

Figure 25: EKG Waveform from receiver shown on our scrolling display
MATLAB Data Analysis Results
The major goals of the data analysis portion of the system were the following:
• Accept serial data transfer of EKG signal from microcontroller
• Display EKG waveforms to user in near real time
• Estimate basic statistical characteristics of the data (mean and standard deviation)
• Construct x-bar control chart for QRS-intervals and heart rate (BPM)
• Construct range control chart for QRS-intervals and heart rate (BPM)
• Monitor new data and evaluate process-based control limits
We were able to meet all of the above goals. It should be noted that the data analysis
software was not designed to be an incredibly rigorous exercise in determining the exact
characteristics of the EKG waveforms. For example, given the way we locate the R-
wave, we could be a sample or two off in our timing. The MATLAB code was designed
for two specific reasons. One, as a way to help confirm that the received data was
consistent with typical EKG waveforms and that the EKG waveforms were not being
massively distorted at other locations in the system. And two, as a convenient tool for
students to learn a little about data capture and analysis. The MATLAB environment
41

allows users to easily build on the tools that we have opted to add. Included in this
section are various parameters extracted from a sample set of heart data that help
illustrate the capabilities of the system. As mentioned before, typically how the software
would be used would be to have it take an initial data set and from that set, generate the
upper- and lower- control limits per control chart type. Those control limits would then
be displayed on an updating chart that would refresh as new data was sampled. In the
results below, we will look at that initial data. This is adequate since it encompassed all
of the capabilities of the software.
The figures below show two suites of plots that are presented to the user when the
characteristic selected is heart rate. Figure 26 and 27 are derived from two different data
sets, the first when the user was at rest and the second after prolonged activity:
0 1000 2000 300050
100
150
200EKG Waveform
time
ampl
itude
60 70 80 900
5
10
15
20
25Distribution of BPM Times
0 10 20 3070
75
80
85
90Mean Control Chart
time
ampl
itude
0 10 20 300
5
10
15Range Control Chart
time
ampl
itude
Figure 26: Suite of Figures Characterizing BPM (group size = 3)
42

0 1000 2000 300050
100
150
200EKG Waveform
time
ampl
itude
70 80 90 1000
5
10
15Distribution of BPM Times
0 10 20 3075
80
85
90
95
100Mean Control Chart
time
ampl
itude
0 10 20 300
5
10
15Range Control Chart
time
ampl
itude
Figure 27: Second Suite of Figures Characterizing BPM (group size = 3)
Similarly, figures 28 and 29 below are two suites of plots that are presented to the user
when the characteristic selected is QRS interval. The data sets are respectively the same
as above.
In each figure the plot in the upper left is a plot of the actual EKG data. In these
plot suites it is impossible to make out the individual waves, so a close-up view is
provided in figure 30. Figure 30 shows the kind of resolution that the user will get in the
MATLAB environment. The QRS interval is quite well pronounced as is the T-wave that
follows. There also appears to be some trace of the P-wave just prior to the main spike.
This figure generally matches the typical EKG waveform patterns discussed in the
background section. One interesting observation that can be made from any of the EKG
plots in this section is that the amplitude of the peak R-wave does not remain constant as
it generally should, but rather it oscillates sinusoidaly back and forth. This is an atypical
behavior and certainly seems to stem from the way our system is
43

0 1000 2000 300050
100
150
200EKG Waveform
time
ampl
itude
0.08 0.1 0.12 0.140
10
20
30Distribution of QRS Interval Times
0 5 10 15 200.09
0.1
0.11
0.12Mean Control Chart
time
ampl
itude
0 5 10 15 200
0.01
0.02
0.03Range Control Chart
time
ampl
itude
Figure 28: Suite of Figures Characterizing QRS-interval (group size = 3)
0 1000 2000 300050
100
150
200EKG Waveform
time
ampl
itude
0 0.1 0.2 0.3 0.40
20
40
60
80Distribution of QRS Interval Times
0 10 20 300.05
0.1
0.15
0.2
0.25Mean Control Chart
time
ampl
itude
0 10 20 300
0.05
0.1
0.15
0.2
0.25Range Control Chart
time
ampl
itude
Figure 29: Second Suite of Figures Characterizing QRS-interval (group size = 3)
44

750 800 850 900 950
90
100
110
120
130
140
150
160
170
180
Figure 30: Close-up view of EKG Waveform
taking in data. The most likely explanation for this sinusoidal variation is that it is a beat
frequency due to the sampling rate. This type of phenomenon is common and can be
explained by observing figure 31 below. The green wave is the signal frequency and the
red signal is the “beat wave” that is generated by sampling at a frequency near the
Nyquist frequency. Hence, despite the fact that the green signal peaks are all at the same
Figure 31: Illustration of beat frequency concept [Kostic (1999)]
45

amplitude, the user may get the false impression that there is another frequency that is
really not there at all. This is likely what is happening with the EKG data, since the
peaks of the R-wave should all be the same height. By sampling the R-wave at cyclic
points just before the peak, then near the peak, then slightly after the peak then before the
peak again, we are generating a beat wave similar to the red wave above.
Going back to the plot suites, the plots in the upper right are distribution
histograms of the signal parameters. Recall that the control limits are calculated in a way
that assumes the parameters are distributed normally. Looking at the BPM distributions
is certainly appears feasible that this random variable could be normally distributed and
that our original assumption was valid. However, looking at the QRS interval
distributions it does not appear that it is distributed normally. This is likely a partial
explanation for why some of the control charts are showing values exceeding the control
limits. This will issue will be touched on shortly.
Ignoring the distributions, the values that the system is giving are very consistent
with what we expect. Going back to table 2 in the background section, notice the
nominal value for the QRS-interval was 0.09 second. In the distributions in figures 28
and 29, notice that there are clusters very near 0.1 seconds, which matches closely to the
nominal result. Also, an average adult resting heart rate typically varies between 70 and
80 BPM, which corresponds to the first BPM figure above. The second has a mean rate
slightly upwardly shifted due to the activity of the user. These results lead us to believe
that the data collection is working properly.
The final two plots in the suites are the x-bar chart (lower left) and the range chart
(lower right). Both plots have fixed horizontal lines that represent the upper- and lower-
control limits. Recall that these limits are generated by grouping the data in sets of a
number that is left up to the user when the software is first run. Depending on how this
group number is set, the control chart’s center lines and limits will change around
somewhat. All control charts’s shown used a grouping of size three. One thing that can
be noticed is that the control charts shown have data extending across the control limits.
One possible reason for this, mentioned above, was that the random variables might not
be normally distributed (the QRS interval certainly is not). In terms of strict process
control, this would be an indication that the limit data was taken when the process was
46

not in control. However, in the case of the EKG data, they need to be interpreted a little
more loosely, as the data outside of the control limits is not out of the bounds of normal
heart activity and it all really depends on how much initial data went into the control limit
calculations. Here, roughly 3000 data points (Note not all these points are used for
calculations) were taken but changing the input buffer in the MATLAB serial connection
can change this number. According to the central limit theorem, as group size goes up
then the original distributions should approach a normal one with the same mean and
with the same variance, now divided by group size. In this case, the process control
calculation should still apply. This would require a large amount input data since only
select data points are used for the computations. For instance, for BPM calculation only
the R-wave peak data points are needed. In our opinion, the control limits here are better
used as a rough guide to the user’s heart activity. Someone might consider putting up a
second set of bounds that mark the nominal heart values, such as those listed in table 2.
That is, two limits can be checked to characterize the user’s heart activity. A running
average calculation could also be used to try and dynamically show how the heart rate
activity compares to values sampled around the same time. This would be relatively easy
to implement.
47

Parts Listing and Price Estimate
This table lists every component necessary
to build a transmitter module, a receiver module,
and the oscilloscope circuitry. The part is
displayed, along with the necessary quantity. The
total price for that quantity of that particular part is
displayed in the column at right. Most of the
resistors and capacitors can be found in any
existing electrical lab. Students can quickly
consume these supplies, so it can be assumed that
these parts must be purchased. Other key
components such as batteries and ICs are also
quickly consumed and listed with the other
components. The cost estimate for this basic
system is $38.82. This project was designed with
the intent of being used as part of Cornell
University’s undergraduate program. Certain
components of this system are much more
expensive, such as the STK500 boards and
televisions. However, these parts are not
consumable and will last for a long time. In
addition, Cornell already possesses these items and
should not need to repurchase them. These
components are listed separately, along with their
estimated price. An FM radio is also required for
this project, but students could be asked to bring
one in, as nearly everyone owns a radio. A few
spares could be purchased if necessary.
The system total cost listed is the cost if
every component must be purchased.
Part Quantity Price 75 1 $ 0.05
150 1 $ 0.05 330 1 $ 0.05 1k 2 $ 0.10
2.2k 1 $ 0.05 3.3k 1 $ 0.05 4.7k 1 $ 0.05 5.5k 1 $ 0.05 6.8k 2 $ 0.10 10k 5 $ 0.25
14.7k 1 $ 0.05 21k 1 $ 0.05 33k 1 $ 0.05 41k 3 $ 0.15 47k 4 $ 0.20 56k 1 $ 0.05 68k 2 $ 0.10 100k 11 $ 0.55 150k 1 $ 0.05 200k 1 $ 0.05 470k 3 $ 0.15 1M 1 $ 0.05
diode 3 $ 0.15 .24nf 1 $ 0.05 1nf 4 $ 0.20
10nf 5 $ 0.25 27nf 4 $ 0.20 .1uf 10 $ 0.50
.33uf 1 $ 0.05 1uf 4 $ 0.20
4.7uF 3 $ 0.15 LM231 2 $ 7.38 2606 1 $ 1.00
LT1079 2 $ 8.00 switch 2 $ 0.60
9 volt battery 2 $ 6.50 LM358 2 $ 0.66
NTE834 1 $ 2.88 INA121 1 $ 6.80 100k pot 1 $ 0.50
battery clips 2 $ 0.60 TOTAL $ 38.82
radio $15.00 TV $50.00
STK500 $80.00 System Total $ 183.82
48

Conclusion
Our final EKG system met each design requirement listed previously in this
report. A low-power EKG system completely independent of wall voltages was designed
at under $50 to transmit a detected EKG signal to a receiver. Both the transmitter and
receiver operate safely and reliably being powered from a 9-volt battery supply. Given
the current drawn from the battery, both circuits are estimated to run for about 65 hours
on one battery. A user sets the transmission frequency, and the receiving range can be up
to 40 ft. The recovered EKG signal is sent to a television controlled by an Atmel
Mega32. The waveform is displayed in an accurate manner, and exhibits all of the
characteristics shown in physiological textbooks. The oscilloscope has different scroll
speeds and voltage scales. Pulse rate and beats per minute calculations are also shown
onscreen.
Most importantly, we feel that this design is useable in an undergraduate
classroom, as was the original intent for this project. There were several components to
this design project, which do not have to be included in the design of this system,
including the PCB layouts and MATLAB data analysis. Time permitting, the course
instructor may want to touch upon these topics. This EKG system lends itself to a
classroom setting by being easily broken down into sub topics needed to design and
understand this system. One topic covered in class could deal with the necessary C
programming skills, cover the basic architecture of the Atmel Mega32, and review coding
in MATLAB (if necessary). A unit on op-amp circuitry could present amplifiers, filters,
peak detectors, and comparators. A unit on V-to-F and RF circuitry could also be
presented. There are many technical areas involved with this project. Unless students
have had a wide exposure to circuit design and microcontroller architecture, this may be
too much material to cover in one semester. If this is the case, this design project can be
presented in a more structured fashion to the students. For example, all of the circuit
topologies can be given to them, and they must pick values for each of the components.
A block diagram of the system, listing each circuit (notch filter, differential amplifier,
etc.) could also be presented to them. The students could then fill in what the circuits
49

would look like. Ultimately, it is up to the instructor to determine the technical level of
the class and decide how to best present this EKG system.
If we had additional time, and could relax the requirement that this system be
built with an undergraduate student in mind, we would have liked to experiment with a
few additional topics. It would have been interesting to try and implement the transmitter
without the RF IC, and see if we could still get the system to work. An AM transmitter
may have been something that was implementable using typical electrical components.
As outlined above, our EKG system has met every requirement, and even gone
beyond what was expected in some cases. As mentioned above, the data analysis wasn’t
originally even included as part of the system. With the discussion included in this
report, a person should be able to redesign the system and understand its functionality. It
is our hope that this project provides undergraduate students with a fun, educational,
challenging design exercise for years to come.
50

Acknowledgments We would like to thank our advisor Dr. Bruce Land for all of his help these past
two semesters. His willingness to share his time and his knowledge with us was truly
integral to the success of this project. This project provided both of us with a real
understanding of all the elements that go into creating a working system from scratch and
Dr. Land helped highlight each of those elements for us along the way. His efforts have
been much appreciated.
References Burr-Brown. INA121 FET-input low-power instrumentation amplifier (document PDS1412, available at www.burr-brown.com). 1997. Cromwell, Leslie and Fred J. Weibell and Erich A. Pfeiffer. (1980). Biomedical Instrumentation and Measurements. Prentice-Hall, Inc., Englewood Cliffs, NJ. Dallas Semiconductor. MAX2606 Integrated IF VCOs with Differential Output (document MAX2605-MAX2609, available at www.maxim-ic.com). 2002. Horowitz, Paul and Winfield Hill. (1980). The Art of Electronics. Cambridge University Press. Cambridge. Jackson, P. (2004, March 2). Lecture presented in SYSEN 520. Cornell University, Ithaca, NY. Kostic, M. (1999), 'The Art of Signal Sampling and Aliasing: Simulation with a
LabVIEW Virtual Instrument”, in NIWeek99 Annual Conference, National Instruments, Austin, TX, 1999.
Land, Bruce. TV Oscilloscope, Circuit Cellar Magazine #161, pp 20-25, Dec 2003. Linear Technology. LT1078/LT1079 Micropower, dual and quad, single supply, precision op amps (document 1078fd, available at www.linear-tech.com). 1994. Montgomery, D.C 1996. Introduction to Statistical Quality and Control. 3rd edition. John Wiley and Sons. New York National Semiconductor. LM231 Precision Voltage-to-Frequency Converter (document LM231, available at www.national.com). 1999. National Semiconductor. LM358N Low Power Dual Op-amp (document LM158, available at www.national.com). 2002.
51

Appendix I: Final Circuit Schematics
Figure 32: Final transmitter schematic
52

Figure 33: Final receiver schematic
53

Appendix II: Pictures of EKG Transmitter and Receiver Circuitry
Figure 34: Final transmitter circuit on proto-board
Figure 35: Final transmitter circuit on a PCB (1.9” x 2.5”)
54

Figure 36: Final transmitter circuit on PCB plus battery (3.8” x 2.5”)
Figure 37: Underside of final transmitter PCB (1.9” x 2.5”)
55

Figure 38: Final receiver circuit on proto-board
Figure 39: Final receiver circuit on a PCB (1.9” x 2.5”)
56

Figure 40: Underside of final receiver PCB (1.9” x 2.5”)
Figure 41: Radio and receiver PCB
57

Appendix III: Comprehensive Instruction Manuel for EKG System
The following steps will walk a user through the use of the EKG system. These
steps detail the use of both the hardware and the software components of the system.
Tips are also given on the best places to hook up the electrodes in order to maximize the
signal quality:
Section 1: Connections
1) Make sure that both the transmitter and receiver are connected to an operational 9V
battery. Also make sure that the STK-500 board’s power supply is connected.
2) Make sure that the STK-500’s RS232-SPARE serial port is connect to COM 1 of the
PC. If the user wishes to use COM 2, then the ‘COM1’ parameter in the “serial” function
of dataprocess.m needs to be changed to ‘COM2’.
3) To hook up the television to the STK-500 simply follow the circuit in figure 21. The
ground connection should be made to the outer conductor of the RCA cable while the
“To TV” connection can be made to the center conductor.
4) Make sure that the connection from ‘RX’ on the receiver PCB is connected to the
‘analog input’ of the Oscilloscope circuitry as shown in Figure 22.
5) Now take three electrodes and three alligator clips and connect one alligator clip to
each electrode’s metal connector. Attach the unconnected side of each clip to the
transmitter PCB wire leads located next to the INA121 IC (one clip per lead). Now take
the electrode that is attached to the lead furthest from the antenna and place it on the
user’s upper left chest, immediately below the collarbone, halfway between the shoulder
and the center of the throat. Take the electrode attached to the middle Transmitter PCB
lead and attach it to the user’s left side, just below the rib cage, several inches off of the
centerline of the body. This location should be about three inches up from and three
inches to the side of the user’s naval. Connect the final electrode near the user’s left
elbow, about one inch from this joint on the upper-arm side. The electrode should be
placed just above the bony part of the elbow.
58

These electrodes are the positive, negative, and ground connections respectively.
Note that the EKG system’s results are highly dependant upon the placement of these
electrodes. If noisy or undesirable results are obtained, consider moving the electrodes
on the user. There are several considerations that can be made to help with placement.
Ideally the skin surface on which the electrode is placed should be clean and free of hair.
Make sure to press the electrode firmly so that a good bond is made with the user’s skin.
In general, electrodes should not be placed directly above any bone. Note that there are
numerous ways to connect up EKG electrodes, each one producing a different EKG
signal. The placement described above was the one we used while designing and testing
the EKG system. It is not necessarily always the most optimal placement. For further
information about electrode placement, see [Cromwell et al.] in Reference section.
Section 2: Tuning the Receiver
1) Turn the Transmitter Power switch to the ‘on’ position.
2) Turn the Receiver Power switch to the ‘on’ position.
3) Turn the radio receiver on.
4) Plug in the earphones provided with the radio receiver into the headphone jack. Tune
the radio until the EKG signal can be clearly heard. This signal will be a constant tone,
with several higher pitched excursions from the constant tone. An easy way to check if
the signal is in fact from the transmitter is to turn the transmitter unit off and see if the
signal goes away.
5) If no signal can be detected, try adjusting the potentiometer on the transmitter. To
turn the dial, a small screwdriver will be needed. Once the potentiometer has been
adjusted, repeat step 4). Note that due to many FM interferences with other radio
broadcasts, steps four and five may have to be repeated several times before the signal
can be detected.
6) Now unplug the earphones and plug in the cable that connects the headphone jack
directly to the receiver PCB. Make sure that the volume on the radio receiver is set to at
least half of the maximum.
59

Section 3: Waveform Display and MATLAB Data Analysis
1) (If the user just wishes to use the scrolling TV scope than this step can be skipped).
Open up MATLAB and run dataprocess.m. The user will receive the prompt, “Unit
Off?”. It is important that the STK-500 board be turned off when dataprocess.m first
runs, or else the program will crash. Once the user turns off the STK-500 they can hit
“enter”, and they will receive a prompt to “Turn unit on.”
2) Turn ON the STK-500 board (press enter at prompt if running MATLAB).
3) If scrolling output is desired, then switch on the television set now. You should see
the EKG waveform scrolling across the screen. You will need to adjust the voltage
threshold with the push buttons as discussed in Table 3 to get the proper BPM reading.
Adjust this so that the pulse indicator is flashing with every R-wave, but is bright for as
short a time possible. The user can also adjust the rate of the wave at this point as well as
stop the wave and inspect it with the cursor. THE USER NEED ONLY READ ON IF
THEY ARE RUNNING THE MATLAB SOFTWARE.
4) Immediately after “enter” is pressed in step 1, the software will begin to take the
warm-up data to create the control limits. After it has done this, it will ask the user if
they would like to track BPM or QRS-interval. The user should enter their choice.
5) Next the program will report how many useable data points were found in the data. It
will then ask the user to enter the size of the groups in which to place the data. The user
can enter any number, although numbers that the total data size is not divisible by will
create one group not of the requested size.
6) The program will then create x-bar and range control charts with the proper control
limits. Data will be refreshed to these charts each time the input buffer is filled.
Depending on the number controlling the loop, the corresponding number of data sets
will be taken.
7) There is no formal shutdown procedure, all components can be turned off at any time
and MATLAB should be exited.
60

Appendix IV: CodeVision C Code for Scrolling Oscilloscope //Modified Video Scope -- EKG Version //Matt Melnyk & Josh Silbermann //2003-2004 MEng Project //Code adapted from Professor Bruce Land's Original Scope Code // [TV Oscilloscope, Circuit Cellar Magazine #161, pp 20-25, Dec 2003]. //D.5 is sync:1000 ohm to 75 ohm resistor //D.6 is video:330 ohm to 75 ohm resistor #pragma regalloc- //I allocate the registers myself #pragma optsize- //optimize for speed #include <Mega32.h> #include <stdio.h> #include <stdlib.h> #include <math.h> #include <delay.h> //cycles = 63.625 * 16 Note that normal NTSC is 63.55 //but this line duration makes each frame exactly 1/60 sec //which is nice for keeping a realtime clock #define lineTime 1018 #define begin { #define end } #define ScreenTop 30 #define ScreenBot 210 //NOTE that v1 to v8 and i must be in registers! //These registers contain the current line to be //blasted to the screen register char v1 @4; register char v2 @5; register char v3 @6; register char v4 @7; register char v5 @8; register char v6 @9; register char v7 @10; register char v8 @11; register int i @12; #pragma regalloc+ //video stuff char syncON, syncOFF; //current line int LineCount; //voltage trace and last one char ADout[128], ADold[128]; // current voltage sample and previous one char ADnow, ADlast; //ii counts current trace length //jj counts sample skipping //k counts trace drawing char ii,jj,k; //trigger variables //level, arm flag, run/stop flag char trigLevel, oneShotenable; char trigmode ; // time scale -- factors of 2 from 8 ms/screen to about 1000 char tscale; // number of samples-1 to skip for each time scale char tscalemask[]={0,1,3,7,15,31,63,127} ;
61

// actual time scale value char tscaleV[]={1,2,4,8,16,32,64,128}; //button state machine //sample rate for buttons, machine state 0-3, actual button data char bstep, bstate, buttons; //voltage bit scale, zero pt on screen, actual point on screen //voltage scale char vscale, vzero, vpoint,vselect; //The actual screen image char screen[90*16], vs[10]; //All the strings char cu1[]="EKGSCOPE"; char thrsh[]="THRSH"; char fast[]="FULL", slow[]="HALF" ; char tbpm[]="BPM", tstop[]="STP"; char blanks[]=" "; char tind[]="PULSE", vind[]="RATE"; //cursor position char curx ; //Point plot lookup table flash char pos[8]={0x80,0x40,0x20,0x10,0x08,0x04,0x02,0x01}; //define some character bitmaps //5x7 characters flash char bitmap[38][7]={ //0 0b01110000, 0b10001000, 0b10011000, 0b10101000, 0b11001000, 0b10001000, 0b01110000, … (Additional characters omitted for length. Please see online version for complete character listing) //figure2 0b01110000, 0b10101000, 0b01110000, 0b00100000, 0b00100000, 0b01010000, 0b10001000}; //================================ //3x5 font numbers, then letters //packed two per definition for fast //copy to the screen at x-position divisible by 4 flash char smallbitmap[39][5]={ //0 0b11101110, 0b10101010, 0b10101010, 0b10101010, 0b11101110,
62

… (Additional characters omitted for length. Please see online version for complete character listing)
//Z 0b11101110, 0b00100010, 0b01000100, 0b10001000, 0b11101110 }; //================================== //This is the sync generator and raster generator. It MUST be entered from //sleep mode to get accurate timing of the sync pulses #pragma warn- interrupt [TIM1_COMPA] void t1_cmpA(void) begin //start the Horizontal sync pulse PORTD = syncON; //count timer 0 at 1/usec TCNT0=0; //update the curent scanline number LineCount ++ ; //begin inverted (Vertical) synch after line 247 if (LineCount==248) begin syncON = 0b00100000; syncOFF = 0; end //back to regular sync after line 250 if (LineCount==251) begin syncON = 0; syncOFF = 0b00100000; end //start new frame after line 262 if (LineCount==263) begin LineCount = 1; end delay_us(2); //adjust to make 5 us pulses //end sync pulse PORTD = syncOFF; //read A/D and restart it ADnow = ADCH ; ADCSR.6 = 1 ; //If the line is a display line, put it on the screen if (LineCount<ScreenBot && LineCount>=ScreenTop) begin //compute byte index for beginning of the next line //left-shift 4 would be individual lines // <<3 means line-double the pixels //The 0xfff8 truncates the odd line bit //i=(LineCount-ScreenTop)<<3 & 0xfff8; // #asm push r16 lds r12, _LineCount lds r13, _Linecount+1 ldi r16, 30 sub r12, r16 ldi r16,0 sbc r13, r16
63

lsl r12 rol r13 lsl r12 rol r13 lsl r12 rol r13 mov r16,r12 andi r16,0xf0 mov r12,r16 pop r16 #endasm //load 16 registers with screen info #asm push r14 push r15 push r16 push r17 push r18 push r19 push r26 push r27 ldi r26,low(_screen) ;base address of screen ldi r27,high(_screen) add r26,r12 ;offset into screen (add i) adc r27,r13 ld r4,x+ ;load 16 registers and inc pointer ld r5,x+ ld r6,x+ ld r7,x+ ld r8,x+ ld r9,x+ ld r10,x+ ld r11,x+ ld r12,x+ ld r13,x+ ld r14,x+ ld r15,x+ ld r16,x+ ld r17,x+ ld r18,x+ ld r19,x pop r27 pop r26 #endasm delay_us(1); //adjust to center image on screen //blast 16 bytes to the screen #asm ;but first a macro to make the code shorter ;the macro takes a register number as a parameter ;and dumps its bits serially to portD.6 ;the nop can be eliminated to make the display narrower .macro videobits ;regnum BST @0,7 IN R30,0x12 BLD R30,6 nop OUT 0x12,R30 BST @0,6 IN R30,0x12 BLD R30,6
64

nop OUT 0x12,R30 BST @0,5 IN R30,0x12 BLD R30,6 nop OUT 0x12,R30 BST @0,4 IN R30,0x12 BLD R30,6 nop OUT 0x12,R30 BST @0,3 IN R30,0x12 BLD R30,6 nop OUT 0x12,R30 BST @0,2 IN R30,0x12 BLD R30,6 nop OUT 0x12,R30 BST @0,1 IN R30,0x12 BLD R30,6 nop OUT 0x12,R30 BST @0,0 IN R30,0x12 BLD R30,6 nop OUT 0x12,R30 .endm videobits r4 ;video line -- byte 1 videobits r5 ;byte 2 videobits r6 ;byte 3 videobits r7 ;byte 4 videobits r8 ;byte 5 videobits r9 ;byte 6 videobits r10 ;byte 7 videobits r11 ;byte 8 videobits r12 ;byte 9 videobits r13 ;byte 10 videobits r14 ;byte 11 videobits r15 ;byte 12 videobits r16 ;byte 13 videobits r17 ;byte 14 videobits r18 ;byte 15 videobits r19 ;byte 16 clt ;clear video after the last pixel on the line IN R30,0x12 BLD R30,6 OUT 0x12,R30 pop r19 pop r18 pop r17 pop r16 pop r15
65

pop r14 #endasm end //of bit-blast to screen GIFR = 0b01000000; //save last sample ADlast = ADnow; //if triggered, then get waveform //set the time scale by skipping samples jj = ++jj & tscalemask[tscale] ; end #pragma warn+ //================================== //plot one point //at x,y with color 1=white 0=black 2=invert #pragma warn- void video_pt(char x, char y, char c) begin #asm ; i=(x>>3) + ((int)y<<4) ; the byte with the pixel in it push r16 ldd r30,y+2 ;get x lsr r30 lsr r30 lsr r30 ;divide x by 8 ldd r12,y+1 ;get y lsl r12 ;mult y by 16 clr r13 lsl r12 rol r13 lsl r12 rol r13 lsl r12 rol r13 add r12, r30 ;add in x/8 ;v2 = screen[i]; r5 ;v3 = pos[x & 7]; r6 ;v4 = c r7 ldi r30,low(_screen) ldi r31,high(_screen) add r30, r12 adc r31, r13 ld r5,Z ;get screen byte ldd r26,y+2 ;get x ldi r27,0 andi r26,0x07 ;form x & 7 ldi r30,low(_pos*2) ldi r31,high(_pos*2) add r30,r26 adc r31,r27 lpm r6,Z ld r16,y ;get c ;if (v4==1) screen[i] = v2 | v3 ; ;if (v4==0) screen[i] = v2 & ~v3; ;if (v4==2) screen[i] = v2 ^ v3 ;
66

cpi r16,1 brne tst0 or r5,r6 tst0: cpi r16,0 brne tst2 com r6 and r5,r6 tst2: cpi r16,2 brne writescrn eor r5,r6 writescrn: ldi r30,low(_screen) ldi r31,high(_screen) add r30, r12 adc r31, r13 st Z, r5 ;write the byte back to the screen pop r16 #endasm end #pragma warn+ //================================== // put a big character on the screen // c is index into bitmap void video_putchar(char x, char y, char c) begin v7 = x; for (v6=0;v6<7;v6++) begin v1 = bitmap[c][v6]; v8 = y+v6; video_pt(v7, v8, (v1 & 0x80)==0x80); video_pt(v7+1, v8, (v1 & 0x40)==0x40); video_pt(v7+2, v8, (v1 & 0x20)==0x20); video_pt(v7+3, v8, (v1 & 0x10)==0x10); video_pt(v7+4, v8, (v1 & 0x08)==0x08); end end //================================== // put a string of big characters on the screen void video_puts(char x, char y, char *str) begin char i ; for (i=0; str[i]!=0; i++) begin if (str[i]>=0x30 && str[i]<=0x3a) video_putchar(x,y,str[i]-0x30); else video_putchar(x,y,str[i]-0x40+9); x = x+6; end end //================================== // put a small character on the screen // x-cood must be on divisible by 4 // c is index into bitmap void video_smallchar(char x, char y, char c) begin char mask; i=((int)x>>3) + ((int)y<<4) ; if (x == (x & 0xf8)) mask = 0x0f; //f8
67

else mask = 0xf0; screen[i] = (screen[i] & mask) | (smallbitmap[c][0] & ~mask); screen[i+16] = (screen[i+16] & mask) | (smallbitmap[c][1] & ~mask); screen[i+32] = (screen[i+32] & mask) | (smallbitmap[c][2] & ~mask); screen[i+48] = (screen[i+48] & mask) | (smallbitmap[c][3] & ~mask); screen[i+64] = (screen[i+64] & mask) | (smallbitmap[c][4] & ~mask); end //================================== // put a string of small characters on the screen // x-cood must be on divisible by 4 void video_putsmalls(char x, char y, char *str) begin char i ; for (i=0; str[i]!=0; i++) begin if (str[i]>=0x30 && str[i]<=0x3a) video_smallchar(x,y,str[i]-0x30); else if (str[i]>=0x41) video_smallchar(x,y,str[i]-0x40+12); else if (str[i]==0x20) video_smallchar(x,y,12); else if (str[i]==0x2e) video_smallchar(x,y,10); else if (str[i]==0x2d) video_smallchar(x,y,11); x = x+4; end end //================================== //plot a line //at x1,y1 to x2,y2 with color 1=white 0=black 2=invert //NOTE: this function requires signed chars //Code is from David Rodgers, //"Procedural Elements of Computer Graphics",1985 void video_line(char x1, char y1, char x2, char y2, char c) begin int e; signed char dx,dy,j, temp; signed char s1,s2, xchange; signed char x,y; x = x1; y = y1; dx = cabs(x2-x1); dy = cabs(y2-y1); s1 = csign(x2-x1); s2 = csign(y2-y1); xchange = 0; if (dy>dx) begin temp = dx; dx = dy; dy = temp; xchange = 1; end e = ((int)dy<<1) - dx; for (j=0; j<=dx; j++) begin video_pt(x,y,c) ; if (e>=0) begin if (xchange==1) x = x + s1; else y = y + s2;
68

e = e - ((int)dx<<1); end if (xchange==1) y = y + s2; else x = x + s1; e = e + ((int)dy<<1); end end //================================== //return the value of one point //at x,y with color 1=white 0=black 2=invert char video_set(char x, char y) begin //The following construction //detects exactly one bit at the x,y location i=((int)x>>3) + ((int)y<<4) ; return ( screen[i] & 1<<(7-(x & 0x7))); end //================================== // set up the ports and timers void main(void) begin //Scroll Variables char inc; //keeps last 3 BPMs saved for averaging char counter; //used to control rate of scroll char thresh; //sets threshold for R-wave detection char rate; //toggles between FULL and HALF scroll speed char bpm; //variables to store BPM intervals float bpm3, bpm3old1,bpm3old2,bpm3old3,bpmout; inc = 0; rate = 1; thresh = 164; //this should be adjusted per individual //init timer 1 to generate sync OCR1A = lineTime; //One NTSC line TCCR1B = 9; //full speed; clear-on-match TCCR1A = 0x00; //turn off pwm and oc lines TIMSK = 0x10; //enable interrupt T1 cmp //init ports DDRD = 0xf0; //video out and int0 input on d.2 //D.5 is sync:1000 ohm + diode to 75 ohm resistor //D.6 is video:330 ohm + diode to 75 ohm resistor // port B is switches with pullups ON DDRB = 0x00; PORTB = 0xff; //init A/D converter to //channel 0 ; internal AVcc reference ; left adjust ADMUX = 0b01100001; //ON--bit7 and start conversion--bit6 //clock of 500 Khz (xtal/32) bits2-0 ADCSR = 0b11000101 ; //initial trigger level trigLevel = 128; //init index to indicate ready to get data ii = 129 ; //trigger mode 0=level 1=edge trigmode = 0; //initialize synch constants
69

LineCount = 1; syncON = 0b00000000; syncOFF = 0b00100000; //init UART and set baud to 19.2 UCSRB = 0x18; UBRRL = 103; //Print "EKGSCOPE" video_puts(4,3,cu1); //initial rate video_putsmalls(64,83,fast); //"FULL" //time and voltage scales video_putsmalls(60,5,tind); //"PULSE" //sprintf(vs,"%4.0f",(float)120*0.063625*(float)(1<<tscale)); //video_putsmalls(64,5,vs); video_putsmalls(92,5,vind); //"RATE" //voltage scale init to 1/4 vscale=2; //zero pt for drawing vzero=76; //threshold level video_putsmalls(84,83,thrsh); //BPM/stop video_putsmalls(4,83,tbpm); #define width 126 //top line & bottom lines video_line(0,1,width,1,1); video_line(0,89,width,89,1); video_line(0,11,width,11,1); video_line(0,79,width,79,1); //enable sleep mode and int0 rising edge MCUCR = 0b10000011; #asm ("sei"); //The following loop executes once/video line during lines //1-230, then does all of the frame-end processing while(1) begin //stall here until next line starts //sleep enable; mode=idle //use sleep to make entry into sync ISR uniform time #asm ("sleep"); //The following code executes during the vertical blanking //Code here can be as long as //a total of 60 lines x 63.5 uSec/line x 8 cycles/uSec if (LineCount==211) begin ++counter; //check rate & stop conditions if ((counter%rate == 0) && !oneShotenable) begin //scroll the data for (k=0; k<127; k++) ADout[k] = ADout[k+1];
70
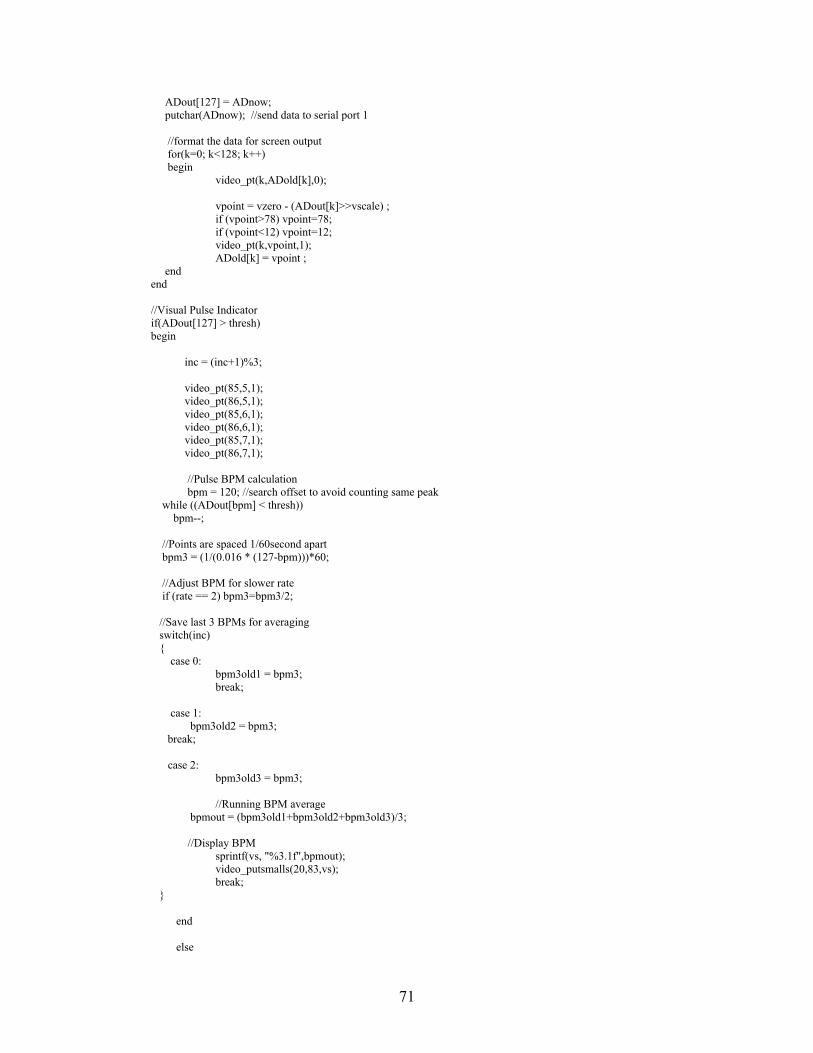
ADout[127] = ADnow; putchar(ADnow); //send data to serial port 1 //format the data for screen output for(k=0; k<128; k++) begin video_pt(k,ADold[k],0); vpoint = vzero - (ADout[k]>>vscale) ; if (vpoint>78) vpoint=78; if (vpoint<12) vpoint=12; video_pt(k,vpoint,1); ADold[k] = vpoint ; end end //Visual Pulse Indicator if(ADout[127] > thresh) begin inc = (inc+1)%3; video_pt(85,5,1); video_pt(86,5,1); video_pt(85,6,1); video_pt(86,6,1); video_pt(85,7,1); video_pt(86,7,1); //Pulse BPM calculation bpm = 120; //search offset to avoid counting same peak while ((ADout[bpm] < thresh)) bpm--; //Points are spaced 1/60second apart bpm3 = (1/(0.016 * (127-bpm)))*60; //Adjust BPM for slower rate if (rate == 2) bpm3=bpm3/2; //Save last 3 BPMs for averaging switch(inc) { case 0: bpm3old1 = bpm3; break; case 1: bpm3old2 = bpm3; break; case 2: bpm3old3 = bpm3; //Running BPM average bpmout = (bpm3old1+bpm3old2+bpm3old3)/3; //Display BPM sprintf(vs, "%3.1f",bpmout); video_putsmalls(20,83,vs); break; } end else
71

begin //Blink pulse indicator video_pt(85,5,0); video_pt(86,5,0); video_pt(85,6,0); video_pt(86,6,0); video_pt(85,7,0); video_pt(86,7,0); end if (ii==128) begin //freerun mode -- just wait for next trigger if(oneShotenable==0) ii=129; //clear armed state in stop mode else video_putsmalls(4,83,tstop); end bstep++ ; //These buttons are not in the state machine //because they should autorep at bstep speed if (oneShotenable && bstep==4) begin bstep=0; //not running -- move cursor if (PINB.7==0 && curx<127) begin video_pt(curx,vzero+2-(ADout[curx]>>vscale),0); curx++ ; video_pt(curx,vzero+2-(ADout[curx]>>vscale),1); end if (PINB.6==0 && curx>0) begin video_pt(curx,vzero+2-(ADout[curx]>>vscale),0); curx-- ; video_pt(curx,vzero+2-(ADout[curx]>>vscale),1); end sprintf(vs,"%5.1f",(float)curx*0.063625*(float)tscaleV[tscale]); video_putsmalls(16,83,vs); if (vselect==0 || vselect==2) sprintf(vs,"%5.2f",(float)ADout[curx]*.0195-2.50); if (vselect==1 || vselect==3) sprintf(vs,"%5.2f",(float)ADout[curx]*.01-1.28); video_putsmalls(40,83,vs); end //Set the pulse rate voltage threshold else if (!oneShotenable && bstep==4) begin //running -- set R-Wave trigger threshold bstep=0; if (PINB.7==0 && trigLevel<255) thresh++ ; if (PINB.6==0 && trigLevel>0) thresh-- ; sprintf(vs,"%03d",thresh); video_putsmalls(108,83,vs); end //button state machine switch (bstate) begin case 0: //unpressed if (PINB==0xff) break; else begin bstate=1; buttons=PINB; end
72

break; case 1: //posible press if (buttons==PINB) //then actual press begin bstate=2; //choose run/stop if (PINB.0==0) oneShotenable=!oneShotenable ; if (oneShotenable) video_putsmalls(4,83,tstop); else begin video_putsmalls(4,83,tbpm); video_putsmalls(16,83,blanks); //wipes t/v readout sprintf(vs,"%02d",bpm); video_putsmalls(20,83,vs); end //fast/slow rate toggle if (PINB.3==0 && !oneShotenable) begin if(rate==1) begin rate = 2; video_putsmalls(64,83,slow); end else begin rate = 1; video_putsmalls(64,83,fast); end end //choose voltage scale--one of 4 levels when running if (PINB.4==0 && !oneShotenable) vselect = ++vselect & 3; if (vselect==0) begin vscale=2; vzero=76; ADMUX = 0b01100001 ; end if (vselect==1) begin vscale=2; vzero=76; ADMUX = 0b11100001 ; end if (vselect==2) begin vscale=0; vzero=-80; ADMUX = 0b01100001 ; end if (vselect==3) begin vscale=0; vzero=-80; ADMUX = 0b11100001 ; end end //actual buton press else bstate=0; break;
73

case 2: //possible release if (buttons==PINB) break; else bstate=3; break; case 3: //release if (buttons==PINB) begin bstate=3; break; end else bstate=0; end end //line 211 end //while end //main
74

Appendix V: MATLAB Script for EKG Data Analysis %Data Processing Code for Wireless EKG% %Josh Silbermann and Matt Melnyk% %MENG Project 2003/2004% close all clear clc %%%%%clean up any leftover serial connections%%%%%%%%%%%%%%%% try fclose(instrfind) %close all serial connections end %%%%%%%%%%%%%%%%%%%%%%%%%%%%%%%%%%%%%%%%%%%%%%%%%%%%%%%%%%%%% input('Unit Off?') %establish serial connection s = serial('COM1',... 'baudrate',9600); s.inputbuffersize = 3000; s.timeout = 80; %open COM1 fopen(s) fprintf(s,'*IDN?') input('Turn Unit On') %centerline = 126 %%%%%THIS CODE CAN BE USED TO RECORD DATA%%%%%%%% % counter1 = 1; % % while (counter1 < 2) % % data2 = fread(s,3000); % plot(data2); % % pause(0.001) %YOU NEED ME TO WORK % % counter1 = counter1 + 1; % end %%%%%%%%%%%%%%%%%%%%%%%%%%%%%%%%%%%%%%%%%%%%%%%%%% %for normal distributions (factor for constructing control charts) d2 = [0 1.128 1.693 2.059 2.326 2.534 2.704 2.847 2.97 3.078 3.173 3.258 3.336 3.407 3.472]; d3 = [0 0.853 0.888 0.88 0.864 0.848 0.833 0.82 0.808 0.797 0.787 0.778 0.77 0.763 0.756]; % Process Control Technique % 1) Gather initial Data on Past Process Assumed in Control data = fread(s,2000); % 2) Extract Desired Observatons track = input('Track BPM(1) or QRS-Interval(2)?? '); %1 = BPM 2 = QRS Interval if(track == 1)
75

%BPM Extraction%%%%%%%%%%%%%%%%%%%%%%%%%%%%%%%%%%%%%%%%%%%%%%%%%%%%%%%%% %set threshold and find points that exceed it (R-waves) threshold = 163; intervals = find(data > threshold); tempCnt = 1; %plot initial EKG data subplot(2,2,1); plot(data); title('EKG Waveform') xlabel('time'); ylabel('amplitude'); %parse R-wave spike vector and find intervals between spikes while(tempCnt < length(intervals)) intervals(tempCnt) = intervals(tempCnt+1)-intervals(tempCnt); tempCnt = tempCnt + 1; end %convert interval vector to seconds intervals = intervals(1:(length(intervals)-1)); intervals = intervals .* (1/60); intervals = 1 ./ intervals; intervals = intervals .* 60; tempCnt = 1; %remove noticibly erroneous data from interval vector %NOTE ON DELMAT FUNCTION: %% Copyright (c) 2003-09-24, B. Rasmus Anthin. % Revision 2003-10-27, 2003-10-29. % GPL license, freeware. while(tempCnt <= length(intervals)) if((intervals(tempCnt) > 120) | (intervals(tempCnt) < 45)) intervals = delmat(intervals,tempCnt); else tempCnt = tempCnt + 1; end end %plot histogram of BPM times subplot(2,2,2); hist(intervals); title('Distribution of BPM Times') data = intervals; end %%%%%%%%%%%%%%%%%%%%%%%%%%%%%%%%%%%%%%%%%%%%%%%%%%%%%%%%%%%%%%%%%%%%% %QRS Interval Extraction%%%%%%%%%%%%%%%%%%%%%%%%%%%%%%%%%%%%%%%%%%%%% if(track == 2) %set threshold and find points that exceed it (R-waves) threshold = 152; peaks = find(data > threshold);
76

%plot initial EKG data subplot(2,2,1); plot(data); title('EKG Waveform') xlabel('time'); ylabel('amplitude'); tempCnt = 1; %parse R-wave spike vector and find intervals between spikes while(tempCnt < length(peaks)) intervals(tempCnt) = (peaks(tempCnt+1)-peaks(tempCnt)); tempCnt = tempCnt + 1; end tempCnt = 1; %basic error correction while(tempCnt < length(intervals)) if((intervals(tempCnt) < 15)) peaks = delmat(peaks,tempCnt); end tempCnt = tempCnt + 1; end currentPeak = peaks(1); %time of first peak tempTime = currentPeak; currentQrsPeak = 1; while (currentPeak < peaks(length(peaks))) %while you are not at last time while((data(tempTime) > 130)) %find start of Q-wave via backwards search tempTime = tempTime - 1; end lowSide = tempTime; %mark this lower time tempTime = currentPeak+1; %reset start time for hi side search dataPrev = data(tempTime-1); %find end of S-wave by checking distance from center and positive slope while((data(tempTime) < 122) | (dataPrev > data(tempTime))) dataPrev = data(tempTime); tempTime = tempTime + 1; end hiSide = tempTime; %mark this upper time %convert QRS-interval to seconds qrsTimes(currentQrsPeak) = (1/((hiSide - lowSide)*60))*60; currentQrsPeak = currentQrsPeak + 1; %if not at end, advance to next peak if(currentQrsPeak <= length(peaks)) currentPeak = peaks(currentQrsPeak); tempTime = currentPeak; end end %plot histogram of QRS times subplot(2,2,2);
77

hist(qrsTimes); title('Distribution of QRS Interval Times') data = qrsTimes; end %%%%%%%%%%%%%%%%%%%%%%%%%%%%%%%%%%%%%%%%%%%%%%%%%%%%%%%%%%%%%%%%%%%%%%% %%%%%%%%%%%%%%%%%%%%%%%%%%%%%%%%%%%%%%%%%%%%%%%%%%%%%%%%%%%%%%%%%%%%%%%% % 3) Group Observations counter = 1; LCV = 1; dataInit = length(data) groupSize = input('Please choose groupsize which dataInit divible by: '); % 4) Calculate Group Means % 5) Calculate Group Ranges while (counter < length(data)) if(counter+groupSize-1 <= length(data)) averages(LCV) = mean(data(counter:(counter+groupSize-1))); ranges(LCV) = max(data(counter:(counter+groupSize-1))) - ... min(data(counter:(counter+groupSize-1))); else averages(LCV) = mean(data(counter:(length(data)))); ranges(LCV) = max(data(counter:(length(data)))) - ... min(data(counter:(length(data)))); end counter = counter + groupSize; LCV = LCV + 1; end %%%%%%%%%%%%%%%%%%%%%%%%%%%%%%%%%%%%%%%%%%%%%%%%%%%%%%%%%%%%%%%%%%%%%% % 6) Estimate Mean and Standard Dev. of y % 7) Estimate Mean and Standard Dev. of R grandMean = mean(averages); grandRange = mean(ranges); muHat = grandMean; sigmaHat = grandRange/(d2(groupSize)); muRHat = grandRange; sigmaRHat = ((d3(groupSize))*(grandRange))/(d2(groupSize)); %%%%%%%%%%%%%%%%%%%%%%%%%%%%%%%%%%%%%%%%%%%%%%%%%%%%%%%%%%%%%%%%%%%%%% % 8) Calculate Estimated Confidence Interval %For normal random variable, 99.7% of observations in 6 SDs yCIL = ones(1,dataInit/groupSize) .* (muHat - (3*sigmaHat)/(sqrt(groupSize))); yCIH = ones(1,dataInit/groupSize) .* (muHat + (3*sigmaHat)/(sqrt(groupSize))); rCIL = ones(1,dataInit/groupSize) .* max([0,(muRHat - 3*sigmaRHat)]); rCIH = ones(1,dataInit/groupSize) .* (muRHat + 3*sigmaRHat);
78

%%%%%%%%%%%%%%%%%%%%%%%%%%%%%%%%%%%%%%%%%%%%%%%%%%%%%%%%%%%%%%%%%%%%%% % 9) Apply Control Limits % 10) Determine if system is in control if(track == 1) %Monitor BPM counter1 = 1; while (counter1 < 4) %Take # Sets of "Live" Data data = fread(s,1500); counter = 1; LCV = 1; subplot(2,2,1); plot(data); title('EKG Waveform') intervals = find(data > threshold); %find peaks tempCnt = 1; while(tempCnt < length(intervals)) %calculate intervals btwn peaks intervals(tempCnt) = intervals(tempCnt+1)-intervals(tempCnt); tempCnt = tempCnt + 1; end %convert intervals to BPM intervals = intervals(1:(length(intervals)-1)); intervals = intervals .* (1/60); intervals = 1 ./ intervals; intervals = intervals .* 60; tempCnt = 1; %filter intervals for obvisouly erroneous data while(tempCnt <= length(intervals)) if((intervals(tempCnt) > 120) | (intervals(tempCnt) < 45)) intervals = delmat(intervals,tempCnt); else tempCnt = tempCnt + 1; end end data = intervals; subplot(2,2,2); hist(intervals); title('Distribution of BPM Times') %calculate groups means and group ranges paying attention to vector %lengths and orginal group sizes making sure no bounds errors occur while (counter < length(data)) if(counter+groupSize-1 <= length(data)) averages(LCV) = mean(data(counter:(counter+groupSize-1))); ranges(LCV) = max(data(counter:(counter+groupSize-1))) - ... min(data(counter:(counter+groupSize-1))); else averages(LCV) = mean(data(counter:(length(data)))); ranges(LCV) = max(data(counter:(length(data)))) - ... min(data(counter:(length(data)))); end
79

counter = counter + groupSize; LCV = LCV + 1; end %Refresh mean plots with fixed control limits subplot(2,2,3); plot(averages); title('Mean Control Chart') hold; plot(yCIL); plot(yCIH); hold; subplot(2,2,4); plot(ranges); title('Range Control Chart') hold; plot(rCIL); plot(rCIH); hold; pause(0.001) %NECESSARY FOR REFRESH EFFECT counter1 = counter1 + 1; end end if(track == 2) %Monitor QRS Int counter1 = 1; while (counter1 < 4) %Take # Sets of "Live" Data data = fread(s,1500); LCV = 1; counter = 1; subplot(2,2,1); plot(data); title('EKG Waveform') peaks = find(data > threshold); tempCnt = 1; while(tempCnt < length(peaks)) intervals(tempCnt) = (peaks(tempCnt+1)-peaks(tempCnt)); tempCnt = tempCnt + 1; end tempCnt = 1; while(tempCnt < length(intervals)) if((intervals(tempCnt) < 15)) peaks = delmat(peaks,tempCnt); end tempCnt = tempCnt + 1; end currentPeak = peaks(1); %time of first peak tempTime = currentPeak; currentQrsPeak = 1; while (currentPeak < peaks(length(peaks))) %while you are not at last time while((data(tempTime) > 130))
80

tempTime = tempTime - 1; end lowSide = tempTime; tempTime = currentPeak+1; %reset start time for hi side search dataPrev = data(tempTime-1); while((data(tempTime) < 122) | (dataPrev > data(tempTime))) dataPrev = data(tempTime); tempTime = tempTime + 1; end hiSide = tempTime; qrsTimes(currentQrsPeak) = (1/((hiSide - lowSide)*60))*60; currentQrsPeak = currentQrsPeak + 1; if(currentQrsPeak <= length(peaks)) currentPeak = peaks(currentQrsPeak); tempTime = currentPeak; end end data = qrsTimes; subplot(2,2,2); hist(qrsTimes); title('Distribution of QRS Interval Times') %calculate groups means and group ranges paying attention to vector %lengths and orginal group sizes making sure no bounds errors occur while (counter < length(data)) if(counter+groupSize-1 <= length(data)) averages(LCV) = mean(data(counter:(counter+groupSize-1))); ranges(LCV) = max(data(counter:(counter+groupSize-1))) - ... min(data(counter:(counter+groupSize-1))); else averages(LCV) = mean(data(counter:(length(data)))); ranges(LCV) = max(data(counter:(length(data)))) - ... min(data(counter:(length(data)))); end counter = counter + groupSize; LCV = LCV + 1; end %Refresh mean plots with fixed control limits subplot(2,2,3); plot(averages); title('Mean Control Chart') hold plot(yCIL); plot(yCIH); hold subplot(2,2,4); plot(ranges); title('Range Control Chart') hold plot(rCIL);
81

plot(rCIH); hold pause(0.001) %NECESSARY FOR REFRESH EFFECT counter1 = counter1 + 1; end end fclose(s);
82

Appendix VI: PCB Layout Files
Figure 42: PCB Layout of Transmitter
Figure 43: PCB Layout of Receiver
83
Related Documents