A WGE analysis of the achievements, potential benefits and damages on health, materials and the environment of Gothenburg Protocol scenarios [email protected] chair of ICP Modelling and Mapping and all WGE’s ICPs and TF

Welcome message from author
This document is posted to help you gain knowledge. Please leave a comment to let me know what you think about it! Share it to your friends and learn new things together.
Transcript
A WGE analysis of the achievements, potential benefits and damages on health,
materials and the environment of Gothenburg Protocol scenarios
chair of ICP Modelling and Mapping
and all WGE’s ICPs and TF
Wge-analysis-WGSR48.ppt - 2
Relevant information from the WGE indicators for the
revision of the Gothenburg protocol
In the context of revision of the Gothenburg Protocol,
What do WGE indicators show:
Field observations and modelling
What are the main conclusions for each pollutants?
Wge-analysis-WGSR48.ppt - 3
Projected available depositions and concentrations
Baseline scenarios and projections
NAT 2000: Historic data (partly Eurostat)
NAT 2020: Projections (mainly) by Parties for the year 2020
PRI 2020 and 2030: Projections (mainly) by PRIMES
MFR 2020: Maximum (technically) feasible reductions for 2020
Data as available in October 2010
Amann M, Bertok I, Cofala J, Heyes C, Klimont Z, Rafaj P, Schöpp W, Wagner F, 2010. Scope for further environmental improvements in 2020 beyond the baseline projections, CIAM report 1/2010
Amann, M., Bertok, I., Borken-Kleefeld, J., Cofala, J., Heyes, C., Höglund-Isaksson, L., Klimont, Z., Rafaj, P., Schöpp, W., et Wagner, F. (2011). "Cost-effective Emission Reductions to Improve Air Quality in Europe in 2020. Scenarios for the Negotiations on the Revision of the Gothenburg Protocol under the Convention on Long-range Transboundary Air Pollution." IIASA.
Wge-analysis-WGSR48.ppt - 4
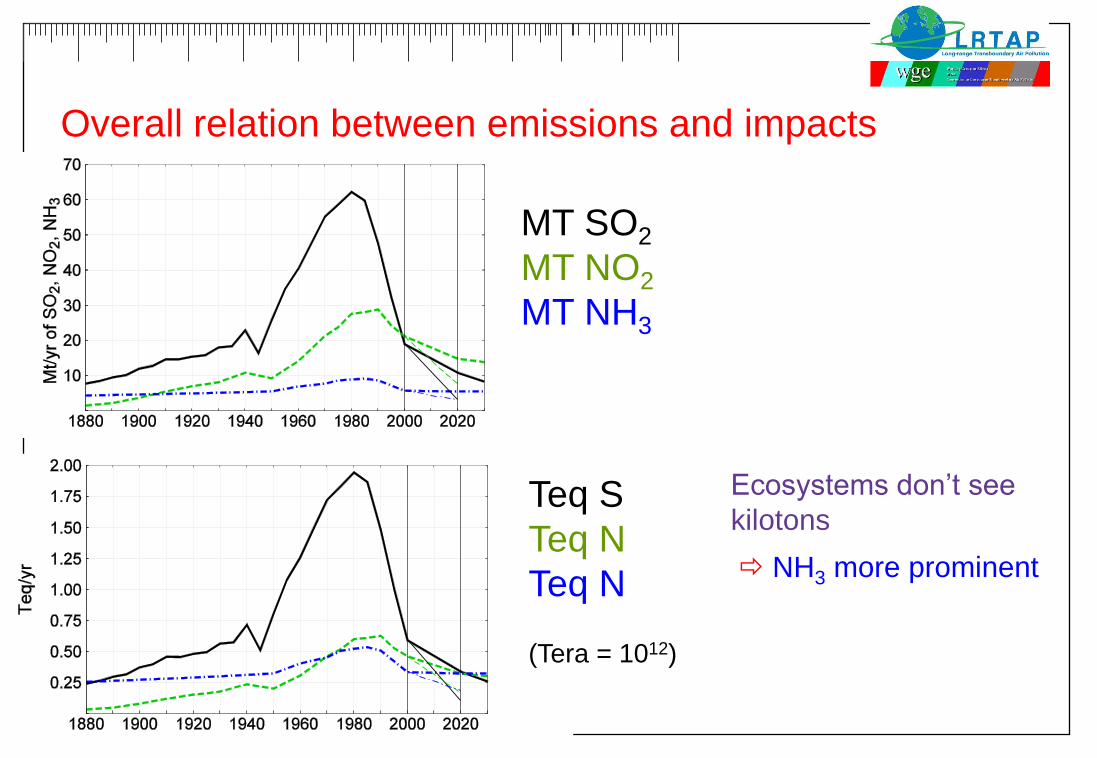
Overall relation between emissions and impacts
Ecosystems don’t see
kilotons
MT SO2
MT NO2
MT NH3
Teq S
Teq N
Teq N
(Tera = 1012)
NH3 more prominent
Wge-analysis-WGSR48.ppt - 5
EUTROPHICATION

Wge-analysis-WGSR48.ppt - 6
Number of sites protected /not protected with respect to
critical loads for eutrophication for terrestrial ecosystems
ICP IM: Decrease of impacts is expected at various sites
Compared to 2000:
The number of sites
impacted decreases by
about 20% with baseline in
2020 (70% with MTFR)
The magnitude of the
impact is reduced by about
40% with baseline in 2020
(80% with MTFR)
Eutrophication
5064
47 47 47
5
3521
38 38 38
80
0
20
40
60
80
100
1995 NAT 2000 NAT 2020 PRI 2020 PRI 2030 MFR 2020
Nb sites not protected Nb sites protected
0
100
200
300
400
500
600
NAT 2000 NAT 2020 PRI 2020 PRI 2030 MFR 2020
529
336 321293
107
CL
nu
t N
eq
/ha/y
ear
Average exceedance of the critical loads for
eutrophication for terrestrial ecosystems
ACIDIFCATION
EUTROPHICATION
Wge-analysis-WGSR48.ppt - 7
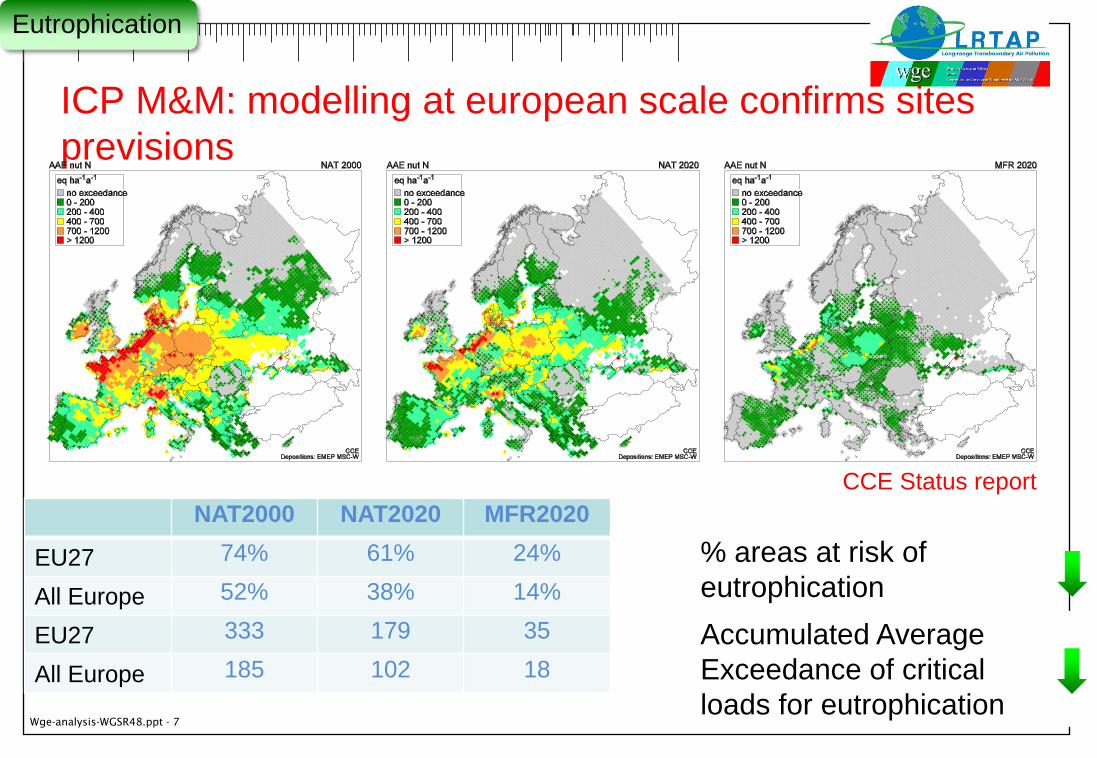
ICP M&M: modelling at european scale confirms sites
previsions
NAT2000 NAT2020 MFR2020
EU27 74% 61% 24%
All Europe 52% 38% 14%
EU27 333 179 35
All Europe 185 102 18
% areas at risk of
eutrophication
Accumulated Average
Exceedance of critical
loads for eutrophication
Eutrophication
CCE Status report
Wge-analysis-WGSR48.ppt - 8
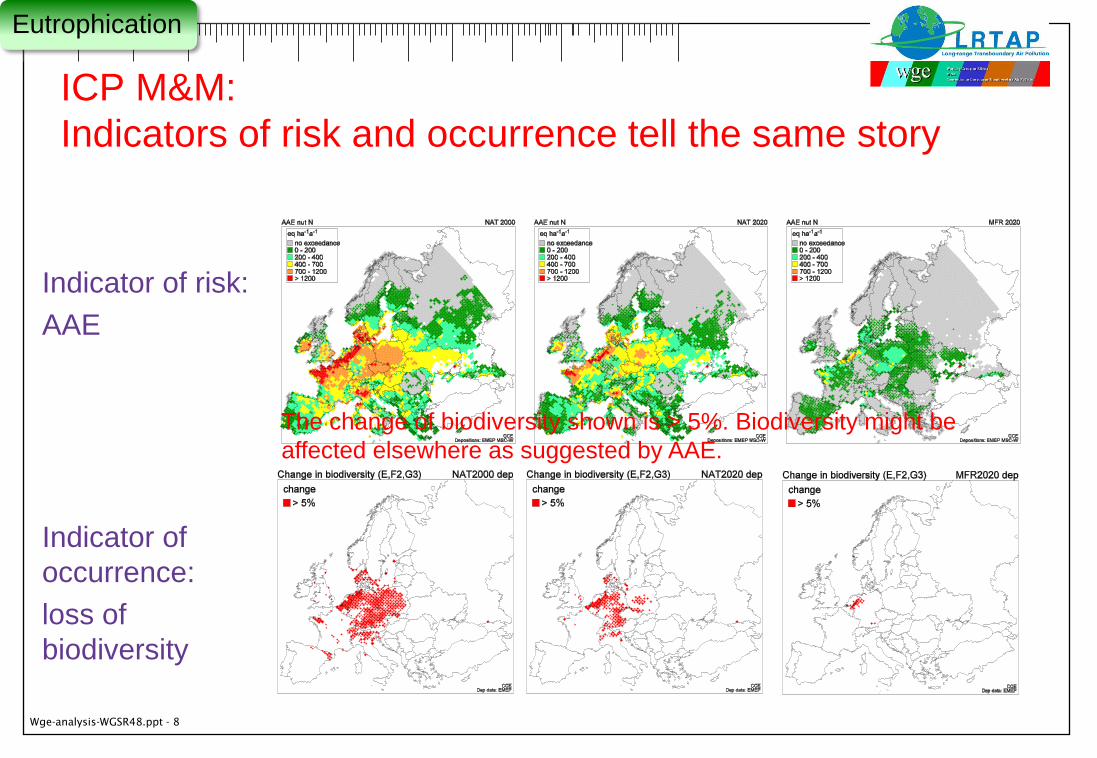
ICP M&M:
Indicators of risk and occurrence tell the same story
Eutrophication
Indicator of risk:
AAE
Indicator of
occurrence:
loss of
biodiversity
The change of biodiversity shown is > 5%. Biodiversity might be
affected elsewhere as suggested by AAE.
Wge-analysis-WGSR48.ppt - 9
EUTROPHICATION
Conclusions:
Areas impacted are reduced.
Magnitude of impact decreases.
Significant differences between baseline and MTFR
Compared to the baseline, the MTFR scenario protects an extra
37% of the EU27 ecosystems area and an extra 24% of the
EMEP ecosystems area.
Wge-analysis-WGSR48.ppt - 10
ACIDIFICATION
Wge-analysis-WGSR48.ppt - 11
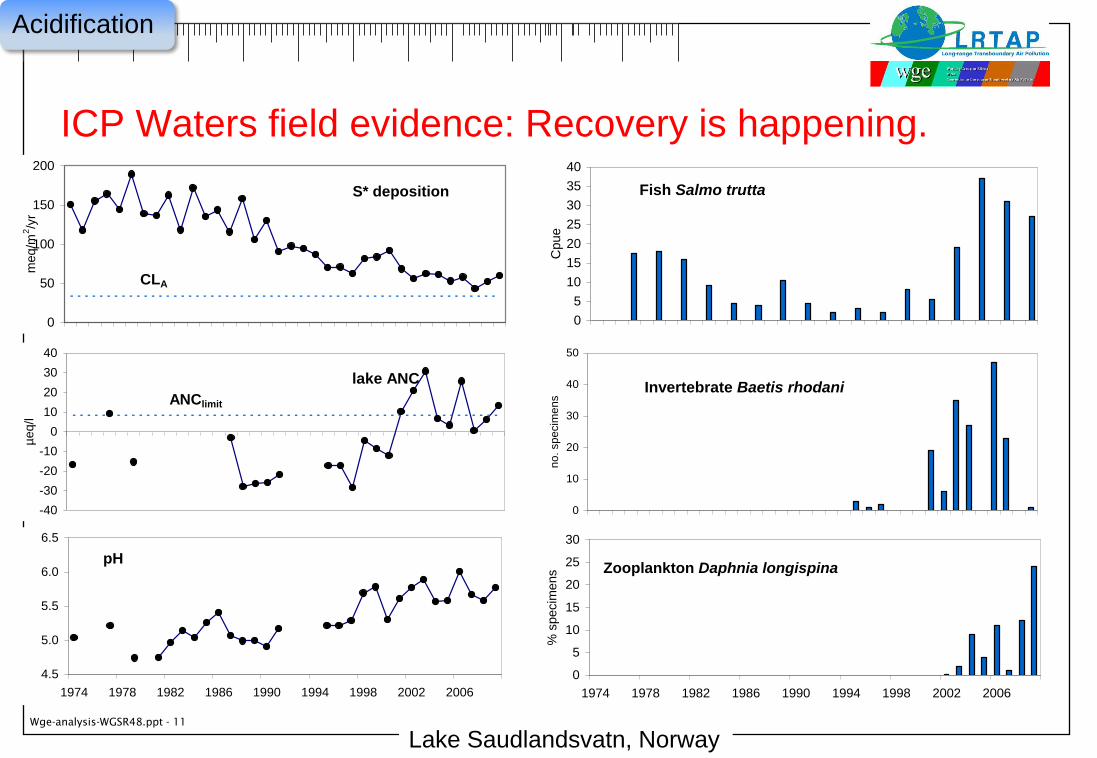
ICP Waters field evidence: Recovery is happening.
0
5
10
15
20
25
30
1974 1978 1982 1986 1990 1994 1998 2002 2006
% s
pecim
ens Zooplankton Daphnia longispina
0
10
20
30
40
50
no
. sp
ecim
en
s
Invertebrate Baetis rhodani
0
5
10
15
20
25
30
35
40
Cpue
Fish Salmo trutta
-40
-30
-20
-10
0
10
20
30
40
µe
q/l
ANClimit
lake ANC
0
50
100
150
200
meq/m
2/y
r
CLA
S* deposition
deposition
4.5
5.0
5.5
6.0
6.5
1974 1978 1982 1986 1990 1994 1998 2002 2006
pH
Acidification
Lake Saudlandsvatn, Norway
0
5
10
15
20
25
30
1974 1978 1982 1986 1990 1994 1998 2002 2006
% s
pecim
ens Zooplankton Daphnia longispina
0
10
20
30
40
50
no
. sp
ecim
en
s
Invertebrate Baetis rhodani
0
5
10
15
20
25
30
35
40
Cpue
Fish Salmo trutta
-40
-30
-20
-10
0
10
20
30
40
µe
q/l
ANClimit
lake ANC
0
50
100
150
200
meq/m
2/y
r
CLA
S* deposition
deposition
4.5
5.0
5.5
6.0
6.5
1974 1978 1982 1986 1990 1994 1998 2002 2006
pH
Wge-analysis-WGSR48.ppt - 12
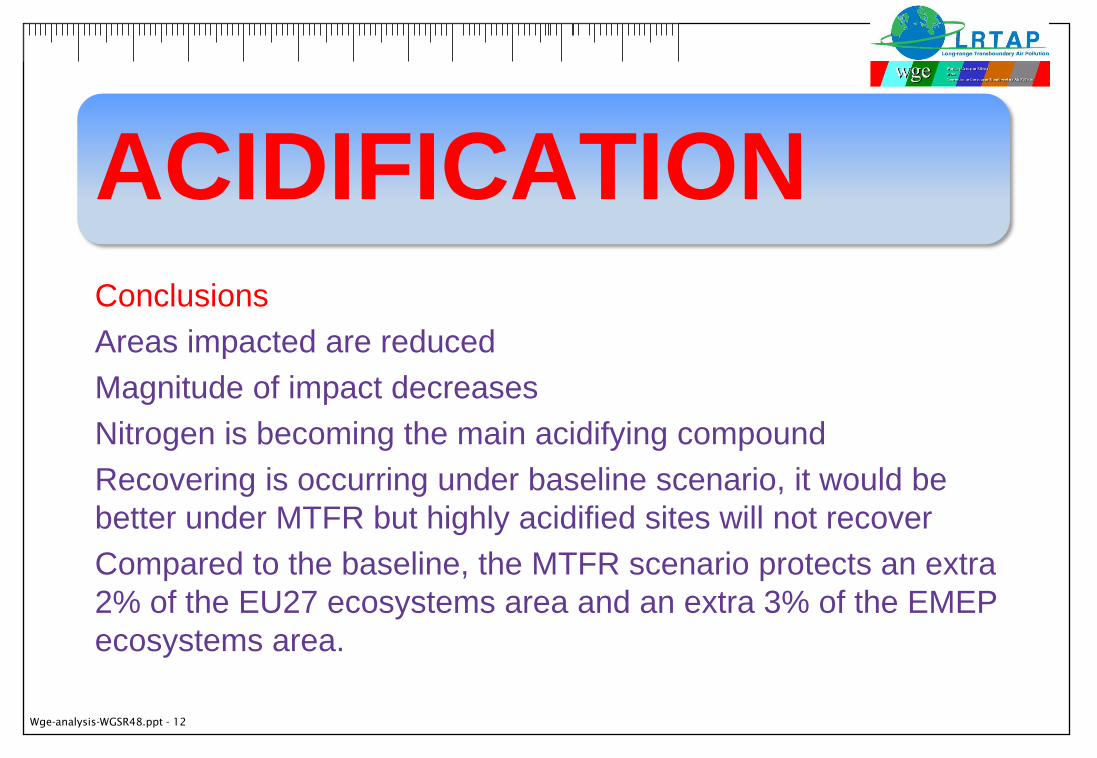
ACIDIFICATIONConclusions
Areas impacted are reduced
Magnitude of impact decreases
Nitrogen is becoming the main acidifying compound
Recovering is occurring under baseline scenario, it would be
better under MTFR but highly acidified sites will not recover
Compared to the baseline, the MTFR scenario protects an extra
2% of the EU27 ecosystems area and an extra 3% of the EMEP
ecosystems area.
Wge-analysis-WGSR48.ppt - 13
OZONE
Wge-analysis-WGSR48.ppt - 14
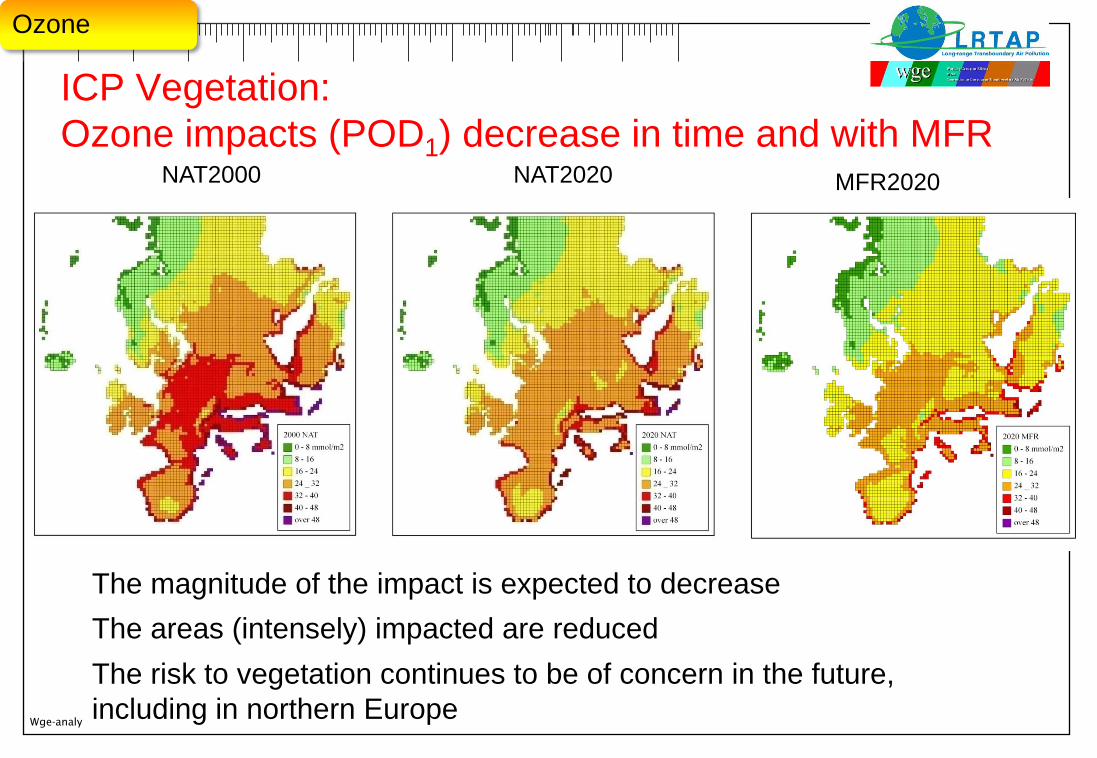
ICP Vegetation:
Ozone impacts (POD1) decrease in time and with MFR
Ozone
NAT2000 NAT2020 MFR2020
The magnitude of the impact is expected to decrease
The areas (intensely) impacted are reduced
The risk to vegetation continues to be of concern in the future,
including in northern Europe
Wge-analysis-WGSR48.ppt - 15
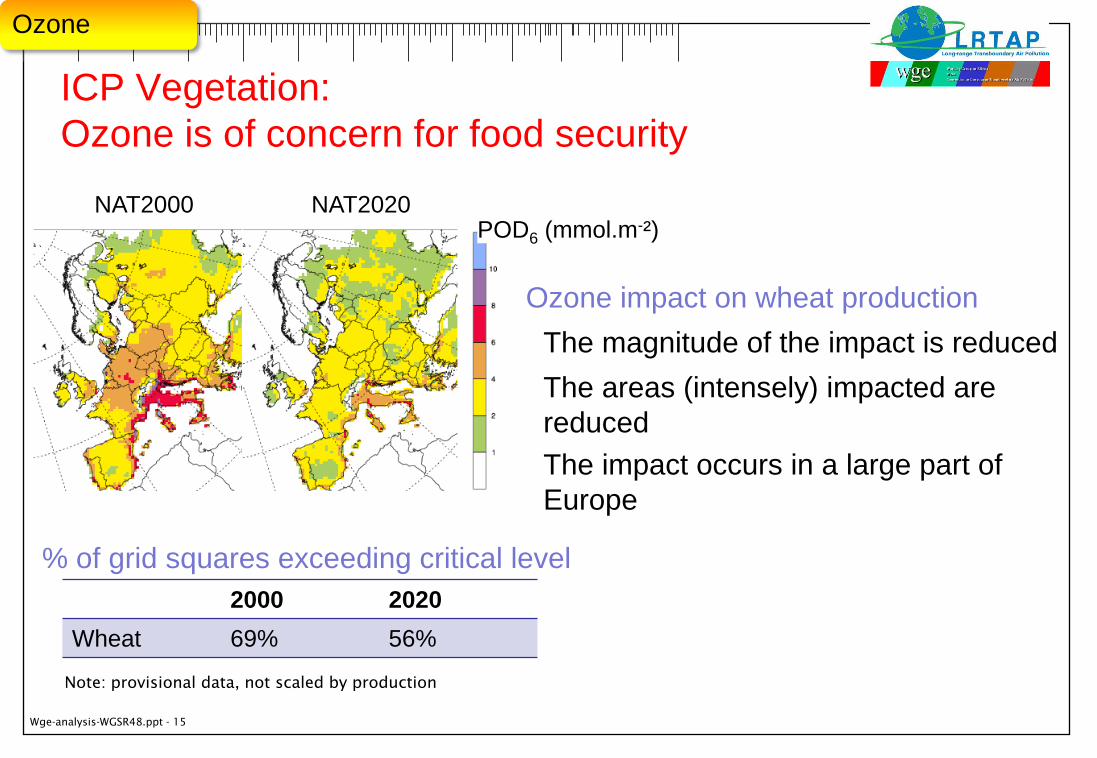
ICP Vegetation:
Ozone is of concern for food security
2000 2020
Wheat 69% 56%
% of grid squares exceeding critical level
The magnitude of the impact is reduced
The areas (intensely) impacted are
reduced
The impact occurs in a large part of
Europe
NAT2000 NAT2020POD6 (mmol.m-²)
Ozone
Note: provisional data, not scaled by production
Ozone impact on wheat production
Wge-analysis-WGSR48.ppt - 16
Conclusion
The areas intensely impacted and the magnitude of impact
are reduced from the baseline to the MTFR scenario.
Ozone continues to be of concern, including in northern part
of Europe.
OZONE
Wge-analysis-WGSR48.ppt - 17
MULTI-POLLUTANT
Wge-analysis-WGSR48.ppt - 18
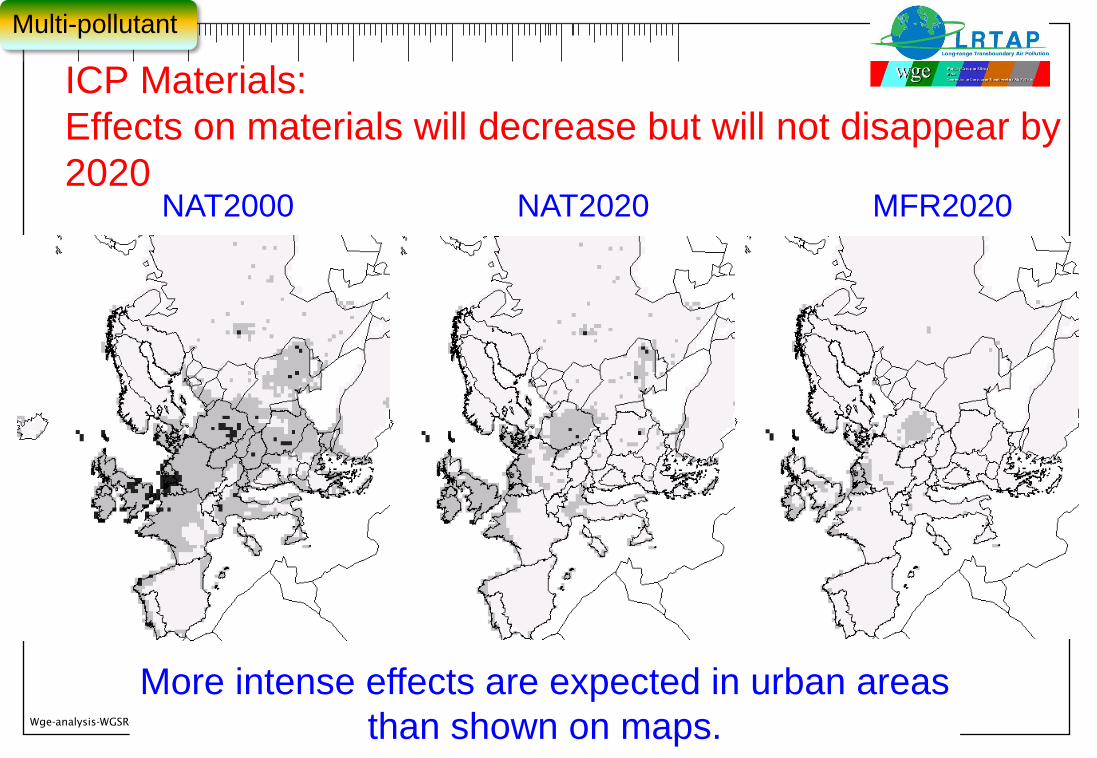
ICP Materials:
Effects on materials will decrease but will not disappear by
2020NAT2000 MFR2020NAT2020
More intense effects are expected in urban areas
than shown on maps.
Multi-pollutant

Wge-analysis-WGSR48.ppt - 19
OVERALL CONCLUSIONS
Wge-analysis-WGSR48.ppt - 20
Conclusions 1
Similar observations from all groups under WGE:
Area impacted decreases
Magnitude of impact decreases
But large areas still impacted
o Eutrophication
o Ozone
o Multi-pollutants (Material, human health)
o Acidification
Wge-analysis-WGSR48.ppt - 21
Conclusions 2
Lots of information, mostly giving the same messages:
Most impacts are in western part of Europe.
Baseline scenario already providing significant improvement to the
condition of the environment. MTFR goes further but not enough
to provide total protection against acidification for all ecosystems
(esp. the most sensitive ecosystems)
Nitrogen remains a problem although improvements are expected.
Effects of ozone on food security, ecosystem services and human
health are important.
Effects of air pollution on materials and health probably
underestimated in urban areas
Health effects already taken into account in GAINS, further data
required to get further information from the assessment.
Acidification
Eutrophication
Ozone
Multi-pollutant

Wge-analysis-WGSR48.ppt - 22
THANK YOU FOR YOUR
ATTENTION
Wge-analysis-WGSR48.ppt - 23
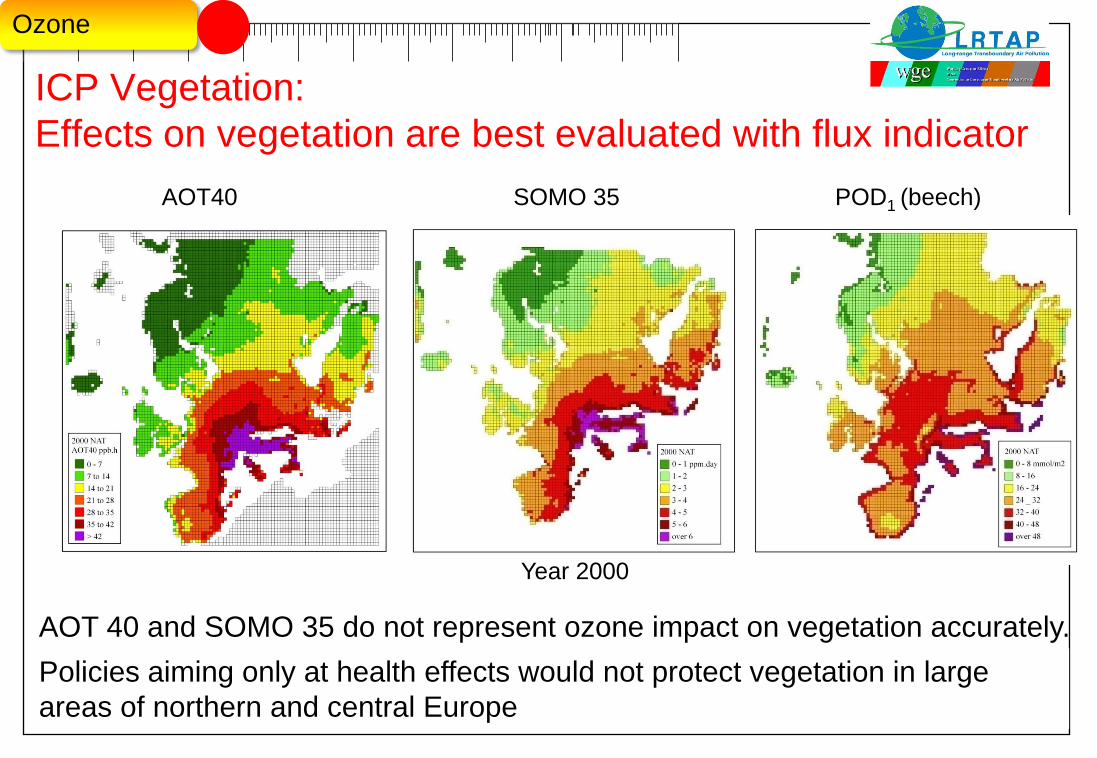
ICP Vegetation:
Effects on vegetation are best evaluated with flux indicator
AOT40 SOMO 35 POD1 (beech)
Ozone
AOT 40 and SOMO 35 do not represent ozone impact on vegetation accurately.
Policies aiming only at health effects would not protect vegetation in large
areas of northern and central Europe
Year 2000
Related Documents