A vibrational spectroscopic study of a hydrated hydroxy-phosphate mineral fluellite, Al 2 (PO 4 )F 2 (OH)7H 2 O Jir ˇí C ˇ ejka a,b , Jir ˇí Sejkora a , Ivo Macek a , Ray L. Frost b,⇑ , Andrés López b , Ricardo Scholz c , Yunfei Xi b a Department of Mineralogy and Petrology, National Museum, Cirkusová 1740, CZ-193 00 Praha 9, Czech Republic b School of Chemistry, Physics and Mechanical Engineering, Science and Engineering Faculty, Queensland University of Technology, GPO Box 2434, Brisbane, Queensland 4001, Australia c Geology Department, School of Mines, Federal University of Ouro Preto, Campus Morro do Cruzeiro, Ouro Preto, MG 35400-00, Brazil highlights We have studied Raman and infrared spectra of two well-defined fluellite samples. From the Krásno near Horní Slavkov (Czech Republic) and Kapunda, South Australia (Australia). Observed bands were assigned to the stretching and bending vibrations of phosphate tetrahedra. Approximate O–HO hydrogen bond lengths were inferred. graphical abstract article info Article history: Received 17 November 2013 Accepted 31 January 2014 Available online 7 February 2014 Keywords: Fluellite Phosphate Hydroxyl ions Raman spectroscopy Infrared spectroscopy abstract Raman and infrared spectra of two well-defined fluellite samples, Al 2 (PO 4 )F 2 (OH)7H 2 O, from the Krásno near Horní Slavkov (Czech Republic) and Kapunda, South Australia (Australia) were studied and tenta- tively interpreted. Observed bands were assigned to the stretching and bending vibrations of phosphate tetrahedra, aluminum oxide/hydroxide/fluoride octahedra, water molecules and hydroxyl ions. Approx- imate O–HO hydrogen bond lengths were inferred from the Raman and infrared spectra. Ó 2014 Elsevier B.V. All rights reserved. Introduction Fluellite Al 2 (PO 4 )F 2 (OH)7H 2 O is very rare, late hydrothermal or supergene mineral formed by alteration of earlier phosphates min- erals. It may be found as a colorless to purple-black crystals [1] but usually forms a colorless to white and yellow crystals or powder aggregates in association with fluorapatite, wavellite, cacoxenite, variscite, strengite, minyulite etc. The size of the crystals is several mm rare up to 1 cm [2]. It occurs in several types of geological environments, for example in complex granitic pegmatites [3,4], phosphatic marbles [5], in lateritic conglomerate and phosphatic sedimentary rocks [6–8] and at ore deposits [1,9–11]. Fluellite was described as a new mineral in 1824 by Lévy [12] without any quantitative chemical tests only with presence of alu- minum and fluorine. Further chemical data were presented in 1882 by Groth [13] and proposed the formula AlF 8 H 2 O. In 1920 Laub- mann and Steinmetz [14] described mineral kreuzbergite from http://dx.doi.org/10.1016/j.saa.2014.01.116 1386-1425/Ó 2014 Elsevier B.V. All rights reserved. ⇑ Corresponding author. Tel.: +61 7 3138 2407; fax: +61 7 3138 1804. E-mail address: [email protected] (R.L. Frost). Spectrochimica Acta Part A: Molecular and Biomolecular Spectroscopy 126 (2014) 157–163 Contents lists available at ScienceDirect Spectrochimica Acta Part A: Molecular and Biomolecular Spectroscopy journal homepage: www.elsevier.com/locate/saa

Welcome message from author
This document is posted to help you gain knowledge. Please leave a comment to let me know what you think about it! Share it to your friends and learn new things together.
Transcript
Spectrochimica Acta Part A: Molecular and Biomolecular Spectroscopy 126 (2014) 157–163
Contents lists available at ScienceDirect
Spectrochimica Acta Part A: Molecular andBiomolecular Spectroscopy
journal homepage: www.elsevier .com/locate /saa
A vibrational spectroscopic study of a hydrated hydroxy-phosphatemineral fluellite, Al2(PO4)F2(OH)�7H2O
http://dx.doi.org/10.1016/j.saa.2014.01.1161386-1425/� 2014 Elsevier B.V. All rights reserved.
⇑ Corresponding author. Tel.: +61 7 3138 2407; fax: +61 7 3138 1804.E-mail address: [email protected] (R.L. Frost).
Jirí Cejka a,b, Jirí Sejkora a, Ivo Macek a, Ray L. Frost b,⇑, Andrés López b, Ricardo Scholz c, Yunfei Xi b
a Department of Mineralogy and Petrology, National Museum, Cirkusová 1740, CZ-193 00 Praha 9, Czech Republicb School of Chemistry, Physics and Mechanical Engineering, Science and Engineering Faculty, Queensland University of Technology, GPO Box 2434, Brisbane, Queensland4001, Australiac Geology Department, School of Mines, Federal University of Ouro Preto, Campus Morro do Cruzeiro, Ouro Preto, MG 35400-00, Brazil
h i g h l i g h t s
�We have studied Raman and infraredspectra of two well-defined fluellitesamples.� From the Krásno near Horní Slavkov
(Czech Republic) and Kapunda, SouthAustralia (Australia).� Observed bands were assigned to the
stretching and bending vibrations ofphosphate tetrahedra.� Approximate O–H� � �O hydrogen bond
lengths were inferred.
g r a p h i c a l a b s t r a c t
a r t i c l e i n f o
Article history:Received 17 November 2013Accepted 31 January 2014Available online 7 February 2014
Keywords:FluellitePhosphateHydroxyl ionsRaman spectroscopyInfrared spectroscopy
a b s t r a c t
Raman and infrared spectra of two well-defined fluellite samples, Al2(PO4)F2(OH)�7H2O, from the Krásnonear Horní Slavkov (Czech Republic) and Kapunda, South Australia (Australia) were studied and tenta-tively interpreted. Observed bands were assigned to the stretching and bending vibrations of phosphatetetrahedra, aluminum oxide/hydroxide/fluoride octahedra, water molecules and hydroxyl ions. Approx-imate O–H���O hydrogen bond lengths were inferred from the Raman and infrared spectra.
� 2014 Elsevier B.V. All rights reserved.
Introduction
Fluellite Al2(PO4)F2(OH)�7H2O is very rare, late hydrothermal orsupergene mineral formed by alteration of earlier phosphates min-erals. It may be found as a colorless to purple-black crystals [1] butusually forms a colorless to white and yellow crystals or powderaggregates in association with fluorapatite, wavellite, cacoxenite,
variscite, strengite, minyulite etc. The size of the crystals is severalmm rare up to 1 cm [2]. It occurs in several types of geologicalenvironments, for example in complex granitic pegmatites [3,4],phosphatic marbles [5], in lateritic conglomerate and phosphaticsedimentary rocks [6–8] and at ore deposits [1,9–11].
Fluellite was described as a new mineral in 1824 by Lévy [12]without any quantitative chemical tests only with presence of alu-minum and fluorine. Further chemical data were presented in 1882by Groth [13] and proposed the formula AlF8�H2O. In 1920 Laub-mann and Steinmetz [14] described mineral kreuzbergite from
158 J. Cejka et al. / Spectrochimica Acta Part A: Molecular and Biomolecular Spectroscopy 126 (2014) 157–163
Oberpfalz, Bavaria as an aluminum phosphate. These two mineralswith similar compositions existed till 1940 when Scholz andStrunz [15] carried out qualitative chemical analyses on kreuzberg-ite and concluded that it has the same composition as fluellite. Thename kreuzbergite was discredited and only fluellite remained.
The mineral fluellite has orthorhombic symmetry with spacegroup Fddd. Its crystal structure was solved by Guy et al. [16,17]and consists of octahedrally [Al–O] and tetrahedrally [PO4] coordi-nated cations in open framework arrangement within which thereare distinct channels containing hydrogen-bonded water mole-cules. The aluminum atoms are situated at centers of symmetryand are bonded octahedrally to two centro-symmetric pairs of oxy-gen atoms and one pair of fluorine ions. Raman spectrum of fluel-lite from Gold Quarry mine, Maggie Creek District, Eureka County,Nevada (USA) was published in the RRUFF’s data base (fluelliteR070473) without any resolution of band wavenumbers andassignment.
The aim of this paper is to report the Raman spectra of well-defined natural hydrated phosphate minerals, fluellite from twodifferent occurrences, and to relate the spectra to this molecularand the crystal structure. The paper follows the systematicresearch of the large group of oxyanion containing minerals[18–21], and especially their molecular structure using IR andRaman spectroscopy [22–25].
Table 2Chemical composition of fluellite from Krásno (CZ).
wt.% Mean 1–4 1 2 3 4 Idealb
Al2O3 36.40 36.98 36.32 36.23 36.06 30.89P2O5 27.29 27.10 27.39 26.93 27.74 21.51
Experimental
Minerals
The studied samples of the mineral fluellite originated from twodifferent occurrences: greisen Sn–W deposit Krásno near HorníSlavkov [2], western Bohemia, Czech Republic (labelled as CZ)and phosphate deposit Kapunda [26], Mt. Lofty Ranges, South Aus-tralia, Australia (labelled as AU). At both occurrences, fluelliteforms very brittle, water-clear translucent dipyramidal crystalsup to 1 cm (CZ) or only 1 mm in size (AU).
Carefully hand-picked samples were used for X-ray powder dif-fraction experiments. To minimize the complicated shape of back-ground, the samples studied were placed on a flat low-backgroundsilicon wafer. Powder XRD measurements were carried out with CuKa radiation at a HZG4/Arem diffractometer (50 kV, 40 mA) in therange 5–70� 2h in the step-scan mode 0.02�/5 s (CZ) and at a BrukerD8 Advance diffractometer (40 kV, 40 mA) in the range 5–70� 2h inthe step-scan mode 0.01�/8 s (AU). The position and intensities ofreflections were calculated using the Pearson VII profile shapefunction in the ZDS program package [27]. The measured patternswere indexed using theoretical pattern calculated from the crystal-structure data of fluellite [16,17]. The unit-cell parameters refinedfrom measured powder XRD using the program of Burnham [28]are compared with published data in Table 1.
The fluellite sample (CZ) was quantitatively analyzed by Came-ca SX 100 electron microprobe system in wavelength dispersionmode for chemical composition. Studied sample was mounted intothe epoxide resin and polished. The polished surface was coatedwith carbon layer 250 Å. An acceleration voltage of 15 kV, a speci-men current of 10 nA, and a beam diameter of 5 lm were used.Well-defined natural and synthetic compounds were used as
Table 1Unit-cell parameters of fluellite.
a [Å] b [Å] c [Å] V [Å3]
Krásno (CZ) 8.558(1) 11.237(1) 21.179(2) 2043.5(3)Kapunda (AU) 8.5703(5) 11.2454(8) 21.175(1) 2040.8(1)Cornwall [16] 8.546(8) 11.222(5) 21.158(5) 2029.12
standards. The raw intensities were converted to the concentra-tions using automatic PAP matrix correction software package.The calculation of theoretical content of H2O corresponding toideal formula provided the totals near 120 wt.% (Table 2); it indi-cates a strong dehydratation, corresponding to loss of two H2Omolecules during sample coating in vacuum and analysis. This lossis indicated by irregular fracturing of the analyzes samples [2]. Onthe basis of 14 (O,OH,F), empirical formula of fluellite from Krásnomay be expressed as Al1.98(PO4)1.07F1.99(OH)0.75�7H2O. Chemicalcomposition of Kapunda fluellite (AU) was check by ED spectrumat the same EMPA, obtained ED spectra for both samples (CZ,AU)are practically identical, only very minor Fe content was found atAU sample.
Raman and infrared spectroscopy
Fragments of single crystals of fluellite were placed on a pol-ished metal surface on the stage of an Olympus BHSM microscope,which is equipped with 10�, 20�, and 50� objectives. The micro-scope is part of a Renishaw 1000 Raman microscope system, whichalso includes a monochromator, a filter system and a CCD detector(1024 pixels). The Raman spectra were excited by a Spectra-Phys-ics model 127 He–Ne laser producing highly polarised light at633 nm and collected at a nominal resolution of 2 cm�1 and a pre-cision of ±1 cm�1 in the range between 200 and 4000 cm�1. Re-peated acquisition on the crystals using the highestmagnification (50�) were accumulated to improve the signal tonoise ratio in the spectra. Spectra were calibrated using the520.5 cm�1 line of a silicon wafer. Previous studies by the authorsprovide more details of the experimental technique. Alignment ofall crystals in a similar orientation has been attempted andachieved. However, differences in intensity may be observed dueto minor differences in the crystal orientation.
Infrared spectrum of fluellite sample from Kapunda was re-corded by microdiffuse reflectance method (DRIFTS) on a NicoletMagna 760 FTIR spectrometer (range 4000–600 cm�1, resolution4 cm�1, 128 scans, 2 level zero-filtering, Happ–Genzel apodiza-tion), equipped with Spectra Tech InspectIR micro FTIR accessory.Sample of amount less than 0.050 mg was mixed without usingpressure with KBr. Samples were immediately recorded togetherwith the same KBr as a reference.
Spectral manipulation such as baseline correction/adjustmentand smoothing were performed using the Spectracalc softwarepackage GRAMS (Galactic Industries Corporation, NH, USA). Bandcomponent analysis was undertaken using the Jandel ‘Peakfit’ soft-ware package that enabled the type of fitting function to be se-lected and allows specific parameters to be fixed or variedaccordingly. Band fitting was done using a Lorentzian–Gaussiancross-product function with the minimum number of componentbands used for the fitting process. The Gaussian–Lorentzian ratiowas maintained at values greater than 0.7 and fitting was
F 13.65 13.54 13.37 13.96 13.75 11.51H2Oa 47.95 48.95 47.94 47.58 47.30 40.95-F = O 5.75 5.70 5.63 5.88 5.79 4.86total 119.54 120.87 119.38 118.82 119.06 100.00
Additional elements (Na, K, Mn, Sr, Ba, Ca, Cu, Zn, Fe, Bi, Si, As, S and Cl) wereanalyzed; the analysis confirmed their absence or contents below detection limits(ca 0.01–0.05 wt.%).
a H2O content was calculated on the basis of ideal composition.b Ideal composition calculated from formula Al2(PO4)F2(OH)�7H2O.
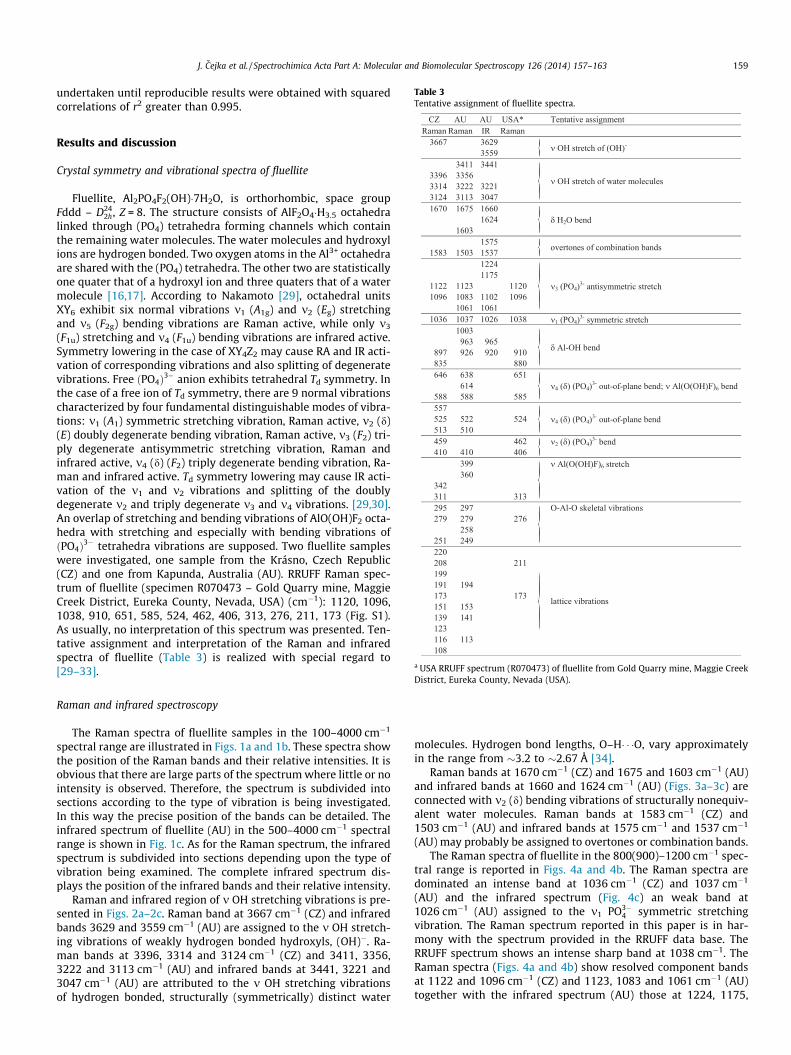
Table 3Tentative assignment of fluellite spectra.
J. Cejka et al. / Spectrochimica Acta Part A: Molecular and Biomolecular Spectroscopy 126 (2014) 157–163 159
undertaken until reproducible results were obtained with squaredcorrelations of r2 greater than 0.995.
a USA RRUFF spectrum (R070473) of fluellite from Gold Quarry mine, Maggie CreekDistrict, Eureka County, Nevada (USA).
Results and discussion
Crystal symmetry and vibrational spectra of fluellite
Fluellite, Al2PO4F2(OH)�7H2O, is orthorhombic, space groupFddd – D24
2h , Z = 8. The structure consists of AlF2O4�H3.5 octahedralinked through (PO4) tetrahedra forming channels which containthe remaining water molecules. The water molecules and hydroxylions are hydrogen bonded. Two oxygen atoms in the Al3+ octahedraare shared with the (PO4) tetrahedra. The other two are statisticallyone quater that of a hydroxyl ion and three quaters that of a watermolecule [16,17]. According to Nakamoto [29], octahedral unitsXY6 exhibit six normal vibrations m1 (A1g) and m2 (Eg) stretchingand m5 (F2g) bending vibrations are Raman active, while only m3
(F1u) stretching and m4 (F1u) bending vibrations are infrared active.Symmetry lowering in the case of XY4Z2 may cause RA and IR acti-vation of corresponding vibrations and also splitting of degeneratevibrations. Free ðPO4Þ3� anion exhibits tetrahedral Td symmetry. Inthe case of a free ion of Td symmetry, there are 9 normal vibrationscharacterized by four fundamental distinguishable modes of vibra-tions: m1 (A1) symmetric stretching vibration, Raman active, m2 (d)(E) doubly degenerate bending vibration, Raman active, m3 (F2) tri-ply degenerate antisymmetric stretching vibration, Raman andinfrared active, m4 (d) (F2) triply degenerate bending vibration, Ra-man and infrared active. Td symmetry lowering may cause IR acti-vation of the m1 and m2 vibrations and splitting of the doublydegenerate m2 and triply degenerate m3 and m4 vibrations. [29,30].An overlap of stretching and bending vibrations of AlO(OH)F2 octa-hedra with stretching and especially with bending vibrations ofðPO4Þ3� tetrahedra vibrations are supposed. Two fluellite sampleswere investigated, one sample from the Krásno, Czech Republic(CZ) and one from Kapunda, Australia (AU). RRUFF Raman spec-trum of fluellite (specimen R070473 – Gold Quarry mine, MaggieCreek District, Eureka County, Nevada, USA) (cm�1): 1120, 1096,1038, 910, 651, 585, 524, 462, 406, 313, 276, 211, 173 (Fig. S1).As usually, no interpretation of this spectrum was presented. Ten-tative assignment and interpretation of the Raman and infraredspectra of fluellite (Table 3) is realized with special regard to[29–33].
Raman and infrared spectroscopy
The Raman spectra of fluellite samples in the 100–4000 cm�1
spectral range are illustrated in Figs. 1a and 1b. These spectra showthe position of the Raman bands and their relative intensities. It isobvious that there are large parts of the spectrum where little or nointensity is observed. Therefore, the spectrum is subdivided intosections according to the type of vibration is being investigated.In this way the precise position of the bands can be detailed. Theinfrared spectrum of fluellite (AU) in the 500–4000 cm�1 spectralrange is shown in Fig. 1c. As for the Raman spectrum, the infraredspectrum is subdivided into sections depending upon the type ofvibration being examined. The complete infrared spectrum dis-plays the position of the infrared bands and their relative intensity.
Raman and infrared region of m OH stretching vibrations is pre-sented in Figs. 2a–2c. Raman band at 3667 cm�1 (CZ) and infraredbands 3629 and 3559 cm�1 (AU) are assigned to the m OH stretch-ing vibrations of weakly hydrogen bonded hydroxyls, (OH)�. Ra-man bands at 3396, 3314 and 3124 cm�1 (CZ) and 3411, 3356,3222 and 3113 cm�1 (AU) and infrared bands at 3441, 3221 and3047 cm�1 (AU) are attributed to the m OH stretching vibrationsof hydrogen bonded, structurally (symmetrically) distinct water
molecules. Hydrogen bond lengths, O–H� � �O, vary approximatelyin the range from �3.2 to �2.67 Å [34].
Raman bands at 1670 cm�1 (CZ) and 1675 and 1603 cm�1 (AU)and infrared bands at 1660 and 1624 cm�1 (AU) (Figs. 3a–3c) areconnected with m2 (d) bending vibrations of structurally nonequiv-alent water molecules. Raman bands at 1583 cm�1 (CZ) and1503 cm�1 (AU) and infrared bands at 1575 cm�1 and 1537 cm�1
(AU) may probably be assigned to overtones or combination bands.The Raman spectra of fluellite in the 800(900)–1200 cm�1 spec-
tral range is reported in Figs. 4a and 4b. The Raman spectra aredominated an intense band at 1036 cm�1 (CZ) and 1037 cm�1
(AU) and the infrared spectrum (Fig. 4c) an weak band at1026 cm�1 (AU) assigned to the m1 PO3�
4 symmetric stretchingvibration. The Raman spectrum reported in this paper is in har-mony with the spectrum provided in the RRUFF data base. TheRRUFF spectrum shows an intense sharp band at 1038 cm�1. TheRaman spectra (Figs. 4a and 4b) show resolved component bandsat 1122 and 1096 cm�1 (CZ) and 1123, 1083 and 1061 cm�1 (AU)together with the infrared spectrum (AU) those at 1224, 1175,
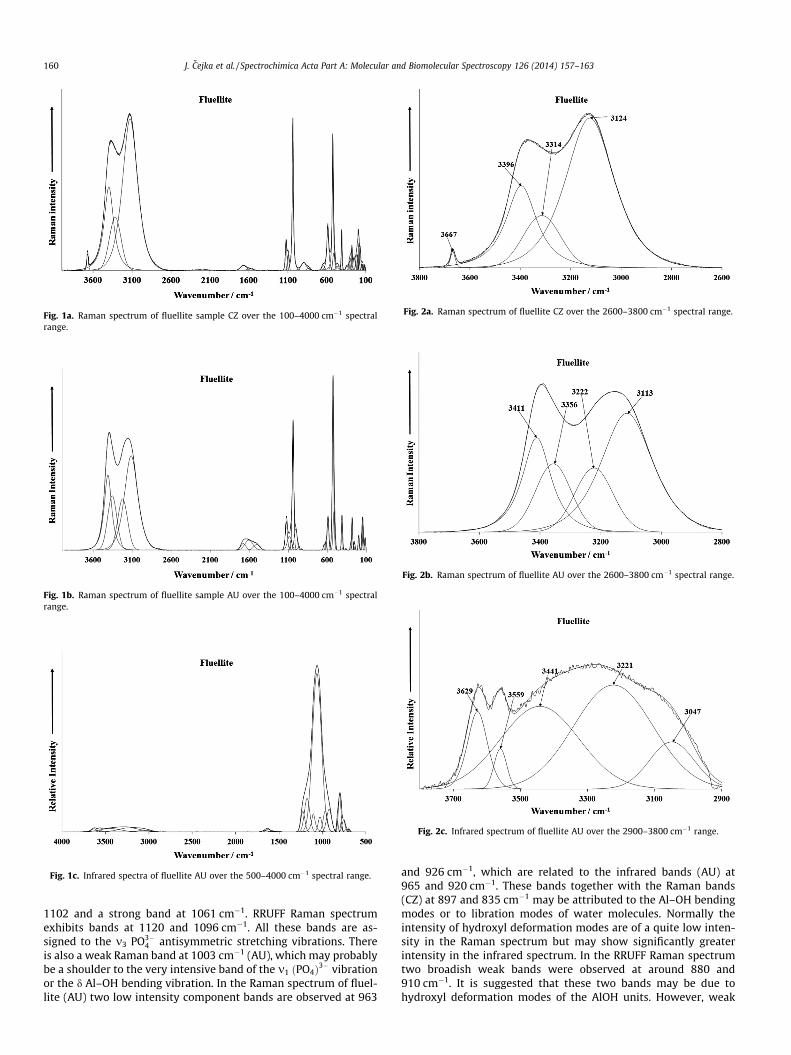
Fig. 1a. Raman spectrum of fluellite sample CZ over the 100–4000 cm�1 spectralrange.
Fig. 1b. Raman spectrum of fluellite sample AU over the 100–4000 cm�1 spectralrange.
Fig. 1c. Infrared spectra of fluellite AU over the 500–4000 cm�1 spectral range.
Fig. 2a. Raman spectrum of fluellite CZ over the 2600–3800 cm�1 spectral range.
Fig. 2b. Raman spectrum of fluellite AU over the 2600–3800 cm�1 spectral range.
Fig. 2c. Infrared spectrum of fluellite AU over the 2900–3800 cm�1 range.
160 J. Cejka et al. / Spectrochimica Acta Part A: Molecular and Biomolecular Spectroscopy 126 (2014) 157–163
1102 and a strong band at 1061 cm�1. RRUFF Raman spectrumexhibits bands at 1120 and 1096 cm�1. All these bands are as-signed to the m3 PO3�
4 antisymmetric stretching vibrations. Thereis also a weak Raman band at 1003 cm�1 (AU), which may probablybe a shoulder to the very intensive band of the m1 ðPO4Þ3� vibrationor the d Al–OH bending vibration. In the Raman spectrum of fluel-lite (AU) two low intensity component bands are observed at 963
and 926 cm�1, which are related to the infrared bands (AU) at965 and 920 cm�1. These bands together with the Raman bands(CZ) at 897 and 835 cm�1 may be attributed to the Al–OH bendingmodes or to libration modes of water molecules. Normally theintensity of hydroxyl deformation modes are of a quite low inten-sity in the Raman spectrum but may show significantly greaterintensity in the infrared spectrum. In the RRUFF Raman spectrumtwo broadish weak bands were observed at around 880 and910 cm�1. It is suggested that these two bands may be due tohydroxyl deformation modes of the AlOH units. However, weak
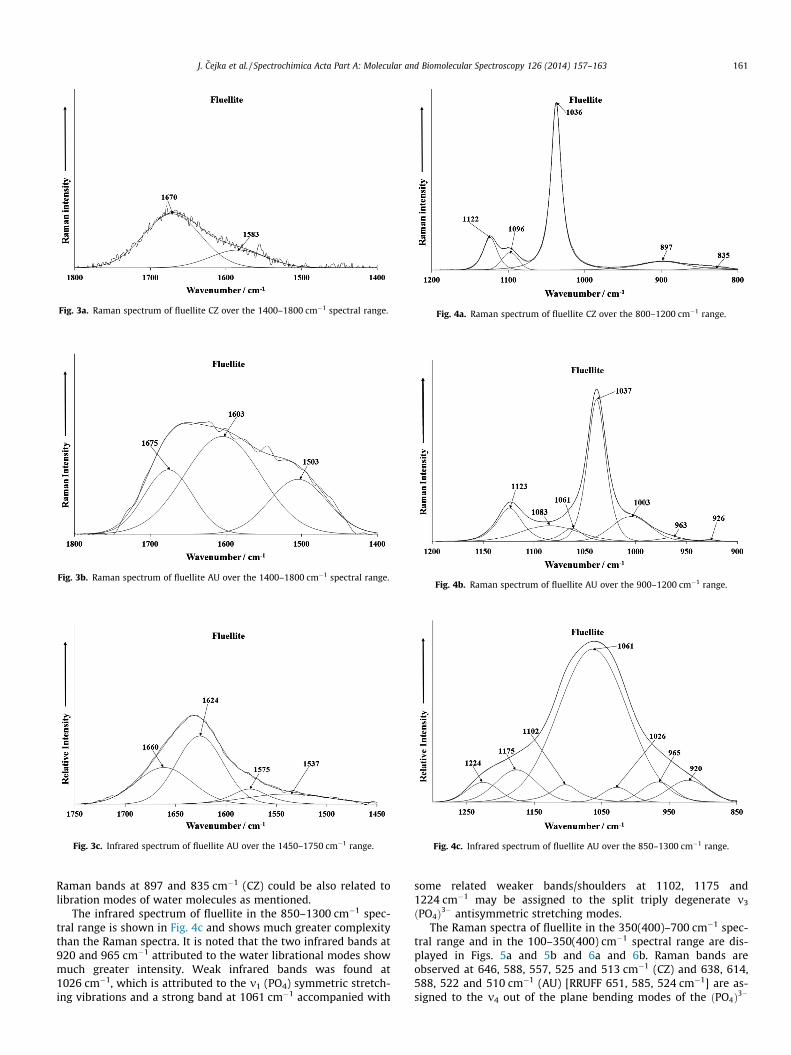
Fig. 3a. Raman spectrum of fluellite CZ over the 1400–1800 cm�1 spectral range.
Fig. 3b. Raman spectrum of fluellite AU over the 1400–1800 cm�1 spectral range.
Fig. 3c. Infrared spectrum of fluellite AU over the 1450–1750 cm�1 range.
Fig. 4a. Raman spectrum of fluellite CZ over the 800–1200 cm�1 range.
Fig. 4b. Raman spectrum of fluellite AU over the 900–1200 cm�1 range.
Fig. 4c. Infrared spectrum of fluellite AU over the 850–1300 cm�1 range.
J. Cejka et al. / Spectrochimica Acta Part A: Molecular and Biomolecular Spectroscopy 126 (2014) 157–163 161
Raman bands at 897 and 835 cm�1 (CZ) could be also related tolibration modes of water molecules as mentioned.
The infrared spectrum of fluellite in the 850–1300 cm�1 spec-tral range is shown in Fig. 4c and shows much greater complexitythan the Raman spectra. It is noted that the two infrared bands at920 and 965 cm�1 attributed to the water librational modes showmuch greater intensity. Weak infrared bands was found at1026 cm�1, which is attributed to the m1 (PO4) symmetric stretch-ing vibrations and a strong band at 1061 cm�1 accompanied with
some related weaker bands/shoulders at 1102, 1175 and1224 cm�1 may be assigned to the split triply degenerate m3
ðPO4Þ3� antisymmetric stretching modes.The Raman spectra of fluellite in the 350(400)–700 cm�1 spec-
tral range and in the 100–350(400) cm�1 spectral range are dis-played in Figs. 5a and 5b and 6a and 6b. Raman bands areobserved at 646, 588, 557, 525 and 513 cm�1 (CZ) and 638, 614,588, 522 and 510 cm�1 (AU) [RRUFF 651, 585, 524 cm�1] are as-signed to the m4 out of the plane bending modes of the ðPO4Þ3�
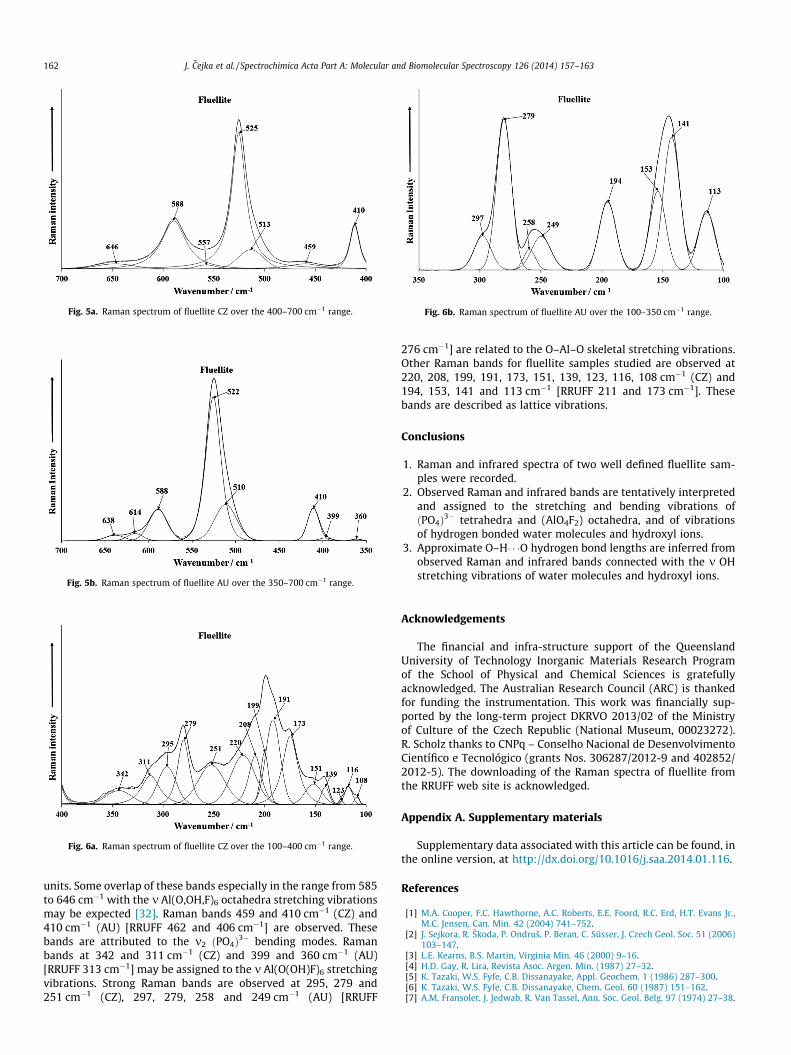
Fig. 5a. Raman spectrum of fluellite CZ over the 400–700 cm�1 range.
Fig. 5b. Raman spectrum of fluellite AU over the 350–700 cm�1 range.
Fig. 6a. Raman spectrum of fluellite CZ over the 100–400 cm�1 range.
Fig. 6b. Raman spectrum of fluellite AU over the 100–350 cm�1 range.
162 J. Cejka et al. / Spectrochimica Acta Part A: Molecular and Biomolecular Spectroscopy 126 (2014) 157–163
units. Some overlap of these bands especially in the range from 585to 646 cm�1 with the m Al(O,OH,F)6 octahedra stretching vibrationsmay be expected [32]. Raman bands 459 and 410 cm�1 (CZ) and410 cm�1 (AU) [RRUFF 462 and 406 cm�1] are observed. Thesebands are attributed to the m2 ðPO4Þ3� bending modes. Ramanbands at 342 and 311 cm�1 (CZ) and 399 and 360 cm�1 (AU)[RRUFF 313 cm�1] may be assigned to the m Al(O(OH)F)6 stretchingvibrations. Strong Raman bands are observed at 295, 279 and251 cm�1 (CZ), 297, 279, 258 and 249 cm�1 (AU) [RRUFF
276 cm�1] are related to the O–Al–O skeletal stretching vibrations.Other Raman bands for fluellite samples studied are observed at220, 208, 199, 191, 173, 151, 139, 123, 116, 108 cm�1 (CZ) and194, 153, 141 and 113 cm�1 [RRUFF 211 and 173 cm�1]. Thesebands are described as lattice vibrations.
Conclusions
1. Raman and infrared spectra of two well defined fluellite sam-ples were recorded.
2. Observed Raman and infrared bands are tentatively interpretedand assigned to the stretching and bending vibrations ofðPO4Þ3� tetrahedra and (AlO4F2) octahedra, and of vibrationsof hydrogen bonded water molecules and hydroxyl ions.
3. Approximate O–H� � �O hydrogen bond lengths are inferred fromobserved Raman and infrared bands connected with the m OHstretching vibrations of water molecules and hydroxyl ions.
Acknowledgements
The financial and infra-structure support of the QueenslandUniversity of Technology Inorganic Materials Research Programof the School of Physical and Chemical Sciences is gratefullyacknowledged. The Australian Research Council (ARC) is thankedfor funding the instrumentation. This work was financially sup-ported by the long-term project DKRVO 2013/02 of the Ministryof Culture of the Czech Republic (National Museum, 00023272).R. Scholz thanks to CNPq – Conselho Nacional de DesenvolvimentoCientífico e Tecnológico (grants Nos. 306287/2012-9 and 402852/2012-5). The downloading of the Raman spectra of fluellite fromthe RRUFF web site is acknowledged.
Appendix A. Supplementary materials
Supplementary data associated with this article can be found, inthe online version, at http://dx.doi.org/10.1016/j.saa.2014.01.116.
References
[1] M.A. Cooper, F.C. Hawthorne, A.C. Roberts, E.E. Foord, R.C. Erd, H.T. Evans Jr.,M.C. Jensen, Can. Min. 42 (2004) 741–752.
[2] J. Sejkora, R. Škoda, P. Ondruš, P. Beran, C. Süsser, J. Czech Geol. Soc. 51 (2006)103–147.
[3] L.E. Kearns, B.S. Martin, Virginia Min. 46 (2000) 9–16.[4] H.D. Gay, R. Lira, Revista Asoc. Argen. Min. (1987) 27–32.[5] K. Tazaki, W.S. Fyfe, C.B. Dissanayake, Appl. Geochem. 1 (1986) 287–300.[6] K. Tazaki, W.S. Fyfe, C.B. Dissanayake, Chem. Geol. 60 (1987) 151–162.[7] A.M. Fransolet, J. Jedwab, R. Van Tassel, Ann. Soc. Geol. Belg. 97 (1974) 27–38.
J. Cejka et al. / Spectrochimica Acta Part A: Molecular and Biomolecular Spectroscopy 126 (2014) 157–163 163
[8] W.A. Henderson Jr., V. Peisley, Min. Rec. 16 (1985) 477–480.[9] S. Menchetti, C. Sabelli, N. Jb, Miner. Mh. 1981 (1981) 505–510.
[10] M.C. Jensen, J.C. Rota, E.E. Foord, Min. Rec. 26 (1995) 449–469.[11] V.Y. Karpenko, L.A. Pautov, A.A. Agakhanov, Zap. Ross. Min. Obsh. 138 (2009)
83–90.[12] A. Levy, Annals Phil. 8 (1824) 241–245.[13] P. Groth, Jahrb. f Min. 2 (1883) 324–327.[14] H. Laubmann, H. Steinmetz, Zeit. Krist. 55 (1920) 549–557.[15] A. Scholz, H. Strunz, Geol. Pal. 1940A (1940) 133–137.[16] B.B. Guy, G.A. Jeffrey, Amer. Min. 51 (1966) 1579–1592.[17] B.B. Guy, G.A. Jeffrey, R. Van Tassel, Amer. Min. 52 (1967) 1577.[18] J. Sejkora, T. Rídkošil, V. Šrein, N. Jb. Miner. Abh. 175 (1999) 105–124.[19] J. Sejkora, F.C. Hawthorne, M.A. Cooper, J.D. Grice, J. Vajdak, J.L. Jambor, Can.
Min. 47 (2009) 159–164.[20] J. Sejkora, K. Babka, R. Pavlícek, Bull. Mineral.-Petrolog. Odd. Nár. Muz. (Praha)
20 (2012) 208–212.[21] J. Sejkora, P. Pauliš, P. Rus, R. Škoda, L. Kotátko, Bull. Mineral.-Petrolog. Odd.
Nár. Muz. (Praha) 20 (2012) 177–182.[22] R.L. Frost, J. Cejka, J. Sejkora, D. Ozdín, S. Bahfenne, E.C. Keeffe, J. Raman
Spectrosc. 40 (2009) 1907–1910.
[23] J. Cejka, R.L. Frost, J. Sejkora, E.C. Keefee, J. Raman Spectrosc. 40 (2009) 1464–1468.
[24] R.L. Frost, J. Sejkora, J. Cejka, E.C. Keeffe, J. Raman Spectrosc. 40 (2009) 1546–1550.
[25] J. Sejkora, J. Litochleb, J. Cejka, P. Cerny, Bull. Mineral.-Petrolog. Odd. Nár. Muz.(Praha) 21 (2013) 37–46.
[26] E.S. Pilkington, E.R. Segnit, J.A. Watts, Min. Mag. 46 (1982) 449–452.[27] P. Ondruš, ZDS – software for analysis of X-ray powder diffraction patterns.
Version 6.01. Users guide (1995), Praha.[28] C.W. Burnham, Yearb. 61 (1962) 132–135.[29] K. Nakamoto, Infrared and Raman Spectra of Inorganand Coordination
Compounds, J. Wiley and Sons, New York, 1986.[30] V.V. Pechkovskii, R.Ya. Mel’nikova, E.D. Dzyuba, T.I. Baranikova, M.V.
Nikanovich, Nauka Moscow, 1981 (in Russian).[31] A. Rahten, P. Benkich, A. Jesih, Acta Chim. Slov. 46 (1999) 339–354.[32] D.K. Breitinger, H.H. Belz, L. Hajba, V. Komlosi, J. Mink, G. Brehm, D. Colognesi,
S.F. Parker, R.G. Schwab, J. Mol. Struct. 706 (2004) 95–99.[33] M. Diafi, M. Omari, Boletin de la Sociedad Española de Cerámica y Vidrio 51
(2012) 337–342.[34] E. Libowitzky, Monatshefte für Chem. 130 (1999) 1047–1059.
Related Documents