DUKE UNIVERSITY Social Science Research Institute • 2024 W Main St • Bay B/Erwin Mill • Durham, NC 27705 http://www.cggc.duke.edu • Phone: (919) 681-6564 • Fax: (919) 681-4183 A Value Chain Analysis of Selected California Crops Report Prepared for Environmental Defense Fund Marcy Lowe and Gary Gereffi Center on Globalization, Governance & Competitiveness Duke University July 4, 2008 CGGC Researchers: Gloria Ayee, Ryan Denniston, Kristen Dubay, Karina Fernandez-Stark, Jennifer Kim, Kimberly Rogers, Mei Li Xia, Naiquan Sang The authors thank Greg Andeck of Environmental Defense Fund for valuable input on early drafts

Welcome message from author
This document is posted to help you gain knowledge. Please leave a comment to let me know what you think about it! Share it to your friends and learn new things together.
Transcript
DUKE UNIVERSITY
Social Science Research Institute • 2024 W Main St • Bay B/Erwin Mill • Durham, NC 27705 http://www.cggc.duke.edu • Phone: (919) 681-6564 • Fax: (919) 681-4183
A Value Chain Analysis of
Selected California Crops Report Prepared for Environmental Defense Fund
Marcy Lowe and Gary Gereffi Center on Globalization, Governance & Competitiveness Duke University July 4, 2008 CGGC Researchers: Gloria Ayee, Ryan Denniston, Kristen Dubay, Karina Fernandez-Stark, Jennifer Kim, Kimberly Rogers, Mei Li Xia, Naiquan Sang The authors thank Greg Andeck of Environmental Defense Fund for valuable input on early drafts

2
Table of Contents I. Introduction ................................................................................................................................. 3
A. Overview of California Agriculture ....................................................................................... 4 Water Use in California .......................................................................................................... 6 Nitrogen Fertilizer Use in California ................................................................................... 10
B. Project Focus: Grain Corn and Tomatoes ............................................................................ 13 II. Processed Tomatoes ................................................................................................................. 14
A. Value Chain for Processed Tomatoes .................................................................................. 15 B. Key Sectors (Boxes) and Leverage ...................................................................................... 16
Eliminated Boxes .................................................................................................................. 17 Key Boxes .............................................................................................................................. 18
C. Top Companies in Each Key Box ........................................................................................ 21 III. Grain Corn for Ethanol and Poultry Feed ............................................................................... 23
A. Value Chain for Grain Corn ................................................................................................. 24 B. Key Sectors (Boxes) and Leverage ...................................................................................... 26
Key Boxes .............................................................................................................................. 26 C. Top Companies in Each Key Box ........................................................................................ 29
IV. Conclusion .............................................................................................................................. 30 A. Summary of Key Findings ................................................................................................... 30 B. Final Companies of Interest ................................................................................................. 31
List of Figures Figure 1. California Agriculture Regions ....................................................................................... 4 Figure 2. Acreage, Market Value and Value per Acre, Major California Crops, 2006 .................. 5 Figure 3. California Water Transfer System ................................................................................... 6 Figure 4. California Total Water Use, by Crop, 2003 .................................................................... 8 Figure 5. California per-acre Water Use, by Crop, 2003 ................................................................ 8 Figure 6. Average Nitrogen Use per Acre, Selected California Crops, 2006 ............................... 11 Figure 7. Cropland Acreage Irrigated and Acreage Treated with Nitrogen, California ............... 12 Figure 8. Major California and U.S. Crop Characteristics, 2006 ................................................. 14 Figure 9. California Tomato Industry Value Chain ...................................................................... 15 Figure 10. Processed Tomato Industry, Relative Leverage of Firms ........................................... 16 Figure 11. Key Boxes in the California Processed Tomato Value Chain ..................................... 18 Figure 12. Top Agriculture Input Companies, 2007 ..................................................................... 22 Figure 13. Top Tomato Marketer and Processing Companies, 2007 ........................................... 23 Figure 14. Corn Acreage in the United States .............................................................................. 24 Figure 15. California Grain Corn Value Chain ............................................................................. 25 Figure 16. California Grain Corn Industry, Relative Leverage of Firms ...................................... 26 Figure 17. Key Boxes in the California Grain Corn Value Chain ................................................ 27 Figure 18. Top Feed Companies, Poultry Producers and Ethanol Refineries, 2007 .................... 29 Figure 19. Ten Final Companies of Interest ................................................................................. 32

3
I. Introduction The Center on Globalization, Governance & Competitiveness at Duke University undertook this application of a value chain framework to selected California agricultural crops on behalf of the environmental advocacy group Environmental Defense Fund (EDF). The organization identified California as a geographic focal point for its effort to reduce two negative environmental impacts related to agriculture: 1) inefficient water use for irrigation in a context of increasing demands on water supplies, and 2) the contribution of nitrogen fertilizers to pollution of surface waters and to the release of powerful greenhouse gases that contribute to global warming. One of EDF’s overall strategies is to partner with corporations to find innovative practices that protect the environment in ways that also accomplish their business goals. Examples of EDF’s corporate partnerships over the past two decades include working with McDonald’s to eliminate polystyrene clamshell packaging, working with FedEx to develop the first hybrid delivery trucks, and with DuPont to ensure the safe development of nanoscale products. This strategy can influence an entire industry, as in the case of McDonald’s in the 1990s, where many other fast-food companies followed McDonald’s lead and eliminated polystyrene containers.1 In case of agriculture in California, the value chain framework is a useful tool for identifying similar points of transformative leverage vis-a-vis the above-mentioned indicators—application of irrigation and nitrogen fertilizers. In other words, CGGC’s research is intended to help EDF identify points in the relevant value chains that have significant influence, direct or indirect, with farmers in California to bring about improved per-acre efficiency in the application of nitrogen fertilizers and the use of water for irrigation. This analysis will focus on two California crops: tomatoes for processed food products, and grain corn. California is the nation’s top producer of processed tomatoes, with 95 percent of U.S. processing tomato production. In addition, tomatoes are representative of agriculture in California insofar as tomatoes, like most vegetables, require much larger amounts of fertilizer and water than most other types of crops. The state is not a major producer of grain corn, in contrast, ranking 30th in the United States; however, because the United States is the world’s largest corn producer, accounting for significant use of water and nitrogen fertilizer on the nation’s farms, we will take this opportunity to provide more broadly applicable industry data on U.S. corn, focusing specifically on grain corn. This report will first present a brief overview of agriculture in California, then proceed with two major sections, one for processed tomatoes, and one for grain corn. For each of these two products we will present an agricultural overview and a value chain that delineates the structure of the industry; we will identify key “boxes” that have specific leverage in the chain; we will identify and compare the top U.S. and California companies in each key box; and finally, we will present a full profile of one final company of interest selected from the top companies in each key box.
1 EDF website, http://www.edf.org/page.cfm?tagID=56, accessed 4/9/08.
4
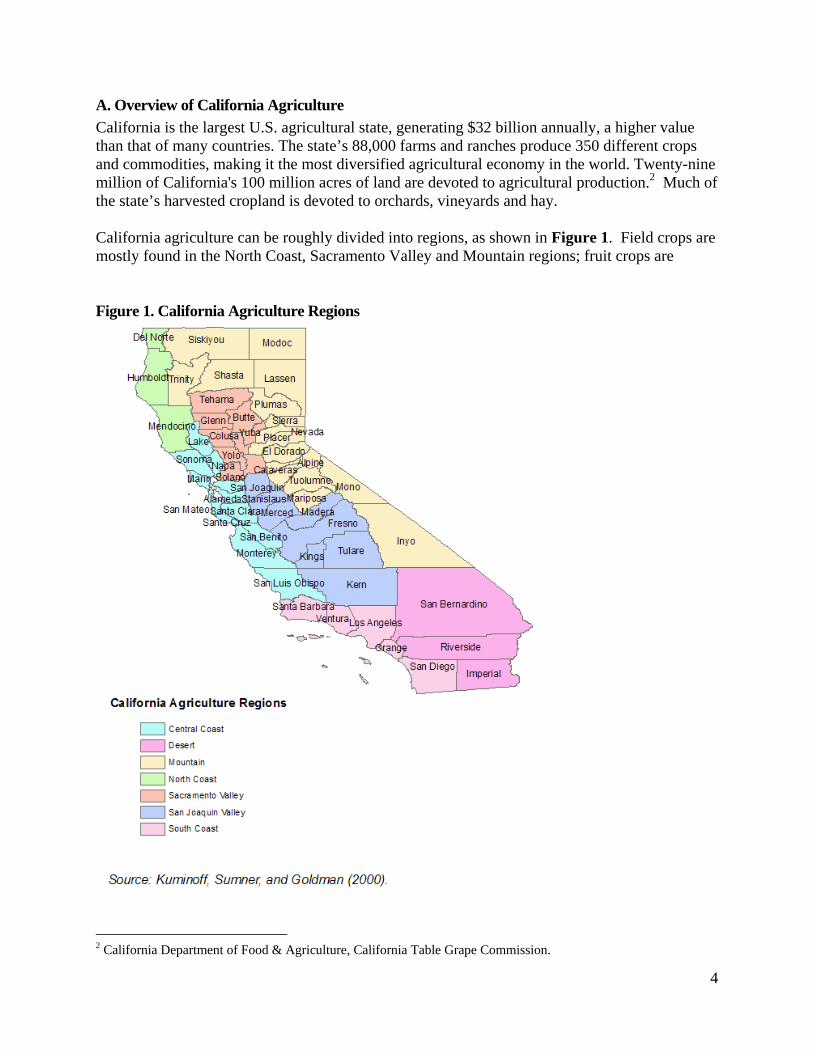
A. Overview of California Agriculture California is the largest U.S. agricultural state, generating $32 billion annually, a higher value than that of many countries. The state’s 88,000 farms and ranches produce 350 different crops and commodities, making it the most diversified agricultural economy in the world. Twenty-nine million of California's 100 million acres of land are devoted to agricultural production.2 Much of the state’s harvested cropland is devoted to orchards, vineyards and hay. California agriculture can be roughly divided into regions, as shown in Figure 1. Field crops are mostly found in the North Coast, Sacramento Valley and Mountain regions; fruit crops are Figure 1. California Agriculture Regions
2 California Department of Food & Agriculture, California Table Grape Commission.
5
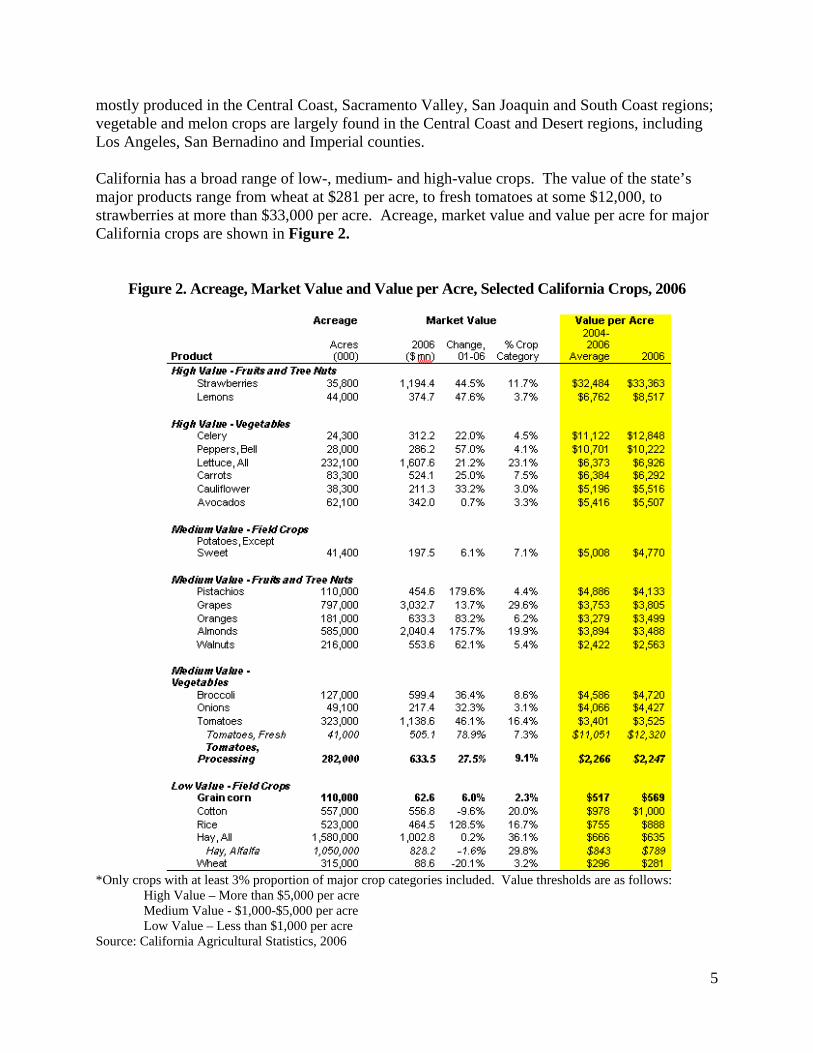
mostly produced in the Central Coast, Sacramento Valley, San Joaquin and South Coast regions; vegetable and melon crops are largely found in the Central Coast and Desert regions, including Los Angeles, San Bernadino and Imperial counties. California has a broad range of low-, medium- and high-value crops. The value of the state’s major products range from wheat at $281 per acre, to fresh tomatoes at some $12,000, to strawberries at more than $33,000 per acre. Acreage, market value and value per acre for major California crops are shown in Figure 2.
Figure 2. Acreage, Market Value and Value per Acre, Selected California Crops, 2006
*Only crops with at least 3% proportion of major crop categories included. Value thresholds are as follows:
High Value – More than $5,000 per acre Medium Value - $1,000-$5,000 per acre Low Value – Less than $1,000 per acre
Source: California Agricultural Statistics, 2006
6
In line with the United States as a whole, the number of farms in California has declined in recent decades, along with a decrease in the total land in farms, from 38 million acres in 1950 to 27 million acres in 2004. During the same period, average farm size increased from 260 acres to 347 acres, and productivity per acre also increased dramatically.3 In several crop categories California accounts for all, or nearly all, of U.S. production. The state produces 100 percent of the U.S. total for several specialty crops, including almonds, artichokes, olives, figs, raisins, prunes, persimmons, pomegranates, and walnuts. 4 California also produces 74% of the nation’s tomatoes, 84% of its grapes, and 85% of its broccoli.5 In addition to its significant lead in many agricultural segments, California has several unique features, including highly capitalized, intensive operations, many small and part-time farms, and a large number of co-operatives. These characteristics are in large part due to the significant proportion of fruit and vegetable farming in California agriculture.
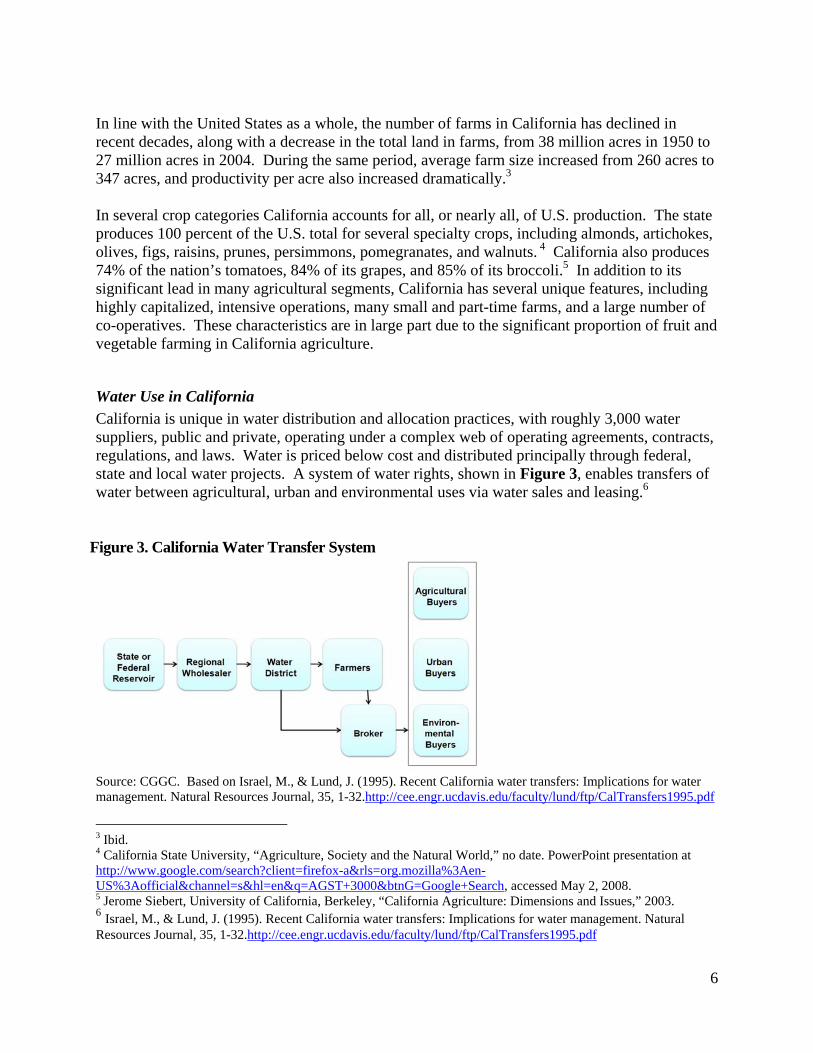
Water Use in California California is unique in water distribution and allocation practices, with roughly 3,000 water suppliers, public and private, operating under a complex web of operating agreements, contracts, regulations, and laws. Water is priced below cost and distributed principally through federal, state and local water projects. A system of water rights, shown in Figure 3, enables transfers of water between agricultural, urban and environmental uses via water sales and leasing.6
Figure 3. California Water Transfer System
Source: CGGC. Based on Israel, M., & Lund, J. (1995). Recent California water transfers: Implications for water management. Natural Resources Journal, 35, 1-32.http://cee.engr.ucdavis.edu/faculty/lund/ftp/CalTransfers1995.pdf
3 Ibid. 4 California State University, “Agriculture, Society and the Natural World,” no date. PowerPoint presentation at http://www.google.com/search?client=firefox-a&rls=org.mozilla%3Aen-US%3Aofficial&channel=s&hl=en&q=AGST+3000&btnG=Google+Search, accessed May 2, 2008. 5 Jerome Siebert, University of California, Berkeley, “California Agriculture: Dimensions and Issues,” 2003. 6 Israel, M., & Lund, J. (1995). Recent California water transfers: Implications for water management. Natural Resources Journal, 35, 1-32.http://cee.engr.ucdavis.edu/faculty/lund/ftp/CalTransfers1995.pdf

7
The Federal government plays a major role in water management in California, chiefly through the Bureau of Reclamation, which owns and operates the Central Valley Project. Together with the California state Water Project, Central Valley meets 30% of the state’s surface water needs. The U.S. Army Corps of Engineers and the EPA also play significant roles, as does the California State government. Key points on California water policy include the following:7
• The National Reclamation Act is a state policy that provides subsidized, below-cost federal water for farms under 960 acres; it is intended for small farmers but, according to the National Resources Defense Council, is increasingly abused by corporations8
• Underpriced water may discourage efficient water use and may encourage farmers to
grow water-hungry crops such as rice, cotton, and alfalfa
• Alfalfa covers the largest land area and uses the most water of any California crop, yet is extremely low-value (4% of state farming revenues, less than 0.1% of total state economy); around 70% of harvested alfalfa is used as feed for livestock
California uses a large amount of irrigation, per acre and per farm, compared to most other states. The amount of irrigation varies across the state, but low-value crops account for the highest shares of water use, as shown in Figure 4; after alfalfa, pasture and rice are the next largest water users in total water applied. In water applied per acre, the top water-using crops are alfalfa, rice, pasture, sugar beets and potatoes (see Figure 5).
7 Department of Water Resources – Summary of Key Litigation, 1998-2005: http://www.waterplan.water.ca.gov/docs/cwpu2005/vol4/vol4-litigation-summaryofsignificantlitigation.pdf California Performance Review – Criticisms of CA Water Policy & DWR Action: http://cpr.ca.gov/report/cprrpt/issrec/inf/inf09.htm Natural Resources Defense Council (2001): http://www.nrdc.org/water/conservation/fcawater.asp 8 Natural Resources Defense Council (2001): http://www.nrdc.org/water/conservation/fcawater.asp

8
Figure 4. California Total Water Use, by Crop, 2003
Figure 5. California per-acre Water Use, by Crop, 2003
Source: California Department of Water Resources - http://www.landwateruse.water.ca.gov/annualdata/agwateruse/2003/landuselevels.cfm?use=5
9
California has the largest proportion of irrigated acreage in the United States, totaling 8.5 million acres. Most of the state’s acreage is irrigated with surface irrigation (flooding), which—depending on local factors such as soil types, rainfall rates, groundwater recharge, and differences in crop response—can be less efficient than either micro-irrigation or sprinklers, the other two major irrigation methods. The state irrigates 60 percent of its crop area using surface irrigation, compared to 44 percent in the rest of the United States.9 According to Gregory Jorgensen, Field Research Manager of the Center for Irrigation Technology, surface irrigation is prevalent in areas where water is inexpensive, for example in Fresno County. In areas where water is costly, in contrast, micro-irrigation and sprinkler systems are more widely used.10 Valmont Industries, the lead company in irrigation systems, asserts that mechanized irrigation can improve water application efficiency by 40-90% compared with traditional irrigation methods including surface irrigation.11 It is important to note, however, that while certain irrigation methods may require farmers to use less water, actual efficiencies are not clear cut when it comes to overall environmental impact. One reason is that much of the water used in flood irrigation is not lost, but rather returned to surface water bodies or to groundwater. Thus, according to Charles Burt of the Irrigation Training and Research Center (ITRC) at California Polytechnic State University, on-farm irrigation efficiencies do not necessarily translate into greater efficiency in the local river basin. This is especially true where the return flows from surface irrigation go back into the hydrologic system of rivers or aquifers, which in California is the case in most of the Central Valley, the Klamath Basin, and the Ogallala Aquifer.12 The ITRC research also stresses that irrigation efficiency can vary greatly depending on rainfall rates, how the local groundwater regenerates, how well the soil retains water, and whether tail water return systems are present (which can increase the efficiency of flood irrigation). A further complicating factor is that some crops perform better with flooding; for example, at least one large fruit grower who tried drip irrigation returned to surface irrigation because it produced higher quality fruit. ITRC emphasizes concepts such as “more crop per drop consumed.” It also considers energy conservation, water quality, and the need to optimize the timing, frequency and amount of water diversion from rivers, lakes, streams and aquifers.13 9 Source: USDA-NASS (2003). Farm and Ranch Irrigation Survey based in 2002 Census of Agriculture. 10 Gregory Jorgensen, Field Research Manager, Center for Irrigation Technology. Personal communication with CGGC research staff, April 15, 2008. 11 Valmont Industries Inc. Annual Report. 2007. 12 Charles Burt, Chairman of the Board, Irrigation Training and Research Center (ITRC), California Polytechnic State University. Personal communication with CGGC research staff, July 2, 2008. 13 Charles Burt, ITRC. Personal communication with Alexandra Bauermeister, EDF Project Manager, Oceans Program, March 5, 2008.

10
Key Finding #1 The impact of different irrigation methods on the local water supply depends on a complex mix of local factors, including rain fall, soil types and groundwater recharge; it is thus difficult to generalize about which methods are more efficient than others. It may be inferred, however, that underpriced water provides a disincentive for farmers to adopt optimal irrigation practices for a given situation or to grow more water-efficient crops. Key Finding #2 In the management of irrigation practices, it is important to consider not only on-farm efficiency but the impact of irrigation on basin-wide water resources. Key Finding #3 It is important to pay close attention to the amount of water being diverted from surface waters and aquifers, ensuring that this diversion occurs at the optimum time and in optimum amounts. Nitrogen Fertilizer Use in California Three main problems are associated with the overuse of chemical fertilizers. First, artificial nutrients can degrade the nutrient holding structures of soil. Second, runoff from farms contributes to non-point source pollution and a resulting oxygen deficit in surface waters, exacerbated by chemical fertilizers’ high solubility. Third, storage and application of nitrogen fertilizers in particular can cause emissions of the powerful greenhouse gas nitrous oxide, which, per unit of weight, has nearly 300 times more impact on climate change than carbon dioxide.14 Figure 6 shows average nitrogen use per acre for selected California crops. In per-acre terms, low nitrogen users include soybeans (which are naturally nitrogen-fixing), rice and grain corn. High nitrogen users include fresh tomatoes, bell peppers and celery.
14 Intergovernmental Panel on Climate Change, “Climate Change 2001.” http://www.grida.no/climate/ipcc_tar/wg1/248.htm accessed 5-5-08.

11
Figure 6. Average Nitrogen Use per Acre, Selected California Crops, 2006
* Corn average nitrogen use value is US lbs per acre for 2005; Soybeans value is US lbs per acre for 2006
Source: National Agricultural Statistics Service, U.S. Department of Agriculture The problem of agricultural runoff is most severe where overuse of nitrogen fertilizers coincides with over-application of water. In California, many of the counties with more than 50 percent of land irrigated are also those with more than 50 percent of acreage treated with nitrogen (see Figure 7). Among the 11 counties with more than 50 percent cropland irrigated, eight counties also had more than 50 percent acreage treated with fertilizers. The three exceptions were Del Norte, Merced and Riverside.15
15 USDA, National Agriculture Statistics Service.

12
Figure 7. Cropland Acreage Irrigated and Acreage Treated with Nitrogen, California
Counties with more than 50% acreage irrigated
Counties with more than 50% acreage treated with fertilizers
County % County % Imperial 92 Imperial 83 Sutter 66 Sutter 68 San Joaquin 64 San Joaquin 56 Kings 63 Kings 61 Colusa 59 Colusa 62 Butte 58 Butte 57 Fresno 57 Fresno 52 Del Norte 55 Del Norte (22) Yolo 54 Yolo 55 Merced 51 Merced (44) Stanislaus 51 Stanislaus (39) Riverside (35) Riverside 56
Source: CGGC, based on data from USDA.
Key Finding #4 To address the problem of nitrogen run-off from agriculture, it is important not only to promote best practices in nitrogen use, but to combine them with best practices in irrigation.
Future developments in crop genetics may offer ways to dramatically reduce nitrogen fertilizer use. Several leading companies are working to develop genetically modified crop varieties that use nitrogen more efficiently. Only one U.S. company has so far reached the stage of outdoor test plantings for nitrogen efficiency: Arcadia Biosciences, based in Davis California, which is focusing on a rice variety that would use half the typical amount of nitrogen fertilizer. Within the next five years the company hopes to commercialize its product in China, the world’s largest rice producer. Monsanto and Pioneer Hi-Bred are each working on nitrogen efficiency in corn, as is Origin Agritech, an agricultural technology company with headquarters in Beijing.16
Proponents of genetically-engineered nitrogen efficiency emphasize the potential of these new varieties to reduce nitrate pollution in water bodies, cut greenhouse gas emissions and help farmers tap into the global market in carbon offsets. Others, including the Washington, D.C.-based Union of Concerned Scientists, point to the risk that genetically modified varieties may have unintended consequences. These concerns pose the additional potential obstacle of rejection in some key markets. For example, although genetically modified corn and soybeans
16 International Service for the Acquisition of Agri-Biotec Applications, ISAA Brief 37-2007, http://www.isaaa.org/resources/publications/briefs/37/executivesummary/default.html accessed 5-13-08.
13
are now in widespread use, genetically engineered rice faces opposition in Europe, Japan, South Korea, and Taiwan.17
Key Finding #5 Within the next five to ten years, genetically engineered crop varieties may become available with potential to dramatically reduce the use of nitrogen fertilizers. However, it is important to determine whether the potential unintended consequences of introducing such crops could outweigh their benefits.
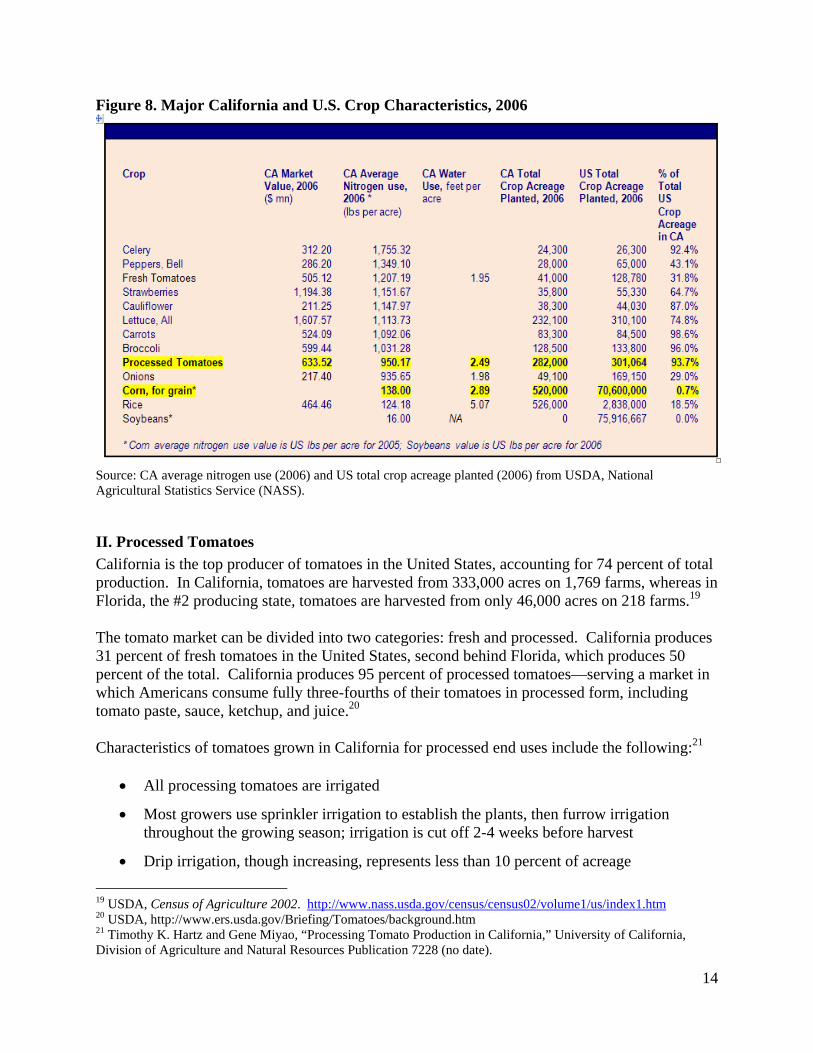
B. Project Focus: Grain Corn and Tomatoes The two crops included in this study, processed tomatoes and grain corn, fall in the middle range of California’s major crops in terms of water and nitrogen use. In terms of total water and per-acre water use, processed tomatoes and grain corn account for a fraction of the level of high-water-using crops such as alfalfa and rice, but significantly more than low-range crops such as safflower and fresh tomatoes (see Figures 4 and 5 above). A similar comparison can be made for nitrogen use. In per-acre terms, grain corn and processed tomatoes account for significantly more nitrogen application than the lowest-use crop, soybeans—which are naturally nitrogen-fixing plants—while using significantly less nitrogen application than either fresh tomatoes or the highest-application crop, celery (see Figure 6 above). A comparison of the two target crops for this study within the national context is shown in Figure 8. Processed tomatoes in California receive an average of 950 pounds of nitrogen per acre, compared with fresh tomatoes, which receive more than 1,200 pounds per acre. Data are unavailable for the average rate of nitrogen use for grain corn grown in California, however the U.S. average application rate is 138 pounds per acre, and it is logical to infer that the California rate is equal to or higher than this figure.18
17 Jim Downing, “’Green' rice on menu: Farmers could profit from carbon offsets,” Sacramento Bee, February 17, 2008
18 USDA, National Agricultural Statistics Service http://www.nass.usda.gov/index.asp#top
14
Figure 8. Major California and U.S. Crop Characteristics, 2006
Source: CA average nitrogen use (2006) and US total crop acreage planted (2006) from USDA, National Agricultural Statistics Service (NASS).
II. Processed Tomatoes California is the top producer of tomatoes in the United States, accounting for 74 percent of total production. In California, tomatoes are harvested from 333,000 acres on 1,769 farms, whereas in Florida, the #2 producing state, tomatoes are harvested from only 46,000 acres on 218 farms.19 The tomato market can be divided into two categories: fresh and processed. California produces 31 percent of fresh tomatoes in the United States, second behind Florida, which produces 50 percent of the total. California produces 95 percent of processed tomatoes—serving a market in which Americans consume fully three-fourths of their tomatoes in processed form, including tomato paste, sauce, ketchup, and juice.20 Characteristics of tomatoes grown in California for processed end uses include the following:21
• All processing tomatoes are irrigated
• Most growers use sprinkler irrigation to establish the plants, then furrow irrigation throughout the growing season; irrigation is cut off 2-4 weeks before harvest
• Drip irrigation, though increasing, represents less than 10 percent of acreage 19 USDA, Census of Agriculture 2002. http://www.nass.usda.gov/census/census02/volume1/us/index1.htm 20 USDA, http://www.ers.usda.gov/Briefing/Tomatoes/background.htm 21 Timothy K. Hartz and Gene Miyao, “Processing Tomato Production in California,” University of California, Division of Agriculture and Natural Resources Publication 7228 (no date).

15
• All California processing tomatoes are harvested mechanically
• Most growers own or lease mechanical harvesters; some use contract harvesting
• Processing tomatoes are grown under contract with processors, basing price on tonnage
and quality
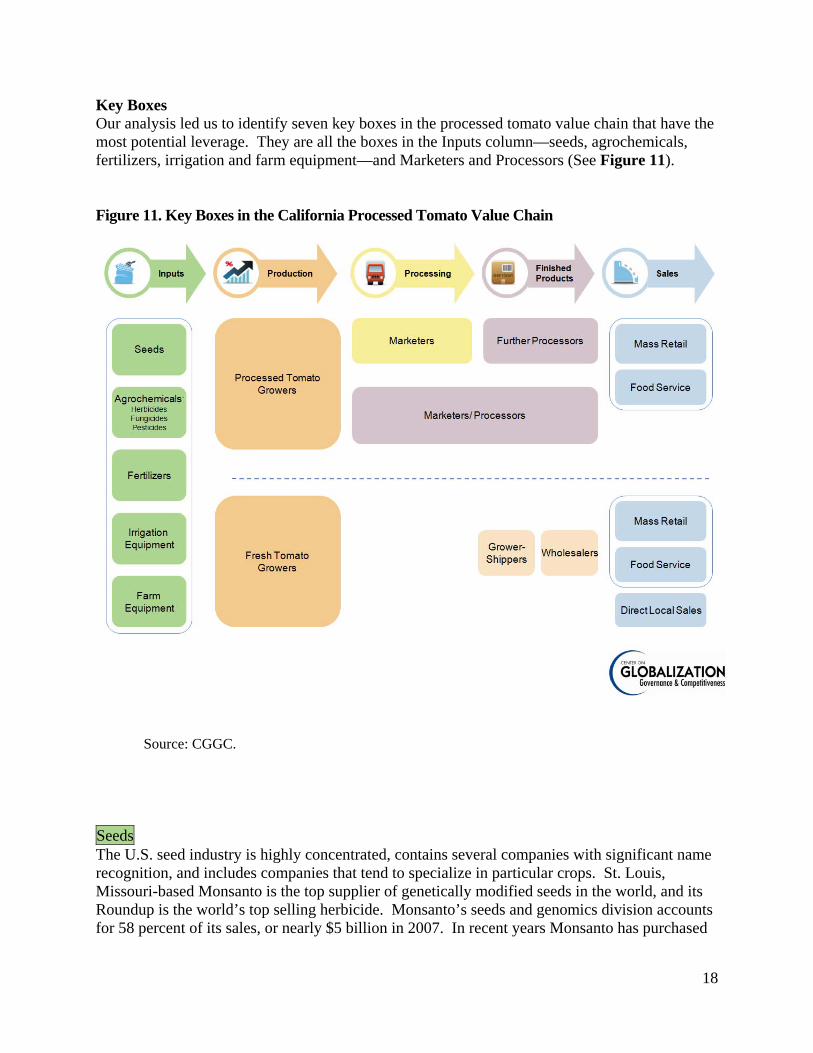
A. Value Chain for Processed Tomatoes The value chain for the California tomato industry shows two distinct paths for fresh versus processed tomatoes (see Figure 9.) The first column in the chain, applying to both paths, includes the inputs to grower operations: seeds, agrochemicals, fertilizers, irrigation equipment and other farm equipment. The separate path for fresh tomatoes, shown here for comparison, differs from processed tomatoes in the role of grower-shippers, which integrate production and logistics and sell directly to supermarkets and other retail stores with no need for a middleman. Figure 9. California Tomato Industry Value Chain
Source: CGGC.

16
The path for processed tomatoes, in contrast, is oriented to the activities of marketers and processors. Marketers process intermediate products such as barrels of tomato paste. These products are then sold to processors—also called remanufacturers—which in turn produce sauces, cans of tomato paste, and other products sold as consumer goods. At the end of the chain these products are then sold to retailers and food service companies.
B. Key Sectors (Boxes) and Leverage We analyzed each box in the processed tomato path of the value chain for its leverage, or partnering potential, with growers. The results of this comparison appear in Figure 10. Figure 10. Processed Tomato Industry, Relative Leverage of Firms
Value Chain Box
Inputs Production Processing
& Distribution
Finished Product
Seed
Companies
Agrochemical
Companies
Fertilizer
Companies
Irrigation
System Companies
Farm Equipment Companies
Processed Tomato Growers
Tomato Marketers
Tomato Processors
Direct Control of Significant Crop Acreage
Indirect Control of Significant Crop Acreage
Highly Concentrated Market*
Single Player with >20% of Market Share
( )
Players with Significant Name Recognition
*Top five firms control at least 50% of the market ( ) Refers to Morning Star, the top producer of tomato paste Source: CGGC. Market concentration and market share based on data from sources cited in Appendix A.

17
We applied the following five criteria to determine leverage:
• Segment includes firms with direct control over significant crop acreage. The only economic actors in this category are the growers themselves. Other players have either varying degrees of indirect influence, or no influence.
• Segment includes firms with indirect control over significant crop acreage. Players that
have indirect influence over the decisions of growers are those that purchase tomatoes for processing intermediate or final products.
• Top five firms in the segment control at least 50% of the market. This measure assesses
the degree of concentration, which may lead to important control over growers’ decisions. With reference to tomato marketers, data on market share is difficult to obtain because the relevant players are private companies and marketing cooperatives. For processors, market share is obscured by the presence of large, diversified food processing companies whose exact footprint in tomatoes is difficult to discern.
• Single player in the segment controls at least 20% of the market. Similar to the above; in
addition, for large, diverse processors such as Campbell’s or Del Monte, market share in just the tomato category is difficult to determine.
• Segment includes players with significant name recognition. All boxes in the pre-production end of the chain, the Inputs category, contain firms with significant name recognition, as do all of the top five tomato processing firms.
Eliminated Boxes Based on the above-mentioned criteria, we eliminated the following boxes from our analysis for lack of significant potential leverage: Processed Tomato Growers Unlike fresh tomatoes, for which spot markets are prevalent, most processed tomatoes are grown under contract with processors. Since the grower segment is clearly much less concentrated than the processing segment for which it produces, we eliminated this category. Mass Retail and Food Service Large retail operations that buy fresh produce directly from growers and grower-shippers have considerable leverage stemming from the perishable nature of the product and the resulting urgency to sell quickly even at disadvantaged prices.22 We eliminated these boxes because in the processed tomato market the greater leverage exists between growers and marketers/processors.
22 Carman, Cook and Sexton, 2003.
18
Key Boxes Our analysis led us to identify seven key boxes in the processed tomato value chain that have the most potential leverage. They are all the boxes in the Inputs column—seeds, agrochemicals, fertilizers, irrigation and farm equipment—and Marketers and Processors (See Figure 11). Figure 11. Key Boxes in the California Processed Tomato Value Chain
Source: CGGC.
Seeds The U.S. seed industry is highly concentrated, contains several companies with significant name recognition, and includes companies that tend to specialize in particular crops. St. Louis, Missouri-based Monsanto is the top supplier of genetically modified seeds in the world, and its Roundup is the world’s top selling herbicide. Monsanto’s seeds and genomics division accounts for 58 percent of its sales, or nearly $5 billion in 2007. In recent years Monsanto has purchased

19
several of its main competitors, including Seminis (world’s largest vegetable seed company) and Emergent Genetics in 2005, Delta and Pine Land in 2006, and De Ruiter in 2008.23 Monsanto now accounts for more than 60 percent of U.S. cotton seed and 32 percent of U.S. corn seed—just ahead of the second largest producer of corn seed, Dupont’s subsidiary Pioneer, with 30 percent. Agrochemicals Many of the top firms in agrochemicals are also leaders in seeds, including Monsanto and Syngenta. At least two of the top five multi-national corporations in the U.S. market for agrochemicals, Dupont and Monsanto, have significant name recognition. The top five U.S. agrochemical companies—Monsanto, Syngenta (Wilmington, Delaware-based subsidiary of the Swiss corporate parent), UAP Holding Corp., J.R. Simplot Company, and FMC Corporation—appear to hold roughly 63% of sales by U.S. companies. Monsanto is a key single player, accounting for an estimated 22 percent, while Syngenta holds 17%, and the remaining three each have 7-9%.24 Globally, concentration is increasing in the agrochemical industry as top firms merge. Analysts predicted in 2005 that only three major companies—BASF (Germany), Syngenta (Switzerland) and Bayer (Germany)—will prevail by 2015.25 Recent acquisitions by these companies are consistent with this prediction. Fertilizers Several recent mergers and acquisitions have led to greater concentration in the fertilizer industry. For example, in 2007 Agrium merged with UAP Holdings, the largest independent distributor of chemicals, fertilizer, and seed in the United States and Canada.26 Top companies specialize in different types of fertilizers (for instance nitrogen, phosphate, and potash), leading to varying market shares across products. For instance, Potash Corporation accounts for 22 percent of the world’s capacity in potash, but only two percent of nitrogen and six percent of phosphate.27 Irrigation Systems Unlike the other boxes in the Inputs column of the value chain, most of the top firms in this box are not diversified but are instead devoted almost exclusively to irrigation equipment. Exceptions are Valmont Industries, the industry leader, and the Toro Company. Commercially available irrigation systems are divided into two major categories: sprinkler systems and micro-
23 See Vanity Fair, May 2008, p.160; New York Times, August 16, 2006, “ Monsanto Buys Delta and Pine Land, Top Supplier of Cotton Seeds in U.S.” http://www.nytimes.com/2006/08/16/business/16seed.html 24 OneSource database, 2008. 25Action Group on Erosion, Technology, and Concentration. (2005). Communiqué: Oligopoly, Inc. Concentration in corporate power. Available at: http://www.etcgroup.org/upload/publication/pdf_file/44 26Source: Standard & Poor’s Industry Survey on Chemicals. (2008).
27 Potash Corporation 2007 Financial Review.

20
irrigation, which includes drip, trickle, and low-flow sprinklers. The most recognized names are Valmont Industries, Inc., Lindsay Corporation, and Netafim. Farm Equipment The total farm equipment industry in the United States in 2005 was $18.3 billion, with a compound annual growth rate of 6.8% for the preceding five years.28 The U.S. industry includes some 1,200 U.S. companies. The market is very concentrated at the top, however; the 20 largest companies account for more than 80% of the market.29 Tractors represent about 30% of the farm equipment market, and combines, roughly 25%. Many of the newer tractors, combines and sprayers have GPS and automated steering. As large farms and agribusinesses become more consolidated, equipment sales are shifting toward the higher end of the market, where there is little price competition. For example, a 500-horsepower John Deere tractor sells for $250,000.30 Three companies dominate in farm equipment: John Deere, CNH Global, and AGCO. A fourth company, Caterpillar, sold its “Challenger” brand of agricultural equipment to AGCO in 2002. The top company, Deere & Company, is the largest such company worldwide and has more than 50 percent of the U.S. market for large tractors and combines. The number-two company, CNH Global, a Dutch company with headquarters in Amsterdam, controls 30 percent of the North American farm equipment market.31 Tomato Marketers Marketers produce intermediate products in bulk for sale to other manufacturers, such as paste, diced tomatoes and sauce. Tomatoes are processed near the farms where they are grown; typically, only 6 hours pass between harvest and processing.32 Processed tomato products are storable for up to 18 months, which enables marketers and processors to rely on stocks as a buffer for fluctuations in price or demand. The top tomato marketer, Morning Star, accounts for 40 percent of the U.S. supply of tomato paste and diced tomatoes. The tomato paste market is typically measured in tons rather than dollar amounts. None of the top companies in this box have significant name recognition outside the industry. Tomato Processors (Remanufacturers) The food processing sector is becoming increasingly concentrated, with significant potential impacts on growers. Further limiting tomato growers’ choices is the fact that raw tomatoes are
28 Data Monitor 29 Hoover’s. 30 Ibid. 31 Company annual report, 2007. 32 California Tomato Growers Association, http://www.ctga.org/newctga/facts.htm, accessed May 3, 2008.
21
highly perishable and pose handling difficulties, so growers typically sell only to local processors located within 150 miles.33 Unlike tomato marketers, all of the top companies in the Processors box have significant name recognition. These companies have diversified product lines that include hundreds of fruits, vegetables and intermediate products, so it is difficult to determine their market share solely for processed tomato products. It is reasonable to conclude, however, that because they have their own successful name-brand products and in most cases their own processing facilities in California, these firms have influence with growers. Note on purchasing power of large retailers in processed tomato products: Wal-Mart’s impact on major tomato processing companies can be estimated using the annual SEC filings of major processing tomato companies. (Because each of these companies is diversified in product offerings well beyond tomato products, this information should be treated with some caution.) Figures for the top tomato processing companies identified in this report are as follows: Wal-Mart represents 32% of Del Monte’s gross sales in 2007,34 15% of Campbell’s sales in 2007,35 10.4% of Heinz’s sales in 2008,36 and 13% of ConAgra’s sales in 2007.37 Unilever does not report comparable information. However, since London-based Unilever is the most globally dispersed among these five producers, it is reasonable to infer that Wal-mart’s share of the company’s business is smaller than that of the top U.S.-based companies.
C. Top Companies in Each Key Box For each of the key boxes we identified in the processed tomato value chain, we also identified the top five companies. For the key boxes in the Inputs column, these included multi-national companies that figure prominently in the U.S. market for their category. For the Tomato Marketers box, all five companies are based in California, where 95 percent of U.S. processed tomatoes are produced. For the Tomato Processors box, four are U.S. companies, one of which, Del Monte Foods Company, is based in San Francisco, California. The fifth tomato processing company is UK-based Unilever Best Foods. For a summary table listing top companies in all five key boxes in the Inputs column of the value chain, please see Figure 12. These companies are relevant to both the processed tomato value chain and the grain corn value chain.
33 Hoy F. Carman, Roberta Cook and Richard J. Sexton. Marketing California’s Agricultural Production in California Agriculture: Dimensions and Issues. 2003 34 Del Monte Foods. 2007. “10-K.” P. 8. 35 Campbell’s Soup. 2007. “10-K.” P. 3. 36 H.J. Heinz Company. 2008. “10-K.” P. 3. 37 ConAgra Foods, Inc. 2008. “10-K.” P. 6.

22
Figure 12. Top Agriculture Input Companies, 2007
Seed Companies Global Annual Sales for Seeds & Genomics
Market Share
Monsanto $5.0 billion 60% of U.S. cotton seed 32% of U.S. corn seed
Syngenta AG $2.0 billion Pioneer $1.8 billion 30% of U.S. corn seed Land O’Lakes Purina Feed $771 million -- Bayer CropScience $450 million -- Agrochemical Companies Global Annual Sales
for Agrochemicals Market Share
Bayer $7.2 billion -- BASF SE. $7.1 billion -- DuPont Agriculture & Nutrition
$7.0 billion --
Monsanto $2.6 billion -- Syngenta $2.2 billion -- Fertilizer Companies Global Annual Sales
for Fertilizers Market Share
The Mosaic Company $5.8 billion > 20% of global potash, phosphate, and nitrogen
Potash Corporation $5.2 billion 22% of global potash Agrium US, Inc. $2.8 billion -- CF Industries Holdings, Inc. $2.8 billion -- Terra Industries Inc. $2.4 billion -- Irrigation System Companies
Global Annual Sales for Irrigation Systems
Market Share
Valmont Industries, Inc. $389 million -- Lindsay Corporation $217 million -- Netafim (Israel) $450 million -- The Toro Company $381 million -- Rain Bird Sprinkler Manuf. $125 million -- Farm Equipment Companies
Global Annual Sales for Entire Company
Market Share
Deere & Company $24.1 billion >50% of U.S. market for large tractors and combines
CNH Global $13.0 billion 30% of North American farm equipment market
AGCO Corporation $5.8 billion -- (Caterpillar) $45.0 billion Note: farm equipment is a very
small portion of company sales Source: CGGC, based on sources cited in Appendix A.
23
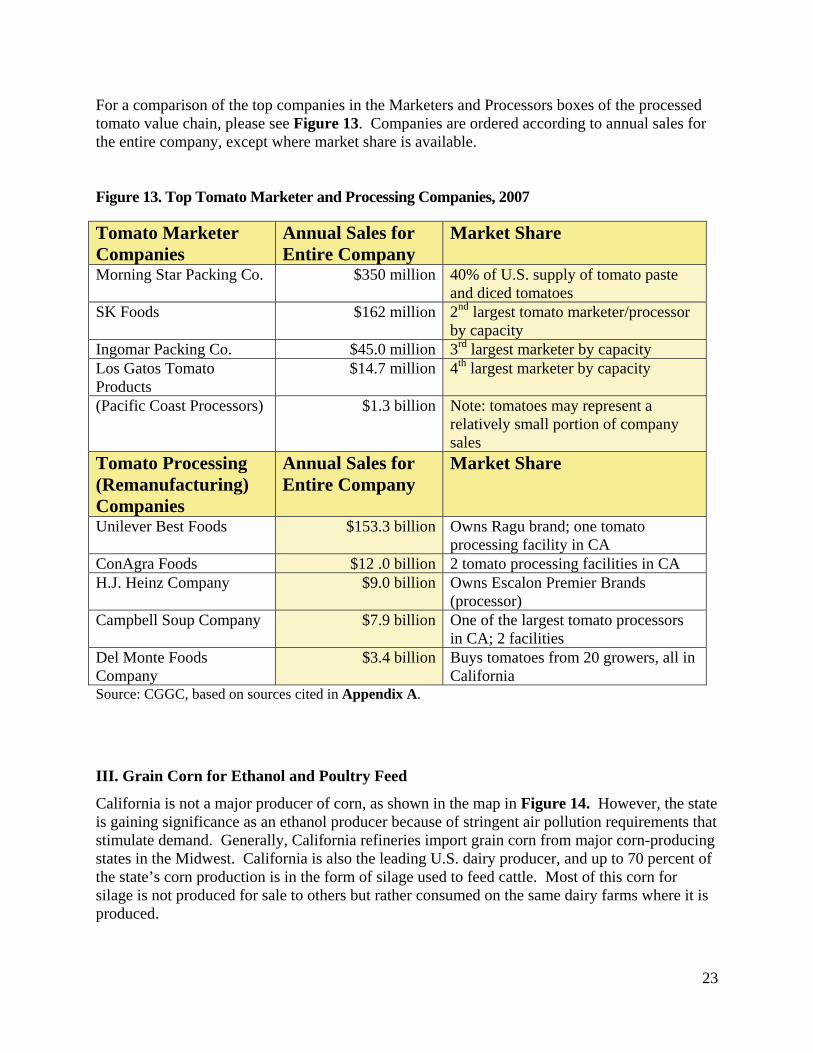
For a comparison of the top companies in the Marketers and Processors boxes of the processed tomato value chain, please see Figure 13. Companies are ordered according to annual sales for the entire company, except where market share is available. Figure 13. Top Tomato Marketer and Processing Companies, 2007 Tomato Marketer Companies
Annual Sales for Entire Company
Market Share
Morning Star Packing Co. $350 million 40% of U.S. supply of tomato paste and diced tomatoes
SK Foods $162 million 2nd largest tomato marketer/processor by capacity
Ingomar Packing Co. $45.0 million 3rd largest marketer by capacity Los Gatos Tomato Products
$14.7 million 4th largest marketer by capacity
(Pacific Coast Processors) $1.3 billion Note: tomatoes may represent a relatively small portion of company sales
Tomato Processing (Remanufacturing) Companies
Annual Sales for Entire Company
Market Share
Unilever Best Foods $153.3 billion Owns Ragu brand; one tomato processing facility in CA
ConAgra Foods $12 .0 billion 2 tomato processing facilities in CA H.J. Heinz Company $9.0 billion Owns Escalon Premier Brands
(processor) Campbell Soup Company $7.9 billion One of the largest tomato processors
in CA; 2 facilities Del Monte Foods Company
$3.4 billion Buys tomatoes from 20 growers, all in California
Source: CGGC, based on sources cited in Appendix A.
III. Grain Corn for Ethanol and Poultry Feed
California is not a major producer of corn, as shown in the map in Figure 14. However, the state is gaining significance as an ethanol producer because of stringent air pollution requirements that stimulate demand. Generally, California refineries import grain corn from major corn-producing states in the Midwest. California is also the leading U.S. dairy producer, and up to 70 percent of the state’s corn production is in the form of silage used to feed cattle. Most of this corn for silage is not produced for sale to others but rather consumed on the same dairy farms where it is produced.

24
For this reason, we focus on grain corn, which in California is mainly grown for ethanol and animal feed. Within animal feed we have chosen to focus on poultry feed, which is a nationally significant category given that chicken is now the most widely consumed meat in the United States, accounting for nearly 90 pounds per capita per year, compared to roughly 65 pounds for beef and some 50 pounds for pork.38
Figure 14. Corn Acreage in the United States
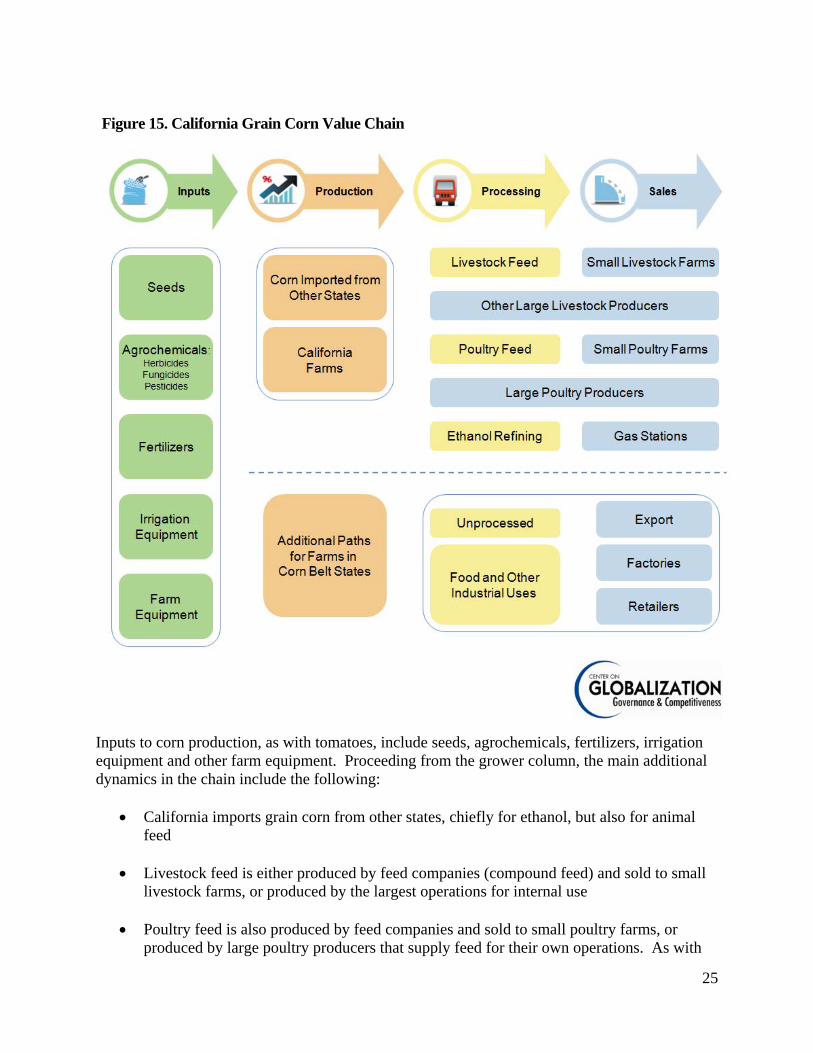
A. Value Chain for Grain Corn We divided the California grain corn industry into three distinct end uses: poultry feed, other livestock feed, and ethanol (see Figure 15.) Outside California, unprocessed grain corn for export and for food and industrial use, such as syrups and oils, are important to the industry, and we provide these end uses at the bottom of the diagram.
38 USDA Economic Research Service, 2008.
25
Figure 15. California Grain Corn Value Chain
Inputs to corn production, as with tomatoes, include seeds, agrochemicals, fertilizers, irrigation equipment and other farm equipment. Proceeding from the grower column, the main additional dynamics in the chain include the following:
• California imports grain corn from other states, chiefly for ethanol, but also for animal feed
• Livestock feed is either produced by feed companies (compound feed) and sold to small
livestock farms, or produced by the largest operations for internal use
• Poultry feed is also produced by feed companies and sold to small poultry farms, or produced by large poultry producers that supply feed for their own operations. As with

26
livestock, feed companies generally produce compound feed, including particular mixes of feed components and minerals
• Ethanol refineries process grain corn into a fuel supplement that is then sold to oil
companies for blending, before distribution to retail outlets such as gas stations
B. Key Sectors (Boxes) and Leverage We analyzed principal boxes in the grain corn value chain for leverage, or partnering potential, with growers. The results of this comparison appear in Figure 16. An explanation of the factors we considered to determine leverage is found on page 17 in the discussion of key boxes and leverage for processed tomatoes. Figure 16. California Grain Corn Industry, Relative Leverage of Firms
Value Chain Box
Inputs Production Processing & Distribution Sales
Seed
Companies
Agrochemical
Companies
Fertilizer
Companies
Irrigation
System Companies
Farm Equipment Companies
Farms Ethanol Refineries
Animal Feed
Producers Poultry
Producers
Direct Control of Significant Crop Acreage
Indirect Control of Significant Crop Acreage
Highly Concentrated Market*
Single Player with >20% of Market Share
Players with Significant Name Recognition
Source: CGGC, based on sources cited in Appendix A.
Key Boxes In addition to the five boxes in the Inputs column already discussed in the context of the processed tomato value chain, we used the above criteria to identify three other key boxes in the value chain for grain corn that have significant potential leverage (see Figure 17).

27
Figure 17. Key Boxes in the California Grain Corn Value Chain
Source: CGGC.
Animal Feed Companies Corn is commonly used as the main energy ingredient in livestock feed, accounting for over 90 percent of the total value and production of feed grains in the United States.39 Some 50 to 60 percent of corn production is currently used as animal feed. Several of the top firms that produce animal feed, including Cargill, Tyson Foods, and Smithfield Foods, also produce and/or process meat and poultry, and they supply animal feed for their own operations.
39 Corn Refiners Association website, http://corn.org/faq.htm accessed 5-13-08.
28
Poultry Producers The poultry industry is highly concentrated, with the three leading companies controlling some 45 percent of the market. Pilgrim’s Pride became number one in market share (20 percent) after acquiring Gold Kist, Inc. in January 2007. Next are Tyson Foods (19 percent), and Perdue, Inc. (6 percent).40 Poultry feed is the most significant cost factor in broiler production, by some estimates accounting for as much as 70% of operating costs.41 The poultry industry remains vulnerable to commodity price swings; in March 2008, Pilgrim’s Pride announced that the rising costs of chicken feed would necessitate the closure of seven U.S. production facilities, cutting 1,100 jobs.42 It is worth noting that an estimated 70 percent of the Earth’s agricultural land—33 percent of all arable land worldwide—is used for livestock feed production alone.43 Ethanol Refineries Ninety-one producers operate 136 ethanol plants in the United States, and the top ten producers account for 54% of total capacity, an increase from 46% in 2005.44 Farmers operate 37% of ethanol plants and 49% of capacity.45 Total U.S. ethanol production is estimated at 6.5 billion gallons.46 Ethanol represents less than 4% of annual gasoline consumption for the United States, but 5.7% for California, which translates to one billion gallons of ethanol for California.47 Although the largest U.S. ethanol refineries are concentrated in the corn-producing Midwestern states, California’s ethanol production is increasing rapidly. As of 2005, only 4.3 million gallons of ethanol were produced in-state.48 In 2006 Pacific Ethanol opened its first plant in California, a 35- to 40-million-gallon facility. Two new plants currently under construction will produce 50 million gallons each annually, and a third plant plans to expand its production from 27 to 35 million gallons.49 In the near future, California’s environmental restrictions on fuel emissions and its resulting demand for ethanol can be expected to increase costs in the state for buyers of corn-based animal feed.
40 IBISWorld, 2007; Perdue from Simon Shane, 2006. 41 Boyd, William. 2001. "Making Meat." Technology and Culture 42:631-664. Pilgrim’s Pride, however, estimates feed costs at only 33-49% of total costs (Pilgrim’s Pride, annual report 2007). 42 Iwata, Edward. 2008. "Pilgrim's Pride Shuts 7 Sites, Blames Cost of Chicken Feed." USA Today, 3/13/08. Wright, Lisa. 2008. "Bio Fuels Push up Feed Costs." The Toronto Star, 3/13/08 43 Steinfeld, Henning, et al., "Livestock's Long Shadow: Environmental Issues and Options." FAO, Rome, 2006. 44 Pacific Ethanol annual report 2007, page 11. 45 Renewable Fuels Association, “Industry Statistics.” 2008. http://www.ethanolrfa.org/industry/statistics/ accessed April 29, 2008. 46 Aventine Renewable Energy, Inc., annual report 2007. http://www.aventinerei.com/pdfs/2007%2010-K.pdf accessed April 29, 2008; Renewable Fuels Association, 2008. 47 Pacific Ethanol, annual report 2007, page 1. 48 California Energy Commission, “Ethanol Market Outlook for California,” November 2005. http://www.energy.ca.gov/2005publications/CEC-600-2005-037/CEC-600-2005-037.PDF accessed 5-13-08.
49 Cary Blake, “Pacific Ethanol escalates California-based ethanol production,” Farm Press, April 3, 2007 http://westernfarmpress.com/environment/040307-ethanol-production/ accessed 5-13-08.
29
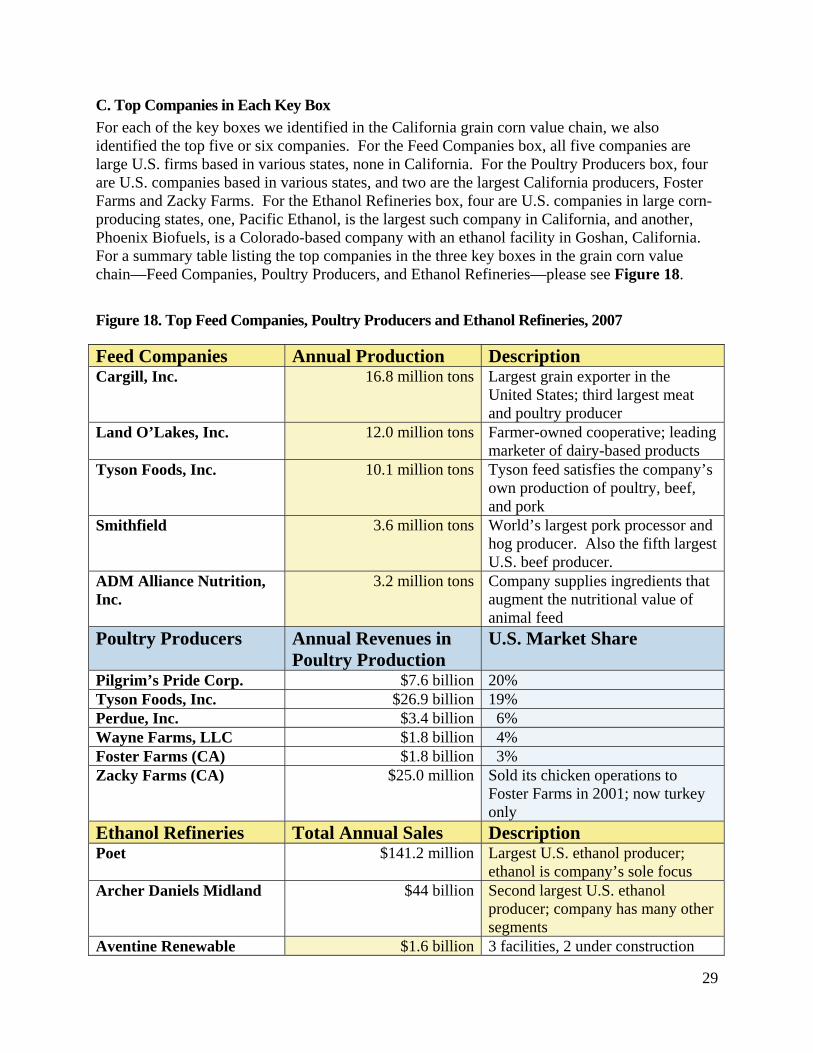
C. Top Companies in Each Key Box For each of the key boxes we identified in the California grain corn value chain, we also identified the top five or six companies. For the Feed Companies box, all five companies are large U.S. firms based in various states, none in California. For the Poultry Producers box, four are U.S. companies based in various states, and two are the largest California producers, Foster Farms and Zacky Farms. For the Ethanol Refineries box, four are U.S. companies in large corn-producing states, one, Pacific Ethanol, is the largest such company in California, and another, Phoenix Biofuels, is a Colorado-based company with an ethanol facility in Goshan, California. For a summary table listing the top companies in the three key boxes in the grain corn value chain—Feed Companies, Poultry Producers, and Ethanol Refineries—please see Figure 18. Figure 18. Top Feed Companies, Poultry Producers and Ethanol Refineries, 2007 Feed Companies Annual Production Description Cargill, Inc. 16.8 million tons Largest grain exporter in the
United States; third largest meat and poultry producer
Land O’Lakes, Inc. 12.0 million tons Farmer-owned cooperative; leading marketer of dairy-based products
Tyson Foods, Inc. 10.1 million tons Tyson feed satisfies the company’s own production of poultry, beef, and pork
Smithfield 3.6 million tons World’s largest pork processor and hog producer. Also the fifth largest U.S. beef producer.
ADM Alliance Nutrition, Inc.
3.2 million tons Company supplies ingredients that augment the nutritional value of animal feed
Poultry Producers Annual Revenues in Poultry Production
U.S. Market Share
Pilgrim’s Pride Corp. $7.6 billion 20% Tyson Foods, Inc. $26.9 billion 19% Perdue, Inc. $3.4 billion 6% Wayne Farms, LLC $1.8 billion 4% Foster Farms (CA) $1.8 billion 3% Zacky Farms (CA) $25.0 million Sold its chicken operations to
Foster Farms in 2001; now turkey only
Ethanol Refineries Total Annual Sales Description Poet $141.2 million Largest U.S. ethanol producer;
ethanol is company’s sole focus Archer Daniels Midland $44 billion Second largest U.S. ethanol
producer; company has many other segments
Aventine Renewable $1.6 billion 3 facilities, 2 under construction

30
Energy, Inc. VeraSun Energy $848.3 million 5 facilities, 11 under construction Pacific Ethanol (CA) $226.4 million 2 plants, 4 under construction Hawkeye Energy Holdings $89.1 million 2 plants, 2 under construction Phoenix Biofuels (CO) N/A One 25-million-gallon facility in
Goshen, CA Source: CGGC, based on sources cited in Appendix A.
IV. Conclusion With this application of a value chain framework to two multi-faceted agricultural industries in California, we have provided an analysis that is intended to help EDF identify a lead firm with significant influence, direct or indirect, with farmers, with the aim of bringing about improved efficiency in the application of nitrogen fertilizers and the use of water for irrigation. We have established key findings regarding best practices in irrigation and the use of nitrogen fertilizers, and we have developed a key company analysis that has led to the identification of a final 10 companies of interest.
A. Summary of Key Findings
Key Finding #1 The impact of different irrigation methods on the local water supply depends on a complex mix of local factors, including rain fall, soil types and groundwater recharge; it is thus difficult to generalize about which methods are more efficient than others. It may be inferred, however, that underpriced water provides a disincentive for farmers to adopt optimal irrigation practices for a given situation or to grow more water-efficient crops. Key Finding #2 In the management of irrigation practices, it is important to consider not only on-farm efficiency but the impact of irrigation on basin-wide water resources. Key Finding #3 It is important to pay close attention to the amount of water being diverted from surface waters and aquifers, ensuring that this diversion occurs at the optimum time and in optimum amounts.
Key Finding #4: To address the problem of nitrogen run-off from agriculture, it is important not only to promote best practices in nitrogen use, but to combine them with best practices in irrigation.
Key Finding #5: Within the next five to ten years, genetically engineered crop varieties may become available with potential to dramatically reduce the use of nitrogen fertilizers. However, it is important to determine whether the potential unintended consequences of introducing such crops could outweigh their benefits.

31
B. Final Companies of Interest From each of the ten key boxes in the value chains for processed tomatoes and grain corn, we selected one final company of interest. A list of these ten companies appears in Figure 19. For a complete company profile of each of the final companies of interest, including detailed descriptions, financial data, market share, global geographic scope, history and mergers, and main competitors, please see Appendix B.

32
Figure 19. Ten Final Companies of Interest
Company Category Description Monsanto Seeds • World’s largest conventional seed
company • Manufactures herbicide Roundup
DuPont Agrochemicals • Third largest U.S. chemical company, after Dow and ExxonMobil Chemicals
Mosaic Fertilizers • World’s #1 producer of phosphates • World’s #2 producer of potash
Valmont Irrigation Equipment • U.S. leader in agricultural irrigation systems
Deere & Company
Farming Equipment • Controls more than 50% of the U.S. market for large tractors and combines
Morning Star Packing Co.
Tomato Marketer • Largest U.S. tomato marketer
ConAgra Tomato Processor • Large retail foods manufacturer, food services manufacturer
Cargill Animal Feed • World’s largest private company • Diverse agricultural operations
Tyson Foods, Inc.
Poultry Producer • Second largest U.S. poultry producer (19% of market) behind Pilgrim’s Pride (20%)
• World’s largest meat processing company
• Third largest U.S. producer of animal feed
Poet Ethanol Refinery • Largest U.S. producer of ethanol
Source: CGGC, based on sources listed in Appendix B.
Related Documents