A User-centered Design of Patient Safety Event Reporting Systems A Dissertation Presented to The Faculty of the Graduate School At the University of Missouri In Partial Fulfillment Of the Requirements for the Degree Doctor of Philosophy By Lei Hua Dr. Yang Gong, Dissertation Supervisor May 2014

Welcome message from author
This document is posted to help you gain knowledge. Please leave a comment to let me know what you think about it! Share it to your friends and learn new things together.
Transcript

A User-centered Design of Patient Safety Event Reporting Systems
A Dissertation
Presented to
The Faculty of the Graduate School
At the University of Missouri
In Partial Fulfillment
Of the Requirements for the Degree
Doctor of Philosophy
By
Lei Hua
Dr. Yang Gong, Dissertation Supervisor
May 2014

The undersigned, appointed by the dean of the Graduate School, have examined the
dissertation entitled
A USER-CENTERED DESIGN OF PATIENT SAFETY EVENT REPORTING SYSTEMS
Presented by Lei Hua,
A candidate for the degree of
Doctor of Philosophy
And hereby certify that, in their opinion, it is worthy of acceptance.
Professor Yang Gong
Professor Chi-Ren Shyu
Professor Suzanne Boren
Professor Illhoi Yoo
Professor Xu Han


ii
Acknowledgements
My acknowledgements go to the people mainly from the MU Informatics Institute
(MUII) at the University of Missouri – Columbia and the School of Biomedical Informatics
(SBMI) at the University of Texas Health Science Center at Houston. Without the guidance
of dissertation committee and the help and support from friends and families, it is
impossible for me to come this far.
My deepest gratitude goes to my program advisor, Dr. Yang Gong, for the
inspiration, the guidance, and the encouragements he has shown along the way and the
five-year financial support he managed for me in the both education organizations. My
appreciation also goes to my committee members, Drs. Chi-Ren Shyu, Sue Boren, Illhoi Yoo
and Tony Han for their teaching and guidance on my course learning and dissertation.
There is no way to measure the help, support and kindness from the fellow
students, friends and MUII staffs, Zhijian Luan, Keila Pena-Hernandez, Miroslav Marinov,
Jiafu Chang, Mohammed Khalilia, James Richardson, Yun li, Yanyan Shen, Rajitha Gopidi,
Dan Wang, Mathew Koelling, Hsing-yi Song, Xinshuo Wu and Robert Sanders, with whom
the interactions have contributed greatly to my study.
The project was also supported in part by the MUII and SBMI over the past five
years. My thanks also go to the director of MUII, Dr. Chi-Ren Shyu and the Dean of SBMI,
Dr. Jiajie Zhang.

iii
Abstract
As a primary source for learning from lessons in healthcare settings, the patient
safety event reporting systems play a key role for health providers in the collection,
aggregation, analysis and dissemination of patient safety events and actionable knowledge.
Usability is critical to the success of computerized system, yet it has received little
attention in the field of patient safety event reporting. Failures in this regard may largely
contribute to the low user acceptance and low-quality data that the reporting system
currently confronted. In this project, we studied about three usability aspects of the system
regarding the efficiency, effectiveness and user attitudes in an iterative process of system
prototyping. With the involvement of user feedback and evaluations, the project identified
and dealt with a number of usability problems that undermined the system acceptance
and data quality.
As demonstrated in a most recent study, two functions of text prediction on
structured and unstructured data entries for event documentation were proposed and
evaluated. With 52 subjects, a two-group randomized experiment was conducted to
quantify the impact of the functions on the three usability aspects.
Consequentially, on structured data entry, the results were an overall 13.0% time
reduction and 3.9% increase of response accuracy with the functions; on unstructured data
entry, there was an overall 70.5% increase in the text generation rate, a 34.1% increase in
the reporting completeness score, and a 14.5% reduction on the amount of text fields
ignored by subjects. Subjects’ usability attitudes were slightly improved with the proposed

iv
functions according to questionnaire result. The user acceptance and data quality have
proven increased over the user-centered design process.
This project has three contributions to health informatics practice and research.
First, it proposed a conceptual model of guiding the usability enhancement of patient
safety event reporting system. Second, it introduced and evaluated the technique of text
prediction to the nursing clinical documentation in reporting. Third, the application of ad-
hoc tools and methods in the project is instructive to researchers who work on the usability
studies of health information systems.

v
Table of Contents
Acknowledgements .................................................................................................................. ii
Abstract .................................................................................................................................... iii
Table of Contents...................................................................................................................... v
List of Figures ......................................................................................................................... viii
List of Tables ............................................................................................................................. x
CHAPTER 1 - INTRODUCTION ................................................................................................... 1
1.1 Primary Challenges to the Usefulness of Patient Safety Reporting Systems ......... 1
1.2 Usability as a Research Gap ...................................................................................... 2
1.3 Three Specific Aims ................................................................................................... 3
CHAPTER 2 – REVIEW OF THE LITERATURE ............................................................................. 6
2.1 Status Quo of Safety Event Reporting Systems ....................................................... 6
2.2 Theoretical Foundations of User-centered Design to the PSRSs .......................... 13
CHAPTER 3 – METHODOLOGY ............................................................................................... 30
3.1 Content Analysis of Historical Safety Event Reports ............................................ 32
3.1.1 The flowchart of content analysis....................................................................... 33
3.1.2 Tools developed to facilitate the analysis .......................................................... 33
3.2 Formal Usability Inspection of a Patient Safety Reporting System ...................... 36
3.2.1 The reporting system - Patient Safety Network................................................. 37
3.2.2 The design of study ............................................................................................. 38
3.3 Usability Inspections of a Prototype System ......................................................... 40
3.4 Usability Testing with Actual Users and Think-aloud Technique ......................... 44

vi
3.4.1 Experimental design ............................................................................................ 46
3.4.2 Processing of data ............................................................................................... 48
3.5 Quantifying the Impacts of Proposed Interface Artifacts ..................................... 49
3.5.1 Experimental design ............................................................................................ 50
3.5.2 Processing of data ............................................................................................... 55
CHAPTER 4 – FINDINGS OF THE RESULTS .............................................................................. 59
4.1 The User Groups and the Problems of Data Quality ............................................. 59
4.2 Common Usability Issues in the Reporting Systems.............................................. 61
4.2.1 Issues that might create unpleasant user attitudes .......................................... 63
4.2.2 Possible usability engineering solutions to usability issues that discourage
users from reporting ....................................................................................................... 65
4.2.3 Design Recommendations .................................................................................. 67
4.3 Usability Improvements and Violations in the Prototype ..................................... 70
4.4 Representation Barriers towards the Efficient and Effective reporting ............... 75
4.4.1 Time in reporting ................................................................................................. 75
4.4.2 Responding consistency and typographical errors ............................................ 77
4.4.3 User attitudes towards usability satisfying ........................................................ 78
4.5 Improved User Performance with Text Prediction Functions ............................... 80
4.5.1 Completion time and reporting accuracy of structured data entry ................. 80
4.5.2 Text generation rate and completeness of unstructured data entry ............... 85
CHAPTER 5 – DISCUSSION AND CONCLUSION ...................................................................... 91
5.1 Severe Usability Violations in Our Initial Prototype .............................................. 91

vii
5.2 Difficulties in Completing a Safety Event Report .................................................. 94
5.2.1 Difficulties in case-independent questions ........................................................ 94
5.2.2 Difficulties in case-dependent questions ........................................................... 95
5.2.3 Usability issues in general ................................................................................... 97
5.3 Text Prediction Leveraging the efficiency and data quality in reporting ............. 98
5.3.1 Time efficiency, keystroke savings and response accuracy of the structured
data entry ........................................................................................................................ 98
5.3.2 The increased performance on unstructured data entry................................100
5.3.3 Usability satisfaction of the interfaces and text prediction functions ............103
5.4 Conclusion..............................................................................................................104
5.5 Limitations .............................................................................................................104
References ............................................................................................................................106
Appendix A, MU Health Science IRB Approval ....................................................................116
Appendix B, UT Health IRB Approval ...................................................................................117
Appendix C, UT Health Consent form ..................................................................................118
Appendix D, T.F.C. Hospital ethics committee approval ....................................................120
Appendix E, The MCQs used in the study ...........................................................................121
Appendix F, Posttest questionnaire in experiment 3 .........................................................124
Appendix G, Five testing cases in experiment 3 .................................................................127
VITA .......................................................................................................................................130

viii
List of Figures
Figure 1. seven stages of user activities in preforming a patient safety reporting task
adapted from Norman’s task action model .......................................................................... 14
Figure 2 , three stages in a circle of patient falls management ........................................... 22
Figure 3, information gaps and proposed features for the gap bridging ............................ 23
Figure 4, A modified framework of user-centered system design –TURF ........................... 27
Figure 5, an analytic model, for our user-centered design of a safety event reporting
system ..................................................................................................................................... 32
Figure 6, a flow chart for content analysis on historical reports from PSNs ....................... 33
Figure 7, a coding interface developed for summarizing necessary and required
information on one page........................................................................................................ 34
Figure 8, a web-based system developed to assist descriptive text converting,
decomposition and statistics ................................................................................................. 35
Figure 9, two dimensions of prototyping modified according to ........................................ 41
Figure 10, the collage of prototype screenshots of five steps in reporting ........................ 46
Figure 11, the layout of interface elements for structured and unstructured data entries
with text prediction functions of the CL and AS ................................................................... 51
Figure 12, auto-complete for name entry ............................................................................. 67
Figure 13, system integration for patient data retrieval ...................................................... 68
Figure 14, knowledge-based designs for the reduction of human errors ........................... 69
Figure 15, procedure-based close-ended questions ............................................................ 70
Figure 16, the categorical distribution of identified 19 usability violations ........................ 74
ix
Figure 17, reportingoffficiency and accuracy on structured data entries increased in the
treatment group ..................................................................................................................... 81
Figure 18, time distribution on question 1, 9 and 10 between control (I) and treatment (II)
groups...................................................................................................................................... 83
Figure 19, time and response accuracy on questions/cases between control (I) and
treatment (II) groups .............................................................................................................. 85
Figure 20, text generation rates in the control group (I) and treatment group (II) ............ 87
Figure 21, text generation raof and data completeness on unstructured data entries
increased in the treatment group.......................................................................................... 87
Figure 22, completeness scores in the control group (I) and treatment group (II) ............ 88
Figure 23, text generation rate increased along the the treatment groupeports in
treatment group ..................................................................................................................... 89
Figure 24, user attitudes slightly improved in the treatment group but nothing
significantly differed ............................................................................................................... 90

x
List of Tables
Table 1, the studies included in the review............................................................................. 8
Table 2, design recommendations in the literature ............................................................. 12
Table 3, usability heuristics developed by Zhang et al ........................................................ 37
Table 4, five steps of reporting in the test ............................................................................ 47
Table 5, the profile and expected outcomes of experiment 3 ............................................. 54
Table 6, key measures at summative level in the experiment ............................................. 56
Table 7, specific measures for structured data entry in reporting ...................................... 56
Table 8, specific measures for unstructured data entry in reporting .................................. 56
Table 9, uncovered facts through unobtrusive content analysis ......................................... 60
Table 10, intervals between the occurrence and report ...................................................... 60
Table 11, overall human difficulties in reporting .................................................................. 61
Table 12, usability problems that create unpleasant user attitudes ................................... 63
Table 13, design suggestions to improve the quality and rate of reporting ....................... 65
Table 14, keystroke, mouse click and memory load in two interfaces ................................ 72
Table 15, an excerpt from major and catastrophic usability violations ............................... 75
Table 16, performance on MCQs with features that influenced the completion time ...... 76
Table 17, time performance and material accessibility by task steps ................................. 76
Table 18, frequent usability problems and user’s attitudes ................................................. 79
Table 19, performance on MCQs between the control and treatment group ................... 82
Table 20, performance on the narrative comment field between groups .......................... 86

1
CHAPTER 1 - INTRODUCTION
In 1999, the prestigious report “to err is human” released by the Institute of
Medicine estimated 44,000 – 98,000 patient deaths each year due to preventable medical
errors (Kohn, 1999). In a recently published study in 2013, the estimation was raised to
210,000 – 440,000, which made the medical errors the third-leading cause of death,
behind the heart disease and cancer in the US (James, 2013).
1.1 Primary Challenges to the Usefulness of Patient Safety Event Reporting Systems
To learn from these mistakes and improve patient safety and quality of care, the
patient safety event reporting systems have been proposed and pushed through the
Congressional funding (AHRQ, 2004), the establishment of legitimate culture (AHRQ, 2003;
Lucian L. Leape & Berwick, 2005; Yale Law & Yale, 2009) and patient safety organizations
(Rockville, 2005) and the development of reporting standards such as the Common
Formats (CFs) (AHRQ, 2011). As of 2008, the system had been implemented in the hospitals
across 26 States in the US (Levinson, 2008b). It was expected that such reporting systems
could be a data source to learn from lessons, in which the medical errors, adverse events
and near misses data were collected in a properly structured format and useful for the
detection of patterns, discovery of underlying factors, and generation of solutions.
However, there are gaps between the status quo and the potential of the reporting
systems, primarily due to the challenges of underreporting (Kim & Bates, 2006) and data
quality(Y. Gong, 2009; Gong, 2010a).
Underreporting was estimated in a range from 50% to 96% (Paul Barach & Stephen
D Small, 2000; Kim & Bates, 2006). Hospital staffs often attribute the issue to: not believe

2
reports lead to improvement; lacking of responsible follow-ups when reports are made;
lacking of time; fear of punishment; failure to track care as patients move through multiple
departments and caregivers; difficulty in distinguishing adverse events from harm caused
by underlying disease, and detailed and duplicative reporting requirements (Conerly, 2007;
Evans et al., 2006; Levinson, 2008a; Taylor et al., 2004).
On the other hand, low-quality of reported data was complained (Yang Gong, 2009;
Gong, 2010a). According to one of our previous studies that evaluated safety event reports
collected from the patient safety reporting system - Patient Safety Network (PSN) (Kivlahan,
Sangster, Nelson, Buddenbaum, & Lobenstein, 2002) at the University of Missouri Health
Care System (UMHC). There were a number of duplicates, typos, mislabels, and big blocks
of descriptive text missing key information identified from the system reports (Yang Gong,
2009; Gong, 2010a). Even after a laborious manual preprocessing, limited useful
knowledge were able to be derived from the reports. As Wachter’s comment of “a
bureaucratic, data-churning, enthusiasm-sucking, money-eating monster”(Wachter, 2009),
the system has been questioned to its effectiveness and potentials for patient safety
improvements.
1.2 Usability as a Research Gap
There are a great number of factors from a variety of perspectives contributing to
the circumstance. Historically, numerous efforts have been made to address the issues
through the theoretical and practical studies, such as multilevel system design and fit
models (Holden & Karsh, 2007; Karsh, Escoto, Beasley, & Holden, 2006), the enhancement
of sense making process (H. S. Kaplan & B. R. Fastman, 2003), and a growing number of

3
system development that emphasized on specialty-based reporting and information
integration(Haller et al., 2007; Holzmueller et al., 2005b; H. S. Mekhjian, T. D. Bentley, A.
Ahmad, & G. Marsh, 2004b; M. R. Miller, Clark, & Lehmann, 2006; Suresh et al., 2004;
Takeda et al., 2003; Tepfers, Louie, & Drouillard, 2007; van der Veer, Cornet, & de Jonge,
2007). In contrast, the research on user interface received little attention, though the
interface has called for more research (Holden & Karsh, 2007) as it is where the interaction
physically occurs.
This research focuses on the usability of the system. That is about to investigate
the interactions between users and system interface through an iterative design and
development process of the system with the involvement of user’s feedback and
evaluation activities. The specific aims of the research are to identify the common usability
issues of the systems, propose and evaluate new user-centered functions of the systems
toward the increased performance and acceptance of the systems.
1.3 Three Specific Aims
Aim 1: Understand intrinsic and extrinsic difficulties that reporters encountered in reporting
through a computerized user interface.
Identify interface problems of an archetype of our proposed VRSRS by usability
inspections
Identify quality problems in reports collected from the archetype by content
analysis
Identify human factors in literature that barricaded user acceptance of PSRSs

4
Based on Norman’s task action model(Donald A. Norman & Draper, 1986),
synthesize all results from above steps to account for the common intrinsic and
extrinsic difficulties that reporter has to overcome to reach a high quality report
In order to instruct the prototype development with respect to what functions
should be added and what interface usability violations should be avoided in order to
address the common difficulties.
Aim 2: Develop and optimize interface artifacts for proposed functions in a specific domain
based on a user-centered design framework.
Develop interface artifacts that can aid data entries, recommend case solutions and
facilitate information communication between reporter and reviewer to address
intrinsic difficulty
Identify and remove extrinsic difficulty that is introduced by the new interface
These two steps will be conducted in an iterative way of development for aim 2. Patient
fall has been selected as the work domain for demonstration. It would represent the
voluntary reporting process in many ways and hold promise in generalizing the
development to other incident types. The whole process will base upon an established
design framework – TURF (Task, User, Representation and Function)(Jiajie Zhang & Walji,
2011) to ensure the system interface will be user-centered.
Aim 3: Test the hypotheses that the use of proposed interface artifacts can improve the
reporting completeness and accuracy, and encourage the user engagement and retention.
We will employ a quantitative method to measure and compare user performance to test

5
the hypotheses. The results are expected to reveal how the quality of reports and system
acceptance are improved and to what extent.
In addition to patient safety reporting system development, this research will propose a
generalizable, flexible guideline that organizes design framework and model with
descriptive power. This power, as Bardram points out, is to shape a study object and
highlight relevant insights (Bardram, 1998). It will guide development of the reporting
systems across the categories of incident and the health facilities. In addition, the guideline
and paradigm are also informative and instructive to develop particular components of a
more complicated informatics system, such as a documentation template of an electronic
health record system, to address barriers in similar perspectives.

6
CHAPTER 2 – REVIEW OF THE LITERATURE
The following paragraphs reported a series of the findings from the literatures that
primarily look at the status quo of current reporting systems and the established theories
and methods in HCI and usability. Respectively, the building blocks and the pearl growing
review methods were applied as the strategies for paper retrieval.
2.1 Status Quo of Safety Event Reporting Systems
To understand the state quo of the systems about what, when, who and how for
safety event reporting, we conducted a systematic literature review with the retrieval
technique of building blocks.
Databases selected for literature searching were (1) Medline (1950-2010); (2)
Compendex (1969-2010); (3) PsycINFO (1987-2010). Terms and keywords fell in three
categories (voluntary participation, computer system, medical errors) for searching: a)
Voluntary programs (MeSH & “explode”), voluntary (Ei controlled vocabulary); b)
Information system (MeSH & “explode”, Ei controlled vocabulary), system analysis (MeSH
& “explode”), system design, reporting system; c) Medical errors (MeSH & “explode”),
medical incident, patient safety event;
The “explode” box of searching tool was checked. It included all narrower terms
under the MeSH terms listed above. The authors are also searching the reference lists to
ensure all relevant articles to be properly reviewed.
The article inclusion criteria were composed of: a) voluntary system; b) medical
incident/error and patient safety event reporting pertinent; c) computer-based system; d)
empirical studies regarding VPSERSs’ design and use.

7
Patient safety event reporting is not a brand new territory. There are a great
number of reporting systems designed in paper forms, call center supported forms and
computerized applications. Usage and design concerns on varied types of forms could
manifest differently. Thus, we excluded the literature about non-electronic systems.
Differing from the comprehensive review of Holden & Karsh (Holden & Karsh, 2007), this
review is more interested in the potentials of system design improvement on a basis of
analyzed reports. Therefore, the papers that refer to the analysis of reports only were
excluded from the review.
We reviewed the titles and abstracts of the identified citations and applied a
screening algorithm based on the inclusion and exclusion criteria described above. The two
investigators rated each paper as “potentially relevant” or “potentially not relevant.” The
authors collected the following information from each “potentially relevant” article: year
of publication, clinical field, reporting amount and ratio, reported data statistics, controlled
vocabulary/terminology/taxonomy in use, discussed contributory factors to system
acceptance.
Comprehensive literature searches identified 80 articles: 69 in Medline, 6 in
Compendex and 5 in PsycINFO. After reading the fully papers, 72 articles were excluded.
Eight articles met the eligibility criteria as shown in Table 1(France, Cartwright, Jones,
Thompson, & Whitlock, 2004; Freestone, Bolsin, Colson, Patrick, & Creati, 2006;
Holzmueller et al., 2005a; Levtzion-Korach et al., 2009; H. S. Mekhjian, T. D. Bentley, A.
Ahmad, & G. Marsh, 2004a; Nakajima, Kurata, & Takeda, 2005; Nast et al., 2005; Suresh et
al., 2004).

8
Table 1, the studies included in the review Paper
Year
Clinical Fields Reporting No.
and Ratio
Report Statistics Terms in Use
(TIU)&System
Acceptance Factors
(SAF)
2004
Pediatric
chemotherapy field in
a Hospital(France et
al., 2004)
97 (Feb. 8,
2002 - Mar. 9,
2003)
Severity: 13% reached patients,
1% increased patient
monitoring, 2% temporary harm
Reporters: chemotherapy
pharmacists (69%), floor nurses
(31%)
Others: no significant different
on age, gender, race and
residence between hospitalized
incident and non-incident
patient populations
TIU: National
Coordinating
Council for
Medication Error
Reporting and
Prevention
SAF: leadership;
project ownership;
standard data
definition; human
factors; team
dynamics; data and
performance
feedback; security
and privacy
2004 Academic and general
field, Ohio State
University Health
System(H. S.
Mekhjian et al.,
2004a)
676 (28 weeks
started from
Oct. 22, 2001)
Ratio: 14.6 -
16.2
events/week
(122 beds);
15.1/week
(207 beds)
Reporters: physicians (10%),
nurses (>50%)
Average time expense: 7
minutes 40 seconds
Others: statistically significant
reduction both in event open
time and management
complete time proves efficiency
improvement
TIU: already-
familiar house
language
SAF: Usability
enhancement; user
classification and
centered; access
and security
control; facilitate
event follow-up
2004
Neonatal intensive
care field, Vermont
Oxford
Network(Suresh et
al., 2004)
1,230 (Oct. 4,
2000 -
Mar.7,2002,17
months)
Severity: 25% minor harm, 1.9%
serious harm, 0.15% death (673
reported harm)
Others: contributory factors
were failure to follow policy or
protocol (47%), inattention
(27%), communications
problem (22%), error in charting
or documentation (13%),
distraction (12%), inexperience
(10%), labeling error (10%), and
poor teamwork (9%); 581 (47%)
reports related to medications,
nutritional agents (breast milk,
TIU: Leape(L. L.
Leape, Lawthers,
Brennan, &
Johnson, 1993),
Nadzam(Nadzam,
1991) and
Kaushal(Kaushal et
al., 2001)
SAF: specialty-
based system;
anonymous
reporting

9
formula, and parenteral
nutrition), or blood products
2005 Intensive care field, in
Johns Hopkins
Hospital(Holzmueller
et al., 2005a)
854 (July 1,
2002 - June 30,
2003)
Severity: 21% led to physical
injury, 14% increase ICU length
of stay, the most are no harm
Average time expense: 12
minutes 45 seconds
TIU: home-made
taxonomy for
coding
SAF: usability e.g.
reduce free text
entry and print
option; feedbacks
to individual and
organization
2005
General field, Osaka
University
Hospital(Nakajima et
al., 2005)
6,041 (June 1,
2001 - Mar. 31,
2004)
Ratio:177
reports/month
(1076 beds)
Reporters: nurses(84.7%),
physicians (10.2%),
pharmacist(2.3%)
Others: uncovered problems on
computer prescription,
intravenous administration of a
high risk drug, and the
manipulation of syringe pumps
and blood transfusion according
to reports analysis
TIU: N/A
SAF: anonymous
and blame free;
new organizational
structure;
education, system
improvement and
feedback;
2005 Cardiothoracic
Intensive care and
post anesthesia care
in Barnes-Jewish
Hospital(Nast et al.,
2005)
157 in total,
112 from ICU
(Jan. 6, 2003 -
Dec. 31, 2003)
Ratio: 25.3
reported
events/1000
patient-
days(ICU)
Severity: 54% patient reached
without harm,
test/treatment/procedure-
related and medication were
the 2 most frequently types of
events contributing to patient
harm
Reporters: nurses (69%),
physicians (19%), other staff
(6%), anonymous (4%)
Others: 20 patients (19%) have
more than 1 event; the median
number of days from hospital
admission to the first event was
3 days; 3-fold increase in
reporting ratio; identified cause
and classification of event
TIU: home-made
taxonomy via
coding
SAF: voluntary,
accessible,
anonymous, and
non-punitive; time
tense and unsure
what to report;
classification and
coding of events
2006 Anesthetic field (via
mobile devices),
Geelong
Hospital(Freestone et
al., 2006)
156 (Aug. 2001
- Feb. 2004)
Ratio: 35
reports/1000
Severity: 46.2% near misses,
53.8% serious outcome
anesthetic trainee
TIU: 8 anesthetic
incident categories
from literatures by
1999; Patient
Safety International
terms ("Glossary of

10
anesthetic
procedures
Average time expense: 5
seconds
Others: summarized categories
and sub-classification for
incident reporting with numbers
of incidents and outcomes
Terms: Patient
Safety
International,
2004,")
SAF: nomenclature
for critical incidents
in health care;
supportive and
blame-free
environment;
timely and efficient
feedback
2009 General field,
Brigham and
Women’s
Hospital(Levtzion-
Korach et al., 2009)
14,179 (May
2004 - Nov.
2006, 31
months)
Ratio: 20
reports/1000
inpatient days
Severity: 24% near misses, 61%
adverse events but no harm,
14% temporary harm, 0.4%
permanent harm, 0.1% death
Reporters: Physicians submitted
only 2.9% of the reports; most
reports were submitted by
nurses, pharmacists, and
technicians
Average time expense: 14
minutes, varies from incident
type to type
TIU: home-made
category of
incident types
SAF: immediate
response and
reassurance; lack of
time; ease of use
Overall, all eight articles exhibited a variety of difficulties in designing and adopting
VPSERS for high-quality incident reports. It includes voluntariness,
terminology/taxonomy/nomenclature (Freestone et al., 2006; Nagamatsu, Kami, & Nakata,
2009; Vozikis, 2009), blame-free environment and reporting culture(Waring, 2005),
usability and utility concerns(P. Barach & S. D. Small, 2000; Clay, Dennis, & Ko, 2005;
Kijsanayotin, Pannarunothai, & Speedie, 2009), feedback("World Alliance for Patient
Safety," 2005) and administrative issues.
Voluntariness shared a controversial point of view in patient safety reporting
system design. In several technology acceptance researches (Clay et al., 2005; Kijsanayotin

11
et al., 2009; Lowry, 2002), it was identified as a negative factor to decline system use at
some point. In the case of low perceived voluntariness, where user felt that the use of the
system is mandatory, the system use will be more often(Clay et al., 2005). However,
voluntary systems are still more dominant and more acceptable in an incident reporting
area than the mandatory ones. The mandatory systems are often adopted in military areas,
and typically designed to identify “bad” practitioners and facilities with an emphasis on
individuals and on the error itself, but not its correction(Cohen, 2000).
Controlled vocabulary/terminology/taxonomy is a prevalent challenge, due to
computerization in all domains requires semantic interoperability among human and
computer systems. In fact, there are a number of medical incident taxonomies or
conceptual frameworks available as candidates for the development of patient safety
reporting systems. E.g. NCC MERP Taxonomy of Medication Errors (NCCMERP), JCAHO
Patient Safety Event Taxonomy (PSET), JCAHO Sentinel Events Reporting (JSER), Taxonomy
of Nursing Errors (TNE), a Preliminary Taxonomy of medical errors in Family Practice (PTFP),
Cognitive Taxonomy of Medical Errors (COG), Taxonomy of Medical Errors for Neonatal
Intensive Care (NIC), MedWatch Index (MEDWATCH), and the International Classification
for Patient Safety (ICPS). These taxonomies or conceptual frameworks do not only guide
what to report, but can also provide an agreed-upon structure to error report data.
Unfortunately, they are lacking of consistency in practice. It may impede the
interoperability among different patient safety systems at a larger scope.
Utility and usability are major technical issues influencing system acceptance. They
refer to not only PSRSs but also aviation error reporting(P. Barach & S. D. Small, 2000),

12
building management (Lowry, 2002), knowledge management (Clay et al., 2005) and the
other health information technology area(Kijsanayotin et al., 2009). They are even
highlighted in Davis’ Technology Acceptance Model (TAM) (Davis, 1989) and Neilson’s
System Acceptability Model (Nielsen, 1994). For example, to the PSERs, users might ask for
better data entry tools that are easy to use and prompt the reuse of reported data. If the
system design failed to deliver a periodical progress or achievement to satisfy users’
evolving requirements and expectations on system performance in a timely manner, the
users might feel frustrated and even stay away from current usage to seek any alternatives.
Feedback between reporters and expert reviewers is expected to encourage
reporting, educate clinicians and notify corrective actions taken(Holden & Karsh, 2007).
Discussed in all investigated articles, it was believed crucial to reduce report open and
complete time (H. S. Mekhjian et al., 2004a). In view of communication science, feedbacks
that meet users’ expectations or provide the perceived benefit that hold the promise of
bridging sense-making or sense-giving gaps to encourage incident reporting activities of
target users.
Upon the above concerns, a computer-based prototype of the PSRS has been under
development since 2009 (L. Hua & Y. Gong, 2010). We reviewed the latest design
suggestions in patient safety reporting area which are based upon and beyond Holden &
Karsh’s work in 2007(Holden & Karsh, 2007). As a result, only three additional papers were
identified and organized with the prior in Table 2 to complement system prototyping based
on our previous studies (Yang Gong, 2009; Gong, 2010b; L. Hua & Y. Gong, 2010).
Table 2, design recommendations in the literature

13
Design recommendations Literature
Specialty-based; Feedback to encourage reporting, educate clinicians and notify corrective actions taken
Holden & Karsh, 2007(Holden & Karsh, 2007)
Handheld computer application narrowing down participation biases
Dollarhide, Rutledge, Weinger, & Dresselhaus, 2008(Dollarhide, Rutledge, Weinger, & Dresselhaus, 2008)
Reinforce process-oriented than outcome-oriented in reporting
Nuckols, Bell, Paddock, & Hilborne, 2009(Nuckols, Bell, Paddock, & Hilborne, 2009)
The group level data sharing might prompt error reporting rate significantly
Anderson, Ramanujam, Hensel, & Sirio, 2010(Anderson, Ramanujam, Hensel, & Sirio, 2010)
2.2 Theoretical Foundations of User-centered Design to the PSRSs
Gulfs of Execution and Evaluation
In performing a reporting task with a computerized system, two action gulfs in
execution and evaluation may appear during the user-interface interaction. As defined by
Norman (E. L. Hutchins, Hollan, & Norman, 1985), the gulf of execution lies between user’s
goals and possible activities that the system can carry; the gulf of evaluation spans between
the users’ perceived and the desired outcomes out of the execution. As illustrated in Figure
1, intrinsic complexity and extrinsic difficulty are often used to account for the contributing
factors underlying the gulfs.

14
Figure 1. seven stages of user activities in preforming a patient safety reporting task
adapted from Norman’s task action model (Donald A. Norman & Draper, 1986)
The intrinsic difficulty reflects work domain complexity (Hammer & Champy, 1993;
Jiajie Zhang & Walji, 2011). Instead of collecting and analyzing a medical event by a safety
generalist, nowadays the adoption of the division of labor, including the reporter, reviewer
and even the system manger reduces organizational efforts and the cost of the work.
Unfortunately, this modification splits a holistic view of the goal, activity, knowledge, and
outcome for individual task persona a.k.a. the system users, and makes the interaction and
collaboration of activities more complicated and determinant than the work itself.
However, most of existing patient safety reporting systems is primarily a data repository
tool (H. Kaplan & B. Fastman, 2003). They are lacking in strength of integrating the
scattered views across users, or providing direct and timely feedback among users towards
effective task communication and collaboration. The reporters, especially for the voluntary

15
ones may hardly know what required elements of the reports are and what is the
usefulness comes out of the reporting, unless they have been the case reviewers. The
interactions for these discrepancies convergences are so remote and indirect that the
feedback and communication about the system state (data collection and knowledge
dissemination) are hardly established in timely and accurate fashions. Thus, the delays,
inaccuracies and frustrations appeared in the interaction and activity flow, to discouraging
the use of the systems. Of bridging the gulfs and alleviating the problems, one way is
through user training, the other is to design the cognitive artifact on which we focus in the
study (Donald A. Norman, 1991).
Cognitive Artifacts
The gulfs of the seven stages of reporting primarily lay in the uncertain knowledge
of the reporting and the difficulties of perceiving the system usefulness. The uncertainty in
the knowledge of reporting implies what should be reported (errors, adverse events, near
misses) and at what level of details (who, when, where, how) is often unclear at the scene
to whom are not patient safety experts (Holden & Karsh, 2007). Norman proposed user-
centered design of cognitive artifacts on the side of system interface for the gap bridging
(Hammer & Champy, 1993; Donald A. Norman, 1991; Donald A. Norman & Draper, 1986).
In fact, this project is to develop the artifacts serve as an enhancer for the acquisition of
reporting knowledge and the perception of system usefulness to reporter, and as a booster
for root cause analysis to reviewer.
Explicitly defined by Norman, a cognitive artifact is an artificial device to maintain,
display or operate upon information in order to serve a representational function(Donald

16
A. Norman, 1991). Apart from the other technical artifacts like vehicles, telescope, and
hammer that aid human physical requirements and enhance physical performance, the
cognitive artifacts emphasize on information representation to enhance or augment
individuals’ mental performance in cognizing and remembering the task and its
surroundings.
They actually do not change the reporter’s ability, but the nature of the task being
performed in the study, from the describing all related details to the responding merely on
expert-selected questions and suggestions represented via the artifacts, and from an
active information recalling and constructing process to a passive answering course. Based
upon the theory of cognition distribution, the transition of performing behavior can be
assisted by the artifacts through the external representation that is more than inputs and
stimuli to the internal mind (E. Hutchins, 1995; Donald A. Norman, 1991; Jiajie Zhang, 1997;
Jiaje Zhang & Norman, 1994; Jiajie Zhang & Patel, 2006). On the other hand, the artifacts
can be developed ahead of the action, which allows the cognitive efforts to be distributed
across time and system users. Hutchins and Norman call this preparatory task of
developing such artifacts “pre-computation” that can be done with convenience, no time
pressures and by patient safety experts than individuals who perform the reporting
(Donald A. Norman, 1991). Our proposed work would take advantage of the “pre-
computation” power and use a series of properties of artifacts as external
representations(Jiajie Zhang, 1997), to:
Provide short-term memory aids to reduce memory load in the reporting

17
Provide knowledge and skills that are unavailable from internal representations of
novice users
Support perceptual operators
Anchor and structure reporting activities without conscious awareness
Change the nature of the reporting task by generating more efficient action
sequences and constraints
Facilitate information interpretation and formulation for easy to perceive and use
in the both reporting and review processes
Historically, memory cue and structure in working memory(Ericsson & Kintsch,
1995), information processing intervention in situation awareness(Endsley, 1995) and
mediator in activity theory(Nardi, 1996) coined the same concept in different perspectives
from which the cognitive artifacts are interpreted, and used across the scientific and
practical fields.
Data Quality as a Core Measuring Facet
Efficiency and data quality are two major facets from which we measured the new
designs for the event reporting systems. Compared to the concept of efficiency that simply
refers to the completion time and text entry speed in the research, the concept of data
quality is complex and needs a clear specification before the measurements start.
The data quality in reporting depends on the process by which the data are
channeled and generated through information systems. Ahead of superimposing any
interventions to the process via artifacts for better quality, it is necessary to know what
the quality means and how it is measured in the patient safety reporting area.

18
The data quality has multiple dimensions. Although there is no general agreement
on data quality dimensions, the most frequently mentioned dimensions are completeness,
accuracy, consistency and timeliness (Strong, Lee, & Wang, 1997; Wand & Wang, 1996;
Wang, Storey, & Firth, 1995). We primarily focused on the first three quality dimensions
that are representative and have most frequently problems encountered in the content
analysis of the existed reports, and merged the consist into the dimension accuracy.
Completeness of Reporting
The completeness, we defined is the state of having entire details that are needed
for a patient safety analysis. It may be achieved if the criteria of completeness are explicitly
delineated and then properly represented to the reporters via artifacts. What makes this
work harder is that the PSRSs comprise of multiple incident categories. The criteria of
completeness are varied from one to the other, and none of them have been established
by far. Two feasible strategies to investigate them are documentation review and expert
panels. Reviewing published studies, official reports to identify what elements of data have
been regulated for the analysis in an according category would be done firstly. If they are
not available or sufficient in the existing literatures, qualitative methods will be applied to
build the criteria by surveying from case reviewers and patient safety experts.
Accuracy of Reporting
The accuracy was defined as the state of all reported data being correct and precise
to reflect the real facts of the incidents. The report ing accuracy is susceptible to user’s
error e.g. typos on event date and cognitive limitations in memory and reasoning e.g.
memory decay, casual attribution and hindsight biases(Holden & Karsh, 2007). These

19
factors are possible to lead the inaccuracy, specifically the mapping deficiencies of value,
data or information between the representing and represented world about medical
incident. One of our previous researches confirmed their existence and severity in a
current PSRSs. It identified over 50 typos on values of event or patient birthday date, and
over one fourth of reports in this 2,919 incidents dataset were mislabeled (Yang Gong,
2009). It is believed the deficiencies will be reduced if well-established taxonomies and
terminologies are provided and reasonable checks are applied to key information, though
what extent can be achieved is still unknown.
Patient Fall Category as a Starting Point
The study is not to develop a practical, fully functional and comprehensive safety
reporting system for implementation purpose. Rather, it applied a user-centered design
framework, namely TURF (Task, User, Representation and Function) to prototyping the
reporting system in specified medical incident category. It is expected to demonstrate a
generalizable process with applicable HCI theories and methods for a complete PSRS or
the similar issues in a more complicated context such as in an EHR system. Hence, starting
prototyping with a proper incident category that is representative and easy for the
definition of quality criteria will benefit the study’s generalizability and efficiency.
A comprehensive event reporting system may refer to multiple categories of
incidents, e.g. eight categories in the AHRQ Common Formats. The quality criterion varies
from one to the other. The existing classification systems (ARHQ CFs, WHO ICPS) could
confuse and impede the criteria construction. Because the classified categories are usually
not consistent across the systems, and lacking of finer subcategories to further

20
differentiate the categorized cases that are actually not that similar. Prototyping with such
a complicated incident category, we must conduct a very complicated taxonomy study
ahead of constructing even very simple quality criteria. An example in CFs is patient fall
versus device category – the patterns, underlying factors and corrective actions of falls are
similar; as an opposition, the scenes, reasons and solutions among device cases may be
significantly different. Obviously, the latter incident category complicates the whole
process due to its complexity.
We choose patient fall as a representative category for many reasons including but
not limited to:
Importance of patient fall incident: Falls lead to serious injury to patients and
reimbursement loss to health providers. This motivates health providers for the
system adoption.
Gaps in informatics research: There are few informatics studies related to the
reporting of patient falls.
Less shame-blame: patient fall cases are usually not caused by health professionals.
Health professionals do not worry about being punished because of fall incident
reporting
Better structured: It is the most structured incident category in the Common
Formats, which simplify the algorithms and information representations for the
design of cognitive artifacts
Information Gaps in the Course of Patient Falls Management
A fall is an unexpected change in position that causes a person to land on an object,

21
on the floor, or the ground(Payson, 2007). The complexity regarding the patterns and
characteristics of falls determines that the collection of related information before, during
and after the event occurrence has to be exhausted for learning purposes (Hitcho et al.,
2004; Wagner, Capezuti, Taylor, Sattin, & Ouslander, 2005). As illustrated in Figure 2, event
related data usually scatter across three stages of an event management circle including
surveillance, prospective and retrospective analyses. Overlapped areas indicate shared and
interoperable data among the three stages. From a working flow angle, each stage in a
long run shapes and is shaped by the others through these overlapped parts.
In this flow, prospective analysis focuses on the prediction and prevention of falls
that might be applicable to a patient. The analysis is usually conducted on new admissions
and every nursing shift in acute care settings and requires extensive data to determine the
level of risk in order to give appropriate interventions. The data include demographics,
history of falling, secondary diagnosis, staying environment, mental status, gait, applicable
interventions, etc. The availability and accessibility of the data thus become critical in
determining the extent to which the risk of patients can be properly handled.

22
Surveillance
(Voluntary Reporting)
Prospective
Analysis (Risk Management)
Retrospective
Analysis
(Corrective Actions)
4
3
12
Interactions and Overlapped
Users/Data
Figure 2 , three stages in a circle of patient falls management
Retrospective analysis is oriented to the identification of event data associated with
a specific occurrence and context (Cacciabue & Vella, 2010). The retrospect indicates a
reviewing process conducted by safety experts on a superset of highly relevant and
accurate details regarding the event. Unfortunately, this set of data would not be available
spontaneously but require manual aggregation and pre-processing of data corpus
scattered across the parallel systems. This often delays and sometimes fails the discovery
and dissemination of patient safety knowledge due to low-quality data in terms of
completeness and accuracy.
Our research sheds light on the surveillance stage that currently relies on a
voluntary reporting strategy and the overlapping spots as shown in Figure 2. It describes
the salient difficulties with respect to the underreporting and low-quality reports. In the

23
Figure 2, #4 indicates a number of key data elements shared by all the stages for risk
assessment, event documenting and expert review. The overlapping #1, #2 and #3 imply
the interactions in between that support the completion of tasks on each stage and the
output of high-quality data for #4. However, most of the current reporting systems are
typically a data repository tool (H. Kaplan & B. Fastman, 2003). They sustain neither
effective human-computer nor human-human interactions for the transaction. The
information gaps thus appear which undermine the system's ease of use and usefulness
and create the gulfs of execution and evaluation as aforementioned.
Prospective Analysis
Risk assessment
Preventive protocols in
place
Event Report
Identification of event
Data collection and reporting
Knowledge acquisition for
corrective actions
Retrospective Analysis
Identification of key elements
Promotion of root cause analysis
Corrective actions and guideline
Culture cultivation
Training/Learning
Safety reassurance
Event reporting
Data driven feedback
for learning and correcting
to be well established
User-centered
Reporting System
Features
Assessment data retrieval
Incident prediction
Safety assurance
Gaps bridging by features
Figure 3, information gaps and proposed features for the gap bridging
With a fusion of Figure 1 and Figure 2, we created a gap-bridging model as shown
in Figure 3. Except for a solid line indicating an established data channel from reports to
retrospective analysis, the dotted lines in red highlight substantial gaps that exist in the
current managing flow of patient falls. As discussed above, they refer to two main barriers

24
in the circle. One is the information asymmetry across the stages. The other is the lack of
technical approaches facilitating information flow from one to another, such as the
features of auto-completion or suggested as data entry aids at all stages; the mechanisms
to improve human-human communication in a timely manner through the computerized
system; a knowledge base for similar events and solution retrieval in support of advanced
system features. In fact, the two barriers inhibit the working process, undermine the
outcomes and could form a vicious circle of the system use.
Text Prediction Functions to Aid Data Entry
Many attempts have been made to investigate the difficulties with data entry in
order to promote the acceptance and quality-in-use of clinical information systems (Kaplan,
1994; McDonald, 1997; Walsh, 2004). The rationale behind is that, with the advance of
efficiency and data quality in documentation, these attempts would prompt system
acceptance and form a virtuous loop leveraging the system performance and patient safety
iteratively. This research made such an effort and utilized text prediction to facilitate data
entry efforts in patient safety reporting.
Commonly, there are two types of data entry carrying off the documentation
activity: structured or unstructured data entry. Structured data entry is of strength in
interoperability and reuse for research purpose, but restrictive and inflexible with respect
to the ambiguity tolerance and argument making as a process of negating options from a
predefined list. On the contrary, the unstructured data entry almost makes up all the
disadvantages of structured data entry to retain the semantic richness and the narrative
phrases connected (Walsh, 2004), but usually requires the rich knowledge, experience and
25
well trained skills to maintain high performance in terms of the speed and data quality, and
is difficult for the reuse of narrative data. To foster the advantages and circumvent t he
disadvantages, many pre- and post- computation efforts have been made. For example,
the initiative of a structured data capture project for the meaningful use of Electronic
Health Records (EHR) ("Structured data capture initiative," 2013) and the continued effort
to develop and refine the standardized structured forms for patient safety event reporting
(AHRQ, 2008), or apply more advanced text-mining technology to prompting the reuse of
narrative data. Nevertheless, these efforts barely made effects as documentation in
progress, in a context specific and dynamic way as the Infobutton (Del Fiol et al., 2008) did
for clinical decision-making. This study then proposed similar functions to cue data entries
for documentation in progress, which are namely text prediction.
Text prediction, also known as word, sentence or context prediction originated in
augmentative and alternative communication (AAC) to increase text generation rates for
people with the disabilities of motor or speech impairment (Beukelman & Mirenda, 2005).
The advance of natural language processing techniques has brought text prediction into a
broad scope of daily computing activities, such as mobile computing (Mackenzie &
Soukoreff, 2002) and radiography reports (Eng & Eisner, 2004). However, text prediction
technique has two concerns when being applied in healthcare. First, there is a scarcity of
research regarding the impact of text prediction on the quality of data entry that clinicians
value. Second, despite text prediction has proven effective in reducing the motor
requirement for text generation, whether this alone translates into an increased efficiency
remains unclear (H. H. Koester & Levine, 1994). In the experiment 3, a two-group

26
randomized design was employed to examine the impact of text prediction on data entry
quality and efficiency in the clinical setting.
Theoretical Framework of User-centered Design
The development of interface artifacts will be a reflection of the system analysis
results upon TURF framework. The TURF framework consists of four analysis steps with
respect to user, function, representation and task as shown in Figure 4. It is built on
distributed cognition theory. The theory investigates how the cognitive efforts of a task are
distributed between human and artificial agents, across time and people, and how user’s
cognition and performance are enhanced by a user interface as the artificial agent (E.
Hutchins, 2000; D.A. Norman, 1993; Jiajie Zhang, Patel, Johnson, Malin, & Smith, 2002).
The framework is consistent with the seven stage model addressing intrinsic and extrinsic
difficulties through a user-centered design. The previous studies based on this framework
have successfully proven its capability for improving system usefulness, ease of use and
satisfaction(Gong & Jackson-Thompson, 2007; Gong, Pasupathy, Vest, Cole, & Jackson-
Thompson, 2008; Y. Gong & J. Zhang, 2005a; Yang Gong & Jiajie Zhang, 2005; Gong et al.,
2004). Our proposed work is expected to carry out the analytical steps reclusively for a
user-friendly system interface.

27
Voluntary Patient
Safety Reporting
System
User Analysis
Function Analysis
Representation
Analysis
Task Analysis
Extrinsic
Difficulty
Intrinsic
Complexity
System
Usability
Useful
Satisfying
Usable
Figure 4, A modified framework of user-centered system design –TURF (Jiajie & Keith,
2008; Jiajie Zhang et al., 2002; Jiajie Zhang & Walji, 2011)
User analysis
We will conduct a user analysis to identify the population and characteristics of
users who report using the system, such as expertise and skills, educational background,
cognitive capacities and limitations, perceptual variations, age-related skills, and time
available for learning. For example, we may find that the user-centered intelligent
reporting system should be tailored differently for a novice physician user or for an
experienced nurse user. The user’s satisfaction in using the system is majorly based upon
the system functions and representations as illustrated in Figure 4.
Function Analysis
Functional analysis is more abstract than task and representation analyses for not
involving details of the two analysis steps. It identifies an abstract structure of work domain

28
– the top-level domain ontology about top-level structures, goals and inherent properties
of the reporting work that are largely independent of implementation.
The human and artificial agents, especially about their capabilities, interactions and
constraints to the task activities are identified and analyzed in this step. It helps understand
the situations when the intrinsic complexities of task turned out to be the difficulties, or
oppositely the shaping forces to enhance user’s mental performance. The function analysis
typically employed ethnography and extensive qualitative data analyses such as those in
aim 1 to identify useful operations and user reflections upon the artifacts. The recursive
analyses on this step will instruct the design of wanted functions/artifacts to encourage
system acceptance and increase reporting quality.
Representation Analysis
We will conduct a representational analysis to identify an appropriate information
display form and language for a reporting task performed by a specific type of user so that
the interaction between users and systems is in a direct interaction mode(E. L. Hutchins et
al., 1985). With direct interaction interfaces, users can directly, completely and efficiently
engage in the primary tasks they intend to perform through the representations and
functions. The form or language of a representation of the function can influence and
sometimes determine what information can be perceived, what processes are activated,
and what can be derived from the representation.
Task Analysis
We will conduct a task analysis to identify the procedures and actions to be carried
out and the information to be processed to achieve task goals for the user-centered PSRS.

29
One important function of task analysis is to ensure that only the functions/artifacts that
match reporter’s capacities (e.g., level of expertise and accessibility of pertinent
information or data) and are required by the task (e.g., determine the case category,
describe when, where, what, and how the case happened) will be included in the system
specifications. Sophisticated functions that do not match the users’ capacities or are not
required by the task will only generate additional processing demands of the user and thus
need to be avoided. This analytic approach will help identify how different reporters
interact with the same medical incident data displays.

30
CHAPTER 3 – METHODOLOGY
There are a number of research methods for user-centered design. To choose one
over another is often determined with the involvement of a few other factors as a trade-
off of cost-effectiveness. For example, the availability of data, the accessibility of state-of-
the-art techniques, the collaboration across the fields, the support of community and the
time and financial constraints, to some extent which influenced the inclusion of the
methods to this research.
Two data resources distinguished our research from the others. They are a set of
one-year (2005 - 2006) incident reports obtained from the University of Missouri Health
Care system (UMHC), and the system wherein the reports were generated. Based on those
materials, the preliminary studies initially answered three basic questions for the design of
the systems.
Who are the users of the system?
What are the task and task steps of reporting?
How may an improved function and/or representation increase user’s performance?
Grounded on the answers and the findings of the literature review, we started an
iterative process of system prototyping. Each iteration involved the feedback and
evaluation of usability experts and/or reporters, as the empirical experiments 1 and 2
indicate. Incrementally, the identified usability violations were fixed and new functions
were added along the prototyping. The latest edition of the prototype was completed in
2012. With all severe representational issues addressed at the time, three fundamental
research questions remained.

31
Do the added functions increase the reporting efficiency?
Do they increase the reporting quality?
Do they improve user’s engagement at the system/task level?
The experiment 3 of two-group randomized test was thereby designed and
conducted for the answers. The prototype was tailored and reengineered to keep the two
most time-consuming and problematic steps in the task of reporting according to the
experiment 2. By logging actual users into the prototype and randomly activating the
proposed functions for text prediction purposes, the experiment successfully validated the
performance improvements with statistical significance.
As a conceptual model of research, Figure 5 illustrates a roadmap, three specific
aims, multiple proposed interface artifacts/functions and corresponding studying methods
of our research. The introduction of Norman’s task action model and Zhang’s TURF design
framework to the model holds promise for a user-centered prototypical system out of the
development iteration. This model may also serve as an innovative analytic guideline to
instruct analysis, development and evaluation of patient safety event reporting systems to
a larger scope.

32
Figure 5, an analytic model, for our user-centered design of a safety event reporting
system
3.1 Content Analysis of Historical Safety Event Reports (Preliminary Study 1)
Content analysis is an unobtrusive method to describe and quantify phenomena to
provide domain knowledge, new insights, a representation of facts and a practical guide to
action (Krippendorff, 1980). The analysis pinpoints several important facts and problems
e.g. the user population, schema of descriptive text, missing information and human errors
from the first-hand reports by statistical and data-mining approaches. It verifies and
complements the results from the direct elicitation technique such as the usability
inspection, and identifies the difficulties and solutions from and for the intrinsic complexity.
Data
source
Interface
Reports
Intrinsic &
extrinsic
Difficulties
Design
principles
Mapping
Visibility
Conceptual models
Feedback
Cognitive artifacts
in prototype
Checklist
Shortcut
Auto-suggestion
Cueing list
Conclude
Identify difficulties
(Aim 1)
Norman’s
action model
Content
analyses
Usability
inspections
Heuristic
evaluation
Performance
comparison
Performance
increased?
Interface
Development and
Optimization (Aim 2)
Interface
Evaluation (Aim 3)
Severe violations
removed? No
Yes
Yes
No
PSNs
Unsatisfied
prototype
Preliminary studies
Cognitive artifacts
Empirical experiments
Pre-analysis
Think-aloud

33
3.1.1 The flowchart of content analysis
The figure 6 illustrates such a flow of content analysis of the raw records to a
specific category of patient fall reports.
Raw Reports
5,654Preprocessing
Unstructured
Report Fields
Structured
Report Fields
Statistical
Findings
SubjectsDisposition or
“Angle”
Qualified
Reports
2,919
Choose the Content of
“Patient Fall” Reports 346
Develop Coding
System & Schema
Recruit and Train
CodersHypotheses
Code ContentAnalyze Coded
Content
Confirm or Reject
Hypothesis
Content Analysis
Findings
Figure 6, a flow chart for content analysis on historical reports from PSNs
Users have to complete two logical steps in a report – documenting the incident
facts and estimating its severity by rating a harm score that determines if it is a must -be-
reported medical error or an adverse event. To analyze these two parts requires laborious
manual works, so we developed two tools in facilitating the process. One tool was designed
to identify the problems in rating and classifying incidents. The other one was to evaluate
the completeness and expressiveness of incident reports.
3.1.2 Tools developed to facilitate the analysis
An Analytical Tool to Facilitate Data Coding and Severity Rating
This interface displays the extracted information from the 2,919 reports in the
database and shows all the follow-up data (solutions and review information) on one page

34
(Figure 7). In addition to the fields pertinent to incident description and severity, we added
two annotation fields for coders to use as needed. The coding results are stored in a
separate table linked to the original reports by “Event ID”. We extracted Event Description,
Solution, Review, Information, and Event Short Summary as they are closely relevant to
answering the questions on consistency, completeness, and accuracy. Other fields, such as
Incident_Type, Error_Description, Reporting_Professionals, not included in the recording
process, were examined through a separate descriptive statistical analysis supported by
the other tool.
Figure 7, a coding interface developed for summarizing necessary and required
information on one page
The tool was designed to correct severity rating and classification of reported cases.
It was to re-evaluate the harm-score and incident classification previously assigned to all
reports by inter-rater approach. Two coders systematically examined the consistency of
35
incident reports and re-evaluated the harm score and classification of each case. All
inconsistent score and classification were identified and corrected. All results of this period
of content analysis are already published in a paper in 2009 (Yang Gong, 2009; Gong,
Richardson, Luan, Alafaireet, & Yoo, 2008).
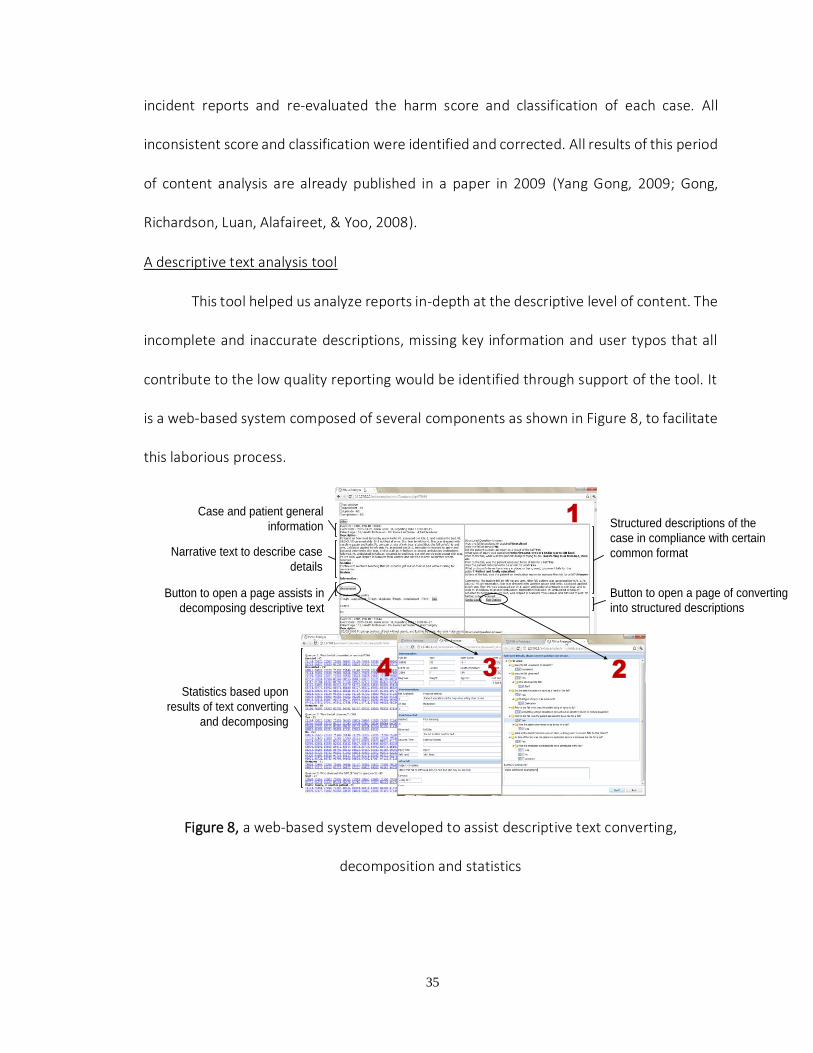
A descriptive text analysis tool
This tool helped us analyze reports in-depth at the descriptive level of content. The
incomplete and inaccurate descriptions, missing key information and user typos that all
contribute to the low quality reporting would be identified through support of the tool. It
is a web-based system composed of several components as shown in Figure 8, to facilitate
this laborious process.
Narrative text to describe case
details
Case and patient general
information Structured descriptions of the
case in compliance with certain
common format
Button to open a page assists in
decomposing descriptive text
Button to open a page of converting
into structured descriptions
Statistics based upon
results of text converting
and decomposing
1
234
Figure 8, a web-based system developed to assist descriptive text converting,
decomposition and statistics

36
Component 1 displays the original reports and converted results side by side. The
selected cases are shown on the left side. On the right side, the structured questions
proposed by the AHRQ Common Formats layout along the case narratives. Component 2
assists two coders in manually converting descriptive text into predefined text under the
questions. For uncovered key information beyond the predefined entries, the Component
3 was developed and modified to collect and fit them into proper data columns.
Component 4 displays primary statistical results with respect to the population of user
groups and the pattern in descriptive text of the selected cases. Initially, 100 randomly
selected cases, after converting were classified into three categories that indicates the
quality level of case description – duplicate, supplement and complement (Gong, 2010a).
These categories helped us determine how to select cases from a case repository to
initialize the user testing on the new prototype interface.
3.2 Formal Usability Inspection of a Patient Safety Reporting System (Preliminary Study 2)
The formal usability inspection is a method we adopted to identify usability
problems on the interface. It combines individual and group inspections in a six-step
procedure with elements of heuristic evaluation and cognitive walk-throughs (Kahn & Prail,
1994). The evaluators were asked to use the 14 usability heuristics developed by Zhang et
al (J. Zhang, Johnson, Patel, Paige, & Kubose, 2003). As shown in Table 3, they include
Consistency, Visibility, Match, Minimalist, Memory, Feedback, Flexibility, Message, Error,
Closure, Undo, Language, Control, and Document. All discrepancies and unique findings
uncovered through the process should be resolved and consolidated by group discussions
and testing to reach the complete consensus.

37
Table 3, usability heuristics developed by Zhang et al (J. Zhang et al., 2003)
Criteria Definition
Consistency and Standards
Users should not have to wonder whether different words, situations, or actions mean the same thing. Standards and conventions in product design should be followed.
Visibility of system state
Users should be informed about what is going on with the system through appropriate feedback and display of information
Match between system and world
The image of the system perceived by users should match the model the users have about the system
Minimalist Any extraneous information is a distraction and a slowdown
Minimize memory load
Users should not be required to memorize a lot of information to carry out tasks. Memory load reduces users’ capacity to carry out the main tasks.
Informative feedback
Users should be given prompt and informative feedback about their actions
Flexibility and efficiency
Users always learn and users are always different. Give users the flexibility of creating customization and shortcuts to accelerate their performance
Good error messages
The messages should be informative enough such that users can understand the nature of errors, learn from errors, and recover from errors
Prevent errors It is always better to design interfaces that prevent errors from happening in the first place
Clear closure Every task has a beginning and an end. Users should be clearly notified about the completion of a task
Reversible actions Users should be allowed to recover from errors. Reversible actions also encourage exploratory learning
Use users’ language
The language should always presented in a form understandable by the intended users
Users in control Do not give users the impression that they are controlled by the systems
Help and documentation
Always provide help when needed
3.2.1 The reporting system - Patient Safety Network
The examined system in this preliminary study is a web based electronic reporting
system called Patient Safety Network (PSN) - a patient safety reporting system

38
implemented in the University of Missouri Health Care System (UMHC). The system has
been used to collect adverse events and near misses from five facilities across UMHC since
2002. The reporting process for medical incidents has five steps. The first step is a few
questions about the profession of reporter, facility name, patient involvement. The second
step is rating the harm severity of the incident. The third step is for patient information in
general. The fourth step is documenting incident details, and the fifth step is to confirm
and submit the report. Depending on the severity of the incident, these incident reports
are either immediately (severe incidents causing patient harm) or periodically (near miss
and less severe incidents without patient harm) reviewed and analyzed to identify the
causal system issues. Feedback about the resolution of an incident is echoed to
confidential users via email, who can track the review and the resolution process.
3.2.2 The design of study
Participants
The entire usability inspection procedure involved five participants. The supervisor
of the study is a usability expert and faculty member; the other four participants are
graduate research assistants with health informatics training (Master or PhD career) at the
Department of Health Management and Informatics of the University of Missouri. One PhD
student spans all steps of inspections as a moderator. The remaining three students
inspected the PSRS to identify usability problems of PSN respectively, during different
semesters in one year.
Six procedural steps of usability examination

39
1. Planning: The supervisor of the study formed an inspection team and scheduled regular
meetings. The moderator prepared the instructions for evaluators and organized
inspectors’ feedback across the study span. The instructions consist of a description of
examined PSN system, learning materials of required knowledge (usability engineering
methods, mainly about heuristic evaluation and cognitive walkthrough), simulative
user profiles, and a set of task scenarios.
2. Kickoff Meetings: The supervisor of the study distributed the instructions and
periodically reviewed inspectors’ proficiency of required knowledge. The moderator
was always available if there were any questions about the process and collected
relevant information from inspectors.
3. Incubation: Each of the inspectors reviewed the inspection instructions and learning
material for required knowledge at the beginning. Once approved by supervisor of
their proficiency on required knowledge, inspectors took the role of users (voluntary
reporters) as described and performed the task steps pre-classified by supervisor and
moderator, in a variety of task scenarios (a walk through) with the consideration of
heuristic principles. During the process, inspectors jotted down all usability concerns
found while completing the tasks.
4. Discussion Meetings: In our study, the discussion meetings are often composed of
three participants – the supervisor, a moderator, and an inspector. We went through
all inspection notes and corresponding system interface and then compared the results
with previous inspection reports if available (the second inspection round and after) to

40
justify the accuracy of identified usability problems. All suggestive information is
updated to current inspector’s notes.
5. Solution Reflection: These meetings also reflected about the solutions to the usability
concerns found. The moderator in this study takes an additional role as a system
designer to prototype, a new PSRS based on PSN that addresses the identified usability
problems (Lei Hua & Yang Gong, 2010).
6. Follow-up: The last inspector, supervisor and moderator who experienced all
inspection rounds synthesized feedback and notes from all three usability inspectors,
and classified these problems based on their potential to cause problems for the basic
purpose of PSRS.
The goal of this study was to report the usability problems based on their potential
to contribute to the problems with voluntary reporting, but not to rank them for their
severity of impact. Usable PSRS should allow potential reporters to create accurate,
complete, and error-free reports in minimal time possible without any frustration.
However, usability examination of PSRS revealed some important problems that could
influence the quality of reports and potentially result in underreporting, which is a major
problem of PSRS. These problems can discourage potential reporters from reporting, and
reduce the usefulness of reports.
3.3 Usability Inspections of a Prototype System (Empirical Usability Experiment 1)
The TURF framework of user-centered design (Y. Gong & J. Zhang, 2005b) requires
the analysis at the user, task, function and representation levels for effective design and

41
evaluation of an information system. On a prototyping process, we started with a dominant
type of users (nurse) and employed a horizontal dimension prototyping method (Nielsen,
1994) to keep the features yet eliminate the depth of functionality. As shown in Figure 9,
the vertical prototype that narrows down the system to a few representative features was
iteratively developed with specialty on patient fall cases to deal with the unstructured data
elements in a tentative standardized format – AHRQ Common Formats. Meanwhile, the
component carrying the structured data elements in common was developed as a
horizontal prototype to simulate common user interface across whole users and various
incident categories.
Figure 9, two dimensions of prototyping modified according to (Nielsen, 1994)
The tested system was developed based on navigational structures of PSN (Kivlahan
et al., 2002). It implemented CFs for collecting case details. Developed by the Agency for
Healthcare Research and Quality (AHRQ), the CFs aims to diminish the disparity of
categorizing and describing patient safety events among the existing patient safety

42
organizations and reporting systems. For each type of event, CFs offers a standardized list
of multiple-choice questions (MCQs) to facilitate data reporting.
Focusing on the functionality of reporting, firstly we conducted a task analysis
inspecting the PSN interface to measure several fixed factors that might influence usage of
the system and set a series of goals for improving identified weakness. Secondly, we
developed a new web-based interface using JavaScript, PHP, MySQL and ExtJS
library(Sencha, 2014) with new features on technology and content management such as
Ajax and procedure based question-answer. The task analysis of the new interface aimed
to confirm achievements of the new design. In the meanwhile, we conducted a heuristic
evaluation to identify severe usability violations and use the results to improve the overall
user-friendliness.
Task Analysis and Heuristic Evaluation
Task analysis is to study how users approach the task, their information
requirements and how they deal with exceptional circumstance, identify points where
users fail to achieve goals, spend excessive time, or feel uncomfortable. The analysis
generates a list of all the information users will need to achieve goals, the steps that need
to be performed and the criteria used to determine the quality and acceptance of results.
In this case, we collected data for three measures at the inspection: mouse click, keystroke
and memory load. By simulating a typical user’s operation in reporting a patient fall
incident, the step counting on these three aspects were summarized and grouped into four
sections: initial questions, event common questions, event details and summary & others,
as it shown in Table 14. The improvement of system on such concerns is believed to visibly

43
reduce the operational and mnemonic workload in the process of incident reporting. What
do these three factors interest us is they can be measured and improved by interface re-
engineering.
Concretely, we went through the PSN and new interface with a patient fall scenario,
which requires the largest number of questions in all existed eight types of event. The
number of mouse click and free text input were calculated and summarized at each
interface. The workload of memory was estimated by the standard of the Keystroke Level
Model. All results in aspects of physical and mental operations were tabulated in a side-
by-side fashion by the systems. This compassion intuitively illustrated the improved task
performance at the keystroke level benefited from the user-centered design.
Heuristic evaluation is a usability inspection method effective in uncovering design
problems, which is considered to yield the most serious problems with the least amount
of effort(Jeffries, Miller, Wharton, & Uyeda, 1991). For this discount evaluation method, 3-
5 usability experts are recruited to inspect interface design problems, and then they are
requested to summarize and report heuristic violations as a basis for usability improving.
For the time and financial constraints, we eventually enrolled three doctoral
students majored in computer science with proper training on the method of heuristic
evaluation. They were asked to use the 14 usability heuristics developed by Zhang et al. (J.
Zhang et al., 2003), which is consistent with the method used in formal usability evaluation
for inspecting the usability of PSN.
Three experts were asked to conduct an on-site evaluation as a group. The entire
process took about 60 minutes. The first 15 minutes were spent to explain the background
44
of evaluation, hand out an evaluation stepwise description and make a brief demonstration
of interface operating. Then the experts did the evaluation as a group but individually, due
to the timely evaluation for the first version of the prototype. One of them played the
interface as an incident reporter, according to the stepwise task description. In the
meanwhile, the rest observed operations and inspected system features and feedbacks.
They were asked to go through the interface together several times with following 14
usability principles and developed pertinent discussions. The group of evaluators jotted
down usability violations and solutions suggested, and then rated a severity score for each
usability violation based on the following scale:
0 - Not a usability problem at all;
1 - Cosmetic problem, need not be fixed unless extra time is available on the project;
2 - Minor usability problem, low priority to fix;
3 - Major usability problem, important to fix, so should be given high priority; and
4 - Usability catastrophe, imperative to fix before product can be released.
In the end, the results organized in Excel format were sent back to us as a feedback.
The entire process was audiotaped and later reviewed several times to find out missing
parts and remove duplicates (same meaning in different expressions). All modifications
were returned via email to each evaluator for verification.
3.4 Usability Testing with Actual Users and Think-aloud Technique (Empirical Usability
Experiment 2)
In the experiment 1, a series of usability violations were identified. Using the
cognitive task analysis and heuristic evaluation methods, the inspection validated the

45
reduction of physical and mental operators comparing to its archetype, and identified a
number of heuristic violations on the interface. Since the inspection was from usability
experts’ point of view, whether the system is user-friendly to actual users or not still
remains a question.
As a response, the experiment 2 examined task performance and reactive attitudes
from the actual user’s point of view. Three objectives were included in the study:
Analysis of reporting performance in terms of completion time, response
consistency and errors
Identification of frequent usability problems and categories according to the
verbalization of user attitudes
Evaluation of all the above measures to understand the usability in a voluntary
patient safety reporting system
Figure 10 is a collage of the screenshots of the updated prototype for this
experiment. All severe usability violations identified through the experiment 1 had been
fixed ahead of the test. The collage lists the screenshots side-by-side according to the
human cognition efforts required by task steps.

46
Figure 10, the collage of prototype screenshots of five steps in reporting
3.4.1 Experimental design
Retrospective Think-aloud User Testing
We employed a method of retrospective think-aloud user testing to gather users’
verbalizations of attitudes after the reporting session activities, instead of during the
session. The method avoids obtrusive task disturbances introduced by concurrent think-
aloud on user’s cognition and execution time.
Participants
Ten subjects were recruited for the test. The invitation letter and screening form
were emailed to the School of Nursing and the School of Medicine at the University of
Missouri for qualified subjects. The qualified respondents were those who had reported
Domain Specific Questions With More
Cognitive Efforts
General Questions With Less Cognitive
Efforts
The first screen asks about a few initial questions
The second screen lets reporter rate a severity score for the incident
The fourth screen adopts the AHRQ Common Formats (fall reporting
form) with a free text box for the justifications and additional case details
The last screen is a preview of report
The third screen collects case-related generic information

47
patient falls at least once and were interested in online patient safety reporting systems.
The first ten available candidates became the testing subjects. Every subject was required
to sign on an informed consent form, according to the approval of the Institutional Review
Board in the university.
Task Scenarios
The task was to report three patient fall events in the system. Three fall cases in a
written format were selected from a library of 346 real fall reports. The cases were
reviewed by domain experts to ensure quality and readability. Fall event cases were chosen
for the test because the fall reporting form in the CFs is simple and structurally
representative, and fall cases are typical in hospitals at all levels. An example of a fall event
scenario selected from the library is shown in the following excerpt:
… the patient indicated need to be toileted. He stood with a walker and walked to the
bathroom. He noted less steady than yesterday, dragging right leg. He turned while in
the bathroom toward the sink…
Each subject needed to complete five subtasks to complete a report (Table 4). In
practice, the reporters at work site often rely on memory for reporting case-dependent
information. Thus, in a simulated test setting, the subjects were not allowed to review the
written materials at the time of completing case-dependent subtasks #2, #4 and #5.
Table 4, five steps of reporting in the test
Task steps Step names Access to written
materials
#1 Answer initial questions Yes
#2 Rate a harm score No #3 Enter patient related info Yes
#4 Answer to case-dependent MCQs No
#5 Document further comments No

48
Testing Steps
Ten subjects were assigned separate time sessions for the test. They were trained
by a video demonstrating how to manipulate the system for completing a report. The
session for each subject had two steps – reporting and reviewing. Both steps were audio
and video recorded using Camtasia Studio® 7 to collect task performance and user
attitudes data. Each subject reported the three cases in a fixed order into the system, and
then reviewed a video recording of the reporting process to verbalize their attitudes
towards the system. A video camera was placed in front of the subjects to identify the time
periods when accidental disturbances occurred (e.g. water or restroom breaks). In the
reviewing step, the observing researcher could provide prompts, but not influential
questions. For example, the researcher may ask “what were you doing?” or “what made
you click here?” or “what were you thinking at the time?” etc.
3.4.2 Processing of data
Three types of data, including the execution time, question response(s), and think-
aloud reports were collected for evaluating the system usability.
To collect the execution time on each subtask and case-dependent question, two
evaluators reviewed the videotape of all reporting sessions independently, and came to a
consensus for each time value. To identify relationships between the execution time and
multiple independent variables, a two-way ANOVA and regression model were applied.
The statistically significant outcomes, if obtained, would indicate the presence of usability
problems and the potentials to the system for efficiency improvement.

49
To evaluate the data quality, question responses were retrieved and examined
typographical errors on case-independent questions and consistency in case-dependent
MCQs. The consistency accounted for the extent to which the subjects reached a
consensus on a MCQ. Lack of consistency also reflected possible usability problems created
by the representation of MCQ that resulted in cognitive difficulty and different responses.
Thus, we considered the response consistency to be a better quality measurement than
accuracy to reflect system usability problems. The generalized Kappa was applied to its
calculation(Fleiss, 1971). Additionally, we examined users’ comments in the free text field
in subtask #5.
All think-aloud verbalizations were transcribed and coded by a scheme developed
by Zhang et al(J. Zhang et al., 2003). The coding scheme comprised 14 usability heuristics
for classifying subjects’ attitudes and usability issues. Any disagreement in classification
was resolved in discussions among research team members until a full agreement was
reached.
3.5 Quantifying the Impacts of Proposed Interface Artifacts on User’s Performance
(Empirical Usability Experiment 3 )
In the previous experiments, heuristic evaluation, cognitive task analysis and “think
aloud user testing” were conducted sequentially (Lei Hua & Yang Gong, 2010; L. Hua & Y.
Gong, 2013; Lei Hua & Yang Gong, 2013) to address interface issues at the representational
level while maximizing design cost effect. The experiments also discovered several new
needs at system functionality mainly for improving data entry. As a response, two text
prediction functions, thus were developed and added to the prototype. To examine the

50
effectiveness of the functions with statistical significance, we employed a two-group
randomized design in the experiment 3.
3.5.1 Experimental design
Participants
Potential candidates who were nurses and experienced in reporting and analyzing
patient safety events in the Tianjin First Central Hospital (TFCH) in Tianjin, China were
identified and invited to participate in the study. Two candidates were on a leave of
absence during the study period, and three candidates felt not confident with operating
computers. As a result, the study enrolled 52 nurses from 21 clinical departments. All of
the nurses were females and between 30 to 52 years old. On average, they had around 20
years of nursing experience and reported patient safety events for at least four years since
the implementation of a citywide computerized reporting system in 2009. None of them
used the interfaces for this study before. During the enrollment, each participant signed
an informed consent form approved by the Ethics Committee at the TFCH. This study was
also approved by the Institutional Review Board at the University of Texas Health Science
Center at Houston.
Interfaces
Two experimental interfaces were developed as an easy control over the
configurations and a means of data collection. The contents and layouts of two interfaces
were identical, carrying off the same task of the 13 structured MCQs (AHRQ, 2011) and
one multiple-line comment field for the collection of patient fall details. One single
exception was the provision of text prediction functions as to the cueing list (CL) and

51
autosuggestion (AS) between the interfaces. Four MCQs that had the single text field as
illustrated in part B of Figure 11 were attached with the CL, and the comment field was
equipped with both the CL and AS in the treatment interface. The interfaces were
developed using PHP 5.2.6, JavaScript, MySQL 5.0.51b plus a JavaScript library (JQuery 1.7
("JQuery,")) and two open source modules (SlidesJS ("SlidesJS,") and Tag-it (Ehlke, Challand,
Schmidt, & Carneiro)).
Entered and
tagged-in text
Initial letters
of input
Auto-suggestion:
matched text
entry hits
(# of hits <=10)
Narrative data entry field equipped with text prediction functions
E
F
GC
B
Main component lists multiple-choice questions in slide-in mode
Cueing list to remind the
content or content categories
of reportable data
(# of cued categories <= 6)
A
D
C
Structured Data Entry – 13 MCQs and four of them have narrative fields as illustrated as the part B
Unstructured Data Entry – One narrative comment field
Figure 11, the layout of interface elements for structured and unstructured data entries
with text prediction functions of the CL and AS

52
Figure 11 demonstrated seven typical features of the treatment interface. The child
question appears only when the corresponding item in its parent question is checked (A).
The CL (C) is activated as the associated single-text field (B) is checked or on the multiple-
line comment field. It reminded reporters of the content or key characteristics of
reportable data associated with the event. The length of the CL was not more than six in
the study. Clicking the button (D) would flip the slide-in page for new question(s) in, which
was constrained into one-way mode and helped capture the preview time on questions.
For unstructured data entry, as the initial letters (F) of description were typed in, the AS
was called out listing not more than ten matched entry candidates. Matched letters and
the focused line were highlighted in blue (G). The reporter was free to select one of them
and make any changes in the text. The keypress of “Enter” would tag the current entry in
a blue text chunk (as those in E).
The items showed in the CL and AS were manually prepared as did similar studies
(Higginbotham, Bisantz, Sunm, Adams, & Yik, 2009; H. H. Koester & Levine, 1994). The
number of listed items in either of functions did not exceed ten, a trade-off number
balancing the inspecting efforts against predicting sensitivity (Hunnicutt & Carlberger,
2001). In the CL, the display of items was predetermined upon the review efforts and the
agreement of experts. At least one of the items in the CL was considerably accurate and
the others were less relevant choices. In the AS, the display of suggested entry candidates
relied on a Soundex-based phonetic matching function of MySQL and reporter’s initial
entries. As illustrated in the part G of Figure 11, the top ten matched text items showed in
the AS list. On the treatment interface, the participants were able to mix selected entries

53
with text inputs on their own. On the control interface, participants were only able to type
in using a standard keyboard as text input required.
Testing cases
In the study, every participant reported five patient fall cases in a randomized
sequence. The cases were selected from two sources – a case depository with 346 fall
reports from a previous study (Gong, 2010a) and a public database of Morbidity and
Mortality (M&M) (AHRQ). Five selected cases were translated into Chinese and rephrased
by the domain experts for the purpose of quality and readability of text. The difficulty of
the five cases was managed at the same level. As an example, the following narrative
excerpted from one of cases, shows here in English.
“… patient was alert and oriented X3 (person, time and location) upon assessment, and
instructed on admit not to getting up without assist. He had been sleeping and
attempted to get up to go to the bathroom. He forgot to call staff to have plexipulses
(a device) undone, and tripped on plexi tubing and attempted to catch self on overhead
bars. He landed on the floor…”
Randomization and study measures
With a permuted-block algorithm and random block sizes of 4, 6 and 8 (Matts &
Lachin, 1988), the 52 participants were randomly assigned to two groups. Twenty-five
participants were allocated into the group using the control interface without text
prediction; twenty-seven were assigned to the group with the treatment interface. The
presenting sequence of five cases for each participant was randomly determined at the
time of allocation by the identical algorithm. The training combined a verbal instruction

54
and practice. Participants were trained and then practiced using both interfaces to report
a sample case until they felt comfortable with the content and interface interactions. Since
the training was ahead of grouping and the grouping procedure was blind to both the
participants and the trainer, this arrangement prevented confounding implications
delivered consciously or unconsciously by the trainer leading to a training bias.
A typical scene in the hospital is that a reporter initiates a report upon witness’s
word-of-mouth information. This study simulated the natural scene by using the five cases
with each appeared on the first page of the interface. Participants read the descriptions
and answered all questions upon recall. The CL and AS functions as explained in Table 5
aided the process of data entry for participants in the treatment group by text prediction.
Table 5, the profile and expected outcomes of experiment 3
Subjects Reporting scenarios
Test Portal Questionnaire
Interfaces Treatments
52 nurses
25 (control group)
27 (treatment group)
Five patient fall cases
Structured data entry, consists of 13 MCQs
CL: cues text entries at specified fields
Usability reflection on
Learnability
Efficiency
Memory & Errors
Satisfaction
Unstructured entry in one multiple-line field for descriptive text
CL: cues the categories of entries A-S: suggests entry text
Table 5 continued, the profile and expected outcomes of experiment 3
Auto-Recorded Test Data Test Results Usability measures
Mouse clicks & keystrokes with timestamps
Number of physical operators
Time on question and confirmation
Efficiency:
Completion time
Text generation rate (TGR)
Selected response alternatives
Descriptive text in chunks
Correctness of selected alternatives
Number and text length of chunks
Effectiveness:
Response accuracy Text completeness & richness
Ignorance rate
Questionnaire responses on a Likert scale (1-low to 5-high)
Likert score on usability attribute Usability satisfying

55
Pauses and pop-up questions were discouraged except when the participant
switched between reports. Keystroke level operations (mouse clicks and keystrokes) for
each participant trial were time stamped and logged into a MySQL database. All reporting
sessions were recorded using Camtasia Studio® 7 for data reconciliation. In the end, the
participants completed a questionnaire (Appendix F) via SurveyMonkey to reflect their
attitudes in the reporting. The questionnaire developed upon the Nielsen’s Attitudes of
Usability was in a five-point Likert scale, where 1 indicated a maximal level of disagreement
of the statement and 5 indicated a maximal level of agreement.
3.5.2 Processing of data
The study generated ordinal and nominal data out of three data sources in terms
of the MCQs, the narrative comment field and the questionnaire. The ordinal data are the
selected responses for the MCQs and questionnaire, and the nominal data are the text
entries in the single-line fields of MCQs and the comment field ending up the reporting.
The authors measured these ordinal and nominal data from three usability aspects of
efficiency, effectiveness and satisfying. Several experimental features associated with the
CL and AS functions were also investigated as miscellaneous measures. Table 6, 7 and 8
illustrates the sources and applied methods of the measures

56
Table 6, key measures at summative level in the experiment
Measures Data sources Unit of analysis
Subject
Age Hospital nursing office Years
Proficiency of reporting falls
Graded prior to the experiment 5 points Likert (1-low to 5-high )
Reporting efficiency
Structured data entry Accumulated time on MCQs Seconds Descriptive comments Completion time on the comment field Seconds
Text generation rate Nominator: letters in length of the comments; Denominator: completion time
Letters/Seconds*
Quality of reports Structured entry accuracy Nominator: accumulation of scores on MCQs;
Denominator: maximum of the accumulation Percentage
Narrative completeness The number of credited text chunks Counts
Survey usability satisfying User attitudes in four dimensions
Posttest questionnaire 5 points Likert (1-low to 5-high )
* To count the length in letters, one UTF-8 encoded Chinese character is equivalent to three English letters in length
Table 7, specific measures for structured data entry in reporting
Measures Data Sources Evaluating dimensions Methods
Response accuracy
Participant’s responses on questions
Single score on question (𝑆𝑛) and overall accuracy in percentage (𝐴𝑠)
expert review and descriptive statistics
Time on question
Logged operations with timestamps
Mean of time values at the millisecond level across reports
descriptive statistics
Prediction list active
frequencies
Logged mouse clicks associated with text
prediction list
Denominator: the times of the question answered. Numerator: the times of the attached list activated.
probability
Keystroke savings
Logged keystroke operations Mean difference of the count of keystroke between groups
descriptive statistics
Table 8, specific measures for unstructured data entry in reporting
Measures Data collection Evaluating dimensions Methods
Efficiency-related
Completion time
Recorded at the millisecond level by interfaces
Time length of completing a narrative comment
Descriptive statistics, and t-test
Keystrokes Recorded by interfaces Keystroke counts of completing the comments
Descriptive statistics, and t-test

57
Text generation rate
Text length divided by completion time
The speed of text generation, at the unit of “letters/second”
Descriptive statistics, and t-test
Effectiveness-related
Text length Recorded and calculated at the unit of the letter
The text length (in letters) of a narrative comment
Descriptive statistics, and t-test
Text chunks
As demonstrated in Figure 11, the keypress of “enter” resulted in a tag-in the text fragment namely text chunk
The number of text chunks in a comment describing the event
Descriptive statistics
Chunk length Text length divided by the number of text chunks
The mean length of text chunks in a comment
Descriptive statistics
Reporting completeness
A blind review by two experts; need to reach an agreement as the score difference > 1
The number of event characteristics described in the text
Expert review, descriptive statistics and t-test
Engagement-related
Ignorance rate
Amount of unanswered commentary fields divided by the amount of commentary fields in each group
The proportion of narrative comment fields that were ignored
Descriptive statistics, and Chi-squared test
AS-related
Influenced chunks by AS
These influenced chunks are identifiable because the typed in text consisted of phonetic letters and the selected text were in Chinese characters
The number of text chunks that accepted the text suggested by AS
Descriptive statistics
AS influential rate
The number of influenced chunks divided by the number of total text chunks in a comment
The percentage of text chunks contained the text selected via AS function rather than key in
Descriptive statistics
The answers in the built-in narrative fields were manually reviewed and graded by
the experts to measure the response accuracy. Specifically, a single-response question n if
correctly answered would result in an integer score 𝑠𝑛=1.0, otherwise 𝑠𝑛=0; a question n
that accepts multiple responses could have an integer score 𝑠𝑛=4.0 maximally in this study.
Considering 𝑄𝑛 is the correct response for question n and 𝑞𝑛 is the response given by
participants, 𝑄𝑛 ∩ 𝑞𝑛 indicates the degree of matching that is either a binary number for
single-response questions or decimal for multiple-responses questions. The equations of

58
calculating the response score 𝑆𝑛 of an individual question and the overall response
accuracy 𝐴𝑠 across all questions for a report used in the study are shown as below.
𝑆𝑛=(𝑄𝑛 ∩ 𝑞𝑛)𝑠𝑛 (Equation 1, individual response score)
𝐴𝑠= ∑ 𝑆𝑛13𝑛=1
∑ 𝑠𝑛13𝑛=1
(Equation 2, overall response accuracy)
To examine the significance of text prediction (CL and AS) functions’ impacts on
participants’ documenting performance, the t-test and Chi-squared test as identified in
Table 9 were conducted using the group as the between-participants factor. Kernel density
was applied to examining the distributions of text generation rate and the reporting
completeness of narrative comments between groups. The linear regression model was
also used in the analysis to examine interactions between the measures. All statistical
computing was executed using MySQL embedded functions or R Studio v0.97.

59
CHAPTER 4 – FINDINGS OF THE RESULTS
This research investigated a whole spectrum of the user-centered design of the
reporting system, including the review of peer systems, the specification of design
requirements by content analysis and usability inspection, the qualitative and quantitative
evaluations of prototypical system and functions. Each step contributed a number of
actionable knowledge and guidelines to the efficiency, effectiveness and safety enhanced
design of the reporting system. The following sections elaborate the findings of the results
along with the aforementioned methods in chapter 3.
4.1 The User Groups and the Problems of Data Quality
In the preliminary study 1, the examined reports repository consists of 5,654
patient safety reports under eight categories. Each record contains 26 data elements
fraught with missing, incomplete and incorrect values. Over one fourth of records were
duplicated due to follow-up and solution field updates. After data processing, 2,919 de-
identified and unique cases were eventually extracted from 5,654 reports. The number of
data attributes of 2,919 qualified records reduced to 15 by removing unused codes and
identifiable information.
All data attributes were classified into two categories: the structured or
unstructured. The structured consist of patient demographics and general incident related
information. They are common across the categories of patient safety event. The
unstructured consist of case details in free text format, but the forms for collecting such
data vary across categories. By analyzing through the two parts respectively, we uncovered

60
facts as shown in Table 9 that are contributing to PSRSs design and referred from prior
papers.
Table 9, uncovered facts through unobtrusive content analysis
Structured data analysis Unstructured data analysis
Top reporting professionals (95.0%): registered nurses (66.2%), anonymous (10.2%), pharmacists (4.1%), physicians (4.0%), respiratory therapists (3.8%), lab technicians (2.6%), other (2.2%), and manager (1.9%)
Hard to read and classify; the pattern of case narrating is unclear; the content of case description is more about incident outcome rather than process Over 75% of reports were submitted within 2 days after it happened
50 typos in date field of 2,919 records (1.5%), which lead to a chain mistake to patient age
The analysis on entire dataset of 2,919 reports claimed the top reporting
professionals (95.0%) are registered nurses (66.2%), anonymous (10.2%), pharmacists
(4.1%), physicians (4.0%), respiratory therapists (3.8%), lab technicians (2.6%), other (2.2%),
and manager (1.9%); other reporting professionals, such as unit clerks, physical therapists,
contributed 5.0% of the total reports(Yang Gong, 2009).
Furthermore, as results shown in Table 10, over 75% of reports are submitted
within 2 days after it happened. The amount of report submissions after a week is fair small
(<1% per day) and does not show any linear association with time difference.
Table 10, intervals between the occurrence and report
Day(s) after incident Case Number Cases in N (N=2919)
0 1548 53.0%
1 657 22.5%
2 123 4.2%
3 63 2.2% 4 42 1.4%
5 31 1.1% 6 37 1.3%
Summary
Reported within a week 2501 85.7%

61
Moreover, the study identified around 50 typos across the attributes of the case
occurred date, case reporting date and patient age while examining on statistics in the
above table. One typical instance is that a case was reported on 12/21/2005 and occurred
on 12/21/1905. The affected patient even fell prior to birth. In the dataset, around 1.5% of
reports have similar issues across these three data attributes.
4.2 Common Usability Issues in the Reporting Systems
Usability problems may drastically increase the reporting time, discouraging the
users from reporting minor incidents and near-miss incidents. In the examined system
(usability experiment 2), the problems referred to the inflexible interface (users cannot
resume where they left off in the previous session, they have gone through all the process
steps to reach where they left), the frustrating response time (highly variable response
times while pulling patient information from other integrated systems) and the
unnecessary details of general information (requiring the user to enter a lot of redundant
information about the patient’s caring staff and caring location which can be accessed
through system integration). All these factors lead to increased time spent on reporting
making the system inefficient and voluntary system reporters have to choose between
reporting or not reporting an incident with all time constraints and busy schedules.
Table 11, overall human difficulties in reporting
Time consuming
o Inappropriate forms and redundant information collection requiring high
memory and cognitive effort
o Long system response times
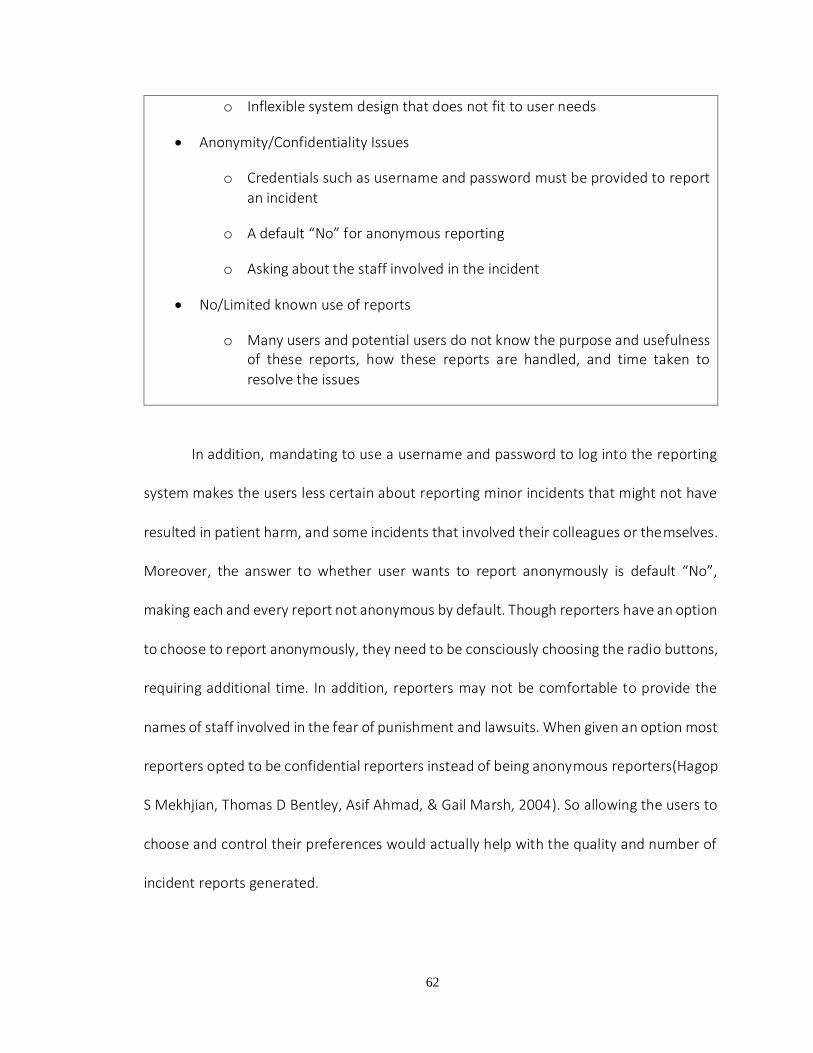
62
o Inflexible system design that does not fit to user needs
Anonymity/Confidentiality Issues
o Credentials such as username and password must be provided to report
an incident
o A default “No” for anonymous reporting
o Asking about the staff involved in the incident
No/Limited known use of reports
o Many users and potential users do not know the purpose and usefulness of these reports, how these reports are handled, and time taken to
resolve the issues
In addition, mandating to use a username and password to log into the reporting
system makes the users less certain about reporting minor incidents that might not have
resulted in patient harm, and some incidents that involved their colleagues or themselves.
Moreover, the answer to whether user wants to report anonymously is default “No”,
making each and every report not anonymous by default. Though reporters have an option
to choose to report anonymously, they need to be consciously choosing the radio buttons,
requiring additional time. In addition, reporters may not be comfortable to provide the
names of staff involved in the fear of punishment and lawsuits. When given an option most
reporters opted to be confidential reporters instead of being anonymous reporters(Hagop
S Mekhjian, Thomas D Bentley, Asif Ahmad, & Gail Marsh, 2004). So allowing the users to
choose and control their preferences would actually help with the quality and number of
incident reports generated.

63
As described earlier, unless the harm score (severity) of an incident is high, these
reports are reviewed at specific intervals, without any feedback (information or action) to
reporters in the meantime. This makes the users to perceive time spent for reporting as a
waste. In addition, there is no way a non-reporter can know about the use and impact of
these incident reports. This discourages the users from reporting in future. Effective
feedback mechanisms encourage users to report more often (T. K. Gandhi, Graydon-Baker,
Neppl, Whittemore, & Gustafson, 2005; Hagop S Mekhjian et al., 2004) and make PSRS
more useful.
4.2.1 Issues that might create unpleasant user attitudes
Some usability problems that influence user experience with a system are listed in
Table 2. Error-proneness is a major design issue that can cause inaccurate reporting. Very
long drop down menus to choose from may lead to juxtaposition errors. In addition, default
values in mandatory fields and availability of irrelevant options contribute to data integrity
challenges and make the reports inaccurate and unreliable. Reporters need to go through
all the steps of the process, to make changes, if they find any discrepancies or mistakes on
the summary screen before submission of report.
Table 12, usability problems that create unpleasant user attitudes
Usability problems causing errors
o Long drop down menus may lead to juxtaposition errors
o Default values in mandatory fields question the integrity of the report
o Availability of irrelevant options also poses a challenge to data integrity
Usability problems causing inefficiency

64
o Inflexible process flow from one screen to another
o Highly variable system response time and system downtime
o Excessive, unnecessary data entry
Usability problems affecting User Satisfaction, Memorability, and Learnability
o Inconsistent window size and constantly changing button location
decreases the subjective pleasantness and frustrate users
o Inconsistent location and number of buttons and window size make the
memorability of the system to suffer
o Users need a lot of effort to learn how to use the system, and to understand the terminology used in the system
The efficiency of the system is another significant issue that suffers due to inflexible
interface, highly variable system response times, and system downtime. These problems,
make the user think twice before reporting an incident to weigh the utility of time spent
on reporting.
Subjective satisfaction could be very low due to time consuming, inefficient,
inflexible interface, and system design inconsistencies with the mental models of the users.
Reporters may not appreciate the usefulness of the reports, as they may not get any
feedback on submitted reports for long intervals of time. In addition, learnability and
memorability of the system interface are poor due to design inconsistency (location and
naming of the buttons, and window size are inconsistent from screen to screen). These
issues contribute to underreporting as well as inaccurate reporting.
Given all these human factors issues, encouraging users of incident reporting is
challenging in the busy health settings with competing priorities. Especially in the scenario

65
where the reporters could not perceive any impact from their efforts, they eventually
would find the way to cope with and even workaround the system of reporting.
4.2.2 Possible usability engineering solutions to usability issues that discourage users
from reporting
Table 13 provides a list of minor design changes that can solve usability issues listed
in Tables 11 and 12. These minor changes can improve the user experience of reporters
working in time-constrained healthcare environments.
Table 13, design suggestions to improve the quality and rate of reporting
Reassure the anonymity and data usage
o Explicit reassurance on the purpose of report collection and usage should be provided at the top of the interface and users should have explicit
choice of being anonymous or non-anonymous reporters.
o User interface can be modified for non-anonymous reporters by asking them to provide brief description of incident and contact information. Reviewers can contact these users for detailed description of incidents depending on severity and frequency of similar incidents (Hagop S Mekhjian et al., 2004).
Provide feedback on Reports and Impact of reports
o Impact of these reports should be available to all users and non-users to learn about the impact of reporting system (such as some de-identified
reports and their impact on policy changes and system changes).
o The feedback on the reported incidents should be available as soon as possible for confidential and anonymous users (Benn et al., 2009; T.
Gandhi, Seder, & Bates, 2000)
Reduce the time load required
o System response times should be faster when providing help with
terminology and patient information
o Extremely long dropdown menus should be shortened depending on the previous chosen answers and autocomplete techniques while reporting

66
(eg: List of attending physicians can be reduced depending on the facility chosen or by filtering the names by entered letters) (Lei Hua & Yang
Gong, 2010).
o All incident related fields should be made mandatory and unnecessary fields should be removed from the reporting forms to make the
information complete and useful.
Be consistent with the interface design and flexible to user needs
o Consistent screen size and consistent button location reduces the user
effort to learn and use the system
o Interface navigation should be flexible allowing the user to move from one process step to other without a great effort, using a tabbed interface
Employ error prevention strategies
o There should be no default values in mandatory fields, though options to choose the common answers is recommended (e.g.: Most of the incidents are reported within 48 hours of incident, so having “Today” and “Yesterday” buttons along with a calendar to choose the incident date
helps) (Lei Hua & Yang Gong, 2010).
o All the irrelevant questions and options should be excluded based on answers to previous questions. (E.g.: If physician was not notified of a harmless incident, then next question asking whether the physician
notified the family is irrelevant, and such questions should not appear).
Comply with user language requirements and minimize user cognitive and
memory load (Dumas, 1999; Nielsen, 1994)
o Terminology used in the system interface should be similar to user language with some explanations should be supplied through pop up
explanation, if needed.
o Help should be available whenever needed, by providing the users with patient and caregiver details via effective systems integration should decrease memory load of the users and speed up the reporting process.
Provide understandable and useful error messages (Dumas, 1999; Nielsen, 1994)
o Unnecessary formatting error messages can be excluded and the system should be able to autocorrect the format. Also, these errors can be prevented if the interface provides explicit format requirement (e.g.

67
Phone Number field should be followed (999) 999-9999), if this is the
required format).
o Error messages should be short and easily understandable.
4.2.3 Design Recommendations
The preliminary study 1 and 2 discovered and identified a series of system facts and
usability violations. As per the findings, we made several new and modified designs to the
prototype prior to the empirical usability evaluations. They are included:
Auto-complete
The auto-completion is not a new technology. It has been widely used to facilitate
data entry on a variety of information systems such as mobile operating system, searching
engine and email service. It involves a mechanism of completing the word/content based
on the limited entry the user has made. It reduces the data entry efforts and speeds up the
overall interaction between the system and the user thereby leading to a more
satisfied/impressed user.
Figure 12, auto-complete for name entry
In the PSN system, there are three long dropdown lists for employee name
selecting. Each list has over one hundred names on it, and users have to scroll down or up
the list to look through all names in an alphabetic sequence. By applying auto-complete

68
mechanism, the user can type first letter of his/her first name to filter out all names starting
with limited entries, shown as Figure 12. It largely saves a lot of time on mouse maneuver
and mental preparation for name entry.
System integration
System integration is another way for this research to improve usability. PSRS is
designed to be able to retrieve patient related health information from external system,
such as EHR or CPOE. As long as the patient identifiable information is available such as
medical record number, or patient name, our system could automatically pull back
relevant patient information from external systems. It could largely avoid the users’
physical and mental efforts on for re-entering the data.
The figure 13 as below shows that the user could obtain patient name, gender and
birthday data by entering a patient medical record number.
Figure 13, system integration for patient data retrieval
Knowledge support
According to data consistency research’s outcome, the biggest group of current
system users is registered nurse, around 66%, and the following large groups of users are
pharmacists (4.1%), physicians (4.0%), respiratory therapists (3.8%) and so on. Therefore,
the option in the dropdown list for user to select one’s health profession is sorted by its
frequency as it shown on the left side of Figure 14 depends on above mentioned numbers.

69
In addition, the auto-complete skill was also available to the list of health professionals for
experienced users. They are familiar with profession names and easier to locate them with
the input first letter than scrolling up and down the list.
On the other hand, around 70% of reported incidents were reported within 2 days
after they occurred. Thus, we designed two shortcut buttons attached to the date picker
for selecting yesterday’s date and today’s date, as shown in the right side of Figure 14.
Furthermore, the today’s date and time will be shown on today’s button in order to save
user’s time on thinking about what date it is today.
Figure 14, knowledge-based designs for the reduction of human errors
Procedure-based question answer
According to AHRQ Common Formats, we redesigned the interface to use close-
ended questions instead of some open-ended questions in the PSN system. Those open-
ended questions in PSN system are major sections for collecting incident descriptions in
free text format. Furthermore, by applying the “if-then” rules to design the procedure-
based questions in PSRS, the system could automatically filter out some unnecessary
questions according to logical relations between different questions.

70
Figure 15, procedure-based close-ended questions
For example, if answering “no” to question “was the fall observed?” shown in
Figure 15, the connecting question “who observed the fall?” will not be shown on the
screen. It not only gives the user the hints for questions’ answer, but also save a lot of
memory load that was consumed in PSN system for identifying what questions was were
supposed to be answered. In addition, such structured data are usable to data comparison
for further case similarity calculation.
4.3 Usability Improvements and Violations in the Prototype
The first usability experiment conducted a task analysis and heuristic evaluation on
our first edition of prototype that incorporated the features demonstrated. The results
showed the improved performance at the keystroke level and identified a series usability
violations induced by new designs.
Table 14 exhibits the detailed results from the task analysis. It manifests the
interface testing outcomes in terms of mouse click, keyboard stroke and the retrieval of

71
mnemonic information. The four sections of tasks were investigated, including initial
questions, event common questions, event details and summary/other. The number of
mouse clicks varies depending on if a default value applies or (e.g. 0/2 means that selecting
“Health Profession” require 0 or 2 mouse clicks) if a question has multiple values (e.g.
4~11+ means that depict a fall event requires 4 to 11 plus mouse clicks to answer questions
in format of radio button and checkbox). The column of keystroke argues the reasons of
text inputting for each interface. The last column elaborates the requirements of
mnemonic data for each section. In total, the new design has a large range of mouse click
counting number, 35~49+ clicks based upon a typical case used for testing; whereas, the
PSN has 42~44+ clicks. For requirements of keystroke and memory load, the new design
requires much lower.

72
Table 14, keystroke, mouse click and memory load in two interfaces
Sec
Tas
kK
ey s
trok
eC
lick
Mem
ory
Loa
d
AR
adio
Gro
up c
heck
(Y/N
)1
BC
heck
box(
defa
ult:u
nche
ck)
0~1
APu
lldow
n lis
t2
BH
as d
efau
lt va
lue,
aut
o-co
mpl
ete
entr
yIn
itial
lett
ers
0/2
Invo
lvem
ent
SR
adio
Gro
up fo
r fac
ility
and
pat
ient
invo
lvem
ent
2
Dem
ogra
phic
S
Nam
e,B
irthd
ay a
nd G
ende
rPa
tient
nam
e en
try
10~1
1
AT
ime
pick
up w
idge
2~3
BA
dd w
ith d
efau
lt va
lue,
two
shor
tcut
but
tons
0~
3
Apu
lldow
n lis
t,tex
t fie
ld7
BA
dd w
ith a
uto-
com
plet
e In
itial
lett
ers
7
Typ
e &
Har
m S
core
SB
oth
are
Rad
ioG
roup
che
ck w
idge
ts2
ASi
ngle
& M
ultip
le te
xtfie
lds,
Rad
ioG
roup
, Che
ckbo
x,
Dro
pdow
n lis
tup
to 6
,000
free
text
inpu
t6+
BPr
oced
ure
base
d qu
estio
n-an
swer
ing
radi
o gr
oups
Spec
ify in
sho
rt fo
r unl
iste
d ite
ms
4~11
+
AR
evie
w b
ut c
anno
t mod
ify in
fo1
BC
an m
odify
mos
t of i
nfo
1
AB
utto
n fo
r bac
king
to p
revi
ous
page
9
BN
avig
atio
nal b
ar ta
kes
page
flip
s9
A
very
muc
h42
~44+
Ba
few
35~4
9+
PS
N(A
) Pro
toty
pe(B
) Bot
h(S
)
Answer Initial
Questions
Ano
nym
ous
Rep
ort
Rec
all t
he ti
tle o
f hea
lth
prof
essi
on, f
acili
ties
whe
re
inci
dent
s oc
curr
ed a
nd le
vel
of p
atie
nt in
volv
emen
t H
ealth
Pro
fess
ion
Event Commom
Questions
Patie
nt ID
or n
ame;
Whe
n
the
inci
dent
hap
pene
d an
d
wha
t dat
e is
that
day
;
patie
nt h
ome
unit
and
rela
ted
doct
ors
Even
t Dat
e
Add
ress
&
clin
cian
s
Event
Details
Rec
all e
ntire
pro
cess
of
inci
dent
and
com
pare
them
with
pag
e qu
esito
ns in
min
d, th
en m
ake
a pr
ecis
e or
com
prom
ised
ans
wer
A s
erie
s of
ques
tions
to d
epic
t
case
s,e.
g."f
all"
TotalSummary
Other
Rev
iew
info
;
save
,sub
mit,
del
ete
mem
oriz
e w
hich
que
stio
n
and
whi
ch p
age
this
ques
tion
is in
Page
flip
s

73
The changes above came with the following technical progresses we made in the new
interface.
Set default values with statistical evidences. E.g., our analysis shows nearly 70% of
reporters are residential nurse and nearly 70% patient safety events were reported
within two days after the occurrence. Therefore, setting “RN” as default value and
creating two shortcut buttons for picking up today’s date and yesterday can facilitate
data entering.
Present accurate and meaningful prompts at the appropriate position. E.g. replace a
chunk of static instructions with over-the-cursor button tips and show concrete date
on today’s date button
Shortcuts. E.g. Easy page flips, can edit almost all entered data on the summary page
Closed-ended questions substitutes open-ended ones.

74
Procedure based (“if-then” rules) process combined with closed-ended questions for
collecting event details. Standardized multiple-choice questions substitute open-
ended questions in formats of multi-lines text field, single-line text field, checkbox,
etc.
Figure 16, the categorical distribution of identified 19 usability violations
By heuristic evaluation, 19 usability violations were identified, which belong to 8 heuristic
categories. Consistency and Language have been the two heuristics most frequently
violated in the new user interface. These two categories alone accounted for nearly 60%
(11/19) of all the identified usability violations. The specific distribution of heuristics
violated in this step is presented in Figure 166.
The concrete descriptions of result were organized into a tabular spreadsheet,
which is a list of 19 usability problems found through the interface as well as hints for
features to support successful user strategies. There are total six sections, including five
sections in reporting (initial info, event common info, event details, summary and harm
score), as well as one section for general problems. The severity scores rated by three

75
evaluators are averaged and the narrative texts are re-organized into proper categories.
The Table 15 is an excerpt from all identified violations with a severity score over 2.5 (major
and catastrophic violations). In this table, the sections are consistent with them in table
14.
Table 15, an excerpt from major and catastrophic usability violations
4.4 Representation Barriers towards the Efficient and Effective reporting
The experiment 2 logged ten actual users to a think aloud testing of the updated
prototype with the major usability violations fixed. From the usability dimensions of
efficiency, effectiveness and satisfaction, the experiment identified a number of facts and
issues that instruct the modification and new design of the reporting prototype.
4.4.1 Time in reporting
On average, subjects took 283.9 seconds to complete a report. The case dependent
subtasks #2, #4 and #5 accounted for the majority of the completion time (58.1%), and #4
was the most time consuming subtask (102.2 – 36.0%) in the study (Table 17).
Sec.
Heuristics
Violations
Severity
Rating
P No explanation to red asterisks for required questions
S Explain at the first place where red asterisks appeared
P Layout of two radio group widgets
S Indent the options of these two widgets, use shaded block to highlight them
P The name of button which triggers a reset of start over the event details question
S Change button text "“restart"” changes into "“reload this page"” or "“clear"”
P Use “check one” to be a alert for radio group that only can check one option
S Remove “check one”
P User is maypossible to forget to rate for event harm score
SA better reminder or put it event harm score section into one a separate page to
instead of on the navigational bar
3Minimalist
Problem Ddescription (P) Recommended Solution (S)
Init
ial
Qu
est
ion
s
Consistency 3
4
2.66
Document
Consistency
3Language
Ev
en
t D
eta
ils

76
Table 16, user’s performance on MCQs with features that influenced the completion time
Question
Question topic NRC
s
Data point
s
Outliers
Mean
(M)
Variance
(V)
VMR
Carry-over effect ( p )
Agreement of
responses (k)
#2.1 (0) Event harm score 6 28 2 26.5 270.8 10.
2 0.10
8 0.385
#4.1 (1) Fall assistance 3 26 4 5.8 7.9 1.4 0.93
4 0.748
#4.2.1 (2) Fall observation 3 24 6 3.0 0.4 0.1 0.43
7 0.867
#4.2.2 (3) Who observed 2 19 1 2.9 0.6 0.2 0.00
3 0.719
#4.3.1 (4) Fall injuries 3 27 3 3.9 1.3 0.3 0.52
4 0.933
#4.3.2 (5) Type of injury* 5 9 1 17.9 26.9 1.5 N/A 1.000
#4.4 (6) Doing prior to fall* 11 29 1 16.1 76.0 4.7 0.09
7 0.304
#4.5.1 (7) Fall risk assessment
3 26 4 7.2 14.9 2.1 0.58
7 0.363
#4.5.2 (8) At fall risk 3 9 2 4.3 2.3 0.5 0.08
2 0.833
#4.6 (9) Preventive protocols*§
16 26 4 28.1 95.2 3.4 0.38
1 N/A
#4.7.1 (10) Med increased risk
3 27 3 5.3 2.7 0.5 0.87
5 0.630
#4.7.2 (11) Med’s contribution
3 9 2 4.4 1.8 0.4 0.67
7 0.696
§ indicates the question allows multiple responses (MRs) * indicates the question had the presence of specified response (PSR) NRCs = number of response choices; VMR = variance-to-mean ratio
Aside from subtask #5 of documenting comments, subtasks #2 and #4 consist of twelve
MCQs. Execution time for each of them was collected and analyzed (Table 16). That was
292 data points regarding question execution time and responses from 30 reports. Thirty-
three time values were considered as outliers by the Quartile method (Devore, 1982).
Table 17, time performance and material accessibility by task steps

77
Task steps Step names Time
(s)
Access to written
materials
#1 Answer initial questions 18.3 Yes
#2 Rate a harm score 28.1 No
#3 Enter patient related info 100.8 Yes
#4 Answer case-dependent MCQs 102.2 No
#5 Document further comments 34.5 No
Total 283.9
Two-way ANOVA tests showed the mean time differences were not statistically
significant between cases, but significant between questions (p <.05).
The variance-to-mean ratio (VMR) was greater than 1.0 on six questions, indicating
the distribution of execution times on each question was statistically over-dispersed.
On question #4.2.2, the execution time was significantly reduced as comparing that in case
1, 2 and 3 (p < .01). Question #4.4 and #4.5.2 implied the same trend but at a low
significance level (p < .1). The value “N/A” in this column was due to no comparable data –
the corresponding question was answerable only for one case.
The other question features, such as the number of response choices (NRCs), the
multiple responses (MRs) and presence of the specified response (PSR) presented
significant effects (p <.01) On execution time.
4.4.2 Responding consistency and typographical errors

78
In Table 16, the last column shows subjects’ agreement of responses. Considering
0.600 as a dividing threshold (Devore, 1982), the low response agreements were on the
questions regarding the harm score, actions prior to fall and fall risk assessment. The “N/A”
value in the column was due to question #4.6 that allowed multiple responses.
The correlation between the agreement of responses and the variance-measure
ratio was significant (p < .01). This showed a significant relation between the high
dispersion of subjects’ execution times and low responding consistency. The question
#4.3.2 was an exception, on which a perfect agreement coexisted with an over-dispersed
distribution of time points.
In subtask #3, five typos out of 30 reports on date fields were identified. Three of
them were in the field of event occurrence date, and the other two were about date of
birth.
In subtask #5, four subjects commented on eight reports and the other six subjects
had no comments at all.
4.4.3 User attitudes towards usability satisfying
In the think-aloud protocols, fifty-seven comments were coded into nine categories
of usability problems reflecting user attitudes as shown in Table 18. Some comments that
referred to multiple categories were categorized into the best fit. The most frequently
identified problem has been the language problem – 15 comments (26.3%) and every
subject had at least one comment on CFs questions. The common issues (# of subjects >=
5) were match (22.8%), memory (15.8%), visibility (12.3%) and feedback (8.8%). Most of

79
the coded problems in the top five categories were commenting on cognitive difficulties
that subjects encountered in the task completion process.
Table 18, frequent usability problems and user’s attitudes
Problem categories # of comments # of subjects
Language 15 10
C1: “I’m not exactly sure the meanings behind ‘unassisted’ and ‘assisted’ options in such a fall scenario. A further clarification is needed.”
C2: “The patient was trying to toilet but he was also ambulating with an assistive device, I have no idea which activity (‘ambulating’ or ‘toileting’) is a better answer.”
C3: “Other, skin ehh… I don’t know what it’s called. It’s likely skin off.”
Match 13 8
C4: “For the reporting purpose, the system should ask more questions … You know I feel like more details should be placed, because you never know when information start to be relevant. ”
C5: “After you completed the first report, you knew what kind of questions the system is going to ask. So again when looking at the written materials, I was focusing on the questions the system is going to ask.”
Memory 9 6
C6: “Too much information was in each item. It was hard to keep all the differences between these items and determine which item was closer to the situation.”
Visibility 7 6
C7: “The list of doctors’ names is too long. It’s hard to pick one from it.”
C8: “They looked not like buttons, because there are dates and times on them. I didn’t get the functions of them in the beginning, but I liked to try clicking and see what would happen, and then realized they filled the upside date field with today or yesterday’s date.”
Feedback 5 5
C9: “… The system should be able to somehow alert from previous incidents to improve reporting quality …”
Flexibility 4 3

80
Document 2 2
Error 1 1
Consistency 1 1
Total 57
4.5 Improved User Performance with Text Prediction Functions
In this two-group randomized experiment, the participants successfully concluded
the experimental sessions with 260 reports (each reported five cases) and 52
questionnaires. On average, the session took around 71 minutes, comprise 17 minutes of
training and practice, 45 minutes for reporting cases and 9 minutes to complete the
questionnaire. There were 25 and 27 participants allocated in the control and treatment
groups respectively, accounting for 125 and 135 reports. Means of participants’ ages were
43.6±5.8 versus 41.1±6.6. The differences of their ages and proficiency scores between
the groups were insignificant (p > 0.05). The 260 reports contained 2,849 MCQs answers
and 238 unstructured narrative comments for the analysis. As shown in Table 20, the
participants had eight significant variations between the groups with the up or down arrow
indicators. Except the increase of mouse clicks, the other seven significant variations are
desirable towards the increased performance of reporting. The study attributed the
improvements to the two text prediction functions of the CL and AS.
4.5.1 Completion time and reporting accuracy of structured data entry
Figure 17 shows the results on two key measures of completion time and response
accuracy on structured data entry. Completing a report of 13 questions on average took

81
131.0±50.0 seconds in the control group and 114.0±41.7 seconds in the treatment group.
The overall response accuracies (𝐴𝑠) were 79.4% and 83.2% respectively.
Figure 17, reporting of efficiency and accuracy on structured data entries increased in the
treatment group
According to the t-test results, both the differences were statistically significant (p
< 0.01), while no significant difference between the groups on either efficiency or response
score was found in the questions not associated with the text prediction function. As for
the questions with the prediction lists, t-test results were significant on question 5 and 9,
and insignificant on question 6 and 10. The active frequencies of prediction lists on these
questions were 90.5% and 70.4% versus 32.8% and 44.0% respectively. On one hand, these
results support the text prediction largely increased participant’s performance in efficiency
and data quality; on the other hand, these effects might be mediated by the active
frequency of prediction list.
131
1140.794
0.832
0.77
0.78
0.79
0.8
0.81
0.82
0.83
0.84
105
110
115
120
125
130
135
control treatment
accu
racy
rat
es
tim
e in
sec
onds
efficiency accuracy

82
Table 19, participants’ performance on MCQs between the control and treatment group
Figure 18 illustrates the distribution of time on three questions between groups,
which presented three typical relationships between prediction lists and questions in the
study. These relationships were: uninfluenced (question 1), influenced significantly
(question 9), and influenced insignificantly (question 10).
List of Questions (Appendix 1)
Options
Time (Seconds)
Score and Accuracy (%)
Ctrl. (N=125)
Trt. (N=135)
p-value
Ctrl. (N=125)
Trt. (N=135)
p-value
1. Assisted 3 4.9±2.2 4.5±2.9 0.235 0.99 0.99 0.563 2. Observed 3 3.2±2.9 3.6±2.9 0.299 0.86 0.88 0.714
3. Witness 2 3.2±2.7 3.0±2.0 0.744 0.90 0.87 0.573
4. Injured 3 5.2±3.7 5.3±4.6 0.678 0.92 0.93 0.826
5. Sustained injuries* 5 14.1±8.7 9.9±7.1 0.000 0.70 0.84 0.015
-- (Prediction list active frequency 90.5%)
6. Prior activity* 11 20.8±15.6 21.9±14.9 0.678 0.59 0.64 0.518
-- (Prediction list active frequency 32.8%)
7. Risk assessment 3 7.7±5.3 7.7±5.0 0.849 1.00 1.00 N/A 8. At risk 3 7.4±4.2 6.5±4.3 0.305 1.00 1.00 N/A 9. Risk factors*§ 6 28.0±23.1 16.7±11.3 0.000 1.02 1.50 0.000
-- (Prediction list active frequency 70.4%)
10. Preventive protocols*§ 16 31.2±20.8 28.7±17.6 0.234 1.31 1.48 0.139
-- (Prediction list active frequency 44.0%)
11. Affected by medication
3 6.3±4.1 6.3±4.0 0.988 0.92 0.97 0.115
12. Risk increased by meds 3 8.5±6.8 7.6±5.6 0.644 0.86 0.81 0.560
13. Affected by physical device
3 7.2±6.6 7.8±5.4 0.416 0.92 0.87 0.155
Summary
131.0±50.
0 114.0±41.
7 0.004
79.4±10.1%
83.2±11.0%
0.005
* indicates the question with a commentary field § indicates a multiple response question

83
Figure 18, time distribution on question 1, 9 and 10 between control (I) and treatment (II) groups

84
Regardless of the time differences between the groups, the text prediction list if
used, showed a trend of bunching up values on the right side of the bell curve and a trend
of narrowing the curve and tail as Figure 18 indicated on question 9 and 10. It means that
the participant who spent much longer time on completing a report than the average were
more likely from the control group than the treatment group. Figure 19 visually presents
the mean differences between and within the groups in terms of time efficiency, response
score and accuracy across the questions and cases. Two stacked lines are notably divergent
at the questions where the prediction lists involved. From the granularity of a report, the
treatment group always reached higher response scores and shorter completion time than
the control group. Within either of the groups, the performance variations across the
questions and cases are large at the significant level (p < 0.01). This indicates the
differences among cases and the MCQ features in terms of the number of options per
question and the allowance of multiple responses had significant effects on participant’s
performance, as did the group factor. Therefore, the coefficients of these factors were
further scrutinized by linear regression statistics. As a result, the coefficient of the group
factor was significant (p < 0.01) which supports the effectiveness of text prediction despite
the influences induced by the other factors in the experiment.

85
Figure 19, time and response accuracy on questions/cases between control (I) and
treatment (II) groups
4.5.2 Text generation rate and reporting completeness of unstructured data entry
According to Table 20, the participants in the two groups completed the narrative
comments within the close time periods differed insignificantly in 2.3% (p = 0.782).
However, the participants in the treatment group contributed 44.7% more text with 28.2%
less keystrokes than in the control group, accounting for a 70.5 % increase in the text
generation rate, which was a significant improvement in reporting efficiency.
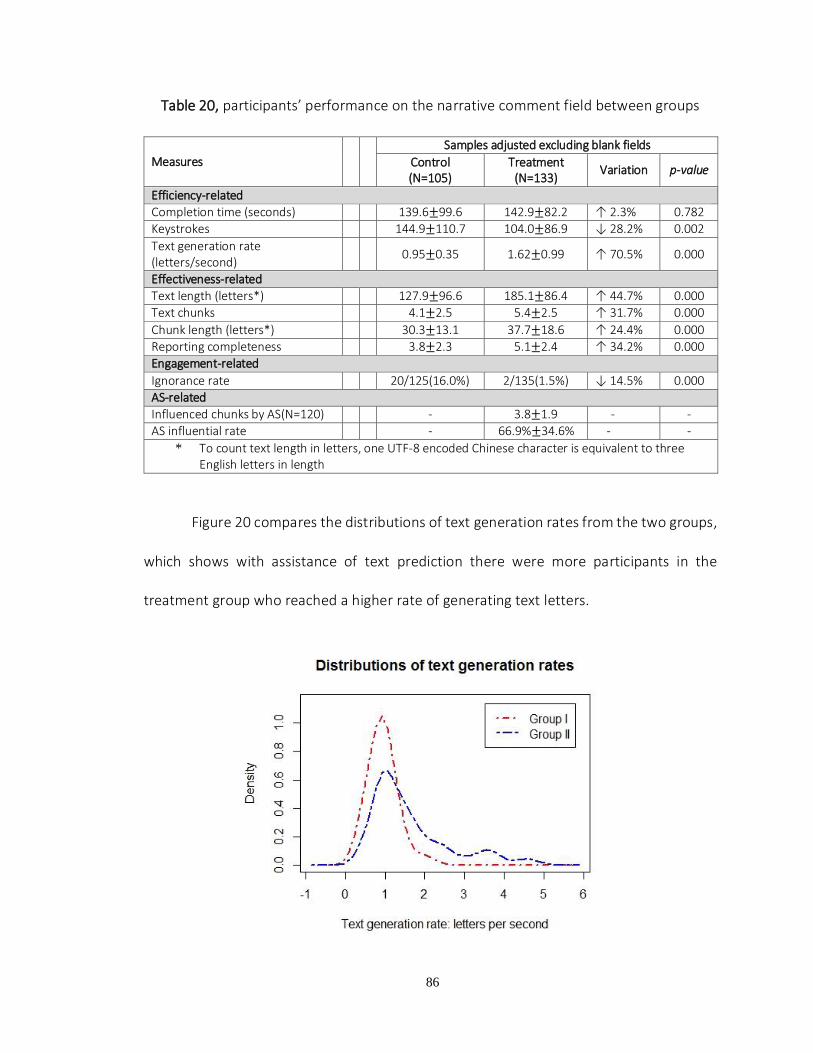
86
Table 20, participants’ performance on the narrative comment field between groups
Figure 20 compares the distributions of text generation rates from the two groups,
which shows with assistance of text prediction there were more participants in the
treatment group who reached a higher rate of generating text letters.
Measures Samples adjusted excluding blank fields
Control (N=105)
Treatment (N=133)
Variation p-value
Efficiency-related Completion time (seconds) 139.6±99.6 142.9±82.2 ↑ 2.3% 0.782
Keystrokes 144.9±110.7 104.0±86.9 ↓ 28.2% 0.002
Text generation rate (letters/second)
0.95±0.35 1.62±0.99 ↑ 70.5% 0.000
Effectiveness-related
Text length (letters*) 127.9±96.6 185.1±86.4 ↑ 44.7% 0.000
Text chunks 4.1±2.5 5.4±2.5 ↑ 31.7% 0.000
Chunk length (letters*) 30.3±13.1 37.7±18.6 ↑ 24.4% 0.000 Reporting completeness 3.8±2.3 5.1±2.4 ↑ 34.2% 0.000 Engagement-related
Ignorance rate 20/125(16.0%) 2/135(1.5%) ↓ 14.5% 0.000
AS-related
Influenced chunks by AS(N=120) - 3.8±1.9 - -
AS influential rate - 66.9%±34.6% - -
* To count text length in letters, one UTF-8 encoded Chinese character is equivalent to three English letters in length

87
Figure 20, text generation rates in the control group (I) and treatment group (II)
The number of text chunks (5.4 ± 2.5) and the mean length of the chunks
(37.7±18.6) in the treatment group are both greater than those are (4.1±2.5 and
30.3±13.1 respectively) in the control group. Most of text chunks scored for reporting
completeness - 92.7% versus 94.5% between the control and treatment groups, which
resulted in completeness scores of 3.8±2.3 and 5.1±2.4 respectively.
Figure 21, text generation rate of and data completeness on unstructured data entries
increased in the treatment group
Figure 22 illustrates the distribution of scores between the groups. The difference
is statistically significant, indicating the effective intervention by two prediction functions.
Inaccurate and duplicated descriptions contributed to the text chunks that were not scored
in the experiment.
0.951.62
3.8
5.130.3
37.7
0
5
10
15
20
25
30
35
40
0
1
2
3
4
5
6
control treatment text
length
per
chu
nk
(le
tter
s)
TG
Rs
/ co
mple
ten
ess
score
s
TGRs completeness text length

88
Figure 22, completeness scores in the control group (I) and treatment group (II)
The Chi-squared test identified a significant difference in the ignorance rates in the
narrative comment field between the groups. The comment fields in 20 out of 125 reports
from the control group were left blank compared to 2 out of 135 from the treatment group.
Participants in the treatment group were more actively engaged in describing the event
details in the field than were those in the control group. Because the presence of the
prediction function CL was the only variation between the two interfaces at the time of
determining whether to make comments, this result indicates that the CL had a significant
impact on the participants’ engagement of the narrative comment field.
Of 133 narrative comments from the treatment group, the function of AS was used
460 times for text inputs on 120 (90.2%) comments. That somehow influenced 3.8±1.9
text chunks in a comment, at an overall influential rate of 66.9% across 133 comments.

89
The regression analysis showed this influential rate increasing along the experiment
proceeded (p < 0.05). Meanwhile, the text generation rate in the treatment group was
increasing at a consistent pace as shown in Figure 23. In contrast, the text generation rates
for participants in the control group were not noticeably shifted along the process of
reporting.
Figure 23, text generation rate increased along the the treatment groupeports in treatment group
Meanwhile, the regression analysis identified a potential negative correlation
between the AS influential rate and the number of text chunks. As the rate increased, the
participants seemed to report on less numbers of event characteristics than when the rate
in low. Though this negative correlation is insignificant at the 95% confidence level (p =
0.0518), it still implied the AS functions might constrain participants’ recall on the breadth
of an event at a certain point.
0.82
1.00 1.000.91
1.000.98
1.581.68
2.041.81
51%
69%65%
80%
70%
0%
10%
20%
30%
40%
50%
60%
70%
80%
90%
0.50
0.70
0.90
1.10
1.30
1.50
1.70
1.90
2.10
2.30
2.50
Report1 Report2 Report3 Report4 Report5
Infl
uet
ial
rate
s
TG
Rs
(let
ters
per
sec
ond)
control treatment influential rates (66.9% on average)

90
The authors also collected the complete questionnaires from all 52 participants
with 1,300 rating answers. According to the analysis as shown in Figure 24, the participants
showed overall good attitudes of usability of the tested interfaces. Although the scores on
all four dimensions slightly increased in the treatment group compared to the control
group, nor are significant.
Figure 24, user attitudes slightly improved in the treatment group but nothing
significantly differed
4.0 4.1
3.53.8
4.14.3
3.8 3.9
1.0
2.0
3.0
4.0
5.0
Learnability Efficiency Memory Satisfaction
Lik
ert
score
control treatment

91
CHAPTER 5 – DISCUSSION AND CONCLUSION
The primary goal of this research is to apply user-centered methods in an iterative
process of safety event reporting system for improving user performance in terms of
efficiency, effectiveness and satisfaction. The preliminary studies, based upon the
historical data and an archetype system, identified the target group of users and a series
of common usability issues of the system for the prototypical system. It also answers the
research questions in specific aim 1. In the usability experiments as the following
discussions delved into, a new reporting system has been prototyped, evaluated and
upgraded in an iterative process toward the increased user performance. In the end, while
maintaining an overall high satisfaction of the system and proposed functions, the
reporting speed and quality have been proved significantly increased. The three empirical
experiments successfully answer the research question in specific aim 2 and 3. In addition,
this research also demonstrates an iterative user-centered design process, from the
analysis, the development for the evaluation, of improving a typical data entry system in
the clinical setting for the purpose of patient safety and quality of care.
5.1 Severe Usability Violations in Our Initial Prototype (experiment 1)
This experiment demonstrated the initial strategy for usability engineering a
patient safety event reporting system. First, the two dimensions of prototyping methods
were introduced to decompose the entire system development into vertical and horizontal
levels. At the vertical level, we did research on reporting functionality of the current PSN
and a new interface to discover variables influencing usage of the system through task
analysis. At the horizontal level, we conducted a heuristic evaluation to inspect the

92
prototype interface primarily for severe and catastrophic usability violations. Such a
usability inspection iteratively ran on every updated edition of the system, to make sure
the violations would not undermine the reliability and validity of the follow-up studies.
There are two reasons for us to follow the PSN system and develop the new system
framework and data entry process. One is because some of the changes made to solve
certain problems may cause new problems. Another reason is about learnability. A
substantial modification could make system new to current users and break down their
previous convention and understanding of reporting a patient safety event. The relearning
could cause the consumption of a great amount of time and the frustration even to expert
users who are often fully booked.
In task analysis, three factors were identified to largely affect users’ performance
of reporting. They are memory load, keystroke and mouse click. Compared to the two
analysis results on the PSN and the prototype, the memory requirements in the prototype
for interface operating and event recalling decreased largely. One prominent advance is
for answering event details. In the PSN system, it used plenty of web widgets for data
collection, including two single-line text fields, two multiline text fields, four pull-down lists,
ten radio/checkbox groups and seven buttons. All these widgets are arranged on one page
with great length. The users have to scroll the page back and forth and leap blindly among
the confusing questions that are considered heavy burdens of memory load. Furthermore,
the PSN system counts on the two multiline text fields for event description in detail, which
hardly guarantee the quality and the levels of details of reporting. The worst-case scenario
is that the fields were left blank or stuffed with coping words.

93
The application of the Common Formats of AHRQ somewhat made up the PSN
design with well-developed MCQs. As with these MCQs, our prototype has been approved
effective in reducing the memory burden and the number of keystrokes for reporting.
Although the number of mouse clicks remains at the same level, the prototype holds the
potentials for the reduction if some default values or shortcuts could apply. For instance,
a nurse reports an Intraday incident. Obviously, the conciseness and easiness achieved by
the prototype is able to enhance reporting efficiency and users’ satisfaction.
For heuristic evaluation results, each usability violation was categorized into four
levels of severity according to the rating scores. They are catastrophic (rating > 3.5), major
(2.5 <rating < 3.5), minor (1.5 < rating < 2.5), and cosmetic (rating < 1.5). Of 19 identified
violations in total, there are nine problems at the major level and five at the catastrophic
level. The violations include four in language, three in consistency, two in memory and
each in the other five categories (document, error, control, flexibility and minimalist).
Three of four Language problems are considered usability catastrophes. All violations
found in the first round of heuristic evaluation would be sequenced to steer enhancement
of system usability.
The task analysis and heuristic evaluation in experiment 1 facilitated the
development of patient safety reporting system in the initial stage to fulfill the users’ needs
and uncover the flaws of usability concerns. Although it is not feasible to work out all the
problems, these two steps will drive usability research into a system development cycle,
especially for patient safety reporting system. As a result, usability problems could be

94
iteratively identified and fixed, and users could be much easier and more satisfied by using
patient safety reporting system over the time.
5.2 Difficulties in Completing a Safety Event Report (Experiment 2)
By collecting and analyzing execution time, response agreement and think-aloud
protocols that reflected subjects’ interactions with the system, we characterized a variety
of usability problems associated with performance variances across the reports.
5.2.1 Difficulties in case-independent questions
Case-independent questions were about patient demographics, facility and clinical
settings, and the reporter’s information. Reporting such was a simple transcribing process
where two usability issues regarding visibility and errors were observed.
Visibility problem of artificial items brought difficulties to user interface operations.
As C8 commented on a function “shortcut buttons” that was developed to reduce date
entry effort and error, the buttons’ text appeared distractive which caused that users
hesitate on if the buttons were clickable. As a result, half of the subjects failed to use them,
though they were told the utility of buttons in the training video prior to the test.
Errors that could happen must happen. Typo is a typical one. It could be
catastrophic if appears at certain fields, e.g. the date of the event, since it is hard to be
identified by proofreading and may lead to the incorrect classification of the event by date.
The aforementioned “shortcut buttons” were designed to alleviate this concern. If they
were correctly used, typos should be largely reduced. Unfortunately, because the visibility
problem and unavailability of time stamp needed for some events (24.7%), three of 30

95
reports (10%) had such a typo in the test. Considerably, it is a very high rate that would
inevitably undermine the quality of reports.
5.2.2 Difficulties in case-dependent questions
Recognition is easier than recall. This is the rationale of using MCQs to collect data
in reporting. In subtasks #2 and #4, there were 12 MCQs gathering fall incident data from
a variety of aspects. MCQs accounted for a large portion of subject’s cognitive effort and
execution time, but incurred a great number of usability problems according to subject’s
verbalizations.
In general, the MCQs’ features of MRs, PSR and NRCs have significant effects on
execution time. To answer MRs that apply, a subject had to go through a multiple-to-
multiple matching process, traversing all items to match up facts in his memory.
Apparently, answering MRs would take more time than responding to a single response
question. The PSR led to the time increase as a result of additional keystrokes and mental
operations involved in describing details in a textual format. The increment is especially
salient when the description is associated with domain knowledge and language. The NRCs
could be used as another predictor of question’s execution time. The more NRCs, the
longer a question would take. In addition, we observed a few exceptional usability
problems that impact reporting efficiency and effectiveness.
Language problems pervaded the MCQs, especially on MCQs from CFs. Lack of
domain knowledge and experience was a leading cause, particularly for voluntary reporters
who were occasional users and preferred a “plug and play” model of using the system
instead of devoting extra time to a special training. As shown in Table 3, C1 reflected one
96
of the problems in this kind on question #4. 1. Moreover, although the MCQs were
developed by experts, response items were not guaranteed to be mutually exclusive nor
exhaustive. As C2 pointed out, it was hard to select a proper term between “toileting” and
“ambulating” as the items overlapped from a certain perspective. Furthermore, filling-in-
the-blanks with proper terms could be cumbersome even to an experienced reporter, as
C3 commented on question #4.3.2. All of these language problems with respect to
semantic ambiguity, overlapped meaning and terminology complexity contributed to
unwanted outcomes regarding time delay and/or quality reduction.
The capacity of short-term memory is limited also known as the seven plus or minus
rule (G. A. Miller, 1956). According to the rule, exceeding the limit in reporting may incur
time increase and quality reduction. Such a situation can be found in question #2.1, rating
a harm score. Based on case facts and the response items given in the system, reporter
has to select one the most appropriate choice. However, the score description on each
item consisted of multiple information chunks, e.g. the description of score zero was “no
injury; no clinical changes; no additional lab diagnostics/tests ordered; no treatment
provided”, thus matching case facts up with descriptive information chunks turned to be a
multiple-to-multiple mapping process. As complained in C6, memory was overloaded, and
selecting a proper harm score was hard. The mean time in completing this question was
26.5s, which was the longest among all single-response questions. The score agreement
was low, which consolidated the finding in our previous research on 2,919 reports
regarding rating inconsistency(Gong, Richardson, Zhijian, Alafaireet, & Yoo, 2008).

97
Despite the fact that MCQs has advantages in reducing memory load, incomplete
listing still exists and ambiguous meaning of response items appear frequently.
Additionally, the format of MCQs is much less flexible than free text in regards to the
ambiguity tolerance and augments making. Therefore, user was often forced to select the
one (or several ones) that most likely applied, which distorted information to some extent
and might cause inaccurate answers. In order to make up for such a situation, a text field
as subtask #5 was provided to improve reporting richness and flexibility. However, the
majority of the subjects left this field blank, and complained the difficulty about what
should be reported and to what extent should be reported.
5.2.3 Usability issues in general
The lack of feedback and mismatched conceptual models were two general
usability issues throughout the test.
Feedback usually helps inform the reporter of what is going on in a failure or
confusing situation. Feedback also relates to other usability problems at times, such as the
visibility and error issues aforementioned for case-dependent questions. The subjects
expressed a demand of feedback functions that prompted reporting and proposed case
solutions based upon prior similar cases. In C9, a subject thought adding data entry cues
by case-based reasoning approach would help improve reporting completeness and
accuracy.
The development of a system has been never complete, because domain
knowledge changes over time and accessibility of high quality data and advanced
technology is often constrained. It is common that both designer’s conceptual model and

98
system image lag behind the reporter’s model, which cause mismatches, as discussed in
C4.
5.3 Text Prediction Leveraging the efficiency and data quality in reporting (experiment 3)
Clinicians working under time constraints are usually expected to document data
in a timely manner (Allan & Englebright, 2000; Poissant, Pereira, Tamblyn, & Kawasumi,
2005). The quality of entered data is critical to the decision-making and creation of
actionable knowledge. This research attempted to promote efficient and accurate patient
safety event reporting by introducing a narrative field supported by text prediction. A two-
group randomized experiment was successfully developed and conducted to justify the
impact of text prediction on data accuracy and time of completion of the structured data
entry for patient safety event. As for a single patient fall report, the improvements in
efficiency and data quality perspectives were small in absolute values and seemingly
uncritical to care delivery. However, given the facts of millions of safety event reports
generated each year (James, 2013; Wachter, 2009) and documentation demands in lethal
situation, the text prediction could save practitioner’s time, reduce cost and improve the
quality of care in clinical settings.
5.3.1 Time efficiency, keystroke savings and response accuracy of the structured data
entry
Text prediction in the study has proved effective in increasing time efficiency on
two questions, question 5 and 9 in the treatment group. As for the other two questions 6
and 10 with text prediction lists, the reason for lacking statistical significance remained
unclear throughout the study. We believe that the low active frequencies of prediction lists

99
and the large number of options per question somehow diminished the significance of the
impacts of the function, yet none of the conjectures were tested in the experiment 3.
The relationship between text prediction and time efficiency shows that the text
prediction was most helpful in reducing the time expense when the reporting process was
cumbersome and took much longer time (e.g. over 30 seconds on question 9 and 40
seconds on question 10). A cumbersome situation could be defined as when a proper
response was not in the predefined option lists or the participant failed to recognize the
correct response due to cognitive issues. When the participant encountered few
cumbersome issues and was able to respond rapidly (e.g. shorter than 10 seconds on
question 9), the text prediction did not make the response even faster.
The analysis also implied that keystroke savings might play a vital role in increasing
time efficiency in this type of data entry. A great portion of keystrokes, as high as 87.1% of
total keystrokes, was reduced in the treatment group. This finding is consistent with the
results of peer studies in a variety of fields (Eng & Eisner, 2004; Tuttle et al., 1998).
Nevertheless, whether keystroke savings alone could translate into increased efficiency
remains unclear. There are mixed studies reporting contradicted results for the increased
cognitive loads, eye gaze movements and mouse clicks (Goodenough-Trepagnier & Rosen,
1988; Heidi Horstmann Koester & Levine, 1996; Light, Lindsay, Siegel, & Parnes, 1990). The
central value of investigating keystroke savings in this study is the savings that could be
amplified for data entry with on-screen keyboards as more and more health information
systems are migrating from desktop to mobile terminals. Usually, keystrokes with on-

100
screen keyboards have a much greater time cost than those with regular computer
keyboards.
In contrast to time efficiency, data quality has often been an ignored measure and
underreported in text prediction research. This is partly because that measuring quality is
not as straightforward as quantifying the numeric values for time efficiency. In addition, in
the originated fields such as AAC and mobile computing, the data quality is much less of
value than the time efficiency for daily normal activities, unworthy of the laborious manual
analysis for the measurement. However, it is not the case in healthcare where the quality
of data matters greatly.
There are multiple dimensions in measuring data quality (Wand & Wang, 1996) and
one of the dimensions that we focused on is the accuracy of question responses. In this
study, the response accuracy could be undermined in many ways, such as typographical
errors, memory decay, casual attribution and hindsight biases (Holden & Karsh, 2007).
Though no relations were systematically established by the study, somehow the text
prediction offsets these difficulties and resulted in significant improvements (p < 0.05) on
the response accuracy and two response scores as Table 2 and Figure 3 demonstrate. This
evidently supported that text prediction would advantage the data quality in structured
data entry, despite the drawbacks such as the over-reliance on predicted text might exist.
5.3.2 The increased performance on unstructured data entry
This experiment also introduced two text prediction functions of CL and AS
attached to the narrative comment field that is widely used in the medical documentation
systems. The two-group randomized design was applied to examining the impacts of the

101
functions on participant performance in terms of efficiency, effectiveness and
engagement. The results are positive and of guidance towards designing and optimizing
health information systems for patient safety and quality of care.
One of the major findings from unstructured data entry is that the text prediction
can improve participant’s efficiency, which is critical to busy clinicians. The study
scrutinized three measures associated with the efficiency as to the completion time,
keystrokes and text generation rates between the groups. During nearly the same amount
of time, the treatment group produced much more text, which translated into a higher
text generation rate than the control group. As Figure 4 illustrates, the difference of rates
even became larger as the participants learned and became more accustomed to the text
prediction functions.
The treatment group encountered 28.2% less keystrokes for more lengthy text than
the control group. This finding is consistent with results from peer studies in a variety of
fields (Eng & Eisner, 2004; Tuttle et al., 1998). Nevertheless, whether the keystroke savings
alone could translate into increased efficiency from an overall perspective remains unclear.
There are mixed study results that contradicted each other for increased cognitive loads,
eye gaze movements and the total number of mouse clicks (Goodenough-Trepagnier &
Rosen, 1988; Heidi Horstmann Koester & Levine, 1996; Light et al., 1990). The central value
of keystroke savings is that, given the trend of health information systems migrating from
desktop to mobile terminals, the impact of the savings could be amplified for data entry
with on-screen keyboards. Usually, keystrokes with on-screen keyboards have a greater
time cost than with regular computer keyboards.

102
According to the results, there is no evidence to favor one prediction function over
another with respect to increasing the completeness score of narrative comments. Most
likely, the CL and AS functioned as a whole to leverage the breadth and depth of comments
by cueing the frequent characteristic categories, sentences and terms potentially
associated with the event. The functions served somewhat as mnemonic devices
transferring a process of full recall into the efforts mixed the recall and recognition upon
cued data. Consequentially, the participants with the cues delivered more textual data in
length, the greater number of information chunks and higher completeness scores in
correspondence than those without cues.
As for the reporting accuracy that was not specifically measured in the study,
though the rich domain experience of participants helped minimize the difference, the
review generally identified more typos, improper or imprecise terms from the control
group than the treatment one. No texts suggested by the AS had these troubles since all
text items were curated ahead of use, as long as the participant picked the right one.
Therefore, we recommend such cueing functions to a broader scope of medical
documentation systems that frequently suffered from data incompleteness and
inaccuracy.
Compared to the ignorance rate of 73.3% in the comment field of the previous
study with inexperienced users (L. Hua & Y. Gong, 2013), the participants were much more
engaged to delivering comments no matter which group they were delivered in. We
attributed this overall improvement primarily to two reasons. First, the experienced
participants were equipped with better knowledge and mental models than the

103
inexperienced regarding the importance of reports in complete and the way of describing
the event in depth. Second, every participant was asked to comment as complete as
possible, and practiced with the CL during the training. On both levels, the participants
were much better prepared ahead of reporting. This is the rationale behind the great leap
of the participants’ engagement in an overall perspective.
Comparatively, as Table 20 indicates, the ignorance rate in the narrative field
dropped 14.5% to a low level of 1.5% in the treatment group, due to the involvement of
CL. Some participants in the control group explained their ignorance for a) a slip of skipping
the field unconsciously; b) no ideas what event characteristics that should be further
described and c) memory fade. As a remedy, the CL forced participant’s conscious
attention (Donald A. Norman, 1991) to the interface content by a dynamic display, as
shown in Figure 11. This dynamic CL signaled a compelling message to the participants
about the importance of filling the field. Although the content and the way of presenting
the instructions in the CL might highly influence the acceptance and quality -in-use of the
narrative comment field as demonstrated in this experiment.
5.3.3 Usability satisfaction of the interfaces and text prediction functions
According to the post-test questionnaire as shown in Figure 23, the 52 participants
show an overall good attitude toward the use of the both interfaces. Although the scores
are slightly higher in the treatment group than in the control group, none significant was
identified. Given the fact that the participants were interacting with a more complicated
interface featured with text prediction functions in the treatment group, the result is
encouraging. It indicates the provision of the functions would not negatively affect the

104
system‘s acceptance, ease of use and easy to learn, in the meanwhile the user performance
would be further improved.
5.4 Conclusion
Medical incident reporting is a key to the patient safety and quality of care in the
clinical settings. It has been suffering from the underreporting and low quality of reports
over the past several decades, from paper forms to digital systems. As a significant
contributing factor to the barriers, the usability of the systems received little attention
from either human computer interaction or health informatics researchers. Our research
fills the gap by a user-centered design process with a variety of usability methods and the
involvement of domain users. The results successfully justified the effectiveness of the
process and the methods toward an improved reporting system. The identified problems
and proposed functions are instructional to the peer researchers who are working on the
development and evaluation of the similar systems.
5.5 Limitations
Human computer interaction is a promising yet complicated field. It has been in an
outward process from hardware and software to a recently higher level about individual
cognitive capability and social influence guided by theories such as distributed cognition
and activity theory. However, the research at every level are never complete and may
tremendously affect the ones (research hypotheses, methods and results) at the levels
above. As a result, that establishing a unified scientific base to ground HCI studies in a
comprehensive view is extremely difficult. The established HCI theories are like dark
glasses: we put them on then the world is tinted to gain and miss something simultaneously.

105
Therefore, the application of HCI theories and methods could always have limitations at
some point.
First, the findings were based on a specific domain, conducted under the controlled
environments and employed obtrusive study techniques, which might limit the
generalizability of identified problems and proposed solutions and the representation of
actual subjects’ performance in a natural context. Even though in every single experiment,
the sample size met the method requirement, the number of subjects was relevantly small.
Therefore, the majority of the statistical outcomes were descriptive but inferential.
For the proposed text prediction functions in the last study, all prediction
candidates were manually prepared upon the review results from the two domain experts.
In reality, the prediction accuracy based upon the event similarity and the frequency of the
mentioned characteristics might not be as high as that in the experiment. In addition, the
number of predicted items may differ in other settings from this design. Usually the longer
the list is, the longer the time it would take for participant’s inspection and the greater the
chance of missing correct responses. Whether the text prediction with a low accuracy and
a long list would have a significant impact on participant’s performance was not
investigated in this study.
Note that, in the last experiment, the investigated comment field appeared as a
complimentary component following a number of structured questions in the same topic.
Therefore, not all the findings are applicable to the text fields that primarily serve for
documentation purposes.

106
References
AHRQ. Web M&M Mobidity and Mortality Rounds on the Web: Cases & Commentaries.
Retrieved 12/4, 2011, from http://www.webmm.ahrq.gov/home.aspx
AHRQ. (2003). Building Foundations, Reducing Risk AHRQ's Patient Safety Initiative Agency
for Healthcare Research and Quality.
AHRQ. (2004). Mission statement: center for quality improvement and patient safety. Retrieved 12/3, 2011, from http://www.ahrq.gov/about/cquips/cquipsmiss.htm
AHRQ. (2008). Users' guide AHRQ Common formats for patient safety organizations :
Agency for healthcare Research and Quality.
AHRQ. (2011). Common Formats. from
https://www.psoppc.org/web/patientsafety/version-1.2_documents
Allan, J., & Englebright, J. (2000). Patient-centered documentation: an effective and efficient use of clinical information systems. Journal of Nursing Administration,
30(2), 90-95.
Anderson, J. G., Ramanujam, R., Hensel, D. J., & Sirio, C. A. (2010). Reporting trends in a regional medication error data-sharing system. Health Care Management Science, 13(1), 74-83.
Barach, P., & Small, S. D. (2000). Reporting and preventing medical mishaps: lessons from
non-medical near miss reporting systems. BMJ, 320(7237), 759-763.
Bardram, J. (1998). Designing for the dynamics of cooperative work activities. Paper presented at the Proceedings of the 1998 ACM conference on Computer supported
cooperative work, Seattle, Washington, United States.
Benn, J., Koutantji, M., Wallace, L., Spurgeon, P., Rejman, M., Healey, A., & Vincent, C. (2009). Feedback from incident reporting: information and action to improve
patient safety. Qual Saf Health Care, 18(1), 11 - 21.
Beukelman, D., & Mirenda, P. (2005). Augmentative and Alternative Communication (Vol.
ISBN 1-55766-333-5): Brookes.
Cacciabue, P. C., & Vella, G. (2010). Human factors engineering in healthcare systems: The problem of human error and accident management. International Journal of
Medical Informatics, 79(4), e1-e17.
Clay, P. F., Dennis, A. R., & Ko, D.-G. (2005). Factors affecting the loyal use of knowledge management systems. Paper presented at the 38th Annual Hawaii International

107
Conference on System Sciences, January 3, 2005 - January 6, 2005, Big Island, HI,
United states.
Cohen, M. R. (2000). Why error reporting systems should be voluntary. BMJ, 320(7237), 728-729. doi: 10.1136/bmj.320.7237.728
Conerly, C. (2007). Strategies to increase reporting of near misses and adverse events.
Journal of Nursing Care Quality, 22(2), 102-106.
Davis, F. D. (1989). Perceived Usefulness, Perceived Ease of Use, and User Acceptance of
Information Technology. MIS Quarterly, 13(3), 319-340.
Del Fiol, G., Haug, P. J., Cimino, J. J., Narus, S. P., Norlin, C., & Mitchell, J. A. (2008). Effectiveness of Topic-specific Infobuttons: A Randomized Controlled Trial. Journal of the American Medical Informatics Association, 15(6), 752-759. doi:
10.1197/jamia.M2725
Devore, J. L. (1982). Probability and statistics for engineering and the sciences. Monterey,
Calif.: Brooks/Cole Pub. Co.
Dollarhide, A. W., Rutledge, T., Weinger, M. B., & Dresselhaus, T. R. (2008). Use of a handheld computer application for voluntary medication event reporting by inpatient nurses and physicians. Journal of General Internal Medicine, 23(4), 418-
422.
Dumas, J. S. (1999). A practical guide to usability testing: Intellect Books.
Ehlke, A., Challand, S., Schmidt, T., & Carneiro, L. Tag-it. from http://aehlke.github.io/tag-it/
Endsley, M. R. (1995). Toward a Theory of Situation Awareness in Dynamic Systems. Human Factors: The Journal of the Human Factors and Ergonomics Society, 37(1), 32-64.
doi: 10.1518/001872095779049543
Eng, J., & Eisner, J. M. (2004). Informatics in radiology (infoRAD): Radiology report entry with automatic phrase completion driven by language modeling. Radiographics, 24(5), 1493-1501. doi: 10.1148/rg.245035197
Ericsson, K. A., & Kintsch, W. (1995). Long-Term Working Memory. Psychological Review,
102(2), 211-245.
Evans, S. M., Berry, J. G., Smith, B. J., Esterman, A., Selim, P., O’Shaughnessy, J., & DeWit, M. (2006). Attitudes and barriers to incident reporting: a collaborative hospital study. Quality and Safety in Health Care, 15(1), 39-43. doi:
10.1136/qshc.2004.012559

108
Fleiss, J. L. (1971). Measuring nominal scale agreement among many raters. Psychological
Bulletin, 76(5), 378-382. doi: 10.1037/h0031619
France, D. J., Cartwright, J., Jones, V., Thompson, V., & Whitlock, J. A. (2004). Improving pediatric chemotherapy safety through voluntary incident reporting: lessons from
the field. Journal of Pediatric Oncology Nursing, 21(4), 200-206.
Freestone, L., Bolsin, S. N., Colson, M., Patrick, A., & Creati, B. (2006). Voluntary incident reporting by anaesthetic trainees in an Australian hospital. International Journal for Quality in Health Care, 18(6), 452-457.
Gandhi, T., Seder, D., & Bates, D. (2000). Methodology matters. Identifying drug safety issues: from research to practice. International Journal for Quality in Health Care,
12(1), 69-76.
Gandhi, T. K., Graydon-Baker, E., Neppl, H., Whittemore, A. D., & Gustafson, M. (2005). Closing the loop: follow-up and feedback in a patient safety program. Joint Commission Journal on Quality and Patient Safety, 31(11), 614-621.
Glossary of Terms: Patient Safety International, 2004. from
http://www.patientsafetyint.com/Glossary.aspx Accessed August 2006
Gong, Y. (2009). Data consistency in a voluntary medical incident reporting system. J Med
Syst, 35(4), 609-615. doi: 10.1007/s10916-009-9398-y
Gong, Y. (2009). Data Consistency in a Voluntary Medical Incident Reporting System. Journal of Medical Systems.
Gong, Y. (2010). Terminology in a Voluntary Medical Incident Reporting System: a Human-Centered Perspective. Paper presented at the ACM International Health Informatics
Symposium.
Gong, Y., & Jackson-Thompson, J. (2007). A Human-centered design of cancer registry system. Paper presented at the NAACCR: North American Association of Central Cancer Registries, Detroit, MI.
Gong, Y., Pasupathy, K., Vest, S., Cole, N., & Jackson-Thompson, J. (2008). A human-centered information system for central cancer registries. Oncology Issues,
23(March-April), 30-35.
Gong, Y., Richardson, J., Luan, Z., Alafaireet, P., & Yoo, I. (2008). Analyzing voluntary medical incident reports. Paper presented at the AMIA Annual Symposium
Washington DC.
Gong, Y., & Zhang, J. (2005a). A distributed information analysis for information search
tasks. AMIA ... Annual Symposium Proceedings/AMIA Symposium, 965.

109
Gong, Y., & Zhang, J. (2005b). A human-centered design and evaluation framework for information search. Paper presented at the AMIA Annu Symp Proc. http://www.ncbi.nlm.nih.gov/entrez/query.fcgi?cmd=Retrieve&db=PubMed&dop
t=Citation&list_uids=16779046
Gong, Y., & Zhang, J. (2005). A human-centered design and evaluation framework for
information search. Proceedings / AMIA. Annual Symposium 2005, 281-285.
Gong, Y., Zhang, T., Rukab, J., Johnson-Throop, K., Malin, J., & Zhang, J. (2004). Design and development of a search interface for an information gathering tool. Studies in
Health Technology & Informatics, 107(Pt 2), 1471-1475.
Goodenough-Trepagnier, C., & Rosen, M. (1988). Predictive assessment for communication aid prescription: Motor-determined maximum communication
rate. The vocally impaired: Clinical practice and research, 167-185.
Haller, G., Myles, P. S., Stoelwinder, J., Langley, M., Anderson, H., & McNeil, J. (2007). Integrating Incident Reporting into an Electronic Patient Record System. Journal of the American Medical Informatics Association, 14(2), 175-181. doi:
10.1197/jamia.M2196
Hammer, M., & Champy, J. (1993). Reengineering the corporation : a manifesto for business revolution. . New York, NY: HarperBusiness.
Higginbotham, D. J., Bisantz, A. M., Sunm, M., Adams, K., & Yik, F. (2009). The effect of context priming and task type on augmentative communication performance.
Augmentative and Alternative Communication, 25(1), 19-31.
Hitcho, E. B., Krauss, M. J., Birge, S., Dunagan, W. C., Fischer, I., Johnson, S., . . . Fraser, V. J. (2004). Characteristics and Circumstances of Falls in a Hospital Setting. JGIM: Journal of General Internal Medicine, 19(7), 732-739. doi: 10.1111/j.1525-
1497.2004.30387.x
Holden, R. J., & Karsh, B. T. (2007). A review of medical error reporting system design considerations and a proposed cross-level systems research framework. Human Factors, 49(2), 257-276.
Holzmueller, C. G., Pronovost, P. J., Dickman, F., Thompson, D. A., Wu, A. W., Lubomski, L. H., . . . Dorman, T. (2005a). Creating the web-based intensive care unit safety reporting system. Journal of the American Medical Informatics Association, 12(2), 130-139.
Holzmueller, C. G., Pronovost, P. J., Dickman, F., Thompson, D. A., Wu, A. W., Lubomski, L. H., . . . Dorman, T. (2005b). Creating the web-based intensive care unit safety
reporting system. J Am Med Inform Assoc, 12(2), 130-139. doi: M1408 [pii]

110
Hua, L., & Gong, Y. (2010). Developing a User-centered Voluntary Medical Incident
Reporting System. Stud Health Technol Inform, 160, 203-207.
Hua, L., & Gong, Y. (2013). Design of a user-centered voluntary patient safety reporting system: Understanding the time and response variances by retrospective think-
aloud protocols. Stud Health Technol Inform, 192, 729-733.
Hua, L., & Gong, Y. (2013). Usability evaluation of a voluntary patient safety reporting system: Understanding the difference between predicted and observed time values by retrospective think-aloud protocols. In M. Kurosu (Ed.), Human-Computer Interaction. Applications and Services (Vol. 8005, pp. 94-100): Springer Berlin
Heidelberg.
Hunnicutt, S., & Carlberger, J. (2001). Improving word prediction using markov models and heuristic methods. Augmentative & Alternative Communication, 17(4), 255-264. doi: 10.1080/714043389
Hutchins, E. (1995). Cognition in the wild. from http://search.ebscohost.com/login.aspx?direct=true&scope=site&db=nlebk&db=
nlabk&AN=1687
Hutchins, E. (2000, 5/18/00). Distributed Cognition. Retrieved Sep. 2. 2003, 2003, from eclectic.ss.uci.edu/~drwhite/Anthro179a/ DistributedCognition.pdf
Hutchins, E. L., Hollan, J. D., & Norman, D. A. (1985). Direct manipulation interfaces. Hum.-
Comput. Interact., 1(4), 311-338. doi: 10.1207/s15327051hci0104_2
James, J. T. (2013). A new, evidence-based estimate of patient harms associated with
hospital care. Journal of patient safety, 9(3), 122-128.
Jeffries, R., Miller, J. R., Wharton, C., & Uyeda, K. M. (1991). User interface evaluation in
the real world: A comparison of four techniques. Proc. ACM CHI, 119-124.
Jiajie, Z., & Keith, A. B. (2008). UFuRT: A Work-Centered Framework and Process for Design and Evaluation of Information Systems.
JQuery. from http://jquery.com/
Kahn, M. J., & Prail, A. (1994). Formal usability inspections Usability inspection methods (pp.
141-171): John Wiley \& Sons, Inc.
Kaplan, B. (1994). Reducing barriers to physician data entry for computer-based patient
records. Top Health Inf Manage, 15(1), 24-34.
Kaplan, H., & Fastman, B. (2003). Organization of event reporting data for sense making and system improvement. Quality & Safety in Health Care, 12 Suppl 2, ii68-72.

111
Kaplan, H. S., & Fastman, B. R. (2003). Organization of event reporting data for sense
making and system improvement. Qual Saf Health Care, 12 Suppl 2, ii68-72.
Karsh, B. T., Escoto, K. H., Beasley, J. W., & Holden, R. J. (2006). Toward a theoretical approach to medical error reporting system research and design. Appl Ergon, 37(3),
283-295. doi: S0003-6870(05)00118-3 [pii]
Kaushal, R., Bates, D. W., Landrigan, C., McKenna, K. J., Clapp, M. D., Federico, F., & Goldmann, D. A. (2001). Medication errors and adverse drug events in pediatric inpatients. JAMA, 285(16), 2114-2120. doi: joc01942 [pii]
Kijsanayotin, B., Pannarunothai, S., & Speedie, S. M. (2009). Factors influencing health information technology adoption in Thailand's community health centers: Applying the UTAUT model. International Journal of Medical Informatics, 78(Compendex),
404-416.
Kim, J., & Bates, D. W. (2006). Results of a survey on medical error reporting systems in Korean hospitals. Int J Med Inform, 75(2), 148-155. doi: S1386-5056(05)00087-0
[pii]
Kivlahan, C., Sangster, W., Nelson, K., Buddenbaum, J., & Lobenstein, K. (2002). Developing a comprehensive electronic adverse event reporting system in an academic health center. Jt Comm J Qual Improv, 28(11), 583-594.
Koester, H. H., & Levine, S. (1996). Effect of a word prediction feature on user performance. Augmentative & Alternative Communication, 12(3), 155-168. doi:
10.1080/07434619612331277608
Koester, H. H., & Levine, S. P. (1994). Learning and performance of able-bodied individuals using scanning systems with and without word prediction. Assist Technol, 6(1), 42-53. doi: 10.1080/10400435.1994.10132226
Kohn, L. T., Corrigan, J.M., Donaldson, M.S. (1999). To err is human: building a safer health system. Report of Committee on Quality of Healthcare in America. Institute of
Medicine, National Academy of Science.
Krippendorff, K. (1980). Content analysis : an introduction to its methodology. Beverly Hills: Sage Publications.
Leape, L. L., & Berwick, D. M. (2005). Five Years After To Err Is Human. JAMA: The Journal of the American Medical Association, 293(19), 2384-2390. doi:
10.1001/jama.293.19.2384
Leape, L. L., Lawthers, A. G., Brennan, T. A., & Johnson, W. G. (1993). Preventing medical injury. QRB Qual Rev Bull, 19(5), 144-149.

112
Levinson, D. R. (2008a). Adverse events in hospitals: overview of key issues. Washington,
DC: US Department of Health and Human Services, Office of the Inspector General
Levtzion-Korach, O., Alcalai, H., Orav, E. J., Graydon-Baker, E., Keohane, C., Bates, D. W., & Frankel, A. S. (2009). Evaluation of the contributions of an electronic web-based
reporting system: enabling action. Journal of patient safety, 5(1), 9-15.
Light, J., Lindsay, P., Siegel, L., & Parnes, P. (1990). The effects of message encoding techniques on recall by literate adults using AAC systems. Augmentative & Alternative Communication, 6(3), 184-201. doi: 10.1080/07434619012331275454
Lowry, G. (2002). Modelling user acceptance of building management systems. Automation in Construction, 11(Compendex), 695-705.
Mackenzie, S. I., & Soukoreff, W. R. (2002). Text entry for mobile computing: Models and
methods, theory and practice. Human-Computer Interaction, 17(2 & 3), 147-198.
Matts, J. P., & Lachin, J. M. (1988). Properties of permuted-block randomization in clinical trials. Controlled Clinical Trials, 9(4), 327-344. doi: http://dx.doi.org/10.1016/0197-2456(88)90047-5
McDonald, C. J. (1997). The barriers to electronic medical record systems and how to overcome them. Journal of the American Medical Informatics Association, 4(3),
213-221. doi: 10.1136/jamia.1997.0040213
Mekhjian, H. S., Bentley, T. D., Ahmad, A., & Marsh, G. (2004a). Development of a Web-based event reporting system in an academic environment. Journal of the American
Medical Informatics Association, 11(1), 11-18.
Miller, G. A. (1956). The magical number seven plus or minus two: some limits on our
capacity for processing information. Psychol Rev, 63(2), 81-97.
Miller, M. R., Clark, J. S., & Lehmann, C. U. (2006). Computer based medication error reporting: insights and implications. Quality and Safety in Health Care, 15(3), 208-213. doi: 10.1136/qshc.2005.016733
Nadzam, D. M. (1991). Development of medication-use indicators by the Joint Commission
on Accreditation of Healthcare Organizations. Am J Hosp Pharm, 48(9), 1925-1930.
Nagamatsu, S., Kami, M., & Nakata, Y. (2009). Healthcare safety committee in Japan: mandatory accountability reporting system and punishment. [Review] [42 refs]. Current Opinion in Anaesthesiology, 22(2), 199-206.
Nakajima, K., Kurata, Y., & Takeda, H. (2005). A web-based incident reporting system and multidisciplinary collaborative projects for patient safety in a Japanese hospital.
Quality & Safety in Health Care, 14(2), 123-129.

113
Nardi, B. A. (1996). Context and consciousness : activity theory and human-computer
interaction. Cambridge, Mass.: MIT Press.
Nast, P. A., Avidan, M., Harris, C. B., Krauss, M. J., Jacobsohn, E., Petlin, A., . . . Fraser, V. J. (2005). Reporting and classification of patient safety events in a cardiothoracic intensive care unit and cardiothoracic postoperative care unit. Journal of Thoracic
& Cardiovascular Surgery, 130(4).
Nielsen, J. (1994). Usability engineering ([Updated ed.). San Francisco, Calif: Morgan Kaufmann Publishers.
Norman, D. A. (1991). Cognitive artifacts Designing interaction (pp. 17-38): Cambridge University Press.
Norman, D. A. (1993). Things That Make Us Smart: Defending Human Attributes in the Age
of the Machine. Massachusetts: Addison-Wesley Perseus.
Norman, D. A., & Draper, S. W. (1986). User centered system design : new perspectives on
human-computer interaction Hillsdale, N.J.: L. Erlbaum Associates.
Nuckols, T. K., Bell, D. S., Paddock, S. M., & Hilborne, L. H. (2009). Comparing process- and outcome-oriented approaches to voluntary incident reporting in two hospitals.
Joint Commission Journal on Quality & Patient Safety, 35(3), 139-145.
Payson, C. A. (2007). Patient Falls Assessment and Prevention (Global ed.).
Poissant, L., Pereira, J., Tamblyn, R., & Kawasumi, Y. (2005). The impact of electronic health records on time efficiency of physicians and nurses: A systematic review. Journal of the American Medical Informatics Association, 12(5), 505-516. doi:
10.1197/jamia.M1700
Rockville. (2005). The Patient Safety and Quality Improvement Act of 2005. Retrieved 12/3,
2011, from http://www.ahrq.gov/qual/psoact.htm
Sencha. (2014). Sencha ExtJS library. from http://www.sencha.com/products/extjs/
SlidesJS. from http://www.slidesjs.com/
Strong, D. M., Lee, Y. W., & Wang, R. Y. (1997). Data quality in context. Commun. ACM,
40(5), 103-110. doi: 10.1145/253769.253804
Structured data capture initiative. (2013). from http://wiki.siframework.org/Structured+Data+Capture+Initiative

114
Suresh, G., Horbar, J. D., Plsek, P., Gray, J., Edwards, W. H., Shiono, P. H., . . . Goldmann, D. (2004). Voluntary anonymous reporting of medical errors for neonatal intensive care. Pediatrics, 113(6), 1609-1618.
Takeda, H., Matsumura, Y., Nakajima, K., Kuwata, S., Zhenjun, Y., Shanmai, J., . . . Inoue, M. (2003). Health care quality management by means of an incident report system and an electronic patient record system. Int J Med Inform, 69(2-3), 285-293. doi: S1386505603000108 [pii]
Taylor, J. A., Brownstein, D., Christakis, D. A., Blackburn, S., Strandjord, T. P., Klein, E. J., & Shafii, J. (2004). Use of Incident Reports by Physicians and Nurses to Document Medical Errors in Pediatric Patients. Pediatrics, 114(3), 729-735. doi:
10.1542/peds.2003-1124-L
Tepfers, A., Louie, H., & Drouillard, M. (2007). Developing an electronic incident report: experiences of a multi-site teaching hospital. Healthc Q, 10(2), 117-122.
Tuttle, M. S., Olson, N. E., Keck, K. D., Cole, W. G., Erlbaum, M. S., Sherertz, D. D., . . . Law, V. (1998). Metaphrase: an aid to the clinical conceptualization and formalization of patient problems in healthcare enterprises. Methods of information in medicine, 37(4-5), 373-383.
van der Veer, S., Cornet, R., & de Jonge, E. (2007). Design and implementation of an ICU incident registry. Int J Med Inform, 76(2-3), 103-108. doi: S1386-5056(06)00204-8
[pii]
10.1016/j.ijmedinf.2006.08.003
Vozikis, A. (2009). Information management of medical errors in Greece: The MERIS proposal. International Journal of Information Management, 29(Compendex), 15-26.
Wachter, R. (2009). Hospital Incident Reporting Systems: Time to Slay the Beast. . Wachter's World Retrieved August 25th 2011, from http://community.the-hospitalist.org/2009/09/20/hospital-incident-reporting-systems-time-to-slay-the-monster/
Wagner, L. M., Capezuti, E., Taylor, J. A., Sattin, R. W., & Ouslander, J. G. (2005). Impact of a Falls Menu-Driven Incident-Reporting System on Documentation and Quality Improvement in Nursing Homes. The Gerontologist, 45(6), 835-842. doi: 10.1093/geront/45.6.835
Walsh, S. H. (2004). The clinician's perspective on electronic health records and how they can affect patient care. BMJ, 328(7449), 1184-1187. doi:
10.1136/bmj.328.7449.1184

115
Wand, Y., & Wang, R. Y. (1996). Anchoring data quality dimensions in ontological
foundations. Commun. ACM, 39(11), 86-95. doi: 10.1145/240455.240479
Wang, R. Y., Storey, V. C., & Firth, C. P. (1995). A framework for analysis of data quality research. Knowledge and Data Engineering, IEEE Transactions on, 7(4), 623-640.
Waring, J. J. (2005). Beyond blame: cultural barriers to medical incident reporting. Social
Science & Medicine, 60(9), 1927-1935.
World Alliance for Patient Safety. (2005). WHO draft guidelines for adverse event reporting
and learning systems.
Yale Law, S., & Yale, U. (2009). A national survey of medical error reporting laws. Yale
journal of health policy, law, and ethics, 9(1), 201-286.
Zhang, J. (1997). The Nature of External Representations in Problem Solving. Cognitive Science, 21(2), 179-217. doi: 10.1016/s0364-0213(99)80022-6
Zhang, J., Johnson, T. R., Patel, V. L., Paige, D. L., & Kubose, T. (2003). Using usability heuristics to evaluate patient safety of medical devices. J Biomed Inform, 36(1-2),
23-30. doi: S1532046403000601 [pii]
Zhang, J., & Norman, D. A. (1994). Representations in distributed cognitive tasks. Cognitive Science, 18(1), 87-122. doi: Doi: 10.1016/0364-0213(94)90021-3
Zhang, J., & Patel, V. L. (2006). Distributed cognition, representation, and affordance.
Pragmatics & Cognition, 14(2), 333-341. doi: 10.1075/pc.14.2.12zha
Zhang, J., Patel, V. L., Johnson, K. A., Malin, J., & Smith, J. W. (2002). Designing Human-Centered Distributed Information Systems. IEEE Intelligent Systems, 17(5), 42-47. doi: 10.1109/mis.2002.1039831
Zhang, J., & Walji, M. F. (2011). TURF: Toward a unified framework of EHR usability. Journal of Biomedical Informatics, 44(6), 1056-1067. doi: 10.1016/j.jbi.2011.08.005

116
Appendix A, MU Health Science IRB Approval

117
Appendix B, UT Health IRB Approval

118
Appendix C, UT Health Consent form

119

120
Appendix D, T.F.C. Hospital ethics committee approval

121
Appendix E, The MCQs used in the study
Page No. Question and response options in detail
One
1. Was the fall unassisted or assisted? CHECK ONE:
a. Unassisted
b. Assisted
c. Unknown
2. Was the fall observed? CHECK ONE:
a. Yes
b. No
c. Unknown
3. Who observed the fall? CHECK FIRST APPLICABLE:
a. Staff
b. Visitor, family, or another patient, but not staff
Two
4. Did the patient sustain a physical injury as a result of the fall? CHECK ONE:
a. Yes
b. No
c. Unknown
5. What type of injury was sustained?
CHECK ONE; IF MORE THAN ONE, CHECK MOST SEVERE:
a. Dislocation
b. Fracture
c. Intracranial injury
d. Laceration requiring sutures
e. Other: PLEASE SPECIFY __________________
Three
6. Prior to the fall, what was the patient doing or trying to do? CHECK ONE:
a. Ambulating without assistance and without an assistive device or
medical equipment
b. Ambulating with assistance and/or with an assistive device or
medical equipment
c. Changing position (e.g., in bed, chair)
d. Dressing or undressing

122
e. Navigating bedrails
f. Reaching for an item
g. Showering or bathing
h. Toileting
i. Transferring to or from bed, chair, wheelchair, etc.
j. Undergoing a diagnostic or therapeutic procedure
k. Unknown
l. Other: PLEASE SPECIFY __________________
Four
7. Prior to the fall, was a fall risk assessment documented? CHECK ONE:
a. Yes
b. No
c. Unknown
8. Was the patient determined to be at increased risk for a fall? CHECK ONE:
a. Yes
b. No
c. Unknown
9. At the time of the fall, were any of the following risk factors present?
CHECK ALL THAT APPLY:
a. History of previous fall
b. Prosthesis or specialty/prescription shoe
c. Sensory impairment (vision, hearing, balance, etc.)
d. None
e. Unknown
f. Other: PLEASE SPECIFY __________________
Five
10. Which of the following were in place and being used to prevent falls for
this patient?
CHECK ALL THAT APPLY:
a. Assistive device (e.g., wheelchair, commode, cane, crutches, scooter,
walker)
b. Bed or chair alarm
c. Bed in low position
d. Call light/personal items within reach
e. Change in medication (e.g., timing or dosing of current medication)
f. Non-slip floor mats

123
g. Hip and/or joint protectors
h. Non-slip footwear
i. Patient and family education
j. Patient sitting close to the nurses’ station
k. Physical/occupational therapy, includes exercise or mobility program
l. Sitter
m. Supplemental environmental or area lighting (when usual facility
lighting is considered insufficient)
n. Toileting regimen
o. Visible identification of patient as being at risk for fall (e.g., Falling
Star)
p. None
q. Unknown
r. Other: PLEASE SPECIFY __________________
Six
11. At time of the fall, was the patient on medication known to increase the
risk of fall?
CHECK ONE:
a. Yes
b. No
c. Unknown
12. Was the medication considered to have contributed to the fall?
CHECK ONE:
a. Yes
b. No
c. Unknown
13. Did restraints, bedrails, or other physical device contribute to the fall
(includes tripping over device electrical power cords)? CHECK ONE:
a. Yes
b. No
c. Unknown

124
Appendix F, Posttest questionnaire in experiment 3
1. Learnability
Strongly
disagree Disagree Neutral Agree
Strongly
agree
Learning to use this system is easy
It is not time-consuming to learn to use the
system
I think new users will find this system easy to
learn
The harm score rating is easy to complete
The questions and choices about the fall
incidence are clear and understandable
2. Efficiency
Strongly
disagree Disagree Neutral Agree
Strongly
agree
This interface is easy to use
The instructions and prompts are helpful
The on-screen instructions and prompts are
consistent
I do not need to follow many steps to
answer all the questions for one case
The structure of the system seems logical
It is easy to move from one question to
another
The sequence that the system asks
questions is logical

125
3. Memorability & Errors
Strongly
disagree Disagree Neutral Agree
Strongly
agree
The system kept me informed of what
information concerning patient fall is
required
The error messages are understandable and
helpful
I will have to look for assistance most times
when using this system
I sometimes wonder if I’m answering
correctly
4. Satisfaction
Strongly
disagree Disagree Neutral Agree
Strongly
agree
Using this system is frustrating
I felt tense at times when using this system
The system is restrictive
It is obvious that users’ needs have been
fully taken into consideration
The system has an attractive view
The system asks questions what I want to
answer
The required steps were as I expected
I would recommend my colleagues to this
system

126
Strongly
disagree Disagree Neutral Agree
Strongly
agree
I would not like to use this system in the
future
5. Please share any additional comments/suggestion:

127
Appendix G, Five testing cases in experiment 3
Case 1
Patient had held on confusion, and a prior fall during night two days ago. Order obtained
for side rail X4 restraints at 20:20. Patient was very restless/agitated. Ativan was ordered
and given at 20:30. Patient continued to be agitated at times afterwards. At 01:30 noise
was heard in room and patient was found lying on floor beside bed with all side rails up.
His roommate saw the fall and stated the patient was trying to get out of bed and fell.
Abrasion to right side neck was noted. Subsequently order obtained for vest restraint,
and bed alarm activated.
Case 2
At the beginning of shift when making rounds patient was found on floor, lying
lengthways by right side of bed on his right side. None witnessed the fall. Patient denied
any discomfort, was able to move all extremities without pain, and did have 1x2cm skin
tear to right elbow. No other or abrasion or reddened areas noted, bed was low and
wheels locked prior to the fall. Patient is quickly gaining strength now to what was flaccid
right side and states he thought he could get up from bed at that time. A nurse noted
that patient was hypoglycemic and had not eaten breakfast, and also was on blood
pressure medication
Case 3
Patient stated she needed to use the restroom and felt strong enough to walk with a
walker. A nurse assisted patient to sit on side of bed and ask her if she felt dizzy or

128
lightheaded, and she stated no. Then the nurse placed the walker in front of patient and
put arm underneath patient’s armpit and assisted her to her feet. Patient began walking
towards bathroom from bed and when she came to the door of the bathroom she began
to complain that her legs where wrong. She let go of the walker and began to fall to the
floor. The nurse held her with arm until get her steady. However, the nurse was unable to
get her steady on her feet so the nurse eased her to the floor.
Case 4
Patient was alert and oriented X3(person, time and location) upon assessment, and
instructed on admit not to get up without assist. He had been sleeping and attempted to
get up to go to bathroom. He forgot to call staff to have plexipulses (a device) undone,
and tripped on plexi tubing and attempted to catch self on overhead bars. He landed
floor on bottom and small abrasion above right and left elbows. Wife was sleeping in
room at bedside and summoned staff after getting patient up. Arm cleansed and dressed.
No further injury at this time. Patient has no complaints. House supervisor notified, on-
call Dr. also notified. No new orders received.
Case 5
Patient has had Alzheimer's disease for approximately 7 years and has been cared for by
her husband and daughter at home. Her other past medical problems include: diabetes
mellitus, hypertension, depression and a history of falls. She has been here for 2 days and
has slept only 3 hours per night. She is extremely restless and anxious and often cries out
for her husband. She constantly wants to get up from her chair or bed. She was found on

129
the floor by staff at 8 pm and apparently had fallen onto her buttocks; only small bruises
were found. Mrs. P was assisted to bed for the night. A waist restraint was placed on her
and all four side rails were positioned in the upright position.

130
VITA
EDUCATION
2003 B.S. Computer Science Tianjin University of Technology, China
PUBLICATIONS DURING STUDY
Peer-reviewed full papers
1. Hua, L., Wang, S., & Gong, Y. (2014). Text prediction on structured data entry in
healthcare: A two-group randomized usability study measuring the prediction impact
on user performance. Applied Clinical Informatics. (To appear)
2. Hua, L., & Gong, Y. (2013). Information gaps in reporting patient falls: the challenges
and technical solutions. Stud Health Technol Inform, 194, 113-118.
3. Hua, L., & Gong, Y. (2013). Design of a user-centered voluntary patient safety
reporting system: Understanding the time and response variances by retrospective
think-aloud protocols. Stud Health Technol Inform, 192, 729-733.
4. Hua, L., & Gong, Y. (2013). Usability evaluation of a voluntary patient safety reporting
system: Understanding the difference between predicted and observed time values
by retrospective think-aloud protocols. In M. Kurosu (Ed.), Human-Computer
Interaction. Applications and Services, 8005, 94-100.
5. Hua, L., & Gong, Y. (2012). Testing of a voluntary patient safety reporting system by
think-aloud protocols: will a common format help quality and efficient reporting?
Advances in Human Aspects of Healthcare, 10, 293-302.
6. Yoo, I., Alafaireet, P., Marinov, M., Pena-Hernandez, K., Gopidi, R., Chang, J.-F., & Hua,
L. (2012). Data mining in healthcare and biomedicine: a survey of the literature.
Journal of Medical Systems, 36(4), 2431-2448.
7. Hua, L., & Gong, Y. (2011). Identifying and addressing effectiveness in a user-centered
design of voluntary medical incident reporting system. e-Health Networking
Applications and Services (Healthcom), 2011 13th IEEE International Conference on,
358-363.
8. Hua, L., & Gong, Y. (2011). Design effective voluntary medical incident reporting
systems: a literature review. In G. Salvendy & M. Smith (Eds.), Human Interface and

131
the Management of Information. (Vol. 6772, pp. 253-261): Springer Berlin /
Heidelberg.
9. Hua, L., & Gong, Y. (2010). Developing a user-centered voluntary medical incident
reporting system. Stud Health Technol Inform, 160(1), 203-207.
Peer-reviewed posters
10. Hua, L., & Gong, Y. (2011). Usability Testing on a Voluntary Medical Incident
Reporting Prototype. AMIA Annu Symp (3), 1808.
11. Hua, L., & Gong, Y. (2010). Synthesized concerns in human-centered design of
voluntary medical incident reporting system. AMIA Annu Symp.
12. Gong, Y., Hua, L., & Shen, Y. (2010). Exploring relations between pre-defined text and
free text entries in a medical voluntary incident reporting system. AMIA Annu Symp.
13. Hua, L., & Gong, Y. (2009). Managing changes of health information system by a
conflict viewpoint. AMIA Annu Symp, 887.
FIELD OF STUDY
Clinical Informatics; Health Informatics; Human-Computer Interaction
Related Documents