A. Update on Type 2 Diabetes

A. Update on Type 2 Diabetes. Natural History of Type 2 Diabetes Adapted from: International Diabetes Center (Minneapolis, Minnesota). Insulin resistance.
Dec 16, 2015
Welcome message from author
This document is posted to help you gain knowledge. Please leave a comment to let me know what you think about it! Share it to your friends and learn new things together.
Transcript
A. Update on Type 2 Diabetes
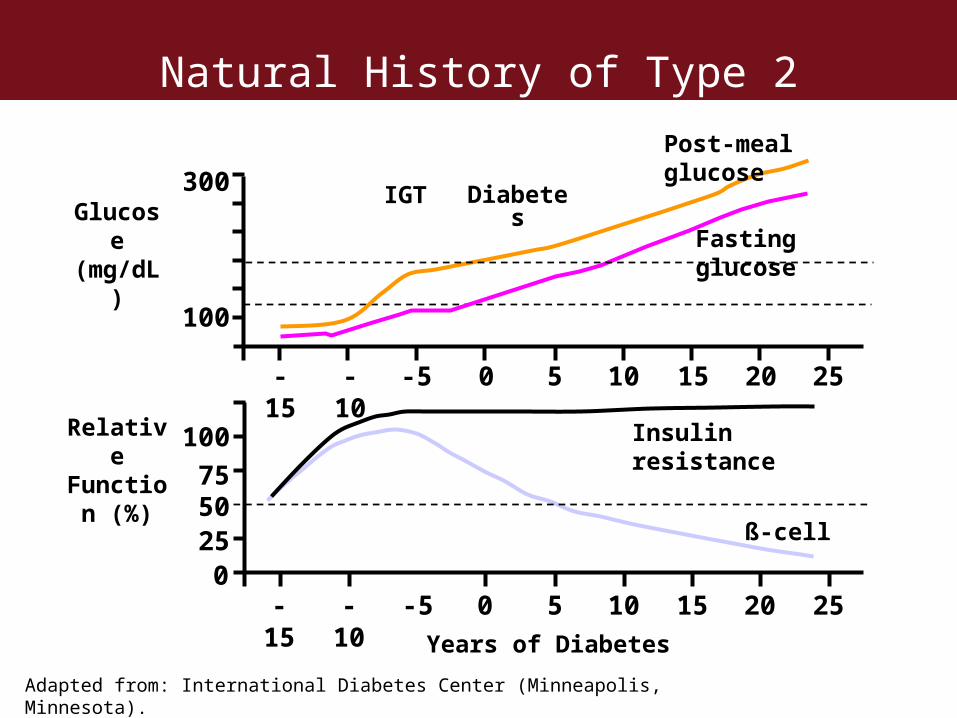
Natural History of Type 2 Diabetes
Adapted from: International Diabetes Center (Minneapolis, Minnesota).
Insulin resistance
Relative
Function (%)
Glucose
(mg/dL)
300
1007550250
Years of Diabetes
-15
-10
-5 0 5 10 15 20 25
-15
-10
-5 0 5 10 15 20 25
Fasting glucose
Post-meal glucose
ß-cell
IGT Diabetes
100
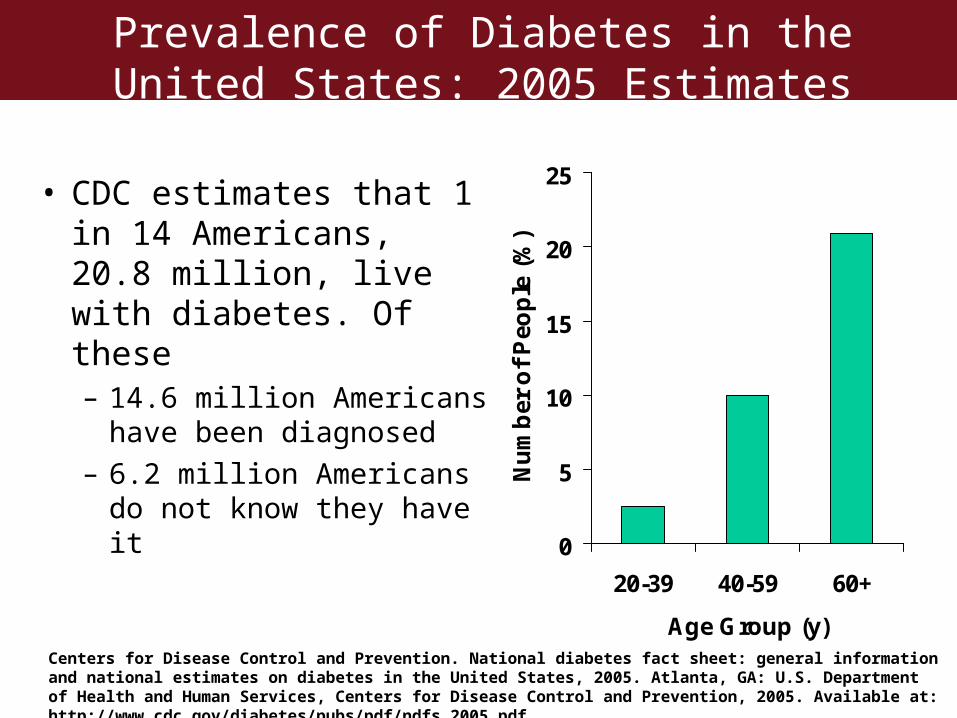
Prevalence of Diabetes in the United States: 2005 Estimates
• CDC estimates that 1 in 14 Americans, 20.8 million, live with diabetes. Of these– 14.6 million Americans
have been diagnosed– 6.2 million Americans do
not know they have it0
5
10
15
20
25
20-39 40-59 60+
Age Group (y)
Nu
mb
er o
f P
eop
le (
%)
Centers for Disease Control and Prevention. National diabetes fact sheet: general information and national estimates on diabetes in the United States, 2005. Atlanta, GA: U.S. Department of Health and Human Services, Centers for Disease Control and Prevention, 2005. Available at: http://www.cdc.gov/diabetes/pubs/pdf/ndfs_2005.pdf.

The Prevalence of Obesity* and Diabetes Continues to Increase
Behavioral Risk Factor Surveillance System, Centers for Disease Control and Prevention. Available at: http://www.cdc.gov/nccdphp/dnpa/obesity/trend/maps/ and http://www.cdc.gov/diabetes/statistics/prev/state/. Accessed January 20, 2006.
1994 2004ObesityNo Data
<10%
10%-14%
15%-19%
20%-24%
≥25%
1994 2004DiabetesMissing Data
<4%
4%-4.9%
5%-5.9%
≥6%
*Obesity defined as BMI ≥30 or ~30 lbs overweight for 5'4" person
The Prevalence of Obesity* and Diabetes Continues to Increase
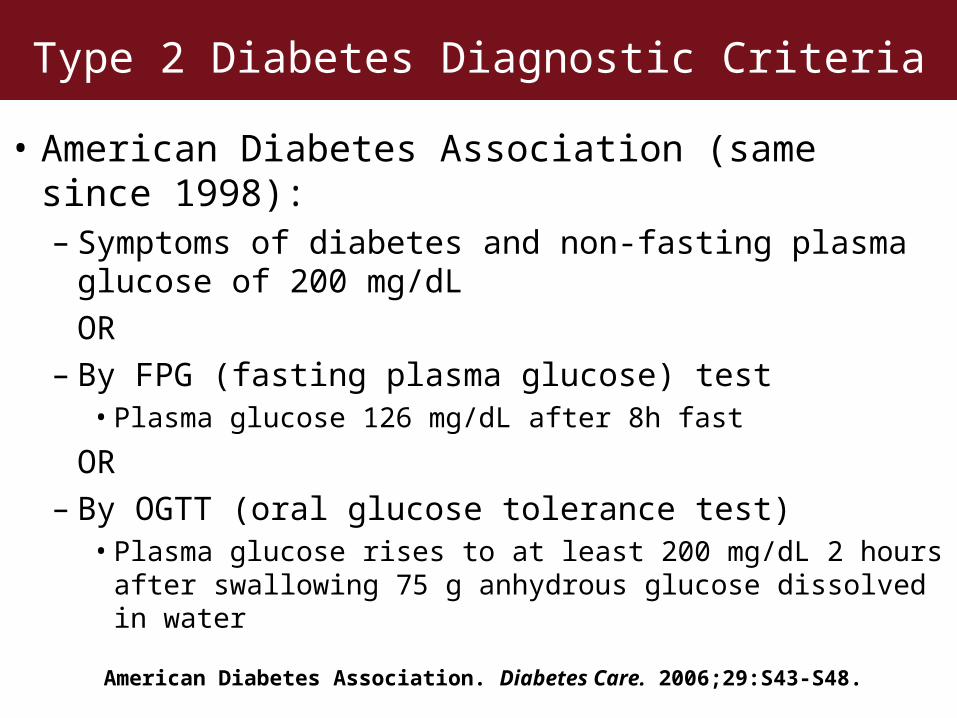
Type 2 Diabetes Diagnostic Criteria
• American Diabetes Association (same since 1998):– Symptoms of diabetes and non-fasting plasma glucose of
200 mg/dL
OR– By FPG (fasting plasma glucose) test
• Plasma glucose 126 mg/dL after 8h fast
OR– By OGTT (oral glucose tolerance test)
• Plasma glucose rises to at least 200 mg/dL 2 hours after swallowing 75 g anhydrous glucose dissolved in water
American Diabetes Association. Diabetes Care. 2006;29:S43-S48.
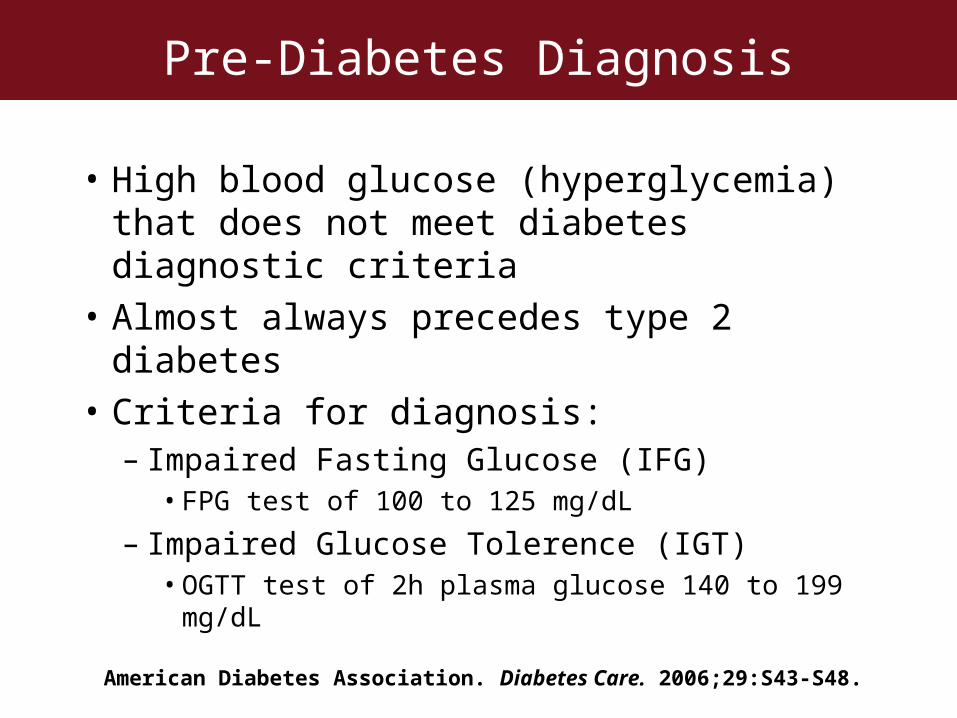
Pre-Diabetes Diagnosis
• High blood glucose (hyperglycemia) that does not meet diabetes diagnostic criteria
• Almost always precedes type 2 diabetes
• Criteria for diagnosis:– Impaired Fasting Glucose (IFG)
• FPG test of 100 to 125 mg/dL
– Impaired Glucose Tolerence (IGT)• OGTT test of 2h plasma glucose 140 to 199 mg/dL
American Diabetes Association. Diabetes Care. 2006;29:S43-S48.
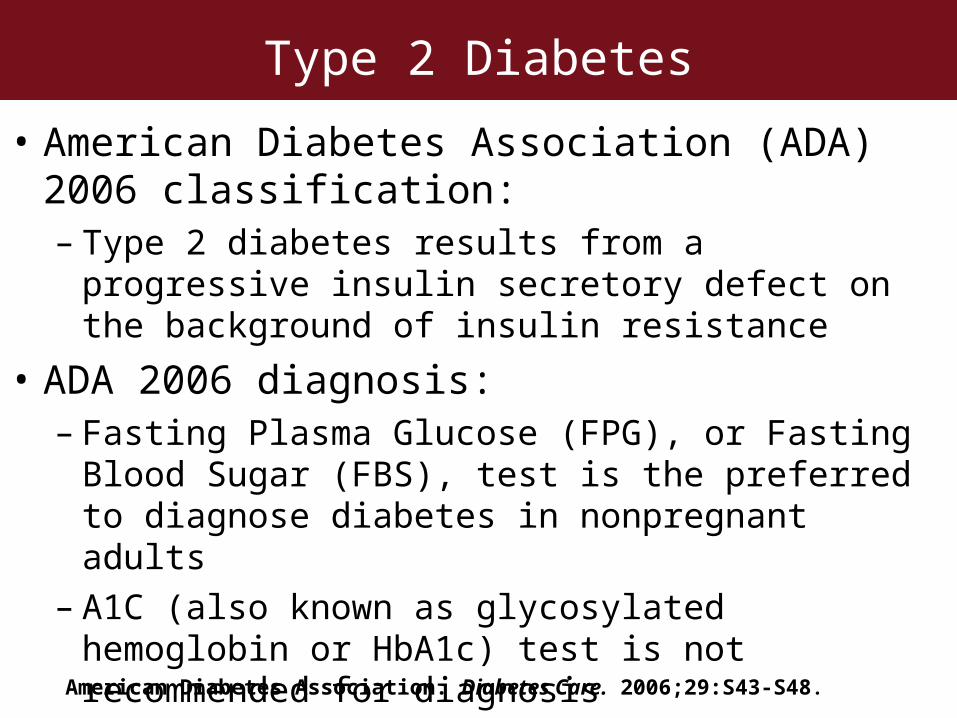
Type 2 Diabetes
• American Diabetes Association (ADA) 2006 classification: – Type 2 diabetes results from a progressive insulin
secretory defect on the background of insulin resistance
• ADA 2006 diagnosis:– Fasting Plasma Glucose (FPG), or Fasting Blood Sugar
(FBS), test is the preferred to diagnose diabetes in nonpregnant adults
– A1C (also known as glycosylated hemoglobin or HbA1c) test is not recommended for diagnosis
American Diabetes Association. Diabetes Care. 2006;29:S43-S48.
B. 24h Glucose Monitoring
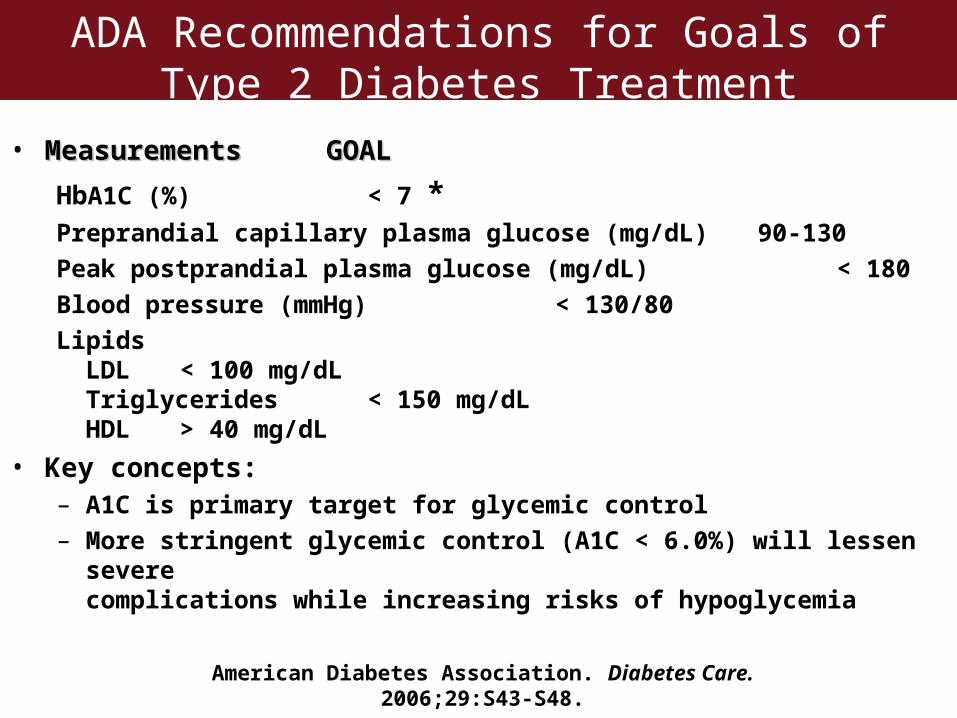
ADA Recommendations for Goals of Type 2 Diabetes Treatment
• Measurements Measurements GOAL GOAL
HbA1C (%) < 7 *Preprandial capillary plasma glucose (mg/dL) 90-130
Peak postprandial plasma glucose (mg/dL) < 180
Blood pressure (mmHg) < 130/80
LipidsLDL < 100 mg/dLTriglycerides < 150 mg/dLHDL > 40 mg/dL
• Key concepts:– A1C is primary target for glycemic control– More stringent glycemic control (A1C < 6.0%) will lessen severe
complications while increasing risks of hypoglycemia
American Diabetes Association. Diabetes Care. 2006;29:S43-S48.
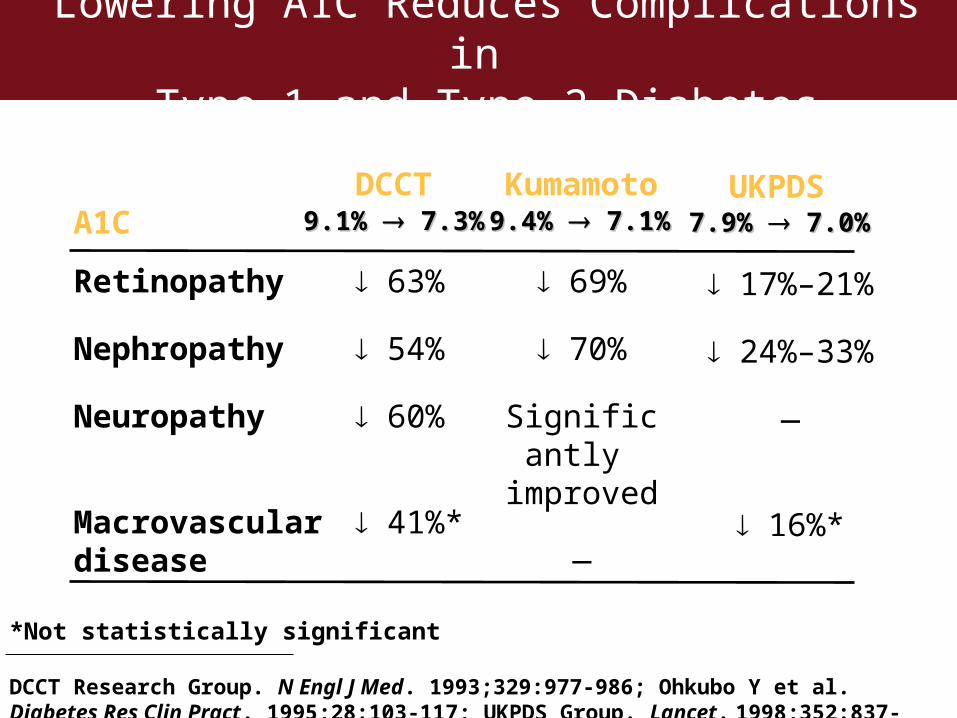
Retinopathy
Nephropathy
Neuropathy
Macrovascular disease
A1C
17%–21%
24%–33%
—
16%*
UKPDS
69%
70%
Significantly
improved
—
Kumamoto
63%
54%
60%
41%*
DCCT
*Not statistically significant
DCCT Research Group. N Engl J Med. 1993;329:977-986; Ohkubo Y et al. Diabetes Res Clin Pract. 1995;28:103-117; UKPDS Group. Lancet. 1998;352:837-853
Lowering A1C Reduces Complications in Type 1 and Type 2 Diabetes
9.1% 9.1% 7.3% 7.3% 9.4% 9.4% 7.1% 7.1% 7.9% 7.9% 7.0% 7.0%
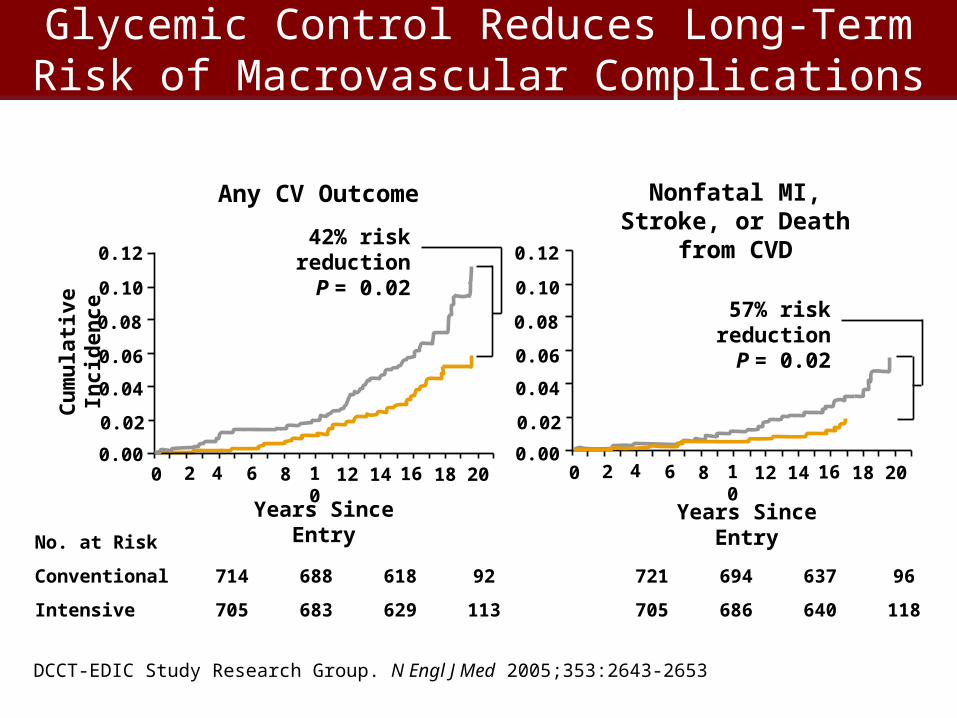
Glycemic Control Reduces Long-Term Risk of Macrovascular Complications
DCCT-EDIC Study Research Group. N Engl J Med 2005;353:2643-2653
No. at Risk
Conventional 714 688 618 92
Intensive 705 683 629 113
721 694 637 96
705 686 640 118
0.12
0.10
0.08
0.06
0.04
0.02
0.000 2 4 6 8 10 12 14 16 18 20
Years Since Entry
Any CV Outcome
Cu
mu
lati
ve In
cid
ence
42% risk reductionP = 0.02 0.12
0.10
0.08
0.06
0.04
0.00
0.02
0 2 4 6 8 10 12 14 16 18 20
Years Since Entry
Nonfatal MI, Stroke, or Death from CVD
57% risk reductionP = 0.02
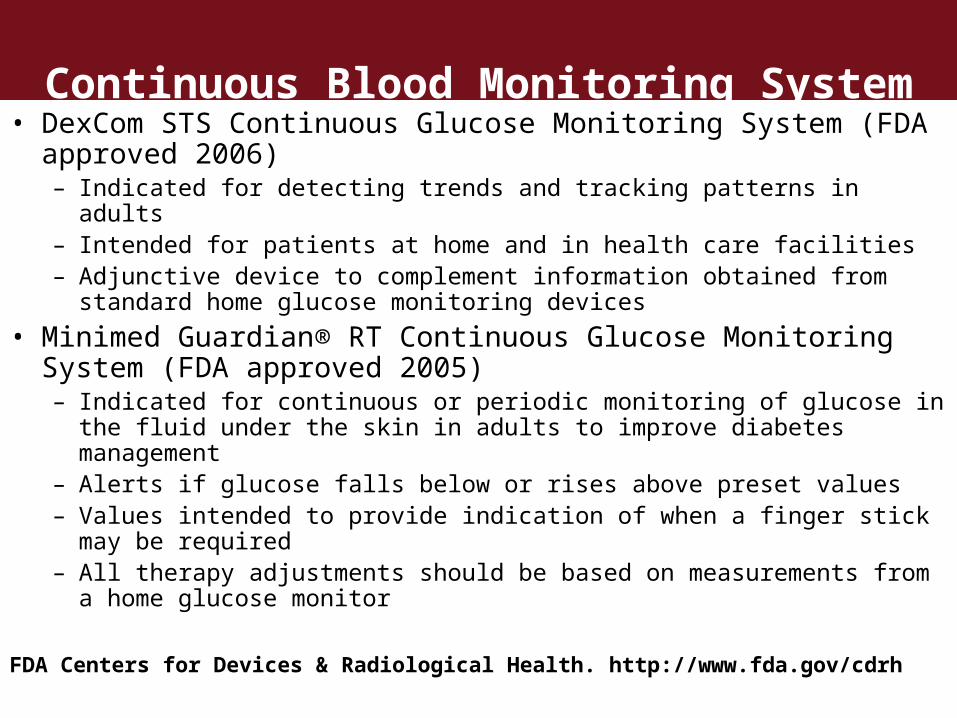
Continuous Blood Monitoring System• DexCom STS Continuous Glucose Monitoring System (FDA
approved 2006)– Indicated for detecting trends and tracking patterns in adults– Intended for patients at home and in health care facilities– Adjunctive device to complement information obtained from standard home
glucose monitoring devices
• Minimed Guardian® RT Continuous Glucose Monitoring System (FDA approved 2005) – Indicated for continuous or periodic monitoring of glucose in the fluid under the
skin in adults to improve diabetes management– Alerts if glucose falls below or rises above preset values– Values intended to provide indication of when a finger stick may be required– All therapy adjustments should be based on measurements from a home glucose
monitor
FDA Centers for Devices & Radiological Health. http://www.fda.gov/cdrh

C. Incretin Biology: Science
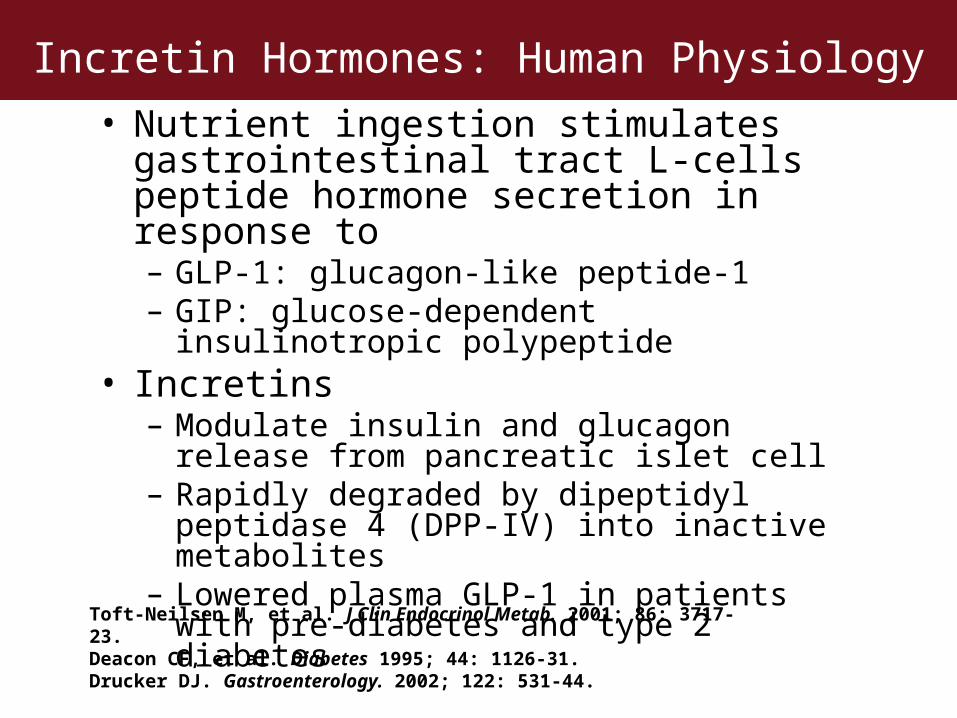
Incretin Hormones: Human Physiology
• Nutrient ingestion stimulates gastrointestinal tract L-cells peptide hormone secretion in response to– GLP-1: glucagon-like peptide-1– GIP: glucose-dependent insulinotropic
polypeptide• Incretins
– Modulate insulin and glucagon release from pancreatic islet cell
– Rapidly degraded by dipeptidyl peptidase 4 (DPP-IV) into inactive metabolites
– Lowered plasma GLP-1 in patients with pre-diabetes and type 2 diabetes
Toft-Neilsen M, et al. J Clin Endocrinol Metab. 2001; 86: 3717-23.Deacon CF, et al. Diabetes 1995; 44: 1126-31.Drucker DJ. Gastroenterology. 2002; 122: 531-44.
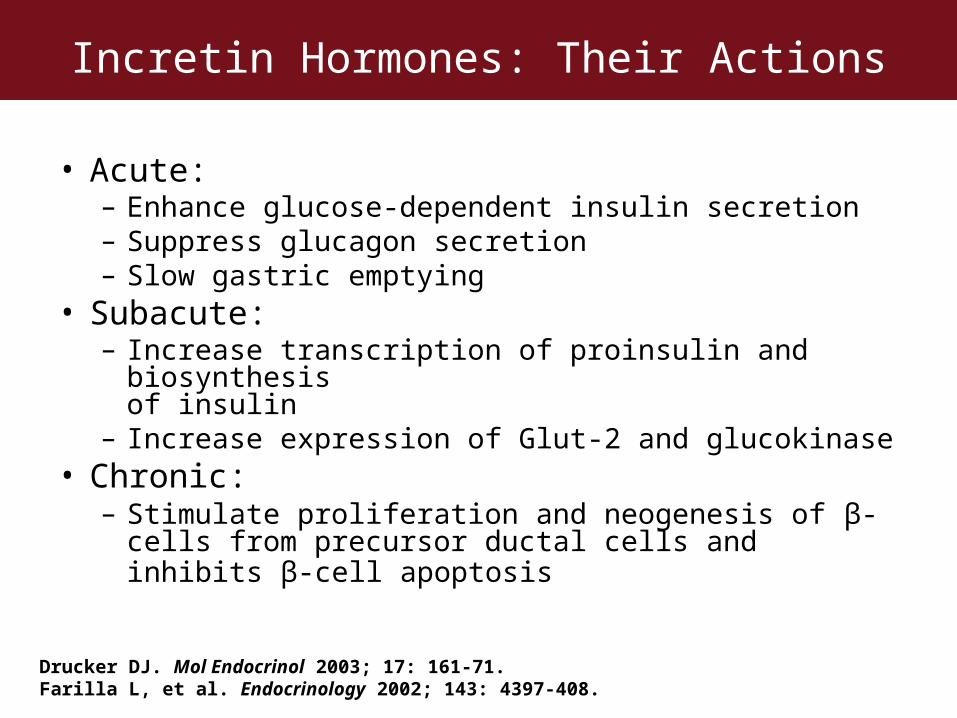
Incretin Hormones: Their Actions
• Acute:– Enhance glucose-dependent insulin secretion– Suppress glucagon secretion– Slow gastric emptying
• Subacute:– Increase transcription of proinsulin and biosynthesis
of insulin– Increase expression of Glut-2 and glucokinase
• Chronic:– Stimulate proliferation and neogenesis of β-cells from
precursor ductal cells and inhibits β-cell apoptosis
Drucker DJ. Mol Endocrinol 2003; 17: 161-71.Farilla L, et al. Endocrinology 2002; 143: 4397-408.
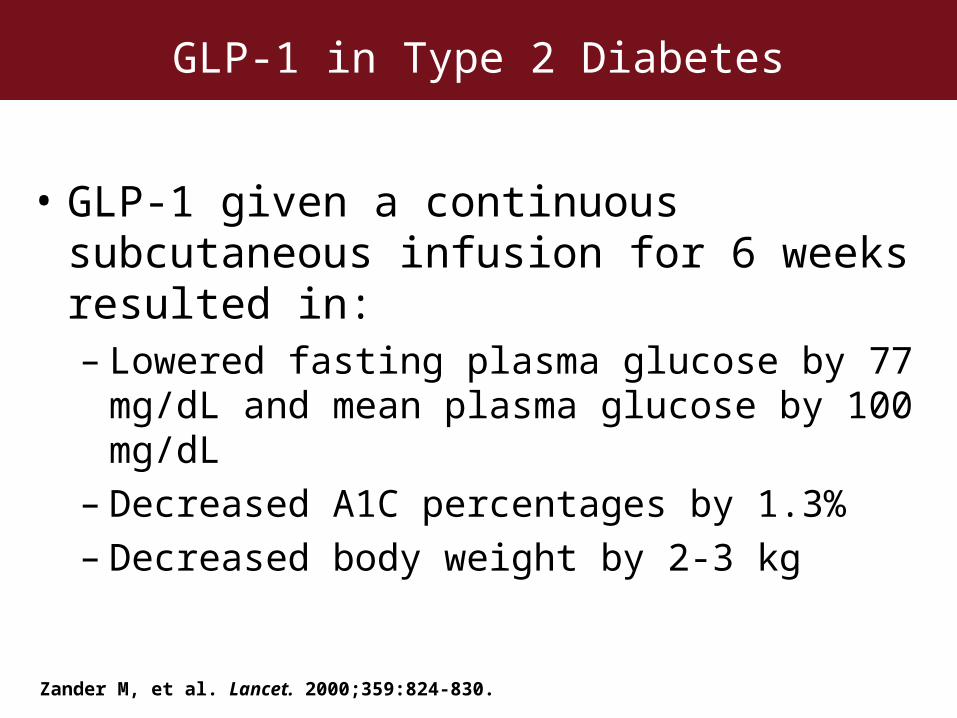
GLP-1 in Type 2 Diabetes
• GLP-1 given a continuous subcutaneous infusion for 6 weeks resulted in:– Lowered fasting plasma glucose by 77 mg/dL and
mean plasma glucose by 100 mg/dL– Decreased A1C percentages by 1.3%– Decreased body weight by 2-3 kg
Zander M, et al. Lancet. 2000;359:824-830.

Strategies to Increase Incretin Hormone
• Subcutaneous infusion of GLP-1 and/or GIP– Use pump to deliver incretin hormones continuously
• Long-acting GLP-1 agonists (Incretin Mimetics)– Exenatide (FDA approved)– Pramlintide (FDA approved)– Liraglutide
• Blocking degradation of GLP-1 (DPP-4 Inhibitors)– Sitagliptin (FDA submission)– Vildagliptin (FDA submission)– Saxagliptin
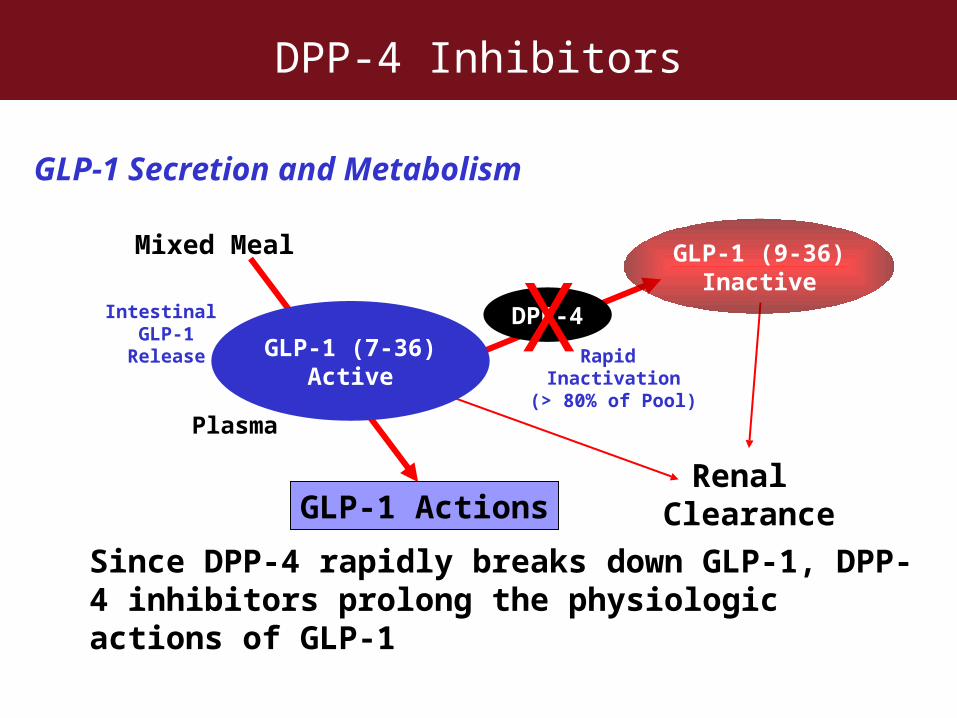
DPP-4 Inhibitors
Since DPP-4 rapidly breaks down GLP-1, DPP-4 inhibitors prolong the physiologic actions of GLP-1
GLP-1 Secretion and Metabolism
Mixed Meal
Intestinal GLP-1
Release
Plasma
GLP-1 ActionsRenal
Clearance
GLP-1 (7-36)Active
DPP-4
GLP-1 (9-36)Inactive
XRapid
Inactivation(> 80% of Pool)

C. Incretin Biology: Clinical Trials
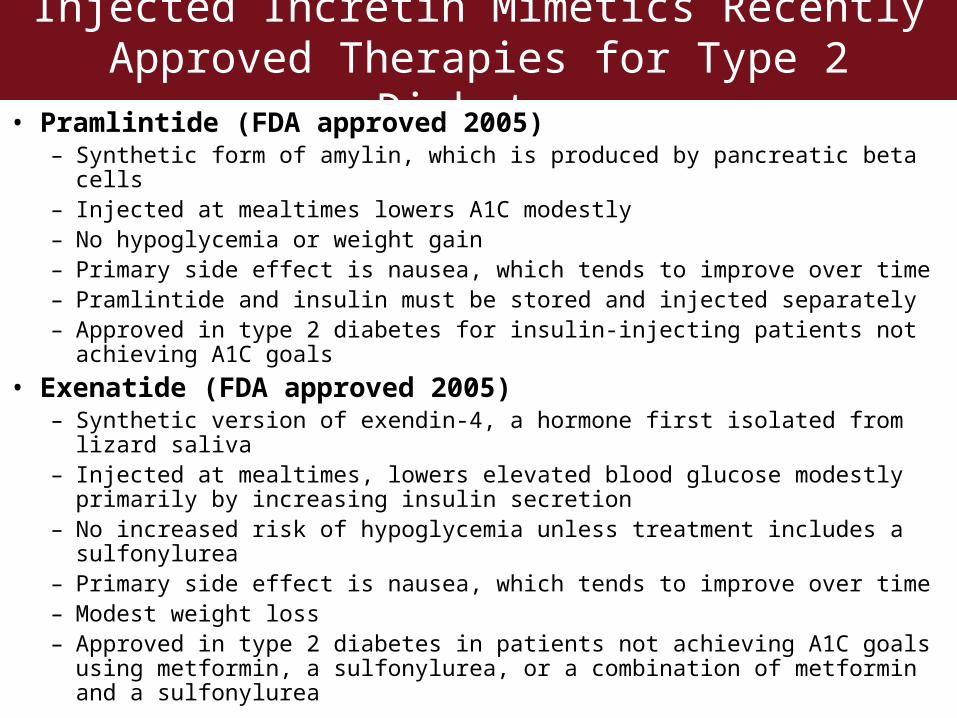
Injected Incretin Mimetics Recently Approved Therapies for Type 2 Diabetes
• Pramlintide (FDA approved 2005)– Synthetic form of amylin, which is produced by pancreatic beta cells– Injected at mealtimes lowers A1C modestly– No hypoglycemia or weight gain– Primary side effect is nausea, which tends to improve over time– Pramlintide and insulin must be stored and injected separately– Approved in type 2 diabetes for insulin-injecting patients not achieving A1C
goals
• Exenatide (FDA approved 2005)– Synthetic version of exendin-4, a hormone first isolated from lizard saliva– Injected at mealtimes, lowers elevated blood glucose modestly primarily by
increasing insulin secretion– No increased risk of hypoglycemia unless treatment includes a sulfonylurea– Primary side effect is nausea, which tends to improve over time– Modest weight loss– Approved in type 2 diabetes in patients not achieving A1C goals using
metformin, a sulfonylurea, or a combination of metformin and a sulfonylurea
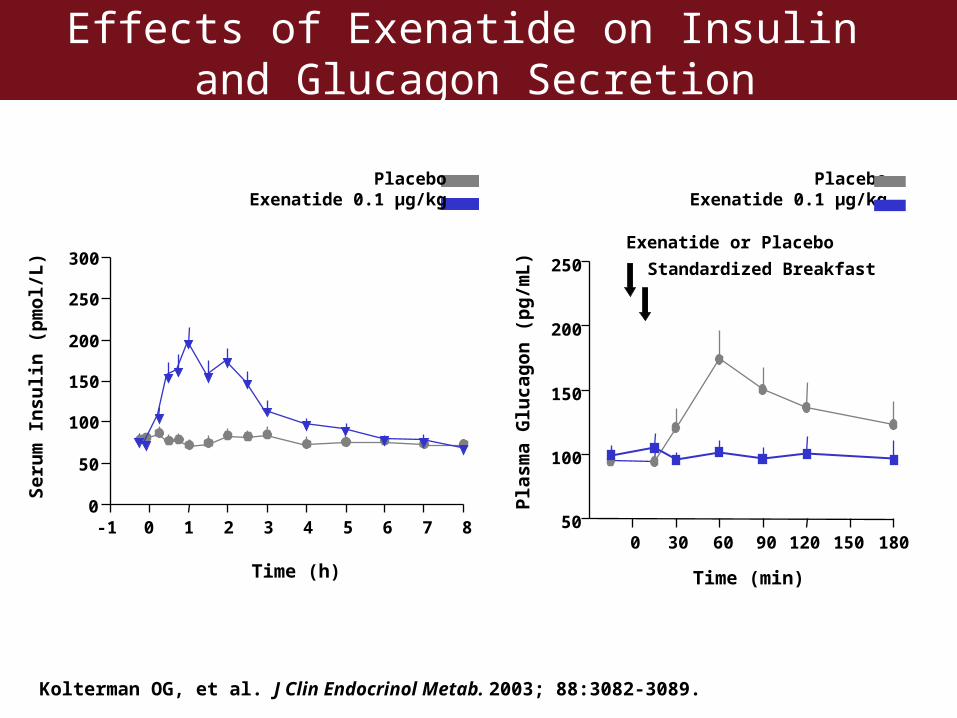
Effects of Exenatide on Insulin and Glucagon Secretion
Pla
sma
Glu
cag
on
(p
g/m
L)
0 120 18030 9060 150
Time (min)
50
100
150
200
250
PlaceboExenatide 0.1 µg/kg
Exenatide or Placebo
Standardized Breakfast
Kolterman OG, et al. J Clin Endocrinol Metab. 2003; 88:3082-3089.
-1 0 1 2 3 4 5 6 7 80
50
100
150
200
250
300
Time (h)
Ser
um
In
suli
n (
pm
ol/
L)
PlaceboExenatide 0.1 µg/kg
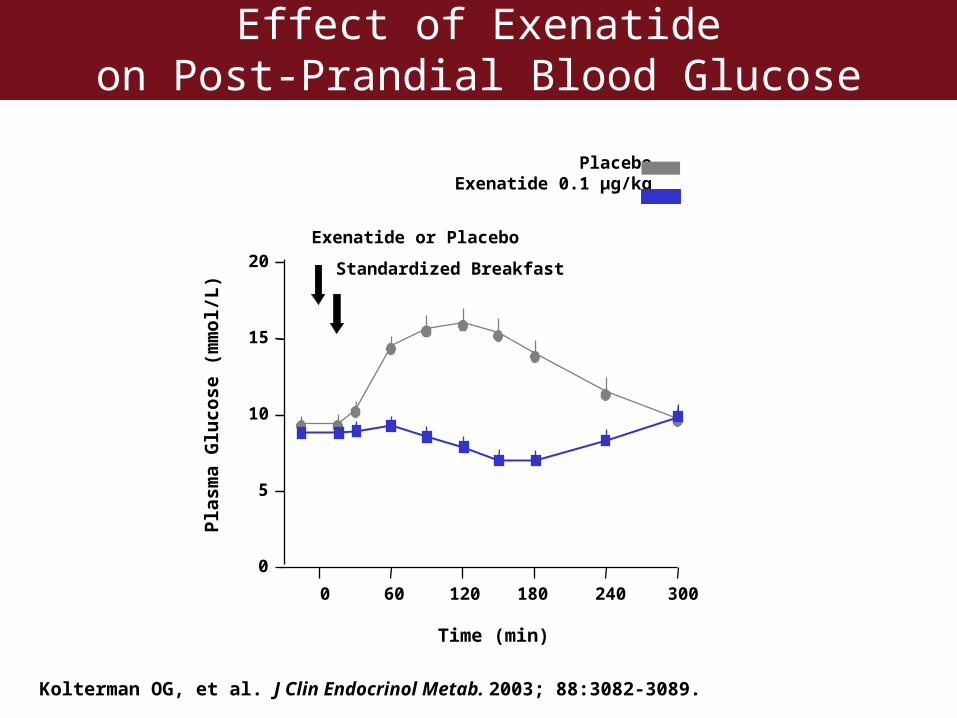
Effect of Exenatideon Post-Prandial Blood Glucose
Pla
sma
Glu
cose
(m
mo
l/L
)
0
5
10
15
20Exenatide or Placebo
Standardized Breakfast
0 60 120 180 240 300
Time (min)
PlaceboExenatide 0.1 µg/kg
Kolterman OG, et al. J Clin Endocrinol Metab. 2003; 88:3082-3089.
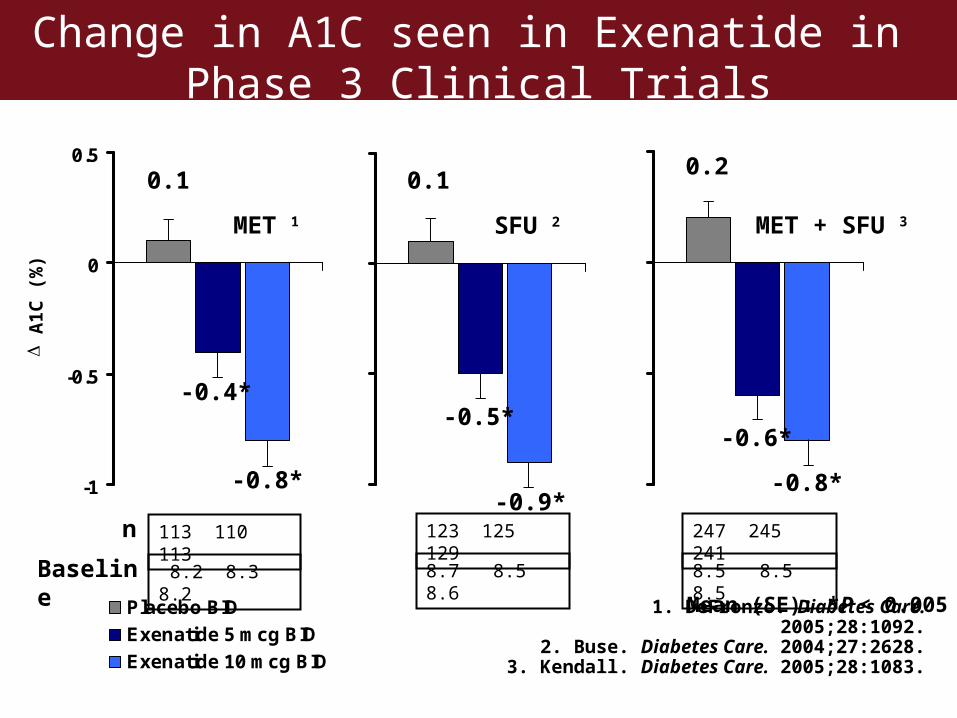
Change in A1C seen in Exenatide in Phase 3 Clinical Trials
1. DeFronzo. Diabetes Care. 2005;28:1092.2. Buse. Diabetes Care. 2004;27:2628.
3. Kendall. Diabetes Care. 2005;28:1083.
Mean (SE): *P < 0.005
-1
-0.5
0
0.5
Placebo BID
Exenatide 5 mcg BID
Exenatide 10 mcg BID
SFU 2 MET + SFU 3MET 1
-0.4*
- 0.8
A
1C (
%)
247 245 241
8.5 8.5 8.5Baseline
n 113 110 113
8.2 8.3 8.2
123 125 129
8.7 8.5 8.6
0.1
-0.4*
-0.8*
-0.5*
-0.9*
0.10.2
-0.6*
-0.8*
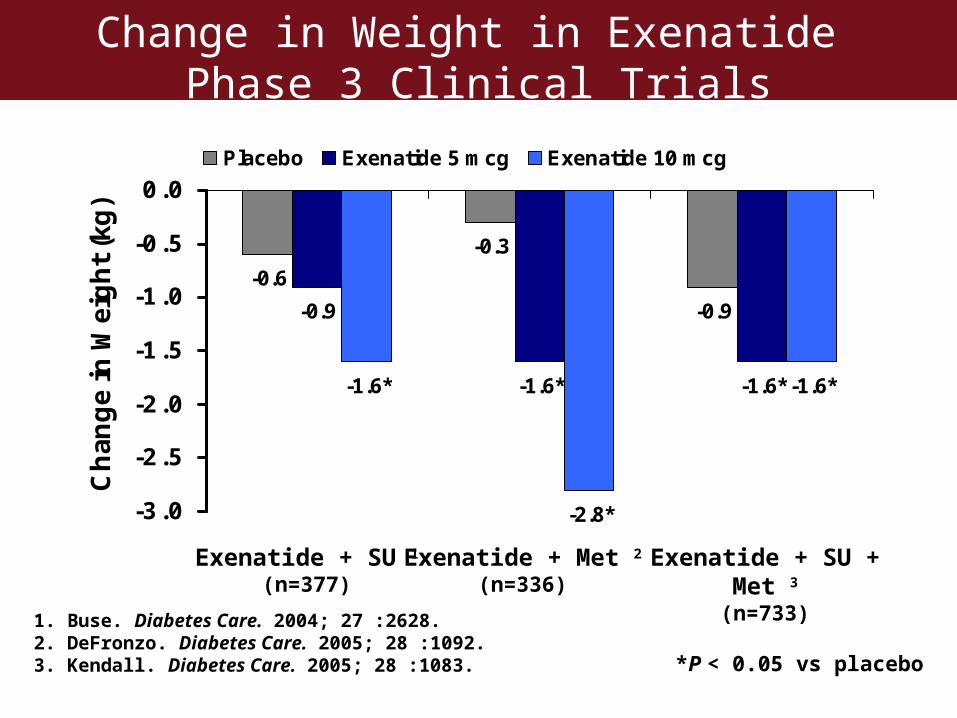
Change in Weight in Exenatide Phase 3 Clinical Trials
-0.6
-0.3
-0.9-0.9
-1.6*-1.6* -1.6*
-2.8*
-1.6*
-3.0
-2.5
-2.0
-1.5
-1.0
-0.5
0.0
Ch
ang
e in
Wei
gh
t (k
g)
Placebo Exenatide 5 mcg Exenatide 10 mcg
Exenatide + SU + Met 3
(n=733)Exenatide + SU 1
(n=377)Exenatide + Met 2
(n=336)
*P < 0.05 vs placebo
1. Buse. Diabetes Care. 2004; 27 :2628.2. DeFronzo. Diabetes Care. 2005; 28 :1092.3. Kendall. Diabetes Care. 2005; 28 :1083.
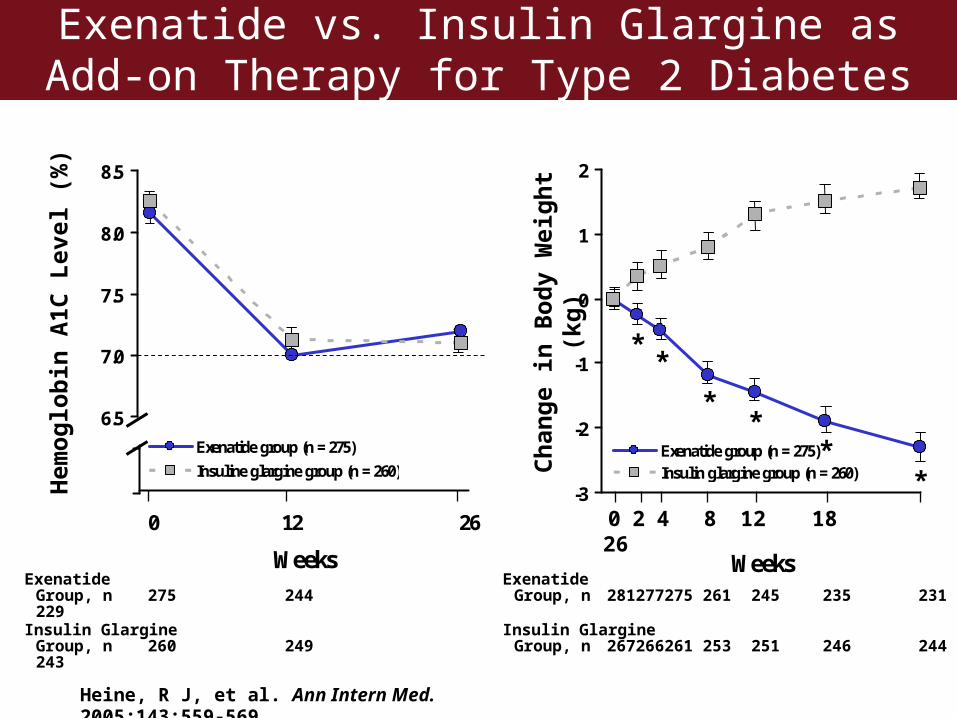
Exenatide vs. Insulin Glargine as Add-on Therapy for Type 2 Diabetes
Heine, R J, et al. Ann Intern Med. 2005;143:559-569.
0 12 26
WeeksExenatide
Group, n 275 244229
Insulin GlargineGroup, n 260 249243
Hem
oglo
bin
A1C
Lev
el (%
)
-3
-2
-1
0
1
2
Weeks
Exenatide group (n = 275)Insulin glargine group (n = 260)
6.5
7.0
7.5
8.0
8.5
Exenatide group (n = 275)
Insuline glargine group (n = 260)
**
**
**
0 2 4 8 12 1826
ExenatideGroup, n 281 277 275 261 245 235 231
Insulin GlargineGroup, n 267 266 261 253 251 246 244
Cha
nge
in B
ody
Wei
ght (
kg)
Liraglutide (NN2211)
• Compared with native GLP-1:– Has prolonged half-life of 11-15 hours
• Phase 2 clinical trials:– Insulin secretion increased – Post-prandial glucagon secretion suppressed – A1C decreased by 0.7-0.8%– Weight loss of 0.7 – 1.2 kg
Madsbad S, et al. Diabetes Care 2004; 27: 1335-42. Harder H, et al. Diabet Care 2004; 27: 1915-21.
Liraglutide (NN2211) vs Placebo
• Dose finding study in patients with diabetes– 165 patients with diet-controlled type 2 diabetes and
baseline A1C 8.1-8.5%– Liraglutide 0.65, 1.25, 1.9 mg Sub-Q daily vs. placebo
for 14 weeks– Fasting plasma glucose 16.7 mg/dL (p<0.001)– A1C 1.74% (mean improvement in 3 groups, p<0.001)– Reaching A1C < 7% were
• 43 - 50% of patients taking liraglutide• 8% of patients taking placebo
– Weight change -3 kg vs. 1.2 kg (p=0.039)– GI side effects were most common, highest incidence
was diarrhea (19.5%) and nausea (10%)
Vilsboll T, et al. ADA 2006 Annual Meeting, Abstract 115-OR
Sitagliptin (MK-0431)-Pioglitazone vs Placebo-Pioglitazone in Patients with Type 2 Diabetes
• Patients– All treated with pioglitazone (30-50 mg/day)– Baseline A1C, 7-10%
• First 24 weeks of treatment– Sitagliptin 100 mg/day given to 353 patients
• Results in sitagliptin-pioglitazone patients– Fasting plasma glucose 16.7 mg/dL (p<0.001)– A1C 0.85% (p<0.001)– 45% of patients reached A1C < 7% vs. 23% taking placebo– No change in weight– Slightly greater percent had hypoglycemia or any GI
adverse event
Rosenstock J, et al. ADA 2006 Annual Meeting, Abstract 556-P
Stein P. ADA 2006 Annual
Meeting.
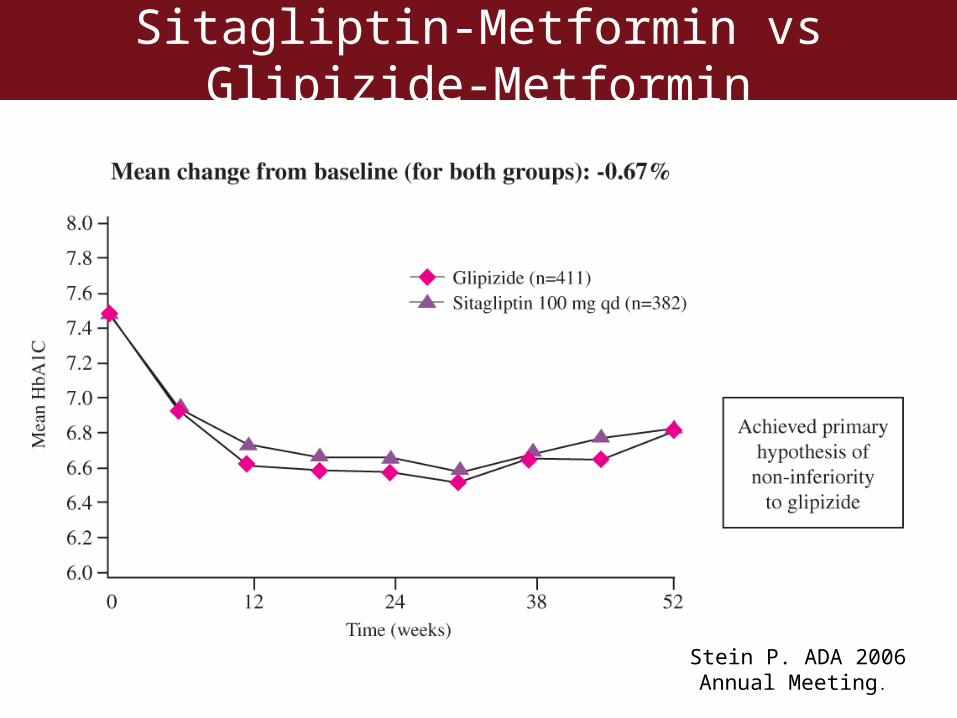
Sitagliptin-Metformin vs Glipizide-Metformin
Stein P. ADA 2006 Annual Meeting.
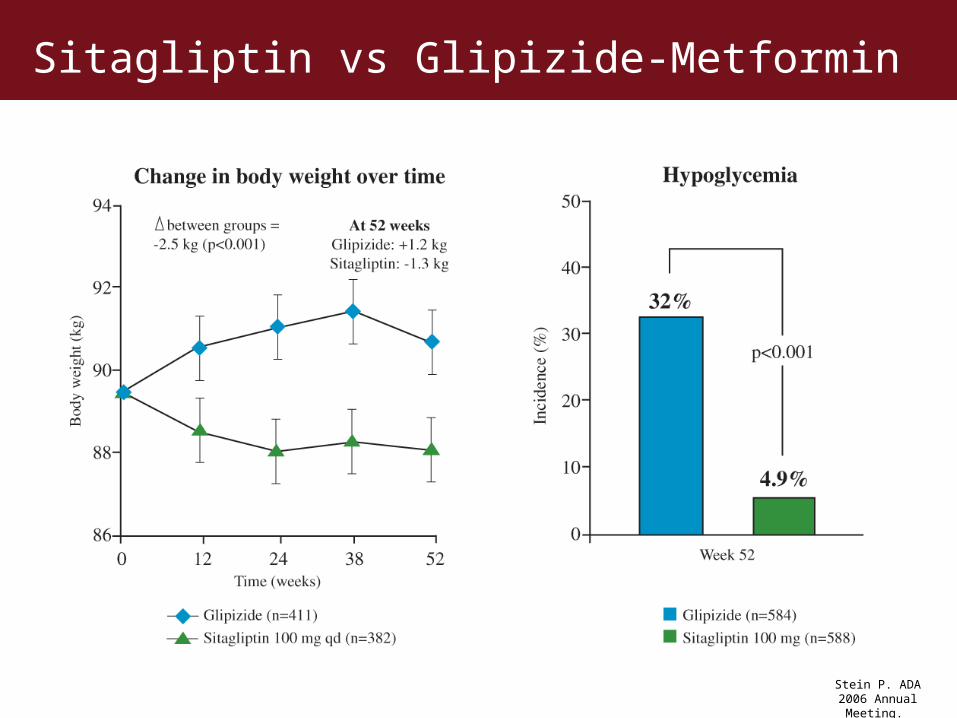
Sitagliptin vs Glipizide-Metformin

Vildagliptin (LAF237)
• Oral selective DDP-IV inhibitor• Like sitagliptin
– Prolonged half life– Can be administered once daily
• In rat models– Increased beta cell mass– Enhanced endogenous incretin activity
• Phase 2 clinical trials – Tested vildagliptin add-on therapy in patients treated with
metformin, or with pioglitazone• Reduces fasting BG• Reduces post-prandial BG and glucagon• No change to 24-hour insulin secretion
American Diabetes Association 2005 Annual Meeting, Abstracts 572-P and 2192-PO Ahrén B, et al. Diabetes Care 2004; 27: 2874-80.Ahrén B, et al. J Clin Endocrinol Metab 2004; 89: 2078-84.
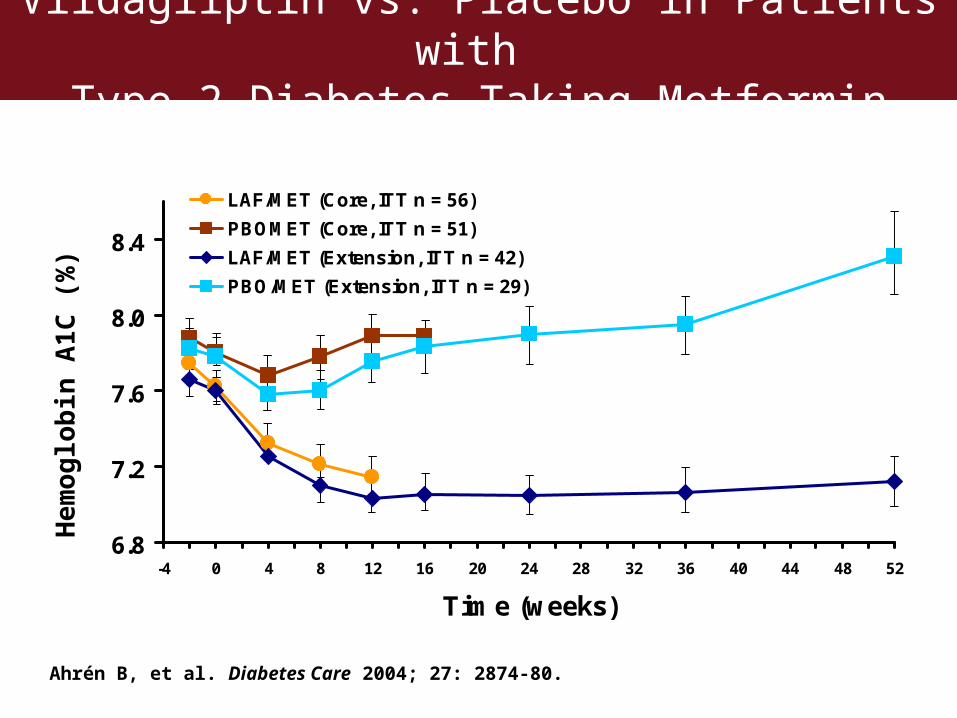
Vildagliptin vs. Placebo in Patients with Type 2 Diabetes Taking Metformin
6.8
7.2
7.6
8.0
8.4
-4 0 4 8 12 16 20 24 28 32 36 40 44 48 52
Time (weeks)
LAF/MET (Core, ITT n = 56)
PBOMET (Core, ITT n = 51)
LAF/MET (Extension, ITT n = 42)
PBO/MET (Extension, ITT n = 29)
Ahrén B, et al. Diabetes Care 2004; 27: 2874-80.
He
mo
glo
bin
A1
C (
%)
Vildagliptin (LAF237) Monotherapy
• Clinical trials with treatment naïve patients with type 2 diabetes– Randomized, blinded 52 week study in 780 patients
with mean baseline A1C = 8.7%– Vildagliptin 50mg BID vs. metformin 1000mg BID
• Results:– A1C 1.0% vs. 1.4% (statistically identical)– Weight change: +0.3 kg vs. -1.9 kg– Incidence of GI side effects lower (22% vs. 44%)
including diarrhea and abdominal pain– Mild hypoglycemia <1% in both groups
Dejager S, et al. ADA 2006 Annual Meeting, Abstract 120-OR
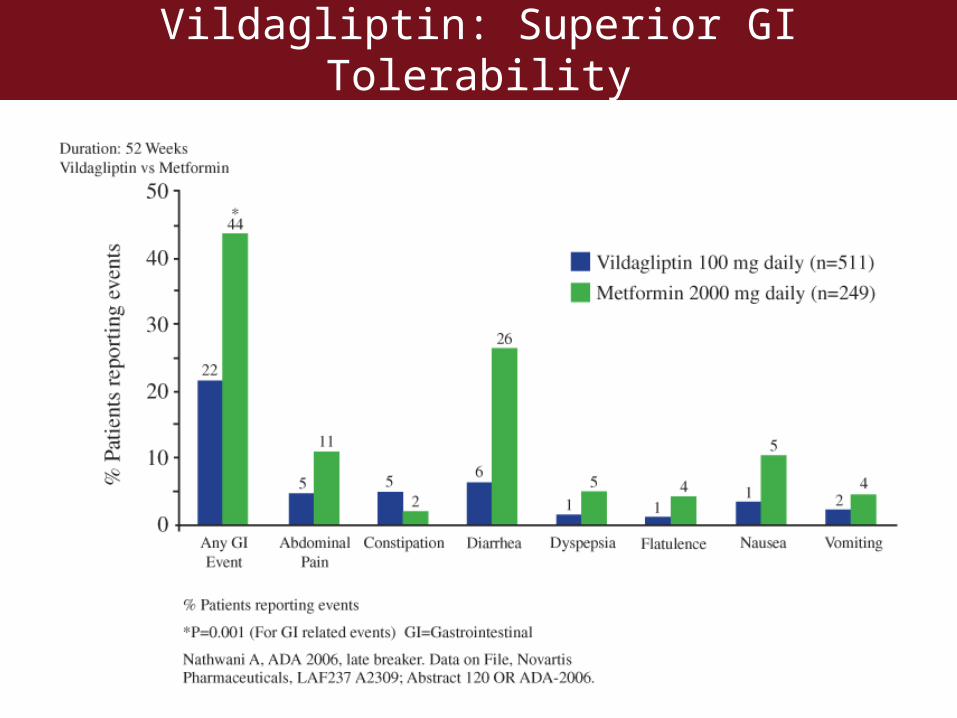
Vildagliptin: Superior GI Tolerability
Vildagliptin (LAF237) vs Rosiglitazone
• Monotherapy in treatment-naïve patients with type 2 diabetes– 697 patients and mean baseline A1C = 8.7%– Randomized, blinded 24 week study– Vildagliptin 50mg BID vs. rosiglitazone 8mg daily– A1C 1.1% vs. 1.2% (non-inferior difference)– Weight change: -0.3 kg vs. +1.6 kg– Changes in lipids compared to rosiglitazone: TG 9%,
LDL 16%, and Total -14% but smaller HDL – Incidence of LE edema was lower (2.5% vs. 4.9%)– Mild hypoglycemia <1% in both groups
Rosenstock J, et al. ADA 2006 Annual Meeting, Abstract 557-P
Vildagliptin (LAF237)
• Add on therapy to insulin– 256 patients with type 2 diabetes
• Insulin injection > 30 units/day)• baseline A1C = 7.5 - 11%
– Randomized, blinded 24 week study– Vildagliptin 50mg BID vs. placebo– Baseline insulin dose 80 units/day– A1C 0.5% vs. 0.2% (p=0.022)– Hypoglycemia was less frequent (33 vs. 45 patients) and
less severe (0 vs. 6 severe events)
Fonseca V, et al. ADA 2006 Annual Meeting, Abstract 467-P
Sitagliptin (MK-0431)
• A competitive, reversible DDP-IV inhibitor
• In healthy volunteers:– Single 100mg dose or 50mg daily provides
>80% inhibition of DDP-IV activity for 24 hrs– Increased GLP-1 plasma levels 2-fold– Well tolerated - did not cause hypoglycemia– Half life of 8-14 hours– Primarily eliminated unchanged in the urine
Herman GA, et al. Clin Pharmacol Ther 2005; 78: 675-88.Bergman A, et al. Clin Therapeutics 2006; 28: 55-72.
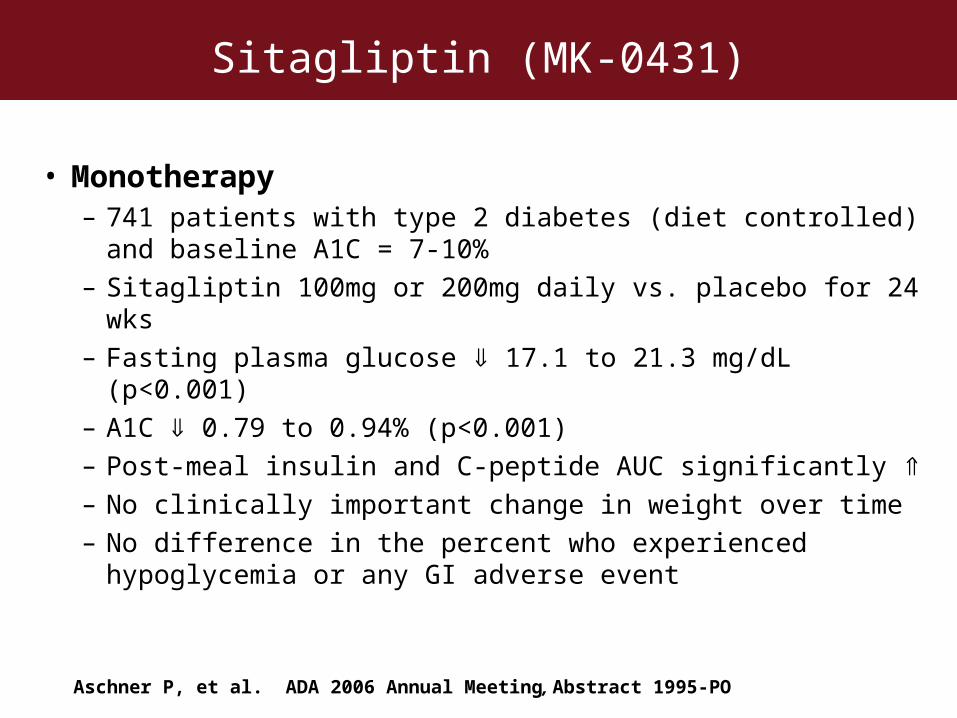
Sitagliptin (MK-0431)
• Monotherapy– 741 patients with type 2 diabetes (diet controlled) and
baseline A1C = 7-10%– Sitagliptin 100mg or 200mg daily vs. placebo for 24 wks– Fasting plasma glucose 17.1 to 21.3 mg/dL (p<0.001)– A1C 0.79 to 0.94% (p<0.001)– Post-meal insulin and C-peptide AUC significantly – No clinically important change in weight over time– No difference in the percent who experienced
hypoglycemia or any GI adverse event
Aschner P, et al. ADA 2006 Annual Meeting, Abstract 1995-PO
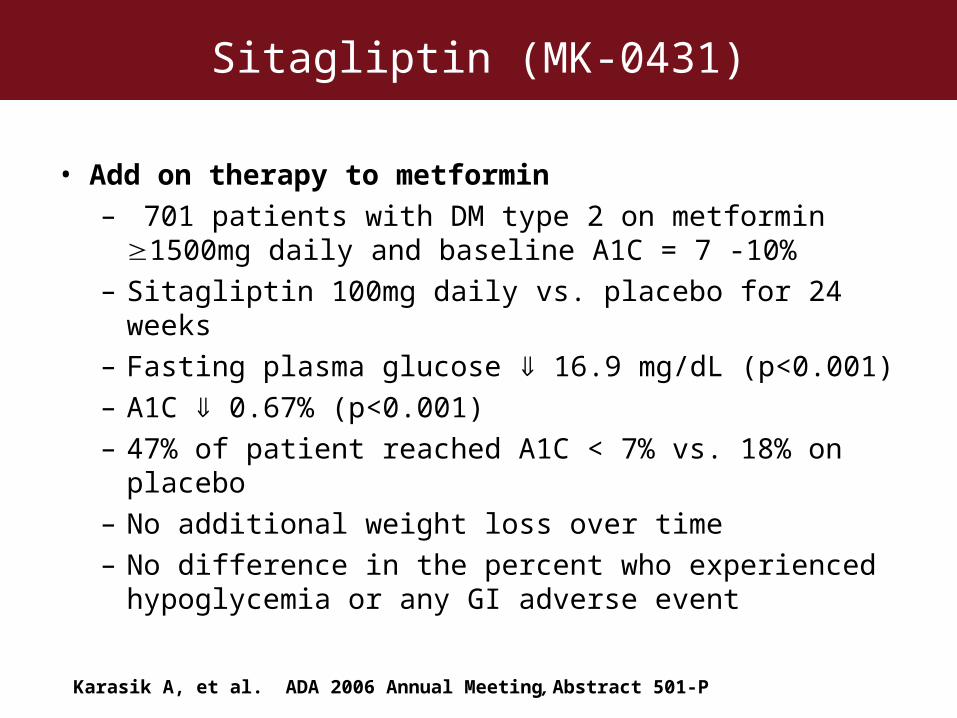
Sitagliptin (MK-0431)
• Add on therapy to metformin– 701 patients with DM type 2 on metformin 1500mg
daily and baseline A1C = 7 -10%– Sitagliptin 100mg daily vs. placebo for 24 weeks– Fasting plasma glucose 16.9 mg/dL (p<0.001)– A1C 0.67% (p<0.001)– 47% of patient reached A1C < 7% vs. 18% on placebo– No additional weight loss over time– No difference in the percent who experienced
hypoglycemia or any GI adverse event
Karasik A, et al. ADA 2006 Annual Meeting, Abstract 501-P
D. Gaps/Obstacles in Type 2 Diabetes Therapies and Treatment
Options
Classes of Therapies for Type 2 Diabetes
• Insulin and insulin analogues• Insulin secretagogues• Biguanides• Alpha-glucosidase inhibitors• Thiazolidinediones• Incretin mimetics• Dipeptidyl Peptidase (DPP)-4 inhibitors
– FDA approval requested for sitagliptin and vildagliptin
Recommendations for Treatment of Type 2 Diabetes
• Patients need to achieve glycemic control
• Patients need to be counseled on lifestyle changes by exercise and weight loss through dietary changes and calorie restriction
• Blood AIC should be measured– Biannually in stable patients meeting glycemic
goals– Quarterly in patients not meeting glycemic goals or
whose therapy has changed
American Diabetes Association. Diabetes Care. 2006;29:S43-S48.
Consequences of Antihyperglycemic Therapy Use
• Patients frequently
– Gain weight
– Have increased risk of hypoglycemia especially when treated with insulin and insulin secretagogue
– Have inadequately controlled postprandial hyperglycemia
– Have wide glycemic fluctuations
– Lack long-term glycemic control
– Do not understand the importance of
• Rigorous adherence to diet and exercise programs
• Frequent blood glucose monitoring
Weight Management
• Overweight and obesity – Strongly linked to the development of type 2 diabetes– Can complicate management of type 2 diabetes– Independent risk factor for hypertension, dyslipidemia,
cardiovascular disease • Moderate weight loss
– Improves glycemic control– Reduces CVD risk– Can prevent the development of type 2 diabetes
• Primary approach for achieving weight loss– Reduction in energy intake and an increase in physical activity
(therapeutic lifestyle change)– Decrease of 500 –1,000 kcal/day will result in weight loss of
1–2 lb/week
American Diabetes Association. Diabetes Care. 2006;29:S43-S48
Prevention or Delay of Type 2 Diabetes
• ADA recommendations for patients with impaired glucose tolerance (IGT). They– Need to be taught benefits of modest weight loss and
regular physical exercise– Need follow-up counseling– Need to be monitored for development of type 2 diabetes– Need to be counseled to lower risk of cardiovascular
disease by being treated for hypertension, dyslipidemia and stopping smoking
– Should not be routinely treated with diabetes drugs until more information is known about cost-effectiveness
American Diabetes Association. Diabetes Care. 2006;29:S43-S48.
Diabetes: Strategies to Achieve Optimal Glycemic Control
• Development and progression of complications can be delayed by treating patients with type 2 diabetes for
– Obesity
– Glycemic control
– Hypertension and dyslipidemia
• Most patients with diabetes do not achieve treatment goals.
• While conventional treatments work well in some patients, in others they are associated with unmet needs including
– Weight gain
– Postprandial hyperglycemia
– Hypoglycemia
– Progressive loss of glycemic control and β-cell function and mass
• Newer therapies may help more patients achieve treatment goals
Related Documents