Welcome message from author
This document is posted to help you gain knowledge. Please leave a comment to let me know what you think about it! Share it to your friends and learn new things together.
Transcript

A Transportation Vision for the City of Toronto Official Plan
1. IntroductionThis report describes the development of a transportation ‘vision’ to serve as the basis forthe transportation component of the new Official Plan now being prepared for theamalgamated City of Toronto. The transportation component is intended to complementvalues and goals embodied in the new Plan and provide flexibility to adapt to the rapidlychanging environmental, economic, and institutional conditions under which the newCity will function.
The transportation component is expected to include:
• policies regarding pricing and finance, transit priority, aspects of urban designthat promote the use of more environmentally friendly modes of transportationsuch as walking and cycling, improvements in goods movement, and protection ofthe environment,
• priorities for investment in transportation infrastructure such as new rapid transitroutes, commuter rail stations, and major renovation to key elements of theexisting system, and
• targets such as transit ridership, reductions in greenhouse gas emissions, andaccessibility for the disadvantaged which are important for measuring progresswith respect to achieving goals.
Interest in a new vision of transportation for the City of Toronto implies some degree ofdissatisfaction with the existing system and the likelihood that it will be able to serveincreased demand resulting from population growth both within and external to the City.Depending upon the point of view, sources of dissatisfaction may include:
• unacceptable congestion and delay,• insufficient road capacity for automobiles and trucks,• the general level of service provided by the transit system,• costs (both public and private),• effects of congestion on goods movement and economic competitiveness,• encouragement of unsustainable forms of growth such as urban sprawl,• safety (injuries and fatalities), particularly for pedestrians and cyclists,• accessibility for specific groups or geographic areas within the community,• traffic impacts on neighbourhoods,• effects on pollution and health, and• contribution to greenhouse gas emissions and climate change.
City of Toronto, Urban Development Services 2
By and large, there is a growing awareness that these problems result directly fromincreased dependence on private automobiles -- a worldwide trend that essentiallyconflicts with the increased interest in sustainable development and moreenvironmentally friendly transportation. Support for that view can be inferred from:
• increasing concerns about congestion, public health impacts ofautomobile use, road safety, urban sprawl, and the high costs associatedwith public transportation, noted above,
• specific policies now being debated by the City’s Environmental TaskForce, national and provincial Round Tables on the Economy and theEnvironment, and the influential Transportation Association of Canada,and
• commitments made by the Government of Canada to achieve substantialreductions in greenhouse gas emissions under the Kyoto Agreement.
Development of a vision of transportation for the future is important for several reasons.First, as already noted, the vision provides a rationale for those proposals andrecommendations that will eventually be presented to City Council.
Second, the process itself can be a useful means of ensuring that the interests andconcerns of as wide a range as possible of constituencies are taken into account beforeformulating specific policies and recommendations.
Third, the rationale included in the vision statement provides a context for assessing themerits of ad hoc transportation proposals or initiatives that so often appear on the urbantransportation scene. Such proposals typically deal with the concerns of special interestgroups or may be promoted by commercial interests in isolation of broader transportationneeds of the entire community.
In short, the fundamental reason for defining a ‘new’ vision of transportation is toprovide a basis for transportation and land use planning that will counteract as many aspossible of the perceived negative impacts of the current system on the community, theeconomy, and the environment, while contributing simultaneously to orderly economicgrowth and development. Committing to a new or revised vision essentially means thatcontinuation of the status quo is not acceptable or good enough, and that at least withrespect to transportation, the future City should be different from the one we now know.
Section 2 of the report describes the process followed in developing the vision statement,a statement that is perceived largely as a response to both present and anticipatedproblems associated with emerging trends in growth, land use and travel patterns.Section 3 provides a rather simplified explanation of the key factors that, on one hand,are generally agreed upon to contribute to increasing automobile dependence and, on theother, to the increasing difficulty of serving traditional growth patterns by publictransportation. Certainly, it can be skipped by those already familiar with the urbantransportation problem.
City of Toronto, Urban Development Services 3
The existing transportation system serving the City of Toronto is described in Section 4in terms of general characteristics and performance. Section 4 also highlights changes intravel patterns over the period 1986 to 1996 (for which the best data are available) andstresses the high degree of interdependence between travel within the City anddevelopment elsewhere in the Greater Toronto Area (GTA).
Section 5 provides selected data on travel projections based on extrapolation of currenttrends to provide some indication of the magnitude of changes and new pressures that canbe expected over the next 20 or so years. This section begins with a a brief summary oftravel forecasting methods, primarily to explain the sensitivity and reliability of theforecasting process to the main assumptions about growth and distribution of populationand employment throughout the GTA. The explanation of forecasting methods can alsobe skipped by those already familiar with transportation modeling.
Section 6 of the report attempts to integrate data and information about the presentsystem, viewpoints of a diverse set of constituents, and the best information currentlyavailable about future transportation pressures, into a transportation vision statementconsistent with the major thrust of the new Official Plan. That vision statement is thensupplemented by a number of guiding principles which might serve as the basis fordeveloping transportation plans and priorities.
Finally, on the basis of these principles, Section 7 describes a number of ‘next steps’ forproceeding with development of the transportation component of the Official Plan.Sections 6 and 7 basically treat the main policy initiatives of the visioning process andmany readers may wish to move directly to those sections.
City of Toronto, Urban Development Services 4
2. The Visioning ProcessThe term ‘vision’ describes the characteristics or attributes of the transportation system tobe embodied in the Official Plan for the City. Those attributes have many dimensionsincluding, but not limited to:
• the degree of integration between land use and roads, parking, and transit, as wellas between local, inter-regional, and intercity transportation,
• road system characteristics,
• transit system characteristics in terms of fares, ridership, mode share, costrecovery, coverage, and general performance,
• accessibility to transit for those with special needs and those without cars,
• friendliness of the system for pedestrians and cyclists,
• costs and travel times related to the movement of goods,
• levels of automobile ownership and use,
• parking policies and pricing, both on-street and off-street,
• energy consumption, air pollution and greenhouse gas emissions related totransportation, and
• methods of finance and funding.
Attributes are largely outcomes of three sets of basic factors, namely,
• the overall economic and demographic environment within which the Cityfunctions,
• transportation and land use decisions made within the City of Toronto, and• external public policy decisions made by other municipalities of the Greater
Toronto Area (GTA), the Government of Ontario, and the Government of Canada.
Overall prospects for growth and economic development of the City will be influencedby:
• provincial, national and even global economic conditions,• inter-provincial and international immigration,• the North American Free Trade Act, and• commercial decisions and marketing practices of key industries such as the
automotive sector.
City of Toronto, Urban Development Services 5
Although the City has little or no direct control over these factors, indirectly, they doinfluence general transportation needs and performance of the transportation systemitself.
By contrast, the City’s own land use and transportation policies have a direct effect ontransportation needs and performance, as well as other attributes of the transportationsystem that eventually emerges. Internal City policies on zoning and other land usecontrols, capital investment in roads and public transportation, fare and parking policies,and regulations pertaining to truck movements and the use of road space, for example, arejust some of the more important factors that influence where, how, and when individualstravel.
Travel patterns within the City are also influenced by a variety of external transportationand land use policies. Automobile oriented residential development and relativelymodest transit services in neighboring municipalities both contribute to more use ofautomobiles for trips to the City. Provincial funding (or lack thereof) for GO Transit andmunicipal transportation also have a strong influence on travel within the City. Inaddition, federal government policies such as tax regulations influence automobileownership and use and motor vehicle regulations have an important impact on vehicularemissions and air pollution. (Exemptions for vans and sports utility vehicles fromvoluntary industry standards for automotive fuel consumption, for example, contributesignificantly to the growth in greenhouse gas emissions.)
Due to the economic interdependence of the entire GTA, these internal City and externalfactors are highly inter-related. Decisions about TTC expansion and fare policies, forexample, influence how neighboring municipalities design their own transit systems.Moreover, City investment in rapid transit expansion and major projects such as UnionStation is strongly influenced by inter-regional travel, and much of the City’s roads’needs derive from land development patterns in the surrounding municipalities.
Interaction between transportation related policies and decisions of the City and those ofthe surrounding municipalities has, of course, long been recognized in numerous studies.These include the provincial government’s Metropolitan Toronto and RegionTransportation Study (1966), Design for Development: The Toronto Centered RegionConcept (1971), the Metropolitan Toronto Transportation Plan Review (1975) andnumerous GTA studies sponsored by the Ontario Ministry of Transportation and theprovincial Office of the Greater Toronto Area.
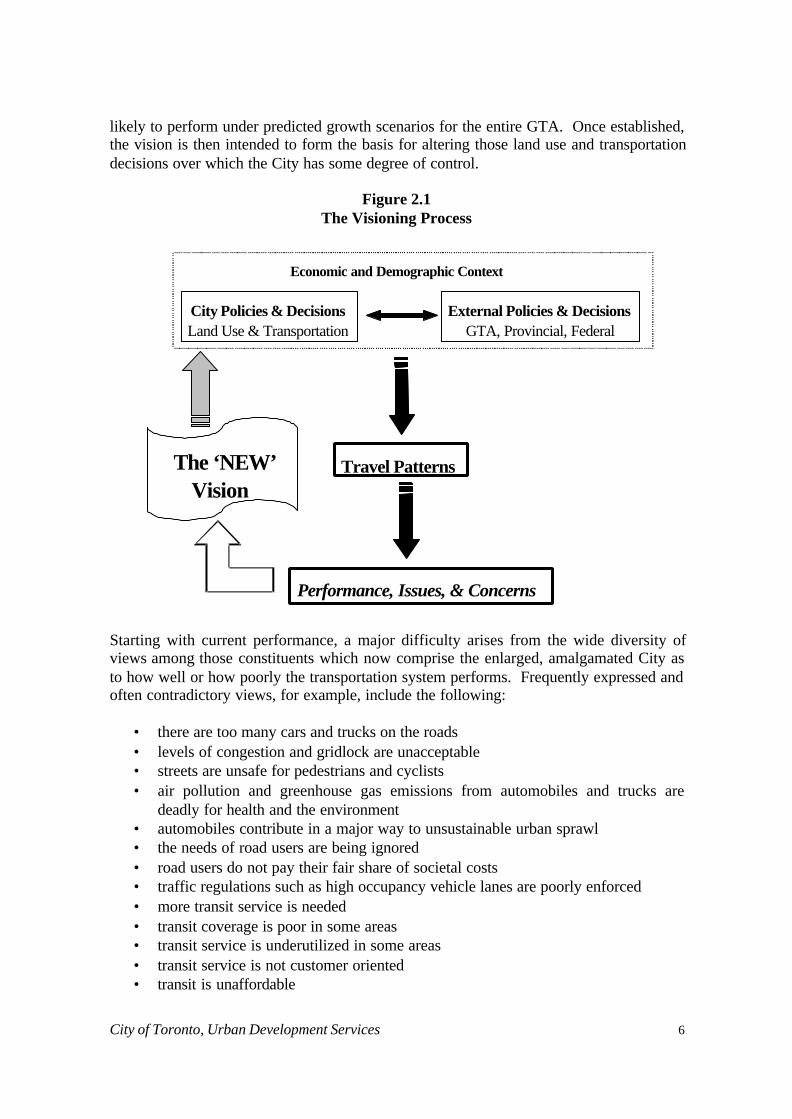
As suggested in Figure 2.1, within the broader economic setting, the combination of Cityand external (GTA and provincial) policies and decisions is the main determinant oftravel patterns that emerge at any particular point in time. The combined effect on travelpatterns basically dictates how the transportation system performs in terms of travel timeand delays, congestion, safety, costs, effects on the local economy, air pollution, andgreenhouse gas emissions.
The underlying assumption of the visioning process is that the vision statement shouldrespond to weaknesses in how the present transportation system performs and how it is
City of Toronto, Urban Development Services 6
likely to perform under predicted growth scenarios for the entire GTA. Once established,the vision is then intended to form the basis for altering those land use and transportationdecisions over which the City has some degree of control.
Figure 2.1The Visioning Process
Starting with current performance, a major difficulty arises from the wide diversity ofviews among those constituents which now comprise the enlarged, amalgamated City asto how well or how poorly the transportation system performs. Frequently expressed andoften contradictory views, for example, include the following:
• there are too many cars and trucks on the roads• levels of congestion and gridlock are unacceptable• streets are unsafe for pedestrians and cyclists• air pollution and greenhouse gas emissions from automobiles and trucks are
deadly for health and the environment• automobiles contribute in a major way to unsustainable urban sprawl• the needs of road users are being ignored• road users do not pay their fair share of societal costs• traffic regulations such as high occupancy vehicle lanes are poorly enforced• more transit service is needed• transit coverage is poor in some areas• transit service is underutilized in some areas• transit service is not customer oriented• transit is unaffordable
City Policies & DecisionsLand Use & Transportation
External Policies & DecisionsGTA, Provincial, Federal
Travel Patterns
Performance, Issues, & Concerns
The ‘NEW’Vision
Economic and Demographic Context
City of Toronto, Urban Development Services 7
• transit fares are too high• transit service is too slow• cross boundary transit services are poorly integrated• inefficient truck movement reduces economic competitiveness• trucks are responsible for most of the serious highway accidents• transportation planners are overly concerned with peak period trips only• too little money is being invested in transit• too little money is being invested in roads.
The diversity and often contradictory nature of these views merely illustrate thattransportation issues, needs, and priorities are all perceived differently by the variousconstituencies which comprise the amalgamated City of Toronto -- constituencies thatinclude a variety of socio-economic and special interest groups, transportation serviceproviders, and authorities responsible for fiscal management. Under these circumstances,reaching agreement on a vision of transportation as defined by basic priorities fortransportation investment, requisite policies, and formal actions is essentially a problemin dispute resolution.
Traditionally, the vision incorporated in previous transportation plans for Toronto hasbeen based on the concept of ‘balanced transportation’ -- a concept in which individualsare intended to have considerable choice among alternative means of high qualitytransportation, primarily automobile or transit oriented.
The Official Plan adopted by the former Metropolitan Toronto Council, for example, isbased “on a vision of Metropolitan Toronto as a sustainable, diverse urban communitythat is environmentally, economically and socially healthy”. For the transportationcomponent, that vision was interpreted as:
(moving) people and goods within and across the Metropolitanboundaries, safely, conveniently, and reliably by providing an integratedand accessible transportation system (comprised of) a balanced range oftravel options.1
The general decline in transit use and increasing road congestion which has beenexperienced throughout the City and the rest of the GTA, coupled with a variety of social,economic, environmental, land use and financial concerns, however, now raises doubts asto either the desirability or feasibility of maintaining this commitment to balancedtransportation. In other words, recent trends suggest that under a balanced concept, theuse of private automobiles dominates area wide travel patterns, often to the detriment ofmore effective transit service and other more environmentally friendly forms oftransportation such as walking and cycling. Recent forecasts of expected growth andcongestion which seem to attract so much media attention further add to the growingperception that more planning emphasis should be placed on alternatives to theautomobile.
11 The Liveable Metropolis, The Official Plan of the Municipality of Metropolitan Toronto,Toronto: December 1994.
City of Toronto, Urban Development Services 8
In short, depending on whose views are considered, weaknesses of the transportationsystem range from perceiving the private automobile as a major threat to a livable city toviewing further investment in public transportation as wasteful of increasingly scarceresources. Part and parcel of assessing this range of views involves dialogue with variousconstituencies of which the City of Toronto is comprised, a debate that might be usefullyserved by considering certain information on present and predicted transportationcharacteristics.
3. The Transportation Problem in ContextTransportation is often described as a ‘derived’ demand, meaning that other than foroccasional trips where travelers wish to experience the “freedom of the road” or may takesome delight in travel by bus, rail, or new technology because of its novelty, trips aremade to satisfy some other purpose like working, shopping, or going to school.
Generally speaking, transportation problems arise when too many individuals try to travelat roughly the same time on a limited number of transportation facilities. Thus a largenumber of commuters trying to use the same expressway or rapid transit route createcongestion and related adverse effects because the total demand for use of these facilitiesexceeds their capacity at that particular time.
Aside from issues of capacity, other transportation problems experienced by pedestrians,cyclists, trucking, and local delivery services have not attracted as much attention on anarea-wide basis. Urban design features such as the lack of sidewalks and poorconnectivity of streets, as well as traffic engineering priorities and street geometry, cancontribute to an unfriendly and unsafe environment for pedestrians and cyclists alike. Inaddition, trucks, couriers, and service vehicles both contribute to and suffer from generaltraffic congestion in ways that appear to detract from objectives for increased economiccompetitiveness of the City.
Although walking constitutes an integral component of almost all trips and the relativeimportance of cycling is on the rise, the largest proportion of all travel is still made first,by private automobile and second, by public transportation. For this large segment of thetotal travel market, some modes such as subways are inherently capable of providinghigher capacity (perhaps as much as 35,000 passengers per hour) than others, such asexpressways (perhaps 1800 to 2000 automobile equivalents per hour per lane). For thisreason, large cities like Toronto place considerable emphasis on building and operatingthese higher capacity and presumably more ‘efficient’ forms of transportation.
Performance of major routes, of course, is not the only determinant of travel decisions.Individuals are influenced primarily by the relative travel time, convenience, and cost ofthe entire ‘door-to-door’ trip. In Toronto, for example, the higher speed and reliability ofthe subway for a downtown work trip is often offset by the added time and inconvenienceto reach a subway station, particularly at the origin end of the typical journey to work.
City of Toronto, Urban Development Services 9
In many cases, ‘park-and-ride’ or ‘kiss-and-ride’ facilities greatly improve access tomajor stations and terminals of both the TTC subway and the GO Transit commuter railsystems. For many other trips, however, walking distances and/or the travel and waitingtimes associated with feeder bus and streetcar routes often detract from thecompetitiveness of transit relative to the private automobile. In addition, even for thosewho have a real choice between private and public transportation, perceived differencesbetween transit and automobile costs (that sometimes affect choice) may understate realdifferences due to hidden subsidies and external costs. Hidden subsidies includeemployer provided car allowances and parking, as well as Revenue Canada regulationsthat permit deductions for automobile but not transit use. External costs refer to costsimposed on society but not paid for by the user (such as environmental damage, airpollution, and greenhouse gas emissions).2
For some of these reasons, it is not surprising that the majority (about 65 percent) of alltrips today in the City of Toronto, including those originating in the surrounding regionalmunicipalities, are made by private automobiles. Moreover, because recent trends showa decline in the proportion of trips taken by public transportation (transit mode split),ways of improving both the competitiveness and effectiveness of transit to combatgrowing dependence on the automobile continues to be one of the major pre-occupationsof transportation planners and elected officials.
The effectiveness with which public transportation service can be provided in anyurbanized area depends primarily upon travel patterns -- the general pattern of origins anddestinations being the determining characteristic. Travel patterns are strongly influencedby land use, automobile ownership, demographic characteristics such as age and income,and by the spatial and service characteristics of the transit network itself, all of which arehighly interrelated. Other factors, including pricing and special regulations such aspriority treatment for transit vehicles, also influence transit attractiveness andeffectiveness.
Practically speaking, the competitiveness or advantages of public transportation relativeto the private automobile depend primarily on the following key factors:
socio-economic and demographic characteristics,population and employment densities,work trip patterns,transit route configuration, service levels, and fares, as well astransit priority.
Socio-economic CharacteristicsThe use of transit is certainly influenced by a variety of socio-economic factors includingage, income, and automobile ownership. Clearly, those too young or too old to drive orthose without automobiles are more likely to use transit and depending upon trip purpose,
2 In fact, alleged hidden subsidies and external costs are the subject of considerable interest in socalled ‘full cost pricing’, a method intended to extract the full costs of the external impactsimposed by automobile use on society from road users.
City of Toronto, Urban Development Services 10
may walk or use bicycles. Data for 1996, for example, show that the proportion of tripsmade by transit
• is highest (about 46 percent) for those too young to drive (11-15 years),• declines to about 30 percent for the 16-24 age group,• subsequently declines continuously to about 7 percent by age 64, and• then increases to about 13 percent for those above 75.
In addition, the data show that for any given age group, trip making by transit is higherfor females than for males (by as much as 50 percent in the 30 to 50 age group).
Although income data are not obtained directly in GTA travel surveys, other data show astrong (negative) relationship between automobile ownership rates (which, in turn, can becorrelated with income) and the use of public transportation throughout the GTA. Themajor exception occurs in the case of long distance commuting by rail where about 80percent of GO Transit users do have an automobile available as an alternative.
Simply stated, transit ridership originating within the City is dominated by those who, forreasons of age or income, do not have access to a private car and by females who,historically, have been less likely to be licensed drivers relative to males. Even for thosewith access to cars, depending upon income, the costs of operation and parking alsoinfluence their choice of travel mode. For these users, of course, transit fares may playan important role in determining how much use is made of the transit system, particularlyfor discretionary travel.
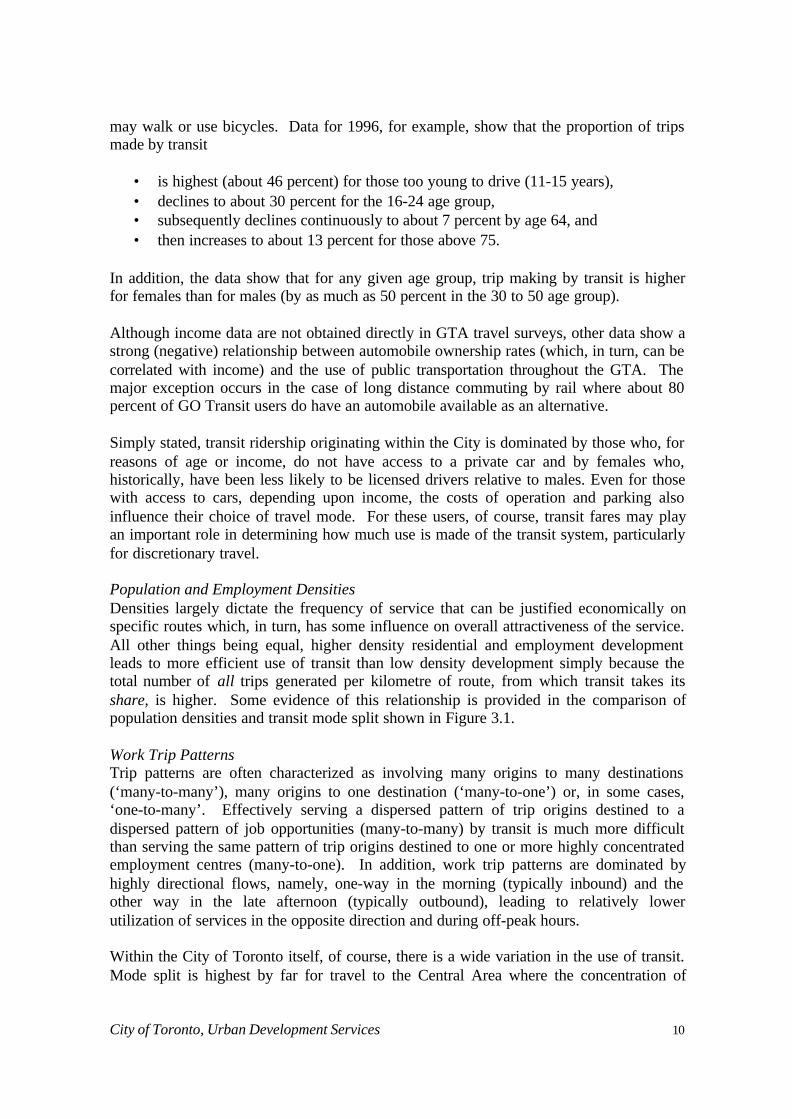
Population and Employment DensitiesDensities largely dictate the frequency of service that can be justified economically onspecific routes which, in turn, has some influence on overall attractiveness of the service.All other things being equal, higher density residential and employment developmentleads to more efficient use of transit than low density development simply because thetotal number of all trips generated per kilometre of route, from which transit takes itsshare, is higher. Some evidence of this relationship is provided in the comparison ofpopulation densities and transit mode split shown in Figure 3.1.
Work Trip PatternsTrip patterns are often characterized as involving many origins to many destinations(‘many-to-many’), many origins to one destination (‘many-to-one’) or, in some cases,‘one-to-many’. Effectively serving a dispersed pattern of trip origins destined to adispersed pattern of job opportunities (many-to-many) by transit is much more difficultthan serving the same pattern of trip origins destined to one or more highly concentratedemployment centres (many-to-one). In addition, work trip patterns are dominated byhighly directional flows, namely, one-way in the morning (typically inbound) and theother way in the late afternoon (typically outbound), leading to relatively lowerutilization of services in the opposite direction and during off-peak hours.
Within the City of Toronto itself, of course, there is a wide variation in the use of transit.Mode split is highest by far for travel to the Central Area where the concentration of
City of Toronto, Urban Development Services 11
employment and commercial activity is also the highest. Where densities are higher,particularly if there is a reasonable mix of residential and other land uses, there is alsogreater likelihood of trips being made by walking or cycling.
Figure 3.11996 GTA Municipal Population Densities and Mode Split
Route Configuration, Service levels, and FaresRoute configuration refers to the general layout of the network and spacing betweenroutes, two important features that determine how well distinct travel patterns can beserved. The TTC’s grid system of closely spaced bus and streetcar routes, for example,makes it easier to travel from almost any origin to almost any destination with one or twotransfers, at most. As a result, this closely spaced, grid street system is well suited forserving both the many-to-many travel, as well as the many-to-one pattern, so long as theterm ‘one’ is broadly defined to include major nodes or concentration of activity as existin downtown Toronto and the North York and Scarborough city centres.
By contrast, a radial system in which most routes serve a common terminal is best suitedto the many-to-one pattern noted above. Essentially, the TTC subway system serving theCentral Area, as well as GO Transit’s existing network of rail services can be describedin this manner.
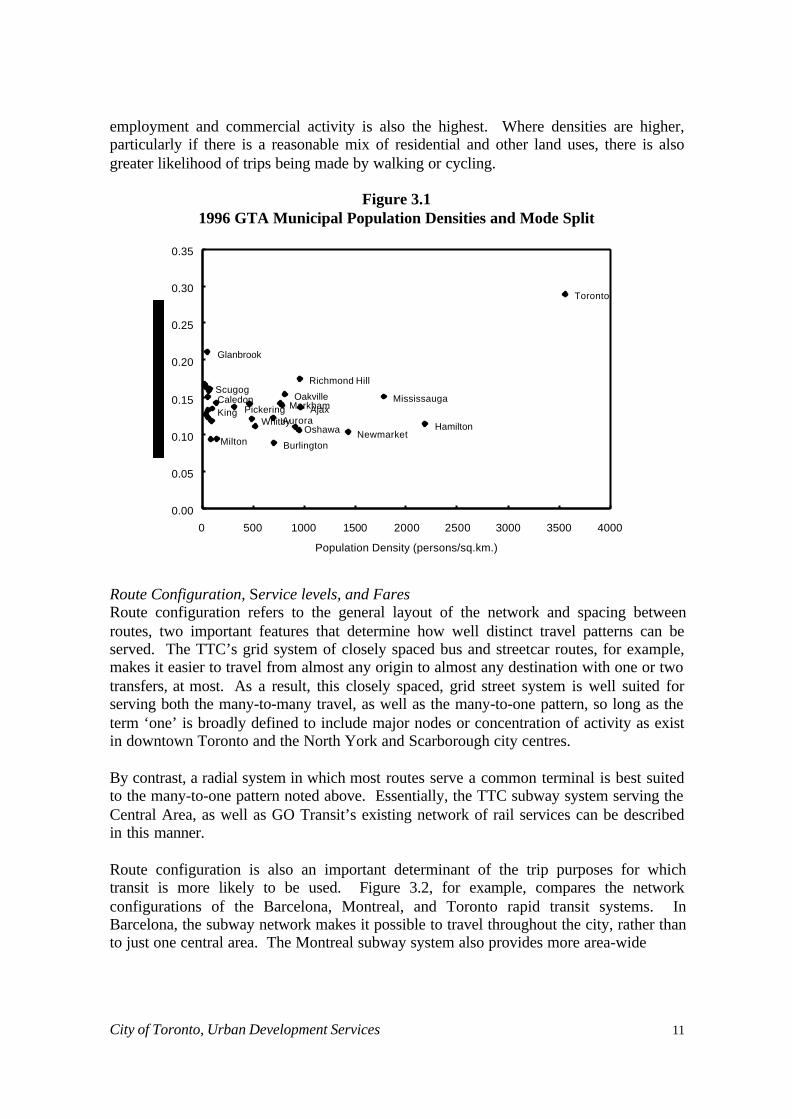
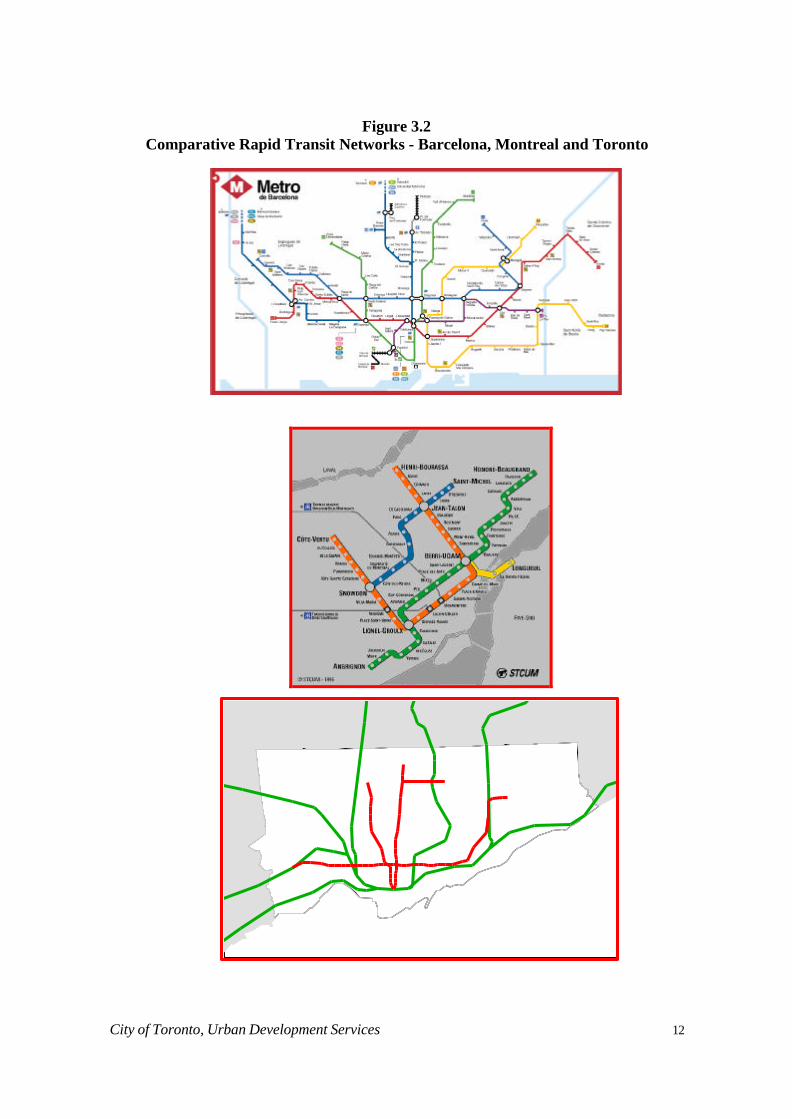
Route configuration is also an important determinant of the trip purposes for whichtransit is more likely to be used. Figure 3.2, for example, compares the networkconfigurations of the Barcelona, Montreal, and Toronto rapid transit systems. InBarcelona, the subway network makes it possible to travel throughout the city, rather thanto just one central area. The Montreal subway system also provides more area-wide
Toronto
Scugog
Pickering AjaxWhitby
Oshawa NewmarketAurora
Richmond Hill
MarkhamKingCaledon Mississauga
Milton
Oakville
Burlington
Glanbrook
Hamilton
0.00
0.05
0.10
0.15
0.20
0.25
0.30
0.35
0 500 1000 1500 2000 2500 3000 3500 4000
Population Density (persons/sq.km.)
City of Toronto, Urban Development Services 12
Figure 3.2Comparative Rapid Transit Networks - Barcelona, Montreal and Toronto
1
City of Toronto, Urban Development Services 13
coverage than Toronto’s system which provides excellent service, largely to the CentralArea. A number of discontinuities, however, combined with missed opportunities forTTC and GO Transit integration, lead to lower overall ‘connectivity’.
Aside from route structure itself, frequency of service, hours of operation, and fare levelsobviously influence transit competitiveness. In the case of commuter rail services, forexample, except for the Lakeshore routes, service is generally unavailable during off-peak periods or on the weekends, and for a number of TTC bus routes, frequency ofservice in off peak periods and on weekends also detracts from transit competitiveness.
Transit fares are also perceived to influence choice of travel mode, particularly for inter-regional trips where more than one fare must be paid for a ‘single’ trip. Even within theCity, there is strong opposition in some circles to any increase in transit fares which areviewed as detrimental to transit competitiveness.3
Transit PriorityFor surface transit (buses and streetcars), the time required for boarding and alighting, aswell as delays at traffic signals, further reduce travel time competitiveness relative to theprivate car. Methods of fare collection such as exact fare and passes can shorten transitvehicle time at stops, but random delays at traffic controlled intersections, often causedby automobile turning movements, further detract from transit competitiveness.4
Unlike typical subway operations where transit priority is guaranteed, the use of transitpriority schemes for surface transit offers benefits both to users and operators of thesystem largely as a result of economies of scale that can be achieved. For example,through priority treatment,
• travel times by transit are reduced,• the increase in speed attracts additional users, and• frequency of service can be increased without any increase in either the number of
vehicles or drivers which, in turn,• further adds to the attractiveness of the service.
In other words, effective application of transit priority means that higher route capacitycan be provided with the same number of vehicles or, alternatively, the same capacity canbe provided with fewer vehicles and drivers.
Transit priority can be achieved through a variety of means including reserved lanes,protected right of way (where other vehicles have no practical means of access), andsignal priority at intersections. Obviously, there will be some negative impacts on
3 Note however, that recent TTC surveys suggest that transit use is more sensitive to convenienceand frequency of service than to fares.4 In fact, on the Bay Street ‘clearway’, bus ridership increased significantly due to theperception of transit priority, even though there was no measurable increase in averagespeed.
City of Toronto, Urban Development Services 14
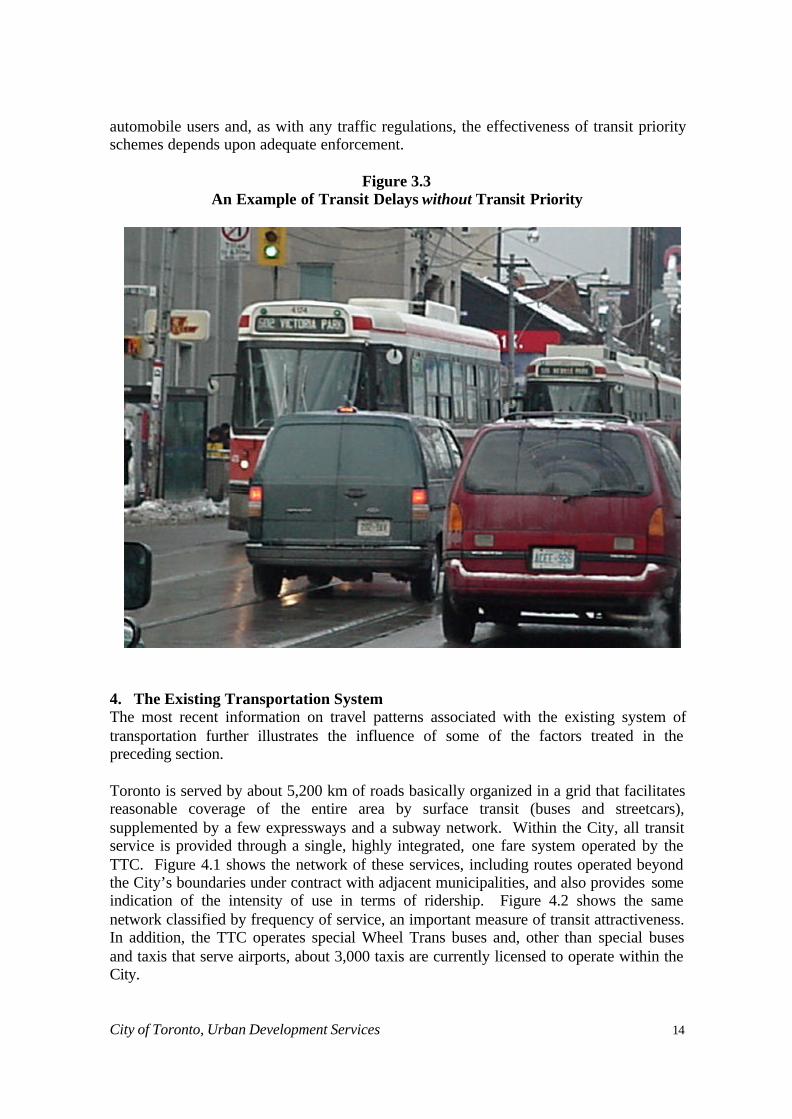
automobile users and, as with any traffic regulations, the effectiveness of transit priorityschemes depends upon adequate enforcement.
Figure 3.3An Example of Transit Delays without Transit Priority
4. The Existing Transportation SystemThe most recent information on travel patterns associated with the existing system oftransportation further illustrates the influence of some of the factors treated in thepreceding section.
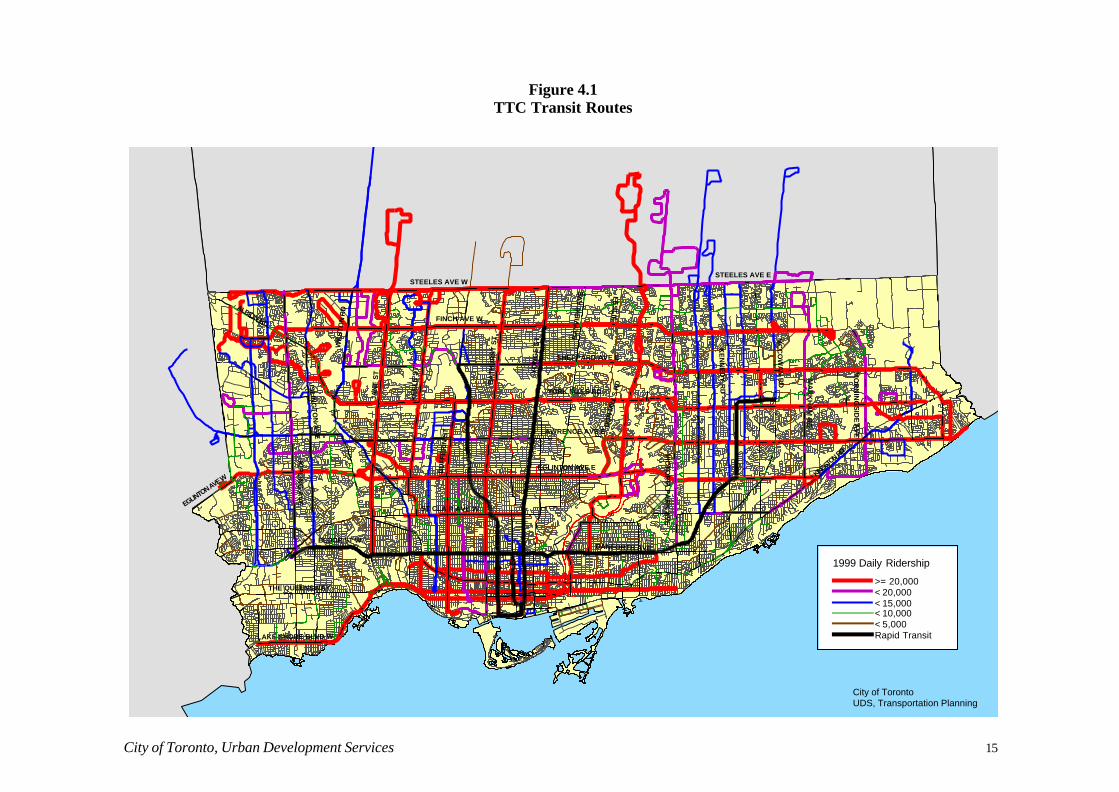
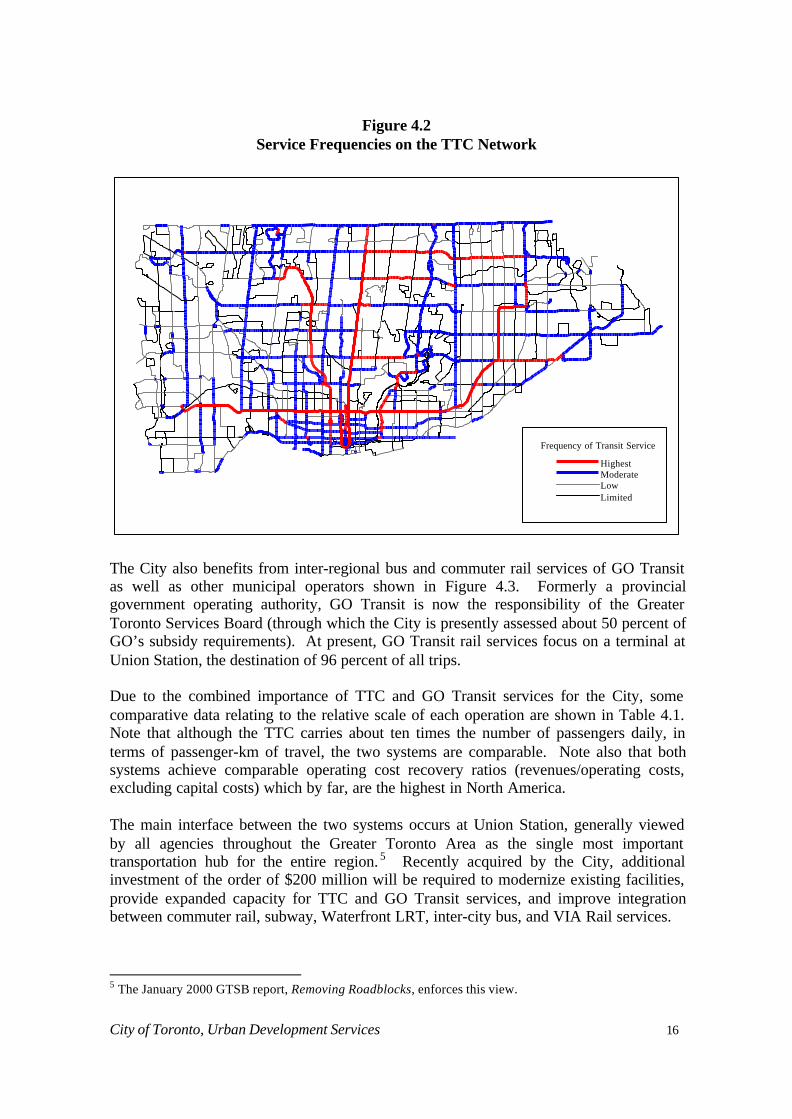
Toronto is served by about 5,200 km of roads basically organized in a grid that facilitatesreasonable coverage of the entire area by surface transit (buses and streetcars),supplemented by a few expressways and a subway network. Within the City, all transitservice is provided through a single, highly integrated, one fare system operated by theTTC. Figure 4.1 shows the network of these services, including routes operated beyondthe City’s boundaries under contract with adjacent municipalities, and also provides someindication of the intensity of use in terms of ridership. Figure 4.2 shows the samenetwork classified by frequency of service, an important measure of transit attractiveness.In addition, the TTC operates special Wheel Trans buses and, other than special busesand taxis that serve airports, about 3,000 taxis are currently licensed to operate within theCity.
City of Toronto, Urban Development Services 15
Figure 4.1TTC Transit Routes
1
LE
SL
IE
MO
RN
ING
SID
E A
VE
KINGSTON RD
MA
RK
HA
M R
D
MC
CO
WA
N R
D
STEELES AVE E
KE
NN
ED
Y R
D
VIC
TO
RIA
PA
RK
AV
E
DANFORTH AVE
EGLINTON AVE E
LAWRENCE AVE E
DO
N M
ILLS
RD
YORK MILLS RD
YO
NG
E S
T
SHEPPARD AVE E
BA
YV
IEW
AV
E
BA
THU
RS
T S
T
FINCH AVE W
STEELES AVE W
ST CLAIR AVE W
DU
FFE
RIN
ST
KE
ELE
ST
JAN
E S
T
WE
STO
N R
DALBION RD
ISL
ING
TO
N A
VE
KIP
LIN
G A
VE
THE QUEENSWAY
BLOOR ST W
EGLINTO
N AVE W
LAKE SHORE BLVD W
City of TorontoUDS, Transportation Planning
1999 Daily Ridership
>= 20,000
< 15,000
< 5,000
< 20,000
< 10,000
Rapid Transit
City of Toronto, Urban Development Services 16
Figure 4.2Service Frequencies on the TTC Network
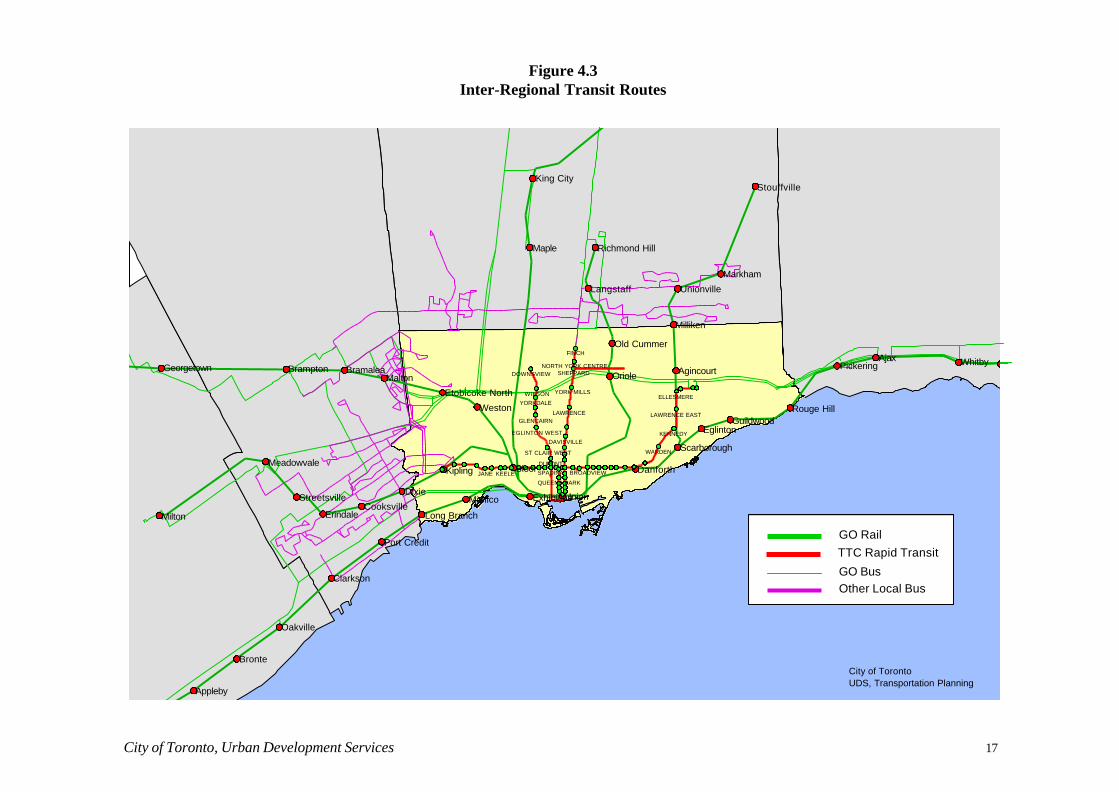
The City also benefits from inter-regional bus and commuter rail services of GO Transitas well as other municipal operators shown in Figure 4.3. Formerly a provincialgovernment operating authority, GO Transit is now the responsibility of the GreaterToronto Services Board (through which the City is presently assessed about 50 percent ofGO’s subsidy requirements). At present, GO Transit rail services focus on a terminal atUnion Station, the destination of 96 percent of all trips.
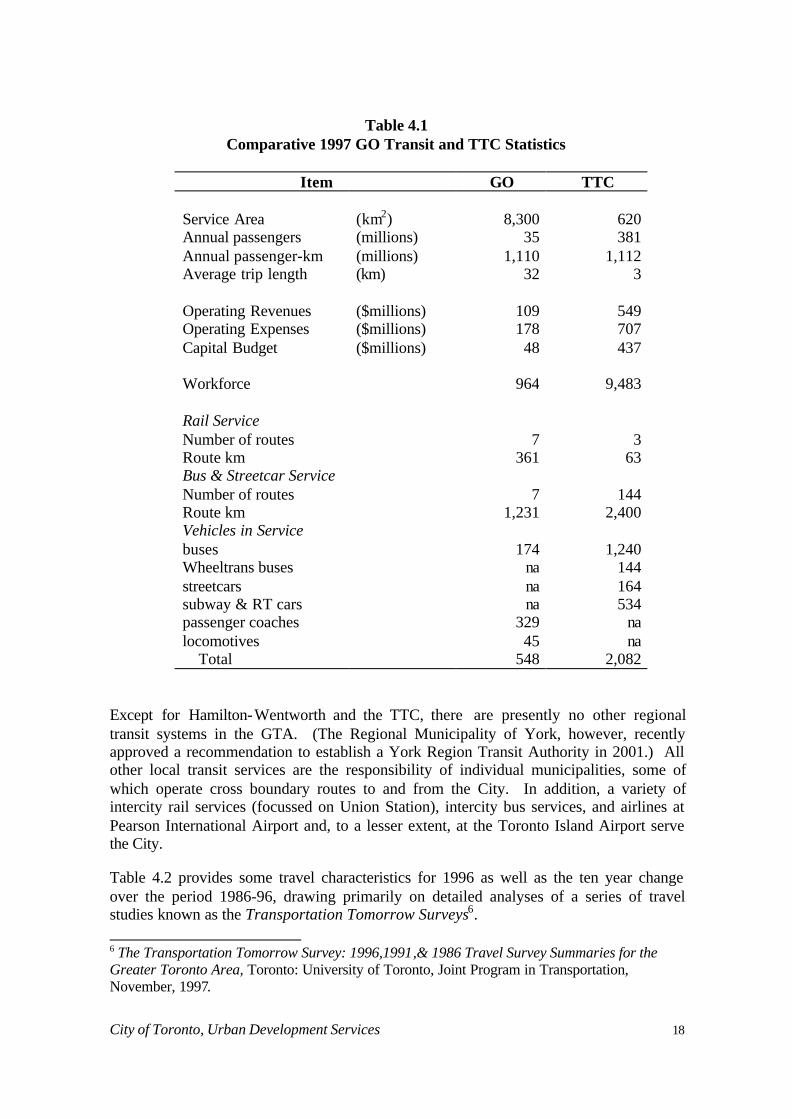
Due to the combined importance of TTC and GO Transit services for the City, somecomparative data relating to the relative scale of each operation are shown in Table 4.1.Note that although the TTC carries about ten times the number of passengers daily, interms of passenger-km of travel, the two systems are comparable. Note also that bothsystems achieve comparable operating cost recovery ratios (revenues/operating costs,excluding capital costs) which by far, are the highest in North America.
The main interface between the two systems occurs at Union Station, generally viewedby all agencies throughout the Greater Toronto Area as the single most importanttransportation hub for the entire region. 5 Recently acquired by the City, additionalinvestment of the order of $200 million will be required to modernize existing facilities,provide expanded capacity for TTC and GO Transit services, and improve integrationbetween commuter rail, subway, Waterfront LRT, inter-city bus, and VIA Rail services.
5 The January 2000 GTSB report, Removing Roadblocks, enforces this view.
Frequency of Transit Service
HighestModerateLowLimited
City of Toronto, Urban Development Services 17
Figure 4.3Inter-Regional Transit Routes
1
4
Appleby
Bronte
Oakville
Clarkson
Port Credit
Long Branch
Mimico ExhibitionUnion
Danforth
Scarborough
EglintonGuildwood
Rouge Hill
PickeringAjax Whitby
Agincourt
Milliken
Unionville
Markham
Stouffville
Richmond Hill
Langstaff
Old Cummer
Oriole
Maple
King City
Bloor
Weston
Etobicoke North
MaltonBramaleaBramptonGeorgetown
Milton
Meadowvale
Streetsville
ErindaleCooksville
Dixie
Kipling JANE KEELE SPADINA BROADVIEW
WARDEN
KENNEDY
LAWRENCE EAST
ELLESMERE
DOWNSVIEW
WILSON
YORKDALE
GLENCAIRN
EGLINTON WEST
ST CLAIR WEST
DUPONT
QUEENS PARK
DAVISVILLE
LAWRENCE
YORK MILLS
SHEPPARDNORTH YORK CENTRE
FINCH
GO RailTTC Rapid Transit
GO BusOther Local Bus
City of TorontoUDS, Transportation Planning
City of Toronto, Urban Development Services 18
Table 4.1Comparative 1997 GO Transit and TTC Statistics
Item GO TTC
Service Area (km2) 8,300 620Annual passengers (millions) 35 381Annual passenger-km (millions) 1,110 1,112Average trip length (km) 32 3
Operating Revenues ($millions) 109 549Operating Expenses ($millions) 178 707Capital Budget ($millions) 48 437
Workforce 964 9,483
Rail ServiceNumber of routes 7 3Route km 361 63Bus & Streetcar ServiceNumber of routes 7 144Route km 1,231 2,400Vehicles in Servicebuses 174 1,240Wheeltrans buses na 144streetcars na 164subway & RT cars na 534passenger coaches 329 nalocomotives 45 na Total 548 2,082
Except for Hamilton-Wentworth and the TTC, there are presently no other regionaltransit systems in the GTA. (The Regional Municipality of York, however, recentlyapproved a recommendation to establish a York Region Transit Authority in 2001.) Allother local transit services are the responsibility of individual municipalities, some ofwhich operate cross boundary routes to and from the City. In addition, a variety ofintercity rail services (focussed on Union Station), intercity bus services, and airlines atPearson International Airport and, to a lesser extent, at the Toronto Island Airport servethe City.
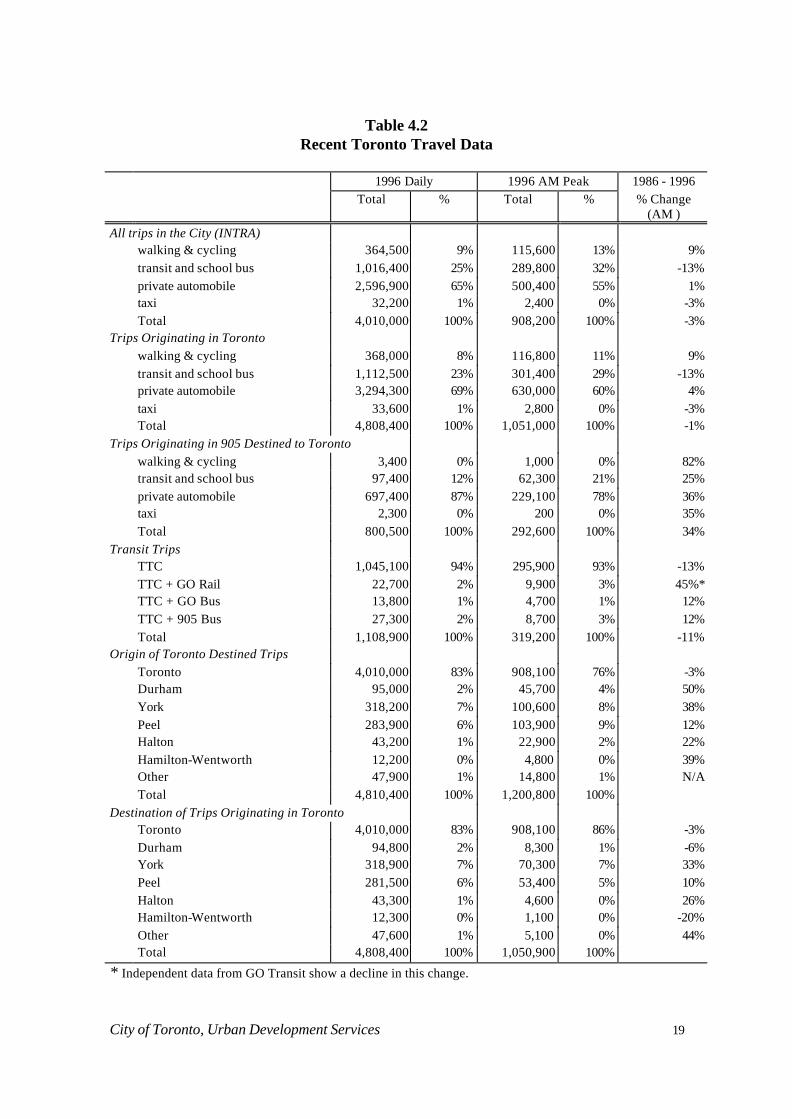
Table 4.2 provides some travel characteristics for 1996 as well as the ten year changeover the period 1986-96, drawing primarily on detailed analyses of a series of travelstudies known as the Transportation Tomorrow Surveys6. 6 The Transportation Tomorrow Survey: 1996,1991,& 1986 Travel Survey Summaries for theGreater Toronto Area, Toronto: University of Toronto, Joint Program in Transportation,November, 1997.
City of Toronto, Urban Development Services 19
Table 4.2Recent Toronto Travel Data
1996 Daily 1996 AM Peak 1986 - 1996Total % Total % % Change
(AM )All trips in the City (INTRA)
walking & cycling 364,500 9% 115,600 13% 9%transit and school bus 1,016,400 25% 289,800 32% -13%private automobile 2,596,900 65% 500,400 55% 1%taxi 32,200 1% 2,400 0% -3%Total 4,010,000 100% 908,200 100% -3%
Trips Originating in Torontowalking & cycling 368,000 8% 116,800 11% 9%transit and school bus 1,112,500 23% 301,400 29% -13%private automobile 3,294,300 69% 630,000 60% 4%taxi 33,600 1% 2,800 0% -3%Total 4,808,400 100% 1,051,000 100% -1%
Trips Originating in 905 Destined to Torontowalking & cycling 3,400 0% 1,000 0% 82%transit and school bus 97,400 12% 62,300 21% 25%private automobile 697,400 87% 229,100 78% 36%taxi 2,300 0% 200 0% 35%Total 800,500 100% 292,600 100% 34%
Transit TripsTTC 1,045,100 94% 295,900 93% -13%TTC + GO Rail 22,700 2% 9,900 3% 45%*TTC + GO Bus 13,800 1% 4,700 1% 12%TTC + 905 Bus 27,300 2% 8,700 3% 12%Total 1,108,900 100% 319,200 100% -11%
Origin of Toronto Destined TripsToronto 4,010,000 83% 908,100 76% -3%Durham 95,000 2% 45,700 4% 50%York 318,200 7% 100,600 8% 38%Peel 283,900 6% 103,900 9% 12%Halton 43,200 1% 22,900 2% 22%Hamilton-Wentworth 12,200 0% 4,800 0% 39%Other 47,900 1% 14,800 1% N/ATotal 4,810,400 100% 1,200,800 100%
Destination of Trips Originating in TorontoToronto 4,010,000 83% 908,100 86% -3%Durham 94,800 2% 8,300 1% -6%York 318,900 7% 70,300 7% 33%Peel 281,500 6% 53,400 5% 10%Halton 43,300 1% 4,600 0% 26%Hamilton-Wentworth 12,300 0% 1,100 0% -20%Other 47,600 1% 5,100 0% 44%Total 4,808,400 100% 1,050,900 100%
* Independent data from GO Transit show a decline in this change.
City of Toronto, Urban Development Services 20
Recognizing the relatively high degree of interdependence between the transportationsystems of the City and its neighbours, data are provided both for Toronto and otherregional municipalities of the GTA.
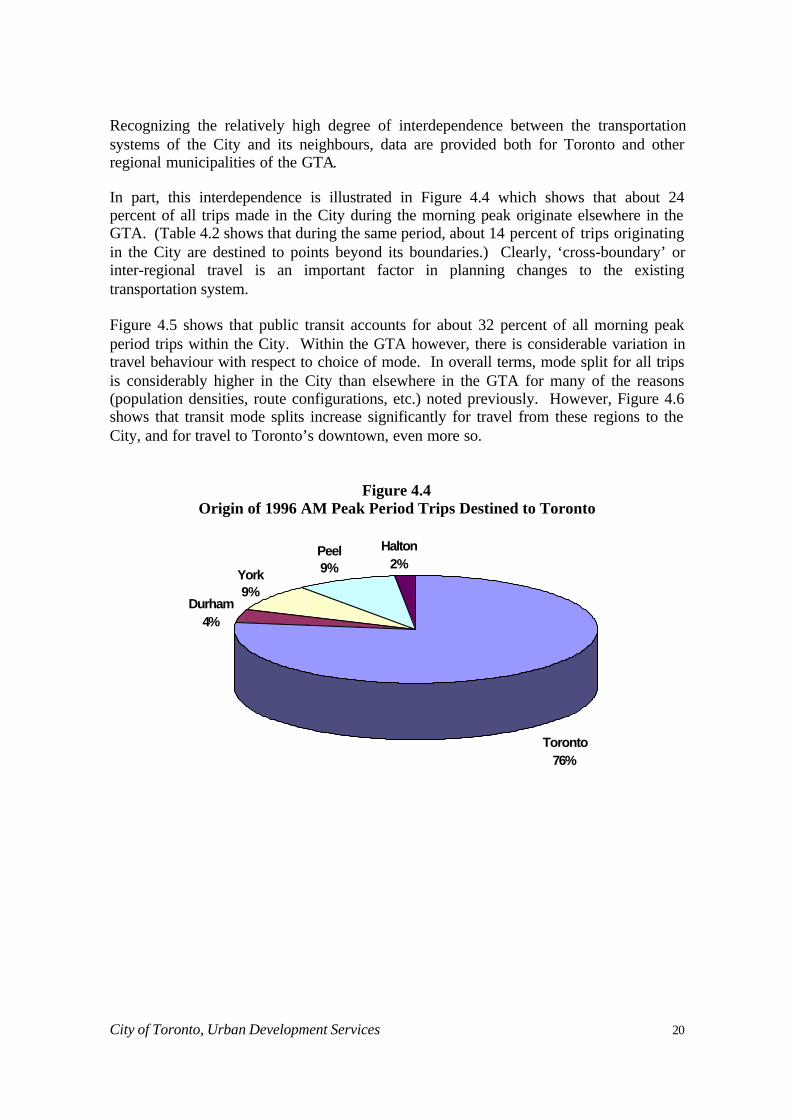
In part, this interdependence is illustrated in Figure 4.4 which shows that about 24percent of all trips made in the City during the morning peak originate elsewhere in theGTA. (Table 4.2 shows that during the same period, about 14 percent of trips originatingin the City are destined to points beyond its boundaries.) Clearly, ‘cross-boundary’ orinter-regional travel is an important factor in planning changes to the existingtransportation system.
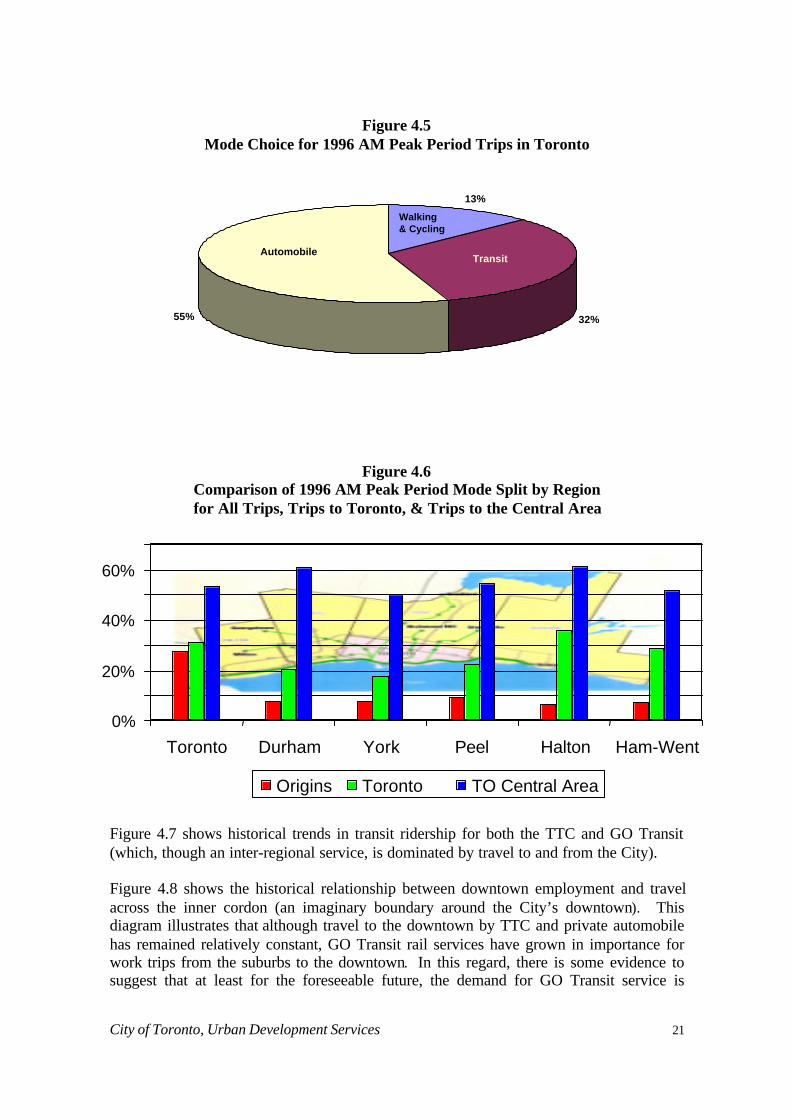
Figure 4.5 shows that public transit accounts for about 32 percent of all morning peakperiod trips within the City. Within the GTA however, there is considerable variation intravel behaviour with respect to choice of mode. In overall terms, mode split for all tripsis considerably higher in the City than elsewhere in the GTA for many of the reasons(population densities, route configurations, etc.) noted previously. However, Figure 4.6shows that transit mode splits increase significantly for travel from these regions to theCity, and for travel to Toronto’s downtown, even more so.
Figure 4.4Origin of 1996 AM Peak Period Trips Destined to Toronto
Toronto76%
Durham4%
York9%
Peel9%
Halton2%
City of Toronto, Urban Development Services 21
Figure 4.5Mode Choice for 1996 AM Peak Period Trips in Toronto
Figure 4.6Comparison of 1996 AM Peak Period Mode Split by Regionfor All Trips, Trips to Toronto, & Trips to the Central Area
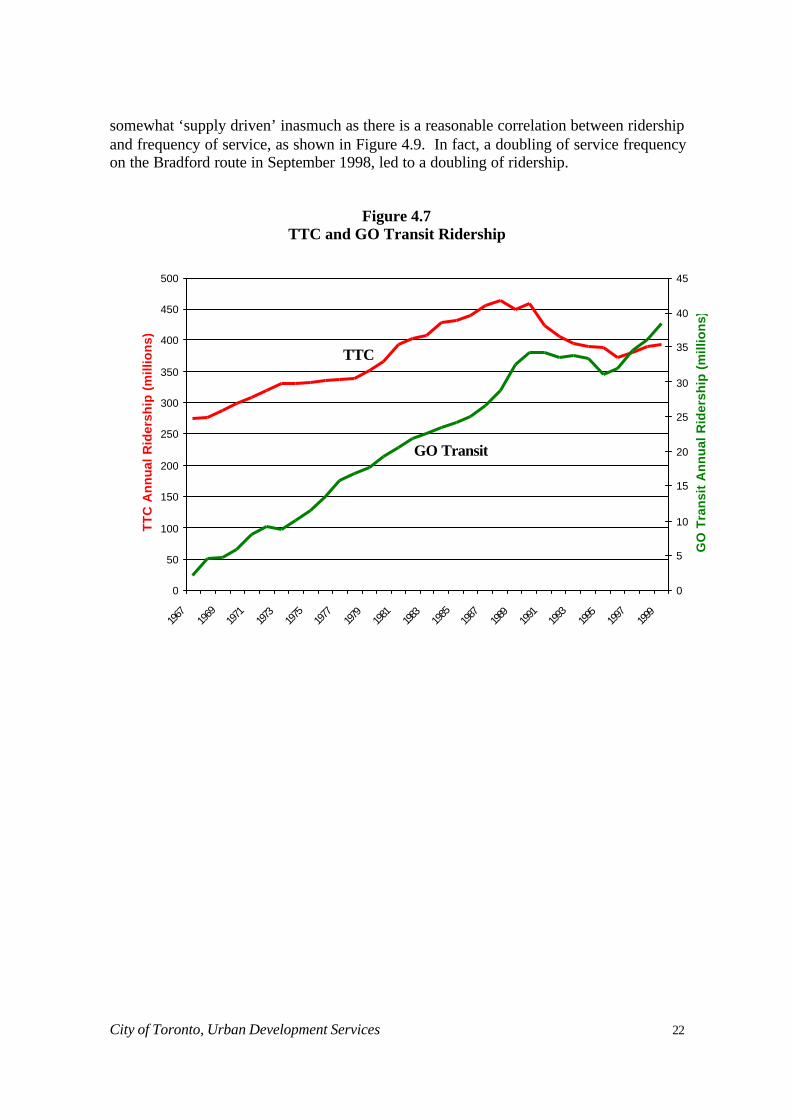
Figure 4.7 shows historical trends in transit ridership for both the TTC and GO Transit(which, though an inter-regional service, is dominated by travel to and from the City).
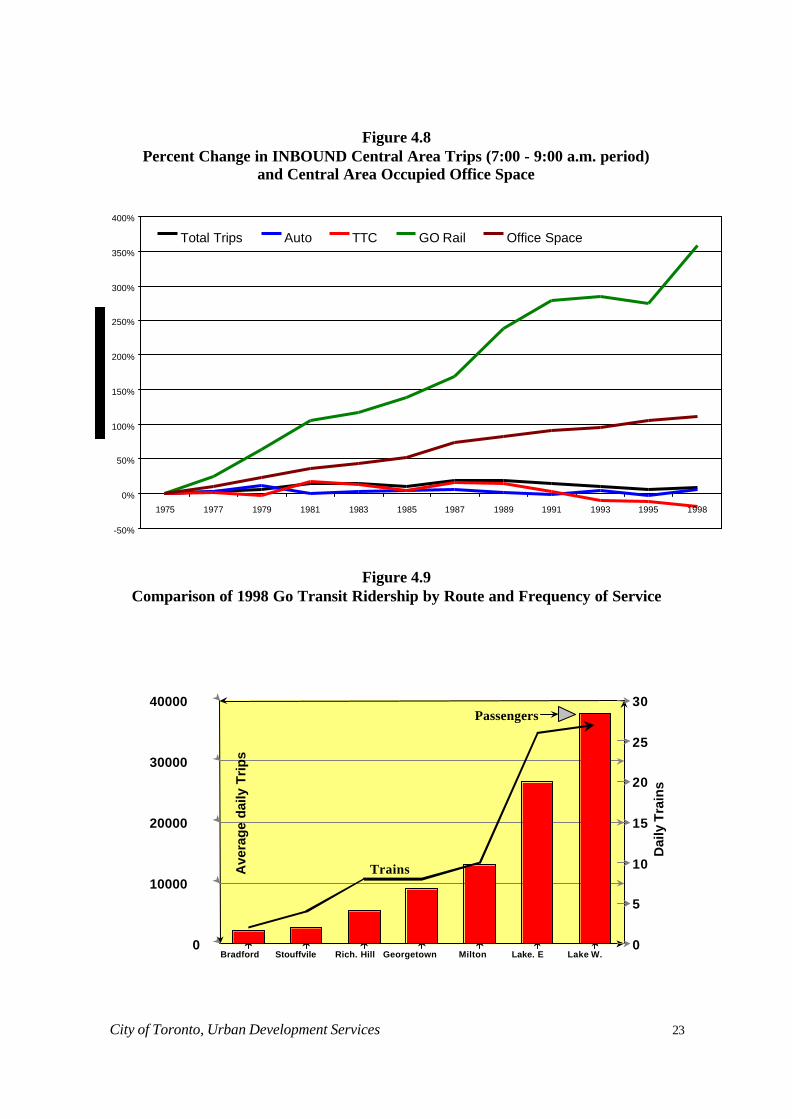
Figure 4.8 shows the historical relationship between downtown employment and travelacross the inner cordon (an imaginary boundary around the City’s downtown). Thisdiagram illustrates that although travel to the downtown by TTC and private automobilehas remained relatively constant, GO Transit rail services have grown in importance forwork trips from the suburbs to the downtown. In this regard, there is some evidence tosuggest that at least for the foreseeable future, the demand for GO Transit service is
0%
20%
40%
60%
Toronto Durham York Peel Halton Ham-Went
Origins Toronto TO Central Area
13%
32%55%
AutomobileTransit
Walking& Cycling
City of Toronto, Urban Development Services 22
somewhat ‘supply driven’ inasmuch as there is a reasonable correlation between ridershipand frequency of service, as shown in Figure 4.9. In fact, a doubling of service frequencyon the Bradford route in September 1998, led to a doubling of ridership.
Figure 4.7TTC and GO Transit Ridership
0
50
100
150
200
250
300
350
400
450
500
1967
1969
1971
1973
1975
1977
1979
1981
1983
1985
1987
1989
1991
1993
1995
1997
1999
TT
C A
nn
ual
Rid
ersh
ip (
mill
ion
s)
0
5
10
15
20
25
30
35
40
45
GO
Tra
nsi
t A
nn
ual
Rid
ersh
ip (
mill
ion
s)
TTC
GO Transit
City of Toronto, Urban Development Services 23
Figure 4.8Percent Change in INBOUND Central Area Trips (7:00 - 9:00 a.m. period)
and Central Area Occupied Office Space
Figure 4.9Comparison of 1998 Go Transit Ridership by Route and Frequency of Service
-50%
0%
50%
100%
150%
200%
250%
300%
350%
400%
1975 1977 1979 1981 1983 1985 1987 1989 1991 1993 1995 1998
Total Trips Auto TTC GO Rail Office Space
0
10000
20000
30000
40000
Ave
rag
e d
aily
Tri
ps
0
5
10
15
20
25
30
Dai
ly T
rain
s
Bradford Stouffvile Rich. Hill Georgetown Milton Lake. E Lake W.
Trains
Passengers
City of Toronto, Urban Development Services 24
From these data and other information available from more detailed analyses of theTransportation Tomorrow surveys, as well as other recent studies for the TTC and GOTransit, the following observations may be particularly relevant to the matter of a revisedvision of transportation for the future:
• the transportation needs of the City of Toronto cannot be consideredindependently of travel by residents of the surrounding municipalities and regionsto and from the City.
• the TTC has faced an uphill struggle to maintain transit ridership in the face ofrising City and GTA populations although, very recently, there appears to havebeen a major reversal of trends.
• lower than expected increases in total travel across the inner cordon can beattributed, in part, to increased residential population within the same area, the1989-95 economic recession, and limits on both road and transit capacity into thedowntown.
• attempts to divert automobile users to transit are likely to be far more successfulfor centrally oriented travel than for the ‘many-to-many’ trips described earlier.
• about 96 percent of GO Transit’s rail passengers are destined to the Central Areaof Toronto and about 48 percent of GO bus riders are destined to TTC rapidtransit stations.
• about 80 percent of commuter rail passengers have an alternative choice of usingan available automobile.
• recent experience suggests that there is a significant latent demand, presentlylimited by available capacity, for even more downtown oriented commuter railservice.
• growth in downtown employment combined with growth in suburban populationappear to be the prime factors contributing to GO Transit’s increase in commuterrail ridership.
City of Toronto, Urban Development Services 25
5. Predicting Future TravelTo the extent that development of a new vision for transportation is influenced byperformance of the existing system, projections as to how the system is likely to performin the future are equally relevant. Clearly, future performance will be influenced byfuture travel patterns.
Predicting the use of any transportation system or facility is a complicated, quasi-scientific process which, in the case of the GTA, has been the major pre-occupation oftransportation planners at the municipal, regional, and provincial levels for as long asanyone can remember.7 Estimating the future utilization of any major element of theGTA transportation system -- roads, local transit, and inter-regional transit -- hastypically involved three basic steps.
First, for a particular point in time, forecasts of total population and employment aremade for the entire GTA. These forecasts are treated as control totals. Assumptions arethen made as to the distribution of increases in population and employment amongvarious regions, municipalities, and sub-areas within those municipalities (usuallyreferred to as traffic zones). Since most methods of estimating growth in population andemployment are based on Census data, population and employment forecasts are usuallymade at the Census tract level, consistent with that municipality’s official plan.
Second, assumptions are also made about what changes in the transportation system (bothroads and transit) will be in place at the same point in time since, obviously, the extent ofthe system influences travel behaviour. Until recently, these assumptions have been quiteoptimistic, reflecting considerable ‘hype’ about capital investment in new rapid transitfacilities and highways. This optimism has been largely in keeping with the high growthmentality that has characterized the provision of public infrastructure throughout theGTA for many decades and, prior to 1998, by the prospect of continued and substantialfunding assistance from the provincial government.
The combination of the existing system and the assumed changes defines the actualtransportation system to be analyzed, usually characterized by a large number of links(e.g. a sections of road or transit) and nodes (e.g. road intersections or subway stations).Definition of the system also incorporates such assumptions as the relationship betweenvolume and travel time, user costs, and transit fares or other forms of pricing.
7 In this regard, it should be noted that prediction, a process of forecasting what will happen,should not be confused with goal setting, a process of targeting achievements. Many officialplans within the GTA, for example, have adopted reduced dependence on the private automobileand therefore higher transit use as a planning goal which travel prediction may or may not revealto be realistic.
City of Toronto, Urban Development Services 26
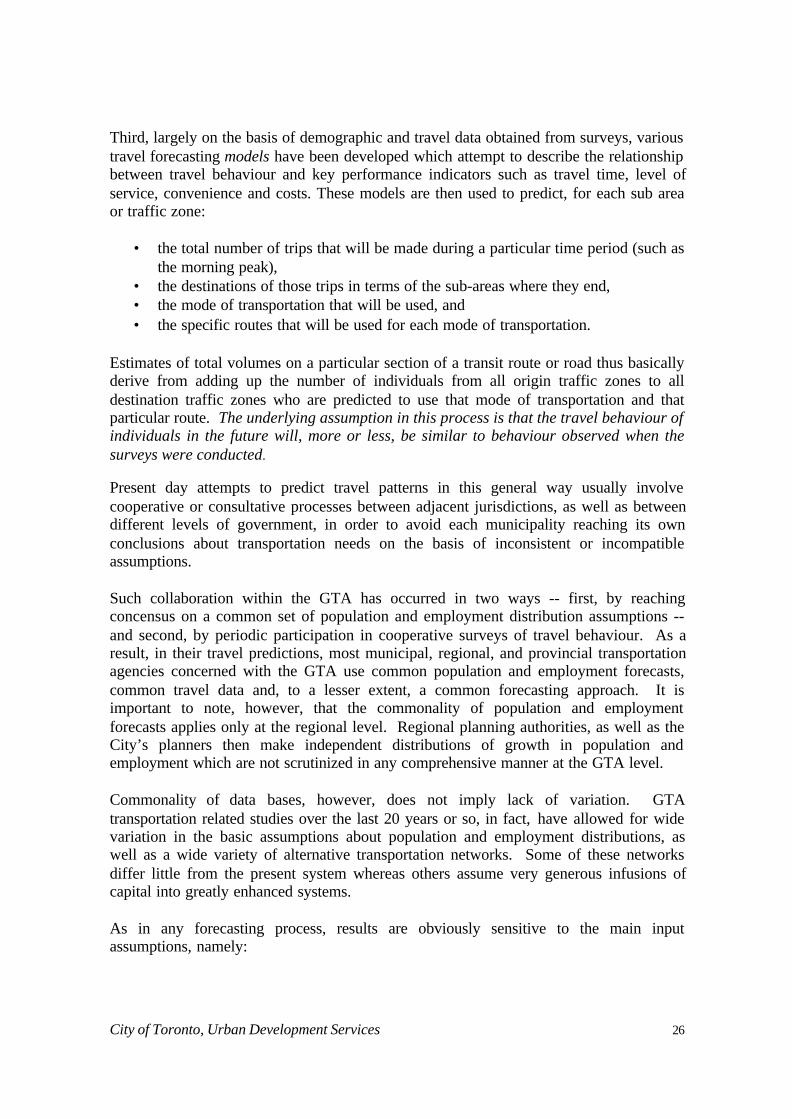
Third, largely on the basis of demographic and travel data obtained from surveys, varioustravel forecasting models have been developed which attempt to describe the relationshipbetween travel behaviour and key performance indicators such as travel time, level ofservice, convenience and costs. These models are then used to predict, for each sub areaor traffic zone:
• the total number of trips that will be made during a particular time period (such asthe morning peak),
• the destinations of those trips in terms of the sub-areas where they end, • the mode of transportation that will be used, and• the specific routes that will be used for each mode of transportation.
Estimates of total volumes on a particular section of a transit route or road thus basicallyderive from adding up the number of individuals from all origin traffic zones to alldestination traffic zones who are predicted to use that mode of transportation and thatparticular route. The underlying assumption in this process is that the travel behaviour ofindividuals in the future will, more or less, be similar to behaviour observed when thesurveys were conducted.
Present day attempts to predict travel patterns in this general way usually involvecooperative or consultative processes between adjacent jurisdictions, as well as betweendifferent levels of government, in order to avoid each municipality reaching its ownconclusions about transportation needs on the basis of inconsistent or incompatibleassumptions.
Such collaboration within the GTA has occurred in two ways -- first, by reachingconcensus on a common set of population and employment distribution assumptions --and second, by periodic participation in cooperative surveys of travel behaviour. As aresult, in their travel predictions, most municipal, regional, and provincial transportationagencies concerned with the GTA use common population and employment forecasts,common travel data and, to a lesser extent, a common forecasting approach. It isimportant to note, however, that the commonality of population and employmentforecasts applies only at the regional level. Regional planning authorities, as well as theCity’s planners then make independent distributions of growth in population andemployment which are not scrutinized in any comprehensive manner at the GTA level.
Commonality of data bases, however, does not imply lack of variation. GTAtransportation related studies over the last 20 years or so, in fact, have allowed for widevariation in the basic assumptions about population and employment distributions, aswell as a wide variety of alternative transportation networks. Some of these networksdiffer little from the present system whereas others assume very generous infusions ofcapital into greatly enhanced systems.
As in any forecasting process, results are obviously sensitive to the main inputassumptions, namely:
City of Toronto, Urban Development Services 27
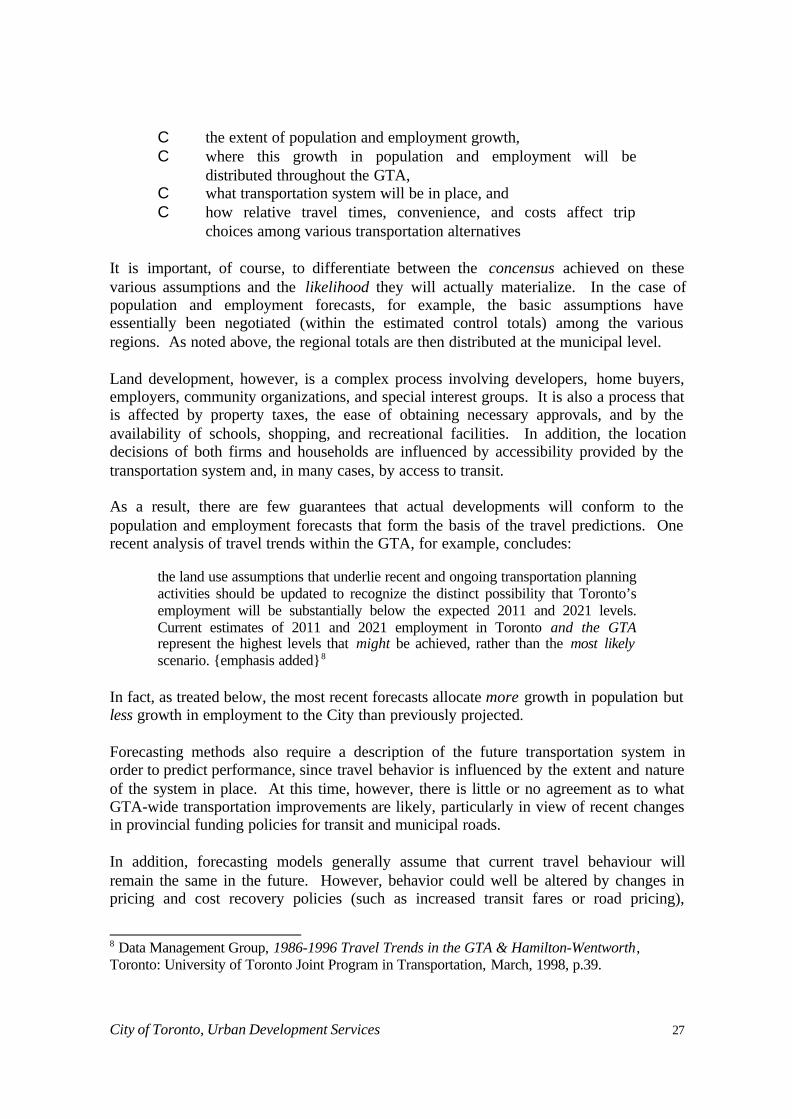
C the extent of population and employment growth,C where this growth in population and employment will be
distributed throughout the GTA,C what transportation system will be in place, andC how relative travel times, convenience, and costs affect trip
choices among various transportation alternatives
It is important, of course, to differentiate between the concensus achieved on thesevarious assumptions and the likelihood they will actually materialize. In the case ofpopulation and employment forecasts, for example, the basic assumptions haveessentially been negotiated (within the estimated control totals) among the variousregions. As noted above, the regional totals are then distributed at the municipal level.
Land development, however, is a complex process involving developers, home buyers,employers, community organizations, and special interest groups. It is also a process thatis affected by property taxes, the ease of obtaining necessary approvals, and by theavailability of schools, shopping, and recreational facilities. In addition, the locationdecisions of both firms and households are influenced by accessibility provided by thetransportation system and, in many cases, by access to transit.
As a result, there are few guarantees that actual developments will conform to thepopulation and employment forecasts that form the basis of the travel predictions. Onerecent analysis of travel trends within the GTA, for example, concludes:
the land use assumptions that underlie recent and ongoing transportation planningactivities should be updated to recognize the distinct possibility that Toronto’semployment will be substantially below the expected 2011 and 2021 levels.Current estimates of 2011 and 2021 employment in Toronto and the GTArepresent the highest levels that might be achieved, rather than the most likelyscenario. {emphasis added}8
In fact, as treated below, the most recent forecasts allocate more growth in population butless growth in employment to the City than previously projected.
Forecasting methods also require a description of the future transportation system inorder to predict performance, since travel behavior is influenced by the extent and natureof the system in place. At this time, however, there is little or no agreement as to whatGTA-wide transportation improvements are likely, particularly in view of recent changesin provincial funding policies for transit and municipal roads.
In addition, forecasting models generally assume that current travel behaviour willremain the same in the future. However, behavior could well be altered by changes inpricing and cost recovery policies (such as increased transit fares or road pricing),
8 Data Management Group, 1986-1996 Travel Trends in the GTA & Hamilton-Wentworth,Toronto: University of Toronto Joint Program in Transportation, March, 1998, p.39.
City of Toronto, Urban Development Services 28
environmental policies aimed at reducing greenhouse gas emissions, and economicchanges that affect employment and automobile ownership.
Recognizing the uncertainty in many of these assumptions, significant effort has beendevoted by various government agencies to develop demographic and travel forecasts asthe basis for transportation planning. Although these studies have yet to result inagreement on a comprehensive transportation plan for the GTA, certain findings areparticularly relevant to future transportation priorities for the City of Toronto.
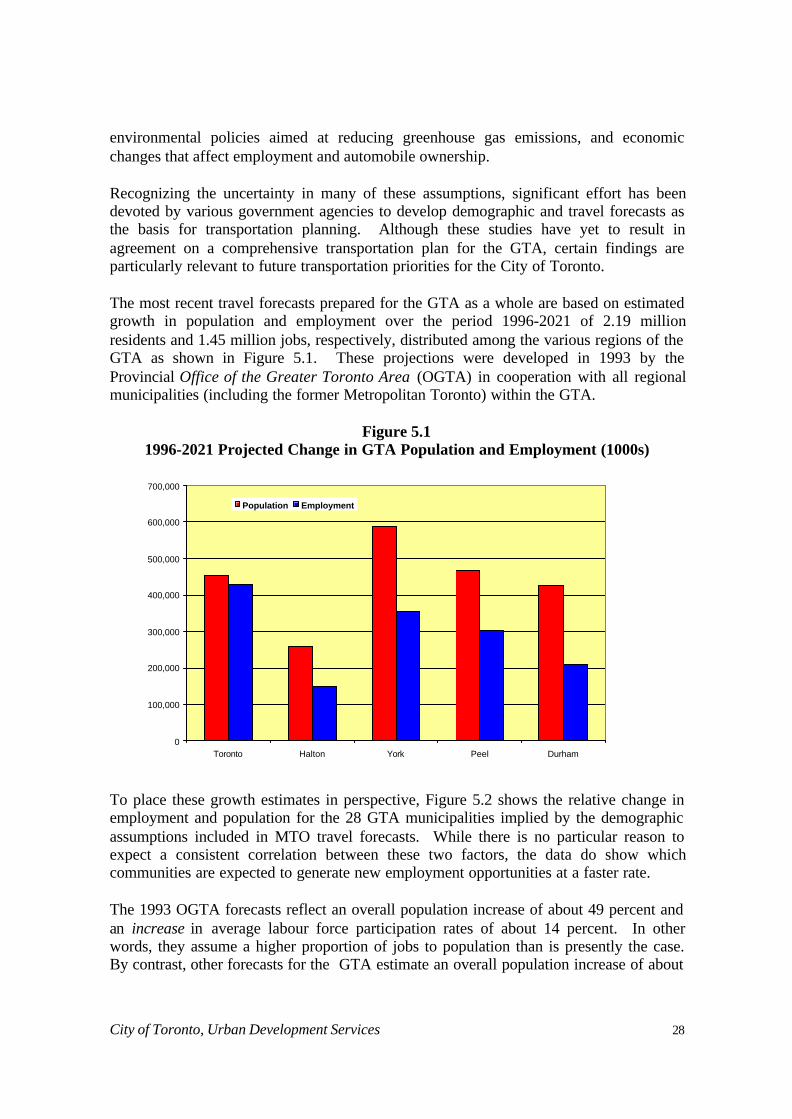
The most recent travel forecasts prepared for the GTA as a whole are based on estimatedgrowth in population and employment over the period 1996-2021 of 2.19 millionresidents and 1.45 million jobs, respectively, distributed among the various regions of theGTA as shown in Figure 5.1. These projections were developed in 1993 by theProvincial Office of the Greater Toronto Area (OGTA) in cooperation with all regionalmunicipalities (including the former Metropolitan Toronto) within the GTA.
Figure 5.11996-2021 Projected Change in GTA Population and Employment (1000s)
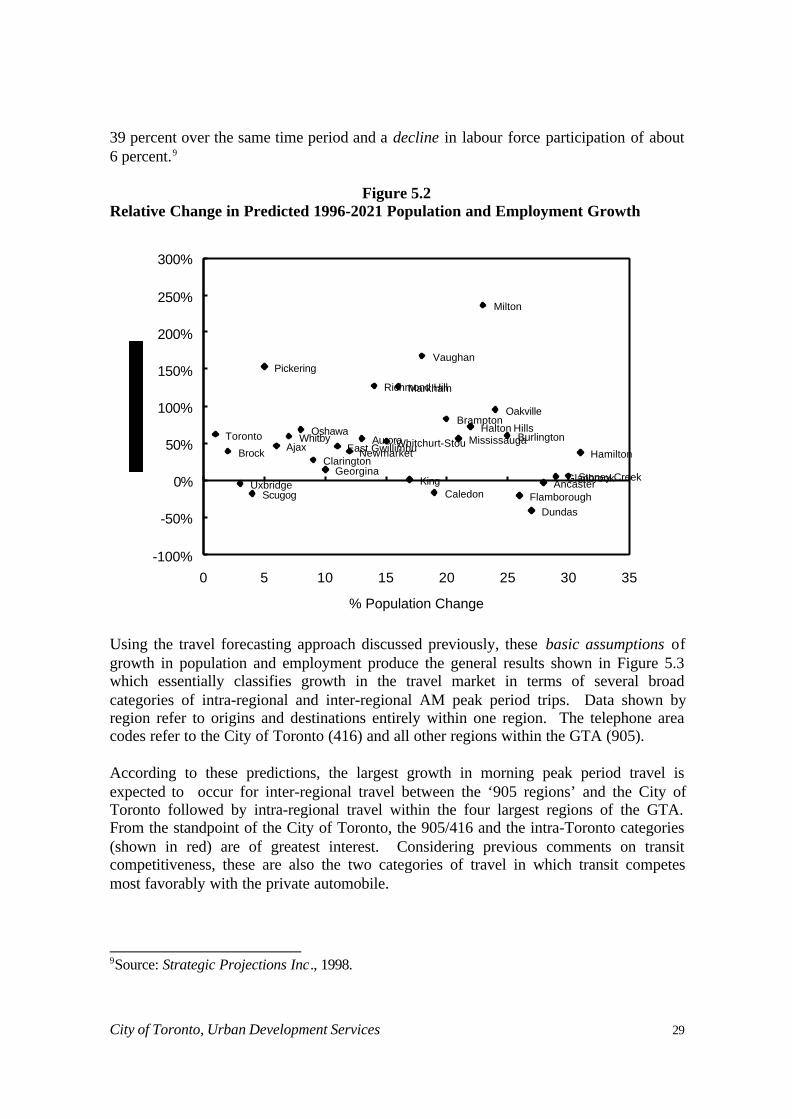
To place these growth estimates in perspective, Figure 5.2 shows the relative change inemployment and population for the 28 GTA municipalities implied by the demographicassumptions included in MTO travel forecasts. While there is no particular reason toexpect a consistent correlation between these two factors, the data do show whichcommunities are expected to generate new employment opportunities at a faster rate.
The 1993 OGTA forecasts reflect an overall population increase of about 49 percent andan increase in average labour force participation rates of about 14 percent. In otherwords, they assume a higher proportion of jobs to population than is presently the case.By contrast, other forecasts for the GTA estimate an overall population increase of about
0
100,000
200,000
300,000
400,000
500,000
600,000
700,000
Toronto Halton York Peel Durham
Population Employment
City of Toronto, Urban Development Services 29
39 percent over the same time period and a decline in labour force participation of about6 percent.9
Figure 5.2Relative Change in Predicted 1996-2021 Population and Employment Growth
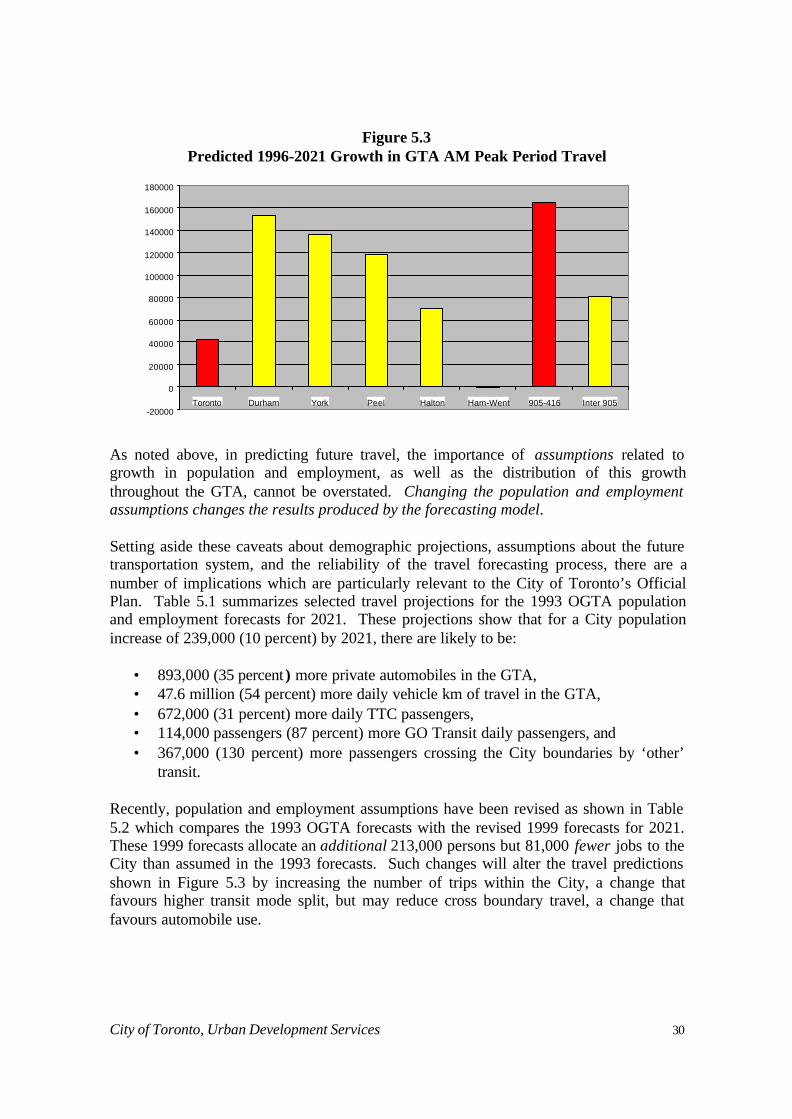
Using the travel forecasting approach discussed previously, these basic assumptions ofgrowth in population and employment produce the general results shown in Figure 5.3which essentially classifies growth in the travel market in terms of several broadcategories of intra-regional and inter-regional AM peak period trips. Data shown byregion refer to origins and destinations entirely within one region. The telephone areacodes refer to the City of Toronto (416) and all other regions within the GTA (905).
According to these predictions, the largest growth in morning peak period travel isexpected to occur for inter-regional travel between the ‘905 regions’ and the City ofToronto followed by intra-regional travel within the four largest regions of the GTA.From the standpoint of the City of Toronto, the 905/416 and the intra-Toronto categories(shown in red) are of greatest interest. Considering previous comments on transitcompetitiveness, these are also the two categories of travel in which transit competesmost favorably with the private automobile.
9Source: Strategic Projections Inc., 1998.
Toronto
Brock
UxbridgeScugog
Pickering
AjaxWhitby
Oshawa
ClaringtonGeorgina
East GwillimbuNewmarketAurora
Richmond Hill
Whitchurt-Stou
Markham
King
Vaughan
Caledon
Brampton
MississaugaHalton Hills
Milton
Oakville
Burlington
FlamboroughDundas
AncasterGlanbrookStoney Creek
Hamilton
-100%
-50%
0%
50%
100%
150%
200%
250%
300%
0 5 10 15 20 25 30 35
% Population Change
City of Toronto, Urban Development Services 30
Figure 5.3Predicted 1996-2021 Growth in GTA AM Peak Period Travel
As noted above, in predicting future travel, the importance of assumptions related togrowth in population and employment, as well as the distribution of this growththroughout the GTA, cannot be overstated. Changing the population and employmentassumptions changes the results produced by the forecasting model.
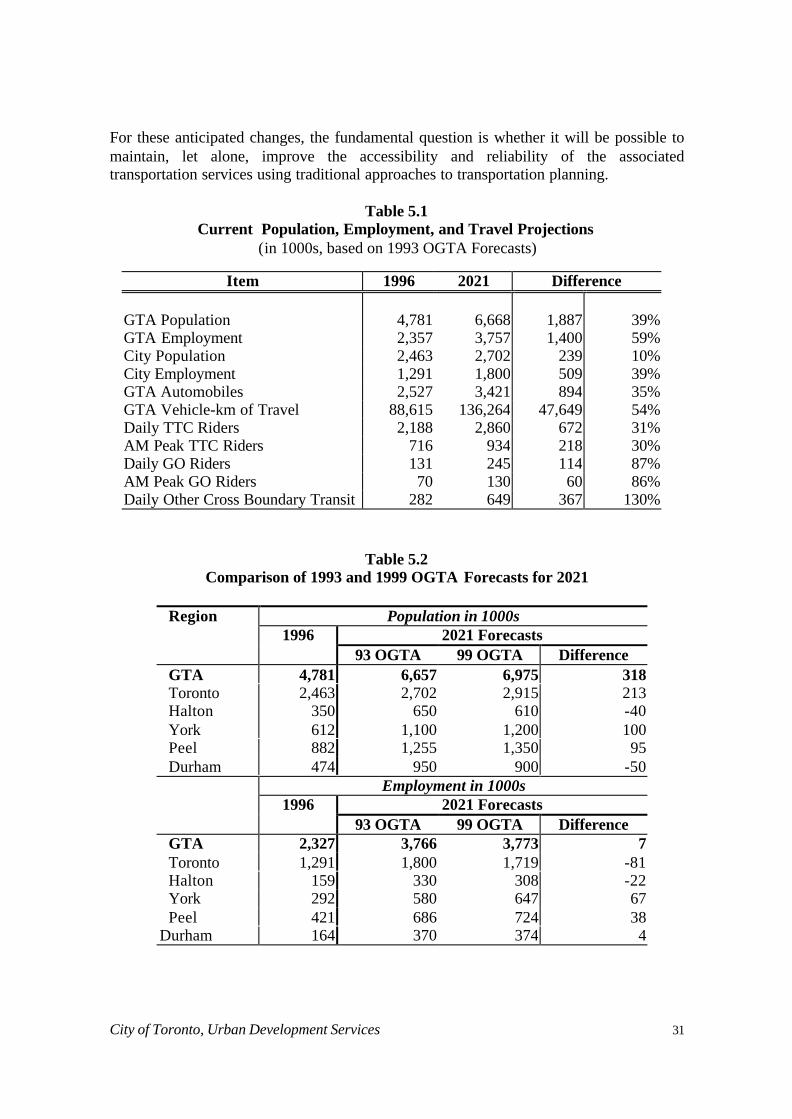
Setting aside these caveats about demographic projections, assumptions about the futuretransportation system, and the reliability of the travel forecasting process, there are anumber of implications which are particularly relevant to the City of Toronto’s OfficialPlan. Table 5.1 summarizes selected travel projections for the 1993 OGTA populationand employment forecasts for 2021. These projections show that for a City populationincrease of 239,000 (10 percent) by 2021, there are likely to be:
• 893,000 (35 percent ) more private automobiles in the GTA,• 47.6 million (54 percent) more daily vehicle km of travel in the GTA,• 672,000 (31 percent) more daily TTC passengers,• 114,000 passengers (87 percent) more GO Transit daily passengers, and• 367,000 (130 percent) more passengers crossing the City boundaries by ‘other’
transit.
Recently, population and employment assumptions have been revised as shown in Table5.2 which compares the 1993 OGTA forecasts with the revised 1999 forecasts for 2021.These 1999 forecasts allocate an additional 213,000 persons but 81,000 fewer jobs to theCity than assumed in the 1993 forecasts. Such changes will alter the travel predictionsshown in Figure 5.3 by increasing the number of trips within the City, a change thatfavours higher transit mode split, but may reduce cross boundary travel, a change thatfavours automobile use.
-20000
0
20000
40000
60000
80000
100000
120000
140000
160000
180000
Toronto Durham York Peel Halton Ham-Went 905-416 Inter 905
City of Toronto, Urban Development Services 31
For these anticipated changes, the fundamental question is whether it will be possible tomaintain, let alone, improve the accessibility and reliability of the associatedtransportation services using traditional approaches to transportation planning.
Table 5.1Current Population, Employment, and Travel Projections
(in 1000s, based on 1993 OGTA Forecasts)
Table 5.2Comparison of 1993 and 1999 OGTA Forecasts for 2021
Population in 1000sRegion1996 2021 Forecasts
93 OGTA 99 OGTA DifferenceGTA 4,781 6,657 6,975 318Toronto 2,463 2,702 2,915 213Halton 350 650 610 -40York 612 1,100 1,200 100Peel 882 1,255 1,350 95Durham 474 950 900 -50
Employment in 1000s1996 2021 Forecasts
93 OGTA 99 OGTA DifferenceGTA 2,327 3,766 3,773 7Toronto 1,291 1,800 1,719 -81Halton 159 330 308 -22York 292 580 647 67Peel 421 686 724 38
Durham 164 370 374 4
Item 1996 2021 Difference
GTA Population 4,781 6,668 1,887 39%GTA Employment 2,357 3,757 1,400 59%City Population 2,463 2,702 239 10%City Employment 1,291 1,800 509 39%GTA Automobiles 2,527 3,421 894 35%GTA Vehicle-km of Travel 88,615 136,264 47,649 54%Daily TTC Riders 2,188 2,860 672 31%AM Peak TTC Riders 716 934 218 30%Daily GO Riders 131 245 114 87%AM Peak GO Riders 70 130 60 86%Daily Other Cross Boundary Transit 282 649 367 130%
City of Toronto, Urban Development Services 32
6. Getting to the VisionIn developing the vision statement presented in this section, the underlying theme wasinfluenced by a number of factors.
First, the transportation vision is intended to enforce and support the broader vision forgrowth and development of the entire City. That vision stresses the concept of“reinvesting in our quality of life”. It also identifies three specific types of planningareas, namely, areas of change, areas of enhancement, and areas of protection.Intensification and redevelopment are both central to the first two of these.
From a transportation perspective, the vision for the City as a whole means:
• using transportation as an instrument for fostering or even leading thekinds of intensification and redevelopment for those areas of changeenvisioned in the Official Plan,
• improving the quality and accessibility of transportation in those areasidentified for enhancement, and
• ensuring that transportation decisions are environmentally progressiveand protect the integrity and quality of life in established communities.
These statements, of course, are sufficiently general and positive as to evoke little or nodisagreement. What is important, however, is to recognize that as specific policies andinvestments are suggested, they should be assessed from the standpoint of these elements,rather than merely as just another idea taken out of context.
Second, as suggested earlier, reaching agreement on the vision of transportationincorporated in the City’s Official Plan is essentially a problem in dispute resolution. Forthis reason, the process for developing the vision statement included considerabledialogue and consultation, with relatively small focus groups in some instances, and withlarger groups in others. The intent was to obtain input from:
• operating departments responsible for the delivery of transportation services,• representatives of special interest groups,• recognized urban transportation experts,• relevant working groups formally associated with the City, and• other GTA agencies.
Specifically, groups consulted included:
• a panel of 10 recognized urban transportation experts from the Toronto area,• a reference group representing special interests and the transportation
industry,• the City of Toronto Environmental Task Force,• the City Council Official Plan Reference Group,
City of Toronto, Urban Development Services 33
• the City Cycling and Pedestrian Committees,• the Toronto Board of Trade,• the Transportation Committee of the Greater Toronto Services Board, and• officials of GO Transit, the TTC, and other City transportation departments.
Recognizing the range of often conflicting views and sensitivities, achieving concensus isprobably an unrealistic expectation. However, ensuring that a representative range ofviews is taken into account, is.
Third, it is important to recognize that rethinking the traditional vision of transportation isnot a particularly novel concept. The need for a new vision of urban transportation hasbeen fostered in many circles based on increasing doubts as to either the desirability orfeasibility of maintaining the historical approach to the so called ‘balanced’ concept inwhich individual travelers have an equal choice between either private automobiles ortransit.
Foremost among these is a vision statement first formalized in 1993 by the UrbanTransportation Council of the Transportation Association of Canada (TAC), a statementthat has been endorsed by a number of municipal governments including the formerCouncil of Metropolitan Toronto.10 The TAC vision statement is based on thefundamental premise that current trends are leading to urban transportation systemswhich do not meet needs and which are not sustainable, a premise that leads to thefollowing 13 decision making principles:
1. Plan for increased densities and more mixed land use.2. Promote walking as the preferred mode for person trips.3. Increase opportunities for cycling as an optional mode of travel.4. Provide higher quality transit service to increase its attractiveness
relative to the private automobile.5. Create an environment in which automobiles can play a more balanced
role.6. Plan parking supply and price to be in balance with walking, cycling,
transit and auto priorities.7. Improve the efficiency of the urban goods distribution system.8. Promote inter-modal and inter-line connections.9. Promote new technologies which improve urban mobility and help
protect the environment.10. Optimize the use of existing transportation systems to move people
and goods.11. Design and operate transportation systems which can be used by the
physically challenged.12. Ensure that urban transportation decisions protect and enhance the
environment.13. Create better ways to pay for future urban transportation systems.
10 Transportation Association of Canada, A New Vision for Urban Transportation, Ottawa:reprinted November 1998.
City of Toronto, Urban Development Services 34
The TAC vision statement is central to the current visioning exercise for the City ofToronto. In combination with various analyses and consultations referred to above, thetransportation vision proposed for the City of Toronto’s Official Plan focuses largely onreducing automobile dependence (relative to current trends) as reflected by levels ofprivate automobile ownership as well as the manner in which automobiles are used.
Note that reduced automobile dependence has already been incorporated in earlierofficial planning documents. The former City of Toronto Official Plan, for example,states “Council’s goal is to ….. reduce dependency on the use of the automobile”. Theformer Metropolitan Toronto Official Plan (still a legally valid planning instrument)states that reductions in reliance on the automobile is “fundamental to the MetropolitanCorporation’s reurbanization strategy” and goes on to emphasize:
It is the policy of Council to discourage further measures which would facilitatethe use of automobiles for commuting into the Central Area.
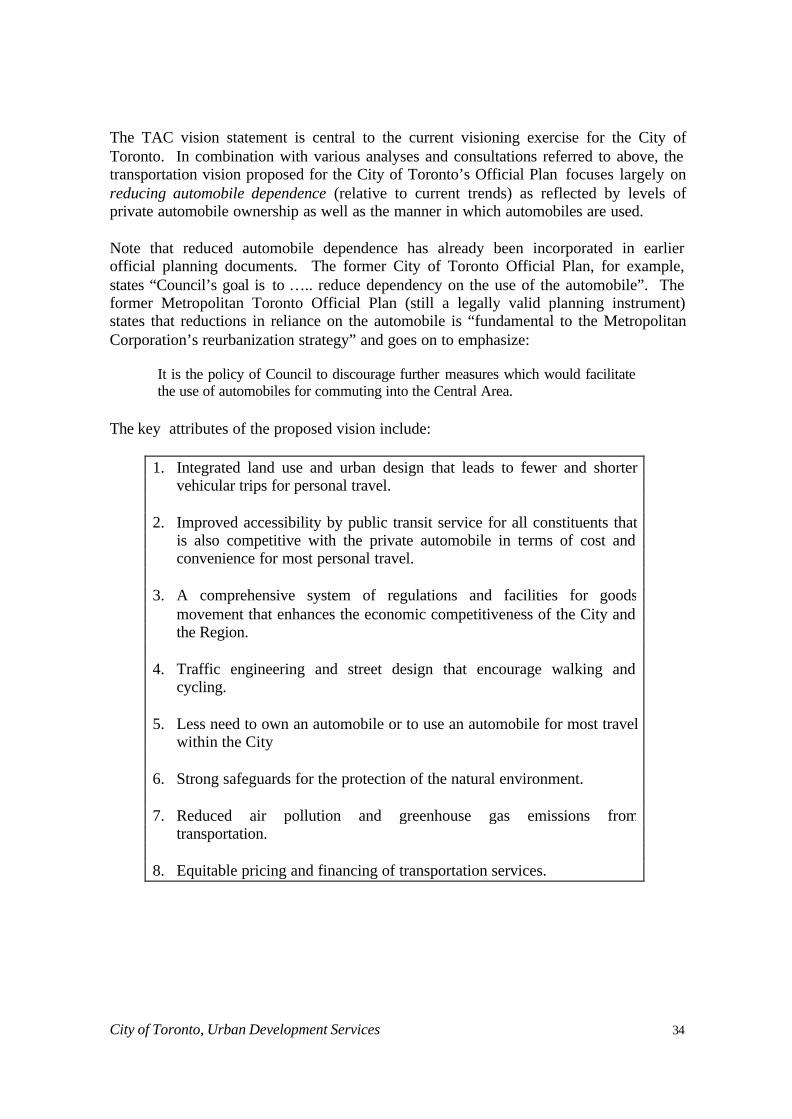
The key attributes of the proposed vision include:
1. Integrated land use and urban design that leads to fewer and shortervehicular trips for personal travel.
2. Improved accessibility by public transit service for all constituents thatis also competitive with the private automobile in terms of cost andconvenience for most personal travel.
3. A comprehensive system of regulations and facilities for goodsmovement that enhances the economic competitiveness of the City andthe Region.
4. Traffic engineering and street design that encourage walking andcycling.
5. Less need to own an automobile or to use an automobile for most travelwithin the City
6. Strong safeguards for the protection of the natural environment.
7. Reduced air pollution and greenhouse gas emissions fromtransportation.
8. Equitable pricing and financing of transportation services.
City of Toronto, Urban Development Services 35
In practical terms, this vision really means:• more people and jobs in the City,• more intensification and mixed land use,• a friendlier environment for pedestrians and cyclists,• efficient goods movement,• improved transit accessibility for the handicapped,• higher transit ridership and mode split,• lower automobile ownership and use,• the development of alternative, non-property tax based sources of funding
from users of the transportation system which permit greater continuity intransportation planning.
Although few if any objections have, thus far, been raised with respect to the eightelements of the proposed vision statement, two points, in particular, are noteworthy.
First, recognizing that efficient goods movement is clearly a desirable attribute of thefuture transportation system, little progress has actually been made in describing just howto go about achieving this goal. A range of measures such as mandatory requirements foroff-street loading/unloading facilities and development of a designated network of truckroutes are frequently cited as examples. Possible measures could also be expanded toinclude reserved truck lanes on major roads and expressways and reorganization of thetrucking industry itself to facilitate consolidated pick-up and delivery. It is important torecognize, however, that competition for limited road capacity by automobiles, cyclists,transit, and pedestrians limits the range of viable options.
Second, with respect to funding, there is growing recognition of the inequity of financingall transit subsidies from the existing property tax base, paralleled by growing politicalpressure to obtain dedicated transit funding from fuel taxes or other automobile levies (asnow practised in Alberta, British Columbia, and Quebec). Without increasing fuel taxes,however, allocating a portion of gasoline taxes to transit means less funding for otherworthwhile government programs such as health, education, and social services.Dedicated funding, moreover, carries with it the likelihood of little innovation or changein the manner in which transit services are now delivered. In the proposed vision,therefore, equitable pricing and funding refer to alternative mechanisms such as roadpricing or new GTA levies on automobiles and their use, for transportation purposes, notnecessarily to the reallocation and dedication of existing sources of revenue.
Reaching the end state represented by the vision statement will, of course, require thatspecific actions and decisions be adopted by the Council of the City of Toronto andsubsequently implemented by the relevant operating departments, the TTC, and GOTransit. ‘Getting there’ involves the application of available policy instruments andendorsement of a key set of principles for planning transportation of the future.
City of Toronto, Urban Development Services 36
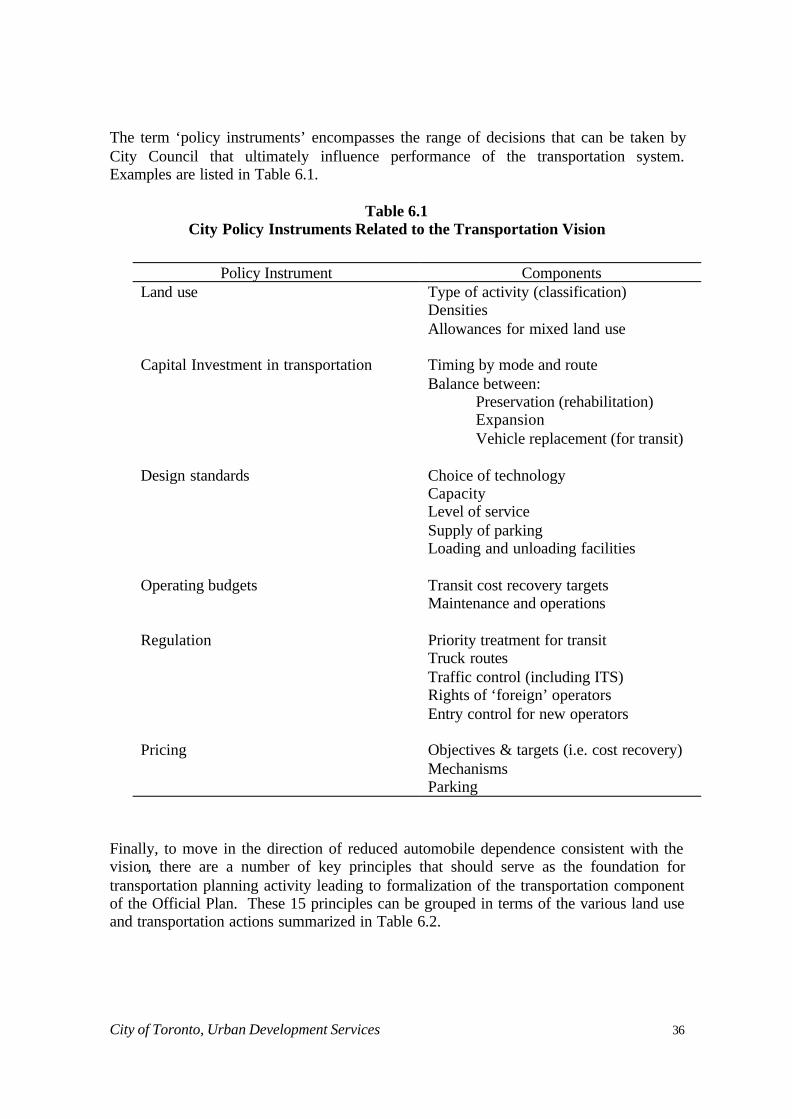
The term ‘policy instruments’ encompasses the range of decisions that can be taken byCity Council that ultimately influence performance of the transportation system.Examples are listed in Table 6.1.
Table 6.1City Policy Instruments Related to the Transportation Vision
Policy Instrument ComponentsLand use Type of activity (classification)
DensitiesAllowances for mixed land use
Capital Investment in transportation Timing by mode and routeBalance between:
Preservation (rehabilitation)ExpansionVehicle replacement (for transit)
Design standards Choice of technologyCapacityLevel of serviceSupply of parkingLoading and unloading facilities
Operating budgets Transit cost recovery targetsMaintenance and operations
Regulation Priority treatment for transitTruck routesTraffic control (including ITS)Rights of ‘foreign’ operatorsEntry control for new operators
Pricing Objectives & targets (i.e. cost recovery)MechanismsParking
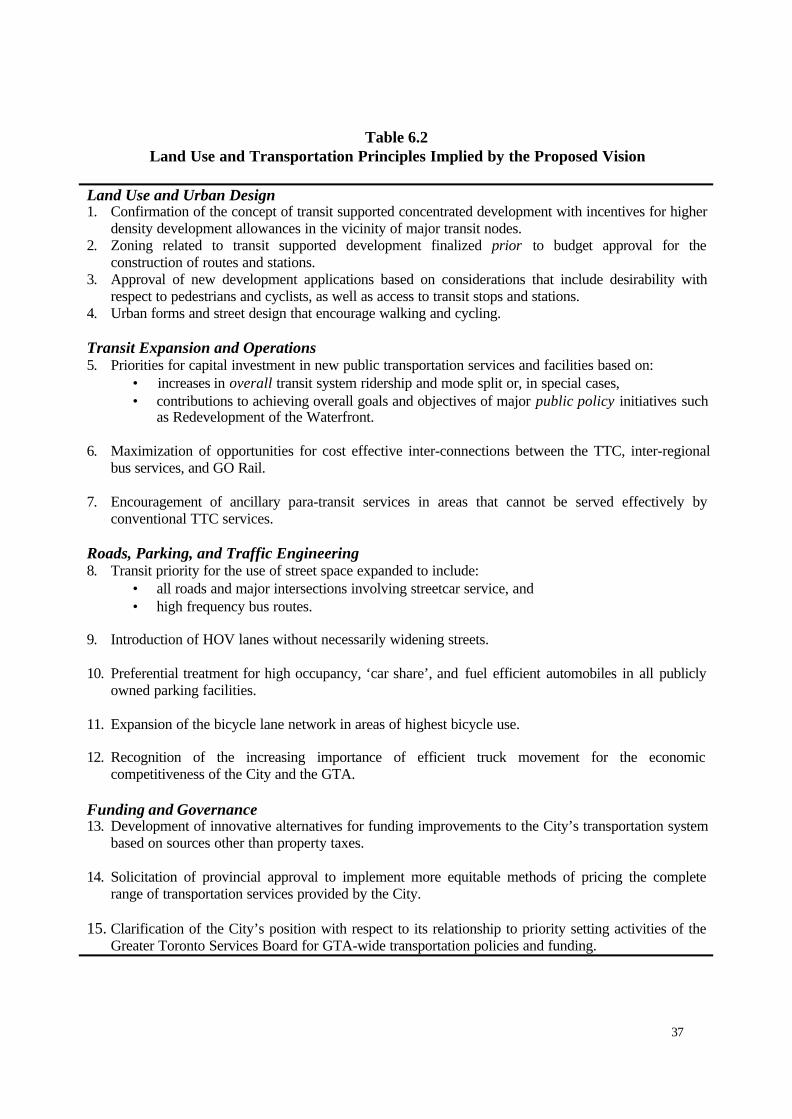
Finally, to move in the direction of reduced automobile dependence consistent with thevision, there are a number of key principles that should serve as the foundation fortransportation planning activity leading to formalization of the transportation componentof the Official Plan. These 15 principles can be grouped in terms of the various land useand transportation actions summarized in Table 6.2.
37
Table 6.2Land Use and Transportation Principles Implied by the Proposed Vision
Land Use and Urban Design1. Confirmation of the concept of transit supported concentrated development with incentives for higher
density development allowances in the vicinity of major transit nodes.2. Zoning related to transit supported development finalized prior to budget approval for the
construction of routes and stations.3. Approval of new development applications based on considerations that include desirability with
respect to pedestrians and cyclists, as well as access to transit stops and stations.4. Urban forms and street design that encourage walking and cycling.
Transit Expansion and Operations5. Priorities for capital investment in new public transportation services and facilities based on:
• increases in overall transit system ridership and mode split or, in special cases,• contributions to achieving overall goals and objectives of major public policy initiatives such
as Redevelopment of the Waterfront.
6. Maximization of opportunities for cost effective inter-connections between the TTC, inter-regionalbus services, and GO Rail.
7. Encouragement of ancillary para-transit services in areas that cannot be served effectively byconventional TTC services.
Roads, Parking, and Traffic Engineering8. Transit priority for the use of street space expanded to include:
• all roads and major intersections involving streetcar service, and• high frequency bus routes.
9. Introduction of HOV lanes without necessarily widening streets.
10. Preferential treatment for high occupancy, ‘car share’, and fuel efficient automobiles in all publiclyowned parking facilities.
11. Expansion of the bicycle lane network in areas of highest bicycle use.
12. Recognition of the increasing importance of efficient truck movement for the economiccompetitiveness of the City and the GTA.
Funding and Governance13. Development of innovative alternatives for funding improvements to the City’s transportation system
based on sources other than property taxes.
14. Solicitation of provincial approval to implement more equitable methods of pricing the completerange of transportation services provided by the City.
15. Clarification of the City’s position with respect to its relationship to priority setting activities of theGreater Toronto Services Board for GTA-wide transportation policies and funding.
38
It is important to emphasize that these principles are part and parcel of the vision andthat, as a result, it is essentially illogical to be willing to commit, on one hand, toachieving the goals and objectives implied by the vision, but on the other, to beunwilling, to accept the need for significant change in the approach to planning andoperations.
It is also important to note that the vision statement embodies a broad variety ofobjectives that are representative of the interests of a range of constituents. For thisreason, it is understandable that there will be conflicts among the objectives themselves,as well as among the associated principles. As noted above, for example, contradictionsmay exist between principles related to transit priority, bicycle lanes, and efficient goodsmovement. Similarly, reducing road capacity for private passenger vehicles throughsome of these same measures is very likely to increase congestion and associatedemissions, at least until such time as other objectives of the vision are achieved. Simplystated, every principle does not apply in every case and in the process of plandevelopment, different tradeoffs will be appropriate in different areas of the City.
It goes without saying that land use planning, probably the single most importantdeterminant of travel patterns, is likely to play the dominant role in determining just howfar it will be possible to move in the direction of reduced automobile dependence.
Land use decisions, of course, can hardly be defined as a matter of transportation policybut as most agree, there is a cyclical relationship between land use and transportationperformance. In other words, each affects the other inasmuch as land use has a strong(but not the only) influence on travel patterns whereas accessibility provided by thetransportation system has a strong influence on land use. Experience has shown,however, that it is easier to change transportation policy (where important decisions aremade at the regional scale) than to change land use policy (where decision making is farmore sensitive to local concerns). All of the expressways included in the 1966 MetroTransportation Plan, for example, were essentially eliminated within ten years.
39
7. Next StepsOnce adopted or modified as the basis for planning, vision statements and associatedprinciples clearly must be translated into a course of action for achieving the implied endproduct. These actions fall into two broad categories, namely,
• formal policies with respect to land use and transportation, and• priorities for capital investment in transportation (including preservation of
existing assets).
One of the key distinctions between policies and investment priorities concerns theirrelative financial impacts. Many policies can be pursued independently of availablefunding whereas priorities for capital investment are somewhat irrelevant in the absenceof funding commitments. Nevertheless, one cannot argue for funding assistance fromsenior levels of government or for powers to generate new revenues to be used fortransportation without having some idea of the magnitude of the funds required.Moreover, both governments and their policies do change. For these reasons, presentuncertainty about funding should not be used as an excuse for failure to establishpriorities and funding needs or, for that matter, not to plan.
Since the vision presented here is essentially one of reduced automobile dependence,initially, these policies and priorities should focus on improving the attractiveness ofpublic transportation throughout the City of Toronto. And, since changes occurincrementally, early action will serve as the bellwether of how likely the transportationsystem that eventually emerges actually corresponds to the vision statement itself.
In the near term, therefore, two types of in depth analysis should be carried out as thebasis for improving the competitiveness of transit for many of the trips now taken byprivate automobile. These include short term policy initiatives and longer term prioritiesfor capital investment.
The main policy initiatives concern first, improving transit from the standpoint of traveltime and reliability for existing surface operations through more widespread applicationof transit priority schemes and second, increasing transit coverage in areas that now haveless than acceptable access to TTC services by introducing new operators.
Surface Transit PriorityEven where transit service is accessible (for example, relatively short walking distances),travel time remains one of its most serious competitive disadvantages relative to theprivate automobile. Transit vehicles, after all, stop frequently to load and unloadpassengers and, depending upon the density of traffic, waiting time at stops can also be asignificant deterrent to transit use. Less frequent stops, of course, can reduce travel timefor some passengers at the expense of reduced convenience for others. Optimization ofstop spacing and frequency of service thus involves balancing these tradeoffs, as well astheir cost implications, a subject that has long been of major importance to thoseresponsible for service planning within the TTC.
40
Other sources of transit delay derive from operation in mixed traffic, particularly undercongested conditions. High occupancy vehicle and/or reserved transit lanes do offersome relief but, by and large, most delays occur at intersections which may be blocked bycross street traffic or automobile turning movements. The cumulative effect over a longroute may increase passenger travel time by 15 or 20 minutes. Lower average speedsalso increase the TTC’s operating costs and capital investment in vehicles, basicallyleading to poorer service at higher cost.
In such cases, there is little justification for allowing a single occupant $20,000 vehicleturning left to force a $2.5 million streetcar with 40 or 50 passengers to sit through onecomplete traffic light sequence.11 Yet it happens day in and day out almost everywhereon the TTC network of surface operations. Admittedly, in recent years, applications oftransit priority measures such as exclusive lanes and turn prohibitions have become morecommon. By and large, however, particularly in view of the uncertainty about fundingfor rapid transit expansion, more aggressive application of these policies will be requiredif the goal of improved transit competitiveness on an area wide basis is to be achieved,consistent with the vision statement.
Ensuring transit vehicle priority at intersections by prohibiting, say in the case of streetcarroutes, left turns by cars and trucks, clearly creates inconvenience for auto users, anddedication of truly exclusive transit lanes would require the elimination of substantial onstreet parking. But that is the true difference between meaningful policy and rhetoric.Improved transit competitiveness, realistically, can only be achieved at some ‘cost’ toother road users.
Achieving political support for policies of this nature does require demonstration of thebenefits to be achieved with respect to higher transit ridership and lower TTC costs, aswell as an objective assessment of the true inconvenience imposed on other road users.Any analysis of this sort, of course, will involve a number of value judgements thatcannot necessarily be quantified. Nevertheless, as a starting point, it would be useful toundertake an analysis of existing streetcar routes to:
• isolate and rank the points of highest delay along each route and major causes,• estimate the cumulative savings in travel time, operating costs, and vehicle
requirements that could be achieved by successively eliminating these causes ofdelay,
• identify the traffic engineering and parking changes required to achieve thesebenefits, and
• determine the negative impacts from the standpoint of other road users andbusinesses affected by the changes.
Streetcar routes have been singled out because of the high initial cost of vehicles. A pilotanalysis of one of the King, Queen, College, or St. Clair streetcar routes would provide 11 One recent study correctly cites an average speed of less than 14 kmh for streetcars in thedowntown, but then erroneously jumps to the conclusion that building new exclusive streetcarsroutes is the only way to deal with the problem. Toronto Star, 4 December 1999.
41
further insight into the overall benefits of such transit priority treatment which could thenbe applied to other streetcar and high density bus routes. Getting more out of the existingsystem may, in fact, represent one of the most cost effective ways of increasing transitridership and reducing automobile dependency. And, as noted earlier in this report,transit priority offers opportunities for significant economies of scale in the provision oftransit service.
Alternative Transit Service DeliveryAside from differences in travel time, poor accessibility is often another deterrent totransit use, particularly at the origin end of a trip (for example, to work or shopping) forindividuals who might otherwise find transit convenient at the destination end. Typically,this situation occurs in lower density residential areas where long walking distances areinvolved or where existing transit service is too infrequent.
In such areas, the lack of adequate transit service derives in part from the nature of theTTC’s cost structure (both operating costs and vehicle investment) which may not bewell suited to these types of needs.12 The mere suggestion of ‘contracting out’ to otheroperators, however, raises some fairly serious political flags, is certainly opposed by theTTC’s own labour force, and is prohibited under current legislation.
Protectionist views notwithstanding, there may well be opportunities for engaging otheroperators with different cost characteristics and more appropriate equipment to servethese areas in ways that increase TTC ridership and reduce automobile dependence at nopublic cost. In other words, there is an untapped market for transit that would beprepared to pay supplementary fares to access the main TTC system, perhaps by mini-bus, perhaps by shared taxis. The unanswered question is just how significant thatmarket might actually be.
Particularly in the light of experience elsewhere (both good and bad) with these types ofintegrated joint operations, examining opportunities for enriching the mix of transitservices available in the City as another means of reducing automobile dependenceappears to be a worthwhile undertaking at this time.
Clearly, the vision statement itself will have to be reflected in the overall transportationcomponent of the Official Plan in terms of both a variety of policies such as transitpriority and alternative transit delivery treated above, as well as infrastructure priorities.In this regard, the subject of rapid transit priorities requires special attention, specificallyin terms of two areas of investigation. One concerns the use of existing railway rights ofway; the second relates to short term rapid transit priorities that may have to beestablished even in advance of the final transportation plan.
12 An analogous situation arises with other forms of commercial transportation. Long haul aircarriers such as Air Canada, for example, have a cost and equipment structure that is not as wellsuited to short haul needs as can be offered by regional carriers such as Air Ontario even thoughthere is a commercial relationship between the two.
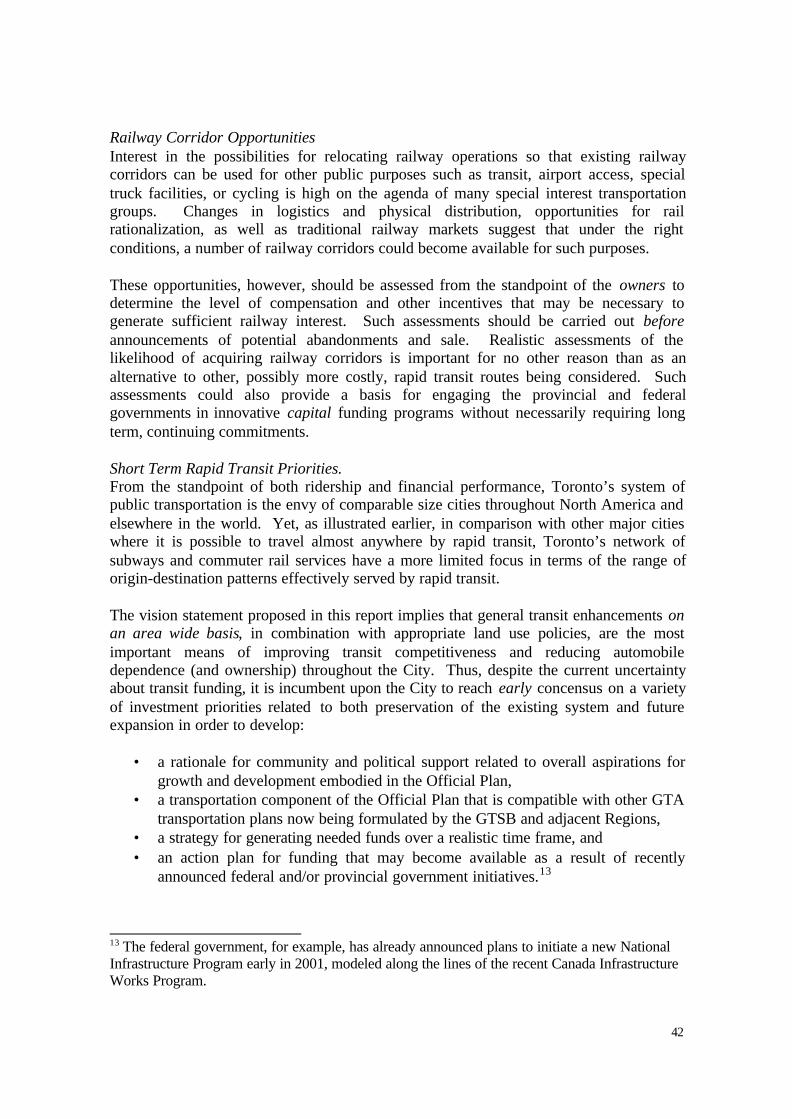
42
Railway Corridor OpportunitiesInterest in the possibilities for relocating railway operations so that existing railwaycorridors can be used for other public purposes such as transit, airport access, specialtruck facilities, or cycling is high on the agenda of many special interest transportationgroups. Changes in logistics and physical distribution, opportunities for railrationalization, as well as traditional railway markets suggest that under the rightconditions, a number of railway corridors could become available for such purposes.
These opportunities, however, should be assessed from the standpoint of the owners todetermine the level of compensation and other incentives that may be necessary togenerate sufficient railway interest. Such assessments should be carried out beforeannouncements of potential abandonments and sale. Realistic assessments of thelikelihood of acquiring railway corridors is important for no other reason than as analternative to other, possibly more costly, rapid transit routes being considered. Suchassessments could also provide a basis for engaging the provincial and federalgovernments in innovative capital funding programs without necessarily requiring longterm, continuing commitments.
Short Term Rapid Transit Priorities.From the standpoint of both ridership and financial performance, Toronto’s system ofpublic transportation is the envy of comparable size cities throughout North America andelsewhere in the world. Yet, as illustrated earlier, in comparison with other major citieswhere it is possible to travel almost anywhere by rapid transit, Toronto’s network ofsubways and commuter rail services have a more limited focus in terms of the range oforigin-destination patterns effectively served by rapid transit.
The vision statement proposed in this report implies that general transit enhancements onan area wide basis, in combination with appropriate land use policies, are the mostimportant means of improving transit competitiveness and reducing automobiledependence (and ownership) throughout the City. Thus, despite the current uncertaintyabout transit funding, it is incumbent upon the City to reach early concensus on a varietyof investment priorities related to both preservation of the existing system and futureexpansion in order to develop:
• a rationale for community and political support related to overall aspirations forgrowth and development embodied in the Official Plan,
• a transportation component of the Official Plan that is compatible with other GTAtransportation plans now being formulated by the GTSB and adjacent Regions,
• a strategy for generating needed funds over a realistic time frame, and• an action plan for funding that may become available as a result of recently
announced federal and/or provincial government initiatives.13
13 The federal government, for example, has already announced plans to initiate a new NationalInfrastructure Program early in 2001, modeled along the lines of the recent Canada InfrastructureWorks Program.
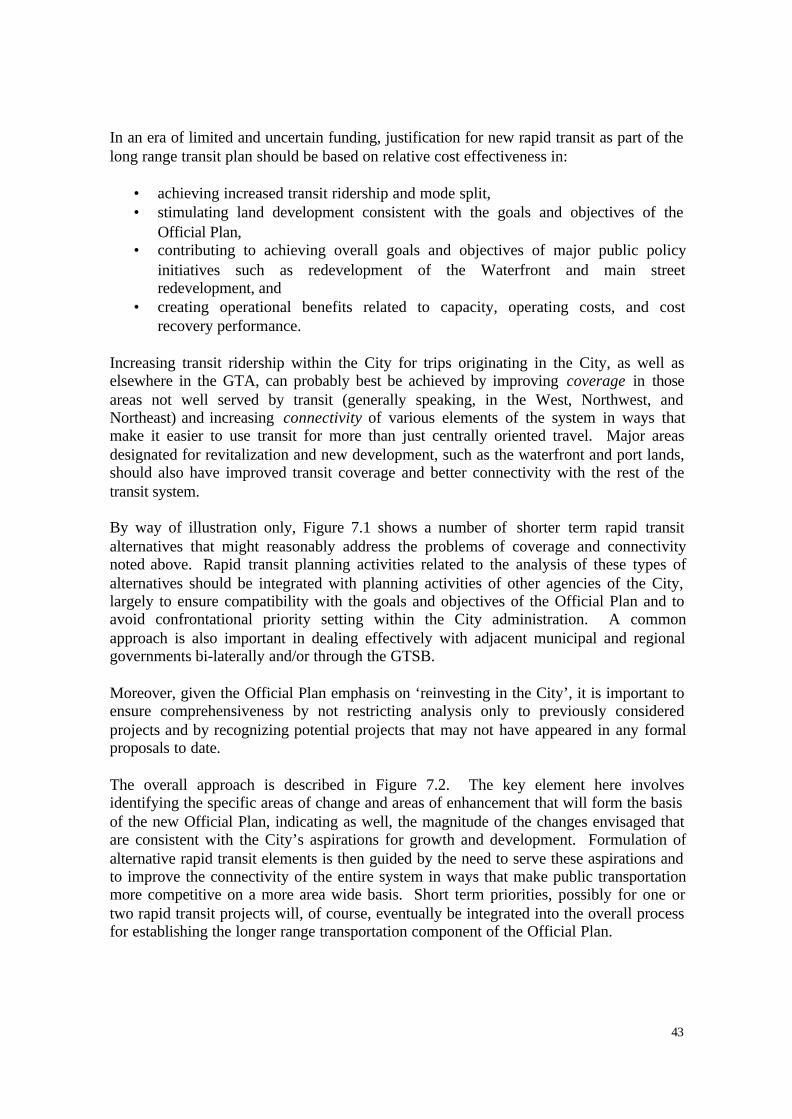
43
In an era of limited and uncertain funding, justification for new rapid transit as part of thelong range transit plan should be based on relative cost effectiveness in:
• achieving increased transit ridership and mode split,• stimulating land development consistent with the goals and objectives of the
Official Plan,• contributing to achieving overall goals and objectives of major public policy
initiatives such as redevelopment of the Waterfront and main streetredevelopment, and
• creating operational benefits related to capacity, operating costs, and costrecovery performance.
Increasing transit ridership within the City for trips originating in the City, as well aselsewhere in the GTA, can probably best be achieved by improving coverage in thoseareas not well served by transit (generally speaking, in the West, Northwest, andNortheast) and increasing connectivity of various elements of the system in ways thatmake it easier to use transit for more than just centrally oriented travel. Major areasdesignated for revitalization and new development, such as the waterfront and port lands,should also have improved transit coverage and better connectivity with the rest of thetransit system.
By way of illustration only, Figure 7.1 shows a number of shorter term rapid transitalternatives that might reasonably address the problems of coverage and connectivitynoted above. Rapid transit planning activities related to the analysis of these types ofalternatives should be integrated with planning activities of other agencies of the City,largely to ensure compatibility with the goals and objectives of the Official Plan and toavoid confrontational priority setting within the City administration. A commonapproach is also important in dealing effectively with adjacent municipal and regionalgovernments bi-laterally and/or through the GTSB.
Moreover, given the Official Plan emphasis on ‘reinvesting in the City’, it is important toensure comprehensiveness by not restricting analysis only to previously consideredprojects and by recognizing potential projects that may not have appeared in any formalproposals to date.
The overall approach is described in Figure 7.2. The key element here involvesidentifying the specific areas of change and areas of enhancement that will form the basisof the new Official Plan, indicating as well, the magnitude of the changes envisaged thatare consistent with the City’s aspirations for growth and development. Formulation ofalternative rapid transit elements is then guided by the need to serve these aspirations andto improve the connectivity of the entire system in ways that make public transportationmore competitive on a more area wide basis. Short term priorities, possibly for one ortwo rapid transit projects will, of course, eventually be integrated into the overall processfor establishing the longer range transportation component of the Official Plan.
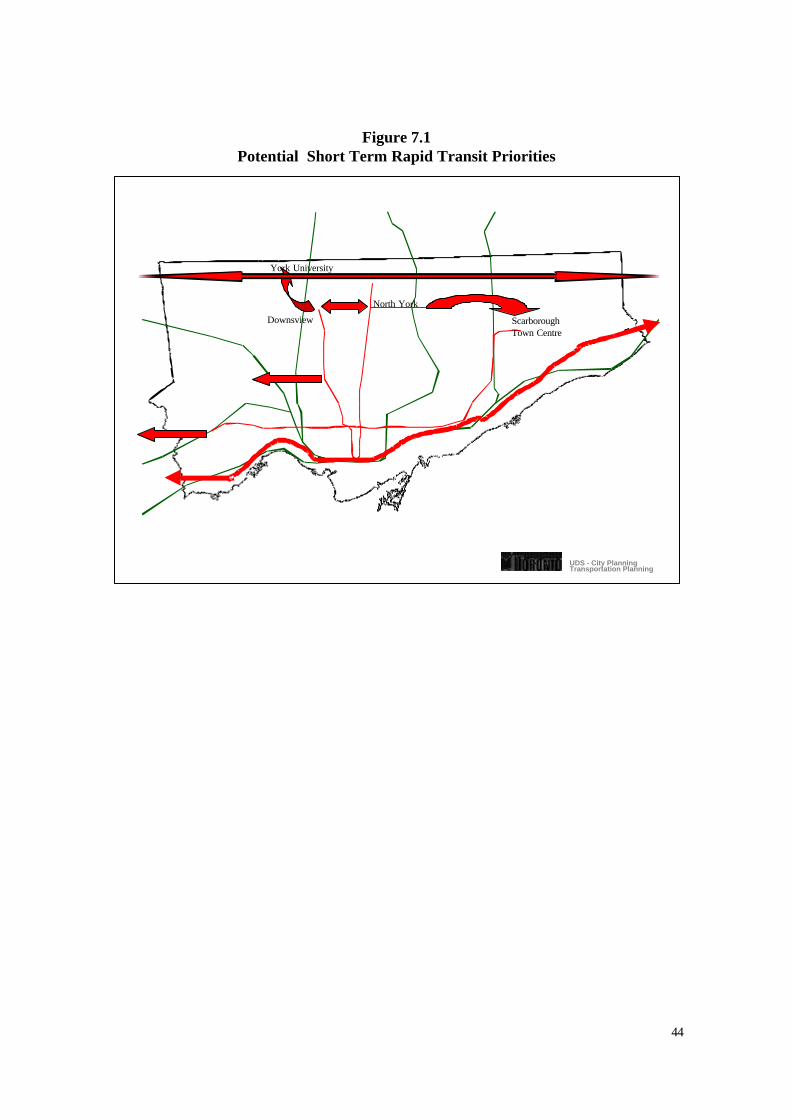
44
Figure 7.1Potential Short Term Rapid Transit Priorities
UDS - City PlanningTransportation Planning
Downsview
York University
ScarboroughTown Centre
North York
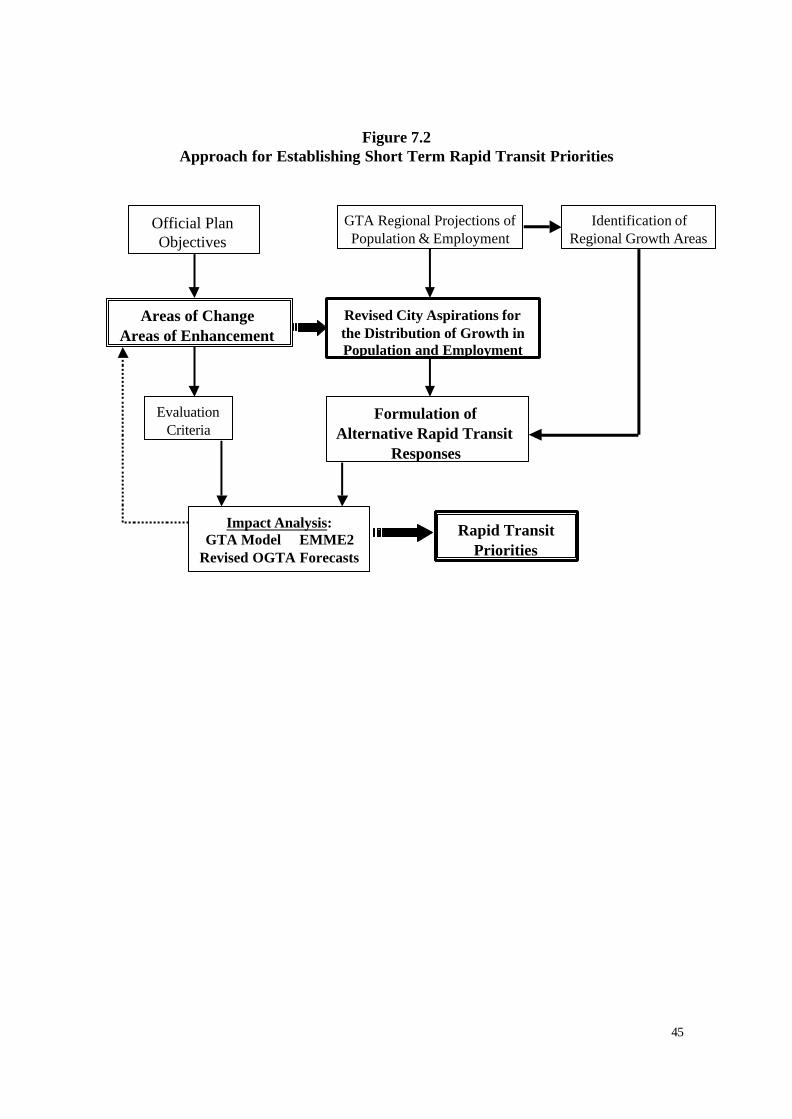
45
Figure 7.2Approach for Establishing Short Term Rapid Transit Priorities
Official PlanObjectives
GTA Regional Projections ofPopulation & Employment
Identification ofRegional Growth Areas
Formulation ofAlternative Rapid Transit
Responses
Areas of ChangeAreas of Enhancement
EvaluationCriteria
Revised City Aspirations forthe Distribution of Growth inPopulation and Employment
Rapid TransitPriorities
Impact Analysis :GTA Model EMME2
Revised OGTA Forecasts
Related Documents