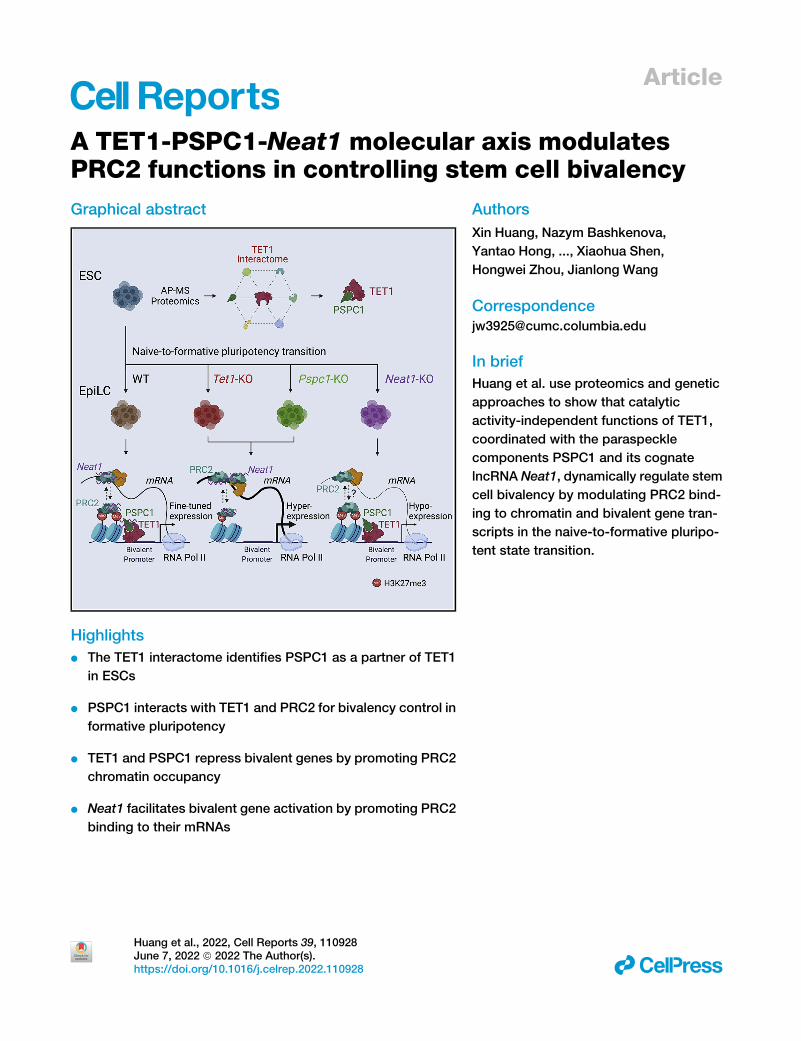
Article A TET1-PSPC1-Neat1 molecular axis modulates PRC2 functions in controlling stem cell bivalency Graphical abstract Highlights d The TET1 interactome identifies PSPC1 as a partner of TET1 in ESCs d PSPC1 interacts with TET1 and PRC2 for bivalency control in formative pluripotency d TET1 and PSPC1 repress bivalent genes by promoting PRC2 chromatin occupancy d Neat1 facilitates bivalent gene activation by promoting PRC2 binding to their mRNAs Authors Xin Huang, Nazym Bashkenova, Yantao Hong, ..., Xiaohua Shen, Hongwei Zhou, Jianlong Wang Correspondence [email protected] In brief Huang et al. use proteomics and genetic approaches to show that catalytic activity-independent functions of TET1, coordinated with the paraspeckle components PSPC1 and its cognate lncRNA Neat1, dynamically regulate stem cell bivalency by modulating PRC2 bind- ing to chromatin and bivalent gene tran- scripts in the naive-to-formative pluripo- tent state transition. Huang et al., 2022, Cell Reports 39, 110928 June 7, 2022 ª 2022 The Author(s). https://doi.org/10.1016/j.celrep.2022.110928 ll

Welcome message from author
This document is posted to help you gain knowledge. Please leave a comment to let me know what you think about it! Share it to your friends and learn new things together.
Transcript
Article
A TET1-PSPC1-Neat1 mol
ecular axis modulatesPRC2 functions in controlling stem cell bivalencyGraphical abstract
Highlights
d The TET1 interactome identifies PSPC1 as a partner of TET1
in ESCs
d PSPC1 interacts with TET1 and PRC2 for bivalency control in
formative pluripotency
d TET1 and PSPC1 repress bivalent genes by promoting PRC2
chromatin occupancy
d Neat1 facilitates bivalent gene activation by promoting PRC2
binding to their mRNAs
Huang et al., 2022, Cell Reports 39, 110928June 7, 2022 ª 2022 The Author(s).https://doi.org/10.1016/j.celrep.2022.110928
Authors
Xin Huang, Nazym Bashkenova,
Yantao Hong, ..., Xiaohua Shen,
Hongwei Zhou, Jianlong Wang
In brief
Huang et al. use proteomics and genetic
approaches to show that catalytic
activity-independent functions of TET1,
coordinated with the paraspeckle
components PSPC1 and its cognate
lncRNA Neat1, dynamically regulate stem
cell bivalency by modulating PRC2 bind-
ing to chromatin and bivalent gene tran-
scripts in the naive-to-formative pluripo-
tent state transition.
ll
OPEN ACCESS
llArticle
A TET1-PSPC1-Neat1molecular axis modulates PRC2functions in controlling stem cell bivalencyXin Huang,1 NazymBashkenova,1 Yantao Hong,2 Cong Lyu,3 Diana Guallar,4 Zhe Hu,1 VikasMalik,1 Dan Li,1 Hailin Wang,3
Xiaohua Shen,2 Hongwei Zhou,1 and Jianlong Wang1,5,*1Department of Medicine, Columbia Center for Human Development, Columbia Stem Cell Initiative, Herbert Irving Comprehensive Cancer
Center, Columbia University Irving Medical Center, New York, NY 10032, USA2Tsinghua Center for Life Sciences, School of Life Sciences, Tsinghua University, Beijing 100084, China3Research Center for Eco-Environmental Sciences, Chinese Academy of Sciences, Beijing 100085, China4Center for Research in Molecular Medicine and Chronic Diseases (CiMUS), Universidade de Santiago de Compostela, Santiago de Com-
postela 15782, Spain5Lead contact*Correspondence: [email protected]
https://doi.org/10.1016/j.celrep.2022.110928
SUMMARY
TET1 maintains hypomethylation at bivalent promoters through its catalytic activity in embryonic stem cells(ESCs). However, TET1 catalytic activity-independent function in regulating bivalent genes is not well under-stood. Using a proteomics approach, we map the TET1 interactome in ESCs and identify PSPC1 as a TET1partner. Genome-wide location analysis reveals that PSPC1 functionally associates with TET1 and Polycombrepressive complex-2 (PRC2). We establish that PSPC1 and TET1 repress, and the lncRNA Neat1 activates,bivalent gene expression. In ESCs, Neat1 is preferentially bound to PSPC1 alongside its PRC2 association atbivalent promoters. During the ESC-to-epiblast-like stem cell (EpiLC) transition, PSPC1 and TET1 maintainPRC2 chromatin occupancy at bivalent gene promoters, while Neat1 facilitates the activation of certain biva-lent genes by promoting PRC2 binding to their mRNAs. Our study demonstrates a TET1-PSPC1-Neat1 mo-lecular axis that modulates PRC2-binding affinity to chromatin and bivalent gene transcripts in controllingstem cell bivalency.
INTRODUCTION
Embryonic stem cells (ESCs) and epiblast stem cells (EpiSCs) of
the naive and primed pluripotency states, respectively, differ
significantly in their transcriptomic features, clonogenicity, and
differentiation potentials (Nichols and Smith, 2009). Epiblast-
like stem cells (EpiLCs), a kind of formative pluripotent cells, tran-
siently emerge when adapting ESCs to primed EpiSCs culture
conditions within a specific period (usually 48 h), while an
extended culture of EpiLCs establishes a stable primed state
(Hayashi et al., 2011; Morgani et al., 2017; Smith, 2017).
Recently, stable cell lines of formative pluripotency state were
generated with specific combinations of cytokines and inhibitors
(Kinoshita et al., 2021; Wang et al., 2021; Yu et al., 2021) with a
notable molecular feature, i.e., the ‘‘super-bivalency’’ at line-
age-specific genes present both in vivo (Xiang et al., 2020) and
in vitro (Wang et al., 2021). Bivalent promoters are marked by
H3K4me3 and H3K27me3 (Bernstein et al., 2006), catalyzed by
KMT2B and polycomb repressive complex-2 (PRC2), respec-
tively, and are considered to poise the expression of develop-
mental regulators in ESCs while allowing timely activation upon
differentiation cues (Voigt et al., 2013). DNA methylation at biva-
lent promoters decreases KMT2B activity and H3K4me3, which
in turn leads to increased PRC2 occupancy at promoters (Mas
This is an open access article under the CC BY-N
et al., 2018). The TET (ten-eleven translocation) family of proteins
regulate gene expression through DNA demethylation (Kohli and
Zhang, 2013), and were thus implicated in regulating bivalency
(Mas et al., 2018; Xiang et al., 2020). Although the loss of TET
proteins (Tet1KO or Tet1/2/3TKO) causes global changes in
the DNA methylation and gene expression in ESCs, the cells
nevertheless retain the ability to self-renew (Dawlaty et al.,
2011; Lu et al., 2014; Verma et al., 2018). In the formative
EpiLCs and the primed EpiSCs, TET1 is the only expressed
TET protein (Fidalgo et al., 2016; Khoueiry et al., 2017). Loss of
TET1 causes dysregulation of gene expression in ESC differen-
tiation (Dawlaty et al., 2011; Koh et al., 2011) and defects in
mouse post-implantation development (Khoueiry et al., 2017).
Notably, TET1 is responsible for maintaining the DNA methyl-
ation valleys at promoters of developmentally regulated genes
to establish a super-bivalency in the post-implantation epiblast
(Xiang et al., 2020). Mechanistically, TET1 activates and re-
presses gene transcription by catalytic activity-dependent and
independent functions through promoter/enhancer demethyla-
tion (Kohli and Zhang, 2013) and association with SIN3A/HDAC
(Williams et al., 2011) or PRC2 (Chrysanthou et al., 2022; Neri
et al., 2013; Wu et al., 2011) complexes, respectively.
The post-transcriptional gene regulation by PRC2 has been
increasingly appreciated through its associationwithRNA-binding
Cell Reports 39, 110928, June 7, 2022 ª 2022 The Author(s). 1C-ND license (http://creativecommons.org/licenses/by-nc-nd/4.0/).
Articlell
OPEN ACCESS
proteins (RBPs) and long noncoding RNAs (lncRNAs) that can
regulate gene expression in cis or in trans (Cifuentes-Rojas et al.,
2014; Davidovich and Cech, 2015; Kaneko et al., 2014; Yan
et al., 2019). In addition, nascent mRNAs and other RNA tran-
scripts were also proposed to antagonize the association of
PRC2 with the chromatin (Beltran et al., 2016; Davidovich et al.,
2015; Kaneko et al., 2013; Long et al., 2020; Wang et al., 2017b).
In vivo, a ‘‘PRC2 eviction’’ model was proposed in which the
nascent mRNA regulates its own production by evicting PRC2
from the promoter, thereby further promoting gene transcription
(Skalska et al., 2021;Wang et al., 2017a). Although TET1 is a puta-
tiveRBP (Heetal., 2016),whether/howTET1may functionallycon-
nect with PRC2 through other RBPs and/or lncRNAs to control
bivalent genes in pluripotent states has not been determined.
By studying the TET1 interactome in mouse ESCs, we here
report the discovery of paraspeckle component 1 (PSPC1), a
RBP generally associated with nuclear paraspeckles (Knott
et al., 2016), as a TET1 partner. We further establish that PSPC1
and its cognate lncRNA Neat1 associate with TET1 and PRC2 at
bivalent promoters. Using genetic loss-of-function approaches,
we demonstrate that TET1 and PSPC1 promote PRC2 chromatin
occupancy through Neat1 to counteract the binding of PRC2 to
bivalent gene transcripts, thereby preventing PRC2 eviction from
chromatin to maintain the super-bivalency during the ESC-to-
EpiLC transition. On the other hand, upon the loss of TET1 or
PSPC1, Neat1 enhances PRC2 binding to mRNAs, thereby acti-
vating transcription ofbivalent genesduringpluripotent-state tran-
sition. Our study thus establishes a previously unappreciated
TET1-PSPC1-Neat1 molecular axis that modulates PRC2 occu-
pancy at chromatin and bivalent gene transcripts in controlling
stem cell bivalency.
RESULTS
The TET1 interactome in ESCs identifies PSPC1 as itsinteracting partnerWe engineered mouse ESCs expressing FLAG-tagged TET1
(FL-Tet1) and purified the TET1 protein complexes using
SILAC (stable isotope labeling by amino acid in cell culture)-
based AP-MS (affinity purification followed by mass spectrom-
etry) method as described in our previous studies (Ding et al.,
2015; Guallar et al., 2018; Huang et al., 2021). Reciprocal
SILAC labeling was performed as biological replicates (Rep1/
2), and the intensity ratios of TET1 versus control immunoprecip-
itation (IP) (Rep1: light/heavy; Rep2: heavy/light) for each protein
were plotted (Figure 1A; Table S1). Validating our approach, we
identified several known TET1 partners such as OGT and SIN3A
(Vella et al., 2013) and components of a ribosome biogenesis
complex consisting of PELP1, TEX10, WDR18, and SENP3
(Finkbeiner et al., 2011), consistent with our previous finding
that TET1 and TEX10 are close partners (Ding et al., 2015). In
addition, we identified several RBPs such as L1TD1 and
PSPC1 (Figures 1A and S1A). Selected candidate proteins in
the TET1 interactome were validated by FLAG co-immunopre-
cipitation (co-IP) followed by western blot analysis (Figure 1B).
We decided to focus on the TET1 and PSPC1 partnership for
several reasons. First, although the functional significance of
the TET1-SIN3A/OGT (Deplus et al., 2013; Vella et al., 2013;
2 Cell Reports 39, 110928, June 7, 2022
Williams et al., 2011) and TET1-TEX10 (Ding et al., 2015) partner-
ships in ESC maintenance or differentiation is well studied, the
functional cooperation between TET1 and PSPC1 is unclear.
PSPC1 does interact with other paraspeckle components
such as SFPQ and NONO in ESCs (Figure S1B), although para-
speckles were not observed in mouse (Figure S1C) or human
(Chen and Carmichael, 2009) ESCs. Second, TET1 activates
and represses lineage gene expression during ESC differentia-
tion through its catalytic activity-dependent and -independent
functions, respectively (Koh et al., 2011; Wu et al., 2011; Zhu
et al., 2018). Whereas TET1 catalytic activity-independent func-
tionmay act through PRC2, their direct physical association was
not detected (Wu et al., 2011), raising the possibility of unknown
bridging proteins and/or RNAs for the functional interaction be-
tween TET1 and PRC2.
We confirmed the interaction between PSPC1 and TET1 by
reciprocal co-IP using endogenous antibodies (Figures 1C and
1D), which were independent of RNAs (Figure S1E). PSPC1
also interacts with the TET1 partners SIN3A and PELP1 (Fig-
ure 1C). Compared with the TET2 interactome, we constructed
with a similar SILAC strategy in ESCs (Guallar et al., 2018), and
we found that SIN3A, PSPC1, OGT, and LMNB1 are shared pro-
teins in both interactomes. However, the proteins in the ribo-
some biogenesis complex (PELP1, TEX10, WDR18, and
LAS1L) are present only in the TET1 interactome (Figure S1F).
To probe the potential biochemical entities associated with
PSPC1, TET1, and TET2, we performed size exclusion chroma-
tography (i.e., gel filtration) on ESC nuclear extracts. We found
the co-fractionation of all these three factors (complex I, blue;
Figure S1G) and the TET1-free co-fractionation of PSPC1 and
TET2 (complex II, red; Figure S1G). While the existent TET1-
free TET2/PSPC1 complex has been demonstrated with the crit-
ical role of TET2 in RNA-dependent targeting for ERV control in
ESCs (Guallar et al., 2018), we wondered whether the PSPC1-
TET1 interaction is mediated by TET2 in light of their co-fraction-
ation as seen in complex I (Figure S1G). We thus employed the
Tet1/2/3 triple-KO (TetTKO) ESCs (Fidalgo et al., 2016), rescued
with either FLAG-tagged TET1 or TET2 (Figure 1E; TET3 is not
expressed in ESCs), and performed FLAG-IP followed by west-
ern blot of PSPC1. Interestingly, we found that both TET1 and
TET2 interact with PSPC1 in the absence of the other TET
proteins (Figure 1F), indicating the TET2-independent TET1-
PSPC1 interaction while further confirming the TET1-indepen-
dent TET2-PSPC1 interaction despite the co-fractionation of
these three proteins in size exclusion chromatography.
We also performed domain-mapping experiments to dissect
the TET1-PSPC1 interaction. The full-length (2,039 amino acids)
or truncated fragments of Tet1 were cloned into the FLAG-
tagged expression vectors (Figure S1H) for transfection in
ESCs followed by Co-IP. We observed that full-length TET1
and its variants (C1, C2, and DCXXC) containing aminimal C-ter-
minal catalytic domain (amino acids 1,367–2,039) interact with
PSPC1 (Figure S1H). Similarly, we cloned the full-length or trun-
cated fragments of Pspc1 into the V5-tagged expression vectors
(Figure S1I) for transfection in ESCs followed by Co-IP.We found
that full-length PSPC1 and its truncated variant F2 containing the
multifunctional Drosophila behavior/human splicing (DBHS)
domain (Knott et al., 2016) were required to interact with TET1
A
D
G H
E F
B C
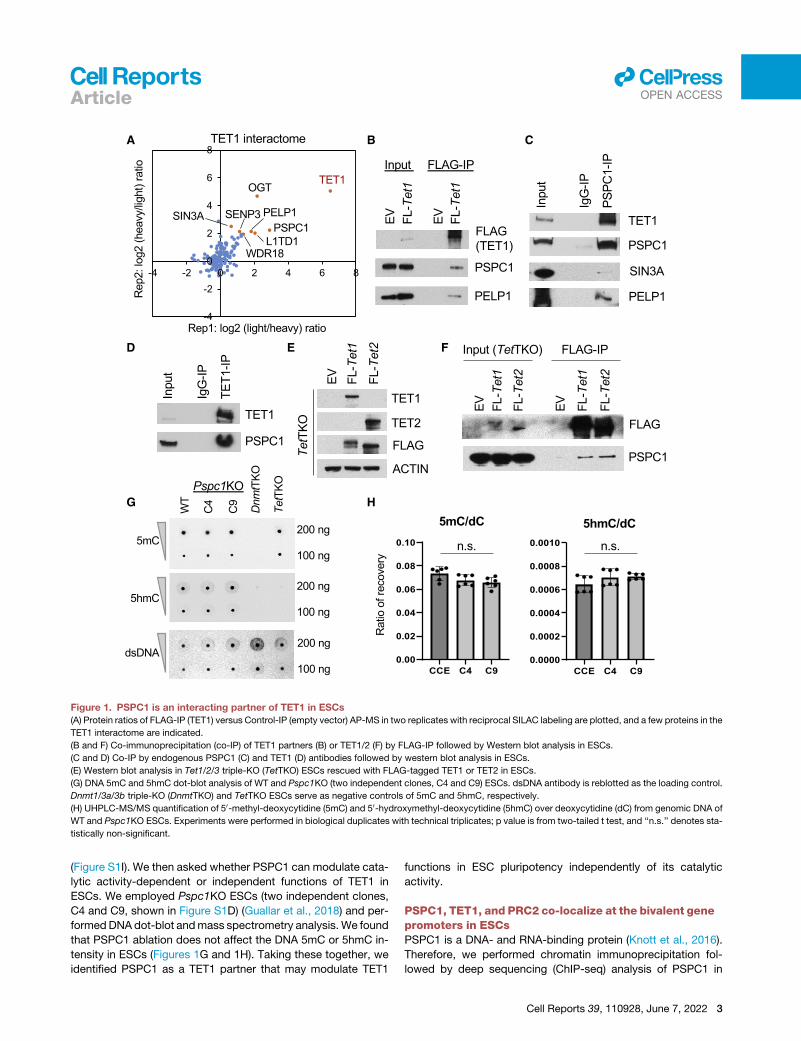
Figure 1. PSPC1 is an interacting partner of TET1 in ESCs(A) Protein ratios of FLAG-IP (TET1) versus Control-IP (empty vector) AP-MS in two replicates with reciprocal SILAC labeling are plotted, and a few proteins in the
TET1 interactome are indicated.
(B and F) Co-immunoprecipitation (co-IP) of TET1 partners (B) or TET1/2 (F) by FLAG-IP followed by Western blot analysis in ESCs.
(C and D) Co-IP by endogenous PSPC1 (C) and TET1 (D) antibodies followed by western blot analysis in ESCs.
(E) Western blot analysis in Tet1/2/3 triple-KO (TetTKO) ESCs rescued with FLAG-tagged TET1 or TET2 in ESCs.
(G) DNA 5mC and 5hmC dot-blot analysis of WT and Pspc1KO (two independent clones, C4 and C9) ESCs. dsDNA antibody is reblotted as the loading control.
Dnmt1/3a/3b triple-KO (DnmtTKO) and TetTKO ESCs serve as negative controls of 5mC and 5hmC, respectively.
(H) UHPLC-MS/MS quantification of 50-methyl-deoxycytidine (5mC) and 50-hydroxymethyl-deoxycytidine (5hmC) over deoxycytidine (dC) from genomic DNA of
WT and Pspc1KO ESCs. Experiments were performed in biological duplicates with technical triplicates; p value is from two-tailed t test, and ‘‘n.s.’’ denotes sta-
tistically non-significant.
Articlell
OPEN ACCESS
(Figure S1I). We then asked whether PSPC1 can modulate cata-
lytic activity-dependent or independent functions of TET1 in
ESCs. We employed Pspc1KO ESCs (two independent clones,
C4 and C9, shown in Figure S1D) (Guallar et al., 2018) and per-
formedDNA dot-blot andmass spectrometry analysis. We found
that PSPC1 ablation does not affect the DNA 5mC or 5hmC in-
tensity in ESCs (Figures 1G and 1H). Taking these together, we
identified PSPC1 as a TET1 partner that may modulate TET1
functions in ESC pluripotency independently of its catalytic
activity.
PSPC1, TET1, and PRC2 co-localize at the bivalent genepromoters in ESCsPSPC1 is a DNA- and RNA-binding protein (Knott et al., 2016).
Therefore, we performed chromatin immunoprecipitation fol-
lowed by deep sequencing (ChIP-seq) analysis of PSPC1 in
Cell Reports 39, 110928, June 7, 2022 3
A B
D
FE
C
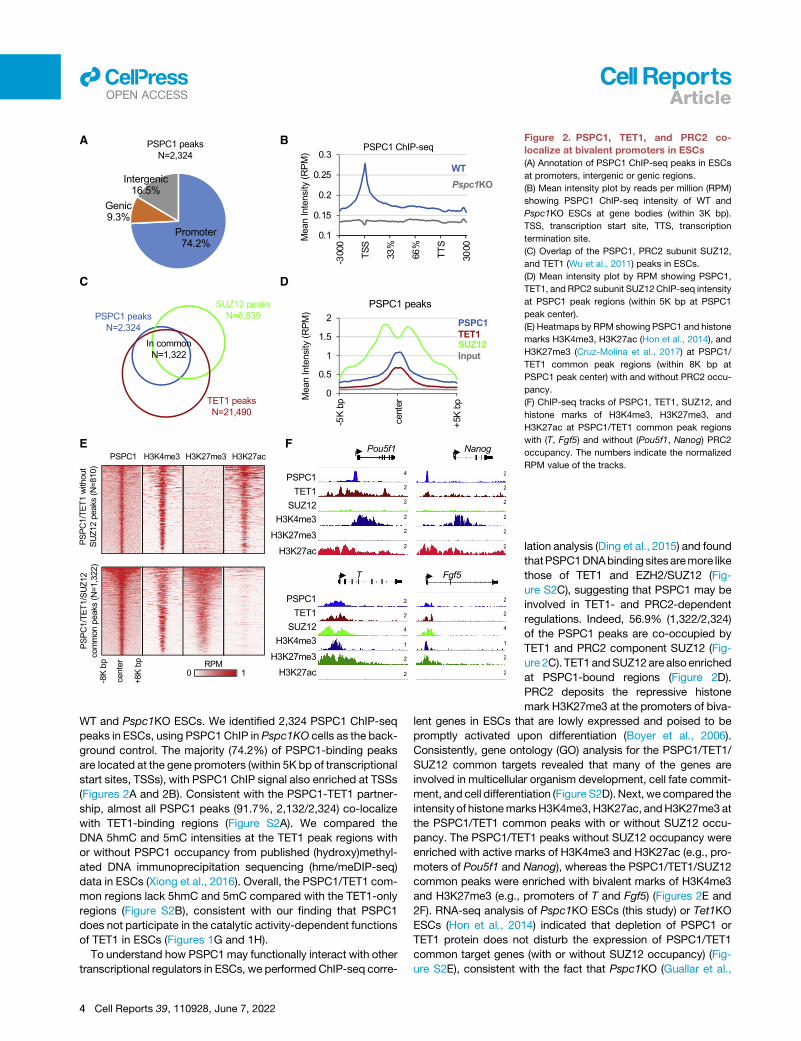
Figure 2. PSPC1, TET1, and PRC2 co-
localize at bivalent promoters in ESCs
(A) Annotation of PSPC1 ChIP-seq peaks in ESCs
at promoters, intergenic or genic regions.
(B) Mean intensity plot by reads per million (RPM)
showing PSPC1 ChIP-seq intensity of WT and
Pspc1KO ESCs at gene bodies (within 3K bp).
TSS, transcription start site, TTS, transcription
termination site.
(C) Overlap of the PSPC1, PRC2 subunit SUZ12,
and TET1 (Wu et al., 2011) peaks in ESCs.
(D) Mean intensity plot by RPM showing PSPC1,
TET1, and RPC2 subunit SUZ12 ChIP-seq intensity
at PSPC1 peak regions (within 5K bp at PSPC1
peak center).
(E) Heatmaps by RPM showing PSPC1 and histone
marks H3K4me3, H3K27ac (Hon et al., 2014), and
H3K27me3 (Cruz-Molina et al., 2017) at PSPC1/
TET1 common peak regions (within 8K bp at
PSPC1 peak center) with and without PRC2 occu-
pancy.
(F) ChIP-seq tracks of PSPC1, TET1, SUZ12, and
histone marks of H3K4me3, H3K27me3, and
H3K27ac at PSPC1/TET1 common peak regions
with (T, Fgf5) and without (Pou5f1, Nanog) PRC2
occupancy. The numbers indicate the normalized
RPM value of the tracks.
Articlell
OPEN ACCESS
WT and Pspc1KO ESCs. We identified 2,324 PSPC1 ChIP-seq
peaks in ESCs, using PSPC1 ChIP in Pspc1KO cells as the back-
ground control. The majority (74.2%) of PSPC1-binding peaks
are located at the gene promoters (within 5K bp of transcriptional
start sites, TSSs), with PSPC1 ChIP signal also enriched at TSSs
(Figures 2A and 2B). Consistent with the PSPC1-TET1 partner-
ship, almost all PSPC1 peaks (91.7%, 2,132/2,324) co-localize
with TET1-binding regions (Figure S2A). We compared the
DNA 5hmC and 5mC intensities at the TET1 peak regions with
or without PSPC1 occupancy from published (hydroxy)methyl-
ated DNA immunoprecipitation sequencing (hme/meDIP-seq)
data in ESCs (Xiong et al., 2016). Overall, the PSPC1/TET1 com-
mon regions lack 5hmC and 5mC compared with the TET1-only
regions (Figure S2B), consistent with our finding that PSPC1
does not participate in the catalytic activity-dependent functions
of TET1 in ESCs (Figures 1G and 1H).
To understand how PSPC1may functionally interact with other
transcriptional regulators in ESCs, we performed ChIP-seq corre-
4 Cell Reports 39, 110928, June 7, 2022
lation analysis (Ding et al., 2015) and found
thatPSPC1DNAbindingsitesaremore like
those of TET1 and EZH2/SUZ12 (Fig-
ure S2C), suggesting that PSPC1 may be
involved in TET1- and PRC2-dependent
regulations. Indeed, 56.9% (1,322/2,324)
of the PSPC1 peaks are co-occupied by
TET1 and PRC2 component SUZ12 (Fig-
ure 2C). TET1andSUZ12arealso enriched
at PSPC1-bound regions (Figure 2D).
PRC2 deposits the repressive histone
mark H3K27me3 at the promoters of biva-
lent genes in ESCs that are lowly expressed and poised to be
promptly activated upon differentiation (Boyer et al., 2006).
Consistently, gene ontology (GO) analysis for the PSPC1/TET1/
SUZ12 common targets revealed that many of the genes are
involved in multicellular organism development, cell fate commit-
ment, and cell differentiation (Figure S2D). Next, we compared the
intensity of histonemarksH3K4me3,H3K27ac, andH3K27me3at
the PSPC1/TET1 common peaks with or without SUZ12 occu-
pancy. The PSPC1/TET1 peaks without SUZ12 occupancy were
enriched with active marks of H3K4me3 and H3K27ac (e.g., pro-
moters of Pou5f1 and Nanog), whereas the PSPC1/TET1/SUZ12
common peaks were enriched with bivalent marks of H3K4me3
and H3K27me3 (e.g., promoters of T and Fgf5) (Figures 2E and
2F). RNA-seq analysis of Pspc1KO ESCs (this study) or Tet1KO
ESCs (Hon et al., 2014) indicated that depletion of PSPC1 or
TET1 protein does not disturb the expression of PSPC1/TET1
common target genes (with or without SUZ12 occupancy) (Fig-
ure S2E), consistent with the fact that Pspc1KO (Guallar et al.,
A
C
E
F G
D
B
Multicellular organismdevelopment
Axon extension
Regulation of osteoblastdifferentiation
Cell fate commitment
Cell-cell signaling
Regulation of cellproliferation
Nervous systemdevelopment
Wnt signaling pathway
Biological Process (C4)-log10 (P-value)
10 2 3 4
(legend on next page)
Cell Reports 39, 110928, June 7, 2022 5
Articlell
OPEN ACCESS
Articlell
OPEN ACCESS
2018) orTet1KO (Honet al., 2014) doesnot affect themaintenance
of ESCs.
Together, these results suggest a potential physical associa-
tion of the TET1-PSPC1 partnership with PRC2 in repressing
bivalent genes in ESCs. However, the possible role of the
TET1-PSPC1 partnership independent of PRC2 in activating plu-
ripotency genes cannot be discounted and warrants future
investigation (see Discussion).
PSPC1 restricts bivalent gene activation during theESC-to-EpiLC transitionTo understand how PSPC1 might contribute to the regulation of
bivalent genes in pluripotent cells, we decided to study the func-
tions of PSPC1 in the pluripotent-state transition, during which
the super-bivalency of a large set of developmental genes was
initially proposed (Morgani et al., 2017; Smith, 2017) and subse-
quently confirmed (Wang et al., 2021) in formative pluripotent
stem cells. By switching the culture medium from serum/LIF to
Fgf2/activin A (FA), ESCs enter a transient formative pluripotency
state of EpiLCs, followed by a primed pluripotency state of
EpiSCs under an extended culture of EpiLCs in the FA condition
(Smith, 2017). We thus adapted WT and Pspc1KO ESCs (day 0,
D0) in FA culture medium for 2 days (D2) and 4 days (D4) and
collected RNAs for RNA-seq analysis (Figure 3A). Of note, the
D2 EpiLCs are considered as the state of formative pluripotency
(Buecker et al., 2014; Fidalgo et al., 2016; Hayashi et al., 2011),
whereas D4 EpiLCs and EpiSCs are of primed pluripotency
when the meso/ectodermal lineage genes (e.g., Fgf5, Fgf8, T,
Eomes, andOtx2) are further activated (Huang et al., 2017). Prin-
cipal-component analysis (PCA) revealed a trajectory of gene
expression profiles moving from D0 (ESC) to D2 and D4
(EpiLC) on PC1, while the differences of gene expression be-
tween WT and KO cells at all three time points are reflected on
PC2 (Figure 3B). By comparing the differentially expressed
genes (DEGs; p < 0.05, fold change > 1.5; Table S2) between
WT and Pspc1KO cells at three time points, we found that mul-
tiple signaling pathways and their associated genes, including
FGF signaling (e.g., Fgf5 and Fgf8), Nodal signaling (e.g., Nodal
and Eomes), and Wnt signaling (e.g., Axin2,Wnt5b, andWnt8a),
are upregulated in Pspc1KO relative to WT EpiLCs (D2 and D4;
Figure S3A). GO analysis of these PSPC1-repressed DEGs in
D2 and D4 EpiLCs indicates that they are involved in embryo
and tissue development (Figure S3B, left). In contrast, the
PSPC1-activated DEGs are involved in multiple cellular regula-
tions, including metabolic process, protein transport, and cell
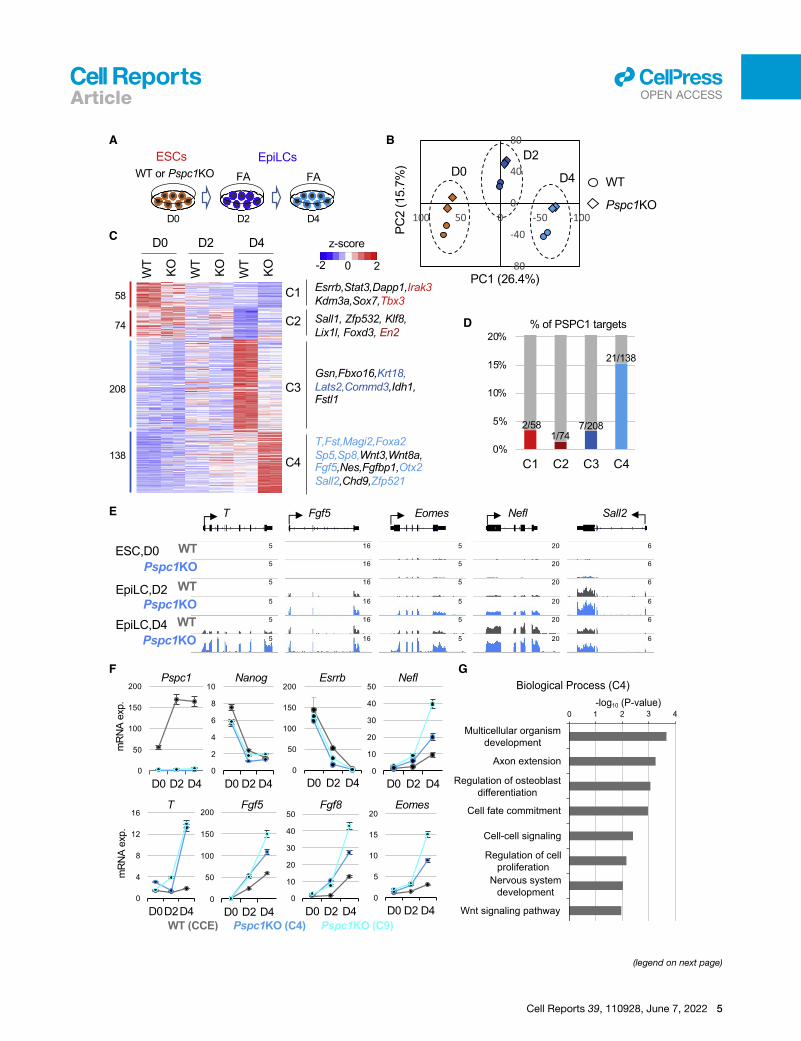
Figure 3. PSPC1 negatively regulates activation of bivalent genes in th(A) Schematic depiction of the naive-to-formative transition ofWT andPspc1KO E
and 4 days.
(B) Principal-component analysis (PCA) of WT and Pspc1KO RNA-seq samples
component (PC) are indicated.
(C) Heatmap showing the relative expression of differentially expressed genes (D
numbers of DEGs are shown on the left, and representative genes in the four cla
analysis are indicated by the color text, which matches the color of the histogram
(D) Histogram showing the percentages (%) and numbers of DEGs in each class
(E) RNA-seq tracks of WT and Pspc1KO ESCs and EpiLCs at bivalent lineage ge
(F) RT-qPCR analysis of pluripotency and lineage genes in WT and Pspc1KO ESC
EpiLC differentiation. Error bars represent the standard deviation of technical trip
(G) Gene ontology (GO) analysis for the C4 genes (Class 4, N = 138) shown in (C
6 Cell Reports 39, 110928, June 7, 2022
death (Figure S3B, right). Interestingly, a majority (75.9%, 129/
170) of the PSPC1-repressed DEGs in EpiLCs are not repressed
by PSPC1 in ESCs (Figure S3B, left), likely due to their low
expression levels and/or alternative repression mechanisms in
ESCs.
Next, we focused on the DEGs between D0 and D4 (ESC vs.
EpiLC) WT cells and between D4 WT and Pspc1KO EpiLCs to
obtain 478 shared DEGs (Figure 3C; Table S2). Clustering anal-
ysis of these genes illustrated different expression patterns
among the samples (class 1–4, or C1–4; Figure 3C). We exam-
ined the number of DEGs in C1–4 that were direct PSPC1 targets
from ChIP-seq analysis and found that C4 contains the highest
percentage (15.2%, 21/138) of PSPC1 targets (Figure 3D). These
PSPC1 targets (e.g., T, Fgf5, and Sall2) are bivalent and mini-
mally expressed in ESCs, while transcriptionally activated in
EpiLCs, and PSPC1 depletion further increases their expression
during EpiLC differentiation (Figures 3C, 3E, and 3F). GO anal-
ysis of these PSPC1-repressed C4 genes indicated that they
were involved in multicellular organism development, cell fate
commitment, and Wnt-signaling pathways (Figure 3G). To
examine whether the repressive effect of PSPC1 on bivalent
gene expression is dependent on its RNA-binding capacity, we
rescued Pspc1KO ESCs with either a PSPC1 WT or an RNA
recognition motif mutant (RRMmut) protein and performed
EpiLC differentiation. Our data revealed that only the WT, but
not the RRMmut protein, could rescue the repressive effect of
PSPC1 on the target genes (e.g., Fgf5, Fgf8, and Wnt8a)
(Figures S3C and S3D). Of note, NONO, a close partner of
PSPC1 (Figure S1B), also interacts with TET1 in ESCs (Li et al.,
2020). Like Pspc1KO, NonoKO is compatible with ESC mainte-
nance (Ma et al., 2016) and causes upregulation of lineage genes
(e.g., Eomes, Fgf5, Fgf8, and T) in EpiLCs (Figures S3E and S3F).
In sum, our results establish PSPC1 as a transcriptional
repressor that restricts bivalent gene activation during the
ESC-to-EpiLC transition.
Neat1 promotes bivalent gene activation during theESC-to-EpiLC transitionPSPC1 as an RBPwas well known for its roles in binding lncRNA
Neat1, which drives the formation of nuclear paraspeckles (Isobe
et al., 2020; Nakagawa et al., 2011). However, pluripotent stem
cells do not form paraspeckles, and thus the functional relation-
ship between PSPC1 and Neat1 in pluripotency is not fully un-
derstood. Neither is it known whether Neat1 plays any role in
modulating TET1 functions. Therefore, we designed two sgRNAs
e pluripotent-state transitionSCs. The ESCs are adapted in Fgf2 and activin A (FA) culturemedium for 2 days
at different time points. Percentages of variance explained in each principal
EGs) by comparing D0 WT with D4 WT cells and D4 WT with D4 KO cells. The
sses (C1–C4) are listed on the right. The direct PSPC1 targets from ChIP-seq
in (D).
(C1–C4) as the PSPC1 ChIP-seq targets.
ne loci. The numbers indicate the normalized RPM value of the tracks.
s (CCE background with two independent clones, C4 and C9) during ESC-to-
licates.
).
A
C
E
F
I
G H
D
B
(legend on next page)
Cell Reports 39, 110928, June 7, 2022 7
Articlell
OPEN ACCESS
Articlell
OPEN ACCESS
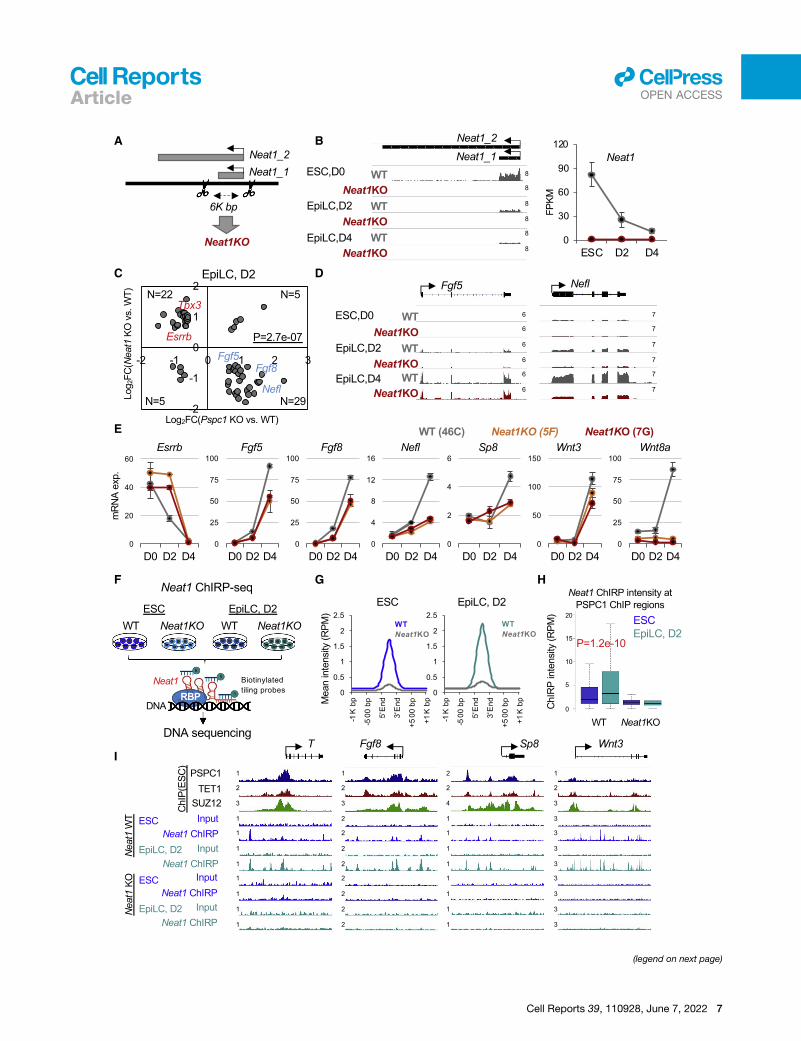
targeting theNeat1 locus and performed CRISPR-Cas9 genome
editing to delete the 6K-bp region containing the short (Neat1_1)
isoform ofNeat1 (Figure 4A), the only isoform expressed in ESCs
(Isobe et al., 2020) and EpiLCs (Figure 4B). Of note, the long
Neat1_2 is a somatic isoform that functions in driving para-
speckle formation (Isobe et al., 2020) and is collaterally abro-
gated by our CRISPR deletion (Figure 4A). We thus collectively
refer to Neat1KO hereafter. We adapted WT and Neat1KO
ESCs in FA culture medium and collected RNAs at D0 (ESC),
D2, and D4 (EpiLC) for RNA-seq analysis. Like Pspc1KO ESCs,
Neat1KO ESCs (two independent clones, 5F and 7G) are prop-
erly maintained with unaltered protein and mRNA expression
of representative pluripotency/lineage genes critical for ESC
maintenance/differentiation (Figures S4A and S4B). We
confirmed that only Neat1_1 (the short isoform) is expressed in
ESCs and EpiLCs, and its expression gradually decreases during
EpiLC differentiation (Figure 4B; reduced signal strengths on the
left panel and FPKM values on the right panel). By comparing the
DEGs (p < 0.05, fold-change > 1.5; Table S3) between the WT
and Neat1KO EpiLCs, we observed many bivalent genes (e.g.,
Fgf5, Fgf8, Nefl, and Wnt8a) are downregulated in D2 or D4
EpiLCs uponNeat1KO compared with theWT cells (Figure S4C),
confirmed by quantitative PCR (qPCR) analysis (Figure 4E). Inter-
estingly, the effect ofNeat1KOon bivalent genes (Figures 4D, 4E,
and S4C) is opposite to that of Pspc1KO (Figures 3E, 3F, and
S3A) in EpiLCs. Fewer DEGswere identified in D4 EpiLCs relative
to D0 ESCs and D2 EpiLCs upon Neat1KO (Figure S4C), likely
due to the relatively low Neat1 expression in D4 EpiLCs
(Figure 4B).
To further investigate the functional relationship between
PSPC1 and Neat1, we compared the RNA-seq gene expression
ratios upon Pspc1KO and Neat1KO at three time points. We
again observed a negative correlation of gene expression in
ESCs (r = �0.27) and D2 EpiLCs (r = �0.23), but a weak positive
correlation (r = 0.08) in D4 EpiLCs (Figure S4D). Next, we plotted
the gene expression ratios of DEGs byPspc1KOandNeat1KOat
different time points (Figures 4C and S4E). Interestingly, whereas
Pspc1KO decreases and increases the expression of pluripo-
tency (e.g., Esrrb and Tbx3) and bivalent (e.g., Fgf5, Fgf8, and
Nefl) genes, respectively, in D2 EpiLCs, as previously observed
Figure 4. Neat1 positively regulates bivalent gene activation in the plu
(A) Schematic depiction of the Neat1KO strategy. The scissors denote two gRNA-
(Neat1_2) isoforms of the mouse Neat1 gene are indicated.
(B) RNA-seq tracks (left) and expression of Neat1 (right) during the ESC-to-EpiLC
(left). Neat1 expression is shown in FPKM (fragments per kilobase of transcript pe
ation of biological duplicates.
(C) Scatter plot of the relative gene expression of DEGs upon Pspc1KO or Neat1K
exact test. Representative genes are labeled on the plot.
(D) RNA-seq tracks of WT and Neat1KO ESCs and EpiLCs at bivalent gene loci (
(E) RT-qPCR analysis of bivalent genes inWT andNeat1KOESCs (46C genetic bac
Error bars represent the standard deviation of technical triplicates.
(F) Schematic depiction of Neat1 ChIRP-seq analysis in WT and Neat1KO ESCs
Neat1_1 RNA were ranked and split into odd and even probes, followed by strep
(G) Mean intensity plot by RPM showing Neat1 ChIRP-seq intensity enriched at th
regions identified in ESCs).
(H) Boxplots depicting quantification of Neat1 ChIRP-seq intensity by RPM at PS
Neat1KO ESCs and D2 EpiLCs. p value is from the Mann-Whitney test.
(I) PSPC1, TET1, and SUZ12 ChIP-seq tracks in ESCs and Neat1 ChIRP-seq track
(T, Fgf8, Sp8, and Wnt3). The numbers indicate the normalized RPM value of the
8 Cell Reports 39, 110928, June 7, 2022
(Figures 3 and S3), Neat1KO exhibits an opposite effect in the
regulation of those genes (Figures 4C–4E and S4E). The PCA
analysis of the Pspc1KO andNeat1KO RNA-seq samples shows
that the D0 (ESC) and D2 and D4 (EpiLC) samples group
together, indicated by dash line circles, and move rightward on
PC1 during EpiLC differentiation (Figure S4F). Consistent with
the correlation analysis (Figures 4C, S4D, and S4E), the
Pspc1KO andNeat1KO samples deviated to opposite directions
compared with their WT samples in D0 and D2 (Figure S4F; refer
to the direction of red versus blue arrows at each time point).
To understand the genomic occupancy of Neat1 in ESCs and
during EpiLC differentiation, we performed ChIRP (chromatin
isolation by RNA purification) with split pools of tiling probes
covering the Neat1_1 isoform followed by deep sequencing
(ChIRP-seq) (Figure 4F). The Neat1KO cells were employed as
the negative control. As expected, theNeat1ChIRP signal signif-
icantly enriched at theNeat1 locus in both ESCs and EpiLCs (Fig-
ure S4G). In addition, we confirmed that Neat1 was highly en-
riched at the Sfi1 locus at chromosome 11.qA1 region
(Figure S4H), a known Neat1 target site previously reported
from a global survey of genome-wide lncRNA-chromatin interac-
tions in ESCs (Bonetti et al., 2020). Interestingly, the Sfi1 locus
was also co-occupied with PSPC1, TET1, and SUZ12 from the
ChIP-seq data in ESCs (Figure S4H), suggesting a genomic as-
sociation of Neat1 and these proteins on chromatin. When
comparing the Neat1 ChIRP reads enriched at the Neat1 peak
regions in ESCs and D2 EpiLCs, we observed an overall higher
intensity in D2 EpiLCs than that in ESCs (Figure 4G) despite its
relatively lower expression level in D2 EpiLCs than in ESCs (Fig-
ure 4B). Importantly, Neat1 ChIRP intensity at the overall PSPC1
ChIP peaks (identified in ESCs) was also significantly higher in D2
EpiLCs than ESCs (Figure 4H). For example, we observed higher
Neat1 ChIRP signals at the PSPC1/SUZ12/TET1 co-occupied
bivalent gene promoters (e.g., T, Fgf8, Sp8, and Wnt3) in D2
EpiLCs than in ESCs (Figure 4I). Together, our results demon-
strate that Neat1 may promote bivalent gene activation through
its enhanced association with bivalent chromatin during the
ESC-to-EpiLC transition, establishing opposing functions of
PSPC1 and its cognate lncRNA Neat1 in controlling bivalent
gene expression in pluripotent-state transition.
ripotent-state transition
targeting sites for CRISPR-Cas9 genome editing. The short (Neat1_1) and long
differentiation. The numbers indicate the normalized RPM value of the tracks
r million mapped reads) values (right). Error bars represent the standard devi-
O relative to WT at D2 EpiLC from RNA-seq analysis; p value is from the Fisher
Fgf5 and Nefl). The numbers indicate the normalized RPM value of the tracks.
kgroundwith two independent clones, 5F and 7G) during EpiLC differentiation.
and D2 EpiLCs. Biotinylated probes based on their relative positions along the
tavidin pull-down and DNA sequencing.
e Neat1 peak regions in ESCs and D2 EpiLCs (within 1K bp around Neat1 peak
PC1 ChIP-seq peak regions (extend 5K bp, identified in ESCs) from WT and
s in WT and Neat1KO ESCs and D2 EpiLCs at the promoters of bivalent genes
tracks.
A
C
F G
H
B
D
E
(legend on next page)
Cell Reports 39, 110928, June 7, 2022 9
Articlell
OPEN ACCESS
Articlell
OPEN ACCESS
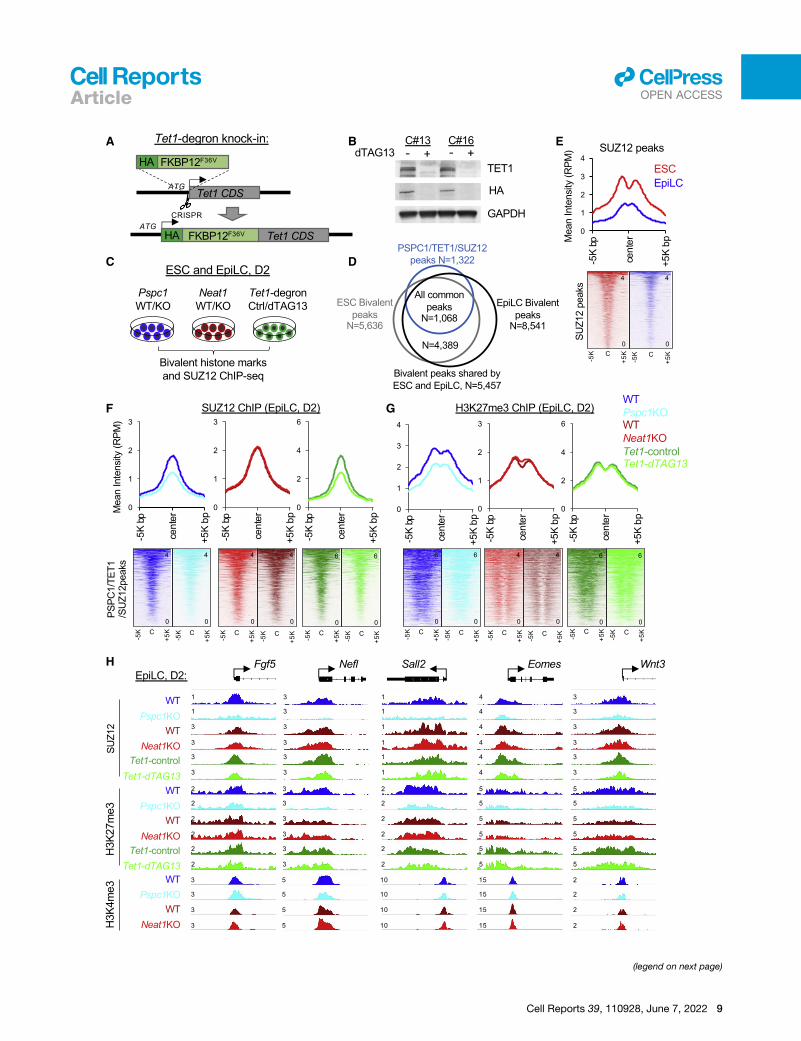
PSPC1 is required for maintaining PRC2 chromatinoccupancy and H3K27me3 deposition at bivalentpromoters during the ESC-to-EpiLC transitionThe opposing functions of PSPC1 and its cognate lncRNANeat1
in controlling bivalent gene expression prompted us to examine
their potential roles in modulating TET1 and PRC2 functions on
transcriptional regulation of bivalent genes. We first asked
whether PSPC1 contributes to TET1 and PRC2 chromatin bind-
ing. In ESCs, Pspc1KO does not affect the chromatin-bound
fraction of TET1 or the PRC2 subunit SUZ12 (Figure S5A). We
then addressed the potential roles of TET1 in the ESC-to-
EpiLC transition. We established a degron system (Nabet
et al., 2018) for rapid and inducible TET1 protein degradation
(Figures 5A and 5B; two independent clones, C#13 and C#16;
see details in STAR Methods). Using Tet1-degron ESCs, we
confirmed that activation of lineage genes (e.g., T, Fgf5, and
Fgf8) during the ESC-to-EpiLC transition is further enhanced
by dTAG13 treatment (i.e., TET1 depletion) (Figure S5B), pheno-
copying Pspc1KO (Figure 3F).
Next, we asked how the PSPC1-TET1 partnership and the
PSPC1/Neat1 opposing functions might impose upon PRC2
and bivalent histone marks in regulating bivalent genes during
the pluripotent-state transition. We performed SUZ12,
H3K4me3, and H3K27me3 ChIP-seq analysis in ESCs and D2
EpiLCs of Pspc1WT/KO orNeat1WT/KO genotypes and control-
or dTAG13-treated Tet1-degron cells (Figure 5C). We chose D2
EpiLCs because a high anti-correlation was observed between
the Pspc1KO and Neat1KO RNA-seq data (Figure 4C), and D2
EpiLCs represent the formative state of pluripotency where su-
per-bivalency was established (Wang et al., 2021; Xiang et al.,
2020). We identified 5,636 and 8,541 bivalent peaks from ESCs
and EpiLCs, respectively, and the majority peaks (N = 5,457,
96.8% of ESC peaks and 63.9% of EpiLC peaks) were shared
between the two pluripotent states. Among those bivalent
peaks, 1,068 (out of 1,322, 80.8%) were shared with the
PSPC1/TET1/SUZ12 common peaks identified in ESCs (Fig-
ure 5D), suggesting that most of the PSPC1/TET1/SUZ12 target
regions preserved bivalency during the ESC-to-EpiLC transition.
As expected, PRC2 chromatin-binding intensity at SUZ12 peak
regions (identified in ESCs) decreased in D2 EpiLCs compared
with ESCs (Figure 5E). Plotting the SUZ12-binding intensity at
SUZ12 peaks from Pspc1KO, Neat1KO, and dTAG13-treated
Tet1-degron D2 EpiLCs, we found that SUZ12 binding
(measured by the mean intensity in RPM) decreased upon the
Figure 5. Depletion of PSPC1 or TET1 accelerates PRC2 eviction from
(A) Schematic depiction of the Tet1-degron knock-in (KI) strategy using CRISPR
donor sequence is inserted right after the start codon (ATG) of TET1 CDS to crea
(B) Western blot analysis of TET1 protein in Tet1-degron ESCs (two independent c
was indicated by both endogenous antibody and HA fusion protein tag.
(C) Schematic depiction of the bivalent histone marks H3K4me3 and H3K27me3
different genotypes (Pspc1 WT/KO and Neat1 WT/KO) or treatment (Tet1-degron
(D) Overlap of the bivalent peaks (H3K4me3 and H3K27me3) identified in ESCs an
(E) Mean intensity plot (top) and heatmap (bottom) by RPM of SUZ12 ChIP-seq i
center, identified in ESCs).
(F and G) Mean intensity plot (top) and heatmap (bottom) by RPM of SUZ12 (F) and
mon peak regions (within 5K bp at peak center, identified in ESCs).
(H) SUZ12, H3K4me3, and H3K27me3 ChIP-seq tracks at the promoters of bivale
cate the normalized RPM value of the tracks.
10 Cell Reports 39, 110928, June 7, 2022
depletion of PSPC1 or TET1, but not Neat1, at the PSPC1/
SUZ12/TET1 common peak regions (Figure 5F), exemplified by
a few bivalent promoters (e.g., Fgf5, Nelf, Sall2, Eomes, and
Wnt3) (Figure 5H).
Next, we investigated the effects of PSPC1, Neat1, or TET1
depletion on bivalent histone marks during the ESC-to-EpiLC
transition. Whereas Pspc1KO does not change H3K4me3 depo-
sition in ESCs or EpiLCs (Figure S5C), Pspc1KO decreases
H3K27me3 deposition in D2 EpiLCs, consistent with reduced
SUZ12 binding at the PSPC1/TET1/SUZ12 common regions
(Figures 5F–5H). However, in ESCs, Pspc1KO slightly increased
the SUZ12 chromatin binding and H3K27me3 (Figures S5D–
S5F), which was opposite to the effects of PSPC1 loss on
SUZ12 and H3K27me3 in D2 EpiLCs (Figures 5F and 5G). This
discrepancy may be due to the expression of the bivalent genes
beingmostly repressed in ESCs but activated in EpiLCs (see Dis-
cussion). The Neat1KO and dTAG13-treated Tet1-degron D2
EpiLCs showed only subtle changes of H3K27me3 relative to
WT and DMSO-treated control cells, respectively, at the
PSPC1/TET1/SUZ12 common regions (Figure 5G). Of note, in
both ESCs and D2 EpiLCs, we observed more pronounced
changes of H3K27me3 upon Pspc1KO than by Neat1KO or
TET1 depletion (compare the D[mean intensity] between
Pspc1KO, Neat1KO, or Tet1-dTAG13 relative to their WT/
DMSO-treated control in Figures 5G and S5D). These results
suggest a closer functional partnership of PSPC1 with PRC2 in
chromatin binding and H3K27me3 deposition than with Neat1
and TET1.
To understand ifNeat1KO could affect PSPC1 and TET1 chro-
matin binding, we also performed ChIP-qPCR analysis on a few
bivalent loci (e.g., Eomes, T, and Fgf5). We found that PSPC1
and TET1 ChIP signals in both ESCs and D2 EpiLCs decreased
in Neat1KO relative to WT (Figure S5G). These results together
demonstrate the requirement ofNeat1 for bivalent chromatin oc-
cupancy of TET1 and PSPC1, which in turn maintain PRC2 chro-
matin occupancy and H3K27me3 deposition at bivalent pro-
moters during the ESC-to-EpiLC transition.
PSPC1 and TET1 act through Neat1 to modulate PRC2binding to bivalent gene transcripts and control stemcell bivalencyWhile a physical association between the PSPC1-TET1 partner-
ship and PRC2 is highly speculated (Figures 2C and 2D) for the
observed functional interactions among these factors, neither a
bivalent promoters
-Cas9 genome-editing tool (the scissor symbol). The HA-tagged FKBP12F36V
te the in-frame fusion protein.
lones, C#13 and C#16) upon dTAG13 treatment for 24 h. Degradation of TET1
and the PRC2 subunit SUZ12 ChIP-seq analysis in ESCs and D2 EpiLCs of
with control/dTAG13).
d EpiLCs and with the PSPC1/TET1/SUZ12 common peaks identified in ESCs.
ntensity in WT ESCs and EpiLCs at SUZ12 peak regions (within 5K bp at peak
H3K27me3 (G) ChIP-seq intensity in D2 EpiLCs at PSPC1/TET1/SUZ12 com-
nt genes (Fgf5, Nefl, Sall2, Eomes, andWnt3) in D2 EpiLCs. The numbers indi-
A
C D
E
F
B
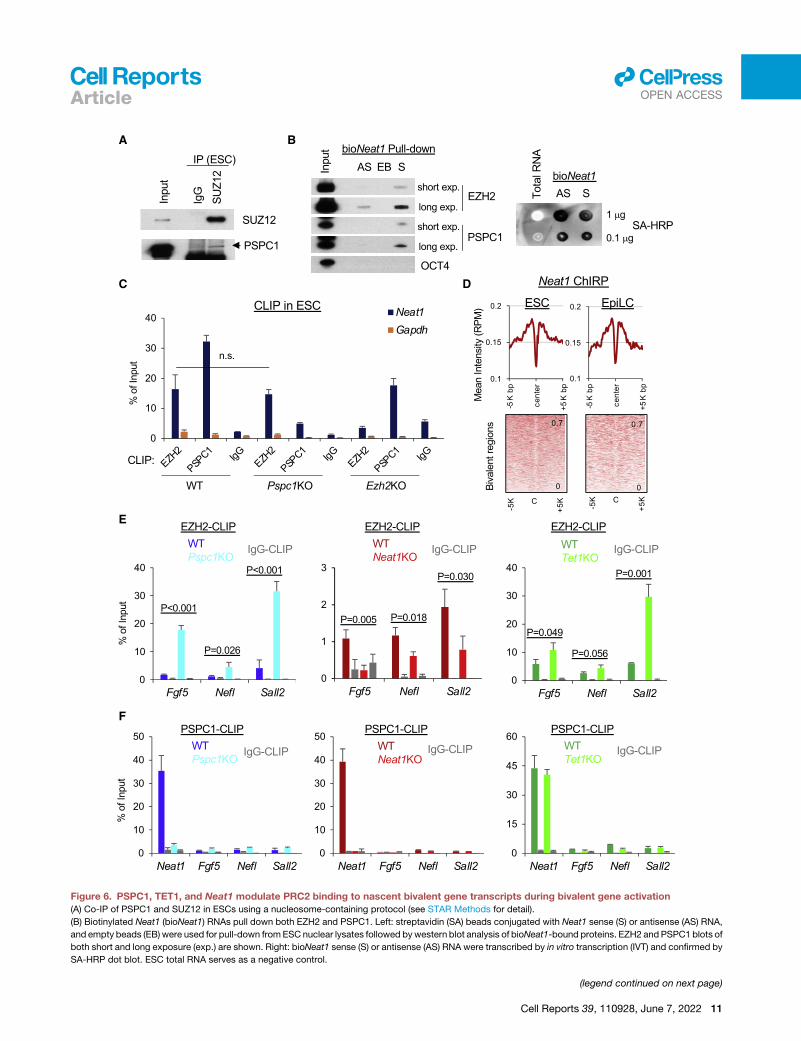
Figure 6. PSPC1, TET1, and Neat1 modulate PRC2 binding to nascent bivalent gene transcripts during bivalent gene activation
(A) Co-IP of PSPC1 and SUZ12 in ESCs using a nucleosome-containing protocol (see STAR Methods for detail).
(B) Biotinylated Neat1 (bioNeat1) RNAs pull down both EZH2 and PSPC1. Left: streptavidin (SA) beads conjugated with Neat1 sense (S) or antisense (AS) RNA,
and empty beads (EB) were used for pull-down fromESC nuclear lysates followed bywestern blot analysis of bioNeat1-bound proteins. EZH2 and PSPC1 blots of
both short and long exposure (exp.) are shown. Right: bioNeat1 sense (S) or antisense (AS) RNA were transcribed by in vitro transcription (IVT) and confirmed by
SA-HRP dot blot. ESC total RNA serves as a negative control.
(legend continued on next page)
Cell Reports 39, 110928, June 7, 2022 11
Articlell
OPEN ACCESS
Articlell
OPEN ACCESS
previously published work (Wu et al., 2011) nor our current AP-
MS study (Figure 1) can detect the TET1 and PRC2 interaction
or the interactions between PSPC1 and PRC2 subunits using a
regular nucleosome-free co-IP protocol (Figure S6A; see STAR
Methods for details). However, using a nucleosome-containing
co-IP protocol with micrococcal nuclease digestion of chro-
matin, we and others readily detected the physical associations
between PSPC1 and PRC2 subunit SUZ12 (Figure 6A) and be-
tween TET1 and PRC2 (Neri et al., 2013) in ESCs, respectively,
raising the possibility of nucleosomal DNA/RNA molecules for
bridging the protein interactions. By examining the datasets of
PRC2 subunit EZH2 PAR-CLIP-seq (photoactivatable ribonucle-
oside-enhanced cross-linking and immunoprecipitation fol-
lowed by sequencing) (Kaneko et al., 2013) and our PSPC1
CLIP-seq (Guallar et al., 2018) in ESCs, we observed that both
EZH2 and PSPC1 were enriched at the Neat1 transcripts (Fig-
ure S6B). In addition, we performed a biotinylated RNA pull-
down assay (Rinn et al., 2007) to identify Neat1-associated pro-
teins in ESCs. Interestingly, we found that EZH2 bound to Neat1
sense (Neat1-S) RNAwith a relatively higher affinity than the anti-
sense (Neat1-AS) RNA. Such a preferential Neat1 sense RNA
binding was even more pronounced for PSPC1 (Figure 6B).
CLIP-qPCR analysis of PSPC1 and EZH2 confirmed the binding
of both proteins to Neat1 transcripts in WT ESCs (Figure 6C).
Importantly, we also observed an enrichment of the Neat1
ChIRP intensity at the bivalent regions in both ESCs and
EpiLCs (Figure 6D). Furthermore, consistent with the nature of
promiscuous RNA binding by PRC2 (Davidovich et al., 2013;
Long et al., 2020), we found that EZH2 binding to Neat1 was
not affected by the loss of Pspc1 in ESCs (Figure 6C) or the
loss of Pspc1 or Tet1 in D2 EpiLCs (Figure S6C), suggesting
that PRC2 binding to Neat1 is independent of other RBPs such
as PSPC1 irrespective of pluripotent states.
Since PRC2 has a higher affinity to RNA than to DNA or his-
tone, the nascent mRNAs during transcription activation decoy
PRC2 and promote PRC2 eviction from chromatin (Wang et al.,
2017a, 2017b). We hypothesized that the TET1-PSPC1-Neat1
molecular interplay might modulate PRC2 binding to nascent
bivalent gene transcripts in controlling stem cell bivalency. To
address this, we performed EZH2 CLIP-qPCR analysis at the
same D2 EpiLCs of Pspc1 WT/KO, Neat1 WT/KO, and Tet1
WT/KO (a genetic KO, see Dawlaty et al., 2011) genotypes. We
first confirmed that EZH2 protein levels were not affected upon
loss of Pspc1, Neat1, or Tet1 in ESCs and D2 EpiLCs (Fig-
ure S6D). PSPC1 mRNA and protein expression increased in
D2 EpiLCs relative to ESCs (Figures 3F and S6D). PSPC1 also in-
teracted with TET1 in D2 EpiLCs (Figure S6E). We then
compared EZH2 binding to the transcripts of bivalent genes
(e.g., Fgf5, Nefl, and Sall2) activated during the ESC-to-EpiLC
(C) EZH2 and PSPC1 CLIP-qPCR analysis ofNeat1 in WT, Pspc1KO, and Ezh2KO
‘‘n.s.’’ denotes statistically non-significant.
(D) Mean intensity plot (top) and heatmap (bottom) by RPM of Neat1 ChIP-seq int
ESCs and D2 EpiLCs.
(E) EZH2 CLIP-qPCR analysis of bivalent gene mRNAs (Fgf5, Nefl, and Sall2) in D2
test.
(F) PSPC1 CLIP-qPCR analysis of Neat1 and bivalent genes’ transcripts (Fgf5, Ne
represent the standard deviation of technical triplicates. Experiments were repea
12 Cell Reports 39, 110928, June 7, 2022
transition (Figures 3E and 3F). We found enhanced EZH2 binding
to these mRNA transcripts upon the loss of Pspc1 or Tet1 (Fig-
ure 6E), accompanied by decreased PRC2 chromatin binding
at promoters (Figure 5H). However, EZH2 binding to these
mRNA transcripts decreased upon the loss of Neat1 (Figure 6E).
Next, we asked whether PSPC1 restricts EZH2 binding to biva-
lent transcripts is through PSPC1’s RNA-binding capacity. Using
the Pspc1KO ESCs rescued with either PSPC1 WT or RRMmut
protein (Figure S3C), we first verified that PSPC1 binding to
Neat1 was significantly compromised in the PSPC1 RRMmut-
rescued ESCs compared with the WT-rescued ESCs (Fig-
ure S6F). In D2 EpiLCs, we found that the WT-rescued but not
the RRMmut-rescued Pspc1KO cells significantly reduced the
heightened EZH2 binding to mRNA transcripts in Pspc1KO cells
to a near-wild-type level (Figure S6G). We then addressed
whether PSPC1 restricts EZH2 binding to bivalent gene tran-
scripts through its RNA-binding capacity to Neat1 and/or biva-
lent gene transcripts. To this end, we performed PSPC1 CLIP-
qPCRonNeat1 and bivalent gene transcripts in D2 EpiLCs. Inter-
estingly, we found that PSPC1 RNA-binding capacity was spe-
cific only to Neat1 but not to the bivalent gene transcripts and
was independent of TET1 (Figure 6F), which was distinct from
the promiscuous RNA binding by PRC2 (Davidovich et al., 2013).
In sum, the enrichment of the Neat1 ChIRP intensity at the
bivalent regions in both ESCs and EpiLCs (Figure 6D) and the
preferential binding of PSPC1 to Neat1 help explain the require-
ment of Neat1 for the bivalent chromatin occupancy of PSPC1
(and its close partner TET1). As TET1 and PSPC1 inhibit, and
Neat1 promotes (Figure 6E), the PRC2 binding to bivalent
mRNA transcripts, these results support that PSPC1 and TET1
act through Neat1 to modulate PRC2 binding to bivalent gene
transcripts and control stem cell bivalency.
DISCUSSION
Whereas a published study establishes a catalytic activity-
dependent role of TET1 in demethylating bivalent promoters
for the super-bivalency in formative pluripotency (Xiang et al.,
2020), our study delineates a catalytic activity-independent
role of TET1 in preventing hyper-activation of bivalent genes
and thus preserving the bivalency in ESCs and during the
ESC-to-EpiLC transition. Our data also support the PRC2 ‘‘evic-
tion’’ models (Wang et al., 2017a, 2017b) and provide detailed
mechanistic insight into the proposed repressive role of TET1
during bivalent gene activation (Koh et al., 2011; Wu et al.,
2011). Our findings are in line with a recent study suggesting
that TET1 regulates bivalent developmental genes indepen-
dently of its catalytic activity (Chrysanthou et al., 2022). We
thus establish a stem cell paradigm whereby TET1 and its close
ESCs.Gapdh serves as a negative control; p value is from two-tailed t test, and
ensity at the bivalent regions (within 5K bp at peak center, identified in ESCs) in
EpiLCs of different genotypes (WT versus KO); p value is from the two-tailed t
ff, and Sall2) in D2 EpiLCs of different genotypes. Error bars in (C), (E), and (F)
ted in biological duplicates.
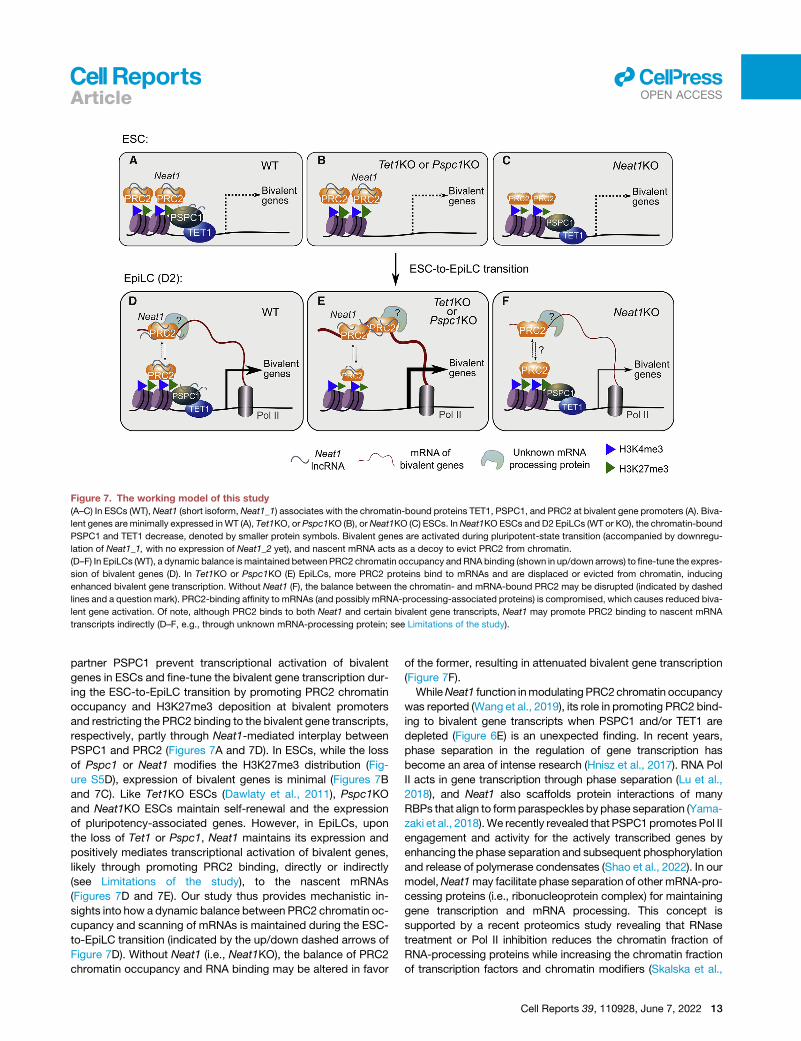
Figure 7. The working model of this study
(A–C) In ESCs (WT), Neat1 (short isoform, Neat1_1) associates with the chromatin-bound proteins TET1, PSPC1, and PRC2 at bivalent gene promoters (A). Biva-
lent genes are minimally expressed inWT (A), Tet1KO, or Pspc1KO (B), orNeat1KO (C) ESCs. InNeat1KO ESCs and D2 EpiLCs (WT or KO), the chromatin-bound
PSPC1 and TET1 decrease, denoted by smaller protein symbols. Bivalent genes are activated during pluripotent-state transition (accompanied by downregu-
lation of Neat1_1, with no expression of Neat1_2 yet), and nascent mRNA acts as a decoy to evict PRC2 from chromatin.
(D–F) In EpiLCs (WT), a dynamic balance ismaintained betweenPRC2 chromatin occupancy andRNA binding (shown in up/down arrows) to fine-tune the expres-
sion of bivalent genes (D). In Tet1KO or Pspc1KO (E) EpiLCs, more PRC2 proteins bind to mRNAs and are displaced or evicted from chromatin, inducing
enhanced bivalent gene transcription. Without Neat1 (F), the balance between the chromatin- and mRNA-bound PRC2 may be disrupted (indicated by dashed
lines and a question mark). PRC2-binding affinity to mRNAs (and possibly mRNA-processing-associated proteins) is compromised, which causes reduced biva-
lent gene activation. Of note, although PRC2 binds to both Neat1 and certain bivalent gene transcripts, Neat1 may promote PRC2 binding to nascent mRNA
transcripts indirectly (D–F, e.g., through unknown mRNA-processing protein; see Limitations of the study).
Articlell
OPEN ACCESS
partner PSPC1 prevent transcriptional activation of bivalent
genes in ESCs and fine-tune the bivalent gene transcription dur-
ing the ESC-to-EpiLC transition by promoting PRC2 chromatin
occupancy and H3K27me3 deposition at bivalent promoters
and restricting the PRC2 binding to the bivalent gene transcripts,
respectively, partly through Neat1-mediated interplay between
PSPC1 and PRC2 (Figures 7A and 7D). In ESCs, while the loss
of Pspc1 or Neat1 modifies the H3K27me3 distribution (Fig-
ure S5D), expression of bivalent genes is minimal (Figures 7B
and 7C). Like Tet1KO ESCs (Dawlaty et al., 2011), Pspc1KO
and Neat1KO ESCs maintain self-renewal and the expression
of pluripotency-associated genes. However, in EpiLCs, upon
the loss of Tet1 or Pspc1, Neat1 maintains its expression and
positively mediates transcriptional activation of bivalent genes,
likely through promoting PRC2 binding, directly or indirectly
(see Limitations of the study), to the nascent mRNAs
(Figures 7D and 7E). Our study thus provides mechanistic in-
sights into how a dynamic balance between PRC2 chromatin oc-
cupancy and scanning of mRNAs is maintained during the ESC-
to-EpiLC transition (indicated by the up/down dashed arrows of
Figure 7D). Without Neat1 (i.e., Neat1KO), the balance of PRC2
chromatin occupancy and RNA binding may be altered in favor
of the former, resulting in attenuated bivalent gene transcription
(Figure 7F).
WhileNeat1 function inmodulatingPRC2chromatin occupancy
was reported (Wang et al., 2019), its role in promoting PRC2 bind-
ing to bivalent gene transcripts when PSPC1 and/or TET1 are
depleted (Figure 6E) is an unexpected finding. In recent years,
phase separation in the regulation of gene transcription has
become an area of intense research (Hnisz et al., 2017). RNA Pol
II acts in gene transcription through phase separation (Lu et al.,
2018), and Neat1 also scaffolds protein interactions of many
RBPs that align to formparaspeckles by phase separation (Yama-
zaki et al., 2018).We recently revealed that PSPC1 promotesPol II
engagement and activity for the actively transcribed genes by
enhancing the phase separation and subsequent phosphorylation
and release of polymerase condensates (Shao et al., 2022). In our
model,Neat1may facilitate phase separation of other mRNA-pro-
cessing proteins (i.e., ribonucleoprotein complex) for maintaining
gene transcription and mRNA processing. This concept is
supported by a recent proteomics study revealing that RNase
treatment or Pol II inhibition reduces the chromatin fraction of
RNA-processing proteins while increasing the chromatin fraction
of transcription factors and chromatin modifiers (Skalska et al.,
Cell Reports 39, 110928, June 7, 2022 13
Articlell
OPEN ACCESS
2021). The nascent mRNAs and other noncoding RNAs, including
Neat1, may contribute to a dynamic matrix or phase-separated
compartments that regulate chromatin states and gene transcrip-
tion (Creamer et al., 2021; Skalska et al., 2021).
The lncRNA Neat1 has two isoforms. The long isoform
Neat1_2 is essential for the assembly of paraspeckles (Jiang
et al., 2017; Nakagawa et al., 2011). The short isoform
Neat1_1, albeit also a paraspeckle component, plays various
paraspeckle-independent roles (Fox et al., 2018; Li et al.,
2017). Our Neat1 ChIRP-seq data (Figures 4F–4I) suggest that
Neat1_1may be necessary for proper activation of bivalent line-
age genes by interaction with other RBPs (e.g., PSPC1 and
EZH2) (Figures 6E and 6F) when their promoters are still bivalent
(Figures 5F–5H). Accordingly, the ‘‘super-bivalency’’ at lineage-
specific genes in formative pluripotency state may represent a
few key molecular features, including the initiation of bivalent
gene transcription, preservation of bivalent histone marks
(H3K4me3 and H3K27me3), occupancy of chromatin-bound
transcriptional co-factors (i.e., PSPC1 and TET1), and homeo-
stasis of RNA-bound and chromatin-bound PRC2 (Figure 7D).
PRC2 is known to bind to thousands of RNA transcripts with
low specificity (Davidovich et al., 2013; Kaneko et al., 2013),
including Neat1 and bivalent gene transcripts, through compe-
tition with various RBPs including PSPC1. In ESCs, since
expression of bivalent gene transcripts is minimal, Pspc1KO
may increase Neat1-mediated PRC2 recruitment and
H3K27me3 (Wang et al., 2019). However, in EpiLCs, the change
of transcription program (i.e., activation of bivalent gene tran-
scripts) rebalances the PRC2 molecules that are available to
chromatin, nascent transcripts, and/or Neat1. In Pspc1KO or
RRMmut-rescued cells, the bivalent gene transcript-bound
PRC2 increases (Figures 6E and S6G), likely through the abro-
gation of PSPC1-Neat1 interaction (Figures 6F and S6F) and
thus more Neat1 available for PRC2 associations. Of note, the
super-bivalency in formative pluripotency (D2 EpiLC) is likely
a transient status because, during further differentiation (D4
EpiLCs or later), depletion of Neat1_1 and higher expression
of the bivalent genes may eliminate (evict) PRC2 and repressive
H3K27me3 on bivalent chromatin. During differentiation of hu-
man ESCs (hESCs), paraspeckles start to form with the expres-
sion of Neat1_2 (Modic et al., 2019). TDP43 post-transcription-
ally regulates alternative polyadenylation (APA) of Neat1 to
produce the long isoformNeat1_2 required for efficient early dif-
ferentiation of hESCs (Grosch et al., 2020; Modic et al., 2019).
Therefore, expression of Neat1_1, albeit lacking paraspeckle
assembly, is conserved in bothmouse and human pluripotency,
akin to the conservation of stem cell bivalency in both mouse
and human.
Limitations of the studyOur current study does not have direct evidence that the nascent
mRNAs of bivalent genes are subjected to PRC2 dynamic bind-
ing during ESC-to-EpiLC transition, which requires CLIP-seq
analysis of PRC2 in a combination of global run-on sequencing
(GRO-seq) to measure the association of PRC2 with the nascent
mRNAs. In addition, we acknowledge that we do not have data
supporting that PRC2 directly interacts with both Neat1 and
the nascent transcript. Although Neat1KO reduces the interac-
14 Cell Reports 39, 110928, June 7, 2022
tions between PRC2 and certain bivalent gene transcripts (Fig-
ure 6E), this could be an indirect effect resulting from alterations
in other mRNA-processing proteins (indicated by ‘‘?’’ in Fig-
ure 7D–F), given that Neat1KO does not lead to changes in the
occupancy of PRC2 on chromatin in D2 EpiLCs (Figures 5F–
5H). As discussed, we reported in another study that nascent
RNAs could synergize with PSPC1 and promote Pol II activity
by enhancing phase separation (Shao et al., 2022), although it re-
mains to be determined whether Neat1 competes with or facili-
tates nascent RNAs in the polymerase condensates on bivalent
genes.
STAR+METHODS
Detailed methods are provided in the online version of this paper
and include the following:
d KEY RESOURCES TABLE
d RESOURCE AVAILABILITY
B Lead contact
B Materials availability
B Data and code availability
d EXPERIMENTAL MODEL AND SUBJECT DETAILS
B Cell culture and in vitro differentiation
B Neat1 knockout (KO) ESCs
B Tet1-degron knock-in (KI) and protein degradation
d METHOD DETAILS
B Affinity purification followed by mass spectrometry
(AP-MS) analysis
B Co-immunoprecipitation (co-IP)
B Subcellular fractionation assay
B Gel filtration assay
B Domain mapping
B Western blot analysis
B Immunofluorescence
B Dot blot analysis
B Biotinylated RNA synthesis, dot blot, and pull-down
assay
B Genomic DNA 5mC and 5hmC quantification by mass
spectrometry
B RT-qPCR
B Chromatin immunoprecipitation (ChIP) and
sequencing
B Chromatin Isolation by RNA purification (ChIRP) and
sequencing
B Crosslinking immunoprecipitation (CLIP) qPCR
B Gene ontology (GO) analysis
d QUANTIFICATION AND STATISTICAL ANALYSIS
B ChIP-seq and ChIRP-seq data processing
B 5mC and 5hmC DNA immunoprecipitation (DIP) data
analysis
B RNA-seq and data analysis
B Statistical analysis
SUPPLEMENTAL INFORMATION
Supplemental information can be found online at https://doi.org/10.1016/j.
celrep.2022.110928.
Articlell
OPEN ACCESS
ACKNOWLEDGMENTS
We thank Dr. Wei Xie for providing the Tet1 vectors for domain mapping, Dr.
Fei Lan for providing the NonoKO ESCs, Dr. Taiping Chen for providing the
Dnmt1/3a/3bTKO ESCs, Dr. Rudolf Jaenisch for providing the Tet1KO
ESCs, and Dr. Francesco Neri for discussion on the TET1 co-IP protocol.
Research in the Shen Laboratory was supported in part by the National Natural
Science Foundation of China (31829003). This work in the Wang laboratory is
funded by grants from the National Institutes of Health (R01GM129157,
R01HD095938, R01HD097268, and R01HL146664) and by contracts from
New York State Stem Cell Science (NYSTEM#C35583GG and C35584GG).
AUTHOR CONTRIBUTIONS
X.H. conceived, designed, and conducted the study, performed bioinformatics
analysis, and wrote the manuscript; N.B., Y.H, and D.G. performed experi-
ments; C.L. and H.W. performed mass spectrometry analysis; Z.H., V.M.,
D.L., H.Z., and X.S. provided reagents and contributed to experiments; J.W.
conceived the project, designed the experiments, and prepared and approved
the manuscript.
DECLARATION OF INTERESTS
The authors declare no competing interests.
Received: August 27, 2021
Revised: March 29, 2022
Accepted: May 18, 2022
Published: June 7, 2022
REFERENCES
Beltran, M., Yates, C.M., Skalska, L., Dawson, M., Reis, F.P., Viiri, K., Fisher,
C.L., Sibley, C.R., Foster, B.M., Bartke, T., et al. (2016). The interaction of
PRC2 with RNA or chromatin is mutually antagonistic. Genome Res. 26,
896–907. https://doi.org/10.1101/gr.197632.115.
Bernstein, B.E., Mikkelsen, T.S., Xie, X., Kamal, M., Huebert, D.J., Cuff, J., Fry,
B., Meissner, A., Wernig, M., Plath, K., et al. (2006). A bivalent chromatin struc-
ture marks key developmental genes in embryonic stem cells. Cell 125,
315–326. https://doi.org/10.1016/j.cell.2006.02.041.
Bonetti, A., Agostini, F., Suzuki, A.M., Hashimoto, K., Pascarella, G., Gimenez,
J., Roos, L., Nash, A.J., Ghilotti, M., Cameron, C.J.F., et al. (2020). RADICL-
seq identifies general and cell type-specific principles of genome-wide RNA-
chromatin interactions. Nat. Commun. 11, 1018. https://doi.org/10.1038/
s41467-020-14337-6.
Boyer, L.A., Plath, K., Zeitlinger, J., Brambrink, T., Medeiros, L.A., Lee, T.I.,
Levine, S.S., Wernig, M., Tajonar, A., Ray, M.K., et al. (2006). Polycomb com-
plexes repress developmental regulators in murine embryonic stem cells. Na-
ture 441, 349–353. https://doi.org/10.1038/nature04733.
Buecker, C., Srinivasan, R., Wu, Z., Calo, E., Acampora, D., Faial, T., Simeone,
A., Tan, M., Swigut, T., and Wysocka, J. (2014). Reorganization of enhancer
patterns in transition from naive to primed pluripotency. Cell Stem Cell 14,
838–853. https://doi.org/10.1016/j.stem.2014.04.003.
Chen, L.L., and Carmichael, G.G. (2009). Altered nuclear retention of mRNAs
containing inverted repeats in human embryonic stem cells: functional role
of a nuclear noncoding RNA. Mol. Cell 35, 467–478. https://doi.org/10.1016/
j.molcel.2009.06.027.
Chrysanthou, S., Tang, Q., Lee, J., Taylor, S.J., Zhao, Y., Steidl, U., Zheng, D.,
and Dawlaty, M.M. (2022). The DNA dioxygenase Tet1 regulates H3K27 modi-
fication and embryonic stem cell biology independent of its catalytic activity.
Nucleic Acids Res. 50, 3169–3189. https://doi.org/10.1093/nar/gkac089.
Chu, C., Qu, K., Zhong, F.L., Artandi, S.E., and Chang, H.Y. (2011).
Genomic maps of long noncoding RNA occupancy reveal principles of
RNA-chromatin interactions. Mol. Cell 44, 667–678. https://doi.org/10.
1016/j.molcel.2011.08.027.
Cifuentes-Rojas, C., Hernandez, A.J., Sarma, K., and Lee, J.T. (2014). Regula-
tory interactions between RNA and polycomb repressive complex 2. Mol. Cell
55, 171–185. https://doi.org/10.1016/j.molcel.2014.05.009.
Creamer, K.M., Kolpa, H.J., and Lawrence, J.B. (2021). Nascent RNA scaffolds
contribute to chromosome territory architecture and counter chromatin
compaction. Mol. Cell 81, 3509–3525.e5. https://doi.org/10.1016/j.molcel.
2021.07.004.
Cruz-Molina, S., Respuela, P., Tebartz, C., Kolovos, P., Nikolic, M., Fueyo, R.,
van Ijcken, W.F.J., Grosveld, F., Frommolt, P., Bazzi, H., and Rada-Iglesias, A.
(2017). PRC2 facilitates the regulatory topology required for poised enhancer
function during pluripotent stem cell differentiation. Cell Stem Cell 20, 689–
705.e9. https://doi.org/10.1016/j.stem.2017.02.004.
Davidovich, C., and Cech, T.R. (2015). The recruitment of chromatin modifiers
by long noncoding RNAs: lessons fromPRC2. RNA 21, 2007–2022. https://doi.
org/10.1261/rna.053918.115.
Davidovich, C., Wang, X., Cifuentes-Rojas, C., Goodrich, K.J., Gooding, A.R.,
Lee, J.T., and Cech, T.R. (2015). Toward a consensus on the binding specificity
and promiscuity of PRC2 for RNA. Mol. Cell 57, 552–558. https://doi.org/10.
1016/j.molcel.2014.12.017.
Davidovich, C., Zheng, L., Goodrich, K.J., and Cech, T.R. (2013). Promiscuous
RNA binding by Polycomb repressive complex 2. Nat. Struct. Mol. Biol. 20,
1250–1257. https://doi.org/10.1038/nsmb.2679.
Dawlaty, M.M., Ganz, K., Powell, B.E., Hu, Y.C., Markoulaki, S., Cheng, A.W.,
Gao, Q., Kim, J., Choi, S.W., Page, D.C., and Jaenisch, R. (2011). Tet1 is
dispensable for maintaining pluripotency and its loss is compatible with em-
bryonic and postnatal development. Cell Stem Cell 9, 166–175. https://doi.
org/10.1016/j.stem.2011.07.010.
Deplus, R., Delatte, B., Schwinn, M.K., Defrance, M., Mendez, J., Murphy, N.,
Dawson, M.A., Volkmar, M., Putmans, P., Calonne, E., et al. (2013). TET2 and
TET3 regulate GlcNAcylation and H3K4 methylation through OGT and SET1/
COMPASS. EMBO J. 32, 645–655. https://doi.org/10.1038/emboj.2012.357.
Ding, J., Huang, X., Shao, N., Zhou, H., Lee, D.F., Faiola, F., Fidalgo, M., Gual-
lar, D., Saunders, A., Shliaha, P.V., et al. (2015). Tex10 coordinates epigenetic
control of super-enhancer activity in pluripotency and reprogramming. Cell
Stem Cell 16, 653–668. https://doi.org/10.1016/j.stem.2015.04.001.
Fidalgo, M., Huang, X., Guallar, D., Sanchez-Priego, C., Valdes, V.J., Saun-
ders, A., Ding, J., Wu, W.S., Clavel, C., and Wang, J. (2016). Zfp281 coordi-
nates opposing functions of Tet1 and Tet2 in pluripotent states. Cell Stem
Cell 19, 355–369. https://doi.org/10.1016/j.stem.2016.05.025.
Finkbeiner, E., Haindl, M., and Muller, S. (2011). The SUMO system controls
nucleolar partitioning of a novel mammalian ribosome biogenesis complex.
EMBO J. 30, 1067–1078. https://doi.org/10.1038/emboj.2011.33.
Fox, A.H., Nakagawa, S., Hirose, T., and Bond, C.S. (2018). Paraspeckles:
where long noncoding RNA meets phase separation. Trends Biochem. Sci.
43, 124–135. https://doi.org/10.1016/j.tibs.2017.12.001.
Grosch, M., Ittermann, S., Rusha, E., Greisle, T., Ori, C., Truong, D.J.J., O’Neill,
A.C., Pertek, A., Westmeyer, G.G., and Drukker, M. (2020). Nucleus size and
DNA accessibility are linked to the regulation of paraspeckle formation in
cellular differentiation. BMC Biol. 18, 42. https://doi.org/10.1186/s12915-
020-00770-y.
Guallar, D., Bi, X., Pardavila, J.A., Huang, X., Saenz, C., Shi, X., Zhou, H.,
Faiola, F., Ding, J., Haruehanroengra, P., et al. (2018). RNA-dependent chro-
matin targeting of TET2 for endogenous retrovirus control in pluripotent
stem cells. Nat. Genet. 50, 443–451. https://doi.org/10.1038/s41588-018-
0060-9.
Hayashi, K., Ohta, H., Kurimoto, K., Aramaki, S., and Saitou, M. (2011). Recon-
stitution of the mouse germ cell specification pathway in culture by pluripotent
stem cells. Cell 146, 519–532. https://doi.org/10.1016/j.cell.2011.06.052.
He, C., Sidoli, S., Warneford-Thomson, R., Tatomer, D.C., Wilusz, J.E., Garcia,
B.A., and Bonasio, R. (2016). High-resolution mapping of RNA-binding regions
in the nuclear Proteome of embryonic stem cells. Mol. Cell 64, 416–430.
https://doi.org/10.1016/j.molcel.2016.09.034.
Cell Reports 39, 110928, June 7, 2022 15
Articlell
OPEN ACCESS
Hnisz, D., Shrinivas, K., Young, R.A., Chakraborty, A.K., and Sharp, P.A.
(2017). A phase separation model for transcriptional control. Cell 169, 13–23.
https://doi.org/10.1016/j.cell.2017.02.007.
Hon, G.C., Song, C.X., Du, T., Jin, F., Selvaraj, S., Lee, A.Y., Yen, C.A., Ye, Z.,
Mao, S.Q., Wang, B.A., et al. (2014). 5mC oxidation by Tet2 modulates
enhancer activity and timing of transcriptome reprogramming during differen-
tiation. Mol. Cell 56, 286–297. https://doi.org/10.1016/j.molcel.2014.08.026.
Huang, X., Balmer, S., Yang, F., Fidalgo, M., Li, D., Guallar, D., Hadjantonakis,
A.K., and Wang, J. (2017). Zfp281 is essential for mouse epiblast maturation
through transcriptional and epigenetic control of Nodal signaling. Elife 6,
e33333. https://doi.org/10.7554/elife.33333.
Huang, X., Park, K.m., Gontarz, P., Zhang, B., Pan, J., McKenzie, Z., Fischer,
L.A., Dong, C., Dietmann, S., Xing, X., et al. (2021). OCT4 cooperates with
distinct ATP-dependent chromatin remodelers in naı̈ve and primed pluripotent
states in human. Nat. Commun. 12, 5123. https://doi.org/10.1038/s41467-
021-25107-3.
Isobe, M., Toya, H., Mito, M., Chiba, T., Asahara, H., Hirose, T., and Naka-
gawa, S. (2020). Forced isoform switching of Neat1_1 to Neat1_2 leads to
the loss of Neat1_1 and the hyperformation of paraspeckles but does not
affect the development and growth of mice. RNA 26, 251–264. https://doi.
org/10.1261/rna.072587.119.
Jiang, L., Shao, C., Wu, Q.J., Chen, G., Zhou, J., Yang, B., Li, H., Gou, L.T.,
Zhang, Y., Wang, Y., et al. (2017). NEAT1 scaffolds RNA-binding proteins
and the Microprocessor to globally enhance pri-miRNA processing. Nat.
Struct. Mol. Biol. 24, 816–824. https://doi.org/10.1038/nsmb.3455.
Kaneko, S., Bonasio, R., Saldana-Meyer, R., Yoshida, T., Son, J., Nishino, K.,
Umezawa, A., and Reinberg, D. (2014). Interactions between JARID2 and non-
coding RNAs regulate PRC2 recruitment to chromatin. Mol. Cell 53, 290–300.
https://doi.org/10.1016/j.molcel.2013.11.012.
Kaneko, S., Son, J., Shen, S.S., Reinberg, D., and Bonasio, R. (2013). PRC2
binds active promoters and contacts nascent RNAs in embryonic stem cells.
Nat. Struct. Mol. Biol. 20, 1258–1264. https://doi.org/10.1038/nsmb.2700.
Khoueiry, R., Sohni, A., Thienpont, B., Luo, X., Velde, J.V., Bartoccetti, M.,
Boeckx, B., Zwijsen, A., Rao, A., Lambrechts, D., and Koh, K.P. (2017). Line-
age-specific functions of TET1 in the postimplantation mouse embryo. Nat.
Genet. 49, 1061–1072. https://doi.org/10.1038/ng.3868.
Kinoshita, M., Barber, M., Mansfield, W., Cui, Y., Spindlow, D., Stirparo, G.G.,
Dietmann, S., Nichols, J., and Smith, A. (2021). Capture of mouse and human
stem cells with features of formative pluripotency. Cell Stem Cell 28, 2180–
2471.e458. https://doi.org/10.1016/j.stem.2021.11.002.
Knott, G.J., Bond, C.S., and Fox, A.H. (2016). The DBHS proteins SFPQ,
NONO and PSPC1: a multipurpose molecular scaffold. Nucleic Acids Res.
44, 3989–4004. https://doi.org/10.1093/nar/gkw271.
Koh, K.P., Yabuuchi, A., Rao, S., Huang, Y., Cunniff, K., Nardone, J., Laiho, A.,
Tahiliani, M., Sommer, C.A., Mostoslavsky, G., et al. (2011). Tet1 and Tet2
regulate 5-hydroxymethylcytosine production and cell lineage specification
in mouse embryonic stem cells. Cell Stem Cell 8, 200–213. https://doi.org/
10.1016/j.stem.2011.01.008.
Kohli, R.M., and Zhang, Y. (2013). TET enzymes, TDG and the dynamics of DNA
demethylation. Nature 502, 472–479. https://doi.org/10.1038/nature12750.
Lai,W., Lyu,C., andWang,H. (2018). Vertical ultrafiltration-facilitatedDNAdiges-
tion for rapidandsensitiveUHPLC-MS/MSdetectionofDNAmodifications.Anal.
Chem. 90, 6859–6866. https://doi.org/10.1021/acs.analchem.8b01041.
Li, R., Harvey, A.R., Hodgetts, S.I., and Fox, A.H. (2017). Functional dissection
of NEAT1 using genome editing reveals substantial localization of the
NEAT1_1 isoform outside paraspeckles. RNA 23, 872–881. https://doi.org/
10.1261/rna.059477.116.
Li, W., Karwacki-Neisius, V., Ma, C., Tan, L., Shi, Y., Wu, F., and Shi, Y.G.
(2020). Nono deficiency compromises TET1 chromatin association and im-
pedes neuronal differentiation of mouse embryonic stem cells. Nucleic Acids
Res. 48, 4827–4838. https://doi.org/10.1093/nar/gkaa213.
Long, Y., Hwang, T., Gooding, A.R., Goodrich, K.J., Rinn, J.L., and Cech, T.R.
(2020). RNA is essential for PRC2 chromatin occupancy and function in human
16 Cell Reports 39, 110928, June 7, 2022
pluripotent stem cells. Nat. Genet. 52, 931–938. https://doi.org/10.1038/
s41588-020-0662-x.
Lu, F., Liu, Y., Jiang, L., Yamaguchi, S., and Zhang, Y. (2014). Role of Tet pro-
teins in enhancer activity and telomere elongation. Genes Develop. 28, 2103–
2119. https://doi.org/10.1101/gad.248005.114.
Lu, H., Yu, D., Hansen, A.S., Ganguly, S., Liu, R., Heckert, A., Darzacq, X., and
Zhou, Q. (2018). Phase-separation mechanism for C-terminal hyperphosphor-
ylation of RNA polymerase II. Nature 558, 318–323. https://doi.org/10.1038/
s41586-018-0174-3.
Ma, C., Karwacki-Neisius, V., Tang, H., Li, W., Shi, Z., Hu, H., Xu, W., Wang, Z.,
Kong, L., Lv, R., et al. (2016). Nono, a bivalent domain factor, regulates Erk
signaling and mouse embryonic stem cell pluripotency. Cell Rep. 17, 997–
1007. https://doi.org/10.1016/j.celrep.2016.09.078.
Mas, G., Blanco, E., Ballare, C., Sanso, M., Spill, Y.G., Hu, D., Aoi, Y., Le Dily,
F., Shilatifard, A., Marti-Renom, M.A., and Di Croce, L. (2018). Promoter biva-
lency favors an open chromatin architecture in embryonic stem cells. Nat.
Genet. 50, 1452–1462. https://doi.org/10.1038/s41588-018-0218-5.
Modic, M., Grosch, M., Rot, G., Schirge, S., Lepko, T., Yamazaki, T., Lee,
F.C.Y., Rusha, E., Shaposhnikov, D., Palo, M., et al. (2019). Cross-regulation
between TDP-43 and paraspeckles promotes pluripotency-differentiation
transition. Mol. Cell 74, 951–965.e13. https://doi.org/10.1016/j.molcel.2019.
03.041.
Morgani, S., Nichols, J., and Hadjantonakis, A.K. (2017). The many faces of
Pluripotency: in vitro adaptations of a continuum of in vivo states. BMC Dev.
Biol. 17, 7. https://doi.org/10.1186/s12861-017-0150-4.
Nabet, B., Roberts, J.M., Buckley, D.L., Paulk, J., Dastjerdi, S., Yang, A., Leg-
gett, A.L., Erb,M.A., Lawlor, M.A., Souza, A., et al. (2018). The dTAG system for
immediate and target-specific protein degradation. Nat. Chem. Biol. 14,
431–441. https://doi.org/10.1038/s41589-018-0021-8.
Nakagawa, S., Naganuma, T., Shioi, G., and Hirose, T. (2011). Paraspeckles
are subpopulation-specific nuclear bodies that are not essential in mice.
J. Cell Biol. 193, 31–39. https://doi.org/10.1083/jcb.201011110.
Neri, F., Incarnato, D., Krepelova, A., Rapelli, S., Pagnani, A., Zecchina, R.,
Parlato, C., and Oliviero, S. (2013). Genome-wide analysis identifies a func-
tional association of Tet1 and Polycomb repressive complex 2 in mouse em-
bryonic stem cells. Genome Biol. 14, R91. https://doi.org/10.1186/gb-2013-
14-8-r91.
Nichols, J., and Smith, A. (2009). Naive and primed pluripotent states. Cell
Stem Cell 4, 487–492. https://doi.org/10.1016/j.stem.2009.05.015.
Rinn, J.L., Kertesz, M., Wang, J.K., Squazzo, S.L., Xu, X., Brugmann, S.A.,
Goodnough, L.H., Helms, J.A., Farnham, P.J., Segal, E., and Chang, H.Y.
(2007). Functional demarcation of active and silent chromatin domains in hu-
man HOX loci by noncoding RNAs. Cell 129, 1311–1323. https://doi.org/10.
1016/j.cell.2007.05.022.
Shao, W., Bi, X., Pan, Y., Gao, B., Wu, J., Yin, Y., Liu, Z., Peng, M., Zhang, W.,
Jiang, X., et al. (2022). Phase separation of RNA-binding protein promotes po-
lymerase binding and transcription. Nat. Chem. Biol. 18, 70–80. https://doi.
org/10.1038/s41589-021-00904-5.
Shen, X., Liu, Y., Hsu, Y.J., Fujiwara, Y., Kim, J., Mao, X., Yuan, G.C., and
Orkin, S.H. (2008). EZH1 mediates methylation on histone H3 lysine 27 and
complements EZH2 in maintaining stem cell identity and executing pluripo-
tency. Mol. Cell 32, 491–502. https://doi.org/10.1016/j.molcel.2008.10.016.
Skalska, L., Begley, V., Beltran, M., Lukauskas, S., Khandelwal, G., Faull, P.,
Bhamra, A., Tavares, M., Wellman, R., Tvardovskiy, A., et al. (2021). Nascent
RNA antagonizes the interaction of a set of regulatory proteins with chromatin.
Mol. Cell 81, 2944–2959.e10. https://doi.org/10.1016/j.molcel.2021.05.026.
Smith, A. (2017). Formative pluripotency: the executive phase in a develop-
mental continuum. Development 144, 365–373. https://doi.org/10.1242/dev.
142679.
Van Nostrand, E.L., Pratt, G.A., Shishkin, A.A., Gelboin-Burkhart, C., Fang,
M.Y., Sundararaman, B., Blue, S.M., Nguyen, T.B., Surka, C., Elkins, K.,
et al. (2016). Robust transcriptome-wide discovery of RNA-binding protein
Articlell
OPEN ACCESS
binding sites with enhanced CLIP (eCLIP). Nat. Methods 13, 508–514. https://
doi.org/10.1038/nmeth.3810.
Vella, P., Scelfo, A., Jammula, S., Chiacchiera, F., Williams, K., Cuomo, A.,
Roberto, A., Christensen, J., Bonaldi, T., Helin, K., and Pasini, D. (2013). Tet
proteins connect the O-linked N-acetylglucosamine transferase Ogt to chro-
matin in embryonic stem cells. Mol. Cell 49, 645–656. https://doi.org/10.
1016/j.molcel.2012.12.019.
Verma, N., Pan, H., Dore, L.C., Shukla, A., Li, Q.V., Pelham-Webb, B., Teijeiro,
V., Gonzalez, F., Krivtsov, A., Chang, C.J., et al. (2018). TET proteins safeguard
bivalent promoters from de novo methylation in human embryonic stem cells.
Nat. Genet. 50, 83–95. https://doi.org/10.1038/s41588-017-0002-y.
Voigt, P., Tee, W.W., and Reinberg, D. (2013). A double take on bivalent pro-
moters. Genes Develop. 27, 1318–1338. https://doi.org/10.1101/gad.
219626.113.
Wang, S., Zuo, H., Jin, J., Lv, W., Xu, Z., Fan, Y., Zhang, J., and Zuo, B. (2019).
Long noncoding RNA Neat1 modulates myogenesis by recruiting Ezh2. Cell
Death Dis. 10, 505. https://doi.org/10.1038/s41419-019-1742-7.
Wang, X., Goodrich, K.J., Gooding, A.R., Naeem, H., Archer, S., Paucek, R.D.,
Youmans, D.T., Cech, T.R., and Davidovich, C. (2017a). Targeting of polycomb
repressive complex 2 to RNA by short repeats of consecutive guanines. Mol.
Cell 65, 1056–1067.e5. https://doi.org/10.1016/j.molcel.2017.02.003.
Wang, X., Paucek, R.D., Gooding, A.R., Brown, Z.Z., Ge, E.J., Muir, T.W., and
Cech, T.R. (2017b). Molecular analysis of PRC2 recruitment to DNA in chro-
matin and its inhibition by RNA. Nat. Struct. Mol. Biol. 24, 1028–1038.
https://doi.org/10.1038/nsmb.3487.
Wang, X., Xiang, Y., Yu, Y., Wang, R., Zhang, Y., Xu, Q., Sun, H., Zhao, Z.A.,
Jiang, X., Wang, X., et al. (2021). Formative pluripotent stem cells show fea-
tures of epiblast cells poised for gastrulation. Cell Res. 31, 526–541. https://
doi.org/10.1038/s41422-021-00477-x.
Williams, K., Christensen, J., Pedersen, M.T., Johansen, J.V., Cloos, P.A.C.,
Rappsilber, J., and Helin, K. (2011). TET1 and hydroxymethylcytosine in tran-
scription and DNA methylation fidelity. Nature 473, 343–348. https://doi.org/
10.1038/nature10066.
Wu, H., D’Alessio, A.C., Ito, S., Xia, K., Wang, Z., Cui, K., Zhao, K., Eve Sun, Y.,
and Zhang, Y. (2011). Dual functions of Tet1 in transcriptional regulation in
mouse embryonic stem cells. Nature 473, 389–393. https://doi.org/10.1038/
nature09934.
Xiang, Y., Zhang, Y., Xu, Q., Zhou, C., Liu, B., Du, Z., Zhang, K., Zhang, B.,
Wang, X., Gayen, S., et al. (2020). Epigenomic analysis of gastrulation iden-
tifies a unique chromatin state for primed pluripotency. Nat. Genet. 52,
95–105. https://doi.org/10.1038/s41588-019-0545-1.
Xiong, J., Zhang, Z., Chen, J., Huang, H., Xu, Y., Ding, X., Zheng, Y., Nishina-
kamura, R., Xu, G.L., Wang, H., et al. (2016). Cooperative action between
SALL4A and TET proteins in stepwise oxidation of 5-methylcytosine. Mol.
Cell 64, 913–925. https://doi.org/10.1016/j.molcel.2016.10.013.
Yamazaki, T., Souquere, S., Chujo, T., Kobelke, S., Chong, Y.S., Fox, A.H.,
Bond, C.S., Nakagawa, S., Pierron, G., and Hirose, T. (2018). Functional do-
mains of NEAT1 architectural lncRNA induce paraspeckle assembly through
phase separation. Mol. Cell 70, 1038–1053.e7. https://doi.org/10.1016/j.mol-
cel.2018.05.019.
Yan, J., Dutta, B., Hee, Y.T., and Chng, W.J. (2019). Towards understanding of
PRC2 binding to RNA. RNA Biol. 16, 176–184. https://doi.org/10.1080/
15476286.2019.1565283.
Yin, Y., Yan, P., Lu, J., Song, G., Zhu, Y., Li, Z., Zhao, Y., Shen, B., Huang, X.,
Zhu, H., et al. (2015). Opposing roles for the lncRNA haunt and its genomic lo-
cus in regulating HOXA gene activation during embryonic stem cell differenti-
ation. Cell StemCell 16, 504–516. https://doi.org/10.1016/j.stem.2015.03.007.
Yu, L., Wei, Y., Sun, H.X., Mahdi, A.K., Pinzon Arteaga, C.A., Sakurai, M.,
Schmitz, D.A., Zheng, C., Ballard, E.D., Li, J., et al. (2021). Derivation of inter-
mediate pluripotent stem cells amenable to primordial germ cell specification.
Cell Stem Cell 28, 550–567.e12. https://doi.org/10.1016/j.stem.2020.11.003.
Zhu, F., Zhu, Q., Ye, D., Zhang, Q., Yang, Y., Guo, X., Liu, Z., Jiapaer, Z., Wan,
X., Wang, G., et al. (2018). Sin3a-Tet1 interaction activates gene transcription
and is required for embryonic stem cell pluripotency. Nucleic Acids Res. 46,
6026–6040. https://doi.org/10.1093/nar/gky347.
Cell Reports 39, 110928, June 7, 2022 17
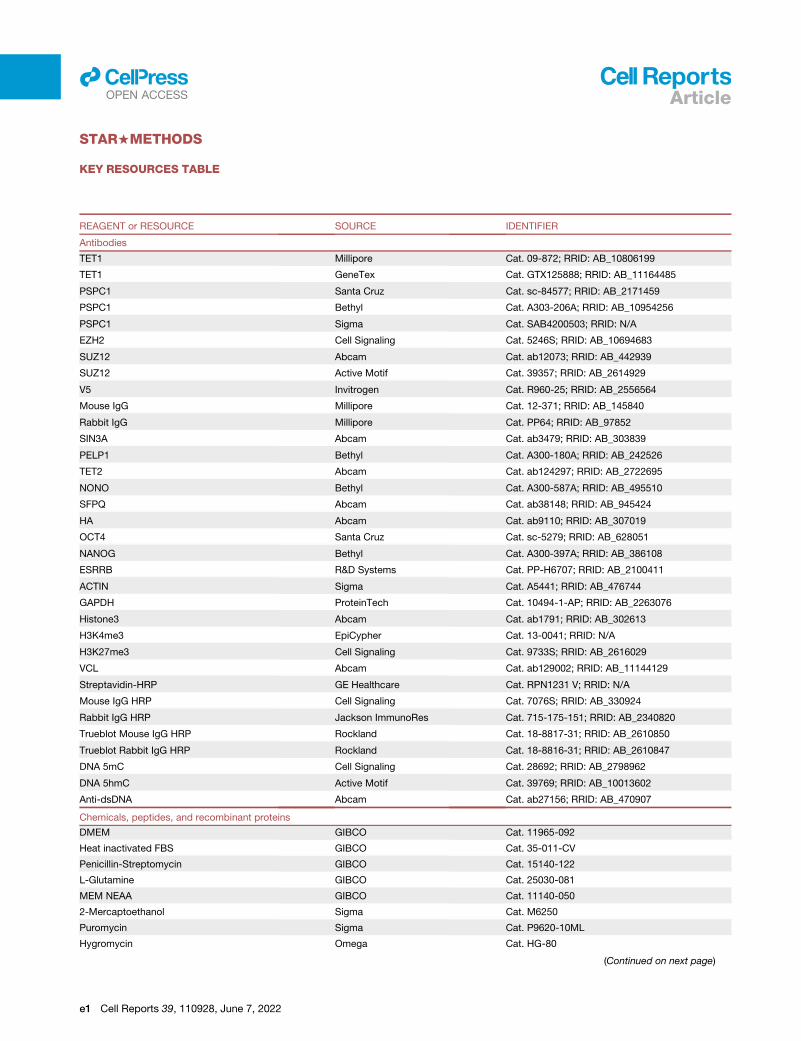
Articlell
OPEN ACCESS
STAR+METHODS
KEY RESOURCES TABLE
REAGENT or RESOURCE SOURCE IDENTIFIER
Antibodies
TET1 Millipore Cat. 09-872; RRID: AB_10806199
TET1 GeneTex Cat. GTX125888; RRID: AB_11164485
PSPC1 Santa Cruz Cat. sc-84577; RRID: AB_2171459
PSPC1 Bethyl Cat. A303-206A; RRID: AB_10954256
PSPC1 Sigma Cat. SAB4200503; RRID: N/A
EZH2 Cell Signaling Cat. 5246S; RRID: AB_10694683
SUZ12 Abcam Cat. ab12073; RRID: AB_442939
SUZ12 Active Motif Cat. 39357; RRID: AB_2614929
V5 Invitrogen Cat. R960-25; RRID: AB_2556564
Mouse IgG Millipore Cat. 12-371; RRID: AB_145840
Rabbit IgG Millipore Cat. PP64; RRID: AB_97852
SIN3A Abcam Cat. ab3479; RRID: AB_303839
PELP1 Bethyl Cat. A300-180A; RRID: AB_242526
TET2 Abcam Cat. ab124297; RRID: AB_2722695
NONO Bethyl Cat. A300-587A; RRID: AB_495510
SFPQ Abcam Cat. ab38148; RRID: AB_945424
HA Abcam Cat. ab9110; RRID: AB_307019
OCT4 Santa Cruz Cat. sc-5279; RRID: AB_628051
NANOG Bethyl Cat. A300-397A; RRID: AB_386108
ESRRB R&D Systems Cat. PP-H6707; RRID: AB_2100411
ACTIN Sigma Cat. A5441; RRID: AB_476744
GAPDH ProteinTech Cat. 10494-1-AP; RRID: AB_2263076
Histone3 Abcam Cat. ab1791; RRID: AB_302613
H3K4me3 EpiCypher Cat. 13-0041; RRID: N/A
H3K27me3 Cell Signaling Cat. 9733S; RRID: AB_2616029
VCL Abcam Cat. ab129002; RRID: AB_11144129
Streptavidin-HRP GE Healthcare Cat. RPN1231 V; RRID: N/A
Mouse IgG HRP Cell Signaling Cat. 7076S; RRID: AB_330924
Rabbit IgG HRP Jackson ImmunoRes Cat. 715-175-151; RRID: AB_2340820
Trueblot Mouse IgG HRP Rockland Cat. 18-8817-31; RRID: AB_2610850
Trueblot Rabbit IgG HRP Rockland Cat. 18-8816-31; RRID: AB_2610847
DNA 5mC Cell Signaling Cat. 28692; RRID: AB_2798962
DNA 5hmC Active Motif Cat. 39769; RRID: AB_10013602
Anti-dsDNA Abcam Cat. ab27156; RRID: AB_470907
Chemicals, peptides, and recombinant proteins
DMEM GIBCO Cat. 11965-092
Heat inactivated FBS GIBCO Cat. 35-011-CV
Penicillin-Streptomycin GIBCO Cat. 15140-122
L-Glutamine GIBCO Cat. 25030-081
MEM NEAA GIBCO Cat. 11140-050
2-Mercaptoethanol Sigma Cat. M6250
Puromycin Sigma Cat. P9620-10ML
Hygromycin Omega Cat. HG-80
(Continued on next page)
e1 Cell Reports 39, 110928, June 7, 2022
Continued
REAGENT or RESOURCE SOURCE IDENTIFIER
N2 GIBCO Cat. 17502-048
B27 GIBCO Cat. 17504-044
DMEM/F-12 GIBCO Cat. 11-330-032
Neurobasal GIBCO Cat. 21-103-049
LIF Lab prep N/A
GSK3i (CHIR99021) Sigma Cat. SML1046-25MG
MEKi (PD0325901) Selleckchem Cat. S1036
Recombinant Fgf2 R&D System Cat. 233-FB
Recombinant Activin A R&D System Cat. 338-AC13C6
15N4 L-arginine Cambridge Isotope Cat. CNLM-539-H13C6
15N2 L-lysine Cambridge Isotope Cat. CNLM-291-H13C6 L-lysine Cambridge Isotope Cat. CLM-2247-H
dTAG-13 Tocris Cat. 6605
Deposited data
PSPC1 ChIP-seq in ESC This paper NCBI GEO: GSE182443
SUZ12 ChIP-seq in ESC This paper NCBI GEO: GSE182443
SUZ12 ChIP-seq in EpiLC upon
Pspc1 KO, Neat1 KO, and
Tet1-degron treatments
This paper NCBI GEO: GSE182443
H3K27me3 ChIP-seq in ESC and
EpiLC upon Pspc1 KO, Neat1 KO,
and Tet1-degron treatments
This paper NCBI GEO: GSE182443
H3K4me3 ChIP-seq in ESC and
EpiLC upon Pspc1 KO and Neat1 KO
This paper NCBI GEO: GSE182443
Neat1 ChIRP-seq in WT and Neat1
KO ESC and EpiLC
This paper NCBI GEO: GSE182443
Pspc1 WT/KO RNA-seq in ESC and EpiLC This paper NCBI GEO: GSE182443
Neat1 WT/KO RNA-seq in ESC and EpiLC This paper NCBI GEO: GSE182443
TET1 affinity purification followed by mass
spectrometry data in ESC
This paper ProteomeXchange PRIDE: PXD033587
TET1 ChIP-seq in ESC Wu et al., 2011 NCBI GEO: GSE26833
PSPC1 CLIP-seq in ESC Guallar et al., 2018 NCBI GEO: GSE103269
H3K4me3 and H3K27ac in ESC Hon et al., 2014 NCBI GEO: GSE48519
5mC and 5hmC meDIP-seq in ESC Xiong et al., 2016 NCBI GEO: GSE57700
Experimental models: Cell lines
Mouse ESC CCE This paper N/A
Pspc1 KO ESC Guallar et al., 2018 N/A
Pspc1 KO ESC rescued with WT or RRMmut
PSPC1 protein
Guallar et al., 2018 N/A
Tet1-degron ESC This paper N/A
Mouse ESC 46C This paper N/A
Neat1 KO ESC This paper N/A
Ezh2 KO ESC Shen et al., 2008 N/A
Mouse ESC V6.5 Laboratory of R. Jaenisch N/A
Tet1 KO ESCs Laboratory of R. Jaenisch N/A
Tet1/2/3 KO ESCs Laboratory of R. Jaenisch N/A
Dnmt1/3a/3b KO ESC Laboratory of T. Chen N/A
Nono KO ESC Laboratory of F. Lan N/A
Oligonucleotides
Oligonucleotides (see Table S4) This paper N/A
(Continued on next page)
Cell Reports 39, 110928, June 7, 2022 e2
Articlell
OPEN ACCESS
Continued
REAGENT or RESOURCE SOURCE IDENTIFIER
Software and algorithms
STAR 2.7.6a https://github.com/alexdobin/STAR
Cufflinks 2.2.1 http://cole-trapnell-lab.github.io/cufflinks/
Bowtie2 2.3.5 http://bowtie-bio.sourceforge.net/bowtie2/
IGV 2.10.2 https://software.broadinstitute.org/software/igv
samtools 1.10 http://www.htslib.org/
PICARD 2.18.5 https://broadinstitute.github.io/picard/
HOMER 4.11.1 http://homer.ucsd.edu/homer/
MACS2 2.2.7 https://github.com/macs3-project/MACS
NGSplot 2.61 https://github.com/shenlab-sinai/ngsplot
Articlell
OPEN ACCESS
RESOURCE AVAILABILITY
Lead contactFurther information and requests for resources and reagents should be directed to and will be fulfilled by the lead contact, Jianlong
Wang ([email protected]).
Materials availabilityThe Neat1KO and Tet1-degron ESC lines generated in this paper are available from the lead contact with a completed Materials
Transfer Agreement.
Data and code availabilityd The ChIP-seq, ChIRP-seq, and RNA-seq data have been deposited at the Gene Expression Omnibus (GEO) with accession
code: GSE182443. The TET1 affinity purification followed by mass spectrometry data have been deposited at the
ProteomeXchange Consortium via the PRIDE partner repository with accession code: PXD033587. The deposited data are
publicly available as of the date of publication. This paper analyzes existing, publicly available data. These accession numbers
for the datasets are listed in the key resources table.
d This paper does not report original code.
d Any additional information required to reanalyze the data reported in this paper is available from the lead contact upon request.
EXPERIMENTAL MODEL AND SUBJECT DETAILS
Cell culture and in vitro differentiationIf not specified, mouse embryonic stem cells (ESCs) were cultured on 0.1% gelatin-coated plates and in ESmedium: DMEMmedium
supplemented with 15% fetal bovine serum (FBS), 1000 units/mL recombinant leukemia inhibitory factor (LIF), 0.1 mM
2-mercaptoethanol, 2 mM L-glutamine, 0.1 mM MEM non-essential amino acids (NEAA), 1% nucleoside mix (100X stock), and
50 U/mL Penicillin/Streptomycin. The Ezh2 KO ESCs (Shen et al., 2008) were cultured on 0.1% gelatin-coated plates and in naive
culture condition (2iL) using serum-free N2B27 medium (DMEM/F12 and Neurobasal medium mixed at a ratio of 1:1, 13 B27 sup-
plement, 13 N2 supplement, 2 mM L-glutamine, 0.1 mM 2-mercaptoethanol, and 50 U/mL Penicillin/Streptomycin) supplemented
with Gsk3b inhibitor (CHIR99021, 3 mM), Mek inhibitor (PD0325901, 1 mM), and LIF (1000 units/mL).
For SILAC labeling, ESCs were cultured in either SILAC heavy or light medium: ES medium with complete supplements but defi-
cient in both L-lysine and L-arginine, and then supplemented with L-lysine and L-arginine (SILAC light) or 13C615N4 L-arginine
(Arg+10) and 13C615N2 L-lysine (Lys+8) or 13C6 L-lysine (Lys+6) (SILAC heavy) amino acids (Cambridge Isotope Laboratories).
For in vitro ESC-to-EpiLC differentiation, ESCs were seeded on fibronectin-coated (10 mg/mL/cm2) plates and in ES medium. On
the next day, the medium was switched to formative culture condition using serum-free N2B27 medium supplemented with Fgf2
(12 ng/mL) and Activin A (20 ng/mL) (FA).
Neat1 knockout (KO) ESCsCRISPR/Cas9-mediated Neat1KO was performed as described in (Yin et al., 2015). Briefly, two vectors (with the same pGL3-U6-
sgRNA-PGK-puromycin backbone, Addgene #51133) containing two sgRNA sequences (Table S4) targeting a 6K bp region contain-
ing the short isoform of Neat1 (Neat1_1) were cotransfected with a Cas9-expressing vector (pST1374-N-NLS-flag-linker-Cas9,
Addgene #44758) into WT 46C ESCs by lipofectamine 2000 (Invitrogen). Transfected cells were selected with puromycin and
e3 Cell Reports 39, 110928, June 7, 2022
Articlell
OPEN ACCESS
blasticidin for 8 days before clones were picked. Then, individual ESC clones were expanded and subjected to genomic DNA extrac-
tion and PCR for genotyping screening. The KO clones were further confirmed by RT-qPCR analysis of Neat1 expression.
Tet1-degron knock-in (KI) and protein degradationThe CRISPR/Cas9 systemwas used to engineer ESCs for protein degradation of TET1 genetically. The 50- and -30 0-homology arms of
Tet1 were PCR amplified from genomic DNA. The P2A-2xHA-FKBP(F36 V) fragment for N-terminal insertion and the mCherry and
BFP sequences were PCR amplified from Addgene plasmids #91792, #104370, #104371, respectively. Tet1 50- and -30 0-homology
arms, FKBP, and mCherry or BFP sequences were assembled by Gibson Assembly 23Master Mix (NEB, E2611S) to obtain 50arm-
FKBP-BPF-30arm and 50arm-FKBP-mCherry-30arm doner vectors in pJET1.2 vector (Thermo Scientific). CRISPR gRNA was subcl-
oned into the pSpCas9(BB)-2A-Puro (PX459) vector (gRNA sequence in Table S4). ESCswere transfected with the two donor vectors
and CRISPR vectors using Lipofectamine 2000 (Invitrogen). After two days of puromycin selection, double-positive cells were sorted
out for mCherry and BFP and seeded on a 96-well plate with single-cell per well using the BD Influx Cell Sorter. Cells were expanded
and genotyped by PCR, and protein degradation was confirmed by Western blot analysis. Clones with a homozygous knock-in tag
were further expanded and used for experiments.
The Tet1-degron ESCs were treated with either DMSO control or dTAG13 (500 nM in DMSO, Tocris, 6605) for rapid degradation of
TET1 protein. ESCs were treated with dTAG13 for 2 days before differentiation, and then cells were treated with dTAG13 during the
ESC-to-EpiLC differentiation. In the control group, cells were treated with DMSO in ESCs and during the ESC-to-EpiLC differentiation.
METHOD DETAILS
Affinity purification followed by mass spectrometry (AP-MS) analysisWe employed a previously validated ESC clone with the ectopic expression of the 3xFLAG tagged mouse Tet1 (FL-Tet1) gene (Ding
et al., 2015). Before the AP-MS experiment, the empty vector (EV)- and FL-Tet1-transfected ESCswere cultured in both SILAC heavy
and light medium for 2 weeks with reciprocal labeling: Replicate#1, light of FL-Tet1 versus heavy of EV (Lys+6); Replicate#2, light of
EV versus heavy of FL-Tet1 (Lys+8, Arg+10). AP-MS was performed using our well-established protocols (Ding et al., 2015; Guallar
et al., 2018; Huang et al., 2021). Briefly, the cell pellets were resuspended in ice-cold hypotonic buffer A (10 mM HEPES, pH 7.9,
1.5 mM MgCl2, 10 mM KCl, 0.5 mM DTT, 0.2 mM PMSF, and protease inhibitor cocktail (PIC, Sigma, P8340)) and incubated for
10 min on ice. The sample was centrifuged at 3,000 3g for 5 min at 4�C, and the pellet containing nuclei was washed by resuspend-
ing with ice-cold buffer A and centrifuging at 10,000 3 g for 20 min at 4�C. Then, nuclei were resuspended with ice-cold nuclear
extract buffer C (20 mM HEPES, pH 7.9, 20% glycerol (v/v), 0.42 M NaCl, 1.5 mM MgCl2, 0.2 mM EDTA, 0.5 mM DTT, 0.2 mM
PMSF, and PIC) and incubated at 4�C for 30 min with continuous mixing. Insoluble materials were pelleted by centrifugation at
25,000 3 g for 20 min at 4�C. The supernatant was collected as nuclear extract (NE) and dialyzed against buffer D (20 mM
HEPES, pH 7.9, 20% glycerol (v/v), 100 mM KCl, 0.2 mM EDTA, 0.5 mM DTT, 0.2 mM PMSF) for 3 h at 4�C. Then, 0.1 mL of Protein
G agarose (Roche Diagnostic) equilibrated in buffer D containing 0.02% NP40 (buffer D-NP) was added to nuclear extracts in 15 mL
tubes, in the presence of Benzonase (25 U/mL, Millipore 70664), and incubated/pre-cleared for 1 h at 4�C with continuous mixing.
Precleared NE samples were incubated with pre-equilibrated anti-FLAGM2 affinity gel (Sigma, F2426) for 4 h at 4�Cwith continuous
mixing. Five washes were performedwith buffer D-NP. Boundmaterial was eluted by incubation with buffer D-NP supplemented with
0.5 mg/mL 3xFLAG peptides (Sigma, F4799) for 2 h at 4�C with continuous mixing. The eluted proteins were concentrated with Ami-
con Ultra Centrifugal Filters (Millipore, UFC500396), boiled 5 min in Laemmli buffer, and fractionated on a 10% SDS-PAGE gel. The
gel lanes were cut horizontally into 5�7 pieces, and each was subjected to LC-MS/MS analysis (Huang et al., 2021).
MS data were processed by Thermo Proteome Discoverer software with SEQUEST engine against mouse International Protein
Index (IPI v3.68) protein sequence database. Carbamidomethylation (CAM) was set as the fixed modification, and methionine oxida-
tionwas set as the variablemodification. Outputs of protein identification fromProteomeDiscoverer were imported into a localMicro-
soft Access database. Common contamination proteins (trypsin, keratins) were removed, and protein Heavy/Light quantification
ratios were obtained.
Co-immunoprecipitation (co-IP)Co-IP in regular (nucleosome-free) conditions was performed as previously described (Ding et al., 2015). The nuclei were purifiedwith
buffer A followed the AP-MS protocol. Then nuclei were resuspendedwith ice-cold lysis buffer (50mMHEPES, pH 7.9, 250mMNaCl,
0.1%NP-40, 0.2 mMEDTA, 0.2 mMPMSF, and PIC) and incubated at 4�C for 30 min with continuous mixing. About 2% of input was
saved, then NE was diluted with 40% volume (v/v = 5:2) of dilution buffer (20 mM HEPES, pH 7.9, 20% glycerol (v/v), 0.05% NP-40,
0.2 mM EDTA, 0.2 mM PMSF, and PIC) as the co-IP buffer with the NaCl concentration of 180 mM. For antibody IP, the antibody and
the same amount of mouse or rabbit IgG as control were added to the co-IP buffer, incubated with protein lysates overnight at 4�Cwith continuousmixing. Then, protein lysates were incubatedwith protein G-Agarose beads (Roche, 11243233001) for 2 h at 4�Cwith
continuous mixing. For FLAG-IP, NE was incubated with anti-FLAG M2 affinity gel (Sigma, F2426) overnight at 4�C with continuous
mixing. Beads were washed 4X with co-IP buffer (lysis buffer/dilution buffer = 5:2, v/v). For RNase A treatment, the beads were split
during the first wash and incubated with or without RNase A (200 mg/mL, Sigma, R6148) at 37�C for 15min. Proteins were eluted from
the beads by boiling in 1X SDS Laemmli loading buffer, followed by SDS-PAGE and Western blot analysis.
Cell Reports 39, 110928, June 7, 2022 e4
Articlell
OPEN ACCESS
Co-IP in nucleosome-containing conditions was performed following a published protocol (Neri et al., 2013). Briefly, cell pellets
were resuspended in isotonic buffer (20 mM HEPES, pH 7.5, 100 mM NaCl, 250 mM Sucrose, 5 mM MgCl2, 5 mM ZnCl2, and
PIC), incubated on ice for 5 min, and spun down 500 g for 5 min at 4�C. Then pellets were resuspended in isotonic buffer (no PIC)
supplemented with 1% NP-40), vortexed for 10 s at the highest setting, incubated on ice for 5 min, and spun down 1000 g for
5 min at 4�C. The pellets (nuclei) were resuspended in 200 mL digestion buffer (50 mM Tris-HCl, pH 8.0, 100 mM NaCl, 250 mM Su-
crose, 0.5mMMgCl2, 5mMCaCl2, 5 mMZnCl2, no PIC) and 1 mL of micrococcal nuclease (MNase, NEB,M0247S), incubated at 37�Cwater bath for 10min. Then theMNase digestion was immediately stopped by adding 20 mL 0.5 M EDTA, and nuclei were spun down
13,000 g for 1 min at 4�C. The digested nuclei were resuspended in digestion buffer (with PIC), subjected to sonication with Bioruptor
Plus, set 30 s ON, 30 s OFF, 5 cycles to break nuclei, and spun down 13,000 g for 5 min at 4�C. Protein supernatants were subjected
to antibody incubation, washing with digestion buffer, protein elution, and SDS-PAGE, like the regular co-IP protocol.
The primary antibodies used for co-IP were: TET1 (Millipore, 09-872 and GeneTex, GTX125888), PSPC1 (Santa Cruz, sc-84577
and Bethyl, A303-206A), SUZ12 (Abcam, ab12073), EZH2 (Cell Signaling, 5246S), V5 (Invitrogen, R960-25), mouse IgG (Millipore,
12-371), and rabbit IgG (Millipore, PP64).
Subcellular fractionation assayThe subcellular fractions of ESCs were extracted using the Subcellular Protein Fractionation Kit for Cultured Cells (Thermo, #78840).
Briefly, about 53 106 cells were used, and each subcellular fraction was collected following the standard protocol. Protein loadings
were balanced according to the protein concentrations in the cytoplasmic fraction before Western blot analysis.
Gel filtration assaySize exclusion chromatography (gel filtration assay) was performed as previously described (Ding et al., 2015). Briefly, nuclear ex-
tracts (10�20 mg) of ESCs were applied to a gel filtration column (S400 HiPrep 16/60 Sephacryl, Amersham Biosciences), samples
were eluted at 1 mL/min and continuously monitored with an online detector at a wavelength of 280 nm. Fractions were collected,
concentrated, and subjected to Western blot analysis with indicated antibodies.
Domain mappingThe FLAG-tagged Tet1 full-length (FL) sequence and truncated variants were cloned in the PiggyBac expression vectors. The Pspc1
full-length sequence and truncated variants were PCR amplified and subcloned into the V5-tagged PiggyBac expression vectors.
The TET1 and PSPC1 PiggyBac expression vectors and control empty vectors (EV) were transfected into ESCs with Lipofectamine
2000 Transfection Reagent (Invitrogen, 11668019) following the standard protocol. After drug selection, ESCswere expanded for co-
IP. FLAG-IP (for TET1 FL and truncated variants) and V5-IP (for PSPC1 FL and truncated variants) were performed, followed byWest-
ern blot analysis of PSPC1 and TET1, respectively.
Western blot analysisWestern blot analysis was performed as previously described (Huang et al., 2017). Total proteins were extracted by RIPA buffer. Protein
concentrations were measured by Bradford assay (Pierce, 23236), balanced, and subjected to SDS-PAGE analysis. The following pri-
mary antibodies were used: PSPC1 (Bethyl, A303-206A and Sigma, SAB4200503), TET1 (Millipore, 09-872 andGeneTex, GTX125888),
SIN3A (Abcam, ab3479), PELP1 (Bethyl, A300-180A), TET2 (Abcam, ab124297), V5 (Invitrogen, R960-25), NONO (Bethyl, A300-587A),
SFPQ (Abcam, ab38148), HA (Abcam, ab9110), OCT4 (Santa Cruz, sc-5279), ESRRB (R&D, PP-H6707), NANOG (Bethyl, A300-397A),
SUZ12 (Abcam, ab12073), EZH2 (Cell Signaling, 5246S), ACTIN (1:5000, Sigma, A5441), GAPDH (ProteinTech, 10494-1-AP), Histone 3
(H3, Abcam, ab1791), and Vinculin (VCL, Abcam, ab129002).
ImmunofluorescenceMouse embryonic fibroblasts (MEFs) and ESCs were grown on 24-well plates coated with 0.1% gelatin (w/v). After fixation with 4%
paraformaldehyde (w/v) for 15 min, cells were permeabilized with 0.25% Triton X-100 (v/v) in PBS for 5 min and incubated with 10%
BSA for 30 min at 37�C. For immunostaining, cells were incubated overnight at 4�C with PSPC1 antibody (Santa Cruz, sc-84577) in
PBS with 3% BSA (w/v). The following day cells were incubated with fluorophore-labeled secondary antibodies for 1 h at RT. Cells
were imaged with a Leica DMI 6000 inverted microscope.
Dot blot analysisThe genomic DNA dot-blot analysis of 5mC and 5hmC was performed following the DNA Dot Blot Protocol (Cell Signaling, #28692)
with modifications. Briefly, genomic DNA of ESCs was extracted using Quick-DNA Miniprep Plus Kit (Zymo Research, D4068), and
DNA concentration wasmeasured by NanoDrop. Next, the same amount of DNAwas denatured with 10X DNA denaturing buffer (1M
NaOH and 0.1MEDTA) and incubated at 95�C for 10min, whichwas then immediatelymixedwith an equal volume of 20X SSCbuffer,
pH 7.0 (Invitrogen, 15557044) and chilled on ice. The DNA samples were diluted with a pre-determined amount and loaded on the
positive-charged Nelyon membrane (GE Amersham, RPN2020B) using a vacuum chamber (Minifold, SRC-96). The membrane was
dried, auto-crosslinked with 1200 3 100 mJ/cm2, and blocked with 5% milk/TBST for 1 h. Next, the membrane was incubated with
5mC (Cell Signaling, 28692) or 5hmC (Active Motif, 39769) antibodies, the same as the Western blot analysis. Then, the membrane
e5 Cell Reports 39, 110928, June 7, 2022
Articlell
OPEN ACCESS
was stripped with the stripping buffer (Thermo Scientific, 21059) and reblotted with the dsDNA (Abcam, ab27156) antibody as the
loading control.
Biotinylated RNA synthesis, dot blot, and pull-down assayNeat1-sense (Neat1-S) and antisense (Neat1-AS) DNAs were amplified with primers containing the T7 promoter sequence at the
50end (Table S4) from a pJET1.2 cloning vector (Thermo Scientific, K1232) containing the Neat1_1 cDNA sequence. Linearized
DNA was biotin-labeled and in vitro transcribed using the Biotin RNA Labeling Mix (Roche, 11685597910) and MEGAscript T7 Tran-
scription Kit (Invitrogen, AM1333). Synthesized RNA was purified with the RNA Clean & Concentrator Kit (Zymo Research, R1015).
The ESC total RNA and biotinylated RNA were loaded on the positive-charged Nelyonmembrane (GE Amersham, RPN2020B), auto-
crosslinked with 12003 100 mJ/cm2, and blocked with 5%milk/TBST for 1 h. Then the membrane was washed with TBST and incu-
bated in TBST containing HRP-Conjugated Streptavidin (GE Healthcare, RPN1231 V) at room temperature (RT) for 2 h. The rest steps
were the same as the Western blot analysis.
The biotinylated RNA pull-down assaywas performed as previously described (Rinn et al., 2007). The ESC cell pellets werewashed
2X with buffer A as in the co-IP protocol. Then nuclei were resuspended with RIP lysis buffer (25 mM Tris-HCl, pH 7.4, 150 mMNaCl,
1.5 mM MgCl2, 0.5% NP-40, 1 mM EDTA, with PMSF, PIC, and RNase inhibitor) and incubated at 4�C for 30 min with continuous
mixing. After centrifuge, nuclear extracts were supplied with tRNA (0.1 mg/mL, Roche, 10109541001) and incubated with 4 mg
Neat1-S, Neat1-AS RNAs, or the beads-only fraction for 1 h at 4�C. Then 40 uL of Streptavidin M280 dynabeads (Invitrogen,
11205D) were added to each binding fraction and further incubated for 1 h at 4�C. Beads were washed 5X with the RIP buffer
and boiled, followed by SDS-PAGE analysis.
Genomic DNA 5mC and 5hmC quantification by mass spectrometryThe UHPLC-MS/MS analysis for 5mC and 5hmC quantification was performed as previously described (Lai et al., 2018) on an Agilent
1290 Infinity II ultrahigh performance LC system coupled with an Agilent 6470 triple quadrupole mass spectrometer equipped with a
jet stream electrospray ionization source (Santa Clara, CA). The mass spectrometer was operated under positive ionization using
multiple reactions monitoring (MRM) mode. The selective MRM transitions were monitored as follows: m/z 242 / 83 for 5mC
andm/z 258/ 142 for 5hmC. The frequencies of 5mdC and 5hmCover total deoxycytidine (dC) were calibrated by their correspond-
ing stable isotope-labeled internal standards.
RT-qPCRTotal RNA was extracted using the GeneJet RNA Purification Kit (Thermo Scientific, K0732). Reverse transcription was performed,
and cDNA was generated using the qScript kit (Quanta, 95048). Relative expression levels were determined using a QuantStudio 5
Real-Time PCR System (Applied Biosystems). Gene expression levels were normalized to Gapdh. Primers for RT-qPCR are listed in
Table S4.
Chromatin immunoprecipitation (ChIP) and sequencingChIP assays were performed as previously described (Huang et al., 2017). Briefly, cell pellets were crosslinked with 1% (w/v) form-
aldehyde for 10 min at RT, followed by the addition of 125 mM glycine to stop the reaction. Next, chromatin extracts were sonicated
into 200–500 bpwith Bioruptor Plus (settings of 30 s ON, 30 s OFF, 30 cycles) or with Bioruptor Pico (settings of 30 s ON, 30 s OFF, 15
cycles). Immunoprecipitation was performed with the following primary antibodies: PSPC1 (Santa Cruz, sc-84577 and Bethyl, A303-
206A), SUZ12 (Active Motif, 39357), H3K4me3 (EpiCypher, 13-0041), H3K27me3 (Cell Signaling, 9733S), TET1 (GenTex,
GTX125888), or rabbit IgG (Millipore, PP64) overnight at 4�C with continuous mixing, followed by incubation with protein G dynaber-
ads (Invitrogen, 10004D) for another 2 h at 4�C. The immunoprecipitated DNA was washed with ChIP RIPA buffer and purified with
ChIP DNA Clean & Concentrator columns (Zymo Research, D5205). qPCR was performed with Roche SYBR Green reagents and a
LightCycler480 (Roche) machine. Percentages of input recovery were calculated. The ChIP-qPCR primers are listed in Table S4.
For ChIP-seq, 10% of sonicated genomic DNA was used as ChIP input. Libraries were prepared using the NEBNext Ultra II DNA
library prep kit and index primers sets (NEB, 7645S, E7335S) following the standard protocol. Sequencing was performed with the
Illumina HiSeq 4000 Sequencer according to the manufacturer’s protocol. Libraries were sequenced as 150-bp paired-end reads.
Chromatin Isolation by RNA purification (ChIRP) and sequencingChIRP assays were performed following an established protocol (Chu et al., 2011) with modifications. Briefly, 32 anti-sense oligo
probes covering the whole Neat1_1 lncRNA (3.2K bp, 1 probe/100 bp of RNA length) were designed using singlemoleculefish.
com. The probes were separated into ‘‘odd’’ and ‘‘even’’ pools before the experiment. Cell pellets were harvested and crosslinked
with 1% of glutaraldehyde in PBS for 10 min at RT, followed by the addition of 125 mM glycine to stop the reaction. Next, chromatin
extracts were sonicated into 100–500 bpwith Bioruptor Pico, set 30 s ON, 30 s OFF, 45 cycles. Sonication efficiency was checked by
running a 1.5% agarose gel. The lysates after sonication were diluted with 2X volume of hybridization buffer and incubated with odd
and even probe pools at 37�C hybridization oven for 4 h with rotation, followed by incubation of streptavidin C1 dynabeads (Invitro-
gen, 65001) for another 30 min. The dynabeads were washed 5X with wash buffer, and ChIRP RNA was purified from 10% beads to
examine the Neat1 RNA enrichment. The ChIRP DNA was eluted from the remaining beads with elution buffer containing RNase
Cell Reports 39, 110928, June 7, 2022 e6
Articlell
OPEN ACCESS
A and RNase H and further treated with proteinase K. DNA was purified with Phenol:Chloroform:Isoamyl Alcohol (25:24:1, v/v, Invi-
trogen, 15593031) and resuspended in TE buffer. ChIRP-seq libraries were prepared using the NEBNext Ultra II DNA library prep kit
and index primers sets (NEB, 7645S, E7335S) following the standard protocol. Sequencing was performed with the Illumina HiSeq
4000 Sequencer according to the manufacturer’s protocol. Libraries were sequenced as 150-bp paired-end reads.
Crosslinking immunoprecipitation (CLIP) qPCRUVcrosslinking and immunoprecipitation (CLIP) were performed according to the eCLIP-seq protocol (VanNostrand et al., 2016) with
modifications. Briefly, cells in culture were washed with ice-cold PBS and crosslinked in PBS with UV type C (254 nm) at 400 mJ/cm2
on ice. Next, cells were scraped, pelleted, and lysed in CLIP lysis buffer (50 mM Tris-HCl, pH 7.4, 100 mM NaCl, 1% NP-40, 0.1%
SDS, 0.5% sodium deoxycholate) supplemented with proteinase and RNase inhibitors, and incubated on ice for 1 h. The lysate was
briefly sonicated with Bioruptor Plus, set 30 s ON, 30 s OFF, 5 cycles to break DNA. Next, Turbo DNase (2 U/mL, 1:500, Invitrogen,
AM2238) was added, and the lysate was incubated in a 37�Cwater bath for 15min, followed by centrifuge 15,000 g for 15 min at 4�C.Primary antibodies PSPC1 (Bethyl, A303-206A) and EZH2 (Cell Signaling, 5246S) or rabbit IgG (Millipore, PP64) were incubated with
Protein-G dynabeads (Invitrogen) for 1 h at RT. Then the lysate and the beadsweremixed overnight at 4�Cwith rotation. The next day,
the beads were washed with wash buffer (low salt, 20mM Tris-HCl, pH 7.4, 10mMMgCl2, 0.2% Tween-20) and high salt wash buffer
(50 mM Tris-HCl, pH 7.4, 1 M NaCl), and digested with Proteins K to elute RNA. The input and CLIP RNAs were purified with the RNA
Clean & Concentrator-5 kit (Zymo, R1015) followed by RT-qPCR analysis. Percentages of input recovery were calculated. CLIP-
qPCR primer sequences are listed in Table S4.
Gene ontology (GO) analysisGene ontology (GO) analyses were performed using the DAVID gene ontology functional annotation tool (https://david.ncifcrf.gov/
tools.jsp) with all NCBI Mus musculus genes as a reference list.
QUANTIFICATION AND STATISTICAL ANALYSIS
ChIP-seq and ChIRP-seq data processingChIP-seq data of histone marks H3K4me3 and H3K27ac in ESCs were downloaded from GSE48519, data of H3K27me3 in ESCs
were downloaded from GSE89211 (Cruz-Molina et al., 2017), and data of TET1 in ESCs were downloaded from GSE26832. All
ChIP-seq and ChIRP-seq reads were pre-processed by trim_galore (v0.6.3) and aligned to the mm9 mouse genome using the bow-
tie2 (v2.3.4) program, and the parameters were ‘‘-X 1000 –no-mixed –no-discordant’’. The aligned reads were exported (-F 0x04 -f
0x02) and sorted with samtools. Duplicates were removed with MarkDuplicates function in the PICARD (v2.14.0) package. The
aligned ChIP-seq and ChIRP-seq bam files of biological replicates were combined. All bam files were converted to a binary tiled
file (tdf) and visualized using IGV (v2.7.2) software.
All ChIP-seq and ChIRP-seq peaks were determined by theMACS2 program (v.2.0.10). PSPC1 ChIP peaks inWT cells were called
using the Pspc1KO ChIP-seq as the control data, and other ChIP peaks were called using the input ChIP-seq as the control data.
Neat1 ChIRP peaks in WT cells were called using the Neat1KO ChIRP-seq as the control data. Broad peaks were called for
PSPC1, SUZ12, and histone marks data, narrow peaks were called for TET1 and Neat1 data, and all other parameters were the
default settings. All peakswere annotated using the annotatePeaksmodule in the HOMERprogram (v4.11) against themm9genome.
A target gene of a called peak was defined as the nearest gene’s transcription start site (TSS) with a distance to TSS less than 5 kb.
Heatmaps and mean intensity curves of ChIP-seq data at specific genomic regions were plotted by the NGSplot program (v2.61)
centered by the middle point ‘‘(start+end)/2’’ of each region.
ChIP-seq correlation analysis of PSPC1 and other factors was performed with an in-house Python program as previously
described (Ding et al., 2015). A phi correlation coefficient was used to calculate the correlation between the ChIP peaks of every
two ChIP-seq data. Heatmap of correlations was shown with the Java TreeView (v1.1.6) program.
5mC and 5hmC DNA immunoprecipitation (DIP) data analysis5mC and 5hmC DIP-seq data in ESCs were downloaded from GSE57700. Reads were aligned to the mouse genome mm9 using the
bowtie (v1.0.0) program, with parameters -m 1 -v 2 –best –strata. The duplicated reads of the aligned datawere removed, then filtered
reads were sorted with samtools (v0.1.19). The reads per million (RPM) values of 5mC and 5hmC DIP-seq at each TET1 ChIP-seq
peak regionwere calculatedwith the NGSplot program (v2.61) and shown in Boxplots using R. p valuewas calculated from two-sided
Mann-Whitney test.
RNA-seq and data analysis100 ng total RNA was processed for RNA-seq library construction using the Ovation Mouse RNA-seq kit (NuGEN, #0348–32)
following themanufacturer’s protocol. Massively parallel sequencing was performed on an Illumina HiSeq 4000 Sequencing System.
Libraries were sequenced as 150-bp paired-end reads. For RNA-seq data processing, reads were aligned to the mouse genome
mm9 using STAR (v2.7.6a) with the default settings. Transcript assembly and differential expression analyses were performed using
Cufflinks (v2.2.1). Assembly of novel transcripts was not allowed (-G). Other parameters of Cufflinks were the default setting. The
e7 Cell Reports 39, 110928, June 7, 2022
Articlell
OPEN ACCESS
summed FPKM (fragments per kilobase per million mapped reads) of transcripts sharing each gene_id was calculated and exported
by the Cuffdiff program. In the gene expression matrix, a value of FPKM+1 was applied to minimize the effect of low-expression
genes. p-values were calculated using a T-test. Differentially expressed genes (DEGs) were determined by two-sided T-test
p-value<0.05 and fold-change>1.5. Boxplots for expression were generated using R. P-value was calculated from the two-sided
Mann-Whitney test.
PCA-analysis was performed for RNA-seq data from different batches. Batch effects were adjusted by ComBat function imple-
mented in the sva Bioconductor package (v.3.18.0). The expression data matrix was imported by Cluster 3.0 software for PCA anal-
ysis. PC values were visualized with the plot3d function in the rgl package using R (v4.1.0) scripts.
Statistical analysisIf not specified, qPCR analysis was performed in technical triplicates, and the error bars indicate standard deviation of the mean.
p-values were calculated using a two-sided T-test in the GraphPad Prism software (v9.2.0). RT-qPCR analyses in Figures 3F, 4E,
and S5B were performed in two independent KO clones. CLIP-qPCR analyses in Figures 6C, 6E, 6F, S6C, S6F, and S6G were
repeated in biological duplicates.
The boxplots in Figures 4H, S2B, and S2E present the 25th, median, and 75th quartiles, and the whiskers extend 1.5 of interquartile
ranges, and the p-value was calculated from the two-sided Mann-Whitney test. In the scatter plots of Figures 4C and S4E, P-value
was calculated using the Fisher-exact test based on the number of DEGs in each category (Pspc1KO Up/Down vs. Neat1KO Up/
Down). In the scatter plot of Figure S4D, Pearson’s product-moment correlation coefficient (r) and P-value of correlation are indicated
in each plot. The statistical analysis was performed with R (v4.1.0) scripts on the R-Studio platform (v1.4.1). The statistical details of
experiment are indicated in the figure legend.
Cell Reports 39, 110928, June 7, 2022 e8
Cell Reports, Volume 39
Supplemental information
A TET1-PSPC1-Neat1 molecular axis modulates PRC2
functions in controlling stem cell bivalency
Xin Huang, Nazym Bashkenova, Yantao Hong, Cong Lyu, Diana Guallar, Zhe Hu, VikasMalik, Dan Li, Hailin Wang, Xiaohua Shen, Hongwei Zhou, and Jianlong Wang
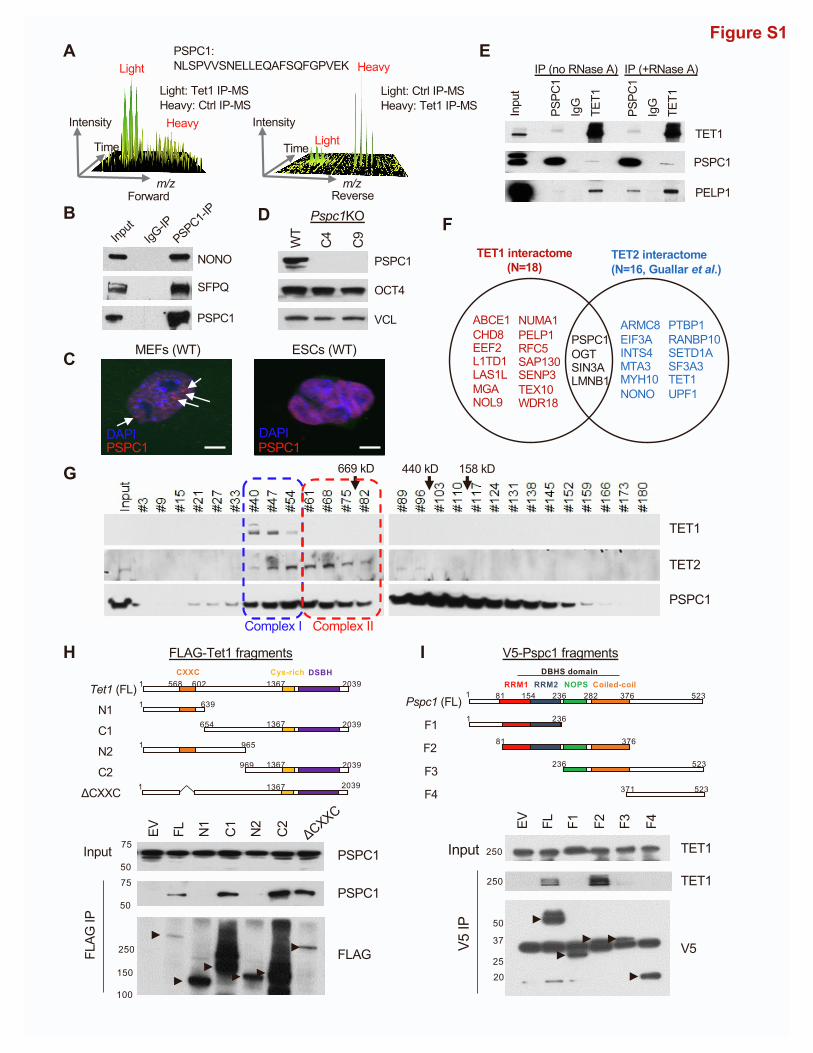
Figure S1
DAPIPSPC1
DAPIPSPC1
MEFs (WT) ESCs (WT)
A
H
Forward Reverse
Light
HeavyLight
Heavy
Time
m/z
Intensity
Time
m/z
Intensity
Light: Tet1 IP-MSHeavy: Ctrl IP-MS
Light: Ctrl IP-MSHeavy: Tet1 IP-MS
PSPC1: NLSPVVSNELLEQAFSQFGPVEK
I
B D
PSPC1
NONO
Input
PSPC1-IP
IgG-IP
SFPQW
T
C4
C9
Pspc1KO
VCL
PSPC1
OCT4
E
C
TET1
TET2
PSPC1
669 kD 440 kD 158 kD
Complex I Complex II
TET1
PSPC1
PELP1
Inpu
t
PSPC
1Ig
GTE
T1
IP (no RNase A)
PSPC
1Ig
GTE
T1
IP (+RNase A)
EV FL N1
C1
N2
C2
PSPC1
PSPC1Input
FLAGFLAG
IP
50
7550
75
250
150
100
EV FL F1 F2 F3 F4
Input TET1
TET1
V5V5 IP 50
37
25
250
250
20
CXXC Cys-rich DSBH1 568 2039602
1 639
2039654
1 965
2039969
1 2039
Tet1 (FL)
N1
C1
N2
C2
ΔCXXC
FLAG-Tet1 fragments
1367
1367
1367
1367
Pspc1 (FL)
F1
F2
F3
F4
1 236
81 376
371 523
236 523
RRM1 RRM2 NOPS Coiled-coil1 23681 282 376 523154
DBHS domain
V5-Pspc1 fragments
ΔCXXC
TET1 interactome (N=18)
TET2 interactome (N=16, Guallar et al.)
ABCE1CHD8EEF2L1TD1LAS1LMGANOL9
NUMA1PELP1RFC5SAP130SENP3TEX10WDR18
ARMC8EIF3AINTS4MTA3MYH10NONO
PTBP1RANBP10SETD1ASF3A3TET1UPF1
PSPC1OGTSIN3ALMNB1
F
G
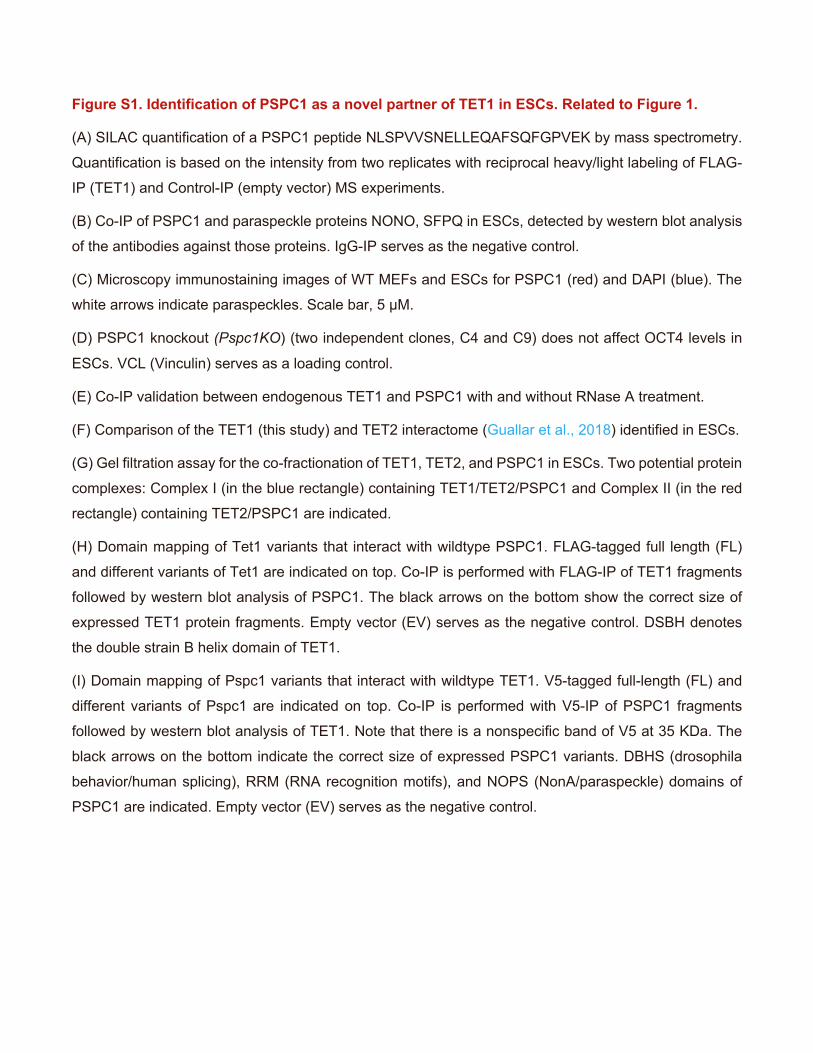
Figure S1. Identification of PSPC1 as a novel partner of TET1 in ESCs. Related to Figure 1.
(A) SILAC quantification of a PSPC1 peptide NLSPVVSNELLEQAFSQFGPVEK by mass spectrometry.
Quantification is based on the intensity from two replicates with reciprocal heavy/light labeling of FLAG-
IP (TET1) and Control-IP (empty vector) MS experiments.
(B) Co-IP of PSPC1 and paraspeckle proteins NONO, SFPQ in ESCs, detected by western blot analysis
of the antibodies against those proteins. IgG-IP serves as the negative control.
(C) Microscopy immunostaining images of WT MEFs and ESCs for PSPC1 (red) and DAPI (blue). The
white arrows indicate paraspeckles. Scale bar, 5 µM.
(D) PSPC1 knockout (Pspc1KO) (two independent clones, C4 and C9) does not affect OCT4 levels in
ESCs. VCL (Vinculin) serves as a loading control.
(E) Co-IP validation between endogenous TET1 and PSPC1 with and without RNase A treatment.
(F) Comparison of the TET1 (this study) and TET2 interactome (Guallar et al., 2018) identified in ESCs.
(G) Gel filtration assay for the co-fractionation of TET1, TET2, and PSPC1 in ESCs. Two potential protein
complexes: Complex I (in the blue rectangle) containing TET1/TET2/PSPC1 and Complex II (in the red
rectangle) containing TET2/PSPC1 are indicated.
(H) Domain mapping of Tet1 variants that interact with wildtype PSPC1. FLAG-tagged full length (FL)
and different variants of Tet1 are indicated on top. Co-IP is performed with FLAG-IP of TET1 fragments
followed by western blot analysis of PSPC1. The black arrows on the bottom show the correct size of
expressed TET1 protein fragments. Empty vector (EV) serves as the negative control. DSBH denotes
the double strain B helix domain of TET1.
(I) Domain mapping of Pspc1 variants that interact with wildtype TET1. V5-tagged full-length (FL) and
different variants of Pspc1 are indicated on top. Co-IP is performed with V5-IP of PSPC1 fragments
followed by western blot analysis of TET1. Note that there is a nonspecific band of V5 at 35 KDa. The
black arrows on the bottom indicate the correct size of expressed PSPC1 variants. DBHS (drosophila
behavior/human splicing), RRM (RNA recognition motifs), and NOPS (NonA/paraspeckle) domains of
PSPC1 are indicated. Empty vector (EV) serves as the negative control.
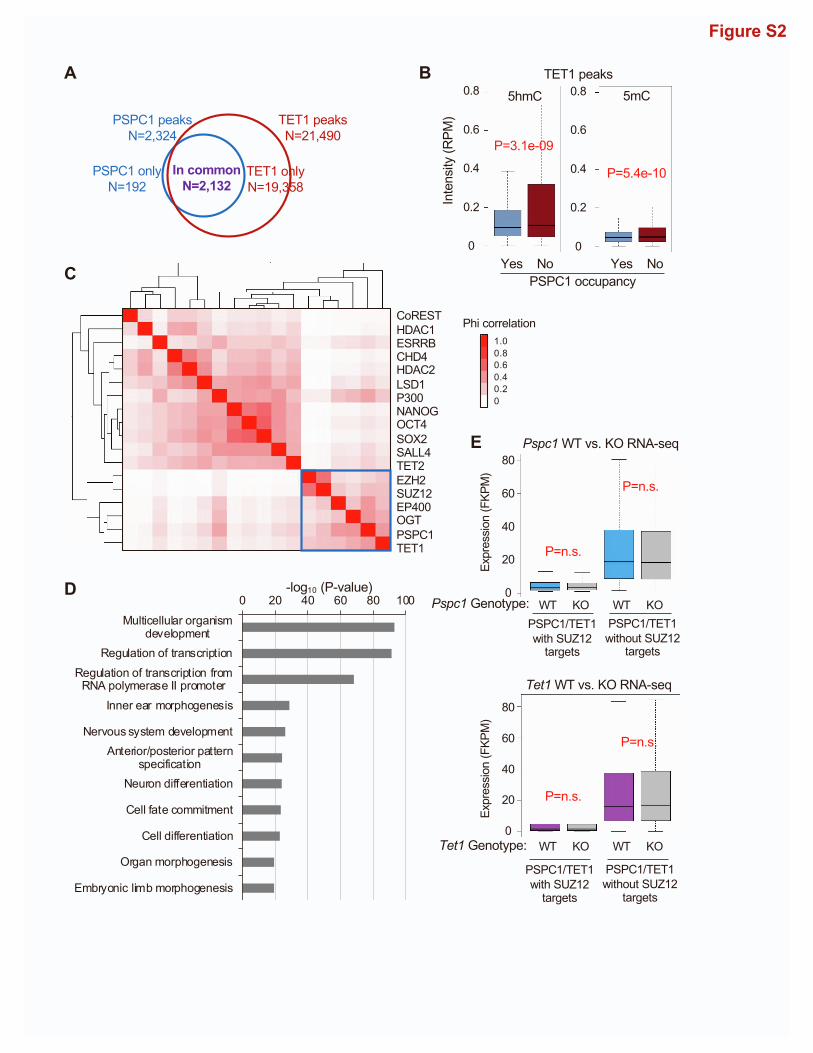
CoRESTHDAC1ESRRBCHD4HDAC2LSD1P300NANOGOCT4SOX2SALL4TET2EZH2SUZ12EP400OGTPSPC1TET1
1.00.80.60.40.20
Phi correlation
0 20 40 60 80 100Multicellular organism
developmentRegulation of transcription
Regulation of transcription fromRNA polymerase II promoter
Inner ear morphogenesis
Nervous system developmentAnterior/posterior pattern
specificationNeuron differentiation
Cell fate commitment
Cell differentiation
Organ morphogenesis
Embryonic limb morphogenesis
-log10 (P-value)
C
Figure S2
E
A
PSPC1 peaks N=2,324
TET1 onlyN=19,358
In commonN=2,132
TET1 peaks N=21,490
PSPC1 onlyN=192
PSPC1 occupancyYes No Yes No
0.8
0.6
0.4
0.2
0
0.8
0.6
0.4
0.2
0
Inte
nsity
(RPM
)
TET1 peaks5hmC 5mC
P=3.1e-09
P=5.4e-10
B
DPspc1 Genotype: WT KO WT KO
80
60
40
20
0
Expr
essio
n (F
KPM
)
Pspc1WT vs. KO RNA-seq
P=n.s.
P=n.s.
80
60
40
20
0WT KO WT KOTet1 Genotype:
Expr
essio
n (F
KPM
)
Tet1WT vs. KO RNA-seq
PSPC1/TET1with SUZ12
targets
PSPC1/TET1without SUZ12
targets
P=n.s.
P=n.s.
PSPC1/TET1with SUZ12
targets
PSPC1/TET1without SUZ12
targets
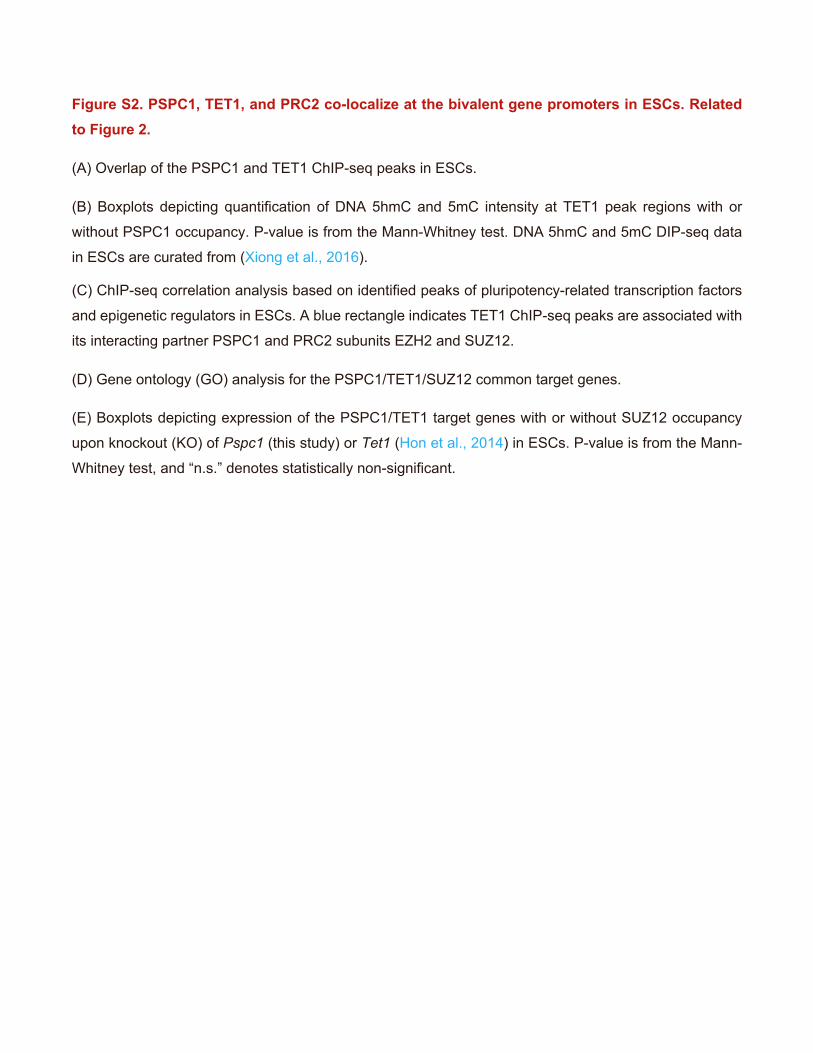
Figure S2. PSPC1, TET1, and PRC2 co-localize at the bivalent gene promoters in ESCs. Related to Figure 2.
(A) Overlap of the PSPC1 and TET1 ChIP-seq peaks in ESCs.
(B) Boxplots depicting quantification of DNA 5hmC and 5mC intensity at TET1 peak regions with or
without PSPC1 occupancy. P-value is from the Mann-Whitney test. DNA 5hmC and 5mC DIP-seq data
in ESCs are curated from (Xiong et al., 2016).
(C) ChIP-seq correlation analysis based on identified peaks of pluripotency-related transcription factors
and epigenetic regulators in ESCs. A blue rectangle indicates TET1 ChIP-seq peaks are associated with
its interacting partner PSPC1 and PRC2 subunits EZH2 and SUZ12.
(D) Gene ontology (GO) analysis for the PSPC1/TET1/SUZ12 common target genes.
(E) Boxplots depicting expression of the PSPC1/TET1 target genes with or without SUZ12 occupancy
upon knockout (KO) of Pspc1 (this study) or Tet1 (Hon et al., 2014) in ESCs. P-value is from the Mann-
Whitney test, and “n.s.” denotes statistically non-significant.
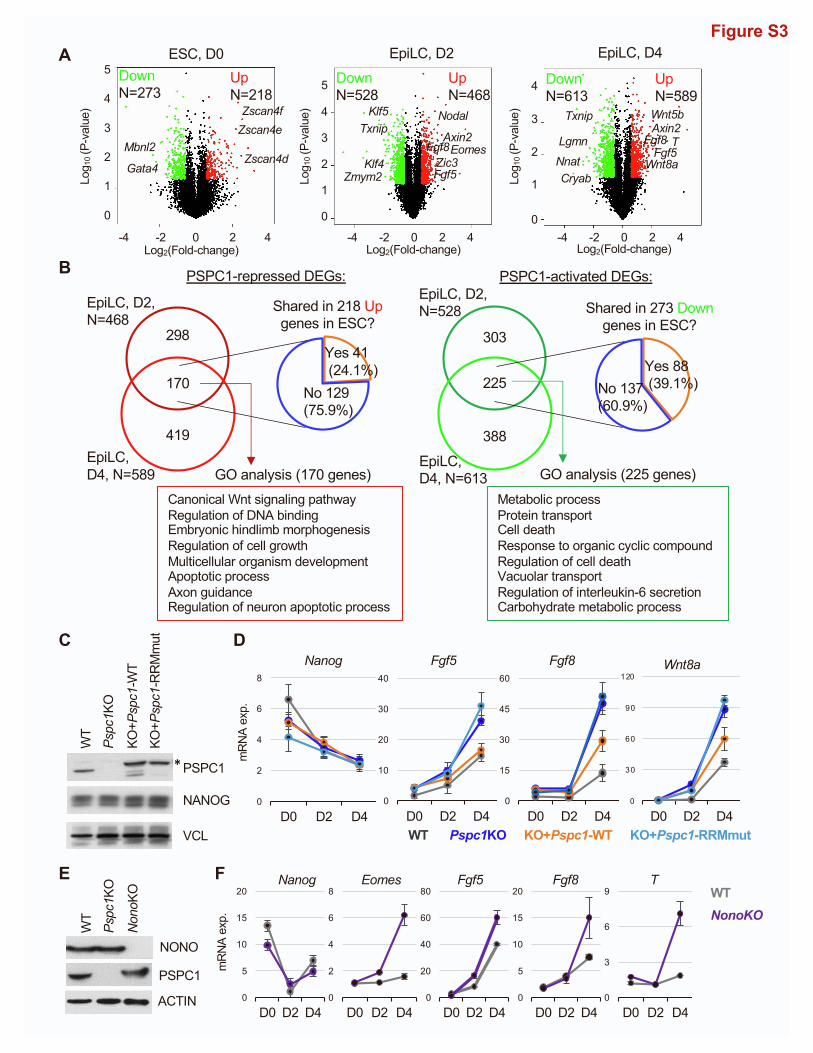
AW
TPspc1K
O
NonoK
O
NONO
PSPC1
ACTIN
F
Figure S3
E
B
303
225
388
Shared in 273 Down genes in ESC?
Yes 88 (39.1%)No 137
(60.9%)
EpiLC, D2, N=528
EpiLC, D4, N=613
PSPC1-activated DEGs:
298
170
419
Shared in 218 Up genes in ESC?
Yes 41 (24.1%)
No 129(75.9%)
EpiLC, D2,N=468
EpiLC,D4, N=589
PSPC1-repressed DEGs:
Metabolic processProtein transportCell deathResponse to organic cyclic compoundRegulation of cell deathVacuolar transportRegulation of interleukin-6 secretionCarbohydrate metabolic process
Canonical Wnt signaling pathwayRegulation of DNA bindingEmbryonic hindlimb morphogenesisRegulation of cell growthMulticellular organism developmentApoptotic processAxon guidanceRegulation of neuron apoptotic process
GO analysis (170 genes) GO analysis (225 genes)
4
5
4
3
2
1
0
-4 -2 0 2
Zscan4fZscan4e
Zscan4dGata4
Log2(Fold-change)
Log 1
0 (P
-val
ue)
-4 -2 0 42
5
4
3
2
1
0
Axin2EomesFgf8
Nodal
Fgf5Zic3Klf4
Klf5
Zmym2
Log2(Fold-change)
Log 1
0 (P
-val
ue)
4
3
2
1
0-4 -2 0 42
TAxin2Wnt5b
Fgf8Fgf5Wnt8a
Log2(Fold-change)
Log 1
0 (P
-val
ue)
ESC, D0 EpiLC, D2 EpiLC, D4DownN=273
UpN=218
DownN=528
UpN=468
DownN=613
UpN=589
Txnip
CryabNnat
LgmnTxnip
Mbnl2
C D
0
10
20
30
40
D0 D2 D4
Fgf5
0
15
30
45
60
D0 D2 D4
Fgf8
0
2
4
6
8
D0 D2 D4
Nanog
WT Pspc1KO KO+Pspc1-WT KO+Pspc1-RRMmut
0
30
60
90
120
D0 D2 D4
Wnt8a
mRN
A ex
p.
WTNonoKO
mRN
A ex
p.
0
2
4
6
8
D0 D2 D4
Eomes
0
5
10
15
20
D0 D2 D4
Fgf8
0
3
6
9
D0 D2 D4
T
0
5
10
15
20
D0 D2 D4
Nanog
0
20
40
60
80
D0 D2 D4
Fgf5
PSPC1
NANOG
VCL
WT
Pspc1K
O
KO+Pspc1-W
TKO
+Pspc1-R
RM
mut
*
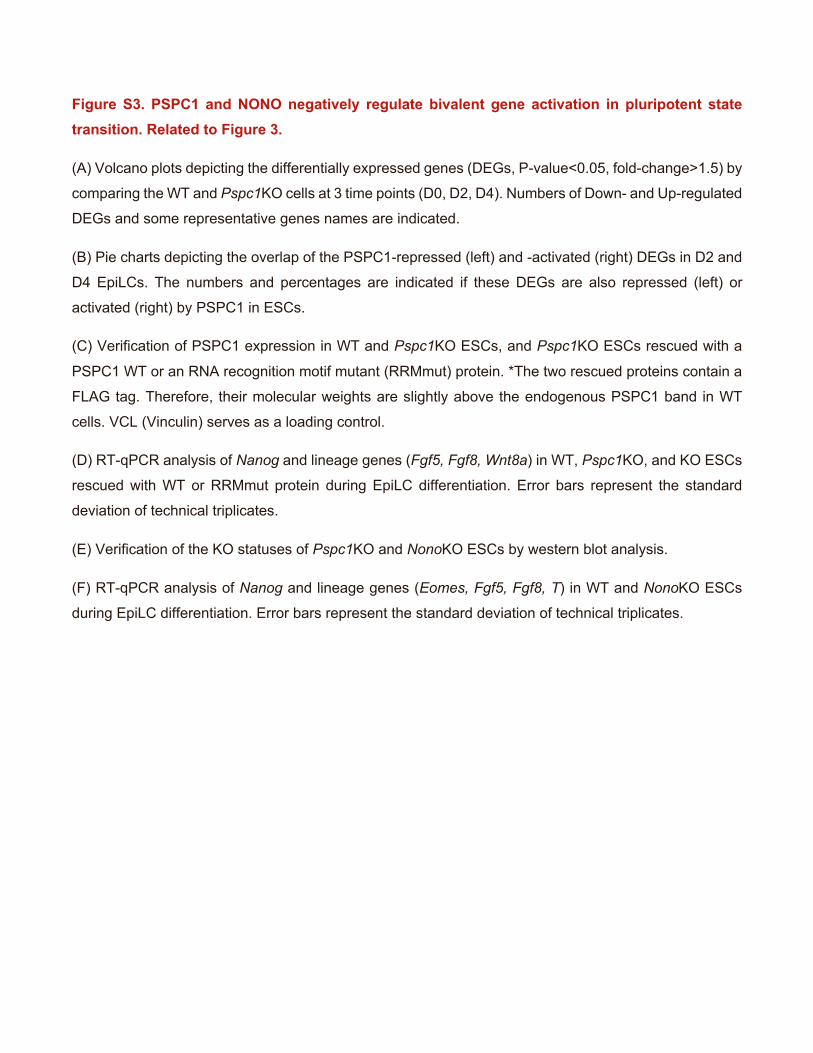
Figure S3. PSPC1 and NONO negatively regulate bivalent gene activation in pluripotent state transition. Related to Figure 3.
(A) Volcano plots depicting the differentially expressed genes (DEGs, P-value<0.05, fold-change>1.5) by
comparing the WT and Pspc1KO cells at 3 time points (D0, D2, D4). Numbers of Down- and Up-regulated
DEGs and some representative genes names are indicated.
(B) Pie charts depicting the overlap of the PSPC1-repressed (left) and -activated (right) DEGs in D2 and
D4 EpiLCs. The numbers and percentages are indicated if these DEGs are also repressed (left) or
activated (right) by PSPC1 in ESCs.
(C) Verification of PSPC1 expression in WT and Pspc1KO ESCs, and Pspc1KO ESCs rescued with a
PSPC1 WT or an RNA recognition motif mutant (RRMmut) protein. *The two rescued proteins contain a
FLAG tag. Therefore, their molecular weights are slightly above the endogenous PSPC1 band in WT
cells. VCL (Vinculin) serves as a loading control.
(D) RT-qPCR analysis of Nanog and lineage genes (Fgf5, Fgf8, Wnt8a) in WT, Pspc1KO, and KO ESCs
rescued with WT or RRMmut protein during EpiLC differentiation. Error bars represent the standard
deviation of technical triplicates.
(E) Verification of the KO statuses of Pspc1KO and NonoKO ESCs by western blot analysis.
(F) RT-qPCR analysis of Nanog and lineage genes (Eomes, Fgf5, Fgf8, T) in WT and NonoKO ESCs
during EpiLC differentiation. Error bars represent the standard deviation of technical triplicates.
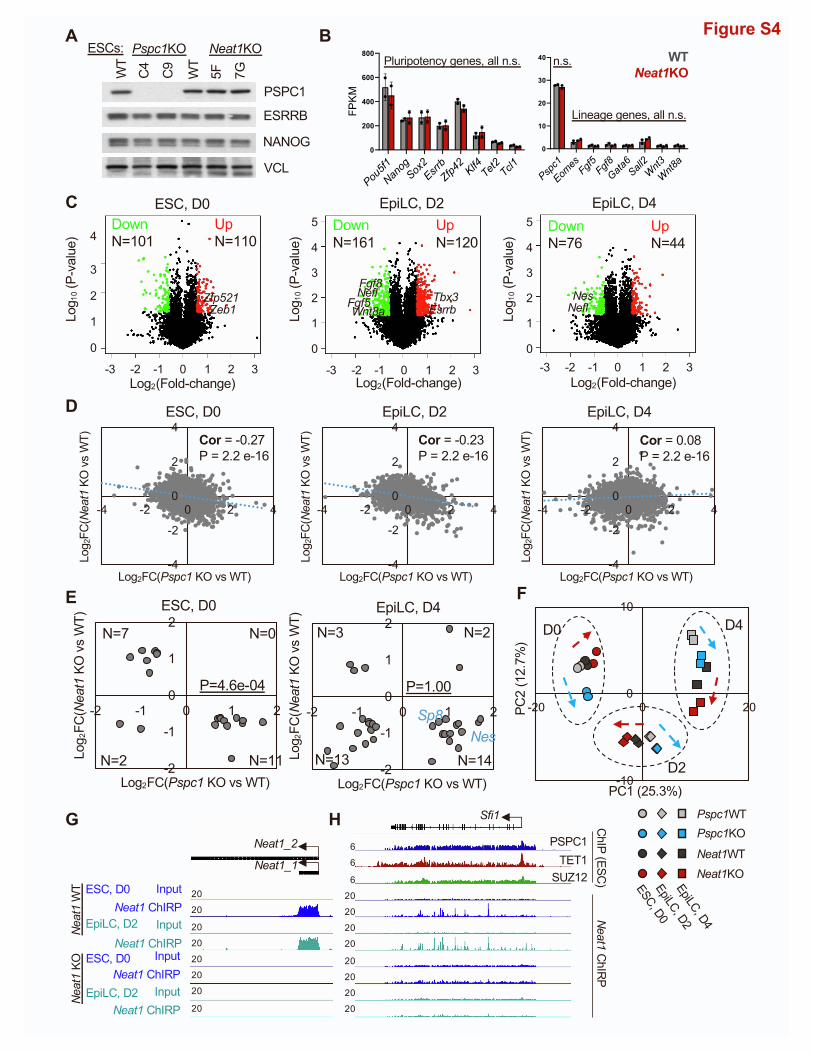
Pspc1
EomesFgf5Fgf8Gata6Sa
ll2Wnt3
Wnt8a
0
10
20
30
40
Pou5f1
NanogSox2EsrrbZfp42 Klf
4Tet2Tcl1
0
200
400
600
800
FPKM
Figure S4
-4
-2
0
2
4
-4 -2 0 2 4
-4
-2
0
2
4
-4 -2 0 2 4
-4
-2
0
2
4
-4 -2 0 2 4
Log2FC(Pspc1 KO vs WT)
Log 2
FC(Neat1
KO v
s W
T)
Log2FC(Pspc1 KO vs WT)
Log 2
FC(Neat1
KO v
s W
T)
Log2FC(Pspc1 KO vs WT)
Log 2
FC(Neat1
KO v
s W
T)
ESC, D0 EpiLC, D2 EpiLC, D4
Cor = -0.27P = 2.2 e-16
Cor = -0.23P = 2.2 e-16
Cor = 0.08P = 2.2 e-16
A
D
E
-2
-1
0
1
2
-2 -1 0 1 2
Log2FC(Pspc1 KO vs WT)
Log 2
FC(Neat1
KO v
s W
T)
ESC, D0
N=0
N=11N=2
N=7
P=4.6e-04
-2
-1
0
1
2
-2 -1 0 1 2
Log2FC(Pspc1 KO vs WT)
Log 2
FC(Neat1
KO v
s W
T)
EpiLC, D4
N=2
N=14N=13
N=3
NesSp8
P=1.00
4
3
2
1
0
Log2(Fold-change)
Log 1
0 (P
-val
ue)
5
4
3
2
1
0
Log2(Fold-change)
Log 1
0 (P
-val
ue)
Log2(Fold-change)
Log 1
0 (P
-val
ue)
ESC, D0 EpiLC, D2 EpiLC, D4
-3 -2 0 321-1-3 -2 0 321-1-3 -2 0 321-1
5
4
3
2
1
0
DownN=101
UpN=110
DownN=161
UpN=120
DownN=76
UpN=44
Fgf8Fgf5NeflWnt8a Esrrb
Tbx3Zeb1Zfp521 Nes
Nefl
F
-10
0
10
-20 0 20
D0
D2
D4
PC1 (25.3%)
PC2
(12.
7%)
Pspc1WTPspc1KO
Neat1WTNeat1KO
ESC, D0EpiLC, D2EpiLC, D4
G
Neat1_1
Neat1_2
InputNeat1 ChIRP
InputNeat1 ChIRP
InputNeat1 ChIRP
InputNeat1 ChIRP
ESC, D0
EpiLC, D2
ESC, D0
EpiLC, D2
Neat1
WT
Neat1
KO
20
20
20
20
20
20
20
20
Sfi1
6
6
6
20
20
20
20
20
20
20
20
PSPC1TET1
SUZ12
ChIP(ESC)
Neat1
ChIRP
PSPC1
ESRRB
NANOG
VCL
WT
C4
C9
WT
5F 7G
Pspc1KO Neat1KOESCs:B
C
H
Lineage genes, all n.s.
Pluripotency genes, all n.s. n.s. WTNeat1KO
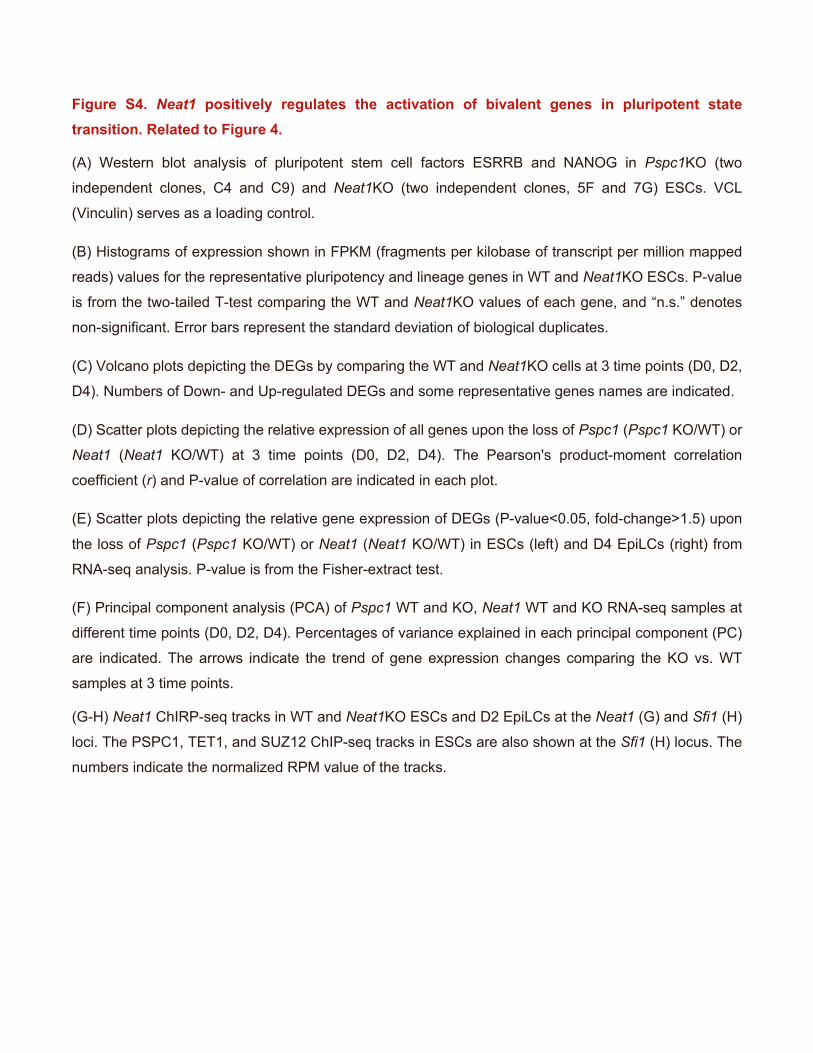
Figure S4. Neat1 positively regulates the activation of bivalent genes in pluripotent state transition. Related to Figure 4.
(A) Western blot analysis of pluripotent stem cell factors ESRRB and NANOG in Pspc1KO (two
independent clones, C4 and C9) and Neat1KO (two independent clones, 5F and 7G) ESCs. VCL
(Vinculin) serves as a loading control.
(B) Histograms of expression shown in FPKM (fragments per kilobase of transcript per million mapped
reads) values for the representative pluripotency and lineage genes in WT and Neat1KO ESCs. P-value
is from the two-tailed T-test comparing the WT and Neat1KO values of each gene, and “n.s.” denotes
non-significant. Error bars represent the standard deviation of biological duplicates.
(C) Volcano plots depicting the DEGs by comparing the WT and Neat1KO cells at 3 time points (D0, D2,
D4). Numbers of Down- and Up-regulated DEGs and some representative genes names are indicated.
(D) Scatter plots depicting the relative expression of all genes upon the loss of Pspc1 (Pspc1 KO/WT) or
Neat1 (Neat1 KO/WT) at 3 time points (D0, D2, D4). The Pearson's product-moment correlation
coefficient (r) and P-value of correlation are indicated in each plot.
(E) Scatter plots depicting the relative gene expression of DEGs (P-value<0.05, fold-change>1.5) upon
the loss of Pspc1 (Pspc1 KO/WT) or Neat1 (Neat1 KO/WT) in ESCs (left) and D4 EpiLCs (right) from
RNA-seq analysis. P-value is from the Fisher-extract test.
(F) Principal component analysis (PCA) of Pspc1 WT and KO, Neat1 WT and KO RNA-seq samples at
different time points (D0, D2, D4). Percentages of variance explained in each principal component (PC)
are indicated. The arrows indicate the trend of gene expression changes comparing the KO vs. WT
samples at 3 time points.
(G-H) Neat1 ChIRP-seq tracks in WT and Neat1KO ESCs and D2 EpiLCs at the Neat1 (G) and Sfi1 (H)
loci. The PSPC1, TET1, and SUZ12 ChIP-seq tracks in ESCs are also shown at the Sfi1 (H) locus. The
numbers indicate the normalized RPM value of the tracks.
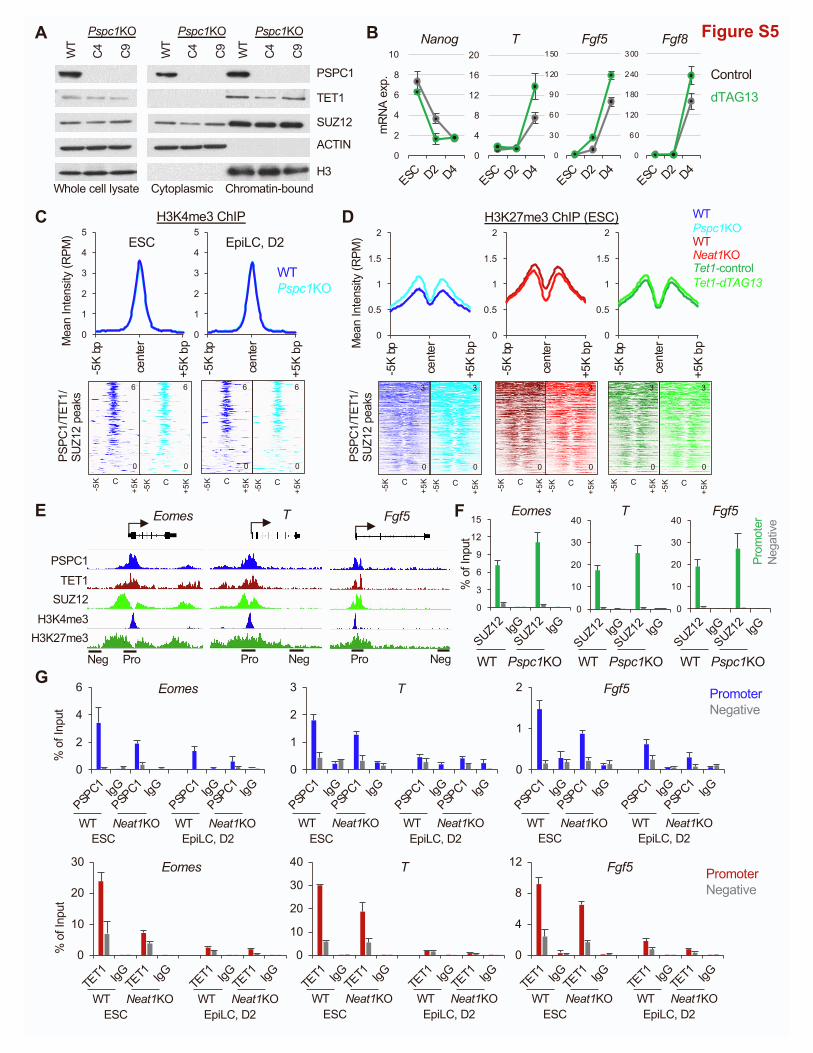
Figure S5A B
0
30
60
90
120
150
ESC D2 D4
Fgf5
0
60
120
180
240
300
ESC D2 D4
Fgf8Nanog
0
2
4
6
8
10
ESC D2 D40
4
8
12
16
20
ESC D2 D4
T
mRN
A ex
p. Control dTAG13
SUZ12
WT
C4 C9 WT
C4 C9
Cytoplasmic Chromatin-bound
Pspc1KO Pspc1KO
PSPC1
ACTIN
H3
TET1
WT
C4 C9
Pspc1KO
Whole cell lysate
PSPC1TET1
SUZ12H3K4me3
H3K27me3
Eomes
Neg Pro
T
NegPro
Fgf5
NegPro
C D
E
0
3
6
9
12
15
SUZ12
IgGSUZ1
2IgG
0
10
20
30
40
SUZ12
IgGSUZ1
2IgG
0
10
20
30
40
SUZ12
IgGSUZ1
2IgG
WT Pspc1KO
Eomes T Fgf5
% o
f Inp
ut
WT Pspc1KO WT Pspc1KO
Prom
oter
Nega
tive
0
1
2
3
4
5
-5K
bp
cent
er
+5K
bp
0
1
2
3
4
5
-5K
bp
cent
er
+5K
bp
WTPspc1KO
ESC EpiLC, D2
Mea
n In
tens
ity (R
PM)
H3K4me3 ChIP
0
6
0
6
C
-5K
+5K C
-5K
+5K
0
6
0
6
C
-5K
+5K C
-5K
+5K
0
0.5
1
1.5
2
-5K
bp
cent
er
+5K
bp
0
0.5
1
1.5
2
-5K
bp
cent
er
+5K
bp
0
0.5
1
1.5
2
-5K
bp
cent
er
+5K
bpMea
n In
tens
ity (R
PM)
WTPspc1KO WTNeat1KOTet1-controlTet1-dTAG13
H3K27me3 ChIP (ESC)
0
3
0
3
C
-5K
+5K C
-5K
+5K
0
3
0
3
C
-5K
+5K C
-5K
+5K
0
3
0
3
C
-5K
+5K C
-5K
+5K
F
G
PSPC
1/TE
T1/
SUZ1
2 pe
aks
PSPC
1/TE
T1/
SUZ1
2 pe
aks
PromoterNegative
% o
f Inp
ut
0
10
20
30
TET1 IgGTE
T1 IgG TET1 IgGTE
T1 IgG0
10
20
30
40
TET1 IgGTE
T1 IgG TET1 IgGTE
T1 IgG0
4
8
12
TET1 IgGTE
T1 IgG TET1 IgGTE
T1 IgG
Eomes T Fgf5
WT Neat1KO WT Neat1KOESC EpiLC, D2
WT Neat1KO WT Neat1KOESC EpiLC, D2
WT Neat1KO WT Neat1KOESC EpiLC, D2
PromoterNegative
0
1
2
3
PSPC1
IgGPSP
C1IgG
PSPC1
IgGPSP
C1IgG
0
1
2
PSPC1
IgGPSP
C1IgG
PSPC1
IgGPSP
C1IgG
0
2
4
6
PSPC1
IgGPSP
C1IgG
PSPC1
IgGPSP
C1IgG
% o
f Inp
ut
Eomes T Fgf5
WT Neat1KO WT Neat1KOESC EpiLC, D2
WT Neat1KO WT Neat1KOESC EpiLC, D2
WT Neat1KO WT Neat1KOESC EpiLC, D2
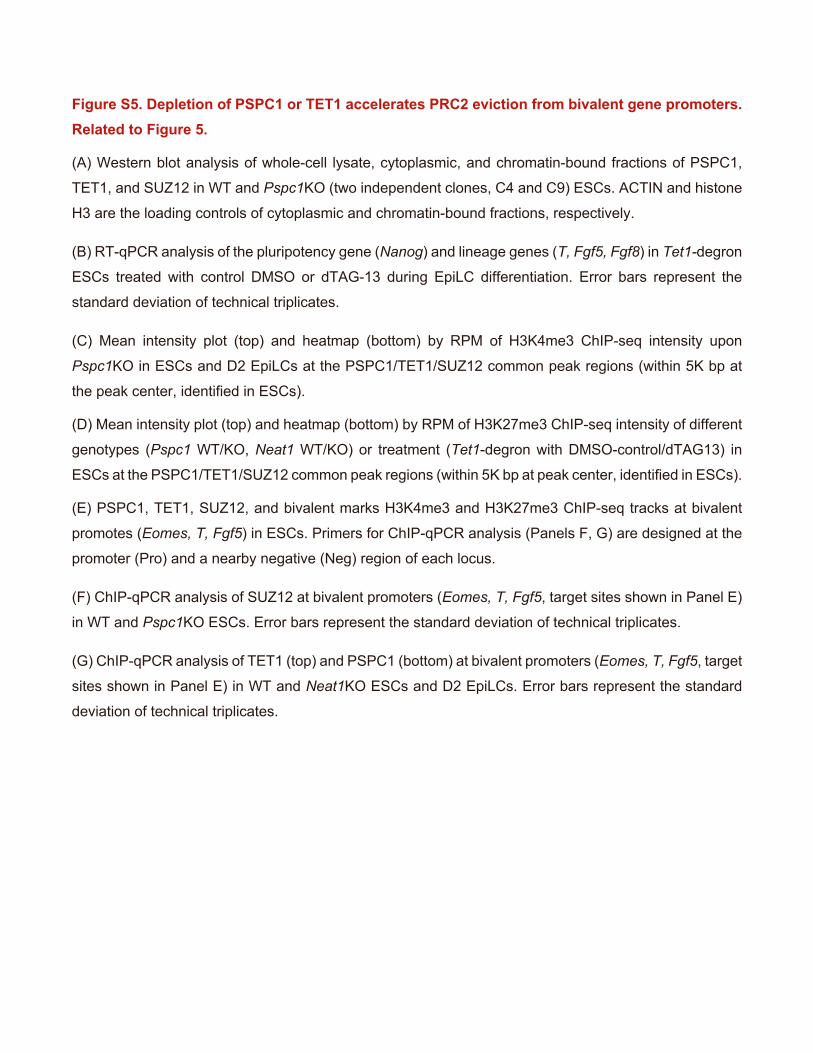
Figure S5. Depletion of PSPC1 or TET1 accelerates PRC2 eviction from bivalent gene promoters. Related to Figure 5.
(A) Western blot analysis of whole-cell lysate, cytoplasmic, and chromatin-bound fractions of PSPC1,
TET1, and SUZ12 in WT and Pspc1KO (two independent clones, C4 and C9) ESCs. ACTIN and histone
H3 are the loading controls of cytoplasmic and chromatin-bound fractions, respectively.
(B) RT-qPCR analysis of the pluripotency gene (Nanog) and lineage genes (T, Fgf5, Fgf8) in Tet1-degron
ESCs treated with control DMSO or dTAG-13 during EpiLC differentiation. Error bars represent the
standard deviation of technical triplicates.
(C) Mean intensity plot (top) and heatmap (bottom) by RPM of H3K4me3 ChIP-seq intensity upon
Pspc1KO in ESCs and D2 EpiLCs at the PSPC1/TET1/SUZ12 common peak regions (within 5K bp at
the peak center, identified in ESCs).
(D) Mean intensity plot (top) and heatmap (bottom) by RPM of H3K27me3 ChIP-seq intensity of different
genotypes (Pspc1 WT/KO, Neat1 WT/KO) or treatment (Tet1-degron with DMSO-control/dTAG13) in
ESCs at the PSPC1/TET1/SUZ12 common peak regions (within 5K bp at peak center, identified in ESCs).
(E) PSPC1, TET1, SUZ12, and bivalent marks H3K4me3 and H3K27me3 ChIP-seq tracks at bivalent
promotes (Eomes, T, Fgf5) in ESCs. Primers for ChIP-qPCR analysis (Panels F, G) are designed at the
promoter (Pro) and a nearby negative (Neg) region of each locus.
(F) ChIP-qPCR analysis of SUZ12 at bivalent promoters (Eomes, T, Fgf5, target sites shown in Panel E)
in WT and Pspc1KO ESCs. Error bars represent the standard deviation of technical triplicates.
(G) ChIP-qPCR analysis of TET1 (top) and PSPC1 (bottom) at bivalent promoters (Eomes, T, Fgf5, target
sites shown in Panel E) in WT and Neat1KO ESCs and D2 EpiLCs. Error bars represent the standard
deviation of technical triplicates.
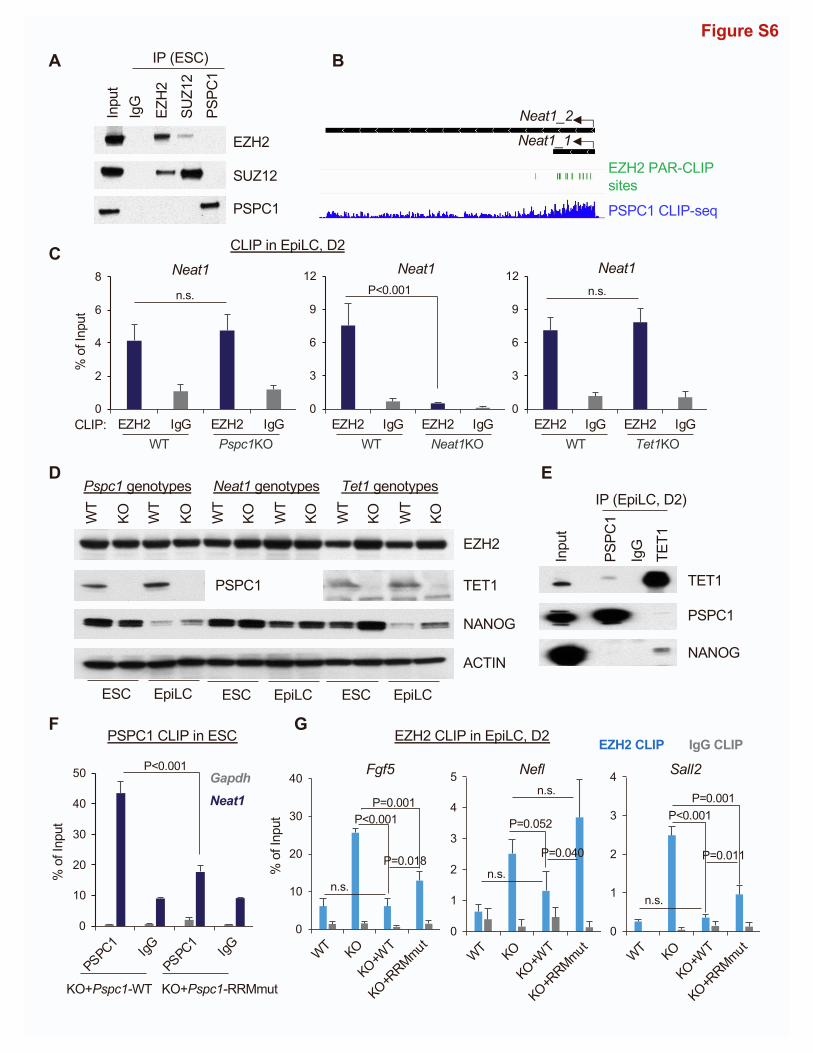
EZH2
SUZ12
PSPC1
Inpu
tIg
G
EZH
2
SUZ1
2
PSPC
1
IP (ESC)
Figure S6A
EZH2 PAR-CLIP sites
PSPC1 CLIP-seq
Neat1_1
Neat1_2
B
EZH2
NANOG
ACTIN
PSPC1 TET1
WT
KO WT
KO WT
KO WT
KO WT
KO WT
KO
Pspc1 genotypes Neat1 genotypes Tet1 genotypes
ESC EpiLC ESC EpiLC ESC EpiLC
C
ED
0
10
20
30
40
WT KO
KO+WT
KO+RRMmut
% o
f Inp
ut
0
1
2
3
4
5
WT KO
KO+WT
KO+RRMmut
0
1
2
3
4
WT KO
KO+WT
KO+RRMmut
EZH2 CLIP IgG CLIP
Fgf5 Nefl Sall2
TET1
PSPC1
NANOG
Inpu
t
PSPC
1
IgG
TET1
IP (EpiLC, D2)
0
10
20
30
40
50
PSPC1IgG
PSPC1IgG
KO+Pspc1-WT
PSPC1 CLIP in ESC
% o
f Inp
ut
FEZH2 CLIP in EpiLC, D2
G
KO+Pspc1-RRMmut
0
2
4
6
8
EZH2 IgG EZH2 IgG0
3
6
9
12
EZH2 IgG EZH2 IgG0
3
6
9
12
EZH2 IgG EZH2 IgG
% o
f Inp
ut
WT Pspc1KO
Neat1 Neat1 Neat1
WT Neat1KO WT Tet1KOCLIP:
CLIP in EpiLC, D2
n.s. n.s.P<0.001
GapdhNeat1
P<0.001
P=0.018
n.s.
P=0.052
P=0.011
P<0.001P=0.001
P=0.040
P<0.001P=0.001
n.s.n.s.
n.s.
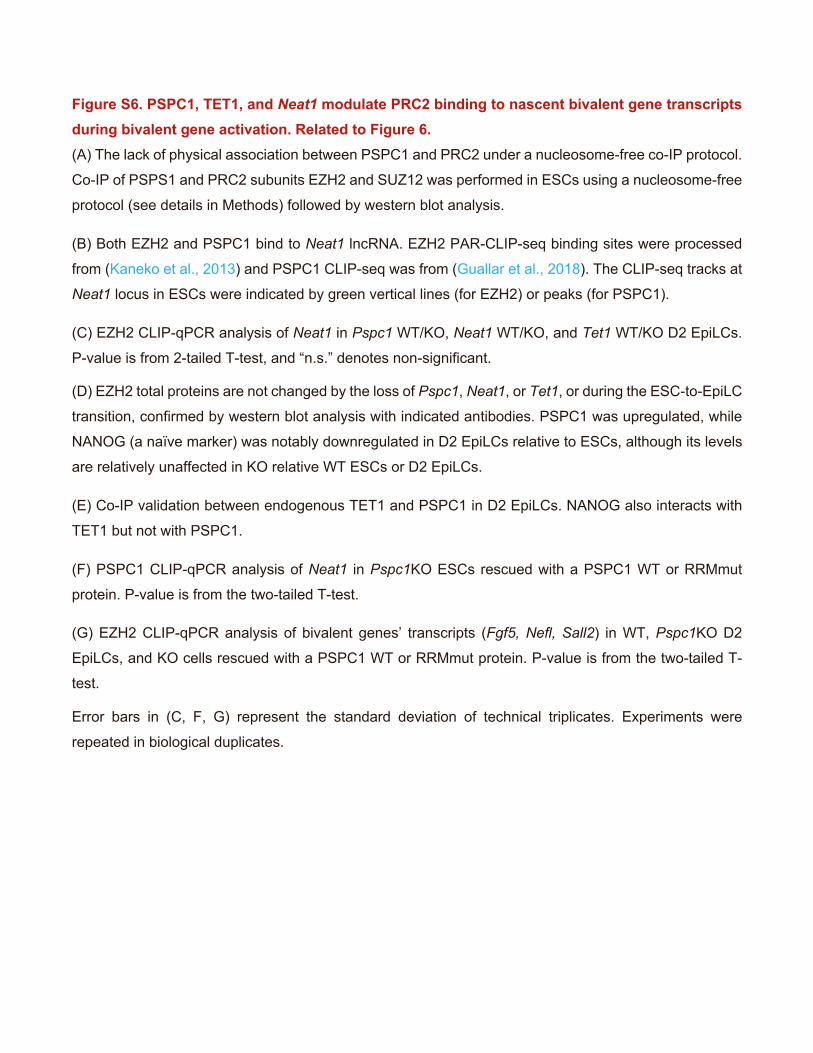
Figure S6. PSPC1, TET1, and Neat1 modulate PRC2 binding to nascent bivalent gene transcripts during bivalent gene activation. Related to Figure 6. (A) The lack of physical association between PSPC1 and PRC2 under a nucleosome-free co-IP protocol.
Co-IP of PSPS1 and PRC2 subunits EZH2 and SUZ12 was performed in ESCs using a nucleosome-free
protocol (see details in Methods) followed by western blot analysis.
(B) Both EZH2 and PSPC1 bind to Neat1 lncRNA. EZH2 PAR-CLIP-seq binding sites were processed
from (Kaneko et al., 2013) and PSPC1 CLIP-seq was from (Guallar et al., 2018). The CLIP-seq tracks at
Neat1 locus in ESCs were indicated by green vertical lines (for EZH2) or peaks (for PSPC1).
(C) EZH2 CLIP-qPCR analysis of Neat1 in Pspc1 WT/KO, Neat1 WT/KO, and Tet1 WT/KO D2 EpiLCs.
P-value is from 2-tailed T-test, and “n.s.” denotes non-significant.
(D) EZH2 total proteins are not changed by the loss of Pspc1, Neat1, or Tet1, or during the ESC-to-EpiLC
transition, confirmed by western blot analysis with indicated antibodies. PSPC1 was upregulated, while
NANOG (a naïve marker) was notably downregulated in D2 EpiLCs relative to ESCs, although its levels
are relatively unaffected in KO relative WT ESCs or D2 EpiLCs.
(E) Co-IP validation between endogenous TET1 and PSPC1 in D2 EpiLCs. NANOG also interacts with
TET1 but not with PSPC1.
(F) PSPC1 CLIP-qPCR analysis of Neat1 in Pspc1KO ESCs rescued with a PSPC1 WT or RRMmut
protein. P-value is from the two-tailed T-test.
(G) EZH2 CLIP-qPCR analysis of bivalent genes’ transcripts (Fgf5, Nefl, Sall2) in WT, Pspc1KO D2
EpiLCs, and KO cells rescued with a PSPC1 WT or RRMmut protein. P-value is from the two-tailed T-
test.
Error bars in (C, F, G) represent the standard deviation of technical triplicates. Experiments were
repeated in biological duplicates.
Related Documents