A TEN YEAR RETROSPECTIVE STUDY ON THERAPEUTIC MANAGEMENT AND CLINICAL OUTCOMES OF ACUTE LYMPHOBLASTIC LEUKEMIA AMONG CHILDREN AT KENYATTA NATIONAL HOSPITAL, KENYA (JANUARY2001-DECEMBER 2010) BOB NYARIBARI AGWATA, B.PHARM. U59/63520/2010 A dissertation submitted in partial fulfillment of requirements for the award of Masters’ degree of University of Nairobi (clinical pharmacy) DEPARTMENT OF PHARMACEUTICS AND PHARMACY PRACTICE SCHOOL OF PHARMACY COLLEGE OF HEALTH SCIENCES UNIVERSITY OF NAIROBI October 2012

Welcome message from author
This document is posted to help you gain knowledge. Please leave a comment to let me know what you think about it! Share it to your friends and learn new things together.
Transcript
i
A TEN YEAR RETROSPECTIVE STUDY ON THERAPEUTIC
MANAGEMENT AND CLINICAL OUTCOMES OF ACUTE
LYMPHOBLASTIC LEUKEMIA AMONG CHILDREN AT KENYATTA
NATIONAL HOSPITAL, KENYA
(JANUARY2001-DECEMBER 2010)
BOB NYARIBARI AGWATA, B.PHARM.
U59/63520/2010
A dissertation submitted in partial fulfillment of requirements for the award of Masters’ degree
of University of Nairobi (clinical pharmacy)
DEPARTMENT OF PHARMACEUTICS AND PHARMACY PRACTICE
SCHOOL OF PHARMACY
COLLEGE OF HEALTH SCIENCES
UNIVERSITY OF NAIROBI
October 2012
ii
DECLARATION
I hereby declare that this dissertation is my original work and has not been presented to any other
academic institution for evaluation, examination and award of degree.
Signature…………………………………… Date ………………………………..
BOB NYARIBARI AGWATA
Supervisors’ approval:
This dissertation is submitted for evaluation and examination with our approval as university
supervisors
1. PROF. GICHURU MURIUKI, PhD, EBS
Department of Pharmacology and Pharmacognosy
University of Nairobi
Signature…………………………………… Date ………………………………..
2. DR. NASSER NYAMWEYA, PhD
Department of Pharmaceutics and Pharmacy Practice
University of Nairobi
Signature…………………………………… Date ……………………………….
iii
3. DR. IRENE W. WERU, M.Pharm
Clinical Pharmacist – Oncology Services
Kenyatta National Hospital
Signature…………………………………… Date ………………………………..
4.DR. DAVID NYAMU, M. Pharm
Department of Pharmaceutics and Pharmacy practice
University of Nairobi
Signature…………………………………… Date ………………………………..

iv
DEDICATION
I dedicate this work to my two sons, Sir Ferdinand William Wilberforce Bob junior and Lloyd
Rutherfold Von Rechenberg Bob II to be future intellectuals, prolific thinkers and academicians,
my parents Mr. and Mr.Samson Agwata and Dorcas mwango for intensive inspiration.
v
ACKNOWLEDGEMENTS
I thank the most high God for strength, good health and all endowments and blessings He has
bestowed upon me.
Secondly, wish to thank all my lecturers and supervisors Prof. Muriuki, Dr.nyamweya,
Dr.Nyamu and Dr.Weru for their selfless assistance, guidance and input from the beginning of
this study to the very end.
I also thank the Kenyatta National Hospital records department and staff for their support in the
retrieval of patients‟ files and providing a conducive environment for data collection.
I thank my classmates and colleagues: Dr. S. Waudo, Dr. H. Sultani, Dr. T. Panga, Dr. N.
Nyambura, Dr. J. Wambui, and Dr. S. Ekeno for their constant motivation, constructive
criticism, company and assistance whenever I called upon them, not to forget Dr. Philip Ayieko,
Dr. F. Okalebo for their tireless work on data analysis.
My brother Peter Vilmer for both company and support and other siblings.
I finally express my gratitude to family both nuclear and extended, especially my wife who
helped me with my typing and their overall moral and financial support.
vi
TABLE OF CONTENTS
DECLARATION ................................................................................................................ ii
DEDICATION ................................................................................................................... iv
ACKNOWLEDGEMENTS ................................................................................................ v
TABLE OF CONTENTS ................................................................................................... vi
LIST OF TABLES ........................................................................................................... viii
LIST OF FIGURES ......................................................................................................... viii
LIST OF ABBREVIATIONS ............................................................................................ ix
ABSTRACT ....................................................................................................................... xi
CHAPTER ONE ............................................................................................................... 1
1.1 INTRODUCTION...................................................................................................... 1
1.2 LITERATURE REVIEW ......................................................................................... 2
1.2.1 Pathophysiology of acute lymphoblastic leukemia..................................................... 2
1.2.2 Etiology of acute lymphoblastic leukemia .................................................................. 2
1.2.3 Epidemiology of acute lymphoblastic leukemia ......................................................... 4
1.2.4 Classification of Acute Lymphoblastic Leukemia ...................................................... 5
1.2.5 Prognostic factors for acute lymphoblastic leukemia ................................................. 6
1.2.6 Chemotherapeutic treatment of Acute Lymphoblastic Leukemia ............................ 12
1.2.7 Treatment outcomes .................................................................................................. 19
1.3 PROBLEM STATEMENT ..................................................................................... 20
1.4 JUSTIFICATION OF THE STUDY ..................................................................... 21
vii
1.5 OBJECTIVES .......................................................................................................... 22
1.5.1 General Objective……………………………………………………………..... 22
1.5.2 Specific Objectives ................................................................................................... 22
CHAPTER TWO: METHODOLOGY… ........................................................... ... ….23
2.1 Ethical Consideration .......................................................................................................... 23
2.2 Study design ........................................................................................................................ 23
2.3 Study Area .......................................................................................................................... 24
2.4 Study population ................................................................................................................. 24
2.4.1Eligibility/ Inclusion criteria ......................................................................................... 24
2.4.2Exclusion criteria……………………………………………………………………...25
2.5 Sample Size Determination................................................................................................. 25
2.6 Sampling method ................................................................................................................ 25
2.7 Data collection .................................................................................................................... 27
2.8 Data Quality Assurance procedures .................................................................................... 27
2.9 Data management................................................................................................................ 27
2.10 Statistical Analysis ............................................................................................................ 28
2.11 Definition of cases ............................................................................................................ 28
2.12 Variables, outcome of Interests and Confounders ............................................................ 29
CHAPTER THREE: RESULTS .................................................................................. 30
CHAPTER FOUR: DISCUSSION ................................................................................ 49
CHAPTER FIVE:
5.0 CONCLUSION ....................................................................................................... 499
5.1 RECOMMENDATIONS ........................................................................................ 50
5.2 STUDY LIMITATIONS .......................................................................................... 51
REFERENCES ................................................................................................................ 52
APPENDICES ................................................................................................................. 58
Appendix 1: Data Collection Form ........................................................................ 58
Appendix 2: Ethics Approval ................................................................................ 62
viii
LIST OF TABLES
Table 1: Demographic characteristics of the study population ..................................................... 30
Table 2: Clinical features among children presenting with ALL at KNH for the period 2001-2010
....................................................................................................................................................... 34
Table 3: ALL treatment regimens and type of patients managed using different regimens at KNH
....................................................................................................................................................... 35
Table 4: Clinical outcomes of children with ALL at KNH during the period 2001-2010 ............ 38
Table 5: Clinical outcomes of children with ALL at KNH according to treatment regimen ....... 40
Table 6: Clinical outcomes of children with ALL at KNH in relation to various factors ............ 42
Table 7: Clinical features among children presenting with ALL at KNH and mortality ............. 43
Table 8: Logistic regression analysis of independent predictors of chemotherapeutic outcome
(mortality) among ALL pediatric patients at KNH....................................................................... 44
LIST OF FIGURES
Figure 1: Sampling Frame ............................................................................................................ 26
Figure 2: Residence of Paediatric patients presenting with ALL at KNH .................................... 31
Figure 3: Prevalence of various sub - types of ALL at KNH between 2001 and 2012 based on
morphological classification ......................................................................................................... 32
Figure 4: Metastatic sites at diagnosis of ALL in paediatric patients at KNH ............................. 33
Figure 5: Phases of ALL treatment undergone by paediatric patients at KNH ............................ 36
Figure 6: Sites of relapse among children with ALL at KNH ...................................................... 39
Figure 7: Kaplan - Meier Survival Estimates ............................................................................... 41
ix
LIST OF ABBREVIATIONS
ACF: Africa Cancer Foundation
ADR: Adverse drug Reactions
AIDS: Acquired Immune Deficiency Syndrome
ALL : Acute Lymphoblastic Leukemia
AML : Acute Myeloblastic leukemia
BFM : Berlin-frankfurt-munster
BMA: Bone Marrow Aspirate
CI : Confidence Interval
CLL: Chronic Lymphoblastic leukemia
CML: Chronic Myeloblastic leukemia
CNS: Central Nervous system
CR : Complete Remission
EFS : Event free survival
FAB: French American British System
FBC: Full Blood Count
HIV : Human Immune Deficiency Virus
IM : Intramuscular
IT : Intrathecal
IV : Intravenous
x
KEMRI: Kenya Medical Research Institute
MDG: Millennium Development Goal
MRC: Medical Research Council
MRD: Minimal Residual Disease
NY : New York
OS : Overall survival
PH : Philadelphia
PO : per oral
QOL: Quality of Life
RBC: Red Blood Cells
SD : Standard deviation
SE : Standard error
USA: United States of America
WBC: White Blood Cells
WHO: World Health Organization
xi
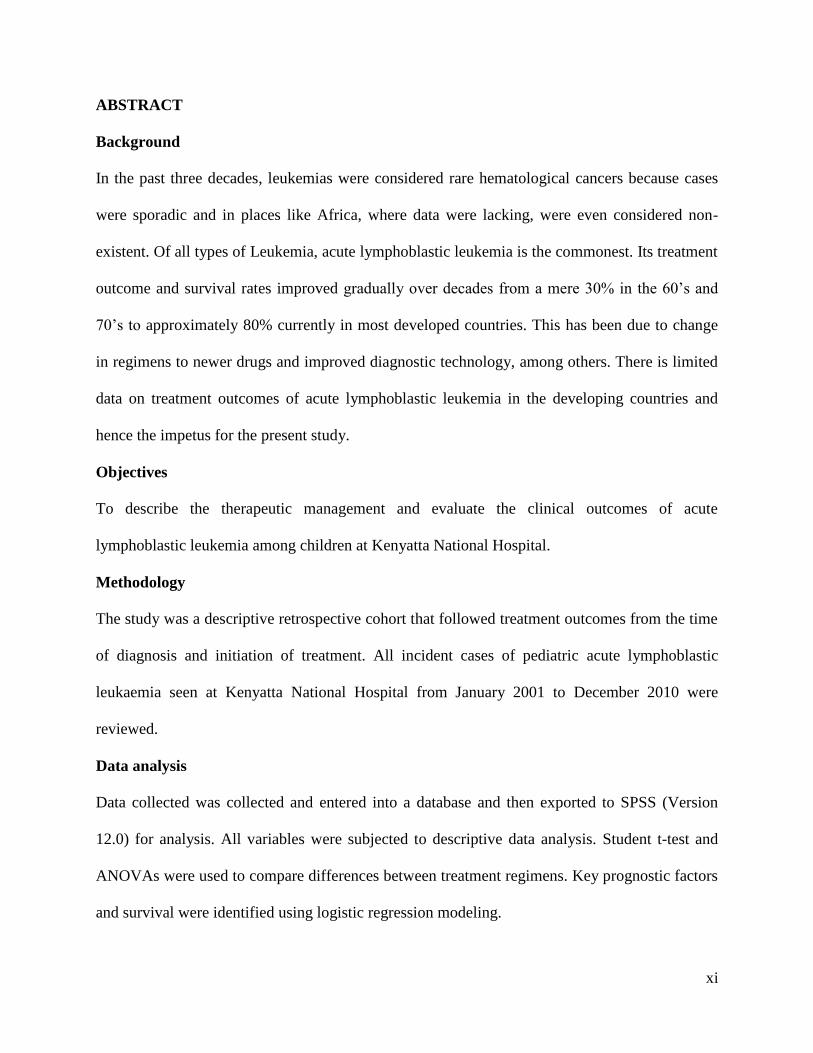
ABSTRACT
Background
In the past three decades, leukemias were considered rare hematological cancers because cases
were sporadic and in places like Africa, where data were lacking, were even considered non-
existent. Of all types of Leukemia, acute lymphoblastic leukemia is the commonest. Its treatment
outcome and survival rates improved gradually over decades from a mere 30% in the 60‟s and
70‟s to approximately 80% currently in most developed countries. This has been due to change
in regimens to newer drugs and improved diagnostic technology, among others. There is limited
data on treatment outcomes of acute lymphoblastic leukemia in the developing countries and
hence the impetus for the present study.
Objectives
To describe the therapeutic management and evaluate the clinical outcomes of acute
lymphoblastic leukemia among children at Kenyatta National Hospital.
Methodology
The study was a descriptive retrospective cohort that followed treatment outcomes from the time
of diagnosis and initiation of treatment. All incident cases of pediatric acute lymphoblastic
leukaemia seen at Kenyatta National Hospital from January 2001 to December 2010 were
reviewed.
Data analysis
Data collected was collected and entered into a database and then exported to SPSS (Version
12.0) for analysis. All variables were subjected to descriptive data analysis. Student t-test and
ANOVAs were used to compare differences between treatment regimens. Key prognostic factors
and survival were identified using logistic regression modeling.
xii
Eligibility Criteria
The patients included in this study met the following criteria: Aged between 0- 15 years,
diagnosed with acute lymphoblastic leukemia with confirmatory laboratory tests, diagnosed
between 2001 and 2010.
Results: One hundred and seventy one patient medical record files were reviewed. Out of the
171 cases, 100(58.5%) were males and 71(41.5%) were females. The mean age at diagnosis was
6.69 years (sd ±3.64). Median follow up time was 17.92 months.The most predominant subtype
of ALL was found to be L2-T precursor cell occurring with 137 cases (80.1%) followed by L1 B
precursor cells with 16 cases (9.4%) while 17 cases (9.9%) were uncharacterised. Mortality was
the most commonly occurring treatment outcome with 110 deaths giving a case fatality rate of
64.3% among childhood cases of acute lymphoblastic leukemia in Kenya. Initial remission
occurred in 105 cases (61.4%). Eighty (46.8%) patients had a relapse, and the commonest site of
relapse was central nervous system with 60 cases (67.4%). Cure rate was 34 cases (22.7%).
Twenty three cases (67.6%) of those that achieved cure were alive while 11 (32.4%) died due to
other causes. Extravasations and treatment failure at the initial stages of therapy rarely occurred.
Among the 171 children with acute lymphoblastic leukaemia, 150 (87.7%) were managed on
KNH 1 regimen. Eight cases (4.7%) were managed using alternative regimens (either KNH 2, n
=2 or “other regimen”, n = 6) while 13 (7.6%) had no treatment instituted. The patient
characteristics that showed significant association with mortality as a treatment outcome were:
blood film (p = 0.011), failure to initiate a regimen (p = 0.005), absence of remission (p <
0.0010). Clinical features that showed statistically significant associations with the outcome of
mortality were bleeding (p < 0.001) and splenomegaly (p = 0.032).
xiii
Conclusion: Overall outcome of chemotherapeutic management of acute lymphoblastic
leukaemia was poor. Mortality being the highest, frequent relapse and overall poor cure and
survival rates were noted. There is, therefore, an opportunity to review the management of
patients with acute lymphoblastic leukemia at Kenyatta National Hospital with the aim of
improving treatment outcomes and overall survival.
1
CHAPTER ONE
1.1 INTRODUCTION
Leukemias are heterogeneous hematologic malignancies characterized by unregulated
proliferation of blood forming cells in the bone marrow. The term leukemia was coined by
Virchow to describe the “white blood “of the patients that he saw under the microscope in
1845[1]
.
Historically leukemia has been classified as acute or chronic based on differences in the cell of
origin and cell line maturation, clinical presentation rapidity of progression of the untreated
disease and response to therapy [1]
.
Four major leukemias are: Acute Lymphoblastic leukemia(ALL), Acute Myeloblastic
leukemia(AML), Chronic Lymphoblastic leukemia(CLL) and Chronic Myeloblastic
Leukemia(CML).The difference between „acute‟ and „chronic‟ is that in acute leukemias
undifferentiated immature cells proliferate autonomously while in chronic, although the cells
proliferate autonomously, they are more differentiated and mature[1]
.
Acute Lymphoblastic leukemia (ALL) is a malignant (clonal) disease of the bone marrow in
which early lymphoid precursors proliferate and replace the normal hematopoietic cells of the
marrow. ALL may be distinguished from other malignant lymphoid disorders by the immune
phenotype of the cells which is similar to B or T precursor cells. Immunochemistry,
cytochemistry and cytogenetic markers may also aid in the categorizing the malignant lymphoid
clone [1]
.
Acute refers to the fact that the disease appears suddenly, is fast developing and may quickly
distribute to the other vital organs. In a healthy individual the T and B lymphocytes produce
antibodies to fight infections. These lymphocytes are distributed in the blood, lymph nodes and
2
spleen. In patients with ALL the lymphocytes remain immature and are referred to as
lymphoblasts. These immature cells rapidly proliferate and outnumber the blood cells in the
blood, bone marrow and lymph tissue.
1.2 LITERATURE REVIEW
1.2.1 Pathophysiology of acute lymphoblastic leukemia
Generally in Leukemia, the normal process of heamatopoiesis is altered and transformation to
malignancy appears to occur in a single cell, usually at the pluripotential stem cell level, but it
may occur in a committed stem cell with capacity for more limited differentiation. Accumulation
of malignant cells leads to progressive impairment of the normal bone marrow function and bone
marrow failure (3).In acute leukemia the normal bone marrow is replaced by a malignant clone
of immature blast cells derived from the lymphoid & myeloid series. Usually more than 30% of
the cellular elements of the bone marrow are replaced with blasts.
In ALL the blasts may infiltrate lymph nodes and other tissues such as liver, spleen, testis and
meninges in particular. In ALL a lymphoid progenitor cell becomes genetically altered and
subsequently undergoes deregulated proliferation, survival and clonal expansion. In most cases
the pathophysiology of the transformed lymphoid cells reflects the altered expression of genes
whose products contribute to the normal development of B cell and T cells [3]
.
1.2.2 Etiology of acute lymphoblastic leukemia
Similar to other cancers, the etiology of leukemia is not fully understood .Leukemia is thought to
arise from combination of factors that induce genetic mutations which allow mutated cells to
3
proliferate faster than normal cells and fail to die in response to normal apoptotic signals. Some
epidemiological studies have identified a number of risk factors for development of leukemia,
ALL included: genetic factors, environmental and polymorphism.
1.2.2.1 Genetic Factors
De keers Maeker et al (2005) in their investigation on the pathogenesis of a T – cell acute
lymphoblastic leukemia identified recurrent chromosomal aberrations and more subtle genetic
defects. They came up with four classes of mutations which are required for development of T –
ALL [4]
.
Down‟s syndrome, constitutional trisomy of chromosome 21 is associated with increased risk or
leukemia development .This alterations may permit the expression of oncogenes which promote
malignant transformation.
Genetic predisposition has been suggested too by Greaves et al(2003) on close study of identical
twins who following initiation of leukemia in one twin‟s fetus clonal progen spread to the co-
twin via vascular anastosomes within a single monochorionic placenta hence giving an
equivocal evidence that twin pairs of leukemia have a common clonal origin . This has been
proofed too by molecular markers of clonality including unique genomic fusion gene sequences
[5].
1.2.2.2 Environmental Factors
Ionizing radiation and benzene exposure are the only environmental risk factors strongly
associated with ALL although a number of environmental factors are inconsistently linked to the
disease like toxic chemicals, herbicides and pesticides, natural use of contraceptives, smoking,
parental exposure to drugs, alcohol consumption before pregnancy and chemical contamination
of ground water [6, 7]
.
4
1.2.2.3 Folate Metabolism Polymorphs
Low penetrance polymorphism and folate metabolizing enzymes have also been associated with
development of ALL. First Polymorphic variants of methylenetetrahydrofolate reductase which
catalyses the reduction of 5, 10, methylenetetrahydrofolate (the predominant circulating form of
folate) have been linked to a decreased risk of adult and pediatric ALL. This protective effect
may be due to the greater availability 5, 10 methylenetetrahydrofolate and thymidine pools and
to an increased fidelity to DNA synthesis [8, 9]
.
1.2.3 Epidemiology of acute lymphoblastic leukemia
Fortunately cancer in children and adolescents are rare, although the overall incidences of
childhood cancer has slowly been increasing since 1975 .In United states ALL is the most
common cancer diagnosed in children and represents 23% of cancer diagnosed at an annual rate
of approximately 30 to 40 per million[10]
.
There are approximately 2900 children and adolescents younger than 20 years diagnosed with
ALL each year in the United States. A sharp peak in ALL incidence is observed among children
aged 2-3 years (> 80 per million per year) with rates decreasing to 20 per million for ages 8-10
years. The incidence of ALL among children aged 2-3 years is approximately four fold greater
than that for infants and is nearly tenfold greater than that for adolescents aged 16-21 years [11]
.
In Europe Childhood lymphoblastic leukemia incidence (including ALL) increased significantly
by an average of 1.4 % per year during 1970 – 1999. In England and Wales, leukemia is the
commonest cancer in children 0-14 years, representing a third of all malignances with incidence
rates increasing up to a at a peak at around age 3-4 years and then declines. Some 400 children
5
are diagnosed in England and Wales each year and about 100 die of it. Four out of ten cases of
leukemia in children are ALL and the remaining is almost all AML [12]
.
Studies have also indicated that there is a higher incidence of ALL in developed countries
compared to developing ones. This difference though may be due to under reporting in most
African countries (13). The incidence of ALL appears highest in Hispanic children; it is three
fold higher for white children aged 2-3 years compared to black children of the same age [14]
.
The above statement has been reinforced by various studies one of which was that carried out by
Swensen et al (1997) which found that white children indeed have a much higher incident rate of
acute lymphoblastic leukemia than African American children. This discrepancy coupled with
the geographical and temporal variations in the incidence of Childhood ALL have led to the
speculation that factors associated with social economic status may play an important role in its
etiology [15]
. According to the study carried out by Kasili et al (1979) in Kenya, The overall
national crude incidence of leukemia by 1979 was 0.5 cases per 100,000 with a maximum tribal
specific incidences being 1.2 cases per 100,000 children below 15 years age group. Leukemia
accounted for 28% of all types of leukemia giving an increase of 0.3 cases per 100,000 where as
adult is 0.7 per 100,000 48% of all acute leukemia occurred in childhood as compared to 4.7
chronic type [16]
.
1.2.4 Classification of Acute Lymphoblastic Leukemia
The classification of acute Leukemia has evolved significantly over the past few decades. The
FAB classification was based entirely on the morphological features of the blast cell population
on Romanousky – stained bone marrow aspirate smears and the results of cytochemical studies.
6
While the FAB classification was modified overtime and eventually included immune
phenotyping to distinguish minimally differentiated AML from ALL and as a means to identify
acute megakaryoblast leukemia, it remained a primarily morphologic classification system. ALL
is classified as follows: L1 or precursor B- Cells, L2 precursor T – Cells and L3 B –
Cells.
1.2.5 Prognostic factors for acute lymphoblastic leukemia
Prognostic variables are important in predicting the general outcome of disease management and
are of help in designing the therapy and management of any disease. Diseases with poor
prognostic factors draw attention to a more aggressive management than those with good
prognosis [17]
.
Risk based treatment assignment is utilized in children with ALL so that patients with favorable
clinical and biological features who are likely to have a very good outcome are treated with
modest therapy and can be spared more intensive and toxic treatment, while a more aggressive
and potentially more toxic therapeutic approach can be provided for patients who have a lower
probability of long term survival [18]
.
For children with ALL a number of clinical and laboratory features have demonstrated
prognostic factors which include Patient characteristics at diagnosis, Leukemia cell
characteristics at diagnosis and response to initial treatment. These prognostic factors have a sub
set which will be discussed below and they are used for stratification of children with ALL for
treatment assignment.
7
1.2.5.1 Patient Characteristics of Diagnosis
Age at diagnosis
Age at diagnosis has a strong prognostic significance, reflecting the different underlying biology
of ALL in different age groups. Younger children aged 1-9 years have a better disease free
survival (DFS) than older children, adolescents and infants. The better prognosis in younger
children is partly explained by the more frequent occurrence of favorable cytogenetic features
in the leukemia blasts including hyperdiploid with 51 or more chromosomes and or favorable
chromosome trisomies [19]
.
Infants with ALL have a particular high risk of treatment failure. Treatment failure is most
common in infants younger than six months and in those with extremely high presenting
leukocyte counts and or poor response to prednisone prophase [20]
. This is because infants with
ALL can be divided into two subgroups on the basis of the presence or absence of translocation
that involve the MLL gene located at chromosome 11q 23[21]
.
Approximately 80% of infants with ALL have an MLL gene rearrangement. The rate of MLL
gene translocation is extremely high in infants younger than six months. From 6 months to 1 year
the incidences of MLL translocation decrease but remain higher than that observed in old
children [22, 23]
.
WBC Count at Diagnosis
Patients with B- precursor ALL and high WBC counts at diagnosis have an increased risk of
treatment failure compared with patients with low initial WBC count. A WBC count of
8
50,000cell/UL is generally used as an operational cut point between better and poor prognosis.
[24].
CNS Involvement at Diagnosis
Usually the presence or absence of CNS leukemia has a significant prognostic value. Patients are
classified into three classes depending on the Lumbar puncture tests and results that are CNS1,
CNS2 and CNS3.
CNS1 is characterized by Cerebrospinal fluid (CSF) that is cytospin negative for blasts
regardless of WBC count. In CNS2 the CSF has fewer than five WBC/UL and cytospin positive
for blasts and finally in CNS 3(CNS Diseases): CSF has five or more WBC/UL and cytospin
positive blasts. Depending on the classes above, children with ALL who present with CNS 3 or
CNS disease at diagnosis are at high risk of treatment failure (both within the CNS and
systemically [25]
.
An adverse prognostic significance with CNS 2 usually guarantees an application of more
intensive intrathecal therapy especially during the induction phase [26]
.
Testicular Involvement at Diagnosis
This remains a controversial issue according to different groups. The Children‟s oncology group
(COG) considers patients with testicular involvement to be at high risk regardless of other
presenting features but most other large clinical trial groups in the United States and Europe do
not consider testicular diseases to be high risk features [27]
.
9
Gender
The prognosis for girls with ALL appears to be slightly better than that for boys. One reason for
poor prognosis for boys is due to the occurrence of testicular relapses among boys. Some studies
indicate that boys appear also to be at increased risk for reasons not well understood [28]
.
Race
Although ALL is more common in white children and Hispanic children, sadly the story in
treatment outcome and survival rates in black children and Hispanic children with ALL have
been lower than in white children [29]
.
Asian Children with ALL fare slightly better than white children. This difference between Asian
and white children doing better than black and Hispanic, has been explained to be partially due
to different spectrum of ALL subtypes. Example most black children seem to have high
incidences of T cell ALL and lower rates of favorable genetic subtypes of ALL [30]
.
1.2.5.2 Leukemia cell characteristics at diagnosis
Morphology
Using the FAB system of classification, ALL lymphoblasts were classified as L1, L2 and L3
Morphology but no independent prognostic significant has been found so far. The only
significant thing is that the L3 morphology express surface immunoglobin (lg) and has a C-MTC
gene translocation identical to that seen in Burkitt‟s lymphoma [31]
.
Cytogenetics
A number of recurrent chromosomal abnormalities have been shown to have prognostic
significance especially in B- Precursor ALL. Some chromosomal abnormalities such as high
10
hyperdiploidy (51-56) chromosomes and the ETV6 –RUNXI Fusion are associated with more
favorable outcomes while others including the Philadelphia chromosomes t (9, 22)
rearrangements of the MLL gene (chromosome LLq23) and intrachromosomal amplication of
the AMLI gene (IAMP21) are associated with poor prognosis [31]
.
A number of Polymorphisms of genes involved in the metabolism of chemotherapeutic agents
have been reported to have prognostic significance in childhood ALL. Patients with mutant
phenotypes of Thiopurine methyl transferase (a gene involved in metabolism of thiopurines such
as 6-mercaptopurine) appear to have more favorable outcomes although such patients may also
be at high risk of developing significant toxicity related to treatment including myelosuppression
and infection[32,33]
.
1.2.5.3 Response to initial treatment
Treatment responses are usually influenced by the drug sensitivity of leukemia cells and host
pharmacodynamics and pharmacogenomics. The rapidity with which Leukemia cells are
eliminated following onset of treatment is usually associated with long term outcomes 34.
Some of
the common ways of evaluating response includes the following.
Day 7 and 14 Bone marrow Response
A reduction of leukemia cells to less than 5% in the bone marrow with 7 to 14 days following
initial induction therapy have a more favorable prognosis than do patients who have slower
clearance [35].
11
Peripheral Blood response to steroid prophase
Children with reduced peripheral blast count to less than 1000/UL after 7 day induction pro
phase with prednisone and one dose intrathecal methotrexate have more favorable prognosis than
those with blast counts above 1000/UL36
. Patients with no circulating blasts on day 7 have a
better outcome than those patients whose circulating blasts level II between 11 and 1000/UL
[ 37,38]
.
Blood response to Multi agent induction therapy
The rate of clearance of peripheral blasts has been found to be of prognostic significance in both
T-cell and B-lineage ALL. Children with persistent circulating Leukemia all at day 7 to 10 after
initiation of multivalent chemotherapy are at increased risk of relapse compared to those who
have no blasts with one week therapy [39]
.
Induction Failure
An induction failure which is characterized by a presence of greater than 5% Lymphoblast at the
end of induction phase, and is a prognostic indicator of poor treatment outcomes [40]
.
Outcome factors
High expression of VLA -4 has been associated with adverse prognostic factors, poor molecular
response to therapy and significantly worse probabilities of event free overall survival. This is an
independent prognostic parameter which basically is a gene expression signaling pathway from
the bone marrow after the start of the therapy [41]
.
12
1.2.6 Chemotherapeutic treatment of Acute Lymphoblastic Leukemia
1.2.6.1 Phases of treatment
There are different phases in treatment of ALL.
Induction Phase/ Remission
This is therapy given immediately at the time of diagnosis. It is aimed at killing as many cancer
cells as possible to achieve a complete remission within four weeks. This phase is said to be
successful if less than 5% blasts are in the bone marrow and blood count have returned to
normal.
Consolidation and Intensification phase
Is the second phase of therapy, it begins when the leukemia is in remission. The purpose of
consolidation/intensification therapy is to kill any remaining Leukemia cells that may not be
active but could begin to grow and cause a relapse. Often the cancer treatments are given in
lower doses than those used for induction and consolidation and intensification therapy .This is
also called the continuation therapy costs.
Maintenance phase
This is the third and usually last phase of treatment. Its purpose is to kill any remaining leukemia
that may regrow and cause a relapse. Often the cancer treatment in this phase are given in low
doses than those used for induction and consolidation/intensification therapy .This is also called
the continuation phase.
CNS Sanctuary Therapy
Usually given during each phase of therapy because chemotherapy that is given by mouth or
injection into a vein may not reach Leukemia Cells in the CNS (brain and spinal code) the cells
13
are able to find a “sanctuary” (hide) in the CNS. This is done by intrathecal chemotherapy and
radiation therapy is also called CNS prophylaxis [42]
.
1.2.6.2 Treatment protocols
Treatment of childhood Leukemia, especially acute Lymphoblastic leukemia (ALL) typically
involves chemotherapy given for 2 to 3 years. Different protocols are used worldwide to treat
ALL. For the purpose of our study we will highlight only 3 of these which are the British
protocols [43]
, American protocol [45]
and the Kasili protocol [46]
that is used in KNH.
The British protocol [43]
Many protocols exist for the treatment of ALL in UK. But the one that is widely used is the one
adopted from the UK medical research council protocol which is as below.
Induction Phase (four weeks)
Vinicristine 1.5mg/m2, IV Weekly for four weeks
Prednisolone 40mg/m2, PO daily for four weeks
L-asparaginase 6000u/m2 IM three times weekly for 3 weeks
Daunorubicin 45mg/m2, IV daily for two days
Intensification stage (one week)
Vinicristine 1.5 mg/m2 IV 1 dose
Paunorubicin 45mg/m2 IV daily for two days
Prednisolone 40mg/m2 orally daily for 5 days
Etoposide 100mg/m2 IV daily for 5 days
Cytarabine 100mg/m2 IV 2X daily for five days
Thioguanine 80 mg/m2 orally daily for five days
14
CNS prophylaxis (3 weeks)
Cranial irradiation 24GY
Methotrexate 1T weekly for 3 weeks also given during induction and intensification.
Maintenance therapy (2 years)
Methotrexate 20 mg/m2 orally weekly
C-Mercaptopurine 75 mg/m2 orally daily
Prednisolone 40 mg/m2 orally 5days /month
Vincristine 1.5 mg/m2 IV Monthly
The American protocol [44]
The American protocols are many, they are similar with British the only difference is that most
therapies are tailored depending on the prognostic factors of individual patient but in general the
drugs are used as follows:
Induction phase
Vincristine
Prednisone & Dexamethasone
L- Asparaginase
IT Therapy (Methotrexate & Cytarabine)
Daunorubicin (High risk factors)
Consolidation (Intensification Therapy)
High Dose Methotrexate (1-5 g/m2)
Leuclophosphamide
Cytarabine
15
Thiopurine
L- Asparaginase
Maintenance Therapy
Mercaptopurine PO Weekly
Methotrexate Parental
IT Chemotherapy
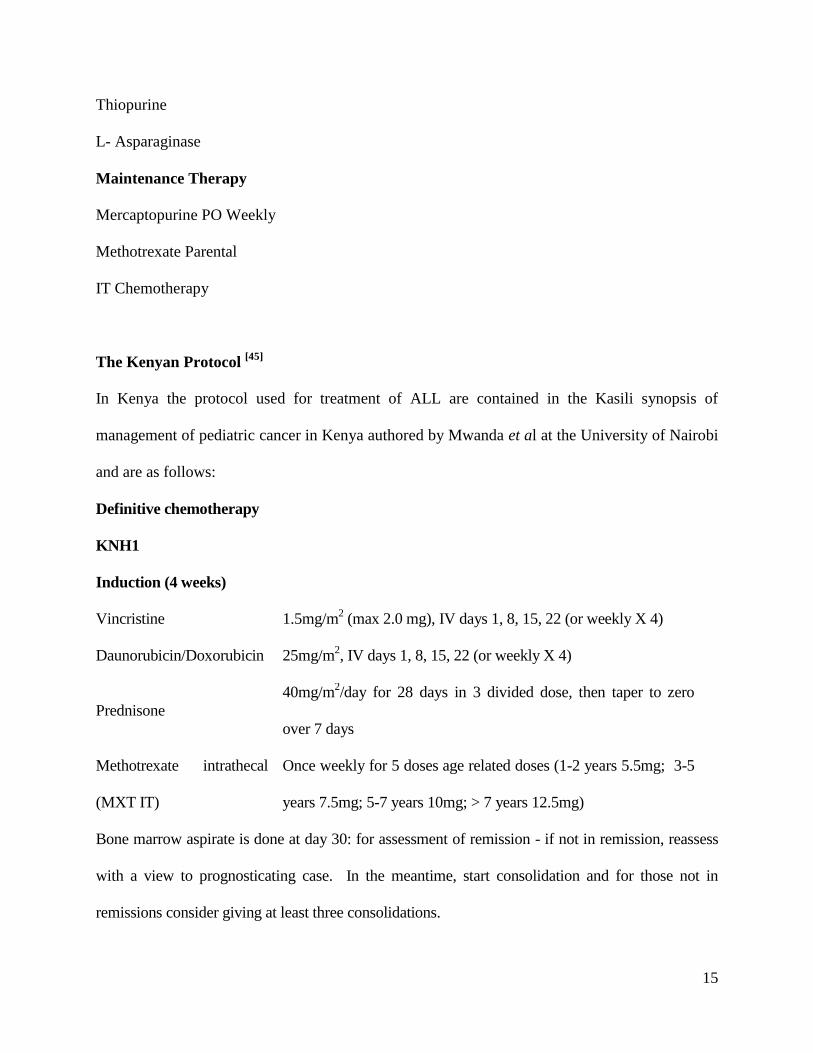
The Kenyan Protocol [45]
In Kenya the protocol used for treatment of ALL are contained in the Kasili synopsis of
management of pediatric cancer in Kenya authored by Mwanda et al at the University of Nairobi
and are as follows:
Definitive chemotherapy
KNH1
Induction (4 weeks)
Vincristine 1.5mg/m2 (max 2.0 mg), IV days 1, 8, 15, 22 (or weekly X 4)
Daunorubicin/Doxorubicin 25mg/m2, IV days 1, 8, 15, 22 (or weekly X 4)
Prednisone
40mg/m2/day for 28 days in 3 divided dose, then taper to zero
over 7 days
Methotrexate intrathecal
(MXT IT)
Once weekly for 5 doses age related doses (1-2 years 5.5mg; 3-5
years 7.5mg; 5-7 years 10mg; > 7 years 12.5mg)
Bone marrow aspirate is done at day 30: for assessment of remission - if not in remission, reassess
with a view to prognosticating case. In the meantime, start consolidation and for those not in
remissions consider giving at least three consolidations.
16
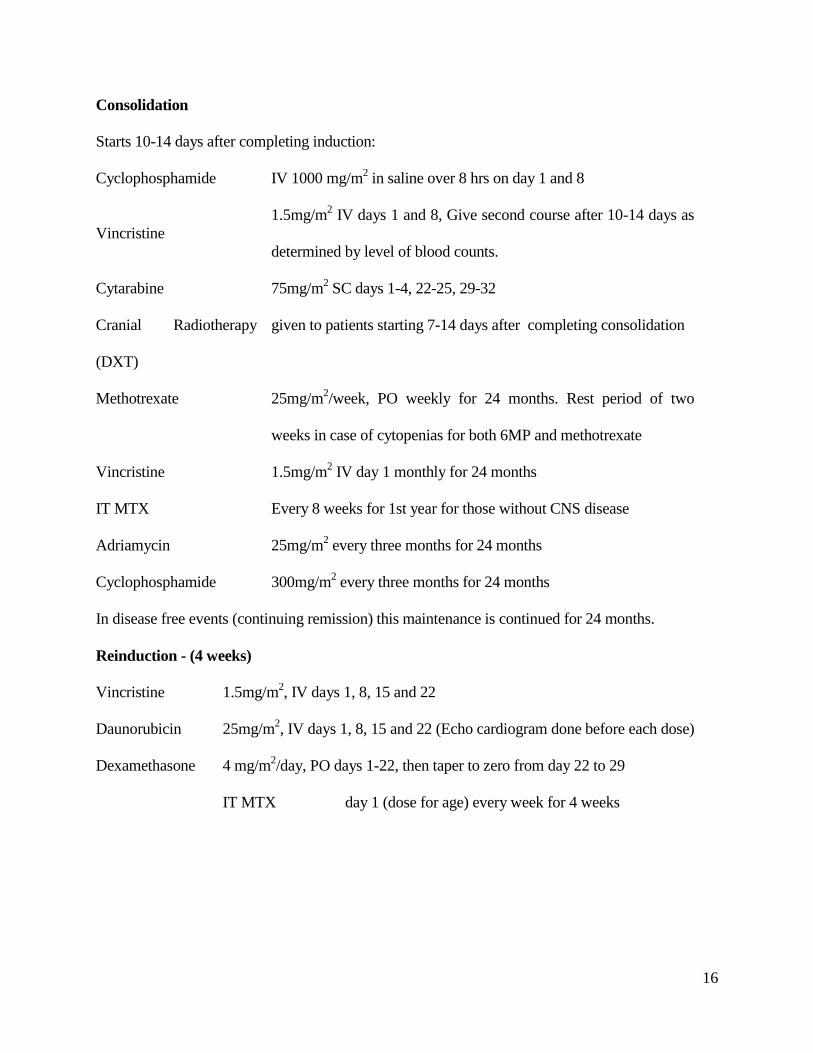
Consolidation
Starts 10-14 days after completing induction:
Cyclophosphamide IV 1000 mg/m2 in saline over 8 hrs on day 1 and 8
Vincristine
1.5mg/m2 IV days 1 and 8, Give second course after 10-14 days as
determined by level of blood counts.
Cytarabine 75mg/m2 SC days 1-4, 22-25, 29-32
Cranial Radiotherapy
(DXT)
given to patients starting 7-14 days after completing consolidation
Methotrexate 25mg/m2/week, PO weekly for 24 months. Rest period of two
weeks in case of cytopenias for both 6MP and methotrexate
Vincristine 1.5mg/m2 IV day 1 monthly for 24 months
IT MTX Every 8 weeks for 1st year for those without CNS disease
Adriamycin 25mg/m2 every three months for 24 months
Cyclophosphamide 300mg/m2 every three months for 24 months
In disease free events (continuing remission) this maintenance is continued for 24 months.
Reinduction - (4 weeks)
Vincristine 1.5mg/m2, IV days 1, 8, 15 and 22
Daunorubicin 25mg/m2, IV days 1, 8, 15 and 22 (Echo cardiogram done before each dose)
Dexamethasone 4 mg/m2/day, PO days 1-22, then taper to zero from day 22 to 29
IT MTX day 1 (dose for age) every week for 4 weeks
17
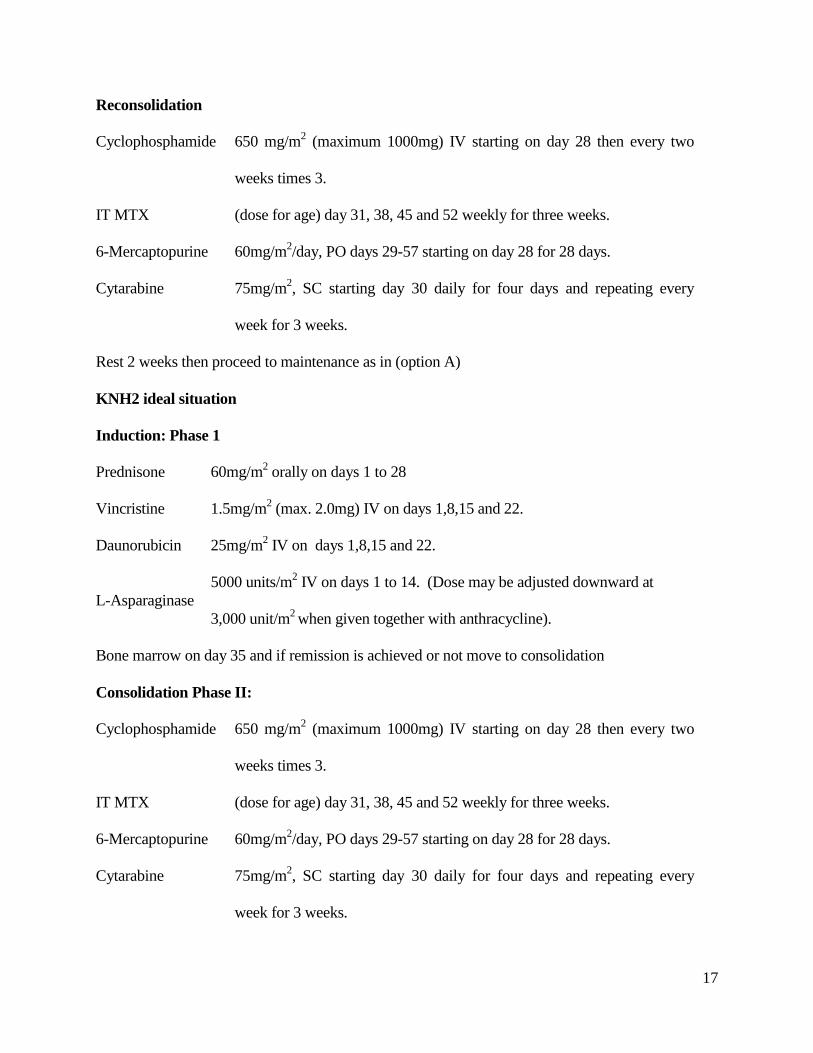
Reconsolidation
Cyclophosphamide 650 mg/m2 (maximum 1000mg) IV starting on day 28 then every two
weeks times 3.
IT MTX (dose for age) day 31, 38, 45 and 52 weekly for three weeks.
6-Mercaptopurine 60mg/m2/day, PO days 29-57 starting on day 28 for 28 days.
Cytarabine 75mg/m2, SC starting day 30 daily for four days and repeating every
week for 3 weeks.
Rest 2 weeks then proceed to maintenance as in (option A)
KNH2 ideal situation
Induction: Phase 1
Prednisone 60mg/m2 orally on days 1 to 28
Vincristine 1.5mg/m2 (max. 2.0mg) IV on days 1,8,15 and 22.
Daunorubicin 25mg/m2 IV on days 1,8,15 and 22.
L-Asparaginase
5000 units/m2 IV on days 1 to 14. (Dose may be adjusted downward at
3,000 unit/m2 when given together with anthracycline).
Bone marrow on day 35 and if remission is achieved or not move to consolidation
Consolidation Phase II:
Cyclophosphamide 650 mg/m2 (maximum 1000mg) IV starting on day 28 then every two
weeks times 3.
IT MTX (dose for age) day 31, 38, 45 and 52 weekly for three weeks.
6-Mercaptopurine 60mg/m2/day, PO days 29-57 starting on day 28 for 28 days.
Cytarabine 75mg/m2, SC starting day 30 daily for four days and repeating every
week for 3 weeks.
18
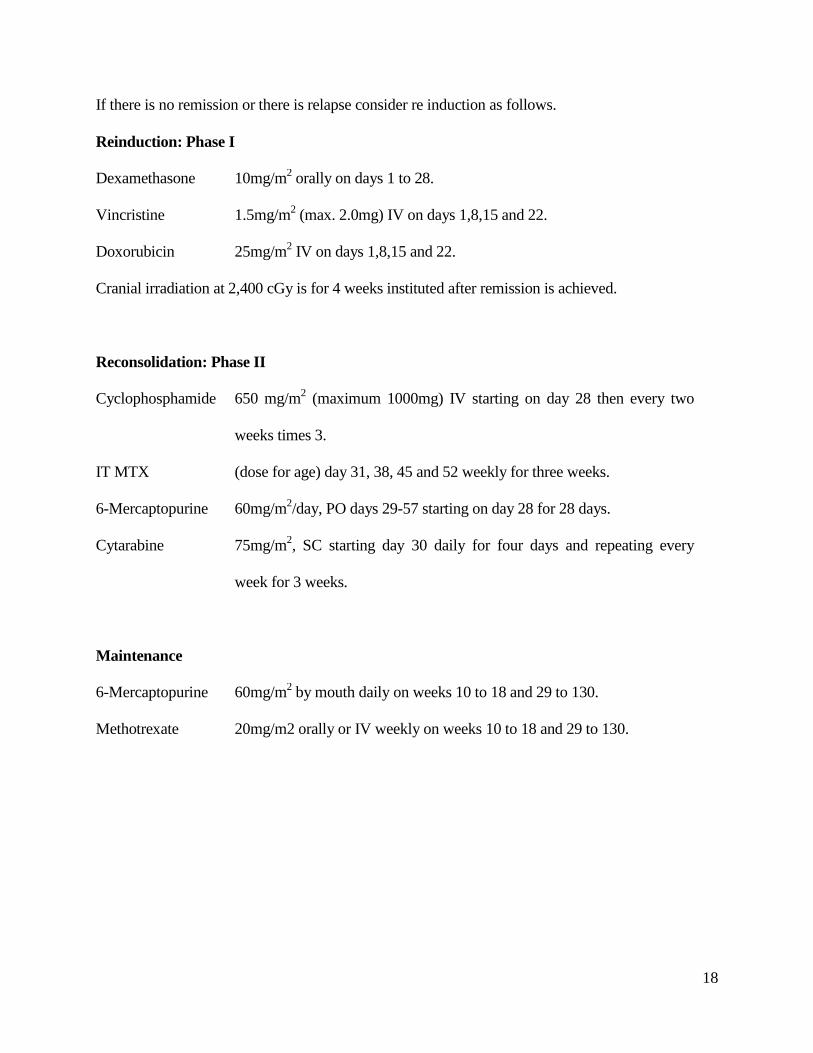
If there is no remission or there is relapse consider re induction as follows.
Reinduction: Phase I
Dexamethasone 10mg/m2 orally on days 1 to 28.
Vincristine 1.5mg/m2 (max. 2.0mg) IV on days 1,8,15 and 22.
Doxorubicin 25mg/m2 IV on days 1,8,15 and 22.
Cranial irradiation at 2,400 cGy is for 4 weeks instituted after remission is achieved.
Reconsolidation: Phase II
Cyclophosphamide 650 mg/m2 (maximum 1000mg) IV starting on day 28 then every two
weeks times 3.
IT MTX (dose for age) day 31, 38, 45 and 52 weekly for three weeks.
6-Mercaptopurine 60mg/m2/day, PO days 29-57 starting on day 28 for 28 days.
Cytarabine 75mg/m2, SC starting day 30 daily for four days and repeating every
week for 3 weeks.
Maintenance
6-Mercaptopurine 60mg/m2 by mouth daily on weeks 10 to 18 and 29 to 130.
Methotrexate 20mg/m2 orally or IV weekly on weeks 10 to 18 and 29 to 130.
19
1.2.7 Treatment outcomes
The treatment outcomes in ALL can be:
Complete Remission (CR)
This is the complete killing of Leukemia cells to untraceable levels and this increases the
chances of event free survival (EFS).
Relapses
This can be the CNS relapse, testicular relapse or even bone marrow relapse. This is basically the
regrowing and reappearing of blasts and Leukemia cells in those areas. Children with relapse are
said to be of poor prognosis and are often treated with more intensive and more toxic drugs.
Treatment Failure
This usually is when a patient is unresponsive to chemotherapy and is usually characterized by
initial failure to achieve remission during induction phase. Treatment failure may spell a danger
to the patient even death.
Different studies have reported different therapeutic outcomes for different countries and places.
For instance, in the Netherlands, Veerman et al (1996) had reported EFS of 81% (SE=3%)
Survival rate of 85% (SE=2.9%) and CNS replace of 1.1 %. [46]
. In Greece Tzortazatou et
al(2001) equally have reported a 5year overall and event free survival rates of 86% and 83%
respectively. The 5 years overall survival rates for good risk and high risk groups were 94% and
81% respectively. The corresponding event free rates were 91% and 78% [47]
.
Another study carried out In India in by Aduan et al (1999), reported a CR in 91.3% patients and
relapse in 29.9%. Going by risk groups those with WBC count < 60 000/m3 without
lymphadenopathy had 77% EFS at 5years. Those with WBC <6000/mm3 with
20
lymphadenopathy had 53% EFS and those with WBC >60 000 and HB 6gm/al or above and 48%
EFS while those with WBC > 60000 and HB below 6g/dl had only 16% EFS [48]
.
In the United States several studies have shown different outcomes one of them is that carried
out by Steinheuz et al (1998) which reported CR of 97% at induction. The overall EFS +-
standard deviation at 4% was 60% 6years after diagnosis in contrast to a historic group which
reported 36% +- 6% SD. The EFS of the 371 T-cell Patients was 62% +-7 %SD. It was best in
NY at 67% +- 7% and the BFM regimen at 67%+-6% arms. Testicular varied from (2-8 %)
compared to 28% in historic group [49]
.
In conclusion Pui et al( 2008) has summarized major international study groups and trials on
treatment of childhood ALL and has found it to be between (70-80) % five year EFS with an
overall cure rate of approximately 80% with a prospect of attaining a cure rate of 90% in the near
future [50]
.
1.3 PROBLEM STATEMENT
Worldwide the therapeutic management and clinical outcomes of acute lymphoblastic Leukemia
has shown a steady increase and improvement over time from 40% to almost 90% in most
developed countries. However, there is minimal data reflecting the situation in developing
countries. The data presented by the developed and high income countries with high social
economic status may not be necessarily representative of the overall worldwide situation.
Anecdotal data in Kenya speculates that the incidence of relapse for ALL in children is high and
the treatment outcomes are poor. Survival rate has been noted to be low. The use of newer
regimens and the ideal one as highlighted in the Kasili‟s protocol has not been adopted due to
limitations in availability of L- Asparaginase which is not only costly but also lacks a local
21
distributor. It is thought that for a season in 2005, when L-asparaginase was available in KNH,
treatment outcomes improved, even though it was used in very few patients. However, this has
not been supported with any designed study. In view of the above observations, it is important to
have a study conducted to evaluate and describe in detail the reality of the situation.
1.4 JUSTIFICATION OF THE STUDY
Treatment of ALL in childhood has been one of the success stories for the last three decades.
According to Pui et al (2005) over 80% of patients achieve a remission lasting more than 5 years
in most developed countries. So this study endeavors to find if the success stories reported by
other countries compare with our local setting specifically in KNH, the largest public hospital
offering cancer treatment in the country.
There has been no recent work done on evaluating outcomes in treatment of Leukemia since
1978, when Kasili et al did a study in prevalence of Leukemia in Kenya. With recent
introduction of new medicines and regimens, there is need for a local study to provide additional
information to the data bank for the management of ALL in this country.
In the Kasili‟s protocol, which is mostly used as a guideline in treatment of most cancers in
Kenya, there are two regimens given as option A and B (as described in our literature review).
The one that is commonly used is the older one (option A), even though option B is more
suitable .Therefore, there is need to evaluate the clinical outcomes of this regimen and give
recommendations.
According to the 66th
WHO general assembly paper, more emphasis has been put on
communicable and infectious disease which has led to a significant neglect of non-
communicable diseases including cancers like ALL. This study is aimed at giving attention to
22
non-communicable diseases (cancers) for the betterment of improved service delivery in their
management.
This study will identify gaps and hence may help the policy makers and oncologists to revise the
treatment guidelines.
1.5 OBJECTIVES
1.5.1 General Objective
To describe the chemotherapeutic management and to evaluate the clinical outcomes of ALL
among children at KNH.
1.5.2 Specific Objectives
1. To determine the prevalence of various subtypes of ALL based on morphological
classification that is L1-B-precursor cells, L2-T-precursor cells and L3-B cells in
children seen at KNH.
2. To find out the clinical outcomes of ALL patients in relation to the therapeutic
management instituted.
3. To determine the frequency of use of various chemotherapeutic agents/regimens of ALL
in KNH
4. To identify factors correlated to the treatment outcomes of ALL in KNH
23
CHAPTER TWO: METHODOLOGY
2.1 Ethical Consideration
Permission to carry out research was sought from the KNH/UON Ethics and Research
Committee before the research was conducted (Appendix 2).
There were no risks involved for the patients since the research involved retrospective review of
patients files hence no direct patient involvement.
For confidentiality, the patients‟ files were only used within the confines of medical department
of KNH and only the investigator, the assistants and the personnel of medical records department
had access to the files for the purposes of the study. The patient names were not included in the
data collection forms and instead, numbers were allocated to each patient files. All the filled data
collection forms were filed and stored by the investigator in a locked drawer.
2.2 Study design
The study was a descriptive retrospective cohort that followed treatment outcomes from the time
of diagnosis and initiation of treatment. All incident cases of pediatric ALL seen at KNH from
January 2001 to December 2010 were reviewed. The design was described as retrospective since
it entailed an evaluation of historical data. It was a cohort study since we were dealing with
patients of similar condition. It was descriptive in nature since it did not involve comparison of
two or more study arms.
24
2.3 Study Area
The study was conducted at KNH medical records department. KNH is the largest referral
hospital in East Africa. The site was appropriate because it is the largest public hospital that
provides cancer management and treatment services. It is also the facility with top oncology
experts in the country hence justifying the large number of referrals to the hospital.
Most patients from all over the country are referred here because ALL is managed by specialists
in an inpatient pediatric oncology clinic .The medical records department unit has a database and
records which facilitated a retrospective study.
2.4 Study population
The study population was pediatric patients aged 0-15years who were diagnosed and treated for
ALL at KNH between January 2001 and December 2010 covering a 10 year period. The time
period was selected because KNH archives inactive patient medical records after every ten years
therefore patient records for children seen before 2001 were not available and shorter period
would not have given us a sufficient sample size since ALL is a rare disease. Those seen beyond
December 2010 were excluded since they were not followed up for a sufficient time given that
treatment of ALL takes 18-24months.
2.4.1 Eligibility/ Inclusion criteria
The patients included in this study met the following criteria
Aged between 0- 15 years
Diagnosed with ALL with confirmatory Laboratory tests
Diagnosed between 2001 and 2010
25
2.4.2 Exclusion criteria
Patients above 15 years of age
Patients whose data on therapeutic management was missing.
Patients diagnosed before 2001 or after 2010
2.5 Sample Size Determination
A sample of 384 patients was initially intended for study but only 171 files were available and
eligible for study. The initial sample size was calculated in assumption of the anecdotal
prevalence of 50% successful treatment outcomes and 5% level of significance. The Fischer et al
formula for determining sample size was used;
n = Z2pq
d2
Where;
n = Sample size
Z = 1.96 Standard normal deviation at required confidence level
p = 0.5 Assumed prevalence or proportion
q = 1 – 0.5 = 0.5
d = 0.05 Precision
n = 1.962 X 0.5 X 0.5 = 384 patients
(0.05) 2
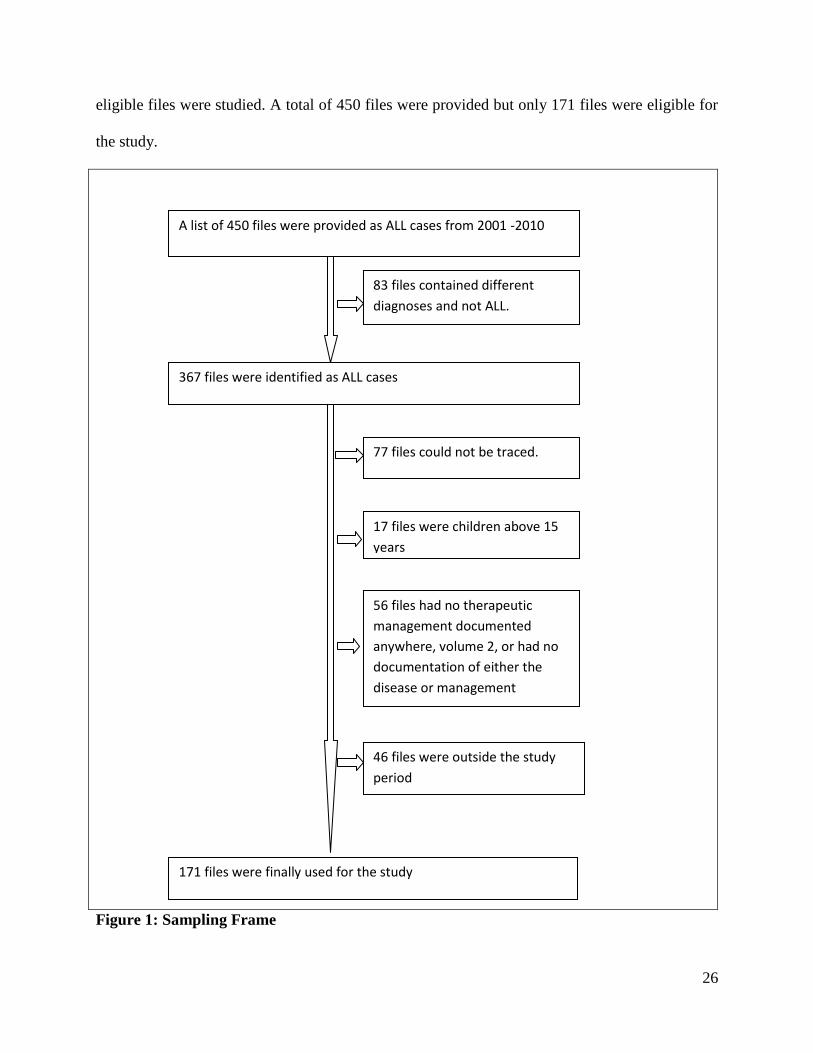
2.6 Sampling method
A list of all cases of ALL was provided but due to limited number of ALL coupled with mixing
of files with different diagnoses; universal sampling was applied whereby all available and
26
eligible files were studied. A total of 450 files were provided but only 171 files were eligible for
the study.
Figure 1: Sampling Frame
A list of 450 files were provided as ALL cases from 2001 -2010
83 files contained different
diagnoses and not ALL.
367 files were identified as ALL cases
77 files could not be traced.
17 files were children above 15
years
56 files had no therapeutic
management documented
anywhere, volume 2, or had no
documentation of either the
disease or management
46 files were outside the study
period
171 files were finally used for the study
27
2.7 Data collection
A pre-designed data collection tool (Appendix I) was pre-tested and used in collecting the
relevant data. Patient demographics and characteristics at diagnosis, subtype of disease,
chemotherapy regimens and other relevant history were recorded.
2.8 Data Quality Assurance procedures
A serialized data collection tool was used to avoid confusion and duplication of the data. The
data collection tool was pre-tested before use. This was done by randomly sampling 10 patient
files. Necessary modifications were done where inconsistencies or inadequacies were noted.
After data collection, at least 10% of the total numbers of patients‟ files were reviewed by an
independent m.med. (Pediatrics and child health) student who was not affiliated to the study who
also filled a separate data collection form for comparison with the investigator‟s data and minor
differences were noted in only one case. After complete information entry to form a database,
data cleaning was done before analysis.
2.9 Data management
2.9.1 Data management
Data collection tools were serialized to minimize chances of data loss. Each participant‟s file was
identified by a unique number to avoid confusion and duplication of the data. The unique
identifier was used when transferring the file data into the data collection tool.
2.9.2 Data entry
Data collected was entered daily using statistical package for the social sciences (SPSS) software
9 version 12.0. At the end of every session of data entry, the data was examined for any
28
inconsistencies and rectified by verifying information as soon as possible from the data
collection tool. Any missing variables were noted and rectified. Double data entry was used to
check on discrepancies in data entry. The biostatistician set up a suitable database.
2.9.3 Data storage
For confidentiality and security, data was password protected and backed up at intervals of 2
weeks. A copy of the backed up and filled data collection tools was stored under lock and key
where only the researcher and the biostatistician had access.
2.10 Statistical Analysis
Descriptive data analysis was carried out on all variables. For continuous variables the mean and
standard deviation was reported. For all other variables the frequency distributions were
reported. Inferential data analysis was conducted using as the Chi-test to compare for differences
across regimens or patient groups. Associations were determined between treatment failure,
outcomes and risk factors.
Key variables that determined prognosis were identified using logistic regression modeling.
In this, mortality was the independent variable. Covariates included patient demographics,
treatment regimens and disease characteristics. A forward stepwise approach was used for model
building. P-values of less than 0.05 were considered statistically significant.
2.11 Definition of cases
A diagnosis of ALL included an elaborate record in the patient‟s file with confirmed laboratory
finding. The support data included any one of the following:-
29
Full blood count film, differential WBC count (high) including thrombocytopenia with
blasts of pancytopenia or without blasts.
Bone marrow aspirate confirming morphology and cytochemistry
Tissue infiltration i.e lymphadenopathy, Splenomegaly (common in ALL), hepatomegaly
Severe anaemia and bleeding
High urate and CNS involvement
Testicle involvement
2.12 Variables, outcome of Interests and Confounders
The outcome of interest were treatment outcomes which included complete remission at
induction phase, treatment failure, relapse of disease and mortality. The secondary outcomes
were overall survival and event free survival by the end of 2 years. The covariates/independent
variables included: treatment duration, age, gender, regimens used, and subtype of ALL.
30
CHAPTER THREE: RESULTS
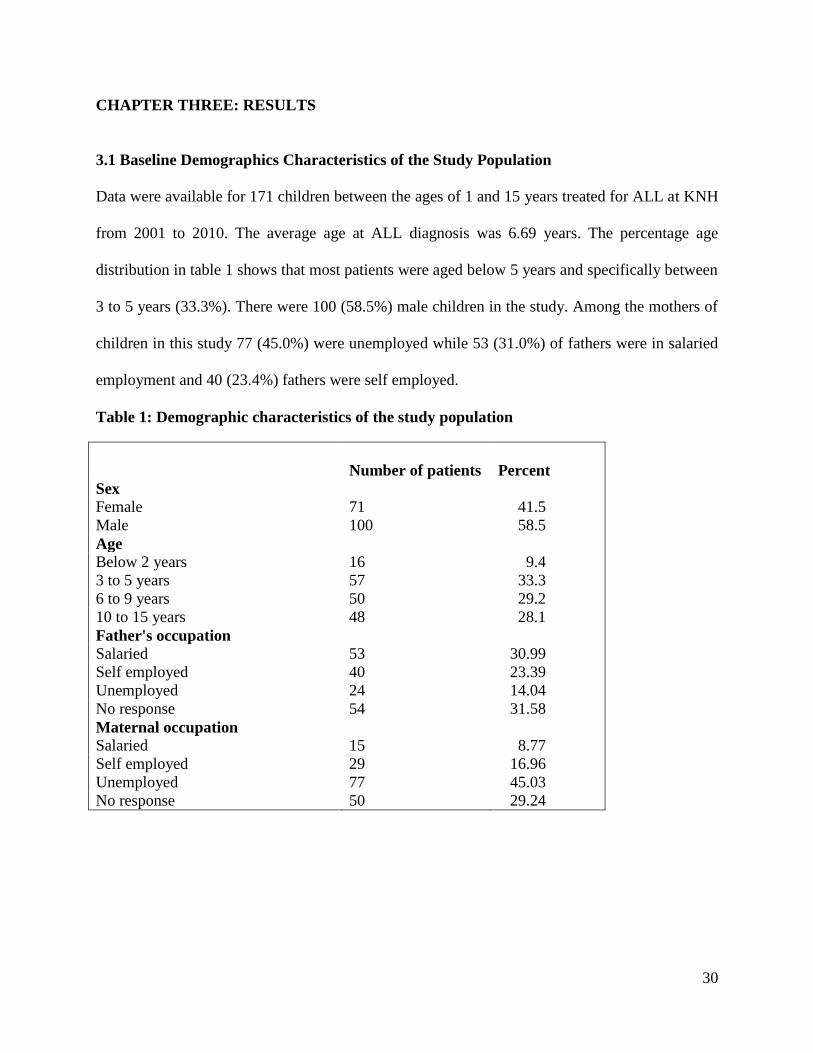
3.1 Baseline Demographics Characteristics of the Study Population
Data were available for 171 children between the ages of 1 and 15 years treated for ALL at KNH
from 2001 to 2010. The average age at ALL diagnosis was 6.69 years. The percentage age
distribution in table 1 shows that most patients were aged below 5 years and specifically between
3 to 5 years (33.3%). There were 100 (58.5%) male children in the study. Among the mothers of
children in this study 77 (45.0%) were unemployed while 53 (31.0%) of fathers were in salaried
employment and 40 (23.4%) fathers were self employed.
Table 1: Demographic characteristics of the study population
Number of patients
Percent
Sex
Female 71 41.5
Male 100 58.5
Age
Below 2 years 16 9.4
3 to 5 years 57 33.3
6 to 9 years 50 29.2
10 to 15 years 48 28.1
Father's occupation
Salaried 53 30.99
Self employed 40 23.39
Unemployed 24 14.04
No response 54 31.58
Maternal occupation
Salaried 15 8.77
Self employed 29 16.96
Unemployed 77 45.03
No response 50 29.24
31
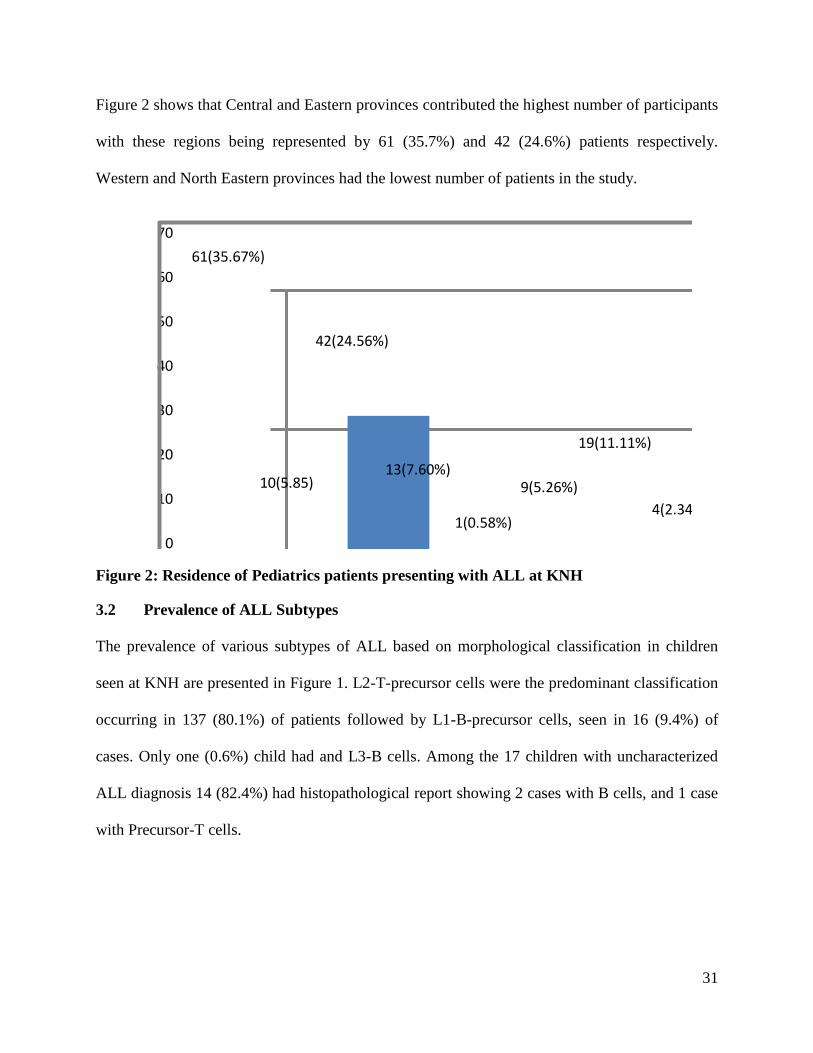
Figure 2 shows that Central and Eastern provinces contributed the highest number of participants
with these regions being represented by 61 (35.7%) and 42 (24.6%) patients respectively.
Western and North Eastern provinces had the lowest number of patients in the study.
61(35.67%)
10(5.85)
42(24.56%)
13(7.60%)
1(0.58%)
9(5.26%)
19(11.11%)
4(2.34%)
12(7.01%)
0
10
20
30
40
50
60
70
Central Coast Eastern Nairobi North Eastern
Nyanza Rift valley Western Not statedProvinces (Residence)
Figure 2: Residence of Pediatrics patients presenting with ALL at KNH
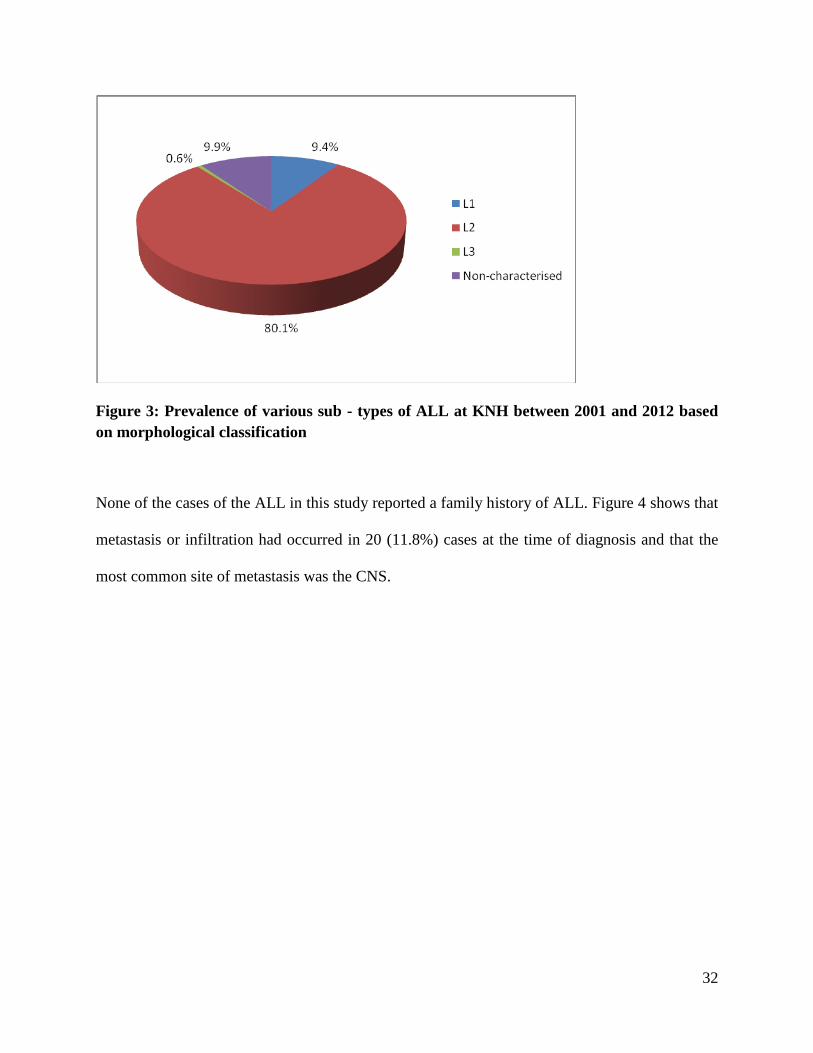
3.2 Prevalence of ALL Subtypes
The prevalence of various subtypes of ALL based on morphological classification in children
seen at KNH are presented in Figure 1. L2-T-precursor cells were the predominant classification
occurring in 137 (80.1%) of patients followed by L1-B-precursor cells, seen in 16 (9.4%) of
cases. Only one (0.6%) child had and L3-B cells. Among the 17 children with uncharacterized
ALL diagnosis 14 (82.4%) had histopathological report showing 2 cases with B cells, and 1 case
with Precursor-T cells.
32
Figure 3: Prevalence of various sub - types of ALL at KNH between 2001 and 2012 based
on morphological classification
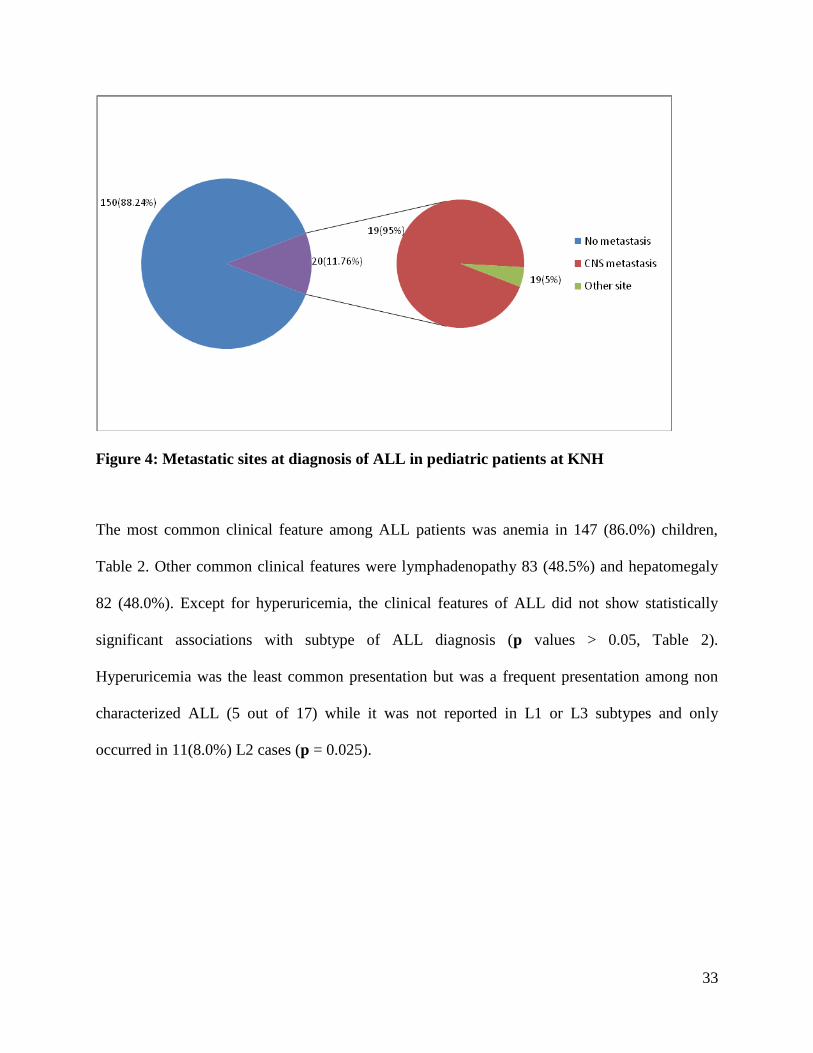
None of the cases of the ALL in this study reported a family history of ALL. Figure 4 shows that
metastasis or infiltration had occurred in 20 (11.8%) cases at the time of diagnosis and that the
most common site of metastasis was the CNS.
33
Figure 4: Metastatic sites at diagnosis of ALL in pediatric patients at KNH
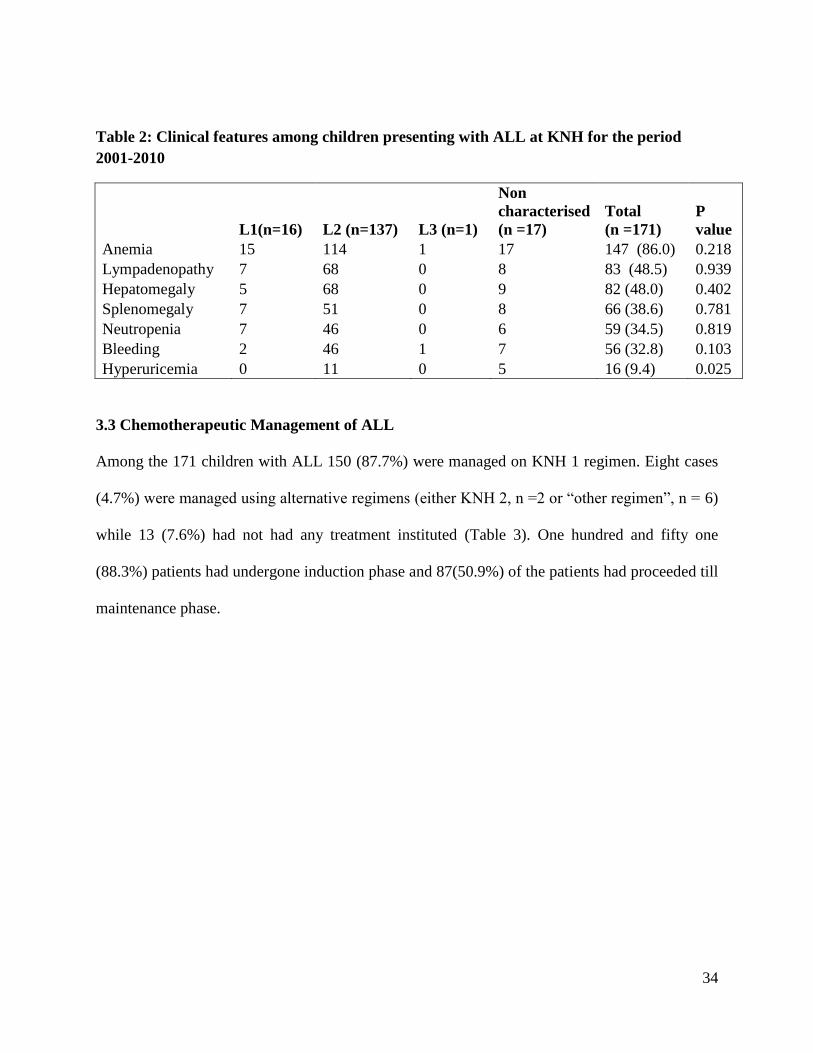
The most common clinical feature among ALL patients was anemia in 147 (86.0%) children,
Table 2. Other common clinical features were lymphadenopathy 83 (48.5%) and hepatomegaly
82 (48.0%). Except for hyperuricemia, the clinical features of ALL did not show statistically
significant associations with subtype of ALL diagnosis (p values > 0.05, Table 2).
Hyperuricemia was the least common presentation but was a frequent presentation among non
characterized ALL (5 out of 17) while it was not reported in L1 or L3 subtypes and only
occurred in 11(8.0%) L2 cases (p = 0.025).
34
Table 2: Clinical features among children presenting with ALL at KNH for the period
2001-2010
L1(n=16) L2 (n=137) L3 (n=1)
Non
characterised
(n =17)
Total
(n =171)
P
value
Anemia 15 114 1 17 147 (86.0) 0.218
Lympadenopathy 7 68 0 8 83 (48.5) 0.939
Hepatomegaly 5 68 0 9 82 (48.0) 0.402
Splenomegaly 7 51 0 8 66 (38.6) 0.781
Neutropenia 7 46 0 6 59 (34.5) 0.819
Bleeding 2 46 1 7 56 (32.8) 0.103
Hyperuricemia 0 11 0 5 16 (9.4) 0.025
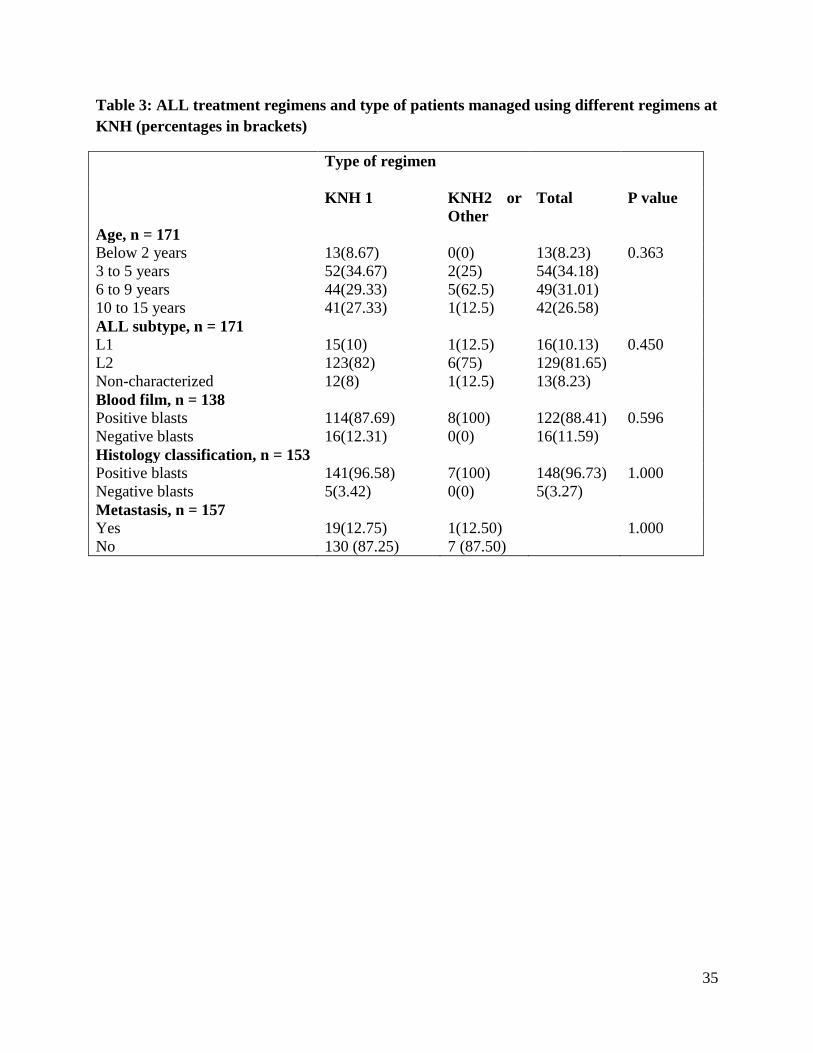
3.3 Chemotherapeutic Management of ALL
Among the 171 children with ALL 150 (87.7%) were managed on KNH 1 regimen. Eight cases
(4.7%) were managed using alternative regimens (either KNH 2, n =2 or “other regimen”, n = 6)
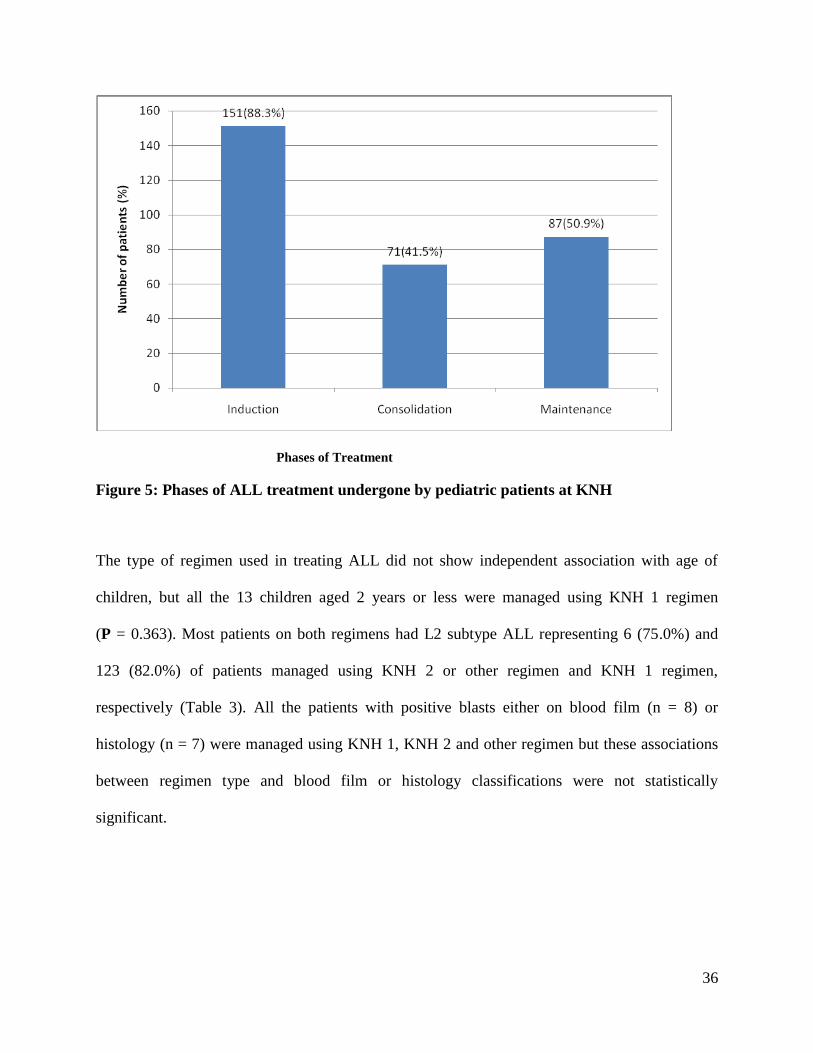
while 13 (7.6%) had not had any treatment instituted (Table 3). One hundred and fifty one
(88.3%) patients had undergone induction phase and 87(50.9%) of the patients had proceeded till
maintenance phase.
35
Table 3: ALL treatment regimens and type of patients managed using different regimens at
KNH (percentages in brackets)
Type of regimen
KNH 1
KNH2 or
Other
Total P value
Age, n = 171
Below 2 years 13(8.67) 0(0) 13(8.23) 0.363
3 to 5 years 52(34.67) 2(25) 54(34.18)
6 to 9 years 44(29.33) 5(62.5) 49(31.01)
10 to 15 years 41(27.33) 1(12.5) 42(26.58)
ALL subtype, n = 171
L1 15(10) 1(12.5) 16(10.13) 0.450
L2 123(82) 6(75) 129(81.65)
Non-characterized 12(8) 1(12.5) 13(8.23)
Blood film, n = 138
Positive blasts 114(87.69) 8(100) 122(88.41) 0.596
Negative blasts 16(12.31) 0(0) 16(11.59)
Histology classification, n = 153
Positive blasts 141(96.58) 7(100) 148(96.73) 1.000
Negative blasts 5(3.42) 0(0) 5(3.27)
Metastasis, n = 157
Yes 19(12.75) 1(12.50) 1.000
No 130 (87.25) 7 (87.50)
36
Phases of Treatment
Figure 5: Phases of ALL treatment undergone by pediatric patients at KNH
The type of regimen used in treating ALL did not show independent association with age of
children, but all the 13 children aged 2 years or less were managed using KNH 1 regimen
(P = 0.363). Most patients on both regimens had L2 subtype ALL representing 6 (75.0%) and
123 (82.0%) of patients managed using KNH 2 or other regimen and KNH 1 regimen,
respectively (Table 3). All the patients with positive blasts either on blood film (n = 8) or
histology (n = 7) were managed using KNH 1, KNH 2 and other regimen but these associations
between regimen type and blood film or histology classifications were not statistically
significant.
37
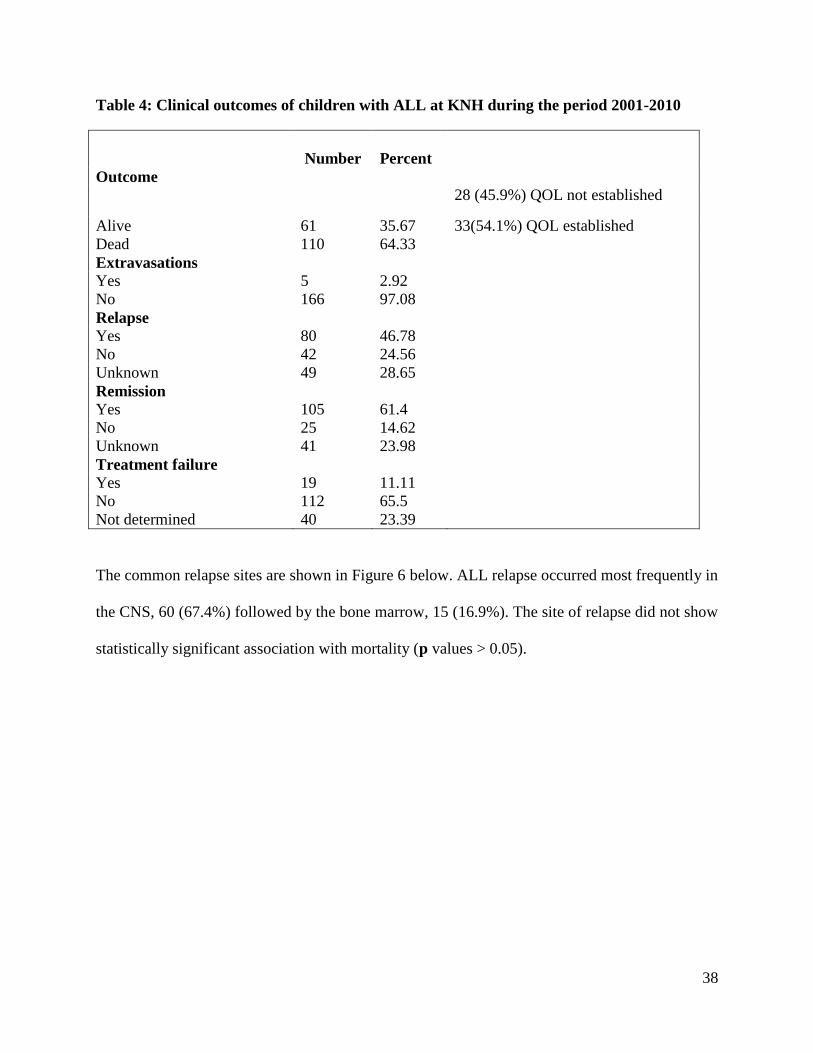
3.4 Clinical Outcomes of ALL Management
A total of five outcomes related to ALL chemotherapeutic management were investigated among
the patients in this study (Table 4). Remission occurred following treatment in 105 (61.4%)
cases. However, the most commonly occurring treatment outcome was mortality. During the
study, 110 deaths occurred giving a case fatality rate of 64.3% among childhood cases of acute
lymphoblastic leukemia at KNH. Eighty (46.8%) patients relapsed. The average duration to
relapse of acute lymphoblastic leukemia was 12.98 months ((SD ±9.9), range 1 to 41 months.
Extravasations and treatment failure rarely occurred (Table 4).
Out of the sixty one patients who were alive, 33 (54.1%) were followed up and duration of
survival during and after treatment was established, while 28 (45.9%) were lost to follow-up.
The absolute determination of the quality of live (QOL) including infection free live, activities,
happiness and fulfillment was beyond the scope of this study.
Only 34(22.7%) of the 158 children in whom therapy was initiated achieved complete cure while
124(77.3%) did not get cured. Cure in this case refers to those who were able to achieve
remission up to and including maintenance phase. Twenty three (67.6%) of those that achieved
cure were alive while 11 (32.4%) died which indicates that the chances of survival after complete
cure is higher than if the patient fails to achieve cure.
38
Table 4: Clinical outcomes of children with ALL at KNH during the period 2001-2010
Number
Percent
Outcome
Alive 61 35.67
28 (45.9%) QOL not established
33(54.1%) QOL established
Dead 110 64.33
Extravasations
Yes 5 2.92
No 166 97.08
Relapse
Yes 80 46.78
No 42 24.56
Unknown 49 28.65
Remission
Yes 105 61.4
No 25 14.62
Unknown 41 23.98
Treatment failure
Yes 19 11.11
No 112 65.5
Not determined 40 23.39
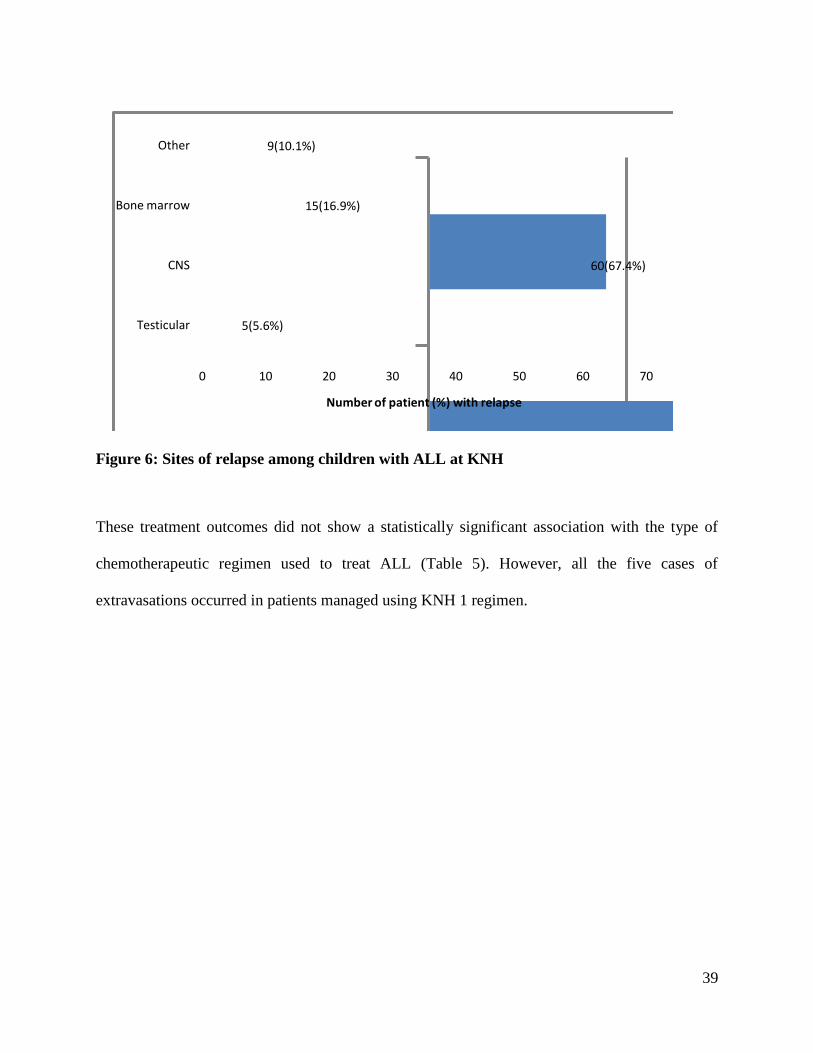
The common relapse sites are shown in Figure 6 below. ALL relapse occurred most frequently in
the CNS, 60 (67.4%) followed by the bone marrow, 15 (16.9%). The site of relapse did not show
statistically significant association with mortality (p values > 0.05).
39
5(5.6%)
60(67.4%)
15(16.9%)
9(10.1%)
0 10 20 30 40 50 60 70
Testicular
CNS
Bone marrow
Other
Number of patient (%) with relapse
Figure 6: Sites of relapse among children with ALL at KNH
These treatment outcomes did not show a statistically significant association with the type of
chemotherapeutic regimen used to treat ALL (Table 5). However, all the five cases of
extravasations occurred in patients managed using KNH 1 regimen.
40
Table 5: Clinical outcomes of children with ALL at KNH according to treatment regimen
Type of regimen
KNH 1
KNH2 or Other
P value
Outcome, n = 158
Alive 59(96.72) 2(3.28) 0.712
Dead 91(93.81) 6(6.19)
Extravasations, n = 158
Yes 5(100) 0 1.000
No 145(94.77) 8(5.23)
Relapse, n = 122
Yes 77(96.25) 3(3.75) 1.000
No 41(97.62) 1(2.38)
Unknown
Remission, n = 130
Yes 102(97.14) 3(2.86) 0.579
No 24(96) 1(4)
Treatment failure, n = 131
Yes 108(96.43) 4(3.57) 1.000
No 19(100) 0
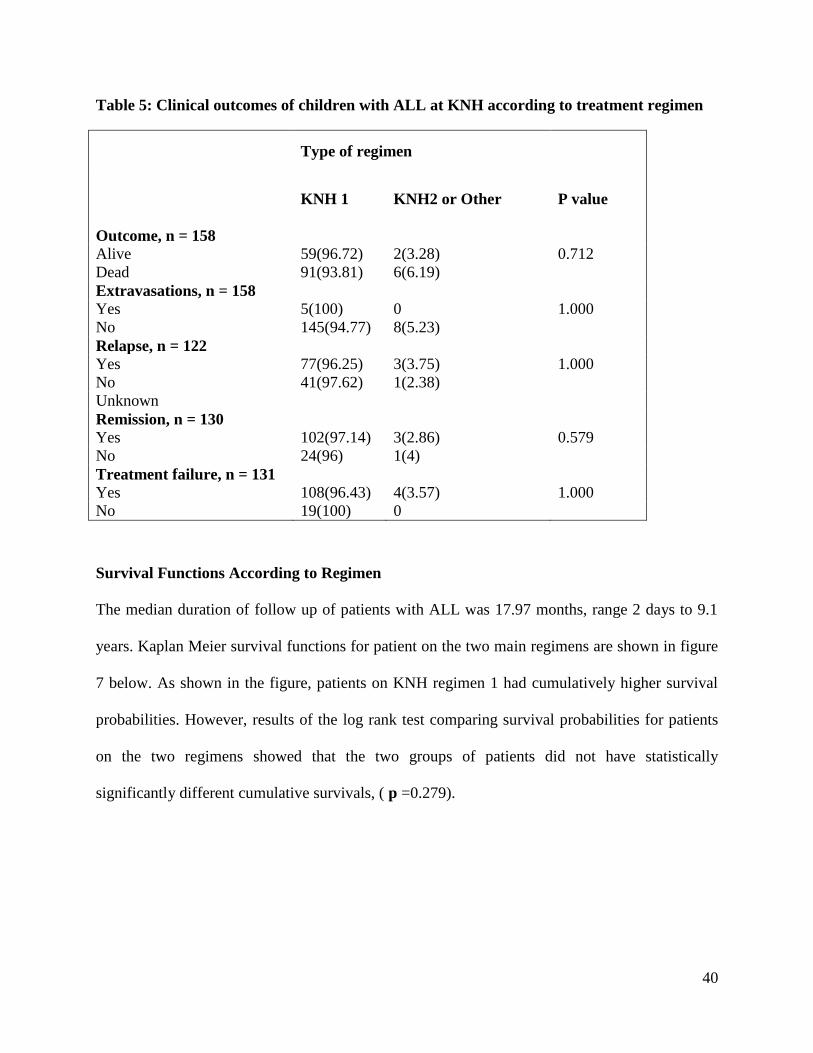
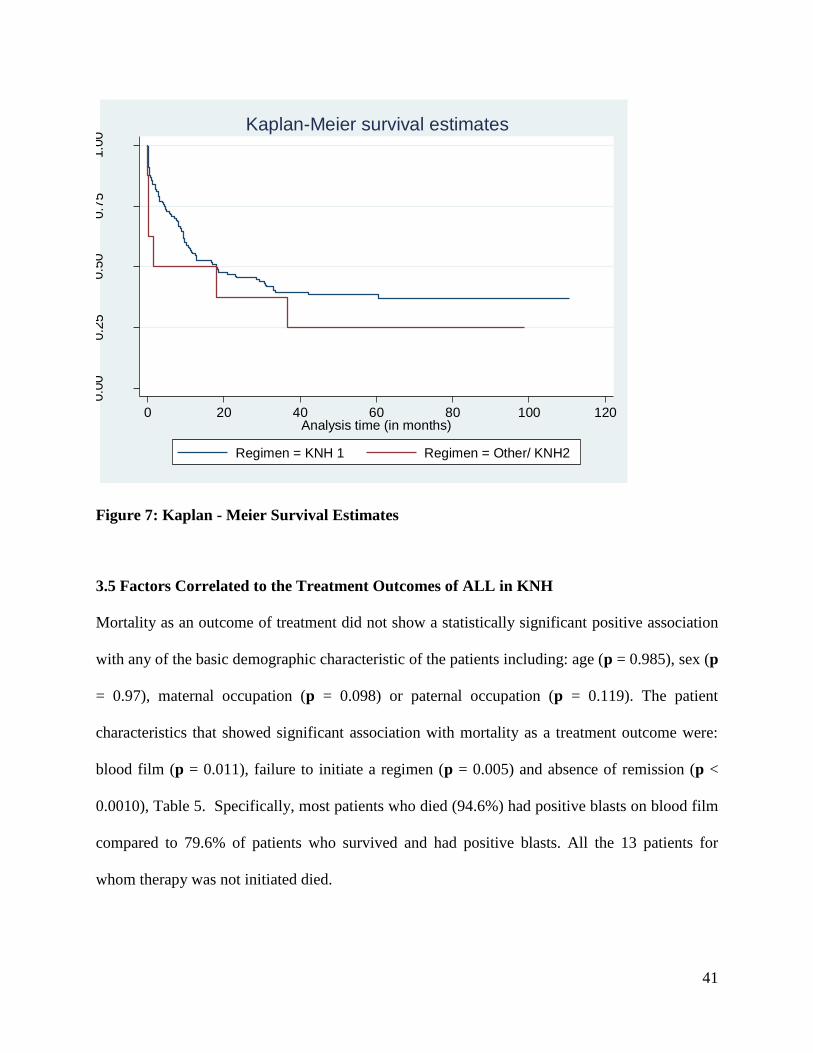
Survival Functions According to Regimen
The median duration of follow up of patients with ALL was 17.97 months, range 2 days to 9.1
years. Kaplan Meier survival functions for patient on the two main regimens are shown in figure
7 below. As shown in the figure, patients on KNH regimen 1 had cumulatively higher survival
probabilities. However, results of the log rank test comparing survival probabilities for patients
on the two regimens showed that the two groups of patients did not have statistically
significantly different cumulative survivals, ( p =0.279).
41
0.0
00.2
50.5
00.7
51.0
0
0 20 40 60 80 100 120Analysis time (in months)
Regimen = KNH 1 Regimen = Other/ KNH2
Kaplan-Meier survival estimates
Figure 7: Kaplan - Meier Survival Estimates
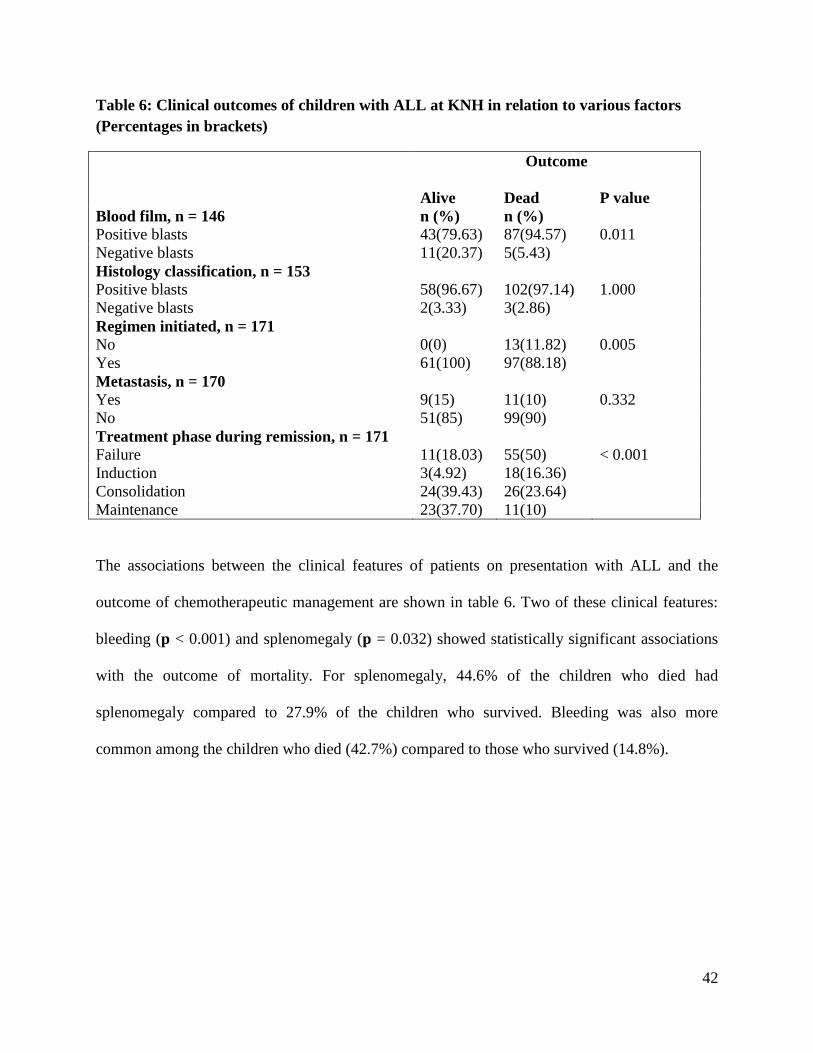
3.5 Factors Correlated to the Treatment Outcomes of ALL in KNH
Mortality as an outcome of treatment did not show a statistically significant positive association
with any of the basic demographic characteristic of the patients including: age (p = 0.985), sex (p
= 0.97), maternal occupation (p = 0.098) or paternal occupation (p = 0.119). The patient
characteristics that showed significant association with mortality as a treatment outcome were:
blood film (p = 0.011), failure to initiate a regimen (p = 0.005) and absence of remission (p <
0.0010), Table 5. Specifically, most patients who died (94.6%) had positive blasts on blood film
compared to 79.6% of patients who survived and had positive blasts. All the 13 patients for
whom therapy was not initiated died.
42
Table 6: Clinical outcomes of children with ALL at KNH in relation to various factors
(Percentages in brackets)
Outcome
Alive
Dead
P value
Blood film, n = 146 n (%) n (%)
Positive blasts 43(79.63) 87(94.57) 0.011
Negative blasts 11(20.37) 5(5.43)
Histology classification, n = 153
Positive blasts 58(96.67) 102(97.14) 1.000
Negative blasts 2(3.33) 3(2.86)
Regimen initiated, n = 171
No 0(0) 13(11.82) 0.005
Yes 61(100) 97(88.18)
Metastasis, n = 170
Yes 9(15) 11(10) 0.332
No 51(85) 99(90)
Treatment phase during remission, n = 171
Failure 11(18.03) 55(50) < 0.001
Induction 3(4.92) 18(16.36)
Consolidation 24(39.43) 26(23.64)
Maintenance 23(37.70) 11(10)
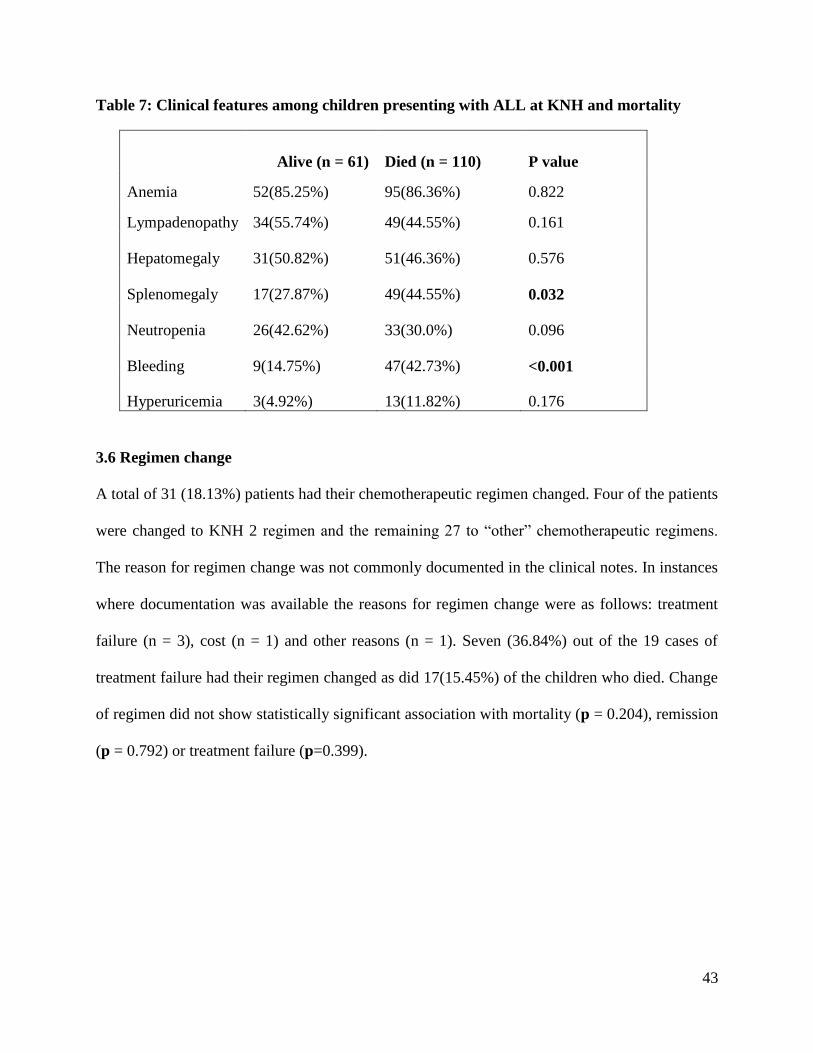
The associations between the clinical features of patients on presentation with ALL and the
outcome of chemotherapeutic management are shown in table 6. Two of these clinical features:
bleeding (p < 0.001) and splenomegaly (p = 0.032) showed statistically significant associations
with the outcome of mortality. For splenomegaly, 44.6% of the children who died had
splenomegaly compared to 27.9% of the children who survived. Bleeding was also more
common among the children who died (42.7%) compared to those who survived (14.8%).
43
Table 7: Clinical features among children presenting with ALL at KNH and mortality
Alive (n = 61) Died (n = 110) P value
Anemia 52(85.25%) 95(86.36%) 0.822
Lympadenopathy 34(55.74%) 49(44.55%) 0.161
Hepatomegaly 31(50.82%) 51(46.36%) 0.576
Splenomegaly 17(27.87%) 49(44.55%) 0.032
Neutropenia 26(42.62%) 33(30.0%) 0.096
Bleeding 9(14.75%) 47(42.73%) <0.001
Hyperuricemia 3(4.92%) 13(11.82%) 0.176
3.6 Regimen change
A total of 31 (18.13%) patients had their chemotherapeutic regimen changed. Four of the patients
were changed to KNH 2 regimen and the remaining 27 to “other” chemotherapeutic regimens.
The reason for regimen change was not commonly documented in the clinical notes. In instances
where documentation was available the reasons for regimen change were as follows: treatment
failure (n = 3), cost (n = 1) and other reasons (n = 1). Seven (36.84%) out of the 19 cases of
treatment failure had their regimen changed as did 17(15.45%) of the children who died. Change
of regimen did not show statistically significant association with mortality (p = 0.204), remission
(p = 0.792) or treatment failure (p=0.399).
44
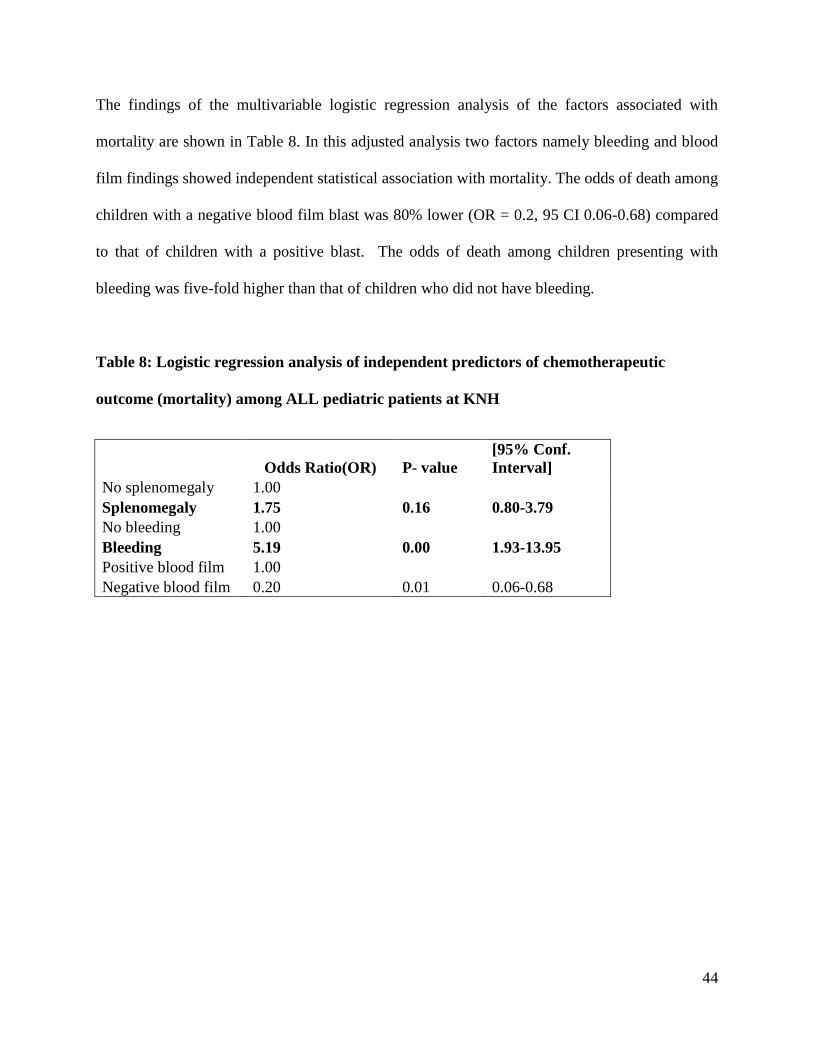
The findings of the multivariable logistic regression analysis of the factors associated with
mortality are shown in Table 8. In this adjusted analysis two factors namely bleeding and blood
film findings showed independent statistical association with mortality. The odds of death among
children with a negative blood film blast was 80% lower (OR = 0.2, 95 CI 0.06-0.68) compared
to that of children with a positive blast. The odds of death among children presenting with
bleeding was five-fold higher than that of children who did not have bleeding.
Table 8: Logistic regression analysis of independent predictors of chemotherapeutic
outcome (mortality) among ALL pediatric patients at KNH
Odds Ratio(OR) P- value
[95% Conf.
Interval]
No splenomegaly 1.00
Splenomegaly 1.75 0.16 0.80-3.79
No bleeding 1.00
Bleeding 5.19 0.00 1.93-13.95
Positive blood film 1.00
Negative blood film 0.20 0.01 0.06-0.68
45
CHAPTER FOUR: DISCUSSION
Demographic characteristics of the study population.
The percentage age distribution in this study showed that most patients were aged below 5 years
and specifically between 3 to 5 years (33.3%).
The age distribution is closely related to the findings by Ries et al in the USA who found the
peak age in ALL incidence to be between 2-5 years, with a decrease to the lowest incidence of
ages 8 years and above. In this study, it was concluded that incidences of ALL among children
aged 2-3 years was approximately four fold greater than that of infants and nearly ten fold
greater than that of adolescents above 15 years[11]
. Similar findings have been documented by
Shah et al in England and Wales where the peak age was around 3-4 years and then it declines
with progress in age [12]
.The male preponderance in our study also agrees with the study carried
out by Lisa et al [51]
.
Prevalence of ALL subtypes
In this study, L2-T-precursor cells were the predominant classification occurring in 80.1% of
patients followed by L1-B-precursor cells (9.4%). Only one (0.6%) child had and L3-B cells.
The prevalence of ALL subtype strongly agrees with the study carried out by Kadan et al which
found out that black children seem to have higher incidence of T-cell ALL than other races, this
according to FAB classification of ALL is ALL-L 2 [30]
.
46
Clinical features among children presenting with ALL
In this study, the most common clinical feature among ALL patients was anemia. Other common
clinical features were lymphadenopathy and hepatomegaly.
These findings are similar to those that have been documented by Karen et al that patients with
acute lymphoblastic leukemia commonly have physical signs of anemia including pallor and
cardiac flow murmur. About 10-20% also present with left upper quadrant fullness and early
satiety which is splenomegaly [53]
.
Chemotherapeutic Regimen
The use of the locally modified regimen which excludes L-Asparaginase by such a big
percentage is by far a contrast to the international standards of the popular studies mostly in
developed countries where L-Asparaginase is central to the treatment guidelines and protocols.
This regimen has shown high cure rates and more favorable outcomes than our regimen in major
studies [50]
.
Our study was unable to conclusively give a fair comparison across regimens due to the small
number of patients that were put on the second regimen 2(1.3%) which includes L-Asparaginase
compared with 150(94.9%) that were put in the KNH1 regimen.
Clinical Outcomes of ALL Management
Our cure rates of 22.7% are by far too low in comparison to the internationally reported cure
rates of 90% in a study done by Hunger et al which was attributed to improved diagnosis and
treatment [52]
.The number of survivors in this study of 23 patients (14.6%) is also low compared
to the reports from meta-analysis done by Pui et al [50]
which reported survival rates of 70-80 %.
47
The poor outcome for both the cure rates and survival rates could not be immediately established
in this study as most of them were statistically insignificant. However, most of the international
studies have included L- asparaginase as part of the treatment regimens and protocols unlike our
settings. The efficacy of regimens with L-asparaginase could not be conclusively established in
our study due to the small number of patients who used the regimen in our case (n=2), compared
to other regimens without L-asparaginase that is KNH 1 and other (n=156) [48, 50]
.
According to Lund et al the poor therapeutic outcome can possibly be in addition to other factors
due to the T-cell subtype (ALL-L2) of acute lymphoblastic leukemia which in their study not
only has poor outcome but also high mortality than other subtypes [56]
.Given that the most
predominant subtype in KNH is T-cell, it can be theorized as one of the reason for the high
mortality.
Factors Correlated to the Treatment Outcomes of ALL in KNH
The patient characteristics that showed significant association with mortality as a treatment
outcome were: blood film (p = 0.011), failure to initiate a regimen (p = 0.005) and absence of
remission (p < 0.0010).
The findings in this study however are a contrast to the findings by Hussein et al who
successively established a correlation between age and mortality. In their study they found out
that younger children aged 1-10 years had better response to therapy than those who are older
than 10 years. But the study strongly agrees that slow early response to therapy or absence of
remission lead to high mortality [54]
.
Two of the clinical features: bleeding (p < 0.001) and splenomegaly (p = 0.032) showed
statistically significant associations with the outcome of mortality.
48
Related findings have been documented by Asim et al in their study who found out that
hemorrhage (bleeding) was the second major reason for mortality at 10.8% among acute
lymphoblastic leukemia patients only to all infections combined which was attributed to 85% of
the total mortality [55]
. The association of splenomegaly with mortality was not comparable to
any known study yet.
49
CHAPTER FIVE
5.0 CONCLUSION
The most predominant subtype of ALL was found to be L2-T precursor cell with 137cases
(80.1%) followed by L1 B precursor cells with 16 cases (9.4 %) and lastly L3 or B cell with
1case (0.6%). Seventeen cases (9.9%) were not characterised.
Mortality was the most commonly occurring treatment outcome with 110 deaths giving a case
fatality rate of 64.3% among childhood cases of ALL in Kenya. Initial remission occurred in 105
cases (61.4%). Eighty (46.8%) of patients had a relapse, and the commonest site of relapse was
CNS at 60 (67.4%).
Cure rate was 34 (22.7%) of the 158 children in whom therapy was initiated compared to
124(77.34%) children who did not get cured. Twenty three (67.6%) of those that achieved cure
were alive while 11 (32.4%) died. Extravasations and treatment failure at the initial stages of
therapy rarely occurred.
Among the 171 children with ALL, 150 (87.7%) were managed on KNH 1 regimen. Eight cases
(4.7%) were managed using alternative regimens (either KNH 2, n =2 or “other regimen”, n = 6)
while 13 (7.6%) had no treatment instituted.
The patient characteristics that showed significant association with mortality as a treatment
outcome were: blood film (p = 0.011), failure to initiate a regimen (p = 0.005), absence of
remission (p < 0.0010).
50
Clinical features that showed statistically significant associations with the outcome of mortality
were bleeding (p < 0.001) and splenomegaly (p = 0.032).
5.1 RECOMMENDATIONS
A controlled study comparing two regimens that is the KNH 1 and L- asparaginase based
regimen is recommended. This is due to the limited number of patients on the L- asparaginase
regimen at KNH which couldn‟t give a conclusive comparison and dependable results.
The poor cure rates and overall survival during and after treatment compared to the international
findings are very alarming. A qualitative study on true causes of mortality and poor outcomes
apart from the regimens instituted needs to be done.
Most patients came from Central and Eastern Provinces of Kenya. A relationship between
geographical location and ALL needs to be established by an epidemiological study.
A five or more year event free survival (EFS) study needs to be done to establish the survival
rates and factors related to the same.
The rate of loss to follow-up was very significant. Some of it could have been attributed to the
long distances that patients travelled to get treatment at KNH. We recommend for establishment
of satellite sites to deal with satellite patients from outside Nairobi.
51
Policy makers and other stakeholders in ALL therapy should revise the guidelines on ALL
treatment in the light of poor outcomes as we wait for a controlled study to establish the overall
efficacy of newer regimens.
ALL like other aggressive childhood cancers has proved to be fatal without proper management,
therefore in agreement with the 66th
WHO general assembly paper emphasis should be put on
non-communicable diseases by allocation of more resources on research, awareness, diagnosis
and treatment by various governments including the government of Kenya.
As a clinical pharmacist together with my colleagues wish to play a major role in the revision
and implementation of up to date chemotherapeutic regimens in not only for ALL but also other
oncology guidelines.
5.2 STUDY LIMITATIONS
The anticipated sample size of 384 files which could have given us unprecedented sensitivity and
precision was not achieved due to unavoidable reasons. Consequently, the precision for this
study was reduced to 0.07(7%) from the intended 0.05(5%), by the sample size of 171. The 2%
precision difference however did not alter the study adversely. In addition, the study was
retrospective in nature and therefore the information obtained from the records could not be
verified or clarified.
52
REFERENCES
1. Scheinberg DA, Maslak P, Weiss M. Acute leukemias. Cancer: Principles and Practice
of Oncology by DeVita VT, Hellman S, Rosenberg SA, 7th edition. Philadelphia:
Lippincott Williams & Wilkins, 2005:2088-2120.
2. Jackson G,Jones G.Leukemia.Clinical pharmacy and therapeutics by Roger Walker, Cate
W. Churchil livingston,4th edition 2008:715-716.
3. http/medicine.medscape.com: Acute lymphoblastic leukemia. (Accessed 10
September 2011)
4. De keers Maecker P,cools J et al:Genetic insights in the pathogenesis of t-cell acute
lymphoblastic leukemia. Hematologica. 2005; 90:1116-1127.
5. Greaves MF, Maia AT, Wiemels JL et al. Leukemia in twins; lessons in natural history.
Blood 2003; 102:2321-2333.
6. Faderls, Jehas, Kartarjian H.M.The biology and therapy of adult acute
lymphoblastic leukemia. Cancer. 2003; 98: 1337-1354
7. Belson M, Kingsley B, Holmes A, et al. Risk factors for acute lymphoblastic leukemia in
children. A review Environ. Health perspective. 2007; 115: 138-145.
8. Pui CH, Mary V, Relling James R, et al. Acute lymphoblastic leukemia. N Engl J med.
2004 April 8; 350: 1535-1548.
9. Kuppen IJ, Hermans FJ, Kasper GJ, et al. Folate related gene polymphism and
susceptibility to develop childhood Acute Lymphoblastic Leukemia. Br J Hematol. 2010;
148. 314.
10. Smith MA, Seibel NL, Altekruse SF, et al.Outcomes for children and adolescents with
cancer challenges for the 21st century. J Clin Oncology. 2010;28 (15):2625-2634,
53
11. Ries LA, Kosary CL, Hankey BF et al. SEER cancer statistics review 1973 – 1976,
Bethesda, Md. National Cancer institute 1999.
12. Shah A, Coleman MP. Increasing incidence of childhood leukemia; a controversy
reexamined. Br J Cancer. 2007 Oct ;97(7): 1009 – 1012.
13. Hrugak O, Trika J, Zuna J et al. Acute lymphoblastic leukemia incidences during social
economic transition; selective increase in children from1-4 years. Leukemia J. 2002
April; 16 (4): 720 – 725.
14. www.medindia.net Acute lymphoblastic leukemia. (accessed 11 september 2011)
15. Swensen AR, Ross JA, Severson RK et al. The age Peak in Childhood Acute
Lymphoblastic leukemia ;Exploring the potential relationship with social economic
status. Cancer. 1997 May 15; 79(10):2045-2051.
16. Kasili E. et al; Leukemia in Kenya. Doctor of medicine theses submitted to the university
of Nairobi 1979.
17. Carroll WL, Bhojwan D, Min DJ, et al;Paedietric acute Lymphoblastic leukemia .
Hematology. Am soc Hematol Edu program. 2003;102-131.
18. Smith M, Arthur D, Camitta B, et al.Uniform approach to risk classification and
treatment assignment for children with acute lymphoblastic leukemia. J Clin Oncology.
1996;14(1): 18-24
19. Morickle A, Zimmerman M, Relter A et al. Prognostic impact of age in children and
adolescents with acute lymphoblastic leukemia : data from the trials ALL BFM 86 , 90
and 95 klin pediatr. 2005 dec; 217 (6): 310 -320.
54
20. Reaman GH, sposto R, Sensel MG et al. Treatment outcome and prognostic factors for
infants with acute lymphoblastic leukemia treated on two consecutive trials of the
children‟s cancer group. J clin oncology.1999; 17(2): 445-455.
21. Kosaka Y, Koh K , Kinukawa N et al. Infant acute lymphoblastic leukemia with MLL
gene rearrangements outcome following intensive chemotherapy and hematopoietic stem
all transplantation. Blood. 2004; 104 (12): 3527-3534.
22. Pieters R, Schrappe M, De Lorenzo P et al. A treatment protocol for infants younger than
1 year with acute lymphoblastic leukemia (interfant 99); an observational study and a
multicentre randomized trial. Lancet. 2007; 370(9583):240-250.
23. Nagayama J, Tomizawa D, Koh K et al. Infants with acute lymphoblastic leukemia and
germline MLL gene are highly curable with use of chemotherapy alone, results from the
Japan infant Leukemia study group. Blood. 2006; 107(12): 4663-4665.
24. Smith M, Arther D, Camilla et al. Uniform approach to risk classification and treatment
assignments for children with acute lymphoblastic Leukemia. J.Clin Oncology. 1996;
14(1): 18-20.
25. Burger B, Zimmermann M, Mann G et al. Diagnostic cerespinal fluid examination in
children with acute lymphoblastic leukemia ; significance of low leukocyte counts with
blasts of a traumatic lumbar puncture. J. Clin oncology.2003; 21(2): 184-188.
26. Pui CH, campana D, pel D et al. Treating childhood acute lymphoblastic leukemia
without cranial irradiation .N Engl J Med. 2009; 360 (26) : 2730-2741.
27. (http://www.cancer.gov/cancer topics/pda /ALL Child treatment. (Accessed 29 September
2011)
55
28. Pui CH, Boyett JM, Relling MV et al. Sex differences in prognosis for children with acute
lymphoblastic leukemia. J clin Oncology.1999; 17(3): 818-824.
29. Bhatia S. Influence of race and social economic status on Outcome of children treated for
childhood acute Lymphoblastic leukemia. Curr opinion paedietr. 2004; 16(1):9-14.
30. Kadan Lottick NS, Ness KK, Bhatia S et al. Survival variability by race and ethnicity in
childhood acute lymphoblastic leukemia. JAMA. 2003; 290(15):2008-2014.
31. Moorman AV, Ensor HM, Richard SM et al. Prognostic effect of chromosomal
abnormalities in childhood B- cell Precursor acute lymphoblastic leukemia results from
UK medical research council ALL 97/99 randomized trial. Lancet Oncol. 2010; 11 (5):
429-438.
32. Relling MV, Hancock ML, Boyett JM et al. Prognostic importance of 6-mercaptopurine
dose intensity in acute lymphoblastic leukemia. Blood. 1999; 93 (9) 2817-2823.
33. Stanulla jM, Schaeffeller E ,Flohr T et al. Thiopurine methyltransferase (TPMT)
genotype and ealier treatment response to mercaptopurine in childhood Acute
Lymphoblastic Leukemia. JAMA. 2005; 293 (12): 1485-1489.
34. Relling MV, Dervieux T: Pharmacogenetics and cancer therapy. Nat Rev Cancer. 2001; 1
(2): 99-108.
35. Gaynon PS, Desai AA, Bostrom BC, et al. Early response to therapy and outcome in
childhood acute lymphoblastic leukemia: a review. Cancer. 1997; 80 (9): 1717-1726.
36. Schrappe M, Reiter A, Ludwig WD, et al. Improved outcome in childhood acute
lymphoblastic leukemia despite reduced use of anthracyclines and cranial radiotherapy:
results of trial ALL-BFM 90. German-Austrian-Swiss ALL-BFM Study Group. Blood.
2000; 95 (11): 3310-3322.
56
37. Lauten M, Stanulla M, Zimmermann M, et al. Clinical outcome of patients with childhood
acute lymphoblastic leukaemia and an initial leukaemic blood blast count of less than
1000 per microlitre. Klin Padiatr. 2001Jul-Aug; 213 (4): 169-174.
38. Manabe A, Ohara A, Hasegawa D, et al.: Significance of the complete clearance of
peripheral blasts after 7 days of prednisolone treatment in children with acute
lymphoblastic leukemia: The Tokyo Children's Cancer Study Group Study L99-15.
Hematology 2008; 93 (8): 1155-1160.
39. Griffin TC, Shuster JJ, Buchanan GR, et al. Slow disappearance of peripheral blood blasts
is an adverse prognostic factor in childhood T cell acute lymphoblastic leukemia: a
Pediatric Oncology Group study. Leukemia. 2000; 14 (5): 792-795.
40. Silverman LB, Gelber RD, Young ML, et al. Induction failure in acute lymphoblastic
leukemia of childhood. Cancer. 1999; 85 (6): 1395-1404.
41. Shalapour S, Hof J, Kiurschner –schwabe R, et al. High VLA -4 expression is associated
with adverse outcome and distinct gene expression changes in childhood, B-cell precursor
acute Lymphoblastic leukemia at first Relapse. Hematologica. 2011Aug 9th
.
42. www.medicinenet.com/acute lymphoblastic leukemia Accessed 21September 2011.
43. Jackson G,Jones G. Leukemia. Clinical pharmacy and therapeutics by Roger Walker,cate
W.Churchil Livingstone 4th
edition 2008:719.
44. Helen L,Bertsy B.Acute leukemias in pharmacotherapy.Apathophysiologic approach by
Dipiro et al.Mc Graw Hill 7th
Ed.2008:2265
45. Mwanda W.O. Kasili‟s synopsis of the management of pediatric cancers in Kenya pg 83-
85.
57
46. Veerman AJ , Hahlen k, Kamps WA, et al. High cure rate with moderately intensive
treatment regimen in non – high risk childhood acute lymphoblastic leukemia. Results of
protocol ALL IV from the Dutch childhood study group. J Clin Oncology. 1996(3); 14(3):
911-918.
47. Tzortazatou-stathopduius F, Papa dopo Ulou AL,Moschovi m et al. Low relapse rate in
children with acute lympho blastic Leukemia after risk directed therapy. J. paed Hem
oncology. 2001(12); 23(9):591-597.
48. Advan S, Pai S, Venzon D, et al. Acute Lymphoblastic Leukemia in India; an analysis of
prognostic factors using a single treatment regimen. Ann oncol. 1999(2); 10(2):167-176.
49. Steinherz PG, Gaynon PS, Breneman JC, et al. Treatment of patients with acute
Lymphoblastic Leukemia with bulky extramedullary disease and T-Cell of other poor
prognostic features randomized controlled trial from the children‟scancer
groups.Cancer.1998 Feb 1st;82(3): 600-612.
50. Pui CH,William E Evans, Treatment of acute Lymphoblastic Leukemia. N Eng J. Med.
2006 Jan; 254: 166 -178.
51. Lisa Lyngsie, Klaus Rostgaad et al. Age- and Sex- Specific Incidence of Childhood
Leukaemia by Immunophenotype in the Nordic Countries. J. Nat Ca Inst. 2003 Oct; 95:
20.
52. Hunger SP,Lu X,Derida SM et al.Improoved survival for children and adolescents with
acute lymphoblastic leukemia between 1990 and 2005:A report from the childrens
oncology group.j clin oncol. 2012 mar 12.
53. http.//emedicine.medscape.com/article/207631 Acute lymphoblastic leukemia clinical
presentation.(accessed 14 October 2012)
58
54. Hussein H,Sidhom I,Naga SA et al.Outcome and prognostic factors of acute lymphblastic
leukemia in children at the national cancer institute, Egypt.J peadiatr hematol oncol. 2004
Aug 26(8): 507-514.
55. Asim M, Zaisi A, Ghatoor T et al.Death analysis of childhood acute lymphoblastic
leukemia; experience at Shaukat Khanum memorial cancer hospital and research centre,
Pakinstan .J pak med assoc. 2011 July 61(7): 666-670.
56. Lund B, Asberg A, Heyman M et al.Risk factors for treatment related mortality in
childhood acute lymphoblastic leukemia;Nordic society of pediatric hematology and
oncology.Pediatr blood cancer.2011 Apri 56(4):551-559.
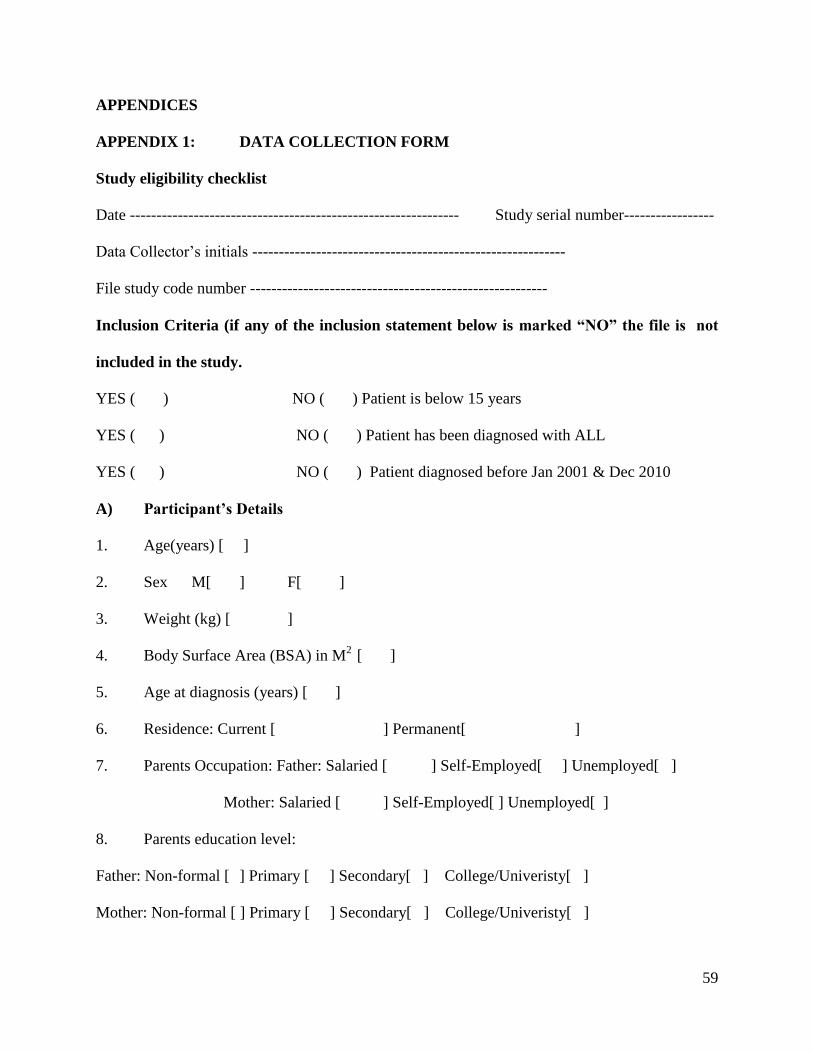
59
APPENDICES
APPENDIX 1: DATA COLLECTION FORM
Study eligibility checklist
Date -------------------------------------------------------------- Study serial number-----------------
Data Collector‟s initials -----------------------------------------------------------
File study code number --------------------------------------------------------
Inclusion Criteria (if any of the inclusion statement below is marked “NO” the file is not
included in the study.
YES ( ) NO ( ) Patient is below 15 years
YES ( ) NO ( ) Patient has been diagnosed with ALL
YES ( ) NO ( ) Patient diagnosed before Jan 2001 & Dec 2010
A) Participant’s Details
1. Age(years) [ ]
2. Sex M[ ] F[ ]
3. Weight (kg) [ ]
4. Body Surface Area (BSA) in M2
[ ]
5. Age at diagnosis (years) [ ]
6. Residence: Current [ ] Permanent[ ]
7. Parents Occupation: Father: Salaried [ ] Self-Employed[ ] Unemployed[ ]
Mother: Salaried [ ] Self-Employed[ ] Unemployed[ ]
8. Parents education level:
Father: Non-formal [ ] Primary [ ] Secondary[ ] College/Univeristy[ ]
Mother: Non-formal [ ] Primary [ ] Secondary[ ] College/Univeristy[ ]
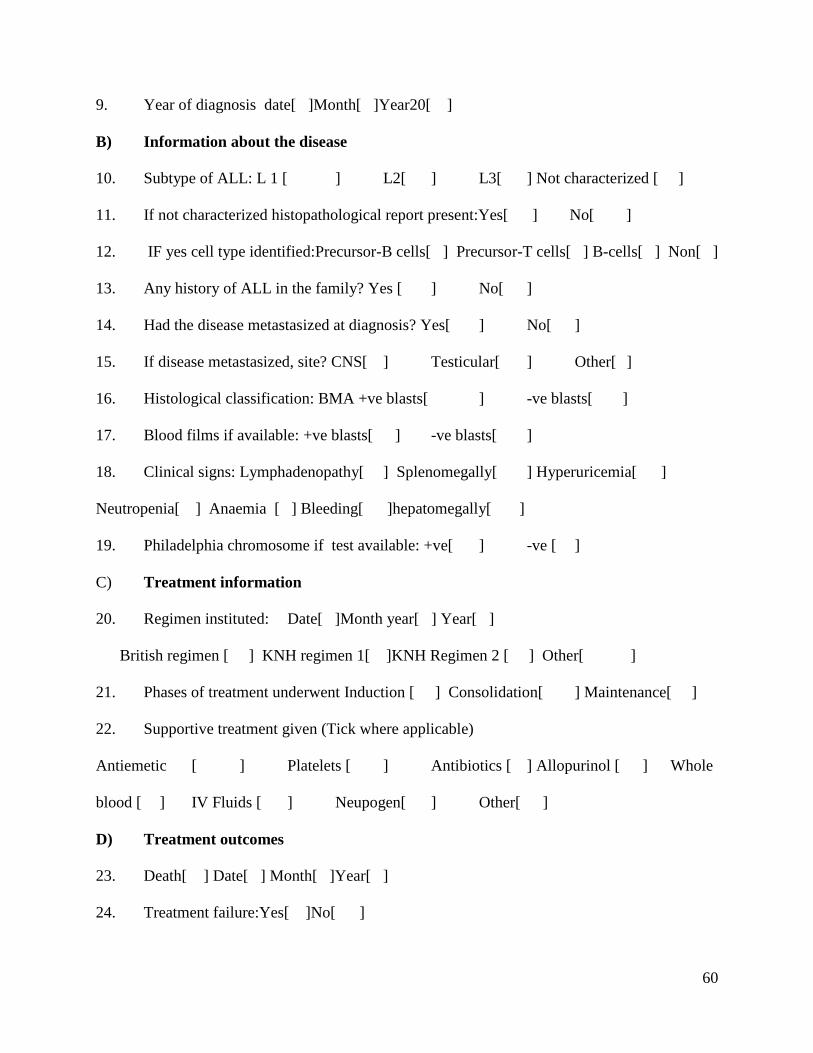
60
9. Year of diagnosis date[ ]Month[ ]Year20[ ]
B) Information about the disease
10. Subtype of ALL: L 1 [ ] L2[ ] L3[ ] Not characterized [ ]
11. If not characterized histopathological report present:Yes[ ] No[ ]
12. IF yes cell type identified:Precursor-B cells[ ] Precursor-T cells[ ] B-cells[ ] Non[ ]
13. Any history of ALL in the family? Yes [ ] No[ ]
14. Had the disease metastasized at diagnosis? Yes[ ] No[ ]
15. If disease metastasized, site? CNS[ ] Testicular[ ] Other[ ]
16. Histological classification: BMA +ve blasts[ ] -ve blasts[ ]
17. Blood films if available: +ve blasts[ ] -ve blasts[ ]
18. Clinical signs: Lymphadenopathy[ ] Splenomegally[ ] Hyperuricemia[ ]
Neutropenia[ ] Anaemia [ ] Bleeding[ ]hepatomegally[ ]
19. Philadelphia chromosome if test available: +ve[ ] -ve [ ]
C) Treatment information
20. Regimen instituted: Date[ ]Month year[ ] Year[ ]
British regimen [ ] KNH regimen 1[ ]KNH Regimen 2 [ ] Other[ ]
21. Phases of treatment underwent Induction [ ] Consolidation[ ] Maintenance[ ]
22. Supportive treatment given (Tick where applicable)
Antiemetic [ ] Platelets [ ] Antibiotics [ ] Allopurinol [ ] Whole
blood [ ] IV Fluids [ ] Neupogen[ ] Other[ ]
D) Treatment outcomes
23. Death[ ] Date[ ] Month[ ]Year[ ]
24. Treatment failure:Yes[ ]No[ ]
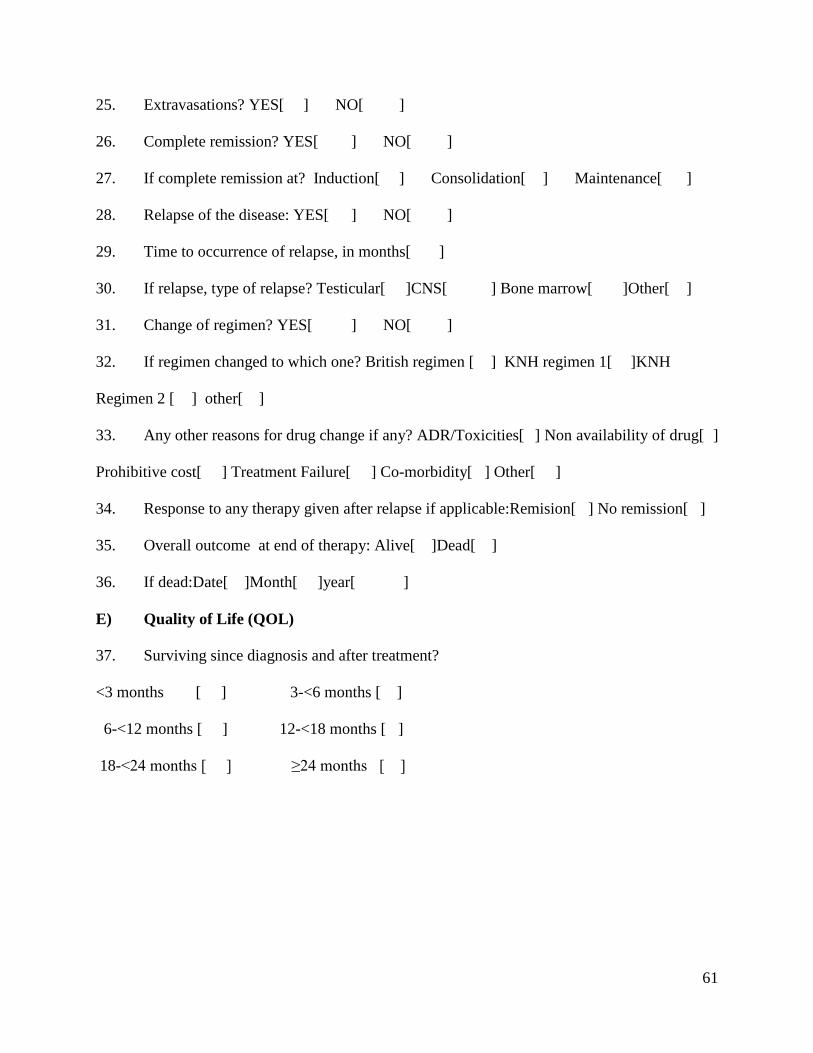
61
25. Extravasations? YES[ ] NO[ ]
26. Complete remission? YES[ ] NO[ ]
27. If complete remission at? Induction[ ] Consolidation[ ] Maintenance[ ]
28. Relapse of the disease: YES[ ] NO[ ]
29. Time to occurrence of relapse, in months[ ]
30. If relapse, type of relapse? Testicular[ ]CNS[ ] Bone marrow[ ]Other[ ]
31. Change of regimen? YES[ ] NO[ ]
32. If regimen changed to which one? British regimen [ ] KNH regimen 1[ ]KNH
Regimen 2 [ ] other[ ]
33. Any other reasons for drug change if any? ADR/Toxicities[ ] Non availability of drug[ ]
Prohibitive cost[ ] Treatment Failure[ ] Co-morbidity[ ] Other[ ]
34. Response to any therapy given after relapse if applicable:Remision[ ] No remission[ ]
35. Overall outcome at end of therapy: Alive[ ]Dead[ ]
36. If dead:Date[ ]Month[ ]year[ ]
E) Quality of Life (QOL)
37. Surviving since diagnosis and after treatment?
<3 months [ ] 3-<6 months [ ]
6-<12 months [ ] 12-<18 months [ ]
18-<24 months [ ] ≥24 months [ ]
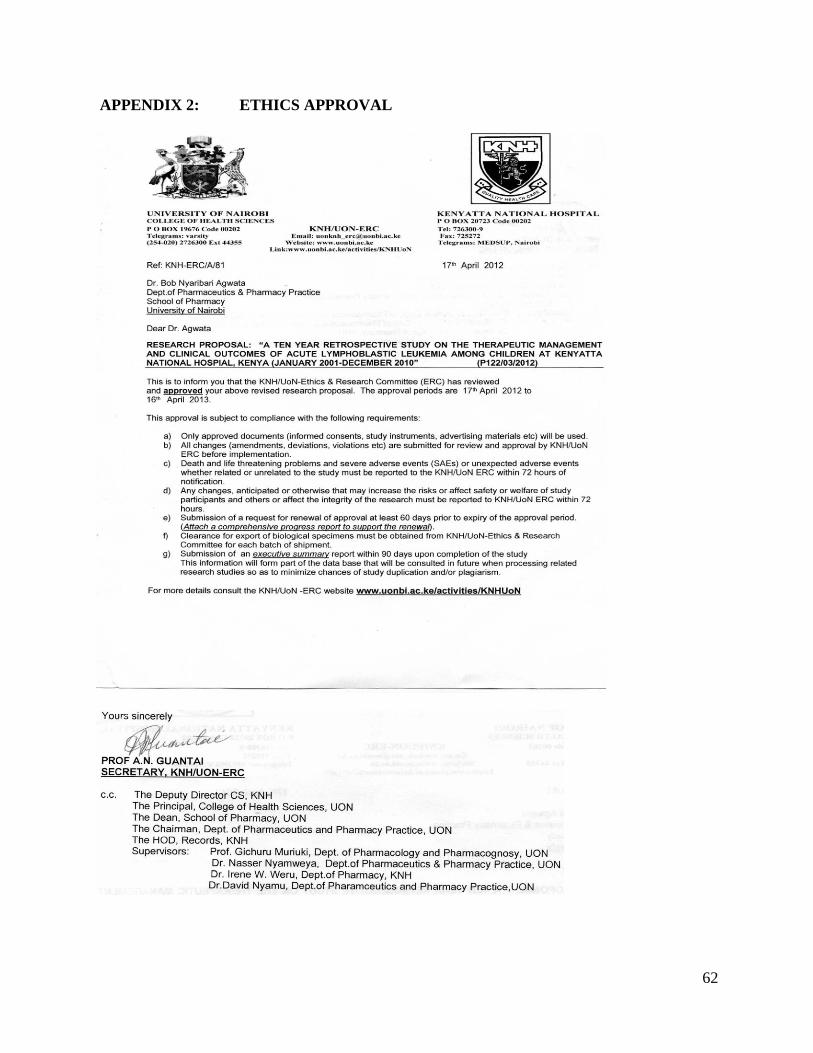
62
APPENDIX 2: ETHICS APPROVAL
Related Documents