Behavioral/Systems/Cognitive A Temporal Hierarchy for Conspecific Vocalization Discrimination in Humans Marzia De Lucia, 1 Stephanie Clarke, 2 and Micah M. Murray 1,2,3,4 1 Electroencephalography Brain Mapping Core, Center for Biomedical Imaging, 2 Neuropsychology and Neurorehabilitation Service, Department of Clinical Neurosciences, and 3 Radiology Department, Vaudois University Hospital Center and University of Lausanne, 1011 Lausanne, Switzerland, and 4 Department of Hearing and Speech Sciences, Vanderbilt University, Nashville, Tennessee 37235 The ability to discriminate conspecific vocalizations is observed across species and early during development. However, its neurophys- iologic mechanism remains controversial, particularly regarding whether it involves specialized processes with dedicated neural ma- chinery. We identified spatiotemporal brain mechanisms for conspecific vocalization discrimination in humans by applying electrical neuroimaging analyses to auditory evoked potentials (AEPs) in response to acoustically and psychophysically controlled nonverbal human and animal vocalizations as well as sounds of man-made objects. AEP strength modulations in the absence of topographic modulations are suggestive of statistically indistinguishable brain networks. First, responses were significantly stronger, but topograph- ically indistinguishable to human versus animal vocalizations starting at 169 –219 ms after stimulus onset and within regions of the right superior temporal sulcus and superior temporal gyrus. This effect correlated with another AEP strength modulation occurring at 291–357 ms that was localized within the left inferior prefrontal and precentral gyri. Temporally segregated and spatially distributed stages of vocalization discrimination are thus functionally coupled and demonstrate how conventional views of functional specialization must incorporate network dynamics. Second, vocalization discrimination is not subject to facilitated processing in time, but instead lags more general categorization by 100 ms, indicative of hierarchical processing during object discrimination. Third, although differences between human and animal vocalizations persisted when analyses were performed at a single-object level or extended to include addi- tional (man-made) sound categories, at no latency were responses to human vocalizations stronger than those to all other categories. Vocalization discrimination transpires at times synchronous with that of face discrimination but is not functionally specialized. Introduction Vocalizations are essential in communication and social interac- tions, conveying the speaker’s identity, gender, intentions, and emotional state. Whether processing conspecific vocalizations recruits dedicated brain resources remains highly controversial. Studies in nonhuman primates demonstrated response sensitiv- ity to conspecific vocalizations within temporal regions. Some argue for selectivity within circumscribed rostral regions (Tian et al., 2001). Others emphasize distributed mechanisms (Poremba et al., 2004; Cohen et al., 2006; Petkov et al., 2008; Recanzone, 2008; Russ et al., 2008; Staeren et al., 2009). In humans, voice recognition deficits (phonagnosia) after (right) temporo-parietal brain lesions can dissociate from aphasia and agnosia (Assal et al., 1981; Van Lancker and Canter, 1982), but frequently cooccur with amusia (Peretz et al., 1994) or can even be observed in the absence of gross structural damage (Garrido et al., 2009). Hemo- dynamic imaging has documented selective responsiveness to human vocalizations within the middle and anterior superior temporal sulcus (STS) (Belin et al., 2000). Interpreting these data in terms of functional selectivity is not straightforward. The speech content of the stimuli may strongly contribute to selective effects (Belin et al., 2000; Fecteau et al., 2004), as can the har- monic structure of sounds, which is greater in vocalizations (Lewis et al., 2005, 2009) (for data showing attention-driving modulations with identical acoustic stimuli, see also von Krieg- stein et al., 2003). Another consideration is that, as in monkeys, effects can extend to regions beyond the STS (von Kriegstein et al., 2003, 2007; Fecteau et al., 2005), highlighting the importance of high spatial and temporal resolution for ascertaining when/ where functional selectivity originates within distributed brain networks. Despite the suitability of auditory evoked potentials (AEPs) for addressing brain dynamics, extant studies have produced discordant results with limited interpretational power. Levy et al. (2001, 2003) documented an attention-dependent “voice-specific response” peaking at 320 ms after stimulus onset. But this effect may instead reflect living versus man-made categorization (Murray et al., 2006) because voices were only contrasted with musical instru- ments. Charest et al. (2009) compared responses to human vo- calizations (speech and nonspeech) with those to environmental Received May 2, 2010; revised July 5, 2010; accepted July 8, 2010. This work was supported by Swiss National Science Foundation Grants 3100AO-118419 (M.M.M.), 3100AO- 103895 (S.C.), and K-33K1_122518/1 (M.D.L.), and the Leenaards Foundation 2005 Prize for the Promotion of Scientific Research (M.M.M.). Cartool software was programmed by Denis Brunet (Functional Brain Mapping Labo- ratory, Geneva, Switzerland) and is supported by the EEG Brain Mapping Core of the Center for Biomedical Imaging. Christoph Michel and Jean-Franc ¸ois Knebel provided additional analysis tools. Christian Camen assisted with data collection. Correspondence should be addressed to Micah M. Murray, Electroencephalography Brain Mapping Core, Center for Biomedical Imaging, Radiology, BH08.078, Vaudois University Hospital Center, rue du Bugnon 46, 1011 Lau- sanne, Switzerland. E-mail: [email protected]. DOI:10.1523/JNEUROSCI.2239-10.2010 Copyright © 2010 the authors 0270-6474/10/3011210-12$15.00/0 11210 • The Journal of Neuroscience, August 18, 2010 • 30(33):11210 –11221

Welcome message from author
This document is posted to help you gain knowledge. Please leave a comment to let me know what you think about it! Share it to your friends and learn new things together.
Transcript
Behavioral/Systems/Cognitive
A Temporal Hierarchy for Conspecific VocalizationDiscrimination in Humans
Marzia De Lucia,1 Stephanie Clarke,2 and Micah M. Murray1,2,3,4
1Electroencephalography Brain Mapping Core, Center for Biomedical Imaging, 2Neuropsychology and Neurorehabilitation Service, Department of ClinicalNeurosciences, and 3Radiology Department, Vaudois University Hospital Center and University of Lausanne, 1011 Lausanne, Switzerland, and4Department of Hearing and Speech Sciences, Vanderbilt University, Nashville, Tennessee 37235
The ability to discriminate conspecific vocalizations is observed across species and early during development. However, its neurophys-iologic mechanism remains controversial, particularly regarding whether it involves specialized processes with dedicated neural ma-chinery. We identified spatiotemporal brain mechanisms for conspecific vocalization discrimination in humans by applying electricalneuroimaging analyses to auditory evoked potentials (AEPs) in response to acoustically and psychophysically controlled nonverbalhuman and animal vocalizations as well as sounds of man-made objects. AEP strength modulations in the absence of topographicmodulations are suggestive of statistically indistinguishable brain networks. First, responses were significantly stronger, but topograph-ically indistinguishable to human versus animal vocalizations starting at 169 –219 ms after stimulus onset and within regions of the rightsuperior temporal sulcus and superior temporal gyrus. This effect correlated with another AEP strength modulation occurring at 291–357ms that was localized within the left inferior prefrontal and precentral gyri. Temporally segregated and spatially distributed stages ofvocalization discrimination are thus functionally coupled and demonstrate how conventional views of functional specialization mustincorporate network dynamics. Second, vocalization discrimination is not subject to facilitated processing in time, but instead lags moregeneral categorization by �100 ms, indicative of hierarchical processing during object discrimination. Third, although differencesbetween human and animal vocalizations persisted when analyses were performed at a single-object level or extended to include addi-tional (man-made) sound categories, at no latency were responses to human vocalizations stronger than those to all other categories.Vocalization discrimination transpires at times synchronous with that of face discrimination but is not functionally specialized.
IntroductionVocalizations are essential in communication and social interac-tions, conveying the speaker’s identity, gender, intentions, andemotional state. Whether processing conspecific vocalizationsrecruits dedicated brain resources remains highly controversial.Studies in nonhuman primates demonstrated response sensitiv-ity to conspecific vocalizations within temporal regions. Someargue for selectivity within circumscribed rostral regions (Tian etal., 2001). Others emphasize distributed mechanisms (Porembaet al., 2004; Cohen et al., 2006; Petkov et al., 2008; Recanzone,2008; Russ et al., 2008; Staeren et al., 2009). In humans, voicerecognition deficits (phonagnosia) after (right) temporo-parietalbrain lesions can dissociate from aphasia and agnosia (Assal et al.,1981; Van Lancker and Canter, 1982), but frequently cooccur
with amusia (Peretz et al., 1994) or can even be observed in theabsence of gross structural damage (Garrido et al., 2009). Hemo-dynamic imaging has documented selective responsiveness tohuman vocalizations within the middle and anterior superiortemporal sulcus (STS) (Belin et al., 2000). Interpreting these datain terms of functional selectivity is not straightforward. Thespeech content of the stimuli may strongly contribute to selectiveeffects (Belin et al., 2000; Fecteau et al., 2004), as can the har-monic structure of sounds, which is greater in vocalizations(Lewis et al., 2005, 2009) (for data showing attention-drivingmodulations with identical acoustic stimuli, see also von Krieg-stein et al., 2003). Another consideration is that, as in monkeys,effects can extend to regions beyond the STS (von Kriegstein etal., 2003, 2007; Fecteau et al., 2005), highlighting the importanceof high spatial and temporal resolution for ascertaining when/where functional selectivity originates within distributed brainnetworks.
Despite the suitability of auditory evoked potentials (AEPs) foraddressing brain dynamics, extant studies have produced discordantresults with limited interpretational power. Levy et al. (2001, 2003)documented an attention-dependent “voice-specific response”peaking at 320 ms after stimulus onset. But this effect may insteadreflect living versus man-made categorization (Murray et al.,2006) because voices were only contrasted with musical instru-ments. Charest et al. (2009) compared responses to human vo-calizations (speech and nonspeech) with those to environmental
Received May 2, 2010; revised July 5, 2010; accepted July 8, 2010.This work was supported by Swiss National Science Foundation Grants 3100AO-118419 (M.M.M.), 3100AO-
103895 (S.C.), and K-33K1_122518/1 (M.D.L.), and the Leenaards Foundation 2005 Prize for the Promotion ofScientific Research (M.M.M.). Cartool software was programmed by Denis Brunet (Functional Brain Mapping Labo-ratory, Geneva, Switzerland) and is supported by the EEG Brain Mapping Core of the Center for Biomedical Imaging.Christoph Michel and Jean-Francois Knebel provided additional analysis tools. Christian Camen assisted with datacollection.
Correspondence should be addressed to Micah M. Murray, Electroencephalography Brain Mapping Core, Centerfor Biomedical Imaging, Radiology, BH08.078, Vaudois University Hospital Center, rue du Bugnon 46, 1011 Lau-sanne, Switzerland. E-mail: [email protected].
DOI:10.1523/JNEUROSCI.2239-10.2010Copyright © 2010 the authors 0270-6474/10/3011210-12$15.00/0
11210 • The Journal of Neuroscience, August 18, 2010 • 30(33):11210 –11221
sounds or bird songs. Voice-related AEP waveform modulationsbegan 164 ms after stimulus onset, but additional analyses revealedtheir effect was mostly (if not wholly) driven by the speech content ofthe stimuli and/or acoustic differences. Moreover, because theseAEP studies analyzed voltage waveforms, the latency and spatial dis-tribution of statistical effects are valid only for the chosen reference(i.e., variance changes with the reference) and therefore have nounequivocal neurophysiologic validity (Murray et al., 2008).Consequently, the spatiotemporal brain mechanisms mediatingconspecific vocalization discrimination in humans remain un-clear. We applied electrical neuroimaging analyses to AEPs frompsychophysically and acoustically controlled sounds to disam-biguate whether vocalization discrimination relies on dedicatedneural mechanisms. Such would be predicted to recruit distinctbrain regions and to therefore result in topographic AEP differ-ences. More generally, by including analyses of a wide range ofobject categories and also by performing analyses on responses toindividual auditory objects in a manner akin to that typicallyperformed in nonhuman primates, we disambiguated categoricalprocesses from low-level acoustic analyses.
Materials and MethodsParticipants. Ten healthy, right-handed individuals (seven females), aged21–34 years, participated. All subjects provided written, informed con-sent to participate in the study, the procedures of which were approvedby the Ethics Committee of the University of Geneva. None had ahistory of neurological or psychiatric illnesses, and all reported nor-mal hearing. Data from these individuals have been previously pub-lished in an investigation of living versus man-made categoricaldiscrimination (Murray et al., 2006) as well as in a study examiningresponses to subclasses of man-made sounds (De Lucia et al., 2009).The primary analyses in the present study are thus a more extensiveanalysis of these data (i.e., the AEPs to specific subclasses of livingstimuli; with additional analyses including AEPs to subsets of soundsof man-made objects, detailed below). Plus, AEPs were calculated inresponse to single vocalizations.
Stimuli. Auditory stimuli were complex, meaningful sounds (16 bitstereo; 22,500 Hz digitization) [for a full listing, including details on theacoustic attributes as well as psychometrics concerning these stimuli, seeMurray et al. (2006), their Table 1]. There were 120 different sound filesin total, 60 of which represented sounds of living objects (3 exemplars of20 different referent objects) and 60 of which represented sounds ofman-made objects (3 exemplars of 20 different reference objects). Eachsound was 500 ms in duration, which included an envelope of 50 msdecay time that was applied to the end of the sound file to minimize clicksat sound offset. All sounds were further normalized according to the rootmean square of their amplitude. Our previous work has demonstrated
that the sounds used in this study were allhighly familiar as well as reliably identified witha high level of confidence (see also supplemen-tal table, available at www.jneurosci.org as sup-plemental material) (Murray et al., 2009a; DeLucia et al., 2010b).
The 60 sound files that were the focus of thepresent investigation were restricted to those ofliving objects, which were further sorted be-tween human nonverbal vocalizations and an-imal vocalizations (hereafter, human andanimal sounds, respectively). The 8 humansounds included 3 exemplars each of the fol-lowing (i.e., a total of 24 unique sound files):whistling, sneezing, screaming, laughing, gar-gling, coughing, clearing one’s throat, andcrying. The 12 animal sounds included 3 exem-plars each of the following animals’ stereotypicalvocalizations (i.e., a total of 36 unique soundfiles): sheep, rooster, pig, owl, frog, donkey, dog,crow, cow, chicken, cat, and birds.
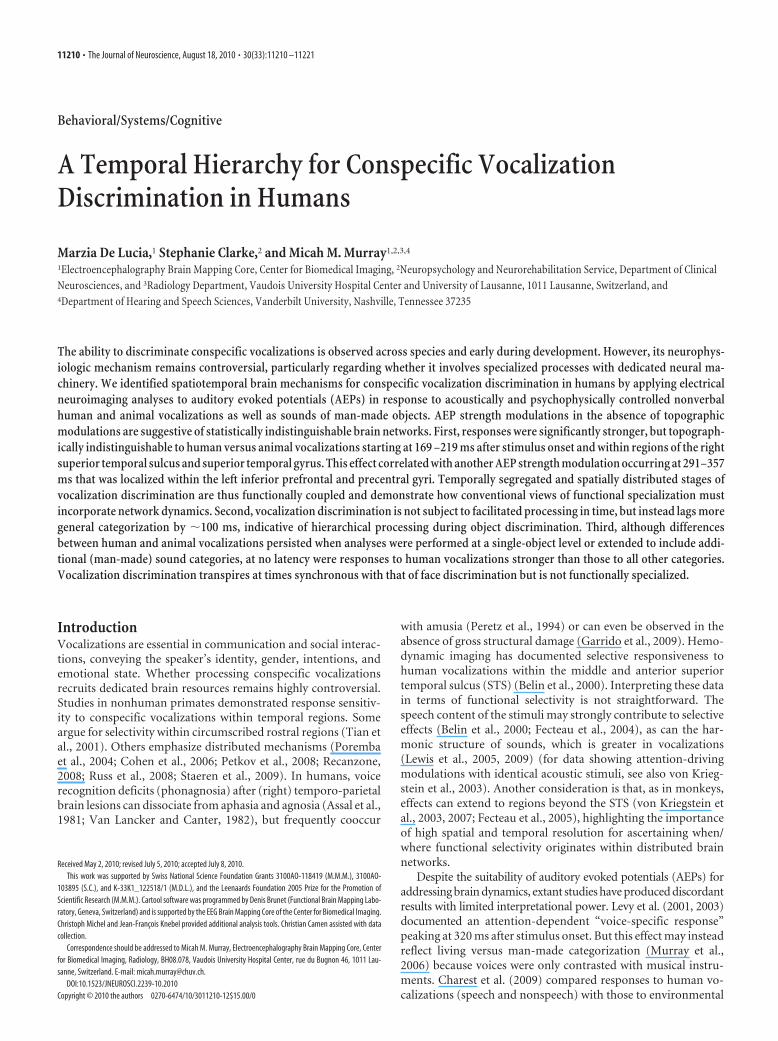
To assess whether these groups of human and animal vocalizationsdiffered acoustically, we statistically compared the spectrograms (definedwith Matlab’s spectrogram function with no overlapping and zero pad-ding), using a time–frequency bin width of �5 ms and �74 Hz. Statisti-cal contrasts entailed a series of nonparametric t tests based on abootstrapping procedure with 5000 iterations per time–frequency bin toderive an empirical distribution against which to compare the actualdifference between the mean spectrograms from each sound category(Aeschlimann et al., 2008; Knebel et al., 2008; De Lucia et al., 2009,2010b). Note that there was no grouping or averaging of the spectro-grams either for a given object or for a given category. Also, it should benoted that this analysis provides complementary (and in some regardsmore comprehensive) information to an analysis of formants, the latterof which would lack the temporal information provided in the spectro-gram analysis. A significant difference at a given time–frequency bin wasonly considered reliable if all eight of its immediately adjacent bins alsoyielded values of p � 0.05 (i.e., a 3 � 3 bin spatial threshold was applied).This constitutes a minimal level of correction for multiple contrastsand time–frequency autocorrelation, as we were particularly inter-ested in this analysis being overly sensitive to acoustic differences.Nonetheless, there were no statistically reliable differences betweenthe spectrograms from each group of sounds (Fig. 1). Individualsound files of course differed one from the other to render the soundreferent identifiable and unique.
The groups of sounds were likewise compared in terms of their meanharmonics-to-noise ratio (HNR), which was calculated using PRAATsoftware (http://www.fon.hum.uva.nl/praat/). HNR provides an indexof the ratio of the energy contained in the harmonics versus nonharmon-ics of a sound. The mean (�SEM) HNR for the 24 human sounds was9.7 � 1.6 (range, �0.1 to 27.1), and for the 36 animal sounds was 9.1 �1.2 (range, 0.0 to 29.1). These values did not significantly differ ( p �0.75). Thus, although HNR may contribute to the general processing ofvocalizations (Lewis et al., 2005, 2009), it should not differentially con-tribute to processing our set of human and animal vocalizations.
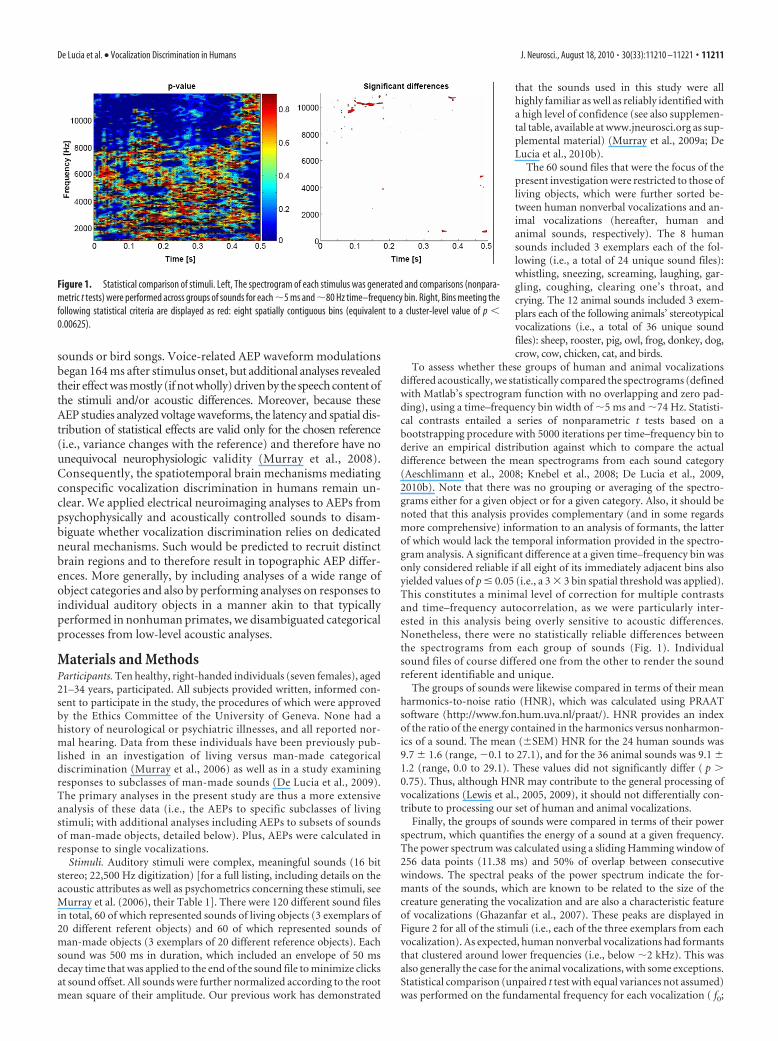
Finally, the groups of sounds were compared in terms of their powerspectrum, which quantifies the energy of a sound at a given frequency.The power spectrum was calculated using a sliding Hamming window of256 data points (11.38 ms) and 50% of overlap between consecutivewindows. The spectral peaks of the power spectrum indicate the for-mants of the sounds, which are known to be related to the size of thecreature generating the vocalization and are also a characteristic featureof vocalizations (Ghazanfar et al., 2007). These peaks are displayed inFigure 2 for all of the stimuli (i.e., each of the three exemplars from eachvocalization). As expected, human nonverbal vocalizations had formantsthat clustered around lower frequencies (i.e., below �2 kHz). This wasalso generally the case for the animal vocalizations, with some exceptions.Statistical comparison (unpaired t test with equal variances not assumed)was performed on the fundamental frequency for each vocalization ( f0;
Figure 1. Statistical comparison of stimuli. Left, The spectrogram of each stimulus was generated and comparisons (nonpara-metric t tests) were performed across groups of sounds for each �5 ms and �80 Hz time–frequency bin. Right, Bins meeting thefollowing statistical criteria are displayed as red: eight spatially contiguous bins (equivalent to a cluster-level value of p �0.00625).
De Lucia et al. • Vocalization Discrimination in Humans J. Neurosci., August 18, 2010 • 30(33):11210 –11221 • 11211
indicated by dots in Fig. 2). First, this was done without averaging thef0 values for the three exemplars of a given object (i.e., so that therewere 60 f0 values; 24 for human vocalizations and 36 for animalvocalizations). There was no evidence that the f0 values differed (0.71 vs0.86 kHz; t(52.6) � 0.71; p � 0.48). Next, we repeated this analysis afterfirst averaging the f0 values across the three exemplars of a given object(i.e., so that there were 20 f0 values; 8 for human vocalizations and 12 foranimal vocalizations). There was no evidence that the f0 values differed(t(16.3) � 0.41; p � 0.69). This was done because the single-object AEPswere calculated by averaging epochs from different exemplars of thesame object (to obtain sufficient signal quality). Thus, we could in turnevaluate whether there was a systematic relationship between thesesingle-object AEPs and their corresponding f0 values.
The other 60 sound files were those of man-made objects. AEPs inresponse to these sounds were included in an analysis targeted at the issueof whether sounds of human vocalizations yielded significantly strongerresponses not only with respect to animal vocalizations, but also moregenerally with respect to other categories of environmental sounds.These sounds of man-made objects were subdivided between musicalinstruments and objects associated with a specific sociofunctional con-text (hereafter “music” and “nonmusic,” respectively). The 10 musicsounds included exemplars of notes being played on the following mu-sical instruments (three exemplars per object): accordion, flute, guitar,harmonica, harp, organ, piano, saxophone, trumpet, and violin (i.e.,both string and brass instruments involving mouth and hand actions).We would emphasize that these stimuli were neither rhythmic nor me-lodic in character and were not perceived as music, but rather in terms ofthe instrument generating the sound. We would also note that none of
the participants were musicians or had extensive musical training. The 10nonmusic sounds included exemplars of the following objects (three perobject): bicycle bell, car horn, cash register, cuckoo clock, doorbell, clos-ing door, glass shattering, police siren, church bell, and telephone [i.e.,sounds that typically trigger a responsive action on being heard, as sup-ported by our previously published psychophysical experiment appear-ing in the study by De Lucia et al. (2009)]. Likewise, these two subcategoriesof sounds of man-made objects were likewise controlled at the group level interms of their acoustic features as assessed with methods akin to those de-scribed above for the evaluation of human and animal vocalizations [cf. DeLucia et al. (2009, 2010b), their supplemental Fig. 1].
Procedure and task. Participants performed a living versus man-made“oddball” detection paradigm, such that on a given block of trials “tar-get” stimuli to which subjects pressed a response button occurred 10% ofthe time. The use of sounds of living and man-made objects as targetstimuli was counterbalanced across blocks. The remaining 90% of stim-uli (“distracters”) were comprised of the other sound category. The livingand man-made stimuli were blocked into series of 300 trials (�18 min)with an interstimulus interval of 3.4 s. Each participant completed fourblocks of trials (two in which man-made sounds were targets and two inwhich living sounds were targets) and took a 5–10 min break betweenblocks to minimize fatigue. The order of blocks was varied across partic-ipants. For all the AEP analyses in this study, only blocks of trials whenthe sounds served as distracters were analyzed. This removes any con-tamination of motor-related activity from the AEPs. For example, togenerate AEPs to the music and nonmusic subcategories of man-madeobjects, we used the two blocks of trials when living sounds were thetargets and man-made sounds were the distracters. To generate AEPs to
Figure 2. Power spectra of each vocalization. Each line is the power spectrum for a single exemplar of a given vocalization. The two leftmost columns display the spectra for human vocalizations,and the three rightmost columns, the spectra for animal vocalizations. The x-axis is frequency in kilohertz, and the y-axis is in arbitrary units. The dots indicate the lowest frequency peak in eachpower spectrum for each of the sounds (i.e., f0 ). These f0 values were not significantly different between the two groups of vocalizations either when considered separately (t(52.6) � 0.71; p � 0.48)or when first averaged across the exemplars of a given object (t(16.3) � 0.41; p � 0.69).
11212 • J. Neurosci., August 18, 2010 • 30(33):11210 –11221 De Lucia et al. • Vocalization Discrimination in Humans

human and animal vocalizations, we used the two blocks of trials whenman-made sounds were the targets and living sounds were thedistracters.
Behavioral as well as EEG data were collected from all conditionsthroughout the length of the experiment, and STIM (Neuroscan) wasused to control stimulus delivery and to record behavioral responses.Audiometric quality insert earphones (supplied by Neuroscan) wereused for stimulus delivery. This paradigm is in many regards similar towhat has recently been used in studies of nonhuman primates (Petkov etal., 2008; Remedios et al., 2009). In these studies, the participants wereawake and centrally fixating, but did not perform any discrimination ofthe acoustic stimuli. Similarly, in the study by Recanzone (2008), theparticipants released a lever when the location of the stimulus changedand thus were arguably attending to spatial features of the sounds. In thepresent study, participants were attending to the auditory modality andalso to the general categories of the stimuli (i.e., whether it was living vsman-made) but did not perform any overt discrimination of humanversus animal vocalizations. In this regard, any discrimination observ-able in the AEPs can be considered as implicit. On the one hand, thisaspect of the design was intended for allowing a closer comparison withresults in animal models. Likewise, any paradigm demonstrating implicitdiscrimination would also be of relevance as a clinical examination tool.Finally, we opted for this design because previous studies have generatedconflicting evidence as to whether AEP correlates of vocalization discrim-ination rely on overt attention to the “voice-ness” of the stimuli (Levy et al.,2001, 2003; Charest et al., 2009).
EEG acquisition. Continuous 64-channelEEG was acquired through Neuroscan Syn-amps (impedances, �5 k�), referenced to thenose, bandpass filtered 0.05–200 Hz, anddigitized at 1000 Hz. In what follows, we firstdescribe the preprocessing and analysis pro-cedures for AEPs calculated across objects(hereafter across-object AEPs). We then de-tail our procedures of AEPs calculated forindividual objects (hereafter, single-objectAEPs).
Across-object AEP preprocessing. For across-object AEPs, peristimulus epochs of continu-ous EEG (�100 to 900 ms) from distractertrials were averaged from each subject sepa-rately to compute AEPs. As mentioned above,EEG from target trials was not analyzed, al-though the behavioral results reported belowrefer to these trials. Trials with blinks or eyemovements were rejected off-line, using hori-zontal and vertical electro-oculograms. An ar-tifact criterion of �100 �V was applied at allother electrodes, and each EEG epoch was alsovisually evaluated. Data from artifact elec-trodes from each subject and condition wereinterpolated using three-dimensional splines(Perrin et al., 1987). There were at least 105acceptable EEG epochs per condition (humanvocalizations, animal vocalizations, music andnonmusic AEPs) for each participant. Afterthis procedure and before group averaging,each subject’s data were 40 Hz low-pass fil-tered, baseline corrected using the �100 msprestimulus period, downsampled to a com-mon 61-channel montage, and recalculatedagainst the common average reference.
Across-object AEP analyses and source estima-tions. The first set of across-object analyses fo-cused on identifying differences in AEPs inresponse to human and animal vocalizations.This was accomplished with a multistep analy-sis procedure that we refer to as electrical neu-roimaging, examining both local and globalmeasures of the electric field at the scalp. These
analyses have been extensively detailed previously (Michel et al., 2004;Murray et al., 2008, 2009b). Briefly, they entail analyses of responsestrength and response topography to differentiate effects attributable tomodulation in the strength of responses of statistically indistinguishablebrain generators from alterations in the configuration of these generators(viz. the topography of the electric field at the scalp). That is, electricalneuroimaging analyses examine two orthogonal features of the electricfield at the scalp—its strength and topography—that have different un-derlying neurophysiologic bases. In addition, we used the local autore-gressive average distributed linear inverse solution (LAURA) (Grave dePeralta Menendez et al., 2001) to visualize and statistically contrast thelikely underlying sources of effects identified in the preceding analysissteps.
Electrical neuroimaging analyses, being reference independent, haveseveral advantages over canonical waveform analyses. The statistical out-come with voltage waveform analyses will change with the choice of thereference electrode (Murray et al., 2008). This is because the intersubject(or intermeasurement) variance at the chosen reference will forcibly bezero and in turn vary elsewhere over the electrode montage. Conse-quently, changing the reference will change the spatial distribution of thevariance and in turn the latency and distribution of statistical effects.Nonetheless, a visual impression of effects within the dataset was ob-tained by analyzing average-reference waveform data from all electrodesas a function of time poststimulus onset in a series of pairwise t tests(thresholded at p � 0.05) with correction for temporal autocorrelation at
Figure 3. a, Exemplar waveforms from a frontocentral midline electrode (FCz). These group-averaged waveforms exhibitprototypical AEP peaks. Response modulations are visually apparent from 160 ms after stimulus onset. b, The results ofmillisecond-by-millisecond paired t tests at each of the scalp electrodes from the group-averaged AEP waveforms are shown (onlyp � 0.05 with a 25 ms temporal criterion are shown).
De Lucia et al. • Vocalization Discrimination in Humans J. Neurosci., August 18, 2010 • 30(33):11210 –11221 • 11213

individual electrodes through the applicationof a 25 consecutive data point criterion for thepersistence of differential effects (i.e., 25 msduration). Note, however, that our conclu-sions are based solely on reference-independentmeasures of the electric field at the scalp.
Changes in the strength of the electric field atthe scalp were assessed using global field power(GFP) (Lehmann and Skrandies, 1980; Koenigand Melie-Garcia, 2010) from each subject andexperimental condition. Values at each timepoint were compared with a paired t test, asabove. This measure indicates the globalstrength of the response, regardless of its topo-graphic distribution. To statistically identifyperiods of topographic modulation, we calcu-lated the global dissimilarity (Lehmann andSkrandies, 1980) between responses for eachtime point and applied a Monte Carlo boot-strapping analysis procedure that is colloqui-ally referred to as topographic ANOVA(TANOVA) (Murray et al., 2008). Becauseelectric field changes are indicative of changesin the underlying generator configuration(Murray et al., 2008), this analysis provides astatistical means of determining whether andwhen brain networks mediating responses tohuman and animal vocalizations differ.
An agglomerative hierarchical clustering analysis of the AEP topogra-phy at the scalp identified time periods of stable topography, which is adata-driven means for defining AEP components (Murray et al., 2008,2009b; De Lucia et al., 2010a). The optimal number of topographies or“template maps” that accounted for the group-averaged data set (i.e., thepoststimulus periods of both conditions, collectively) was determined bya modified Krzanowski–Lai criterion (Murray et al., 2008, 2009b). Thepattern of template maps identified in the group-averaged data was thenstatistically tested in the data of each individual subject, using spatialcorrelation. The output is a measure of relative map presence for eachsubject that is in turn submitted to a repeated-measure ANOVA withfactors of condition and map. In conjunction with the aforementionedTANOVA, this procedure reveals whether AEPs from a given conditionare more often described by one map versus another, and thereforewhether different intracranial generator configurations better accountfor AEPs from each condition.
Intracranial sources were estimated using a distributed linear inversesolution and LAURA regularization approach (Grave de Peralta Menen-dez et al., 2001). LAURA uses a realistic head model, and the solutionspace included 4024 nodes, selected from a 6 � 6 � 6 mm grid equallydistributed within the gray matter of the Montreal Neurological Institute(MNI) average brain (courtesy of R. Grave de Peralta Menendez and S.Gonzalez Andino, both at the University Hospital of Geneva, Geneva,Switzerland). The above AEP analyses defined the time periods overwhich sources were estimated. Statistical analyses of source estimationswere performed by first averaging the AEP data across time to generate asingle data point for each participant and condition. This procedureincreases the signal-to-noise ratio of the data from each participant. Theinverse solution (10 participants � 2 conditions) was then estimated foreach of the 4024 nodes in the solution space. Paired t tests were calculatedat each node using the variance across participants. Only nodes withvalues of p � 0.005 (t(9) � 3.68) and clusters of at least 12 contiguousnodes were considered significant. This spatial criterion was determinedusing the AlphaSim program (available from the Analysis of FunctionalNeuroImages website), which entailed performing 10,000 Monte Carlopermutations on the 4024 nodes of our lead field matrix to determine thefalse discover rate for clusters of different sizes. In our case, there was afalse-positive probability of 0.0192 for observing a cluster of minimally12 contiguous nodes. The results of the source estimations were renderedon the MNI brain with the Talairach and Tournoux (1988) coordinatesof the largest statistical differences indicated. Functional coupling between
regions identified during statistical analysis of source estimations was evalu-ated using nonparametric correlation (Spearman’s �).
The second set of across-object AEP analyses focused on determiningwhether or not there are selectively enhanced responses to human vocal-izations relative not only to animal vocalizations but also to the musicand nonmusic conditions described above. For this, we used the GFP inresponse to each condition from each subject. Area measures were takenover time periods either defined based on our previous work (Murray etal., 2006) or based on the above analyses. These were submitted to aone-way ANOVA using the within-subject factor of sound variety.
Single-object AEP preprocessing and analyses. For single-object AEPs,peristimulus epochs of continuous EEG (�100 to 500 ms) from dis-tracter trials were averaged from each subject separately to computeAEPs. A shorter time interval than above was selected in part becausethese analyses were conducted as a follow-up to the above analyses. Con-sequently, we could focus our analyses on time intervals identified fromthe across-object AEPs. Likewise, a shorter epoch length improved theacceptance rate and the consequent signal quality of the single-objectAEPs. Trials with blinks or eye movements were rejected off-line, usinghorizontal and vertical electro-oculograms. An artifact criterion of �100�V was applied at all other electrodes, and each EEG epoch was alsovisually evaluated. Data from artifact electrodes from each subject andcondition were interpolated using three-dimensional splines (Perrin etal., 1987). There was a minimum of 15 acceptable EEG epochs per objectfor any given participant. After this procedure and before group averag-ing, each subject’s data in response to each object were 40 Hz low-passfiltered, baseline corrected using the �100 ms prestimulus period, down-sampled to a common 61-channel montage, and recalculated against thecommon average reference.
Analyses of single-object AEPs were limited to GFP waveforms andarea measures. As is detailed below in Results, the across-object AEPanalyses identified robust GFP differences between responses to humanand animal vocalizations in the absence of any modulations in AEP to-pography. The earliest of these effects was over the 169 –219 ms post-stimulus interval. Consequently, the single-object AEP analyses werelimited to GFP area measures over this same time interval, although forcompletion we include displays of the full time series. These GFP areameasures were submitted to a univariate ANCOVA using vocalizationtype as the fixed factor, subject as the random factor, and f0 for eachobject as the covariate. In addition, we used a nonparametric linear re-gression analysis (Spearman’s �) both at the single-subject and group
Figure 4. a, Modulations in response strength were identified using GFP. Group-averaged GFP waveforms are displayed alongwith the results of millisecond-by-millisecond paired t tests. b, Topographic modulations between conditions were assessed usingglobal dissimilarity. The results of the TANOVA procedure are illustrated as a function of time (in both panels 1 minus p value isshown after applying a p � 0.05 and 25 ms temporal criterion, as in Fig. 3).
11214 • J. Neurosci., August 18, 2010 • 30(33):11210 –11221 De Lucia et al. • Vocalization Discrimination in Humans
level to assess whether GFP area over the 169 –219 ms period was linkedto the f0 of the vocalization.
ResultsBehavioral resultsParticipants accurately performed the target detection task (Mur-ray et al., 2006). The mean (�SEM) percentage of correct re-sponses to human and animal sounds when they served as targetswere 85.8 � 4.1 and 90.2 � 2.7%, respectively, and did not sig-nificantly differ (t(9) � 1.50; p � 0.15). Likewise, reaction times tohuman and animal sounds were 895 � 36 and 901 � 44 ms,respectively, and did not significantly differ (t(9) � 0.32; p �0.75). Thus, behavioral differences cannot readily account for theAEP modulations described below. Plus, because the main AEPanalyses were based on data from distracter trials, any response-related activity in the effects we obtained were minimized (if noteliminated).
Vocalization discrimination:across-object AEPsThe first level of analysis focused on deter-mining the onset of response differences(based on average-referenced voltage wave-forms) between across-object AEPs in re-sponse to sounds of human and animalvocalizations. Figure 3 displays the group-average AEPs from a fronto-central mid-line electrode (FCz) where the magnitudeof the earliest difference was largest, aswell as the results of the millisecond-by-millisecond paired t test across the 61-channel electrode montage. Temporallysustained and statistically reliable differ-ences were observed across several elec-trodes of the montage beginning �100–200ms after stimulus onset.
The remainder of analyses with theseacross-object AEPs was therefore basedon reference-independent measures ofthe electric field at the scalp: one examin-ing response strength independent oftopography and the other examining re-sponse topography independent ofresponse strength (i.e., GFP and dissim-ilarity, respectively). The first of these, amillisecond-by-millisecond analysis ofthe group-averaged GFP waveforms re-vealed sustained differences between re-sponses over the 169 –219, 291–357, and487– 621 ms poststimulus periods (Fig.4a). Responses were stronger in responseto human vocalizations over all of these timeperiods. Second, global dissimilarity be-tween conditions tested on a millisecond-by-millisecond basis whether thetopographies of the AEPs differed be-tween conditions. Sustained topographicdifferences were observed over the 389 –667 ms poststimulus periods (Fig. 4b), butnot over the earlier time periods whenGFP modulations were observed. In fact,over the 169 –219 ms period, the p value ofthe TANOVA never dropped below 0.32(the average p value over this time periodwas 0.67). Thus, there was no evidence of
either short-lived significant periods of topographic difference ortrends of such. It is perhaps worthwhile to mention that thesefeatures (i.e., response strength and response topography) areordinarily overlooked in canonical analyses of AEPs. The aboveanalyses therefore allow for differentiating, as a function of time,when AEPs to human versus animal vocalizations differ in either/both of these features that in turn have distinct underlying neu-rophysiologic bases for their appearance. This pattern wouldsuggest that the earliest differentiation between across-objectAEPs is attributable to modulations in the strength of statisti-cally indistinguishable configurations of intracranial brain net-works. In other words, the earliest differentiation of humanand animal vocalizations appears to rely on the same (or atleast statistically indistinguishable) brain networks. Distinct,specialized regions do not appear to be implicated duringthese early stages.
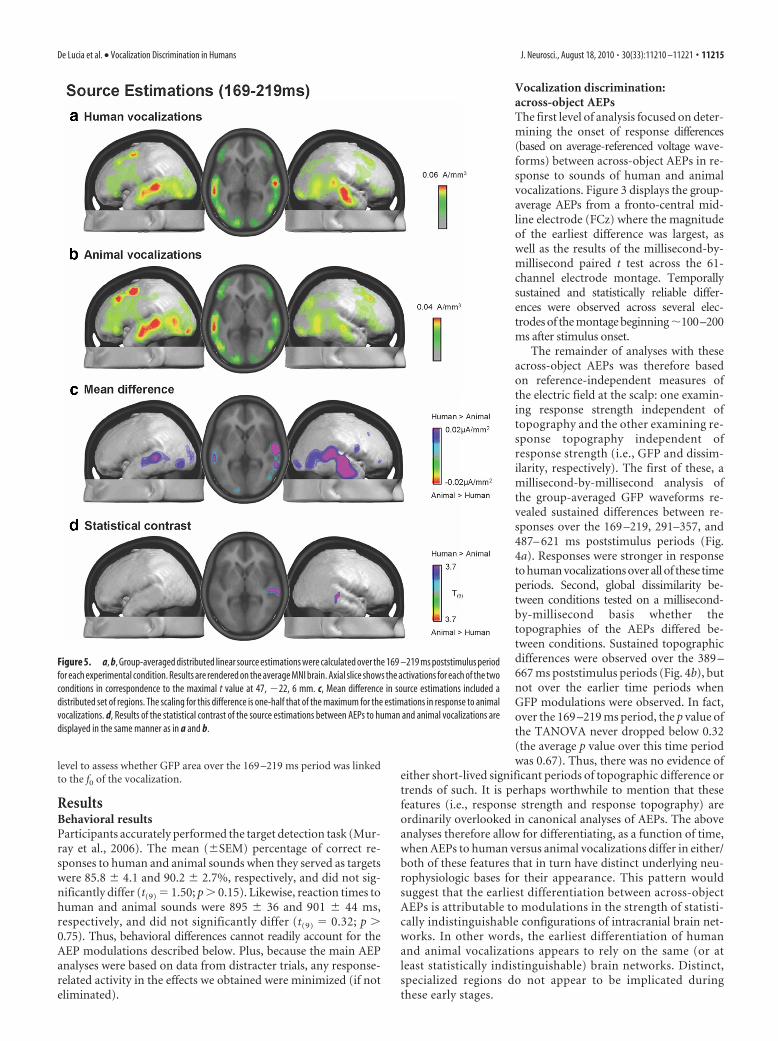
Figure 5. a, b, Group-averaged distributed linear source estimations were calculated over the 169 –219 ms poststimulus periodfor each experimental condition. Results are rendered on the average MNI brain. Axial slice shows the activations for each of the twoconditions in correspondence to the maximal t value at 47, �22, 6 mm. c, Mean difference in source estimations included adistributed set of regions. The scaling for this difference is one-half that of the maximum for the estimations in response to animalvocalizations. d, Results of the statistical contrast of the source estimations between AEPs to human and animal vocalizations aredisplayed in the same manner as in a and b.
De Lucia et al. • Vocalization Discrimination in Humans J. Neurosci., August 18, 2010 • 30(33):11210 –11221 • 11215
A topographic hierarchical clusteranalysis was then conducted to identifytime periods of stable electric field topog-raphy both within and between experi-mental conditions. This analysis, firstperformed at the group-averaged across-object AEP level, is a means of identifyingAEP components and for determiningwhether the above topographic modula-tion follows from a singular and stable to-pographic difference or rather frommultiple configuration changes (Murrayet al., 2008). The global explained vari-ance of this clustering for the concate-nated group-averaged dataset from bothexperimental conditions was 97.38%. Thisanalysis indicated similar maps were ob-served for both conditions until �400 msafter stimulus onset, mirroring the effectsobtained when measuring global dissimilar-ity. Over the 389–667 ms poststimulus pe-riod, four different maps were observed atthe group average level; two of which pre-dominated in the responses to human vo-calizations (supplemental Fig. 1, available atwww.jneurosci.org as supplemental mate-rial). This was statistically evaluated using ameasure of map presence that is based onthe spatial correlation between the templatemaps identified in the group-averaged AEPsand single-subject data. Over the 389–667ms period, there was a significant main ef-fect of map (F(2,8) � 4.502; p � 0.049) and asignificant interaction between factors of ex-perimental condition and template map(F(2,8) � 6.429; p � 0.022). Follow-up con-trasts revealed that one template map (map HV) was more oftenspatially correlated with responses to human vocalizations (t(9) �4.074; p � 0.003), whereas another was more often spatially corre-lated with responses to animal vocalizations (map AV; t(9) � 2.821;p � 0.020). There was no reliable difference between conditions foreither of the other two template maps (map X and map Y) (seesupplemental Fig. 1, available at www.jneurosci.org as supplementalmaterial).
Vocalization discrimination: across-object source estimationsAnalyses to this point indicate that AEP responses to sounds ofhuman vocalizations and animal vocalizations first differed bothin their strength, but not topography, over the 169 –219 ms pe-riod and that a single and common topography was identifiedover this time period for both conditions. By extension, such apattern of effects suggests that human and animal vocalizationprocessing initially involves a statistically indistinguishable brainnetwork that varies in its response strength. This is highly consis-tent with findings emerging from recent studies in nonhumanprimates in which recordings across five auditory regions all ex-hibited similar selectivity in their responses to conspecific vocaliza-tions (Recanzone, 2008) (see also Petkov et al., 2008).
Intracranial sources were estimated with a distributed inversesolution (for details, see Materials and Methods) for each across-object AEP and participant over the 169 –219 ms period and thengroup-averaged (Fig. 5a,b). Responses to both human and ani-mal vocalizations included prominent sources along the superior
temporal lobes with additional sources evident posteriorly at thetemporo-parietal junction and also within the occipital lobe. Themean difference in source estimations revealed a widespread net-work of brain regions exhibiting stronger activation in responseto human than animal vocalizations (Fig. 5c). This network prin-cipally included bilateral superior temporal and temporo-parietal cortices. It is noteworthy that in these regions groupaverage responses to human vocalizations were �1.5 times thoseto animal vocalizations (note difference in scales across Fig. 5a,b).Figure 5d displays the statistical difference between these sourceestimations, which after applying our threshold criteria yieldedone cluster of 13 voxels that was located in BA22/41 in the righthemisphere [maximal t value at 47, �22, 6 mm, using the coor-dinate system of Talairach and Tournoux (1988)]. This distrib-uted difference in absolute source strength is likely the basis forour observation of a GFP modulation in the absence of topo-graphic effects, even though statistical differences between sourceestimations were spatially restricted with the threshold weapplied.
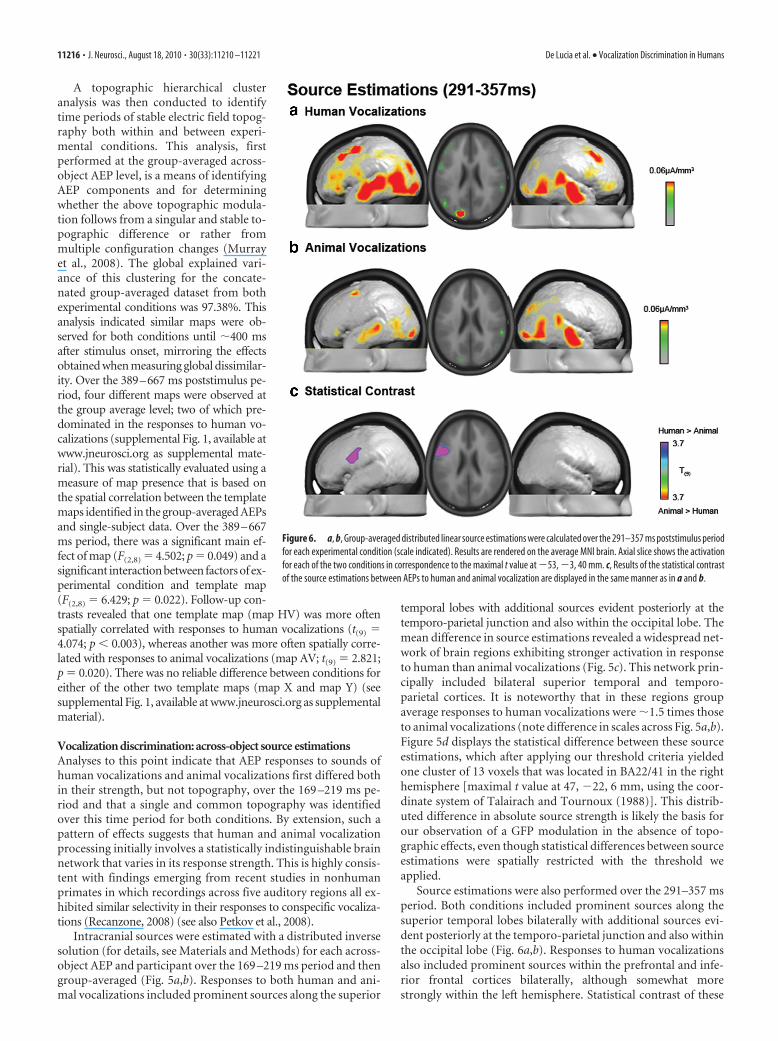
Source estimations were also performed over the 291–357 msperiod. Both conditions included prominent sources along thesuperior temporal lobes bilaterally with additional sources evi-dent posteriorly at the temporo-parietal junction and also withinthe occipital lobe (Fig. 6a,b). Responses to human vocalizationsalso included prominent sources within the prefrontal and infe-rior frontal cortices bilaterally, although somewhat morestrongly within the left hemisphere. Statistical contrast of these
Figure 6. a, b, Group-averaged distributed linear source estimations were calculated over the 291–357 ms poststimulus periodfor each experimental condition (scale indicated). Results are rendered on the average MNI brain. Axial slice shows the activationfor each of the two conditions in correspondence to the maximal t value at �53, �3, 40 mm. c, Results of the statistical contrastof the source estimations between AEPs to human and animal vocalization are displayed in the same manner as in a and b.
11216 • J. Neurosci., August 18, 2010 • 30(33):11210 –11221 De Lucia et al. • Vocalization Discrimination in Humans
source estimations identified a single cluster of 30 significantvoxels that extended across BA45 and BA6 in the left hemisphere(maximal t value at �53, �3, 40 mm) (Fig. 6c). Thus, distincttime periods of differential processing of human vocalizationsmodulate responses in spatially disparate brain regions (i.e.,BA22/41 at 169 –219 ms vs BA45/6 at 291–357 ms). This patternof results suggests that conspecific vocalization discrimination inhumans likely involves a wide network of brain regions, each ofwhich is potentially performing a distinct computation at a spe-cific poststimulus latency.
A final set of source estimations was conducted over the 389 –667 ms period and revealed sources similar to those observedduring the preceding time periods (supplemental Fig. 2, availableat www.jneurosci.org as supplemental material). Statistical com-parisons revealed a single cluster of nine voxels within BA10 in
the left hemisphere (maximal t value at �23, 53, 15 mm). As thiscluster did not meet our spatial extent threshold, we only discussit as a basis for generating hypotheses for future research.
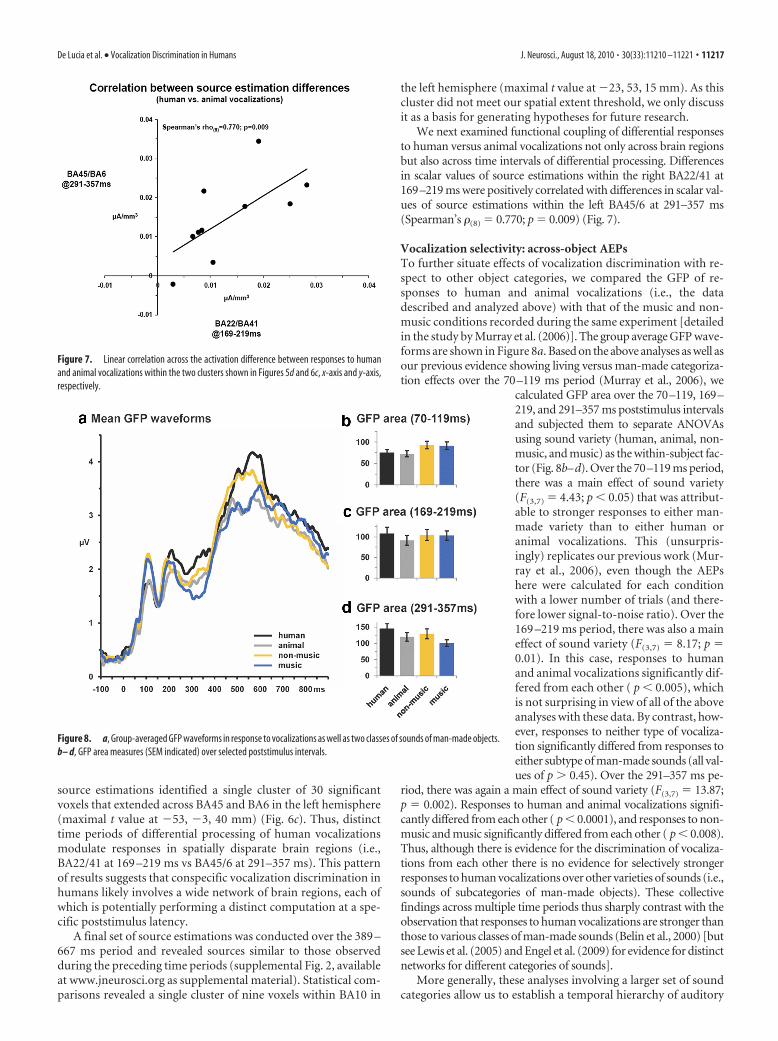
We next examined functional coupling of differential responsesto human versus animal vocalizations not only across brain regionsbut also across time intervals of differential processing. Differencesin scalar values of source estimations within the right BA22/41 at169–219 ms were positively correlated with differences in scalar val-ues of source estimations within the left BA45/6 at 291–357 ms(Spearman’s �(8) � 0.770; p � 0.009) (Fig. 7).
Vocalization selectivity: across-object AEPsTo further situate effects of vocalization discrimination with re-spect to other object categories, we compared the GFP of re-sponses to human and animal vocalizations (i.e., the datadescribed and analyzed above) with that of the music and non-music conditions recorded during the same experiment [detailedin the study by Murray et al. (2006)]. The group average GFP wave-forms are shown in Figure 8a. Based on the above analyses as well asour previous evidence showing living versus man-made categoriza-tion effects over the 70–119 ms period (Murray et al., 2006), we
calculated GFP area over the 70–119, 169–219, and 291–357 ms poststimulus intervalsand subjected them to separate ANOVAsusing sound variety (human, animal, non-music, and music) as the within-subject fac-tor (Fig. 8b–d). Over the 70–119 ms period,there was a main effect of sound variety(F(3,7) � 4.43; p � 0.05) that was attribut-able to stronger responses to either man-made variety than to either human oranimal vocalizations. This (unsurpris-ingly) replicates our previous work (Mur-ray et al., 2006), even though the AEPshere were calculated for each conditionwith a lower number of trials (and there-fore lower signal-to-noise ratio). Over the169 –219 ms period, there was also a maineffect of sound variety (F(3,7) � 8.17; p �0.01). In this case, responses to humanand animal vocalizations significantly dif-fered from each other ( p � 0.005), whichis not surprising in view of all of the aboveanalyses with these data. By contrast, how-ever, responses to neither type of vocaliza-tion significantly differed from responses toeither subtype of man-made sounds (all val-ues of p � 0.45). Over the 291–357 ms pe-
riod, there was again a main effect of sound variety (F(3,7) � 13.87;p � 0.002). Responses to human and animal vocalizations signifi-cantly differed from each other ( p � 0.0001), and responses to non-music and music significantly differed from each other ( p � 0.008).Thus, although there is evidence for the discrimination of vocaliza-tions from each other there is no evidence for selectively strongerresponses to human vocalizations over other varieties of sounds (i.e.,sounds of subcategories of man-made objects). These collectivefindings across multiple time periods thus sharply contrast with theobservation that responses to human vocalizations are stronger thanthose to various classes of man-made sounds (Belin et al., 2000) [butsee Lewis et al. (2005) and Engel et al. (2009) for evidence for distinctnetworks for different categories of sounds].
More generally, these analyses involving a larger set of soundcategories allow us to establish a temporal hierarchy of auditory
Figure 7. Linear correlation across the activation difference between responses to humanand animal vocalizations within the two clusters shown in Figures 5d and 6c, x-axis and y-axis,respectively.
Figure 8. a, Group-averaged GFP waveforms in response to vocalizations as well as two classes of sounds of man-made objects.b– d, GFP area measures (SEM indicated) over selected poststimulus intervals.
De Lucia et al. • Vocalization Discrimination in Humans J. Neurosci., August 18, 2010 • 30(33):11210 –11221 • 11217
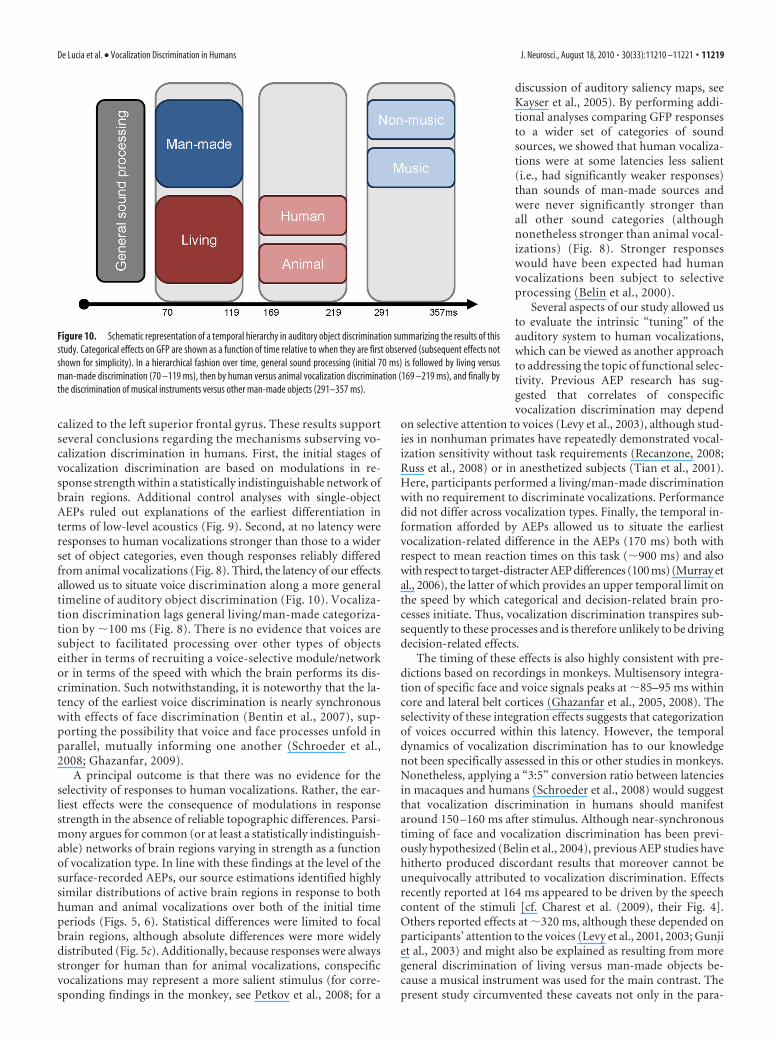
object discrimination, with living versusman-made sounds discriminated first at70 –119 ms, followed by human versus an-imal nonverbal vocalizations at 169 –219ms, and later still by continued discrimi-nation of vocalizations as well as the dis-crimination of subtypes of man-madesounds at 291–357 ms (Murray andSpierer, 2009; Spierer et al., 2010). Thesetemporal considerations provide a com-plementary argument against a model offacilitated and/or selective discriminationof conspecific vocalizations, because at nolatency were responses to human vocal-izations reliably distinct from those to allother sound categories tested here. More-over, there was no evidence to indicatethat human vocalizations are subject toearlier discrimination than other catego-ries of sound objects. Rather, the hightemporal resolution of our data provideevidence for the contrary (i.e., that ageneral-level of living/man-made catego-rization precedes discrimination of hu-man vocalizations).
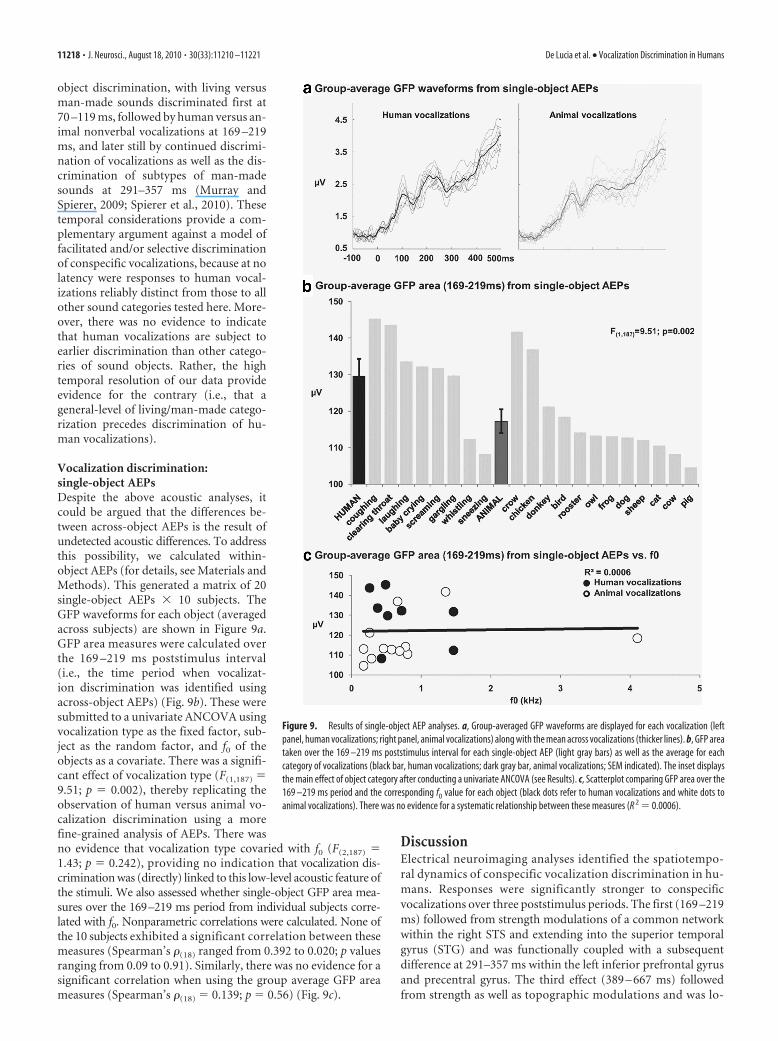
Vocalization discrimination:single-object AEPsDespite the above acoustic analyses, itcould be argued that the differences be-tween across-object AEPs is the result ofundetected acoustic differences. To addressthis possibility, we calculated within-object AEPs (for details, see Materials andMethods). This generated a matrix of 20single-object AEPs � 10 subjects. TheGFP waveforms for each object (averagedacross subjects) are shown in Figure 9a.GFP area measures were calculated overthe 169 –219 ms poststimulus interval(i.e., the time period when vocalizat-ion discrimination was identified usingacross-object AEPs) (Fig. 9b). These weresubmitted to a univariate ANCOVA usingvocalization type as the fixed factor, sub-ject as the random factor, and f0 of theobjects as a covariate. There was a signifi-cant effect of vocalization type (F(1,187) �9.51; p � 0.002), thereby replicating theobservation of human versus animal vo-calization discrimination using a morefine-grained analysis of AEPs. There wasno evidence that vocalization type covaried with f0 (F(2,187) �1.43; p � 0.242), providing no indication that vocalization dis-crimination was (directly) linked to this low-level acoustic feature ofthe stimuli. We also assessed whether single-object GFP area mea-sures over the 169–219 ms period from individual subjects corre-lated with f0. Nonparametric correlations were calculated. None ofthe 10 subjects exhibited a significant correlation between thesemeasures (Spearman’s �(18) ranged from 0.392 to 0.020; p valuesranging from 0.09 to 0.91). Similarly, there was no evidence for asignificant correlation when using the group average GFP areameasures (Spearman’s �(18) � 0.139; p � 0.56) (Fig. 9c).
DiscussionElectrical neuroimaging analyses identified the spatiotempo-ral dynamics of conspecific vocalization discrimination in hu-mans. Responses were significantly stronger to conspecificvocalizations over three poststimulus periods. The first (169 –219ms) followed from strength modulations of a common networkwithin the right STS and extending into the superior temporalgyrus (STG) and was functionally coupled with a subsequentdifference at 291–357 ms within the left inferior prefrontal gyrusand precentral gyrus. The third effect (389 – 667 ms) followedfrom strength as well as topographic modulations and was lo-
Figure 9. Results of single-object AEP analyses. a, Group-averaged GFP waveforms are displayed for each vocalization (leftpanel, human vocalizations; right panel, animal vocalizations) along with the mean across vocalizations (thicker lines). b, GFP areataken over the 169 –219 ms poststimulus interval for each single-object AEP (light gray bars) as well as the average for eachcategory of vocalizations (black bar, human vocalizations; dark gray bar, animal vocalizations; SEM indicated). The inset displaysthe main effect of object category after conducting a univariate ANCOVA (see Results). c, Scatterplot comparing GFP area over the169 –219 ms period and the corresponding f0 value for each object (black dots refer to human vocalizations and white dots toanimal vocalizations). There was no evidence for a systematic relationship between these measures (R 2 � 0.0006).
11218 • J. Neurosci., August 18, 2010 • 30(33):11210 –11221 De Lucia et al. • Vocalization Discrimination in Humans
calized to the left superior frontal gyrus. These results supportseveral conclusions regarding the mechanisms subserving vo-calization discrimination in humans. First, the initial stages ofvocalization discrimination are based on modulations in re-sponse strength within a statistically indistinguishable network ofbrain regions. Additional control analyses with single-objectAEPs ruled out explanations of the earliest differentiation interms of low-level acoustics (Fig. 9). Second, at no latency wereresponses to human vocalizations stronger than those to a widerset of object categories, even though responses reliably differedfrom animal vocalizations (Fig. 8). Third, the latency of our effectsallowed us to situate voice discrimination along a more generaltimeline of auditory object discrimination (Fig. 10). Vocaliza-tion discrimination lags general living/man-made categoriza-tion by �100 ms (Fig. 8). There is no evidence that voices aresubject to facilitated processing over other types of objectseither in terms of recruiting a voice-selective module/networkor in terms of the speed with which the brain performs its dis-crimination. Such notwithstanding, it is noteworthy that the la-tency of the earliest voice discrimination is nearly synchronouswith effects of face discrimination (Bentin et al., 2007), sup-porting the possibility that voice and face processes unfold inparallel, mutually informing one another (Schroeder et al.,2008; Ghazanfar, 2009).
A principal outcome is that there was no evidence for theselectivity of responses to human vocalizations. Rather, the ear-liest effects were the consequence of modulations in responsestrength in the absence of reliable topographic differences. Parsi-mony argues for common (or at least a statistically indistinguish-able) networks of brain regions varying in strength as a functionof vocalization type. In line with these findings at the level of thesurface-recorded AEPs, our source estimations identified highlysimilar distributions of active brain regions in response to bothhuman and animal vocalizations over both of the initial timeperiods (Figs. 5, 6). Statistical differences were limited to focalbrain regions, although absolute differences were more widelydistributed (Fig. 5c). Additionally, because responses were alwaysstronger for human than for animal vocalizations, conspecificvocalizations may represent a more salient stimulus (for corre-sponding findings in the monkey, see Petkov et al., 2008; for a
discussion of auditory saliency maps, seeKayser et al., 2005). By performing addi-tional analyses comparing GFP responsesto a wider set of categories of soundsources, we showed that human vocaliza-tions were at some latencies less salient(i.e., had significantly weaker responses)than sounds of man-made sources andwere never significantly stronger thanall other sound categories (althoughnonetheless stronger than animal vocal-izations) (Fig. 8). Stronger responseswould have been expected had humanvocalizations been subject to selectiveprocessing (Belin et al., 2000).
Several aspects of our study allowed usto evaluate the intrinsic “tuning” of theauditory system to human vocalizations,which can be viewed as another approachto addressing the topic of functional selec-tivity. Previous AEP research has sug-gested that correlates of conspecificvocalization discrimination may depend
on selective attention to voices (Levy et al., 2003), although stud-ies in nonhuman primates have repeatedly demonstrated vocal-ization sensitivity without task requirements (Recanzone, 2008;Russ et al., 2008) or in anesthetized subjects (Tian et al., 2001).Here, participants performed a living/man-made discriminationwith no requirement to discriminate vocalizations. Performancedid not differ across vocalization types. Finally, the temporal in-formation afforded by AEPs allowed us to situate the earliestvocalization-related difference in the AEPs (170 ms) both withrespect to mean reaction times on this task (�900 ms) and alsowith respect to target-distracter AEP differences (100 ms) (Murray etal., 2006), the latter of which provides an upper temporal limit onthe speed by which categorical and decision-related brain pro-cesses initiate. Thus, vocalization discrimination transpires sub-sequently to these processes and is therefore unlikely to be drivingdecision-related effects.
The timing of these effects is also highly consistent with pre-dictions based on recordings in monkeys. Multisensory integra-tion of specific face and voice signals peaks at �85–95 ms withincore and lateral belt cortices (Ghazanfar et al., 2005, 2008). Theselectivity of these integration effects suggests that categorizationof voices occurred within this latency. However, the temporaldynamics of vocalization discrimination has to our knowledgenot been specifically assessed in this or other studies in monkeys.Nonetheless, applying a “3:5” conversion ratio between latenciesin macaques and humans (Schroeder et al., 2008) would suggestthat vocalization discrimination in humans should manifestaround 150 –160 ms after stimulus. Although near-synchronoustiming of face and vocalization discrimination has been previ-ously hypothesized (Belin et al., 2004), previous AEP studies havehitherto produced discordant results that moreover cannot beunequivocally attributed to vocalization discrimination. Effectsrecently reported at 164 ms appeared to be driven by the speechcontent of the stimuli [cf. Charest et al. (2009), their Fig. 4].Others reported effects at �320 ms, although these depended onparticipants’ attention to the voices (Levy et al., 2001, 2003; Gunjiet al., 2003) and might also be explained as resulting from moregeneral discrimination of living versus man-made objects be-cause a musical instrument was used for the main contrast. Thepresent study circumvented these caveats not only in the para-
Figure 10. Schematic representation of a temporal hierarchy in auditory object discrimination summarizing the results of thisstudy. Categorical effects on GFP are shown as a function of time relative to when they are first observed (subsequent effects notshown for simplicity). In a hierarchical fashion over time, general sound processing (initial 70 ms) is followed by living versusman-made discrimination (70 –119 ms), then by human versus animal vocalization discrimination (169 –219 ms), and finally bythe discrimination of musical instruments versus other man-made objects (291–357 ms).
De Lucia et al. • Vocalization Discrimination in Humans J. Neurosci., August 18, 2010 • 30(33):11210 –11221 • 11219

digm but also in the use of electrical neuroimaging analyses withacross-object and single-object AEPs. These analyses firmly situ-ate the timing of conspecific vocalization discrimination at laten-cies consistent with observations in nonhuman primates andcontemporaneous with face discrimination.
In addition to their timing and likely mechanism, we localizeddifferential processing of conspecific vocalizations first to BA22/BA41 in the right hemisphere (169 –219 ms) and subsequently toBA45/6 in the left hemisphere (291–357 ms), although we wouldnote that a wider network of regions was also observed to beequally responsive to both types of vocalizations (Figs. 5, 6).These loci are in general agreement with previous hemodynamicimaging evidence in humans (Belin et al., 2000, 2002, 2004; vonKriegstein et al., 2003; Fecteau et al., 2005) and monkeys(Poremba et al., 2004; Petkov et al., 2008), as well as microelec-trode recordings in monkeys (Cohen et al., 2007; Romanski,2007; Recanzone, 2008; Russ et al., 2008).
The temporal information provided in the present study al-lows us to situate effects of vocalization discrimination with re-spect to general semantic analyses and task-related effects. Ourprevious research has shown that object discrimination processesalready onset at 70 ms with task-related effects at 100 ms afterstimulus (Murray et al., 2006). Aside from their consistency withhuman imaging, our findings are also highly consistent with re-cent imaging findings in awake monkeys showing a set of audi-tory fields whose activity was enhanced in response to conspecificvocalizations versus vocalizations from other animals and pri-mates as well as phase-scrambled counterparts (Petkov et al.,2008). In particular, right-lateralized primary and posterior para-belt fields as well as bilateral anterior fields exhibited responseenhancements. It should be noted, however, that imaging studiesin nonhuman primates either limited their field of view (Petkovet al., 2008) or selected regions of interest (Poremba et al., 2004),leaving unknown the full spatial distribution of differential re-sponses to vocalizations. More germane, differential activity dur-ing the 169 –219 ms period observed in the present studyextended across what are undoubtedly multiple distinct func-tional regions from the STG to the STS and middle temporalcortex. Together, the results of Petkov et al. (2008) and our ownhighlight the role of several distributed auditory regions in con-specific vocalization discrimination (Recanzone, 2008).
The distributed nature of these processes is all the more evi-dent in the fact that several distinct time periods of differentialresponsiveness were observed. In particular, stronger sourcestrengths within the left inferior prefrontal cortex in response tohuman versus animal vocalizations were observed over the 291–357 ms poststimulus period. Studies in both humans (Fecteau etal., 2005) and monkeys (Cohen et al., 2006, 2007; Romanski,2007; Russ et al., 2008) have shown that prefrontal neurons re-spond differentially to conspecific vocalizations. One possibilityis that the initial differentiation of human vocalizations withinthe right STS/STG is causally related to effects at 291–357 mswithin left prefrontal cortices, particularly given the known con-nectivity between the temporal and frontal cortices (Romanski etal., 1999; Petrides and Pandya, 2007) (for the role of interhemi-spheric fibers, see also Poremba et al., 2004). This propositionreceives some support from our analysis showing a significantpositive correlation between response modulations at 169 –219ms within right BA22/41 and those at 291–357 ms within leftBA45/6 (Fig. 7).
In conclusion, the present electrical neuroimaging findingsreveal that voice discrimination transpires substantially earlierthan conventionally held and occurs over multiple, functionally
coupled stages in a wide network of brain regions. Such findingshighlight that models of functional specialization must incorpo-rate network dynamics.
ReferencesAeschlimann M, Knebel JF, Murray MM, Clarke S (2008) Emotional pre-
eminence of human vocalizations. Brain Topogr 20:239 –248.Assal G, Aubert C, Buttet J (1981) Asymetrie cerebrale et reconnaissance de
la voix. Revue Neurolog 137:255–268.Belin P, Zatorre RJ, Lafaille P, Ahad P, Pike B (2000) Voice-selective areas in
human auditory cortex. Nature 403:309 –312.Belin P, Zatorre RJ, Ahad P (2002) Human temporal-lobe response to vocal
sounds. Brain Res Cogn Brain Res 13:17–26.Belin P, Fecteau S, Bedard C (2004) Thinking the voice: neural correlates of
voice perception. Trends Cogn Sci 8:129 –135.Bentin S, Taylor MJ, Rousselet GA, Itier RJ, Caldara R, Schyns PG, Jacques C,
Rossion B (2007) Controlling interstimulus perceptual variance doesnot abolish N170 face sensitivity. Nat Neurosci 10:801– 802; author reply802– 803.
Charest I, Pernet CR, Rousselet GA, Quinones I, Latinus M, Fillion-BilodeauS, Chartrand JP, Belin P (2009) Electrophysiological evidence for anearly processing of human voices. BMC Neurosci 10:127.
Cohen YE, Hauser MD, Russ BE (2006) Spontaneous processing of abstractcategorical information in the ventrolateral prefrontal cortex. Biol Lett2:261–265.
Cohen YE, Theunissen F, Russ BE, Gill P (2007) Acoustic features of rhesusvocalizations and their representation in the ventrolateral prefrontal cor-tex. J Neurophysiol 97:1470 –1484.
De Lucia M, Camen C, Clarke S, Murray MM (2009) The role of actions inauditory object discrimination. Neuroimage 48:475– 485.
De Lucia M, Michel CM, Murray MM (2010a) Comparing ICA-based andsingle-trial topographic ERP analyses. Brain Topogr 23:119 –127.
De Lucia M, Cocchi L, Martuzzi R, Meuli RA, Clarke S, Murray MM (2010b)Perceptual and semantic contributions to repetition priming of environ-mental sounds. Cereb Cortex 20:1676 –1684.
Fecteau S, Armony JL, Joanette Y, Belin P (2004) Is voice processing species-specific in human auditory cortex? An fMRI study. Neuroimage 23:840–848.
Fecteau S, Armony JL, Joanette Y, Belin P (2005) Sensitivity to voice inhuman prefrontal cortex. J Neurophysiol 94:2251–2254.
Garrido L, Eisner F, McGettigan C, Stewart L, Sauter D, Hanley JR,Schweinberger SR, Warren JD, Duchaine B (2009) Developmental phon-agnosia: a selective deficit of vocal identity recognition. Neuropsychologia47:123–131.
Ghazanfar AA (2009) The multisensory roles for auditory cortex in primatevocal communication. Hear Res 258:113–120.
Ghazanfar AA, Maier JX, Hoffman KL, Logothetis NK (2005) Multisensoryintegration of dynamic faces and voices in rhesus monkey auditory cortex.J Neurosci 25:5004 –5012.
Ghazanfar AA, Turesson HK, Maier JX, van Dinther R, Patterson RD,Logothetis NK (2007) Vocal-tract resonances as indexical cues in rhesusmonkeys. Curr Biol 17:425– 430.
Ghazanfar AA, Chandrasekaran C, Logothetis NK (2008) Interactions be-tween the superior temporal sulcus and auditory cortex mediate dynamicface/voice integration in rhesus monkeys. J Neurosci 28:4457– 4469.
Grave de Peralta Menendez R, Gonzalez Andino S, Lantz G, Michel CM,Landis T (2001) Noninvasive localization of electromagnetic epilep-tic activity. I. Method descriptions and simulations. Brain Topogr14:131–137.
Gunji A, Koyama S, Ishii R, Levy D, Okamoto H, Kakigi R, Pantev C (2003)Magnetoencephalographic study of the cortical activity elicited by humanvoice. Neurosci Lett 348:13–16.
Kayser C, Petkov CI, Augath M, Logothetis NK (2005) Integration of touchand sound in auditory cortex. Neuron 48:373–384.
Knebel JF, Toepel U, Hudry J, le Coutre J, Murray MM (2008) Generatingcontrolled image sets in cognitive neuroscience research. Brain Topogr20:284 –289.
Koenig T, Melie-Garcia L (2010) A method to determine the presence ofaveraged event-related fields using randomization tests. Brain Topogr23: 233–242.
Lehmann D, Skrandies W (1980) Reference-free identification of compo-nents of checkerboard-evoked multichannel potential fields. Electroen-cephalogr Clin Neurophysiol 48:609 – 621.
11220 • J. Neurosci., August 18, 2010 • 30(33):11210 –11221 De Lucia et al. • Vocalization Discrimination in Humans
Levy DA, Granot R, Bentin S (2001) Processing specificity for human voicestimuli: electrophysiological evidence. Neuroreport 12:2653–2657.
Levy DA, Granot R, Bentin S (2003) Neural sensitivity to human voices:ERP evidence of task and attentional influences. Psychophysiology40:291–305.
Lewis JW, Brefczynski JA, Phinney RE, Janik JJ, DeYoe EA (2005) Distinctcortical pathways for processing tool versus animal sounds. J Neurosci25:5148 –5158.
Lewis JW, Talkington WJ, Walker NA, Spirou GA, Jajosky A, Frum C,Brefczynski-Lewis JA (2009) Human cortical organization for process-ing vocalizations indicates representation of harmonic structure as a sig-nal attribute. J Neurosci 29:2283–2296.
Michel CM, Murray MM, Lantz G, Gonzalez S, Spinelli L, Grave de Peralta R(2004) EEG source imaging. Clin Neurophysiol 115:2195–2222.
Murray MM, Spierer L (2009) Auditory spatio-temporal brain dynamicsand their consequences for multisensory interactions in humans. HearRes 258:121–133.
Murray MM, Camen C, Gonzalez Andino SL, Bovet P, Clarke S (2006) Rapidbrain discrimination of sounds of objects. J Neurosci 26:1293–1302.
Murray MM, Brunet D, Michel CM (2008) Topographic ERP analyses: astep-by-step tutorial review. Brain Topogr 20:249 –264.
Murray MM, De Santis L, Thut G, Wylie GR (2009a) The costs of crossingpaths and switching tasks between audition and vision. Brain Cogn69:47–55.
Murray MM, De Lucia M, Brunet D, Michel CM (2009b) Principles of to-pographic analyses for electrical neuroimaging. In: Brain signal analysis:advances in neuroelectric and neuromagnetic methods (Handy TC, ed),pp 21–54. Cambridge, MA: MIT.
Perrin F, Pernier J, Bertrand O, Giard MH, Echallier JF (1987) Mapping ofscalp potentials by surface spline interpolation. Electroencephalogr ClinNeurophysiol 66:75– 81.
Petkov CI, Kayser C, Steudel T, Whittingstall K, Augath M, Logothetis NK(2008) A voice region in the monkey brain. Nat Neurosci 11:367–374.
Petrides M, Pandya DN (2007) Efferent association pathways from the ros-tral prefrontal cortex in the macaque monkey. J Neurosci 27:11573–11586.
Poremba A, Malloy M, Saunders RC, Carson RE, Herscovitch P, Mishkin M(2004) Species-specific calls evoke asymmetric activity in the monkey’stemporal poles. Nature 427:448 – 451.
Recanzone GH (2008) Representation of con-specific vocalizations in thecore and belt areas of the auditory cortex in the alert macaque monkey.J Neurosci 28:13184 –13193.
Remedios R, Logothetis NK, Kayser C (2009) An auditory region in theprimate insular cortex responding preferentially to vocal communicationsounds. J Neurosci 29:1034 –1045.
Romanski LM (2007) Representation and integration of auditory and visualstimuli in the primate ventral lateral prefrontal cortex. Cereb Cortex 17[Suppl 1]:i61–i69.
Romanski LM, Tian B, Fritz J, Mishkin M, Goldman-Rakic PS, RauscheckerJP (1999) Dual streams of auditory afferents target multiple domains inthe primate prefrontal cortex. Nat Neurosci 2:1131–1136.
Russ BE, Ackelson AL, Baker AE, Cohen YE (2008) Coding of auditory-stimulus identity in the auditory non-spatial processing stream. J Neuro-physiol 99:87–95.
Schroeder CE, Lakatos P, Kajikawa Y, Partan S, Puce A (2008) Neuronaloscillations and visual amplification of speech. Trends Cogn Sci12:106 –113.
Spierer L, De Lucia M, Bernasconi F, Grivel J, Bourquin NMP, Clarke S,Murray MM (2010) Learning-induced plasticity in human audition:objects, time, and space. Hear Res. Advance online publication. RetrievedJuly 29, 2010. doi:10.1016/j.heares.2010.03.086.
Staeren N, Renvall H, De Martino F, Goebel R, Formisano E (2009) Soundcategories are represented as distributed patterns in the human auditorycortex. Curr Biol 19:498 –502.
Talairach J, Tournoux P (1988) Co-planar stereotaxic atlas of the humanbrain. New York: Thieme.
Tian B, Reser D, Durham A, Kustov A, Rauschecker JP (2001) Func-tional specialization in rhesus monkey auditory cortex. Science 292:290 –293.
Van Lancker DR, Canter GJ (1982) Impairment of voice and face recogni-tion in patients with hemispheric damage. Brain Cogn 1:185–195.
von Kriegstein K, Eger E, Kleinschmidt A, Giraud AL (2003) Modulation ofneural responses to speech by directing attention to voices or verbal con-tent. Brain Res Cogn Brain Res 17:48 –55.
von Kriegstein K, Smith DR, Patterson RD, Ives DT, Griffiths TD (2007)Neural representation of auditory size in the human voice and in soundsfrom other resonant sources. Curr Biol 17:1123–1128.
De Lucia et al. • Vocalization Discrimination in Humans J. Neurosci., August 18, 2010 • 30(33):11210 –11221 • 11221
Related Documents