A talk of two halves: 1. Drifting snow in Antarctica : modelling the interaction with the boundary layer & consequences for ice cores. 2. Modelling denitrification of the Arctic stratosphere: issues of polar stratospheric cloud nucleation and the controlling influence of meteorology Graham Mann Acknowledgements : 1. Stephen Mobbs, Sarah Dover, Michelle Smith (Univ of

A talk of two halves: 1. Drifting snow in Antarctica : modelling the interaction with the boundary layer & consequences for ice cores. 2. Modelling denitrification.
Dec 22, 2015
Welcome message from author
This document is posted to help you gain knowledge. Please leave a comment to let me know what you think about it! Share it to your friends and learn new things together.
Transcript

A talk of two halves:1. Drifting snow in Antarctica : modelling the interaction with the boundary layer & consequences for ice cores.
2. Modelling denitrification of the Arctic stratosphere: issues of polar stratospheric cloud nucleation and the controlling influence of meteorology
Graham MannAcknowledgements:
1. Stephen Mobbs, Sarah Dover, Michelle Smith (Univ of Leeds) John King, Phil Anderson, Russ Ladkin, David Vaughan (B.A.S.) 2. Ken Carslaw, Stewart Davies, Martyn Chipperfield
Funding : NERC studentship, NERC grants, EU Framework V initiative

Why are we interested in blowing snow?
1) Role in mass balance of ice sheets : • transport across grounding line • evaporation (sublimation) during wind-blown transport
2) Modification of atmospheric boundary layer: • evaporation cools and moistens surrounding air (conventional surface layer theory breaks down)
3) Consequences for ice core interpretation: • long-term temperature trends are deduced from precipitation changes inferred from ice core accumulation histories. However, spatial variability in snow transport can introduce spurious features unconnected with any change in the paleoclimate.
Blowing/drifting snow --- the basics
Two transport processes : 1) saltation (skipping), zsalt ~ 10cm 2) suspension by turbulence
Increase in snow surface area exposed to air during strong wind events --- sublimation during transport can be important.
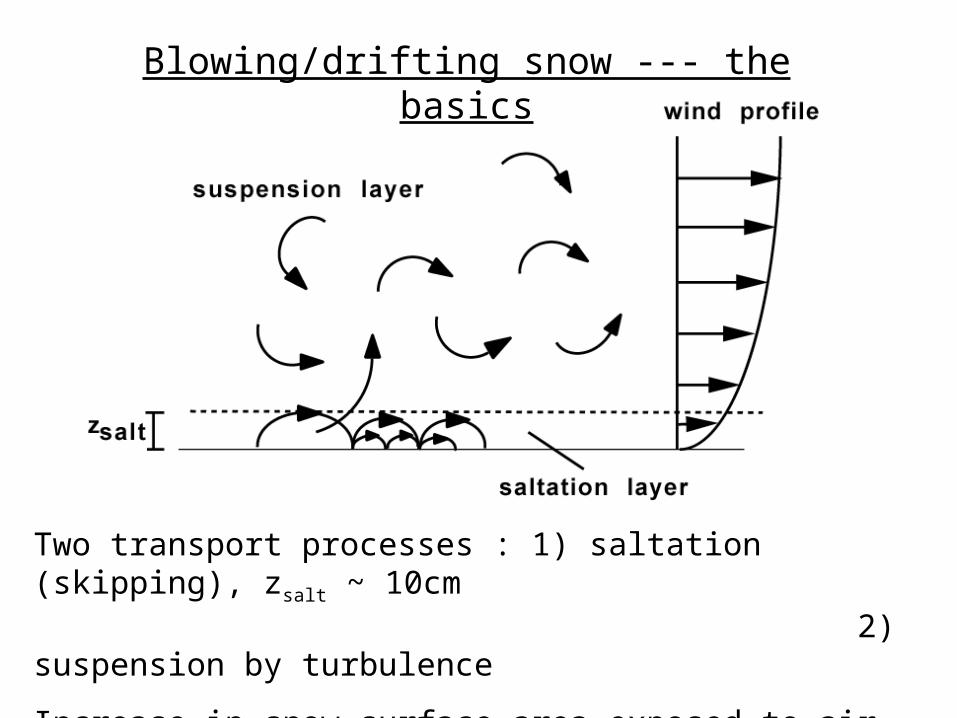
• Blowing snow particles are relatively fine (r~100 m)
• Crystalline snow structure destroyed by abrasion
Blowing snow particle size

From Smith (1995), PhD thesis
Winter seasonal mean blowing snow mass flux
Winter Antarctic wind climatology dominated by drainage flow from Antarctic plateau.
Boundary layer stably stratified giving rise to katabatic flow --- very strong downslope winds often lasting several days.
Blowing snow transport large enough to be important in ice sheet mass balance.

From Smith (1995), PhD thesis
Winter seasonal mean blowing snow sublimation
Total modelled winter season sublimation during transport.
At warmer, windier coastal sites sublimation during transport is important.
Airborne Sublimation(mm water equivalent)

STABLE2 experiment, Antarctic winter 1991
• Suspended snow sampled 0.1-10 m• Monitor interaction with surface layer
Halley

Blowing snow particle size distribution
• STABLE2 experiment used Formvar resin-coated slides in particle collectors to gain sample of blowing snow particles.
• Examined using image processing (Dover, PhD thesis, 1993)
• Size distributions fit well to a 2-parameter gamma distribution
• Particle numbers from counters converted to mass fluxes

Threshold wind speed required for blowing snow
Fallen snow becomes airborne once wind is strong enough to overcome cohesive forces and provide sufficient aerodynamic lift.
Required surface stress defines threshold friction velocity, u*t
Because of cohesive forces and momentum of already saltating particles, u*t is higher at beginning of strong wind event than at end.

Parameterizing blowing snow transport
Figure shows four different blowing snow episodes from the STABLE2 experiment.
Different episodes give very different transport rates for equivalent wind strengths.
Post-depositional snow transport depends strongly on the value of u*t

Interaction of blowing snow with the boundary layer
• Lower temperatures mean lower saturation humidities
• Source of moisture and latent cooling from sublimating airborne snow raises relative humidity (w.r.t. ice) easily.
• Stable boundary layer inhibits vertical transport of moisture and surface layer quickly saturates w.r.t. ice.
• This negative feedback restricts airborne snow sublimation

Numerical modelling of interaction with boundary layer (1)
• Use simple 1D boundary layer model (1st order mixing length closure) with source of moisture of sink of heat (Mobbs & Dover, 1993).
• Use parameterization of snow particle number vs u* and assume particle size distribution at lower boundary

Numerical modelling of interaction with boundary layer (2)
• Introduce spectrum of snow particle sizes into neutral PBL
• Near-surface relative humidity rises quickly

Numerical modelling of interaction with boundary layer (3)
• Sublimation of blowing snow also reduces mass flux of blowing snow c.f. “no-sublimation run”
• Modelled relative humidity profiles show that the rh increase is due to effect of blowing snow sublimation
subl. off
subl. on
10.10.010.1
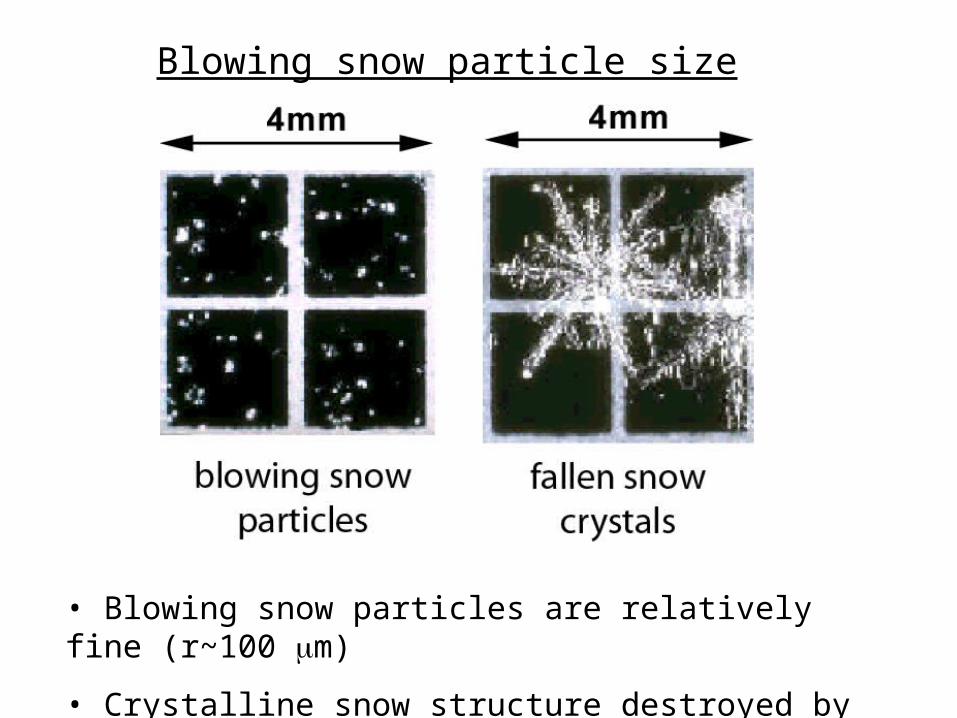
Numerical modelling of interaction with boundary layer (4)
• Total blowing snow transport strongly reduced by blowing snow sublimation
• Column b.s. sublimation restricted by negative feedback

Snowfall
• Oxygen isotopes• Other chemical and physical tracers
Icecore
Addition of wind-borne snow
Removal of wind-borne snow
Blowing snow : consequences for ice core interpretation
Problems arising from snow transport
• Incorrect measurement of precipitation
• Dating problems if annual layers lost
• Biasing of annual means if snow lost/added preferentially during certain seasons
• Temporal changes in snow transport may introduce spurious trends

Hypothesis to be examined:
Wind-borne snow transport can result in significantredistribution of snowfall around relatively gentletopographic features in Antarctica
Lyddan Ice Rise project 1998-2001
J.C. King, P.S. Anderson,D.G. Vaughan and R.S. Ladkin
British Antarctic Survey, NERC,Cambridge, UK
G.W. Mann, S.D. Mobbs and S.B. Vosper
School of the Environment, University of Leeds, UK.

Methodology of Lyddan Ice Rise project
• Make field measurements of snow accumulation
and airflow round a topographic feature
• Model airflow using 3d Vosper Orographic Model (Vosper, 2003) and validate against observations
• Calculate snow transport using a simple parametrisation from STABLE2 measurements (Mann et al., 2000)
• Compare observed accumulation with computed horizontal snow transport divergence

Study area - Lyddan Ice Rise
Distance (m)
Ele
va
tio
n (
m)
W E
WeddellSea
Riiser-LarsenIce Shelf
Stancomb-Wills Ice Stream
N
20 km
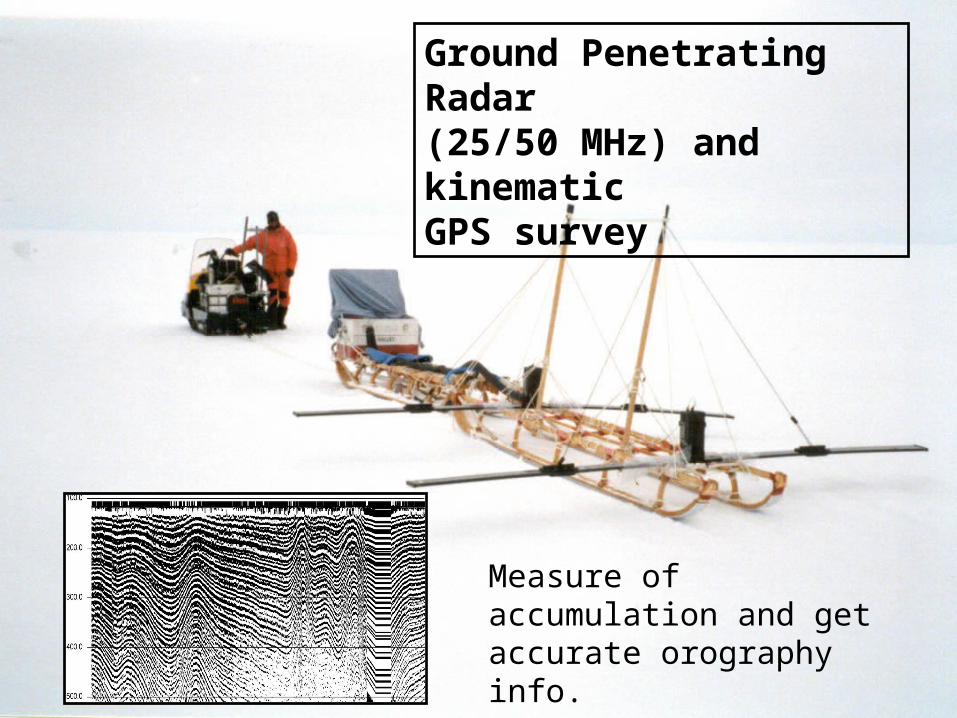
Ground Penetrating Radar (25/50 MHz) and kinematicGPS survey
Measure of accumulation and get accurate orography info.

Snow stake array andsnow density cores
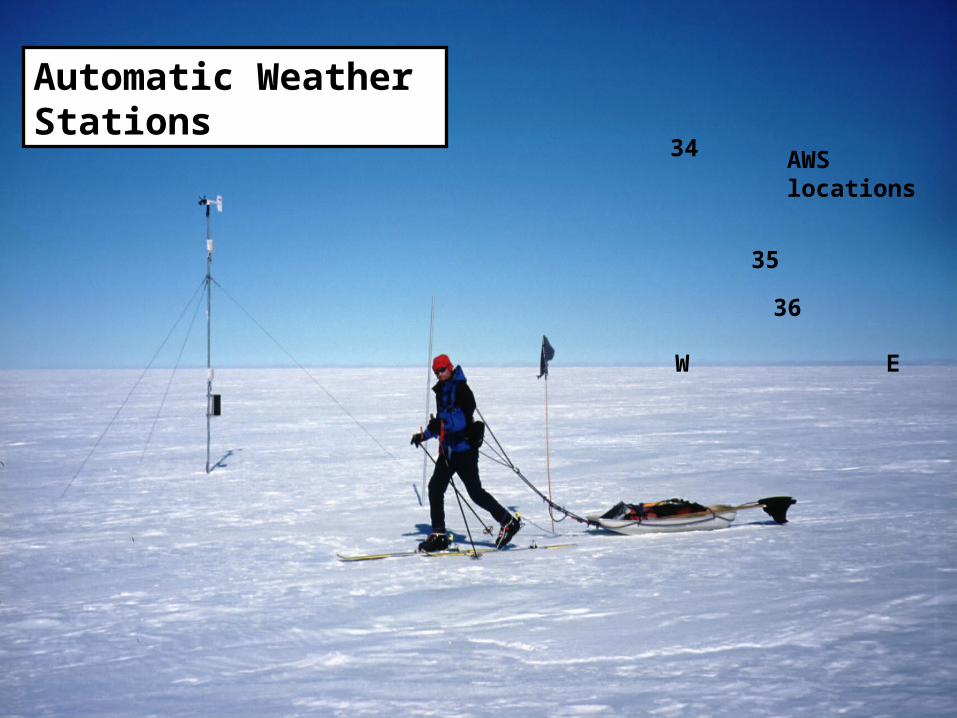
Automatic WeatherStations
W E
AWSlocations
34
36
35

AW
S 3
5 (
ms
-1)
Eas
t sl
op
e
AWS 34 (ms-1) Summit
Easterly
Westerly
Wind component across Lyddan ice rise

?
?
Easterly
Westerly
N.B. Accelerating flow over hill (erosion) in both cases

Ground Penetrating Radar Transect
-20
0
20
40
60
80
100
120
140
-3000 -2000 -1000 0 1000 2000 3000 4000 5000 6000 7000 8000
5 -
10 -
15 -
20 -
Dep
th (
m)

2000-01
2001-02
Annual accumulation from stakes

Scaled accumulation from stakes and GPR
00-01 01-02 GPR

Airflow modelling methodolgy
Radiosonde wind and temperatures recorded daily at Halley.
Initialise 3dVOM using radiosonde data for selected strong wind cases
Incorporate 1D boundary layer model and match to daily mean AWS wind speeds at Lyddan.
Use this as upwind u,v, profile
Use GPS measured Lyddan orography and solve for surface stress transect across ice rise.

Airflow modelling results
Airflow model predicts:
• slowdown on upstream side of ridge
• speed-up on lee slope of ridge
Then apply blowing snow transport parameterization to predict erosion/deposition

• Strong wind event from Sept 2000 shows erosion at summit & at 2 points on upstream slope and deposition on lee slope.
Erosion/deposition from 3dVOM plus blowing snow

Erosion/deposition for different upstream wind strengths
To predict annual erosion, all Halley radiosondes strong enough for blowing snow used to gain erosion/deposition parameterization dependent on near-surface wind speed.
This enables estimate of annual erosion/deposition using Lyddan AWS data
But: erosion/deposition also depends strongly on static stability profile of troposphere(gravity waves strongly affect speed-up across ridge)

Annual erosion/deposition calculated from AWS data
Although erosion signal is largest in strongest wind events, more modest strong-wind-events are more frequent: these dominate.
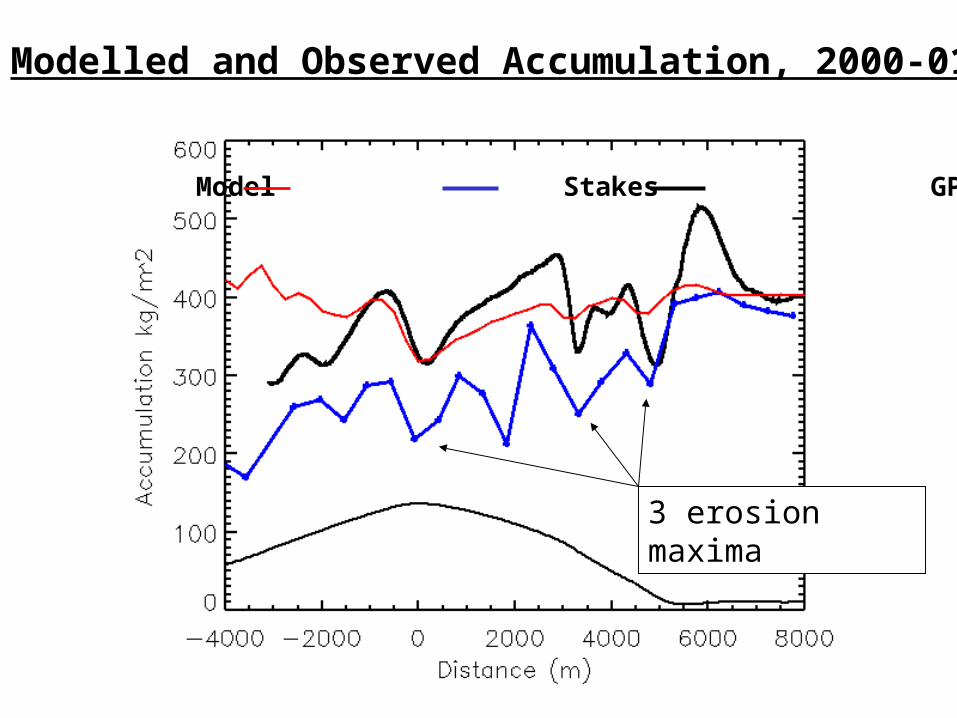
Model Stakes GPR
Modelled and Observed Accumulation, 2000-01
3 erosion maxima

Conclusions• Measurements at Lyddan Ice Rise (LIR) show large accumulation variations associated with this very gentle topographic feature.
• AWS measurements show significant variations in wind speed across LIR. In particular, speeds on the lee slope are much greater than those at the summit when summit wind speeds are less than about 8 ms-1.
• Broad-scale annual average snow redistribution calculated from AWS data agrees well with stake measurements
• Pattern of redistribution calculated using a linear airflow model agrees well with stake and GPR measurements, although absolute values of annual average erosion are too small
• The LIR results suggest that caution should be exercised when interpreting ice core data obtained from regions of even quite gentle topography.

HALF-TIME
And now for something completely different…

• Denitrification is the irreversible removal of HNO3 from the lower stratosphere by the sedimentation of HNO3-containing particles (nitric acid hydrates or ice)
• Removal of HNO3 reduces chlorine deactivation to ClONO2 and hence results in enhanced ozone loss
• Chemical Transport Model simulations have shown that denitrification can increase Arctic ozone loss by 30%
• Denitrification is a ubiquitous feature of Antarctic winters and has been observed in the Arctic in the cold winters 1988/9, 1994/5, 1995/6, 1996/7
• In a future colder Arctic stratosphere, denitrification could become more common, widespread and intense.
Denitrification of the Arctic stratosphere : Introduction

Davies et al. (2002)

New insight into Arctic denitrification
• Prior to 1999/2000, denitrification thought to be caused by ice coated with NAT.
• NAT particles assumed to be too small to sediment significantly (r~1 m, n~0.1 cm-3)
• In-situ observations by Fahey et al. (2001) revealed the existence of large (r~10 m, n~10-4 cm-3) HNO3-containing particles capable of widespread denitrification
• NAT particles take 8 days to grow to 10 m• Consequently, an equilibrium based NAT scheme
may be invalid.

Denitrification by Lagrangian Particle Sedimentation (DLAPSE) A 3D microphysical model coupled to
SLIMCAT
• Designed specifically to simulate denitrification by NAT particles alone and understand and test their evolution and formation
•non-equilibrium model forced by ECMWF analysed wind, T
•time-dependent growth and sedimentation of ~50,000 model NAT particles
•flexible nucleation scheme
•NAT particles grow in competition with STS particles
• full 41 tracer chemistry of SLIMCAT CTM included
Carslaw et al. (2002)
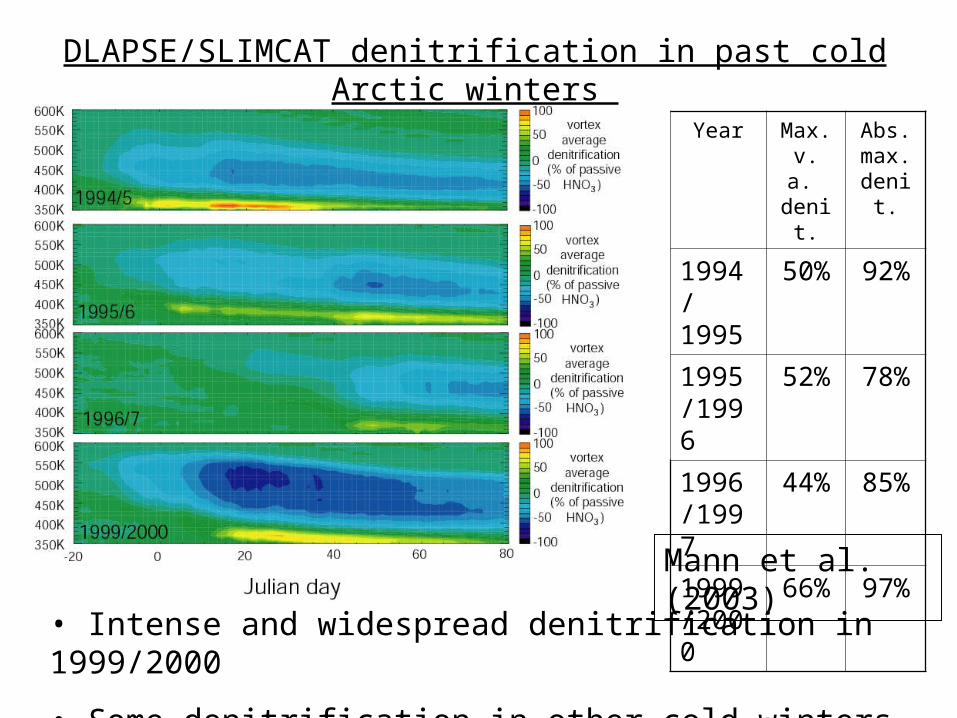
DLAPSE/SLIMCAT denitrification in past cold Arctic winters
• Intense and widespread denitrification in 1999/2000
• Some denitrification in other cold winters but not as strong
Year Max. v. a. denit.
Abs.max. denit.
1994/ 1995
50% 92%
1995/1996
52% 78%
1996/1997
44% 85%
1999/2000
66% 97%
Mann et al. (2003)
Factors controlling Arctic denitrification
Q. What was special about the 1999/2000 Arctic winter?
Q. What conditions allow NAT particles to grow to “rock” sizes and cause strong denitrification?
Several factors control intensity and extent of denitrification
• horizontal area & vertical depth of NAT super-saturated region
• nitric acid and water vapour mixing ratios
• minimum temperature
• number concentrations of solid hydrate particles which form
• METEOROLOGY (proximity of vortex and cold pool centres)

Idealised study of meteorology controlling denitrification
• Use fixed ECMWF wind & temperature from 23rd Dec 99 for 10 days
• 20o solid body rotation of temperature field relative to wind field
Mann et al (2002)
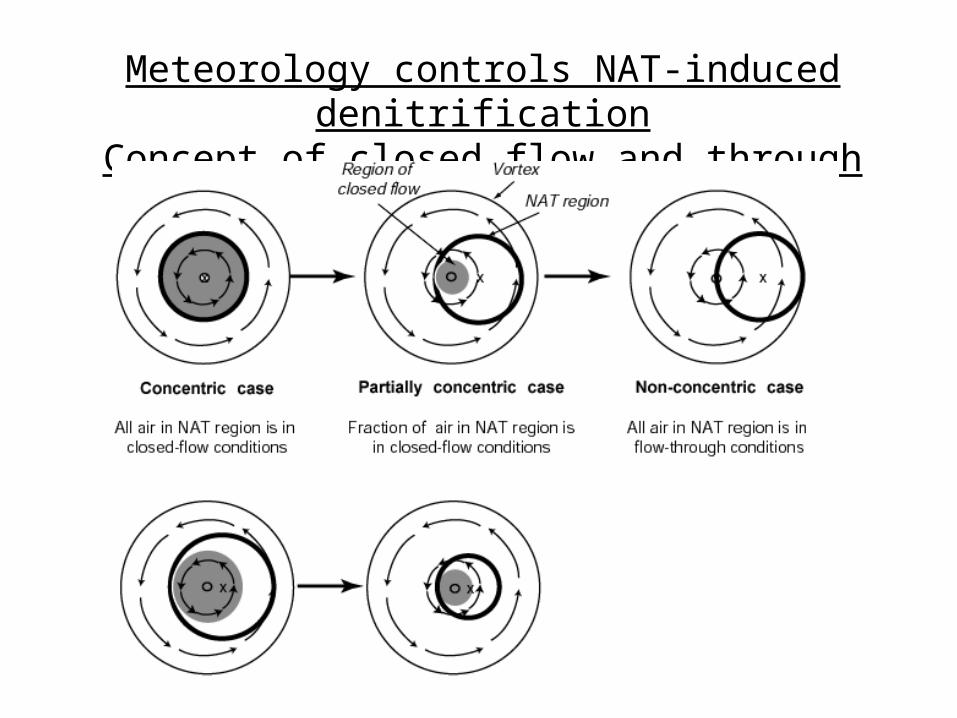
Meteorology controls NAT-induced denitrificationConcept of closed flow and through flow

The big unknown:What is the nucleation process for NAT rocks?
• Condensation onto ice followed by ice evaporation?• Homogeneous freezing of ternary solutions?• Heterogeneously on e.g. meteoritic debris, ion
clusters (due to cosmic rays?), etc?• Another mechanism?
DLAPSE has a flexible nucleation scheme.
Usually use slow nucleation rate everywhere T<TNAT.This was a pragmatic rather simplistic approach.
Now done Arctic simulations with nucleation controlled by ice produced on mesoscale via mountain waves

High resolution 1x1 DLAPSE/SLIMCAT run with particles rained from base of mother clouds (Fueglistaler et al., 2002) produced from mesoscale ice regions using Mountain Wave Forecast Model of Eckermann & Preusse (1999)
Mountain Wave induced ice PSCs produce mother cloud which then rains out NAT

Mountain Waves Mother clouds

High resolution large-scale slow nucleation run

High resolution mother cloud nucleation run
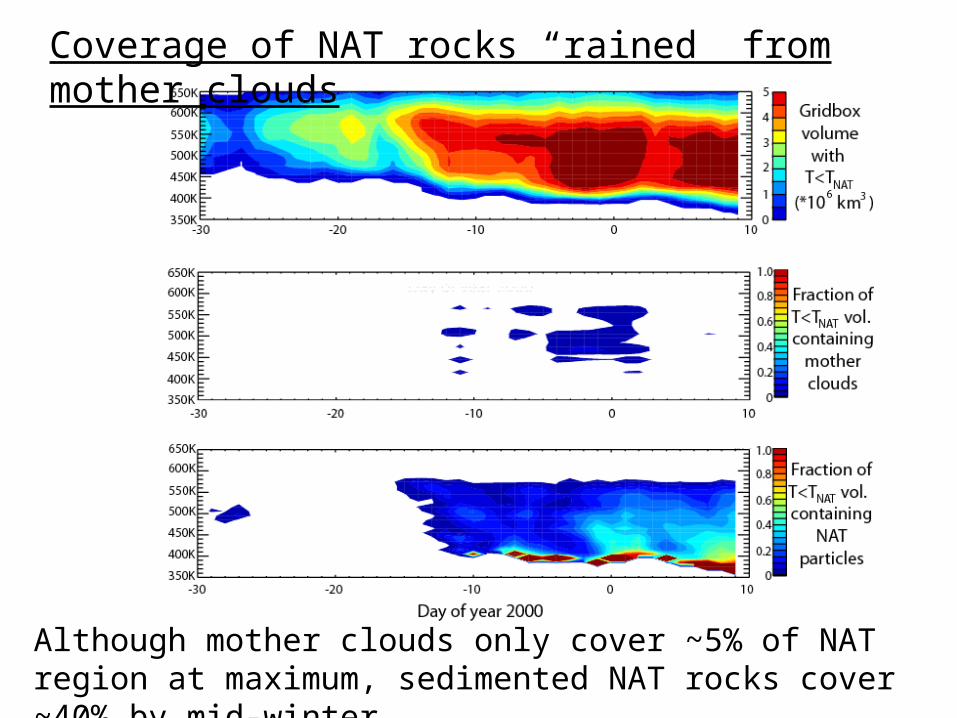
Coverage of NAT rocks “rained” from mother clouds
Although mother clouds only cover ~5% of NAT region at maximum, sedimented NAT rocks cover ~40% by mid-winter.
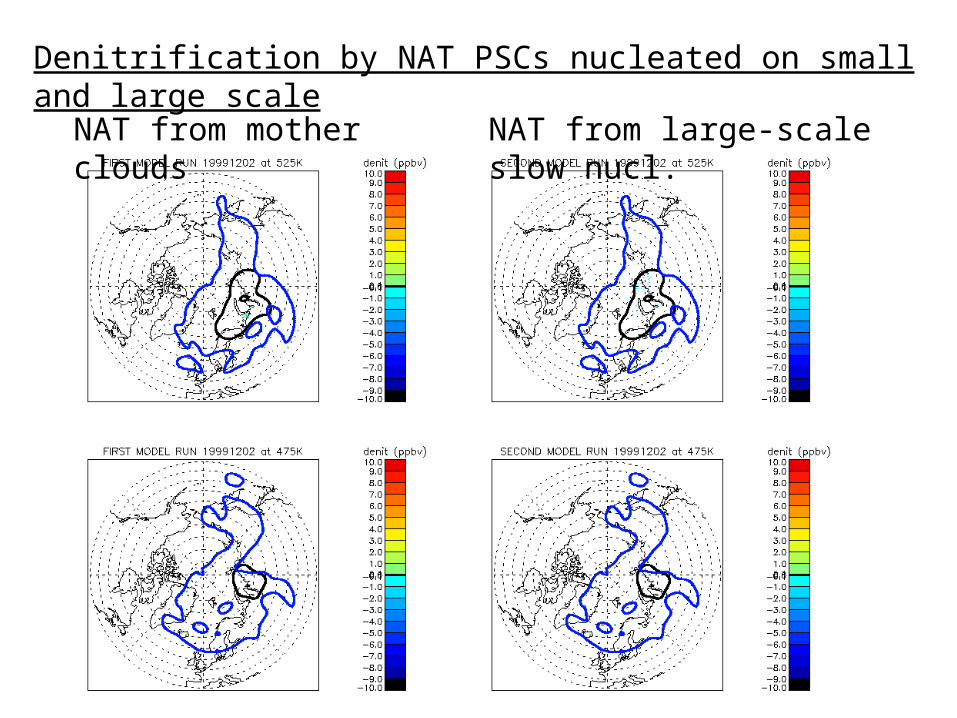
Denitrification by NAT PSCs nucleated on small and large scale
NAT from mother clouds NAT from large-scale slow nucl.

Comparing PSC properties and denitrification
• Denitrification in mother cloud run is significant but is weaker
and occurs later than in large-scale slow nucleation run
• Large-scale run has been shown to agree well with timing and scale of denit observations (if anything underestimates).
NAT from mother clouds NAT from large-scale slow nucl.
Conclusions• Arctic denitrification is caused by slowly-growing nitric acid tri-hydrate (NAT) particles which sediment removing HNO3.
• Although nucleation mechanism remains uncertain, NAT rocks produced via mountain waves caused significant denitrification in the Arctic winter 1999/2000.
• Timing of denitrification in observations is consistent with the production of NAT via some large-scale nucleation mechanism.
• Whatever the mechanism for producing widespread NAT rocks during cold Arctic winters, the flow regime of the polar vortex-cold pool is the dominant controlling factor for denitrification.
Related Documents