A TALE OF TWO ENERGY BOOMS Alberta Imprudence Texas Prudence MARCH 2015 MARK MILKE

Welcome message from author
This document is posted to help you gain knowledge. Please leave a comment to let me know what you think about it! Share it to your friends and learn new things together.
Transcript
A TALE OF TWO ENERGY BOOMS
AlbertaImprudence
TexasPrudence
MARCH 2015
MARK MILKE

March 2015
A Tale of Two Energy Booms
by Mark Milke

fraserinstitute.org

fraserinstitute.org / i
Contents
Executive summary / iii
Introduction / 1
The Texas and Alberta economies compared / 3
Alberta and Texas: A fiscal comparison / 14
Conclusion / 19
References / 20
About the author / 25
Acknowledgments / 25
Publishing information / 26
Supporting the Fraser Institute / 27
Purpose, funding, & independence / 27
About the Fraser Institute / 28
Editorial Advisory Board / 29

fraserinstitute.org

fraserinstitute.org / iii
Executive summary
Non-renewable resource prices, especially oil prices, and associated revenues to governments have fallen significantly over recent months. This is not the first time such gyrations in oil and gas prices and then government revenues have occurred. Recent events then provide an opportunity to explore the eco-nomic and fiscal ups and downs of two jurisdictions, Alberta and Texas, both well known for their oil and gas sectors (26.8 percent of GDP in Alberta and 11.0 percent in Texas), and to compare how they performed through resource price fluctuations.
This report analyzes the economic and fiscal records of Alberta and Texas with the goal of answering two questions: Which jurisdiction performed better economically, and which performed better on fiscal measurements?
The economic records of Alberta and Texas reveal that both have experienced similar rates of real GDP growth from 2001 to 2013 (3.2 and 3.1 percent respectively, averaged annually). Texas performed better on real per-capita GDP growth (1.2 percent on an annual average, compared with Alberta’s at 0.9 percent over the period), and also does better when real GDP per worker is examined. However, by most economic measurements—total employment growth, private sector employment growth, unemployment rate, and population growth—Alberta has performed better than Texas. Also, as of 2013, Alberta had significantly higher per-capita GDP, at $75,605, compared with Texas, at $64,450 (Canadian dollars).
On balance then, Alberta has had the better economic record. That meant Alberta’s government could have had a superior fiscal record. More people employed, higher employment growth, and lower unemployment equate to more personal income taxes collected and lower demands for prov-incial social assistance, for example. All of that should have made balanced budgets more possible.
However, Alberta’s fiscal record has been generally poor in comparison to Texas since the year 2000. On fiscal measurements, Alberta has had sig-nificantly larger government expenditures relative to the economy (an annual average of 13.1 percent of GDP in Alberta; 9.0 percent in Texas), higher pub-lic sector employment growth (2.8 versus 1.1 percent growth on average

iv / A tale of two energy booms
fraserinstitute.org
annually), and much higher per-capita government spending on an annual average ($8,607 per person in Alberta; $4,952 per person in Texas).
Even accounting for differing responsibilities in Texas and Alberta, the growth in per-capita government spending illustrates relative Texan prudence and Albertan imprudence. Between 2000/01 and 2012/13, Alberta’s per-cap-ita government spending rose by 69.5 percent, compared with a 59.5 per-cent rise in Texas. Such significantly higher expenditures and public sector employment growth meant that once resource prices declined dramatically it was more difficult for Alberta to achieve a balanced budget in compari-son to Texas during and after the last recession. From 2008/09 to 2012/13, as a percentage of GDP, Texas recorded one deficit (in that first year). It has recorded a surplus in every year since. In contrast, Alberta did not record a single surplus in any of those five years.
On average, Alberta demonstrated a better fiscal record on just one important fiscal measurement: net public debt relative to GDP. However, Alberta’s fiscal position (its net assets) have been in decline since 2006/07, whereas Texas stanched the bleeding in 2010/11. Simply put, if Alberta con-tinues to perform poorly on the other above-mentioned fiscal indicators, it is only a matter of time until that favourable indicator for Alberta—net public assets/debt—is also eventually lost to Texas.

fraserinstitute.org / 1
Introduction
Two resource economies, two different government spending patterns
Since the millennium, energy and natural gas prices have weakened, soared, crashed, strengthened, and then crashed once again. Between 2000 and 2013, the years examined in this report, the price of one barrel of oil (West Texas Intermediate, on a monthly average) has ranged from a low of US$19.39 (December 2001) to a high of $133.88 (July 2008). Natural gas prices (dollars per thousand cubic feet on a monthly average) have ranged from a low of US$2.04 (April 2012) to a high of $11.78 (July 2008) (US Energy Administration, undated a, undated b).
This study will examine two jurisdictions where resource extraction is responsible for a significant share of each entity’s economy, the Province of Alberta and the State of Texas. In both jurisdictions, energy has provided employment opportunities, income growth, and population growth.
One previous study (Clemens, Emes, and Di Matteo 2014) analyzed ten energy-producing provinces and states and found that Alberta did relatively well before the last recession on selected fiscal indicators such as an avoid-ance of budget deficits, but that it has not fared as well in the years since the 2008/2009 recession.
This study will more narrowly focus on just the Alberta-Texas com-parison, with the goal of answering two questions: How do Alberta and Texas compare on measurements of economic performance and on measurements of fiscal performance? Expressed differently, given the similar performance of the two economies, how do Alberta and Texas compare on measurements that governments have some control over—government expenditures, and related measurements such as public sector employment growth, deficits and debt?

2 / A tale of two energy booms
fraserinstitute.org
Measurements and outline
This study will first outline the similar economic performance of Texas and Alberta. Measurements here include oil and gas activity as a percentage of GDP, real GDP growth, population growth, real per-capita GDP growth, total employment growth, private sector employment growth (public sec-tor employment growth is noted here as well to keep employment statistics together), unemployment rates, and real GDP per worker.
Second, this report will analyze the Albertan and Texan fiscal records. Measurements here are per-capita surplus/deficit by year, net public debt as a percentage of GDP, per-capita government expenditure, and the ratio of government expenditures to GDP.
All figures that follow in this report have been converted to Canadian dollars. Also, the years analyzed in this study are from 2000 to 2013 inclu-sive, unless otherwise noted. Comparator measurements of growth begin in 2001, i.e., the statistic for GDP growth is identified as 2001 given the com-parator year is 2000.

fraserinstitute.org / 3
The Texas and Alberta economies compared
Figure 1: Oil and gas activity as a share of the economy
Oil and gas activity both form a large part of the Alberta and Texas econ-omies. As a percentage of GDP, oil and gas activity amounted to 26.8 per-cent in Alberta (6.6 percent of the Canadian economy). In Texas, oil and gas activity amounted to 11.0 percent of that state’s economy (1.7 percent of the US economy).
0.0
5.0
10.0
15.0
20.0
25.0
30.0
United StatesTexasCanadaAlberta
%
26.8%
6.6%
1.7%
11.0%
Sources: Statistics Canada, 2015a, 2015b; US Bureau of Economic Analysis, 2015a.

4 / A tale of two energy booms
fraserinstitute.org
Figure 2: Real GDP growth in Alberta and Texas
The Alberta and Texas economies performed broadly similarly over the 2001–2013 period, with average annual real GDP growth of 3.2 percent in Alberta and 3.1 percent in Texas. Interestingly, Alberta’s economy experienced a much more severe decline in the last recession. In 2009, Alberta’s economy shrank by 4.1 percent, compared with a comparatively modest 0.5 percent decline in real GDP in Texas.
-5
-4
-3
-2
-1
01
2
3
4
5
6
7
2013201220112010200920082007200620052004200320022001
%
1.5
3.0
2.11.8
3.4
0.7
5.5
4.6
2.0
4.4
6.25.9
1.7
4.2
1.7
0.7
-4.1
-0.5
4.5
3.0
5.7
4.24.5
6.9
3.8 3.7
TexasAlberta
Sources: Statistics Canada, 2014a; US Bureau of Economic Analysis, 2014a, 2014b; International Monetary Fund, 2013.

A tale of two energy booms / 5
fraserinstitute.org
Figure 3: Real per-capita GDP; Alberta tops but Texas gaining
In the years examined (2000 to 2013), Alberta demonstrated a significant advantage over Texas in per-capita GDP. In 2000, per-capita GDP in Alberta was $67,653, rising to $75,605 by 2013. The growth in Texan per-capita GDP followed the same trajectory but started from a lower base. In 2000, per-person GDP in Texas was $54,999, rising to $64,450 by 2013. In 2000, Alberta’s per-person GDP advantage was $12,654; by 2013, the gap had nar-rowed slightly to $11,155.1
1. All figures in this study are in real Canadian dollars unless otherwise noted.
Sources: Statistics Canada, 2014a, 2014b; US Bureau of Economic Analysis, 2014a, 2014b, 2014c; International Monetary Fund, 2013.
40,000
45,000
50,000
55,000
60,000
65,000
70,000
75,000
80,000
20132012201120102009200820072006200520042003200220012000
$ CD
N
Alberta, 2013: $75,605
Texas, 2013: $64,450Alberta, 2000: $67,653
Texas, 2000: $54,999

6 / A tale of two energy booms
fraserinstitute.org
Figure 4: Real per-capita GDP growth in Alberta and Texas
Between 2001 and 2013 (2001 growth rates vis-à-vis 2000), the average annual growth in real per-person GDP was 0.9 percent in Alberta compared with an annual average of 1.2 percent in Texas. Alberta’s occasional declines in GDP have been sharper than those in Texas. In Alberta, the sharpest decline in real per-person GDP occurred in 2009 (-6.2 percent); the highest year-over-year growth rate was 4.1 percent (2011). In Texas, the sharpest decline in real per-capita GDP was in 2009 (-2.5 percent); the strongest growth year was 2012 with a 5.2 percent rise.
Sources: Statistics Canada, 2014a, 2014b; US Bureau of Economic Analysis, 2014a, 2014b, 2014c; International Monetary Fund, 2013.
-7
-6
-5
-4
-3
-2
-1
0
1
2
3
4
5
2013201220112010200920082007200620052004200320022001
%-0.2
1.2
-0.2
0.0
1.7
-0.9
3.7
2.9
0.3
1.8
3.1 3.2
-1.0
2.1
-0.6-1.3
-6.2
-2.5
3.0
1.2
4.1
2.61.9
5.2
0.7
2.1
TexasAlberta

A tale of two energy booms / 7
fraserinstitute.org
Figure 5: Real GDP per worker; Texas soars past Alberta
The only measurement where Alberta and Texas switched positions over the 2000–2013 period concerns real GDP per worker. This is significant as it is a measurement of productivity—and it tells us that Texas has simply boomed. In 2000, real GDP per Alberta worker was $128,383; in Texas, the figure was $116,509, or $11,874 below Alberta. By 2013, real GDP per worker was $141,660 in Texas and $137,027 in Alberta—a $4,633 advantage for Texas.2
2. To some extent, the results illustrated in figures 2 through 5 reflect differences between extensive and intensive economic growth. Extensive economic growth refers to changes in GDP that are a result of the expansion of the quantity of inputs. For instance, increases in population increase the labour input in GDP. Intensive growth, on the other hand, refers to economic growth that comes about through increases in efficiency, meaning that the economy can produce more from the same level of inputs due to innovation or other technological improvements. Extensive growth may also be a precursor to intensive economic growth. For a discussion of extensive vs. intensive economic growth, please see Irmen (2005).
Sources: Statistics Canada, 2014a, 2014d; US Bureau of Economic Analysis, 2014a, 2014b, 2014c; US Department of Labor, various years a, various years b.
110,000
115,000
120,000
125,000
130,000
135,000
140,000
145,000
150,000
20132012201120102009200820072006200520042003200220012000
$ CD
N Alberta, 2013:$137,027
Texas, 2013: $141,660
Alberta, 2000: $128,383
Texas, 2000: $116,509

8 / A tale of two energy booms
fraserinstitute.org
Figure 6a: Total employment growth; Alberta significantly stronger
In most years, both Alberta and Texas recorded employment growth, though Alberta’s was notably stronger. Between 2001 and 2013, total employment growth averaged 2.6 percent in Alberta and 1.5 percent in Texas. The strong-est year for employment growth in Alberta was in 2006 (5.0 percent). The sharpest decline in employment was in 2009 (-1.4 percent). The strongest year for employment growth in Texas was 2006 (3.0 percent) with the steep-est decline in 2009 (-1.1 percent).
Sources: Statistics Canada, 2014d; US Department of Labor, various years a, various years b, various years c.
-2
-1
0
1
2
3
4
5
2013201220112010200920082007200620052004200320022001
%
3.0
0.7
2.8
1.2
3.4
1.0
2.6
1.6
2.92.7
5.0
3.0
3.9
0.4
3.1
1.2
-1.4-1.1
-0.4
1.3
3.8
2.92.7
2.9 2.9
1.9
TexasAlberta

A tale of two energy booms / 9
fraserinstitute.org
Figure 6b: Private sector employment growth; Alberta significantly stronger
Private sector employment growth was stronger in Alberta than in Texas, on an annual average between 2001 and 2013. Alberta’s annual average growth rate in private sector employment was 2.8 percent, whereas the annual aver-age for Texas was 1.9 percent. The strongest year in Alberta for private sector employment growth was 2011 (6.5 percent) and for Texas, 2005 (4.5 percent). The sharpest decline for private sector employment was in 2009 for both Alberta (-4.2 percent) and Texas (-1.8 percent). Notably, however, Texas has outperformed Alberta in the post-recession years.
Sources: Statistics Canada, 2014d; US Department of Labor, various years a, various years b, various years c.
-5
-4
-3
-2
-1
0
1
2
3
4
5
6
7
2013201220112010200920082007200620052004200320022001
%
4.0
0.6
3.3
2.1 2.3
0.5
2.3
0.8
4.5
0.5
6.4
3.2
4.9
1.7
3.7
0.7
-4.2
-1.8
0.7
1.6
6.5
4.03.5
3.9
2.42.7
TexasAlberta

10 / A tale of two energy booms
fraserinstitute.org
Figure 6c: Public sector employment growth; Alberta 147 percent higher than Texas
Of relevance to the next section on fiscal records, public sector employment growth was significantly higher in Alberta than in Texas. Between 2001 and 2013, Alberta’s average annual growth in public sector employment was 2.8 percent, almost two and a half times the 1.1 percent annual average annual rate of growth observed in Texas. Alberta’s growth in public sector employment was thus 147 percent higher than that of Texas, on average, annually between 2001 and 2013. Alberta’s highest years for public sector employment growth were 2005 and 2006 (7.3 percent in each); in Texas it was 2004 (5.1 percent).3
3. Some of this high public sector growth is attributable to relatively higher population growth in Alberta, but a comparison of the growth in per-capita government expenditures over the 2000/01 to 2012/13 period demonstrates that Texas restrained its public service growth relative to Alberta even after accounting for population. Per-capita expenditures grew by 69.5 percent in Alberta compared with 59.5 percent in Texas (figure 10).
Sources: Statistics Canada, 2014d; US Department of Labor, various years a, various years b, various years c.
-6
-4
-2
0
2
4
6
8
2013201220112010200920082007200620052004200320022001
%
3.63.0
2.5
-1.3
1.30.7
1.9
5.1
2.7
7.3 7.3
3.5 3.1
-3.6
2.8
3.7
5.8
1.3
-1.0
1.8
-4.5
-1.2
4.0
-5.6
1.8
4.5
TexasAlberta

A tale of two energy booms / 11
fraserinstitute.org
Figure 7: Unemployment rates; Alberta consistently lower than Texas
Alberta’s unemployment rates were consistently lower over the measured years. On an annual average, Alberta’s unemployment rate was 4.1 percent compared with Texas at 5.5 percent. The highest unemployment years for Alberta occurred in 2009 and 2010 (5.8 percent) while the highest year in Texas was 2010 (7.4 percent). The lowest unemployment year in Alberta was 2006 (2.8 percent); for Texas it was 2000 (3.8 percent).
Sources: Statistics Canada, 2014c; US Department of Labor, various years a, various years b.
0
1
2
3
4
5
6
7
8
20132012201120102009200820072006200520042003200220012000
%4.2
3.84.0
4.44.6
5.9
4.4
6.3
5.5
4.1
3.3
4.8
2.8
4.8
2.8
4.3
2.9
3.9
5.8
7.0
5.8
7.4
4.6
7.2
3.8
6.1TexasAlberta
3.9
5.6
12 / A tale of two energy booms
fraserinstitute.org
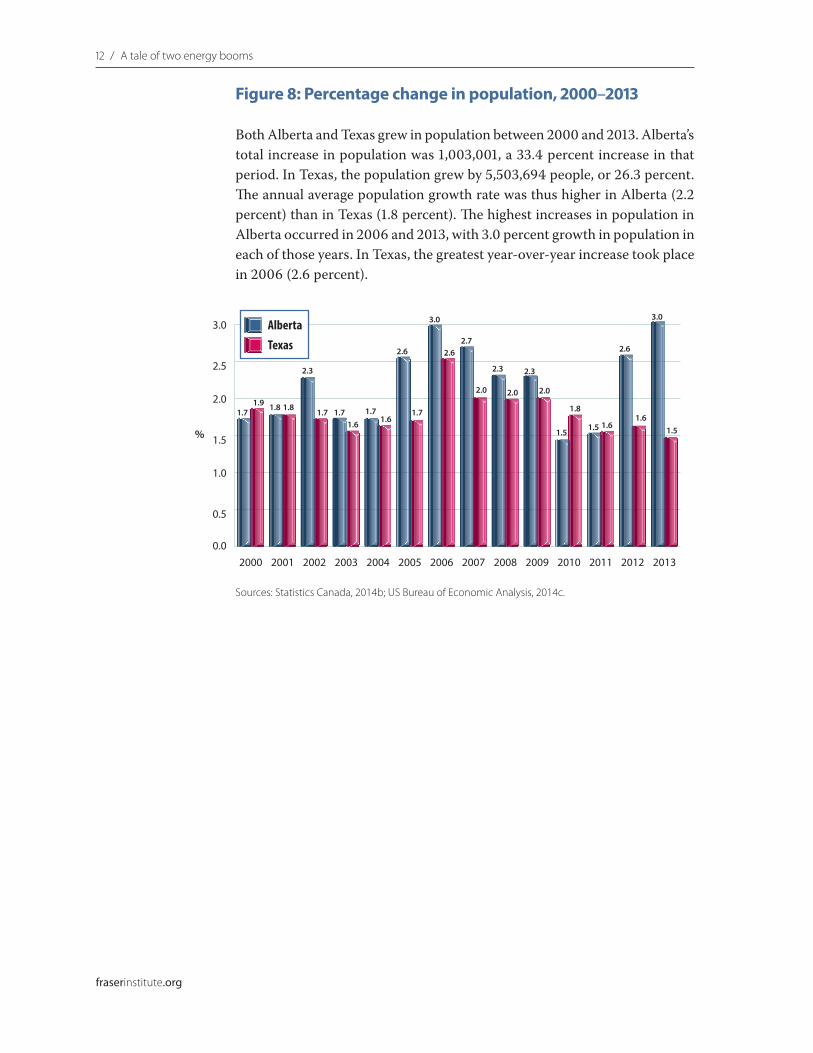
Figure 8: Percentage change in population, 2000–2013
Both Alberta and Texas grew in population between 2000 and 2013. Alberta’s total increase in population was 1,003,001, a 33.4 percent increase in that period. In Texas, the population grew by 5,503,694 people, or 26.3 percent. The annual average population growth rate was thus higher in Alberta (2.2 percent) than in Texas (1.8 percent). The highest increases in population in Alberta occurred in 2006 and 2013, with 3.0 percent growth in population in each of those years. In Texas, the greatest year-over-year increase took place in 2006 (2.6 percent).
Sources: Statistics Canada, 2014b; US Bureau of Economic Analysis, 2014c.
0.0
0.5
1.0
1.5
2.0
2.5
3.0
20132012201120102009200820072006200520042003200220012000
%
1.71.9 1.8 1.8
2.3
1.7 1.71.6
1.61.7
2.6
1.7
3.0
2.62.7
2.0
2.3
2.0
2.3
2.0
1.5
1.8
1.5 1.6
2.6
1.6
TexasAlberta
3.0
1.5

A tale of two energy booms / 13
fraserinstitute.org
Summary of the economic record
The economic record of Alberta and Texas reveals that each experienced simi-lar rates of real GDP growth from 2001 to 2013 inclusive. During that period, Texas’ real per-capita GDP growth was higher. Texas also did better when real GDP per worker is examined, catching up to and surpassing Alberta. By most other economic measurements though, Alberta has performed better than Texas: on total employment growth, private sector employment growth, unemployment rates, and population growth. Thus, on balance, Alberta per-formed better economically.

14 / fraserinstitute.org
Alberta and Texas: A fiscal comparison
As the next measurements show, Texas’ fiscal record has mostly been superior to that of Alberta, even though it recorded slightly slower GDP growth, signifi-cantly slower employment growth, significantly slower private sector employ-ment growth, higher average annual unemployment rates, and a lower pro-portion of the state’s working age population employed.
Figure 9: Per-capita government expenditures
Alberta’s per-capita government expenditures have been significantly higher than those of Texas between 2000/01 and 2012/13. Alberta spent $8,607 on average, while Texas spent $4,952. Alberta’s per-person spending ranged from a low of $6,310 (2000/01) to a high of $10,697 (2012/13). In Texas, it ranged from a low of $3,712 (2000/01) to $6,094 (2010/11).
0
2,000
4,000
6,000
8,000
10,000
12,000
2012/13
2011/12
2010/11
2009/10
2008/09
2007/08
2006/07
2005/06
2004/05
2003/04
2002/03
2001/02
2000/01
$
TexasAlberta
$6,310
$10,697
$5,920
$3,712
$6,094
Sources: Canada, 2014; Statistics Canada, 2014b; US Census Bureau, various years a, various years c, 2012b, 2013b; International Monetary Fund, 2013; US Bureau of Economic Analysis, 2014c.

A tale of two energy booms / 15
fraserinstitute.org
Figure 10: Growth in per-capita government expenditures
A revealing statistic to note in conjunction with the above figure is the growth in per-capita government expenditures. Given that there may be unique responsibilities in Texas or in Alberta that could affect per-capita spending, it is helpful to consider the growth in such spending. That, at a minimum, is one way to see if Alberta or Texas has more carefully controlled spending despite any unique responsibilities that might exist for one or the other. Here, Alberta’s per-capita expenditures rose from $6,310 in 2000/01 to $10,697 in 2012/13, a 69.5 percent rise. In Texas, per-capita government spending rose from $3,712 per person in 2000/01 to $5,920 in 2012/13, or a 59.5 percent increase.
50
55
60
65
70
75
TexasAlberta
%
69.5%
59.5%
Sources: Canada, 2014; Statistics Canada, 2014b; US Census Bureau, various years a, various years c, 2012b, 2013b; International Monetary Fund, 2013; US Bureau of Economic Analysis, 2014c.

16 / A tale of two energy booms
fraserinstitute.org
Figure 11: Government expenditures relative to the economy
Alberta’s government expenditures relative to GDP have been consistently higher than Texas’.4 As an annual average between 2000/01 and 2012/13, gov-ernment expenditures relative to GDP were 13.1 percent in Alberta and 9.0 percent in Texas—or 45 percent higher in Alberta than in Texas. The pattern is consistent over all the years examined: Alberta government expenditures have taken up a larger percentage of its economy in every single year rela-tive to Texas.
4. It might be asserted that higher public (government) health care expenditures in Canada explain the difference between state and provincial expenditures. However, using national averages (provincial and state breakdowns are unavailable), adjusted for pur-chasing power parity, the United States spends more than Canada per person on public health care. In the most recent year available (2012), health care expenditures through government amounted to $4,160 per person in United States and $3,224 per person in Canada (OECD, 2014; US dollars, in purchasing power parity). All of the years relevant to this study, 2000 and after, show the same result according to the OECD data: Higher per-person spending by government in the United States as compared with Canada.
0
2
4
6
8
10
12
14
16
2012/13
2011/12
2010/11
2009/10
2008/09
2007/08
2006/07
2005/06
2004/05
2003/04
2002/03
2001/02
2000/01
%
TexasAlberta
12.9% 13.2%
8.5%8.7%
Sources: Canada, 2014; Statistics Canada, 2014e; US Census Bureau, various years a, various years b, 2012b, 2013b; US Bureau of Economic Analysis, 2014a

A tale of two energy booms / 17
fraserinstitute.org
Figure 12: Provincial and state surplus/deficit as a percentage of total government spending5
Alberta has performed better than Texas on average in this measurement. Between 2000/01 and 2012/13, Alberta produced an annual average surplus that was 11.1 percent of total government spending compared to Texas with an annual average surplus at 7.7 percent. However, Alberta’s better record here results entirely from pre-recession surpluses. In contrast, Texas recorded a deeper one-year deficit in 2008/09 (as a percentage of total government spending) and none since, while Alberta recorded only deficits.
5. Note that this report uses broad definitions of government spending, which means that state surplus/deficit (and other indicators) may seem unusual to those who normally calculate only “general fund” figures. As the focus of this report is to compare Alberta’s performance to that of Texas, we have chosen to base our analysis on the values which best represent Alberta’s fiscal performance. For Alberta this means using consolidated revenue, spending, and hence surplus/deficit. Using a broad definition for the provincial government requires we do the same for the comparator jurisdiction.
-20
-10
0
10
20
30
40
2012/13
2011/12
2010/11
2009/10
2008/09
2007/08
2006/07
2005/06
2004/05
2003/04
2002/03
2001/02
2000/01
%
TexasAlberta
Sources: Canada, 2014; US Census Bureau, various years a, various years b, various years c, 2012a, 2012b, 2013a, 2013b.

18 / A tale of two energy booms
fraserinstitute.org
Figure 13: Net Public Debt Relative to GDP
Alberta is in a better position on net public debt. Over the period examined (2000/01 to 2012/13 for Alberta; 2000/01 to 2011/12 for Texas), Alberta’s net public debt has been -7.2 percent of GDP. In other words, Alberta has recorded net assets. In contrast, Texas’ net public debt has averaged 1.4 per-cent of GDP. However, as with several other indicators, pre-recession and post-recession numbers reveal a more recent pattern. Alberta enjoyed its best year here in 2006/07 and has been in decline ever since (in essence, whittling away at its net assets). Texas increased its net public debt after 2006/07, but arrested that decline as of 2010/11.
-15
-12
-9
-6
-3
0
3
2012/13
2011/12
2010/11
2009/10
2008/09
2007/08
2006/07
2005/06
2004/05
2003/04
2002/03
2001/02
2000/01
%
TexasAlberta
Sources: Canada, 2014; Statistics Canada, 2014e; Urban Institute-Brookings Institution Tax Policy Center, 2015; US Census Bureau, 2006; US Bureau of Economic Analysis, 2014a.

fraserinstitute.org / 19
Conclusion
Alberta’s economic record has mostly been better than Texas
The economic records of Alberta and Texas reveal that they have experienced similar rates of real GDP growth (3.2 and 3.1 percent respectively, averaged annually). Texas has the advantage on real per-capita GDP growth (1.2 percent on an annual average compared with Alberta’s 0.9 percent growth), though Alberta’s real per-capita GDP was still significantly higher than Texas’ in 2000 and again in 2013, albeit with a slight narrowing between the province and state over those years. Texas also has performed better when real GDP per worker is examined, and has surpassed Alberta on that measurement.
On most other economic measurements, however, Alberta has per-formed better than Texas: on total employment growth, private sector employ-ment growth, the unemployment rate, and population growth.
The Texas advantageTexas’ fiscal record mostly better than Alberta
Despite having a lower unemployment rate (which has had a beneficial effect on government finances), Alberta’s fiscal record is poor in comparison to Texas on measurements of public sector employment growth, deficits in the last five years, per-capita government expenditures, and government expendi-tures relative to the economy.6 Alberta has, thus far, shown a better fiscal rec-ord on one measurement—net public debt relative to GDP—but that measure has been in decline since 2006/07. Meanwhile Texas stanched the bleeding here as of 2010/11. Thus, if Texas continues to perform well on the other four of the five indicators, it is only a matter of time until the last favourable indi-cator for Alberta is also eventually lost.
6. One reason Texas has a better fiscal record could be explored further by research-ers—the effect of constitutional spending limits. In Texas, the state constitution has four types of limits: debt limit, welfare spending limit, pay-as-you-go limit, and a limit on the growth of certain appropriations (Texas, 2014: 2).

20 / fraserinstitute.org
References
Alberta (2003). Consolidated Financial Statements of the Government of Alberta: Annual Report 2002–03. Government of Alberta.
Canada, Finance Canada (2014). 2014 Fiscal Reference Tables. Government of Canada. <https://www.fin.gc.ca/frt-trf/2014/frt-trf-14-eng.asp>
Clemens, Jason, Joel Emes, and Livio Di Matteo (2014). An Economic and Fiscal Comparison of Alberta and Other North American Energy Producing Provinces and States. Fraser Institute. <http://www.fraserinstitute.org/uploadedFiles/fraser-ca/Content/research-news/research/publications/economic-and-fiscal-comparison-of-alberta-and-other-north-american-energy-producing-provinces-and-states.pdf>
International Monetary Fund (2013). World Economic Outlook Database, 2013. International Monetary Fund. <http://www.imf.org/external/pubs/ft/weo/2013/02/weodata/download.aspx>
Irmen, A. (2005). Extensive and Intensive Growth in a Neoclassical Framework. Journal of Economic Dynamics and Control 29, 8: 1427–48.
Organisation for Economic Co-operation and Development [OECD] (2014). OECD Health Statistics 2014 - Frequently Requested Data. OECD. <http://www.oecd.org/els/health-systems/oecd-health-statistics-2014-frequently-requested-data.htm>
Statistics Canada (2014a). Table 384-0038 - Gross Domestic Product, Expenditure-Based, Provincial and Territorial, Annual. <http://www5.statcan.gc.ca/cansim/a26?lang=eng&retrLang=eng&id=3840038&paSer=&pattern=&stByVal=1&p1=1&p2=-1&tabMode=dataTable&csid>
All websites retrievable as of March 17, 2015.

A tale of two energy booms / 21
fraserinstitute.org
Statistics Canada (2014b). Table 051-0001—Estimates of Population, by Age Group and Sex for July 1, Canada, Provinces and Territories. <http://www5.statcan.gc.ca/cansim/a26?lang=eng&retrLang=eng&id=0510001&paSer=&pattern=&stByVal=1&p1=1&p2=-1&tabMode=dataTable&csid>
Statistics Canada (2014c). Table 282-0086—Labour Force Survey Estimates (LFS), Supplementary Unemployment Rates by Sex and Age Group. <http://www5.statcan.gc.ca/cansim/a26?lang=eng&retrLang=eng&id=2820086&paSer=&pattern=&stByVal=1&p1=1&p2=-1&tabMode=dataTable&csid>
Statistics Canada (2014d). Table 282-0012—Labour Force Survey Estimates (LFS), Employment by Class of Worker, North American Industry Classification System (NAICS) and Sex, Annual (Persons). <http://www5.statcan.gc.ca/cansim/a26?lang=eng&retrLang=eng&id=2820012&paSer=&pattern=&stByVal=1&p1=1&p2=-1&tabMode=dataTable&csid=>
Statistics Canada (2014e). Table 384-0037—Gross Domestic Product, Income-Based, Provincial and Territorial, Annual. <http://www5.statcan.gc.ca/cansim/a26?lang=eng&retrLang=eng&id=3840037&paSer=&pattern=&stByVal=1&p1=1&p2=-1&tabMode=dataTable&csid>
Statistics Canada (2015a). Cansim Table 379-0030 - Gross Domestic Product (GDP) at Basic Prices, by North American Industry Classification System (NAICS), Provinces and Territories. <http://www5.statcan.gc.ca/cansim/a26?lang=eng&retrLang=eng&id=3790030&paSer=&pattern=&stByVal=1&p1=1&p2=-1&tabMode=dataTable&csid>
Statistics Canada (2015b). Cansim Table 379-0031 - Gross Domestic Product (GDP) at Basic Prices, by North American Industry Classification System (NAICS). <http://www5.statcan.gc.ca/cansim/a26?lang=eng&retrLang=eng&id=3790031&paSer=&pattern=&stByVal=1&p1=1&p2=-1&tabMode=dataTable&csid>
Texas, Legislative Budget Board (2014). Constitutional Spending Limits. Government of Texas. <http://www.lbb.state.tx.us/Documents/Publications/Presentation/1987_HACSpendingLimitandOverview.pdf>
US Bureau of Economic Analysis (2014a). Gross Domestic Product (GDP) by State. Government of the United States. <http://1.usa.gov/192Owny>
US Bureau of Economic Analysis (2014b). Implicit Price Deflator (2009=100). Government of the United States. <http://1.usa.gov/192Owny>
22 / A tale of two energy booms
fraserinstitute.org
US Bureau of Economic Analysis (2014c). SA1-3 Personal Income Summary, Population (Number of Persons). Government of the United States. <http://1.usa.gov/192Owny>
US Bureau of Economic Analysis (2015a). Real GDP by State (Millions of Chained 2009 Dollars). Government of the United States. <http://1.usa.gov/192Owny>
US Census Bureau (2006). Annual Survey of State and Local Government Finances and Census of Governments. Government of the United States. <http://www2.census.gov/pub/outgoing/govs/special60/Govt_Finances.zip> Please note that this zip file link will download a large amount of data.
US Census Bureau (various years a, 2001–2008). Annual Survey of State and Local Government Finances and Census of Governments. Government of the United States. <http://www2.census.gov/pub/outgoing/govs/special60/Govt_Finances.zip> Please note that this zip file link will download a large amount of data.
US Census Bureau (various years b, 2009–2011). Summary Table: State Government Tax Collections. Annual Survey of State and Local Government Finances and Census of Governments. Government of the United States. <https://www.census.gov/govs/statetax/>
US Census Bureau (various years c, 2009–2011). Summary Table. Annual Survey of State and Local Government Finances and Census of Governments. Government of the United States. <http://www.census.gov/govs/state/>
US Census Bureau (2012a). 2012 Annual Survey of State Government Tax Collections Detailed Table. Government of the United States <https://www.census.gov/govs/statetax/historical_data_2012.html>
US Census Bureau (2012b). Summary Table, 2012 Census of Governments, Survey of State Government Finances. Government of the United States. <http://factfinder2.census.gov/faces/tableservices/jsf/pages/productview.xhtml?src=bkmk>
US Census Bureau (2013a). 2013 Annual Survey of State Government Tax Collections Detailed Table. Government of the United States. <https://www.census.gov/govs/statetax/>

A tale of two energy booms / 23
fraserinstitute.org
US Census Bureau (2013b). Summary Table, 2013 Census of Governments, Survey of State Government Finances. Government of the United States. <http://factfinder2.census.gov/faces/tableservices/jsf/pages/productview.xhtml?src=bkmk>
US Department of Commerce, Census Bureau (2011). Table 1, Intercensal Estimates of the Resident Population by Sex and Age for the United States: April 1, 2000 to July 1, 2010. Government of the United States. <http://www.census.gov/popest/data/intercensal/national/nat2010.html>
US Department of Commerce, Census Bureau (2012). Intercensal Estimates of the Resident Population by Sex and Age for States: April 1, 2000 to July 1, 2010. Government of the United States. <http://www.census.gov/popest/data/intercensal/national/nat2010.html>
US Department of Commerce, Census Bureau (2014). Annual Estimates of the Resident Population for Selected Age Groups by Sex for the United States, States, Counties, and Puerto Rico Commonwealth and Municipios: April 1, 2010 to July 1, 2013. Government of the United States. <http://factfinder2.census.gov/faces/tableservices/jsf/pages/productview.xhtml?pid=PEP_2013_PEPAGESEX&prodType=table>
US Department of Labor (various years a, 2000–2002). Geographic Profile of Employment and Unemployment, Table 18. Government of the United States. <http://www.bls.gov/gps/#tables>
US Department of Labor (various years b, 2003–2013). Geographic Profile of Employment and Unemployment, Table 21. Government of the United States. <http://www.bls.gov/gps/#tables>
US Department of Labor (various years c, 1997–1999). Geographic Profile of Employment and Unemployment, Table 16. Government of the United States. <http://www.bls.gov/gps/#tables>
US Energy Administration (undated a). Cushing WTI Intermediate Spot Price, Monthly Average. Government of the United States. <http://www.eia.gov/dnav/pet/hist/LeafHandler.ashx?n=PET&s=RWTC&f=M>
US Energy Administration (undated b). Price of US Natural Gas Imports (Dollars per Thousand Cubic Feet). Government of the United States. <http://www.eia.gov/dnav/ng/hist/n9100us3m.htm>

24 / A tale of two energy booms
fraserinstitute.org
Urban Institute-Brookings Institution (2015). State & Local Government Finance Data Query System. Data from US Census Bureau, Annual Survey of State and Local Government Finances and Census of Governments (2000–2012). <http://slfdqs.taxpolicycenter.org>

A tale of two energy booms / 25
fraserinstitute.org
About the author
Mark MilkeMark Milke is Senior Fellow at the Fraser Institute. A long-time contributor to the Institute, Mr. Milke is the author of four books on Canadian politics and policy and dozens of studies, on topics such as property rights, public sector pensions, corporate welfare, competition policy, aboriginal matters, and taxes. Mr. Milke is the former research director for the Frontier Centre for Public Policy and former BC and Alberta director with the Canadian Taxpayers’ Federation. His work has been published widely in Canada since 1997 and, in addition to the Fraser Institute, his papers have also been published in the United States by the American Enterprise Institute, the Competitive Enterprise Institute, and the Heritage Foundation, and in Europe by the Brussels-based Centre for European Studies.
Mr. Milke is a Saturday columnist for the Calgary Herald and his columns also appear in the National Post, Globe and Mail, Reader’s Digest, Edmonton Journal, Montreal Gazette, Vancouver Sun, BC’s The Province, Victoria’s Times Colonist, and the Sun newspaper chain. Mr. Milke has a Master’s degree from the University of Alberta, where his MA thesis analyzed human rights in East Asia; he also has a PhD in Political Science from the University of Calgary, where his doctoral dissertation analyzed the rhetoric of Canadian-American relations. Mr. Milke is chairman of the editorial board of Canada’s Journal of Ideas C2C Journal, president of Civitas, and a past lecturer in Political Philosophy and International Relations at the University of Calgary.
Acknowledgments
The author thanks Joel Emes for his data collection for this report and Jason Clemens and the anonymous reviewers who provided feedback on early drafts. Any errors and omissions are the sole responsibility of the author. As the researcher worked independently, the views and conclusions expressed in this paper do not necessarily reflect those of the Board of Directors of the Fraser Institute, the staff, or supporters.
26 / A tale of two energy booms
fraserinstitute.org
Publishing information
DistributionThese publications are available from <http://www.fraserinstitute.org> in Portable Document Format (PDF) and can be read with Adobe Acrobat® or Adobe Reader®, versions 7 or later. Adobe Reader® XI, the most recent ver-sion, is available free of charge from Adobe Systems Inc. at <http://get.adobe.com/reader/>. Readers having trouble viewing or printing our PDF files us-ing applications from other manufacturers (e.g., Apple’s Preview) should use Reader® or Acrobat®.
Ordering publicationsTo order printed publications from the Fraser Institute, please contact the publications coordinator:
• e-mail: [email protected] • telephone: 604.688.0221 ext. 580 or, toll free, 1.800.665.3558 ext. 580 • fax: 604.688.8539.
MediaFor media enquiries, please contact our Communications Department:
• 604.714.4582 • e-mail: [email protected].
CopyrightCopyright © 2015 by the Fraser Institute. All rights reserved. No part of this publication may be reproduced in any manner whatsoever without written permission except in the case of brief passages quoted in critical articles and reviews.
ISBN 978-0-88975-347-1
Date of issue March 2015
CitationMilke, Mark (2015). A Tale of Two Energy Booms. Fraser Institute.<http://www.fraserinstitute.org>

A tale of two energy booms / 27
fraserinstitute.org
Supporting the Fraser Institute
To learn how to support the Fraser Institute, please contact
• Development Department, Fraser Institute Fourth Floor, 1770 Burrard Street Vancouver, British Columbia, V6J 3G7 Canada
• telephone, toll-free: 1.800.665.3558 ext. 586
• e-mail: [email protected]
Purpose, funding, & independence
The Fraser Institute provides a useful public service. We report objective information about the economic and social effects of current public policies, and we offer evidence-based research and education about policy options that can improve the quality of life.
The Institute is a non-profit organization. Our activities are funded by charitable donations, unrestricted grants, ticket sales, and sponsorships from events, the licensing of products for public distribution, and the sale of publications.
All research is subject to rigorous review by external experts, and is conducted and published separately from the Institute’s Board of Directors and its donors.
The opinions expressed by the authors are those of the individuals themselves, and do not necessarily reflect those of the Institute, its Board of Directors, its donors and supporters, or its staff. This publication in no way implies that the Fraser Institute, its trustees, or staff are in favour of, or oppose the passage of, any bill; or that they support or oppose any particular political party or candidate.
As a healthy part of public discussion among fellow citizens who de-sire to improve the lives of people through better public policy, the Institute welcomes evidence-focused scrutiny of the research we publish, including verification of data sources, replication of analytical methods, and intelligent debate about the practical effects of policy recommendations.

28 / A tale of two energy booms
fraserinstitute.org
About the Fraser Institute
Our mis sion is to improve the quality of life for Canadians, their families, and future generations by studying, measuring, and broadly communicating the effects of government policies, entrepreneurship, and choice on their well-being.
Notre mission consiste à améliorer la qualité de vie des Canadiens et des générations à venir en étudiant, en mesurant et en diffusant les effets des poli-tiques gouvernementales, de l’entrepreneuriat et des choix sur leur bien-être.
Peer review —validating the accuracy of our researchThe Fraser Institute maintains a rigorous peer review process for its research. New research, major research projects, and substantively modified research conducted by the Fraser Institute are reviewed by experts with a recognized expertise in the topic area being addressed. Whenever possible, external review is a blind process. Updates to previously reviewed research or new editions of previously reviewed research are not reviewed unless the update includes substantive or material changes in the methodology.
The review process is overseen by the directors of the Institute’s re-search departments who are responsible for ensuring all research published by the Institute passes through the appropriate peer review. If a dispute about the recommendations of the reviewers should arise during the Institute’s peer review process, the Institute has an Editorial Advisory Board, a panel of scholars from Canada, the United States, and Europe to whom it can turn for help in resolving the dispute.
A tale of two energy booms / 29
fraserinstitute.org
Editorial Advisory Board
Members
Past members
* deceased; † Nobel Laureate
Prof. Terry L. Anderson
Prof. Robert Barro
Prof. Michael Bliss
Prof. Jean-Pierre Centi
Prof. John Chant
Prof. Bev Dahlby
Prof. Erwin Diewert
Prof. Stephen Easton
Prof. J.C. Herbert Emery
Prof. Jack L. Granatstein
Prof. Herbert G. Grubel
Prof. James Gwartney
Prof. Ronald W. Jones
Dr. Jerry Jordan
Prof. Ross McKitrick
Prof. Michael Parkin
Prof. Friedrich Schneider
Prof. Lawrence B. Smith
Dr. Vito Tanzi
Prof. Armen Alchian*
Prof. James M. Buchanan* †
Prof. Friedrich A. Hayek* †
Prof. H.G. Johnson*
Prof. F.G. Pennance*
Prof. George Stigler* †
Sir Alan Walters*
Prof. Edwin G. West*

fraserinstitute.org
Related Documents


