A survey study of energy saving activities of industrial companies in Taicang, China Xianbing Liu a, * , Dongjie Niu b , Cunkuan Bao b , Sunhee Suk a , Tomohiro Shishime a a Kansai Research Centre, Institute for Global Environmental Strategies (IGES), Hitomirai Building 5F,1-5-2, Wakinohama Kaigan Dori, Chuo-ku, Hyogo 651-0073, Japan b College of Environmental Science and Engineering, Tongji University, China article info Article history: Received 30 September 2011 Received in revised form 1 December 2011 Accepted 27 December 2011 Available online 2 January 2012 Keywords: Energy saving activity Small and medium-sized enterprises Taicang China abstract This paper seeks to measure industrial energy saving activities (ESAs) and identify their major deter- minant factors by an empirical study of small and medium-sized enterprises (SMEs) in Taicang city, China. The surveyed SMEs indicate high participation ratios of pre-classified ESAs even with weak regulation and limited support from industrial associations at present. The classified factors are partly confirmed by the econometric analysis. The energy management level of competitors and internal training on energy saving have significant and positive influences on a company’s involvement level of ESAs. The findings suggest that Chinese policy makers should gradually expand the regulative require- ments currently focusing on the large energy-consuming companies to SMEs. Providing economic incentives and technical support are important for assisting the SMEs in better practice of ESAs. Ó 2011 Elsevier Ltd. All rights reserved. 1. Introduction The fast increase of primary energy use and corresponding greenhouse gases (GHGs) emissions has driven the attention of policy makers on energy efficiency. The global energy use reveals a worrying perspective, with an annual increase of about 1.8% in average between 2006 and 2030 mainly due to the growth of non- OECD economies (EIA, 2008). As a major energy user, the industry used 78.5% of the world’s coal, 9.5% of global oil, 35.1% of the world’s gas and 41.7% of all the electricity in 2008 (IEA, 2010). Current and future energy and climate policies shall emphasize the industrial sector to make the industry utilize energy more efficiently. As the largest GHGs emitting country in the world, China’s role is critical in combating climate change (SEI, 2009). The climate policy of China was outlined in its ‘National Climate Change Program’ of 2007 and ‘Climate Change White Paper’ of 2008. While China has traditionally avoided to target CO 2 emissions explicitly, its energy and forestry policies have provided the base for the ‘National Climate Change Program’. The central government set up two ambitious energy policy goals in 2006. One was to reduce national energy intensity by 20% by the end of 2010 from 2005 levels. The other is to increase the share of renewable energy in the total energy mix to 15% by 2020 (Seligsohn et al., 2009). China further pledged in November 2009 to cut off its CO 2 emissions per unit of GDP (Gross Domestic Product) by 40e45% by 2020 compared with 2005 levels. This is a voluntary action to tackle climate change problems considering its own conditions (China Daily, 2009). In overall, China’s climate policies are diverse and highly focus on the measures improving industrial energy effi- ciency. On the energy supply side, improving energy efficiency of power sector has been a key effort. Estimated by IEA (2009), by 2011, 80% of China’s coal-fired power plants will be escalated to modern ones with the capacity over 300 MW and this ratio will exceed 90% by 2020. On the energy demand side, energy efficiency standards and assessment system have been gradually established for the investments of new manufacturing facilities and equip- ments in energy-intensive sectors such as iron & steel, petroleum refinery and cement industries, etc. The 11th Five-Year Plan (FYP, 2006e2010) calls for the closure of small, inefficient and outdated production capacities in energy-intensive sectors (Zhou et al., 2010). The ‘Top 1000 Energy-Consuming Enterprises Program’ is a key effort to improve industrial energy efficiency. Initiated in 2006, this program imposes a large portion of national 20% reduction target of energy intensity by directly targeting nearly 1000 of the largest state-owned enterprises with the majority in heavy industries (Price et al., 2008). Providing financial incentives like subsidies and rewards is frequently applied to encourage * Corresponding author. Tel.: þ81 78 262 6634; fax: þ81 78 262 6635. E-mail addresses: [email protected], [email protected] (X. Liu). Contents lists available at SciVerse ScienceDirect Journal of Cleaner Production journal homepage: www.elsevier.com/locate/jclepro 0959-6526/$ e see front matter Ó 2011 Elsevier Ltd. All rights reserved. doi:10.1016/j.jclepro.2011.12.030 Journal of Cleaner Production 26 (2012) 79e89

Welcome message from author
This document is posted to help you gain knowledge. Please leave a comment to let me know what you think about it! Share it to your friends and learn new things together.
Transcript
at SciVerse ScienceDirect
Journal of Cleaner Production 26 (2012) 79e89
Contents lists available
Journal of Cleaner Production
journal homepage: www.elsevier .com/locate/ jc lepro
A survey study of energy saving activities of industrial companies in Taicang,China
Xianbing Liu a,*, Dongjie Niu b, Cunkuan Bao b, Sunhee Suk a, Tomohiro Shishime a
aKansai Research Centre, Institute for Global Environmental Strategies (IGES), Hitomirai Building 5F, 1-5-2, Wakinohama Kaigan Dori, Chuo-ku, Hyogo 651-0073, JapanbCollege of Environmental Science and Engineering, Tongji University, China
a r t i c l e i n f o
Article history:Received 30 September 2011Received in revised form1 December 2011Accepted 27 December 2011Available online 2 January 2012
Keywords:Energy saving activitySmall and medium-sized enterprisesTaicangChina
* Corresponding author. Tel.: þ81 78 262 6634; faxE-mail addresses: [email protected], xianbingliu@hotm
0959-6526/$ e see front matter � 2011 Elsevier Ltd.doi:10.1016/j.jclepro.2011.12.030
a b s t r a c t
This paper seeks to measure industrial energy saving activities (ESAs) and identify their major deter-minant factors by an empirical study of small and medium-sized enterprises (SMEs) in Taicang city,China. The surveyed SMEs indicate high participation ratios of pre-classified ESAs even with weakregulation and limited support from industrial associations at present. The classified factors are partlyconfirmed by the econometric analysis. The energy management level of competitors and internaltraining on energy saving have significant and positive influences on a company’s involvement level ofESAs. The findings suggest that Chinese policy makers should gradually expand the regulative require-ments currently focusing on the large energy-consuming companies to SMEs. Providing economicincentives and technical support are important for assisting the SMEs in better practice of ESAs.
� 2011 Elsevier Ltd. All rights reserved.
1. Introduction
The fast increase of primary energy use and correspondinggreenhouse gases (GHGs) emissions has driven the attention ofpolicy makers on energy efficiency. The global energy use revealsa worrying perspective, with an annual increase of about 1.8% inaverage between 2006 and 2030 mainly due to the growth of non-OECD economies (EIA, 2008). As a major energy user, the industryused 78.5% of the world’s coal, 9.5% of global oil, 35.1% of theworld’s gas and 41.7% of all the electricity in 2008 (IEA, 2010).Current and future energy and climate policies shall emphasize theindustrial sector to make the industry utilize energy moreefficiently.
As the largest GHGs emitting country in the world, China’s roleis critical in combating climate change (SEI, 2009). The climatepolicy of China was outlined in its ‘National Climate ChangeProgram’ of 2007 and ‘Climate Change White Paper’ of 2008. WhileChina has traditionally avoided to target CO2 emissions explicitly,its energy and forestry policies have provided the base for the‘National Climate Change Program’. The central government set uptwo ambitious energy policy goals in 2006. One was to reducenational energy intensity by 20% by the end of 2010 from 2005
: þ81 78 262 6635.ail.com (X. Liu).
All rights reserved.
levels. The other is to increase the share of renewable energy in thetotal energy mix to 15% by 2020 (Seligsohn et al., 2009). Chinafurther pledged in November 2009 to cut off its CO2 emissions perunit of GDP (Gross Domestic Product) by 40e45% by 2020compared with 2005 levels. This is a voluntary action to tackleclimate change problems considering its own conditions (ChinaDaily, 2009). In overall, China’s climate policies are diverse andhighly focus on the measures improving industrial energy effi-ciency. On the energy supply side, improving energy efficiency ofpower sector has been a key effort. Estimated by IEA (2009), by2011, 80% of China’s coal-fired power plants will be escalated tomodern ones with the capacity over 300 MW and this ratio willexceed 90% by 2020. On the energy demand side, energy efficiencystandards and assessment system have been gradually establishedfor the investments of new manufacturing facilities and equip-ments in energy-intensive sectors such as iron & steel, petroleumrefinery and cement industries, etc. The 11th Five-Year Plan (FYP,2006e2010) calls for the closure of small, inefficient and outdatedproduction capacities in energy-intensive sectors (Zhou et al.,2010). The ‘Top 1000 Energy-Consuming Enterprises Program’ isa key effort to improve industrial energy efficiency. Initiated in2006, this program imposes a large portion of national 20%reduction target of energy intensity by directly targeting nearly1000 of the largest state-owned enterprises with the majority inheavy industries (Price et al., 2008). Providing financial incentiveslike subsidies and rewards is frequently applied to encourage
X. Liu et al. / Journal of Cleaner Production 26 (2012) 79e8980
industrial energy saving at national and local levels. China hasachieved some experience in international carbonmarkets throughthe implementation of individual CDM (Clean DevelopmentMechanism) projects.
There remain great potentials of energy saving for Chineseindustries, especially for those energy-intensive sectors(Hasanbeigi et al., 2010; Li et al., 2010). Nevertheless, it is proventhat quite few studies have been devoted to identify the determi-nants and suggest effective policies of energy saving especially forthe small and medium-sized enterprises (SMEs) (Thollander et al.,2007). With aims to close the existing research gap, this paperidentifies the major factors determining a company’s energy savingefforts and provides an empirical study in China. Taicang city ofJiangsu Province, based in the Yangtze River Delta, is selected as thesurvey area considering its relatively developed economycompared with the other regions. Two topics are mainly discussedin this paper: a) the current status of energy saving activities (ESAs)of the companies in the study area; and, b) determinant factors,external and internal, predicting the level of a company’s involve-ment in ESAs.
2. Literature review
The drivers and barriers of industrial energy efficiency havebeen surveyed in developed countries since late 1980s. At thebeginning, the researchers devoted their attention to the reasonsbehind the failure in the application of the best available technol-ogies/practices (e.g., De Canio, 1993; Weber, 1997). The evaluationof the identified barriers has extended from energy-intensivesectors, such as iron & steel industry, to the other manufacturingindustries (e.g., Rohdin et al., 2007; Zhang and Wang, 2008).Broader analyses discussed the policy proposals enhancing indus-trial energy efficiency (e.g., Sardianou, 2008; Schleich, 2009).Industrial energy programs such as energy audit and long-termagreements (LTAs) are common means for promoting energy effi-ciency in industry (Thollander and Dotzauer, 2010). As an example,Rietbergen et al. (2002) concluded that between a quarter to a halfof energy savings in Dutch manufacturing industry can be attrib-uted to the LTAs. De Groot et al. (2001) analyzed the determinantsof energy saving of Dutch firms by an empirical study. Using a dataset of 135 samples, they concluded that the cost saving potential isthe most important driver behind investment decisions for energysaving. More attractive opportunities and uncertainty of possibledeclines in the price of new technologies are impediments for notinvesting in energy saving. Based upon the results of a telephonesurvey covering 304 Danish industrial firms, Christoffersen et al.(2006) confirmed low levels of energy management practices ofthese companies and concluded that electricity utilities emerge asthe main source of inspiration for energy management. A ques-tionnaire to Swedish foundry industry confirmed that limitedaccess of capital is the largest barrier to energy efficiency. Barrierswithin private foundries are more related to information problems.The most important driver was found to be long term energystrategies of the companies (Rohdin et al., 2007). Social mecha-nisms by establishing regional or local learning networks ofcompanies are used to motivate the improvement of energy effi-ciency in Switzerland and Germany. Substantial progress has beenmade in implementing organizational measures and investmentsin energy efficiency in the participating companies (Jochem andGruber, 2007). Cagno and Trianni (2010) conducted a survey to104 SMEs in northern Italy, and identified the access to capital andthe lack of information of energy efficiency solutions as the mostrelevant barriers. Prindle (2010) distributed a questionnaire surveyto nearly 100 companies of the U.S. These firms’ energy efficiencystrategies are driven by the commitment to reduce CO2 emissions
and the desire to reduce operating cost. The common barriers forthe U.S. companies include lack of funding; lack of personnel withthe appropriate skills and insufficient technical information. The‘split incentives’ of different internal departments of a companymay create persistence to energy efficiency improvement (Prindle,2010). The lack of energy cost allocation by means of sub-meteringprobably contributes to reinforce the ‘split incentive’ problem(Thollander and Ottosson, 2010). As a representative study indeveloping countries, Herrero Sola and Xavier (2007) verified thecorrelation between organizational factors and the energy losses incompanies from ten industrial sectors in Brazil. The determinantsare linked with education of employees and company’s strategicvision. A lack of access of appropriate financing mechanisms is oneof the important barriers for realizing the tremendous potential toincrease energy efficiency in developing countries (Painuly et al.,2003). Energy service companies (ESCOs), as a market orientedmechanism, had successful experiences in the U.S., Canada and theRepublic of Korea. Along with a financial barrier, an institutionalbarrier should be lifted for promoting energy efficiency investmentand ESCO business from the Korean experience (Lee et al., 2003).
Employing a set of panel data of approximate 2500 of China’smost energy-intensive large and medium-sized companies during1997e1999, Fisher-Vanden et al. (2004) identified the rising rela-tive energy price as a principal driver of the declining energyintensity. Andrews-Speed (2009) examined the context of nearly 30years of measures to enhance energy efficiency in China andaddressed a number of constraints including the reluctance to useeconomic and financial instruments, the dependency of energypolicy on industrial and social policies, shortage of necessary skillsand so on. Hasanbeigi et al. (2010) surveyed 16 cement plants inChina and conducted a benchmarking analysis. Their result indi-cated an average primary energy savings of 12%would be possible ifthe cement plants operated at domestic best practice levels, and23% of energy savings would be realized if the plants operated atinternational best practice levels. Li et al. (2010) conducted a casestudy of glass works in China and found that energy auditinglargely contributed to the reduction of comprehensive energyintensity of the company. CDP (2010) interviewed 11 largecompanies in China to identify the drivers of companies to invest inenergy efficiency. The result indicated that company’s internalpolicy is an important driver for the investment.
Even considering the relatively wide literatures reviewed above,the existing research is limited to the analysis of barriers hinderingthe improvement of industrial energy efficiency. There is a lack ofcomprehensive study of various matters explaining the company’senergy saving efforts, particularly for the developing countries likeChina. An integrative approach including more factors needs to betested. As a kind of proactive environmental management ofcompanies, energy saving is new for many Chinese SMEs. Thisstudy may fill up the research gap by qualitatively measuring thelevel of ESAs of companies and clarifying the behind reasons.
3. The analytical framework of this study
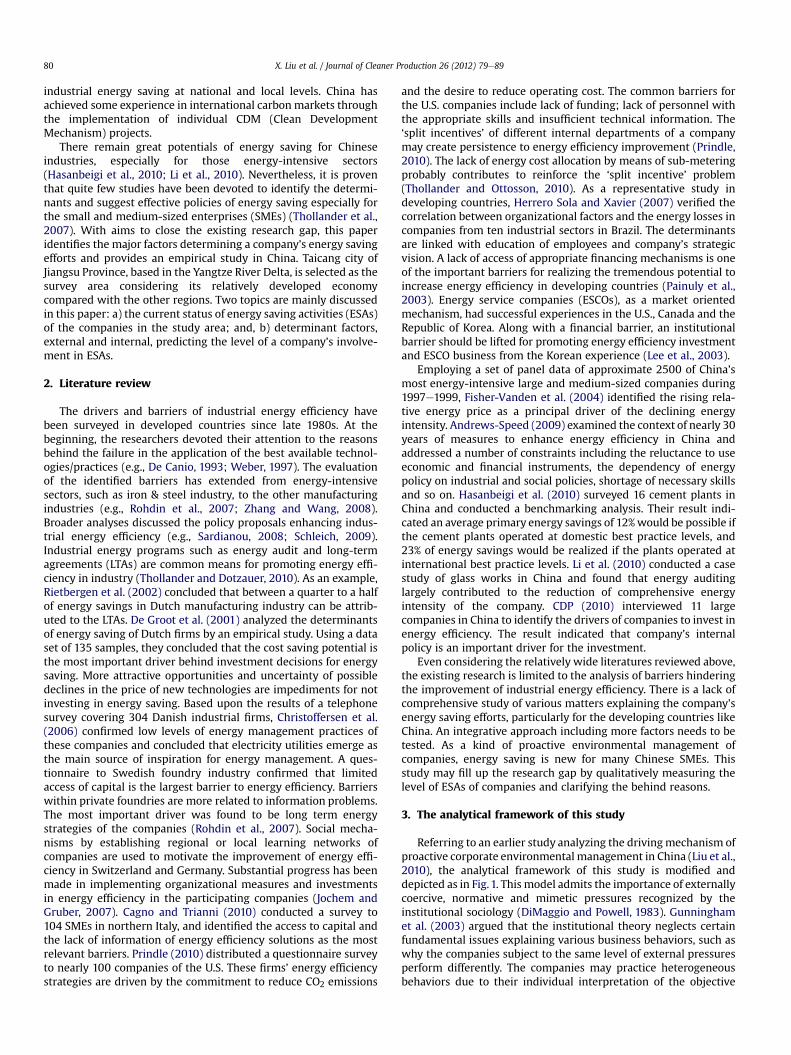
Referring to an earlier study analyzing the drivingmechanism ofproactive corporate environmental management in China (Liu et al.,2010), the analytical framework of this study is modified anddepicted as in Fig.1. This model admits the importance of externallycoercive, normative and mimetic pressures recognized by theinstitutional sociology (DiMaggio and Powell, 1983). Gunninghamet al. (2003) argued that the institutional theory neglects certainfundamental issues explaining various business behaviors, such aswhy the companies subject to the same level of external pressuresperform differently. The companies may practice heterogeneousbehaviors due to their individual interpretation of the objective
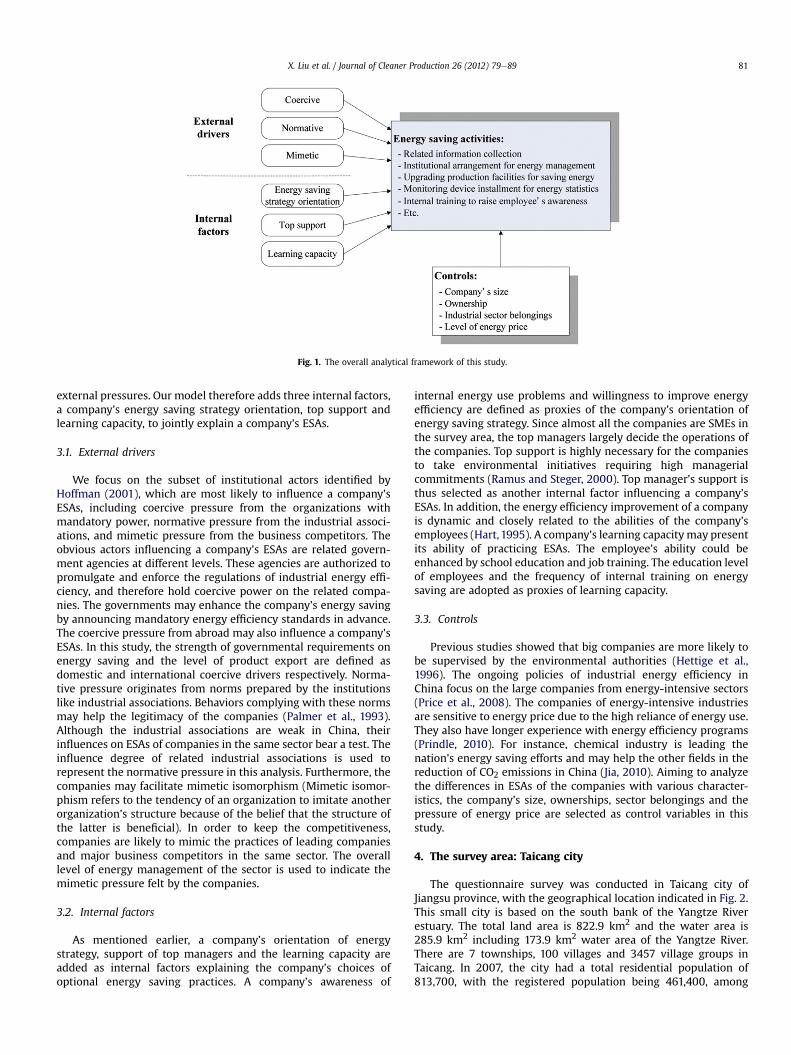
Fig. 1. The overall analytical framework of this study.
X. Liu et al. / Journal of Cleaner Production 26 (2012) 79e89 81
external pressures. Our model therefore adds three internal factors,a company’s energy saving strategy orientation, top support andlearning capacity, to jointly explain a company’s ESAs.
3.1. External drivers
We focus on the subset of institutional actors identified byHoffman (2001), which are most likely to influence a company’sESAs, including coercive pressure from the organizations withmandatory power, normative pressure from the industrial associ-ations, and mimetic pressure from the business competitors. Theobvious actors influencing a company’s ESAs are related govern-ment agencies at different levels. These agencies are authorized topromulgate and enforce the regulations of industrial energy effi-ciency, and therefore hold coercive power on the related compa-nies. The governments may enhance the company’s energy savingby announcing mandatory energy efficiency standards in advance.The coercive pressure from abroad may also influence a company’sESAs. In this study, the strength of governmental requirements onenergy saving and the level of product export are defined asdomestic and international coercive drivers respectively. Norma-tive pressure originates from norms prepared by the institutionslike industrial associations. Behaviors complying with these normsmay help the legitimacy of the companies (Palmer et al., 1993).Although the industrial associations are weak in China, theirinfluences on ESAs of companies in the same sector bear a test. Theinfluence degree of related industrial associations is used torepresent the normative pressure in this analysis. Furthermore, thecompanies may facilitate mimetic isomorphism (Mimetic isomor-phism refers to the tendency of an organization to imitate anotherorganization’s structure because of the belief that the structure ofthe latter is beneficial). In order to keep the competitiveness,companies are likely to mimic the practices of leading companiesand major business competitors in the same sector. The overalllevel of energy management of the sector is used to indicate themimetic pressure felt by the companies.
3.2. Internal factors
As mentioned earlier, a company’s orientation of energystrategy, support of top managers and the learning capacity areadded as internal factors explaining the company’s choices ofoptional energy saving practices. A company’s awareness of
internal energy use problems and willingness to improve energyefficiency are defined as proxies of the company’s orientation ofenergy saving strategy. Since almost all the companies are SMEs inthe survey area, the top managers largely decide the operations ofthe companies. Top support is highly necessary for the companiesto take environmental initiatives requiring high managerialcommitments (Ramus and Steger, 2000). Top manager’s support isthus selected as another internal factor influencing a company’sESAs. In addition, the energy efficiency improvement of a companyis dynamic and closely related to the abilities of the company’semployees (Hart,1995). A company’s learning capacity may presentits ability of practicing ESAs. The employee’s ability could beenhanced by school education and job training. The education levelof employees and the frequency of internal training on energysaving are adopted as proxies of learning capacity.
3.3. Controls
Previous studies showed that big companies are more likely tobe supervised by the environmental authorities (Hettige et al.,1996). The ongoing policies of industrial energy efficiency inChina focus on the large companies from energy-intensive sectors(Price et al., 2008). The companies of energy-intensive industriesare sensitive to energy price due to the high reliance of energy use.They also have longer experience with energy efficiency programs(Prindle, 2010). For instance, chemical industry is leading thenation’s energy saving efforts and may help the other fields in thereduction of CO2 emissions in China (Jia, 2010). Aiming to analyzethe differences in ESAs of the companies with various character-istics, the company’s size, ownerships, sector belongings and thepressure of energy price are selected as control variables in thisstudy.
4. The survey area: Taicang city
The questionnaire survey was conducted in Taicang city ofJiangsu province, with the geographical location indicated in Fig. 2.This small city is based on the south bank of the Yangtze Riverestuary. The total land area is 822.9 km2 and the water area is285.9 km2 including 173.9 km2 water area of the Yangtze River.There are 7 townships, 100 villages and 3457 village groups inTaicang. In 2007, the city had a total residential population of813,700, with the registered population being 461,400, among
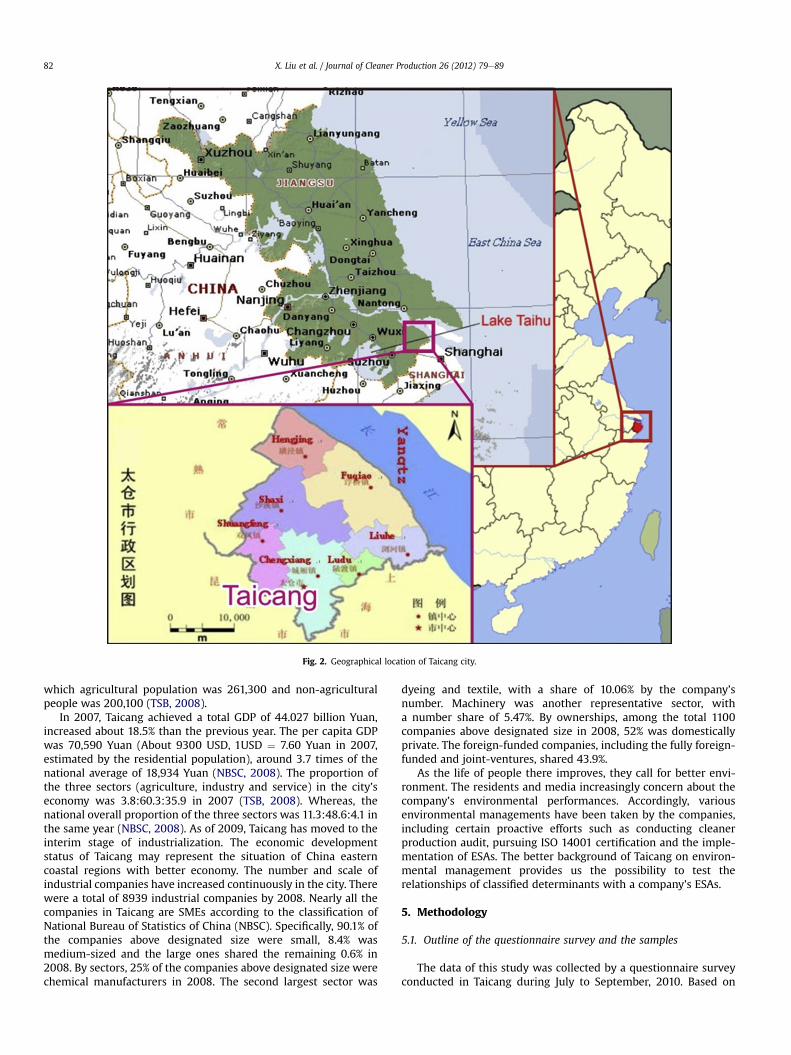
Fig. 2. Geographical location of Taicang city.
X. Liu et al. / Journal of Cleaner Production 26 (2012) 79e8982
which agricultural population was 261,300 and non-agriculturalpeople was 200,100 (TSB, 2008).
In 2007, Taicang achieved a total GDP of 44.027 billion Yuan,increased about 18.5% than the previous year. The per capita GDPwas 70,590 Yuan (About 9300 USD, 1USD ¼ 7.60 Yuan in 2007,estimated by the residential population), around 3.7 times of thenational average of 18,934 Yuan (NBSC, 2008). The proportion ofthe three sectors (agriculture, industry and service) in the city’seconomy was 3.8:60.3:35.9 in 2007 (TSB, 2008). Whereas, thenational overall proportion of the three sectors was 11.3:48.6:4.1 inthe same year (NBSC, 2008). As of 2009, Taicang has moved to theinterim stage of industrialization. The economic developmentstatus of Taicang may represent the situation of China easterncoastal regions with better economy. The number and scale ofindustrial companies have increased continuously in the city. Therewere a total of 8939 industrial companies by 2008. Nearly all thecompanies in Taicang are SMEs according to the classification ofNational Bureau of Statistics of China (NBSC). Specifically, 90.1% ofthe companies above designated size were small, 8.4% wasmedium-sized and the large ones shared the remaining 0.6% in2008. By sectors, 25% of the companies above designated size werechemical manufacturers in 2008. The second largest sector was
dyeing and textile, with a share of 10.06% by the company’snumber. Machinery was another representative sector, witha number share of 5.47%. By ownerships, among the total 1100companies above designated size in 2008, 52% was domesticallyprivate. The foreign-funded companies, including the fully foreign-funded and joint-ventures, shared 43.9%.
As the life of people there improves, they call for better envi-ronment. The residents and media increasingly concern about thecompany’s environmental performances. Accordingly, variousenvironmental managements have been taken by the companies,including certain proactive efforts such as conducting cleanerproduction audit, pursuing ISO 14001 certification and the imple-mentation of ESAs. The better background of Taicang on environ-mental management provides us the possibility to test therelationships of classified determinants with a company’s ESAs.
5. Methodology
5.1. Outline of the questionnaire survey and the samples
The data of this study was collected by a questionnaire surveyconducted in Taicang during July to September, 2010. Based on
X. Liu et al. / Journal of Cleaner Production 26 (2012) 79e89 83
a preliminary understanding of the study area, a questionnaire wasdesigned with the principal objectives to measure the company’sESAs and analyze the classified determinants. The questionnaireformat mainly consists of three components: background infor-mation of the company including the size, ownership and sectorbelongings, etc.; adoption of various ESAs, such as whether thecompany has invested in new production facilities or equipmentsfor energy saving; and, the degrees of external pressures andinternal factors of the company, which have been identified in theanalytical framework.
The survey targeted the company’s environmental and energymanagers. Over a period of approximate three months, the surveywas carried out in three steps. The local government officials wereinterviewed at the beginning for clearly understanding the policyprogress of industrial energy saving of the city. Then the tentativequestionnaire format was sent to 24 companies to test its feasibilityfor answering. The finalized questionnaire was lastly posted to thecompanies on a name list provided by the city’s environmentalprotection bureau. A total of 141 firms responded, among which125 were confirmed to be valid. The distribution of the usablesamples by sectors is summarized in Table 1.
The samples from the sectors of chemicals, textile and dyeing,and machinery manufacturing account for more than 80% of thetotal, which are representative industries of the city.
5.2. Econometric approach
5.2.1. Identification of econometric modelAs described in Fig. 1, a company’s level of ESAs is hypothesized
to be jointly determined by the external drivers and internalfactors. The coercive, normative, and mimetic pressures may beindicated by vector C, N and M, respectively. In a similar way,a company’s energy saving strategy orientation is represented bya vector E, top management support is abbreviated as T, and itslearning capacity is represented by a vector L. A company’s char-acteristics, such as size, ownership, sector belongings and thedegree of energy price pressure, are indicated by a vector Ch. Acompany’s overall level of ESAs (TESA) can be presented ina reduced-form as Eq. (1).
TESA ¼ f ðC;N;M; E; T; L;ChÞ (1)
5.2.2. Valuation of the variables5.2.2.1. Dependent variable. The TESA is the dependent variable inthis analysis. The comprehensiveness of a company’s energy savingefforts may be presented by a series of energy saving goals,management procedures as well as the practical activities. It isdifficult to measure a company’s energy saving practice level sinceit does not necessarily equal to the sum of energy saving plans and
Table 1Distribution of the valid respondents by industrial sectors.
Sector Number ofrespondents
Percentage
Production and supply of electricity & heat 2 1.6Electronics 3 2.4Pharmaceutical industry 2 1.6Chemical fiber 1 0.8Machinery manufacturing 19 15.2Textile and dyeing 33 26.4Chemicals 51 40.8Paper making 2 1.6Food processing 1 0.8Others 11 8.8In total 125 100.0
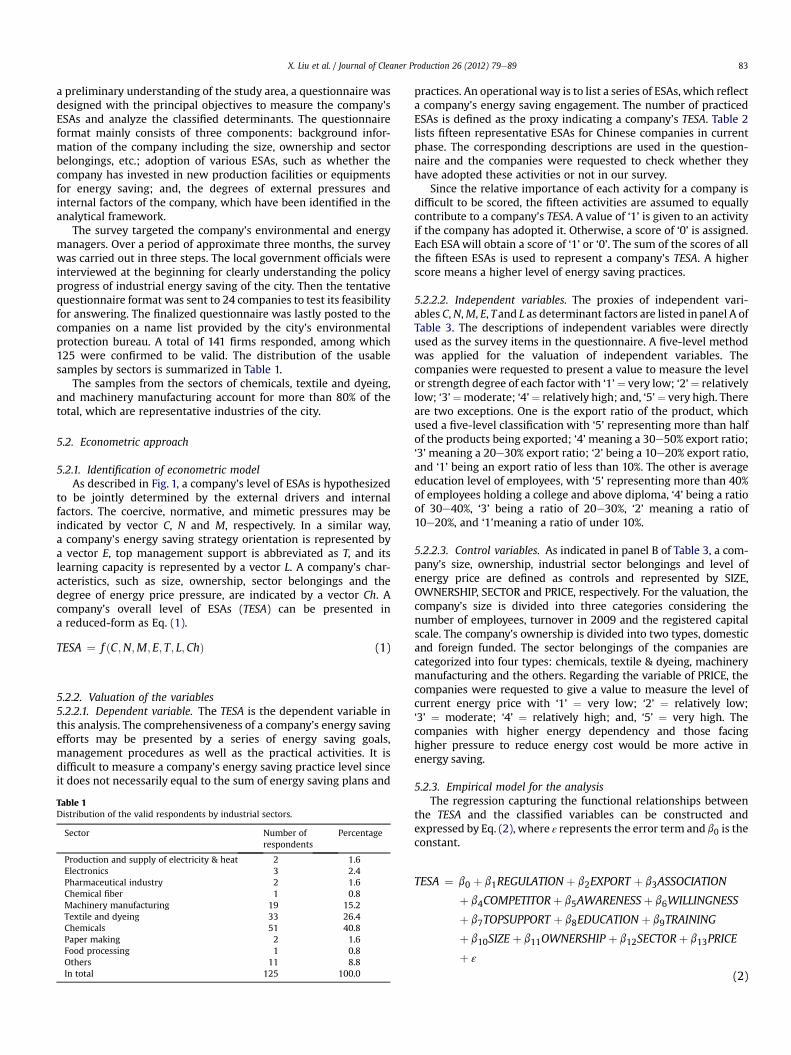
practices. An operational way is to list a series of ESAs, which reflecta company’s energy saving engagement. The number of practicedESAs is defined as the proxy indicating a company’s TESA. Table 2lists fifteen representative ESAs for Chinese companies in currentphase. The corresponding descriptions are used in the question-naire and the companies were requested to check whether theyhave adopted these activities or not in our survey.
Since the relative importance of each activity for a company isdifficult to be scored, the fifteen activities are assumed to equallycontribute to a company’s TESA. A value of ‘1’ is given to an activityif the company has adopted it. Otherwise, a score of ‘0’ is assigned.Each ESAwill obtain a score of ‘1’ or ‘0’. The sum of the scores of allthe fifteen ESAs is used to represent a company’s TESA. A higherscore means a higher level of energy saving practices.
5.2.2.2. Independent variables. The proxies of independent vari-ables C,N,M, E, Tand L as determinant factors are listed in panel A ofTable 3. The descriptions of independent variables were directlyused as the survey items in the questionnaire. A five-level methodwas applied for the valuation of independent variables. Thecompanies were requested to present a value to measure the levelor strength degree of each factor with ‘1’¼ very low; ‘2’¼ relativelylow; ‘3’¼moderate; ‘4’¼ relatively high; and, ‘5’¼ very high. Thereare two exceptions. One is the export ratio of the product, whichused a five-level classification with ‘5’ representing more than halfof the products being exported; ‘4’meaning a 30e50% export ratio;‘3’meaning a 20e30% export ratio; ‘2’ being a 10e20% export ratio,and ‘1’ being an export ratio of less than 10%. The other is averageeducation level of employees, with ‘5’ representing more than 40%of employees holding a college and above diploma, ‘4’ being a ratioof 30e40%, ‘3’ being a ratio of 20e30%, ‘2’ meaning a ratio of10e20%, and ‘1’meaning a ratio of under 10%.
5.2.2.3. Control variables. As indicated in panel B of Table 3, a com-pany’s size, ownership, industrial sector belongings and level ofenergy price are defined as controls and represented by SIZE,OWNERSHIP, SECTOR and PRICE, respectively. For the valuation, thecompany’s size is divided into three categories considering thenumber of employees, turnover in 2009 and the registered capitalscale. The company’s ownership is divided into two types, domesticand foreign funded. The sector belongings of the companies arecategorized into four types: chemicals, textile & dyeing, machinerymanufacturing and the others. Regarding the variable of PRICE, thecompanies were requested to give a value to measure the level ofcurrent energy price with ‘1’ ¼ very low; ‘2’ ¼ relatively low;‘3’ ¼ moderate; ‘4’ ¼ relatively high; and, ‘5’ ¼ very high. Thecompanies with higher energy dependency and those facinghigher pressure to reduce energy cost would be more active inenergy saving.
5.2.3. Empirical model for the analysisThe regression capturing the functional relationships between
the TESA and the classified variables can be constructed andexpressed by Eq. (2), where ε represents the error term and b0 is theconstant.
TESA ¼ b0 þ b1REGULATION þ b2EXPORT þ b3ASSOCIATION
þ b4COMPETITORþ b5AWARENESSþ b6WILLINGNESS
þ b7TOPSUPPORT þ b8EDUCATION þ b9TRAINING
þ b10SIZE þ b11OWNERSHIP þ b12SECTORþ b13PRICE
þ ε
(2)
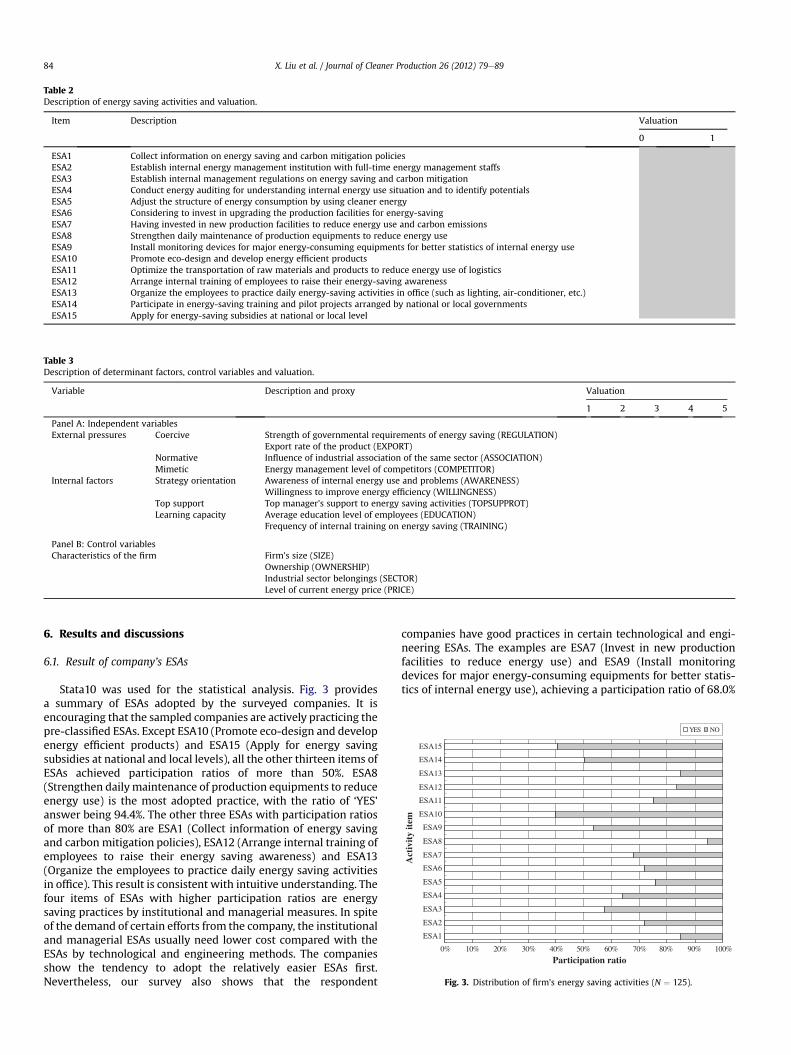
Table 3Description of determinant factors, control variables and valuation.
Variable Description and proxy Valuation
1 2 3 4 5
Panel A: Independent variablesExternal pressures Coercive Strength of governmental requirements of energy saving (REGULATION)
Export rate of the product (EXPORT)Normative Influence of industrial association of the same sector (ASSOCIATION)Mimetic Energy management level of competitors (COMPETITOR)
Internal factors Strategy orientation Awareness of internal energy use and problems (AWARENESS)Willingness to improve energy efficiency (WILLINGNESS)
Top support Top manager’s support to energy saving activities (TOPSUPPROT)Learning capacity Average education level of employees (EDUCATION)
Frequency of internal training on energy saving (TRAINING)
Panel B: Control variablesCharacteristics of the firm Firm’s size (SIZE)
Ownership (OWNERSHIP)Industrial sector belongings (SECTOR)Level of current energy price (PRICE)
Table 2Description of energy saving activities and valuation.
Item Description Valuation
0 1
ESA1 Collect information on energy saving and carbon mitigation policiesESA2 Establish internal energy management institution with full-time energy management staffsESA3 Establish internal management regulations on energy saving and carbon mitigationESA4 Conduct energy auditing for understanding internal energy use situation and to identify potentialsESA5 Adjust the structure of energy consumption by using cleaner energyESA6 Considering to invest in upgrading the production facilities for energy-savingESA7 Having invested in new production facilities to reduce energy use and carbon emissionsESA8 Strengthen daily maintenance of production equipments to reduce energy useESA9 Install monitoring devices for major energy-consuming equipments for better statistics of internal energy useESA10 Promote eco-design and develop energy efficient productsESA11 Optimize the transportation of raw materials and products to reduce energy use of logisticsESA12 Arrange internal training of employees to raise their energy-saving awarenessESA13 Organize the employees to practice daily energy-saving activities in office (such as lighting, air-conditioner, etc.)ESA14 Participate in energy-saving training and pilot projects arranged by national or local governmentsESA15 Apply for energy-saving subsidies at national or local level
0% 10% 20% 30% 40% 50% 60% 70% 80% 90% 100%
ESA1
ESA2
ESA3
ESA4
ESA5
ESA6
ESA7
ESA8
ESA9
ESA10
ESA11
ESA12
ESA13
ESA14
ESA15
Act
ivit
y it
em
Participation ratio
YES NO
Fig. 3. Distribution of firm’s energy saving activities (N ¼ 125).
X. Liu et al. / Journal of Cleaner Production 26 (2012) 79e8984
6. Results and discussions
6.1. Result of company’s ESAs
Stata10 was used for the statistical analysis. Fig. 3 providesa summary of ESAs adopted by the surveyed companies. It isencouraging that the sampled companies are actively practicing thepre-classified ESAs. Except ESA10 (Promote eco-design and developenergy efficient products) and ESA15 (Apply for energy savingsubsidies at national and local levels), all the other thirteen items ofESAs achieved participation ratios of more than 50%. ESA8(Strengthen dailymaintenance of production equipments to reduceenergy use) is the most adopted practice, with the ratio of ‘YES’answer being 94.4%. The other three ESAs with participation ratiosof more than 80% are ESA1 (Collect information of energy savingand carbon mitigation policies), ESA12 (Arrange internal training ofemployees to raise their energy saving awareness) and ESA13(Organize the employees to practice daily energy saving activitiesin office). This result is consistent with intuitive understanding. Thefour items of ESAs with higher participation ratios are energysaving practices by institutional and managerial measures. In spiteof the demand of certain efforts from the company, the institutionaland managerial ESAs usually need lower cost compared with theESAs by technological and engineering methods. The companiesshow the tendency to adopt the relatively easier ESAs first.Nevertheless, our survey also shows that the respondent
companies have good practices in certain technological and engi-neering ESAs. The examples are ESA7 (Invest in new productionfacilities to reduce energy use) and ESA9 (Install monitoringdevices for major energy-consuming equipments for better statis-tics of internal energy use), achieving a participation ratio of 68.0%
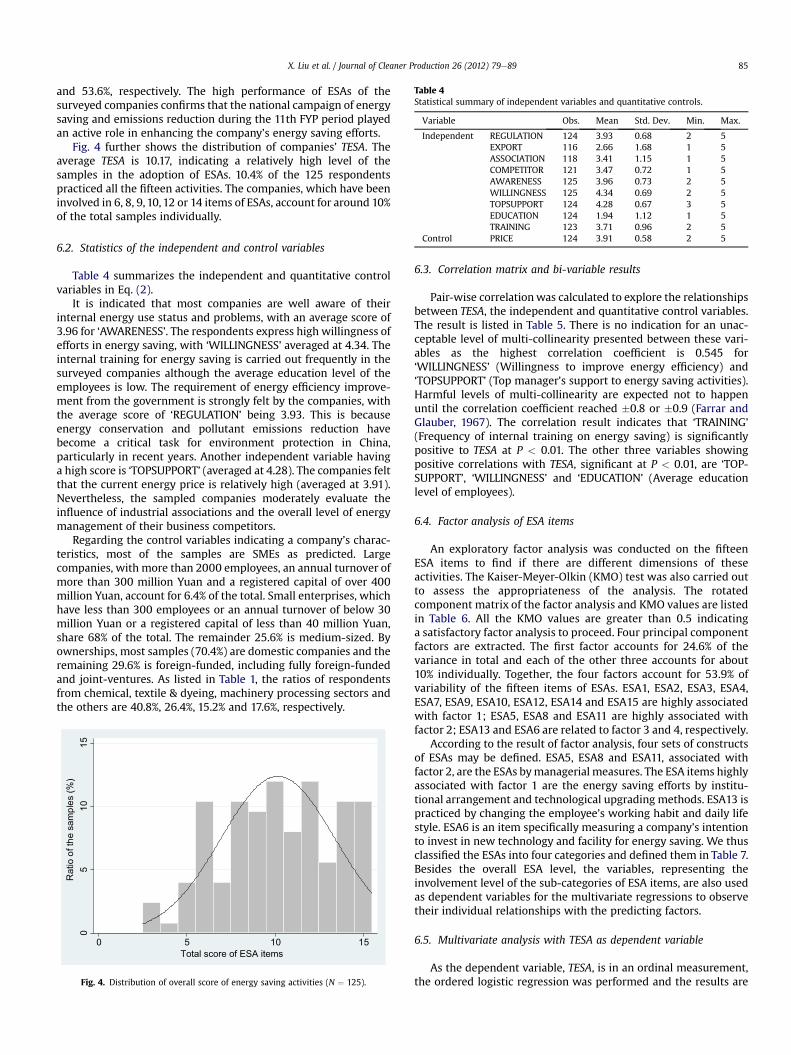
Table 4Statistical summary of independent variables and quantitative controls.
Variable Obs. Mean Std. Dev. Min. Max.
Independent REGULATION 124 3.93 0.68 2 5EXPORT 116 2.66 1.68 1 5ASSOCIATION 118 3.41 1.15 1 5COMPETITOR 121 3.47 0.72 1 5AWARENESS 125 3.96 0.73 2 5WILLINGNESS 125 4.34 0.69 2 5TOPSUPPORT 124 4.28 0.67 3 5EDUCATION 124 1.94 1.12 1 5TRAINING 123 3.71 0.96 2 5
Control PRICE 124 3.91 0.58 2 5
X. Liu et al. / Journal of Cleaner Production 26 (2012) 79e89 85
and 53.6%, respectively. The high performance of ESAs of thesurveyed companies confirms that the national campaign of energysaving and emissions reduction during the 11th FYP period playedan active role in enhancing the company’s energy saving efforts.
Fig. 4 further shows the distribution of companies’ TESA. Theaverage TESA is 10.17, indicating a relatively high level of thesamples in the adoption of ESAs. 10.4% of the 125 respondentspracticed all the fifteen activities. The companies, which have beeninvolved in 6, 8, 9, 10, 12 or 14 items of ESAs, account for around 10%of the total samples individually.
6.2. Statistics of the independent and control variables
Table 4 summarizes the independent and quantitative controlvariables in Eq. (2).
It is indicated that most companies are well aware of theirinternal energy use status and problems, with an average score of3.96 for ‘AWARENESS’. The respondents express high willingness ofefforts in energy saving, with ‘WILLINGNESS’ averaged at 4.34. Theinternal training for energy saving is carried out frequently in thesurveyed companies although the average education level of theemployees is low. The requirement of energy efficiency improve-ment from the government is strongly felt by the companies, withthe average score of ‘REGULATION’ being 3.93. This is becauseenergy conservation and pollutant emissions reduction havebecome a critical task for environment protection in China,particularly in recent years. Another independent variable havinga high score is ‘TOPSUPPORT’ (averaged at 4.28). The companies feltthat the current energy price is relatively high (averaged at 3.91).Nevertheless, the sampled companies moderately evaluate theinfluence of industrial associations and the overall level of energymanagement of their business competitors.
Regarding the control variables indicating a company’s charac-teristics, most of the samples are SMEs as predicted. Largecompanies, with more than 2000 employees, an annual turnover ofmore than 300 million Yuan and a registered capital of over 400million Yuan, account for 6.4% of the total. Small enterprises, whichhave less than 300 employees or an annual turnover of below 30million Yuan or a registered capital of less than 40 million Yuan,share 68% of the total. The remainder 25.6% is medium-sized. Byownerships, most samples (70.4%) are domestic companies and theremaining 29.6% is foreign-funded, including fully foreign-fundedand joint-ventures. As listed in Table 1, the ratios of respondentsfrom chemical, textile & dyeing, machinery processing sectors andthe others are 40.8%, 26.4%, 15.2% and 17.6%, respectively.
05
1015
Rat
io o
f the
sam
ples
(%)
0 5 10 15Total score of ESA items
Fig. 4. Distribution of overall score of energy saving activities (N ¼ 125).
6.3. Correlation matrix and bi-variable results
Pair-wise correlationwas calculated to explore the relationshipsbetween TESA, the independent and quantitative control variables.The result is listed in Table 5. There is no indication for an unac-ceptable level of multi-collinearity presented between these vari-ables as the highest correlation coefficient is 0.545 for‘WILLINGNESS’ (Willingness to improve energy efficiency) and‘TOPSUPPORT’ (Top manager’s support to energy saving activities).Harmful levels of multi-collinearity are expected not to happenuntil the correlation coefficient reached �0.8 or �0.9 (Farrar andGlauber, 1967). The correlation result indicates that ‘TRAINING’(Frequency of internal training on energy saving) is significantlypositive to TESA at P < 0.01. The other three variables showingpositive correlations with TESA, significant at P < 0.01, are ‘TOP-SUPPORT’, ‘WILLINGNESS’ and ‘EDUCATION’ (Average educationlevel of employees).
6.4. Factor analysis of ESA items
An exploratory factor analysis was conducted on the fifteenESA items to find if there are different dimensions of theseactivities. The Kaiser-Meyer-Olkin (KMO) test was also carried outto assess the appropriateness of the analysis. The rotatedcomponent matrix of the factor analysis and KMO values are listedin Table 6. All the KMO values are greater than 0.5 indicatinga satisfactory factor analysis to proceed. Four principal componentfactors are extracted. The first factor accounts for 24.6% of thevariance in total and each of the other three accounts for about10% individually. Together, the four factors account for 53.9% ofvariability of the fifteen items of ESAs. ESA1, ESA2, ESA3, ESA4,ESA7, ESA9, ESA10, ESA12, ESA14 and ESA15 are highly associatedwith factor 1; ESA5, ESA8 and ESA11 are highly associated withfactor 2; ESA13 and ESA6 are related to factor 3 and 4, respectively.
According to the result of factor analysis, four sets of constructsof ESAs may be defined. ESA5, ESA8 and ESA11, associated withfactor 2, are the ESAs bymanagerial measures. The ESA items highlyassociated with factor 1 are the energy saving efforts by institu-tional arrangement and technological upgrading methods. ESA13 ispracticed by changing the employee’s working habit and daily lifestyle. ESA6 is an item specifically measuring a company’s intentionto invest in new technology and facility for energy saving. We thusclassified the ESAs into four categories and defined them in Table 7.Besides the overall ESA level, the variables, representing theinvolvement level of the sub-categories of ESA items, are also usedas dependent variables for the multivariate regressions to observetheir individual relationships with the predicting factors.
6.5. Multivariate analysis with TESA as dependent variable
As the dependent variable, TESA, is in an ordinal measurement,the ordered logistic regression was performed and the results are
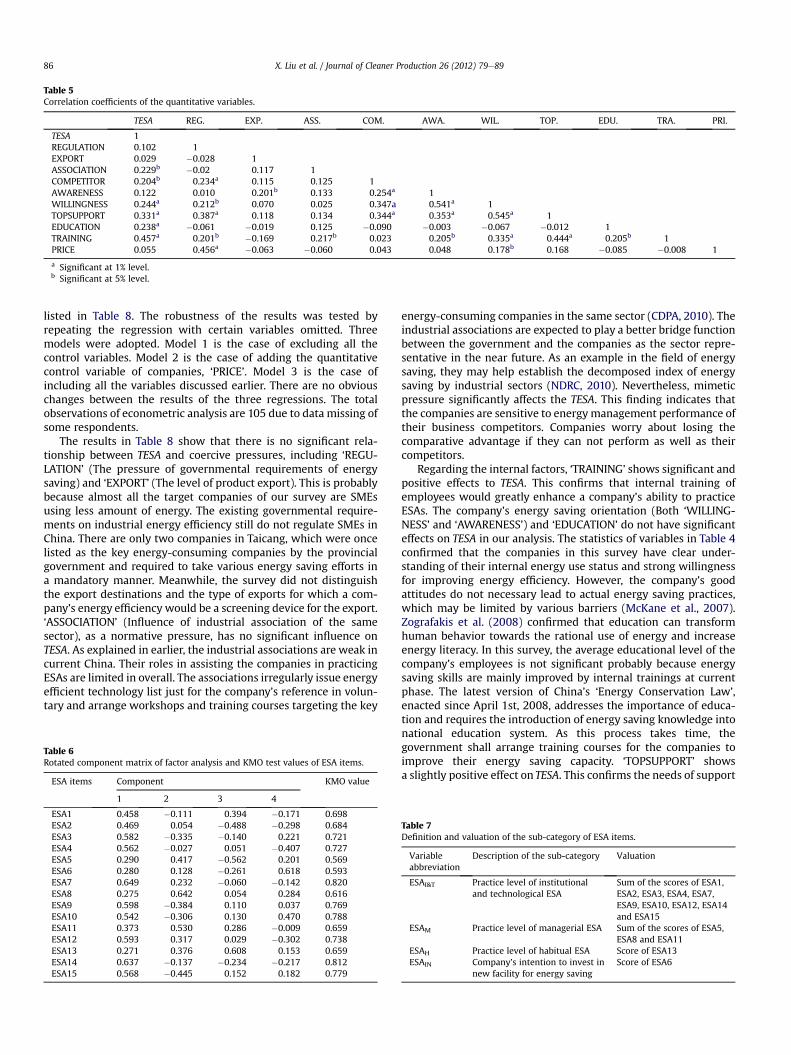
Table 5Correlation coefficients of the quantitative variables.
TESA REG. EXP. ASS. COM. AWA. WIL. TOP. EDU. TRA. PRI.
TESA 1REGULATION 0.102 1EXPORT 0.029 �0.028 1ASSOCIATION 0.229b �0.02 0.117 1COMPETITOR 0.204b 0.234a 0.115 0.125 1AWARENESS 0.122 0.010 0.201b 0.133 0.254a 1WILLINGNESS 0.244a 0.212b 0.070 0.025 0.347a 0.541a 1TOPSUPPORT 0.331a 0.387a 0.118 0.134 0.344a 0.353a 0.545a 1EDUCATION 0.238a �0.061 �0.019 0.125 �0.090 �0.003 �0.067 �0.012 1TRAINING 0.457a 0.201b �0.169 0.217b 0.023 0.205b 0.335a 0.444a 0.205b 1PRICE 0.055 0.456a �0.063 �0.060 0.043 0.048 0.178b 0.168 �0.085 �0.008 1
a Significant at 1% level.b Significant at 5% level.
X. Liu et al. / Journal of Cleaner Production 26 (2012) 79e8986
listed in Table 8. The robustness of the results was tested byrepeating the regression with certain variables omitted. Threemodels were adopted. Model 1 is the case of excluding all thecontrol variables. Model 2 is the case of adding the quantitativecontrol variable of companies, ‘PRICE’. Model 3 is the case ofincluding all the variables discussed earlier. There are no obviouschanges between the results of the three regressions. The totalobservations of econometric analysis are 105 due to data missing ofsome respondents.
The results in Table 8 show that there is no significant rela-tionship between TESA and coercive pressures, including ‘REGU-LATION’ (The pressure of governmental requirements of energysaving) and ‘EXPORT’ (The level of product export). This is probablybecause almost all the target companies of our survey are SMEsusing less amount of energy. The existing governmental require-ments on industrial energy efficiency still do not regulate SMEs inChina. There are only two companies in Taicang, which were oncelisted as the key energy-consuming companies by the provincialgovernment and required to take various energy saving efforts ina mandatory manner. Meanwhile, the survey did not distinguishthe export destinations and the type of exports for which a com-pany’s energy efficiency would be a screening device for the export.‘ASSOCIATION’ (Influence of industrial association of the samesector), as a normative pressure, has no significant influence onTESA. As explained in earlier, the industrial associations are weak incurrent China. Their roles in assisting the companies in practicingESAs are limited in overall. The associations irregularly issue energyefficient technology list just for the company’s reference in volun-tary and arrange workshops and training courses targeting the key
Table 6Rotated component matrix of factor analysis and KMO test values of ESA items.
ESA items Component KMO value
1 2 3 4
ESA1 0.458 �0.111 0.394 �0.171 0.698ESA2 0.469 0.054 �0.488 �0.298 0.684ESA3 0.582 �0.335 �0.140 0.221 0.721ESA4 0.562 �0.027 0.051 �0.407 0.727ESA5 0.290 0.417 �0.562 0.201 0.569ESA6 0.280 0.128 �0.261 0.618 0.593ESA7 0.649 0.232 �0.060 �0.142 0.820ESA8 0.275 0.642 0.054 0.284 0.616ESA9 0.598 �0.384 0.110 0.037 0.769ESA10 0.542 �0.306 0.130 0.470 0.788ESA11 0.373 0.530 0.286 �0.009 0.659ESA12 0.593 0.317 0.029 �0.302 0.738ESA13 0.271 0.376 0.608 0.153 0.659ESA14 0.637 �0.137 �0.234 �0.217 0.812ESA15 0.568 �0.445 0.152 0.182 0.779
energy-consuming companies in the same sector (CDPA, 2010). Theindustrial associations are expected to play a better bridge functionbetween the government and the companies as the sector repre-sentative in the near future. As an example in the field of energysaving, they may help establish the decomposed index of energysaving by industrial sectors (NDRC, 2010). Nevertheless, mimeticpressure significantly affects the TESA. This finding indicates thatthe companies are sensitive to energymanagement performance oftheir business competitors. Companies worry about losing thecomparative advantage if they can not perform as well as theircompetitors.
Regarding the internal factors, ‘TRAINING’ shows significant andpositive effects to TESA. This confirms that internal training ofemployees would greatly enhance a company’s ability to practiceESAs. The company’s energy saving orientation (Both ‘WILLING-NESS’ and ‘AWARENESS’) and ‘EDUCATION’ do not have significanteffects on TESA in our analysis. The statistics of variables in Table 4confirmed that the companies in this survey have clear under-standing of their internal energy use status and strong willingnessfor improving energy efficiency. However, the company’s goodattitudes do not necessary lead to actual energy saving practices,which may be limited by various barriers (McKane et al., 2007).Zografakis et al. (2008) confirmed that education can transformhuman behavior towards the rational use of energy and increaseenergy literacy. In this survey, the average educational level of thecompany’s employees is not significant probably because energysaving skills are mainly improved by internal trainings at currentphase. The latest version of China’s ‘Energy Conservation Law’,enacted since April 1st, 2008, addresses the importance of educa-tion and requires the introduction of energy saving knowledge intonational education system. As this process takes time, thegovernment shall arrange training courses for the companies toimprove their energy saving capacity. ‘TOPSUPPORT’ showsa slightly positive effect on TESA. This confirms the needs of support
Table 7Definition and valuation of the sub-category of ESA items.
Variableabbreviation
Description of the sub-category Valuation
ESAI&T Practice level of institutionaland technological ESA
Sum of the scores of ESA1,ESA2, ESA3, ESA4, ESA7,ESA9, ESA10, ESA12, ESA14and ESA15
ESAM Practice level of managerial ESA Sum of the scores of ESA5,ESA8 and ESA11
ESAH Practice level of habitual ESA Score of ESA13ESAIN Company’s intention to invest in
new facility for energy savingScore of ESA6
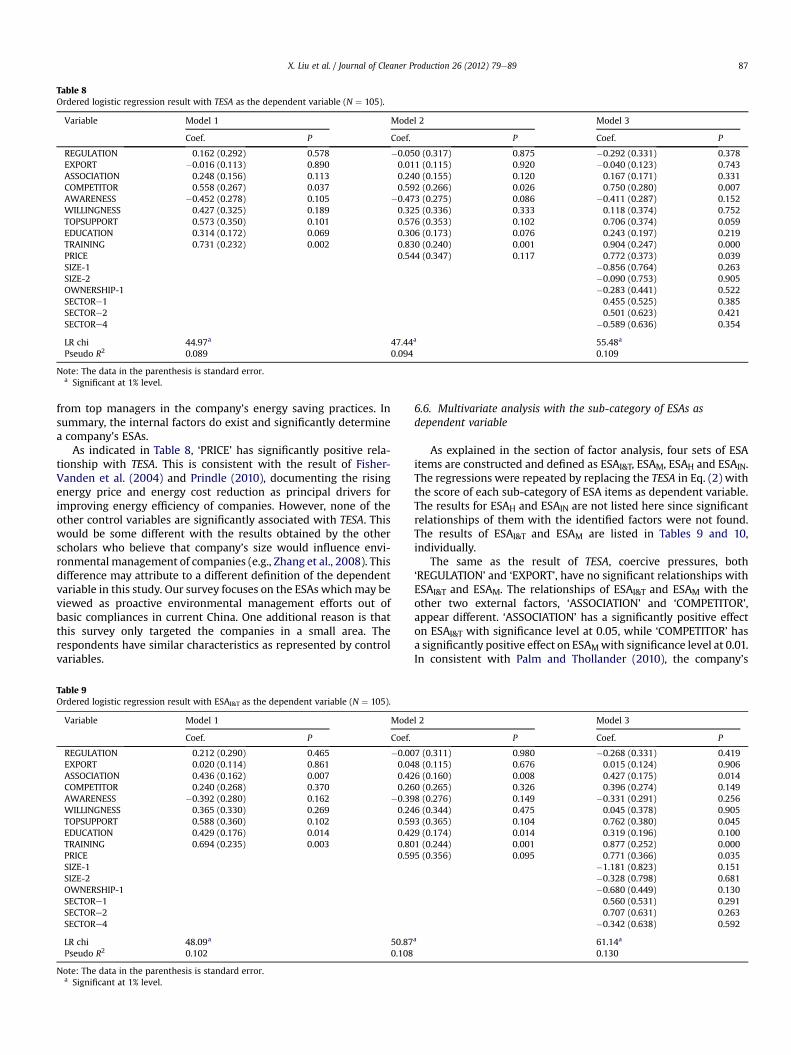
Table 8Ordered logistic regression result with TESA as the dependent variable (N ¼ 105).
Variable Model 1 Model 2 Model 3
Coef. P Coef. P Coef. P
REGULATION 0.162 (0.292) 0.578 �0.050 (0.317) 0.875 �0.292 (0.331) 0.378EXPORT �0.016 (0.113) 0.890 0.011 (0.115) 0.920 �0.040 (0.123) 0.743ASSOCIATION 0.248 (0.156) 0.113 0.240 (0.155) 0.120 0.167 (0.171) 0.331COMPETITOR 0.558 (0.267) 0.037 0.592 (0.266) 0.026 0.750 (0.280) 0.007AWARENESS �0.452 (0.278) 0.105 �0.473 (0.275) 0.086 �0.411 (0.287) 0.152WILLINGNESS 0.427 (0.325) 0.189 0.325 (0.336) 0.333 0.118 (0.374) 0.752TOPSUPPORT 0.573 (0.350) 0.101 0.576 (0.353) 0.102 0.706 (0.374) 0.059EDUCATION 0.314 (0.172) 0.069 0.306 (0.173) 0.076 0.243 (0.197) 0.219TRAINING 0.731 (0.232) 0.002 0.830 (0.240) 0.001 0.904 (0.247) 0.000PRICE 0.544 (0.347) 0.117 0.772 (0.373) 0.039SIZE-1 �0.856 (0.764) 0.263SIZE-2 �0.090 (0.753) 0.905OWNERSHIP-1 �0.283 (0.441) 0.522SECTORe1 0.455 (0.525) 0.385SECTORe2 0.501 (0.623) 0.421SECTORe4 �0.589 (0.636) 0.354
LR chi 44.97a 47.44a 55.48a
Pseudo R2 0.089 0.094 0.109
Note: The data in the parenthesis is standard error.a Significant at 1% level.
X. Liu et al. / Journal of Cleaner Production 26 (2012) 79e89 87
from top managers in the company’s energy saving practices. Insummary, the internal factors do exist and significantly determinea company’s ESAs.
As indicated in Table 8, ‘PRICE’ has significantly positive rela-tionship with TESA. This is consistent with the result of Fisher-Vanden et al. (2004) and Prindle (2010), documenting the risingenergy price and energy cost reduction as principal drivers forimproving energy efficiency of companies. However, none of theother control variables are significantly associated with TESA. Thiswould be some different with the results obtained by the otherscholars who believe that company’s size would influence envi-ronmental management of companies (e.g., Zhang et al., 2008). Thisdifference may attribute to a different definition of the dependentvariable in this study. Our survey focuses on the ESAs whichmay beviewed as proactive environmental management efforts out ofbasic compliances in current China. One additional reason is thatthis survey only targeted the companies in a small area. Therespondents have similar characteristics as represented by controlvariables.
Table 9Ordered logistic regression result with ESAI&T as the dependent variable (N ¼ 105).
Variable Model 1 Mode
Coef. P Coef.
REGULATION 0.212 (0.290) 0.465 �0.00EXPORT 0.020 (0.114) 0.861 0.04ASSOCIATION 0.436 (0.162) 0.007 0.42COMPETITOR 0.240 (0.268) 0.370 0.26AWARENESS �0.392 (0.280) 0.162 �0.39WILLINGNESS 0.365 (0.330) 0.269 0.24TOPSUPPORT 0.588 (0.360) 0.102 0.59EDUCATION 0.429 (0.176) 0.014 0.42TRAINING 0.694 (0.235) 0.003 0.80PRICE 0.59SIZE-1SIZE-2OWNERSHIP-1SECTORe1SECTORe2SECTORe4
LR chi 48.09a 50.87Pseudo R2 0.102 0.108
Note: The data in the parenthesis is standard error.a Significant at 1% level.
6.6. Multivariate analysis with the sub-category of ESAs asdependent variable
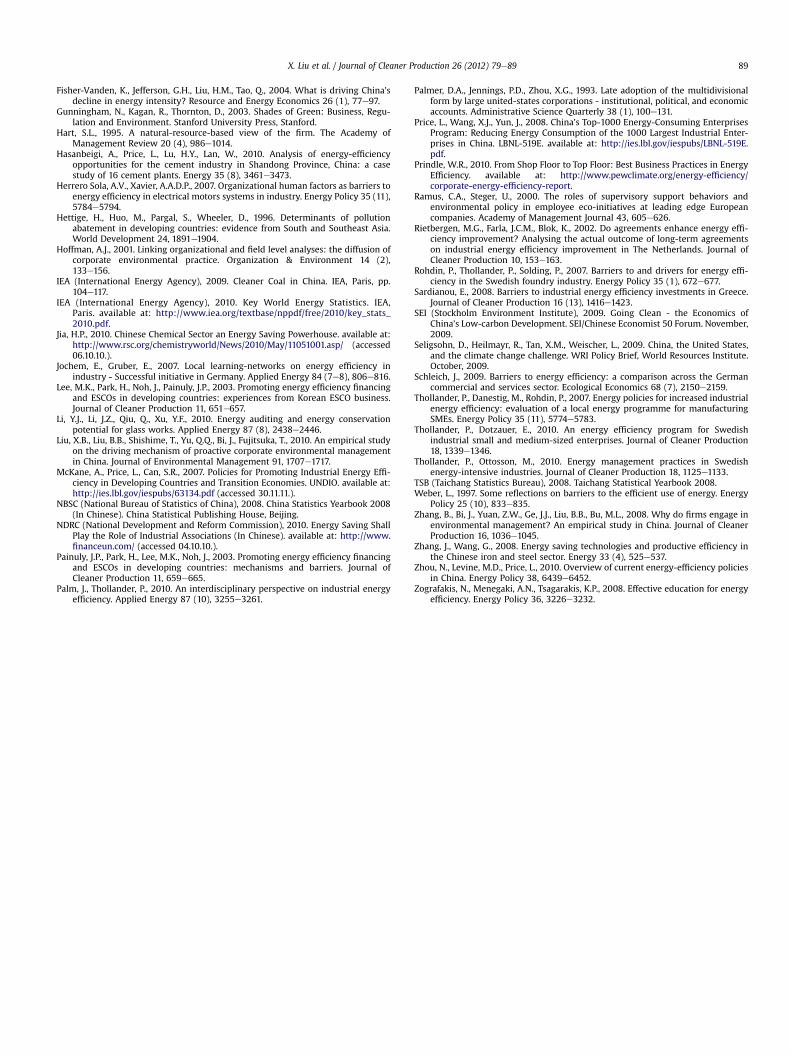
As explained in the section of factor analysis, four sets of ESAitems are constructed and defined as ESAI&T, ESAM, ESAH and ESAIN.The regressions were repeated by replacing the TESA in Eq. (2) withthe score of each sub-category of ESA items as dependent variable.The results for ESAH and ESAIN are not listed here since significantrelationships of them with the identified factors were not found.The results of ESAI&T and ESAM are listed in Tables 9 and 10,individually.
The same as the result of TESA, coercive pressures, both‘REGULATION’ and ‘EXPORT’, have no significant relationships withESAI&T and ESAM. The relationships of ESAI&T and ESAM with theother two external factors, ‘ASSOCIATION’ and ‘COMPETITOR’,appear different. ‘ASSOCIATION’ has a significantly positive effecton ESAI&T with significance level at 0.05, while ‘COMPETITOR’ hasa significantly positive effect on ESAMwith significance level at 0.01.In consistent with Palm and Thollander (2010), the company’s
l 2 Model 3
P Coef. P
7 (0.311) 0.980 �0.268 (0.331) 0.4198 (0.115) 0.676 0.015 (0.124) 0.9066 (0.160) 0.008 0.427 (0.175) 0.0140 (0.265) 0.326 0.396 (0.274) 0.1498 (0.276) 0.149 �0.331 (0.291) 0.2566 (0.344) 0.475 0.045 (0.378) 0.9053 (0.365) 0.104 0.762 (0.380) 0.0459 (0.174) 0.014 0.319 (0.196) 0.1001 (0.244) 0.001 0.877 (0.252) 0.0005 (0.356) 0.095 0.771 (0.366) 0.035
�1.181 (0.823) 0.151�0.328 (0.798) 0.681�0.680 (0.449) 0.1300.560 (0.531) 0.2910.707 (0.631) 0.263
�0.342 (0.638) 0.592
a 61.14a
0.130
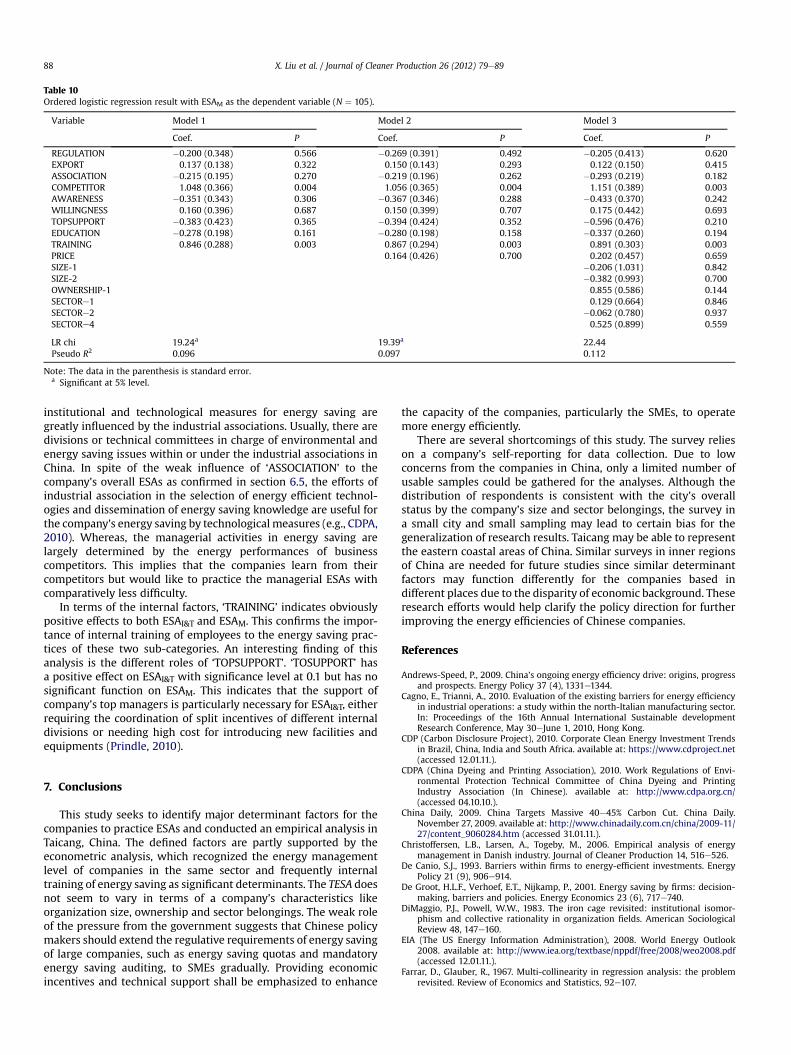
Table 10Ordered logistic regression result with ESAM as the dependent variable (N ¼ 105).
Variable Model 1 Model 2 Model 3
Coef. P Coef. P Coef. P
REGULATION �0.200 (0.348) 0.566 �0.269 (0.391) 0.492 �0.205 (0.413) 0.620EXPORT 0.137 (0.138) 0.322 0.150 (0.143) 0.293 0.122 (0.150) 0.415ASSOCIATION �0.215 (0.195) 0.270 �0.219 (0.196) 0.262 �0.293 (0.219) 0.182COMPETITOR 1.048 (0.366) 0.004 1.056 (0.365) 0.004 1.151 (0.389) 0.003AWARENESS �0.351 (0.343) 0.306 �0.367 (0.346) 0.288 �0.433 (0.370) 0.242WILLINGNESS 0.160 (0.396) 0.687 0.150 (0.399) 0.707 0.175 (0.442) 0.693TOPSUPPORT �0.383 (0.423) 0.365 �0.394 (0.424) 0.352 �0.596 (0.476) 0.210EDUCATION �0.278 (0.198) 0.161 �0.280 (0.198) 0.158 �0.337 (0.260) 0.194TRAINING 0.846 (0.288) 0.003 0.867 (0.294) 0.003 0.891 (0.303) 0.003PRICE 0.164 (0.426) 0.700 0.202 (0.457) 0.659SIZE-1 �0.206 (1.031) 0.842SIZE-2 �0.382 (0.993) 0.700OWNERSHIP-1 0.855 (0.586) 0.144SECTORe1 0.129 (0.664) 0.846SECTORe2 �0.062 (0.780) 0.937SECTORe4 0.525 (0.899) 0.559
LR chi 19.24a 19.39a 22.44Pseudo R2 0.096 0.097 0.112
Note: The data in the parenthesis is standard error.a Significant at 5% level.
X. Liu et al. / Journal of Cleaner Production 26 (2012) 79e8988
institutional and technological measures for energy saving aregreatly influenced by the industrial associations. Usually, there aredivisions or technical committees in charge of environmental andenergy saving issues within or under the industrial associations inChina. In spite of the weak influence of ‘ASSOCIATION’ to thecompany’s overall ESAs as confirmed in section 6.5, the efforts ofindustrial association in the selection of energy efficient technol-ogies and dissemination of energy saving knowledge are useful forthe company’s energy saving by technological measures (e.g., CDPA,2010). Whereas, the managerial activities in energy saving arelargely determined by the energy performances of businesscompetitors. This implies that the companies learn from theircompetitors but would like to practice the managerial ESAs withcomparatively less difficulty.
In terms of the internal factors, ‘TRAINING’ indicates obviouslypositive effects to both ESAI&T and ESAM. This confirms the impor-tance of internal training of employees to the energy saving prac-tices of these two sub-categories. An interesting finding of thisanalysis is the different roles of ‘TOPSUPPORT’. ‘TOSUPPORT’ hasa positive effect on ESAI&T with significance level at 0.1 but has nosignificant function on ESAM. This indicates that the support ofcompany’s top managers is particularly necessary for ESAI&T, eitherrequiring the coordination of split incentives of different internaldivisions or needing high cost for introducing new facilities andequipments (Prindle, 2010).
7. Conclusions
This study seeks to identify major determinant factors for thecompanies to practice ESAs and conducted an empirical analysis inTaicang, China. The defined factors are partly supported by theeconometric analysis, which recognized the energy managementlevel of companies in the same sector and frequently internaltraining of energy saving as significant determinants. The TESA doesnot seem to vary in terms of a company’s characteristics likeorganization size, ownership and sector belongings. The weak roleof the pressure from the government suggests that Chinese policymakers should extend the regulative requirements of energy savingof large companies, such as energy saving quotas and mandatoryenergy saving auditing, to SMEs gradually. Providing economicincentives and technical support shall be emphasized to enhance
the capacity of the companies, particularly the SMEs, to operatemore energy efficiently.
There are several shortcomings of this study. The survey relieson a company’s self-reporting for data collection. Due to lowconcerns from the companies in China, only a limited number ofusable samples could be gathered for the analyses. Although thedistribution of respondents is consistent with the city’s overallstatus by the company’s size and sector belongings, the survey ina small city and small sampling may lead to certain bias for thegeneralization of research results. Taicang may be able to representthe eastern coastal areas of China. Similar surveys in inner regionsof China are needed for future studies since similar determinantfactors may function differently for the companies based indifferent places due to the disparity of economic background. Theseresearch efforts would help clarify the policy direction for furtherimproving the energy efficiencies of Chinese companies.
References
Andrews-Speed, P., 2009. China’s ongoing energy efficiency drive: origins, progressand prospects. Energy Policy 37 (4), 1331e1344.
Cagno, E., Trianni, A., 2010. Evaluation of the existing barriers for energy efficiencyin industrial operations: a study within the north-Italian manufacturing sector.In: Proceedings of the 16th Annual International Sustainable developmentResearch Conference, May 30eJune 1, 2010, Hong Kong.
CDP (Carbon Disclosure Project), 2010. Corporate Clean Energy Investment Trendsin Brazil, China, India and South Africa. available at: https://www.cdproject.net(accessed 12.01.11.).
CDPA (China Dyeing and Printing Association), 2010. Work Regulations of Envi-ronmental Protection Technical Committee of China Dyeing and PrintingIndustry Association (In Chinese). available at: http://www.cdpa.org.cn/(accessed 04.10.10.).
China Daily, 2009. China Targets Massive 40e45% Carbon Cut. China Daily.November 27, 2009. available at: http://www.chinadaily.com.cn/china/2009-11/27/content_9060284.htm (accessed 31.01.11.).
Christoffersen, L.B., Larsen, A., Togeby, M., 2006. Empirical analysis of energymanagement in Danish industry. Journal of Cleaner Production 14, 516e526.
De Canio, S.J., 1993. Barriers within firms to energy-efficient investments. EnergyPolicy 21 (9), 906e914.
De Groot, H.L.F., Verhoef, E.T., Nijkamp, P., 2001. Energy saving by firms: decision-making, barriers and policies. Energy Economics 23 (6), 717e740.
DiMaggio, P.J., Powell, W.W., 1983. The iron cage revisited: institutional isomor-phism and collective rationality in organization fields. American SociologicalReview 48, 147e160.
EIA (The US Energy Information Administration), 2008. World Energy Outlook2008. available at: http://www.iea.org/textbase/nppdf/free/2008/weo2008.pdf(accessed 12.01.11.).
Farrar, D., Glauber, R., 1967. Multi-collinearity in regression analysis: the problemrevisited. Review of Economics and Statistics, 92e107.
X. Liu et al. / Journal of Cleaner Production 26 (2012) 79e89 89
Fisher-Vanden, K., Jefferson, G.H., Liu, H.M., Tao, Q., 2004. What is driving China’sdecline in energy intensity? Resource and Energy Economics 26 (1), 77e97.
Gunningham, N., Kagan, R., Thornton, D., 2003. Shades of Green: Business, Regu-lation and Environment. Stanford University Press, Stanford.
Hart, S.L., 1995. A natural-resource-based view of the firm. The Academy ofManagement Review 20 (4), 986e1014.
Hasanbeigi, A., Price, L., Lu, H.Y., Lan, W., 2010. Analysis of energy-efficiencyopportunities for the cement industry in Shandong Province, China: a casestudy of 16 cement plants. Energy 35 (8), 3461e3473.
Herrero Sola, A.V., Xavier, A.A.D.P., 2007. Organizational human factors as barriers toenergy efficiency in electrical motors systems in industry. Energy Policy 35 (11),5784e5794.
Hettige, H., Huo, M., Pargal, S., Wheeler, D., 1996. Determinants of pollutionabatement in developing countries: evidence from South and Southeast Asia.World Development 24, 1891e1904.
Hoffman, A.J., 2001. Linking organizational and field level analyses: the diffusion ofcorporate environmental practice. Organization & Environment 14 (2),133e156.
IEA (International Energy Agency), 2009. Cleaner Coal in China. IEA, Paris, pp.104e117.
IEA (International Energy Agency), 2010. Key World Energy Statistics. IEA,Paris. available at: http://www.iea.org/textbase/nppdf/free/2010/key_stats_2010.pdf.
Jia, H.P., 2010. Chinese Chemical Sector an Energy Saving Powerhouse. available at:http://www.rsc.org/chemistryworld/News/2010/May/11051001.asp/ (accessed06.10.10.).
Jochem, E., Gruber, E., 2007. Local learning-networks on energy efficiency inindustry - Successful initiative in Germany. Applied Energy 84 (7e8), 806e816.
Lee, M.K., Park, H., Noh, J., Painuly, J.P., 2003. Promoting energy efficiency financingand ESCOs in developing countries: experiences from Korean ESCO business.Journal of Cleaner Production 11, 651e657.
Li, Y.J., Li, J.Z., Qiu, Q., Xu, Y.F., 2010. Energy auditing and energy conservationpotential for glass works. Applied Energy 87 (8), 2438e2446.
Liu, X.B., Liu, B.B., Shishime, T., Yu, Q.Q., Bi, J., Fujitsuka, T., 2010. An empirical studyon the driving mechanism of proactive corporate environmental managementin China. Journal of Environmental Management 91, 1707e1717.
McKane, A., Price, L., Can, S.R., 2007. Policies for Promoting Industrial Energy Effi-ciency in Developing Countries and Transition Economies. UNDIO. available at:http://ies.lbl.gov/iespubs/63134.pdf (accessed 30.11.11.).
NBSC (National Bureau of Statistics of China), 2008. China Statistics Yearbook 2008(In Chinese). China Statistical Publishing House, Beijing.
NDRC (National Development and Reform Commission), 2010. Energy Saving ShallPlay the Role of Industrial Associations (In Chinese). available at: http://www.financeun.com/ (accessed 04.10.10.).
Painuly, J.P., Park, H., Lee, M.K., Noh, J., 2003. Promoting energy efficiency financingand ESCOs in developing countries: mechanisms and barriers. Journal ofCleaner Production 11, 659e665.
Palm, J., Thollander, P., 2010. An interdisciplinary perspective on industrial energyefficiency. Applied Energy 87 (10), 3255e3261.
Palmer, D.A., Jennings, P.D., Zhou, X.G., 1993. Late adoption of the multidivisionalform by large united-states corporations - institutional, political, and economicaccounts. Administrative Science Quarterly 38 (1), 100e131.
Price, L., Wang, X.J., Yun, J., 2008. China’s Top-1000 Energy-Consuming EnterprisesProgram: Reducing Energy Consumption of the 1000 Largest Industrial Enter-prises in China. LBNL-519E. available at: http://ies.lbl.gov/iespubs/LBNL-519E.pdf.
Prindle, W.R., 2010. From Shop Floor to Top Floor: Best Business Practices in EnergyEfficiency. available at: http://www.pewclimate.org/energy-efficiency/corporate-energy-efficiency-report.
Ramus, C.A., Steger, U., 2000. The roles of supervisory support behaviors andenvironmental policy in employee eco-initiatives at leading edge Europeancompanies. Academy of Management Journal 43, 605e626.
Rietbergen, M.G., Farla, J.C.M., Blok, K., 2002. Do agreements enhance energy effi-ciency improvement? Analysing the actual outcome of long-term agreementson industrial energy efficiency improvement in The Netherlands. Journal ofCleaner Production 10, 153e163.
Rohdin, P., Thollander, P., Solding, P., 2007. Barriers to and drivers for energy effi-ciency in the Swedish foundry industry. Energy Policy 35 (1), 672e677.
Sardianou, E., 2008. Barriers to industrial energy efficiency investments in Greece.Journal of Cleaner Production 16 (13), 1416e1423.
SEI (Stockholm Environment Institute), 2009. Going Clean - the Economics ofChina’s Low-carbon Development. SEI/Chinese Economist 50 Forum. November,2009.
Seligsohn, D., Heilmayr, R., Tan, X.M., Weischer, L., 2009. China, the United States,and the climate change challenge. WRI Policy Brief, World Resources Institute.October, 2009.
Schleich, J., 2009. Barriers to energy efficiency: a comparison across the Germancommercial and services sector. Ecological Economics 68 (7), 2150e2159.
Thollander, P., Danestig, M., Rohdin, P., 2007. Energy policies for increased industrialenergy efficiency: evaluation of a local energy programme for manufacturingSMEs. Energy Policy 35 (11), 5774e5783.
Thollander, P., Dotzauer, E., 2010. An energy efficiency program for Swedishindustrial small and medium-sized enterprises. Journal of Cleaner Production18, 1339e1346.
Thollander, P., Ottosson, M., 2010. Energy management practices in Swedishenergy-intensive industries. Journal of Cleaner Production 18, 1125e1133.
TSB (Taichang Statistics Bureau), 2008. Taichang Statistical Yearbook 2008.Weber, L., 1997. Some reflections on barriers to the efficient use of energy. Energy
Policy 25 (10), 833e835.Zhang, B., Bi, J., Yuan, Z.W., Ge, J.J., Liu, B.B., Bu, M.L., 2008. Why do firms engage in
environmental management? An empirical study in China. Journal of CleanerProduction 16, 1036e1045.
Zhang, J., Wang, G., 2008. Energy saving technologies and productive efficiency inthe Chinese iron and steel sector. Energy 33 (4), 525e537.
Zhou, N., Levine, M.D., Price, L., 2010. Overview of current energy-efficiency policiesin China. Energy Policy 38, 6439e6452.
Zografakis, N., Menegaki, A.N., Tsagarakis, K.P., 2008. Effective education for energyefficiency. Energy Policy 36, 3226e3232.
Related Documents