A survey report on “CAUSES OF ROAD ACCIDENT" in Patna [An Initiative of SANKALP JYOTI & SAFETY ALLIANCE] BE CAREFUL...,WE CARE...! BE SAFE...,WE SAFE...! STOP, LOOK & GO

Welcome message from author
This document is posted to help you gain knowledge. Please leave a comment to let me know what you think about it! Share it to your friends and learn new things together.
Transcript

A survey report on “CAUSES OF ROAD ACCIDENT" in Patna [An Initiative of SANKALP JYOTI & SAFETY ALLIANCE]
BE CAREFUL...,WE CARE...!
BE SAFE...,WE SAFE...!
STOP, LOOK & GO

Recommendations: From this study it is recommended that awareness on road safety rules, signs & proper training of traffic staff is required in Bihar. We also recommend that the better trainings of the learner drivers and testing techniques for issuing the licence will also reduce number of accidents. Awareness program on road safety from the student level will also assist in reducing the accidents at all levels. We should conduct road safety awareness campaign across the year. Profile of Respondents: In this survey 627(61%) male & 394(39%) female of age group above 18 years (21%), 18-30 years (54%), 31-40 years (16%) 41-50 Years (5%) and 51 Above (2%) out of 1021 were actively participated. The education level of 170 (22%)up to 10th, 32(4%) up to 12th, 489(63%) BA & MA and 84 (11%) illiterate out of 1021 participated respondents. Project: Goal and Objectives: Goal: Reduction of Road accident in Bihar.
Objectives:
Public opinion on causes of road accident Reduce the risk of road accidents in Bihar.
Awareness on road accident among the communities by tag line “YES! I FOLLOW SAFETY RULES.”
Spread the awareness activities across the Bihar.
Involve the CSOs of Safety Alliance partners in this campaign.
Advocate the govt. & private parties to establish the trauma centre at every 10 kms on highways on PPP mode.
To convince the concerned department to modify the policies on road safety.
To increase the no. of govt. Authorized motor driving schools in Bihar
To prepare a separate road accident data portal at state level to measure the actual rate of road accidents & loss of infrastructure regularly.
Action Plan:
The awareness campaign will be conducted for next three years.
Initially conduct public opinion on causes of road accident in Patna after that conduct it at the headquarters of rest of commissionaires in Bihar.
Implement the awareness campaign initially at headquarter of 09 commissionaires after that district & block level.
Meeting with Commissionaires, district & block level administration on this campaign quarterly.
Meeting with Health departments to ensure the emergency equipments & treatment for the victims of road accident.
Install the tag line at cities key points & every one km distance of National Highways across the Bihar.
Aware the communities by sticking 100000 pieces of this tag line at public transport (e.g.-Auto, Rikshaw, bus etc.) & personal vehicles.
Awareness training on road safety in 5 govt. & 5 private schools as well as 2 colleges in each districts of Bihar.
Advocate the govt. to provide the emergency services like oxygen cylinder, first aid kit at each traffic check post in cities & each road tax collection point on all highways across the Bihar.
Objective of Baseline study:
To investigate public opinion on “Causes of Road Accident” in state and further guiding principle for designing of road safety
activities.
SANKALP JYOTI & SAFETY ALLIANCE
ASHOK NAGAR-1, KANKARBAGH, PATNA-800020,Bihar(India)
M-9470741490/9430954712 Email:[email protected]/[email protected]
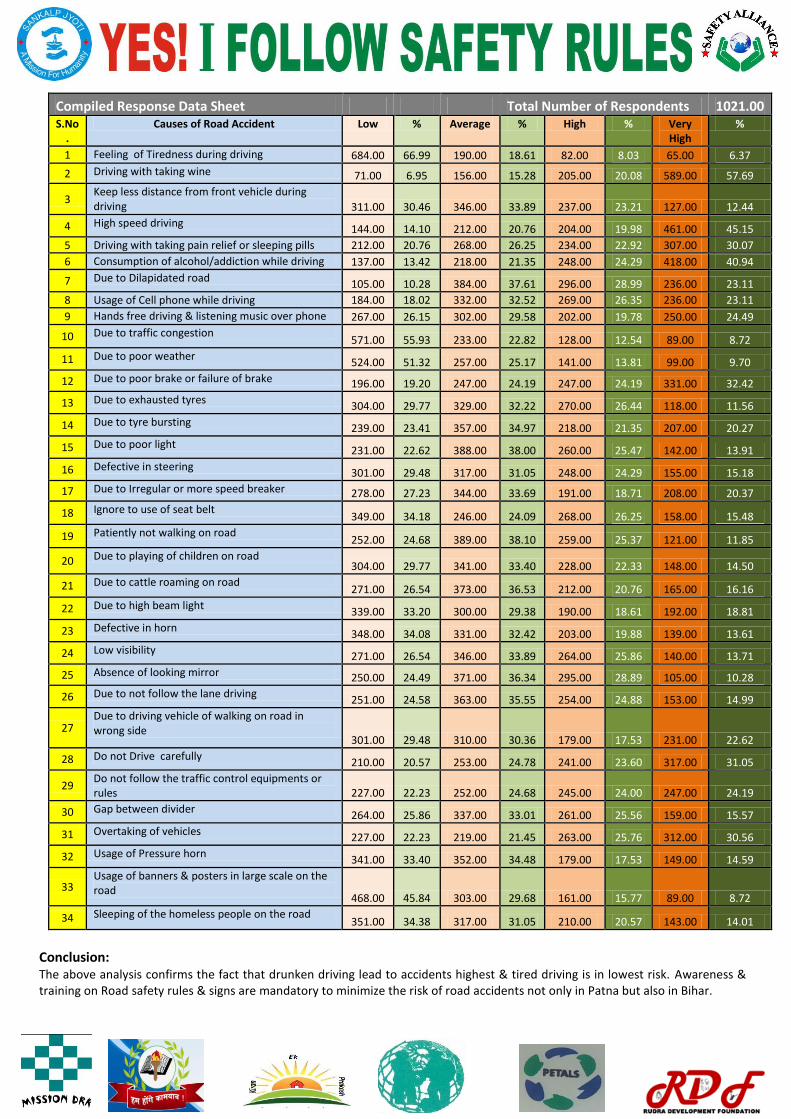
Compiled Response Data Sheet Total Number of Respondents 1021.00 S.No
. Causes of Road Accident Low % Average % High % Very
High %
1 Feeling of Tiredness during driving 684.00 66.99 190.00 18.61 82.00 8.03 65.00 6.37
2 Driving with taking wine 71.00 6.95 156.00 15.28 205.00 20.08 589.00 57.69
3 Keep less distance from front vehicle during driving 311.00 30.46 346.00 33.89 237.00 23.21 127.00 12.44
4 High speed driving 144.00 14.10 212.00 20.76 204.00 19.98 461.00 45.15
5 Driving with taking pain relief or sleeping pills 212.00 20.76 268.00 26.25 234.00 22.92 307.00 30.07
6 Consumption of alcohol/addiction while driving 137.00 13.42 218.00 21.35 248.00 24.29 418.00 40.94
7 Due to Dilapidated road 105.00 10.28 384.00 37.61 296.00 28.99 236.00 23.11
8 Usage of Cell phone while driving 184.00 18.02 332.00 32.52 269.00 26.35 236.00 23.11
9 Hands free driving & listening music over phone 267.00 26.15 302.00 29.58 202.00 19.78 250.00 24.49
10 Due to traffic congestion 571.00 55.93 233.00 22.82 128.00 12.54 89.00 8.72
11 Due to poor weather 524.00 51.32 257.00 25.17 141.00 13.81 99.00 9.70
12 Due to poor brake or failure of brake 196.00 19.20 247.00 24.19 247.00 24.19 331.00 32.42
13 Due to exhausted tyres 304.00 29.77 329.00 32.22 270.00 26.44 118.00 11.56
14 Due to tyre bursting 239.00 23.41 357.00 34.97 218.00 21.35 207.00 20.27
15 Due to poor light 231.00 22.62 388.00 38.00 260.00 25.47 142.00 13.91
16 Defective in steering 301.00 29.48 317.00 31.05 248.00 24.29 155.00 15.18
17 Due to Irregular or more speed breaker 278.00 27.23 344.00 33.69 191.00 18.71 208.00 20.37
18 Ignore to use of seat belt 349.00 34.18 246.00 24.09 268.00 26.25 158.00 15.48
19 Patiently not walking on road 252.00 24.68 389.00 38.10 259.00 25.37 121.00 11.85
20 Due to playing of children on road 304.00 29.77 341.00 33.40 228.00 22.33 148.00 14.50
21 Due to cattle roaming on road 271.00 26.54 373.00 36.53 212.00 20.76 165.00 16.16
22 Due to high beam light 339.00 33.20 300.00 29.38 190.00 18.61 192.00 18.81
23 Defective in horn 348.00 34.08 331.00 32.42 203.00 19.88 139.00 13.61
24 Low visibility 271.00 26.54 346.00 33.89 264.00 25.86 140.00 13.71
25 Absence of looking mirror 250.00 24.49 371.00 36.34 295.00 28.89 105.00 10.28
26 Due to not follow the lane driving 251.00 24.58 363.00 35.55 254.00 24.88 153.00 14.99
27 Due to driving vehicle of walking on road in wrong side
301.00 29.48 310.00 30.36 179.00 17.53 231.00 22.62
28 Do not Drive carefully 210.00 20.57 253.00 24.78 241.00 23.60 317.00 31.05
29 Do not follow the traffic control equipments or rules 227.00 22.23 252.00 24.68 245.00 24.00 247.00 24.19
30 Gap between divider 264.00 25.86 337.00 33.01 261.00 25.56 159.00 15.57
31 Overtaking of vehicles 227.00 22.23 219.00 21.45 263.00 25.76 312.00 30.56
32 Usage of Pressure horn 341.00 33.40 352.00 34.48 179.00 17.53 149.00 14.59
33 Usage of banners & posters in large scale on the road
468.00 45.84 303.00 29.68 161.00 15.77 89.00 8.72
34 Sleeping of the homeless people on the road 351.00 34.38 317.00 31.05 210.00 20.57 143.00 14.01
Conclusion: The above analysis confirms the fact that drunken driving lead to accidents highest & tired driving is in lowest risk. Awareness & training on Road safety rules & signs are mandatory to minimize the risk of road accidents not only in Patna but also in Bihar.

India has a road network of over 4,865,000 kilometre in 2014,the second largest road network in the world. At 0.66 km of roads per square kilometre of land, the quantitative density of India's road network is similar to that of the United States (0.65) and far higher than that of China (0.16) or Brazil (0.20). Road transport in India is very popular for various reasons, but the condition of lndian roads is very poor and deplorable. The rate of road-accidents and fatality in the country is very high. Pressure on roads has been on increase and the number of vehicles is increasing by leaps and bounds. Travel by road provides a lot of flexibility, convenience, speed and reliability, particularly at short distances in cities and towns. Therefore, it is the most preferred medium of transport. But lndian roads in cities, towns and those connecting them have been in a very poor condition. Their development and maintenance have not kept pace with the growth in vehicular population. Consequently, there are accidents, serious injuries and deaths all around. Indian roads are red with human blood. Road accident is one of the most common disasters worldwide. The degree of accidents varies from place to place and time to time. India has about 1 % of the world’s vehicles but accounts for about 10 % of the World’s Road Crash fatalities. In 2004 the number of accidents were recorded 4,13,900 out of which 91,376 deaths took place but by 2013 it rose to 4,69,900 accidents and 1,37,423 deaths.1 Meaning thereby the fatality of the accidents has increased severely. In addition, 111% road crashes are under reported, found in the study conducted by Save Life Foundation. This led to partially or permanent disability to over 5, 00,000 populations in the country. Bihar was ranked 10th in road accident having 4,989 deaths in 2013 & Patna was ranked 5
th in road
accident in 2014. The economic growth and increasing infrastructure, specially road and bridge, has decrease the gap between cities and villages. The increasing number of vehicles, two wheelers to long Lorries, has really increased the probability of the road accidents and it is vividly transferring in fatalities. As predicted the economic growth and infrastructural expansion is very much on roll, the increase in vehicular traffic is bound to grow very steep and further increase the number of road accidents. It is a serious challenge for the road commuters, transporters, doctors and government. Therefore it is joint responsibility of each individual, transport companies, commercial vehicle operators/drivers, transport department, road construction department, medical professionals, hospitals, CSOs and finally government to act swiftly and educate the mass about the safety norms and practicing the same. A policy level action, implementation of the rules and regulations, road behaviour by the commuters is need of the time. The campaign “Yes! I Follow Safety Rules” is a small but important initiative form Sankalp Jyoti. It is expected that the campaign would reach out to each ear of last lanes of villages and cities for safeguarding themselves by following safety rules set by the policy makers time to time. Hopefully, such practice would inculcate as a habits of the commuters gradually which would minimize the road accidents in the state and the country. Bihar is one of the underdeveloped states in India in terms of infrastructures of road. Most of the people of this state use their mobility by road or train. They feel road is more reliable, convenient & accessible to move from one place to another place in terms of logistics or person. The state government have been given their focus to develop the infrastructure of roads within 10 years. The result is that no. of concrete roads have been increased not only in urban areas but also in rural areas. The central government also contributed to increase the length of National Highways in Bihar. Now a day, the mobility of people and no. of vehicles in Bihar have been increased tremendously. But the sense to use the road & vehicles has not been developed as per the traffic rules. They ignored & drive the vehicles mannerless. Not only the motor drivers but also the hand pullers cart, pedestrian, villagers across the highways are also not aware about to use the roads & traffic rules. Due to which many road accidents occurs in cities, villages & highways. Sankalp Jyoti & Safety Alliance (A group of CSOs & individuals) jointly conducted a survey on “Causes of Road Accident” in Patna at ten points (Kankarbagh auto stand, Dinakr chowk, Patancity chowk, Kargil chowk, Dakbunglow, Boring road, Danapur bus stand, Anisabad-bypass more, Zero mile & Mithapur bus stand). Hundred respondents (Bikers-30, Car Drivers-25, Auto-20, Rickshaw puller-10, Cycling-07 & Pedestrian-08) were interacted at each points from 06
th June’16 to 15
th June’16. During this survey total
1021 respondents were interacted with 34 questions. Brief analysis reports of this survey are below.
1 http://savelifefoundation.org/statistics/?gclid=Cj0KEQjw7-
K7BRCkkIH3t_WwoskBEiQAD8oY3rJ49a5x4pXC3fFK1JYA1UJj7eRRhYGowtbu6Uuqxj0aAqtp8P8HAQ
Related Documents