This is a repository copy of A survey on multiaxial fatigue damage parameters under non-proportional loadings. White Rose Research Online URL for this paper: http://eprints.whiterose.ac.uk/119468/ Version: Accepted Version Article: Luo, P., Yao, W., Susmel, L. orcid.org/0000-0001-7753-9176 et al. (2 more authors) (2017) A survey on multiaxial fatigue damage parameters under non-proportional loadings. Fatigue & Fracture of Engineering Materials and Structures, 40 (9). pp. 1323-1342. ISSN 8756-758X https://doi.org/10.1111/ffe.12659 [email protected] https://eprints.whiterose.ac.uk/ Reuse Items deposited in White Rose Research Online are protected by copyright, with all rights reserved unless indicated otherwise. They may be downloaded and/or printed for private study, or other acts as permitted by national copyright laws. The publisher or other rights holders may allow further reproduction and re-use of the full text version. This is indicated by the licence information on the White Rose Research Online record for the item. Takedown If you consider content in White Rose Research Online to be in breach of UK law, please notify us by emailing [email protected] including the URL of the record and the reason for the withdrawal request.

Welcome message from author
This document is posted to help you gain knowledge. Please leave a comment to let me know what you think about it! Share it to your friends and learn new things together.
Transcript

This is a repository copy of A survey on multiaxial fatigue damage parameters under non-proportional loadings.
White Rose Research Online URL for this paper:http://eprints.whiterose.ac.uk/119468/
Version: Accepted Version
Article:
Luo, P., Yao, W., Susmel, L. orcid.org/0000-0001-7753-9176 et al. (2 more authors) (2017) A survey on multiaxial fatigue damage parameters under non-proportional loadings. Fatigue & Fracture of Engineering Materials and Structures, 40 (9). pp. 1323-1342. ISSN 8756-758X
https://doi.org/10.1111/ffe.12659
[email protected]://eprints.whiterose.ac.uk/
Reuse
Items deposited in White Rose Research Online are protected by copyright, with all rights reserved unless indicated otherwise. They may be downloaded and/or printed for private study, or other acts as permitted by national copyright laws. The publisher or other rights holders may allow further reproduction and re-use of the full text version. This is indicated by the licence information on the White Rose Research Online record for the item.
Takedown
If you consider content in White Rose Research Online to be in breach of UK law, please notify us by emailing [email protected] including the URL of the record and the reason for the withdrawal request.
1
A survey on multiaxial fatigue damage parameters under
non-proportional loadings
Peng Luo 1, Weixing Yao2*, Luca Susmel3, Yingyu Wang1, Xiaoxiao Ma1
(1 Key Laboratory of Fundamental Science for National Defense-Advanced Design
Technology of Flight Vehicle, Nanjing University of Aeronautics and Astronautics, Nanjing
210016, China
2 State Key Laboratory of Mechanics and Control of Mechanical Structures, Nanjing
University of Aeronautics and Astronautics, Nanjing 210016, China
3 Department of Civil and Structural Engineering, the University of Sheffield, Sheffield S1
3JD, UK)
* Corresponding author. Tel.: +86 25 84892177
E-mail address: [email protected]
ABSTRACT
In this paper, several multiaxial fatigue damage parameters taking into account
non-proportional additional hardening are reviewed. According to the way non-proportional
additional hardening is considered in the model, the damage parameters are classified into two
categories: (i) equivalent damage parameters and (ii) direct damage parameters. The
equivalent damage parameters usually define a non-proportional coefficient to consider
non-proportional additional cyclic hardening, and make a combination of this
non-proportional coefficient with stress and/or strain quantities to calculate the equivalent
2
damage parameters. In contrast, the direct damage parameters are directly estimated from the
stress and strain quantities of interest. The accuracy of four multiaxial fatigue damage
parameters in predicting fatigue lifetime is checked against about 150 groups of experimental
data for 10 different metallic materials under multiaxial fatigue loading. The results revealed
that both Itoh’s model, one of equivalent damage parameters, and Suemel’s model, which
belong to direct damage parameters, could provide a better correlation with the experimental
results than others assessed in this paper. So, direct damage parameters are not better than the
equivalent damage parameters in predicting fatigue lifetime.
Key words: multiaxial fatigue; non-proportional additional hardening; equivalent
damage parameters; direct damage parameters
NOMENCLATURE
b fatigue strength exponent
b0 shear fatigue strength exponent
b-1 bending fatigue limit under R=-1
c fatigue ductility exponent
c0 shear fatigue ductility exponent
AC half of the longest chord of the loading path
E Young's modulus
Er error index

3
f-1 axial fatigue limit under R=-1
fnp coefficient quantifying additional non-proportional cyclic hardening
H phase-difference coefficient
Hs filling coefficient
k material constant
K’ cyclic strain hardening coefficient
Kc non-proportional factor for circular loading paths
lnp non-proportional factor expressing the severity of non-proportional loading
m easy glide direction
n’ cyclic strain hardening exponent
N number of cycles to fatigue crack initiation
Ncal calculated number of cycles to failure
Nexp experimental number of cycles to failure
n material constant
p, q, r material constants
S constant coefficient, S = 1 or S = 2
cS statistically average value of the dislocation free movement spacing on the slip plane
under the circular loading path
nS statistically average value of the dislocation free movement spacing on the slip plane
under non-proportional loading paths
pS statistically average value of the dislocation free movement spacing on the slip plane
under the proportional loading path
T cycle period

4
t-1 torsional fatigue limit under R=-1
tk time instant
T maximum value of macroscopic shear stress
W(tk) weight function
np material non-proportionality factor
eq equivalent shear strain
けf° shear fatigue ductility coefficient
max maximum shear strain
45 shear strain range at 45 to maximum shear plane
max maximum shear strain range
pmax maximum plastic shear strain range
if° fatigue ductility coefficient
I ( )t maximum absolute value of principal strains at time t, Imax Imax[ ( )]t
I maximum principal strain range
n normal strain range
angle of the cycle path orientation with respect to the principal axis
strain ratio, a a
Poisson’s ratio
( )t angle between Imax and I ( )t
stress ratio of the crack initiation plane and max * * * *n a( , ) / ( , )
a normal stress amplitude

5
b tensile strength
eq equivalent stress
jf° fatigue stress coefficient
maxn
maximum normal stress during a loading cycle
y yield strength
n normal stress range
1 modified shear fatigue limit
a shear stress amplitude
kf° shear fatigue stress coefficient
CPA
MDP
equivalent shear stress on the critical plane determined according to McDiarmid
phase angle of non-proportional loadings
k( )t maximum principal stress direction at time tk
weighted mean principal stress direction
pl,i microscopic plastic shear strain amplitude in the i-th cycle
cumulated plastic strain
1 Introduction
Mechanical components usually undergo multiaxial fatigue loadings, which could be
non-proportional and random. It is important for structural engineers to accurately estimate
fatigue strength of metallic materials under multiaxial fatigue loadings to avoid unwanted

6
in-service failures. The problem of designing real components and structures against
multiaxial fatigue is very complex due to the effect of additional non-proportional cyclic
hardening under multiaxial non-proportional loadings. The effect of additional
non-proportional cyclic hardening on multiaxial fatigue damage must be considered properly
in modelling the crack initiation process, in estimating the cumulated fatigue damage as well
as in predicting fatigue lifetime. Many fatigue damage parameters have been proposed by
researchers over the years, such as the parameters devised by Brown and Miller [1],
Papadopoulos [2], Sines [3], Findley [4] and many more. In general, Multiaxial fatigue damage
parameters are subdivided into the following three different groups [5-7]: equivalent
stress/strain criteria, critical-plane criteria and energy criteria. The equivalent stress/strain
criteria (that are based on static strength approaches) give satisfactory estimates of multiaxial
fatigue lives under in-phase fatigue loadings. However, these criteria are not suitable for
predicting fatigue lifetime under multiaxial out-of-phase fatigue loading. Critical-plane
criteria take into account not only the magnitude of stresses and strains, but also the
orientation of the associated crack initiation plane. Energy criteria are able to describe the
fatigue problem and, under particular circumstances, give a relatively better prediction of
fatigue lives under multiaxial loading. However, the main problem associated with the use of

7
these criteria is that energy is a scalar quantity and it is not suitable for estimating the
orientation of those planes on which fatigue cracks initiate and propagate. In order to
overcome this limitation, several critical plane-strain energy density criteria have been
proposed and validated [8-10], with these approaches being based on a combination of the
energy criteria and the critical plane concept in order to improve the accuracy in predicting
fatigue lifetime.
According to the way additional non-proportional cyclic hardening is usually assessed,
this paper classifies multiaxial fatigue damage parameters into two categories: (i) equivalent
damage parameters and (ii) direct damage parameters. The fundamental difference between
these two types of parameter is whether a non-proportional coefficient is used to calculate the
multiaxial damage parameter of interest. Equivalent damage parameters perform qualitative
analyses to assess the effect of non-proportional loadings, and make a combination of
non-proportional coefficients and stress and/or strain quantities to predict fatigue life.
However, additional non-proportional cyclic hardening effect is directly taken into account
through stress and/or strain quantities in direct damage parameters.
In this paper, some popular multiaxial fatigue damage parameters proposed in recent
years are reviewed. Among them, four typical models are evaluated based on almost 150

8
groups of experimental data in order to find out the most reliable engineering solutions for
different materials.
2 Equivalent damage parameters
The equivalent damage parameters are developed by introducing the coefficient of
non-proportionality, which is designed to quantify the severity of the degree of
non-proportionality of the load history being assessed. To be convenient to compare the
following parameters with each other, the adopted symbols are unified as follows:
lnp is a non-proportional factor quantifying the severity of non-proportional load
histories;
np is a material parameter quantifying the non-proportional factor characterizing the
material under investigation;
fnp is the coefficient of the non-proportional additional cyclic hardening;
is the out-of-phase angle characterizing the non-proportional loading.
Generally speaking, the correlation between fnp, lnp and gnp can be expressed as follows:
np np np( , )f f l (1)
where f is a function that varies with the characteristics of damage parameter being used.
Kanazawa, Miller and Brown et al. [11-12] investigated the low-cycle fatigue strength

9
problem and the stabilized cyclic stress-strain response of l% Cr-Mo-V steel under
out-of-phase combined axial and torsional loadings. Their experimental results clearly suggest
that the plane of slip bands is much closely aligned with the material plane experiencing the
maximum shear stress amplitude. Garud [12] has a similar point of view. Kanazawa et al. [11]
defined a principal axes rotation factor, in terms of the amount of slips experienced by the
critical planes in the specimen. The rotation factor is defined as the ratio of the shear strain
range on the maximum shear strain plane and that on the plane having 45°included angle to
the maximum shear strain plane. Then the loadings non-proportional factor is defined as
follows [11]:
1/222 2 22 2
45np 22 2 22 2max
1 1 2 (1 )cos
1 1 2 (1 )cos
l
(2)
The equivalent shear strain is
eq max np max np np(1 )k f k l (3)
where 1 1/k f t is the ratio of fully reversed axial fatigue limit and torsional fatigue limit.
Through observations and analyses of the experimental results of 1045 HR steel and
Inconel 718 under biaxial fatigue loading, Fatemi [14][14] proposed to replace the normal strain
term on the maximum shear plane in Brown and Miller's equation with a normal stress on that
plane, so that the additional cyclic hardening of materials due to the rotation of the principal
10
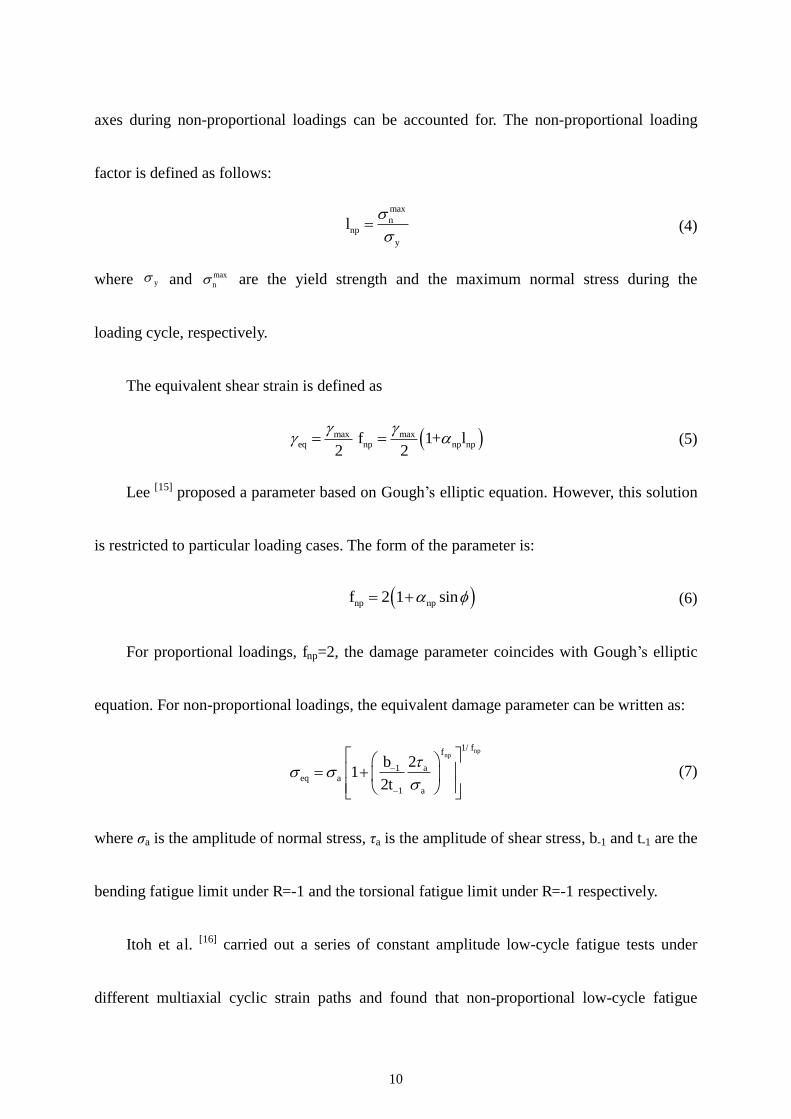
axes during non-proportional loadings can be accounted for. The non-proportional loading
factor is defined as follows:
maxn
npy
l
(4)
where y and maxn are the yield strength and the maximum normal stress during the
loading cycle, respectively.
The equivalent shear strain is defined as
max maxeq np np np1+
2 2f l
(5)
Lee [15] proposed a parameter based on Gough’s elliptic equation. However, this solution
is restricted to particular loading cases. The form of the parameter is:
np np2 1 sinf (6)
For proportional loadings, fnp=2, the damage parameter coincides with Gough’s elliptic
equation. For non-proportional loadings, the equivalent damage parameter can be written as:
npnp
1/
a1eq a
1 a
21
2
ffb
t
(7)
where ja is the amplitude of normal stress, ka is the amplitude of shear stress, b-1 and t-1 are the
bending fatigue limit under R=-1 and the torsional fatigue limit under R=-1 respectively.
Itoh et al. [16] carried out a series of constant amplitude low-cycle fatigue tests under
different multiaxial cyclic strain paths and found that non-proportional low-cycle fatigue

11
strength is significantly influenced by the changed range of the principal strain direction and
the strain paths. The non-proportional factor that expresses the severity of the
non-proportional loading under investigation is defined as follows:
npmax 0
1.57sin ( ) ( )d
T
l t t tT
(8)
where I ( )t is the maximum absolute value of the principal strains at instant t,
Imax Imax[ ( )]t , t is the angle between Imax and I ( )t , T is loading period, respectively.
Based on previous studies by Itoh [16], Itoh and Yang [17] further found that the reduction
of fatigue life in the low-cycle fatigue regime due to non-proportional loading is related to the
effect of the additional cyclic hardening. Then they developed a suitable expression of the
material constant which is closely related to the static deformation behavior of the material.
The formulation of the material constant can be expressed as:
b ynp
b
S
(9)
where b is tensile strength, y is yielding stress or 0.2% proof stress, coefficient S takes
S=1 for face-centered cubic structure (FCC) materials and S=2 for body-centered cubic
structure (BCC) materials.
Choosing the maximum principal strain range as the equivalent damage parameter, the
fatigue damage parameter of Itoh model can be written as follows:

12
eq np np np(1 )f f (10)
where I is the maximum principal strain range with I Imax Imax[ cos ( ) ( )]t t .
Many other researchers, such as Chen [18] and Durprat [19] have developed their own
approaches on the basis of Itoh’s method.
Borodii [20-22] considered the additional hardening effect resulting from the strain range
and the shape of cycle loading path. In order to take the influence of the strain paths into
account, a number of parameters (stress/strain/energy) have been proposed to establish an
unambiguous relation between loading path and strain hardening. Then Itoh’s strain
criterion[16] was modified. The relative change between the cycle path direction and the
principal strain axis is taken into account by Borodii [22] in the new coefficient of
non-proportionality. The modified non-proportionality of multiaxial loadings and the new
coefficient of non-proportionality are defined as follows:
0
np e de / e de
r
L L
l
(11)
np np np(1 sin )(1 )f k l (12)
where e , de are the vectors of strain and strain increment respectively; L' is the
deformation path of the cycle or the convex equivalent path of the cycle; L0 is the circular
path; the procedure of determination of the exponent r is contained in Appendix A of

13
reference [21]; k is the material constant which characterizes the difference in the cyclic
properties (from the lifetime) for proportional strain paths and is commonly obtained by
experiments; is the angle of the cycle path orientation with respect to the principal axis.
The equivalent damage parameter is expressed as follows:
eq npf (13)
He et al. [23] investigated the microscopic mechanism of the decrease of materials’
fatigue lifetime under non-proportional loadings, and found that more micro cracks initiate
under low-cycle fatigue complex non-proportional loading than those initiate under
proportional loadings. The increasing number of micro cracks accelerates the propagating rate
of the subsequent fatigue cracks. The non-proportional factor of the strain path is defined as
the distribution of the dislocation free movement spacing on the slip plane which can be
expressed as follows:
1/2
n p
np 1/2
c p
/ 1
/ 1c
S Sl K
S S
(14)
where S is the statistically average value of the free movement spacing of the dislocations
on the slip plane under the loading of identical equivalent strain amplitudes but different
loading paths. In Eq. (14), subscripts n, c and p denote non-proportional loadings path,
circular loadings path and proportional loadings path, respectively. Kc is the non-proportional
14
factor of the circular loadings path.
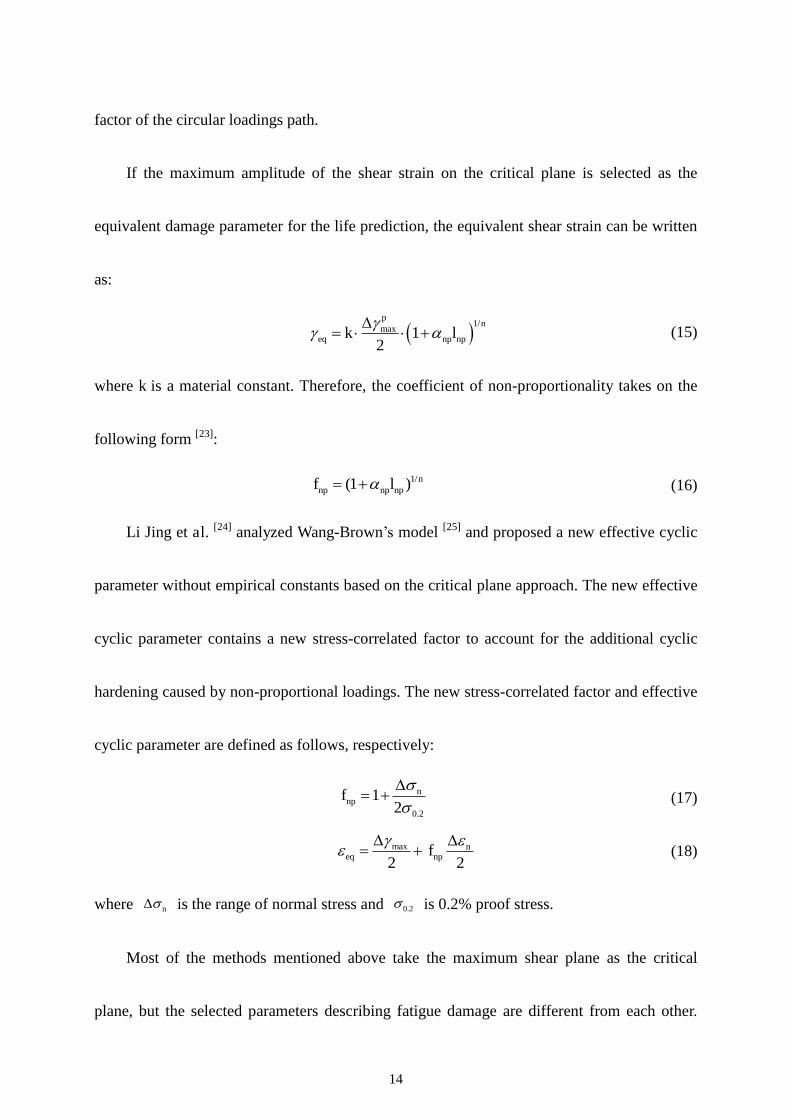
If the maximum amplitude of the shear strain on the critical plane is selected as the
equivalent damage parameter for the life prediction, the equivalent shear strain can be written
as:
p
1/max
eq np np12
nk l
(15)
where k is a material constant. Therefore, the coefficient of non-proportionality takes on the
following form [23]:
1/np np np(1 ) nf l (16)
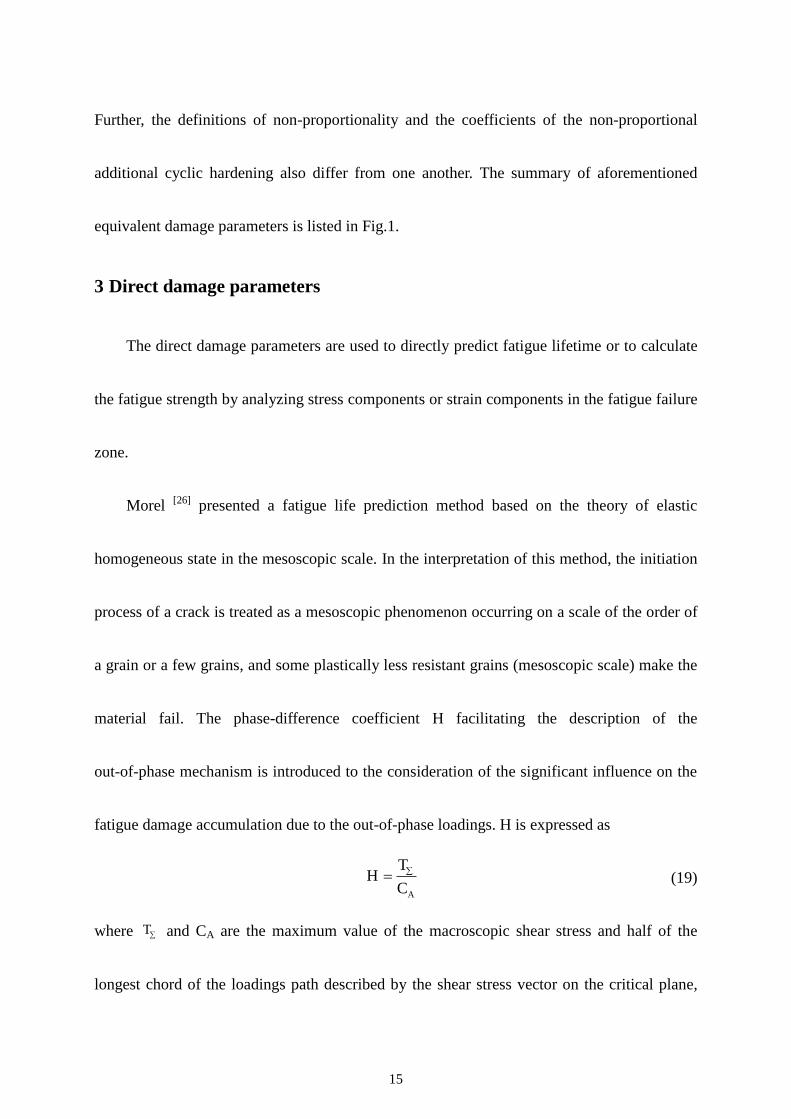
Li Jing et al. [24] analyzed Wang-Brown’s model [25] and proposed a new effective cyclic
parameter without empirical constants based on the critical plane approach. The new effective
cyclic parameter contains a new stress-correlated factor to account for the additional cyclic
hardening caused by non-proportional loadings. The new stress-correlated factor and effective
cyclic parameter are defined as follows, respectively:
nnp
0.2
12
f
(17)
max neq np2 2
f
(18)
where n is the range of normal stress and 0.2 is 0.2% proof stress.
Most of the methods mentioned above take the maximum shear plane as the critical
plane, but the selected parameters describing fatigue damage are different from each other.
15
Further, the definitions of non-proportionality and the coefficients of the non-proportional
additional cyclic hardening also differ from one another. The summary of aforementioned
equivalent damage parameters is listed in Fig.1.
3 Direct damage parameters
The direct damage parameters are used to directly predict fatigue lifetime or to calculate
the fatigue strength by analyzing stress components or strain components in the fatigue failure
zone.
Morel [26] presented a fatigue life prediction method based on the theory of elastic
homogeneous state in the mesoscopic scale. In the interpretation of this method, the initiation
process of a crack is treated as a mesoscopic phenomenon occurring on a scale of the order of
a grain or a few grains, and some plastically less resistant grains (mesoscopic scale) make the
material fail. The phase-difference coefficient H facilitating the description of the
out-of-phase mechanism is introduced to the consideration of the significant influence on the
fatigue damage accumulation due to the out-of-phase loadings. H is expressed as
A
TH
C (19)
where T and CA are the maximum value of the macroscopic shear stress and half of the
longest chord of the loadings path described by the shear stress vector on the critical plane,

16
respectively, with these quantities being calculated via the algorithm proposed by
Papadopoulos [27].
The chosen fatigue damage variable is the accumulated plastic strain at the mesoscopic
scale and the number of cycles of fatigue crack initiation is
A 1
A 1 A 1 A
lnC r
N p qC C C
(20)
where p, q, r are material constants that depend on the hardening parameters, whereas
lim A lim1
T C T
H T
is the modified shear fatigue limit.
Spagnoli & Carpinteri [28] took as a starting point the idea that there is a deviation angle
between the critical plane of materials under non-proportional loadings and that under
proportional loadings. In particular, a correlation between the weighted mean direction of the
maximum principal stress (normal to the fatigue fracture plane) and the normal to the critical
plane is proposed to modify the orientation of the critical plane. The fatigue damage
parameter is defined as a nonlinear combination of the maximum normal stress Nmax and the
shear stress amplitude acting on the critical plane Ca:
2
2 2afeq max
afaC N
(21)
where af and af are the fatigue limit stress respectively deduced from the S–N curve for
uniaxial tension-compression and torsion with loading ratio R=-1. The weighted mean
17
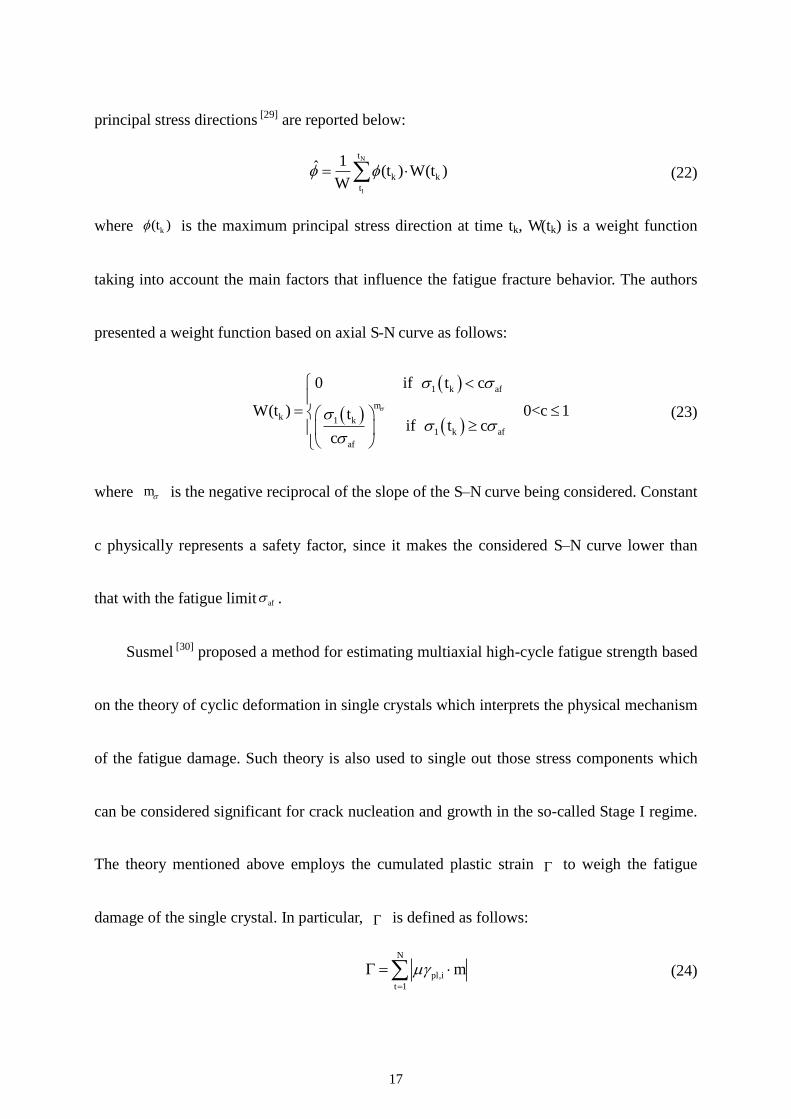
principal stress directions [29] are reported below:
N
1
k k
1ˆ ( ) ( )t
t
t W tW
(22)
where k( )t is the maximum principal stress direction at time tk, W(tk) is a weight function
taking into account the main factors that influence the fatigue fracture behavior. The authors
presented a weight function based on axial S-N curve as follows:
1 k af
k 1 k1 k af
af
0 if
( ) 0< 1 if
m
t c
W t ctt c
c
(23)
where m is the negative reciprocal of the slope of the S–N curve being considered. Constant
c physically represents a safety factor, since it makes the considered S–N curve lower than
that with the fatigue limit af .
Susmel [30] proposed a method for estimating multiaxial high-cycle fatigue strength based
on the theory of cyclic deformation in single crystals which interprets the physical mechanism
of the fatigue damage. Such theory is also used to single out those stress components which
can be considered significant for crack nucleation and growth in the so-called Stage I regime.
The theory mentioned above employs the cumulated plastic strain to weigh the fatigue
damage of the single crystal. In particular, is defined as follows:
pl,1
N
it
m
(24)
18
where pl,i is the microscopic plastic shear strain amplitude in the i-th cycle and N is the
total number of cycles, m is the slip direction.
Under the hypothesis of a purely elastic macroscopic strain, the relation between the
macroscopic shear stress versus the microscopic plastic shear stress can be expressed as
follows[29]:
pm b m (25)
where b is a monotonic function and k is the macroscopic shear stress.
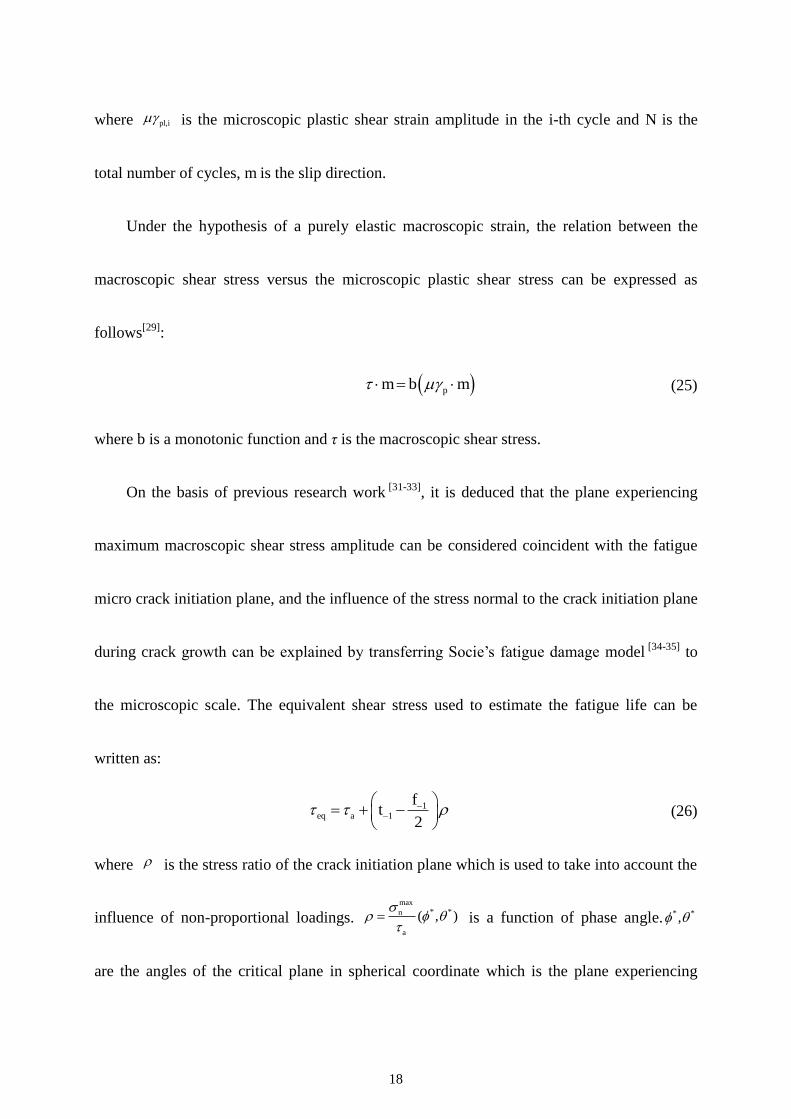
On the basis of previous research work [31-33], it is deduced that the plane experiencing
maximum macroscopic shear stress amplitude can be considered coincident with the fatigue
micro crack initiation plane, and the influence of the stress normal to the crack initiation plane
during crack growth can be explained by transferring Socie’s fatigue damage model [34-35] to
the microscopic scale. The equivalent shear stress used to estimate the fatigue life can be
written as:
1eq a 1 2
ft
(26)
where is the stress ratio of the crack initiation plane which is used to take into account the
influence of non-proportional loadings. max
* *n
a
( , )
is a function of phase angle.* *,
are the angles of the critical plane in spherical coordinate which is the plane experiencing

19
maximum shear stress amplitude.
Skibicki [36] suggested a loading non-proportionality measure based on McDiarmid’s
critical plane fatigue criterion [37] for the case of multiaxial fatigue. The presented loading
non-proportionality parameter known as the filling coefficient, Hs, was based on observations
of stress hodographs of the maximum shear stress for different loading with
non-proportionality degrees. Filling coefficient Hs is defined as a quotient of the area within
the hodograph and the area of the circle described on the hodograph.
CPA
MDP
2MDP / 2s
W
H
(27)
where MDP is the equivalent stress on the material plane, g is calculated according to
McDiarmid [37] relation under out-of-phase loadings, CPA
MDP is the equivalent stress on critical
plane, kCPAsin[2( )] W is a weight function and the index k which influences the
character of changeability of the function W is obtained by experimental data fitting.
The general form of the fatigue damage parameter under non-proportional loadings was
postulated by the author as follows:
CPA
MDP 1eq
1
1 ntH
b
(28)
where n is obtained by experimental data fitting.
In addition, Liu et al. [38] also proposed a multiaxial fatigue criterion involving the

20
critical plane rotation approach in which the critical plane is directly correlated with the
fatigue fracture plane. Farahani [39] took the influencing factors of axial mean stress and
additional hardening under out-of-phase strain path into consideration. Many other
researchers such as Chu [40], Huyen [41] et al. proposed their own damage parameters correlated
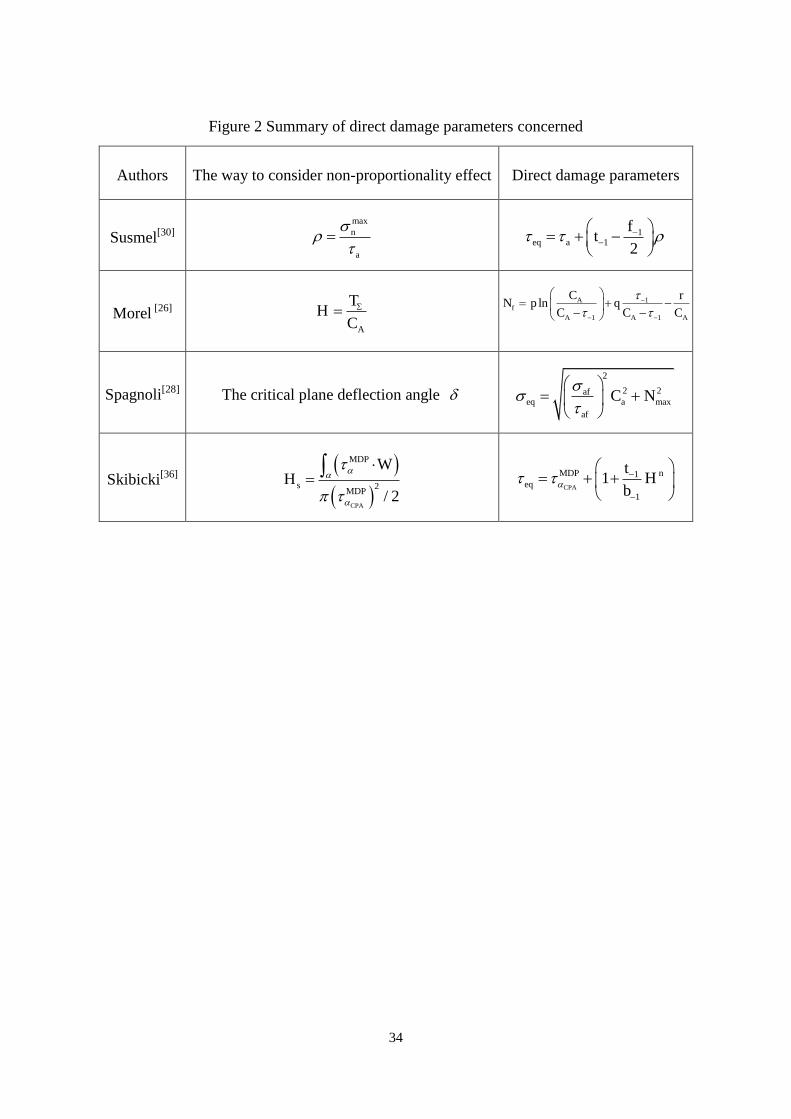
with the critical plane approaches and energy based approaches. Fig.2 is a summary of direct
damage parameters.
4 Evaluation of multiaxial fatigue failure criteria
4.1 How to select the fatigue criteria to estimate fatigue life under multiaxial loading?
In this section, four typical multiaxial fatigue failure criteria are chosen for validation by
experimental data. There are many reasons for choosing these among others fatigue failure
criteria. Firstly, these four criteria have a significant influence on the other multiaxial fatigue
failure criteria and are widely referenced by other researchers. Many multiaxial fatigue life
prediction methods are derived from them.
Secondly, these four criteria could be used to estimate multiaxial fatigue life
conveniently and do not have unambiguous definitions and contain less or no material
property parameters. For example, the damage parameters proposed by Susmel[29] and
Spagnoli[28] require only material constants of axial fatigue and torsional fatigue property.
21
Similarly, Kanazawa’s [11-12] and Itoh’s [16] approaches just need one extra material
non-proportional parameter and in particular, the way to determine these parameters
experimentally was introduced in detail in the references.
The aim for researchers is to decrease the dependence on large numbers of experiments,
experiential elements and material constants as far as possible in fatigue life analyses. In
consequence, the number of material property parameters can be taken as one of the standards
to judge the relevance of a multiaxial fatigue criterion.
4.2 Test data collection
To avoid the inaccuracy of fatigue life prediction for a single specimen, group test data
should be chosen to verify the criteria. In this paper, nearly 150 groups of multiaxial fatigue
experimental data generated by testing 10 different materials under different load conditions
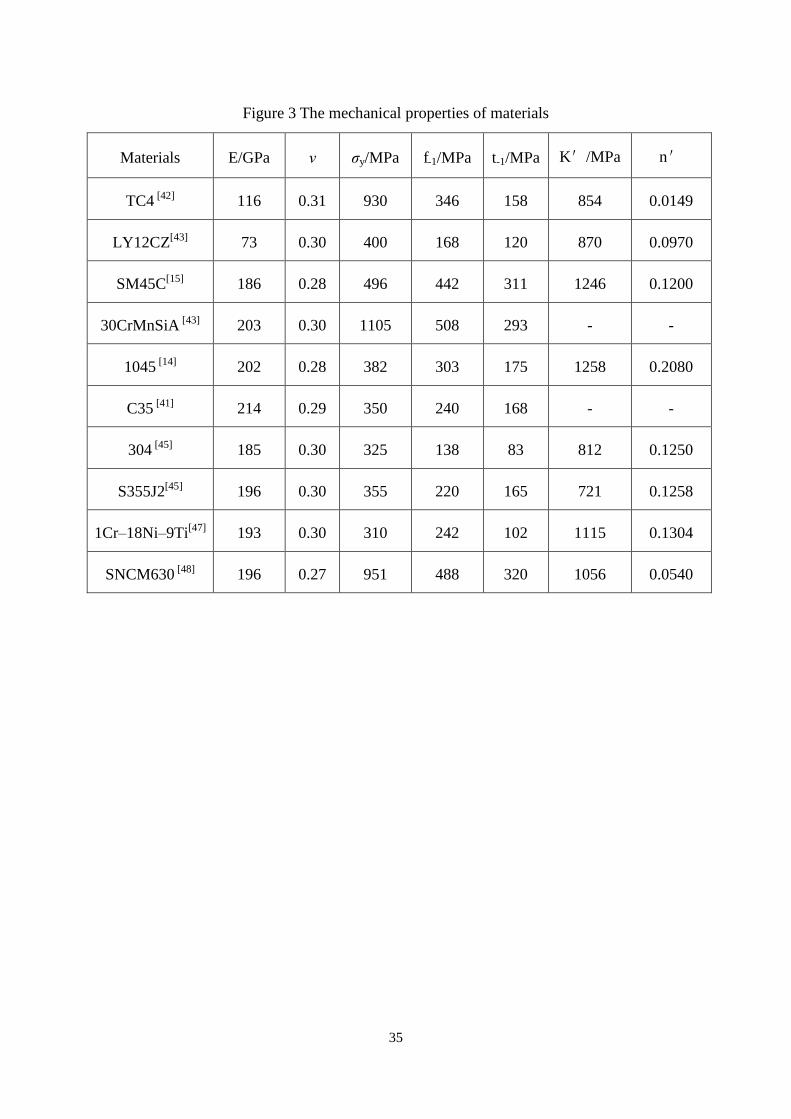
are collected. The data about the mechanical and fatigue properties of the materials being
considered are listed in Fig. 3 and Fig. 4, respectively. All the test results are under constant
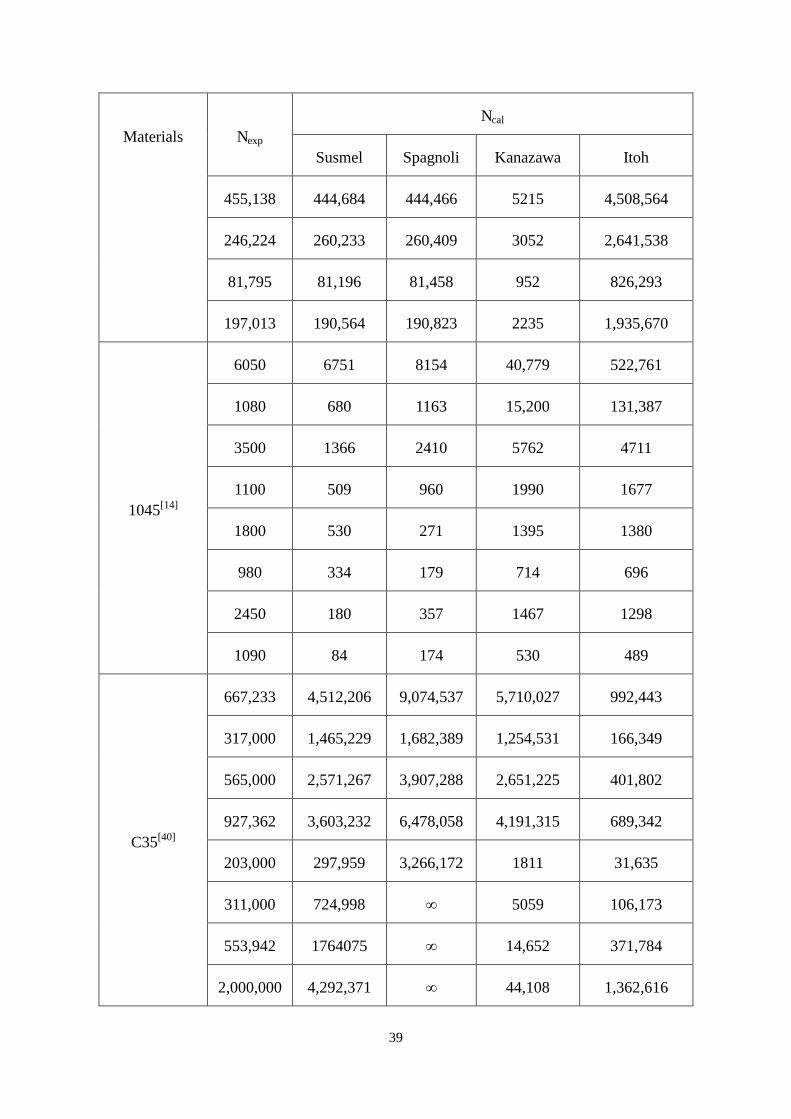
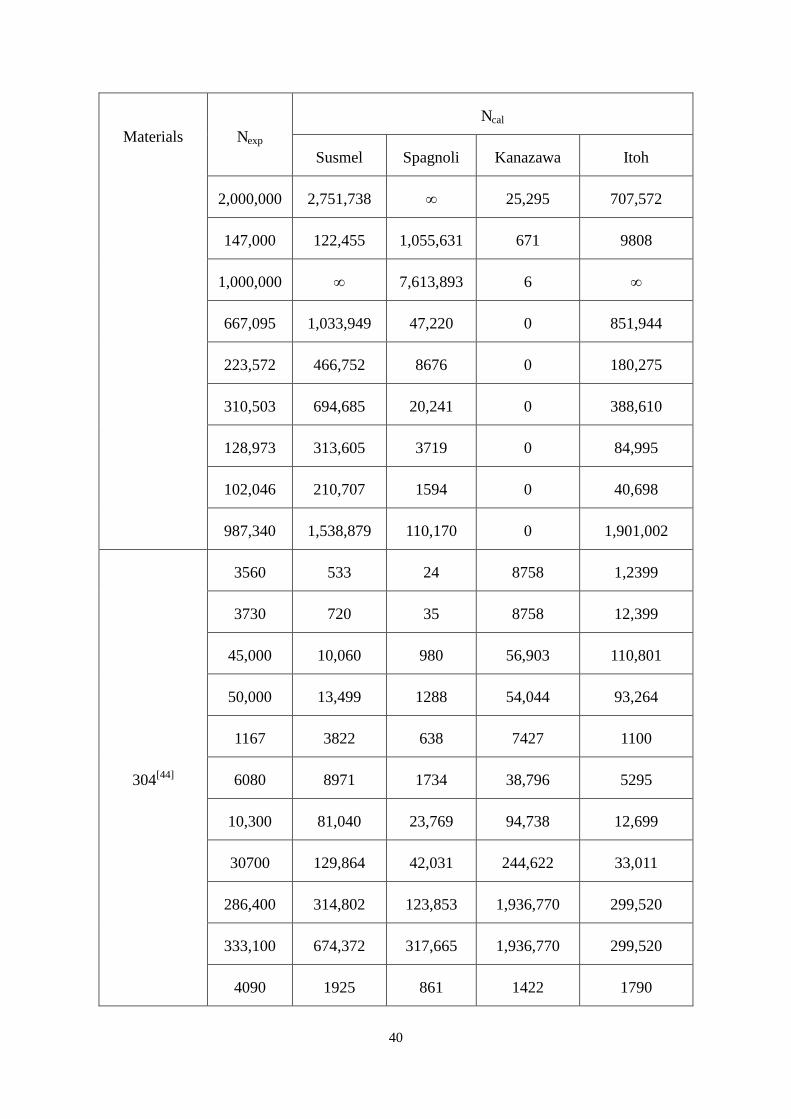
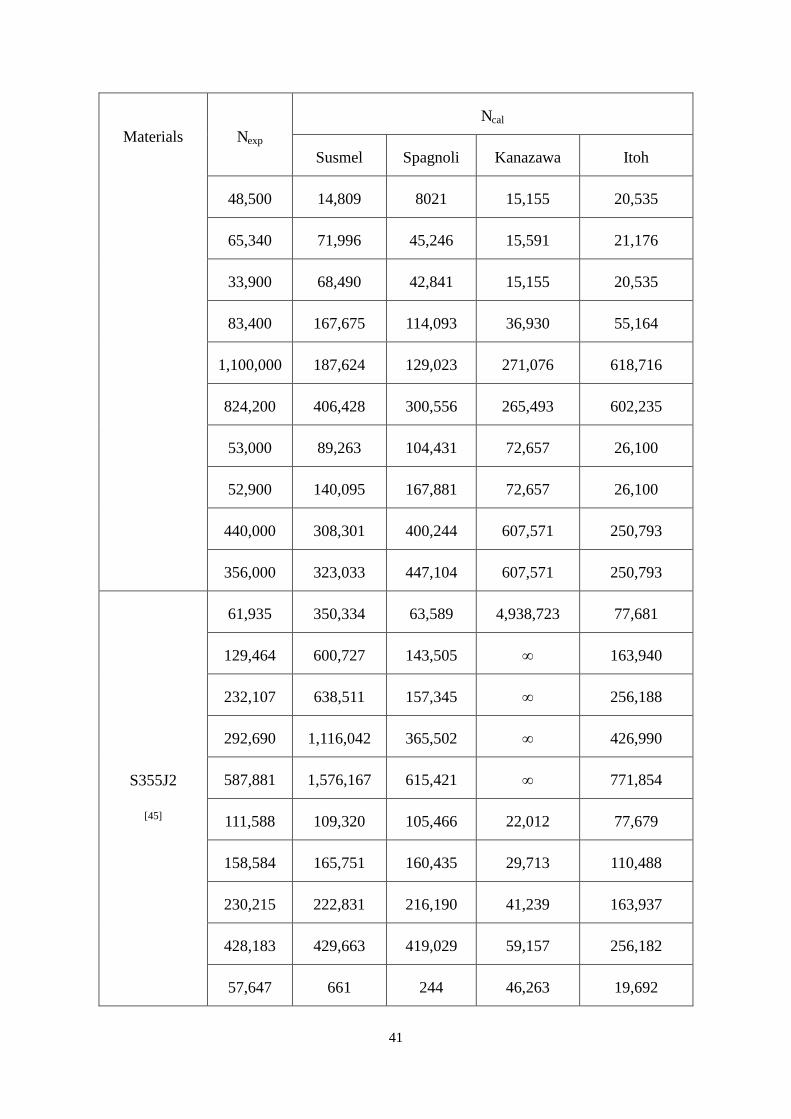
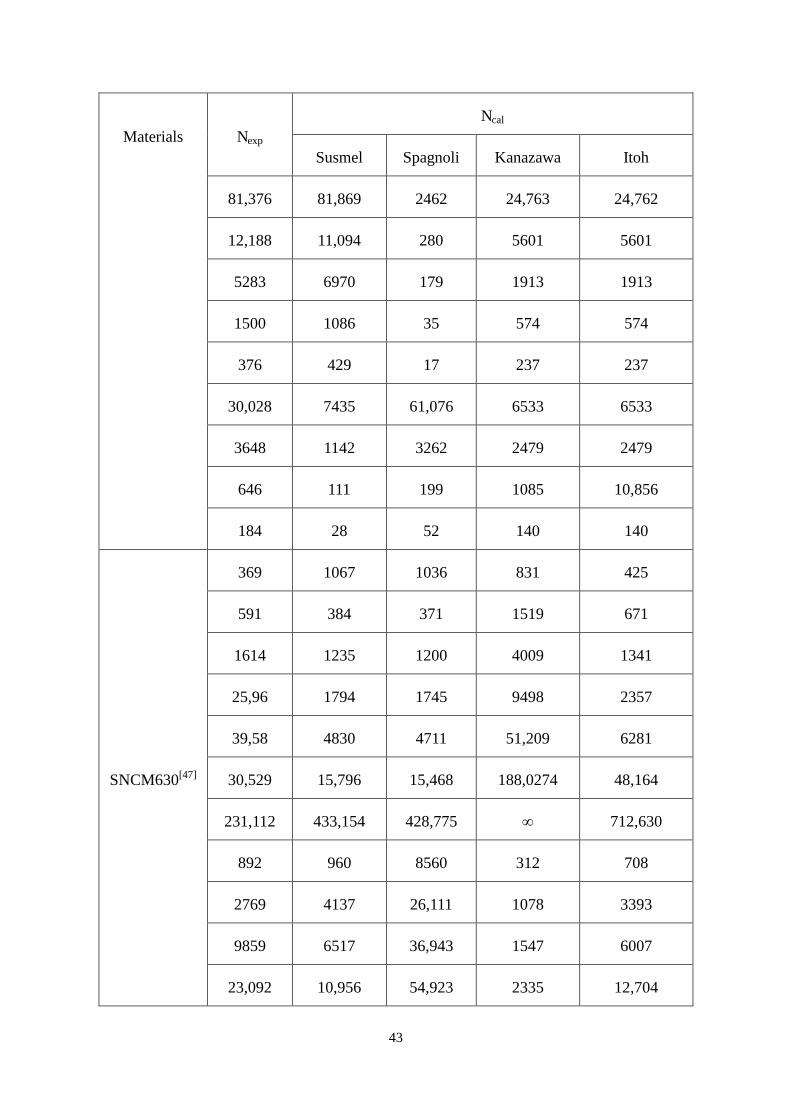
amplitude sinusoidal load with R=-1, and they are summarized in Fig. 5. By implementing the
assessed fatigue damage parameters in specific numerical codes, their accuracy and reliability
will be checked against the experimental results listed in Fig. 5.
4.3 Evaluation results and discussion
22
In order to measure the deviation and correlation between predicted lives and
experimental lives, error index Er is defined as shown in Fig.6.
Obviously, the closer the error index Er is to 1, the more accurate the prediction by using
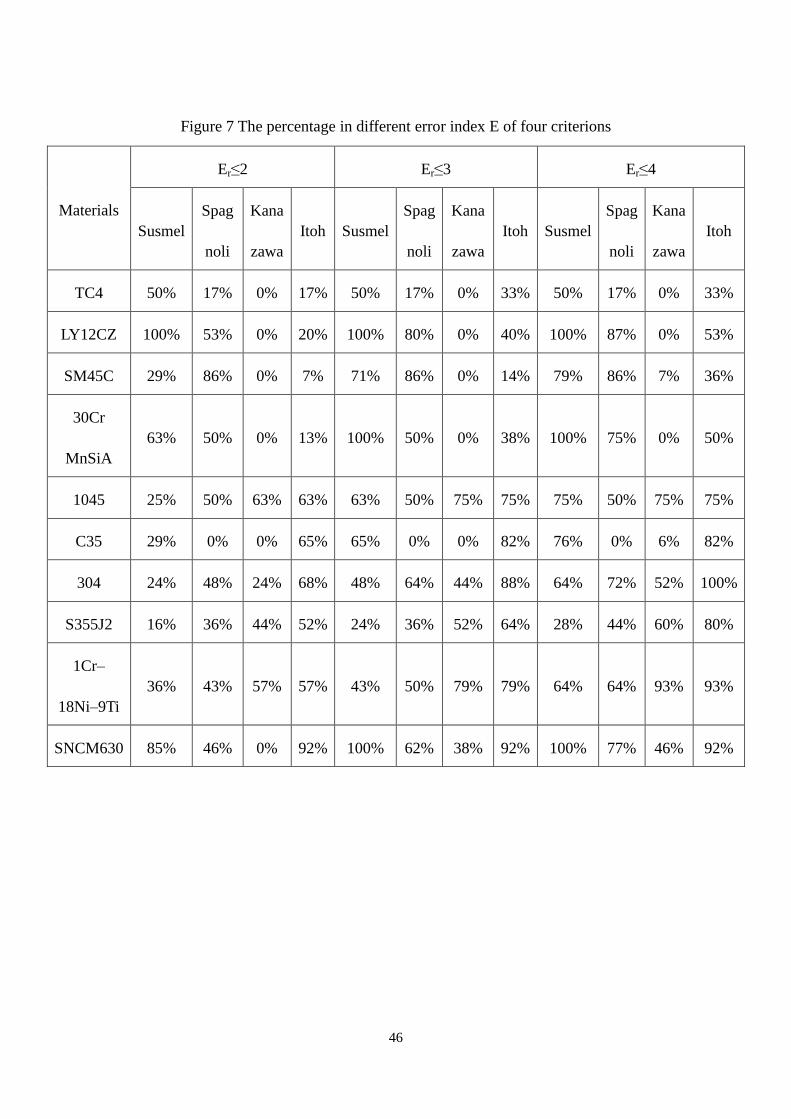
multiaxial fatigue failure criterion is. The percentages of estimations obtained by using the
selected four criteria that fall within different error index Er are listed in Fig. 7. The
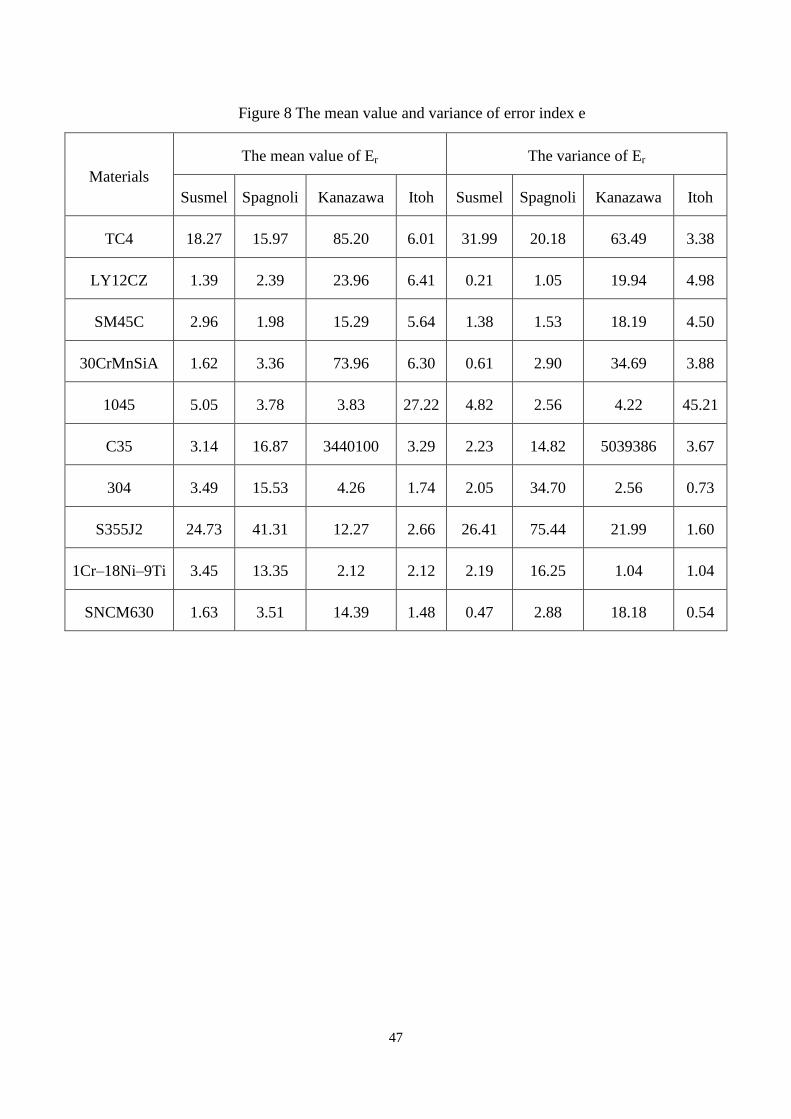
corresponding histograms are reported in Figs. 2-5. Moreover, Fig. 7 reports the mean value
and variance of error index Er for the different fatigue critera.
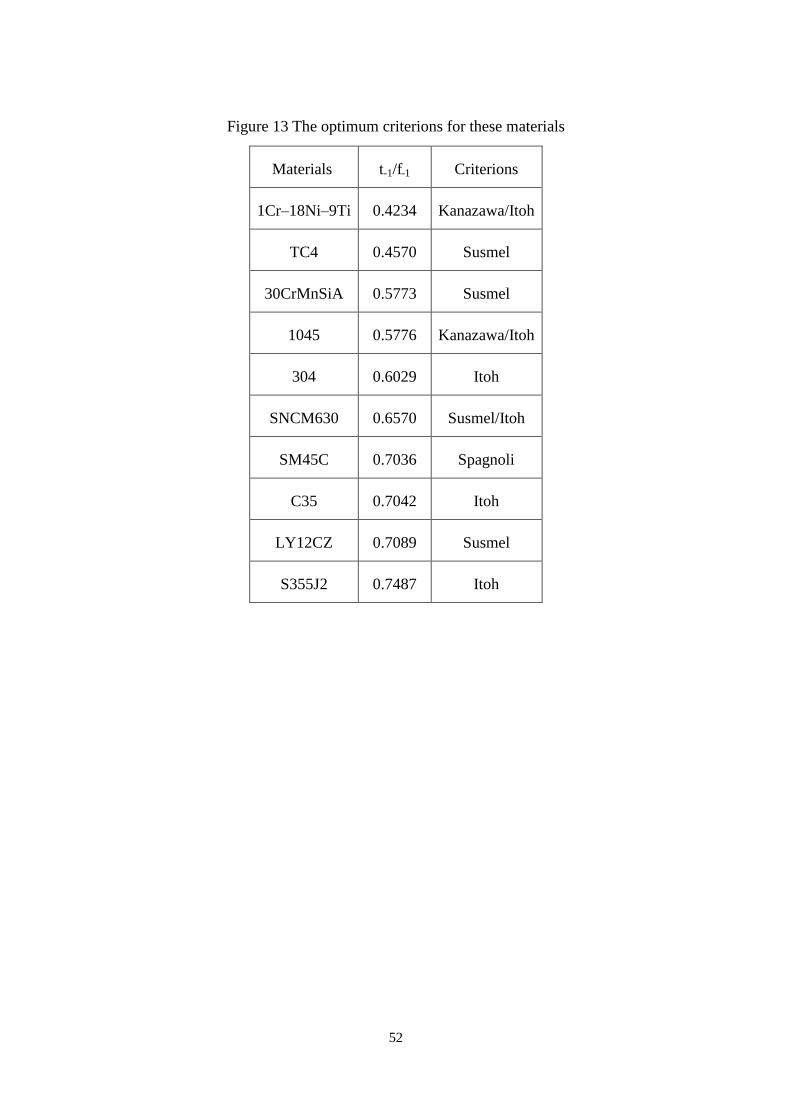
According to Fig. 7, Fig. 8 and Figs. 9-12, we can find the optimum multiaxial fatigue
failure criteria for these materials, see Fig. 13. The ratio between the pure torsion and tension
fatigue strengths, 1 1/t f , is also listed in Fig. 13 to reveal the ductility of material. In
general, ductile materials have ratios close to 0.5 or 0.58, whereas brittle materials have ratios
approaching 1. [52]
It can be concluded from Fig. 9 to Fig. 12 that:
For all of the four methods studied above, life prediction results for different materials
vary greatly. For example, predictions of 1045 stainless steel, 1Cr–18Ni–9Ti steel(75% and
93% data points respectively) can perfectly fit Kanazawa’s model within a factor of 4. But the
predictive capabilities of Kanazawa’s model are rather poor for other chosen materials. This
23
indicates the fact that dispersion of fatigue life estimation is significant and the applicability
of each method is limited.
Spagnoli’s parameter returned very good life estimates for SM45C (86% data points
respectively within a factor of 2), and reasonably good life estimates for SM45C and LY12CZ
(86% and 87% data points respectively within a factor of 4).
Susmel’s parameter and the Itoh’s parameter returned reliable estimates for most of the
collected materials, including brittle materials and ductile materials. For Susmel’s parameter
and Itoh’s parameter, there are 9 and 8 of the 10 kinds of collected materials respectively
which achieved more than 50% data points within a factor of 4.
From Figs. 9 to 12 and Fig. 5, it can be concluded that:
On the whole, it is observed that the predicted fatigue life of Susmel’s and Itoh’s models
is close to the experimental life for designed specimens (70% and 75% of all the data points
respectively within a factor of 4 in Figs.4.). But for the Kanazawa’s and Spagnoli’s models,
only 38% and 49% of all the data points are located within a factor of 4 respectively. In other
word, Suemel’s and Itoh’s models are more accurate and stable than others.
The direct damage parameters are generally derived through rigorous theoretical
deduction without empirical and experimental elements while the equivalent damage

24
parameters depend more on the experimental data and material coefficients. However, the life
estimation results prove that direct damage parameters are not better than the equivalent
damage parameters due to the fact both Suemel’s and Itoh’s models could provide a good
correlation with the experimental results.
Each method includes more or less empirical and experimental constants and the life
prediction result of each method for different materials is unstable, so far there isn't a
multiaxial fatigue theory which is universally applicable.
5.Conclusions
(1) The non-proportional equivalent damage parameters are mostly developed from
proportional multiaxial fatigue damage parameters which are relatively mature and widely
proved. They can be understood intuitively, deduced concisely and employed conveniently
and easily, but sometimes they could lead to large errors because of their great dependence on
the empirical and experimental components.
(2) The direct damage parameters are generally derived through rigorous theoretical
deduction, but most of them use classical and ideal theories of single crystal theory, elastic
homogeneous state and elastic-plastic damage accumulation theory and so on. The methods
using direct damage parameters to predict fatigue life are restricted to simple working

25
conditions of engineering structures due to their ideal assumptions which are different from
the actual situations.
(3) The research in the future is to establish a widely applicable multiaxial fatigue failure
criterion in engineering. At present, there are several important problems needed to be solved
such as how to consider the impact of the mean value and loadings path of non-proportional
loadings on high and low cycle fatigue life, and meanwhile how to reduce the material
constants and simplify the uncertain parameters in the criteria.
References
[1] Brown, M.W. and Miller, K.J. (1982) Two decades of progress in the assessment of
multiaxial low-cycle fatigue life. In: Amzallag C, Leis B, Rabbe P, editors. Low-cycle
fatigue and life prediction, ASTM STP 770. 482–99.
[2] Papadopoulos, I.V., Davoli, P., Gorla, C., Fillippini, M.and Bernasconi, A. (1997) A
comparative study of multiaxial high-cycle fatigue criteria for metals. Int. J. of Fatigue
,19,219-35.
[3] Sines, G. (1959) Behaviour of metals under complex stresses. Metal Fatigue. 145–69.
[4] Findley, W.N. (1959) A theory for the effect of mean stress on fatigue of metals under
combined torsion and axial load or bending. J. Eng. Ind. Trans. ASME,81,301–6.
26
[5] Zhu, Z.Y., He, G.Q., Zhang, W.H. and Liu, X.S.(2006) Recent advances on microscopic
mechanism of multiaxial fatigue under non-proportional loading. J. of TongJi University,
34, 1510-1514.
[6] Feng, C.Y. (2010) Recent development of study on multiaxial low cycle fatigue under
non-proportional loadings. Corrosion Science and Protection Technology, 22, 124-127.
[7] Liu, L.L. and Nie, H. (2009) General description of multiaxial low cycle fatigue under
non-proportional loading. J. of North China Institute of Sci. and Tech., 6, 60-63.
[8] Chu, C.C., Conle, F.A. and Bonnen, J.J. (1993) Multiaxial stress-strain modeling and
fatigue life prediction of SAE axle shafts. In: Edited by McDowell DL, Ellis R. Advances
in Multiaxial Fatigue, ASTM STP 1191, 37-54.
[9] Glinka, G., Plumtree, A. and Shen G. A. (1995) Multiaxial fatigue strain energy parameter
related to the critical plane. Fatigue Fract Eng. Mater. Struct., 18, 37-46.
[10] Glinka, G., Wang G. and Plumtree, A. (1995) Mean stress effects in multiaxial fatigue.
Fatigue Fract. Eng. Mater. Struct., 18, 755-764.
[11] Kanazawa, K., Miller, K.J., and Brown, M.W. (1979) Cyclic deformation of 1% Cr-Mo-V
steel under out-of-phase loads. Fatigue Fract. Eng. Mater. Struct., 2, 217-228.
[12] Kanazawa, K., Miller, K. J., and Brown, M. W. (1977). Low-cycle fatigue under

27
out-of-phase loading conditions. J. of Eng. Mat. Tech., 99, 222.
[13] Garud, Y.S. (1981) A new approach to the evaluation of fatigue under multiaxial loadings.
J. of Eng. Mater. and Tech., 103, 118-126.
[14] Fatemi, A. and Socie, D. F. (1988) A critical plane approach to multiaxial fatigue damage
including out-of-phase loading. Fatigue Fract. Eng. Mater. Struct., 11, 149-165.
[15] Lee, S.B. (1989) Out-of-phase combined bending and torsion fatigue of steels. Biaxial
and Multiaxial Fatigue, EGF 3, Mechanical Engineering Publications, 621~634.
[16] Itoh, T., Sakane, M., Ohnami, M. and Socie, D.F. (1995) Non-proportional low cycle
fatigue criterion for type 304 stainless steel. Int. J. of Fatigue, 117,285-292.
[17] Itoh, T., and Yang, T. (2011) Material dependence of multiaxial low cycle fatigue lives
under non-proportional loading. Int. J. of Fatigue ,33,1025-1031.
[18] Chen, X. (1996) Low-cycle fatigue under non-proportional loading. Fatigue Fract. Eng.
Mater. Struct. , 19, 837-854.
[19] Duprat, D. (2013) A model to predict fatigue life of aeronautical structures with
out-of-phase multiaxial stress condition. Proc. Fifth International Conference on
Biaxial/multiaxial Fatigue and Fracture, Technical University of Opole, 1, 111-123.
[20] Borodii, M.V. (1996) Engineering method of determining non-proportionality parameter
28
under biaxial fatigue loading. ASME Pressure Vessels & Piping Conf. Montreal,
323,21-26.
[21] Borodii, M.V.and Strizhalo, V.A. (2000) Analysis of the experimental data on a low cycle
fatigue under non-proportional straining. Int. J. of Fatigue, 22, 275-282.
[22] Borodii, M.V. and Adamchuk, M.P. (2009) Life assessment for metallic materials with the
use of the strain criterion for low cycle fatigue. Int. J. of Fatigue, 31, 1579-1587.
[23] He, G. Q., Chen, C. S., Ding, X. Q., and Xu, R. X. (2004). New low cycle fatigue life
criterion under nonproportional loading based on critical plane methods. J. of Tongji
University, 32, 1637-1641.
[24] Li, J. (2010). The biaxial fatigue life prediction model based on the critical plane
approach under combined loading of tension and torion. Chinese J. of Solid Mech., 31,
101-106.
[25] Wang, C.H. and Brown, M.W. (1993) A path-independent parameter for fatigue under
proportional and non-proportional loading. Fatigue Fract. Eng. Mater. Struct., 16,
1285-1298.
[26] Morel, F. (1998) A fatigue life prediction method based on a mesoscopic approach in
constant amplitude multiaxial loading. Fatigue Fract. Eng. Mater. Struct.,21, 241-256.

29
[27] Papadopoulos, I.V., Davoli, P., Gorla, C., Filippini, M., and Bernasconi, A. (1997). A
comparative study of multiaxial high-cycle fatigue criteria for metals. Int. J. of Fatigue,
19, 219-235.
[28] Spagnoli, A. (2001) A new high-cycle fatigue criterion applied to out-of-phase biaxial
state. Int. J. of Mech. Sci., 43, 2581-2595.
[29] Carpinteri, A., Macha, E., Brighenti, R., and Spagnoli, A. (1999). Expected principal
stress directions under multiaxial random loading. part I: theoretical aspects of the weight
function method. Int. J. of Fatigue, 21, 83-88.
[30] Susmel, L., and Lazzarin, P. (2002) A bi-parametric Wohler curve for high cycle
multiaxial fatigue assessment. Fatigue Fract. Eng. Mater. Struct., 25, 63-78.
[31] Lazzarin, P., and Susmel, L. (2003) A stress-based method to predict lifetime under
multiaxial fatigue loadings. Fatigue Fract. Eng. Mater. Struct., 26,1171-1187.
[32] Susmel, L., Tovo, R., and Lazzarin, P. (2005) The mean stress effect on the high-cycle
fatigue strength from a multiaxial fatigue point of view. Int. J. of Fatigue, 27,928-943.
[33] Susmel, L. (2008) Multiaxial fatigue limits and material sensitivity to non-zero mean
stresses normal to the critical planes. Fatigue Fract. Eng. Mater. Struct., 31,295-309.
[34] Socie, D. F., Waill, L. A. and Dittmer, D. F. (1985) Biaxial fatigue of Inconel 718
30
including mean stress effects. In: Multiaxial Fatigue, ASTM STP 853, American Society
for Testing and Materials,463-481.
[35] Socie, D. F. (1987) Multiaxial fatigue damage models. Trans. ASME J. Eng. Mater.
Technol. 109, 293-298.
[36] Skibiciki, D., and Sempruch, J. (2004) Use of a load non-proportionality measure in
fatigue under out-of-phase combined bending and torsion. Fatigue Fract. Eng. Mater.
Struct., 27, 369-377.
[37] McDiarmid, D.L. (1991) A general criterion for high cycle multiaxial fatigue failure.
Fatigue Fract. Eng. Mater. Struct. 14, 429-453.
[38] Liu, Y., and Mahadevan, S. (2005) Multiaxial high-cycle fatigue criterion and life
prediction for metals. Int. J. of Fatigue, 27, 790-800.
[39] Farahani, A.V. (2000) A new energy critical plane parameter for fatigue life assessment of
various materials subjected to in-phase and out-phase multiaxial fatigue loading
conditions. Int. J. of Fatigue, 22, 295-305.
[40] Chu, C. C. (1995). Fatigue damage calculation using the critical plane approach. J. of
Eng. Mat. Tech., 117,41-50.
[41] Huyen, N., Flaceliere, L., and Morel, F. (2008) A critical plane fatigue model with
31
coupled meso-plasticity and damage. Fatigue Fract. Eng. Mater. Struct., 31, 12-28.
[42] Kallmeyer, A.R., Krgo, A., and Kurath, (1989) P. Evaluation of multiaxial fatigue life
prediction methodologies for Ti-6Al-4V. Diss. Abstr. Int.,50,178.
[43] Zhang, C.C. (2010) Fatigue life prediction of structures in HCF region under complex
stress field, Nanjing University of Aeronautics and Astronautics Ph.D. Thesis,11-17.
[44] Nishihara, T., and Kawamoto, M. (1941). The strength of metals under combined
alternating bending and torsion. J. of the Japan Society of Mech. Eng., 44, 722-723.
[45] Doong, S. H., Socie, D. F., and Robertson, I. M. (1990). Dislocation substructures and
non-proportional hardening. J. of Eng. Mat. Tech., 112, 456-464.
[46] Gómez, C., Canales, M., Calvo, S., Rivera, R., Valdés, J. R., and Núñez, J. L. (2011).
High and low cycle fatigue life estimation of welding steel under constant amplitude
loading: analysis of different multiaxial damage models and in-phase and out-of-phase
loading effects. Int. J. of Fatigue, 33, 578-587.
[47] Chen, X., An, K., and Kim, K. S. (2004). Low-cycle fatigue of 1Cr-18Ni-9Ti stainless
steel and related weld metal under axial, torsional and 90° out-of-phase loading.
Fatigue Fract. Eng. Mater. Struct., 27, 439-448.
[48] Han, C., Chen, X., and Kim, K. S. (2002). Evaluation of multiaxial fatigue criteria under
32
irregular loading. Int. J. of Fatigue, 24, 913-922.
[49] Chaves, V., Navarro, A., and Madrigal, C. (2015). Stage I crack directions under in-phase
axial-torsion fatigue loading for AISI 304l stainless steel. Int. J. of Fatigue, 80, 10-21.

33
Fig. 1 Summary of the equivalent damage parameters considered
Authors Non-proportional
loading factor lnp
Non-proportional
coefficient fnp Damage parameter
Kanazawa
[11-12]
a, 45
a,max
np np1 l eq max npk f
Fatemi[14] maxn
y
np np1 l maxeq np2
f
Itoh[16] max 0
1.57sin ( ) ( )d
T
t t tT
b ynp
b
1 S l
eq npf
Borodii
[20][22] 0
e de / e der
L L
np np(1 sin )(1 )k l eq npf
He Guoqiu
[23]
1/2
n p
1/2
c p
/ 1
/ 1c
S SK
S S
1/
np np(1 ) nl 1/max
eq np np12
pn
k f
SB Lee[15] sin np2(1 sin )
npnp
1/
a1eq a
1 a
21
2
ffb
t
Li Jing[24] / n
0.2
12
max neq np2 2
f
34
Figure 2 Summary of direct damage parameters concerned
Authors The way to consider non-proportionality effect Direct damage parameters
Susmel[30] maxn
a
1eq a 1 2
ft
Morel [26] A
TH
C
A 1f
A 1 A 1 A
lnC r
N p qC C C
Spagnoli[28] The critical plane deflection angle 2
2 2afeq a max
af
C N
Skibicki[36]
CPA
MDP
2MDP / 2s
WH
CPA
MDP 1eq
1
1 ntH
b
35
Figure 3 The mechanical properties of materials
Materials E/GPa ち jy/MPa f-1/MPa t-1/MPa K°/MPa n°
TC4 [42] 116 0.31 930 346 158 854 0.0149
LY12CZ[43] 73 0.30 400 168 120 870 0.0970
SM45C[15] 186 0.28 496 442 311 1246 0.1200
30CrMnSiA [43] 203 0.30 1105 508 293 - -
1045 [14] 202 0.28 382 303 175 1258 0.2080
C35 [41] 214 0.29 350 240 168 - -
304 [45] 185 0.30 325 138 83 812 0.1250
S355J2[45] 196 0.30 355 220 165 721 0.1258
1Cr–18Ni–9Ti[47] 193 0.30 310 242 102 1115 0.1304
SNCM630 [48] 196 0.27 951 488 320 1056 0.0540

36
Figure 4 The fatigue properties of materials
Materials jf°/MPa if° b c kf°/MPa けf° b0 c0
TC4[42] 1117 0.5790 -0.0490 -0.6790 716.9 2.240 -0.0600 -0.8000
LY12CZ[43] 759 0.215 -0.0638 -0.6539 - - - -
SM45C[15] 843 0.3270 -0.1050 -0.5460 559 0.496 -0.1080 -0.4690
30CrMnSiA [43] 1864 2.788 -0.086 -0.7735 - - - -
1045 [14] 930 0.2980 -0.1060 -0.4900 505 0.413 -0.0970 -0.4450
C35 [41] - - - - - - - -
304 [45] 1000 0.1710 -0.1140 -0.4020 709 0.413 -0.1210 -0.3530
S355J2[45] 525 0.0662 -0.0521 -0.3987 386 0.081 -0.0503 -0.3317
1Cr–18Ni–9Ti[47] 1124 0.8072 -0.0910 -0.6650 644 0.812 -0.0880 -0.5330
SNCM630 [48] 1272 1.5400 -0.0730 -0.8230 858 1.510 -0.0610 -0.7060
Note: “-” means that fatigue curves are estimated by fitting data points

37
Figure 5 The experimental data and predicted life of four criterions
Materials Nexp Ncal
Susmel Spagnoli Kanazawa Itoh
TC4[41]
6200 35,466 1074 1100 660
72,141 52,782 1200 468 105,874
241,250 433,433 29,062 3884 2,585,606
961,806 732,288 64,284 6527 5,744,415
67,965 677,053 372,055 10,344 153,159
111,783 ∞ 134,234 826 696,059
LY12CZ
[43]
482,666 367,353 827,597 7821 4,198,500
76,451 72,327 168,721 4824 158,000
23,003 15,237 40,152 3060 16,900
420,261 271,424 619,640 6810 176,000
63,584 50,639 117,199 3887 10,600
275,527 200,597 535,607 5556 1,885,300
57,004 39,372 94,679 3231 68,700
231,348 145,750 408,476 4666 48,300
30,893 30,135 78,778 2630 4600
15,459 22,353 66,303 2013 46,200
66,940 102,221 350,838 3525 967,200
14,296 25,562 49,165 1716 260,300
4634 6531 9451 1006 16,400

38
Materials Nexp Ncal
Susmel Spagnoli Kanazawa Itoh
37,789 34,947 71,389 1764 496,100
6811 10,188 13,744 1030 25,300
SM45C
[15]
29,900 17,289 29,306 5128 22,432
35,700 15,230 34,665 7757 16,181
50,000 109,096 38,619 14,083 19,193
73,800 24,846 52,172 8680 21,443
106,000 209,404 69,438 11,501 28,803
106,000 34,115 70,369 9014 28,198
112,000 273,832 91,114 19,923 30,566
131,000 247,077 84,773 24,716 28,465
333,000 68,287 211,945 11,501 43,296
431,000 1,125,272 301,980 50,859 40,111
1,660,000 ∞ ∞ 36,398 256,900
1,860,000 ∞ ∞ 27,914 95,221
104,143 75,355 139,564 26,235 22,,985
92,309 37,347 63,431 15,173 19,735
30CrMnSiA[43
]
104,143 259,356 991,849 9244 356,600
92,309 205,227 558,015 2780 241,058
71,822 156,446 236,801 541 180,856
105,211 205,261 411,122 1453 138,467
39
Materials Nexp Ncal
Susmel Spagnoli Kanazawa Itoh
455,138 444,684 444,466 5215 4,508,564
246,224 260,233 260,409 3052 2,641,538
81,795 81,196 81,458 952 826,293
197,013 190,564 190,823 2235 1,935,670
1045[14]
6050 6751 8154 40,779 522,761
1080 680 1163 15,200 131,387
3500 1366 2410 5762 4711
1100 509 960 1990 1677
1800 530 271 1395 1380
980 334 179 714 696
2450 180 357 1467 1298
1090 84 174 530 489
C35[40]
667,233 4,512,206 9,074,537 5,710,027 992,443
317,000 1,465,229 1,682,389 1,254,531 166,349
565,000 2,571,267 3,907,288 2,651,225 401,802
927,362 3,603,232 6,478,058 4,191,315 689,342
203,000 297,959 3,266,172 1811 31,635
311,000 724,998 ∞ 5059 106,173
553,942 1764075 ∞ 14,652 371,784
2,000,000 4,292,371 ∞ 44,108 1,362,616
40
Materials Nexp Ncal
Susmel Spagnoli Kanazawa Itoh
2,000,000 2,751,738 ∞ 25,295 707,572
147,000 122,455 1,055,631 671 9808
1,000,000 ∞ 7,613,893 6 ∞
667,095 1,033,949 47,220 0 851,944
223,572 466,752 8676 0 180,275
310,503 694,685 20,241 0 388,610
128,973 313,605 3719 0 84,995
102,046 210,707 1594 0 40,698
987,340 1,538,879 110,170 0 1,901,002
304[44]
3560 533 24 8758 1,2399
3730 720 35 8758 12,399
45,000 10,060 980 56,903 110,801
50,000 13,499 1288 54,044 93,264
1167 3822 638 7427 1100
6080 8971 1734 38,796 5295
10,300 81,040 23,769 94,738 12,699
30700 129,864 42,031 244,622 33,011
286,400 314,802 123,853 1,936,770 299,520
333,100 674,372 317,665 1,936,770 299,520
4090 1925 861 1422 1790
41
Materials Nexp Ncal
Susmel Spagnoli Kanazawa Itoh
48,500 14,809 8021 15,155 20,535
65,340 71,996 45,246 15,591 21,176
33,900 68,490 42,841 15,155 20,535
83,400 167,675 114,093 36,930 55,164
1,100,000 187,624 129,023 271,076 618,716
824,200 406,428 300,556 265,493 602,235
53,000 89,263 104,431 72,657 26,100
52,900 140,095 167,881 72,657 26,100
440,000 308,301 400,244 607,571 250,793
356,000 323,033 447,104 607,571 250,793
S355J2
[45]
61,935 350,334 63,589 4,938,723 77,681
129,464 600,727 143,505 ∞ 163,940
232,107 638,511 157,345 ∞ 256,188
292,690 1,116,042 365,502 ∞ 426,990
587,881 1,576,167 615,421 ∞ 771,854
111,588 109,320 105,466 22,012 77,679
158,584 165,751 160,435 29,713 110,488
230,215 222,831 216,190 41,239 163,937
428,183 429,663 419,029 59,157 256,182
57,647 661 244 46,263 19,692

42
Materials Nexp Ncal
Susmel Spagnoli Kanazawa Itoh
120,993 1193 412 92,829 29,620
88,117 1628 542 137,762 36,973
113,733 3224 3192 61,014 37,857
219,319 6058 5529 135,601 65,154
360,616 8444 7402 216,152 88,548
216,056 12,911 31,337 68,511 54,540
790,266 25,251 55,700 159,577 102,449
595,355 35,984 75,648 263,175 147,474
759,229 52,019 104,224 464,285 221,085
13,700 410 232 13,117 26,779
50,203 5168 15,096 39,332 19,876
44,559 2612 4394 46,575 56,802
287,166 9382 30,544 73,500 48,650
153,845 12,789 44,308 103,488 84,113
47,087 844 556 20,144 83,963
1Cr–18Ni–9Ti[46]
200,000 24,564 187,364 58,600 585,994
12,410 3417 13,179 13340 133,404
5500 2108 7520 5601 56,014
3100 593 1955 3049 30,494
950 305 1027 574 574
43
Materials Nexp Ncal
Susmel Spagnoli Kanazawa Itoh
81,376 81,869 2462 24,763 24,762
12,188 11,094 280 5601 5601
5283 6970 179 1913 1913
1500 1086 35 574 574
376 429 17 237 237
30,028 7435 61,076 6533 6533
3648 1142 3262 2479 2479
646 111 199 1085 10,856
184 28 52 140 140
SNCM630[47]
369 1067 1036 831 425
591 384 371 1519 671
1614 1235 1200 4009 1341
25,96 1794 1745 9498 2357
39,58 4830 4711 51,209 6281
30,529 15,796 15,468 188,0274 48,164
231,112 433,154 428,775 ∞ 712,630
892 960 8560 312 708
2769 4137 26,111 1078 3393
9859 6517 36,943 1547 6007
23,092 10,956 54,923 2335 12,704

44
Materials Nexp Ncal
Susmel Spagnoli Kanazawa Itoh
48,613 79,376 249,091 4513 53,219
162,566 196,997 498,598 6299 117,317
Note: ∞ refers to life time larger than 107 cycles to failure.

45
Nexp>Ncal
Er=Nexp/Ncal Er=Ncal/Nexp
Y N
Figure 6 The method to calculate error index Er
46
Figure 7 The percentage in different error index E of four criterions
Materials
Er≤2 Er≤3 Er≤4
Susmel Spag
noli
Kana
zawa Itoh Susmel
Spag
noli
Kana
zawa Itoh Susmel
Spag
noli
Kana
zawa Itoh
TC4 50% 17% 0% 17% 50% 17% 0% 33% 50% 17% 0% 33%
LY12CZ 100% 53% 0% 20% 100% 80% 0% 40% 100% 87% 0% 53%
SM45C 29% 86% 0% 7% 71% 86% 0% 14% 79% 86% 7% 36%
30Cr
MnSiA 63% 50% 0% 13% 100% 50% 0% 38% 100% 75% 0% 50%
1045 25% 50% 63% 63% 63% 50% 75% 75% 75% 50% 75% 75%
C35 29% 0% 0% 65% 65% 0% 0% 82% 76% 0% 6% 82%
304 24% 48% 24% 68% 48% 64% 44% 88% 64% 72% 52% 100%
S355J2 16% 36% 44% 52% 24% 36% 52% 64% 28% 44% 60% 80%
1Cr–
18Ni–9Ti 36% 43% 57% 57% 43% 50% 79% 79% 64% 64% 93% 93%
SNCM630 85% 46% 0% 92% 100% 62% 38% 92% 100% 77% 46% 92%
47
Figure 8 The mean value and variance of error index e
Materials The mean value of Er The variance of Er
Susmel Spagnoli Kanazawa Itoh Susmel Spagnoli Kanazawa Itoh
TC4 18.27 15.97 85.20 6.01 31.99 20.18 63.49 3.38
LY12CZ 1.39 2.39 23.96 6.41 0.21 1.05 19.94 4.98
SM45C 2.96 1.98 15.29 5.64 1.38 1.53 18.19 4.50
30CrMnSiA 1.62 3.36 73.96 6.30 0.61 2.90 34.69 3.88
1045 5.05 3.78 3.83 27.22 4.82 2.56 4.22 45.21
C35 3.14 16.87 3440100 3.29 2.23 14.82 5039386 3.67
304 3.49 15.53 4.26 1.74 2.05 34.70 2.56 0.73
S355J2 24.73 41.31 12.27 2.66 26.41 75.44 21.99 1.60
1Cr–18Ni–9Ti 3.45 13.35 2.12 2.12 2.19 16.25 1.04 1.04
SNCM630 1.63 3.51 14.39 1.48 0.47 2.88 18.18 0.54

48
Figure 9 Error index Er≤2

49
Figure 10 Error index Er≤3

50
Figure 11 Error index Er≤4

51
Figure 12 The percentage of 4 kinds of multiaxial fatigue failure criteria
52
Figure 13 The optimum criterions for these materials
Materials
t-1/f-1 Criterions
1Cr–18Ni–9Ti 0.4234 Kanazawa/Itoh
TC4 0.4570 Susmel
30CrMnSiA 0.5773 Susmel
1045 0.5776 Kanazawa/Itoh
304 0.6029 Itoh
SNCM630 0.6570 Susmel/Itoh
SM45C 0.7036 Spagnoli
C35 0.7042 Itoh
LY12CZ 0.7089 Susmel
S355J2 0.7487 Itoh
Related Documents