A supertree of Temnospondyli: cladogenetic patterns in the most species-rich group of early tetrapods Marcello Ruta 1, * , Davide Pisani 2 , Graeme T. Lloyd 1 and Michael J. Benton 1 1 Department of Earth Sciences, University of Bristol, Wills Memorial Building, Queen’s Road, Bristol BS8 1RJ, UK 2 Laboratory of Evolutionary Biology, The National University of Ireland, Maynooth, Kildare, Ireland As the most diverse group of early tetrapods, temnospondyls provide a unique opportunity to investigate cladogenetic patterns among basal limbed vertebrates. We present five species-level supertrees for temnospondyls, built using a variety of methods. The standard MRP majority rule consensus including minority components shows slightly greater resolution than other supertrees, and its shape matches well several currently accepted hypotheses of higher-level phylogeny for temnospondyls as a whole. Also, its node support is higher than those of other supertrees (except the combined standard plus Purvis MRP supertree). We explore the distribution of significant as well as informative changes (shifts) in branch splitting employing the standard MRP supertree as a reference, and discuss the temporal distribution of changes in time-sliced, pruned trees derived from this supertree. Also, we analyse those shifts that are most relevant to the end-Permian mass extinction. For the Palaeozoic, shifts occur almost invariably along branches that connect major Palaeozoic groups. By contrast, shifts in the Mesozoic occur predominantly within major groups. Numerous shifts bracket narrowly the end-Permian extinction, indicating not only rapid recovery and extensive diversification of temnospondyls over a short time period after the extinction event (possibly less than half a million years), but also the role of intense cladogenesis in the late part of the Permian (although this was counteracted by numerous ‘background’ extinctions). Keywords: Temnospondyli; supertree; diversification; Stereospondyli; Permian; Triassic 1. INTRODUCTION The origin and early radiation of limbed vertebrates (or tetrapods) are the focus of much renewed interest and interdisciplinary research at the interface between evolutionary and developmental biology. Outstanding palaeontological discoveries continue to refine the complex picture of character acquisition and transfor- mation that accompanied vertebrate terrestrialization. At the same time, phylogeny-based macroevolutionary studies are beginning to decipher quantitative and qualitative aspects of early tetrapod diversification (e.g. Laurin 2004; Ruta et al. 2006; Wagner et al. 2006; Marjanovic & Laurin 2007). In the present work, we examine for the first time models of cladogenesis (i.e. branch subdivision) in Temnospondyli, the largest group of primitive tetrapods. Our focus is the identification of portions of the temnospondyl phylogeny that underwent significant changes in lineage splitting. This is achieved through analyses of the degree of asymmetry (i.e. imbalance), count of taxa and overall shape of the two branches that descend from each internal node in the phylogeny. Throughout, we employ the term ‘branching’ in the sense of multiplication of lineages. In this context, ‘branching’ is more appropriate than ‘diversification’, as our analysis revolves exclusively around tree topology and is not concerned with measures of morphological character change or with the tempo and mode of evolutionary transformations (e.g. Simpson 1944). Comprehensive temnospondyl phylogenies are still unavailable. Compilation of an exhaustive data matrix for all described species is unrealistic at present. However, several species-level trees have been published for nearly all families or superfamilies of temnospondyls. Thus, given a set of partially overlapping input trees, supertree techniques can be used to combine these trees and generate a synthetic ‘consensus’ phylogeny (e.g. Pisani & Wilkinson 2002; Wilkinson et al. 2005a; Pisani et al. 2007). Here, we present various supertrees for temnos- pondyls built using different methods and employ them for an analysis of cladogenetic patterns. Temnospondyls are particularly amenable to this kind of analysis and to macroevolutionary studies in general, given their sheer diversity and their broad stratigraphical and geographical distributions, with records from all continents and spanning approximately 210 Myr (Early Carboniferous– late Early Cretaceous; Milner 1990). Temnospondyls are of great zoological significance because they are implicated in the current debate on amphibian origins (e.g. Ruta & Coates 2007), although this is disputed by a number of researchers (e.g. Vallin & Laurin 2004). Regardless of their systematic affinities, temnospon- dyls present an interesting case study for elucidating macroevolutionary patterns in species-rich fossil groups. We address two main questions: (i) which portions of temnospondyl phylogeny underwent a significant branching shift (i.e. a significant change in lineage Proc. R. Soc. B (2007) 274, 3087–3095 doi:10.1098/rspb.2007.1250 Published online 10 October 2007 Electronic supplementary material is available at http://dx.doi.org/10. 1098/rspb.2007.1250 or via http://www.journals.royalsoc.ac.uk. * Author for correspondence ([email protected]). Received 12 September 2007 Accepted 18 September 2007 3087 This journal is q 2007 The Royal Society

Welcome message from author
This document is posted to help you gain knowledge. Please leave a comment to let me know what you think about it! Share it to your friends and learn new things together.
Transcript
Proc. R. Soc. B (2007) 274, 3087–3095
doi:10.1098/rspb.2007.1250
A supertree of Temnospondyli: cladogeneticpatterns in the most species-rich group
of early tetrapodsMarcello Ruta1,*, Davide Pisani2, Graeme T. Lloyd1 and Michael J. Benton1
1Department of Earth Sciences, University of Bristol, Wills Memorial Building, Queen’s Road, Bristol BS8 1RJ, UK2Laboratory of Evolutionary Biology, The National University of Ireland, Maynooth, Kildare, Ireland
Published online 10 October 2007
Electron1098/rsp
*Autho
ReceivedAccepted
As the most diverse group of early tetrapods, temnospondyls provide a unique opportunity to investigate
cladogenetic patterns among basal limbed vertebrates. We present five species-level supertrees for
temnospondyls, built using a variety of methods. The standard MRP majority rule consensus including
minority components shows slightly greater resolution than other supertrees, and its shape matches well
several currently accepted hypotheses of higher-level phylogeny for temnospondyls as a whole. Also, its
node support is higher than those of other supertrees (except the combined standard plus Purvis MRP
supertree). We explore the distribution of significant as well as informative changes (shifts) in branch
splitting employing the standard MRP supertree as a reference, and discuss the temporal distribution of
changes in time-sliced, pruned trees derived from this supertree. Also, we analyse those shifts that are most
relevant to the end-Permian mass extinction. For the Palaeozoic, shifts occur almost invariably along
branches that connect major Palaeozoic groups. By contrast, shifts in the Mesozoic occur predominantly
within major groups. Numerous shifts bracket narrowly the end-Permian extinction, indicating not only
rapid recovery and extensive diversification of temnospondyls over a short time period after the extinction
event (possibly less than half a million years), but also the role of intense cladogenesis in the late part of the
Permian (although this was counteracted by numerous ‘background’ extinctions).
Keywords: Temnospondyli; supertree; diversification; Stereospondyli; Permian; Triassic
1. INTRODUCTIONThe origin and early radiation of limbed vertebrates (or
tetrapods) are the focus of much renewed interest and
interdisciplinary research at the interface between
evolutionary and developmental biology. Outstanding
palaeontological discoveries continue to refine the
complex picture of character acquisition and transfor-
mation that accompanied vertebrate terrestrialization. At
the same time, phylogeny-based macroevolutionary
studies are beginning to decipher quantitative and
qualitative aspects of early tetrapod diversification (e.g.
Laurin 2004; Ruta et al. 2006; Wagner et al. 2006;
Marjanovic & Laurin 2007). In the present work, we
examine for the first time models of cladogenesis (i.e.
branch subdivision) in Temnospondyli, the largest group
of primitive tetrapods. Our focus is the identification of
portions of the temnospondyl phylogeny that underwent
significant changes in lineage splitting. This is achieved
through analyses of the degree of asymmetry (i.e.
imbalance), count of taxa and overall shape of the two
branches that descend from each internal node in the
phylogeny. Throughout, we employ the term ‘branching’
in the sense of multiplication of lineages. In this context,
‘branching’ is more appropriate than ‘diversification’, as
our analysis revolves exclusively around tree topology and
is not concerned with measures of morphological
ic supplementary material is available at http://dx.doi.org/10.b.2007.1250 or via http://www.journals.royalsoc.ac.uk.
r for correspondence ([email protected]).
12 September 200718 September 2007
3087
character change or with the tempo and mode of
evolutionary transformations (e.g. Simpson 1944).
Comprehensive temnospondyl phylogenies are still
unavailable. Compilation of an exhaustive data matrix
for all described species is unrealistic at present. However,
several species-level trees have been published for nearly
all families or superfamilies of temnospondyls. Thus,
given a set of partially overlapping input trees, supertree
techniques can be used to combine these trees and
generate a synthetic ‘consensus’ phylogeny (e.g. Pisani &
Wilkinson 2002; Wilkinson et al. 2005a; Pisani et al.
2007). Here, we present various supertrees for temnos-
pondyls built using different methods and employ them for
an analysis of cladogenetic patterns. Temnospondyls are
particularly amenable to this kind of analysis and to
macroevolutionary studies in general, given their sheer
diversity and their broad stratigraphical and geographical
distributions, with records from all continents and
spanning approximately 210 Myr (Early Carboniferous–
late Early Cretaceous; Milner 1990).
Temnospondyls are of great zoological significance
because they are implicated in the current debate on
amphibian origins (e.g. Ruta & Coates 2007), although this
is disputed by a number of researchers (e.g. Vallin & Laurin
2004). Regardless of their systematic affinities, temnospon-
dyls present an interesting case study for elucidating
macroevolutionary patterns in species-rich fossil groups.
We address two main questions: (i) which portions
of temnospondyl phylogeny underwent a significant
branching shift (i.e. a significant change in lineage
This journal is q 2007 The Royal Society
3088 M. Ruta et al. Cladogenetic patterns in early tetrapods
multiplication)? and (ii) what was the distribution of shifts
immediately before and after the end-Permian extinction?
The end-Permian extinction (Benton 2003; Benton et al.
2004; Erwin 2006) had by far the most dramatic impact
on terrestrial and marine life of all known mass extinctions
and continues to play an unrivalled role in our under-
standing of the consequences that large-scale biological
crises have for faunal turnovers, ecological remodelling
and adaptive radiations.
2. MATERIAL AND METHODS(a) Input trees
Temnospondyl phylogenies (see appendix 1a in the electronic
supplementary material) were chosen according to several
criteria (Ruta et al. 2003; Bininda-Emonds et al. 2004). First,
current knowledge of the large-scale interrelationships of
temnospondyls relies extensively on Milner’s (1990) over-
arching family-level study, which was therefore selected as the
starting point for our survey. Second, we included trees with
four or more temnospondyl taxa (either species or supraspe-
cific units). Third, if an original tree included different
tetrapod groups, then only its temnospondyl portion was
used as an input tree. Fourth, if several trees were obtained
from an original analysis, we used either their strict consensus
(if presented) or the tree selected by the original author(s)
(in the absence of a consensus). Last manually generated
trees were considered only if accompanied by apomorphy
lists. Original data were not reanalysed (for supraspecific
taxon replacement, see ‘a’ in the electronic supplementary
material).
(b) Supertree analyses
Input trees were built using MACCLADE 4 (Maddison &
Maddison 2005). Baum & Ragan’s (1993) and Purvis’ (1995)
codings were employed to generate matrix representations of
these trees and to build standard and Purvis MRP supertrees,
respectively. In addition, we used the Baum and Ragan’s
matrix to generate a split-fit supertree (SFIT; Wilkinson et al.
2005b). Finally, we built a most similar supertree (MSS;
Creevey et al. 2004) and a combined consensus of the
standard plus Purvis MRP supertrees (for details of methods,
see ‘b’ in the electronic supplementary material). All super-
trees represent Majority Rule consensus topologies including
minority components (see appendix 1b–f in the electronic
supplementary material).
For the MRP analyses, we carried out two independent
searches, using Quicke et al.’s (2001) strategy for estimating
large phylogenies and Nixon’s (1999) parsimony ratchet
(implemented in PERLRAT.PL v. 1.0.9a; Bininda-Emonds
2004). Both of these methods produced trees of identical
minimal length. A maximum of 100 000 trees were retained
owing to computer memory limitations. A standard plus
Purvis MRP supertree was built from 200 000 trees (i.e. using
100 000 trees from each of the standard and Purvis MRP
analyses).
Methodological artefacts are common in phylogenetic
reconstruction (e.g. Delsuc et al. 2005). As the standard and
Purvis MRP methods show different properties and opposite
shape-related biases (e.g. Wilkinson et al. 2005b), we
conjecture that nodes present in the consensus of the
combined standard plus Purvis MRP are less likely to be
artefactual. Therefore, we regard this consensus (see
appendix 1f and g in the electronic supplementary material)
Proc. R. Soc. B (2007)
as the most conservative estimate of temnospondyl phylo-
geny, given available data, although it is obviously less
resolved than both the standard and the Purvis MRP
supertrees.
PAUP� v. 4.0b10 (Swofford 1998) was used to run all the
parsimony analyses and to calculate consensus topologies. We
employed the following programs: MIX (Felsenstein 2000)
for the SFIT analysis (1000 random additions; threshold
parsimony set to 1.8); CLANN (Creevey & McInerney 2005)
for the MSS analysis (default settings); and MESA (http://
www.agapow.net) to calculate Colless’ imbalance index
(Colless 1995) for the standard MRP supertree.
Node support, shown here only for standard MRP
(figure 1) and for the consensus of standard plus Purvis
MRP (see appendix 1g in the electronic supplementary
material), is expressed using Wilkinson et al.’s (2005a) V1
index. Values of this index range from C1 to K1 and show
different degrees of support between supertree and input
trees, i.e. from complete support to total conflict. Our dataset
is not amenable to input tree bootstrapping (Creevey et al.
2004; see also Burleigh et al. 2006) due to sparse taxon
sampling (Moore et al. 2006).
Wilkinson et al. (2005b) have shown that biases occur in
most supertree methods, and within the limits of feasibility,
method dependence of results should be assessed. No
approach exists for ranking a set of supertrees based upon
their fit to the input trees (as in the standard Shimodaira’s
(2002) approximately unbiased test). Therefore, we
employed a tree-based randomization test (see Rodrigo
et al. 1993) to evaluate the degree of similarity of our
supertrees (see appendix 1b–f in the electronic supplementary
material; figure 1) relative to a set of random trees of identical
size (i.e. having the same number of taxa). In PAUP�, we
calculated pairwise tree-to-tree distances among our super-
trees using Robinson & Foulds’ (1981) symmetric difference.
For two trees, the symmetric difference is the number of splits
present on one tree but not on the other (a split is the partition
of a set of taxa into two non-empty subsets; Thorley & Page
2000). We thus generated 1000 random trees of the same size
as our supertrees (173 taxa) and calculated tree-to-tree
distances for each pair of random trees. Finally, we plotted the
distribution of these distances and tested whether our
supertrees are more similar to one another than are 99% of
the random trees. In addition, we used the Templeton (1983)
test to assess whether topological differences among our
supertrees are significant when evaluated against the standard
MRP matrix. The application of this test is not dissimilar
from that in character-based analyses. As used here, the test
evaluates statistically significant differences in supertree
topologies against a matrix in which ‘characters’ represent
nodes in the input trees rather than biological traits.
(c) Diversification analyses
Chan & Moore (2002, 2005) and Moore et al. (2004) devised
a tree topology-dependent method for detecting diversifica-
tion rate shifts (i.e. significant changes in lineage branching,
based upon differences in the number of taxa and degree of
imbalance on the left and right branches subtended by tree
nodes) and for calculating whole-tree tests of rate variations.
This method is implemented in SYMMETREE v. 1 (http://
www.phylodiversity.net/bmoore/software_symmetree.html).
Briefly, in the triplet (A(BC)), the probability that a shift
occurred along the internal branch that subtends BC is
calculated through a statistic termed D1. This is expressed as
outg
roup
E
dops
cra
igi
Pro
coch
leos
auru
s ja
rrow
ensi
s
Adam
ante
rpet
on o
nioe
nsis
Coc
hleo
saur
us b
ohem
icus
Coc
hleo
saur
us fl
oren
sis
Nig
erpe
ton
ricq
lesi
Che
nopr
osop
us le
wis
i
Che
nopr
osop
us m
iller
i
Bala
nerp
eton
woo
di
Den
drer
peto
n ac
adia
num
Trim
eror
hach
is sa
ndov
alen
sis
Nel
dasa
urus
wri
ghta
e
Trim
eror
hach
is in
sign
is
Dvi
nosa
urus
prim
us
Acro
plou
s vor
ax
Isod
ecte
s obt
usus
Brac
hyop
s lat
icep
s
Thab
anch
uia
oom
ie
Tupi
lako
saur
us w
etlu
gens
is
Capet
us p
alus
tris
Saha
raste
ga m
orad
iens
is
Iber
ospo
ndylu
s sch
ultze
i
Pala
tiner
peto
n kra
etsch
meri
Pario
xys f
erric
olus
Eryop
s meg
acep
halu
s
Onchi
odon
laby
rinth
icus
Acant
hosto
matop
s vor
ax
Zatrac
hys s
erra
tus
Achelo
ma cum
minsi
Phonerpeto
n pricei
Actiobates
peabodyi
Anconaste
s vesp
erus
Tambach
ia trog
alles
Platyhyst
rix ru
gosus
Ecolso
nia cutle
rensis
Broiliellu
s texe
nsis
Dissorophus m
ulticinctu
s
Cacops a
spidephorus
Kamacops acer
valis
Micropholis
stowi
Eoscopus lo
ckardi
Platyrhinops lyelli
Tersomius m
osesi
Amphibamus grandiceps
Doieserpeton annectens
Stegops d
ivaricata
Eimerisaurus g
raumanni
Micromelerpeton credneri
Branchiosaurus salamandroides
Apateon pedestris
0.7 0.6 0.6 0.6 0.31
11
1
1
1
1
ErZa
0.14
1
1
0 1
1110.14
0.750.75
0.750.5 0.75
0.77
0.66 0 –11 1
1
1 11
1 1 1
11
1 11
1 1 1
11
1 1 1
111
0
0
–1–1
–1
–0.3
1
–1
0.33
1
0.40.3–0.3
–0.3–1
1
0.140.14
0.30.3
10.6
0.6
0.2
11
11
1
1
–1
1 1
1
111
11
1
1 1
1
1
11
1
1
11
0.3
0.6
0.25
0
Ca
–.09
0.6
–0.5
–0.5
–0.5
–1
–1
11
11
11
11
1
1
11
111
10
–0.50.5
0.50.5
0.3
0.4
0.4
0.5
0.5
1
0
Tr –1
Ed
Dv
0.45
1
0.87
0.75 0.750.81
0.81
0.81
0.88
0.81
0.22
1
Di
–0.2
0.2
Ar
0.66
0.6
0.46
0.46
0.46
0.7
0.66
RyRh
–0.4
St
Ch
Br
Ar, basal ArchegosauriformesBr, BrachyopidaeCa, CapitosauroideaCh, ChigutisauridaeDi, DissorophoideaDv, DvinosauriaEd, EdopoideaEr, EryopidaePa, ParioxeidaeRh, RhinesuchidaeRy, RhytidosteaSt, StereospondyliTr, TrematosauroideaZa, Zatracheidae
Leptorophus tener
Schoenfelderpeton prescheri
Lysipterygium risinense
Sclerocephalus haeuseri
Syndyodosuchus tetricus
Cheliderpeton vranyi
Cheliderpeton latirostre
Intasuchus silvicola
Konzhukovia vetusta
Tryphosuchs paucidens
Koinia silantjevi
Melosaurus uralensis
Uralosuchus tverdochlebovae
Archegosaurus dyscriton
Archegosaurus decheni
Collidosuchus tchudinovi
Kashmirosaurus ornatus
Australerpeton cosgriffi
Bashkirosaurus cherdyncevi
Platyoposaurus stuckenbergi
Prionosuchus plummeri
Gerrothorax pulcherrimus
Peltobatrachus pustulatus
Lapillopsis nana
Rhineceps nyasaensis
Rhinesuchus whaitsi
Rhinesuchoides tenuiceps
Muchocephalus kitchingi
Broomistega putterilli
Uranocentrodon senekalensis
Eolydekkerina magnaBroomulus dutoitiLimnoiketes paludinatansLydekkerina huxleyiDeltacephalus whiteiWatsonisuchus gunganjEdingerella madagascariensisWatsonisuchus aliciaeWatsonisuchus magnusChomatobatrachus haleiLuzocephalus blomiIndobrachyops panchetensisPneumatostega potamicaLaidleria gracilisRhytidosteus capensisTrucheosaurus majorAcerastea wadeiDerwentia warreniRawana quadricuneata
Deltasaurus kimberleyensisMahavisaurus dentatusBothriceps australis
Keratobrachyops australisChigutisaurus mendozensis
Compsocerops cosgriffi
Kuttycephalus triangularis
Pelorocephalus tenax
Siderops kehliSinobrachyops placenticephalus
Xenobrachyops allos
Banksiops townrowi
Batrachosuchus henwoodi
Vanastega plurimidens
Vigilius wellesiBatrachosuchus browni
Batrachosuchus watsoni
Odenwaldia heidelbergensis
Sassenisaurus spitzbergensis
Wetlugasaurus angustitrons
Watsonisuchus rewanensis
Cherninia megarhina
Kestrosaurus dreyeri
Parotosuchus nasutus
Parotosuchus orenburgensis
Parotosuchus n.sp.
Parotosuchus helgolandicus
Paracyclotosaurus davidi
Stanocephalosaurus n.sp.
Stanocephalosaurus birdi
Stanocephalosaurus lapparenti
Stanocephalosaurus pronus
Procyclotosaurus stantonensis
Meyerosuchus fuerstenbergianus
Stenotosaurus semiciausus
Wellesaurus peabodyi
Cyclotosaurus robustus
Kupferzellia wildi
Tatrasuchus kulczyckii
Yuanansuchus laticeps
Eocyciotosaurus lehmani
Quasicyclotosaurus campi
Eryosuchus tverdochlebovi
Heptasaurus cappelensis
Mastodonsaurus giganteus
Benthosphenus lozowskii
Benthosuchus sushkini
Vyborosaurus mirus
Prothoosuchus blomi
Thoosuchus yakovlevi
Angusaurus dentatus
Trematotegm
en otschevi
Hyperokynodon keuperinus
Microposaurus casei
Trematosaurus brauni
Trematosuchus sobeyi
Lyrocephaliscus euri
Platystega depressa
Inflectosaurus amplus
Almasauridae n.g.
Almasaurus habbazi
Apachesaurus gregoni
Metoposaurus diagnosticus
Buettneria perfecta
Dutuitosaurus ouazzoui
Tertrema acuta
Erythrobatrachus noonkanbahensis
Trematolestes hagdorni
Bukobaja enigmatica
Tertremoides m
adagascariensis
Aphaneram
ma rostratum
Cosgriffius cam
pi
Stoschiosaurus nielseni
Wantzosaurus elongatus
Pa
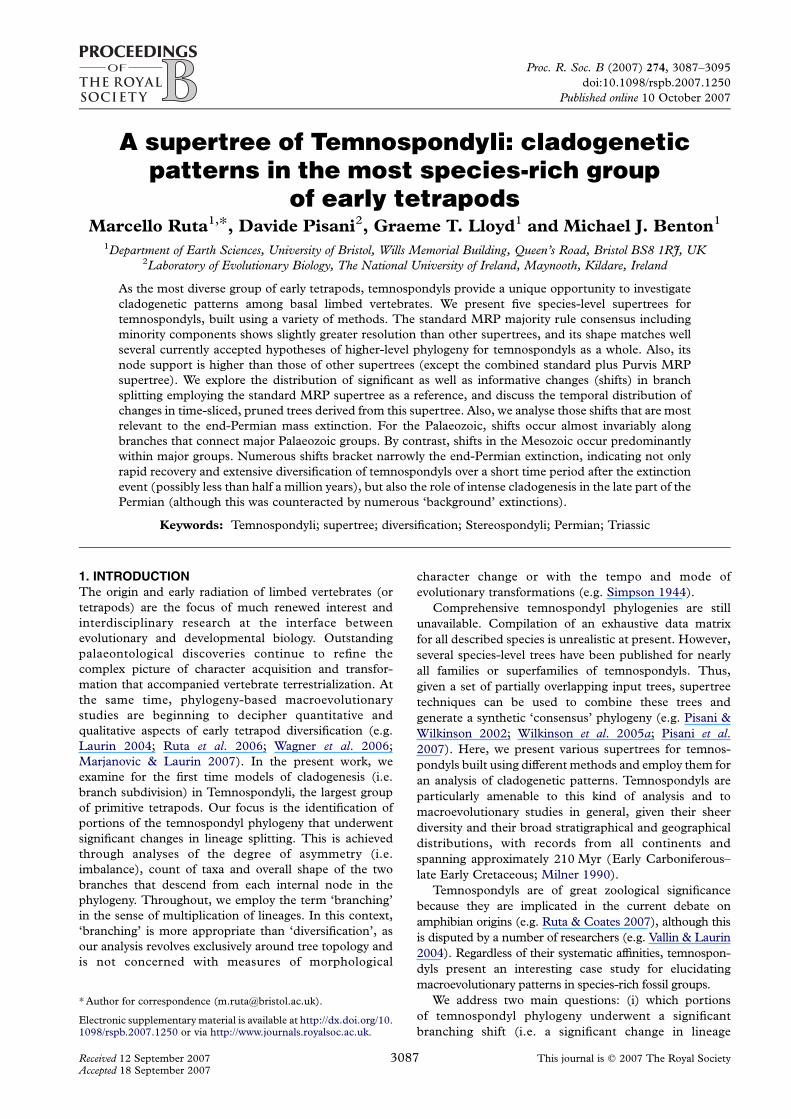
Figure 1. Standard MRP majority rule consensus supertree with minority components; V1 support values (Wilkinson et al.2005a) are reported for each node.
Cladogenetic patterns in early tetrapods M. Ruta et al. 3089
Proc. R. Soc. B (2007)
bc d
e g h
fk
l
a
b c d
e
f i f j k l
stage 1
stage 2
(a)
(b) (c)x
stage 1 pruned tree
stage 2 pruned tree
a
ij
g h
b c d i
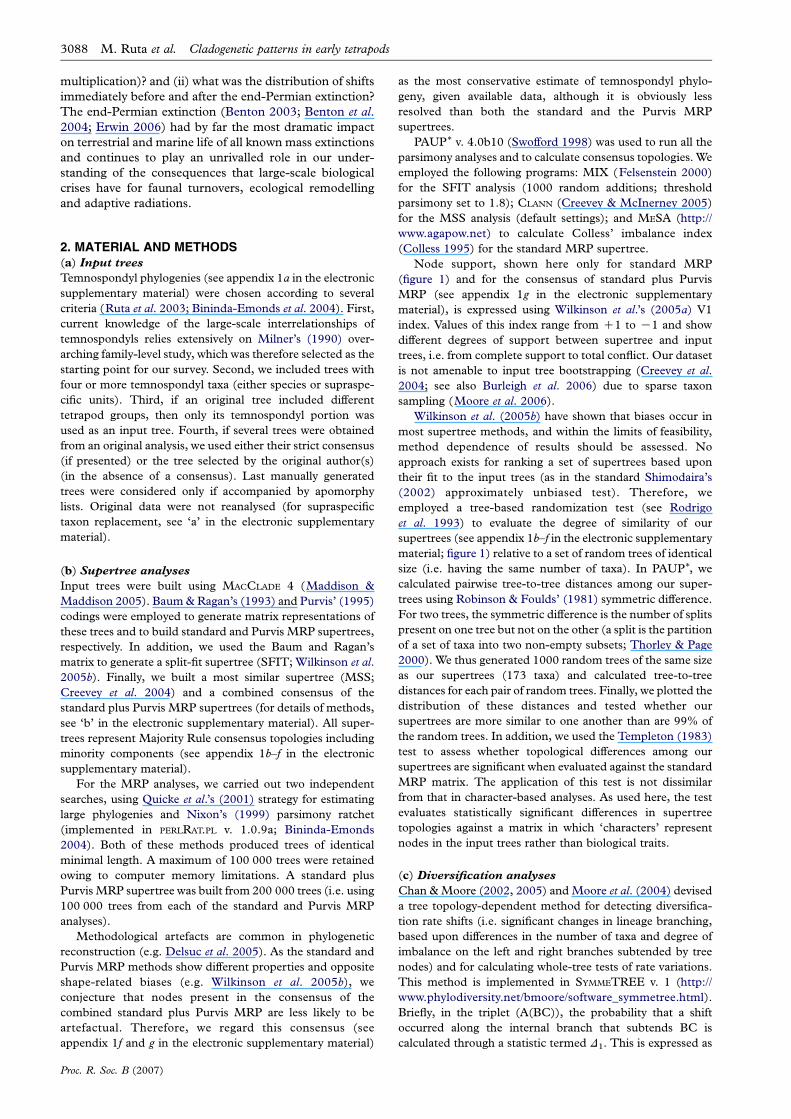
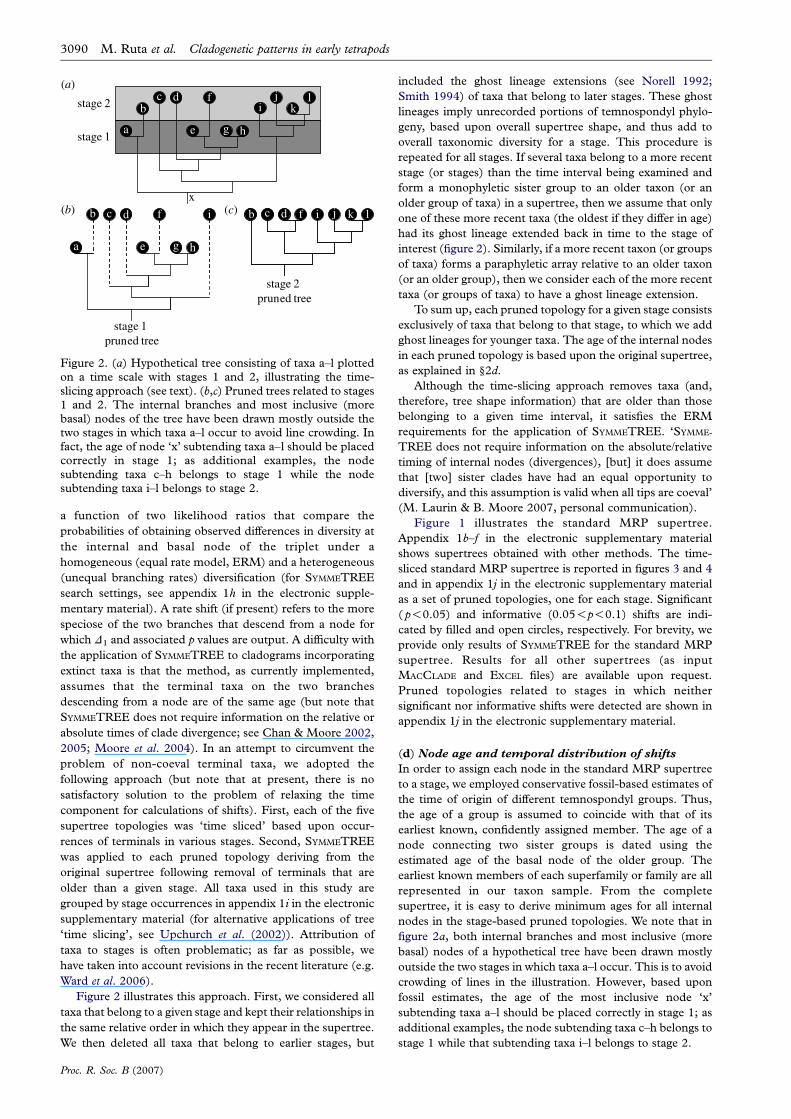
Figure 2. (a) Hypothetical tree consisting of taxa a–l plottedon a time scale with stages 1 and 2, illustrating the time-slicing approach (see text). (b,c) Pruned trees related to stages1 and 2. The internal branches and most inclusive (morebasal) nodes of the tree have been drawn mostly outside thetwo stages in which taxa a–l occur to avoid line crowding. Infact, the age of node ‘x’ subtending taxa a–l should be placedcorrectly in stage 1; as additional examples, the nodesubtending taxa c–h belongs to stage 1 while the nodesubtending taxa i–l belongs to stage 2.
3090 M. Ruta et al. Cladogenetic patterns in early tetrapods
a function of two likelihood ratios that compare the
probabilities of obtaining observed differences in diversity at
the internal and basal node of the triplet under a
homogeneous (equal rate model, ERM) and a heterogeneous
(unequal branching rates) diversification (for SYMMETREE
search settings, see appendix 1h in the electronic supple-
mentary material). A rate shift (if present) refers to the more
speciose of the two branches that descend from a node for
which D1 and associated p values are output. A difficulty with
the application of SYMMETREE to cladograms incorporating
extinct taxa is that the method, as currently implemented,
assumes that the terminal taxa on the two branches
descending from a node are of the same age (but note that
SYMMETREE does not require information on the relative or
absolute times of clade divergence; see Chan & Moore 2002,
2005; Moore et al. 2004). In an attempt to circumvent the
problem of non-coeval terminal taxa, we adopted the
following approach (but note that at present, there is no
satisfactory solution to the problem of relaxing the time
component for calculations of shifts). First, each of the five
supertree topologies was ‘time sliced’ based upon occur-
rences of terminals in various stages. Second, SYMMETREE
was applied to each pruned topology deriving from the
original supertree following removal of terminals that are
older than a given stage. All taxa used in this study are
grouped by stage occurrences in appendix 1i in the electronic
supplementary material (for alternative applications of tree
‘time slicing’, see Upchurch et al. (2002)). Attribution of
taxa to stages is often problematic; as far as possible, we
have taken into account revisions in the recent literature (e.g.
Ward et al. 2006).
Figure 2 illustrates this approach. First, we considered all
taxa that belong to a given stage and kept their relationships in
the same relative order in which they appear in the supertree.
We then deleted all taxa that belong to earlier stages, but
Proc. R. Soc. B (2007)
included the ghost lineage extensions (see Norell 1992;
Smith 1994) of taxa that belong to later stages. These ghost
lineages imply unrecorded portions of temnospondyl phylo-
geny, based upon overall supertree shape, and thus add to
overall taxonomic diversity for a stage. This procedure is
repeated for all stages. If several taxa belong to a more recent
stage (or stages) than the time interval being examined and
form a monophyletic sister group to an older taxon (or an
older group of taxa) in a supertree, then we assume that only
one of these more recent taxa (the oldest if they differ in age)
had its ghost lineage extended back in time to the stage of
interest (figure 2). Similarly, if a more recent taxon (or groups
of taxa) forms a paraphyletic array relative to an older taxon
(or an older group), then we consider each of the more recent
taxa (or groups of taxa) to have a ghost lineage extension.
To sum up, each pruned topology for a given stage consists
exclusively of taxa that belong to that stage, to which we add
ghost lineages for younger taxa. The age of the internal nodes
in each pruned topology is based upon the original supertree,
as explained in §2d.
Although the time-slicing approach removes taxa (and,
therefore, tree shape information) that are older than those
belonging to a given time interval, it satisfies the ERM
requirements for the application of SYMMETREE. ‘SYMME-
TREE does not require information on the absolute/relative
timing of internal nodes (divergences), [but] it does assume
that [two] sister clades have had an equal opportunity to
diversify, and this assumption is valid when all tips are coeval’
(M. Laurin & B. Moore 2007, personal communication).
Figure 1 illustrates the standard MRP supertree.
Appendix 1b–f in the electronic supplementary material
shows supertrees obtained with other methods. The time-
sliced standard MRP supertree is reported in figures 3 and 4
and in appendix 1j in the electronic supplementary material
as a set of pruned topologies, one for each stage. Significant
( p!0.05) and informative (0.05!p!0.1) shifts are indi-
cated by filled and open circles, respectively. For brevity, we
provide only results of SYMMETREE for the standard MRP
supertree. Results for all other supertrees (as input
MACCLADE and EXCEL files) are available upon request.
Pruned topologies related to stages in which neither
significant nor informative shifts were detected are shown in
appendix 1j in the electronic supplementary material.
(d) Node age and temporal distribution of shifts
In order to assign each node in the standard MRP supertree
to a stage, we employed conservative fossil-based estimates of
the time of origin of different temnospondyl groups. Thus,
the age of a group is assumed to coincide with that of its
earliest known, confidently assigned member. The age of a
node connecting two sister groups is dated using the
estimated age of the basal node of the older group. The
earliest known members of each superfamily or family are all
represented in our taxon sample. From the complete
supertree, it is easy to derive minimum ages for all internal
nodes in the stage-based pruned topologies. We note that in
figure 2a, both internal branches and most inclusive (more
basal) nodes of a hypothetical tree have been drawn mostly
outside the two stages in which taxa a–l occur. This is to avoid
crowding of lines in the illustration. However, based upon
fossil estimates, the age of the most inclusive node ‘x’
subtending taxa a–l should be placed correctly in stage 1; as
additional examples, the node subtending taxa c–h belongs to
stage 1 while that subtending taxa i–l belongs to stage 2.
DoleserpetonAmphibamus
PlatyrhinopsTers. mosesi
EoscopusMicropholisBranchiosaurusApateonMicromelerpetonEimer. graumanni
EcolsoniaActiobatesZatrachysEryopsSclerocephalusPalatinerpetonIberospondylusSaharastegaCapetusIsodectesAcroplousBrachyopsDvinosaurusNeldasaurusTrim. sandovalensisCochle. florensisCochle. bohemicusChenop. lewisiAdamanterpetonEdops
Stegops
(a)EdopsNigerpetonChenop. lewisiChenop. milleriTrim. sandovalensisNeldasaurusTrim. insignisDvinosaurusAcroplousBrachyopsSaharastegaPalatinerpetonLysipterygiumRhinesuchoidesArcheg. decheniSclerocephalusSyndyodosuchusParioxysEryopsOnchiodonAcanthostomatopsZatrachysAchelomaAnconastesTambachiaPlatyhistrixEcolsoniaBroiliellusTers. mosesiEimer. graumanniMicromelerpetonApateonLeptorophusSchoenfelderpeton
(b)
*
*
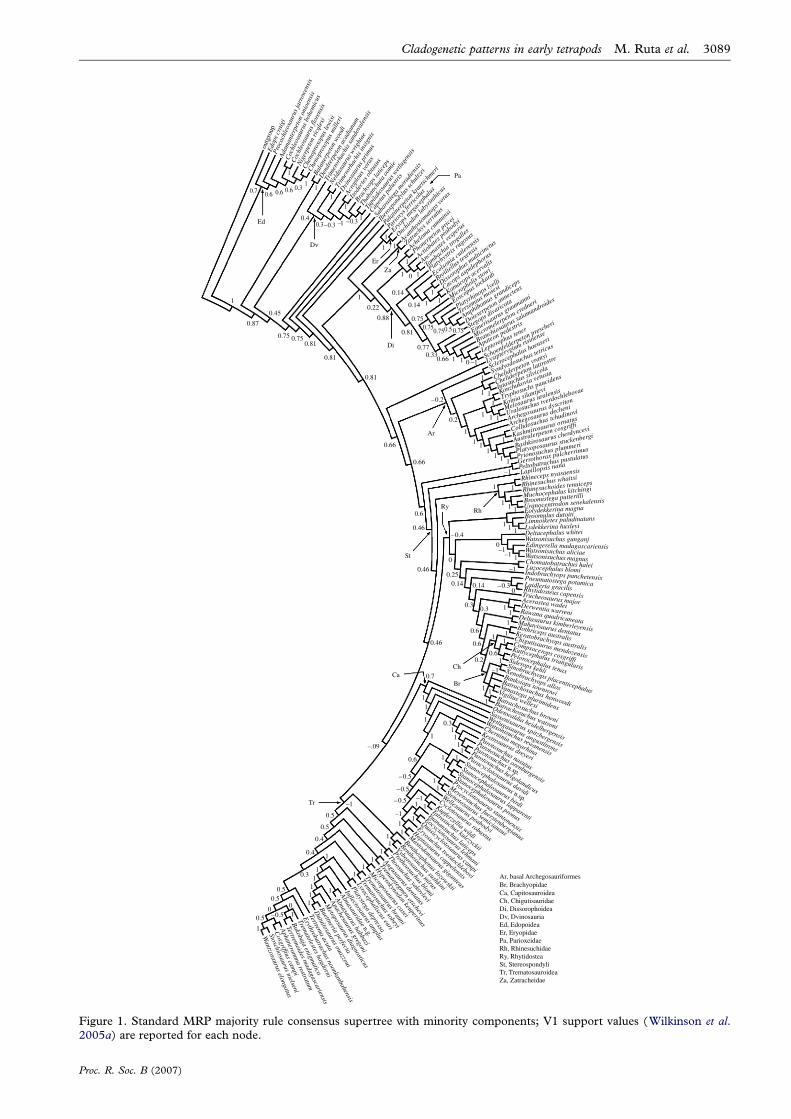
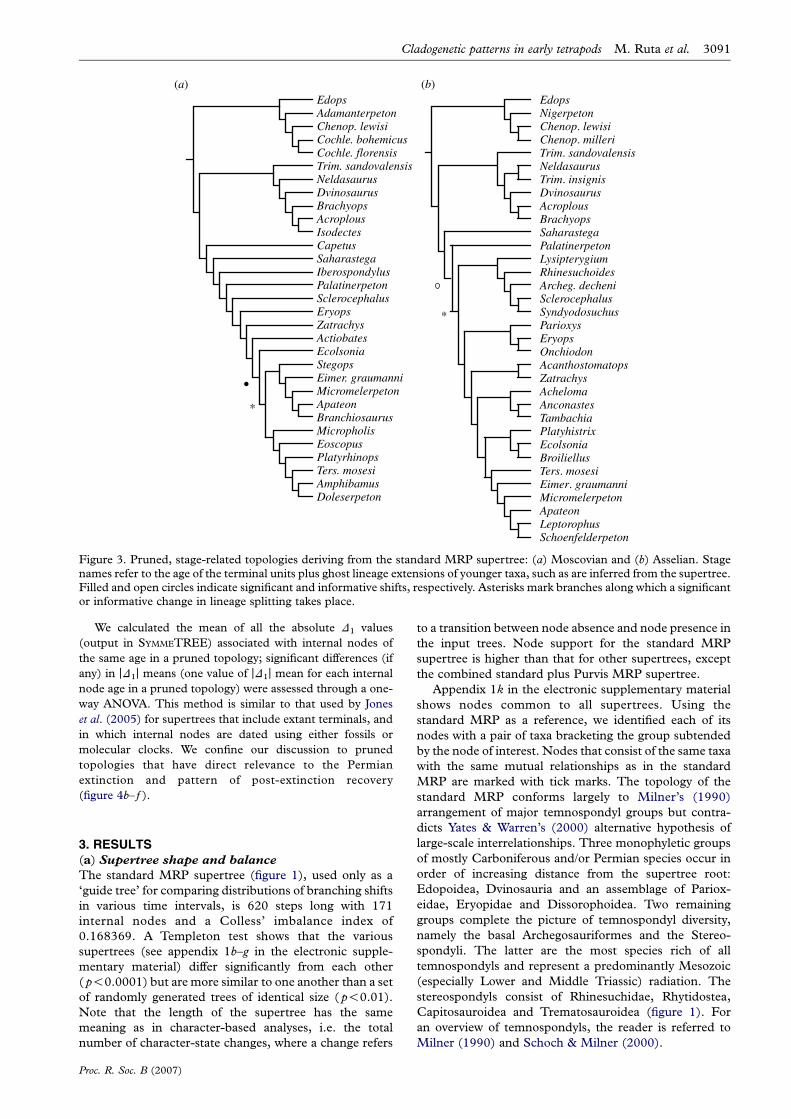
Figure 3. Pruned, stage-related topologies deriving from the standard MRP supertree: (a) Moscovian and (b) Asselian. Stagenames refer to the age of the terminal units plus ghost lineage extensions of younger taxa, such as are inferred from the supertree.Filled and open circles indicate significant and informative shifts, respectively. Asterisks mark branches along which a significantor informative change in lineage splitting takes place.
Cladogenetic patterns in early tetrapods M. Ruta et al. 3091
We calculated the mean of all the absolute D1 values
(output in SYMMETREE) associated with internal nodes of
the same age in a pruned topology; significant differences (if
any) in jD1j means (one value of jD1j mean for each internal
node age in a pruned topology) were assessed through a one-
way ANOVA. This method is similar to that used by Jones
et al. (2005) for supertrees that include extant terminals, and
in which internal nodes are dated using either fossils or
molecular clocks. We confine our discussion to pruned
topologies that have direct relevance to the Permian
extinction and pattern of post-extinction recovery
(figure 4b– f ).
3. RESULTS(a) Supertree shape and balance
The standard MRP supertree (figure 1), used only as a
‘guide tree’ for comparing distributions of branching shifts
in various time intervals, is 620 steps long with 171
internal nodes and a Colless’ imbalance index of
0.168369. A Templeton test shows that the various
supertrees (see appendix 1b–g in the electronic supple-
mentary material) differ significantly from each other
( p!0.0001) but are more similar to one another than a set
of randomly generated trees of identical size ( p!0.01).
Note that the length of the supertree has the same
meaning as in character-based analyses, i.e. the total
number of character-state changes, where a change refers
Proc. R. Soc. B (2007)
to a transition between node absence and node presence in
the input trees. Node support for the standard MRP
supertree is higher than that for other supertrees, except
the combined standard plus Purvis MRP supertree.
Appendix 1k in the electronic supplementary material
shows nodes common to all supertrees. Using the
standard MRP as a reference, we identified each of its
nodes with a pair of taxa bracketing the group subtended
by the node of interest. Nodes that consist of the same taxa
with the same mutual relationships as in the standard
MRP are marked with tick marks. The topology of the
standard MRP conforms largely to Milner’s (1990)
arrangement of major temnospondyl groups but contra-
dicts Yates & Warren’s (2000) alternative hypothesis of
large-scale interrelationships. Three monophyletic groups
of mostly Carboniferous and/or Permian species occur in
order of increasing distance from the supertree root:
Edopoidea, Dvinosauria and an assemblage of Pariox-
eidae, Eryopidae and Dissorophoidea. Two remaining
groups complete the picture of temnospondyl diversity,
namely the basal Archegosauriformes and the Stereo-
spondyli. The latter are the most species rich of all
temnospondyls and represent a predominantly Mesozoic
(especially Lower and Middle Triassic) radiation. The
stereospondyls consist of Rhinesuchidae, Rhytidostea,
Capitosauroidea and Trematosauroidea (figure 1). For
an overview of temnospondyls, the reader is referred to
Milner (1990) and Schoch & Milner (2000).
MastodonsaurusHeptasaurusEryosuchusQuasicyclotosaurusEocyclotosaurusYuanansuchusTatrasuchusKupferzelliaCyclotosaurusStenotosaurusMeyerosuchusProcyclotosaurusStanoc. pronusStanoc. lapparentiParacyclotosaurusCherniniaTrematolestesBukobajaAlmasauridae new
HyperokinodonVigiliusVanastegaSinobrachyopsPelorocephalusGerrothorax
Microposaurus
PrionosuchusPlatyoposaurusBashkirosaurusAustralerpetonKashmirosaurusCollidosuchusUralosuchusMelosaurusKoiniaTryphosuchusKonzhukoviaUranocentrodonMuchocephalusRhinesuchoidesRhinesuchusTrucheosaurusLapillopsisPeltobatrachusLysipterygiumMicropholisKamacopsSaharastegaDvinosaurusNigerpeton
BrachyopsThabanchuiaTupilakosaurusMicropholisGerrothoraxLapillopsisBroomistegaOdenwaldiaSassenisaurusWetlugasaurusWatson. rewanensisParacyclotosaurusCherniniaKestrosaurusParotos. nasutusBenthosphenusBenthosuchusVyborosaurusProthoosuchusAngusaurusMicroposaurusTrematosaurusLyrocephaliscusTertremaErythrobatrachusTrematolestesBukobajaTertremoidesAphanerammaCosgriffiusStoschiosaurusWantzosaurusEolydekkerinaBroomulusLimnoiketesLydekkerinaDeltacephalusWatson. gunganjEdingerellaWatson. aliciaeWatson. magnusChomatobatrachusLuzocephalusIndobrachyopsPneumatostegaLaidleriaRhytidosteusAcerasteaDerwentiaRewanaDeltasaurusMahavisaurusBothricepsKeratobrachyopsChigutisaurusSinobrachyopsBanksiopsBatrachos. browni
Nigerpeton
Eimer. graumanniTers. mosesiDissorophusBroiliellusPhonerpetonAchelomaTambachiaAcanthostomatopsOnchiodonParioxysCollidosuchusArcheg. decheniArcheg. dyscritonKonzhukoviaIntasuchusChelid. latirostreChelid. vranyiSyndyodosuchusRhinesuchoidesLysipterygiumSaharastegaDvinosaurusTrim. insignis
(a)
(b)
Chomatobatrachus
RhytidosteusIndobrachyops
DeltacephalusEolydekkerinaWetlugasaurusMuchocephalusBroomistegaRhinesuchusRhinecepsLapillopsisPeltobatrachusGerrothoraxPrionosuchusAustralerpetonMicropholisSaharastegaDvinosaurusBrachyopsNigerpeton
AcerasteaTrucheosaurus
(c)
(d )
( f )
*
*
*
*
BukobajaCosgriffius
ErythrobatrachusTertremaInflectosaurusAlmasauridae newPlatystegaLyrocephaliscusTrematosuchusTrematosaurusMicroposaurusTrematotegmenAngusaurusThoosuchusProthoosuchusVyborosaurusBenthosphenusStanoc.n.sp.Stanoc. birdiStanoc. pronusParacyclotosaurusWellesaurusTatrasuchusStenotosaurusParot. n.sp.Parot. helgolandicusParot. orenburgensisParot. nasutusCherniniaSassenisaurusOdenwaldiaBatrach. watsoniBatrach. browniVigiliusBatrach. henwoodiXenobrachyopsSinobrachyopsPelorocephalusDeltasaurusLaidleriaGerrothorax
(e)
*
*
*
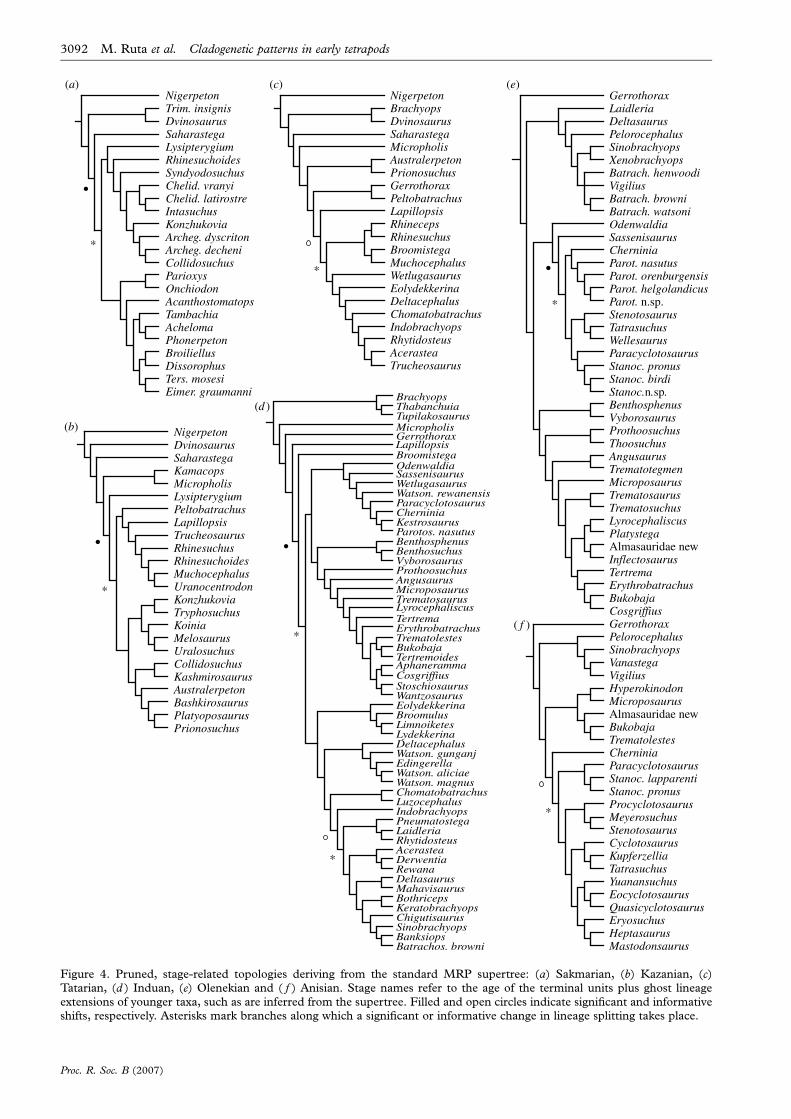
Figure 4. Pruned, stage-related topologies deriving from the standard MRP supertree: (a) Sakmarian, (b) Kazanian, (c)Tatarian, (d ) Induan, (e) Olenekian and ( f ) Anisian. Stage names refer to the age of the terminal units plus ghost lineageextensions of younger taxa, such as are inferred from the supertree. Filled and open circles indicate significant and informativeshifts, respectively. Asterisks mark branches along which a significant or informative change in lineage splitting takes place.
3092 M. Ruta et al. Cladogenetic patterns in early tetrapods
Proc. R. Soc. B (2007)
Cladogenetic patterns in early tetrapods M. Ruta et al. 3093
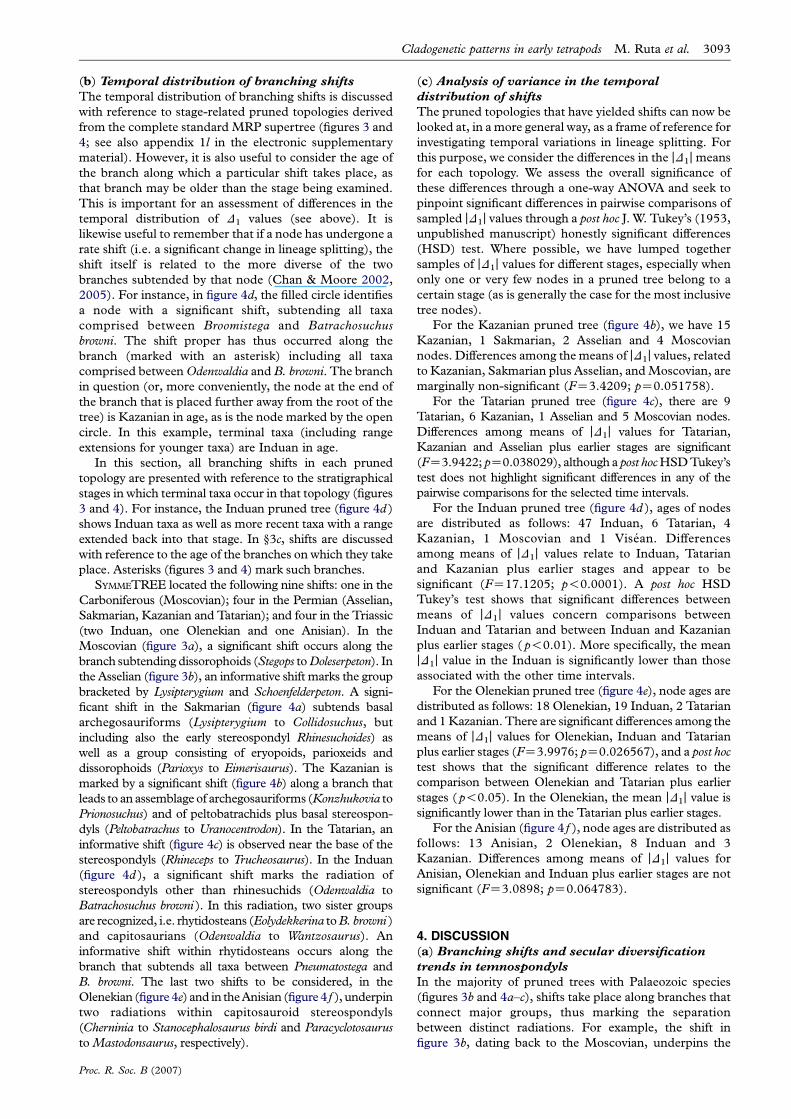
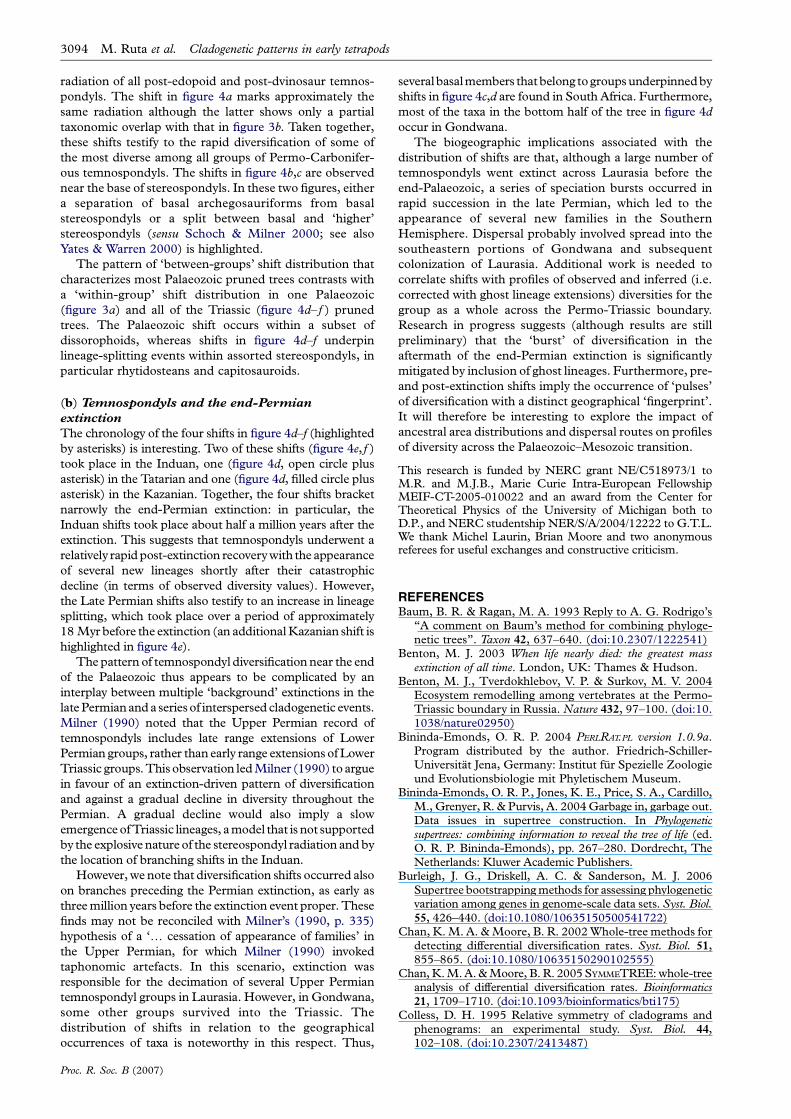
(b) Temporal distribution of branching shifts
The temporal distribution of branching shifts is discussed
with reference to stage-related pruned topologies derived
from the complete standard MRP supertree (figures 3 and
4; see also appendix 1l in the electronic supplementary
material). However, it is also useful to consider the age of
the branch along which a particular shift takes place, as
that branch may be older than the stage being examined.
This is important for an assessment of differences in the
temporal distribution of D1 values (see above). It is
likewise useful to remember that if a node has undergone a
rate shift (i.e. a significant change in lineage splitting), the
shift itself is related to the more diverse of the two
branches subtended by that node (Chan & Moore 2002,
2005). For instance, in figure 4d, the filled circle identifies
a node with a significant shift, subtending all taxa
comprised between Broomistega and Batrachosuchus
browni. The shift proper has thus occurred along the
branch (marked with an asterisk) including all taxa
comprised between Odenwaldia and B. browni. The branch
in question (or, more conveniently, the node at the end of
the branch that is placed further away from the root of the
tree) is Kazanian in age, as is the node marked by the open
circle. In this example, terminal taxa (including range
extensions for younger taxa) are Induan in age.
In this section, all branching shifts in each pruned
topology are presented with reference to the stratigraphical
stages in which terminal taxa occur in that topology (figures
3 and 4). For instance, the Induan pruned tree (figure 4d )
shows Induan taxa as well as more recent taxa with a range
extended back into that stage. In §3c, shifts are discussed
with reference to the age of the branches on which they take
place. Asterisks (figures 3 and 4) mark such branches.
SYMMETREE located the following nine shifts: one in the
Carboniferous (Moscovian); four in the Permian (Asselian,
Sakmarian, Kazanian and Tatarian); and four in the Triassic
(two Induan, one Olenekian and one Anisian). In the
Moscovian (figure 3a), a significant shift occurs along the
branch subtending dissorophoids (Stegops toDoleserpeton). In
the Asselian (figure 3b), an informative shift marks the group
bracketed by Lysipterygium and Schoenfelderpeton. A signi-
ficant shift in the Sakmarian (figure 4a) subtends basal
archegosauriforms (Lysipterygium to Collidosuchus, but
including also the early stereospondyl Rhinesuchoides) as
well as a group consisting of eryopoids, parioxeids and
dissorophoids (Parioxys to Eimerisaurus). The Kazanian is
marked by a significant shift (figure 4b) along a branch that
leads to an assemblage of archegosauriforms (Konzhukovia to
Prionosuchus) and of peltobatrachids plus basal stereospon-
dyls (Peltobatrachus to Uranocentrodon). In the Tatarian, an
informative shift (figure 4c) is observed near the base of the
stereospondyls (Rhineceps to Trucheosaurus). In the Induan
(figure 4d ), a significant shift marks the radiation of
stereospondyls other than rhinesuchids (Odenwaldia to
Batrachosuchus browni ). In this radiation, two sister groups
are recognized, i.e. rhytidosteans (Eolydekkerina toB. browni )
and capitosaurians (Odenwaldia to Wantzosaurus). An
informative shift within rhytidosteans occurs along the
branch that subtends all taxa between Pneumatostega and
B. browni. The last two shifts to be considered, in the
Olenekian (figure 4e) and in theAnisian (figure 4 f ), underpin
two radiations within capitosauroid stereospondyls
(Cherninia to Stanocephalosaurus birdi and Paracyclotosaurus
to Mastodonsaurus, respectively).
Proc. R. Soc. B (2007)
(c) Analysis of variance in the temporal
distribution of shifts
The pruned topologies that have yielded shifts can now be
looked at, in a more general way, as a frame of reference for
investigating temporal variations in lineage splitting. For
this purpose, we consider the differences in the jD1j means
for each topology. We assess the overall significance of
these differences through a one-way ANOVA and seek to
pinpoint significant differences in pairwise comparisons of
sampled jD1j values through a post hoc J. W. Tukey’s (1953,
unpublished manuscript) honestly significant differences
(HSD) test. Where possible, we have lumped together
samples of jD1j values for different stages, especially when
only one or very few nodes in a pruned tree belong to a
certain stage (as is generally the case for the most inclusive
tree nodes).
For the Kazanian pruned tree (figure 4b), we have 15
Kazanian, 1 Sakmarian, 2 Asselian and 4 Moscovian
nodes. Differences among the means of jD1j values, related
to Kazanian, Sakmarian plus Asselian, and Moscovian, are
marginally non-significant (FZ3.4209; pZ0.051758).
For the Tatarian pruned tree (figure 4c), there are 9
Tatarian, 6 Kazanian, 1 Asselian and 5 Moscovian nodes.
Differences among means of jD1j values for Tatarian,
Kazanian and Asselian plus earlier stages are significant
(FZ3.9422; pZ0.038029), although a post hocHSD Tukey’s
test does not highlight significant differences in any of the
pairwise comparisons for the selected time intervals.
For the Induan pruned tree (figure 4d ), ages of nodes
are distributed as follows: 47 Induan, 6 Tatarian, 4
Kazanian, 1 Moscovian and 1 Visean. Differences
among means of jD1j values relate to Induan, Tatarian
and Kazanian plus earlier stages and appear to be
significant (FZ17.1205; p!0.0001). A post hoc HSD
Tukey’s test shows that significant differences between
means of jD1j values concern comparisons between
Induan and Tatarian and between Induan and Kazanian
plus earlier stages ( p!0.01). More specifically, the mean
jD1j value in the Induan is significantly lower than those
associated with the other time intervals.
For the Olenekian pruned tree (figure 4e), node ages are
distributed as follows: 18 Olenekian, 19 Induan, 2 Tatarian
and 1 Kazanian. There are significant differences among the
means of jD1j values for Olenekian, Induan and Tatarian
plus earlier stages (FZ3.9976; pZ0.026567), and a post hoc
test shows that the significant difference relates to the
comparison between Olenekian and Tatarian plus earlier
stages ( p!0.05). In the Olenekian, the mean jD1j value is
significantly lower than in the Tatarian plus earlier stages.
For the Anisian (figure 4 f ), node ages are distributed as
follows: 13 Anisian, 2 Olenekian, 8 Induan and 3
Kazanian. Differences among means of jD1j values for
Anisian, Olenekian and Induan plus earlier stages are not
significant (FZ3.0898; pZ0.064783).
4. DISCUSSION(a) Branching shifts and secular diversification
trends in temnospondyls
In the majority of pruned trees with Palaeozoic species
(figures 3b and 4a–c), shifts take place along branches that
connect major groups, thus marking the separation
between distinct radiations. For example, the shift in
figure 3b, dating back to the Moscovian, underpins the
3094 M. Ruta et al. Cladogenetic patterns in early tetrapods
radiation of all post-edopoid and post-dvinosaur temnos-
pondyls. The shift in figure 4a marks approximately the
same radiation although the latter shows only a partial
taxonomic overlap with that in figure 3b. Taken together,
these shifts testify to the rapid diversification of some of
the most diverse among all groups of Permo-Carbonifer-
ous temnospondyls. The shifts in figure 4b,c are observed
near the base of stereospondyls. In these two figures, either
a separation of basal archegosauriforms from basal
stereospondyls or a split between basal and ‘higher’
stereospondyls (sensu Schoch & Milner 2000; see also
Yates & Warren 2000) is highlighted.
The pattern of ‘between-groups’ shift distribution that
characterizes most Palaeozoic pruned trees contrasts with
a ‘within-group’ shift distribution in one Palaeozoic
(figure 3a) and all of the Triassic (figure 4d– f ) pruned
trees. The Palaeozoic shift occurs within a subset of
dissorophoids, whereas shifts in figure 4d–f underpin
lineage-splitting events within assorted stereospondyls, in
particular rhytidosteans and capitosauroids.
(b) Temnospondyls and the end-Permian
extinction
The chronology of the four shifts in figure 4d–f (highlighted
by asterisks) is interesting. Two of these shifts (figure 4e, f )
took place in the Induan, one (figure 4d, open circle plus
asterisk) in the Tatarian and one (figure 4d, filled circle plus
asterisk) in the Kazanian. Together, the four shifts bracket
narrowly the end-Permian extinction: in particular, the
Induan shifts took place about half a million years after the
extinction. This suggests that temnospondyls underwent a
relatively rapid post-extinction recovery with the appearance
of several new lineages shortly after their catastrophic
decline (in terms of observed diversity values). However,
the Late Permian shifts also testify to an increase in lineage
splitting, which took place over a period of approximately
18 Myr before the extinction (an additional Kazanian shift is
highlighted in figure 4e).
The pattern of temnospondyl diversification near the end
of the Palaeozoic thus appears to be complicated by an
interplay between multiple ‘background’ extinctions in the
late Permianand a seriesof interspersed cladogenetic events.
Milner (1990) noted that the Upper Permian record of
temnospondyls includes late range extensions of Lower
Permian groups, rather than early range extensions of Lower
Triassic groups. This observation led Milner (1990) to argue
in favour of an extinction-driven pattern of diversification
and against a gradual decline in diversity throughout the
Permian. A gradual decline would also imply a slow
emergence of Triassic lineages, a model that is not supported
by the explosive nature of the stereospondyl radiation and by
the location of branching shifts in the Induan.
However, we note that diversification shifts occurred also
on branches preceding the Permian extinction, as early as
three million years before the extinction event proper. These
finds may not be reconciled with Milner’s (1990, p. 335)
hypothesis of a ‘. cessation of appearance of families’ in
the Upper Permian, for which Milner (1990) invoked
taphonomic artefacts. In this scenario, extinction was
responsible for the decimation of several Upper Permian
temnospondyl groups in Laurasia. However, in Gondwana,
some other groups survived into the Triassic. The
distribution of shifts in relation to the geographical
occurrences of taxa is noteworthy in this respect. Thus,
Proc. R. Soc. B (2007)
severalbasalmembers thatbelong togroups underpinnedby
shifts in figure 4c,d are found in South Africa. Furthermore,
most of the taxa in the bottom half of the tree in figure 4d
occur in Gondwana.
The biogeographic implications associated with the
distribution of shifts are that, although a large number of
temnospondyls went extinct across Laurasia before the
end-Palaeozoic, a series of speciation bursts occurred in
rapid succession in the late Permian, which led to the
appearance of several new families in the Southern
Hemisphere. Dispersal probably involved spread into the
southeastern portions of Gondwana and subsequent
colonization of Laurasia. Additional work is needed to
correlate shifts with profiles of observed and inferred (i.e.
corrected with ghost lineage extensions) diversities for the
group as a whole across the Permo-Triassic boundary.
Research in progress suggests (although results are still
preliminary) that the ‘burst’ of diversification in the
aftermath of the end-Permian extinction is significantly
mitigated by inclusion of ghost lineages. Furthermore, pre-
and post-extinction shifts imply the occurrence of ‘pulses’
of diversification with a distinct geographical ‘fingerprint’.
It will therefore be interesting to explore the impact of
ancestral area distributions and dispersal routes on profiles
of diversity across the Palaeozoic–Mesozoic transition.
This research is funded by NERC grant NE/C518973/1 toM.R. and M.J.B., Marie Curie Intra-European FellowshipMEIF-CT-2005-010022 and an award from the Center forTheoretical Physics of the University of Michigan both toD.P., and NERC studentship NER/S/A/2004/12222 to G.T.L.We thank Michel Laurin, Brian Moore and two anonymousreferees for useful exchanges and constructive criticism.
REFERENCESBaum, B. R. & Ragan, M. A. 1993 Reply to A. G. Rodrigo’s
“A comment on Baum’s method for combining phyloge-netic trees”. Taxon 42, 637–640. (doi:10.2307/1222541)
Benton, M. J. 2003 When life nearly died: the greatest massextinction of all time. London, UK: Thames & Hudson.
Benton, M. J., Tverdokhlebov, V. P. & Surkov, M. V. 2004Ecosystem remodelling among vertebrates at the Permo-Triassic boundary in Russia. Nature 432, 97–100. (doi:10.1038/nature02950)
Bininda-Emonds, O. R. P. 2004 PERLRAT.PL version 1.0.9a.Program distributed by the author. Friedrich-Schiller-Universitat Jena, Germany: Institut fur Spezielle Zoologieund Evolutionsbiologie mit Phyletischem Museum.
Bininda-Emonds, O. R. P., Jones, K. E., Price, S. A., Cardillo,M., Grenyer, R. & Purvis, A. 2004 Garbage in, garbage out.Data issues in supertree construction. In Phylogeneticsupertrees: combining information to reveal the tree of life (ed.O. R. P. Bininda-Emonds), pp. 267–280. Dordrecht, TheNetherlands: Kluwer Academic Publishers.
Burleigh, J. G., Driskell, A. C. & Sanderson, M. J. 2006Supertree bootstrapping methods for assessing phylogeneticvariation among genes in genome-scale data sets. Syst. Biol.55, 426–440. (doi:10.1080/10635150500541722)
Chan, K. M. A. & Moore, B. R. 2002 Whole-tree methods fordetecting differential diversification rates. Syst. Biol. 51,855–865. (doi:10.1080/10635150290102555)
Chan, K. M. A. & Moore, B. R. 2005 SYMMETREE: whole-treeanalysis of differential diversification rates. Bioinformatics21, 1709–1710. (doi:10.1093/bioinformatics/bti175)
Colless, D. H. 1995 Relative symmetry of cladograms andphenograms: an experimental study. Syst. Biol. 44,102–108. (doi:10.2307/2413487)
Cladogenetic patterns in early tetrapods M. Ruta et al. 3095
Creevey, C. J. & McInerney, J. O. 2005 Clann: investigating
phylogenetic information through supertree analyses.
Bioinformatics 21, 390–392. (doi:10.1093/bioinformatics/
bti020)
Creevey, C. J., Fitzpatrick, D. A., Philip, G. K., Kinsella,
R. J., O’Connell, M. J., Pentony, M. M., Travers, S. A.,
Wilkinson, M. & McInerney, J. O. 2004 Does a tree-like
phylogeny only exist at the tips in the prokaryotes? Proc. R.
Soc. B 22, 2551–2558. (doi:10.1098/rspb.2004.2864)
Delsuc, F., Brinkmann, H. & Philippe, H. 2005 Phyloge-
nomics and the reconstruction of the tree of life. Nat. Rev.
Genet. 6, 361–375. (doi:10.1038/nrg1603)
Erwin, D. H. 2006 Extinction: how life on Earth nearly ended 250
million years ago. Princeton, NJ: Princeton University Press.
Felsenstein, J. 2000 PHYLIP version 3.6 alpha. Seattle, WA:
Department of Genetics, University of Washington.
Jones, K. E., Bininda-Emonds, O. R. P. & Gittleman, J. L.
2005 Bats, clocks, and rocks: diversification patterns in
Chiroptera. Evolution 59, 2243–2255.
Laurin, M. 2004 The evolution of body size. Cope’s Rule and
the origin of amniotes. Syst. Biol. 53, 594–622. (doi:10.
1080/10635150490445706)
Maddison, D. R. & Maddison, W. P. 2005 MACCLADE 4:
analysis of phylogeny and character evolution version 4.08 OS
X. Sunderland, MA: Sinauer Associates.
Marjanovic, D. & Laurin, M. 2007 Fossils, molecules,
divergence times, and the origin of lissamphibians. Syst.
Biol. 56, 369–388. (doi:10.1080/10635150701397635)
Milner, A. R. 1990 The radiations of temnospondyl amphibians.
In Major evolutionary radiations (eds P. D. Taylor & G. P.
Larwood), pp. 321–349. Oxford, UK: Clarendon Press.
Moore, B. R., Chan, K. M. A. & Donoghue, M. J. 2004
Detecting diversification rate variation in supertrees. In
Phylogenetic supertrees: combining information to reveal the tree
of life (ed. O. R. P. Bininda-Emonds), pp. 487–533.
Dordrecht, The Netherlands: Kluwer Academic Publishers.
Moore, B. R., Smith, S. A. & Donoghue, M. J. 2006
Increasing data transparency and estimating phylogenetic
uncertainty in supertrees: approaches using nonpara-
metric bootstrapping. Syst. Biol. 55, 662–676. (doi:10.
1080/10635150600920693)
Nixon, K. C. 1999 The parsimony ratchet, a new method for
rapid parsimony analysis. Cladistics 15, 407–414. (doi:10.
1111/j.1096-0031.1999.tb00277.x)
Norell, M. A. 1992 Taxic origin and temporal diversity: the
effect of phylogeny. In Extinction and phylogeny (eds M. J.
Novacek & Q. D. Wheeler), pp. 88–118. New York, NY:
Columbia University Press.
Pisani, D. & Wilkinson, M. 2002 Matrix representation with
parsimony, taxonomic congruence and total evidence. Syst.
Biol. 51, 151–155. (doi:10.1080/106351502753475925)
Pisani, D., Cotton, J. A. & McInerney, J. O. 2007 Supertrees
disentangle the Chimerical origin of eukaryotic genomes.
Mol. Biol. Evol. 24, 1752–1760. (doi:10.1093/molbev/
msm095)
Purvis, A. 1995 A modification to Baum and Ragan’s method
for combining phylogenetic trees. Syst. Biol. 44, 251–255.
(doi:10.2307/2413710)
Quicke, D. L. J., Taylor, J. & Purvis, A. 2001 Changing the
landscape: a new strategy for estimating large phylogenies.
Syst. Biol. 50, 60–66. (doi:10.1080/106351501750107477)
Robinson, D. F. & Foulds, L. R. 1981 Comparison of
phylogenetic trees. Math. Biosci. 53, 131–147. (doi:10.
1016/0025-5564(81)90043-2)
Proc. R. Soc. B (2007)
Rodrigo, A. G., Kelly-Borges, M., Bergquist, P. R. &Bergquist, P. L. 1993 A randomisation test of the nullhypothesis that two cladograms are sample estimates of aparametric phylogenetic tree. N. Zeal. J. Bot. 31, 257–268.
Ruta, M. & Coates, M. I. 2007 Dates, nodes and characterconflict: addressing the lissamphibian origin problem. J. Syst.Palaeontol. 5, 69–122. (doi:10.1017/S1477201906002008)
Ruta, M., Jeffery, J. E. & Coates, M. I. 2003 A supertree ofearly tetrapods. Proc. R. Soc. B 273, 2107–2111. (doi:10.1098/rspb.2006.3577)
Ruta, M., Wagner, P. J. & Coates, M. I. 2006 Evolutionarypatterns in early tetrapods. I. Rapid initial diversificationfollowed by decrease in rates of character change. Proc. R.Soc. B 270, 2507–2516. (doi:10.1098/rspb.2003.2524)
Schoch, R. R. & Milner, A. R. 2000 Handbuch derPalaoherpetologie: Teil 3B, Stereospondyli. Munich,Germany: Pfeil.
Shimodaira, H. 2002 An approximately unbiased test ofphylogenetic tree selection. Syst. Biol. 51, 492–508.(doi:10.1080/10635150290069913)
Simpson, G. G. 1944 Tempo and mode in evolution. New York,NY: Columbia University Press.
Smith, A. B. 1994 Systematics and the fossil record: documentingevolutionary patterns. London, UK: Blackwell ScientificPublications.
Swofford, D. L. 1998 PAUP�: phylogenetic analysis usingparsimony (�and other methods) version 4.0b10 Altivec.Sunderland, MA: Sinauer Associates.
Templeton, A. 1983 Phylogenetic inference from restrictionendonuclease cleavage site maps with particular referenceto the evolution of humans and the apes. Evolution 37,221–224. (doi:10.2307/2408332)
Thorley, J. L. & Page, R. D. M. 2000 RADCON: phylogenetictree comparison and consensus. Bioinformatics 16,486–487. (doi:10.1093/bioinformatics/16.5.486)
Upchurch, P., Hunn, C. A. & Norman, D. B. 2002 Ananalysis of dinosaurian biogeography: evidence for theexistence of vicariance and dispersal patterns caused bygeological events. Proc. R. Soc. B 269, 613–621. (doi:10.1098/rspb.2001.1921)
Vallin, G. & Laurin, M. 2004 Cranial morphology andaffinities of Microbrachis, and a reappraisal of thephylogeny and lifestyle of the first amphibians. J. Vert.Paleontol. 24, 56–72. (doi:10.1671/5.1)
Wagner, P. J., Ruta, M. & Coates, M. I. 2006 Evolutionarypatterns in early tetrapods. II. Differing constraints onavailable character space among clades. Proc. R. Soc. B273, 2113–2118. (doi:10.1098/rspb.2006.3561)
Ward, P., Labandeira, C., Laurin, M. & Berner, R. A. 2006Confirmation of Romer’s Gap as a low oxygen intervalconstraining the timing of initial arthropod and vertebrateterrestrialization. Proc. Natl Acad. Sci. USA 103,16 818–16 822. (doi:10.1073/pnas.0607824103)
Wilkinson, M., Pisani, D., Cotton, J. A. & Corfe, I. 2005aMeasuring support and finding unsupported relationshipsin supertrees. Syst. Biol. 54, 823–831. (doi:10.1080/10635150590950362)
Wilkinson, M. et al. 2005b The shape of supertrees to come:tree shape related properties of fourteen supertreemethods. Syst. Biol. 54, 419–431. (doi:10.1080/10635150590949832)
Yates, A. M. & Warren, A. A. 2000 The phylogeny of the‘higher’ temnospondyls (Vertebrata: Choanata) and itsimplications for the monophyly and origins of theStereospondyli. Zool. J. Linn. Soc. 128, 77–121. (doi:10.1006/zjls.1998.0184)
Related Documents