A Study of Imbibition Mechanisms in the Naturally Fractured Spraberry Trend Area by YANFIDRA THESIS Submitted in Partial Fulfillment of the Requirements for Degree of Master of Science in Petroleum Engineering New Mexico Institute of Mining and Technology Socorro, New Mexico November, 1998

Welcome message from author
This document is posted to help you gain knowledge. Please leave a comment to let me know what you think about it! Share it to your friends and learn new things together.
Transcript

A Study of Imbibition Mechanisms in theNaturally Fractured Spraberry Trend Area
by
YANFIDRA
THESIS
Submitted in Partial Fulfillment
of the Requirements for Degree of
Master of Science in Petroleum Engineering
New Mexico Institute of Mining and TechnologySocorro, New Mexico
November, 1998

This thesis is accepted on behalfof thefaculty
ofthe institute bythe following committee:
Advisor
Ncv£M6I?^Date

ABSTRACT
The importance of characterizing the imbibition mechanism foranalysis of reservoir performance during waterflooding in the naturallyfractured Spraberry Trend Area has been studied. Analyzing reservoirperformance during waterflooding is obviously useful before other EORmethods such as CO2 injection are applied. When waterflooding is performedin this type of reservoir, the intent is to fill the fractiu'es with water toinitiate spontaneous counter-current imbibition. Using the action of capillaryforces, oil from the interior of matrix blocks is displaced to surroundingfractures. Once the oil is in the fractures, the water displaces the oil to theproducing well by viscous forces, depending on the volume of water injected.Thus, the imbibition mechanism plays a very important role iii recovering ofoil from this reservoir.
The purposes of this study are (i) to investigate the wettability of lowpermeability Spraberry reservoir rock, oil and brine that affect recoverymechanisms in the Spraberry Trend Area reservoir; Hi) to upscale thelaboratory imbibition results to field-scale dimensions, (Hi) to predict the oilrecovery from the imbibition mechanisms, and (iv) to determine the criticalwater injection rate at laboratory and field dimensions.
Two types of imbibition experiments were performed, i.e., the staticimbibition test and the d3aiamic imbibition test. The static imbibitionexperiments followed by waterflooding were carried out at ambient, mixedand reservoir conditions to investigate the rock wettability. Theseexperiments demonstrate that Spraberry rock and oil is a very weaMy water-wet system. The static imbibition data were also upscaled to field dimensionsin order to determine the contribution of spontaneous imbibition mechanismto oil recovery and to investigate degree ofheterogeneity in the matrix andnatural fracture systems. Dynamic imbibition experiments were performedusing artificially fractured cores at reservoir conditions to illustrate theactual waterflooding process in naturally fractured reservoirs. The results ofthese experiments were used to generate capillary pressure and to determinethe critical injection rate. Knowledge of the injection rate is helpful to solvethe problem of early water breakthrough, one of common problems ofwaterflooding in naturally fractured reservoirs.
With these two sets ofexperiments, understanding static and dynamicimbibition mechanisms in naturally fractured, low permeability matrix isuseful as a guideline for field development. The results serve as a tool toupscale and predict oil recovery from the imbibition mechanism in naturallyfract\ired reservoirs.
-1'

ACKNOWLEDGEMENT
I would like to express my deep gratitude to my research adviser, Dr.
David S. Schechter, Head of the Integrated Naturally Fractured Reservoir
Study Group, Petroleimi Recovery Research Center (PRRC), for all of his
invaluable gmdance, suggestions, patience, and encouragement throughoutthe course of this study. I also express my appreciation to my academic
advisor. Dr. Robert L. Lee, and my other thesis committee members. Dr. H.Y.
Chen and Dr. Donald Weinkauf, for all of their valuable comments and
suggestions.
I wish to express my gratitude to the Petroleum Recovery Research
Center (PRRC) for the financial support through research assistantship
grant. Appreciation is also extended to the Department of Petroleum and
Chemical Engineering ofthe New Mexico Institute ofMining £ind Technology
for the partial financial support provided during the first semester of the
study.
I also wish to thank Erwin Putra, Dr. Boyun Guo, Hujun Li, Cletus
Scharle, Mary Downes, Bob Svec and Mary Watson for their assistance and
helpful discussions during this study, Ucok Siagian and Liz Bustamante for
their help in correction of the thesis manuscript, Drs. Pudji Permadi, Doddy
Abdassah and Leksono Mucharam for their recommendation to go to this
school, and many thanks are also extended to the entire staff of the PRRC for
their kindness and assistance.
Above all, I dedicate this work to my wife, Ribelti, my son, Febrian, my
parents and my other family members for their love, understanding, moral
support and encouragement during this study.
- II •

TABLE OF CONTENTS
ABSTRACT i
ACKNOWLEDGMENT H
TABLE OF CONTENTS Hi
LIST OF TABLES vi
LIST OF FIGURES vii
CHAPTER 1 INTODUCTION 1
CHAPTER 2 LITERATURES REVIEW 6
2.1 Wettability of Rocks 6
2.2 Imbibition 8
2.2.1 Static Imbibition Experiments 13
2.2.2 D3mamic Imbibition Experiments 14
2.2.3 Effect of Temperature and Pressure on SpontaneousImbibition 16
2.2.4 Scaling of Imbibition Data 18
CHAPTER 3 EXPERIMENTAL DESCRIPTION 20
3.1 Materials 20
3.1.1 Rock Preparation and Properties 20
3.1.2 Brine Compositions 24
3.1.3 Oil Sample 24
3.2 Experimental Procedures 33
3.2.1 Cleaning Process 33
• Hi-

3.2.2 Saturating the Core with Brine 34
3.2.3 Establishing Initial Water Saturation 34
3.2.4 Aging Procedures 35
3.2.5 Spontaneous Imbibition Tests 36
3.2.6 Brine Displacement 45
3.2.7 D3aiamic Imbibition Tests in ArtificiallyFractured System 46
CHAPTER 4 PRESENTATION AND DISCUSSION OF EXPERIMENTALRESUTLS 51
4.1 Static Imbibition 52
4.1.1 Experiment using Berea Cores 52
4.1.1.1 Effect ofTemperature 52
4.1.1.2 Effect ofpressure 60
4.1.1.3 Effect ofInitial Water Saturation 67
4.1.1.4 Effect ofRock Permeability 72
4.1.2 Experiment using Reservoir Cores 74
4.1.2.1 Effect ofAging Time 74
4.1.2.2 Effect of Temperature 79
4.1.2.3 Wettability Index 85
4.1.2.4 Heterogeneity in Rock Properties 88
4.1.2.5 Numerical Analysis ofSpontaneousImbibition 92
4.2 Dynamic Imbibition 96
4.2.1 Experiment using Berea Cores 98
4.2.2 Experiment using Reservoir Cores 104
4.2.3 Critical Injection Rate 112
•IV '

CHAPTER 5 RESERVOIR PERFORMANCE ANALYSIS 115
5.1 Scaling of Imbibition Data 115
5.1.1 Imbibition Recovery Model 116
5.1.2 Production Decline Model 120
5.2 Analysis of Recovery Mechanisms 122
5.2.1 Recovery Based on Scaling of Imbibition Data 122
5.2.2 Recovery Field Performance 132
5.2.3 Sensitivity Study of Imbibition Model 138
5.3 Upscaling of Djmamic Imbibition Data 147
5.3.1 Critical Fracture Capillary Number 147
CHAPTER 6 CONCLUSIONS AND RECOMMENDATIONS 153
REFERENCES 158
APPENDIXES
- V •

LIST OF TABLES
Table 2-1 : Summary of experimental studies of water imbibition 11
Table 3-la : The physical properties of Berea core samples for static imbibitionexperiments 22
Table 3-lb : The physical properties of Berea core samples for d3niamicimbibition experiments 22
Table 3-2a : The physical properties of the reservoir core samples for staticimbibition experiments 23
Table 3-2b : The physical properties of the reservoir core samples for dynamicimbibition experiments 23
Table 3-3 : Synthetic Reservoir Brine 25
Table 3-4 : Properties of Spaberry Crude Oil 25
Table 3-5 : Spraberry Crude Oil Composition 25
Table 5-1 : The average absolute permeability and porosity for both sand units(lU and 5U) in Spraberry Trend Area Reservoir 131
Table 5-2 : Evaluation ofWater Saturation and Current Oil Saturation 134
Table 5-3 : Evaluation of Displacement Efficiency and Volumetric Efficiency onbasis of Cores from Different Wells 138
Table 5-4. : Reservoir parameters as input data 140
Table 5-5 : Fracture Spacing 140
Table 5-6 : Upscaling of dynamic imbibition experiments to determine criticalinjection rate 150
Table 5-7 : Estimated critical injection rates for wells in E.T. O'Daniel pilotarea 151
' VI •

LIST OF FIGURES
. Scliema.tic process ofimbibition flooding in Spraberry Trend Area3
Fig. 3-1 : Variation in viscosity ofsynthetic Spraberry brine with temperature26
Fig. 3-2 : Variation in density ofsynthetic Spraberry brine with temperature27
Fig. 3-3 : Variation in viscosity of Spraberry oil with temperature 28
Fig. 3-4 : Variation in densityof Spraberry oil with temperature 29
Fig. 3-5 : Interfacial tension ofSpraberry oil —brineat elevated pressure 30
Fig. 3-6 : Interfacial tension ofSpraberry oil - brineat elevated temperature31
Fig. 3-7 : Thermal expansion of Spraberry oil 32
Fig. 3-8 : A good correlation was obtained by making comparison ofcorepermeabilities determined &om Minipermeameter and Hassler-sleeve measurements 39
Fig. 3-9 : Spontaneous imbibition glass 40
Fig. 3-10 : High pressure and high temperature of Spontaneous imbibitionapparatus
Fig. 3-11 : Reproducibility of spontaneous imbibition for Crude Oil-Brine andBerea Rocks using glass imbibition cell at reservoir temperaturewith no initial water saturation 42
Fig. 3-12 : Reproducibility of spontaneous imbibition for Crude Oil-Brine andSpraberry Rocks using glass imbibition cell at reservoir temperature
43
Fig. 3-13 : Reproducibility of spontaneous imbibition for Crude Oil-Brine andBerea using glass imbibition cell at reservoir temperature andpressure 44
- Vll '

Fig. 3-14 : Flooding Apparatus
Fig. 3-15 : Experimental apparatus for dynamic imbibition test 49
Fig. 3-16 : Reproducibility of the d3aiamic imbibition flooding result 50
Fig.4-1 : Effect of temperature on the imbibition mechanism for a Spraberryoil, brine, and Berea sandstone system 55
Fig. 4-2 : Effectof temperature on the imbibitionmechanism in terms ofdimensionless time 57
Fig.4-3 : Effect ofchange in temperature on oil recovery by imbibition forcores without an initial water saturation 58
Fig. 4-4 : Effect ofchange in temperatureonoil recovery byimbibition forcores with 42% initial water saturation 59
Fig.4-5 : Effect of confining pressure on imbibition mechanism for cores with35% average initial water saturation. Reference curve is from staticimbibition performed at reservoir condition using refine oil for avery strongly water-wet system 63
Fig.4-6 : Effect of confining pressiire on imbibition mechanism for cores with25% average initial water saturation. Reference curve is from staticimbibition performedat reservoir conditionusing refine oil for avery strongly water-wet system 64
Fig.4-7 : Effect of confining pressure on imbibition mechanism for coreswithout initial water saturation. Reference curve is from staticimbibition performed at reservoir condition using refine oil for avery strongly water-wet system 65
Fig.4-8 : Effect ofpresent ofinitial water saturation for cores were agedforseven days and the imbibition experiments were performed at 138oFand 1000 psi confining pressure. Reference curve is from staticimbibition performed at reservoir condition using refine oil for avery strongly water-wet system 69
Fig.4-9 : Effect ofpresent of initial water saturation for coreswere aged forseven days and the imbibition experiments were performed at 138oFand atmospheric pressure. Reference curve is from static imbibitionperformed at reservoir condition using refine oil for a very stronglywater-wet system 70
- Vlll -

Fig.4-10 : Effect of present of initial water saturation for cores were withoutaging in oil and the imbibition experiments were performed at138oF and atmospheric pressure. Reference curve is from staticimbibition performed at reservoir condition using refine oil for aveiy strongly water-wet system 71
Fig.4-11 : Effect of rock permeability on the imbibition mechanism 73
Fig. 4-12 : Schematic of experimental program using low permeabilitySpraberry cores 75
Fig. 4-13 : Complete oil recovery curves obtained from imbibition experimentperformed at reservoir and room temperature 76
Fig. 4-14 : Effect of aging time on recovery by imbibition 77
Fig. 4-15 : Total recovery (recovery from imbibition and recovery from brinedisplacement) versus aging time to exclude the effects of aging timeon the recovery mechanism 78
Fig. 4-16 ; Effect of temperature in imbibition tests 82
Fig. 4-17 : Effect of change in temperature on oil recovery by imbibition due tochange in mobility of fluid, expansion of oil and reduce in interfacialtension 83
Fig. 4-18 : Effect of aging time on total recovery at elevated temperatures . 84
Fig. 4-19 : Wettability index to water versus aging time for the differentexperiment temperatures 87
Fig. 4-20 : Effect of initial water saturation on recovery by imbibition 90
Fig. 4-21 : Effect of initial water saturation on total recovery 90
Fig. 4-22 : Effect of permeability on recovery by imbibition 91
Fig. 4-23 : Effect of permeability on total recovery 91
Fig.4-24 : Matching between spontaneous imbibition experiment results andnumericsd solution 93
Fig. 4-25 : Water distribution at different imbibition time from x-plane view94
Fig.4-26 : Imbibition capillary pressure obtained from matching ofspontaneous imbibition data 95
- ix •

Fig.4-27 : Schematic representation of the displacement process in fracturedporous media
Fig.4-28 : Results of dynamic imbibition experiment for Spraberry oil, brineand fractured Berea cores 100
Fig.4-29 : Effect of the injection rate on oil recovery versus total fluid producedfor Spraberry oil, brine and fractured Berea cores 101
Fig.4-30 : Water-cut produced during the dynamic imbibition experiment forSpraberry oil, brine and fractured Berea core 102
Fig. 4-31 : The effect of initial water saturation on the dynamic imbibitionprocess at the same injection rate (4 cc/hr) 103
Fig.4-32 : Comparison of recovery for dynamic imbibition experiments usingfractured and unfractured Spraberry core 105
Fig.4-33 : Water-cut during the djmamic imbibition experiment for Sprabenyfractiu'ed and unfractured cores during the dynamic imbibitionprocess 106
Fig.4-34a : Match of oil recovery and water produced for Berea Sandstone .. 108
Fig. 4-34b : Match of oil recovery and water produced for Spraberry reservoirrocks 109
Fig.4-35 : Capillary pressure curves obtained as a result of matchingexperimental data 110
Fig. 4-36 : Effective capillary pressure obtained from simulation, compared tocapillary pressure obtained in the static equilibriimi experimentmethod Ill
Fig. 4-37 : Injection rate versus oil-cut curve for Berea and Spraberry cores 114
Fig.5-1 : Oil recovery curves performed at reservoir condition plotted usingdimensionless variables and compared with oil recoveries curvesperformed at ambient condition 118
Fig.5-2 : Averaging ofimbibitioncurves using Aranofsky equation to fit theimbibition experimental data by adjusting empirical constant X 121
Fig.5-3 : Porosity and absolute permeability ofUpper Spraberry lU Unitversus depth (data taken from Well Shackleford 1-38A) 124
- X -

Fig.5-4 : Porosity and absolute permeability of Upper SpraberrySU Unitversus depth (data taken from Well E.T.O'Daniel 37) 125
Fig.5-5 : Calculated imbibition oil recoveryfor 5 years waterflood from UpperSpraberry lU formation based on scaling of experimental data andfracture spacing of 3.79 feet 126
Fig.5-6 : Calculated imbibition oil recovery for 5 years waterflood from UpperSpraberry 5U formation based on scaling of experimental data andfracture spacing of 3.79 feet 127
Fig.5-7 : History of waterflood recovery profiles from Upper Spraberry lUformation based on scaling of experimental data and fracturespacing of 3.79 feet 128
Fig.5-8 : History of waterflood recovery profiles from Upper Spraberry 5Uformation based on scaling of experimental data and fracturespacing of 3.79 feet 129
Fig.5-9 : Calculated imbibition oil recovery for 40 years waterflood fromSpraberry lU and 5U formations based on scaling of imbibition dataand using the same fracture spacing of 3.79 feet for both sand units
131
Fig.5-10 : Initial water saturation in Spraberry reservoir 134
Fig. 5-11 : Evaluated water saturations after wells have been waterflooded inSpraberry reservoir (data from Guo, 1995) 135
Fig. 5-12 : Effect ofmatrix permeability on imbibition recovery 143
Fig. 5-13 : Effect of matrix permeability on calculation of production rates . 144
Fig. 5-14 : Effect of fracture spacing on imbibition waterflooding 145
Fig. 5-15 : Effect of matrix permeability and fracture spacing to decline ratesconstant 146
Fig. 5-16 : Fracture capillary number versus oil-cut for Berea and Spraberrycores 149
- XI -

Chapter 1
Introduction
In the naturally fractured Spraberry Trend Area of West Texas, the
reservoirs behave considerably differently from conventional reservoirs, due to
the existence of two interconnecting paths i.e. fractures and matrix with
completely different properties. The fractures constitute a continuous path for
fluid flow in the reservoir, while the low permeability matrix blocks are
discontinuous and provide the main storage for oil and gas.
The Spraberry Trend Area originally contained about 10 Bbbls lOIP, of
which less than 10% has been recovered by primary production under solution
gas drive (Elkins, 1953; Schechter, 1996(a) & (b)). The concept of displacement
of the oil from the matrix by capillary imbibition led to implementation of
large-scale waterflooding in the Spraberry Trend. However, after more than 40
years of waterflooding, the current oil recovery in most areas is still less than
15% (Dimon, 1991; Baker, 1996(b), Guo, et al 1998).
-1-

-2-
This study addresses the importance of characterizing the imbibition
mechanism for analysis ofreservoir performance during waterflooding in the
naturally fractured Spraberry Trend Area. Analyzing reservoir performance
during waterflooding is obviously useful before other EOR methods such as
CO2 injection are applied. When waterflooding is performed in this type of
reservoir, the intent is to fill the fractures with water to initiate spontaneous
counter-current imbibition. Using the action of capillary forces, oil from the
interior of matrix blocks is displaced to surroimding fractures. Once the oil is
in the fractures, the water displaces the oil to the producing well by viscous
forces, depending on the volimie of water injected, as illustrated in Fig. 1-2.
Therefore, the imbibition mechanism plays a very important role in recovering
of oil from this reservoir.
Numerous laboratory studies have been conducted regarding this
subject, as can be seen in Chapter 2. However, most of those experiments were
performed using certain types of oil and brine with homogeneous high
permeability rocks (Berea sandstone) as the porous medium, and mostly
conducted at ambient conditions. Thus, the imbibition mechanism based on
those experiments cannot be upscaled to reservoir dimensions since high
permeability rock at ambient conditions may not be representative of low
permeability matrix at reservoir pressure and temperature.

Counter-current exchangemechanism
Invaded Zone
Matrix
Matrix
Fracture
Oil + Water
^ Fracture
Fig.1-1 : Schematic process of imbibition flooding in Spraberry TrendArea.
The purposes of this study are (i) to investigate the interaction between
low permeability Spraberry reservoir rock, oil and brine that affect recovery
mechanisms in the Spraberry Trend Area reservoir; (ii) to upscale the
laboratory imbibition results to field-scale dimensions, (Hi) to predict the oil
recovery from the imbibition mechanisms, and (iv) to determine the critical
water injection rate at laboratory and field dimensions.

-4-
In order to achieve these objectives, two types ofimbibition experiments
were performed, i.e., the static imbibition test and the dynamic imbibition test.
The static imbibition experiment were carried out at ambient and reservoir
conditions to determine the rock wettability. These data were also upscaled to
field dimensions in order to determine the contribution of spontaneous
imbibition mechanism to oil recovery. While, dynamic imbibition experiments
were performed using artificially firactured cores at reservoir conditions to
illustrate the actual waterflooding process in naturally fractured reservoirs.
The results of these experiments were used to generate capillaiy pressure and
to determine the critical injection rate. Quantification of capillary pressure is
vital in imderstanding the imbibition process, where this capillary pressure
can also be used to indicate rock wettability. Knowledge of the injection rate is
helpful to solve the problem of early water breakthrough, one of common
problems ofwaterflooding in natiirally firactured reservoirs.
Chapter 3 describes materials and experimental procedures for the
static and dynamic imbibition experiments conducted in this study. Two types
of porous media were used; Berea sandstone and Sprabeny reservoir rocks.
The Berea sandstone was used to verify the effects of temperature, pressure,
and initial water saturation on the behavior of static and d3aiamic imbibition
mechanisms using Sprabeny oil and brine in a porous medium. The results
show that pressure has less effect on recovery. Thus, the reservoir cores taken
from low-permeability Sprabeny reservoir were used in order to investigate

-5-
static and dynamic imbibition at reservoir temperature and atmospheric
pressure. With these two experiments, understanding static and dynamic
imbibition mechanisms in naturally fractured, low permeability matrix is
useful as a guideline for field development. The results serve as a tool to
upscale and predict the oil recovery from the imbibition mechanism in
naturally fractured reservoirs.
The experimental results of static and d3niamic imbibitions are
presented and discussed in Chapter 4. The rates of imbibition and recovery
mechanisms from both types of experiments were analyzed. The experimental
results were also simulated using a numerical analysis to determine the
matrix capillary pressure curves. Finally, the scaling of experimental results
from static and dynamic imbibition experiments were discussed in Chapter 5
to determine contribution of capillary imbibition mechanisms and critical
water injection rates during full-scale waterflooding in a naturally fractured
reservoir.
The final chapter of this thesis (Chapter 6) concludes the thesis and
proposes recommendation for future studies regarding this subject.

Chapter 2
Literature Review
In this chapter a literature review regarding wettabihty and imbibition
is presented, and the efforts to perform the experiments under representative
conditions are described.
2.1 Wettability of Rocks
The term of wettability is commonly used to describe the ability of a
fluid to wet a solid surface in the presence of a second fluid. Amott (1959)
defined wettability as the relative preference of a particular surface to be
covered by one of the fluids under consideration. The wettability of reservoir
rock is a critical factor in determining the displacement effectiveness and
ultimate oil recovery by driving fluids, such as water in waterflooding.
Quantitatively, the wettability index can be determined after
establishing the initial water saturation using Amott test method, which
-6-

-7-
consists of two parts. The first part is spontaneous imbibition in water and
the second part is followed by forced displacement by water. The amount
fluid expelled by spontaneous displacement is recorded. Numerical value of
this is called index for water, which expressed as:
(2.1)^iw ^ ^dw
where Viw is oil produced from imbibition process and Vdw is oil produced from
displacement process.
Wettability in porous media is generally classified as either
homogeneous or heterogeneous. For the homogeneous case the entire rock
surface has a uniform molecular affinity for either water or oil. Conversely,
heterogeneous wettability indicates distinct surface regions that exhibit
different affinities for oil or water. Three classifications of homogeneous
wetability exist; strongly water-wet, strongly-oil wet, and intermediate-wet.
Two t3rpes of homogeneous wettability are generally recognized. Mixed
wettability refers to distinct and separates water-wet and oil wet surfaces,
which coexist a porous medium. Speckled or spotted wettability refers to
continuous water wet surface enclosing regions of discontinuous oil-wet
surfaces or vice-versa.
Before 1940's, it was widely believed that most oil reservoirs were
strongly water wet because the reservoirs were deposited in a water

-8-
enviromnent and buried for a very long geologic time before oil migrated and
occupied part of the rock pore spaces. This idea was disputed in the early
1940's because some crude oil samples showed an ability to wet sand grains
(Bartell and Miller, 1928) or silica (Benner and Bartell, 1941). Later, the
terms intermediate (Marsden and Nikias, 1962), fractional (Fatt and Klikoff,
1959; Iwankow, 1960) or heterogeneous (Browns and Fatt, 1956), mixed
wettability (Salathiel, 1973) and speckled (Morrow et al., 1986; Cuiec, 1991))
were introduced to indicate types of wetting conditions which are not simply
either strongly water wet or oil wet. In general, quantification of wettability
depends upon the methods adopted in the evaluation. The most common
methods used today are contact angle (Treiber et. al., 1972; Morrow, 1976),
spontaneous imbibition and forced displacements (Amott, 1959; Boneau and
Clampitt, 1977; Cuiec, 1984) and capillary pressure curves (Donaldson et al.,
1969).
2.2 Imbibition
The transfer of fluids by imbibition mechanism can play a very
important role in the oil recovery from most reservoirs during waterflooding.
In naturally fractured reservoirs, the imbibition process may be the dominant
recovery mechanism during water injection. Therefore, understanding the
imbibition process and the key parameters that control the imbibition process
are crucial. The imbibition mechanism can be characterized by its rate and by

-9-
the total amount of fluid displaced, which depends on the wettability. The
imbibition mechanisms have been studied extensively both theoretically and
experimentally in the past. Nimierous publications dealing with these
subjects have appeared in the literature.
In Table 2-1, a selection of published work on imbibition is presented
together with a list of the main parameters that was investigated. As
presented in this table, most of the early experimental studies of imbibition
were made with strongly water-wet system and constant fluid properties [1-
lll*>. Several investigators have introduced changes in fluid properties, rock
properties and boundary conditions [12-20,25-27]. Other experimental
parameters such as exposure of rock to oil, aging temperature, temperature
effect on imbibition mechanism, handling of the crude oil, and all of which
affect wetting properties were taken into account [22,23,26]. A detailed study of
oil recovery from crude oil/brine/rock systems including measurements of
spontaneous imbibition rates has been investigated [19,24]. Lately, the
imbibition studies were focused on fluid exchange mechanism in fractured
porous medium [21,25,27] and upscaling of laboratory to field dimensions [28].
*) Listing number on Table 2-1

-10-
Detennination ofthe imbibition mechanism provides knowledge about
capillary forces and displacement behavior that related to changes in wetting
behavior of system. In laboratory, the imbibition experiments can be
performed under two conditions, which are static and/or dynamic conditions.
In static imbibition experiments, capillary forces only govern the drive
mechanism. While in d3aiamic imbibition process, both capillary and viscous
forces involve during displacement of fluid mechanisms.

-11-
Table 2-1: Summary ofExperimental Studies ofWater Imbibition
No. Author Porous
MediumGeometry Partly open (S)
All open (0)
Forces Type ofFluids
Fluidproperties
S.,
(%)
Wettebility ExperimentalConditions
1. Brownscombe& Dyes(1952)
Spraberrysandstone
CylindersPlates
S + 0 Imbibition WaterX-rayopaque
phenyl
Constant 5.6-
63.3
Stronglywater-wet
Ambient
2. Graham&
Richardson(1959)
Fused quartz Triangular S ImbibitionPressure
Distilledwater
Constant 24 Stronglywater-wet
Ambient
3. Handy (1960) SandstoneLimestone
Cylinders 0 ImbibitionGravity
WaterAir
Constant 0 Stronglywater-wet
Elevated P&T
4. Mettax &Kyle (1962)
AlundumSandstone
CylindersCubes
S-t-0 ImbibitionGravity
Water(^1
Constant 0 Variable Ambient
S. Parsons &Chaney(1966)
Dolomite Cubes S + 0 ImbibitionGravi^
Distilledwater
White
Constant 0 Stronglywater-wet
Ambient
6. Kyte(1970) Sandstone Cylinders 0 ImbibitionGravity
WaterOil
Constant -0 SlighUy Ambient
7. IfHy, et al.(1972)
Siltstone Cylinders S*0 ImbibitionGravity
WaterNapthetnicoil
Constant 11-43 Variable Ambient
8. KleppeAMorse
(1974)
Berea
sandstoneCylinders 0 Imbibition
GravityWater
KeroseneConstant -0 Strongly
water-wet
AmbientElevated
9. Kazemi &
Menu(1977)
Berea
sandstoneCylindersBlocks
s ImbibitionGravity
WaterDiesel
Constant 0 &43 Stronglywater-wet
AmbientElevated
10. Lefebvre duPrey(1978)
Fontaine-bleau
sandstone
CylindersBlocks
s>0 ImbibitionGravityPressure
DistiUedwater
5(V50BayolParaffin/
Constant -0 Stronglywater-wet
AmbientElevated
pressure
11. Torsaeter(1984)
Chaik Cylinders 0 ImbibitionGravity
WaterCrude oil
Constant 2-56 WettabilityindecesfromOto 1
Ambient
12. TorsaeterASilseth(1986)
SandstoneChalk
BlocksCylindersPrism
IneKular
S>0 ImbibitionGravity
WaterPnrnflRn
Variables 0-32 Stronglywater-wet
Ambient
13. Hamon &Vidal(1986)
AlundumSilicate
Sandstone
Cylinders Si-O ImbibitionGravity
Water
Refined oilVariables 8-35 Strongly
water-wet
Ambient
14. Bourbiaux &Kalaydjian(1988)
Sandstone Blocks s ImbibitionGravity
WaterSoltiol 130
Variables 40 Stronglywater-wet
Ambient(68*F and atm
15. Cuiec, et al(1990)
Chalk Blocks
Cylinderss Imbibition
GravityWaterPara£Rn
Variables -3031-48
Stronglywater-wet
Ambient
16. Keijzef&De Vries(1990)
Bereasandstone
Cylinders s ImbibitionGravity
WaterSurfactantn-
hexadeeanen-dodecane
Variables 24 Ambient
17. Ghedan&
Poettmann(1990)
Berea
sandstoneCylinders s + 0 Imbibition
GravityPressure
VariousbrinesPolymersVarious oil
Variables•
Stronglywater-wet
Elevatedpressure

-12-
Table 2.1 (continued)
18. Schechter,et al. (1991)
LimestoneSandstone
Cylinders 0 ImbibitionGravity
Brine
isoctane
isopropanol
Variables 0 Ambient
19. JadhiinandanSt Morrow
U991)
Berea
landstoneCylinders 0 Imbibition
GravityBrineRefine oil
Variables 21-40 Neutral toStrongly
Ambient
20. Peres, et al.(1992)
Sandstonelimestone
Cylinders S ImbibitionGravity
Carbonatewater
Kerosene
Variables Variab
leAmbient
21. Babadagli &Ershaghi(1992)
Berea
sandstoneCylinders S Imbibition
PressureBrine
KeroseneConstant 0 Strongly
water-wet
Ambient
22. Zhou &Morrow
(1993)
Berea
sandstoneCyUnders 0 Imbibition
GravityBrineCrude oil
Constant -25 Stronglywater-wet
Aging atelevatedtempertureImbibition at
23. Babadagli(1994)
BereaSandstone
CylindersGlass beadmodels
S ImbibitionPressure
BrineKerosene
Constant 0 Stronglywater-wet
Ambient
24. Morrow, etal.(1994)
Berea
sandstoneCylinders 0 Imbibition
GravityBrine
Refined oUKerosene
Constant -25 Neutral toStronglywater-wet
Ambient
25. Babadagli(1996)
Berea
sandstoneCylinders 0 Imbibition Brine
KeroseneVariable 0 Strongly
water-wet
Elevatedtemperature
26. Tang,etal.(1996)
Berea
sandstoneCylinders 0 Imbibition
GravityBrine
3 types ofVariable 21-25 Strongly
water-wet
Elevatedtemperature
27. Babadagli(1997)
Bereasandstone
Cylinders S^OImbibitionGravity
Brine
Kerosene Variable 0 Strongly Elevated
28. Guo St
Schechter(1998)
Sprabenysandstone
Cylinder 0 ImbibitionGravity
BrineCrude oil
Constant 30-40 WeaUywater-wet
Ambient

-13-
2.2.1 Static Imbibition Experiments
Spontaneous imbibition or static imbibition is defined as the
displacement of non-wetting flmd by wetting fluid through the action of
capillary forces alone. The process occurs when a porous medium saturated
with non-wetting fluid is brought into contact with wetting fluid. The
magnitude of the capillary force is proportional to the geometry and pore
structure of the porous medium, the interfacial tension between the two
fluids and the cosine of the contact angle.
In term of parameters that affect static imbibition process, several
studies have been performed by different authors and can be classified as
follows:
- size of the rocks sample (Mattax and Kjrte, 1962; Torsaeter, 1985)
- rock characteristics such as porosity, permeability, and local
variations of these parameters (Mattax and Kjrte, 1962; Torsaeter,
1984; Thomas 1984; Hemion and Vidal, 1988)
- low permeability of Chsdk reservoirs (Torsaeter, 1984; Bourbiaux
and Kalaydjian, 1990; Cuiec et al., 1990)
- boundary conditions (Ififly et al., 1972; Hamon and Vidal, 1988;
Bourbiaux and Kalaydjian, 1990)
- wettability (Thomas, 1984; Hjelmeland, 1986; Zhou et al., 1995)

-14-
- fluid properties such as viscosity, density, interfacial tension and
chemical composition of water (Iffly et al., 1972; Cuiec et al., 1990;
Keijzer and De Vries, 1990; Ghedan and Poetmann, 1990;
Schechter et al., 1991; Babadagli, 1995; Al-Lawati and Saleh, 1996)
- aging time and temperature (Zhou et al., 1993)
- initial water saturations (Jadhunandan and Morrow, 1991; Zhou et
al., 1995)
2.2.2 Dynamic Imbibition Experiments
In the fractured porous media, viscous displacement occurs in the
fracture network due to its higher conductivity compared to the matrix, while
an exchange of fluids occurs between these two media. This means that
imbibition process occurs due to continuous flow in fracture.
Brownscombe and Dyesf^l (1952) introduced a concept of the process,
which is called dynamic imbibition, for the Spraberry Trend Area. The
process was visualized in terms of a single fracture in which water is injected
at one end and production is collected at the other end. As the injected water
flows toward the producing end, it imbibes into the matrix and releases the
oil. If the rate of natural imbibition into the matrix is greater than the
injection rate, all of the water will soak into the matrix and only oil will reach
the producing end of the fractures. Any water injected above the rate of
natural imbibition will increase the water oil ratio. The water oil ratio is a
-15-
function of both injection rate and imbibition rate. However, to verify this
concept, instead of dynamic conditions, they conducted a laboratory
imbibition experiment under static conditions on the rate of natural
imbibition for very low matrix permeability, by assuming that the matrix
rock was water wet.
Graham and Richardson^21 (1960) presented the results of theoretical
and experimental studies of dynamic water imbibition. They investigated the
effect of fracture flow rate on the matrix imbibition. They found that
imbibition is rate sensitive and proportional to the square root of matrix
permeability, interfacial tension, contact angle, and viscosity ratio. At high
rates, it is necessary to inject more water to produce the same amount of oil.
Kleppe and Morse^®! (1974) numerically studied the effect of injection rate on
the recovery of oil and experimentally verified the results. Similar study was
performed by Kazemi and MerrilU^l (1977) for high permeability matrix
element (Berea Sandstone) and nimierically verified the results.
Babadagli and Ershaghi^^H (1992) performed laboratory experiments
on tighter matrix elements to define pseudo relative permeability curves for
fractured system. Babadaglit23) (1994) continued this type of laboratory
experiments to examine the influence of the injection rate on capillary
imbibition behavior and saturation distribution in the matrix. They observed
that the limiting value of the injection rate (critical rate) was a function of
maximum matrix capillaiy pressure and matrix permeability.

-16-
2.2.3 Effect of Temperature and Pressure on Spontaneous Imbibition
It is well known that there are numerous possible factors that causes
the difference between the reservoir and the laboratory that can affect
fluids/rock interaction and capillary imbibition transfer, such as
thermodjniamic conditions, i.e., temperature and pressure.
Numerous studies were conducted to investigate the effect of
temperature on imbibition transfer. The results show that there is a tendency
to increase the affinity to water as temperature increases. Hjelmeland (1986)
demonstrated that a strongly oil wet system at room temperature becomes
water wet at higher temperatiwe (60oC). Anderson (1986) observed that
changing the temperature tends to make the core more water-wet at higher
temperatures. Two different effects occur during this change; first, an
increase in temperature tends to increase the solubility of the wettability-
altering compounds. Some of these compounds will even desorb from the
surface as the temperature increases. Second, the IFT and the contact angle
measured through the water will decrease as the temperature increases.
However, other experiment results show the opposite tendency. The
water wettability diminishes when temperature increases. In recent studies,
Jadhunandan and Morrow (1990 & 1995) have demonstrated that Berea
sandstone aged with various crude oils becomes more oil-wet when the aging
temperature of the rock/fluids system increases. They realize that this result

-17-
is difficult to interpret, as the adsorption of polar compounds of oils should
decrease with an increase in temperature. To explain the result, reference is
made to the potential for change in the stability, the solubility or the
dispersal of asphalthenes in the oil phase, as well as to the influence of
temperature on the stability ofwater films.
Regarding the imbibition mechanism, increasing temperature
substantially increases the spontaneous imbibition rate as demonstrated
numerically by Briggs et al. (1988). If the matrix contains heavy-oil, the only
way to increase the efficiency of spontaneous imbibition is to reduce the oil
viscosity by injecting steam or hot water into the reservoir. Zhou et al. (1993)
conducted static imbibition experiments at room temperature on samples
saturated and aged with crude oil at high temperatures. They found that
increasing the aging time and temperature decreased the early time rate of
imbibition ofwater.
Hjelmeland et al. (1986) foimd little difference in contact angles
measured using stock-tank versus live crude at the reservoir temperature
(190oF) and pressure (3800 psi). Mugan (1972) measured water advancing
contact angle of 87° using live reservoir crude oil and S3nithetic formation
brine at reservoir temperature (138oF) and pressure (1200 psi). The water-
advancing contact angle was almost identical (85°), using degassed crude and
brine at ambient pressure and reservoir temperature. In general, pressure
has the little effect on fluid-rock interaction

-18-
2.2.4 Scaling of Imbibition Data
In composite systems, the mechanisms of matrix-fracture counter-
current imbibition have mostly concentrated on the behavior of a single
matrix block. Mattax and K3rtef' J (1962) studied the effect of matrix block size
on the recovery for reservoir scaling purposes. They proposed the scaling
equation based on the theoretical work of Rapoport (1955).
t[) = Ctkm CT 1
(2.1)0 tiw
They showed that the imbibition time required to recover a given
fraction of oil from a single matrix block is proportional to the square of the
distance between fractures. Using this relationship, and by neglecting gravity
and capillary forces, recovery behavior for large reservoir matrix block was
predicted from an imbibition test on a small core sample. The prediction was
then extended to analyze the recovery behavior of fracture-matrix, water-
drive reservoirs in which imbibition is the dominant oil-producing
mechanism.
Later, Lefebvre Du Preyt^oi (1978) presented another reference time for
scaling of capillary imbibition as follows;
tD=' (2.2)

-19-
He investigated the effect of gravity and capillary forces in recovery
processes from matrix blocks (using Fontainebleau sandstone). He compared
centrifugal and conventional imbibition results for various ratios between
capillary and gravity forces. The results indicated that a great discrepancy
exists among the scaled recovery curves corresponding to different block
sizes. The failure of scaling rules was due to the effect of boundary condition,
local heterogeneities, and instabilities in the water sweep.
Cuec et allisi (1990) proposed a modified form of Mattax and Kyte's
dimensionless group for low permeability Chalk, by replacing the water
viscosity with oil viscosity. Zhang et al (1996), on the other hand, combined
the oil and water viscosities as the geometric mean of the viscosity of both
phases. While in terms of rock properties Ma et al (1995) was modified the
dimensionless group by defining the characteristic length as:
4 =
1
(2.3)
Guo and Schechterl^si (1998) applied combination Ma and Zhang's
scaling equation and modified Gupta and Civan*s (1996) analytical equations
to evaluate Spraberry waterflood performances fi'om small core plugs to field
dimensions. However, they performed the static imbibition experiment under
ambient conditions, in stead of at reservoir conditions.

Chapter 3
Experimental Description
This chapter describes the spontaneous and d3niainic imbibition
experiments conducted in this study. Two types of porous medium, i.e. Berea
and reservoir rocks, liquids and chemicals employed in this study are
described. Experimental procedures, including core treatments, spontaneous
imbibition and followed by dynamic imbibition tests are explained in detail.
3.1 Materials
Materials used in this study consisted of Berea outcrop and reservoir
rock samples, S3nithetic brine and crude oil from the Sprabeny Trend Area.
3.1.1 Rock Preparation and Properties.
Two porous media, i.e. Berea sandstone and reservoir rock were used
in this study. Berea sandstone was selected because it is widely used as a
standard porous rock for experimental work in the petroleum industry. These
-20-
-21 -
porous rocks were utilized to study the temperature and pressure effects on
the behavior of Spraberry crude oil in porous medium. The reservoir rock
taken from low permeability Spraberry reservoir formation was used to
measure, model and upscale to reservoir conditions. Restored state core
analysis for this rockwas performed during this experiment.
Berea cores. The core samples were cut from 0.5 blocks of Berea
sandstone. The diameter of all samples was 3.75 cm. The length of the cores
varied between 6.4 to 7.4 cm long. Each dimension is an average value of3 to
4 measurements using a vernier caliper. Before being used, the core samples
were dried at ambient temperature. The samples were then dried in an oven
at 110 °C for at least 3 days and cooled in a vacuum chamber until gas
permeability measurements were conducted. The physical properties of core
samples are listed in Table 3-la and 3-lb for static and d)mamic imbibtion
experiments, respectively.
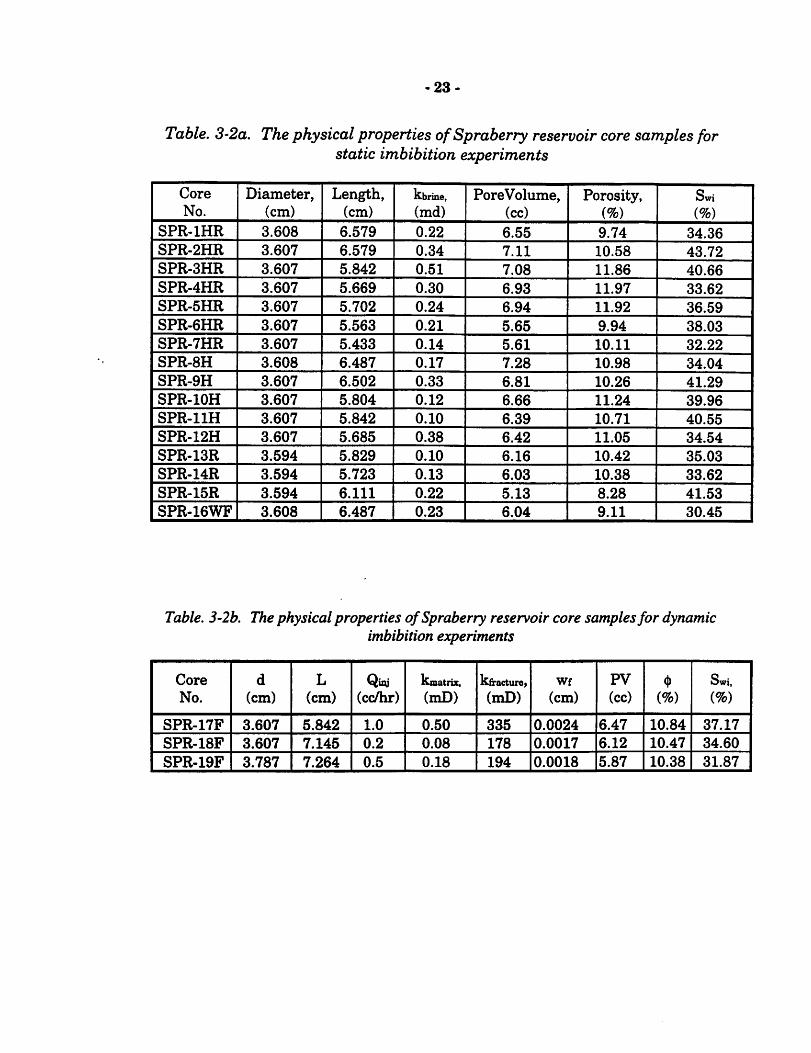
Reservoir cores. The reservoir cores used in this study were
prepared from 4-inch diameter cores taken from the Spraberry Shackelford
Unit 1-38. The cores were cut to 3.80 cm in diameter and about 5.10 cm long.
The air permeabilities of some cores were measured which varied from 0.1 to
1.5 mD. All cores have porosity ranging from 9.5 to 12 percent, and the
absolute permeabilities to brine ranged from 0.10 to 0.51 mD. The physical
properties of the reservoir core samples are presented in Table 3'2a and 3'
2b for static and dynamic imbibtion experiments, respectively.

•22-
Table, 3-la. The physical properties ofBerea core samples
Core Diameter, Length, kbm. ko. Pore Volume, Porosity, Swi,No. (cm) (cm) (mD) (mD) (cc) (%) (%)
B-1 3.620 4.920 74.70 - 8.05 15.90 41.63B-2 3.620 4.610 - 67.87 8.34 17.60 0.00B-3 3.620 4.940 86.13 - 8.10 15.90 41.96B-4 3.620 4.605 - 70.51 8.30 17.50 0.00B-5 3.785 6.769 11.24*> - 9.95 13.10 0.00B-6 3.800 6.167 237.61 - 13.44 19.20 25.60B-7 3.805 6.193 237.99 - 14.76 21.00 35.60B-8 3.810 6.421 245.40 - 15.16 20.70 35.30B-9 3.800 6.477 294.01 - 13.61 18.50 38.30B-10 . 3.800 6.477 - 220.61 13.85 18.90 0.00B-11 3.810 6.525 - 216.75 14.89 20.00 0.00B-12 3.769 5.918 266.79 - 13.46 20.40 25.00B-13 3.602 7.049 - 216.94 13.65 19.00 0.00B-14 3.777 7.264 - 51.17 12.47 15.33 0.00B-15 3.777 7.330 - 37.17 12.19 14.85 0.00B-16 3.787 6.871 78.17 - 13.35 17.26 42.00B-17 3.787 6.894 - 54.70 13.32 17.16 0.00
Note : *)Air permeability
Table. 3-lb. Thephysical properties ofBerea coresamples
Core d L Qiiy kmatrix. kfracture, Wf PV 0 Swi,No. (cm) (cm) (cc/hr) (mD) (mD) (cm) (cc) (%) (%)
B-14 3.603 7.198 8.0 66.74 4876 0.0090 12.47 16.99 0.00
B-15 3.607 7.145 8.0 63.56 5072 0.0093 12.24 16.78 0.00
B-16 3.787 7.264 4.0 64.13 4977 0.0092 12.47 16.82 0.00
B-17 3.607 7.193 2.0 60.44 5456 0.0097 12.75 17.36 0.00
B-18 3.607 7.216 16.0 64.19 5201 0.0094 11.60 15.74 0.00
B-19 3.607 7.391 40.0 63.12 5168 0.0094 11.42 15.14 0.00
B-20 3.787 6.871 4.0 78.17 4003 0.0083 13.35 17.26 42.00
B-21 3.607 6.432 1.0 61.69 5231 0.0094 11.70 17.09 0.00
-23-
Table. 3-2a. The physical properties ofSpraberry reservoir core samples forstatic imbibition experiments
Core Diameter, Length, kbrine. PoreVolume, Porosity, SwiNo. (cm) (cm) (md) (cc) (%) (%)
SPR-IHR 3.608 6.579 0.22 6.55 9.74 34.36
SPR-2HR 3.607 6.579 0.34 7.11 10.58 43.72
SPR-3HR 3.607 5.842 0.51 7.08 11.86 40.66
SPR-4HR 3.607 5.669 0.30 6.93 11.97 33.62
SPR-5HR 3.607 5.702 0.24 6.94 11.92 36.59
SPR-6HR 3.607 5.563 0.21 5.65 9.94 38.03
SPR-7HR 3.607 5.433 0.14 5.61 10.11 32.22
SPR-8H 3.608 6.487 0.17 7.28 10.98 34.04
SPR-9H 3.607 6.502 0.33 6.81 10.26 41.29
SPR-IOH 3.607 5.804 0.12 6.66 11.24 39.96
SPR-llH 3.607 5.842 0.10 6.39 10.71 40.55
SPR-12H 3.607 5.685 0.38 6.42 11.05 34.54
SPR-13R 3.594 5.829 0.10 6.16 10.42 35.03
SPR-14R 3.594 5.723 0.13 6.03 10.38 33.62
SPR-15R 3.594 6.111 0.22 5.13 8.28 41.53
SPR-16WF 3.608 6.487 0.23 6.04 9.11 30.45
Table. 3-2b. The physical properties ofSpraberry reservoir core samplesfor dynamicimbibition experiments
Core d L Quv kmatrix. kfractiire, Wf PV <1) Swi,No. (cm) (cm) (cc/hr) (mD) (mD) (cm) (cc) (%) (%)
SPR-17F 3.607 5.842 1.0 0.50 335 0.0024 6.47 10.84 37.17
SPR-18F 3.607 7.145 0.2 0.08 178 0.0017 6.12 10.47 34.60
SPR-19F 3.787 7.264 0.5 0.18 194 0.0018 5.87 10.38 31.87

•24-
3.1.2 Brine composition
Synthetic Spraberry brine was used in the experiments. It was
prepared by dissolving NaCl and CaCl2.2H20 in distilled water. The brine
compositions are shown in Table 3-5. The viscosity and density of the
synthetic brine at elevated temperature are presented in Fig. 3-1 and Fig, 3-
2, respectively.
3.1.3 Oil samples
Sprabeny dead oil is used in the investigation. Table 3-4 sximmarizes
the physical and chemical properties of the oil samples. The composition of
the sample, determined from gas chromatography analysis, is listed in Table
3-5. The viscosity of Sprabeny oil was determined using Cannon-Fenske
Routine Viscometer and the density was determined using Digital Density
Meter. The plots of oil viscosity and density at elevated temperature are
shown in Fig, 3-3 and Fig, 3-4, respectively. The interfacial tensions (IFT) of
oil/brine systems were also measured using a Pendant Drop instrument and
de Nouy Ring. Fig, 3-5 shows the interfacial tensions of Spraberry oil/brine
at different pressures determined using Pendent Drop. The plot of IFT at
elevated temperature is presented in Fig, 3-6. Both methods show that the
results of IFT measurement at room and reservoir temperature are in

-25
agreement. In addition, the volumetric expansion due to increase in
temperature was also measured and it is shown in Fig» 3'7.
Table- 3-3. Synthetic Reservoir Brine
Salts Content Concentrations (mg/L)
NaCl 122,699CaCl2.2H20 7,497Total Dissolved Solids 130,196
Table, 3-4. Properties ofSpaberry Crude Oil*)
API Gravity @ 60oF 31
Acid Number (mg KOH/ff oil) 0.085 ± 0.022
Base Number (mg KOH/g oil) 2.65 ± 0.040
Density @ 25oC (g/ml) 0.8635
Refractive index @ 20oC 1.47824 ± 0.00007
PRI with n-C7 n/a
Asphalthene ppt with n-Cs (wt %) 0.39
Asphalthene ppt with n-C? (wt %) 0.16
Molecular Weight 180
*) Chang, v., and Buckley, J.S., (1997)
Table, 3-5. Spraberry Crude Oil Composition**)
Components Mole fractions
Ci 0.0211
C2 0.0172
C3 0.0351
C4 0.0212
Cs - Clo 0.5137
Cii - C20 0.2151
C21 - C30 0.0710
C30 - C36 0.0302
0CO
+
0.0740
Total 1.0000
**) Siagian, W.R., (1997)

1.4
1.2-
1.0 •
&-0.8 +
CQO
^0.6 +
0.4-
0.2-
•26.
Reservoirten5)erature
50 70 90 110 130 150
Teccperature, °F
170 190
Fig. 3-1. Variation in viscosity ofsynthetic Spraberry brine withtemperature.

1.090
1.088-
1.086-
1.084 ••oo
&1.082
§g 1.080-1<D
Q1.078 •;
1.076-1
1.074-1
1.072 +
-27-
Beservoir ten^rature
50 70 90 110 130 150
' • I •
170
Tenoperature, °F
Fig, 3-2. Variation in density ofsynthetic Spraberry brine withtemperature:
190

30
25-
Oho
•3 15o
CO
5-
-28-
0 I I I '• I ' I I I I t I I I I I I t I I
0 20 40 60 80 1CX) 120 140 160 180
Temperature, °F
Beservoir temperature
I I I I I I • • • •
Fig. 3-3 : Variation in viscosity of Spraberry oil with temperature.

0.880
0.870 • •
0.860 ••uo
&^ 0.850 ••*w
§o
0.840 +
0.830-•
-29-
Reservoir temperature
0.820-H-•-'--H-*-'-'-H• I • • ' • I '
0 20 40 60 80 100 120 140 160 180
Temperature, °F
Fig. 3-4: Variation in density of Spraberry oil withtemperature.

40
35 ••
30--
g25.:
Si5-:
-30
10.! # IFT at Room Temperature
• IFT at Reservoir Temperature
500 1000 1500 2000 2500 3000
Pressure, psig
Fig. 3-5. Interfacial tension ofSpraberry oil - brine at elevatedpressure.

40
38-
g364
la.fl32
I 300
13 28-f•fH
,cd^126
1A 24
22 +
20
-31-
IFr@room teix^ierature = 30.35 dyne/cmIFr@^:«senroirtenq)erature = 26.22 dyne/cm
Equation:y=35.523e-®"®^
Reservoir teirperature
20 40 60 80
• I • •
100
Tenqjerature, °F
120 140 160
Fig. 3-6 Interfacial tension ofSpraberry oil - brine at elevatedtemperature.
180

-32-
H-*-
80 100 120
Temperature,(°F)
Reservoir temperature
Fig. 3-7. Thermal expansion ofSpraherry oil.
200

-33-
3.2 Experimental Procedures
3.2.1 Cleaning Process
The cleaning process was performed particularly carefully for reservoir
cores. The objective of core cleaning is to remove all organic compounds
without altering the basic pore structure of the rock. The process is the early
step in performing re-established reservoir wettability condition. In order to
clean very tight core samples from the Spraberry formation, traditional
toluene Dean-Stark extraction, which removes water and light components
by boiUng was used. To insure the core sample was really clean, the process
was then followed by injecting chloroform into the core sample under 200 psi
injection pressure until the color of produced fluid was clear. These clean
cores were then dried in an oven at 110 for at least 5 days.
To determine the permeability homogeneity of reservoir rock samples,
the permeability distribution of several reservoir cores were measured using
a Scanning Minipermeameter (SMP). The measurements were performed on
each face of the core samples. Each face of the core samples has nine points of
measurement with 0.5 in x 0.5 in area of measurement. Nine values of
permeability were gathered from one side of core face. Then, these values
were compared with values from the other side of core face. As shown in

-34-
Fig,3-8j core permeabilities determined from minipermeameter compare well
with those determined using Hassler-sleeve apparatus.
3.2.1 Saturating the Core with Brine
Dry core samples were weighed on a balance after measurement of the
air permeability. The core sample was then saturated with deaerated brine
using a vacuum pump for at least 12 hours. After saturating the core samples
with brine, a period of about 3 days was allowed for the brine to achieve ionic
equiUbrium with the rock. The porosity and pore volvmie of the core were
determined from the dry and saturated weights of core sample, bulk volume,
and brine density. The core sample was then inserted into a Hassler core
holder using a confining pressure of 500 psig to measure the core absolute
permeability to brine.
3.2.2 Establishing Initial Water Saturation
The core sample was saturated with oil by injecting oil through the
core confined in a Hassler core holder with a confining pressure of 500 psig to
establish initial water saturation in core.
Berea cores. The oil flooding pressure applied varied from a few psi to
50 psig with oil throughput ranging from 2 to 10 pore volimies, depending on
the initial water saturation desired. In establishing initial water saturation,
the direction of flooding was reversed halfway through the oilflooding cycle to

-35-
minimize unevenness in saturation distribution. The lowest initial water
saturation achieved was 30%.
For lower initial water saturations, high viscosity paraffin oil was
injected into the core sample until initial water saturation was achieved.
About 10 pore-volimies of Spraberry oil then was injected into the core to
displace paraffin oil. The initial water saturation achieved using this method
was about 25%.
Reservoir cores. To establish initial water saturation, oil was
injected into a brine-saturated core. The injection was ceased aiter 2 to 5 pore
volumes oil was produced from the core. The lowest initial saturation
achieved was 32 %.
3.2.3 Aging Procedure
In an oil reservoir the adsorption equilibrium between the rock surface
and the oil is established over the geologic time of the rock-oil system. In an
effort to restore adsorption equilibrium, prior to each of the imbibition tests,
the core samples were aged by immersing the core samples in an oil bath at
the reservoir temperature (60oC) for a certain period of time. To investigate
the effect of adsorption eqmlibrium level on the imbibition process, the aging
period was varied between 3 to 30 days. The Berea core samples were aged

-36-
for seven days while the reservoir cores were aged for 3, 7, 14, 21 and 30
days. As comparison, some ofthe cores were not aged.
3.2.4 Spontaneous Imbibition Tests
To investigate the effect of thermodynamic parameters on the
imbibition mechanism, the imbibition tests were carried out under two
different conditions i.e. Low Pressure High Temperature (LPHT) and High
Pressure High Temperature (HPHT). The temperature of the tests was set
constant at the temperature of the reservoir under consideration which is
about 138 op.
Low Pressure High Temperature (LPHT). The LPHT imbibition
tests were performed using a low pressure imbibition apparatus
schematically shown in Fig. 3-9. As can be seen from the figure, the
apparatus is a simple glass container eqtdpped with a graduated glass cap.
To perform an imbibition test, a core sample was immersed in the glass
container filled with preheated brine solution. The container was then
covered with the graduated cap. Afler fully filling the cap with brine solution,
the container was then stored in an air bath that had been set at a constant
temperature of 138 F. Due to capillary imbibition action, oil was displaced
from the core sample by the imbibing brine. The displaced oil accumulated in
the graduated cap by gravity segregation. During the experiment, the volume
of produced oil was recorded against time. Before taking the oil volimie

-37-
reading, the glass container was gently shaken to expel oil drops adhered at
the core surface and the lower part of the cap so that all of the produced oil
accumulated in the graduated portion of the glass cap. At the early stage of
the test the oil volume was recorded every 1/2 hour while near the end of the
test the oil volume reading was recorded every 24 hoiu*s. Excluding the core
preparation, one test was usually completed within 21 days.
High Pressure High Temperature (HPHT). To simulate the
elevated pressure in the reservoir, an imbibition test at elevated pressure
was designed. The test was performed using an apparatus schematically
shown in Fig. 3-10. The apparatus consisted of a high-pressure imbibition
cell, a brine storage tank, a high-pressure nitrogen gas bottle and a
graduated glass cylinder to collect the produced fluids. Excluding the gas
bottle and the glass cylinder the apparatus was enclosed in a temperature-
controlled air bath.
The imbibition cell, which is the main part of the apparatus, is four
inches in diameter and 6 inches long mounted steel pipe designed to expose a
core to pressurized brine solution. The inlet and outlet ports of the cell were
located at the bottom and the top ends of the cell, respectively. As shown in
the enlarged cross section of the cell in Figure 3-10, the top part of the cell
was equipped with a metal cap specially designed to confine and direct the oil
produced during the imbibition test to flow into the cell outlet port. Also
shown in the cross section is the lower part of the cell was equipped with a

-38-
secondary inlet port which was used to create tangential flow of brine
injected into the cell to help lift and accumulate the produced oil at the top
cap of the cell.
To perform the experiment, the vessel was first filled with preheated
brine solution. A treated corewas then immersed in the cell. After connecting
the top cap with the graduated cylinder and closing the outlet valve, the inlet
port of the cell was then connected to the brine storage tank and pressurized
to the desired pressure. The pressure of the brine solution was created and
maintained by connecting the brine tank to a high-pressure nitrogen bottle.
The oil produced during the imbibition test was collected and recorded
periodically by carefully opening the outlet valve of the cell. The
measurement of produced oil was made eveiy 12 hours. The test was usually
completed within 21 days.
To investigate the reproducibility of the experimental methods used in
this study, each experiment was repeated using cores of similar properties.
The results for low pressure - high temperature tests are presented in Fig, 3-
11 for Berea cores and Fig. 3-12 for reservoir cores. Figure 3-13 shows the
results of tests for Berea cores at HPHT. As shown in the figures, the
reproducibility of the experimental method is satisfactory.

0) 0.5
-39-
=0.9848
0.5 1.0
Mmipermeameter Permeabilities, (mD)
Fig. 3-8.A good correlation was obtained by making comparison of corepermeabilities determined from minipermeameter and Hassler-sleeve measurements.

-40.
Air Bath
Oil recovered
Oil bubble
Glass funnel
Core plug
Fig. 3-9. Spontaneous imbibition cell

AGraduated
Cylinder
N2 tank(2000 psi)
NB = Ball Valve
NV = Needle Valve
PR = Pressure Regulator
-41 -
Air Bath
Side View
Inlet for creatingUttccntiBl Oow
Fig. 3-10. High pressure, high temperature imbibition apparatus.

7:3 20
A-Core B-10, Swi = 0 %
-*-Core B-13, Swi = 0%
Expprimfint Tbmppratairp;
138°F at atmospheric pressure
42-
0.10 1.00 10.00
limB, hours100.00 1,000.00
Fig. 3-11. Reproducibility ofspontaneous imbibition for Crude Oil-Brine and Berea Rocks using a glass imbibition cell atreservoir temperature with no initial water saturation.

25
20--
PhHH
o
5 15t:0)
1^'
5-
0.1
-O-CoreSPR-lHR
-0-CoreSPR-12H
-43-
Experiment Temperature:
138°Fat atmos{dierLC pressure
I I I
10
Time, Hours
100 1000
Fig. 3-12. Reproducibility ofspontaneous imbibition for Crude Oil-Brine and Spraberry Rocks using a glass imbibition cell atreservoir temperature.

A5
40-
35-
Core B-8, Swi = 35.33%
-A-Core B-9, Swi = 38.29%
.44.
T<!xpprimp!rit TV^i iniMm<.nra •
138^at 1(XX) psiocmfinmgpressure
10
TLme,hours
100 1000
Fig. 3-13. Reproducibility ofspontaneous imbibition for Crude Oil-Brine and Berea using a glass imbibition cell at reservoirtemperature and reservoir pressure.

-45-
3.2.5 Brine displacement
To determine the wettability index for water (Iw) quantitatively, after
the core had attained an oil production plateau in spontaneous imbibition,
the core was then transferred to a Hassler Sleeve for brine displacement. The
pressure gradient varied from 4 to 8 psi/inch for Berea core samples and from
60 to 100 psi/inch for reservoir cores, depending on the wetting condition. The
injections were performed under ambient and reservoir temperature. The
flooding apparatus was used for this experimental process as shown in Fig,
3-14.
Eh
Brine
Pump
W
OU
Pump
Ol ti nk Bri
Air Bath
;e mk
Confiningpressure gauge
Core
Fig. 3-14 : Flooding Apparatus,
Graduated
cylinder
•46-
3.2.6 Dynamic Imbibition Tests
In fractured porous media, viscous displacement occurs in the fracture
network due to its higher conductivity compared to matrix. In addition to
that, an exchange of fluids occurs between these two media.. The
displacement process as water is injected into the fractured medium thereby
displacing by the imbibition mechanism is called dynamic imbibition or
forced imbibition.
In order to understand imbibition processes in fractured core, dynamic
imbibition experiments using a low injection rate core flood experiment were
performed. A single fracture on the core sample was generated along the axis
of a cylinderical core by using a hydraulic cutter as shown in Fig.3'15. The
cut section was reassembled without polishing the cut surfaces and without
spacers. Sjmthetic Spraberry brine and oil was used respectively as wetting
and non-wetting phases. In detail, the experimental procedure is described as
follows:
1) After the core dimensions and weight were determined, the core sample
was saturated with brine. The core saturation was performed in a
Hassler-type core holder using a confining pressure of 500 psi. About 2-5
pore volimies of synthetic Spraberry brine were injected into the core
sample using a constant pressure of 30 psi for Berea cores and of 200 psi
for reservoir cores. By measuring brine rate and differential pressure, the

-47-
absolute matrix permeability to brine was calculated. The brine-saturated
core was then weighed to determine pore volume and porosity.
2) The initial water saturation was established by injecting oil into the
brine-saturated core. Once the initial water saturation was established,
the oil permeability at initial water saturation was determined. Then, the
oil-saturated core was taken out from the core holder. To prevent air from
penetrating into the core sample, aluminum foil was used to cover the
core. Then, the core was cut in half to generate artificial fracture
horizontally along the axis of the core using hydraulic cutter.
3) The fractured core was then inserted back into the Hassler-t3rpe core
holder. The effective permeability of the core was then determined by
injecting oil into the core and measuring the differential pressure across
the core and flow rate. The fracture permeability (Guo and Svec, 1998)
was calculated based on the following relations by assuming the fracture
porosity is 1%:
ke=k^+<l>fl^f (3.1)
where ke, km, kf and <fff are the effective reservoir permeability, matrix
permeability, fracture permeability and fracture porosity, respectively.
The fracture width (wf^ in cm) was calculated based on modification of
correlation developed by Seright et al (1996):

-48-
Wf =0.000m^ (3.2)
4) The oil-saturated, artificially fractured core again was taken out from the
core holder to remove oils adhering on the core surfaces. Then, the core
was inserted back into the core holder. The djniamic imbibition test was
performed by injecting brine into the core. In order to allow the injected
brine to flow only through the fracture, the matrix surface was sealed off
at the injection end using a plastic sheet and aluminimi foil. The
experiment was performed at a constant temperature of 138°F. The brine
injection rate was held constant at either of 4.0 and 8.0 cc/hour for Berea
cores and 1.0 cc/hour for Spraberry core. The schematic diagram of the
dynamic imbibition test is presented in Fig, 3-15.
5) During the experiment, the produced oil and brine volumes were recorded
against time. The experiment was terminated when the oil production
ceased. Each test usually was completed within 48 hours.
6) The experiment for cores with zero initial water saturation was basically
the same as that for cores with initial water saturations, except that Step-
1 (brine saturation) was omitted. Brine saturation as described in Step-1
on the procedure is replaced by saturating the core by oil directly. Then,
the procedure is continued from Step-2 to Step-5. The core porosity was
determined by the weight of the oil-saturated core.

-49-
To determine the reproducibility of the imbibition procedure, two series of
tests with different cores at the same experimental conditions were
performed. As shown in Fig.3-16, the reproducibility of the procedure used in
this study is satisfactory for dynamic imbibition tests.
NjTank(2000 psi)
Ruska
Pump Fracture
Air Bath
Brine tank
Confining pressuregauge
Artificiallyfractured core
Matrix
Fig. 3-15, Experimental apparatus for dynamic imbibition tests.
Graduated
cylinder

0.01
First Run
-5K-SecondRun(repeated)1st Run
2ndRun(rq]eated)
j = 8cc/hr=0%
= 138f^
0.1
-50-
QQ curves
1 10
Hme^bours
100
Fig. 3-16. Reproducibility ofthe dynamic imbibition floodingresult *
1000

Chapter 4
Presentation and Discussion of
Experimental Results
In order to understand the interaction between reservoir rock, oil, and
brine in the Spraberry Trend Area reservoir, water imbibition experiments
using Spraberry oil, S3mthetic reservoir brine, and porous media under
reservoir temperature (138 oF) were performed. Two porous media were used
in this study; Berea sandstone and Spraberry reservoir rock. The Berea
sandstone was used to study the effects of temperature, pressure, and initial
water saturation pn the behavior of Spraberry oil and brine in a porous
medium. The reservoir rocks taken from the low-permeability Spraberry
reservoir were used in order to represent reservoir conditions in the
spontaneous and dynamic imbibition experiments.
-51-

-52-
In this chapter, the experimental results of static imbibition and
dynamic imbibition are presented and discussed. Based on study performed
by Putra, et al., (1998), the rate of imbibition and recovery mechanisms in
both types of experiments were also investigated, mathematically modeled,
and nimierically simulated using a commercial simulator.
4.1 STATIC IMBIBITION
4.1.1 EXPERIMENT USING BEREA CORES
The following section presents the experimental results and discussion
on the effect of experiment temperature and pressure on brine imbibition in
Berea sandstone cores. The results of the experimental study on the effect of
initial water saturation and rock permeability on the imbibition process are
also presented and discussed.
4.1.1.1 Effect of Temperature
In considering the effect of temperature, it is necessaiy to distinguish
between the aging temperature (Ta), the imbibition temperature (Timb), and
the displacement temperature (Td). The aging temperature is the
temperature condition applied when core is aged in oil. The imbibition
temperature is the temperature condition when spontaneous imbibition

-53-
experiments are performed. Finally, the displacement temperature is applied
during brine displacement after the imbibition test has been completed.
To investigate the effect of temperature on the spontaneous imbibition
mechanism, two series of experiments have been performed. The first series
was performed at room and reservoir temperature using cores with zero
initial water saturation. The second series was performed at the same
temperature, but using cores with 42% initial water saturation. The brine
displacement temperature depends upon the imbibition temperature of each
test. All preparations before a test were conducted at room temperature and
all cores were prepared without any aging in oil. Based on fluid properties, by
changing the experimental temperature, the viscosity of oil and brine and
interfacial tension between oil and brine are altered (see Fig»3-2 to Fig.3'8).
As is demonstrated in these figures, the values of oil viscosity are 20.6 cp at
room temperature and 5.92 cp at reservoir temperature. The viscosity of
water changes fi:om 1.21 cp at room temperature to 0.68 cp at reservoir
temperature. The interfacial tension decreases fi*om 30.35 dynelcm to 26.22
d3nie/cm when the temperature is increased. All of these parameters are
expected to influence the imbibition process.
The effect of temperature on the rate of brine imbibition is presented
in Fig.4'lf where the recovery of oil produced fi*om the core sample as a
function of time for different imbibition temperatures and initial water
saturations are plotted. The results demonstrate that the rock imbibes water

60
50--
gj400
b30
1d 20 4
10-
0.01 0.1
-55-
Swi s 0%, Reservoir ConditiQn
Swi = 42%, Resezvoir Condition
B-2, Swi = 0%, Room Condition
Swi = 42%, Room Condition
Reference
10 100
Tiiiie» hours
1000 10000
Fig.4-1: Effect oftemperature on the imbibition mechanism for aSpraberry oil, brine, and Berea sandstone system. Referencecurve is from imbibition test using refine oil for a very stronglywater-wet system.

-56-
These results agree with previous studies (Handy, 1960; Anderson
(1986); Reis (1990); Babadagli, 1995; Tang, G.Q., et aL, 1996). If the contact
angle is not affected by changes in temperature, the rate of imbibition
increase with an increase in temperature is can be attributed to changes in
water and oil viscosity, or interfacial tension between oil and water. In
addition, based on known concepts in surface physical chemistry (Anderson,
1986), an increase in temperature tends to increase the solubility of
wettability-altering compounds in the brine. A decrease in the viscosity ratio
of oil and water due to increasing temperature results in oil being recovered
easily and improved ultimate recovery. Figure 4-2 shows the plot of
imbibition curves in terms of dimensionless time, where the effect of viscosity
and interfacial tension are normalized.
To test the sensitivity of the imbibition mechanism to temperature,
after oil recovery ceased at the end of the imbibition test performed at
ambient temperature, the experimental temperature was increased to
reservoir temperature. Figures 4-3 and 4-4 presents respectively the effect of
temperature changing on oil recovery for cores with 0% and 42% initial water
saturation. It can be seen that changing the temperature from ambient to
reservoir results in a dramatic increase in the rate of spontaneous imbibition.
The increase in imbibition rate is related to improvement in recovery, as it is
almost the same as the ultimate recovery for imbibition at reservoir
conditions.

-57-
According to Tang (1996), in contrast to the large change in imbibition
recovery for crude oil, increasing temperature during the course of imbibition
has essentially no effect on refined oil. Therefore, the crude oil^rine/rock
interactions are responsible for the dramatic increase in oil recovery with
temperature increase. Comparable behavior has also been reported for chalk
core samples (Dangerfield, et al, 1985).
§
II
60
; -A-B-2,Swi =0%, Room Temperature
B-3, Swi =42%,Room Tenq)eratuTe 0 Q-O 0—0 00-0- B-4, Swi = 0%, Reservoir Temperature
• -^B-l,Swi = 42%, Reservoir Temperature
Rwm Tgmwrafare;^e =20.6q>yu 3 1.21 q)
IFT s 30.35 dyne/cm
Reservoir Temoerature:
Me s:5.92q>
(iw sO.eSq)
IFT a 26.22 dyne/cm
20-
10-
10 100 1000 10000
Dimensionless Time
100000 1000000
Fig. 4-2: Effect oftemperature on the imbibition mechanism in terms ofdimensionless time.
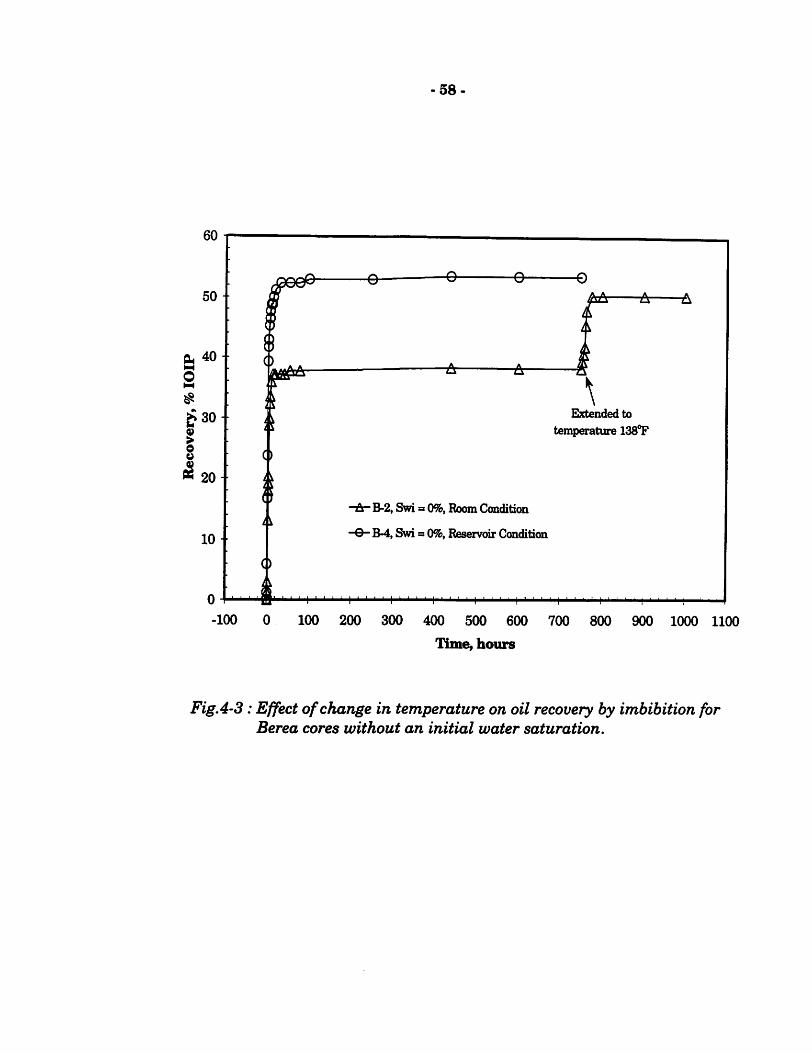
-58-
60
50^ee© ^
t5s A
J?30
II 20
:o-
0 J
-100 0 100 200 300 400 500 600 700 800 900 1000 1100
lime, hours
()
-A-
Extended to
temperature 138°F
-Ar B-2, Swi = 0%, Room Condition
B-4, Swi = 0%, Reservoir Condition
I ' ' I I I i ' • ' ' 1
Fig.4-3: Effect ofchange in temperature on oil recovery by imbibition forBerea cores without an initial water saturation.

45
40
35
2 SO-f
f? 25
I .S 20 4
15 -
10 •
5 -
-100
H
-59-
r-h A
\Extended to
temperature 138 °F
-A- B-3, Swi = 42%, Room Condition
B-1, Swi = 42%, Reservoir Condition
100 200 300 400 500 600 700 800 900 1000 1100
Timey hours
Fig. 4-4 : Effect ofchange in temperature on oil recovery by imbibition forBerea cores with 42% initial water saturation.
-60-
4.1.1.2 Effect of Pressure
To investigate the effect of confining pressure on spontaneous
imbibition, three pairs of imbibition experiments were performed using six
Spraberry oil and/or brine-saturated Berea cores. Each pair was designed for
0%, 25% and 35% initial water saturation. All of these saturated cores were
tested at constant temperature of 138 °F and at variable confining pressure of
atmospheric pressure (13.5 psig) and 1000 psig. For experiments at
atmospheric confining pressure, the LPHT apparatus was used, while HPHT
apparatus was used for 1000 psi confining pressure experiments. To examine
the reproducibility of tests, two additional tests were performed at 1000 psig
confining pressure with 35% initial water saturation and at atmospheric
pressure with 0% initial water saturation. All cores were aged in oil. The
resvilts of these experiments are presented inFig8.4'5 to Fig.4'7.
From Fig.4'5, one can see that all runs have a similar trend in
unbibition curves. In each run, the initial water saturation of core was about
35%. Imbibition Curve-A represents a test result performed at atmospheric
confining pressure and Curve-B is a test result at 1000 psig confining
pressiire. To determine the repeatability of the test, an additional test was
performed using similar material properties with Curve-B. The repeatabihty
of test is satisfactory, as presented in Curve-C. From the figure, it can be
seen that imbibition started at about the same time for all cases. However,
-61 -
increased oil recovery at atmospheric pressure is faster than that at higher
pressure after 0.5 hour of imbibition until no more oil is produced. At high
confining pressure, the rock imbibed brine slowly to expel oil from core;
therefore, the recovery rate at high confining pressure is slightly slower than
that at atmospheric conditions.
Figure 4-6 shows the initial water saturation was reduced to 25%.
From the figure one can see that the early imbibition for the test performed
at 1000 psig confining pressure (Curve B) is slower than that of the test
performed at atmospheric confining pressure (Curve A). It was observed that
the imbibition rate for high confining pressure increased rapidly in middle of
the experiment. Curve B crossed over Curve A after eight hours of imbibition
time. However, the final recoveries for both tests are almost the same.
Furthermore, when the experiments at zero initial water saturation were
performed, as shown in Fi^.4-7, changes in pressure give a slight effect on
imbibition curves at the beginning of imbibition time.
It is shown in Fig»4'5 to Fig,4-7 that when imbibition tests were
conducted at high confining pressure for variations of initial water
saturations of 35%, 25% and 0%, the initial rate of imbibition was slower
than that at atmospheric confining pressure. It was also observed that the
ultimate recoveries of each experiment run were almost the same. However,
for 25% Swi, due to unknown reasons, the imbibition rate increased rapidly in
the middle of imbibition time until the same final recoveries were achieved.
-62-
A method to establish the initial water saturation for cores that have
initial water saturation of 25% was different from that used with the other
cores. The low viscosity of Spraberry oil results in difficulty in estabhshing
initial water saturation below 30%. As mentioned in the experimental
procedure, paraffin oil was used to displace brine until 25% brine remained in
the core. Spraberry oil was then injected for about 3 to 4 PV to flush out all of
the paraffin oil. The different method of establishing initial water saturation
causes imbibition curves for this type of test to be distinguished from the
other two t3rpes of tests.

60
0.01 0.1
-63
SWW
Curve A
Curve C
Curves
Experiment Temperature: 138T
B-7, Swi = 35.73%, P = 13.5 psi
<— Swi = 35.33%, P = 1000 psiA— B-9, Swi = 38.29%, P = 1000 psi
Reference
I I I I 111 ^ —I I 111 lll
1 10
Time, hours
100 1000
Fig.4-5: Effect ofconfining pressure on imbibition mechanism for Bereacores with 35% average initial water saturation. Reference curveis from static imbibition performed at reservoir condition usingrefine oil for a very strongly water-wet system.

60t
50-
£j40o
b30
20-
10-
0.01
sww ..
/
0.1
/•
-64-
\Curve A
ExperimentTenqwrature: 138°F
A B-6, Swi = 25%, P = 13.5 psi
-^B-12, Swi = 25%, P = 1000 psi
Reference
1 10
Tinie, hours
100 1000
Fig.4-6: Effect ofconfining pressure on imbibition mechanism for Bereacores with 25% average initial water saturation. Reference curveis from static imbibition performed at reservoir condition usingrefine oil for a very strongly water-wet system.

70
60-
50
O
^.40
>
§ 30
O 20
10-
0.01
-*~B-13,P=13.5psi"A-B-10,P=13.5psi—^B-ll,P=1000psi
Reference
SWW
/'
/'
-65-
Ejqjeriment Temperature: 138TFInitial water saturation : 0 %
I ii]|
0.1
-M-
1 10
Tiiiie» hours100 1000
Fig.4'7: Effect ofconfining pressure on imbibition mechanism for Bereacores without initial water saturation. Reference curve is fromstatic imbibition performed at reservoir condition using refineoil for a very strongly water-wet system.

-66-
With similar variable conditions in experiments, according to Handy
(1960), the final water saturation increased due to a decrease in confining
pressure during a gas-water imbibition test. However, there are three
examples in the literature indicating that pressure is much less important
than temperature. Mugan (1972) found an identical value ofwater-advancing
contact angle at different pressures. Hjelmeland (1986) found little difference
in contact angles measured at 190°? and 3800 psi compared to measurement
of those at ambient conditions. Recently, Cuiec (1995) concluded fi-om
experimental results that each reservoir is unique and it is currently
impossible to predict the influence of a change in temperature, pressure and
type of oil on the wettability of a rock/fluid system.
In this study, it can be concluded that in terms of ultimate recovery
firom d3aiamic imbibition tests, there is no significant effect in changing
confining pressure. However, in terms of the rate of imbibition, the initial
imbibition rate is slightly slower at high confining pressure than it is at
atmospheric confining pressure. The reason for this might because, the use of
dead oil at ambient temperature and reservoir pressure may change the
wettability because the properties of the crude oil are altered. Light ends are
lost fi:om the crude oil, while the heavy eiids are less soluble, which may
render the core less water-wet.

-67-
4.1.1.3 Effect of Initial Water Saturation
Initial water saturation is an important parameter of the imbibition
process in porous media that does not enter the more basic measures of
wettability, which are made in the absence of the rock. The effects of initial
saturation have been included in previous experiments. Testing of initial
water saturation of 0, 25 and 35% at reservoir temperature with varied
pressure condition of atmospheric and 1000 psig confining pressure indicated
that the initial rate of imbibition decreased with an increase in initial water
saturation. It is also seen that experiments performed at higher initial water
saturation showed of oil recovery by spontaneous imbibition. The results are
shown in Fig8.4-8, 4-9, and 4-10. In those three figures, effects of initial
water saturation on the imbibition mechanism were obtained under different
experimental conditions. In Fig.4'8 and Fig.4'9, the experiments were
performed with seven days aging time at reservoir temperature and
imbibition tests conducted at low and high confining pressures, respectively.
On the other hand, no aging was performed for results shown in Fig,4'10.
The core permeabilities used for experiments presented in Fig,4-8 and Fig,4-
9 were higher than those in Fig.4'10. However, all these experiments were
carried out at the same temperature (138oF).
The efifect of an increase in initial water saturation on the imbibition
rate is related to change in imbibition capillary pressure, decrease in

-68-
volumetric displacement, and water/oil mobility ratio for countercurrent flow.
An increase in initial water saturation and the subsequent increase in water
saturation by imbibition will decrease the capillary imbibition pressure,
which drives the imbibition process. At the beginning of imbibition, relative
permeability to water is very low, while relative permeability to oil is very
high. The water mobility increases more readily during imbibition with an
increase in initial water saturation. Thus as initial water saturation
increases during imbibition there are opposing effects which determine the
imbibition rate; the mobility of the water phase increases while the capillary
pressure, which drives imbibition, decreases. Jadhunandan and Morrow
(1991) explained that the configuration of coexisting water and oil within the
space of the rock during aging also affects this imbibition behavior. If the
initial water saturation is low, the fraction ofdrained surface exposed to oil is
relatively high, then partially emptied pores with a higher water content
tend to have higher oil-water interfacial areas. Imbibition curvatures also
tend to be higher than in equivalent pores with low water saturation, because
the oil-water interfaces associated with water held in the pore comers are
equivalent to a completely water-wet surface.
The effect of increase in initisd water saturation on ultimate recovery is
also related to the capillary pressure in the system. Increase in initial water
saturation will decrease capillary pressure, which results in a decrease of the
ultimate oil recovery.

^40 +
> 30-
-69-
&8,Swi = 35'%\k=:245iid
A-B-12, Swi=2595% k=267 nd
B-11,Swi=0%^ k=217 md
Refeaienoe
Tdavsagjpg
I I I 1111A
Texperiiffint =138PF^xnfining = 1000psi
SWW
1 10
Hme, hours100
FigA-8: Effect of initial water saturation for cores aged for 7 days andimbibition experiments performed at 138°F and 1000 psiconfining pressure. Reference curve is from static imbibitionperformed at reservoir condition using refine oil for a verystrongly water-wet system.
1000

70
60--
50 +CU
o
>30 +
20-
10-'
-70-
-a-B-7, Swi = 35%, k = 238 md
—^ B-6, Swi = 25%, k = 238 md
-5K-B.13, Swi =10%, k = 217 md
Refe-ence
7 days agiDg
/' T«cperiiiient=138* '^confining ~ 13«5 psi
SWW
Fig.4-9 : Effect ofinitial water saturation for cores aged for 7 days andimbibition experiments performed under 138°F and atmosphericpressure. Reference curve is from static imbibition performed atreservoir condition using refine oil for a very strongly water-wetsystem.

TO
60--
50-
PU
0
540
1> 30O
&
10-
0.01
Texperi»ent=138'FPowifining = 13.5 psi
0.1
-TI
SWW
No flffinpr
•e—&4,Swi = 0%
-^B-l,Swi = 42%
Reference
100 1000 10000
Fig.4-10: Effect of initial water saturation for cores without aging in oiland imbibition experiments performed at 138°F andatmospheric pressure. Reference curve is from static imbibitionperformed at reservoir condition using refine oil for a verystrongly water-wet system.

-72-
4.1.1.4 E^ect of Permeability
The core permeabihties were also considered in this study. As a
comparison, two different permeability rocks from Berea cores (which have
201 md and 11 md of absolute air permeability) and one low permeability
rock from Spraberry core (k = 0.6 mD for air) were used to investigate the
effect of rock permeability on the imbibition mechanism. There was no aging
performed for any of these cores before the imbibition test started. The result
of the effect of core permeability on the imbibition process is presented in
Fig.4-11.
The result shows that both the rates of imbibition and ultimate
recoveries of imbibition increase with an increase in absolute permeability of
the rock. This is expected, because; it is easy for brine to imbibe into higher
permeability porous medium.

-73-
60
50-
Bereacore, Air penneability = 201md
-A- Bereacore. Air penneability= 11.24md ,
-0-Sprabenycore. Airpermeabilily =0.60 md
A A—A
' 4 / /
!• wrTxui 1^ 1'Mill 1—1 111lll| -j—' I'll"!
0 0
£S 40O
^30
(S20
10-
0.01 0.1 1 10
Time, hours
100
FigA-11: Effect ofrock permeability on the imbibition mechanism.
1000

-74-
4.1.2 EXPERIMENT USING RESERVOIR CORES
The following section presents the experimental results and
discussions on the effect of aging time, experimental temperature during
brine imbibition and brine displacement, and rock wettability using low
permeability Spraberry cores. During the preparation of cores for the
experiments, the heterogeneity in rock properties was also considered, such
as initial water saturation and rock permeability. The spontaneous
imbibition results using Spraberry oil, S3mthetic reservoir brine and a
Spraberry rock system performed at reservoir temperature can be scaled
from the laboratory model to reservoir scale. A schematic of the experimental
program is presented in Fig, 4^12.
4.1.2.1 Effect ofAging Time
The effect of aging time with crude oil before brine imbibition was
investigated using eleven cores aged in oil at 138 ^F. The aging time varied
from seven to 30 days and for a comparison two cores were not aged in oil. Oil
recovery from spontaneous imbibition tests plotted against time in hours
shows that the rate of imbibition for cores without aging is faster than that
with aging (see Fig, 4-13). Slightly different imbibition rates at the beginning
of the imbibition test are observed for cores aged from seven to 30 days.
However, oil recovery after 21 days of imbibition decreased systematically
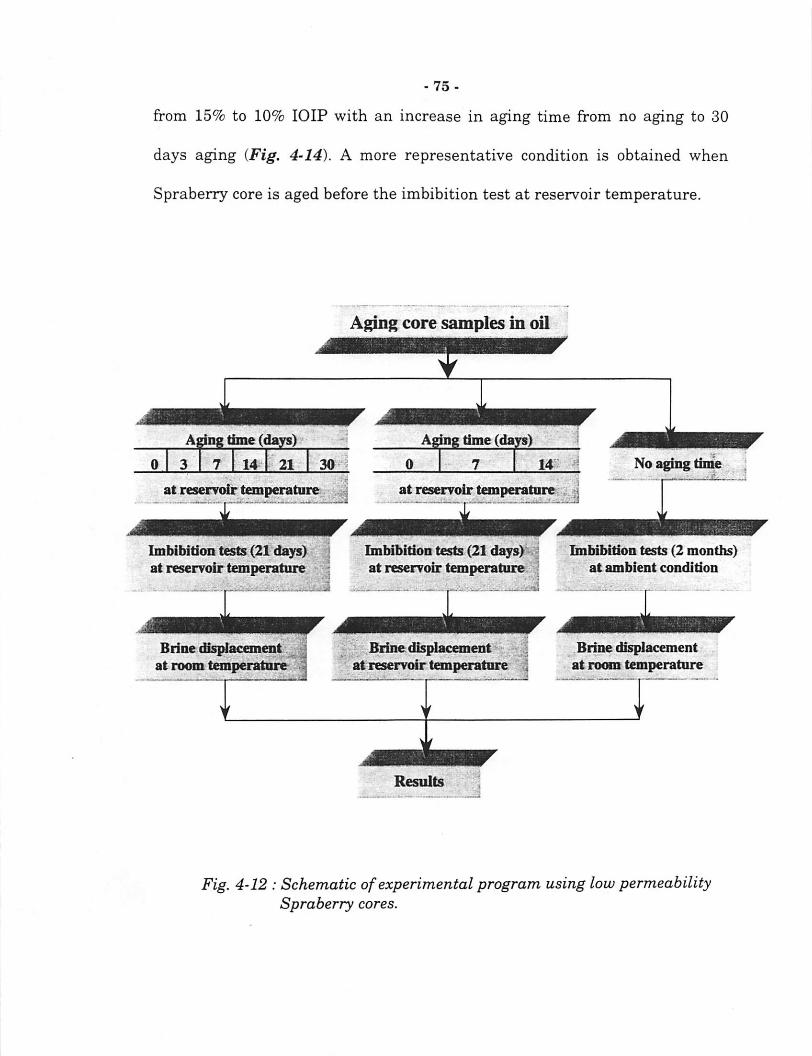
-75-
from 15% to 10% lOIP with an increase in aging time from no aging to 30
days aging {Fig, 4-14). A more representative condition is obtained when
Spraberry core is aged before the imbibition test at reservoir temperature.
Aging core samples in oil
time (days)
14 21
Imbibition tests(21 days) ] Imbibition tests (21 days)'.]at reservoir temperature at reservoir temperature -}
Brine displaconentat room temperature
Brine displacement' at reservoir t^peratnre
Results
Ibnbibition tests (2 months)at ambient condition
Brine displacementat Twm temperature
Fig. 4-12 : Schematic of experimental program using low permeabilitySpraberry cores.

20 -r
18 -J
16
£)l4.i2 ;^12":
^ 10|.s «•:
4.:
2 ••
0.01
-0-Core SPR-IHR
-©-Core SPR.8H-A-CoreSPR-9H
-*-CoreSPR.12H
-♦-CoreSPR-lOH
-•-Core SPR-2HR
*CoreSPR-6HR
—•—Core SPR-5HR
H-CoreSPR-7HR
—^Core SPR-3HR
CoreSPR-llH
-^SPRrl3R
-»«-SPR.14R
-»-SPR.15R
-76-
Time, Hours
Noaging
7 days aging
X ^ 14 days aging
21 days aging
30 days
70 T
100 1000 10000
Fig. 4-13: Complete oil recovery curves obtained from imbibitionexperiments performed at reservoir and room temperature.

-77-
25
20-
g Reservoir Ten^wrature
§ 00 i
•L. V
§0
0
\RoomTemperature
&1S
I§ 10
a
g
-1 14 19
AgingHme, days
24 29
4-i4 ; Effect ofaging time on recovery hy imbibition.
34

-78-
The effects of aging become less important for the recovery mechanism
if force imbibition or brine displacement takes place after spontaneous
imbibition. Figure 4-15 shows a plot of total recovery (i.e., recovery after
imbibition plus recovery after brine displacement) versus aging time. The
total oil recoveries appear to remain constant for cores aged more than seven
days. For the Spraberry, a reasonable time to start the brine imbibition and
displacement test is after the core has aged in oil at reservoir conditions for
at least seven days.
> 30
I • • ' • I
9 14 19 24
Aging Time, ta (days)
Fig. 4-15: Total recovery(recovery from imbibition and recovery frombrine displacement) versus aging time to exclude the effectsofaging time on the recovery mechanism.

-79-
4.1.2.2 Effect of Temperature
Previous experiments using Berea cores show that there is a sUght
effect of pressure on fluid-rock interactions. Some of the literature also
reports that the effect of pressure is much less important than the effect of
temperature. In the spontaneous imbibition experiment using low
permeability Spraberry cores, the temperature effect was taken into
consideration more than the pressure effect. Thus, all experiments for low
permeability Spraberry cores were performed at reservoir temperature and
atmospheric pressure using a glass imbibition apparatus described in
Section 4.1,1.2,
Temperature Effect on Spontaneous Imbibition. A series of
experiments were performed to investigate the effect of temperature on
spontaneous imbibition using a volumetric method. Four Spraberry cores
were used to investigate the effect of temperature during imbibition tests.
Two of these cores were prepared for spontaneous imbibition at reservoir
temperature (138 ^F). The other two cores were prepared for spontaneous
imbibition under ambient conditions (70 ^F). All cores were reduced to almost
the same initial water saturation of about 34%. The preparations to establish
initial water saturation were made at room temperature and there was no
aging of cores in oil performed for this test.

-80-
The effect of temperature on the rate of brine imbibition in low
permeability Spraberry cores is presented in Fig, 4-16. The recovery of oil
produced from the core sample as a function of time for different imbibition
temperatures is plotted. Two measurements were carried out for each
temperature and good reproducibility is indicated in Fig, 4-16. The results
demonstrate that during the process of brine imbibition into low permeability
core, the water is imbibed by rock faster at reservoir temperature than at
room temperature. The ultimate recovery is also affected by the temperature.
Higher ultimate recovery can be expected as the temperature increase with
all other parameter remaining constant.
Similar to the experiments described with Berea cores with Berea
cores, a sensitivity test of the imbibition mechanism to temperature was
performed. After oil recovery ceased at the end of the imbibition test
performed under ambient temperature, the experimental temperature was
changed to reservoir temperature (see Fig, 4'17). As indicated in Fig, 4'17,
changing the temperature from ambient to reservoir results in a dramatic
increase in the rate of spontaneous imbibition, due to change in fluid
mobility, oil expansion and decrease in interfacial tension.
Temperature Effect on Brine Displacement. After imbibition
tests, all core plugs were waterflooded with brine. As shown in the
experimental program presented in Fig, 4-12, brine displacements were
performed under two different temperatures (i.e. room and reservoir

-81-
temperature). Figure 4-18 shows total recovery (recovery after imbibition
plus recovery after brine displacement) versus aging time at elevated
temperatures during the displacement process. The total recoveries for cores
aged more than seven days and flooded by brine at room temperature after
imbibition was performed at reservoir temperature remained constant at an
average of about 35% lOIP. When brine displacement was performed at
reservoir temperature, the total oil recoveries improve to 65% lOIP for
Spraberry cores with and without aging in oil. Increase in temperature
during the brine displacement process appears to increase the displacement
recovery, thus significantly increasing total recovery. It is also shown in Fig,
4-18 that the total recovery was 44% after both brine imbibition and
displacement at room temperature.

0.1
-82-
-0-Core SPR-1HR, Reservoir Temperature
©-Core SPR-12H, Reservoir Temperature
-O-CJore SPR-13R, Room Temperature
-^Core SPR-14R, Room Temperature
10 100
Time, Hours
1000
Fig. 4-16: Effect oftemperature for imbibition tests.
10000

-83-
-0- Core SPR-1HR, Reservoir Temperature
-e-Core SPR-12H, Reservoir Temperature
-A-Core SPR-15R, RoomTemperature
=0
AAA A
/A A—A
I • • ' • I '
\extended to
reservoir temperature
-100 100 300 500 700 900 1100 1300 1500 1700 1900 2100
Time, Hours
Fig. 4-17: Effect ofchange in temperature on oil recovery by imbibitiondue to change in mobility offluid, expansion ofoil andreduce in interfacial tension.
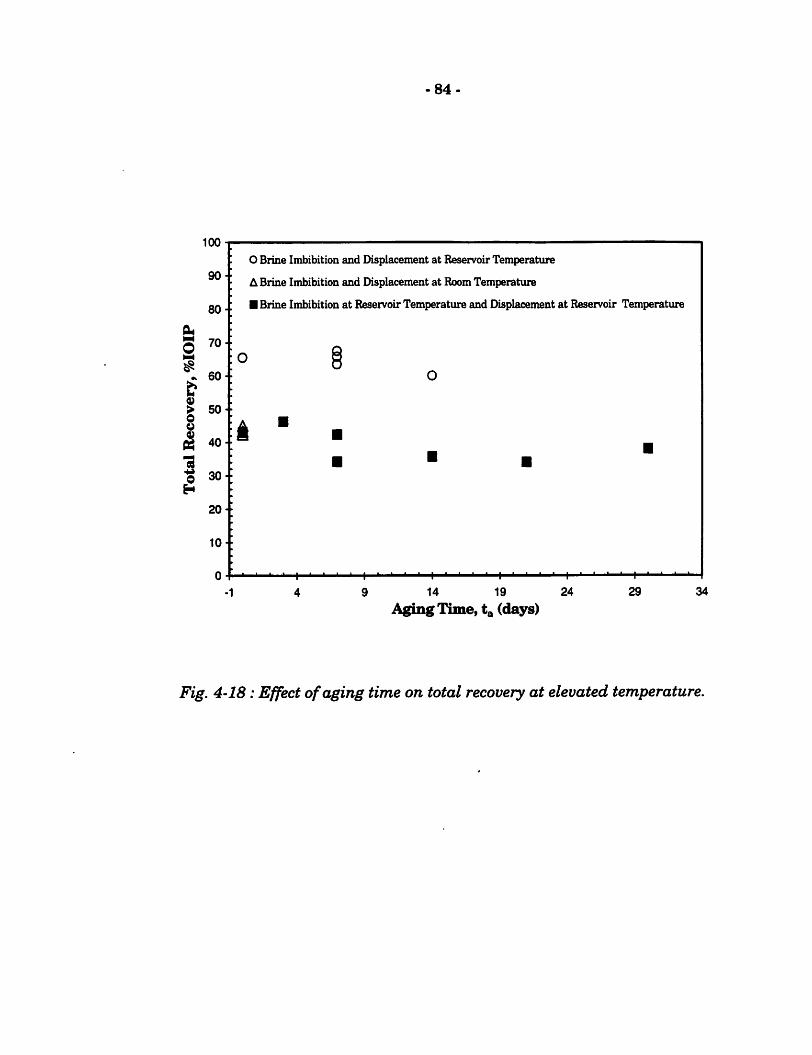
100-r
go-
so-
1 70-
60-
&> 50-0u
& 40-
50 30-
H
20-
10-
0-
-84-
O Brine Imbibition and Displacement at Reservoir Temperature
A Brine Imbibition and Displacement at Room Temperatime
• Brine Imbibition at Reservoir Temperature and Displacement at Reservoir Temperature
i
9 14 19 24
Aging Time, (days)29 34
Fig. 4-18: Effect ofaging time on total recovery at elevated temperature.

-83-
4.1.2.3 Wettability Index
The wettability index is determined on the basis of oil recovery by
imbibition and subsequent brine displacement. The relationship is expressed
as:
WI =^wi ^wf
(4.1)
where Rwi is oil recovery by water imbibition andRwf is oil recovery by water
displacement.
A plot of the brine wettability index, versus aging time for brine
displacement at different temperatures is shown in Fig. 4-19. This figure
shows that the wettability index is about 0.35 for brine imbibition at
reservoir temperatures with brine displacement at room temperature. The
wettability index is 0.24 for both brine imbibition and displacement at
reservoir temperature. This result can be explained as an effect of a low
viscosity ratio between oil and brine at high temperatures. As the
temperatvire rises, the viscosity ratio of oil to brine decreases. The decrease in
viscosity is much greater for oil than for brine. Thus, an increase in
temperature can result in asubstantial decrease in the viscosity ratio of oil to
brine.

-86-
When brine is injected to displace oil at high temperature, a decrease
in the viscosity ratio ofoil and water due to increasing temperature results in
oil being recovered more easily from the core and improvement in ultimate
recovery, due to the higher temperature brine displacement.
As observed previously, oil recovery after brine imbibition decreased
corresponding to aging time. If oil recovery for brine displacement performed
at reservoir temperature is higher than recovery with brine at room
temperature, then based on the wettability index equation (Eq. 4.1), the
wettability index must be lower.
As a comparison, Fig. 4-19 also shows the plot of the wettability index
versus aging time for both brine imbibition and displacement at room
temperatxire. The wettability index is 0.22. This low value is due to low oil
recovery obtained with brine imbibition. This result is close to the wettability
index for both brine imbibition and displacement at reservoir temperatures.
The wettability results shows that performing imbibition tests at
reservoir temperature and displacement tests at room temperature results in
a WI that is approximately 0.3 to 0.4. However, performing both imbibition
and displacement tests at the same temperature (i.e., reservoir temperatiire
or at room temperature) lowers the WI in range of 0.20 to 0.25; thus, the
temperature during the experimental sequence significantly affects
wettability index determination. In conclusion, comprehensive experimental

-87-
data clearly demonstrates that Spraberry reservoir rock is a very weakly
water-wet system.
s
I
1I
0.9
0.8
0.7
0.6
0.5
OA':
0.3':
0.2 ':
0.1 -
O Brine Imbibitionand Displacementat ReservoirTemperature
A Brine Imbibitionand Displacementat Room Temperature
• Brine Imbibitionat Reservoir Temperatureand Displacement at Room Temperature
& 0
0.0
-1
I • ' • ' I ' • • • I • • • • I
9 14 19 24
Aging Time, ta (days)
29 34
Fig. 4-19: Wettability index to water versus aging time for the differentexperimental temperatures.

•88.
4.1.2.4 Heterogeneity in Rock Properties
The initial water saturation and permeability of different low
permeability Spraberry cores were not the same. An imderstanding of the
effects of initial water saturation and core permeability on the recovery
mechanisms is also necessary to resolve scading issues. In this study,
variation of initisil water saturation and permeability using Spraberry cores
are presented in Appendix-F.
Initial water saturations were found to vary from 32% to 43%. Thus,
there is difficulty establishing constant values for initial water saturation in
low permeability matrix. The initial water saturations established in these
cores do not provide a great enough variability to conclusively state that the
initial water saturation does not have an effect on the recovery. However, the
initial water saturation data in this experiment does indicate that for the
range under discussion, both imbibition and total recovery are affected only
slightly, if at all, by the initial water saturations in these cores (see Fig, 4-20
and 4'21), If the initial water saturations have a wide variability, as expected
in the capillary pressure curve where the initial water saturation is related to
the capillary pressure in the system, increase in initial water saturation will
decrease capillary pressure, which results in decrease of ultimate oil
recovery.

-89-
Cores used in this study have variable permeabilities, which ranged
from 0.1 to 0.5 md. To investigate the effect of core penneability on the
recovery mechanism, oil recoveries from imbibition were plotted against
permeability as shown in Fig, 4-22. The results show that the imbibition
recoveries were not significantly affected by core heterogeneity. Total
recovery values indicate no effect from heterogeneity {Fig. 4-23). In
summary, the results show that aging time has a large influence on
imbibition recovery with permeability affecting the imbibition recovery only
slightly.

40
7
35
&230
h2
5
S«2
0
01
5
saS10
15
+
-9
0-
•B
rineIm
bibitionat
ReservoirT
emperature
andD
isplacementat
Room
Tem
perature
AB
rineIm
bibitionand
Displacem
entat
Room
Tem
perature
OB
rineIm
bibitionand
Displacem
entatR
eservoirTem
perature
jfje"
02
04
06
08
0
Initia
lW
ate
rS
atu
ratio
n(S
^i),%P
V
Fig.
4-2
0:E
ffectofin
itialw
atersatu
ration
on
recoveryby
imbibition.
10
0
90
•
370-
i60-
I§5
0-
&§-
330-
^.0-1
0•
0-
•B
rine
Imb
ibitio
nat
Reserv
oir
Tem
peratu
rean
dD
isplacem
enta
tR
oomT
emp
erature
AB
rine
Imbibition
and
Disp
lacemen
tat
Room
Tem
peratu
re
OB
rine
Imbibition
and
Disp
lacemen
tat
Reservoir
Tem
peratu
re
8Sa
"
10
0
20
40
60
Initia
lW
ate
rS
atu
ratio
n(S
^i),
80
10
0
PV
Fig.
4-2
1:E
ffectofin
itialw
atersatu
ration
onto
talrecovery.

-91-
fiu
O
25 -
O Brine Imbibition and Displacement at ReservoirTemperature
A Brine Imbibition and Displacement at Room Temperature
• BrineImbibition Reservoir at Temperature and Displacement at Room Temperature
^ 20
>O
1'^o
:-210A•p4
a5
o •
A A
OO
0.00 0.10 0.20 0.30 0.40
Permeability, md
Fig. 4-22: Effect ofpermeability on recovery by imbibition.
0.50 0.60
euM
o
100
fu
&
I
O Brine Imbibition and Displacement at Reservoir Temperature
A Brine Imbibition and Displacement at Room Temperature
• Brine ImbibitionReservoirat Temperature and Displacementat Room Temperature
i ° 0>o o
o
^ A •A•
•
• • ••
0.00 0.10 0.20 0.30 0.40
Permeability, md
0.50 0.60
Fig. 4-23 : Effect ofpermeability on total recovery.

-92-
4.1.2.5 Numerical Analysis of Spontaneous Imbibition
The imbibition process was also simulated numerically, based on
spontaneous imbibition data, to investigate the effect of key variables on the
static imbibition rate. A fully finite-difference implicit scheme was developed
to solve non-Unear diffusion of the spontaneous imbibition equation
(Schechter, 1998). The numerical results matched satisfactorily with the four
spontaneous imbibition experiments as presented in Fig,4-24. The distance
of water imbibed into the core plug is demonstrated by the water satiu-ation
profile as shown in Fig, 4-25. As time increases, more water is imbibed into
the core plug and in turn, more oil is recovered. The ability of water to soak
into the rock is weak, only 0.6 cm into the core plug after 200 hours with the
oil volume recovered less than 14% lOIP. This mechanism is caused by low
capillary pressure diiring displacement of oil by water. The effective capillary
pressure during the displacement process is presented in Fig. 4-26.

0.8 1
0.7 -
^0.6-w
0.5 -
O© 0.4 is
5 0.3 -o
>0.2 -
0.1 -
0 ^
1
-93-
—Numerical Solution
o SPR-8H
• SPR-9H
♦ SPR-7HR
• SPR-11H
100 10000
Time (Sec)
• •
1000000 100000000
Fig.4-24 : Matching between spontaneous imbibition experiments resultsand numerical solution.

-=^0.80
o
2 0.60LL
W 0.40
0.00-1
0.5
1hr-o-20hr
-94-
1.5 2
x-Plane(cnf^
50 hr-o-100 hr150 hr
2.5
200 hr
Fig. 4-25: Water distribution at different imbibition time from x-plane view.

0.025
^ 0.020 +•pN
ft
9 0.015 +
I>» 0.010
&0.005-
0.000
-95-
0.4 0.5 0.6 0.7
Water Saturation, (%FV)
Fig.4-26: Imbibition capillary pressure for Spraberry reservoir rockobtained from matching ofspontaneous imbibition data.

-96-
4.2 DYNAMIC IMBIBITION
A series of dynamic imbibition experiments were performed using
Berea sandstone and Spraberry reservoir rocks to investigate fluid
interaction between matrix and fracture. During the dynamic process, viscous
displacement and imbibition mechanisms are involved. In this type of
experiment, a viscous pressure gradient is created by injecting the wetting
flmd through the fracture continuously. Wetting fluid (brine) flowing in the
fracture is imbibed by the matrix element thereby displacing non-wetting
fluid (oil) into the fracture. The schematic representation of this process is
presented in Fig, 4-27. The displacement of oil in the fracture is due to the
applied viscous gradient, whereas the displacement of oil in the matrix is
achieved only by capillary pressure.
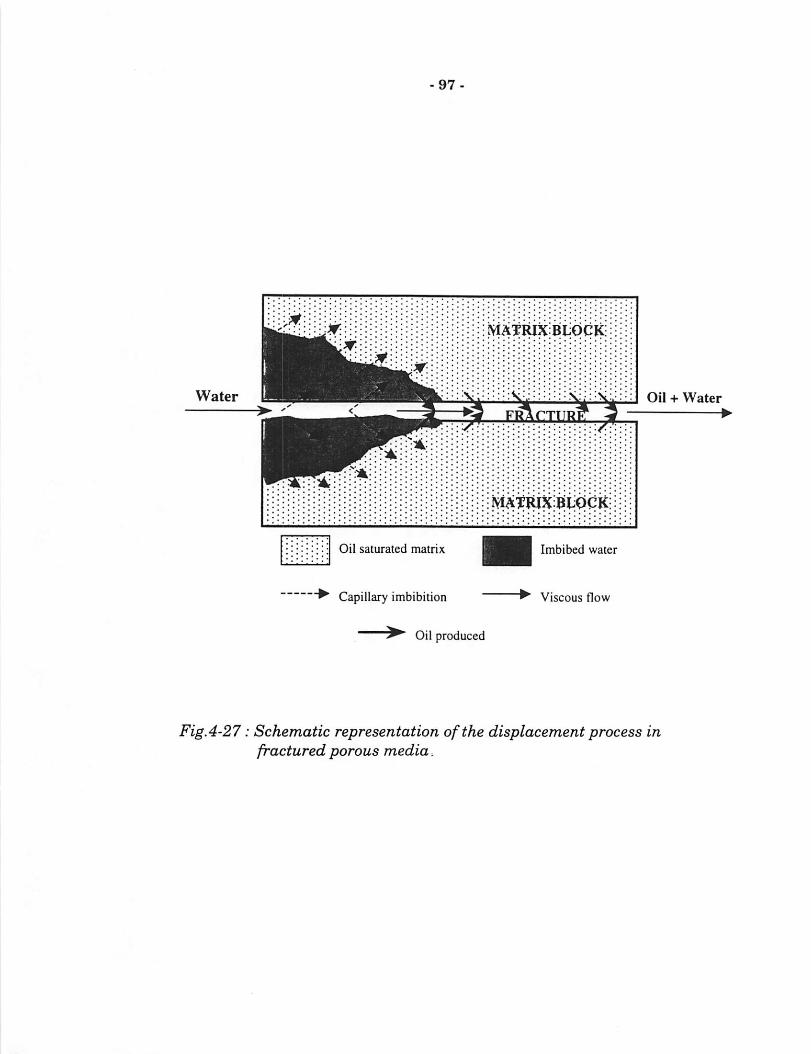
Water Oil + Water
Oil saturated matrixOi Imbibed water
Capillary imbibition Viscous flow
Oil produced
Fig.4-27: Schematic representation of the displacement process infractured porous media .

-98-
4.2.1 EXPERIMENT USING BEREA CORES
An artificially fractured core was designed and water injection
experiments were conducted at different rates {i.e., 1, 2, 4, 8,16 and 40 cc/hr).
Foreach experiment, the core was stored in a core holder at 500 psi confining
pressure. All the oil was stored in the matrix, and there was no oil in the
fracture. The initial water saturation for all cores in this set of experiments
was zero. During the experiment, brine was injected at a constant rate and
recovery was monitored versus time.
The oil recovery curves versus time for continuous flow in the fracture,
obtained by varying the brine injection rate of 1, 2, 4, 8, 16 and 40 cc/hr are
presented in Fig. 4-28. In the experiment, it was observed that increasing
injection rate caused faster recovery. However, the ultimate recovery for all
cases is almost the same. Figure 4-29 shows a plot of oil recovery versus
total amount of produced fluid. The recovery curves seen in this figure imply
that once capillary imbibition is initiated (i.e., the first drop of water
penetrates the matrix), imbibition is continuous until the recoverable amount
of the oil in the matrix is displaced by capillary imbibition. However, the oil
recovery rate of this process is different at each injection rate. As the
injection rate is increased, the brine tends to flow in the fracture because of
the high fracture-matrix permeability ratio, which results in slower oil
recovery until ultimate recovery is approached. Because faster injection rates

-99-
allow water a shorter time to contact the matrix, the result is weaker
capillary imbibition. In Fig»4'30, the water-cuts at different injection rates
were also plotted against time. The plot indicates that an increase in the
injection rate causes higher water-cut, which results in significantly faster
water breakthrough.
Figure 4-31 shows the effect of initial water saturation on the
dynamic imbibition process at the same injection rate (4 cc/hr). The initial
water saturation for djniamic imbibition is a similar to that for static
imbibition. When initial water saturation is not present in the core, the rate
of oil recovery is slower than it is for a core with initial water saturation.
However, ultimate oil recovery for core without initial water satviration is
higher than it is for core with initial water saturation due to the capillary
pressure effect.

O 20-
0.01
Qinj = Icc/hr
-A-Qinj =2cc/hr
-O-Qiiq =4cc/hr
Qu\j = 8 cc/hr
Qiiy = 8 cc/hr (repeated)Qily = 16 cc/hr
Qinj = 40 cc/hr
0.1
-100-
10
Time, hours
Fig.4-28: Results ofdynamic imbibition experiment for Spraberry oil,brine and fractured Berea cores.
100

0.01
Qiiy = Icc/hr
-A-Qiiy =2cc/hr
-O-Qiiy =4cc/hr
-Q-Qinj = 8cc/hr
-5K-Qinj = 8 cc/hr (repeated)
Qinj s 16 cc/hr
•;>- Qinj = 40 cc/hr
0.1
-101-
10 100
Total Production, PV
Fig.4'29: Effect of injection rate on oil recovery versus total fluidproduced for Spraberry oil, brine and fractured Berea cores.

^0.6
-•-Qinj = lcc/hr= 2a^
-O-Qinj =4o(yhr-©-^j sScolir-5K-Qnj = 8 cc/hr(repeated)-♦-C^j =16oc/hr
=40cc/hr
0.01 0.1
-102-
10 100
Tune, hours
Fig.4-30Water-cut produced during the dynamic imbibition experimentfor Spraberry oil, brine and fractured Berea core.

70
60 ••
50 •
I40 •
t30 • •
20 •
10 •
0.01
-O- Qiiy = 4 cc/hr, Swi = 0%
-dr- Qiiy = 4 cc/hr, Swi = 42%
-103-
Time, hours
100
Fig. 4-31: The effect of initial water saturation on the dynamic imbibitionprocess at the same injection rate (4 cdhr).
-104-
4.2.2 EXPERIMENT USING RESERVOIR CORES
An extension of the dynamic imbibition experiment was performed
using low-permeability Spraberry rock as a porous medium. Four Spraberry
cores were used in this experiment. Three cores were designated as fractured
core with djoiamic imbibition investigated at different injection rates. The
other core was designated as an unfractured core. The experiments were
carried out for 70 hours. The results are presented in Fig.4-32, If unfractured
core is compared with fractured core at the same injection rate of 0.2 cc/hr,
brine displaces oil in a piston-like process in the unfractured core with an
ultimate recovery of about 55% lOIP at the production end. The ultimate
recovery of the fractured core was lower than it was for unfractured core (30%
lOIP). Obviously, this is due to a difference in displacement mechanisms. The
experiment using unfractured core is piston-like displacement, while
countercurrent imbibition and viscous displacement were involved in the
fractured core.
For fractured cores with different injection rates (i.e., 0.2, 0.5 and 1.0
cc/hr), the behavior was similar to that of fractured Berea cores. Faster
injection rates resulted in a slower rate of oil recovery, while the ultimate
recovery approached the same value (see Fig. 4-32). The reason is that
increasing injection rate decreases contact time with the matrix in the
wetting phase resulting in weaker capillary imbibition transfer. This effect

-105-
can also be observed experimentally by plotting time versus water-cut, as
presented in Fig. 4-53, where an increase in the injection rate results in
higher water fraction, and simultaneously, faster water breakthrough.
0.50
Unfractuied core, Qii\j = 0.2 cc/hr
-O-Fractured core, Qiiy = 0.2 cc/hr
Fractured core, Qiiy = 0.5 cc/hr
-^Fractured core, Qiiy s 1.0 cc/hr
1.00 1.50 2.00 2.50
Total Production, PV3.50
Fig.4-32: Comparison ofrecovery for dynamic imbibition experimentsusing fractured and unfractured Spraberry core.

-106-
A A A
Ibfiractured one, Qinj = 0.2 cc^
HD-FVactured core, Qinj = 0.2
Fractured core,Qiifl= 0.5 oc/hr
FVacturedOOTe, Qig s 1 colir
30 40 50
Tiliie, hours
Fig.4-33: Water-cut during the dynamic imbibition experiment forSpraberry fractured and unfractured cores during thedynamic imbibition process.
-107-
The experimental data from fractured Berea and Spraberry core
experiments were then matched by numerical modeling using an ECLIPSEtm
simulator (Putra, 1998). The experiment data were taken from the recovery
curves with four cc/hr and one cc/hr injection for Berea and Spraberry cores.
In the ntunerical modeling of the imbibition flooding process, the matrix
capillary pressure controlling the imbibition mechanism was the primary
parameter, adjusted to match the experimental data. Meanwhile, the fracture
capillary pressure was set to zero. The oil recovery and produced water were
used as parameter for matching between observed experimental data with
the numerical model. The final matches can be seen in Fig8.4-34a and 4'34b
for Berea and Spraberry, respectively. The effective capillary pressure for
Berea and Spraberry cores which match the experimental study are shown in
Fig8.4'35. The matrix capillary pressure from dynamic imbibition
experiments indicates that wettability of Berea core is more water-wet than
Spraberry core. Thus, the imbibition capillaiy pressure is more dominant in
Berea core than Spraberry core. Figure 4-36 shows the plot of the capillary
pressure determined from matching of dynamic imbibition experimental data
from Spraberry core. This capillary pressure curve is compared with the
capillaiy pressure curve determined experimentally using a static
equilibrivmi method from a previous study (Schechter, 1997).

- 108.
WO = ^ =ROCUC£i:? VS 'IVIE M3io got vs ~ VE obs
CUMM. Oii_ PRODUCTION <CC)
^ o .. p.. 0 -
V'"Id'
30.0TIME (HOURS)
Figure 4. 18/06/98 at 17:13:25
1BO.O
1 60.0
1 AO.O
120.0
lOO.O
ao.o
60.0
♦o.o
20.0
O.O
O O QWT VS TIME OBSWWPT PRODUCER VS TIME IMBI
CUMM. WATER PRODUCTION (CO)
,<s
20.0 30.0TIME (HOURS)
Figure 2 18/06/98 ot 17:10:51
O O 0
,0
a'
Fig.4-34a : Match ofoil recovery and water produced for BereaSandstone.

-109-
WOPT f=RODoC£R VS TIME IM3lO QOT VS Time OBS
CUMM. OIL PRODUCTION (CC)
A.O r—
Qinj = l.Occ/hrSwi = 36.6%Wf =0.0024 cmkf =335 md
<90
o.o.1 o.o 20.0 30.0
time (HOURS)
Figure 4- 18/06/98 ot 17:13:25
1 60.0
1 60.0
1 ■♦O.O
1 20.0
1 OO.O
ao.o
60.0
AO.O
20.0
O.O
O QWT VS time OBS-- WWPT PRODUCER VS TIME IMBI
CUMM. WATER PRODUCTION (CC)
Qinj = 1.0 cc/hrSwi—36,6%Wf = 0.0024 cmkf =335md
rOW
-OO'O'
TIME (HOURS)
Figure 2 18/06/98 at 17:10:51
.''0
Fig.4-34b : Match ofoil recovery and water produced for Spraberry reservoirrocks.

-110-
0.3 0.4 0.5 0.6
Water Saturation, (%PV)
Fig. 4-35: Capillary pressure curves obtained as a result ofmatchingexperiment data.

30
25--
t6
« 20a
Imbibition
-Ill-
•Pc deteminedexperimentally at roomtemperatiire
' Pc determined bynimierically at reservoir temperatiire
Drainage
0.4 0.5 0.6 0.7
Water Saturation (PV)
1.0
Fig.4-36: Effective capillary pressure obtained from simulation, comparedto capillary pressure obtained in the static equilibriumexperiment method.

-112-
4.2.3. CRITICAL INJECTION RATE
According to Babadagli (1994), when the injection rate increases and
reaches a certain value, there is no capillary imbibition because the contact
time with the matrix was not long enough. Based on this mechanism, the
limiting value of injection rate can be defined for an efficient capillary
imbibition transfer, which is defined as a critical injection rate.
The critical injection rate is the rate at which the injected fluid does
not contact the matrix long enough to initiate capillary imbibition. Thus,
water flows only in the fracture displacing the oil and no matrix interaction
occurs.
The critical injection rate is related to the oil production from the
matrix and the injected amount of wetting phase to recover oil in the matrix.
It can be defined as oil-cut which means the ratio of oil produced from the
matrix (OPFM) by capillary imbibition to the total amount of injected water
(TIW) to recover that much oil. If only the oil in the fracture is recovered, this
ratio becomes zero, which means there is no matrix interaction with fluids.
In this study, injection rate versus oil cut (OPFM/TIW) plots for Berea
sandstone and Spraberry reservoir rock samples are shown in Fig, 4'37.
According to the experimental observation, the curves will intersect the x-
axis because the oil-cut approaches zero at a certain rate. Based on
-113-
exponential correlation to fit experimental data using Berea cores, increasing
the injection rate results in constant of ratio of oil produced form matrix and
total injected water. The limiting injection rate value is the point where the
curves bend and beyond this point the curves are essentially constant. The
limiting values were defined as the critical rate for djoiamic imbibition in
fractured Sprabeny and Berea cores and are marked by arrows in Fig. 4-37.
An exponential correlation is used to fit the experimental data. Then, the
injection rate beyond experimental points can be approximated. The critical
rate for dynamic dynamic imbibition performed with Spraberry reservoir rock
was found to be 5 cc/hr. These vedues can be upscaled to reservoir dimensions
by introducing a dimensionless variable which we refer to as the Fractured
Capillary Number (FCN).
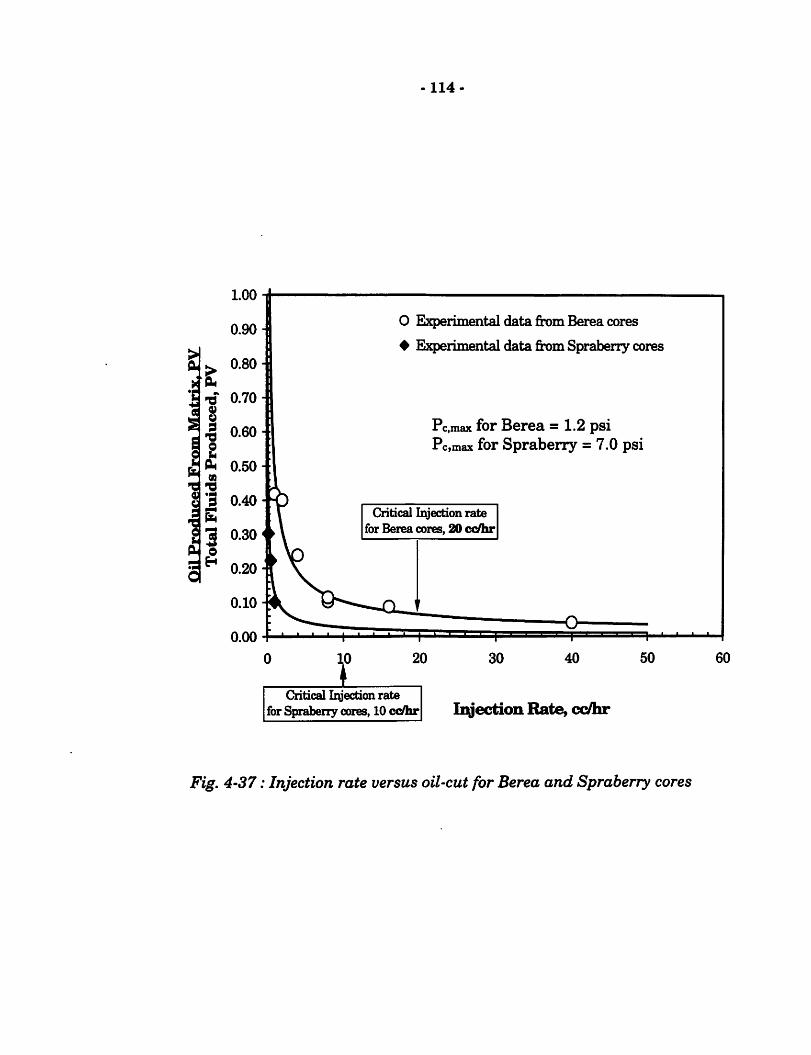
1.00
0.90
q. ^ 0.80 -
I 'O 0.70 -
0.50-
'3 0.40S3 0.30
^ 0.20
0.10
0.00
-114-
O Experimental data from Berea cores
♦ Experimental data fit)m Spraberry cores
c,max for Berea = 1.2 psifor Spraberry = 7.0 psi
Critical Injection ratefor Berea cores, 20 cc/hr
Critical Injection ratefor Spraberry cores, 10 cc/hr Injection Rate, cc/hr
Fig. 4-37: Injection rate versus oil-cut for Berea and Spraberry cores

Chapter 5
Scaling of Static and Dynamic Imbibition
Mechanisms
In this chapter, the static and dynamic imbibition results are upscaled
to field dimensions. The contribution of spontaneous imbibition on oil
recovery mechanism in the West Texas Spraberry reservoir is evaluated on
basis of static imbibition experimental data. The critical water injection
injection rate during the waterflood process is determined based on djniamic
experimental data.
5.1 SCALING OF STATIC IMBIBITION DATA
The anal3rtical model for describing oil recovery by water imbibition
was developed by Aronofsky et al (1958). This recovery model can be applied
using small reservoir core samples to scale the laboratory imbibition data to
field dimensions. All laboratory parameters are converted into dimensionless
forms (Mattax and Kyte, 1962). :he following conditions must be met for
-115 -
-116-
scaling imbibition: (t) the gravity effects are negligible, (ii) the rock type used
in the laboratory must be identical to that of the matrix block of the
reservoir, {Hi) the wettability and relative permeability represents the matrix
block, (iv) the capillary pressure functions for the matrix block and the
laboratory model must be related by direct proportionality through Leverett's
dimensionless J-function, (y) the viscosity ratio of oil to water must be
duplicated.
5.1.1 Imbibition Recovery Model
In order to apply the experimental imbibition data to field scale
imbibition waterflooding, the dimensionless time (to) initially proposed by
Mattax and Kyte (1962) and then modified by Ma et al. (1995) is used:
tp = Ctkm <7 cos(g) (51)
where t is imbibition time, C is a constant, km is permeability, 0 is porosity, a
is interfacial tension, Hg is the geometric mean of viscosity, and d is the
contact angle. The characteristic length, Lc, of the matrix block is given in
another relation defined by Ma et al (1995):
(5.2)" A
/=I "^Ai
-117-
In the above equation V is the volume of a matrix block where there are n
fracture faces exposed to imbibition, Ai is the surface area of face i and xai is
the distance from the fracture face to the center of the matrix block.
Aronofsky (1958) showed that for the capillary imbibition mechanism,
the recovery versus time curve could be approximated by the following
exponential decline equation:
(5.3)
Then, the recovery equation is normalized as:
(5.4)
where is ultimate recovery and A, is a curve fitting parameter and it can
take any value to yield matching effort.
Based on laboratory imbibition experiments conducted at reservoir
temperature using Spraberry cores and oil, recoverable oil by water
imbibition can be up to 13% of lOIP. In analysis of the imbibition data from
Spraberry cores, all of the imbibition experimental data presented in
Chapter-4 (Fig,4'13) are plotted in Fig.5-1 using dimensionless time, which
is defined in Eq.(5.1). As a comparison, the experimental data from
imbibition tests imder ambient condition were also plotted in Fig,5'l, In
these experiments, the rate of imbibition at reservoir temperature is greater
than the rate of imbibition at ambient condition.

1.0
0.9
0.8
I*0.7-;%I as,10.5-;•S^ 0.43
I"-®-:0.2 •:
0.1-
0.01
—Core SPRr3HR
-O-Core SrarSHR
-•-CoreSPEWHR
-A-CoreSPRr7HR
-•-CoreSPIWH
-0-CareSPR-9H
-3)6-Core SPRrlOH
-o-CoreSPRrllH
-t-CoreSPR-lSR
-•-CoreSPR-14R
—Core SFR-15R
0.1
-H8-
Reservoir Condition
Ambient Condition
10 100
Diineiisioiiless Tune
1000 10000 100000
Fig.5'1 : Oil recovery curves performed at reservoir temperature plottedusing dimensionless variables and compared with oil recoveriescurves performed at ambient condition
- 119-
A composite imbibition curve is shown in Fig.5-2. A composite
imbibition curve obtained for very strongly water-wet Berea sandstone with
zero initial water saturation is also shown for reference. Ma and Morrow
(1997) derived a correlation for this curve as:
I-(l+0.04r„rj
(5.5)
where R„ is the ultimate recovery by spontaneous imbibition data and to is
dimensionless time. The composite imbibition curves obtained from Berea
sandstone were then used to compjire the imbibition cxirves obtained from
Spraberry rock as shown in Fig»5'2. To achieve the best match of the
experimental data from Spraberry cores, an average recovery curve was
established using Eq.(5.4) by adjusting the value of X, A curve fit of Eq.(5.4)
for the experimental data as shown in Fig»5'2 is obtained when the following
relation is used for Spraberry cores as :
Af = 0.0053 (5-®)
Substituting Eq.(5.6) into Eq.(5.4), the recovery curve fit presented inFig,5'2
can be expressed as
D ?__i_g-0.0053(, (5.7)
Using the dimensionless time to defined by Eq. (5.1), the decline rate
or the rate coefficient which has unit 1/days can be expressed as :

-120-
A = 0.0053 Ckfn G COs{d)
0 Z-c(5.8)
The experimental data was then normalized and fit to an empirical
model using Eq. (5.1) and substituting into Eq. (5.7). Then, recovery can be
expressed as:
<7COS(0)-0.0053 a ' "n —— —2
M.L. (5.9)Aoo
The characteristic length (Lc) for a matrix block in the reservoir is assumed to
be half of the fracture spacing (Ls). Equation (5.9) can be used for analysis of
the recovery mechanism in a naturally fractured reservoir during
waterflooding
5.1.2 Production Decline Model
Guo and Schechter (1997) modified an analytical model for decline
curve analysis based on imbibition theory. It was developed on the basis of
the rate law that governs mass transfer (Gupta and Civan, 1996). Decline of
oil production rate is expressed as:
a cos(e)q. =0.0053CV., g ^Kf, i-. (5.10)M P tig

121-
where Vo is the original oil in place recoverable by imbibition. The above
equations are valid when consistent units are used. The derivation of Eq.
(5.10) is presented in Appendix-A.
iI
VN
I
1.00
0.90 +
0.80 AranofskyEg: swwBereaCore ,Rn=1-&(p('XtD) (' erenceci^) /
0.70
0.60-;
0.50 ••
0.40 •;
0.30
0.20-;
0.10 • •
0.00 4-0000 •
0.01 0.1
Spraberry Cores
XaaooBs
Sprabeny Coresat Airhitwt P/tivtiHnn
Xaaoois
H 1 I initil • • I
10 100 1000 10000
Diniensioiiless Hme
100000
Fig.5-2 : Averaging of imbibition curves using Aranofsky equation tofit the experimental imbibition data by adjusting theempirical constant X.

-122-
5.2 ANALYSIS OF RECOVERY MECHANISMS
5.2.1 Recovery Based on Scaling of Imbibition Data
The oil recovery in the lU Unit (data from Well Shackleford 138) and
5U Unit (data from Well E.T. O'Daniel 37) of the Spraberry reservoir were
calculated based on the imbibition model developed and log-derived porosity
and permeability (Banik and Schechter, 1996) as shown in Fig.5-3 and 5-4.
In Figs. 5-5 and 5'6 show the plot of oil recovery together with pore size of
rocks versus well depth. The pore size is the square root of ratio of
fkpermeability and porosity , which is proportional to a macroscopic
11I0J
radius in porous medium. The characteristic length (Lc) for a matrix block in
the reservoir core which is half of the maximum fracture spacing of 3.79 ft, as
determined from horizontal core analysis (Lorenz, 1996), was used in the
scaling equation (Eq.(5.1)). The calculations of imbibition recovery were
performed using Eq.(5.9) on the basis of 13% ultimate oil recovery from static
imbibition data. In analysis of five years waterflooding performance, pore size
of lU and 5U Units is plotted versus well depth as presented in Fig,5-5 and
5-6, respectively. The oil recoveries are then plotted in the same figures,
respectively. As shown in these figures, the integration of recovery profiles
along the depth of the pay zone resulted in an estimation of average oil
-123-
recovery at about 9% 10IP for lU sand and 11% lOIP for 5U sand. This data
is consistent with waterflood recoveries in the Spraberry Trend Area.
The effect of time on recovery profiles was investigated. Several
scenarios were performed at 1, 5, 10, 20 and 40 years waterflood. The
recovery calculations based on imbibition model are plotted against well
depth for Upper Spraberry lU and 5Usands as presented in Fig,5-7 and 5-8,
respectively. Within 10years ofwaterflood initiation, the average recovery is
11% to 13% for oil recovered from lU Sand and 5U sand, respectively. When
waterflooding is extended up to 20 years, the recovery improves to 12.5% for
the lU sand. At 20 years there is no more oil recovered from the 5U sand
indicating that the 5Usandhas reached the ultimate recovery. After 40 years
of waterflooding, there is no increase in oil recovery from both lU and 5U
sands. Thus, the scaling from coreflood geometry to reservoir matrix block
geometry in the lU and 5U Units of the Upper Spraberry zone resulted in oil
recovery ofonly13% lOIP after 40years ofwaterflooding.

-124-
0.160
0.--... / \ / \/ .O..® \J '® \ /\ * p-' \ ^
—A— Porosity \ /
••o ••Absolute Penneability ®,.o.
• .0'' \
0*' 0
RoufBcdng pay zone Non-pay muddy zone
0.140
0.120
a.2 0.100u
I0.080
10 0.060
04
0.040
0.020
0.000
7080 7082 7084 7086 7088 7090 7092 7094 7096
Depth in Shackelford 1-38A, feet
10.00
B1.00 s;
.0eo
£•w
o.,o I
0.01
7098
Fig.5-3 : Porosity and absolute permeability of Upper Spraberry lUUnit versus depth (data taken from Well Shackleford 1-38A)

0.160
0.140
0.120
J 0.100ts
I0.080
O 0.060cu
0.040
0.020
0.000
7215
-A—Porosity
•o •• Absolute Permeability
-125-
Ftourendng pay zone
7220 7225 7230 7235
Depth in WellE.T.O'Daniel 37, feet
10
1
jaC9
Is9
0.1 "o01
0.01
7240
Fig.5-4 : Porosity and absolute permeability of Upper Spraberry 5UUnit versus depth (data taken from Well E.T.O Daniel 37)

a
'•S•Mi
rS
I
16
14
12
I1& 10(SS
81 ®
o
1s
•a
2
7082
-126-
'-^Calculated Imbibition Oil Recoveiy
•Pore size
5 years waterfloodAverage Recovery = 9%Fracture Spacing = 3.79 ft
7083 7084 7085 7086 7087 7088 7069
Depth in Well l^iackelford l-SaA, feet
7090 7091
4.0
3.5
3.0
1.0
0.5
0.0
7092
Fig.5-5 : Calculated imbibition oil recovery for 5 years waterflood fromUpper Spraberry lUformation based on scaling ofexperimental data and measured fracture spacing of3.79 feet.

§
I§1 a.al
III
I
7220
-127-
5 years waterfloodAverage Recovery=11%Fracture Spacing = 3.79 ft
•Calculated Imbibition Oil Recovery
•Pore size
7225 7230 7235
D^th in WenE.T.ODaniel 37, feet
7240
6.00
5.00
4.00 ^
fW
3.00
cn
S(22.00 ^
1.00
0.00
7245
Fig.5-6: Calculated imbibition oil recovery for 5years waterflood fromUpper Spraberry 5Uformation based on scaling ofexperimental data and measured fracture spacing of3.79 feet.

7080
4>7a82--
7084-•
g 7086
pSs 7088MQQ
« 7090
.aja 7092
ft
® 7094 +
7096
•128-
C^ciilated Recoveiy Based on Lnbibitiaa Model, %lOlP2 3
-1—I—y-
4 5 6
I . I • I
' 1 year iminbition-floodiiig
' 10years imbibitiaQ-floodiiig
' 20 years imbibition-fioodiiig
10 11 12 13 14 15
H—.—I—I—I—1—I—.—I—.
-5 years imMbition-flooding
-15 yeais imbibitioi>floodiiig
-40 years imbilntian-floQiiig
Fig.5-7: History ofwaterflood recovery profiles from Upper SpraberrylU formation based on scaling of experimental data andmeasured fracture spacing of3.79 feet.

7210
7215-
«
<5
I> 7220-CO
3*i 7225QbH 7230
^ 7235.9^ 7240A
7245
7250
-129-
C^culated Recovery Based on Imbibition Model, %[OIP
1 year imbilntian-flooding
10years imbibition-flooding
-20years imbibition-flooding
10 11 12 13 14 15
H r—t-
e-5 years imbilntion-flooding
15years imbibition-flooding
40years imbibition-flooding
Fig.5-8: History ofwaterflood recovery profiles from Upper Spraberry5U formation based on scaling of experimental data andmeasured fracture spacing of3.79 feet.

-130-
For further analysis, the calculated recovery of lU and 5U sands were
plotted versus time. The average permeability and porosity for both sand
units (lU and 5U) as input data in the calculation was tabulated in Table 5-
1, Because waterflooding in this field has been ongoing for 40 years, the
recovery analysis is performed on the basis ofthis time period. Equation (5.9)
was then utilized to analyze 40 years of waterflood performance in the
Spraberry Trend Area reservoir. The result is plotted in Fig. 5-9. This figure
indicates that the time reqxiired to recover oil on the basis of the contribution
of imbibition mechanism fi-om 5U Unit sands is almost double that of the
permeability of the lU unit sands. Based on Table 5'1, the average porosity
for both sand units are almost the same. However, the average permeability
in 5U Unit is higher than that in lU Unit. Figure 5-9 shows that the matrix
permeability is one of the key factors affecting this oil recovery mechanism.
As expected, higher permeability results in faster recovery of oil until an
ultimate recovery of about 13% lOIP is reached. For the Spraberry, this was
achieved after 11 years of waterflooding. This implies that no more oil can be
produced by the imbibition process after the field undergoes 11 years of
waterflooding. This also confirms that the calculated imbibition oil recoveries
are in agreement with the observed 8 to 15% lOIP for 40 years of waterflood
experience in the Upper Spraberry sand. The ultimate recovery for each zone
is indicated to be the same for each zone by Fig. 5-9.

do
14
12-
10-
-131-
Table 5-1. The average absolute permeability and porosityfor both sand units (lU and 5U) in SpraberryTrend Area Reservoir
Sand Units Absolute Permeability(mD)
Porosity(%)
lU Sand 0.34 10.10
5U Sand 0.70 9.93
rs-
a 0o|2
Q
8-
Porosity = 10.10%, Permeability = 0.34mD —
-A-Porosity =9.93%, Permeability=0.7 mD T
/ Of 40years
5U Unit Sand
/ lUIMtSand
P&rameters for 40 vears waterfloodinfir:TmhihitinnEfficiencys 13%
Fracture Spadngs 3.79 ftBrine Viscosity s 0.68 q>Oil Viscosity s 5.92 q)Inter&cial Tension = 26.22 dyn^cm
6-
4-
2-
10 100
Tune, Years
Fig.5-9 : Calculated imbibition oil recovery for 40 years waterflood fromSpraberry lU and 5U formation based on scaling ofexperimental data and using the same fracture spacing of3.79feet for both units.

-132-
5.2.2 Recovery Field Performance
Evaluation of the fluid saturation of the Spraberry field is an
important parameter to be determined. The initial water saturation (Swi) and
current oil saturation (Sor) are crucial data for estimating waterflood
performance, i.e., displacement efficiency and volumetric sweep efficiency.
These data can be used to explain the low recovery in Spraberry Trend Area
reservoir.
Fluid saturation. Water saturations have been evaluated on the
basis of permeability cutoff criteria to determine the oil saturation of the
Spraberry field. In 1953, Elkin used a cutoff of Swi = 60%, which roughly
corresponds to a permeability of 0.1 mD. Baker (1996a) determined the
average water saturation of cores taken fi-om four wells in the Spraberry
field. He used air permeabilities cutoff value of 0.3 and 0.8 mD for these
cores. The average water saturation was determined to be 49.3% and 52.6%
for cutoff of 0.3 mD and 0.8 mD, repectively. These values corresponded to
50.7% and 47.4% oil saturation (assuming no gas saturation to be present).
By reviewing all methods of analysis to estimate initial water saturation.
Baker concluded that the initial water saturation in the Spraberry rock is
about 30 to 40%. The water saturation data and reservoir oil recovery by
waterflood were then used to determine the displacement ef&ciency and
volumetric sweep efficiency. Initial water saturation was established based
on cores taken fi-om 46 wells drilled prior to waterfiooding before 1954
-133-
(Schechter 1996b). In this study, the initial water saturations based on data
from Guo (1995) were re-plotted against the absolute permeability ofcores, as
presented in Fig,5'10. The correlation of the average initial water saturation
was then determined to be:
Swi = 0.20 + 0.13 e-o-6(k-o.i) (5 ID
where Swi is the initial water saturation and k is absolute permeability of the
core in millidarcies. From the plot, the high water saturations in the higher
permeability rock are probably associated with a microporosity system in
which both the oil and the water are immobile (Baker, 1996a).
The current water saturations (Sw) were then analyzed using cores
taken from wells that were waterflooded. The plot of absolute permeability
versus water saturation is shown in Fig. 5-11. By assimiing there is no gas
saturation, the current oil saturation can be determined. The results of this
analysis are presented in Table 5-2. These data will be used later to
determine the displacement ef&ciency and volumetric sweep efficiency.
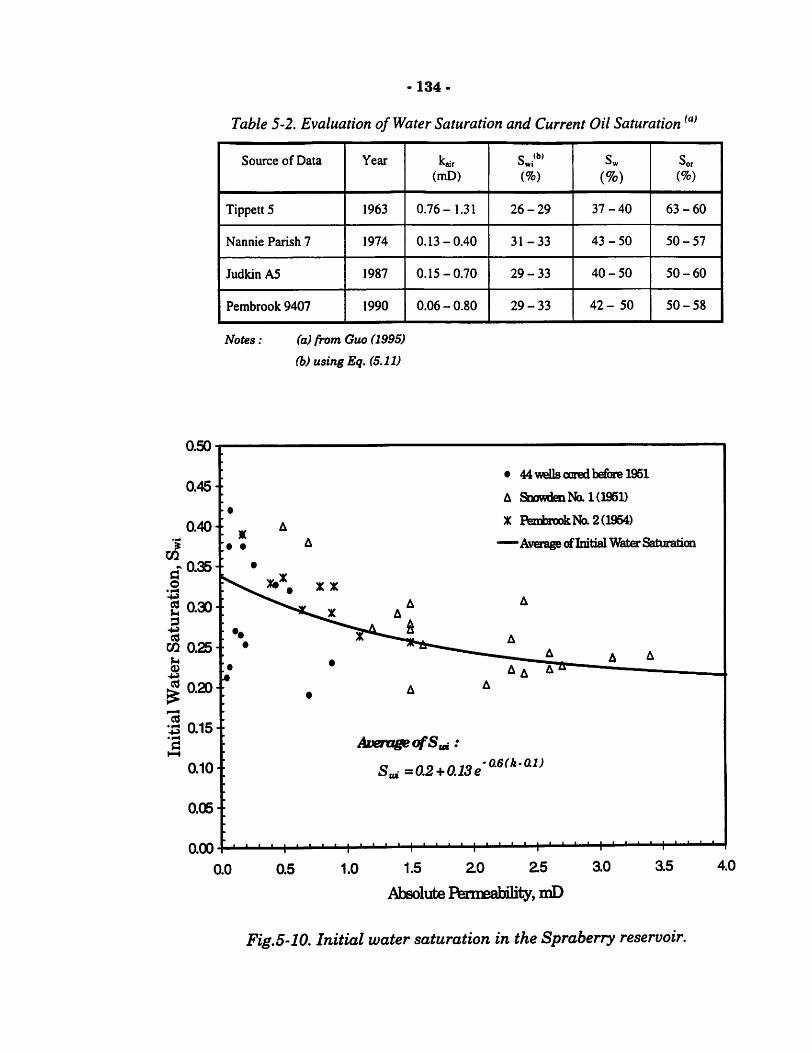
0.50
0.45
0.40
ofa a®0
2 0.30
1M 0.25
I^ 0.20•C 0.15•fN
A
0.10
0.05
0.00
-134-
Table 5-2. Evaluation of Water Saturation and Current Oil Saturation
Source of Data Year kairc *b) Sw Sor
(mD) (%) (%) (%)
Tippett 5 1963 0.76-1.31 26-29 37-40 63-60
Nannie Parish 7 1974 0.13-0.40 31-33 43-50 50-57
Judidn A5 1987 0.15-0.70 29-33 40-50 50-60
Pembrook 9407 1990 0.06-0.80 29-33 42- 50 50-58
Notes: (a) from Guo (1995)
(b) using Eq. (5.11)
• 44 wdls oared befiH« 1961
• •
A SbowdenNd 1(1951)
X PtentowkNd 2(1954)
Average rfInitial WaterSatuFation
XX
AA
A
A
: •••
"t •
•A
AverageafS^:
A
^ A ^AaA"®
A
Sui =0.2+ 0.13 e'0.6(k-ai)
• ' • I 1 • • ' • 1 • • ' • 1 ' ' • •
0.0 0.5 1.0 1.5 2.0 25
AbsolutePermeability, mD
3.0 3.5 4.0
Fig.5'10. Initial water saturation in the Spraberry reservoir.

0.7
0.6
ta
i
I
0.5-
10.4-
§
u
IGO
I
0.3-
0.2-
0.1-
0.0-h-*
0.0
-135-
^—Average Initial Water Saturation
• TlppettSdSeS)
A P&rish-7(1974)
• Judkins-5(1987)
X Pfeiiibrook.9407(1990)
•H—'—'—'—'—I—'—'—'—'—I—'—^
0.5 1.0 1.5
Absoliite Permeability, md
2.0 2.5
Fig. 5-11: Evaluated water saturations after wells have been waterflooded
in the Spraberry reservoir (data from Guo, 1995).
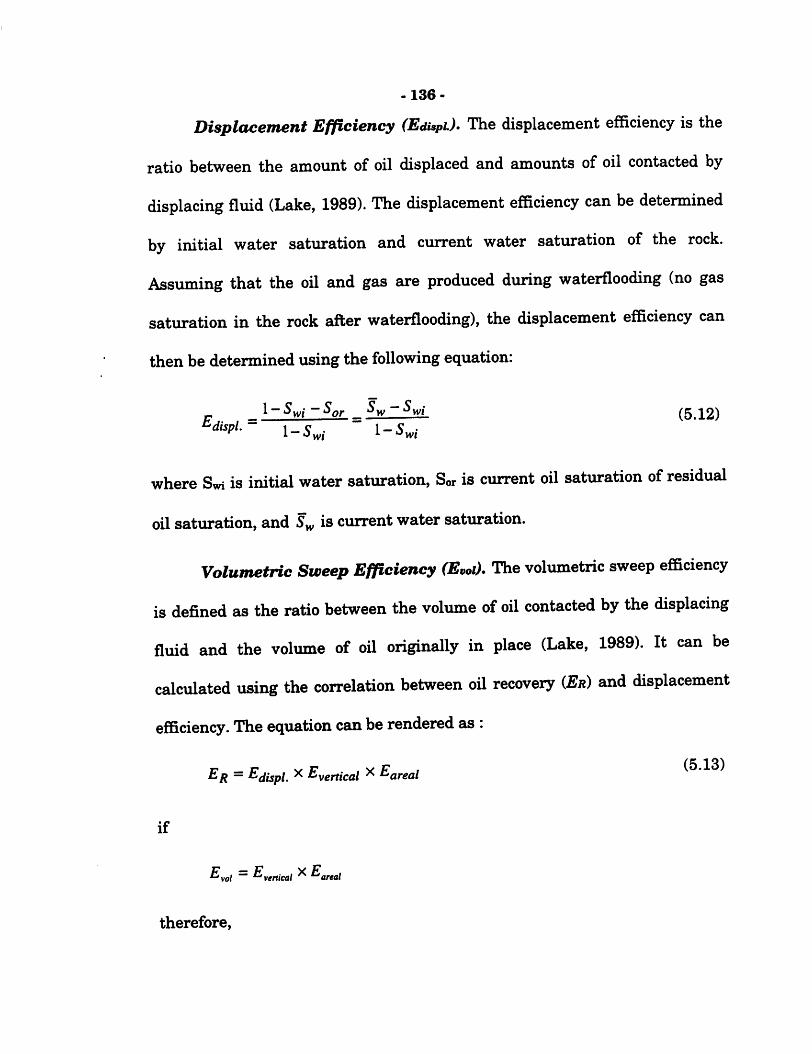
-136-
Displacement Efficiency (EdispO* The displacement efficiency is the
ratio between the amount of oil displaced and amounts of oil contacted by
displacing fluid (Lake, 1989). The displacement efficiency can be determined
by initial water saturation and current water saturation of the rock.
Assuming that the oil and gas are produced during waterflooding (no gas
saturation in the rock after waterflooding), the displacement efficiency can
then be determined using the following equation:
l-5^w/ -Spr _ (5.12)^dispL-
where Swi is initial water saturation, Sor is current oil saturation of residual
oilsaturation, and Sy^ is current water saturation.
Volumetric Sweep Efficiency (Evoi). The volumetric sweep efficiency
is defined as the ratio between the volume of oil contacted by the displacmg
fluid and the volume of oil originally in place (Lake, 1989), It can be
calculated using the correlation between oil recovery (Er) and displacement
efficiency. The equation canbe rendered as :
Er —Efjispl. ^ Eygj^ical ^ ^areal
if
Eyoi = ^vrrtica/ ^ ^areal
therefore.

- 137-
Er^vol=-^ (5.14)
^displ.
Oil recovery in the Spraberry field after more than 40 years of
waterflooding is estimated in the range of 8 to 15% lOIP. Thus, the
displacement and volimietric sweep efficiency in the Sprabeny can be
determined using the water saturation data presented in Table 5-2 and the
estimated oil recovery fi-om waterflooding. The results are presented in
Table 5-3.
The results show that the volumetric sweep efficiency in the Spraberry
reservoir ranges firom 47 to 83%, which is much higher than the displacement
efficiency (15 to 26%). The high volumetric sweep ef&ciencies £ire also
supported by infill drilling and pressure interference testing data. The infill
drilling programs in Spraberry tend to produce wells with high water cuts
indicating that water has contacted a large portion of the reservoir fi-acture
system (Baker, 1996a), and pressure interference test dtiring waterflooding
showed conclusively that pressure commimication was very good (Elkin,
1960). Low displacement efficiency is indicated by low recovery imbibition
experiments. The results show that the waterflood was less successful than
t3rpical waterfloods primarily becatise of low imbibition displacement
efficiency, not because of poor volumetric sweep efficiency. However, the
maximum recovery by imbibition, as indicated previously, is about 13%.

-138-
Table5-3. Evaluation ofDisplacement Efficiency (Ed) and VolumetricEfficiency on basis of Cores from Different Wells
Source of Data Year Swi(%)
Sw(%)
Edis/'(%)
c (d)Cvol
(%)
Tippeti 5 1963 26-29 37-40 15-16 76-83
Nannie Parish 7 1974 31-33 43-50 18-26 47-68
Judkin A5 1987 29-33 40-50 15-26 47-78
Pembrook 9407 1990 29-33 42- 50 19-25 48-64
Note: • (c)usingEq. (5.12) • (d) usingEq. (5.14)
• Average ofreservoir oil recovery is 12% lOIP
5.2.3 Sensitivity Study of Imbibition Model
Previously, several key parameters involved in the analysis of the oil
recoveiy mechanism based on the imbibition model have been described.
Understanding the individual parameters of the recoveiy mechanism helps
define the effects, interaction, and range of these key parameters. Matrix
permeability and fracture spacing are used in this study to define and limit
the uncertainty of the reservoir model. The contribution of the imbibition
process is a dominant effect on oil production. It is analyzed here by
performing sensitivity studies in the Humble Pilot Waterflood.
A pilot waterflood program was inaugurated on Humble's L.H.
Shackelford B lease in the west central portion of the Spraberry Trend Area
in March 1955. The pilot consisted of four injection wells with a center
-139-
producer, creating a confined 80-acre five-spot pattern. Oil production firom
the center well increased within six months of initiating water injection. The
water injection was then stopped. Although injection had stopped, the center
well still produced oil at a higher rate above primary.
The reservoir performance in this pilot study demonstrated non-
conventional waterflood characteristics according to observed Sraberry area
response. It appears that during the first injection, the injected water
displaced oil fi-om the firactures and simultaneously imbibed into the matrix.
When injection was stopped, the water continuously imbibed into the matrix
rock to expel oil fi-om the matrix, which resulted in improvement of oil
production. The imbibition mechanism is believed to have strongly affected
the waterflood recovery mechanism.
The Humble pilot was considered a successful Spraberry waterflood.
Subsequently, fiill-scale waterflood was initiated. However, the performance
did not emulate the results ofthe Humblepilot. Understanding the difference
between this pilot and field-wide waterflooding is vitally important for
improving waterflood performance in theSpraberry Trend Area.
Reservoir Parameters. The initial oil in place(lOIP) in the pilot area
was estimated to be about 724,181 reservoir barrels. The mechanism of
primary oil production in the Spraberry Trend Area is believed to be
dominated by solution gas drive (Elkin, 1953). The gas saturation after
reservoir repressurization by waterflooding was assumed to be zero. The

-140-
reservoir parameters used in the calculation of oil recovery based on the
imbibition model are summarized in Table 5-4. A recent horizontal core
study by Lorenz (1996) showed three distinct fracture sets. The fracture sets
present in cores from the lU and 5U reservoirs trend NNE, NE and ENE.
Table 5-5 presents the spacing of these sets. As shown in the table, the
arithmetic average of the fractures spacing is 2.86 fl. All data were then used
as the input for performing the sensitivity analysis ofoil recovery for 15 years
of waterflooding experience.
Table 5-4. Reservoir parameters as input data
Area 80 acreNet Pay 20 feetBulk Volume 69,696,000 cuftPorosity 10.02 %Pore Volume 6,983,539.20 cuftWater saturation 31.53 - 33.72%Gas Saturation (assumed after waterflood initiated) 9.0 - 9.3%Oil Saturation 57.3-59.2%Initial Oil In Place 712,404 - 735,957 rbImbibition Efficiency 13%
Recoverable Oil 92,613 - 95,674 rbOil Formation Volume Factor 1.294 rb/STBInterfacial Tension 26.22 dyne/cmViscosity 2.01 cp
Table 5-5. Fracture Spacing
Fracture Set Spacing Range (ft) Average Spacing (ft)
NNE 0.05 - 4.50 1.62
NE 0.73 - 5.75 3.17
ENE 0.04-13.00 3.79
Average 2.86

-141-
Matrix Permeability. Matrix permeability is an important parameter
in modeling imbibition data, because when water comes in contact with the
oil zone, water may imbibe into the matrix block to displace oil. Higher
permeability results in less time required for the water to imbibe into the
matrix block.
In this study, to investigate the effect of matrix permeability on field
recovery mechanism, four values of permeability (i.e., 0.01, 0.03, 0.10 and
0.30 md) were used. Based on the experimental imbibition results from core
plugs, the imbibition efficiency is 13% and the constant rate of imbibition (A.)
is 0.0053. Using initial water saturation as a function of absolute
permeability (Eq.ll), an average fracture spacing of 2.86 ft, and an average
porosity from logs of 10.02%, the oil recovery using the imbibition model for
15 years of waterflooding is simulated and the result is presented in Fig.5-
12. From figure 5-12, the recovery rates of this pilot field, as expected, are
dependent on the matrix permeabiUty. An increase in the matrix
permeability results in an increase in the rate of recovery. For the reservoir
with the highest matrix permeability to reach the ultimate recovery of 13%
takes approximately six years. The production rate drops from 185 Bpd to
below 10 Bpd within six years of production (see Fig.5-13). For reservoirs
with lower matrix permeability, afi;er 15 years of waterflooding the recoveries
still increase with time.

-142-
Fracture Spacing. Fracture permeability is a function of fracture
spacing. A decrease in fracture spacing results in an increase in fracture
density and therefore an increase in the fracture permeability. To investigate
the effect of fracture spacing on the recovery after 15 years of waterflooding,
the four sets of fracture spacing shown in Table 5-5 were used in a
sensitivity study. The calculated matrix permeability was 0.1 mD while the
other parameters were the same as the previous calculation in the sensitivity
of matrix permeability. The model assumes that all fractures are evenly
spaced, perpendicular and extend the full length of the zone. The result
presented in Fig»5'14 shows that recovery is sensitive to fracture spacing.
Increasing the fracture spacing jdelds improvement in recovery. For example,
the ultimate recovery is achieved within five years for the shortest fracture
spacing, while the ultimate recovery is not reached yet for the longest one
after 15 years of waterflooding. When the average fracture spacing is 2.86 ft,
the ultimate recovery will be reached after 15 years of waterflooding.
Production Decline. The sensitivity sinalysis for the production
decline parameters is presented in Fig, 5-15, Figure 5-15 shows that the
decline rate constant increases with matrix permeability and also increases
with decreasing fracture spacing. The figure shows that for the lowest
fracture spacing (1.62 ft), the decline rate constant increases rapidly with
small increases in permeability. Thus it appears that both the matrix
permeability and the fracture spacing affect these parameters.

-143-
k=:0.01mD
k=0.03mD
k=0.1inD
k=0.3mD
Tiiiie, Years
Psirainetera:
IOIP=712,404 - 735,957 ri)
IU = 13%Porosity = 10.02%Bb = L294riySrB
Fracture spadng, 1^= 2.86ft
Srt=0.2+0.13e^'^"
Fig. 5-12 : Effect ofMatrix Permeability on Imbibition Recovery.

250
>»200-
150-
100-
-144-
lOIP = 712,404- 735,957ibIU = 13%Porosity = 10.02%
Bb= 1.294 riySTB
Fracture spacing, L, s 2.86 ft
S«i =0.2+0.13e-®®^-^"
Apta
10
Tiine, years
k = 0.01mD
k = 0.03niD
— - 'ksO-lniD
k=:0.3inD
12 14 16
Fig.5-13 : Effect of matrix permeability on calculation of productionrates.
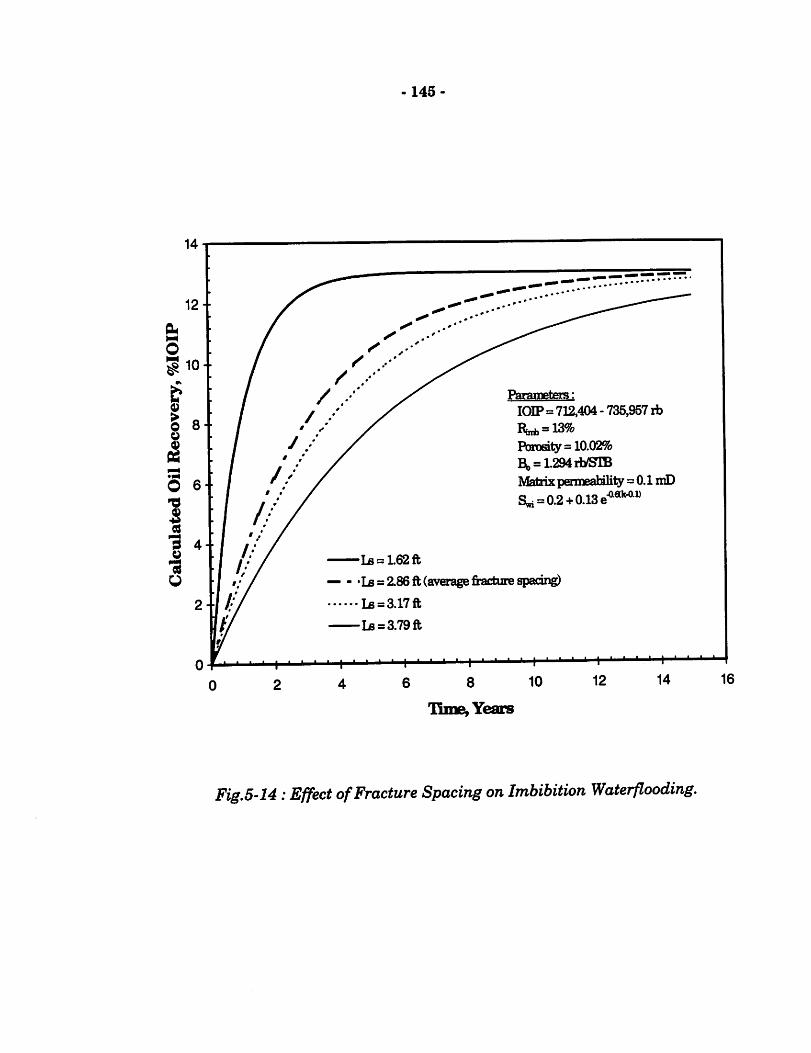
-145-
U = 1.62ft
lOIP=712,404 - 735,957 rb
IU = 13%Porosity = 10.02%Bb = 1.294 riySIBMatrixpermeability =0.1mD8^=0.2 +0.136^®''"*^"
— - •!£ = 2.86ft (averagefracture spadn^
l£ = 3.17ft
Ls=3.79ft
Time, Years
Fig.5'14 :Effect ofFracture Spacing on Imbibition Waterflooding.

0.006
0.005-
Q 0.004
§O 0.003
= 0.002
0.000-
146-
-e-Ls = 162ft
Ls=2.86ft (aweragB fiadiirespacing)
-6-l£ = ai7ft
0.05 0.10 0.15 0.20 0.25
lVfe±ixK Permeeliilily, noD
ax 0.35
Fig.5-15: Effect ofMatrix Permeability and Fracture Spacing on theDecline Rate Constant
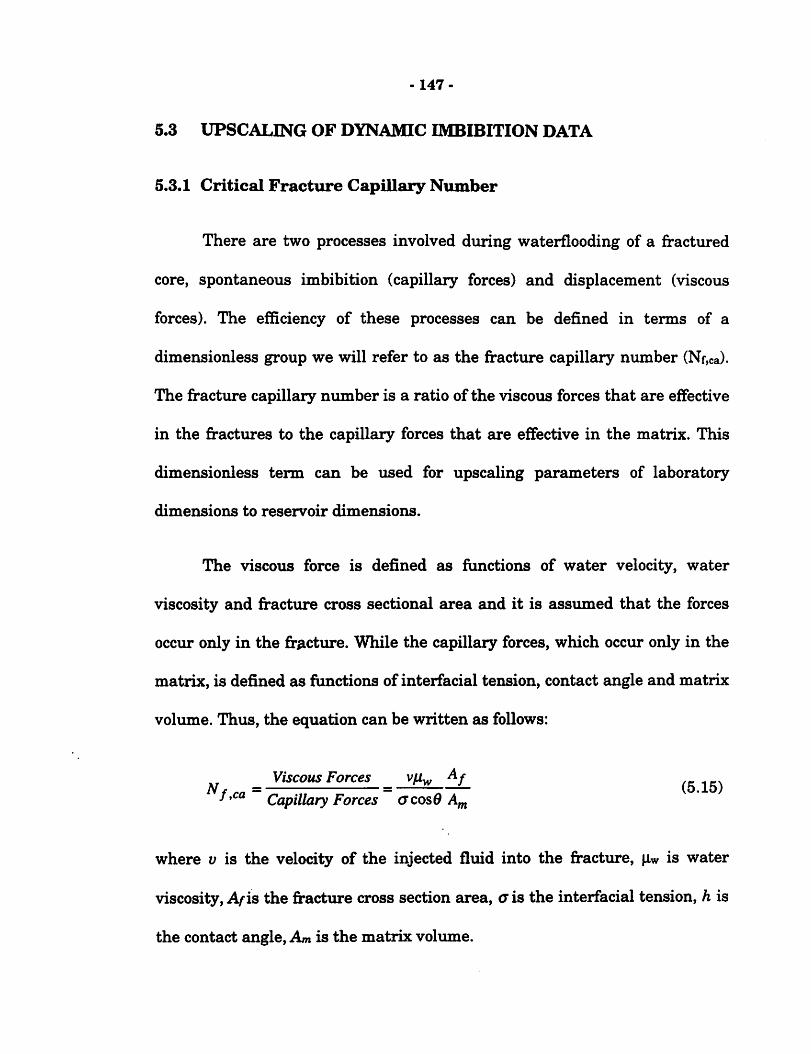
-147-
5.3 UPSCALING OF DYNAMIC IMBIBITION DATA
5.3.1 Critical Fracture Capillary Number
There are two processes involved during waterflooding of a fractured
core, spontaneous imbibition (capillary forces) and displacement (viscous
forces). The efficiency of these processes can be defined in terms of a
dimensionless group we will refer to as the fracture capillary number (Nf,ca).
The fracture capillary number is a ratio of the viscous forces that are effective
in the fractures to the capillary forces that are effective in the matrix. This
dimensionless term can be used for upscaling parameters of laboratory
dimensions to reservoir dimensions.
The viscous force is defined as fimctions of water velocity, water
viscosity and fracture cross sectional area and it is assimied that the forces
occur only in the fr^icture. While the capillary forces, which occur only in the
matrix, is defined as functions of interfacial tension, contact angle and matrix
volume. Thus, the equation can be written as follows:
Viscous Forces vfj^ Af .eNf = = (.5.15)
Capillary Forces CTCOS0
where v is the velocity of the injected fluid into the fracture, ^iw is water
viscosity, Afis the fracture cross section area, c is the interfacial tension, h is
the contact angle. Am is the matrix volume.

-148-
In lab units unit the equation can be rewritten as follows:
^ 0.0127 (cc /hr)ii^ {cp)
A^icm ),
In a similar manner, the lab units can be written to field units as :
0.0905 qinj (STB / day)]U^ (cp)N
krnimd)
/a2x
AS^i) ^km(md)
0,m
(5.16)
(5.17)
The derivation ofthis equation is presented in Appendix-B.
Higher firacture capillary number (higher rate, water viscosity or
fracture permeability) results in stronger tendencies of water to flow in the
firactures. Whereas, the lower values of the fi-acture capillary number, which
is provided by the slower rate (weaker viscous forces), cause stronger
capillary imbibition.
In order to upscale laboratory experiment to field dimensions,
equation 5.16 was used to produce plots as presented in Fig, 5-15, This
figure shows the correlation of the firacture capillary number with oil-cut
(OPFM/TIW). As shown in Fig,4'36, the laboratorjr's critical injection rate is
20 cc/hr and 10 cc/hr for Berea and Spraberry cores, respectively. If these
values are converted into dimensionless terms, the fi-acture capillary
nvunbers are 0.00028 for Berea cores and 0.0001 for Spraberry cores. It

-149-
means, the limiting capillary number in these experiments was to be 0.00028
and 0.0001 for Berea and Spraberry cores, respectively, which beyond a
limiting capillary fracture number, the capillary imbibition dominated
displacement in artificially fractured porous media can be considered as an
inefficient process.
0.45 -
0.40 -
0.35 -
0.30 ^
0.25 -
0.15 •
0.05 •0.0001
O Experimental data from Berea cores
^ Experimental data from Spraberry
Viscous forces
Capillary forces
^ 0.0127 qinj{cclhr)n^(cp)
0.00028
Berea cores
Spraberry cores
0.0001 0.0002 0.0003 0.0004 0.0005
Fracture Capillary Number, Nf,ca
Fig. 5-16: Fracture capillary number versus oil-cut for Berea andSpraberry cores.
0.0006

-150-
Once the fracture capillary number is found, the laboratory data can
be upscaled to reservoir dimensions. The critical rate of water injection for
field dimensions can be calculated using a rearranged of Eq, 5-17. The
upscahng of laboratory data to field dimensions is tabulated in Table 5-6,
and Berea sandstone is used as comparison. For the Spraberry waterflood
case, the waterflood pilot consistes of four injection wells with a center
producer for creating a confined 80-acre five-spot pattern, 0.1 matrix
permeability, 10% porosity and 10 ft pay zone, the critical injection rate is
about 751 bbl/day water.
Table 5-6: Upscaling ofdynamic imbibition experiments to determinecritical injection rate.
Porous
mediumBerea sandstone Sprab(^rry
Dimension Core size Field scale Core size Field scale
Nf.ca 0.00028 0,000110
Area - 80 acre -80 acre
|Xwater 0.68 cp 0.68 cp 0.68 cp 0.68 cp
Linj-prod 7.12 cm 1320 ft 6.8 cm 1320 ft
h 3.63 cm 10 ft 3.7 cm 10 ft
Ani 25.81 cm2 13200 ft2 24.8 cm2 13200 ft2
k 63.41 md 63.41 md 0.1 md 0.1 md
<!> 16.6 % 16.6 % 10% 10%
Pcmax 1.2 psi 1.2 psi 7 psi 7 psi
J (Swi) 0.99 0,99 0.2 0.2
Critical Water 20 cc/hr 1435 bbl/day 10 cc/hr 751 bbl/day

-151-
The fracture capillary number concept can be applied to the O'Daniel
Pilot Area to determine the critical water injection rates. This pilot area
consists ofsix water injection wells (two injection wells are perpendicular to
fracture orientation), four CO2 injection wells, three oil production wells, and
two loging-observation wells. Well location is shown in Fig* 5'16. Before C02
flooding, this pilot area will be waterflooded. The ciirrent oil reserve in this
area is estimated to be about 38,500 STB. The distance between center
production well (Well-39) and the four water injection wells (Well-25, 47, 45,
and 48) that are parallel to fracture orientation is presented in Table 5-7.
Using the fracture capillary number concept, the critical injection rate for
OT)aniel Pilot Area can be estimated, and the results are tabulated in Table
5-7.
Table 5-7: Estimated Critical Injection Rates for Wells in 0*DanielPilot Area.
InjectionWell
Distance to well-39
(ft)
Critical waterinjection rate
(STB/D)
W.45 1420 807
W-47 1450 824
W-48 1460 830
W-25 1450 824

\
+
t
4
1
50
00
0»e
txvM
ww
aoca
oLP
UK
W9
>m
Mii
nn
xff
li»
n
#8
^xi
)lo
xd:.
^N
imHH
SCTf
MIH
SU.
XP
^O
VO
nD
LO
OQ
ZtlO
OB
SE
KV
anO
H
^4PI
IOPO
PP00
,W
nCTZ
fWN
ILb
5U
(N3
2E
)//
lU(N
42lj
//
y^J
U(N
«()E
)
//
//
// /
Fra
ctu
reo
rien
tati
on
yF
ig.
5-1
6:
E.T
.O
'Dan
iel
Pil
otA
rea
-1
52
-

Chapter 6
Conclusions and Recommendations
6.1 CONCLUSIONS
This study suggests the following conclusions:
1. Imbibition tests using Spraberry oil, brine, and Berea sandstone show
that
• Effect of pressure is much less importeint than the effect of
temperature on imbibition rate and recovery.
• Performing the imbibition tests at higher temperature results in faster
imbibition rate and higher recovery due to change in mobility of fluids.
• The effect of an increase in initial water saturation on the imbibition
recovery is related to decrease in imbibition capillary pressure, which
results in a decrease in ultimate oil recovery.
153-
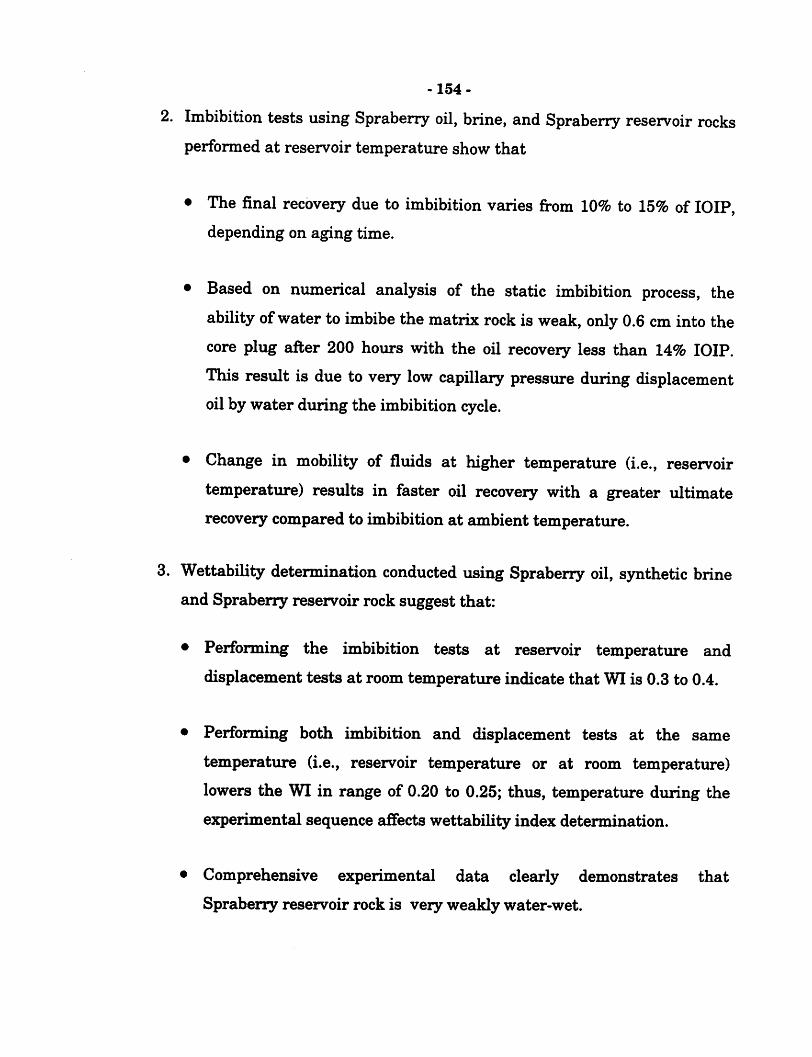
-154-
2. Imbibition tests using Spraberry oil, brine, and Spraberry reservoir rocks
performed at reservoir temperature show that
• The final recovery due to imbibition varies from 10% to 15% of lOIP,
depending on aging time.
• Based on numerical analysis of the static imbibition process, the
ability ofwater to imbibe the matrix rock is weak, only 0.6 cm into the
core plug after 200 hours with the oil recovery less than 14% lOIP.
This result is due to very low capillary pressure during displacement
oil by water during the imbibition cycle.
• Change in mobility of fluids at higher temperature (i.e., reservoir
temperature) results in faster oil recovery with a greater ultimate
recovery compared to imbibition at ambient temperature.
3. Wettability determination conducted using Spraberry oil, synthetic brine
and Spraberry reservoir rock suggest that:
• Performing the imbibition tests at reservoir temperature and
displacement tests at room temperature indicate that WI is 0.3 to 0.4.
• Performing both imbibition and displacement tests at the same
temperature (i.e., reservoir temperature or at room temperature)
lowers the WI in range of 0.20 to 0.25; thus, temperature during the
experimental sequence affects wettability index determination.
• Comprehensive experimental data clearly demonstrates that
Spraberry reservoir rock is very weakly water-wet.

-155-
4. Performing the imbibition experiment under dynamic condition using
both Berea sandstone and Spraberry reservoir rocks as porous media
show that:
• Injection rate is an important parameter on the dynamic imbibition
process in fracture systems, as the flow rate increases, contact time
between matrix and fluid in fracture decreases causing less effective
capillary imbibition.
Increase in injection rate causes higher water-cut which results in
significantly faster water breakthrough.
The initial water satiu*ation for dynamic imbibition is similar to that
for static. When initial water saturation is not present in the core, the
rate of oil recovery is slower than for a core with an initial water
saturation. However ultimate oil recovery for core without initial water
saturation is higher than it is for core with initial water saturation due
to the capillary pressure effect.
• An effective capillary pressure curve can be obtained from dynamic
imbibition experiments by matching the recovery curves from
experimental data and numerical simulation.
The capillary ctirve obtained from dynamic imbibition experiments ishigher that it is from static imbibition experiments due to viscousforces during the dynamic imbibition process that are not present inthe static imbibition case.

-156-
• The limiting value of fracture capillary number for an efficient
displacement process in this study was found to be 0.0001 and 0.00028
for Berea and Spraberry cores, respectively. Beyond this range, the
displacement process is inefficient due to high water-cut.
5. Analysis of field fluid saturation indicates that the volvunetric sweep
efficiency in the Spraberry reservoir is much higher than the
displacement efficiency. This indicates that the waterflood in the
Spraberry trend was less successful than tjrpical waterfloods primarily
because of very poor imbibition displacement efficiency. The results from
this work support this observation.
6. Scaling of imbibition data under reservoir conditions indicates that the
contribution of the imbibition mechanism to oil recovery is up to 13%
lOIP, depending on rock properties and wettability.
7. Degree of heterogeneity in the matrix and natural firacture systems
controls the efficiency ofSpraberry waterflood performance.

-157-
6.2 RECOMMENDATIONS
1. Since the dynamic imbibition is more representatives of reservoir
conditions, it is necessary to correlate the static and dynamic tests in
order to achieve proper upscaling.
2. The capillary pressure curve obtained from dynamic imbibition
experiments using artificially fractured core can be used as input data in
naturally fractured reservoir simulations instead of using mercury
injection capillary pressure curves or difficult to measure imbibition
capillary pressure curves.
REFERENCES
[1] Amott, E.: "Observations Relating to the Wettability ofPorous Rock,"Trans., AIME, 216, 1959, 156-162.
[2] Anderson, G. W.: "Wettability Literature Survey- Part 1: Rock/Oil/BrineInteraction and the Effects of Core Handling on Wettability," J. Pet Tech(Oct. 1986).
[31 Anderson, G. W.: "Wettability Literatiu'e Survey- Part 2: WettabilityMeasurement," J. Pet. Tech. (Nov. 1986).
[4] Al-Lawati, S. and Saleh, S.: "Oil Recovery in Fractured Oil Reservoirs byLow IFT Imbibition Process," paper SPE 36688 presented at the 1996Annual Technical Conference and Exhibition of SPE, Denver, Oct. 6-9.
[5] Aronofsky, J.S., Masse, L., and Natanson, S.G., "A Model for theMechanism of Oil Recovery from the Porous Matrix due to Water Invasionin Fractured Reservoirs," paper T.P. 4703 in Petroleum Technology,AIME, vol. 213,1958.
[6] Babadagli, T.: " Temperature Effect on Heavy-oil Recovery by Imbibitionin Fractured Reservoirs," J. Pet. Sci. and Eng., 14 (1996), 197-208.
[7] Babadagli, T. and Ershaghi, I.: "Imbibition Assisted Two-phase Flow inNatural Fractures," paper SPE 24044 presented at the 1992 SPE WestrenRegional Meeting, Bakersfield, Mar. 30 - April 1.
[8] Babadagli, T. and Ershaghi, I.: "Improved Modeling of OilAVater Flow inNaturally Fractured Reservoirs using Effective Fracture RelativePermeabilities," paper SPE 26076 presented at the 1993 SPE WesternRegional Meeting, Anchorange, May 26-28.
[9] Babadagli, T.: "Injection Rate Controlled Capillary Imbibition Transfer inFractured Systems," paper SPE 28640 presented at the 1994 AnnualTechnical Conference and Exhibition New Orleans, Sep. 25-28.
[10] Babadagli, T.: "Scaling of Capillary Imbibition Under Static Thermal andDjoiamic Fracture Flow Conations," paper SPE 39027 presented at theFifth Latin American and Carribean Petroleimi engineering Conferenceand Exhibition held in Rio de Janeiro, 30 August - 3 Sep., 1997.
-158-

-159-
[11] Baker, R., memo from Epic Consulting Service Limited, March 6,1996(a).
[12] Baker, R.: "Reasons for the Relatively Low Recovery of the SpraberryWateiioods," PRRC Database, June, 1996(b).
[131 Bartell, F.E. andMiller, F.L.: "Degree ofWetting Silica by CrudePetroleum Oils," Ind. Eng. Chem.y July 1928, 20, No.7, 738-742.
[14] Benner, F.C. andBartell, F.E.: 'The Effect ofPolar Impurities UponCapillary and Surface Phenomena in Petroleum Production," Drill andProd. Prac.f API, New York City, 1942, 341-348.
[151 Blair, P.M.: "Calculation of Oil Displacement by Countercurrent WaterImbibition," Trans., AIME(1964), 231, 343-355.
[16] Bobek., J.E., Mattax., C.C. andDenekas., M.O.: "Reservoir RockWettability - ItsSignificant and Evaluation," Trans., AIME (1958), 213,155.
[17] Bourbiaux, B.J. and Kalaydjian, F.J.: "Experimental Study of Cocurrentand CountercurrentFlows in Natiiral Porous Media," SPERE (August1990) 361-368
[18] Boneau, D.F. and Clmpitt, R.L.: "ASurfactant System for the Oil-WetSandstone ofthe North Burbank Unit," J. Pet Tech. (May 1977), 501-506.
[19] Briggs, P.J., Baron, R.P, Fulleylove, R.J., and Wright, M.S.: "DevelopmentofHeavy-oil Reservoir," J. Pet. Tech. (1988), 40(2), 1206-214.
[20] Briggs, B.J., Beck, D.L., Black, C.J.J., and Bissel, R.: "Heavy-oil fromFractured CarbonateReservoir," SPERE, 7(2), 1992,173-179.
[21] Brownscombe, E.R. and Dyes, A.B.: "Water Imbibition Displacement: APosibility for the Sprabeny," Drill, and Prod. Prac. ,API (1952), 383-390.
[22] Brown, R.J.S. and Fat, I.: "Measurements ofFractional Wettability ofOilfield Rocks by the Nuclear Magnetic Relaxation Method," Trans.,AIME (1956), 207, 262-264.
[23] Chang, V. and Buckley, J.S.: "COBR Interaction of Some Medium GravityCrude Oils," PRRC internal report, PRRC 98-4,1997.
[24] Cuiec, L.E., Bourbiax, B.J., and Kalaydjian, F.J.: "Imbibition in LowPermeability porous media: Understanding and Improvement ofOilRecovery," paper SPE 20259 presented at the 1990 SPE/DOE 7 Symp.Enhanced Oil recovery, Tulsa, 833-864.
- 160-
[25] Cuiec, L.: "Wettability Laboratory Evaluation Under ReservoirConditions: A New Apparatus," paper 9529 presented at the 1995 SCA,Calgary, Canada.
[26] Cuiec, L.: "Rock/Crude-Oil Interactions and Wettability : AnAttempttoUnderstand Their Interrelation," paper SPE 13211 presented at the 1984SPE Annual Technical Conference and Exhibition, Houston, Sept. 16-19.
[27] Dangerfield, J.A. and Brown, D.A.: "The Ekofisk Field, North Sea Oil andGas Reservoirs, J.Klepe et al (eds), Graham and Trotman, London (1985).
[28] Denekas, IVI.O, IMattax, C.C., and Davis,. G.T.: "Effect ofCrude OilComponents on Rock Wettability," Trans., AIME (1959), 216, 330.
[29] Dimon., C. A.: "Design andMonitoring ofImbibition Waterflooding in theFractured Spraberry Reservoir," IVIobil InternalReport, Aug. 1991.
[30] Donaldson, E.C., Thomas, R.D., and Lorenz, P.B.: "WettabilityDetermination and Its Effect on Recovery Efficiency," Soc. Pet. Eng. J.(IMarch 1969), 13-20.
[31] Elkin, L.F.: "Reservoir Performance and Well Spacing, Spraberry TrendArea Field of West Texas," Trans. AIME, Volume 198,1953.
[32] Elkin, L.F. and Skov, A.1VI.: "Determination ofFracture Orientation fromPressure Interference," Trans. AIME - 219,1960.
[33] Fatt, I.And KlikofiF, W.A.: "Effect ofFractional WettabiUty on IMultiphaseFlow Through Porous l^edia," Trans. AIIME (1959), 216, 426-432.
[34] Gatenby, W.A. and Marsden, S.S.: "Some Wettability Characteristics ofSynthetic Porous Mediua," Producer Montly (Nov. 1957), 22(2).
[35] Ghedan, S.G., and Poetmann, F.H.: "Oil Recovery from Fractured 'Reservoir Through Imbibition by Water and Polymer flooding," paper SPE20244 presented at the 1990 SPE/DOE 7' Symp. Enhanced Oil Recovery,Tulsa, Oklahoma, 644-687.
[36] Graham., J.W. and Richardson., J.G.: "Theory and Application ofImbibition Phenomena in Recovery ofOil," Trans. AIME(1960), 216, 377.
[37] Guo, B., and Svec, R.: "A preliminary Analysis ofPermeabilities in theTeague-Blinebry Reservoir based on Step-rate Test on Well LamunyonFederaW62 and Whole Cores from Well Lamunyon Federal ^50,'* PRRCReport no. 98-12, January 29,1998.

-161-
[38] Guo, B.: "Imbibition and Drainage Studies in Spraberry Reservoir Rocli,"proceeding ofCharacterization and Fluid Flow, Naturally FracturedReservoir Forum, PRRC of New Mexico Tech, April 19,1995.
[39] Guo, B., Schechter, D.S., and Baker, R.O.: "An Integrated Study ofImbibitionWaterflooding in the Naturally Fractured Spraberry TrendArea Reservoirs," SPE Permian Basin Oil and Gas Recovery Conference,Midland, 25-27 March 1998.
[40] Gupta, A. and Civans, F.: "Correlation ofthe Imbibition Drive Matrix-to-Fracture OilTransfer," paper SPE 28929 submittedfor publication in theSPE Journal, January 30,1996.
[41] Guzman, R.E., and Aziz, K.: "Fine Grid Simulation ofTwo Phase Flow inFractured Porous Media," Paper SPE 24916presented at the SPE 67^^Annual Technical Conference and Exhibition, Washington, DC, Oct 4-7.
[42] Handy., L.L.: " Determination ofEffective Capillary Pressure ForPorousMedia from Imbibition Data," Trans. AIME (1960), 219, 75-80.
[43] Hamon, G. and Vidal, J.: "Scaling-Up the Capillary Imbibition Processfrom Laboratory Experiments on Homogeneous and HeterogeneousSamples," paperSPE 15852 presented at the 1986 SPE EuropeanPetroleimi Conference, London, Oct. 20-22.
[44] Hjelmeland, O.S. and Larrondo, L.E.: "Experimental Investigation of theEffects ofTemperature, pressureand Crude Oil Composition onInterfacial Properties," paper 12124 presented at the 58*^ SPE AnnualConference, San Francisco, CA.
[45] Iffly., R., Rousselet., D.C. and Vermeulen., J.L.: "Fundamental Study ofImbibition Process in Fissured OilField," paper SPE 4102 presented atthe 1972 Annual Fall Meeting of SPE, San Antonio, Texas.
[46] Iwankow, E.N.: "A Correlation of Interstitial Water Saturation andHeterogeneous Wettability," Producer Monthly, 24, Oct. 1960,18-26.
[47] Jadhimandan, P.P. and Morrow, N. R.: " Spontaneous Imbibition ofWaterby Crude oiybrine/rock System," InSitu, 15(4), Macel Dekker Inc., 1991.
[48] Jadhunandan, P.P. and Morrow, N.R.: "Effect ofwettabihty on WaterfloodRecovery for Crude Oil/Brine/Rock Systems," SPERE (Feb. 1995). 4.
[49] Kazemi, H. and Merrill, L.S.: "Numerical Simulation ofWater Imbibitionin Fractured Cores," SPE 6895 presented at the 1977 SPE-AIME 52"Annual Fall Technical Conference and Exhibition, Denver, Oct. 9-12.

-162-
[50] Keijzer, P.P.M. and de Vries,A.S.: "Imbibition ofSurfactant Solutions,"paper SPE/DOE 20222 presented at the 1990 SPE/DOE SeventhSymposium on EOR, Tulsa, OK, April 22-25.
[51] Kleppe, J. and Morse, R.A.: "Oil Production from Fractiired Reservoirs byWater Displacement," paper SPE 5084 presentedat the 1974 SPE AnnualMeeting, Houston, TX., Oct. 6-9.
[52] Lake, L.W.: ""Enhanced Oil Recovery,"* Prentice-Hall, Inc., NewJersey,1989.
[53] Lefebvre du Prey., E.: "Gravity and Capillary Effects on Imbibition inPorous Media," Soc. Petr. Eng. J. (June 1978).
[54] Lorenz, J.: "Summary ofObservations and Interim Interpretations:Fractures in Horizontal Spraberry Cores, E.T. O'Daniel Well #28," PRRCDatabase, Dec. 12,1996.
[55] Ma, S. and Morrow, N.R.: "Mathematical Modeling ofSpontaneousImbibition Data for Strongly Water-Wet Systems," unpublishedmanuscript, (1997).
[56] Mannon, R.W. and Chilingar, G.V.: "Experiments ofEffects ofWaterInjection RateonImbibition Rate in Fractured Reservoirs," paper 4101presented at the 1972 SPEmeeting, San Antonio, Texas.
[57] Marsden, S.S. and Nikia, P.A.: "The Wettability ofthe Bradford SandL,"Producers Monthly (May 1962), 2-5.
[58] Mattax., C.C. and Kyte., J.R.,: "Imbibition Oil Recovery from Fractured,Water Drive Reservoir,"Soc. Petr. Eng. J. (June 1962), 177-84.
[59] Morrow, N. R., Ma, S.,Zhou, X. and Zhang, X.: " Characterization ofWettability from Spontaneous Imbibition Measurements," presented atthe 1994Annual technical Meeting ofthe Petroleum Society ofCIM,Calgary, Canada, June 12-15.
[60] Morrow, N.R., Lim, H.T. andWard, J.S.: "Effect ofCrude Oil InducedWettability Changes on Oil recovery," SPEFE (Feb. 1986), 89-103.
[61] Morrow, N.R.: "Capillary Pressure Correlations For Uniformly WettedPorous Media," e/. Cdn. Pet. Tech. (Oct.-Dec. 1976), 49-69.
[62] Mugan, N.: "Relative Permeability Measurements using ReservoirFluids," Soc. Pet. Eng. J. (Oct. 1972), 398-402.
-163-
[63] Reis, J.C.: "Oil Recovery Mechanisms in Fractured Reservoir duringSteam Injection," paper SPE 20204 presented at the 1990 SPE/DOESeventh Sjnnposiimi on Enhanced Oil Recovery, Tulsa, April 22-25.
[64] Putra, E., Fidra, Y. and Schechter, D.S.,: "Dynamic Imbibition Modellingof Artificially Fractured Core using a Numerical Simulator," paperincluded in, "Advanced Reservoir Characterization and Evaluation of C02Gravity Drainage in the Naturally Fractured Spraberry Trend Area,"annual report, Contract No. DEFC2295BC14942, U.S. DOE (1998).
[65] Putra, E., Fidra, Y. and Schechter, D.S.,: "Spontaneous ImbibitionModeling ofSpraberry Core Plugs using a Numerical Finite DifferenceScheme," paper included in, "Advanced Reservoir Characterization andEvaluation of C02 Gravity Drainage in the Naturally FracturedSpraberry Trend Area," Annual Report, Contract No. DEFC2295BC14942,U.S. DOE (1998).
[66] Putra, E., Fidra, Y. and Schechter, D.S.,: "Note on Critical WaterInjection Rate," unpublished report, PRRC, 1998.
[67] Salathiel, R.A.: "Oil recovery by Surface Film Drainage in MixedWettabiUty Rocks," J. Pet Tech. (Oct 1973), 1216-1224.
[68] Schechter, D.S., Zhou, D. and Orr, F.M.: "Capillary Imbibition andGravity Segregation in Low IFT Systems," paper SPE 22594 presented atthe 1991 Annual Tecnical Conference and Exhibition ofSPE, Dallas,Texas, Oct. 6-9.
[69] Schechter, D.S., and Guo, B.: "Imbibition Studies in Spraberry ReservoirRock," PRRC Spraberry Database(1995).
[70] Schechter, D.S., McDonald, P., Sheffield, P., and Baker, R.: "ReservoirCharacterization and CO2 Pilot Design in the Naturally FracturesSpraberry Trend Area,"paper SPE 35469presented at the 1996 SPEPermian Basin Oil & Gas Recovery Conference, Midland, Texas, March27-29.
[71] Schechter, D.S.: "Advanced Reservoir Characterization and Evaluation ofCO2 Gravity Drainage in the Naturally Fractured Spraberry Trend Area,"First Annual Technical Progress Report to DOE under Contract No. DE-FC22-95BC14942, PRRC Report 96-42, Dec. 17,1996.
[72] Schechter, D.S.: '*Advanced Reservoir Characterization and Evaluation ofCO2 Gravity Drainage in the Naturally Fractured Spraberry TrendArea"SecondAnnual Technical Progress Report to DOE under Contract No. DE-FC22-95BC14942, PRRC Report 96-42, Oct., 1997.

-164-
[73] Schechter, D.S.: "^AdvancedReservoir Characterization and Evaluation ofCO2 Gravity Drainage in the Naturally Fractured Spraberry Trend Area,""Third Annual Technical Progress Report to DOE under Contract No. DE-FC22-95BC14942, PRRC Report 98-33, Oct., 1998.
[74] Seright, S.i?.: '^Improved Methods for water Shutoff,"" Annual Report toDOE under Contract No. DE-AC22-94PC91008, November, 1997.
[75] Siagian, W.U.: "ALaboratory Study of the Extraction ofHydrocarbonsfrom Crude Oil by High pressure Carbon Dioxide,MS thesis. New MexicoInstitute of Mining and Technology, Socorro, NM , 1997
[76] Tang, G.Q. and Morrow, N.R.: "EffectofTemperature, Salinity and OilComposistion on Wetting Behavior and Oil," paper SPE 36680 presentedat the 1996 SPE Annual Technical Conference and Exhibition held inDenver, Colorado, 6-9 Oct.
[77] Thomas, L.K, Dixon, T.N., Evans, C.E. and Vienot, M.E.: "EkofiskWaterflood Pilot," paper SPE 13120 presented at the 1984 AnnualTechnical Conference and Exhibition, Houston, Sept.
[78] Torsaeter, O. and Silseth, J.K.: "Effect of Sample Shape and BoundaryConditions on Capillary Imbibition," paper 10 presented at the 1985Chalk Research Program Symposium/Seminar, Stavanger, May 21-22.
[79] Torsaeter., O.: "AnExperimental Study ofWater imbibition in Chalk fromthe Ekofisk Field,"paper SPE/DOE 12688 presented at the 1984 4*^S3rmposiimi on EOR, Tulsa.
[80] Treiber, L.E., Archer,D.L. and Owens, W.W.: "Alaboratory Evaluation ofthe Wettability ofFifty OilProducing Reservoirs," Soc, Pet. Eng. J. (Dec.1972), 531-540.
[81] Zhou, X., Torsaeter,O., Xie, X. and Morrow, N. R.: " The Effect ofCrude-Oil Aging Time and temperature onthe RateofWaterImbibition andLong-Term Recovery by Imbibition," paperpresented at the 1993 AnnualTechnical Conference and Exhibition, Houton, Oct. 3-6.
[82] Zhou, X., Morrow, N.R. and Ma, S.: "Interrelationship ofWettability,Initial Saturation, AgingTime, and Oil Recovery by SpontaneousImbibition and Waterflooding," paper SPE/DOE 35436 presented at the1996 SPE/DOE Tenth Symposium on lOR, Tulsa Oklahoma, April 21-24.

APPENDIX-A
Mathematical Models to Scaling-up
the Experimental Imbibition Data
The imbibition process may be mathematically modeled using the followingrate law governing mass transfer (Guo, et al. 1998):
dV^=-AV« (A-l)
where V is the volume of oil in place recoverable by imbibition, t is time, Ais aproportionality coef&cient, and a is an empirical exponent. Equation (A-l) iswidely used in chemical engineering and frequently employed by petroleumresearchers such sis Gupta and Civan (1994) for analyzing mass transfer innaturally fractured reservoirs.
If an initial condition of V=Vo at ^=0 is used, where Vo is the volume ofrecoverable oil by imbibition, the following two solutions to Eq. (A-l) can beobtained:
V=V^e'^ (A-2)
for a = 1, and
1
V=[v/"-A(l(A-3)
for a not equal to unity.
1. Recovery Equations.
Dimensionless oil recovery due to imbibition is defined as
V -V(A-4)
" o
Substitutions of Eqs. (A-2) and (A-3) into Eq. (A-4) result in
(A.5)
A-l

APPENDIX-A
for a = 1, and
1-X{\-a)t
\-a
\-a
(A-6)
for oc not equal to unity.
2. Production Decline Equations.
The volume of produced oil (cumulative oil production due to imbibition) isexpressed as:
y,=yo-v (A-7)
Substitution of Eq. (A-2) into Eq. (A-7) yields:
(A-8)
An expression for oil production rate is obtained by taking the derivative ofEq. (A-8) with respect to time:
dV(A-9)
Eq. (A-9) represents an exponential decline model.
Other decline models can be derived from Eqs. (A-3) and (A-7). Substitutionof Eq. (A-3) into Eq. (A-7) yields:
l-a
Taking derivative ofEq. (A-10) with respect to time gives:
dV,dt
1 +
l-a
Xat
V'""(^—)Of
o-l
A-2
(A-10)
(A-11)

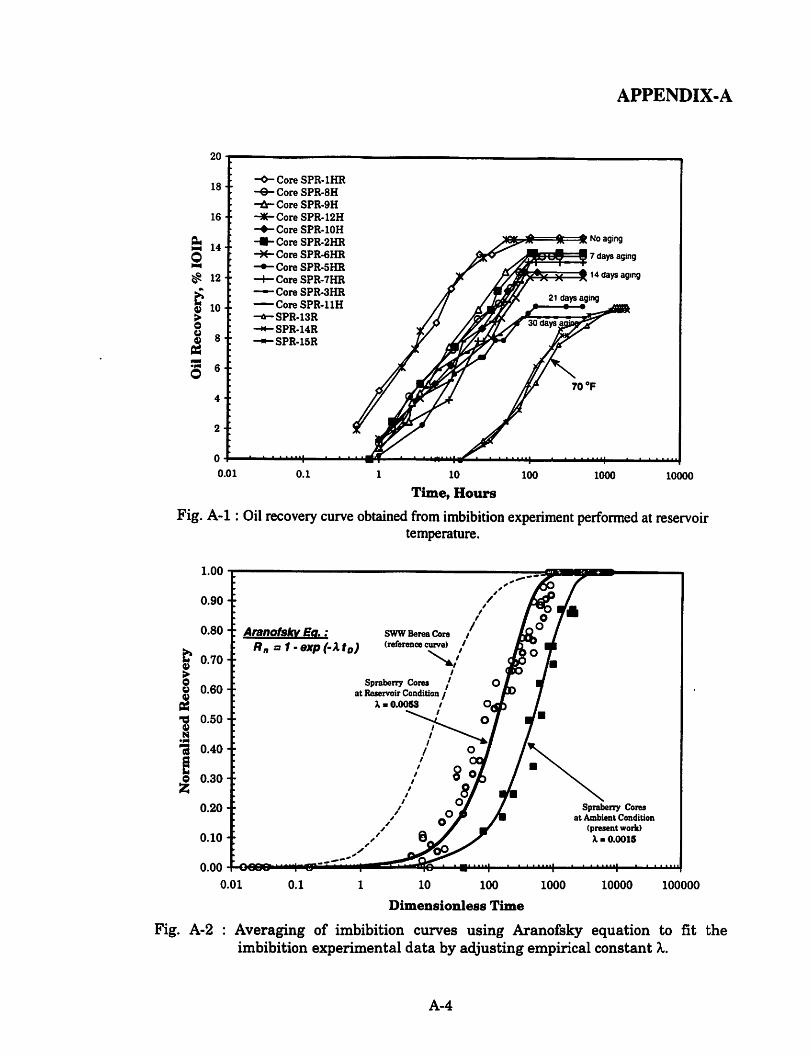
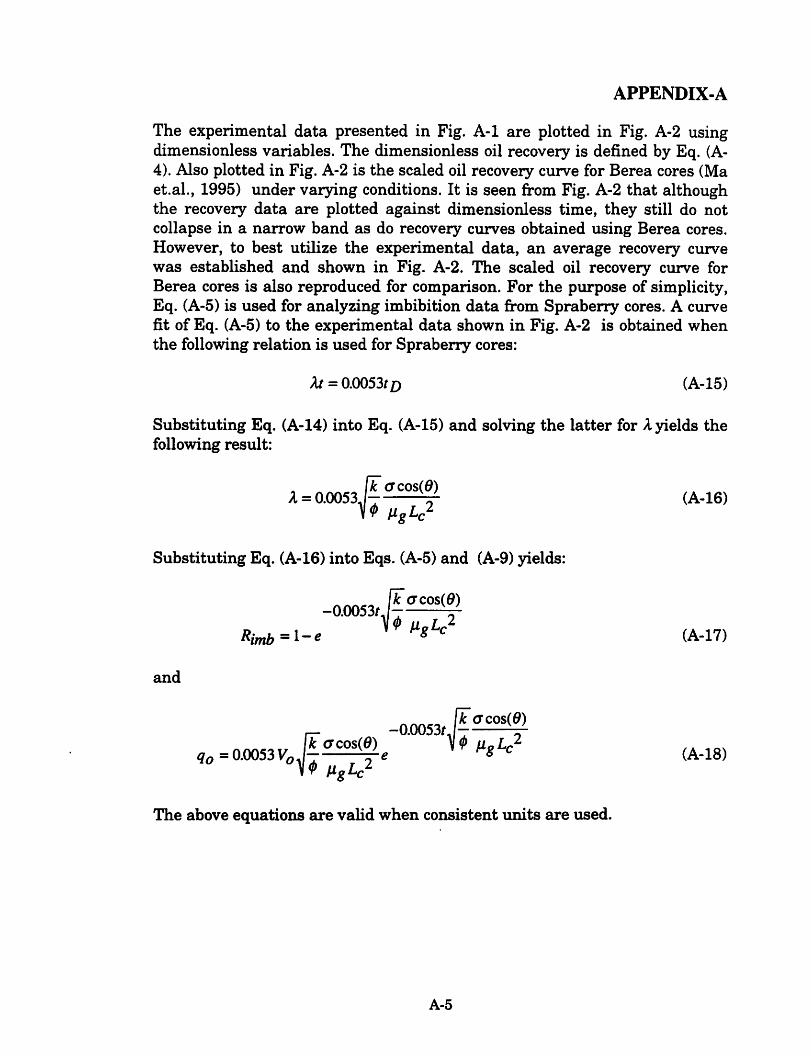


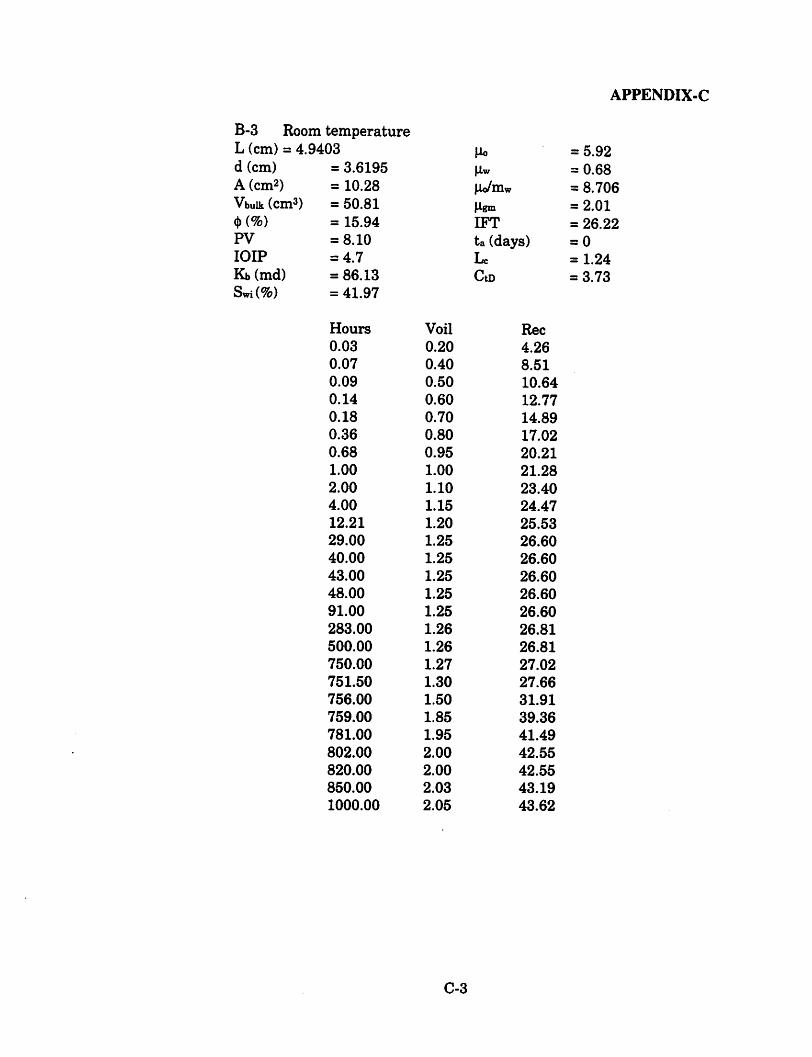


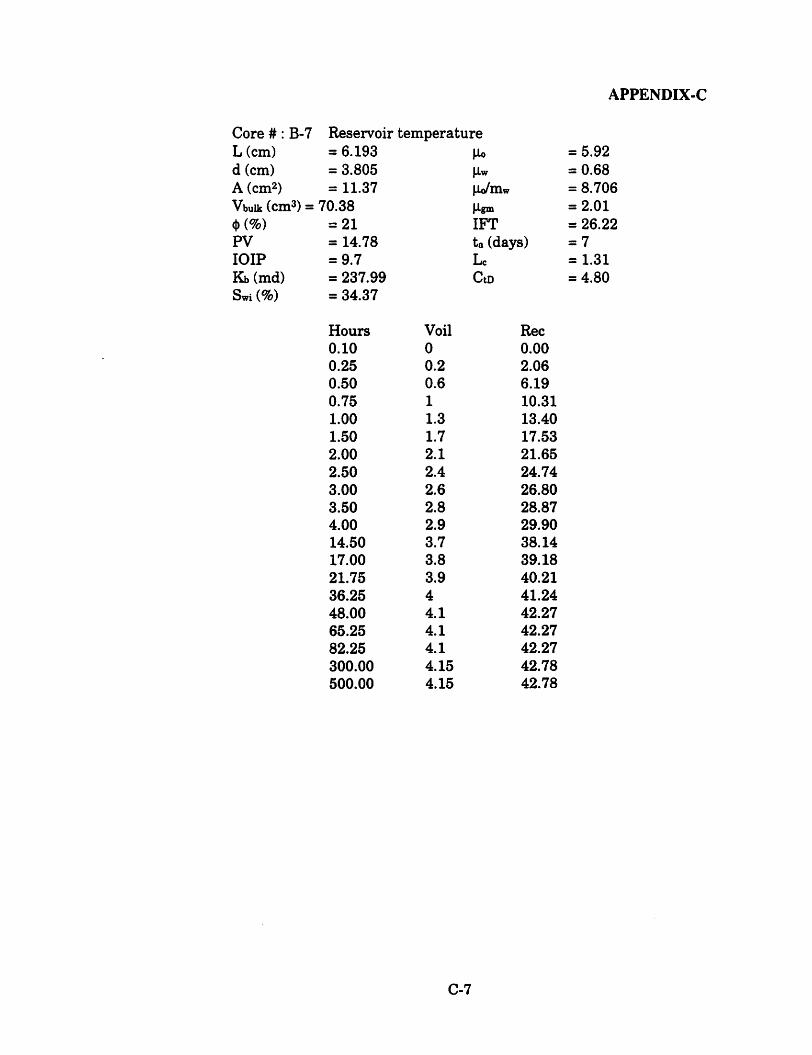


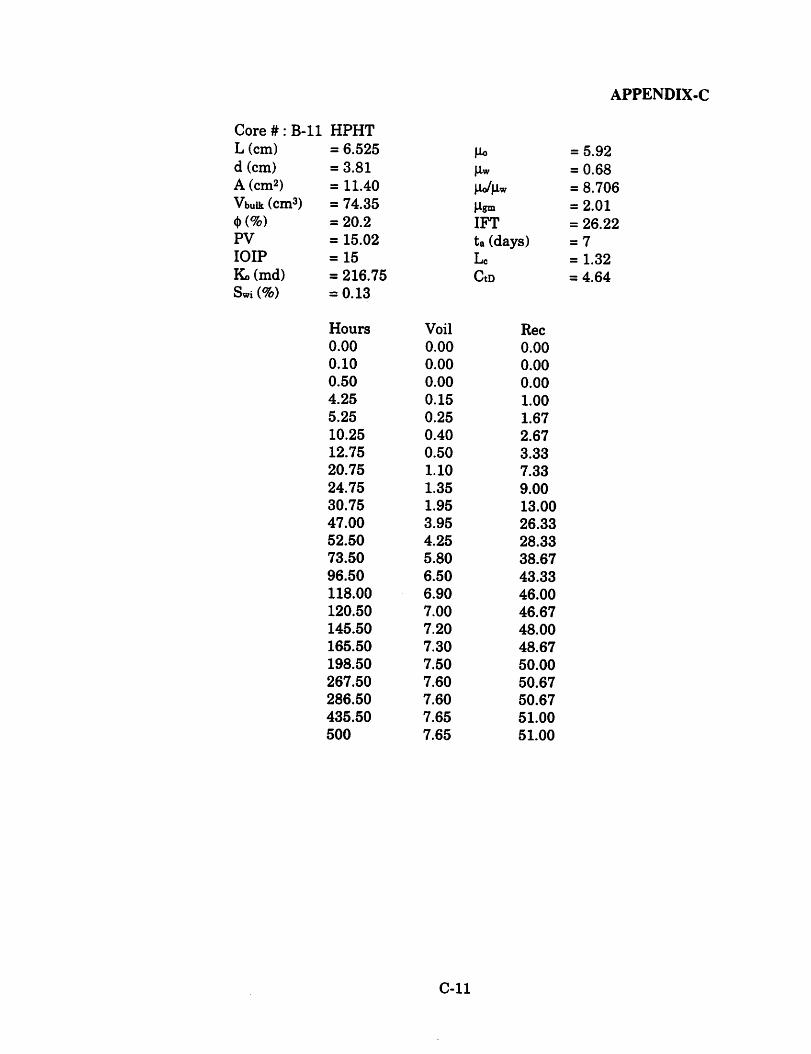

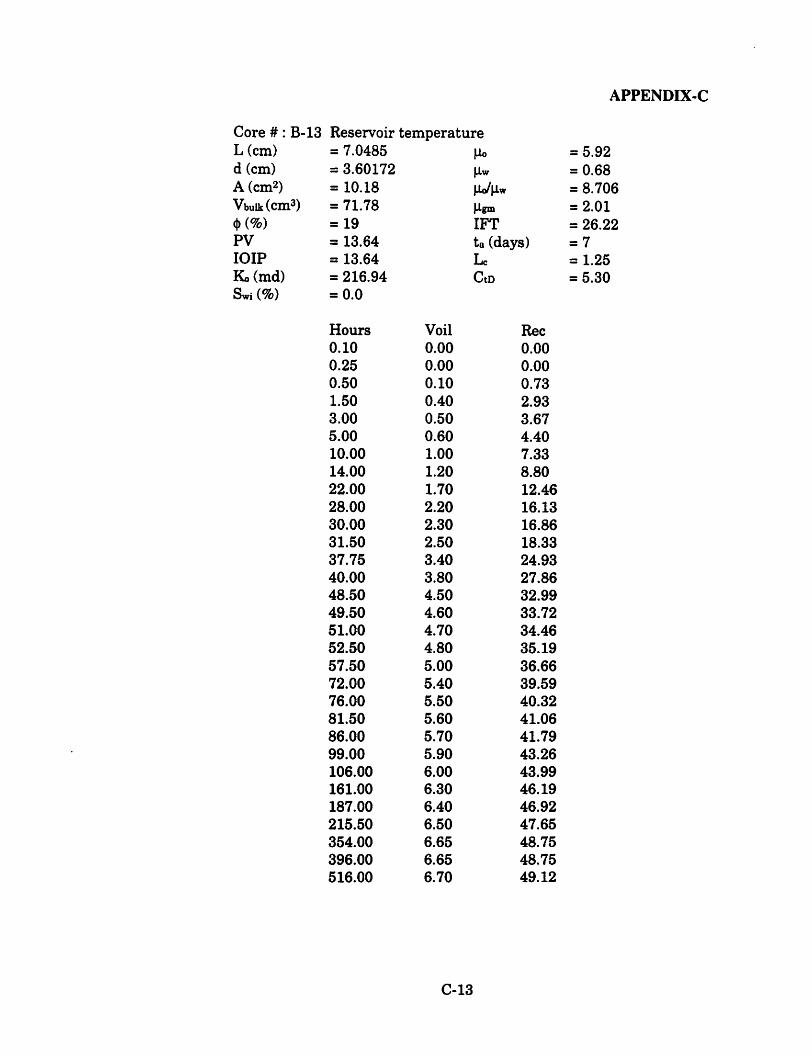


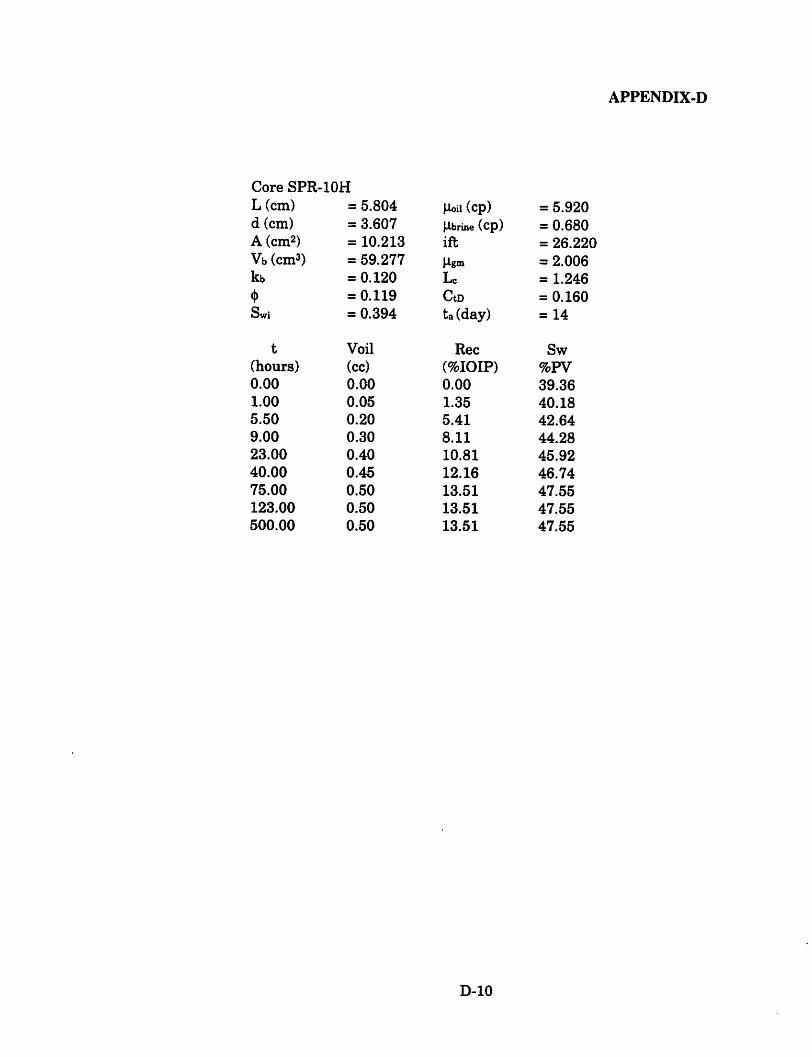


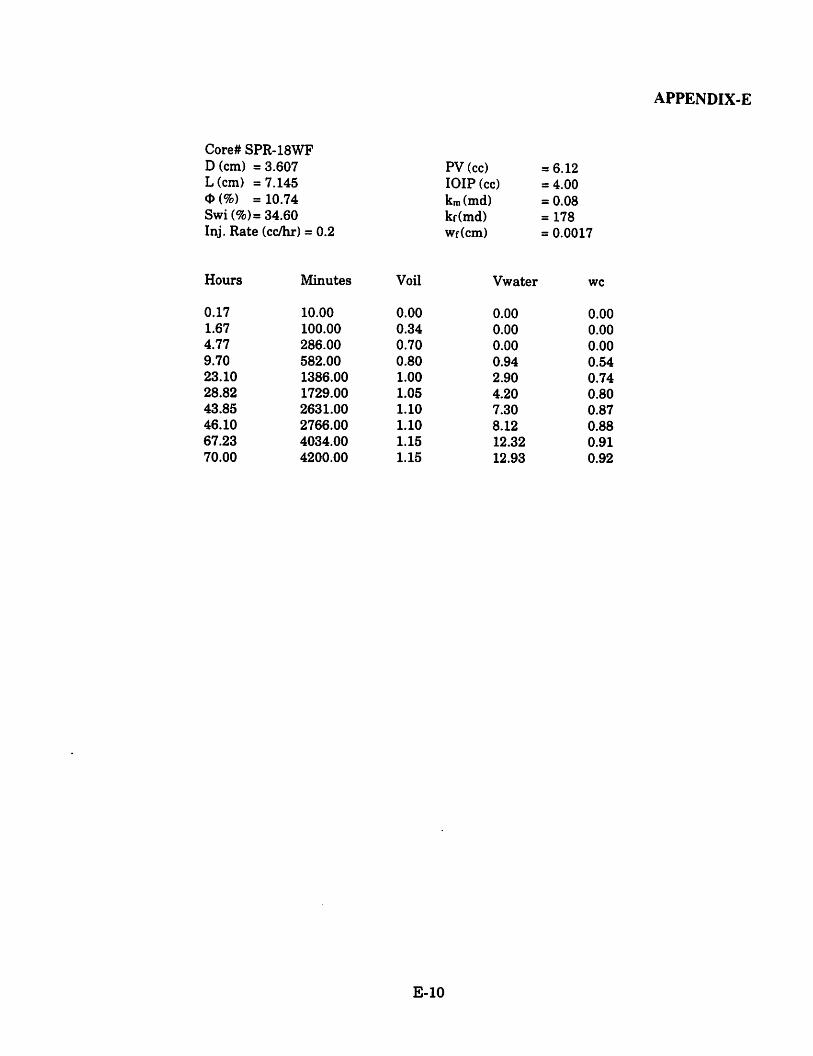


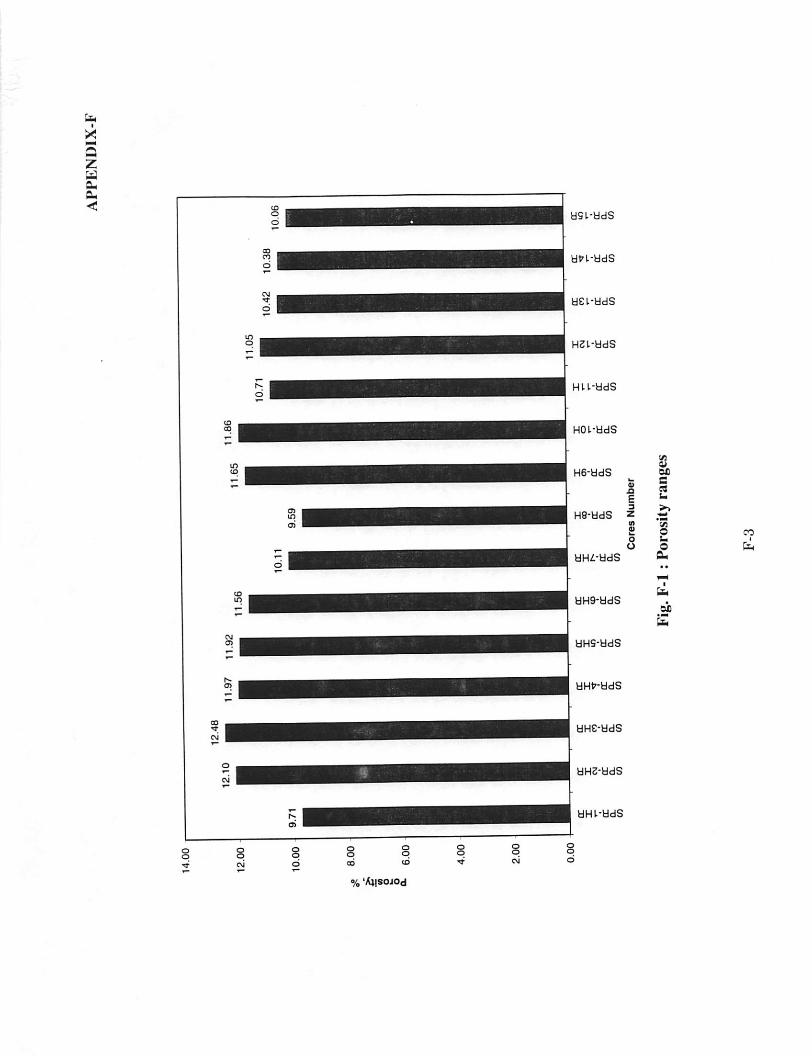
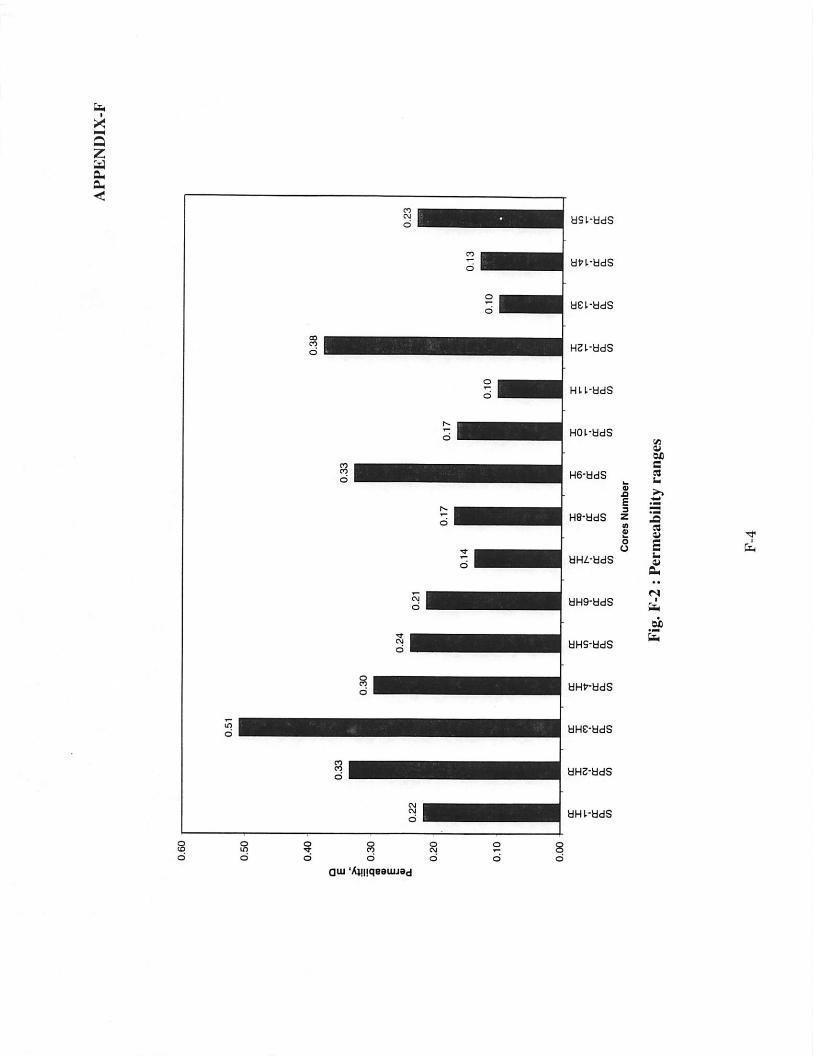


Related Documents