Data from the NATIONAL VITAL STATISTICS SYSTEM A studyof infant mortality from linkedrecordx ComparisonofNeonatalMortality FromTwoCohortStudies UnitedStates,January-March1950 and1960 Comparison of neonatal mortality in the United States based on two cohort studies for infants born alive during January-March 1950 and 1960; includes consideration of color, sex, plurality, weight at birth, gestation, age of mother, total-birth order, cause of death, and age at death. DI-IEW Publication No. (HSM) 72-1056 U.S. DEPARTMENT OF HEALTH, EDUCATION, AND WELFARE Public Health Service Health Services and Mental Health Administration National Center for Health Statistics Series 20 Number 13 Rockville, Md. June 1972

Welcome message from author
This document is posted to help you gain knowledge. Please leave a comment to let me know what you think about it! Share it to your friends and learn new things together.
Transcript
Data from theNATIONAL VITAL STATISTICS SYSTEM
Astudyof infant mortalityfrom linkedrecordx
Comparisonof NeonatalMortalityFromTwoCohortStudiesUnitedStates, January-March1950 and1960
Comparison of neonatal mortality in the United States based on
two cohort studies for infants born alive during January-March
1950 and 1960; includes consideration of color, sex, plurality,
weight at birth, gestation, age of mother, total-birth order, cause
of death, and age at death.
DI-IEW Publication No. (HSM) 72-1056
U.S. DEPARTMENT OF HEALTH, EDUCATION, AND WELFAREPublic Health Service
Health Services and Mental Health Administration
National Center for Health Statistics
Series 20
Number 13
Rockville, Md. June 1972

VitaI and Health Statistics-Series 20-No. 13
Fur sdo by the SufMntmdmt of Documents, U.S. Government PrIntinE Office, Wnsbiruton, D.C. 2040?- Pricu $LWI
NATIONAL CENTER FOR HEALTH STATISTICS
THEODORE D. WOOLSEY, Director
PHILIP S. LAWRENCE, SC.D., Associate Director
OSWALD K. SAGEN, Ph.D., Assistant Director for Health Statistics Development
WALT R. SIMMONS, FAA., Assistant Director for Research and Scientific Development
JAMES E. KELLY, D.D.S., Dental Advisor
EDWARD E. MINTY, Executive Officer
ALICE HAYWOOD, Information Officer
OFFICE OF HEALTH STATISTICS ANALYSIS
IWAO M. MORIYAMA, Ph.D., Director
DEAN E. KRUEGER, M.S. Deputy Director
DIVISION OF VITAL STATISTICS
ROBERT A. ISRAEL, M.S., Director
JOHN E. PA’ITERSO<N,Assistant Director for Demographic Affairs
ROBERT J. ARMSTRONG, M.S., Chief Mortality Statistics Branch
Vital and Health Statistics-Series 20-No. 13
DHEW Publication No. (HSM) 72-1056
Library of Congress Catalog Card Number 79-190016
This is the third in a group of analytical studies appearing in Vitaland Health Statistics, Series 20, dealing with death in the first year oflife among infants born alive in the United States in 1960. The firstreport (Series 20, No. 7) was concerned with methods of study andregistration aspects, and the second (Series 20, No. 12) dealt withinfant mortality by birth weight, period of gestation, and othervariables.
The mortality data are derived from infant death records linked tolive-birth records for the same infants, representing the mortalityexperience among the 1960 cohort of Iiveborn infants. Because thepurpose of the present report is to compare the experience of the1960 cohort with an earlier cohort which was limited to neonatalmortality, it was necessary to limit the present report to the neonatalperiod as well.
In the conduct of the study, use was made of procedures alreadyin existence for the regular production of national vital statistics. TheNational Center for Health Statistics had microfilm copies of theoriginal records and computer tapes which contained selected datataken from the records. The States and some cities had alphabeticindexes of births and deaths and were in a position to complete thelinkage between the birth and death records. Although the study wascarried out by the National Center for Health Statistics, thecooperative assistance of State and city offices of vital recordscontributed substantially to the final outcome. This study of infantmortality is but one example in a long history of cooperativeFederal-State relations in vital statistics.
...Ill
CONTENTS
Preface . . . . . . . . . . . . . . . . . . . . . . . . . . . . . . . . . . . .
Introduction . . . . . . . . . . . . . . . . . . . . . . . . . . . . . . . . . .Highlights . . . . . . . . . .. . . . . . . . . . . . . . . . . . . . . . . . .Descriptionof1950Study . . . . . . . . . . . . . . . . . . . . . . . . .Descriptionof1960Study . . . . . . . . . . . . . . . . . . . . . . . . .RelevancetoPresentSituation . . . . . . . . . . . . . . . . . . . . . . .
LimitationsofData . . . . . . . . . . . . . . . . . . . . . . . . . . . . . .
PresentationofData . . . . . . . . . . . . . . . . . . . . . . . . . . . . . .
ResultsoftheStudy . . . . . . . . . . . . . . . . . . . . . . . . . . . . . .Color,Sex,andPlural.ity . . . . . . . . . . . . . . . . . . . . . . . . . .WeightatBirth . . . . . . . . . . . . . . . . . . . . . . . . . . . . . . .PeriodofGestation . . . . . . . . . . . . . . . . . . . . . . . . . . . . .AgeofMother . . . . . . . . . . . . . . . . . . . . . . . . . . . . . . .Total-BirthOrder . . . . . . . . . . . . . . . . . . . . . . . . . . . . . .CauseofDeath . . . . . . . . . . . . . . . . . . . . . . . . . . . . . . .AgeatDeath . . . . . . . . . . . . . . . . . . . . . . . . . . . . . . . .
Discussion . . . . . . . . . . . . . . . . . . . . . . . . . . . . . . . . . . .
AreasforFurtherStudy . . . . . . . . . . . . . . . . . . . . . . . . . . . .Weight Gain . . . . . . . . . . . . . . . . . . . . . . . . . . . . . . . . .Birth Weight, Race, and Socioeconomic Level . . . . . . . . . . . . . . .BirthWeightandGestation. . . . . . . . . . . . . . . . . . . . . . . . .LinkedRecordsStudies . . . . . . . . . . . . . . . . . . . . . . . . . . .
SummaryandConclusion . . . . . . . . . . . . . . . . . . . . . . . . . . .
References . . . . . . . . . . . . . . . . . . . . . . . . . . . . . . . . . . .
ListofDetailedTables . . . . . . . . . . . . . . . . . . . . . . . . . . . .
Appendix I. Standard Certificate ofLive Birth . . . . . . . . . . . . . . .
Appendix II. StandardCertificateofDeath . . . . . . . . . . . . . . . . .
AppendixIII. Technical Notes . . . . . . . . . . . . . . . . . . . . . . . .
...111
12333
4
5
778
1420262729
32
3939404041
42
43
45
94
95
96
v
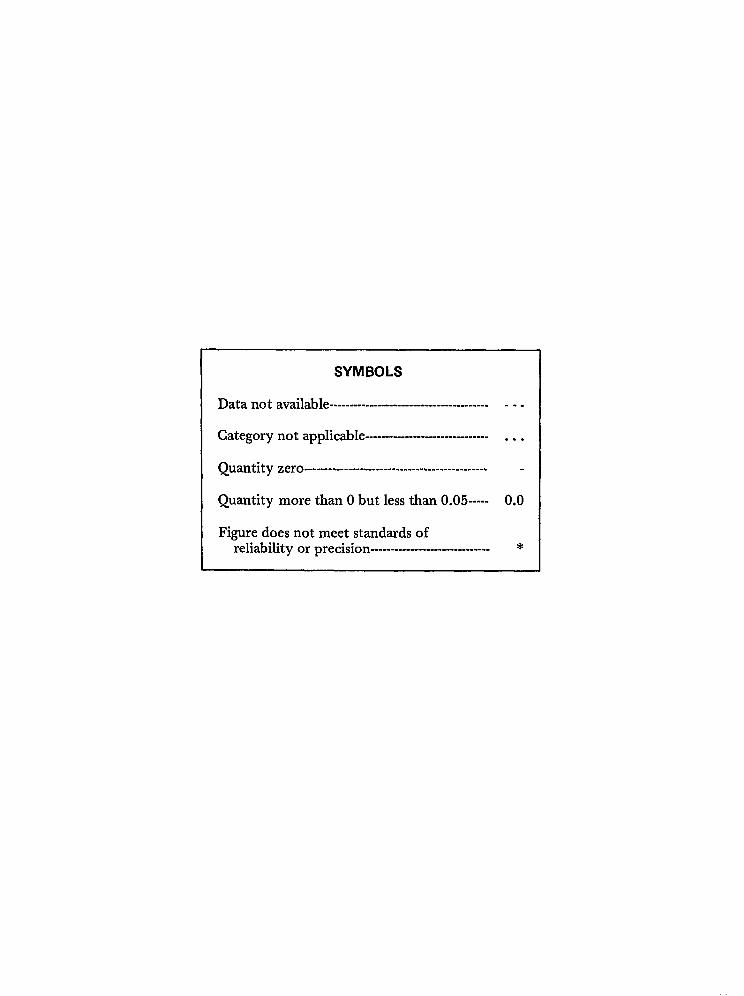
SYMBOLS
Datanot available---------------------------------------- ---
Category not applicable ------------------------------- . . .
Qumtity zero ---------------------------------------------- -
Quantity morethan Obutless than0.05----- 0,0
Figure does not meet standards ofreliability or precision ------------------------------ *
A STUDY OF INFANT MORTALITY
FROM LINKED RECORDS
COMPARISON OF NEONATAL MORTALITYFROM TWO COHORT STUDIES
Helen C. Chase, Dr. P.H., National Academy of Sciencesa
INTRODUCTION
As routinely published in official vital statis-tics, infant mortality rates and their componentsare derived from two independent sets ofrecords: the numerators are based on deathcertificates, and the denominators are based onlive-birth certificates. Each set of records istabulated separately according to characteristicscontained therein, and the summary figures fordeaths are divided by those for births, and theresult is multiplied by a constant (usually 1,000)to produce the desired results. For character-istics which appear on both records (e.g., colorand sex), infant mortality rates can be computedin this manner. For other characteristics such asage of mother, order of birth, or birth weight, itis impossible to compute infant mortality ratesin this manner because these items of informa-tion are not repeated on the death records.
To study infant mortality in relation to thelatter items, the death record for each specificindividual must be linked to the birth record
aDr. Chase is Staff Associate (Biostatistics) at the HealthServices Research Study, Institute of Medicine,National Acad-emy of Sciences. At the time this study was conducted, she wasStatistician (Health), Office of Health Statistics Analysis, Na-tionalCenter for HealthStatistics.
for the same individual and the data for livebirths and for the linked infant deaths must betabulated according to the desired basic factors.For the United States, two nationwide studies of
linked records relating to infancy are available:one study of neonatal death among infants bornalive in January-March 1950 and another studyof infant death among infants born alive in1960. The purpose of the present report is tocompare the results of the two studies. Becausethe earlier study was limited to deaths in thefirst 4 weeks of life (neonatal period), thepresent comparison is necessarily limited to thatperiod.
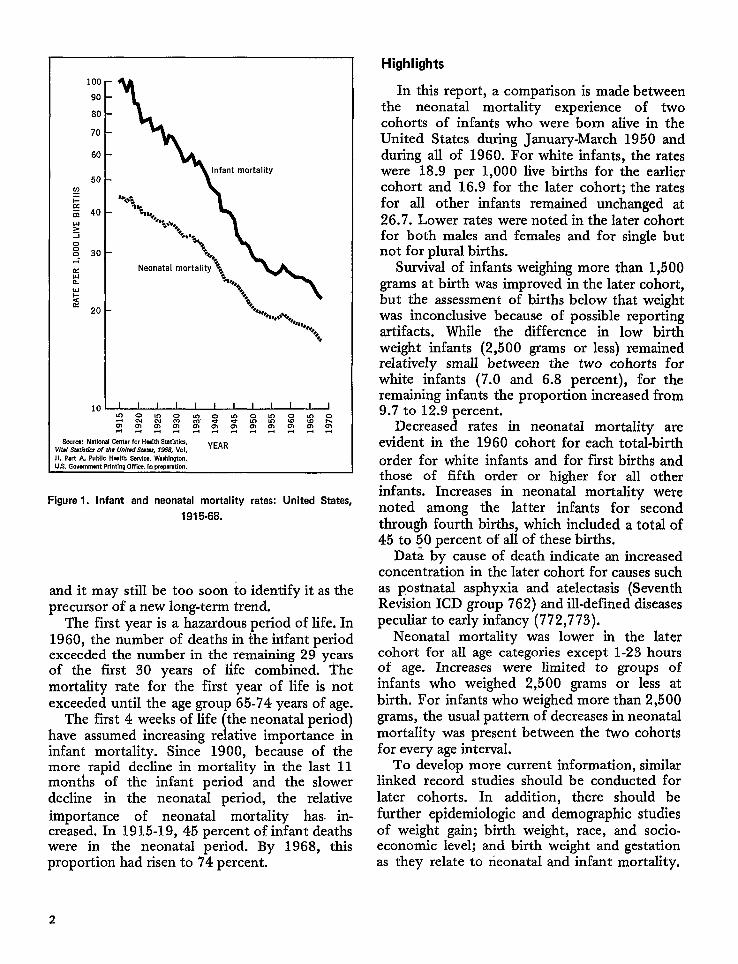
At the turn of the century, infant mortality inthe United States was probably in excess of 100deaths per 1,000 live births. That is, about 1 ofevery 10 liveborn infants died in the first year oflife. During the first half of the 20th century,the rates fell rapidly until, in 1950, infantmortality was 29.2 per 1,000 live births—arelative decrease of about 70 percent (figure 1).During the 1950’s the rapidity of the declinedecelerated, and between 1956 and 1958 therewere actually small increases in the infantmortality rates. Thereafter, the rates began todecline once more. Since 1965, there is again asuggestion of a definite decline in infant mortal-ity, but at a slower pace than before 1950. Thisdecline has been occurring for only a few years,
1
100 –
90 -
80 -
70 -
60 -
50 -108+
; 40 -
%’i0
z 30 ---ccUIRw~
E 20 -
,0 ~U-I OUIOUJ,2 o~u)go
m S?S’z g %ao %mmcs &
.,-1 ..- . . ..- .,-l
Sam: National Cmtor for Health Statistics,Vial SmMks of tha Unh7’ .W8mt, Isl?-s,vol. YEARN, Part A. Pub4k H“lth SWVke. Wahlcgt. an.U.S. Gawnnnnt Prlnthq Office. In preparation.
Figure 1. Infant and neonatal mortality rates: United Stetes,
1915-68.
and it may still be too soon to identify it as theprecursor of a new long-term trend.
The first year is a hazardous period of life. In1960, the riumber of deaths in the irifant periodexceeded the number in the remaining 29 yearsof the first 30 years of Iife combined. Themortality rate for the first year of life is notexceeded until the age group 65-74 years of age.
The first 4 weeks of life the neonatal period)\have assumed increasing re ative importance in
infant mortality. Since 1900, because of themore rapid decline in mortality in the last 11months of the infant period and the slowerdecline in the neonatal period, the relativeimportance of neonatal mortality has. in-creased. In 1915-19, 45 percent of infant deathswere in the neonatal period. By 1968, thisproportion had risen to 74 percent.
Highlights
In this report, a comparison is made betweenthe neonatal mortality experience of twocohorts of infants who were born aIive in theUnited States during January-March 1950 andduring all of 1960. For white infants, the rateswere 18.9 per 1,000 live births for the earliercohort and 16.9 for the later cohort; the ratesfor all other infants remained unchanged at26.7. Lower rates were noted in the later cohortfor both males and females and for single butnot for plural births.
Survival of infants weighing more than 1,500grams at birth was improved in the later cohort,but the assessment of births below that weightwas inconclusive because of possible reportingartifacts. While the difference in low birthweight infants (2,500 grams or less) remainedrelatively small between the two cohorts forwhite infants (7.0 and 6.8 percent), for theremaining infants the proportion increased from9.7 to 12.9 percent.
Decreased rates in neonataI mortality areevident in the 1960 cohort for each total-birthorder for white infants and for first births andthose of fifth order or higher for all otherinfants. Increases in neonatal mortality werenoted among the latter infants for secondthrough fourth births, which included a total of45 to 50 percent of all of these births.
Data by cause of death indicate an increasedconcentration in the later cohort for causes suchas p,o.stnatal asphyxia and atelectasis (SeventhRevmon ICD group 762) and ill-defined diseasespeculiar to early infancy (772,773).
Neonatal mortality was lower in the latercohort for all age categories except 1-23 hoursof age. Increases were limited to groups ofinfants who weighed 2,500 grams or less atbirth. For infants who weighed more than 2,500grams, the usual pattern of decreases in neonatalmortality was present between the two cohortsfor every age interval.
To develop more current information, similarlinked record studies should be conducted forlater cohorts. In addition, there should befurther epidemiologic and demographic studiesof weight gain; birth weight, race, and socio-economic level; and birth weight and gestationas they relate to neonatal and infant mortality.
2
Description of 1950 Study
The earlier nationwide study of neonatalmortality in the United States was a byproductof a study of the completeness of live-birthregistration.1 ~z The study was conducted by theNational Office of Vital Statistics, which is nowa part of the National Center for Health Statis-tics, in cooperation with the U.S. Bureau of theCensus and State vital statistics agencies. When acensus enumerator called at a household tocomplete the census return on or shortly afterApril 1, 1950, he was directed to complete anInfant Card for any child in the household whowas born during January, February, or March ofthat year. The Infant Card was to be completedirrespective of whether the child was dead oralive at the time of the census. These cards werecompared with live-birth certificates for thesame 3-month period; and, as a byproduct, theneonatal deaths among this group of births wereidentified by the State vital statistics agencies.Since the neonatal death and live-birth recordsfor specific individuals were linked, the neonatalmortality experience among this group ofinfants was analyzed. The results of this study,with particular emphasis on weight at birth, areavailable in a number of publications.3’6 Therates shown in these reports are cohort mortalityrates; that is, they represent the probabilityy orrisk of death among a given group of infantswho were born alive during the first 3 months of1950.
Description of 1960 Study
The procedures for the 1960 study differed insome respects from the 1950 study. One impor-tant difference is that the study was basedentirely on registered vital events, and it lackedthe benefits which could have been derived fromhousehold visits like those made by censusenumerators 10 years earlier. As a result, the1960 study cannot be used to evaluate thecompleteness of live-birth registration. The onlyaspect of registration which can be analyzed isthe registration of live births for those infantswho died under 1 year of age. These aspects ofthe study have been reported in another publica-tion in considerable detail.7
In 1959 the National Center for HealthStatistics (NCHS) invited the States to partici-pate in a cohort study of infant mortality. Thestudy depended on identifying all deaths under1 year of age among the cohort of infants bornalive in the United States in 1960. The Stateswere asked to supply copies of the linked infantdeath and live-birth certificates from their offi-cial permanent files, and these were forwardedto the National Center for Health Statistics.These certificates are patterned after the Stand-ard Certificates of Live Birth and Death (appen-dixes I and II). To complete the national file oflinked records, a number of other searches wererequired in other States for infants who movedacross State boundaries between the time ofbirth and death; and at the Center a search wasmade of microfilm copies of certificates andcomputer tapes of statistical records. As a result,a nationwide file of linked infant death andlive-birth records was compiled, of which onlythe neonatal records are of particular interest tothis comparison. In addition to the 78,330linked neonatal death records, there were 1,190neonatal death records for which no birthrecords could be found and 92 linked neonataldeath records supplied by the States for whichno record could be found at the Center. Whilethe 1960 study included all deaths in the firstyear of life, the present comparison covers onlythe neonatal period, an age interval comparableto that of the January-March 1950 study. Thestudy procedures and a consideration of theefficacy of the record linkage procedures arereported elsewhere.T
Relevance to Present Situation
Although the data which form the basis of thepresent report refer to mortality among infantsborn a number of years ago, there was relativelylittle change in infant mortality as late as 1965.The data are, therefore, important in consideringthe changes between the two cohorts and for anumber of years thereafter. Although there areno comparable cohort mortality rates after the1960 cohort, there are data for live births whichcan be compared with the 1960 data to gain abetter understanding of the relevance of the.1960 study to present patterns and problems.
3
LIMITATIONS OF DATA
For this report, the basic data consist ofneonatal mortality rates for two cohorts of livebirths–i.e., infants born alive during January-March 1950 and those born in 1960. Certaindifferences in the conduct of the two studieshave already been mentioned. The earlier studyhad the advantage of including unregistered livebirths, while the latter did not. However, thehigh degree of completeness of birth registrationin January-March 1950 (98 percent) enhancedthe confidence in the live-birth statistics pro-duced for the country as a whole. Although theproportions varied according to State, the na-tional data for live births were consideredacceptably complete for use in the later study.For the 1960 study, the States were requestedto supply copies of linked records for all deathswhich met the study criteria. These records weresupplemented with neonatal deaths identifiedthrough searches in other States and at NCHS.The combined file was used to produce tabula-tions for the numerators of the mortality rates.The live-birth data for the denominators weretaken from the publication Vital Statistics of theUnited States, 1960 and from unpublishedtabulations for that year at the National Centerfor Health Statistics.
In the earlier study for births in January-March 1950, linked birth certificates could notbe found for 2.4 percent of the neonatal deathrecords, 2.0 percent for white, and 4.6 percentfor all other {nfants.1 As has been mentioned, inthe study for 1960, it was impossible to deter-mine the incompleteness of birth registration. Aswould be expected in a large-scale study, live-birth records could not be found for a numberof neonatal deaths, and the unlinked neonataldeaths are omitted from the study. They repre-sent 2.1 percent of the neonatal deaths, 1.7percent for the white, and 3.2 percent for allother neonatal deaths. The level of under-registration of live births for the neonatal deathsin the 1960 study was less than in the earlierstudy, and it is therefore assumed that live-birthregistration in 1960 was at least equal to andprobably more complete than that in 1950.
Another difference between the two studies isthe method in which the unregistered eventswere handled statistically. In the January-March
1950 study, the live-birth data were adjusted toinclude the unregistered events, while the data inthe 1960 study were not. Estimates of the effectof this factor can be made, and on the nationallevel the bias is not serious. However, if the datawere to be examined more closely for individualStates, the effects would be serious for some ofthe States. The discrepancies associated withincomplete birth registration or linkage failureswere felt to be relatively minor and withinacceptable limits for the analysis of nationwidedata.
The preparation of a new set of punchedcards for the 1960 study introduced someinconsistencies with published data even thoughthe same instruction manual was used forpunching. Many of these were resolved afterthey were identified through geographic areatabulations, but some could not be detectedthrough this means.
Another limitation of the data from the twostudies for comparative purposes rests in the factthat the data for January-March 1950 reflect thelive births which occurred in the first quarter ofthe year, while the data for 1960 reflect the livebirths which occurred throughout the entireyear. Neonatal mortality in the first quarter ofthe year is about 3 percent lower than theannual rate, and therefore the rates for January-March 1950 were probably underestimates ofthe rate for the year 1950 by approximatelythat degrees This differential should be kept inmind when comparing the experience in the twostudies.
A further limitation of the data is the result~f sampling the records for preparation of thehve-birth data for 1960. For that year, everysecond live-birth record for each State waspunched, yielding a 50-percent systematicsample. Tabulated frequencies were doubled forpublication. However, for the present study, alllinked infant death and live-birth records wereincluded whether the corresponding birth recordfell into the sample or not. Estimates of the;ampling errors for the 1960 cohort are includedin appendix III. The data for the earlier study ofevents in 1950 were not based on a sample buton complete counts of live births and neonataldeaths and consequently are not subject tosampling errors.
Not all of the 79,612 neonatal deaths which
4
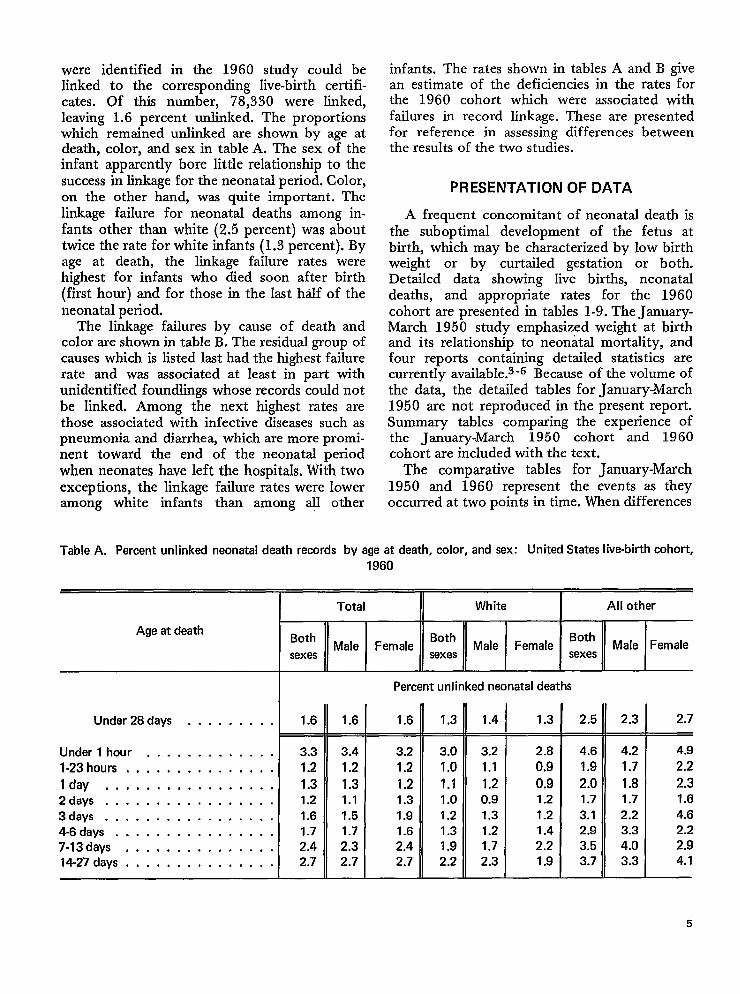
were identified in the 1960 study could belinked to the corresponding live-birth certifi-cates. Of this number, 78,330 were linked,leaving 1.6 percent unlinked. The proportionswhich remained unlinked are shown by age atdeath, color, and sex in table A. The sex of theinfant apparently bore little relationship to thesuccess in linkage for the neonatal period. Color,on the other hand, was quite important. Thelinkage failure for neonatal deaths among in-fants other than white (2.5 percent) was abouttwice the rate for white infants (1.3 percent). Byage at death, the linkage failure rates werehighest for infants who died soon after birth(first hour) and for those in the Iast hdf of theneonatal period.
The linkage failures by cause of death andcolor are shown in table B. The residual group ofcauses which is listed last had the highest failurerate and was associated at least in part withunidentified foundlings whose records could notbe linked. Among the next highest rates arethose associated with infective diseases such aspneumonia and diarrhea, which are more promi-nent toward the end of the neonatal periodwhen neonates have left the hospitals. With twoexceptions, the linkage failure rates were loweramong white infants than among all other
infants. The rates shown in tables A and B givean estimate of the deficiencies in the rates forthe 1960 cohort which were associated withfailures in record linkage. These are presentedfor reference in assessing differences betweenthe results of the two studies.
PRESENTATION OF DATA
A frequent concomitant of neonatal death isthe suboptimal development of the fetus atbirth, which may be characterized by low birthweight or by curtailed gestation or both.Detailed data showing live births, neonataldeaths, and appropriate rates for the 1960cohort are presented in tables 1-9. The January-March 1950 study emphasized weight at birthand its relationship to neonatal mortality, andfour reports containing detailed statistics arecurrently available.s’6 Because of the volume ofthe data, the detailed tables for January-March1950 are not reproduced in the present report.Summary tables comparing the experience ofthe January-March 1950 cohort and 1960cohort are included with the text.
The comparative tables for January-March1950 and 1960 represent the events as theyoccurred at two points in time. When differences
TableA, Percent unlinked neonatal death records by age at death, color, and sex: United States live-birth cohort,
1960
Age at death
Under 28days . . . . . . . . .
Under l hour . . . . . . . . . . . . .
l-23hours, . . . . . . . . . . . . . .
lday . . . . . . . . . . . . . . . . .2ciays . . . . . . . . . . . . . . . . .
3days . . . . . . . . . . . . . . . . .4-6days . . . . . . . . . . . . . . . .7.13days . . . . . . . . . . . . . . .14-27 days, . . . . . . . . . . . . . .
Total
w
1.6
3.3
1.2
1.31.2
1.61.72.42.7
1.6
3.4
1.2
1.31.1
1.51.7
2.32.7
White I All other
Percent unlinked neonatal deaths
1.6
3.2
1.2
1.21.3
1.91.62.42.7
1.3
3.0
1.0
1.11.0
1.2
1.31.92.2
1.4
3.2
1.1
1.20.9
1.31.2
1.72.3
1.3
2.8
0.9
0.91.21.21.4
2.21.9
2.5
4.6
1.9
2.01.73.12.9
3.5
3.7
2.3 I 2.7
4.2 4.9
1.7 2.2
1.8 2.31.7 1.6
2.2 4.6
3.3 2.2
4.0 2.9
3.3 4.1
5
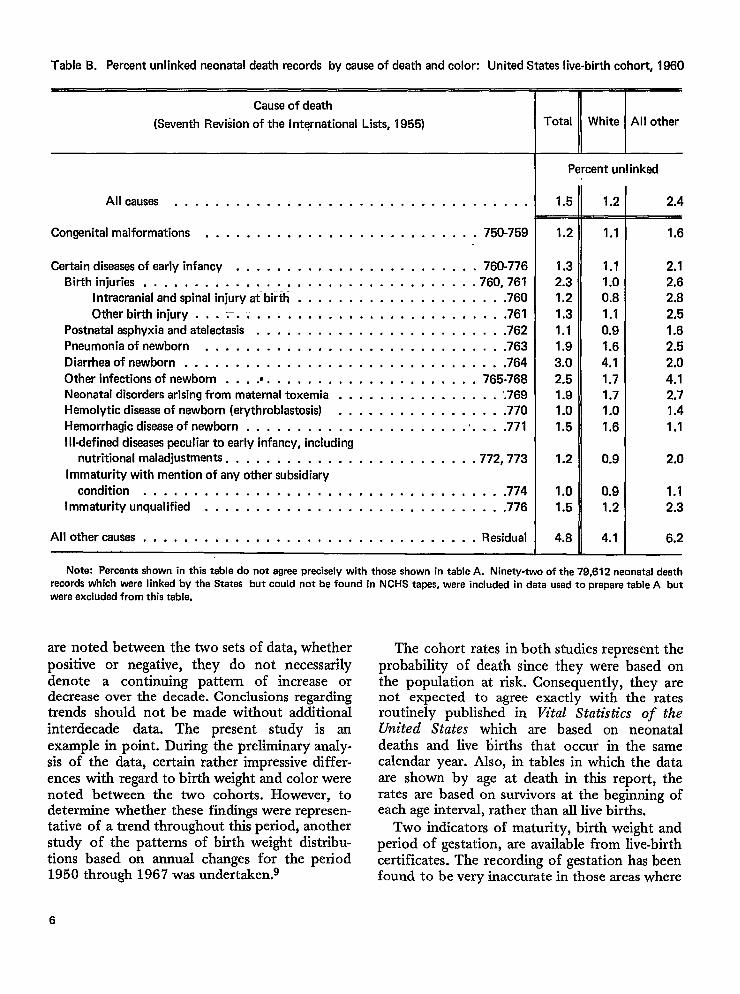
Table B. Percent unlinked neonatal death records by cause of death and color: United States live-birth cohort, 1960
Cause of death
(Seventh Revidon of the international Lists, 1955)
Allcauses . . . . . . . . . . . . . . . . . . . . . . . . . . . . . . . . . . .
Congenital malformations . . . . . . . . . . . . . . . . . . . . . . . . ...750-759
Certain diseasesofearly infancy . . . . . . . . . . . . . . . . . . . . . . . . 760-776
Birth injuries . . . . . . . . . . . . . . . . . . . . . . . . . . . . . . . . .760, 761Intracranial and spinal injury atbirth . , . . . . . . . . . . . . . . . . . . .760
Other birth injury . . . .. . .. . . . . . . . . . . . . . . . . . . . . . . ...761Postnatal asphyxia and atelectasis . . . . . . . . . . . . . . . . . . . . . . . . .762
Pneumonia of newborn . . . . . . . . . . . . . . . . . . . . . . . . . . . ...763
Diarrhea of newborn......,.. . . . . . . . . . . . . . . . . . . . . . ..764
Other infections of newborn . . . .@. . . . . . . . . . . . . . . . . . . . . 765-768Neonatal disorders arising from maternal toxemia . . . . . . . . . . . . . . . . ‘.769
Hemolytic disease of newborn (erythroblastosis) . . . .. . . , . . . . . . . . . .770
Hemorrhagic disease of newborn . . . . . . . . . . . . . . . . . . . . . . . . . . .771
I Ii-defined diseasespeculiar to early infancy, including
nutritional maladjustments. . . . . . . . . . . . . . . . . . . . . . . . .772, 773
Immaturity with mention of any other subsidiary
condition . . . . . . . . . . . . . . . . . . . . . . . . . . . . . . . . . ...774Immaturity unqualified . . . . . . . . . . . . . . . . . . . . . . . . . . . . ..776
All other causes . . . . . . . . . . . . . . . . . . . . . . . . . . . . . . . .. Residual
ITotal White All other
Percent unlinked
1.5 1.2
1.2
1.3
2.31.2
1.3
1.1
1.9
3.0
2.51.91.0
1.5
1.2
1.01.5
4.8
1.1
1.1
1.00.8
1.1
0.9
1.6
4.1
1.71.7
1.0
1.6
0.9
0.9
1.2
4.1
2.4
1.6
2.1
2.62,8
2.5
1.6
2.!5
2.0
4.1
2.71.4
1.1
2.0
1.12.3
6.2
Note: Percents shown in this table do not agree precisely with those shown in table A. Ninetv-two of the 79.612 neonatal deathrecords which were linked by the States but could not be found in NCHS tapes, were included in data used to prepare table A butwere excluded from this table.
are noted between the two sets of data, whetherpositive or negative, they do not necessarilydenote a continuing pattern of increase ordecrease over the decade. Conclusions regardingtrends should not be made without additionalinterdecade data. The present study is artexample in point. During the preliminary analy-sis of the data, certain rather impressive differ-ences with regard to birth weight and color werenoted between the two cohorts. However, todetermine whether these findings were represen-tative of a trend throughout this period, anotherstudy of the patterns of birth weight distribu-tions based on annual changes for the period1950 through 1967 was undertaken.g
The cohort rates in both studies represent theprobability of death since they were based onthe population at risk. Consequently, they arenot expected to agree exactly with the ratesroutinely published in Vital Statistics of theUnited States which are based on neonataldeaths and live births that occur in the samecalendar year. Also, in tables in which the dataare shown by age at death in this report, therates are based on survivors at the beginning ofeach age interval, rather than all live births.
Two indicators of maturity, birth weight andperiod of gestation, are available from live-birthcertificates. The recording of gestation has beenfound to be very inaccurate in those areas where
6
the certificates require “weeks” or “months ofgestation.”g~10 In 1960, the certificates for afew registration areas asked for the date atwhich the last nornd menses began and usedtMs to cahxdate gestation age. As a result, theperiods of gestation had a more ratioxuddisMm-tion. The certificates for only four areas (14.3percent of the live-birth certificates for thecountry) were based on this type of rnquiry;therefore the reco~ded data for the country as awhoIe are deemed to be deficient. As a result,far greater emphasis iu this report was placed onbirth weight as the primary indicator of matu-rity. This was -not intended to indicate a prefer-ence for birth weight over gestation as anindicator of maturity. The 1968 revision of theStandard Certificate of Live Birth, which hasbeen recommended to the States by the SurgeonGeneral of the PubIic HeaIth Service, requiresthe “date last nornd menses begam” This wiUpermit the calculation of the -weeksof gestationin a uniform manner by computer. Futurestudies may be expected to gain from thisimprovement in the basic data.
RESULTS OF THE STUDY
Color, Sex, and Phmd-ky
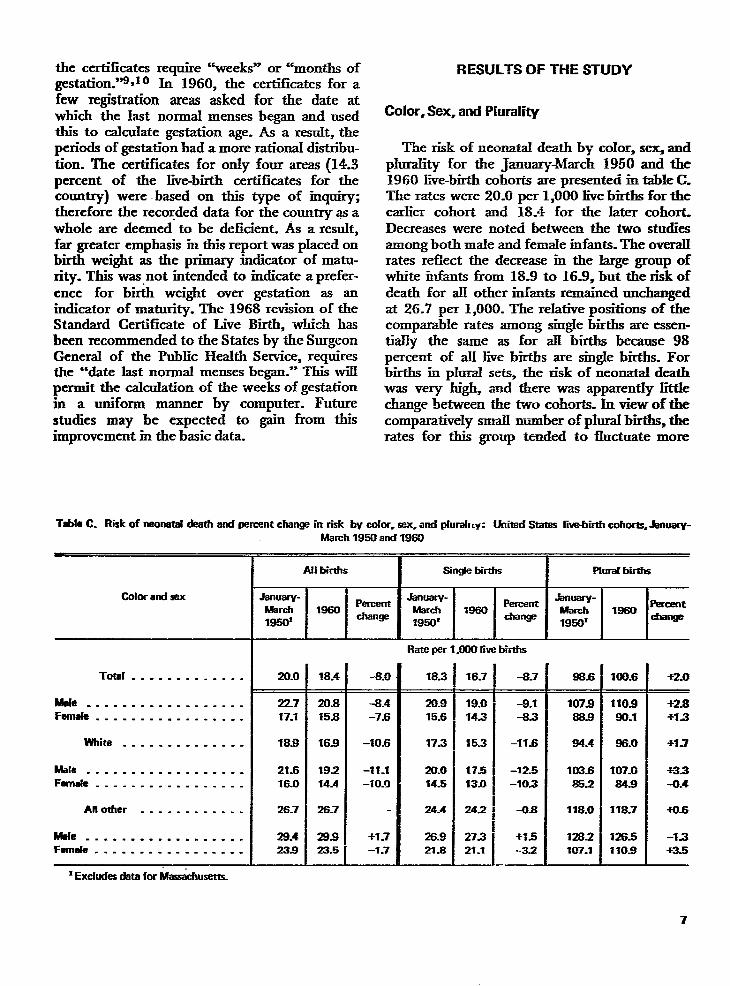
The risk of neonatal death by color, sex, andplurality for fhe january-March 1950 and the1960 Ewe-birth cohorts are presented in table C.The rates were 20.0 per 1,000 live births for theeadier cohort and 18.4 for tie later cohort-Decreases were noted between the two studiesamong both male and femaIe rnfats. The overallrates refiect the decrease m the large group ofwhite infants from 18.9 to 16.9, but the risk ofdeath for ZW other infants remained unchangedat 26.7 per 1,000. The reIative positions of thecomparable rates amoEg singIe births are essen-tially the same as for aH births because 98percent of rdI Jive births are single births. Forbirths in pIural sets, the risk of neonatzd deathwas very high and there was apparently IittIechange between the two cohorts. In view of thecomparatively small number of plural births, therates for ‘tis group tended to fluctuate more
Tfile C. Risk of neonatal dssth and parcarrtchangs in risk by SOIOrCsex, and @udlLy: United 8tates live-birth COhOrlS=&nUaIV-
Cofor and sex
Total . . . . . . . . . . . . .
We . . . . . . . . . . . . . . . . . .Fernde. . . . . . . . . . . . . . . . .
white . . . . . . . . . . . . . .
Male . . . . . . . . . . . . . . . . . .Fwnele . . . . . . . . . . . . . . . . .
Another . . . . . . . . . . . .
Wal e . . . . . . . . . . . . . . . . .Fernde . . . . . . . . . . . . . . . . .
March 1950 and 1860
Ail bhdls I 6in@e birtbs Plud births
Jsnuary- Parcem January- .knlrJary-March 1960 March m60
Percent W* ~= U?rcent
18501change
1950’change
1950’cha~
Rate per 1,(M)Olive births
20.0
22717.1
18.8
21.616.0
26.7
28.4239
18.4
20.815.8
169
19.214.4
26.7
28.823.5
-8.0
-8.4-7.6
-106
-11.1-10.!)
+1.7–1.7
18.3
20.915.6
17.3
20.014.5
24.4
26.921s
16.7-
19.0143
15.3
17.513.0
242
27.321-1
-8.7—
-8.1-83
–11s
-125-103
-0s
+15-32
.—
86-6—
107988.8
84.4
103.6852
118.0
128.2107.1
mL6
110980.1
86.0
107.0&s
118.7
126.51109
+2.0
+2.8+-1.3
*1.7
+33-(L4
+0s
-13-r-3.5
*Excludesdatafor Mtus&husem.
7
than for single births. The lower neonatalmortality among females was marked and wasconsistent regardless of plurality or color. Sincethe primary focus of this report is on acomparison between the two cohorts, the signifi-cant factors to be noted from table C are thedecrease between the cohorts for both sexes, thedecrease for single but not for plural births, andthe decrease for white infants but not for otherinfants.
Between the two cohorts, there was a relativedecrease of 8.0 percent in the risk of neonataldeath for aU Iive births. If adjustment had beenmade for the seasonal factor, the rate for theyear 1950 would have been about 3 percenthigher (20.6), and the estimated relative decreasebetween the two groups would have been about10.7 percent. The seasonal adjustment must bekept in mind in gauging the small differencesshown in table C.
Decreases were noted between the two studiesamong both male and female infants and weresubstantial: 8.4 and 7.6 percent, respectively.However, it is apparent that the major contrib-utor to the decreases for the total group was theexperience of the single white births, whichconstituted 82.9 percent of the total group.While the risk of neonatal death dropped from18.9 to 16.9 per 1,000 live births for whiteinfants, it remained unchanged at 26.7 for allother infants. The decreases for white male andwhite female infants were around 10 percent,but the small changes for all other male andfemale infants offset each other.
The lesser risk of neonatal death noted forsingle white births was not apparent for pluralbirths, and if allowances for seasonal factors aremade, the small increases which were observedfor plural births may be illusory. However, thelack of change in risk of neonatzd death forplural births in contrast with the notabledecrease for single white births is significant forobstetrical planning.
Weight at Birth
Weight at birth is an important correlate ofneonatal survival. For infants weighing 2,500grams or less at birth (low birth weight infants),7.8 percent of the total, the risk of neonatal
death was very high: 171.6 per 1,000 live birthsin the 1960 birth cohort (table D). That is, ofevery 1,000 low birth weight infants who wereborn alive in 1960, on the average 171.6 diedduring the first 4 weeks of life. For theremaining 92.2 percent of infants, the rate wasmuch lower—5.5 per 1,000. The ratio betweenthe two rates (30: 1) represents the relative riskof neonatal death to a newborn infant if thatinfant weighs 2,500 grams or less at birth; suchinfants have 30 times the risk of dying in thefirst 4 weeks of life compared with infantsweighing more than 2,500 grams at birth.
For most of the birth weight range (4,000grams or less), the risk of death was inverselyrelated to weight at birth. VirtualIy aU infantsweighing less than 1,000 grams at birth diedduring the neonatal period (figure 2). The ratesdropped precipitously in succeeding weightgroups up to and including 3,000 grams. Maxi-mum survival occurred at 3,501-4,000 grams,and the risk of neonatal death was again higheramong heavier infants. The general contour ofthe curves for the two cohorts is similar inshape. There was relatively little difference inthe rates for low birth weight infants, but therewas considerable improvement for the remainingbirth weight categories.
Between the two cohorts, there was relativelylittle change in the risk of death for low birthweight infants (a relative decrease of 1.2 per-cent), whiIe for infants weighing more than2,500 grams at birth there was a substantialdecrease: 29.5 percent (table D). For the lattergroup, the decreases were of about the samemagnitude regardless of sex, color, or plurality.In only one instance, that of white femaleinfants of plural sets, was the relative decreaseless than 20 percent. Thus, there was substantialimprovement in survival for the 92.2 percent ofinfants who weighed over 2,500 grams at birth.
On the other hand, the risk of neonatal deathfor the low birth weight groups taken as a wholeremained remarkably unchanged. The relativelysmall changes which were observed—some posi-tive, some negative—implied that relatively littleprogres had been made between the twocohorts in improving the survival of low birthweight infants. For the lowest weight group(1,000 grams or less), the data indicated in-creases in every comparison followed by de-creases in higher weight groups in virtually every
8
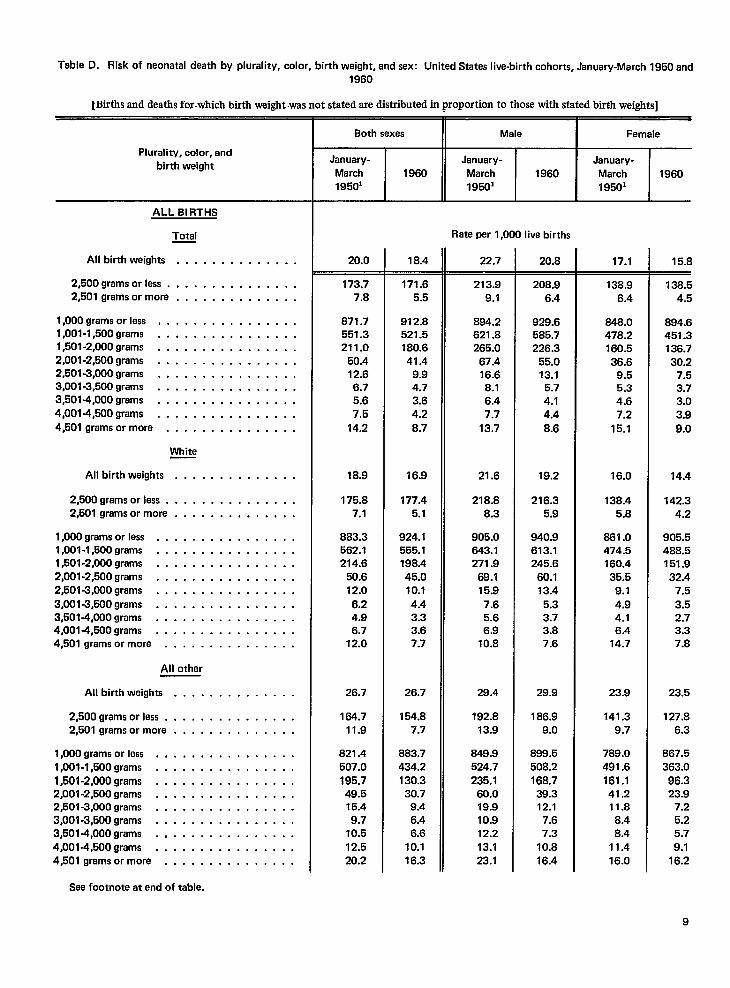
Table D. Risk of neonatal daath by plurality, color, birth weight, and sex: United States live-birth cohorts, January-March 1950 and
1960
~Mrths and deaths for.which birth weight was not stated are distributed in proportion to those with stated birth weights]
Plurelity, color, and
birth weight
ALL BIRTHS
Total
All birth weights . . . . . . . . . . . . . .
2,500 grams orless. . . . . . . . . . . . . . .2,501 grams ormore . . . . . . . . . . . . . .
1,000 grams orless, . . . . . . . . . . . . . . .l,001-l,500grams . . . . . . . . . . . . . . . .l,501-2,000grams . . . . . . . . . . . . . . . .2,001 -2,500 grams . . . . . . . . . . . . . . . .2,501 -3,000 grams . . . . . . . . . . . . . . . .3,001 -3,500 grams . . . . . . . . . . . . . . . .3,5014,000 grams . . . . . . . . . . . . . . . .
4,001 -4,500 grams . . . . . . . . . . . . . . . .
4,501 grams ormore . . . . . . . . . . . . . . .
Whita
All birth waights . . . . . . . . . . . . . .
2,500 grams orless . . . . . . . . . . . . . . .2,501 grams ormore . . . . . . . . . . . . . .
l,OOOgrams orless . . . . . . . . . . . . . . . .1,001 -l,500grams . . . . . . . . . . . . . . . .1,501 -2,000 grams . . . . . . . . . . . . . . . .2,001 -2,500 grams . . . . . . . . . . . . . . . .2,501 -3,000 grams . . . . . . . . . . . . . . . .3,001 -3,500 grams . . . . . . . . . . . . . . . .3,501 -4,000 grams . . . . . . . . . . . . . . . .4,0014,500 grams . . . . . . . . . . . . . . . .4,501 grams ormore . . . . . . . . . . . . . . .
All other
All birth weights . . . . . . . . . . . . . .
2,500 grams orless . . . . . . . . . . . . . . .2,501 grams ormore . . . . . . . . . . . . . .
1,000 grams orless . . . . . . . . . . . . . . . .l,001-l,500grams . . . . . . . . . . . . . . . .l,501-2,000grams . . . . . . . . . . . . . . . .2,001 -2,500 grams . . . . . . . . . . . . . . . .2,501 -3,000 grams . . . . . . . . . . . . . . . .3,001 -3,500 grams . . . . . . . . . . . . . . . .3,5014,000 grams . . . . . . . . . . . . . . . .4,001 -4,500 grams . . . . . . . . . . . . . . . .4,501 grams ormore . . . . . . . . . . . . . . .
Sae footnote at end of tabla.
Both sexes MaleI
Famale
January-March19501
1960January-
March19501
1960January-March19501
1960
20.0
173.77.8
871.7551.3211.0
50.412.66.75.67,5
14.2
18.9
175.87.1
883.3562.1214.6
50.612.0
6.24.96.7
12.0
26.7
164.711.9
821.4507.0
195.749.515.49.7
10.512.520.2
18.4
171.65.5
912.8521.5180.641.4
9.94.73.64.2
8.7
16.9
177.45.1
924.1555.1198.445.010.1
4.43.33.67.7
26.7
154.87.7
883.7434.2130.330.7
9.46.46.6
10.116.3
Rate per 1,000 live births
22.7
213.99.1
894.2621.8265.0
67.416.68.16.47.7
13.7
21.6
218.88.3
905.0643.1271.9
69.115.9
7.65.66.9
10.8
28.4
192.813.9
649.9524.7
235.160.019.910.912.213.123.1
20.8
208.96.4
929.6585.7226.3
55.013.1
5.74.14.4
8.6
19.2
216.35.9
940.9613.1245.6
60.113.4
5.33.73.87.6
29.9
186.99.0
B99.5508.2168.7
39.312.1
7.67.3
10.816.4
17.1
138.9
6.4
848.0478.2160.536.6
9.55.34.67.2
15.1
16.0
138.45.8
861.0474.5160.435.5
9.14.94.16.4
14.7
23.9
141.39.7
789.0491.6161.141.211.8
8.48.4
11.416.0
15.8
138.54.5
894.6451.3136.7
30.27.53.73.03,9
9.0
14.4
142.34.2
905.5488.5151.9
32.47.5
3.52.73.37.8
23.5
127.86.3
867.5363.0
96.323.9
7.25.25.7
9.116.2
9
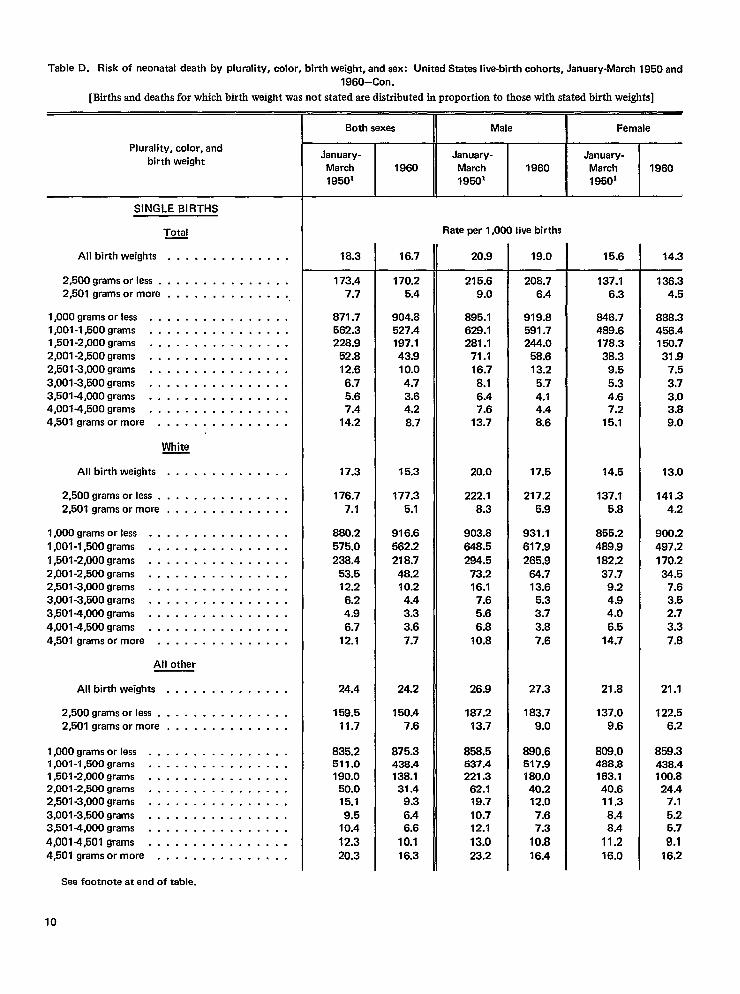
Table D. Risk of neonatal death by plurality, color, birth waight, and sex: United States live-birth cohorts, January-March 195o and
1960-Con.
[Births and deaths for which birth weight was not stated are distributed in proportion to those with stated birth weights]
Plurality, color, and
birth weight
SINGLE BIRTHS
Total
All birth weights . . . . . . . . . . . . . .
2,500 grams or less. . . . . . . . . . . . . . .
2,501 grams ormore . . . . . . . . . . . . . .
1,000 grams or less . . . . . . . . . . . . . . . .
1,001 -l,500grams . . . . . . . . . . . . . . . .
l,501-2,000grams . . . . . . . . . . . . . . . .
2,001 -2,500 grams . . . . . . . . . . . . . . . .
2,501 -3,000 grams . . . . . . . . . . . . . . . .
3,001 -3,500 grams . . . . . . . . . . . . . . . .
3,501 -4,000 grams . . . . . . . . . . . . . . . .
4,001 -4,500 grams . . . . . . . . . . . . . . . .
4,501 grams ormore . . . . . . . . . . . . . . .
White
All birth weights . . . . . . . . . . . . . .
2,500 grams orless. . . . . . . . . . . . . . .
2,501 grams ormore . . . . . . . . . . . . . .
1,000 grams orless . . . . . . . . . . . . . . . .
l,001-l,500grams . . . . . . . . . . . . . . . .
l,501-2,000grams . . . . . . . . . . . . . . . .
2,001 -2,500 grams . . . . . . . . . . . . . . . .
2,501 -3,000 grams . . . . . . . . . . . . . . . .
3,001 -3,500 grams . . . . . . . . . . . . . . . .
3,501 -4,000 grams . . . . . . . . . . . . . . . .
4,001 -4,500 grams . . . . . . . . . . . . . . . .
4,501 grams ormore . . . . . . . . . . . . . . .
All other
All birth weights . . . . . . . . . . . . . .
2,500 grams or less. . . . . . . . . . . . . . .
2,501 grams ormore . . . . . . . . . . . . . .
1,000 grams or less . . . . . . . . . . . . . . . .1,001 -l,500grams . . . . . . . . . . . . . . . .
1,501 -2,000 grams . . . . . . . . . . . . . . . .
2,001 -2,500 grams . . . . . . . . . . . . . . . .
2,501 -3,000 grams . . . . . . . . . . . . . . . .
3,001 -3,500 grams . . . . . . . . . . . . . . . .
3,501 -4,000 grams . . . . . . . . . . . . . . . .
4,001 -4,501 grams . . . . . . . . . . . . . . . .
4,501 grams ormore . . . . . . . . . . . . . . .
Both sexes
January-
March 1960
19501
18.3
173.47.7
871.7562.3228.9
52.812.6
6.75.67.4
14.2
17.3
176.77.1
880.2575.0238.4
53.512.2
6.24.96.7
12.1
24.4
159.511.7
835.2511.0190.0
50.015.1
9.510.4
12.320.3
16.7
170.25.4
904.8527.4197.143.910.0
4.73.64.28.7
15.3
177.35.1
916.6562.2
218.748.210.24.43.33.67.7
24.2
150.47.6
875.3438.4138.131.4
9.36.46.6
10.116.3
MaleI
Female
January-
March
19501
1960January-
March
19501
1960
Rate par 1,000 live births
20.9
215.69.0
895.1628.1281.1
71.116.78.16.47.6
13.7
20.0
222.18.3
903.8648.5294.5
73.216.1
7.65.6
6.810.8
26.9
187.213.7
858.5537.4221.3
62.119.710.712.1
13.023.2
19.0
208.76.4
919.8591.7244.0
58.613.2
5.74.14.48.6
17.5
217.25.9
931.1617.9265.9
64.713.6
5.33.73.87.6
27.3
183.79.0
880.6517.9180.040.212.07.67.3
10.8
16.4
15.6
137.16.3
846.7488.6178.338.3
9.55.34.67.2
15.1
14.5
137.15.8
855,2489.9
182.237.7
9.24.94.06.5
14.7
21.8
137.09.6
808.0488.8163.140.611.38.48.4
11.216.0
14.3
136.34.5
888.3456.4150.731.9
7.53.73.03.89.0
13.0
141.34.2
900.2497.2170.234.5
7.63.52.73.37.8
21.1
122.56.2
859.3438.4100.8
24.4
7.1
5.2
5.7
9.116.2
See footnote at end of table.
10
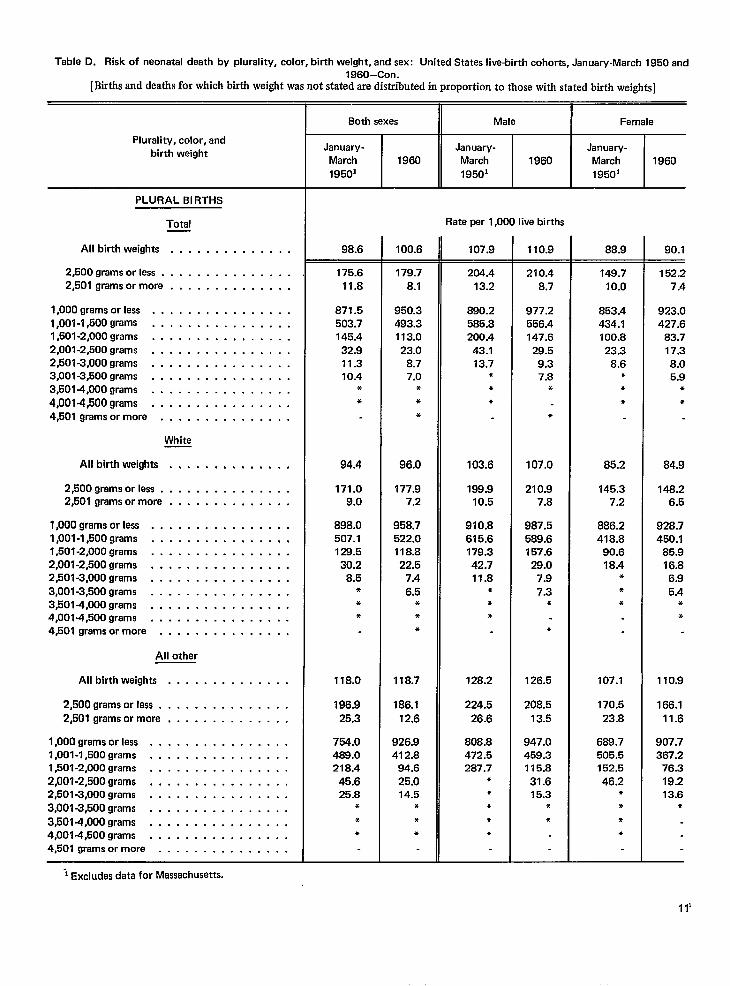
Table D. Risk of neonatal death by plurality, color, birth weight, and sex: United States live-birth cohorts, January-March 1950 and1960–CorI.
[Births and deaths for which birth weight was not stated are distributed in proportion to those with stated birth weights]
Plurality, color, andbirth weight
PLURAL BIRTHS
Total
All birth weights . . . . . . . . . . . . . .
2,500 grams or less . . . . . . . . . . . . . . .2,501 grams ormore . . . . . . . . . . . . . .
1,000 grams orless . . . . . . . . . . . . . . . .
1,001 -l,5009rams . . . . . . . . . . . . . . . .l,601-2,000grams . . . . . . . . . . . . . . . .2,001 -2,500 grams . . . . . . . . . . . . . . . .2,501 -3,000 grams . . . . . . . . . . . . . . . .3,001 -3,500 grams . . . . . . . . . . . . . . . .3,5014,000 grams . . . . . . . . . . . . . . . .
4,001 -4,500 grams . . . . . . . . . . . . . . . .4,501 grams ormore . . . . . . . . . . . . . . .
White
All birth weights . . . . . . . . . . . . . .
2,500 grams orless. . . . . . . . . . . . . . .2,501 grams ormore . . . . . . . . . . . . . .
1,000 grams orless . . . . . . . . . . . . . . . .l,001-l,500grams . . . . . . . . . . . . . . . .l,501-2,000grams . . . . . . . . . . . . . . . .2,001 -2,500 grams . . . . . . . . . . . . . . . .2,501 -3,000 grams . . . . . . . . . . . . . . . .
3,001 -3,500 grams . . . . . . . . . . . . . . . .3,5014,000 grams . . . . . . . . . . . . . . . .4,001 -4,500 grams . . . . . . . . . . . . . . . .4,501 grams ormore . . . . . . . . . . . . . . .
All other
All birth weights . . . . . . . . . . . . . .
2,500 grams orless. . . . . . . . . . . . . . .
2,501 grams ormore . . . . . . . . . . . . . .
1,000 grams orless . . . . . . . . . . . . . . . .l,001-l,500grams . . . . . . . . . . . . . . . .l,501-2,000grams . . . . . . . . . . . . . . . .2,001 -2,500 grams . . . . . . . . . . . . . . . .2,501 -3,000 grams . . . . . . . . . . . . . . . .3,001 -3,500 grams . . . . . . . . . . . . . . . .
3,501 -4,000 grams . . . . . . . . . . . . . . . .4,0014,500 grams . . . . . . . . . . . . . . . .4,501 grams ormore . . . . . . . . . . . . . . .
1Excludes data for Massachusetts.
Both sexes II Male i Female
January-March1950’
1960January-
March
195011960
January-March1950’
1960
98.6
175.611.8
871.5503.7145.4
32.911.310.4
**
94.4
171.09.0
898.0507.1128.5
30.28.5
●
●
●
118.0
196.925.3
754.0488.0218.4
45.625.8
***
100.6
179.78.1
950.3493.3113.023.0
8.77.0
●
**
96.0
177.97.2
958.7522.0118.822.5
7.46.5
●
●
*
118.7
186.112.6
926.9412.8
94.625.014.5
*
**
Rate per 1,000 live births
107.9
204.413.2
890.2585.8200.4
43.113.7
***
103.6
199.910.5
910.8615.6179.342.711.8
***
128.2
224.526.6
808.8472.5287.7
●
●
***
110.9
210.48.7
977.2556.4147.6
29.59.37.8
*
*
107.0
210.97.8
987.5589.6157.6
29.07.97.3
●
*
126.5
208.513.5
947.0459.3115.8
31.615.3
*●
88.9
149.710.0
853.4434.1100.823.3
8.6*●
*
85.2
145.37.2
886.2418.8
90.618.4
**●
107.1
170.5
23.8
689.7505.5152.5
46.2●
*
*●
90.1
152.27.4
923.0427.6
83.717.38.05.9
**
84.9
148.26.5
928.7450.1
85.916.86.95.4
●
*
110.9
166.111.6
907.7367.2
76.319.213.6
*
11’
1,000800
500
%E 1006 *Ow>i
0 50
is-.cw0-WF& 10
c 8
5
0
— January-March 1950
m,ms,mati1960
50
45
40 [
+zuc-l~
n
BIRTH WEIGHT IN GRAMS
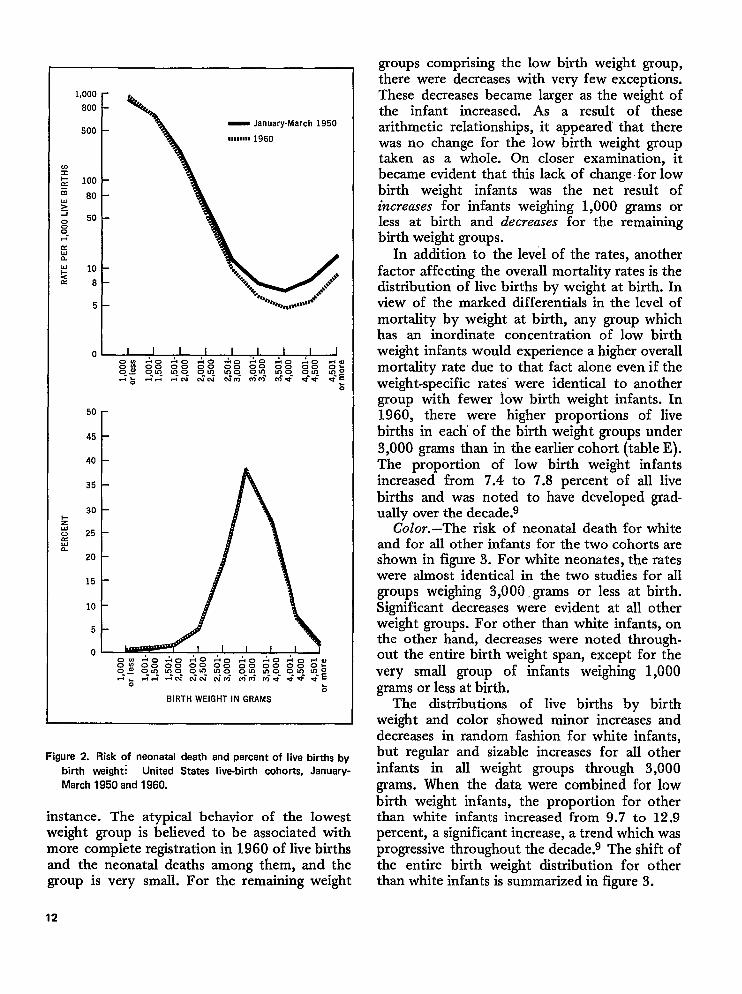
Figure 2. Risk of neonatal daath and percent of live births by
birth weight~ United States live-birth cohorts, January-
March 1950 and 1960.
instance. The atypical behavior of the lowestweight group is believed to be associated withmore complete registration in 1960 of live birthsand the neonatal deaths among them, and thegroup is very small. For the remaining weight
12
groups comprising the low birth weight group,there were decreases with very few exceptions.These decreases became larger as the weight ofthe infant increased. As a result of thesearithmetic relationships, it appeared’ that therewas no change for the low birth weight grouptaken as a whole. On closer examination, itbecame evident that this lack of change for lowbirth weight infants was the net result ofincreases for infants weighing 1,000 grams orless at birth and decreases for the remainingbirth weight groups.
In addition to the level of the rates, anotherfactor affecting the overall mortality rates is thedistribution of live births by weight at birth. Inview of the marked differentials in the level ofmortality by weight at birth, any group whichhas an inordinate concentration of low birthweight infants would experience a higher overallmortality rate due to that fact alone even if theweight-specific rates’ were identical to anothergroup with fewer low birth weight infants. In1960, there were higher proportions of livebirths in each’ of the birth weight groups under3,000 grams than in the earlier cohort (table E).The proportion of low birth weight infantsincreased from 7.4 to 7.8 percent of all livebirths and was noted to have developed grad-ually over the decade.g
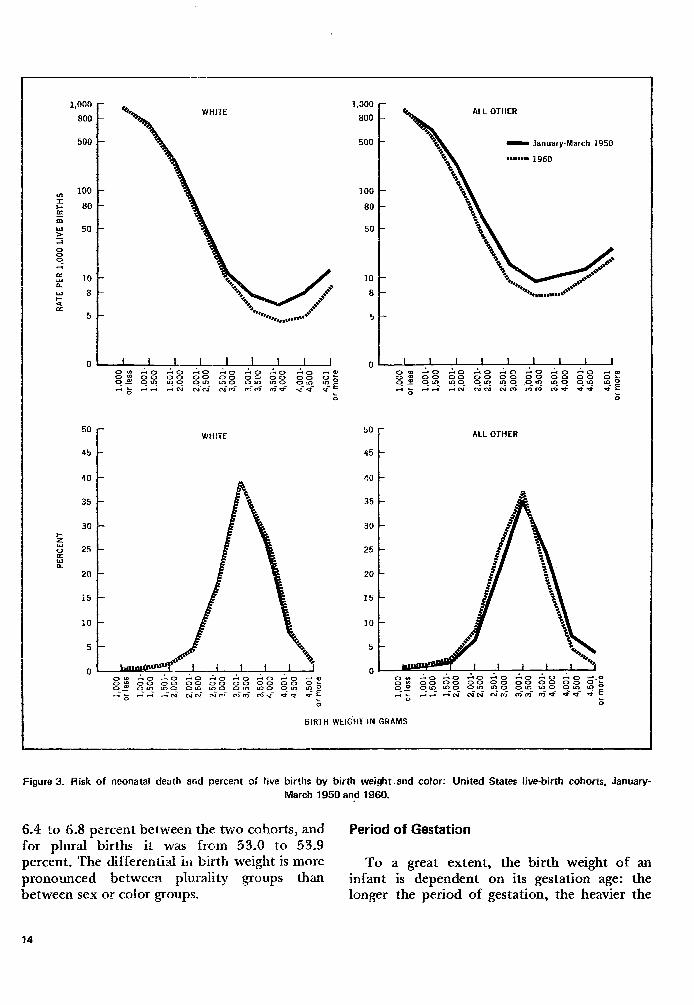
Color.–The risk of neonatal death for whiteand for all other infants for the two cohorts areshown in figure 3. For white neonates, the rateswere almost identical in the two studies for allgroups weighing 3,000, grams or less at birth.Significant decreases were evident at all otherweight groups. For other than white infants, onthe other hand, decreases were noted through-out the entire birth weight span, except for thevery small group of infants weighing 1,000grams or less at birth.
The distributions of live births by birthweight and color showed minor increases anddecreases in random fashion for white infants,but regular and sizable increases for all otherinfants in all weight groups through 3,000grams. When the data were combined for lowbirth weight infants, the proportion for otherthan white infants increased from 9.7 to 12.9percent, a significant increase, a trend which wasprogressive throughout the decade.g The shift ofthe entire birth weight distribution for otherthan white infants is summarized in figure 3.
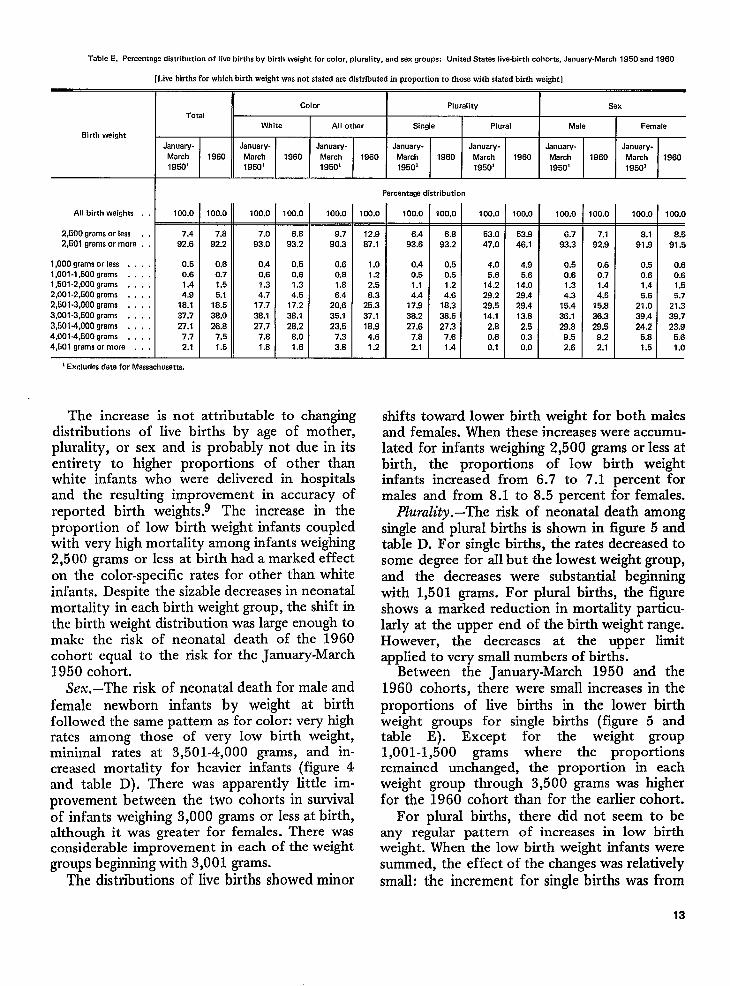
Table E. Percentage distribution of live births by birth weight for color, plurality, and sex groups: United States live-birth cohorts, Januaw-March 1950 and 1960
[Live births for which birth weight was not stated are distributed in proportion to those with stated birth weight]
>
Color Plurality SexTotal
White All other Single Plural Male FemaleBirth weight
January- January. January. January- January- JanuaW- January-March 1960 March 1960 March 1960 March 1960 March 1960 March 1960 March195J3’
19801950’ 1950’ 1950’ 19501 1950’ 1950’
All birth weights . . 1(XI.O
2,600 grams or lass . . 7.4
2,601 grama or mom . . 92.6
1,000 grama or less . . . . 0.51,001-1,600 grams . . . . 0.61,501-2,000 grams . . . . 1.42,001-2,600 grams , . . . 4.92,601-3,000 grams . , . . 1s.13,001.3,600 grams . . . . 37.7
3,6014,000 grams , , , . 27.14,001-4,600 grams , . . . 7.74,501 grams or more . , . 2.1
1Excludes data for Massachusetts.
-il-100.0 100.0
7.8 7.0
92.2 93.0
10.6 0.4
0.7 0.6
1,5 1.3
5.1 4.7
1s.5 17.7
3s.0 3s.1
26.6 27.7
7.5 7.s
1.5 1.s
1OQ.o
6.8
93.2
0.5
0.6
1.3
4.6
17.2
38.1
26,2
S.o
1.6
100.0—
9.7
90.3
0.6
0.s
1.8
6.4
20,6
35.1
23.5
7.3
3.8
Parcentaga distribution
100.0_
12.9
87.1
1.0
1.22.56.3
25.3
37.1
18.9
4.6
1.2
100.0
6.4
93.6
0.4
0.5
1.1
4.4
17.9
38.2
27.6
7.8
2.1
100.0.
6.8
93.2
0.5
0.6
1.2
4.6
18.3
3s.5
27.37.6
1.4
100.0
53.0
47.0
4.05.6
14.2
29.2
29.5
14.1
2.6
0.6
0.1
100.0
53.9
46.1
4.95.6
14.0
29.4
29.4
13.s
2.5
0.3
0.0 I1CQ.o 100.0
6.7 7.1
93.3 92.9
0.5 0.6
0.6 0.7
1.3
4.3 E
15.4 15.8
36.1 36.3
29.8 29.5
9.5 9.2
2.6 2.1
100.0_
8.1
91.9
0.5
0.6
1.4
5.6
21.0
39.4
24.2
5.8
1.5
100.0.
8.5
91.5
0.6
0.6
1.5
5.7
21.3
39.7
23.95.6
1.0
The increase is not attributable to chanting shifts toward lower birth weight for both malesdistributions of live births by age of mo&erjplurality, or sex and is probably not due in itsentirety to higher proportions of other thanwhite infants who were delivered in hospitalsand the resulting improvement in accuracy ofreported birth weights.g The increase in theproportion of low birth weight infants coupledwith very high mortality among infants weighing2,500 grams or less at birth had a marked effecton the color-specific rates for other than whiteinfants. Despite the sizable decreases in neonatalmortality in each birth weight group, the shift inthe birth weight distribution was large enough tomake the risk of neonatal death of the 1960cohort equal to the risk for the January-March1950 cohort.
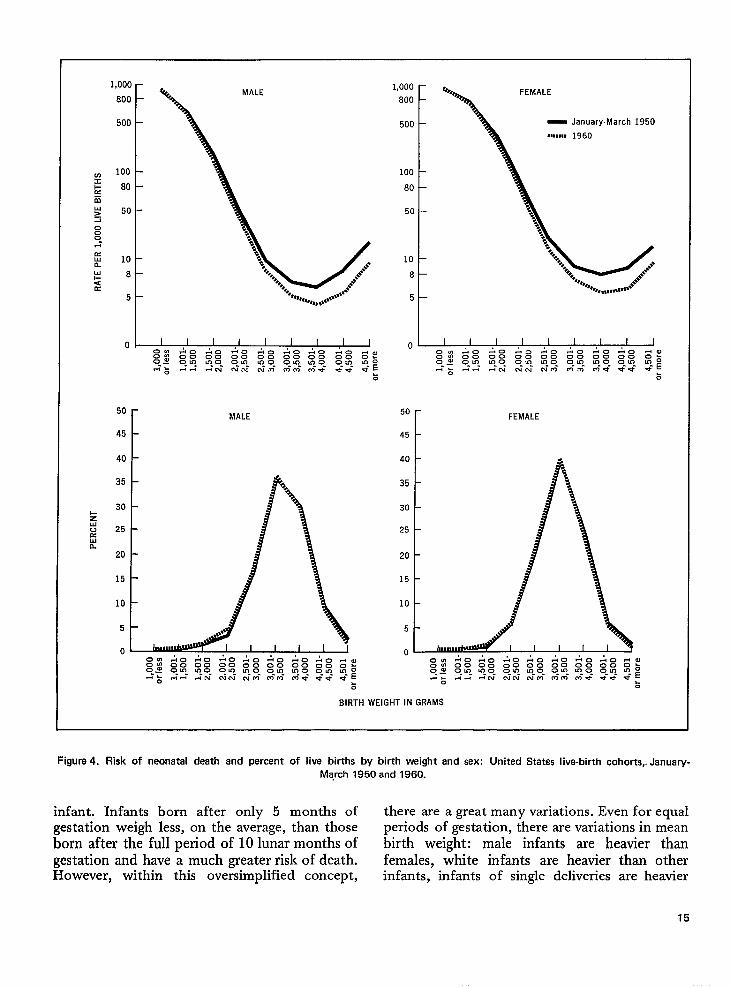
Sex.–The risk of neonatal death for male andfemale newborn infants by weight at birthfollowed the same pattern as for color: very highrates among those of very low birth weight,minimal rates at 3,501-4,000 grams, and in-creased mortality for heavier infants (figure 4and table D). There was apparently little im-provement between the two cohorts in survivalof infants weighing 3,000 grams or less at birth,although it was greater for females. There wasconsiderable improvement in each of the weightgroups beginning with 3,001 grams.
The distributions of live births showed minor
and females. When these increases were accumu-lated for infants weighing 2,500 grams or less atbirth, the proportions of low birth weightinfants increased from 6.7 to 7.1 percent formales and from 8.1 to 8.5 percent for females.
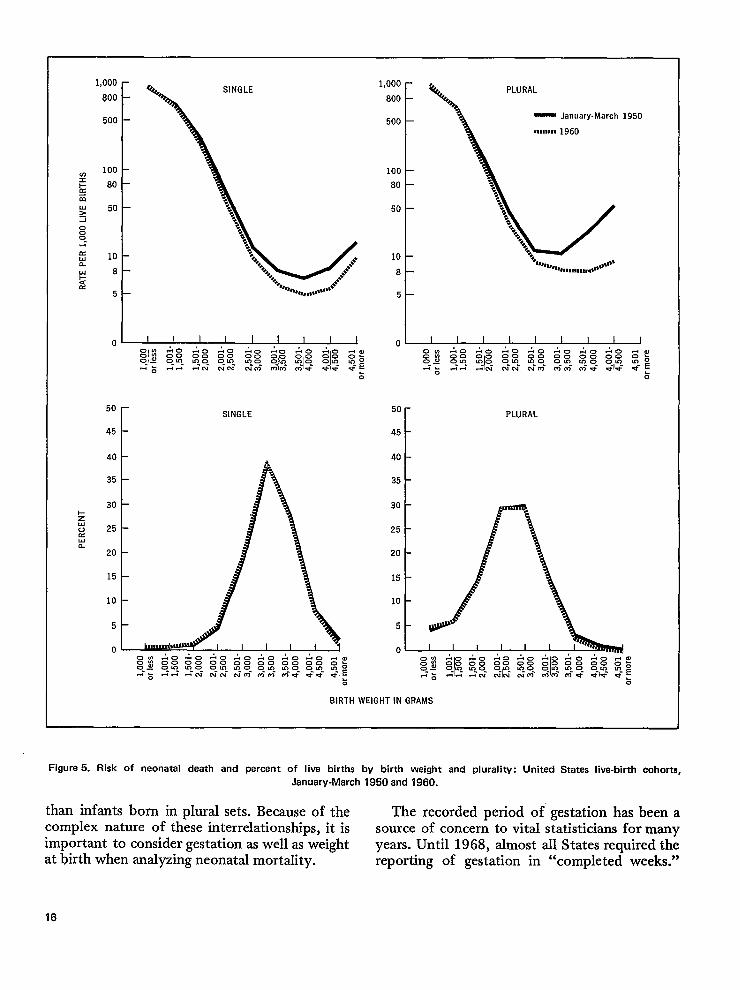
Plurality .–The risk of neonatal death amongsingle and plural births is shown in figure 5 andtable D. For single births, the rates decreased tosome degree for all but the lowest weight group,and the decreases were substantial beginningwith 1,501 grams. For plural births, the figureshows a marked reduction in mortality particu-larly at the upper end of the birth weight range.However, the decreases at the upper limitapplied to very small numbers of births.
Between the January-March 1950 and the1960 cohorts, there were small increases in theproportions of live births in the lower birthweight groups for single births (figure 5 andtable E). Except for the weight group1,001-1,500 grams where the proportionsremained unchanged, the proportion in eachweight group through 3,500 grams was higherfor the 1960 cohort than for the earlier cohort.
For plural births, there did not seem to beany regular pattern of increases in low birthweight. When the low birth weight infants weresummed, the effect of the changes was relativelysmall: the increment for single births was from
13
WHlTE -
i- 2 0”
%
50
45
WHlTE
40
35
3e
25
20
15
10
5
0
1,000
800
500
100
80
50
10
8
ALL OTHER
- January-March 1950
BBBBBBBB 1 gfio
-
50
f ALL OTHER
45
40
35
30
25
20
15
10
5
0
BIRTH WElG-HT IN GRAMS
Figure 3, Risk of neortatai death and percent of live births b\f birth weight-and color: United States be-birth cohorts, January- March 1950 and 3960.
6.4 to 6.8 percent between the two cohorts, and Period of Gestation for plural births it Was from 53,O to 53.9 percent. The differential in birth weight is more To a great extent, the birth weight of an pronounced between plraraiitv groups th&an /
- infant is dependent on its gestation age: the
between sex or color groups. longer the period of gestation, the heavier the
14
1,000 –
800–
500-
100-80-
50-
10-8 –
5 –
50
45
40[
MALE
1,000800
500
100
80
50
108
5
0
FEMALE
_ January-March 1950,,,,,,, 1960
I i I I I I I I I0. .40:0 4=40404 0!400.00000000000000 z?02 Oln k--o- am m-o- O-IQ u--o- o-m- loo
--:+-+--mm- CJmmmmme *W *- E&
50
45[
FEMALE
BIRTH WEIGHT IN GRAMS
Figure 4. Risk of neonatal death and percent of live births by birth weight and sex: United States live-birth cohorts,. January-
March 1950 and 1960.
infant. Infants born after only 5 months of there are a great many variations. Even for equalgestation weigh less, on the average, than those periods of gestation, there are variations in mean
born after the full period of 10 lunar months of birth weight: male infants are heavier thangestation and have a much greater risk of death. females, white infants are heavier than otherHowever, within this oversimplified concept, infants, infants of single deliveries are heavier
15
SINGLE
1,000-PLURAL
800 –
500 –_ January-March 1950
,,,,,,,, 1960
100 -
80 –
50 –
10 –
8 –
5
t
BIRTH WEIGHT IN GRAMS
FigUre 5. Risk of neonatal death and percent of live births by birth weight and plurali~: united states Iiva.birth cohorts,
January-March 1950 and 1960.
than infants born in plural sets. Because of the The recorded period of gestation has been acomplex nature of these interrelationships, it is source of concern to vital statisticians for manyimportant to consider gestation as well as weight years. Until 1968, almost all States required theat birth when analyzing neonatal mortality. reporting of gestation in “completed weeks.”
16
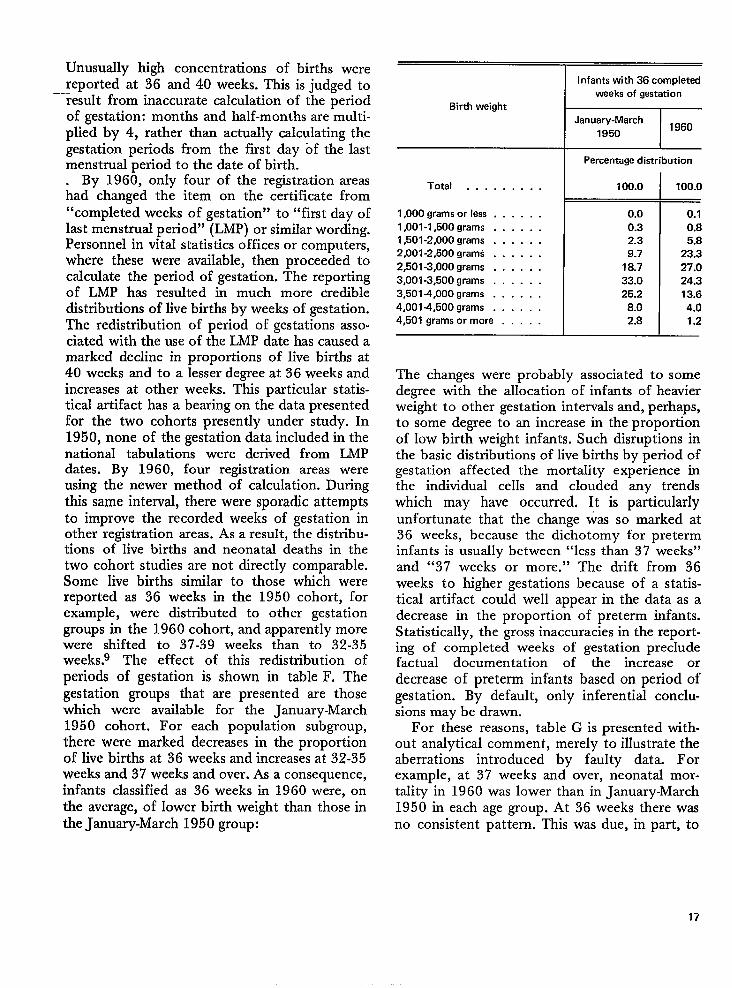
Unusually high concentrations of births werereported at 36 and 40 weeks. This is judged toresult from inaccurate calculation of the periodof gestation: months and half-months are multi-plied by 4, rather than actually calculating thegestation periods from the first day of the lastmenstrual period to the date of birth.
By 1960, only four of the registration areas.had changed the item on the certificate from“completed weeks of gestation” to “first day oflast menstrual period” (LMP) or similar wording.Personnel in vital statistics offices or computers,where these were available, then proceeded tocalculate the period of gestation. The reportingof LMP has resulted in much more credibledistributions of live births by weeks of gestation.The redistribution of period of gestations asso-ciated with the use of the LMP date has caused amarked decline in proportions of live births at40 weeks and to a lesser degree at 36 weeks andincreases at other weeks. This particular statis-tical artifact has a bearing on the data presentedfor the two cohorts presently under study. In1950, none of the gestation data included in thenational tabulations were derived from LMPdates. By 1960, four registration areas wereusing the newer method of calculation. Duringthis same interval, there were sporadic attemptsto improve the recorded weeks of gestation inother registration areas. As a result, the distrib-utionsof live births and neonatal deaths in thetwo cohort studies are not directly comparable.Some live births similar to those which werereported as 36 weeks in the 1950 cohort, forexample, were distributed to other gestationgroups in the 1960 cohort, and apparently morewere shifted to 37-39 weeks than to 32-35weeks.g The effect of this redistribution ofperiods of gestation is shown in table F. Thegestation groups that are presented are thosewhich were available for the January-March1950 cohort. For each population subgroup,there were marked decreases in the proportionof live births at 36 weeks and increases at 32-35weeks and 37 weeks and over. As a consequence,infants classified as 36 weeks in 1960 were, onthe average, of lower birth weight than those inthe January-March 1950 group:
Birth weight L=E!!C
I January-March
1950 I 1960
I Percentage distribution
Total . . . . . . . . . I 100.0 I 100.0
1,000 grams or less . . . . . .
1,001-1,500 grams . . . . . .
1,501-2,000 grams . . . . . .
2,001-2,500 grams . . . . . .
2,501-3,000 grams . . . . . .
3,001-3,500 grams . . . . . .
3,5014,000 grams . . . . . .
4,0014,500 grams . . . . . .
4,501 grams or more . . . . .
0.00.32.39.7
18.733.025.2
8.02.8
0.10.85.8
23.327.024.313.6
4.01.2
1 I
The changes were probably associated to somedegree with the allocation of infants of heavierweight to other gestation intervals and, perhaps,to some degree to an increase in the proportionof low birth weight infants. Such disruptions inthe basic distributions of live births by period ofgestation affected the mortality experience inthe individual cells and clouded any trendswhich may have occurred. It is particularlyunfortunate that the change was so marked at36 weeks, because the dichotomy for preterminfants is usually between “less than 37 weeks”and “37 weeks or more.” The drift from 36weeks to higher gestations because of a statis-tical artifact could well appear in the data as adecrease in the proportion of preterm infants.Statistically, the gross inaccuracies in the report-ing of completed weeks of gestation precludefactual documentation of the increase ordecrease of preterm infants based on period ofgestation. By default, only inferential conclu-sions may be drawn.
For these reasons, table G is presented with-out analytical comment, merely to illustrate theaberrations introduced by faulty data. Forexample, at 37 weeks and over, neonatal mor-tality in 1960 was lower than in January-March1950 in each age group. At 36 weeks there wasno consistent pattern. This was due, in part, to
17
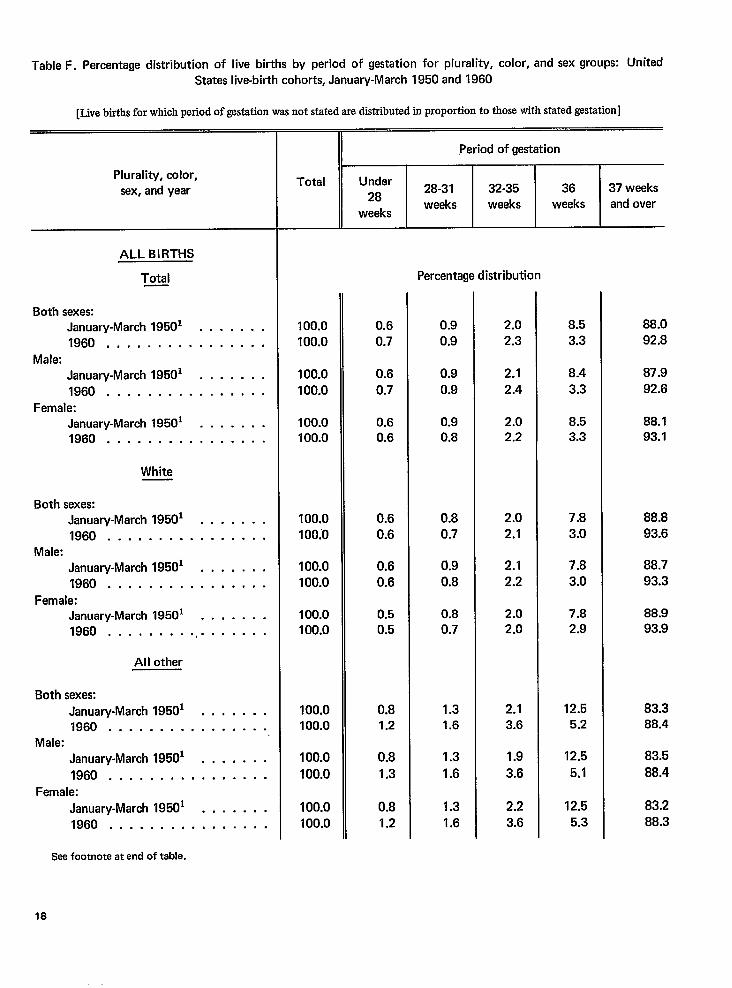
Table F. Percentage distribution of live births by period of gestation for plurality, color, and sex groups: UnitedStates live-birth cohorts, January-March 1950 and 1960
[Live births for which period of gestation was not stated are distributed in proportion to those with stated gestation]
Plurality, color,
sex, and year
ALL BIRTHS
Total
Both sexes:January-March 19501 . . . . . . .
1960 . . . . . . . . . . . . . . . .
Male:
January-March 19501 . . . . . . .
1960 . . . . . . . . . . . . . . . .
Female:January-March 19501 . . . . . . .1960 . . . . . . . . . . . . . . . .
White
Both sexes:January-March 19501 . . . . . . .
1960 . . . . . . . . . . . . . . . .Male:
January-March 19501 . . . . . . .
1960 . . . . . . . . . . . . . . . .
Female:January-March 19501 . . . . . . .1960 . . . . . . . . . . . . . . . . .
All other
Both sexes:
January-March 19501 . . . . . . .1960 . . . . . . . . . . . . . . . .
Male:
January-March 19501 . . . . . . .
1960 . . . . . . . . . . . . . . . .
Female:
January-March 19501 . . . . . . .
1960 . . . . . . . . . . . . . . . .
Seefootnote at end of table.
,Period of gestation
Total Under28
28-31 32-35 36 37 weeks
weeks weeksweeks
weeks and over
Percentage distribution
100.0100.0
100.0100.0
100.0100.0
100.0100.’0
100.0100.0
100.0100.0
100.0100.0
100.0100.0
100.0100.0
0.6
0.7
0.6
0.7
0.60.6
0.6
0.6
0.6
0.6
0.50.5
0.81.2
0.8
1.3
0.8
1.2
0.9
0.9
0.9
0.9
0.90.8
0.8
0.7
0.9
0.8
0.80.7
1.31.6
1.3
1.6
1.3
1.6
2.0
2.3
2.1
2.4
2.02.2
2.0
2.1
2.1
2.2
2.02.0
2.13.6
1.9
3.6
2.2
3.6
8.5
3.3
8.4
3.3
8.53.3
7.8
3.0
7.8
3.0
7.82.9
12.55.2
12.5
5.1
12.5
5.3
88.0
92.8
87.9
92.6
88.193.1
88.8
93.6
88.7
93.3
88.993.9
83.388.4
83.5
88.4
83.2
88.3
18
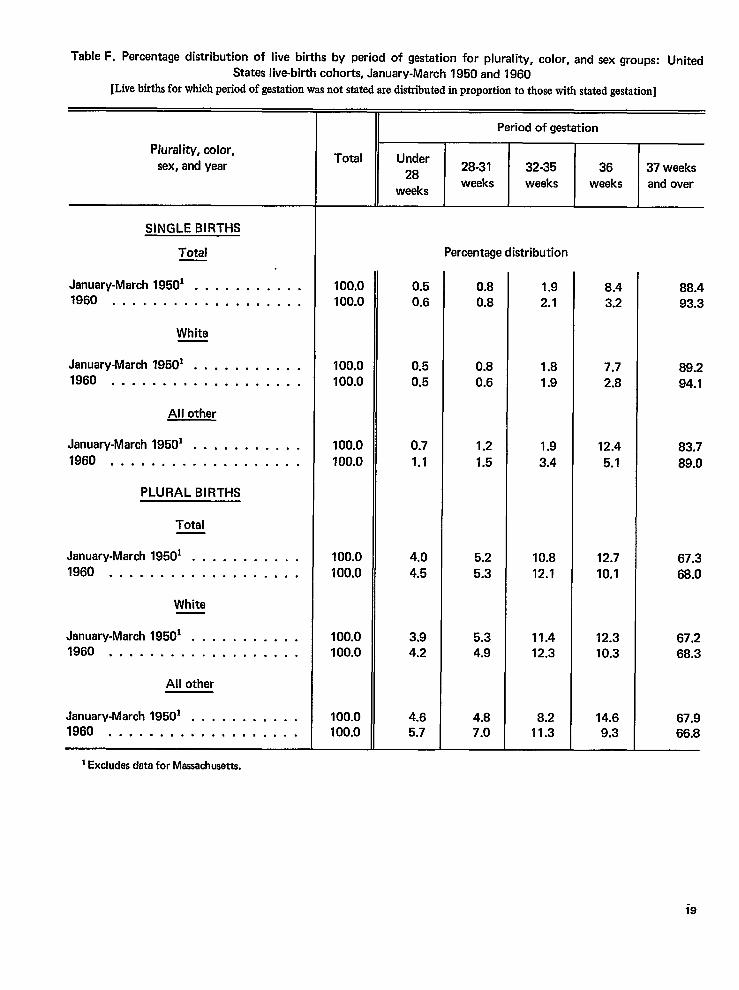
Table F. Percentage distribution of live births by period of gastation for plurality, color, and sex groups: United
States live-birth cohorts, January-March 1950 and 1960[Live birthsfor which period of gestation was not stated are distributed in proportion to those with stated gestation]
Plurality, color,
sex, and year
SINGLE BIRTHS
Total
January-March 19501 . . . . . . . . . . .1960 . . . . . . . . . . . . . . . . . . .
White
January-March 19501 . . . . . . . . . . .1960 . . . . . . . . . . . . . . . . . . .
All other
January-March 19501 . . . . . . . . . . .
1960 . . . . . . . . . . . . . . . . . . .
PLURAL BIRTHS
Total
January-March 19501 . . . . . . . . . . .
1960 . . . . . . . . . . . . . . . . . . .
White
January-March 19501 . . . . . . . . . . .1960 . . . . . . . . . . . . . . . . . . .
All other
January-March 19501 . . . . . . . . . . .1960 . . . . . . . . . . . . . . . . . . .
1Excludesdeta for Massachusetts.
Total
100.0100.0
100.0
100.0
100.0
?00.0
100.0
100.0
100.0100.0
100.0100.0
II Period of gestation
TUnder
2828-31
weeksweeks
0.50.6
0.5
0.5
0.7
1.1
4.0
4.5
3.94.2
4.65.7
Percentage
0.80.8
0.80.6
1.2
1.5
5.2
5.3
5.34.9
4.87.0
32-35weeks
stribution
1.92.1
1.8
1.9
1.9
3.4
10.8
12.1
11.412.3
8.211.3
36
weeks
8.43.2
7.7
2.8
12.4
5.1
12.7
10.1
12.310.3
14.69.3
37 weeksand over
88.493.3
89.2
94.1
83.7
89.0
67.3
68.0
67.268.3
67.966.8
i9
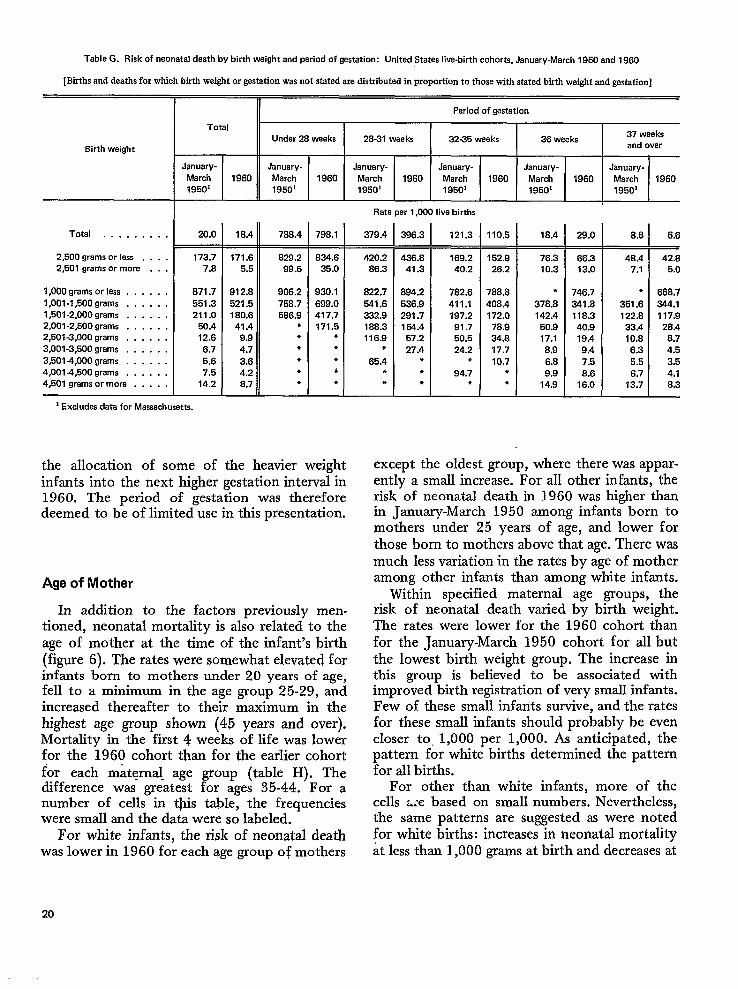
Table G. Risk of neonatal death by birth weight andperiod of gestation: United Stataslive-Mrth cohorM, January-March l95Oandl96O
[Btihs and deaths for which birth weight or gestation was not stated are distributed in proportion to those with stated birth weight and gestation]
8irth weight
Total . . . . . . . . .
2,500 grams or less . . . .2,501 grams or more . . .
1,000 grams or less . . . . . .1,001-1,500 grams . . . . . .1,501-2,000 grams . . . . . .2,001-2,500 grams . . . . . .2,501.3,000 grams . . . . . .3,001-3,500 grams . . . . . .3,5014,000 grams . . . . . .4,001-4,500 grams . . . . . .4,501 grams or more . . . . ,
Period of gestation
TotalUndar 26 weeks 26-31 waeke 32-35 weeks 36 weaka
37 weeksand over
January- January- January- January- January- January-March 1960 March 1960 March 1960 March 1960 March 1960 March 196019501 19501 19501 19501 1950’ 1950’
Rate per 1,000 live births
20.0
173.77.6
871.7551.3211.0
50.412.66.75.67.5
14.2
] Excludes data for Massachusetts.
18.4 788.4 798.1 379.4
171.6 629.2 634.6 420.25.5 99.6 35.0 66.3
912.8 908.2 930.1 822.7521.5 758.7 699.0 541.6160.6 566.9 417.7 332.941.4 * 171.5 188.3
9.9 ● ● 116.94.7 ● ● ●
3.8 ● ● 65.44.2 * d *
8.7 * ● *
the allocation of some of the heavier weightinfants into the next higher gestation interval in1960. The period of gestation was thereforedeemed to be of limited use in this presentation.
Age of Mother
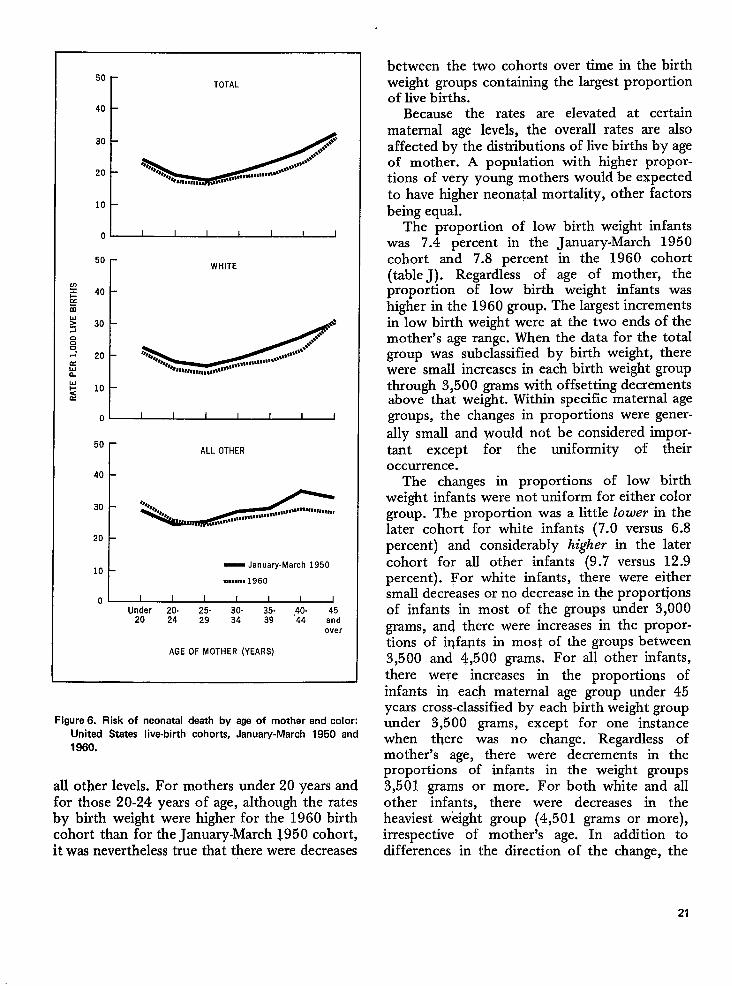
In addition to the factors previously men-tioned, neonatal mortality is also related to theage of mother at the time of the infant’s birth(figure 6). The rates were somewhat elevated forinfants born to mothers under 20 years of age,fell to a minimum in the age group 25-29, andincreased thereafter to their maximum in thehighest age group shown (45 years and over).Mortality in the first 4 weeks of life was lowerfor the 1960 cohort than for the earlier cohortfor each maternal- age group (table H). Thedifference was greatest for ages 35-44. For anumber of cells in this table, the frequencieswere small and the data were so labeled.
For white infants, the risk of neonatal deathwas lower in 1960 for each age group of mothers
396.3 I 121.3
L436.8 169.2
41.3 40.2
894.2 762.6536.9 411.1291.7 197.2154.4 91.7
57.2 50.527.4 24.2
● *● 94.7● ●
110.5
152.926.2
788.8408.4172.0
76.934.817.710.7
*●
18.4 29.0
176.3 66.310.3 13.0
● 746.7378.8 341.8142.4 116.3
50.9 40.917.1 19.48.9 9.46.8 7.59.9 8.6
14.9 16.0
8.8 6,6
146.4 42.6
7.4 5.0
● 668.7351.6 344.1122.8 117.9
33.4 28.410.6 8.7
6.3 4.55.5 3.56.7 4.1
13.7 8.3
except the oldest group, where there was appar-entl~ a small incre-me.“For all other infant;,-therisk of neonatal death in 1960 was higher thanin January-March 1950 among infants born tomothers under 25 years of age, and lower forthose born to mothers above that age. There wasmuch less variation in the rates by age of motheramong other infants than among white infants.
Within specified maternal age groups, therisk of neonatal death varied by birth weight.The rates were lower for the 1960 cohort thanfor the January-March 1950 cohort for all butthe lowest birth weight group. The increase inthis group is believed to be associated withimproved birth registration of very small infants.Few of these small infants survive, and the ratesfor these small infants should probably be evencloser to, 1,000 per 1,000. As anticipated, thepattern for white births determined the patternfor all births.
For other than white infants, more of thecells ~:e based on small numbers. Nevertheless,the same patterns are suggested as were notedfor white births: increases in neonatal mortalityat less than 1,000 grams at birth and decreases at
20
50
40
30
20
10
0
50 r
TOTAL
d
I I I I I I I
WHITE
50
40
30
20
10
0
ALL OTHER
— January-March 1950
. . . . . ...1960
Under 20. 25- 30- 35- ,40. 4520 24 29 34 39 44 and
over
AGE OF MOTHER (YEARS)
Figure 6. Risk of neonatal death by aga of mother and color:Unitad States Iiva-birth cohorts, January-March 1950 and1960.
all other levels. For mothers under 20 years andfor those 20-24 years of age, although the ratesby birth weight were higher for the 1960 birthcohort than for the January-March 1950 cohort,it was nevertheless true that there were decreases
between the two cohorts over time in the birthweight groups containing the largest proportionof live births.
Because the rates are elevated at certainmaternal age levels, the overall rates are alsoaffected by the distributions of live births by ageof mother. A population with higher propor-tions of very young mothers would be expectedto have higher neonatal mortality, other factorsbeing equal.
The proportion of low birth weight infantswas 7.4 percent in the January-March 1950cohort and 7.8 percent in the 1960 cohort(table J). Regardless of age of mother, theproportion of low birth weight infants washigher in the 1960 group. The largest incrementsin low birth weight were at the two ends of themother’s age range. When the data for the totalgroup was subclassified by birth weight, therewere small increases in each birth weight groupthrough 3,500 grams with offsetting decrementsabove that weight. Within specific maternal agegroups, the changes in proportions were gener-ally small and would not be considered impor-tant except for the uniformity of theiroccurrence.
The changes in proportions of low birthweight infants were not uniform for either colorgroup. The proportion was a little 10wer in thelater cohort for white infants (7.0 versus 6.8percent) and considerably higher in the latercohort for all other infants (9.7 versus 12.9percent). For white infants, there were eithersmall decreases or no decrease in the proportionsQf infants in most of the groups under 3,000grams, and there were increases in the propor-tions of iqfa@s in most of the groups between3,5oo and 4,500 grams. For all other infants,there were increases in the proportions ofinfants in each maternal age group under 45years cross-classified by each birth weight groupunder 3,500 grams, except for one instancewhen there was no change. Regardless ofmother’s age, there were decrements in theproportions of infants in the weight groups3,501 grams or more. For both white and allother infants, there were decreases in theheaviest weight group (4,501 grams or more),irrespective of mother% age. In addition todifferences in the direction of the change, the
21
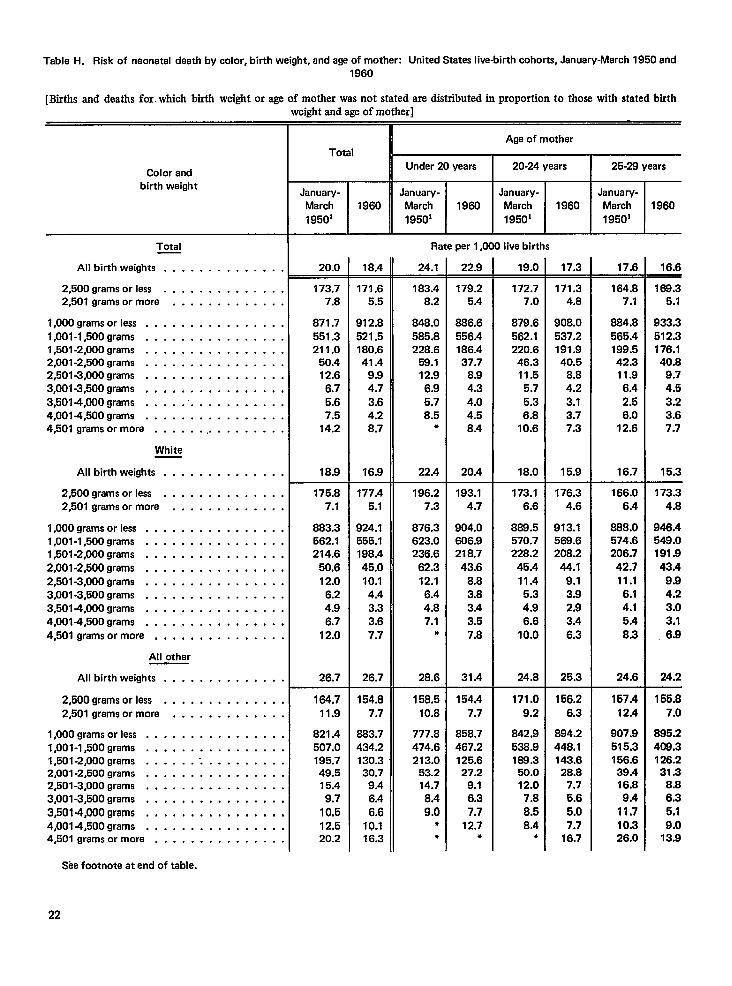
Table H. Risk of neonatal death by color, birth weight, and age of mother: United States live-birth cohorts, January-March 1950 and1960
[Btis and deaths for. which birth weight or age of mother was not stated are distributed in proportion to those with stated birthweight and age of mother]
Age of motherTotal
Under 20 years I 20-24 years I 25-28 yearsColor andbirth weight
January-March
1950’
January-March
19501 J-January-
March 1960
19501
.Lenuary-March
19501
1960 1960 1960
Rate per 1,000 live birthsTotal
24.1 22.9 19.0 17.3All birth weights . . . . . . . . . . . . . . 20.0 18.4 17.6 16.6
2,500 grams or less . . . . . . . . . . . . . .2,501 grams ormore . . . . . . . . . . . . ,
173.77.8
871.7551.3211.0
50.412.6
6.75.67.5
14.2
18.9
171.65.5
912.8521.5180.641.4
9.94.73.64.28.7
16.9
183.48.2
848.0585.8228.6
59.112.96.95.78.5
●
22.4
179.25.4
886.6556.4186.437.7
8.94.34.04.58.4
20.4
172.77.0
879.6562.1220.6
46.311.5
5.75.36.8
10.6
18.0
171.34.8
908.0537.2191.940.5
8.84.23.13.77.3
15.9
164.87.1
664.8565.4199.542.311.9
6.42.56.0
12.6
16.7
168.35.1
933.3512.3176.1
40.89.74.53.23.67.7
15.3
1,000 grams orless . . . . . . . . . . . . . . . .1,001-1,500 grams . . . . . . . . . . . . . . . .1,501 -2,000 grams . . . . . . . . . . . . . . . .2,001 -2,500 grams . . . . . . . . . . . . . . . .2,501 -3,000 grams . . . . . . . . . . . . ...43,001 -3,500 grams . . . . . . . . . . . . . . . .3,5014,000 grams . . . . . . . . . . . . . . . .4,001 -4,500 grams . . . . . . . . . . . . ...44,501 grams ormore . . . . . . .. . . . . . . . .
White
All birth weights . . . . . . . . . . . . . .
2,500 grams orless . . . . . . . . . . . . . .2,501 grams ormore . . . . . . . . . . . . .
175.87.1
883.3562.1214.6
50.612.0
6.24.96.7
12.0
26.7
177.45.1
924.1555.1198.445.010.1
4.43.33.67.7
26.7
196.27.3
876.3623.0236.6
62.312.16.44.87.1
*
28.6
158.510.8
777.8474.6213.0
53.214.78.49.0
●
●
193.14.7
904.0606.9218.7
43.68.83.83.43.57.8
31.4
154.47.7
858.7467.2125.627.2
9.16.37.7
12.7●
173.16.6
868.5570.7228.2
45.411.45.34.96.6
10.0
24.8
176.34.6
913.1569.6208.2
44.19.13.92.93.4
6.3
25.3
166.06.4
888.0574.6206.7
42.711.1
6.14.15.4
8.3
24.6
173.34.8
946.4549.0191.943.4
9.94.23.03.1
6.9
24.2
l,OOOgrams or less . . . . . . . . . . . . . . . .1,001 -l,500grams . . . . . . . . . . . . . . . .1,501 -2,000 grams . . . . . . . . . . . . . . . .2,001 -2,500 grams . . . . . . . . . . . . . . . .2,501 -3,000 grams . . . . . . . . . . . . . ..(3,001 -3,500 grams . . . . . . . . . . . . ...43,5014,000 grams . . . . . . . . . . . . . ..(4,0014,500 grams . . . . . . . . . . . . . . . .4,501 grams ormore . . . . . . . . . . . . . .
All other
All birth weights . . . . . . . . . . . . .
164.7
11.9
821.4507.0195.749.515.4
9.7
10.512.520.2
154.87.7
683.7434.2130.330.7
9.46.4
6.610.116.3
171.09.2
842.9536.9188.3
50.012.0
7.8
8.58.4
●
156.26.3
894.2448.1143.6
28.87.75.6
5.07.7
16.7
157.412.4
907.9515.3156.639.416.89.4
11.710.326.0
155,87.0
895.2408,3126.231.3
8.86.35.19.0
13.9
2,500 grams orlass . . . . . . . . . . . . .(2,501 grams ormore . . . . . . . . . . . .
1,000 grams orless . . . . . . . . . . . . . . .1,001 -l,500grams . . . . . . . . . . . . . . .l,501-2,000grams . . . . . . .. . . . . . . . . .2,001 -2,500 grams . . . . . . . . . . . . . . .2,501 -3,000 grams . . . . . . . . . . . . . . .3,001 -3,500 grams . . . . . . . . . . . . . ..(3,5014,000 grams . . . . . . . . . . . . . . .4,0014,500 grams . . . . . . . . . . . . . . .4,501 grams or more . . . . . . . . . . . . . .
See footnote at end of table.
22
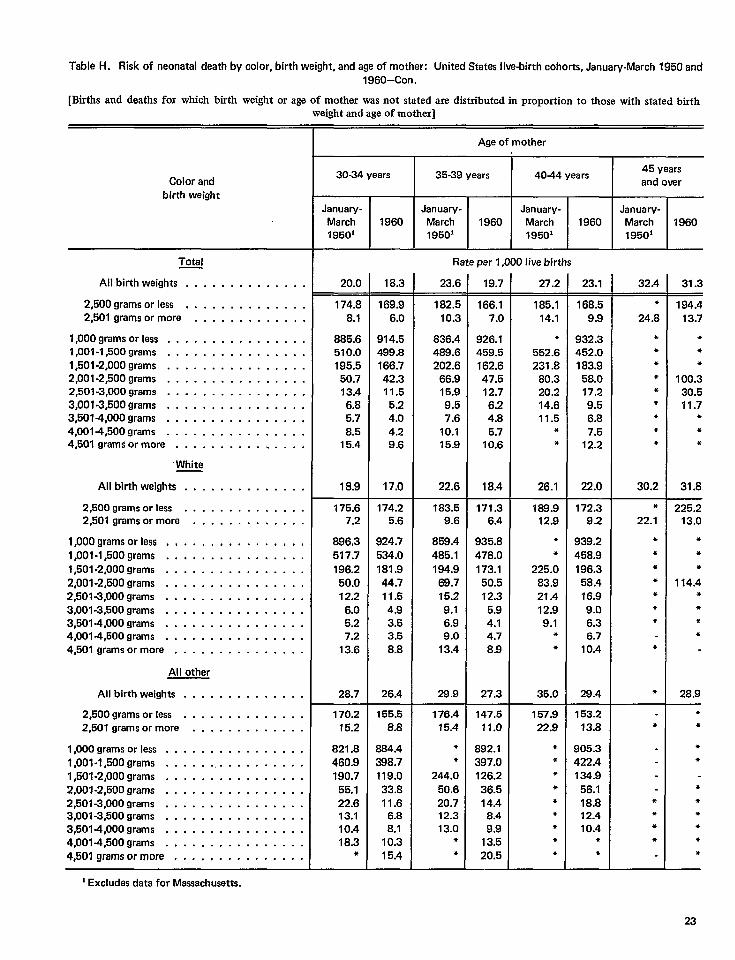
Table H. Risk of naonatal death by color, birth weight, and age of mother: United States live-birth cohorts, January-March 1950 and
1960–Con.
[Births and deaths for which birth weight or age of mother was not stated are distributed in proportion to those with stated birthweight and age of mother]
Age of mother
I 1 1
30-34 years I 35-39 years I 4044 years I 45 yaarsand overColor and
birth weightJanuary-
March19501
January-March19501
January-March1950’
January-March19501
1960 1960 1960
Rate per 1,000 live birthsTotal
23.6 19.7 27.2 23.1All birth weights . . . . . . . . . . . . . . 20.0 18.3 32.4 31.3
2,500 grams or less . . . . . . . . . . . . . .2,601 grams ormore . . . . . . ., . . . . .
174.88.1
885.6510.0195.5
50.713.4
6.85.78.5
15.4
18.9
169.96.0
914.5499.8166.742.311.55.24.04.29.6
17.0
182.510.3
836.4489.6202.6
66.915.99.57.6
10.115.9
22.6
166.17.0
926.1459.5162.647.512.76.24.85.7
10.6
18.4
185.114.1
●
562.6231.8
80.320.214.611.5
*●
26.1
168.59.9
932.3462.0183.9
58.017.29.56.87.5
12.2
22.0
172.39.2
939.2458.9196.3
58.416.99.06.36.7
10.4
28.4
●
24.8
*●
**●
●
●
**
30.2
194.413.7
*●
*
100.330.511.7
**●
31.8
1,000 grams orless . . . . . . . . . . . . . . . .1,001 -l,500grams . . . . . . . . . . . . . . . .1,501 -2,000 grams . . . . . . . . . . . . . . . .2,001 -2,500 grams . . . . . . . . . . . . . . . .2,501 -3,000 grams . . . . . . . . . . . . . . . .3,001 -3,500 grams . . . . . . . . . . . . . . . .3,5014,000 grams . . .. m..... . . . . . .4,001 -4,500 grams . . . . . . . . . . . . . . . .4,601 grams ormore . . . . . . . . . . . . . . .
“White
All birth waights . . . . . . . . . . . . . .
2,500 grams orlass . . . . . . . . . . . . . .2,501 grams ormore . . . . . . . . . . . . .
183.59.6
859.4485.1194.9
68.715.29.16.99.0
13.4
28.9
175.67.2
896,3517.7196.2
50.012.2
6.05.27.2
13.6
28.7
174.25.6
924.7534.0181.944.711.64.93.53.58.8
26.4
171.36.4
935.8478.0
173.150.512.35.94.14.78.9
27.3
189.912.9
●
●
225.083.921.412.99.1
●
●
35.0
*22.1
**
●
+●
*●
*
●
225.213.0
*+*
114.4●
**●
28.9
1,000 grams orless . . . . . . . . . . . . . . . .1,001 -l,500grams . . . . . . . . . . . . . . . .1,501 -2,000 grams . . . . . . . . . . . . . . . .2,001 -2,500 grams . . . . . . . . . . . . . . . .2,501 -3,000 grams . . . . . . . . . . . . . . . .3,001 -3,500 grams . . . . . . . . . . . . . . . .3,501 -4,000 grams . . . . . . . . . . . . . . . .4,0014,500 grams . . . . . . . . . . . . . . . .4,501 grams ormore . . . . . . . . . . . . . . .
All other
All birth weights . . . . . . . . . . . . . .
2,500 grams orlass . . . . . . . . . . . . . .2,501 grams ormore . . . . . . . . . . . . .
170.215.2
821.8460.9190.7
55.122.613.110.418.3
*
155.58.8
984.4398.7119.033.811.6
6.88.1
10.315.4
176.415.4
●
*
244.050.620.712.313.0
*●
147.511.0
892.1397.0126.236.514.4
8.49.9
13.520.5
157.922.9
●
*●
*●
●
●
●
●
153.213.8
905.3422.4134.9
56.118.812.410.4
*●
*●
●
☛
☛
●
●
●
●
☛
23
●
●
●
●
●
1,000 grams or less . . . . . . . . . . . . . . . .l,001-l,500grams . . . . . . . . . . . . . . . . .1,501 -2,000 grams d o........ . . . . . .2,00 f-2,500 grams . . . . . . . . . . . . . . . .2,501 -3,000 grams . . . . . . . . . . . . . . . .3,001 -3,500 grams . . . . . . . . . . . . . . . .3,501 -4,000 grams . . . . . . . . . . . . . . . .4,001 =l,500grams . . . . . . . . . . . . . . . .4,501 grams ormore . . . . . . . . . . . . . . .
‘ Excludes data for Massachusetts.
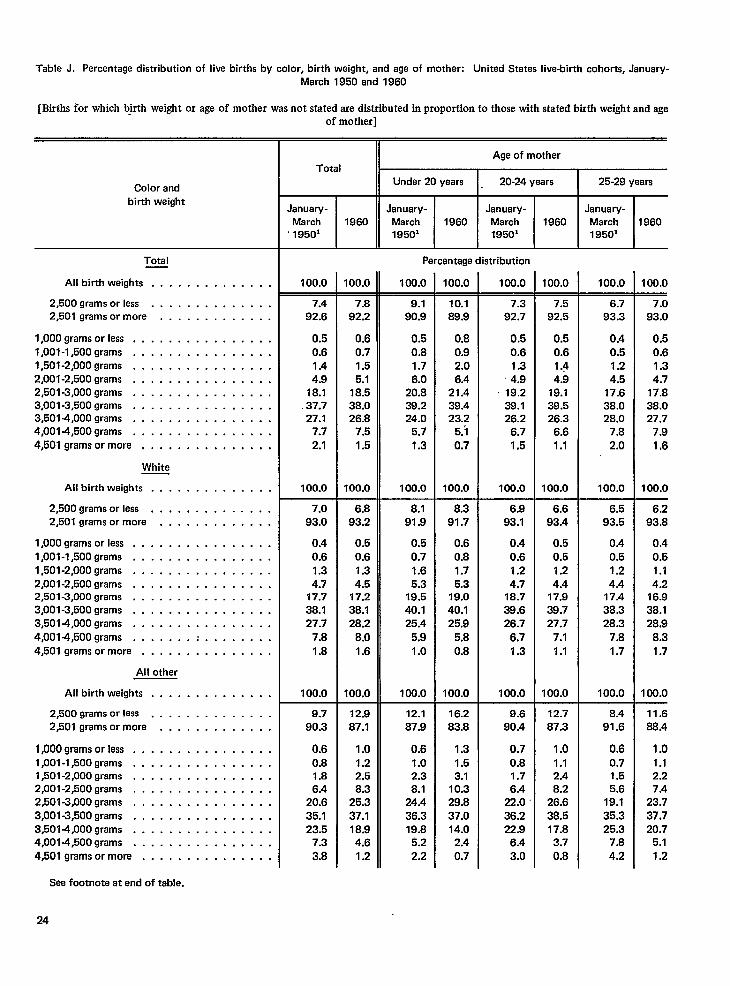
Table J. Percentage distribution of live births by color, birth weight, and aga of mothar: United States live-birth cohorts, January-March 1950 and 1960
[Births for which birth weight or age of mother was not stated are distributed in proportion to those with stated birth weight and ageof mother]
Age of mother
Under 20 years 20-24 years 25-29 yearsTotal
Color andbirth weight
--LJanuary-March 19601950’
January-March1950’
January-March1950’
January-March1950’
1980 1960 1960
Percentage distributionTotal
100.0100.0 100.0All birth weights . . . . . . . . . . . . . . 100.0 100.0 100.0 100.0 100.0
2,500 grams or less . . . . . . . . . . . . . .2,501 grams or more . . . . . . . . . . . . .
7.492.6
0.50.61.44.9
18.1.37.727.1
7.7
2.1
100.0
7.093.0
0.40.6
1.34.7
17.738.127.7
7.81.8
100.0
7.892.2
0.60.71.55.1
18.538.026.8
7.5
1.5
100.0
9.190.9
0.50.81.76.0
20.839.224.0
5.7
1.3
100.0
8.191.9
0.50.71.65.3
19.540.125.4
5,91.0
100.0
10.189.9
0.80.92.06.4
21.439.423.2
5.3
0.7
100.0
8.391.7
0.60.81.75.3
19.040.125.9
5.80.8
100.0
16.283.8
1.31.53.1
10.329.837.014.0
2.4
0.7
7.392.7
0.50.61.34.9
s 19.238.126.2
6.71.5
100.0
7.592.5
0.50.61.44.9
19.139.526.3
6.61.1
100.0
6.793.3
0.40.51.24.5
17.638.028.0
7.8
2.0
100.0
7.093.0
0.50.61,34.7
17.838.027.7
7.91,6
100.0
1,000 grams orless . . . . . . . . . . . . . . . .1,001 -l,500grams . . . . . . . . . . . . . . . .1,501 -2,000 grams . . . . . . . . . . . . . . . .2,001 -2,500 grams . . . . . . . . . . . . . . . .2,501 -3,000 grams . . . . . . . . . . . . . . . .3,001 -3,500 grams . . . . . . . . . . . . . . . .3,5014,000 grams . . . . . . . . . . . . . . . .4,0014,500 grams . . . . . . . . . . . . . . . .
4,501 grams ormore . . . . . . . . . . . . . . .
White
All birth weights . . . . . . . . . . . . . .
2,500 grams orless . . . . . . . . . . . . . .2,501 grams ormore . . . . . . . . . . . . .
6.893.2
0.50.61.34.5
17.238.128.2
8.01.6
100.0
6.993.1
0.40.61.24.7
18.738.626.7
6.71.3
100.0
6.693.4
0.50.51.24.4
17.939.727.7
7.11.1
100.0
6.593.5
0.40.51.24.4
17.438.328,3
7.81.7
100.0
6.293.8
0.40.51.14.2
16.938.128.9
8.31.7
100.0
1,000 grams orless . . . . . . . . . . . . . . . .1,001 -l,500grams . . . . . . . . . . . . . . . .1,501 -2,000 grams . . . . . . . . . . . . . . . .2,001 -2,500 grams . . . . . . . . . . . . . . . .2,501 -3,000 grams . . . . . . . . . . . . . . . .3,001 -3,500 grams . . . . . . . . . . . . . . . .3,5014,000 grams . . . . . . . . . . . . . . . .4,0014,500 grams . . . . . . . . . . . . . . . .
4,501 grams ormore . . . . . . . . . . . . . . .
AH other
All birth weights . . . . . . . . . . . . . .
2,500 grams or less . . . . . . . . . . . . . .2,501 grams ormore . . . . . . . . . . . . .
9.790.3
0.60.81.86.4
20.635.123.5
7.3
3.8
12.987.1
1.01.22.58.3
25.337.118.94.6
1.2
12.187.9
0.61.02.38.1
24.436.319.8
&2
2.2
9.690.4
0.70.81.76.4
22.036.222.9
6.43.0
12.787.3
1.01.12.48.2
26.638.517.8
3.70.8
8.491.6
0.6
0.71.55.6
19.135.325.3
7.8
4.2
11.688.4
1.0
1.12.27.4
23.7
37.720.7
5.1
1.2
1,000 grams or Fess . . . . . . . . . . . . . . . .1,001 -l,500grams . . . . . . . . . . . . . . . .1,501 -2,000 grams . . . . . . . . . . . . . . . .2,001 -2,500 grams . . . . . . . . . . . . . . . .2,501 -3,000 grams . . . . . . . . . . . . . . . .3,001 -3,500 grams . . . . . . . . . . . . . . . .3,5014,000 grams . . . . . . . . . . . . . . . .4,0014,500 grams . . . . . . . . . . . . . . . .4,501 grams ormore . . . . . . . . . . . . . . .
See footnote at end of table.
24
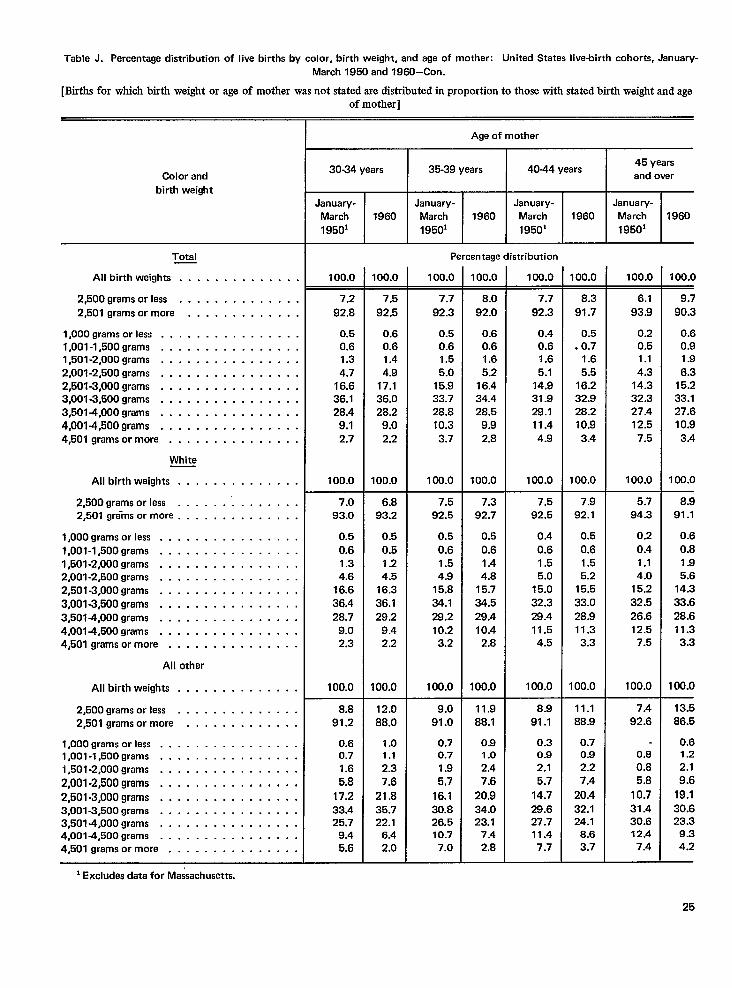
Table J. Parentage distribution of live births by color, birth waight, and age of mother: United States live-birth cohorts, January-
March 1950 and 1960-Con.
[Births for which birth weight or age of mother was not stated are distributed in proportion to those with stated birth weight and ageof mother]
Age of mother
30-34 years 35-39 years 4044 years45 years
and overColor and
birth weight
January- January-
March 1960 March
19501 19501
January-
March
1950’
January-
March
19501
1960 1960 1960
Percentage distributionTotal
All birth weights . . . . . . . . . . . . . .
2,500 grams orless . . . . . . . . . . . . . .
2,501 grams ormore . . . . . . . . . . . . .
l,OOOgrams orless . . . . . . . . . . . . . . . .
1,001 -l,500grams, . . . . . . . . . . . . . . .
1,501 -2,000 grams m........ . . . . . . .
2,001 -2,500 grams . . . . . . . . . . . . . . . .
2,501 -3,000 grams . . . . . . . . . . . . . . . .
3,001 -3,500 grams . . . . . . . . . . . . . . . .
3,5014,000 grams . . . . . . . . . . . . . . . .
4,0014,500 grams . . . . . . . . . . . . . . . .
4r501gramsormore . . . . . . . . . . . . . . .
White
All bkthweights . . . . . . . . . . . . . .
2,500 grams orless . . . . . .’. . . . . . . .
2,501 gr{ms or more . . . . . . . . . . . . . .
l,OOOgrams or less . . . . . . . . . . . . . . . .
1,001-1,500 grams . . . . . . . . . . . . . . . .
1,501-2,000 grams . . . . . . . . . . . . . . . .
2,001 -2,500 grams . . . . . . . . . . . . . . . .
2,501 -3,000 grams . . . . . . . . . . . . . . . .
3,001 -3,500 grams . . . . . .. o.. . . . . . .
3,5014,000 grams .. m....... . . . . . .
4,0014,500 grams . . . . . . . . . . . . . . . .
4,501 grams ormore . . . . . . . . . . . . . . .
All other
All birth weights . . . . . . . . . . . . . .
2,500 grams orless . . . . . . . . . . . . . .
2,501 grams ormore . . . . . . . . . . . . .
1,000 grams or less . . . . . . . . . . . . . . . .1,001-1,500 grams . . . . . . . . . . . . . . . .
1,501 -2,000 grams . . . . . . . . . . . . . . . .
2,001 -2,500 grams, . . . . . . . . ..a . . . .2,501 -3,000 grams . . . . . . . . . . . . . . . .3,001 -3,500 grams . . . . . . . . . . . . . . . .
3,5014,000 grams m........ . . . . . . .
4,001 -4,500 grams . . . . . . . . . . . . . . . .
4,501 grams ormore . . . . . . . . . . . . . . .
100.0 100.0 100.0100.0 100.0 100.0 100.0 100.0
7.5
92.5
0.6
0.6
1.4
4.9
17.1
36.0
28.2
9.02.2
100.0
7.7
92.3
0.5
0.6
1.5
5.0
15.9
33.7
28.8
10.3
3.7
100.0
8.0
92.0
0.6
0.6
1.6
5.2
16.4
34.4
28.5
9.9
2.8
100.0
7.7
92.3
0.4
0.6
1.6
5.1
14.9
31.9
28.1
11.4
4.9
100.0
7.5
92.5
0.4
0.6
1.5
5.0
15.0
32.3
28.4
11.5
4.5
100.0
8.3
91.7
0.5
.0.7
1.6
5.5
16.2
32.9
28.2
10.9
3.4
100.0
6.1
93.9
0.2
0.5
1.1
4.3
14.3
32.3
27.4
12.5
7.5
100.0
5.7
94.3
0.2
0.4
1.1
4.0
15.2
32.5
26.6
12.5
7.5
100.0
9.7
90.3
0.6
0.9
1.9
6.3
15.2
33.1
27.6
10.9
3.4
100.0
8.9
91.1
0.6
0.8
1.9
5.6
14.3
33.6
28.6
11.3
3.3
100.0
7.2
92.8
0.5
0.6
1.3
4.7
16.6
36.1
28.4
9.1
2.7
100.0
7.0
93.0
0.5
0.6
1.3
4.6
16.6
36.4
28.7
9.0
2.3
100.0
6.8
93.2
0.5
0.5
1.2
4.5
16.3
36.1
29.2
9.4
2.2
100.0
7.5
92.5
0.5
0.6
1.5
4.9
15.8
34.1
28.2
10.2
3.2
100.0
9.0
91.0
0.70.7
1.9
5,7
16.1
30.8
26.5
10.7
7.0
7.3
92.7
0.5
0.6
1.4
4.8
15.7
34.5
29.4
10.4
2.8
100.0
7.9
92.1
0.5
0.6
1.5
5.2
15.5
33.0
28.9
11.3
3.3
100.0
8.8
91.2
0.60.7
1.6
5.8
17.2
33.4
25.7
9.4
5.6
12.0
88.0
1.01.1
2.3
7.6
21,8
35.7
22.1
6.4
2.0
11.9
88.1
0.91.0
2.4
7.6
20.9
34.0
23.1
7.4
2.8
8.9
91.1
0.30.9
2.1
5.7
14.7
29.6
27.7
11.4
7.7
11.188.9
0.70.9
2.2
7.4
20.4
32.1
24.1
8.6
3.7
7.4
92.6
0.8
0.8
5.8
10.7
31.4
30.612.4
7.4
13.5
86.5
0.61.2
2.1
9.619.130.623.3
9.3
4.2
25
1Excludes data for Massachusetts.
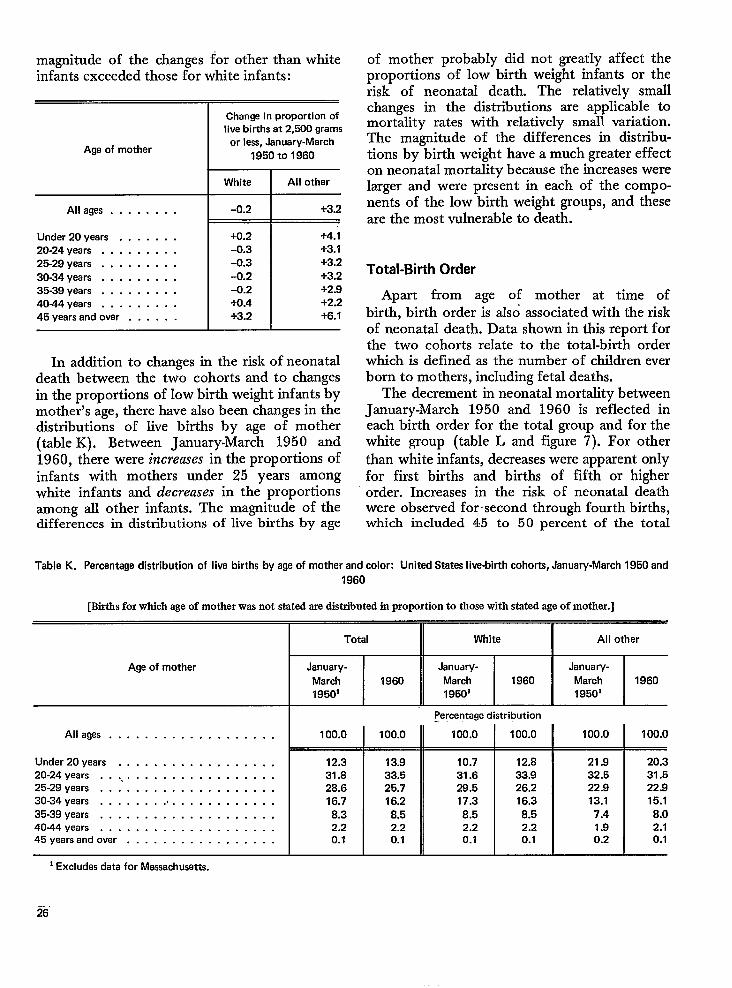
magnitude of the changes for other than whiteinfants exceeded those for white infants:
Age of mother
Allages . . . . . . . .
Under 20 years . . . . . . .20-24 years . . . . . . . . .25-29 years . . . . . . . . .30-34 years . . . . . . . . .35-39 years . . . . . . . . .40-44 years . . . . . . . . .45 years and over . . . . . .
Change in proportion oflive births at 2,500 grams
or less, January-March1950 to 1960
White
-0.2
+0.2-0.3
-0.3
-0.2-0.2+().4
+3.2
All other
+3.2
+4.1+3.1
+3.2+3.2+2.9+2,2+6.1
In addition to changes in the risk of neonataldeath between the two cohorts and to changesin the proportions of low birth weight infants bymother’s age, there have also been changes in thedistributions of live births by age of mother(table K). Between January-March 1950 and1960, there were increases in the proportions ofinfants with mothers under 25 years amongwhite infants and decreases in the proportionsamong all other infants. The magnitude of thedifferences in distributions of live births by age
of mother probably did not greatly affect theproportions of low birth weight infants or therisk of neonatal death. The relatively smallchanges in the distributions are applicable tomortality rates with relatively small variation.The magnitude of the differences in distribu-tions by birth weight have a much greater effecton neonatal mortality because the increases werelarger and were present in each of the compo-nents of the low birth weight groups, and theseare the most vulnerable to death.
Total-Birth Order
Apart from age of mother at time of
birth, birth order is zdso associated with the riskof neonatal death. Data shown in this report forthe two cohorts relate to the total-birt-h orderwhich is defined as the number of children everborn to mothers, including fetal deaths.
The decrement in neonatal mortality betweenJanuary-March 1950 and 1960 is reflected ineach birth order for the total group and for thewhite group (table L and figure 7). For otherthan white infants, decreases were apparent onlyfor first births and births of fifth or higherorder. Increases in the risk of neonatal deathwere observed for ~second through fourth births,which included 45 to 50 percent of the total
Table K. Percentage distribution of live births by age of mother and color: United States live-birth cohorts, January-March 1950 and
1960
[Btis forwhich ageof motherwas not statedaredutriiuted in proportion to thosewith statedageof mother.]
Age of mother
Alleges . . . . . . . . . . . . . . . . . . .
Under 20years . . . . . . . . . . . . . . . . . .20-24 years . . .. . . . . . . . . . . . . . . . . .25-29 years . . . . . . . . . . . . . . . . . . . .30-34 years . . . . . . . .. . . . . . . . . . . . .35-39 years . . . . . . . . . . . . . . . . . . . .4044 years . . . . . . . . . . . . . . . . . . . .45 years And over . . . . . . . . . . . . . . . . .
100.0
12.331.828.616.78.32.20.1
100.0
13.933.525.716.2
8.52.20.1
Percentage distribution
100.0 I 100.0
10.7 12.831.6 33.928.5 26.217.3 16.38.5 8.52.2 2.20.1 0.1
All other
100.0
21.932.522.913.1
7.41.90.2
100.0
20.331.522.915.1
8.02.10.1
1Excludes data for Massachusetts.
-.26
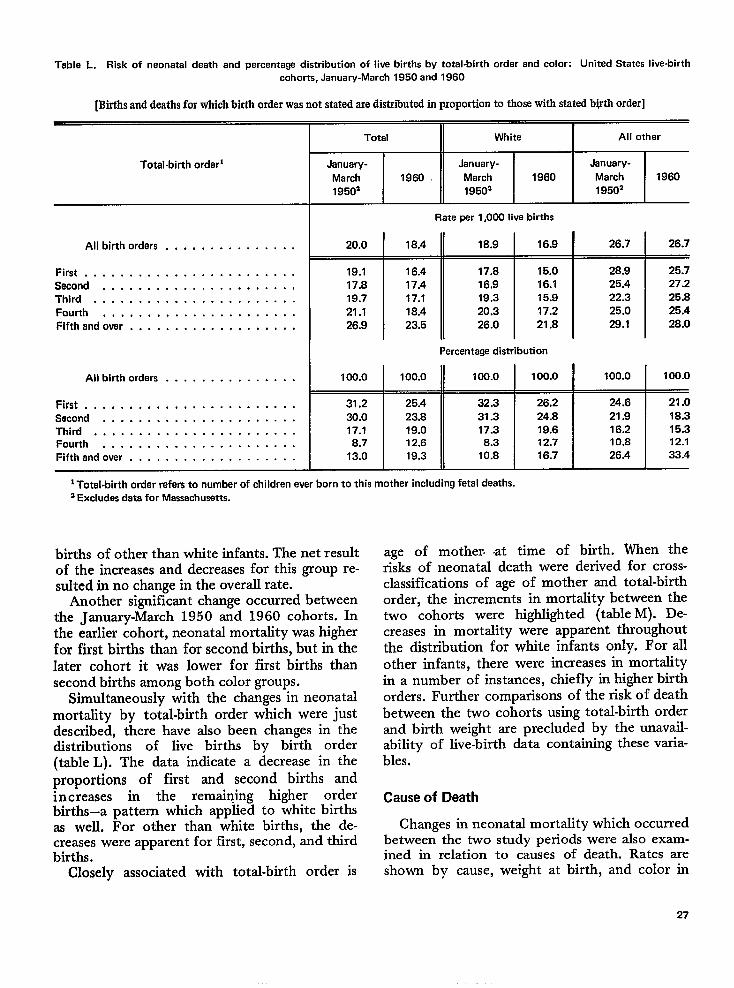
Table L. Risk of neonatal death and percentage distribution of live births by total-birth order and color: United States live-birthcohorts, January-March 1950 and 1960
[Births anddeathsforwhichbirthorderwas not statedaredistributedinproportionto thosewithstatedb@tlsorder]
Total-birth order]
All birth orders . . . . . . . . . . . . . . .
First . . . . . . . . . . . . . . . . . . . . . . . .Second . . . . . . . . . . . . . . . . . . . . . .Third . . . . . . . . . . . . . . . . . . . . . . .Fourth . . . . . . . . . . . . . . . . . . . . . .Fifthandover, . . . . . . . . . . . . . . . . . .
Allbirthordars . . . . . . . . . . . . . . .
First . . . . . . . . . . . . . . . . . . . . . . . .Second . . . . . . . . . . . . . . . . . . . . . .Third . . . . . . . . . . . . . . . . . . . . . . .Fourth . . . . . . . . . . . . . . . . . . . . . .Fifthandover . . . . . . . . . . . . . . . . . . .
Total White All other
January- January- January-
March 1960 March 1960 March 196019502 19502 19502
Rateperl,OOOlive births
20.0 18.4 18.9 16.9 26.7 26.7
19.1 16.4 17.8 15.0 28.9 25.717.8 17.4 16,9 16.1 25.4 27.219.7 17.1 19.3 15.9 22.3 25.821.1 18.4 20.3 17.2 25.0 25.426.9 23.5 26.0 21.8 29.1 28.0
Percentage distribution
100.0 100.0 100.0 100.0 100.0 100.0
31.2 25.4 32.3 26,2 24.6 21.030.0 23.8 31.3 24.8 21.9 18.317.1 19.0 17.3 19.6 16.2 15.3
8.7 12.6 8.3 12.7 10.8 12.1
13.0 19.3 10.8 16.7 26.4 33.4
1Total-birth ordar refers to numbar of children ever born to this mother including fetal deaths.2Excludes deta for Massachusetts.
bkthsofotherthan white infants. The netresultof the increases and decreases for this group re-sultedin no change inthe overall rate.
Another significant change occurred betweenthe January-March 1950 and 1960 cohorts. Inthe earlier cohort, neonatal mortality was higherfor first births than for second births, but in thelater cohort it was lower for first births thansecond births among both color groups.
Simultaneously with the changes in neonatalmortality by total-birth order which were justdescribed, there have also been changes in thedistributions of live births by birth order(table L). The data indicate a decrease in theproportions of first and second births andincreases in the remaining higher orderbirths–a pattern which applied to white birthsas well. For other than white births, the de-creases were apparent for first, second, and thirdbirths.
Closely associated with total-birth order is
age of mother at time of birth. When therisks of neonatal death were derived for cross-classifications of age of mother and total-birthorder, the increments in mortality between thetwo cohorts were highlighted (table M). De-creases in mortality were apparent throughoutthe distribution for white infants only. For allother infants, there were increases in mortalityin a number of instances, chiefly in higher birthorders. Further comparisons of the risk of deathbetween the two cohorts using total-birth orderand birth weight are precluded by the unavail-ability of live-birth data containing these varia-bles.
Cause of Death
Changes in neonatal mortality which occurredbetween the two study periods were also exam-ined in relation to causes of death. Rates areshown by cause, weight at birth, and color in
27
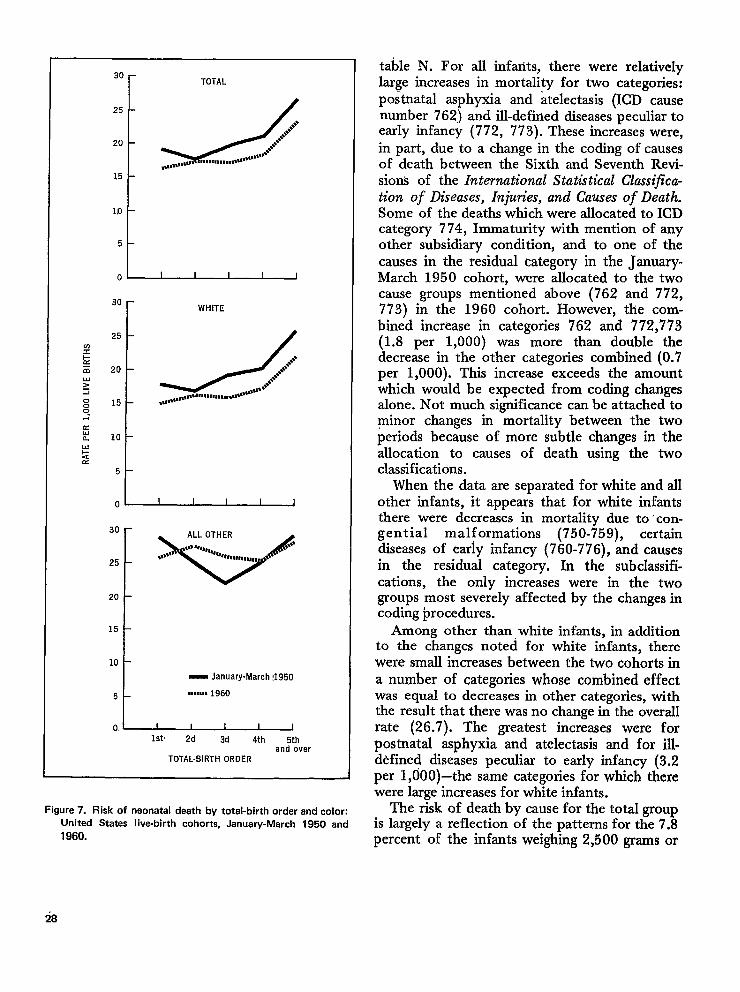
30 r TOTAL
15
110
5
1
30
r
WHITE
25
?I’&
~J
●**.+E 20 8+,$,.Y &I
,..muna.mt..,,,,***8n”s”s”00 15 **,,,*,*,*0-
.
20
15
10
1
- January-March !1950
5 ,,,,,,, 1960
0, ~Ist 2d 3d 4th 5th
and overTOTAL-BIRTHOROER
Figure 7. Risk of neonatal death by total-birth order and colon
United States live-birth cohorts, January-March 1950 and
1960.
table N. For all infants, there were relativelylarge increases in mortality for two categories:postnatal asphyxia and atelectasis (ICD causenumber 762) and ill-defined diseases peculiar toearly infancy (772, 773). These increases were,in part, due to a change in the coding of causesof death between the Sixth and Seventh Revi-sions of the International Statistical Classijica-i$on of Diseases, Injura”es, and Causes of Death.Some of the deaths which were allocated to ICDcategory 774, Immaturity with mention of anyother subsidiary condition, and to one of thecauses in the residual category in the January-March 1950 cohort, were allocated to the twocause groups mentioned above (762 and 772,773) in the 1960 cohort. However, tlie com-bined increase in categories 762 and 772,773(1.8 per 1,000) was more than double thedecrease in the other categories combined (0.7per 1,000). This increase exceeds the amountwhich would be expected from coding changesalone. Not much significance can be attached tominor changes in mortality between the twoperiods because of more subtle changes in theallocation to causes of death using the twoclassifications.
When the data are separated for white and allother infants, it appears that for white infantsthere were decreases in mortality due to -con-genial malformations (750-759), certaindiseases of early infancy (760-776), and causesin the residual category. In the subclassifi-cations, the only increases were in the twogroups most severely affected by the changes incoding procedures.
Among other than, white infants, in additionto the changes noted for white infants, therewere small increases between the two cohorts ina number of categories whose combined effectwas equal to decreases in other categories, withthe result that there was no change in the overallrate (26.7). The greatest increases were forpostnatal asphyxia and atelectasis and for ill-d~fined diseases peculiar to early infancy (3.2per 1,000)–the same categories for which therewere large increases for white infants.
The risk of death by cause for the total groupis largely a reflection of the patterns for the 7.8percent of the infants weighing 2,500 grams or
28
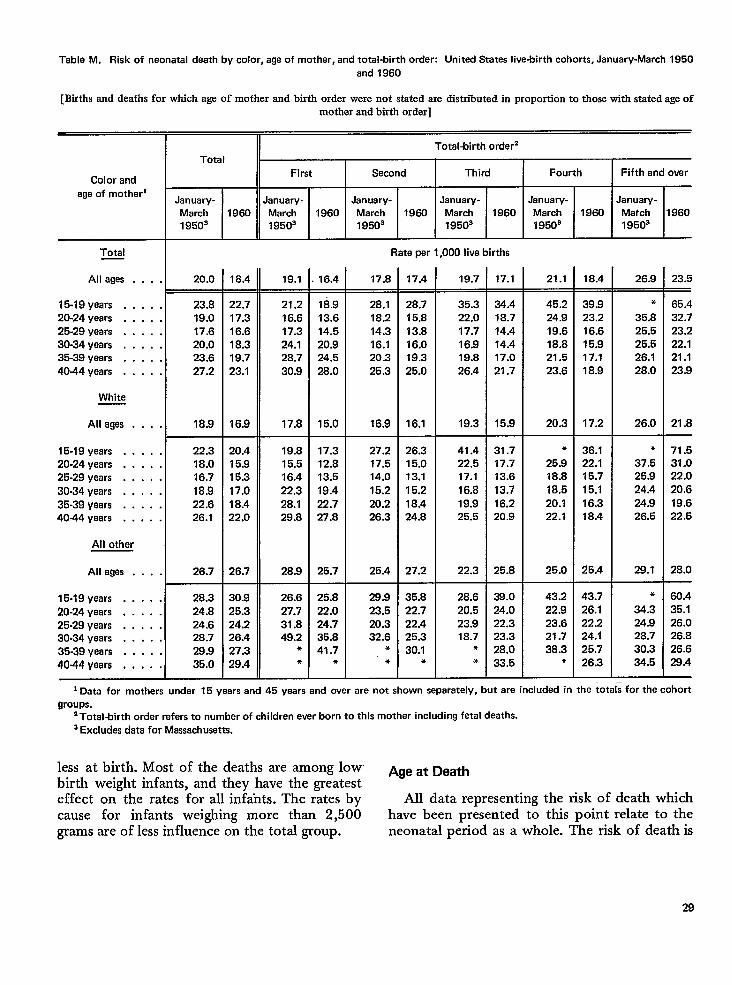
Table M. Risk of neonatal death by color, age of mother, and total-birth order: United States live-birth cohorts, January-March 1950
and 1960
[Births and deaths for wJdch age of mother and birth order were not stated are distributed in proportion to those with stated age of
Total
T
January-
March 1980
1950s
mother and birth order]
Total-birth order2
First Second Third
January- January- January-
March 1960 March 1980 March 1960
1950’ 19503 19503
Fourth I Fifth andoverColor and
age of motherlJanuary-
March
1950’
January-
Match
19503
1960 1960
Rate par 1,000 live birthsTotal
All ages . . .
15-19 yaars . . . .
20-24 years . . . .
25-29 years . . . .
30-34 years . . . .
35-39 years . . . .
4044 years . . . .
White
All ages . . .
15-19 years . . . .
20-24 years . . . .
25-29 years . . . .
30-34 years . . . .
35-39 years . . . .
40-44 years . . . .
All other
All ages . . .
15-19 yaars . . . .
20-24 years . . . .
25-29 years . . . .
30-34 years . . . .
35-39 years . . . .
4044 yaars . . . .
18.4 26.9 23.520.0 18.4 19.1 16.4 17.8 17.4 19.7 17.1 21.1—
23.8
19.0
17.6
20.0
23.6
27.2
18.9
22.7
17.3
16.6
18.3
19.7
23.1
16,9
21.2
16.6
17.3
24.1
28.7
30.9
17.8
18.9
13.6
14.5
20.9
24.5
28.0
15.0
28.1
18.2
14.3
16.1
20.3
25.3
16.9
28.7
15.8
13.8
16.0
19.3
25.0
16.1
35.3
22.0
17.7
16.9
19.8
26.4
19.3
34.4
18.7
14.4
14.4
17.0
21.7
15.9
45.2
24.9
19.6
18.8
21.5
23.6
20.3
*
25.9
18.8
18.5
20.1
22.1
25.0
39.9
23.2
16.6
15.9
17.1
18.9
17.2
36.1
22.1
15.7
15.1
16.3
18.4
25.4
*
35.8
25.5
25.5
26.1
28.0
26.0
●
37.5
25.9
24.4
24.9
26.5
29.1
65.4
32.7
23.2
22.1
21.1
23.9
21.8
71.5
31.0
22.0
20.6
19.6
22.5
28.0
22.3
18.0
16.7
18.9
22.6
26.1
26.7
28.3
24.8
24.6
28.7
29.9
35.0
20.4
15.9
15.3
17.0
18.4
22.0
26.7
19.8
15,5
16.4
22.3
28.1
29.8
28.9
26.6
27.7
31.8
49.2*
●
17.3
12.8
13.5
19.4
22.7
27.8
25.7
27.2
17.5
14.0
15.2
20.2
26.3
25.4
26.3
15.0
13.1
15.2
18.4
24.8
27.2
35.8
22.7
22.4
25.3
30.1*
41.4
22.5
17.1
16.8
19.9
25.5
22.3
31.7
17.7
13.6
13.7
16.2
20.9
25.8
25.8
22.0
24.7
35.8
41.7*
28.9
23.5
20.3
32.6*
*
28.6
20.5
23.9
18.7●
*
38.024.0
22.3
23.3
28.0
33.5
43.2
22.9
23.6
21.7
38.3*
43.7
26.1
22.2
24.1
25.7
26.3
●
34.3
24.9
28.7
30.3
34.5
60.4
35.1
26.0
26.8
26.6
29.4
30.9
25.3
24.2
26.4
27.3
29.4
i Data for mothers under 15 years and 45 years end over are not shown separately, but are included in the totals for the cohort
groups.
2Total-birth order refers to number of children ever born to this mother including fetal deaths.
a Excludes data for Massachusetts.
less at birth. Most of the deaths are among lowbirth weight infants, and they have the greatest
Age at Death
effect on the rates for all infa-nts. The rates by All data representing the risk of death whichcause for infants weighing more than 2,500 have been presented to this point relate to thegrams are of less influence on the total group. neonatal period as a whole. The risk of death is
29
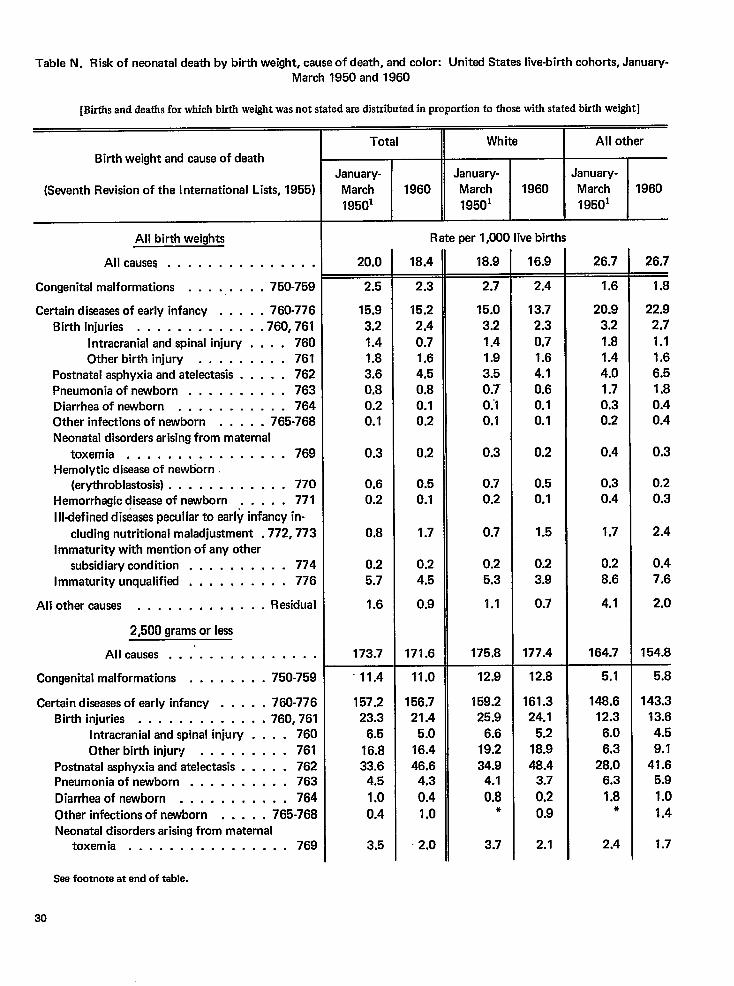
Table N. Risk of neonatal death by birth weight, cause of death, and color: United States live-birth cohorts, January-March 1950 and 1960
[Births and deaths for which birth weight was not stated are distributed in proportion to those with stated buth weight]
Birth weight and cause of death
(Seventh Revision of the International Lists, 1955)
All birth weights
All causes . . . . . . . . . . . . . . .
Congenital malformations . . . . . . . . . 750-759
Certain diseasesof early infancy . . . . . 760-776
Birth injuries , . . . . . . . . . , . .760,761
Intracranial and spinal injury . . . . 760
Other birth injury . . . . . . . . . 761Postnatal asphyxia and atelectasis . . . . . 762
Pneumonia of newborn . . , . . . . . . . 763Diarrhea of newborn . . . . . . . . . . . 764Other infections of newborn . . . . . 765-768
Neonatal disorders arising from maternal
toxemia . . . . . . . . . . . . . . .. 769Hemolytic disease of newborn
(erythroblastosis) . . . . . . . . . . . . 770
Hemorrhagic disease of newborn . . . . . 771
Illdefined diseases peculiar to early infancy in-
cluding nutritional maladjustment .772, 773
Immaturity with mention of any other
subsidiary condition . . . . . . . . . . 774
Immaturity unqualified . . . . . . . . . . 776
All other causes . . . . . . . . . . . . . Residual
2,500 grams or less
All causes . . .’ . . . . . . . . . . . .
Congenital malformations . . . . . . . . 750-759
Certain diseases of early infancy . . . . . 760-776Birth injuries . . . . . . . . . . . . .760,761
Intracranial and spinal injury . . . . 760
Other birth injury . . . . . . . . . 761Postnatal asphyxia and atelectasis . . . . . 762Pneumonia of newborn . . . . . . . . . . 763
Diarrhea of newborn . . . . . . . . . . . 764
Other infections of newborn . . . . . 765-768Neonatal disorders arising from maternal
toxemia . . . . . . . . . . . . . . ..769
Total
January-March 1960
19501
20.0
2.5
15.9
3,2
1.41.8
3.60.8
0.20.1
0.3
0.60.2
0.8
0.2
5.7
1.6
173.7
“ 11.4
157.223.3
6.5
16.833.6
4.5
1.0
0.4
3.5
White
January-
March 1960
19501
Rate per 1,000 live births
18.4
2.3
15.2
2.4
0.71.6
4.5
0.80.10.2
0.2
0.50.1
1.7
0.2
4.5
0.9
171.6
11.0
156.721.4
5.0
16.4
46.64.3
0.4
1.0
2.0
18.9
2.7
15.0
3.2
1.41.9
3.5
0.7”0.’10.1
0.3
0.7
0.2
0.7
0.25.3
1.1
175.8
12,9
159.225.9
6.6
19.2
34.94.1
0.8*
3.7
16.9
2.4
13.72.3
0.71.6
4.1
0.60.10.1
0.2
0.50.1
1.5
0.2
3.9
0.7
177.4
12.8
161.324.1
5.2
18.9
48.43.7
0.20.9
2.1
All other
IJanuary-
March 1960
19501
26.7
1.6
20.9
3.2
1.81.4
4.0
1.70.30.2
0.4
0.30.4
1.7
0.2
8.6
4.1
164.7
5.1
148.612.3
6.0
6.328.0
6.3
1.8*
2.4
26.7~
1.8
22.92,71.11.66.!31.80.40.4
0.3
0.20.3
2.4
0.47.6
2.0
154.8
5.8
143.313.6
4.5
9.1
41.65.9
1.0
1.4
1.7
Seefootnote at end of table.
30
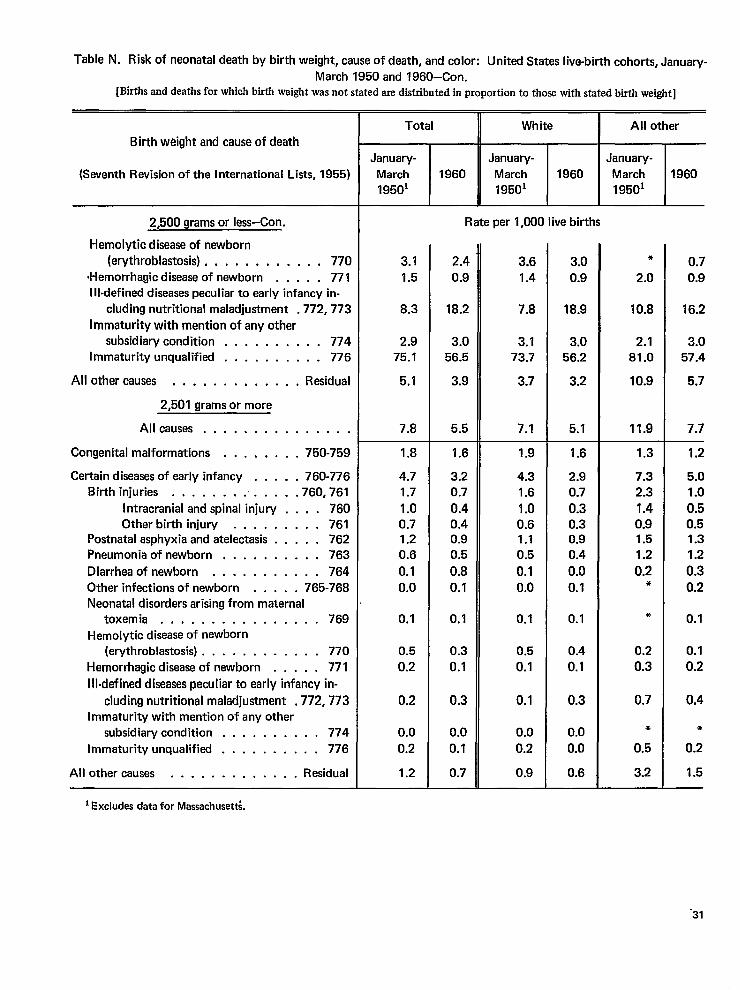
Table N. Risk of neonatal death by birth weight, cause of death, and color: United States live-birth cohorts, January-
March 1950 and 1960–Con.[Birthsand deaths for which birth weight was not stated are distributed in proportion to those with stated birth weight]
Birth weight and cause of death
(Seventh Revision of the International Lists, 1955)
2,500 grams or less–Con.
Hemolytic disease of newborn
(erythroblastosis) . . . , . . . . . . . . 770
(Hemorrhagic disease of newborn . . . . . 771111-defined diseasespeculiar to early infancy in-
cluding nutritional maladjustment .772,773
Immaturity with mention of any other
subsidiary condition . . . . . . . . . . 774Immaturity unqualified . . . . . . . . . . 776
All other causes . . . . . . . . . . . . . Residual
2,501 grams or more
All causes . . . . . . . . . . . . . . .
Congenital malformations . . . . . . . . 750-759
Certain diseasesof early infancy . . . . . 760-776Birth injuries . . . . . . . . . . . . .760,761
Intracranial and spinal injury . . . . 760Other birth injury . . . . . . . . . 761
Postnatal asphyxia and atelectasis . . . . . 762Pneumonia of newborn . . . . . . . . . . 763
Diarrhea of newborn . . . . . . . . . . . 764
Other infections of newborn . . . . . 765-768
Neonatal disorders arising from maternal
toxemia, . . . . . . . . . . . . . .. 769
Hemolytic disease of newborn(erythroblastosis) . . . . . . . . . . . . 770
Hemorrhagic disease of newborn . . . . . 771
ill-defined diseases peculiar to early infancy in-
cluding nutritional maladjustment .772,773Immaturity with mention of any other
subsidiary condition . . . . . . . . . . 774
Immaturity unqualified . . . . . . . . . . 776
All other causes . . . . . . . . . . . . . Residual
Total
January-
March
19501
1960
White
January-
March 1960
19501
All other
January-
March
19501
1960
3.1
1.5
8.3
2.975.1
5.1
7.8
1.8
4.7
1.7
1.00.71.20.6
0.1
0.0
0.1
0.5
0.2
0.2
0.0
0.2
1.2
Rate per 1,000 live births
2.4
0.9
18.2
3.056.5
3.9
5.5
1.6
3.20.7
0.40.40.90.5
0.8
0.1
0.1
0.3
0.1
0.3
0.0
0.1
0.7
3.6
1.4
7.8
3.173.7
3.7
7.1
1.9
4.31.6
1.00.61.10.5
0.1
0.0
0.1
0.5
0.1
0.1
0.0
0.2
0.9
3.0
0.9
18.9
3.056.2
3.2
5.1
1.6
2.90.7
0.30.30.90.4
0.0
0.1
0.1
0.4
0.1
0.3
0.0
0.0
0.6
*
2.0
10.8
2.181.0
10.9
11.9
1.3
7.32.3
1.40.91.51.2
0.2*
*
0.2
0.3
0.7
*
0.5
3.2
0.7
0.9
16.2
3.057.4
5.7
7.7
1.2
5.01.0
0.50.51.31.2
0.3
0.2
0.1
0.1
0.2
0.4
*
0.2
1.5
I Excludes data for Massaclr Usett;
-31
not uniform throughout the first morlth of life,and the changes between January-March 1950and 1960 are, likewise, not uniform by age(table O). In this table, the rates shown for eachage group are based on the number of survivorsat the beginning of each age interval. This wasdone to make a direct comparison of the risks ofdeath in each age group between the twocohorts.
For the total births, mortality was lower forthe 1960 cohort than for the earlier cohort ineach age interval except 1-23 hours; the samepattern prevailed for white infants. For all otherinfants, the decreases were limited to the agegroups from 2 days through the end of theneonatal period. Furthermore, the increaseswere limited to the low birth weight group. Forinfants weighing mo,re than 2,500 grams, therewere decreases between the two cohorts in everyage interval.
In presenting these data, attention must bedrawn to the inappropriateness of comparing therates for time intervals of unequal length with-out adjusting for the differences in the periodsof exposure to death. For example, for the 1960cohort the rate for the first hour of life is shownas 1.8 per 1,000 live births for all races anddescribes the risk of death for only 1 hour(table O). At the other end of the age scale, therisk of death at age 14 through 27 days is 1.0per 1,000 infants alive at the beginning of thatage interval, and the period includes 672 hoursof exposure to possible death. If an adjustmentwere made for the length of exposure, thehourly risk in the first hour of life would bemuch higher in relation to the hotirly risk in thelast 2 weeks of the neonatal period, somewhatof the order of a ratio of 1,210 to 1. However,since the purpose of the present report is tocompare experience of the January-March 1950with the 1960 cohort, this adjustment was notmade in table O.
DISCUSSION
The results of the comparison of neonatalmortality among the January-March 1950 andthe 1960 live-birth cohorts demonstrate impor-tant relationships between neonatal mortalityand factors apparent at birth. In table P, relative
ratios are presented to compare the levels of therates for a number of characteristics with acommon base for each cohort. The rate for eachbirth cohort is set equal to 1.00, and the ratiosof the rates to the base rate are shown in the lasttwo columns. For example, in the January-March 1950 live-birth cohort, white infantsexperienced neonatal mortality which was 95percent of the level of the total rate. In otherwords, their mortality was 5 percent below theoverall rate. The 1960 cohort showed a greaterrange between the rates for white and all otherinfants (0.92 versus 1.45 ) compared with theJanuary-March 1950 cohort (0.95 versus 1.34).Thus, in a relative sense, the two groups werefarther apart in 1960 than in January-March1950.
Differentials by sex remained fairly stable.For the January-March 1950 cohort, maleinfants experienced mortality which was 14percent above the overall rate. Neonatzd mortal-ity for female infants was 14 percent below therate for the two sexes combined. For each of thesexes, there was virtually no change between thetwo cohorts in their relation to overall neonatalmortality.
Infants born of plural deliveries are subject toa much higher risk of death than are singlebirths. In the earlier cohort, the neonatal mortal-ity of single born infants was 8 percent belowthe overall experience. In sharp contrast, neo-natal mortality among infants born of pluraldeliveries was five times the overall rate. Forsingle births, the relative position remainedunchanged between the two cohorts, but forplural births the ratio was higher in the latercohort. This observation may be related toimproved prenatal survival, accompanied byelevated postnatal mortality. Two explanationshave been offered to account for this phenom-enon: one obstetrical, the other statistical. Fromthe obstetrical viewpoint, it is contended thatrelatively more infants of this weight class whoformerly died in utero may now survive to bedelivered as live births; however, because of theirphysiological immaturity, they succumb soonafter delivery. From the statistical viewpoint, itis contended that registration of very smallinfants has improved during the decade, and theincrease in the ratios in the later cohort maybedue to improved registration of very small
32
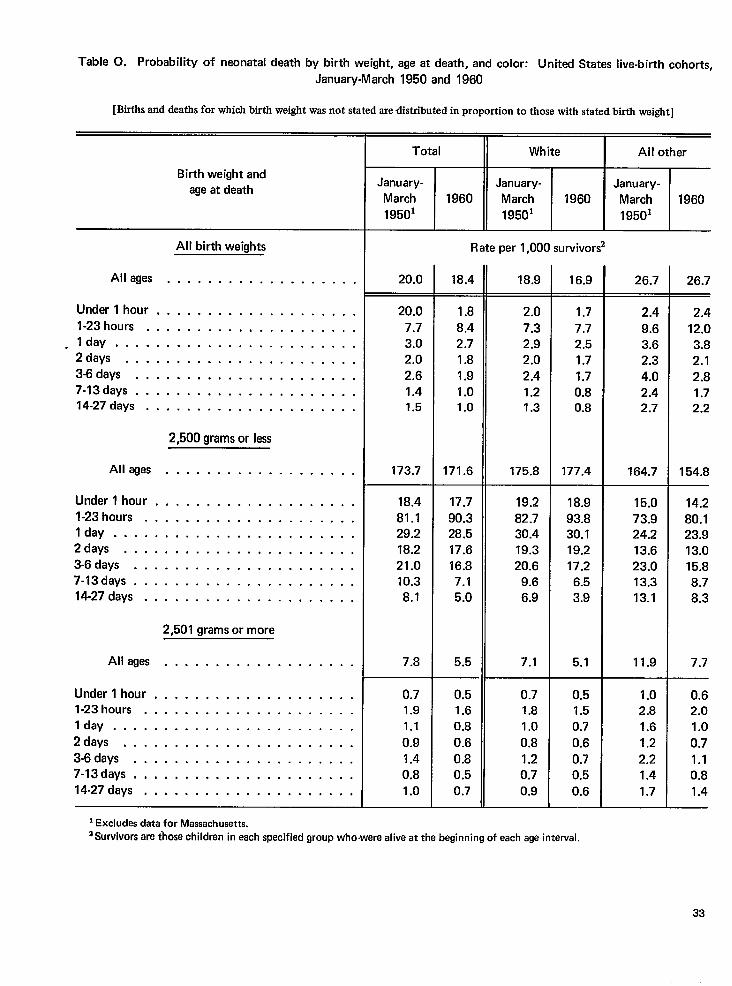
Table O. Probability of neonatal death by birth weight, age at death, and color: United States live-birth cohorts,
January-March 1950 and 1960
[Births and deaths for which birth weight was not stated are distributed in proportion to those with stated birth weight]
Total White All other
Birth weight andage at death
January-
March
19501
January-
March
19501
January-
March
19501
1960 1960
I
All birth weiahts Rate per 1,000 survivors
Alleges . . . . . . . . . . . . . . . . . . .
Under l hour . . . . . . . . . . . . . . . . . . . .
l-23hours . . . . . . . . . . . . . . . . . . . . .
. I day . . . . . . . . . . . . . . . . . . . . . . . .2days . . . . . . . . . . . . . . . . . . . . . . .
3-6days . . . . . . . . . . . . . . . . . . . . . .
7-13days . . . . . . . . . . . . . . . . . . . . . .14-27days . . . . . . . . . . . . . . . . . . . . .
20.0 18.4 18.9 16.9 26.7 26.7
20.0
7.7
3.0
2.0
2.6
1.41.5
173.7
1.8
8.42.7
1.8
1.9
1.01.0
171.6
2.0
7.3
2.9
2.0
2.4
1.21.3
175.8
1.7
7.7
2.5
1.7
1.7
0.80.8
177.4
2.4
9.63.6
2.3
4.02.42.7
164.7
15.0
73.924.213.6
23.0
13.313.1
11.9
2.4
12.0
3.8
2.1
2.81.72.2
154.8
14.2
80.123.913.0
15.8
8.7
8.3
7.7
2,500gramsorless
All ages . . . . . . . . . . . . . . . . . . .
. . . . . . . . . . . . . . . . . . .
. . . . . . . . . . . . . . . . . . .
. . . . . . . . . . . . . . . . . . .
. . . . . . . . . . . . . . . . . . .
. . . . . . . . . . . . . . . . . . .
. . . . . . . . . . . . . . . . . . .
. . . . . . . . . . . . . . . . . . .
2,501 gramsor more
. . . . . . . . . . . . . . . . . . .
. . . . . . . . . . . . . . . . . . .
. . . . . . . . . . . . . . . . . . .
. . . . . . . . . . . . . . . . . . .
. . . . . . . . . . . . . . . . . . .
. . . . . . . . . . . . . . . . . . .
. . . . . . . . . . . . . . . . . . .
. . . . . . . . . . . . . . . . . . .
Under lhour .
l-23hours . .lday . . . . .2days . . . .
3-6days . . .
7-13days . . .
14-27 days . .
18.4
81.129.2
18.2
21.0
10.3
8.1
7.8
17.7
90.328.5
17.6
16.87.1
5.0
5.5
19.2
82.730.419.3
20.69.6
6.9
7.1
18.9
93.830.1
19.2
17.2
6.53.9
5.1All ages
Under 1 hour .1-23 hours . .
Iday . . . . .
2days . . . .
3-6 days . . .7-13 days , , ,
14-27 days . .
0.71.9
1.1
0.9
1.4
0.8
1.0
0.51.6
0.8
0.6
0.80.5
0.7
0.71.8
1.0
0.8
1.20.7
0.9
0.51.5
0.7
0.6
0.70.50.6
1.02.8
1.6
1.2
2.21.41.7
0.62.0
1.0
0.71.10.81.4
1Excludes deta for Massachusetts.~Survivors are ihose children in each specified group who-were alive at the beginning of each age interval.
33
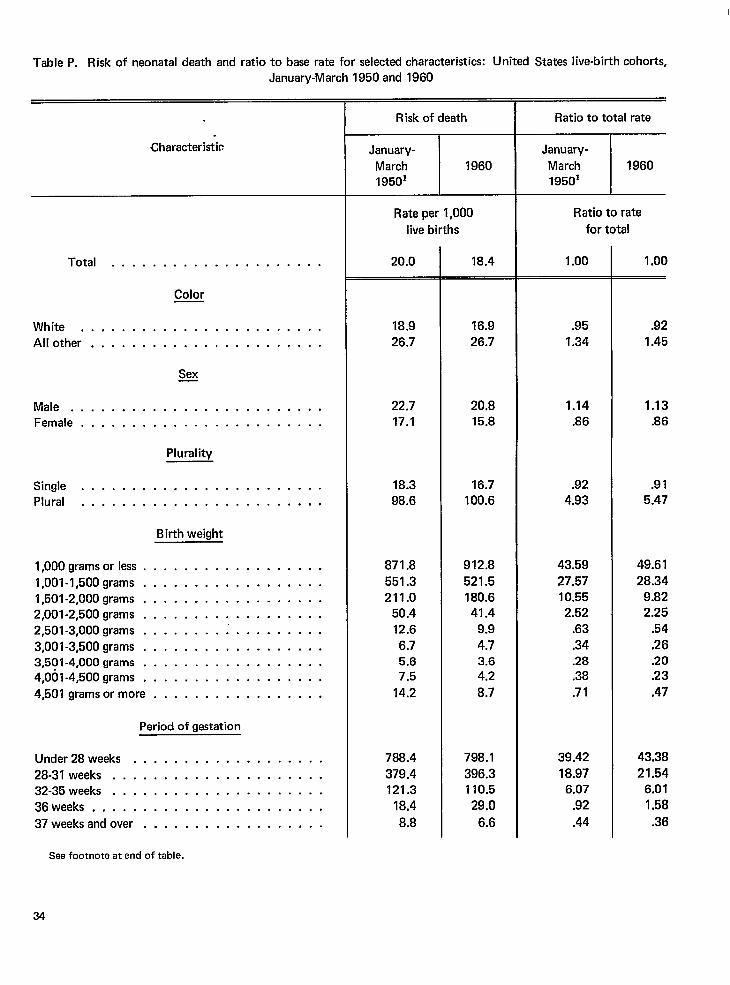
Table P. Risk of neonatal death and ratio to base rate for selected characteristics: United States live-birth cohorts,January-March 1950 and 1960
Characteristic
Total . . . . . . . . . . . . . . . . . . . . .
Color
White . . . . . . . . . . . . . . . . . . . . . . . .
Another . . . . . . . . . . . . . . . . . . . . . . .
Sex—
Male . . . . . . . . . . . . . . . . . . . . . . . . .Female . . . . . . . . . . . . . . . . . . . . . . . .
Plurality
Single . . . . . . . . . . . . . . . . . . . . . . . .Plural . . . . . . . . . . . . . . . . . . . . . . . .
Birthweight
l,OOOgramsorless . . . . . . . . . . . . . . . . . .
1,001-l,500grams . . . . . . . . . . . . . . . . . .
l,501-2,000grams . . . . . . . . . . . . . . . . . .
2,001-2,500grams . . . . . . . . . . . . . . . . . .
2,501-3,000grams . . . . . . . . ; . . . . . . . . .
3,001-3,500grams . . . . . . . . . . . . . . . . . .3,501-4,000grams . . . . . . . . . . . . . . . . . .4,001-4,500grams . . . . . . . . . . . . . . . . . .
4,501 gramsormore . . . . . . . . . . . . . . . . .
Period of gestation
Under 28weeks . . . . . . . . . . . . . . . . . . .
28-31 weeks . . . . . . . . . . . . . . . . . . . . .32-35 weeks . . . . . . . . . . . . . . . . . . . . .
36weeks . . . . . . . . . . . . . . . . . . . . . . .
37weeks And over . . . . . . . . . . . . . . . . . .
Risk of death
3z_k_Rate per 1,000
live births
20.0
18.9
26.7
22.717.1
18.3
98.6
871.8
551.3211.0
50.4
12.6
6.75.67.5
14.2
788.4
379.4121.3
18.4
8.8
18.4
16.9
26.7
20.815.8
16.7100.6
912.8
521.5
180.641.4
9.9
4.73.6
4.2
8.7
798.1
396.3110.5
29.0
6.6
Ratio to total rate
F
Ratio to rate
for total
1.00
.95
1.34
1.14
.86
.924.93
43.59
27.5710.552.52
.63
.34
.28
.38
.71
39.42
18.976.07
.92
.44
1.00
.92
1.45
1.13.86
.91
5.47
49.61
28.34
9.822.25
.54
.26
.20
.23
.47
43.38
21.546.01
1.58
.36
See footnote at end of table.
34
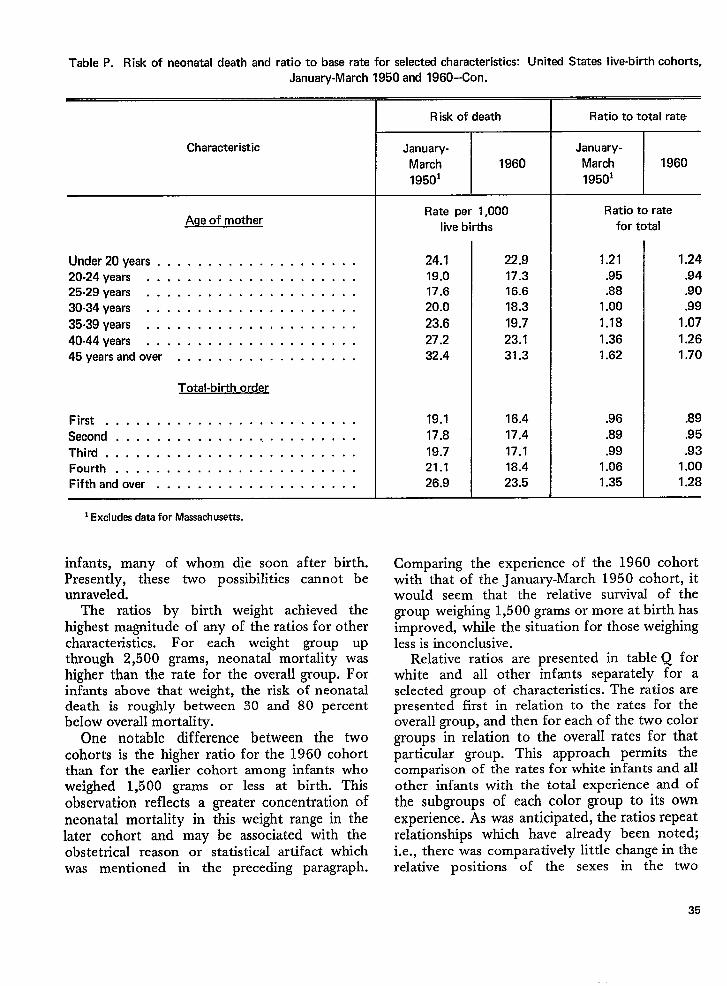
Table P. Risk of neonatal death and ratio to base rate for selected characteristics: Unitad States liva-birth cohorts,
January-March 1950 and 1960–Con.
Characteristic
Age of mother
Under 20years . . . . . . . . . . . . . . . . . . . .20-24 years . . . . . . . . . . . . . . . . . . . . .25-29 years . . . . . . . . . . . . . . . . . . . . .
30.34years . . . . . . . . . . . . . . . . . . . . .
35m39years . . . . . . . . . . . . . . . . . . . . .
40.44years . . . . . . . . . . . . . . . . . . . . .45yearsandover . . . . . . . . . . . . . . . . . .
Total-birth order
First, . . . . . . . . . . . . . . . . . . . . . . . .
Second . . . . . . . . . . . . . . . . . . . . . . . .
Third . . . . . . . . . . . . . . . . . . . . . . . . .Fourth . . . . . . . . . . . . . . . . . . . . . . . .Fifthandover . . . . . . . . . . . . . . . . . . . .
*Excludes data for Massachusetts.
infants, many of whom die soon after birth.Presently, these two possibilities cannot beunraveled.
The ratios by birth weight achieved thehighest magnitude of any of theratios for othercharacteristics. For each weight group upthrough 2,500 grams, neonatal mortality washigher than the rate for the overall group. Forinfants above that weight, the risk of neonataldeath is roughly between 30 and 80 percentbelow overall mortality.
One notable difference between the twocohorts is the higher ratio for the 1960 cohortthan for the earlier cohort among infants whoweighed 1,500 grams or less at birth. Thisobservation reflects a greater concentration ofneonatal mortality in this weight range in thelater cohort and may be associated with theobstetrical reason or statistical artifact whichwas mentioned in the preceding paragraph.
Risk of death
*
Rate per 1,000
live births
24.119.017.6
20.0
23.6
27.232.4
19.1
17.8
19.721.126.9
22.917.316.6
18.3
19.7
23.131.3
16.4
17.4
17.118.423.5
Rat io to total rate
T
Ratio to rate
for total
1.21
.95
.881.00
1.18
1.361.62
.96
.89
.991.061.35
1.24
.94
.90
.99
1.07
1.261.70
.89
.95
.931.001.28
Com~arinrz the experience of the 1960 cohortwith’ that “of the J&-mary-March 1950 cohort, itwould seem that the relative survival of thegroup weighing 1,500 grams or more at birth hasimproved, while the situation for those weighingless is inconclusive.
Relative ratios are presented in table Q forwhite and all other infants separately for aselected group of characteristics. The ratios arepresented first in relation to the rates for theoverall group, and then for each of the two colorgroups in relation to the overall rates for thatparticular group. This approach permits thecomparison of the rates for white infants and allother infants with the total experience and ofthe subgroups of each color group to its ownexperience. As was anticipated, the ratios repeatrelationships which have already been noted;i.e., there was comparatively little change in therelative positions of the sexes in the two
35
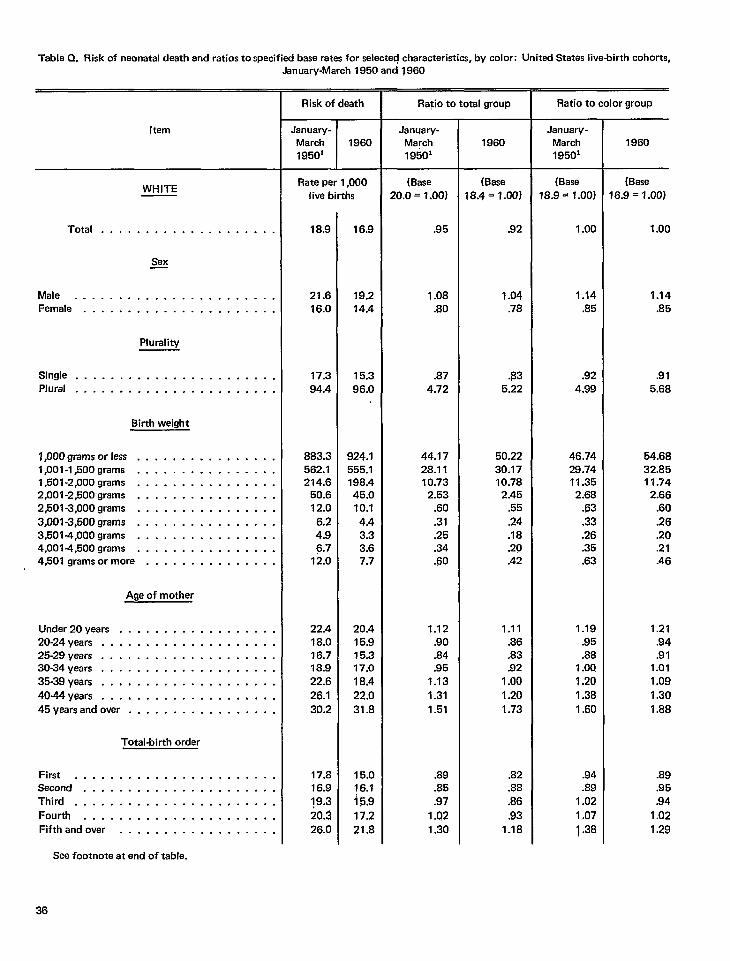
Table Q. Risk of neonatal death and ratios to specified base rates for selected characteristics, by color: Unitad States live-birth cohorts,
[tern
WHITE
Total . . . . . . . . . . . . . . . . . . . .
Sex—
Male . . . . . . . . . . . . . . . . . . . . . . .Female . . . . . . . . . . . . . . . . . . . . . .
Plurality
Single . . . . . . . . . . . . . . . . . . . . . . .Plural . . . . . . . . . . . . . . . . . . . . . . .
Birth weight
l,OOOgramsorlass . . . . . . . . . . . . . . . .1,001-l,500grams . . . . . . . . . . . . . . . .1,501-2,000grams . . . . . . . . . . . . . . . .2,001-2,500grams . . . . . . . . . . . . . . . .2,501-3,000grams . . . . . . . . . . . . . . . .
3,001-3,500grams . . . . . . . . . . . . . . . .3,5014,000grams . . . . . . . . . . . . . . . .4,001-4,500grams . . . . . . . . . . . . . . . .4,501gramsormore . . . . . . . . . . . . . . .
Ageofmother
Under20years . . . . . . . . . . . . . . . . . .20-24years . . . . . . . . . . . . . . . . . . . .25-29years . . . . . . . . . . . . . . . . . . . .30-34years . . . . . . . . . . . . . . . . . . . .35-39years . . . . . . . . . . . . . . . . . . . .
4044years . . . . . . . . . . . . . . . . . . . .
45yearsandover . . . . . . . . . . . . . . . . .
Total-birth order
First . . . . . . . . . . . . . . . . . . . . . . .Second . . . . . . . . . . . . . . . . . . . . . .Third . . . . . . . . . . . . . . . . . . . . . . .
Fourth . . . . . . . . . . . . . . . . . . . . . .
Fifthandovar . . . . . . . . . . . . . . . . . .
Jenuary-March 1950 and1960
Risk of death
.lanuary-March 196019501
Rate per 1,000live births
18.9
21.616.0
17.394.4
883.3562.1214.6
50.612.0
6.24.96.7
12.0
22.418.016.718.922.6
26.1
30.2
17.816.919.3
20.326.0
16.9
19.214.4
15.396.0
924.1555.1198.445.010.1
4.43.33.67.7
20.415.915.317a
18.422.0
31.8
15.016.1i 5.9
17.2
21.8
Ra~io to total group
Janqary-March1950’
(Base20.0=1.00)
.95
1.08.80
.874.72
44.1728.1110.73
2.53.60.31.25.34.60
1.12.90.84,95
1.13
1.31
1.51
.89
.85
.97
1.021.30
1960
(Base18.4=1.00)
.92
1.04.78
$35.22
50,2230.1710.78
2.45.55
.24
.18
.20
.42
1.11.86.83.92
1.00
1.201.73
.82
.88
.86
.931.18
Ratio to color group
January-March19501
(Base
18.9 = 1.00)
1.00
1.14.85
.924.99
46.7428.7411.352.68
.63
.33
.26
.35
.63
1.19.95.88
1.OQ1.201.381.60
.94
.891.02
1.07
1.38
1960
(Base16.9 = 1.00)
1.00
1.14.85
.915.68
54.6832.8511.74
2.66.60
.26
.20
.21
.46
1.21.94,91
1.011.09
1.30
1.88
.89
.95
.94
1.02
1.29
See footnote at end of table.
36
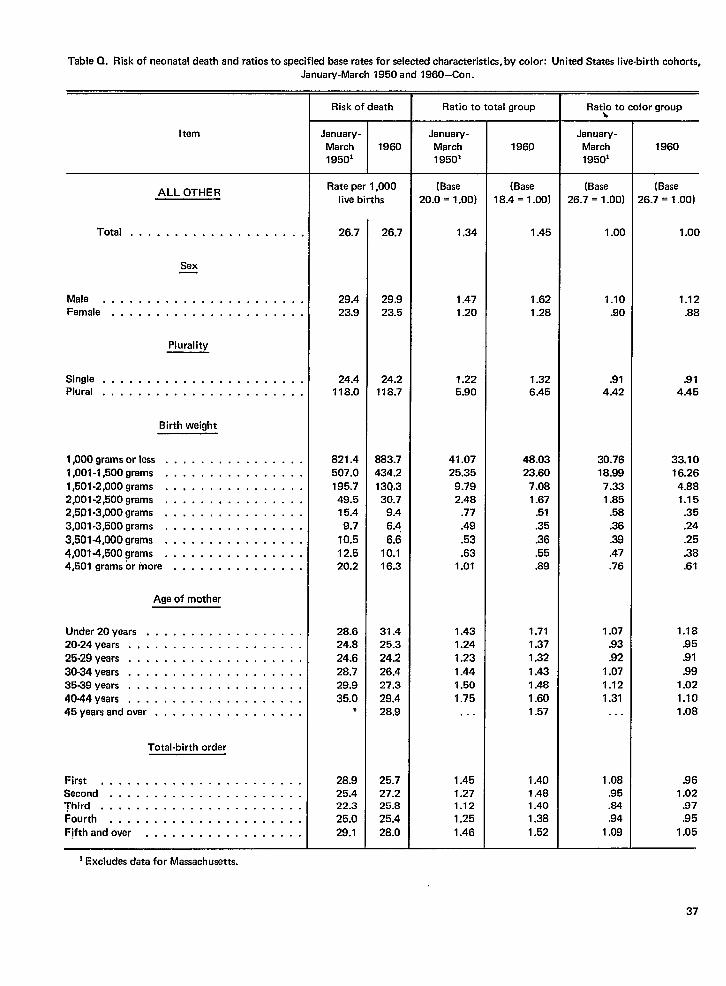
Table Q. Risk ofneonatal death andratios tospecifid base rates forseletied characteristic, by color: United Stataslive-birth cohorts,January-March 1950 and 1960–Con.
Item
ALL OTHER
Total, . . . . . . . . . . . . . . . . . . .
Sex
Male . . . . . . . . . . . . . . . . . . . . . . .Female, . . . . . . . . . . . . . . . . . . . . .
Plurality
Single . . . . . . . . . . . . . . . . . . . . . . .Plural . . . . . . . . . . . . . . . . . . . . . . .
Birth weight
l,OOOgramsorless . . . . . . . . . . . . . . . .1,001-l,500grams . . . . . . . . . . . . . . . .1,501-2,000grams ..,... . . . . . . . . . .2,001-2,500grams . . . . . . . . . . . . . . . .2,5C)l-3,000grams . . . . . . . . . . . . . . . .3,001-3,500grams . . . . . . . . . . . . . . . .3,501-4,000grams .,..... . . . . . . . . .
4,0014,5009rams . . . . . . . . . . . . . . . .4,501gramsormore . . . . . . . . . . . . . . .
Age of mother
Under 20years, . . . . . . . . . . . . . . . . .20-24 years . . . . . . . . . . . . . . . . . . . .
25.29 years, . . . . . . . . . . . . . . . . . . .30-34 years . . . . . . . . . . . . . . . . . . . .35-39 years . . . . . . . . . . . . . . . . . . . .4044yaars, . . . . . . . . . . . . . . . . . . .45years And over . . . . . . . . . . . . . . . . .
Total-birth order
First . . . . . . . . . . . . . . . . . . . . . . .Second . . . . . . . . . . . . . . . . . . . . . .Third . . . . . . . . . . . . . . . . . . . . . . .
Fourth, . . . . . . . . . . . . . . . . . . . . .Fifthandover . . . . . . . . . . . . . . . . . .
1Excludes data for Massachusetts.
Risk of death
I
January-March 196019501
Rate per 1,000live births
26.7
29.423.9
24.4118.0
821.4507.0195.749.515.49.7
10.512.520.2
28.624.824.628.729.935.0
*
28.925.422.3
25.029.1
26.7
29.923.5
24.2118.7
883.7434.213Q.330.7
9.46.4
6.610.116.3
31.425.324.226.427.329.428.9
25.727.225.8
25.428,0
Ratio to total group
March1950’
(Base20.0 = 1.00)
1.34
1.471.20
1.225.90
41.0725.35
9.792.48
.77
.49
.53
.631.01
1.431.241.231.441.501.75
. . .
1.451.271.12
1.25
1.46
1960
(8ase18.4=1.00)
1.45
1.621.28
1.326.45
48.0323.60
7.081.67
.51
.35
.36
.55
.89
1.711.371.32
1.431.481.601.57
1.401.481.401.38
1.52
Rat~ to color group
January-March1950’
26.7 = 1.00)
1.00
1.10.90
.91
4.42
30.7618.997.331.85
.58
.36
.39
.47
.76
1.07.93.92
1.071.121.31. . .
1.08.95.84.94
1.09
1960
(Base26.7 = 1.00)
1.00
1.12.88
.914.45
33.1016.264.881.15
.35
.24
.25
.38
.61
1.18.95.91
.991.021.101.08
.961.02
.97
.951.05
37
cohorts, and there was a suggestion of lessfavorable relative positions in the later cohortfor infants born in plural sets, infants of verylow birth weight (1,5 00 grams or less), andinfants born to mothers 45 years or older. Thus,the same conclusions are reached whether thebase rate is that for total live births or for eachcolor group.
The report highlights some of the high riskgroups which remained resistant to sizabledecreases between the January-March 1950 andthe 1960 cohorts. For example, despite signifi-cant decreases in the risk of neonatal death inalmost all birth weight groups, the risk ofneonatal death for other than white infants as awhole failed to show a change: It was 26.7 per1,000 live births for both cohorts. This figurewas 34 percent higher than the overall rate inthe earlier cohort and 45 percent higher thanthe overzdIrate for the later cohort.
Male infants experienced a higher risk ofneonatal death than their female counterpartsfor infants of both color groups and in bothcohorts. Infants born of plural deliveries experi-enced very high neonatal mortality comparedwith single infants in both cohorts as well.
The highest relative risk of neonatal death wasfor infants of low birth weight. Because of theextremely high magnitude of the relative risk,the total rate was markedly affected even whensmall changes occurred in the distributions oflive births by weight at birth. The data from thepresent study can be used to consider which ofthe two factors could have had a greaterstatistical effect on the differences in the overallrates between the two cohorts. For illustration,adjusted rates are computed under two differentassumptions to gauge how the rates would havevaried in the two cohorts if (a) the weightdistributions had been identical, but the mortal-ity rates varied, and (b) the rates had beenidentical, but the weight distributions varied.Which of these two alternatives could theoreti-cally have caused the greatest variation in theadjusted rates by color in the two cohorts?
The statistical effect on neonatal mortality ofchanges in distributions by weight at birth canbe examined using the birth weight distributionsshown in table E in conjunction with the overallneonatal mortality rates for the total 1960cohort (table D). The hypothetical neonatal
mortality rates which were obtained were asfollows :
Color groupJanuary-March
1950~o
Total . . . . . . . . . . 17.3 19.0
White . . . . . . . . . . . . . 16.1 16.9All other . . . . . . . . . . . 20.7 28.6
With only one set of neonatal mortality rates(1960 cohort rates), but with the actualobserved distributions of live births by birthweight for the two cohorts, the rates for thefour detailed cells varied from 16.1 to 28.6.These rates reflect the potential influence ofbirth weight distributions, since the mortalityrates were identical for all groups. This range(16.1 to 28.6) demonstrates the marked statis-tical effect of actual distributions of infants byweight at birth on neonatal mortality rates.
Similarly, one could simulate the alternativesituation by using a single distn”bution of livebirths by weight at birth, but with the observedrisks of neonatal death for the four groupsshown in the previous paragraph. In thisinstance, one obtains an understanding of thestatistical effect of the variations in mortalityrates on a constant distribution of birth weights(1960 total live births):
Color groupJanuary-March
19501960
Total . . . . . . . . . . 22.0 19.0
White, . . . . . . . . . . . . 21.6 19.5
Another. , . . . . . . . . . 24,5 18,8
Using the single base of live births and theobserved II(?OI_IZL~dl rates, the rates vaned from18.8 to 24.5. This range is smaller than thatobtained when the rates were held constant andthe birth weight distributions varied. It wouldseem, therefore, that the observed differences inthe distributions of births by weight groupexerted a greater influence on differential in therisk of neonatal death than did observed varia-tions in the weight-specific neonatal mortalityrates.
In considering the practical implications ofthese findings with regard to birth weight, twopossibilities present themselves. On the one
38
hand, one could attempt (through prevention ortherapy) to reduce mortality among newborninfants, particularly low birth weight infants.However, since the great majority of neonataldeaths are due to causes for which there are noglowing solutions, this approach has not beenfruitful, until the present. Because there are nosimple mass preventive measures such as treat-ment of water supplies or mass inoculationprocedures which are effective, progress willnecessarily be slow.
As a second alternative, one might attempt toalter the birth weight distributions of newborninfants. This goal could theoretically be achievedby preventing preterm delivery, but this has alsoproven to be a difficult objective to achieve.However, another alternative has recently beenrecommended. In a recent report, the Commit-tee on Maternal Nutrition of the NationalAcademy of Sciences took cognizance of varying
obstetric practices with regard to the restrictionof weight gain among pregnant women. 11 Thereport stated:
Current obstetric practice in the United States tends torestrict weight gain during pregnancy. In view of theevidence available, one may raise the question of whether
the practice is in effect contributing to the large number
of low birth weight infants to the perinatal- and infant-
mortality rates.
Elsewhere in the same report, the Committeeconcluded:
An average gain in weight during pregnancy of 24 pounds(range of 20 to 25 pounds) is considered reasonable. . . .
Limiting the weight gain of normal women to 10 to 14pounds is not justified; because of the possibility of
adverse effects on birth weight and neurological develop-
ment, weight-reduction programs and severe caforic re-striction should not be undertaken.
The interrelationship of maternal and infanthealth implies that epidemiological studiesrecognize the continuum of pregnancy.l 2 Thisconcept embraces all factors relating to themother, the fetus, and the newborn infant as acontinuous process of reproduction from thetime of conception until some specified timefollowing birth. It advocates that reproductionshould not be separated conceptually into twoperiods which are separated by the birth of theinfant. The effect of such a unified philosophy isto bring the specialties of obstetrics and pediat-rics into closer cooperation. In practice, thisimplies that obstetricians will make prenatal
information available to pediatricians. In
some hospitals, pediatri~ians are present indelivery rooms before babies are delivered. Suchcloser cooperation is advocated because of thepossible effect which prenatal or intranatal careof the mother may have on the fetus and infant.Elements of maternal care such as prenatalweight gain, medications and drugs which aretaken during pregnancy, prenatal infectivediseases, or the use of anesthesia during theintrapartum period must be considered from theviewpoint of their effects on the fetus and infantas well as on the mother.
Baird and his associates 3‘1 8 have extendedthe concept of continuum of pregnancy toinclude the developing years of the mother aswell. Studies which have included the height ofthe mother, her husband’s and father’s socialclass, and her nutrition have espoused thephilosophy that the best reproductive results areamong groups of women whose youthful devel-opment is most favorable to a healthful physicaIand social state. This view includes the impor-tance of the well being of the potential motherfrom the time of her birth through the period ofher growth and development, with conceptionoccurring at those ages which portend the bestoutcome for mother and infant, with adequateprenatal care, and with delivery under auspiciousconditions. Birth weight is an important illustr-ation of this point. On the one hand, it can beviewed as an endpoint of the mother’s healthand physical development, while, on the otherhand, it can be viewed as a characteristic of thebeginning of an infant’s extrauterine life, andcan be closely associated with infant survival andwell-being.
AREAS FOR FURTHER STUDY
The present comparisons suggest a number ofareas which need further research and areamenable to epidemiologic or demographicstudies.
Weight Gain
Among the areas requiring definitive evalua-tion is the effect of modification of the recom-mended weight gain of pregnant women on thebirth weight, neurological state, and mortality of
39
their infants. Such a study is a natural out-growth of the recommendation of the NationalAcademy ofSciences.11
Birth Weight, Race, and Socioeconomic Level
Another hypothesis which is in need oftesting is the relationship of socioeconomicfactors and food and nutrient intakes to thebirth weight of infants in both color groups.There is a significant difference between themean birth weight of these two groups of infantsin the United States. It is not clear whether thedifference is due entirely to either socio-economic or biological factors, or to a combina-tion of the two factors. While some investigatorsmay feel that the resolution of such questionsare relatively unimportant,l g an answer to thisquestion would greatly clarify the methodsneeded to modify the birth weight differentialsbetween these groups of infants. In view of thecomplexities of other sociological and humanphysiological factors, it would indeed be sur-prising if the difference in mean birth weightbetween white and all other infants could beattributable in to to to either of these twofactors.
The evidence with regard to the interrelation-ships is not entirely conclusive. Data publishedannually in this country have shown differentialsin infant and neonatal. mortality and in birthweight between white and all other infants.z 0Since “all other” infants are composed of about90 percent Negroes, the contrast is thereforebroadly interpreted on a racial basis; i.e., Cauca-sian compared with Negro infants. However, theclassification by color (or race) is confoundedwith socioeconomic differentials because of thehigh correlation between race and socioeco-nomic level. Other studies have further docu-mented the inverse relationship between infantmortality and socioeconomic level (as deter-mined from the father’s occupation group) evenwhen the data are limited only to whiteinfants.z I ~22 Data from New York City havedemonstrated similar socioeconomic gradientswithin both of these groups,z 3 and similarresults have been reported from North Carolinawhen the mother’s education was used as theindicator of socioeconomic level.z 4 The evidencewhich is presently available indicates that there
is an inverse association between mean birthweight and socioeconomic level as well asbetween infant mortality and socioeconomiclevel, and these relationships are present forboth color groups.
As yet unanswered is the following question:If the differences in birth weight which areattributable to socioeconomic differences wereeliminated, would differences still exist in themean birth weight between racial groups?Studies from the State of Hawaii25‘27 havedocumented differences in mean birth weightfor several racial groups such as Caucasian,Japanese, Hawaiian, and Filipino; and a study ofbirth weight of infants born in Sweden and inthe United States have shown significant differ-ences.z 8 However, the relationship of socio-economic levels to these findings is unclear.
There is virtually no information availableconcerning racial differences in birth weight ofequal socioeconomic levels for thk country. Afrequently expressed need for future research inthis area is the need for a simple standardizedindicator of socioeconomic level similar to thefive-class grouping of social classes used byBritish vital statisticians. The introduction ofcompleted years of education on the 1968Revisions of the Standard Certificates of LiveBirth and Fetal Death may provide this vehicle.While the lack of such information should notdeter the deliberate solution of problems relatedto socioeconomic differentials, increased infor-mation regarding racial differences betweensimilar socioeconomic levels would clarify thegoals which the Nation could expect to achieve.
Birth Weight and Gestation
At approximately 10-year intervals, theSurgeon General of the U.S. Public HealthService recommends to the States revised copiesof the Standard Certificates as suggested modekafter which the States can pattern their docu-ments. The States have the option of adoptingthe entire form, rejecting the entire form, ormodifying the form. Although there is never com-plete agreement on all items in all State certifi-cate forms, the States generally pattern theirdocuments after the Standard Certificates. Themost recent revisions are the 1968 Revisions ofthe Standard Certificates.
40
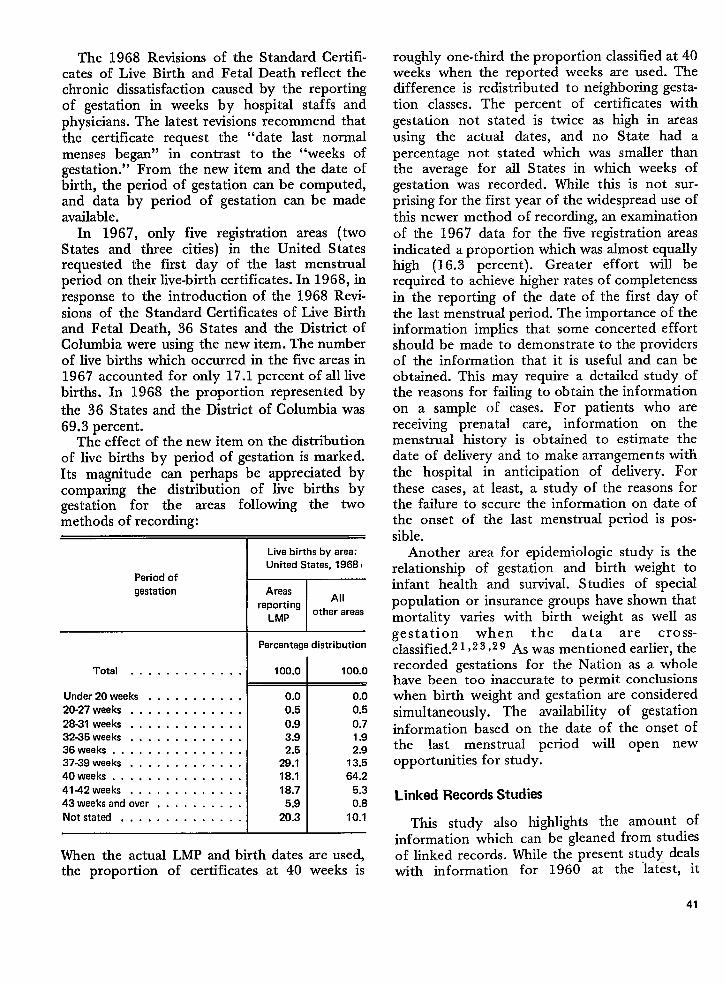
The 1968 Revisions of the Standard Certifi-cates of Live Birth and Fetal Death reflect thechronic dissatisfaction caused by the reportingof gestation in weeks by hospital staffs andphysicians. The latest revisions recommend thatthe certificate request the “date last normalmenses began” in contrast to the “weeks ofgestation.” From the new item and the date ofbirth, the period of gestation can be computed,and data by period of gestation can be madeavailable.
In 1967, only five registration areas (twoStates and three cities) in the United Statesrequested the first day of the last menstrualperiod on their live-birth certificates. In 1968, inresponse to the introduction of the 1968 Revi-sions of the Standard Certificates of Live Birthand Fetal Death, 36 States and the District ofColumbia were using the new item. The numberof live births which occurred in the five areas in1967 accounted for only 17.1 percent of all livebirths. In 1968 the proportion represented by
the 36 States and the District of Columbia was69.3 percent.
The effect of the new item on the distributionof live births by period of gestation is marked.Its magnitude can perhaps be appreciated bycomparing the distribution of live births bygestation for the areas following the twomethods of recording:
Period ofgestation
Total . . . . . . . . . . . . .
Under 20weeks . . . . . . . . . . .
20-27 weeks . . . . . . . . . . . . .
28-31 weeks . . . . . . . . . . . . .32-35 weeks . . . . . . . . . . . . .36weeks . . . . . . . . . . . . . . .37-39 weeks . . . . . . . . . . . . .40weeks, . . . . . . . . . . . . . .41-42 weeks . . . . . . . . . . . . .43weeksand over . . . , . . . . . .Notstatad . . . . . . . . . . . . . .
Live births by area:United States, 1968 I
AreasAH
reportingLMP
other areas
Percentage distribution
100.0
0.00.5
0.93.92.5
29.118.1
18.75.9
20.3
100.0
0.00.5
0.71.92.9
13.564.2
5.30.8
10.1
When the actual LMP and birth dates are used,the proportion of certificates at 40 weeks is
roughly one-third the proportion classified at 40weeks when the reported weeks are used. Thedifference is redistributed to neighboring gesta-tion classes. The percent of certificates withgestation not stated is twice as high in areasusing the actual dates, and no State had apercentage not stated which was smaller thanthe average for all States in which weeks ofgestation was recorded. While thk is not sur-prising for the first year of the widespread use ofthis newer method of recording, an examinationof the 1967 data for the five registration areasindicated a proportion which was almost equallyhigh (16.3 percent). Greater effort will berequired to achieve higher rates of completenessin the reporting of the date of the first day ofthe last menstrual period. The importance of theinformation implies that some concerted effortshould be made to demonstrate to the providersof the information that it is useful and can beobtained. This may require a detailed study ofthe reasons for failing to obtain the informationon a sample of cases. For patients who arereceiving prenatal care, information on themenstrual history is obtained to estimate thedate of delivery and to make arrangements withthe hospital in anticipation of delivery. Forthese cases, at least, a study of the reasons forthe failure to secure the information on date ofthe onset of the last menstrual period is pos-sible.
Another area for epidemiologic study is therelationship of gestation and birth weight toinfant health and survival. Studies of specialpopulation or insurance groups have shown thatmortality vanes with birth weight as well asgestation when the data are cross-classified.z1Y23 )29 As was mentioned earlier, therecorded gestations for the Nation as a wholehave been too inaccurate to permit conclusionswhen birth weight and gestation are consideredsimultaneously. The availability of gestationinformation based on the date of the onset ofthe last menstrual period will open newopportunities for study.
Linked Records Studies
This study also highlights the amount ofinformation which can be gleaned from studiesof linked records. While the present study dealswith information for 1960 at the latest, it
41
demonstrates the need to produce infant mortal-ity data periodically from linked records.
Cohort studies of infant mortality are anecessary adjunct to the production of routineinfant mortality rates produced from vital statis-tics. In a majority of States, infant or neonataldeath records are routinely linked to the corre-sponding birth records. Such data should bemade an integmd part of national vital statisticsfor monitoring infant mortality. Without cohortstudies from linked records, populationwidestudies of infant or neonatal mortality based oncertain very important characteristics (e.g., ageof mother, age of father, birth weight, plurality)are impossible. Populationwide studies are essen-tial to avoid the unintended biases which maybeintroduced by the self-selection of groupsadmitted to certain hospitals, or clustered incertain cities. The experience for individualhospitals, cities, or States often do not providesufficient numbers of cases for analysis becauseof relatively small groups in some cells, andnationwide studies are the only available meansof answering questions regarding the completerange of some factors.
The studies of the January-March 1950 and1960 cohorts were a decade apart, and anotherdecade has already passed. The Program AreaCommittee on Child Health of the AmericanPublic Health Association recommended in 1967that such studies be undertaken at 5-year inter-vals.30 If these recommendations were followed,the next cohort studies should be for the 1965and 1970 cohorts. From available data, it isapparent that since 1960 the proportion of lowbirth weight infants continues to be largeenough to remain a matter of concern:
Year
1950 . . . . . . . . . . . . . . . . .
1860 . . . . . . . . . . . . . . . . .1961 . . . . . . . . . . . . . . . . .1862 . . . . . . . . . . . . . . . . .
1863 . . . . . . . . . . . . . . . . .1864 . . . . . . . . . . . . . . . . .1965 . . . . . . . . . . . . . . . . .1866 . . . . . . . . . . . . . . . . .1867 . . . . . . . . . . . . . . . . .1868 . . . . . . . . . . . . . . . . .
42
-Perc(
WI
Total
7.5
7.77.88.0
8.28.28.38.38.28.2
t of low birthIht infants
White
7.1
6.86.97.0
7.17.17.27.27.17.0
All)ther
10.2
12.813.0
13.113.613.913.813.913.613.0
Thus, the problems of the proportion of lowbirth weight infants outlined in this report havenot diminished. What the risk of neonatal deathby weight at birth since 1960 may be is notknown, and will not be known until cohort datafor more recent periods become available.
SUMMARY AND CONCLUSION
The results of this study of neonatal mortalityfrom linked records have added much informa-tion regarding differences between infants bornin January-March 1950 and those born in 1960.Among the outstanding differences are thosebetween white infants and all other infants. Therisk of neonatal death for white infants was 18.9per 1,000 live births in the earlier cohort, and16.9 in the later cohort. For all other infants therate remained unchanged at 26.7. Lower rates inthe later cohort were evident for males and forfemales, and for single but not for plural births.
Although the risk of neonatal death by weightat birth was lower in 1960 than in January-March 1950 for other than white infants in eachof the weight groups except the small group ofinfants weighing 1,000 grams or Iess at birth, therates for the total group of these infants in thetwo cohorts remained unchanged: 26.7. Thisobservation resulted from the shifting of thedistribution of weight at birth toward lowerweights between the two periods in time. Thisobserved shift in weight distribution was notaccompanied by a comparable phenomenon forwhite infants. The distribution of infants byweight at birth is considered in greater depth inanother report.g It was concluded that the rateincrease among other than white infants was notassociated with changing distributions of age ofmother, plurality, or sex, nor was it entirelyattributable to increasing proportions of theseinfants who are born in hospitals. The analysisby period of gestation and birth weight wasprecluded by the poor quality of the reportedperiods of gestation for the Nation as a whole.
When, in the present report, the risk ofneonatal death was examined by age of mother,it was apparent that, for white infants, there wasa small increase in mortality for infants born tomothers 45 years of age and over in the latercohort (table Q and figure 6). However, theseinfants constitute only one-tenth of 1 percent of
live births. In all other age of mother groups, therisks of neonatal death for the 1960 cohort werelower than for the earlier cohort. For all otherinfants, on the other hand, there were increasedrisks for infants born to mothers under 25 yearsof age, and these constituted over 50 percent ofthe live births for this group.
By birth order, there was also a notabledifference (table Q and figure 7). For whiteinfants, the risk of neonatal death was lower inthe 1960 cohort than in the January-March1950 cohort regardless of birth order. For allother infants, the risk of neonatal death washigher in 1960 for second, third, and fourthbirths which together constituted 45.7 percentof the live births in this color group.
By cause of death, higher risks of neonataldeath were noted in the 1960 cohort frompostnatal asphyxia and atelectasis (ICD 762) andfrom ill-defined diseases peculiar to earlyinfancy (ICD 772,773) for both color groups.These increases are larger than the decreasesattributable to the use of two revisions of theInternational Statistical Classification for codingcauses of death. The changes in mortality werelimited to the group of infants weighing 2,500grams or less at birth, and this small group ofinfants (7.8 percent) contributes the largestshare to neonatal mortality (72.6 percent); Inaddition to these two cause groups (ICD 762and 772,7 73), there were relatively smallerincreases in a number of cause categories forother than white infants which, when added tothose mentioned previously, were sufficient toovercome the decreases in other cause groupsand kept the risk of neonatal death among theseinfants unchanged at 26.7 for the two cohorts.
The risk of death was higher in the 1960cohort than in the January-March 1950 cohortfor both white and all other infants at 1-23hours of age. For the former group this age
interval was the only one for which there was anincrease, while for the latter group there was nochange in the first hour of life and an increase at1 day of age.
Neonatal mortality continues to be the majorcomponent of infant mortality: 73.2 percent ofthe total. As the bulk of infant deaths becomesmore and more concentrated in the neonatalperiod, the focus of medical interest is alsochanging. Concentration on the early postnatalperiod brings the concerns of obstetricians andpediatricians closer together. Closer cooperationbetween the two specialties should enhance theoutlook for both mothers and their infants.
There has been considerable discussion regard-ing what a realistic goal for infant or neonatalmortality might be for the United States.19Other nations have achieved rates which areconsiderably below those for this country, sothat one can conclude that the irreducibleminimum has not been achieved.s 1 Among thelowest rates which were found in the presentstudy is a neonatal mortality rate of 3.o per1,000 live births for white infants, weighingbetween 3,501 and 4,000 grams at birth, withmothers 25-29 years of age. This rate is farbelow the overall neonatal mortality rate of 18.4for the 1960 live-birth cohort, and couldprobably not be achieved by the totality of livebirths in the near fiture. Nevertheless, it isindicative of the fact that there is considerableroom for improvement.
This report has attempted to examine anumber of factors which are known to beassociated with neonatal mortality. Its purposeis to establish the degree of their relationship toneonatal mortality and to the changes whichoccurred between the January-March 1950 and1960 live-birth cohorts. The study methodwhich was selected was that of cohort ratesderived from linked infant-death and live-birthrecords. Because the study was based on officialvital records, a number of other relevant factorssuch as family income, housing, and so forthwere not available for study. Despite theselimitations, the study provides substantial guid-ance for the medical profession, program direc-tors, and health planners.
REFERENCES
lNationsl Office of Vital Statistics: Birth registration com- 2 : Mrth registration completeness in the Unitedplcteness in the United States and geographic areas, 1950. Part I. States and geographic areas, 1950. Part II. Data for local areas,Data for each State, by S. Shapiro and J. Schachter. Vital by S. Shapiro and J. Unger. Vital Statistics-Special Reports,Statistics–Special Reports, Vol. 39, No. 2. Public Health Service. Vol. 39, No. 4. Public Health Service. Washington, D.C., Jan. 20,Washington, D.C., Sept. 21, 1954. 1955.
43
3 _: Weight at birth and its effect on survival of thenewborn in the United States, early 1950, by S. Shapiro and J.Unger. Vital Statistics–Specshl Reports, Vol. 39, No. 1. PublicHe~th Service. Wash@ton, D.C., July 23,1954.
: Relation of weight at birth to cause of death sindage at death in the neonatal period: United States, early 1950,by S. Shapiro and J. Unger. Vital Statistics–Speciul Re~orts,
Vol. 39, No. 6. Public Health Service. Washington, D.C., Feb. 23,195$
: Weight at birth and its effect on survival of thenewborn: United States by geographic divisions and by urbanand rural areas, early 1950, by J. Unger. Vital Statistics—S@echlReports, Voi. 45, No. 10. Public Health Service. Wasb@ton,D.Cd Apr. 30, 1957.
_: Weight at birth and survival of newborn, by age ofmother and total-birth orde~ United States, early 1950, by J.Loeb. Vital Statistics-Special Reports, Vol. 47, No. 2. PublicHealth Service. Washington, D. C., Aug. 6, 1958.
7National Center for Health Statistics: A i.tudy of infantmortality from linked records: method of study and registrationaspects: United States, 1960 live-birth cohort. Vital and HealthStatistics. PHS Pub. No. 1006-Senes 20-No. 7. Public HealthService. Washington. U.S. Government Printing Office, Feb.1970.
‘Chase, H. C.: Infant mortality and weight at birth: 1960United States birth cohort. Am.].Pub.Health 59(9):1618-1628,Sept. 1969.
‘National Center for Herdth .Watisiics: Trends in “prema-turity”: United States, 1950-1967. ,Vital and Health Statistics,
Series 3-No.15. DHEW Pub. No. (H~M)72-1 030. [email protected]. Government Printing Office, Jan. 1972.
10Chase, H. C.: The current status of fetal death registmtionin the United States, Am.J.Pub.Heatth 56(10) :1734-1 744, Oct.
1966.1 lNatiorial Academy of Sciences: Maternal Nutrition and
the Course of Pregnuncy. A Report of the Committee onMaternal Nutrition, National Research Council. Wash@ton,D.C., 1970.
12Peller, S.: Mortality, past and future, Population Studies1:405 -4!56, Mar. 1948.
13Baird, D., and Wyper, J. F. B.: High stillbirth and neonatalrnortahties, Lancet 241(6170):657-659, Nov. 29, 1941.
14Baird, D.: The influence of social and economic factors on
stillbirths and neonatal deaths, J. Obst.& Gynaec.Bra”t.Emp.52:’2;7-234,,June 1945 and 52:339-366, Aug. 1945.
_: Social class and foetal mortality, Lancet
253~~476):531-535, Oct. 11,1947.—: Preventive medicine in obstetrics, New Engkmd
J.Med. 246:561-568, April 10,1952.17Baird, D., and Illsley, R.: Environment and childbearing.
Proc.Roy.Soc.Med. 46:53-59, Feb. 1953.18Baird, D.: The evolution of modern obstetrics, Lancet
2(7151):609-614, Sept. 17,1960.1‘National Institute of Child Health and Human Develop-
ment: Key Issues in Infant Mortality, report of a conference,April 16-18, 1969. W&hington. U.S. Government PrintingOffice.
‘“National Center for Health Statistics: Vital Statistics of
the United States, 1967, Vols. I and 11A. Public Health Service.Washington. U.S. Government Printing Office, 1969.
21New York State Department of Health: The ReZa-
tt”onship of Certain Biolo@”c and Socioeconomic Factors to ‘Feta~ Infant, and Early Childhood Mortality, by H. C, Chase,Albany, N.Y.
k-u-tI. Father’s occupation, parental age, and infant’s birthrank (1961]
Part IL Father’s occupation, infant’s birthweight, andmother’s age (1962)
Part III. Previous loss (1963)22Cahfornia Department of Public HeaIth: PerinatalMortaL
ity and Suroiva~ California, 1949-1959, revised. Berkeley, C#lf.,1963.
23Shapiro, S., Schlesinger, E. R., Nesbltt, R. E. L., Jr.:Infant, Perinatal, Maternal, and Childhood Mortality in theUnited States. Cambridge, Mass. Harvard University Press, 1968.
388&p”Nortli Carolina State Board of Health: Perinatal MortalityStatistics, 1968. Raleigh, N.C. (no publication date).
25Taff, M. A., Jr., and Wdbar, C. L., Jr.: Immaturity ofsingle live births according to weight, with particular reference torace. Am.J.lYis.Child. 85(3):279-284, Mar. 1953.
26Connor, A., Bennett, C. G., hd Louis, L, S. K.: Birth
weight patterns by race in Hawaii, Hawaii M.J. 16(6) :626-632,July-Aug. 1957.
27 Bennett, C. G., and Louis, L. S. K.: Demographic factorsinfluencing bktb weight, Hawaii M.J. 18(3):239-244, Jan.-Feb.i959.
28Geijerstam, G. *. Low btih weight and perirsatal mortal-
ity, pub. Health Rep. 84:939-94$, Nov. 1969.29Yerushalmy, J., van den Berg, B. J., Erhardt, C. L., and
Jacobziner, H.: Birth weight smd gestation as indices of “imma-turity’’-neonatal mortaM.y and congenital anomtiles of the“immature,” Am.J.DkChild. 109(1]:43-57, jam 1965.
30American Public Health Association: Requirements fordata on infant and perinatsd mort~lty. Report of the ProgramArea Committee on Child Health, APHA. Am.J.Pub.Health
57(10):1848-1861, Oct. 1967.3 lNational Center for Health Statistics: Intematiostal com-
parison of perinatal and infant mortality: the United States andsix west European countries. Vital and Hedlth Statists”cs. PHSPub. No. 1000-Series 3-No. 6. Public Health Service. [email protected]. Government Printing Office, Mar; 1967.
32National Office of Vital Statistics: Vital Statistics Instruc-
tion Manual. Part L Coding and punching geographic andpersonal particular. Section B, Births, deaths, and fetal deathsoccurring in 1960. Public Health Service. Washington, D.C., Oct.1960.
33U.S. Bureau of the Census: Studies in completeness ofbirth registration, Part I. Completeness of bwth registration inthe United States, Dec. 1, 1939 to March .31, 1940, by R, D.Grove. Vital Statistics-Special Reports, Vol. 17, No. 18.Washington, D.C., April 1943.
34National Center for Health Statistics: Matched recordcomparison of bkth certificate and census information, UnitedStates, 1950. Vital Statistics–Special Reports, Vol. 47, No. 12.Public Health Service. Washington, D.C., Mar. 1962.
44
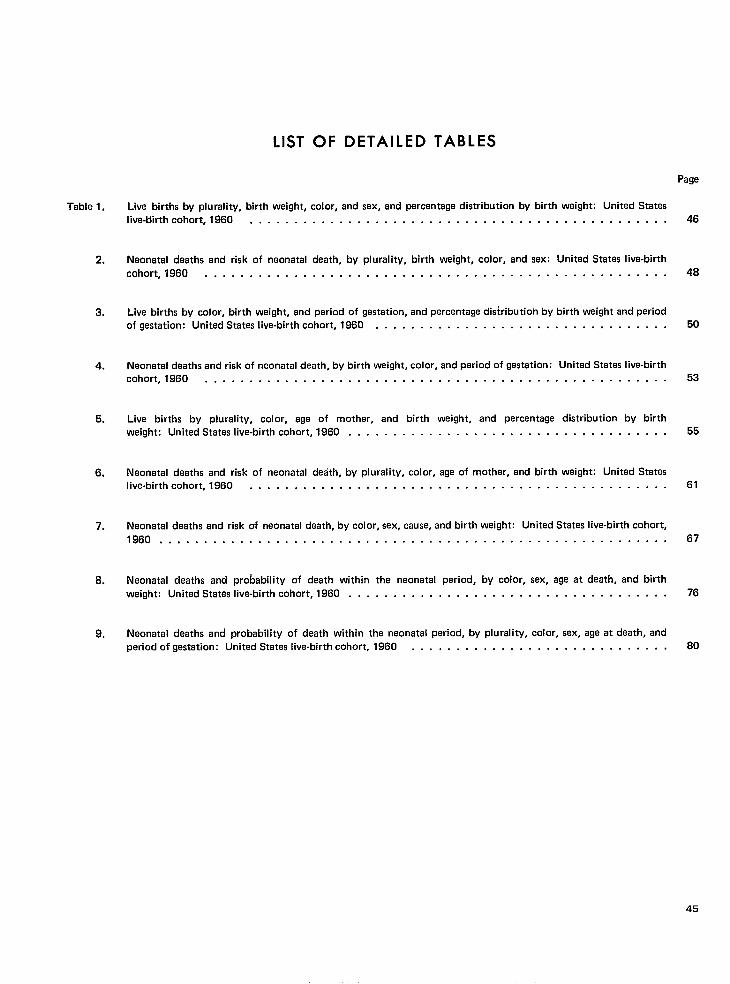
LIST OF DETAILED TABLES
Table 1.
2.
3,
4.
5.
6.
7.
8.
9.
Live births by plurality, birth weight, color, and sex, and percentage distribution by birth weight: United States
live-birth cohort, 1960 . . . . . . . . . . . . . . . . . . . . . . . . . . . . . . . . . . . . . . . . . . . . . . .
Neonatal deaths and risk of naonatal death, by plurality, birth weight, color, and sex: United States live-birth
cohort, 1960 . . . . . . . . . . . . . . . . . . . . . . . . . . . . . . . . . . . . . . . . . . . . . . . . . . . .
Live births by color, birth weight, and period of gestation, and percentage distribution by birth weight and period
of gestation: United States live-birth cohort, 1960 . . . . . . . . . . . . . . . . . . . . . . . . . . . . . . . . .
Neonatal deaths and risk of neonatal death, by birth might, color, andperiod of gestation: United States live-birth
cohort,1960 , . . . . . . . . . . . . . . . . . . . . . . . . . . . . . . . . . . . . . . . . . . . . . . . . . . .
Live births by plurality, color, age of mother, and birth weight, and percentage distribution by birth
weight: UnitedStateslive-birth cohort,1960 . . . . . . . . . . . . . . . . . . . . . . . . . . . . . . . . . . . .
Neonatal deaths and risk of neonatal death, by plurality, color, age of motherland birth weight: United States
live-birthcohort, 1960... . . . . . . . . . . . . . . . . . . . . . . . . . . . . . . . . . . . . . . . . . . . .
Neonatal daaths and risk of neonatal daath, bycolor, sex, cause, and birth weight: United States live-birth cohort,
1960 . . . . . . . . . . . . . . . . . . . . . . . . . . . . . . . . . . . . . . . . . . . . . . . . . . . . . . . . .
Neonatal deaths and probability of death within the neonatal period, by color, sex, age at death, and birth
weight: UnitedStateslive-birthcohort, 1960 . . . . . . . . . . . . . . . . . . . . . . . . . . . . . . . . . . . .
Neonatal deaths and probability of death within the neonatal period, by plurality, color, sex, ageatdeath, and
period of gestation: Unitad States live-birth cohort, 1960 . . . . . . . . . . . . . . . . . . . . . . . . . . . . .
rage
46
48
50
53
55
61
67
76
80
45
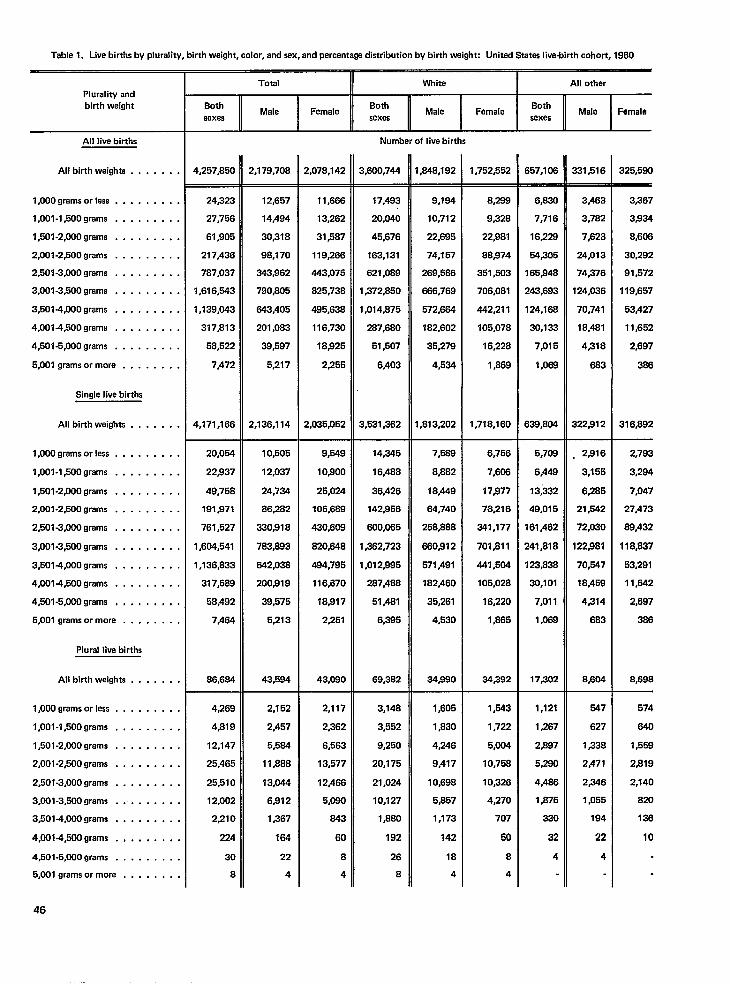
Tablel. Mvetirthsby plurali~, tirthwaight, color, andsex, andpercenta& dstribution bytimhwight: United States live-birth cohort, 1960
Total II White I All otherPlurality andbirth weight
All live births
All birth weighta . . . . . . .
1,000 grema Orleas . . . . . . . . .
1,001 -l,500grams . . . . . . . . .
1,501 -2,000 grams . . . . . . . . .
2,001-2,500 grams . . . . . . . . .
2,501-3,000 grams . . . . . . . . .
3,001-3,500 grams . . . . . . . . .
3,5014,000 grams . . . . . . . . .
4,0014,500 grams . . . . . . . . .
4,501-5,000 grams . . . . . . . . .
5,001 grams or mora . . . . . . . .
single live births
All birth weights . . . . . . .
1,000 grams orless . . . . . . . . .
1,001 -l,500grams . . . . . . . . .
l,501-2,000grams . . . . . . . . .
2,001-2,500 grams . . . . . . . . .
2,501-3,000 grams . . . . . . . . .
3,001-3,500 grams . . , , . . , . .
3,5014,000 grams . . . . . . . . .
4,001-4,500 grams . . . . , , . . .
4,501-5,000 grams , , . , . , , . ,
5,001 grams or more . . . . . . . .
Plural live births
All birth weights . . . . . . .
l,OOOgramsorless . . . . . . . . .
1,001 -l,500grams . , . . . . . . .
1,501 -2,000 grams . . . . . . . . .
2,001-2,500 grams . . . . . . . . .
2,501-3,000 grams . . . . . . . . .
3,001 -3,500 grams . . . . . . . . .
3AO14,000grams . . . . . . . . .
4,001 +OOgrams . , . . . . . . .
4,501-5,000 grams . . . . . . . . .
5,001 grams or more . . . . . . . .
46
BothMale Female
BothMale Famale
Bothsexes
Malesexes
Femalesexes
Number of live births
4,257~50 2,179,708 2,078,142 3,600,744 ,848,792 1,762,652 657,108 331$16 325,580
24323
27,756
61,905
217,436
787,037
1,616,543
1,139,043
317,813
58,522
7,472
4,171,166
20,054
22937
49,758
191,971
761,527
1,604,541
1,136,833
317,589
58,492
7,464
86,664
12,657
14,494
30S18
98,170
343,962
7903305
843,405
201,083
39,597
5,217
2,136,114
11,666
13,262
31,587
119,266
443,075
825,736
495,638
116,730
18)825
2,255
2,035,052
17,493
20,040
45,676
163,131
621,069
1,372,850
1,014,876
287,680
51,507
6,403
1,531,362
9.194
10,712
22,695
74,157
269,568
866,769
672,684
182,602
35,279
4,534
,813,202
8,288
9,328
22s81
88,874
351,503
706,081
442,211
105,076
16,228
1,869
1,716,160
6,82Q
7,716
16,2231
54,305
165,948
243,693
124,188
30,133
7,015
1,069
639,BU4
3,463
3,782
7,623
24,013
74276
124,036
70,741
16,481
4/318
663
322S12
3,367
3,834
8,606
30,292
91,572
119,657
53,427
11,662
2,697
386
316~92
10,505
12,037
24,734
86,282
330318
783,893
642,038
200919
39,575
5,213
43,594
9,549
10$300
25,024
105,689
430,608
14,345
16,488
36,426
142S56
600,065
1,362,723
1,012,995
287,488
51,481
6,395
69,382
7,569
8,882
16,449
64,740
258,888
860s12
571,491
182,460
35,261
4,530
34s0
6,756
7,606
17977
78,216
341,177
7ol~ll
441,504
105,028
16,220
1,665
34,392
5,708
6,449
13;332
49,0t 5
161,462
241,818
123,838
30,101
7,011
1,069
17,302
, 2916
3,155
6265
21,542
72,030
122/881
70,547
18j459
4314
683
2,793
3,284
7,047
27,473
88,432
118,837
53,291
11,642
2,697
366
8,698
820,848
484,795
116,670
18,917
2,251
43,080 8,604
4,269
4,819
12,147
25,465
25,510
12,002
2#21o
224
30
8
2,152
2.457
5,564
11,888
13,044
6j812
1j367
184
22
4
2,117
2,362
6,563
13,577
12,466
5,080
843
60
8
4
3,148
3,662
9,250
20,175
21,024
10,127
1$60
192
26
B
1$06
1,830
4Z46
9,477
10,698
5,857
1,173
142
18
4
1,543
1,722
5,004
10.758
10,326
4,270
707
50
8
4
1,121
1,267
2,887
5,280
4,485
1,875
330
32
4
547
627
1,338
2,471
236
1,055
194
22
4
574
840
1,568
2,819
2,140
820
136
10
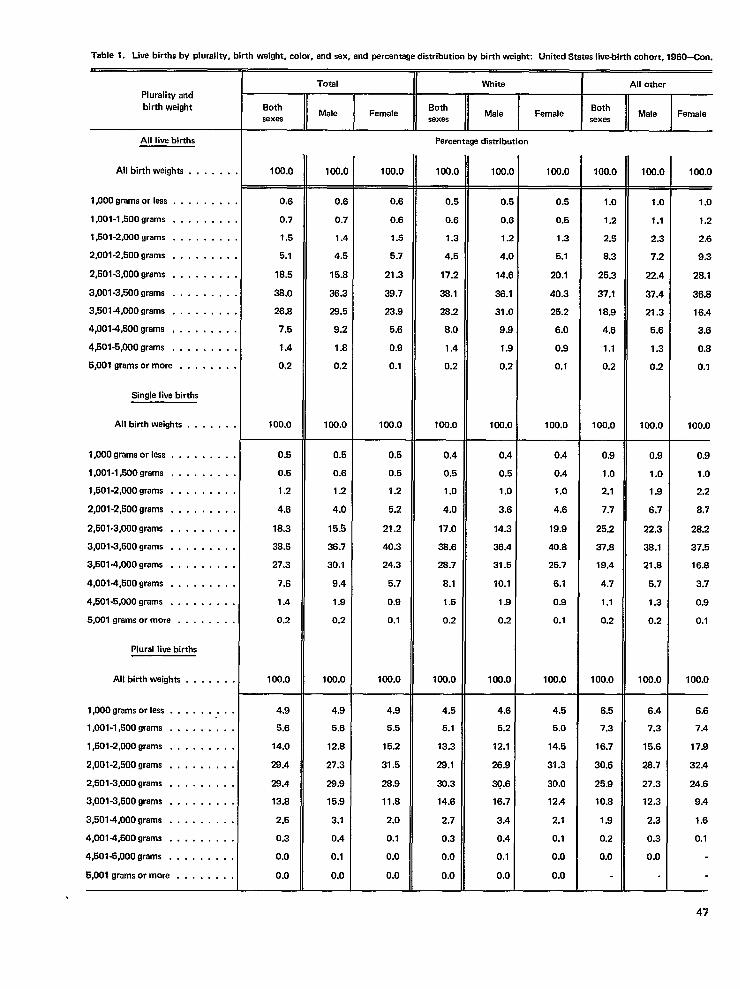
Table 1. Live births by pluraliw, birth weight, color, and sex, and percentage distribution by birth weight: United States Iive.bitih cohort, 1960-Con.
Plurality andbirth weight
Total I White I All other
BothMale Female
BothMale Famale
Bothsexas sexas
Male Femalesexes
All live births
All birth weights . .
1,000 grams or less . , . .
1,001-1,500 grams . . . .
1,501-2,000 grams . . . .
2,001-2,500 grama . . . .
2,501-3,000 grams . . . .
3,001-3,500 grams . . . .
3,5014,000 grama . . . .
4,001.4,500 grams , . . .
4,501.5,000 grams . . . .
5,001 grams or more . . .
Single live births
All birth weighta , .
1,000 grams or lass . . . .
1,001-1,500 grams . . . .
1,501-2,000 grams . . . .
2,001.2,500 grams . . . .
2,501-3,000 grams , . . . .
Percentage distribution
100.0 100.( 100.0 100.( 1Oo.c 100.0 100.0 1Oo.c 100.0. . . .
. . . .
. . . .
. . . .
. . . .
. . . .
. . . .
. . . .
. . . .
. . . .
. . . .
. . . .
. . . .
. . . .
1 ...,
,.. .
0.6
0.7
1.5
5,1
18.5
38,0
26.8
7.5
1.4
0.2
100,0
0.5
0.5
1.2
4.6
18.3
38.5
27.3
7.6
1.4
0.2
100.0
0.6
0.7
1.4
4.5
15.s
38.3
28.5
9.2
1.8
0.2
100.0
0.5
0.6
1.2
4.0
15.5
38.7
30.1
9.4
1.9
0.2
100.0
0.6
0.6
1.5
5.7
21.3
38.7
23.9
5.6
0.9
0.1
100.0
0.5
0.5
1.2
5.2
21.2
40.3
24.3
5.7
0.9
0.1
100.0
0.[
O.f
1.:
4.J
77.:
3%.1
282
8.C
1.4
0.2
100.0
0.4
0.5
1.0
4.0
17.0
38.6
28.7
8.1
1.5
0.2
100.0
of
of
1.2
4.0
14.6
38.1
31.0
9.8
1.9
0.2
100.0
0.5
0.5
1.3
5.1
20.1
40.3
25.2
6.0
0.9
0.1
100.0
1.0
1.2
2.5
8.3
25.3
37.1
18.9
4.6
1.1
0.2
100.0
1.0
1.1
2.3
7.2
22.4
37.4
21.3
5.5
1.3
0.2
100.0
1.0
1.2
2.6
9.3
28.1
36.8
16.4
3.6
0.8
0.1
100.0
0.4
0.5
1.0
3.6
14.3
38.4
31.5
10.1
1.9
0.2
100.0
0.4
0.4
1.0
4.8
19.9
40.8
25.7
6.1
0.9
0.1
100.0
0.9
1.0
2.1
7.7
25.2
37.8
19.4
4.7
1.1
0.2
100.0
0.9
1.0
1.9
6.7
22.3
38.1
21.8
5.7
1.3
0.2
100.0
0.9
1.0
2.2
8.7
28.2
37.5
16.8
3.7
0.9
0.1
100.0
,. ..<
3,001-3,500 grams . . . . , . . .
3,501-4,000 grams . . . . . . . . ,
4,0014,500 grams . . . . . . . .
4,601-5,000 grams . . . . . . . .
6,001 grams or more . . . . . . . .
Plural live births
All birth weighta . . , . . . .
1,000 grams orless . . . . . . . . .
l,001-l,500grama . . . . , . . . .
l,501-2,000grams . . . . . . . . .
2,001-2,500 grams . . . , , . . . .
2,501-3,000 grams . . . . . . . . .
3,001-3,500 grams . . . . . . . . .
3,501.4,000 grams . . . . . . . . .
4,001-4,500 grams . . . . . . . . .
4,501-5,000 grams . . . . . . . . .
5,001 grams or mora . . . . . . . .
4.9
5.6
14.0
28.4
28.4
13.8
2.5
0.3
0.0
0.0
4.9
5.6
12.8
27.3
28.9
15.9
3.1
0.4
0.1
0.0
4.9
5.5
15.2
31.6
28.9
11.6
2.0
0.1
0.0
0.0
4.5
5.1
13.3
28.1
30.3
14.6
2.7
0.3
0.0
0.0
4.6
5.2
12.1
26.9
30.6
16.7
3.4
0.4
0.1
0.0
4.5
5.0
14.5
31.3
30.0
12.4
2.1
0.1
0.0
0.0
6.5
7.3
16.7
30.6
25.9
10.8
1.9
0.2
0.0
6.4
7.3
15.6
26.7
27.3
12.3
2.3
0.3
0.0
6.6
7.4
17.9
32.4
24.6
9.4
1.6
0.1
47
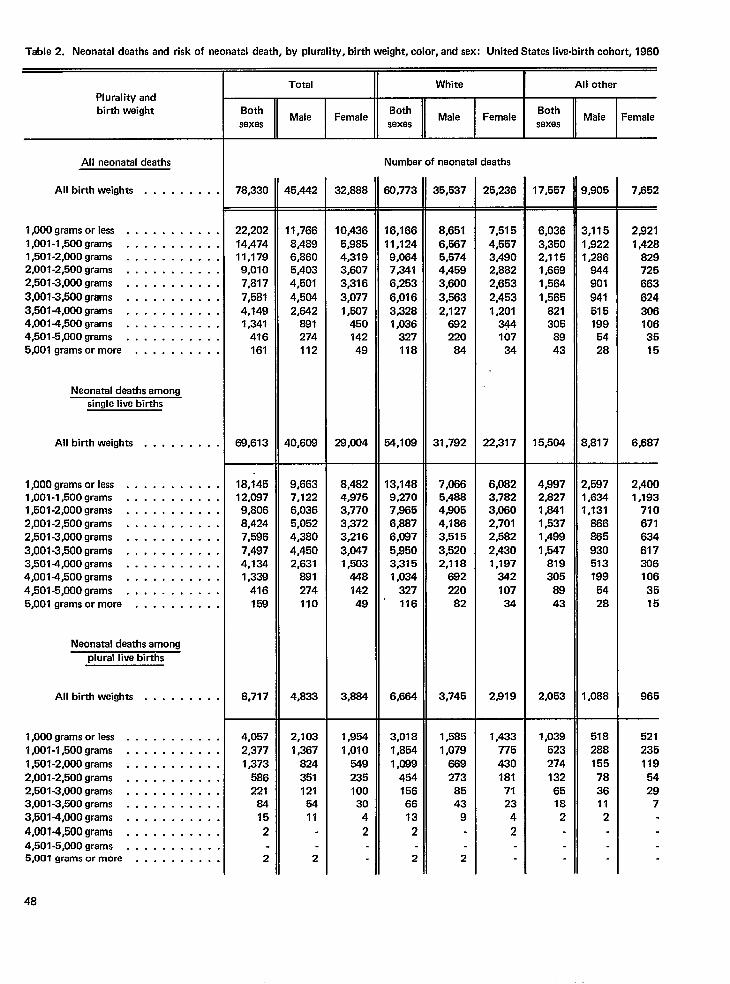
Table 2. Neonatal deaths and risk of neonatal death, by plurality, birth weight, color, and sex: United States live-birth cohort, 1960
Plurality andbirth weight
All neonatal deaths
All birth weights . . . . . . . . .
1,000 grams orless . . . . . . . . . . .l,001-l,500grams . . . . . . . . . . .l,501-2,000grams . . . . . . . . . . .2,001-2,500 grams . . . . . . . . . . .2,501-3,000 grams . . . . . . . . . . .
3,001 -3,500 grams . . . . . . , . . . ,3,501 -4,000 grams . . . . . . . . . . .4,001 -4,500 grams . . . . . . . . . . .4,501-5,000 grams . . . . . . . . . . .5,001 grams ormore . . . . . . . . . .
Neonatal deaths amongsingle live births
All birth weights . . . . . . . . .
1,000 grams orless . . . . . . . . . . .1,001 -l,500grams . . . . . . . . . . .l,501-2,000grams . . . . . . . . . . .2,001 -2,500 grams . . . . . . . . . . .2,501-3,000 grams . . . . . . . . . . .
3,001-3,500 grams . . . . . . . . . . .3,5014,000 grams . . . . . . . . . . .4,0014,500 grams . . . . . . . . . . .4,501 -5,000 grams . . . . . . . . . . .5,001 grams ormora . . . . . . . . . .
Neonatal deaths amongplural live births
All birth weights . . . . . . . . .
1,000 grams orless . . . . . . . . . . .1,001 -l,500grams . . . . . . . . . . .l,501-2,000grams . . . . . . . . . . ,2,001-2,500 grams . . . . . . . . . . ,2,501-3,000 grams . . . . . . . . . . .3,001-3,500 grams . . . . . . . . . . ,3,5014,000 grams . . . . . . . . . . ,
4,0014,500 grams , , . . . . . . . . ,4,501 -5,000 grams . . . . . . . . . .5,001 grams ormore . . . . . . . . . .
Total White I All other
BothMale Female
BothMale Female
Bothsexes sexes
Male Femalesexes
Number of neonatal deaths
78,330
22,20214,47411,1799,0107,817
7,5814,1491,341
416161
69,613
18,14512,0879,8068,4247,5967,4974,1341,339
416158
8,717
4,0572,3771,373
586221
8415
2
2
45,442
11,7668,4896,8605,4034,501
4,5042,842
891274112
40,609
9,6637,1226,0365,0524,380
4,4502,631
881274110
4,833
2,1031,367
824
351121
5411
2
32,888
10,4365,9854,3793,6073,316
3,0771,507
45014249
29,004
8,4824,9753,7703,3723,216
3,0471,503
44814249
3,884
1,9541,010
54923510030
4
2
60,773
16,16611,1249,0847,341
6,253
6,0163,3281,036
327118
54,109
13,1489,2707,9656,8876,0875,9503,3151,034
327116
6,684
3,0181,8541,089
4541566613
2
2
35,537
8,6516,5675,5744,4593,600
3,5632,127
682220
84
31,792
7,0665,4884,9054,1863,5153,5202,118
692220
82
3,745
1,5851,079
889273
8543
9
2
25,236
7,5154,5573.4902,8822,663
2,4531,201
34410734
22,317
6,0823,7823,0602,7012,5822,4301,197
34210734
2,919
1,433775430181
7123
4
2
17,557
6,0363,3502,1151,6691,564
1,565821305
8943
15,504
43972,8271,8411,5371,4991,547
819305
8943
2,053
1,039523274
1326518
2
3,905
3,1151,9221,286
844901
941515199
5428
3,817
2,5971,6341,131“8868659305131995428
I ,088
518288155
783611
2
7,652
29211,428
829725663
6243061063515
6,687
2,4001,193
7106716346173061063516
965
5212351195429
7
48
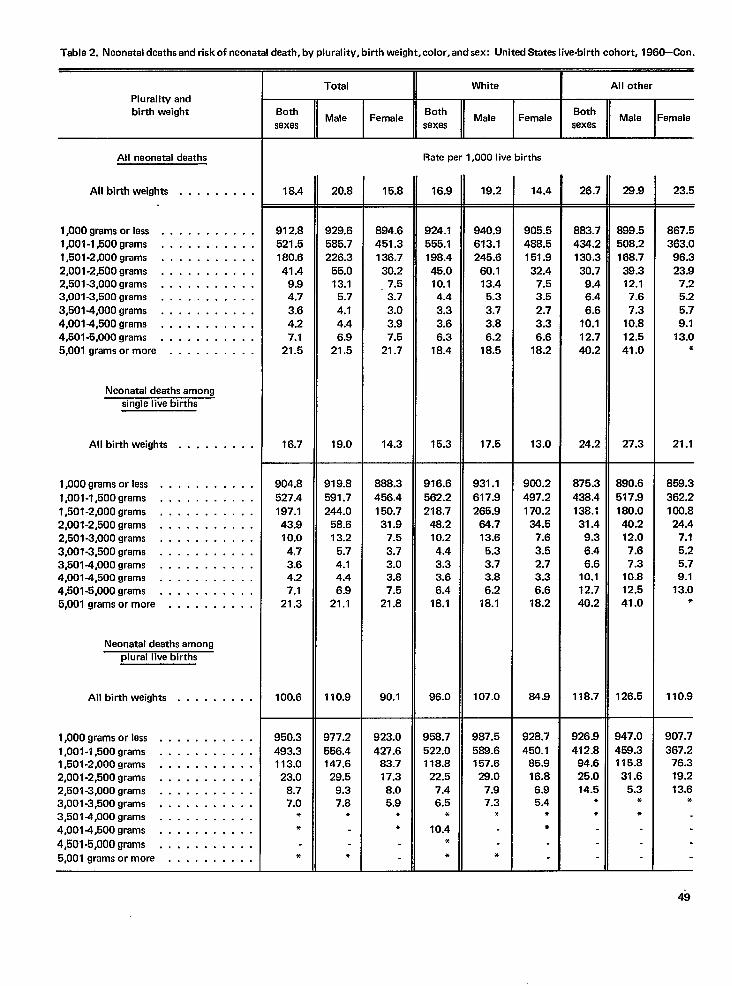
Table 2. Neonatal deaths and risk of neonatal death, by plurality, birth weight, color, and sex: United States live-birth cohort, 1960–Con.
Total II White I All otherPlurality andbirth weight Both
Male FemaleBoth
Male FemeleBoth
sexes sexesMale Female
sexes
Rate per 1,000 live birthsAll neonetal deaths
All birth weights . . . . . . . . . 18.4 20.8 15.8 16.9 19.2 14.4 26.7 28.9 23.5
l,OOOgramsorless . . . . . . . . . . .l,001-l,500grams . . . . . . . , . . .l,501-2,000grams . . . . . . . . . . .2,001-2,500 grams . . . . . . . . . . .2,501 -3,000 grams . . . . . . . . . . .3,001 -3,500 grams . . . . . . . . . . .3,5014,000 grams . . . . . . . . . . .4,001 +l,500grams . . . . . . . . . . .4,501-5,000 grams . . . . . . . . . . .5,001 grams ormore . . . . . . . . . .
912.8521.5180.641.4
9.94.7
3.64.27.1
21.5
16.7
904.8527.4197.143.910.04.73.64.27.1
21.3
100.6
950.3493.3113.023.0
8.77.0
**
*
929.6585.7226.3
55.013.1
5.7
4.14.46.9
21.5
19.0
919.8591.7244.0
58.613.2
5.74.14.46.9
21.1
110.9
894.6451.3136.7
30.27.53.73.03.97.5
21.7
14.3
888.3456.4150.7
31.97.53.73.03.87.5
21.8
90.1
923.0427.6
83.717.38.05.9
**
924.1555.1198.445.010.14.43.33.66.3
18.4
15.3
916.6562.2218.7
48.210.24.43.33.66.4
18.1
96.0
940.9613.1245.6
60.113.4
5.33.73.86.2
18.5
17.5
931.1
617.9265.9
64.713.6
5.33.73.86.2
18.1
107.0
905.5488.5151.9
32.47.53.52.73.36.6
18.2
13.0
900.2497.2170.2
34.57.6
3.52.73.36.6
18.2
64.9
883.7434.2130.3
30.79.46.46.6
10.112.740.2
24.2
899.5508.2168.7
38.312.17.67.3
10.812.541.0
27.3
867.5363.0
96.323.9
7.25.25.79.1
13.0*
21.1
859.3
362.2100.824.4
7.15.25.79.1
13.0*
110.9
Neonatal daaths amongsirmle Iiva births
All birth weights . . . . . . . . .
l,OOOgramsorless . . . . . . . . . . .
1,001 -l,500grams . . . . . . . . . . .l,501-2,000grams . . . . . . . . . . .2,001-2,500 grams . . . . . . . . . . .2,501-3,000 grams . . . . . . . . . . .3,001-3,500 grams . . . . . . . . . . .3,501 -4,000 grams . . . . . . . . . . .4,001 -4,500 grams . . . . . . . . . . .4,501-5,000 grams . . . . . . . . . . .5,001 grams ormore . . . . . . . . . ,
875.3
438.4138.131.4
9.36.46.6
10.112.740.2
118.7
B90.6517.9180.040.212.07.67.3
10.812.541.0
126.5
Neonatal deaths amongplural live births
All birth weights . . . . . . . . .
l,OOOgramsorlass . . . . . . . . . . .1,001 -l,500grams . . . . . . . . . . .l,501-2,000grams . . . . . . . . . . .2,001-2,500 grams . . . . . . . . . . .2,501 -3,000 grams . . . . . . . . . . .3,001 -3,500 grams . . . . . . . . . . .3,5014,000 grams . . . . . . . . . . .4,001 -4,500 grams . . , . . . . . . . .
4,501.5,000grams . . . . . . . . . . .5,001 grams or more . . . . . . . . . .
977.2556.4147.6
29.59.37.8
*
*
958.7522.0118.8
22.57.46.5
●
10.4*
*
987.5588.6157.628.0
7.97.3
*
*
928.7450.1
85.916.86.95.4
●
*
926.9412.8
94.625.014.5
●
●
347.0$59.3115.831.6
5.3●
*
907.7
367.276.319.213.6
*
49
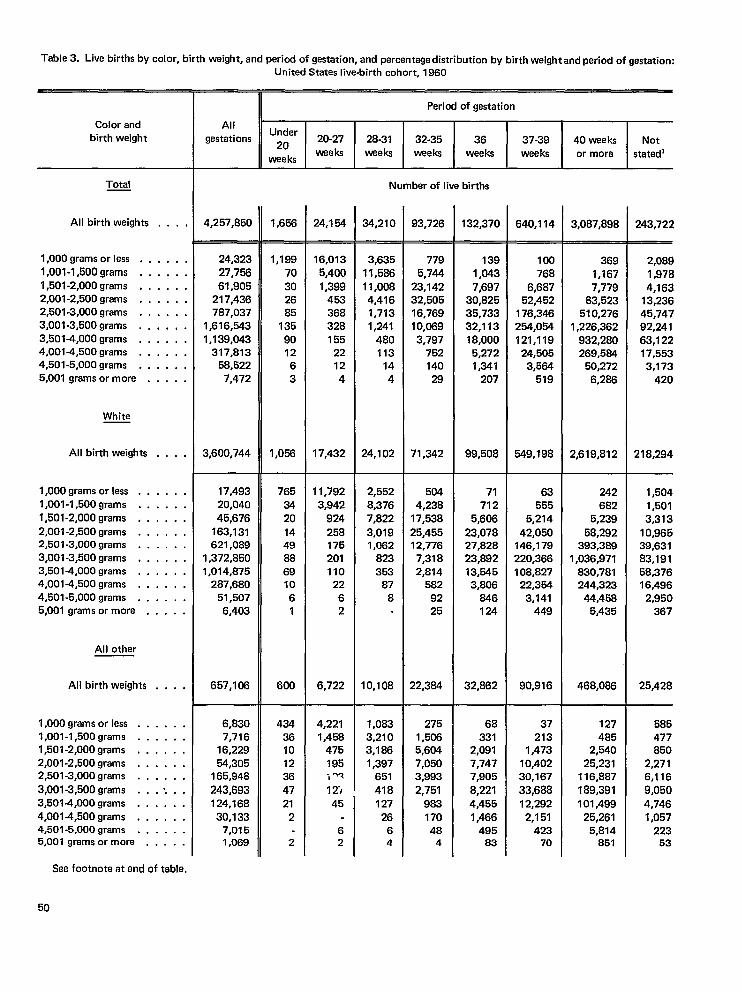
Table 3. Live births by color, birth weight, and period of gestation, and percentage distribution by birth weight and period of gastation:
United Statas live-birth cohort, 1960
Period of gestation
AllUnder
gestations20
20-27 28-31 32-35 36 37-39 40 weeks Notweeks
weeksweeks weeks weeks weeks or more statad’
Color andbirth weight
Number of live birthsTotal
AH birth weights . . . .
1,000 grams or less . . . . . .1,001-1,500 grams . . . . . .1,501-2,000 grams . . , . . .2,001-2,500 grams . . . . . .2,501-3,000 grams . . . . . .
4,257,850 1,656 24.154 34,210 93,726 132,370 640,114 3,087,898 243,722
24,32327,756
61,905217,436787,037
1,616,5431,139,043
317,81358,5227,472
3,600,744
1,18870302685
135
901263
1,058
16,0135,400
1,399453368328155
22124
17,432
3,63511,58611,0084,4161,7131,241
480113
144
24,102
7795,744
23,14232,50516,76910,0693,797
752140
29
71,342
1391,0437,697
30,82535,73332,11318,000
5,2721,341
207
99,508
100768
6,68752,452
176,346254,054121,119
24,5053,584
519
549,198
3691,1677,779
83,523510,276
1,226,362932,280269,5&
50,2726,288
2,619,812
242682
5,239
58,292393,389
1,036,971830,781244,323
44,4585,435
468,088
2,0891,9784,163
13,23645,74792,24163,12217,5533,173
420
218,294
3,001-3,500 grams . ,3,501+000 grams . ,4,001-4,500 grams . .4,501-5,000 grams . .5,001 grams or more .
... .
. . . .
. . . .
. . . .
. . . .
. . . .
. . . .
. . . .,.. .. . . .. . . .... .. . . .. . . .. . . .. . . .
. . . .
. . . .
. . . .
.,. .
. . . .,.. .,’. . .
. . . .
.,, .
. . . .
. . . .
White
AH birth weights
1,000 grams or less . .1,001-1,500 grams . .1,501-2,000 grams . .2,001-2,500 grams . .2,501-3,000 grams . .3,001-3,500 grams . .3,5014,000 grams . .4,001-4,500 grams . .4,501-5,000 grams . .5,001 grams or more .
17,49320,04045,676
163,131621,089
1,372,8501,014,875
287,68051,5076,403
657,108
7653420
144988691061
600
11,7923,942
924258175201110
2262
6,722
2,5528,3767,822
3,0191,062
823353
878
10,108
5044,238
17,538
25,45512,776
7,3182,814
5829225
22,3&1
71712
5,606
23,07827,82823,89213,5453,806
846124
32,862
63555
5,214
42,050146,179220,366108,827
22,3543,141
449
90,916
1,5041,5013,313
10,96539,63183,19158,37616,496
2,950367
25,428
All other
AH birth weights
1,000 grams or less . .1,001-1,500 grams . .1,501-2,000 grams , .2,001-2,500 grams . .2,501-3,000 grams . ,
3,001-3,500 grams . .3,5014,000 grams . .4,0014,500 grams . .4,501-5,000 grams . .5,001 grams or more .
6,8307,716
16,22954,305
165,948
243,693124,168
30,1337,0151,069
434361012364721
2
2
4,2211,458
475195>W
12)
1,0833,2103,1861,397
651418
2751,5065,6047,0503,993
2,75198317048
4
68331
2,0917,7477,905
8,2214,4551,466
49583
37213
1,47310,40230,16733,68812,292
2,151423
70
127485
2,54025,231
116,887189,391101 #499
25,2615,814
851
585477850
2,2716,1169,0504,7461,057
22353
45 12726
6 62 4
See footnote at end of table.
50
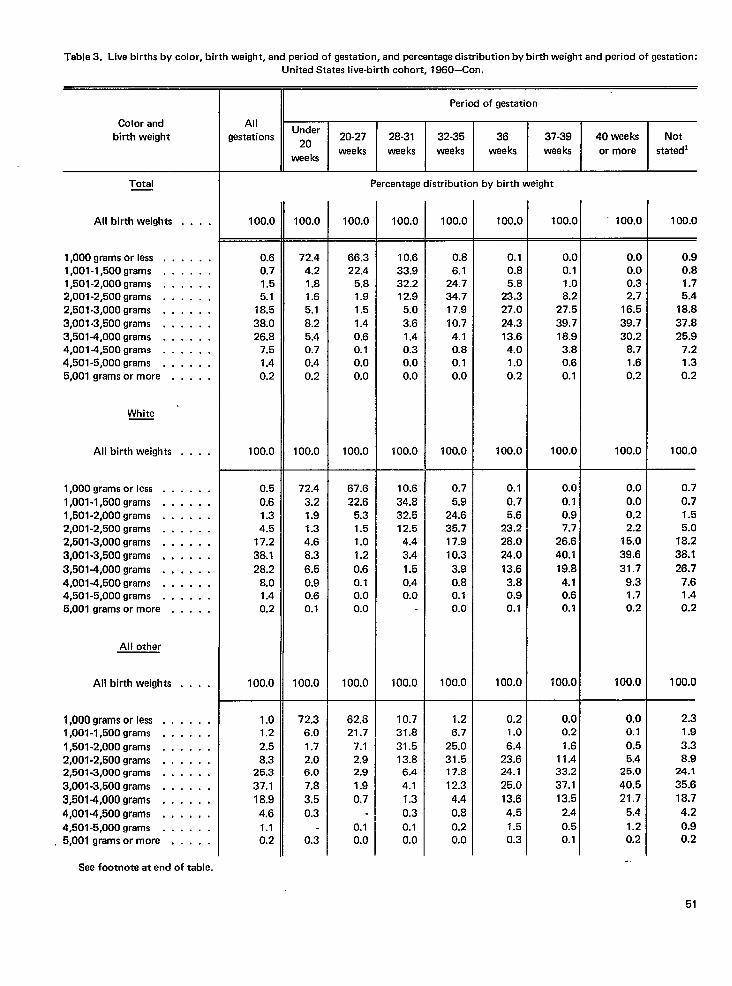
Table 3. Live births by color, birth weight, and period of gestation, and percentage distribution by birth weight and period of gestation:United States live-birth cohort, 1860-Con.
Color andbirth weight
Period of gestation
AllUnder
gestations *O 20-27 28-31 32-35 36 37-39 40 weeks Notweeks weeks weeks weeks weeks or more statedl
weeks
Percentage distribution by birth weightTotal
All birth weights 100.0 100.0 100.0 100.0 100.0 100.0 100.0 100.0 100.0. . . .
. . . .
. . . .
. . . .,.. .. . . .. . . .. . . .. . . .. . . .. . . .
. . . .
. . . .,., ,. . . .. . . .. . . .,.. !
,,. .
. . . .
. . . .
. . . .
. . . .
.,. .
. . . .
. . . .
. . . .
. . . .
. . . .
.,. ,
,,, .
. . . .
.,. .
— —
1,000 grams or less . .1,001-1,500 grams . .1,501-2,000 grams . .2,001-2,500 grams . .2,501-3,000 grams . .3,001-3,500 grams . .3,501-4,000 grams . .4,0014,500 grams . .4,501-5,000 grams . .5,001 grams or more ,
0.60.71.55.1
18.538.026.8
7.51.40.2
100.0
72.44.21.81.65.18.25.40.70.40.2
100.0
66.322.4
5.81.91.51.40.60.10.00.0
100.0
10.633.932.212.9
5.0
3.61.40.30.00.0
100.0
0.86.1
24.734.717.910.74.10.80.10.0
100.0
0.10.85.8
23.327.024.313.64.01.00.2
100.0
0.00.11.08.2
27.5
39.718.93.80.60.1
100.0
0.00.00.32.7
16.5
39.730.2
8.71.60.2
100.0
0.90.81.75.4
18.837.825.9
7.21.30.2
100.0
White
All birth weights
1,000 grams or less . .1,001-1,500 grams . .1,501-2,000 grams . .2,001-2,500 grams . .2,501-3,000 grams . .3,001-3,500 grams , ,
3,501-4,000 grams . ,4,001-4,500 grams . .4,501-5,000 grams , .5,001 grams or more .
0.5
0.61.34.5
17.238.128.2
8.01.40.2
100.0
1.01.22.58.3
25.3
37.118.9
4.61.10.2
72.4
3.21.91.34.68.3
6.50.90.60.1
100.0
67.622.6
5.31.51.01.2
0.60.10.00.0
100.0
10.634.832.512.54.43.41.50.40.0
100.0
0.75.9
24.635.717.910.3
3.90.80.10.0
100.0
0.10.75.6
23.228.024.0
13.63.80.90.1
100.0
0.00.10.97.7
26.640.1
19.84.10.60.1
100.0
0.00.00.22.2
15.0
39.631.7
9.31.70.2
100.0
0.7
0.71.55.0
18.238.126.7
7.61.40.2
100.0
All other
All birth weights
1,000 grams or less . .1,001-1,500 grams . .
1,501-2,000 grams . .2,001-2,500 grams . .2,501-3,000 grams . .
3,001-3,500 grams . .3,501-4,000 grams . .
4,001-4,500 grams . .4,501-5,000 grams . .5,001 grams or more .
72.36.01.72.06.07.8
3.50.3
0.3
62.321.7
7.12.92.9
1.90.7
0.10.0
10.731.8
31.513.86.44.11.3
0.30.10.0
1.26.7
25.031.517.812.3
4.40.80.20.0
0.21.0
6.423.624.125.013.6
4.51.50.3
0,00.2
1.611.433.237.113.5
2.4
0.50.1
0.00.10.55.4
25.0
40.521.7
5.4
1.20.2
-.
2.31.9
3.38.9
24.135.618.7
4.2
0.90.2
See footnote at end of table.
51
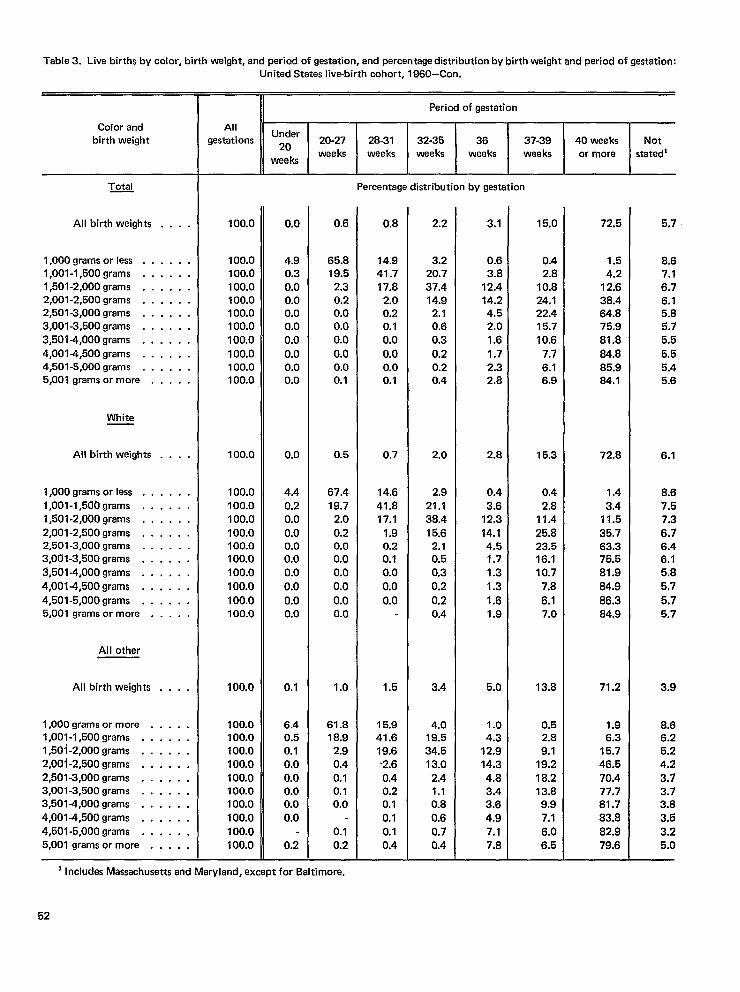
Table 3. Live births by color, birth weight, and pariod of gestation, and percentage distribution by birth weight and period of gestation:
Color andbirth weight
All birth weights
1,000 grams or less . .1,001-1,500 grams . .1,501-2,000 grams . .2,001-2,500 grams . .2,501-3,000 grams . .3,001-3,500 grams . .
3,501-4,000 grams . .4,0014,500 grams . .4,501-5,000 grams . .5,001 grams or more .
White
All birth weights
1,000 grams or less . .1,001-1 ,50&Jgrams . .1,501-2,000 grams . .2,001-2,500 grams . .2,501-3,000 grams . .3,001-3,500 grams . .2!,501-4,000 grams . .
4,0014,500 grams . .
4,501-5,000 grams . .5,001 grams or more .
All other
All birth weights
1,000 grams or more .1,001-1,500 grams . .1,501-2,000 grams . .2,001-2,500 grams . .2,501-3,000 grams . .3,001-3,500 grams . .3,501-4,000 grams . .
4,001-4,500 grams . .4,501-5,000 grams . .5,001 grams or more .
. . . .
. . . .
. . . .
. . . .
. . . .
. . . .
. . . .
. . . .
. . . .
. . . .
. . . .
. . . .
. . . .
. . . .
. . . .
. . . .
. . . .
. . . .
. . . .
. . . .
. . . .
. . . .
. . . .
. . . .
. . . .
. . . .
. . . .
. . . .
. . . .
. . . .
. . . .,.. .... .
United States live-birth cohort, 1960–Con.
Period of gastation
AllUnder
gestations Z. 20-27 28-31 32-35 36 37-39 40 weeks Notweeks weeks weeks weeks weeks or more
wee ksstatedi
Percentage distribution by gestation
100.0
100.0100.0100.0100.0100.0100.0100.0100.0100.0100.0
100.0
100.0100.0100.0100.0100.0100.0100.0100.0100.0100.0
100.0
100.0100.0100.0100.0100.0100.0100.0100.0100.0100.0
0.0
4.90.30.00.00.00.00.0
0.00.00.0
0.0
4.40.20.0
0.00.00.00.0
0.0
0.00.0
0.1
6.40.50.10.00.00.00.0
0.0
0.2
0.6
65.819.5
2.30.20.00.00.0
0.00.00.1
0.5
67.419.7
2.0
0.20.00.00.00.0
0.00.0
1.0
61.818.9
2.90.40.10.10.0
0.10.2
0.8
14.941.717.8
2.00.20.10.0
0.00.00.1
0.7
14.641.817.1
1.90.20.10.0
0.0
0.0
1.5
15.941.619.6b2.60.40.20.10.10.10.4
2.2
3.220.737.414.92,10.60.3
0.20.20.4
2.0
2.921.138.415.6
2.10.50.30.2
0.20.4
3.4
4.019.534.513.0
2.41.10.80.60.70.4
3.1
0.63.8
12.414.24.52.01.6
1.72.32.8
2.8
0.43.6
12.3
14.14.51.71.31.3
1.61.9
5.0
1.04.3
12.914.34.83.43.64.97.17.8
15.0
0.42.8
10.824.122.415.710.6
7.76.16.9
15.3
0.42.8
11.425.823.516.110.7
7.8
6.17.0
13.8
0.52.89.1
19.2
16.213.89.97.1
6.06.5
72,5
1.54.2
12.638.464.875.981.884.885.984.1
72.8
1.43.4
11.5
35.763.375.581.9
84.9
86.384.9
71.2
1.96.3
15.746.570.477.781.783,8
82.979,6
5.7
8.67.16.76.15.85.75.5
5.55.45.6
6.1
8.67.57.3
6.76.46.15.85,7
5.75.7
3.9
8.66.25.24.2
3.73.73.83.53.25,0
] Includes Massachusetts and Maryland, except for Baltimore.
52
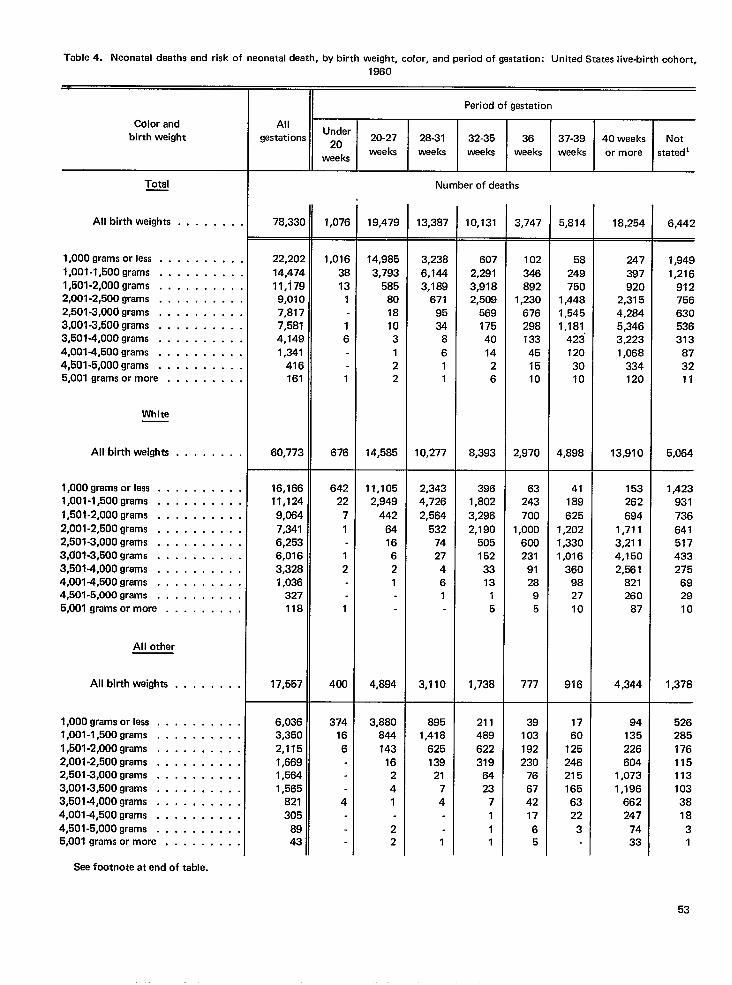
Table 4. Neonatal deaths and risk of neonatal death, by birth weight, color, and period of gestation: United States live-birth cohort,1960
II Period of gestation
AllUnder
gestations ~. 20-27 28-31 32-35 36 37-39 40 weeks Notweeks weeks weeks weeks weeks or more
weeksstated’
Color andbirth weight
Total Number of deaths
All birth weights 78,33( 1,076 19,479 13,387 10,131 3,747 5,814 18,254 6,442. . . . . . .
. . . . . . ,,
. . . . . . .,
. . . . . . .,
. . . . . . .,
. . . . . . . .
. . . . . . .,
. . . . . . .,
. . . . . . . .
. . . . . . . .
. . . . . . . .
. . . . . . . .
. . . . . . . .
. . . . . . . .
. . . . . . . .
. . . . . . . .
.,, . . . . .
. . . . . . . .
. . . . . . . .
. . . . . . . .
. . . . . . . .
. . . . . . . .
1,000 grams or less , ,1,001-1,500 grams . ,1,501-2,000 grams . .2,001-2,500 grams . .2,501-3,000 grams . .3,001-3,500 grams . ,3,501-4,000 grams . .4,001-4,500 grams . .4,501-5,000 grams . .5,001 grams or more .
22,20:
14,47411,17:9,01C7,8177,5814,1491,341
416161
60,773
1,016
3813
1
16
1
676
14,985
3,793585
8018103122
14,585
3,2386,1443,189
6719534
8611
10,277
6072,2913,9182,509
569175401426
8,393
102346892
1,230676298133451510
2,970
58
249750
1,4481,5451,181
4231203010
4,898
247397920
2,3154,2845,3463,2231,068
334120
13,910
1#9491,216
912756630536313
873211
5,064
1,423931736
641517433275
692910
1,378
White
All birth weights
1,000 grams or less . .1,001-1,500 grams . .
1,501-2,000 grams . .2,001-2,600 grams . .2,501-3,000 grams , ,3,f101-3,500 grams . .3,501-4,000 grams . .4,001-4,500 grams . .4,501-5,000 grams . .5,001 grams or more .
16,16611,124
9,0647,3416,2536,0163,3281,036
327118
17,557
64222
7
1
12
1
400
11,1052,949
442
6416621
4,894
2,3434,726
2,564532
7427461
3,110
3961,802
3,2962,190
5051523313
-15
1,738
63243
700
1,000600231
9128
95
777
41189
6251,2021,3301,016
360982710
916
153262
6941,7113,2114,1502,561
821260
87
4,344
All other
All birth weights . . . . . . . .
1,000 gremsorless . . . . . . . . . ,1,001 -l,500grams . . . . . . . . . .1,501 -2,000 grams . . . . . , . . . .2,001-2,500 grams . . , . . . . . . .2,501-3,000 grams . . . . . . . . . .3,001-3,500 grams . . . . . . . . . .3,501-4,000 grams . . . . , . . . . .4,001-4,500 grams . . . . . . . . . .4,501-5,000 grams . . . . . . . . . .5,001 grams or more . . . . . . . . .
Sea footnote at end of table.
6,0363,3502,1151,6691,5641,565
821305
8943
374166
4
3,880844
14316241
22
8951,418
62513921
74
1
211489
622319
6423
7111
39103192230
76674217
65
1760
1252462151656322
3
94135226604
1,0731,196
662247
7433
5262851761151131033818
31
53
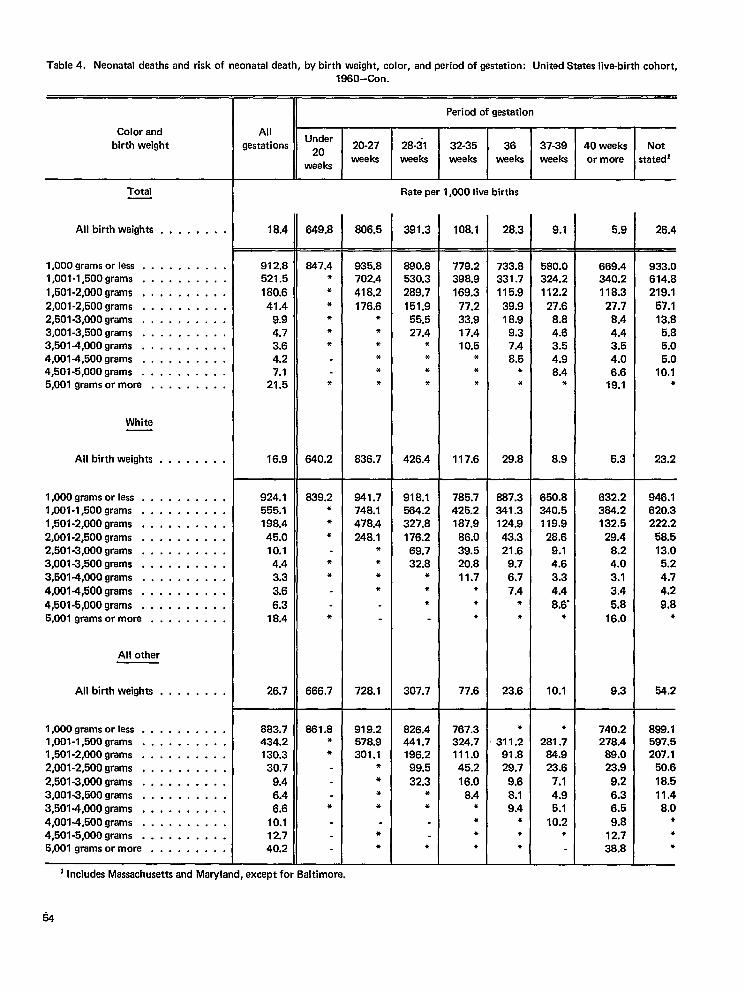
Table 4. Neonatal deaths and risk of neonatal death, by birth weight, color, and period of gestation: United States live-birth cohort,1960–Con.
11
Period of gestation
AllUnder
gestations ~. 20-27 28-31 32-35 36 37-39 40 weeks Notweeks
weeksweeks weeks weeks weeks or more statedi
Color andbirth weight
Total Rate per 1,000 live births
All birth weights . . . . . . . . 18.4 649.8
—
847.4**
****
*
640.2
806.5
—
935.8702.4
418.2176,6
******
636.7
391.3
—
680.8530,3289.7
151.956.527.4
***●
426.4
108.1 28.3 9.1 6.9 26.4
— —
l,OOOgramsor less . . . . . . . . . .l,001-l,500grams , . . . . . . . . .
l,501-2,000grams . . . . . . . . . .2,001-2,500 grams . . . . . . . . . .2,501-3,000 grams . . . . . . . . . .3,001-3,500 grams . . . . . . . . . .3,501 -4,000 grams . , . . . . . . . .4,0014,500 grams . . . . . . . . . .4,501-5,000 grams . . . . . . . . . .5,001 grams or more . . . . . . . . .
912.8521.5
180.6
41.49.94.73.64.27.1
21.5
16.9
779.2398.9169.3
77.233.917.410.5
**●
117.6
733.833i .7115.9
39.918.9
9.37.48.5
**
29.8
580.0324.2112.2
27.68.84.63.64.98.4
*
8.9
669.4340.2118.3
27.78.44.43.54.06.6
19.1
5.3
933.0614.8219.1
67.113.8
6,85.05.0
10.1●
23,2
White
All birth weights . . . . . . . .
1,000 grams orless . . . . . . . . . .1,001-1,500 grams . . . . . . . . . .1,501-2,000 grams . . , . . . . . . .2,001-2,500 grams . . . . . . . . . .2,501-3,000 grams . . . . . . . . . .3,001-3,500 grams , . . . . . . . . .3,5014,000 grams . . . . . . . . . .
4,0014,500 grams . . . . . . . . . .
4,501-5,000 grams . . . . . . . . . .5,001 grams or more . . . . . . . . .
924.1555.1198.445.010.14.43.33.6
6.318.4
26.7
639.2***
**
*
666.7
841.7748.1478.4248.1
*●
**
728.1
918.1564.2327.8176.269.732.8
**
●
307.7
785.7425.2187.9
86.039.520.811.7
●
**
77.6
887.3341.3124.943.321.6
9.76.77.4
●
*
23.6
650.8340.5119.9
28.69.14.63.34.4
8.6’*
10.1
632.2364.2132.5
29.48.24.03.13.4
5.816.0
9.3
946.1620.3222.2
58.513.05.24.74.2
9.8*
54.2
All other
All birth weights . , . . . . . .
1,000 grams orless . . . . . . . . . .1,001-1,500 grams . . . . . . . . . .l,501-2,000grams . . . . . . . . . .2,001-2,500 grams . . . . . . . . . .
2,501-3,000 grams . . . . . . . . . .3,001-3,500 grams . . . . . . . . . .3,5014,000 grams . . . . . . . . . .4,0014,500 grams . . . . . . . . . .4,501-5,000 grams . . . . . . . . . .5,001 grams or more . . . . . . . . .
883.7434.2130.330.7
9.46.46.6
10.112.740.2
861.8*●
*
919.2678.9301.1
●
***
●
●
826.4441.7196.299.5
32.3**
●
767.3324.7111.045.216.0
8.4●
●
●
*
●
311.291.829.7
9.68.19.4
*●
*
●
281.784.923.6
7.14.95.1
10.2●
740.2278.4
89.023.9
9.26.36.5
9.812.738.8
888.1597.5207.1
50.6
18.511.48.0
●
●
●
1 Includes Massachusettsand Maryland, except for 8altimore.
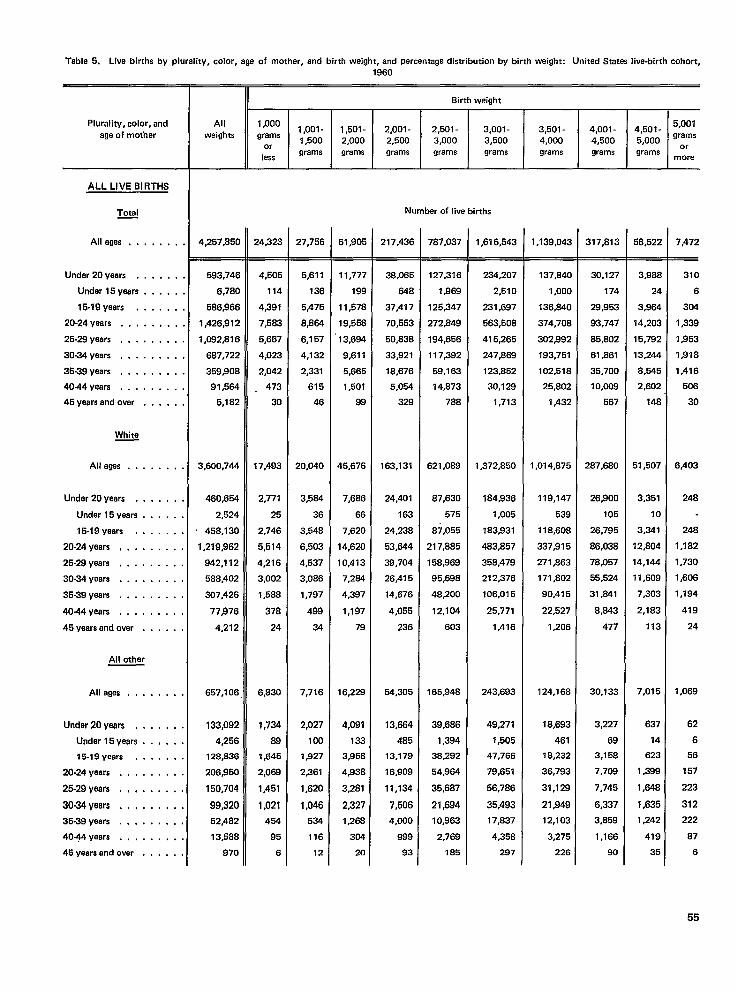
Table 5. Live births by plurality, color, age of mother, and birth weight, and percentage distribution by birth weight: United States live-birth cohort,
Plurality, color, andage of mother
ALL LIVE BIRTHS
Total—
Alleges . . . . . . .
Under 20 years . . . . . .
Under 15 years . . . . .
15.19 years . . . . . .
20-24 yaars . , . . . , . .
25-29 years . . . . . . . .
30-34 yeers . . . . . . . .
36-39 years . . . . . . . .
4044years . . . . . . . .
46 years and over . . . . .
White
All agas . . .
Under 20 years . ,
Under 15 years .
15-19 years . .
20-24 yeers , , . .
25-29 years . . . .
30-34 years . . . .
35-39 yeers . . . .
4044 years . . . .
45 years and over .
All other
All ages . . .
Under 20 years , ,
Undar 15 years .
15-19 years . .
20-24 years . . . .
25.29 yaars . . , .
30.34 yaars . , , ,
35-39 years . . . .
40+4 years . . . .
45 yeers and over .
. . . .
. . . .
. . . .
. . . .
. . . .
. . . .
. . . .
. . . .
... .
. . . .
. . . .
. . . .
.,. .
. . . .
. . . .
. . . .
. . . .
. . . .
. . . .
. . . .
1960
Birth weiqht
All 1,0001,001- 1,501- 2,001- 2,501- 3,001- 3,501-
5,001weights
4,001 -grams
4,501-1,500 2,000 2,500 3,000 3,500 4,000 4,500
gramsor
5,000 or
lessgrams grams grams grams grams grams grams grams
more
Number of Iiva births
4,257,850
593,746
6,780
586S66
1,426,912
1,082,816
687,722
359,908
91,564
5,182
3,600,744
460,654
2,524
458,130
1,219~62
942,112
588,402
307,426
77$)76
4,212
657,106
133,092
4,256
128,836
206,950
150,704
99,320
52,482
13,588
970
24,323
4,505
114
4391
7,583
5,687
4,023
2,042
. 473
30
17,493
2,777
25
2,746
5,514
4,216
3,002
1,588
378
24
6,830
1,734
88
1,645
2,069
1,451
1,021
454
95
6
27,756
5,811
136
5,475
8,864
6,157
4,132
2,331
615
46
20,040
3,584
36
3,548
6,503
4,537
3,086
1,797
499
34
7,716
2,027
100
1,927
2,361
1,620
1,046
534
116
12
61,905
11,777
199
11,578
19,558
13,694
9,611
5,665
1,501
99
$5,676
7,686
66
7,620
14,620
10,413
7,264
4,397
1,197
79
16,229
4,091
133
3,956
4,938
3,281
2,327
1,266
304
20
217,43C
38,065
648
37,417
70,553
50,838
33,921
18,676
5,054
328
163,131
24,401
163
24,238
53,644
39,704
26,415
14,676
4,055
236
54,305
13,664
485
13,179
16,909
11,134
7,506
4,000
889
93
787,037
127,316
1,969
125,347
272,849
194,656
117,392
59,163
14,873
788
621,089
87,630
575
B7,055
217,885
158,969
95,698
48,200
12,104
603
165,948
39,686
1,394
3B,292
54,964
35,687
21,694
10,963
2,769
185
1,616,543
234,207
2,510
231,697
563,508
415,265
247,859
123,852
30,129
1,713
1,372,850
184,836
1,005
183,931
483,857
358,479
212,376
106,015
25,771
1,416
243,693
49,271
1,505
47,766
79,651
56,786
35,493
17,637
4,358
297
1,139,043
137,B40
1,000
136,840
374,708
302,992
193,751
102,518
25,802
1,432
1,014,875
119,147
539
118,606
337,915
271,863
171,802
90,415
22,527
1,206
124,166
18,693
461
18,232
36,793
31,128
21,949
12,103
3,275
226
317,813
30,127
174
28,953
93,747
65,802
61 ,B61
35,700
10,009
567
287,680
26,900
105
26,795
86,038
78,057
55,524
31,641
8,843
477
30,133
3,227
69
3,158
7,706
7,745
6,337
3,859
1,166
90
5B,522
3,98&
24
3,964
14,203
15,792
13,244
8,545
2,602
148
51,507
3,351
10
3,341
12,804
14,144
11,609
7,303
2,183
113
7,015
637
14
623
1,399
1,648
1,635
1,242
419
35
,472
310
6
304
,339
,853
$318
,416
506
30
.403
248
248
,182
,730
,606
,194
419
24
,069
62
6
56
157
223
312
222
87
6
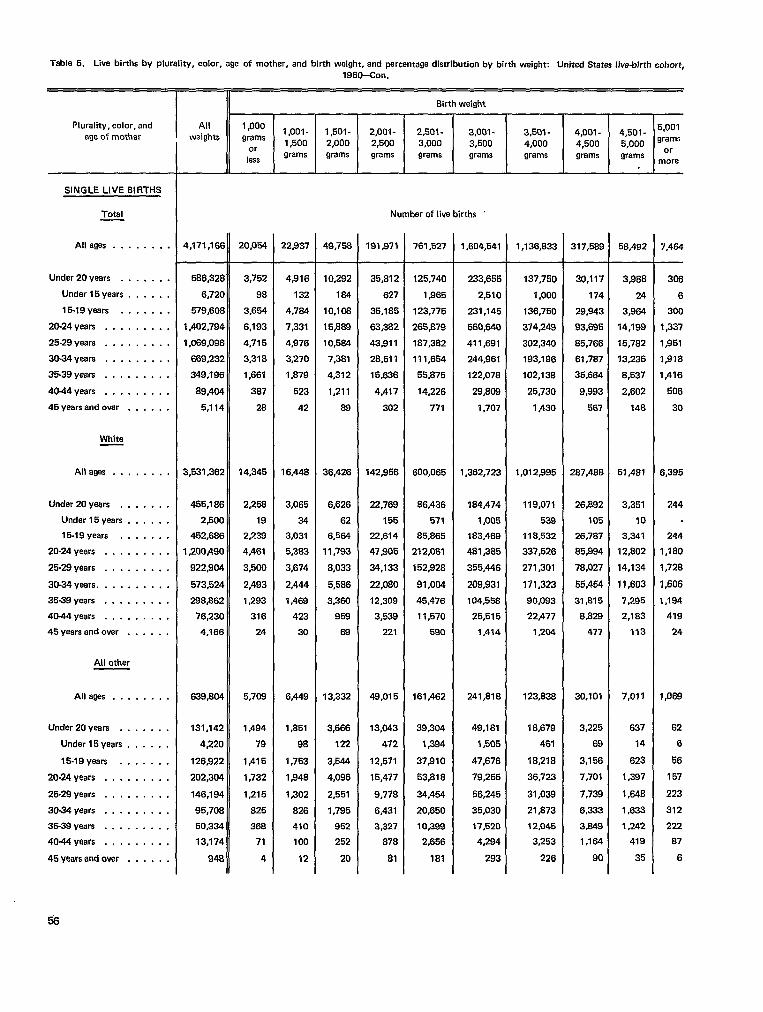
Table 5. Live births by plurality, color, age of mother, and birth weight, and percentage distribution by birth weight: United States Jive-birth cohort.
Plurality, color, andage of mother
—
SINGLE LIVE BIRTHS
Total
All ages . . . . . . . .
Under 20 years . . . , . . .
Under 15years . . . . . .
15-19 years . . . , . . .
20-24 years . . . . . . . . .
25-29 years do.......
30-34 years .,.......
35-39 years . . . . . . . . .
40-44 years . . . . . . . . .
45yaarsandovar . . . . . .
White
Alleges . . . . . . . .
Under 20 years . . . . . . .
Under 15years . . . . . ,
15-19 years . . . . . . .
20-24 years . . . . . . . . .
25-29 years , , . . . . . . .
30-34 years . . . . . . . . . .
35-39 years . . . . . . . . .
4044years . . . . . . . . .
45 years and over . . . . . .
All other
Alleges . . . . . . . .
Under 20 years . . . . . . .
Under 15years . . . . . .
15-19 yeers . . . . . . .
20-24 years . . . . . . . . .
25-29 years . . . . . . . .,
30-34 years . . . . . . . . .
35-39 years . . . . . . . . .
4044yaars . . . . . . . . .
45 years and over . . . . , .
1960-Con.
Allweights
4,171,166
586,328
6,720
579,608
1,402,794
1,089,098
589,232
349,196
89,404
5,114
3,531,362
4!35,186
2,500
452,666
1,200,490
922904
573,524
288@62
76,230
4,166
639,604
131,142
4,220
126,922
202,304
146,194
95,708
50,334
13,174
948
1,000grams
orless
20,054
3,752
98
3,654
6,193
4,715
3,318
1,661
387
28
14,345
2,286
19
2,239
4,461
3,500
2,493
1,293
316
24
5,709
1,494
79
1,415
1,732
1,215
825
368
71
4
6irth weight
i I I I I I I1,001- 1,501- 2,001- 2,501- 3,001- 3,501- 4,001- 4,501-1,500 2,000 2,500 3,000 3,500 4,000 4,500 5,000grams grams grams grams grams grams grams grams
I t I I I I I
Number of live births ‘
22,937
4,916
132
4,764
7,331
4,976
3,270
1,879
523
42
16,448
3,065
34
3,031
5,383
3,674
2,444
1,469
423
30
6,449
1,851
98
1,753
1,948
1,302
826
410
100
12
49,758
10,292
184
10,106
15#rM9
10,564
7,381
4,312
1,211
89
36,426
6,626
62
6,554
11,793
8,033
5,586
3,350
959
59
13,332
3,666
122
3,544
4,096
2,651
1,795
952
252
20
191971
35,812
627
35,185
63,382
43,811
28,511
15,636
4,417
302
142,956
22,769
155
22,614
47.905
34,133
22,080
12,309
3,539
221
49,015
13,043
472
12,571
15,477
9,778
6,431
3,327
878
81
761,527
125,740
1,965
123,775
265,879
187,382
111,654
55,675
14,226
771
500,065
86,436
571
85,865
212,061
152,928
91,004
45,476
11,570
590
161,462
39,304
1,394
37,910
53,818
34,454
20,650
10,398
2,656
181
1,604,541
233,655
2,510
231,145
560,640
411,691
244,961
122,078
29,8C9
1,707
1,362,723
184,474
1,005
183,469
481,385
355,446
209,931
104,558
25,515
1,414
241,816
49,181
1,505
47,676
79,255
56,245
35,030
17,520
4,294
293
1,136,833
137,750
1,000
136,750
374,249
302,340
193,196
102,138
25,730
1,430
1,012,995
119,071
539
118,532
337,526
271,301
171,323
90,093
22,477
1,204
123,836
18,679
461
18,218
36,723
31,039
21,873
12,045
3,253
226
317,589
30,117
174
26,943
93,695
85,766
61,787
35,664
9,993
567
287,466
26,892
105
26,7S7
85,994
78,027
55,454
31,815
8,82?r
477
30,101
3,225
69
3,156
7<701
7,739
6,333
3,s49
1,164
90
58,492
3,986
24
3,964
14,199
15,782
13,236
8,537
2,602
148
51,481
3,351
10
3,341
12,802
14,134
11,603
7,295
2,183
113
7*OJ1
537
14
623
1,397
1,648
1,633
1,242
419
35
5.001grams
ormore
7,464
306
6
300
1,337
1,951
1,918
1,416
506
30
6,395
244
244
1,180
1,728
1,606
I ,194
419
24
1,069
62
6
56
157
223
312
222
87
6
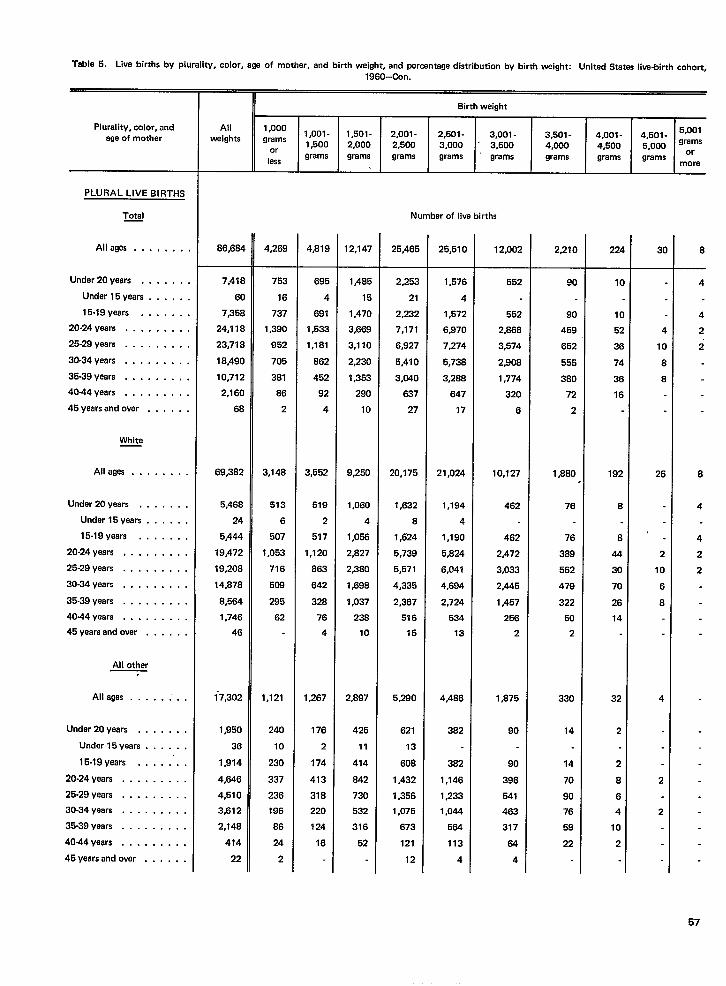
Table 5. Live births by plurality, color, age of mother, and birth weight, and percentage distribution by birth weight: United States live-birth cohort.
Plurality, color, andage of mother
PLURAL LIVE BIRTHS
Total—
Alleges ...,...
Under 20 years . . . . . .
Under 15 years . . . . .
15-19 years . . . . . .
20-24 years . . . . . . . .
25-29 years . . . . . . . .
30.34 yeara . . . . . . . .
35-39 years, . . . . . . . .
40-44 years . . . . . . . . .
45 years and ovar . . . . .
White
Alleges .,......
Undar 20 years . . . . . . .
Under 15years . . . . . .
15-19 years . . . . . . .
20-24 years ,. . . . . . . .
25-29 years . . . . . . . . .
30-34 years . . . . . . . . .
35.39 years . . . . . . . . .
40.44 veals . . . . . . . . .
45 years and over . . . . . .
All other.
Alleges . . . ...”..
Under 20 yaars . . . . . . .
Under 15years . . . . . .
15-19 years . . . . .’. .
20-24 years . . . . . . . . .
25-29 years , . . . . . . . .
30-34 years . . . . . . . . .
35-39 years . . . . . . . . .
4044yaars, . . . . . . . .
45 yaers and over . . . . . .
1960-Con.
Birth weight
All 1,0001,oo1- 1,501- 2,001- 2,501- 4,501- :::weights grams 3,001- 3,501- 4,001-1,500
or2,000 2,500 3,000 3,500 4,000 4,500 5,000
lessgrams grama grams grams grams grams grams grams ‘r
more
Number of live births
86,684
7,418
60
7,358
24,118
23,718
18,490
10,712
2,160
68
69,382
5,46S
24
5,444
19,472
19,208
14,s78
8,564
1,746
46
~7,302
1,950
36
1,914
4,646
4,510
3,612
2,14S
474
22
4,269
753
16
737
1,390
952
705
381
S6
2
3,148
513
6
507
1,053
716
509
295
62
1,121
240
10
230
337
236
196
86
24
2
4,81S
695
4
691
1,533
1,1s1
862
452
92
4
3,552
519
2
517
1,120
863
642
328
76
4
1,267
176
2
174
413
318
220
124
16
12,147
1,485
15
1,470
3,669
3,110
2,230
1,353
290
10
9,250
1,060
4
1,058
2,827
2,3S0
1,598
1,037
23a
10
2,897
425
11
414
842
730
532
316
52
25,46!
2,252
21
2,232
7,171
6,927
5,410
3,(?40
637
27
20,175
1,632
6
1,624
5,739
5,571
4,335
2,387
516
15
5,2??0
621
13
608
1,432
1,356
1,075
673
121
12
25,510
1,576
4
1,572
6,970
7,274
5,738
3,2S8
647
17
21,024
1,194
4
1,190
5,824
6,041
4,694
2,724
534
13
4,4B6
382
382
1,146
1,233
1,044
564
113
4
12,002
552
552
2,S66
3,574
2,908
1,774
320
6
10,127
462
462
2,472
3,033
2,445
1,457
256
2
1,875
90
90
396
541
463
317
64
4
2,21C
90
90
459
652
555
380
72
2
1,860
76
76
389
562
479
322
50
2
330
74
14
70
90
76
58
22
Zzt
1(
1(
5:
3t
74
3E
16
192
6
8
44
30
70
26
14
32
2
2
8
6
4
10
2
3(
4
la
8
8
26
2
10
6
8
4
2
2
6
4
4
2
2
6
4
4
2
2
57
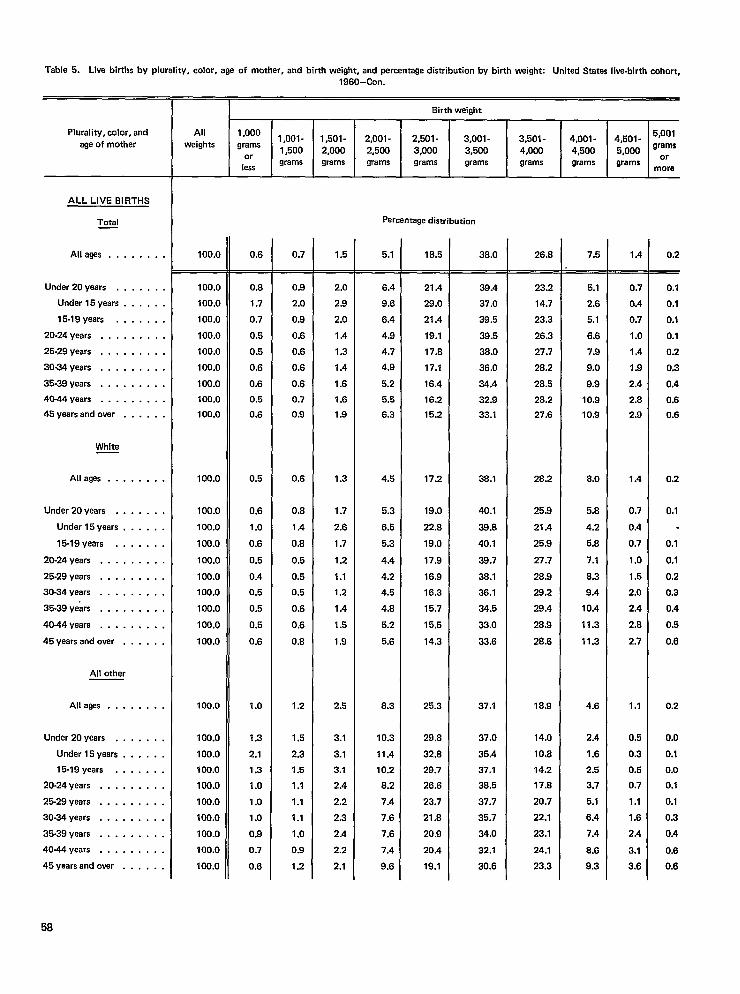
Table 5. Live births by plurality, color, age of mother, and birth weight, and percentage distribution by birth weight: United States live-birth cohort,
Plurality, color, andage of mother
ALL LIVE BIRTHS
Total—
Alleges ..,.....
Under 20 years . . . . . . .
Under 15years . . . . . .
15-19 years . . . . . . .
20-24 years . . . . . . . . .
25-29 years . . . . . . . . .
30-34 years . . . . . . . . .
35-39 years . . . . . . . . .
4044years . . . . . . . . .
45 years and over . . . . . .
White
Allays . . . . . . . .
Under 20 years . . . . . . .
Under 15years . . . . . .
15-19 years . . . , . . .
20-24 years . . . . . . . . .
25-29 years . . . . . . . .,
30-34 years . . . . . . . . .
35-39 ye&s . . . . . . . . .
40-44 years . . . . . . . . .
45 years and over . . . . . .
All other
Allays . . . . . . . .
Under 20 years . . . . . . .
Under 15years . . . . . .
15-19 years . . . . . . .
20-24 years . . . . . . . . .
25-29 years . . . . . . . . .
30-34 years . . . . . . . . .
35-39 years . . . . . . . . .
4044years . . . . . . . . .
45 years and over . . . . . .
1960-Con.
8irth weight
All 1,0001,oo1- 1,501- 2,001- 2,501- 3,001- 3,501-
5,001weights grams
4,001- 4,501-1,500 2,000 2,500 3,000 3,500 4,000
s 000 grams4,500 ,
orless
grams grams grams grams grams grams grams grams M:re
pereantage distributim
100.0
100.0100.0
100.0
100.0
100.0
100.0
100.0
100.0
100.0
100.0
100.0100.0
100.0
100.0
100.0
100.0
100.0
100.0
100.0
100.0
100.0100.0100.0
100.0
100.0
100.0
100.0
100.0
100.0
0.6
0.8
1.7
0.7
0.5
0.5
0.6
0.6
0.5
0.6
0.5
0.6
1.0
0.6
0.5
0.4
0.5
0.5
0.5
0.6
1.0
1.3
2.1
1.3
1.0
1.0
1.0
0.9
0.7
0.6
0.7
0.9
2.0
0.9
0.6
0.6
0.6
0.6
0.7
0.9
0.6
0.8
1.4
0.8
0.5
0.5
0.5
0.6
0.6
0.8
1.2
1.5
2.3
1.5
1,1
1.1
1.1
1.0
0.9
1,2
1.5
2.0
2.9
2.0
1.4
1.3
1.4
1.6
1.6
1.9
1.3
1.7
2.6
1.7
1.2
1.1
1.2
1.4
1.5
1.9
2.5
3.1
3.1
3.1
2.4
2.2
2.3
2.4
2.2
2.1
5.1
6.4
9.6
6.4
4.9
4.7
4.9
5.2
5.6
6.3
4.5
5.3
6.5
5.3
4.4
4.2
4.5
4.B
5.2
5.6
8.3
10.3
11.4
10.2
6.2
7.4
7.6
7.6
7.4
9.6
18.5
21.4
29.0
21.4
19.1
17.8
17.1
16.4
16.2
15.2
17.2
19.0
22.8
19,0
17.9
16.9
16.3
15.7
15.5
14.3
25.3
29.8
32.8
29.7
26.6
23.7
21.8
20.9
20.4
19.1
38.0
39.4
37.0
39.5
39.5
38.0
36.0
34.4
32.9
33.1
38.1
40.1
39.B
40.1
39.7
38.1
36.1
34.5
33.0
33.6
37.1
37.0
35.4
37.1
38.5
37.7
35.7
34.0
32.1
30.6
26.8
23.2
14.7
23.3
26.3
27.7
28.2
28.5
28.2
27.6
26.2
25.9
21.4
25.9
27.7
28.9
29.2
29.4
26.9
2B.6
18.9
14.0
10,8
14.2
17.8
20.7
22.1
23.1
24.1
23.3
7.5
5.1
2.6
5.1
6.6
7.9
9.0
9.9
10.9
10.9
8.o
5.8
4.2
6.B
7.1
8.3
9.4
10.4
11.3
11.3
4.6
2.4
1.6
2.5
3.7
5.1
6.4
7.4
6.6
9.3
1.4
0.7
0.4
0.7
1.0
1.4
1.9
2.4
2.8
2.9
1.4
0,7
0.4
0.7
1.0
1.5
2.0
2.4
2.8
2.7
1.1
0.5
0.3
0.5
0.7
1.1
1.6
2.4
3.1
3.6
0.2
0.1
0,1
0,1
0.1
0.2
0,3
0.4
0.6
0.6
0.2
0.1
0.1
0.1
0.2
0.3
0.4
0.5
0.6
0.2
0.0
0.1
0.0
0.1
0.1
0.3
0.4
0.6
0.6
58
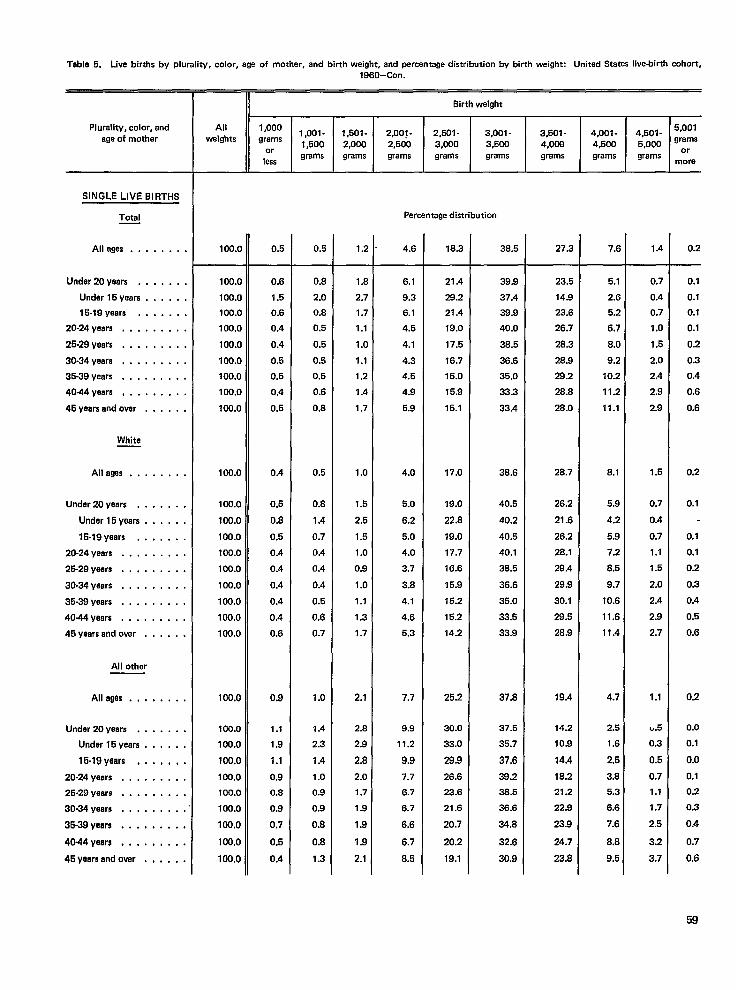
Table 5. Live births by plurality, color, age of mother, and birth weight, and percentage distribution by birth weight: United States live-birth cohort,
Plurality, color, andage of mother
SINGLE LIVE BIRTHS
Total
Alleges . . . . . . . .
Under 20 years . . . . . . .
Under 15years . . . . . .
15-19 years . . . . . . .
20-24 years . , , . . . . . .
26-29 yeara . . . , . . . . .
30-34 yeara . . . . . . . . .
35.39 yeara . . . . . . . . .
40-44 years . . . . . . . . .
45 yaars and over . . . . . .
Whita
Allagea . . . . . . . .
Undar 20 yeara . . . . . . .
Under 15yeara . , , . . .
15-19 yeara . . . . . . .
20-24 yeera . . . . . . . . .
25-29 yeara . . . . . . . . .
30.34 yeara . . . . . . . . .
36-39 years . . , , . . . . .
4044years . . . . . . . . .
46 yaars and over . . . . . .
All othar
Alleges .,....,.
Under 20 yeers . . . . . . .
Under 15years . . . . . .
15-19 yeers , . . , , , .
20-24 yeara . . ,. . . . . .
26-29 yeers . . . . . . . . .
30-34 yeara . . . . . . . . .
36-39 yeers . . , . . . . . .
40-44 years . . . . . . . . .
45 yeera end over . . . . . .
1960-Con.
II Birth weight
All 1,0001,oo1- 1,501 - 2,001 - 2,501- 3,001- 3,501- 4,501- :::,weights grams
4,001-1,500 2,000 2,500 3,000 3,500
or4,006 4,500 5,000
lessgrams grams grams grama grams grams grams grams ‘r
more
Percentage distributimr
100.0
100.0
100.0
100.0
100.0
100.0
100.0
100.0
100.0
100.0
100.O
100.0
100.0
100.0
100.0
100.0
100.0
100.0
100.0
100.0
100.0
100.0
100.0
100,0
100.0
100.0
100.0
loir.o
100.0
100.0
0.5
0.6
1.5
0.6
0.4
0.4
0.5
0.5
0.4
0.5
0.4
0.5
0.8
0.5
0.4
0.4
0.4
0.4
0.4
0.6
0.9
1.1
1.9
1.1
0.9
0.6
0.9
0.7
0.5
0.4
0.5
0.8
2.0
0.8
0,5
0.5
0.5
0.5
0.6
0.8
0.5
0.8
1.4
0.7
0.4
0.4
0.4
0.5
0.6
0.7
1.0
1.4
2.3
1.4
1.0
0.9
0.9
0.8
0.8
1.3
1.2
1.8
2.7
1.7
1.1
1.0
1.1
1.2
1.4
1.7
1.0
1.5
2.5
1.6
1.0
0.9
1.0
1.1
1.3
1.7
2.1
2.8
2.9
2.8
2.0
1.7
1.9
1.9
1.9
2.1
4.6
6.1
9.3
6.1
4.5
4.1
4.3
4.5
4.9
5.9
4.0
5.0
6.2
5.0
4.0
3.7
3.8
4.1
4.6
5.3
7.7
9.9
11.2
9.9
7.7
6.7
6.7
6.6
6.7
6.5
18.3
21.4
29.2
21.4
19.0
17.5
16.7
16.0
15.9
15.1
17.0
19.0
22.8
19.0
17.7
16.6
15.9
15.2
15.2
14.2
25.2
30.0
33.0
28.9
26.6
23.6
21.6
20.7
20.2
19.1
38.5
39.9
37.4
39.9
40.0
38.5
36.6
35.0
33.3
33.4
38.6
40.5
40.2
40.6
40.1
36.5
36.6
35.0
33.5
33.9
37.8
37.5
35.7
37.6
39.2
38.5
36.6
34.8
32.6
30.9
27.3
23.5
14.9
23.6
26.7
28.3
28.9
29.2
28.8
28.0
28.7
26.2
21.6
26.2
28.1
29.4
29.9
30.1
29.5
28.9
19.4
14.2
10.9
14.4
18.2
21.2
22.9
23.9
24.7
23.8
7.6
6.1
2.6
5.2
6.7
8.0
9.2
10.2
11.2
11.1
8.1
5.9
4.2
5.9
7.2
8.5
9.7
10.6
11.6
11.4
4.7
2.5
1.6
2.6
3.8
5.3
6.6
7.6
8.8
9.5
1.4
0.7
0.4
0,7
1.0
1.5
2.0
2.4
2.8
2.9
1.5
0.7
0.4
0.7
1.1
1.5
2.0
2.4
2.9
2.7
1.1
e.5
0.3
0.5
0.7
1.1
1.7
2.5
3.2
3.7
0.2
0.10.1
0.1
0.1
0.2
0.3
0.4
0.6
0.6
0.2
0,1
0.1
0.1
0.2
0.3
0.4
0.5
0.6
0.2
0.0
0.1
0.0
0.1
0.2
0.3
0.4
0.7
0.6
59
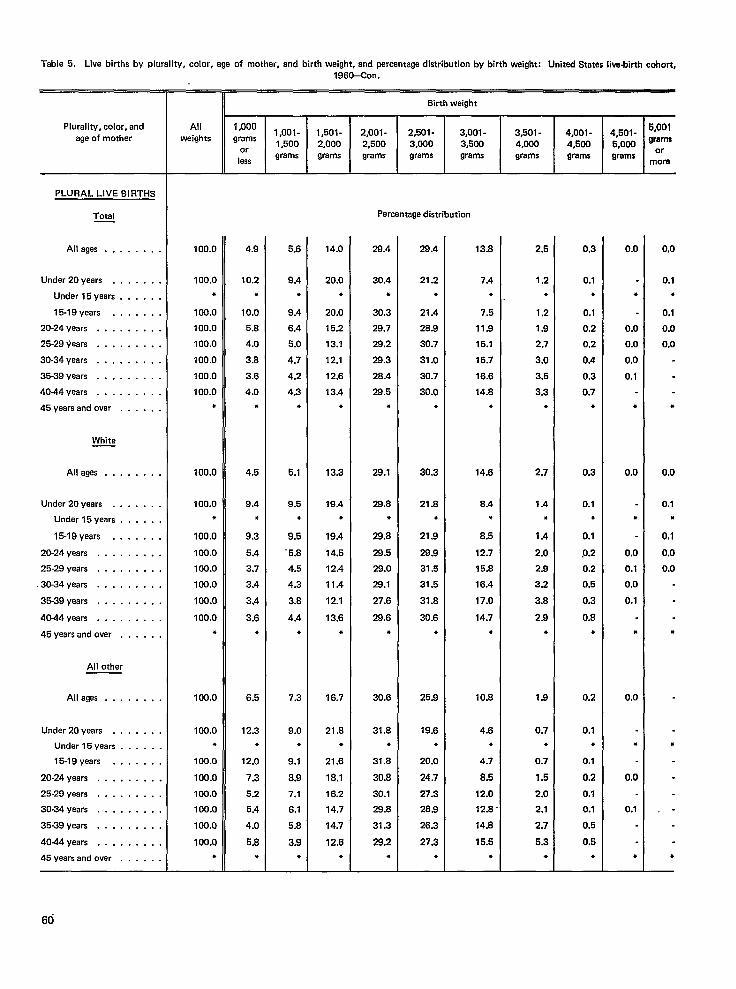
Table 5. Live births by plurality, color, age of mothar, and birth weight, and percentage distribution by birth weight: Unitad States live-birth cohort,
Plurality, color, andage of mother
PLURAL LIVE BIRTHS
Total—
Alleges . . . . . . . .
Under 20years . . . . . . .
Under 15years . . . . . .
15-19 years . . . . . . .
20-24 years . . . . . . . . .
25-29 yeara . . . . . . . . .
30-34 years . . . . . . . . .
35-39 years . . . . . . . . .
4044years . . . . . . . . .
45 yeara and over . . . . . .
White
All ages . . . . . . . .
Under 20 years . . . . . . .
Under 15years . . . . . .
15-19 years . . . . . . .
20-24 yeara . . . . . . . . .
25-29 years . . . . . . . . .
,30-34 years . . . . . . . . .
35-39 years . . . . . . . . .
4044years . . . . . . . . .
45 years and over . . . . . .
All other
Alleges . . . . . . . .
Under 20 yeara . . . . . . .
Under 15years . . . . . .
15-19 yeara . . . . . . .
20-24 years . . . . . . . . .
25-29 years . . . . . . . . .
30-34 yaars . . . . . . . . .
35-39 years . . . . . . . . .
4044years . . . . . . . . .
45 years and over . . . . . .
1960–Con.
Birth weight
All 1,000weights
1#ool- 1,501 -grams 2,001- 2,501- 3,001- 3,501- 4,001- 4501- 5’00’
1,500 2,000 2,500 3,000 3,5W 4,000; OM grams4,500 ,
orless
grams grama grams grama grams grams grams grams ‘rmom
Percentage distribution
100.0
100.0●
100.0
100.0100.0
100.0
100.0100.0
●
100.0
100.0●
100.0
100.0100.0100.0
100.0
100.0●
100.0
100.0*
100.0
100.0100.0
100.0
100.0
100.0!+
4.9
10.2
●
10.0
5.8
4.0
3.8
3.6
4.0
●
4.5
9.4
●
9.3
5.4
3.7
3,4
3.4
3.6
*
6.5
12.3
*
12.0
7.3
5.2
5.4
4.0
5.8
●
5.6
9.4
●
9,4
6.4
5.0
4.7
4.2
4.3
●
5.1
9.5
●
9.6
-5.8
4.5
4.3
3.8
4.4
*
7.3
9.0●
9.1
8.9
7.1
6.1
5.8
3.9
●
14.0
20.0
●
20.0
15.2
13.1
12.1
12.6
13.4
●
13.3
19.4*
19.4
14.5
12.4
11.4
12.1
13.6
●
16.7
21.8*
21.6
18.1
16.2
14.7
14.7
12.6
*
28.4
30.4
●
30.3
29.7
29.2
28.3
26.4
26.5
,
29.1
28.8●
29.8
28.5
29.0
29.1
27.6
28.6
●
30.6
31.8
●
31.8
30.8
30.1
29.8
31.3
29.2
●
28.4
21.2
●
21.4
28.9
30.7
31.0
30.7
30.0
*
30.3
21.6
●
21.9
28.9
31.5
31.5
31.8
30.6
●
25.9
19.6
●
20.0
24.7
27.3
28.8
26.3
27.3
●
13.8
7.4
●
7.5
11.9
15.1
15.7
16.6
14.8
●
14.6
8.4●
6.5
12.7
15.8
16.4
17.0
14.7
●
10.8
4.6
●
4.7
8.6
12.0
12.8 “
14.8
16.5
●
2.5
1.2
●
1.2
1.9
2.7
3.0
3.5
3.3
●
2.7
1.4
●
1.4
2.0
2.9
3.2
3.8
2.9
●
1.9
0.7
●
0.7
1.6
2.0
2.1
2.7
5.3
*
0.3
0.1
●
0.1
0.2
0.2
0.4
0.3
0.7
●
0,3
0.1*
0.1
0.2
0.2
0.5
0.3
0.8
●
0,2
0.1*
0.1
0.2
0.1
0.1
0.5
0.5
●
0.0
●
0.00.0
0.00.1
●
0.0
●
0.0
0.1
0.0
0.1
*
0.0
●
0.0
0.1
●
0,0
0.1
●
0,1
0.0
0.0
.
0.0
0.1●
0.1
0.0
0.0
●
●
,.
●
60
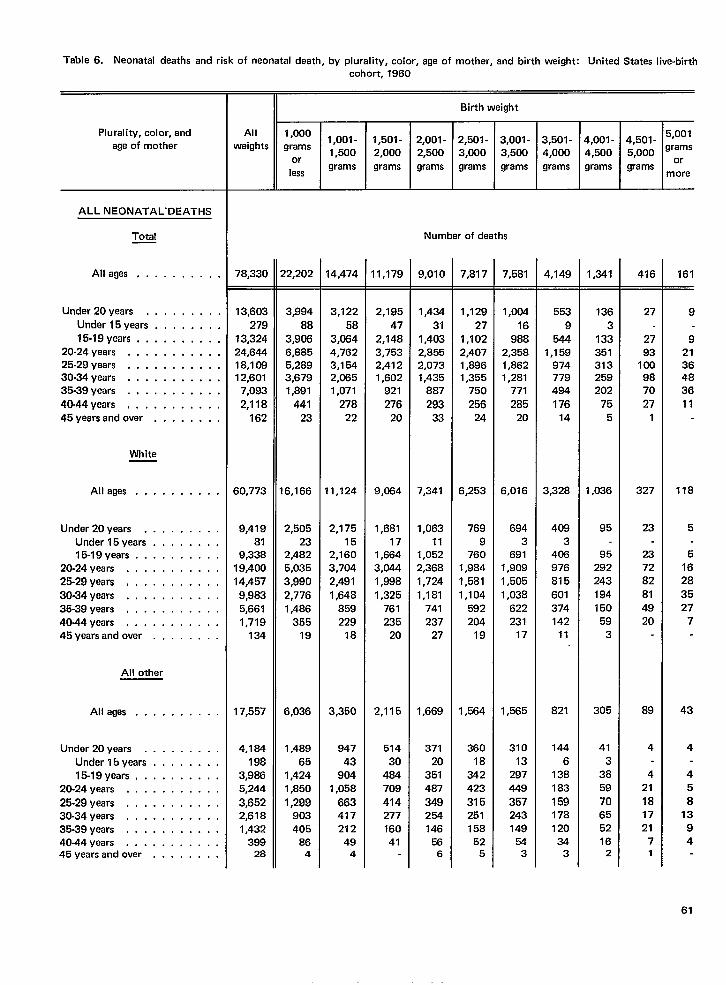
Table 6. Neonatal deaths and risk of neonatal death, by plurality, color, ege of mother, and birth weight: United States live-birth
cohort, 1960
Birth weight
2,501-
3,000gramsT
1,0001,001-
grams1,500
or
lessgrams
2,001-2,500grams
Plurality, color, and
age of mother
Al I
weights4,001 - 4,501 - 5’00’4,500 5,000 ‘ramsgrams grams M:re
1,501-2,000grams
3,001-3,500grams
3,501-4,000grams
ALL NEONATALDEATHS
Total Number of deaths
Alleges . . . . . . . . . . 78,330 qzoz 14,474 11,179 9,010 7,817 7,581 4,149-
553
9544
1,159974779494176
14
3,328
4083
408976815
601374142
11
821
144
6138183
159178120
343
1,341 416 161
Under 20years . . , . . . . . .
Under 15years . . . . . . . .
15-19 years, . . . . . . . . .
20-24 years . . . . . . . . . . .
25-29 years . . . . . . . . . . .
30-34 years . . . . . . . . . . .
35-39 years . . . . . . . . . . .
40-44 years, . . . . . . . . . .
45yearsand over . . . . . . . .
13,603
27913,32424,84418,10812,601
7,093
2,118162
60,773
9,41981
9,33819,40014,457
9,9835,6611,719
134
17,557
4,184198
3,9865,244
3,6522,6181,432
39928
3,99488
3,9066,8855,2893,6791,891
44123
6,166
2,50523
2,4825,0353,9902,7761,486
35519
6,036
1,48965
1,4241,850
1,299903405
864
3,12258
3,0644,7623,1542,0851,071
27822
11,124
2,17515
2,1603,7042,4911,648
859229
18
3,350
94743
9041,058
663417212
494
2,195
47
2,148
3,753
2,412
1,602
921
276
20
9,064
1,68117
1,6643,0441,9981,325
761235
20
2,115
51430
484709
414277160
41
1,434
311,4032,8552,0731,435
887
29333
7,341
1,06311
1,0522,3681,7241,181
741237
27
1,669
37120
351487
349254146
!566
1,129
27
1,102
2,407
1,896
1,355
750
256
24
6,253
769
9
760
1,984
1,581
1,104
592
204
19
1,584
360
18
342
423
315
251
158
525
1,00416
9882,3581,8621,281
771285
20
6,016
6943
6911,9091,5051,038
622231
17
1,565
31013
297449
357243149
543
1363
133351313259202
755
1,036
95
95292243194150
593
305
413
3859
70655216
2
27
2793
1009870
271
327
23
237282814920
89
4
421
181721
71
9
92136483611
118
5
51628
3527
7
43
4
45
813
94
61
White
Alleges . . . . . . . . . .
Under 20years . . . . . . . . .
Under 15years . . . . . . . .
15-19 years . . . . . . . . . .
20-24 years . . . . . . . . . . .
25-29 years, . . . . . . . . . .
30-34 years . . . . . . . . . . .
35-39 years . . . . . . . . . . .
40-44 years . . . . . . . . . . .
45years and over . . . . . . . .
All other
All ages . . . . . . . . . .
Under 20years . . . . . . . . .
Under 15years . . . . . . . .
15-19 years, . . . . . . . . .
20-24 years . . . . . . . . . . .
25.29 years . . . . . . . . . . .
30-34 years . . . . . . . . . . .
35-39 years . . . . . . . . . . .
40-44 years . . . . . . . . . . .45yearsand over . . . . . . . .
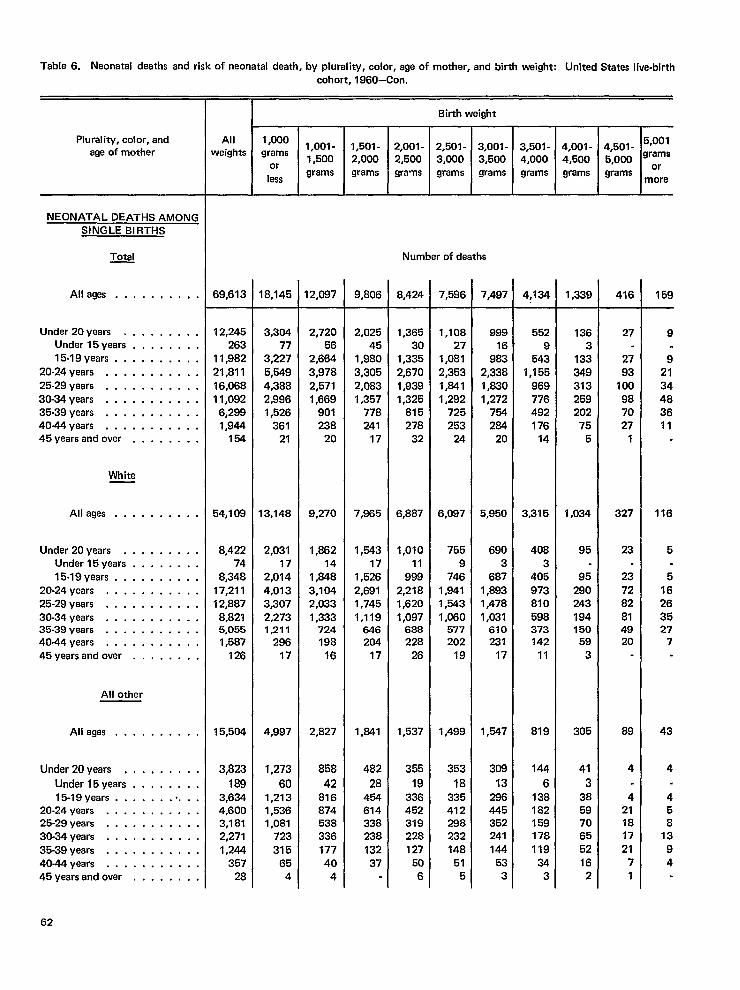
Table 6. Neonatal deaths and risk of neonatal death, by plurality, color, age of mother, and birth weight: United States live-birthcohort, 1960—Con.
mAll 1,0001,001- 1,501-
weights grams1,500 2,000
orless
grams grams
Birth weight
Plurality, color, and
age of mother4,501-5,000grams
5,001grams
ormore
2,001-2,500grams
2,501- 3,001- 3,501- 4,001-3,000 3,500 4,000 4,500grams grams grams grams
I I I
NEONATAL DEATHS AMONGSINGLE BIRTHS
~ Number of daaths
Alleges . . . . . . . . . . 69,613 18,145 12,087 9,806 8,424 7,596 ,497 4,134 1,339 416 159
Under 20years . . . . . . . . .Under 15years . . . . . . . .15-19 years . . . . . . . . . .
20-24 years . . . . . . . . . . .25-29 years . . . . . . . . . . .30-34 years . . . . . . . . . . .35-39 years . . . . . . . . . . .40-44 years . . . . . . . . . . .45yearsand over . . . . . . . .
12,245263
11,98221,811
16,06811,092
6,2991,944
154
54,109
8,42274
8,34817,21112,887
8,8215,0551,587
126
15,504
3,823
1893,6344.6003,1812,271
1#244357
28
3,30477
3,2275,5494,3882,9961,526
36121
13,148
2,03117
2,0144,0133,3072,2731,211
29617
4,997
1,273
601,2131,5361,081
723
31565
4
2,72056
2,6643,9782,5711,669
901238
20
9,270
1,86214
1,8483,1042,0331,333
724198
16
2,827
858
4281687453833617740
4
2,02545
1,9803,3052,0831,357
778241
17
7,965
1,54317
1,5262,6911,7451,119
646204
17
1,841
482
2845461433823813237
1,36530
1,3352,6701,9391,325
815278
32
6,887
1,01011
9992,2181,6201,097
688228
26
1,537
355
19336452319228127
506
1,10827
1,0812,3531,8411,292
725253
24
6,097
7559
7461,8411,6431,060
577202
19
1,499
353
18335412288232148
515
99916
983,338,830,272754264
20
,950
6903
687,893,478,031610231
17
,547
308
13286445352241144
533
5529
5431,155
969776492176
14
3,315
4083
405973810598373142
11
819
144
6138182159178119
343
1363
133349313259202
755
1,034
95
95290243194150
593
305
41
3
385970655216
2
27
2793
100987027
1
327
23
237282814920
89
4
421181721
71
9
92134483611
116
5
516263527
7
43
4
458
1394
White
All ages . . . . . . . . . .
Under 20years . . . . . . . . .Under 15years . . . . . . . .15-19 years . . . . . . . . . .
20-24 years . . . . . . . . . . .25-29 years . . . . . . . . . . .30-34 years . . . . . . . . . . .35-39 years . . . . . . . . . . .4044years . . . . . . . . . . .45yearsand over . . , . . . . .
All other
Alleges . . . . . . . . . .
Under 20yaars . , . . . . . . .
Under 15years . . . . . . . .15-19 years . . . . . . . .. . .
20-24 years . . . . . . . . . . .25-29 years . . . . . . . . . . .30-34 years . . . . . . . . . . .35-39 years . . . . . . . . . . .40-44 years . . . . . . . . . . .45yearsandover . . . . . . . .
62
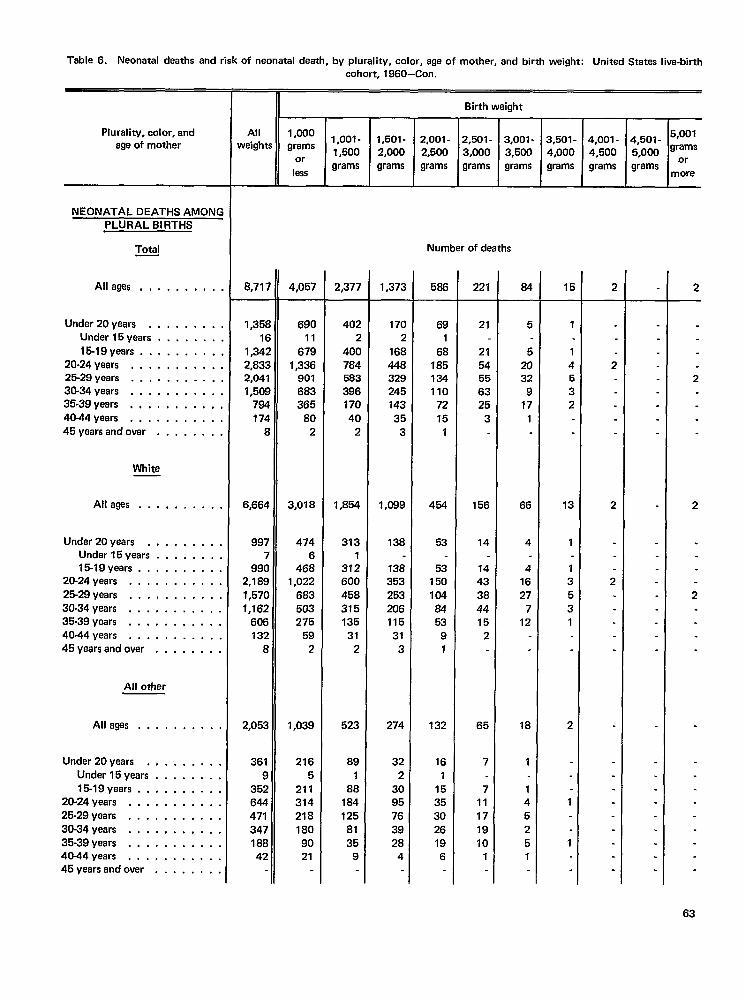
Table 6. Neonatal daaths and risk of naonatal death, by plurality, color, aga of mother, and birth weight: Unitad States live-birth
Plurality, color, andage of mother
NEONATAL DEATHS AMONCPLURAL BIRTHS
Total
All ages .,.....,,
Under 20yaars . , , . , . . .Under 15yaars . . . . . . .
15-19 yaars . . . . . . . . .20-24 years, . .. mm....25-29 years . . . . . . . . . .30-34 years . . . . . . . . . .35.39 years . . . . . . . . . .40-44 years . . . . . . . . . .45yearsandovar . . . . . . .
White
Alleges . . . . . . . . . .
Under 20years , . . . . , . . ,Undar15years . . . . . . . ,15-19 years . . . . . . . . . .
20.24 years . . . . . . . . . . .
25-29 years m. . . . . . . . . .30.34 years . . . . . . . . . . .35-39 years . . . . . . . . . . .40-14 years . . . . . . . . . . .45yaarsandover . . , , . . . .
All other
Alleges . . . . . . . . . .
Under 20years . , . . . . . . .Under 15years . . . . . . . .15-19 years . . . . . . . . . .
20-24 years . . . . . . . . . . .25-29 years . . . . . . . . . . .30-34 years . . . . . . . . . . .35-39 years . . . . . . . . . . .40-44 years . . . . . . . . . . .45yearsand over . . . . . . . .
cohort, 1960—Con.
n
II Birth weight
All 1,000weights
1,oo1-grams II1,501- 2,001- 2,501-
1,500or
2,000 2,500 3,000
lessgrams grams grams grams
3,001-3,500grams
8,71 “
1,35[1(
1,342,832,04”1,50!
7917L
[
6,664
997i
99C2,1 8C1,57C1,161
6rX132
E
2,052
361
935264447134718842
4,057
69011
6791,336
901663365
802
3,018
4746
4681,022
683503275
592
1,039
2165
2113142181809021
2,377
402:
40C78458239C17C4C
2
1,854
3131
372600458315135
312
523
89
188
1841258135
9
1,373
I 7a2
16844a32924514335
3
1,099
138
13835325320611531
3
274
322
3095763928
4
Number of deaths
586
691
68185134110
7215
1
454
53
53150104&53
91
132
161
15353026196
221
21
2154556325
3
156
14
1443384415
2
65
7
711171910
1
64
5
52032
917
1
66
4
41627
712
18
1
145251
3,501-4,000grams
1
14532
13
1
135
31
2
1
1
4,001-4,500grams
2
2
2
2
I4,501- 5’W’~,ooo grams
grams m~re
2
2
2
2
63
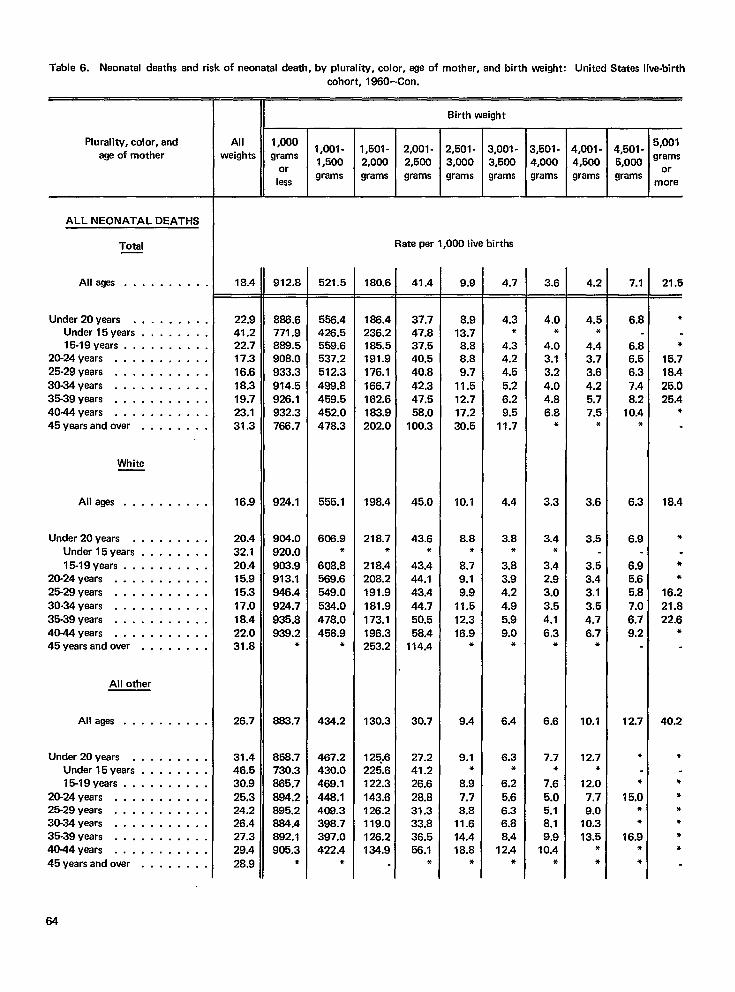
Table 6. Neonatal deaths and risk of neonatal death, by plurality, color, age of mother, and birth weight: United States live-birth
Plurality, color, andage of mother
ALL NEONATAL DEATHS
Total
Allagas . . . . . . . . . .
Under 20years . . . . . . . . .Under 15years . . . . . . . .15-19 years . . . . . . . . . .
20-24 years . . . . . . . . . . .25-29 years . . . . . . . . . . .30-34 years . . . . . . . . . . .35-39 years . . . . . . . . . . .40-44 years . . . . . . . . . . .45yearsandover . . . . , . . .
White
Alleges . . . . . . . . . .
Under 20years . . . . . , . . .Under 15years . . . , . . . .15-19 years . . . . . . . . . .
20-24 years . . . . . . . . . . .25-29 years . . . . . . . . . . .
30-34 years . . . . . . . . . . .35-39 years . . . . . . . . . . .40-44 years . . . . . . . . . . .45yaarsandover . . . . . . . .
All other
Alleges . . . . . . . . . .
Under 20years . . . . . . . . .Under 15years . . . . . . . .15-19 years . . . . . . . . . .
20-24 years, . . . . . . . . . .25-29 years . . . . . . . . . . .30-34 years . . . . . . . . . . .35-39 years . . . . . . . . . . .40-44 years........,..
45yearsandover . . . . . . . .
cohort, 1960–Con.
II Birth weight
18.4
22.9
41.222.717.316.618.319.723.131.3
16.9
20.432.120.415.915.317.018.422.031.8
26.7
31.446.530.925.324.226.427.329.428.9
912.8
886.6771.9889.5908.0933.3914.5926.1932.3766.7
924.1
904.0920.0903.9913.1946.4924.7935.8939.2
*
883.7
856.7730.3865.7
884.2895.2864.4892.1905.3
*
521.5
556.4426.5559.6537.2512.3488.8459.5452.0478.3
555.1
606.9*
608.8569.6549.0534.0478.0458.9
*
434.2
467.2430.0469.1448.1408.3398.7397.0422.4
●
180.6
166.4236.2185.5191.9176.1166.7162.6183.9202.0
198.4
218.7*
218.4208.2191.9181.9173.1196.3253.2
130.3
125.6225.6122.3143.6126.2119.0126.2134.9
3,001-3,500grams
—.
Rate per 1,000 live births
41.4
37.747.837.540.540.842.347.558.0
100.3
45.0
43.6*
43.444.143.444.750.558.4
114.4
30.7
27.241.226.628.831.333.836.556.1
*
9.9
8.913.78.88.89.7
11.512.717.230.5
10.1
8.8*
8.79.19.9
11.512.316.9
*
9.4
9.1*
8.97.78.8
11.614.418.8
*
4.7
4.3*
4.34.24.55.26.29.5
11.7
4.4
3.8*
3.83.94.24.95.99.0
*
6.4
6.3●
6.25.66.36.88.4
12.4●
Ir-3,501- 4,001- 4,501-4,000 4,500 5,000grams grams grams
3.6
4.0*
4.03.13.24.04.86.8
*
3,3
3.4*
3.42.93.03.54.16.3
*
6.6
7.7*
7.6
5.06.18.19.9
10.4*
4.2
4.5*
4.43.73.64.25.77.5
*
3.6
3.5
3.53.43.13.54.76.7
*
10.1
12.7*
12.07.79.0
10.313.5
**
7.1=
6.8
6.86.56.37.48.20.4
*
6.3
6.9
6.95.65.87.06.79.2
2.7
*
●
5.0&●
6.9●
●
5,001grams
ormore
21.5
*
*
15.71B,425.025.4
*
18.4
*
**
16.221.822.6
*
40.2
*
***●
**
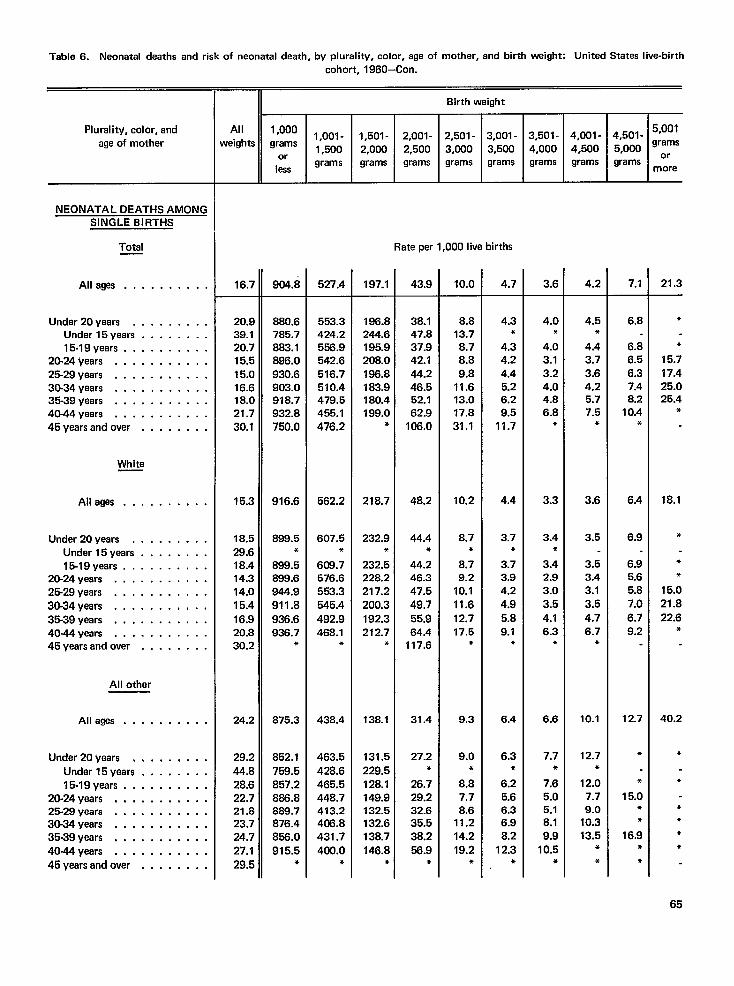
Table 6. Neonatal deaths and risk of neonatal death, by plurality, color, age of mother, and birth weight: United States live-birth
cohort, 1960–Con.
LAll 1,000weights grams
orless
Birth weight
I I iPlurality, color, and
age of mother -L1,001- l,501-1,500 2,000grams grams
2,001-2,500grams
2,501- 3,001-3,000 3,500grams grams grams I grams grams m~re
I I
NEONATAL DEATHS AMONGSINGLE BIRTHS
Total Rate per 1,000 Iive births
904.8
880.6785.7883.1896.0930.6903.0918.7932.8750.0
916.6
899.5*
899.6899.6944.9911.8936.6936.7
*
875.3
852.1
759.5857.2866.8889.7876.4856.0
915.5*
Alleges . . . . . . . . . . 16.7
20.939.120.715.515.016.618.021.730.1
15.3
18.529.618.414.314.015.416.920.830.2
24.2
29.2
44.828.622.721.823.724.727.1
29.5
527.4 197.1 43.9 10.0 4.7 3.6 4.2 7.1 21.3
8.813.78.78.89.8
11.613.017.831.1
10.2
8.7*
8.79.2
10.111.6
12.717.5
*
9.3
9.0*
8.87.78.6
11.214.219.2
●
4.0●
4.5*
4.43.73.64.25.77.5
*
3.6
3.5
3.53.43.13.54.76.7
*
10.1
12.7*
12.07.79.0
10.313.5
*
●
6.8
6.86.56.37.48.2
10.4*
6.4
6.9
6.95.65.87.0
6.79.2
12.7
●
*
15.0*●
16.9*
*
*
●
15.717.425.025.4
*
18.1
*
●
●
15.021.8
22.6●
40.2
●
●
****
65
Undar20years . . . . . . . . .Under 15years . . . . . . . .15-19 years . . . . . . . . . .
20-24 ~ears . . . . . . . . . . .25-29 years . . . . . . . . . . .30-34 years . . . . . . . . . . .35-39 years . . . . . . . . . . .40-44 years . . . . . . . . . . .
45yearsandovar . . . . . . . .
553.3424.2556.9542.6516.7510.4479.5455.1476.2
562.2
607.5*
608.7576.6553.3
545.4
492.9468.1
*
438.4
463.5
428.6465.5448.7413.2405.8431.7400.0
*
186.8244.6195.9208.0186.8183.9180.4199.0
*
218.7
232.9*
232.5228.2217.2200.3
192.3212.7
*
13B.I
131.5229.5128.1149.9132.5132.6138.7146.8
*
38.147.837.942.144.246.652.162.9
106.0
48.2
44.4*
44.246.347.549.755.964.4
117.6
31.4
27.2*
26.729.232.635.538.2
56.9*
4.3*
4.34.24.45.26.29.5
11.7
4.4
3.7*
3.73.94.24.9
5.89.1
*
6.4
6.3*
6.25.66.36.98.2
12.3*
4.03.13.24.04.86.8
*
White
Alleges . . . . . . . . . . 3.3
3.4●
3.42.93.03.5
4.16.3
●
Under 20years . . . . . . . . .Under 15years . . . . . . . .15-19 years . . . . . . . . . .
20-24 years . . . . . . . . . . .25-29 years . . . . . . . . . . .30-34 years . . . . . . . . . . .35-39 years . . . . . . . . . . .40-44 years . . . . . . . . . . .45yaarsandover . . . . . . . .
All other
6.6Alleges . . . . . . . . . .
Under 20~ears . . . . . . . . .
Undar15years . . . . . . . .15-19 years . . . . . . . . . .
20-24 years . . . . . . . . . . .25.29 years . . . . . . . . . . .30-34 years . . . . . . . . . . .35-39 years . . . . . . . . . . .40-44 years . . . . . . . . . . .
46yaarsandover . . . . . . . .
7.7*
7.65.05.18.19.9
10.5+
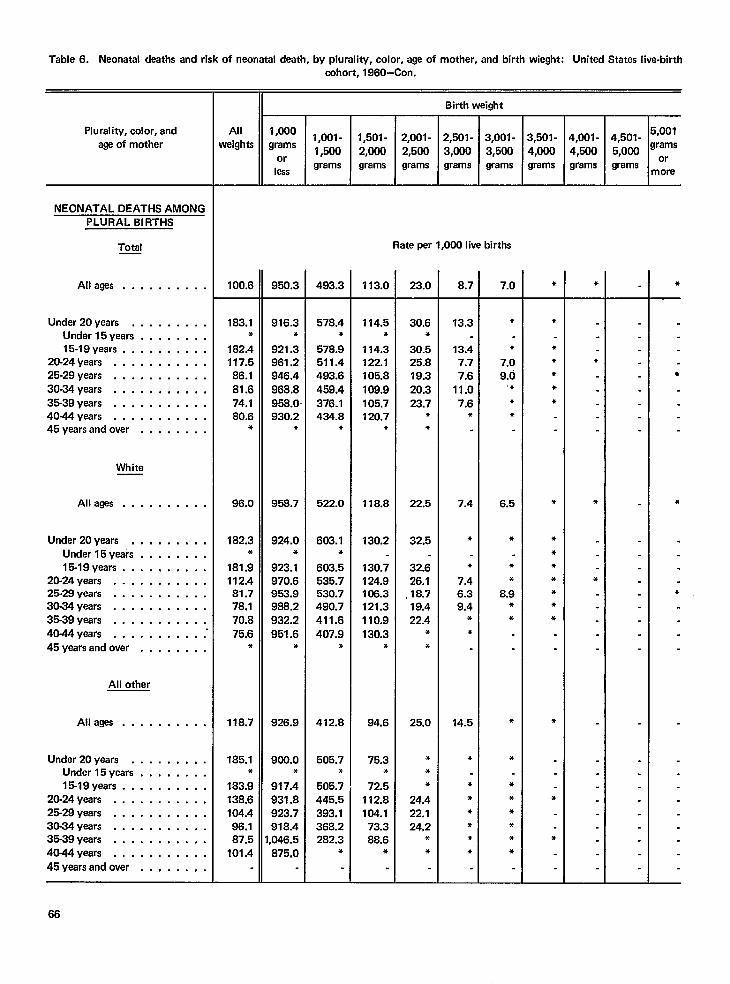
Table 6. Neonatal deaths and risk of neonatal death, by plurality, color, age of mother, and birth wieght: United States live-birthcohort, 1960–Con.
IIIAll 1,0001,001-
weights grams1,500
orless
grams
Birth weight
E
Plurality, color, and
age of mother4,001 - 4,501 - 5’00’4,500 5,000 ‘ramsgrams grams m:re
NEONATAL DEATHS AMONGPLURAL BIRTHS
Total Rate per 1,000 live births
All ages . . . . . . . . . . 100.6 950.3 493.3 113.0 23.0 8.7 7.0 ● *
Under 20years , . . . . . . . .Under 15years . . . . . . . .15-19 years . . . . . . . . . .
20-24 ~ears . . . . . . . . . . .25-29 years . . . . . . . . . . .
30-34 years . . . . . . . . . . .
35-39 years . . . . . . . . . . .4044years . . . . . . . . . . .45yearsandover . . . . . . . .
183.1*
182.4117.586.1
81.674.180.6
*
96.0
182.3*
181.9112.481.778.170.875.6
*
118.7
185.1*
183.9138.6104.496.187.5
101.4
916.3*
921.3961.2946.4968.8958.0930.2
*
958.7
924.0*
923.1970.6963.9988.2932.2
951.6*
926.9
900.0●
917.4931.8923.7918.4,046.5875.0
578.4*
578.9511.4493.6
459.4376.1434.8
*
522.0
603.1*
603.5535.7530.7490.7
411.6407.9
*
412.8
505.7*
505.7445.5393.1368.2282.3
*
114.5*
114.3122.1105.8
108.9105.7120.7
*
118.8
130.2
130.7124.9106.3121.3110.9130.3
*
94.6
75.3*
72.5112.8104.1
73.388.6
*
30.6*
30.525.819.320.323.7
**
22.5
32.5
32.626.1
,18.719.422.4
●
*
25.0
**●
24.422.124,2
**
13.3
13.47.77.6
11.07.6
*
7.4
*
●
7.46.39.4
*
*
14.5
*
●
*●
●
**
*
●
7.09.0
,*
**
6.5
*
**
8.9**
●
*
******
*
*****
*
****●
●
☛
☛
●
●
*
*
●
●
●
☛✌
White
All ages . . . . . . . . . .
Under 20years . . . . . . . . .Under 15years . . . . . . . .15-19 years . . . . . . . . . .
20-24 years . . . . . . . . . . .25-29 years . . . . . . . . . . .30-34 years . . . . . . . . . . .35-39 years . . . . . . . . . . .40-44 years . . . . . . . . ...”
45years andover . . . . . . . .
All other
All ages . . . . . . . . . .
Under 20years . . . . . . . . .Under 15years . . . . . . . .15-19 years . . . . . . . . . .
20-24 ~ears . . . . . . . . . . .25-29 years . . . . . . . . . . .30-34 years . . . . . . . . . . .35-39 years . . . . . . . . . . .40-44 years . . . . . . . . . . .
45yearsandover . . , . . . . .
66
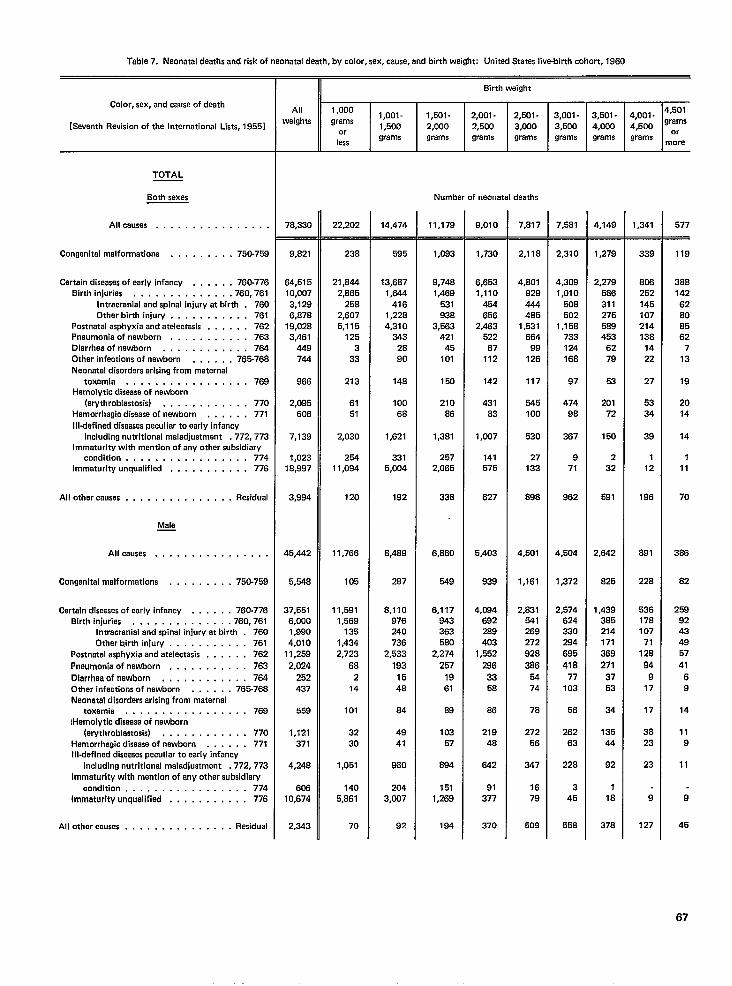
Table 7. Neonatal deaths and risk of neonatal death, by color, sex, cause, and birth weight: United States live-birth cohort, 1960
Color, sex, and cause of death
[Seventh Revision of the International Lists, 1955]
TOTAL
Both sexes
Allcauaes . . . . . . . . . . . . . . . .
Congenital malformations . . . . . . . . . 750-759
Certain diseases ofearly infancy . . . . . . 760-776
Birth injuries . . . . . . . . . . . ...760.761
Intracranial andspinal injury at birth . 760
Other birth injury . . . . . . . . . . . 761
Postnatal asphyxia andatelectasis . . . . . . 762
Pneumonia of newborn , . . . . . . . . . . 763
Dlarrheaofnawborn . . . . . . ,. . . . . 764
Other Infections of nawborn . . , , , . 765-768
Neonatal disorders arising from maternal
toxamla . . . . . . . . . . . . . ,. ..769
Hemolytlc disaesa of newborn
(erythroblastosia) . , . . . . , . . . , . 770
Hemorrhagic disease of newborn , . . . . . 771
Illdefined diseases peculiar to early infancy
including nutritional maladjustment .772,773
Immaturity with mention of any other subsidiary
condition . . . . . . . . . . . . . . ...774Immaturity unqualified . . . . . . . . . . . 776
All other causes . . . . , . . . . , . . , . . Residual
Mala—
Allcauses ., . . . . . . . . . . . . . .
Congenital malformations . . . . . . . . . 760-769
Certain diseases ofearly infancy . . . . . . 760-776
BirthInjuries . ,. ., . . , . . . . . .760,761
Intracranial andspinal injury at birth . 760
Other b.irth injury . . . . . . . . . . . 761
Postnatal asphyxie andatelectasis . . . . , . 762
Pneumonia of newborn . . . , , , . , . . . 763
Dlarrhaa of newborn . , , , . , . . . , . . 764
Other infections of newborn . . . . . . 766-76S
Neonatal disordars arising from matarnal
toxemia . . . . . . . . . . . . . . ...769
lHemolytic disease of nawborn
(erythroblestosis) , . . . . . . . . . . . 770
Hemorrhagic disease of newborn . . . . . . 771
Illdefinad diseeses peculiar to early infancy
including nutritional maladjustment ,772,773
Immaturity with mantion of any other subsidiary
condition . . . . . . . . . . . . . . ...774
immaturity unqualified . . . . . . . . . . . 778
All othar causes . , . . . . . . . , . . . . . Residual
II Birth weight
All 1,000
waighta1,oo1-
grams1,501 - 2,001- 2,501- 3,001- 3,501- 4,001- 4’50’
1,500 2,000 2,500 3,000 3,500 4,000 4,500 gr:yor
lessgrams grams grams grams grams grams grams
more
Number of neonatal deaths
7B,330
9,821
64,515
10,007
3,129
6,678
19,028
3,461
449
744
966
2,095
606
7,139
1,023
18,997
3,994
46,442
5,548
37,551
6,000
1,990
4,010
11,259
2,024
252
437
659
1,121
371
4,248
606
10,874
2,343
22,202
238
21,844
2,865
258
2,607
5,115
125
3
33
213
61
51
2,030
254
11,094
120
11,766
105
11,591
1,569
135
1,434
2,723
68
2
14
101
32
30
1,051
140
5,661
70
14,474
595
13,687
1,644
416
1,228
4,310
343
28
90
14B
100
6B
1,621
331
5,004
192
8,4S9
287
8,110
976
240
736
2,533
193
15
48
84
49
41
960
204
3,007
92
11,179
1,093
9,748
1,469
531
938
3,563
421
45
101
150
210
86
1,381
257
2,065
338
6,860
549
6,117
943
363
560
2,274
267
19
61
88
103
57
894
151
1,269
184
9,010
1,730
6,653
1,110
454
656
2,483
522
67
112
142
431
83
1,007
141
575
627
5,403
939
4,084
692
2B9
403
1,552
298
33
58
86
219
48
642
91
377
370
7,817
2,118
4,801
929
444
485
1,531
664
99
126
117
545
100
530
27
133
898
4,501
1,161
2,831
541
269
272
928
386
54
74
78
272
56
347
16
79
509
7,581
2,310
4,309
1,010
508
502
1,15s
733
124
168
97
474
98
367
9
71
962
4,504
1,372
2,574
624
330
294
695
418
77
103
56
262
63
228
3
45
558
4,149
1,279
2,279
586
311
275
589
453
62
79
53
201
72
150
2
32
591
2,642
825
1,439
“385
214
171
369
271
37
53
34
135
44
92
1
18
378
1,341
339
806
252
145
107
214
138
14
22
27
53
34
39
1
12
196
891
228
536
178
107
71
128
94
9
17
17
38
23
23
9
127
577
119
388
142
62
80
85
62
7
13
19
20
14
14
1
11
70
366
82
259
92
43
49
57
41
6
9
14
11
9
11
9
45
67
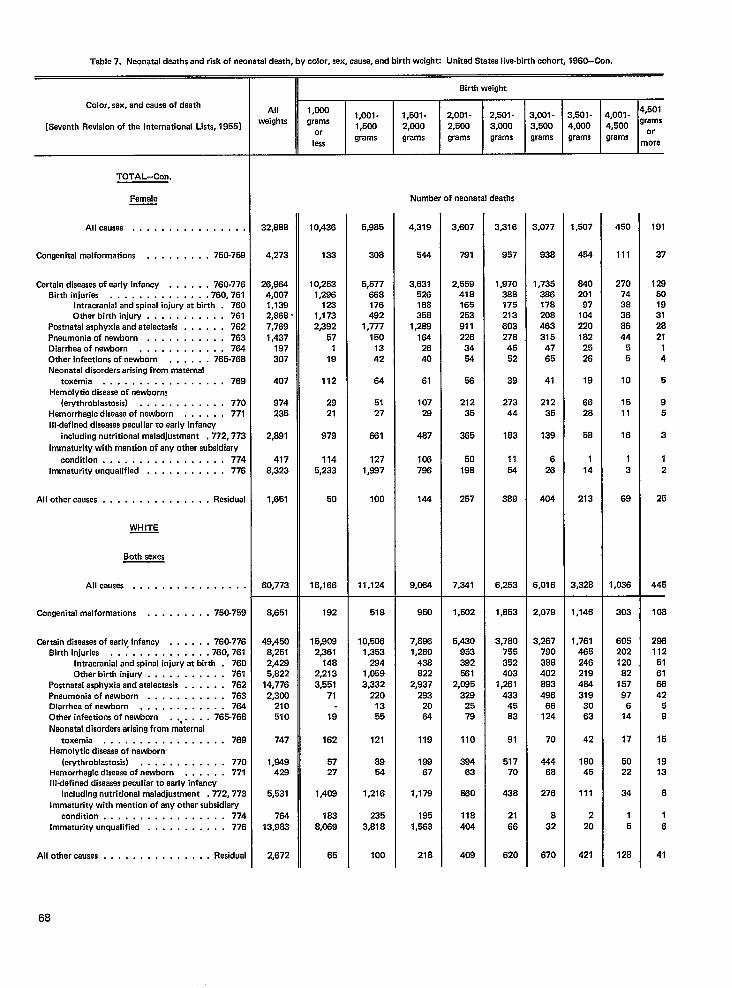
Table 7. Neonatal deaths and risk of neonetel deeth, by color, sex, cause, and birth weight Unitad States live-birth cohort, 1960–Con.
Color, sex, and cause of death
[Seventh Revision of the International Lists, 19551
TOTAL-Con.
Female
All causes . . . . . . . . . . . . . . .,
Congenital malformations . . . . . . . . . 750-75S
Certain diseases ofearly infancy . . . . . . 760-776
Birth injuries . . . . . . . . . . . . ..7S0. 761
Intracranial andspinal injury at birth . 76C
Other birth injury . . . . . . . . . . . 761
Postnatal asphyxia and atelectasis . . . . . . 762
Pneumonia of newborn . . . . . . . . . . . 763
Diarrhea ofnewisorn . . . . . . . . . . . . 784
Other infections of newborn . . . . . . 765-768
Neonatal disorders arising from maternal
toxemia . . . . . . . . . . . . . . . ..76S
Hemolytic disease of newborn!
(ewthroblastosis) . . . . . . . . . . . . 77cHemorrhagic disease of newborn . . . . . . 771
I Ildefined diseases peculiar to earl y infancy
including nutritional maladjustment , 772,772
Immaturity with mention of any other subsidiary
condition . . . . . . . . . . . . . . ...774
Immaturity unqualified . . . . . . . . . . . 77E
All other causes . . . . . . . . . . . . . . . Residual
WHITE
Both sexes
All causea . . . . . . . . . . . . . . .
Congenital malformations . . . . . . . . . 750-75S
Cartain diseases of early infancy . . . . . . 760-776
Birth injurias . . . . . . . . . . . ...760.761
Intracranial and spinal injury at birth . 760
Other birth injury . . . . . . . . . . . 761
Postnatal asphyxia and atelectesis . . . . . . 762
Pneumonia of newborn . . . . . . . . . . . 763
Diarrhea of newborn . . . . . . . . . . . . 754
Other infections of nawborn . . . . . . . 765-76S
Naonatal disorders arising from maternal
toxemia . . . . . . . . . . . . . . ...769
Hemolytic disease of nawborn
(ewthroblastoais) . . . . . . . . . . . . 770Hemorrhagic disaase of newborn . . . . . . 771
Illdefined diseases peculiar to early infancy
including nutritional maladjustment .772, 773
Immaturity with mention of any other subsidiary
condition . . . . . . . . . . . . . . . . . 774
Immaturity unqualified . . . . . . . . . . . 776
All other causas . . . . . . . . . . . . . . . Residual
II 8irth weight
All 1,000
weights1,001- 1,501- 2,001-
grams2,501- 3,0QI - 3,501- 4,001- 4’50’
1,500or
2,000 2,500 3,0Q0 3,500 4,000 4,500 gr:’”
leasgrama grams grams grama grams grams grams more
Number of neonatal deaths
32,S86
4,273
26,884
4,007
1,139
2,S6S .
7,769
1,437197
307
407
974
235
2,B91
417
S,323
1,651
60,773
S,651
49,450
8,251
2,429
5,S22
14,776
2,300
210
510
747
1,949
429
5,531
784
13,983
2,672
10,436
133
10,253
1,296
123
1,173
2,392
57
1
18
112
29
21
979
114
5,233
50
16,166
182
15,9C9
2,361
14B2,213
3,551
71
19
162
57
27
1,408
183
8,0+39
65
5,9s5
308
5,577
886
176
492
1,777
150
13
42
64
51
27
861
127
1 ,s97
100
11,124
51 s
10,WJ6
1,363
284
1,059
3,332
220
13
55
121
89
54
1,216
235
3,S18
100
4,319
544
3,631
526
166
356
1,2s8
1s4
26
40
61
107
28
487
108
788
144
9,064
960
7,868
1,260
438
S22
2,937
293
20
84
119
188
67
1,179
195
1,583
218
3,607
791
2,559
41 s
165
253
911
226
34
54
58
212
35
385
50
198
257
7,341
1,602
5,430
953
392
!561
2,085
329
26
79
110
294
63
260
llB
404
408
3,316
957
1,970
3ss
175
213
603
27B
45
52
39
273
44
183
11
54
3B8
6,253
1,s53
3,780
755
352
403
1,281
433
45
S3
91
517
70
436
21
66
620
3,077
938
1,735
3S6
17s
20s
463
315
47
65
41
212
35
139
6
26
404
6,016
2,079
3,267
790
388
402
883
496
66
124
70
4446S
276
8
32
670
1,507
464
&lo
201
97
104
220
162
25
26
19
66
2s
58
1
14
213
3,328
1,146
1,761
485
246
219
484
319
30
63
42
1BO
45
111
2
20
421
450
111
270
74
3s
36
86
44
5
5
10
15
11
16
1
3
68
1,036
303
605
202
120
82
157
97
6
14
17
50
22
34
1
5
128
191
37
129
50
19
3!
28
21
1
4
5
9
5
3
1
2
25
446—
108
288
112
51
61
66
42
5
8
15
19
13
8
1
6
41
68
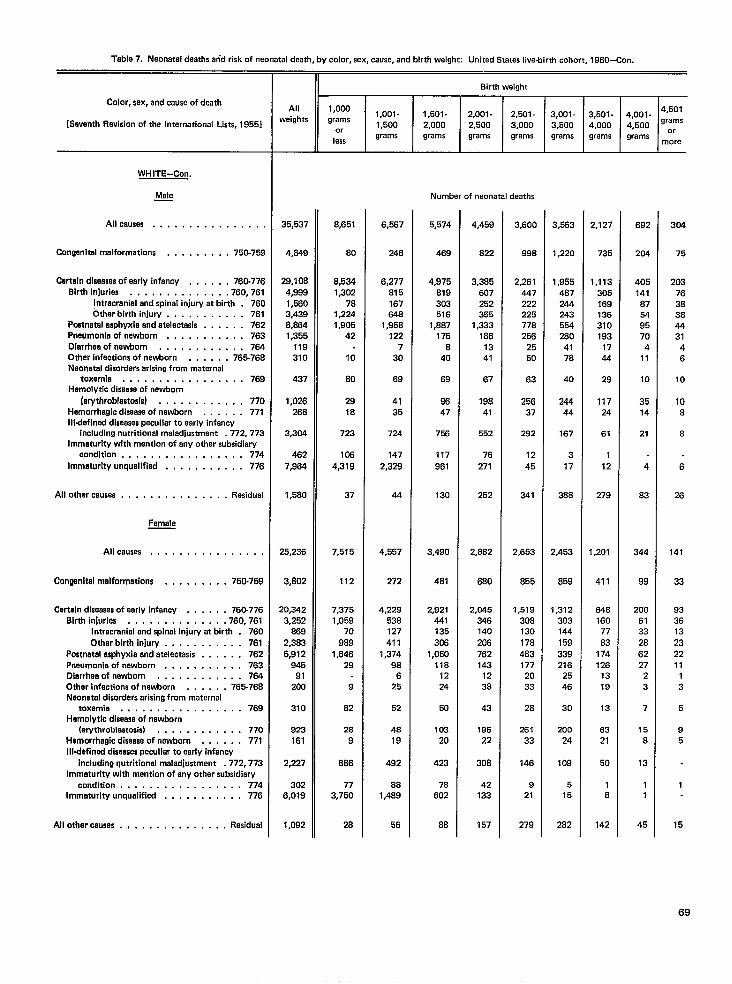
Table 7. Neonatal deathsarid risk of neonataldeath, by color, sex, cause,and birth weight: United States live-birth cohort, 1960-Con.
Color, sex, end muse of death
[Sevanth Ravisionof the International Lists,1955]
WHITE-Con,
Male—
Allceusas . . . . . . . . . . . . . . .,
Congenltelmalformations . . . . . . . . . 760-759
Certeln diseasesof eerly infency . . . . . . 760-776Birth InJuries . . . . . . . . . . . . .. 760,761
Intrecreniel end spinal injury at birth . 760Other birth injury . . . . . . . . . . . 761
Poetnetalasphyxia and atelactasis . . . . . . 762Pneumoniaof newborn . , . . . . . . . . . 763Diarrhea of newborn . , , , . . . . . . . . 764Other infectionsof newborn . , . . . . 765-768Neonatal disordersarisingfrom maternal
toxemia . . . . . . . . . . . . . . ...769Hemolytic diseaesof newborn
(erythroblastosis) . . . . . . ., . . . , 770Hemorrhagicdiseaseof nawborn . . . . . . 771111.defineddiseasespeculiar to early infancy
includingnutritional maladjustment .772,773Immaturity with mention of any other subsidiary
condition ...,,.. . . . . . . . ...774Immeturlty unqualified , , , , , . . . . . . 776
All other causes . . . . , . , . . . . . . . . Residual
Femala
All causes . . . . . . . . . . . . . . . .
Congenitalmalformations . . . . . . . . . 750-769
Certain diseasesof early infancy . . . . . . 760.776Birth injuries , . . . . . . . . . . . . .760,761
Intracranial and spinal injury at birth . 760Other birth injury . . . . . . . . . . . 761
Postnatelasphyxia and atelectasis . , . . . . 762Pneumoniaof newborn . . . . . . . . . . . 763Dierrheeofnewtsorn . . . . . . . . . . . . 764Other infectionsof newborn . . . . . . 765-768Neonatal disordersarisingfrom maternal
toxemia, . . . . . . . . . . . . . ...769Hemolytic diseaseof nawborn
(erythroblastosis) . . . . . . . . . . . . 77oHemorrhagicdiseaseof newborn . . . . . . 771Illdefirred diseesaspeculiar to early infancy
including nutritional maladjustment .772,773Immaturity with mention of any other subsidiary
condition . . . . . . . . . . . . . . ...774Immaturity unqualified . . . . . . . . . . . 776
All other causas . , . . . . , . . . , . . . . Rasidual
Allweights
35,537
4,649
29,1084,8991,5603,4398,8641,355
119310
437
1,026268
3,304
4627,964
1,580
25,236
3,802
20,3423,252
8692,3836,912
94591
200
310
923161
2,227
3026,019
1,092
II Birth weight
1,000
I1,oo1-grams 1,501-1,500or 2,000
lessgrams grams
8,651
80
8,5341,302
781,2241,905
42
10
so
2918
723
1064,319
37
7,515
112
7,3751,059
70969
1,64629
9
S2
289
686
773,750
28
6,667
246
6,277815167548
1,858122
730
68
4135
724
1472,329
44
4,557
272
4,229536127411
1,37498
625
52
4819
492
881,488
56
2,001- 2,501-2,500 3,000grams grams
Number of neonatal deaths
5,574
469
4,975819303516
1,8B7175
640
69
8647
756
117861
130
3,480
4B1
2,9214411353@3
1,050118
1224
50
10320
423
78602
88
4,459
S22
3,365607252355
1,3331861341
67
19841
552
76271
252
2,662
680
2,045346140206762143
1238
43
19622
306
42133
157
3,600
99s
2,261447222225778256
2550
63
25637
292
1245
341
2,653
855
1,5193081301784631772033
28
26133
146
921
279
3,001- 3,501-3,500 4,000grams grams
,563
,220
,9554672442435542604178
40
24444
167
317
388
453
859
3123031441593392182546
30
20024
109
515
282
2,127
735
1,113305168136310193
1744
29
11724
61
112
279
1,201
411
6481607783
17412s
1318
13
6321
50
18
142
4,001 - 4’5014,500 g’:ygrams
more
682
204
405141875495704
11
10
3514
21
4
83
344
99
2006133286227
23
7
156
13
11
45
304
75
203763838443146
10
108
8
6
26
141
33
933613232211
13
5
95
1
15
69
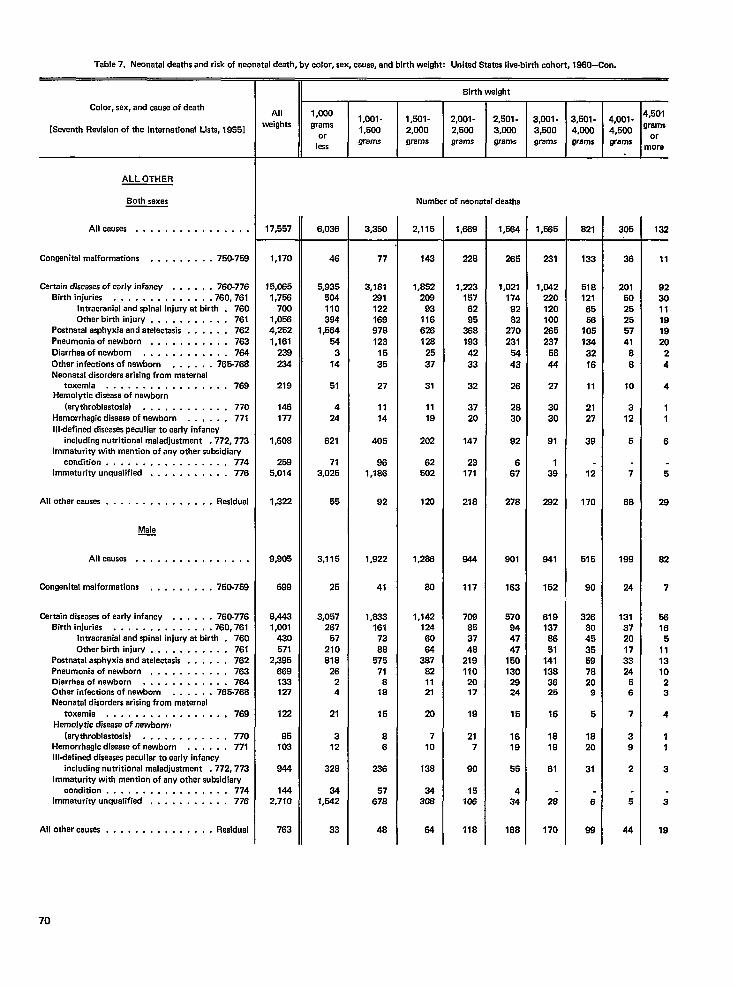
Table 7. Neonatal deatha and risk of neonatal death, by color, sex, cause, and birth weighe Unitad States live-birth cohort, 1960-Con.
II Sirth weight
All
r1,000
wtights grams
or
less
Color, sex, and eeusa of death
[Seventh Revision of tha International Lists, 1955]
4,501
grams
or
more
1,oo1- 1,601- 2,001-
1,500 2,000 2,500
grams grams grams
2,501-
3,000
grams
3,001- 3,501.
3,500 4,000
grams grams
4,001-
4,500
grams
ALL OTHER
Both sexes
Allcauses . . . . . . . . . . . . . . . .
Congenital malformations . . . . . . . . . 750-758
Certain diseases ofearlyinfancy . . . . . . 76C-776
Sirthinjuriea . . . . . . . . . . . ...760.761
Intracranial andspinal injury at birth . 760
Other birth injuw . . . . . . . . . . . 761Postnatal asphyxia and atalactasis . . . . . . 762
Pnaumcmia of newborn , . , , . . . . . . . 763
Oiarrhaaofnawborn . . . . . . . . . . . . 784
Other inactions of newborn . . . . . . 765-7S8
Neonatal disorders arising from maternal
toxemia . . . . . . . . . . . . . . ...769Hemolytic disease of newborn
(arythroblastosis) . . . . . . . . . . . . 77o
Hemorrhagic disease of nawborn . . , , . . 771
Illdefined diseasas peculiar to aarly infancy
including nutritional maladjustment .772, 773
Immaturity with mention of any othar subsidiary
condition . . . . . . . . . . . . . . ...774Immaturity unqualified . . . . . . . . . . . 776
All other causes . . . . . . . . . . . . . . .Residual
Male—
Allcauses . . . . . . . . . . . . . . . .
Congenital malformations . . . . . . . . . 75Cr-758
Certain diseases of early infancy . . . . . . 760-776
Shthinjuries . . . . . . . . . . . ...760.761
Intracranial and spinal injury at birth . 760
Other birth injury . . . . . . . . . . . 761
Postnatal asphyxia and atalactasis . . . . . . 762
Pneumonia of nawborn . . . . . . . . . . . 763
Diarrhea of newborn . . . . . . . . . . . . 7s4Other infections of netiorn . . . . . . 7S5-76B
Neonatal disordars arising from maternal
toxemia ,, ..,.........,.,769
Hemol ytic disease of newborn!
(erythroblastosis) . . . . . . . . . . . . 770
Hemorrhagic disease of newborn . . . . . . 771
Illdefined diseases paculiar to early infancy
including nutritional maladjustment .772,773
Immaturity with mantion of any other aubaidiary
condition . . . . . . . . . . . . . . ...774
Immaturity unqualified . . . . . . . . . . . 776
Allotharcauses . . . . . . . . . . , . , . . Residual
Number of naonatal deaths
17,557 3,350 2,115 1,689 1 ,W4 1,585 821 305 132
1,170
~5,C65
1,756
700
1,056
4,252
1,161
239
234
219
148
177
1,608
259
5,014
1,322
9,905
688
S,443
1,001
430
571
2,395
869
133127
122
95
103
844
144
2,710
48
5,935
504
110
384
1,584
54
3
14
51
4
24
821
71
3,025
55
3,115
25
3,057
267
57
210
818
26
2
4
21
3
12
328
34
1,542
33
77
3,181
281
122
169
97s
123
16
35
27
1114
405
96
1,186
92
1,922
41
1#833
161
73
86
675
71
s
18
15
8
6
236
57
678
48
143
1,852
208
93
116
628
128
25
37
31
11
19
202
62
502
120
228
1,223
157
62
95
388
193
42
33
32
37
20
147
23
171
216
844
117
708
85
37
46
219
110
2017
19
21
7
90
15
708
118
265
1,021
174
92
82
270
231
54
43
26
28
30
92
6
67
276
901
163
670
94
47
47
150
130
2824
15
16
19
55
4
34
168
231
1,(M2
133
518
121
65
56
36
201
50
25
25
57
41
6
8
10
3
12
5
7
68
199
24
131
37
20
17
33
24
5
6
7
3
9
2
5
44
11
92
30
11
19
19
20
2
4
4
1
1
6
6
29
82
7
66
16
5
11
13
10
2
3
4
1
1
3
3
19
220
120
100
265
237
58
44
27
30
30
91
1
39
292
841
152
619
137
86
51
141
138
3625
16
18
19
61
28
170
105
13432
16
11
21
27
39
12
170
515
9080
1,142
124
60
84
387
82
11
21
20
7
10
138
34
308
84
326
80
45
35
59
78
209
5
18
20
31
6
98763
70
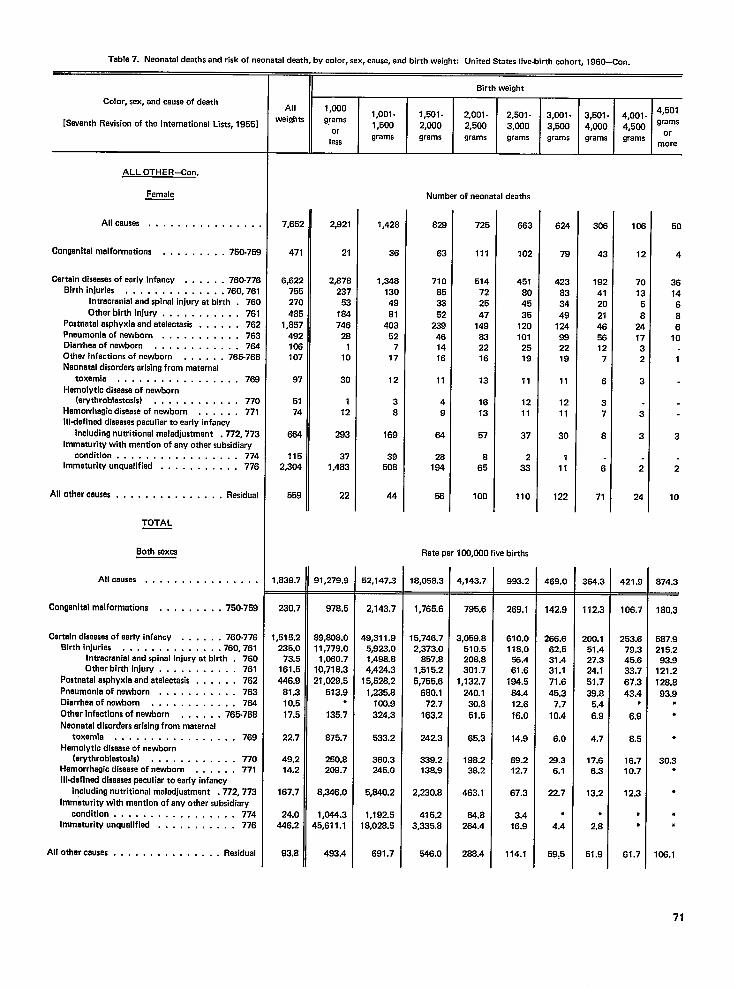
Table 7. Neonatal deaths and risk of neonatal death, by color, sex, cause, and birth weight: United States live-birth cohort, 1960-Con.
Color, sex, and cause of death
[Seventh Revisionof the International Lists, 1955]
ALL OTHER-Con.
Femele
All causes . . . . . . . . . . . . . . .
Congenitalmalformations . . . . . . . . . 750-75S
Certain diseasesof eerly infancy . . . . . . 760-776Blrthlnjuries , . . . . . . . . . . ...760.761
Intrecraniel end spinel injury at birth . 760Other birth in]ury . . . , . . . . . . . 761
Postnetelesphyxie end atelectasis . . . . . . 762pneumonie of newborn . . . . . . . . . . . 763Diarrhee of newborn . . . . . . . . . . . . 764Other infectionsof newborn . . . . . . 765-766Neonatal disordarsarisingfrom maternal
tOXWSda , . . . . . . . . . . . . . ...769Hemolytlc diseeseof newborn
(erythroblestosis) . . . . . . . . . . . . 77oHemorrhagicdiseaseof newborn . . . . . . 771Illdefinad dlseesespeculiar to early infancy
includingnutritional maladjustment .772,773immaturity with mention of any other subsidiary
condition . . . . . . . . . . . . . . ...774hWOatUri~ unqualified . . . . . . . . . . , 776
All other causes . . . . . . . . . . . . . . . Residual
TOTAL
Both saxes
All causes . . . . . . . . . . . . . . . .
Conganltalmalformations . . , , , . . . . 750-759
Certain diseesesof early infancy . . . . . . 760-776Bkthhr]uries . . . . . . . . . . . . .. 760,761
Intracranial end spinal injury at birth . 760Other birth injury . . . . . . . . . . . 76 I
postnatalasphyxia and atalactasls . . . . . . 762pneumonia of nawborn . , , . . . . . . . . 763Diarrheeof newborn . . . . . . . . . . . . 784Othar inactions of nawborn . . , , . , 765-766Neonatal disorderserisingfrom meternal
toxemia . . . . . . . . . . . . . . ...769Hemolytlc disaeseof newborn
(ewthroblestosis) . . . . . . . . . . . . 77oHemorrhagicdiseaseof nawborn . . . . . . 771Illdefinad diseasespeculiar to aarly infancy
including nutritional maladjustment .772,773Immaturity with mantion of any other subsidiary
condition, . . . . . . , . . . . . . ...774lMMatUri~ Unquelifiad . . . . . . . . . . . 776
All other causes . . . . . . , . . . . . . . . Residual
8irth weight
All 1,000
weights grams1,oo1- 1,501- 2,001- 2,501- 3,001- 3,5431- 4,001- 4’50’1,500 2,000
or2,5W 3,(XIO 3,500 4,000 4,5C0 ‘=’:;
lessgrams grams grams grams grams grams grams
more
7,652
471
6,622755270485
1,857492106107
97
5174
664
1152,304
559
,838.7
230.7
,515.2235.0
73.5161.5446,9
81.310.517.5
22.7
49.214.2
167.7
24.0446.2
93.8
2,921
21
2,878237
53184746
281
10
30
112
293
371,483
22
31,279.9
978,5
38,806.0I1,779.01,060.7
10,7IB.321,029.5
513.9●
135.7
875.7
250.8208.7
8,346.0
1,044.345,611.1
493.4
1,428
36
1,34813049El
40352
717
12
38
168
3950B
44
<2,147.3
2,143.7
19,311.9
1,498.84,424.3
15,528.21,235.8100.9324.3
533.2
360.3245.0
5,640.2
1,192.518,028.5
691.7
82$
63
710853352
238461416
11
49
84
28184
58
725
111
514722547
149832216
13
1613
57
865
100
663
102
451804535
1201012519
11
12
11
37
2
33
110
Rate per 100,000 live births
8,058.3
1,765.6
5,746.72,373.0
857.81,515.25,755.6
680.172.7
163.2
242.3
339.2138.9
2,230.8
415.23,335.8
546.0
%,143.7
795.6
3,059.8510.5208.8301.7
1,132,7240.130.651.5
65.3
198.238.2
463.1
84.8264.4
2B8.4
993.2
269.1
610.0116.0!%.461.6
184.534.412.616.0
14.9
69.212.7
67.3
3.416.9
114.1
624
79
423833449
124992219
11
1211
30
111
122
469.0
142.9
268.662.531.431.171.645.3
7.710.4
6.0
29.36.1
22.7
●
4.4
59,5
30E
43
1924120214656127
6
37
8
6
71
354.3
112.3
200.151.427.324.151.739.8
5.46.9
4.7
17.66.3
13.2
●
2.8
51.9
105
12
701358
241732
3
3
3
2
24
421.9
106.7
253.679.345.633.767.343.4
●
6.9
8.5
16.710.7
12.3
●
●
61.7
50
4
3614686
10
1
3
2
10
874.3
180,3
587.9215.293.9
121.2128.893.9
●
●
●
30.3●
●
●
●
108.1
71
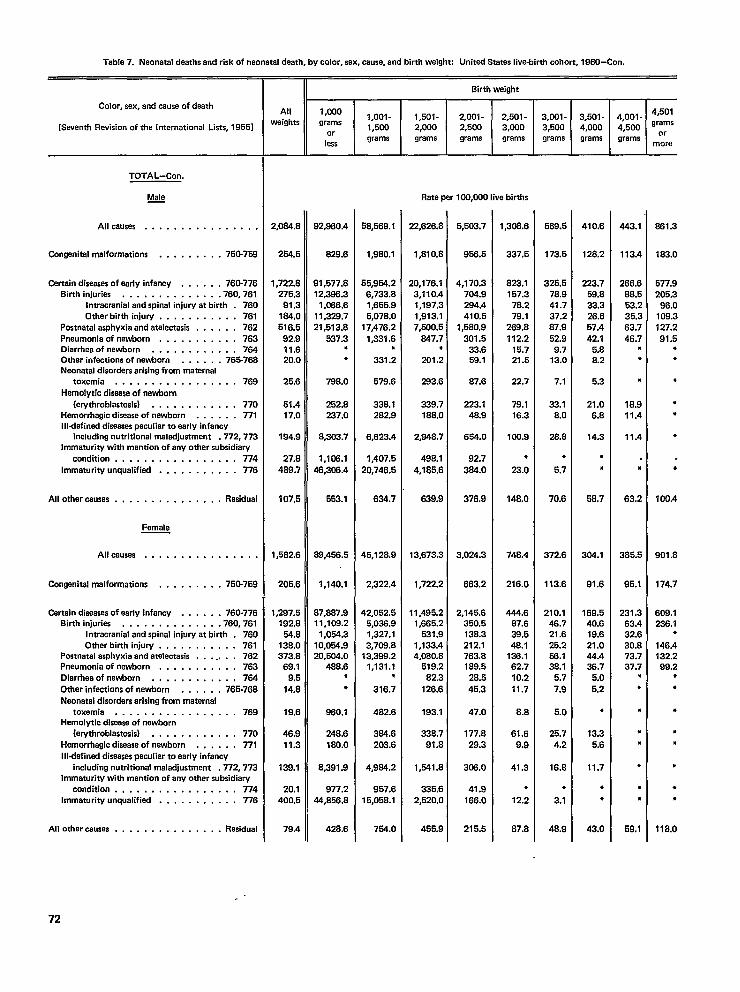
Table 7. Neonatal deaths and risk of neonatal death, by color, sex, cause, and birth weight: Unitad Statas live-birth cohort, 1960-Con.
Color, sex, and cause of death
[Seventh Revision of the international Lists, 19561
TOTAL-Con.
Male—
Allcauses . . . . . . . . . . . . . . . .
Gmgenitelm alformatiom . . . . . . . . . 750-758
Cartairr diseases ofearly infancy . . . . . , 760-776
Birth injuries . . . . . . . . . . . . . .760,761
Intracranial andspinal injury at birth . 760
Other birth injury . . . . . . . . . . . 761
Postnatal asphyxia andatalectasis . . . , . . 762
Pnaumonia of newborn . . . . . . . . . . . 763
Diarrhea of newborn . . . . . . . . . . . . 764
Other infections of newborn . . . . . . 765-768
Naorratal disorders arising from maternal
toxemia . . . . . . . . . . . . . . ...769
Hemolytic disaase of nawborn
(erythroblastosis) . . . . . . . . . . . . 770
Hemorrhagic disease of newborn . , . . . . 771
Illdefinrxl disea$es peculiar to early infancy
including nutritional maladjustment .772, 773
Immaturity with mention of any other subsidiary
condition .,...... . . . . . . . . . 774
Immaturity unqualified . . . . . . . . . . . 776
Allothercausas . . . . . . . . . , . . . . . Rasidual
Female
Allcausea . . . . . . . . . . . . . . . .
Congenital malformations . . . . . . . . . 750-759
Certain diseases of early infancy . . . . . . 760-776
Birth iniurias . . . . . . . . . . . ...760.761
Intracranial and spinal injury at birth . 760
Other bhthinjury. . . . . . . . . . . 761Postnatal asphyxia and atelectasis . . . . . . . 762
Pneumonia of newborn . . . . . . . . . . . 763
Oiarrheaofnewborn ,. . . . . . . .,, , 764
Other infections of newborn . . . . . . 766-768
Neonatal disorders arising from matarnal
toxemia . . . . . . . . . . . . . . ...769
Hemolytic disaasa of newborn
(erythroblastosis) . . . . . . . . . . . . 770
Hemorrhagic disease of newborn . . . . . . 771
Illdafinad diseasaspeculiar to early infancyincludingnutritional maladjustment .772, 773
Immaturity with mention of any other subsidiary. .
condtttion . . . . . . . . . . . . . . . . . 774Immaturity unqualified . . . . . . . . . . . 776
Allotfrercauses . . . . . . . . . . . . . . . Residual
Allwaigfsts
2,084.B
254.5
1,722.6
275.3
91.3
1W,o516.5
92.911.620.0
25.6
51.417.0
194.9
27.8489.7
107.5
1,582.6
205.6
1,297.5192.6
54.6138.0373.6
69.19.5
14.8
19.6
46.911.3
139.1
20,1400.5
79.4
II Birth weight
1,0001,oo1-
grams1,500
or
lessgrams
92,S60.4
828.6
91,577.812,388.3
1,056.611,328.721,513.8
637.3●
●
798.0
252.82s7.0
8,303.7
1,106.146,306.4
553.1
68,456.5
1,140.1
67,687.911,108.2
1,054.310,054.920,504.0
468.6*●
960.1
248.6180.0
8,391.9
977.244,B.56.8
428.6
58,569.1
1,950.1
55,954.26,733.61,655.95,076.0
17,476.21,331.6
●
331.2
579.6
338.12S2.9
6,623.4
1,407.520,746.5
634.7
45,126.9
2,322.4
42,052.55,036.91,327.13,708.8
13,398.21,131.1
●
316.7
482.6
384.6203.6
4,964.2
957.615,05s.1
754.0
1,501- 2,001- 2,501- 3,001- 3,501- 4,001-2,000 2,500 3,000 3,500 4,000 4,500grams grams grams grams grams grams
Rate per 100,WO Iiva births
22,626.8
1,Bl 0.8
20,176.13,110.41,197.31,913.17,500.5
247.7●
201.2
283.6
339.7188.0
2,Q46.7
498.14,185.6
639.9
13,673.3
1,722.2
11,495.21,665.2
631.91,133.44,060.S
519.282.3
126.6
193.1
S38.791.8
1,541.8
335.62,520.0
455.9
5,503.7
956.5
4,170.3704.9294.4410.5
1,580.9301.5
33.659.1
S7.6
223.14B.9
654.0
92.7324.0
376.9
3,024.3
663.2
2,145.6350.5138.3212.1763.8189.5
28.545.3
47.0
177.829.3
305.0
41.9166.0
216.5
1,308.6
337.5
823.1157.378.279.1
269.8112.2
15.721.5
22.7
79.116.3
100.9
*
23.0
148.0
74s.4
216.0
444.6B7.638.548.1
126.162.710.2+1.7
8.8
61.69.9
41.3
●
12.2
87.8
569.5
173.5
325.578.941.737.267,952.99.7
13.0
7.1
33.1S.o
2s.s
,
5.7
70.6
372.6
113.8
210.146.721.625.258.13B.1
5.77.9
5.0
25.74.2
16.8
●
3.1
48.9
410.8
128.2
223.759.833.326.657.442.1
5.s8.2
5.3
21.06.6
14.3
●
*
58,7
304.1
91.6
169.540.619.621.044.438.7
5.05,2
●
13.35.6
11.7
●
●
43.0
443.1
113.4
266,666.553.235.363.746.7
●
●
●
18.911.4
11.4
●
63.2
385.5
95.1
231.363.432.630.873.737.7
●
●
●
●
●
●
●
●
59.1
4,501grams
or
mora
861.3
183.0
577,9205.3
96.0108.3127.291.5
●
●
●
●
●
●
*
100,4
901 .s
174.7
809.1236.1
●
146.4132.299.2
●
●
●
●
●
●
●
●
118,0
72
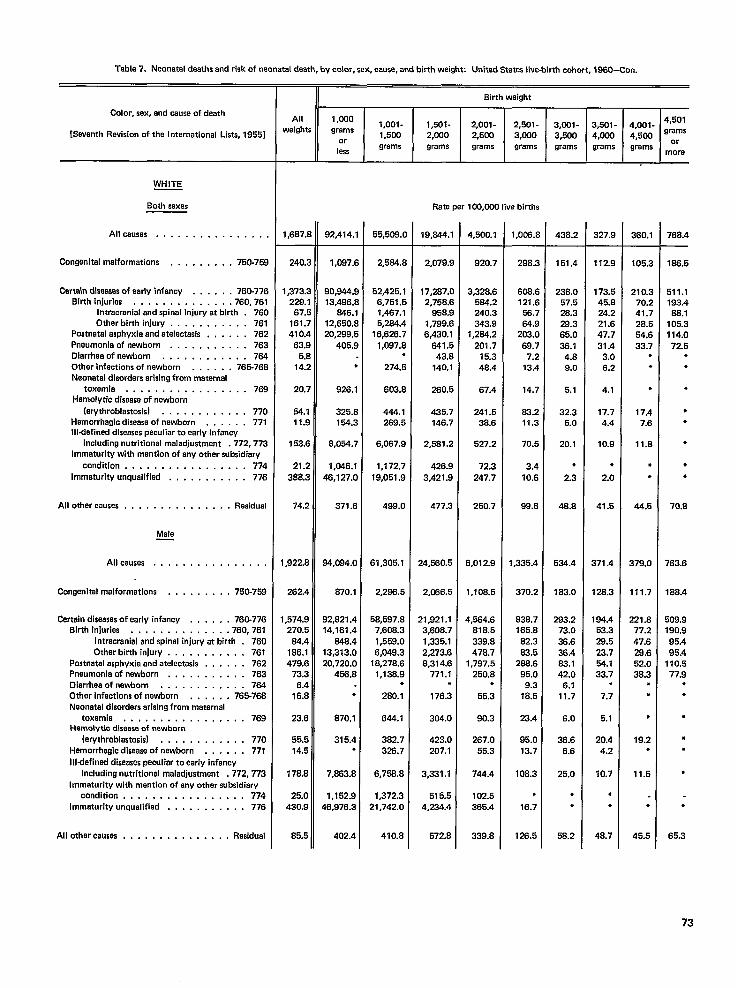
Table 7. Neonatal deaths and risk of neonatal death, by color, sax, cause, and birth weight United States Iive-bisth cohort, 1960-Con.
Color, sex, and cause of death
[Seventh Revision of the International Lists, 1955]
WHITE
Seth sexas
Allcauses . . . . . . . . . . . . . . .
Congenital malformations . , , . . . . . , 750-75S
Certeln dlseesesof eerly infancy . . . . , . 760-77E
Birth injuries , . . . . . . . . . . . ..760.7s1
Intracranlel andspinel injury at birth . 76c
Other birth injury . . . . . . . . . . . 761
Postnatal asphyxie andatelectasis . , . . . . 762
Pneumonia of newborn , . . . . . . . . . . 763
Dlarrheaofnawborn . . . . . . . . . . . . 7S4
Other infections of newborn . . . . . . 7S5-768
Neonatal disorders arising from maternal
toxemia, . . . . . . . . . . . . . ...769
Hemolytic disease of nawborn
(erythroblastosis) . . . . . . . . . . . . 770
Hemorrhagic diseese of newborn . . . . . . 771
Illdefined diseases peculiar to early infancy
including nutritional maladjustment .772,773
Immaturity with mention of any other subsidiary
condition . . . . . . . . . . . . . . ...774
Immaturity unqualified . , . . . . . . . . . 776
All other causes . . . . . . . . . . . . . . . Rasidual
Male—
Allcauses . . . . . . . . . . . . . . . .
Congenital malformations . . . . . . . , , 750_759
Certain diseases of early infancy . . . . . . 760.776
Bkth injuries . . . . . . . , ., . . .. 760,761
Intracranial end spinal injury at birth . 760
Otharbirth injury . . , . . . . . . . , 761
Postnetal asphyxia and atelectesis . . . . . . 762
Pneumonie of newborn . . . . . . . . . , . 763
Dlarrhaaofnev.4om . . . . . . . . . . . . 7S4
Other infections of newborn , . , . . . 765-76S
Neonetel disorders arising from maternal
toxemia . . . . . . . . . . . . . . ...769
Hamalytic disease of newborn
(erythroblastosis) . . . , . . . . . . . . 77o
Hemorrhagic disease of newborn . . . . . . 771
Illdefinad diseases peculier to early infancy
including nutritional maladjustment .772,773
Immaturity with mantion of any other subsidiary
condition . . . . . . . . . . . . . . ...774
Immaturity unqualified . . . . . . . . . . . 776
All other causes . . , . . . . . . . . . . . . Residual
All
weights
1,6S7.1
240:
1,373:
229.’(37,!
161.:
410.,63,f
5.[
14:
20:
54.111.$
153.(
21.:
38S.2
74.2
1,922.8
262.4
I ,574.9
270.5
64.4
186.1
479.6
73.3
6.4
16.8
23.6
55.5
14.5
176.6
26.0
430.9
B5.5
Birth weight
1 ,CKlo1,oo1- 1,501 - 2,001- 2,501-
grams3,001- 3,501- 4,001- 4’50’
1,500 2,000or
2,500 3,000 3,500 4,000 4,500 9::
leesgrams grams grams grams grams grams grams
more
Rate per 100,000 live births
92,414.”
1,087.[
90,844.s
13,496.[
646.1
12,650.[
20,299.[
405.:
,
926.1
325.:
154.2
B,054.i
1,046.1
46,127.C
371.6
94,084.0
S70,1
92,S21 .4
14,161,4
64s.4
13,313.0
20,720.0
455.s
●
870.1
315.4●
7,6s3.s
1,152.9
48,976.3
402.4
55,508.(
2,564.:
52,425.1
6,751.5
1,467.1
5,264.4
16,62s.7
1,097.8●
274.5
603.8
444.1
269.5
6,067.9
1,172.7
19,051.9
499.0
61,305.1
2,29S.5
5S,597.8
7,606.3
1,559.0
6,049.3
18,278.6
1,13s.9●
260.1
644.1
382.7
328.7
6,75$3.8
1,372.3
21,742.0
410.s
19,644.1
2,079.9
17,287.0
2,75B.6
95s.9
1,799.6
6,430.1
641.5
43.s
140.1
2s0.5
435.7
146.7
2,561.2
426.9
3,421.9
477.3
24,580.5
2,C66.5
21,921.1
3,608.7
1,335.1
2,273.6
S,314.6
771.1●
176.3
304.0
423.0
207.1
3,331.1
516.5
4,234.4
572.S
4,500.1
920.7
3,328.6
584.2
240.3
343.9
1,264.2
201.7
15.3
4s.4
67.4
241.5
3s.5
527.2
72.3
247.7
250.7
6,012.9
1,10s.5
4,564.6
S1 8.5
339.8
478.7
1,797.5
250.S.
55.3
90.3
267.0
55.3
744.4
102.5
385.4
339.s
1,006.[
298.:
606.(
121 .E
5s.7&4~
203.C
69.7
7.2
13.4
14.7
23.2
11.3
70.5
3.4
10.6
6?J.8
1,335.4
370.2
838.7
165.8
S2.3
63.5
288.6
95,0
9.3
1s.5
23.4
95.0
13.7
106,3
●
16.7
126.5
438.:
151.4
23S.C
57.528.3
282
65.0
38.14.8
9.0
5.1
32.3
5.0
20.1
●
2.3
46.8
534.4
163.0
293.2
73.0
3S.6
3s.4
83.1
42.0
6.1
11.7
6.0
26.6
6.6
25.0
●
.
58.2
327.9
112.9
173.5
45.8
24.2
21.8
47.7
31.4
3.0
6.2
4.1
17.7
4.4
10.9
●
2.0
41.5
371.4
128.3
184.4
53.3
28.5
23.7
54.1
33.7.
7.7
5.1
20.4
4.2
10.7
●
*
48.7
360.1
105.3
210.3
70.2
41.7
28.5
54.6
33.7●
.
●
17.4
7.6
11.s
●
●
44.5
379.0
111.7
221.8
77.2
47.6
29.6
52.0
3B.3●
*
●
19.2●
11.5
*
45.5
768.4
166.5
511.1
193.4
8S.1
105.3
114.0
72.6●
●
●
●
●
●
●
●
70.8
763.6
168.4
509.9
190,9
95.4
95.4
110.5
77.9●
+
●
●
●
●
●
65.3
73
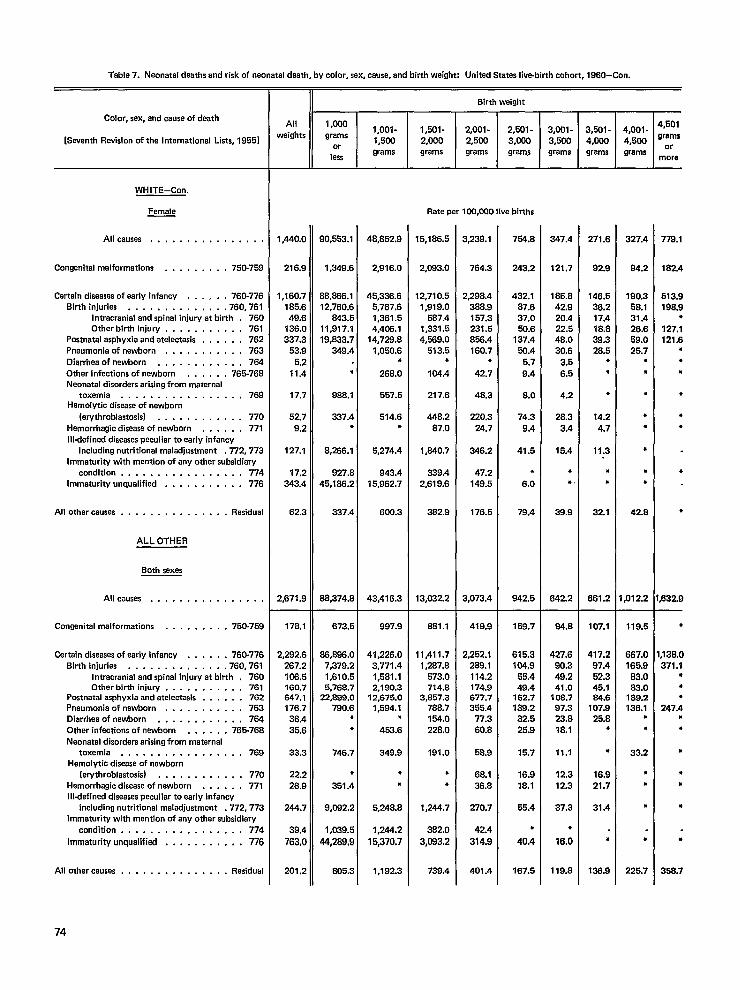
Table 7. Neonatal daaths and risk of naonatal death, by color, sex, cause, and birth weight: United Statas Iiva-birth cohort, 1960-Con.
Color, sex, and cause of death
[Savanth Revision of the International Lists, 1955]
WHITE-Con.
Female
Allcauses . . . . . . . . . . . . . . . .
Congenital malformations . . . . . . . . . 750-759
Certain diseasas of early infancy . . . , . . 760-776
Sirth injuries . . . . . . . . . . . . . .760,761
Intracranial and spinal injury at birth . 760
Other birth injury . . . . . . . . . . . 761
Postnatal asphyxia and atelectaais . . . . . . 762
Pneumonia of newborn . . . . . . . . . . . 763
Dierrhea of newborn . . . . . . . . . . . . 764
Othar infections of newborn . . . . . . 765-76S
Neonatal disorders arising from maternal
toxemia . . . . . . . . . . . . . . ...769Hemolytic disease of newborn
(arythroblastosis) . . . . . . . . . . . . 770
Hemorrhagic diseasa of newborn . . . . . . 771
Illdefinad diseases peculiar to early infancy
including nutritional maladjustment .772,773
Immaturity with mention of any other subsidiary
condition . . . . . . . . . . . . . . ...774
Immaturity unqualified . . . . . . . . , . . 776
All other causes . . . . . . . . . . . . . . . Residual
ALL OTHER
Both sexes
All causes . . . . . . . . . . . . . . . .
Congenital malformations . . . . . . . . . 750-759
Cartain diseases of early infancy . . . . . . 760-776
Birth iniuriaa . . . . . . . . . . . ...760.761
Intracranial and spinal injury at birth . 760
Other birth injury . . . . . . . . . . . 761Postnatal asphyxia and atelectasis . . . . . . 762
Pnaumonia of newborn . . . . . . . . . . . 763
Oiarrheaofnewborn . . . . . . . . . . . . 764
Other infections of newborn . . . . . . 765-76S
Neonatal disorders arising from maternal
toxemia . . . . . . . . . . . . . . ...769
Hemolytic diseasa of nawborn
(erythroblastosis) . . . . . . . . . . . . 770
Hemorrhagic disease of newborn . . . . . . 777
Illdafinad diseases peculiar to early infancy
including nutritional maladjustment .772, 773
Immaturity with mantion of any other subsidiary
condition . . . . . . . . . . . . . . ...774
Immaturity unqualified . . . . . . . . , . . 776
All other causes . . . . . . . . . . . . . . . Residual
Birth weight
All 1,000
weights1,oo1-
grams1,501- 2,001- 2,501- 3,001- 3,501-
1,5CCI 2,000or
2,5fM 3,000 3,500 4,000
leasgrams grams grams grams grams grams
1,440.0
216.9
1,160.7
165.6
49.6
136.0
337.3
53,9
5.2
11.4
17.7
62.7
9.2
127.1
17.2
343.4
62.3
2,671.9
178.1
2,292.6
267.2
10s.5
160.7647.1
176,7
36.4
35.6
33.3
22.2
26.9
244.7
39.4
763,C
201.2
90,553.1
1,349.6
66,266,1
12,760.6
&3.5
11,917.1
19,833.7
349.4
●
988.1
337.4●
S,266.1
927.8
45,186.2
337.4
88,374.8
673.5
68,686.o
7,379.2
1,610.5
5,76S.7
22,899.0
790.6,
,
746.7
●
351.4
9,082.2
1,039.5
44,289,9
605.3
48,852.9
2,916.0
46,336.6
6,767.6
1,361.5
4,40s.1
14,729.8
1,050.6●
268.0
557.5
514.6,
5,274.4
943.4
16,862.7
800.3
43,416.3
997.9
41,226.0
3,771.4
1,581.1
2,190.312,675.0
1,584.1●
453.6
349.9
●
●
5,248.8
1,244.2
15,370.7
1,192.3
Rate per 100,000 live births
15,1 S6.5
12,710.6
1,919.0
587.4
1,331.5
4,569.0
513.5*
104.4
217.6
448.2
87.0
1,640.7
339.4
2,619.6
332.9
13,032.2
8S1 .1
11,411.7
1,287.8
573.0
714.s3,B57.3
788.7
154.0
228.0
191.0
●
●
1,244.7
382.0
3,083.2
3,239.1
764.3
2,298.4
388.9
157.3
231.5
856.4
160.7●
42.7
4B.3
220.3
24.7
346.2
47.2
149.5
176.5
3,073.4
419.9
2,252.1
289.1
114.2
174.9
677.7
355.4
77.3
80.8
58.9
68.1
36.8
270.7
42.4
314.9
401.4
754.8
243.2
432.1
87.6
37.0
50.6
137.4
.50.4
5.7
9.4
8.0
74.3
9.4
41.5
●
6.0
79.4
942.5
169.7
615.3
104.9
55.4
49.4162.7
139.2
32.6
26.9
15.7
18.9
18.1
65.4
●
40.4
157.5
347.4
121.7
185.8
42.9
20.4
22.5
48.0
30.6
3.5
6.5
4.2
28.3
3.4
15.4
●
●
39.9
642.2
84.8
427.5
90.3
49.2
41.010s.7
97.3
23.8
18.1
11.1
12.3
12.3
37.3
●
16.0
119.8
271.6
92.8
146.5
36.2
17.4
18.8
39.3
28.5●
●
●
14.2
4.7
11.3
●
●
32.1
661.2
107.1
417.2
97.4
52.3
45.184.8
107.9
25.8●
●
16.9
21.7
31.4
●
136,9
4,001-
4,600
grams
327.4
94.2
190.3
58.1
31.4
26.6
59.0
25.7●
●
●
●
●
●
●
●
42.8
,012.2
119.6
667.0
165.8
83,0
83,0189.2
136.1●
●
33.2
●
●
,
●
226.7
4,501
grams
or
more
778,1
182.4
613.9
198.9●
127.1
121.6●
●
●
●
●
●
●
●
S32.9
●
,138.0
371,1●
●
●
247.4●
●
●
●
●
●
●
358.7
74
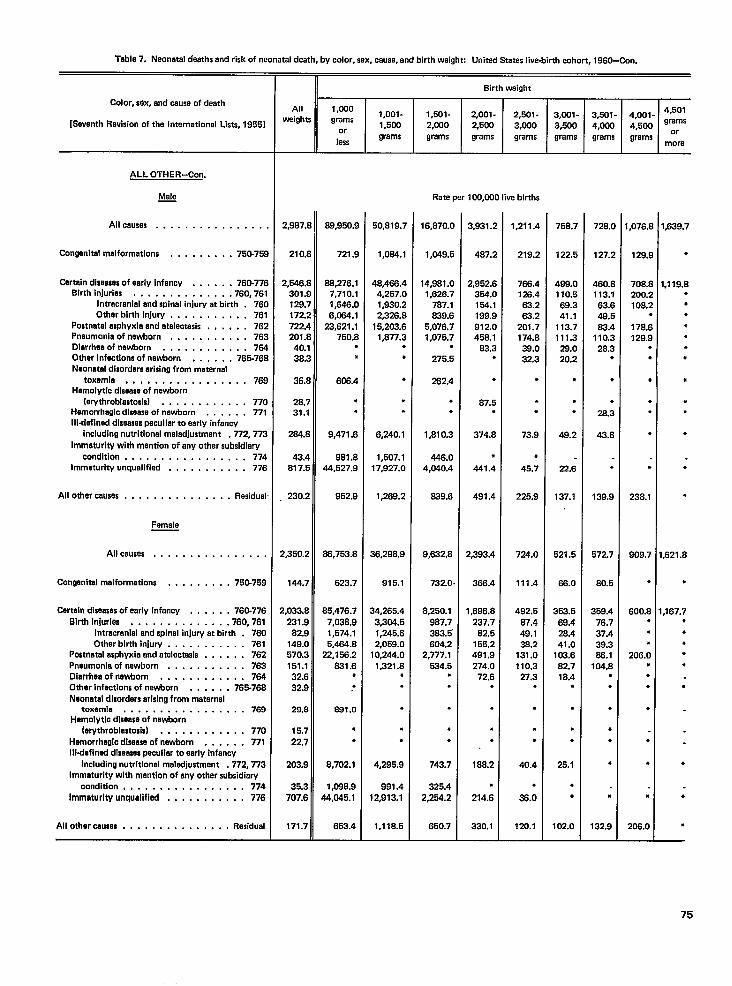
Table 7, Neonatal deathsand risk of neonataldeath, by color, sex, cause,end birth weight: Unitad States live-birth cohort, 1960-Con.
Color, sex, and causeof death
[Seventh Revisionof the International Liste, 19551
ALL OTHER-Con.
Male—
Allcausas . . . . . . . . . . . . . . .
Congenitalmalformations , . , . . . . . . 750-75:
Captaindiseasasofearly infancy . . . . . . 760-776Blrthinjuries . . . . . . . . . . . . . .760,761
Intracranial and spinal injury at birth . 76COtharbirth injury . . . . . . . , . , . 761
Postnatalasphyxie and atelectasis ., , . , . 762pnaumonia of nawborn . . . , . . . . . . . 763Diarrhaaofnawborn . . . . . . . . . . . . 784Other infaotlonsof newborn . . . . . . 765-76ENeonatal disordersarisingfrom maternal
toxamia . .,.,....,,......769Hemolytlc diseaseof newborn
(erythroblastosis) . . . . . . . . . . . . 770Hemorrhagicdiseaseof newborn . . . . . . 771Illdafinad diseaseapeculiar to early infancy
includingnutritional maladjustment .772,773Immaturity with mention of any other subsidiary
condition, ,,, . . . . . . . . . . ...774Immaturity unqualified . . . . . . . . . . . 776
Allotharcausas . . , , , , , . . . . . . . . Residual
Female
Allcauses . . . . . . . . . . . . . . . .
Congenitalmalformations . . . . . . . . . 75&759
Certain diseasasof early infancy . . . . . . 760-776Birth in]urlas . . . . . . . . . . . ...760.761
Intracranial and spinal injury at birth . 760Other birth injury . . . . . . . . . . . 761
Postnatalasphyxia and atalactasis . . . . . . 762Pnaumoniaof nawborn . . . . . . . . . . . 763Diarrhaaofnawborn . . . . . . ., . . . . 784Other infaotionaof newborn . . . . . . 76%766Naonatal dlsordarsarisingfrom metarnal
toxemia . . . . . . . . . . . . . . ...769Hamolytic dlseasaof newborn
(arythroblastosis) . , , . ., ., . , . . 770Hemorrheglodiseaseof nawtsorn . . . . . . 771Illdefinad dlseasaspeculiar to early infancy
includingnutritional maladjustment .772,773Immaturity with mantlon of any othar subsidiary
condition, . . . . . . . . . . . . . ...774Immaturity unqualified , , , . . . . . . ., 776
All other causes . , . . . . . . . . . . . . . Residual
11
II Birthweight
All 1,000 1,001- 1,501-vmighta grams
2,001- 2,54M - 3,W1 - 3,501- 4,001- 4’50’
1,500or
2,000 2,5W 3,000 3,500 4,000 4,500 ‘rams
lasagrams grams grama grams grams grams grams M;re
Rate per 100,000 live births
2,9S7.1
210.[
2,546.1301.!
129.:
172:
722.,
201.[
40.’
3s:
36.[
2s.731.1
284.[
43.4
S1 7.!
230.2
?,350.2
144.7
!,033.8
231.9
82.9
149.0
570.3
151.1
32.6
32.8
29.8
15.7
22.7
203.9
35.3
707.6
171.7
89,950.<
721 .!
88,276.1
7,710.1
1,646.(
6,064.1
23,621.1
750.[
,
608.4
,●
9,471.6
981 .~
44,527.9
952.9
88,763.8
623.7
B5,476.7
7,038.9
1,574.1
5,4S4.8
22,156.2
831.6●
●
881.0
●
●
8,702.1
1,098.9
$4,046.1
653.4
50,819.;
1,084.1
48,486.4
4,257.C
1,930.2
2,326.E
15,203.E
1,877.2●
●
●
●
●
6,240.1
1,507.1
17,927.0
1,269.2
36,296.9
915.1
34,265.4
3,304.5
1,245.6
2,059.0
I0,244.0
1,321.8●
●
.
●
●
4,295.9
991.4
12,913.1
1,118.5
16,870.0
1,049.5
14,981.0
1,628.7
787.1
839.6
5,076,7
1,075.7●
275.5
262.4
.
●
1,810.3
446.0
4,040.4
839.6
9,632.8
732.0
8,250.1
887.7
383.5’
604.2
2,777.1
534.5●
.
.
●
●
743.7
325.4
2,264.2
650.7
3,93t .:
487:
2,952.[
354.[
154.1
199.$
91 2.(
458.1
83.:,
*
87.E●
374.s
4
441.4
491.4
2,393.4
386.4
1,698.6
237.7
62.5
155.2
491.9
274.0
72.6●
.
●
●
188.2
●
214.6
330.1
1,211.~
219.:
788.4125.463.283.:
201.7174.E38.C32.3
●
.
.
73.9
●
45.7
225.9
724.0
111.4
492.5
87.4
49.1
38.2
131.0
110.327.3
●
.
●
●
40.4
●
3s.0
120.1
758.7
122.E
498.C110.569.2
41.1
113.7
111.3
28.0
20.2
●
.*
49.2
22.6
137.1
521.5
S&o
3K3.5
69.4
28.4
41.0
103.6
82.7
18.4●
.
●
●
25.1
●
●
102.0
728.0
127.2
460.8113.1
63.6
49.5
83.4
110.3
28.3●
●
.
28.3
43.6
●
139,9
572.7
80.5
359.4
76.7
37.4
39.3
88.1
104.8●
●
●
●
●
●
●
132.9
,076.1
129.!
708.[
200:
108:4
178S
129.{
*
.
,
●
238.1
909.7
.
600.8●
●
●
206.0●
●
●
.
●
●
●
206.0
1,639.7
●
1.119.8.
●
●
●
●
●
●
●
.
.
●
●
●
,621.8
●
,167.7●
●
●
●
●
●
●
●
●
75
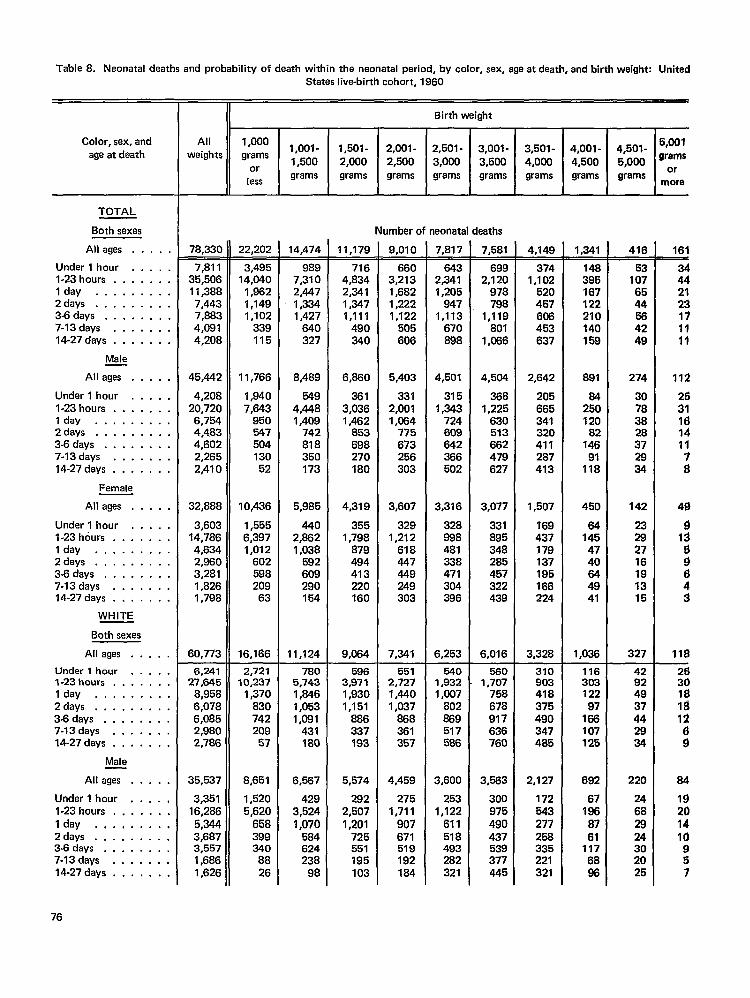
Table 8. Neonatal deaths and probability of death within the neonatal period, by color, sex, age at death, and birth weight: UnitedStates live-birth cohort, 1960
II Birth weight
Allweights
Color, sex, andage at death
1,000grams
orless
1,001- 1,501-1,500 2,000grams grams
2,001-2,500grams
2,501-3,000grams
TOTAL
Both sexes
All agas . . . . .
Under 1 hour . . . . .l-23hours . ., . . . .Iday . . . . . . . . .Zdays . . . . . . . . .3-6days . . . . . . . .7-13days . . . . . . .14-27 days . . . . . . .
Male
All ages . . . . .
Under 1 hour . . . . .l-23hours . . . . . . .Iday . . . . . . . . .2days . . . . . . . . .3-6 days . . . . . . . .7-13days . . . . . . .14-27 days . . . . . . .
Female
All ages . . . . .
Under 1 hour . . . . .l-23hours . . . . . . .Iday . . . . . . . . .Zdays . . . . . . . . .3-6 days . . . . . . . .7-13days . . . . . . .14-27 days . . . . . . .
WHITE
Both sexes
All ages . . . . .
Under 1 hour . . . . .l-23hours . . . . . . .Iday . . . . . . . . .Zdays . . . . . . . . .3-6 days . . . . . . . .7-13days . . . . . . .14-27 days . ,. . . . .
Male
All ages . . . . .
Under 1 hour . . . . ,l-23hours . . . . . . .Iday . . . . . . . . .Zdays . . . . . . . . .3-6 days . . . . . . . .7-13days . . . . . . .14-27 days . . . . . . .
Number of neonatal deaths
11,179—716
4,B342,3411,3471,111
490340
6,660
3613,0361,462
853698270IBO
4,319
3551,798
B79494413220160
9,064
9,010—660
3,2131,6821,2221,122
505606
5,403
3312,0011,064
775673256303
3,607
3291,212
618447449249303
7,341
7,817_543
2,3411,205
9471,113
670898
4,501
3151,343
724609642366502
3,316
7,581
6992,120
978798
1,119BOI
1,066
4,504
3681,225
630513662479627
3,077
331895348285457322439
6,016
78.330 22.202 14.474 4,149—374
1,102520457605453637
2,642
205665341320411287413
1,507
?69437179137195166224
3,328
1,341-148395167122210140168
891
84250120
82146
91118
450
64145
4740644941
1,036
416
Y1076544564249
274
307838
E
E
142
23282716191315
327
161
34442123171111
112
2631161411
;
49
913
:
:3
11$
7,81135,50611 ,3B87,4437,8834,0914,208
45,442
4,20820,7206,7544,4834,6022,2652,410
32,8B8
3,60314,7864,6342,9603,2811,B261,798
60,773
3,49514,040
1,9621,1491,102
339115
11,766
1,8407,643
95054750413052
10,436
1,5556,3971,012
60259B209
63
16,166
9897,3102,4471,3341,427
640327
8,489
5494,4481,409
742818350173
5,985
4402,8621,038
592609290154
11,124
89B481338471304396
6,253
6,24127,645
8,9586,0786,0852,9802,786
35,537
3,35116,2865,3443,6B73,5571,6861,626
2,72110,237
1,370830742209
57
8,651
1,5205,620
658399340
8826
7805,7431,8461,0531,081
431180
6,567
4293,5241,07058462423B
98
5963,9711,9301,151
886337193
5,574
2822,5071,201
725551195103
5512,7271,4401,037
86B361357
4,459
2751,711
907671519192184
5401,9321,007
802869517586
3,600
2531,122
611518493282321
5601,707
758678917636760
3,563
300975490437539377445
31090341B375490347485
2,127
172543277258335221321
11630312297
166107125
692
67186
8761
1176886
42924937442934
220
24682924302025
2!330181$12
:
84
19201410957
76
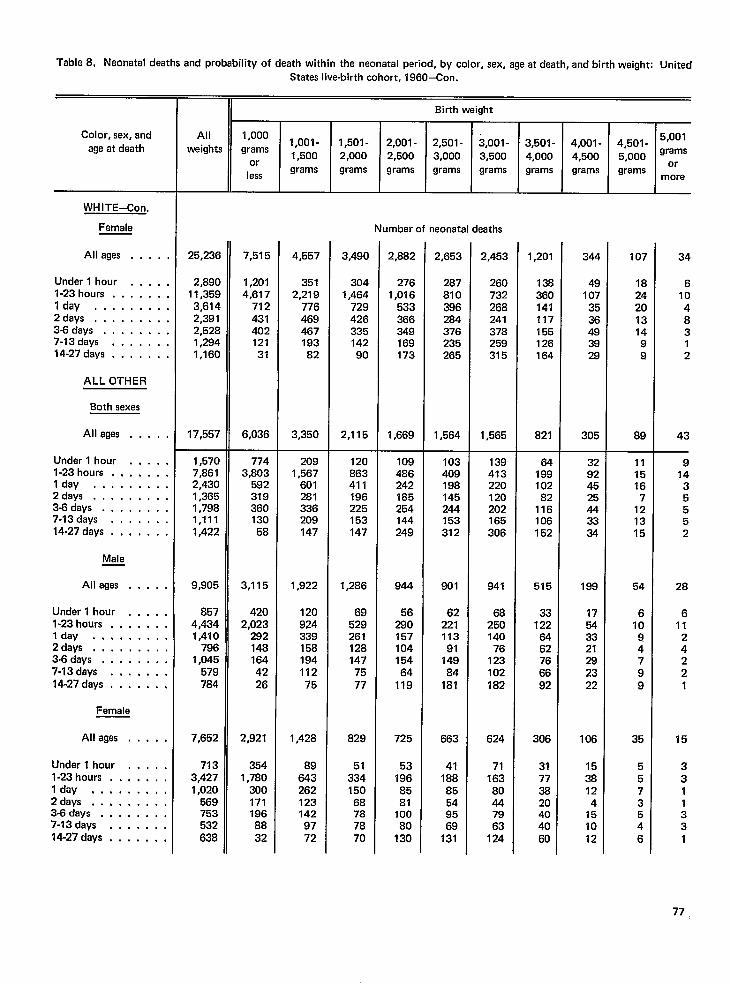
Table 8, Neonatal deeths and probability of death within the neonatal period, by color, sex, age at death, and birth weight: UnitedStates live-birth cohort, 1960–Con.
Birth weight
All 1,000
weights1,oo1-
grams1,501 - 2,001 - 2,501 - 3,001-
1,500 2,000 2,500or
3,000 3,500
lessgrams grams grams grams grams
Color, sex, andage at death 1-4,501-
5,001~ 000 grams
,grams ‘r
more
3,501-4,000grams
4,001-4,500grams
WHITE-Con.
Female
All agas . . . .
Under 1 hour . . . .l-23hours . . . . . .Iday . . . . . . . .2days, . . . . . . . .3-6days .,.....,7-13days . . . . . .14-27 days . . . . . .
ALL OTHER
Both sexes
All ages . . . . .
Under 1 hour . . . . ,l-23 hours . . . . . . .Iday . . . . . . . . .2 days . . . . . . . . .3-6days . . . . . . . .7-13days . . . . . . .14-27 days . . . ,. . .
Male
All ages . . . . .
Under 1 hour . . . . .l-23hours . . . . . . .lday . . . . . . . . .2days .,,......343days ..,,....7-13days . . . . . . .14.27 days , ,. . . . .
Female
All ages . . . . .
Under 1 hour . . . . .l-23 hours . . . . . . .lday . . . . . . . . .2days, . . . . . . . .3-6 days ..,.....7-13days . , . . . . .14-27 days . . . . . . .
Number of neonatal deaths
25,236
2,B9011,3593,6142,3912,5281,2941,160
17,557
7,515
1,2014,617
71243140212131
6,036
4,557
3512,219
776469467193B2
3,350
3,490
3041,464
72942633514290
2,115
2,882
2761,016
533366349169173
1,669
2,653
2B7810396284376235265
1,564
2,453
260732268241378259315
1,565
1,201
136360141117155126164
821
344
49107
3536493929
305
107
182420131499
89
34
61048312
43
1,5707,8612,4301,3651,7981,1111,422
9,905
8574,4341,410
7961,045
579784
7,652
7133,4271,020
569753532638
7743,803
59231936013058
3,115
4202,023
2921481644226
2,921
3541,780
3001711968832
2091,567
601281336209147
1,922
12092433915819411275
1,428
896432621231429772
120863411196225153147
1,286
6952926112B1477577
829
513341506B787870
1094862421B5254144249
944
5629015710415464
119
725
531968581
10080
130
103409198145244153312
801
6222111391
14984
181
663
4118885549569
131
139413220120202165306
941
68250140
76123102182
624
7116380447963
124
6419910282
116106152
515
331226462766692
306
31773820404060
32924525443334
199
17543321282322
106
1538124
151012
111516
7121315
54
61094799
35
5573546
914
35552
28
611
24221
15
3311331
77
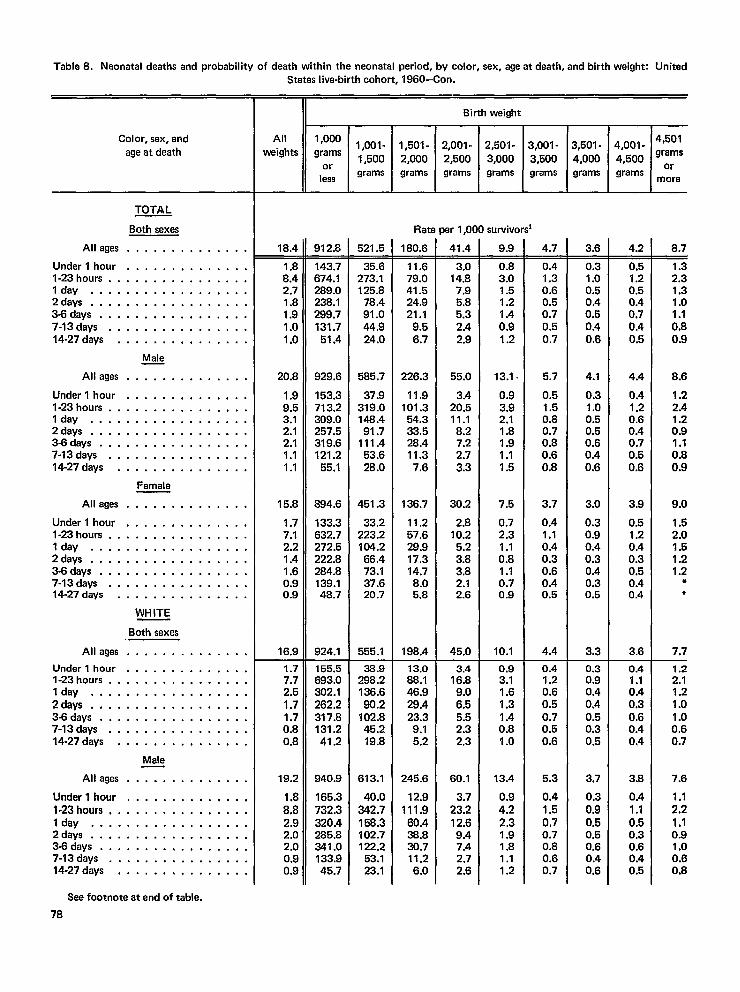
Table 8. Neonatal deaths and probability of death within the neonatal period, by color, sex, age at daath, and birth weight: United
Color, sex, andage at daath
TOTAL
Both sexes
Alleges . . . . . . . . . . . . . .
Under l hour . . . . . . . . . . . . . .l-23 hours . . . . . . . . . . . . . . . .I day . . . . . . . . . . . . . . . . . .2days . . . . . . . . . . . . . . . . . .3-6days . . . . . . . . . . . . . . . . .7-13days . . . . . . . . . . . . . . . .14-27days . . . . . . . . . . . . . . .
Male
Alleges . . . . . . . . . . . . . .
Underl hour .,....... . . . . .l-23hours . . . . . . . . . . . . . . . .Idly . . . . . . . . . . . . . . . . . .2days . . . . . . . . . . . . . . . . . .3-6days . . . . . . . . . . . . . . . . .7-13days . . . . . . . . . . . . . . . .14-27days . . . . . . . . . . . . . . .
Female
Alleges . . . . . . . . . . . . . .
Undarl hour . . . . . . . . . . . . . .l-23hours . . . . . . . . . . . . . . . .I day . . . . . . . . . . . . . . . . . .2days . . . . . . . . . . . . . . . . . .3-f3days . . . . . . . . . . . . . . . . .7-13days . . . . . . . . . . . . . . . .14-27days . . . . . . . . . . . . . . .
WHITE
Both sexes
Alleges . . . . . . . . . . . . . .
Underl hour . . . . . . . . . . . . . .l-23hours . . . . . . . . . . . . . . . .Idly . . . . . . . . . . . . . . . . . .2days . . . . . . . . . . . . . . . . .,3-6days . . . . . . . . . . . . . . . . .7-13days . . . . . . . . . . . . . . . .14-27days . . . . . . . . . . . . . . .
Male
Alleges . . . . . . . . . . . . . .
Underl hour, . . . . . . . . . . . . .l-23hours, . . . . . . . . . . . . . . .Idly . . . . . . . . . . . . . . . . . .2days . . . . . . . . . . . . . . . . . .3-6days . . . . . . . . . . . . . . . . .7-13days . . . . . . . . . . . . . . . .14-27days . . . . . . . . . . . . . . .
States live-birthcohort, 1960–Con.
II
II Birth weight
Rate per 1,000 survivors’
18.4—1.88.42.71.81.91.01.0
20.8
1.99.53.12.12.11.11.1
15.8
1.77.12.21.41.60.90.9
16.9
1.77.72.51.71.70.80.8
19.2
::;2.92.02.00.90.9
912.8-143.7674.1289.0238.1299.7131.7
51.4
929.6
153.3713.2309.0257.5319.6121.2
55.1
894.6
133.3632.7272.5222.8284.8139.148.7
924.1
155.5693.0302.1262.2317.8131.241.2
940.9
165.3732.3320.4285.8341.0133.945.7
521.5-35.6
273.1125.8
78.491.044.924.0
585.7
37.9319.0148.491.7
111.453.628.0
451.3
33.2223.2104.266.473.137.620.7
555.1
36.9298.2136.690.2
102.845.219.8
613.1
40.0342.7158.3102.7122.2
53.123.1
180.6-11.679.041.524.921.1
9.56.7
226.3
11.9101.3
54.333.528.411.3
7.6
136.7
11.257,629.917.314.78.05.8
198.4
13.088.146.929.423.3
9.15.2
245.6
12.9111,9
60.433.830.711.26.0
41.4-3.0
14.87.95.85.32.42.9
55.0
3.420.511.18.27.22.73.3
30.2
2.810.2
5.23.83.82.12.6
45.0
3.416.8
9.06.55.52.32.3
60.1
3.723,212.69.47.42.72.6
9.9—0.83.01.51.21.40.91.2
13.1 ~
0.93.92.11.81,91.11.5
7.5
0.72.31.10.81.10.70.9
10.1
0.93.11.61.31.40.81.0
13.4
0.94.22.31.91.81.11.2
4.7—0.41.30.60.50.70.50,7
5.7
0.51.50.80.70.80.60.8
3.7
0.41.10.40.30.60.40.5
4.4
0.41.20.60.50.70.50.6
5.3
0.41.50.70.70.80.60.7
3,501-4,000
3.6-0.31.00.50.40.50.40.6
4.1
0.31.00.50.50.60.40.6
3.0
0,30.90.40.30.40.30.5
3.3
0.30.9
:::0.50.30.5
3.7
0.30.90.50.50.60.40.6
4,001-
4,500grams
4.2—0.51.20.5
z0.40.5
4.4
0.41.20.60.40.70.50.6
3.9
0.51.20.40.30.50.40.4
3.6
0.41.10.40.30.60.40.4
3.8
0.41.10.50.30.60.40.5
4,501grams
ormora
8.7-
1.32.31.31.01.10.80.9
8.6
1.22.41.20.91.1
::;
9.0
1.52.01.51.21.2
*●
7.7
1.22.11.21.01.00,60.7
7.6
1.12.21.10.91.00.60.8
See footnote at end of tabla.
78
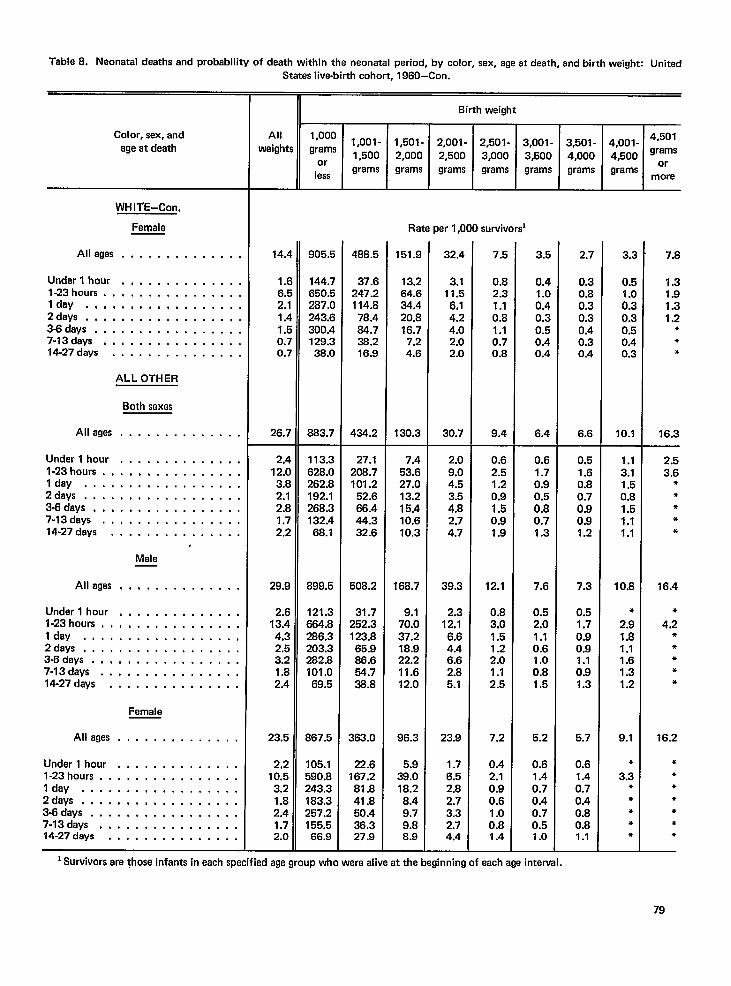
Table8. Neonatal deaths and probability of death within the naonatal period, by color, sex, aqeatdeath. and birth weiaht: United.-States live-birth cohort, 1960–Con.
—
8irth weight
I‘ ’000 1,001-grams
1,500or
lessgrams II3,501- 4,001- 4“50’
4,000 4,500 ‘ramsgrams grams ~’&
Color, sex, andage at daath
Allwaights !!J_EEE
Rate per 1,000 survivors
WHITE-Con.
Female
Alleges . . . . . . . . . . . . . .
Under l hour, . . . . . . . . . . . . .l-23 hours . . . . . . . . . . . . . . . .Idly, ,,, , ., . . . . . . . . . . .2deys . . . . . . . . . . . . . . . . . .3-6days . . . . . . . . . . . . . . . . .7-13days . . . . . . . . . . . . . . . .14-27days . . . . . . . . . . . . . . .
ALLOTHER
Both saxas
Alleges, . . . . . . . . . . . . .
Underl hour . . . . . . . . . . . . . .l-23hours . . . . . . . . . . . . . . . .Idly, . . . . . . . . . . . . . . . . .2days . . . . . . . . . . . . . . . . . .3Gdays . . . . . . . . . . . . . . . .,7-13days . ., ..,..,... . . . .14-27days . . . . . . . . . . . . . . .
Male
151.9 2.7 7.814.4
1.(6~
2,11.4If
0.70.7
26.7
905.E
144.7650.5287.C243.E300.4129.S38.0
883.7
488.5
37.6247.2114.8
78.484.738.216.9
434.2
32.4
3.111.56.14.24.02.02.0
30.7
7.5
0.82.31.10.81.10.70.8
9.4
3.5
0.4
:::0.30.50.40.4
6.4
3’..
o~
1.C0’..0’(j:;
0.4of
10.1
13.264.634.420.816.77.24.6
130.3
0.30.80.30.30.40.30.4
6.6
1.3
;::1.2
***
16.3
2,412.03.82.12.81.72.2
29.9
1::4.32.53.21.82.4
23.5
2,210.53.21.82.41.72.0
113.3628.0262.8192.1268.3132.468.1
899.5
121.3664.8266.3203.3282.8101,069.5
867.5
105.1590.8243.3183.3257.2155.566.9
27.1206.7101.2
52.666.444.332.6
508.2
31.7252.3123.865.986.6
%
363.0
22.6167.281.841.850.436.327.9
7.453.627.013.215.410.610.3
168.7
9.170.037.218.922.211.612.0
96.3
5.939.018.28.49.79.88.9
2.09.04.5
::;2.74.7
39.3
2.312.1
6.64.46.62.85.1
23.9
1.76.52.82.73.32.74.4
0.62.51.20.91.50.91.9
12.1
0.83.01.51.22.01.12.5
7.2
0.42.10.90.61.00.81.4
0.61.70.9
:::0.71.3
7.6
0.52.01.10.61.00.81.5
5.2
0.61.40.70.40.70.51.0
0.51.60.80.70.90.91.2
7.3
0.51.70.90.91.10.91.3
5.7
0.61.40.70.40.80.81.1
1.13.11.50.81.51.11.1
10.8
●
2.91.81.11.61.31.2
9.1
●
3.3***●
●
2.53.6
*●
***
16.4
●
4.2***●
*
16.2
●
*●
●
*●
*
Aliases . . . . . . . . . . . . . .
Undarl hour . . . . . . . . . . . . . .l-23hours, ,,, ..,.,.. . . . . .Idly ., . . . . . . . . . . . . . . .,2days, . . . . . . . . . . . . . . . . .3-6days . . . . . . . . . . . . . . . . .7-13days . . . . . . . . . . . . . . . .14-27days . . . . . . . . . . . . . . .
Female
Alleges . . . . . . . . . . . . . .
Undarl hour .,,..,.., . . . . .l-23hours . . . . . . . . . . . . . . . .Idly . . . . . . . . . . . . . . . . . .2days . .,, , .,, ..,..... . .3-6days . . . . . . . . . . . . . . . . .7-13days . . . . . . . . . . . . . . . .14-27days . . . . . . . . . . . . . . .
lSurvivors arethosa infants inaach specified agegroup wlsoware alive atthe beginning of each age interval.
79
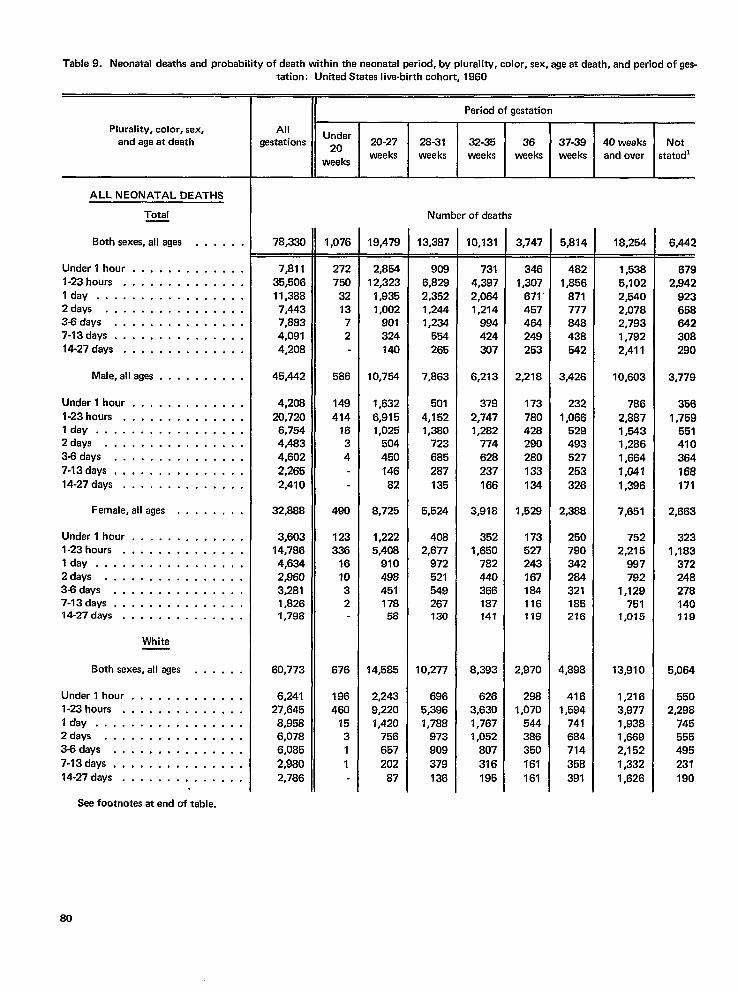
Table9. Neonatal deaths andprobaMlity ofdeath within theneonatal period, bypluraliW, color, sex, ageatdeath, andperiodofges-
Plurality, color, sex,and age at death
ALL NEONATAL DEATHS
Total
Both sexes, all ages . . . . . .
Under l hour . . . . . . . . . . . . .l-23hours, ...,.,,,,,,, .Idly . . . . . . . . . . . . . . . . .2days . . . . . . . . . . . . . . . .3-6days . . . . . . . . . . . . . . .7-13days . . . . . . . . . . . . . . .
14-27days . . . . . . . . . . . . . .
Male,allages . . . . . . . . . .
Underl hour . . . . . . . . . . . . .
l-23hours . . . . . . . . . . . . . .Idly . . . . . . . . . . . . . . . . .2days . . . . . . . . . . . . . . . .3-6days . . . . . . . . . . . . . . .
7-13days, . . . . . . . . . . . . . .14-27days . . . . . . . . . . . . . .
Female,allages . . . . . . , .
Underl hour . . . . . . . . . . . . .l-23hours . . . . . . . . . . . . . .Idly . . . . . . . . . . . . . . . . .2days . . . . . . . . . . . . . . . .3-6days . . . . . . . . . . . . . . .7-13days . . . . . . . . . . . . . . .14-27days . . . . . . . . . . . . . .
White
Both sexes, all ages . . . . . .
Underl hour . . . . . . . . . . . . .l-23hours . . . . . . . . . . . . . .Idly . . . . . . . . . . . . . . . . .2days . . . . . . . . . . . . . . . .3-6days . . . . . . . . . . . . . . .
7-13days . . . . . . . . . . . . . . .14-27days . . . . . . . . . . . . . .
tetion: United States live-birth cohort, 1960
II Period of gestation
AllUnder
gestations ~. 20-27 28-31 32-35 36 37-39 40 weeks Notweeks weeks
weeksweeks weeks weeks and over stated’
Number of deaths
78,330
7,81135,50611,3887,4437,8834,0914,208
45,442
4,20820,720
6,7544,4834,6022,2652,410
32,888
3,60314,7864,6342,9603,2811,8261,798
60,773
6,24127,645
8,9586,0786,085
2,9802,786
1,076
272750
321372
586
149414
1634
490
123336
161032
676
186460
1531
1
19,479
2,85412,323
1,9351,002
901324140
10,754
1,632
6,9151,025
504450
14682
8,725
1,2225,408
91049845117858
14,585
2,2439,2201,420
756657
202
87
13,387
9086,8282,3521,2441,234
554265
7,863
501
4,1521,380
723685287
135
5,524
4082,677
972521549267130
10,277
6965,3961,788
973909
379136
10,131
7314,3972,0641,214
994424
307
6,213
379
2,7471,282
774628237
166
3,918
3521,650
782440366187141
8,393
6263,6301,7671,052
807
316195
3,747
3461,307
671457464249253
2,218
173
780428290280
133124
1,528
173527243167184116119
2,970
2981,070
544386350
161
161
5,814
4821,856
871777848438542
3,426
232
1,066529493527
253326
2,388
250790342284321185216
4,898
4161,594
741684714
391
18,254
1,5385,1022,5402,0782,7931,7922,411
10,603
786
2,8871,5431,2861,664
7,047
1,396
7,651
7522,215
887792
1,129751
1,015
13,910
1,2163,9771,9381,6692,152
1,332
1,626
6,442
6792,942
923658642308290
3,779
3561,759
551410364168
171
2,663
3231,183
372248278140719
5,064
5502,298
745555495
231
190
See footnotes at end of table.
80
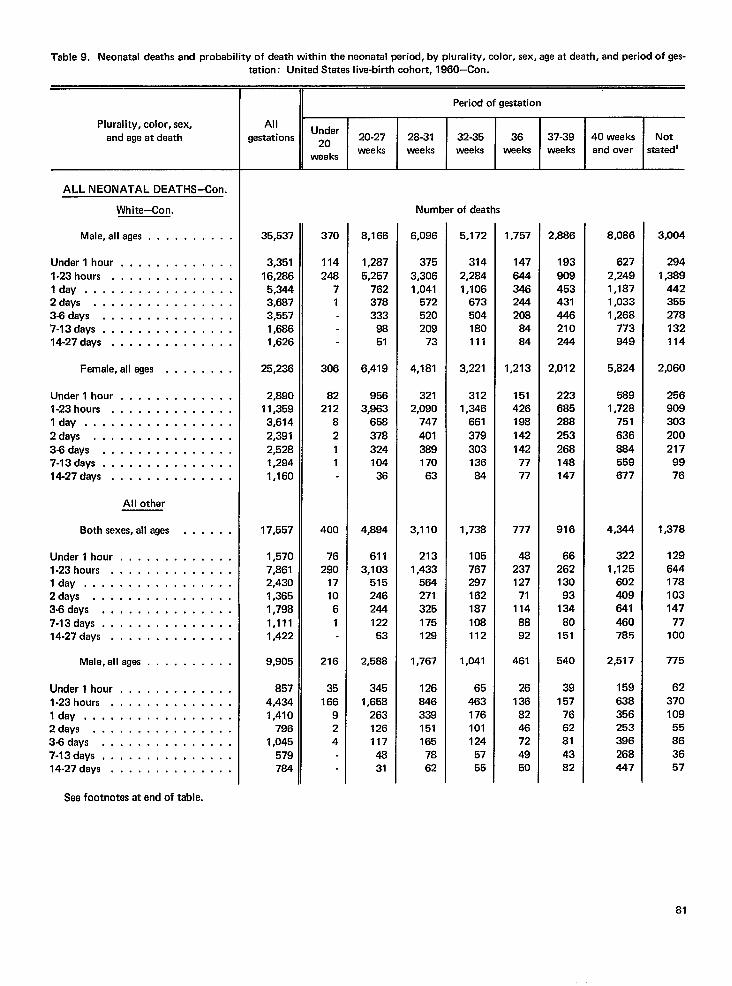
Table9, Neonatal deeths and probability ofdeath within theneonatal period, byplurality, coior, sex, ageatdeath, andperiodofges-
Plurality, color, sex,
and age at death
ALL NEONATAL DEATHS–Con.
White-Con.
Male, alleges . . . . . . . . . .
Under l hour . . . . . . . . . . . . .l-23hours . . . . . . . . . . . . . .I day . . . . . . . . . . . . . . . . .2days . . . . . . . . . . . . . . . .3.6days . . . . . . . . . . . . . . .7-13days . . . . . . . . . . . . . . .14-27days . . . . . . . . . . . . . .
Female,allages . . . . . . . .
Underl hour . . . . . . . . . . . . .l-23hours . . . . . . . . . . . . . .Idly . . . . . . . . . . . . . . . . .2days . . . . . . . . . . . . . . . .3-8days . . . . . . . . . . . . . . .7-13days . . . . . . . . . . . . . . .14.27days . . . . . . . . . . . . . .
Al I other
Both sexes, all ages . . . . . .
Undarl hour, . . . . . . . . . . . .l-23hours . . . . . . . . . . . . . .Idly . . . . . . . . . . . . . . . . .2days . . . . . . . . . . . . . . . .3-6days . . . . . . . . . . . . . . .7-13days . . . . . . . . . . . . . . .14-27days . . . . . . . . . . . . . .
Male,allages . . . . . . . . . .
Underl hour, . . . . . . . . . . . .l-23hours . . . . . . . . . . . . . .Idly . . . . . . . . . . . . . . . . .2days . . . . . . . . . . . . . . . .3Sdays . . . . . . . . . . . . . . .7-13days . . . . . . . . . . . . . . .14-27days . . . . . . . . . . . . . .
Sea footnotes at end of table.
tation: United States live-birth cohort, 1960-Con.
II Period of gestation1
AllUnder
gestations *O 20-27 28-31 32-35 36weeks weeks weeks
weaksweeks
Number of daaths
35,537
3,35116,2865,3443,6873,5571,6861,626
25,236
2,89011,3593,6142,3912,5281,2941,160
17,557
1,5707,8612,4301,3651,7981,1111,422
9,905
8574,4341,410
7961,045
579784
370
114248
71
306
82212
8211
400
76290
171061
216
35166
924
8,166
1,2875,257
762378333
9851
6,419
9563,963
65837832410436
4,894
6113,103
515246244122
53
2,588
3451,658
2631261174831
6,096
3753,3061,041
572520209
73
4,181
3212,090
747
40138917063
3,110
2131,433
564271325175129
1,767
126846339151165
7862
5,172
3142,2841,106
673504180111
3,221
3121,346
661
37930313684
1,738
105767297162187108112
1,041
65463176101124
5755
1,757
147
644346244208
8484
1,213
151426198142142
7777
777
48237127
711148892
461
26136
8246724950
37-39weeks
2,886
193
909453431446210244
2,012
223685288
253268148147
916
6626213093
13480
151
540
39157
7662814382
40 weeksand over
8,086
6272,2491,1871,0331,268
773949
5,824
5891,728
751
636884559677
4,344
3221,125
602
641460785
2,517
159638356253396268447
Notstated’
3,004
2941,389
442355278132114
2,060
256
303
200217
9976
1,378
129644178103147
77100
775
6237010955863657
81
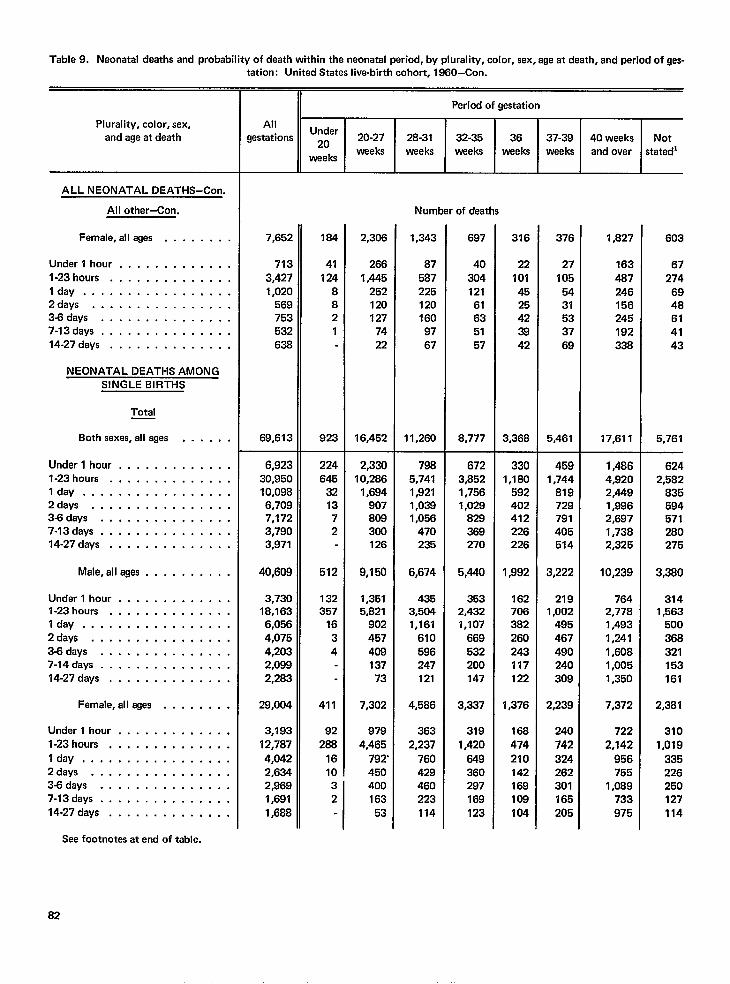
Table9. Neonatal deaths andprobatility ofdeath within theneonatal period, byplurality, color, sex, ageatdaath, andpariod of gas-tation: United States live-birth cohort, 1960-Con.
Plurality, color, sex,and age at death
ALL NEONATAL DEATHS–Con.
All othar-Con.
Female, all ages . . . . . . . .
Under l hour . . . . . . . . . . . . .
l-23hours . . . . . . . . . . . . . .Idly . . . . . . . . . . . . . . . . .2days . . . . . . . . . . . . . . . .3-6days . . . . . . . . . . . . . . .7-13days . . . . . . . . . . . . . . .14-27days . . . . . . . . . . . . . .
NEONATAL DEATHS AMONGSINGLE BIRTHS
Total
Both sexes, all ages . . . . , .
Underl hour . . . . . . . . . . . . .l-23hours . . . . . . . . . . . . . .Idly . . . . . . . . . . . . . . . . .2days . . . . . . . . . . . . . . . .3-6days . . . . . . . . . . . . . . .7-13days . . . . . . . . . . . . . . .14-27days . . . . . . . . . . . . . .
Male,allages ...,...,..
Undarl hour . . . . . . . . . . . . .l-23hours . . . . . . . . . . . . . .Idly . . . . . . . . . . . . . . . . .2days . . . . . . . . . . . . . . . .36days . . . . . . . . . . . . . . .7-14days . . . . . . . . . . . . . . .14-27days . . . . . . . . . . . . . .
Famale,allages . . . . . . . .
Underl hour . . . . . . . . . . . . .l-23hours . . . . . . . . . . . . . .
I day . . . . . . . . . . . . . . . . .2days . . . . . . . . . . . . . . . .3-6days . . . . . . . . . . . . . . .7-13days . . . . . . . . . . . . . . .
14-27days . . . . . . . . . . . . . .
II Period of gestation
AllUnder
gestations Z. 20-27 28-31 32-35 36 37-39 40 weeks Notweeks
weeksweeks waeks weeks waeks and over statedl
Number of deaths
7,652
713
3,4271,020
569753532638
69,613
6,92330,95010,0986,7097,1723,7903,971
40,609
3,73018,1636,0564,0754,2032,0992,283
29,004
3,193
12,787
4,0422,6342,9691,691
1,688
184
41124
8821
923
224645
321372
512
132357
1634
411
92288
1610
2,306
266
1,4452521201277422
16,452
2,33010,286
1,694907808300126
9,150
1,3515,821
90245740813773
7,302
9794,465
792’450
3 4002 163
53
1,343
875872251201609767
11,260
7985,7411,9211,0381,056
470235
6,674
4353,5041,161
610596247121
4,586
3632,237
760429460223
114
697
40
304121
61635157
8,777
6723,8521,7561,029
369270
5,440
3532,4321,107
669532200147
3,337
319
1,420
549360297169123
316
22
1014525423842
3,368
3301,180
592
412226226
1,992
1627063B2
243117122
1,376
168
474
210142169108104
376
27
1055431533769
5,461
4591,744
819729791405514
3,222
2191,002
495467490240309
2,239
240
742
324262301165205
1,827
163
487246156245192338
17,611
1,4864,9202,4491,9962,6971,7382,325
10,239
7642,7781,4931,2411,6081,0051,350
7,372
722
2,142
956755
1,089733
975
603
67274
6948614143
5,761
6242,582
835594571280275
3,380
3141,563
500
368321153161
2,381
3101,019
335226250127114
See footnotas at end of table.
82
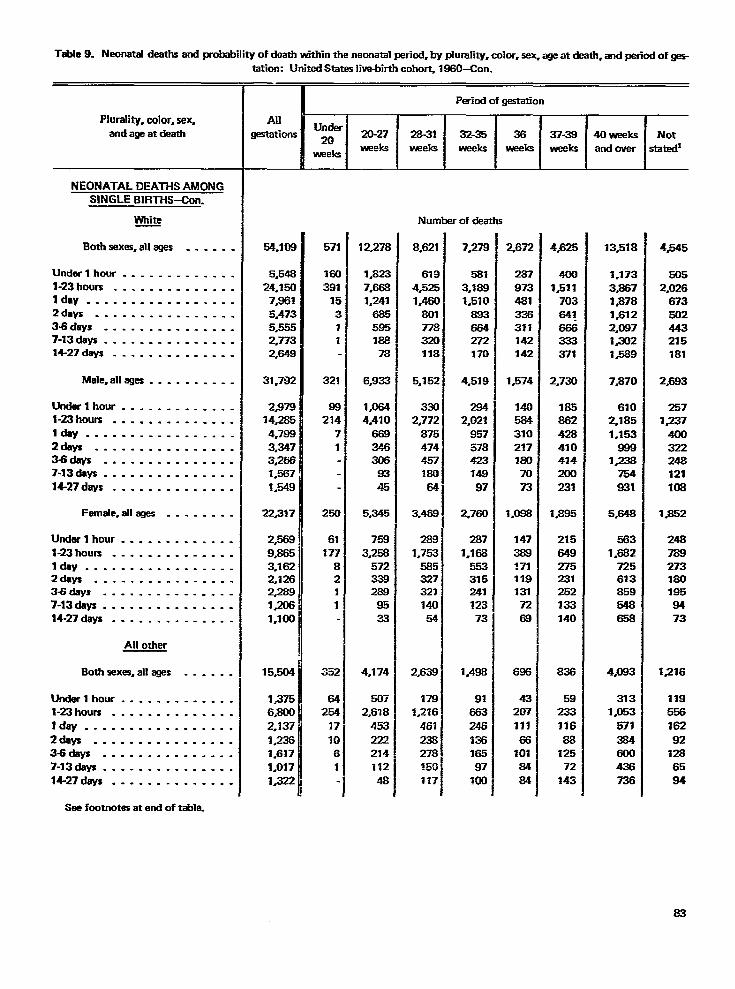
Table 9. Neonatal deaths and probability of death within the neonatal period, by pfurality. color. sex. age at death. and mtiod of m
Plurality, color, sa~and age at death
NEONATAL DEATHS AMONGSINGLE BIRTHS<on.
White
Bothsexas, allagas . . . . . .
Undarl hour ---------- . . .l-23hours . . . . . . . . . . . . . .Idly . . . . . . . . . . . . . . . . .2days . . . . . . . . . . . . . . . .
343days . . . . . . . . . . . . ..-7-13days . . . . . . . . . . . . . . .14-27 days . . . . . . . . . . . . . .
Male, alleges . . . . . . . . . .
Lktdarlhou r . . . . . ------- .l-23hours . . . . . . . . . . . . . .
IdaY -----------------2days . . . . . . . . . . . . . . . .Widays . . . . . . . . . . . . . . .7-13daw . . . . . - . . . . . . . . .14-27 days . . . . . . . . . . . . . .
Farnale, allages . . . . . ..-
Utiwl hour . . . . . . . . . . . . .l-23hours . . . . . . . . . . . . . .Idly . . . . . . . . . . . . . . . . .2days . . . . . . . . . . . . . . . .345days . . . . . . . . . . . . ..-7-13rJays . . . . . . . . . . . . . . .14-27days . . . . . . . . . . . . -.
All other
Bothsexes,ailages . . . ..-
Undarlhour . . . . . . . . . . . . .l-23hours . . . . . . . . . . . . . .IdaY . . . . . . . . . . . . . . . . .2&~ . . . . . . . . . . . . . . . .36days . . . . . . . . . . . . . . .7-13days . . . . . . . . . . ..- . .14-27days . . . . . . . . . . . . . .
tation: UnitedStatesliva-birthcohort, lW)-Con.
54.109
5.548
24,150
7J16Y
5,473
5.5552*7732,649
31.782
2,97914,285
4,788
3.3473,2661.567
1.548
22,317
2,568
9.8653.1622,1262=9
1,206
1.100
15,504
1375
6.800
2.137
1.23S1.617
%.0171.322
571
16(
391J!
<.11
321
9$
214
3
1
25C
61
In
a21
1
S32
642!54
?7
70
6
1
12.278
1,823
7.666
1.241
685
595188
78
6,933
1.0644,410
669
346306
83
45
5,345
758
3,258
572339289
95
33
4,174
507
2.678
453
222214
IY2
48
NUII
8.621
6194.5251,46C
80177332a118
5,152
3362,772
875
474457180
64
3.469
288
1.753
5853273X
140
54
2,639
179
1,216
461
238278
150117
%riodofgestation
3235
erofdea
7.278
5813.1881,510
883664272370
4,519
2942,021
957578423149
97
2,760
287
1,168
553315241
12373
1.488
91663246Z16~6597
XIO
2.672
287973481336311142142
1,574
1405843102?7amm73
1.088
1473881711191317268
4320711166
1018484
4.625
4CJ01J511
70364!666333371
2,730
185862428410434200231
1#885
215649275231252133140
5923311688
12572
143
13~18
1.1733#86713781.6122.0873#xf21=9
7#870
6102,1851.153
898la
754831
5.648
5631382
725613859548658
4.083
3131,053
671284W438736
4545
5052,026
673502443215181
2@3
2571#237
44nl322248121108
1.852
2487892731801958473
1~16
11955616292
1286584
Saefootnotesat endoftable.
83
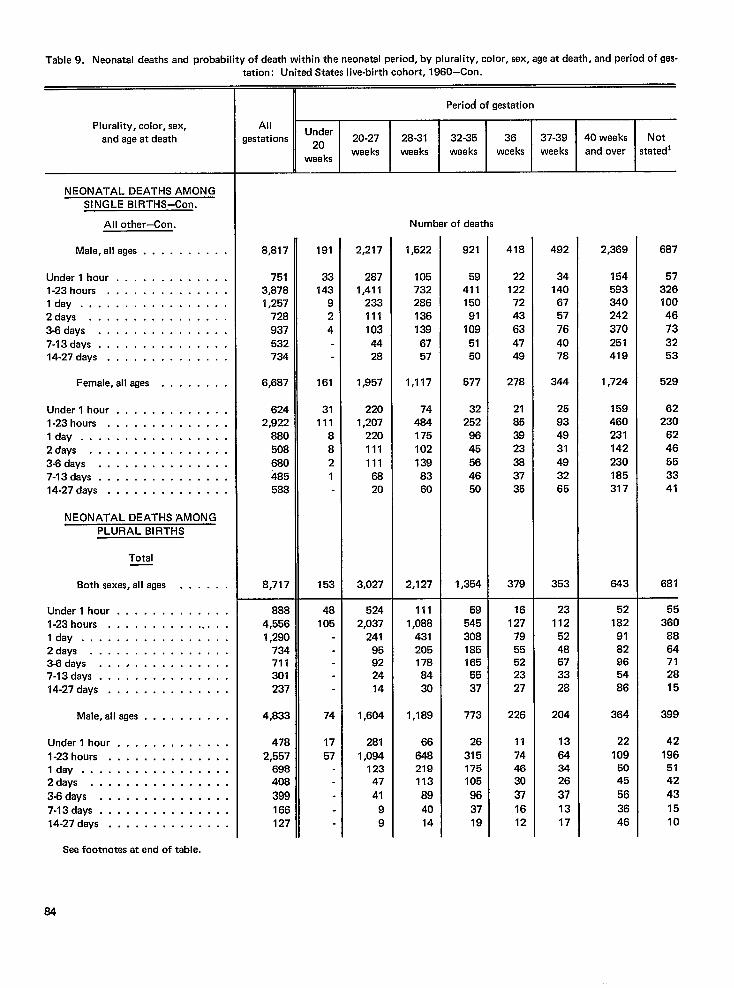
Table9. Neonatal deaths and probability ofdeath within theneonatal period, byplurality, color, sex, ageatdeath, andperiod of gas-tation: United States live-birth cohort, 1960–Con.
Plurality, color, sex,and age at death
NEONATAL DEATHS AMONG
SINGLE BIRTHS–Con.
All other–Con.
Male, alleges . . . . . . . . . .
Under l hour . . . . . . . . . . . . .l-23 hours . . . . . . . . . . . . . .Idly . . . . . . . . . . . . . . . . .2days . . . . . . . . . . . . . . . .3-6days . . . . . . . . . . . . . . .7-13days . . . . . . . . . . . . . . .14-27days . . . . . . . . . . . . . .
Female,allages . . . . . . . .
Underl hour . . . . . . . . . . . . .l-23hours . . . . . . . . . . . . . .Idly . . . . . . . . . . . . . . . . .2days . . . . . . . . . . . . . . . .3-6days . . . . . . . . . . . . . . .7-13days . . . . . . . . . . . . . . .14-27days . . . . . . . . . . . . . .
NEONATAL DEATHS AMONGPLURAL BIRTHS
Total
Both sexes, all ages . . . . . .
Underl hour . . . . . . . . . . . . .l-23hours . . . . . . . . . . . . . . .I day . . . . . . . . . . . . . . . . .2days . . . . . . . . . . . . . . . .343days . . . . . . . . . . . . . . .7-13days . . . . . . . . . . . . . . .14-27days . . . . . . . . . . . . . .
Male,allages . . . . . . . . . .
Underl hour . . . . . . . . . . . . .
l-23hours . . . . . . . . . . . . . .I day . . . . . . . . . . . . . . . . .2days . . . . . . . . . . . . . . . .
3-6days . . . . . . . . . . . . . . .7-13days . . . . . . . . . . . . . . .14-27days . . . . . . . . . . . . . .
Period of gestation
AllUnder
Gestations Z. 20-27 2B-31 32-35 36 37-39 40 weaks Notwee ks weeks weeks weeks weeks
waeksand over stated’
Number of deaths
8,817
7513,8781,257
728937532734
6,687
6242,922
8805086804855B8
8,717
8884,5561,290
734711301237
4,833
4782,557
69B408
399166127
191
33143
924
161
31111
8821
153
48105
74
1757
2,217
2871,411
2331111034428
1,957
2201,207
2201111116820
3,027
5242,037
24195922414
1,604
2BI
1,09412347
41
99
1,522
105732286136139
6757
1,117
74484175102
1398360
2,127
1111,088
4312051788430
1,189
66
648219113
894014
921
5941115091
1095150
577
32252
9645564650
1,354
59545308185165
5537
773
26
315175105
963719
418
22122
7243
634749
278
21853923383735
379
16127
7955522327
226
11744630
37
1612
492
34140
6757764078
344
25934931493265
353
23112
5248573328
204
13
643426
371317
2,369
154593340242
370251419
1,724
159460231142230185317
643
521829182965486
364
22
1095045
56
3646
687
5732610046733253
529
62230
6246553341
681
55360
8864712815
399
421965142
431510
See footnotes at end of table.
64
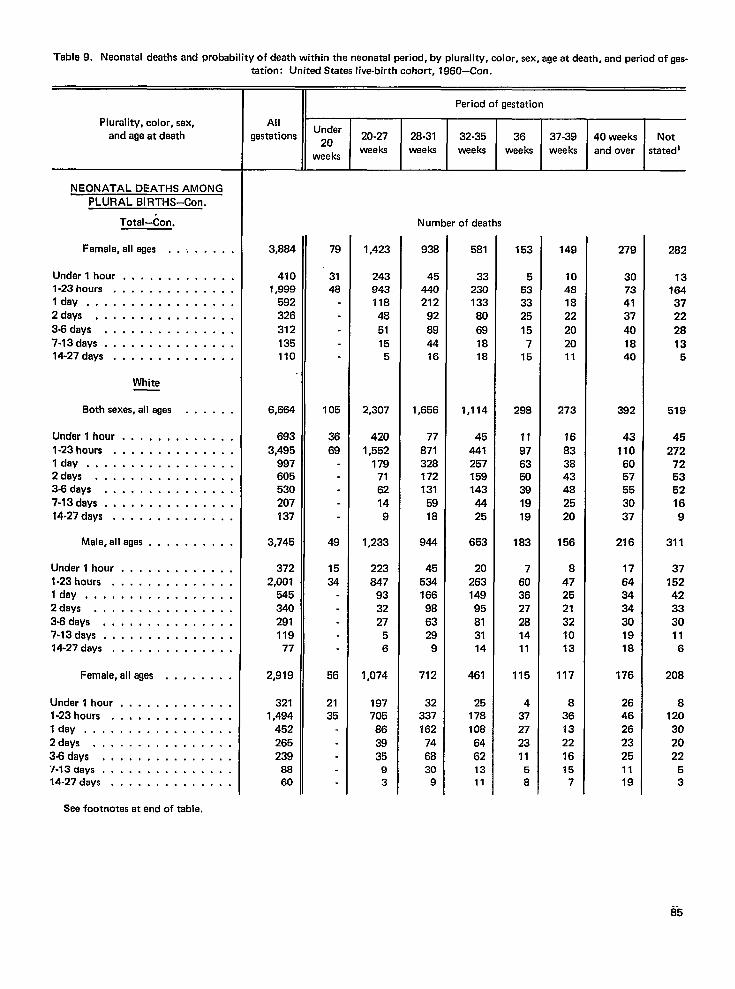
Table9. Naonatal deaths and probability ofdeath within theneonatal period, bypluraliW, color. sex. aqeatdeath. and Deriodofaes-
Plurality, color, sex,
and age at death
NEONATAL DEATHS AMONGPLURAL BIRTHS–Con.
Total-Con.
Female, all ages . .
Under lhour . . . . . . .l-23hours . . . . . . . .Idly . . . . . . . . . . .2days . . . . . . . . . .3.8days . . . . . . . . .
7-13days .,..,....14-27 days . . . , ., . .
White
Both sexes, all ages
Under l hour . . . . . . .
l-23hours . . . . ,. . .Idajr . . . . . . . . . . .2days . . . . . . . . . .3-6days . . . . . . . . .7-13days .,.......14-27 days . . . . . . . .
Male, all agas . . . .
Under l hour . . . . . . .l-23hours . . . . . . . . .
. . . . . .
. . . . . .
. . . . . .
. . . . . .
. . . . . .
. . . . . .
. . . . . .
. . . . . .
. . . . . .
. . . . . .
. . . . . .
. . . . . .
. . . . . .
. . . . . .
. . . . . .
. . . . . .
. . . . . .
. . . . . .
. . . . . .Idea, . . . . . . . . . . . . . . . .2days . . . . . . . . . . . . . . . .3-8days . . . . . . . . . . . . . . .7-13days, . . . . . . . . . . . . . .14.27 days, . . . . . . . . . . . . .
Female, all ages . . , . . , , .
Undarl hour, . . . . . . . . . . . .l-23hours . . . . . . . . . . . . . .lay, . . . . . . . . . . . . . . . .2days . . . . . . . . . . . . . . . .
3-6days . . . . . . . . . . . . . . .“1-13ciays . . . . . . . . . . . . . . .14-27 days . . . . . . . . . . . . . .
See footnotes at end of table.
tation: United States live-birth cohort, ”1960–Con. -
__ltEAllUnder
gestations *O 20-27weeks
weeks
3,884
410‘1,999
592326
312135110
6,664
6933,495
997605530
207137
3,745
3722,001
545340291119
77
2,919
3211,494
452265239
8860
79
3148
105
3669
49
1534
56
2135
1,423
24394311848
51155
2,307
4201,552
1797162149
1,233
223847
933227
56
1,074
197705
863935
93
28-31weeks
Period of gestation
32-35waeka
36weeks
Number of deaths
938
45440212
92
894416
1,656
77871328172131
5918
944
45534166986329
9
712
32337162
746830
9
581
3323013380
691818
1,114
45441257159143
4425
653
2026314995813114
461
251781086462
13
11
153
5533325
157
15
298
11
976350391919
183
7603627281411
115
437272311
5
8
I37-39 40weaks Not
wee ks and over stated]
149
10481822
202011
273
16833843482520
156
8472521321013
117
83613221615
7
279
30734137
401840
382
431106057553037
216
17643434301918
176
26462623251119
282
13
164
3722
2813
5
519
45272
725352169
311
3715242333011
6
208
8120302022
53
%5
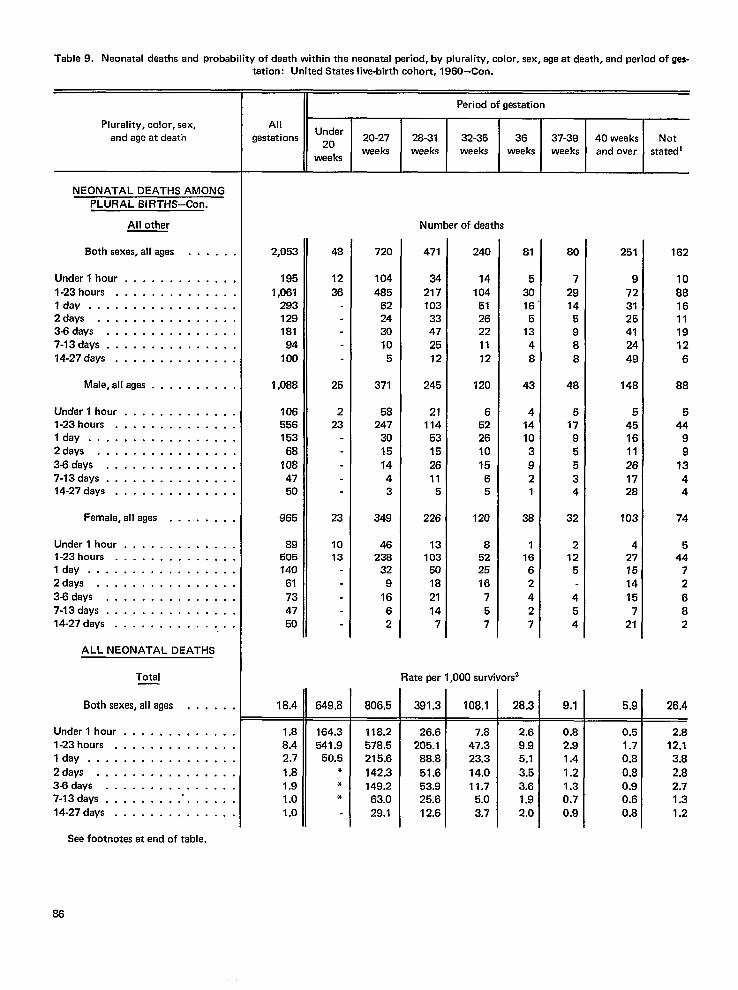
Table9. Neonatal daathsand pro& bilityof daathwithin theneonatal wriod, byplurality, color, sex, ageatdeath, andperiodofges-
Plurality, color, sex,and age at death
NEONATAL DEATHS AMONGPLURAL BIRTHS–Con.
All other
Both sexes, all ages . . . . . .
Under l hour . . . . . . . . . . . . .
l-23hours . . . . . . . . . . . . . .Idly . . . . . . . . . . . . . . . . .2days . . . . . . . . . . . . . . . .3-6days . . . . . . . . . . . . . . .7-13days, . . . . . . . . . . . . . .14-27days . . . . . . . . . . . . . .
Mala,allages . . . . . . . . . .
Undarl hour . . . . . . . . . . . . .l-23hours . . . . . . . . . . . . . .Idly . . . . . . . . . . . . . . . . .2days . . . . . . . . . . . . . . . .
3-6days . . . . . . . . . . . . . . .7-13days . . . . . . . . . . . . . . .14-27days . . . . . . . . . . . . . .
Famale,allages . . . . . . . .
Underl hour . . . . . . . . . . . . .l-23hours . . . . . . . . . . . . . .Idly . . . . . . . . . . . . . . . . .2days . . . . . . . . . . . . . . . .
3-6days . . . . . . . . . . . . . . .7-13days . . . . . . . . . . . . . . .14-27days . . . . . . . . . . . . . .
ALL NEONATAL DEATHS
Total
Both sexes, all ages
Underlhour . . . . . .l-23hours . . . . . . .lay . . . . . . . . . .
2days . . . . . . . . .3-6days . . . . . . . .7-13days . . . . . . . .14-27days . . . . . . .
. . . . . .
. . . . . . .
. . . . . . .
. . . . . . .
. . . . . . ,
. . . . . . .
. . . . . . .
. . . . . . .
tetion: United Stataslive-birth cohort, 1960-Con.
II Period of gestation
AllUnder
gestations Z. 20-27 28-31 32-35 36 37-39 40 waeks Notweeks weeks weeks weeks
weekeweeks and over stated’
Number of deaths
2,053
1951,061
29312918194
100
1,068
10655615368
1084750
965
89505140
61734750
18,4
1.88.42.7
1.81.91.01.0
48
12
36
25
223
23
1013
649,8
164.3541.9
50.5***
720
104
485622430105
371
58247
3015
1443
349
46236
329
1662
806.5—
118.2578.5215.6
142.3149.2
63.029.1
471
3421710333472512
245
21114
5315
2611
5
226
131035018
21147
240
14104
5126221112
120
6522610
?565
120
8522516
757
Rata per 1,000 survivors
391.3
26.6205.1
88.8
51.653.925.612.6
108.1
7.847.323.3
14.011.75.03.7
81
530165
1348
43
414103921
36
11662
427
28.3
2.69.95.13.53.61.92.0
80
729145988
48
51795534
32
212
5
454
9.1
0.82.91.4
1.21.30.70.9
251
97231254124
49
148
5451611261728
103
427751415
721
5.9
0.51.70.8
0.80.90.60.8
162
1088161119126
88
544
99
1344
74
544
72
682
26.4
2.812.13.8
2,82.71.31.2
Sea footnotas at end of table.
86
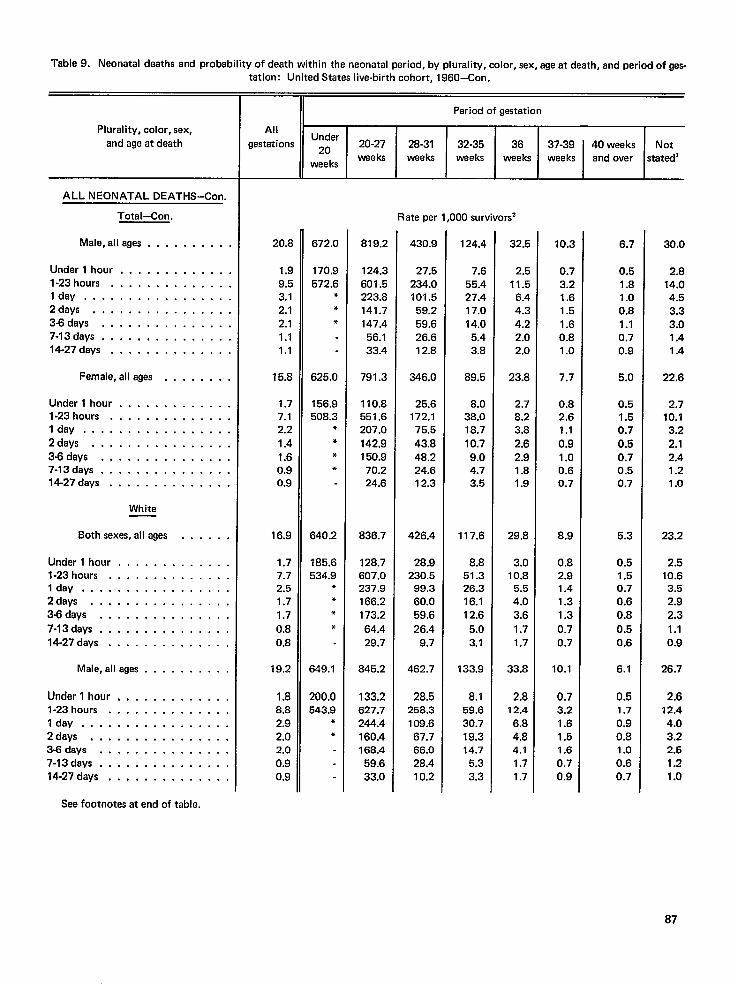
Table9. Neonatal deaths and probability ofdeath within theneonatal ~riod, byplurality, color, sex, ageatdeath, andperiodofges-
Plurality, color, sex,
and age at death
ALL NEONATAL DEATHS–Con.
Total–Con,
Male, alleges . . . . . . . . . .
Under l hour, . . . . . . . . . . . .l-23 hours . . . . . . . . . . . . . .Idly, . . . . . . . . . . . . . . . .2days . . . . . . . . . . . . . . . .3-6days . . . . . . . . . . . . . . .7-13days . . . . . . . . . . . . . . .14-27days . . . . . . . . . . . . . .
Female,allages . , . . . . . .
Underl hour . . . . . . . . . . . . .l-23hours . . . . . . . . . . . . . .Idly . . . . . . . . . . . . . . . . .
2days . . . . . . . . . . . . . . . .3J3days . . . . . . . . . . . . . . .7-13days . . . . . . . . . . . . . . .14-27days . . . . . . . . . . . . . .
White
Both sexes, all ages . . , . . .
Undarl hour . . . . . . . . . . . . .l-23hours . . . . . . . . . . . . . .lay . . . . . . . . . . . . . . . . .2days . . . . . . . . . . . . . . . .345days . . . . . . . . . . . . . . .
7-13days, . . . . . . . . . . . . . .14.27days . . . . . . . . . . . . . .
Male,allages . . . . . . . . . .
Underl hour, . . . . . . . . . . .,l-23hours . . . . . . . . . . . . . .Idly . . . . . . . . . . . . . . . . .2days . . . . . . . . . . . . . . . .3-8days, . . . . . . . . . . . . . .7-13days . . . . . . . . . . . . . . .14-27days . ., .,,...... . .
See footnotes at end of table.
tation: United States live-birth cohort, 1960-Con.
Period of gestation
AllUnder
gestations Z. 20-27 28-31 32-35 36 37-39 40 weeks Notweeks weeks
wee ksweeks weeks wee ks and over statedl
Rate per 1,000 survivors’
20.8
1.99.53.12.12.11.11.1
15.8
1.77.12.2
1.41.60.90.9
16.9
1.77.72.51.71.7
0.80.8
19.2
1.88.82.92.02.00.90.9
672.0
170.9572.6
***
625.0
156.9508.3
****
640.2
185.6534.9
***
*
B49.I
200.0543.9
**
819.2
124.3601.5223.8141.7147.456.133.4
791.3
110.8551.6207.0
142.9150.970.224.6
836.7
128.7607.0237.9166.2173.2
64.429.7
845.2
133.2627.7244.4160.4168.459.633.0
430.9
27.5234.0101.559.259.626.612.8
346.0
25.6172.175.5
43.848.224.612.3
426.4
28.9230.5
99.360.059.6
26.49.7
462.7
28.5258.3109.667.766.028.410.2
124.4
7.655.427.417.014.0
5.43.8
89.5
8.038.018.7
10.79.04.73.5
117.6
8.851.326.316.112.6
5.03.1
133.9
8.159.630.719.314.7
5.33.3
32.5
2.511.5
6.44.34.22.02.0
23.8
2.78.23.82.62.91.81.9
29.8
3.010.8
5.54.03.6
1.71.7
33.8
2.812.4
6.84.84.11.71.7
1 ().2
0.73.21.61.51.60.81.0
7.7
0.82.61.1
0.91.00.60.7
8.9
0.82.91.41.31.3
0.70.7
10.1
0.73.21.61.51.60.70.9
6.7
0.51.81.00.81.10.70.9
5.0
0.51.50.70.50.70.50.7
5.3
0.51.50.70.60.8
0.50.6
6.1
0.51.70.90.81.00.60.7
30.0
2.814.04.53.33.01.41.4
22.6
2.710.13.22.12.41.21.0
23.2
2.510.6
3.52.92.3
1.10.9
26.7
2.612.44.03.22.51.21.0
87
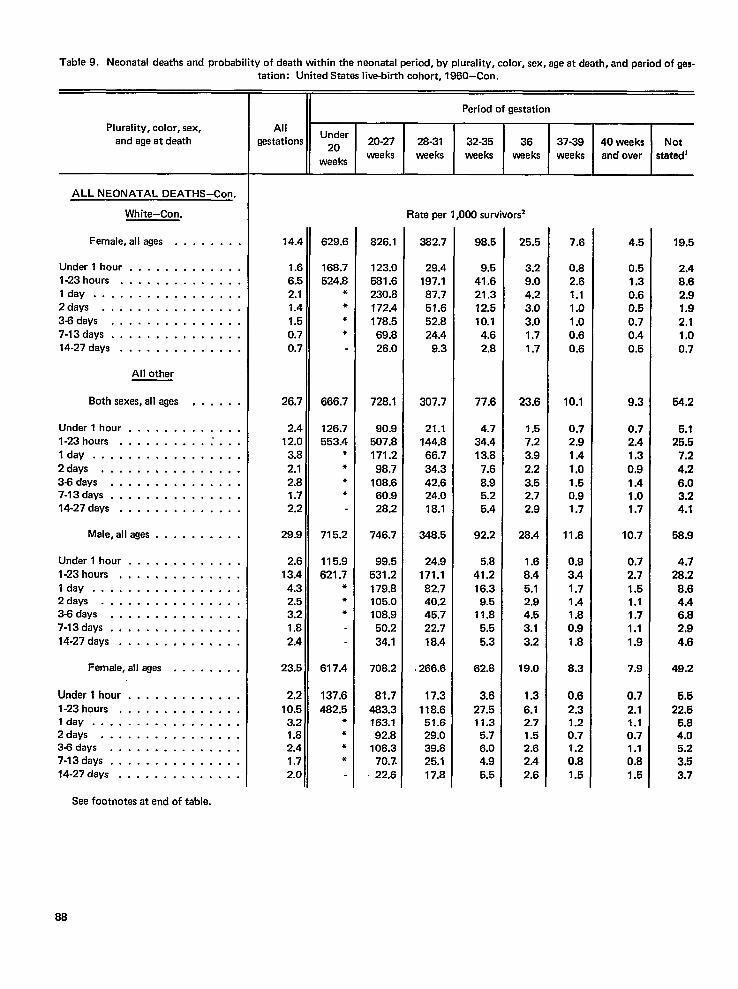
Table9. Neonatal deaths andprobability ofdeath within theneonatal pried, bypluraliW, color, sex, ageatdeath, andperiodofges-
Plurality, color, sex,and age at death
ALL NEONATAL DEATHS-Con.
White-Con.
Female, all ages . . . . . . . .
Under l hour . . . . . . . . . . . . .l-23hours . . . . . . . . . . . . . .lay . . . . . . . . . . . . . . . . .2days . . . . . . . . . . . . . . . .3-6days . . . . . . . . . . . . . . .7-13days . . . . . . . . . . . . . . .14-27 days . . . . . . . . . . . . . .
All other
Both sexes, all ages , . . . . .
Under l hour . . . . . . . . . . . . .l-23 hours . . . . . . . . ...’. . .Idly . . . . . . . . . . . . . . . . .2days . . . . . . . . . . . . . . . .36days . . . . . . . . . . . . . . .7-13days . . . . . . . . . . . . . . .14-27days . . . . . . . . . . . . . .
Male,allages . . . . . . . . . .
Underl hour . . . . . . . . . . . . .
l-23hours . . . . . . . . . . . . . .Idly . . . . . . . . . . . . . . . . .2days . . . . . . . . . . . . . . . .345days . . . . . . . . . . . . . . .7-13days . . . . . . . . . . . . . . .14-27days . . . . . . . . . . . . . .
Female, all ages . , . . . . , .
Underl hour........,.. . .
l-23hours . . . . . . . . . . . . . .Idly . . . . . . . . . . . . . . . . .2days . . . . . . . . . . . . . . . .34days . . . . . . . . . . . . . . .7-13days . . . . . . . . . . . . . . .14-27days . . . . . . . . . . . . . .
See footnotes at end of table.
tation: United States liva-birth cohort, 1960–Con.
Period of gestation
AllUnder
gestations Z. 20-27 28-31 32-35 36 37-39 40 weeks Not
weeksweeks weeks weeks weeks weeks and over stated4
Rate per 1,000 survivors
14.4
1.66.52.11.41.50.70.7
26.7
2.412.0
3.82.12.81.72.2
29.9
2.613.44.32.53.21.8
2.4
23,5
2,2
10.53.21.82.41.72.0
629.6
168.7524.8
****
666.7
126.7553.4
*●
*●
715.2
115.9621.7
*●
●
617.4
137.6482.5
*●
*●
826.1
123.0581.6230.8172.4178.569.826.0
728.1
90.9507.8171.2
98.7108.660.928.2
746.7
99.5531.2179.8105.0108.950.2
34.1
708.2
81.7
483.3163.192.8
108.370.7.22.6
382.7
29.4197.187.751.652.824.4
9.3
307.7
21.1144.866.7
34.342.624.018.1
348.5
24.9171.182.740.245.722.7
18.4
.266.6
17.3
118.651.629.039.825.117.8
98.5
9.541.621.312.510.1
4.62.8
77.6
4.734.413.8
7.68.95.25.4
92.2
5.841.216.3
9.511.8
5.55,3
62.8
3.627.511.3
5.76.04.95.5
25.5
3.29.04.23.03.01.71.7
23.6
1.57.23.9
2.23.52.72.9
28.4
1.68.45.12.94.53.13.2
19.0
1.3
6.12.71.52.62.42.6
7.6
0.82.61.11.01.00.60.6
10.1
0.72.91.4
1.01.50.91.7
11.8
0.93.41.71.41.80.91.8
8.3
0.62.31.20.71.20.81.5
4.5
0.51.30.60.50.70.40.5
9.3
0.72.41.30,91.41.01.7
10.7
0.72.71.51.11.71.11.9
7.9
0.7
2.11.10.71.10.81.5
19.5
2.48.62.91.92,11.00.7
54.2
5.125.5
7.2
4.26.03.24.1
58.9
4.728.2
8.64.46.82.94.6
49.2
5.522.5
5,84.05.23.63,7
88
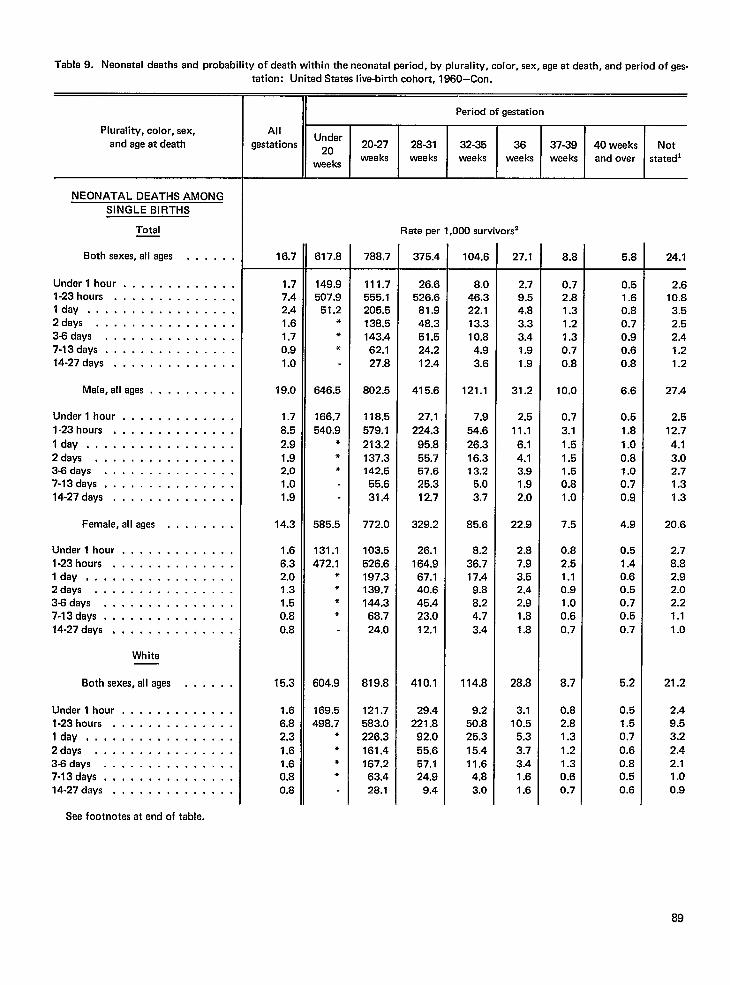
Table9. Neonatal deaths and probability ofdeath within theneonatal period, byplurality, color, sex, ageatdeath, andpariodofqes-
Plurality, color, sex,
and aga at death
NEONATAL DEATHS AMONG
SINGLE BIRTHS
Total
Both sexes, all ages
Under l hour . . . . . .l-23 hours . . . . . . .Idly . . . . . . . . . .2days . . . . . . . . .3-6 days . . . . . . . .7-13days . . . . . . . .14-27 days . . . . . . .
Male, all ages . . .
Under l hour . . . . . . .
. . . . . .
. . . . . . .
. . . . . . .
. . . . . . .
. . . . . . .
. . . . . . .
. . . . . . .
. . . . . . .
. . . . . . .
. . . . . . .1.23 hours . . . . . . . . . . . . . .
Idly . . . . . . . . . . . . . . . . .2days . . . . . . . . . . . . . . . .3-8 days . . . . . . . . . . . . . . .7-13days . . . . . . . . . . . . . . .14.27 days, . . . . . . . . . . . . .
Female, all ages . . . . . . . .
Under l hour . . . . . . . . . . . . .l-23 hours, . . . . . . . . . . . . .Idly, . . . . . . . . . . . . . . . .2days . . . . . . . . . . . . . . . .3-8days . . . . . . . . . . . . . . .7.13days . . . . . . . . . . . . . . .14-27 days . . . . . . . . . . . . . .
White
Both sexes, all ages . . . . . .
Under l hour . . . . . . . . . . . . .l-23hours . . . . . . . . . . . . . .Idly, . . . . . . . . . . . . . . . .2days . . . . . . . . . . . . . . . .3-8days . . . . . . . . . . . . . . .7-13days . . . . . . . . . . . . . . .14-27days, . . . . . . . . . . . . .
See footnotes at end of table.
tation: United States live-birth cohort, 1960-Con.
Period of gestation
AllUnder
gestations Z. 20-27 28-31 32-35 36 37-39 40 weeks Notwee ks
waekswee ks weaks weeks wee ks and over statedl
Rate per 1,000 survivors
16.7
1.77.42.41.61.70.91.0
19.0
1.78.5
2.91.92.01.01.9
14.3
1.66.32.01.31.50.80.8
15.3
1.66.82,3
1.61.60,80.8
617.8
149.9507.9
51.2***
646.5
166.7540.9
***
585.5
131.1472.1
****
604.9
169.5498.7
*
***
788.7
111.7555.1205.5138.5143.462.127.8
802.5
118.5579.1
213.2137.3142.5
55.631.4
772.0
103.5526.6197.3139.7144.368.724.0
819.8
121.7583.0226,3161.4167.263.428.1
375.4
26.6526.6
81.948.351.524.212.4
415.6
27.1224.3
95.855.757.625.312.7
329.2
26.1164.967.140.645.423.012.1
410.1
29.4221.8
92.055.657.124.9
9.4
104.6
8.046.322.113.310.84.93.6
121.1
7.954.6
26.316.313.2
5.03.7
85.6
8.236.717.4
9.88.24.73.4
114.8
9.250.825.315.411.64.83.0
27.1
2.79.54.83.33.41.91.9
31.2
2.511.1
6.14.13.91.92.0
22.9
2.87.93.52.42.91.B1.8
28.8
3.110.5
5.33.73.41.61.6
8.8
0.72.81.31.21.30.70.8
10.0
0.73.1
1.51.51.50.81.0
7.5
0.82.51.10.91.00.60.7
8.7
0.82.81.31.21.30.60.7
5.8
0.51.60.80.70.90.60.8
6.6
0.51.8
1.00.81.00.70.9
4.9
0.51.40.60.50.70.50.7
5.2
0.51.50.7
0.60.80.50.6
24.1
2.610.83.52.52.41.21.2
27.4
2.512.7
4.13.02.71.31.3
20.6
2.78.82.92.02.21.11.0
21.2
2.49.53.22.42.11.00.9
89
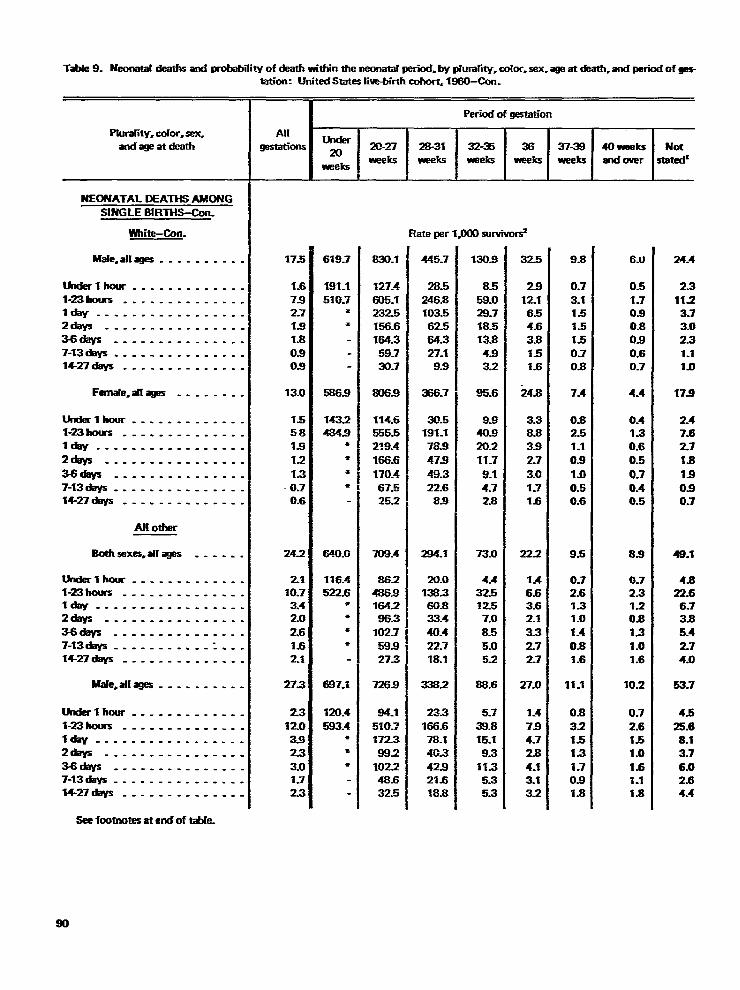
TX 9. Neonatal deaths ad probability of cketh wMin the neonata[ IEriod. by phmafity,color. sex. age at death,and pwiod of ges-
Pludity. color, sex,andageatdeeth
NEONATAL DEATHS AMONG
SINGLE BIRTHS-Con-
Wh-~n.
Male, al[ages . . . . . . . . . .
rhxferl her . . . . . . . . . . . . .l-23hours. ..... .. ...-. .I. .. .. ..... .. ... .. .Zdays . . . . . . . . . . . . . . . .
3-6days . . . . . . . . . . . . . . .7-13deys . . . . . . . . . . . . . . .14-27days . . . . . . . . . . . . . .
Famak=aflages . . . . . . . .
Ultkrlh oar. . . . . . . . . . . . .l-23hours . . . . . . . . . . . . . .Idly . . . . . . . . . . . . . . . . .
2d@% . . . . . . . . . . . . . . . .
3-6diiys . . . . . . . . . . . . . . .7-13cfeys ------------- . .m-zfdays- ---------- . . .
Al[ other
ErOthsxes=arrm . . . . . .
Wak-lhour . . . .. -....- -.X!3holm . . . . . . . . . . . . . .Idly -------------- ---2day5 . . . . . . . . . . . . . . . .
W3days . . . . . . . . . . . . ..-7-13days .. -- . . . . . . . . . . .‘f4-27c@s . . . . . . . ..-. . . .
MaIe.atfqes . .. -------
Underlhcmr . . . . . . . . ..-. .H3rnnlrs . . . . . . . . . . . . . .Idly . . . . . . . . . . . . . . . --2days . . . . . . . . . . . . . . . .
3-6crays . . . . . . . . . . . . . . .7-13days . . . . . . . . . . . . . . .14-27days . . . . . . . . . . . . -.
Seefmtnotesatend of-e.
W-on: UniteclState51iw-birlhcohort.l!Wl-Con.
Alr
mi-
175
1-67s2.71.8
la0.90s
13.0
155.8
1.8
12
13
-0.70.6
24.2
2110.73.42.0
261.62.1
27.3
231203.9
233.01.7
23
Period of ~-OrI
Under20
20-27 28-31 32-35 36 37-38Ww’eks -k
weksweeks W4t5 W?ercs
619.7
191.1
510-7●
*
5869
1432484.8
*
‘E
*
●
640.CJ
116.4522.6
*●
●
*
6873
120.4
593.4**
●
830.1
127.4
605.1232.5156.6164.359-730-7
W6.8
114.6555.52:9=4
166.6
170.4~~
252
709.4
8624869164286.3
102.759.927S
7269
84.1
510.?1723
882
102248.632.5
Fkteperl#M3sucvivu&
445.7
28.5
246.8103.562.564.327.19.9
=.7
30.5191.178.9
479
49.322.683
Z94.t
20.0138.360.833.4
40.422.718.1
-.2
23.3
166.678.14(L3
42.921s18.8
130s
8.559.028.718.513.8
4.83.2
95.6
9s40.820.211.7
9.14.72.8
73.0
4.432.512.57.0
8.5
5.05.2
88.6
5.7
S).815.1
9.311.35.35.3
325
29
12.16.54.6
3.8%51.6
24s
3.38.839
27
3.01-71-6
22.2
1.46.63.62.1
3.32.727
27.0
1-4
794.72s
4-13.13.2
9.8
0.7
3.11.51.51-5
0.70.8
7.4
0.82.51.1
0.8
1.00.50.6
9.5
0.72.6131.0
1.4
0-81s
11.1
0.8
321.51.3
1.70slx
40 weeksand over
6.tJ
0.5
1.70.90.80.9
0.60.7
4.4
0.4Is0.6
0.5
0.70.40.5
8.9
0.72.31.20.8
1.3
1.01.6
10.2
0.7
2.6151.0
1.61.11.8
Notsratarr
24.4
2.3
11.23.73.02.3
1.110
17s)
2.47s2.7
2.8
19
0.90.7
48.1
4.822.66.73.8
5.4
2.74.0
53.7
4.5
25.68.13.7
6.02.64.4
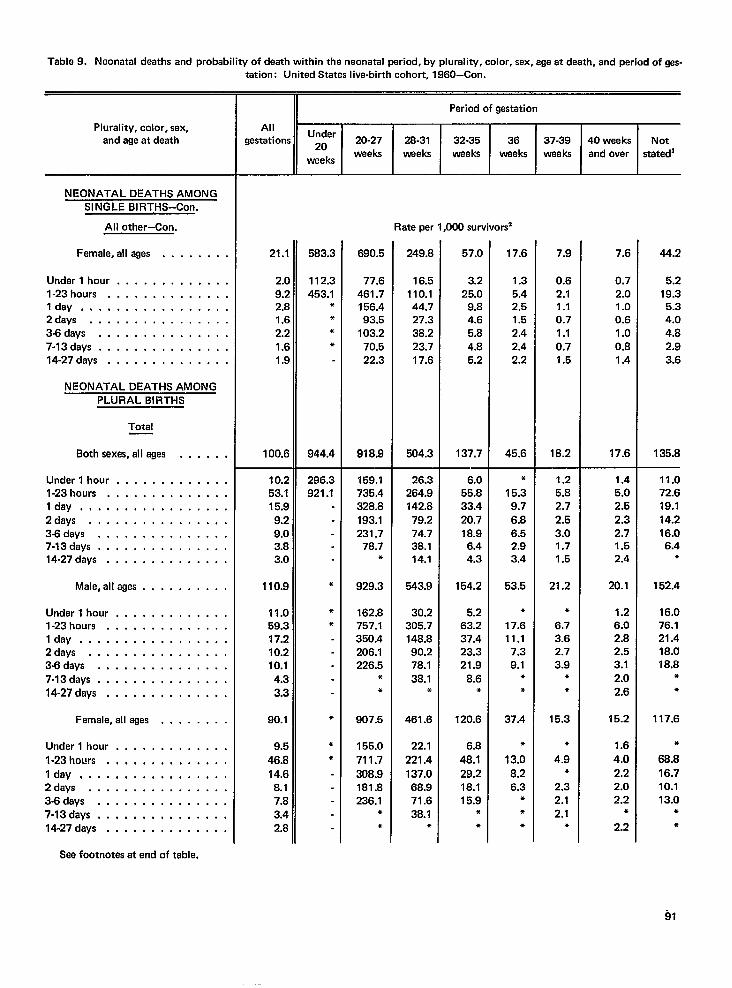
Tabla9. Neonatal deaths endprobebility ofdeath within theneonatal wriod, bypluraliW, color, sex, ageatdeath, and~riodof @s-
Plurality, color, sex,and age at death
NEONATAL DEATHS AMONGSINGLE BIRTHS-Con,
All other–Con.
Female, all ages . . . . . . .
Under l hour . . . . . . . . . . . .1.23hours . . . . . . . . . . . . .Idly, . . . . . . . . . . . . . . . .2days . . . . . . . . . . . . . . .3-6days . . . . . . . . . . . . . .7-13days . . . . . . . . . . . . . .14-27 days . . . . . . . . . . . . . .
NEONATAL DEATHS AMONGPLURAL BIRTHS
Total
Both sexas, all ages . . . . . ,
Under l hour . . . . . . . . . . . .,l-23hours . . . . . . . . . . . . . .Idly . . . . . . . . . . . . . . . . ,2days . . . . . . . . . . . . . . . .3-6days . . . . . . . . . . . . . . .7-13days . . . . . . . . . . . . . . .14-27days . . . . . . . . . . . . . .
Male,allages . . . . . . . . . .
Underl hour . . . . . . . . . . . . .l-23hours . . . . . . . . . . . . . .Idea . . . . . . . . . . . . . . . . .2days . . . . . . . . . . . . . . . .3-6days . . . . . . . . . . . . . . .
7-13days . . . . . . . . . . . . . . .14-27days . . . . . . . . . . . . . .
Female,allages . . . . . . . .
Undarl hour . . . . . . . . . . . . .
l-23hours . . . . . . . . . . . . . .
Idea, . . . . . . . . . . . . . . . .2days . . . . . . . . . . . . . . . .3-6days . . . . . . . . . . . . . . .7-13days, . . . . . . . . . . . . . .14-27days . . . . . . . . . . . . . .
tation: United States live-birth cohort, 1960–Con.
Allgestations
21.1
2.[9;2,.$1.C2.:1.f1.$
1Oo.t
10.253.1I 5.~
9.29.03.a3.0
110.9
11.059.317.210.210.1
4.33.3
90.1
9.5
46.8
14.68.17.a3.42.a
Under20
weeks
583.2
112.:453.1
*●
**
944.4
296.3921.1
●
**
*
**
20-27weeks
690.5
77.6461.7156.493.5
103.270.522.3
918.9
159.1735.4328.8193.1231.7
78.7*
929.3
162.8757.1350.4206.1226.5
*●
907.5
155.0
711.7
308.9181.8236.1
**
Period of gestation
28-31 32-35 36 37-39 40 weeks Notweeks weeks weeks waeks and over stated]
Rate per 1,000 survivors
249.8
16.5110.144.727.338.223.717.6
504.3
26.3264.9142.8
79.274.738.114.1
543.9
30.2305.7148.890.278.1
38.1*
461.6
22.1
221.4
137.068.971.638.1
●
57.0
3.225.0
9.84.65.84.85.2
137.7
6.055.833.420.718.9
6.44.3
154.2
5.263.237.423.321.9
8.6*
120.6
6.8
48.129.218.115.9
●
●
17.6
1.35.42.51.52.42.42.2
45.6
●
15.39.7
6.86.52.93.4
53.5
●
17.611.1
7.39.1
●
●
37.4
*
13.0
8.26.3
+●
*
7.9
0.62.11.10.71.10.71.5
18.2
1.25.82.72.53.01.71.5
21.2
●
6.73.62.73.9
*●
15.3
●
4.9*
2.32.12.1
●
7.6
0.72.01.00.61.00.81.4
17.6
1.45.02.52.32.71.52.4
20.1
1.26.02.82.53.12.02.6
15.2
1.6
4.0
2.22.02.2
●
2.2
44.2
5.219.35.34.04.82.93.6
135.8
11.072.619.114.216.06.4
*
152.4
16.076.121.418.018.8
●
●
117.6
●
68.8
16.710.113.0
*●
See footnotes at end of table.
91
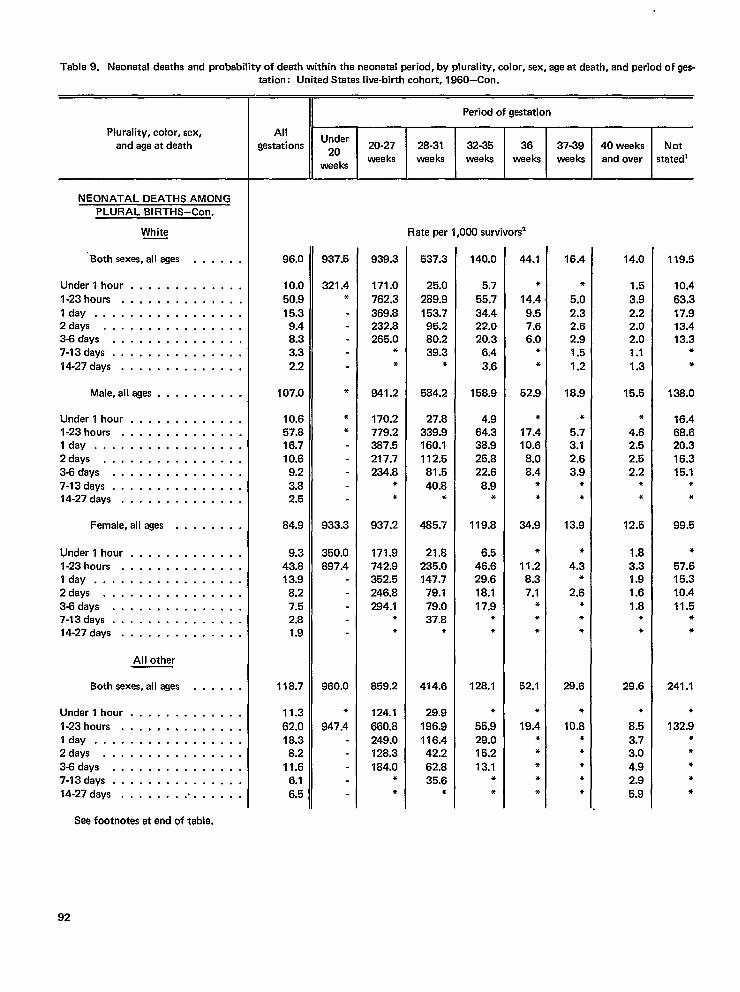
Table9. Neonatal deaths and probability ofdeath within thaneonatal ~riod, byplurality, color, sex, ageatdeath, andperiod of gas-
Plurality, color, sex,and aga at death
NEONATAL DEATHS AMONGPLURAL BIRTHS–Con.
White
‘Both sexas, all ages . . . . . .
Under l hour . . . . . . . . . . . . .
l-23hours . . . . . . . . . . . . . .Idly . . . . . . . . . . . . . . . . .2days . . . . . . . . . . . . . . . .3-8days . . . . . . . . . . . . . . .7-13days . . . . . . . . . . . . . . .
14-27days . . . . . . . . . . . . . .
Male,allages . . . . . . . . . .
Underl hour . . . . . . . . . . . . .l-23hours . . . . . . . . . . . . . .Idly . . . . . . . . . . . . . . . . .2days . . . . . . . . . . . . . . . .3-8days . . . . . . . . . . . . . . .7-13days . . . . . . . . . . . . . . .14-27days . . . . . . . . . . . . . .
Female,alleges . . . . . . . .
Undarl hour . . . . . . . . . . . . .l-23hours . . . . . . . . . . . . . .Idly . . . . . . . . . . . . . . . . .2days . . . . . . . . . . . . . . . .3-6days . . . . . . . . . . . . . . .7-13days . . . . . . . . . . . . . . .14-27days . . . . . . . . . . . . . .
All other
Both sexes, all ages . . . . . .
Underl hour . . . . . . . . . . . . .
l-23hours . . . . . . . . . . . . . .Idly . . . . . . . . . . . . . . . . .2days . . . . . . . . . . . . . . . .343days . . . . . . . . . . . . . . .7-13days . . . . . . . . . . . . . . .14-27days . . . . . . . . . . . . . .
tation: Unitad States live-birth cohort, 1960-Con.
Allgestations
96.0
10.0
50.915.39.48.33.3
2.2
107.0
10.657.816.710.6
9.23.82.5
84.9
9.343.813.9
8.27.52.81.9
118.7
11.3
62.018.38,2
11.66.16.5
Period ofgestation
Under20
20-27 28-31 32-35 36 37-39 40 weeksweeks weeks weeks
weeksweeks weeks and ovar
937.5
321.4*
*
*●
933.3
350.0897.4
960.0
*
947.4
939.3
171.0
762.3369.8232.8265.0
**
941.2
170.2779.2387.5217.7234.8
**
937.2
171.9742.9352.5246.8284.1
*●
859.2
124.1
660.8249.0128.3184.0
**
Rate per 1,000 survivors2
537.3
25.0
289.9153.795.280.239.3
*
584.2
27.8339.9160.1112.581.5
40.8*
485.7
21.8235.0147.7
79.179.037.8
*
414.6
29.9
196.9116.442.2
62.835.6
*
140.0
5.7
55.734.422.020.3
6.4
3.6
158.9
4.964.338.925.822.6
8.9*
119.8
6.546.629.618.117.9
●
*
126.1
●
55.929.015.213.1
**
44.1
*
14.49.57.66.0
*
*
52.9
*
17.410.6
8.08.4
**
34.9
*
11.28.37.1
***
52.1
*
19.4*●
***
16.4
*
5.02.32.62.91.5
1.2
18.9
*
5.73.12.63.9
**
13.9
*
4.3*
2.6*●
*
28.6
*
10.8●
●
**●
14.0
1.5
3.92.22.02.01.1
1.3
15.5
●
4.62.52.52,2
**
12.5
1.83.31.91.61.8
**
29.6
●
8.5
3.73.04.92.95.9
Notstatedl
119.5
10.4
63.317.913.413.3
●
*
138.0
16.468.620.316.315.1
●
*
99.5
*
57.615.310.411.5
**
241.1
●
132.9**●
**
See footnotes at end of table.
92
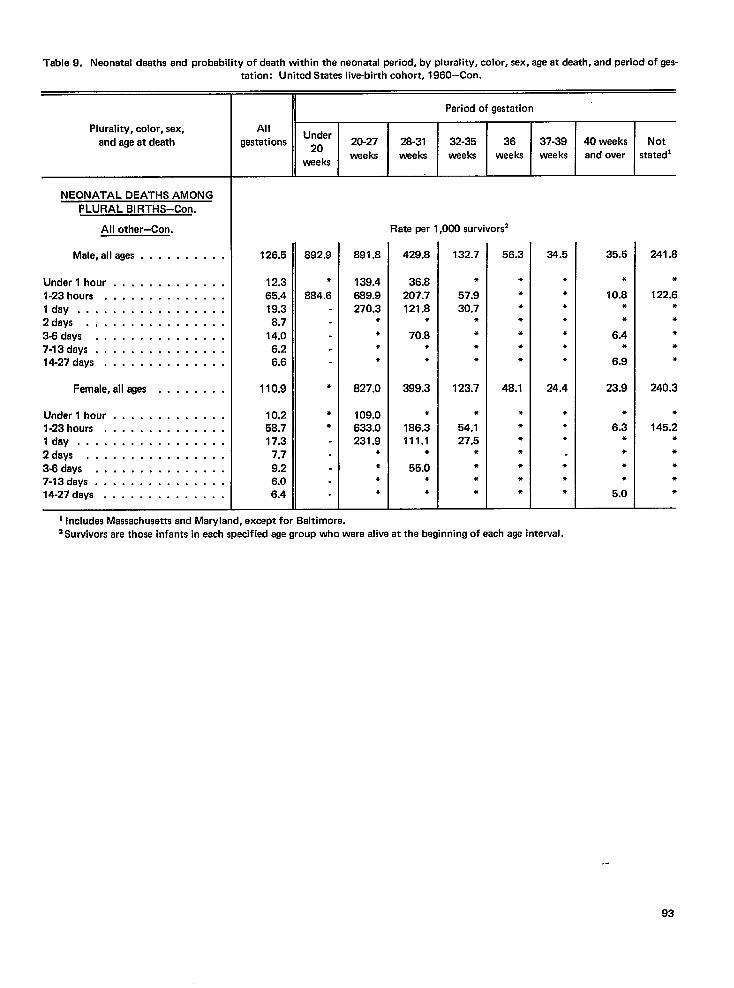
Table9, Neonatal deaths and probability ofdeath within thenaonatal ~riod, byplurality, color, sex, ageatdeath, andperiodofnes-
Plurality, color, sex,and age at death
NEONATAL DEATHS AMONGPLURAL BIRTHS-Con.
All othar–Con.
Male, alleges . . . . . . . . . .
Under l hour . . . . . . . . . . . . .l-23hours . . . . . . . . . . . . . .Idly . . . . . . . . . . . . . . . . .2days . . . . . . . . . . . . . . . .3-6days . . . . . . . . . . . . . . .7-13days . . . . . . . . . . . . . . .14-27deys . . . . . . . . . . . . . .
Famale,alleges . . . . . . . .
Underl hour . . . . . . . . . . . . .l-23hours . . . . . . . . . . . . . .Idly . . . . . . . . . . . . . . . . .2days . . . . . . . . . . . . . . . .3J3days . . . . . . . . . . . . . . .7-13days . . . . . . . . . . . . . . .14-27days . . . . . . . . . . . . . .
tation: United States liva-birth cohort, 1960-Con.—u
,,Period ofgestation
AllUnder
gestations *O 20-27 28-31 32-35 36 37-39 40 weeks Notweeks weeks weeks weeks weeka and over statadi
weeks
Rate per 1,000 survivors2
126.5
12.365.419.38.7
14.06.26.6
110.9
10.258.717.3
7.79.26.06.4
892.9
*
884.6
*
**
891.8
139.4869.9270.3
****
827.0
109.0633.0231.9
**●
*
429.8
36.8207.7121.8
*
70.8**
399.3
*
186.3111.1
*
55.0●
●
132.7
*
57.930.7
*●
*●
123.7
●
54.127.5
●
●
*●
56.3
●
●
●
**●
●
48.1
●
●
●
●
●
●
●
34.5
**●
●
●
●
●
24.4
*●
●
●
*●
35.5
●
10.8●
*
6.4*
6.9
23.9
●
6.3*●
*●
5.0
241.8
*
122.6***●
*
240.3
*
145.2●
●
*●
*
1 Includes Massachusetts and Maryland, except for Baltimore.‘ Suwivors ara those infants in each specified age group who were alive at the beginning of each age intewal.
.-
93
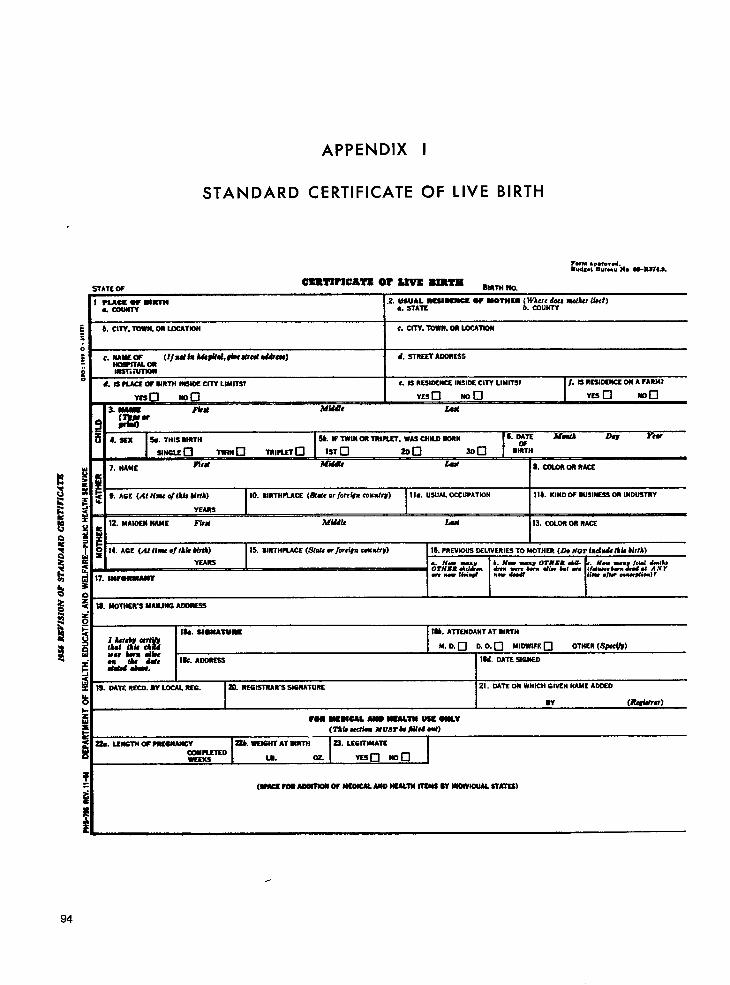
APPENDIX I
STANDARD CERTIFICATE OF LIVE BIRTH
ram .p*,.”cdred,,% E.”ruu ?s..U-WA7LS.
E b.ClTV.ToWN. OR LOCATION:
c. CITY.Tows. OR LOCATWS
,. SAWSm (lJnd fs his#ifd,6iEcsIw4 *E-)
WSPLTAL md. WREST AcoR5SS
bssw iunoR
t. IS ?LUE OF SIRTIS MIDI? CITY LIMITS? c. IS RSSID6WS IIW.1= CITY LIMllWl f. SSRESbC4JNCEW A FARM7
Y6s VEscl ma
3. m
V6scl son
la ““
Mwle Iku( mu
4. S6s Ss. TIM MRTH Sk if TWIN m TRlnm. WASCHILD SDRN S MTE NW b Yra
s4?bwLEa TWIN•1 TWI?LETo 1s7 ❑ 200 300 BI%H-
7. NAME F6tu Mid& JkSA S.wxoRDRnAcs
I
9. AcE (At fimt c/tAis MrfA) 10. BIRlllPi.ACE (SSMCor fOrCiURc0M9f@ 1la. USUALOCCUPATION I lb. KIND OF DUSINESSOR lUOLWmY
YEAss I I Ir12. MAIIEN NAME Fi?ti Afiuk lid 13. CDmR OR RACS
14. AGE (AA tiw 8J Ikk WLA) 15. 11RTHPLA4X (f?tti OrfOrd#n -niry) 16. PREVIOUSEWLIVERIEETO MOTHER (2h //07 ind~ (Ah b{rl~)
LYEARS . . n“ -, b. Mow =.” OTHER AU. ,. H.9 99 .y#J ~;.y
Ornm ddk ~ j@l?J&r9 diw hl ad w-. k.m - Siciwf Uu ./l* rouvlion]f
Q
18. MDIWR3 UAlbJffi A~
~18b. ATKlbOANT AT BIRTH
$ lA&sbJkEwf& ““ “-w=~ M.D. ❑ D. O. ❑ MIMIFs ❑
mnksm9iiPsOTHER (Sx)
: a&sA8A8afs Ik. AoDRESS Iu. DATESPabEo
sz 19. Mm RECD.w LOCALRm. I ~. REGISTRAR sIGNATURE 21. DATEON WHICH GIVEN NAMEAOCSO
94
I I w (R4sium)
Fow MW6CAL MO S6ULTW Wss Olmv(S”M Wdi9a nvsrksbfsd 09s)
a. LEswm OF MSSWANCY -. WEIANTATSIWS’N 23. LSGlllbSATE
~XED u. 02 Yssn ma I
(wmwAoasms W E4SOWALNAo HSlAlS4 l16AW SS -IOUAL sTA71S)
.
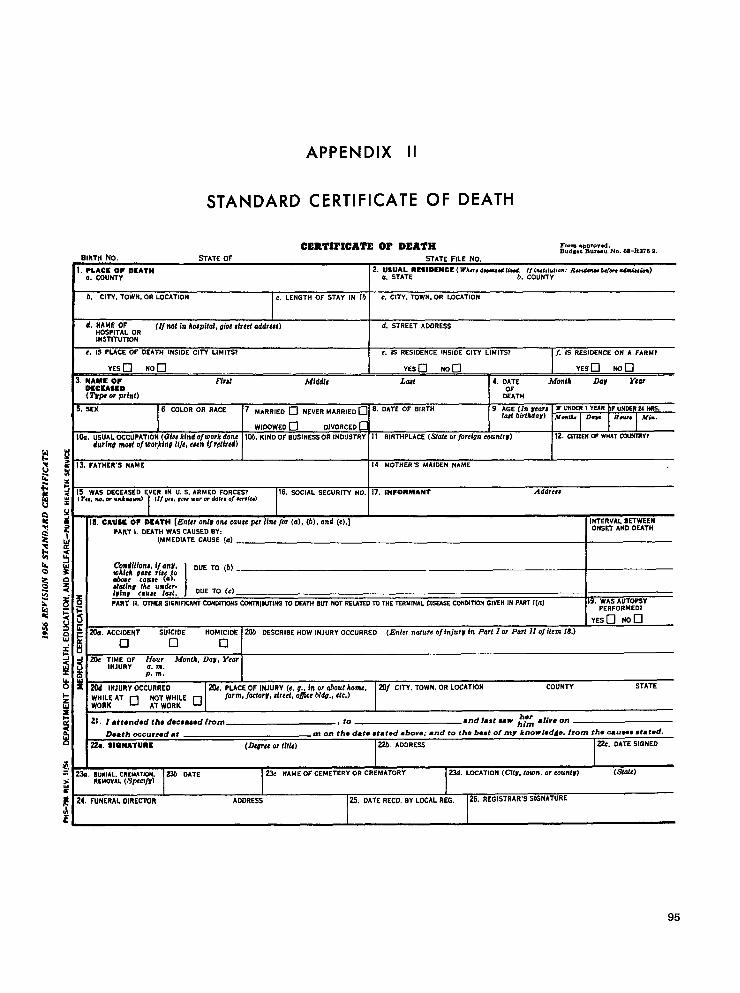
STANDARD
APPENDIX II
CERTIFICATE OF DEATH
CERTII’ICATE OP DEATH Form.Lwovod.BIRTH No. STATE OF
Bud’,t lhl,”” No. 6s-Ra752.STATE FILE No.
2. USUAL RESIOCNCE ( WA”, d-od lind. /f khttd,on: Radcna we+, cdm,u,fen)a. STATE b. COUNTY
1
I h. CITY. TOWN. OR LOCATION c. LENGTH OF STAY IN lb c. CITY.ToWN.OR LOCATION
1 ,
d, NAME OFHOSPITAL OR
(If nak In kE@fa2, gioe tfreef addrw) d. STREET ADORESS
INSTITUTION
t. IS PLACE OF DEATH tNSIDE CITY LIMITS? e. IS RESIDENCE INSIDE CITY LIMITS? [f. IS RESIDENCE ON A FARM?
NAMC OFOSCSASID(Tsfw orprint)
Fht Lax 4. DATE Month Dar Year
~TN1
s.SEX 6 COLOR OR RACE 7 ~A~R,~o o N~”E~ ~ARR,~~ ❑ 8. DATE OF BIRTH 9 AGE (h #ear# IF U~~R I y~R bF uNDSR 24 %.la! birlAdav) ~.& De” H- ~{”,
WIOOWEO ❑ DIVORCEO c
Ik. uSUAL OCCUPATION (L?h kindoJworkdone 105.KIND OF BUSINESS OR 1NDUSTR% 11 BIRTHPLACE (Sftie or fOrei971 COUIWV)durint mod of workltw Nfe, ewn if rdirtd)
12. ClnzEtl w WHATauHsRYt
IIS WAS DCCEASEO EVER IN U. S. ARMED FoRCES?(v,,, lw,dr”mknaun, I (t,#,,,&,,w.rm&*# o,#mk,
16. SOCIAL SECURITY NO. 17. IPEFORMANT
#
Addrczz
31 I!!1 I
.-,.. .. ------..... ....... .
‘“”E”’ATEcAu’E(a’-~mdl/iOnL i/ dtl~. ] oUE TO (b) _,1.A ..- .J.. ,.ii co!
wk.” .-. ... ..04Due C4U*C (0),
? Xasina the un&r-lvint c.mwe lat. t DUE TO (c)
g f PART IL OTHEf?SIGNIFICANT COHDIWC+ISCOK7RWUTING TO OWN Bu7 NOT RELATEDTO THE TERMINAL 01~~ COHMTWN GWEN IN PA.@Tl(a) 19. WAS AUTOPSY
: ~ m
PERFORMED7
YESO Non
w
E
.— ..-
p“•1 c1 IJ
~ -J 20c :IJ;R:F Hour MontA, Dam, Yearg ~ a. m.
p. m.IL UJo x 20d INJURY OCCURRfO [ 2(k. PLACE OF INJURY (e. u., in or uhout koms, I i?(lf CITY. TOWN. OR LDCATmN COUNTY STATE
FACCIOENr SUICIOE HOMICIDE i ~ OESCRIBE How INJURY OCCURRED fEnter nature olin)um in part I or Part lx of item 18.)
I~~w “ o Fw%w ~ farm,JacAorv,dreit, ofjice W7,, Ctc.)
z 21. I ●tt@ndad tha dmeaamd from , to ‘or ●live on●ndlast mw him
E Death occurred d m on the date stated above; and to the best of my knowledde. from the C.US=8 #tat-d.
22A SlaNATURC (2kvtc or (Ilk) 22b, ADORESS ~. OATE SIGNEO
E= 23a. BuRIAL. CREMATiUN. S.?/i OA’7E>
REMOVAL (t@fC1jr)2Sc NAME OF cEMETERY OR CREMATORY SSd. LOckTlON (CisV, town. or exmtvl (5k7fe)
; 24. FUNERAL oIREC’WJR AOORESS 26. DATE RECO. BY LOCAL REG. 26. REGISTRAR’S SIGNATURE
~
95
APPENDIX Ill
TECHNICAL NOTES
The data in this report are derived from twosources. Data referring to all live births in 1960are taken from Volume I of Vital Statistics ofthe United States, 1960. Data on birth charac-teristics of infants in the 1960 live-birth cohortwho died before reaching 28 days of- age arederived from computer tapes prepared from anew set of punched cards which contained bothbirth and death information.
The punching instructions for detailed infor-mation in the new set of cards corresponded tothe instructions for preparing cards for use inVital Statistics of the United States, 1960. Theclassification and interpretation of certain im-portant items is discussed in the following pages.The complete rules followed in the classificationof geographic and personal items for births areset forth in Vital Statistics InstructionManual.3 z
Registration Completeness
Although every State has adopted a lawrequiring the registration of births, deaths, andfetal deaths, these laws are not uniformlyobserved. In most areas practically all births anddeaths are registered. For some areas, however,there is enough underregistration to affect theuse of the statistics for certain purposes.
Nationwide tests of completeness of birthregistration were made in both 1940 and1950.1 ~ss For the United States as a whole,these tests indicated that ‘birth registration was,respectively, 92.5 and 97.9 percent complete. Adetailed discussion of the results of these testswas given in chapter 6, Volume I, Vital Statisticsof the United States, 1950. On the basis ofresults of the 1950 test, it is estimated by the
Division ofregistrationthe countryfor all other
Vital Statistics that in 1960 birthcompleteness was 98.9 percent foras a whole–99.3 for white and 96.4groups, respectively.
Classification by Occurrence and Residence
For the 1960 statistics by place of occur-rence, events are classified according to the placewhere the birth occurred. Place of residence inbirth statistics refers to the geographic areawhich constituted the mother’s usual residenceat time of the birth.
For residence statistics, all events occurringwithin the United States (i.e., 50 States and theDistrict of Columbia) are allocated to a place ofresidence within the United States. For nonresi-dent aliens, the place of residence is consideredto be the same as the place of occurrence.
Age of Mother
The birth certificate asks for “Age (at time ofthis birth).” Some sources of minor errors in theage data have been noted. A small number ofrecords are filed with age unspecified, an,dsomebirths are not registered. Measures of variationof completeness of registration with age ofmother are available from tests of completenessin 1950 and 1940.1$33 They show that registra-tion completeness is approximately the same forall ages except for the oldest age group, where itis lower.
Color
The category “white “ includes, in addition topersons reported as white, persons reported to
96
be Mexican or Puerto Rican and those with racenot stated. The category “all other” consists ofpersons reported as Negro, American Indian,Chinese, and Japanese; persons of numericallysmall racial groups; and persons of mixed whiteand other races.
Completeness of birth registration in 1960 isestimated by the Division of Vital Statistics,National Center for Health Statistics, to be 99.3percent for “white” births and 96.4 percent for“all other” births. The most recent figures forother groups are from the 1950 test whichindicated registration completeness at that timeto be 85.1 percent for American Indians and97.4 percent for “other races,” chiefly Chineseand Japanese. Both figures are probably higherfor 1960, but later data are not available.
A comparison of the race designation inmatched sets of birth certificates and infantcards from the 1950 registration completenesstest indicates very high agreement for white andNegro infants. There were, however, substan-tially fewer American Indians recorded on birthrecords than on census records.s 4
Hospital Delivery
Births are classified as occurring “in hospitalor institution” on the basis of entries on thebirth certificate. The classification is unrelatedto the American Hospital Association (AHA)registered hospital listings.
Birth Weight
In practically all areas, birth weight isreported in terms of pounds and ounces ratherthan in grams. However, the metric system hasbeen used in tabulating and presenting thestatistics to facilitate comparison with datapublished by other groups in the United States.
Period of Gestation
In 1960, the live-birth record forms for theState of Massachusetts and that part of Mary-land outside the city of Baltimore did notprovide for information on the period of gesta-tion. These areas account for about 60 percentof the records with gestation unspecified.
Such records are distributed in the tables in thetext of this report but not in the detailed tables.
An examination of the reported informationon period of gestation suggests a substantialheaping at the interval “40 weeks and over.”This bias probably results from the fact thatgestation period is not carefully calculated, andinstead the newborn infant of normal size isassumed to have a gestation period of 40 weeks.Such errors in reporting are minimized in areaswhere the birth certificate asks for the date ofonset of last normal menstrual period. Placesusing this question (California, Baltimore City,the District of Columbia, and New York City)contributed about 14 percent of the live-birthrecords.
Control of Errors
The coding and punching of birth data for thelive-birth records for 1960 were performedsimultaneously, and the major portion of thework was verified using a partial sequentialsample. This procedure was used in verifying thework of employees whose performance (asindicated by complete verification) was such asto produce consistently less than 4-percent errordistributed among all the items. For any oneitem, less than 1-percent error would beexpected under these procedures.
For this study, a new set of punched cards,using the same procedures, was prepared com-bining the necessary birth and death informationinto one card. However, to preserve the consist-ency of the death information, once the infantdeath was identified, the coded cause-of-deathinfop-nation from NCHS computer tapes for alldeaths was used.
Published data for all live births taken fromVolume I of Vital Statistics of the United States,1960, were used. For live-birth characteristics ofneonatal deaths, the newly created tapes wereused. There are no estimates available of thedegree of concordance between these twosources of information. Tabulating, computing,table preparation, and all other operations subse-quent to the preparation of punched cards wereverified.
Sampling of Birth Records
In this report, birth data for 1960 have beenderived from a 50-percent systematic samplewhich consists of only even-numbered birth
97
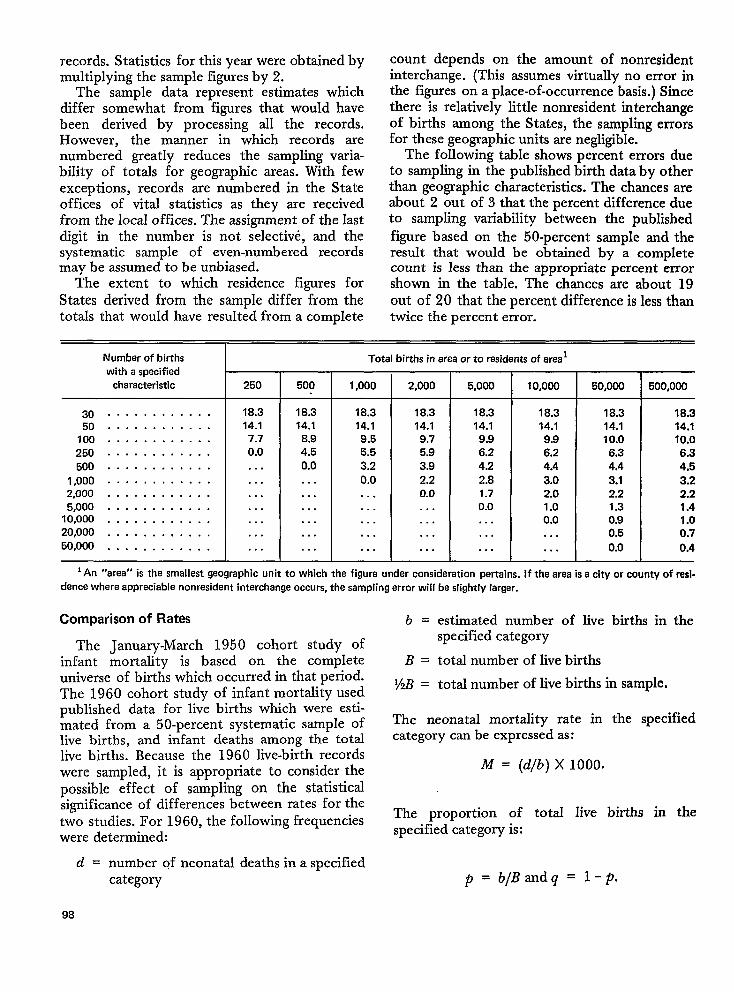
records. Statistics for this year were obtained bymultiplying the sample figures by 2.
The sample data represent estimates whichdiffer somewhat from figures that would havebeen derived by processing all the records.However, the marmer in which records arenumbered greatly reduces the sampling varia-bility of totals for geographic areas. With fewexceptions, records are numbered in the Stateoffices of vital statistics as they are receivedfrom the local offices. The assignment of the lastdigit in the number is not selective, and thesystematic sample of even-numbered recordsmay be assumed to be unbiased.
The extent to which residence figures forStates derived from the sample differ from thetotals that would have resulted from a complete
count depends on the amount of nonresidentinterchange. (This assumes virtually no error inthe figures on a place-of-occurrence basis.) Sincethere is relatively little nonresident interchangeof births among the States, the sampling errorsfor these geographic units are negligible.
The following table shows percent errors dueto sampling in the published birth data by otherthan geographic characteristics. The chances areabout 2 out of 3 that the percent difference dueto sampling variability between the publishedfigure based on the 50-percent sample and theresult that would be obtained by a completecount is less than the appropriate percent error
shown in the table. The chances are about 19out of 20 that the percent difference is less thantwice the percent error.
Number of births
with a specifiedcharacteristic
3050
100250
500
1,0002,0005,000
10,00020,00050,000
. . . . . . . . . . . .
. . . . . . . . . . . .
. . . . . . . . . . . .
. . . . . . . . . . . .
. . . . . . . . . . . .
. . . . . . . . . . . .
. . . . . . . . . . . .
. . . . . . . . . . . .
. . . . . . . . . . . .
. . . . . . . . . . . .
. . . . . . . . . . . .
250
18.314.17.70.0
. . .
. . .
. . .
. . .
. . .
. . .
. . .
500
18.314.1
8.94.50.0
. . .
. . .
. . .
. . .
. . .
. . .
Totalbirths in area or to residents of area 1
2,0001,000
18.314.19.55.53.2
0.0. . .. . .. . .. . .
. . .
18.314.19.75.9
3.92.20.0. . .. . .. . .
. . .
5,000
18.314.19.96.24.22.81.70.0. . .. . .. . .
10,000
18.314.19.96.24.4
3.02.01.00.0. . .. . .
50,000
18.314.110.0
6.34.43.12.21.30.90.5
0.0
500,000
18.314.110.06.34.53.22.21.41.00.7
0.4
1An “area” is the smallest geographic unit to which the figure under consideration pertains. If the area is a city or county of rasi.dence where appreciable nonresident interchange occurs, the sampling error will be slightly larger.
Comparison of Rates b = estimated number of live births in the
The January-March 1950 cohort study ofspecified category
infant mortality is based on the complete B = total number of live birthsuniverse of births which occurred in that period. y~ .The 1960 cohort study of infant mortality used
total number of live births in sample.
published data for live births which were esti-mated from a 5O-percent systematic sample of The neonatal mortality rate in the specified
live births, and infant deaths among the total category can be expressed as:
live births. Because the 1960 live-birth recordswere sampled, it is appropriate to consider the M = (d/b) X 1000.
Possible effect of sampling on the statisticalsignificance of differences b>tween rates for thetwo studies. For 1960, the following frequencies The proportion of total live births in the
were determined: specified category is:
d = number of neonatal deaths in a specifiedcategory ~ = b/Bandq = 1-P.
98
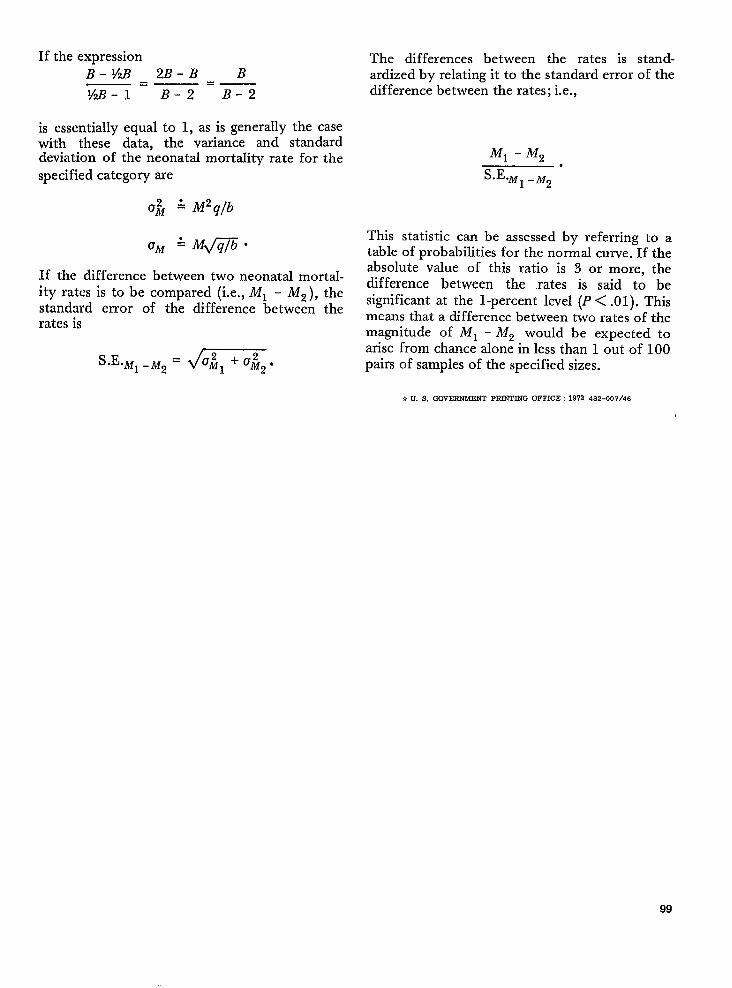
If the expression
.2B-B BB-?4B =—~f.~ B-2 B-2
is essentially equal to 1, as is generally the casewith these data, the variance and standarddeviation of the neonatal mortality rate for the
specified category are
If the difference between two neonatal mortal-ity rates is to be compared (i.e., Ml - M2 ), thestandard error of the difference between therates is
The differences between the rates is stand-ardized by relating it to the standard error of thedifference between the rates; i.e.,
Ml - Mz
S.E ““M1-M2
This statistic can be assessed by referring to atable of probabilities for the normal curve. If theabsolute value of this ratio is 3 or more, thedifference between the rates is said to besignificant at the l-percent level (P < .01). Thismeans that a difference between two rates of themagnitude of Ml – M2 would be expected toarise from chance alone in less than 1 out of 100pairs of samples of the specified sizes.
* U. S. GOVERNMENT PRINTENG OFFICE :1972 482-007/46
99
VITAL AND HEALTH STATISTICS PUBLICATION SERIES
Formerly Public Health Service Publication No. 1000
l+o~ams and collection pvocedun?s. — Reports which describe the general programs of the NationalCenter for Health Statistics and its offices and divisions, data collection methods used, definitions,WI other material necessary for understanding the data.
Data evaluation and methods research. — Studies of new statistical methodology including: experi-mental tests of new survey methods, studies of vital statistics collection methods, new analyticaltechniques, objective evaluations of reliability of collected data, contributions to statistical theory.
.4nalvtical studias.-Reports presenting analytical or interpretive studies basedon vital and healthstatistics, carrying the analysis further than the expository types of reports in the other series.
.D9cumrnts and committee vepoYts.— Final reports of major committees concerned with vital andhealth statistics, and documents such as recommended model vital registration laws and revisedbirth and death certificates.
Data from the Health Interview Swvev. —Statistics on illness, accidental injuries, disability, useof hospital, medical, dental, and other services, and other health-related topics, based on datacollected in a continuing national household interview survey.
llzta .@orn the Health Examination Swwey. —Data from direct examination, testing, and measure-ment of national samples of the civilian, noninstitutional population provide the basis for two typesOf reports: (1) estimates of the medically defined prevalence of specific diseases in the UnitedStates and the distributions of the population with respect to physical, physiological, and psycho-Iqical characteristics; and (2) analysis of relationships among the various measurements withoutreference to an explicit finite universe of persons.
i?ata j~om the Institutional Population Surveys. —Statistics relating to the health characteristics ofpersons in institutions, and their medical, nursing, and personal csre received, based on nationalsamples of establishments providing these services and samples of the residents or patients.
Data ji%li?l the Hospital Discharge Swvey. — Statistics relating to discharged patients in short-stayhospitals, based on a sample of patient records in a national sample of hospitals.
Datu on htzalth ~esowces: manpowe~ and facilities. —Statistics on the numbers, geographic distri-bution, and characteristics of health resources including physicians, dentists, nurses, other healthoccupations, hospitals, nursing homes, and outpatient facilities.
Lkztu an wzo?Wity.-Various statistics on mortality other than as included in regukr annual ormommy reports— -~peci~ SIEdYSeS by cause of death, age, and other demographic variables, alsogeobyaphlc and time series analyses.
llIta cm natality, mawiage, and diwrce. —Various statistics on natality, marriage, and divorceother than as included in regular annual or monthly reports+pecial analyses by demographicvariables, also geographic and time series analyses, studies of fertility.
LWa jVom the National Atnblity and Mon2Wty Surveys. — Statistics on characteristics of birthsamd deaths not available from the vital records, based on sample surveys stemming ti-om theserecords, including such topics as mortality by socioeconomic class, hospital experience in thelast yew of life, medical care during pregnancy, health insurance coverage, etc.
For a list of titles d reports published in these series, write to: (.XFice of IrtiormationNational Center for Health StatisticsPublic Health Service, HSMHARockville, Md. 20S52
U.S. DEPARTMENT OF
HEALTH, EDUCATION, AND WELFARE
Public Health Service
HEALTH SERVICES AND MENTAL HEALTH ADMINISTRATION
5600 Fishers Lane
Rockville, Md. 20852
OFFICIAL BUSINESSPenalty for Private Use, $300
Related Documents