A STUDY ON THE CRYSTAL GROWTH OF SELECT II-VI OXIDES BY CZOCHRALSKI AND BRIDGMAN TECHNIQUES By JALAL MOHAMMAD NAWASH A dissertation submitted in partial fulfillment of the requirements for the degree of DOCTOR OF PHILOSOPHY WASHINGTON STATE UNIVERSITY School of Mechanical and Materials Engineering DECEMBER 2006

Welcome message from author
This document is posted to help you gain knowledge. Please leave a comment to let me know what you think about it! Share it to your friends and learn new things together.
Transcript
A STUDY ON THE CRYSTAL GROWTH OF SELECT II-VI OXIDES BY
CZOCHRALSKI AND BRIDGMAN TECHNIQUES
By
JALAL MOHAMMAD NAWASH
A dissertation submitted in partial fulfillment of
the requirements for the degree of
DOCTOR OF PHILOSOPHY
WASHINGTON STATE UNIVERSITY
School of Mechanical and Materials Engineering
DECEMBER 2006

To the Faculty of Washington State University:
The members of the Committee appointed to examine the dissertation of
JALAL MOHAMMAD NAWASH find it satisfactory and recommend that it be accepted.
Chair
ii
ACKNOWLEDGMENTS
I would like to thank Dr. Kelvin Lynn whose support and guidance throughout the entire period
of this research made this work achievable. Several materials’ characteristics were carried out in several
laboratories at both Washington State University and University of Idaho. Many thanks go to the
collaborators of these laboratories especially Dr. Roger Willett, Dr. Brendan Twamley, and Scott
Cornelius. I am also grateful for every employee, graduate students, and undergraduate students who
contributed to this work. I thank Robert Novotney and Lloyd Pilant for their technical assistance, Guido
Ciampi, Kelly Jones, Romit Dhar, Charles Shawley, Christie Skrip, and Russ Tjossem either for helping
in measurements or for sharing their ideas.
This research was sponsored by: Space Missile Defense Command (SMDC). Contract
Number: DASG60-02-C-0084 and VLOC Incorporated.
iii
A STUDY ON THE CRYSTAL GROWTH OF SELECT II-VI OXIDES BY
CZOCHRALSKI AND BRIDGMAN TECHNIQUES
Abstract
By Jalal Mohammad Nawash, Ph.D.
Washington State University
December 2006
Chair: Kelvin G. Lynn
The crystal growth of ZnO-TeO2 system was experimented by Czochralski and Bridgman
techniques. The series of many runs and experimentations helped optimize the growth process,
which was faced by a lot of difficulties. These difficulties include, but are not limited to, the
evaporation of TeO2 material above 700 ºC, the formation of more than one phase during the
growth, and the lack of a ZnO-TeO2 single crystal to start the growth. It was concluded that the
main and most persisting problem is that there is no stable phase, in the system that forms a line
component at which the crystal growth should be attempted. However, Zn2Te3O8 and ZnTeO3
single crystals were grown using Czochralski and Bridgman techniques, respectively. It was
possible to study some of their important optical and electrical properties for the first time.
The phase diagram of this system was investigated using powder x-ray diffraction and
scanning electron microprobe. CrystalDiffract 1.3 for Windows software was used to simulate x-
ray patterns to find the percentages of the resulting phases. It was found that the type of forming
phases might be affected by the process, whether if it was calcining, melting, or pulling.
Moreover, the history of the material plays an important role in determining what phases form.
iv
The glass form of ZnO-TeO2 system was studied as well for this research. One important finding
is that the cut-off band edge of this glass depends greatly on the thickness of the sample used.
Dielectric constants and resistivities of several glasses were determined.
Bridgman technique was used to grow CdTe2O5 single crystals. These crystals are
transparent to visible light, and have a mica-like structure. Optical and electrical properties of
these crystals, like the dielectric constant and resistivity, of these crystals, were investigated.
v
TABLE OF CONTENTS
Page
ACKNOWLEDGMENTS ………………………..…………………………………………….iii
ABSTRACT…………………………………………………………………………………….iv
LIST OF TABLES……………………………………………………………………………...x
LIST OF FIGURES…………………………………………………………………………….xiii
CHAPTER
1. BACKGROUND AND LITRATURE REVIEW....…………………...........…....................1
1.1 Introduction ..................................................................................................................1
1.2 Literature Review..........................................................................................................2
1.3 Motivation ....................................................................................................................7
References ............................................................................................................................9
2. EXPERIMENTAL SETUP AND MATERIALS..................................................................14
2.1 Introduction ................................................................................................................14
2.2 The Furnace ...............................................................................................................14
2.3 LabView Programming ..............................................................................................17
2.4 Experimental Setup ....................................................................................................18
2.4.1 Build Up for Czochralski Growth ..............................................................20
2.4.2 Build Up for Bridgman Growth .................................................................28
2.5 Powders ......................................................................................................................32
References.............................................................................................................................33
3. MEASUREMENTS AND EXPERIMENTAL METHODS ...............................................34
3.1 Introduction................................................................................................................34
vi
3.2 Sample Preparation....................................................................................................34
3.3 Measurements............................................................................................................35
3.3.1 X-ray Diffraction........................................................................................35
3.3.2 Single Crystal Diffractometer.....................................................................38
3.3.3 Scanning Electron Microprobe ..................................................................39
3.3.4 Optical and Electrical Properties................................................................42
3.3.4.1 Dielectric measurements..............................................................42
3.3.4.2 Transmission and absorption.......................................................44
3.3.4.3 I-V tests.......................................................................................46
3.3.4.4 More optical Properties...............................................................47
3.3.5 Piezoelectric Tests......................................................................................48
3.3.5.1 Poling...........................................................................................48
3.3.5.2 Thickness coupling coefficient factor calculations (Kt)..............49
3.3.6 Mass Measurements....................................................................................50
References.............................................................................................................................52
4. ZnO-TeO2 and CdO- TeO2 GROWTHS..................................................................................55
4.1 Zn2Te3O8 Single Crystal Growth............................................................................55
4.1.1 (ZTO8)1 Run..............................................................................................56
4.1.2 (ZTO8)2 Run.............................................................................................58
4.1.3 (ZTO8)3 Run.............................................................................................59
4.1.4 (ZTO8)4 Run..............................................................................................61
4.1.4.1 Discussion and Analysis..............................................................65
4.2 ZnTeO3 Single Crystal Growth................................................................................75
vii
4.2.2 ZT I............................................................................................................77
4.2.2.1 Microprobe Analysis.....................................................................79
4.2.3 ZT II............................................................................................................81
4.2.3.1 Discussion and Analysis.............................................................83
4.3 CdTe2O5 Crystal Growth.........................................................................................92
4.3.1 Introduction.................................................................................................92
4.3.2 The Growth.................................................................................................94
4.3.2.1 Discussion and Analysis..............................................................95
4.4 Summary....................................................................................................................102
References........................................................................................................................103
5. THE PHASE DIAGRAM...............................................................................................105
5.1 Introduction..............................................................................................................105
5.2 ZnO - TeO2 Phase Diagram.....................................................................................107
5.2.1 ZnO:TeO2 - 9:91 .......................................................................................108
5.2.2 ZnO:TeO2 - 16.7: 83.3...............................................................................111
5.2.3 ZnO:TeO2 - 21:79.....................................................................................114
5.2.3.1 21:79 – A general look...............................................................114
5.2.3.2 Phase formation in 21:79..........................................................117
5.2.3.3 ZnO:TeO2 - 21:79 Top Cooling................................................118
5.2.3.4 ZnTe6O13 Crystal from 21:79 Mole Percentage........................128
5.2.3.5 Reaction Detection of 21:79.....................................................134 5.2.3.6 Devitrification of 21:79 Glass ..................................................139
5.2.4 ZnO:TeO2 - 33.3:66.7..................................................................................142
viii
5.2.5 ZnO:TeO2 - 36.5:63.5.................................................................................143
5.2.6 ZnO:TeO2 - 40:60........................................................................................144
5.2.7 ZnO:TeO2 - 50:50.......................................................................................151
5.3 Summary.................................................................................................................151
5.4 Glass........................................................................................................................155
5.4.1 Optical Properties...........................................................................................158
References........................................................................................................................162
6. CONCLUSIONS.............................................................................................................164
APPENDIX......................................................................................................................169
Appendix 1...........................................................................................................169
Appendix 2...........................................................................................................170
Appendix 3...........................................................................................................179
Appendix 4...........................................................................................................185
ix
LIST OF TABLES
2.1 Set of fieldpoints used as an interface between the computer and the furnace.................17
2.2 Data from the furnace as it was recorded every 10 seconds. Only two thermocouples are
shown. The table was split into two halves to accommodate paper format.....................18
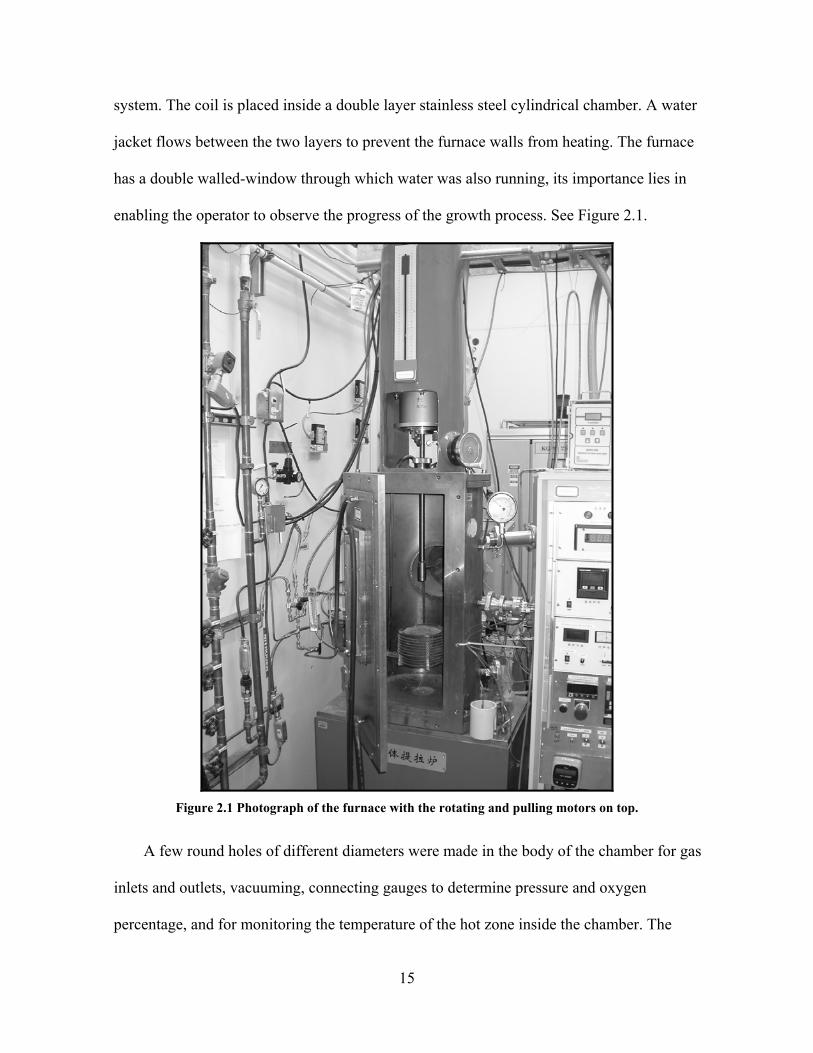
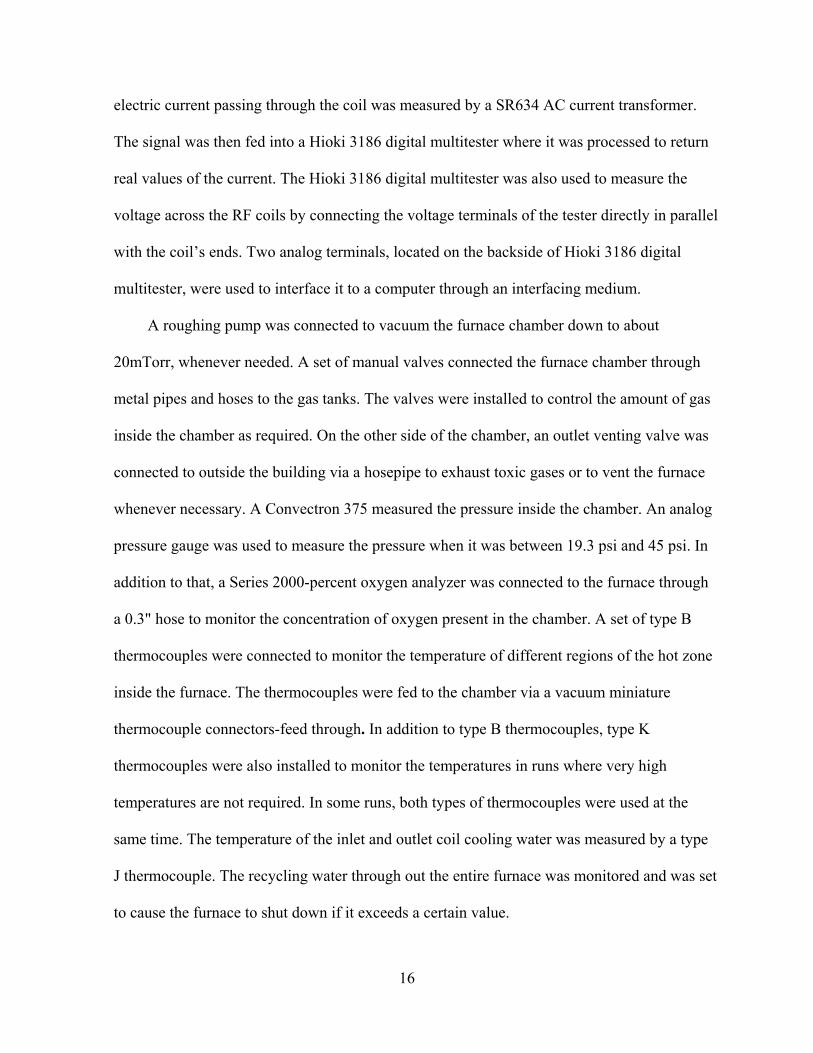
2.3 Properties of all types of felt insulations. Source: Zircar Zirconia...................................19
2.4 Alumina (AD-998) properties. This high purity alumina was used to make the base for
the set up in the hot zone chamber. Source: CoorsTek......................................................20
2.5A S-3629 type insulating cylinders. Source: Zircoa Inc....................................................21
2.5B Composition of S-3629 type insulating cylinders. Source: Zircoa Inc..........................21
2.6A ZYFB-3 type insulating material. Source: Zircar Zirconia............................................22
2.6B ZYFB is nominally 90 wt% ZrO2 + HfO2 and 10 wt% Y2O3composition. Source:
Zircar Zirconia...................................................................................................................22
2.7 Properties of type FBD rigid disk (Base). Source: Zircar Zirconia..................................23
2.8 Composition and properties of ZR-CEM cement. Source: Zircar Zirconia......................26
2.9 Electrical and mechanical data of aluminuim silicate after firing. Source: Maryland Lava
Company, Inc.....................................................................................................................29
3.1 List of the software package used to identify the new discovered crystal……….........…39
3.2 Data and data analysis in the scanning electron microprobe……………………………41
4.1 A summary of the most important runs used in an attempt to grow Zn2Te3O8 single
crystals...............................................................................................................................65
4.2 Unit cell parameters of Zn2Te3O8.....................................................................................73
x

4.3 Some important parameters that have been found using CrystalMaker 1.3 for
Windows............................................................................................................................73
4.4 The general equivalent positions......................................................................................74
4.5 Summary of input positional parameter data from Feger et al.........................................74
4.6 Listing of atomic coordinates for the first unit cell. Total of 52 atoms exist in the
complete unit cell...............................................................................................................74
4.7 A series of three measurements at different points on the sample. Calculations were made
based on the oxide weight percentage and number of oxygen atoms available. At least,
95% of the sample is Zn2Te3O8.........................................................................................80
4.8 A series of four measurements at different points on the minor phase. Calculations were
made based on the oxide weight percentage and number of oxygen atoms available. The
minor phase was found to be TeO2 with a very few Zn occurrence..................................80
4.9 Microprobe analyses for ZnTeO3 phase...........................................................................83
4.10 Unit cell parameters for ZnTeO3 crystal.........................................................................90
4.11 Some important parameters that have been found using CrystalMaker 1.3 for
Windows………......……………………………………………………………………..90
4.12 General equivalent positions. Found by CrystalMaker 1.3 for Windows.......................91
4.13 Summary of input positional parameter data obtained from University of Idaho x-ray
library.......................................................................................................................................91
4.14 Listing of atomic coordinates for the first unit cell. Total of 48 atoms exist in the
complete unit cell. Found using CrystalMaker 1.3 for Windows......................................91
xi
4.15 Crystal structure parameters for the grown crystals.....................................................102
4.16 Crystal structure and electrical properties of the grown crystals..................................103
4.17 Some important optical and electrical constants that were found for the grown
crystals.............................................................................................................................103
5.1 Summary of some details of 21:79 runs using the same powder....................................116
5.2 Processes that led to the formation of the new phase.....................................................128
5.3 Atomic coordinates (x 10-4) and equivalent isotropic displacement parameters (Å2x 10³)
for ZnTe6O13 crystal. U(eq) is defined as one third of the trace of the orthogonalized Uij
tensor................................................................................................................................131
5.4 Crystal data and refinement parameters for the ZnTe6O13 phase...................................132
5.5 Scanning microprobe analysis for 40:60 pulled material...............................................147
5.6 Phases formed due to the effect of calcining, melting, and/or pulling the ZnO-TeO2
system at different mole percentages. For melting and pulling, the temperature was
measured near the outside bottom of the crucible...........................................................153
5.7 Percentage of each phase for some compositions found by CrystalDiffract 1.3. The
margin of error for each phase is ± 5%............................................................................154
5.8 Some electrical and optical properties of glass...............................................................161
xii
LIST OF FIGURES
1.1 Schematic diagram of CZ setup. Source after modification:
http://rcswww.urz.tu-dresden.de/~cwinkler/poverview.htm accessed on August 24 2006.2
2.1 Photograph of the furnace with the rotating and pulling motors on top...........................15
2.2 Felt insulation type ZYF-100 thermal conductivity as a function of temperature.
Source: Zircar Zirconia...............................................................................................…...19
2.3 FBD type insulating board was modified to fit in the setup……………...……………..23
2.4 Schematic diagram of the setup for CZ growths………………………………………..24
2.5 Bottom setup with the crucible inside. Crucible level is 0.5″ below the RF top
level....................................................................................................................................24
2.6 Setup with a cover on top……………………………………………………………......25
2.7 Another design of the top setup........................................................................................25
2.8A TeO2 seed attached to alumina seed holder via a platinum/ rhodium wire…………....27
2.8B A seed attached to the seed holder with high temperature epoxy..................................27
2.9A Side view of the bottom setup for Bridgman technique. Three thermocouples were
attached to the base through springs. The position of each thermocouple was carefully
chosen to measure the axial thermal gradient across the crucible.....................................29
2.9B Top view of the chair where the crucible sets. Notice the holes and thermocouples
through them. The distance of each hole from the center was chosen carefully to monitor
the thermal gradient of the crucible..................................................................................30
xiii
2.10 The insulating cylinder attached to the pulling shaft via high temperature fiber glass
robes. The vertical level of the cylinder can be changed as desired..................................30
2.11A Thermal conductivity of some insulating materials as a function of temperature and
bulk density in lb/ft3. Source: Zircar Zirconia...................................................................31
2.11B Change after 2 hours of heating several types of insulation products at 1750 ºC in
Hydrogen atmosphere…..………………………………………………………………..31
3.1 The ZnTeO3 single crystal before sputtering (left), and after sputtering (right)...............35
3.2 Bragg’s diffraction. Taken from http://en.wikipedia.org/wiki/Bragg_diffraction............36
3.3 Schematic for x-ray diffraction. Source: http://pubs.usgs.gov/of/2001/of01-
041/htmldocs/xrpd.htm, after modification.......................................................................37
3.4 Sample box holder for high Curie temperature measurements. Arrow shows machined
lava on one side of the box................................................................................................44
3.5 Schematic diagram of the setup used to obtain the absorption and the transmission
spectra...............................................................................................................................45
3.6 birefringence of light. O-beam is the ordinary beam, and e-beam is the extraordinary
beam……………………………………………………………………………………...48
3.7 Poling of PMN-PT sample. When poling take place, leakage current increases
dramatically as shown in the Figure..................................................................................49
3.8 Weighing system to measure the mass of the growing crystal as a function of time......51
3.9 The mass of the growing crystal as a function of time…………………………….......51
xiv
4.1 Spoke pattern for 40:60 melt. Similar pattern was observed for other mole
percentages……………………………………………………………………………….56
4.2 Top view of the setup used to pull Zn2Te3O8 crystals………………………………......56
4.3 Seed obtained from a previous growth, attached to the seed holder by platinum wire
passing through notches made in the seed and the holder…………………………….....57
4.4 Multicrystalline material resulted from pulling 35.5:64.5 melt for 8 hours. Single crystals
were extracted and scanning electron microprobe shows that they are Zn2Te3O8 single
crystals………………………………………………………………………………......57
4.5 The mother crystal obtained in (ZTO8)2, the rotation was increased to 15 rpm rather than
10 rpm................................................................................................................................58
4.6 Some of the single crystals were extracted from the mother crystal shown in Figure 4.5.
Scanning electron microprobe indicates that these single crystals are Zn2Te3O8 with TeO2
inclusions...........................................................................................................................59
4.7 The crystals are almost wholly Zn2Te3O8, with a small proportion of TeO2 in places. The
orange-brown phase is Zn2Te3O8, and the yellow phase is TeO2. The proportions of the
two phases in this image are not representative, as TeO2 is a small percentage of the
entire sample......................................................................................................................59
4.8A Side view for setup used for the small platinum dish...................................................60
4.8B Setup used for the small platinum dish, top view..........................................................60
4.9 Crystal pulled using a platinum wire................................................................................61
4.10 Temperature of the bottom of the crucible as a function of time...................................62
xv
4.11A Coupling power of the RF coil with the crucible as the run develops in time. The large
vertical sudden changes are due to resetting the temperature to a different value............63
4.11B Coupling power of the first section (shown in Figure 4.11A) of the growth process.
The power drops slowly as the growth progresses. The total power drop for both growth
sections is 27.7 watts..........................................................................................................63
4.12 The 35.5:64.5 as grown crystals.....................................................................................64
4.13A X-ray diffraction for Zn2Te3O8 a single crystal. The x-ray diffraction was performed
using Siemens D-500 with the following control variables P.V. = 35 kV, I = 30 mA, and
CuKα radiation. Data was simulated using CrystalDiffract 1.3 software.........................66
4.13B X-ray diffraction for Zn2Te3O8 a single crystal. The x-ray diffraction was performed
using Siemens D-500 with the following control variables P.V. = 35 kV, I = 30 mA, and
CuKα radiation. Data was simulated using CrystalDiffract 1.3 software..........................67
4.14 A photograph of the single crystal obtained under polarized light. The regions of color
might be due to distortion of light caused by crystal surface roughness...........................67
4.15 Single crystal diffractometer measurement shows that Zn2Te3O8 is a single crystal......68
4.17 Dielectric constant in the (001) direction as a function of temperature for Zn2Te3O8
single crystal......................................................................................................................69
4.18 Current-voltage relation for Zn2Te3O8 single crystal......................................................69
4.19 Absorption spectrum for both Zn2Te3O8 single crystal before and after
solarization........................................................................................................................70
4.20 Transmission spectrum for Zn2Te3O8 solarized single crystal........................................71
xvi
4.21 Birefringence of Zn2Te3O8 crystal. Left photograph shows birefringence in the vertical
direction, but when the crystal was rotated 90 degrees, birefringence took place in the
horizontal direction............................................................................................................72
4.22 Zn2Te3O8 crystal structure built using CrystalMaker 1.3 for Windows.........................73
4.23 40:60 pulled material. The formation of more than one phase and the tendency of the
material to detach from the melt were just a few problems resulting from pulling the
material..............................................................................................................................76
4.24 Setup used in ZT I run....................................................................................................77
4.25 Temperature as a function of time for ZT I....................................................................78
4.26 The resulting ingot from ZT I run...................................................................................78
4.27 A photograph of the bottom of ZT I ingot......................................................................79
4.28 Single crystals extracted from ZT I ingot.......................................................................79
4.29 A representative BSE image of Zn2Te3O8 single crystal with some white TeO2
phase..................................................................................................................................80
4.30 TeO2 minor phase from Figure 4.30. The yellow stripe is TeO2 and the brown region is
Zn2Te3O8. There is a Zn2Te3O8 phase within The TeO2 stripe. This inhomogeneous TeO2
type is not dominant. The white center dot is just the beam when the machine is in the
“beam mode”. ...................................................................................................................81
4.31 Development of ZT II run as a function of time.............................................................82
4.32 A single crystal after cutting and polishing resulted from run ZT II..............................83
xvii
4.33A ZnTeO3 powder x-ray pattern and the correspondent simulation................................85
4.33B ZnTeO3 powder x-ray pattern and the correspondent simulation................................85
4.34 Dielectric constant of ZnTeO3 single crystal as a function of temperature at (010).......86
4.35 I-V relation for ZnTeO3 single crystals..........................................................................87
4.36 Absorption spectrum for ZnTeO3 single crystal.............................................................87
4.37 Poling did not take place for ZnTeO3 sample since the energy stored in the sample is
very small...........................................................................................................................88
4.38 Log impedance as a function of frequency. No piezoelectric effect was noticed...........89
4.39 A diagram shows the crystal structure of ZnTeO3. It was constructed by CrystalMaker
1.3 for Windows.................................................................................................................90
4.40 The phase diagram of TeO2 and CdO system. Taken from “A study of crystals in the
cadmium oxide-tellurium dioxide system” by I.M. Young, Journal of Materials Science
13, 1978..............................................................................................................................93
4.41 Spoke lines of Cdo-TeO2 melt. It shows that the center of the spoke pattern is shifted
towards the edge of the crucible........................................................................................94
4.42 33.3:64.7 CdO: TeO2 crystal growth by Bridgman technique.......................................95
4.43 CdTe2O5 Single crystals grown by Bridgman technique using a RF coil furnace.........96
4.44 CdTe2O5 x-ray pattern compared with a PDF card number 24-0169.............................97
4.45 CoKα x-ray pattern collected at several non ambient temperatures for CdTe2O5 single
crystals to look for stability and Curie temperature...........................................................98
xviii
4.46 Dielectric for CdTe2O5 single crystal in the (001) direction as a function of
temperature.......................................................................................................................99
4.47 I-V relation for CdTe2O5 single crystal........................................................................100
4.48 Transmission spectrum for CdTe2O5 single crystal......................................................100
4.49A Poling did not take place for CdTe2O5 sample since the energy stored in the sample is
very small.........................................................................................................................101
4.49B Log Admittance as a function of time. No piezoelectric effect was noticed as no
resonance and anti-resonance peaks showed up..............................................................101
4.50 The straight lines are ferroelectric walls separating domains of different
polarization............................................................................................................................102
5.1 Part of the phase diagram of the ZnO-TeO2 system. The phase diagram was taken from
Bürger et al after modification. Arrows show where potential line components would
form..................................................................................................................................107
5.2 Cooling down the crucible in a temperature-controlled process. Each dip in the power
curve marks the formation of a different phase...............................................................108
5.3 The resultant 9:91material.............................................................................................109
5.4 A BSE image of one of the non-homogeneous areas, as seen by scanning electron
microprobe representative image.....................................................................................110
5.5 A BSE representative image of homogeneous region. The yellow represents TeO2 and
the orange contains both TeO2 and Zn2Te3O8..................................................................110
xix
5.6 Microprobe image of 16.7:83.3 calcined powder. The black area is the glass
substrate...........................................................................................................................111
5.7A X-ray pattern for 16.7:83.3..........................................................................................112
5.7B X-ray pattern for 16.7:83.3 compared with PDF patterns of TeO2 and Zn2Te3O8 . Phase
diagram composition of TeO2 and Zn2Te3O8 is 58.25 and 41.75, respectively...............113
5.8A X-ray pattern of 16.7:83.3 and the generated patterns for TeO2 and Zn2Te3O8..........113
5.8B X-ray pattern of 16.7:83.3 and the generated patterns for TeO2 and Zn2Te3O8. The fit
shows a perfect match......................................................................................................114
5.9 Pulled 21:79 material. ....................................................................................................115
5.10 BSE image of 21:79 pulled material. Zn2Te3O8 was found to form 52.5% and TeO2
forms 46.6%, the rest is cracks and some Zn...................................................................115
5.11 Difference in color and physical appearance for several 21:79 runs............................116
5.12 Coupling power and temperature as a function of time................................................117
5.13 Cooling down the melt of 21:79 after losing some TeO2 due to evaporation. Two humps
can be seen indicating the formation of two phases at two different temperatures.........118
5.14 A series of photographs of 21:79 melt after dropping a Zn2Te3O8 seed on the surface.
Time is in minutes............................................................................................................119
5.15 The right photograph shows a close up look at the growing material. A stabled solid
material floats on top of the melt.....................................................................................120
5.16 X-ray patterns for 21:79 with top cooling at 25 degrees /hour. All tested parts of the
ingot show almost the same pattern.................................................................................121
xx
5.17A X-ray pattern of a 21:79 sample taken from the top side area of the ingot. The red
pattern is a simulation of a mixture of TeO2 and Zn2Te3O8............................................121
5.17B X-ray pattern of a 21:79 sample taken from the top middle area of the ingot. The red
pattern is a simulation of a mixture of TeO2 and Zn2Te3O8...........................................122
5.17C X-ray pattern of a 21:79 sample taken from the bottom middle area of the ingot. The
red pattern is a simulation of a mixture of TeO2 and Zn2Te3O8......................................122
5.18A X-ray pattern of 21:79 material and the simulated patterns for the TeO2 and Zn2Te3O8
mixture.............................................................................................................................123
5.18B X-ray pattern of 21:79 and the generated patterns for TeO2 and Zn2Te3O8. The fit
shows a perfect match.....................................................................................................124
5.19 21:79 material, where two patterns are shown. One pattern is of a powder that was
grinded hard, and the one other is of a powder that was grinded gently.........................125
5.20 21:79 material, one grinded by pestle and mortar, and the other one grinded by the tips
of fingers. The peaks appearing in the hand grinded pattern were not identified. No PDF
card has a similar pattern.................................................................................................125
5.21 X-ray patterns for the 21:79 material which was barely melted in a standard box
furnace. Patterns show that the material has two phases, namely TeO2 and Zn2Te3O8...126
5.22A X-ray pattern and simulation for 21:79 material melted at 621 ºC............................127
5.22B X-ray pattern and simulation for 21:79 material melted at 621 ˚C............................127
5.23 A diagram shows a part of the unit cell of ZnTe6O13. Selected bond lengths and angles:
Te1-O1 2.1244(7); Te1-O2 1.936(4); Te1-O3 1.851(4); Te1-O2a 2.168(4); Te2-O3
xxi
2.204(4); Te2-O4 1.922(4); Te2-O5 1.857(4); Te2-O4a 2.026(4) Å; O1-Te1-O2a,
154.7(1); O3-Te2-O4a, 176.8(1)º………………………………………………………130
5.24 Calculated powder pattern (λ = CuKα) using ZnTe6O13 single crystal data................ 131
5.25 X-ray data for ZnTe6O13 compared with the simulation data of the Zn2Te3O8 and
ZnTe6O13 mixture.............................................................................................................133
5.26 BSE representative image. The yellow area is ZnTe6O13 and the brown area is
Zn2Te3O8. The black area is just the glass substrate........................................................134
5.27 Reaction detection for 21:79 mixed powder.................................................................135
5.28A X-ray patterns for TeO2 PDF, ZnO powder, and 21:79 mixture at room temperature
after smoothing. The patterns were collected using a cobalt tube...................................137
5.28B X-ray patterns for TeO2 PDF, ZnO Powder, and 21:79 mixture T = 400 ˚C after
smoothing. The patterns were collected using a cobalt tube. .........................................137
5.28C X-ray patterns for TeO2 PDF, ZnO Powder, and 21:79 mixture T = 450 ˚C after
smoothing. The patterns were collected using a cobalt tube...........................................138
5.28D X-ray patterns for TeO2 PDF, ZnO Powder, and 21:79 mixture at T = 585 ˚C after
smoothing. The patterns were collected using a cobalt tube. .........................................138
5.29A 21:79 glass devitrifies as a response to a temperature increase. The appearing peaks
were matched with the appropriate PDF cards in 2 theta range between 25-40 degrees. O2
refers to TeO2 and O8 refers to Zn2Te3O8. ......................................................................140
xxii
5.29B A 21:79 glass devitrifies as a response to a temperature increase further up to 430 ˚C.
The appearing peaks were matched with the appropriate PDF cards in 2 theta range
between 20 to 60 degrees.................................................................................................140
5.30A X-ray pattern for 21:79 glass devitrified at 585 ˚C. Data was collected at room
temperature. Simulation shows that TeO2 bears 49% while the rest is
Zn2Te3O8..........................................................................................................................141
5.30B X-ray pattern for 21:79 glass devitrified at 585 ˚C. Data was collected at room
temperature. Simulation shows that TeO2 bears 49% while the rest is
Zn2Te3O8..........................................................................................................................141
5.31A X-ray for 33.3:66.7 material melted at 700 ˚C simulated with the TeO2 and Zn2Te3O8
mixture.............................................................................................................................142
5.31B X-ray for 33.3:66.7 material melted at 700 ˚C simulated with the TeO2 and Zn2Te3O8
mixture.............................................................................................................................143
5.32 X-ray pattern for 36.5:63.5 material extracted from the center of the ingot. Simulation
shows that it has 9.4% TeO2, 89% Zn2Te3O8, and 1.6% ZnTeO3...................................144
5.33 Phase formation of 40:60 material upon cooling down at 40 degrees/hr.....................144
5.34A BSE image of 40:60 pulled material. The yellow area is Zn2Te3O8 and the orange area
is ZnTeO3. This image is almost representative...............................................................145
5.34B BSE image of 40:60 pulled material. The yellow area is ZnTe5O11 and the orange area
is Zn2Te3O8. This image is not representative..................................................................146
xxiii
5.34C BSE image of 40:60 pulled material. The yellow area is Zn2Te3O8, the orange area is
Zn3TeO6, and the white area is ZnTe5O11. This image is not representative...................146
5.35 Simulation patterns for Zn2Te3O8, and ZnTeO3...........................................................147
5.36A X-ray data of pulled 40:60 material fit with simulation patterns for Zn2Te3O8 and
ZnTeO3.............................................................................................................................148
5.36B X-ray data of pulled 40:60 material fit with simulation patterns for Zn2Te3O8 and
ZnTeO3.............................................................................................................................148
5.37A X-ray pattern for 40:60 melted at 820 ºC in a box furnace........................................150
5.37B X-ray pattern for 40:60 melted at 820 ºC in a box furnace.........................................150
5.38 X-ray pattern for 50:50 material and its simulation. Some peaks were not
identified..........................................................................................................................151
5.39 Several glasses made out from different mole percentages of ZnO as shown in the
photograph.......................................................................................................................155
5.40 X-ray for 25:75 glass....................................................................................................156
5.41 Phase diagram for the ZnO-TeO2 system, it shows the glass forming region. The solid
line corresponds to cooling rates of 1 K/min and the dotted line corresponds to cooling
rates of 10 K/s. The phase diagram was taken from Bürger et al [10]............................157
5.42 Transmission curves for the glasses shown in Figure 5.36...........................................158
5.43 Cut-off edge as a function of thickness in mm for the 32:68 glass...............................159
5.44 Dependence of the transmission on the angle of the glass sample...............................160
5.45 Absorption curves for both the 35.5:64.5 glass and Zn2Te3O8 single crystal...............161
xxiv

DEDICATION
To my late mother and my late father,
for their unconditional love and support, may God bless their souls.
xxv
CHAPTER ONE
BACKGROUND AND LITERATURE REVIEW
1.1 Introduction
The II-VI oxides have been the focus of many studies for there useful optical and electronic
properties. In this research, Czochralski (CZ) as well as vertical Bridgman techniques were used
in an effort to grow single crystals of Zn2Te3O8 and ZnTeO3. There is no report in literature of
any attempt to grow these crystals using CZ or Bridgman techniques, yet, very small crystals
were produced hydrothermally to study the crystal structure and other simple physical properties
like color, appearance, and density.
The growth of Zn2Te3O8 and ZnTeO3 was faced with challenging difficulties. The phase
diagram of ZnO-TeO2 system does not show the formation of stoichiometric compounds for
either of these two materials. Attempts to grow these crystals were carried out to replicate other
researchers’ efforts that effectively grew nonstoichiometric oxide crystals.
Phase diagram of the ZnO-TeO2 system was investigated by calcining, melting, and pulling
mixed powders of various mole percentages. The primary focus was on 21%:79% - ZnO:TeO2
by mole. The glass forming ability of this system was also examined for this mole percentage.
Different mole percentages of ZnO:TeO2 glasses were also formed and their transmission
properties were investigated.
On the other hand, another II-VI oxide, CdTe2O5 was successfully grown using top cooling
vertical Bridgman technique. Earlier researchers used only the CZ method. Electrical and optical
properties of this crystal were compared to the properties of the crystals grown by CZ technique.
For the three single crystals that were grown, optical band gap, resistivity, dielectric constant and
other properties were determined.
1.2 Literature Review
Although the development of crystal growth started early in the twentieth century [1],
Czochralski (CZ) crystal growth was well established by the mid-1950s. It had shown a great
potential to pull oxide crystals [2,3,4], as well as semiconductor crystals such as silicon [5] and
germanium [6]. Many other types of crystals were also grown by CZ technique [7,8,9].
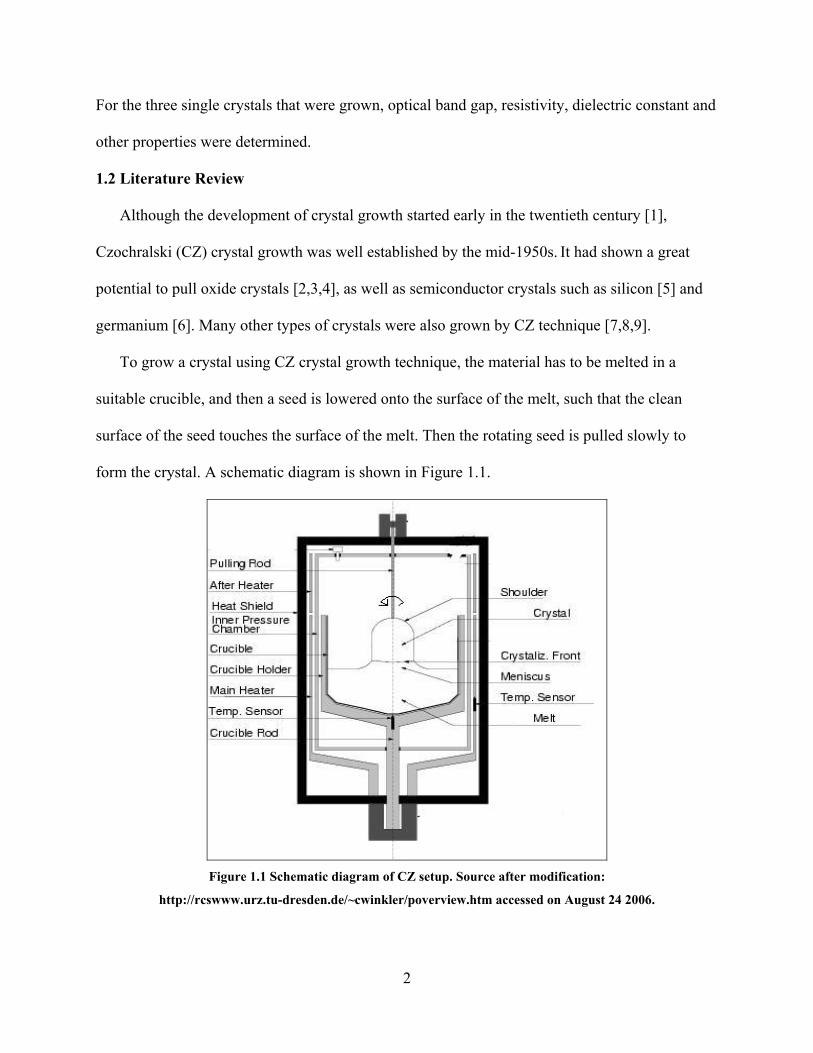
To grow a crystal using CZ crystal growth technique, the material has to be melted in a
suitable crucible, and then a seed is lowered onto the surface of the melt, such that the clean
surface of the seed touches the surface of the melt. Then the rotating seed is pulled slowly to
form the crystal. A schematic diagram is shown in Figure 1.1.
Figure 1.1 Schematic diagram of CZ setup. Source after modification:
http://rcswww.urz.tu-dresden.de/~cwinkler/poverview.htm accessed on August 24 2006.
2
The material is placed inside a suitable crucible and heated by a radio frequency (RF) coil
[10] or a regular ceramic heater. The mixture of the materials is preferred to be at the congrue
melting point of the constituents to avoid complications of forming undesired phases while
growing, but some researchers were able to pull single crystals at incongruent points [11]. Ot
workers reported the growth of single crystals from non stoichiometric melts [12, 13] and others
grew multiphase semiconductor crystals at the peritectic phase transformation [14].
Several parameters have to be controlled during the crystal growth. . These parameters
include the temperature gradient, the melt-crystal interface shape, the rotation of the seed, th
pulling rate, and the growth direction. Because of the dynamicity of CZ crystal growth, some o
these parameters have to be modified as the growth process progresses. Since CZ growth is very
sensitive to these parameters, the outcome could be different from one researcher to another.
Different outcome
nt
her
e
f
s can also occur for the same operator where two successive runs yield
evel
al, the melting temperature of
different results, even if both of the runs have almost the same constraints. The temperature
gradient across both the melt and the space above the melt, which will in turn, affects the axial
temperature gradient on the seed and the growing crystal is the most important variable that
needs to be controlled. A good axial temperature gradient above the melt surface will help grow
a crystal with the least amounts of defects. Defects that can occur include macroscopic and
microscopic cracks, high intensity of dislocations, impurities and/or dopant inhomogeneities,
core and/or surface facets and other defects [15]. Another parameter that will determine whether
defects occur is the dopant percentage level. Cracks often appear if the dopant percentage l
is incorrect [16].
The temperature gradient for both the melt and the room above of it strongly depends on the
size and the emissivity of the crucible and the melt, the melt materi
3
the material, the size of the crystal needed to be grown and its emissivity, as well as the melt’s
emissivity [17]. Temperature gradient also depends on the diameter and height of the build up
around the growing crystal, the type of insulation material used around the crucible and the
growing crystal. A good axial and radial temperature gradient in the melt will maintain suitable
convection currents that are needed to stir the melt. These convection currents will help conduc
the heat from the hot spots in the crucible to the cold ones and prevent severe temperature
gradients from existing. In the case where the melt contains dopants, these convection curr
will keep the concentrat
t
ents
ion of these dopants uniform through out the entire volume of the melt,
al is considerably less that that for the
e
s done, either by polishing or cutting.
which is a superior benefit of CZ technique over other techniques.
The melt-crystal interface shape is strongly affected by the internal radiative heat transfer
[18,19]. It was found that a deflected interface towards the melt is promoted by heat transfer. In
oxides, this happens because the absorptivity in the cryst
m lt. Also, because of that effect, it was found that a steady spoke line pattern can be seen when
the melt is not assumed to be transparent, in this case the Marangoni effect is enhanced due to
the existence of a thermal gradient [20]. Many simulations were performed to better understand
the convection flow of the melt and its effect on both the melt-crystal interface and spoke
patterns [21,22,23,24].
Increasing the rotation of the seed/crystal could result in changing the solid-melt interface
shape [2,16] from convex to flat. This has the good effect of displacing the facets from the center
of the crystal to the sides. This will make it an uncomplicated process to get rid of these facets
when the growth i
Verifying a suitable thermal gradient in the melt mostly depends on noticing the spoke line
patterns that appear on the surface of the melt [25]. In most melts, these spoke lines form a star-
4
like shape, in which the center of the star is almost at the center of the crucible and the branches
of the star rotate around the center in a slow motion that ranges from 1-3 rpm. This speed
depends greatly on the material of the melt, the diameter and the height of the crucible and other
es
t
thermal gradient becomes larger, and this could cause the
p,
placed
the
variables. Spoke lines form a star-like shape at the center of the crucible in most melts, in TeO2-
CdO melts, spoke pattern center is shifted towards the crucible edge and has very small branch
that move slowly, along each line, towards that center, while new branches appear at the tip of
each spoke line.
Another variable that is essential to the crystal growth is the pulling rate [26, 27]. In mos
materials, pulling rates range from 0.5 to 20 mm/hr. The pulling rate should be adjusted as the
crystal grows and gets bigger, since the heat transfer dynamics change accordingly. For example,
as the diameter of the crystal increases, more melt is crystallizing in a shorter time, and this will
make the latent heat released bigger and cause the flow dynamics in the melt to change.
As the crystal gets longer, the axial
crystal to crack [28]. A good, but not adequate, solution to this problem is to slow the pulling
rate to its minimum value. Some researchers use a heat shield and/or an afterheater [28,29] to
reduce the axial thermal gradient. Another problem that could rise in growing big crystals is the
melt level dropping in the crucible; again this changes the fluid dynamics and heat transfer.
Some researchers [30] overcame this difficulty by melting the material in a two- crucible setu
such that one of them is inside the other, a powder supply system provides the outer crucible
with a powder to compensate for the loss of melt level due to growth. Other researchers
crucible assembly on top of a stepping motor that slowly raises the setup, which holds the
crucible as the crystal grows [31, 32].
5
Growth direction is another variable that could be significant to crystal growth [27, 33],
Some growth directions are easier to execute than others are. Some crystals have the likelihood
to develop certain types of defects in one direction, but when grown in another direction, there
less probability for them to appear. The crystal growth direction depends on the seed used,
seed is in a certain direction, then the growth will be in the same direction as the seed. Some
researchers use seeds that were made out by slow spontaneous nucleation of the melt [34] or
used seeds that were made with the help of a platinum wire [35] or iridium wire [36].
In the Bridgman technique, a thermal gradient is utilized to grow large single crystals either
by lowering the melted charge through a hot zone with a thermal gradient or by creating the
gradient via electronic control. Better crystals are grown when using the electronic control
gradient, since moving the melt down the thermal gradient zone may disturb the formation of
defect free single crystal. In the mid twenties of the past century, Bridgman was
is
if the
a
able to grow
me
ell
rmal gradient. Some crystals that are not well grown by CZ technique can be
gr
tallic crystals several times. A modified version of Bridgman technique was introduced by
Stockbarger's method [37], in which the thermal gradient was made steeper to grow large
crystals of Lithium Fluoride by separating the hot zone from the cold zone via a partition made
of platinum. To grow a crystal that has the same direction as the seed, the crucible may have a
thin vertical hollow extension at the bottom where a cylindrical seed can fit [38]. More
sophisticated furnaces were found when the multizone furnace was introduced. In this furnace,
which was first built by Mellen [39] the axial temperature was controlled via local heaters
separated by insulation material stacked vertically. This provided a uniform, short, and w
maintained the
own by Bridgman method; some of these crystals are those of volatile melts.
6
The solid-liquid interface shape in a Bridgman-Stockbarger furnace is generally convex in th
hot zone (solid point of view), but reverses to concave in the cold zone [40]. This mainly
happens as a result of heat transfer between the crucible and the heat source which leads to
curving of the isotherms [41]. The study of the interface shape was the focus of many authors for
its importance in determining the quality of the grown crystal [42,43]. For example, it is known
that defects tend to spre
e
the
ad normal to the growth interface, if the melt was concave (melt point of
ll form inside the crystal, but if the melt was convex, defects form on the
out
id
or
,
expected to be
e used in
view), defects wi
side. Flat interfaces are best for melts with dopants, since it provides uniform radial
distribution.
Some Bridgman techniques use a horizontal thermal gradient, in which the polycrystalline
material is placed in a boat, and this boat is exposed to a uniform thermal gradient [44]. In this
process, which is more complicated than vertical Bridgman is, at least 40% of the solid-liqu
interface is free of contact with the crucible. This causes no chemical, mechanical, thermal
kinetic interactions occur. This provides the situation of growing defect (dislocation) free
crystals [45]. Finally, Bridgman method is used mostly to grow x-ray and gamma ray detectors
II-VI and III-V semiconductors, and piezoelectric materials, in addition to the growth of some
metal single crystals.
1.3 Motivation
Materials with wide band gaps are used in optoelectronic devices, as well as in acousto-
optical instruments. Good quality grown Zn2Te3O8 and ZnTeO3 crystals are
transparent to visible light. This means that it has a wide band gap, with all the benefits that
come with this property. As soon as these crystals are successfully grown, they could b
the solar cell industries. The grown crystal has a resistivity of the order of 1013 ohm.cm or
7
higher, once doped with the appropriate dopants before the growth; it can be used in many
applications that involve semiconductor manufacturing. If the resultant crystal has low ligh
absorption and high transmissivity, this makes it a candidate to become a laser crystal. This is
conditioned by the fact that the population inversion can be achieved [46]. It has been reported
that the II-VI oxide crystals have very high refractive indices and are optically active. They
present non-linear optical propertie
t
s [47, 48], second harmonic generation (SHG) effect, and
their useful properties. When the
ing
oxide (ZnO) crystals have a wide band gap width of 3.3 eV at room temperature
hort wavelength lasers and light emitting diodes (LED) [55]. The average refractive index and
e average static dielectric constant of ZnO crystals are 2.0 and 10.0, respectively [56]. On the
ls have useful applications in acousto-optic devices
birefringence. This makes it a good material in manufacturing fiber optics, polarizers, wave
plates, depolarizers, and optical filters and many other optical instruments.
The study of this system as a crystal was not examined in the literature. A quick investigation
of the crystal structure and phase formation was done by some authors [49,50,51,52].
Unfortunately, these studies came because these authors were studying the glass that forms when
this material is quenched from melt, not because they were interested in the crystal form of this
system. Similar II-VI oxides have attracted attention for
powders of CdO and TeO2 are mixed in certain mole percentages and melted for growth by CZ
technique, the resulting crystal is transparent with piezoelectric properties [48]. Other mixing
percentages, which produce MTeO3 crystals, where M stands for Zn or Cd, show promis
nonlinear optical properties [53].
The zinc
[54]. This makes the crystal a good candidate for applications in optoelectronic devices such as
s
th
other hand, Paratellurite (TeO2) crysta
8
[57,58], many of which are used in data display devices (DDD)[59]. TeO2 crystal has band gap
In addition to the benefits that II-VI oxide crystals may have to offer, glasses of this group,
ns in SHG after thermal poling [61, 62], and
] H. J. Scheel, The Development of crystal growth technology: Crystal growth technology
of 3.5 eV [60] and a refractive index of about 2.2 [56].
particularly the glass of ZnO- TeO2 have applicatio
can show non-linear optical properties. ZnO-TeO2 glasses are also known for their high
refractive indices, and dielectric constants [63], and they are also chemically stable [64].
References
[1 .
Czochralski growth of oxides, Journal of crystal growth 264: 593 - 604, 2004.
] L. Fornasiero, E. Mix, V. Peters, G. Petermann, and G. Huber, Crest. Res. Technol., 34, No.
] N.V. Abrosimov, H. Riemann, W. Schröder, H.-J Pohl, A. K. Kaliteevski, O. N. Godisov, V.
allmoos, P. Bastie, B. Hamelin, and R. K. Smither, Growth and properties of Ge1-xSix osaic single crystals for γ-ray lens application, Journal of Crystal Growth, 278: e495 - e500.
S. X. Gao, W. S. Zhan, Y. X. Li, J. P. Qu, and G. Z. Xu, ingle crystal growth and phase diagram of Tb2Fe17 compound, Journal of Crystal Growth, 222
0] L. C. F. Blackman, p. H. Dundas, A. W. Moore, and A. R. Ubbelohde, An induction furnace
John Wiley & Sons, Ltd. New York, 3 - 14, 2003. [2] C. D. Brandle, [3] S. Kumaragurubaran, D. Krishnamurthy, C. Subramanian, and P. Ramasamy, Journal of crystal growth, 211: 276 - 280, 2000. [42: 255 - 260, 1999. [5A. Korolyov, and A. J. Zhilnikov , 29Si and 30Si single crystal growth by mini-Czochralski technique, Crys. Res. Technol., 38 No. 7-8: 654 - 658, 2003. [6] P. Dold, Czochralski growth of doped germanium with an applied rotating magnetic field, Crys. Res. Technol., 38 No. 7-8: 659 - 668, 2003. [7] K. Sankaranarayanan, and P. Ramasamy, Journal of crystal growth, 193: 552 - 256, 1998. [8] N.V. Abrosimov, A. Lüdge, H. Riemann, N. V. Kurlov, D. Borissova, V. Klemm, H. Halloin, P. V. Bm2005. [9] J.L. Chen, G. H. Wu, D. Q. Zhao, S779 - 785, 2001. [1to attain temperatures above 3000 ºC in controlled atmospheres, British Journal of Applied Sciences, 12: 377 – 383,1960.
9
[11] D. S. Robertson, N. Shaw, I. M. Young, Journal of Materials Science, 13: 1986 – 1990, 1978. [12] J. R. Carruthers, G. E. Peterson, and M. Grasso, and P. M. Bridenbaugh, Nonstoichiometry
etani, Growth of FeS single crystals from onstoichiometric melts by normal freezing, Journal of Crystal Growth, 20: 89 – 92, 1973.
e oSb3 grown by vertical Bridgman method, Journal of alloys and Compounds, 386: 228 – 233,
eguez, and J. J. Derby, A Heat shield to control thermal gradients, melt
6] D. E. Eakins, J. B. LeBret, M. G. Norton, D. F. Bahr, and J. Q. Dumm, Electron microscopy
7] P. C. Nordine, J. K. Weber, and J. G. Abadie, Properties of high-temperature melts using
shi, S. Maeda, and K. Nakamura, Prediction of solid-liquid shape during CZ Si rystal growth using experimental and global simulation, Journal of Crystal Growth, 266: 28 -
interface shape in Czochralski oxide growth, ournal of Crystal Growth, 266: 96 - 102, 2004.
. Hozawa, N. Imaishi, K. Shimamura, nd N. Ichinose, Effect of internal radiative heat transfer on spoke pattern on oxide melt surface
o, Numerical simulation of combined flow in Czochralski rystal growth, Journal of Crystal Growth, 179: 309 - 319, 1997.
, Prediction of the growth shape in industrial 300 mm CZ Si crystal growth, Journal of rystal Growth, 266: 34 - 39, 2004.
rystal Growth, 139: 197 - 205, 1994.
and crystal growth of Lithium Nibote, 42 No 5: 1846 – 1851, 1970. [13] T. Takahashi, O. Yamada, and, K. Amn [14] M. Akasak, T. Iida, G. Sakuragi, S. Furuyama, M. Noda, M. Ota, H. Suzuki, H. Sato, Y. Takanshi, and S. Sakuragi, Effects of post-annealing on thermoelectric properties of p-typC2005. [15] J. C. Rojo, E. Diconvection, and interface shape during shouldering in Czochralski oxide growth, Journal of Crystal growth, 200: 329 – 334, 1999. [1of compound oxide laser materials, Proceedings of SPIE 4970, 1, 2003. [1levitation, Pure Appl. Chem, 72 No. 11: 2127 - 2136, 2000. [18] Y. Shiraic33, 2004. [19] O.N. Budenkova, V. M. Mamedov, M. G. Vasiliev, V. S. Yoferev, and Y. N. Makarov, Effect of internal radiation on the crystal-melt J [20] C.J. Jing, A. Hayashi, M. Kobayashi, T. Tsukada, Maon Czochralski crystal growth, Journal of Crystal Growth, 259: 367 - 373, 2003. [21] X. Geng, X. B. Wu, and Z. Y. Cuc [22] T. Wetzel, J. Virbulis, A. Muiznieks, W. V. Ammon, E. Tomzig, G. Raming, and M. WeberC [23] K. Kakimoto, M. Watanabe, M. Eguchi, and T. Hibiya, Flow instability of the melt during Czochralski Si crystal growth, Journal of C
10
[24] Y. Shiraishi, S. Maeda, and K. Nakamura, Prediction of liquid-solid interface shape during CZ Si crystal growth using experimental and global simulation, Journal of Crystal Growth, 266:
8 - 33, 2004.
: 70 – 76, 1983.
. Fukuda, ingle crystal, Journal of
rystal Growth, 180: 546 - 550, 1997.
0.39 Nb2O6 BN) crystals using real-time computer control, Journal of Crystal Growth, 113: 337 - 359,
0] Y. Furukawa, K. Kitamura, E. Suzuki, and K. Niwa, Stoichiometric LiTaO3 single crystal
1] K. Riedling, Autonomous liquid encapsulated Czochralski (LEC) growth of single crystal
2] C. W. Lan, H.J. Chen, C. B. Tsai., Zone-melting Czochralski pulling growth of Bi12SiO20
, S. Q. Wang, N. Konishi, H. Inaba, and J. Harada, Growth habits of 3 and 4-inch
4] X. Lin, Y. Chen, J. Liao, Z. Luo, and Y. Huang, Czochralski growth and spectral properties
Z. You, J. Li, and B. Wu, Crystal growth and spectral properties of aB3O6:Nd crystal, Journal of Crystal growth, 266; 292 – 495, 2004.
rnal of Crystal Growth, 265; 154 – 158, 2004.
2 [25] A. D. W. Jones, Spoke lines, Journal of Crystal Growth, 63 [26] S. Wu, G. Wang, J. Xie, X. Wu, and G. Li, Growth of large birefringent YVO4 crystal, Journal of Crystal Growth, 249: 176 - 178, 2003. [27] S. Wu, G. Wang, and J. Xiea, Growth of high quality and large-sized Nd3+:YVO4 single crystal, Journal of Crystal Growth, 266: 496 - 499, 2004. [28] T. Tsukada, K. Kakinoki, M. Hozawa, N. Imaishi, K. Shimamura, and TNumerical and experimental studies on crack formation in LiNbO3 sC [29] J.P. Wilde, L. Hesselink, Diameter stabilization of Czochralski-grown Sr0.61Ba(S1991. [3growth by double crucible Czochralski method using automatic powder supply system, Journal of Crystal Growth, 197: 889 - 895, 1999. [3GaAs by “intelligent” digital control, Journal of Crystal Growth 89: 435 - 446, 1988. [3single crystals, Journal of Crystal Growth, 245: 56 - 62, 2002. [33] S. Udalangasite single crystals, Journal of Crystal Growth, 237-239: 709 - 713, 2002. [3of Er3+:La2(WO4)3 crystals, Journal of Crystal Growth, 266: 487 – 491, 2004. [35] G. Jia, C. Tu,
3+L [36] C. Tu, Y. Wang, Z. You, J. Li, Z. Zhu, and B. Wu, Growth and spectroscopic characteristics of Ca3Gd(BO3)4:Yb3+ laser crystals, Jou [37] D. C. Stockbarger, The Production of large single crystals of lithium fluoride, Review of Scientific Instruments, 7: 133 – 136, 1936.
11
[38] S. E. King, H. B. Dietrich, R. L. Henry, D. S. Katzer, W. J. Moore, G. W. Philips, and R. C.
, 43, No 3: 1376 – 1380, 1996.
7.
– 155, 1998.
l Growth, 266: 16 – 223, 2004.
T. Zawilski, M. C.C. Custodio, R. C. DeMattei, R. S. Feigelson, Control of growth terface shape using vibroconvective stirring applied to vertical Bridgman growth, Journal of
4] E. D. Bourret, J. B. Guitron, and E. E. Haller, Evaluation of the Mellen “EDG” furnace for
7 – 1224, 1988.
Mania, Development and characterization of zone melt growth GaAs for Gamma-Ray Detectors, IEEE Transaction on Nuclear Science [39] S. Rajendran and R. Mellen, Sr., Advances towards “intelligent processing” of electronic materials, Journal of Crystal Growth, 85: 130 – 135, 198 [40] Chang and W. R. Wilcox, Control of interface shape in the vertical Bridgman-Stockbarger technique, Journal of Crystal Growth: 21, Issue 1: 135 – 140, 1974. [41] C. Barat, T. Duffar, and J-P. Garandet, Estimation of the curvature of the solid-liquid interface during Bridgman crystal growth, Journal of Crystal Growth, 194: 149 [42] R. Ma, H. Zhang, D. J. Larson Jr., and K. C. Mandal, Dynamic of melt-crystal interface and thermal stress in rotational Bridgman crystal growth process, Journal of Crysta2 [43] K.inCrystal Growth, 282: 236 – 250, 2005. [4growth of large diameter GaAs single crystals in the horizontal configuration, Journal of Crystal Growth, 85: 124 – 129, 1987. [45] P. Rudolph, F. M. Kiessling, The Horizontal Bridgman method, Crystal and Research Technology, 23: 120 [46] C. R. Barrett, W.D. Nix, A. S. Tetelman, The Principle of Engineering Materials, Englewood Cliffs, New jersey, Prentice Hall, Inc,1973.
8] D. S. Robertson, N. Show, and I. M. Young, A study of crystals in the cadmium oxide-
rov, Phase equilibrium in the ZnO-TeO2 system,
0] A. Nukui, T. Taniguchi, M. Miyata, Journal of Non-Crystalline Solids, 293-295: 255-260,
1] H. Bürger, K. Kneipp, H. Hobert, and W. Vogel, Glass formation properties and structure of
[47] J. G. Bergman, G.D boyd, and A. Ashken, New nonlinear optical materials: Metal oxides with nonbonded electrons, Journal of Applied Physics, 40, No. 7: 2860-2863, 1969. [4tellurium dioxide system, Journal of Materials Science, 13: 1986-1990, 1978. [49] M.R. Marinov, and V. S. KozhouhaComptes rendus de l’Academei bulgare des Sciences, 25, No 3: 329 – 331, 1972. [52001. [5glasses in the TeO2-ZnO system, Journal of Non-Crystalline Solids, 151: 134 - 142, 1992.
12
[52] M. L. Öveçoğlu M. R. Özlap, G. Özen, F. Altin, and V. Kalem, Crystallization behavior of
3] V. Krämer, and G. Brandt, Structure of Cadmium Tellurate (IV), CdTeO3, Act. Cryst., C41:
nt and D. R. Clarke, On the optical band gap of ZnO, Journal of Applied Physics, 3, No 10:5447 – 5451, 1998.
hesized by plasma-enhanced chemical vapor deposition, Journal of Applied hysics, 95 No 6: 3141-3147, 2004.
some TeO2-ZnO Glasses, Key Engineering Materials, 264-268: 1891 - 1894, 2004. [51152-1154, (1985). [54] V. Srika8 [55] X. Liu, X. Wu, H, Cao, and R. P. H. Chang, Growth mechanism and properties of ZnO nanorods syntP [56] D. R. Lide, Handbook of Chemistry and Physics, 86TH Edition, Taylor & Francis Group Boca Ranton, 2005.
8] T. Lukasiewicz, and A. Majchrowski, Czochralski growth of TeO2 single crystals under conditions of forced convection in the melt, Journal of Crystal Growth, 116: 346-368, 1992. [59] J. G Grabmaier, R. D. Plattner, and ssion of constitutional supercooling in Czochralski-grown paratellurite, Journal of Crystal Growth, 20: 82-88,1973. [60] R. Nayak, A. Nayak, V. Gupta, and K. Sreenivas, Optical interactions in ZnO-TeO2 Bi- layer for AO device applications, IEEE Ultrasonic Symposium-1129, 2003. [61 atterer, M. Wachtler, M. Bettinelli, A. Speghini, and D. Ajò, Optical spectroscopy of lanthanide ions in ZnO-TeO2 glasses, Spectrochimica Acta Part A, 57: 2009 – 2017, 2 [62 ptical second harmonic intensity for ZnO-TeO2 glasses, Journal of Materials Research, 11 No. 10: 2651 – 2 [6 tellurite glasses, Physical Review B, 51:14919 – 14922, 1995. [64] A. N. Moiseev, A. V. Chilyasov, V. V. Dorofeev, O. A. Vostrukhin, E. M. Dianov, B. G. Pl or deposition from organo-metallic compounds, Journal of Optoelectronics and Advanced Materials, 7: 1875 – 1879, 2005.
[57] S. Kumaragurubaran, D. Krishnamurthy, C. Subramanian, and P. Ramasamy, Investigation on the growth of Bi2TeO5 and TeO2 crystals, Journal of Crystal Growth, 197: 210-215, 1999. [5
M. Schieber, Suppre
] R. Rolli, K. G
001.
] Y. Shimizugawa, K. Hirao, The relation between glass structure and poling-induced o
655, 1996.
3] S. Suehara, K. Yamamoto, S. Hishita, T. Aizawa, S. Inoue, and A. Nukui, Bonding nature in
otnichenko, and V. V. Koltashev, Production of TeO2-Zno glasses by chemical vap
13
CHAPTER TWO
EXPERIMENTAL SETUP AND MATERIALS
2.1 Introduction
ZnO-TeO2 and CdO-TeO2 crystals were grown after melting the powders in high purity
containers known as crucibles. Most of these crucibles were pure platinum. Heating th
powders to their melting point was done in a radio frequency coil furnace. The atmosphere in
the furnace can be controlled. Bridgman and Czochr
e
alski were the growth techniques used to
grow
th.
shaft that
holds the seed holder so Czochralski growth could be performed. A manual crank with a
handle was attached to the shaft through a system of gears to reset the vertical position of the
shaft as needed. Both vertical and rotational speeds of the two motors were primarily
controlled by two potentiometers, the rotation motor speed ranged from 2 to 22 rpm, while the
pulling speed ranged from 0.5 mm/hr to 20 mm/hr.
The RF coil was used to heat the material with an operating frequency of 2.5 kHz, and a
maximum power of 45 KVA. The coil’s inside diameter (ID) is 5.6˝ and its total height is 4.8˝.
It has two layers of square tubing and is kept from over heating by a continuous water flow
the crystals. Identification and analysis of the grown crystals were conducted using
XRD, scanning electron microprobe, and by investigating some of the optical and electrical
properties of those crystals.
2.2 The Furnace
The main equipment that was used in this research was a radio frequency (RF) coil
furnace. This furnace was designed and manufactured in China to perform CZ crystal grow
Two high precision motors were mounted on top of the furnace to rotate and pull the
14
system. The coil is placed inside a double layer stainless steel cylindrical chamber. A water
jacket flows between the two layers to prevent the furnace walls from heating. The furnace
has a double walled-window through which water was also running, its importance lies in
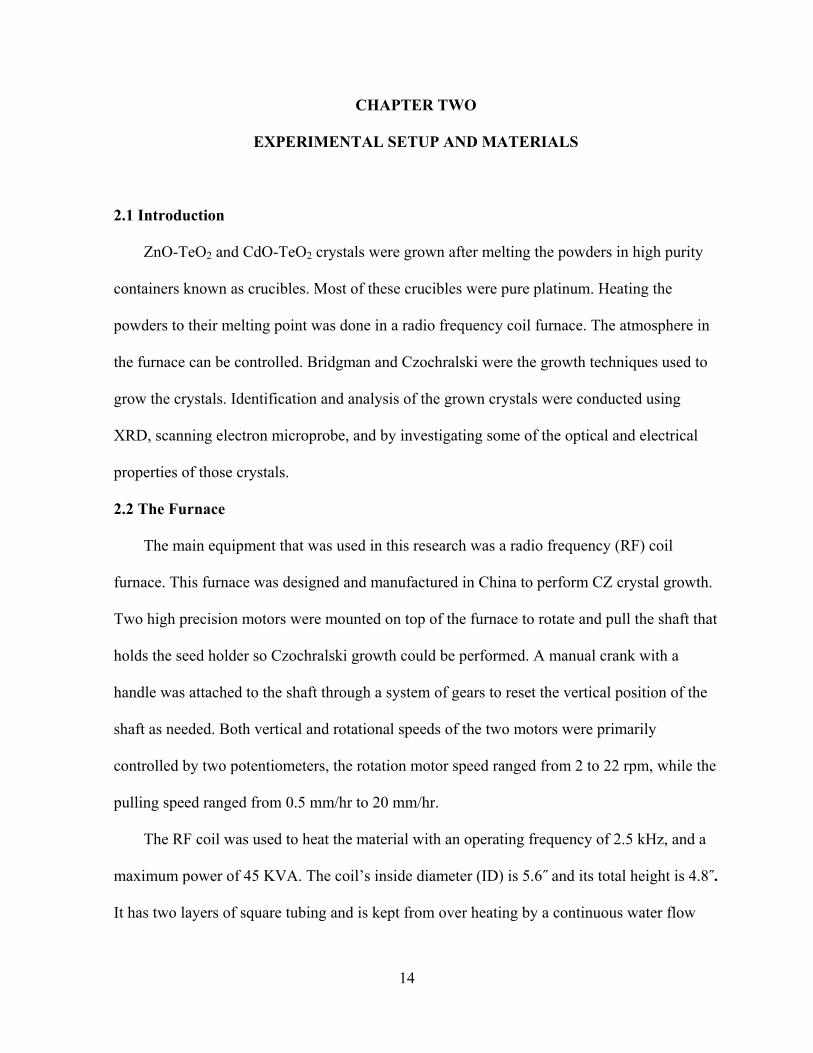
enabling the operator to observe the progress of the growth process. See Figure 2.1.
Figure 2.1 Photograph of the furnace with the rotating and pulling motors on top.
A few round holes of different diameters were made in the body of the chamber for gas
inlets and outlets, vacuuming, connecting gauges to determine pressure and oxygen
percentage, and for monitoring the temperature of the hot zone inside the chamber. The
15
electric current passing through the coil was measured by a SR634 AC current transformer.
The signal was then fed into a Hioki 3186 digital multitester where it was processed to return
real the
el
e
i. In
through
B
ne
n runs where very high
In some runs, both types of thermocouples were used at the
same type
J et
t
values of the current. The Hioki 3186 digital multitester was also used to measure
voltage across the RF coils by connecting the voltage terminals of the tester directly in parall
with the coil’s ends. Two analog terminals, located on the backside of Hioki 3186 digital
multitester, were used to interface it to a computer through an interfacing medium.
A roughing pump was connected to vacuum the furnace chamber down to about
20mTorr, whenever needed. A set of manual valves connected the furnace chamber through
metal pipes and hoses to the gas tanks. The valves were installed to control the amount of gas
inside the chamber as required. On the other side of the chamber, an outlet venting valve was
connected to outside the building via a hosepipe to exhaust toxic gases or to vent the furnac
whenever necessary. A Convectron 375 measured the pressure inside the chamber. An analog
pressure gauge was used to measure the pressure when it was between 19.3 psi and 45 ps
addition to that, a Series 2000-percent oxygen analyzer was connected to the furnace
a 0.3" hose to monitor the concentration of oxygen present in the chamber. A set of type
thermocouples were connected to monitor the temperature of different regions of the hot zo
inside the furnace. The thermocouples were fed to the chamber via a vacuum miniature
thermocouple connectors-feed through. In addition to type B thermocouples, type K
thermocouples were also installed to monitor the temperatures i
temperatures are not required.
time. The temperature of the inlet and outlet coil cooling water was measured by a
thermocouple. The recycling water through out the entire furnace was monitored and was s
o cause the furnace to shut down if it exceeds a certain value.
16

2
d from National Instruments, were used. These fieldpoints work as an
interfac
signals. The fieldpoints were powered by a PS-3 National Instruments power supply with
13.8 V and 4 A DC output. They were c r by a RS232 data cable
via PC I /O card.
A set of fieldpoin he furnace.
time
perature of the cooling water of the
coil, pressure inside the furnace, oxygen percentage concentration, rotating and pulling speeds,
Excel spread sheet periodically every certain of most conducted runs, the
prog ord ta ev sec ee .2.
.3 LabView Programming
At the early stages of the research, a LabView program was developed to make the
process of monitoring and controlling the furnace variables easier. A set of fieldpoints (see
table 2.1) purchase
e between the computer and the furnace using small analog voltage and current
onnected to a local compute
Table 2.1 ts used as an interface between the computer and t
Fieldpoint function
1 FP-PS-4 Power supply for the fieldpoints
2 FP-1000 Conn or ects the rest of the fieldpoints with the computer via RS232 connect
3 FP-AI-110 Receives the small analog voltage signals coming from the sensor
4 FP-TB-10 Sends small analog voltage signals to the controllers
5 FP-TC-120 Receives the analog voltage signals that come from the thermocouples
The program currently controls input power, rotating and pulling speeds, it returns real
data of temperatures of the crucible and the hot zone, tem
6 FP-RLY-420 To control the translation and rotation speeds of the shaft
7 FP-Quad-510 Receives the signals from the rotation and the translation motors
current, voltage, apparent coupling power, and mass of the growing crystal. It records data on an
period time. For
ram rec ed da ery 10 onds. S table 2
17

Tabl a fro furn was recorded sec nly rm are The table wa halves paper at.
Pressure Temp.1 Temp.2 Coil Water Te )
e 2.2 Dat m the ace as it every 10 onds. O two the ocouples shown. s split into two to accommodate form
Time Power (Torr) (ºC) (ºC) mp. (ºC Current Time Power
31131.3 1.479 749.232 436.117 361.626 16.879 84.504 31131.3 1.479
31141.29 1.492 749.232 436.117 361.626 16.879 8 31141.29 1.492 5.258
3 74 4 31151.3 1.468 1151.31 1.468 9.232 36.459 361.626 16.879 85. 972 1
31161.3 1.48 74 4 86. 31161.3 1.48 9.232 36.459 361.626 16.973 687
31171.31 1.494 7 4 85. 31171.3 1.494 49.232 36.459 362.062 16.911 457 1
P t O Heat
Ra /s) Real T Rate Time Voltage ower ou xygen % mass (g) Set point te(K ime Heat
31131.3 92.866 0.5 2.027 100.43 436.049 40 41.089
311 29 93.5 0.5 2.027 100.43 436.16 40 41.089 41.
31151.31 94.369 0.522 2.027 100.43 436.272 40 41.089
31161.3 93.618 0.522 2.027 100.43 436.383 40 41.089
31171.31 93.665 0.511 2.027 100.43 436.494 40 41.089
2.4 Experimental Setup
To ensure a uniform and adequate heating process of the crucible inside the furnace, the
crucible was placed inside a special build up which was constructed from high temperature
insulating materials. These insulations were mostly made out of ZrO2, Y2O3, and SiO2/HfO2. A
felt type ZYF-100 made out of ZrO2, Y2O3, and HfO2 was inserted to make the build up uniform
to improve the insula
,
tion construction, and sometimes it was added to make an appropriate
ermal gradient. ZYF-100 type felt properties are listed in table 2.3. The thermal conductivity of
YF-100 type felt insulating material as a function of temperature for different atmospheres is
iven in Figure 2.2.
th
Z
g
18
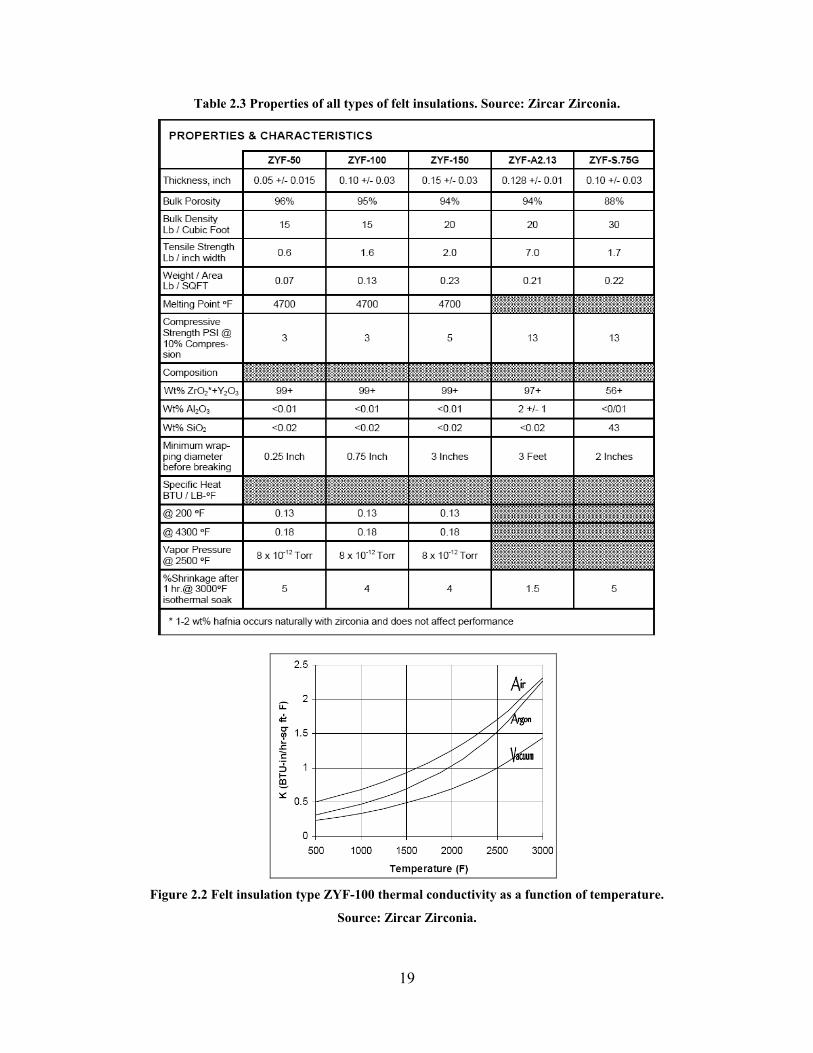
Table 2.3 Properties of all types of felt insulations. Source: Zircar Zirconia.
YF-10 conductivity as a function of tem ture.
Sour Zircon
Figure 2.2 Felt insulation type Z 0 thermal pera
ce: Zircar ia.
19
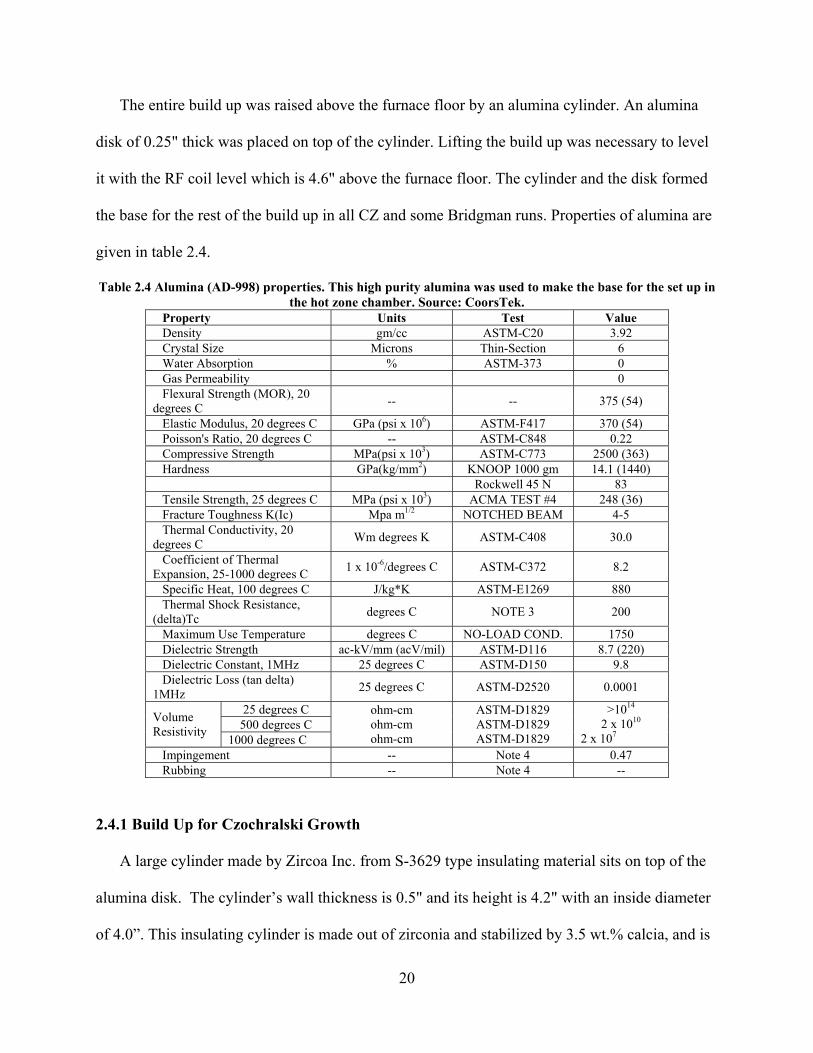
The d above floor b cylinder. An alumina
disk of 0.25" thick was placed on top of the cylinder. Liftin was necessary to level
it with th el which is 4.6" above t furnace floor. isk formed
e base for the rest of the build up in all CZ and some Bridgman runs. Properties of alumina are
Tab the hot zone chamber. Source: CoorsTek.
entire build up was raise the furnace y an alumina
g the build up
e RF coil lev he The cylinder and the d
th
given in table 2.4.
le 2.4 Alumina (AD-998) properties. This high purity alumina was used to make the base for the set up in
Property Units Test Value Density gm/cc ASTM-C20 3.92 Crystal Size Microns Thin-Section 6 Water Absorption % ASTM-373 0 Gas Permeability 0 Flexural Strength (MOR), 20 degrees C -- -- 375 (54)
Elastic Modulus, 20 degrees C GPa (psi x 106) ASTM-F417 370 (54) Poisson's Ratio, 20 degrees C -- ASTM-C848 0.22 Compressive Strength MPa(psi x 103) ASTM-C773 2500 (363) Hardness GPa(kg/mm2) KNOOP 1000 gm 14.1 (1440) Rockwell 45 N 83 Tensile Strength, 25 degrees C MPa (psi x 103) ACMA TEST #4 248 (36) Fracture Toughness K(Ic) Mpa m1/2 NOTCHED BEAM 4-5 Thermal Conductivity, 20 degrees C Wm degrees K ASTM-C408 30.0
Coefficient of Thermal -6
Expansion, 25-1000 degrees C 1 x 10 /degrees C ASTM-C372 8.2
Specific Heat, 100 degrees C J/kg*K ASTM-E1269 880 Thermal Shock Resistance, (delta)Tc degrees C NOTE 3 200
Maximum Use Temperature degrees C NO-LOAD COND. 1750 Dielectric Strength ac-kV/mm (acV/mil) ASTM-D116 8.7 (220) Dielectric Constant, 1MHz 25 degrees C ASTM-D150 9.8 Dielectric Loss (tan delta) 1MHz 25 degrees C ASTM-D2520 0.0001
25 degrees C 500 degrees C Volume
Resistivity ohm-cm ohm-cm 1000 degrees C
ohm-cm ASTM-D1829 ASTM-D1829 ASTM-D1829
>1014
2 x 10¹⁰
2 x 10⁷
Impingement -- Note 4 0.47 Rubbing -- -- Note 4
2.4.1 Build Up for Czochralski Growth
A large cylinder made by Zircoa Inc. from 9 type insulating material sits on top of the
alumina disk. The cylind its height is 4.2" with an inside diameter
of 4.0”. This insulating c f zirconia and stabilized by 3.5 wt.% calcia, and is
S-362
er’s wall thickness is 0.5" and
ylinder is made out o
20
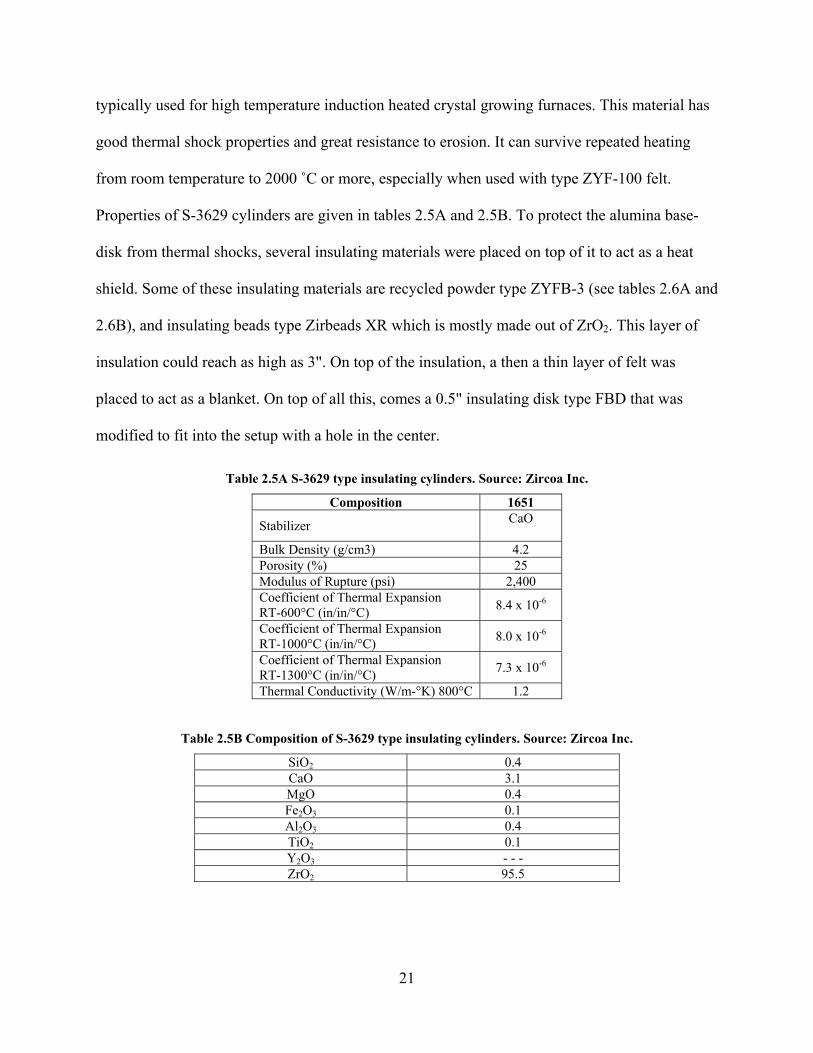
typically used for high te stal gr rnaces. This material has
good thermal shock prop n. It can survive repeated heating
from room te felt.
Properties of S-3629 cylinders are given in tables 2.5A and 2.5B. To protect the alumina base-
disk from thermal shocks, several insulating materials were placed on top of it to act as a heat
shield. Some of these insulati aterials are recycled powder type ZYFB-3 (see tables 2.6A and
2.6B), and insulating beads type Zirbeads XR which is mostly out of ZrO2. This layer of
insulation could reach as high as 3". On top of the insulation, a then a thin layer of felt was
placed to act as a blank
modified to fit into the setup with a hole in the center.
Table 2.5A S-3629 type insulating cylinders. Source: Zircoa Inc.
Composition 1651
mperature induction heated cry owing fu
erties and great resistance to erosio
mperature to 2000 ˚C or more, especially when used with type ZYF-100
ng m
made
et. On top of all this, comes a 0.5" insulating disk type FBD that was
Stabilizer CaO
Bulk Density (g/cm3) 4.2 Porosity (%) 25 Modulus of Rupture (psi) 2,400 Coefficient of Thermal Expansion RT-600°C (in/in/°C) 8.4 x 10⁻⁶
Coefficient of Thermal Expansion RT-1000°C (in/in/°C) 8.0 x 10⁻⁶
Coefficient of Thermal Expansion RT-1300°C (in/in/°C) 7.3 x 10⁻⁶
Thermal Conductivity (W/m-°K) 800°C 1.2
Table 2.5B Composition of S-3629 type i ulating cylinders. Source: Zircoa Inc. ns
SiO2 0.4 CaO 3.1 MgO 0.4 Fe2O3 0.1 Al2O3 0.4 TiO2 0.1 Y2O3 - - - ZrO2 95.5
21
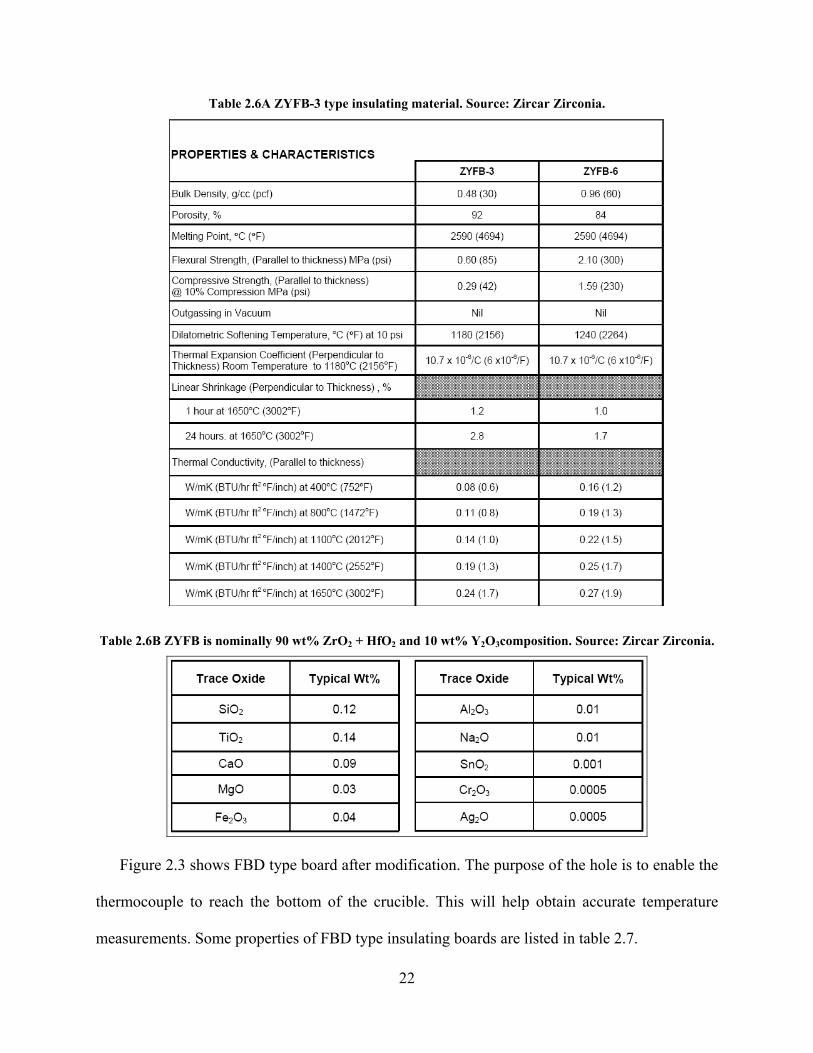
Table 2.6A ZYFB-3 type insulating material. Source: Zircar Zirconia.
ble 2.6B ZYFB is nominally 90 wt% ZrOTa sition. Source: Zircar Zirconia. 2 + HfO2 and 10 wt% Y2O3compo
Figure 2.3 shows FBD type board after modification. The purpose of the hole is to enable the
thermocouple to reach the bottom of the crucible. This will help obtain accurate temperature
measurements. Some properties of FBD type insulating boards are listed in table 2.7.
22
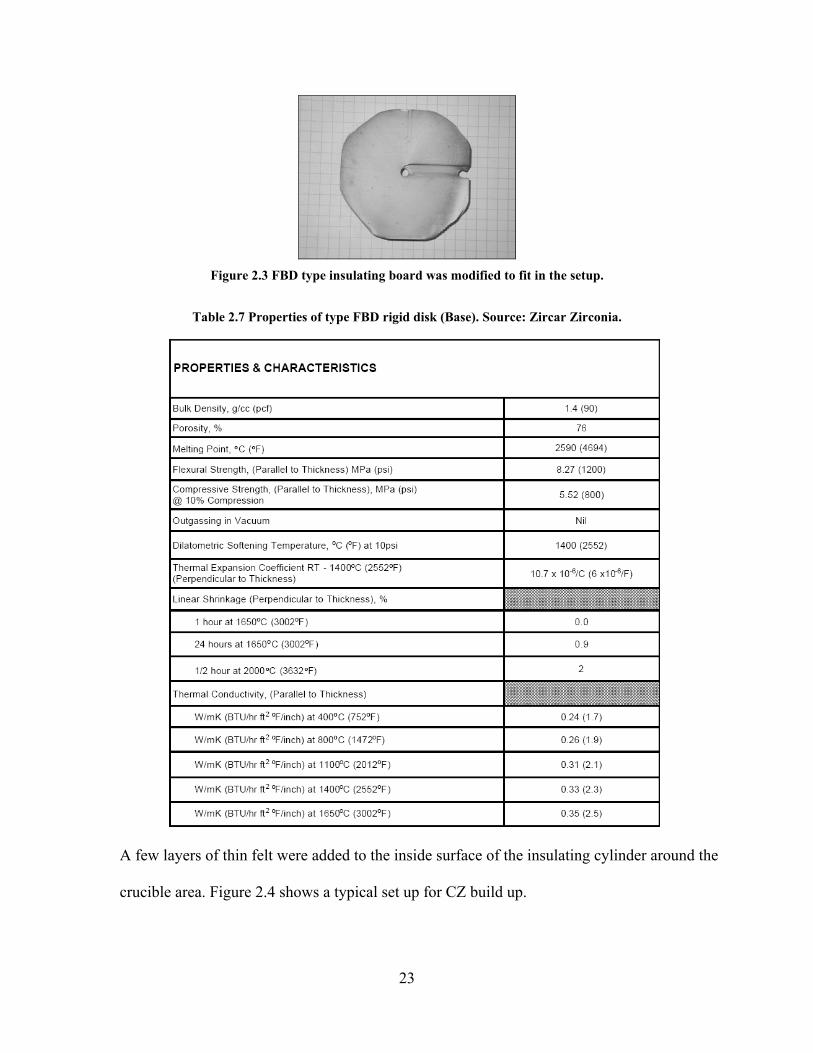
Figure 2.3 FBD type insulating board was modified to the setup. fit in
Table 2.7 Properties of type FBD rigid disk (Base). Source: Zircar Zirconia.
A few layers of thin felt were added to the inside surface of the insulating cylinder around the
crucible area. Figure 2.4 shows a typical set up for CZ b
uild up.
23
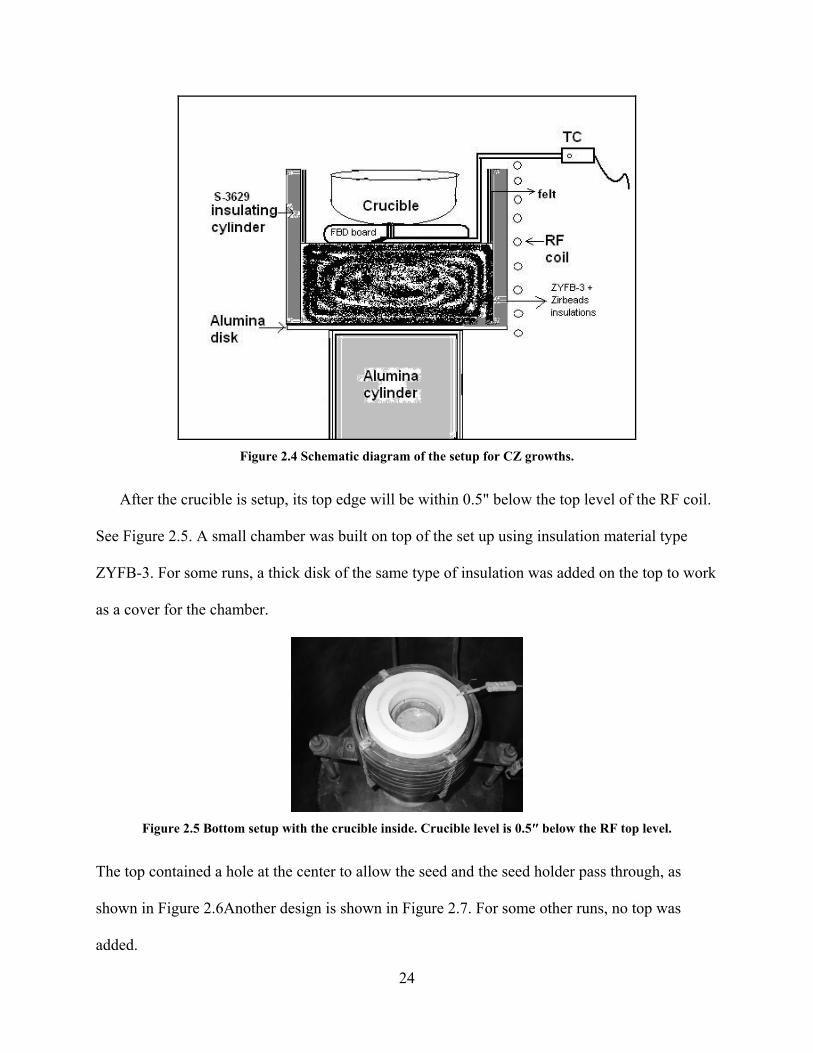
Figure 2.4 Schematic diagram of the setup for CZ growths.
After the crucible is setup, its top edge will be within 0.5" below the top level of the
See Figure 2.5. A small chamber was built on top of the set up using insulation material type
ZYFB-3. For some runs, a thick d
RF coil.
isk of the same type of insulation was added on the top to work
as a cover for the chamber.
Fig el.
e center to allow the seed and the seed holder pass through, as
shown in Figu top was
added.
ure 2.5 Bottom setup with the crucible inside. Crucible level is 0.5″ below the RF top lev
The top contained a hole at th
re 2.6Another design is shown in Figure 2.7. For some other runs, no
24
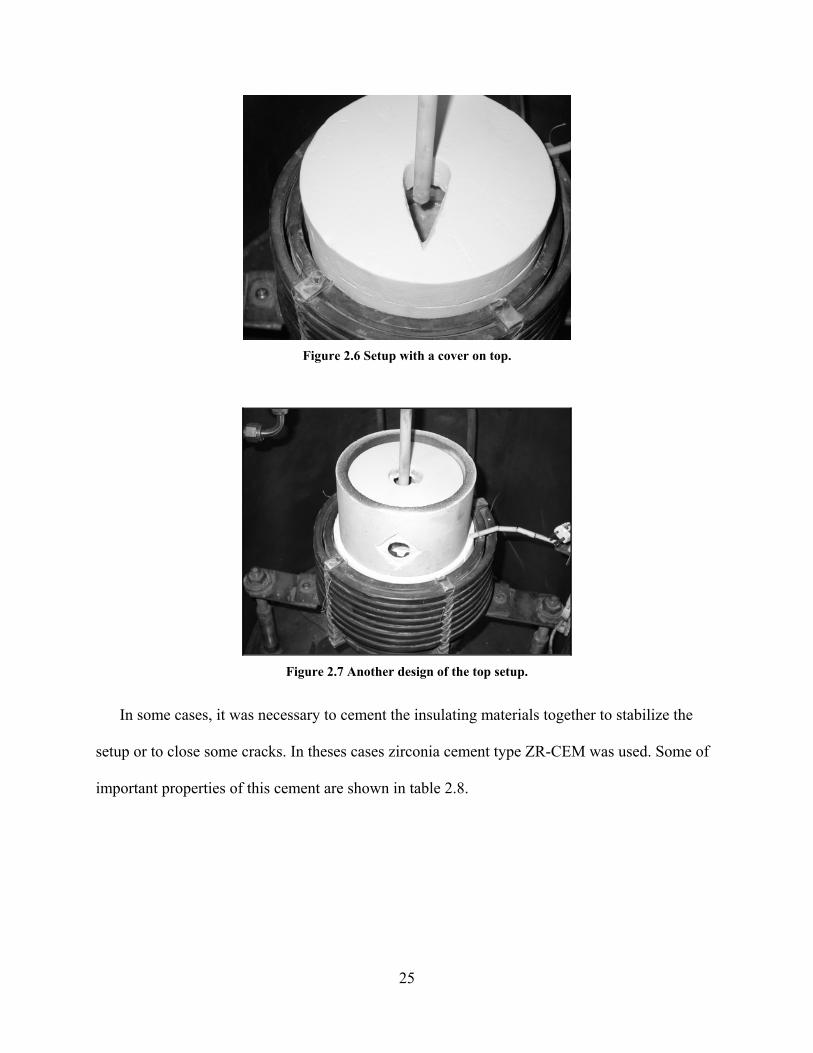
Figure 2.6 Setup with a cover on top.
Figure 2.7 Another design of the top setup.
In some cases, it was necessary to cement the insulating materials together to stabilize the
setup or to close some cracks. In theses cases zirconia cement type ZR-CEM was used. Some of
important properties of this cement are shown in table 2.8.
25
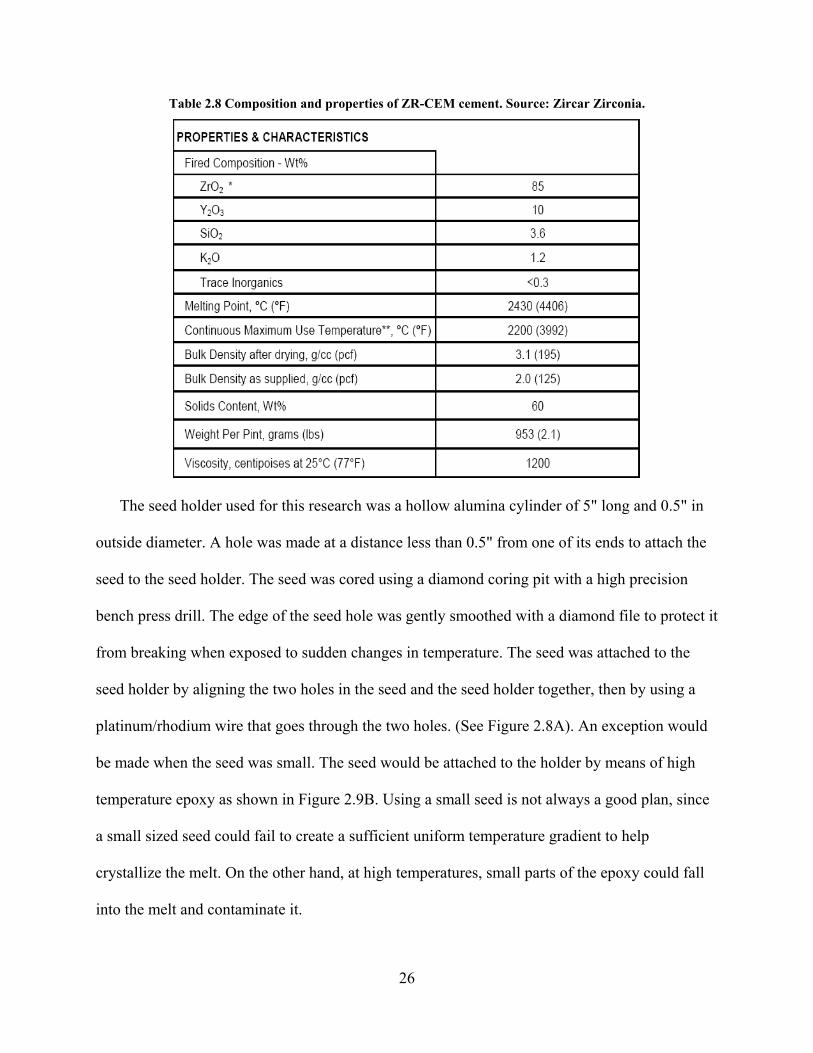
Table 2.8 Composition and properties of ZR-CEM cement. Source: Zircar Zirconia.
The seed holder used for this research was a ollow alumina cylinder of 5" long and 0.5" in
outs e
seed to the see he seed was diamond coring pit with a high precision
bench pre f the se smoothed with a diamond file to protect it
from breaking when exposed to sudden changes in temperature. The seed was attached to the
seed holder by aligning the two holes the se ether, then sing a
platinum es thr s. (Se A). An ex would
be m . The seed ould be attache holder by h
temp all seed is not always a good plan, since
a small size l to creat rm temperature gradient to
crystallize th e other hand, at high temperatures, rts of the epo uld fall
to the melt and contaminate it.
h
ide diameter. A hole was made at a distance less than 0.5" from one of its ends to attach th
d holder. T cored using a
ss drill. The edge o ed hole was gently
in the s ed and e ed holder tog uby
/rh goodium wire that ough the two hole e Figure 2.8 ception
ade when the seed was small
erature epoxy as shown in Figure 2.9B. Using a sm
w d to the means of hig
d seed could fai e a sufficient unifo help
e melt. On th small pa xy co
in
26
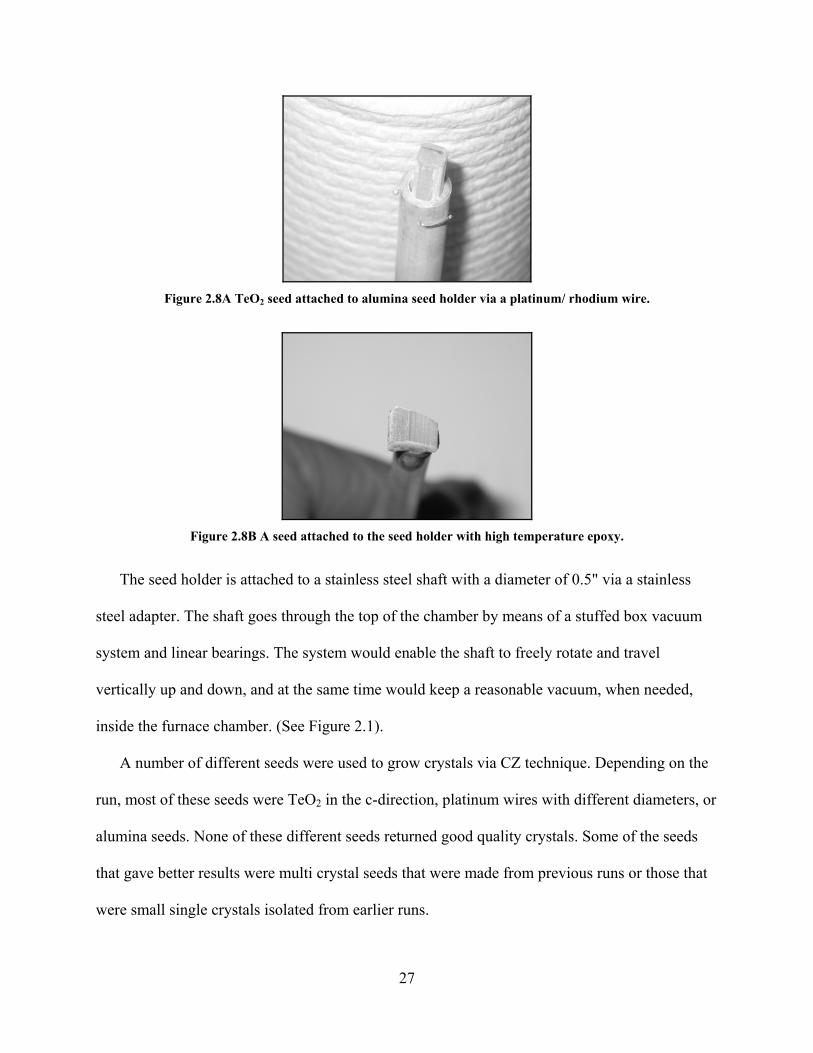
Figure 2.8A TeO2 seed attached to alumina seed holder via a platinum/ rhodium wire.
Figure 2.8B A seed attached to the seed holder with high temperature epoxy.
inside the furnace chamber. (See Figure 2.1).
The seed holder is attached to a stainless steel shaft with a diameter of 0.5" via a stainless
steel adapter. The shaft goes through the top of the chamber by means of a stuffed box vacuum
system and linear bearings. The system would enable the shaft to freely rotate and travel
vertically up and down, and at the same time would keep a reasonable vacuum, when needed,
ost of these seeds were TeO2 eters, or
alu
at
A number of different seeds were used to grow crystals via CZ technique. Depending on the
in the c-direction, platinum wires with different diamrun, m
mina seeds. None of these different seeds returned good quality crystals. Some of the seeds
that gave better results were multi crystal seeds that were made from previous runs or those th
were small single crystals isolated from earlier runs.
27
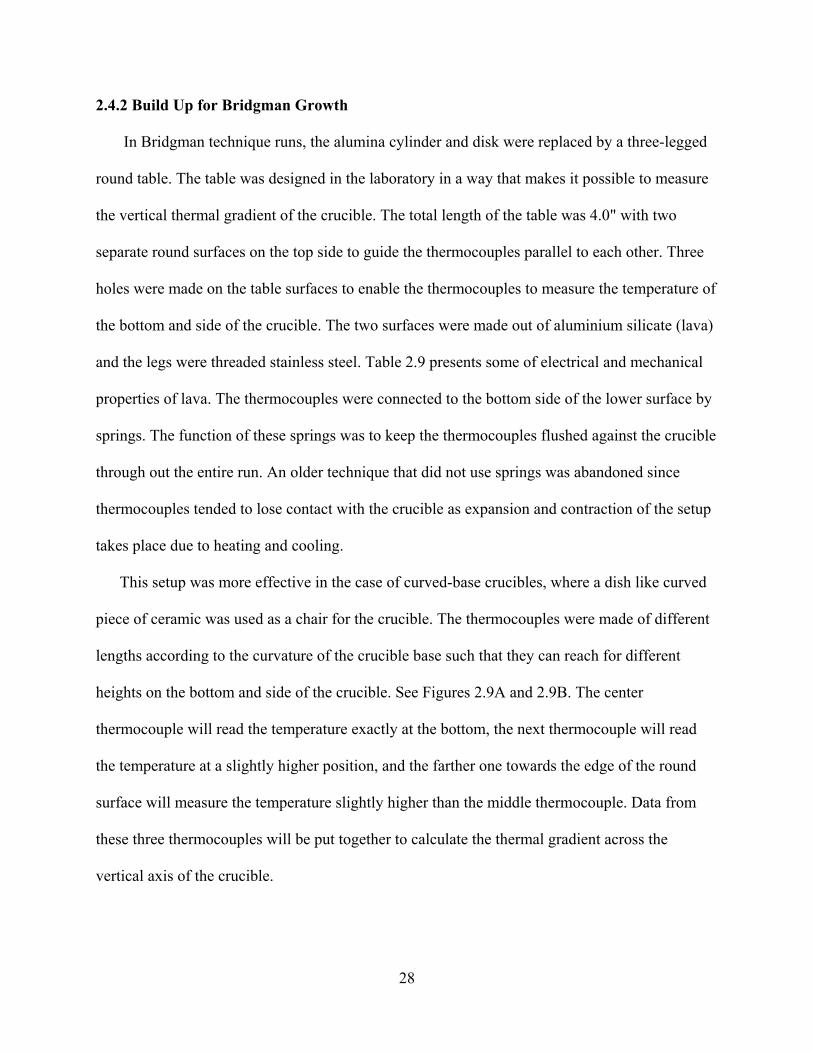
2.4.2 Build Up for Bridgman Growth
In Bridgman technique runs, the alumina cylinder and disk were replaced by a three-legged
round table. The table was designed in the laboratory in a way that makes it possible to measure
the vertical thermal gradient of the crucible. The total length of the table was 4.0" with two
separate round surfaces on the top side to guide the thermocouples parallel to each other. Three
holes were made on the table surfaces to enable the thermocouples to measure the temperature of
the bottom and side of the crucible. The two surfaces were made out of aluminium silicate (lava)
and the legs were threaded stainless steel. Table 2.9 presents some of electrical and mechanical
properties of lava. The thermocouples were connected to the bottom side of the lower surface by
springs. The function of these springs was to keep the thermocouples flushed against the crucible
thr
ermocouples tended to lose contact with the crucible as expansion and contraction of the setup
ta
as more effective in the case of curved-base crucibles, where a dish like curved
d
ough out the entire run. An older technique that did not use springs was abandoned since
th
kes place due to heating and cooling.
This setup w
piece of ceramic was used as a chair for the crucible. The thermocouples were made of different
lengths according to the curvature of the crucible base such that they can reach for different
heights on the bottom and side of the crucible. See Figures 2.9A and 2.9B. The center
thermocouple will read the temperature exactly at the bottom, the next thermocouple will rea
the temperature at a slightly higher position, and the farther one towards the edge of the round
surface will measure the temperature slightly higher than the middle thermocouple. Data from
these three thermocouples will be put together to calculate the thermal gradient across the
vertical axis of the crucible.
28
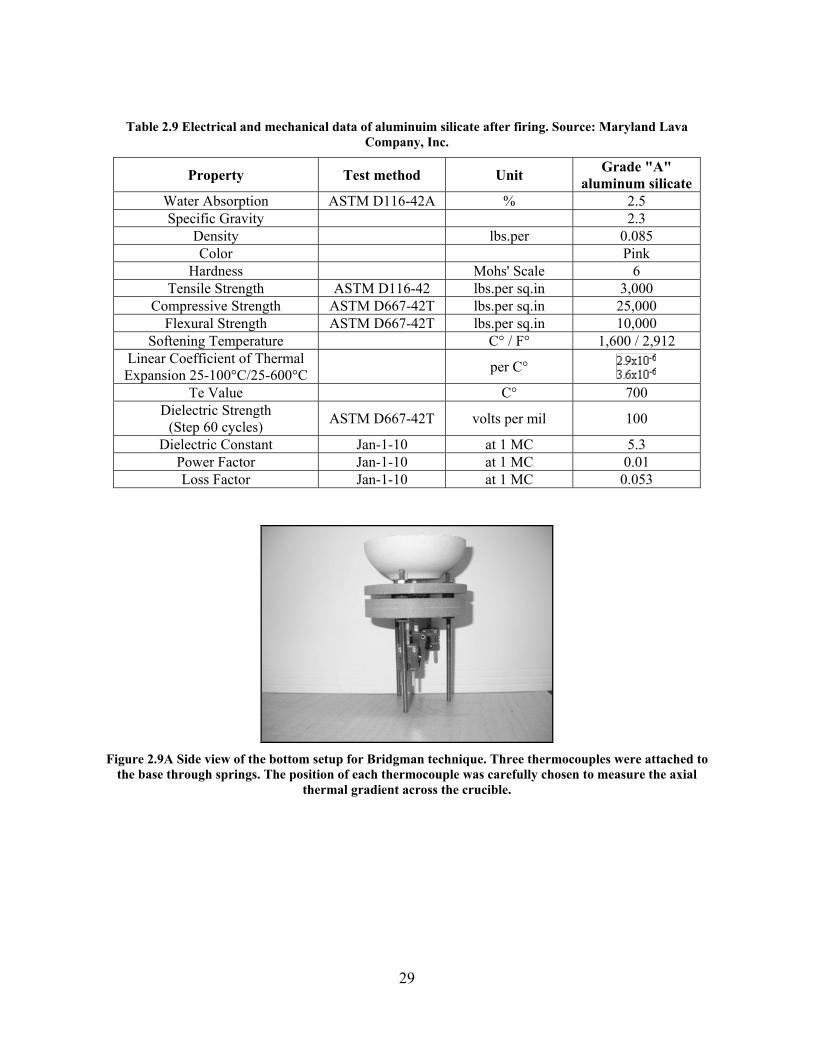
Company, Inc.
Property Test method Unit Grade "A" aluminum silicate
Table 2.9 Electrical and mechanical data of aluminuim silicate after firing. Source: Maryland Lava
Water Absorption ASTM D116-42A % 2.5 Specific Gravity 2.3
Density lbs.per 0.085 Color Pink
Hardness Mohs' Scale 6 Tensile Strength ASTM D116-42 lbs.per sq.in 3,000
Compressive Strength ASTM D667-42T lbs.per sq.in 25,000 Flexural Strength ASTM D667-42T lbs.per sq.in 10,000
Softening Temperature C° / F° 1,600 / 2,912 Linear Coefficient of Thermal per C° Expansion 25-100°C/25-600°C
Te Value C° 700 Dielectric Strength
(Step 60 cycles) ASTM D667-42T volts per mil 100
Dielectric Constant Jan-1-10 at 1 MC 5.3 Power Factor Jan-1-10 at 1 MC 0.01 Loss Factor Jan-1-10 at 1 MC 0.053
Figure 2.9A Side view of the bottom setup for Bridgman technique. Three thermocouples were attached to
the base through springs. The position of each thermocouple was carefully chosen to measure the axial thermal gradient across the crucible.
29
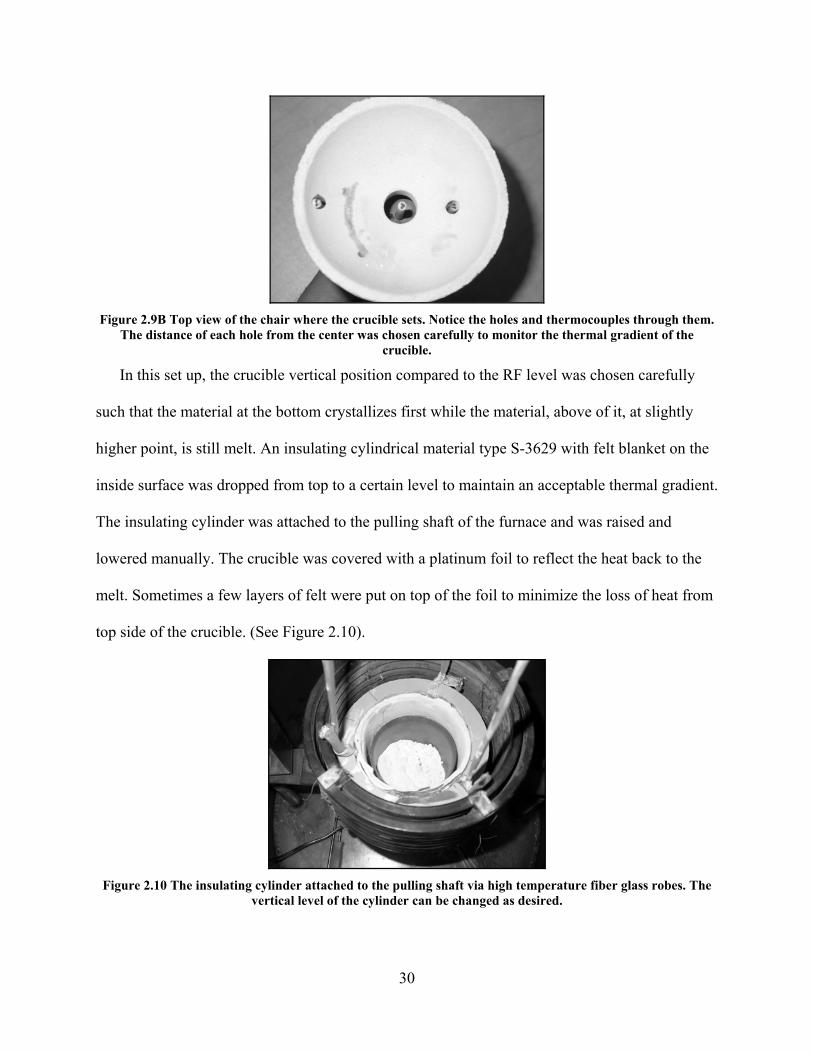
Figure 2.9B Top view of the chair where the crucible s the holes and thermocouples through them.
The distance of each hole from the center was chos carefully to monitor the thermal gradient of the crucible.
In this set up, the crucible vertical position compared to the RF level was chosen carefully
such that the material at the bottom crystallizes f st while the material, above of it, at slightly
higher point, is still melt. An insulating cylindrical material type S-3629 with felt blanket on the
inside surface was dropped from top to a certain level to maintain an acceptable thermal gradient.
The insulating cylinder was attached to the pulling shaft of the furnace and was raised and
lowered manually. The crucible was covered with a platinum foil to reflect the heat back to the
melt. Sometimes a few layers of felt were put on top of the foil to minimize the loss of heat from
top side of the crucible. (See Figure 2.10).
ets. Notice en
ir
Figure 2.10 The insulating cylinder attached to the pulling shaft via high temperature fiber glass robes. The
vertical level of the cylinder can be changed as desired.
30
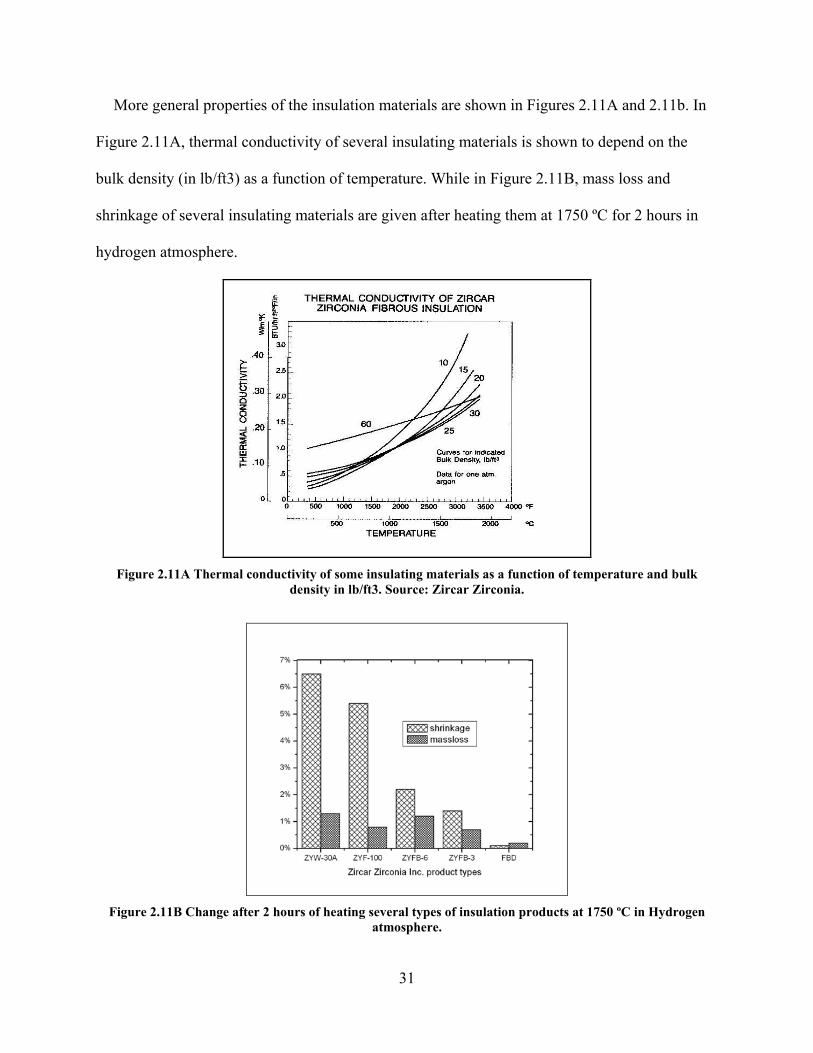
More general properties of the insu wn in Figures 2.11A and 2.11b. In
Figure 2.11A, the pend on the
bulk density (in lb/ft3) as a function of temperature. While in Figure 2.11B, mass loss and
l insulating materials are given after heating them at 1750 ºC for 2 hours in
hyd
lation materials are sho
rmal conductivity of several insulating materials is shown to de
shrinkage of severa
rogen atmosphere.
Figure 2.11A Thermal conductivity of some insulating materials as a function of temperature and bulk
density in lb/ft3. Source: Zircar Zirconia.
n
atmosphere. Figure 2.11B Change after 2 hours of heating several types of insulation products at 1750 ºC in Hydroge
31
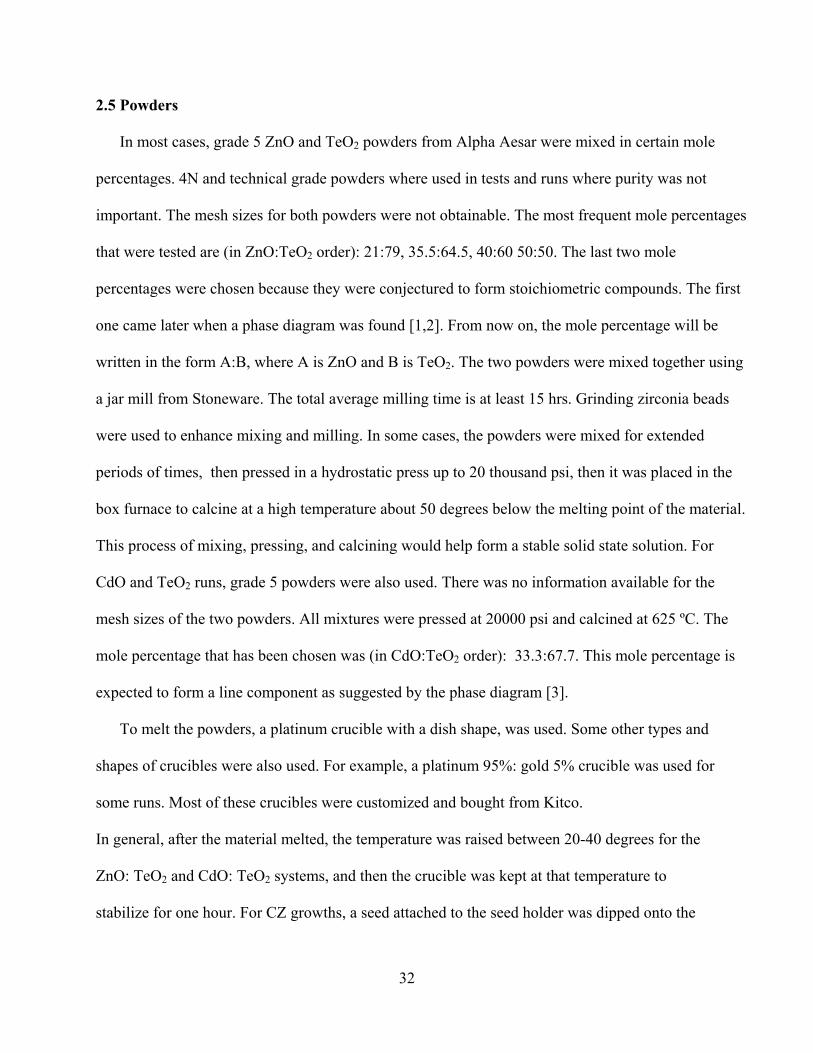
2.5 Powders
In most cases, grade 5 ZnO and TeO2 powders from Alpha Aesar were mixed in certain mole
percentages. 4N and technical grade powders where used in tests and runs where purity was n
important. The mesh sizes for both powders were not obtainable. The most frequent mole percen
that were tested are (in ZnO:TeO
ot
tages
percentages were chosen because they were conjectured to form stoichiometric compounds. The first
one came later when a phase diagram was found [1,2]. From now on, the mole percentage will be
written in the form A:B, where A is ZnO and B is TeO2. The two powders were mixed together using
a jar mill from Stoneware. The total average milling time is at least 15 hrs. Grinding zirconia beads
were used to enhance mixing and milling. In some cases, the powders were mixed for extended
per aced in the
material.
o used. There was no information available for the
powders. All mixtures were pressed at 20000 psi and calcined at 625 ºC. The
een chosen was (in CdO:TeO2 order): 33.3:67.7. This mole percentage is
for
e
e
2 order): 21:79, 35.5:64.5, 40:60 50:50. The last two mole
iods of times, then pressed in a hydrostatic press up to 20 thousand psi, then it was pl
box furnace to calcine at a high temperature about 50 degrees below the melting point of the
This process of mixing, pressing, and calcining would help form a stable solid state solution. For
CdO and TeO2 runs, grade 5 powders were als
mesh sizes of the two
mole percentage that has b
expected to form a line component as suggested by the phase diagram [3].
To melt the powders, a platinum crucible with a dish shape, was used. Some other types and
shapes of crucibles were also used. For example, a platinum 95%: gold 5% crucible was used
some runs. Most of these crucibles were customized and bought from Kitco.
In general, after the material melted, the temperature was raised between 20-40 degrees for th
ZnO: TeO2 and CdO: TeO2 systems, and then the crucible was kept at that temperature to
stabilize for one hour. For CZ growths, a seed attached to the seed holder was dipped onto th
32
melt surface. The seed is made to rotate at a speed between 10-15 rpm while being pulled at a
speed ranging from 0.8 to 3.0 mm/hr. ZnO: TeO2 crystals were grown by both CZ and Bridgman
technique, CdO: TeO2 system was only
References
[1] M.R. Marinov, and V. S. Kozhouharov, Phase equilibrium in the ZnO-TeO system, Comptes
some TeO -ZnO Glasses, Key Engineering Materials, 264-268: 1891 - 1894, 2004.
[3] D. S. Robertson, N. Shaw, I. M. Young, Journal of Materials Science, 13: 1986 – 1990, 1978.
grown by Bridgman method.
2rendus de l’Academei bulgare des Sciences, 25, No 3: 329 – 331, 1972.
[2] M. L. Öveçoğlu M. R. Özlap, G. Özen, F. Altin, and V. Kalem, Crystallization behavior of2
33
CHAPTER THREE
MEASUREMENTS AND EXPERIMENTAL METHODS
e
le
e in
e and
val
, in
se
n from melt to solid to
n a power-controlled mode, the freezing process could be
ext
l
3.1 Introduction
In the present research, the study of the new grown crystals requires an investigation of som
electrical and optical properties. Most of these measurements were performed using the availab
instruments in the laboratories of Washington State University. Few measurements were don
the laboratories of University of Idaho. The growth of crystals by CZ and Bridgman techniques
were carried out in two different modes, a temperature-controlled mode, or a power-controlled
mode. In temperature control route, the power is adjusted constantly to keep a steady rat
ue of the crucible temperature. This mode was, generally, used in the CZ growths, because it
was necessary to keep a constant temperature while pulling the crystal. On the other hand
Bridgman growths, power-controlled mode was mainly employed. The power-controlled mode
in Bridgman growths, was used because cooling the crucible down through the melting point,
could have resulted in a disruption of the temperature around that point, due to a quick respon
from the PID control system. This would have caused the phase transitio
take place in a short time (1-2 hours). I
ended, for the same temperature cooling rate, up to more than 12 hours.
3.2 Sample Preparation
Optical and electrical studies of the resulting single crystals were performed. Single crystals
were isolated from the other phases (when necessary) and checked for cracks under an optica
microscope. Crack- free crystals were cut using a diamond wire saw, these crystals were cut in a
random direction to obtain the biggest possible uniform crystal. Crystals and samples were
34
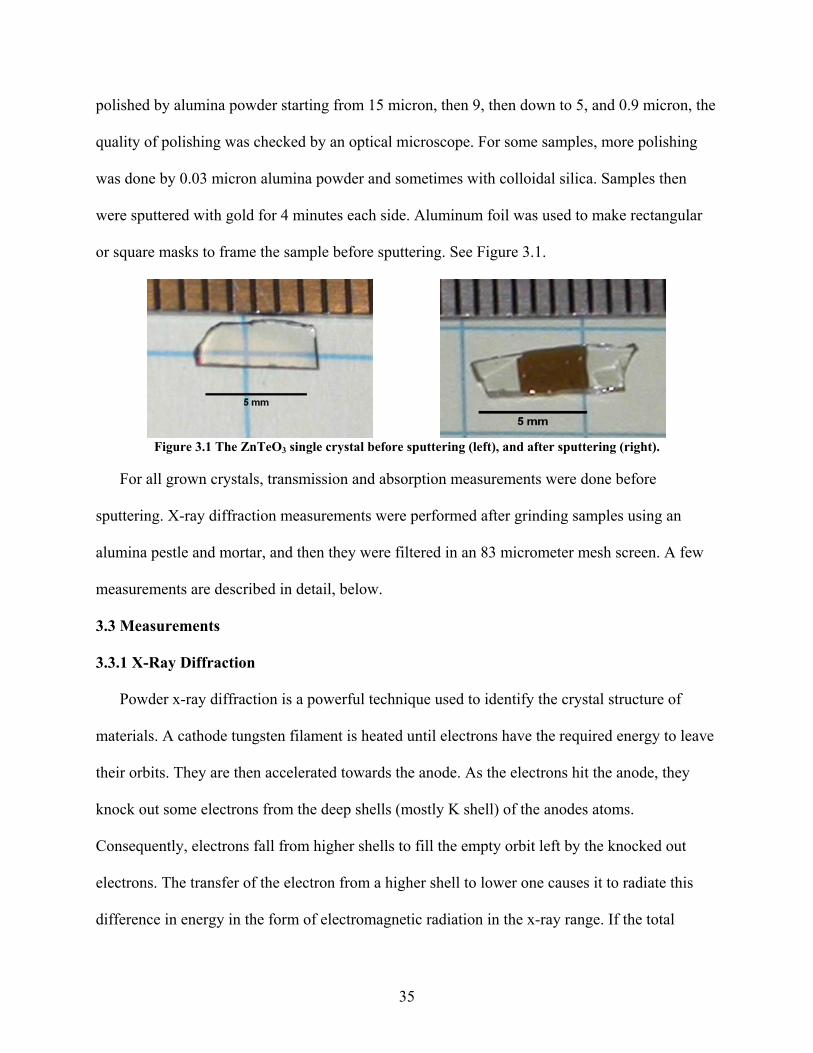
pol
me the sample before sputtering. See Figure 3.1.
3
y
ft by the knocked out
electrons. Th ate this
difference in energy in the form of electro x-ray range. If the total
ished by alumina powder starting from 15 micron, then 9, then down to 5, and 0.9 micron, the
quality of polishing was checked by an optical microscope. For some samples, more polishing
was done by 0.03 micron alumina powder and sometimes with colloidal silica. Samples then
were sputtered with gold for 4 minutes each side. Aluminum foil was used to make rectangular
or square masks to fra
Figure 3.1 The ZnTeO single crystal before sputtering (left), and after sputtering (right).
For all grown crystals, transmission and absorption measurements were done before
sputtering. X-ray diffraction measurements were performed after grinding samples using an
alumina pestle and mortar, and then they were filtered in an 83 micrometer mesh screen. A few
measurements are described in detail, below.
3.3 Measurements
3.3.1 X-Ray Diffraction
Powder x-ray diffraction is a powerful technique used to identify the crystal structure of
materials. A cathode tungsten filament is heated until electrons have the required energy to leave
their orbits. They are then accelerated towards the anode. As the electrons hit the anode, the
knock out some electrons from the deep shells (mostly K shell) of the anodes atoms.
Consequently, electrons fall from higher shells to fill the empty orbit le
e transfer of the electron from a higher shell to lower one causes it to radi
magnetic radiation in the
35
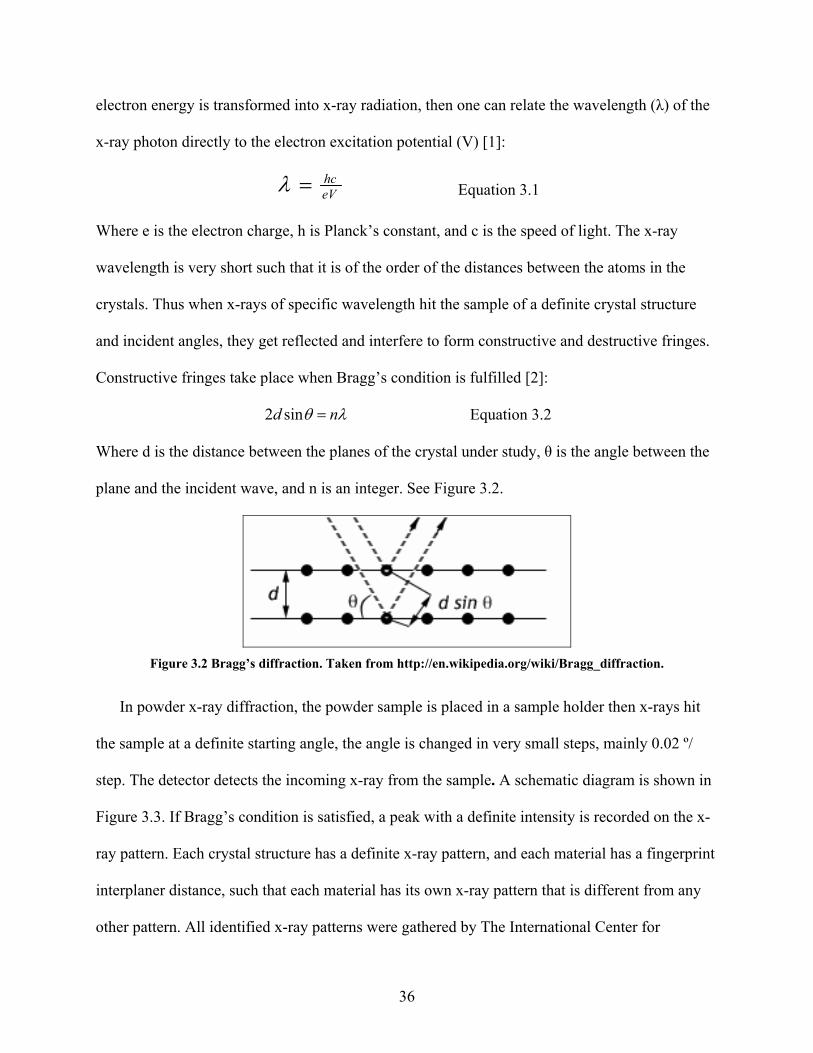
electron energy is transfor th (λ) of the
x-ray photon dire y to the
med into x-ray radiation, then one can relate the waveleng
ctl electron excitation potential (V) [1]:
eVhc=λ Equation 3.1
Where e is the el ron ch e x-ray
avelength is very short such that it is of the order of the distances between the atoms in the
avelength hit the sample of a definite crystal structure
and
ect arge, h is Planck’s constant, and c is the speed of light. Th
w
crystals. Thus when x-rays of specific w
incident angles, they get reflected and interfere to form constructive and destructive fringes.
Constructive fringes take place when Bragg’s condition is fulfilled [2]:
λθ nd =sin2 Equation 3.2
Where d is the distance between the planes of the crystal under study, θ is the angle between the
plane and the incident wave, and n is an integer. See Figure 3.2.
In powder x-ray diffraction, the powder sample is placed in a sample holder then x-rays h
the sample at a definite starting angle, the angle is changed in very small steps, mainly 0.02 º/
step. The detector detects the incoming x-ray from the sample. A schematic diagram is s
Figure 3.3. If Bragg’s condition is satisfied, a peak with a definite intensity is recorded on the x-
ray pattern. Each crystal structure has a definite x-ray pattern, and each material has a fingerpr
interplaner distance, such that each material has its ow
Figure 3.2 Bragg’s diffraction. Taken from http://en.wikipedia.org/wiki/Bragg_diffraction.
it
hown in
int
n x-ray pattern that is different from any
other pattern. All identified x-ray patterns were gathered by The International Center for
36
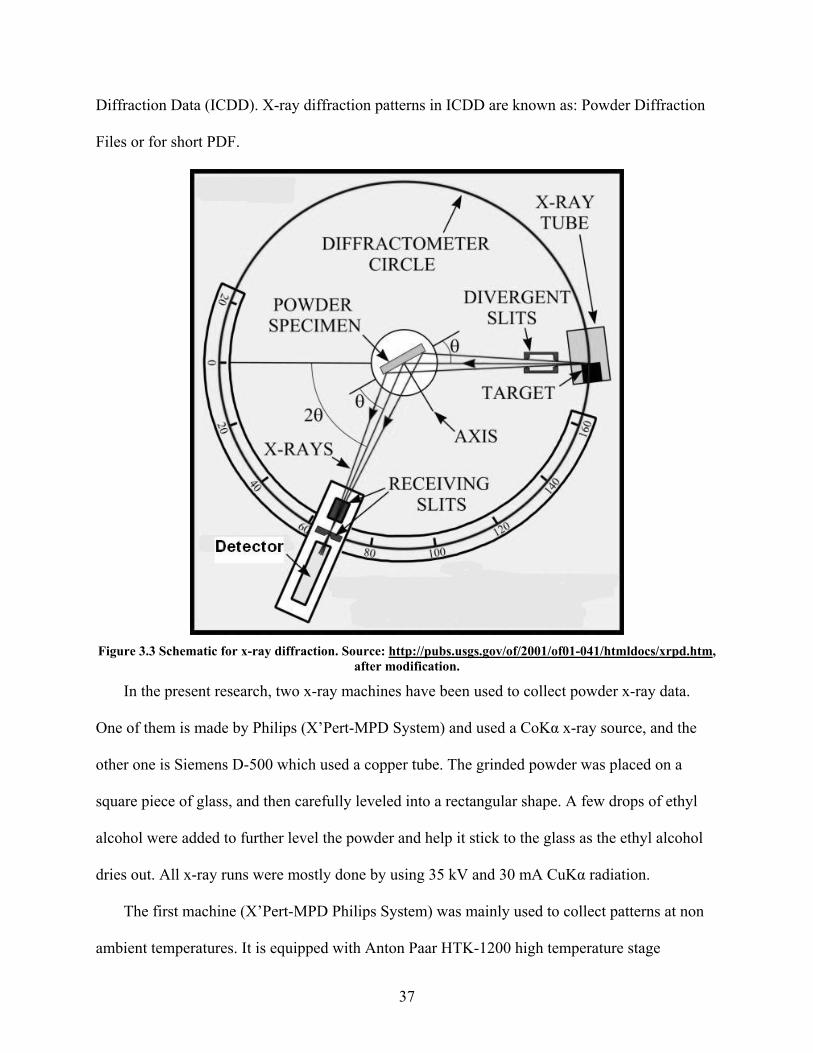
Diffraction Data (ICDD). X-ray diffraction patterns in ICDD are known as: Powder Diffraction
Files or for short PDF.
Figure 3.3 Schematic for x-ray diffraction. Source: http://pubs.usgs.gov/of/2001/of01-041/htmldocs/xrpd.htm,
.
er tube. The grinded powder was placed on a
square piece of glass, and then carefully leveled into a rectangular shape. A few drops of ethyl
alcohol were added to further level the powder and help it stick to the glass as the ethyl alcohol
dries out. All x-ray runs were mostly done by using 35 kV and 30 mA CuKα radiation.
The first machine (X’Pert-MPD Philips System) was mainly used to collect patterns at non
ambient temperatures. It is equipped with Anton Paar HTK-1200 high temperature stage
after modification.
In the present research, two x-ray machines have been used to collect powder x-ray data
One of them is made by Philips (X’Pert-MPD System) and used a CoKα x-ray source, and the
other one is Siemens D-500 which used a copp
37
controlled chamb f x-ray patterns
at temperatures higher or lower than room temperature. The powder was placed and distributed
evenly inside an alumina disk holder, then the threaded disk was screwed on a stand, and the
stand is inserted inside HTK-1200, which can be heated up to 1200 ºC.
3.3.2 Single Crystal Diffractometer
X-ray results from single crystal diffractometer can be utilized to confirm the crystal system,
measure the unit cell constants, and sometimes used to find the space group of the crystal [4].
There are many methods and techniques in single crystal diffractometer, and generally, the math
is more complicated than the one in powder x-ray diffraction. In the present research, single
crystal diffractometer was used to identify whether the crystal is truly a single crystal or not as in
the case of Zn2Te3O8 single crystals. It was also used to identify the direction of sample surfaces
for Zn2Te3O8 , ZnTeO3 and CdTe2O5 single crystals.
The single crystal method rotates the sample and diffraction from atoms is recorded. A non-
single crystal would give multiple orientations which eventually, if there are enough random
rientations, all combine to give the ring seen in traditional powder methods. For example, if a
rystal is twinned, the sample would give two diffraction peaks where there should be one for
on twinned crystal.
rt of the crystals resulted from a special 21:79 ZnO:
2 d from the rest of the material then covered with a layer of
hyd
erIce
er, in which the sample can be placed and allow the collection o
o
c
n
For ZnTe6O13 crystals which were pa
TeO material, crystals were isolate
rocarbon oil. A suitable crystal was selected, attached to a glass fiber and placed in a low-
temperature nitrogen stream. Data for the sample were collected using a Bruker/Siemens1
SMART APEX instrument (MoKα radiation, λ = 0.71073 Å) equipped with a Cryocool Nev
low temperature device. Data were measured using omega scans of 0.3 ° per frame for 10
38
seconds, and a full sphere of data was collected. A total of 2400 frames were collected wi
final resolution of 0.83 Å. The first 50 frames were recollected at the end of data collectio
monitor for decay. Cell parameters were retrieved using SMART
th a
n to
as performed using the SAINTPlus
direct methods and refined L program package5. The
ere
rs
are name, source.
2 software and refined using
SAINTPlus3 on all observed reflections. Data processing w
software. Absorption corrections were applied using SADABS4. The structure was solved by
by least squares method using the SHELXT
structure was solved in the space group R-3 by analysis of systematic absences. All atoms w
refined anisotropically. No decomposition was observed during data collection. The list of
software package that were used in this measurement are shown in table 3.1, where the numbe
that appear as a superscript above, is the software number in the table.
Table 3.1 List of the software package used to identify the new discovered crystal.
Software number Softw
1 1, 1. Hope, H. Prog. Inorg. Chem., 1994, 4
2 Tool, Bruker AXS, Madison, WI, 2002. SMART: v.5.626, Bruker Molecular Analysis Research
3 SAINTPlus: v. 6.45a, Data Reduction and Correction Program, Bruker AXS, Madison, WI, 2003.
4 program, Bruker AXS Inc., Madison, WI, 2004. SADABS: v.2.01, an empirical absorption correction
5 Suite, Sheldrick, G.M., Bruker AXS Inc., Madison, WI, SHELXTL: v. 6.10, Structure Determination Software
2001.
3.3.3 Scanning Electron Microprobe
Electron Microprobe Analyzer is a technique best used for quantitative chemical analysis of
mit x-rays, secondary electrons
and back scattered electrons and other types of radiations. The characteristic x-rays are used for
chemical analysis. Specific x-ray wavelengths are selected using a certain diffracting crystal[5],
which was chosen to filter out all unwanted wavlengths using Bragg diffraction. The filtered
the sample. A beam of electrons hit the samples and causes it to e
39
diffracted x-ray, hits a gas detector and couns are made by means of a wave-length dispersive
spectrometry (WDS)[6]. Since each element has its own characteristic x-ray wavelength/s, x-rays
coming from the sample will be compared with the standard, and elements in the sample are
identified. Electron probe microanalysis and elemental analysis are used to calculate the weight
ach element in each phase in the sample, and a chemical formula may be
dete
es.
s organic tissue (soft or hard),
cry
e
carried out taking into account the available oxidation number(s) for each atom. A very good
percentage of e
rmined. This is somewhat is an indirect method, and does not prove that phase. Electron
backscattering may be of assistance in corroborating this method. The advantage of scanning
electron microprobe is that it can detect elements down to 0.5 wt %, and it can give the
percentage of existence of each element or each phase. Imaging of the sample is possible using
backscattered electrons (BSE); false colors can be created to distinguish between the phas
Elemental x-ray colored graphs can also be mapped.
For the purpose of elemental analyses and phase study, samples were thinned down to a few
hundreds of microns (typically ~100 microns) and mounted on a glass substrate. A 10
micrometer in diameter electron beam was generated by a 15 kV potential and 15 mA current.
These values can be changed depending on the sample atomic number (Z), homogeny of the
sample, sample preparation and type of the sample whether it i
stalline, or glass[7]. Data were analyzed in two ways; the first one is to calculate the oxide
weight percentage of each constituent in the phase, from which the number of moles are
calculated by solving two equations with two unknowns (assuming there is only two different
oxides in the phase), and then the stoichiometric compound of the phase can be found. On th
other hand, the second way to analyze data is to specify or suggest the number of oxygen atoms
in each phase, and based on this suggestion, the calculation of the number of other atoms are
40
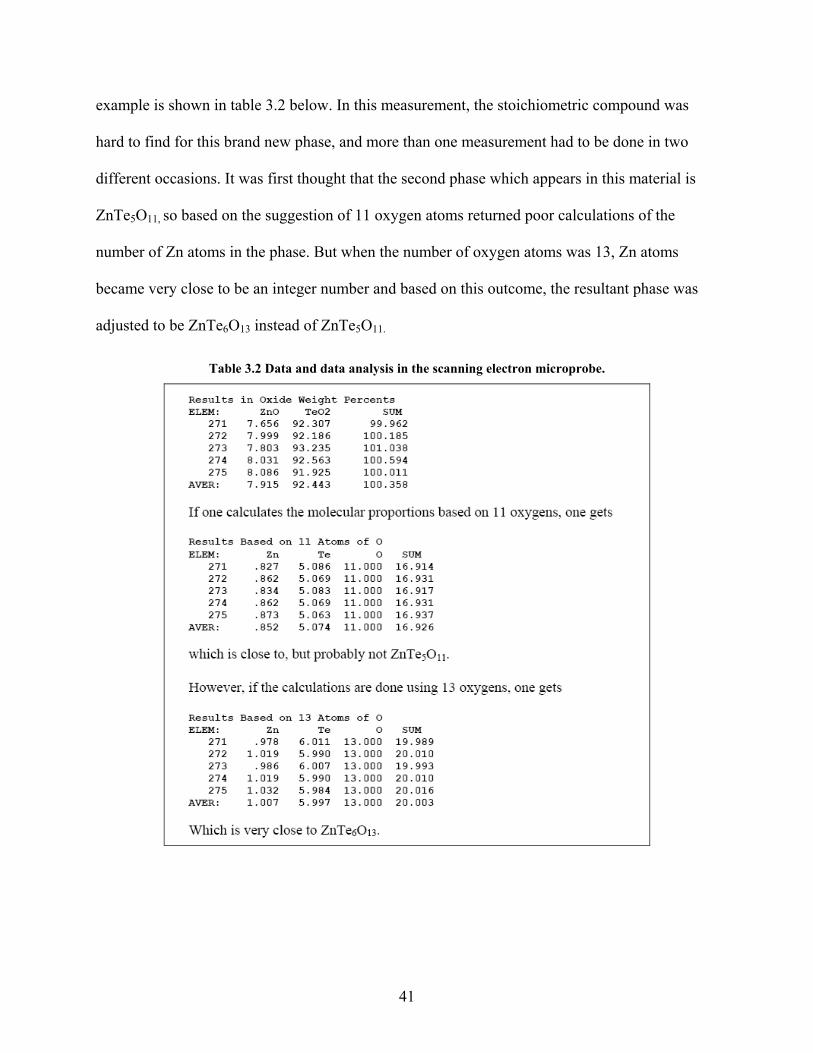
example is shown in table 3.2 below. In this measurement, the stoichiometric compound was
hard to find for this brand new phase, and more than one measurement had to be done in two
different occasions. It was first thought that the second phase which appears in this material is
ZnTe5O11, so ba ns of the
umber of Zn atoms in the phase. But when the number of oxygen atoms was 13, Zn atoms
er and based on this outcome, the resultant phase was
adjusted to be ZnTe6O13 instead of ZnTe5O11.
Table 3.2 Data and data analysis in the scanning electron microprobe.
sed on the suggestion of 11 oxygen atoms returned poor calculatio
n
became very close to be an integer numb
41
3.3
ield is
ic constant could be a very complicated
quantity, such that tensor algorithms and Maxwell’s equations could be needed to describe how
the electromagnetic radiation reacts with the medium[10].
A closely related quantitiy of the dielectric constant is the permitivity (Є), which is defined as:
Є = KЄo Equation 3.3
where Єo is 8.85 x10⁻¹² F/m, defined as the permitivity of free space [11]. Permitivity is a
measure of the ability of the dipoles in a dielectric material to align themselves during electric
field presence. When an alternating electric field with a certain frequency is applied across a
dielectric material, the dipoles inside the medium tend to switch directions accordingly. In their
res
a co
The energy loss or the dielectric loss c
.4 Optical and Electrical Properties
3.3.4.1 Dielectric Measurements
The ratio of the stored energy in an insulator relative to vacuum, when a static electric f
imposed across the insulator, gives the dielectric constant. The dielecrtic constant (K) is one of
the most importan optical properties of the material. Once measured, many other important
constants can be calculated and hence many charechteristics of the meterial can be predicted.
However, the dielectric constant is not a simple scalor quantitiy. For anisotropic crystals, the
measurement of dielelctric consatnt should be associated with the direction at which it is
measured [8, 9]. As a matter of fact, the dielectr
ponse, electric field energy is dissipated in the meadium and is lost as heat. The permitivty is
mplex quantity and can be defiend as [12]:
Є* = Є΄ – j Є˝ Equation 3.4
an be calculated as =δtan Є˝/ Є΄, tan δ is also known as
the dissipation factor [13].
42
In a ferroelectric material, where spontaneous polarization exists at room temperature, the
dielectric constant is a function of temperature [14]. Ferroelectricity exists below a specific
temperature of the material known as Curie point. At Curie temperature, the material loses its
natural polarization and all dipoles become randomly oriented in what is known as ferroelectric
state [15].
According to Curie –Weiss law for ferroelectric materials [16]:
CTT−C=χ Equation 3.5
where C Curie constsnt, Tc is Curie temperature, and χ is the suseiptibility of the material. The
dielectric constant (K) is related to χ as in [17]:
Є = 1 + 4 π χ Equation 3.6
As equation 3.5 suggests, susceptibility becomes a large value in the neighborhood of Curri
to
red at
ues
constant values upon cooling down were taken into account.
temperature .
In the present study, dielectric constant and dielectric loss are measured for the samples in a
controled temperature chamber (Tenny Environmental test chamber). This cahmber is capable
work in a temperature range between -75 ºC to 185 ºC, it is connected to QuadTech 7600
Precesion LCR meter, and interfaced to a computer. The first measurement was taken at room
temperature, then the temperature was incresead in 5 degree-steps up to 180 ºC, then the
temperautre was lowered to room temperature in the same fashion. At each point, the sample was
soaked for 100 seconds before measurement was recorded. Dielctric consatant was measu
both heating up and cooling down process, but only the heating up dielectric constants val
were adopted. Each measurement was recorded for several frequencies of the applied electric
field signals. Below room temperature measurements were made seperately, were dielectric
43
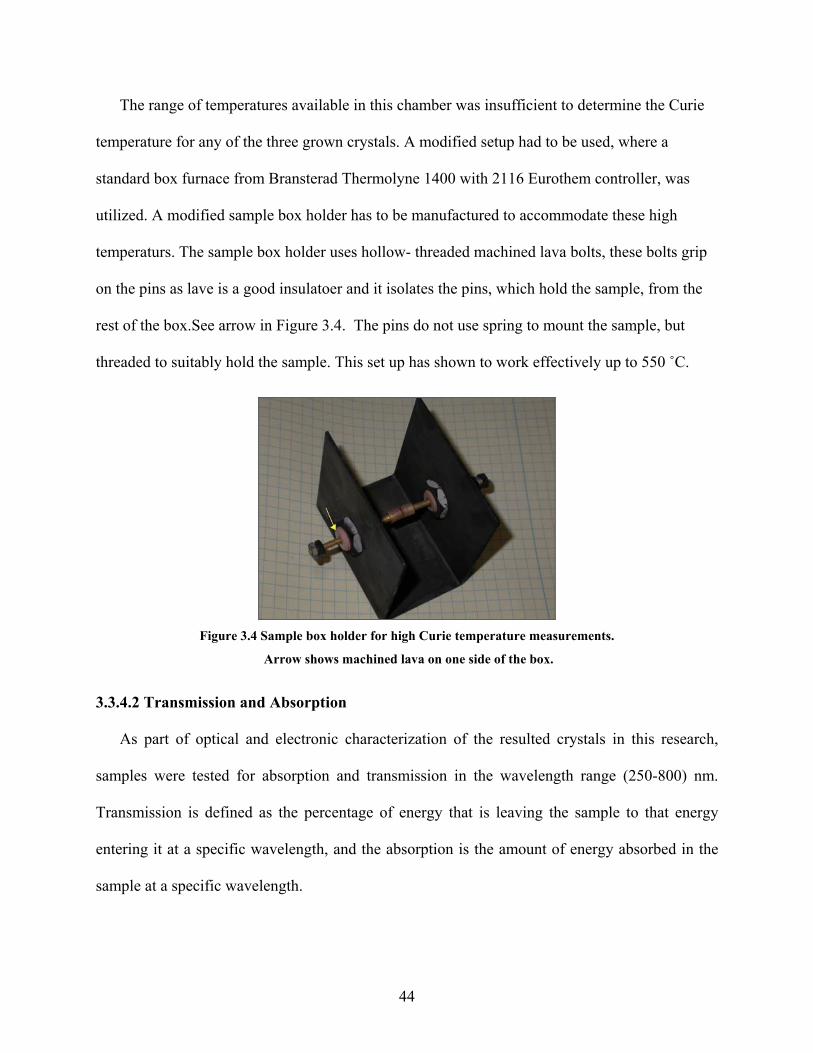
The range of temperatures available in this chamber was insufficient to determine the Curie
temperature for any of the three grown crystals. A modified setup had to be used, where a
rad Thermolyne 1400 with 2116 Eurothem controller, was
util
he
standard box furnace from Branste
ized. A modified sample box holder has to be manufactured to accommodate these high
temperaturs. The sample box holder uses hollow- threaded machined lava bolts, these bolts grip
on the pins as lave is a good insulatoer and it isolates the pins, which hold the sample, from t
rest of the box.See arrow in Figure 3.4. The pins do not use spring to mount the sample, but
threaded to suitably hold the sample. This set up has shown to work effectively up to 550 ˚C.
Arrow shows machined lava on one side of the box.
3.3.4.2 Transmission and Absorption
As part of optical and electronic characterization of the resulted crystals in this r
samples were tested for absorption and transmission in the wavelength range (250-800)
Transmission is defined as the percentage of energy that is leaving the sample to that energy
entering it at a specific wavelength, and the absorption is the amount of energy absorbed in th
sample at a specific wavelength.
Figure 3.4 Sample box holder for high Curie temperature measurements.
esearch,
nm.
e
44
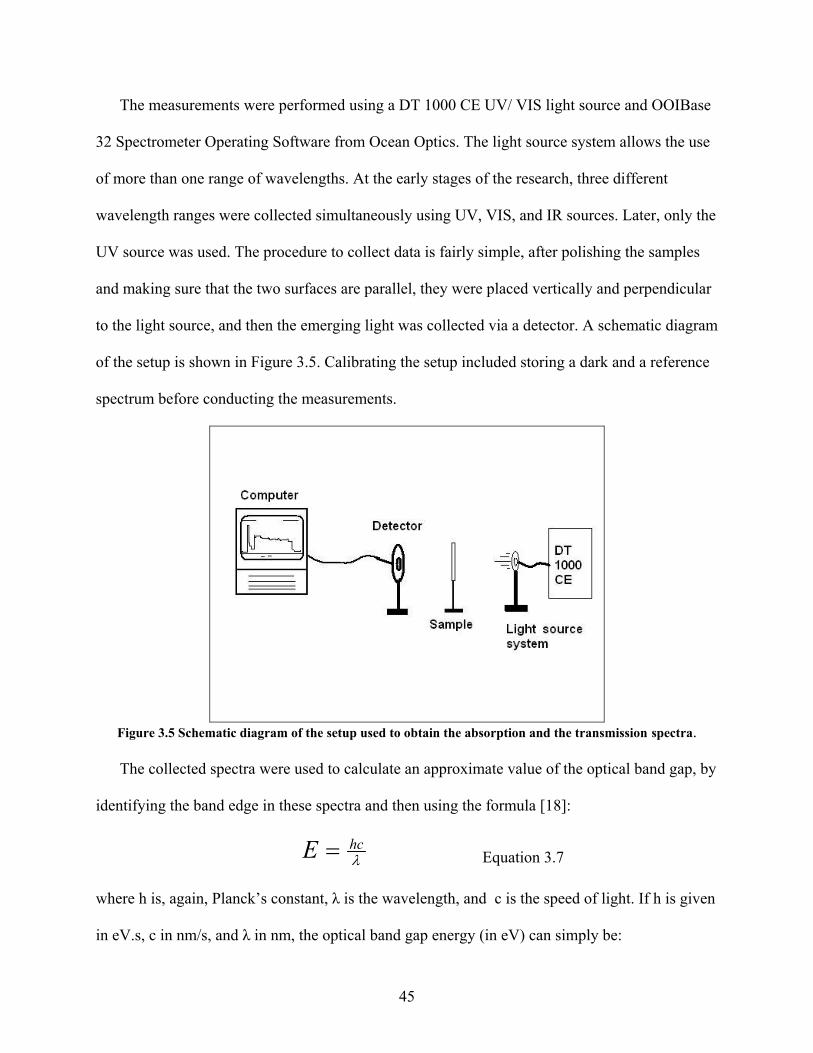
The measurements were performed using a DT 1000 CE UV/ VIS light source and O
32 Spectrometer Operating Software from Ocean Optics. The light source s
OIBase
ystem allows the use
of more than one range of wavelengths , three different
the
ple, after polishing the samples
and making sure that the two surfaces are parallel, they were placed vertically and perpendicular
to the light source, and then the emerging light was collected via a detector. A schematic diagram
of the setup is shown in Figure 3.5. Calibrating the setup included storing a dark and a reference
spectrum before conducting the measurements.
. At the early stages of the research
wavelength ranges were collected simultaneously using UV, VIS, and IR sources. Later, only
UV source was used. The procedure to collect data is fairly sim
Figure 3.5 Schematic diagram of the setup used to obtain the absorption and the transmission spectra.
The collected spectra were used to calculate an approximate value of the optical band gap, by
identifying the band edge in these spectra and then using the formula [18]:
λhc=
where h is, again, Planck’s constant, λ is the wavelength, and c is the speed of light. If h is give
in eV.s, c in nm/s, and λ in nm, the optical band gap energy (in eV) can simply be:
E Equation 3.7
n
45
ooE 1240λ≈
Equation 3.8
λ is the wavelength at which the band edge is located.
Absorption spectra are very important, because they can be used to calculate the refractive index
as a function of wavelength by applying Kramers-Kronig transformations [19]. However, the
refractive index can be measured by matching the refractive index of several oils to the medium
of interes n
refractive index. If the sam
used oil.
3.3.4.3 I-V tests
This is a procedure where samples are exposed to a voltage difference and the leakage
current is measured at each voltage step. The sample thickness and the gold electric contacts
dimensions are measured, and then the sample is placed in a small dark chamber between two
poles. Several voltage differences were applied across the sample. Usually the voltage difference
will start from -100 V then it is stepped up by 10 volts each time until it reaches +100 V after
passing through zero. The result is a relation between the voltage and the current. Several
graphing patterns could result as these patterns depend on the sample material. The simplest
pattern is a linear one where, ohmic [21] relations can be applied. Some samples will still show a
leakage current at zero, when the voltage difference is changed from a certain value to zero, i.e.
the sample stores charge as in a capacitor. The resistivity of each sample was calculated
assuming an ohmic relationship between the current and voltage. This behavior is mostly
observed when the voltage values are in the neighborhood of zero. All resistivity measurements
were done when the voltage range was between -1 V to +1 V. In this range, the current is more
o
t. This method [20] depends on immersing the sample in certain oil with a know
ple becomes invisible, then its refractive index is the same as of the
46
stable and such an approximation is valid. The capacitance of each sample was measured using
the 3321 Keithley LCZ meter.
rties
mple
n
fter all,
this leads to the rotation of the linearly polarized light. All anisotropic materials (non cubic) are
optically active and can be used in wave plates, depolarizers, polarizers, and optical filters [22].
Some of these applications are using polarimetry to detect glaucoma in the eye [23].
Another example is the birefringence or double refraction. When unpolarized light enters an
anisotropic material, its perpendicular magnetic and electric components interact with orthogonal
axis of the crystal, which in turn have different refractive indices, and therefore different
dielectric constant, this will cause the perpendicular components to travel with different
velocities. As a result, the original beam of light splits into two as shown in Figure 3.6, one
traveling in the same direction as the original beam and is known as the ordinary beam, the other
ray travels into a different direction and this one is called the extraordinary beam. Birefrengent
materials can be used in manufacturing different types of prism polarizers [24].
3.3.4.4 More Optical Prope
If an optically active crystal is placed between the two crossed linear polarizers, the sa
will appear brighter than the dark surroundings. The sample is optically active, if it can rotate the
components of a linearly polarized light to a different angle depending on the thickness and
rotating power of the crystal [8]. Basically, Plane or linearly polarized light is composed of two
circularly polarized components, one is polarized to the left and the other is to the right. Whe
they enter optically active material, a difference in phase velocity results due to the difference in
the way these two polarizations react with the anisotropic medium. This difference comes mostly
from the electronic polarization in the crystal which is not the same in each direction. A
47
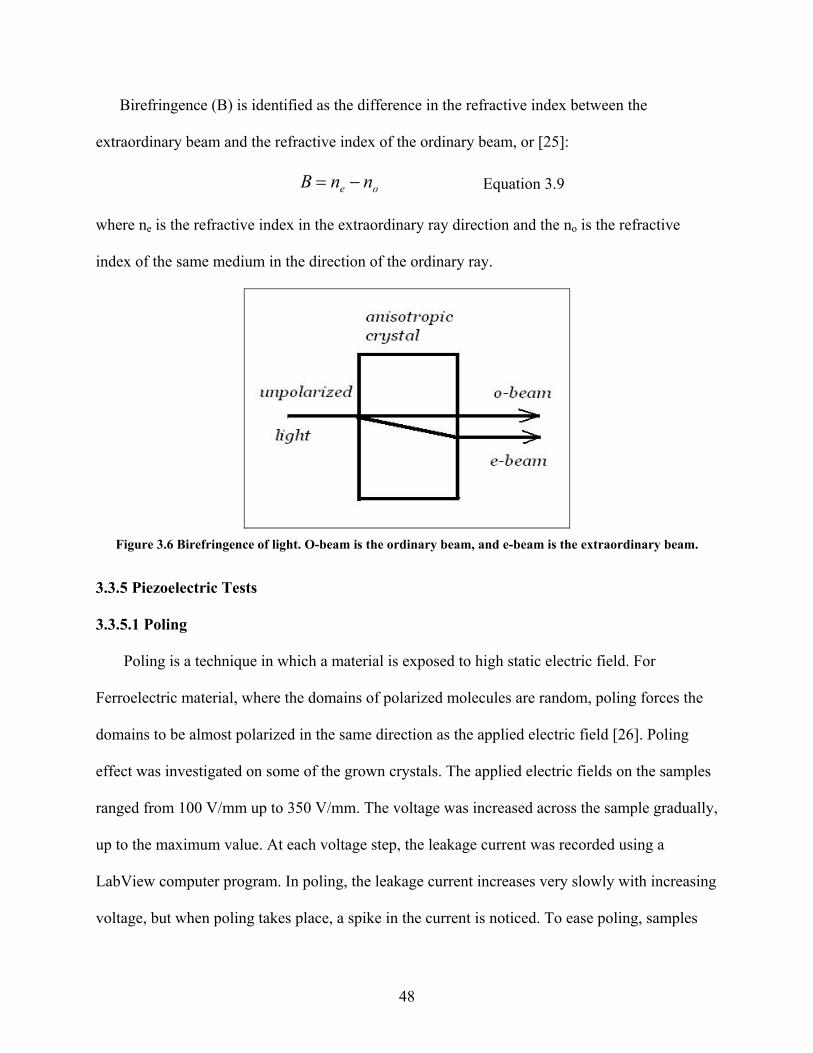
Birefringence (B) is identified as the difference in the refractive index between the
extraordinary beam and the refractive index of the ordinary beam, or [25]:
oe nnB −= Equation 3.9
where ne is the refractive index in the extraordinary ray direction and the no is the refractive
index of the same medium in the direction of the ordinary ray.
Figu am.
Poling is a technique in which a material is exposed to high static electric field. For
Fer
ples
re 3.6 Birefringence of light. O-beam is the ordinary beam, and e-beam is the extraordinary be
3.3.5 Piezoelectric Tests
3.3.5.1 Poling
roelectric material, where the domains of polarized molecules are random, poling forces the
domains to be almost polarized in the same direction as the applied electric field [26]. Poling
effect was investigated on some of the grown crystals. The applied electric fields on the sam
ranged from 100 V/mm up to 350 V/mm. The voltage was increased across the sample gradually,
up to the maximum value. At each voltage step, the leakage current was recorded using a
LabView computer program. In poling, the leakage current increases very slowly with increasing
voltage, but when poling takes place, a spike in the current is noticed. To ease poling, samples
48
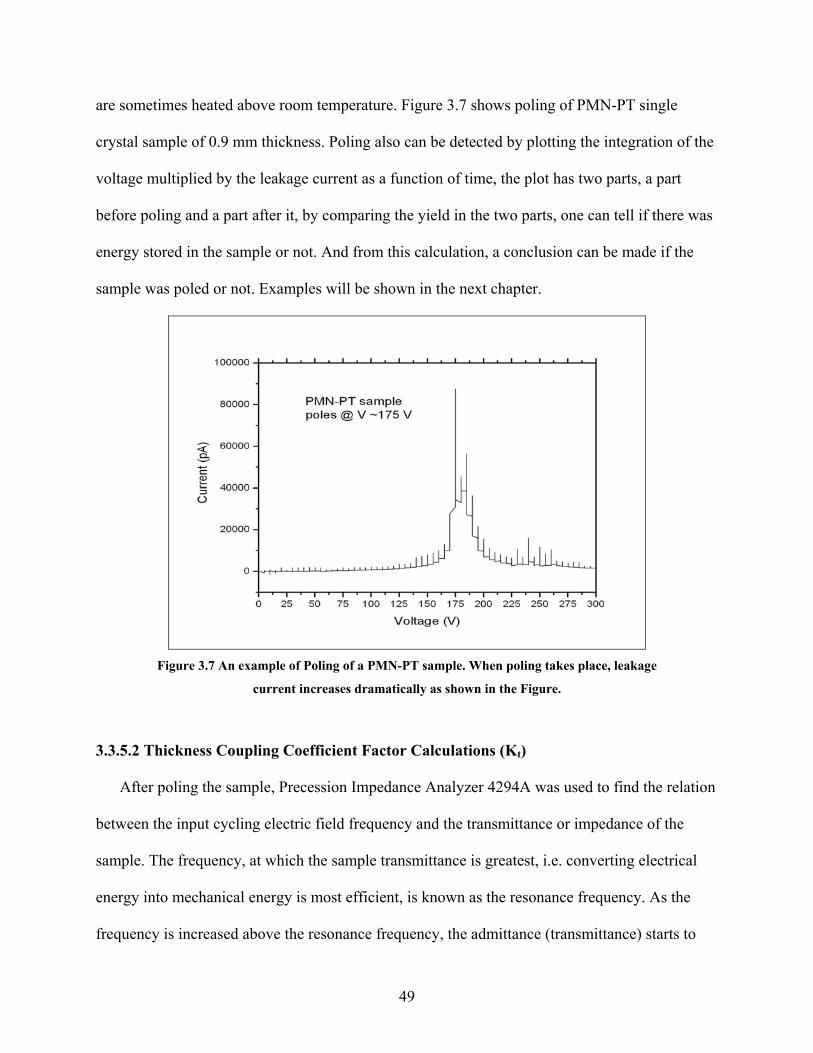
are sometimes heated above room temperature. Figure 3.7 shows poling of PMN-PT single
crystal sample of 0.9 mm thickness. Poling also can be detected by plotting the integration of the
voltage multiplied by the leakage current as a function of time, the plot has two parts, a part
and a part after it, by comparing the yield in the two parts, one can tell if there was
xamples will be shown in the next chapter.
before poling
energy stored in the sample or not. And from this calculation, a conclusion can be made if the
sample was poled or not. E
gure 3.7 An example of Poling of a PMN-PT sample. When poling takes place, leakage
3.3.5.2 Thickness Coupling Coefficient Factor Calculations (K )
After poling the sample, Precession Impedance Analyzer 4294A was used to find the relation
between the input cycling electric field frequency and the transmittance or impedance of the
sample. The frequency, at which the sample transmittance is greatest, i.e. converting electrical
energy into mechanical energy is most efficient, is known as the resonance frequency. As the
frequency is increased above the resonance frequency, the admittance (transmittance) starts to
Fi
current increases dramatically as shown in the Figure.
t
49
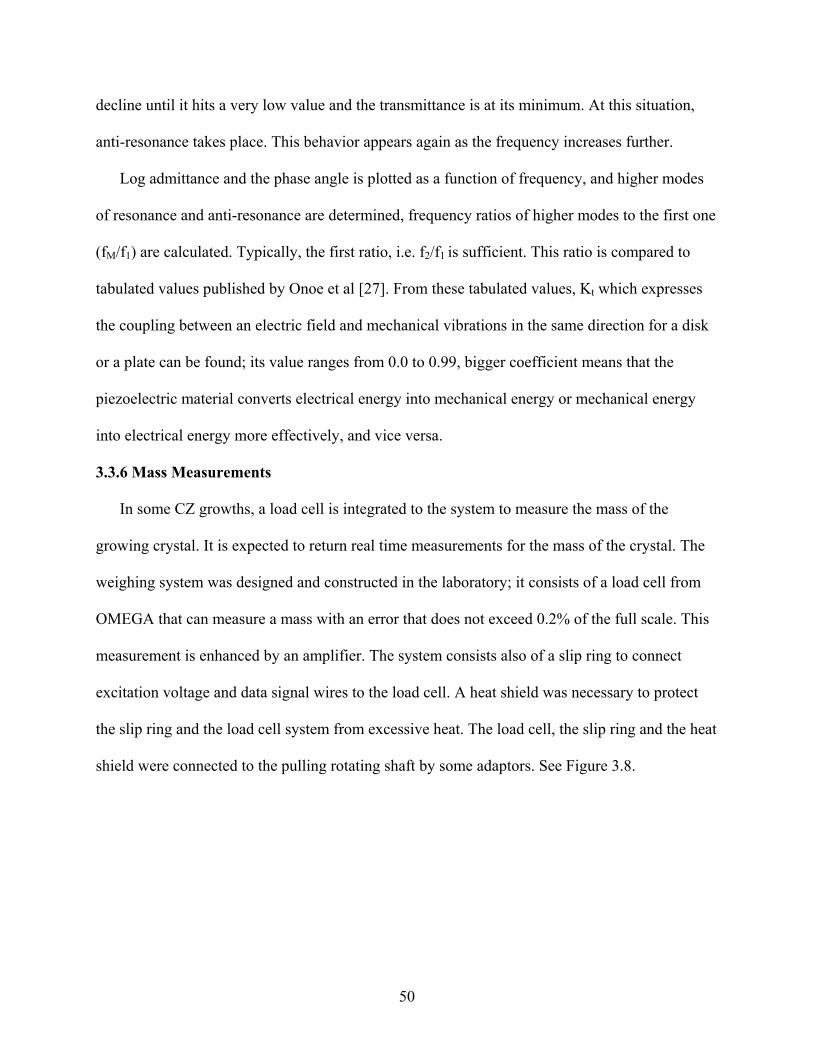
decline until it hits a very low value and the transmittance is at its minimum. At this situation,
anti-resonance takes place. This behavior appears again as the frequency increases further.
quency, and higher modes
igher modes to the first one
to
Onoe et al [27]. From these tabulated values, Kt which expresses
k
e found; its value ranges from 0.0 to 0.99, bigger coefficient means that the
e CZ growths, a load cell is integrated to the system to measure the mass of the
cted in the laboratory; it consists of a load cell from
s
ct
ltage and data signal wires to the load cell. A heat shield was necessary to protect
Log admittance and the phase angle is plotted as a function of fre
of resonance and anti-resonance are determined, frequency ratios of h
(fM/f1) are calculated. Typically, the first ratio, i.e. f2/f1 is sufficient. This ratio is compared
tabulated values published by
the coupling between an electric field and mechanical vibrations in the same direction for a dis
or a plate can b
piezoelectric material converts electrical energy into mechanical energy or mechanical energy
into electrical energy more effectively, and vice versa.
3.3.6 Mass Measurements
In som
growing crystal. It is expected to return real time measurements for the mass of the crystal. The
weighing system was designed and constru
OMEGA that can measure a mass with an error that does not exceed 0.2% of the full scale. Thi
measurement is enhanced by an amplifier. The system consists also of a slip ring to conne
excitation vo
the slip ring and the load cell system from excessive heat. The load cell, the slip ring and the heat
shield were connected to the pulling rotating shaft by some adaptors. See Figure 3.8.
50
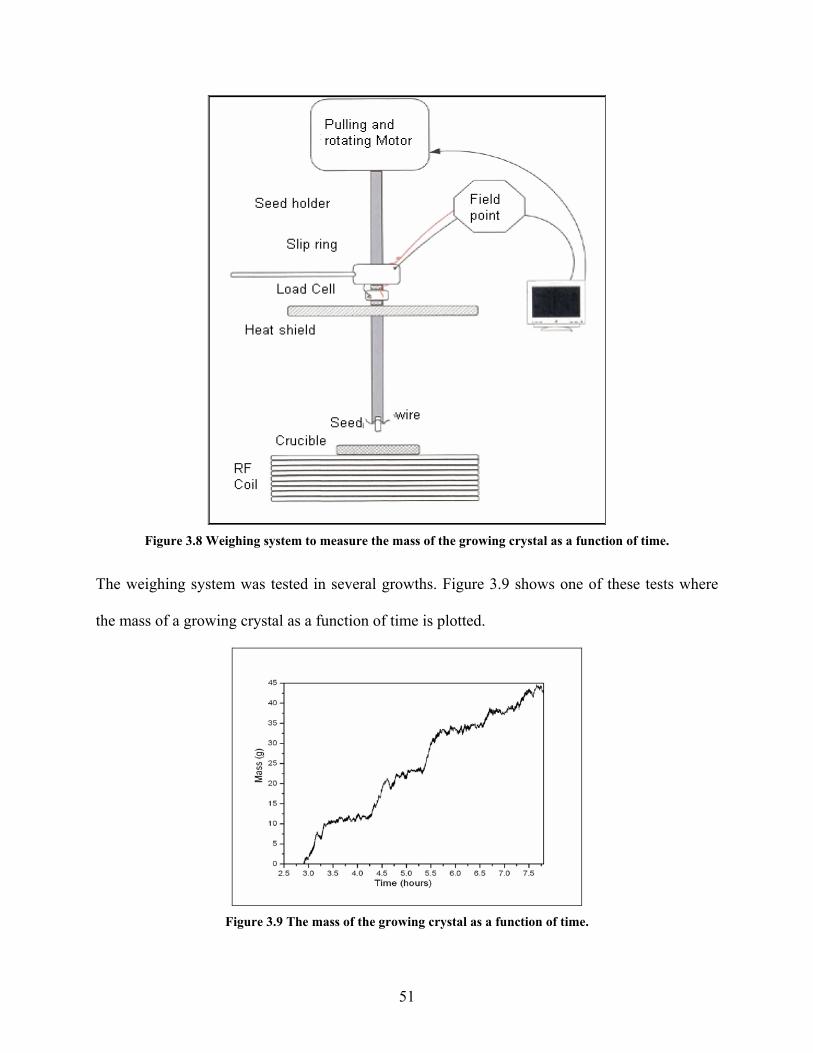
Figure 3.8 Weighing system to measure the mass of the growing crystal as a function of time.
ss of a growing crystal as a function of time is plotted.
The weighing system was tested in several growths. Figure 3.9 shows one of these tests where
the ma
Figure 3.9 The mass of the growing crystal as a function of time.
51
It is worth mentioning at the end, that temperature readings were calibrated using a standard
setup, where the thermocouple was snuck under the crucible and its tip was touching th
Pure TeO
e bottom.
e
degrees. Temperature error in the standard used box furnace at 600 ºC does
not
2 powder was used in this process, since the melting temperature of TeO2 is well
defined to be 733 ºC [28]. It was found that the material melts at 670 ºC, which means that about
60 degrees have to be added to the bottom thermocouple temperature readings. On the other
hand, if the thermocouple was not touching the bottom such that it is about 0.3-0.5 mm away, an
extra 30-50 degrees should be added. In temperature control runs the uncertainty of temperatur
reading is ± 0.0005
exceed ± 5 degrees.
References
[1] C. Suryanarayana and M. G. Norton, X-ray Diffraction: A practical Approach, Plenum Pre
New York, 1998, pp 8-9.
[2] J. R. Christman,
ss.
Fundamentals of Solid State Physics, John Wiley & Sons, New York, 1988,
pp 86-87.
[4] M. F. C. Ladd and R. A. Palmer, Structure Determination by X-Ray Crystallography, 2nd
Edition, Plenum Press. New York, 1985, p. 126.
[5] P. J. Goodhew, J. Humphreys, and R. Beanland, Electron Microscopy and Analysis, Third
Edition, Taylor & Francis, London and New York, 2001, pp 181-183.
[6] S. J. B. Reed,
Electron Microprobe Analysis and Scanning Electron Microscopy in Geology,
Cambridge University Press, Cambridge, 1996, pp 53-63.
[7] C. A. Anderson, Microprobe Analysis, John Wiley & Sons, New York, 1973, pp 56-60, &
241-314.
52
[8] G. R. Fowles, Introduction to Modern Optics, Second Edition, Dover Publications, Inc., New
York, 1975, pp 169-180.
[9] M. H. Nayfeh and M. K. Brussel, Electricity and Magnetism, John Wiley and Sons, New
York, 1985, pp 139-141.
[10] F. Wooten, Optical Properties of Solids, Academic Press, New York and London, 1972. pp
34-38.
11] D. Halliday, R. Resnick, and J. Walker, Fundamentals of Physics[ , 5 Edition, John Wiley
and
orldwide.com/tech2209.htm accessed 05/07/06
th
Sons, New York, 1997, pp 686 – 689.
[12] http://en.wikipedia.org/wiki/Permittivity accessed on 09/01/06.
[13] http://www.nttw
[14] on to Solid State Physics C. Kittle, Introducti , 7th Edition, John Wiley and sons, Inc.,
Canada, 1996, pp 393 – 403.
[15] M. Déri, Ferroelectric Ceramics, Gordon and Research Scientific Publishers, New York,
1969, pp 3-7.
[16] C. R. Barrett, W. D. Nix, and A. S. Tetelman, The principles of Engineering Materials,
Pre ontice Hall, Englewo d Cliffs, New Jersey, 1973, pp 468-470
[17] M. Schwartz, Principles of Electrodynamics, Dover Publications, New York, 1972, pp 50-
51.
[18] R. L. Liboff, Introductory Quantum Mechanics, 2nd Edition, Addison-Wesley Publishing
Company, Inc., Reading, 1992, pp 30-44.
[19] J. B. Huang, and M. W. Urban, Evaluation and Analysis of Attenuated Total Reflectance
FT-IR Spectra Using Kramers-Kronig Transforms, Applied Spectroscopy 46 (11): 1666-
1672,1992.
53
[20] Y. Zhao, K. Lyytikainen, M. A. van Eijkelenborg, S. Fleming, Optical Society of America/
Optics Express, Nondestructive measurement of refractive index profile for holey fiber performs
11 (20), 2474 – 2479, 2003.
[21] F. H. Grabel, Basic Electric Engineering, 4th Edition, McGraw-Hill, Inc., New York, 1967,
pp 15-16.
[22] S. C. MaClain, L. W. Hillman, and R. A. Chipman, Polarization Ray Tracing in Anisotropic
Optically Active Media, Journal of Optical
[23] R. N. Weinreb L. Zangwill, C. ple
Society of America A 10 (11): 2371-2382, 1993.
C. Berry, R. Bathija, and P. A. Sam .Detection of
gl
1998.
[24] D. S. Kliger, J.W. Lewis, and C. E. Randall, Polarized Light in Optics and Spectroscopy,
Academic Press Inc. Boston, 1990, pp 32-36.
[25] D. Clarck, and J. F. Grainger, Polarized Light and Optical Measurement, Volume 35,
Pergamon Press, Oxford, 1971, pp 73-78.
[26] http://www.sou.edu/physics/ferro/nsf_wht.htm accessed 05/07/06
[27] M. Onoe, H. F. Tiersten, and A. H. Meitzler, Shift in the location of resonance frequencies
caused by large electromechanical coupling in thicknesmode resonators, The Journal of the
Acoustical Society of America 35, number 1: 36-42, 1963.
[28] http://www.mt-berlin.com/frames_cryst/descriptions/teo2_pmo.htm accessed on August 16
2006.
aucoma with scanning laser polarimetry, Archives of Ophthalmology, 116 (12):1583-1589,
54
CHAPTER FOUR
same
rials
e
Several mole percentages have been tested for growths, such as 33.3:66.7, and 36.5:63.5. The
choices were limited by several factors, such as the melting temperature, and phase formation.
Microprobe analysis of the grown material of 33.3:66.7 showed it has excess TeO2. The second
mole percentage (36.5:63.5) formed 5-15 mm3 crystals. Optical and electrical measurements
were hard to perform on these crystals. Other growths showed that the 35.5:64.5 mole percentage
gave the best results such that crystals had the least amount of defects. This mole percentage has
a moderate melting point of 650 ˚C, and the resultant material has relatively good-sized crystals
in the range between 50-200 mm3.
an indication of temperature and thermal gradient in the hot zone. These patterns are used by
c
ZnO-TeO2 and CdO-TeO2 GROWTHS
4.1 Zn2Te3O8 Single Crystal Growth
As discussed previously, to pull a single crystal of a certain material, a seed that has the
crystal structure of the projected grown material, has to be used to obtain best results.
Unfortunately, single crystals of Zn2Te3O8 to use as a seed were not found. Many other mate
were examined to be used as a seed, such as tellurium oxide (TeO2) single crystal oriented in th
c-direction, YAG, alumina, zirconia, and a special seed made by dipping the Pt/Rh wire in a
40:60 melt. Sometimes, a platinum wire was used to pull a crystal. Unlike CdO-TeO2 melt, ZnO-
TeO2 melt attaches very well to all these seeds, but the growth of one ingot of a single crystal
was not observed.
As mentioned in Chapter 1, spoke line patterns are used in Nd:YAG melts and other melts as
rystal growers as a starting point of the growth. In ZnO- TeO2 melts, spoke lines were hard to
55
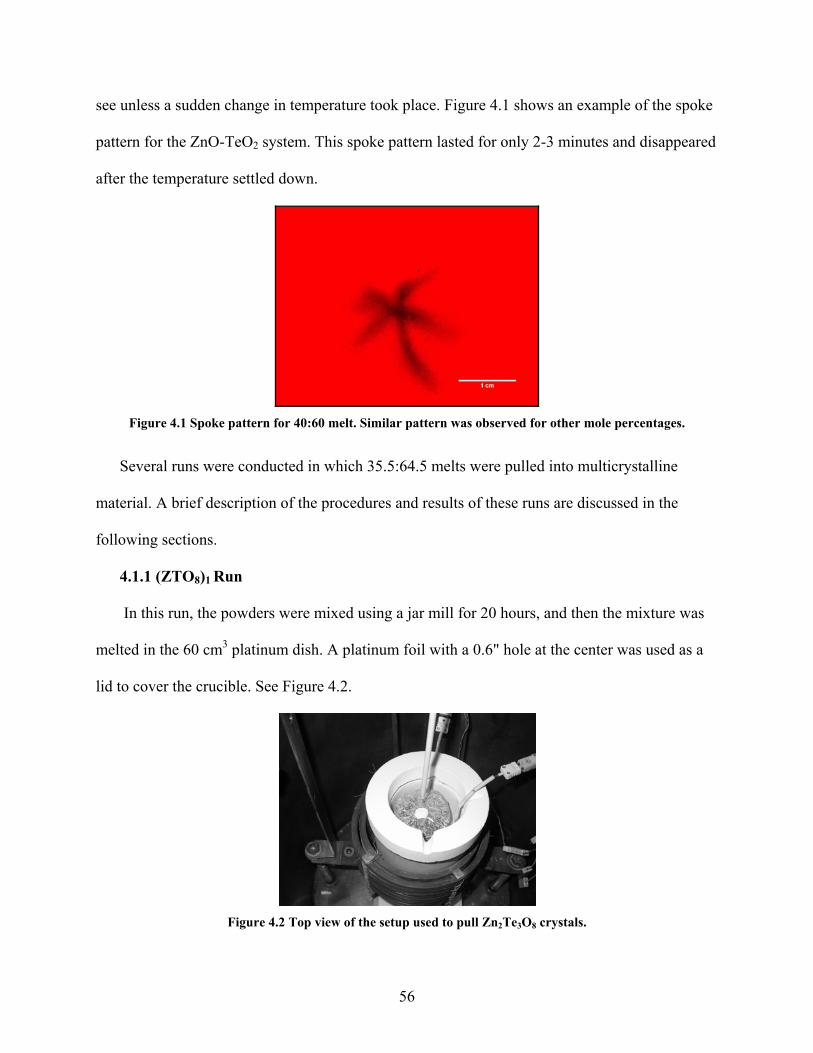
see unless a sudden change in temperature took place. Figure 4.1 shows an example of the spoke
pattern for the ZnO-TeO2 system. This spoke pattern lasted for only 2-3 minutes and disappeared
after the temperature settled down.
ke pattern for 40:60 melt. Similar pattern was observed for other moleFigure 4.1 Spo percentages.
ns were conducted in which 35.5:64.5 melts were pulled into multicrystalline
mat
3
Several ru
erial. A brief description of the procedures and results of these runs are discussed in the
following sections.
4.1.1 (ZTO8)1 Run
In this run, the powders were mixed using a jar mill for 20 hours, and then the mixture was
melted in the 60 cm platinum dish. A platinum foil with a 0.6" hole at the center was used as a
lid to cover the crucible. See Figure 4.2.
Figure 4.2 Top view of the setup used to pull Zn2Te3O8 crystals.
56

A seed of Zn2Te3O8 with minor TeO2 inclusions, obtained from a previous run, was used. A
shown in Fig
s
ure 4.3, the seed was attached to the alumina seed holder by making a notch in both
the seed and the holder and then passing a platinum wire through the two notches. After the
aterial melted, the seed /hr with a
rotation speed of 10 rpm. After a pulling time of 8 hours, the final product was made of
multicrystals that are held together by a powder-like phase. See Figure 4.4. Some single crystals
were extracted and analyzed by a scanning electron microprobe and they were only formed of
Zn2Te3O8. These crystals were too small (5-15 mm3) to carry out further analysis.
m was dipped onto the melt surface, and was pulled at 0.9 mm
ained from a previous growth, attached to the seed holder by platinum wire passing Figure 4.3 Seed obt
through notches made in the seed and the holder.
Figure 4.4 Multicrystalline material resulted from pulling 35.5:64.5 melt for 8 hours. Single crystals were
extracted and scanning electron microprobe shows that they are Zn2Te3O8 single crystals.
57
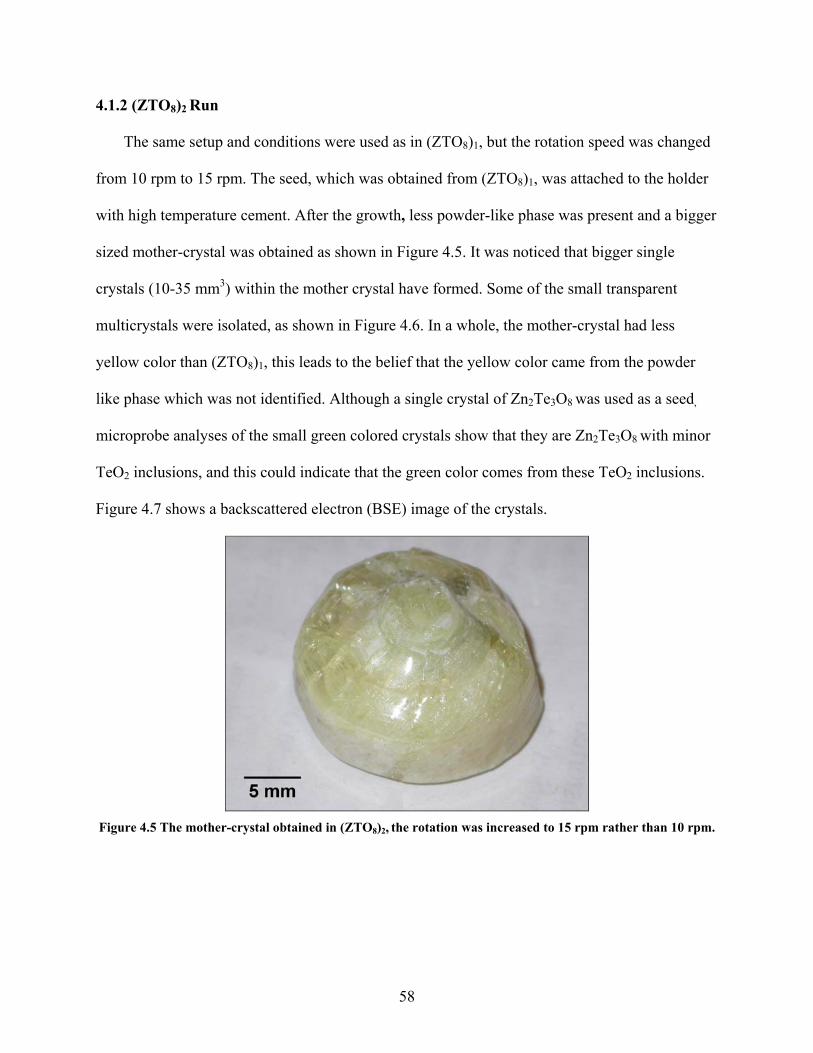
4.1.2 (ZTO8)2 Run
The same setup and conditions were used as in (ZTO8)1, but the rotation speed was changed
from 10 rpm to 15 rpm. The seed, which was obtained from (ZTO8)1, was attached to the ho
with high temperature cement. After the growth, less powder-like phase was present and a bi
sized mother-crystal was obtained as shown in Figure 4.5. It was noticed that b
lder
gger
igger single
crystals (10-35 mm3) within the mother crystal have formed. Some of the small transparent
multicrystals were isolated, as shown in Figure 4.6. In a whole, the mother-crystal had less
yellow color than (ZTO8)1, this leads to the belief that the yellow color came from the powder
like phase which was not identified. Although a single crystal of Zn2Te3O8 was used as a seed,
microprobe analyses of the small green colored crystals show that they are Zn2Te3O8 with minor
TeO2 inclusions, and this could indicate that the green color comes from these TeO2 inclusions.
Figure 4.7 shows a backscattered electron (BSE) image of the crystals.
Figure 4.5 The mother-crystal obtained in (ZTO8)2, the rotation was increased to 15 rpm rather than 1
0 rpm.
58
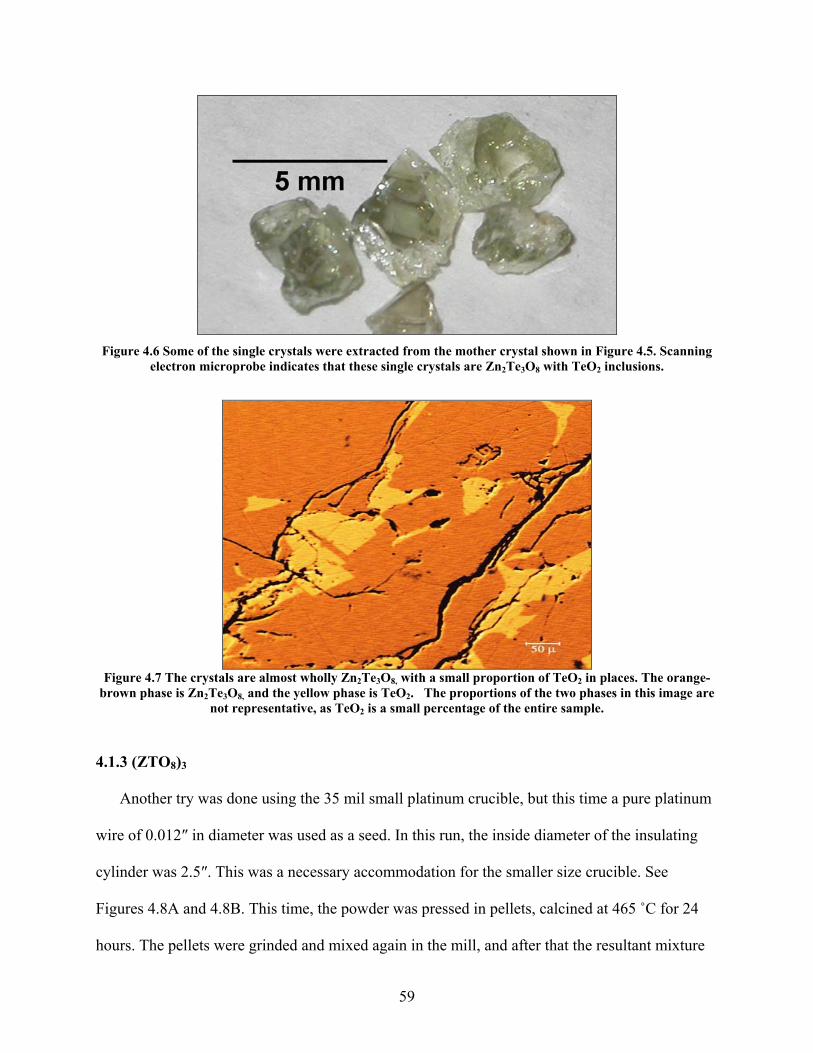
Figure 4.6 Some of the single crystals were extracted from the mother crystal shown in Figure 4.5. Scanning
electron microprobe indicates that these single crystals are Zn2Te3O8 with TeO2 inclusions.
Figure 4.7 The crystals are almost wholly Zn Te O with a small proportion of TeO in places. The oran
brown phase is Zn2 3 8, 2 ge-
are
4.1.3 (ZTO )
Another try was done using the 35 mil small platinum crucible, but this time a pure platinum
wire of 0.012″ in diameter was used as a seed. In this run, the inside diameter of the insulating
cylinder was 2.5″. This was a necessary accommodation for the smaller size crucible. See
Figures 4.8A and 4.8B. This time, the powder was pressed in pellets, calcined at 465 ˚C for 24
hours. The pellets were grinded and mixed again in the mill, and after that the resultant mixture
2Te3O8, and the yellow phase is TeO2. The proportions of the two phases in this image not representative, as TeO2 is a small percentage of the entire sample.
8 3
59
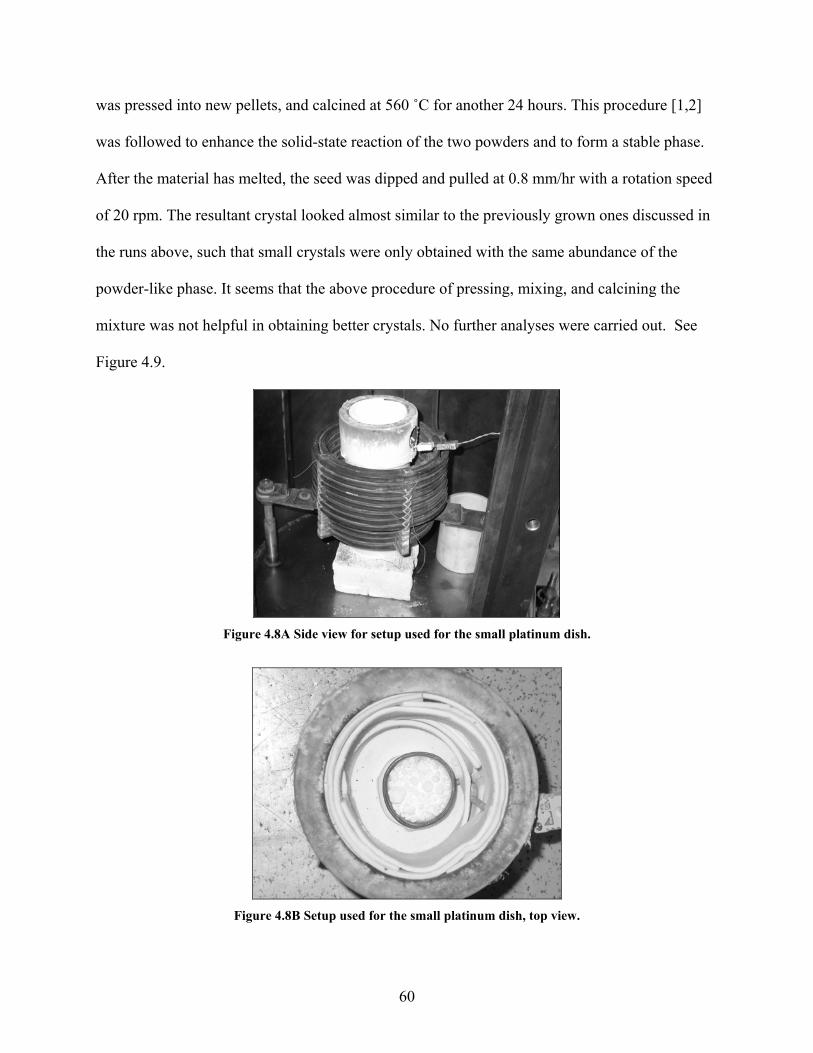
was pressed into new pellets, and calcined at 560
as followed to enhance the solid-state reaction of the two powders and to form a stable phase.
ft
ussed in
the runs above, such that small crystals were only obtained with the same abundance of the
powder-like phase. It seems that the above procedure of pressing, mixing, and calcining the
m wa pful in ining ls. ther ses w rrie
9.
˚C for another 24 hours. This procedure [1,2]
w
A er the material has melted, the seed was dipped and pulled at 0.8 mm/hr with a rotation speed
of 20 rpm. The resultant crystal looked almost similar to the previously grown ones disc
ixture s not hel obta better crysta No fur analy ere ca d out. See
Figure 4.
Figure 4.8A Side view for setup used for the small platinum dish.
Figure 4.8B Setup used for the small platinum dish, top view.
60
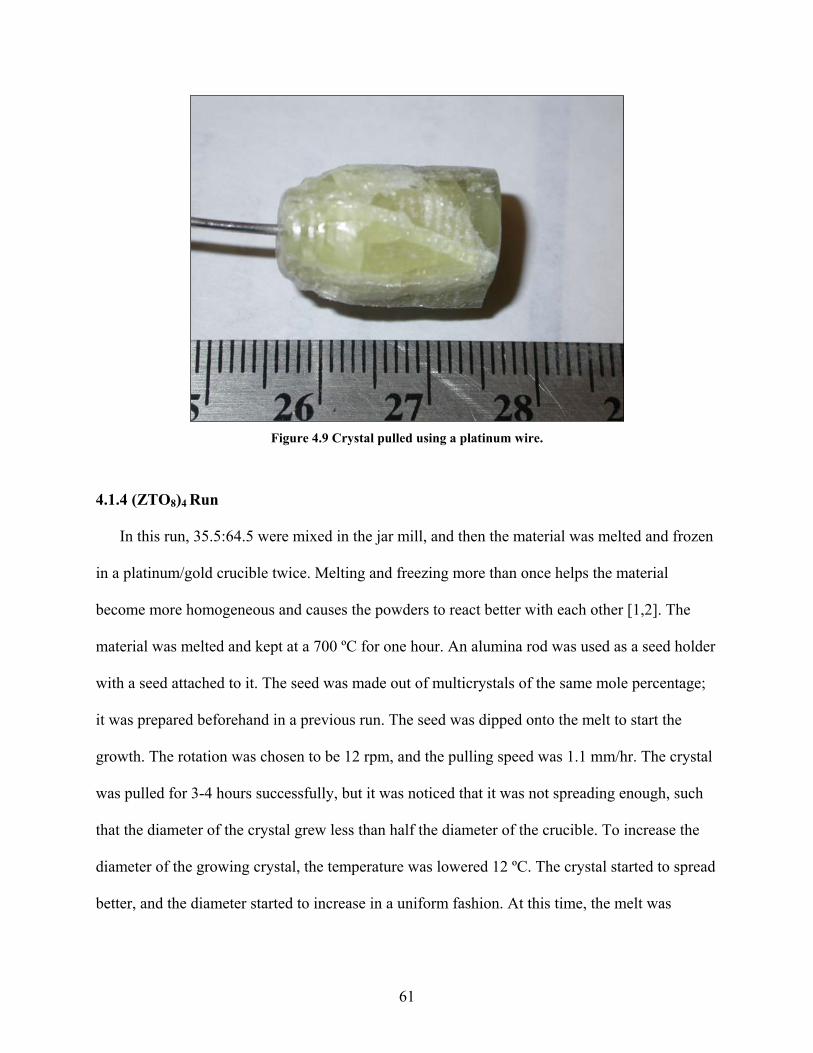
ire.
4.1.4 (ZTO8)4 Run
In this run, 35.5:64.5 were mixed in the jar mill, and then the material was melted and frozen
in a platinum/gold crucible twice. Melting and freezing more than once helps the material
become more homogeneous and causes the powders to react better with each other [1,2]. The
material was melted and kept at a 700 ºC for one hour. An alumina rod was used as a seed holder
with a seed attached to it. The seed was made out of multicrystals of the same mole percentage;
it was prepared beforehand in a previous run. The seed was dipped onto the melt to start the
growth. The rotation was chosen to be 12 rpm, and the pulling speed was 1.1 mm/hr. The crystal
was pulled for 3-4 hours successfully, but it was noticed that it was not spreading enough, such
that the diameter of the crystal grew less than half the diameter of the crucible. To increase the
diameter of the growing crystal, the temperature was lowered 12 ºC. The crystal started to spread
b
Figure 4.9 Crystal pulled using a platinum w
etter, and the diameter started to increase in a uniform fashion. At this time, the melt was
61
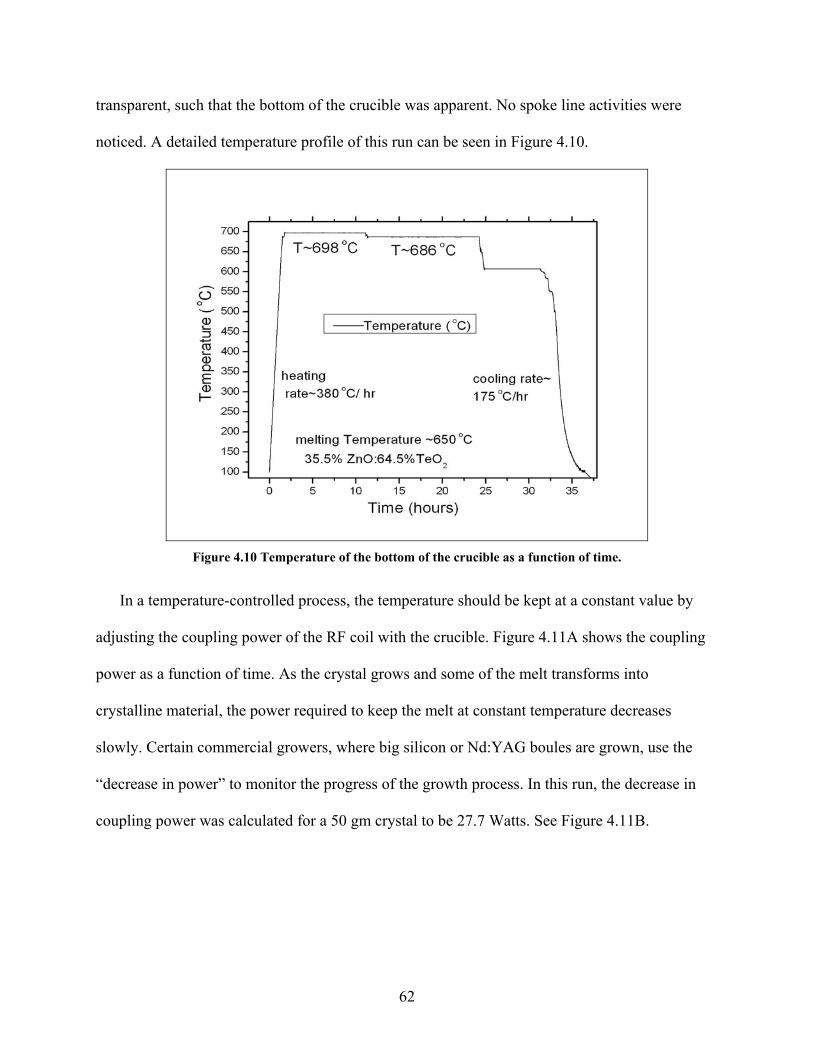
transparent, such that the bottom of the crucible was apparent. No spoke line activities were
noticed. A detailed temperature profile of this run can be seen in Figure 4.10.
Figure 4.10 Temperature of the bottom of the crucible as a function of time.
In a temperature-controlled process, the temperature should be kept at a constant value by
a
power as a function of time. As the crystal grows and some of the melt transforms into
crystalline m
owly. Certain commercial growers, where big silicon or Nd:YAG boules are grown, use the
“decrease in power” to monitor the progress of the growth process. In this run, the decrease in
coupling power was calculated for a 50 gm crystal to be 27.7 Watts. See Figure 4.11B.
djusting the coupling power of the RF coil with the crucible. Figure 4.11A shows the coupling
aterial, the power required to keep the melt at constant temperature decreases
sl
62

Figure 4.11A Coupling power of the RF coil with the crucible as the run develops in time. The large vertical
sudden changes are due to resetting the temperature to a different value.
Figure 4.11B Coupling power of the first
drops slowly as the growth progressesection (shown in Figure 4.11A) of the growth process. The power s. The total power drop for both growth sections is 27.7 watts.
The resultant crystal was a conglomeration of 40-50 small single crystals of different sizes,
ach one is grown in a different direction. The total length of the crystal was 28 mm, and its e
63
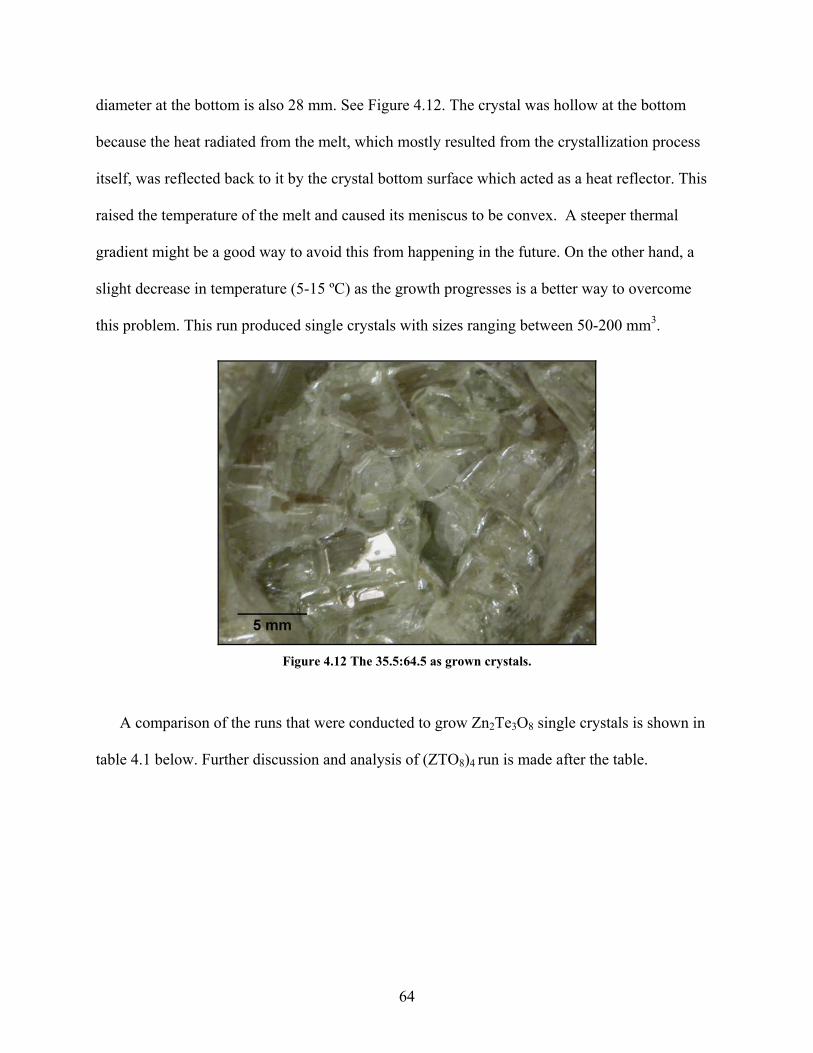
diam
On the other hand, a
light decrease in temperature (5-15 ºC) as the growth progresses is a better way to overcome
is problem. This run produced single crystals with sizes ranging between 50-200 mm3.
eter at the bottom is also 28 mm. See Figure 4.12. The crystal was hollow at the bottom
because the heat radiated from the melt, which mostly resulted from the crystallization process
itself, was reflected back to it by the crystal bottom surface which acted as a heat reflector. This
raised the temperature of the melt and caused its meniscus to be convex. A steeper thermal
gradient might be a good way to avoid this from happening in the future.
s
th
Figure 4.12 The 35.5:64.5 as grown crystals.
A comparison of the runs that were conducted to grow Zn2Te3O8 single crystals is shown in
table 4.1 below. Further discussion and analysis of (ZTO8)4 run is made after the table.
64

Table 4.1 A summary of the most important runs used in an attempt to grow Zn2Te3O8 single crystals.
Run # Crucible Seed Pulling speed
(mm/hr) ± 0.1 mm/hr
Rotation speed
± 1 rpm
General Single crystal
size
Microprobe analysis of
single crys
.1.4.1 Discussion and Analysis
I. Single Crystals Analysis
Some of the (ZTO ) run single crystals were isolated. A few of these colorless single crystals
were grinded for powder x-ray diffraction. The resultant x-ray pattern accompanied with a
simulation made by CrystalDiffract 1.3 is shown in Figure 4.13.The pattern was divided into two
segments to obtain a better resolution of the peaks. The resultant data was matched with the PDF
file # 44-0241, known as zinc tellurium or Zn2Te3O8. No other phases were found in this pattern,
but there were two peaks that appear in the simulations but do not appear in the pattern, these
two peaks are marked by arrows. There are also two unidentified peaks that appear in the pattern
at 2 theta = 26 ˚ and 2 theta = 28 ˚. Two more tests were conducted to see if the formed material
is a single crystal or not. The first test is shown in Figure 4.14 where an unpolished single crystal
(rpm) color tals
(ZTO8)1 Zn2Te3O8 with minor TeO2 inclusions
0.9 10 yellow ~5-15 mm3
Zn2Te3O8 only
60 ml Pt dish
(ZTO8)2
60 m Pt dish
Zn2Te3O8 from
light yellow.
crystals are
greenish
mm
Zn2Te3O8 with minor TeO2 inclusions
l (ZTO8)1 0.9 15 Single 10-35 3
(ZTO8)3
A 15 ml
Pt dish platinum wire 0.8 20 yellow and green
~5-20 mm3 N/
(ZTO )
125 ml8 4
wall
from a
run
50-200 2 3 8
y
95%Pt/ 5%Au straight
multicrystals
previous 35.5 1.1 12 clear
white and green mm3
Zn Te OOnly
Done by x-ra
4
8 4
was placed on a polarizer. It shows that the crystal blocks the light at a certain orientation, which
65
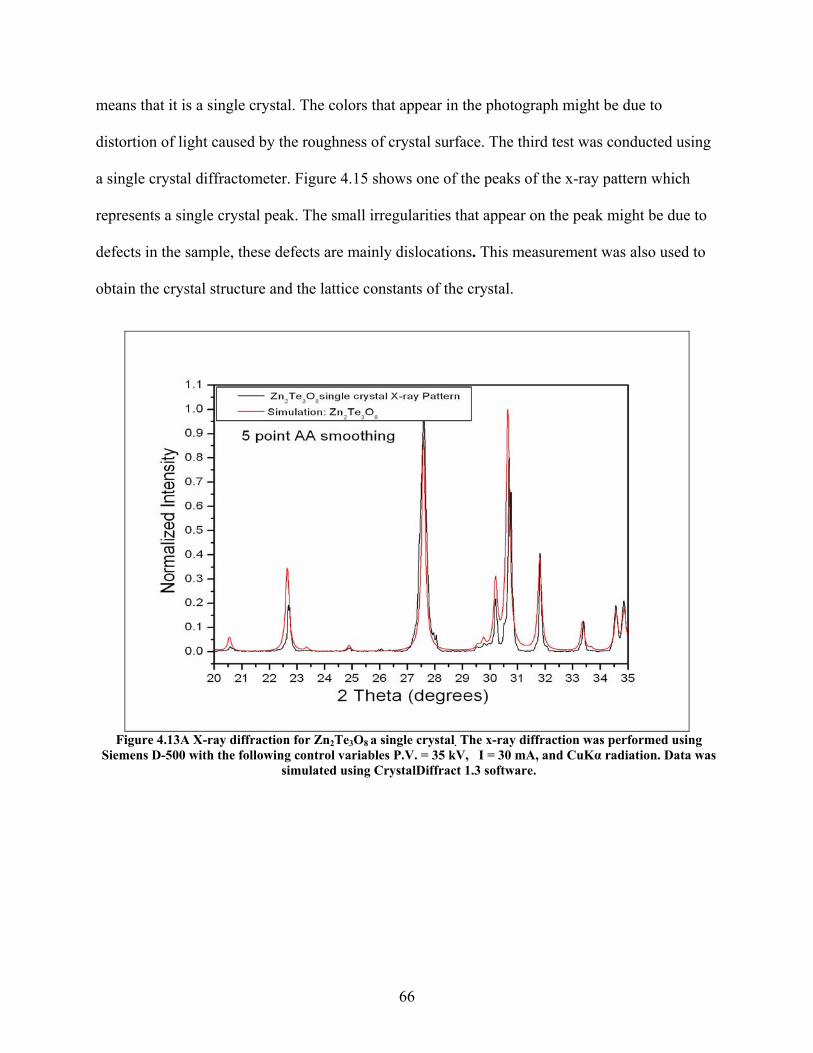
means that it is a single crystal. The colors that appear in the photograph might be due to
distortion of light caused by the roughness of crystal surface. The third test was conducted using
a single crystal diffractometer. Figure 4.15 shows one of the peaks of the x-ray pattern which
represents a single crystal peak. The small irregularities that appear on the peak might be due to
defects in the sample, these defects are mainly dislocations. This measurement was also used to
obtain the crystal structure and the lattice constants of the crystal.
Figure 4.13A X-ray diffraction for Zn2Te3O8 a single crystal. The x-ray diffraction was performed using
Siemens D-500 with the following control variables P.V. = 35 kV, I = 30 mA, and CuKα radiation. Data was simulated using CrystalDiffract 1.3 software.
66
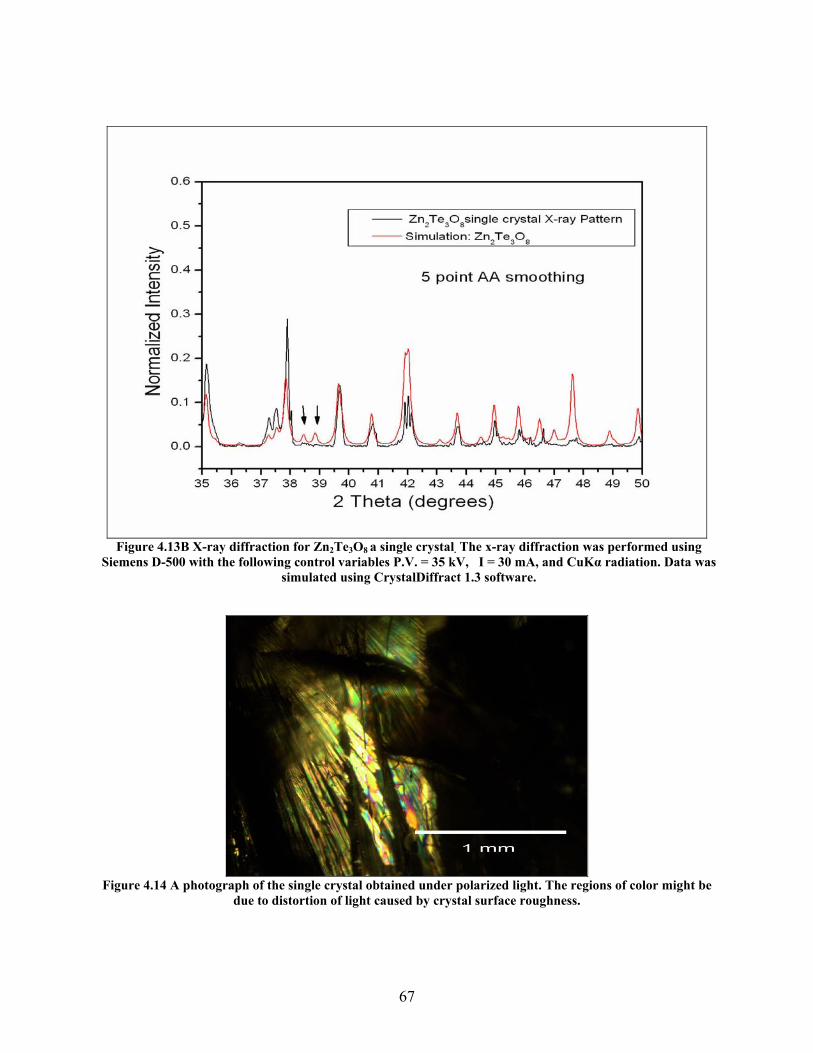
Figure 4.13B X . using
Siemens D-500 with the following contr V. = 35 tion. Data was ate alDiffr .3 software
-ray diffraction for Zn Te O a single crystal The x-r2 3 8 ol variables P.d using Cryst
ay diffraction was performed V, I = 30 mA, and CuKα radk
act 1ia
simul .
Figure ph gra singl obtain er pol t. T s of ght be
d storti ght caus rystal ugh4.14 A oto ph of the e crystal ed und arized ligh he region color mi
ue to di on of li ed by c surface ro ness.
67
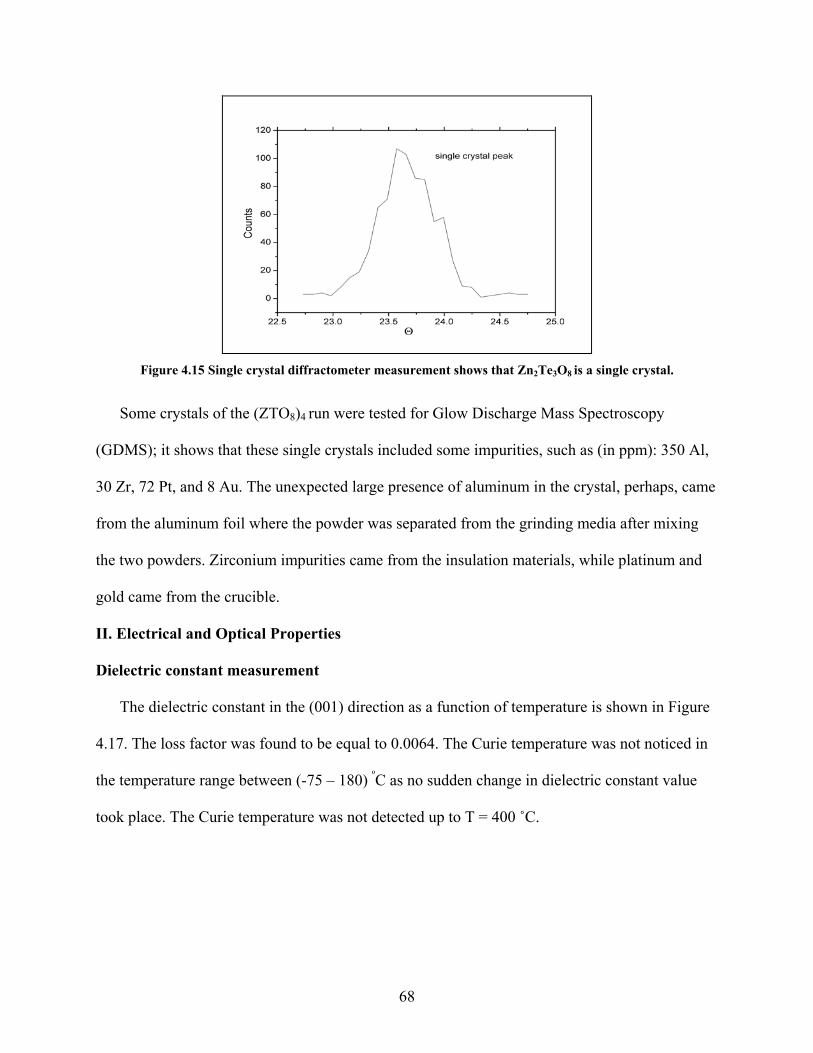
Figure 4.1 ingl l diffr ter mea t sho 2Te ngl
Som ysta f t 8)4 run were tested for Glow M tro
(GDMS); it shows that these singl tals included some s, s n p 0 Al,
30 Zr, , an Au nexp large p of a in l, came
from the alumin fo e the r was ed fr ind ia a ing
the two powders. Zirconium impurities came fro e insu ter e p
gold c om cru .
II. Electrical a Op ope
Dielec ns t m men
Th ct on the irectio unctio mperature is shown in Figure
4.17. T s f r w d to al to 0 The perature was not noticed in
the tem ture ge n (-7 0) ºC as no sudden change in dielectric constant value
took place. The Curie temperature ot dete to T
5 S e crysta actome suremen ws that Zn 3O8 is a si e crystal.
e cr ls o he (ZTO D geischar ass Spec scopy
e crys impuritie uch as (i pm): 35
72 Pt d 8 . The u ected resence luminum the crysta perhaps,
um il wher powde separat om the gr ing med fter mix
m th lation ma ials, whil latinum and
ame fr the cible
nd tical Pr rties
tric co tan easure t
e diele ric c stant in (001) d n as a f n of te
he los acto as foun be equ .0064. Curie tem
pera ran betwee 5 – 18
was n cted up = 400 ˚C.
68
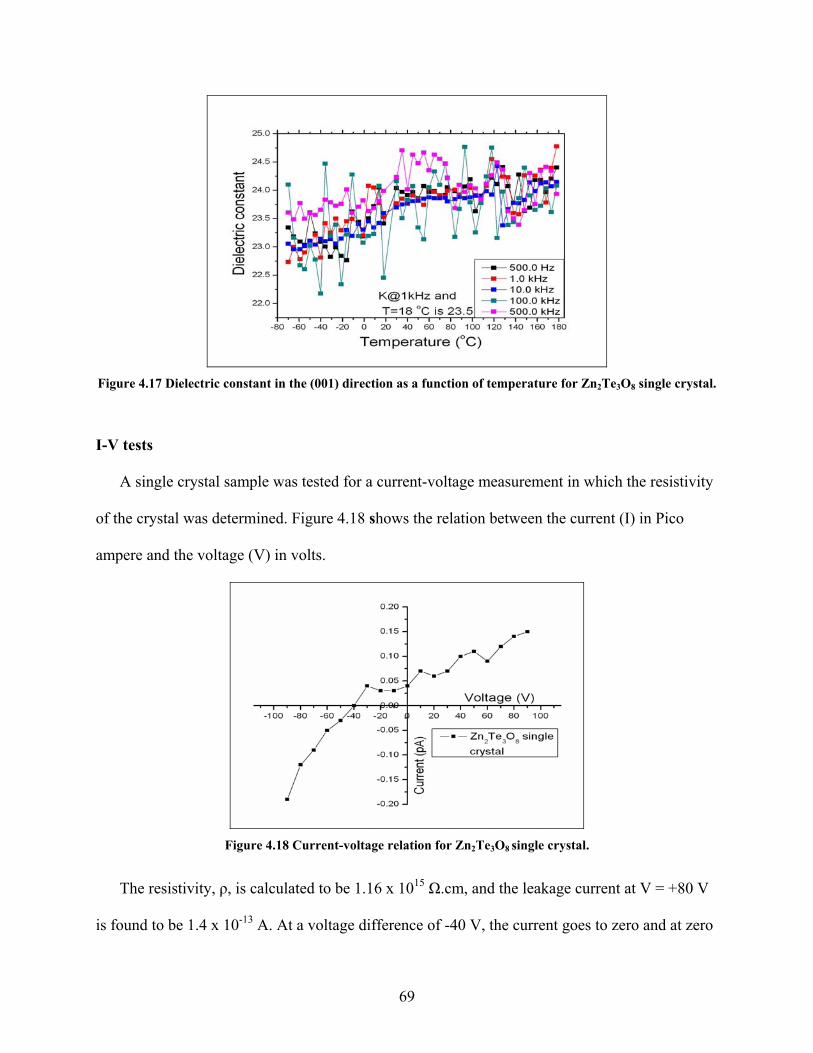
Figure 4.17 Dielectric constant in the (001) direction as a function of temperature for Zn2Te3O8 single crystal
I-V tests
.
A single crystal sample was tested for a current-voltage measurement in which the resistivity
o
amp
f the crystal was determined. Figure 4.18 shows the relation between the current (I) in Pico
ere and the voltage (V) in volts.
Figure 4.18 Current-voltage relation for Zn2Te3O8 single crystal.
The resistivity, ρ, is calculated to be 1.16 x 10
is found to be 1.4 x 10⁻¹³ A. At a voltage difference of -40 V, the current goes to zero and at zero
15 Ω.cm, and the leakage current at V = +80 V
69
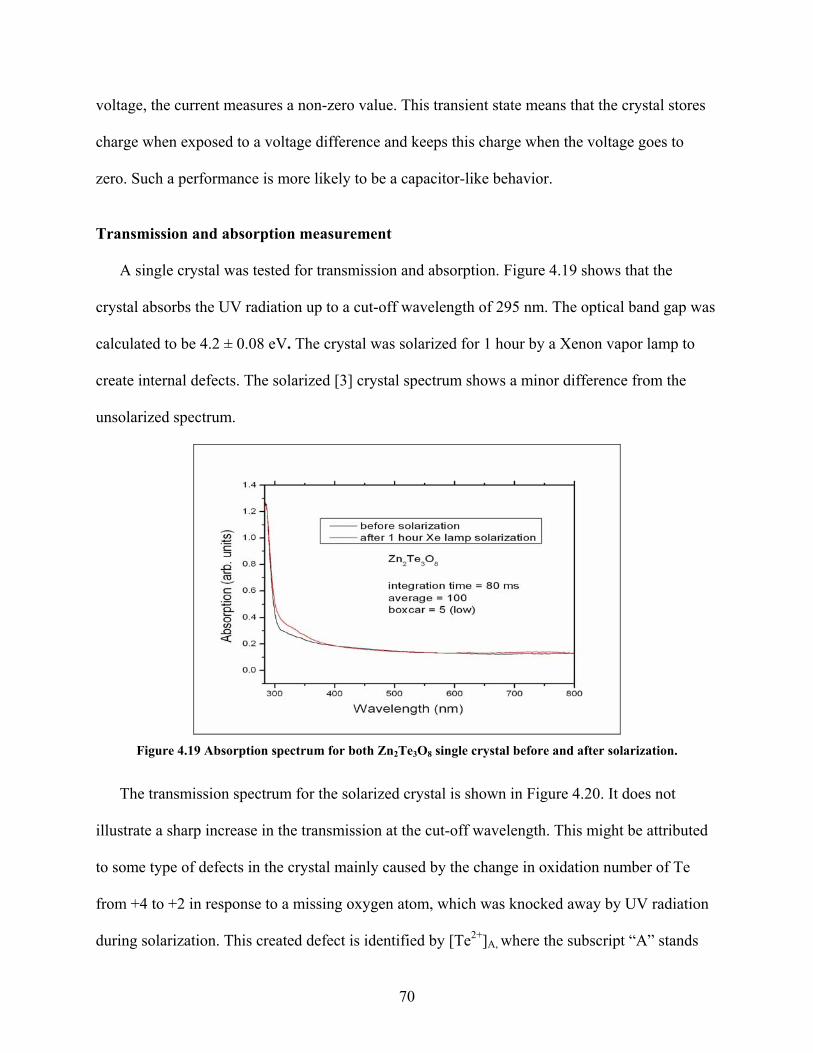
voltage, the current measures a non-zero value. This transient state means that the crystal stores
charge when exposed to a voltage difference and keeps this charge when the voltage goes to
ero. Such a performance is more likely to be a capacitor-like behavior.
Transmission and absorption measurement
A single crystal was tested for transmission and absorption. Figure 4.19 shows that the
crystal absorbs the UV radiation up to a cut-off wavelength of 295 nm. The optical band gap was
calculated to be 4.2 ± 0.08 eV. The crystal was solarized for 1 hour by a Xenon vapor lamp to
create internal defects. The solarized [3] crystal spectrum shows a minor difference from the
unsolarized spectrum.
z
Figure 4.19 Absorption spectrum for both Zn2Te3O8 single crystal before and after solarization.
The transmission spectrum for the solarized crystal is shown in Figure 4.20. It does not
illustrate a sharp increase in the transmission at the cut-off wavelength. This might be attributed
to some type of defects in the crystal m ber of Te
om +4 to +2 in response to a missing oxygen atom, which was knocked away by UV radiation
during solarization. Thi ubscript “A” stands
ainly caused by the change in oxidation num
fr
s created defect is identified by [Te2+]A, where the s
70
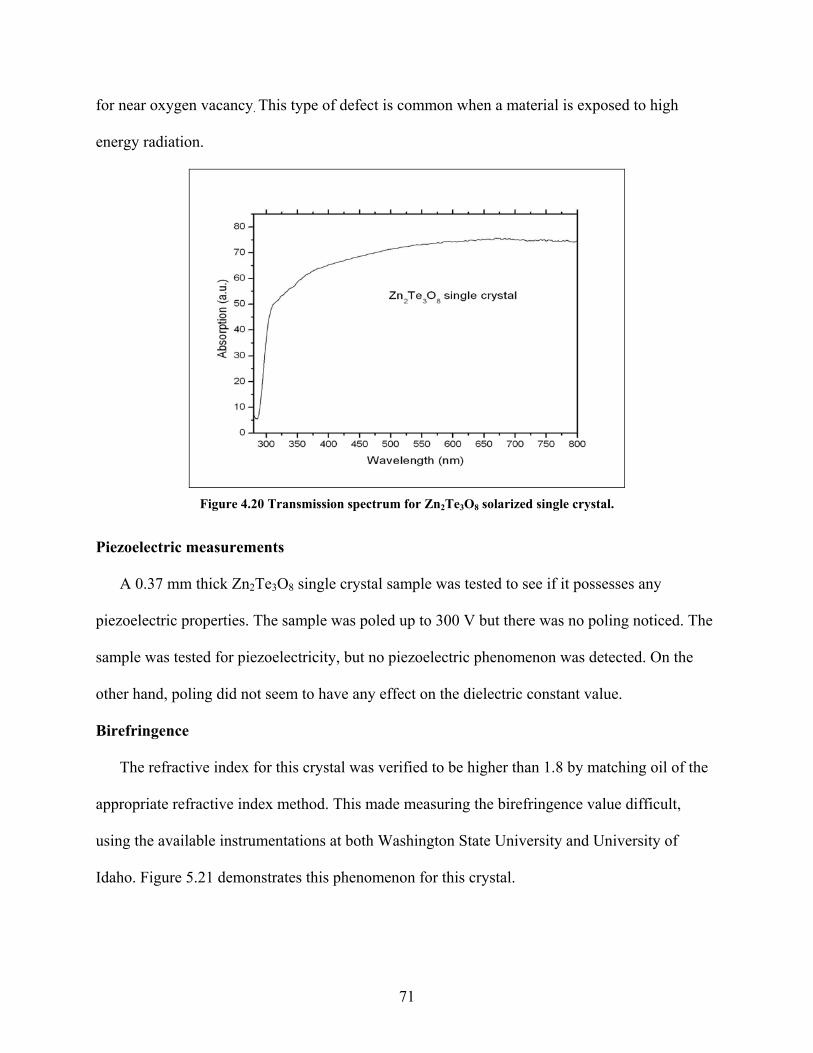
for near oxygen vacancy. This type of defect is common when a material is exposed to high
energy radiation.
Figure 4.20 Transmission spectrum for Zn2Te3O8 solarized single crystal.
Piezoelectric measurements
A 0.37 mm thick Zn2Te3 if it possesses any
piezoelectric properties. The sample was poled up to 300 V but there was no poling noticed. The
ple was tested for piezoelec
oth
this crystal was verified to be higher than 1.8 by matching oil of the
appropriate refractive index method. This made measuring the birefringence value difficult,
using the available instrumentations at both Washington State University and University of
Idaho. Figure 5.21 demonstrates this phenomenon for this crystal.
O8 single crystal sample was tested to see
sam tricity, but no piezoelectric phenomenon was detected. On the
er hand, poling did not seem to have any effect on the dielectric constant value.
Birefringence
The refractive index for
71
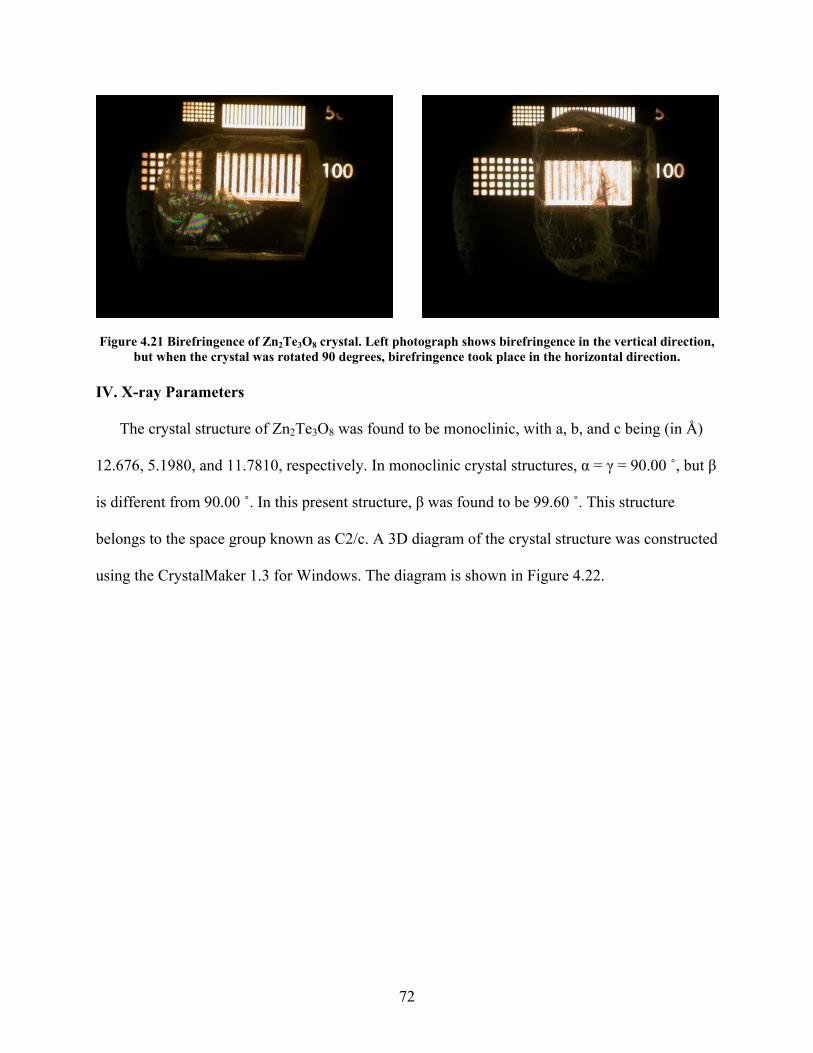
3O8 crystal. Left photograph shows birefringence in the vertical direction, 90 degrees, birefringence took place in the horizontal direction.
IV.
ut β
cted
Figure 4.21 Birefringence of Zn2Te
but when the crystal was rotated
X-ray Parameters
The crystal structure of Zn2Te3O8 was found to be monoclinic, with a, b, and c being (in Å)
12.676, 5.1980, and 11.7810, respectively. In monoclinic crystal structures, α = γ = 90.00 ˚, b
is different from 90.00 ˚. In this present structure, β was found to be 99.60 ˚. This structure
belongs to the space group known as C2/c. A 3D diagram of the crystal structure was constru
using the CrystalMaker 1.3 for Windows. The diagram is shown in Figure 4.22.
72
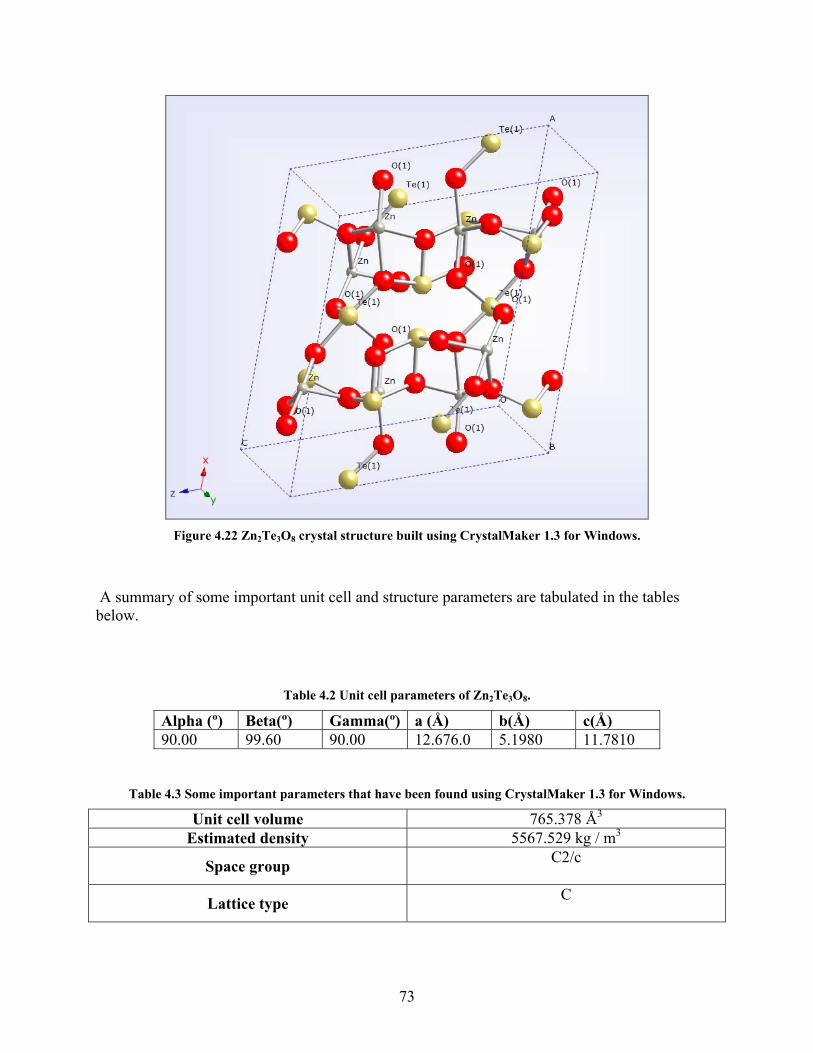
A summary of some important unit cell and structure parameters are tabulated in the tables belo
Figure 4.22 Zn2Te3O8 crystal structure built using CrystalMaker 1.3 for Windows.
w.
Table 4.2 Unit cell parameters of Zn2Te3O8.
Alpha (º) Beta(º) Gamma(º) a (Å) b(Å) c(Å) 90.00 99.60 90.00 12.676.0 5.1980 11.7810
Table 4.3 Some important parameters that have been found using CrystalMaker 1.3 for Windows. 3Unit cell volume 765.378 Å
Estimated density 5567.529 kg / m3
Space group C2/c
Lattice type C
73
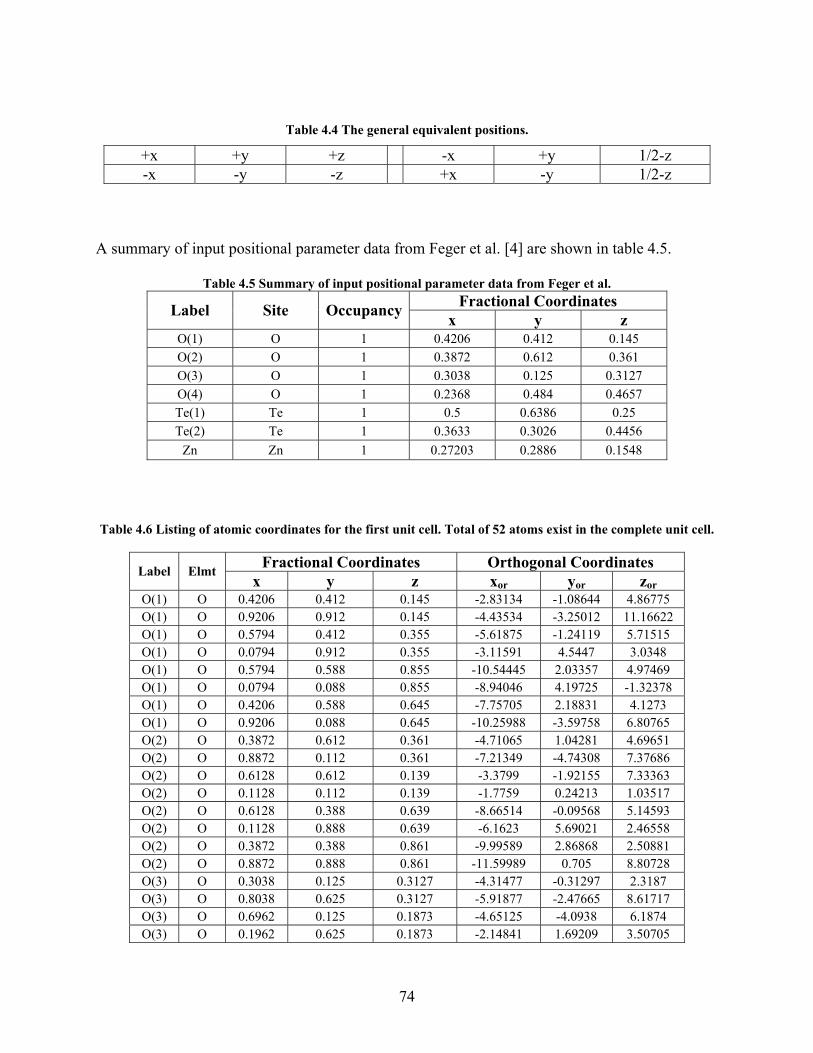
Table 4.4 The general equivalent positions.
+x +y +z -x +y 1/2-z -x -y -z +x -y 1/2-z
A summary of input positional parameter data from Feger et al. [4] are shown in table 4.5.
Table 4.5 Summary of input positional parameter data from Feger et al. Fractional Coordinates Label Site Occupancy x y z
O(1) O 1 0.4206 0.412 0.145 O(2) O 1 0.3872 0.612 0.361 O(3) O 1 0.3038 0.125 0.3127 O(4) O 1 0.2368 0.484 0.4657 Te(1) Te 1 0.5 0.6386 0.25 Te(2) Te 1 0.3633 0.3026 0.4456
Zn Zn 1 0.27203 0.2886 0.1548
Table 4.6 Listing of atom the complete unit cell.
ic coordinates for the first unit cell. Total of 52 atoms exist in
Fractional Coordinates Orthogonal Coordinates Label Elmt x y z x y zor or or
O(1) O 0.4206 0.412 0.145 -2.83134 -1.08644 4.86775 O(1) O 0.9206 0.912 0.145 -4.43534 -3.25012 11.16622 O(1) O 0.5794 0.412 0.355 -5.61875 -1.24119 5.71515 O(1) O 0.0794 0.912 0.355 -3.11591 4.5447 3.0348 O(1) O 0.5794 0.588 0.855 -10.54445 2.03357 4.97469 O(1) O 0.0794 0.088 0.855 -8.94046 4.19725 -1.32378 O(1) O 0.4206 0.588 0.645 -7.75705 2.18831 4.1273 O(1) O 0.9206 0.088 0.645 -10.25988 -3.59758 6.80765 O(2) O 0.3872 0.612 0.361 -4.71065 1.04281 4.69651 O(2) O 0.8872 0.112 0.361 -7.21349 -4.74308 7.37686 O(2) O 0.6128 0.612 0.139 -3.3799 -1.92155 7.33363 O(2) O 0.1128 0.112 0.139 -1.7759 0.24213 1.03517 O(2) O 0.6128 0.388 0.639 -8.66514 -0.09568 5.14593 O(2) O 0.1128 0.888 0.639 -6.1623 5.69021 2.46558 O(2) O 0.3872 0.388 0. 1 -9.99589 2.86868 2.50881 86O(2) 728 O 0.8872 0.888 0.861 -11.59989 0.705 8.80O(3) O 0.3038 0.125 0.3127 -4.31477 -0.31297 2.3187 O(3) O 0.8038 0.625 0.3127 -5.91877 -2.47665 8.61717 O(3) O 0.6962 0.125 0.1873 -4.65125 -4.0938 6.1874 O(3) O 0.1962 0.625 0.1873 -2.14841 1.69209 3.50705
74
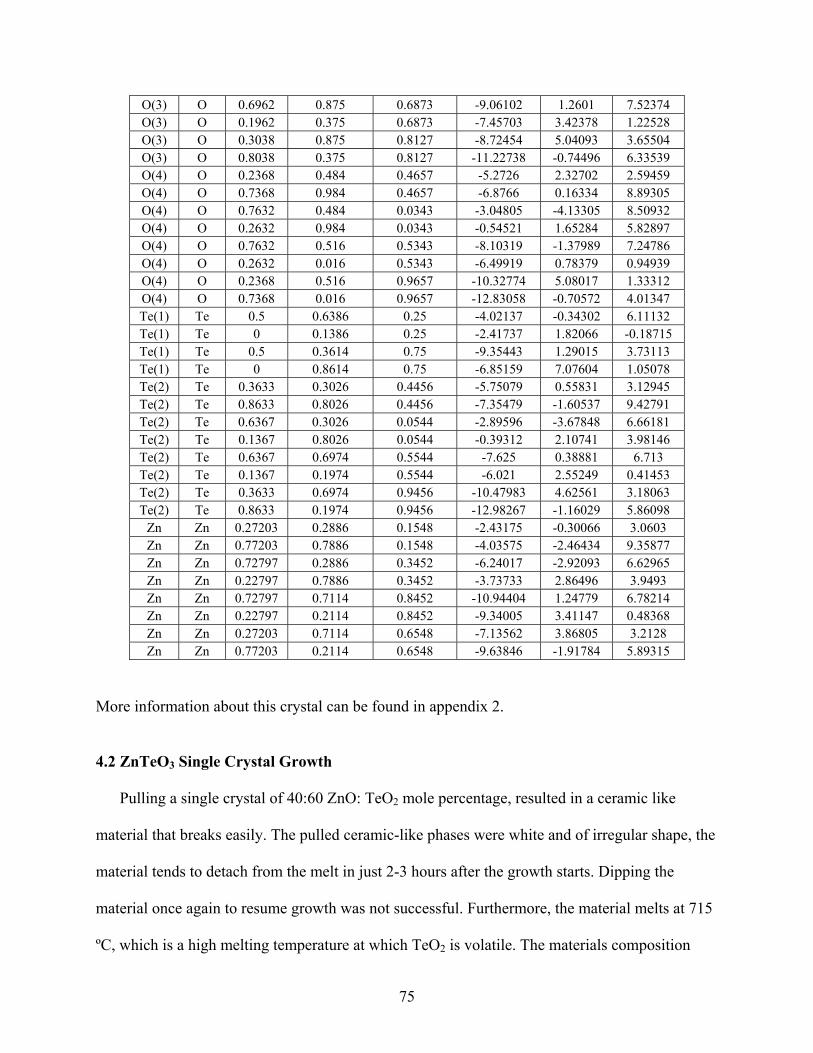
O(3) O 0.6962 0.875 0.6873 -9.06102 1.2601 7.52374 O(3) O 0.1962 0.375 0.6873 -7.45703 3.42378 1.22528 O(3) O 0.3038 0.875 0.8127 -8.72454 5.04093 3.65504 O(3) O 0.8038 0.375 0.8127 -11.22738 -0.74496 6.33539 O(4) O 0.2368 0.484 0.4657 -5.2726 2.32702 2.59459 O(4) O 0.7368 0.984 0.4657 -6.8766 0.16334 8.89305 O(4) O 0.763 -4.13305 8.50932 2 0.484 0.0343 -3.04805 O(4) O 0.26 1.65284 5.82897 32 0.984 0.0343 -0.54521 O(4) O 0.7632 0.516 0.5343 -8.10319 -1.37989 7.24786 O(4) O 0.2632 0.016 0.5343 -6.49919 0.78379 0.94939 O(4) O 0.2368 0.516 0.9657 -10.32774 5.08017 1.33312 O(4) O 0.7368 0.016 0.9657 -12.83058 -0.70572 4.01347 Te(1) Te 0.5 0.6386 0.25 -4.02137 -0.34302 6.11132 Te(1) Te 0 0.1386 0.25 -2.41737 1 066 -0.18715 .82Te(1) Te 0.5 0.3614 0.75 -9.35443 1.29015 3.73113 Te(1) Te 0 0.8614 0.75 -6.85159 7.07604 1.05078 Te(2) Te 0.3633 0.3026 0.4456 -5.75079 0.55831 3.12945 Te(2) Te 0.8633 0.8026 0.4456 -7.35479 -1.60537 9.42791 Te(2) Te 0.6367 0.3026 0.0544 -2.89596 -3.67848 6.66181 Te(2) Te 0.1367 0.8026 0.0544 -0.39312 2.10741 3.98146 Te(2) Te 0.6367 0.6974 0.5544 -7.625 0.38881 6.713 Te(2) Te 0.1367 0.1974 0.5544 -6.021 2.55249 0.41453 Te(2) Te 0.3633 0.6974 0.9456 -10.47983 4.62561 3.18063 Te(2) Te 0.8633 0.1974 0.9456 -12.98267 -1.16029 5.86098
Zn Zn 0.27203 0.2886 0.1548 -2.43175 -0.30066 3.0603 Zn Zn 0.77203 0.7886 0.1548 -4.03575 -2.46434 9.35877 Zn Zn 0.72797 0.2886 0.3452 -6.24017 -2.92093 6.62965 Zn Zn 0.22797 0.7886 0.3452 -3.73733 2.86496 3.9493 Zn Zn 0.72797 0.7114 0.8452 -10.94404 1.24779 6.78214 Zn Zn 0.22797 0.2114 0.8452 -9.34005 3.41147 0.48368 Zn Zn 0.27203 0.7114 0.6548 -7.13562 3.86805 3.2128 Zn Zn 0.77203 0.2114 0.6548 -9.63846 -1.91784 5.89315
More information about this crystal can be found in appendix 2.
4.2 ZnTeO Single Crystal Growth
Pulling a single crystal of 40:60 ZnO: TeO mole percentage, resulted in a ceramic like
material that breaks easily. The pulled ceramic-like phases were white and of irregular shape, the
material tends to detach from the melt in just 2-3 hours after the growth starts. Dipping the
material once again to resume growth was not successful. Furthermore, the material melts at 715
ºC, which is a high melting temperature at which TeO2 is volatile. The materials composition
3
2
75
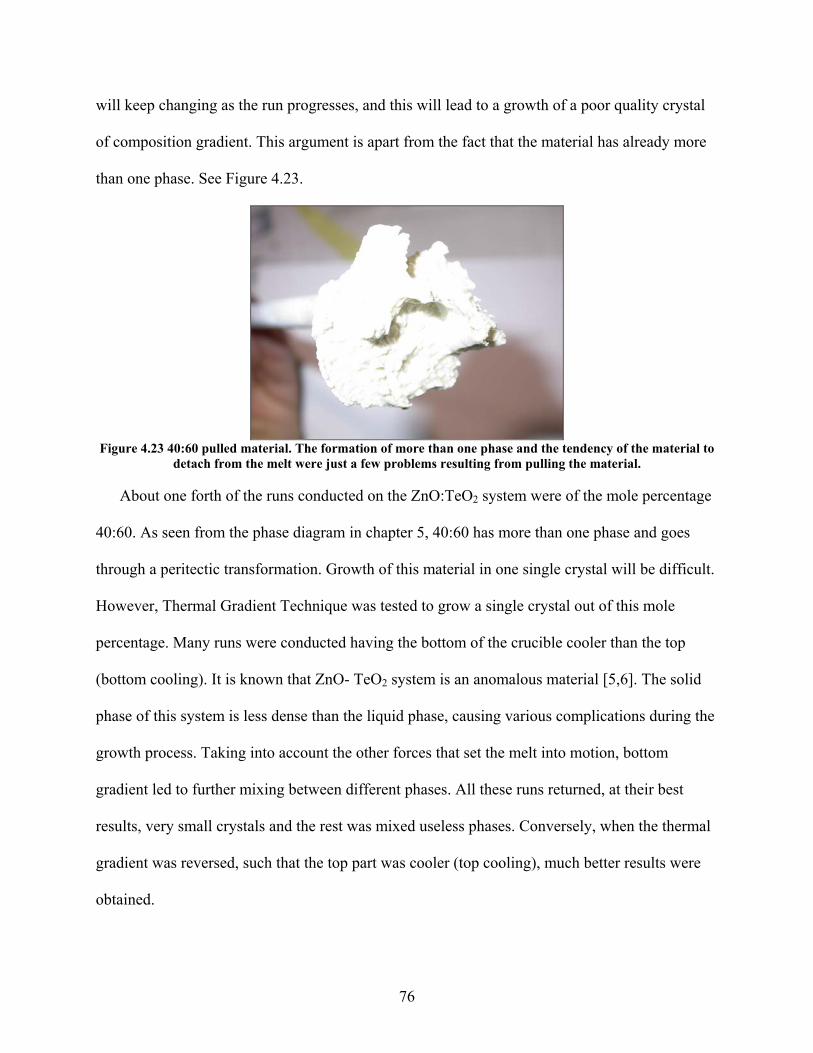
will keep changing as the run progresses, and this will lead to a growth of a poor quality crystal
of composition gradient. This argument is apart from the fact that the material has already more
than one phase. See Figure 4.23.
Figure 4.23 40:60 pulled material. The formation of more than one phase and the tendency of the material to
detach from the melt were just a few problems resulting from pulling the material.
About one forth of the runs conducted on the ZnO:TeO2 system were of the mole percentage
40:60. As seen from the phase diagram in chapter 5, 40:60 has more than one phase and goes
through a peritectic transformation. Growth of this material in one single crystal will be difficult.
However, Thermal Gradient Technique was tested to grow a single crystal out of this mole
percentage. Many runs were conducted having the bottom of the crucible cooler than the top
(bottom cooling). It is known that ZnO- TeO2 system is an anomalous material [5,6]. The solid
phase of this system is less dense than the liquid phase, causing various complications during the
growth process. Taking into account the other forces that set the melt into motion, bottom
gradient led to further m
as mixed useless phases. Conversely, when the thermal
op part was cooler (top cooling), much better results were
obt
ixing between different phases. All these runs returned, at their best
results, very small crystals and the rest w
gradient was reversed, such that the t
ained.
76
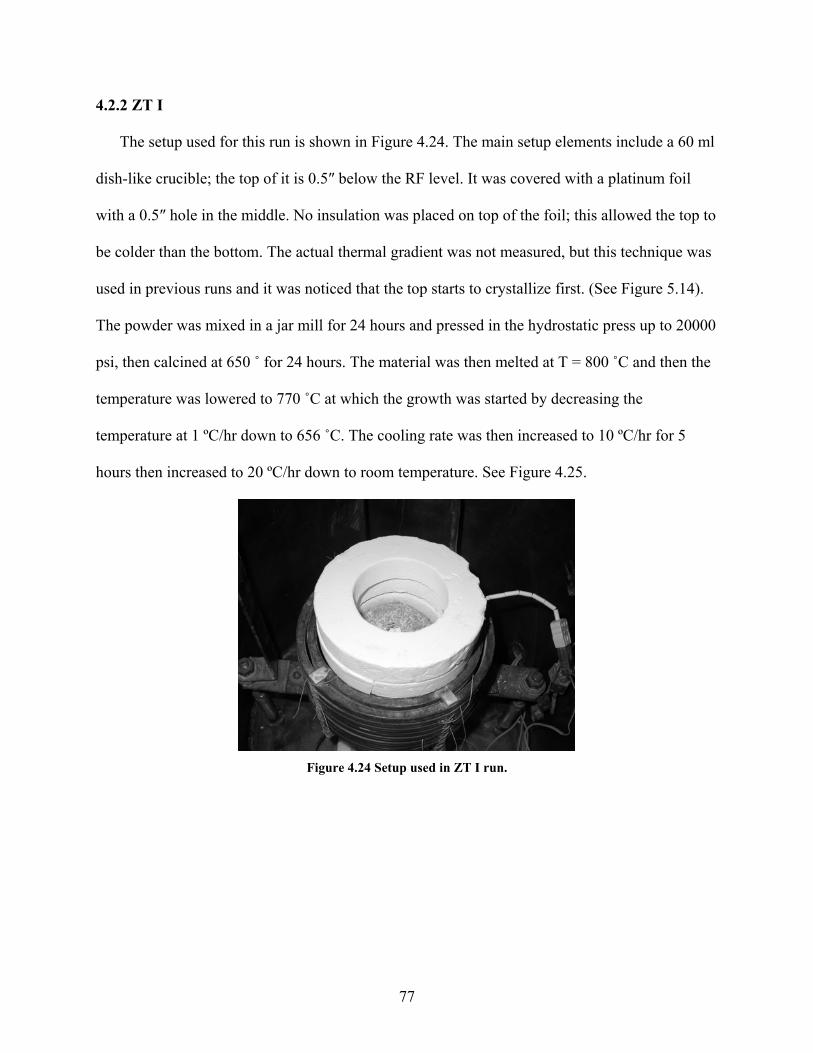
4.2.2 ZT I
The setup used for this run is shown in Figure 4.24. The main setup elements include a 6
dish-like crucible; the top of it is 0.5″ below the RF level. It was covered with a platinum foil
with a 0.5″ hole in the middle. No insulation was placed on top of the foil; this allowed the to
0 ml
p to
be colder than the bottom. The actual thermal gradient was not measured, but this technique was
ixed in a jar mill for 24 hours and pressed in the hydrostatic press up to 20000
psi, then calcined at 650
used in previous runs and it was noticed that the top starts to crystallize first. (See Figure 5.14).
The powder was m
˚ for 24 hours. The material was then melted at T = 800 ˚C and then the
temperature was lowered to 770 ˚C at which the growth was started by decreasing the
temperature at 1 ºC/hr down to 656 ˚C. The cooling rate was then increased to 10 ºC/hr for 5
hours then increased to 20 ºC/hr down to room temperature. See Figure 4.25.
Figure 4.24 Setup used in Z I run. T
77
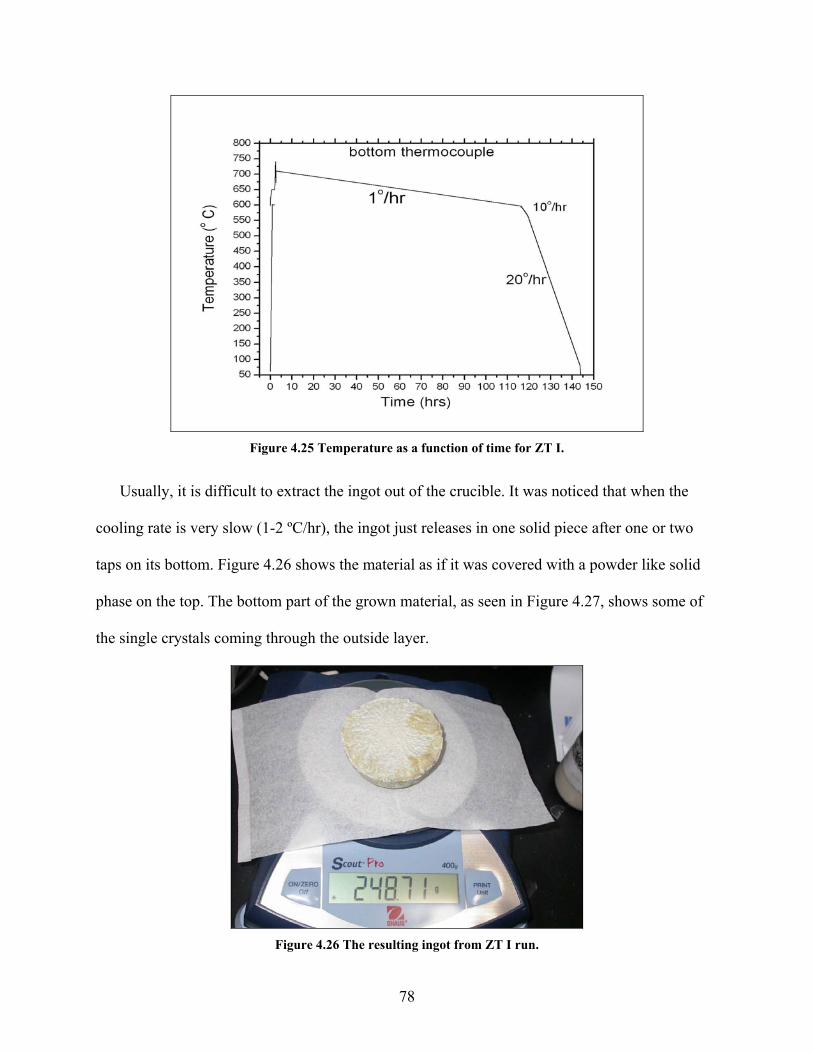
Usually, it is difficult to extract the ingot out of the crucible. It was noticed that when the
cooling rate is very slow (1-2 ºC/hr), the ingot just releases in one solid piece after one or two
taps on its bottom. Figure 4.26 shows the material as if it was covered with a powder like solid
Figure 4.25 Temperature as a function of time for ZT I.
phase on the top. The bottom part of the grown material, as seen in Figure 4.27, shows some of
the single crystals coming through the outside layer.
Figure 4.26 The resulting ingot from ZT I run.
78
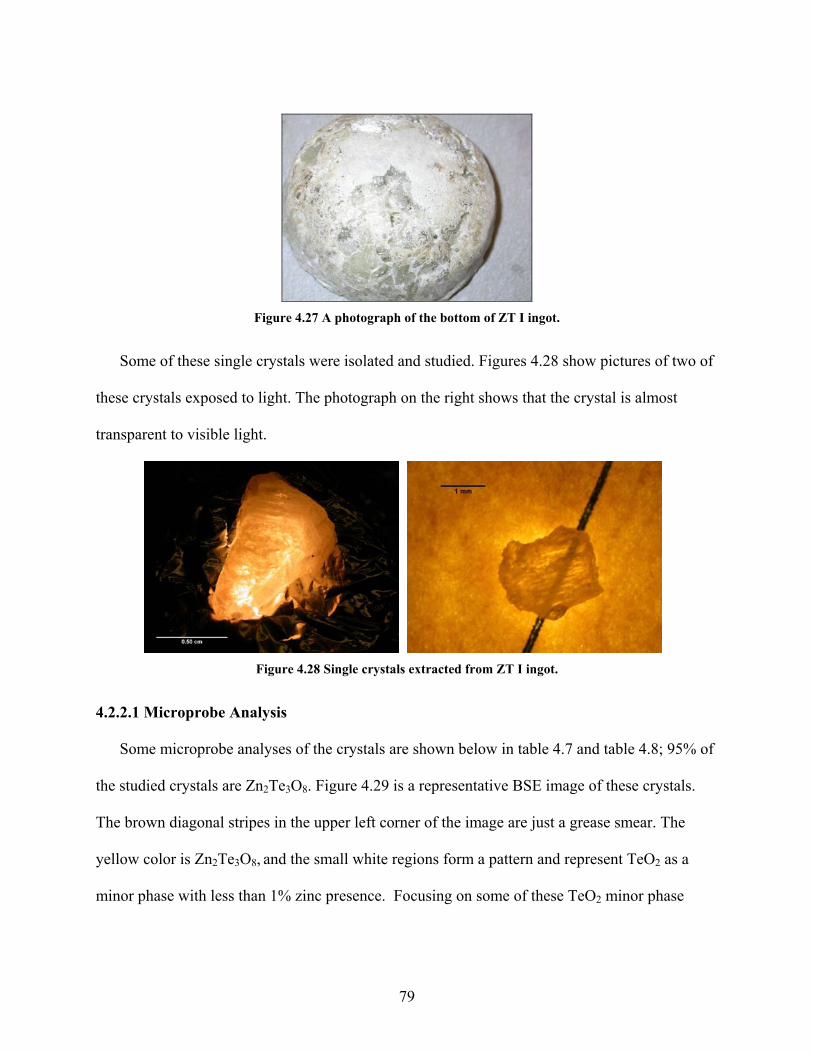
79
Figure 4.27 A photograph of the bottom of ZT I ingot.
Some of these single crystals were isolated and studied. Figures 4.28 show picture
s of two of
light. The photograph on the right shows that the crystal is almost
tran
Figure 4.28 Single crystals extracted from ZT I ingot.
4.2.2.1 Microprobe Analysis
Some microprobe analyses of the crystals are shown below in table 4.7 and table 4.8; 95% of
the studied crystals are Zn2Te3O8. Figure 4.29 is a representative BSE image of these crystals.
The brown diagonal stripes in the upper left corner of the image are just a grease smear. The
yellow color is Zn2Te3O8, and the small white regions form a pattern and represent TeO2 as a
minor phase with less than 1% zinc presence. Focusing on some of these TeO2 minor phase
these crystals exposed to
sparent to visible light.
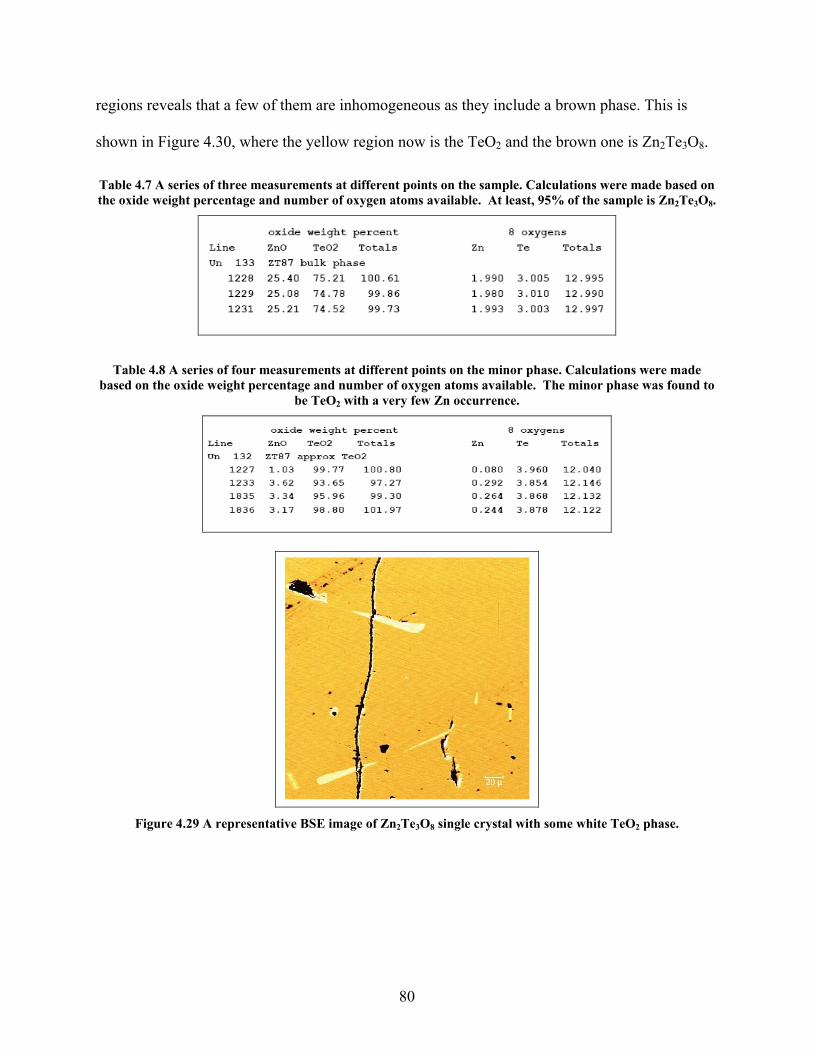
regions reveals that a few of them are inhomogeneous as they include a brown phase. This is
shown in Figure 4.30, where the yellow region now is the TeO2 and the brown one is Zn2Te3O8.
Table 4.7 A series of three measurements at different points on the sample. Calculations were made based on the oxide weight percentage and number of oxygen atoms available. At least, 95% of the sample is Zn2Te3O8.
Table 4.8 A series of four measurements at different points on the minor phase. Calculations were made based on the oxide weight percentage and number of oxygen atoms available. The minor phase was found to
be TeO2 with a very few Zn occurrence.
Figure 4.29 A image of Zn2Te3O8 single cryst TeO2 phase.
representative BSE al with some white
80
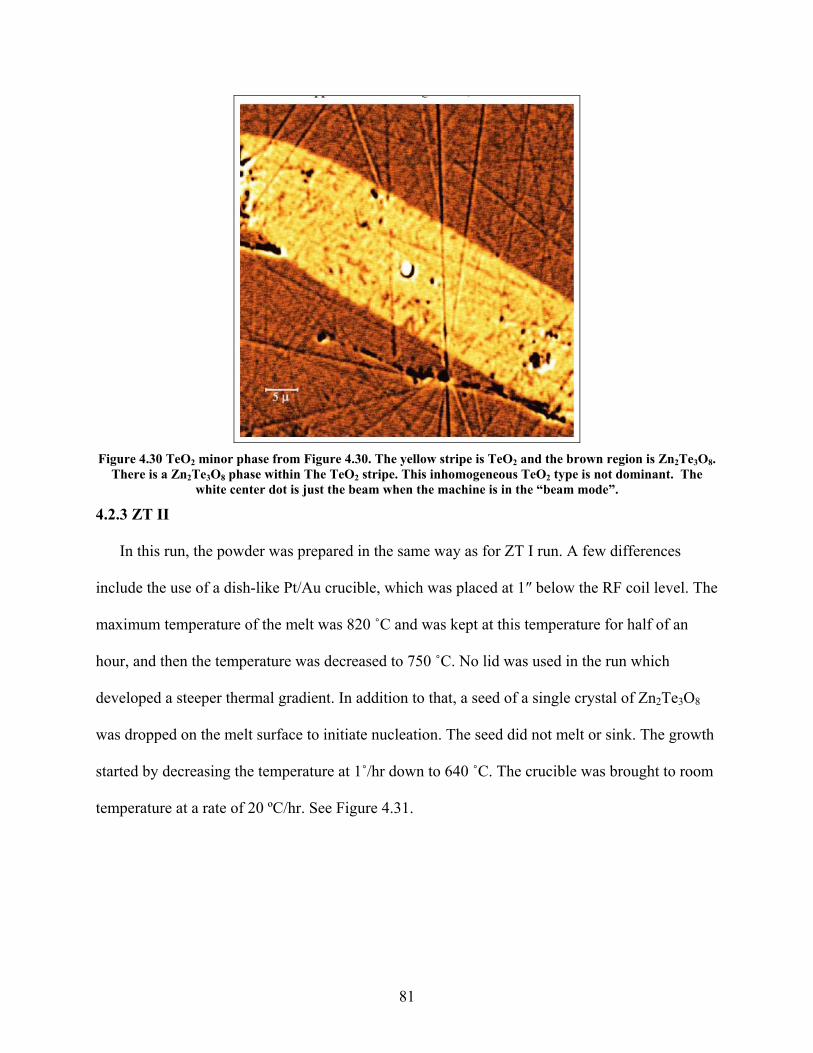
Figu TeO r phase f m ripe is TeO 3O8.
There is a Zn2Te O8 phase within The TeO ripe. This i omogeneo O type domina he w e cente st th hen ine am
4.2.3
In this run, the powder was prepared in the sam s fo n. fe
include the use of a dish- u cr hic ace low the RF coil level. The
maxi tempe ure of wa and t a er a
hour, and then the temper as de to 7 o l w
developed a steeper therm ient. on t see gle f Z
was dropped on the melt surface to in leat see m . T h
starte decre g the t ture dow ˚C. The crucible was brought to room
temp re at a of 2 ee .31.
re 4.30 2 mino ro Figure 4.30. The yellow stnh
2 aus Te
nd the brown region is Zn2Tent. T3 2
e beam w st 2
is in the “beis not
hit r dot is ju the mach mode”.
ZT II
e way a r ZT I ru A few dif rences
like Pt/A ucible, w h was pl d at 1″ be
mum rat the melt s 820 ˚C was kep t this temp ature for h lf of an
ature w creased 50 ˚C. N id was used in the run hich
al grad In additi o that, a d of a sin crystal o n2Te3O8
itiate nuc ion. The d did not elt or sink he growt
d by asin empera at 1˚/hr n to 640
eratu rate 0 ºC/hr. S Figure 4
81
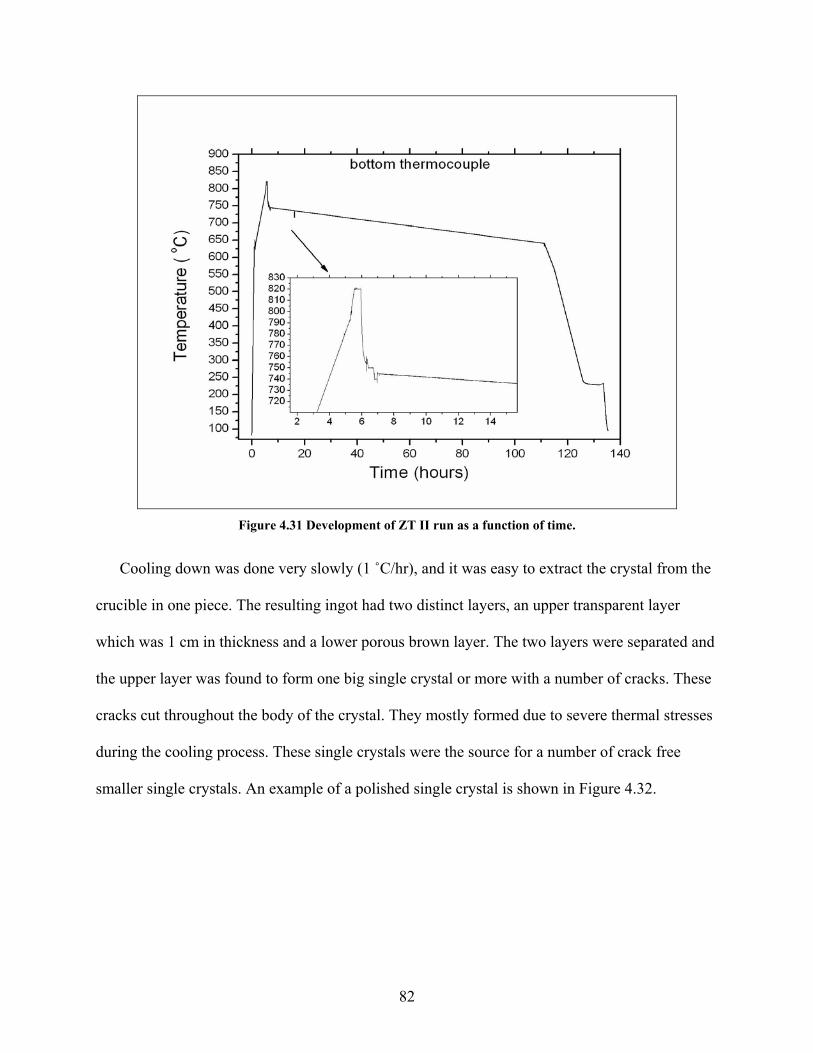
Figure 4.31 Development of ZT II run as a function of time.
Cooling down was done very slowly (1 ˚C/hr), and it was easy to extract the crystal fr
crucible in one piece. The resulting ingot had two distinct layers, an upper transparent laye
which was 1 cm in thickness and a lower porous brown layer. The two layers were separa
the upper layer was found to form one big single crystal or more with a number of cracks. These
cracks cut throughout the body of the crystal. They mostly formed due to severe thermal stresses
during the cooling process. These single crystals were the source for a number of crack free
smaller single crystals. An example of a polished single crystal is shown in Figure 4.32.
om the
r
ted and
82
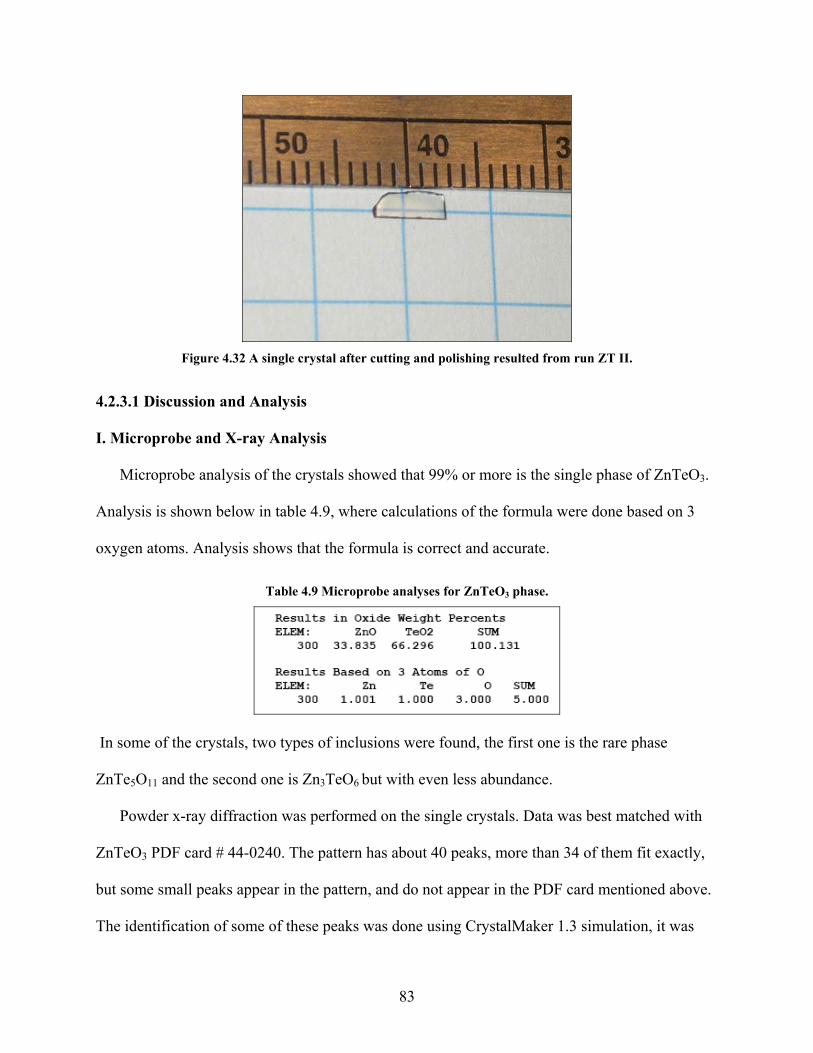
Figure 4.32 A single crystal after cutting and polishing resulted from run ZT II.
4.2.3.1 Discussion and Analysis
I. Microprobe and X-ray Analysis
Microprobe analysis of the crystals showed that 99% or more is the single phase of ZnTeO3.
Analysis is shown below in table 4.9, where calculations of the formula were done based on 3
oxygen atoms. Analysis shows that the formula is correct and accurate.
Table 4.9 Microprobe analyses for ZnTeO3 phase.
In some of the crystals, two types of inclusions were found, the first one is the rare phase
ZnTe5O11 and the second one is Zn3TeO6 but with even less abundance.
ith
,
.
s
Powder x-ray diffraction was performed on the single crystals. Data was best matched w
ZnTeO3 PDF card # 44-0240. The pattern has about 40 peaks, more than 34 of them fit exactly
but some small peaks appear in the pattern, and do not appear in the PDF card mentioned above
The identification of some of these peaks was done using CrystalMaker 1.3 simulation, it wa
83
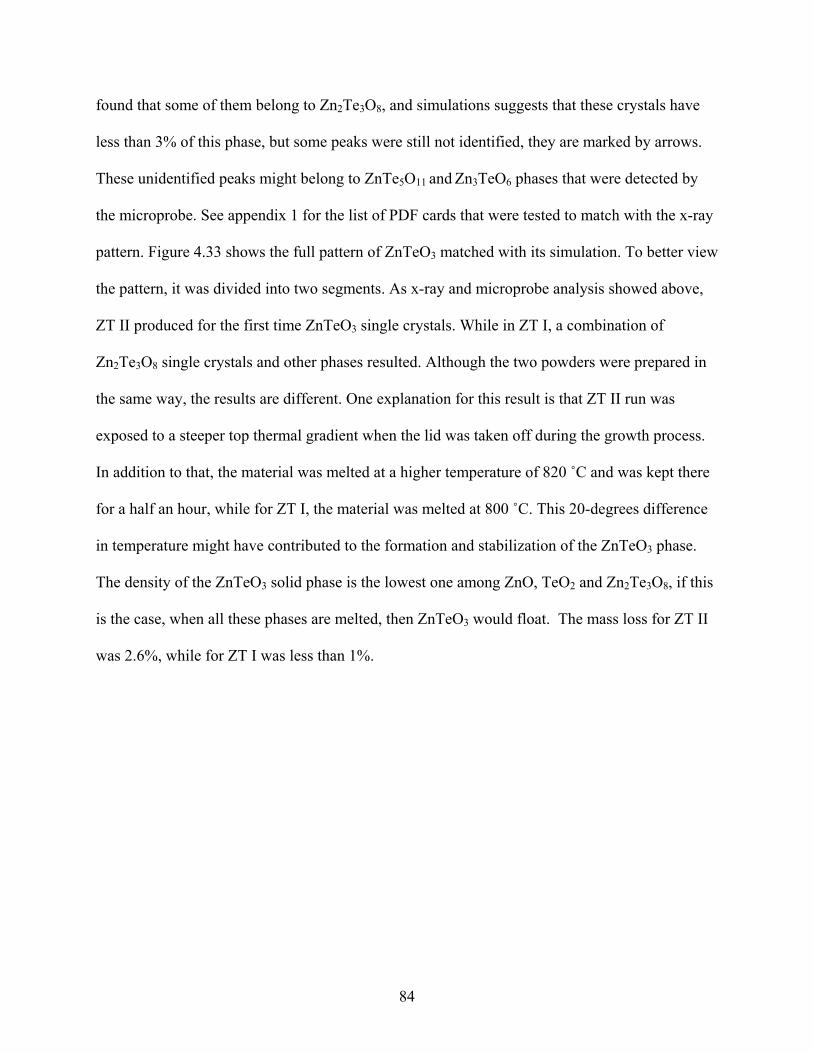
found that some of them belong to Zn2Te3O8, and simulations suggests that these crystals have
less than 3% of this phase, but some peaks were still not identified, they are marked by arrows.
These unidentified peaks might belong to ZnTe
the x-ray
ded into two segments. As x-ray and microprobe analysis showed above,
ZT II produced for the first time ZnTeO3 single crystals. While in ZT I, a combination of
2Te3O8 single crystals and other phases resulted. Although the two powders were prepared in
s melted at a higher temperature of 820 ˚C and was kept there
aterial was melted at 800 ˚C. This 20-degrees difference
in tem
5O11 and Zn3TeO6 phases that were detected by
the microprobe. See appendix 1 for the list of PDF cards that were tested to match with
pattern. Figure 4.33 shows the full pattern of ZnTeO3 matched with its simulation. To better view
the pattern, it was divi
Zn
the same way, the results are different. One explanation for this result is that ZT II run was
exposed to a steeper top thermal gradient when the lid was taken off during the growth process.
In addition to that, the material wa
for a half an hour, while for ZT I, the m
perature might have contributed to the formation and stabilization of the ZnTeO3 phase.
The density of the ZnTeO3 solid phase is the lowest one among ZnO, TeO2 and Zn2Te3O8, if this
is the case, when all these phases are melted, then ZnTeO3 would float. The mass loss for ZT II
was 2.6%, while for ZT I was less than 1%.
84
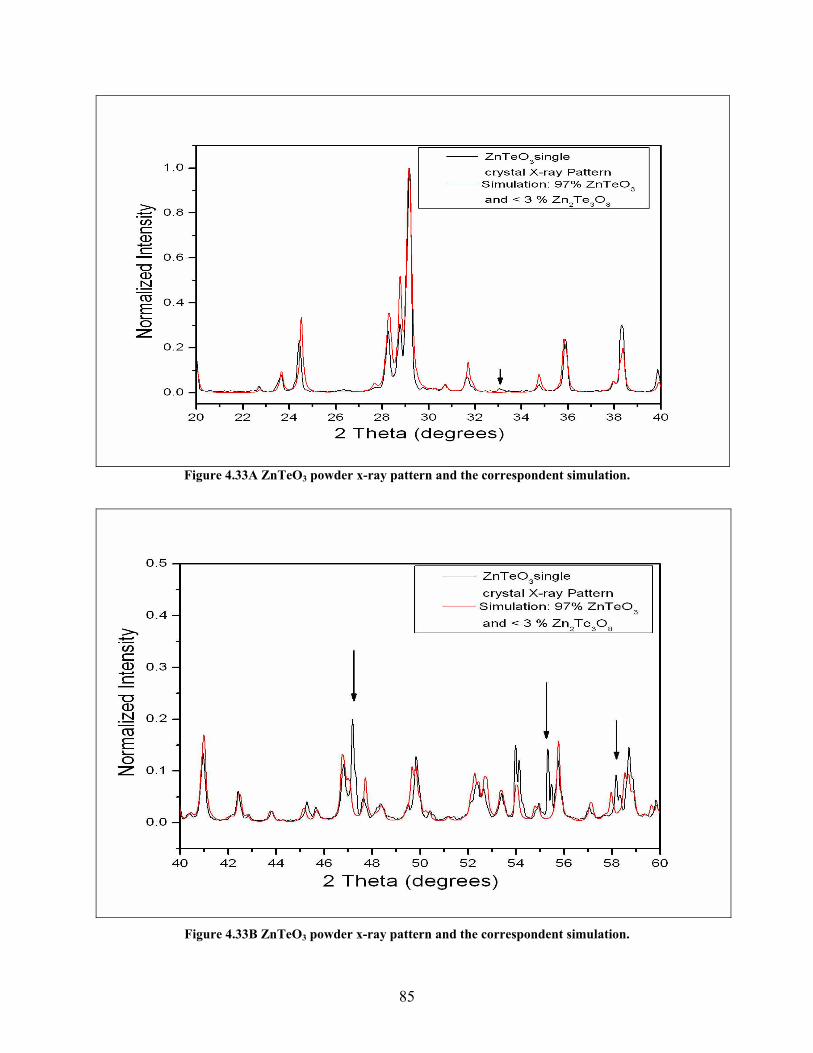
Figure 4.33A ZnTeO3 powder x-ray pattern and the correspondent simulation.
Figure 4.33B ZnTeO3 powder x-ray pattern and the correspondent simulation.
85
III. Electrical and Optical Properties
Dielectric constant measurement
Dielectric measurement was carried out on the ZnTeO3 single crystal in the (010) direction as
shown in Figure 4.34. The discontinuity in the dielectric value around T = 24 ºC for 1.5 MHz
and 1.0 kHz is due to combining two sets of data collected at two different occasions together. At
room temperature, the average dielectric constant is 14.4 at 1 kHz and the dielectric loss is
0.0375 at 100Hz. A Curie temperature does not seem to exist for the temperature range shown in
Figure 4.35. The sample was also tested up to 500 ˚C, and no Curie temperature was found.
Figure 4.34 Dielectric constant of ZnTeO3 single crystal as a function of temperature at (010).
I-V relation
A current-voltage graph is shown in Figure 4.35. The resistivity, ρ, is calculated to be 3.29 x
014 Ω.cm, and the leakage current at v = +80 V is found to be 8.0 x 10⁻¹³A. Comparing these
alues with t 2 3 8 2Te3O8
single crystals are more insulating crystals than ZnTeO3 single crystal.
1
hose obtained for the Zn Te O single crystal, one can conclude that Znv
86
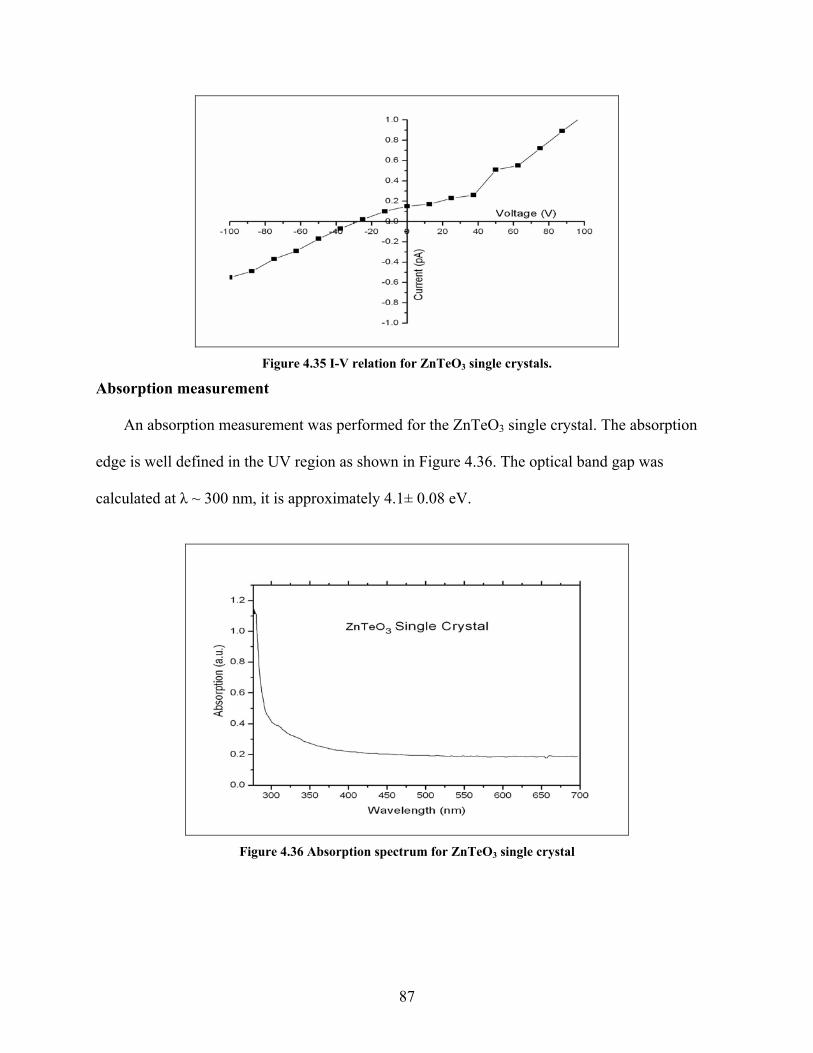
Figure 4.35 I-V relation for ZnTeO3 single crystals.
Absorption measurement
An absorption measurement was performed for the ZnTeO3 single crystal. The absorption
edge is well defined in the UV region as shown in Figure 4.36. The optical band gap was
calculated at λ ~ 300 nm, it is approximately 4.1± 0.08 eV.
Figure 4.36 Absorption spectrum for ZnTeO3 single crystal
87
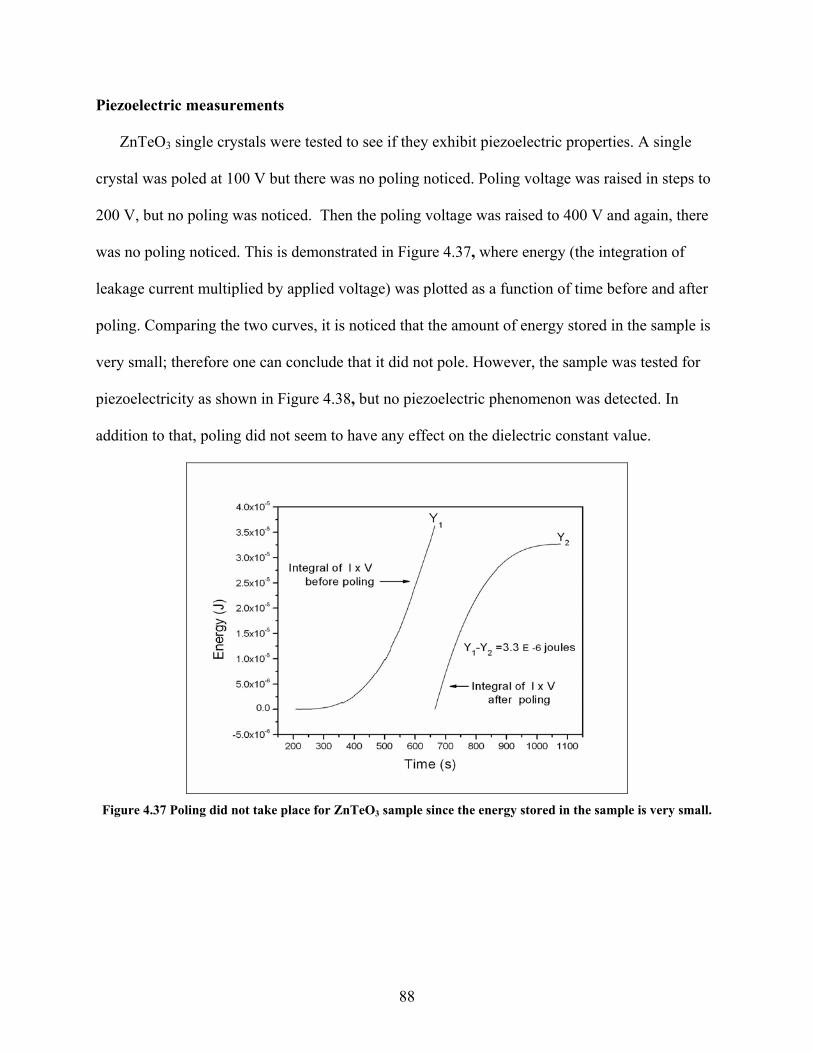
Piezoelectric measurements
ZnTeO3 single crystals were tested to see if they exhibit piezoelectric properties. A single
crystal was poled at 100 V but there was no poling noticed. Poling voltage was raised in steps to
200 V, but no poling was noticed. Then the poling voltage was raised to 400 V and again, there
was no poling noticed. This is demonstrated in Figure 4.37, where energy (the integration of
leakage current multiplied by applied voltage) was plotted as a function of time before and after
poling. Comparing the two curves, it is noticed that the amount of energy stored in the sample is
very r
ricity as shown in Figure 4.38, but no piezoelectric phenomenon was detected. In
add
small; therefore one can conclude that it did not pole. However, the sample was tested fo
piezoelect
ition to that, poling did not seem to have any effect on the dielectric constant value.
Figure 4.37 Poling did not take place for ZnTeO3 sample since the energy stored in the sample is very small.
88
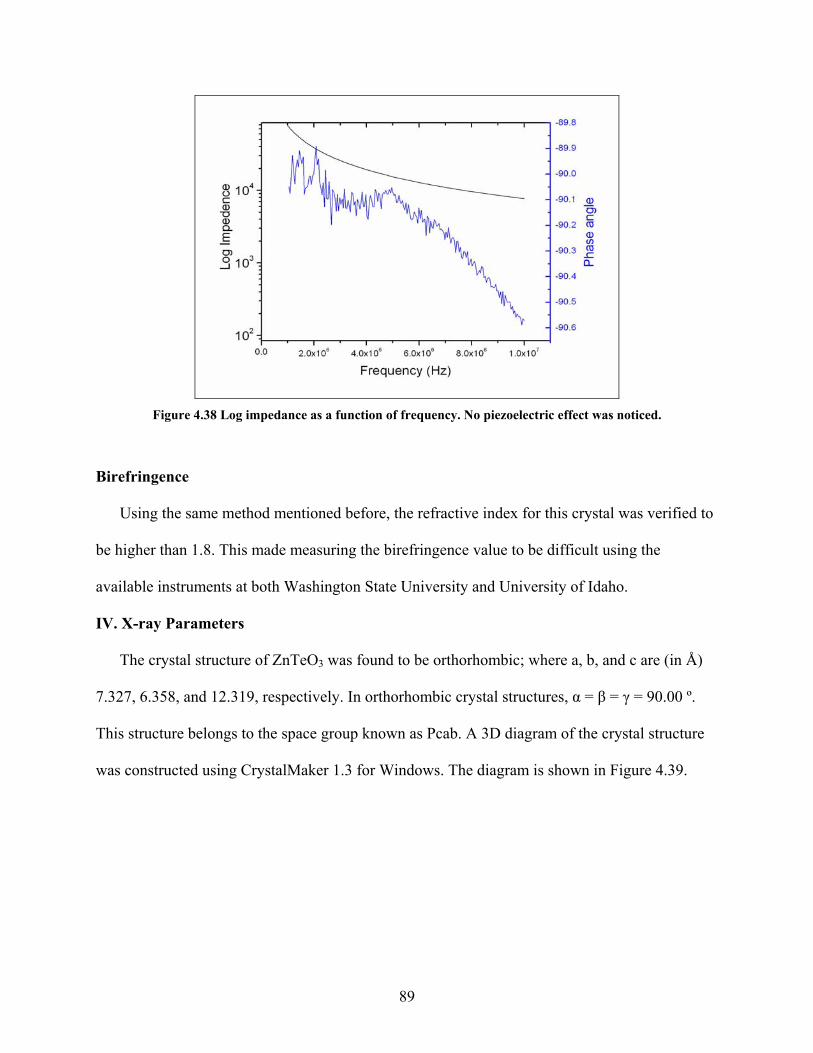
Figure 4.38 Log impedance as a function of frequency. No piezoelectric effect was noticed.
Birefringence
e higher than 1.8. This made measuring the birefringence value to be difficult using the
ents at both Washington State University and University of Idaho.
IV. X-ray Parameters
The crystal structure of ZnTeO3 was found to be orthorhombic; where a, b, and c are (in Å)
7.327, 6.358, and 12.319, respectively. In orthorhombic crystal structures, α = β = γ = 90.00 º.
This structure belongs to the space group known as Pcab. A 3D diagram of the crystal structure
was constructed using CrystalMaker 1.3 for Windows. The diagram is shown in Figure 4.39.
Using the same method mentioned before, the refractive index for this crystal was verified to
b
available instrum
89
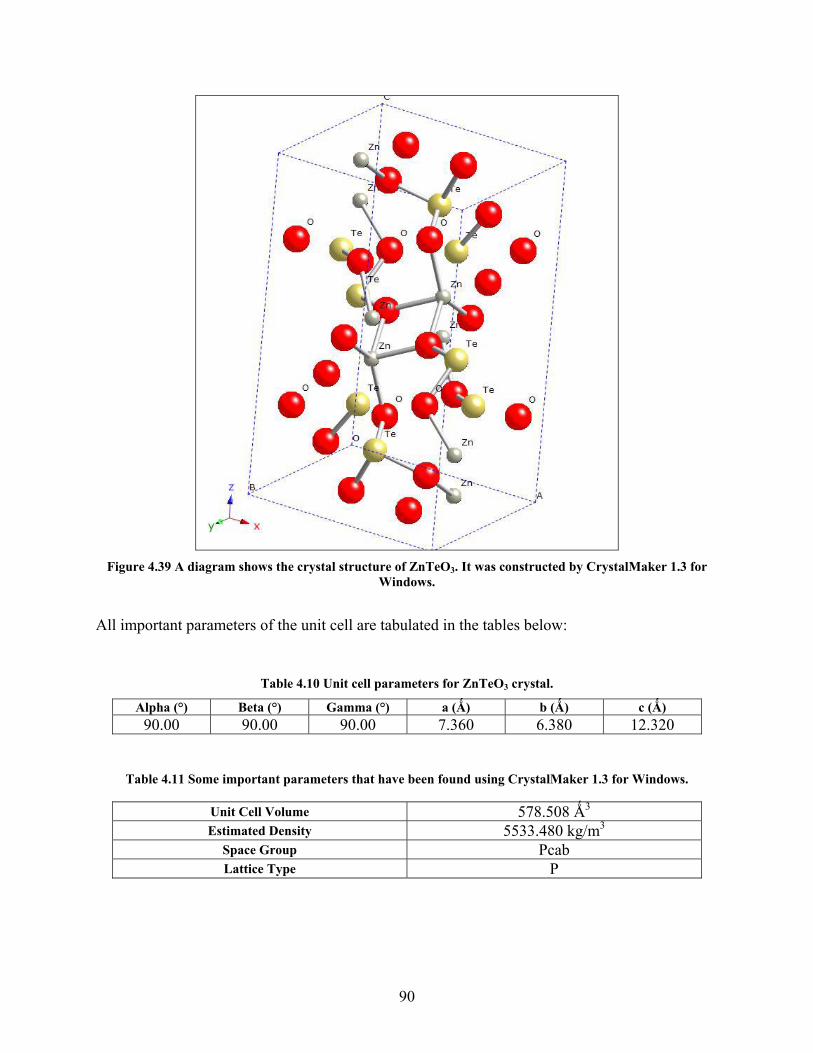
Figure 4.3 iagra s t tru f O s tr s r
n
rtant parameters of the unit cell are tabulated in the tables below:
Table me for 3
p a ( m a ) Ǻ)
9 A d m show he crystal s cture oWi
ZnTedows.
3. It wa cons ucted by Cry talMake 1.3 for
All impo
crystal. 4.10 Unit cell para ters ZnTeO
Al ha (°) Bet °) Gam a (°) (Ǻ) b (Ǻ c (90.00 90.00 90.00 7.360 6.380 12.320
Table 4.11 Some important parameters that have been found using CrystalMaker 1.3 for Windows.
Unit Cell Volume 578.508 Ǻ3
Estimated Density 5533.480 kg/m3
Space Group Pcab Lattice Type P
90
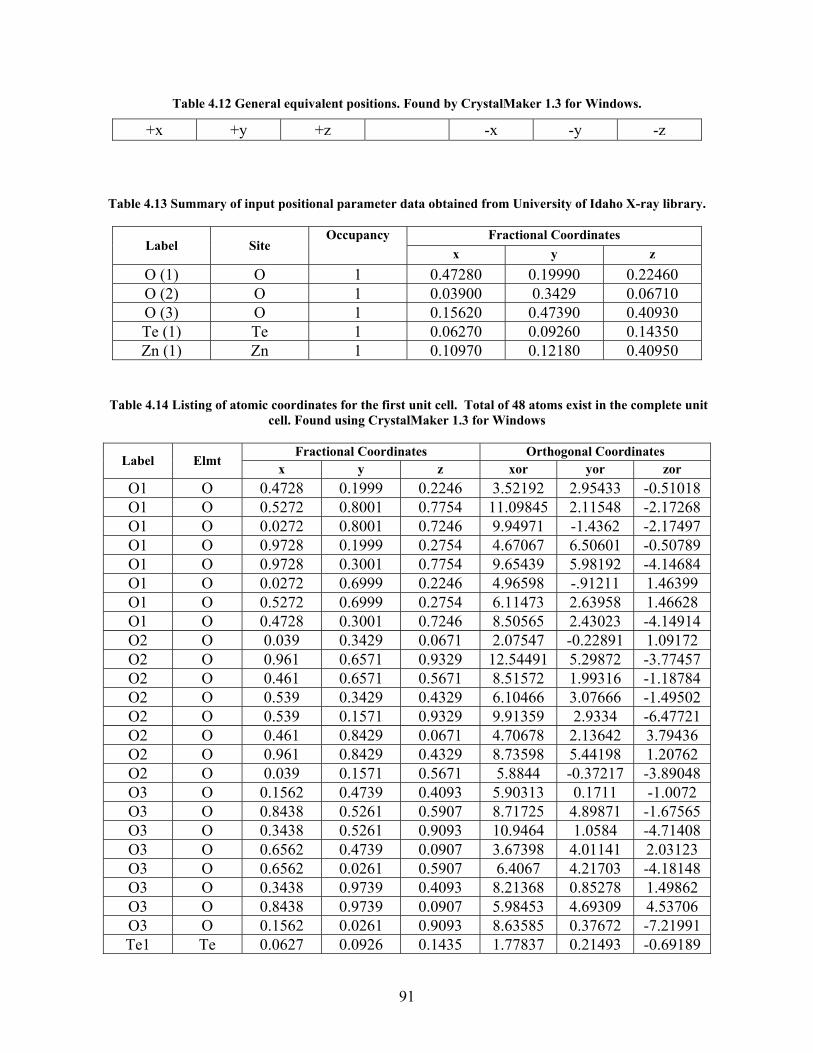
Tab s.
+x +y +z -x -y -z
le 4.12 General equivalent positions. Found by CrystalMaker 1.3 for Window
Table 4.13 Summa of input positional para ta ed from University of Idaho X-ray library.
Fracti al Coordi
ry meter da obtain
on nates Label Site x y z
Occupancy
O (1) O 1 80 .19990 0.22460.472 0 0 O (2) O 1 0.03900 0.3429 0.06710 O (3) O 1 20 .47390 0.40930.156 0 0 Te (1) Te 1 0.06270 0.09260 0.14350 Zn (1) Zn 1 0.10970 0.12180 0.40950
Tab nit cell. Found using CrystalMaker ndows
al C s l Coordi
le 4.14 Listing of atomic coordinates for the first unit cell. Total of 48 atoms exist in the complete u 1.3 for Wi
Fraction oordinate Orthogona nates Label Elmt x y r yor z xo zor O1 O 0.4728 0.1999 0.2246 .521 5433 -0.51018 3 92 2.9O1 O 0.5272 0.8001 0.77 9845 2.11548 -2.17268 54 11.0O1 O 0.0272 0.8001 0.7246 9.94971 -1.4362 -2.17497 O1 O 0 .199 0.27 7067 6.506.9728 0 9 54 4.6 01 -0.50789 O1 O 0.9728 0.3001 0.775 .65439 5.98192 -4.14684 4 9O1 O 0.0272 0.6999 0.2246 4.96598 -.91211 1.46399 O1 0 0.699 0.27 147 .639O .5272 9 54 6.1 3 2 58 1.46628 O1 O 0.4728 0.3001 0.724 .50565 2.43023 -4.14914 6 8O2 O 0.039 0.0671 754 .220.3429 2.0 7 -0 891 1.09172 O2 O 0.961 0.6571 0.9329 5449 .29812. 1 5 72 -3.77457 O2 O 0.461 0.6571 0.5671 .51572 1.99316 -1.18784 8O2 O 0.539 0.3429 0.4329 6.10466 3.07666 -1.49502 O2 O 0.539 0.1571 0.9329 9.91359 2.9334 -6.47721 O2 O 0.461 0.8429 0.0671 4.70678 2.13642 3.79436 O2 O 0.961 0.8429 0.4329 8.73598 5.44198 1.20762 O2 O 0.039 0.1571 0.5671 5.8844 -0.37217 -3.89048 O3 O 0.1562 0.4739 0.4093 5.90313 0.1711 -1.0072 O3 O 0.8438 0.5261 0.5907 8.71725 4.89871 -1.67565 O3 O 0.3438 0.5261 0.9093 10.9464 1.0584 -4.71408 O3 O 0.6562 0.4739 0.0907 3.67398 4.01141 2.03123 O3 O 0.6562 0.0261 0.5907 6.4067 4.21703 -4.18148 O3 O 0.3438 0.9739 0.4093 8.21368 0.85278 1.49862 O3 O 0.8438 0.9739 0.0907 5.98453 4.69309 4.53706 O3 O 0.1562 0.0261 0.9093 8.63585 0.37672 -7.21991 Te1 Te 0.0627 0.0926 0.1435 1.77837 0.21493 -0.69189
91
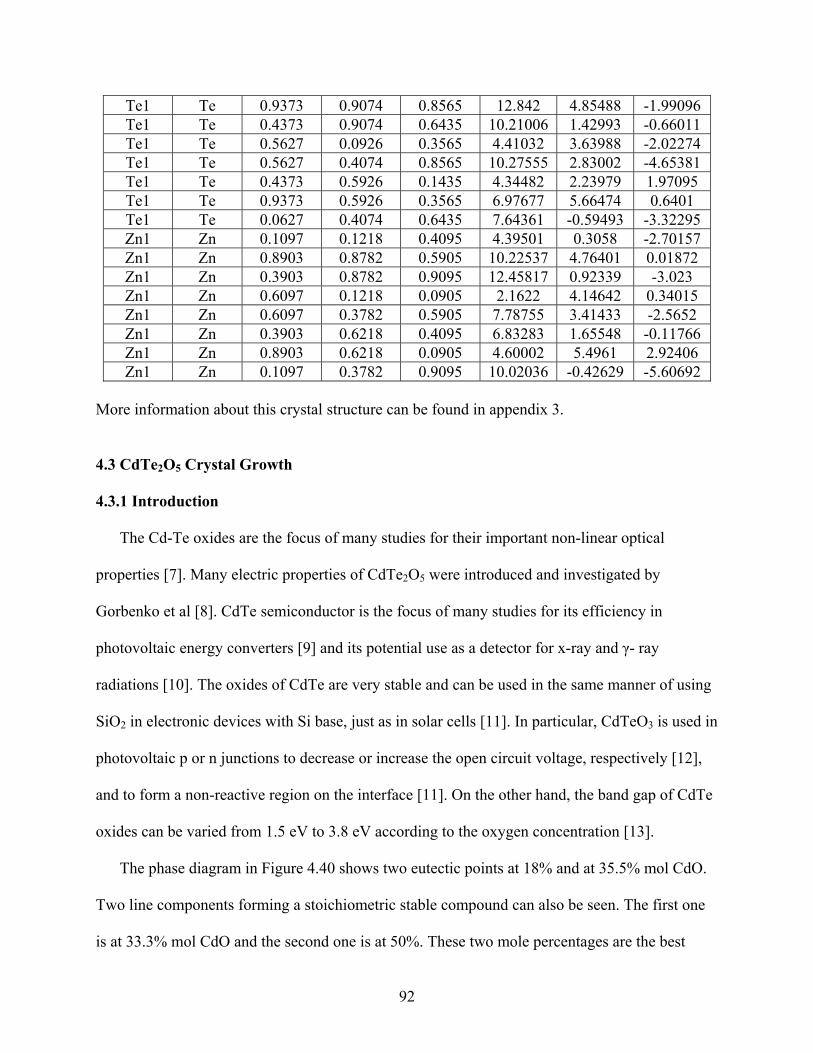
Te1 Te 0.9373 0.9074 0.8565 12.842 4.85488 -1.99096 Te1 Te 0.4373 0.9074 0.6435 10.21006 1.42993 -0.66011 Te1 Te 0.5627 0.0926 0.3565 4.41032 3.63988 -2.02274 Te1 Te 0.5627 0.4074 0.8565 10.27555 2.83002 -4.65381 Te1 Te 0.4373 0.5926 0.1435 4.34482 2.23979 1.97095 Te1 Te 0.9373 0.5926 0.3565 6.97677 5.66474 0.6401 Te1 Te 0.0627 0.4074 0.6435 7.64361 -0.59493 -3.32295 Zn1 Zn 0.1097 0.1218 0.4095 4.39501 0.3058 -2.70157 Zn1 Zn 0.8903 0.8782 0.5905 10.22537 4.76401 0.01872 Zn1 Zn 0.3903 0.8782 0.9095 12.45817 0.92339 -3.023 Zn1 Zn 0.6097 0.1218 0.0905 2.1622 4.14642 0.34015 Zn1 Zn 0.6097 0.3782 0.5905 7.78755 3.41433 -2.5652 Zn1 Zn 0.3903 0.6218 0.4095 6.83283 1.65548 -0.11766 Zn1 Zn 0.8903 0.6218 0.0905 4.60002 5.4961 2.92406 Zn1 Zn 0.1097 0.3782 0.9095 10.02036 -0.42629 -5.60692
More information about this crystal structure can be found in appendix 3.
4.3 CdTe2O5 Crystal Growth 4.3.1 Introduction
by
oltaic energy converters [9] and its potential use as a detector for x-ray and γ- ray
[11]. In particular, CdTeO3 is used in
photovoltaic p or n junctions to decrease or increase the open circuit voltage, respectively [12],
and to form a non-reactive region on the interface [11]. On the other hand, the band gap of CdTe
oxides can be varied from 1.5 eV to 3.8 eV according to the oxygen concentration [13].
The phase diagram in Figure 4.40 shows two eutectic points at 18% and at 35.5% mol CdO.
Two line components forming a stoichiometric stable compound can also be seen. The first one
is at 33.3% mol CdO and the second one is at 50%. These two mole percentages are the best
The Cd-Te oxides are the focus of many studies for their important non-linear optical
properties [7]. Many electric properties of CdTe2O5 were introduced and investigated
Gorbenko et al [8]. CdTe semiconductor is the focus of many studies for its efficiency in
photov
radiations [10]. The oxides of CdTe are very stable and can be used in the same manner of using
SiO2 in electronic devices with Si base, just as in solar cells
92
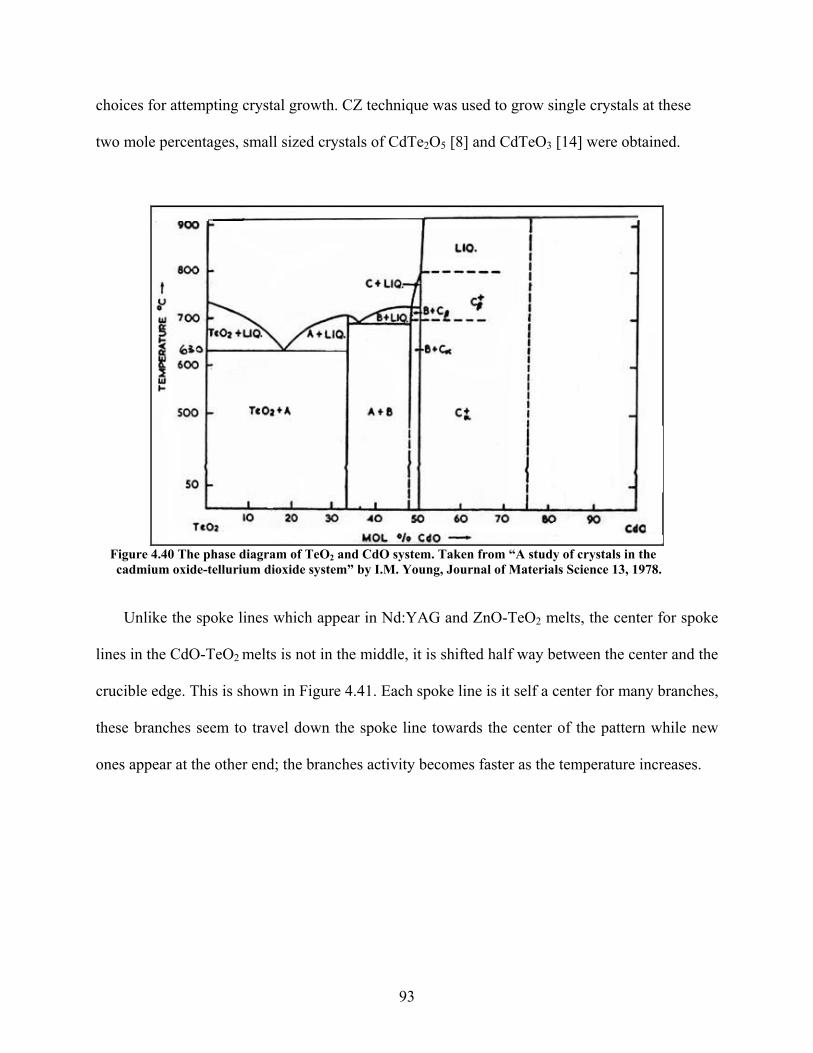
choices for attempting crystal growth. ed to grow single crystals at these
two mole percentages, small sized dTeO3 [14] were obtained.
CZ technique was us
crystals of CdTe2O5 [8] and C
igure 4.40 The phase diagram of TeOF
ke
nd the
s,
ew
es.
2 and CdO system. Taken from “A study of crystals in the cadmium oxide-tellurium dioxide system” by I.M. Young, Journal of Materials Science 13, 1978.
Unlike the spoke lines which appear in Nd:YAG and ZnO-TeO2 melts, the center for spo
lines in the CdO-TeO2 melts is not in the middle, it is shifted half way between the center a
crucible edge. This is shown in Figure 4.41. Each spoke line is it self a center for many branche
these branches seem to travel down the spoke line towards the center of the pattern while n
ones appear at the other end; the branches activity becomes faster as the temperature increas
93
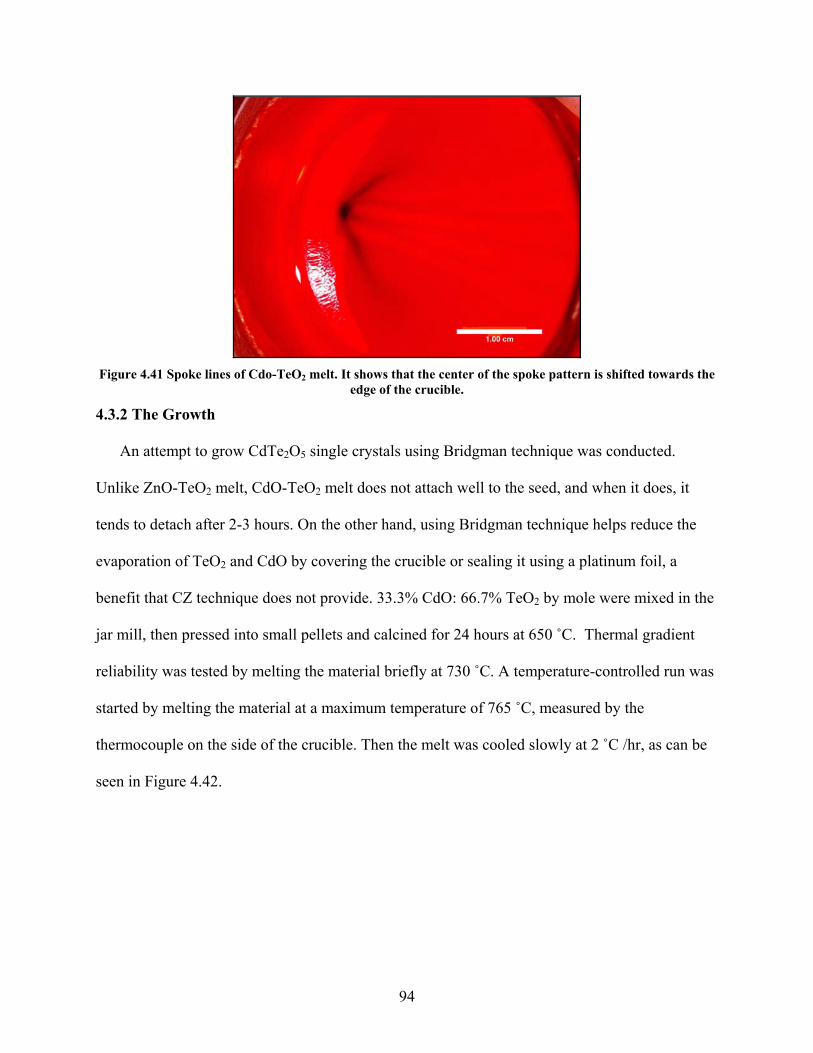
Figure 4.41 Spoke lines of Cdo-TeO melt. It shows that the center of the spoke pattern is shifted towards the
edge of the crucible. 2
4.3.2 The Growth
An attempt to grow CdTe2O5 single crystals using Bridgman technique was conducted.
Unlike ZnO-TeO2 melt, CdO-TeO2 melt does not attach well to the seed, and when it does, it
tends to detach after 2-3 hours. On the other hand, using Bridgman technique helps reduce the
evaporation of TeO2 and CdO by covering the crucible or sealing it using a platinum foil, a
benefit that CZ technique does not provide. 33.3% CdO: 66.7% TeO2 by mole were mixed in the
jar mill, then pressed into small pellets and calcined for 24 hours at 650 ˚C. Thermal gradient
reliability was tested by melting the material briefly at 730 ˚C. A temperature-controlled run was
started by melting the material at a maximum temperature of 765 ˚C, measured by the
thermocouple on the side of the crucible. Then the melt was cooled slowly at 2 ˚C /hr, as can be
seen in Figure 4.42.
94

Figure 4.42 33.3:64.7 CdO: TeO2 crystal growth by Bridgman technique.
After passing the freezing point of the material, the crystal was brought to room temperature at a
higher cooling rate. The total mass loss after the run was 0.084%.
4.3.2.1 Discussion and Analysis
I. Microprobe and X-ray Analysis
material was formed of transparent sheets; some parts of a few sheets contained brown colored
areas. Some of these mica structure sheets were separated and studied. See Figure 4.43. Scanning
electron microprobe shows that the transparent layers are CdTe O and the sporadic brown areas
are mainly CdTe O with minor TeO .
The crystal was extracted, easily, from the platinum/ gold dish shaped-crucible. The resultant
2 5
2 5 2
95
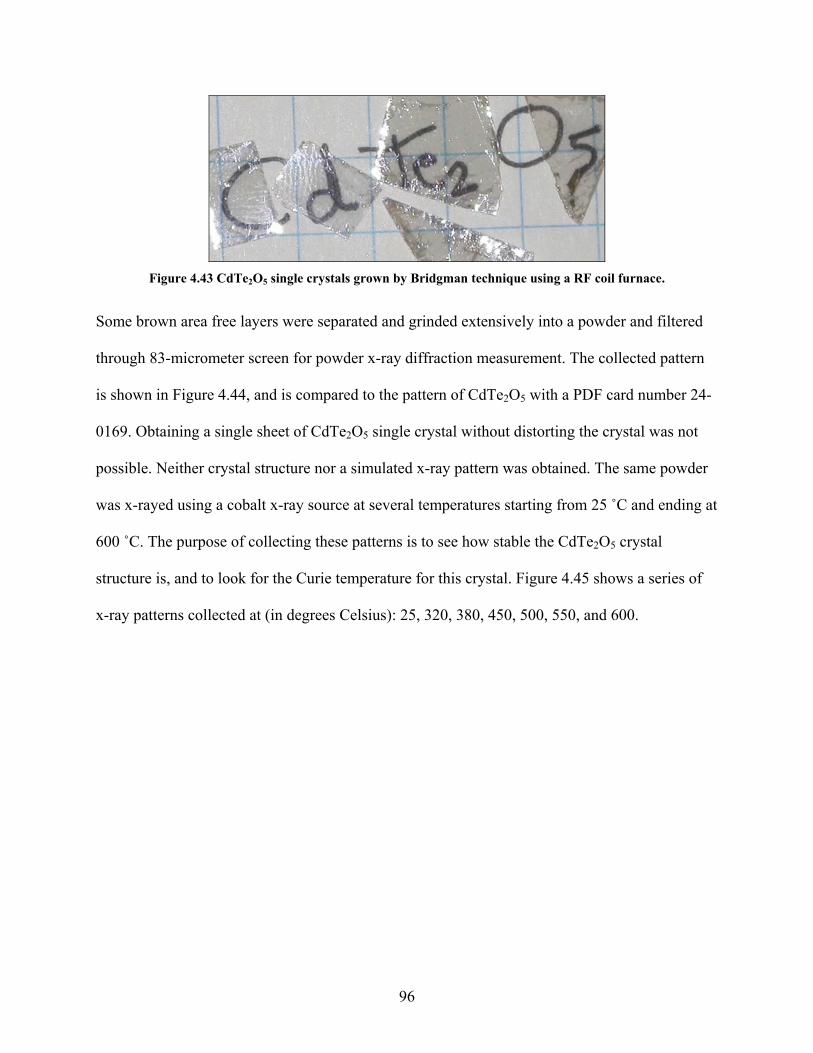
Figure 4.43 CdTe2O5 single crystals grown by Bridgman technique using a RF coil furnace.
Some brown area free layers were separated and grinded extensively into a powder and filtered
through 83-micrometer screen for powder x-ray diffraction measurement. The collected p
is shown in Figure 4.44, and is compared to the pattern of CdTe
attern
4-
er
at
0, 500, 550, and 600.
2O5 with a PDF card number 2
0169. Obtaining a single sheet of CdTe2O5 single crystal without distorting the crystal was not
possible. Neither crystal structure nor a simulated x-ray pattern was obtained. The same powd
was x-rayed using a cobalt x-ray source at several temperatures starting from 25 ˚C and ending
600 ˚C. The purpose of collecting these patterns is to see how stable the CdTe2O5 crystal
structure is, and to look for the Curie temperature for this crystal. Figure 4.45 shows a series of
x-ray patterns collected at (in degrees Celsius): 25, 320, 380, 45
96
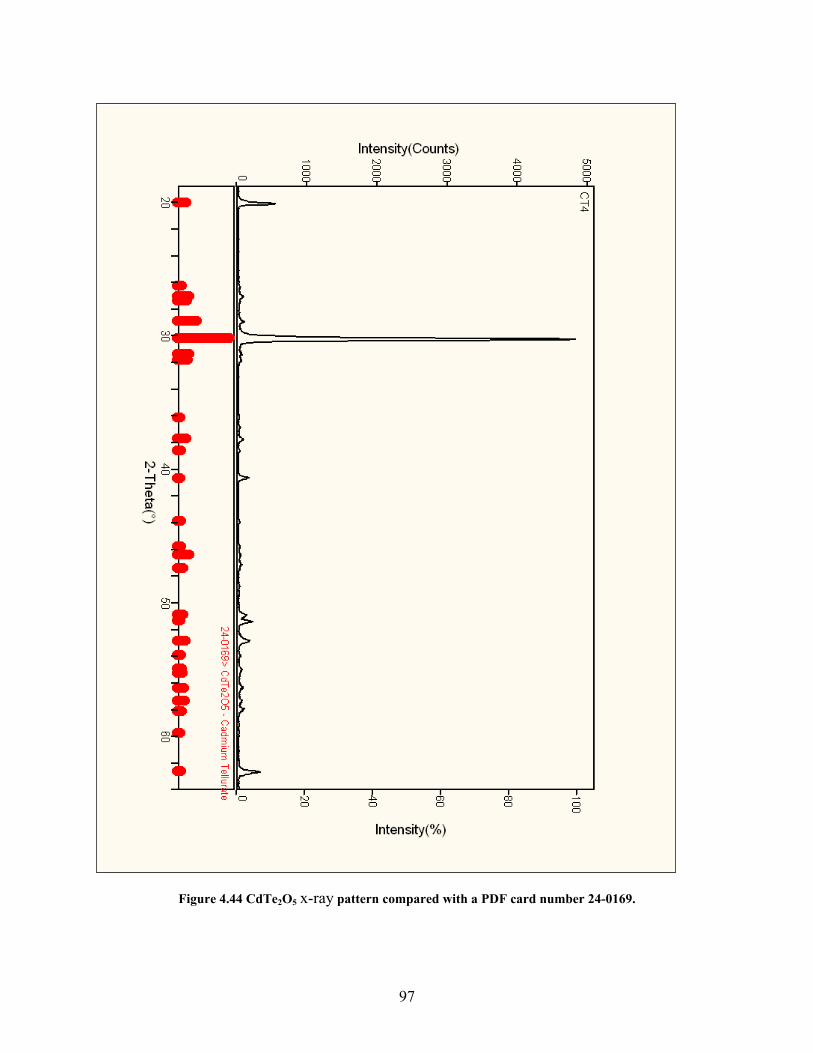
97
Figure 4.44 CdTe2O5 x-ray pattern compared with a PDF card number 24-0169.
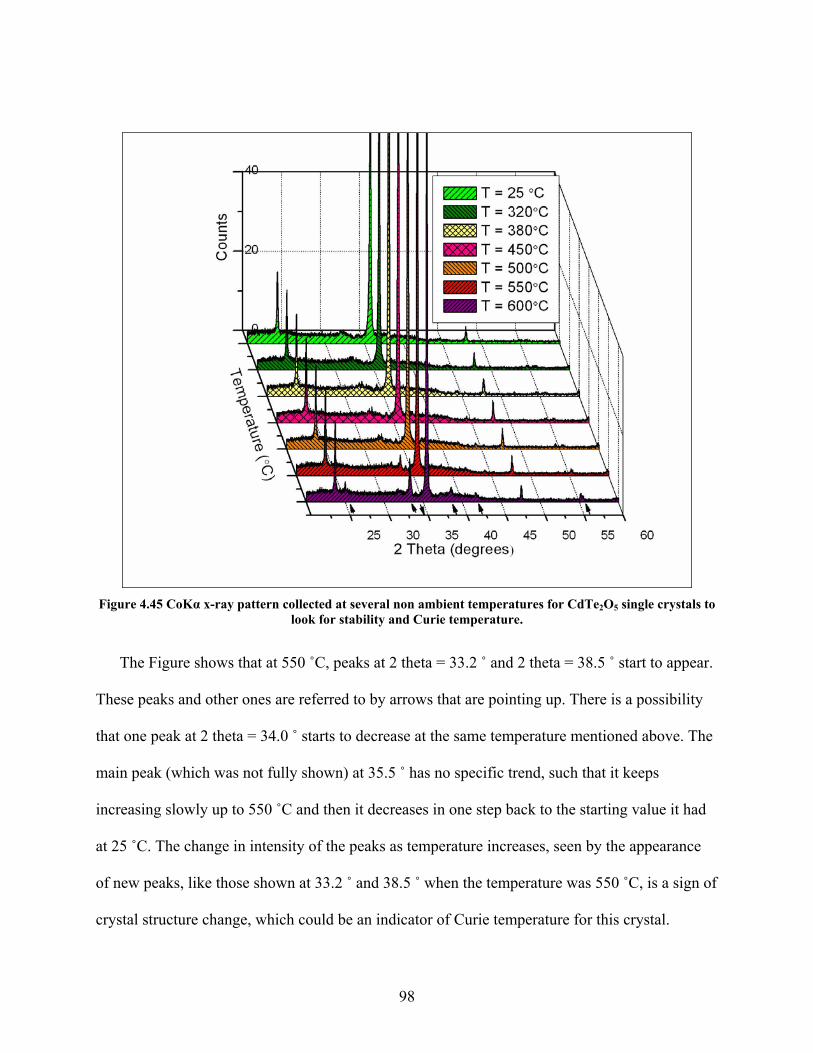
Figure 4.45 CoKα x-ray pattern collected at several non ambient temperatures for CdTe2O5 sin
look for stability and Curie temperature. gle crystals to
The Figure shows that at 550 ˚C, peaks at 2 theta = 33.2 ˚ and 2 theta = 38.5 ˚ start to appear.
These peaks and other ones are referred to by arrows that are pointing up. There is a possibility
that one peak at 2 theta = 34.0 ˚ starts to decrease at the same temperature mentioned above. The
main peak (which was not fully shown) at 35.5 ˚ has no specific trend, such that it keeps
increasing slowly up to 550 ˚C and then it decreases in one step back to the starting value it had
at 25 ˚C. The change in intensity of the peaks as temperature increases, seen by the appearance
of new peaks, like those shown at 33.2 ˚ and 38.5 ˚ when the temperature was 550 ˚C, is a sign of
crystal structure change, which could be an indicator of Curie temperature for this crystal.
98
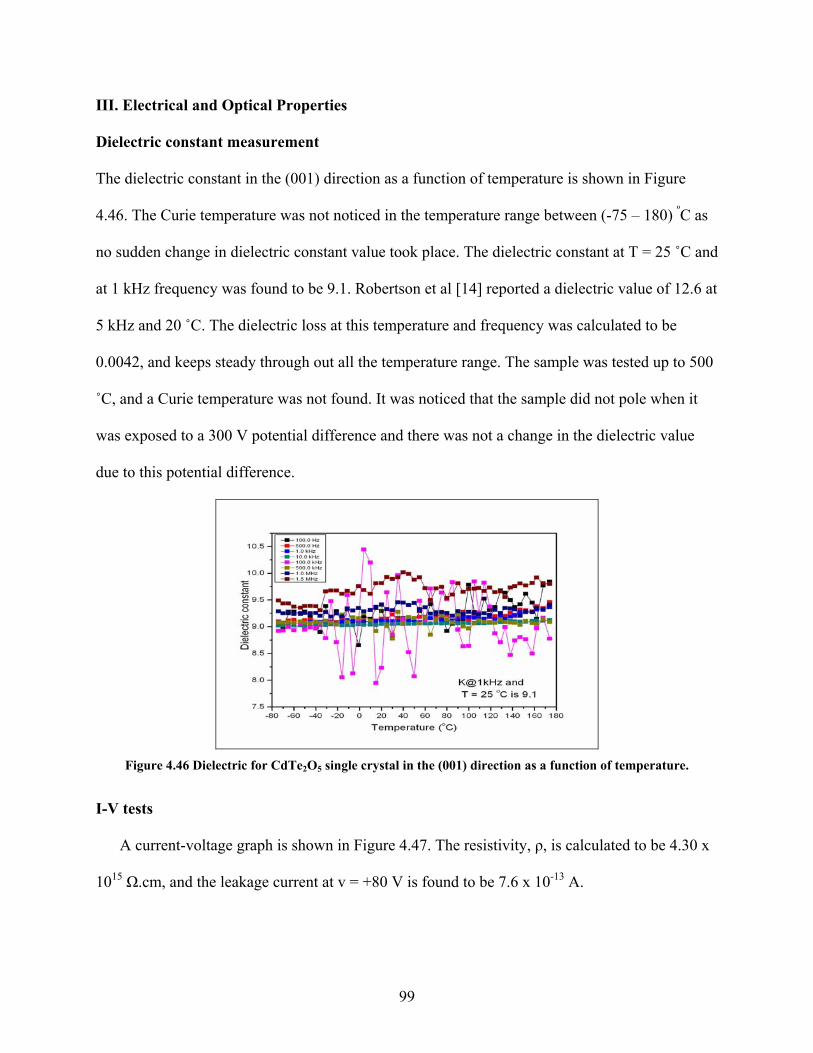
III. Electrical and Optical Properties
Dielectric constant measurement
The dielectric constant in the (001) direction as a function of temperature is shown in Figure
4.46. The Curie temperature was not noticed in the temperature range between (-75 – 180) ºC
no sudden change in dielectric consta
as
nt value took place. The dielectric constant at T = 25 ˚C and
at 1 kHz frequency was found to be 9.1. Robertson et al [14] reported a dielectric value of 12.6 at
5 kHz and 20 ˚C. The dielectric loss at this temperature and frequency was calculated to be
0.0042, and keeps steady through out all the temperature range. The sample was tested up to 500
˚C, and a Curie temperature was not found. It was noticed that the sample did not pole when it
was exposed to a 300 V potential difference and there was not a change in the dielectric value
due to this potential difference.
Figure 4.46 Dielectric for CdTe2O5 single crystal in the (001) direction as a function of temperature.
I-V tests
A current-voltage graph is , ρ, is calculated to be 4.30 x
1015 Ω.cm, and the leakage current at v = +80 V is found to be 7.6 x 10⁻¹³ A.
shown in Figure 4.47. The resistivity
99
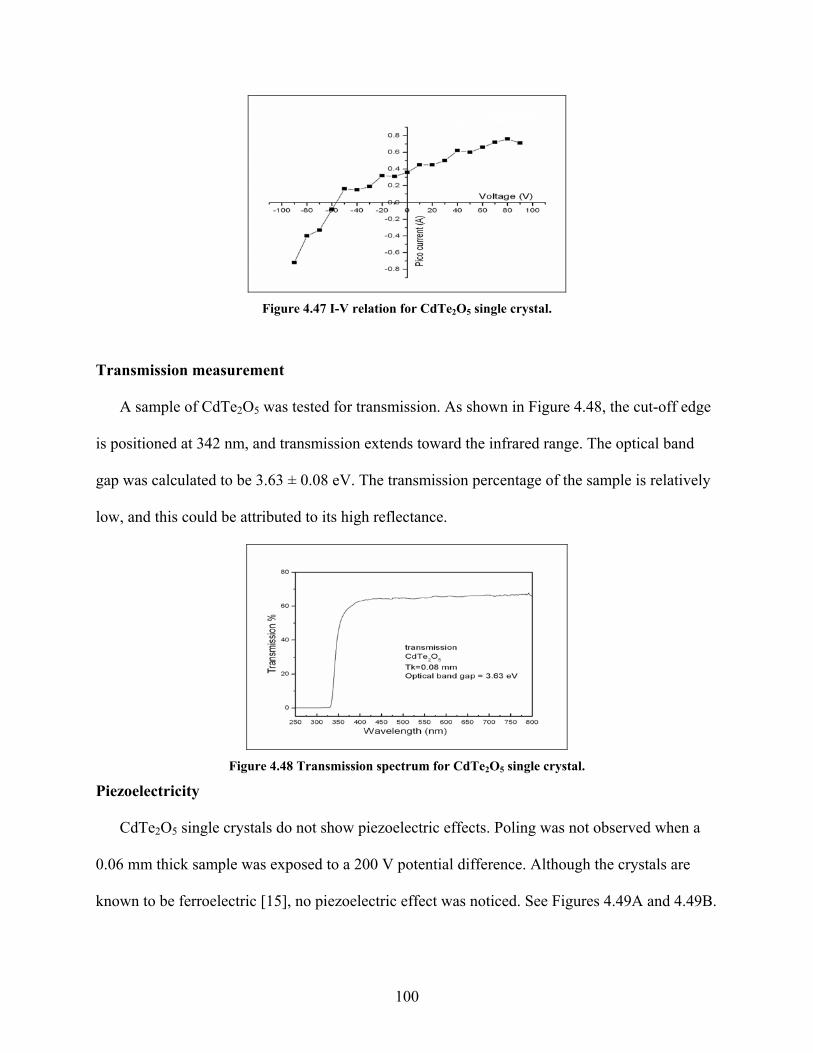
Figure 4.47 I-V relation for CdTe2O5 single crystal.
Transmission measurement
A sample of CdTe2O5 was tested for transmission. As shown in Figure 4.48, the cut-off edge
is positioned at 342 nm, and transmission extends toward the infrared range. The optical band
gap was calculated to be 3.63 ± 0.08 eV. The transmission percentage of the sample is relatively
low, and this could be attributed to its high reflectance.
Figure 4.48 Transmission spectrum for CdTe2O5 single crystal.
Piezoelectricity
CdTe2O5 single crystals do not show piezoelectric effects. Poling was not observed when a
0.06 mm thick sample was exposed to a 200 V potential difference. Although the crystals are
known to be ferroelectric [15], no piezoelectric effect was noticed. See Figures 4.49A and 4.49B.
100
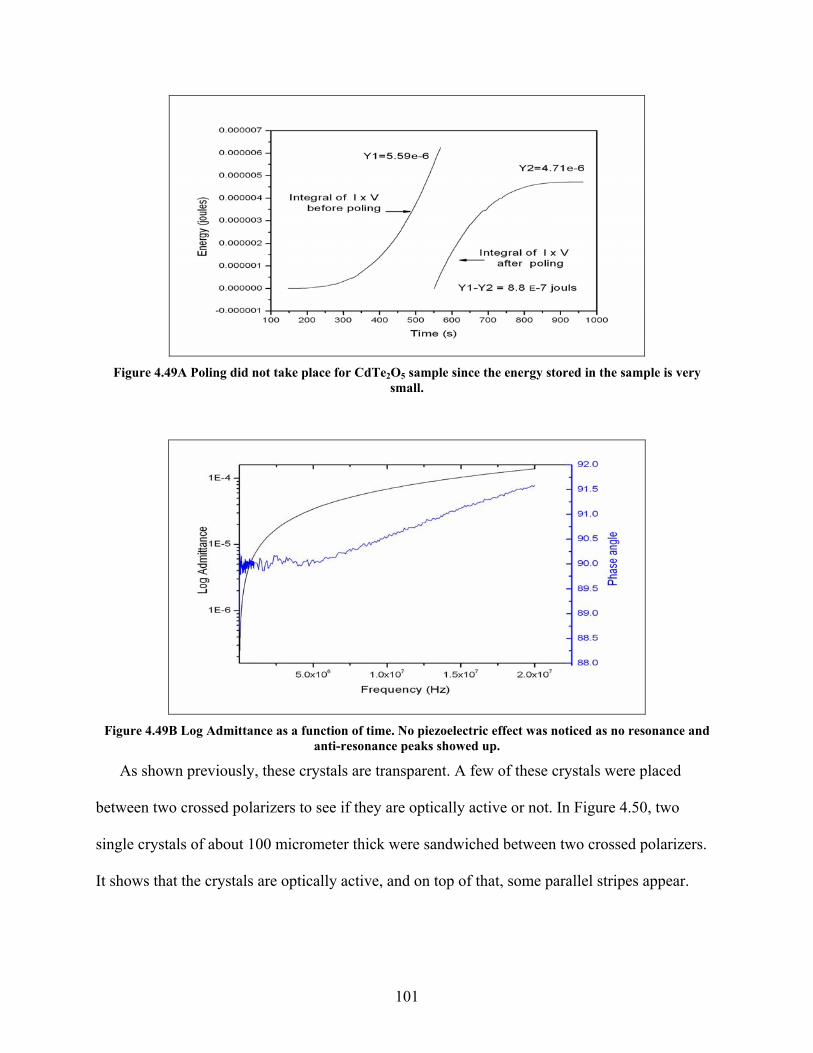
Figure 4.49A Poling did not take place for CdTe2O5 sample since the energy stored in the sample is very
small.
anti-resonance peaks showed up. Figure 4.49B Log Admittance as a function of time. No piezoelectric effect was noticed as no resonance and
As shown previously, these crystals are transparent. A few of these crystals were placed
between two crossed polarizers to see if they are optically active or not. In Figure 4.50, two
single crystals of about 100 micrometer thick were sandwiched between two crossed polarizers.
It shows that the crystals are optically active, and on top of that, some parallel stripes appear.
101
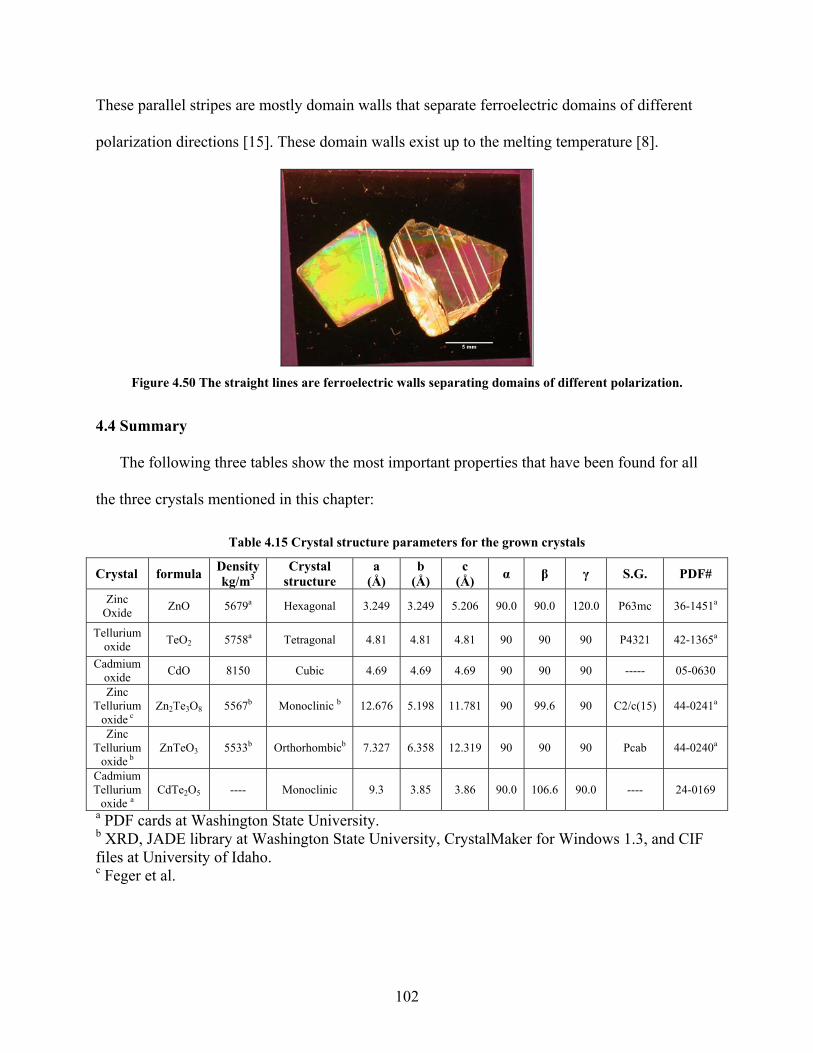
These parallel stripes are mostly domain walls that separate ferroelectric domains of different
polarization directions [15]. These domain walls exist up to the melting temperature [8].
Figure 4.50 The straight lines are ins of different polarization.
4.4 Summary
The following three tables show the most important properties that have been found for all
the three crystals mentioned in this chapter:
Table 4.15 Crystal structure parameters for the grown crystals
Crystal formula Density kg/m3
Crystal structure
a (Å)
b (Å)
c (Å) α β γ S.G. PDF#
ferroelectric walls separating doma
Zinc Oxide
aZnO 5679a Hexagonal 3.249 3.249 5.206 90.0 90.0 120.0 P63mc 36-1451
Tellurium oxide TeO2 5758a Tetr 90 90 P4321 42-1365aagonal 4.81 4.81 4.81 90
Cadmium CdO 8150 Cubic 4.69 4.69 4.69 90 90 90 ----- 05-063oxide 0
Zinc Tellurium Zn
oxide c2Te3O8 5567b Monoclinic b 12.676 5.198 11.781 90 99.6 90 C2/c(15) 44-0241a
Zinc Tellurium
oxideZnTeO 5533
b3 44-0240ab Orthorhombicb 7.327 6.358 12.319 90 90 90 Pcab
Cadmium
oxide Tellurium CdTe2O5 ---- Monoclinic 9.3 3.85 3.86 90.0 106.6 90.0 ---- 24-0169
a
a PDF cards at Washington State University. XRD, JADE library at Washington State University, CrystalMaker for Windows 1.3, and C
files at University of Idaho. b IF
c Feger et al.
102
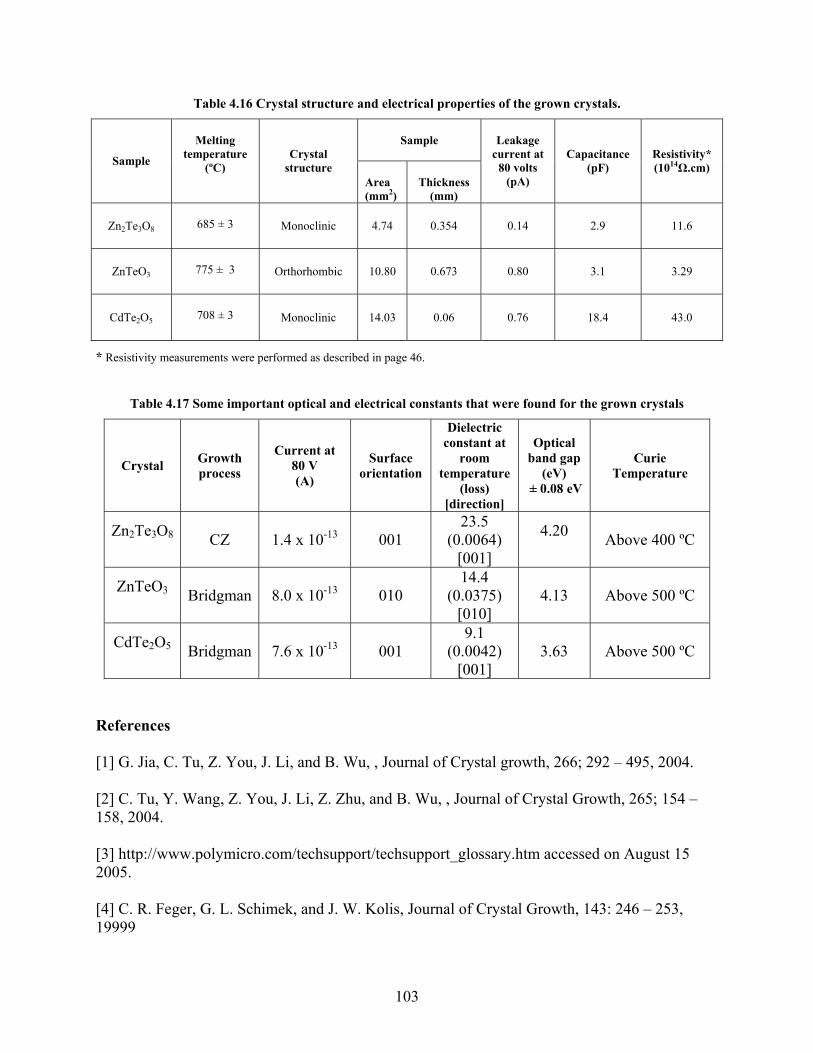
T
able 4.16 Crystal structure and electrical properties of the grown crystals.
Sample
Sample temperature Crystru
Area (mm2)
ckness
Leakrren
80 volts (pA)
c(pF)
sistivity* 14Ω.cm)
Melting
(ºC) stal
cture Thi
(mm)
age t at Capacitancu e Re
(10
Zn2Te3O
Monoc 4.74 0.14 2.9 11.6 8
685 ± 3 linic 0.354
ZnTeO3
775 ± 3 0.673 0.80 3.1 3.29 Orthorhombic 10.80
CdTe2O5
708 ± 3 Monoclinic 14.03 0.06 0.76 18.4 43.0
* Resistivit eas p ge
Table 4.17 Some import cal constants that were found for the grown crystals
Crystal Growth process
C80(A)
Surface orientation
Dielectric cons at
room temperature
(loss) [direction]
Oband gap
(eV) ± 0.08 eV
Curie Temperature
y m urements were erformed as described in pa 46.
ant optical and electri
urrent at V
tant ptical
Zn2Te3O8 CZ 1.4 x 10⁻¹³ 001
23.5 (0.0064)
[001]
4.20 Above 400 ºC
ZnTeO3 Bridgman 8.0 x 10⁻¹³ 010
14.4 (0.0375)
[010] 4.13 Above 500 ºC
CdTe2O5 Bridgman 7.6 x 10⁻¹³ 001
9.1 (0.0042)
[001] 3.63 Above 500 ºC
References [1] G. Jia, C. Tu, Z. You, J. Li, and B. Wu, , Journal of Crystal growth, 266; 292 – 495, 2004. [2] C. Tu, Y. 6 154 – 158, 2004.
support/techsupport_glossary.htm accessed on August 15 2005.
Wang, Z. You, J. Li, Z. Zhu, and B. Wu, , Journal of Crystal Growth, 2 5;
[3] http://www.polymicro.com/tech
[4] C. R. Feger, G. L. Schimek, and J. W. Kolis, Journal of Crystal Growth, 143: 246 – 253, 19999
103
[5] P. Sveshtarov , M. Gospodinov, Journal of Crystal Growth, 113: 186-208,1991.
[6] T.H. Johanson, Journal of Crystal Growth, 84: 609-620, 1987.
[7] V. Krämer, and G. Brandt, Act. Cryst., C41, 1152-1154, (1985).
[8] V. M. Gorbenko, A. Y. Kudzin, L. J. Sadovskaja, G. X. Sokoljanski, and V. P. Avramenko,
Ferroelectrics, Vol. 110, 47 – 50, 1990.
[9] K. V. Krishna, V. Dutta, P. D. Paulson, Thin Solid Films: 444, 17 – 22, 2003.
[10] S. A
. Awadallah, A. W. Hunt, R. B. Tjossem, K. G. Lynn, C. Szeles, and M. Bliss, Hard X-
ray and Gamma Detector Physics III, Proceedings of SPIE: 4507, 2001.
Thi
990,
, C. Loppacher, M. E.
Lukes, Surface Science, Vol. 532 – 535, 493 – 500, 2003.
[11] M. Y. El Azhari, M. Azizan, A. Bennouna, A. Outzourhit, E.L. Ameziane, and M. Burnel,
n Solid Films, 366, 82 – 87, 2000.
[12] R. H. Bube, Photovoltaic Materials, Vol. 1, Imperial College Press, London, 1998, pp.144 –
146.
[13] A. Iribarren, E. Menèndez-Proupin, R. Castro_Rodrίguez, V. Sosa, J. L. Peňa, and F.
Caballero_Briones, Journal of Applied Physics, Vol. 86, No. 8, 4688 – 4690, 1999.
[14] D. S. Robertson, N. Shaw, I. M. Young, Journal of Materials Science, Vol. 13, 1986 – 1
1978.
[15] L. L. Patricio, H. Z. Rodolfo, N. Velasco, G. Tarrach, F. Schlaphof
104
CHAPTER FIVE
THE PHASE DIAGRAM
5.1 Introduction
Differences between the phase diagram [1,2] and the experimental results were found.
Results showed that the melting temperature for 21:79 ZnO:TeO2 is higher than 596 ˚C [1] by at
least 20 degrees. Another difference was found when unexpected phases formed as the material
was cooled down from the melt, the formation of these phases were not mentioned in literature.
Conversely, these differences were a motivation to conduct crystal growths on this system. It was
cooling down process takes place. The biggest cha
compound and, eventually, a single crystal can form.
e the
conjectured that there might be a line component forming at a certain composition, when the
llenge was to find the mole percentage of ZnO
and TeO2 at which a stable stoichiometric
The phase diagram shown in Figure 5.1 has two peritectic phase transformations, wher
material transforms from a solid/melt phase into solid. The first transformation takes place at 700
˚C and at 50-mole percentage of TeO2, while the second one takes place at 644 ˚C at 60-TeO2
mole percentage. The eutectic transformation takes place at 596 ˚C when TeO2 is 79-mole
percentage. Some authors [3] refer to 20% mole TeO2 as the eutectic transformation. Two line
components also appear. One at 50% TeO2 and shows that ZnTeO3 compound forms and the
other one appears at 60% TeO2 where Zn2Te3O8 forms. The formation of each of these two
compounds does not come from a single melting phase, but from a combination of (a) melt
phase/s and a solid phase. As a result, tuning the melt and the solid phase to the exact required
composition to form the line component would be extremely difficult. This explains how in
crystal growth, it was very hard to obtain a single crystal. But luckily, the thermodynamics were,
105
occasionally, correct for some single crystals to grow, as occurred in the growth of single
crystals of ZnTeO3 and Zn2Te3O8. Unfortunately, the existence of these “correct
thermodynamic” conditions would not stay for a long time. The combination of composition,
temperature, and cooling rate should be optimized to continue the growth of a single crystal. As
the single crystal growth continues, the composition of the melt required for a single crystal
growth changes, and this causes the composition to shift either to the left or to the right in the
phase diagram. In any case, another/ other phase/s will appear. Consequently, this will terminate
the growth of the single crystal. Another growth difficulty includes the existence of a solid phase
above each line component. At 450 ˚C, the solid phase that has formed at higher temperatures
will go through another phase transformation and polymorphism will exist, such that more than
horizontally up to 100% TeO . At this line, α-Zn O transforms into β-Zn Te O . The phase
diagram in Figure 5.1 shows all possible stable phases that could form, accompanied with their
required ZnO mole percentages.
one solid phase will coexist. The polymorphous line starts at 50% mole TeO2 and extends
2 3 8 2 3 82Te
106
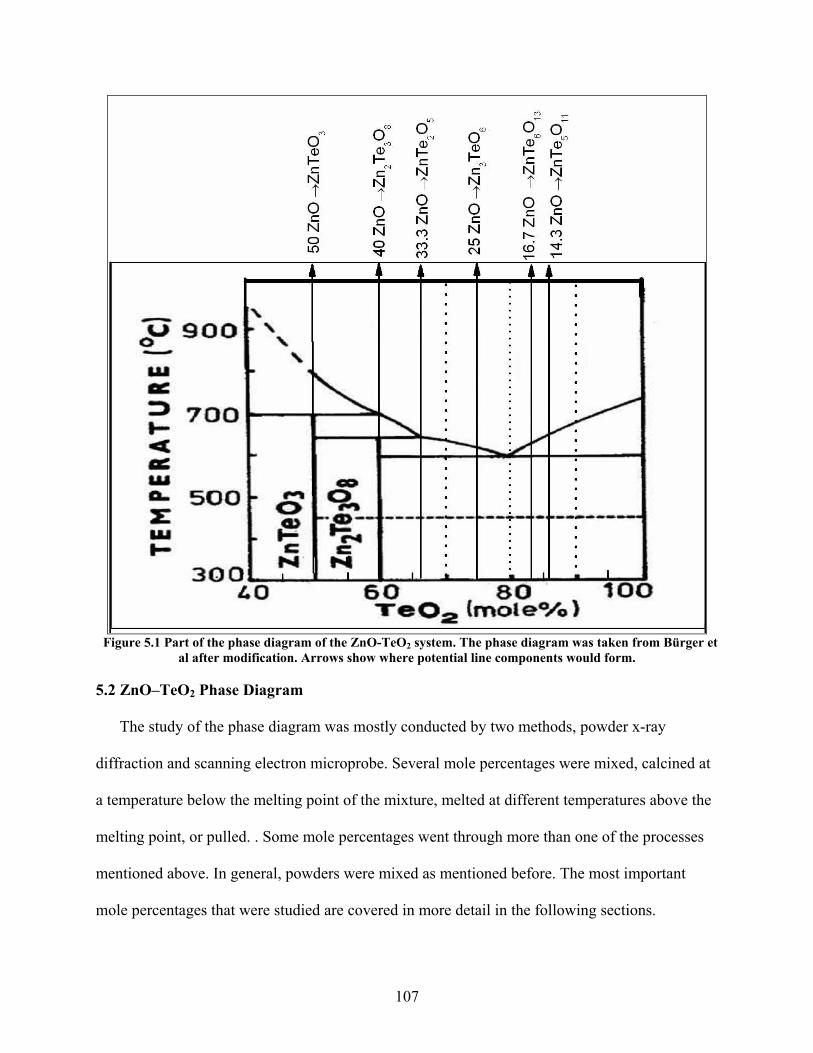
Figure 5.1 Part of the phase diagram of the ZnO-TeO2 system. The phase diagram was taken from Bürger e
5.2 ZnO–Te
t al after modification. Arrows show where potential line components would form.
O2 Phase Diagram
The study of the phase diagram was mostly conducted by two methods, powder x-ray
diffraction and scanning electron mic ercentages were mixed, calcined at
a temperature below the melting point of the mixture, melted at different temperatures above the
melting point, or pulled. . Some mole percentages went through more than one of the processes
mentioned above. In general, powders were mixed as mentioned before. The most important
mole percentages that were studied are covered in more detail in the following sections.
roprobe. Several mole p
107
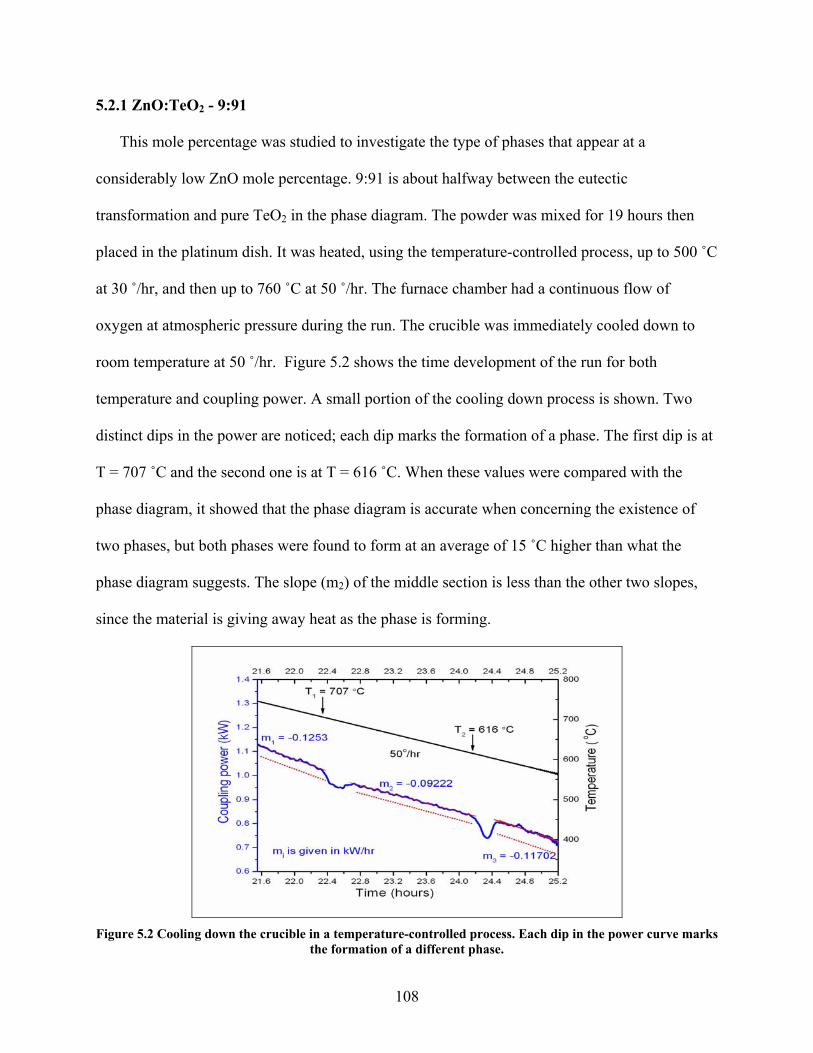
5.2.1 ZnO:TeO2 - 9:91
This mole percentage was studied to investigate the type of phases that appear at a
considerably low ZnO mole percentage. 9:91 is about halfway between the eutectic
transformation and pure TeO2 in the phase diagram. The powder was mixed for 19 hours then
placed in the platinum dish. It was heated, using the temperature-controlled process, up to 500 ˚C
at 30 ˚/hr, and then up to 760 ˚C at 50 ˚/hr. The furnace chamber had a continuous flow of
oxygen at atmospheric pressure during the run. The crucible was immediately cooled down to
room temperature at 50 ˚/hr. Figure 5.2 shows the time development of the run for both
temperature and coupling power. A small portion of the cooling down process is shown. Two
distinct dips in the power are noticed; each dip marks the formation of a phase. The first dip is at
T
phase diagram, it showed that the phase diagram is accurate when concerning the existence of
t
phase diagram suggests. The slope (m2) of the middle section is less than the other two slopes,
since the material is giving away heat as the phase is forming.
= 707 ˚C and the second one is at T = 616 ˚C. When these values were compared with the
wo phases, but both phases were found to form at an average of 15 ˚C higher than what the
Figure 5.2 Cooling down the crucible in a temperature-controlled process. Each dip in the power curve marks
the formation of a different phase.
108
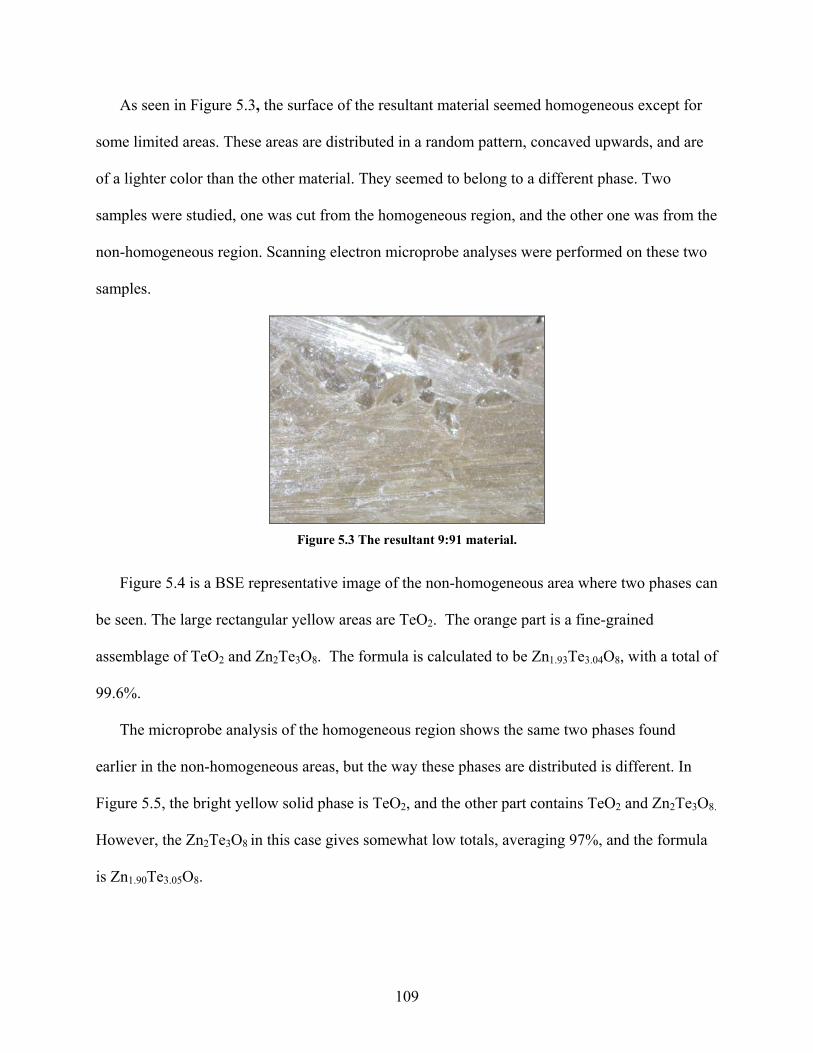
As seen in Figure 5.3, the surface of the resultant material seemed homogeneous except for
some limited areas. These areas are distributed in a random pattern, concaved upwards, and are
of a lighter color than the other material. They seemed to belong to a different phase. Two
samples were studied, one was cut from the homogeneous region, and the other one was from the
non-homogeneous region. Scanning electron microprobe analyses were performed on these two
samples.
Figure 5.3 The resultant 9:91 material.
Figure 5.4 is a BSE representative image of the non-homogeneous area where two phases can
be seen. The large rectangular yellow areas are TeO . The orange part is a fine-grained
assemblage of TeO and Zn Te O . The formula is calculated to be Zn Te O , with a total of
99.6%.
The microprobe analysis of the homogeneous region shows the same two phases found
earlier in the non-homogeneous areas, but the way these phases are distributed is different. In
owever, the Zn2Te3O8 in this case gives somewhat low totals, averaging 97%, and the formula
Zn1.90Te3.05O8.
2
2 2 3 8 1.93 3.04 8
Figure 5.5, the bright yellow solid phase is TeO2, and the other part contains TeO2 and Zn2Te3O8.
H
is
109
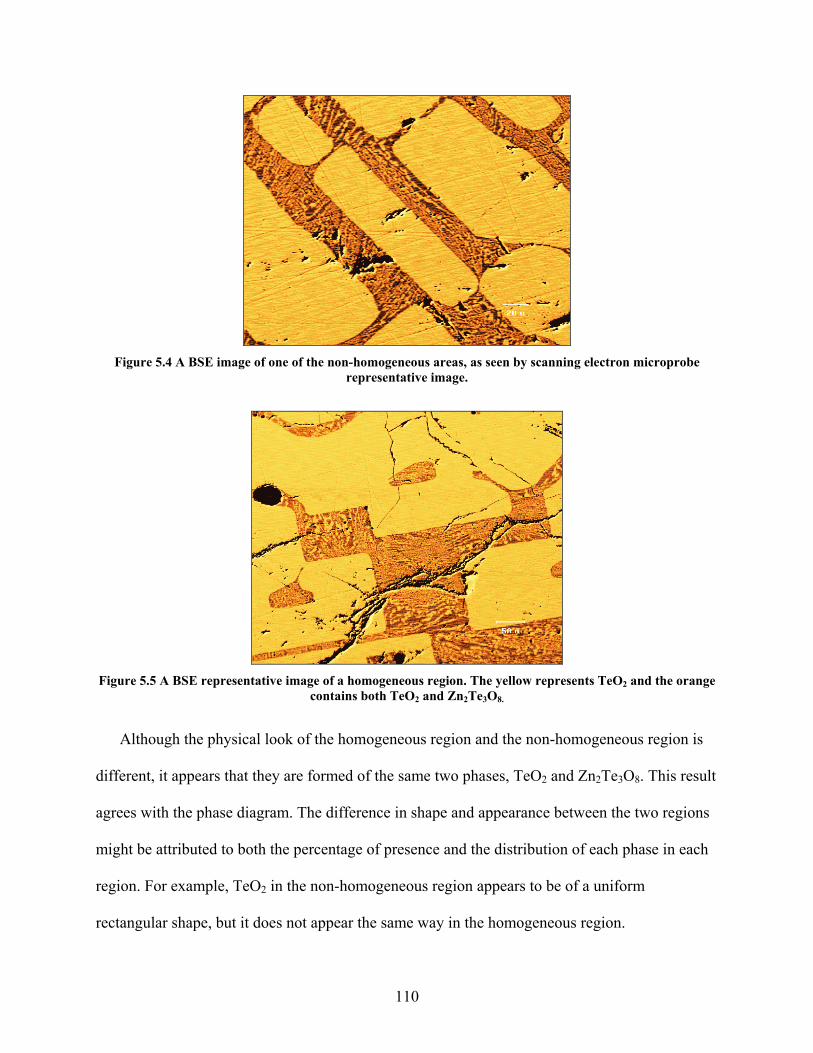
Figure 5.4 A BSE image of one of the non-homogeneous areas, as seen by scanning electron microprobe
representative image.
Figure 5.5 A BSE representative image of a homogeneous region. The yellow represents TeO2 and the ora
contains both TeOnge
sult
rectangular shape, but it does not appear the same way in the homogeneous region.
2 and Zn2Te3O8.
Although the physical look of the homogeneous region and the non-homogeneous region is
different, it appears that they are formed of the same two phases, TeO2 and Zn2Te3O8. This re
agrees with the phase diagram. The difference in shape and appearance between the two regions
might be attributed to both the percentage of presence and the distribution of each phase in each
region. For example, TeO2 in the non-homogeneous region appears to be of a uniform
110
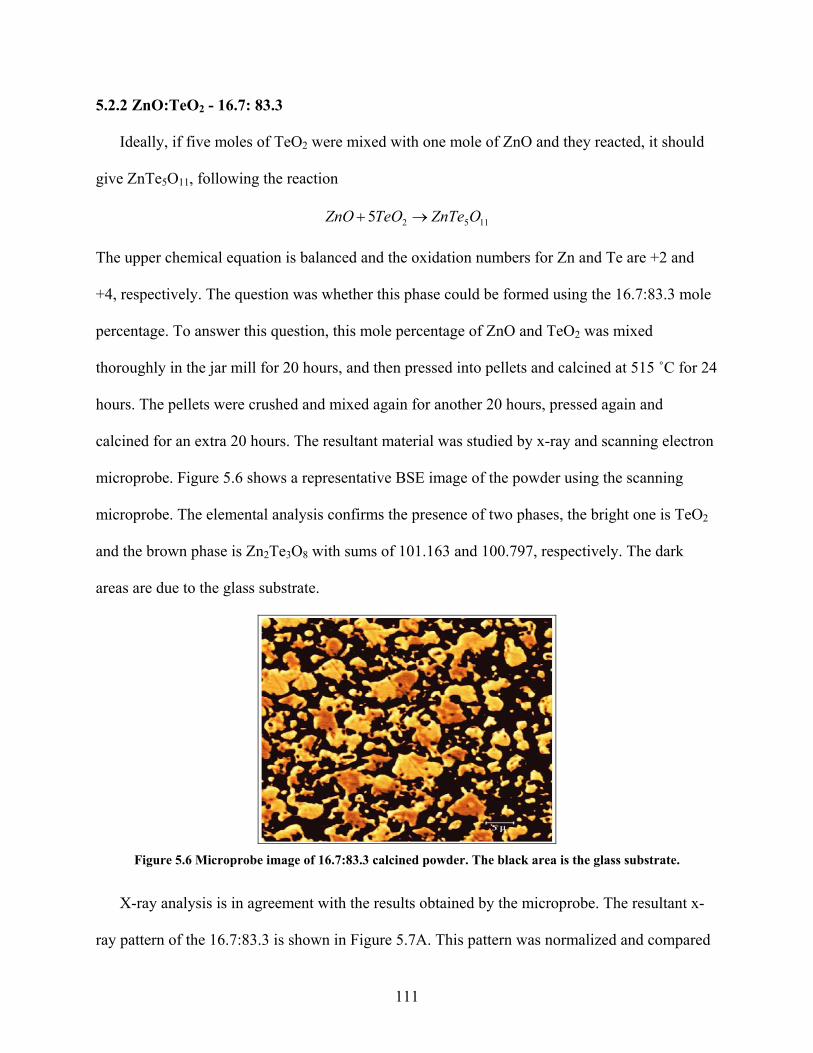
5.2.2 ZnO:TeO2 - 16.7: 83.3
Ideally, if five moles of TeO2 were mixed with one mole of ZnO and they reacted, it should
give ZnTe5O11, following the reaction
11525 OZnTeTeOZnO →+
The upper chemical equation is balanced and the oxidation numbers for Zn and Te are +2 and
+4, respectively. The question was whether this phase could be formed using the 16.7:83.3 mole
percentage. To answer this question, this mole percentage of ZnO and TeO2 was mixed
thoroughly in the jar mill for 20 hours, and then pressed into pellets and calcined at 515 ˚C for 24
hours. The pellets were crushed and mixed again for another 20 hours, pressed again and
calcined for an extra 20 hours. The resultant material was studied by x-ray and scanning electron
microprobe. Figure 5.6 shows a representative BSE image of the powder using the scanning
microprobe. The elemental analysis confirms the presence of two phases, the bright one is TeO2
and the brown phase is Zn2Te3O8 with sums of 101.163 and 100.797, respectively. The dark
areas are due to the glass substrate.
Figure 5.6 Microprobe image of 16.7:83.3 calcined powder. The black area is the glass substrate.
X-ray analysis is in agreement with the results obtained by the microprobe. The resultant x-
ray pattern of the 16.7:83.3 is shown in Figure 5.7A. This pattern was normalized and compared
111
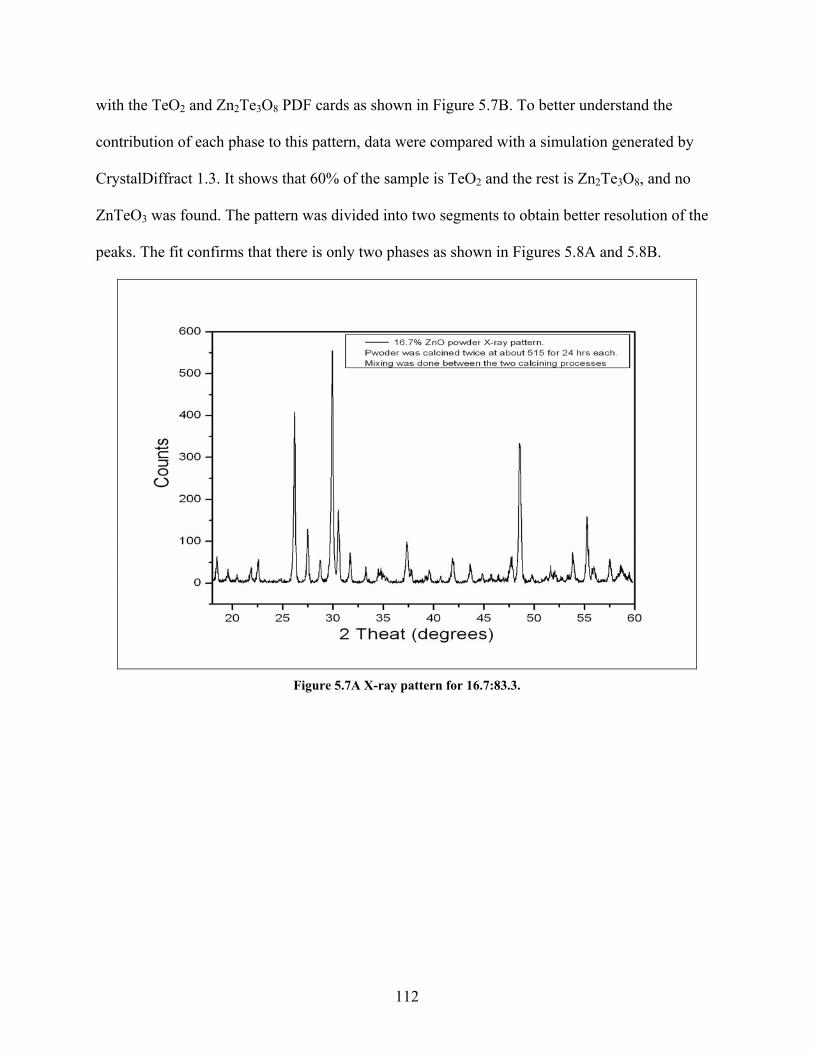
with the TeO2 and Zn2Te3O8 PDF cards as shown in Figure 5.7B. To better understand the
contribution of each phase to this pattern, data were compared with a simulation generated by
CrystalDiffract 1.3. It shows that 60% of the sample is TeO2 and the rest is Zn2Te3O8, and no
ZnTeO3 e
ea
was found. The pattern was divided into two segments to obtain better resolution of th
ks. The fit confirms that there is only two phases as shown in Figures 5.8A and 5.8B. p
Figure 5.7A X-ray pattern for 16.7:83.3.
112
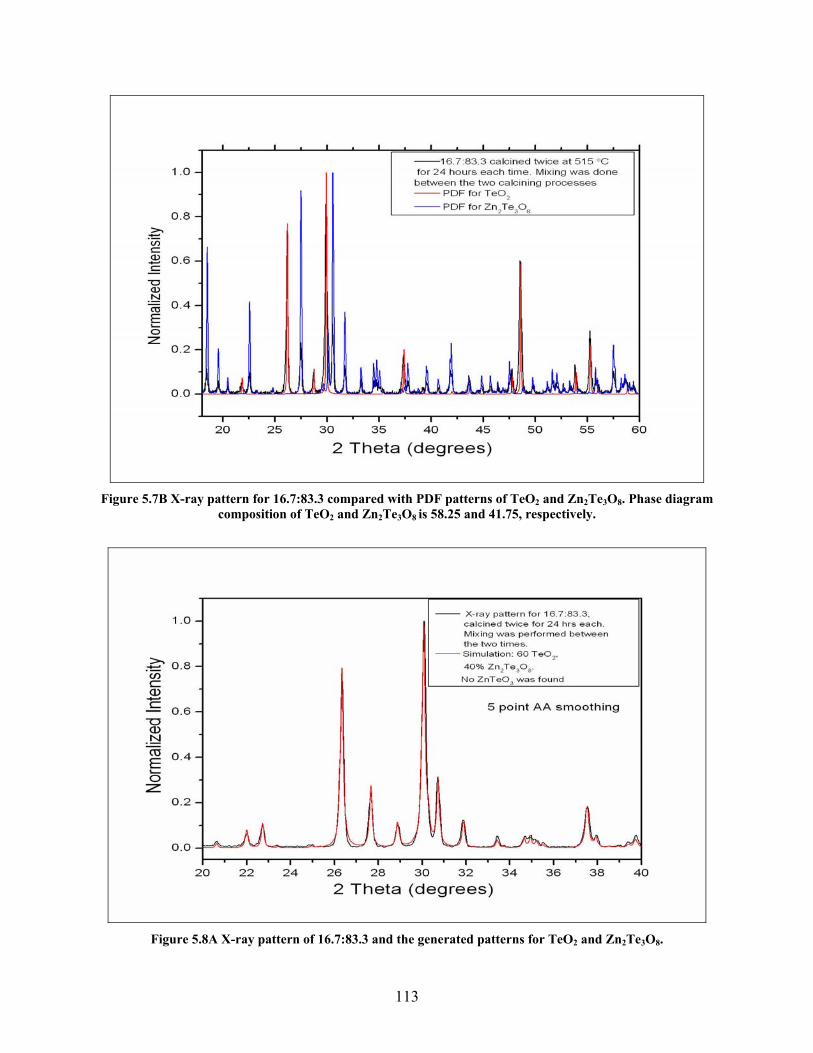
Figure 5.7B X-ray p 16.7:83.3 compared with PDF patterns of TeO2 and Zn2Te3 m
on o and Zn2 8 is 58.2 1.75, r vely.
attern for co siti
O8. Phase diagrampo f TeO2 Te3O 5 and 4 especti
Figure 5.8A X-ray pattern of 16.7:83.3 and the generated patterns for TeO2 and Zn2Te3O8.
113
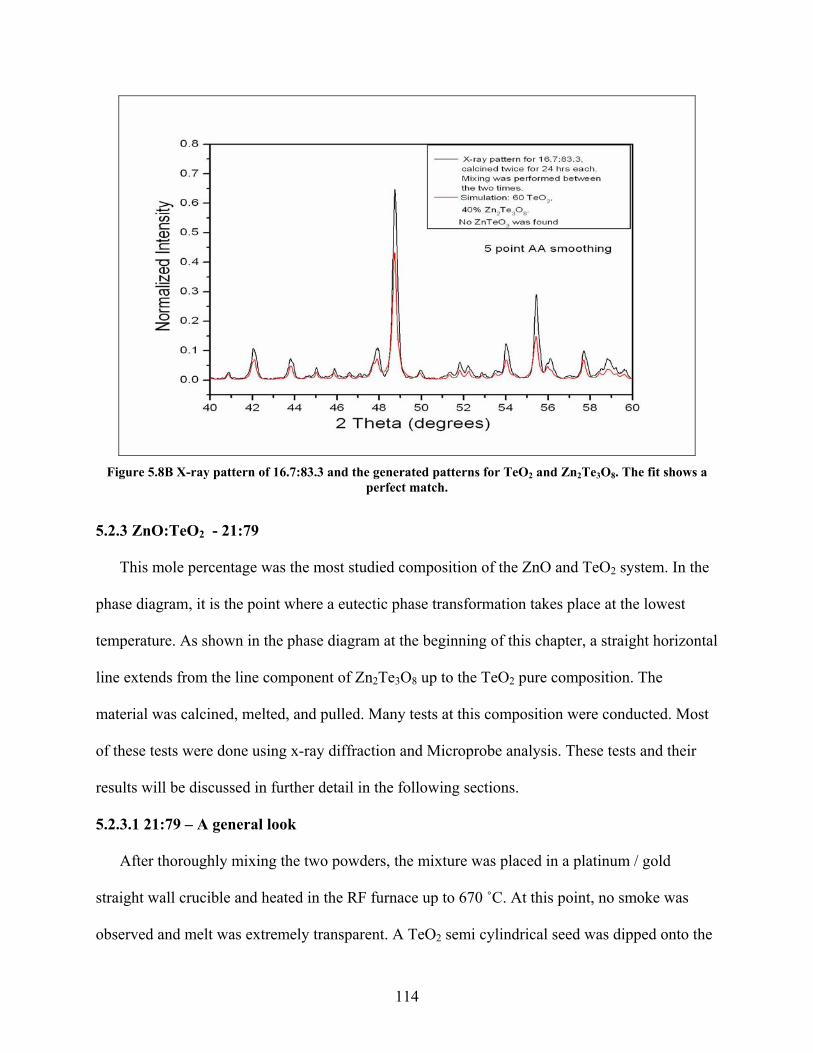
Fi re 5.8B X-ray pattern of 16.7:83.3 and the generated patterns for TeO2 and Zn2Te3O8. The fit shows a
perfect match.
5.2.3 ZnO:TeO2 - 21:79
This mole percentage was the most studied composition of the ZnO and TeO2 system. In the
phase diagram, it is the point where a eutectic phase transformation takes place at the lowest
temperature. As shown in the phase diagram at the beginning of this chapter, a straight horizontal
line extends from the line component of Zn2Te3O8 up to the TeO2 pure composition. The
material was calcined, melted, and pulled. Many tests at this composition were conducted. Most
of these tests were done using x-ray diffraction and Microprobe analysis. These tests and their
results will be discussed in further detail in the following sections.
5.2.3.1 21:79 – A general look
After thoroughly mixing the two powders, the mixture was placed in a platinum / gold
straight wall crucible and heated in the RF furnace up to 670 ˚C. At this point, no smoke was
observed and melt was extremely transparent. A TeO2 semi cylindrical seed was dipped onto the
gu
114
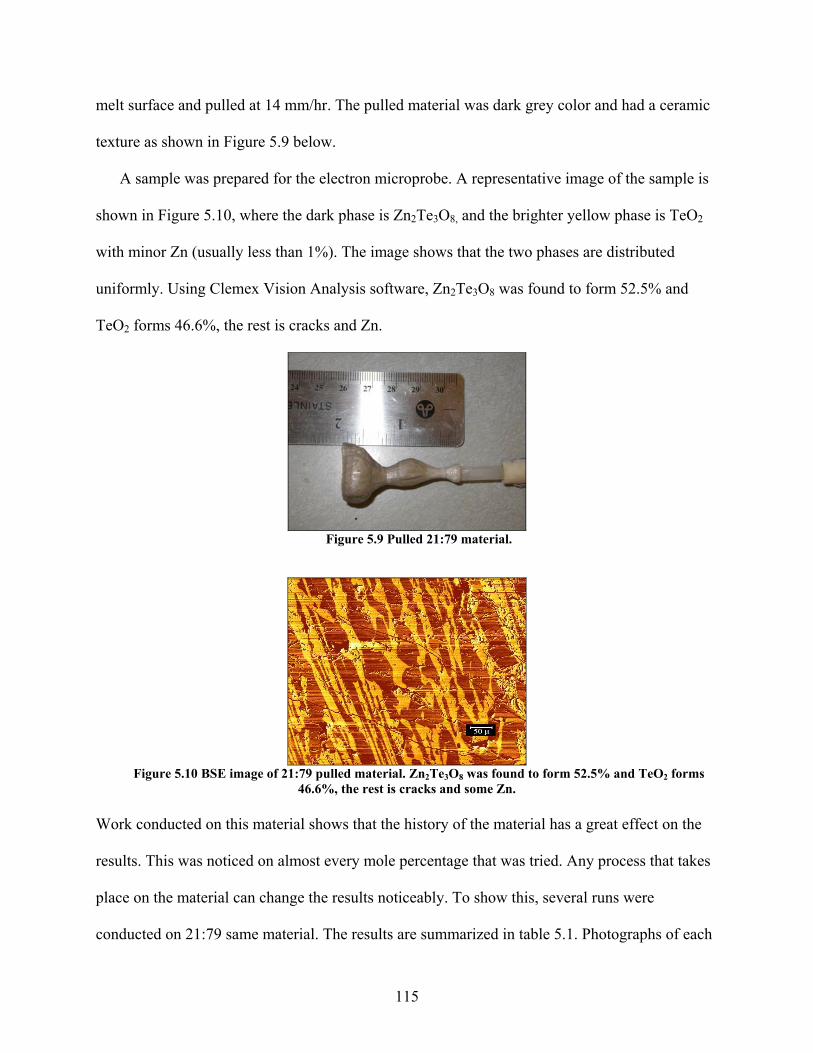
m
texture as show
A sample was prepared for the electron microprobe. A representative image of the sample is
hown in Figure 5.10, where the dark phase is Zn Te3O8, and the brighter yellow phase is TeO2
with minor ted
uniformly. Using Clemex Vision Analysis software, Zn2Te3O8 was found to form 52.5% and
TeO
elt surface and pulled at 14 mm/hr. The pulled material was dark grey color and had a ceramic
n in Figure 5.9 below.
s 2
Zn (usually less than 1%). The image shows that the two phases are distribu
2 forms 46.6%, the rest is cracks and Zn.
Figure 5.9 Pulled 21:79 material.
s found to foFigure 5.10 BSE image of led material. Zn2Te3O8 wa rm 52.5% and TeO2 forms
.6%, the rest is cracks and som Work conducted on this ma story of the has a great effect on the
results. This was noticed on almost every mole percentage that was tried. Any process that takes
place on the material can change the results noticeably. To show this, several runs were
conducted on 21:79 same material. The results are summarized in table 5.1. Photographs of each
21:79 pul46 e Zn.
terial shows that the hi material
115
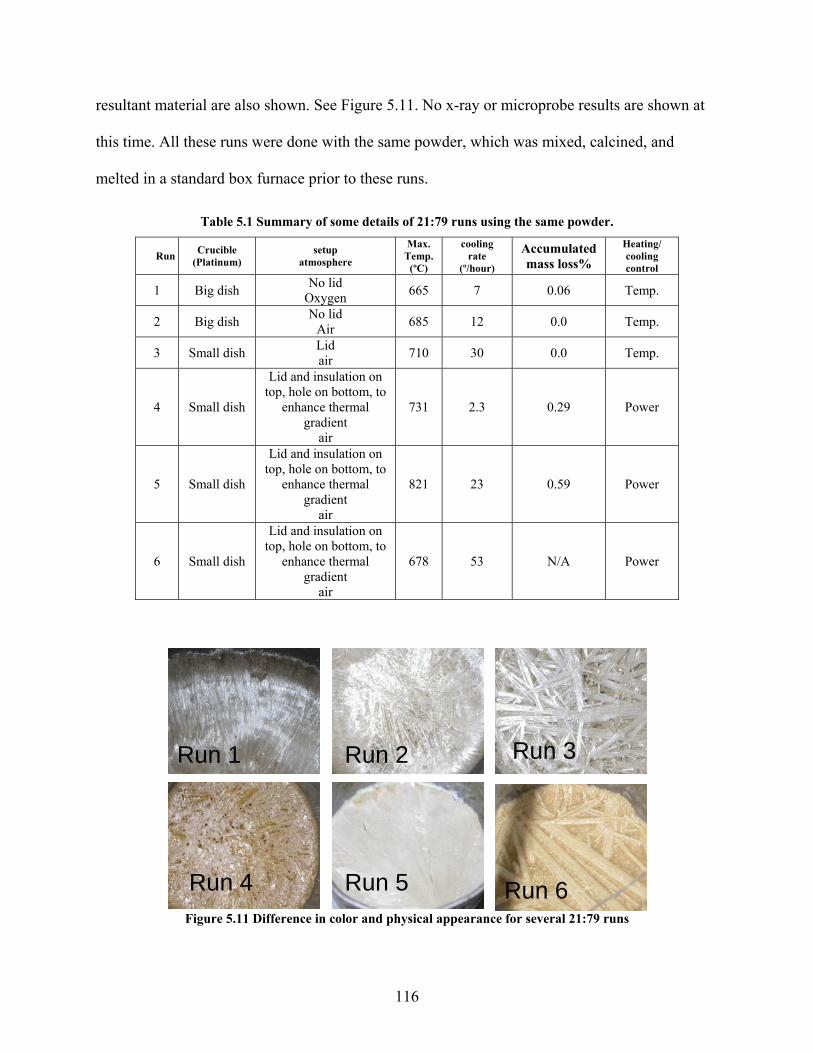
resultant material are also shown. See Figure 5.11. No x-ray or probe results are shown at
this time. All these runs were done with the same powder, which was mixed, calcined, and
melted in a standard b to these runs.
Table 5.1 Summary of some details of 21:79 runs using the same powder.
Run Crucible (Platinum) ere
Max.Temp
(ºC) (º/hour) ass loss% Heating/ cooling control
micro
ox furnace prior
setup atmosph
.
cooling rate Accumulated
m
1 Big dish 665 Temp. No lid
Oxygen 7 0.06
2 Big di 685 12 0.0 Temp. sh No lid Air
3 Small dish Lid 710 30 0.0 Temp. air
4 Small dish
lation on top, hole on bottom, to
ermal 731 2.3 0.29 Power enhance th
Lid and insu
gradient air
5 Small
Lid and insulation on top, hole on bottom, to
gradient air
Power dish enhance thermal 821 23 0.59
6 Small dish
Lid and insulation on
enhance thermal gradient
air
678 53 N/A Power top, hole on bottom, to
Figure 5.11 Difference in color and physical appearance for several 21:79 runs
Run 1 Run 2 Run 3
Run 4 Run 5 Run 6
116
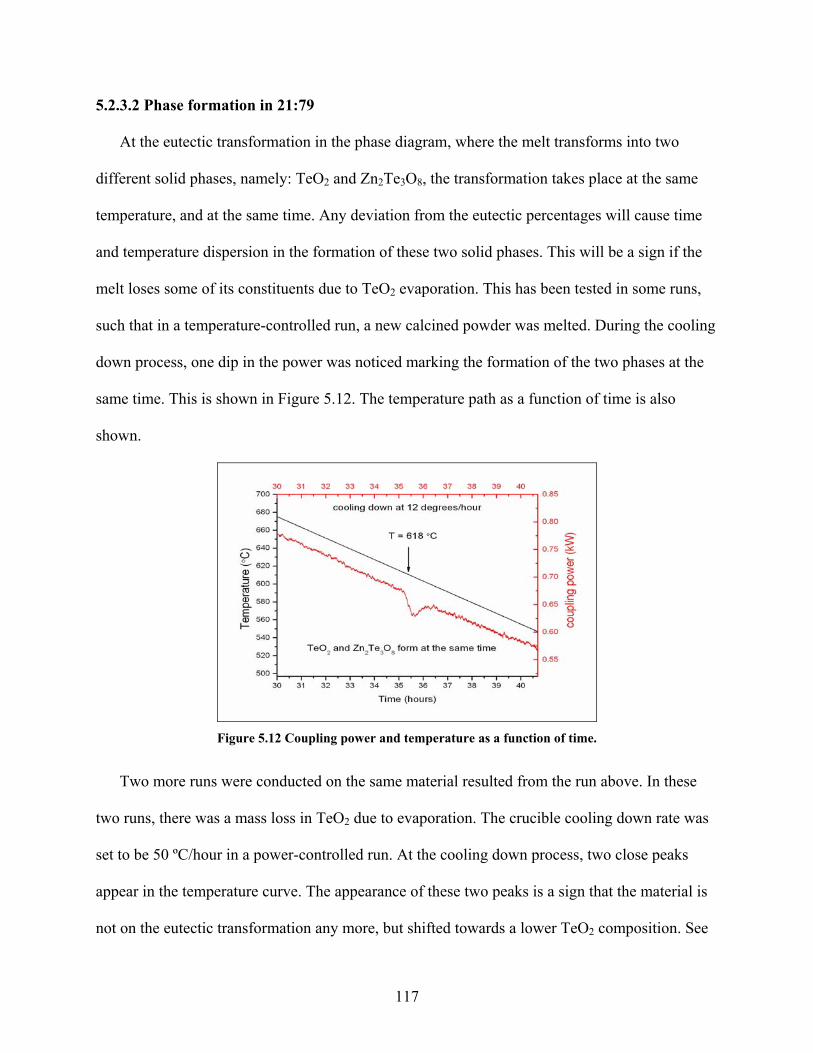
5.2.3.2 Phase formation in 21:79
At the eutectic transformation in the phase diagram, where the melt transforms into two
different solid phases, namely: TeO2 and Zn2Te3O8, the transformation takes place at the same
temperature, and at the same time. Any deviation from the eutectic percentages will cause time
and temperature dispersion in the formation of these two solid phases. This will be a sign if the
melt loses some of its constituents due to TeO2 evaporation. This has been tested in some runs,
such that in a temperature-controlled run, a new calcined powder was melted. During the cooling
down process, one dip in the power was noticed marking the formation of the two phases at the
same time. This is shown in Figure 5.12. The temperature path as a function of time is also
shown.
s, there was a mass loss in TeO2 due to evaporation. The crucible cooling down rate was
set
Figure 5.12 Coupling power and temperature as a function of time.
Two more runs were conducted on the same material resulted from the run above. In these
two run
to be 50 ºC/hour in a power-controlled run. At the cooling down process, two close peaks
appear in the temperature curve. The appearance of these two peaks is a sign that the material is
not on the eutectic transformation any more, but shifted towards a lower TeO2 composition. See
117

Figure 5.13. The Figure is accompanied by the ZnO-TeO2 phase diagram, where the arrow
indicates the possible place at which the cooling process took place. The arrow position is an
exaggeration of the situation; it should be closer to the eutectic reaction.
Figure 5.13 Cooling down the melt of 21:79 after losing some TeO2 due to evaporation. The two humps c
5.2.3.3 ZnO:TeO
an be seen indicating the formation of two phases at two different temperatures.
ontrolled run was used as a trial to melt a calcined 21:79 powder. A
relatively slow cooling rate and temperature gradient were employed in an attempt to see the way
the material starts to crystallize. For this purpose, the material was melted in the crucible with a
platinum lid on top. When the top temperature value reached 625 ˚C, the lid was taken off and a
small Zn2Te3O8 crystal was carefully dropped in the middle of the melt surface. The crystal did
not sink, which indicates that the crystal density is less than the melt density. At this time, the
bottom thermocouple was reading 685 ˚C, with a thermal gradient of 30-degrees/ cm. After a few
minutes, straight, radial, and uniform rays started to form and grew bigger to form a star like
2 - 21:79 Top Cooling
A temperature-c
118
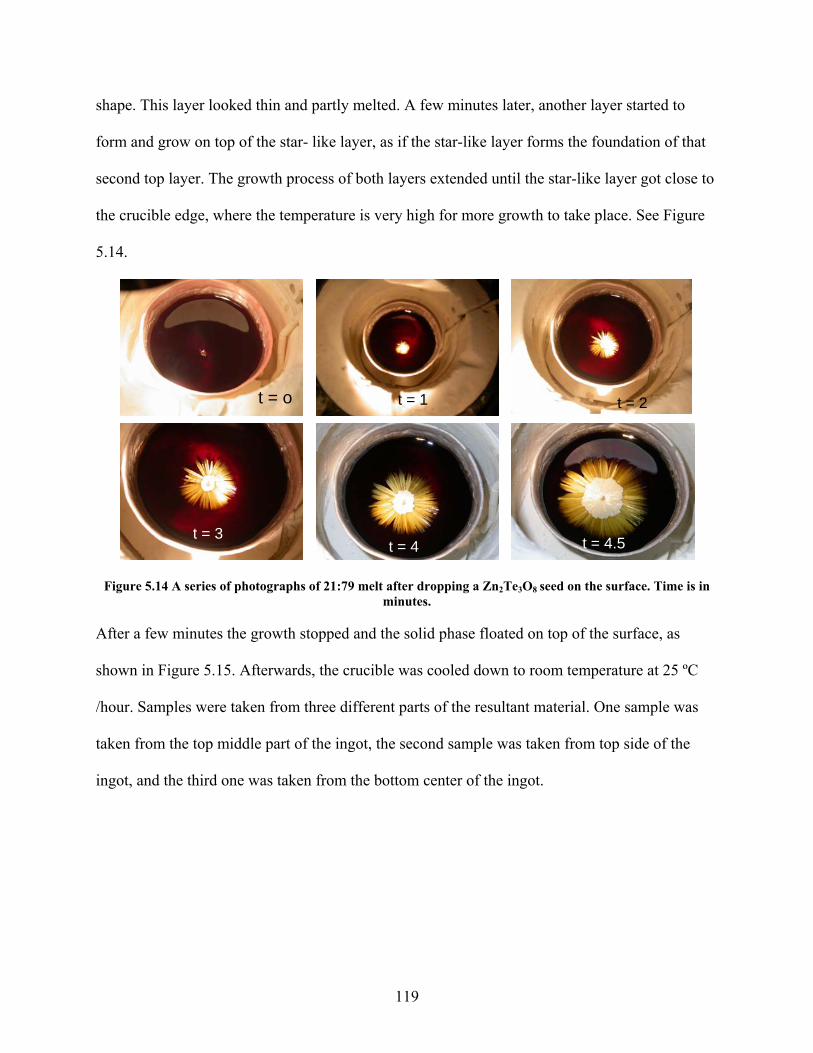
shape. This layer looked thin and partly melted. A few minutes later, another layer started to
form and grow on top of the star- like layer, as if the star-like layer forms the foundation of that
second top layer. The growth process of both layers extended until the star-like layer got close to
the crucible edge, where the temperature is very high for more growth to take place. See Figure
5.14.
in
minutes.
After a few minutes the growth stopped and the solid phase floated on top of the surface, as
/hour. Samples were taken from three different parts of the resultant material. One sample was
ingot, and the third one was taken from the bottom center of the ingot.
Figure 5.14 A series of photographs of 21:79 melt after dropping a Zn2Te3O8 seed on the surface. Time is
shown in Figure 5.15. Afterwards, the crucible was cooled down to room temperature at 25 ºC
taken from the top middle part of the ingot, the second sample was taken from top side of the
t = o t = 1 t = 2
t = 3 t = 4 t = 4.5
119
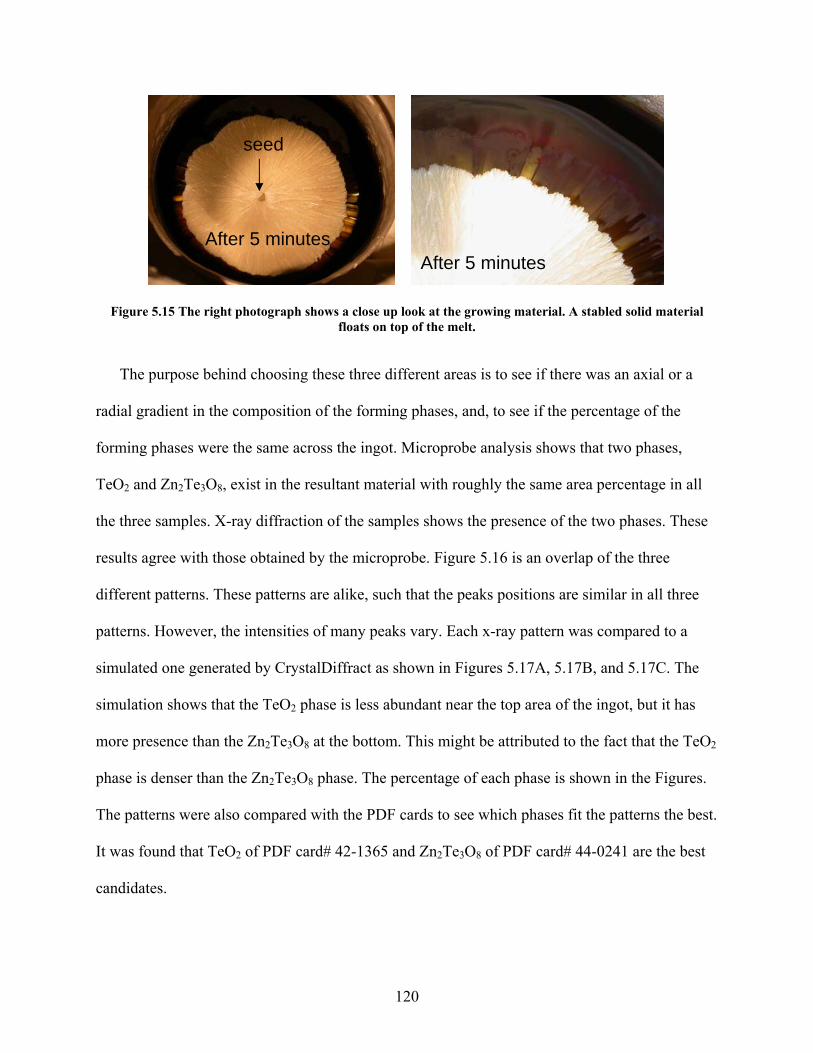
Figure 5.15 The right photograph shows a close up look at the growing material. A stabled solid material floats on top of the melt.
The purpose behind choosing these three different areas is to see if there was an axial or a
radial gradient in the composition of the forming phases, and, to see if the percentage of the
forming phases were the same across the ingot. Microprobe analysis shows that two phases,
TeO and Zn Te O , exist in the resultant material with roughly the same area percentage in all
the three samples. X-ray diffraction of the samples shows the presence of the two phases. These
results agree with those obtained by the microprobe. Figure 5.16 is an overlap of the three
After 5 minutes After 5 minutes
seed
2 2 3 8
different patterns. These patterns are alike, such that the peaks positions are similar in all three
patterns. However, the s compared to a
simulated one generated by CrystalDiffract as shown in Figures 5.17A, 5.17B, and 5.17C. The
simulation shows that the TeO2 phase is less abundant near the top area of the ingot, but it has
more presence than the Zn2Te3O8 at the bottom. This might be attributed to the fact that the TeO2
phase is denser than the Zn2Te3O8 phase. The percentage of each phase is shown in the Figures.
The patterns were also compared with the PDF cards to see which phases fit the patterns the best.
It was found that TeO2 of PDF card# 42-1365 and Zn2Te3O8 of PDF card# 44-0241 are the best
candidates.
intensities of many peaks vary. Each x-ray pattern wa
120

Figure 5.16 X-ray patterns for 21:79 with top cooling at 25 degrees /hour. All tested parts of the ingot show
almost the same pattern.
Figure 5.17A X-ray pattern of a 21:79 sample taken from the top side area of the ingot. The red pattern is a
simulation of a mixture of TeO2 and Zn2Te3O8.
121
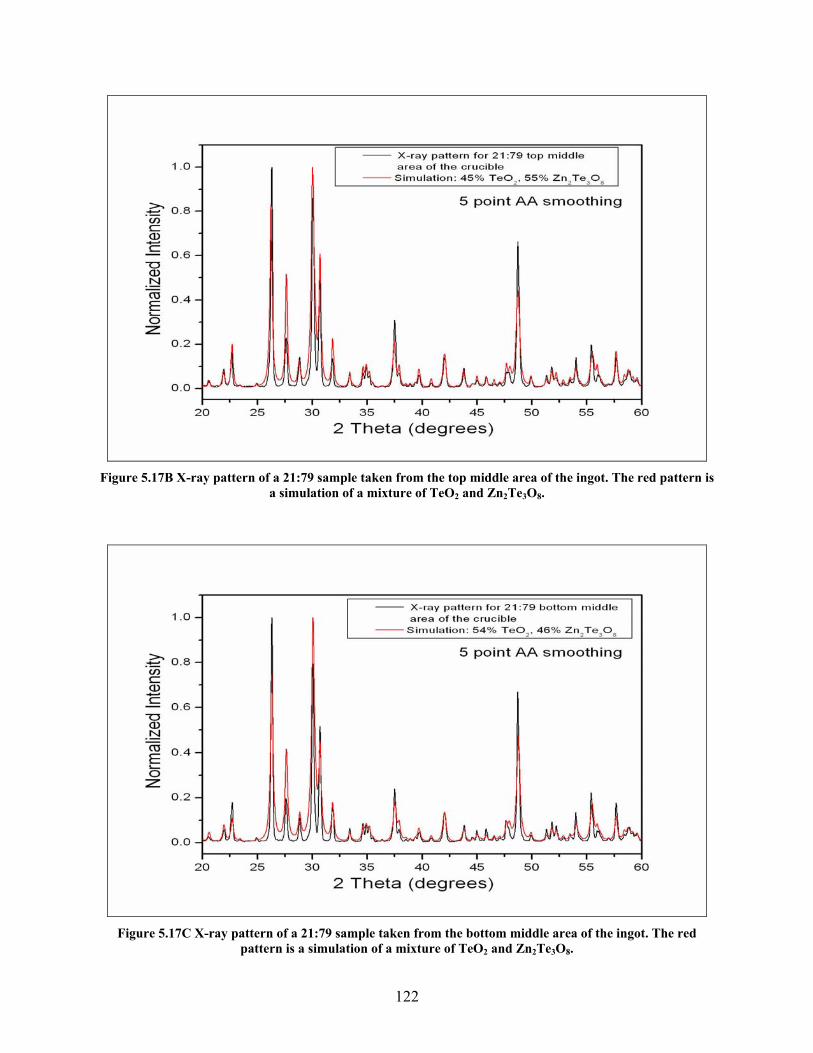
Figure 5.17B X-ray pattern of a 21:79 sample taken from the top middle area of the ingot. The red pattern is
a simulation of a mixture of TeO2 and Zn2Te3O8.
Figure 5.17C X-ray pattern of a 21:79 sample taken from the bottom middle area of the ingot. The red
pattern is a simulation of a mixture of TeO2 and Zn2Te3O8.
122
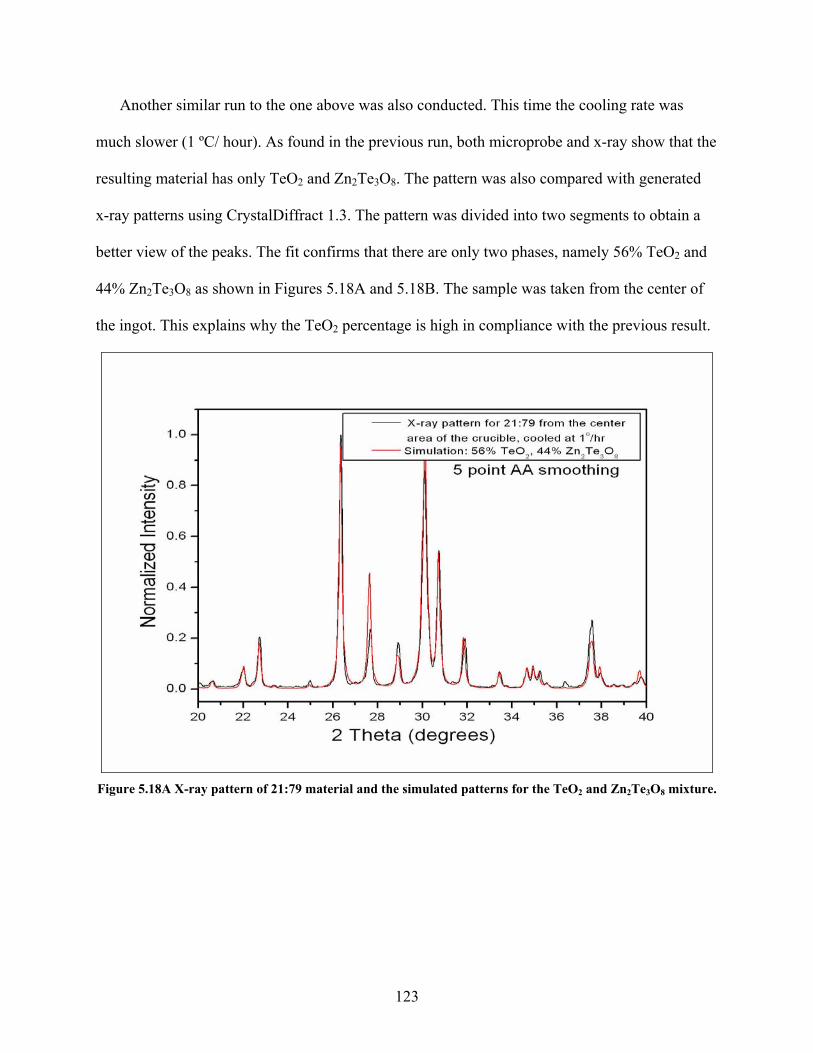
Another similar run to the one above was also conducted. This time the cooling rate was
much slower (1 ºC/ hour). As found in the previous run, both microprobe and x-ray show that the
resulting material has only TeO2 and Zn2Te3O8. The pattern was also compared with generated
x-ray patterns using CrystalDiffract 1.3. The pattern was divided into two segments to obtain a
better view of the peaks. The fit confirms that there are only two phases, namely 56% TeO2 and
44% Zn2Te3O8 as shown in Figures 5.18A and 5.18B. The sample was taken from the center of
the ingot. This explains why the TeO2 percentage is high in compliance with the previous result.
Figure 5.18A X-ray pattern of 21:79 material and the simulated patterns for the TeO2 and Zn2Te3O8 mixture.
123
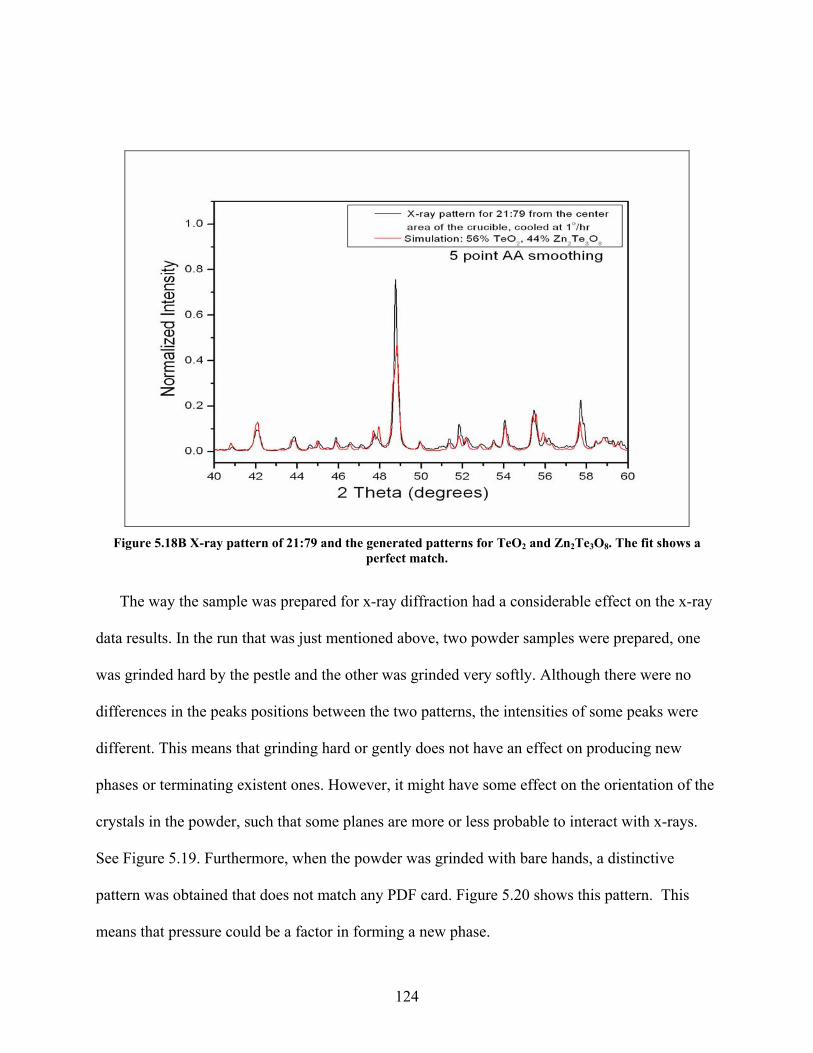
Figure 5.18B X-ray pattern of 21:79 and the generated patterns for TeO2 and Zn2Te3O8. The fit shows a
perfect match.
The way the sample was prepared for x-ray diffraction had a considerable effect on the x-ray
da
nsities of some peaks were
ifferent. This means that grinding hard or gently does not have an effect on producing new
hases or terminating existent ones. However, it might have some effect on the orientation of the
crystals in the powder, such that some planes are more or less probable to interact with x-rays.
See Figure 5.19. Furthermore, when the powder was grinded with bare hands, a distinctive
pattern was obtained that does not match any PDF card. Figure 5.20 shows this pattern. This
means that pressure could be a factor in forming a new phase.
ta results. In the run that was just mentioned above, two powder samples were prepared, one
was grinded hard by the pestle and the other was grinded very softly. Although there were no
differences in the peaks positions between the two patterns, the inte
d
p
124
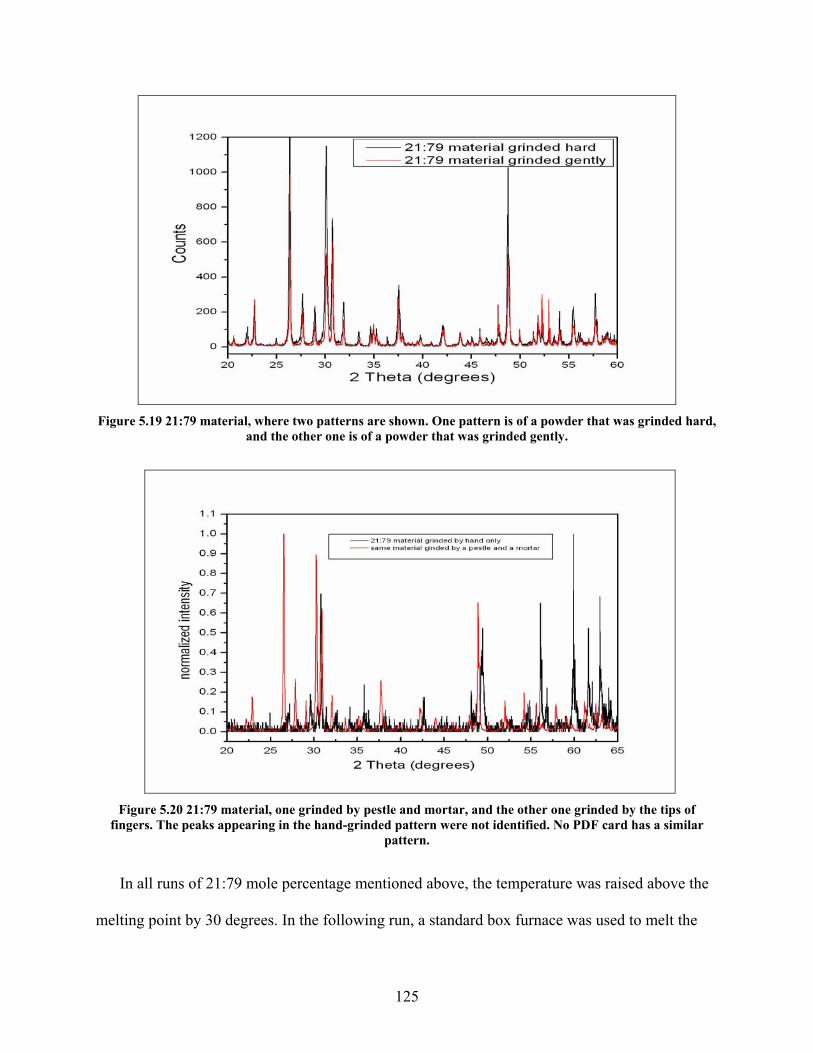
Figure 5.19 21:79 material, where two patterns are shown. One pattern is of a powder that was grinded hard,
and the other one is of a powder that was grinded gently.
fpattern.
was used to melt the
Figure 5.20 21:79 material, one grinded by pestle and mortar, and the other one grinded by the tips of ingers. The peaks appearing in the hand-grinded pattern were not identified. No PDF card has a similar
In all runs of 21:79 mole percentage mentioned above, the temperature was raised above the
melting point by 30 degrees. In the following run, a standard box furnace
125
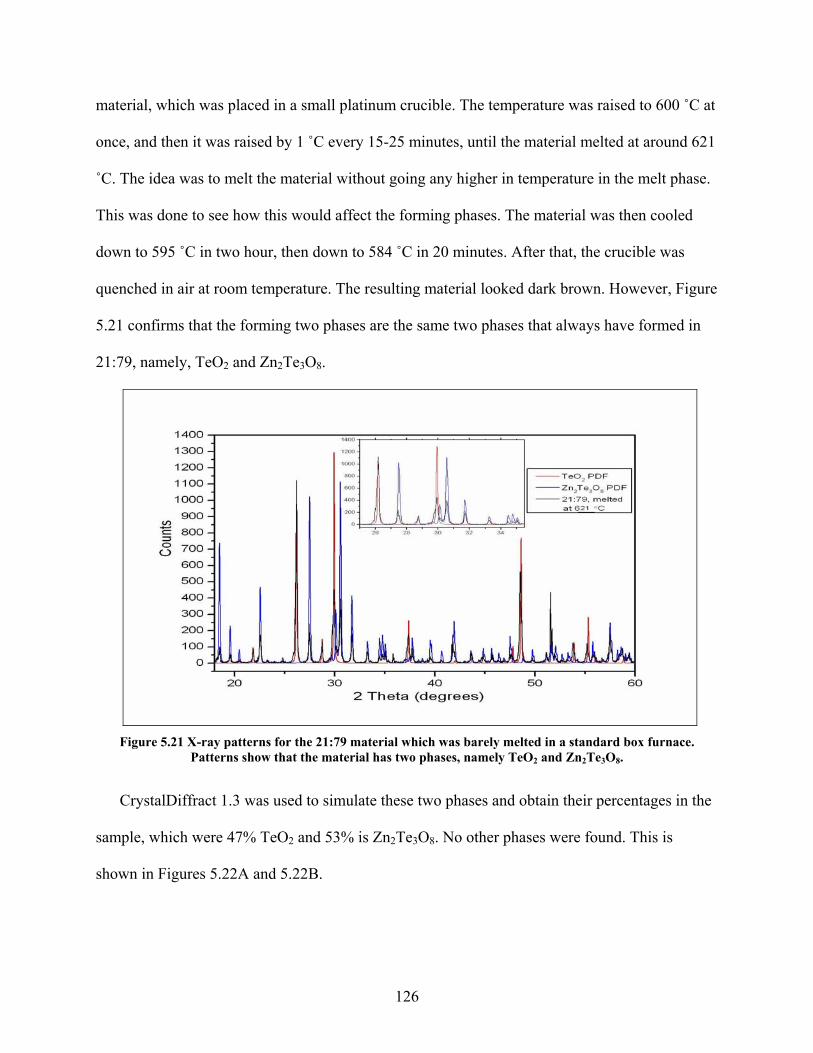
material, which was placed in a small platinum crucible. The temperature was raised to 600 ˚C at
elt the material without going any higher in temperature in the melt phase.
this would affect the forming phases. The material was then cooled
dow
ooked dark brown. However, Figure
5.21 confirms that the forming two phases are the same two phases that always have formed in
21:79, namely, TeO2 and Zn2Te3O8.
once, and then it was raised by 1 ˚C every 15-25 minutes, until the material melted at around 621
˚C. The idea was to m
This was done to see how
n to 595 ˚C in two hour, then down to 584 ˚C in 20 minutes. After that, the crucible was
quenched in air at room temperature. The resulting material l
Figure 5.21 X-ray patterns for the 21:79 material which was barely melted in a standard box furnace.
CrystalDiffract 1.3 was used to simulate these r percentages in the
samp
Patterns show that the material has two phases, namely TeO2 and Zn2Te3O8.
two phases and obtain thei
le, which were 47% TeO2 and 53% is Zn2Te3O8. No other phases were found. This is
shown in Figures 5.22A and 5.22B.
126
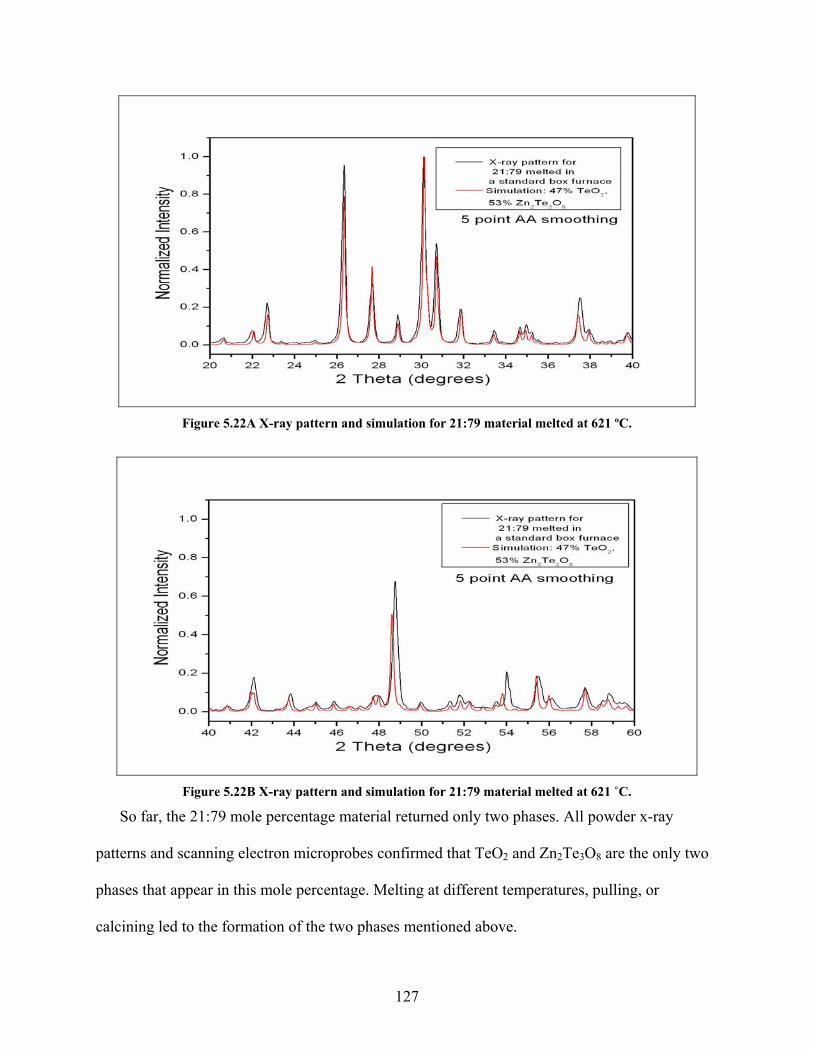
Figure 5.22A X-ray pattern and simulation for 21:79 material melted at 621 ºC.
Figure 5.22B X-ray pattern and simulation for 21:79 material melted at 621 ˚C.
So far, the 21:79 mole percentage material returned only two phases. All powder x-ray
patterns and scannin 8 are the only two
hases that appear in this mole percentage. Melting at different temperatures, pulling, or
alcining led to the formation of the two phases mentioned above.
g electron microprobes confirmed that TeO2 and Zn2Te3O
p
c
127
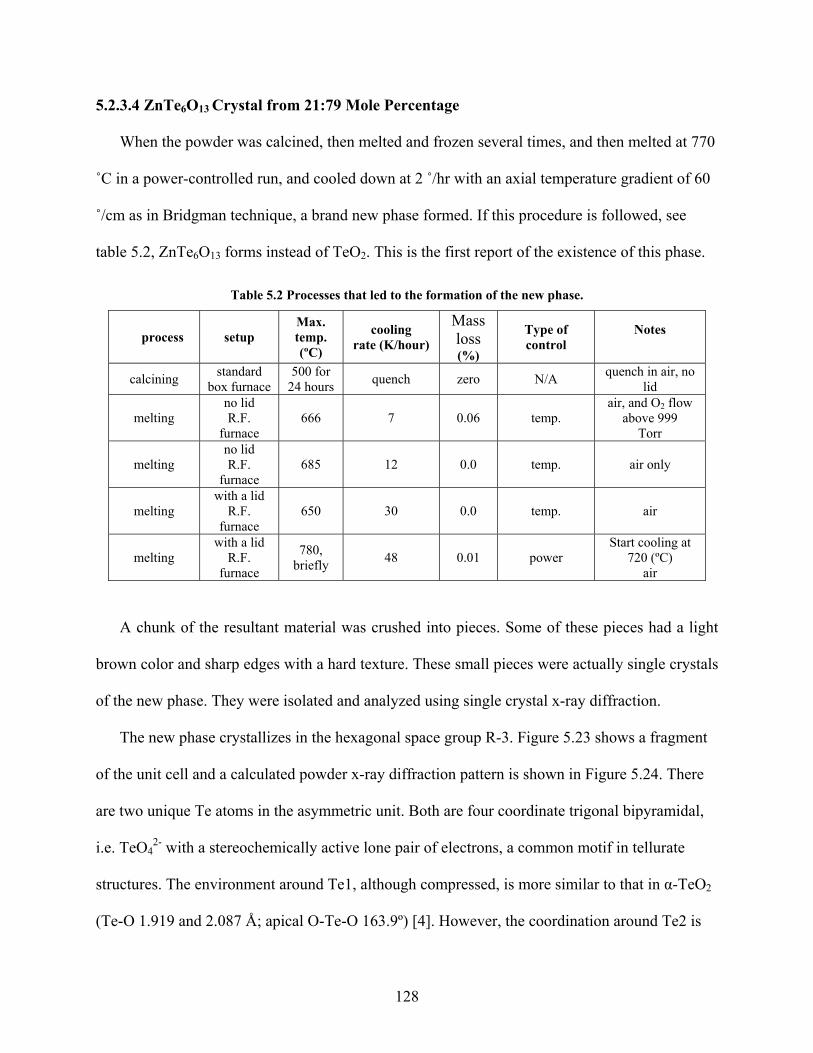
5.2.3.4 ZnTe6O13 C
When the powder was calcined, then melt se es, t 770
˚C in a power-controlled run, and cooled down at 2 t of 60
˚/cm as in Bridgman t ique, a br new phas ed. If this procedure is followed, see
table O13 fo instead o O2. This i irst repo
Max. Mass
(%)
rystal from 21:79 Mole Percentage
ed and frozen veral tim and then melted a
˚/hr with an axial temperature gradien
echn and e form
5.2, ZnTe6 rms f Te s the f rt of the existence of this phase.
Table 5.2 Processes that led to the formation of the new phase.
process setup temp. (ºC)
cooling rate (K/hour) loss
Type of control
Notes
calcining standard box furnace
500 for 24 hours quench zero N/A quench in air, no
lid
melting n lid R.F. 666 7 0.06 temp.
air, and Oo
furnace Torr
2 flow above 999
melting R.F. 685 12 0.0 temp. air only no lid
furnace
melting
R.F. furnace
650 30 0.0 temp. air with a lid
melting with a lid
R.F. furnace
780, briefly 48 0.01 power
Start cooling at 720 (ºC)
air
A chunk of the resultant material was crushed into pieces. Some of these pieces had a light
brown color and sharp edges with a hard texture. These small pieces were actually single crystals
of the new phase. They were isolated and analyzed using single crystal x-ray diffraction.
The new phase crystallizes in the hexagonal space group R-3. Figure 5.23 shows a fragment
of the unit cell and a calculated powder x-ray diffraction pattern is shown in Figure 5.24. There
are two unique Te atoms in the asymmetric unit. Both are four coordinate trigonal bipyramidal,
i.e. TeO42- with a stereochemically active lone pair of electrons, a common motif in tellurate
structures. The environment around Te1, although compressed, is more similar to that in α-TeO2
(Te-O 1.919 and 2.08 ion around Te2 is 7 Å; apical O-Te-O 163.9º) [4]. However, the coordinat
128
similar to the TeO3+1 coordination of e.g. CuTe2O [5] and CuTe3O8 [6] with three Te-O
istances 1.857(4), 1.922(4), 2.026(4)Å, and the fourth significantly longer at 2.204(4)Å. The
coordination sphere around the Zn atom is a highly distorted octahedron with trans O-Zn-O
angles of ca. 163º. Three of the oxygen atoms are linked to Te1 units and the other three are
linked to Te2 units. The three Te2 units and the Zn1 form an adamantly type substructure. The
three Te1 units and Zn1 form a “paddle wheel” arrangement with oxygen bridged O2-Te1-O2
atoms (see Figure 5.23). The complete packing superstructure is shown in appendix 4 and
consists of a bilayer of tellurium oxide linked by the Te1-O2 bridging units. These bilayers are
connected via the Zn atoms. Table 5.3 shows Summary of input positional parameter data.
Crystal data and refinement parameters can be found in table 5.4. More information about the
crystal structure and bonding can be found in appendix 4.
5
d
129
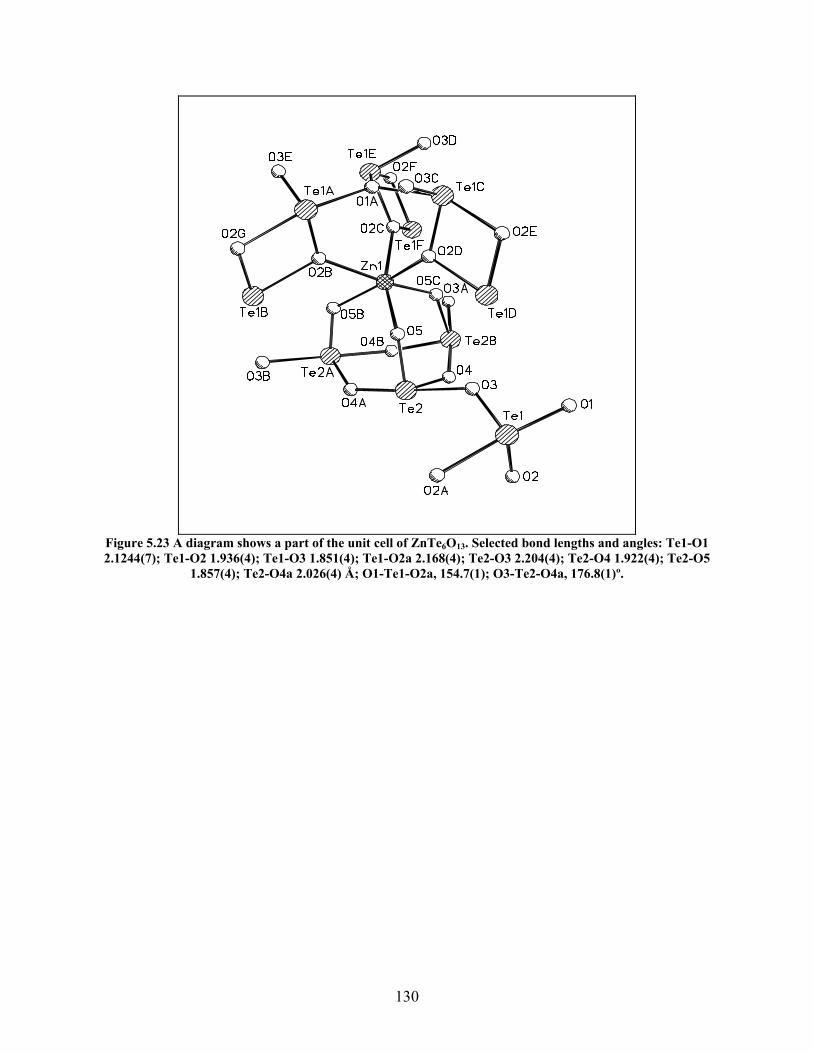
Figure 5.23 A diagram shows a part of the unit cell of ZnTe6O13. Selected bond lengths and angles: Te1-O1 2.1244(7); Te1-O2 1.936(4); Te1-O3 1.851(4); Te1-O2a 2.168(4); Te2-O3 2.204(4); Te2-O4 1.922(4); Te2-O5
1.857(4); Te2-O4a 2.026(4) Å; O1-Te1-O2a, 154.7(1); O3-Te2-O4a, 176.8(1)º.
130
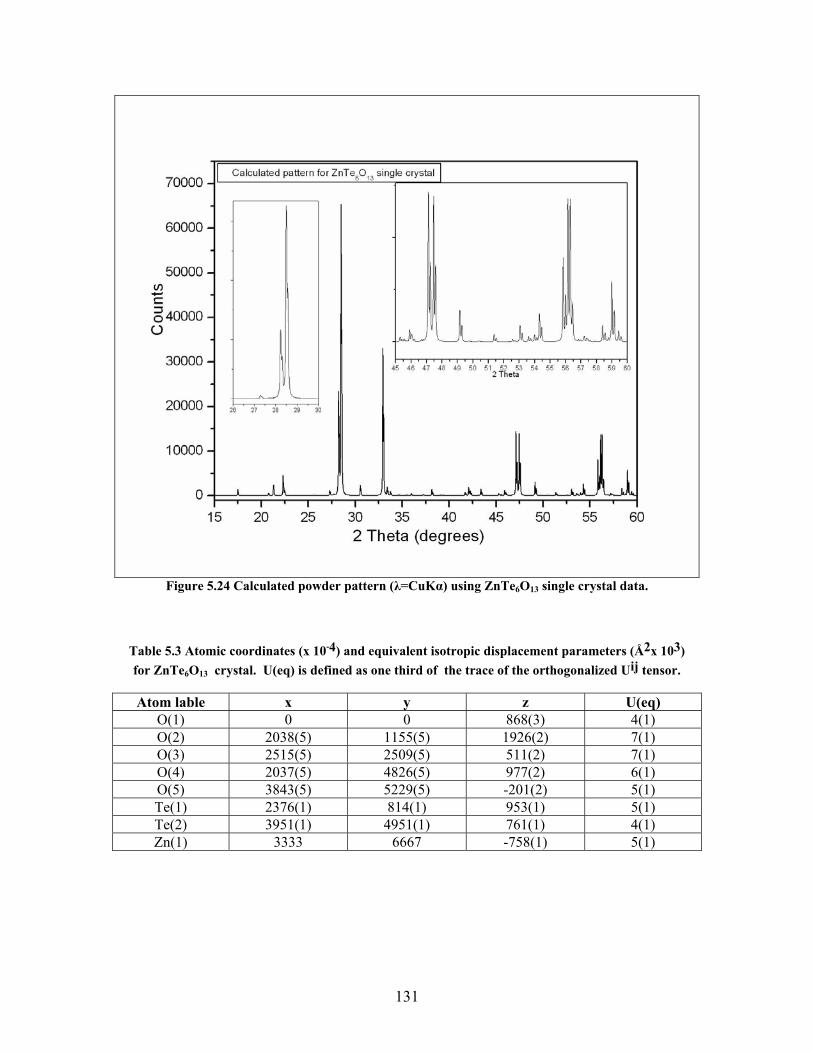
Figure 5.24 Calculated powder pattern (λ=CuKα) using ZnTe6O13 single crystal data.
Table 5.3 Atomic coordinates (x 10
for ZnTe O crystal. U(eq) is defined as one third of the trace of the orthogonalized Uij tensor.
Atom lable x y z U(eq)
-4) and equivalent isotropic displacement parameters (Å2x 10³) 6 13
O(1) 0 0 868(3) 4(1) O(2) 2038(5) 1155(5) 1926(2) 7(1) O(3) 2515(5) 2509(5) 511(2) 7(1) O(4) 2037(5) 4826(5) 977(2) 6(1) O(5) 3843(5) 5229(5) -201(2) 5(1) Te(1) 2376(1) 814(1) 953(1) 5(1) Te(2) 3951(1) 4951(1) 761(1) 4(1) Zn(1) 3333 6667 -758(1) 5(1)
131
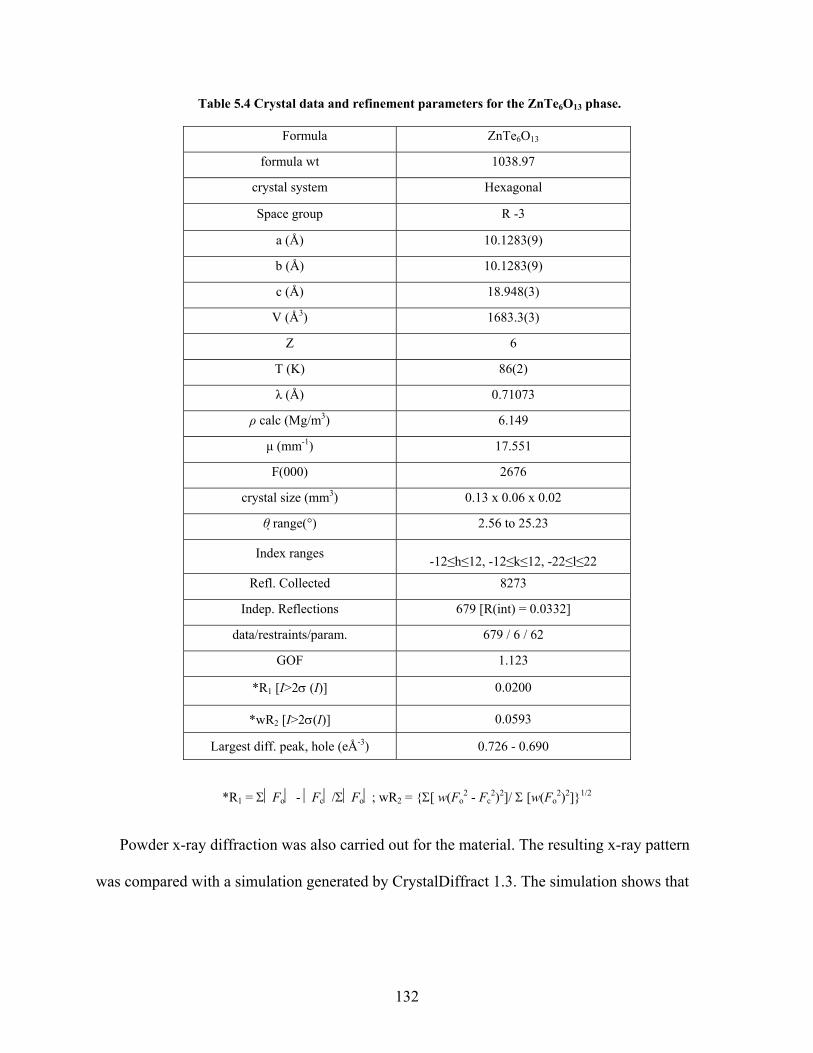
Table 5.4 Crystal data and refinement parameters for the ZnTe6O13 phase.
Formula ZnTe6O13
formula wt 1038.97
crystal system Hexagonal
Space group R -3
a (Å) 10.1283(9)
b (Å) 10.1283(9)
c (Å) 18.948(3)
V (Å3) 1683.3(3)
Z 6
T (K) 86(2)
λ (Å) 0.71073
ρ calc (Mg/m3) 6.149
µ (mm-1) 17.551
F(000) 2676
crystal size (mm3) 0.13 x 0.06 x 0.02
θ range(°) 2.56 to 25.23
Index ranges -12≤h≤12, -12≤k≤12, -22≤l≤22 Refl. Coll 8ected 273
Indep. Refle 9 [R(int) = 0.033ctions 67 2]
da traints/ . 679 / 6 / ta/res param 62
GOF 1.123
*R1 [I>2σ (I)] 0.0200
*wR2 [I>2σ( )] 0.0593 I
Larges . peak, Å-3) 0.726 - t diff hole (e 0.690
1 = ΣFo - ΣFo; wR Σ F 2 - Fc2)2]/ Σ
Powder x-ray diffraction was also carried out for the material. Th
was compared with a simulation generated b
*R Fc / 2 = [ w( o [w(Fo
e resulting x-ray pattern
2)2]1/2
y CrystalDiffract 1.3. The simulation shows that
132
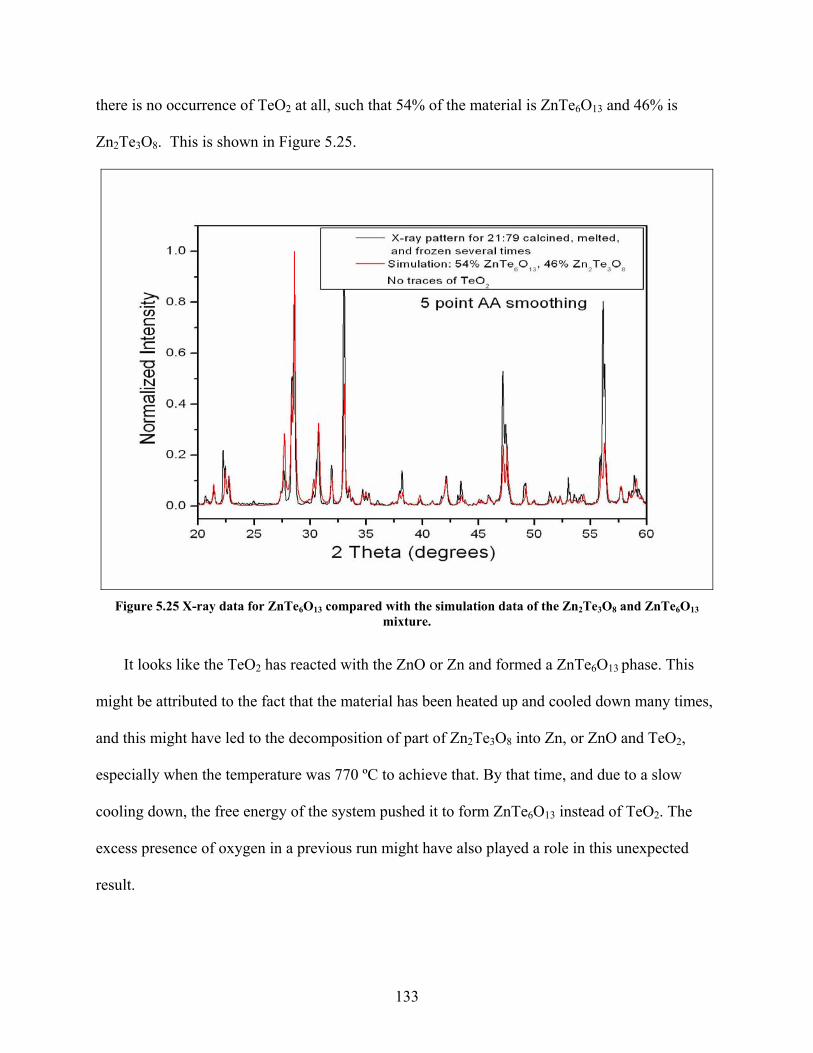
there is no o e o O2 at uch th aterial is
Z O8. T ow Figu 25.
ccurrenc f Te all, s at 54% of the m ZnTe6O13 and 46% is
n2Te3 his is sh n in re 5.
Figure 5.25 X da Te6O13 compared with tion data of the Zn2Te d Zn
u
It lik e Te as re wit ZnO Zn an ormed a ZnTe6 ha
might be attributed to the ma has hea up and led d n ma
2Te3 8 into , or ZnO and Te
especially when the temperature was 770 ºC to achieve that. By that ti , and due to a sl
li n, t free e y of yste shed o for nTe6O stea TeO2
excess presence of oxygen in a previous run might h e also layed a role in this unex
resu
-ray ta for Zn the simula 3O a8 n Te6O13 mixt re.
looks e th O2 h a dcte h the or d f O13 p se. This
fact that the terial been ted coo ow n s, y time
and this might have led to the decomposition of part of Zn O Zn O , 2
me ow
coo ng dow he nerg the s m pu it t m Z 13 in d of . The
av p pected
lt.
133
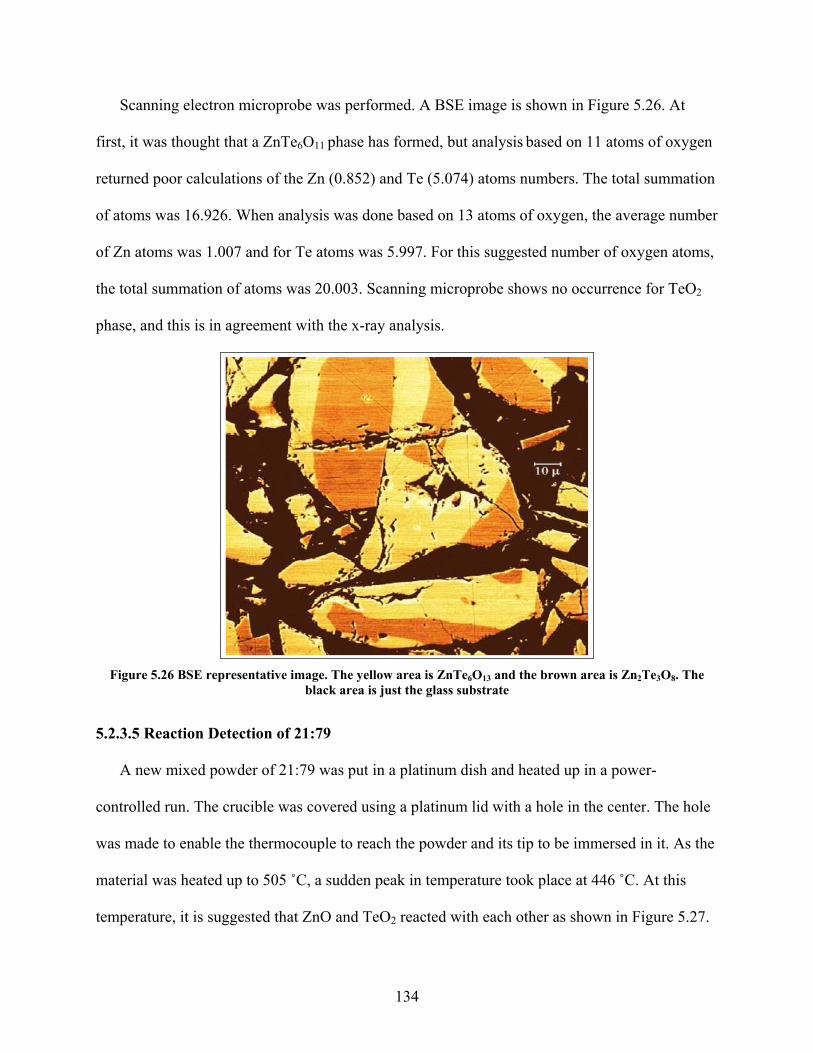
Scanning electron microprobe was performed. A BSE image is shown in Figure 5.26. At
first, it was thought that 6O phase has formed, but analysis based on 11 atom
return r c lat the Z (0.85 d Te .074) s num rs. The total summation
oms of oxygen, the average number
of Zn atoms was 1.007 and for Te atoms was 5.997. For this suggested number of oxygen atoms,
s was 20.003. Scanning microprobe shows no occurrence for TeO2
phase, and this is in agreement with the x-ray analysis.
a ZnTe 11 s of oxygen
ed poo alcu ions of n 2) an (5 atom be
of atoms was 16.926. When analysis was done based on 13 at
the total summation of atom
Figure 5.26 BSE representative image. The yellow area is ZnTe6O13 and the brown area is Zn2Te3O8. The
black area is just the glass substrate
2
5.2.3.5 Reaction Detection of 21:79
A new mixed powder of 21:79 was put in a platinum dish and heated up in a power-
controlled run. The crucible was covered using a platinum lid with a hole in the center. The hole
was made to enable the thermocouple to reach the powder and its tip to be immersed in it. As the
material was heated up to 505 ˚C, a sudden peak in temperature took place at 446 ˚C. At this
temperature, it is suggested that ZnO and TeO reacted with each other as shown in Figure 5.27.
134
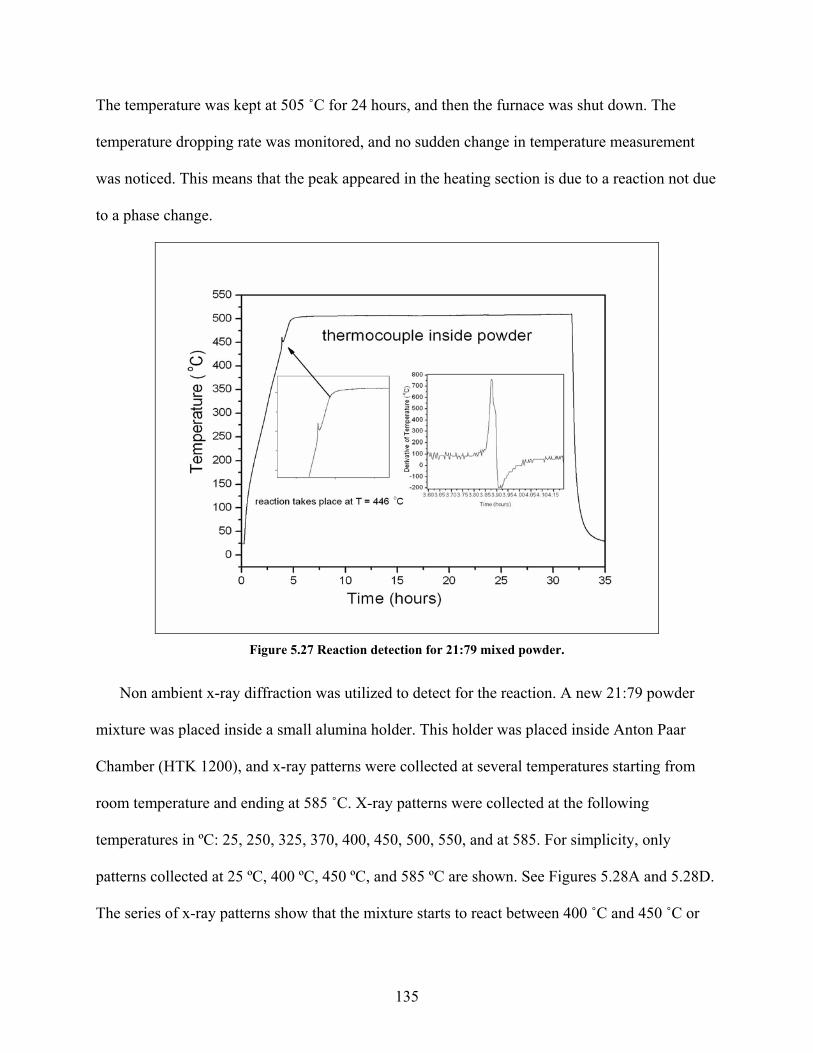
The temperature was kept at 505 ˚C for 24 hours, and then the furnace was shut down. The
temperature dropping rate was monitored, and no sudden change in temperature measurement
was noticed. This means that the peak appeared in the heating section is due to a reaction not due
to a phase change.
Figure 5.27 Reaction detection for 21:79 mixed powder.
Non ambient x-ray diffraction was utilized to detect for the reaction. A new 21:79 powder
holder was placed inside Anton Paar
rns were collected at several temperatures starting from
ing
.
ow that the mixture starts to react between 400 ˚C and 450 ˚C or
mixture was placed inside a small alumina holder. This
Chamber (HTK 1200), and x-ray patte
room temperature and ending at 585 ˚C. X-ray patterns were collected at the follow
temperatures in ºC: 25, 250, 325, 370, 400, 450, 500, 550, and at 585. For simplicity, only
patterns collected at 25 ºC, 400 ºC, 450 ºC, and 585 ºC are shown. See Figures 5.28A and 5.28D
The series of x-ray patterns sh
135
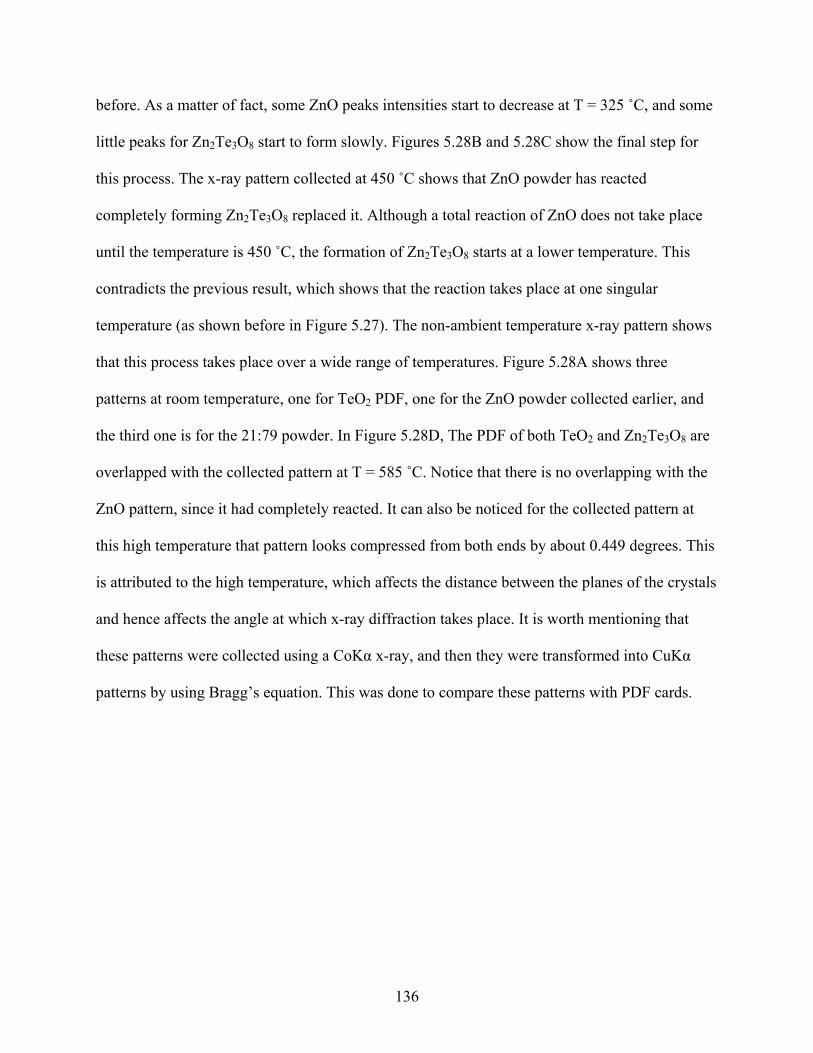
before. As a matter of fact, some ZnO peaks intensities start to decrease at T = 325 ˚C, and some
little peaks for Zn2Te3O8 start to form slowly. Figures 5.28B and 5.28C show the final step for
this process. The x-ray pattern collected at 450 ˚C shows that ZnO powder has reacted
completely forming Zn2Te3O8 replaced it. Although a total reaction of ZnO does not take place
until the temperature is 450 ˚C, the formation of Zn2Te3O8 starts at a lower temperature. This
contradicts the previous result, which shows that the reaction takes place at one singular
temperature (as shown before in Figure 5.27). The non-ambient temperature x-ray pattern shows
that this process takes place over a wide range of temperatures. Figure 5.28A shows three
p
e e
with the
ing that
atterns at room temperature, one for TeO2 PDF, one for the ZnO powder collected earlier, and
th third one is for the 21:79 powder. In Figure 5.28D, The PDF of both TeO2 and Zn2Te3O8 ar
overlapped with the collected pattern at T = 585 ˚C. Notice that there is no overlapping
ZnO pattern, since it had completely reacted. It can also be noticed for the collected pattern at
this high temperature that pattern looks compressed from both ends by about 0.449 degrees. This
is attributed to the high temperature, which affects the distance between the planes of the crystals
and hence affects the angle at which x-ray diffraction takes place. It is worth mention
these patterns were collected using a CoKα x-ray, and then they were transformed into CuKα
patterns by using Bragg’s equation. This was done to compare these patterns with PDF cards.
136
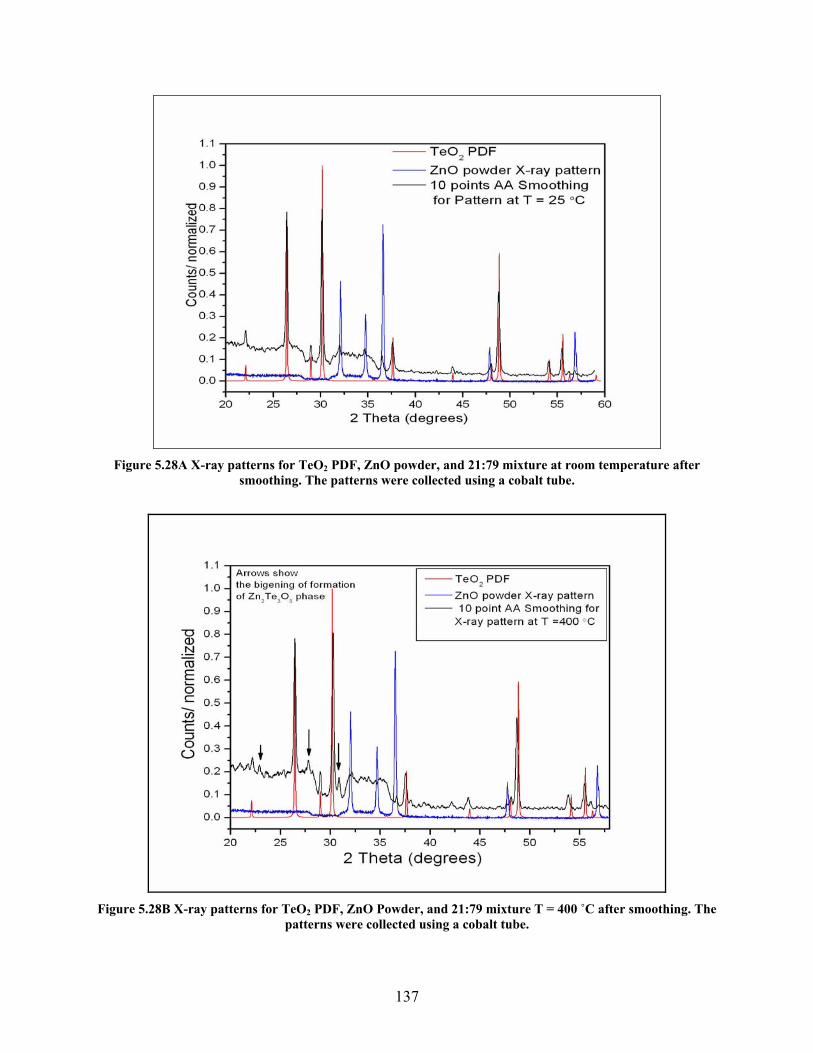
smoothing. The patterns were collected using a cobalt tube. Figure 5.28A X-ray patterns for TeO2 PDF, ZnO powder, and 21:79 mixture at room temperature after
Figure 5.28B X-ray patterns for TeO2 PDF, ZnO Powder, and 21:79 mixture T = 400 ˚C after smoothing. The
patterns were collected using a cobalt tube.
137
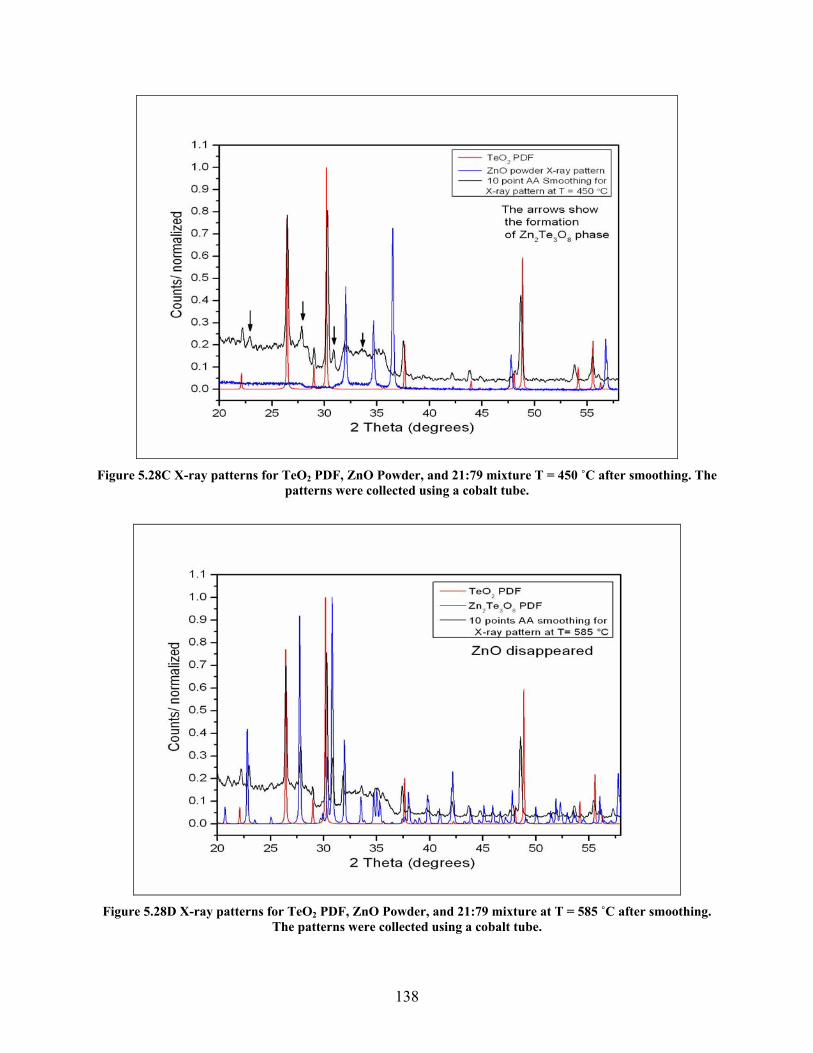
Figure 5.28C X-ray patterns for TeO2 PDF, ZnO Powder, and 21:79 mixture T = 450 ˚C after smoothing. The
patterns were collected using a cobalt tube.
Figure 5.28D X-ray patterns for TeO2 PDF, ZnO Powder, and 21:79 mixture at T = 585 ˚C after smoothing.
The patterns were collected using a cobalt tube.
138
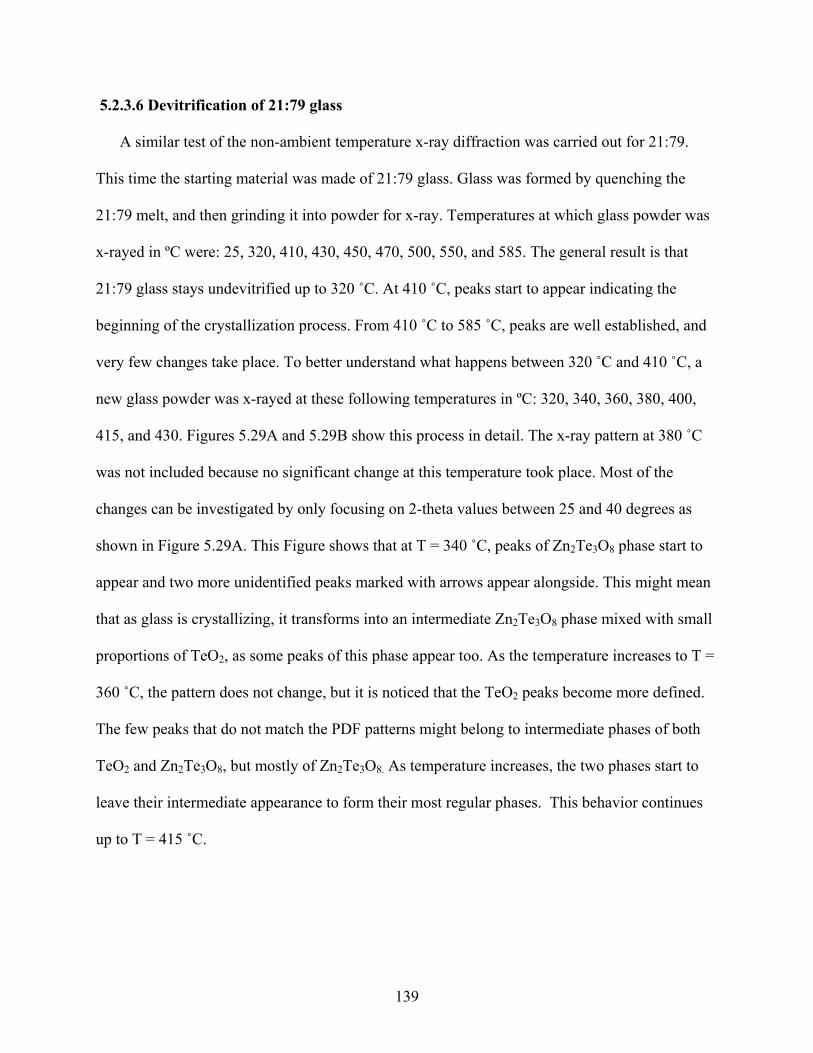
5.2
t
s undevitrified up to 320 ˚C. At 410 ˚C, peaks start to appear indicating the
beg
, a
s temperature took place. Most of the
changes can be investigated by only focusing on 2-theta values between 25 and 40 degrees as
shown in Figure 5.29A. This Figure shows that at T = 340 ˚C, peaks of Zn2Te3O8 phase start to
appear and two more unidentified peaks marked with arrows appear alongside. This might mean
that as glass is crystallizing, it transforms into an intermediate Zn2Te3O8 phase mixed with small
proportions of TeO2, as some peaks of this phase appear too. As the temperature increases to T =
360 ˚C, the pattern does not change, but it is noticed that the TeO2 peaks become more defined.
The few peaks that do not match the PDF patterns might belong to intermediate phases of both
TeO2 and Zn2Te3O8, but mostly of Zn2Te3O8. As temperature increases, the two phases start to
leave their intermediate appearance to form their most regular phases. This behavior continues
p to T = 415 ˚C.
.3.6 Devitrification of 21:79 glass
A similar test of the non-ambient temperature x-ray diffraction was carried out for 21:79.
This time the starting material was made of 21:79 glass. Glass was formed by quenching the
21:79 melt, and then grinding it into powder for x-ray. Temperatures at which glass powder was
x-rayed in ºC were: 25, 320, 410, 430, 450, 470, 500, 550, and 585. The general result is tha
21:79 glass stay
inning of the crystallization process. From 410 ˚C to 585 ˚C, peaks are well established, and
very few changes take place. To better understand what happens between 320 ˚C and 410 ˚C
new glass powder was x-rayed at these following temperatures in ºC: 320, 340, 360, 380, 400,
415, and 430. Figures 5.29A and 5.29B show this process in detail. The x-ray pattern at 380 ˚C
was not included because no significant change at thi
u
139
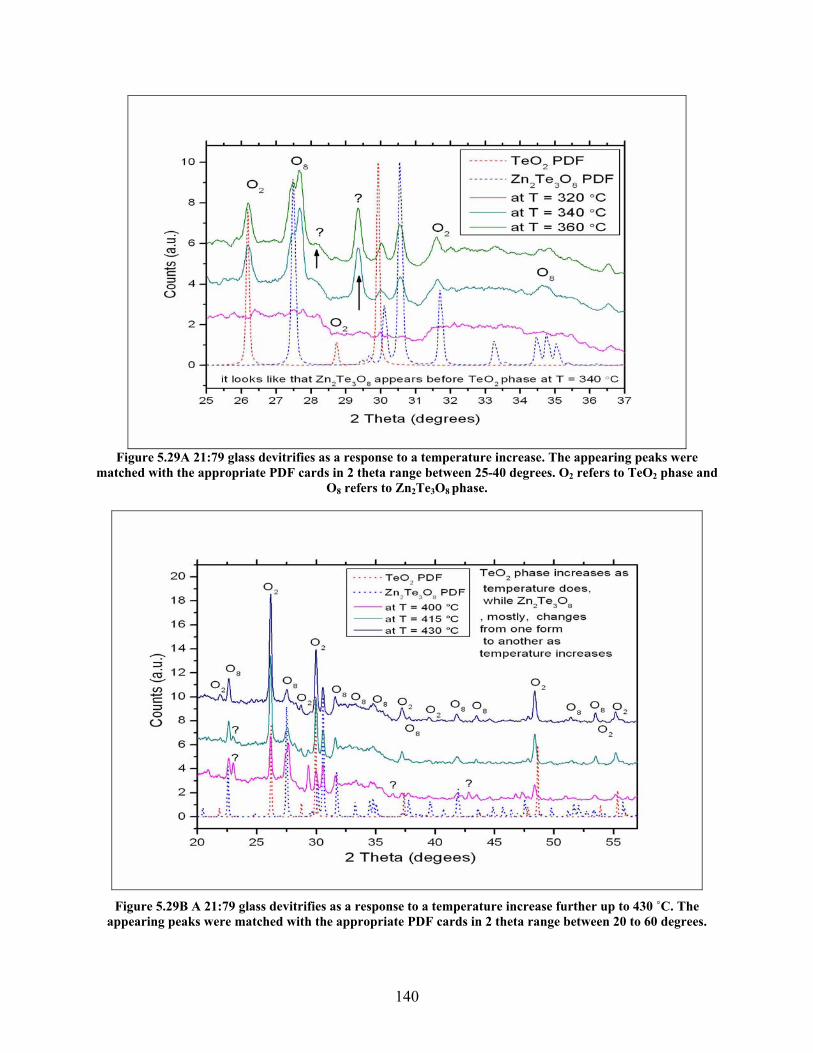
were hase and
8 refers to Zn2Te3O8 phase.
Figure 5.29A 21:79 glass devitrifies as a response to a temperature increase. The appearing peaksmatched with the appropriate PDF cards in 2 theta range between 25-40 degrees. O2 refers to TeO2 p
O
Figure 5.29B A 21:79 glass devitrifies as a response to a temperature increase further up to 430 ˚C. The
appearing peaks were matched with the appropriate PDF cards in 2 theta range between 20 to 60 degrees.
140
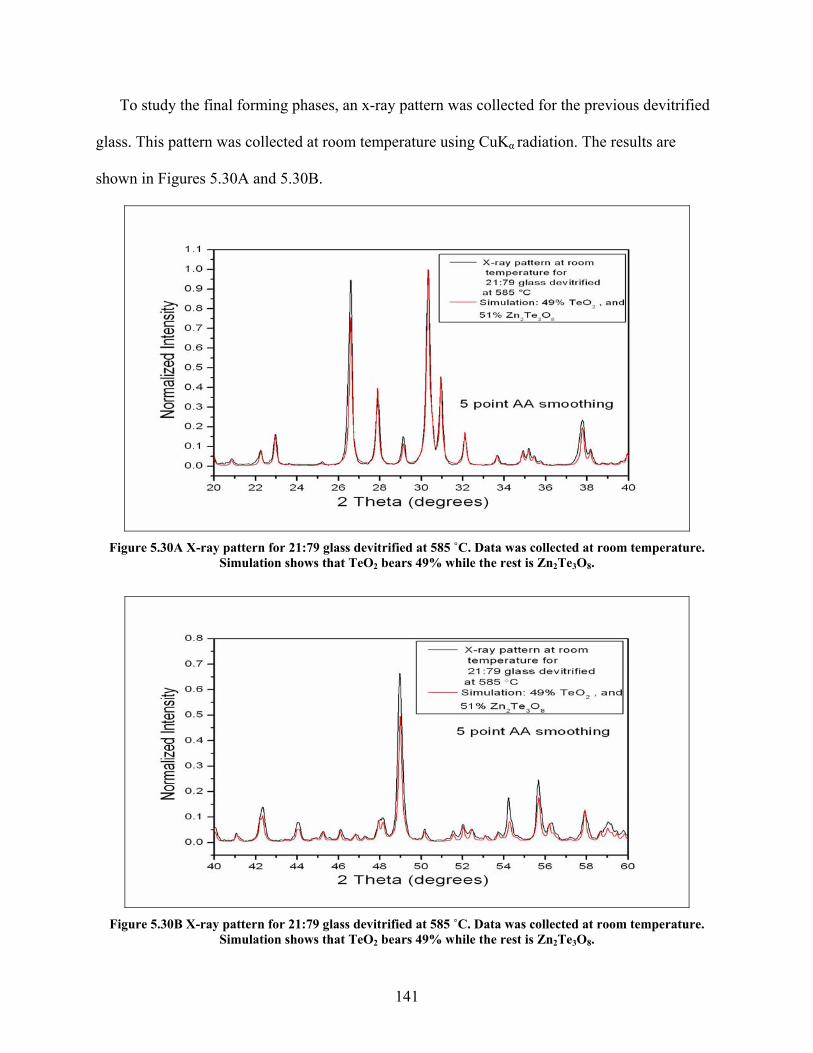
To study the final forming phases, an x-ray pattern was collected for the previous devitrified
glass. This pattern was collected at room temperature using CuKα radiation. The results are
shown in Figures 5.30A and 5.30B.
SFigure 5.30A X-ray pattern for 21:79 glass devitrified at 585 ˚C. Data was collected at room temperature.
imulation shows that TeO2 bears 49% while the rest is Zn2Te3O8.
Figure 5.30B X-ray pattern for 21:79 glass devitrifie at 585 ˚C. Data was collected at room temperature.
Simulation shows that TeO2 bear 49% while the rest is Zn2Te3O8. d s
141
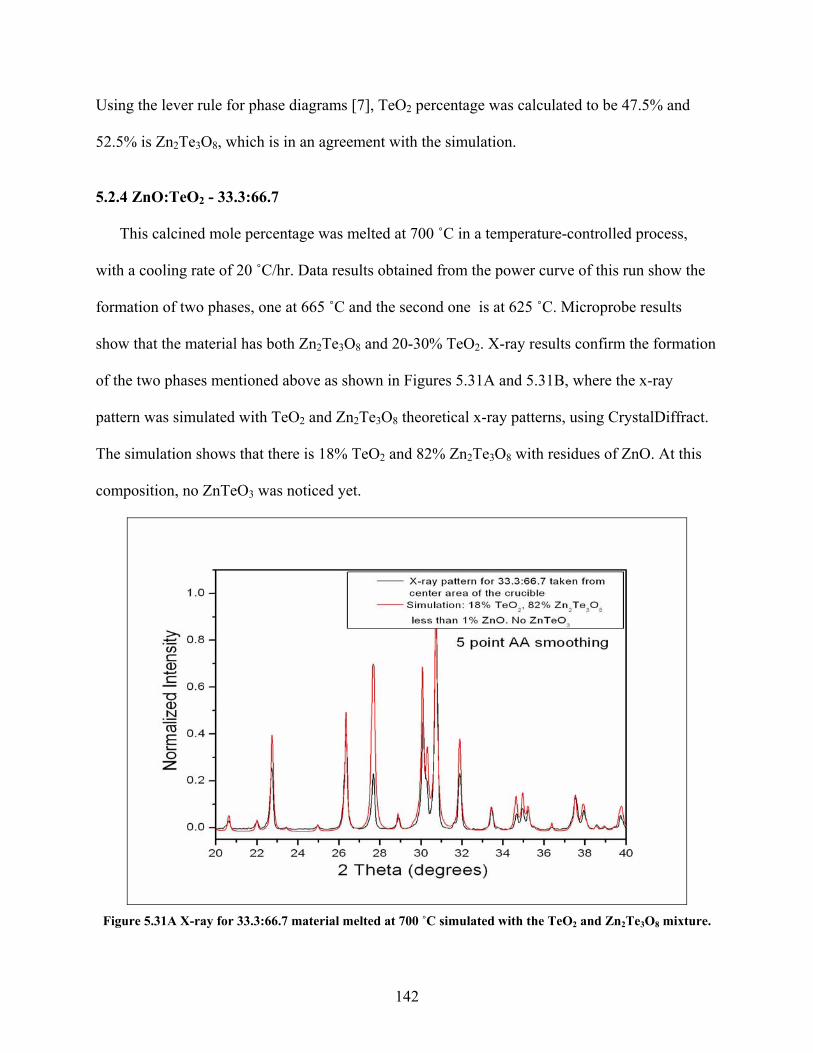
Using the lever rule for phase diagrams [7], TeO tage was calculated to be 47.5% and
52.5% is Zn2Te3O8, which is in an agreement with the simulation.
5.2.4 ZnO:TeO2 - 33.3:66.7
This calcined mole percentage was melted at 700 ˚C in a temperature-controlled process,
with a cooling rate of 20 ˚C/hr. Data results obtained from the power curve of this run show the
formation of two phases, one at 665 ˚C and the second one is at 625 ˚C. Microprobe results
show that the material has both Zn2Te3O8 and 20-30% TeO2. X-ray results confirm the formation
of the two phases mentioned above as shown in Figures 5.31A and 5.31B, where the x-ray
pattern was simulated with TeO2 and Zn2Te3O8 theoretical x-ray patterns, using CrystalDiffract.
The simulation shows that there is 18% TeO2 and 82% Zn2Te3O8 with residues of ZnO. At this
composition, no ZnTeO3 was noticed yet.
2 percen
Figure 5.31A X-ray for 33.3:66.7 material melted at 700 ˚C simulated with the TeO2 and Zn2Te3O8 mixture.
142
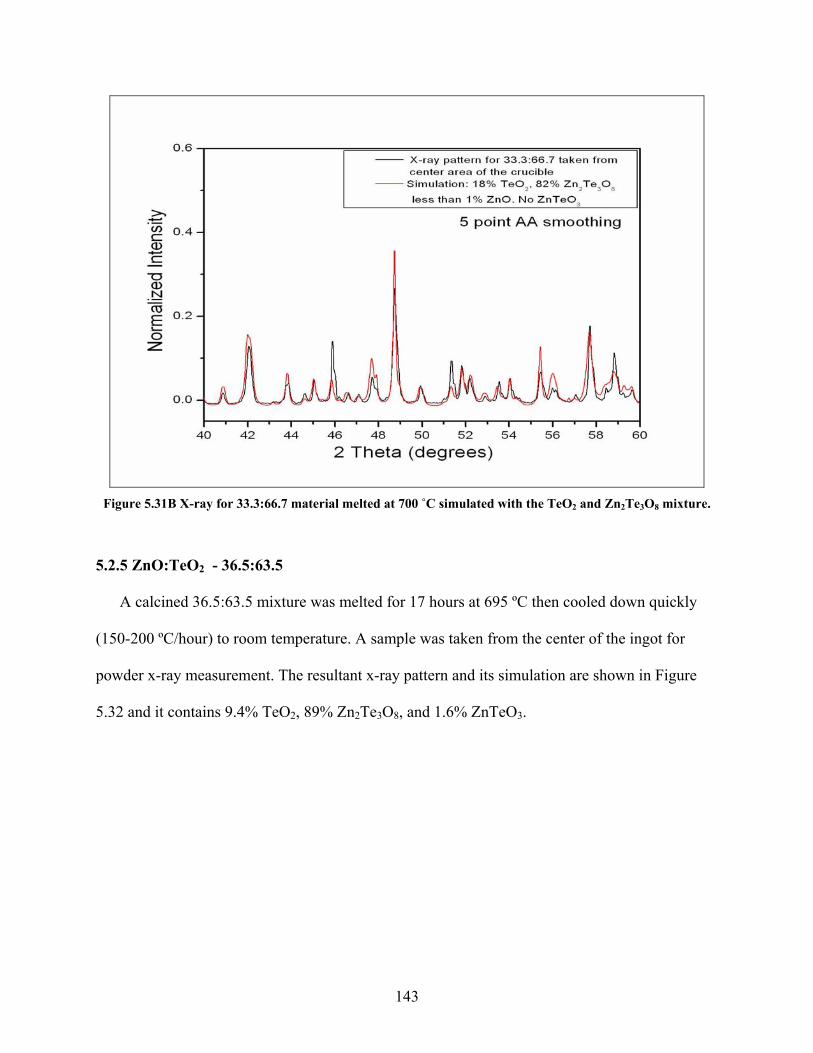
Figure 5.31B X-ray for 33.3:66.7 material melted at 700 ˚C simulated with the TeO2 and Zn2Te3O8 mixture.
5.2.5 ZnO:TeO - 36.5:63.5
A calcined 36.5:63.5 mixture was melted for 17 hours at 695 ºC then cooled down quickly
(150-200 ºC/hour) to room temperature. A sample was taken from the center of the ingot for
powder x-ray measurement. The resultant x-ray pattern and its simulation are shown in Figure
5.32 and it contains 9.4% TeO2, 89% Zn2Te3O8, and 1.6% ZnTeO3.
2
143
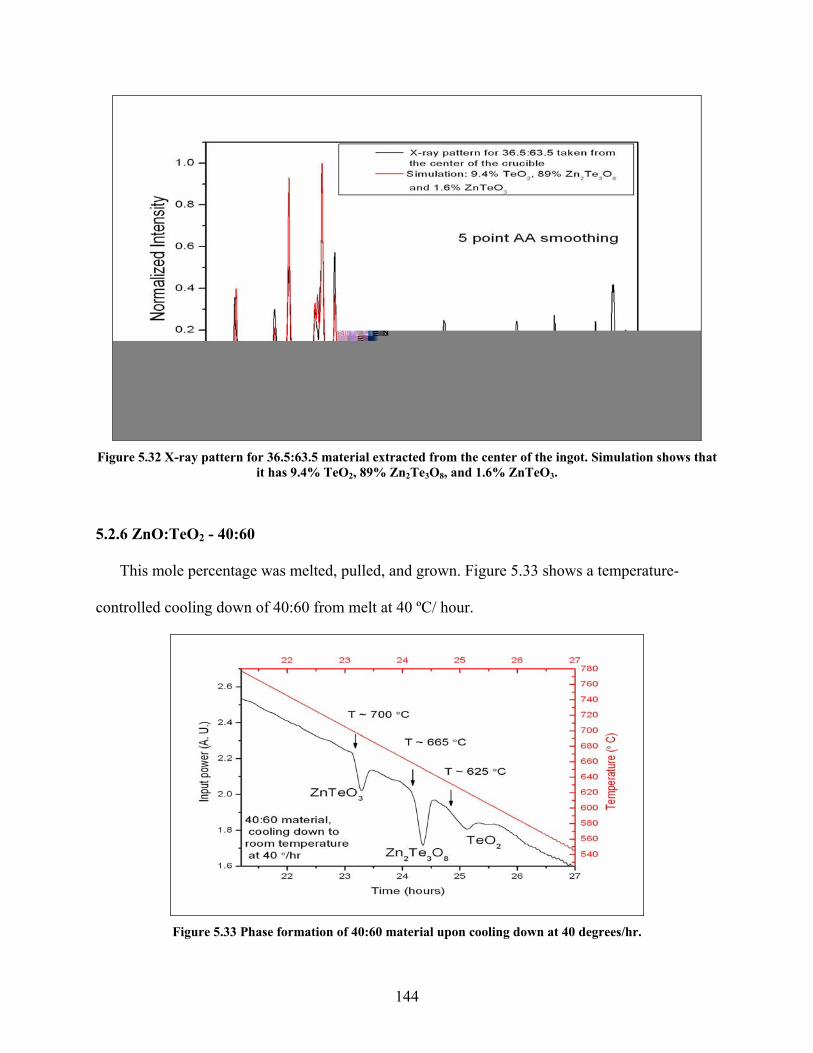
it has 9.4% TeOFigure 5.32 X-ray pattern for 36.5:63.5 material extracted from the center of the ingot. Simulation shows that
5.2.6 Zn
This m elted, pulled, and grown. Figure 5.33 shows a tem
controlled cooling down of 40:60
2, 89% Zn2Te3O8, and 1.6% ZnTeO3.
O:TeO2 - 40:60
ole percentage was m perature-
from melt at 40 ºC/ hour.
Figure 5.33 Phase formation of 40:60 material upon cooling down at 40 degrees/hr.
144
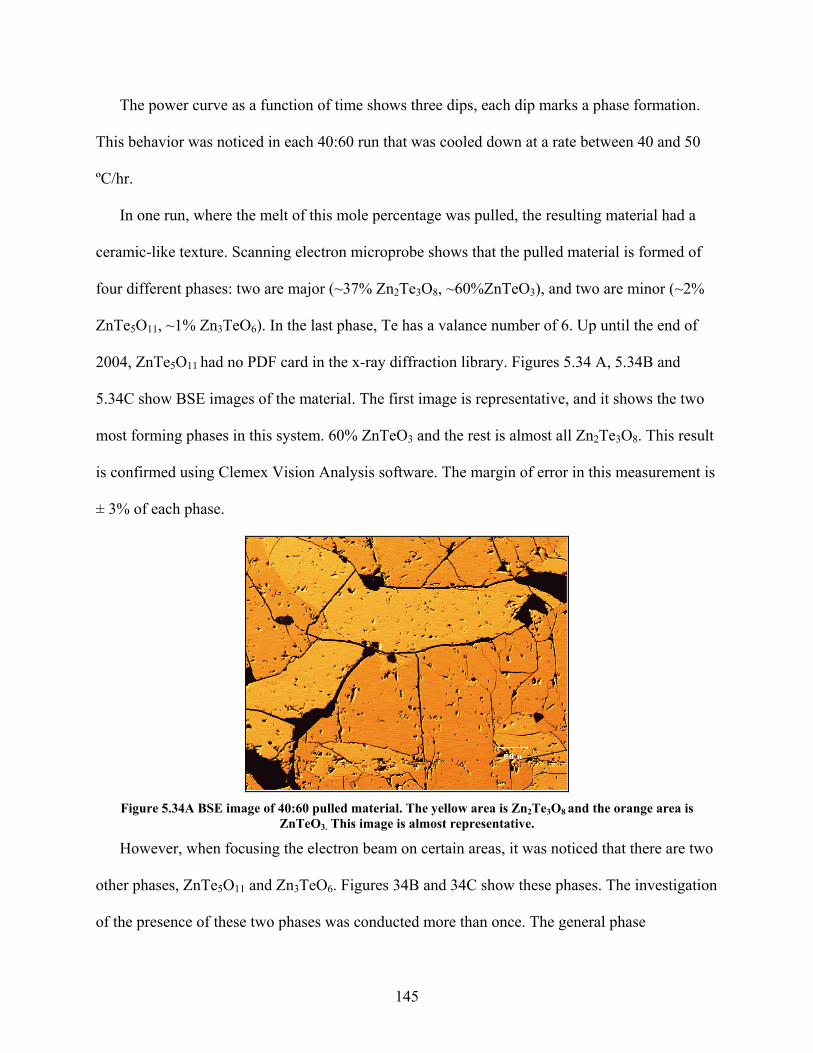
The
This be oled down at a rate between 40 and 50
ºC/
In o
ceramic
four dif 2%
ZnTe5O ce number of 6. Up until the end of
x-ray diffraction library. Figures 5.34 A, 5.34B and
5.34C s
most fo sult
is confi
± 3% o
power curve as a function of time shows three dips, each dip marks a phase formation.
havior was noticed in each 40:60 run that was co
hr.
ne run, where the melt of this mole percentage was pulled, the resulting material had a
-like texture. Scanning electron microprobe shows that the pulled material is formed of
ferent phases: two are major (~37% Zn2Te3O8, ~60%ZnTeO3), and two are minor (~
11, ~1% Zn3TeO6). In the last phase, Te has a valan
2004, ZnTe5O11 had no PDF card in the
how BSE images of the material. The first image is representative, and it shows the two
rming phases in this system. 60% ZnTeO3 and the rest is almost all Zn2Te3O8. This re
rmed using Clemex Vision Analysis software. The margin of error in this measurement is
f each phase.
Figu rea is
ZnTeO3. This image is almost representative.
How wo
other p
of the p
re 5.34A BSE image of 40:60 pulled material. The yellow area is Zn2Te3O8 and the orange a
ever, when focusing the electron beam on certain areas, it was noticed that there are t
hases, ZnTe5O11 and Zn3TeO6. Figures 34B and 34C show these phases. The investigation
resence of these two phases was conducted more than once. The general phase
145
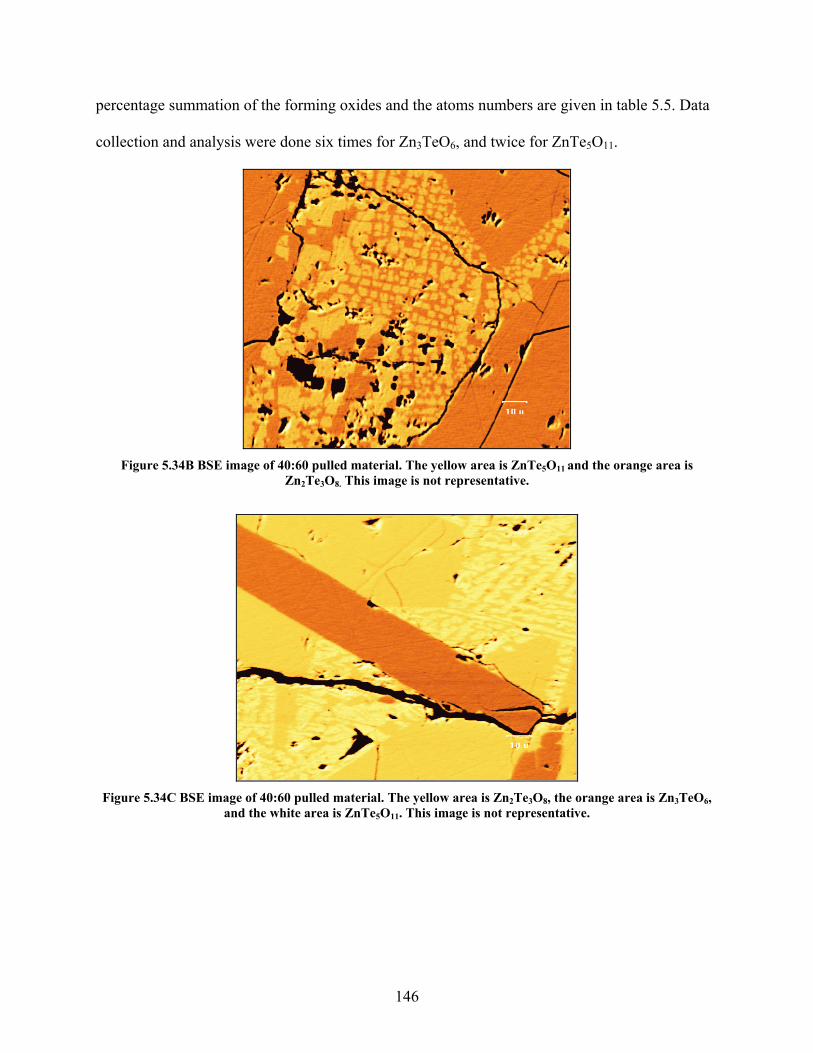
per t
collecti
cen age summation of the forming oxides and the atoms numbers are given in table 5.5. Data
on and analysis were done six times for Zn3TeO6, and twice for ZnTe5O11.
Figure 5.34B BSE image of 40:60 pulled material. he yellow area is ZnTe5O11 and the orange area is
Zn2Te3O8. This image is not representative.
T
Figure 5.34C BSE image of 40:60 pulled material. Th low area is Zn2Te3O8, the orange area is Zn3TeO6,
and the white area is ZnTe5O11. This image is not representative.
e yel
146
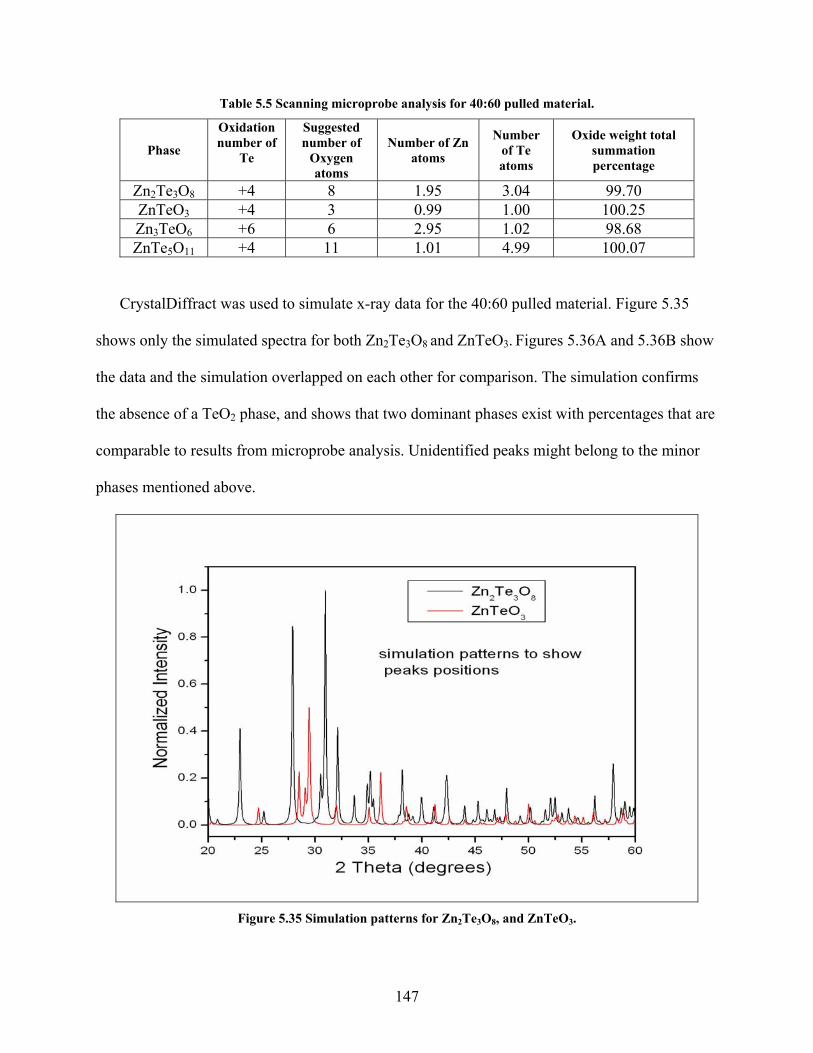
Table 5.5 Scanning microprobe analysis for 40:60 pulled material.
Phase
Oxidation number of
Te
Suggested number of
Oxygen atoms
Number of Zn oms
Number of Te atoms
Oxide weight total summation percentage at
Zn2Te3O8 +4 8 1.95 3.04 99.70 ZnTeO3 +4 3 0.99 1.00 100.25 Zn3TeO6 +6 6 2.95 1.02 98.68 ZnTe5O11 +4 11 1.01 4.99 100.07
ffract was used to simulate x-ray data for the 40:60 pulled material. Figure 5.35
sh
the data and the simulation overlapped on each o parison. The simulation confirms
the absence of a eO shows that two domina ses exist w ntages that are
comparable to results from microprobe analysis. Unidentified peaks might belong to the minor
phases mention ab
CrystalDi
ows only the simulated spectra for both Zn2Te3O8 and ZnTeO3. Figures 5.36A and 5.36B show
ther for com
T 2 phase, and nt pha ith perce
ed ove.
Figure 5.35 Simulation patterns for Zn2 , and ZnTeO
Te3O8 3.
147
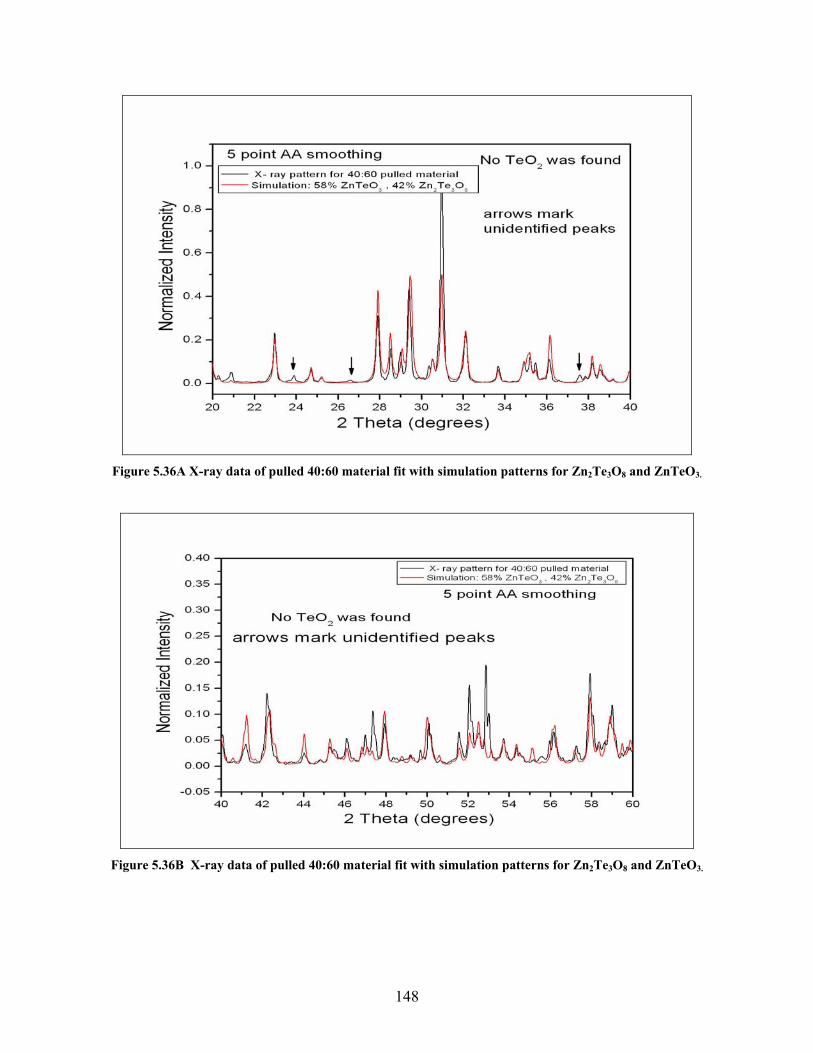
Figure 5.36A X-ray data of pulled 40:60 material fit with simulation patterns for Zn2Te3O8 and ZnTeO3.
Figure 5.36B X-ray data of pulled 40:60 material fit with simulation patterns for Zn2Te3O8 and ZnTeO3.
148
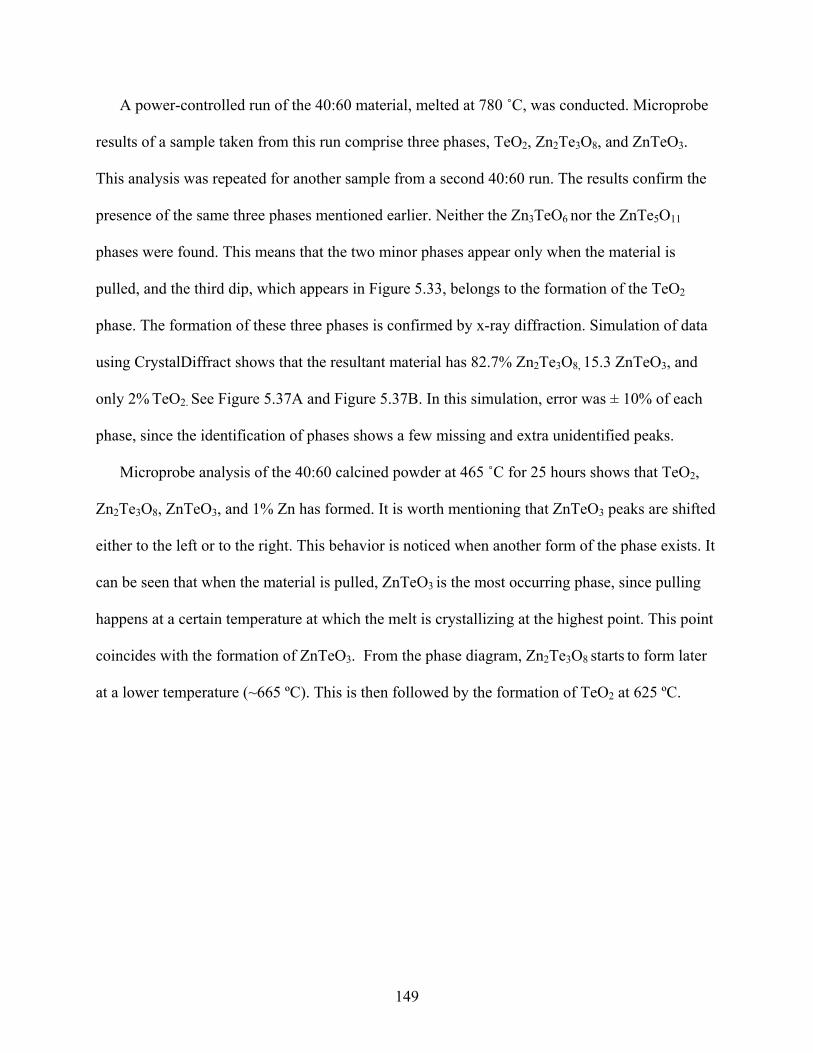
A power-controlled run of the 40:60 material, melted at 780 ˚C, was conducted. Microprobe
2, Zn2Te3O8, and ZnTeO3.
from a second 40:60 run. The results confirm the
n3TeO6 nor the ZnTe5O11
only when the material is
ulled, and the third dip, which appears in Figure 5.33, belongs to the formation of the TeO2
ed by x-ray diffraction. Simulation of data
sultant material has 82.7% Zn2Te3O8, 15.3 ZnTeO3, and
igure 5.37B. In this simulation, error was ± 10% of each
es shows a few missing and extra unidentified peaks.
calcined powder at 465 ˚C for 25 hours shows that TeO2,
rmed. It is worth mentioning that ZnTeO3 peaks are shifted
ehavior is noticed when another form of the phase exists. It
an be seen that when the material is pulled, ZnTeO3 is the most occurring phase, since pulling
at the highest point. This point
, Zn2Te3O8 starts to form later
mation of TeO2 at 625 ºC.
results of a sample taken from this run comprise three phases, TeO
This analysis was repeated for another sample
presence of the same three phases mentioned earlier. Neither the Z
phases were found. This means that the two minor phases appear
p
phase. The formation of these three phases is confirm
using CrystalDiffract shows that the re
only 2% TeO2. See Figure 5.37A and F
phase, since the identification of phas
Microprobe analysis of the 40:60
Zn2Te3O8, ZnTeO3, and 1% Zn has fo
either to the left or to the right. This b
c
happens at a certain temperature at which the melt is crystallizing
coincides with the formation of ZnTeO . From the phase diagram3
at a lower temperature (~665 ºC). This is then followed by the for
149
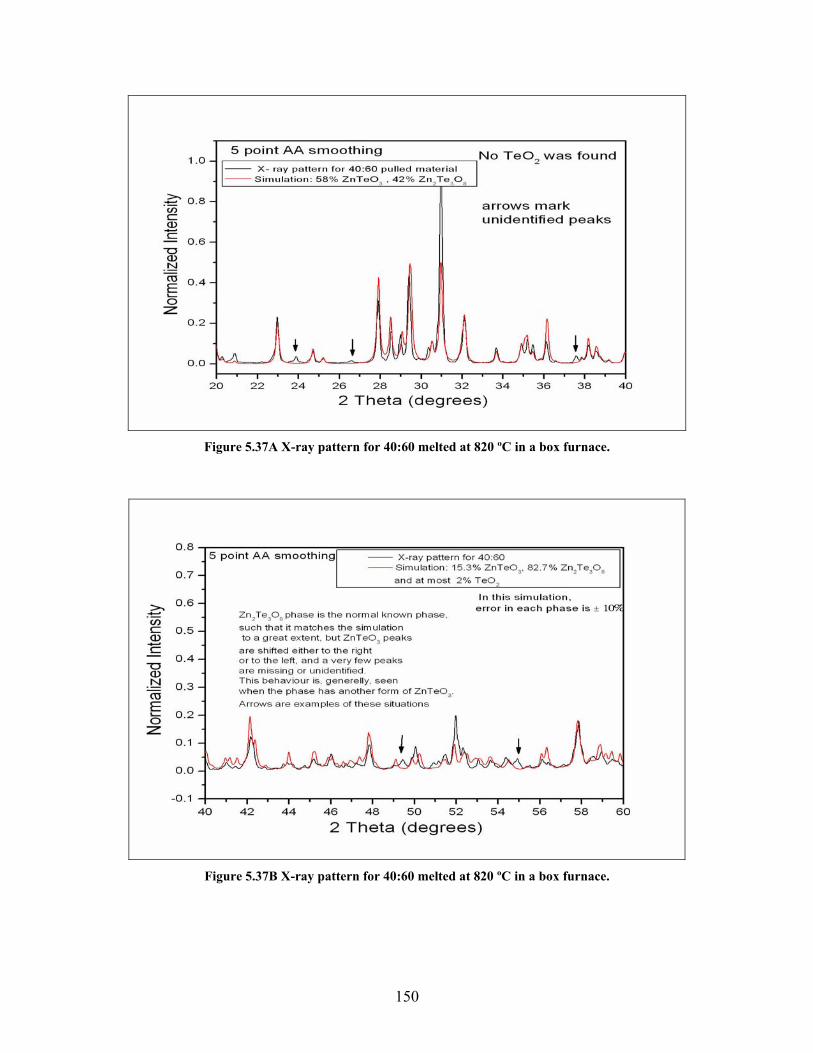
Figure 5.37A X-ray pattern for 40:60 melted at 820 ºC in a box furnace.
rn for 40:60 melted at 820 ºC in a box furnace. Figure 5.37B X-ray patte
150
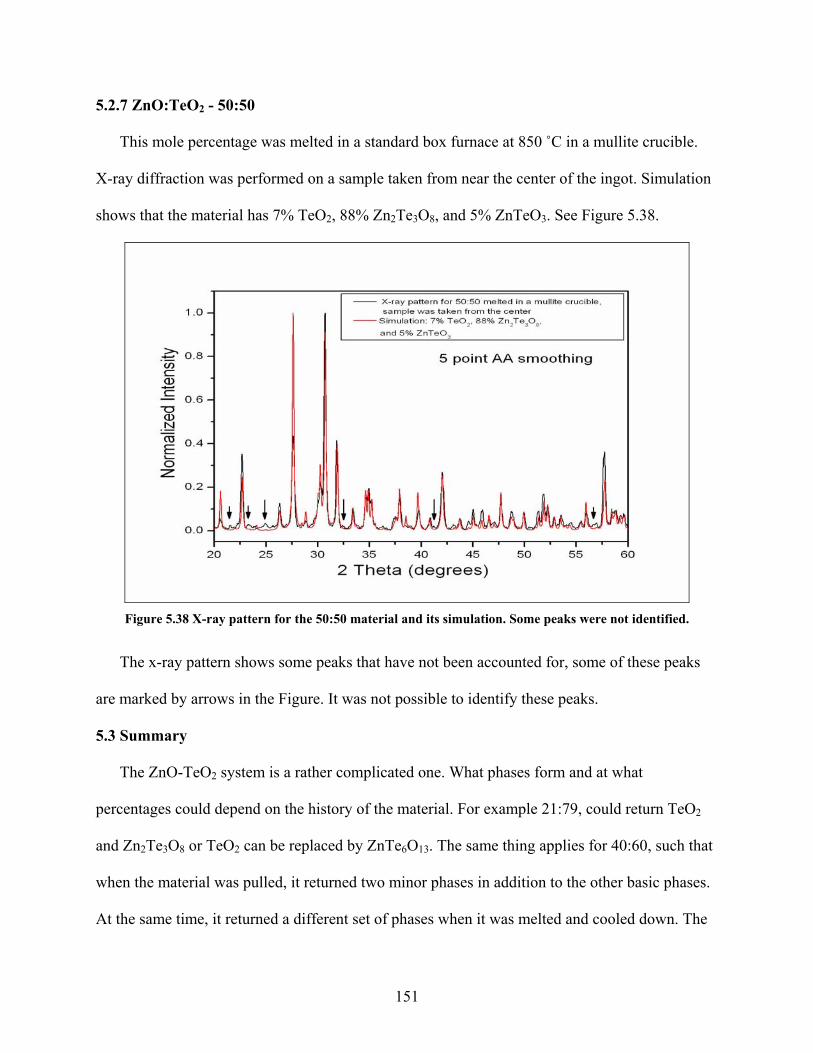
5.2.7 ZnO:TeO2 - 50:50
This mole percentage was melted in a standard box furnace at 850 ˚C in a mullite crucible.
center of the ingot. Simulation
eO3. See Figure 5.38.
X-ray diffraction was performed on a sample taken from near the
shows that the material has 7% TeO2, 88% Zn2Te3O8, and 5% ZnT
ome peaks were not identified.
nted for, some of these peaks
these peaks.
hat phases form and at what
y of the material. For example 21:79, could return TeO2
by ZnTe6O13. The same thing applies for 40:60, such that
ned two minor phases in addition to the other basic phases.
nt set of phases when it was melted and cooled down. The
Figure 5.38 X-ray pattern for the 50:50 material and its simulation. S
The x-ray pattern shows some peaks that have not been accou
are marked by arrows in the Figure. It was not possible to identify
5.3 Summary
The ZnO-TeO2 system is a rather complicated one. W
percentages could depend on the histor
and Zn2Te3O8 or TeO2 can be replaced
when the material was pulled, it retur
At the same time, it returned a differe
151
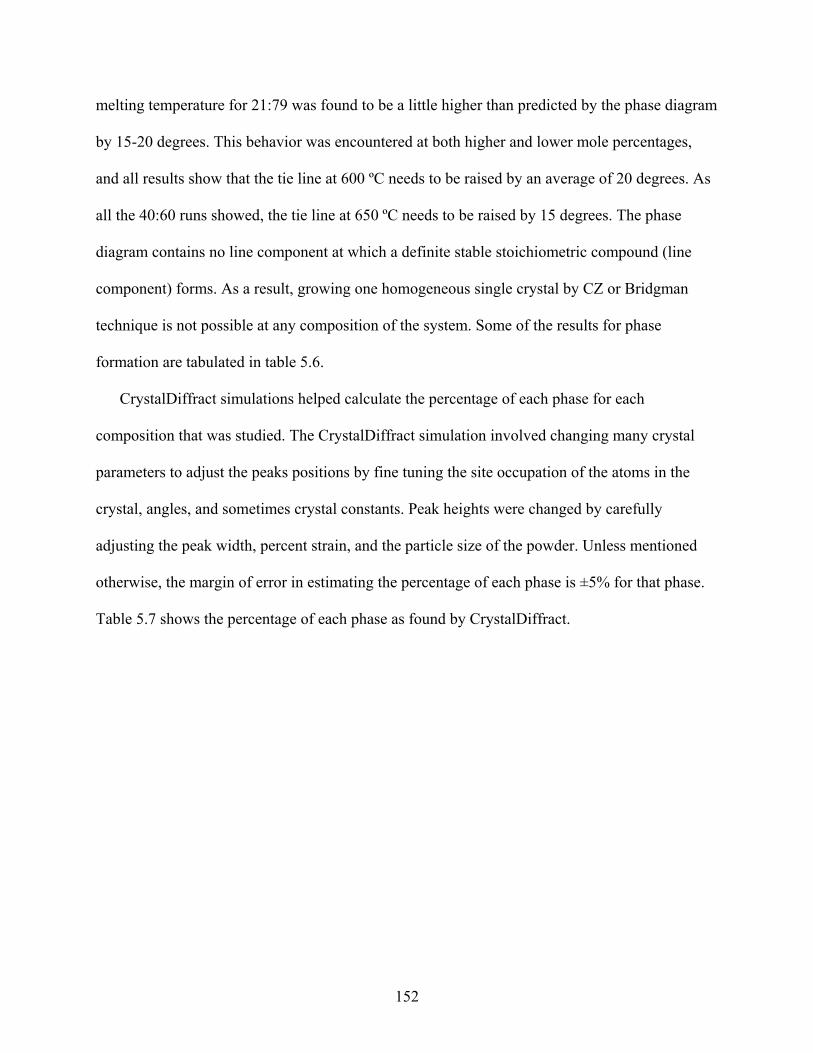
melting temperature for 21:79 was found to be a little higher than predicted by the phase diagram
encountered at both higher and lower mole percentages,
00 ºC needs to be raised by an average of 20 degrees. As
ll the 40:60 runs showed, the tie line at 650 ºC needs to be raised by 15 degrees. The phase
iagram contains no line component at which a definite stable stoichiometric compound (line
crystal by CZ or Bridgman
f the results for phase
each phase for each
lved changing many crystal
upation of the atoms in the
e changed by carefully
e powder. Unless mentioned
h phase is ±5% for that phase.
lDiffract.
by 15-20 degrees. This behavior was
and all results show that the tie line at 6
a
d
component) forms. As a result, growing one homogeneous single
technique is not possible at any composition of the system. Some o
formation are tabulated in table 5.6.
CrystalDiffract simulations helped calculate the percentage of
composition that was studied. The CrystalDiffract simulation invo
parameters to adjust the peaks positions by fine tuning the site occ
crystal, angles, and sometimes crystal constants. Peak heights wer
adjusting the peak width, percent strain, and the particle size of th
otherwise, the margin of error in estimating the percentage of eac
Table 5.7 shows the percentage of each phase as found by Crysta
152
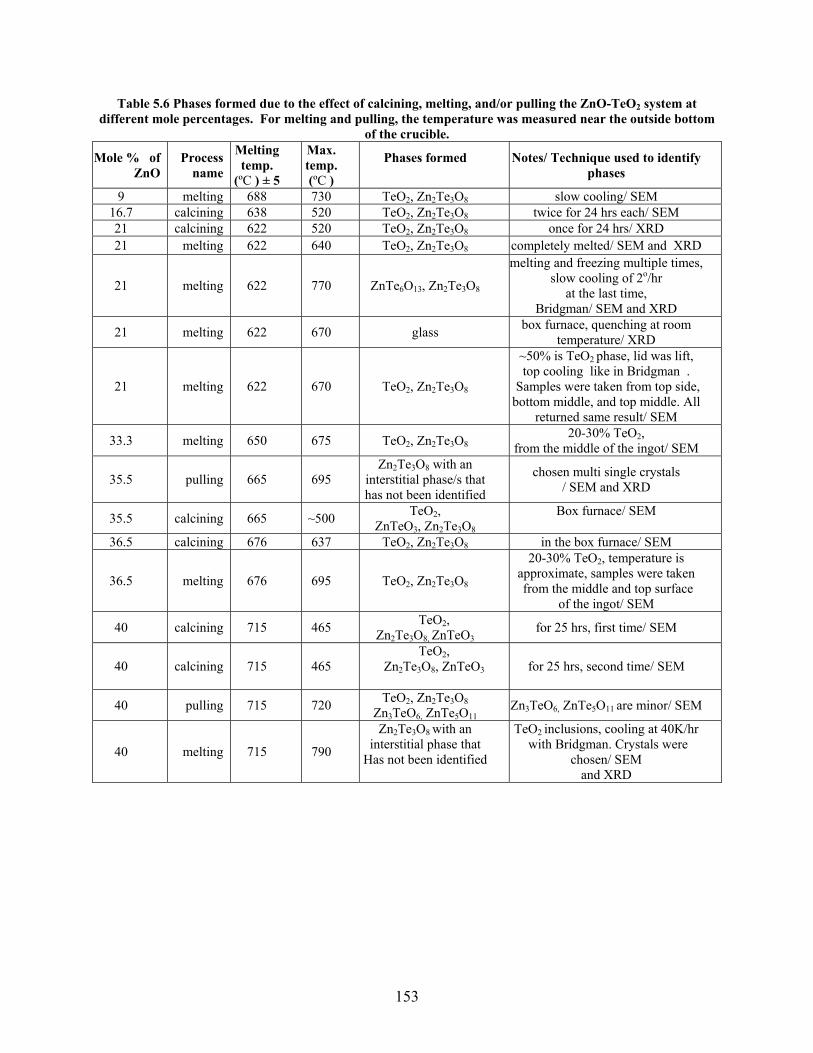
Table 5.6 Phases formed due to the effect of calcining, melting, and/or pulling the ZnO-TeO2 system at s measured near the outside bottom
nique used to identify phases
different mole percentages. For melting and pulling, the temperature waof the crucible.
Mole % of Process Melting temp.
Max. temp. Phases formed Notes/ Tech
ZnO name (ºC ) ± 5 (ºC )
9 melting 688 730 TeO2, Zn2Te3O8 slow cooling/ SEM 16.7 calcining 638 520 TeO2, Zn2Te3O8 twice for 24 hrs each/ SEM 21 calcining 622 520 TeO2, Zn2Te3O8 once for 24 hrs/ XRD 21 melting 622 640 TeO2, Zn2Te3O8 completely melted/ SEM and XRD
melt
21 melting 622 770 ZnTe6O13, Zn2Te3O8
ing and freezing multiple times, slow cooling of 2o/hr
at the last time, Bridgman/ SEM and XRD
21 melting 622 670 glass box furnace, quenching at room temperature/ XRD
21 melting 622 670 TeO2, Zn2Te3O8
~50% is TeO2 phase, lid was lift, top cooling like in Bridgman .
ples were taken from top side, ottom middle, and top middle. All
returned same result/ SEM
Samb
33.3 melting 650 675 TeO2, Zn2Te3O820-30% TeO2,
from the middle of the ingot/ SEM
35.5 pulling 665 695 Zn2Te3O8 with an
interstitial phase/s that has not been identified
chosen multi single crystals / SEM and XRD
TeO2, 35.5 calcining 665 ~500 ZnTeO3, Zn2Te3O8
Box furnace/ SEM
36.5 calcining 676 637 TeO2, Zn2Te3O8 in the box furnace/ SEM
36.5 melting 676 695 TeO2, Zn2Te3O8
20-30% TeO2, temperature is approximate, samples were taken from the middle and top surface
of the ingot/ SEM
40 calcining 715 465 TeO2, Zn2Te3O8, ZnTeO3
for 25 hrs, first time/ SEM
TeO2, Zn2Te3O8, ZnTeO3 for 25 hrs, second time/ SEM 40 calcining 715 465
40 pulling 715 720 TeO2, Zn2Te3O8 Zn3TeO6, ZnTe5O11
Zn3TeO6, ZnTe5O11 are minor/ SEM
Zn Te O with an
40 melting 715 790 Has not been identified
2 3 8 interstitial phase that
TeO2 inclusions, cooling at 40K/hr with Bridgman. Crystals were
chosen/ SEM and XRD
153
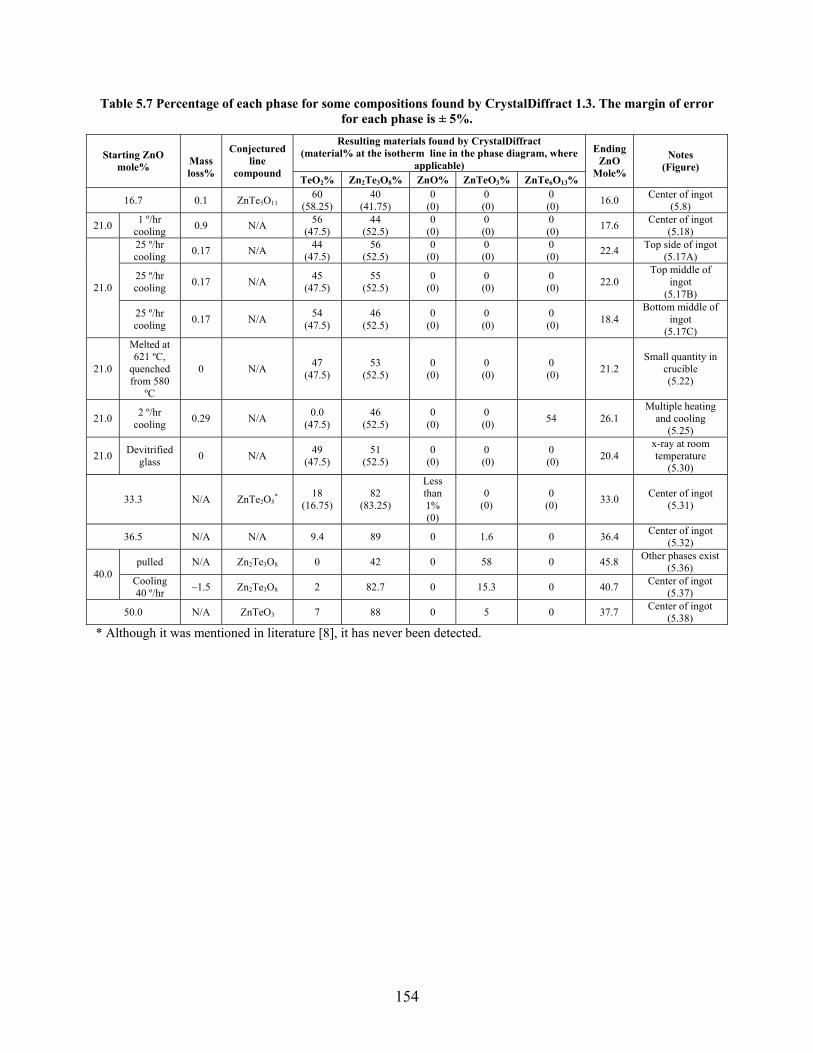
Table 5.7 Percentage of each phase for some compositions found by CrystalDiffract 1.3. The margin of error or each phase is ± 5%. esulting materials found by CrystalDiffract % at the isotherm line in the phase diagram, where
applicable)
fR
al(materiStarting ZnO mole% Mass line
Conjectured
loss% compound TeO2% Zn2Te3O8% ZnO% ZnTeO3% ZnTe6O13%
Ending ZnO
Mole%
Notes (Figure)
16.7 0.1 ZnTe5O1160
(58.25) 40
(41.75) 0
(0) 0
(0) 0
(0) 16.0 Center of ingot (5.8)
21.0 cooling 0.9 N/A (47.5) 1 º/hr 56 44
(52.5) 0
(0) 0
(0) 0
(0) 17.6 Center of ingot (5.18)
25 º/hr cooling 0.17 N/A 44
(47.5) 56
(52.5) 0
(0) 0
(0) 0
(0) 22.4 Top side of ingot (5.17A)
25 º/hr cooling 0.17 N/A 45
(47.5) 55
(52.5) 0
(0) 0
(0) 0
(0) 22.0 Top middle of
ingot (5.17B) 21.0
0 (0) 18.4
Bottom middle of ingot
(5.17C)
25 º/hr cooling 0.17 N/A 54
(47.5) 46
(52.5) 0
(0) 0
(0)
Melted at
21.0 quenched from 580
0 N/A (47.5) (52.5) (0) (0)
621 ºC, 47 53 0 0
ºC
0 (0) 21.2
Small quantity in crucible (5.22)
21.0 2 º/hr 0.29 N/A 0.0 46 0 0 cooling (47.5) (52.5) (0) (0) 54 26.1
Multiple heating and cooling
(5.25)
21.0 Devitrified 0 N/A 49 51glass (47.5) (52.5) (0) (0)
0 0 0 (0) 20.4
x-ray at room temperature
(5.30)
18 82 Less than 0 33.3 N/A ZnTe2O5
*(16.75) (83.25) 1%
(0) (0)
0 (0) 33.0 Center of ingot
(5.31)
36.5 N/A N/A 9.4 89 0 1.6 0 36.4 Center of ingot (5.32)
pulled N/A Zn2Te3O8 0 42 0 58 0 45.8 Other phases exist (5.36) 40.0 Cooling
40 º/hr ~1.5 Zn2Te3O8 2 82.7 0 15.3 0 40.7 Center of ingot (5.37)
50.0 N/A ZnTeO3 7 88 0 5 0 37.7 Center of ingot (5.38)
* Although it was mentioned in literature [8], it has never been detected.
154
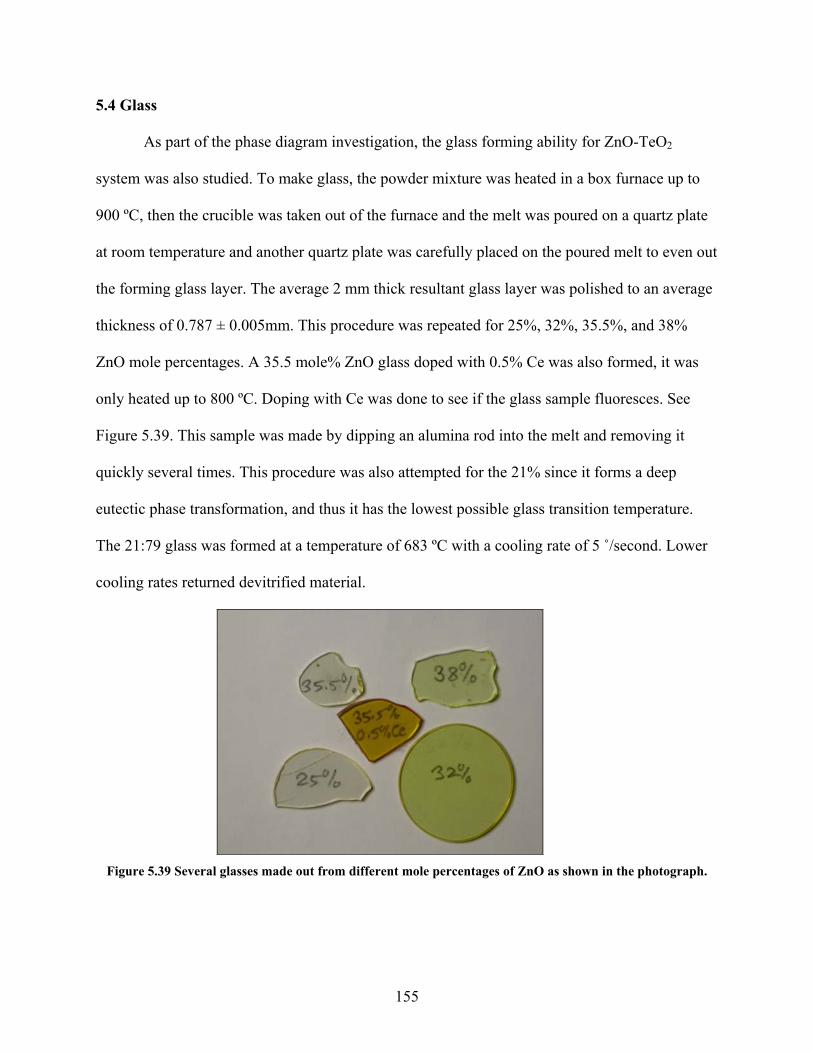
5.4 Glass
As part of the phase diagram investigation, the glass forming ability for ZnO-TeO2
powder mixture was heated in a box furnace up to
lt was poured on a quartz plate
d on the poured melt to even out
yer was polished to an average
5%, 32%, 35.5%, and 38%
Ce was also formed, it was
as done to see if the glass sample fluoresces. See
to the melt and removing it
uickly several times. This procedure was also attempted for the 21% since it forms a deep
ation, and thus it has the lowest possible glass transition temperature.
med at a temperature of 683 ºC with a cooling rate of 5 ˚/second. Lower
evitrified material.
system was also studied. To make glass, the
900 ºC, then the crucible was taken out of the furnace and the me
at room temperature and another quartz plate was carefully place
the forming glass layer. The average 2 mm thick resultant glass la
thickness of 0.787 ± 0.005mm. This procedure was repeated for 2
ZnO mole percentages. A 35.5 mole% ZnO glass doped with 0.5%
only heated up to 800 ºC. Doping with Ce w
Figure 5.39. This sample was made by dipping an alumina rod in
q
eutectic phase transform
The 21:79 glass was for
cooling rates returned d
Figure 5.39 Several glasses made out from different mole percentages of ZnO as shown in the photograph.
155
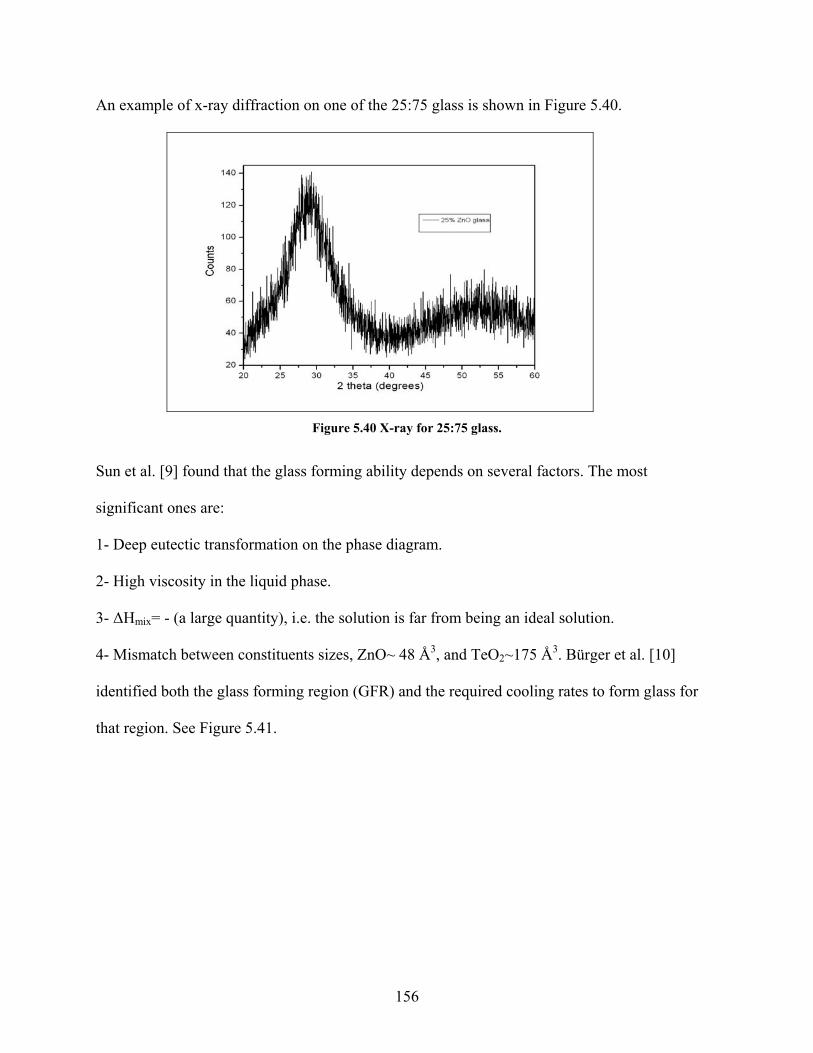
An example of x-ray diffraction on one of the 25:75 glass is shown in Figure 5.40.
Figure 5.40 X-ray for 25:75 glass.
ming ability depends on several factors. The most
hase diagram.
lution is far from being an ideal solution.
- Mismatch between constituents sizes, ZnO~ 48 Å3, and TeO2~175 Å3. Bürger et al. [10]
entified both the glass forming region (GFR) and the required cooling rates to form glass for
at region. See Figure 5.41.
Sun et al. [9] found that the glass for
significant ones are:
1- Deep eutectic transformation on the p
2- High viscosity in the liquid phase.
3- ∆Hmix= - (a large quantity), i.e. the so
4
id
th
156
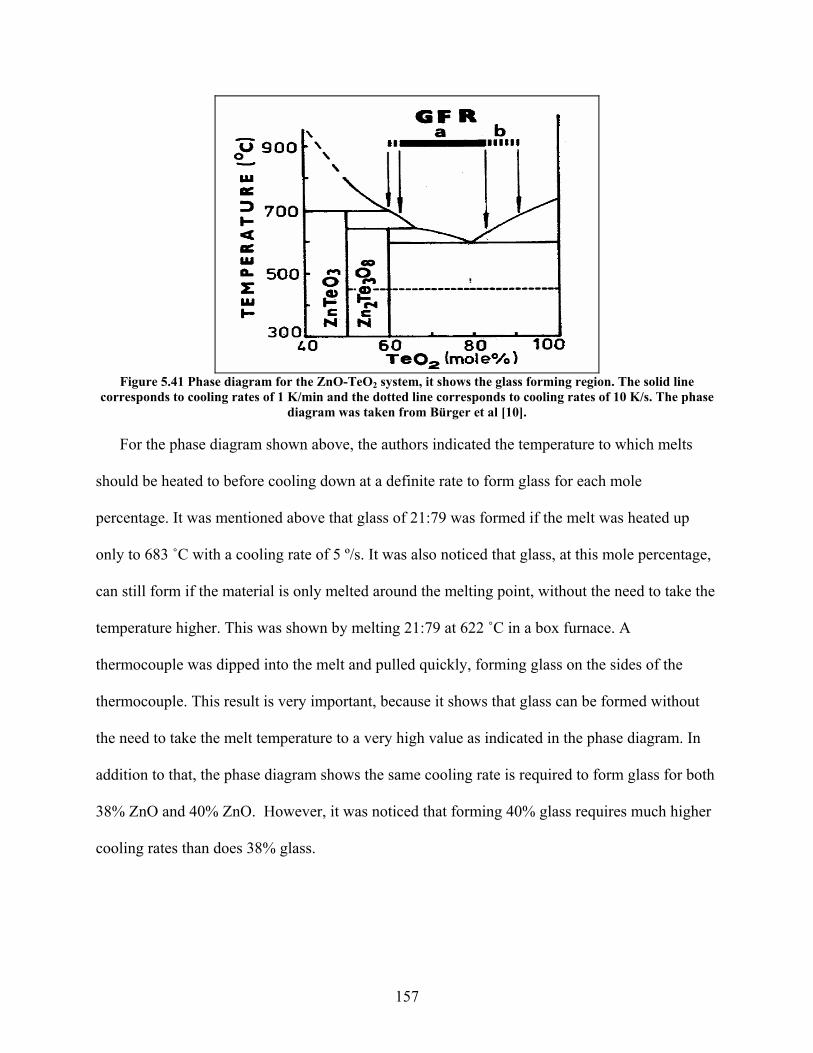
Figure 5.41 Phase diagram for the ZnO-TeO2 system, it shows the glass forming region. The solid line
the dotted line corresponds to cooling rates of 10 K/s. The phase as taken from Bürger et al [10].
e, the authors indicated the temperature to which melts
wn at a definite rate to form glass for each mole
at glass of 21:79 was formed if the melt was heated up
º/s. It was also noticed that glass, at this mole percentage,
oint, without the need to take the
a box furnace. A
g glass on the sides of the
t glass can be formed without
ated in the phase diagram. In
glass for both
0% glass requires much higher
corresponds to cooling rates of 1 K/min anddiagram w
For the phase diagram shown abov
should be heated to before cooling do
percentage. It was mentioned above th
only to 683 ˚C with a cooling rate of 5
can still form if the material is only melted around the melting p
temperature higher. This was shown by melting 21:79 at 622 ˚C in
thermocouple was dipped into the melt and pulled quickly, formin
thermocouple. This result is very important, because it shows tha
the need to take the melt temperature to a very high value as indic
addition to that, the phase diagram shows the same cooling rate is required to form
38% ZnO and 40% ZnO. However, it was noticed that forming 4
cooling rates than does 38% glass.
157
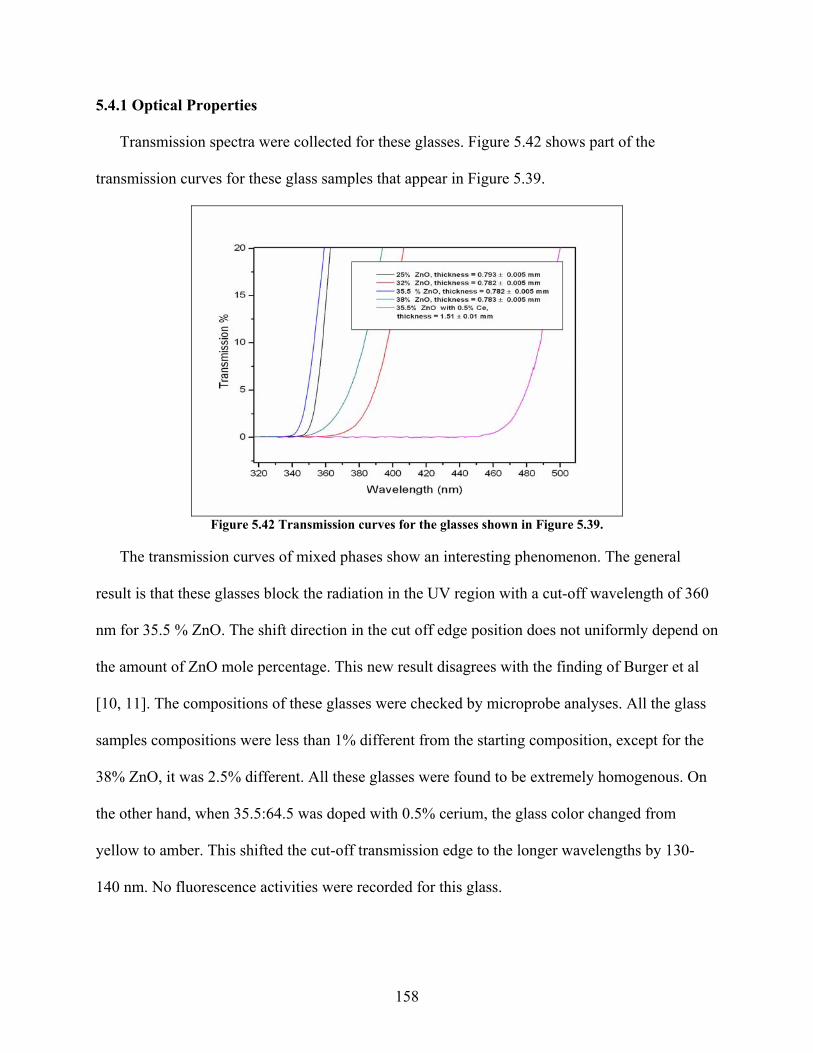
5.4.1 Optical Properties
Transmission spectra were collected for these glasses. Figure 5.42 shows part of the
that appear in Figure 5.39. transmission curves for these glass samples
Figure 5.42 Transmission curves for the glasses shown in Figure 5.39.
The transmission curves of mixed phases show an interesting phenomenon. The general
with a cut-off wavelength of 360
ition does not uniformly depend on
th the finding of Burger et al
oprobe analyses. All the glass
g composition, except for the
glass color changed from
longer wavelengths by 130-
result is that these glasses block the radiation in the UV region
nm for 35.5 % ZnO. The shift direction in the cut off edge pos
the amount of ZnO mole percentage. This new result disagrees wi
[10, 11]. The compositions of these glasses were checked by micr
samples compositions were less than 1% different from the startin
38% ZnO, it was 2.5% different. All these glasses were found to be extremely homogenous. On
the other hand, when 35.5:64.5 was doped with 0.5% cerium, the
yellow to amber. This shifted the cut-off transmission edge to the
140 nm. No fluorescence activities were recorded for this glass.
158
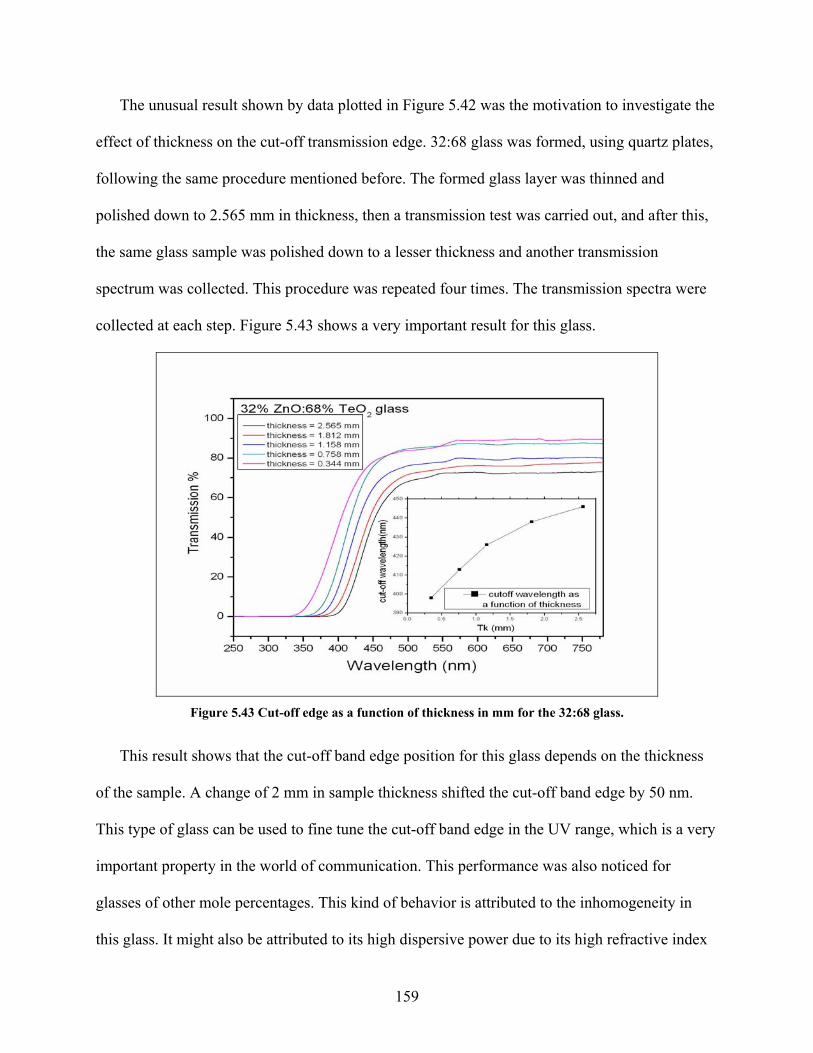
The unusual result shown by data plotted in Figure 5.42 was the motivation to investigate the
as formed, using quartz plates,
s layer was thinned and
was carried out, and after this,
d another transmission
The transmission spectra were
for this glass.
effect of thickness on the cut-off transmission edge. 32:68 glass w
following the same procedure mentioned before. The formed glas
polished down to 2.565 mm in thickness, then a transmission test
the same glass sample was polished down to a lesser thickness an
spectrum was collected. This procedure was repeated four times.
collected at each step. Figure 5.43 shows a very important result
Figure 5.43 Cut-off edge as a function of thickness in mm for the 32:68 glass.
and edge position for this glass depends on the thickness
e cut-off band edge by 50 nm.
the UV range, which is a very
nce was also noticed for
ted to the inhomogeneity in
ue to its high refractive index
This result shows that the cut-off b
of the sample. A change of 2 mm in sample thickness shifted th
This type of glass can be used to fine tune the cut-off band edge in
important property in the world of communication. This performa
glasses of other mole percentages. This kind of behavior is attribu
this glass. It might also be attributed to its high dispersive power d
159
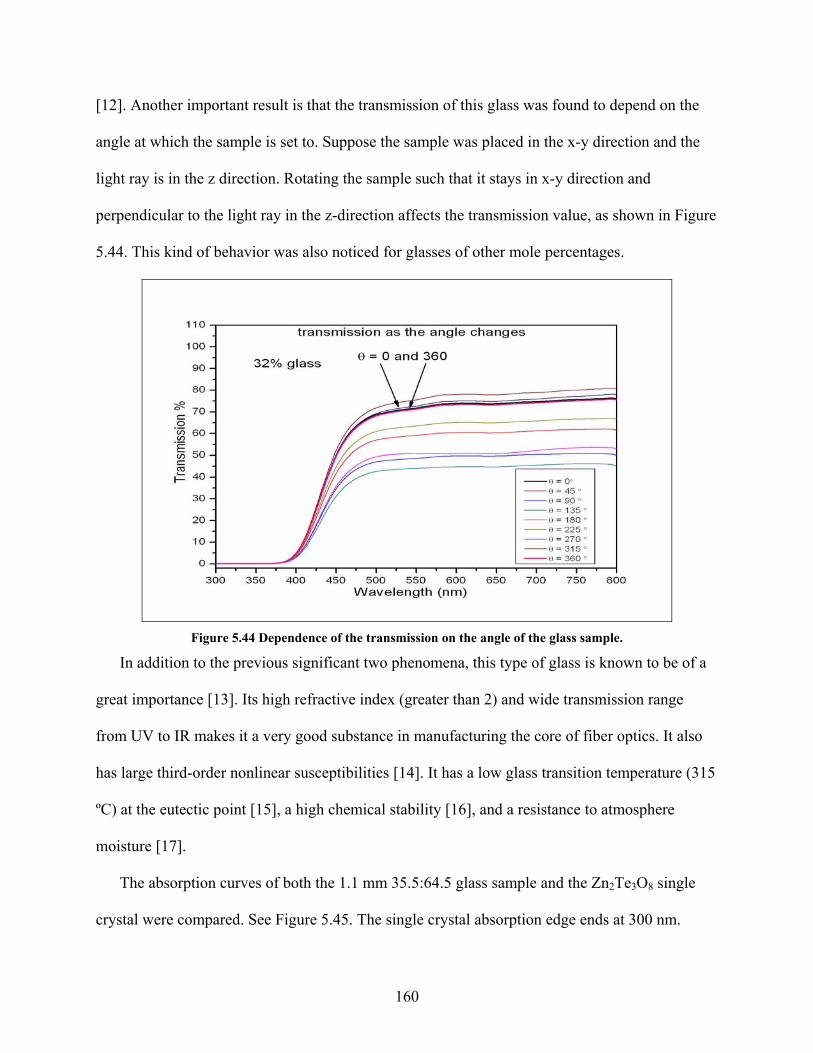
[12]. Another important result is that the transmission of this glass was found to depend on the
in the x-y direction and the
s in x-y direction and
ole percentages.
angle at which the sample is set to. Suppose the sample was placed
light ray is in the z direction. Rotating the sample such that it stay
perpendicular to the light ray in the z-direction affects the transmission value, as shown in Figure
5.44. This kind of behavior was also noticed for glasses of other m
Figure 5.44 Dependence of the transmission on the angle of the glass sample.
pe of glass is known to be of a
d wide transmission range
the core of fiber optics. It also
perature (315
resistance to atmosphere
.1 mm 35.5:64.5 glass sample and the Zn2Te3O8 single
45. The single crystal absorption edge ends at 300 nm.
In addition to the previous significant two phenomena, this ty
great importance [13]. Its high refractive index (greater than 2) an
from UV to IR makes it a very good substance in manufacturing
has large third-order nonlinear susceptibilities [14]. It has a low glass transition tem
C) at the eutectic point [15], a high chemical stability [16], and aº
moisture [17].
The absorption curves of both the 1
crystal were compared. See Figure 5.
160
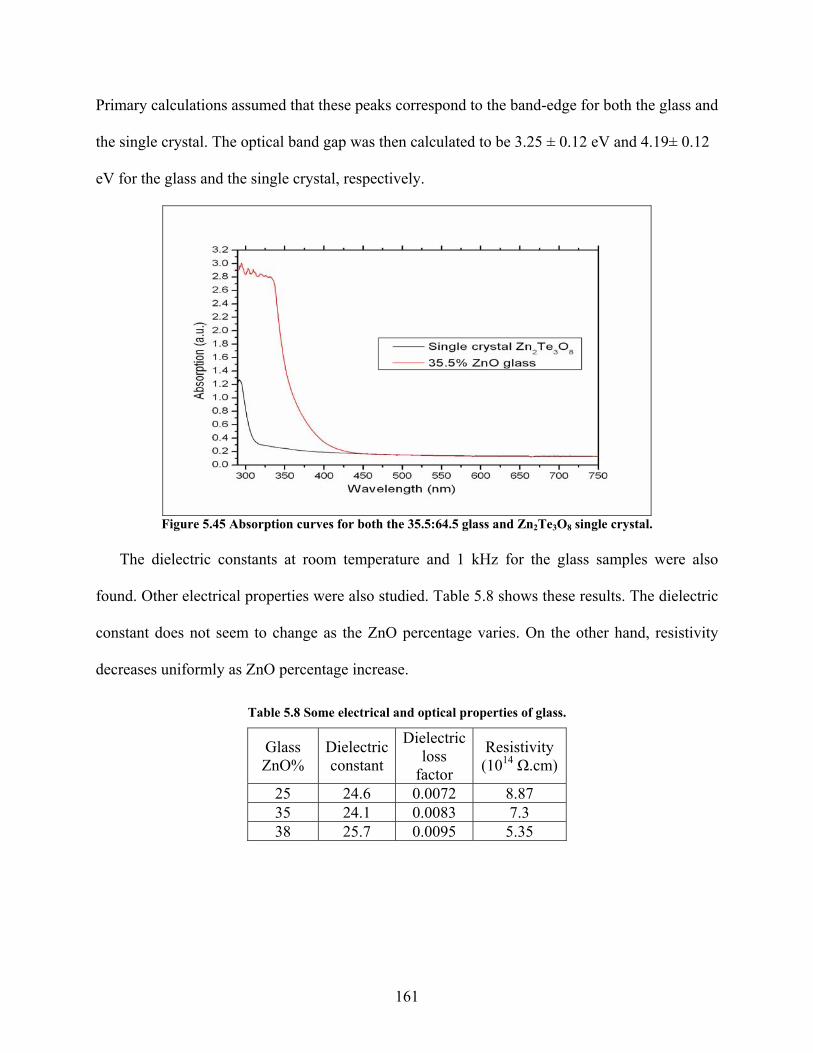
Primary calculations assumed that these peaks correspond to the band-edge for both the glass and
p was then calculated to be 3.25 ± 0.12 eV and 4.19± 0.12
V for the glass and the single crystal, respectively.
the single crystal. The optical band ga
e
Zn Te O single crystal.
or the glass samples were also
und. Other electrical properties were also studied. Table 5.8 shows these results. The dielectric
he ZnO percentage varies. On the other hand, resistivity
increase.
electrical and optical properties of glass.
ielectric nstant
Dielectric loss
factor
Resistivity (1014 Ω.cm)
Figure 5.45 Absorption curves for both the 35.5:64.5 glass and 2 3 8
The dielectric constants at room temperature and 1 kHz f
fo
constant does not seem to change as t
decreases uniformly as ZnO percentage
Table 5.8 Some
Glass DZnO% co
25 24.6 0.0072 8.87 35 24.1 0.0083 7.3 38 25.7 0.0095 5.35
161
References [1] M.R. Marinov, and V. S. Kozhouharov, Comptes rendus de l’Academei bulgare des
on-Crystalline Solids, 151: 134
e Solids, 293-295: 255-260,
] J. Leciejewicz, Zeitschrift fuer Kristallographie, 116: 345 – 353, 1961.
Lindqvist, Acta Crystallographica, B37: 963 – 970, 1973.
W. Journal of Solid State Chemistry, 143: 246-253,
ering Materials
Sciences, 25, No 3: 329 – 331, 1972. [2] H. Bürger, K. Kneipp, H. Hobert, and W. Vogel, Journal of N- 142, 1992. [3] A. Nukui, T. Taniguchi, M. Miyata, Journal of Non-Crystallin2001. [4
[5] K. Hanke, V. Kupcik, and
[6] C.R. Feger, G.L. Schimek, and Kolis, J.
1999.
[7] V. John, Introduction to Engine , 3rd Edition, Antony Rowe Limited,
Great Britain, pp. 144 – 147, 1992.
iams, and R. S. Mitchell, Canadian Meneralogist, 7: 443 – 452,
. Z. Ding, and Z. Q. Hu, Journal of Materials Research:19(9), 2523
.Vogel, Journal of Non-Crystalline Solids: 151, 134 - (1992).
in, V. Kalem, and M. L Öveçoğlu, Key Engineering Materials:
004
chott.com/optics_devices/english/download/tie-35_transmittance_us.pdf
006
l of Materials Research: 11(10), 2651 - 2655 ,1996.
shite. K Kamiya, H. Kobayashi, and K. Kubodera, Journal of non-
rystalline solids: 124(2-3), 257 - ,1990.
Chippenham, Wiltshire,
[8] J. A Mandarino, S. J. Will
1963.
[9] W.S. Sun , H. F. Zhang, B- 2526, (2004). [10] H. Bürger, K. Hobert, W
[11] M. R. Özlap, G. Özen, F. Alt
264-268, 1907 - 1910, 2
[12] http://www.us.s
accessed on August 2, 2
[13] Y. Shimizugawa, K. Hirao, Journa
[14] H. Nasu O. Matsu
c
162
[15] M. L. Öveçoğlu, M. R. Özalp, G. Özen, F. Alten, V. Kalem., Key Engineering Materials:
64-268, 1891 - ,2004.
6] A. N. Moiseef, A. V. Chilyasov, V.V. Dorofeev, O. A. Vostrukhim, E. M. Dianov, B. G.
lotnichenko, and V. V. Koltashev, Journal of Optoelectronics and Advanced Materials: 7 (4),
875 – 1879, 2005.
V. Kalem, G. Özen, M. L Öveçoğlu, and M. R. Özlap, Key Engineering Materials:
2
[1
P
1
[17] F. Altin,
264-268, 1875 - 1878, 2004.
163
CHAPTER SIX
CONCLUSIONS
Growth of the ZnO-TeO2 system using Czochralski (CZ) and Bridgman techniques was
conducted. CZ technique was more efficient in the Zn2Te3O8 growths, while Bridgman was
better in growing ZnTeO3 crystals. In the CZ crystal growth of ZnO-TeO2, the Zn2Te3O8 crystals
were much bigger, between 50-200 mm3 when the pulling rate was 1.1 mm/ hr and the rotation
speed was 12 rpm. Using different pulling rates and rotation speeds returned smaller crystals
with the sizes ranging between 15-35 mm3. It was noticed that reducing the temperature by 10-20
ºC after a few hours of the growth prolonged the growth period such that the crystal did not
detach from the melt. The size of the crucible might have an effect on the size of the Zn2Te3O8
grown crystals. For the growth of ZnTeO3, it was noticed that combining heating of the material
to 820 ºC and exposing the hot zone to a steeper thermal gradient helped form the crystal.
In Zn2Te3O8, the grown single crystals were between 50-200 mm3 in size, which was big
enough to conduct some optical and electrical measurements. In ZnTeO3, the crystal was of a
good size (~5 cm3), but it had a few big cracks. Both types of crystals were clear such that they
are both transparent to visible light. The two crystals both have a refractive index that is higher
than 1.8, and they are both birefringent and optically active. They were tested to examine their
iezoelectric properties, but detected none. Both crystals exhibit a very high resistivity that is of
the order o
In the Zn2Te3O8 crystals, the Curie temperature value does not fall in the temperature range
etween -75 ºC and 400 ºC. The dielectric constant at room temperature, 1 kHz, and in the (001)
p
f 1014 Ω.cm. They both have capacitance-like behavior.
b
164
direction was found to be a moderately high value of 23.5 with 0.0064 dielectric loss factor,
o be 4.20 eV.
urie temperature in the range between -
d at 100 Hz. The
stals that are
falls near the top
om temperature, 1
lue reported for a
or of 0.0042 was
d 500 ºC. Several
. It was found that
cate the occurrence
tric, no piezoelectric
xtremely hard to
ee if a line
diagram still needs
gion, and the
The findings of this
which is relatively small. The band gap was calculated t
For the ZnTeO3 single crystals, they also show no C
75 ºC and 500 ºC. The dielectric constant at room temperature, 1 kHz, and in the (010) direction
was measured to be 14.4, with a relatively high loss factor of 0.0375 measure
band gap was determined to be 4.13 eV.
Bridgman crystal growth of CdTe2O5 produced mica sheet structured cry
transparent to visible light. The band gap was calculated to be 3.63 eV, which
range of the set of values mentioned in literature. The dielectric constant at ro
kHz, and in the (001) direction was found to be 9.1, which is less than the va
CZ grown crystal mentioned in literature at 5 kHz, by 3. A very low loss fact
found. The Curie temperature was not found in the range between – 75 ºC an
powder x-ray diffraction patterns were collected at non-ambient temperatures
the crystals structure changes at T = 550 ºC. This structure change could indi
of the Curie temperature. Although the material was reported to be ferroelec
properties of this crystal were detected.
The phase diagram of the ZnO-TeO2 system reveals the reason why it is e
grow a single crystal. The system was tested at several mole percentages to s
component forms, but with out any success. It was determined that the phase
more investigation, especially at two regions, the first one is at the eutectic re
second one is at the region that extends from 37 to 50 mole percentage ZnO.
research conclude some discrepancies. Some of them are:
165
1- The melting temperature for the eutectic transformation is higher than stated by the phase
conducted at both
3.3:66.7 mole
0 mole percentage
ined for 40 mole%,
e3O8, some minor
ulled, but these
O2, Zn2Te3O8, and
tory phases, which
erature is lowered.
tectic
as heated to 820
hase instead of
ls to simulate the
ost 40%,
hen 40% ZnO was
ome of Zn2Te3O8
Te3O8. It appears at
.5 mole% ZnO, and
er when 40:60 was
diagram by 15-20 ºC. This also agrees with the results of experiments
sides of the eutectic point such as the 9:91 mole percentage, and the 3
percentage. Also, all cooling rates ranging from 40-50 ºC for the 40:6
confirms the previous results. Moreover, according to the results obta
the isotherm at 650 ºC had to be raised by 15 ºC.
2- At 40-mole% ZnO and in one event, in addition to ZnTeO3 and Zn2T
phases, namely, ZnTe5O11 and Zn3TeO6 appear when the material is p
phases do not appear when the material was cooled down. Instead, Te
ZnTeO3 appear. This could mean that the two minor phases are transi
form only at high temperatures, but they cease to exist when the temp
3- The appearance of a new phase, namely, ZnTe6O13 appeared at the eu
transformation instead of TeO2 phase. This happened when the melt w
ºC, which might be responsible for the formation of ZnTe6O13 stable p
TeO2. CrystalDiffract shows no presence of the TeO2 phase, but it fai
exact mole percentage of the new phase, such that calculations show it is at m
while simulation shows that it is 56%. The same behavior is noticed w
heated above 800 ºC, which might have led to the decomposition of s
and the formation of more material of ZnTeO3.
4- CrystalDiffract simulations show that the most dominant phase is Zn2
very low ZnO percentages, and continues to increase up to 89% at 36
stays almost the same for 40 mole% ZnO and 50 mole% ZnO. Howev
166
pulled, CrystalDiffract shows that 42% is Zn2Te3O8 and the rest is mostly ZnTeO3,
uch that the reaction
ows that ZnO
al reaction happens
esting a solid state
rtion of TeO2,
C and 415 ºC, such
e place above 415
ed that the cutoff
dition, the
rection of light
mperature. The cut
t of the glass.
rystal structure. The
main crystal
parameters were determined.
• Some inconsistencies between CrystalDiffract simulations and several patterns appear. It
was noticed that a few peaks show in some patterns and were not accounted for in the
including the minor two phases mentioned above.
Some other important conclusions are:
• The reaction of ZnO and TeO2 in 21:79 does not take place at once, s
occurs over a range of temperatures. Non-ambient x-ray diffraction sh
powder starts to disappear, slowly, as early as T = 325 ºC, but the tot
between 400 ºC and 450 ºC, which agrees with an earlier finding sugg
reaction takes place at 446 ºC.
• Non ambient x-ray diffraction shows that glass starts to crystallize at T = 340 ºC. It was
found that an intermediate phase of Zn2Te3O8 mixed with small propo
began to appear. The devitrification process takes place between 320 º
that the TeO2 and Zn2Te3O8 phases are formed. No phase changes tak
ºC.
• The glass of the ZnO-TeO system offers a new property, it was notic2
band-edge depends greatly on the thickness of the glass sample. In ad
transmissivity changes as the sample is rotated perpendicular to the di
propagation. Glass has an average dielectric constant of 25 at room te
off band edge position does not uniformly depend on the ZnO conten
• The new phase of ZnTe O was found to crystallize in a hexagonal c6 13
powder x-ray diffraction pattern for this phase was calculated, and the
167

simulations, and vice versa. These peaks could represent one or more of the minor
ame phase but of a different form of that phase.
phases, or could belong to the s
168
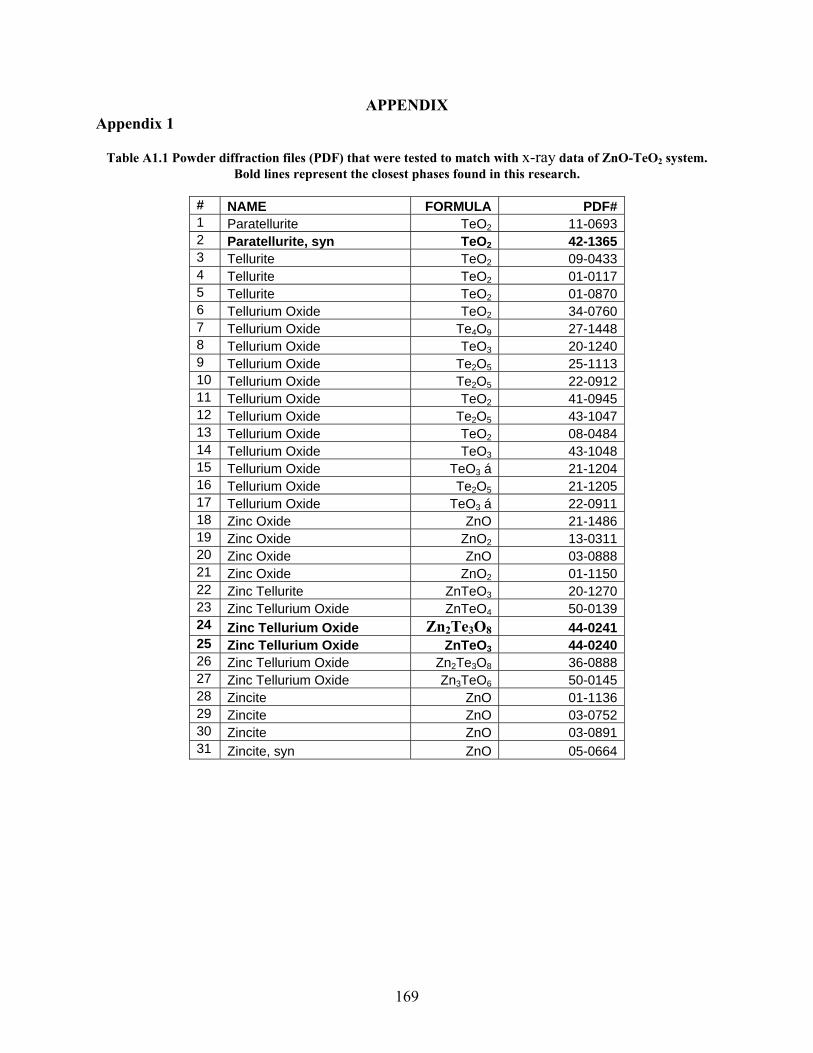
APPENDIX Appendix 1
x-ray data of ZnO-TeO2 system. is research.
PDF#
Table A1.1 Powder diffraction files (PDF) that were tested to match with
Bold lines represent the closest phases found in th
# NAME FORMULA1 Paratellurite TeO2 11-0693 2 Paratellurite, syn TeO2 42-1365 3 Tellurite TeO2 09-0433 4 Tellurite TeO2 01-0117 5 01-0870 Tellurite TeO26 Tellurium Oxide TeO2 34-0760 7 Tellurium Oxide Te O4 9 27-1448 8 Tellurium Oxide TeO3 20-1240 9 Tellurium Oxide Te2O5 25-1113 10 Tellurium Oxide Te2O5 22-0912 11 Tellurium Oxide TeO2 41-0945 12 Tellurium Oxide Te2O5 43-1047 13 Tellurium Oxide TeO2 08-0484 14 Tellurium Oxide TeO3 43-1048 15 Tellurium Oxide TeO3 á 21-1204 16 Tellurium Oxide Te2O5 21-1205 17 Tellurium Oxide TeO3 á 22-0911 18 Zinc Oxide ZnO 21-1486 19 Zinc Oxide ZnO2 13-0311 20 Zinc Oxide ZnO 03-0888 21 Zinc Oxide ZnO2 01-1150 22 Zinc Tellurite ZnTeO3 20-1270 23 Zinc Tellurium Oxide ZnTeO4 50-0139 24 Zinc Tellurium Oxide Zn2Te3O8 44-0241 25 Zinc Tellurium Oxide ZnTeO3 44-0240 26 Zinc Tellurium Oxide Zn2Te3O8 36-0888 27 Zinc Tellurium Oxide Zn3TeO6 50-0145 28 Zincite ZnO 01-1136 29 Zincite ZnO 03-0752 30 Zincite ZnO 03-0891 31 Zincite, syn ZnO 05-0664
169
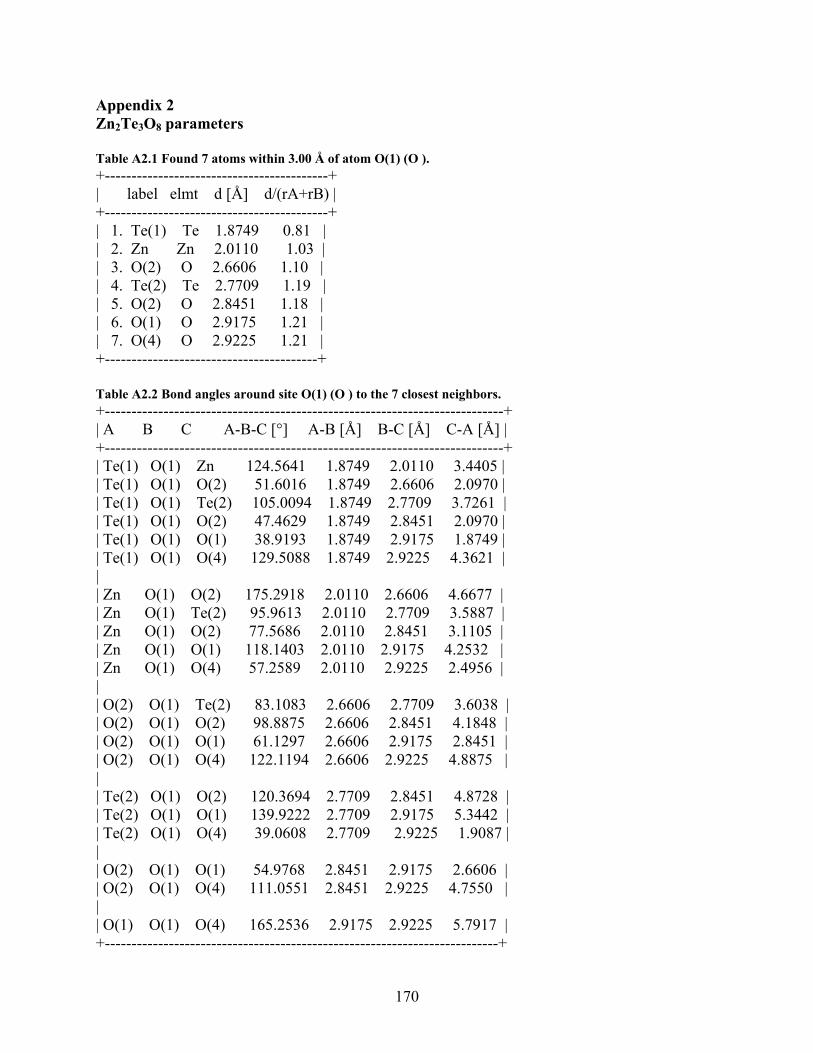
Appendix 2 Zn2Te3O8 parameters Table A2.1 Found 7 atoms within 3.00 Å of atom O(1) (O ). +------------------------------------------+ | label elmt d [Å] d/(rA+rB) | +------------------------------------------+ | 1. Te(1) Te 1.8749 0.81 | | 2. Zn Zn 2.0110 1.03 | | 3. O(2) O 2.6606 1.10 | | 4. Te(2) Te 2.7709 1.19 | | 5. O(2) O 2.8451 1.18 | | 6. O(1) O 2.9175 1.21 | | 7. O(4) O 2.9225 1.21 | +----------------------------------------+ Table A2.2 Bond angles around site O(1) (O ) to the 7 closest neighbors. +---------------------------------------------------------------------------+ | A B C A-B-C [°] A-B [Å] B-C [Å] C-A [Å] | +---------------------------------------------------------------------------+ | Te(1) O(1) Zn 124.5641 1.8749 2.0110 3.4405 | | Te(1) O(1) O(2) 51.6016 1.8749 2.6606 2.0970 | | Te(1) O(1) Te(2) 105.0094 1.8749 2.7709 3.7261 | | Te(1) O(1) O(2) 47.4629 1.8749 2.8451 2.0970 | | Te(1) O(1) O(1) 38.9193 1.8749 2.9175 1.8749 | | Te(1) O(1) O(4) 129.5088 1.8749 2.9225 4.3621 | | | Zn O(1) O(2) 175.2918 2.0110 2.6606 4.6677 | | Zn O(1) Te(2) 95.9613 2.0110 2.7709 3.5887 | | Zn O(1) O(2) 77.5686 2.0110 2.8451 3.1105 | | Zn O(1) O(1) 118.1403 2.0110 2.9175 4.2532 | | Zn O(1) O(4) 57.2589 2.0110 2.9225 2.4956 | | | O(2) O(1) Te(2) 83.1083 2.6606 2.7709 3.6038 | | O(2) O(1) O(2) 98.8875 2.6606 2.8451 4.1848 | | O(2) O(1) O(1) 61.1297 2.6606 2.9175 2.8451 | | O(2) O(1) O(4) 122.1194 2.6606 2.9225 4.8875 | | | Te(2) O(1) O(2) 120.3694 2.7709 2.8451 4.8728 | | Te(2) O(1) O(1) 139.9222 2.7709 2.9175 5.3442 | | Te(2) O(1) O(4) 39.0608 2.7709 2.9225 1.9087 | | | O(2) O(1) O(1) 54.9768 2.8451 2.9175 2.6606 | | O(2) O(1) O(4) 111.0551 2.8451 2.9225 4.7550 | | | O(1) O(1) O(4) 165.2536 2.9175 2.9225 5.7917 | +--------------------------------------------------------------------------+
170
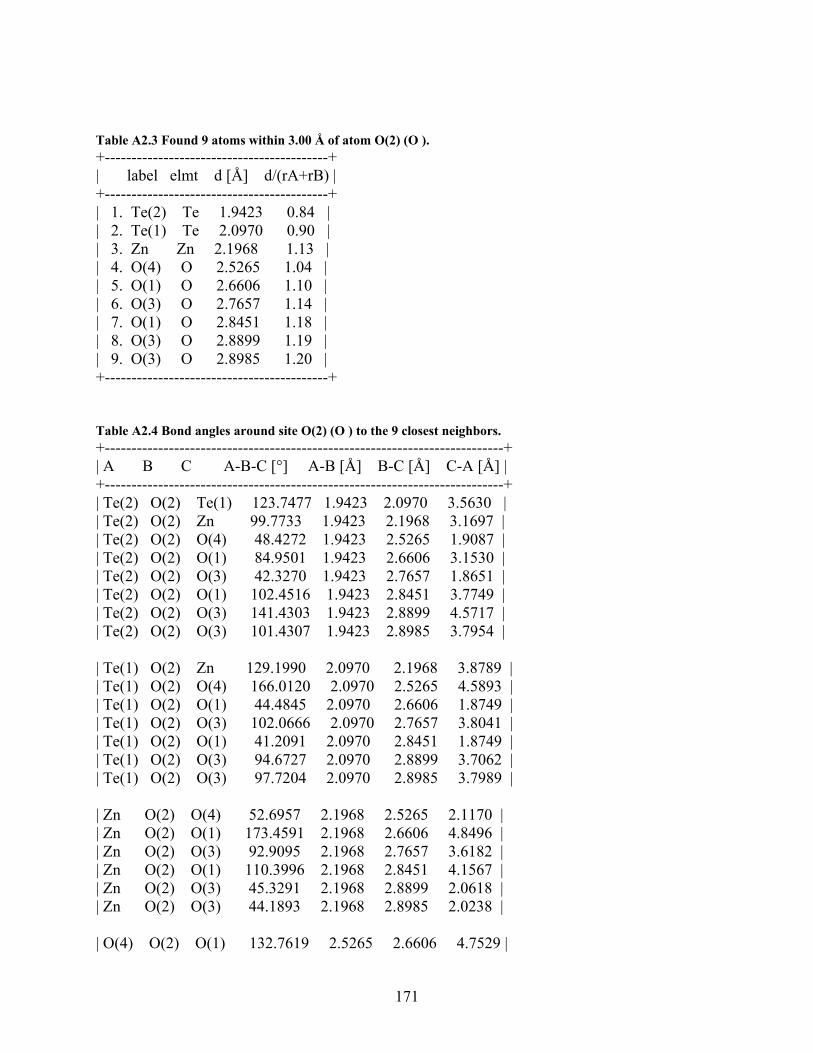
Table A2.3 Found 9 atoms within 3.00 Å of atom O(2) (O ). +------------------------------------------+ | label elmt d [Å] d/(rA+rB) | +------------------------------------------+ | 1. Te(2) Te 1.9423 0.84 | | 2. Te(1) Te 2.0970 0.90 | | 3. Zn Zn 2.1968 1.13 | | 4. O(4) O 2.5265 1.04 | | 5. O(1) O 2.6606 1.10 | | 6. O(3) O 2.7657 1.14 | | 7. O(1) O 2.8451 1.18 | | 8. O(3) O 2.8899 1.19 | | 9. O(3) O 2.8985 1.20 | +------------------------------------------+ Table A2.4 Bond angles around site O(2) (O ) to the 9 closest neighbors. +---------------------------------------------------------------------------+ | A B C A-B-C [°] A-B [Å] B-C [Å] C-A [Å] | +---------------------------------------------------------------------------+ | Te(2) O(2) Te(1) 123.7477 1.9423 2.0970 3.5630 | | Te(2) O(2) Zn 99.7733 1.9423 2.1968 3.1697 | | Te(2) O(2) O(4) 48.4272 1.9423 2.5265 1.9087 | | Te(2) O(2) O(1) 84.9501 1.9423 2.6606 3.1530 | | Te(2) O(2) O(3) 42.3270 1.9423 2.7657 1.8651 | | Te(2) O(2) O(1) 102.4516 1.9423 2.8451 3.7749 | | Te(2) O(2) O(3) 141.4303 1.9423 2.8899 4.5717 | | Te(2) O(2) O(3) 101.4307 1.9423 2.8985 3.7954 | | Te(1) O(2) Zn 129.1990 2.0970 2.1968 3.8789 | | Te(1) O(2) O(4) 166.0120 2.0970 2.5265 4.5893 | | Te(1) O(2) O(1) 44.4845 2.0970 2.6606 1.8749 | | Te(1) O(2) O(3) 102.0666 2.0970 2.7657 3.8041 | | Te(1) O(2) O(1) 41.2091 2.0970 2.8451 1.8749 | | Te(1) O(2) O(3) 94.6727 2.0970 2.8899 3.7062 | | Te(1) O(2) O(3) 97.7204 2.0970 2.8985 3.7989 | | Zn O(2) O(4) 52.6957 2.1968 2.5265 2.1170 | | Zn O(2) O(1) 173.4591 2.1968 2.6606 4.8496 | | Zn O(2) O(3) 92.9095 2.1968 2.7657 3.6182 | | Zn O(2) O(1) 110.3996 2.1968 2.8451 4.1567 | | Zn O(2) O(3) 45.3291 2.1968 2.8899 2.0618 | | Zn O(2) O(3) 44.1893 2.1968 2.8985 2.0238 | | O(4) O(2) O(1) 132.7619 2.5265 2.6606 4.7529 |
171
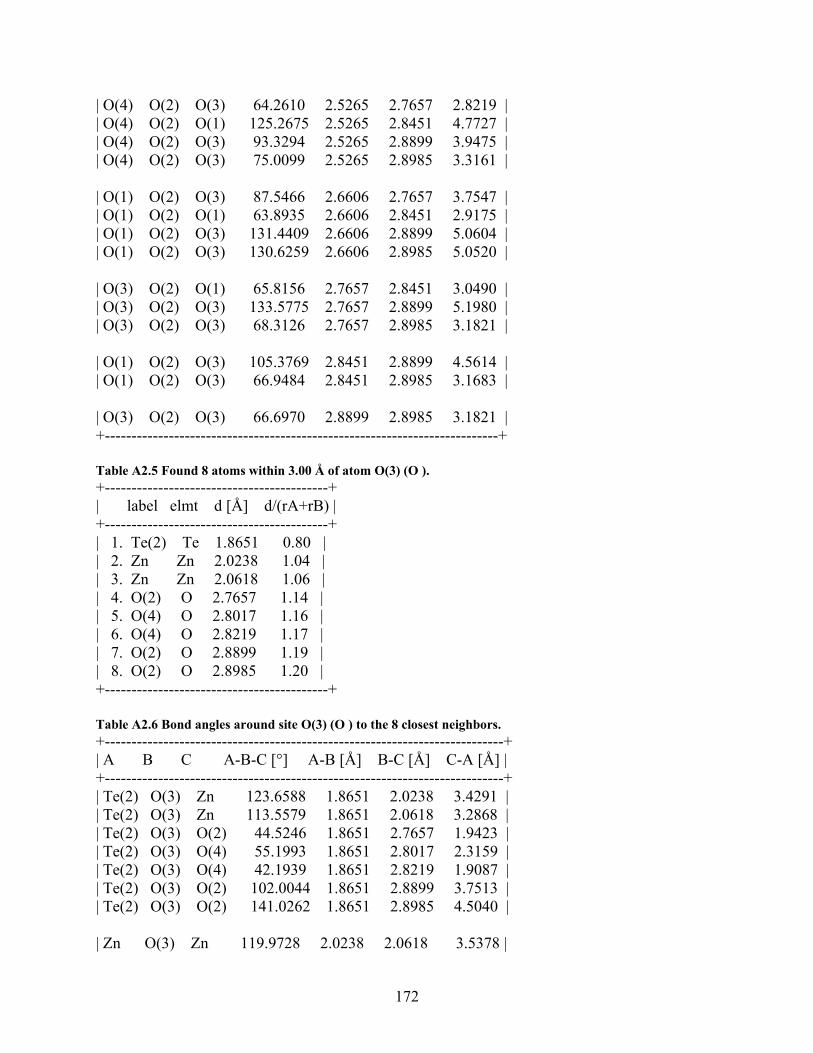
| O(4) O(2) O(3) 64.2610 2.5265 2.7657 2.8219 | | O(4) O(2) O(1) 125.2675 2.5265 2.8451 4.7727 | | O(4) O(2) O(3) 93.3294 2.5265 2.8899 3.9475 | | O(4) O(2) O(3) 75.0099 2.5265 2.8985 3.3161 | | O(1) O(2) O(3) 87.5466 2.6606 2.7657 3.7547 | | O(1) O(2) O(1) 63.8935 2.6606 2.8451 2.9175 | | O(1) O(2) O(3) 131.4409 2.6606 2.8899 5.0604 | | O(1) O(2) O(3) 130.6259 2.6606 2.8985 5.0520 | | O(3) O(2) O(1) 65.8156 2.7657 2.8451 3.0490 | | O(3) O(2) O(3) 133.5775 2.7657 2.8899 5.1980 | | O(3) O(2) O(3) 68.3126 2.7657 2.8985 3.1821 | | O(1) O(2) O(3) 105.3769 2.8451 2.8899 4.5614 | | O(1) O(2) O(3) 66.9484 2.8451 2.8985 3.1683 | | O(3) O(2) O(3) 66.6970 2.8899 2.8985 3.1821 | +--------------------------------------------------------------------------+ Table A2.5 Found 8 atoms within 3.00 Å of atom O(3) (O ). +------------------------------------------+ | label elmt d [Å] d/(rA+rB) | +------------------------------------------+ | 1. Te(2) Te 1.8651 0.80 | | 2. Zn Zn 2.0238 1.04 | | 3. Zn Zn 2.0618 1.06 | | 4. O(2) O 2.7657 1.14 | | 5. O(4) O 2.8017 1.16 | | 6. O(4) O 2.8219 1.17 | | 7. O(2) O 2.8899 1.19 | | 8. O(2) O 2.8985 1.20 | +------------------------------------------+ Table A2.6 Bond angles around site O(3) (O ) to the 8 closest neighbors. +---------------------------------------------------------------------------+ | A B C A-B-C [°] A-B [Å] B-C [Å] C-A [Å] | +---------------------------------------------------------------------------+ | Te(2) O(3) Zn 123.6588 1.8651 2.0238 3.4291 | | Te(2) O(3) Zn 113.5579 1.8651 2.0618 3.2868 | | Te(2) O(3) O(2) 44.5246 1.8651 2.7657 1.9423 | | Te(2) O(3) O(4) 55.1993 1.8651 2.8017 2.3159 | | Te(2) O(3) O(4) 42.1939 1.8651 2.8219 1.9087 | | Te(2) O(3) O(2) 102.0044 1.8651 2.8899 3.7513 | | Te(2) O(3) O(2) 141.0262 1.8651 2.8985 4.5040 | | Zn O(3) Zn 119.9728 2.0238 2.0618 3.5378 |
172
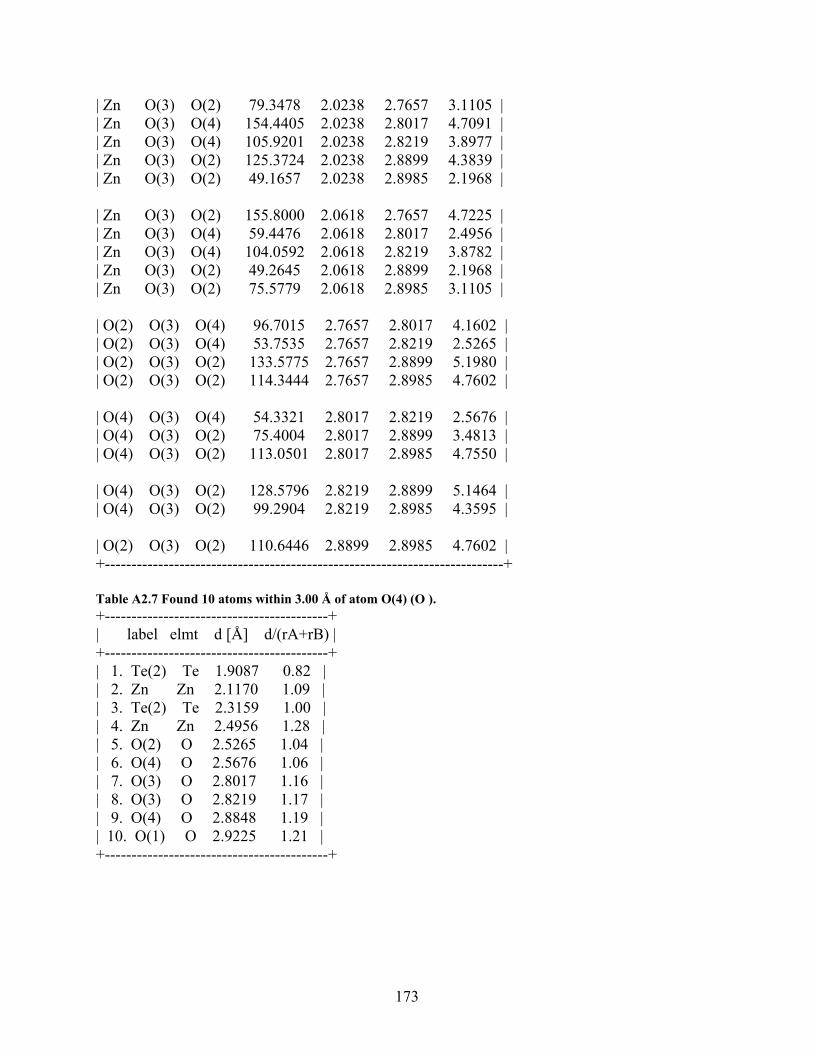
| Zn O(3) O(2) 79.3478 2.0238 2.7657 3.1105 | | Zn O(3) O(4) 154.4405 2.0238 2.8017 4.7091 | | Zn O(3) O(4) 105.9201 2.0238 2.8219 3.8977 | | Zn O(3) O(2) 125.3724 2.0238 2.8899 4.3839 | | Zn O(3) O(2) 49.1657 2.0238 2.8985 2.1968 | | Zn O(3) O(2) 155.8000 2.0618 2.7657 4.7225 | | Zn O(3) O(4) 59.4476 2.0618 2.8017 2.4956 | | Zn O(3) O(4) 104.0592 2.0618 2.8219 3.8782 | | Zn O(3) O(2) 49.2645 2.0618 2.8899 2.1968 | | Zn O(3) O(2) 75.5779 2.0618 2.8985 3.1105 | | O(2) O(3) O(4) 96.7015 2.7657 2.8017 4.1602 | | O(2) O(3) O(4) 53.7535 2.7657 2.8219 2.5265 | | O(2) O(3) O(2) 133.5775 2.7657 2.8899 5.1980 | | O(2) O(3) O(2) 114.3444 2.7657 2.8985 4.7602 | | O(4) O(3) O(4) 54.3321 2.8017 2.8219 2.5676 | | O(4) O(3) O(2) 75.4004 2.8017 2.8899 3.4813 | | O(4) O(3) O(2) 113.0501 2.8017 2.8985 4.7550 | | O(4) O(3) O(2) 128.5796 2.8219 2.8899 5.1464 | | O(4) O(3) O(2) 99.2904 2.8219 2.8985 4.3595 | | O(2) O(3) O(2) 110.6446 2.8899 2.8985 4.7602 | +---------------------------------------------------------------------------+ Table A2.7 Found 10 atoms within 3.00 Å of atom O(4) (O ). +------------------------------------------+ | label elmt d [Å] d/(rA+rB) | +------------------------------------------+ | 1. Te(2) Te 1.9087 0.82 | | 2. Zn Zn 2.1170 1.09 | | 3. Te(2) Te 2.3159 1.00 | | 4. Zn Zn 2.4956 1.28 | | 5. O(2) O 2.5265 1.04 | | 6. O(4) O 2.5676 1.06 | | 7. O(3) O 2.8017 1.16 | | 8. O(3) O 2.8219 1.17 | | 9. O(4) O 2.8848 1.19 | | 10. O(1) O 2.9225 1.21 | +------------------------------------------+
173
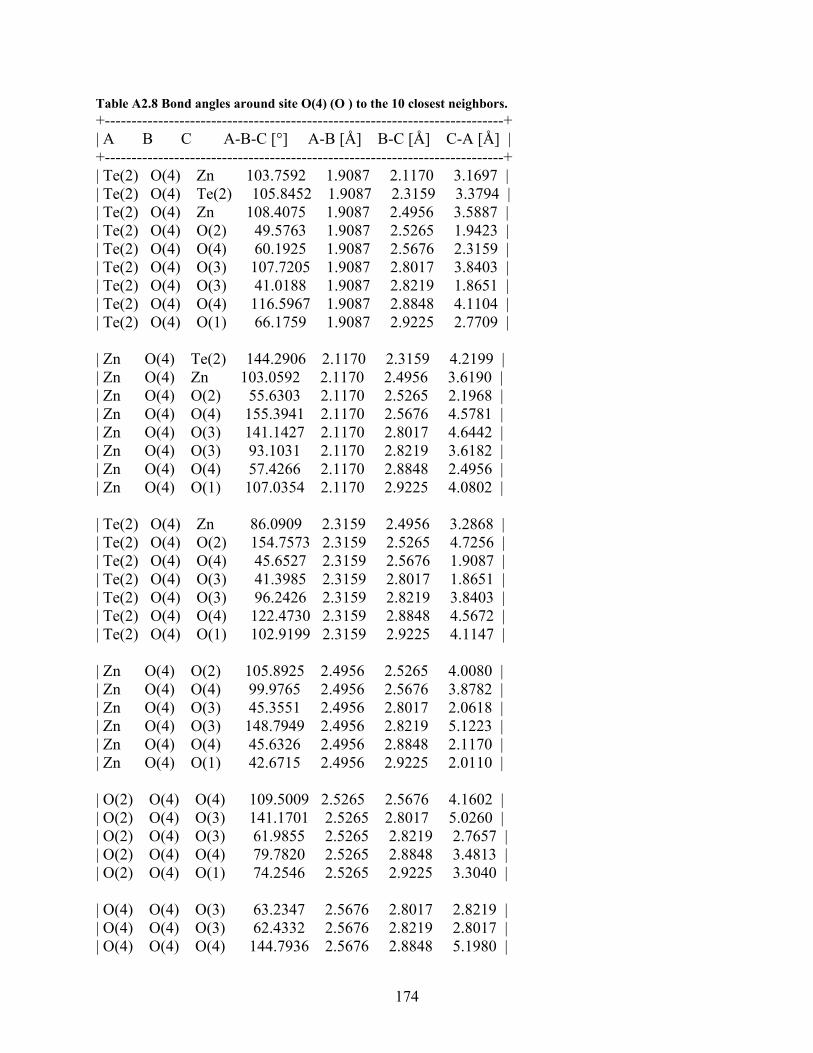
Table A2.8 Bond angles around site O(4) (O ) to the 10 closest neighbors. +---------------------------------------------------------------------------+ | A B C A-B-C [°] A-B [Å] B-C [Å] C-A [Å] | +---------------------------------------------------------------------------+ | Te(2) O(4) Zn 103.7592 1.9087 2.1170 3.1697 | | Te(2) O(4) Te(2) 105.8452 1.9087 2.3159 3.3794 | | Te(2) O(4) Zn 108.4075 1.9087 2.4956 3.5887 | | Te(2) O(4) O(2) 49.5763 1.9087 2.5265 1.9423 | | Te(2) O(4) O(4) 60.1925 1.9087 2.5676 2.3159 | | Te(2) O(4) O(3) 107.7205 1.9087 2.8017 3.8403 | | Te(2) O(4) O(3) 41.0188 1.9087 2.8219 1.8651 | | Te(2) O(4) O(4) 116.5967 1.9087 2.8848 4.1104 | | Te(2) O(4) O(1) 66.1759 1.9087 2.9225 2.7709 | | Zn O(4) Te(2) 144.2906 2.1170 2.3159 4.2199 | | Zn O(4) Zn 103.0592 2.1170 2.4956 3.6190 | | Zn O(4) O(2) 55.6303 2.1170 2.5265 2.1968 | | Zn O(4) O(4) 155.3941 2.1170 2.5676 4.5781 | | Zn O(4) O(3) 141.1427 2.1170 2.8017 4.6442 | | Zn O(4) O(3) 93.1031 2.1170 2.8219 3.6182 | | Zn O(4) O(4) 57.4266 2.1170 2.8848 2.4956 | | Zn O(4) O(1) 107.0354 2.1170 2.9225 4.0802 | | Te(2) O(4) Zn 86.0909 2.3159 2.4956 3.2868 | | Te(2) O(4) O(2) 154.7573 2.3159 2.5265 4.7256 | | Te(2) O(4) O(4) 45.6527 2.3159 2.5676 1.9087 | | Te(2) O(4) O(3) 41.3985 2.3159 2.8017 1.8651 | | Te(2) O(4) O(3) 96.2426 2.3159 2.8219 3.8403 | | Te(2) O(4) O(4) 122.4730 2.3159 2.8848 4.5672 | | Te(2) O(4) O(1) 102.9199 2.3159 2.9225 4.1147 | | Zn O(4) O(2) 105.8925 2.4956 2.5265 4.0080 | | Zn O(4) O(4) 99.9765 2.4956 2.5676 3.8782 | | Zn O(4) O(3) 45.3551 2.4956 2.8017 2.0618 | | Zn O(4) O(3) 148.7949 2.4956 2.8219 5.1223 | | Zn O(4) O(4) 45.6326 2.4956 2.8848 2.1170 | | Zn O(4) O(1) 42.6715 2.4956 2.9225 2.0110 | | O(2) O(4) O(4) 109.5009 2.5265 2.5676 4.1602 | | O(2) O(4) O(3) 141.1701 2.5265 2.8017 5.0260 | | O(2) O(4) O(3) 61.9855 2.5265 2.8219 2.7657 | | O(2) O(4) O(4) 79.7820 2.5265 2.8848 3.4813 | | O(2) O(4) O(1) 74.2546 2.5265 2.9225 3.3040 | | O(4) O(4) O(3) 63.2347 2.5676 2.8017 2.8219 | | O(4) O(4) O(3) 62.4332 2.5676 2.8219 2.8017 | | O(4) O(4) O(4) 144.7936 2.5676 2.8848 5.1980 |
174
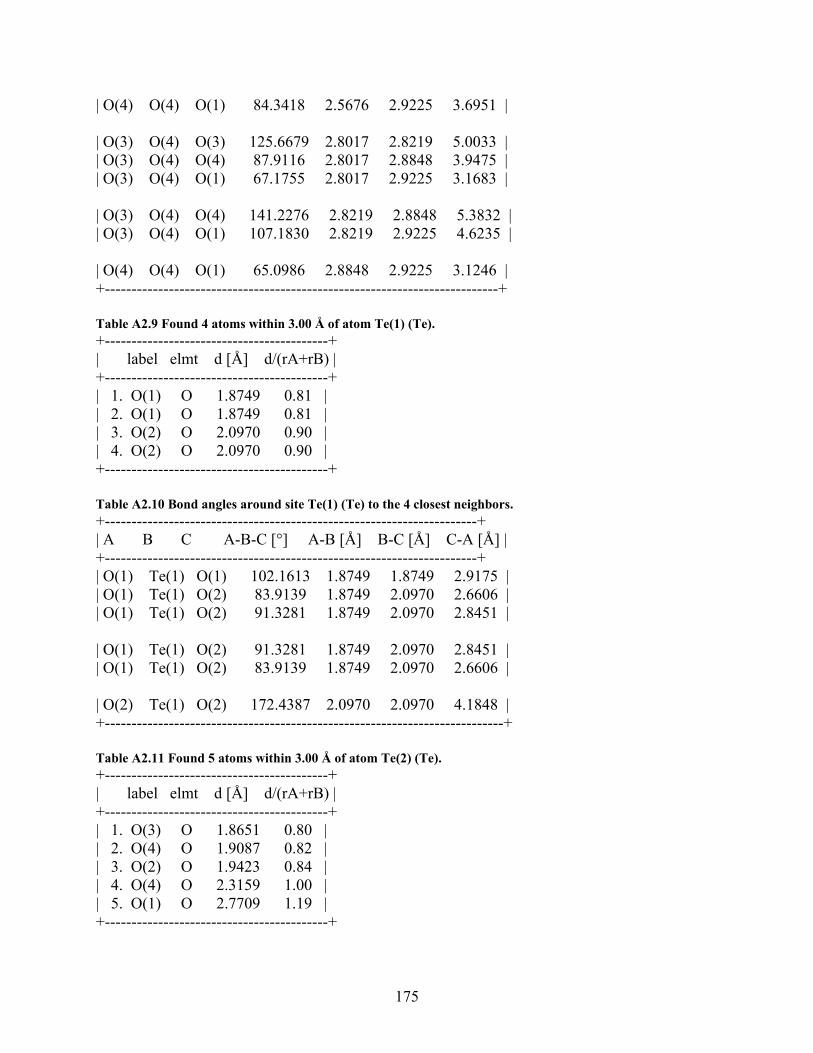
| O(4) O(4) O(1) 84.3418 2.5676 2.9225 3.6951 | | O(3) O(4) O(3) 125.6679 2.8017 2.8219 5.0033 | | O(3) O(4) O(4) 87.9116 2.8017 2.8848 3.9475 | | O(3) O(4) O(1) 67.1755 2.8017 2.9225 3.1683 | | O(3) O(4) O(4) 141.2276 2.8219 2.8848 5.3832 | | O(3) O(4) O(1) 107.1830 2.8219 2.9225 4.6235 | | O(4) O(4) O(1) 65.0986 2.8848 2.9225 3.1246 | +--------------------------------------------------------------------------+ Table A2.9 Found 4 atoms within 3.00 Å of atom Te(1) (Te). +------------------------------------------+ | label elmt d [Å] d/(rA+rB) | +------------------------------------------+ | 1. O(1) O 1.8749 0.81 | | 2. O(1) O 1.8749 0.81 | | 3. O(2) O 2.0970 0.90 | | 4. O(2) O 2.0970 0.90 | +------------------------------------------+ Table A2.10 Bond angles around site Te(1) (Te) to the 4 closest neighbors. +----------------------------------------------------------------------+ | A B C A-B-C [°] A-B [Å] B-C [Å] C-A [Å] | +----------------------------------------------------------------------+ | O(1) Te(1) O(1) 102.1613 1.8749 1.8749 2.9175 | | O(1) Te(1) O(2) 83.9139 1.8749 2.0970 2.6606 | | O(1) Te(1) O(2) 91.3281 1.8749 2.0970 2.8451 | | O(1) Te(1) O(2) 91.3281 1.8749 2.0970 2.8451 | | O(1) Te(1) O(2) 83.9139 1.8749 2.0970 2.6606 | | O(2) Te(1) O(2) 172.4387 2.0970 2.0970 4.1848 | +---------------------------------------------------------------------------+ Table A2.11 Found 5 atoms within 3.00 Å of atom Te(2) (Te). +------------------------------------------+ | label elmt d [Å] d/(rA+rB) | +------------------------------------------+ | 1. O(3) O 1.8651 0.80 | | 2. O(4) O 1.9087 0.82 | | 3. O(2) O 1.9423 0.84 | | 4. O(4) O 2.3159 1.00 | | 5. O(1) O 2.7709 1.19 | +------------------------------------------+
175
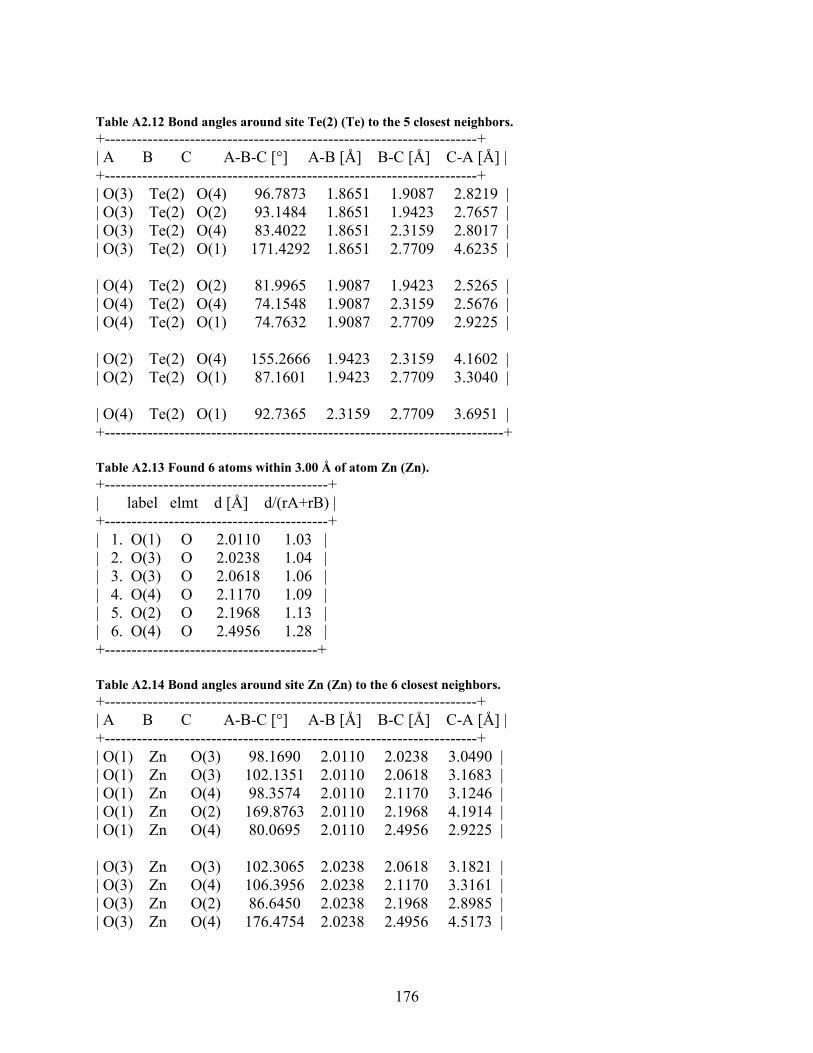
Table A2.12 Bond angles around site Te(2) (Te) to the 5 closest neighbors. +----------------------------------------------------------------------+ | A B C A-B-C [°] A-B [Å] B-C [Å] C-A [Å] | +----------------------------------------------------------------------+ | O(3) Te(2) O(4) 96.7873 1.8651 1.9087 2.8219 | | O(3) Te(2) O(2) 93.1484 1.8651 1.9423 2.7657 | | O(3) Te(2) O(4) 83.4022 1.8651 2.3159 2.8017 | | O(3) Te(2) O(1) 171.4292 1.8651 2.7709 4.6235 | | O(4) Te(2) O(2) 81.9965 1.9087 1.9423 2.5265 | | O(4) Te(2) O(4) 74.1548 1.9087 2.3159 2.5676 | | O(4) Te(2) O(1) 74.7632 1.9087 2.7709 2.9225 | | O(2) Te(2) O(4) 155.2666 1.9423 2.3159 4.1602 | | O(2) Te(2) O(1) 87.1601 1.9423 2.7709 3.3040 | | O(4) Te(2) O(1) 92.7365 2.3159 2.7709 3.6951 | +---------------------------------------------------------------------------+ Table A2.13 Found 6 atoms within 3.00 Å of atom Zn (Zn). +------------------------------------------+ | label elmt d [Å] d/(rA+rB) | +------------------------------------------+ | 1. O(1) O 2.0110 1.03 | | 2. O(3) O 2.0238 1.04 | | 3. O(3) O 2.0618 1.06 | | 4. O(4) O 2.1170 1.09 | | 5. O(2) O 2.1968 1.13 | | 6. O(4) O 2.4956 1.28 | +----------------------------------------+ Table A2.14 Bond angles around site Zn (Zn) to the 6 closest neighbors. +----------------------------------------------------------------------+ | A B C A-B-C [°] A-B [Å] B-C [Å] C-A [Å] | +----------------------------------------------------------------------+ | O(1) Zn O(3) 98.1690 2.0110 2.0238 3.0490 | | O(1) Zn O(3) 102.1351 2.0110 2.0618 3.1683 | | O(1) Zn O(4) 98.3574 2.0110 2.1170 3.1246 | | O(1) Zn O(2) 169.8763 2.0110 2.1968 4.1914 | | O(1) Zn O(4) 80.0695 2.0110 2.4956 2.9225 | | O(3) Zn O(3) 102.3065 2.0238 2.0618 3.1821 | | O(3) Zn O(4) 106.3956 2.0238 2.1170 3.3161 | | O(3) Zn O(2) 86.6450 2.0238 2.1968 2.8985 | | O(3) Zn O(4) 176.4754 2.0238 2.4956 4.5173 |
176
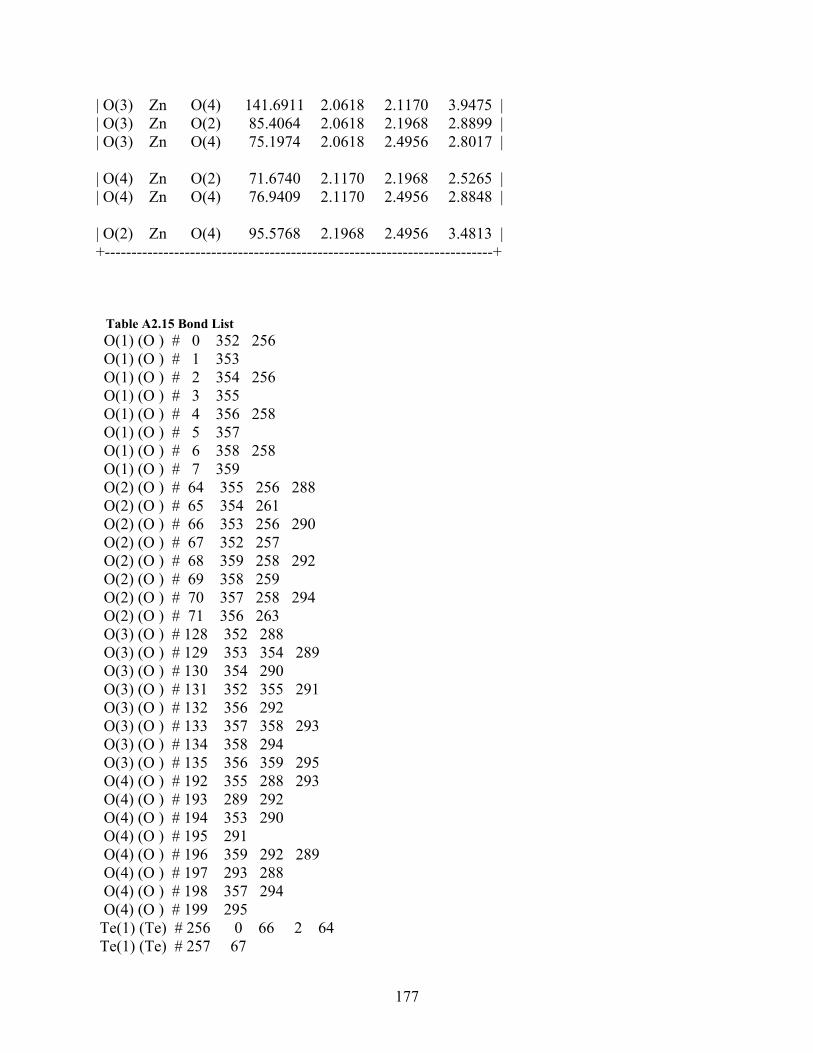
| O(3) Zn O(4) 141.6911 2.0618 2.1170 3.9475 | | O(3) Zn O(2) 85.4064 2.0618 2.1968 2.8899 | | O(3) Zn O(4) 75.1974 2.0618 2.4956 2.8017 | | O(4) Zn O(2) 71.6740 2.1170 2.1968 2.5265 | | O(4) Zn O(4) 76.9409 2.1170 2.4956 2.8848 | | O(2) Zn O(4) 95.5768 2.1968 2.4956 3.4813 | +-------------------------------------------------------------------------+ Table A2.15 Bond List O(1) (O ) # 0 352 256 O(1) (O ) # 1 353 O(1) (O ) # 2 354 256 O(1) (O ) # 3 355 O(1) (O ) # 4 356 258 O(1) (O ) # 5 357 O(1) (O ) # 6 358 258 O(1) (O ) # 7 359 O(2) (O ) # 64 355 256 288 O(2) (O ) # 65 354 261 O(2) (O ) # 66 353 256 290 O(2) (O ) # 67 352 257 O(2) (O ) # 68 359 258 292 O(2) (O ) # 69 358 259 O(2) (O ) # 70 357 258 294 O(2) (O ) # 71 356 263 O(3) (O ) # 128 352 288 O(3) (O ) # 129 353 354 289 O(3) (O ) # 130 354 290 O(3) (O ) # 131 352 355 291 O(3) (O ) # 132 356 292 O(3) (O ) # 133 357 358 293 O(3) (O ) # 134 358 294 O(3) (O ) # 135 356 359 295 O(4) (O ) # 192 355 288 293 O(4) (O ) # 193 289 292 O(4) (O ) # 194 353 290 O(4) (O ) # 195 291 O(4) (O ) # 196 359 292 289 O(4) (O ) # 197 293 288 O(4) (O ) # 198 357 294 O(4) (O ) # 199 295 Te(1) (Te) # 256 0 66 2 64 Te(1) (Te) # 257 67
177
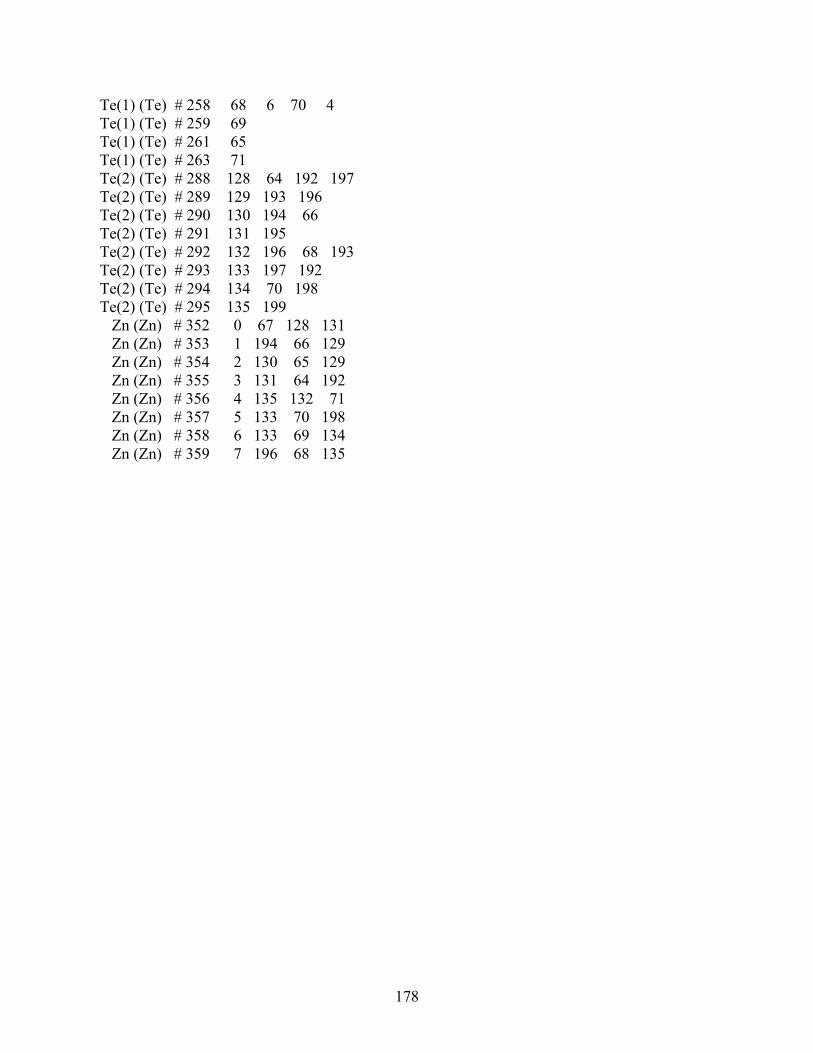
Te(1) (Te) # 258 68 6 70 4 Te(1) (Te) # 259 69 Te(1) (Te) # 261 65 Te(1) (Te) # 263 71 Te(2) (Te) # 288 128 64 192 197 Te(2) (Te) # 289 129 193 196 Te(2) (Te) # 290 130 194 66 Te(2) (Te) # 291 131 195 Te(2) (Te) # 292 132 196 68 193 Te(2) (Te) # 293 133 197 192 Te(2) (Te) # 294 134 70 198 Te(2) (Te) # 295 135 199 Zn (Zn) # 352 0 67 128 131 Zn (Zn) # 353 1 194 66 129 Zn (Zn) # 354 2 130 65 129 Zn (Zn) # 355 3 131 64 192 Zn (Zn) # 356 4 135 132 71 Zn (Zn) # 357 5 133 70 198 Zn (Zn) # 358 6 133 69 134 Zn (Zn) # 359 7 196 68 135
178
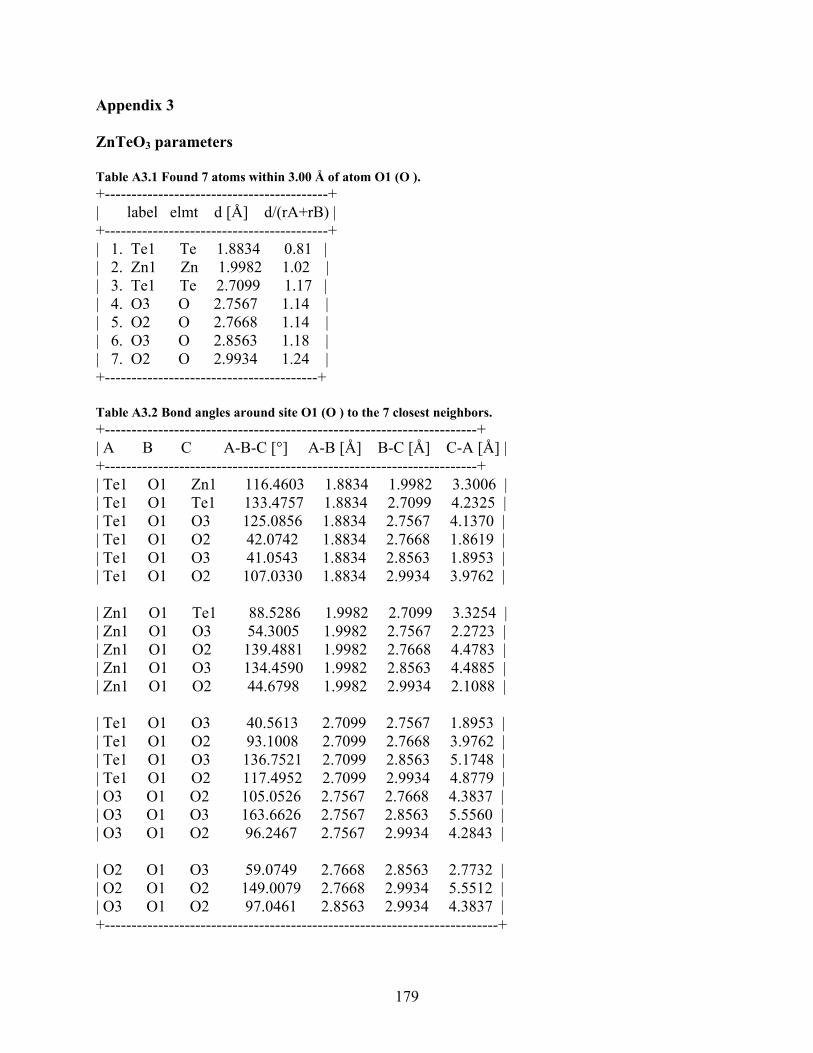
Appendix 3 ZnTeO3 parameters Table A3.1 Found 7 atoms within 3.00 Å of atom O1 (O ). +------------------------------------------+ | label elmt d [Å] d/(rA+rB) | +------------------------------------------+ | 1. Te1 Te 1.8834 0.81 | | 2. Zn1 Zn 1.9982 1.02 | | 3. Te1 Te 2.7099 1.17 | | 4. O3 O 2.7567 1.14 | | 5. O2 O 2.7668 1.14 | | 6. O3 O 2.8563 1.18 | | 7. O2 O 2.9934 1.24 | +----------------------------------------+ Table A3.2 Bond angles around site O1 (O ) to the 7 closest neighbors. +----------------------------------------------------------------------+ | A B C A-B-C [°] A-B [Å] B-C [Å] C-A [Å] | +----------------------------------------------------------------------+ | Te1 O1 Zn1 116.4603 1.8834 1.9982 3.3006 | | Te1 O1 Te1 133.4757 1.8834 2.7099 4.2325 | | Te1 O1 O3 125.0856 1.8834 2.7567 4.1370 | | Te1 O1 O2 42.0742 1.8834 2.7668 1.8619 | | Te1 O1 O3 41.0543 1.8834 2.8563 1.8953 | | Te1 O1 O2 107.0330 1.8834 2.9934 3.9762 | | Zn1 O1 Te1 88.5286 1.9982 2.7099 3.3254 | | Zn1 O1 O3 54.3005 1.9982 2.7567 2.2723 | | Zn1 O1 O2 139.4881 1.9982 2.7668 4.4783 | | Zn1 O1 O3 134.4590 1.9982 2.8563 4.4885 | | Zn1 O1 O2 44.6798 1.9982 2.9934 2.1088 | | Te1 O1 O3 40.5613 2.7099 2.7567 1.8953 | | Te1 O1 O2 93.1008 2.7099 2.7668 3.9762 | | Te1 O1 O3 136.7521 2.7099 2.8563 5.1748 | | Te1 O1 O2 117.4952 2.7099 2.9934 4.8779 | | O3 O1 O2 105.0526 2.7567 2.7668 4.3837 | | O3 O1 O3 163.6626 2.7567 2.8563 5.5560 | | O3 O1 O2 96.2467 2.7567 2.9934 4.2843 | | O2 O1 O3 59.0749 2.7668 2.8563 2.7732 | | O2 O1 O2 149.0079 2.7668 2.9934 5.5512 | | O3 O1 O2 97.0461 2.8563 2.9934 4.3837 | +--------------------------------------------------------------------------+
179
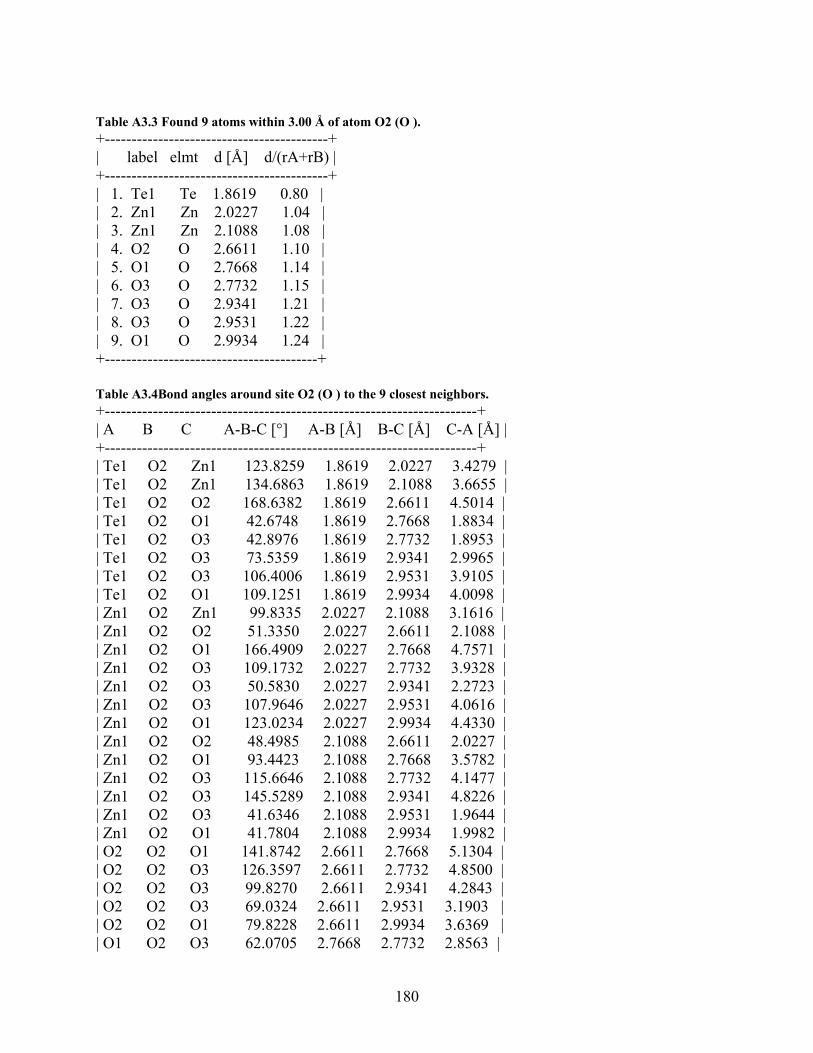
180
Table A3.3 Found 9 atoms within 3.00 Å of atom O2 (O ). +------------------------------------------+ | label elmt d [Å] d/(rA+rB) | +------------------------------------------+ | 1. Te1 Te 1.8619 0.80 | | 2. Zn1 Zn 2.0227 1.04 | | 3. Zn1 Zn 2.1088 1.08 | | 4. O2 O 2.6611 1.10 | | 5. O1 O 2.7668 1.14 | | 6. O3 O 2.7732 1.15 | | 7. O3 O 2.9341 1.21 | | 8. O3 O 2.9531 1.22 | | 9. O1 O 2.9934 1.24 | +----------------------------------------+ Table A3.4Bond angles around site O2 (O ) to the 9 closest neighbors. +----------------------------------------------------------------------+ | A B C A-B-C [°] A-B [Å] B-C [Å] C-A [Å] | +----------------------------------------------------------------------+ | Te1 O2 Zn1 123.8259 1.8619 2.0227 3.4279 | | Te1 O2 Zn1 134.6863 1.8619 2.1088 3.6655 | | Te1 O2 O2 168.6382 1.8619 2.6611 4.5014 | | Te1 O2 O1 42.6748 1.8619 2.7668 1.8834 | | Te1 O2 O3 42.8976 1.8619 2.7732 1.8953 | | Te1 O2 O3 73.5359 1.8619 2.9341 2.9965 | | Te1 O2 O3 106.4006 1.8619 2.9531 3.9105 | | Te1 O2 O1 109.1251 1.8619 2.9934 4.0098 | | Zn1 O2 Zn1 99.8335 2.0227 2.1088 3.1616 | | Zn1 O2 O2 51.3350 2.0227 2.6611 2.1088 | | Zn1 O2 O1 166.4909 2.0227 2.7668 4.7571 | | Zn1 O2 O3 109.1732 2.0227 2.7732 3.9328 | | Zn1 O2 O3 50.5830 2.0227 2.9341 2.2723 | | Zn1 O2 O3 107.9646 2.0227 2.9531 4.0616 | | Zn1 O2 O1 123.0234 2.0227 2.9934 4.4330 | | Zn1 O2 O2 48.4985 2.1088 2.6611 2.0227 | | Zn1 O2 O1 93.4423 2.1088 2.7668 3.5782 | | Zn1 O2 O3 115.6646 2.1088 2.7732 4.1477 | | Zn1 O2 O3 145.5289 2.1088 2.9341 4.8226 | | Zn1 O2 O3 41.6346 2.1088 2.9531 1.9644 | | Zn1 O2 O1 41.7804 2.1088 2.9934 1.9982 | | O2 O2 O1 141.8742 2.6611 2.7668 5.1304 | | O2 O2 O3 126.3597 2.6611 2.7732 4.8500 | | O2 O2 O3 99.8270 2.6611 2.9341 4.2843 | | O2 O2 O3 69.0324 2.6611 2.9531 3.1903 | | O2 O2 O1 79.8228 2.6611 2.9934 3.6369 | | O1 O2 O3 62.0705 2.7668 2.7732 2.8563 |
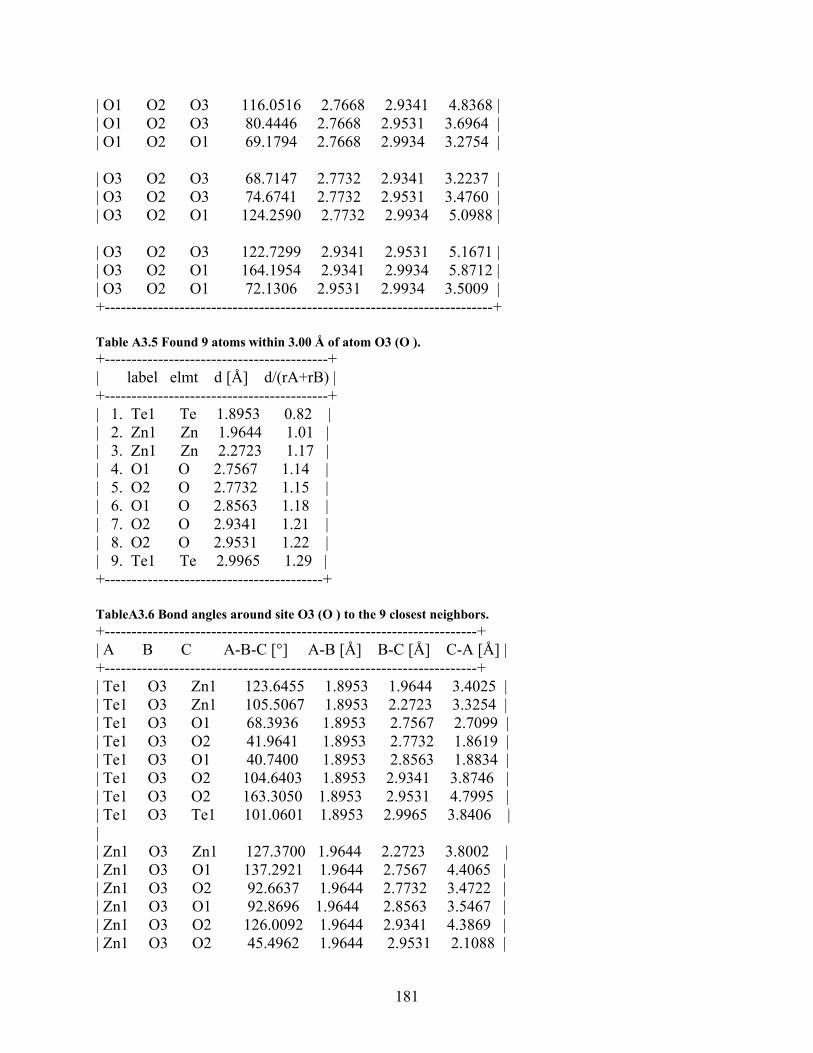
181
| O1 O2 O3 116.0516 2.7668 2.9341 4.8368 | | O1 O2 O3 80.4446 2.7668 2.9531 3.6964 | | O1 O2 O1 69.1794 2.7668 2.9934 3.2754 | | O3 O2 O3 68.7147 2.7732 2.9341 3.2237 | | O3 O2 O3 74.6741 2.7732 2.9531 3.4760 | | O3 O2 O1 124.2590 2.7732 2.9934 5.0988 | | O3 O2 O3 122.7299 2.9341 2.9531 5.1671 | | O3 O2 O1 164.1954 2.9341 2.9934 5.8712 | | O3 O2 O1 72.1306 2.9531 2.9934 3.5009 | +-------------------------------------------------------------------------+ Table A3.5 Found 9 atoms within 3.00 Å of atom O3 (O ). +------------------------------------------+ | label elmt d [Å] d/(rA+rB) | +------------------------------------------+ | 1. Te1 Te 1.8953 0.82 | | 2. Zn1 Zn 1.9644 1.01 | | 3. Zn1 Zn 2.2723 1.17 | | 4. O1 O 2.7567 1.14 | | 5. O2 O 2.7732 1.15 | | 6. O1 O 2.8563 1.18 | | 7. O2 O 2.9341 1.21 | | 8. O2 O 2.9531 1.22 | | 9. Te1 Te 2.9965 1.29 | +-----------------------------------------+ TableA3.6 Bond angles around site O3 (O ) to the 9 closest neighbors. +----------------------------------------------------------------------+ | A B C A-B-C [°] A-B [Å] B-C [Å] C-A [Å] | +----------------------------------------------------------------------+ | Te1 O3 Zn1 123.6455 1.8953 1.9644 3.4025 | | Te1 O3 Zn1 105.5067 1.8953 2.2723 3.3254 | | Te1 O3 O1 68.3936 1.8953 2.7567 2.7099 | | Te1 O3 O2 41.9641 1.8953 2.7732 1.8619 | | Te1 O3 O1 40.7400 1.8953 2.8563 1.8834 | | Te1 O3 O2 104.6403 1.8953 2.9341 3.8746 | | Te1 O3 O2 163.3050 1.8953 2.9531 4.7995 | | Te1 O3 Te1 101.0601 1.8953 2.9965 3.8406 | | | Zn1 O3 Zn1 127.3700 1.9644 2.2723 3.8002 | | Zn1 O3 O1 137.2921 1.9644 2.7567 4.4065 | | Zn1 O3 O2 92.6637 1.9644 2.7732 3.4722 | | Zn1 O3 O1 92.8696 1.9644 2.8563 3.5467 | | Zn1 O3 O2 126.0092 1.9644 2.9341 4.3869 | | Zn1 O3 O2 45.4962 1.9644 2.9531 2.1088 |
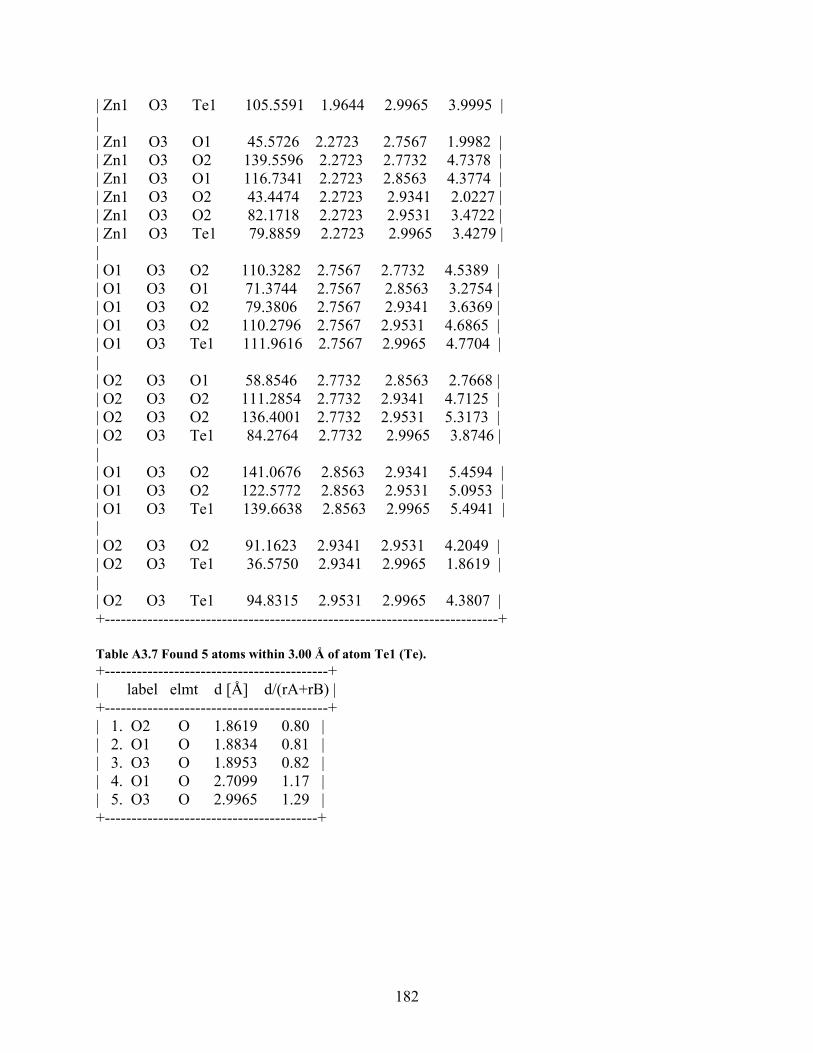
182
| Zn1 O3 Te1 105.5591 1.9644 2.9965 3.9995 | | | Zn1 O3 O1 45.5726 2.2723 2.7567 1.9982 | | Zn1 O3 O2 139.5596 2.2723 2.7732 4.7378 | | Zn1 O3 O1 116.7341 2.2723 2.8563 4.3774 | | Zn1 O3 O2 43.4474 2.2723 2.9341 2.0227 | | Zn1 O3 O2 82.1718 2.2723 2.9531 3.4722 | | Zn1 O3 Te1 79.8859 2.2723 2.9965 3.4279 | | | O1 O3 O2 110.3282 2.7567 2.7732 4.5389 | | O1 O3 O1 71.3744 2.7567 2.8563 3.2754 | | O1 O3 O2 79.3806 2.7567 2.9341 3.6369 | | O1 O3 O2 110.2796 2.7567 2.9531 4.6865 | | O1 O3 Te1 111.9616 2.7567 2.9965 4.7704 | | | O2 O3 O1 58.8546 2.7732 2.8563 2.7668 | | O2 O3 O2 111.2854 2.7732 2.9341 4.7125 | | O2 O3 O2 136.4001 2.7732 2.9531 5.3173 | | O2 O3 Te1 84.2764 2.7732 2.9965 3.8746 | | | O1 O3 O2 141.0676 2.8563 2.9341 5.4594 | | O1 O3 O2 122.5772 2.8563 2.9531 5.0953 | | O1 O3 Te1 139.6638 2.8563 2.9965 5.4941 | | | O2 O3 O2 91.1623 2.9341 2.9531 4.2049 | | O2 O3 Te1 36.5750 2.9341 2.9965 1.8619 | | | O2 O3 Te1 94.8315 2.9531 2.9965 4.3807 | +--------------------------------------------------------------------------+ Table A3.7 Found 5 atoms within 3.00 Å of atom Te1 (Te). +------------------------------------------+ | label elmt d [Å] d/(rA+rB) | +------------------------------------------+ | 1. O2 O 1.8619 0.80 | | 2. O1 O 1.8834 0.81 | | 3. O3 O 1.8953 0.82 | | 4. O1 O 2.7099 1.17 | | 5. O3 O 2.9965 1.29 | +----------------------------------------+
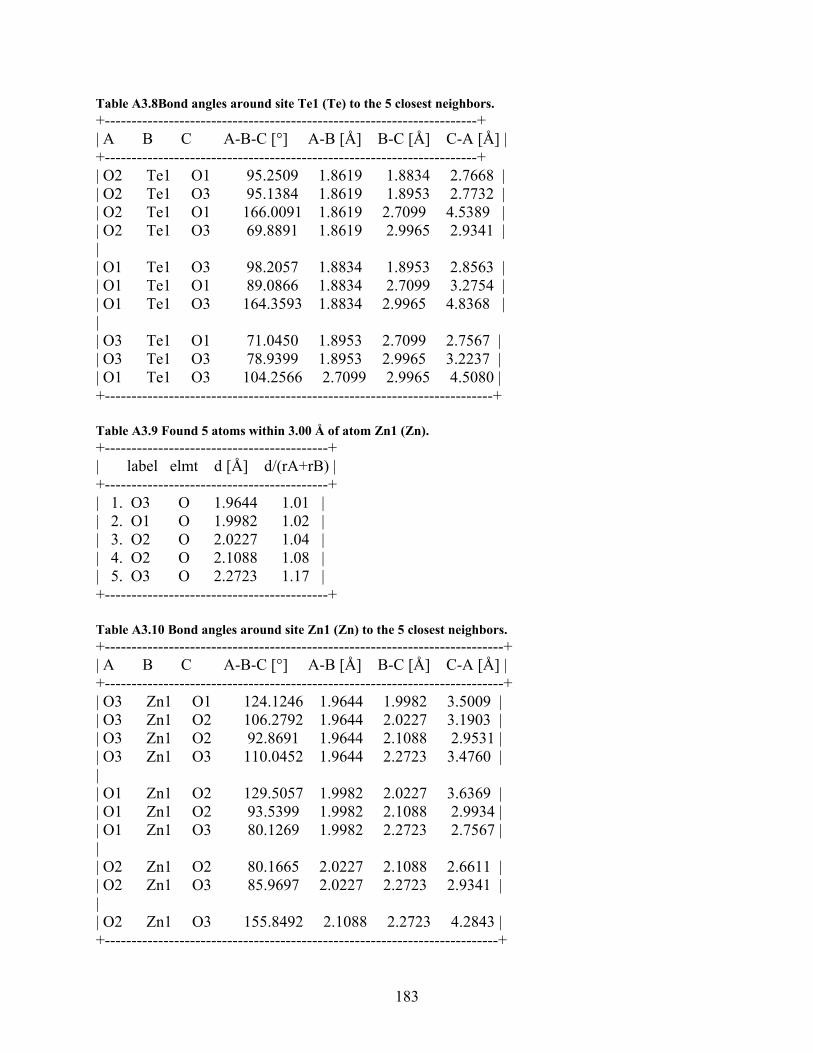
183
Table A3.8Bond angles around site Te1 (Te) to the 5 closest neighbors. +----------------------------------------------------------------------+ | A B C A-B-C [°] A-B [Å] B-C [Å] C-A [Å] | +----------------------------------------------------------------------+ | O2 Te1 O1 95.2509 1.8619 1.8834 2.7668 | | O2 Te1 O3 95.1384 1.8619 1.8953 2.7732 | | O2 Te1 O1 166.0091 1.8619 2.7099 4.5389 | | O2 Te1 O3 69.8891 1.8619 2.9965 2.9341 | | | O1 Te1 O3 98.2057 1.8834 1.8953 2.8563 | | O1 Te1 O1 89.0866 1.8834 2.7099 3.2754 | | O1 Te1 O3 164.3593 1.8834 2.9965 4.8368 | | | O3 Te1 O1 71.0450 1.8953 2.7099 2.7567 | | O3 Te1 O3 78.9399 1.8953 2.9965 3.2237 | | O1 Te1 O3 104.2566 2.7099 2.9965 4.5080 | +-------------------------------------------------------------------------+ Table A3.9 Found 5 atoms within 3.00 Å of atom Zn1 (Zn). +------------------------------------------+ | label elmt d [Å] d/(rA+rB) | +------------------------------------------+ | 1. O3 O 1.9644 1.01 | | 2. O1 O 1.9982 1.02 | | 3. O2 O 2.0227 1.04 | | 4. O2 O 2.1088 1.08 | | 5. O3 O 2.2723 1.17 | +------------------------------------------+ Table A3.10 Bond angles around site Zn1 (Zn) to the 5 closest neighbors. +---------------------------------------------------------------------------+ | A B C A-B-C [°] A-B [Å] B-C [Å] C-A [Å] | +---------------------------------------------------------------------------+ | O3 Zn1 O1 124.1246 1.9644 1.9982 3.5009 | | O3 Zn1 O2 106.2792 1.9644 2.0227 3.1903 | | O3 Zn1 O2 92.8691 1.9644 2.1088 2.9531 | | O3 Zn1 O3 110.0452 1.9644 2.2723 3.4760 | | | O1 Zn1 O2 129.5057 1.9982 2.0227 3.6369 | | O1 Zn1 O2 93.5399 1.9982 2.1088 2.9934 | | O1 Zn1 O3 80.1269 1.9982 2.2723 2.7567 | | | O2 Zn1 O2 80.1665 2.0227 2.1088 2.6611 | | O2 Zn1 O3 85.9697 2.0227 2.2723 2.9341 | | | O2 Zn1 O3 155.8492 2.1088 2.2723 4.2843 | +--------------------------------------------------------------------------+
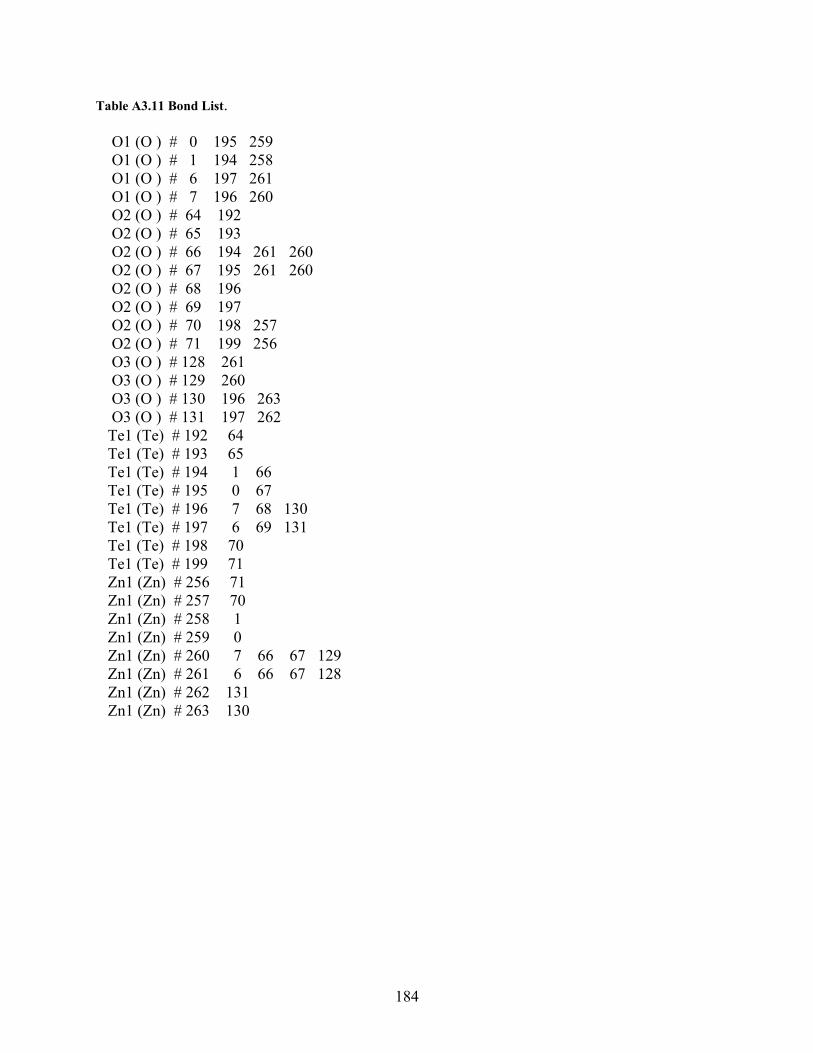
184
Table A3.11 Bond List. O1 (O ) # 0 195 259 O1 (O ) # 1 194 258 O1 (O ) # 6 197 261 O1 (O ) # 7 196 260 O2 (O ) # 64 192 O2 (O ) # 65 193 O2 (O ) # 66 194 261 260 O2 (O ) # 67 195 261 260 O2 (O ) # 68 196 O2 (O ) # 69 197 O2 (O ) # 70 198 257 O2 (O ) # 71 199 256 O3 (O ) # 128 261 O3 (O ) # 129 260 O3 (O ) # 130 196 263 O3 (O ) # 131 197 262 Te1 (Te) # 192 64 Te1 (Te) # 193 65 Te1 (Te) # 194 1 66 Te1 (Te) # 195 0 67 Te1 (Te) # 196 7 68 130 Te1 (Te) # 197 6 69 131 Te1 (Te) # 198 70 Te1 (Te) # 199 71 Zn1 (Zn) # 256 71 Zn1 (Zn) # 257 70 Zn1 (Zn) # 258 1 Zn1 (Zn) # 259 0 Zn1 (Zn) # 260 7 66 67 129 Zn1 (Zn) # 261 6 66 67 128 Zn1 (Zn) # 262 131 Zn1 (Zn) # 263 130
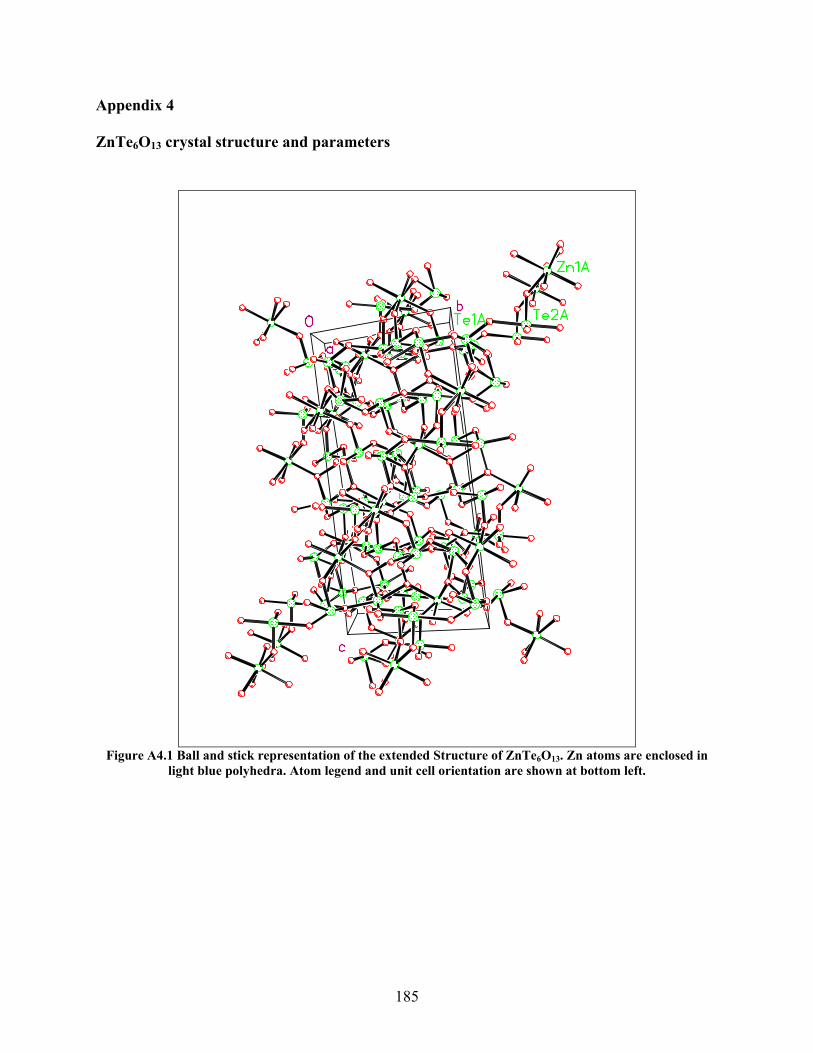
185
Appendix 4 ZnTe B6 BO B13B crystal structure and parameters
Figure A4.1 Ball and stick representation of the extended Structure of ZnTeB6BO B13B. Zn atoms are enclosed in
light blue polyhedra. Atom legend and unit cell orientation are shown at bottom left.
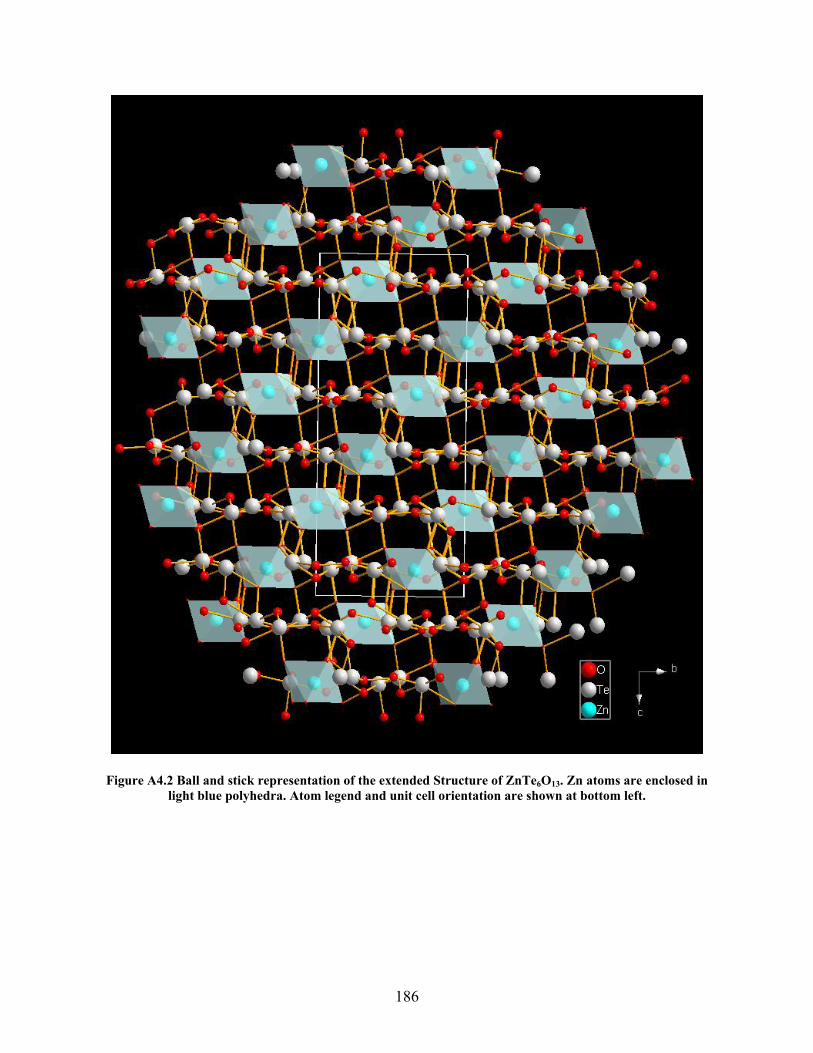
186
Figure A4.2 Ball and stick representation of the extended Structure of ZnTeB6BO B13B. Zn atoms are enclosed in light blue polyhedra. Atom legend and unit cell orientation are shown at bottom left.
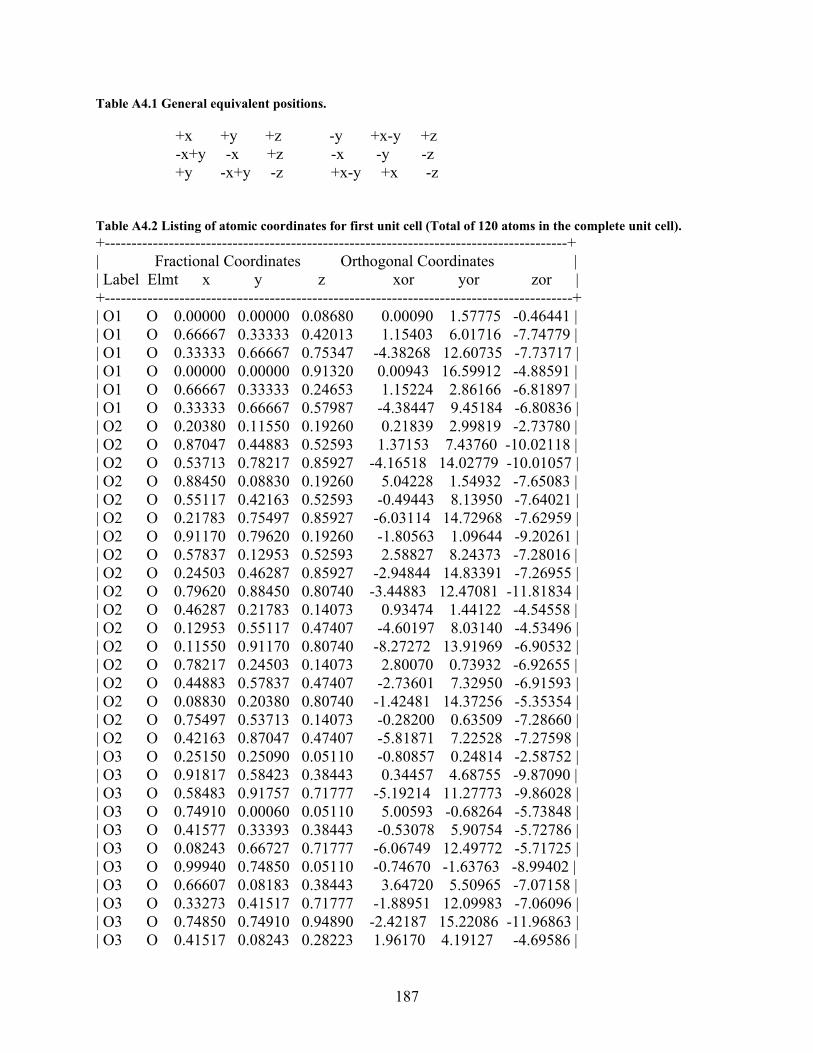
187
Table A4.1 General equivalent positions. +x +y +z -y +x-y +z -x+y -x +z -x -y -z +y -x+y -z +x-y +x -z Table A4.2 Listing of atomic coordinates for first unit cell (Total of 120 atoms in the complete unit cell). +---------------------------------------------------------------------------------------+ | Fractional Coordinates Orthogonal Coordinates | | Label Elmt x y z xor yor zor | +----------------------------------------------------------------------------------------+ | O1 O 0.00000 0.00000 0.08680 0.00090 1.57775 -0.46441 | | O1 O 0.66667 0.33333 0.42013 1.15403 6.01716 -7.74779 | | O1 O 0.33333 0.66667 0.75347 -4.38268 12.60735 -7.73717 | | O1 O 0.00000 0.00000 0.91320 0.00943 16.59912 -4.88591 | | O1 O 0.66667 0.33333 0.24653 1.15224 2.86166 -6.81897 | | O1 O 0.33333 0.66667 0.57987 -4.38447 9.45184 -6.80836 | | O2 O 0.20380 0.11550 0.19260 0.21839 2.99819 -2.73780 | | O2 O 0.87047 0.44883 0.52593 1.37153 7.43760 -10.02118 | | O2 O 0.53713 0.78217 0.85927 -4.16518 14.02779 -10.01057 | | O2 O 0.88450 0.08830 0.19260 5.04228 1.54932 -7.65083 | | O2 O 0.55117 0.42163 0.52593 -0.49443 8.13950 -7.64021 | | O2 O 0.21783 0.75497 0.85927 -6.03114 14.72968 -7.62959 | | O2 O 0.91170 0.79620 0.19260 -1.80563 1.09644 -9.20261 | | O2 O 0.57837 0.12953 0.52593 2.58827 8.24373 -7.28016 | | O2 O 0.24503 0.46287 0.85927 -2.94844 14.83391 -7.26955 | | O2 O 0.79620 0.88450 0.80740 -3.44883 12.47081 -11.81834 | | O2 O 0.46287 0.21783 0.14073 0.93474 1.44122 -4.54558 | | O2 O 0.12953 0.55117 0.47407 -4.60197 8.03140 -4.53496 | | O2 O 0.11550 0.91170 0.80740 -8.27272 13.91969 -6.90532 | | O2 O 0.78217 0.24503 0.14073 2.80070 0.73932 -6.92655 | | O2 O 0.44883 0.57837 0.47407 -2.73601 7.32950 -6.91593 | | O2 O 0.08830 0.20380 0.80740 -1.42481 14.37256 -5.35354 | | O2 O 0.75497 0.53713 0.14073 -0.28200 0.63509 -7.28660 | | O2 O 0.42163 0.87047 0.47407 -5.81871 7.22528 -7.27598 | | O3 O 0.25150 0.25090 0.05110 -0.80857 0.24814 -2.58752 | | O3 O 0.91817 0.58423 0.38443 0.34457 4.68755 -9.87090 | | O3 O 0.58483 0.91757 0.71777 -5.19214 11.27773 -9.86028 | | O3 O 0.74910 0.00060 0.05110 5.00593 -0.68264 -5.73848 | | O3 O 0.41577 0.33393 0.38443 -0.53078 5.90754 -5.72786 | | O3 O 0.08243 0.66727 0.71777 -6.06749 12.49772 -5.71725 | | O3 O 0.99940 0.74850 0.05110 -0.74670 -1.63763 -8.99402 | | O3 O 0.66607 0.08183 0.38443 3.64720 5.50965 -7.07158 | | O3 O 0.33273 0.41517 0.71777 -1.88951 12.09983 -7.06096 | | O3 O 0.74850 0.74910 0.94890 -2.42187 15.22086 -11.96863 | | O3 O 0.41517 0.08243 0.28223 1.96170 4.19127 -4.69586 |
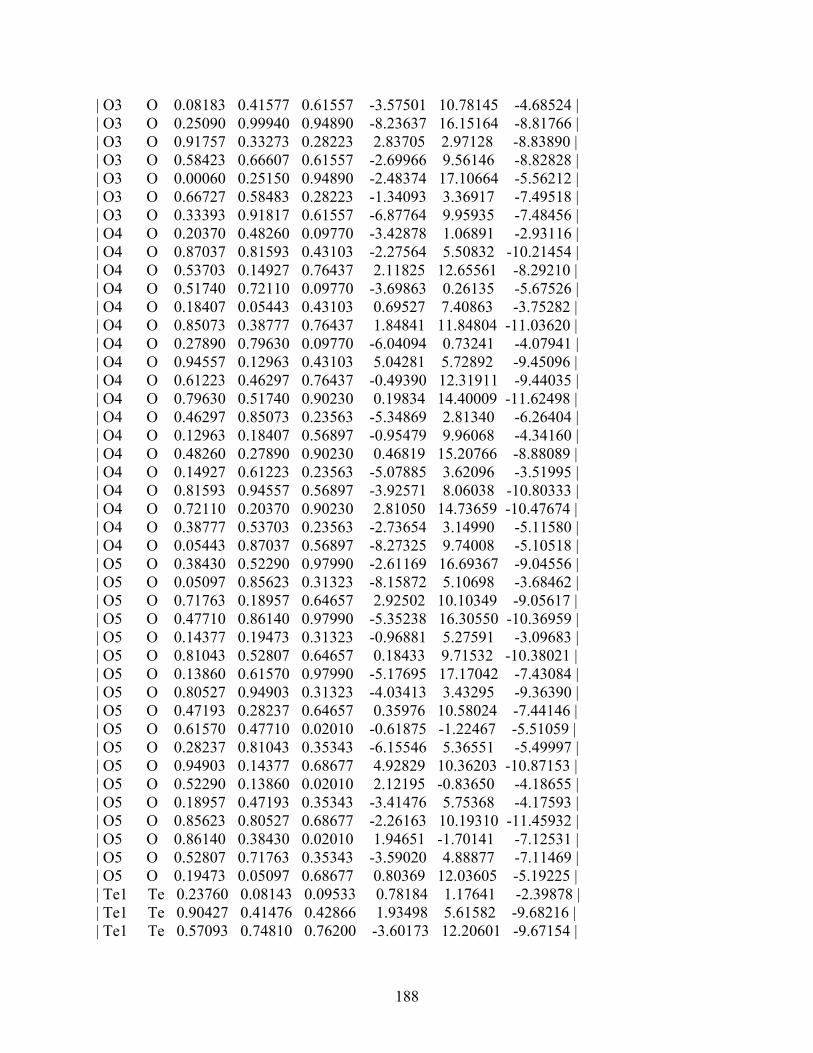
188
| O3 O 0.08183 0.41577 0.61557 -3.57501 10.78145 -4.68524 | | O3 O 0.25090 0.99940 0.94890 -8.23637 16.15164 -8.81766 | | O3 O 0.91757 0.33273 0.28223 2.83705 2.97128 -8.83890 | | O3 O 0.58423 0.66607 0.61557 -2.69966 9.56146 -8.82828 | | O3 O 0.00060 0.25150 0.94890 -2.48374 17.10664 -5.56212 | | O3 O 0.66727 0.58483 0.28223 -1.34093 3.36917 -7.49518 | | O3 O 0.33393 0.91817 0.61557 -6.87764 9.95935 -7.48456 | | O4 O 0.20370 0.48260 0.09770 -3.42878 1.06891 -2.93116 | | O4 O 0.87037 0.81593 0.43103 -2.27564 5.50832 -10.21454 | | O4 O 0.53703 0.14927 0.76437 2.11825 12.65561 -8.29210 | | O4 O 0.51740 0.72110 0.09770 -3.69863 0.26135 -5.67526 | | O4 O 0.18407 0.05443 0.43103 0.69527 7.40863 -3.75282 | | O4 O 0.85073 0.38777 0.76437 1.84841 11.84804 -11.03620 | | O4 O 0.27890 0.79630 0.09770 -6.04094 0.73241 -4.07941 | | O4 O 0.94557 0.12963 0.43103 5.04281 5.72892 -9.45096 | | O4 O 0.61223 0.46297 0.76437 -0.49390 12.31911 -9.44035 | | O4 O 0.79630 0.51740 0.90230 0.19834 14.40009 -11.62498 | | O4 O 0.46297 0.85073 0.23563 -5.34869 2.81340 -6.26404 | | O4 O 0.12963 0.18407 0.56897 -0.95479 9.96068 -4.34160 | | O4 O 0.48260 0.27890 0.90230 0.46819 15.20766 -8.88089 | | O4 O 0.14927 0.61223 0.23563 -5.07885 3.62096 -3.51995 | | O4 O 0.81593 0.94557 0.56897 -3.92571 8.06038 -10.80333 | | O4 O 0.72110 0.20370 0.90230 2.81050 14.73659 -10.47674 | | O4 O 0.38777 0.53703 0.23563 -2.73654 3.14990 -5.11580 | | O4 O 0.05443 0.87037 0.56897 -8.27325 9.74008 -5.10518 | | O5 O 0.38430 0.52290 0.97990 -2.61169 16.69367 -9.04556 | | O5 O 0.05097 0.85623 0.31323 -8.15872 5.10698 -3.68462 | | O5 O 0.71763 0.18957 0.64657 2.92502 10.10349 -9.05617 | | O5 O 0.47710 0.86140 0.97990 -5.35238 16.30550 -10.36959 | | O5 O 0.14377 0.19473 0.31323 -0.96881 5.27591 -3.09683 | | O5 O 0.81043 0.52807 0.64657 0.18433 9.71532 -10.38021 | | O5 O 0.13860 0.61570 0.97990 -5.17695 17.17042 -7.43084 | | O5 O 0.80527 0.94903 0.31323 -4.03413 3.43295 -9.36390 | | O5 O 0.47193 0.28237 0.64657 0.35976 10.58024 -7.44146 | | O5 O 0.61570 0.47710 0.02010 -0.61875 -1.22467 -5.51059 | | O5 O 0.28237 0.81043 0.35343 -6.15546 5.36551 -5.49997 | | O5 O 0.94903 0.14377 0.68677 4.92829 10.36203 -10.87153 | | O5 O 0.52290 0.13860 0.02010 2.12195 -0.83650 -4.18655 | | O5 O 0.18957 0.47193 0.35343 -3.41476 5.75368 -4.17593 | | O5 O 0.85623 0.80527 0.68677 -2.26163 10.19310 -11.45932 | | O5 O 0.86140 0.38430 0.02010 1.94651 -1.70141 -7.12531 | | O5 O 0.52807 0.71763 0.35343 -3.59020 4.88877 -7.11469 | | O5 O 0.19473 0.05097 0.68677 0.80369 12.03605 -5.19225 | | Te1 Te 0.23760 0.08143 0.09533 0.78184 1.17641 -2.39878 | | Te1 Te 0.90427 0.41476 0.42866 1.93498 5.61582 -9.68216 | | Te1 Te 0.57093 0.74810 0.76200 -3.60173 12.20601 -9.67154 |
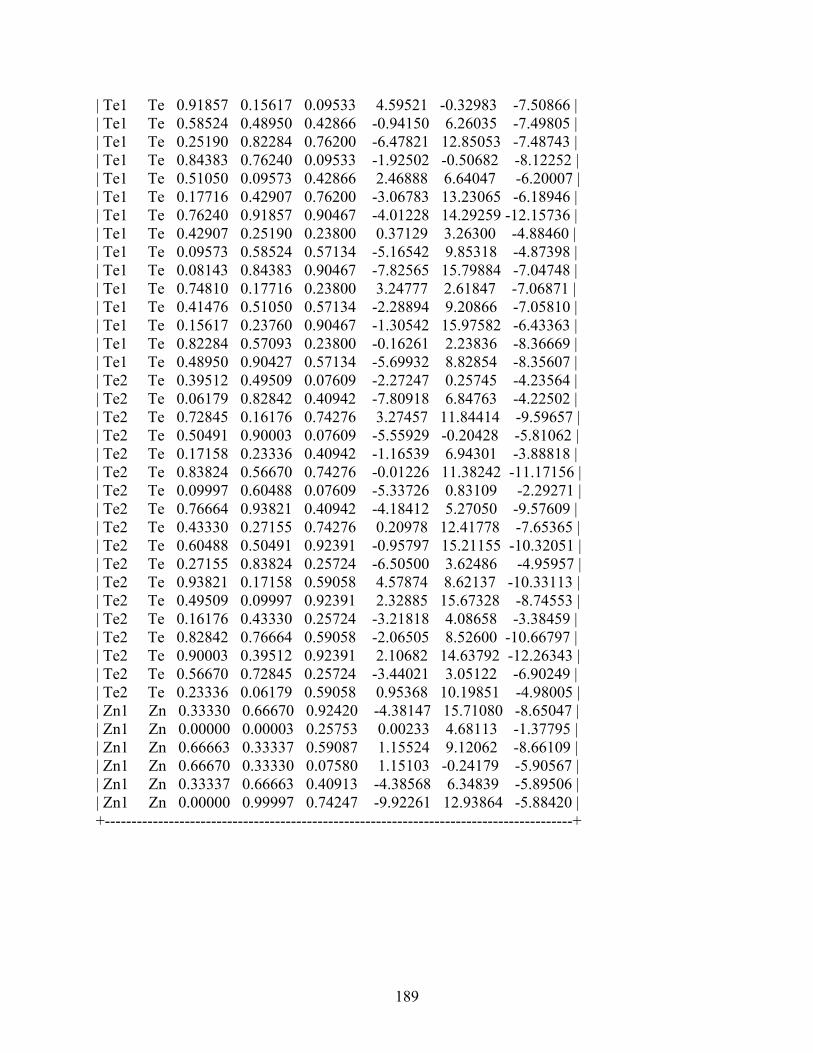
189
| Te1 Te 0.91857 0.15617 0.09533 4.59521 -0.32983 -7.50866 | | Te1 Te 0.58524 0.48950 0.42866 -0.94150 6.26035 -7.49805 | | Te1 Te 0.25190 0.82284 0.76200 -6.47821 12.85053 -7.48743 | | Te1 Te 0.84383 0.76240 0.09533 -1.92502 -0.50682 -8.12252 | | Te1 Te 0.51050 0.09573 0.42866 2.46888 6.64047 -6.20007 | | Te1 Te 0.17716 0.42907 0.76200 -3.06783 13.23065 -6.18946 | | Te1 Te 0.76240 0.91857 0.90467 -4.01228 14.29259 -12.15736 | | Te1 Te 0.42907 0.25190 0.23800 0.37129 3.26300 -4.88460 | | Te1 Te 0.09573 0.58524 0.57134 -5.16542 9.85318 -4.87398 | | Te1 Te 0.08143 0.84383 0.90467 -7.82565 15.79884 -7.04748 | | Te1 Te 0.74810 0.17716 0.23800 3.24777 2.61847 -7.06871 | | Te1 Te 0.41476 0.51050 0.57134 -2.28894 9.20866 -7.05810 | | Te1 Te 0.15617 0.23760 0.90467 -1.30542 15.97582 -6.43363 | | Te1 Te 0.82284 0.57093 0.23800 -0.16261 2.23836 -8.36669 | | Te1 Te 0.48950 0.90427 0.57134 -5.69932 8.82854 -8.35607 | | Te2 Te 0.39512 0.49509 0.07609 -2.27247 0.25745 -4.23564 | | Te2 Te 0.06179 0.82842 0.40942 -7.80918 6.84763 -4.22502 | | Te2 Te 0.72845 0.16176 0.74276 3.27457 11.84414 -9.59657 | | Te2 Te 0.50491 0.90003 0.07609 -5.55929 -0.20428 -5.81062 | | Te2 Te 0.17158 0.23336 0.40942 -1.16539 6.94301 -3.88818 | | Te2 Te 0.83824 0.56670 0.74276 -0.01226 11.38242 -11.17156 | | Te2 Te 0.09997 0.60488 0.07609 -5.33726 0.83109 -2.29271 | | Te2 Te 0.76664 0.93821 0.40942 -4.18412 5.27050 -9.57609 | | Te2 Te 0.43330 0.27155 0.74276 0.20978 12.41778 -7.65365 | | Te2 Te 0.60488 0.50491 0.92391 -0.95797 15.21155 -10.32051 | | Te2 Te 0.27155 0.83824 0.25724 -6.50500 3.62486 -4.95957 | | Te2 Te 0.93821 0.17158 0.59058 4.57874 8.62137 -10.33113 | | Te2 Te 0.49509 0.09997 0.92391 2.32885 15.67328 -8.74553 | | Te2 Te 0.16176 0.43330 0.25724 -3.21818 4.08658 -3.38459 | | Te2 Te 0.82842 0.76664 0.59058 -2.06505 8.52600 -10.66797 | | Te2 Te 0.90003 0.39512 0.92391 2.10682 14.63792 -12.26343 | | Te2 Te 0.56670 0.72845 0.25724 -3.44021 3.05122 -6.90249 | | Te2 Te 0.23336 0.06179 0.59058 0.95368 10.19851 -4.98005 | | Zn1 Zn 0.33330 0.66670 0.92420 -4.38147 15.71080 -8.65047 | | Zn1 Zn 0.00000 0.00003 0.25753 0.00233 4.68113 -1.37795 | | Zn1 Zn 0.66663 0.33337 0.59087 1.15524 9.12062 -8.66109 | | Zn1 Zn 0.66670 0.33330 0.07580 1.15103 -0.24179 -5.90567 | | Zn1 Zn 0.33337 0.66663 0.40913 -4.38568 6.34839 -5.89506 | | Zn1 Zn 0.00000 0.99997 0.74247 -9.92261 12.93864 -5.88420 | +----------------------------------------------------------------------------------------+
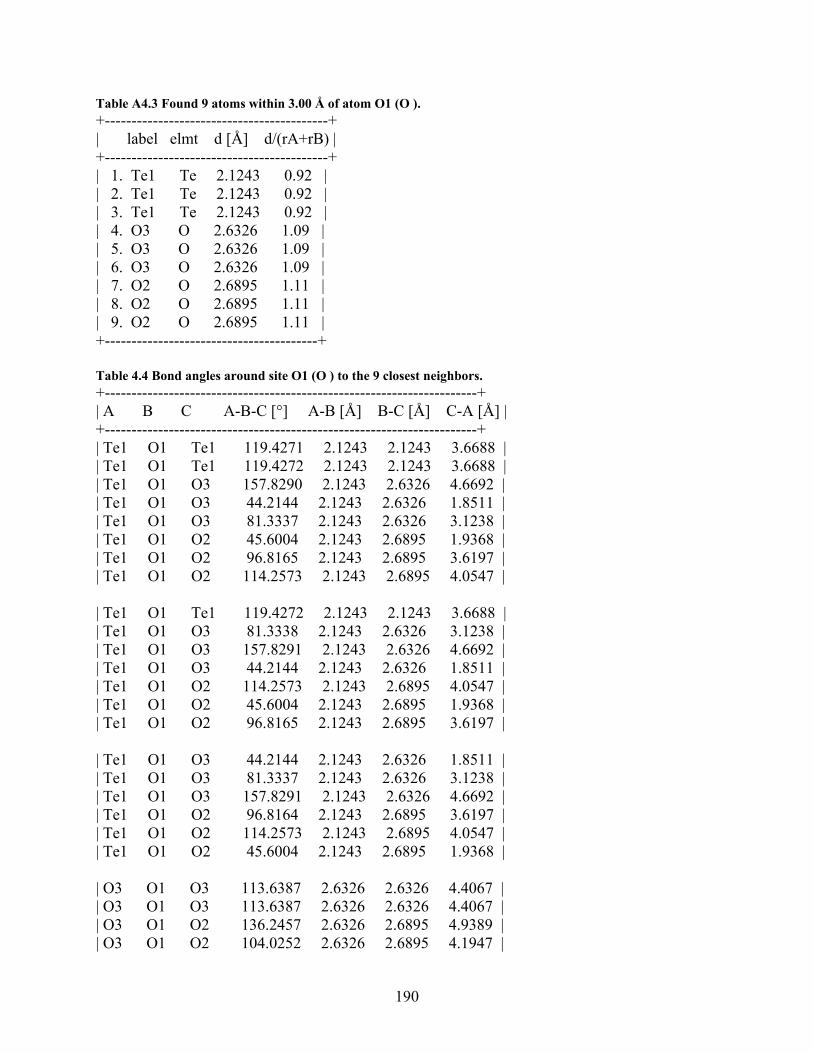
190
Table A4.3 Found 9 atoms within 3.00 Å of atom O1 (O ). +------------------------------------------+ | label elmt d [Å] d/(rA+rB) | +------------------------------------------+ | 1. Te1 Te 2.1243 0.92 | | 2. Te1 Te 2.1243 0.92 | | 3. Te1 Te 2.1243 0.92 | | 4. O3 O 2.6326 1.09 | | 5. O3 O 2.6326 1.09 | | 6. O3 O 2.6326 1.09 | | 7. O2 O 2.6895 1.11 | | 8. O2 O 2.6895 1.11 | | 9. O2 O 2.6895 1.11 | +----------------------------------------+ Table 4.4 Bond angles around site O1 (O ) to the 9 closest neighbors. +----------------------------------------------------------------------+ | A B C A-B-C [°] A-B [Å] B-C [Å] C-A [Å] | +----------------------------------------------------------------------+ | Te1 O1 Te1 119.4271 2.1243 2.1243 3.6688 | | Te1 O1 Te1 119.4272 2.1243 2.1243 3.6688 | | Te1 O1 O3 157.8290 2.1243 2.6326 4.6692 | | Te1 O1 O3 44.2144 2.1243 2.6326 1.8511 | | Te1 O1 O3 81.3337 2.1243 2.6326 3.1238 | | Te1 O1 O2 45.6004 2.1243 2.6895 1.9368 | | Te1 O1 O2 96.8165 2.1243 2.6895 3.6197 | | Te1 O1 O2 114.2573 2.1243 2.6895 4.0547 | | Te1 O1 Te1 119.4272 2.1243 2.1243 3.6688 | | Te1 O1 O3 81.3338 2.1243 2.6326 3.1238 | | Te1 O1 O3 157.8291 2.1243 2.6326 4.6692 | | Te1 O1 O3 44.2144 2.1243 2.6326 1.8511 | | Te1 O1 O2 114.2573 2.1243 2.6895 4.0547 | | Te1 O1 O2 45.6004 2.1243 2.6895 1.9368 | | Te1 O1 O2 96.8165 2.1243 2.6895 3.6197 | | Te1 O1 O3 44.2144 2.1243 2.6326 1.8511 | | Te1 O1 O3 81.3337 2.1243 2.6326 3.1238 | | Te1 O1 O3 157.8291 2.1243 2.6326 4.6692 | | Te1 O1 O2 96.8164 2.1243 2.6895 3.6197 | | Te1 O1 O2 114.2573 2.1243 2.6895 4.0547 | | Te1 O1 O2 45.6004 2.1243 2.6895 1.9368 | | O3 O1 O3 113.6387 2.6326 2.6326 4.4067 | | O3 O1 O3 113.6387 2.6326 2.6326 4.4067 | | O3 O1 O2 136.2457 2.6326 2.6895 4.9389 | | O3 O1 O2 104.0252 2.6326 2.6895 4.1947 |
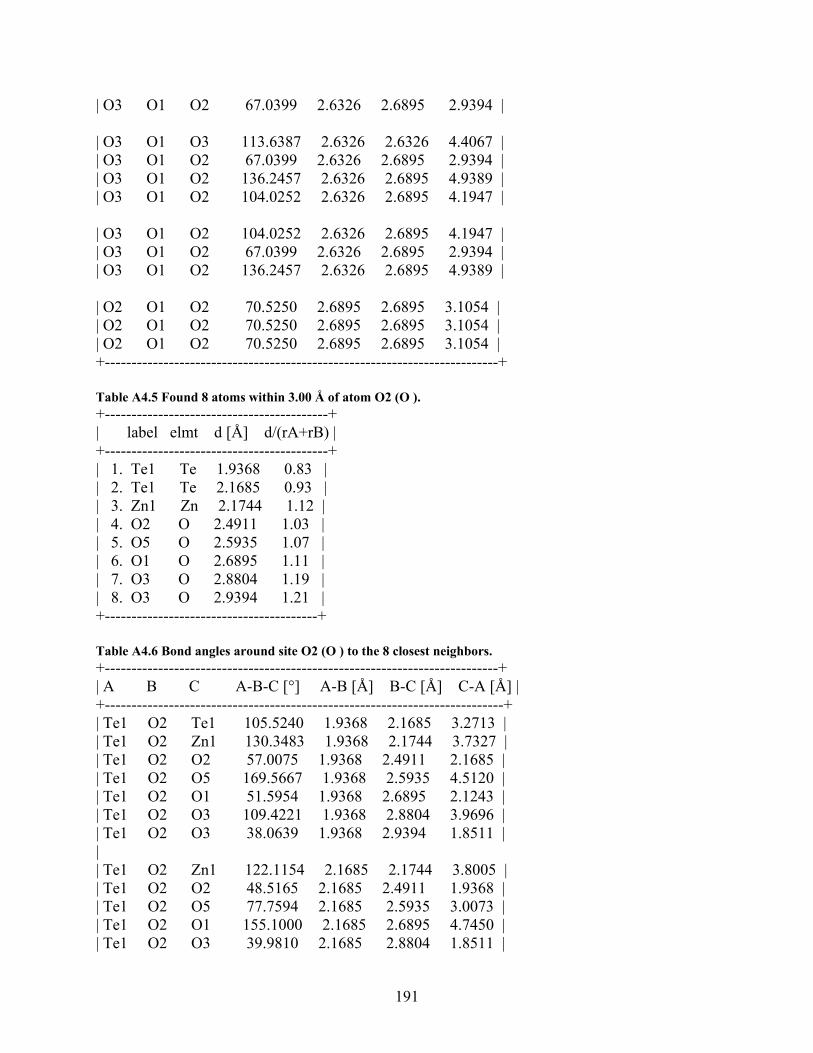
191
| O3 O1 O2 67.0399 2.6326 2.6895 2.9394 | | O3 O1 O3 113.6387 2.6326 2.6326 4.4067 | | O3 O1 O2 67.0399 2.6326 2.6895 2.9394 | | O3 O1 O2 136.2457 2.6326 2.6895 4.9389 | | O3 O1 O2 104.0252 2.6326 2.6895 4.1947 | | O3 O1 O2 104.0252 2.6326 2.6895 4.1947 | | O3 O1 O2 67.0399 2.6326 2.6895 2.9394 | | O3 O1 O2 136.2457 2.6326 2.6895 4.9389 | | O2 O1 O2 70.5250 2.6895 2.6895 3.1054 | | O2 O1 O2 70.5250 2.6895 2.6895 3.1054 | | O2 O1 O2 70.5250 2.6895 2.6895 3.1054 | +--------------------------------------------------------------------------+ Table A4.5 Found 8 atoms within 3.00 Å of atom O2 (O ). +------------------------------------------+ | label elmt d [Å] d/(rA+rB) | +------------------------------------------+ | 1. Te1 Te 1.9368 0.83 | | 2. Te1 Te 2.1685 0.93 | | 3. Zn1 Zn 2.1744 1.12 | | 4. O2 O 2.4911 1.03 | | 5. O5 O 2.5935 1.07 | | 6. O1 O 2.6895 1.11 | | 7. O3 O 2.8804 1.19 | | 8. O3 O 2.9394 1.21 | +----------------------------------------+ Table A4.6 Bond angles around site O2 (O ) to the 8 closest neighbors. +--------------------------------------------------------------------------+ | A B C A-B-C [°] A-B [Å] B-C [Å] C-A [Å] | +---------------------------------------------------------------------------+ | Te1 O2 Te1 105.5240 1.9368 2.1685 3.2713 | | Te1 O2 Zn1 130.3483 1.9368 2.1744 3.7327 | | Te1 O2 O2 57.0075 1.9368 2.4911 2.1685 | | Te1 O2 O5 169.5667 1.9368 2.5935 4.5120 | | Te1 O2 O1 51.5954 1.9368 2.6895 2.1243 | | Te1 O2 O3 109.4221 1.9368 2.8804 3.9696 | | Te1 O2 O3 38.0639 1.9368 2.9394 1.8511 | | | Te1 O2 Zn1 122.1154 2.1685 2.1744 3.8005 | | Te1 O2 O2 48.5165 2.1685 2.4911 1.9368 | | Te1 O2 O5 77.7594 2.1685 2.5935 3.0073 | | Te1 O2 O1 155.1000 2.1685 2.6895 4.7450 | | Te1 O2 O3 39.9810 2.1685 2.8804 1.8511 |
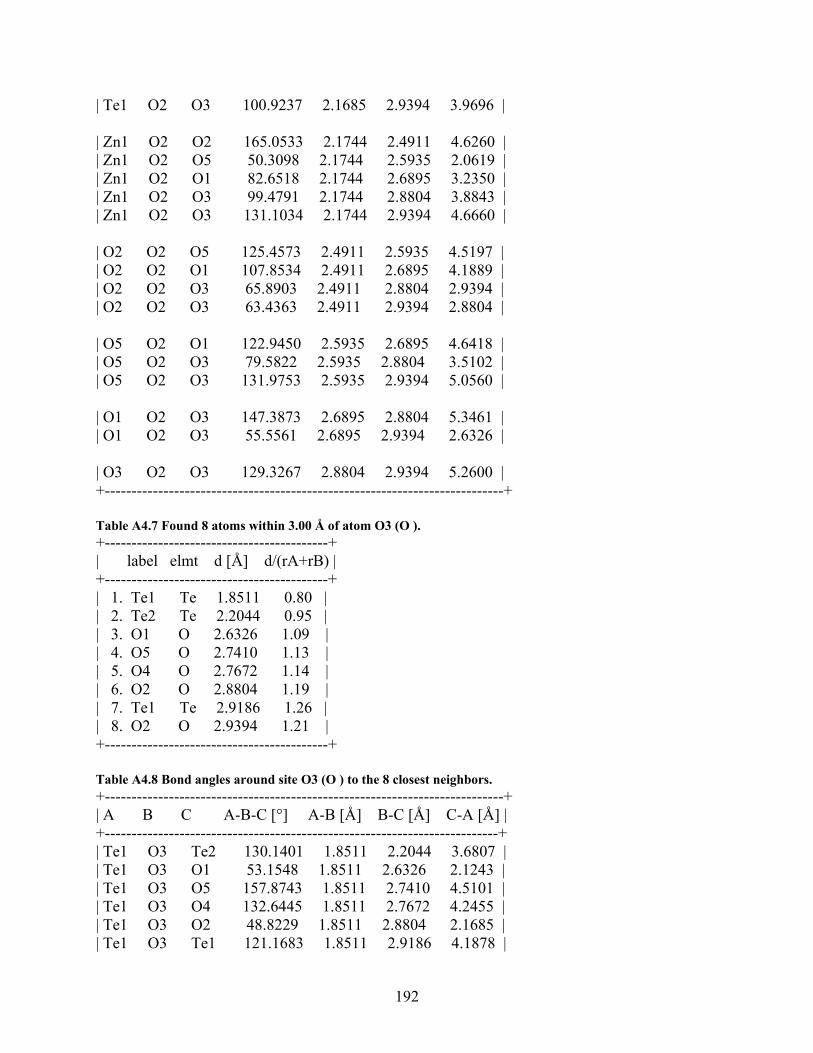
192
| Te1 O2 O3 100.9237 2.1685 2.9394 3.9696 | | Zn1 O2 O2 165.0533 2.1744 2.4911 4.6260 | | Zn1 O2 O5 50.3098 2.1744 2.5935 2.0619 | | Zn1 O2 O1 82.6518 2.1744 2.6895 3.2350 | | Zn1 O2 O3 99.4791 2.1744 2.8804 3.8843 | | Zn1 O2 O3 131.1034 2.1744 2.9394 4.6660 | | O2 O2 O5 125.4573 2.4911 2.5935 4.5197 | | O2 O2 O1 107.8534 2.4911 2.6895 4.1889 | | O2 O2 O3 65.8903 2.4911 2.8804 2.9394 | | O2 O2 O3 63.4363 2.4911 2.9394 2.8804 | | O5 O2 O1 122.9450 2.5935 2.6895 4.6418 | | O5 O2 O3 79.5822 2.5935 2.8804 3.5102 | | O5 O2 O3 131.9753 2.5935 2.9394 5.0560 | | O1 O2 O3 147.3873 2.6895 2.8804 5.3461 | | O1 O2 O3 55.5561 2.6895 2.9394 2.6326 | | O3 O2 O3 129.3267 2.8804 2.9394 5.2600 | +---------------------------------------------------------------------------+ Table A4.7 Found 8 atoms within 3.00 Å of atom O3 (O ). +------------------------------------------+ | label elmt d [Å] d/(rA+rB) | +------------------------------------------+ | 1. Te1 Te 1.8511 0.80 | | 2. Te2 Te 2.2044 0.95 | | 3. O1 O 2.6326 1.09 | | 4. O5 O 2.7410 1.13 | | 5. O4 O 2.7672 1.14 | | 6. O2 O 2.8804 1.19 | | 7. Te1 Te 2.9186 1.26 | | 8. O2 O 2.9394 1.21 | +------------------------------------------+ Table A4.8 Bond angles around site O3 (O ) to the 8 closest neighbors. +---------------------------------------------------------------------------+ | A B C A-B-C [°] A-B [Å] B-C [Å] C-A [Å] | +--------------------------------------------------------------------------+ | Te1 O3 Te2 130.1401 1.8511 2.2044 3.6807 | | Te1 O3 O1 53.1548 1.8511 2.6326 2.1243 | | Te1 O3 O5 157.8743 1.8511 2.7410 4.5101 | | Te1 O3 O4 132.6445 1.8511 2.7672 4.2455 | | Te1 O3 O2 48.8229 1.8511 2.8804 2.1685 | | Te1 O3 Te1 121.1683 1.8511 2.9186 4.1878 |
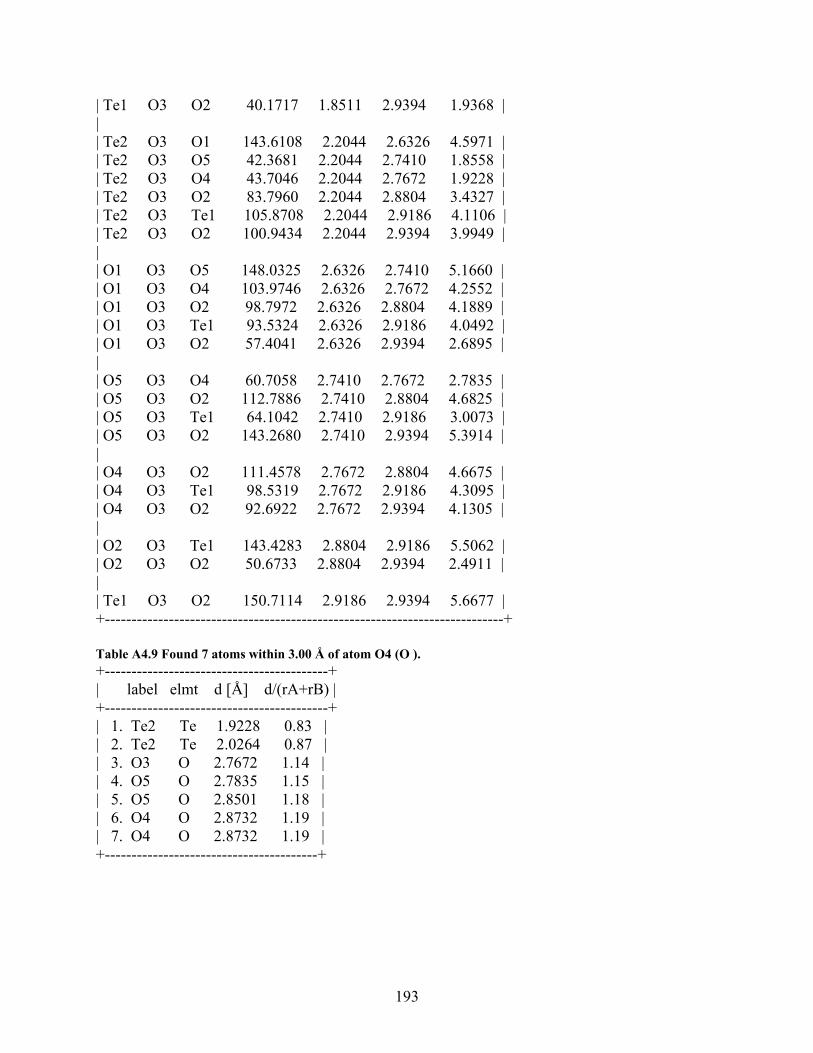
193
| Te1 O3 O2 40.1717 1.8511 2.9394 1.9368 | | | Te2 O3 O1 143.6108 2.2044 2.6326 4.5971 | | Te2 O3 O5 42.3681 2.2044 2.7410 1.8558 | | Te2 O3 O4 43.7046 2.2044 2.7672 1.9228 | | Te2 O3 O2 83.7960 2.2044 2.8804 3.4327 | | Te2 O3 Te1 105.8708 2.2044 2.9186 4.1106 | | Te2 O3 O2 100.9434 2.2044 2.9394 3.9949 | | | O1 O3 O5 148.0325 2.6326 2.7410 5.1660 | | O1 O3 O4 103.9746 2.6326 2.7672 4.2552 | | O1 O3 O2 98.7972 2.6326 2.8804 4.1889 | | O1 O3 Te1 93.5324 2.6326 2.9186 4.0492 | | O1 O3 O2 57.4041 2.6326 2.9394 2.6895 | | | O5 O3 O4 60.7058 2.7410 2.7672 2.7835 | | O5 O3 O2 112.7886 2.7410 2.8804 4.6825 | | O5 O3 Te1 64.1042 2.7410 2.9186 3.0073 | | O5 O3 O2 143.2680 2.7410 2.9394 5.3914 | | | O4 O3 O2 111.4578 2.7672 2.8804 4.6675 | | O4 O3 Te1 98.5319 2.7672 2.9186 4.3095 | | O4 O3 O2 92.6922 2.7672 2.9394 4.1305 | | | O2 O3 Te1 143.4283 2.8804 2.9186 5.5062 | | O2 O3 O2 50.6733 2.8804 2.9394 2.4911 | | | Te1 O3 O2 150.7114 2.9186 2.9394 5.6677 | +---------------------------------------------------------------------------+ Table A4.9 Found 7 atoms within 3.00 Å of atom O4 (O ). +------------------------------------------+ | label elmt d [Å] d/(rA+rB) | +------------------------------------------+ | 1. Te2 Te 1.9228 0.83 | | 2. Te2 Te 2.0264 0.87 | | 3. O3 O 2.7672 1.14 | | 4. O5 O 2.7835 1.15 | | 5. O5 O 2.8501 1.18 | | 6. O4 O 2.8732 1.19 | | 7. O4 O 2.8732 1.19 | +----------------------------------------+
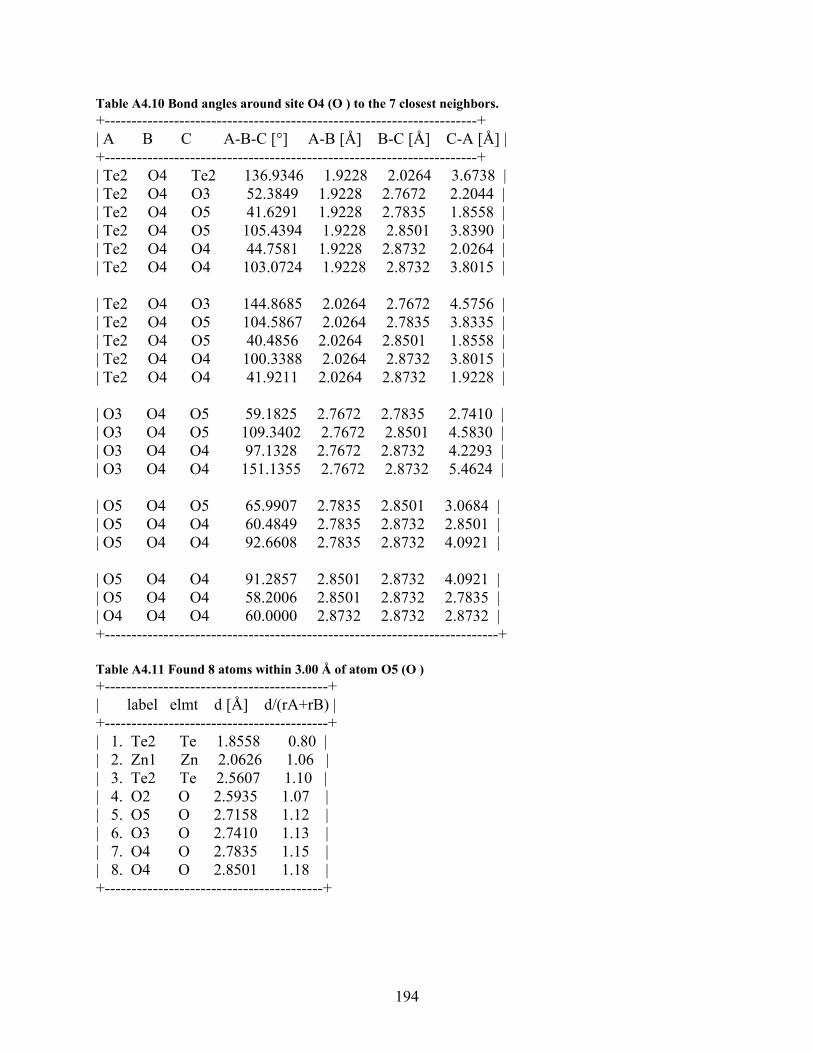
194
Table A4.10 Bond angles around site O4 (O ) to the 7 closest neighbors. +----------------------------------------------------------------------+ | A B C A-B-C [°] A-B [Å] B-C [Å] C-A [Å] | +----------------------------------------------------------------------+ | Te2 O4 Te2 136.9346 1.9228 2.0264 3.6738 | | Te2 O4 O3 52.3849 1.9228 2.7672 2.2044 | | Te2 O4 O5 41.6291 1.9228 2.7835 1.8558 | | Te2 O4 O5 105.4394 1.9228 2.8501 3.8390 | | Te2 O4 O4 44.7581 1.9228 2.8732 2.0264 | | Te2 O4 O4 103.0724 1.9228 2.8732 3.8015 | | Te2 O4 O3 144.8685 2.0264 2.7672 4.5756 | | Te2 O4 O5 104.5867 2.0264 2.7835 3.8335 | | Te2 O4 O5 40.4856 2.0264 2.8501 1.8558 | | Te2 O4 O4 100.3388 2.0264 2.8732 3.8015 | | Te2 O4 O4 41.9211 2.0264 2.8732 1.9228 | | O3 O4 O5 59.1825 2.7672 2.7835 2.7410 | | O3 O4 O5 109.3402 2.7672 2.8501 4.5830 | | O3 O4 O4 97.1328 2.7672 2.8732 4.2293 | | O3 O4 O4 151.1355 2.7672 2.8732 5.4624 | | O5 O4 O5 65.9907 2.7835 2.8501 3.0684 | | O5 O4 O4 60.4849 2.7835 2.8732 2.8501 | | O5 O4 O4 92.6608 2.7835 2.8732 4.0921 | | O5 O4 O4 91.2857 2.8501 2.8732 4.0921 | | O5 O4 O4 58.2006 2.8501 2.8732 2.7835 | | O4 O4 O4 60.0000 2.8732 2.8732 2.8732 | +--------------------------------------------------------------------------+ Table A4.11 Found 8 atoms within 3.00 Å of atom O5 (O ) +------------------------------------------+ | label elmt d [Å] d/(rA+rB) | +------------------------------------------+ | 1. Te2 Te 1.8558 0.80 | | 2. Zn1 Zn 2.0626 1.06 | | 3. Te2 Te 2.5607 1.10 | | 4. O2 O 2.5935 1.07 | | 5. O5 O 2.7158 1.12 | | 6. O3 O 2.7410 1.13 | | 7. O4 O 2.7835 1.15 | | 8. O4 O 2.8501 1.18 | +-----------------------------------------+
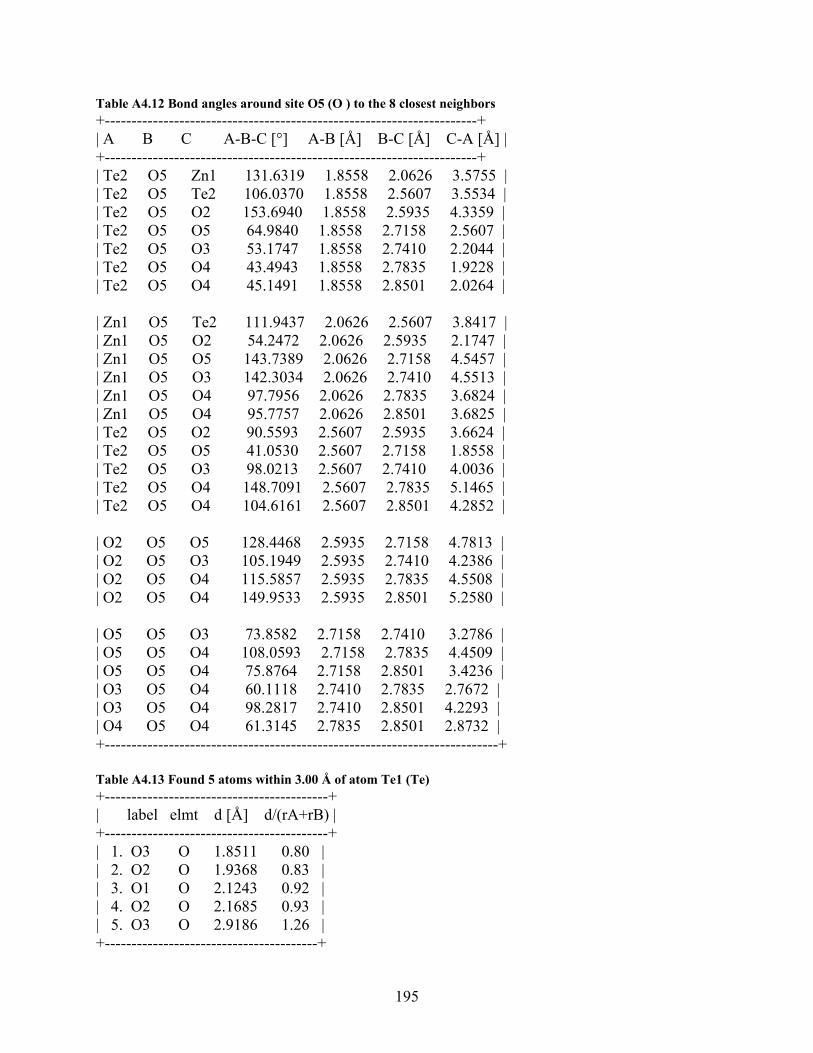
195
Table A4.12 Bond angles around site O5 (O ) to the 8 closest neighbors +----------------------------------------------------------------------+ | A B C A-B-C [°] A-B [Å] B-C [Å] C-A [Å] | +----------------------------------------------------------------------+ | Te2 O5 Zn1 131.6319 1.8558 2.0626 3.5755 | | Te2 O5 Te2 106.0370 1.8558 2.5607 3.5534 | | Te2 O5 O2 153.6940 1.8558 2.5935 4.3359 | | Te2 O5 O5 64.9840 1.8558 2.7158 2.5607 | | Te2 O5 O3 53.1747 1.8558 2.7410 2.2044 | | Te2 O5 O4 43.4943 1.8558 2.7835 1.9228 | | Te2 O5 O4 45.1491 1.8558 2.8501 2.0264 | | Zn1 O5 Te2 111.9437 2.0626 2.5607 3.8417 | | Zn1 O5 O2 54.2472 2.0626 2.5935 2.1747 | | Zn1 O5 O5 143.7389 2.0626 2.7158 4.5457 | | Zn1 O5 O3 142.3034 2.0626 2.7410 4.5513 | | Zn1 O5 O4 97.7956 2.0626 2.7835 3.6824 | | Zn1 O5 O4 95.7757 2.0626 2.8501 3.6825 | | Te2 O5 O2 90.5593 2.5607 2.5935 3.6624 | | Te2 O5 O5 41.0530 2.5607 2.7158 1.8558 | | Te2 O5 O3 98.0213 2.5607 2.7410 4.0036 | | Te2 O5 O4 148.7091 2.5607 2.7835 5.1465 | | Te2 O5 O4 104.6161 2.5607 2.8501 4.2852 | | O2 O5 O5 128.4468 2.5935 2.7158 4.7813 | | O2 O5 O3 105.1949 2.5935 2.7410 4.2386 | | O2 O5 O4 115.5857 2.5935 2.7835 4.5508 | | O2 O5 O4 149.9533 2.5935 2.8501 5.2580 | | O5 O5 O3 73.8582 2.7158 2.7410 3.2786 | | O5 O5 O4 108.0593 2.7158 2.7835 4.4509 | | O5 O5 O4 75.8764 2.7158 2.8501 3.4236 | | O3 O5 O4 60.1118 2.7410 2.7835 2.7672 | | O3 O5 O4 98.2817 2.7410 2.8501 4.2293 | | O4 O5 O4 61.3145 2.7835 2.8501 2.8732 | +--------------------------------------------------------------------------+ Table A4.13 Found 5 atoms within 3.00 Å of atom Te1 (Te) +------------------------------------------+ | label elmt d [Å] d/(rA+rB) | +------------------------------------------+ | 1. O3 O 1.8511 0.80 | | 2. O2 O 1.9368 0.83 | | 3. O1 O 2.1243 0.92 | | 4. O2 O 2.1685 0.93 | | 5. O3 O 2.9186 1.26 | +----------------------------------------+
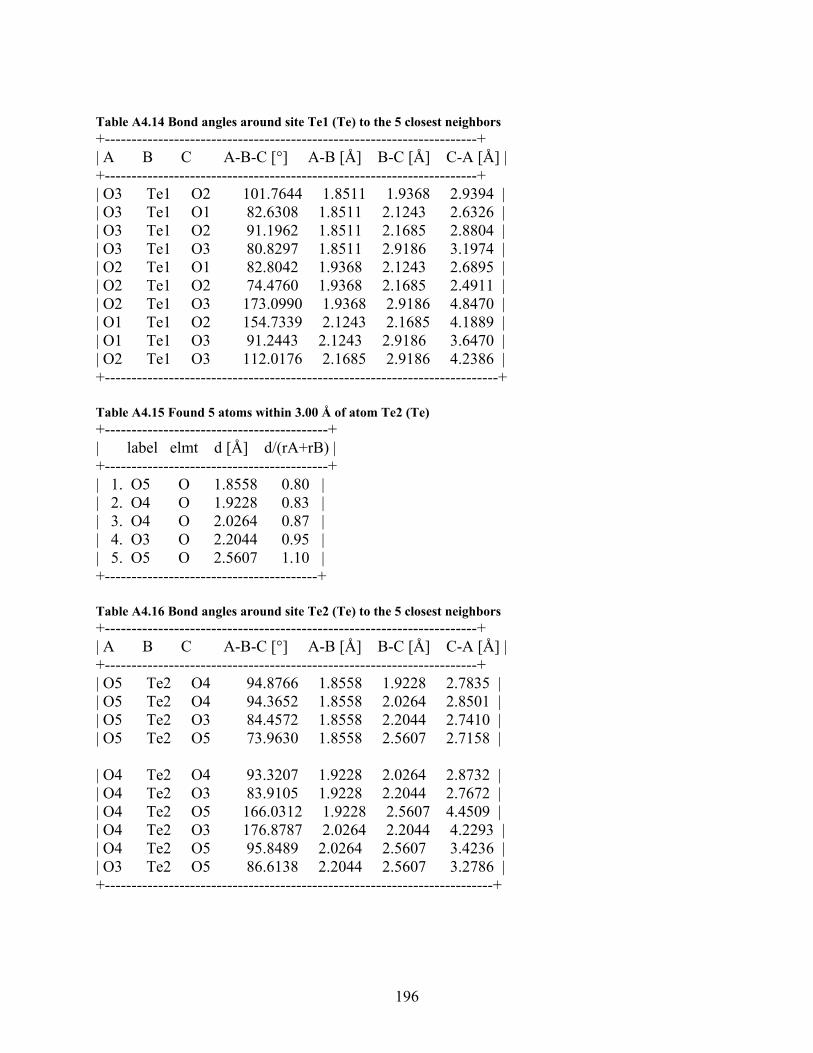
196
Table A4.14 Bond angles around site Te1 (Te) to the 5 closest neighbors +----------------------------------------------------------------------+ | A B C A-B-C [°] A-B [Å] B-C [Å] C-A [Å] | +----------------------------------------------------------------------+ | O3 Te1 O2 101.7644 1.8511 1.9368 2.9394 | | O3 Te1 O1 82.6308 1.8511 2.1243 2.6326 | | O3 Te1 O2 91.1962 1.8511 2.1685 2.8804 | | O3 Te1 O3 80.8297 1.8511 2.9186 3.1974 | | O2 Te1 O1 82.8042 1.9368 2.1243 2.6895 | | O2 Te1 O2 74.4760 1.9368 2.1685 2.4911 | | O2 Te1 O3 173.0990 1.9368 2.9186 4.8470 | | O1 Te1 O2 154.7339 2.1243 2.1685 4.1889 | | O1 Te1 O3 91.2443 2.1243 2.9186 3.6470 | | O2 Te1 O3 112.0176 2.1685 2.9186 4.2386 | +--------------------------------------------------------------------------+ Table A4.15 Found 5 atoms within 3.00 Å of atom Te2 (Te) +------------------------------------------+ | label elmt d [Å] d/(rA+rB) | +------------------------------------------+ | 1. O5 O 1.8558 0.80 | | 2. O4 O 1.9228 0.83 | | 3. O4 O 2.0264 0.87 | | 4. O3 O 2.2044 0.95 | | 5. O5 O 2.5607 1.10 | +----------------------------------------+ Table A4.16 Bond angles around site Te2 (Te) to the 5 closest neighbors +----------------------------------------------------------------------+ | A B C A-B-C [°] A-B [Å] B-C [Å] C-A [Å] | +----------------------------------------------------------------------+ | O5 Te2 O4 94.8766 1.8558 1.9228 2.7835 | | O5 Te2 O4 94.3652 1.8558 2.0264 2.8501 | | O5 Te2 O3 84.4572 1.8558 2.2044 2.7410 | | O5 Te2 O5 73.9630 1.8558 2.5607 2.7158 | | O4 Te2 O4 93.3207 1.9228 2.0264 2.8732 | | O4 Te2 O3 83.9105 1.9228 2.2044 2.7672 | | O4 Te2 O5 166.0312 1.9228 2.5607 4.4509 | | O4 Te2 O3 176.8787 2.0264 2.2044 4.2293 | | O4 Te2 O5 95.8489 2.0264 2.5607 3.4236 | | O3 Te2 O5 86.6138 2.2044 2.5607 3.2786 | +-------------------------------------------------------------------------+
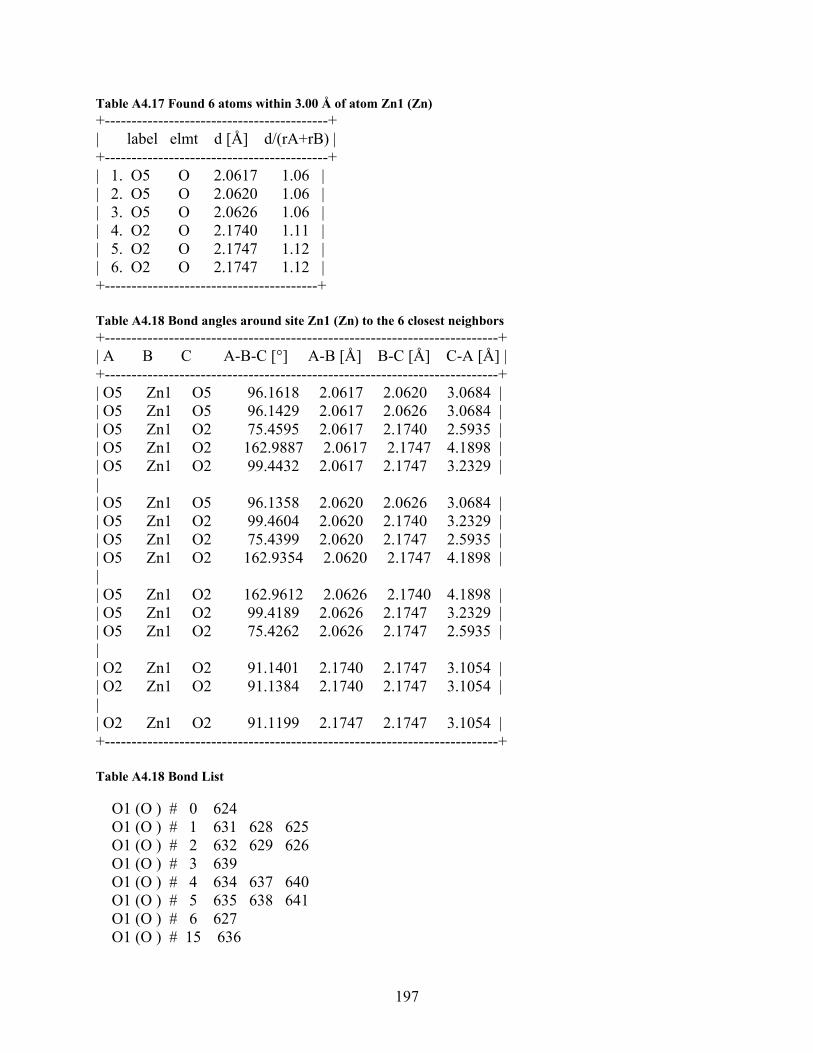
197
Table A4.17 Found 6 atoms within 3.00 Å of atom Zn1 (Zn) +------------------------------------------+ | label elmt d [Å] d/(rA+rB) | +------------------------------------------+ | 1. O5 O 2.0617 1.06 | | 2. O5 O 2.0620 1.06 | | 3. O5 O 2.0626 1.06 | | 4. O2 O 2.1740 1.11 | | 5. O2 O 2.1747 1.12 | | 6. O2 O 2.1747 1.12 | +----------------------------------------+ Table A4.18 Bond angles around site Zn1 (Zn) to the 6 closest neighbors +--------------------------------------------------------------------------+ | A B C A-B-C [°] A-B [Å] B-C [Å] C-A [Å] | +--------------------------------------------------------------------------+ | O5 Zn1 O5 96.1618 2.0617 2.0620 3.0684 | | O5 Zn1 O5 96.1429 2.0617 2.0626 3.0684 | | O5 Zn1 O2 75.4595 2.0617 2.1740 2.5935 | | O5 Zn1 O2 162.9887 2.0617 2.1747 4.1898 | | O5 Zn1 O2 99.4432 2.0617 2.1747 3.2329 | | | O5 Zn1 O5 96.1358 2.0620 2.0626 3.0684 | | O5 Zn1 O2 99.4604 2.0620 2.1740 3.2329 | | O5 Zn1 O2 75.4399 2.0620 2.1747 2.5935 | | O5 Zn1 O2 162.9354 2.0620 2.1747 4.1898 | | | O5 Zn1 O2 162.9612 2.0626 2.1740 4.1898 | | O5 Zn1 O2 99.4189 2.0626 2.1747 3.2329 | | O5 Zn1 O2 75.4262 2.0626 2.1747 2.5935 | | | O2 Zn1 O2 91.1401 2.1740 2.1747 3.1054 | | O2 Zn1 O2 91.1384 2.1740 2.1747 3.1054 | | | O2 Zn1 O2 91.1199 2.1747 2.1747 3.1054 | +--------------------------------------------------------------------------+ Table A4.18 Bond List O1 (O ) # 0 624 O1 (O ) # 1 631 628 625 O1 (O ) # 2 632 629 626 O1 (O ) # 3 639 O1 (O ) # 4 634 637 640 O1 (O ) # 5 635 638 641 O1 (O ) # 6 627 O1 (O ) # 15 636
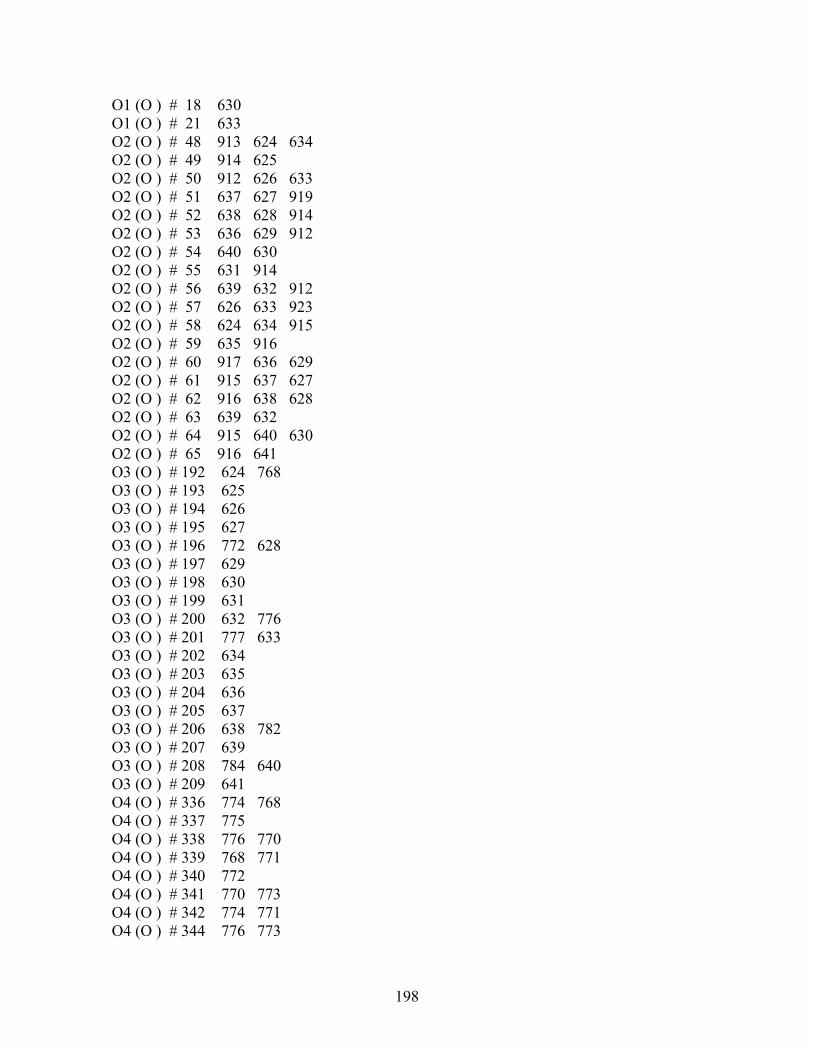
198
O1 (O ) # 18 630 O1 (O ) # 21 633 O2 (O ) # 48 913 624 634 O2 (O ) # 49 914 625 O2 (O ) # 50 912 626 633 O2 (O ) # 51 637 627 919 O2 (O ) # 52 638 628 914 O2 (O ) # 53 636 629 912 O2 (O ) # 54 640 630 O2 (O ) # 55 631 914 O2 (O ) # 56 639 632 912 O2 (O ) # 57 626 633 923 O2 (O ) # 58 624 634 915 O2 (O ) # 59 635 916 O2 (O ) # 60 917 636 629 O2 (O ) # 61 915 637 627 O2 (O ) # 62 916 638 628 O2 (O ) # 63 639 632 O2 (O ) # 64 915 640 630 O2 (O ) # 65 916 641 O3 (O ) # 192 624 768 O3 (O ) # 193 625 O3 (O ) # 194 626 O3 (O ) # 195 627 O3 (O ) # 196 772 628 O3 (O ) # 197 629 O3 (O ) # 198 630 O3 (O ) # 199 631 O3 (O ) # 200 632 776 O3 (O ) # 201 777 633 O3 (O ) # 202 634 O3 (O ) # 203 635 O3 (O ) # 204 636 O3 (O ) # 205 637 O3 (O ) # 206 638 782 O3 (O ) # 207 639 O3 (O ) # 208 784 640 O3 (O ) # 209 641 O4 (O ) # 336 774 768 O4 (O ) # 337 775 O4 (O ) # 338 776 770 O4 (O ) # 339 768 771 O4 (O ) # 340 772 O4 (O ) # 341 770 773 O4 (O ) # 342 774 771 O4 (O ) # 344 776 773
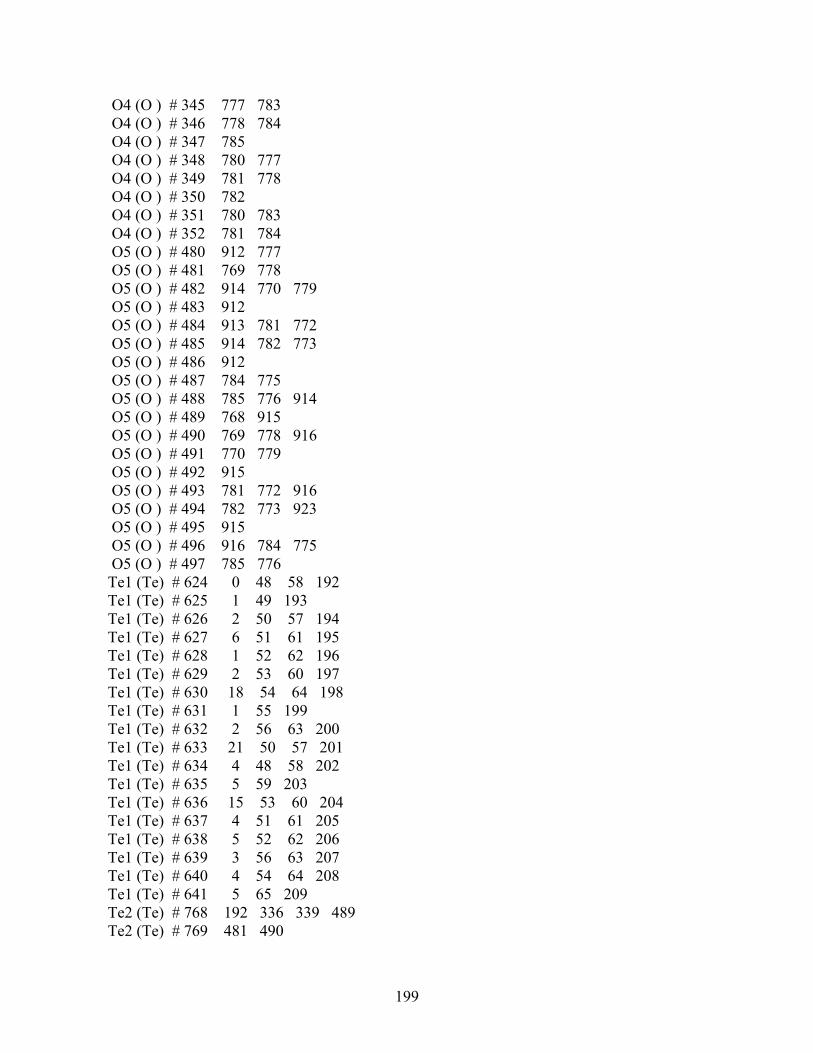
199
O4 (O ) # 345 777 783 O4 (O ) # 346 778 784 O4 (O ) # 347 785 O4 (O ) # 348 780 777 O4 (O ) # 349 781 778 O4 (O ) # 350 782 O4 (O ) # 351 780 783 O4 (O ) # 352 781 784 O5 (O ) # 480 912 777 O5 (O ) # 481 769 778 O5 (O ) # 482 914 770 779 O5 (O ) # 483 912 O5 (O ) # 484 913 781 772 O5 (O ) # 485 914 782 773 O5 (O ) # 486 912 O5 (O ) # 487 784 775 O5 (O ) # 488 785 776 914 O5 (O ) # 489 768 915 O5 (O ) # 490 769 778 916 O5 (O ) # 491 770 779 O5 (O ) # 492 915 O5 (O ) # 493 781 772 916 O5 (O ) # 494 782 773 923 O5 (O ) # 495 915 O5 (O ) # 496 916 784 775 O5 (O ) # 497 785 776 Te1 (Te) # 624 0 48 58 192 Te1 (Te) # 625 1 49 193 Te1 (Te) # 626 2 50 57 194 Te1 (Te) # 627 6 51 61 195 Te1 (Te) # 628 1 52 62 196 Te1 (Te) # 629 2 53 60 197 Te1 (Te) # 630 18 54 64 198 Te1 (Te) # 631 1 55 199 Te1 (Te) # 632 2 56 63 200 Te1 (Te) # 633 21 50 57 201 Te1 (Te) # 634 4 48 58 202 Te1 (Te) # 635 5 59 203 Te1 (Te) # 636 15 53 60 204 Te1 (Te) # 637 4 51 61 205 Te1 (Te) # 638 5 52 62 206 Te1 (Te) # 639 3 56 63 207 Te1 (Te) # 640 4 54 64 208 Te1 (Te) # 641 5 65 209 Te2 (Te) # 768 192 336 339 489 Te2 (Te) # 769 481 490
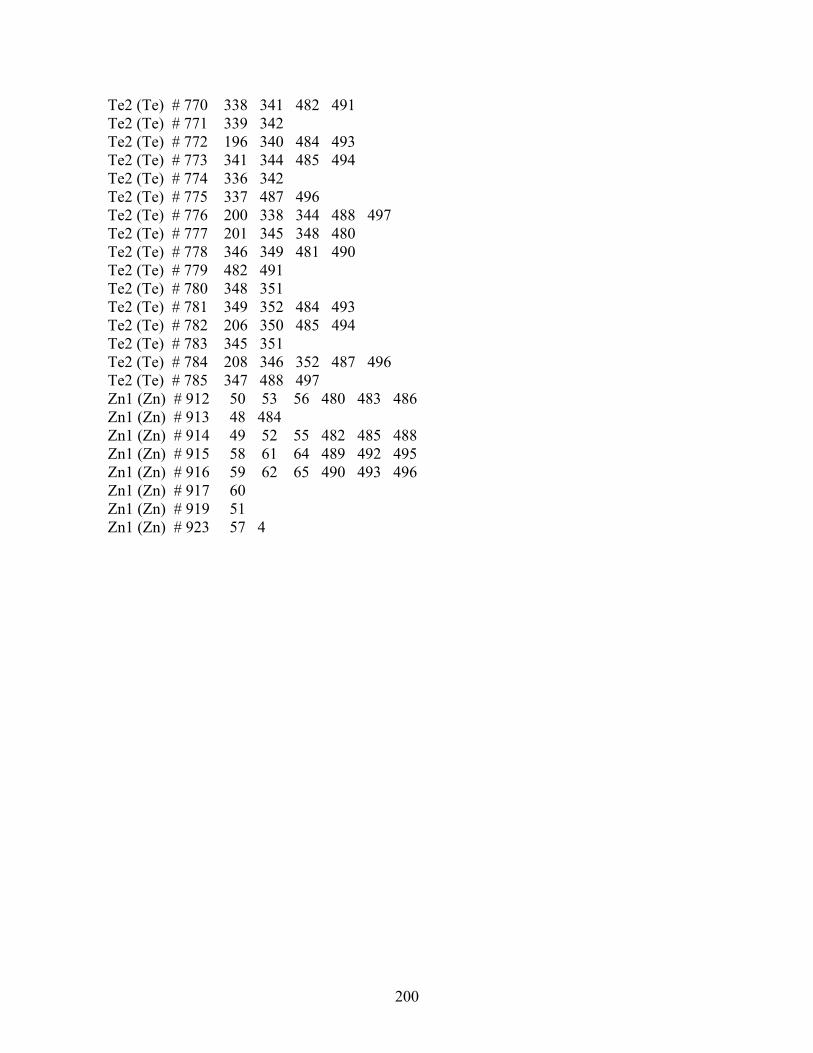
200
Te2 (Te) # 770 338 341 482 491 Te2 (Te) # 771 339 342 Te2 (Te) # 772 196 340 484 493 Te2 (Te) # 773 341 344 485 494 Te2 (Te) # 774 336 342 Te2 (Te) # 775 337 487 496 Te2 (Te) # 776 200 338 344 488 497 Te2 (Te) # 777 201 345 348 480 Te2 (Te) # 778 346 349 481 490 Te2 (Te) # 779 482 491 Te2 (Te) # 780 348 351 Te2 (Te) # 781 349 352 484 493 Te2 (Te) # 782 206 350 485 494 Te2 (Te) # 783 345 351 Te2 (Te) # 784 208 346 352 487 496 Te2 (Te) # 785 347 488 497 Zn1 (Zn) # 912 50 53 56 480 483 486 Zn1 (Zn) # 913 48 484 Zn1 (Zn) # 914 49 52 55 482 485 488 Zn1 (Zn) # 915 58 61 64 489 492 495 Zn1 (Zn) # 916 59 62 65 490 493 496 Zn1 (Zn) # 917 60 Zn1 (Zn) # 919 51 Zn1 (Zn) # 923 57 4

Related Documents