A STUDY ON TECHNOLOGICAL PARAMETERS IN INTER-SIZE CROP LEVEL AGRICULTURAL PRODUCTION FUNCTION WITH REFERENCE TO PADDY CROP IN NELLORE DISTRICT: ANDHRA PRADESH *Dr. E. Lokanadha Reddy 1 , Professor of Economics, Sri Venkateswara College of Engineering & Technology, Chittoor, Andhra Pradesh, India. Dr. D. Radhakrishna Reddy 2 , Associate Professor of Economics, Sri Venkateswara College of Engineering & Technology, Chittoor, Andhra Pradesh, India. *Corresponding author address : *Dr. E. Lokanadha Reddy,Professor of Economics, Sri Venkateswara College of Engineering & Technology,R.V.S. Nagar, Chittoor – 517 127, Chittoor District Andhra Pradesh.Mobile Nos: +91 9581993355, +91 9440498718 E-mail id : [email protected] ABSTRACT: Crop-wise production function analysis will clearly indicate many points which are not evident in aggregate and size-wise models. But crop-wise analysis is a farm of aggregate model as the output of a crop coming from different size enterprises has been put together. Land is an important factor for production and its effect on technology must be fully emphasized. It is only an inter-size analysis of production function for a particular crop, which can do away the limitations of an aggregate crop model. Inter-size crop models would also indicate the relative superiority of different crops for different size-group of farms that it is helpful for crop- cum-size level planning. The study aims to analyse the Inter-size crop level Agricultural Production Function for staple crop-paddy based on entire sample of Farms in Three Revenue Mandals of Nellore District, Andhra Pradesh. Data was collected for the explanatory and explained variables with the help of survey method through personal interviews of the farmers selected through mixed sampling in three revenue mandals of Nellore district. Regression co-efficients are estimated to study the relationship between gross output and various factors of production. The sum of the elasticities and their statistical significance was also studied to decide the returns to scale. KEY WORDS: Inter-size Crop level Agricultural Production Function, Ordinary Least Squares Method, Regression Co-efficients, Human Labour, HYV Seeds. 1. INTRODUCTION Production is a process, where by some goods and services called inputs and transformed into other goods and services called outputs. Many types of activities are involved in the production including changes in farms, location and the time of use of products. Each of these changes involves the use of inputs to produce the desired outputs. The farms outputs of products depends upon the quantities of inputs used in production. This relation between input and output can be characterized by a production function. A production function provides information concerning the quantity of output that may be expected when particular inputs are combined in a specific manner. The chemical, physical and biological properties determine the kind and amount of output which will be received from particular combination of inputs. Crop-wise production function analysis will clearly indicate many points which are not evident in aggregate and size-wise models. But crop-wise analysis is a farm of aggregate model as the output of a crop coming from different size enterprises has been put together. Dr.E.Lokanadha Reddy1.,Dr.D.Radhakrishna Reddy2 Int. J. Eco. Res., 2013, v4i6, 41 - 61 ISSN: 2229-6158 IJER | NOV - DEC 2013 Available [email protected] 30

Welcome message from author
This document is posted to help you gain knowledge. Please leave a comment to let me know what you think about it! Share it to your friends and learn new things together.
Transcript
A STUDY ON TECHNOLOGICAL PARAMETERS IN INTER-SIZE
CROP LEVEL AGRICULTURAL PRODUCTION FUNCTION WITH REFERENCE TO PADDY CROP IN NELLORE DISTRICT: ANDHRA
PRADESH *Dr. E. Lokanadha Reddy1, Professor of Economics,
Sri Venkateswara College of Engineering & Technology, Chittoor, Andhra Pradesh, India.
Dr. D. Radhakrishna Reddy2, Associate Professor of Economics, Sri Venkateswara College of Engineering & Technology, Chittoor, Andhra Pradesh, India.
*Corresponding author address :*Dr. E. Lokanadha Reddy,Professor of Economics,
Sri Venkateswara College of Engineering & Technology,R.V.S. Nagar, Chittoor – 517 127, Chittoor District Andhra Pradesh.Mobile Nos: +91 9581993355, +91 9440498718
E-mail id : [email protected] ABSTRACT: Crop-wise production function analysis will clearly indicate many points which are not evident in aggregate and size-wise models. But crop-wise analysis is a farm of aggregate model as the output of a crop coming from different size enterprises has been put together. Land is an important factor for production and its effect on technology must be fully emphasized. It is only an inter-size analysis of production function for a particular crop, which can do away the limitations of an aggregate crop model. Inter-size crop models would also indicate the relative superiority of different crops for different size-group of farms that it is helpful for crop-cum-size level planning. The study aims to analyse the Inter-size crop level Agricultural Production Function for staple crop-paddy based on entire sample of Farms in Three Revenue Mandals of Nellore District, Andhra Pradesh. Data was collected for the explanatory and explained variables with the help of survey method through personal interviews of the farmers selected through mixed sampling in three revenue mandals of Nellore district. Regression co-efficients are estimated to study the relationship between gross output and various factors of production. The sum of the elasticities and their statistical significance was also studied to decide the returns to scale. KEY WORDS: Inter-size Crop level Agricultural Production Function, Ordinary Least Squares Method, Regression Co-efficients, Human Labour, HYV Seeds. 1. INTRODUCTION
Production is a process, where by some goods and services called inputs and transformed into
other goods and services called outputs. Many types of activities are involved in the
production including changes in farms, location and the time of use of products. Each of
these changes involves the use of inputs to produce the desired outputs. The farms outputs of
products depends upon the quantities of inputs used in production. This relation between
input and output can be characterized by a production function. A production function
provides information concerning the quantity of output that may be expected when particular
inputs are combined in a specific manner. The chemical, physical and biological properties
determine the kind and amount of output which will be received from particular combination
of inputs.
Crop-wise production function analysis will clearly indicate many points which are not
evident in aggregate and size-wise models. But crop-wise analysis is a farm of aggregate
model as the output of a crop coming from different size enterprises has been put together.
Dr.E.Lokanadha Reddy1.,Dr.D.Radhakrishna Reddy2 Int. J. Eco. Res., 2013, v4i6, 41 - 61 ISSN: 2229-6158
IJER | NOV - DEC 2013 Available [email protected]
30
Land is an important factor for production and its effect on technology must be fully
emphasized. It is only an inter-size analysis of production function for a particular crop,
which can do away the limitations of an aggregate crop model. Inter-size crop models would
also indicate the relative superiority of different crops for different size-group of farms that it
is helpful for crop-cum-size level planning.
There are number of studies on the agricultural sector in Nellore district. Among these
studies, the research on agricultural production is very limited. The empirical investigations
are needed to study the Inter-size crop level agricultural production function. Hence the
empirical and scientific investigational study of Inter-size crop level agricultural production
function in the rural economy of Nellore district is an important phenomena. In the present
study, an attempt has been made to study the Inter-size crop level production function for
staple crop-paddy basing on entire sample of farms of three mandals, namely, Kaligiri,
Muttukur and Pellakur of Nellore district of Andhra Pradesh.
2. REVIEW OF LITERATURE
Hanumantha Rao[1965] has used production function to analyse agricultural data. His
contribution lies in the adoption of disaggregated approach. He runs regression separately for
farmers in different size-groups and also for three natural regions of the Hyderabad State. He
used Cobb-Douglas Function and relates production with inputs of land and labour. Firstly,
he finds positive production elasticity for labour. Second and important one is the production
elasticity of labour is higher for large farms with holdings above 5 to 10 acres and it is
contradicted in the case of small farmers. Further, he finds the production elasticity of labour
to be higher than that of land in two relatively less fertile regions and a reverse situation in
the track of Marathwada.
Mathur and Balishter[1973] studied the impact of HYV’s of crops on farm labour use. An
attempt has been made to know the extent of labour utilization across different size of farms
under various types of HYV’s in a sub-region of Agra district of Utter Pradesh. It is pointed
out that average labour use per hectare in high-yielding varieties is higher than that of other
type of varieties. It is also observed that the family employment has increased by 8 percent in
1967-68 over 1966-67 due to switching over to high-yielding varieties.
Venkatesam, Naidu and Venkateswarlu[1988] discussed the resource use efficiency on maize
farms in Karimnagar district of Andhra Pradesh. They adopted Cobb-Douglas Production
Function to study the resource use efficiency of sample farms. The authors identified in the
case of maize production, contribution of family labour and total cost of cultivation decreases
with the increase in farm size. Small farmers used more manures and less fertilizers, whereas
Dr.E.Lokanadha Reddy1.,Dr.D.Radhakrishna Reddy2 Int. J. Eco. Res., 2013, v4i6, 41 - 61 ISSN: 2229-6158
IJER | NOV - DEC 2013 Available [email protected]
31
medium and large farmers used more fertilizers and less manures. It is also observed that the
average yield of hybrid maize was more on small farms and decreased as the farm size
increased. Cost of production was the lowest in small farms.
Bal[1982] studied the factor share in farm income and farm income inequality in Punjab. It
was observed that the size of the farm accounted for the major part of the farm income
inequality. It was further showed that large farms had better access to the yield increasing
input as a result of which the skewness in income distribution is more than that of skewness
in farm size distribution. He told that speedy implementation of land reform measures can go
a long way in reducing the existing disparities in farm incomes and farm income distribution.
Sharma and Sharma[2000] study concerns with micro evidence from an agriculturally
developed region, where new agricultural technology had permeated quite thoroughly,
showed the existence of inverse farm size-productivity relationship in the production of
wheat and paddy. The results showed that the small farms used higher amount of human
labour and fertilizer as compared to higher farm size categories. The regression results also
confirmed the inverse relationship between the farm-size and inputs use. In broad terms, the
results of the study do not support the view that the inverse farm size-productivity
relationship has disappeared with the spread of new agricultural technology.
Singh and Pandey[1971] studied the resource use efficiency in a dry farming area of Banda
district of Utter Pradesh. The study concluded that the farmers are handicapped with
inadequacy of growth promoting inputs such as manure, fertilizer and irrigation facilities and
are using the conventional input, labour in excessive quality due to non-availability of other
non-farmer employment opportunities. The author observed that the new technology of high
yielding variety was still in its infancy owing to the un assured irrigation facilities. Therefore,
policy for the growth of this dry farming area of crop thriving under low rain-fed conditions
and adequate provision for credit and non-farm employment is made for raising the farm
productivity and for uplifting the standard of living of the people in the region.
Rathore[1984] studied the contribution of various factors such as neutral technology non-
neutral technology and other inputs to the overall productivity differences and / or the overall
efficiency differences between small and large farms of Himachal Pradesh and Maharashtra.
The study reveals that while applying neutral technology the farm productivity will be less on
small farms on the other hand applying non-neutral technology, small farms have an
advantage over the large ones. After the neutral and non-neutral technology components, the
study finds that present technology is also in favour of large farms.
Ninan[1984] studied the pattern and intensity of labour use in the tapioca and paddy
cultivation. The study shows that there is a positive association between per acre labour input
Dr.E.Lokanadha Reddy1.,Dr.D.Radhakrishna Reddy2 Int. J. Eco. Res., 2013, v4i6, 41 - 61 ISSN: 2229-6158
IJER | NOV - DEC 2013 Available [email protected]
32
and tapioca/paddy yield per acre. It was found that per acre family labour input is inversely
related to size of holding both in the case of tapioca and paddy. Average productivity for
tapioca was found to be higher than that of paddy in all size groups.
3. OBJECTIVE OF THE STUDY
The following is the objective of the study:
- To study the Technological Parameters in Inter-Size Crop Level Agricultural
Production Function for staple crop-paddy based on entire sample of farms in Three
Revenue Mandals of Nellore District, Andhra Pradesh.
4. METHODOLOGY
The following methodology is adopted to study the above objective. The present study
extends over Nellore district of Andhra Pradesh. A multistage random sampling design was
used. We purposefully selected three mandals, Namely Kaligiri, Muttukur and Pellakur of
Nellore District at the first stage and later with help of random sampling ten to twelve
villages were selected from each Mandal. After the selection of villages a complete list of
agricultural families was prepared. As it is generally believed that the technology was size-
based, the list of farmers was further divided into three categories of farms defined as under;
0.00 acres - 2.50 acres - small farms
2.51 acres - 5.00 acres - medium farms
5.01 acres and above - large farms
From the sub-divided list of farmers 15-20 farmers were selected from each village for
preparing a sample of 420 farmers taking for Kaligiri, Muttukur and Pellakur mandals. Data
was collected for the explanatory and explained variables with the help of survey method
through personal interviews of the farmers selected through mixed sampling for this study
relating to the agricultural year 2004-2005.
4.1. Specification of Variables
A great deal of caution is essential in the selection, classification and aggregation of input
variables used in the production process for studying resources productivity. Different
researchers have classified and aggregated farm inputs in different ways suitable for their
studies. Various ways of classifying and aggregating input variables in production function
Dr.E.Lokanadha Reddy1.,Dr.D.Radhakrishna Reddy2 Int. J. Eco. Res., 2013, v4i6, 41 - 61 ISSN: 2229-6158
IJER | NOV - DEC 2013 Available [email protected]
33
studies together with a brief description of variables used as explanatory variables in the
present study are giving below.
Bullock-Labour
Preparation of farm is an important agricultural work and bullock-power have been taken as
an explanatory variable by a number of writers. Chaudhari[1962], Reddy and Sen[2004],
Hopper[1965] and Radhakrishna[1962] have used it in terms of plough unit days consisting
of one pair of animal-labour day and one human-labour day comprising one plough unit.
While Rajkrishna[1964], Badal and Singh[2001] specified this variable in terms of bullock-
labour days, Robellow and Desai[1966] included a labour with a pair of bullocks. Here, we
also include one human-labour to a pair of bullocks and specify them in value terms. This
done with the help of accounting prices.
Human-Labour
Human-labour too, has been used as an explanatory variable in the estimation of production
functions either in physical units of time or in value of terms. Shan[1969] and Goyal[2003]
used all human labour while, Hopper[1965] and Mathur[1960] used all human-labour except
those associated with plough unit in value terms. Sharma and Sharma[2000], Hanumantha
Rao[1965], Rajkrishna[1964], Singh[1975] and Eswara Prasad[1988] have used all human-
labour in terms of man-days. We also include human-labour as an explanatory variable but
from it exclude those labourers who are engaged in traditional irrigation work and are
associated with bullock units. Variable is specified in terms of rupees.
Seeds
A few writers have used seeds as explanatory variable in their functions. Prasad[1973],
Debnarayan Sarker and Sudptia De[2004] used seeds as a separate explanatory variable in his
study terms of expenditure on seeds. We also include seeds in our functions, the prices of
seeds are determined at the prevailing market price of the seeds at the seeding time.
Irrigation
Assured and effective irrigation which has been one of the most important factors in the
production function studies. Rajkrishna[1964], Timothy and Krishna Moorthy[1990] has
specified this variable in terms of expenses on irrigation. We also specify it in the same term.
Expenses on irrigation include permanent of wages to labourers used in traditional system of
irrigation, water charges paid to the Government for the use of state tube-wells, hire-price of
Dr.E.Lokanadha Reddy1.,Dr.D.Radhakrishna Reddy2 Int. J. Eco. Res., 2013, v4i6, 41 - 61 ISSN: 2229-6158
IJER | NOV - DEC 2013 Available [email protected]
34
the water received from private tube-wells and pumping sets. Expenses also include
accounting prices for the water received from farmers own pumping sets and tube-wells.
Fertilizer
Fertilizer is one of the most important components in Agricultural Production. Parikh[1996]
and Shan[1969] Mythili and Shanmugam[2000] have used chemical fertilizers as separate
variable, while Basak and Choudhary[1954-1957] has included manure along with chemical
fertilizers as an explanatory variable. Yadav and Gangwar[1986] considered various
categories of chemical fertilizers as independent explanatory variables. In the present study,
though category-wise chemical fertilizer is not taken, chemical fertilizers and pesticides and
natural fertilizers are specified as separate variables, and taken in value terms. While
expenses on chemical fertilizer are the actual expenses, help of accounting price has been
taken to determine the expenses on traditional fertilizers, like seen manure, compost burnt of
waste goods and cow-dewing.
Plant Protection
Plant protection measures are included as explanatory variable. Prasad[1973] and Badal and
Singh[2001] taken them in terms of expenditure on their use. In our study also this variable is
specified in terms of actual expenditure.
Like specification of variables, specification of an equation showing functional relationship
between inputs and output is an important aspect of production function studies. Many of the
economists used the generalized Cobb-Douglas Production Function to study the relation
between the inputs and output in production analysis. The following production function has
been specified for Inter-size crop level analysis.
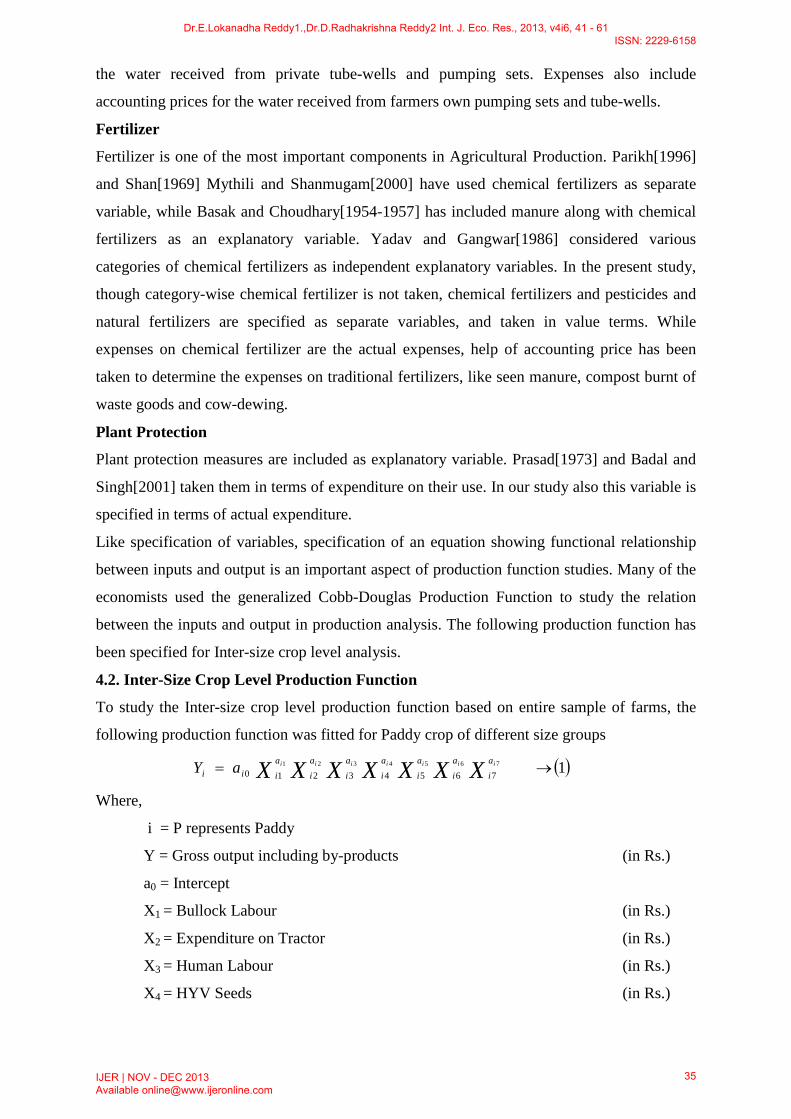
4.2. Inter-Size Crop Level Production Function
To study the Inter-size crop level production function based on entire sample of farms, the
following production function was fitted for Paddy crop of different size groups
( )1 7654321
76543210 →= XXXXXXX iiiiiii ai
ai
ai
ai
ai
ai
aiii a Y
Where,
i = P represents Paddy
Y = Gross output including by-products (in Rs.)
a0 = Intercept
X1 = Bullock Labour (in Rs.)
X2 = Expenditure on Tractor (in Rs.)
X3 = Human Labour (in Rs.)
X4 = HYV Seeds (in Rs.)
Dr.E.Lokanadha Reddy1.,Dr.D.Radhakrishna Reddy2 Int. J. Eco. Res., 2013, v4i6, 41 - 61 ISSN: 2229-6158
IJER | NOV - DEC 2013 Available [email protected]
35
X5 = Chemical Fertilizers (in Rs.)
X6 = Manures (in Rs.)
X7 = Pesticides and other Plant Protection Expenditure (in Rs.)
and a1, a2, a3, a4, a5, a6 and a7 are the elasticities.
5. FINDINGS
Paddy is the most important crop in the district. Around 60 percent cultivated area is devoted
to this paddy. In order to analyse the nature and significance of technology in the different
size of holdings under the paddy crop, it is necessary to analyse the parameters of different
factors. Equation – 1 gives the estimated parameters of different factors, in respect of
different size of holdings.
To study the Inter-size crop level production function for Paddy crop of different size groups
based on entire sample of farms, we considered the production function
XXXXXXX iiiiiii ai
ai
ai
ai
ai
ai
aiii a Y 7654321
76543210= The equation is estimated by the method of ordinary least squares and the estimated
parameters with the other related statistics are presented in the tables 1, 2 & 3. By using the
Klein[1965] and Heady-Dillon[1961] test of multi co-llinearity was carried out to examine
the presence of multi co-llinearity and results were indicate the absence of multi co-llinearity
between the variables.
5.1. Kaligiri Mandal
Table – 1 shows the value of R2 for different categories of farms for Paddy crop in Kaligiri
Mandal. F-test was carried out and it is found significant at 5 percent probability level for the
Kaligiri mandal. The variables explained 97 percent of variation in output of the small farms,
93 percent in medium farms and 98 percent in large farms of Kaligiri mandal. The estimated
equation shows true relationship between output and inputs. Thus all the functions fulfill the
goodness of fit.
Dr.E.Lokanadha Reddy1.,Dr.D.Radhakrishna Reddy2 Int. J. Eco. Res., 2013, v4i6, 41 - 61 ISSN: 2229-6158
IJER | NOV - DEC 2013 Available [email protected]
36
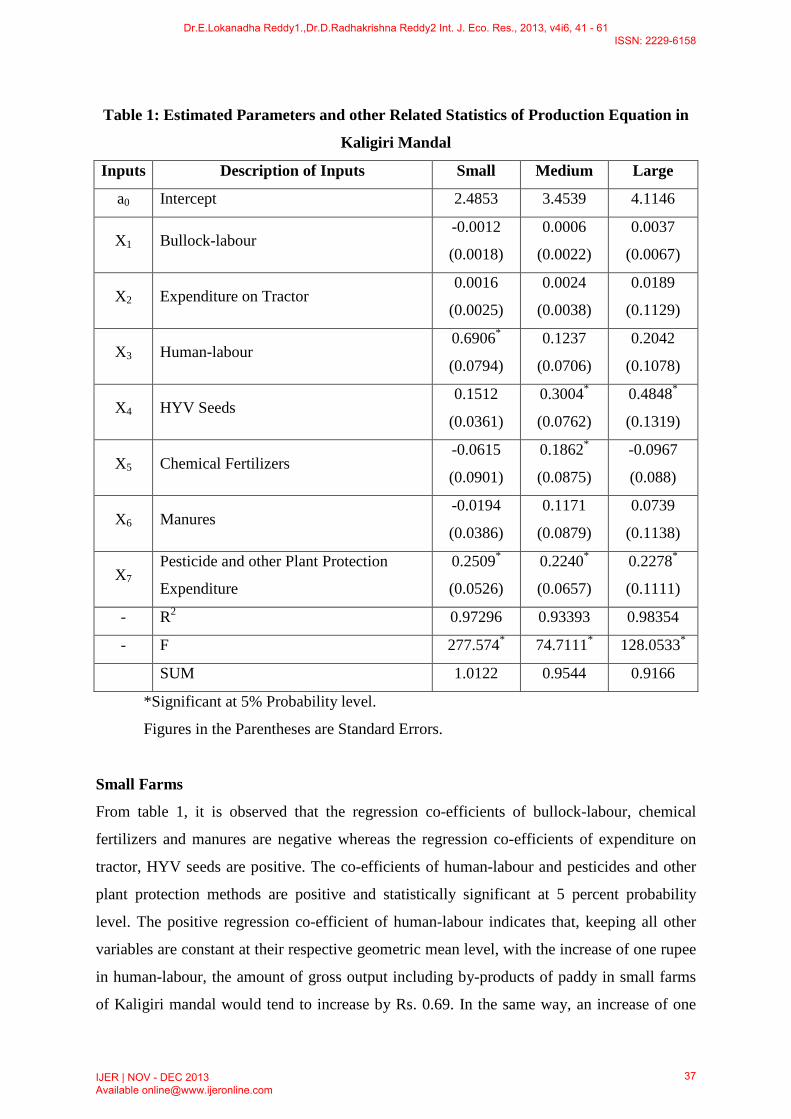
Table 1: Estimated Parameters and other Related Statistics of Production Equation in
Kaligiri Mandal
Inputs Description of Inputs Small Medium Large
a0 Intercept 2.4853 3.4539 4.1146
X1 Bullock-labour -0.0012
(0.0018)
0.0006
(0.0022)
0.0037
(0.0067)
X2 Expenditure on Tractor 0.0016
(0.0025)
0.0024
(0.0038)
0.0189
(0.1129)
X3 Human-labour 0.6906*
(0.0794)
0.1237
(0.0706)
0.2042
(0.1078)
X4 HYV Seeds 0.1512
(0.0361)
0.3004*
(0.0762)
0.4848*
(0.1319)
X5 Chemical Fertilizers -0.0615
(0.0901)
0.1862*
(0.0875)
-0.0967
(0.088)
X6 Manures -0.0194
(0.0386)
0.1171
(0.0879)
0.0739
(0.1138)
X7 Pesticide and other Plant Protection
Expenditure
0.2509*
(0.0526)
0.2240*
(0.0657)
0.2278*
(0.1111)
- R2 0.97296 0.93393 0.98354
- F 277.574* 74.7111* 128.0533*
SUM 1.0122 0.9544 0.9166
*Significant at 5% Probability level.
Figures in the Parentheses are Standard Errors.
Small Farms
From table 1, it is observed that the regression co-efficients of bullock-labour, chemical
fertilizers and manures are negative whereas the regression co-efficients of expenditure on
tractor, HYV seeds are positive. The co-efficients of human-labour and pesticides and other
plant protection methods are positive and statistically significant at 5 percent probability
level. The positive regression co-efficient of human-labour indicates that, keeping all other
variables are constant at their respective geometric mean level, with the increase of one rupee
in human-labour, the amount of gross output including by-products of paddy in small farms
of Kaligiri mandal would tend to increase by Rs. 0.69. In the same way, an increase of one
Dr.E.Lokanadha Reddy1.,Dr.D.Radhakrishna Reddy2 Int. J. Eco. Res., 2013, v4i6, 41 - 61 ISSN: 2229-6158
IJER | NOV - DEC 2013 Available [email protected]
37
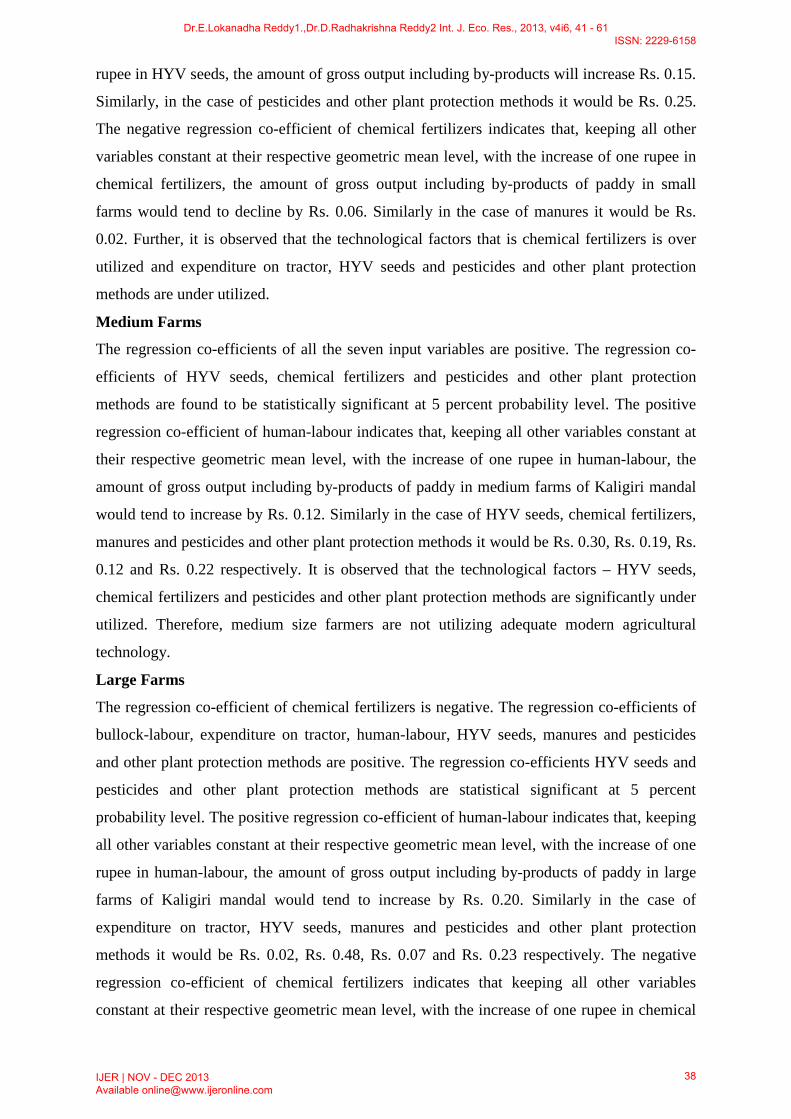
rupee in HYV seeds, the amount of gross output including by-products will increase Rs. 0.15.
Similarly, in the case of pesticides and other plant protection methods it would be Rs. 0.25.
The negative regression co-efficient of chemical fertilizers indicates that, keeping all other
variables constant at their respective geometric mean level, with the increase of one rupee in
chemical fertilizers, the amount of gross output including by-products of paddy in small
farms would tend to decline by Rs. 0.06. Similarly in the case of manures it would be Rs.
0.02. Further, it is observed that the technological factors that is chemical fertilizers is over
utilized and expenditure on tractor, HYV seeds and pesticides and other plant protection
methods are under utilized.
Medium Farms
The regression co-efficients of all the seven input variables are positive. The regression co-
efficients of HYV seeds, chemical fertilizers and pesticides and other plant protection
methods are found to be statistically significant at 5 percent probability level. The positive
regression co-efficient of human-labour indicates that, keeping all other variables constant at
their respective geometric mean level, with the increase of one rupee in human-labour, the
amount of gross output including by-products of paddy in medium farms of Kaligiri mandal
would tend to increase by Rs. 0.12. Similarly in the case of HYV seeds, chemical fertilizers,
manures and pesticides and other plant protection methods it would be Rs. 0.30, Rs. 0.19, Rs.
0.12 and Rs. 0.22 respectively. It is observed that the technological factors – HYV seeds,
chemical fertilizers and pesticides and other plant protection methods are significantly under
utilized. Therefore, medium size farmers are not utilizing adequate modern agricultural
technology.
Large Farms
The regression co-efficient of chemical fertilizers is negative. The regression co-efficients of
bullock-labour, expenditure on tractor, human-labour, HYV seeds, manures and pesticides
and other plant protection methods are positive. The regression co-efficients HYV seeds and
pesticides and other plant protection methods are statistical significant at 5 percent
probability level. The positive regression co-efficient of human-labour indicates that, keeping
all other variables constant at their respective geometric mean level, with the increase of one
rupee in human-labour, the amount of gross output including by-products of paddy in large
farms of Kaligiri mandal would tend to increase by Rs. 0.20. Similarly in the case of
expenditure on tractor, HYV seeds, manures and pesticides and other plant protection
methods it would be Rs. 0.02, Rs. 0.48, Rs. 0.07 and Rs. 0.23 respectively. The negative
regression co-efficient of chemical fertilizers indicates that keeping all other variables
constant at their respective geometric mean level, with the increase of one rupee in chemical
Dr.E.Lokanadha Reddy1.,Dr.D.Radhakrishna Reddy2 Int. J. Eco. Res., 2013, v4i6, 41 - 61 ISSN: 2229-6158
IJER | NOV - DEC 2013 Available [email protected]
38
fertilizers, the amount of gross output would tend to decline by Rs. 0.10. In the case of large
farms, the influence of bullock-labour is not seen on paddy yield. It is observed that the
technological factors – HYV seeds and pesticides and other plant protection methods are
significantly under utilized where as chemical fertilizers is over utilized. Hence, the large size
farmers are not utilizing the modern agricultural technology except chemical fertilizers.
5.2. Muttukur Mandal
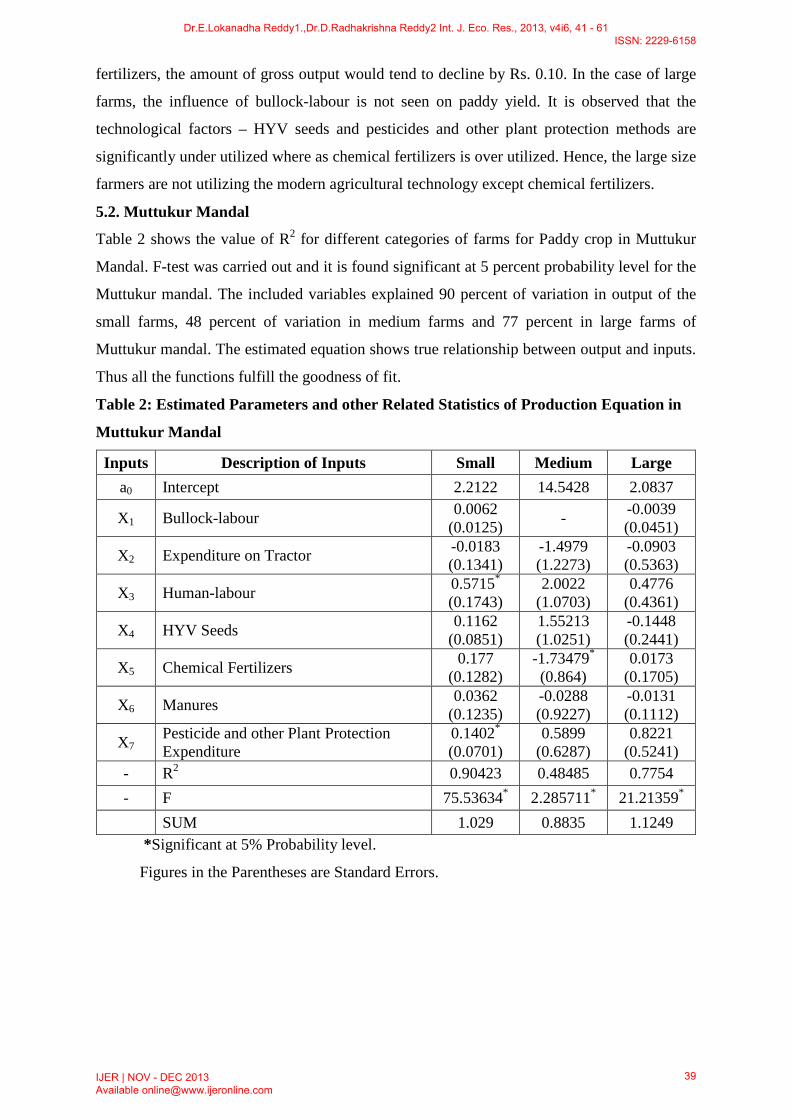
Table 2 shows the value of R2 for different categories of farms for Paddy crop in Muttukur
Mandal. F-test was carried out and it is found significant at 5 percent probability level for the
Muttukur mandal. The included variables explained 90 percent of variation in output of the
small farms, 48 percent of variation in medium farms and 77 percent in large farms of
Muttukur mandal. The estimated equation shows true relationship between output and inputs.
Thus all the functions fulfill the goodness of fit.
Table 2: Estimated Parameters and other Related Statistics of Production Equation in
Muttukur Mandal
Inputs Description of Inputs Small Medium Large a0 Intercept 2.2122 14.5428 2.0837
X1 Bullock-labour 0.0062 (0.0125) - -0.0039
(0.0451)
X2 Expenditure on Tractor -0.0183 (0.1341)
-1.4979 (1.2273)
-0.0903 (0.5363)
X3 Human-labour 0.5715* (0.1743)
2.0022 (1.0703)
0.4776 (0.4361)
X4 HYV Seeds 0.1162 (0.0851)
1.55213 (1.0251)
-0.1448 (0.2441)
X5 Chemical Fertilizers 0.177 (0.1282)
-1.73479* (0.864)
0.0173 (0.1705)
X6 Manures 0.0362 (0.1235)
-0.0288 (0.9227)
-0.0131 (0.1112)
X7 Pesticide and other Plant Protection Expenditure
0.1402* (0.0701)
0.5899 (0.6287)
0.8221 (0.5241)
- R2 0.90423 0.48485 0.7754 - F 75.53634* 2.285711* 21.21359*
SUM 1.029 0.8835 1.1249 *Significant at 5% Probability level.
Figures in the Parentheses are Standard Errors.
Dr.E.Lokanadha Reddy1.,Dr.D.Radhakrishna Reddy2 Int. J. Eco. Res., 2013, v4i6, 41 - 61 ISSN: 2229-6158
IJER | NOV - DEC 2013 Available [email protected]
39
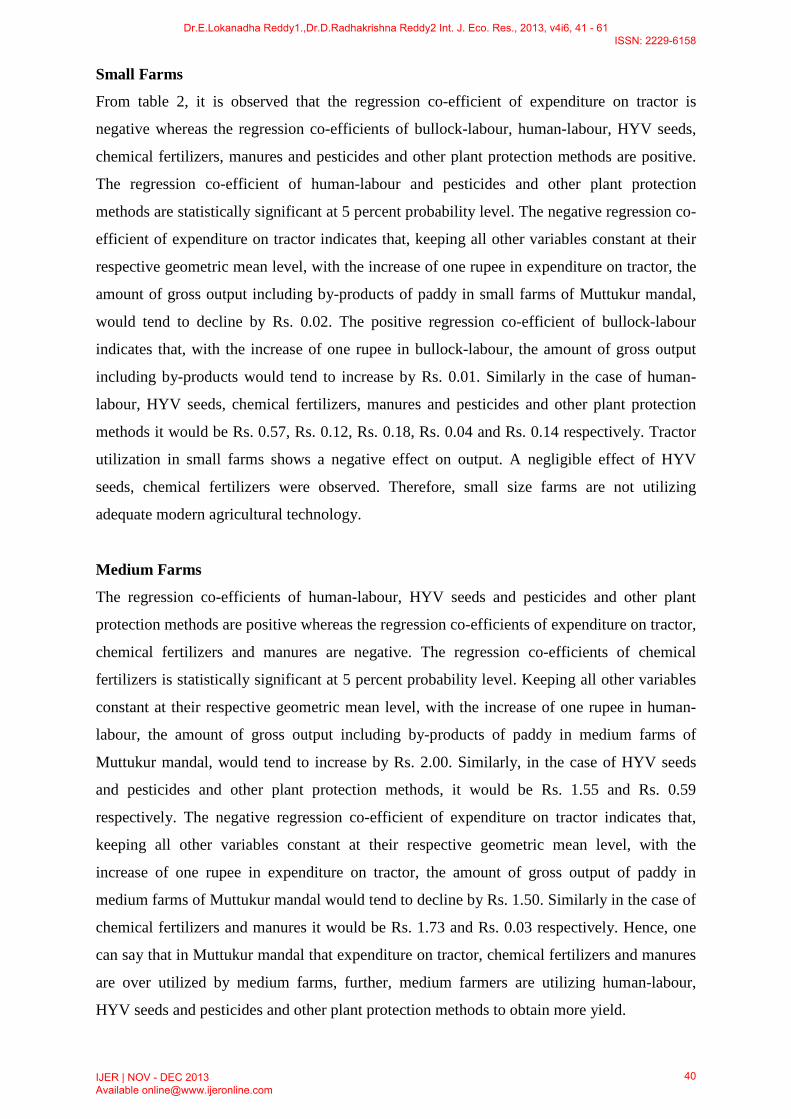
Small Farms
From table 2, it is observed that the regression co-efficient of expenditure on tractor is
negative whereas the regression co-efficients of bullock-labour, human-labour, HYV seeds,
chemical fertilizers, manures and pesticides and other plant protection methods are positive.
The regression co-efficient of human-labour and pesticides and other plant protection
methods are statistically significant at 5 percent probability level. The negative regression co-
efficient of expenditure on tractor indicates that, keeping all other variables constant at their
respective geometric mean level, with the increase of one rupee in expenditure on tractor, the
amount of gross output including by-products of paddy in small farms of Muttukur mandal,
would tend to decline by Rs. 0.02. The positive regression co-efficient of bullock-labour
indicates that, with the increase of one rupee in bullock-labour, the amount of gross output
including by-products would tend to increase by Rs. 0.01. Similarly in the case of human-
labour, HYV seeds, chemical fertilizers, manures and pesticides and other plant protection
methods it would be Rs. 0.57, Rs. 0.12, Rs. 0.18, Rs. 0.04 and Rs. 0.14 respectively. Tractor
utilization in small farms shows a negative effect on output. A negligible effect of HYV
seeds, chemical fertilizers were observed. Therefore, small size farms are not utilizing
adequate modern agricultural technology.
Medium Farms
The regression co-efficients of human-labour, HYV seeds and pesticides and other plant
protection methods are positive whereas the regression co-efficients of expenditure on tractor,
chemical fertilizers and manures are negative. The regression co-efficients of chemical
fertilizers is statistically significant at 5 percent probability level. Keeping all other variables
constant at their respective geometric mean level, with the increase of one rupee in human-
labour, the amount of gross output including by-products of paddy in medium farms of
Muttukur mandal, would tend to increase by Rs. 2.00. Similarly, in the case of HYV seeds
and pesticides and other plant protection methods, it would be Rs. 1.55 and Rs. 0.59
respectively. The negative regression co-efficient of expenditure on tractor indicates that,
keeping all other variables constant at their respective geometric mean level, with the
increase of one rupee in expenditure on tractor, the amount of gross output of paddy in
medium farms of Muttukur mandal would tend to decline by Rs. 1.50. Similarly in the case of
chemical fertilizers and manures it would be Rs. 1.73 and Rs. 0.03 respectively. Hence, one
can say that in Muttukur mandal that expenditure on tractor, chemical fertilizers and manures
are over utilized by medium farms, further, medium farmers are utilizing human-labour,
HYV seeds and pesticides and other plant protection methods to obtain more yield.
Dr.E.Lokanadha Reddy1.,Dr.D.Radhakrishna Reddy2 Int. J. Eco. Res., 2013, v4i6, 41 - 61 ISSN: 2229-6158
IJER | NOV - DEC 2013 Available [email protected]
40
Large Farms
The regression co-efficients of human-labour, chemical fertilizers and pesticides and other
plant protection methods are positive whereas the regression co-efficients of bullock-labour,
expenditure on tractor, HYV seeds and manures are negative. Keeping all other variables are
constant at their respective geometric mean level, with the increase of one rupee in bullock-
labour, the amount of gross output including by-products of paddy in large farms of Muttukur
mandal would tend to decline by Rs. 0.004. In the same way keeping all other variables are
constant at their respective geometric mean level, with the increase of one rupee in
expenditure on tractor, the amount of gross output of paddy in large farms would tend to
increase by Rs. 0.09. Similarly in the case of HYV seeds and manures it would be Rs. 0.14
and Rs. 0.01 respectively. The positive regression co-efficient of human-labour indicates that
with the increase of one rupee in human-labour, the amount of gross output would tend to
increase by Rs. 0.48. Similarly in the case of chemical fertilizers and pesticides and other
plant protection methods it would be Rs. 0.02 and Rs. 0.82 respectively. In large farms, a
significant influence of HYV seeds, chemical fertilizers and pesticides and other plant
protection methods are not seen on paddy yield. Hence, the large size farms are not utilizing
the modern agricultural technology.
5.3. Pellakur Mandal
Table 3 shows the value of R2 for different categories of farms for Paddy crop in Pellakur
Mandal. F-test was carried out and it is found significant at 5 percent probability level for the
Pellakur mandal. The included variables explained 91 percent of variation in output of the
small farms, 96 percent in medium farms and 98 percent in large farms of Pellakur Mandal.
The estimated equation shows true relationship between output and inputs. Thus all the
functions fulfill the goodness of fit.
Dr.E.Lokanadha Reddy1.,Dr.D.Radhakrishna Reddy2 Int. J. Eco. Res., 2013, v4i6, 41 - 61 ISSN: 2229-6158
IJER | NOV - DEC 2013 Available [email protected]
41
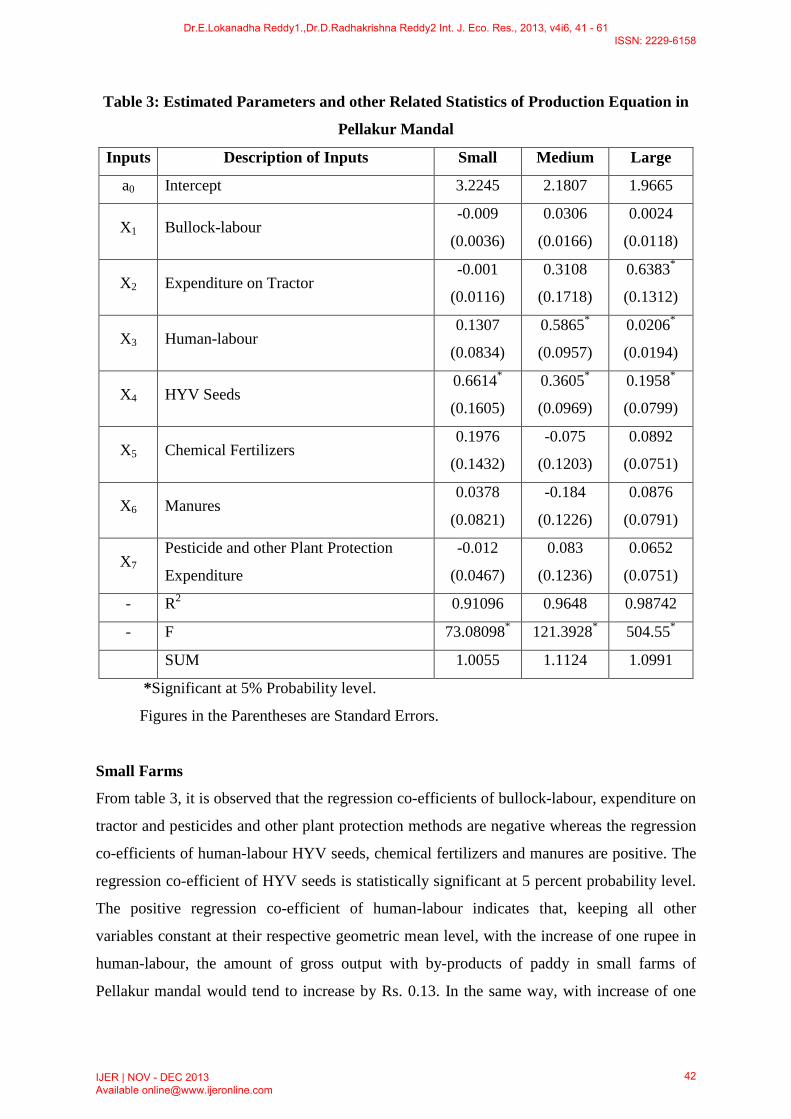
Table 3: Estimated Parameters and other Related Statistics of Production Equation in
Pellakur Mandal
Inputs Description of Inputs Small Medium Large
a0 Intercept 3.2245 2.1807 1.9665
X1 Bullock-labour -0.009
(0.0036)
0.0306
(0.0166)
0.0024
(0.0118)
X2 Expenditure on Tractor -0.001
(0.0116)
0.3108
(0.1718)
0.6383*
(0.1312)
X3 Human-labour 0.1307
(0.0834)
0.5865*
(0.0957)
0.0206*
(0.0194)
X4 HYV Seeds 0.6614*
(0.1605)
0.3605*
(0.0969)
0.1958*
(0.0799)
X5 Chemical Fertilizers 0.1976
(0.1432)
-0.075
(0.1203)
0.0892
(0.0751)
X6 Manures 0.0378
(0.0821)
-0.184
(0.1226)
0.0876
(0.0791)
X7 Pesticide and other Plant Protection
Expenditure
-0.012
(0.0467)
0.083
(0.1236)
0.0652
(0.0751)
- R2 0.91096 0.9648 0.98742
- F 73.08098* 121.3928* 504.55*
SUM 1.0055 1.1124 1.0991
*Significant at 5% Probability level.
Figures in the Parentheses are Standard Errors.
Small Farms
From table 3, it is observed that the regression co-efficients of bullock-labour, expenditure on
tractor and pesticides and other plant protection methods are negative whereas the regression
co-efficients of human-labour HYV seeds, chemical fertilizers and manures are positive. The
regression co-efficient of HYV seeds is statistically significant at 5 percent probability level.
The positive regression co-efficient of human-labour indicates that, keeping all other
variables constant at their respective geometric mean level, with the increase of one rupee in
human-labour, the amount of gross output with by-products of paddy in small farms of
Pellakur mandal would tend to increase by Rs. 0.13. In the same way, with increase of one
Dr.E.Lokanadha Reddy1.,Dr.D.Radhakrishna Reddy2 Int. J. Eco. Res., 2013, v4i6, 41 - 61 ISSN: 2229-6158
IJER | NOV - DEC 2013 Available [email protected]
42
rupee in HYV seeds, the amount of gross output would tend to increase by Rs. 0.66. Similarly
in the case of chemical fertilizers and manures it would be Rs. 0.20 and Rs. 0.04 respectively.
The negative regression co-efficient of bullock-labour indicates that, every increase of one
rupee in bullock-labour, the amount of gross output including by-products of paddy in small
farms would tend to decline by Rs. 0.009. Similarly, in the case of expenditure on tractor and
pesticides and other plant protection methods it would be Rs. 0.001 and Rs. 0.01 respectively.
Further, it is observed that the technological factors – HYV seeds and chemical fertilizers are
under utilized.
Medium Farms
The regression co-efficients of bullock-labour, expenditure on tractor, human-labour, HYV
seeds and pesticides and other plant protection methods are positive whereas the regression
co-efficients of chemical fertilizers and manures are negative. The regression co-efficients of
human-labour and HYV seeds are statistically significant at 5 percent probability level. The
positive regression co-efficient of bullock-labour indicates that, for every increase of one
rupee in bullock-labour, the amount of gross output of paddy in medium farms of Pellakur
mandal would tend to increase by Rs. 0.03. Similarly, in the case of expenditure on tractor,
human-labour, HYV seeds and pesticides and other plant protection methods it would be Rs.
0.31, Rs. 0.59, Rs. 0.36 and Rs. 0.08 respectively. The negative regression co-efficient
chemical fertilizers indicates that, keeping other variables constant, with the increase of one
rupee in chemical fertilizers, the amount of gross output would tend to decline by Rs. 0.07.
Similarly, in the case of manures it would be Rs. 0.18. Hence, one can say that the medium
size farms are utilizing modern agricultural technology to obtain more yield in the case of
paddy.
Large Farms
The regression co-efficients of all seven input variables are positive. The regression co-
efficients of expenditure on tractor, human-labour, HYV seeds are statistically significant at 5
percent probability level. The positive regression co-efficient of bullock-labour indicates that,
keeping all other variables constant at their respective geometric mean level, with the
increase of one rupee in bullock-labour, the amount of gross output including by-products of
paddy in large farms of Pellakur mandal would tend to increase by Rs. 0.002. Similarly for
every one rupee increase in expenditure on tractor, amount of gross output would tend to
increase by Rs. 0.64. Also in the case of human-labour, HYV seeds, chemical fertilizers,
manures and pesticides and other plant protection methods also it would be Rs. 0.02, Rs.
0.19, Rs. 0.09, Rs. 0.08 and Rs. 0.06 respectively. Therefore, large size farmers are not
utilizing adequate modern agricultural technology. Usage of tractors, HYV seeds are
Dr.E.Lokanadha Reddy1.,Dr.D.Radhakrishna Reddy2 Int. J. Eco. Res., 2013, v4i6, 41 - 61 ISSN: 2229-6158
IJER | NOV - DEC 2013 Available [email protected]
43
significant and also it is noticed that chemical fertilizers and pesticides and other plant
protection methods effect also positive on crop output.
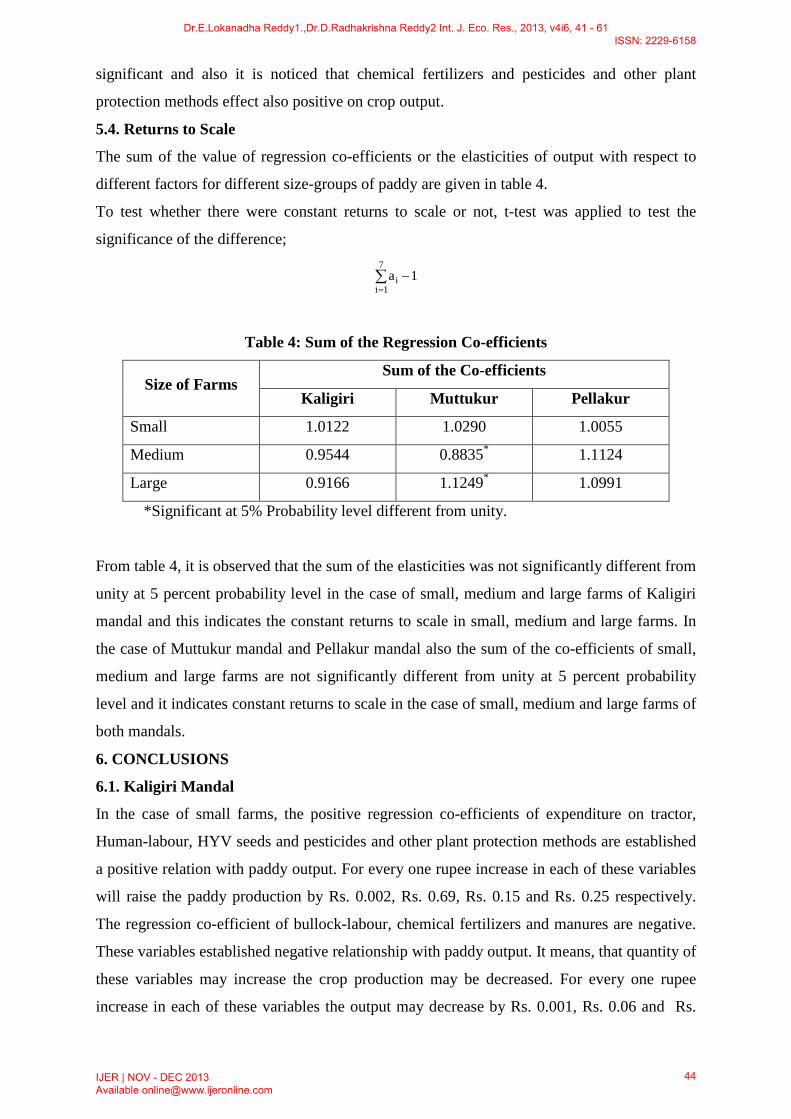
5.4. Returns to Scale
The sum of the value of regression co-efficients or the elasticities of output with respect to
different factors for different size-groups of paddy are given in table 4.
To test whether there were constant returns to scale or not, t-test was applied to test the
significance of the difference;
∑=
−7
1ii 1a
Table 4: Sum of the Regression Co-efficients
Size of Farms Sum of the Co-efficients
Kaligiri Muttukur Pellakur
Small 1.0122 1.0290 1.0055
Medium 0.9544 0.8835* 1.1124
Large 0.9166 1.1249* 1.0991
*Significant at 5% Probability level different from unity.
From table 4, it is observed that the sum of the elasticities was not significantly different from
unity at 5 percent probability level in the case of small, medium and large farms of Kaligiri
mandal and this indicates the constant returns to scale in small, medium and large farms. In
the case of Muttukur mandal and Pellakur mandal also the sum of the co-efficients of small,
medium and large farms are not significantly different from unity at 5 percent probability
level and it indicates constant returns to scale in the case of small, medium and large farms of
both mandals.
6. CONCLUSIONS
6.1. Kaligiri Mandal
In the case of small farms, the positive regression co-efficients of expenditure on tractor,
Human-labour, HYV seeds and pesticides and other plant protection methods are established
a positive relation with paddy output. For every one rupee increase in each of these variables
will raise the paddy production by Rs. 0.002, Rs. 0.69, Rs. 0.15 and Rs. 0.25 respectively.
The regression co-efficient of bullock-labour, chemical fertilizers and manures are negative.
These variables established negative relationship with paddy output. It means, that quantity of
these variables may increase the crop production may be decreased. For every one rupee
increase in each of these variables the output may decrease by Rs. 0.001, Rs. 0.06 and Rs.
Dr.E.Lokanadha Reddy1.,Dr.D.Radhakrishna Reddy2 Int. J. Eco. Res., 2013, v4i6, 41 - 61 ISSN: 2229-6158
IJER | NOV - DEC 2013 Available [email protected]
44
0.02 respectively. A constant returns to scale was observed in small farms of paddy in
Kaligiri mandal. Therefore in order to obtain more yield of paddy in small farms, application
of human-labour, HYV seeds and pesticides and other plant protection methods should be
increased whereas application of chemical fertilizers and manures should be decreased.
Further it is noticed that the small farmers of Kaligiri mandal are utilizing modern
agricultural technology like pesticides and other plant protection methods and HYV seeds in
growing paddy. Pesticides and other plant protection methods shows a significant effect.
Chemical fertilizers shows some negative impact.
In the case of medium farms, all explanatory variables shows some positive effective on crop
production. It reveals the paddy output was more are less positively affected by the all input
factors. It is observed that three major technological factors – HYV seeds, chemical fertilizers
and pesticides and other plant protection methods are significantly affecting the crop output.
It may be inferred that the medium farms in Kaligiri mandal are using modern technology.
For every one rupee increase in each of the variables bullock-labour, expenditure on tractor,
human-labour, HYV seeds, chemical fertilizers, manures and pesticides and other plant
protection methods will increase the output by Rs. 0.006, Rs. 0.002, Rs. 0.12, Rs. 0.30, Rs.
0.19, Rs. 0.12 and Rs. 0.22 respectively. It is observed all most a constant returns to scale in
medium farms of paddy. By increasing all the input factors, the paddy output may be
increased.
In the case of large farms also, except the factor chemical fertilizers, all factors shows a
positive effect on crop output. It means a rupee increase in each variables bullock-labour,
expenditure on tractor, human-labour, HYV seeds, manures and pesticides and other plant
protection methods will increase the paddy production by Rs. 0.004, Rs. 0.02, Rs. 0.20, Rs.
0.49, Rs. 0.07 and Rs. 0.23 respectively. A rupee increase in chemical fertilizers will decrease
the paddy output by Rs. 0.097. The two technological factors – HYV seeds and pesticides and
other plant protection methods will shows a significant positive effect on production. Hence,
it is noticed that the large farmers in Kaligiri mandal are using modern agricultural
technology. The regression co-efficient of HYV seeds (0.4848) is at highest level. It is
observed a constant return to scale in large farms of paddy. To obtain more yield of paddy in
large farms, application of HYV seeds and pesticides and other plant protection methods
should be increased whereas application of chemical fertilizers should be decreased.
6.2. Muttukur Mandal
In the case of small farms, the positive regression co-efficients of input factors indicates a
positive relationship. Except the factor expenditure on tractor, all factors shows a positive
relation with the paddy output in Muttukur mandal. A rupee increase in each of these factors,
Dr.E.Lokanadha Reddy1.,Dr.D.Radhakrishna Reddy2 Int. J. Eco. Res., 2013, v4i6, 41 - 61 ISSN: 2229-6158
IJER | NOV - DEC 2013 Available [email protected]
45
bullock-labour, human-labour, HYV seeds, chemical fertilizers, manures and pesticides and
other plant protection methods would be increased by Rs. 0.006, Rs. 0.57, Rs. 0.17, Rs. 0.18,
Rs. 0.04 and Rs. 0.14 respectively. An increase of one rupee in expenditure on tractor, the
amount of gross output including by-products would tend to decline by Rs. 0.02 because it
shows negative effect on output. It is found a constant returns to scale in small farms of
paddy. It is also found that to obtain more yield of paddy in Muttukur mandal, application of
human-labour, HYV seeds, chemical fertilizers and pesticides and other plant protection
methods should be increased whereas application of expenditure on tractor should be
decreased.
In the case of medium farms, the positive regression co-efficient of human-labour indicates
that, with the increase of one rupee in human-labour, the amount of gross output of paddy in
medium farms of Muttukur mandal would tend to increase by Rs. 2.00. Similarly, in the case
of HYV seeds and pesticides and other plant protection methods it would be Rs. 1.55 and Rs.
0.59 respectively. The co-efficients of expenditure on tractor, chemical fertilizers and
manures are negative. An increase of one rupee in expenditure on tractor, chemical fertilizers
and manures, the paddy output would tend to decline by Rs. 1.49, Rs. 1.73 and Rs. 0.03. The
two technological factors – HYV seeds and pesticides and other plant protection methods
influence the output positively and expenditure on tractor and chemical fertilizers influencing
negatively. A decreasing returns to scale in medium farms of paddy was noticed. To obtain
more yield of paddy in medium farms of Muttukur mandal, application of human-labour,
HYV seeds and pesticides and other plant protection methods may be increased. Whereas the
application of expenditure on tractor, chemical fertilizers and manures should be increased.
In the case of large farms, the positive regression co-efficient of human-labour indicates that,
an increase of one rupee in human-labour, the amount of gross output of paddy in large farms
of Muttukur mandal would tend to increase by Rs. 0.48. Similarly in the case of chemical
fertilizers and pesticides and other plant protection methods it would be Rs. 0.17 and Rs. 0.82
respectively. The co-efficients of bullock-labour, expenditure on tractor, HYV seeds and
manures are negative. An increase of one rupee in each of these factors the amount of gross
output would tend to decline by Rs. 0.004, Rs. 0.09, Rs. 0.15 and Rs. 0.01 respectively. It is
noticed a decreasing returns to scale in large farms of paddy. To get more yield of paddy in
large farms of Muttukur mandal, application of expenditure on tractor, HYV seeds and
manures may be decreased whereas application of human-labour, chemical fertilizers and
pesticides and other plant protection methods should be increased. Still there is some scope to
raise the paddy production by increasing the input factors chemical fertilizers and pesticides
and other plant protection methods.
Dr.E.Lokanadha Reddy1.,Dr.D.Radhakrishna Reddy2 Int. J. Eco. Res., 2013, v4i6, 41 - 61 ISSN: 2229-6158
IJER | NOV - DEC 2013 Available [email protected]
46
6.3. Pellakur Mandal
In the case of small farms, the positive regression co-efficients of human-labour, HYV seeds,
chemical fertilizers and manures established a positive relationship with paddy production.
For every one rupee increase in these factors, the amount of gross output of paddy in small
farms of Pellakur mandal would tend to increase by Rs. 0.13, Rs. 0.66, Rs. 0.20 and Rs. 0.04
respectively. The co-efficients of bullock-labour, expenditure on tractor and pesticides and
other plant protection methods are negative. It means an unit increase in these factors leads a
decline in output. Every one rupee increase in bullock-labour, expenditure on tractor and
pesticides and other plant protection methods the amount of gross output of paddy in small
farmers would tend to decline by Rs. 0.01, Rs. 0.001 and Rs. 0.012 respectively. It is found
that there is increasing returns to scale in small farms of paddy. To obtain more yield of
paddy in small farms of Pellakur mandal the application of HYV seeds, human-labour,
chemical fertilizers and manures may be increased, remaining three variables should be
decreased. It may be inferred that the technological variable HYV seeds shows a positive
significant effect on output, whereas chemical fertilizers expressed a positive effect. The
factors pesticides and other plant protection methods affecting the crop production
negatively.
In the case of medium farms, except two factors chemical fertilizers and manures, all input
factors co-efficients are positive. It means a positive relationship was noticed with paddy
output with each of these variables. For every one rupee increase in these variables, bullock-
labour, expenditure on tractor, human-labour, HYV seeds and pesticides and other plant
protection methods, the paddy production may be increased by Rs. 0.03, Rs. 0.31, Rs. 0.59,
Rs. 0.36 and Rs. 0.08 respectively. The remaining two variables chemical fertilizers and
manures established a negative relationship. A rupee increase in chemical fertilizers and
manures each, the output may be decreased by Rs. 0.08 and Rs. 0.18. But this decrease is not
significant. To obtain more yield of paddy in medium farms of Pellakur mandal, the
application of bullock-labour, expenditure on tractor, human-labour, HYV seeds and
pesticides may be increased, whereas the application of chemical fertilizers and manures may
be decreased. The medium farms are significantly affected by the major technological factor
HYV seeds. But the pesticides and other plant protection methods and expenditure on tractor
are shown a positive effect. Unfortunately the important technical factor chemical fertilizer’s
effect is negative. Hence, it may be concluded that an appropriate measure has to be taken to
raise the paddy production in Pellakur mandal.
In the case of large farms, the positive regression co-efficients of bullock-labour, expenditure
on tractor, human-labour, HYV seeds, chemical fertilizers, manures and pesticides and other
Dr.E.Lokanadha Reddy1.,Dr.D.Radhakrishna Reddy2 Int. J. Eco. Res., 2013, v4i6, 41 - 61 ISSN: 2229-6158
IJER | NOV - DEC 2013 Available [email protected]
47
plant protection methods reveals a positive relation with output. Every one rupee raise in each
factors, the gross production of paddy would be increased by Rs. 0.03, Rs. 0.64, Rs. 0.02, Rs.
0.19, Rs. 0.09, Rs. 0.08 and Rs. 0.06 respectively. An increasing returns to scale in large
farms of paddy was observed. To obtain more yield of paddy in large farms of Pellakur
mandal, application of expenditure on tractor, HYV seeds, chemical fertilizers, manures and
pesticides and other plant protection methods should be increased. The two technological
factors expenditure on tractor and HYV seeds reveals a significant positive effect on output.
The remaining factors shows a positive effect only.
7. REFERENCES
1. Hanumantha Rao, C.H. (1965), “Agricultural Production Functions – Costs and Returns.” India Asian Publishing House, Bombay.
2. Mathur, S.C., and Balishter. (1973). Impact of HYVs of Crops on Farm Labour Use – A Case Study of Wheat and Paddy Cultivation in Barava Village in Agra District. Manpower Journal, Vol.8, No.4, January –March, pp.18-38.
3. Venkatesam, P., Naidu, M.R., and Venkateswarlu, V. (1988). Resource Use Efficiency on Maize Farms in Karimnagar District of Andhra Pradesh. The Andhra Agricultural Journal, Vol33, No.2, pp.111-114.
4. Bal, M.S. (1982). Factor Share in Farm Income Inequality in Punjab. Agricultural Situation in Indian, October, pp. 439-445.
5. Sharma, H.R., and Sharma, R.K. (2000). Farm Size – Productivity Relationship: Empirical Evidence from on Agriculturally Developed Region of Himachal Pradesh, Indian Journal of Agricultural Economics, Vol.55, No.4, October-December, pp.605-615.
6. Singh, L.R., and Pandey, L.R. (1971). Resource Use Efficiency in a Dry Farming Area of Banda District of Utter Pradesh. Indian Journal of Agricultural Economics, Vol.22, No.4, October-December, pp.296-299.
7. Rathore, M.S. (1984). Contribution of Factors to the Productivity Differential Between Small and Large Farms. Indian Journal of Agricultural Economics, Vol.39, No.1, January-March, pp.70-77.
8. Ninan, K.N. (1984). Labour Use in Agriculture – Case Study of Topiaca and Paddy.
Economic and Political Weekly, Vol.19, No.51&52, December, pp.A-199-A-24.
9. Chaudhari, T.P.S., et al. (1962). Optimum combination of comparative crops in the intensive cultivation scheme area Delhi. Indian Journal of Agricultural Economics, Vol.17, No.1.
10. Reddy, A.R., and Sen, C. (2004). Technical Inefficiency in Rice Production and its relationship with Farm – Specific Socio-Economic Characteristics. Indian Journal of Agricultural Economics, Vol. 59, No.2, April-June, pp.259-267.
Dr.E.Lokanadha Reddy1.,Dr.D.Radhakrishna Reddy2 Int. J. Eco. Res., 2013, v4i6, 41 - 61 ISSN: 2229-6158
IJER | NOV - DEC 2013 Available [email protected]
48
11. Hopper, W.D. (1965). Allocation Efficiency in Traditional Indian Agriculture. Journal of Farm Economics, Vol.47, No.3.
12. Radhakrishna, D. (1962). Share of Fixed Factors of Production in the Net Earning from Agriculture in West Godavari District (A.P.). Arthavijnana, Vol.4, No.2.
13. Rajkrishna. (1964). Some Production Functions for Punjab. Indian Journal of Agricultural Economics, Vol.19, No.3&4, July-December, pp.87-97.
14. Badal, P.S., and Singh, R.P. (2001). Technological Change in Maize Production : A Case Study of Bihar. Indian Journal of Agricultural Economics, Vol.56, No.2, April-June.
15. Robellow, M.S.P., and Desai, D.K. (1966). A Study of Efficiency of Production of Wheat in Kanjhawala Block. Indian Journal of Agricultural Economics, April-June, pp.45-55.
16. Shan, S.L., et al. (1969). A Socio-Economic Study of progressive and less progressive Farms in Varanasi District. Research Project, U.P. – Agricultural University, Pant Maurer.
17. Goyal, S.K. (2003). Supply Response and Input Demand on Paddy Farms in Haryana, India – A Panel Data Analysis, Vol.58, April-June.
18. Mathur, P.N. (1960). Studies in the Economics of Farm Management in Madya Pradesh, Report for the year 1956-1957. Directorate of Economics and Statistics, Ministry of Food and Agriculture, New Delhi.
19. Singh, J.P. (1975). Resource use, Farm size and Returns to Scale in a Backward Agriculture. Indian Journal of Agricultural Economics, Vol.30, No.2, April-June, pp.32-46.
20. Eswara Prasad, Y., Srirama Murthy, C., Satyanarayana, G., Chennarayudu, K.C., and Lalith Acoth. (1988). An Econometric Analysis of Cotton Production in Guntur District of Andhra Pradesh. Margin, October-December, pp.79-85.
21. Prasad, V. (1973). Resource use Efficiency and level of production in Multiple cropping in Farrukhabad District in U.P. An un Published Ph.D. Thesis, C.S. Azad University, Manpet.
22. Dehnarayan Sarker., and Sudpita, De. (2004). High Technical Efficiency of Farms in two Different Agricultural Lands: A Study under Determine Production Frontier Approach. Indian Journal of Agricultural Economics, Vol.59, No.2, April-June.
23. Timothy, O., and Krishna Moorthy, S. (1990). Productivity Variation and water use in Farms of Madurantakam Tankfed Area of Changal Pattu District, Tamil Nadu. Indian Journal of Agricultural Economics, Vol.XLV, January-March.
24. Parikh, A. (1996). Rates of returns on Chemical Fertilizers in the Package Programme Districts. Indian Journals of Agricultural Economics, Vol.21, No.2, April-June, pp.31-46.
25. Mythili, G., and Shanmugam, K.R. (2000). Technical Efficiency of Rice Growers in Tamilnadu: A Study Based on Panel Data. Indian Journal of Agricultural Economics, Vol.55, No.1, January-March, pp.15-25.
Dr.E.Lokanadha Reddy1.,Dr.D.Radhakrishna Reddy2 Int. J. Eco. Res., 2013, v4i6, 41 - 61 ISSN: 2229-6158
IJER | NOV - DEC 2013 Available [email protected]
49
26. Basak, K.C., and Choudhary, B.K. (1954-1957), “Studies in the Economics of Farm Management in West Bengal.” Report for the Years 1954-1957, Directorate of Economic and Statistics, Ministry of Food and Agriculture, New Delhi.
27. Yadav, R.N., and Gangwar, A.C. (1986). Economics of Technological Change in Rice Production. Economic Affairs, Vol.31, Qr.3, September.
28. Lasrence, R. Klein. (1965), “An Introduction to Econometrics.” Prentice – Hall of India, Pvt., New Delhi.
29. Heady Earl, O., and Dillon John. (1961), “Agricultural Production Function.” Kalyani Publishers, Ludhiana.
Dr.E.Lokanadha Reddy1.,Dr.D.Radhakrishna Reddy2 Int. J. Eco. Res., 2013, v4i6, 41 - 61 ISSN: 2229-6158
IJER | NOV - DEC 2013 Available [email protected]
50
Related Documents


