A study on processing, characterization and erosion behavior of fish (Labeo-rohita) scale filled epoxy matrix composites Alok Satapathy a, * , Amar Patnaik b , Manoj Kumar Pradhan c a Department of Mechanical Engineering, National Institute of Technology, Rourkela 769008, Orissa, India b Department of Mechanical Engineering, National Institute of Technology, Hamirpur 177005, India c Department of Mechanical Engineering, Purushottam School of Engineering and Technology, Rourkela, Orissa, India article info Article history: Received 6 September 2008 Accepted 31 October 2008 Available online 24 November 2008 Keywords: Labeo rohita Fish scales Taguchi method ANOVA GA abstract This paper describes the processing and characterization of epoxy matrix composites reinforced with short flakes obtained from the scales of a typical fresh water fish (Lobea rohita) and also reports on their erosion wear characteristics. Composites are developed by reinforcement of randomly oriented short flakes obtained from fish scales into epoxy resin. Erosion characteristics are studied with the help of an air jet type erosion test rig employing the design of experiments approach based on Taguchi’s orthog- onal arrays. The findings of the experiments indicate that the rate of erosion by impact of solid erodent is greatly influenced by various control factors. The experimental results are in good agreement with the values from the theoretical model. An artificial neural network (ANN) approach is also applied to predict the wear rate of the composites and compared with the theoretical results. An optimal parameter com- bination is determined, which leads to minimization of erosion rate. Analysis of variance (ANOVA) is per- formed on the measured data and S/N (signal to noise) ratios. A mathematical correlation, consistent with the experimental observations is proposed as a predictive equation for estimation of erosion rate of these composites. Finally, popular evolutionary approach known genetic algorithm (GA) is used to generalize the method of finding out optimal factor settings for minimum wear rate. Ó 2008 Elsevier Ltd. All rights reserved. 1. Introduction Fiber reinforced polymer composites have many applications in automobile, marine and aerospace industries. Due to operational requirements in dusty environments, the erosion characteristics of these composites are of vital importance. Since erosive wear of engineering components caused by abrasive particles is a major industrial problem, a full understanding of the effects of all system variables on the wear rate is necessary in order to undertake appropriate steps in the design of machine or structural compo- nent and in the choice of materials to reduce/control this wear. Various applications of polymers and their composites in erosive wear situations are reported by Pool et al. [1], Kulkarni and Kishore [2] and Aglan and Chenock [3] in the literature. But solid particle erosion of polymers and their composites has not been investi- gated to the same extent as for metals or ceramics. However, a number of researchers Barkoula and Karger-Kocsis [4], Tewari et al. [5] have evaluated the resistance of various types of polymers and their composites to solid particle erosion. It is widely recog- nized that polymers and their composites have poor erosion resis- tance. Their erosion rates are considerably higher than metals. In some cases that the erosion rates of polymer composites are even higher than that of neat polymers as reported by Häger et al. [6]. The solid particle erosion behavior of polymer composites as a function of fiber content has been studied to a limited extent by investigators like Miyazaki and Takeda [7]. Tilly and Sage [8] have investigated the influence of velocity, impact angle, particle size and weight of impacted abrasives on nylon, carbon-fiber-rein- forced nylon, epoxy resin, polypropylene and glass-fiber-reinforced plastic. In recent years, a number of investigations have been re- ported which prove the worth of natural fibers against their syn- thetic counterparts such as glass and/or carbon. It has been found that addition of vegetable fibers to poly-vinyl-chloride (PVC) without coupling agent notably decreases the strain at break and the maximum tensile strength while it increases the elastic modulus. Natural fibers are being used in polymers both in long and continuous form and also in the form of short fibers or flakes. The reported studies on short fiber reinforced composites by differ- ent investigators are found to have focused mostly on the strength properties of the composites. Beyerlein et al. [9] have described the influence of fiber shape in short fiber composites. Kari et al. [10] have evaluated numerically the effective material properties of composites with randomly distributed short fibers. Hine et al. [11] have presented a numerical simulation of the effects of fiber 0261-3069/$ - see front matter Ó 2008 Elsevier Ltd. All rights reserved. doi:10.1016/j.matdes.2008.10.033 * Corresponding author. Tel.: +91 9437085490. E-mail address: [email protected] (A. Satapathy). Materials and Design 30 (2009) 2359–2371 Contents lists available at ScienceDirect Materials and Design journal homepage: www.elsevier.com/locate/matdes

Welcome message from author
This document is posted to help you gain knowledge. Please leave a comment to let me know what you think about it! Share it to your friends and learn new things together.
Transcript
Materials and Design 30 (2009) 2359–2371
Contents lists available at ScienceDirect
Materials and Design
journal homepage: www.elsevier .com/locate /matdes
A study on processing, characterization and erosion behavior of fish(Labeo-rohita) scale filled epoxy matrix composites
Alok Satapathy a,*, Amar Patnaik b, Manoj Kumar Pradhan c
a Department of Mechanical Engineering, National Institute of Technology, Rourkela 769008, Orissa, Indiab Department of Mechanical Engineering, National Institute of Technology, Hamirpur 177005, Indiac Department of Mechanical Engineering, Purushottam School of Engineering and Technology, Rourkela, Orissa, India
a r t i c l e i n f o a b s t r a c t
Article history:Received 6 September 2008Accepted 31 October 2008Available online 24 November 2008
Keywords:Labeo rohitaFish scalesTaguchi methodANOVAGA
0261-3069/$ - see front matter � 2008 Elsevier Ltd. Adoi:10.1016/j.matdes.2008.10.033
* Corresponding author. Tel.: +91 9437085490.E-mail address: [email protected] (A. Sata
This paper describes the processing and characterization of epoxy matrix composites reinforced withshort flakes obtained from the scales of a typical fresh water fish (Lobea rohita) and also reports on theirerosion wear characteristics. Composites are developed by reinforcement of randomly oriented shortflakes obtained from fish scales into epoxy resin. Erosion characteristics are studied with the help ofan air jet type erosion test rig employing the design of experiments approach based on Taguchi’s orthog-onal arrays. The findings of the experiments indicate that the rate of erosion by impact of solid erodent isgreatly influenced by various control factors. The experimental results are in good agreement with thevalues from the theoretical model. An artificial neural network (ANN) approach is also applied to predictthe wear rate of the composites and compared with the theoretical results. An optimal parameter com-bination is determined, which leads to minimization of erosion rate. Analysis of variance (ANOVA) is per-formed on the measured data and S/N (signal to noise) ratios. A mathematical correlation, consistent withthe experimental observations is proposed as a predictive equation for estimation of erosion rate of thesecomposites. Finally, popular evolutionary approach known genetic algorithm (GA) is used to generalizethe method of finding out optimal factor settings for minimum wear rate.
� 2008 Elsevier Ltd. All rights reserved.
1. Introduction
Fiber reinforced polymer composites have many applications inautomobile, marine and aerospace industries. Due to operationalrequirements in dusty environments, the erosion characteristicsof these composites are of vital importance. Since erosive wear ofengineering components caused by abrasive particles is a majorindustrial problem, a full understanding of the effects of all systemvariables on the wear rate is necessary in order to undertakeappropriate steps in the design of machine or structural compo-nent and in the choice of materials to reduce/control this wear.Various applications of polymers and their composites in erosivewear situations are reported by Pool et al. [1], Kulkarni and Kishore[2] and Aglan and Chenock [3] in the literature. But solid particleerosion of polymers and their composites has not been investi-gated to the same extent as for metals or ceramics. However, anumber of researchers Barkoula and Karger-Kocsis [4], Tewariet al. [5] have evaluated the resistance of various types of polymersand their composites to solid particle erosion. It is widely recog-nized that polymers and their composites have poor erosion resis-
ll rights reserved.
pathy).
tance. Their erosion rates are considerably higher than metals. Insome cases that the erosion rates of polymer composites are evenhigher than that of neat polymers as reported by Häger et al. [6].The solid particle erosion behavior of polymer composites as afunction of fiber content has been studied to a limited extent byinvestigators like Miyazaki and Takeda [7]. Tilly and Sage [8] haveinvestigated the influence of velocity, impact angle, particle sizeand weight of impacted abrasives on nylon, carbon-fiber-rein-forced nylon, epoxy resin, polypropylene and glass-fiber-reinforcedplastic. In recent years, a number of investigations have been re-ported which prove the worth of natural fibers against their syn-thetic counterparts such as glass and/or carbon. It has beenfound that addition of vegetable fibers to poly-vinyl-chloride(PVC) without coupling agent notably decreases the strain at breakand the maximum tensile strength while it increases the elasticmodulus. Natural fibers are being used in polymers both in longand continuous form and also in the form of short fibers or flakes.The reported studies on short fiber reinforced composites by differ-ent investigators are found to have focused mostly on the strengthproperties of the composites. Beyerlein et al. [9] have described theinfluence of fiber shape in short fiber composites. Kari et al. [10]have evaluated numerically the effective material properties ofcomposites with randomly distributed short fibers. Hine et al.[11] have presented a numerical simulation of the effects of fiber
2360 A. Satapathy et al. / Materials and Design 30 (2009) 2359–2371
length distribution on the elastic and thermo-elastic properties ofshort fiber composites. Fu et al. [12] have studied the flexural prop-erties of misaligned short fiber reinforced polymers by taking intoaccount the effects of fiber length and fiber orientation. It is evi-dent from the existing literature that polymer composites rein-forced with natural fibers like jute, sisal etc. have long been usedin various structural applications. Bio-fibers like animal whiskersand poultry feather have also recently drawn the attention ofresearchers [13]. But the potential use of fish scale fiber in compos-ite making has not been explored so far.
Fish is one of the most abundantly available aqueous speciesand its scale, regarded as a waste material, can be gainfully con-verted to value added products. It is expected to contribute im-proved functional properties to the neat polymer apart frommaking the composite lighter and cheaper. Fish scales, the dermalderivatives of fish body, are important structures used as versatileresearch material in fisheries. They exhibit distinct pattern of darkand light bands corresponding to closely and widely spaced circulithat form annular zones depicting the age of fish in years. The en-graved pattern of circuli on scale serves as a blueprint for the phys-iological epochs of fish life, narrating its growth history. Besidesthis established role of scales in fish biology, these have numeroushidden details in their sculptural design that contribute effectivelyto fish identification and classification. Although some earlierworks studied fish body scales to strengthen their role in fish tax-onomy [14], the available reports on fish scale research are rela-tively less. Ikoma et al. [15] have studied the micro-structural,mechanical, and bio-mimetic properties of fish scales from Pagrusmajor. They have reported the tensile strength of the scale to beas high as �90 MPa and have attributed this to the hierarchicallyordered structure of mineralized collagen fibers. An inexpensiveand easy-to-operate experimental strategy based on Taguchi’sparameter design has been adopted to study the effect of variousparameters and their interactions. This experimental procedurehas already been successfully applied for parametric appraisal inwire electrical discharge machining (WEDM) process, drilling ofmetal matrix composites and wear behavior of polymer matrixcomposites [16–21], etc. However, there is no report available inscientific and engineering journals on composites using fish scaleas a constituent.
Like any experimental investigation, erosion trials on polymercomposites also demand substantial amount of time, energy andmaterials. Hence, there is a need for a prediction tool to supple-ment to the experiments. In the present study, a model based onartificial neural network (ANN) is implemented to predict erosionrate of the composites subjected to different operating conditions.Artificial neural network is an information processing paradigm,that is, inspired by the way that biological nervous systems processinformation. It is composed of a large number of interconnectedprocessing elements (neurons) working in a unison [22,23]. Inother words, ANN represents a powerful tool for the identificationof the relevant parameters and their interactions especially whenrelationships are very complex and highly non-linear [24].
Against this background, the present investigation is under-taken which explores the possible utilization of fish scales in theform of flakes in polymer composites. In view of the above, theobjective of the present investigation is to study the erosive wearbehavior of fish scales reinforcement with epoxy resin under mul-tiple impact conditions. An attempt is made to optimize the pro-cess parameters for minimum erosion. Besides, it also comparesthe theoretical wear rates with the values obtained from experi-ments carried out as per Taguchi’s design and also with the valuesfrom ANN prediction model. An evolutionary approach known asgenetic algorithm has also been applied in the present study forthe determination of optimal factor settings to minimize the ero-sion rate.
2. Experimental details
2.1. Materials
Epoxy LY 556, chemically belonging to the ‘epoxide’ family isused as the matrix material. Its common name is Bisphenol ADiglycidyl Ether. The hardener with IUPAC name N,N0-bis(2-aminoethylethane-1,2-diamin) used with the epoxy has thedesignation HY-951. The epoxy resin and the hardener are suppliedby Ciba Geigy India Ltd. The fish scales are collected from a fisher-men’s market in Rourkela, located in the eastern part of India. Labe-o rohita (common local names are rohi, rui) is a typical fresh waterfish normally located in weedy and slow flowing or standingwaters of lakes, ponds, pools and rivers. It can be identified bythe dark scales in its upper body, golden brown lower body andbelly and dark brown dorsal fin and tail. It has pelvic, pectoraland anal fins with red tint. Mature fish scales are washed repeat-edly with water to remove adhering dust and soluble impuritiesform their surface. The scales are allowed to dry in sunshine fortwo days and are then kept in an oven at 70 �C till they becomecrispy. The dried scales are then cut into short flakes of dimension,approximately 6–8 mm in length and 1 mm in width. These flakesare used as the reinforcing phase.
2.2. Composite fabrication
The low temperature curing epoxy resin (Araldite LY 556) andcorresponding hardener (HY951) are mixed in a ratio of 10:1 byweight as recommended. Density of the epoxy resin system is1.1 g/cc. The dried flakes of fish scales in three pre-determinedweight proportions (5, 10 and 15 wt%) are reinforced with randomorientation into the epoxy resin. The matrix and the short flakesare thoroughly mixed and blocks of size (300 mm �150 mm � 6 mm); one each of 5 wt%, 10 wt% and of 15 wt% arethus cast. The castings are put under load for about 24 hours forproper curing at room temperature. Specimens of suitable dimen-sion are cut using a diamond cutter for physical and mechanicalcharacterization.
2.3. Micro-hardness
Micro-hardness measurement is done using a Leitz micro-hard-ness tester. A diamond indenter, in the form of a right pyramidwith a square base and an angle 136� between opposite faces, isforced into the material under a load of 24.54 N.
2.4. Density
The theoretical density of composite materials in terms ofweight fraction can easily be obtained as for the following equa-tions given by Agarwal and Broutman [25].
qct ¼1
ðW f=qfÞ þ ðWm=qmÞð1Þ
where W and q represent the weight fraction and density respec-tively. The suffix f, m and ct stand for the fiber, matrix and the com-posite materials respectively.
The composites under this investigation consists of three com-ponents namely matrix, fiber and particulate filler. Hence the mod-ified form of the expression for the density of the composite can bewritten as
qct ¼1
ðW f=qfÞ þ ðWm=qmÞ þ ðWp=qpÞð2Þ
where the suffix ‘p’ indicates the particulate filler materials.
A. Satapathy et al. / Materials and Design 30 (2009) 2359–2371 2361
The actual density (qce) of the composite, however, can bedetermined experimentally by simple water immersion technique.The volume fraction of voids (Vv) in the composites is calculatedusing the following equation:
Vv ¼qct � qce
qctð3Þ
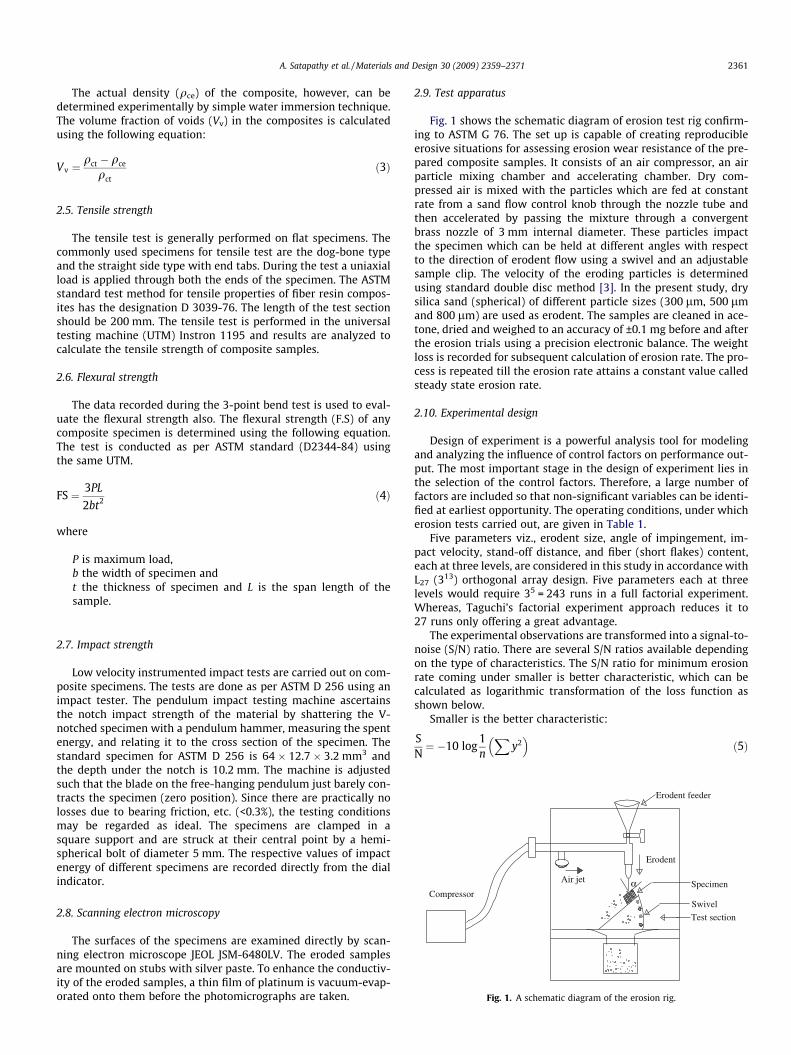
αAir jet
Compressor
Test section
Swivel
Specimen
Erodent
Erodent feeder
Fig. 1. A schematic diagram of the erosion rig.
2.5. Tensile strength
The tensile test is generally performed on flat specimens. Thecommonly used specimens for tensile test are the dog-bone typeand the straight side type with end tabs. During the test a uniaxialload is applied through both the ends of the specimen. The ASTMstandard test method for tensile properties of fiber resin compos-ites has the designation D 3039-76. The length of the test sectionshould be 200 mm. The tensile test is performed in the universaltesting machine (UTM) Instron 1195 and results are analyzed tocalculate the tensile strength of composite samples.
2.6. Flexural strength
The data recorded during the 3-point bend test is used to eval-uate the flexural strength also. The flexural strength (F.S) of anycomposite specimen is determined using the following equation.The test is conducted as per ASTM standard (D2344-84) usingthe same UTM.
FS ¼ 3PL
2bt2 ð4Þ
where
P is maximum load,b the width of specimen andt the thickness of specimen and L is the span length of thesample.
2.7. Impact strength
Low velocity instrumented impact tests are carried out on com-posite specimens. The tests are done as per ASTM D 256 using animpact tester. The pendulum impact testing machine ascertainsthe notch impact strength of the material by shattering the V-notched specimen with a pendulum hammer, measuring the spentenergy, and relating it to the cross section of the specimen. Thestandard specimen for ASTM D 256 is 64 � 12.7 � 3.2 mm3 andthe depth under the notch is 10.2 mm. The machine is adjustedsuch that the blade on the free-hanging pendulum just barely con-tracts the specimen (zero position). Since there are practically nolosses due to bearing friction, etc. (<0.3%), the testing conditionsmay be regarded as ideal. The specimens are clamped in asquare support and are struck at their central point by a hemi-spherical bolt of diameter 5 mm. The respective values of impactenergy of different specimens are recorded directly from the dialindicator.
2.8. Scanning electron microscopy
The surfaces of the specimens are examined directly by scan-ning electron microscope JEOL JSM-6480LV. The eroded samplesare mounted on stubs with silver paste. To enhance the conductiv-ity of the eroded samples, a thin film of platinum is vacuum-evap-orated onto them before the photomicrographs are taken.
2.9. Test apparatus
Fig. 1 shows the schematic diagram of erosion test rig confirm-ing to ASTM G 76. The set up is capable of creating reproducibleerosive situations for assessing erosion wear resistance of the pre-pared composite samples. It consists of an air compressor, an airparticle mixing chamber and accelerating chamber. Dry com-pressed air is mixed with the particles which are fed at constantrate from a sand flow control knob through the nozzle tube andthen accelerated by passing the mixture through a convergentbrass nozzle of 3 mm internal diameter. These particles impactthe specimen which can be held at different angles with respectto the direction of erodent flow using a swivel and an adjustablesample clip. The velocity of the eroding particles is determinedusing standard double disc method [3]. In the present study, drysilica sand (spherical) of different particle sizes (300 lm, 500 lmand 800 lm) are used as erodent. The samples are cleaned in ace-tone, dried and weighed to an accuracy of ±0.1 mg before and afterthe erosion trials using a precision electronic balance. The weightloss is recorded for subsequent calculation of erosion rate. The pro-cess is repeated till the erosion rate attains a constant value calledsteady state erosion rate.
2.10. Experimental design
Design of experiment is a powerful analysis tool for modelingand analyzing the influence of control factors on performance out-put. The most important stage in the design of experiment lies inthe selection of the control factors. Therefore, a large number offactors are included so that non-significant variables can be identi-fied at earliest opportunity. The operating conditions, under whicherosion tests carried out, are given in Table 1.
Five parameters viz., erodent size, angle of impingement, im-pact velocity, stand-off distance, and fiber (short flakes) content,each at three levels, are considered in this study in accordance withL27 (313) orthogonal array design. Five parameters each at threelevels would require 35 = 243 runs in a full factorial experiment.Whereas, Taguchi’s factorial experiment approach reduces it to27 runs only offering a great advantage.
The experimental observations are transformed into a signal-to-noise (S/N) ratio. There are several S/N ratios available dependingon the type of characteristics. The S/N ratio for minimum erosionrate coming under smaller is better characteristic, which can becalculated as logarithmic transformation of the loss function asshown below.
Smaller is the better characteristic:
SN¼ �10 log
1n
Xy2
� �ð5Þ
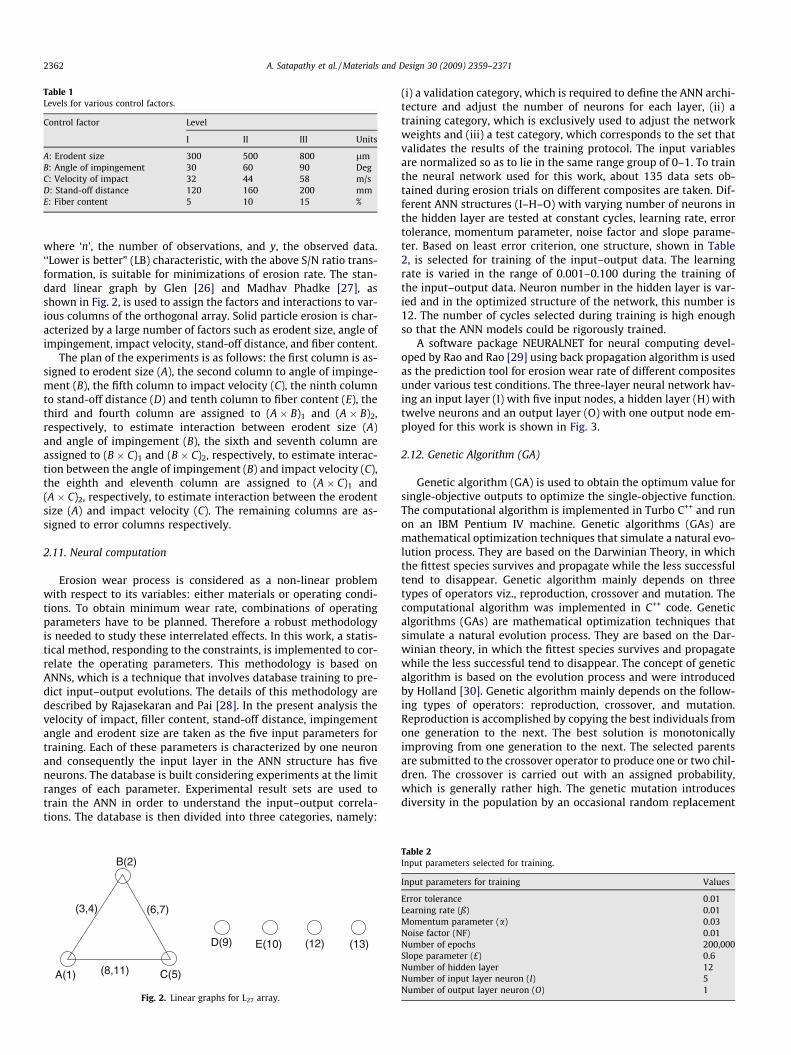
Table 1Levels for various control factors.
Control factor Level
I II III Units
A: Erodent size 300 500 800 lmB: Angle of impingement 30 60 90 DegC: Velocity of impact 32 44 58 m/sD: Stand-off distance 120 160 200 mmE: Fiber content 5 10 15 %
2362 A. Satapathy et al. / Materials and Design 30 (2009) 2359–2371
where ‘n’, the number of observations, and y, the observed data.‘‘Lower is better” (LB) characteristic, with the above S/N ratio trans-formation, is suitable for minimizations of erosion rate. The stan-dard linear graph by Glen [26] and Madhav Phadke [27], asshown in Fig. 2, is used to assign the factors and interactions to var-ious columns of the orthogonal array. Solid particle erosion is char-acterized by a large number of factors such as erodent size, angle ofimpingement, impact velocity, stand-off distance, and fiber content.
The plan of the experiments is as follows: the first column is as-signed to erodent size (A), the second column to angle of impinge-ment (B), the fifth column to impact velocity (C), the ninth columnto stand-off distance (D) and tenth column to fiber content (E), thethird and fourth column are assigned to (A � B)1 and (A � B)2,respectively, to estimate interaction between erodent size (A)and angle of impingement (B), the sixth and seventh column areassigned to (B � C)1 and (B � C)2, respectively, to estimate interac-tion between the angle of impingement (B) and impact velocity (C),the eighth and eleventh column are assigned to (A � C)1 and(A � C)2, respectively, to estimate interaction between the erodentsize (A) and impact velocity (C). The remaining columns are as-signed to error columns respectively.
2.11. Neural computation
Erosion wear process is considered as a non-linear problemwith respect to its variables: either materials or operating condi-tions. To obtain minimum wear rate, combinations of operatingparameters have to be planned. Therefore a robust methodologyis needed to study these interrelated effects. In this work, a statis-tical method, responding to the constraints, is implemented to cor-relate the operating parameters. This methodology is based onANNs, which is a technique that involves database training to pre-dict input–output evolutions. The details of this methodology aredescribed by Rajasekaran and Pai [28]. In the present analysis thevelocity of impact, filler content, stand-off distance, impingementangle and erodent size are taken as the five input parameters fortraining. Each of these parameters is characterized by one neuronand consequently the input layer in the ANN structure has fiveneurons. The database is built considering experiments at the limitranges of each parameter. Experimental result sets are used totrain the ANN in order to understand the input–output correla-tions. The database is then divided into three categories, namely:
A(1)
B(2)
C(5)
D(9) E(10) (12) (13)
(3,4) (6,7)
(8,11)
Fig. 2. Linear graphs for L27 array.
(i) a validation category, which is required to define the ANN archi-tecture and adjust the number of neurons for each layer, (ii) atraining category, which is exclusively used to adjust the networkweights and (iii) a test category, which corresponds to the set thatvalidates the results of the training protocol. The input variablesare normalized so as to lie in the same range group of 0–1. To trainthe neural network used for this work, about 135 data sets ob-tained during erosion trials on different composites are taken. Dif-ferent ANN structures (I–H–O) with varying number of neurons inthe hidden layer are tested at constant cycles, learning rate, errortolerance, momentum parameter, noise factor and slope parame-ter. Based on least error criterion, one structure, shown in Table2, is selected for training of the input–output data. The learningrate is varied in the range of 0.001–0.100 during the training ofthe input–output data. Neuron number in the hidden layer is var-ied and in the optimized structure of the network, this number is12. The number of cycles selected during training is high enoughso that the ANN models could be rigorously trained.
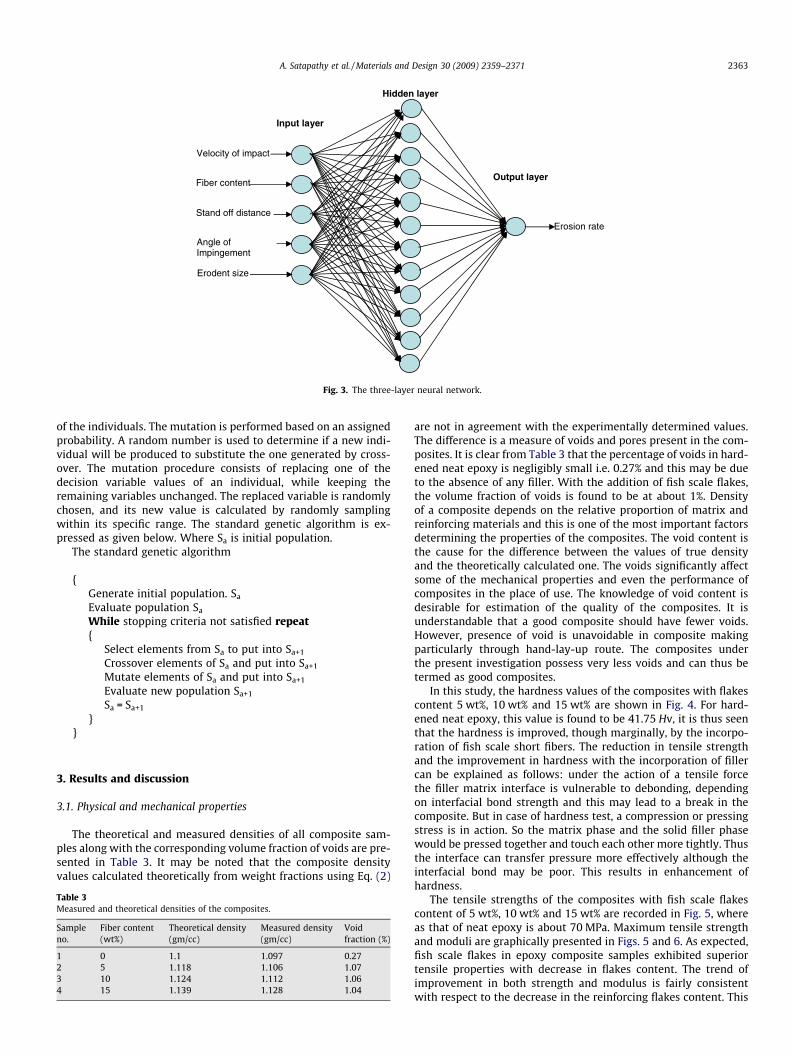
A software package NEURALNET for neural computing devel-oped by Rao and Rao [29] using back propagation algorithm is usedas the prediction tool for erosion wear rate of different compositesunder various test conditions. The three-layer neural network hav-ing an input layer (I) with five input nodes, a hidden layer (H) withtwelve neurons and an output layer (O) with one output node em-ployed for this work is shown in Fig. 3.
2.12. Genetic Algorithm (GA)
Genetic algorithm (GA) is used to obtain the optimum value forsingle-objective outputs to optimize the single-objective function.The computational algorithm is implemented in Turbo C++ and runon an IBM Pentium IV machine. Genetic algorithms (GAs) aremathematical optimization techniques that simulate a natural evo-lution process. They are based on the Darwinian Theory, in whichthe fittest species survives and propagate while the less successfultend to disappear. Genetic algorithm mainly depends on threetypes of operators viz., reproduction, crossover and mutation. Thecomputational algorithm was implemented in C++ code. Geneticalgorithms (GAs) are mathematical optimization techniques thatsimulate a natural evolution process. They are based on the Dar-winian theory, in which the fittest species survives and propagatewhile the less successful tend to disappear. The concept of geneticalgorithm is based on the evolution process and were introducedby Holland [30]. Genetic algorithm mainly depends on the follow-ing types of operators: reproduction, crossover, and mutation.Reproduction is accomplished by copying the best individuals fromone generation to the next. The best solution is monotonicallyimproving from one generation to the next. The selected parentsare submitted to the crossover operator to produce one or two chil-dren. The crossover is carried out with an assigned probability,which is generally rather high. The genetic mutation introducesdiversity in the population by an occasional random replacement
Table 2Input parameters selected for training.
Input parameters for training Values
Error tolerance 0.01Learning rate (ß) 0.01Momentum parameter (a) 0.03Noise factor (NF) 0.01Number of epochs 200,000Slope parameter (£) 0.6Number of hidden layer 12Number of input layer neuron (I) 5Number of output layer neuron (O) 1
Velocity of impact
Fiber content
Stand off distance
Angle of Impingement
Erodent size
Input layer
Hidden layer
Output layer
Erosion rate
Fig. 3. The three-layer neural network.
A. Satapathy et al. / Materials and Design 30 (2009) 2359–2371 2363
of the individuals. The mutation is performed based on an assignedprobability. A random number is used to determine if a new indi-vidual will be produced to substitute the one generated by cross-over. The mutation procedure consists of replacing one of thedecision variable values of an individual, while keeping theremaining variables unchanged. The replaced variable is randomlychosen, and its new value is calculated by randomly samplingwithin its specific range. The standard genetic algorithm is ex-pressed as given below. Where Sa is initial population.
The standard genetic algorithm
{
Generate initial population. SaEvaluate population Sa
While stopping criteria not satisfied repeat{
Select elements from Sa to put into Sa+1
Crossover elements of Sa and put into Sa+1
Mutate elements of Sa and put into Sa+1
Evaluate new population Sa+1
Sa = Sa+1
}}
3. Results and discussion
3.1. Physical and mechanical properties
The theoretical and measured densities of all composite sam-ples along with the corresponding volume fraction of voids are pre-sented in Table 3. It may be noted that the composite densityvalues calculated theoretically from weight fractions using Eq. (2)
Table 3Measured and theoretical densities of the composites.
Sampleno.
Fiber content(wt%)
Theoretical density(gm/cc)
Measured density(gm/cc)
Voidfraction (%)
1 0 1.1 1.097 0.272 5 1.118 1.106 1.073 10 1.124 1.112 1.064 15 1.139 1.128 1.04
are not in agreement with the experimentally determined values.The difference is a measure of voids and pores present in the com-posites. It is clear from Table 3 that the percentage of voids in hard-ened neat epoxy is negligibly small i.e. 0.27% and this may be dueto the absence of any filler. With the addition of fish scale flakes,the volume fraction of voids is found to be at about 1%. Densityof a composite depends on the relative proportion of matrix andreinforcing materials and this is one of the most important factorsdetermining the properties of the composites. The void content isthe cause for the difference between the values of true densityand the theoretically calculated one. The voids significantly affectsome of the mechanical properties and even the performance ofcomposites in the place of use. The knowledge of void content isdesirable for estimation of the quality of the composites. It isunderstandable that a good composite should have fewer voids.However, presence of void is unavoidable in composite makingparticularly through hand-lay-up route. The composites underthe present investigation possess very less voids and can thus betermed as good composites.
In this study, the hardness values of the composites with flakescontent 5 wt%, 10 wt% and 15 wt% are shown in Fig. 4. For hard-ened neat epoxy, this value is found to be 41.75 Hv, it is thus seenthat the hardness is improved, though marginally, by the incorpo-ration of fish scale short fibers. The reduction in tensile strengthand the improvement in hardness with the incorporation of fillercan be explained as follows: under the action of a tensile forcethe filler matrix interface is vulnerable to debonding, dependingon interfacial bond strength and this may lead to a break in thecomposite. But in case of hardness test, a compression or pressingstress is in action. So the matrix phase and the solid filler phasewould be pressed together and touch each other more tightly. Thusthe interface can transfer pressure more effectively although theinterfacial bond may be poor. This results in enhancement ofhardness.
The tensile strengths of the composites with fish scale flakescontent of 5 wt%, 10 wt% and 15 wt% are recorded in Fig. 5, whereas that of neat epoxy is about 70 MPa. Maximum tensile strengthand moduli are graphically presented in Figs. 5 and 6. As expected,fish scale flakes in epoxy composite samples exhibited superiortensile properties with decrease in flakes content. The trend ofimprovement in both strength and modulus is fairly consistentwith respect to the decrease in the reinforcing flakes content. This
42.30
42.60
42.90
43.20
43.50
43.80
15105
Flakes content (%)
Mic
roha
rdne
ss (
Hv)
Fig. 4. Comparison of hardness values of different flake content.
62.00
63.00
64.00
65.00
66.00
67.00
15105Flakes content (%)
Ten
sile
str
engt
h (M
Pa)
Fig. 5. Variation of tensile strength of composites with different flake content.
7.00
7.20
7.40
7.60
7.80
8.00
15105Flakes content (%)
Ten
sile
mod
ulus
(G
Pa)
Fig. 6. Variation of tensile modulus of composites with different flake content.0.30
0.50
0.70
0.90
1.10
15105Flakes content (%)
Impa
ct s
tren
gth
(J)
Fig. 8. Variation of impact strength of composites with different flake content.
2364 A. Satapathy et al. / Materials and Design 30 (2009) 2359–2371
may also suggest a poor interfacial adhesion and incomplete ma-trix fusion as indicated in Figs. 5 and 6. Similarly, incase of flexuralstrength the incorporation of flakes has not shown significantimprovement in flexural strength with the increase in flakes con-tent (Fig. 7). The voids within the matrix indicated boundary areaswhere complete fusion was not attained. There can be two reasonsfor this decline in the strength properties of these fish scale fiberfilled composites compared to the unfilled one. One possibility isthat the chemical reaction at the interface between the flakesand the matrix may be too weak to transfer the tensile stress;
50.00
55.00
60.00
65.00
15105Flake content (%)
Flex
ural
str
engt
h (M
Pa)
Fig. 7. Variation of flexural strength of composites with different flake content.
the other is that the corner points of the irregular shaped shortflakes result in stress concentration in the epoxy matrix. Thesetwo factors are responsible for reducing the tensile strengths ofthe composites so significantly.
The impact energy values of different composites recorded dur-ing the impact tests are given in Fig. 8. It shows that the resistanceto impact loading of fish scale flakes content epoxy composites im-proves with addition of flakes content. However this improvementis not very significant. It is seen that with incorporation of flakescontent the impact strength of composite increases in a slower rateby about 5–15%. The suitability of a composite for such applica-tions should therefore be determined not only by usual designparameters, but by its impact or energy absorbing properties. Thusit is important to have a good understanding of the impact behav-ior of composites for both safe and efficient design of structuresand to develop new composites having good impact properties.
3.2. Surface morphology
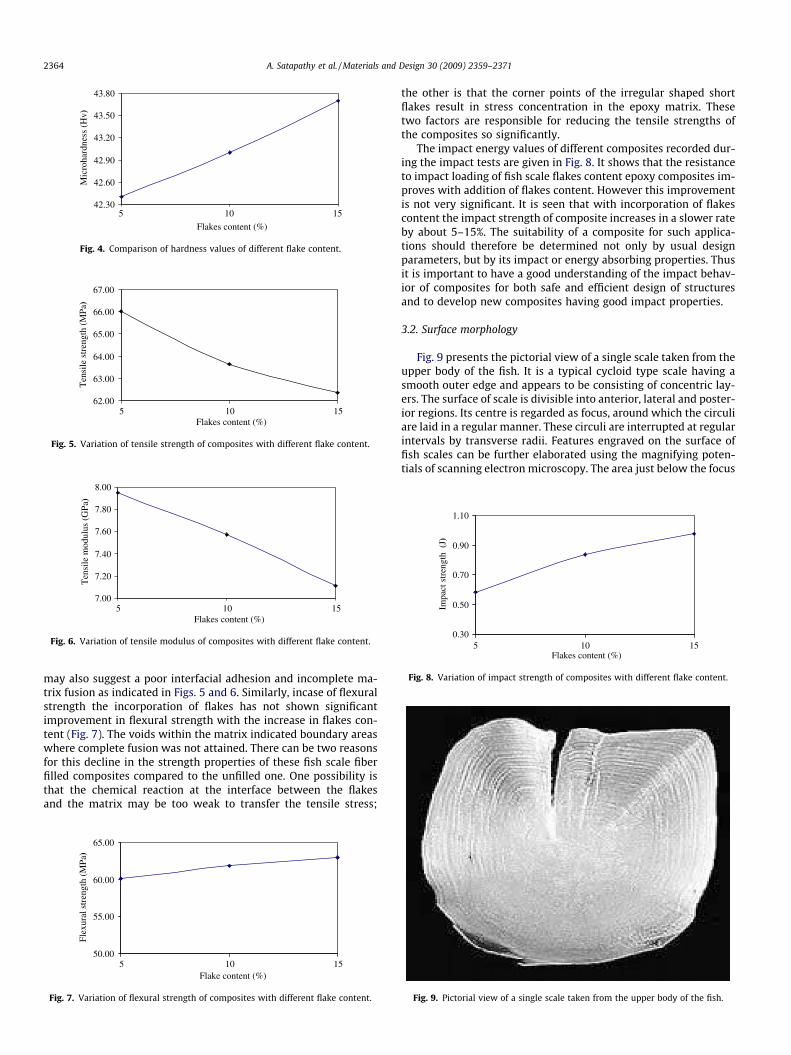
Fig. 9 presents the pictorial view of a single scale taken from theupper body of the fish. It is a typical cycloid type scale having asmooth outer edge and appears to be consisting of concentric lay-ers. The surface of scale is divisible into anterior, lateral and poster-ior regions. Its centre is regarded as focus, around which the circuliare laid in a regular manner. These circuli are interrupted at regularintervals by transverse radii. Features engraved on the surface offish scales can be further elaborated using the magnifying poten-tials of scanning electron microscopy. The area just below the focus
Fig. 9. Pictorial view of a single scale taken from the upper body of the fish.
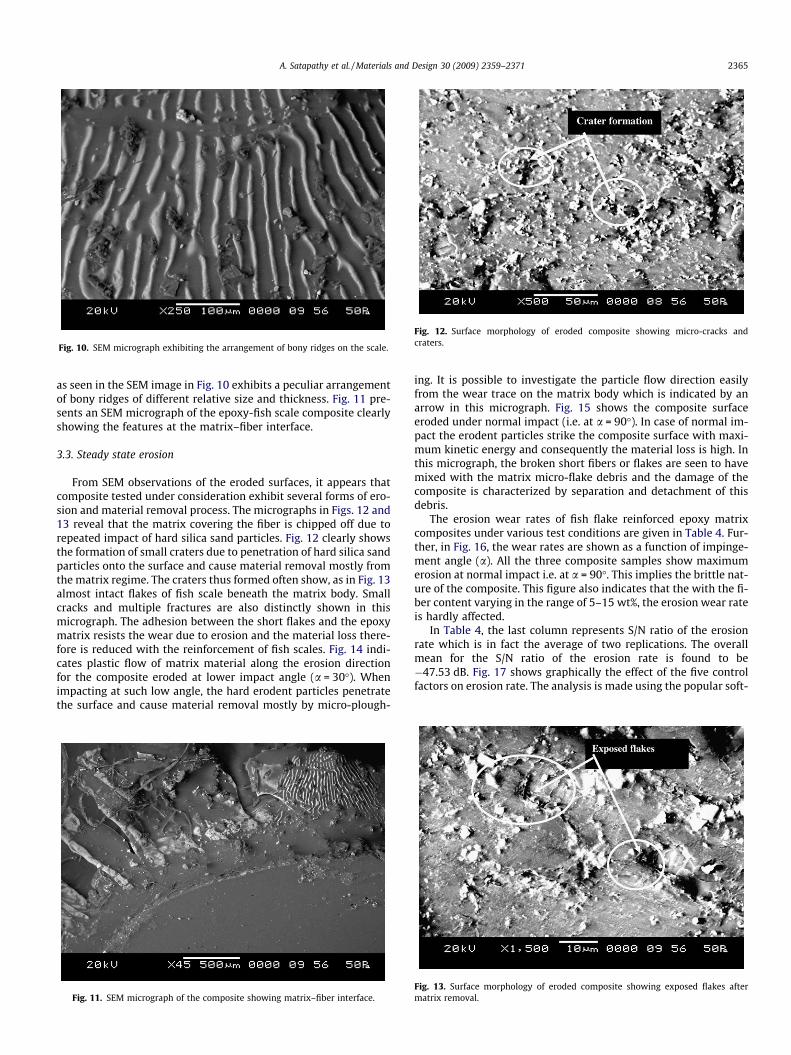
Fig. 10. SEM micrograph exhibiting the arrangement of bony ridges on the scale.
Fig. 12. Surface morphology of eroded composite showing micro-cracks andcraters.
A. Satapathy et al. / Materials and Design 30 (2009) 2359–2371 2365
as seen in the SEM image in Fig. 10 exhibits a peculiar arrangementof bony ridges of different relative size and thickness. Fig. 11 pre-sents an SEM micrograph of the epoxy-fish scale composite clearlyshowing the features at the matrix–fiber interface.
3.3. Steady state erosion
From SEM observations of the eroded surfaces, it appears thatcomposite tested under consideration exhibit several forms of ero-sion and material removal process. The micrographs in Figs. 12 and13 reveal that the matrix covering the fiber is chipped off due torepeated impact of hard silica sand particles. Fig. 12 clearly showsthe formation of small craters due to penetration of hard silica sandparticles onto the surface and cause material removal mostly fromthe matrix regime. The craters thus formed often show, as in Fig. 13almost intact flakes of fish scale beneath the matrix body. Smallcracks and multiple fractures are also distinctly shown in thismicrograph. The adhesion between the short flakes and the epoxymatrix resists the wear due to erosion and the material loss there-fore is reduced with the reinforcement of fish scales. Fig. 14 indi-cates plastic flow of matrix material along the erosion directionfor the composite eroded at lower impact angle (a = 30�). Whenimpacting at such low angle, the hard erodent particles penetratethe surface and cause material removal mostly by micro-plough-
Fig. 11. SEM micrograph of the composite showing matrix–fiber interface.
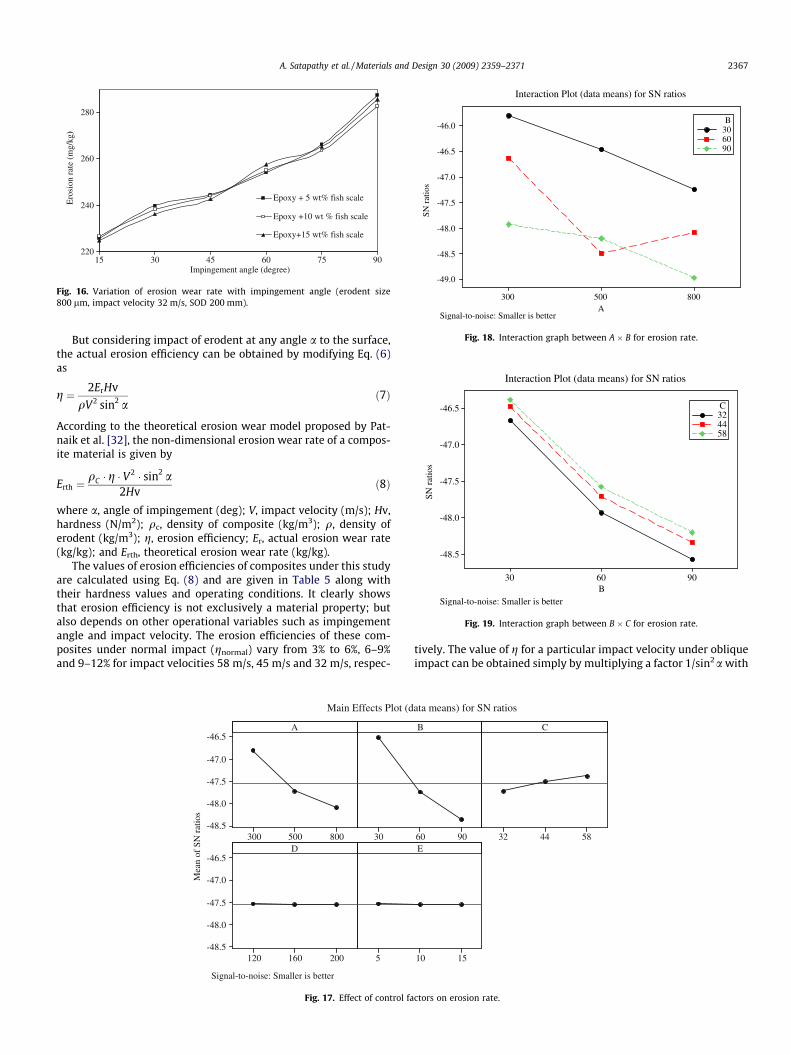
ing. It is possible to investigate the particle flow direction easilyfrom the wear trace on the matrix body which is indicated by anarrow in this micrograph. Fig. 15 shows the composite surfaceeroded under normal impact (i.e. at a = 90�). In case of normal im-pact the erodent particles strike the composite surface with maxi-mum kinetic energy and consequently the material loss is high. Inthis micrograph, the broken short fibers or flakes are seen to havemixed with the matrix micro-flake debris and the damage of thecomposite is characterized by separation and detachment of thisdebris.
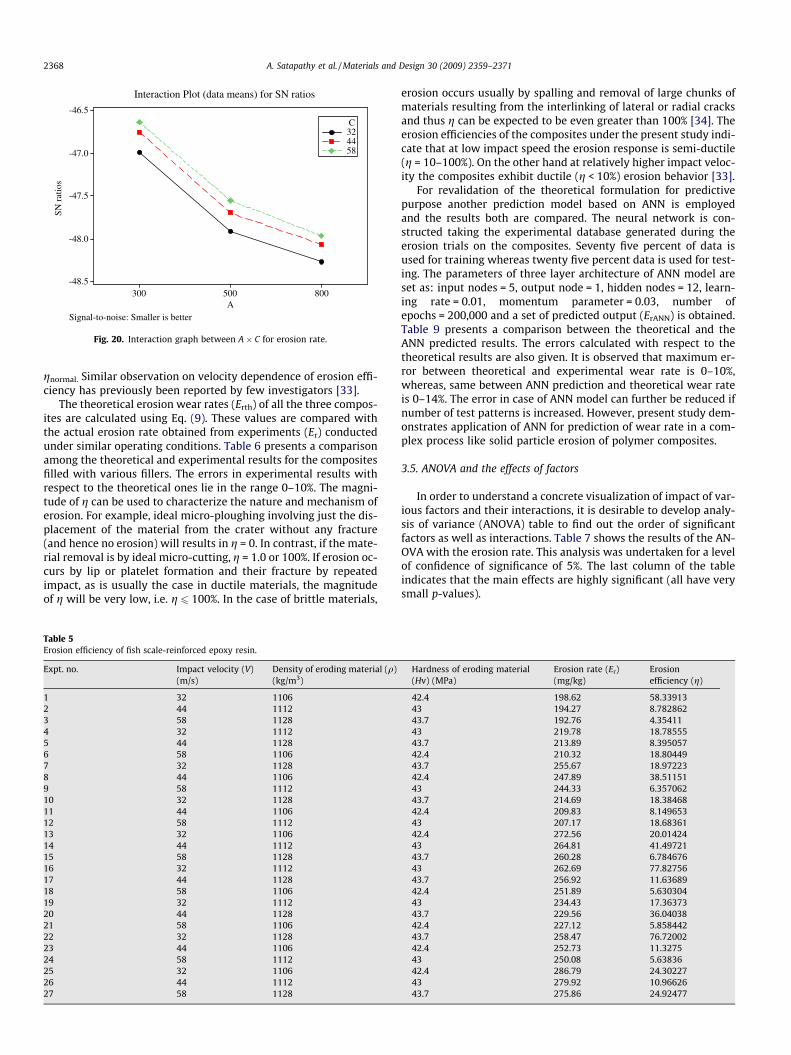
The erosion wear rates of fish flake reinforced epoxy matrixcomposites under various test conditions are given in Table 4. Fur-ther, in Fig. 16, the wear rates are shown as a function of impinge-ment angle (a). All the three composite samples show maximumerosion at normal impact i.e. at a = 90�. This implies the brittle nat-ure of the composite. This figure also indicates that the with the fi-ber content varying in the range of 5–15 wt%, the erosion wear rateis hardly affected.
In Table 4, the last column represents S/N ratio of the erosionrate which is in fact the average of two replications. The overallmean for the S/N ratio of the erosion rate is found to be�47.53 dB. Fig. 17 shows graphically the effect of the five controlfactors on erosion rate. The analysis is made using the popular soft-
Fig. 13. Surface morphology of eroded composite showing exposed flakes aftermatrix removal.
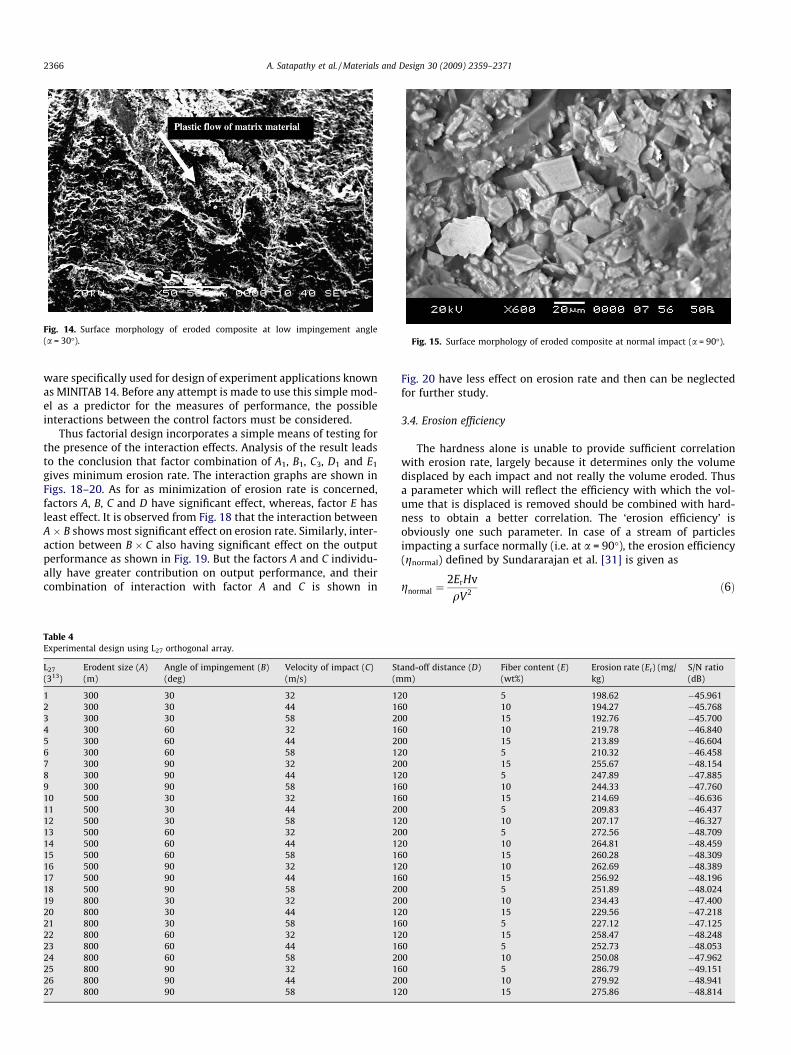
Fig. 14. Surface morphology of eroded composite at low impingement angle(a = 30�). Fig. 15. Surface morphology of eroded composite at normal impact (a = 90�).
2366 A. Satapathy et al. / Materials and Design 30 (2009) 2359–2371
ware specifically used for design of experiment applications knownas MINITAB 14. Before any attempt is made to use this simple mod-el as a predictor for the measures of performance, the possibleinteractions between the control factors must be considered.
Thus factorial design incorporates a simple means of testing forthe presence of the interaction effects. Analysis of the result leadsto the conclusion that factor combination of A1, B1, C3, D1 and E1
gives minimum erosion rate. The interaction graphs are shown inFigs. 18–20. As for as minimization of erosion rate is concerned,factors A, B, C and D have significant effect, whereas, factor E hasleast effect. It is observed from Fig. 18 that the interaction betweenA � B shows most significant effect on erosion rate. Similarly, inter-action between B � C also having significant effect on the outputperformance as shown in Fig. 19. But the factors A and C individu-ally have greater contribution on output performance, and theircombination of interaction with factor A and C is shown in
Table 4Experimental design using L27 orthogonal array.
L27
(313)Erodent size (A)(m)
Angle of impingement (B)(deg)
Velocity of impact (C)(m/s)
St(m
1 300 30 32 122 300 30 44 163 300 30 58 204 300 60 32 165 300 60 44 206 300 60 58 127 300 90 32 208 300 90 44 129 300 90 58 1610 500 30 32 1611 500 30 44 2012 500 30 58 1213 500 60 32 2014 500 60 44 1215 500 60 58 1616 500 90 32 1217 500 90 44 1618 500 90 58 2019 800 30 32 2020 800 30 44 1221 800 30 58 1622 800 60 32 1223 800 60 44 1624 800 60 58 2025 800 90 32 1626 800 90 44 2027 800 90 58 12
Fig. 20 have less effect on erosion rate and then can be neglectedfor further study.
3.4. Erosion efficiency
The hardness alone is unable to provide sufficient correlationwith erosion rate, largely because it determines only the volumedisplaced by each impact and not really the volume eroded. Thusa parameter which will reflect the efficiency with which the vol-ume that is displaced is removed should be combined with hard-ness to obtain a better correlation. The ‘erosion efficiency’ isobviously one such parameter. In case of a stream of particlesimpacting a surface normally (i.e. at a = 90�), the erosion efficiency(gnormal) defined by Sundararajan et al. [31] is given as
gnormal ¼2ErHvqV2 ð6Þ
and-off distance (D)m)
Fiber content (E)(wt%)
Erosion rate (Er) (mg/kg)
S/N ratio(dB)
0 5 198.62 �45.9610 10 194.27 �45.7680 15 192.76 �45.7000 10 219.78 �46.8400 15 213.89 �46.6040 5 210.32 �46.4580 15 255.67 �48.1540 5 247.89 �47.8850 10 244.33 �47.7600 15 214.69 �46.6360 5 209.83 �46.4370 10 207.17 �46.3270 5 272.56 �48.7090 10 264.81 �48.4590 15 260.28 �48.3090 10 262.69 �48.3890 15 256.92 �48.1960 5 251.89 �48.0240 10 234.43 �47.4000 15 229.56 �47.2180 5 227.12 �47.1250 15 258.47 �48.2480 5 252.73 �48.0530 10 250.08 �47.9620 5 286.79 �49.1510 10 279.92 �48.9410 15 275.86 �48.814
220
240
260
280
15 30 45 60 75 90Impingement angle (degree)
Ero
sion
rat
e (m
g/kg
)
Epoxy + 5 wt% fish scale
Epoxy +10 wt % fish scale
Epoxy+15 wt% fish scale
Fig. 16. Variation of erosion wear rate with impingement angle (erodent size800 lm, impact velocity 32 m/s, SOD 200 mm).
A
SN r
atio
s
800500300
-46.0
-46.5
-47.0
-47.5
-48.0
-48.5
-49.0
B
90
3060
Interaction Plot (data means) for SN ratios
Signal-to-noise: Smaller is better
Fig. 18. Interaction graph between A � B for erosion rate.
B
SN r
atio
s
906030
-46.5
-47.0
-47.5
-48.0
-48.5
C
58
3244
Interaction Plot (data means) for SN ratios
Signal-to-noise: Smaller is better
Fig. 19. Interaction graph between B � C for erosion rate.
A. Satapathy et al. / Materials and Design 30 (2009) 2359–2371 2367
But considering impact of erodent at any angle a to the surface,the actual erosion efficiency can be obtained by modifying Eq. (6)as
g ¼ 2ErHv
qV2 sin2 að7Þ
According to the theoretical erosion wear model proposed by Pat-naik et al. [32], the non-dimensional erosion wear rate of a compos-ite material is given by
Erth ¼qC � g � V
2 � sin2 a2Hv
ð8Þ
where a, angle of impingement (deg); V, impact velocity (m/s); Hv,hardness (N/m2); qc, density of composite (kg/m3); q, density oferodent (kg/m3); g, erosion efficiency; Er, actual erosion wear rate(kg/kg); and Erth, theoretical erosion wear rate (kg/kg).
The values of erosion efficiencies of composites under this studyare calculated using Eq. (8) and are given in Table 5 along withtheir hardness values and operating conditions. It clearly showsthat erosion efficiency is not exclusively a material property; butalso depends on other operational variables such as impingementangle and impact velocity. The erosion efficiencies of these com-posites under normal impact (gnormal) vary from 3% to 6%, 6–9%and 9–12% for impact velocities 58 m/s, 45 m/s and 32 m/s, respec-
Mea
n of
SN
rat
ios
800500300
-46.5
-47.0
-47.5
-48.0
-48.530
200160120
-46.5
-47.0
-47.5
-48.0
-48.55
A
D
Main Effects Plot (d
Signal-to-noise: Smaller is better
Fig. 17. Effect of control fa
tively. The value of g for a particular impact velocity under obliqueimpact can be obtained simply by multiplying a factor 1/sin2a with
9060 584432
1510
B C
E
ata means) for SN ratios
ctors on erosion rate.
A
SN r
atio
s
800500300
-46.5
-47.0
-47.5
-48.0
-48.5
C
58
3244
Interaction Plot (data means) for SN ratios
Signal-to-noise: Smaller is better
Fig. 20. Interaction graph between A � C for erosion rate.
2368 A. Satapathy et al. / Materials and Design 30 (2009) 2359–2371
gnormal. Similar observation on velocity dependence of erosion effi-ciency has previously been reported by few investigators [33].
The theoretical erosion wear rates (Erth) of all the three compos-ites are calculated using Eq. (9). These values are compared withthe actual erosion rate obtained from experiments (Er) conductedunder similar operating conditions. Table 6 presents a comparisonamong the theoretical and experimental results for the compositesfilled with various fillers. The errors in experimental results withrespect to the theoretical ones lie in the range 0–10%. The magni-tude of g can be used to characterize the nature and mechanism oferosion. For example, ideal micro-ploughing involving just the dis-placement of the material from the crater without any fracture(and hence no erosion) will results in g = 0. In contrast, if the mate-rial removal is by ideal micro-cutting, g = 1.0 or 100%. If erosion oc-curs by lip or platelet formation and their fracture by repeatedimpact, as is usually the case in ductile materials, the magnitudeof g will be very low, i.e. g 6 100%. In the case of brittle materials,
Table 5Erosion efficiency of fish scale-reinforced epoxy resin.
Expt. no. Impact velocity (V)(m/s)
Density of eroding material (q)(kg/m3)
1 32 11062 44 11123 58 11284 32 11125 44 11286 58 11067 32 11288 44 11069 58 111210 32 112811 44 110612 58 111213 32 110614 44 111215 58 112816 32 111217 44 112818 58 110619 32 111220 44 112821 58 110622 32 112823 44 110624 58 111225 32 110626 44 111227 58 1128
erosion occurs usually by spalling and removal of large chunks ofmaterials resulting from the interlinking of lateral or radial cracksand thus g can be expected to be even greater than 100% [34]. Theerosion efficiencies of the composites under the present study indi-cate that at low impact speed the erosion response is semi-ductile(g = 10–100%). On the other hand at relatively higher impact veloc-ity the composites exhibit ductile (g < 10%) erosion behavior [33].
For revalidation of the theoretical formulation for predictivepurpose another prediction model based on ANN is employedand the results both are compared. The neural network is con-structed taking the experimental database generated during theerosion trials on the composites. Seventy five percent of data isused for training whereas twenty five percent data is used for test-ing. The parameters of three layer architecture of ANN model areset as: input nodes = 5, output node = 1, hidden nodes = 12, learn-ing rate = 0.01, momentum parameter = 0.03, number ofepochs = 200,000 and a set of predicted output (ErANN) is obtained.Table 9 presents a comparison between the theoretical and theANN predicted results. The errors calculated with respect to thetheoretical results are also given. It is observed that maximum er-ror between theoretical and experimental wear rate is 0–10%,whereas, same between ANN prediction and theoretical wear rateis 0–14%. The error in case of ANN model can further be reduced ifnumber of test patterns is increased. However, present study dem-onstrates application of ANN for prediction of wear rate in a com-plex process like solid particle erosion of polymer composites.
3.5. ANOVA and the effects of factors
In order to understand a concrete visualization of impact of var-ious factors and their interactions, it is desirable to develop analy-sis of variance (ANOVA) table to find out the order of significantfactors as well as interactions. Table 7 shows the results of the AN-OVA with the erosion rate. This analysis was undertaken for a levelof confidence of significance of 5%. The last column of the tableindicates that the main effects are highly significant (all have verysmall p-values).
Hardness of eroding material(Hv) (MPa)
Erosion rate (Er)(mg/kg)
Erosionefficiency (g)
42.4 198.62 58.3391343 194.27 8.78286243.7 192.76 4.3541143 219.78 18.7855543.7 213.89 8.39505742.4 210.32 18.8044943.7 255.67 18.9722342.4 247.89 38.5115143 244.33 6.35706243.7 214.69 18.3846842.4 209.83 8.14965343 207.17 18.6836142.4 272.56 20.0142443 264.81 41.4972143.7 260.28 6.78467643 262.69 77.8275643.7 256.92 11.6368942.4 251.89 5.63030443 234.43 17.3637343.7 229.56 36.0403842.4 227.12 5.85844243.7 258.47 76.7200242.4 252.73 11.327543 250.08 5.6383642.4 286.79 24.3022743 279.92 10.9662643.7 275.86 24.92477

Table 7ANOVA table for erosion rate.
Source DF Seq SS Adj SS Adj MS F P
A 2 8.1643 8.1643 4.0822 14340.13 0.000B 2 16.1089 16.1089 8.0544 28294.14 0.000C 2 0.5167 0.5167 0.2583 907.47 0.000D 2 0.0017 0.0017 0.0008 2.95 0.163E 2 0.0003 0.0003 0.0002 0.55 0.615A*B 4 2.4093 2.4093 0.6023 2115.92 0.000A*C 4 0.0034 0.0034 0.0009 3.02 0.155B*C 4 0.0064 0.0064 0.0016 5.65 0.061Error 4 0.0011 0.0011 0.0003Total 26 27.2122
Table 8Results of the confirmation experiments for erosion rate.
Optimal control parameters
Prediction Experimental
Level A2B2C1D2 A3B2C1D2
S/N ratio for erosion rate (dB) �48.6942 �47.4865
Table 6Comparison of theoretical, experimental and ANN results.
Expt. no. Erth (mg/kg) Erexpt. (mg/kg) ErANN (mg/kg) Error (%) (Erth � Erexpt) Error (%) (Erth � ErANN)
1 190.42 198.62 175.006 4.30627 8.09452 205.45 194.27 197.314 5.44171 3.96013 210.49 192.76 202.022 8.42320 4.02264 214.18 219.78 186.955 2.61462 12.7115 229.46 213.89 209.568 6.78549 8.66876 196.59 210.32 170.958 6.98408 13.0387 268.48 255.67 235.371 4.77130 12.3328 246.52 247.89 214.753 0.55574 12.8869 236.34 244.33 223.311 3.38072 5.512510 225.61 214.69 211.197 4.84021 6.388211 206.87 209.83 191.618 1.43085 7.372712 215.43 207.17 192.842 3.83419 10.48513 282.16 272.56 276.126 3.40232 2.138514 258.24 264.81 252.372 2.54414 2.272215 246.37 260.28 245.151 5.64598 0.494716 253.68 262.69 250.271 3.55172 1.343817 248.47 256.92 214.948 3.40081 13.49118 239.49 251.89 216.722 5.17767 9.506719 227.11 234.43 196.856 3.22311 13.32120 228.26 229.56 219.113 0.56953 4.006921 246.19 227.12 222.671 7.74605 9.552922 244.68 258.47 212.286 5.63593 13.23923 276.82 252.73 242.737 8.70240 12.31224 242.64 250.08 219.705 3.06627 9.451925 296.46 286.79 267.422 3.26182 9.794726 269.48 279.92 233.348 3.87413 13.40827 267.91 275.86 240.130 2.96741 10.369
A. Satapathy et al. / Materials and Design 30 (2009) 2359–2371 2369
From Table 7, one can observe that the erodent size (p = 0.000),angle of impingement (p = 0.000), velocity of impact (p = 0.000)and stand-off distance (p = 0.163) have great influence on erosionrate. The interaction between erodent size � angle of impingement(p = 0.000) and angle of impingement � velocity of impact(p = 0.061) show significance of contribution on the erosion rateand the factor fiber content (p = 0. 615) and erodent size � velocityof impact (p = 0.615) present less significance of contribution onerosion rate.
3.6. Confirmation experiment
The confirmation experiment is the final test in the design ofexperiment process. The purpose of the confirmation experimentis to validate the conclusions drawn during the analysis phase.The confirmation experiment is performed by conducting a newset of factor settings A2B3D2E3 to predict the erosion rate. The esti-mated S/N ratio for erosion rate can be calculated with the help offollowing prediction equation:
g1 ¼ �T þ ð�A2 � �TÞ þ ð�B2 � �TÞ þ ½ð�A2�B2 � �TÞ � ð�A2 � �TÞ
� ð�B2 � �TÞ� þ ð�C1 � �TÞ þ ½ð�B2�C1 � �TÞ � ð�B2 � �TÞ
� ð�C1 � �TÞ� þ ð�D2 � �TÞ ð9Þ
�g1, predicted average; �T , overall experimental average mean; and�A2; �B2; �C1 and �D2, mean response for factors and interactions atdesignated levels.
By combining like terms, the equation reduces to
�g1 ¼ �A2�B2 þ �B2
�C1 � �B2 þ �D2 � �T ð10Þ
A new combination of factor levels A2, B2, C1 and D2 are used topredict deposition rate through prediction equation and it is foundto be �g1 ¼ �48:6942dB. For each performance measure, an exper-iment was conducted for a different factors combination and com-pared with the result obtained from the predictive equation asshown in Table 8. The resulting model seems to be capable of pre-dicting erosion rate to a reasonable accuracy. An error of 2.48% forthe S/N ratio of erosion rate is observed. However, the error can befurther reduced if the number of measurements is increased. Thisvalidates the development of the mathematical model for predict-ing the measures of performance based on knowledge of the inputparameters.
3.7. Factor settings for minimum erosion rate
In this study, an attempt is made to derive optimal settings ofthe control factors for minimization of erosion rate. The single-objective optimization requires quantitative determination of therelationship between erosion rates with combination of controlfactors. In order to express, erosion rate in terms of mathematicalmodel in the following form is suggested.

Table 9Optimum conditions for performance output.
Control factors and performance characteristics Optimum conditions
A: erodent size (lm) 308.8B: impingement angle (deg) 30.51C: impact velocity (m/s) 52.37E: stand-off distance (mm) 124.6Erosion rate (mg/kg) 196.64
2370 A. Satapathy et al. / Materials and Design 30 (2009) 2359–2371
Er ¼ K0 þ K1 � Aþ K2 � Bþ K3 � C þ K4 � Dþ K5 � A� B
þ K6 � B� C ð11Þ
Here, Er is the performance output terms and Ki (i = 0,1 , . . ., 6) arethe model constants. The constant are calculated using non-linearregression analysis with the help of SYSTAT 7.0 software and thefollowing relations are obtained.
Er ¼ 0:550þ 0:205� Aþ 0:316� B� 0:040� C þ 0:005� D� 0:023� A� B� 0:048� B� C
r2 ¼ 0:98 ð12Þ
The correctness of the calculated constants is confirmed as highcorrelation coefficients (r2) in the tune of 0.98 are obtained for Eq.(12) and therefore, the models are quite suitable to use for furtheranalysis. Here, the resultant objective function to be maximized isgiven as:
Maximize Z ¼ 1=f ð13Þ
� f normalized function for erosion rate
Subjected to constraints:
Amin 6 A 6 Amax ð14ÞBmin 6 B 6 Bmax ð15ÞCmin 6 C 6 Cmax ð16ÞDmin 6 D 6 Dmax ð17Þ
The min and max in Eqs. (14)–(17) shows the lowest and high-est control factors settings (control factors) used in this study (Ta-ble 1).
In genetic optimization, population size, probability of cross-over and mutation are set at 50%, 75%, and 5% respectively, forall the cases. Number of generation is varied till the output is con-verted. Table 9 shows the optimum conditions of the control fac-tors with optimum performance out put gives a bettercombination of set of input control factors.
4. Conclusions
Successful fabrication of epoxy matrix composites reinforcedwith flakes of fish (Labeo rohita) scale is possible by simple hand-lay-up technique. These composites possess very low amount ofporosity and improved micro-hardness. However, they exhibitslightly inferior tensile and flexural strengths than those of theneat polymer. This study opens up a new avenue for utilizationof a bio-waste like fish scale. These composites using fish scalehave adequate potential for applications in highly erosive environ-ments. They exhibit improved erosion wear performance as com-pared to neat epoxy resin. The erosion efficiency (g), in general,characterizes the wear mechanism of composites. All these partic-ulate filled composites exhibit semi-ductile erosion response(g = 10–60%) for low impact velocities and ductile erosion response
(g < 10%) for relatively high impact velocity. A study on the depen-dence of erosion wear on impingement angle also reveals theirsemi-ductile nature as the peak erosion rate is found to be occur-ring at 90� impingement angle for all the composites. Two predic-tive models; one based on ANN approach and the other on Taguchiapproach are proposed. It is demonstrated that these models wellreflect the effects of various factors on the erosion loss and theirpredictive results are consistent with theoretical observations.Therefore, the obtained results are satisfactory and can be usedto investigate erosion wear loss of any composites. Factors likeimpingement angle, erodent size and impact velocity, in this se-quence, are identified as the significant factors affecting the ero-sion rate. Optimal factor settings for minimum wear rate of anycomposite can be determined using an effective technique basedon genetic algorithm. The rationale behind the use of genetic algo-rithm lies in the fact that it has the capability to find the globaloptimal parameter settings, whereas, the traditional optimizationtechniques are normally stuck up at the local optimum values. Thisstudy leaves wide scope for future investigations. It can be ex-tended to newer composites using other reinforcing phases andthe resulting experimental findings can be similarly analyzed.These composites form a new class of bio-fibre reinforced compos-ites which may find potential applications as suitable materials forconveyor belt rollers, passenger seat frames (replacing wood/steel)in railway coaches/automobiles, pipes carrying pulverized coal inpower plants, pump and impeller blades, household furnitureand also as low cost housing materials.
References
[1] Pool KV, Dharan CKH, Finnie I. Erosion wear of composite materials. Wear1986;107:1–12.
[2] Kulkarni SM, Kishore K. Influence of matrix modification on the solid particleerosion of glass/epoxy composites. Polym Compos 2001;9:25–30.
[3] Aglan HA, Chenock Jr TA. Erosion damage features of polyimide thermosetcomposites. SAMPE Quart 1993:41–7.
[4] Barkoula NM, Karger-Kocsis J. Effect of fiber content and relative fiber-orientation on the solid particle erosion of GF/PP composite. Wear2002;252:80–7.
[5] Tewari US, Harsha AP, Hager AM, Friedrich K. Solid particle erosion ofunidirectional carbon fiber reinforced polyetheretherketone composites. Wear2002;252:992–1000.
[6] Häger A, Friedrich K, Dzenis YA, Paipetis SA. Study of erosion wear of advancedpolymer composites. In: Street K, Whistler BC, editors. Proceedings of theICCM-10. Cambridge: Canada Wood Head Publishing Ltd.; 1995. p. 155–62.
[7] Miyazaki N, Takeda T. Solid particle erosion of fiber reinforced plastic. JCompos Mater 1993;27:21–31.
[8] Tilly GP, Sage W. The interaction of particle and material behaviour in erosionprocess. Wear 1970;16:447–65.
[9] Beyerlein IJ, Zhu YT, Mahesh S. On the influence of fiber shape in boneshapedshort-fiber composites. Compos Sci Technol 2001;61:1341–57.
[10] Kari S, Berger H, Gabbert U. Numerical evaluation of effective materialproperties of randomly distributed short cylindrical fibre composites. ComputMater Sci 2007;39:198–204.
[11] Hine PJ, Davidson ND, Ward IM. Measuring the fiber orientation and modelingthe elastic properties of injection molded long-fiber reinforced nylon. ComposSci Technol 1995;53:125–31.
[12] Fu SY, Hu XY, Chee Y. The flexural modulus of misaligned short fiber reinforcedpolymers. Compos Sci Technol 1999;59:1533–42.
[13] Ananda Rao V, Satapathy A, Mishra SC. Polymer composites reinforced withshort fibers obtained from poultry feathers. In: International conference onfuture trends in composite materials and processing, Indian Institute ofTechnology, Kanpur; 2007. p. 530–4.
[14] Namanpreet K, Anish D. Species specificity as evidenced by scanning electronmicroscopy of fish scales. Curr Sci 2004;10:692–6.
[15] Ikoma T, Kobayashi H, Tanaka J, Walsh D, Mann S. Microstructure, mechanical,and bio-mimetic properties of fish scales from Pagrus major. J Struct Biol2003;142(3):327–33.
[16] Mahapatra SS, Patnaik A. Optimization of wire electrical discharge machining(WEDM) process parameters using Taguchi method. Int J Adv Manuf Technol2007;34:911–25.
[17] Mahapatra SS, Patnaik A, Khan MS. Development and analysis of wearresistance model for composites of aluminium reinforced with redmud. JSolid Waste Technol Manage 2006;32(1):28–35.
[18] Patnaik A, Biswas Sandhyarani, Mahapatra SS. An evolutionary approach forparameter optimization of submerged arc welding in hard facing process. Int JManuf Res 2007;2(4):462–83.
A. Satapathy et al. / Materials and Design 30 (2009) 2359–2371 2371
[19] Mahapatra SS, Patnaik A, Satapathy A. Taguchi method applied to parametricappraisal of erosion behaviour of GF-reinforced polyester composites. Wear2008;265:214–22.
[20] Patnaik A, Satapathy A, Mahapatra SS, Dash RR. A modeling approach forprediction of erosion behavior of glass fiber–polyester composites. J PolymRes. doi: 10.1007/s10965-007-9154-2.
[21] Patnaik A, Satapathy A, Mahapatra SS, Dash RR. A Taguchi approach forinvestigation of erosion of glass fiber–polyester composites. J Reinf PlastCompos. doi:10.1177/0731684407085728.
[22] Kai Cai, Juntao Xia, Longtu Li, Zhilun Gui. Analysis of the electrical properties ofPZT by a BP artificial neural network. Comput Mater Sci 2005;34:166–72.
[23] Dong Guo, Longtu Li, Cewen Nan, Juntao Xia, Zhilun Gui. Modeling and analysisof the electrical properties of PZT through neural networks. J Eur Ceram Soc2003;23(12):2177–81.
[24] Bhadeshia MKDH. ISIJ Int 1999;39(10):966–79.[25] Agarwal BD, Broutman LJ. Analysis and performance of fiber composites. 2nd
ed. New York: John Wiley and Sons, Inc.; 1990.[26] Glen SP. Taguchi methods: a hands on approach. New York: Addison-Wesley;
1993.
[27] Phadke MS. Quality engineering using robust design. Eaglewood Cliffs,NJ: Prentice Hall; 1989.
[28] Rajasekaran S, Vijayalakshmi Pai GA. Neural networks, fuzzy logic and geneticalgorithms – synthesis and applications. New Delhi: Prentice Hall of India Pvt.Ltd.; 2003.
[29] Rao V, Rao H. C++ neural networks and fuzzy systems. BPB Publications; 2000.[30] Holland JH. Adaptation in natural and artificial systems. Ann Arbor, MI: The
University of Michigan Press; 1975.[31] Sundararajan G, Roy M, Venkataraman B. Erosion efficiency-a new parameter
to characterize the dominant erosion micro-mechanism. Wear1990;140(2):369.
[32] Patnaik A, Satapathy A, Mahapatra SS, Dash RR. Tribo-performance of polyesterhybrid composites: damage assessment and parameter optimization usingTaguchi design. Mater Des. doi:10.1016/j.matdes.2008.04.057.
[33] Arjula S, Harsha AP. Study of erosion efficiency of polymers and polymercomposites. Polym Test 2006;25(2):188–96.
[34] Roy M, Vishwanathan B, Sundararajan G. The solid particle erosion of polymermatrix composites. Wear 1994;171(1–2):149–61.
Related Documents