CHAPTER I INTRODUCTION 1.1 ERGONOMICS Ergonomics is a science concerned with the ‘fit’ between people and their work. Its concerned with the fit between the user,equipment and the environments It puts people first, taking account of their capabilities and limitations. Ergonomics aims to make sure that tasks, equipment,information and the environment fit each worker. To assess the fit between a person and their work, you have to consider a range of factors, including: The job/task being done: The demands on the worker (activities, workload, work pacing, shiftwork and fatigue). The equipment used (its design in terms of size, shape, controls, displays, and how appropriate it is for the task). The information used (how it is presented, accessed, and changed). The physical environment (temperature, humidity, lighting, noise, vibration). The individual’s physical and psychological characteristics: Body size and shape. Fitness and strength. Posture. 1

Welcome message from author
This document is posted to help you gain knowledge. Please leave a comment to let me know what you think about it! Share it to your friends and learn new things together.
Transcript

CHAPTER I
INTRODUCTION
1.1 ERGONOMICS
Ergonomics is a science concerned with the ‘fit’ between
people and their work. Its concerned with the fit between the
user,equipment and the environments It puts people first,
taking account of their capabilities and limitations.
Ergonomics aims to make sure that tasks, equipment,information
and the environment fit each worker. To assess the fit between
a person and their work, you have to consider a range of
factors, including:
The job/task being done:
The demands on the worker (activities, workload, work
pacing, shiftwork and
fatigue).
The equipment used (its design in terms of size, shape,
controls, displays, and
how appropriate it is for the task).
The information used (how it is presented, accessed, and
changed).
The physical environment (temperature, humidity,
lighting, noise, vibration).
The individual’s physical and psychological characteristics:
Body size and shape.
Fitness and strength.
Posture.
1
The senses, especially vision, hearing and touch.
Mental abilities.
Personality.
Knowledge.
Training.
Experience.
The organisation and social environment:
Teamwork and team structure.
Supervision and leadership.
Supportive management.
Communications.
Resources
By assessing people’s abilities and limitations, their jobs,
equipment and working environment and the interaction between
them, it is possible to design safe, effective and productive
work systems. Ergonomics draws on many disciplines in its
study of humans and their environment including anthropometry,
biomechanics, mechanical engineering, industrial engineering,
industrial design, information design, kinesiology, physiology
and psychology
Ergonomics is also called ‘Human Factors Engineering’
Ergonomics looks at what kind of work you do , what tools
you use and your whole job environment. The aim is to find the
best fit between you and your job conditions. Examples of
ergonomic changes to your work may include
Adjusting the position of your mouse or computer keyboard
to prevent carpal tunnel syndrome.
2

Being sure that the height of your desk chair allows your
feet to rest flat on floor
Learning the right way to lift heavy objects to prevent
back injuries.
Using handle coating or special gloves to suppress
vibrations from power tools or dampen the vibrating tools
On the whole no matter what the job is , the goal is to make
sure that your safe, comfortable and less prone to work
related injuries.
1.1.2 WHAT IS INDUSTRIAL ERGONOMICS
Its the field of ergonomics focussed on the study of how
people use and interact with work equipment. Its used to
improve occupational efficiency and safety. Its related to
type of work tasks such as manufacture foundry, equipment
operators and so on.
There are infinite members of different work tasks to be
considered and to do industrial ergonomics a medical,
anatomical and engineering background is necessary to develop
and install a solution. In industrial ergonomics we are
dealing with someone’s injury or pain following by some
serious engineering thought and prototyping to develop a
solution.
3
Testing
Retestin
Final
Prototyping
Figure 1 : Industrial Ergonomics
The most prominent area of industrial ergonomics is the
creation of safer and more effective workplace equipment and
procedures. Often its called as physical ergonomics.
1.1.3 HOW CAN ERGONOMICS AND HUMAN FACTORS IMPROVE HEALTH AND
SAFETY ?
Applying ergonomics to the workplace can
Reduce the potential for accidents
Reduce the potential for injury and ill health
Improve performance and productivity
Taking account of ergonomics and human factors can reduce
the likelihood of an accident. Ergonomics can also reduce the
potential for ill health at work such as aches, pains and
damage to the wrists , shoulders and back , noise induced
hearing loss and work related asthma. Its also a known fact
that many well known accidents might have been prevented if
ergonomics and human factors had been considered in designing
people’s jobs and the systems they worked in.
What kind of problems can ergonomics and human factors solve ?
Ergonomics is typically known for solving physical problems.
But ergonomics also deals with psychological and social
aspects of the person and their work.Some of the typical
ergonomic problems found in the workplace can be summarized as
follows:
Design of tasks related problems
4
Manual handling of load related problems
Workstation layout related problems
Working day shifts related problems
These problems can lead to tiredness or exhaustion which can
increase the likelihood of accidents and ill health.
How can I check if there are ergonomic problems ?
Checking for ergonomic problems is part of normal risk
assessment process. This can be done by :
Talking to employees and seeking their views
Walking around your workplace to see if you can spot any
hazards
Reviewing any accidents or reports or ill health you have
had in the past
1.1.4 IMPORTANCE OF EMPLOYEE ERGONOMICS
Industries increasingly require higher production rates and
advances in technology to remain competitive and stay in
business. As a result jobs today can involve :
Frequent lifting . carrying and pushing or pulling loads
without help from other workers or devices
Working at a quicker pace of work such as faster assembly
line speeds and
Having tighter grip when using tools
Why is ergonomics so important today ?
Its because ergonomics have multi faceted , far reaching
effects on all phases of business. Even simple ergonomic
changes in workplace will have profound effects.
As such, may have as much of an impact on the social
revolution in manufacturing in this new century as did
5
mechanical manufacturing on the industrial revolution in the
past century.
As seen, the implementation of the effective ergonomics
in the workplace will produce returns of significant magnitude
of the company. By selecting ergonomically designed equipment
and making sure it is used correctly management will be
rewarded with lower disability costs, insurance premiums,
lower absenteeism , increased productivity , fewer rejects and
a greater quality of work life, etc. All important components
to improve profitability and the ability to compete more
effectively.
Although the initial cost of providing equipment
specifically designed with ergonomics in mind may be slightly
higher than purchasing “standard” equipment it is clear that
the tangible and intangible results associated to paying
attention to ergonomics in workplace , will provide benefits
that far outweighs the initial equipment purchase cost. The
equipment purchase costs in reality , are very small and
easily justified from an overall financial “return on
investment” viewpoint.
1.1.5 MEANING
Ergonomics is the study of designing equipments and
devices that fit the human body, its movements and its
cognitive abilities. Ergonomics is employed to fulfil the
three main goals of health, productivity and good employee
morale. Its relevant in design of such things such as safe
furniture and easy-to-use interfaces to machines and
equipment. Proper ergonomic design is necessary to prevent
6

repetitive strain injuries, which can develop over time and
can lead to long-term disability.
Ergonomics is sometimes defined as the science of fitting
the work to the user instead of forcing the user to fit the
work. However this is more a primary ergonomic principle
rather than a definition.
Also known as : Human Factors, Human engineering, Human
Factors Engineering
Examples :
Using proper posture and body mechanics , good placement
of computer equipment , comfortable handles and grips as well
as efficient layout of workplace appliances are all aspects of
ergonomics.
DEFINITION :
Ergonomics is defined as the science related to man and
his work, embodying the anatomic , physiologic, and
mechanical principles affecting the efficient use of
human energy.
The International Ergonomic Association has adopted this
technical definition : ergonomics (or human factors) is
the scientific discipline concerned with the
understanding of interactions among humans and other
elements of a system , and the profession that applies
theory , principles , data and methods to deign inorder
to optimize human well-being and overall system
performance.
7
Ergonomics defined as the scientific study of the
relationship between man and his working environment.
CONCEPT OF ERGONOMICS :
Ergonomics or human factors is the scientific discipline
concerned with the understanding of the interactions among
humans and other elements of a system, and the profession that
applies theoretical principles , data and methods to design in
order to optimize human well being and overall system
performance. Practitioners of ergonomics, ergonomists
contribute the planning, design and evaluation of tasks,
jobs, products, organisations, environments and systems in
order to make them compatible with the needs, abilities and
limitations of people.
Human factors and ergonomics is the discipline that
focuses on the nature of human artefact interactions, viewed
from the unified perspective of the science , engineering
design technology and management of human-compatible systems.
The ILO defined ergonomics as , ‘The application of human
biological sciences in conjunction with engineering sciences
to the worker and his working environment, so as to obtain
maximum satisfaction of the work which at the same time
enhances productivity.’ An analysis of the ILO definition ,
therefore provides a more meaningful basis to understand
ergonomics .An ergonomist inorder to make work more
effective , tries to integrate the work system (which broadly
includes the tasks, working conditions, and working place)
with the capabilities and requirements of work. In this
process therefore he/she tries to ensure job satisfaction for8

the workers, which among other things increases their
productivity.
In all schemes of human activity ergonomics can be applied ,
be it in offices, factories, shops or airlines.Some of the
areas where ergonomics has been successfully applied are as
follows :
Design of equipment power and hand tools
Design of displays and warning systems
Design of furniture, seats, rests and steps for operators
Design of tools, jigs and fixtures
Plant layout
Improvement in working conditions and environment
Computation of relaxation allowances for workers
Selection, training, placement of personnel
Motivation of workers
In short , ergonomics concepts include
Tool design
Workstation design
Material handling limits
Visual and auditory task design
TYPES OF ERGONOMICS :
Physical ergonomics :
Physical ergonomics is concerned with human anatomical ,
anthropometric, physiological and biomechanic characteristics
as they relate to physical activity . The relevant topics
include working postures , material handling, repetitive
movements, work related musculoskeletal disorders, workplace
9

layout, safety and health. Sources mainly used to collect are
injury and illness logs, medical records and job analysis
Cognitive ergonomics :
Cognitive ergonomics is concerned with mental processes ,
such as perception, memory, reasoning and motor response as
they affect interactions among humans and other elements of a
system. The relevant topics include mental workload, decision
making, skilled performance , human-computer interaction,
human reliability, work stress and training as these may
relate to human-system design.
Organizational ergonomics :
Organizational ergonomics is concerned with the
optimization of socio technical systems, including their
organizational structures , policies and processes. The
relevant topics include communication, crew resource
management, work design, design of working times , teamwork,
participatory design, community ergonomics , cooperative work,
new work paradigms, organizational culture, virtual
organizations, telework and quality management.
BENEFITS OF ERGONOMICS
Lower injury and accident rates
Improved reliability
Products that are easier to use
Systems and products that operate efficiently
Greater user comfort
Faster learning times10

Fewer errors
Easier maintenance
Improved aesthetics
A general increase in job satisfaction
Less absenteeism
Less labour turnover ( with less recruitment, training
time and down-time costs)
Improved competitiveness of products and services
Increase in productivity
PRINCIPLES OF ERGONOMICS
Principle 1 : Work in neutral postures
Principle 2 : Reduce excessive force
Principle 3 : Keep everything in easy reach
Principle 4 : Work at proper heights
Principle 5: Reduce excessive motions
Principle 6 : Minimise fatigue and static load
Principle 7 : Minimise pressure points
Principle 8 : Provide clearance
Principle 9 : Move , exercise and stretch
Principle 10 : Maintain a comfortable environment
THE VALUE OF ERGONOMICS
11
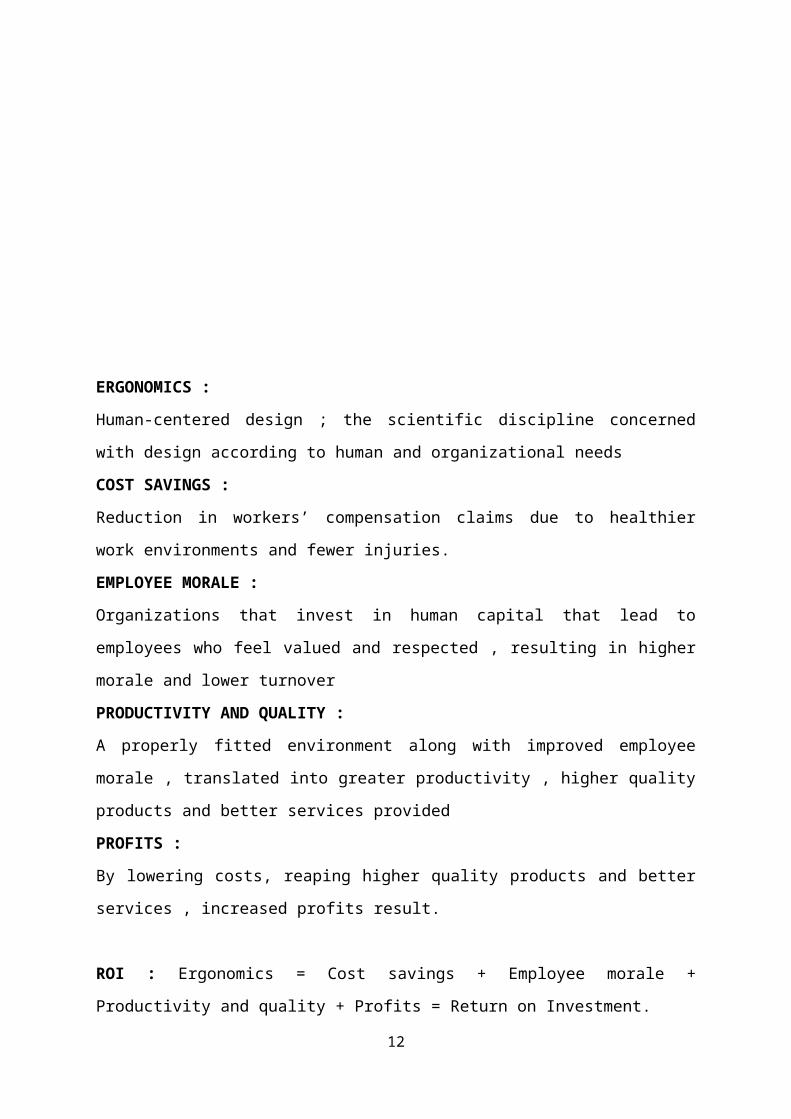
ERGONOMICS :
Human-centered design ; the scientific discipline concerned
with design according to human and organizational needs
COST SAVINGS :
Reduction in workers’ compensation claims due to healthier
work environments and fewer injuries.
EMPLOYEE MORALE :
Organizations that invest in human capital that lead to
employees who feel valued and respected , resulting in higher
morale and lower turnover
PRODUCTIVITY AND QUALITY :
A properly fitted environment along with improved employee
morale , translated into greater productivity , higher quality
products and better services provided
PROFITS :
By lowering costs, reaping higher quality products and better
services , increased profits result.
ROI : Ergonomics = Cost savings + Employee morale +
Productivity and quality + Profits = Return on Investment.
12
SCOPE OF ERGONOMICS :
The scope of ergonomics is extremely wide and is not
limited to any particular industry or application. Ergonomics
comes into everything which involves people. Work systems ,
sports and leisure, health and safety should all embody
ergonomics principles if well designed.
AIM OF ERGONOMICS :
The aim of ergonomics is to enhance and preserve human
health and satisfaction and to optimize the human performance
in a system perspective.
Ergonomics is concerned with both employees’ well-being and
organization well-being.
ERGONOMIC PROBLEMS :
Ergonomic problems can be caused both work associated and
non-work associated conditions can either individually or by
both interacting with each other.
There are many ways to determine which are the conditions
of workplace that can lead to ergonomic problems. The main
risk for ergonomic problems like Repetitive Strain Injury and
Carpal Tunnel Syndrome are the frequent repetitive motion
tasks , awkward posture, vibrations, forceful movements,
stress at workplace, poor workplace setup.
Symptoms of ergonomic problems :
1. Pain in wrists , forearms, elbows, neck or back followed
by discomfort
2. Aching or tingling
3. Dry, itchy or sore eyes
4. Loss of colour in affected regions
13
5. Blurred or double vision
6. Cramping
7. Numbness or a burning sensation
8. Reduced grip strength in the hand
9. Swelling or stiffness in the wrist joints
10. Reduced range of motion in the shoulder , neck or
back
11. Weakness
12. Tension stress headaches and related ailments
The main causes of these problems are :
1. Awkward posture
2. Frequent repetitive motion tasks
3. Stress at workplace
4. Vibrations
5. Forceful movements
6. Poor workplace setup
7. Sitting in same posture for continuous long hours
8. Lower back support is inadequate
TYPES OF ERGONOMIC PROBLEMS :
1. Musculoskeletal Disorders
2. Ergonomic Problem –Eye
3. Repetitive Strain Injury
4. Carpal Tunnel Syndrome
5. Other Ergonomic Problems
MUSCULOSKELETAL DISORDERS (MSD):
14
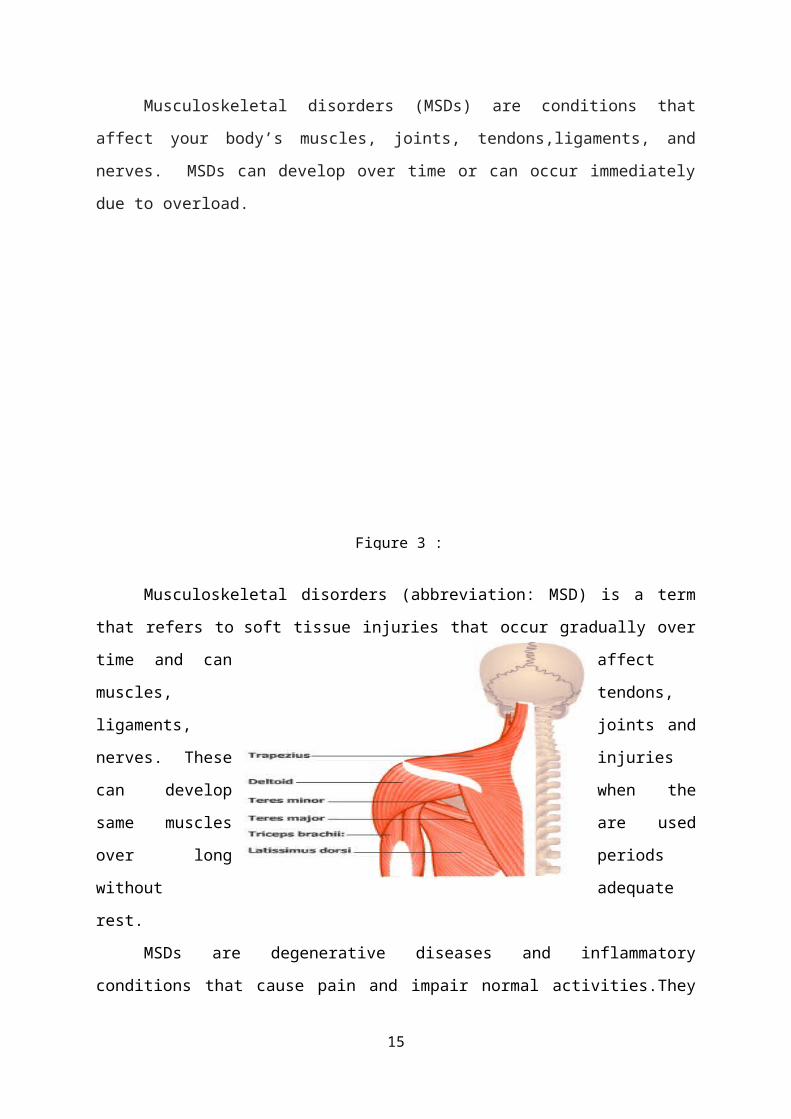
Musculoskeletal disorders (MSDs) are conditions that
affect your body’s muscles, joints, tendons,ligaments, and
nerves. MSDs can develop over time or can occur immediately
due to overload.
Musculoskeletal disorders (abbreviation: MSD) is a term
that refers to soft tissue injuries that occur gradually over
time and can affect
muscles, tendons,
ligaments, joints and
nerves. These injuries
can develop when the
same muscles are used
over long periods
without adequate
rest.
MSDs are degenerative diseases and inflammatory
conditions that cause pain and impair normal activities.They
15
Figure 3 :
can affect many different parts of the body including upper
and lower back, neck, shoulders and extremities (arms, legs,
feet, and hands).MSDs can arise from a sudden exertion (e.g.,
lifting a heavy object), or they can arise from making the
same motions repeatedly repetitive strain, or from repeated
exposure to force, vibration, or awkward posture. Examples of
specific MSD disorders are carpal tunnel
syndrome, epicondylitis, and tendinitis. Abrasions,
contusions, and fractures that occur from sudden physical
contact with objects that might occur in an accident are not
considered MSDs.
Remember, identifying problems at the early stage
significantly reduces the risk of developing a serious
musculoskeletal disorder.
MSD Signs and Symptoms Include:
1. Inflammation
2. Redness
3. Decreased range of motion.
4. Loss of function
5. Tingling
6. Numbness
7. Stiffness
8. Pain/tenderness
9. Muscle weakness
10. Fatigue
11. Decreased grip strength
16
Work-related musculoskeletal disorders (WMSDs) are associated
with these factors:
Work postures and movements.
Repetitiveness and pace of work.
Force of movements.
Vibration.
Temperature.
Lack of influence or control over one's job.
Increase pressure (e.g., to produce more).
Lack of or poor communication.
Monotonous tasks.
Perception of low support (e.g., manager or co-worker).
Certain workplace conditions, for example, the layout of
the workstation, the speed of work (especially in conveyor-
driven jobs), and the weight of the objects being handled
influence these factors. In other situations, the psychosocial
factors at the workplace may contribute to Work-related MSDs.
It is recommended that both physical and psychosocial factors
be addressed.
How are work postures and movements a risk for WMSDs?
Any body position can cause discomfort and fatigue if it
is maintained for long periods of time. Standing, for
example, is a natural body posture, and by itself poses no
particular health hazards. However, working for long periods
in a standing position can cause sore feet, general muscular
fatigue, and low back pain. In addition, improper layout of
17
work areas, and certain tasks can make workers use unnatural
standing positions.
Two aspects of body position can contribute to injuries.
The first relates to body position. When parts of the body are
near the extremes of their range of movements, stretching and
compression of tendons and nerves occur. The longer a fixed or
awkward body position is used, the more likely we are to
develop WMSDs. For example, working with the torso bent
forward (Figure 1), backward or twisted can place too much
stress on the low back. Other examples of stressful body
positions include reaching above shoulder level (Figure 2),
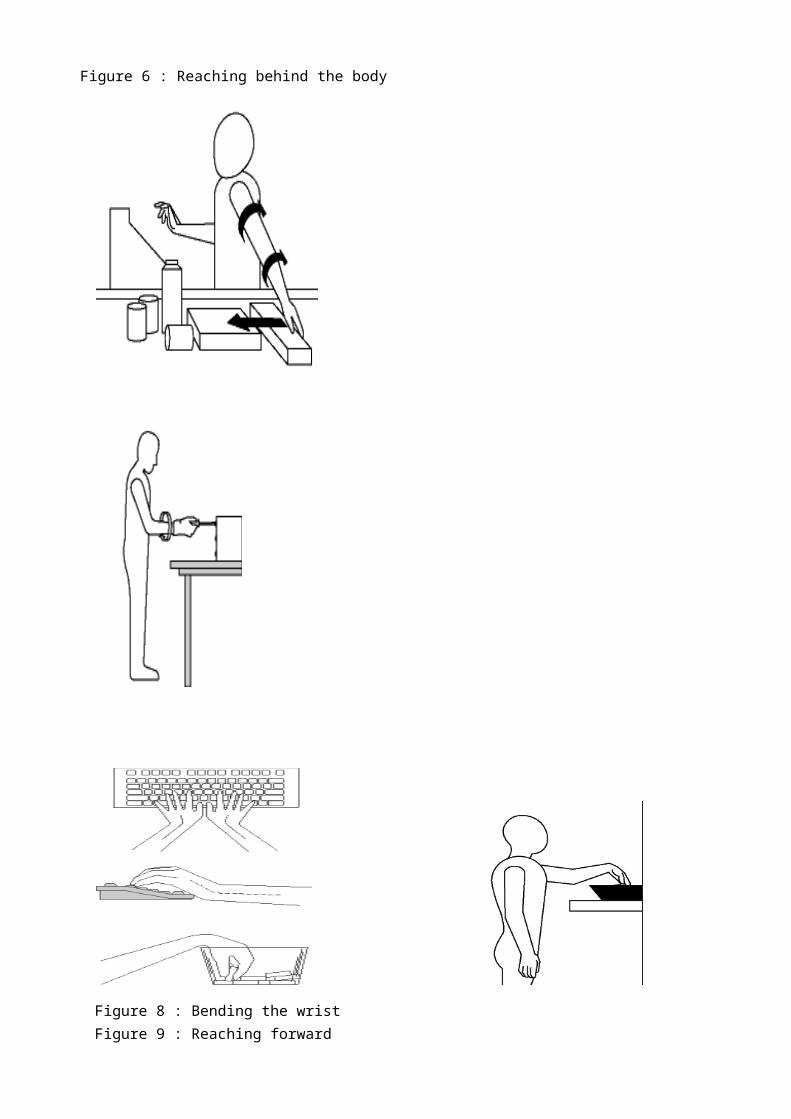
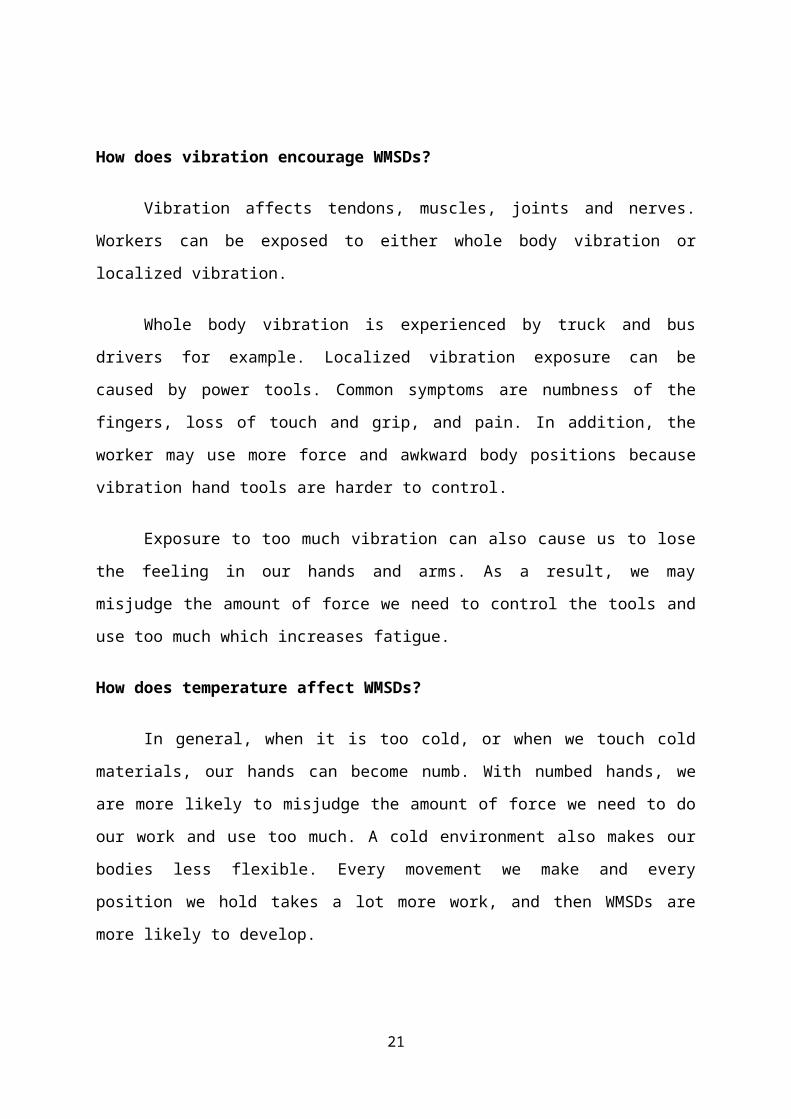
reaching behind the body (Figure 3), rotating the arms (Figure
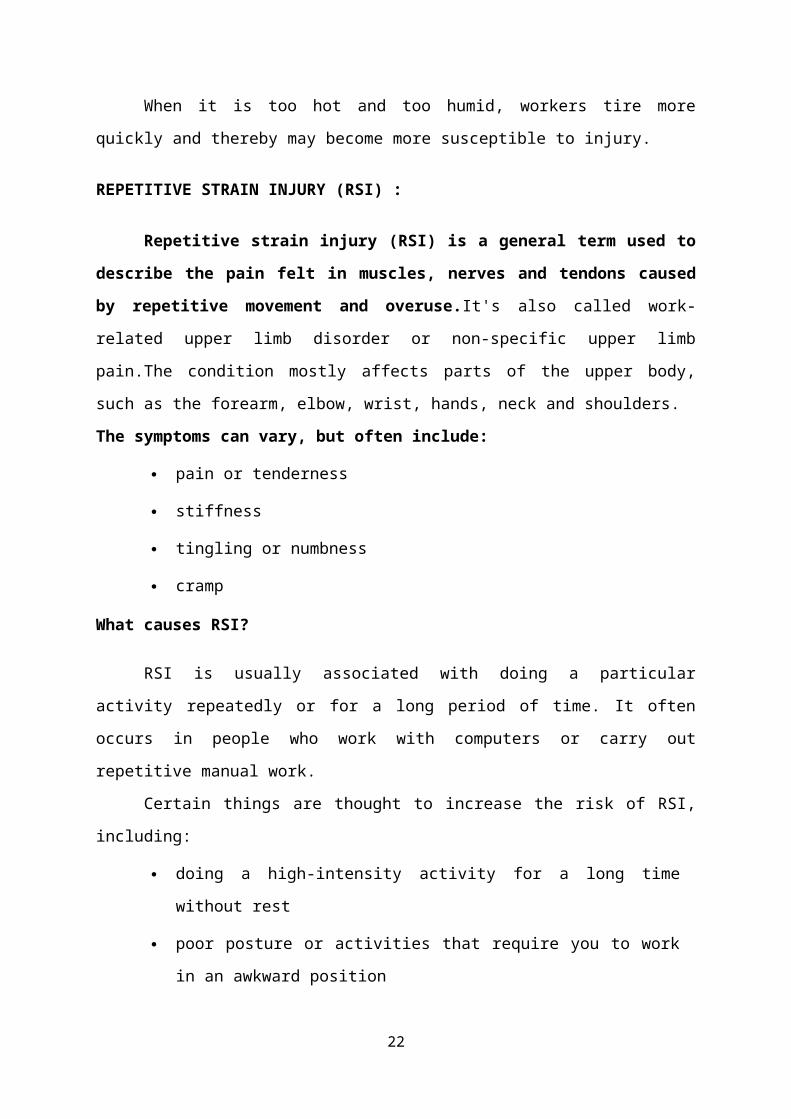
4), bending the wrist forward, backward, or side to side
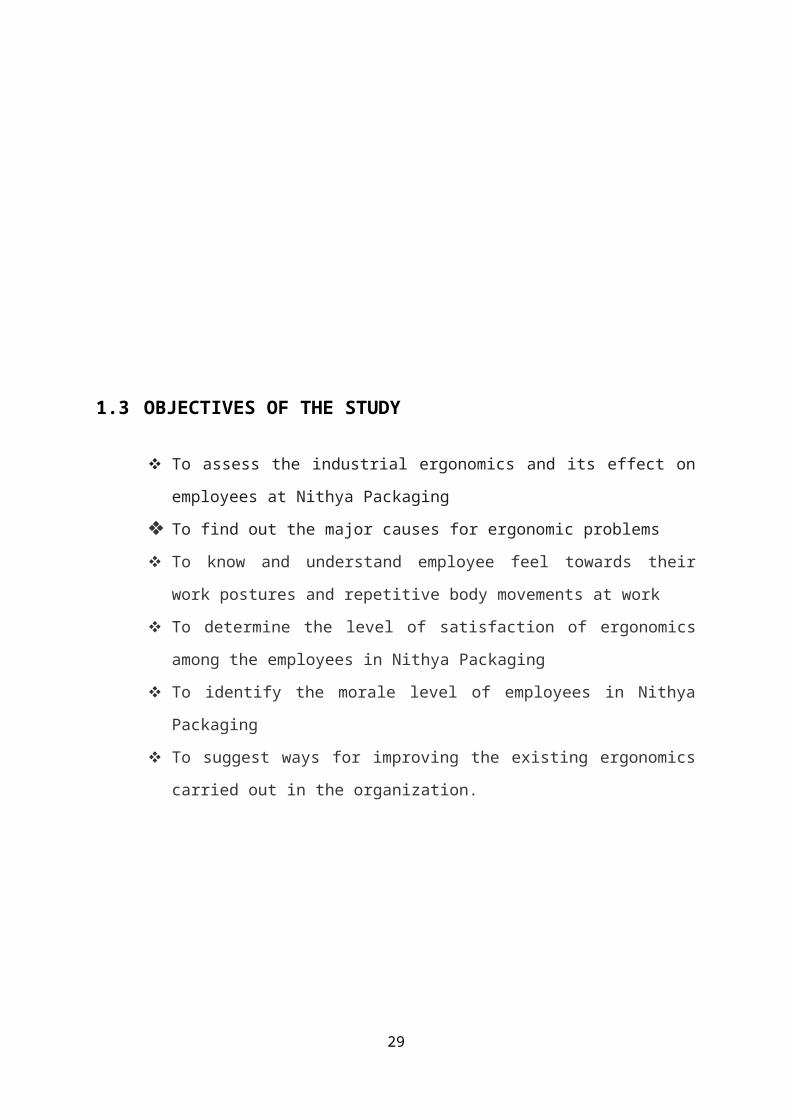
(Figure 5), and reaching forward too far out in front of the
body (Figure 6).
The second aspect that contributes to WMSDs is holding
the neck and the shoulders in a fixed position. To perform any
controlled movement with the arm, muscles in the shoulder and
the neck contract and stay contracted for as long as the task
requires.
The contracted muscles squeeze the blood vessels, which
restricts the flow of blood all the way down to the working
muscles of the hand.
However, this is where the blood is needed the most
because of the intense muscular effort. Two things happen as a
result. The neck/shoulder muscles become overtired even though
18

there is little or no movement. At the same time, the reduced
blood supply to the rest of the arm accelerates fatigue in the
muscles that are moving, making them more prone to injury.
19
Figure 4 : Bending forward Figure 5 : Reaching aboveshoulder level
20
Figure 6 : Reaching behind the body Figure 7 : Rotating the arms
Figure 8 : Bending the wrist Figure 9 : Reaching forward
How does vibration encourage WMSDs?
Vibration affects tendons, muscles, joints and nerves.
Workers can be exposed to either whole body vibration or
localized vibration.
Whole body vibration is experienced by truck and bus
drivers for example. Localized vibration exposure can be
caused by power tools. Common symptoms are numbness of the
fingers, loss of touch and grip, and pain. In addition, the
worker may use more force and awkward body positions because
vibration hand tools are harder to control.
Exposure to too much vibration can also cause us to lose
the feeling in our hands and arms. As a result, we may
misjudge the amount of force we need to control the tools and
use too much which increases fatigue.
How does temperature affect WMSDs?
In general, when it is too cold, or when we touch cold
materials, our hands can become numb. With numbed hands, we
are more likely to misjudge the amount of force we need to do
our work and use too much. A cold environment also makes our
bodies less flexible. Every movement we make and every
position we hold takes a lot more work, and then WMSDs are
more likely to develop.
21
When it is too hot and too humid, workers tire more
quickly and thereby may become more susceptible to injury.
REPETITIVE STRAIN INJURY (RSI) :
Repetitive strain injury (RSI) is a general term used to
describe the pain felt in muscles, nerves and tendons caused
by repetitive movement and overuse.It's also called work-
related upper limb disorder or non-specific upper limb
pain.The condition mostly affects parts of the upper body,
such as the forearm, elbow, wrist, hands, neck and shoulders.
The symptoms can vary, but often include:
pain or tenderness
stiffness
tingling or numbness
cramp
What causes RSI?
RSI is usually associated with doing a particular
activity repeatedly or for a long period of time. It often
occurs in people who work with computers or carry out
repetitive manual work.
Certain things are thought to increase the risk of RSI,
including:
doing a high-intensity activity for a long time
without rest
poor posture or activities that require you to work
in an awkward position
22

stress
cold temperatures
How RSI is treated
The first step in treating RSI is usually to identify and
modify the task or activity that is causing the symptoms. If
necessary, you may need to stop doing the activity altogether.
RSI can be divided into two types. Type I is when the
pain is the result of a specific medical condition, such
as carpal tunnel syndrome or tennis elbow. Type II is when no
specific cause can be found and is often referred to as non-
specific upper limb pain.
How to prevent RSI
Employers have a legal duty to prevent work-related RSI
and make sure that the symptoms of anyone who already has the
condition do not get worse.Most employers will carry out a
risk assessment when you join a company to check your work
area is suitable and comfortable for you.
There are also things you can do to help reduce your risk
of RSI, such as maintaining a good posture at work, taking
regular breaks from long or repetitive tasks, and trying
relaxation techniques if you are stressed.
CARPAL TUNNEL SYNDROME (CTS) :
Carpal tunnel syndrome is a hand and arm condition that
causes numbness, tingling and other symptoms. Carpal tunnel
syndrome is caused by a pinched nerve in your wrist.A number
of factors can contribute to carpal tunnel syndrome, including
23

the anatomy of your wrist, certain underlying health problems
and possibly patterns of hand use.
Bound by bones and ligaments, the carpal tunnel is a
narrow passageway located on the palm side of your wrist. This
tunnel protects a main nerve to your hand and the nine tendons
that bend your fingers. Compression of the nerve produces the
numbness, tingling and, eventually, hand weakness that
characterize carpal tunnel syndrome. Fortunately, for most
people who develop carpal tunnel syndrome, proper treatment
usually can relieve the tingling and numbness and restore
wrist and hand function.
Symptoms :
Carpal tunnel syndrome usually starts gradually with
numbness or tingling in your thumb, index and middle fingers
that comes and goes. This may be associated with discomfort in
your wrist and hand. Common carpal tunnel syndrome symptoms
include:
Tingling or numbness. You may experience tingling and
numbness in your fingers or hand, especially your thumb and
index, middle or ring fingers, but not your little finger.
This sensation often occurs while holding a steering wheel,
phone or newspaper or, commonly, waking you from sleeping.
The sensation may extend from your wrist up your arm.
Many people "shake out" their hands to try to relieve their
symptoms. As the disorder progresses, the numb feeling may
become constant.
24

Weakness. You may experience weakness in your hand and a
tendency to drop objects. This may be due to the numbness in
your hand or weakness of the thumb's pinching muscles, which
are controlled by the median nerve.
ORGANIZATIONAL ERGONOMICS
Organizational ergonomics is a branch, or domain,
of ergonomics that focuses mainly on the optimization of what
are known as "sociotechnical" systems, or systems that include
people and stuff. The concept of a sociotechnical system does
include a number of abstract components that need to be
considered for optimization including culture, habits, human
capability, human-machine interfaces, production streamlining,
reliability, et al. Organizational ergonomics looks at the
components that make up a sociotechnical system as well as the
organizational structure and all policies and processes that
govern the system.
The dominant public view of ergonomics focuses only upon
the physical domain, and most ergonomic products and services
fall into this field. Meanwhile, with the evolution of the
automated workplace , the domains of cognitive and
organizational ergonomics are gradually gaining importance.
Organizational ergonomics, which combines elements of both the
physical and cognitive domains, comprises the newest of these
fields.
Organizational ergonomics most often deals with the work
related subjects of: communication; teamwork; resource
management work design and elements of how people work
independently and together effectively; organizational25

culture; telecommuting and telework; matrix management; and
quality management.
THE FOCUS OF ORGANIZATIONAL ERGONOMICS
Also sometimes known as macro-ergonomics,
organizational ergonomics focuses on optimizing socio-
technical systems and organizing structures, policies and
processes in order to maximize efficiency. This domain
addresses more subjective aspects of the workplace:
Communication
Crew resources and management
Work schedule design
Teamwork
Participatory design
Cooperative work
New work paradigms
Quality management
Virtual organizations
Community ergonomics
AIM OF ORGANIZATIONAL ERGONOMICS
The goal of organizational ergonomics is the
attainment of a fully harmonized work system that
ensures employee job satisfaction and commitment. It also
includes the study of technology’s consequences on human
relationships, processes, and institutions. Typical
interventions are as follows:
26

Including workers in identifying and resolving ergonomic
issues. This is also known as participatory ergonomics
Improving total system processes, such as manufacturing value
streams and managerial processes
Successfully installing safety as an integral part of
the organizational culture.
APPLICATIONS OF ORGANIZATIONAL ERGONOMICS
The most widespread application for organizational
ergonomics is in the introduction and integration of new
technology into the workplace. As companies implement new
technologies, they must consider several factors of those
tools:
Functions
Capabilities
Capacities
User-friendliness
Integration
The organizational branch of ergonomics is often overlooked
in the workplace because it concentrates on intangible
factors. While it may be more difficult to quantify the
effects of organizationally ergonomic interventions, employers
will reap benefits. These include greater employee
satisfaction and higher productivity.
27

1.2 STATEMENT OF THE PROBLEM :
The key issue in industrial ergonomics is to analyse the
workplace ergonomics of the organization which maximizes the
productivity and at the same time serves to improve the
employee morale. This study aims at analyzing factors
influencing ergonomics in Nithya packaging Pvt .Ltd. and to
find out the level of satisfaction of ergonomics among the
employees in the organization.
28
1.3 OBJECTIVES OF THE STUDY
To assess the industrial ergonomics and its effect on
employees at Nithya Packaging
To find out the major causes for ergonomic problems
To know and understand employee feel towards their
work postures and repetitive body movements at work
To determine the level of satisfaction of ergonomics
among the employees in Nithya Packaging
To identify the morale level of employees in Nithya
Packaging
To suggest ways for improving the existing ergonomics
carried out in the organization.
29

1.4 RESEARCH HYPOTHESIS :
CORRELATION :HYPOTHESIS
Ho = There is no significant relationship between the
ergonomic effort and morale level of employees
H1= There is significant relationship between the
ergonomic effort and morale level of employees
T-TEST :HYPOTHESIS
30
Ho = There is no significant difference between the
gender and opinion of the existing ergonomic effort taken
by the company.
H1 = There is no significant difference between the
gender and opinion of the existing ergonomic effort taken
by the company.
ONE WAY ANNOVA:HYPOTHESIS
Ho = There is no significant difference between the
stressed postures and designation of employees.
H1 = There is significant difference between the
stressed postures and designation of employees.
TWO WAY ANNOVA:HYPOTHESIS
Ho = There is no significant difference between the
morale level and salary, designation of employees.
H1 = There is significant difference between the morale
level and salary, designation of employees.
1.5 SCOPE OF THE STUDY :
The overall objective of the project is to identify the
difficulties of the employees at workplace, to determine the
safety measures of the employees and to examine the efficiency
level of employee morale at Nithya Packaging. Scope of the
31

study is to improve their organization ergonomics and to
maximize the employee morale and thereby maximize productivity
with the help of this project
32

1.6 LIMITATIONS OF STUDY
The focus of the study was to evaluate the industrialworkplace ergonomics at Nithya Packaging Private Limited.
Some of the limitations were :-
The success of the study largely depends on the response
of the respondents.
The responses given by the selected respondents may be
subjected to bias.
Getting permission from the Human Resource Department
and meeting the employees was difficult.
Since the time duration is short , it was not enough to
conduct elaborate study.
Some of the employees were reluctant in giving their
whole-hearted opinion due to the fear on their
management.
Evaluation was conducted on the employees’ reaction only
through questionnaire. Other experimental tests of
evaluation were not followed.
33
1.7 MAIN STUDY – RESEARCH METHODOLOGY
INTRODUCTION :
Research methodology is a systematic way to solve a
problem. It is a science of studying how research is to be
carried out. Essentially, the procedures by which
researchers go about their work of describing, explaining
and predicting phenomena are called research methodology.
It is also de ned as the study of methods by whichfi
knowledge is gained. Its aim is to give the work plan of
research.
It is necessary for a researcher to design a methodology
for the problem chosen. One should note that even if the
method considered in two problems are same the methodology
may be different. It is important for the researcher to know
not only the research methods necessary for the research
under taken but also the methodology.34

MEANING OF RESEARCH :
It is an investigation of nding solutions to scienti cfi fi
and social problems through objective and systematic
analysis. It is a search for knowledge, that is, a
discovery of hidden truths. Here knowledge means
information about matters. The information might be
collected from di erent sources like experience, humanff
beings, books, journals, nature, etc. A research can lead
to new contributions to the existing knowledge. Only
through research is it possible to make progress in a eld.fi
Research is indeed civilization and determines the
economic, social and political development of a nation. The
results of scienti c research very often force a change infi
the philosophical view of problems which extend far beyond
the restricted domain of science itself.
Research is not con ned to science and technology only.fi
There are vast areas of research in other disciplines such
as languages, literature, history and sociology. Whatever
might be the subject, research has to be an active,
diligent and systematic process of inquiry in order to
discover, interpret or revise facts, events, behaviours and
theories. Applying the outcome of research for the
re nement of knowledge in other subjects, or in enhancingfi
the quality of human life also becomes a kind of research
and development.
RESEARCH DESIGN :
Plan your work and work your plan is the suggestion of
Napolean Hill. For a scienti c research one has to preparefi
35

a research design. It should indicate the various
approaches to be used in solving the research problem,
sources and information related to the problem and, time
frame and the cost budget. Essentially, the research design
creates the foundation of the entire research work. The
design will help perform the chosen task easily and in a
systematic way.
Once the research design is completed the actual work can
be initiated. The rst step in the actual work is to learnfi
the facts pertaining to the problem. Particularly,
theoretical methods, numerical techniques, experimental
techniques and other relevant data and tools necessary for
the present study have to be collected and learnt.
The research design undertaken for the study is
Descriptive one . A fact-finding investigation with adequate
interpretation. Its used when the researcher wants to
describe a specific behaviour. Its mostly qualitative in
nature.
DESCRIPTIVE RESEARCH :
Descriptive research involves three main
categories: observation, case studies, and surveys. Of these
I have chosen the survey method of descriptive research
because to gather information related to the interests,
preferences, and motivation of a target group of people
which would be relevant for my project The purpose of a
descriptive research is to examine a phenomenon that is
occurring at a specific place(s) and time. A descriptive
research is concerned with conditions, practices,36
structures, differences or relationships that exist,
opinions held, processes that are going on or trends that
are evident. Further the descriptive research can be further
considered as cross sectional and longitudinal study of
which I have chosen the cross sectional research for my
study
SAMPLING SIZE AND TECHNIQUE :
Selecting a particular group of target people from a wider
population is sampling.
Convenience sampling : technique was adopted . Here the
population data is selected based on the ease of access of
researcher. The population selected is readily
available.This type of sampling is suitable for pilot
study .Its also used for small scale quantitative research
to avoid time and money being wasted.
TYPE OF UNIVERSE : The first step in developing any sample
is clearly defining the set of objectives, technically
called universe, to be studies. Here the universe is the
employees of Nithya Packaging Private Limited.
Sampling Plan :
Due to enormity of cost and time involved in collecting
information from all the respondents, it becomes a
compulsion to schoose a sample of population. Sample plan
explains the sampling unit, sample size and sampling method.
Sampling Technique:
37

A sampling plan is a definite design for obtaining a sample
from the sampling frame. It refers to the techniques or the
procedure that the researcher would adopt in selecting some
sampling units from which inferences about the population is
drawn. Sampling design is determined before any data are
collected.
Sampling Method:
Sampling method followed by the investigator is Convenience
Sampling. In this method the researcher select those units
of the population in the sample, which appear convenient to
him or the management of the organization where he is
conducting research.
1.8 SAMPLE SIZE :It refers to the number of elements to be included in the
study. The total population is 175. In this study the sample
size was bounded to 80. A well-structured questionnaire was
framed in order to extract the required information from the
respondents. Questionnaire was collected through personal
interview.
1.9 GEOGRAPHICAL COVERAGE :
The study has been conducted at Nithya Packaging Pvt .Ltd.,
Thirukanchi village Villianur Commune, Puducherry. The study
has been undertaken for a period of 2 months.
1.10 FIELDWORK AND COLLECTION OF DATA :
38

The field work is done at Nithya Packaging Private
Limited , Puducherry.
Primary Data :
The data that is collected afresh for the first time and
thus happen to be original in character is called primary
data.The primary data was collected from the employees of
Nithya Packaging Private Limited, through a direct structured,
standard questionnaire. The questionnaire was distributed and
the respondents were asked to fill the questionnaire.
Data Collection Method :
Survey method is considered the best method for data
collection and the tool used for data collection is
Questionnaire. Private individuals , research workers, private
and public organizations and even government are adopting
it .In this method a questionnaire is collected through
personal interview. A questionnaire consists of a number of
questions which involves both specific and general questions
related to industrial ergonomics.
Questionnaire Construction :
In constructing questionnaire , care was taken to
investigate the difficulties the respondent may face while
answering them. It was prepared keeping in view the objective
of the study. During the constructing care was taken to avoid
questions, which may lead to misinterpretation. The question
thus constructed was a structured one so as to collect all the
relevant information. The questions were arranged in a logical
order/sensible sequence. The questions were collected by
39

ordering them into different sections to make it clear to the
respondents about what they are answering. The questionnaire
consists of a variety of questions presented to the employees
for their response. A combination of yes/no , multiple choice
questions and likert 5 point scale questions were used to
collect data.
1.11DATA ANALYSIS & STATISTICAL TOOLS :
In this study data analysis is mainly done using five
important statistical tools like Percentage Method, One way
anova method, Two way anova method, Correlation method and
Independent Samples T-test for testing the reliability and
40
accuracy of the collected data. Each and every analysis of
data is interpreted by drawing inference for clear and easy
understanding to the readers.
Percentage Method :
The earliest method used in analysis is percentage
method.
No. of respondents for each
response
Percentage =
------------------------------------------------------ *
100
Total Number of
respondents
Descriptive Statistics :
Minimum. The smallest value of a numeric variable.
Maximum. Mean and Sum. The mean, or arithmetic average,
is displayed by default.
Dispersion. Statistics that measure the spread or
variation in the data include the standard deviation,
variance, range, minimum, maximum, and standard error of
the mean.
Std. deviation. A measure of dispersion around the mean.
In a normal distribution, 68% of cases fall within one
standard deviation of the mean and 95% of cases fall
within two standard deviations. For example, if the mean
age is 45, with a standard deviation of 10, 95% of the
cases would be between 25 and 65 in a normal
distribution.41
Variance. A measure of dispersion around the mean, equal
to the sum of squared deviations from the mean divided by
one less than the number of cases. The variance is
measured in units that are the square of those of the
variable itself.
Range. The difference between the largest and smallest
values of a numeric variable, the maximum minus the
minimum.
Thelargestvalueofanumericvariable.
S.E. mean. A measure of how much the value of the mean
may vary from sample to sample taken from the same
distribution. It can be used to roughly compare the
observed mean to a hypothesized value (that is, you can
conclude the two values are different if the ratio of the
difference to the standard error is less than -2 or
greater than +2).
Correlation :
Correlation is a statistical technique that can show
whether and how strongly pairs of variables are related.
Allows an examination of the relationship between variables;
is there a relationship between these variables? Are they
positively or negatively related? A correlation coefficient of
0 means that there is no relationship between the variables, -
1 negative relationship, 1 positive relationship.
The most familiar measure of dependence between two
quantities is the Pearson product-moment correlation
coefficient, or "Pearson's correlation coefficient", commonly
called simply "the correlation coefficient". It is obtained by
42
dividing the covariance of the two variables by the product of
their standard deviations. Karl Pearson developed the
coefficient from a similar but slightly different idea
by Francis Galton.
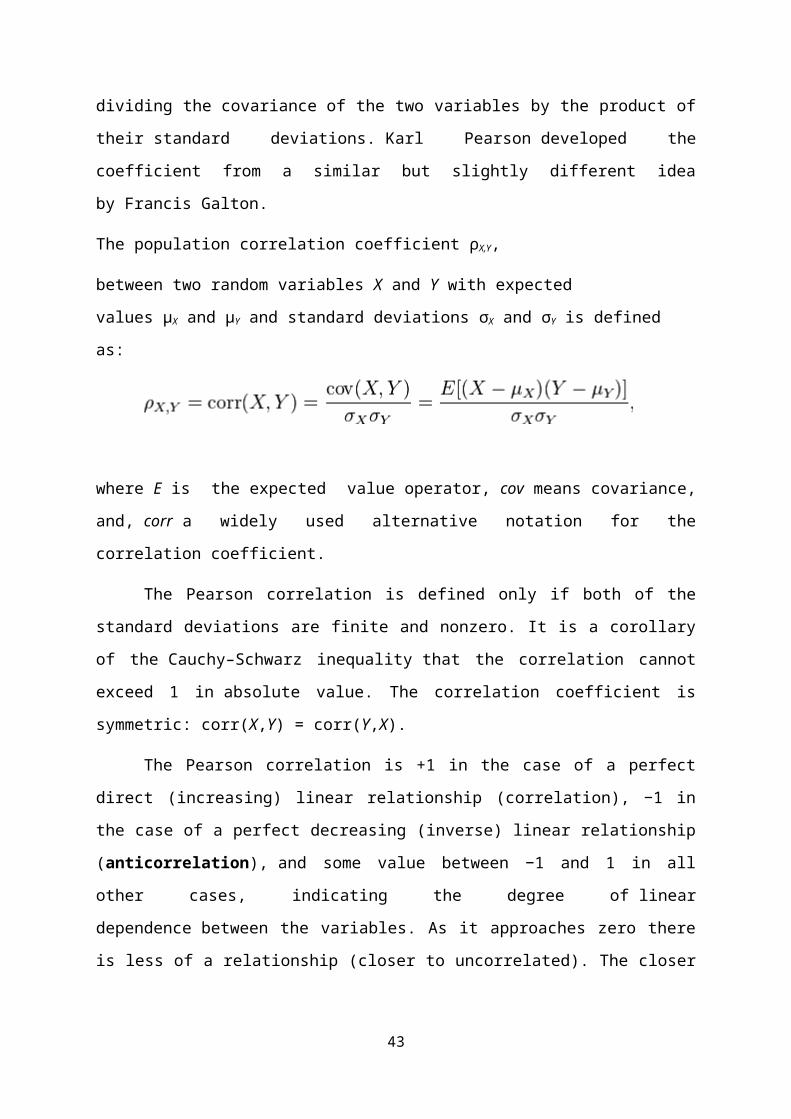
The population correlation coefficient ρX,Y,
between two random variables X and Y with expected
values μX and μY and standard deviations σX and σY is defined
as:
where E is the expected value operator, cov means covariance,
and, corr a widely used alternative notation for the
correlation coefficient.
The Pearson correlation is defined only if both of the
standard deviations are finite and nonzero. It is a corollary
of the Cauchy–Schwarz inequality that the correlation cannot
exceed 1 in absolute value. The correlation coefficient is
symmetric: corr(X,Y) = corr(Y,X).
The Pearson correlation is +1 in the case of a perfect
direct (increasing) linear relationship (correlation), −1 in
the case of a perfect decreasing (inverse) linear relationship
(anticorrelation), and some value between −1 and 1 in all
other cases, indicating the degree of linear
dependence between the variables. As it approaches zero there
is less of a relationship (closer to uncorrelated). The closer
43
the coefficient is to either −1 or 1, the stronger the
correlation between the variables.
If the variables are independent, Pearson's correlation
coefficient is 0, but the converse is not true because the
correlation coefficient detects only linear dependencies
between two variables. For example, suppose the random
variable X is symmetrically distributed about zero, and Y = X2.
Then Y is completely determined by X, so that X and Y are
perfectly dependent, but their correlation is zero; they
are uncorrelated. However, in the special case
when X and Y are jointly normal, uncorrelatedness is
equivalent to independence.
ANALYSIS OF VARIANCE(ANOVA) :
Analysis of variance (ANOVA) is a collection
of statistical models used to analyze the differences between
group means and their associated procedures (such as
"variation" among and between groups), developed by R.A.
Fisher. In the ANOVA setting, the observed variance in a
particular variable is partitioned into components
attributable to different sources of variation. In its
simplest form, ANOVA provides a statistical test of whether or
not the means of several groups are equal, and therefore
generalizes the t-test to more than two groups.
ANOVA is used in the analysis of comparative experiments,
those in which only the difference in outcomes is of interest.
The statistical significance of the experiment is determined
by a ratio of two variances. This ratio is independent of
44

several possible alterations to the experimental observations:
Adding a constant to all observations does not alter
significance. Multiplying all observations by a constant does
not alter significance. So ANOVA statistical significance
results are independent of constant bias and scaling errors as
well as the units used in expressing observations.
1. ONE WAY ANOVA
2. TWO WAY ANOVA
ONE WAY ANOVA :
It has been termed as one-way as there is only one
category whose effect has been studied and balanced as the
same number of men has been assigned on each exercise. Thus
the basic idea is to test whether the samples are all alike or
not.
TWO WAY ANOVA : In statistics, the two-way analysis of
variance (ANOVA) is an extension of the one-way ANOVA that
examines the influence of two different categorical
independent variables on one dependent variable. The two-way
ANOVA can not only determine the main effect of contributions
of each independent variable but also identifies if there is
a significant interaction effect between them.
T-TEST :
A t-test helps you compare whether two groups have
different average values , “independent samples t-test”, the
most common form of t-test. The t-test’s statistical
45
significance and the t-test’s effect size are the two primary
outputs of the t-test. Statistical significance indicates
whether the difference between sample averages is likely to
represent an actual difference between populations (as in the
example above), and the effect size indicates whether that
difference is large enough to be practically meaningful.
The “One Sample T-Test” is similar to the “Independent
Samples T-Test” except it is used to compare one group’s
average value to a single number .The independent-samples t-
test (or independent t-test, for short) compares the means
between two unrelated groups on the same continuous, dependent
variable
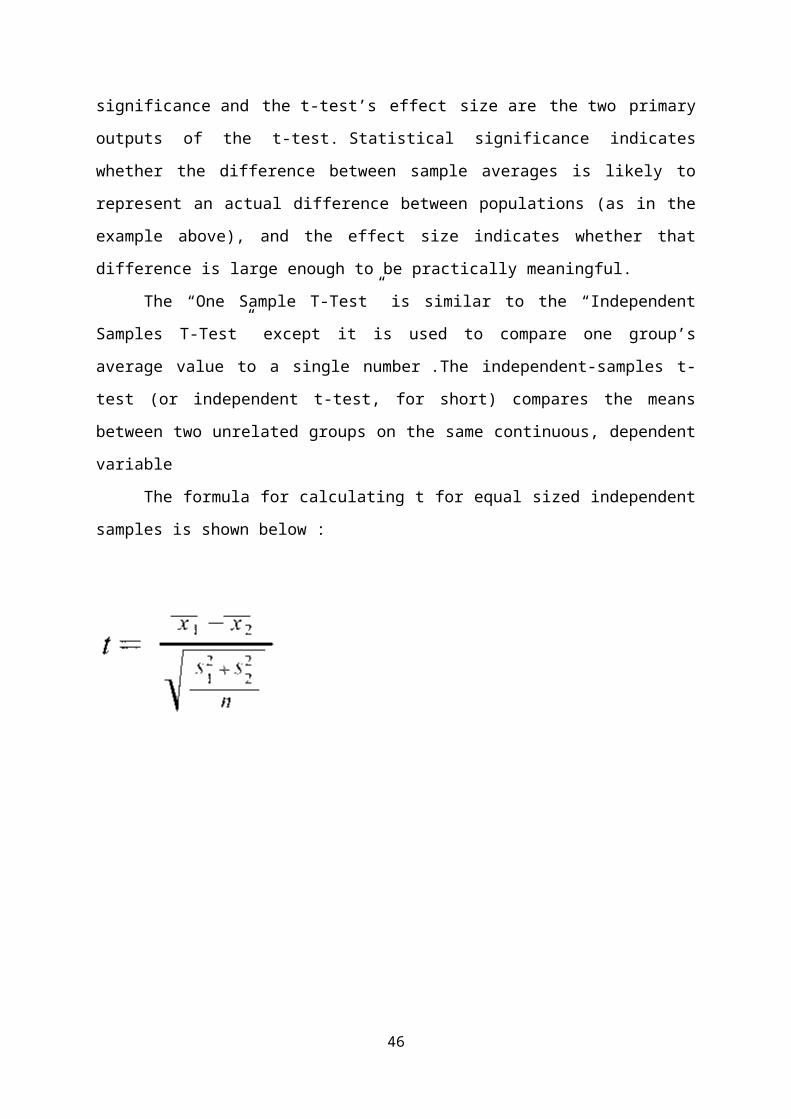
The formula for calculating t for equal sized independent
samples is shown below :
46
CHAPTER II
REVIEW OF LITERATURE
I. AUTHOR : D.Battini , Year : 2000
LINKING ERGONOMICS EVALUATION AND ASSEMBLY SYSTEM DESIGN
PROBLEM IN A NEW INTEGRATED PROCEDURE :
Several published case studies demonstrate that
ergonomics considerations might lead to change the
workstations layout and task time values. Traditional
procedures take into account only task time analysis and
precedence relations, while human postures evaluation is often
not integrated in these techniques. Up to now many industrial
fields require a systematic approach to allow assembly system
design including ergonomics guidelines. The aim of this paper
is to investigate how ergonomics and assembly system
configurations are intimately related in practice, and to
develop a conceptual framework for the assembly system design,
in conjunction with ergonomics optimization of the work place.
An industrial case to illustrate the procedure application is
presented and advanced simulation software is used, as final
step, to validate the procedure and support the theoretical
framework.
II. AUTHOR : Jorgan Eklund , Year : 2001
47

A DEVELOPMENT QUALITY APPROACH FOR ERGONOMICS :
The relationships between the two disciplines quality and
ergonomics have been given increasing attention during the
last years. The aim of this paper is to elaborate on the
opportunities of improving ergonomics applications on the
basis of a quality development approach. Participation in
quality development concepts such as Continuous Improvement
has a good record and potential to contribute to improved
ergonomics. TQM is a proponent for process orientation. A
process is in fact a series of human work activities. High
qualityproducts and efficiency can only be obtained if each
employee gets the opportunity to perform and deliver good
quality to the next process. Quality production and survival
of quality concepts necessitate considerations to the
employees in the organisation. The introduction of ISO 9000
seems to give mixed results, both regarding organizational
performance and quality of work. The main issue deciding
whether the effects of quality concepts on health, safety and
working conditions will be positive or not seems to be the way
the quality concepts are practised and implemented. A
regulatory view restricts personnel involvement and produces
few benefits, while a development oriented approach instead
contributes to a positive outcome
III. AUTHOR : Majorkumar Govindaraju, Technical Information
Management Services, Inc.,Ohio, Arunkumar Pennathur,
University Of Texas At El Paso,Texas Usa, Anil Mital
University Of Cincinnati ,Ohio, Usa., Year : 2002
48
QUALITY IMPROVEMENT IN MANUFACTURING THROUGH HUMAN
PERFORMANCE ENHANCEMENT
In the increasingly competitive global economy, survival of
an industry depends on catering to customer needs by quickly
producing quality products and providing quality service at an
affordable price. In production, or in service, ergonomic
considerations have manifested themselves in two distinct, yet
related, domains. Focuses on the humans who contribute to
product manufacture/service. It is frequently advocated that
since humans are unreliable and less consistent, compared to
machines, they are primarily responsible for lowering product
and service quality. Ergonomic considerations, which,
ironically, can improve human performance, are paid lip
service during manufacturing system design. Compounding the
problem is the current inability of most ergonomists to make
ergonomic recommendations that do not run counter to the
productivity and quality goals of system designers. Addresses
these two issues by illustrating, through four case studies,
the relationship between quality and variables that affect
human performance
IV. AUTHOR : W.P. Neumann , Year : 2002
INITIATING AN ERGONOMIC PROCESS
Establishing a new ergonomics process in a company
poses a special challenge to the ergonomics practitioner. The
aim of this paper is to identify barriers and assists to the
initiation of an ergonomics process and to raise awareness of
these issues for both practitioners and researchers trying to
49

initiate ergonomics intervention activities. We report on
results from focus group sessions held with industrial
personnel focussing on the initiation of ergonomics processes.
Two cases of ergonomics process initiation are then presented
and interpreted in light of these findings. Critical aspects
for start up may include the point of entry into the
organisation as well as both the base of support for
ergonomics and the chain of authority in the organisation.
Awareness of these factors will allow a growth strategy to be
applied so that credibility, support, and activity expand from
small but visible first ergonomics initiatives. Gaining
support of top and middle managers is a key first objective.
V. AUTHOR : Jan Kaczmerak, Munchira Akita USA, Year : 1991
ERGONOMIC DESIGN OF MAN-MACHINE SYSTEMS
From the review of International design activity which is
limited to Japan and the USA (Munehira Akita, 1991), Its clear
that design is of increasing importance as an integral part of
modern ergonomics, whether micro or macro The word design is
prevalent among human factors engineering texts and is widely
used when conslderlng almost every problem. For example, one
might cite the following
I) the design of visual dlsplays for ease and speed of
integration,
ii) the design of knobs, control handles and pedals to match
human
performance,
50

iii) the design of visual and auditory equipment and
communication system to
ensure accurate communication,
iv) the design of visual display terminals and human computer
interface
systems to fit the user's physiological and cognitive
functions,
v) the design of homes, public and commercial buildings,
cities and their
environment to secure satisfactory Iife, welfare and
prosperity,
vi) the design of transport systems for safe and convenient
movement, and,
vii) the design for human-machine system organisations for
simple and effective
management
Thus any product/machine/equipment, no matter what its,
whatever its function, must be evaluated In terms of
maximising the interaction between the
product/machine/equipment and user to make
product/machine/equipment appropriate for human use. Generally
speaking ergonomics seeks to design elements from simple tools
to the work environment itself, that are best matched in terms
of the capabillties and limitations of human performances. The
human activities involved in the operation will be analysed
51
and assessed by the designer through task analysis but he or
she will also draw on data obtained from experimentation with
a potentia1 user Product specification should be matched to
user equipment (Jan Kaczmarek, 1979). In Japan almost all
products including modern high-tech products such as cameras,
audio-visual equipment, automobiles, personal computers are
designed 5 5 ergonomically The Japan lndustrial Design
Promotion Organisation (JIDPO) awards "Good Design" for
products with G-Marks, considering all aspects of design
including ergonomics (Munchira Akita, 1991)
The products that ergonomists have helped in the design
and development cover an enormous range (A.Chapanis, 1995)
such as tooth brushes, hammers, chairs, dental equipment,
telephones, keyboards, copiers, computer work stations,
automobiles, tractors, aircraft, military weapons systems,
nuclear power plants, off shore or drilling platforms, arr
traffic control systems and space vehicles
52
CHAPTER III
CONCEPTUAL FRAMEWORK OF INDUSTRY
3.1 PROFILE OF THE INDIAN MANUFACTURING INDUSTRY :
Manufacturing is the production of merchandise for use or
sale using labor and machines, tools, chemical and biological
processing, or formulation. The term may refer to a range of
human activity, from handicraft to high tech, but is most
commonly applied to industrialproduction, in which raw
materials are transformed into finished goods on a large
scale. Such finished goods may be used for manufacturing
other, more complex products, such as aircraft, household
appliances or automobiles, or sold to wholesalers, who in turn
sell them to retailers, who then sell them to end users – the
"consumers". Manufacturing systems are concerned with the
conversion of physical inputs into physical outputs by using
workers, machines, and equipment.
Production systems are concerned with the modeling
and engineering management of converting inputs into outputs
using forecasting, inventory, production planning, and
scheduling. Operation systems are concerned with a broad view
of such conversions; they include strategic decisions such as
53
product design and development, quality policies, logistical
systems,facility location decisions, facility layout, human
resources , supply chain management, quality
control, reliability, and maintenance.
Operation systems are also concerned with efficiently
delivering quality products and services to customers in a
timely and cost-effective manner. Supply chain management
involves purchasing, storing, and distributing raw materials
and semifinished and finished products through a network of
suppliers, production facilities, and distributors.
Production, operation, and manufacturing systems are also
concerned with developing systems’ capabilities and utilizing
resources effectively to fulfill the needs of the customers.
Manufacturing takes turns under all types of economic
systems. In a free market economy, manufacturing is usually
directed toward the mass production of products for sale
toconsumers at a profit. In a collectivist economy,
manufacturing is more frequently directed by the state to
supply a centrally planned economy. In mixed market economies,
manufacturing occurs under some degree of
government regulation.
Modern manufacturing includes all intermediate processes
required for the production and integration of a product's
components. Some industries, such
as semiconductor andsteel manufacturers use the
term fabrication instead.
The manufacturing sector is closely connected
with engineering and industrial design.54

Industrial policy :
Economics of manufacturing :
According to some economists, manufacturing is a wealth-
producing sector of an economy, whereas a service sector tends
to be wealth-consuming. Emerging technologieshave provided
some new growth in advanced manufacturing employment
opportunities in the Manufacturing Belt in the United States.
Manufacturing provides important material support for
national infrastructure and for national defense.
On the other hand, most manufacturing may involve
significant social and environmental costs. The clean-up costs
of hazardous waste, for example, may outweigh the benefits of
a product that creates it. Hazardous materials may
expose workers to health risks. These costs are now well known
and there is effort to address them by improving efficiency,
reducing waste, using industrial symbiosis, and eliminating
harmful chemicals. The increased use of technologies such
as 3D printing also offer the potential to reduce the
environmental impact of producing finished goods
through distributed manufacturing.
The negative costs of manufacturing can also be addressed
legally. Developed countries regulate manufacturing activity
with labor laws and environmental laws. Across the globe,
manufacturers can be subject to regulations and pollution
taxes to offset the environmental costs of manufacturing
activities. Labor unions and craft guilds have played a
historic role in the negotiation of worker rights and wages.
55

Environment laws and labor protections that are available in
developed nations may not be available in the third
world. Tort lawand product liability impose additional costs
on manufacturing. These are significant dynamics in the on-
going process, occurring over the last few decades, of
manufacture-based industries relocating operations to
"developing-world" economies where the costs of production are
significantly lower than in "developed-world" economies.
Manufacturing and investment :
Surveys and analyses of trends and issues in manufacturing
and investment around the world focus on such things as:
the nature and sources of the considerable variations that
occur cross-nationally in levels of manufacturing and wider
industrial-economic growth;
competitiveness; and
attractiveness to foreign direct.
In addition to general overviews, researchers have examined
the features and factors affecting particular key aspects of
manufacturing development. They have compared production and
investment in a range of Western and non-Western countries and
presented case studies of growth and performance in important
individual industries and market-economic sectors.
56

3.2 PROFILE OF THE COMPANYNithya Packaging was started in the year 1996 and it has
been in the field for more than a decade. The main motive of
the company was to fulfill the customer’s satisfaction for
which we have implemented the FIVE PLY AUTOMATIC PLANT, FOUR
COLOR PRINTER SLOTTER AND AUTO FOLDER GLUER. The company is
renowned for its quality output. Every employee in our
organization made to understand, what total quality is and the
means to attain it.
Company Profile of M/s. Nithya Packaging Pvt Ltd., Pondicherry
57

Name of the Company : Nithya Packaging Private Ltd
Factory address : R.S. No. 258/1 & 2, IOC GasPlant Road,
Odiyampet Village, Villianur,
Pondicherry- 605 110
Phone: 0413-2667078 Fax: 2667079
Management : N. Gokulakrishnan - Managing Director
P. Thamodharan – Joint Managing Director R. Vijayaraman - Director
Person to be contacted : Mr. PARI - (GM) Mob: 9344289012
Manufacturing Activity : Printed Corrugated boxes and other Packing Matls
58
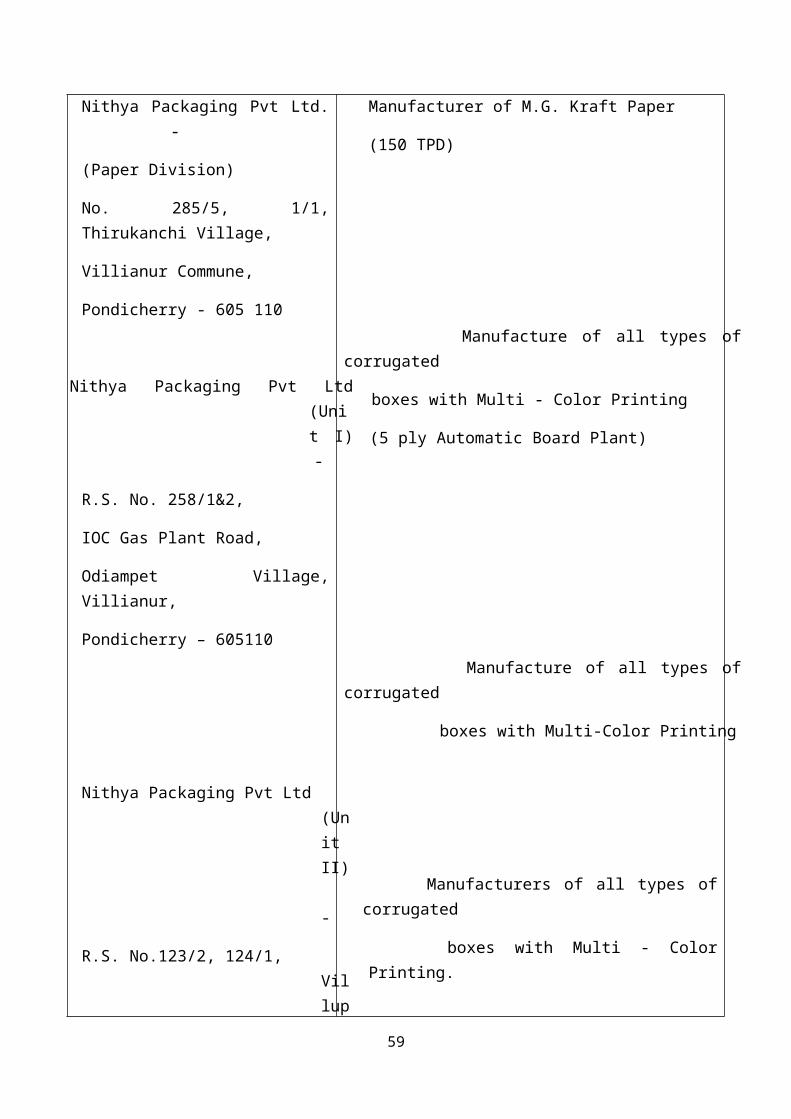
Nithya Packaging Pvt Ltd.-
(Paper Division)
No. 285/5, 1/1,Thirukanchi Village,
Villianur Commune,
Pondicherry - 605 110
Nithya Packaging Pvt Ltd(Unit I)-
R.S. No. 258/1&2,
IOC Gas Plant Road,
Odiampet Village,Villianur,
Pondicherry – 605110
Nithya Packaging Pvt Ltd (Unit II)
-
R.S. No.123/2, 124/1, Villup
Manufacturer of M.G. Kraft Paper
(150 TPD)
Manufacture of all types ofcorrugated
boxes with Multi - Color Printing
(5 ply Automatic Board Plant)
Manufacture of all types ofcorrugated
boxes with Multi-Color Printing
Manufacturers of all types ofcorrugated
boxes with Multi - ColorPrinting.
59

uram
Main Road, Thiruvandarkoil Village
Pondicherry – 605 102
Akshaya Packaging ,-
Sedarapet IndustrialEstate,
Sedarpet,
Pondicherry.
Ashwath Printers &Convertors, -
No. 258/1, IOC Road,
Odiyampet Village,Villiyanur,
Multi Color Offset Printing
QUALITY POLICY
We at Nithya Packaging Pvt. Ltd., committed to deliver
quality products to our customers, on time, every time.We
strive continually to improve the effectiveness of our quality
management system through meeting the customer requirements,
upgrading the skills of the employees through training.60
Group Concerns

QUALITY OBJECTIVES
Improving Customer satisfaction index.
Improving On-time Delivery performance.
Reducing In- house rejection.
Reduction in Customer complaints.
Improving Employees Skills.
Plant Production and Storage Area:
Total Production Area in Square feet - 26,000 Sq.ft
Total Area of Storage Capacity in Square feet - 40,000 Sq.ft
Machinery Details:
1. Steam Heating Five Layer High Speed corrugator Line.
Machine Speed 200 Mt/ min; 80 Tons per Day
(Approximately) 1 No
Work Speed 150 -170M / min; 60 Tons per day.
(Approximately)
2. Topra MD 1228 Four Color Printer Slotter Die Cutter with
Stacker.
Machinery Speed 200 Pcs / minute
1 No
Work Speed 170 Pcs/min
Maximum Printing Area 1200 x 2760 mm
3. Topra AD 924 Two Color Printer Slotter & Auto Stacker.
61
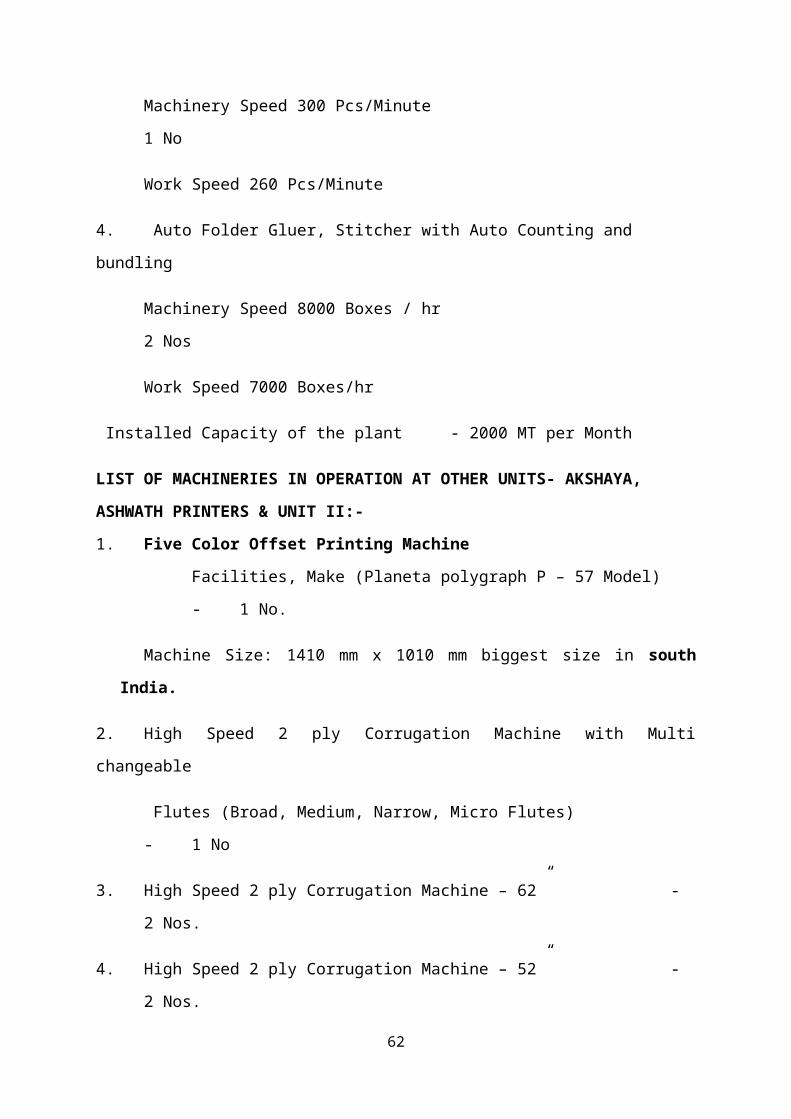
Machinery Speed 300 Pcs/Minute
1 No
Work Speed 260 Pcs/Minute
4. Auto Folder Gluer, Stitcher with Auto Counting and
bundling
Machinery Speed 8000 Boxes / hr
2 Nos
Work Speed 7000 Boxes/hr
Installed Capacity of the plant - 2000 MT per Month
LIST OF MACHINERIES IN OPERATION AT OTHER UNITS- AKSHAYA,
ASHWATH PRINTERS & UNIT II:-
1. Five Color Offset Printing Machine
Facilities, Make (Planeta polygraph P – 57 Model)
- 1 No.
Machine Size: 1410 mm x 1010 mm biggest size in south
India.
2. High Speed 2 ply Corrugation Machine with Multi
changeable
Flutes (Broad, Medium, Narrow, Micro Flutes)
- 1 No
3. High Speed 2 ply Corrugation Machine – 62” -
2 Nos.
4. High Speed 2 ply Corrugation Machine – 52” -
2 Nos.
62
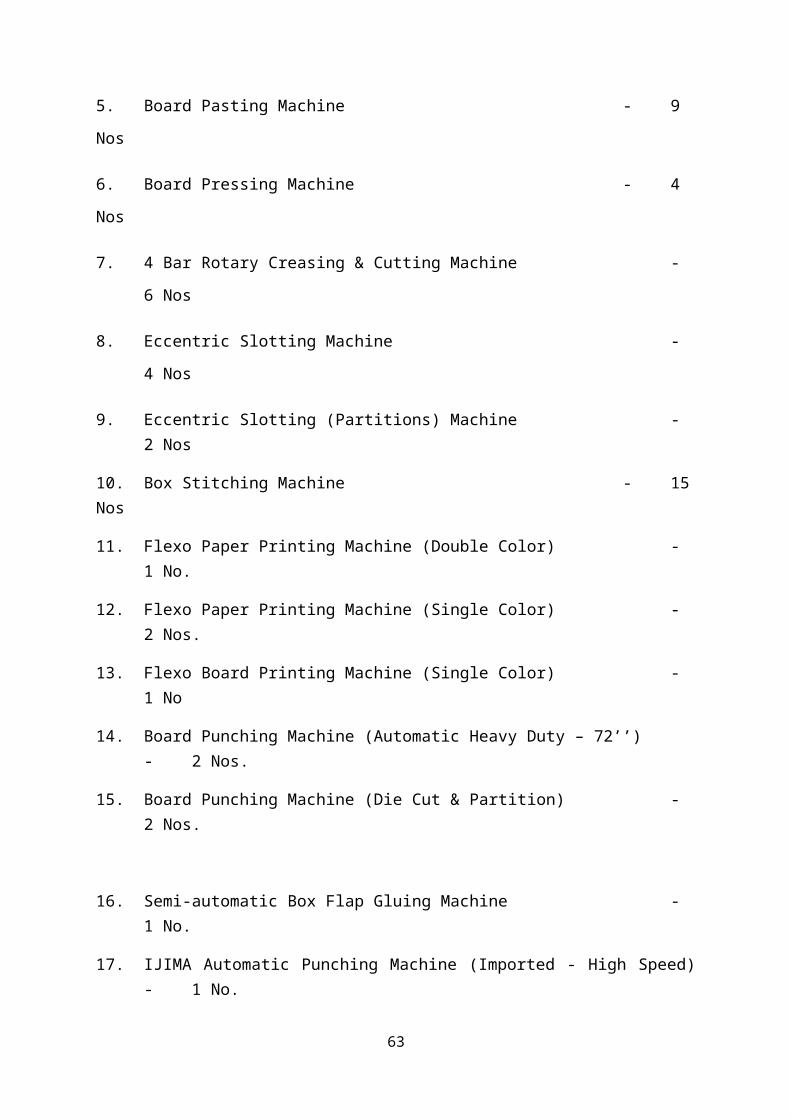
5. Board Pasting Machine - 9
Nos
6. Board Pressing Machine - 4
Nos
7. 4 Bar Rotary Creasing & Cutting Machine -
6 Nos
8. Eccentric Slotting Machine -
4 Nos
9. Eccentric Slotting (Partitions) Machine -2 Nos
10. Box Stitching Machine - 15Nos
11. Flexo Paper Printing Machine (Double Color) -1 No.
12. Flexo Paper Printing Machine (Single Color) -2 Nos.
13. Flexo Board Printing Machine (Single Color) -1 No
14. Board Punching Machine (Automatic Heavy Duty – 72’’)- 2 Nos.
15. Board Punching Machine (Die Cut & Partition) -2 Nos.
16. Semi-automatic Box Flap Gluing Machine -1 No.
17. IJIMA Automatic Punching Machine (Imported - High Speed)- 1 No.
63

18. Board Laminating Machine - 1No.
19. Board Varnishing Machine - 1No.
20. Automatic Folder Gluer (Mono Carton) -1 No.
QUALITY TESTING EQUIPMENTS:-
1. Bursting Strength Tester - 3
Nos.
2. GSM Manual Tester - 2
Nos.
3. GSM Tester (Electronic) - 2
Nos.
4. COBB Value Tester - 2
Nos.
5. Box Compression Tester - 2
Nos.
6. Moisture Tester - 2
Nos.
7. Crush Tester - 2
Nos.
8. Flute Caliper - 1
No.
Connected Power Load
64
(UNIT – I) – 500 KVA
ALTERNATE POWER SOURCE:-1. 500 KVA Diesel Genset - 1
No.
2. 165 KVA Diesel Genset - 1
No.
Bankers : Indian Bank, Main Branch, Pondicherry – 1
Details of Manpower:
Women - 22
Men - 75
Raw Material Handling Vehicle:
Forklift (3 Ton capacity) - 4 Nos.
Details of Own Transport:
1. Eicher 11.10 : 11
Trucks(Closed containers)
2. Eicher 10.90 : 10 Trucks (open
type)
3. Eicher 10.90 : 1Truck(Closed
Container)
4. AL Comet Lorry : 2 Nos.
5. AL Tarus Lorry : 1 Nos.
6. TATA Ace (Mini truck) : 2 Trucks
Other details :
65

Sales Tax : L.T (VAT) 3 % & Inter State (CST) 2%
against “C form”
Duty Applicable : Central Excise (Basic+Cess) 6%+2%
+1%
Industry Category : SSI- Registered
No of Shifts operated : General, if necessary two
shifts on demand
Built up Factory Area : (UNIT – II) - 40000 Sq Ft
(AKSHAYA- (UNIT – III)) - 10000 Sq Ft
Manufacturing Area : (UNIT – II) - 25000 Sq Ft
(AKSHAYA- (UNIT – III)) - 6000 Sq Ft
Storage Area : (UNIT – II) - 15000 Sq Ft
(AKSHAYA- (UNIT – III)) - 4000 Sq Ft
List of Major Customers:-
1. Hindustan Uni-Lever Limited
2. Clarion groups
3. Godrej Consumers Products Pvt ltd,
4. Marico Industries Limited – Pondy
5. Marico Industries Limited – Kanjikode
6. HCL Infosystems Limited.,Pondy
7. HNGIL- Pondicherry & Naidupet
8. Lenevo India Pvt ltd
9. The Supreme Industries
10. Jyothy Laboratories Limited
66

11. AGI Glass Factory, Hyderabad.
12. SNJ Distillers Pvt Limited, Chennai
13. SNJ Breweries Limited , Chennai
14. Livia Polymers,Tirchy.
15. Kals Breweries, Trichy.
16. ITC, Pondicherry
17. Nilkamal Plastics, Pondicherry
18. SKM Egg Exports, Erode
19. Natural Capsules Pvt ltd.,Pondicherry.
20. Swasthik Group of Companies, Pondicherry.
Competitive Advantage
1. In South India, Nithya Packaging is the only Industry in
packaging having the biggest size Five Colors Offset
Printer and Paper Mill within the same campus.
2. They have imported Four color Printer Slotter with die
punching, having printing capacity of 18000 boards/hr
3. They have Five Ply Automatic Board making Plant with
high speed with the Installed capacity of 2000 MT /
Month.
4. On-time delivery will be effected with the use of our
own transport facility- 30 goods vehicle.
5. Theirs is the only Packaging Division in and around
Pondicherry have Industries in three different
Industrial Estates.
6. They have the Imported Automatic Folder Gluer & Stitcher
with counting and strapping unit. Can do stitching 6000
Boxes/ hour & Gluing 8000 Boxes/hour.
67

ORGANIZATION CHART
68
Figure 10 : Organization Chart

PRODUCTS AND SERVICES :
We are leading Manufacturer for the Products which also
includes Full Telescoping Style & One Piece Folders since 2010
Full Telescoping Style
Print my box offers custom telescoping boxes, custom
telescoping boxes, cheap telescoping boxes, corrugated
telescoping boxes up to full color printing on quality
materials at a very reasonable price. In accordance with your
specifications, thoughts, ideas and contents, we will produce
custom made telescoping boxes.Full color printed software
boxes with yourartwork/ graphics.
Typical applications:
Custom software boxes in all shapes and sizes,Matte or
high gloss UV finish,Made from card or corrugated stock,NO die
charges or set-up fees, free shipping, fast delivery.
69
Figure 11
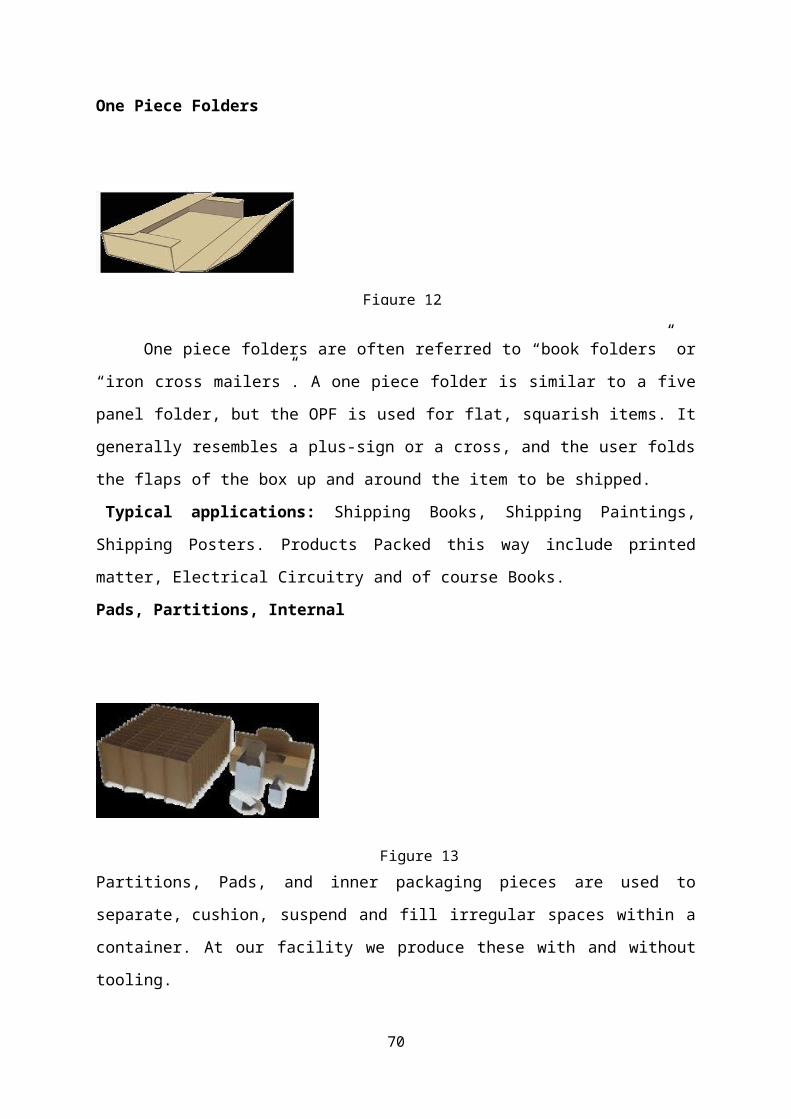
One Piece Folders
One piece folders are often referred to “book folders” or
“iron cross mailers”. A one piece folder is similar to a five
panel folder, but the OPF is used for flat, squarish items. It
generally resembles a plus-sign or a cross, and the user folds
the flaps of the box up and around the item to be shipped.
Typical applications: Shipping Books, Shipping Paintings,
Shipping Posters. Products Packed this way include printed
matter, Electrical Circuitry and of course Books.
Pads, Partitions, Internal
Partitions, Pads, and inner packaging pieces are used to
separate, cushion, suspend and fill irregular spaces within a
container. At our facility we produce these with and without
tooling.
70
Figure 12
Figure 13
Typical applications:
Layer pads, Dividers, Slip Sheets, Poster Backings, Void Fill,
Structural Support, “Clamshell” Shipping Folders.
CHAPTER IV
DATA ANALYSIS AND INTERPRETATION
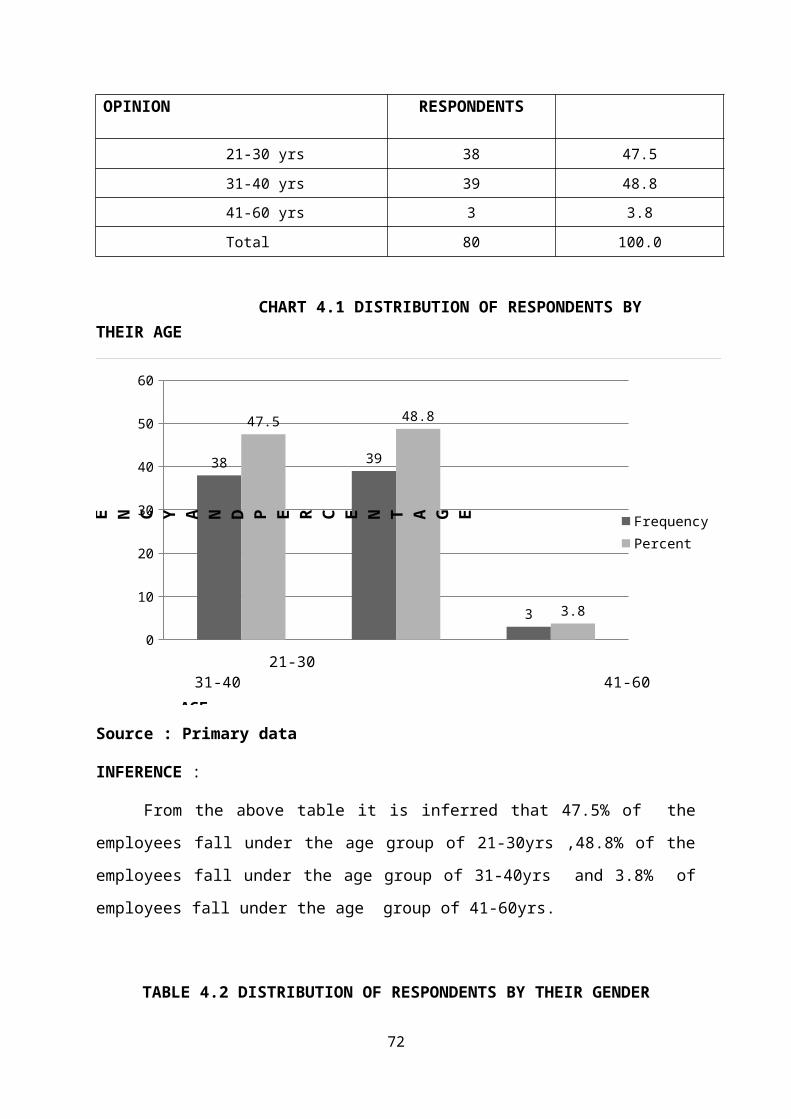
TABLE 4.1 DISTRIBUTION OF RESPONDENTS BY THEIR AGE
NO OF
PERCENTAGE
71
OPINION RESPONDENTS
21-30 yrs 38 47.531-40 yrs 39 48.841-60 yrs 3 3.8Total 80 100.0
CHART 4.1 DISTRIBUTION OF RESPONDENTS BY THEIR AGE
0
10
20
30
40
50
60
38 39
3
47.5 48.8
3.8
FrequencyPercent
21-30 31-40 41-60
AGE
F R E Q U E N C Y A N D P E R C E N T A G E
Source : Primary data
INFERENCE :
From the above table it is inferred that 47.5% of the
employees fall under the age group of 21-30yrs ,48.8% of the
employees fall under the age group of 31-40yrs and 3.8% of
employees fall under the age group of 41-60yrs.
TABLE 4.2 DISTRIBUTION OF RESPONDENTS BY THEIR GENDER
72
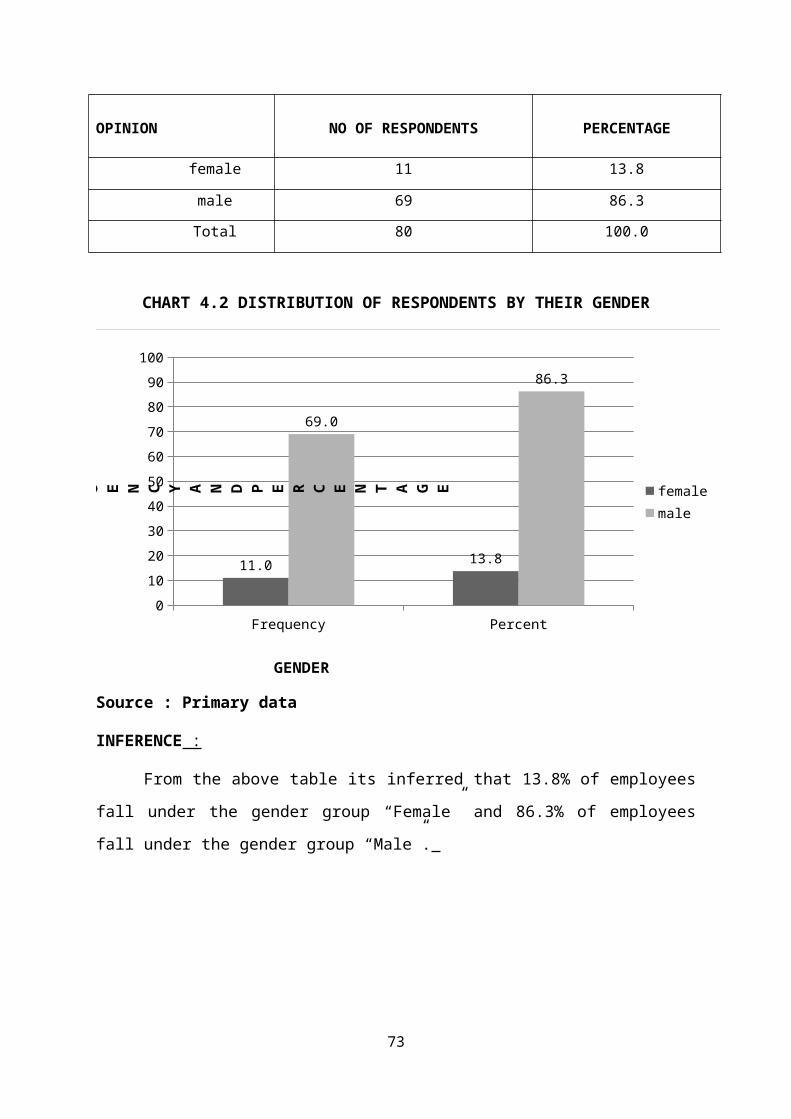
OPINION NO OF RESPONDENTS PERCENTAGE
female 11 13.8
male 69 86.3
Total 80 100.0
CHART 4.2 DISTRIBUTION OF RESPONDENTS BY THEIR GENDER
Frequency Percent0102030405060708090
100
11.0 13.8
69.0
86.3
femalemale
GENDER
F R E Q U E N C Y A N D P E R C E N T A G E
Source : Primary data
INFERENCE :
From the above table its inferred that 13.8% of employees
fall under the gender group “Female” and 86.3% of employees
fall under the gender group “Male”.
73
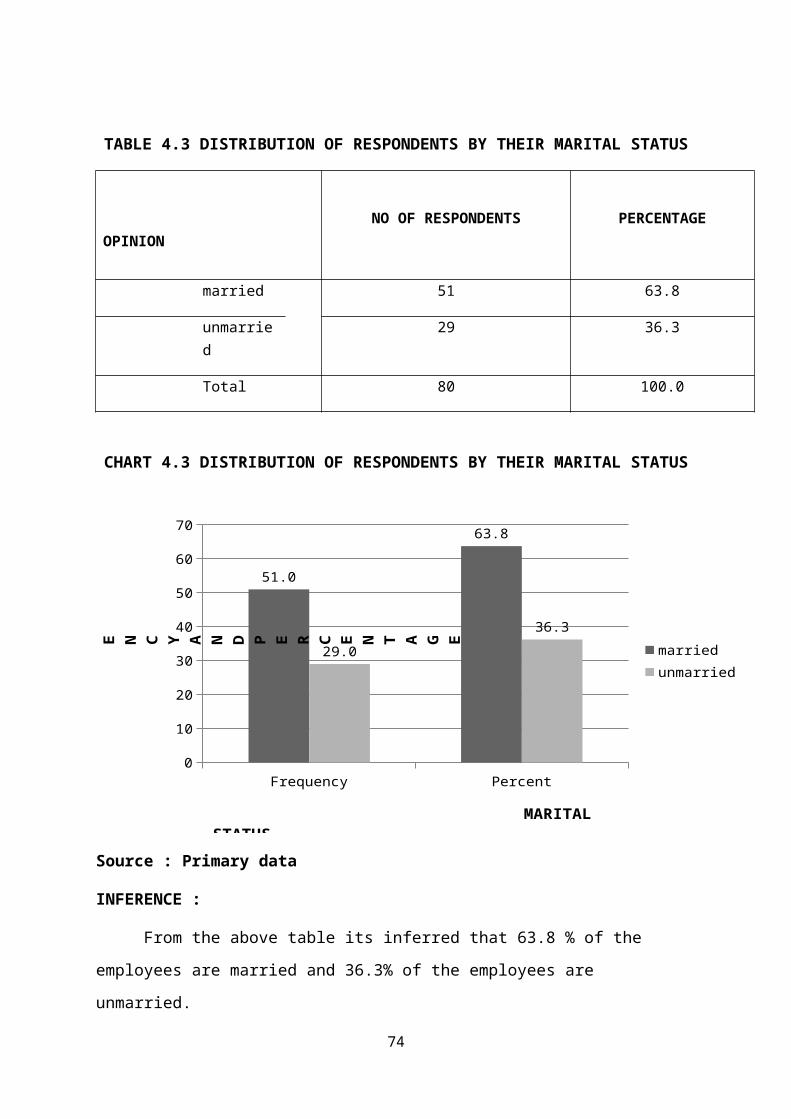
TABLE 4.3 DISTRIBUTION OF RESPONDENTS BY THEIR MARITAL STATUS
OPINION
NO OF RESPONDENTS PERCENTAGE
married 51 63.8
unmarried
29 36.3
Total 80 100.0
CHART 4.3 DISTRIBUTION OF RESPONDENTS BY THEIR MARITAL STATUS
Frequency Percent0
10
20
30
40
50
60
70
51.0
63.8
29.036.3
marriedunmarried
MARITAL STATUS
F R E Q U E N C Y A N D P E R C E N T A G E
Source : Primary data
INFERENCE :
From the above table its inferred that 63.8 % of the
employees are married and 36.3% of the employees are
unmarried.
74

75
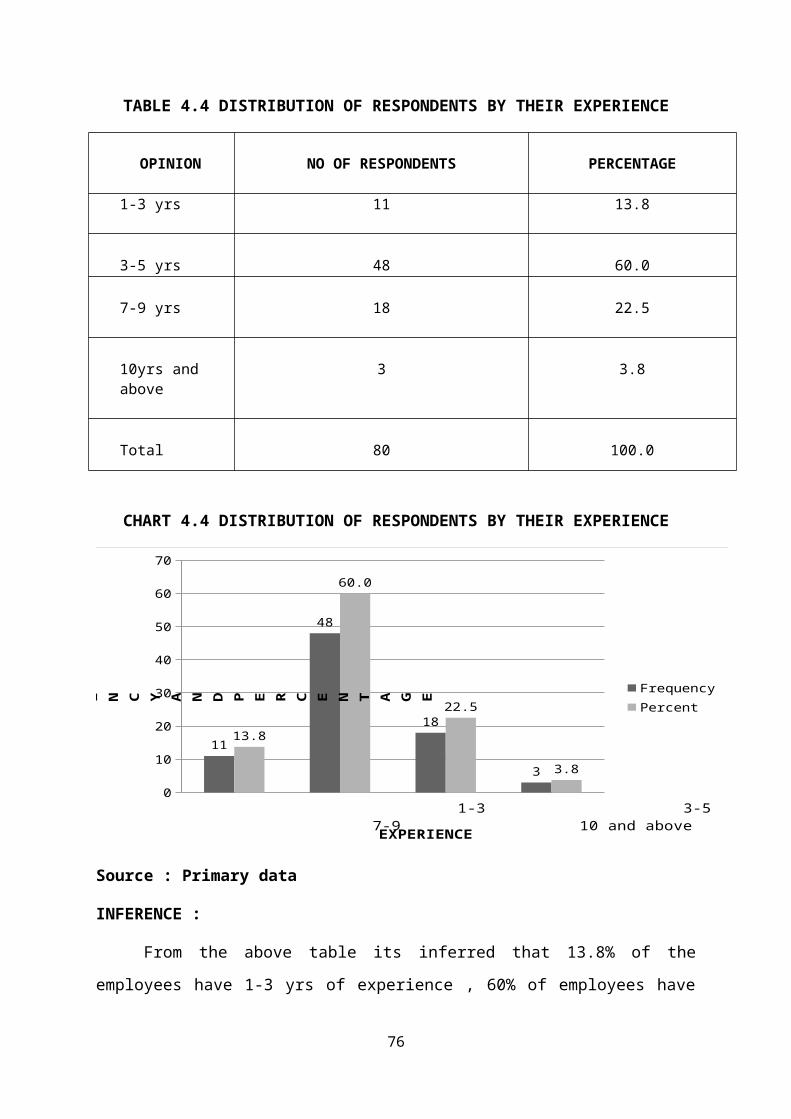
TABLE 4.4 DISTRIBUTION OF RESPONDENTS BY THEIR EXPERIENCE
OPINION NO OF RESPONDENTS PERCENTAGE
1-3 yrs 11 13.8
3-5 yrs 48 60.0
7-9 yrs 18 22.5
10yrs and above
3 3.8
Total 80 100.0
CHART 4.4 DISTRIBUTION OF RESPONDENTS BY THEIR EXPERIENCE
0
10
20
30
40
50
60
70
11
48
18
3
13.8
60.0
22.5
3.8
FrequencyPercent
1-3 3-5 7-9 10 and above
F R E Q U E N C Y A N D P E R C E N T A G E
EXPERIENCE
Source : Primary data
INFERENCE :
From the above table its inferred that 13.8% of the
employees have 1-3 yrs of experience , 60% of employees have
76
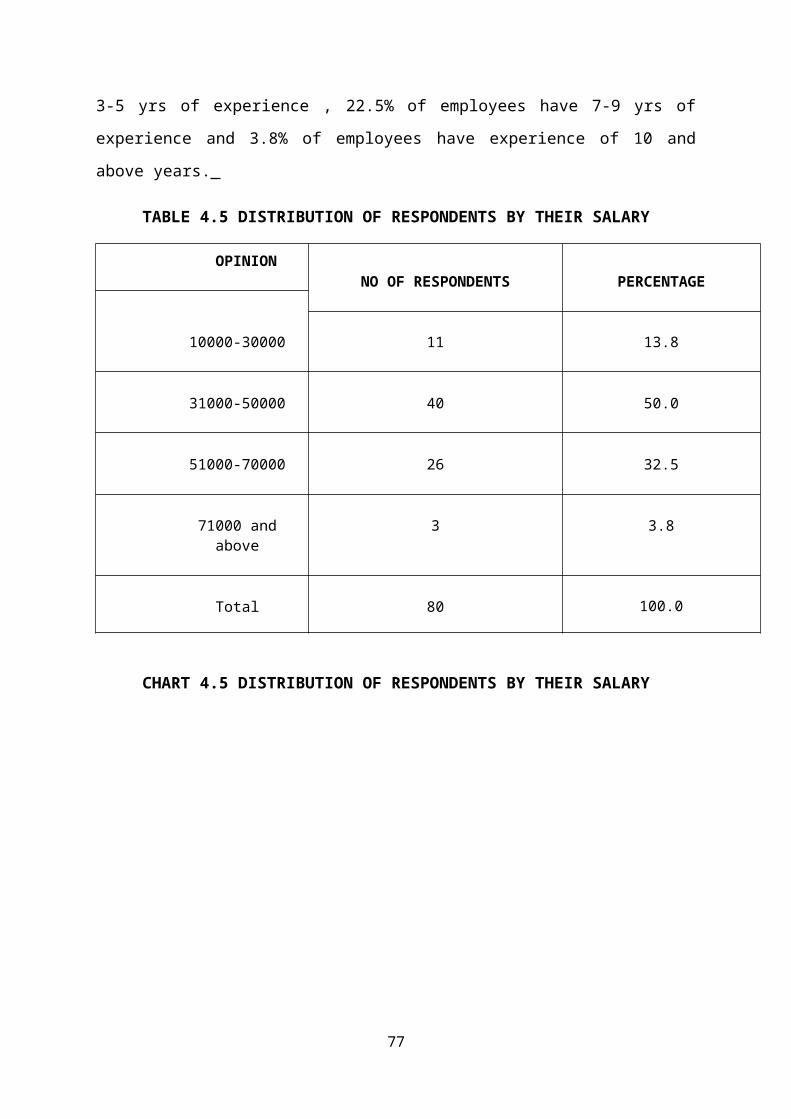
3-5 yrs of experience , 22.5% of employees have 7-9 yrs of
experience and 3.8% of employees have experience of 10 and
above years.
TABLE 4.5 DISTRIBUTION OF RESPONDENTS BY THEIR SALARY
OPINIONNO OF RESPONDENTS PERCENTAGE
10000-30000 11 13.8
31000-50000 40 50.0
51000-70000 26 32.5
71000 andabove
3 3.8
100.0Total 80
CHART 4.5 DISTRIBUTION OF RESPONDENTS BY THEIR SALARY
77
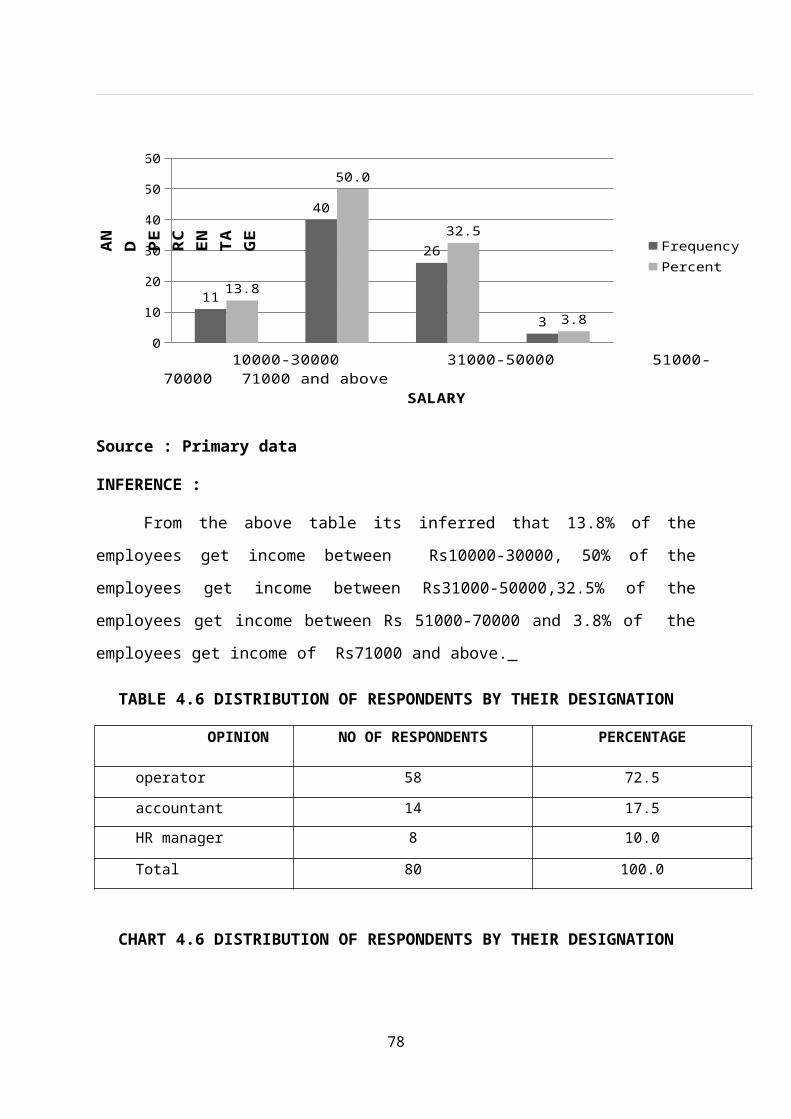
0
10
20
30
40
50
60
11
40
26
3
13.8
50.0
32.5
3.8
FrequencyPercent
10000-30000 31000-50000 51000-70000 71000 and above
SALARY
FR EQ UE NC Y AN D PE RC EN TA GE
Source : Primary data
INFERENCE :
From the above table its inferred that 13.8% of the
employees get income between Rs10000-30000, 50% of the
employees get income between Rs31000-50000,32.5% of the
employees get income between Rs 51000-70000 and 3.8% of the
employees get income of Rs71000 and above.
TABLE 4.6 DISTRIBUTION OF RESPONDENTS BY THEIR DESIGNATION
OPINION NO OF RESPONDENTS PERCENTAGE
operator 58 72.5
accountant 14 17.5HR manager 8 10.0
Total 80 100.0
CHART 4.6 DISTRIBUTION OF RESPONDENTS BY THEIR DESIGNATION
78
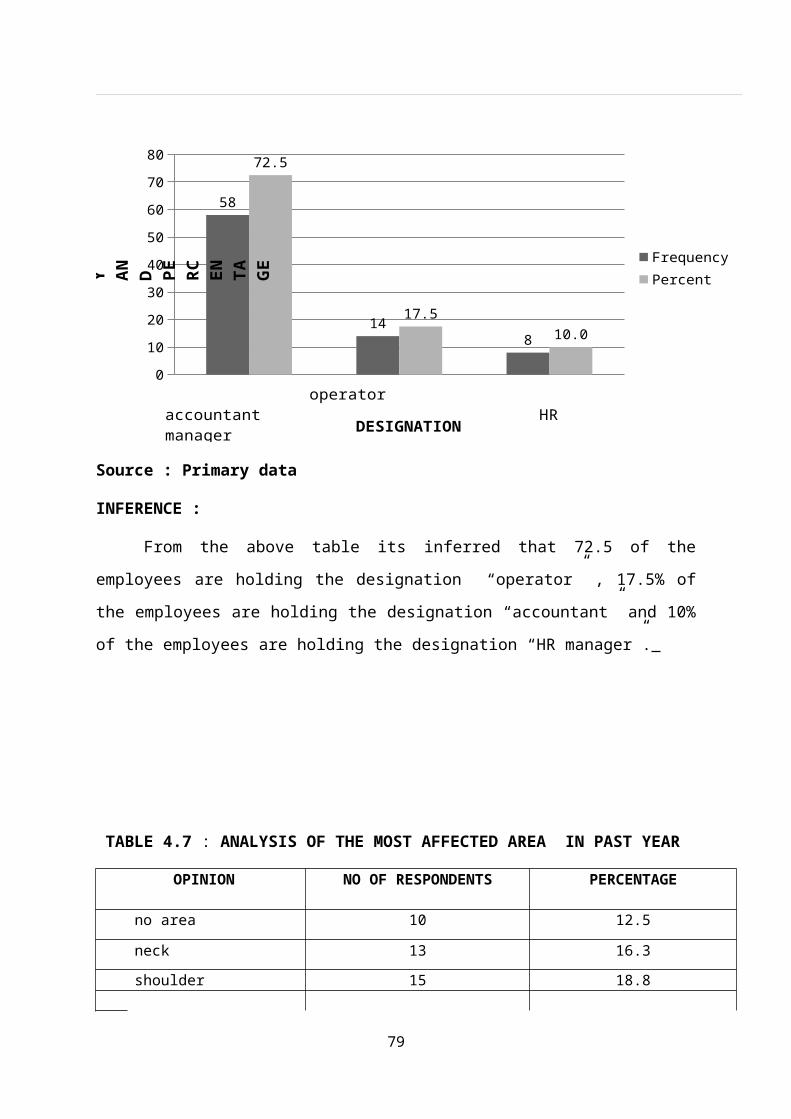
01020304050607080
58
148
72.5
17.510.0
FrequencyPercent
operator accountant HR manager DESIGNATION
FR EQ UE NC Y AN D PE RC EN TA GE
Source : Primary data
INFERENCE :
From the above table its inferred that 72.5 of the
employees are holding the designation “operator” , 17.5% of
the employees are holding the designation “accountant” and 10%
of the employees are holding the designation “HR manager”.
TABLE 4.7 : ANALYSIS OF THE MOST AFFECTED AREA IN PAST YEAR
OPINION NO OF RESPONDENTS PERCENTAGE
no area 10 12.5
neck 13 16.3
shoulder 15 18.8
79

elbow 7 8.8
wrist/forearm 15 18.8
lower back 16 20.0
foot 4 5.0
Total 80 100.0
CHART 4.7 : ANALYSIS OF THE MOST AFFECTED AREA IN PAST YEAR
0
5
10
15
20
25
10
1315
7
15 16
4
12.5
16.318.8
8.8
18.820.0
5.0
FrequencyPercent
Noarea neck shoulder elbow wrist lowback foot
AFFECTED AREA_PAST
FR EQ UE NC Y AN D PE RC EN TA GE
Source : Primary data
INFERENCE :
From the above table its inferred that 12.5% of the
employees had no area affected ,16.3% of the employees were
affected in their neck region, 18.8% of the employees were
affected in their shoulder region,8.8% of the employees were
affected in their elbow region, 18.8% of the employees were
affected in their wrist/forearm region, 20% of the employees
were affected in their lower back region, 5% of the employees
were affected in their foot region in the past year.
80

TABLE 4.8 : ANALYSIS OF LIGHTING CONDITIONS CAUSINGDISCOMFORT
OPINION NO OF RESPONDENTS PERCENTAGE
Strongly agree 37 46.3
agree 35 43.8undecided 1 1.3
disagree 7 8.8Total 80 100.0
CHART 4.8 : ANALYSIS OF LIGHTING CONDITIONS CAUSINGDISCOMFORT
05101520253035404550
37 35
17
46.3 43.8
1.3
8.8
FrequencyPercent
Strongly agree agree undecided disagree
LIGHTING CONDITIONS
FR EQ UE NC Y AN D PE RC EN TA GE
Source : Primary data
INFERENCE :
From the above table its inferred that 46.8% of the
employees strongly agree, 43.8% of the employees agree, 1.3%
of the employees neither agree nor
81

disagree(undecided/neutral), 8.8% of the employees disagree
that the lighting conditions in the workplace are good.
TABLE 4.9 : ANALYSIS OF THERMAL CONDITIONS CAUSINGDISCOMFORT
OPINION NO OF RESPONDENTS PERCENTAGE
Strongly agree 25 31.3
agree 30 37.5
undecided 17 21.3
disagree 8 10.0
Total 80 100.0
TABLE 4.9 : ANALYSIS OF THERMAL CONDITIONS CAUSINGDISCOMFORT
0
5
10
15
20
25
30
35
40
25
30
17
8
31.3
37.5
21.3
10.0
FrequencyPercent
Strongly agree agree undecided disagree THERMAL CONDITIONS
FR EQ UE NC Y AN D PE RC EN TA GE
82

Source : Primary data
INFERENCE :
From the above table its inferred that 31.3% of the
employees strongly agree,37.5% of the employees agree ,21.3%
neither agree nor disagree(undecided/neutral),10% of the
employees disagree that the thermal conditions in workplace
are good.
TABLE 4.10 : ANALYSIS OF WORK DIMENSIONS CAUSING DISCOMFORT
OPINION
NO OF RESPONDENTS PERCENTAGE
Strongly agree 2 2.5
undecided 2 2.5disagree 54 67.5Stronglydisagree
22 27.5
Total 80 100.0
CHART 4.10 : ANALYSIS OF WORK DIMENSIONS CAUSING DISCOMFORT
83
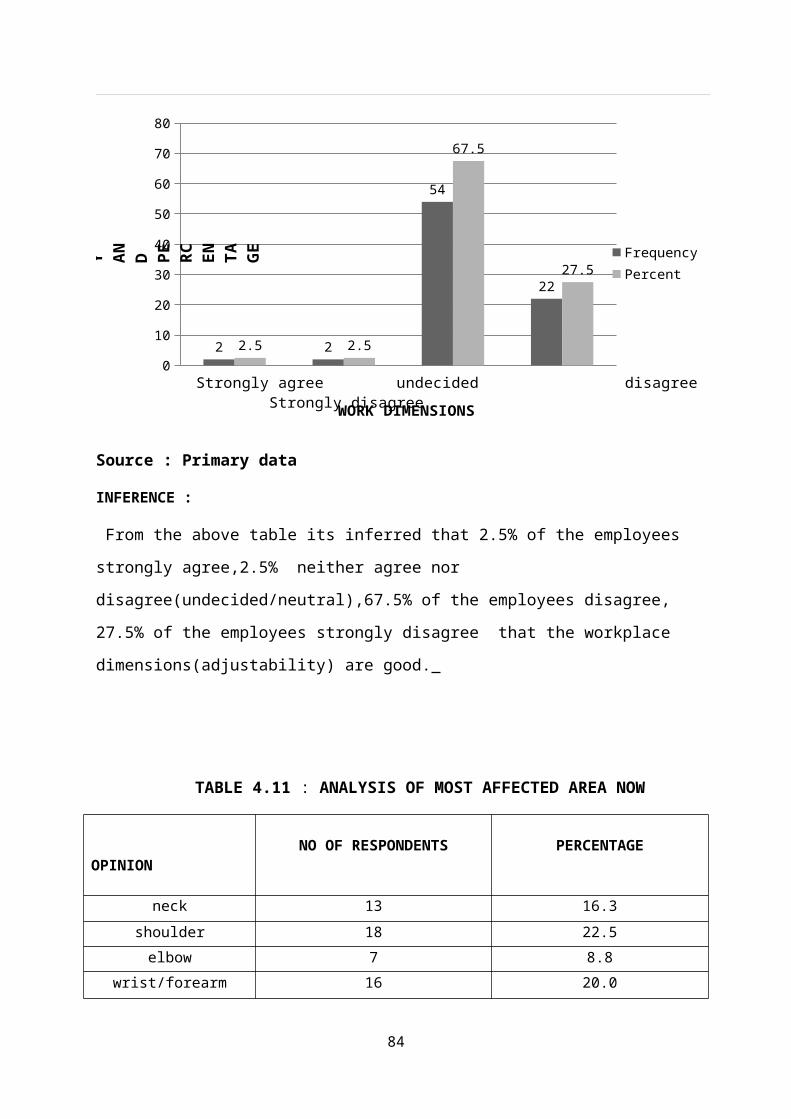
0
10
20
30
40
50
60
70
80
2 2
54
22
2.5 2.5
67.5
27.5FrequencyPercent
Strongly agree undecided disagree Strongly disagree WORK DIMENSIONS
FR EQ UE NC Y AN D PE RC EN TA GE
Source : Primary data
INFERENCE :
From the above table its inferred that 2.5% of the employees
strongly agree,2.5% neither agree nor
disagree(undecided/neutral),67.5% of the employees disagree,
27.5% of the employees strongly disagree that the workplace
dimensions(adjustability) are good.
TABLE 4.11 : ANALYSIS OF MOST AFFECTED AREA NOW
OPINION
NO OF RESPONDENTS PERCENTAGE
neck 13 16.3shoulder 18 22.5elbow 7 8.8
wrist/forearm 16 20.0
84
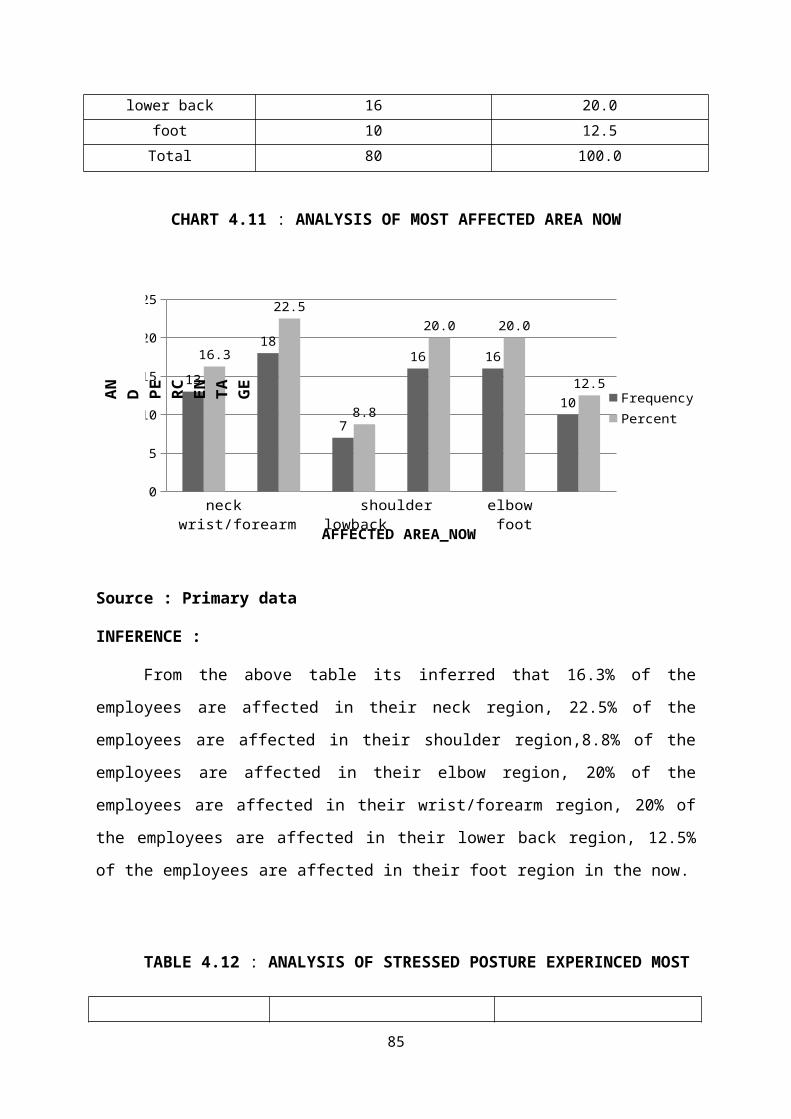
lower back 16 20.0foot 10 12.5Total 80 100.0
CHART 4.11 : ANALYSIS OF MOST AFFECTED AREA NOW
0
5
10
15
20
25
13
18
7
16 16
10
16.3
22.5
8.8
20.0 20.0
12.5FrequencyPercent
neck shoulder elbow wrist/forearm lowback footAFFECTED AREA_NOW
FR EQ UE NC Y AN D PE RC EN TA GE
Source : Primary data
INFERENCE :
From the above table its inferred that 16.3% of the
employees are affected in their neck region, 22.5% of the
employees are affected in their shoulder region,8.8% of the
employees are affected in their elbow region, 20% of the
employees are affected in their wrist/forearm region, 20% of
the employees are affected in their lower back region, 12.5%
of the employees are affected in their foot region in the now.
TABLE 4.12 : ANALYSIS OF STRESSED POSTURE EXPERINCED MOST
85

OPINION
NO OF RESPONDENTS PERCENTAGE
back bending 6 7.5kneeling down 36 45.0pulling load 3 3.8lifting boxes 3 3.8handling screw
devices5 6.3
handling drillingmachines
3 3.8
operating mouse 11 13.8talking on phoneswith neck bending
13 16.3
Total 80 100.0CHART 4.12 : ANALYSIS OF STRESSED POSTURE EXPERINCED MOST
05101520253035404550
6
36
3 3 5 3
11 137.5
45.0
3.8 3.86.3
3.8
13.816.3
Bb Kd Pl Lb Hsd Hdm Om tpnb
Bb - Back bendingKd - Kneeling downPl - Pulling loadLb - Lifting boxesHsd - Handling screw devicesHdm - Handling drilling machinesOm - Operating mouseTpnb - talking on phones with neck bending
STRESSED POSTURE EXPERIENCED
F R E Q U E N C Y
A N D
P E R C E N T A G E
Source : Primary data
INFERENCE :
From the above table its inferred that 7.5% of employees
are involved in back bending , 45% of employees are involved
in kneeling down,3.8% of employees are involved in pulling
load, 3.8% of employees are involved in lifting boxes , 6.3%
of employees are involved in handling screws,3.8% of employees
are involved in handling drilling machines, 13.8% of
86
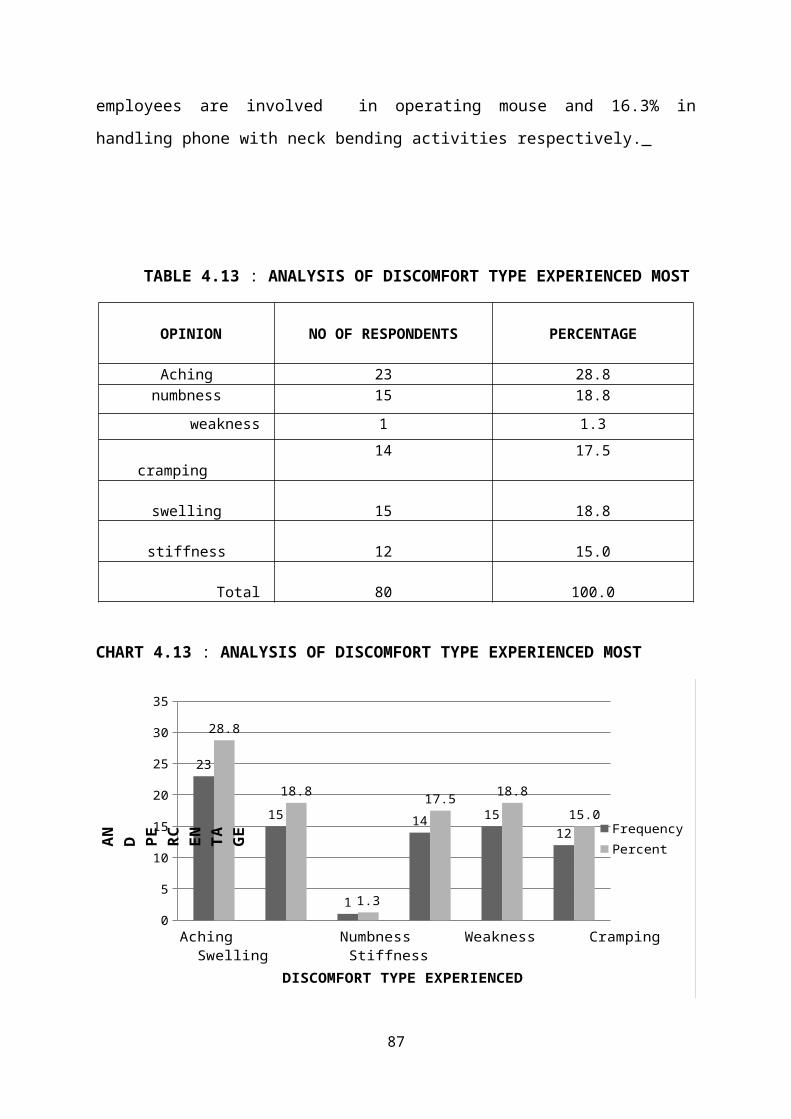
employees are involved in operating mouse and 16.3% in
handling phone with neck bending activities respectively.
TABLE 4.13 : ANALYSIS OF DISCOMFORT TYPE EXPERIENCED MOST
OPINION NO OF RESPONDENTS PERCENTAGE
Aching 23 28.8numbness 15 18.8
weakness 1 1.3 cramping
14 17.5
swelling 15 18.8
stiffness 12 15.0 Total 80 100.0
CHART 4.13 : ANALYSIS OF DISCOMFORT TYPE EXPERIENCED MOST
0
5
10
15
20
25
30
35
23
15
1
14 1512
28.8
18.8
1.3
17.5 18.815.0
FrequencyPercent
Aching Numbness Weakness Cramping Swelling Stiffness
DISCOMFORT TYPE EXPERIENCED
FR EQ UE NC Y AN D PE RC EN TA GE
87

Source : Primary data
INFERENCE :
From the above table its inferred that 28.8% of the
employees are having aching problems, 18.8% of the employees
are having numbness problems, 1.3% of the employees are having
weakness problems, 17.5% of the employees are having cramping
problems, 18.8% of the employees are having swelling problems
and 15% of employees are having stiffness problems.
TABLE 4.14 : ANALYSIS OF TOOL CONVENIENCE-DESIGN CONDITIONS
OPINION NO OF RESPONDENTS PERCENTAGE
yes 52 65.0
no 28 35.0Total 80 100.0
CHART 4.14 : ANALYSIS OF TOOL CONVENENCE-DESIGN CONDITIONS
Frequency Percent0
10
20
30
40
50
60
70
52.0
65.0
28.035.0
tooldesign_good_yestooldesign_good_no
TOOL DESIGN CONDITIONS
FR EQ UE NC Y AN D PE RC EN TA GE
88

Source : Primary data
INFERENCE :
From the above table its inferred that 65% of the
employees have said yes to good tool design conditions and 35%
of employees have said no to good tool design conditions.
TABLE 4.15 : ANALYSIS OF TOOL CONVENENCE-GRIP CONDITIONS
OPINION NO OF RESPONDENTS PERCENTAGE
yes 27 33.8no 53 66.3
Total 80 100.0
CHART 4.15 : ANALYSIS OF TOOL CONVENENCE-GRIP CONDITIONS
89

Frequency Percent0
10
20
30
40
50
60
70
27.033.8
53.0
66.3
toolgrip_good_yestoolgrip_good_no
TOOL GRIP CONDITIONS
FR EQ UE NC Y AN D PE RC EN TA GE
Source : Primary data
INFERENCE :
From the above table its inferred that 33.8% of the
employees have said yes to good tool design conditions and
66.3% of employees have said no to good tool grip conditions.
TABLE 4.16 : ANALYSIS OF TOOL CONVENIENCE-SAFETY CONDITIONS
OPINION NO OF RESPONDENTS PERCENTAGE
yes 38 47.5no 42 52.5
Total 80 100.0
90

CHART 4.16 : ANALYSIS OF TOOL CONVENENCE-SAFETY CONDITIONS
Frequency Percent0
10
20
30
40
50
60
38.0
47.542.0
52.5
Toolsafety_good_yesToolsafety_good_no
TOOL SAFETY CONDITIONS
FR EQ UE NC Y AN D PE RC EN TA GE
Source : Primary data
INFERENCE :
From the above table its inferred that 47.5% of the
employees have said yes to good tool design conditions and
52.5% of employees have said no to good tool safety
conditions.
TABLE 4.17 : ANALYSIS OF TOOL CONVENIENCE-WEIGHT CONDITIONS
OPINION NO OF RESPONDENTS PERCENTAGE
91

yes 50 62.5no 30 37.5
Total 80 100.0
CHART 4.17 : ANALYSIS OF TOOL CONVENIENCE-WEIGHT CONDITIONS
Frequency Percent0
10
20
30
40
50
60
70
50.0
62.5
30.037.5
Toolweight_good_yesToolweight_good_no
TOOL WEIGHT CONDITIONS
FR EQ UE NC Y AN D PE RC EN TA GE
Source : Primary data
INFERENCE :
From the above table its inferred that 62.5% of the
employees have said yes to good tool design conditions and 37.5%
of employees have said no to good tool weight conditions
92

TABLE 4.18 : OPINION OF RESPONDENTS ABOUT EXISTING REST BREAKS
OPINION
NO OF RESPONDENTS PERCENTAGE
yes 1 1.3
no 79 98.8
Total 80 100.0
CHART 4.18 : OPINION OF RESPONDENTS ABOUT EXISTING REST BREAKS
0
20
40
60
80
100
120
1.0 1.3
79.0
98.8
FrequencyPercent
Yes NoEXISTING REST BREAKS OPINION
FR EQ UE NC Y AN D PE RC EN TA GE
Source : Primary data
INFERENCE :
From the above table its inferred that only 1.3% of the
employees are getting rest breaks and the remanining 98.8% of
the employees do not get any rest breaks
93

TABLE 4.19 : OPINION OF RESPONDENTS ABOUT LEISURE TIMEPROVISION
OPINION NO OF RESPONDENTS PERCENTAGE
agree 15 18.8undecided 13 16.3Disagree 21 26.3Stronglydisagree
31 38.8
Total 80 100.0
CHART 4.19 : OPINION OF RESPONDENTS ABOUT LEISURE TIMEPROVISION
0
5
10
15
20
25
30
35
40
45
1513
21
31
18.816.3
26.3
38.8
FrequencyPercent
Strongly agree Agree Disagree Strongly Disagree
LEISURE TIME PROVISION
FR EQ UE NC Y AN D PE RC EN TA GE
Source : Primary data
INFERENCE :
94

From the above table its inferred that 18.8% of the employees
agree, 16.3% of the employees are neutral/undecided, 26.3% of
the employees disagree, 38.8% of the employees Strongly
disagree regarding the lesiure time they are getting in their
workplace.
TABLE 4.20 : OPINION OF RESPONDENTS ABOUT OCCASIONAL REST
BREAKS
OPINION NO OF RESPONDENTS PERCENTAGE
agree 8 10.0 undecided 8 10.0
Disagree 32 40.0
Strongly disagree
32 40.0
Total 80 100.0
CHART 4.20 : OPINION OF RESPONDENTS ABOUT OCCASIONAL RESTBREAKS
051015202530354045
8 8
32 32
10.0 10.0
40.0 40.0
FrequencyPercent
Agree Undecided Disagree Strongly DisagreeOCCASIONAL REST BREAKS
FR EQ UE NC Y AN D PE RC EN TA GE
95

Source : Primary data
INFERENCE :
From the above table its inferred that 10% of the
employees agree, 10% of the employees are neutral/undecided,
40% of the employees disagree, 40% of the employees Strongly
disagree regarding the occasional rest breaks they are allowed
to take in their workplace.
TABLE 4.21 : OPINION OF RESPONDENTS ABOUT PERSONAL RELAXATION
OPINION NO OF RESPONDENTS PERCENTAGE
Yes
14 17.5
no 66 82.5
Total 80 100.0
CHART 4.21 : OPINION OF RESPONDENTS ABOUT PERSONAL RELAXATION
0102030405060708090
14.0 17.5
66.0
82.5
FrequencyPercent
Yes No
PERSONAL RELAXATION
FR EQ UE NC Y AN D PE RC EN TA GE
Source : Primary data
96
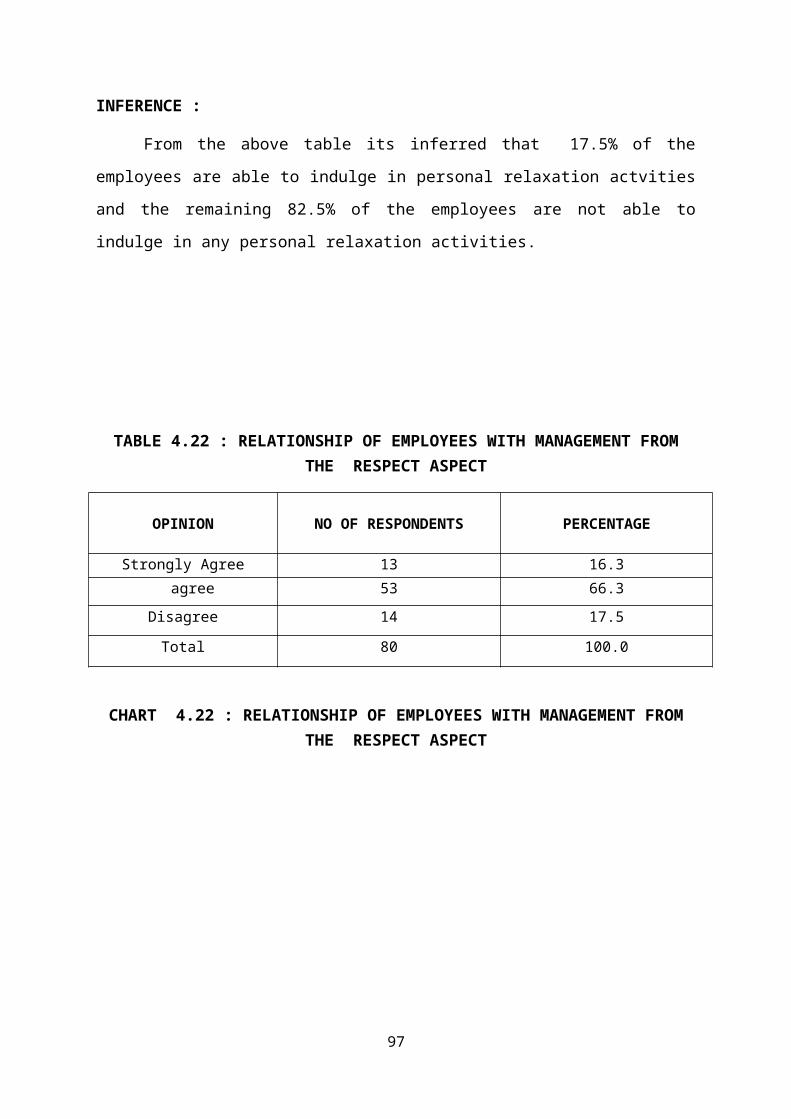
INFERENCE :
From the above table its inferred that 17.5% of the
employees are able to indulge in personal relaxation actvities
and the remaining 82.5% of the employees are not able to
indulge in any personal relaxation activities.
TABLE 4.22 : RELATIONSHIP OF EMPLOYEES WITH MANAGEMENT FROMTHE RESPECT ASPECT
OPINION NO OF RESPONDENTS PERCENTAGE
Strongly Agree 13 16.3agree 53 66.3
Disagree 14 17.5
Total 80 100.0
CHART 4.22 : RELATIONSHIP OF EMPLOYEES WITH MANAGEMENT FROMTHE RESPECT ASPECT
97

0
10
20
30
40
50
60
70
13
53
1416.3
66.3
17.5
Frequency
Strongly Agree Agree Disagree RESPECT RELATIONSHIP
FR EQ UE NC Y AN D PE RC EN TA GE
Source : Primary data
INFERENCE :
From the above table its inferred that, 16.3% of the
employees Strongly agree, 66.3% of the employees agree,
17.5% of the employees disagree about good respect
relationship with management.
TABLE 4.23 : RELATIONSHIP OF EMPLOYEES WITH MANAGEMENT FROMTHE TRUST ASPECT
OPINION NO OF RESPONDENTS PERCENTAGE
StronglyAgree
6 7.5
agree 44 55.0undecided 27 33.8
98
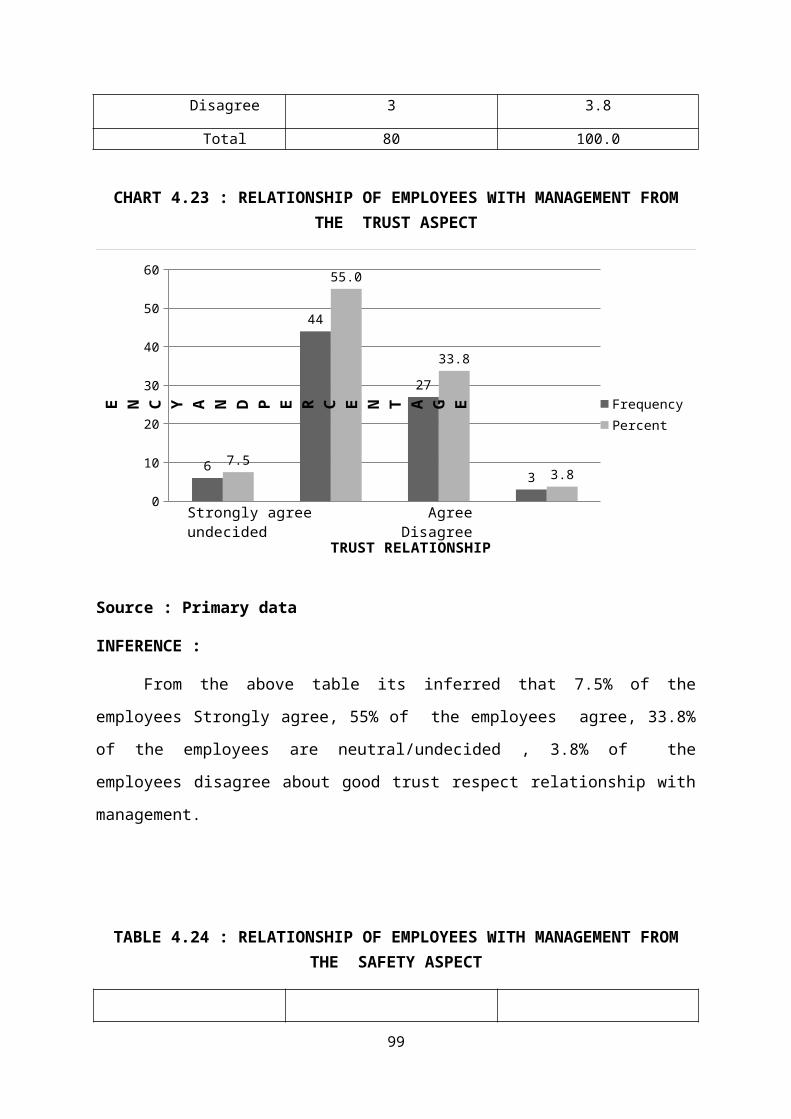
Disagree 3 3.8
Total 80 100.0
CHART 4.23 : RELATIONSHIP OF EMPLOYEES WITH MANAGEMENT FROMTHE TRUST ASPECT
0
10
20
30
40
50
60
6
44
27
37.5
55.0
33.8
3.8
FrequencyPercent
Strongly agree Agree undecided Disagree
TRUST RELATIONSHIP
F R E Q U E N C Y A N D P E R C E N T A G E
Source : Primary data
INFERENCE :
From the above table its inferred that 7.5% of the
employees Strongly agree, 55% of the employees agree, 33.8%
of the employees are neutral/undecided , 3.8% of the
employees disagree about good trust respect relationship with
management.
TABLE 4.24 : RELATIONSHIP OF EMPLOYEES WITH MANAGEMENT FROMTHE SAFETY ASPECT
99

OPINION NO OF RESPONDENTS PERCENTAGE
agree 10 12.5
undecided 59 73.8Disagree 11 13.8
Total 80 100.0
CHART 4.24 : RELATIONSHIP OF EMPLOYEES WITH MANAGEMENT FROMTHE SAFETY ASPECT
0
10
20
30
40
50
60
70
80
10
59
1112.5
73.8
13.8
FrequencyPercent
Agree undecided Disagree
SAFETY RELATIONSHIP
FR EQ UE NC Y AN D PE RC EN TA GE
Source : Primary data
INFERENCE :
From the above table its inferred that 12.5% of the
employees agree, 73.8% of the employees are neutral/undecided
, 13.8% of the employees disagree about good safety
relationship with management.
100

TABLE 4.25 : ANALYSING THE RANGE OF THE EMPLOYEE MORALE USINGDISCRIPTIVE STATISTICS
NRANGE
MINIMUM MAXIMUM MEAN
STD.DEVIATI
ON
Moralelevel
80 7.00 4.00 11.00 7.5375
1.50899
ValidN
(listwise)
80
INFERENCE :
From the above table we infer that the range with respect
to the morale level of the employees was found to be 7 which
lies between the expected range of 3 to 15.So thereby we infer
that the morale level of employees in the firm is neither too
high nor too low but lies in between so its found that the
employee morale is nominal or moderate within the company.
101
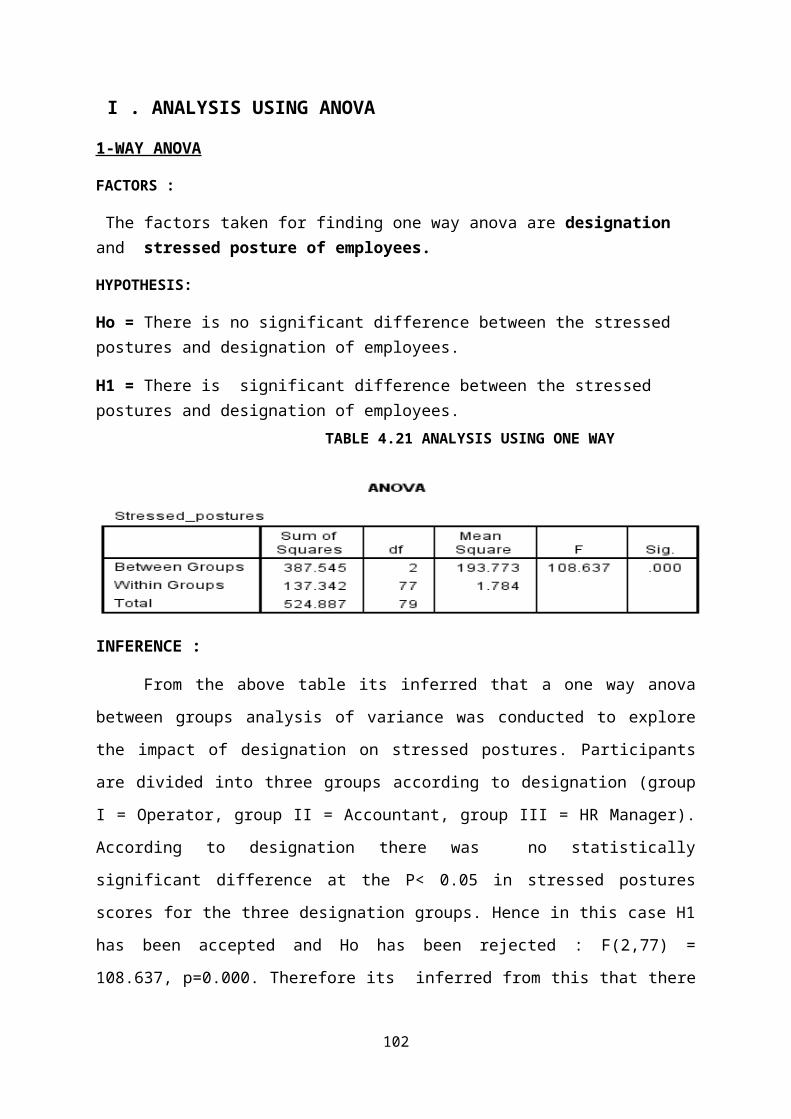
I . ANALYSIS USING ANOVA
1-WAY ANOVA
FACTORS :
The factors taken for finding one way anova are designation and stressed posture of employees.
HYPOTHESIS:
Ho = There is no significant difference between the stressed postures and designation of employees.
H1 = There is significant difference between the stressed postures and designation of employees.
INFERENCE :
From the above table its inferred that a one way anova
between groups analysis of variance was conducted to explore
the impact of designation on stressed postures. Participants
are divided into three groups according to designation (group
I = Operator, group II = Accountant, group III = HR Manager).
According to designation there was no statistically
significant difference at the P< 0.05 in stressed postures
scores for the three designation groups. Hence in this case H1
has been accepted and Ho has been rejected : F(2,77) =
108.637, p=0.000. Therefore its inferred from this that there
102
TABLE 4.21 ANALYSIS USING ONE WAY ANOVA
is significant difference between the designation and
stressed postures .
2-WAY ANOVA
FACTORS :
The factors taken for finding two way anova aresalary,designation and morale level of employees.
HYPOTHESIS:
Ho = There is no significant difference between the moralelevel and salary, designation of employees.
H1 = There is significant difference between the morale leveland salary, designation of employees.
103
TABLE 4.22 ANALYSIS USING TWO WAY ANOVA
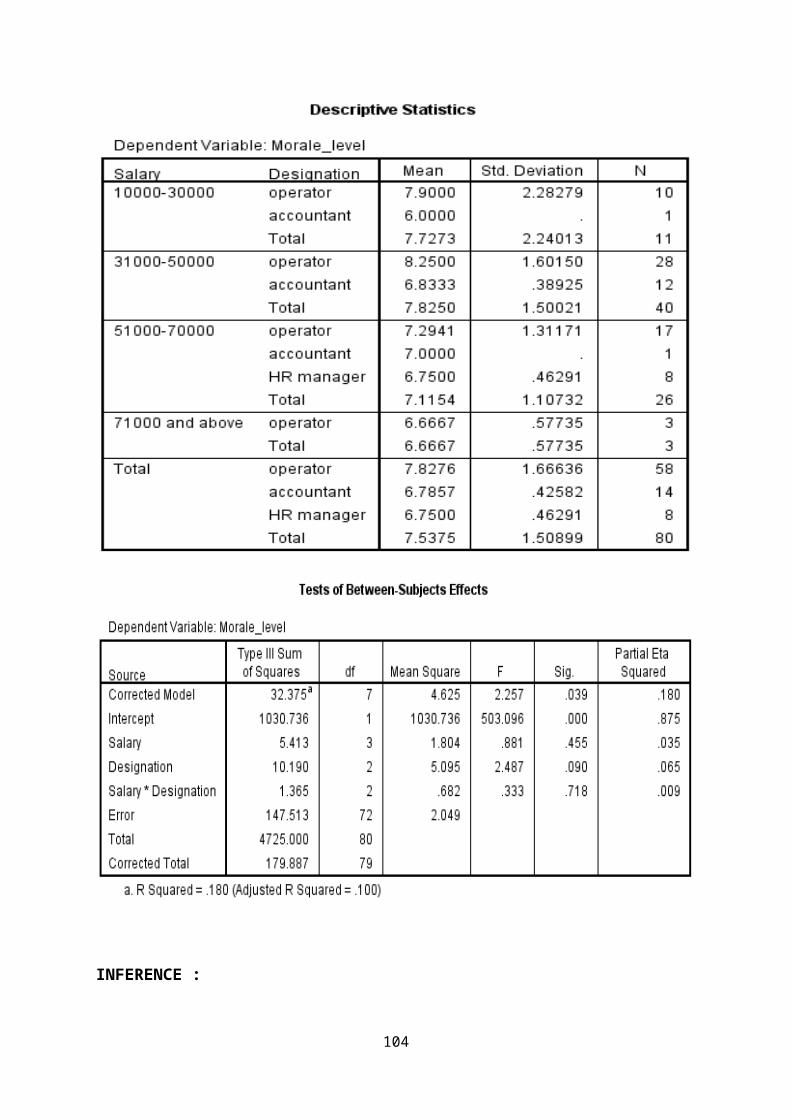
INFERENCE :
104
From the above table its inferred that a two way anova
between groups analysis of variance was conducted to explore
the impact of salary and designation on morale level.
Participants divided into four groups according to salary
(group I = 10000-30000 , group II = 31000-50000, group III =
51000-70000, group IV = 71000 and above) and into three groups
according to designation (group I = Operator, group II =
Accountant, group III = HR Manager). . According to
salary*designation value there was a statistically significant
difference at the P> 0.05 and hence in this case H1 has been
rejected and Ho has been accepted: F(3,2) = 1.44, p=0.718.
Therefore its inferred from this that there is no significant
difference between salary and designation and the morale level
of the employees.
105

II . ANALYSIS USING T-TEST
T-TEST
FACTORS :
The factors taken for finding t-test are gender of employeesand ergonomic effort taken by company.
HYPOTHESIS:
Ho = There is no significant difference between the gender andopinion of the existing ergonomic effort taken by the company.
H1 = There is no significant difference between the gender andopinion of the existing ergonomic effort taken by the company.
TABLE 4.23 ANALYSIS USING T-TEST
INFERENCE :
From the above table its inferred that a Independent T-
test was conducted to explore the impact of gender on the
opinion of existing ergonomic effort taken by the company.
Participants were divided into two groups (group I :female,
group II : male).From the Independent samples test table
obtained it has been inferred that P>0.05 hence in this case
106

H1 is rejected and Ho is accepted and F = 2.844, p=0.096.
Therefore its inferred from this that there is no significant
difference between gender of employees and the existing
ergonomic effort taken by the company.
III . ANALYSIS USING CORRELATION
To know whether there is relationship between the existing ergonomic effort taken by the company and the morale level of the employees.
FACTORS :
The factors taken for finding correlation are ergonomic_effort and morale_level.
INFERENCE :
From the above table its inferred that correlation
analysis is used to describe the strength and direction of the
linear relationship between two variables. The relationship
between the ergonomic effort taken by company and the morale
107
TABLE 4.24 ANALYSIS USING CORRELATION

level of employees was investigated using Pearson product
moment correlation coefficient . Preliminary analysis were
performed to ensure more violation of assumption normality
and linearity , There was weak correlation between two
variables : r = 0.268, N = 80 , p < 0.05, in this case low
levels of ergonomic effort associated with low levels of
employee morale.
IV . ANALYSIS USING PERCENTAGE METHOD
To know what is the percentage of mostly experienced stressedpostures among employees of Nithya packaging private limited.
TABLE 4.25 : ANALYSIS USING PERCENTAGE METHOD
OPINIONNO OF
RESPONDENTS PERCENTAGEVALID
PERCENTAGECUMULATIVEPERCENTAGE
backbending 6 7.5 7.5 7.5
kneelingdown 36 45.0 45.0 52.5
pullingload 3 3.8 3.8 56.3
liftingboxes 3 3.8 3.8 60.0
handlingscrew
devices5 6.3 6.3 66.3
handling 3 3.8 3.8 70.0
108
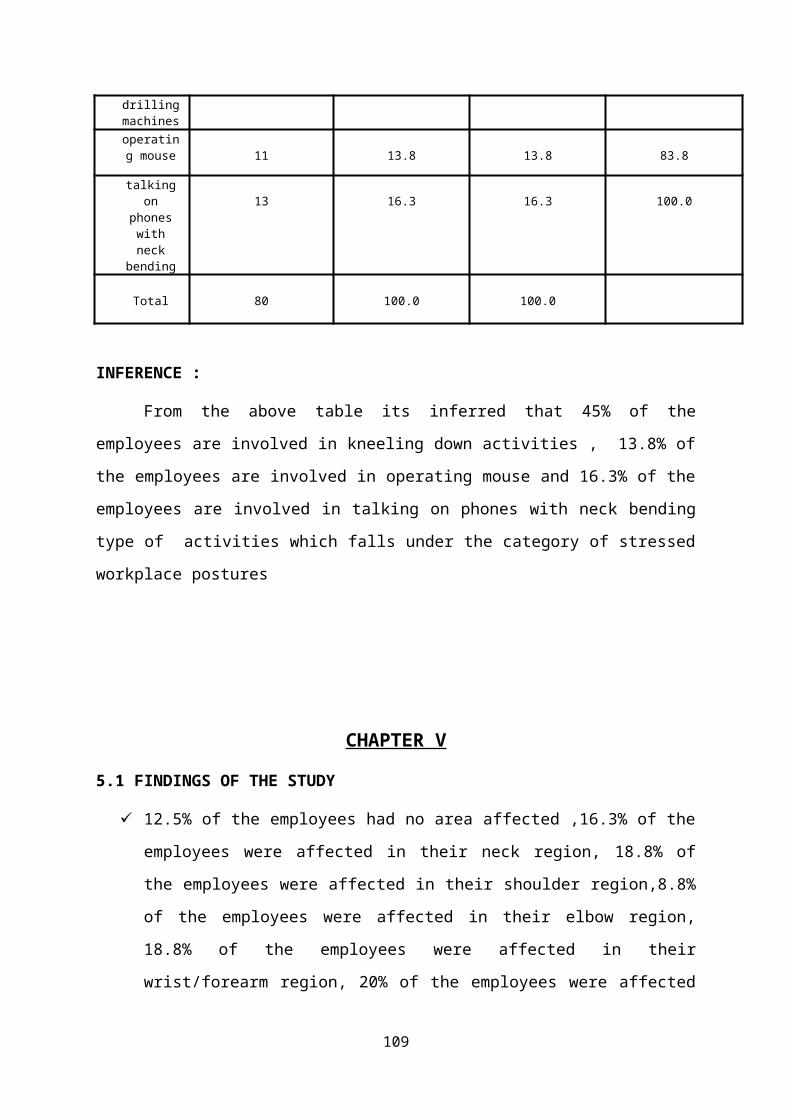
drillingmachinesoperating mouse 11 13.8 13.8 83.8
talkingon
phoneswithneck
bending
13 16.3 16.3 100.0
Total 80 100.0 100.0
INFERENCE :
From the above table its inferred that 45% of the
employees are involved in kneeling down activities , 13.8% of
the employees are involved in operating mouse and 16.3% of the
employees are involved in talking on phones with neck bending
type of activities which falls under the category of stressed
workplace postures
CHAPTER V
5.1 FINDINGS OF THE STUDY
12.5% of the employees had no area affected ,16.3% of the
employees were affected in their neck region, 18.8% of
the employees were affected in their shoulder region,8.8%
of the employees were affected in their elbow region,
18.8% of the employees were affected in their
wrist/forearm region, 20% of the employees were affected
109
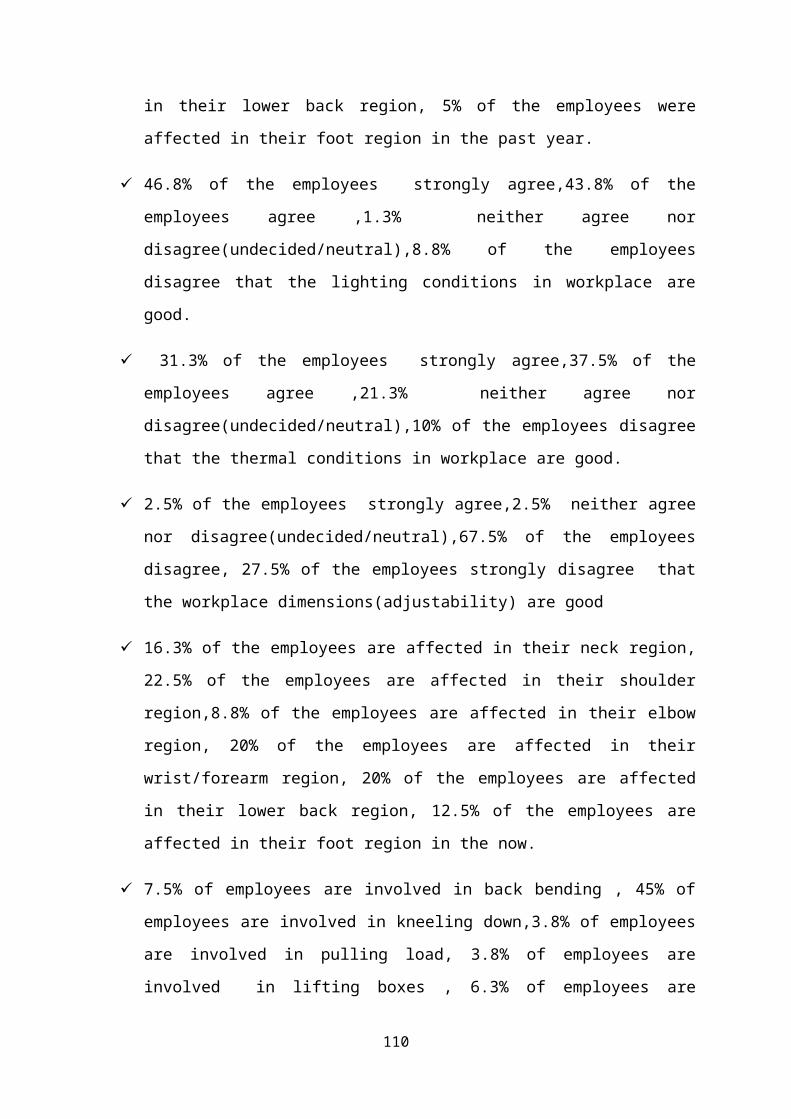
in their lower back region, 5% of the employees were
affected in their foot region in the past year.
46.8% of the employees strongly agree,43.8% of the
employees agree ,1.3% neither agree nor
disagree(undecided/neutral),8.8% of the employees
disagree that the lighting conditions in workplace are
good.
31.3% of the employees strongly agree,37.5% of the
employees agree ,21.3% neither agree nor
disagree(undecided/neutral),10% of the employees disagree
that the thermal conditions in workplace are good.
2.5% of the employees strongly agree,2.5% neither agree
nor disagree(undecided/neutral),67.5% of the employees
disagree, 27.5% of the employees strongly disagree that
the workplace dimensions(adjustability) are good
16.3% of the employees are affected in their neck region,
22.5% of the employees are affected in their shoulder
region,8.8% of the employees are affected in their elbow
region, 20% of the employees are affected in their
wrist/forearm region, 20% of the employees are affected
in their lower back region, 12.5% of the employees are
affected in their foot region in the now.
7.5% of employees are involved in back bending , 45% of
employees are involved in kneeling down,3.8% of employees
are involved in pulling load, 3.8% of employees are
involved in lifting boxes , 6.3% of employees are
110

involved in handling screws,3.8% of employees are
involved in handling drilling machines, 13.8% of
employees are involved in operating mouse and 16.3% in
handling phone with neck bending activities respectively.
28.8% of the employees are having aching problems, 18.8%
of the employees are having numbness problems, 1.3% of
the employees are having weakness problems, 17.5% of the
employees are having cramping problems, 18.8% of the
employees are having swelling problems and 15% of
employees are having stiffness problems.
65% of the employees have said yes to good tool design
conditions and 35% of employees have said no to good tool
design conditions.
33.8% of the employees have said yes to good tool design
conditions and 66.3% of employees have said no to good
tool design conditions.
47.5% of the employees have said yes to good tool design
conditions and 52.5% of employees have said no to good
tool design conditions.
62.5% of the employees have said yes to good tool design
conditions and 37.5% of employees have said no to good
tool design conditions.
1.3% of the employees are getting rest breaks and the
remanining 98.8% of the employees do not get any rest
breaks.
111
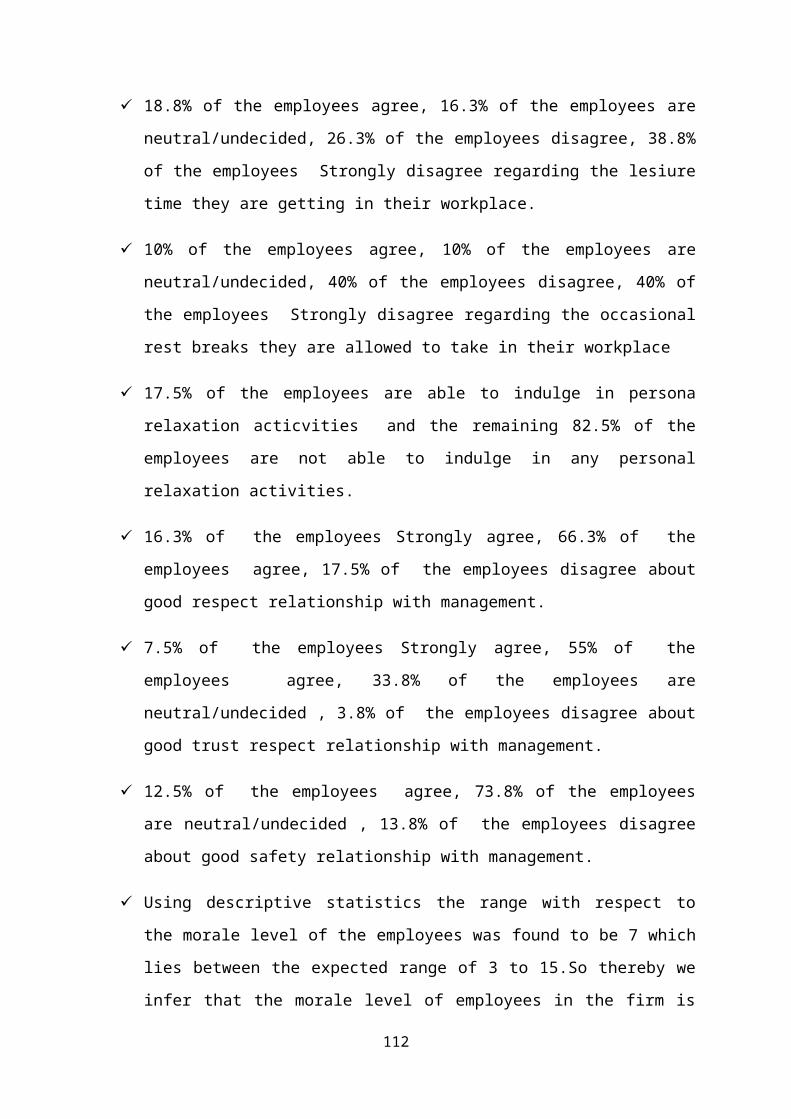
18.8% of the employees agree, 16.3% of the employees are
neutral/undecided, 26.3% of the employees disagree, 38.8%
of the employees Strongly disagree regarding the lesiure
time they are getting in their workplace.
10% of the employees agree, 10% of the employees are
neutral/undecided, 40% of the employees disagree, 40% of
the employees Strongly disagree regarding the occasional
rest breaks they are allowed to take in their workplace
17.5% of the employees are able to indulge in persona
relaxation acticvities and the remaining 82.5% of the
employees are not able to indulge in any personal
relaxation activities.
16.3% of the employees Strongly agree, 66.3% of the
employees agree, 17.5% of the employees disagree about
good respect relationship with management.
7.5% of the employees Strongly agree, 55% of the
employees agree, 33.8% of the employees are
neutral/undecided , 3.8% of the employees disagree about
good trust respect relationship with management.
12.5% of the employees agree, 73.8% of the employees
are neutral/undecided , 13.8% of the employees disagree
about good safety relationship with management.
Using descriptive statistics the range with respect to
the morale level of the employees was found to be 7 which
lies between the expected range of 3 to 15.So thereby we
infer that the morale level of employees in the firm is
112
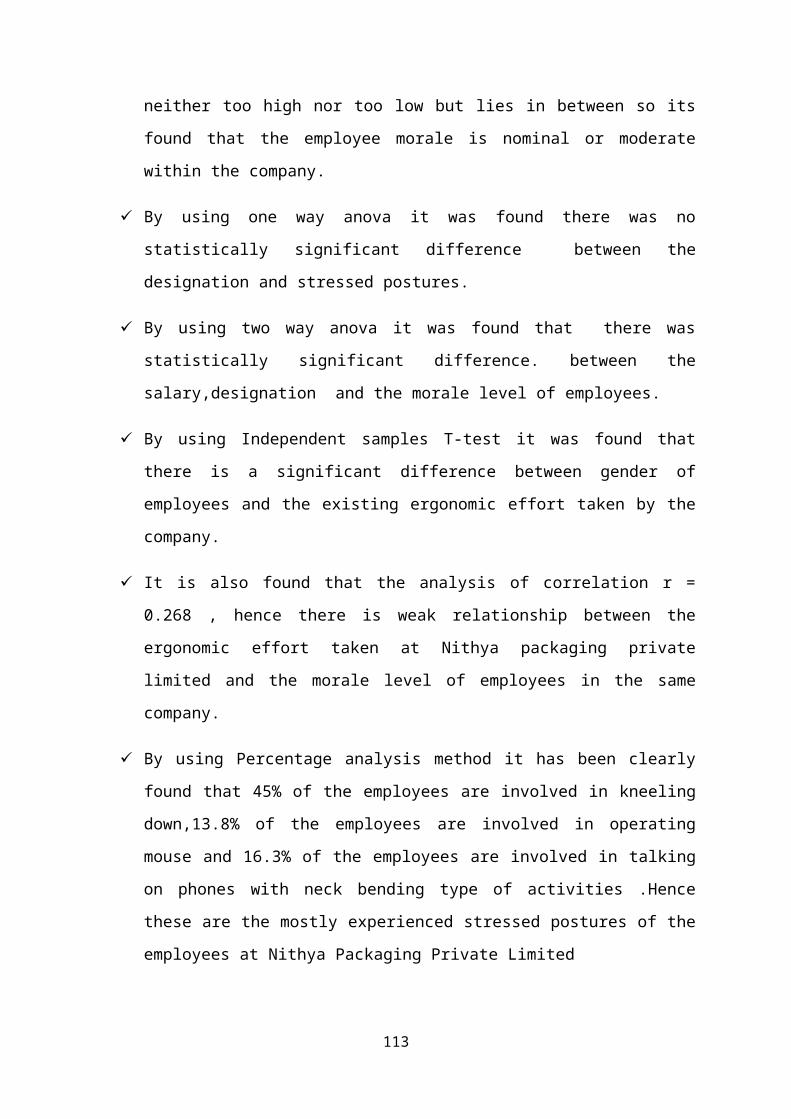
neither too high nor too low but lies in between so its
found that the employee morale is nominal or moderate
within the company.
By using one way anova it was found there was no
statistically significant difference between the
designation and stressed postures.
By using two way anova it was found that there was
statistically significant difference. between the
salary,designation and the morale level of employees.
By using Independent samples T-test it was found that
there is a significant difference between gender of
employees and the existing ergonomic effort taken by the
company.
It is also found that the analysis of correlation r =
0.268 , hence there is weak relationship between the
ergonomic effort taken at Nithya packaging private
limited and the morale level of employees in the same
company.
By using Percentage analysis method it has been clearly
found that 45% of the employees are involved in kneeling
down,13.8% of the employees are involved in operating
mouse and 16.3% of the employees are involved in talking
on phones with neck bending type of activities .Hence
these are the mostly experienced stressed postures of the
employees at Nithya Packaging Private Limited
113

5.2 SUGGESTIONS
Minor alterations can be made in the existing ergonomicsystem so that the work can be made easier and safer. Sayfor example most of the employees in the firm havereported that they do not get leisure time or rest breakshence it would sound more beneficial if rest breaks arescheduled properly to employees as per their job type.
Also it would be good to train the employees to involvein personal relaxation exercises periodically which wouldserve as a useful measure for removing their work relatedstress at home and health related stress at work. Thistype of exercise guidance can be provided by well knownorganisations like OSHA(Occupational Health and SafetyAssociation).
By doing so the morale level of employees can be found tobe improved to a considerable better level and thereexists better relationship of employees with management.
Other suggestions to improve the existing ergonomicefforts of the firm can be summarized as follows :
WITH REGARDS TO STRESSED POSTURES EXPERIENCED
Stressed postures
Ergonomic solutions
114

1.BACK BENDING
2.LIFTING BOXES
115
Tools with extension handle can reduce back bending
Solution 1
Solution 2
Solution 3

Solution 1 : It indicates the usage of lever below the load
containers so that on adjusting the lever the load can be
easily brought to the reach of the worker.
Solution 2 : It indicates the usage of load with grip handles
so that accidental injuries caused due to poor grip during the
lifting operation can be avoided
Solution 3 : It indicates the usage of vacuum hoist which
helps the worker to lift even heavy loads easily .
Solution 4 : Purchase backsaver lift tables available online
to reduce lifting injuries
Stressed postures
Ergonomic Solutions
116
Solution 4

3.PULLING LOAD
WITH REGARDS TO TOOLS USED AT WORK AND THE STRESS THEY CREATE WITH ERGONOMIC SOLUTIONS
Stressed postures
Ergonomic solutions
4.HANDLING PLIERS/SCREW DEVICES
117
Instead of pulling loads canbe pushed with carts with wheels attached but it must be ensured that the room
Working continuously with the pliers as shownin the left-hand picturecan create a lot of stress on the wrist. By using pliers with an

5.HANDLING DRILLERS/VIBRATING DEVICES
6.OPERATING MOUSE
7.TALKING ON PHONES
Besides implementing the above mentioned ergonomic
solutions its always better to set up a separate team to
periodically update on the performance of employees after
implementing ergonomics.
118
Inorder to reduce the stress caused due to vibrating tools ,the better solution is that the vibrating tools can be dampened.Use a 3M ergonomic mouse to reduce stress caused due to continuous mouse
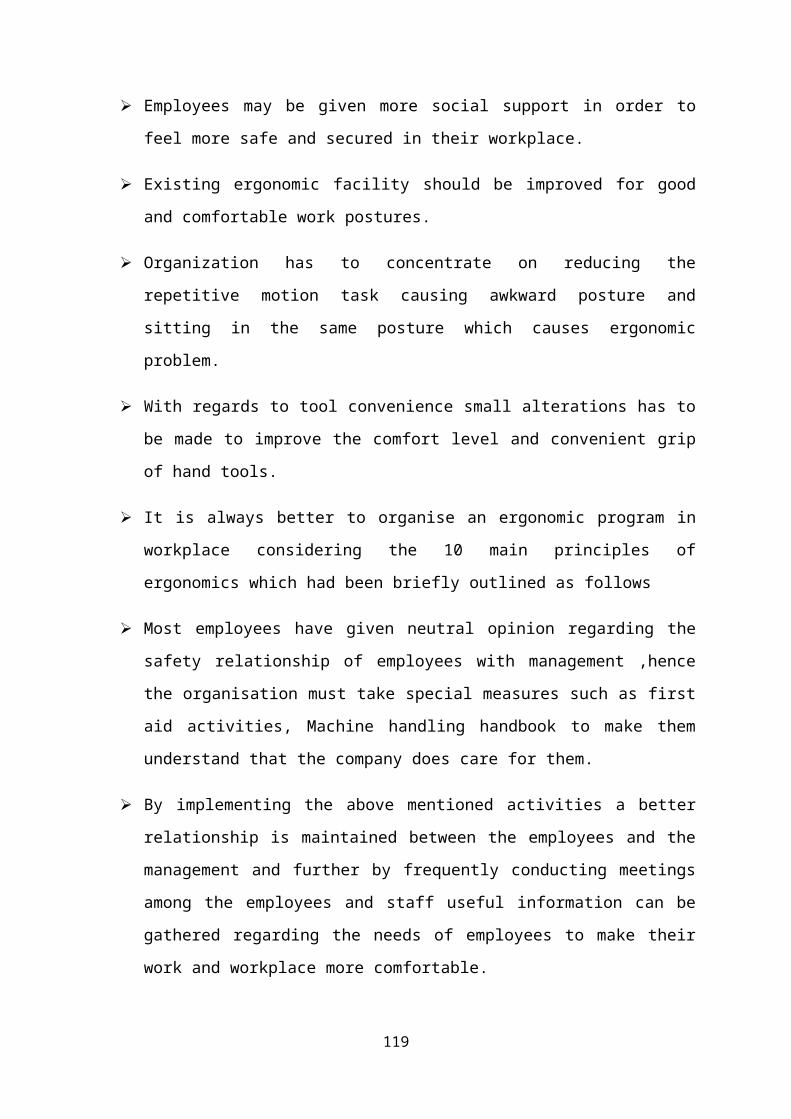
Employees may be given more social support in order to
feel more safe and secured in their workplace.
Existing ergonomic facility should be improved for good
and comfortable work postures.
Organization has to concentrate on reducing the
repetitive motion task causing awkward posture and
sitting in the same posture which causes ergonomic
problem.
With regards to tool convenience small alterations has to
be made to improve the comfort level and convenient grip
of hand tools.
It is always better to organise an ergonomic program in
workplace considering the 10 main principles of
ergonomics which had been briefly outlined as follows
Most employees have given neutral opinion regarding the
safety relationship of employees with management ,hence
the organisation must take special measures such as first
aid activities, Machine handling handbook to make them
understand that the company does care for them.
By implementing the above mentioned activities a better
relationship is maintained between the employees and the
management and further by frequently conducting meetings
among the employees and staff useful information can be
gathered regarding the needs of employees to make their
work and workplace more comfortable.
119
In general it has been analysed that workers find
difficulty in acheiving their goals and perform their
work mainly because of various ergonomics problems which
leads to discomforts of various types. Hence its
suggested to the management to maintain efficient and
good ergonomics which in turn will increase the morale of
employees and their workplace health and safety.
5.3 CONCLUSION
The present study was carried out to find the
relationship between existing ergonomic effort taken by
Nithya packaging Private Limited and the morale level of
employees in the same organisation and it has been found that
there is weak positive correlation between the ergonomic
effort and morale level . Hence its found that ergonomics
implemented at Nithya Packaging Private Limited
influences/increases the morale level only to certain extent.
120
It is also found that the employees at Nithya Packaging
Private limited are satisfied with the lighting and thermal
conditions in their workplace but not with their workplace
dimensions. Also its a considerable truth that the employees
are completely satisfied with the tool design and weight
conditions but not with the grip and safety conditions of hand
tools which can be improved by considering the ergonomic
solutions suggested above. The employees can be given more
social support and awareness about industrial ergonomics in
order to make them feel more secured and the policies can be
updated and ergonomic principles can be effectively
implemented for further improvements in employee health at
workplace.
121

122
Related Documents