International Journal of Management and Commerce Innovations ISSN 2348-7585 (Online) Vol. 8, Issue 1, pp: (31-42), Month: April 2020 - September 2020, Available at: www.researchpublish.com Page | 31 Research Publish Journals A Study on Impact Training and Development on Employee Performance at Weavetech 1 Janki Lakhani, 2 Ms. Vaishali Pillai 1 Student of BBA, Uka Tarsadia University, Bardoli, Gujarat. 2 Teaching Assistant, Uka Tarsadia University, Bardoli, Gujarat. Abstract: This study presents a literature review on the significant of training and development on employees’ productivity. The main objective of this research study is to study the impact of training and development an employee’s performance. To explore different methods of training and development that affects employee’s performance. To Examine how training and development contribute to the individual performance and productivity. Employees tends to become absolute, and therefore making the need to adapt to the continuous learning and updating of the skill and knowledge invaluable, due to the organizational, technological and social dynamics. This research study is mainly for identifying the effectiveness of the training and development of the company. A simple random sample is a sample of 100 employees drawn from a population of size 128 of the company in such a way that sample size 100 has the same chance of being selected. Keywords: Employee Training, Employees Development, Employee. 1. INTRODUCTION Employees training and development implies a programme in which specific knowledge, skills and abilities are imparted to the employees, with the aim of raising their performance level, in their existing roles, as well as providing them learning opportunities, to further their growth. Thus, organization should have employees that have capability of adjusting to swift dynamic business environment. Therefore, in order to maintain sustainability, organizations must see continuous employees training and development as invaluable. Training and development are very essential at all employee’s level, due to the reason that skills erode and become obsolete over a period of time and has to be replenished. 2. REVIEW OF LITERATURE Mohammad Raja Salah (2016) This study conclude that training and development has positive relationship and strong positive impact on employee performance and productivity. Respondents across studied companies showed high agreement on the statement that the use of different methods of training and developments is beneficial not only to them but also for the organization as well. Eunice Jane Amadi (2014) From the results of the study, it can be concluded that Safaricom certainly has a well-established policy to invest in the training and development of employees, however, the processes involved are not being duly followed. Employees who realized the need for change of attitude and want to develop themselves through formal education in order to be abreast with modern technological advances sponsored have themselves to acquire these skills. Neelam Tahir, Israr Khan & Dr. Shahid Jan Hassim April, 2014 employees are the resources and assets of an organization if they are skilled and trained would perform better than those who are unskilled and untrained. Therefore, the purpose of this study was to find out the relationship between Training and Development and Employees’ performance and Productivity. Anam Amin, Rashid Saeed, Mr. Rab Nawaz Lodhi, Mizna, Simra (2013) This research has focused on the relationship between liking a training program (positive reactions) and employee learning or subsequent performance, but has paid less attention to relationships between affective states during training and learning. Atif Anis, Ijaz-Ur-Rehman, Abdul Nasir and Nadeem Safwan (2011) analyzed that these variables are positively related to each other, and it means that when training is provided to the employees, it has positive effect on employee compensation packages.

Welcome message from author
This document is posted to help you gain knowledge. Please leave a comment to let me know what you think about it! Share it to your friends and learn new things together.
Transcript

International Journal of Management and Commerce Innovations ISSN 2348-7585 (Online) Vol. 8, Issue 1, pp: (31-42), Month: April 2020 - September 2020, Available at: www.researchpublish.com
Page | 31 Research Publish Journals
A Study on Impact Training and Development
on Employee Performance at Weavetech
1Janki Lakhani,
2Ms. Vaishali Pillai
1Student of BBA, Uka Tarsadia University, Bardoli, Gujarat.
2Teaching Assistant, Uka Tarsadia University, Bardoli, Gujarat.
Abstract: This study presents a literature review on the significant of training and development on employees’
productivity. The main objective of this research study is to study the impact of training and development an
employee’s performance. To explore different methods of training and development that affects employee’s
performance. To Examine how training and development contribute to the individual performance and
productivity. Employees tends to become absolute, and therefore making the need to adapt to the continuous
learning and updating of the skill and knowledge invaluable, due to the organizational, technological and social
dynamics. This research study is mainly for identifying the effectiveness of the training and development of the
company. A simple random sample is a sample of 100 employees drawn from a population of size 128 of the
company in such a way that sample size 100 has the same chance of being selected.
Keywords: Employee Training, Employees Development, Employee.
1. INTRODUCTION
Employees training and development implies a programme in which specific knowledge, skills and abilities are imparted
to the employees, with the aim of raising their performance level, in their existing roles, as well as providing them
learning opportunities, to further their growth. Thus, organization should have employees that have capability of adjusting
to swift dynamic business environment. Therefore, in order to maintain sustainability, organizations must see continuous
employees training and development as invaluable. Training and development are very essential at all employee’s level,
due to the reason that skills erode and become obsolete over a period of time and has to be replenished.
2. REVIEW OF LITERATURE
Mohammad Raja Salah (2016) This study conclude that training and development has positive relationship and strong
positive impact on employee performance and productivity. Respondents across studied companies showed high
agreement on the statement that the use of different methods of training and developments is beneficial not only to them
but also for the organization as well. Eunice Jane Amadi (2014) From the results of the study, it can be concluded that
Safaricom certainly has a well-established policy to invest in the training and development of employees, however, the
processes involved are not being duly followed. Employees who realized the need for change of attitude and want to
develop themselves through formal education in order to be abreast with modern technological advances sponsored have
themselves to acquire these skills. Neelam Tahir, Israr Khan & Dr. Shahid Jan Hassim April, 2014 employees are the
resources and assets of an organization if they are skilled and trained would perform better than those who are unskilled
and untrained. Therefore, the purpose of this study was to find out the relationship between Training and Development
and Employees’ performance and Productivity. Anam Amin, Rashid Saeed, Mr. Rab Nawaz Lodhi, Mizna, Simra (2013)
This research has focused on the relationship between liking a training program (positive reactions) and employee
learning or subsequent performance, but has paid less attention to relationships between affective states during training
and learning. Atif Anis, Ijaz-Ur-Rehman, Abdul Nasir and Nadeem Safwan (2011) analyzed that these variables are
positively related to each other, and it means that when training is provided to the employees, it has positive effect on
employee compensation packages.

International Journal of Management and Commerce Innovations ISSN 2348-7585 (Online) Vol. 8, Issue 1, pp: (31-42), Month: April 2020 - September 2020, Available at: www.researchpublish.com
Page | 32 Research Publish Journals
3. RESEARCH METHODOLOGY
The research design of this study considering its objective is exploratory as well as descriptive nature. To determine the
appropriate data for research mainly two kinds of data was collected primary & secondary data. Questionnaire, Informal
Interviews, Observation. A simple random sample is a sample of 100 employees drawn from a population of size 128 of
the company in such a way that sample size 100 has the same chance of being selected. Random sampling technique use
for this study and frequency, T-Test are the main statistical tools used for the collection and analysed of data in the
project.
Objectives:
To study the impact of training and development on employee performance.
To explore different methods of training and development that affects employee performance.
To examine how training and development contribute to the individual performance and productivity.
4. DATA ANALYSIS
1. Statistics:
Organization provide training for new employees
N Valid 100
Missing 0
Mean 1.2200
Median 1.0000
Mode 1.00
Organization provide training for new employees
Frequency Percent Valid Percent Cumulative Percent
Valid Yes 78 78.0 78.0 78.0
No 22 22.0 22.0 100.0
Total 100 100.0 100.0
Interpretation:
From the about table and chart it can interpreted that out of 100 respondents, 78% respondents say yes that organization
provide training for new employees and 22% respondents say no that organization do not provide training for new
employees.
2. Statistics:
Instructor response to trainees doubts
N Valid 100
Missing 0
Mean 2.1600
Median 2.0000
Mode 1.00

International Journal of Management and Commerce Innovations ISSN 2348-7585 (Online) Vol. 8, Issue 1, pp: (31-42), Month: April 2020 - September 2020, Available at: www.researchpublish.com
Page | 33 Research Publish Journals
Instructor response to trainees doubts
Cumulative
Percent Frequency Percent Valid
Percent
Valid Stringly Agree 44 44.0 44.0 44.0 Neither Agree nor Disagree 23 23.0 23.0 67.0
Strongly Disagree 7 7.0 7.0 74.0 Agree 25 25.0 25.0 99.0
Disagree 1 1.0 1.0 100.0
Total 100 100.0 100.0
Interpretation:
From the about table and chart it can interpreted that out of 100 respondents, 44.00% is strongly Agree instructor
responses to trainees doubts, 23.00% is Neither Agree nor Disagree instructor responses to trainees doubts,7.00%
Strongly Disagree instructor response to trains doubts, 25.00% Agree instructor responses to trainees doubts, 1.00%
Disagree instructor responses to trainees doubts.
One-Sample Test
Test Value = 1
t df Sig. (2-tailed) Mean
Difference
95% Confidence Interval of
the
Difference
Lower Upper
Instructor
response
to
trainees Doubts
5.284 99 .000 .22000 .1374 .3026
H0: Easy availability of the attribute which is not mostly liked by the employees in training
H1: Easy availability of the attribute which is mostly` liked by the employees in training
Significant p value is 0.000 which is more than 0.05 therefore null hypotheses are rejected and alternative hypotheses are
accepted it means easy availability of the attribute which is mostly liked by the instructor responses to trainees’ doubts.
3. Statistics:
Training is well planned
N Valid 100
Missing 0
Mean 1.9000
Median 1.0000
Mode 1.00
Training is well planned
Frequency Percent Valid
Percent
Cumulative
Percent
Valid Strongly Agree 55 55.0 55.0 55.0
Neither Agree nor Disagree 20 20.0 20.0 75.0 Strongly Disagree 7 7.0 7.0 82.0
Agree 16 16.0 16.0 98.0 Disagree 2 2.0 2.0 100.0
Total 100 100.0 100.0

International Journal of Management and Commerce Innovations ISSN 2348-7585 (Online) Vol. 8, Issue 1, pp: (31-42), Month: April 2020 - September 2020, Available at: www.researchpublish.com
Page | 34 Research Publish Journals
Interpretation:
From the about table and chart it can interpreted that out of 100 respondents,55.00% is strongly Agree with training is
well planned,20.00%is Neither Agree nor Disagree with training is well planned,7.00%Strongly Disagree with training is
well planned,16.00%Agree with training well planned, 2.00% Agree with training is well planned.
One-Sample Test
Test Value = 2
t df Sig. (2-tailed) Mean
Difference
95% Confidence Interval of the
Difference
Lower Upper
Training is well
planned 3.069 99 .003 .35000 .1237 .5763
H0: Easy availability of the attribute which is not mostly liked by the employees in training
H1: Easy availability of the attribute which is mostly` liked by the employees in training
Significant p value is 0.003 which is more than 0.05 therefore null hypotheses are rejected and alternative hypotheses are
accepted it means easy availability of the attribute which is mostly liked by the training is well planned.
4. Statistics:
Training is sufficient duration
N Valid 100 Missing 0
Mean 2.3500
Median 2.0000 Mode 2.00
Training is sufficient duration
Frequency Percent Valid Percent Cumulative
Percent
Valid Strongly Agree 28 28.0 28.0 28.0
Neither Agree nor Disagree 33 33.0 33.0 61.0
Strongly Disagree 16 16.0 16.0 77.0
Agree 22 22.0 22.0 99.0
Disagree 1 1.0 1.0 100.0
Total 100 100.0 100.0
Interpretation:
From the about table and chart it can interpreted that out of 100 respondents,28.00% is strongly Agree with training is of
sufficient duration,33.00%is Neither Agree nor Disagree with training is of sufficient duration,16.00%Strongly Disagree
with training is of sufficient duration,22.00%Agree with training is of sufficient duration, 1.00% Agree with training is of
sufficient duration.
One-Sample Test
Test Value = 1
t df Sig. (2-tailed) Mean
Difference
95% Confidence Interval of the
Difference
Lower Upper
Training is sufficient
duration 4.819 99 .000 .19000 .1118 .2682

International Journal of Management and Commerce Innovations ISSN 2348-7585 (Online) Vol. 8, Issue 1, pp: (31-42), Month: April 2020 - September 2020, Available at: www.researchpublish.com
Page | 35 Research Publish Journals
H0: Easy availability of the attribute which is not mostly liked by the employees in training
H1: Easy availability of the attribute which is mostly` liked by the employees in training
Significant p value is 0.000 which is more than 0.05 therefore null hypotheses are rejected and alternative hypotheses are
accepted it means easy availability of the attribute which is mostly liked by the training is of sufficient duration.
5. Statistics:
Training program helpful in personal growth
N Valid 100
Missing 0
Mean 1.1900
Median 1.0000
Mode 1.00
Training program helpful in personal growth
Frequency Percent Valid Percent Cumulative Percent
Valid Yes 81 81.0 81.0 81.0
No 19 19.0 19.0 100.0
Total 100 100.0 100.0
Interpretation:
From the about table and chart it can interpreted that out of 100 respondents,81.00% is respondents that training program
helpful in personal growth and 19.00% said that training program is not helpful in personal growth.
One-Sample Test
Test Value = 2
t df Sig. (2-tailed) Mean
Difference
95% Confidence Interval of the
Difference
Lower Upper
Training program
helpful in
personal growth
1.601 99 .113 .13000 -.0312 .2912
H0: Easy availability of the attribute which is mostly liked by the employees in training
H1: Easy availability of the attribute which is not mostly` liked by the employees in training
Significant p value is 0.113 which is more than 0.05 therefore null hypotheses are rejected and alternative hypotheses are
accepted it means easy availability of the attribute which is mostly liked by the training program helpful in personal
growth.
6. Statistics:
Opinion about Present training system
N Valid 100
Missing 0
Mean 2.1300
Median 2.0000
Mode 2.00

International Journal of Management and Commerce Innovations ISSN 2348-7585 (Online) Vol. 8, Issue 1, pp: (31-42), Month: April 2020 - September 2020, Available at: www.researchpublish.com
Page | 36 Research Publish Journals
Opinion about Present training system
Interpretation:
From the about table and chart it can interpreted that out of 100 respondents,24.00% respondents say that present training
system is Excellent ,42.00%said that present training system is Good,31.00% said that present training system is average
3.00% respondents say that present training system is Below Average.
One-Sample Test
Test Value = 2
t df Sig. (2-tailed) Mean
Difference
95% Confidence Interval of the
Difference
Lower Upper
Training program
helpful in
personal growth
1.269 99 .208 .16000 -.0902 .4102
H0: Easy availability of the attribute which is mostly liked by the employees in training
H1: Easy availability of the attribute which is not mostly` liked by the employees in training
Significant p value is 0.208which is more than 0.05 therefore null hypotheses are rejected and alternative hypotheses are
accepted it means easy availability of the attribute which is mostly liked by the opinion about present training system.
7. Statistics:
Industry provide gloves during production
N Valid 100
Missing 0
Mean 1.9200
Median 2.0000
Mode 2.00
Industry provide gloves during production
Frequency Percent Valid Percent Cumulative Percent
Valid Yes 8 8.0 8.0 8.0
No 92 92.0 92.0 100.0
Total 100 100.0 100.0
Interpretation:
From the about table and chart it can interpreted that out of 100 respondents, 8%respondents say yes that industry provide
gloves during production and 92% respondents say no that industry do not provide gloves during production.
Frequency Percent Valid Percent Cumulative
Percent
Valid Excellent 24 24.0 24.0 24.0
Good 42 42.0 42.0 66.0
Average 31 31.0 31.0 97.0
Below Average 3 3.0 3.0 100.0
Total 100 100.0 100.0

International Journal of Management and Commerce Innovations ISSN 2348-7585 (Online) Vol. 8, Issue 1, pp: (31-42), Month: April 2020 - September 2020, Available at: www.researchpublish.com
Page | 37 Research Publish Journals
8. Statistics:
Training helps to do the job with more commitment
N Valid 100
Missing 0
Mean 1.9300
Median 2.0000
Mode 1.00
Training helps to do the job with more commitment
Frequency Percent Valid Percent Cumulative
Percent
Valid Strongly Agree 38 38.0 38.0 38.0
Neither Agree nor Disagree 33 33.0 33.0 71.0
Agree 27 27.0 27.0 98.0
Disagree 2 2.0 2.0 100.0
Total 100 100.0 100.0
Interpretation:
From the about table and chart it can interpreted that out of 100 respondents,38% respondent is strongly Agree that
training helps to do the job with more commitment, 33% respondent is neither agree nor disagree that training helps to do
job or to do not job with more commitment,27% respondent is agree that training helps to do the job with more
commitment, 2% respondent disagree that training do not help the job with more commitment.
One-Sample Test
Test Value = 1
t df Sig. (2-tailed) Mean
Difference
95% Confidence Interval of the
Difference
Lower Upper
Training helps to do the
job
with more commitment
6.205 99 .000 .28000 .1905 .3695
H0: Easy availability of the attribute which is not mostly liked by the employees in training
H1: Easy availability of the attribute which is mostly` liked by the employees in training
Significant p value is 0.00 which is more than 0.05 therefore null hypotheses are rejected and alternative hypotheses are
accepted it means easy availability of the attribute which is mostly liked by the training helps to do the job with more
commitment.
9. Statistics:
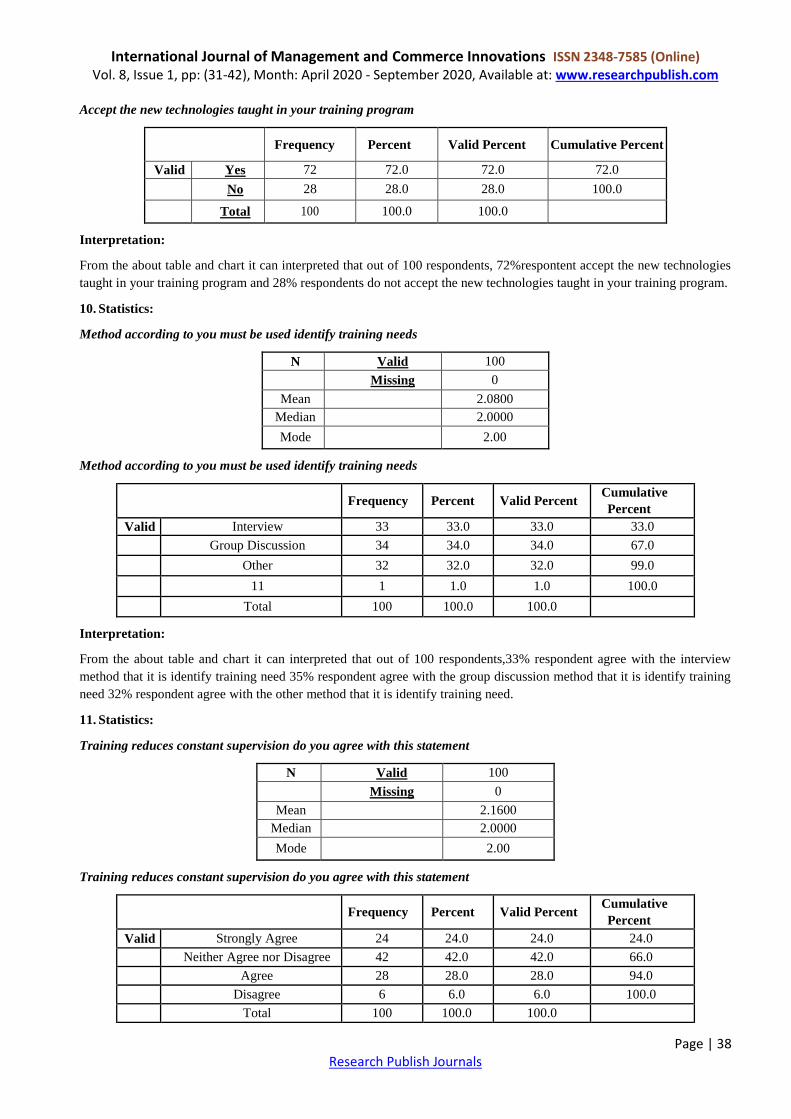
Accept the new technologies taught in your training program
N Valid 100
Missing 0
Mean 1.2800
Median 1.0000
Mode 1.00
International Journal of Management and Commerce Innovations ISSN 2348-7585 (Online) Vol. 8, Issue 1, pp: (31-42), Month: April 2020 - September 2020, Available at: www.researchpublish.com
Page | 38 Research Publish Journals
Accept the new technologies taught in your training program
Frequency Percent Valid Percent Cumulative Percent
Valid Yes 72 72.0 72.0 72.0
No 28 28.0 28.0 100.0
Total 100 100.0 100.0
Interpretation:
From the about table and chart it can interpreted that out of 100 respondents, 72%respontent accept the new technologies
taught in your training program and 28% respondents do not accept the new technologies taught in your training program.
10. Statistics:
Method according to you must be used identify training needs
N Valid 100
Missing 0
Mean 2.0800
Median 2.0000
Mode 2.00
Method according to you must be used identify training needs
Frequency Percent Valid Percent Cumulative
Percent
Valid Interview 33 33.0 33.0 33.0
Group Discussion 34 34.0 34.0 67.0
Other 32 32.0 32.0 99.0
11 1 1.0 1.0 100.0
Total 100 100.0 100.0
Interpretation:
From the about table and chart it can interpreted that out of 100 respondents,33% respondent agree with the interview
method that it is identify training need 35% respondent agree with the group discussion method that it is identify training
need 32% respondent agree with the other method that it is identify training need.
11. Statistics:
Training reduces constant supervision do you agree with this statement
N Valid 100
Missing 0
Mean 2.1600
Median 2.0000
Mode 2.00
Training reduces constant supervision do you agree with this statement
Frequency Percent Valid Percent Cumulative
Percent
Valid Strongly Agree 24 24.0 24.0 24.0
Neither Agree nor Disagree 42 42.0 42.0 66.0
Agree 28 28.0 28.0 94.0
Disagree 6 6.0 6.0 100.0
Total 100 100.0 100.0

International Journal of Management and Commerce Innovations ISSN 2348-7585 (Online) Vol. 8, Issue 1, pp: (31-42), Month: April 2020 - September 2020, Available at: www.researchpublish.com
Page | 39 Research Publish Journals
Interpretation:
From the about table and chart it can interpreted that out of 100 respondents, 24%respondent strongly agree that training
reduces constant supervision, 42% neither agree nor disagree that training reduces constant supervision, 28% respondent
agree that training reduces constant, 6% respondent disagree that training reduces constant supervision.
One-Sample Test
Test Value = 1
t df Sig. (2-tailed) Mean
Difference
95% Confidence Interval of the
Difference
Lower Upper
Training reduces constant
supervision do you agree
with this statement
4.975 99 .000 .20000 .1202 .2798
H0: Easy availability of the attribute which is not mostly liked by the employees in training
H1: Easy availability of the attribute which is mostly` liked by the employees in training
Significant p value is 0.000 which is more than 0.05 therefore null hypotheses are rejected and alternative hypotheses are
accepted it means easy availability of the attribute which is mostly liked by the Training reduces constant supervision do
you agree with this statement.
12. Statistics:
Training help you to achieve short term and long term goals.
N Valid 100
Missing 0
Mean 1.2000
Median 1.0000
Mode 1.00
Training help you to achieve short term and long term goals
Frequency Percent Valid Percent Cumulative Percent
Valid Yes 80 80.0 80.0 80.0
No 20 20.0 20.0 100.0
Total 100 100.0 100.0
Interpretation:
From the about table and chart it can interpreted that out of 100 respondents, 80% respondent said that training help you
to achieve short term and long-term goals, 20% respondent said that training do not help to achieve short term and long-
term goals.
13. Statistics:
Training has helped in motivating employees and giving them job security
N Valid 100
Missing 0
Mean 2.1700
Median 2.0000
Mode 2.00

International Journal of Management and Commerce Innovations ISSN 2348-7585 (Online) Vol. 8, Issue 1, pp: (31-42), Month: April 2020 - September 2020, Available at: www.researchpublish.com
Page | 40 Research Publish Journals
Training has helped in motivating employees and giving them job security
Frequency Percent Valid Percent Cumulative
Percent
Valid Strongly Agree 27 27.0 27.0 27.0
Neither Agree nor Disagree 44 44.0 44.0 71.0
Strongly Disagree 15 15.0 15.0 86.0
Agree 13 13.0 13.0 99.0
Disagree 1 1.0 1.0 100.0
Total 100 100.0 100.0
Interpretation:
From the about table and chart it can interpreted that out of 100 respondents, 27%respondents strongly agree that training
has helped in motivation employees and giving them job security 44% neither agree nor disagree that training has helped
in motivation employees and giving them job security 15% respondents agree that training has helped in motivation
employees and giving them job security 13% respondents disagree that training has helped in motivation employees and
giving them job security.
One-Sample Test
H0: Easy availability of the attribute which is not mostly liked by the employees in training
H1: Easy availability of the attribute which is mostly` liked by the employees in training
Significant p value is 0.000 which is more than 0.05 therefore null hypotheses are rejected and alternative hypotheses are
accepted it means easy availability of the attribute which is mostly liked by the training has helped in motivating
employees and giving them job security
14. Statistics:
Training program help to acquire new skills and technology
N Valid 100
Missing 0
Mean 1.2100
Median 1.0000
Mode 1.00
Training program help to acquire new skills and technology
Frequency Percent Valid Percent Cumulative Percent
Valid Yes 79 79.0 79.0 79.0
No 21 21.0 21.0 100.0
Total 100 100.0 100.0
Test Value = 1
t df Sig. (2-tailed) Mean
Difference
95% Confidence Interval of the
Difference
Lower Upper
Training has hipped in
motivating employees
and
giving them job
security
5.130 99 .000 .21000 .1288 .2912

International Journal of Management and Commerce Innovations ISSN 2348-7585 (Online) Vol. 8, Issue 1, pp: (31-42), Month: April 2020 - September 2020, Available at: www.researchpublish.com
Page | 41 Research Publish Journals
Interpretation:
From the about table and chart it can interpreted that out of 100 respondents, 79%% respondent said that training program
help to acquire new skills and technology, 21% respondent said that training program do not help to acquire new skills
and technology.
15. Statistics:
Management feedback after the training program
N Valid 100
Missing 0
Mean 1.1700
Median 1.0000
Mode 1.00
Management feedback after the training program
Frequency Percent Valid Percent Cumulative Percent
Valid Yes 83 83.0 83.0 83.0
No 17 17.0 17.0 100.0
Total 100 100.0 100.0
Interpretation:
From the about table and chart it can interpreted that out of 100 respondents, 83% respondent said that yes management
provide feedback after training program, 17% respondent said that management do not provide feedback after training
program.
5. CONCLUSION
From the search it is concluded that overall the respondents are satisfied with the training and development of employee’s
performance method. It also increases the effectiveness and productivity of employees and organization as a whole.
Employees strength and weakness is known and is communication in a well-maintained way to them.
Overall the training and development of employer’s performanse method is designed well and is benefice for the
employees as it helps to know the training needs of an individual in the organization.
REFERENCES
[1] Adesola, M. ,. (2013) Empirical Study of the Relationship between Staff Training and Job Satisfaction among
Nigerian Banks Employees. International Journal of Academic Research in Economics and Management Sciences.
[2] Anam Amin, R. S. (2013) The Impact of Employees Training On the Job Performance in Education Sector of
Pakistan. Middle-East Journal of Scientific Research.
[3] Atif Anis1, I.-U.-R. A. (2010) Employee retention relationship to training and development: A compensation
perspective. African Journal of Business Management.
[4] Boadu, F. (2014) TRAINING AND DEVELOPMENT: A TOOL FOR EMPLOYEE PERFORMANCE IN THE
DISTRICT ASSEMBLIES IN GHANA. International Journal of Education and Research.
[5] Bodjrenou Kossivi, M. X. (2016) Study on Determining Factors of Employee Retention . Open Journal of Social
Sciences, 261-268.
[6] Darkwa, D. A.-M. (2016) TRAINING AND DEVELOPMENT PROCESS AND EMPLOYEES’ PERFORMANCE
IN THE “CHOP BAR” INDUSTRY. Journal of Research and Development (JRnD).
[7] GAMAGE, M. P., & IMBULANA, M. L. (2013) TRAINING AND DEVELOPMENT AND PERFORMANCE OF
EMPLOYEES: EVIDENCE FROM SRI LANKA TELECOM . International Journal of Marketing, Financial
Services & Management Research.
International Journal of Management and Commerce Innovations ISSN 2348-7585 (Online) Vol. 8, Issue 1, pp: (31-42), Month: April 2020 - September 2020, Available at: www.researchpublish.com
Page | 42 Research Publish Journals
[8] Khawaja Jehanzeb1, 2., & Bashir1, D. N. (2013) Training and Development Program and its Benefits to Employee.
European Journal of Business and Management.
[9] Kraiger2, H. A. (n.d.) Training and Development for Individuals and Teams, Organizations, and Society.
[10] MAHMOOD ASAD, J. M.(2015) Training and Development and its Impact on the Employee's Performance.
International Review of Management and Business Reserch.
[11] Manzoor, Q.-A. (n.d.) Impact of Employees Motivation on Organizational Effectiveness . European Journal of
Business and Management.
[12] Neelam Tahir, I. K. (2014) The Impact of Training and Development on Employees Performance and Productivity A
case study of United Bank Limited Peshawar City, KPK, Pakistan . International Journal of Academic Research in
Business and Social Sciences.
[13] Qasim Saleem, M. S. (2011) TRAINING AND DEVELOPMENT ON EMPLOYEES BEHAVIOR. International
Journal of Computing and Business Research.
[14] Salah, M. R. (2016) The Impact of Training and Development on Employees Performance and Productivity .
International Journal of Management Sciences and Business Research.
[15] Shah Rollah Abdul Wahab1, A. H. (2014) Employees’ Perception and Motivation towards Training and
Development Programmes in Health Sector of Pakistan. Research Journal of Recent Sciences .
[16] Uzma Hafeez,W. A. (2015) Impact of Training on Employees Performance”(Evidence from Pharmaceutical
Companies in Karachi, Pakistan). Business Management & Strategy .
[17] Victor A Malaolu1, J. E. (2013) Training and Manpower Development, Employee Productivity and Organizational
Performance in Nigeria: an Empirical Investigation. International Journal of Advances in Management and
Economics.
[18] Waheed, A. H. (2011) Employee Development and Its Affect on Employee Performance A Conceptual Framework .
International Journal of Business and Social Science .
[19] Woyemi, O. A. (2011) Enhancing Employees’ Commitment to Organisation through Training . International Journal
of Business and Management .
Related Documents