GEOTHERMAL TRAINING PROGRAMME Reports 2012 Orkustofnun, Grensasvegur 9, Number 10 IS-108 Reykjavik, Iceland 99 A STUDY OF THERMODYNAMIC MODELLING AND GAS EXTRACTION SYSTEM DESIGN FOR ALUTO LANGANO GEOTHERMAL POWER PLANT II IN ETHIOPIA Habtamu Geremew Ethiopian Electric Power Corporation - EEPCo Generation Operation Aluto Langano Geothermal Power Plant P.O. Box 351 Zeway ETHIOPIA [email protected] ABSTRACT This report describes thermodynamic modelling and gas extraction system design for the Aluto Langano geothermal power plant phase II expansion project. The Aluto Langano geothermal field is presented as well as information on the condition of the Ethiopian electric market. Basic design data, like the well production curve of previously drilled wells as well as geographical and meteorological data of the area, are used to design the expansion of the power plant. The well pads and pipe layouts are hypothetically sited and pressure drop in the pipelines is estimated. Two flow models are presented for two-phase flow pipe calculations. The processes of other power plant equipment such as separators, turbines, the condenser and cooling towers are discussed. The basics of possible standard-flash power plant thermodynamic models, with the aid of EES software, were built. The model for a single-flash plant, a double-flash with two condensing turbines and a double-flash with one back pressure unit and one condensing turbine unit are discussed and compared. Non-condensable gases (NCG) have great impact in the power production efficiency of geothermal power plants. In Aluto Langano geothermal field, the total gas flow in one typical well is about 6.3% by weight of the total steam phase. Studies of gas extraction system design in regard to the plant model with the highest gross turbine output are presented. Four gas extraction system methods are presented. Economic evaluations, using the net present value method of these gas extraction systems, are performed. The results from the power calculations show that the double flash with a back-pressure turbine unit has the highest power output with a generation capacity of 25 MWe. A centrifugal compressor is the most economic method of gas extraction with a total updated net present cost of 2.5 million USD. 1. INTRODUCTION Geothermal systems have different classifications based on total salinity and other dominant chemical characteristics, the temperature range, structural and stratigraphic environments, the presence or absence of permeable reservoirs, and insulating cap rocks. Geothermal reservoirs are classified with different methods. When defining geothermal resources based on the temperature range, the categories will be

Welcome message from author
This document is posted to help you gain knowledge. Please leave a comment to let me know what you think about it! Share it to your friends and learn new things together.
Transcript

GEOTHERMAL TRAINING PROGRAMME Reports 2012 Orkustofnun, Grensasvegur 9, Number 10 IS-108 Reykjavik, Iceland
99
A STUDY OF THERMODYNAMIC MODELLING AND GAS EXTRACTION SYSTEM DESIGN FOR ALUTO LANGANO
GEOTHERMAL POWER PLANT II IN ETHIOPIA
Habtamu Geremew Ethiopian Electric Power Corporation - EEPCo
Generation Operation Aluto Langano Geothermal Power Plant P.O. Box 351 Zeway
ETHIOPIA [email protected]
ABSTRACT
This report describes thermodynamic modelling and gas extraction system design for the Aluto Langano geothermal power plant phase II expansion project. The Aluto Langano geothermal field is presented as well as information on the condition of the Ethiopian electric market. Basic design data, like the well production curve of previously drilled wells as well as geographical and meteorological data of the area, are used to design the expansion of the power plant. The well pads and pipe layouts are hypothetically sited and pressure drop in the pipelines is estimated. Two flow models are presented for two-phase flow pipe calculations. The processes of other power plant equipment such as separators, turbines, the condenser and cooling towers are discussed. The basics of possible standard-flash power plant thermodynamic models, with the aid of EES software, were built. The model for a single-flash plant, a double-flash with two condensing turbines and a double-flash with one back pressure unit and one condensing turbine unit are discussed and compared. Non-condensable gases (NCG) have great impact in the power production efficiency of geothermal power plants. In Aluto Langano geothermal field, the total gas flow in one typical well is about 6.3% by weight of the total steam phase. Studies of gas extraction system design in regard to the plant model with the highest gross turbine output are presented. Four gas extraction system methods are presented. Economic evaluations, using the net present value method of these gas extraction systems, are performed. The results from the power calculations show that the double flash with a back-pressure turbine unit has the highest power output with a generation capacity of 25 MWe. A centrifugal compressor is the most economic method of gas extraction with a total updated net present cost of 2.5 million USD.
1. INTRODUCTION Geothermal systems have different classifications based on total salinity and other dominant chemical characteristics, the temperature range, structural and stratigraphic environments, the presence or absence of permeable reservoirs, and insulating cap rocks. Geothermal reservoirs are classified with different methods. When defining geothermal resources based on the temperature range, the categories will be

Habtamu Geremew 100 Report 10
high-temperature (>200°C at 1 km depth) or high-enthalpy fields, and low-temperature (<150°C at 1 km depth) or low-enthalpy geothermal fields. And when classification is made referring to reservoir properties, the geothermal resource is classified as vapour-dominated system, liquid-dominated system or hot dry rock. Classification of a geothermal system can also be made based on the non-condensable gas (NCG) content because geothermal systems all over the world vary considerably from almost zero to as much as 25% of gas by weight of steam. The Aluto Langano geothermal field is grouped as a high-temperature liquid-dominated geothermal system with high non-condensable gas concentrations. The reservoir temperature reaches as high as 350°C with an enthalpy of more than 1600 kJ/kg and the NCG content in the steam phase is about 6.3% by weight. This study, which focuses on the Aluto-Langano geothermal power plant II expansion, shows a thermodynamic plant model for development of the area. At the same time, it shows the general technical aspects and an economic analysis of a gas removal system. Because of the nature of the geothermal resources, three standard-flash thermodynamic models were selected for comparison. The report begins with an overview of the historical data for the geothermal area of Aluto Langano. Weather data are presented as well as the project information for the current condition of the Ethiopian electric energy market. The productivity of exploratory wells is the starting point for this study. The productivity of well LA-6 was selected and, in this study, it is estimated that planned wells are likely to have the same nature. On the thermodynamic modelling section, three standard-flash thermodynamic models are compared with their respective results gained by using the Engineering Equation Solver (EES) software (F-Chart Software, 2012). The site layout, the well pads, the power plant locations and the pipe routes are hypothetically demonstrated in the study. The selection of optimal piping diameter for two-phase geothermal fluid pipelines from each well pad to the common primary separator located in the power plant are presented. An overview of the operation of major system equipment, such as turbines, the condenser, cooling tower and vacuum gas extraction systems, is presented. Based on the gross power production results, one energy process will be selected for designing gas extraction systems. In the third section, the gas extraction system designs that are most commonly used in geothermal industry are analysed to calculate the steam and electric power consumption requirements. In the fourth section, the economic evaluation of the selected gas extraction system is performed with the net present value method. In the results and discussion section, every computed result is presented and conclusions drawn. 1.1 The Aluto Langano geothermal field The Aluto Langano geothermal field is located in the central southern portion of Ethiopia within the East African Rift System as shown in Figure 1. The area is a high-temperature liquid-dominated field which produces two-phase fluid when transported to the surface. The deep wells in the upflow zone (wells LA-3 and LA-6) produce fluids of high enthalpy (1610-1650 kJ/kg) while the wells along the outflow zone (wells LA-4 and LA-8) produce fluids with a lower enthalpy (1000-1250 kJ/kg). The geothermal fluids are characterized by high gas content, with partial pressure of CO2 from 6 to 58 bar (Teklemariam and Beyene, 2001). At pressure about 30 bar, the partial pressure of CO2 in the Aluto Langano reservoir is three times that of the CO2 rich system Broadlands geothermal field in New Zealand (Gizaw, 1996). One of the exploratory wells in the Aluto Langano geothermal field, LA-6, was measured and the CO2 ratio in the steam phase accounted for 2.6% mole fraction (6.3% by weight) (Gizaw, 2007). Table 1 describes the total steam phase flow of well LA-6, the mole and mass percentage of gases. Table 2 shows the gas ratio and H2S percentage in the steam phase of these four productive exploratory wells. The location of the pilot plant of Aluto Langano, which is defined here as Aluto I, is shown in Figure 1. It started operation in 1998 with two generating units. The first one is a “geothermal combined cycle unit” (GCCU), which is a combination of a single-flash and an Organic Rankine Cycle (ORC). This unit uses wells LA-3 and LA-6 for power generation. The other unit is of an ORC type, referred to as

Report 10 101 Habtamu Geremew
FIGURE 1: The geographic map of Ethiopia and the location of Aluto Langano geothermal field including the expansion site
TABLE 1: CO2 in the steam phase of well LA-6 (Gizaw, 2007)
Well mM/100M xi Mol % Wt % SP
LA-6 2606 0.026 2.6 6.3 7.4
Habtamu Geremew 102 Report 10
“Ormat energy converter” (OEC), operated by wells LA-4, LA-8 with brine from all four wells. The installed combined gross production of the two units is 7.28 MWe. A recent feasibility study of the Aluto Langano geothermal power plant II expansion was conducted in 2009 and 2010. That study indicated that geothermal power expansion at Aluto was feasible. Another feasibility study project is to be carried out by drilling four deep appraisal wells for further confirmation. Following that, additional five deep production and three re-injection wells will be drilled to
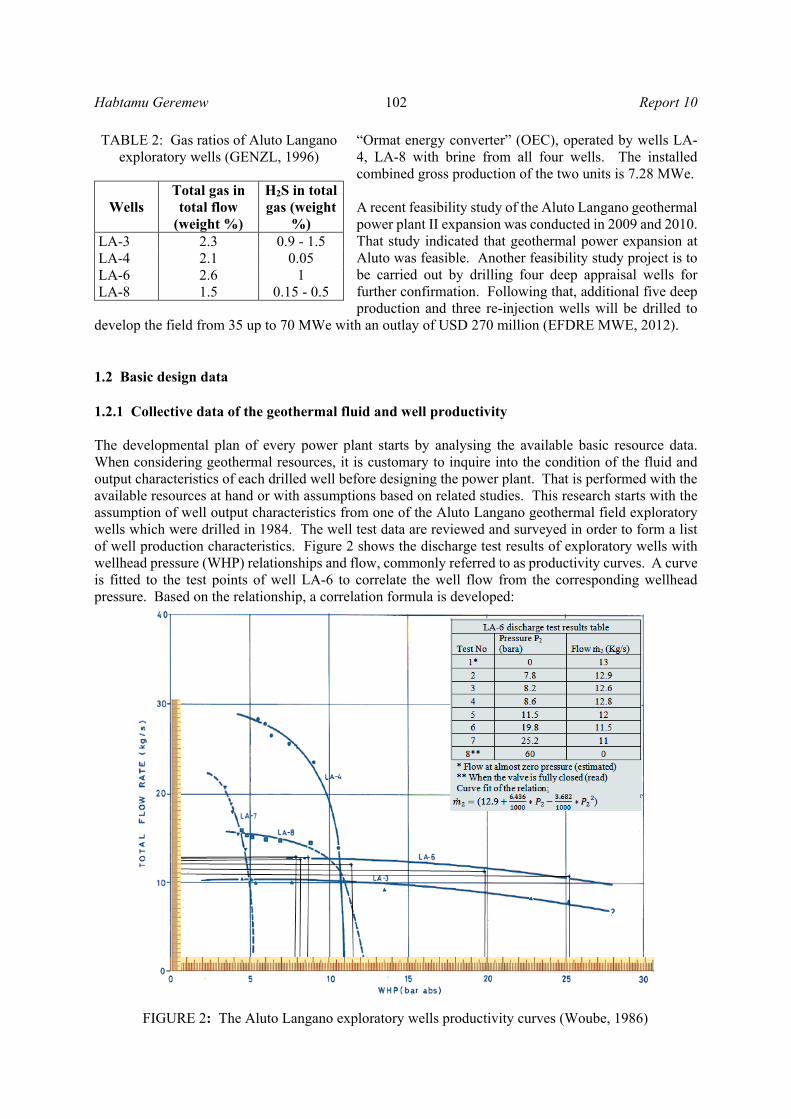
develop the field from 35 up to 70 MWe with an outlay of USD 270 million (EFDRE MWE, 2012). 1.2 Basic design data 1.2.1 Collective data of the geothermal fluid and well productivity The developmental plan of every power plant starts by analysing the available basic resource data. When considering geothermal resources, it is customary to inquire into the condition of the fluid and output characteristics of each drilled well before designing the power plant. That is performed with the available resources at hand or with assumptions based on related studies. This research starts with the assumption of well output characteristics from one of the Aluto Langano geothermal field exploratory wells which were drilled in 1984. The well test data are reviewed and surveyed in order to form a list of well production characteristics. Figure 2 shows the discharge test results of exploratory wells with wellhead pressure (WHP) relationships and flow, commonly referred to as productivity curves. A curve is fitted to the test points of well LA-6 to correlate the well flow from the corresponding wellhead pressure. Based on the relationship, a correlation formula is developed:
TABLE 2: Gas ratios of Aluto Langano exploratory wells (GENZL, 1996)
Wells Total gas in total flow
(weight %)
H2S in total gas (weight
%) LA-3 2.3 0.9 - 1.5 LA-4 2.1 0.05 LA-6 2.6 1 LA-8 1.5 0.15 - 0.5
FIGURE 2: The Aluto Langano exploratory wells productivity curves (Woube, 1986)
Report 10 103 Habtamu Geremew
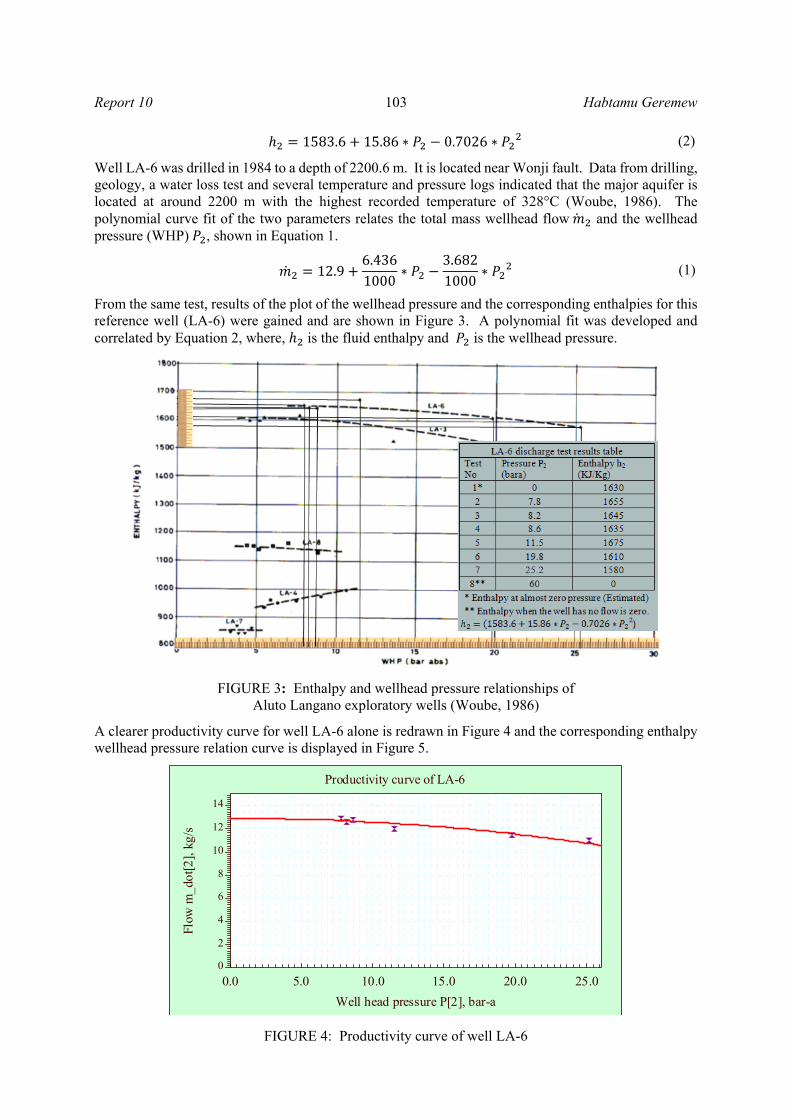
Well LA-6 was drilled in 1984 to a depth of 2200.6 m. It is located near Wonji fault. Data from drilling, geology, a water loss test and several temperature and pressure logs indicated that the major aquifer is located at around 2200 m with the highest recorded temperature of 328°C (Woube, 1986). The polynomial curve fit of the two parameters relates the total mass wellhead flow and the wellhead pressure (WHP) , shown in Equation 1.
12.96.4361000
∗3.6821000
∗ (1)
From the same test, results of the plot of the wellhead pressure and the corresponding enthalpies for this reference well (LA-6) were gained and are shown in Figure 3. A polynomial fit was developed and correlated by Equation 2, where, is the fluid enthalpy and is the wellhead pressure.
FIGURE 3: Enthalpy and wellhead pressure relationships of Aluto Langano exploratory wells (Woube, 1986)
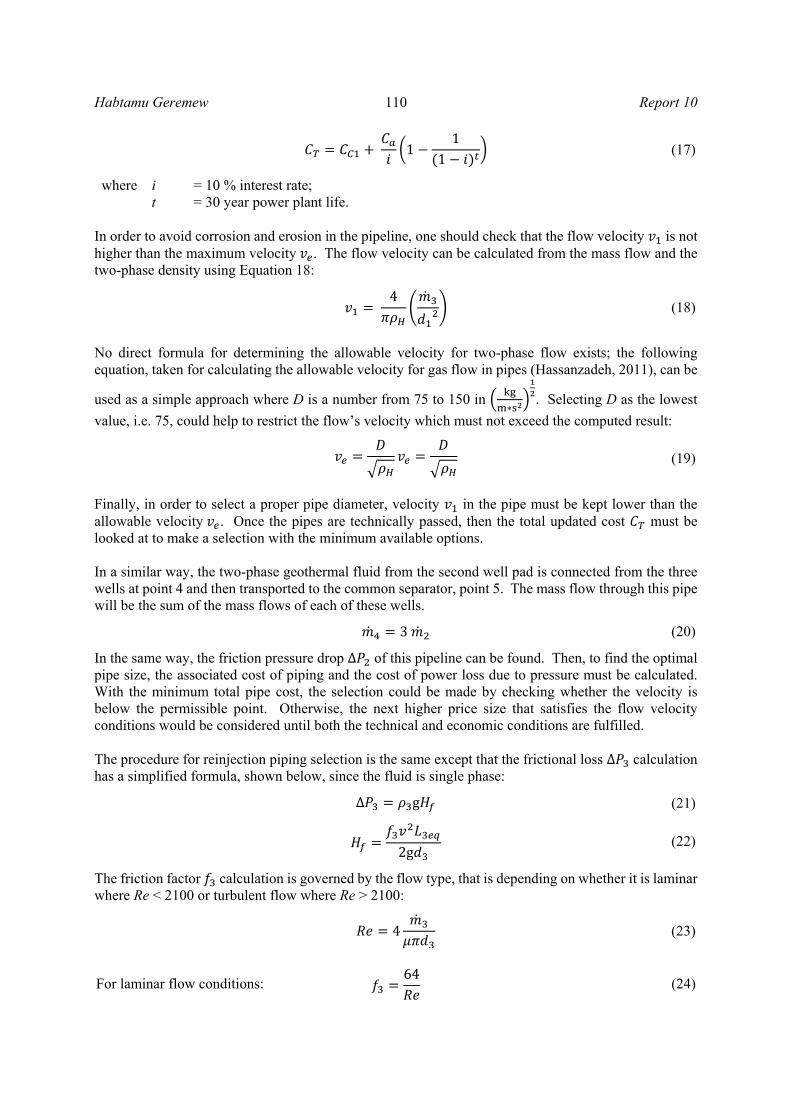
A clearer productivity curve for well LA-6 alone is redrawn in Figure 4 and the corresponding enthalpy wellhead pressure relation curve is displayed in Figure 5.
FIGURE 4: Productivity curve of well LA-6
Productivity curve of LA-6
Well head pressure P[2], bar-a
Flow
m_d
ot[2
], k
g/s
0.0 5.0 10.0 15.0 20.0 25.00
2
4
6
8
10
12
14
1583.6 15.86 ∗ 0.7026 ∗ (2)

Habtamu Geremew 104 Report 10
Figure 6 shows the location of the current wells and power plant as well as the planned expansion project. The current planned drilling site (well pad 1) is close to the Wonji fault, in the upflow zone where wells LA-3 and LA-6 are located. According to the drilling plans, the new wells on well pad 1 are expected to intersect the Wonji fault. The new wells are estimated to have similar output as wells LA-3 and LA-6. In this research project, it is assumed that all of the new wells will take the production characteristics of well LA-6. The presumption of unsuccessful wells is 15% (EFDRE MME, 2008). So, of the nine planned wells, at least seven should be successful. 1.2.2 Weather and climate data The elevation of the Aluto Langano geothermal project plant site is about 1920 m a.s.l. with an atmospheric pressure of 0.80 bar-a, a wet bulb temperature of 18°C, wind speed at an average of 2 m
FIGURE 5: Enthalpy and wellhead pressure relationship of well LA-6
FIGURE 6: The Aluto Langano geothermal expansion project geographic map
Well head pressure and enthalpy relation curve
Well head pressure P[2], bar-a
Ent
halp
y h[
2], k
J/kg
0.0 5.0 10.0 15.0 20.0 25.00
200
400
600
800
1000
1200
1400
1600
1800
2000
Well Pad 1
Well Pad 2
LA-6
LA-8
LA-4
LA-7
LA-3
Aluto I
Aluto II
C.S

Report 10 105 Habtamu Geremew
height is 2.0 m/s, and annual rainfall is in excess of 1000 mm. Generally, the climate is dry. The highest rainfall occurs between June and September with lighter rains in February and March. Highest temperatures generally occur between January and April and lowest between June and September (GENZL, 1996). Table 3 summarizes the weather data of the area. 1.2.3 Current Ethiopian electricity market information and the Aluto Langano geothermal project plan In Ethiopia the central electricity operator on the market is the Ethiopian Electric Power Corporation (EEPCo) which is a state owned enterprise. Its role includes electricity generation, grid operation and the supply of electricity. When funding major electric projects, an important part is also played by international donor organizations in funding large scale projects like this one, the Aluto Langano geothermal expansion project. The Ethiopian Energy Agency (EEA) is responsible for the electricity pricing tariff. Its tasks include price regulation, the licensing and supervision of independent power producers, approving power purchase agreements (PPAs) and regulating access to the grid by private sectors. EEA drafted, as of 2012, a feed-in tariff (FiT) proclamation for a variety of renewable energy resources including geothermal. Geothermal tariffs range from 0.08 to 0.10 USD/kWh for a producer generating power within a range of 100-500 kW. EEPCo will pay 0.055 USD/kWh to a company which generates electricity ranging from 25,000 to 50,000 kW capacity. Tariffs will be valid for up to 20 years (EFDRE MWE, 2012). The costs of a power system are usually expressed in terms of long run marginal costs. The average system generation cost for the planned expansion is 0.0455 USD/ kWh. The generation cost by source type is indicated in Table 4. The cost for transmission is estimated to be 0.007 USD/kWh. The distribution system is estimated to be 0.014 USD/kWh. Therefore, the cost of the power supply is estimated at 0.067 USD/kWh (EFDRE MWE, 2012).
TABLE 4: Electricity market figures in Ethiopia
Costs UScent/kWh IPP price sales for EEPCo UScent/kWhGeneration cost by type Production range up to - Hydro generation cost 4.02 100 kW 8 - Geothermal generation cost 7 500 kW 10 - Wind generation cost 8.7 25-50 MW 5.5 Average generation cost 4.55
EEPCo av. prise to customer 6
- Transmission cost 0.7 - Distribution cost 1.4 Total project development cost 6.7
2. MAIN DESIGN PARAMETERS OF THE POWER PLANT The Aluto Langano geothermal field is a high temperature liquid-dominated geothermal field. For the power production, three thermodynamic processes were modelled:
TABLE 3: Aluto Langano weather data (GENZL, 1996)
Annual mean maximum temperature 25°C Annual mean temperature 18°C Minimum temperature 5°C Maximum temperature 35°C Mean relative humidity 60% Mean Wet bulb temperature 18°C Atmospheric pressure 0.80 bar-a

Habtamu Geremew 106 Report 10
A. Single flash; B. Double flash with condensing turbines; C. Double flash with back-pressure turbine.
The organic Rankin cycle (ORC) and Kalina cycle were not taken into account because many studies indicated that they are better suited for lower-temperature and lower-enthalpy geothermal source power utilization than for the resource described here. 2.1 Major power plant equipment and their characteristics 2.1.1 Aluto Langano well pads (1 and 2) and the geothermal field layout The current Aluto Langano geothermal field, which is subject to expansion in the second phase, lies within an approximate circular 12 km2 area. Figure 6 shows the area where the project for development is planned. The solid lines indicate the existing power plant and its components; the dotted lines indicate one of the sited well pads with a second hypothetical well pad and ideal piping routes. The hypothetical power plant lies almost at the centre where the elevation is the lowest. So, in this study it is assumed that at one of the on-going drilling sites, four production wells will be drilled and, at the other well pad, three other production wells will be drilled. At each of the two well pads, the corresponding wells will be connected to the adjacent connection point or junction. The two-phase fluid is gathered and conveyed to the common primary separator, located near the power plant. Of the planned nine wells, these seven wells are assumed to be successful production wells and are responsible for the required power production. The other two wells are not considered in the modelling as at least 15% of the wells are presumed to be unsuccessful. So, in this study seven production wells are used hereafter
concerning the thermodynamic modelling of the power plant. For the gathering of two-phase geothermal fluid, proper evaluation is made to find the optimum diameter of pipe by optimizing the cost of piping and the effect on the loss of electricity production due to corresponding pressure drop. The amount of these pressure losses is accounted for by frictional losses. The power station site, as seen on the geographic map of the field, is at the lowest elevation so the fluids gain static head. The static head gain would, of course, compensate for the acceleration head loss. That effect is, however, neglected, so for the two-phase flow calculation of the pipe loss, only the frictional pipe loss is taken into account and not the compensation due to elevation differences. 2.1.2 Steam gathering system and spent fluid (brine and condensate) disposal There are two options for transporting geo-fluids from two-phase producing geothermal wells to power stations. Option 1, shown in Figure 7, involves transporting the two phases
FIGURE 7: Hypothetical steam gathering line and the power plant layout for Aluto Langano II
power station - option 1

Report 10 107 Habtamu Geremew
together and then separating them in the power station separator. Option 2, shown in Figure 8, first separates the phases, steam and liquid, near the well, then transports each phase separately to the power station. For this paper, the first option was chosen. As illustrated in Figure 7, the geothermal fluid reservoir is point 1. The geo-fluid in the wellhead at point 2 is then at the location connected to the respective junctions, at point 3 at well pad 1, and at point 4 at well pad 2. The flow is then transported as two phases to the common separator which is point 5. When considering fluid transport, it is important to find the optimal solution for reducing pipe frictional losses in order to keep the total costs, capital and operational costs as low as possible, and to keep the flow velocity below a reasonable allowable limit to protect the pipes from erosion. As there is no fundamental analytical formula for solving the pressure drop of any two-phase flow in a pipe, two different methods were found in the literature for our calculations. One is the homogeneous flow model where the two phases are treated as a single fluid; the other is the separate flow model where each phase is treated separately. The formula used to calculate the pressure drop according to the homogeneous flow model is shown in Equation 3:
∆2
∗ (3)
where = Length of the pipe line from point 3 to the common separator point 5; = Pipe internal diameter; = Total two-phase flow from the four production wells at well pad 1; = Homogeneous density calculated with Equation 7; = Friction factor expressed in terms of Reynolds number can be calculated from
Equation 9, and the Reynolds number is defined by Equation 10. The calculation described here refers to well pad 1. The same procedure was performed for well pad 2. The total flow from well pad 1 is the sum of each well flow as given by Equation 4:
4 ∗ (4)
where = Two-phase flow from each production well. The length is the direct length measured based on the best topographic route dimension between the two points. However, pipe fittings like bends, flange connections, expansions etc. will add to the length, proportional to the diameter of the pipe. For this reason, the equivalent length must be considered in the calculation, expressed in Equation 5:
FIGURE 8: Hypothetical steam gathering line and the power plant layout for Aluto Langano II
power station - option 2

Habtamu Geremew 108 Report 10
(5)
where = Equivalent length with the subscript indications; n = the number of pipe features existing in the total pipe route; = Subscript stands for bend; = Subscript stands for connections; = Subscript stands for expansion units; = Subscript stands for gate valve fully open.
The number of pipe fittings and the estimated possibilities over the range of the whole pipe length are shown in Table 5. The equivalent length of the pipe fittings for each size of pipes is also shown in the same table, adopted from Jónsson (2012).
TABLE 5: Number of pipe fittings used and equivalent length with pipe diameter
nb nc nu nv hb hc hu hv
6 2 3 2 = 20∗ =20∗ =20∗ =13∗
To calculate the homogeneous fluid density, , the homogeneous void fraction should first be calculated by Equation 6:
1
1 (6)
The homogeneous fluid density at the given temperature and pressure can be calculated by Equation 7:
1 (7)
where the G and the L subscripts identify the vapour and liquid properties of the geothermal fluid at point 3.
is the steam quality at point 3 which is equal to the quality at each wellhead , due to the assumptions made earlier and determined from the thermodynamic property table of water as a function of wellhead pressure and the corresponding enthalpy as follows:
(8)
The two-phase friction factor will be equal to the two-phase homogeneous friction factor when the mixture is treated as a homogeneous fluid and can be calculated by the following equation:
0.079
. (9)
The Reynolds number itself is calculated by
(10)
The homogeneous two-phase dynamic viscosity can also be found:
1 1 (11) To determine if the results of the homogeneous flow model is a good estimation or not, a separate flow model is also used for comparison. There are numerous separate flow models available, but the

Report 10 109 Habtamu Geremew
recommended one is the Friedel correlation, Equation 12. The Friedel correlation is the preferred two-phase flow computational method when the ratio of the dynamic viscosity of the liquid phase to the steam phase is less than 1000, i.e. when 1000 (Van Rooyen, 2006):
∆ ∆ ɸ (12)
In this case, a new parameter two-phase multiplier ɸ multiplied by the liquid phase pressure drop∆P gives the pressure drop of two phases∆ :
∆ 4 /12
(13)
At this time, the liquid friction factor and the Reynolds number are calculated with the same procedure as above but with the liquid property of the fluid at point 3. To calculate the two-phase multiplier, ɸ , several dimensionless factors: , E, F and H are needed. All can be found as follows (Equation 14 and Table 6):
ɸ3.24 ∗ ∗
. . (14)
where = The liquid number.
TABLE 6: Dimensionless factors for Equation 14
F H
g 1 . 1 .
. .
1.
Every calculable parameter expressed above is computed from the fluid property that gives maximum power output for each power plant model which will be given in Section 2.2, using an Excel sheet for ease of computing. After doing all these calculations, the corresponding power loss due to pressure drop is found. The second thing to look at when determining the optimum piping network is the cost. The investment cost and the power loss corresponding to friction loss in the piping are the main parameters to be minimized. The annual punishment of power in frictional pressure loss in the pipe is given in Equation 15:
∆ (15)
The initial capital cost, of the piping is calculated:
(16)
where = Cost of electric energy in $/kWh; = Number of operating hours in a year with 90% availability; = Cost of pipe and insulation in $/m; = Cost of pipe bends in $/unit; = Cost of connections in $/unit; = Cost of valves in $/unit; = Cost of pumps $/unit; n = The numbers of each pipe fitting.
The net present value total updated cost of the pipe for each series is given by:
Habtamu Geremew 110 Report 10
11
1 (17)
where i = 10 % interest rate; t = 30 year power plant life.
In order to avoid corrosion and erosion in the pipeline, one should check that the flow velocity is not higher than the maximum velocity . The flow velocity can be calculated from the mass flow and the two-phase density using Equation 18:
4
(18)
No direct formula for determining the allowable velocity for two-phase flow exists; the following equation, taken for calculating the allowable velocity for gas flow in pipes (Hassanzadeh, 2011), can be
used as a simple approach where D is a number from 75 to 150 in ∗
. Selecting D as the lowest
value, i.e. 75, could help to restrict the flow’s velocity which must not exceed the computed result:
(19)
Finally, in order to select a proper pipe diameter, velocity in the pipe must be kept lower than the allowable velocity . Once the pipes are technically passed, then the total updated cost must be looked at to make a selection with the minimum available options. In a similar way, the two-phase geothermal fluid from the second well pad is connected from the three wells at point 4 and then transported to the common separator, point 5. The mass flow through this pipe will be the sum of the mass flows of each of these wells.
3 (20)
In the same way, the friction pressure drop ∆ of this pipeline can be found. Then, to find the optimal pipe size, the associated cost of piping and the cost of power loss due to pressure must be calculated. With the minimum total pipe cost, the selection could be made by checking whether the velocity is below the permissible point. Otherwise, the next higher price size that satisfies the flow velocity conditions would be considered until both the technical and economic conditions are fulfilled. The procedure for reinjection piping selection is the same except that the frictional loss ∆ calculation has a simplified formula, shown below, since the fluid is single phase:
∆ g (21)
2g
(22)
The friction factor calculation is governed by the flow type, that is depending on whether it is laminar where Re < 2100 or turbulent flow where Re > 2100:
4 (23)
For laminar flow conditions: 64
(24)

Report 10 111 Habtamu Geremew
And for turbulent flow conditions:
0.25
log.
..
(25)
To find the velocity of the pipe, , we have a straightforward formula expressed in Equation 26; the allowable velocity, determined by rule of thumb for single-phase liquid, is 3 m/s.
4 (26)
TABLE 7: Piping and pipe feature cost table (Jónsson, 2012)
No. Nominal diameter
(mm)
Pipe and insulation (USD/m)
Bends (USD/unit)
Valve (USD/unit)
Connection (USD/unit)
Pump (USD/unit)
1 150 40 64 233 70 4260 2 200 66 76 246 81 4020 3 250 87 120 298 130 4430 4 300 110 145 340 150 4370 5 400 145 164 420 200 4680 6 500 153 189 480 260 4940 7 600 196 221 560 310 5630 8 700 247 276 590 470 6400 9 800 325 325 687 550 7230 10 900 392 392 754 760 9450
Then keeping the velocity below the maximum allowable, the proper pipe size diameter of the re-injection pipe will be found by minimizing the capital cost, from Equation 29:
∆ (27)
(28)
11
1 (29)
The pressure loss in the selected pipe must be compensated for by pumping the fluid because otherwise flashing of the fluid might occur causing great vibrations in the pipe. That could destroy the pipe network since the reinjection temperature is higher than 100°C (conclusion of the thermodynamic models, given in Subsection 2.2) and flashing could occur if the pressure is not increased. 2.1.3 Primary separator (5) The output of the seven production wells is seven times the productivity of well LA-6. The conditions at the reservoir are considered to remain constant, while the behaviour of the production wells is assumed to follow the productivity curve of well LA-6. The separation pressure is lower than the wellhead pressure with a difference of friction loss as shown in Equation 30:
∆ (30)
And the mass flow at the separator, :
5 ∗ 12.96.4361000
∗3.6821000
∗ (31)

Habtamu Geremew 112 Report 10
The purpose of the separator is to separate the two-phase mixtures into separate streams of steam and liquid. But how low the pressure is set in the separator determines how much dry steam is produced as a result of flashing from the reservoir. For the single-flash model, the goal is to obtain an optimal separation pressure that can give the highest possible outputs:
(32) 2.1.4 Secondary separator (9 and 10) In the case of a double-flash system, the separated brine from the primary separator is throttled and sent to a second stage separator. This second stage separator may also get steam from the back pressure turbine in the case of double flash with back pressure; otherwise, if the double-flash plant has condensing turbine units, only the low-grade brine that came from the common separator will be allowed to be flashed alone. As the flashed dry steam goes to the low-pressure turbine, the spent brine is sent for reinjection. The two parameters that can provide maximum output are the separator pressures in both the first and second stages:
(33) 2.1.5 Turbines The geothermal steam at the steam turbine inlet is in a similar condition as the separator steam phase except with a little pressure drop due to losses during the transportation of the steam from the separator to the turbine inlet. But if the separators are located within or near the power station, the loss can be ignored. The mass of steam at the inlet steam condition determines, in conjunction with the outlet condition, how much power production would be possible for the available enthalpy. Output power of the turbine depends on steam consumption of the steam turbine and the efficiency of the turbine. The efficiency will depend on turbine size or rotor diameter, blade geometries, speed, extreme conditions of the steam and other losses. Hence, efficiency is a fixed value decided upon during turbine selection in the turbine manufacturer’s catalogue. The isentropic turbine efficiency, , is defined as the ratio of the actual work to the isentropic work, given by Equation 34:
(34)
Most turbines can attain isentropic dry turbine efficiency of 0.85%. So, this value is used for the calculations in this report. Taking into account that the steam that exists inside the turbine may not be 100% dry then, according to the Baumann rule, the wet turbine efficiency will be related to the dryness fraction of the steam entering and leaving the turbine with the dry isentropic efficiency (DiPippo, 2007). The enthalpy exiting the turbine would then be:
∗ 1
1 (35)
Factor A is: 0.425 ∗ (36)
where the subscript numbers indicate the state points and the associated subscript letters ‘f’, ‘g’ and ‘s’ are the liquid, the steam phase and the isentropic state values, respectively. The state points refer to the property plot and schematic diagrams presented in Section 2.2.
Report 10 113 Habtamu Geremew
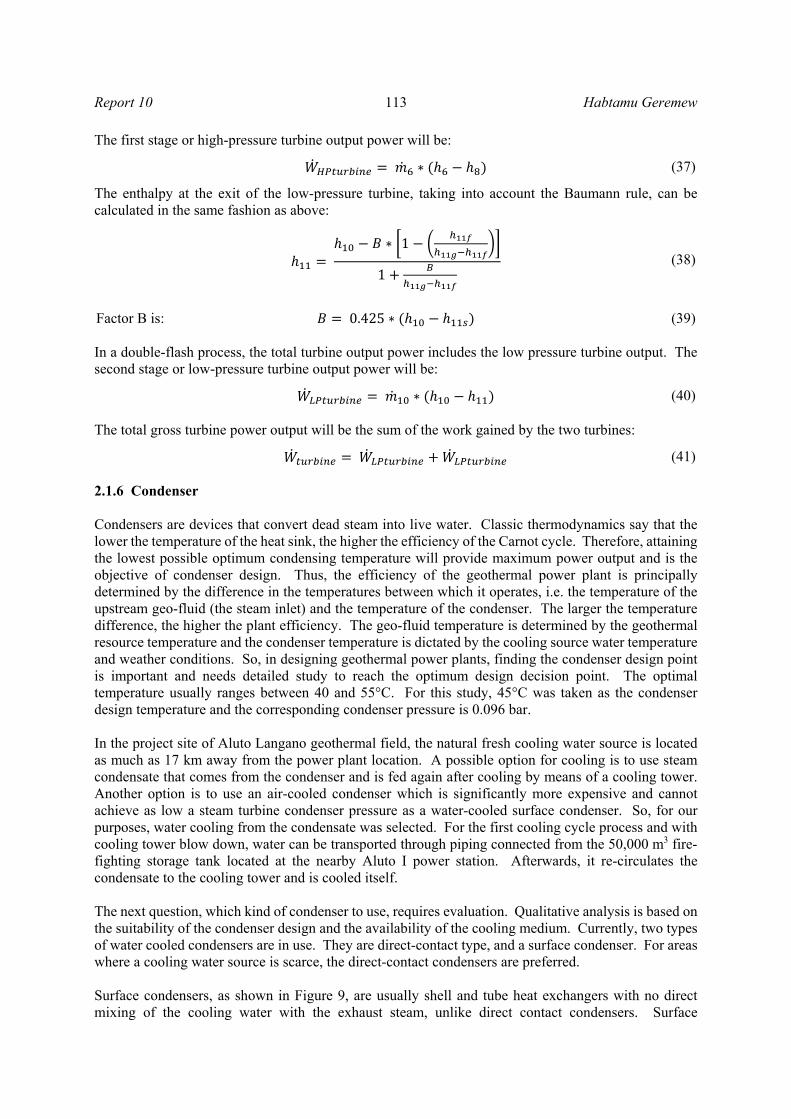
The first stage or high-pressure turbine output power will be:
∗ (37)
The enthalpy at the exit of the low-pressure turbine, taking into account the Baumann rule, can be calculated in the same fashion as above:
∗ 1
1 (38)
Factor B is: 0.425 ∗ (39) In a double-flash process, the total turbine output power includes the low pressure turbine output. The second stage or low-pressure turbine output power will be:
∗ (40) The total gross turbine power output will be the sum of the work gained by the two turbines:
(41) 2.1.6 Condenser Condensers are devices that convert dead steam into live water. Classic thermodynamics say that the lower the temperature of the heat sink, the higher the efficiency of the Carnot cycle. Therefore, attaining the lowest possible optimum condensing temperature will provide maximum power output and is the objective of condenser design. Thus, the efficiency of the geothermal power plant is principally determined by the difference in the temperatures between which it operates, i.e. the temperature of the upstream geo-fluid (the steam inlet) and the temperature of the condenser. The larger the temperature difference, the higher the plant efficiency. The geo-fluid temperature is determined by the geothermal resource temperature and the condenser temperature is dictated by the cooling source water temperature and weather conditions. So, in designing geothermal power plants, finding the condenser design point is important and needs detailed study to reach the optimum design decision point. The optimal temperature usually ranges between 40 and 55°C. For this study, 45°C was taken as the condenser design temperature and the corresponding condenser pressure is 0.096 bar. In the project site of Aluto Langano geothermal field, the natural fresh cooling water source is located as much as 17 km away from the power plant location. A possible option for cooling is to use steam condensate that comes from the condenser and is fed again after cooling by means of a cooling tower. Another option is to use an air-cooled condenser which is significantly more expensive and cannot achieve as low a steam turbine condenser pressure as a water-cooled surface condenser. So, for our purposes, water cooling from the condensate was selected. For the first cooling cycle process and with cooling tower blow down, water can be transported through piping connected from the 50,000 m3 fire-fighting storage tank located at the nearby Aluto I power station. Afterwards, it re-circulates the condensate to the cooling tower and is cooled itself. The next question, which kind of condenser to use, requires evaluation. Qualitative analysis is based on the suitability of the condenser design and the availability of the cooling medium. Currently, two types of water cooled condensers are in use. They are direct-contact type, and a surface condenser. For areas where a cooling water source is scarce, the direct-contact condensers are preferred. Surface condensers, as shown in Figure 9, are usually shell and tube heat exchangers with no direct mixing of the cooling water with the exhaust steam, unlike direct contact condensers. Surface

Habtamu Geremew 114 Report 10
condensers require abundant amounts of clean cooling water to reduce the condenser temperature and, hence, to create a high level of vacuum. In a direct-contact condenser, the spent steam from the turbine flows down through a concurrent section and mixes with cool water released from above the structured packing layer. A typical geothermal direct-contact condenser is shown in Figure 10. Most of the steam condenses on the structured packing framework and drips down into a hot well to be pumped to cooling towers. Any steam that has not condensed is drawn upward through the counter-current section, and non-condensable gases are then taken out by the integral gas extraction equipment. Most geothermal condensers are direct contact condensers, constructed to condense steam and other condensable vapours by means of direct contact with condensing water. So, based on the above mentioned qualitative advantage, a direct condenser was selected as the preferred condenser type. 2.1.7 Cooling tower To attain a good condenser operation, temperature effective design is required for rejecting as much of the exhaust heat as possible to the atmosphere, the heat sink. This can be done by implementing effective use of the cooling tower, which is an integral part of the condenser. Cooling towers are devices that reject heat primarily by evaporating the water that comes from the condenser into the air. Heat rejection is accomplished via the heat and mass transfer occurring at the direct contact between hot water droplets and ambient air. The two most common tower designs are forced air counter flow and induced air cross flow. Cooling tower energy use is a function of fan and pump power. To generate the same quantity of cooling, forced air counter flow towers require more fan and more pump energy than induced air cross flow towers. Thus, with the least power consumption, mechanical draft counter-flow wet cooling towers are usually adopted and were selected for this case also. Figure 11 shows a typical mechanical draft counter flow wet cooling tower. There are a lot of parameters which affect cooling tower design and operation. The most influential parameters for the design are the water flow rate, the entering air flow, the ambient wet bulb temperature, the hot water temperature and the cold water
FIGURE 9: A typical surface condenser (Wikipedia, 2012)
FIGURE 10: A direct-contact condenser (Hicks, 2010)
FIGURE 11: A cooling tower diagram

Report 10 115 Habtamu Geremew
temperature. The temperature of the cooling water exiting a cooling tower is a function of the wet bulb temperature Twb of the air at the site. When evaluating cooling tower performance, key data is the site weather information, particularly wet bulb temperatures throughout the year. So, in deciding the design ambient wet bulb temperature, the value should never be exceeded by more than 3-5%. Aluto Langano field Twb = 18.2°C was selected as an optimal design wet bulb temperature. In addition, an optimal cold water temperature was chosen on the basis of how close the temperature of the cold water was to the wet bulb temperature; this is called the approach. The temperature difference between the cold water and the hot water is called range and is another design decision point. The approach and range are demonstrated in Figure 12. Generally, cooling towers are designed with an approach, AP , of 10-15°F (Leeper, 1981). Keeping this rule, the selected AP was 6°C for 24°C ambient design temperature. For a given set of cooling tower design conditions, an optimum design (outlet air temperature / water-air flow rate ratio) exists. Optimum design will result in minimum construction and operating costs. A good correlation exists between the optimum outlet air temperature and the inlet and outlet water temperatures (Leeper, 1981):
2
(42)
With T13 the condenser temperature and T14 the cold water temperature, the design air exit temperature will be Twb = 34.6°C. Having set all the design decision point requirements (the internal process involves the exchange of both heat and mass between the air and the water), the mass and energy balance equations will provide all the remaining necessary parameters. In Figure 11, the cooling tower number labels are given for the single-flash model; all the labels are listed in Subsection 2.2.1. State point 16 is inlet air; dry air is state point 17, and water vapour is state point 18. Similarly, cooling tower exit air is state point 19, with dry air 20, and exit water vapour 21. State point 15 is cooled water going to the condenser, and 13 is incoming hot water from the hot well of the condenser for subsequent cooling. Water mass balance: ∗ ∗ (43)
Energy balance: ∗ ∗ ∗ ∗ (44)
Leaving mass flow of water vapour: ∗ (45)
Entering mass flow of water vapour: ∗ (46)
where and are the specific humidity of the air at the inlet and at the exit of the cooling tower, respectively.
FIGURE 12: Cooling tower approach and range
Habtamu Geremew 116 Report 10
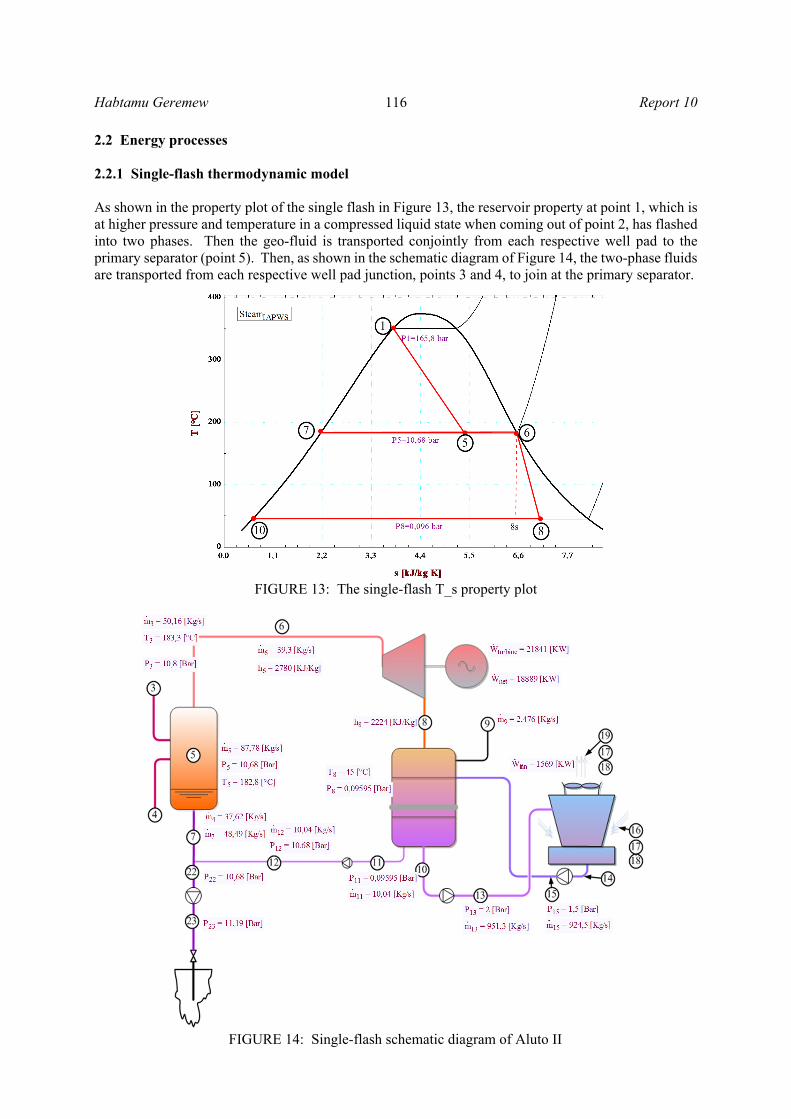
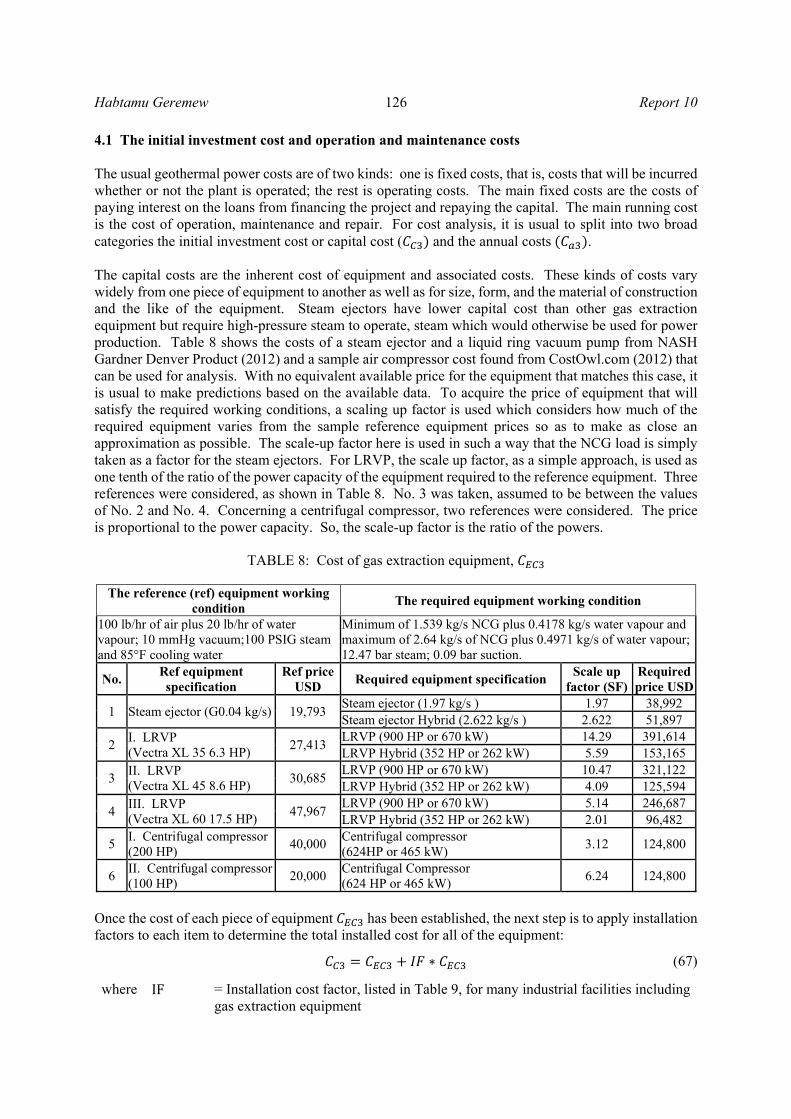
2.2 Energy processes 2.2.1 Single-flash thermodynamic model As shown in the property plot of the single flash in Figure 13, the reservoir property at point 1, which is at higher pressure and temperature in a compressed liquid state when coming out of point 2, has flashed into two phases. Then the geo-fluid is transported conjointly from each respective well pad to the primary separator (point 5). Then, as shown in the schematic diagram of Figure 14, the two-phase fluids are transported from each respective well pad junction, points 3 and 4, to join at the primary separator.
FIGURE 13: The single-flash T_s property plot
FIGURE 14: Single-flash schematic diagram of Aluto II

Report 10 117 Habtamu Geremew
Work output from the turbine is the product of the steam flow rate and the difference of the inlet and outlet enthalpies. In the single-flashing system, the lower the flashing pressure the higher the steam production rate. However, the steam energy (enthalpies) will go down. With the aid of the Engineering Equation Solver (EES), it was found that the particular optimum point P5 in the model is where maximum power output, , can be found. The thermodynamic process of a single-flash system is when separated steam at state point 6 goes to the turbine, while liquid brine (state point 7) goes to reinjection. After running the turbine and producing work output, the exhaust steam at state point 8 enters the condenser where a cooling process takes place with an exchange of heat energy and mass. Non-condensable gases are eliminated through the suction line at point 9. Two outlets of hot water from the hot well of the condenser are provided; most of the hot water is recirculated in the cooling tower while the remaining fraction joins the spent brine, after being pumped to separation pressure where it is pumped to the reinjection well with the aid of an intermittent high pressure booster pump to compensate for consequent pressure drop. Sufficient condensed water is circulated each time to the cooling tower. So, make-up water is not required most of the time. But whenever maintenance activity is going on, water from the fire protection storage tank from Aluto I will enhance the tower. In the system, four pumps are required: the hot well recirculation pump, the cold well recirculation pump, the spent condensation pump and the reinjection pump. The auxiliary power consumption of each pump is:
∗ ∗ ∗ 100
(47)
where is the amount of condensate to be pumped by the pump, is the specific volume of condensate, is the pressure at the pump discharge and is the pump suction pressure. A total pump efficiency of 85% was used for this report. The total pump power consumption is the sum of the power consumption of all four pumps which is
(48)
The fan power requirement is: ∗ ∆
(49)
The volume flow rate of air: (50)
2.2.2 Double flash with condensing turbines thermodynamic model By employing another stage of flashing, the temperature of the discharged water is lowered and thus the work output of the plant can be greatly increased. Figure 15 shows a simplified scheme for double flash with two condensing turbines. The flashed steam from the primary separator goes to the high-pressure turbine. The exhaust goes directly to the condenser. The separated brine at the first stage is throttled to second stage optimal pressure where it flashes again and the flashed steam is allowed to run the low-pressure turbine. Part of the condensate is pumped to the cooling tower for cooling system circulation and the leftover joins the spent brine to be later pumped to the reinjection well. The temperature-entropy diagram, Figure 16, also displays how the double-flash system starts at state point 1 which is the reservoir. State point 5 is at the common separation station where the two-phase

Habtamu Geremew 118 Report 10
fluid from the two well pads (state points 3 and 4) join. State point 6 is the turbine inlet, and state point 8 is the condenser inlet. The brine at point 7 is throttled through a valve and the pressure is reduced to the optimum pressure which is point 9. At state point 10, flashed steam drives the low-pressure turbine with the exhaust at point 11, joins with point 8 to mark state point 13 and is then admitted into the condenser. The steam is condensed and at state point 15 becomes pure saturated liquid fluid, which is the desired condition.
FIGURE 16: A T_s property plot for double flash with condensing turbines
0,0 1,1 2,2 3,3 4,4 5,5 6,6 7,70
100
200
300
400
s [kJ/kg-K]
T [
°C]
P1=165,6 bar
P5=12,38 bar
P9=1,566 bar
P13=0,096 bar
SteamIAPWS
FIGURE 15: Double-flash schematic diagram with condensing turbines

Report 10 119 Habtamu Geremew
2.2.3 Double flash with back pressure turbine and condensing turbines In this system, a double flash is combined with a high-pressure turbine to act as a back-pressure turbine unit where the steam exhaust at point 8, which is still at a higher pressure and temperature, joins the throttled brine at point 9. With the mixture flashed in the secondary separator, the flashed steam drives the low-pressure turbine while the spent brine is disposed of at point 12. Figure 17 is a temperature-entropy (T-s) diagram of a double flash with a back pressure first turbine and a low-pressure condensing turbine. Figure 18 is its schematic diagram. The reservoir fluid at the compressed liquid state at point
FIGURE 17: A T_s property plot of double flash with back
pressure and condensing turbine
FIGURE 18: A schematic diagram of double flash with back
pressure and condensing turbine
0,0 1,1 2,2 3,3 4,4 5,5 6,6 7,70
100
200
300
400
s [kJ/kg-K]
T [
°C]
P1=165,6 bar
P5=12,47 bar
P9=1,443 bar
P13=0,096 bar
SteamIAPWS
13s
8s
P3 = 12,59 [Bar]
m3 = 49,59 [Kg/s]
m4 = 37,19 [Kg/s]
h6 = 2786 [KJ/Kg]
h8 = 2484 [KJ/Kg]
h11 = 2692 [KJ/Kg]
m6 = 37,95 [Kg/s]
m8 = 37,95 [Kg/s]
T3 = 190,2 [°C]
T4 = 190,2 [°C]
P4 = 12,59 [Bar]
P5 = 12,47 [Bar]
P27 = 1,443 [Bar]
Wturbine = 25213 [KW]
Wnet = 21913 [KW]
T13 = 45 [°C]
m14 = 2,643 [Kg/s]
P28 = 1,956 [Bar]
m12 = 44,84 [Kg/s]
P9 = 1,443 [Bar]
T5 = 189,7 [°C]
T10 = 110,2 [°C]
m9 = 48,83 [Kg/s]
h13 = 2364 [KJ/Kg]
P13 = 0,09595 [Bar]
P17 = 1,443 [Bar]
Twb = 18,2 [°C]
P20 = 1,5 [Bar]
Wfan = 1788 [KW]
m11 = 41,95 [Kg/s]
m20 = 1055 [Kg/s]

Habtamu Geremew 120 Report 10
1 gets flashed adiabatically into two phases at state point 2 at the wellhead. The wells are all connected to one another at the nearby well pad junction. Connection point 3 is the junction point for well pad one, whereas well pad two is connected at point 4. The two-phase fluids from each well pad are transported separately to the separator, point 5. There the total geothermal well flow is conjoined and the steam and brine are separated. The steam enters the turbine at state point 6 and the turbine exhaust is state point 8. The brine from the separator, state point 7, is throttled to point 9 with an isenthalpic process and joined with point 8 at the flasher, point 10. The flashed steam at state point 11 enters the low-pressure separator and comes out as a mixture of liquid and low-grade steam at state point 13. To keep the turbine output of pure liquid, point 15, the system requires a condenser to convert the mixture at state point 13. 3. GAS EXTRACTION DESIGNS Non-condensable gases (NCG) are transported with the steam to the turbine and the condenser. They do not condense in water and tend to collect in the steam space in the condenser. Unless removed continuously and efficiently, they may sharply interfere with the heat transfer process in the condenser and hence lead to an increase in condenser pressure which results in great generation power reduction. Therefore, efficient collection and removal of non-condensable gases is of great importance for efficient power production. A reliable design for the collection and expulsion of non-condensable gases is particularly important in the design of the condensers used in geothermal plants where the geothermal steam extracted from the ground has a large fraction of associated gases. The most familiar gas extraction systems used in geothermal power plants are steam jet ejectors, liquid ring vacuum pumps (LRVP), centrifugal compressors and hybrid systems (any combination of the above systems, but the most common hybrid system is a steam jet ejector combined with LRVP). Each of the above systems has been studied thoroughly. Their usage range in geothermal application is classified in terms of the gas content of the geothermal field and the degree of vacuum requirements. In this paper, the above four gas extraction systems were designed for the Aluto Langano geothermal power plant II, based on the results of the energy model of a double flash with a back pressure turbine unit, which turned out to be the process giving the highest energy outputs (see Section 5.2). 3.1 Steam ejector design Ejectors are supersonic flow induction devices employed for the generation of a vacuum for compressing a fluid. High-pressure motive fluid at enters a converging diverging nozzle and is accelerated to a supersonic Mach number. This creates lower pressure than the condenser ( < ) so that the entrained fluids, NCG and saturated water vapour are sucked in and drawn into the ejector. Then, the uniform mixture is diffused to reach discharge pressure . In the steam ejector (Figurer 19) design, the first thing to do is to
FIGURE 19: Steam ejector
P6 = 12,47 [Bar] m6M = 13,98 [Kg/s]
m6T = 23,97 [Kg/s] m13T = 27,97 [Kg/s]
P14 = 0,09595 [Bar]
P14suc = 0,08636 [Bar]
T 14suc = 38,81 [°C]
m14 = 2,094 [Kg/s]
m14NCG = 1,762 [Kg/s]
m14wv = 0,3316 [Kg/s]
P29 = 0,84 [Bar]

Report 10 121 Habtamu Geremew
specify all the design conditions based on the data available and follow the recommended design procedure. Since 2/3 of the NCG mass flow is CO2, and the rest are gases with lower molecular weight, the NCG are assumed to be only carbon dioxide here and the mixture is treated as an ideal gas. The design data for this study case are: the total pressure of the motive fluid; the pressure of the entrained fluid, , the associated total temperatures, and ; and the amount of NCG in the steam flow into the condenser. Ejectors are typically sized based on a gas and vapour inlet temperature equal to 7.5°F (around 4.5°C for 43°C saturation suction temperature) below the saturation temperature, corresponding to the design suction pressure of the venting equipment (HEI, 2004). The design suction pressure itself is 10% lower than the condenser pressure, taking into account the pressure drop through the suction of the ejector; the design discharge pressure is 10% higher than atmospheric pressure. The non-condensable and condensable suction load is:
(51) The required mass flow of water vapour for the steam ejecting process can be determined by:
∗ ∗ (52)
where = Molecular weight of water vapour; = Molecular weight of carbon dioxide (NCG); = Partial pressure of carbon dioxide; = Partial pressure of water vapour which is approximately equal to the vapour
pressure at the cooling water temperature T ; The partial pressure of NCG is: P P P (53)
The main thing is to calculate the amount of motive steam required to evacuate the NCG load of . First it is required to convert the NCG and water vapour of the load gas into the air equivalent of
21°C. To do so, temperature correction (TCF) and molecular weight correction (WER) charts are available, as shown in Figures 20 and 21, respectively. After correcting the NCG and water vapour into the air equivalent, the individual values are added to finally get the total air equivalent. In the air to steam ratio vs. expansion ratio chart, compression ratio values are available and the air to steam ratio can be read from Figure 22 (Teke, 2011).
FIGURE 20: Temperature correction factor (Teke, 2011)
FIGURE 21: Molecular weight entrainment ratio (Teke, 2011)

Habtamu Geremew 122 Report 10
The compression ratio is:
(54)
The expansion ratio, ER, is:
(55)
The dry air equivalent of water vapour is:
∗
(56)
The dry air equivalent of NCG is:
∗
(57)
The dry air equivalent of total gas load is:
(58)
Finally, the motive steam required, SC, is:
(59)
FIGURE 22: Air to steam ratio (Teke, 2011)

Report 10 123 Habtamu Geremew
3.2 Liquid-ring vacuum pump design Next to ejectors, liquid-ring vacuum pumps (LRVP) are the most widely used vacuum-producing devices in the industry. The LRVP is a specific form of rotary positive-displacement pump utilizing liquid as the principal element in gas compression. The compression is performed by a ring of liquid formed as a result of the relative eccentricity between the pump’s casing and a rotating multi-bladed impeller. The eccentricity results in almost completely filling the partial emptying of each rotor chamber during every revolution. The filling-and-emptying action creates a piston action within each set of rotor impeller blades. The pump’s components are positioned in such a manner that they admit gas when the rotor chamber is emptying the liquid, and then to allow the gas to discharge once compression is completed. Sealing areas between the inlet and discharge ports are provided to close the rotor areas and to separate the inlet and discharge flows. In Figure 23, the liquid-ring vacuum pump is connected to the suction end of condenser 14 and the NCG discharge 29. The required power of the LRVP is calculated by the following equation (Siregar, 2004):
1∗ ∗∗
1 (60)
3.3 Centrifugal compressor design In geothermal power plants where high concentrations of NCG are included in the geo-fluid, a centrifugal compressor is the usual preferred NCG removal equipment. Centrifugal compressors, also known as turbo-compressors, belong to the roto-dynamic type of compressors. The installation of a centrifugal compressor is the same as for LRVP with the suction (14) at the inlet of the NCG load and the discharge at 29, shown in Figure 24. In these compressors, the required pressure rise takes place due to the continuous conversion of angular momentum imparted to the gas load by a high-speed impeller into static pressure. So the isentropic power input to the compressor, neglecting the heat transfer rate, is given by:
FIGURE 23: Liquid-ring vacuum pump (LRVP) gas extraction system
where = Suction temperature (°K); = Universal gas constant in (J/mol °K); = Isentropic pump efficiency of 85%; = Ratio of specific heats for CO2 which is 1.28.
P14suc = 0,0864 [Bar]
T14suc = 38,81 [°C]
m14 = 3,14 [Kg/s]
P14 = 0,096 [Bar]
Wlrvp = 668,2 [KW]
P29 = 0,88 [Bar]

Habtamu Geremew 124 Report 10
∗(61)
For actual centrifugal compressors, the polytrophic efficiency is normally in the range of 70-85% (Hanlon, 2001). Because the gas load is a mixture of NCG and water vapour, we need to find the compressor inlet and outlet enthalpies for them separately. Suction enthalpy: (62) where = Enthalpy of CO2 at and ; = Enthalpy of water vapour at and ; For further analysis in finding the outlet enthalpies, entropies for NCG and water vapour at the suction parameter should be read from the property tables. Assuming isentropic compression entropy across the compressor is not changed, outlet entropies are equal. So from the energy balance of the mixture at the discharge, the discharge enthalpy will be:
Discharge enthalpy: ∗ ∗
(63)
Knowing the compressor outlet pressure and the entropy values from property tables of steam and CO2, the corresponding enthalpies and can be read. Finally, Equation 63 will be solved. 3.4 Hybrid system, steam ejector and liquid ring vacuum pump combination The combination of liquid ring vacuum pumps with steam jet ejectors, commonly referred to as a hybrid system, is one of the more efficient methods for producing a vacuum. In the hybrid system, a steam jet
FIGURE 24: Centrifugal compressor gas extraction system
P14suc = 0,08636 [Bar]
P14 = 0,09595 [Bar]
m14 = 3,14 [Kg/s]
P29 = 0,88 [Bar]
m29 = 3,14 [Kg/s]
Wcompressor = 465 [K
m14NCG = 2,643 [Kg/s]
m14wv = 0,4974 [Kg/s]
T14suc = 38,81 [°C]

Report 10 125 Habtamu Geremew
ejector is used as the first stage of the unit, shown in Figure 25. The ejector discharges into an inter-condenser which is followed by a liquid ring vacuum pump which compresses the gas load to the final stage. The compression shared by the steam ejector and the LRVP is assumed to be equal:
(64)
In the inter-condenser, the mixture of steam ejector motive steam and entrained load gas are allowed to cool with direct mixing of cooling water. Again here, the NCG saturated water vapour is sucked up by the LRVP while the remaining hot water goes to the cooling tower after joining with condensate from the main condenser. So, here simple mass and energy balance equations will decide how much cooling water is required to keep the inter-cooler temperature the same as that of the main condenser. The mass balance: (65) The energy balance: h ∗ m h ° ∗ m h ∗ m h ∗ m (66) 4. ECONOMIC EVALUATION OF GAS EXTRACTION SYSTEMS USING THE NET PRESENT VALUE METHOD There are several important determinants of the cost of electricity generated by a geothermal power plant. Some of these are intuitively clear whilst others are less obvious. Gas extraction systems are one of the generated electricity cost determinants and are among the major geothermal power plant equipment that need detail evaluation. In this specific study, the economics of gas extraction systems, using the costs of their equipment, their calculated energy performance and or energy savings, will come into analysis. The total capital and operating costs of an integrated power plant are not involved in this analysis.
FIGURE 25: Hybrid gas extraction system
P6 = 12,47 [Bar] m6M = 4,033 [Kg/s]
m6T = 33,92 [Kg/s]
m13T = 37,92 [Kg/s]
P14suc = 0,0864 [Bar]
T 14suc = 38,81 [°C]
P14 = 0,096 [Bar]
T 20 = 24,2 [°C]
m15HW2 = 69,34 [Kg/s]
T 15 = 45 [°C]
m20CW2 = 65,24 [Kg/s]
P29 = 0,2757 [Bar]
P30 = 0,2757 [Bar]
T 30 = 45 [°C] P31 = 0,88 [Bar]
Inter condenser
Habtamu Geremew 126 Report 10
4.1 The initial investment cost and operation and maintenance costs The usual geothermal power costs are of two kinds: one is fixed costs, that is, costs that will be incurred whether or not the plant is operated; the rest is operating costs. The main fixed costs are the costs of paying interest on the loans from financing the project and repaying the capital. The main running cost is the cost of operation, maintenance and repair. For cost analysis, it is usual to split into two broad categories the initial investment cost or capital cost ( and the annual costs . The capital costs are the inherent cost of equipment and associated costs. These kinds of costs vary widely from one piece of equipment to another as well as for size, form, and the material of construction and the like of the equipment. Steam ejectors have lower capital cost than other gas extraction equipment but require high-pressure steam to operate, steam which would otherwise be used for power production. Table 8 shows the costs of a steam ejector and a liquid ring vacuum pump from NASH Gardner Denver Product (2012) and a sample air compressor cost found from CostOwl.com (2012) that can be used for analysis. With no equivalent available price for the equipment that matches this case, it is usual to make predictions based on the available data. To acquire the price of equipment that will satisfy the required working conditions, a scaling up factor is used which considers how much of the required equipment varies from the sample reference equipment prices so as to make as close an approximation as possible. The scale-up factor here is used in such a way that the NCG load is simply taken as a factor for the steam ejectors. For LRVP, the scale up factor, as a simple approach, is used as one tenth of the ratio of the power capacity of the equipment required to the reference equipment. Three references were considered, as shown in Table 8. No. 3 was taken, assumed to be between the values of No. 2 and No. 4. Concerning a centrifugal compressor, two references were considered. The price is proportional to the power capacity. So, the scale-up factor is the ratio of the powers.
TABLE 8: Cost of gas extraction equipment,
The reference (ref) equipment working condition
The required equipment working condition
100 lb/hr of air plus 20 lb/hr of water vapour; 10 mmHg vacuum;100 PSIG steam and 85°F cooling water
Minimum of 1.539 kg/s NCG plus 0.4178 kg/s water vapour and maximum of 2.64 kg/s of NCG plus 0.4971 kg/s of water vapour; 12.47 bar steam; 0.09 bar suction.
No. Ref equipment specification
Ref price USD
Required equipment specification Scale up
factor (SF) Required price USD
1 Steam ejector (G0.04 kg/s) 19,793 Steam ejector (1.97 kg/s ) 1.97 38,992 Steam ejector Hybrid (2.622 kg/s ) 2.622 51,897
2 I. LRVP (Vectra XL 35 6.3 HP)
27,413 LRVP (900 HP or 670 kW) 14.29 391,614 LRVP Hybrid (352 HP or 262 kW) 5.59 153,165
3 II. LRVP (Vectra XL 45 8.6 HP)
30,685 LRVP (900 HP or 670 kW) 10.47 321,122 LRVP Hybrid (352 HP or 262 kW) 4.09 125,594
4 III. LRVP (Vectra XL 60 17.5 HP)
47,967 LRVP (900 HP or 670 kW) 5.14 246,687 LRVP Hybrid (352 HP or 262 kW) 2.01 96,482
5 I. Centrifugal compressor (200 HP)
40,000 Centrifugal compressor (624HP or 465 kW)
3.12 124,800
6 II. Centrifugal compressor (100 HP)
20,000 Centrifugal Compressor (624 HP or 465 kW)
6.24 124,800
Once the cost of each piece of equipment has been established, the next step is to apply installation factors to each item to determine the total installed cost for all of the equipment:
where IF = Installation cost factor, listed in Table 9, for many industrial facilities including gas extraction equipment
∗ (67)

Report 10 127 Habtamu Geremew
TABLE 9: Installation factors (IF) for different major equipment (Uppal, 1997)
The installation factors include field labour, piping, foundations, site preparation, electrical installation, etc. (Uppal, 1997). So, the capital cost is the sum of the total equipment price plus the installation cost, which itself is the installation factor multiplied by the equipment price. Annual costs are resource costs that are needed for keeping the equipment running in the specified equipment work time. Such costs include electric power consumption for LRVP and centrifugal compressors, the worth of the steam that is used for running the steam ejector, and the operational costs. Operational and maintenance costs are expenses that are incurred for the safe running of the equipment:
where MCF = Maintenance cost factor The electric energy cost is the equipment power consumption capacity in kWh multiplied by the electricity tariff and operating time range. Steam ejectors may not use direct electricity; instead, they may use steam which can then generate electricity in the energy process. So, to get the equivalent electric power of the steam used here, the gross turbine power output is deducted when the motive steam is (and is not) used and then multiplied by the generator efficiency.
where = Turbine power output when part of steam goes to the steam ejector in [kW]. The operational and maintenance costs are often quoted as a percentage of the investment costs for power plants. Steam ejectors do not have rotating or moving parts during operation so the costs for repair and the use of lubricant are very low, whereas LRVP and centrifugal pumps constantly demand follow-up and repairs for efficient and reliable operation. For this reason, 2% of the capital investment of the equipment is assumed to be the operation cost of a steam ejector; while for LRVP and centrifugal compressors, 5% of their capital cost is assumed to be the cost of operation. Table 10 summarizes the maintenance cost factors of the gas extraction systems.
TABLE 10: Operation and maintenance costs given as a percentage of capital costs (Teke, 2011)
Equipment Maintenance cost [% of investment cost]
Steam ejectors 2 Compressor 5 Liquid ring vacuum pump 5
(68)
∗ (69)
∗ ∗ W W ∗ η (70)

Habtamu Geremew 128 Report 10
4.2 Decision and economic evaluation using the net present value method When considering the four gas extraction system investment options stated above, some kind of evaluation method that will indicate that one system could be better than the others must be available for comparison purposes. There are a number of analysis techniques that can help answer this question. In engineering economics, four evaluation methods are most commonly used: the payback method, the accounting rate of return (ROR) method, the internal rate of return (IRR) method, and the net present value (NPV) method. However, most modern books and courses recommend the NPV method as being the most effective and accurate technique (Norris, 1996). The net present value method calculates the net amount of the discounted cash flows of an investment. Using the discount cash flow (DCF) formula, the future cash flows are discounted by the rate of return offered by comparable investment alternatives. The present total updated net cost of of the equipment can be calculated by the following formula:
5. RESULTS AND DISCUSSION 5.1 Pipe diameter determination
The results of the pipe diameter selection for two-phase flow are shown in Table 11 and Figure 26. The results confirm that whichever of the two-phase pressure drop flow calculation models (homogenous and separate flow models) is used, the pressure drop is nearly the same. The maximum error encountered was 30% at one point. But the results were too close to favour one of the models over the other for further analysis. Pipe sizes < 0.25 m and smaller pipe diameters were not capable of transporting the fluids at all as the
pressure drop was much higher than the available pressure at the inlet of the junction. Pipe sizes between 0.3 and 0.4 m were disqualified as the flow velocity exceeded the allowable velocity. They were excluded from the technical optional analysis. The remaining sizes were compared in terms of economic benefits. As shown in Figure 27, the minimum total updated cost was for a pipe of 0.7 m diameter (or 20”).
1
11
(71)
FIGURE 26: Two-phase pressure drop and velocity for different pipe sizes

Report 10 129 Habtamu Geremew
FIGURE 27: Two-phase pipe line costs for different pipe sizes
Using the same interpretation of the results for the reinjection piping network, the pressure drop computed results and the flow velocity for each pipe size diameter are shown in Figure 28. Figure 29 displays that the minimum NPV total cost for piping had a pipe diameter of 0.2 m. At this size, the computed velocity is 2.2 m/s, which is lower than the allowable 3 m/s. So, the pipe selection for the reinjection pipe line is size 0.2 m (or 8”).
TABLE 11: Two-phase flow calculation results
Pipe size V
(m/s) Cc
(USD)
Homogeneous flow model Separate flow model DN (m)
Leq (m)
∆Pf (Bar)
Co (USD)
Ct (USD)
∆Pf (Bar)
Co (USD)
Ct (USD)
0.15 1027 193 68,574 145.3 - - 123.9 - -0.2 1036 107 107,433 36.41 - - 33.13 - -
0.25 1046 68 140,403 12.54 - - 12.01 - -0.3 1055 47 175,350 5.28 6,976,364 7,151,714 5.27 6,976,364 7,151,714 0.4 1074 26 229,116 1.36 1,553,623 1,782,739 1.45 1,663,173 1,892,289 0.5 1092 17 242,271 0.48 532,813 775,084 0.54 597,547 839,818 0.6 1111 12 308,724 0.2 219,101 527,825 0.24 263,917 572,641 0.7 1130 9 387,534 0.1 109,550 497,084 0.12 129,469 517,003 0.8 1148 7 507,663 0.05 54,775 562,438 0.07 74,693 582,356 0.9 1167 5 613,182 0.03 24,898 638,080 0.04 44,816 657,998

Habtamu Geremew 130 Report 10
FIGURE 28: Reinjection pipeline pressure drop and velocity for different pipe sizes
FIGURE 29: Cost for reinjection pipeline
Report 10 131 Habtamu Geremew
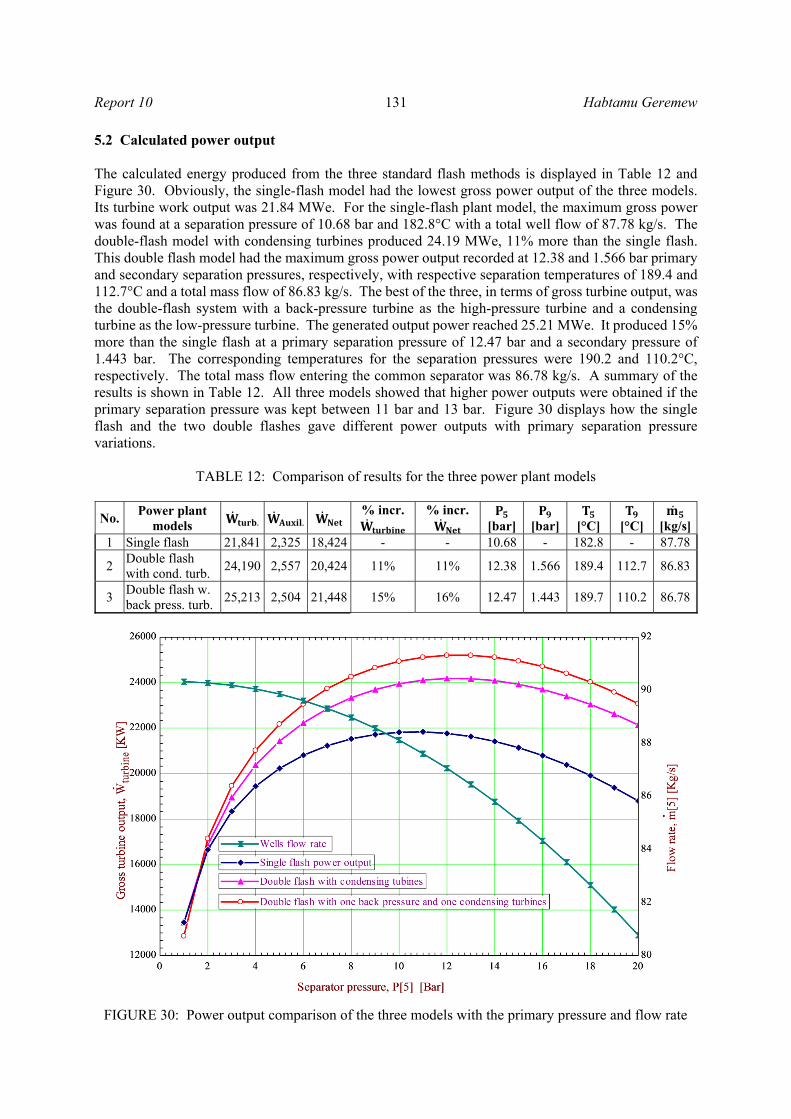
5.2 Calculated power output The calculated energy produced from the three standard flash methods is displayed in Table 12 and Figure 30. Obviously, the single-flash model had the lowest gross power output of the three models. Its turbine work output was 21.84 MWe. For the single-flash plant model, the maximum gross power was found at a separation pressure of 10.68 bar and 182.8°C with a total well flow of 87.78 kg/s. The double-flash model with condensing turbines produced 24.19 MWe, 11% more than the single flash. This double flash model had the maximum gross power output recorded at 12.38 and 1.566 bar primary and secondary separation pressures, respectively, with respective separation temperatures of 189.4 and 112.7°C and a total mass flow of 86.83 kg/s. The best of the three, in terms of gross turbine output, was the double-flash system with a back-pressure turbine as the high-pressure turbine and a condensing turbine as the low-pressure turbine. The generated output power reached 25.21 MWe. It produced 15% more than the single flash at a primary separation pressure of 12.47 bar and a secondary pressure of 1.443 bar. The corresponding temperatures for the separation pressures were 190.2 and 110.2°C, respectively. The total mass flow entering the common separator was 86.78 kg/s. A summary of the results is shown in Table 12. All three models showed that higher power outputs were obtained if the primary separation pressure was kept between 11 bar and 13 bar. Figure 30 displays how the single flash and the two double flashes gave different power outputs with primary separation pressure variations.
TABLE 12: Comparison of results for the three power plant models
No. Power plant
models . . % incr.
% incr.
[bar]
[bar]
[°C]
[°C]
[kg/s]1 Single flash 21,841 2,325 18,424 - - 10.68 - 182.8 - 87.78
2 Double flash with cond. turb.
24,190 2,557 20,424 11% 11% 12.38 1.566 189.4 112.7 86.83
3 Double flash w. back press. turb.
25,213 2,504 21,448 15% 16% 12.47 1.443 189.7 110.2 86.78
FIGURE 30: Power output comparison of the three models with the primary pressure and flow rate

Habtamu Geremew 132 Report 10
5.3 Gas extraction methods Table 13 displays the computational parameters that were obtained from the previous results and were the key data used for calculating the gas extraction equipment design.
TABLE 13: Main design parameters used for the gas extraction system design
No Description Main parameter 1 Suction load a) Non-condensable gases 2.643 kg/s b) Water vapour 0.4974 kg/s
2 Operating steam pressure 12.47 bar 3 Motive steam temperature 190.7°C 4 Suction pressure 0.086 bar 5 Discharge pressure 0.84 bar-g 6 Design suction temperature 38.81°C 7 Electricity price $/kWh 0.067 USD/kWh8 Power plant life expectancy 30 years 9 Interest rate 10% 10 Plant availability 90%
A summary of the power consumption results is shown in Table 14. The steam ejector consumes lots of steam, or 13.98 kg/s, which means around one third of the steam that is supposed to go to the turbine for electric generation is taken by the ejector. For this reason, the annual utility cost is here very much higher than for the other systems. The LRVP requires 700 kW electric power for its operation in order to extract the required amount of gas load and to create the specified suction pressure. The annual electric energy and the equivalent cost of electricity is around 350 thousand USD. The centrifugal compressor requires less electric power than LRVP and costs close to 250 thousand USD. The hybrid system is not in the same range as the others as the steam ejector consumes 4 kg/s of steam which is worth nearly 1 million USD alone. But the integrated LRVP require less electric power, 261 kW, an equivalent money value of 140 thousand USD.
TABLE 14: Gas extraction system power consumption comparison table
No. Electric power or
steam consumption Steam ejector
LRVP Centrif.
compress.
The hybrid system Steam ejector
LRVP Hybrid
1 Motive steam (kg/s) 13.98 - - 4.03 - 4.03
2 Electrical equivalent of steam (kW)
7378 - - 2210 - 2210
3 Electric energy equiv. of steam (kWh/Year)
49,442,929 - - 14,810,094 - 14,810,094
4 Money equiv. of steam (USD)
3,312,676 - - 992,276 - 992,276
5 Electric power (kW) - 668 465 - 261 261
6 Electric energy (kWh/Year)
- 5,266,512 3,666,060 - 2,057,724 2,057,724
7 Electric cost (USD/Year) - 352,856 245,626 - 137,868 137,868
8 Total utilities cost (USD/Year)
3,312,676 352,856 245,626 992,276 137,868 1,130,144

Report 10 133 Habtamu Geremew
TABLE 15: The NPV total updated cost of the gas extraction equipment
No. Electric power or
steam consumption Steam ejector
LRVP Centrifug.
compressor
The hybrid system Steam ejector
LRVP Hybrid
1 O & M cost (USD/Year)
2% 5% 5% 2% 5%
2 Total utilities per year (USD/Year)
3,312,676 352,856 245,626 992,276 137,868 1,130,144
3 Capital cost (USD) 38,992 321,122 124,800 51,897 125,594 177,492 4 Installation Factor 0.9 1.4 1.2 0.9 1.4
5 Installed system cost (USD)
35,093 449,571 149,760 46,708 175,832 222,540
The NPV tot. updated cost 31,263,409 3,775,917 2,465,255 9,400,811 1,475,497 10,876,309
Table 15 summarizes the NPV total updated cost of the gas extraction equipment. As the plant life was assumed to last 30 years, the economic analysis of the gas extraction systems was based on the evaluations for the life time of the plant. According to the evaluation results, the centrifugal compressor is by far the most cost effective gas extraction system for Aluto Langano power plant II. This is because it had the smallest NPV total updated cost, 2.5 million USD. A single-stage steam ejector was not the recommended option because the Aluto geothermal field has such a high NCG percentage (up to 6.3% in the steam phase) that it would require 30 million USD for this specific plant throughout the power plant life. The LRVP is the second best option, requiring 4 million NPV. With a cost of 11 million USD, the hybrid system ranked third. 6. CONCLUSIONS Two-phase flows of geothermal fluid can be transported safely. The consequent pressure drop can be determined by either a homogeneous flow model or by using the Friedel correlation of a separate flow model with little acceptable error between the two methods. While determining pipe sizes, three factors must be looked at: the capital cost of piping, the effect of frictional loss on the power production and the velocity of the flow. Steam to the turbines and every piping network that has not been considered in this paper should be calculated using the same approach for a detailed study. For obtaining maximum power, the range of optimal flashing pressures should be surveyed over a range of different possible options. The production of other power plant modelling approaches, beyond the standard flash modelling, should be analysed in the same way. Every possible combination should be surveyed before deciding upon power plant construction. The required costs for developing each specific kilowatt from every possible production angle must be compared. In order to use a steam ejector for the power plant, an amount of staging is required as the reduction of the compression ratio at each stage would minimize steam requirements and load sharing could make the steam ejectors a viable possibility in the economical computation list. Otherwise, with high compression ratio requirements and high gas load situations, it cannot be considered an option. The hybrid gas extraction system requires two or more stages of a steam ejector to be cost effective. The combination of a steam ejector and centrifugal compressors (not analysed here) needs to be studied and compared. Other technologies such as re-boilers should also be included on the possible gas extraction option list. Otherwise, the centrifugal compressor is the sole viable option for the proposed new plant. As shown in Table 2, reference well LA-6 has nearly 1% by weight of H2S in the 2.6% weight of non-condensable gases. The other exploratory wells exhibit similar numbers which supports the theory that

Habtamu Geremew 134 Report 10
the field has high concentrations of H2S which could destroy plant equipment and affect working personnel. For overall safety considerations, H2S abatement requires the same attention as the gas extraction system. The condenser pressure and, hence, the condenser temperature influence the cost of the new plant but also play roles in adding power. The optimal condenser pressure needs a detailed study to find the optimal point. Rule of thumb decisions on the cooling tower parameters, such as the approach, the range and the air exit temperature, need reiteration to find the actual optimum points. The best of the three surveyed models exhibited a gross turbine power output of 25 MWe, acquired from seven production wells. This means that from a single production well, nearly 4 MWe was attained. If the other two presumed unsuccessful wells were actually successful, it might be possible to obtain 33 MWe from the double flash with back-pressure model. If the hot 110°C brine would be harnessed via bottoming an organic Rankine (ORC) or Kalina cycle, definitely more than 35 MWe would be produced from the expansion project area. So, this would indicate that the Aluto Langano geothermal power plant II expansion project could potentially lead to development from 35MWe to 70MWe. But to make a final decision on the planned project and for Ethiopia to make good progress in geothermal development, like its neighbouring country Kenya, every concerned interdisciplinary professional from all over the developing organisation should coordinate and share their knowledge with one another. Then, the power plant could be a realistic possibility with hope for geothermal development. Of course, in order to attain this goal, development of geothermal professionals is just as vital.
ACKNOWLEDGEMENTS I would like to thank many people who have made this research report possible. First, to Dr. Ingvar Birgir Fridleifsson and Mr. Lúdvík S Georgsson, I wish to express my gratitude for their kind guidance and positive encouragement from the beginning of the geothermal training programme to the end. Great thanks and appreciation should go to the UNU-GTP staff, Mr. Ingimar Gudni Haraldsson, Ms. Thórhildur Ísberg, Ms. Málfrídur Ómarsdóttir and Mr. Markús A.G. Wilde, for their day to day multi-dimensional assistance in making us feel safe, just like home, free to focus on our studies. I should like especially to give thanks to my advisor, Ms. María Sigrídur Gudjónsdóttir, for her interest and awesome assistance in the pursuit of this study and in the preparation of this research report. During all the research preparation time, her glorious and persistent guidance inspired me a lot and gave me the strength to work as hard and as much as I could. I wish to thank Dr. Páll Valdimarsson and all the geothermal utilization instructors for their aid and direction during my time in the geothermal utilization specialized courses and for their hard work in assisting all of us to gain a lot of basic geothermal knowledge. I also wish to acknowledge the instructors and Iceland GeoSurvey - ÍSOR, staff members who taught me in the general geothermal introductory training courses. Without their instructions and help, this research study might not have been concluded. Great thanks also should go to my company, the Ethiopian Electric Power Corporation (EEPCo) for allowing me to take part in this training and for many EEPCo personnel who helped me in indescribably many ways. Especially, Mr. Mulugeta Assay, geothermal expansion projects coordinator, for his keen support in the process of facilitating my participation in the training after UNU-GTP awarded me the opportunity, and Mr. Tarekegn Alamirew, EEPCo human training and development head, for his enthusiastic consideration of the UNU-GTP training award.

Report 10 135 Habtamu Geremew
REFERENCES CostOwl.com, 2012: How much does an industrial air compressor cost? CostOwl, webpage: www.costowl.com/b2b/air-compressor-industrial-cost.html. DiPippo, R., 2007: Geothermal power plants. Principles, applications, case studies and environmental impact (2nd ed.). Butterworth Heineman, Elsevier, Oxford UK, 493 pp. EFDRE MME, 2008: Investment opportunities in geothermal energy development. Abaya geothermal prospect, Ethiopia, Ministry of Mine and Energy, Ethiopia, 20 pp. EFDRE MWE, 2012: Scaling-up renewable energy program Ethiopia investment plan. Ministry of Water and Energy, Ethiopia, investment plan for Ethiopia. Climate investment funds intersessional meeting of the SREP sub-committee, Nairobi, Kenya, SREP/SC.IS.2/41. F-Chart Software, 2012: EES, Engineering equation solver. F-Chart Software internet website, www.fchart.com/ees/ees.shtml. GENZL, 1996: Aluto pilot project detail technical specification. Geothermal Energy New Zealand Ltd., Contract AL-I: Ethiopian Electric Light & Power Authority. Gizaw, B., 1996: The origin of high bicarbonate and fluoride concentrations in waters of the Main Ethiopian Rift Valley, East African Rift System. J. African Earth Sciences, 22-4, 391-402. Gizaw, B., 2007: Geochemistry of Aluto-Langano and Corbetti geothermal systems. Geological Survey of Ethiopia, report, 7 pp. Hanlon, P.C. (editor), 2001: Compressor handbook. McGraw-Hill, NY, 754 pp. Hassanzadeh, H., 2011: Surface production operations. University of Calgary, School of Engineering. Website: www.scribd.com/doc/58416432/5/Allowable-flow-velocity-in-pipes. HEI, 2004: Vacuum systems: Understanding a key component of a modern power plant. Heat Exchange Institute, Techn. sheet 110, 15 pp, webpage: www.heatexchange.org. Hicks, D., 2010: Advanced condenser boosts geothermal power plant output (fact sheet). The Spectrum of Clean Energy Innovation, NREL, NREL/FS-6A42-49152. Jónsson, M.Th., 2012: Mechanical design - steam gathering systems. UNU-GTP, Iceland, unpubl. lecture notes. Leeper, S.A., 1981: Wet cooling towers: ‘Rule-of-thumb’ design and simulation. US DoE, Idaho Operations Office, Idaho National Engineering Laboratory, EGG-GTH-5775. NASH, 2012: Steam ejector hybrid systems in the chemical industry. NASH – Gardner Denver, Trumbull, CT, APP-1086A-0310. Norris, L.D., 1996: Chapter 16: Engineering economics. In: Pope, J.E. (ed.), Rules of thumb for mechanical engineers. Gulf Professional Publ., 372-393. Siregar, P.H.H., 2004: Optimization of electrical power production process for the Sibayak geothermal field, Indonesia. Report 16 in: Geothermal training in Iceland 2004. UNU-GTP, Iceland, 349-376.
Habtamu Geremew 136 Report 10
Teke, M.A., 2011: Guidelines for optimum gas extraction system selection. University of Iceland, Reykjavík, MSc. thesis, 54 pp. Teklemariam, M., and Beyene, K., 2001: Geochemical monitoring of the Aluto-Langano geothermal field. Proceedings of the 26thWorkshop on Geothermal Reservoir Engineering, Stanford University, Stanford, Ca., 8 pp. Uppal, K.B., 1997: Cost estimating made simple. Hydrocarbon Processing, Sept.1997, 168-C/E. Van Rooyen, E., 2006: Two-phase pressure drops. Chapter 13 in: Wolverine Tube Inc. Engineering Data Book III, 34 pp. Wikipedia, 2012: Surface condenser. Wikipedia, webpage: en.wikipedia.org/wiki/Surface_condenser. Woube, Z., 1986: Analysis of well test data from the Langano-Aluto geothermal field, Ethiopia. UNU-GTP, Iceland, report 11, 50 pp.
Related Documents