AFMUR.75.13a CD a* A STUDY OF THE UNSTEADY FLOW OVER CONCAVE CONIC MODELS AT MACH 15 AND 20 O VON KARMAN INSTITUTE FOR FLUID DYNAMICS CHAUSSEE DE WATERLOO, 7S imRHODESTGENESE, BELGIUM. OCTOBER 1975 TECHNICAL REPORT AFML-TR-76-188 INTERIM SCIENTIFIC REPORT N0.2 1 JUNE 1972 - 80 NOVEMBER 1978 n n n i t ^ Approved for public rttom: distribution naUmitod AIR FORCE MATERIALS LABORATORY AIR FORCE WRI6HT AERONAUTICAL LAiORATORtES Air Fore» Syit«ini Command WrtghtPcrttaiwn Air Foie« lot*. Ohio 46433

Welcome message from author
This document is posted to help you gain knowledge. Please leave a comment to let me know what you think about it! Share it to your friends and learn new things together.
Transcript
AFMUR.75.13a
CD
a*
A STUDY OF THE UNSTEADY FLOW OVER CONCAVE CONIC MODELS AT MACH 15 AND 20
O VON KARMAN INSTITUTE FOR FLUID DYNAMICS CHAUSSEE DE WATERLOO, 7S imRHODESTGENESE, BELGIUM.
OCTOBER 1975
TECHNICAL REPORT AFML-TR-76-188 INTERIM SCIENTIFIC REPORT N0.2 1 JUNE 1972 - 80 NOVEMBER 1978
n n n i t
^
Approved for public rttom: distribution naUmitod
AIR FORCE MATERIALS LABORATORY AIR FORCE WRI6HT AERONAUTICAL LAiORATORtES Air Fore» Syit«ini Command WrtghtPcrttaiwn Air Foie« lot*. Ohio 46433
HOTICE
When Government drawings, specifications, or other data are used for any purpose other than in connection with a definitely related Government procurement operation, the United States Govern- ment thereby incurs no responsibility nor any obligation vhatsoeven and the fact that the government may have formulated, furnished, or in any vay supplied the said drawings, specifications, or other data, is not to be regarded by implication or otherwise as in any manner licensing the holders or any other person or corporation, or convey- ing any rights or permission to manufacture, use, or sell any patented invention that may in any way be related thereto.
This final report was submitted by the von Karman Institute, 72, Chaussee de Waterloo, 161*0 Rhode-St-Gendse, Belgium, under contract AroSR-72-2227, with the Air Force Materials Laboratory, Air Force Wright Aeronautical Laboratories, Air Force Systems Command, Wright-Patterson Air Force Base, Ohio, U5U33. George Y. Jumper, Jr., Capt., USAF, with the Space and Missiles Branch, Systems Support Division was the Project Engineer.
This report has been reviewed by the Information Office (10) and is releasable to the National Technical Information Service (HTI8). At NTIS, it will be available to the general public, in- eluding foreign nations.
This technical report has been publication.
reviewed and is approved for
x EVERETT W. HEtfONEN, Capt, USASTKKKÜÜ^ Project Engineer rZT v* ? ««•!»
FOR THE DIRECTOR
fixy^ HENRyB7«fCK, Major, USAF Chlef^space and Missiles Branch Systems Support Division AF Materials Laboratory
Copies of this report should not be returned unless return is required by security consideration, contractual obligations, or notice on a specific document. »IR FORCE - 9-t-7» - 100
1 ■
Unclaggifiad tKCUNITV CLAMiriCATION Of THIS PASi (9hm> Dim XnWra«
-75-138]^
ITJREPORT DOCUMENTATION PAGE 2. 30VT ACCCMION NO
r? NSTEADY FLOW OVER
/ CONIC MODELS AT MACH 15 AND
^ON?)
KENWORTHY Bfe RICHARDS * J 1
t. PtRFORMINO OROANIZATION NAME AND ADOREU
i/von Karman Institute for Fluid Dynamics 72, Chaussee de Waterloo /^"T^ 16Ü0 Rhode-St-GenSse. Belgium Qj^ it
It. CONTROLLING OFFICE NAME AND ADORES»
EOARD (Box Ik FPO N.Y, 09510
1«. MONITORING AOENCV NAME A ADORESSfil dlllmnnl Awn ConMINnJ OHIc»)
EOARD (Box Ik) FPO N.Y. 09510
READ INSTRUCTIONS BEFORE COMPLETING PORM
ECIFIENFS CATALOG NUMBER
If TYRE OF REPORT ft PERIOD COVERED
Interim Scientific /eptJ 1 Jun» 72 ^>. 3< Nov/,73-
^jMHJRW^qRORA^NyjJIfJKjr
AF0'sR4il-2227- 7X- /
10. PROGRAM ELEMENT, PROJECT, TASK AREA A WORK UNIT NUMBERS
IS. SECURITY CLASS, (ol (hi* ttporl)
Unclassified ISa. DECLASSIFICATION/DOWNORADING
SCHEDULE
I«. DISTRIBUTION STATEMENT (ol M» R»port)
Approved for public release; distribution unlimited
17. DISTRIBUTION STATEMENT (ol Ol* *ft*lr«el tntond In Block 20, II lUHotml Inm Ropotl)
Approved for public release; distribution unlimited
IS. SUPPLEMENTARY NOTES
It. KEY WORDS fCondnu* on r*m** »Id» II noeoitonr and t&nllly by Meek nunbu)
Hypersonic Flow Re-entry Ablation
Nose Shapes High Speed Phot.Q- Unsteady Flow graphy Pressure Measurements
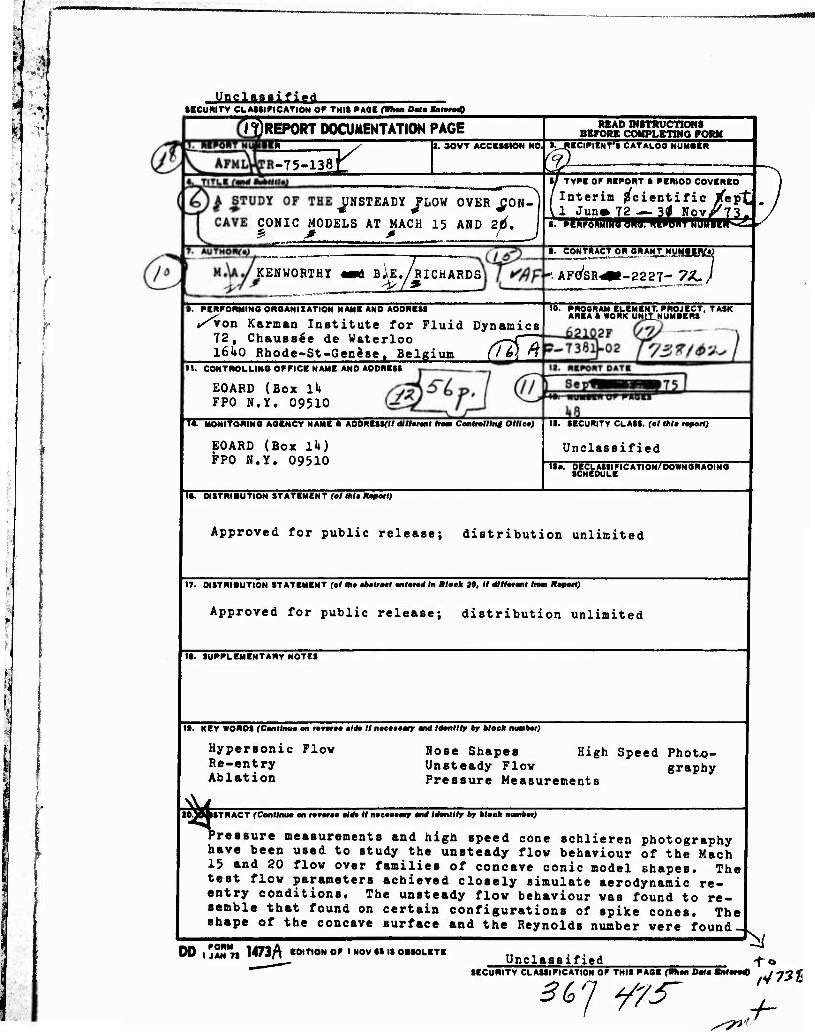
J^gjfcjTRÄCT (Cent
Pressure
fConMnu* en re**r** »14» II n*e»»»mr and Idonllty by block mmbtt)
measurements and high speed cone schlieren photography have been used to study the unsteady flow behaviour of the Mach 15 and 20 flow over families of concave conic model shapes. The test flow parameters achieved closely simulate aerodynamic re- entry conditions. The unsteady flow behaviour was found to re- semble that found on certain configurations of spike cones. The shape of the concave surface and the Reynolds number were found
DO I JAN 7» w3n EDITION OF I NOV SS IS OBSOLETE ^
Unclassified -To SECURITY CLASSIFICATION OF THIS PAGE fBhen Data IMara« / j? «
3^ y/s-
m tMCLASSIFIED p/^iL tICUWITV CLAttlFICATIQW OF THIS WMt(m>mt Pat» «mwwQ 5^
'to be important parameters controlling the type of unstability. Further test programmes are considered necessary to understand the flow processes and to define the boundaries of the instabi- lities.
R
UNCLASSIFIED
ISCUMITV CLASSIFICATION OF THIS PAOCfWkM Data Bnfnd)
PREFACE
The activities and results documented in this report
were supported under project 7301 "Materials Application",
Task 7381-02 "Space, Missile and Propulsion System Materials
and Component Evaluation" vith Mr. Gary L. Denman, Technical
Manager for Thermal Protective Systems, System Support
Division, Air Force Materials Laboratory, acting as project
engineer. The report covers work conducted during the period
June 1972 through December 1973.
The technical advice and guidance by Mr. Victor
Di Cristina, Manager, Thermodynamics and Material Test
Department, Avco Systems Division, Avco Corporation,
Wilmington, Mass., Dr. Michael Abbett, Accurex/Aerotherm,
Moutain-View, California, and their colleagues was parti-
cularly valuable. The authors acknowledge the help given by
Mr. Roger Conniasselle and members of the Longshot personnel,
members of the electronics department, and Mr. Jean-Paul Lobet
and his assistants of the photographic laboratory.
111
1 PRBCEDINB PiOI BLANK-MOT PIIUBD
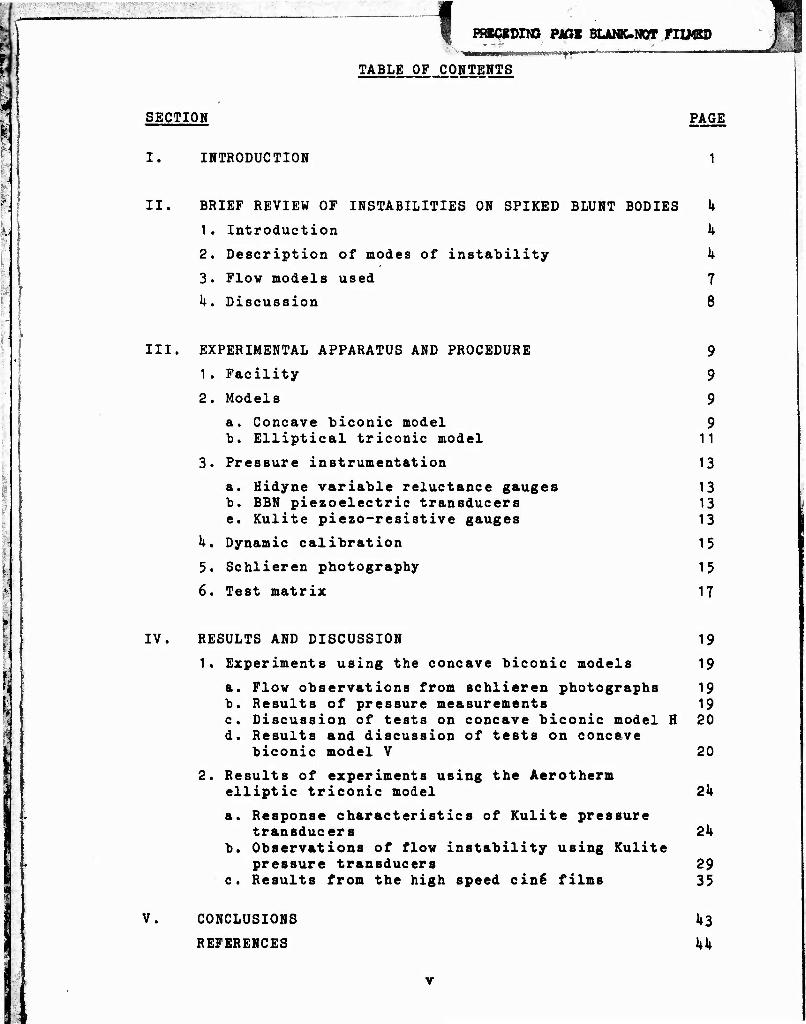
TABLE OF CONTENTS
SECTION PAGE
I. INTRODUCTION
II. BRIEF REVIEW OF INSTABILITIES ON SPIKED BLUNT BODIES U
1. Introduction 1*
2. Description of modes of instability k 3. Flow models used 7
k. Discussion 8
III. EXPERIMENTAL APPARATUS AND PROCEDURE
1 . Facility
2. Models a. Concave biconic model b. Elliptical triconic model
3. Pressure instrumentation
a. Hidyne variable reluctance gauges b. BBN piezoelectric transducers e. Kulite piezo-resistive gauges
k. Dynamic calibration
5. Schlieren photography
6. Test matrix
9
9
9
9 11
13
13 13 13
15
15
17
IV. RESULTS AND DISCUSSION 19
1. Experiments using the concave biconic models 19
a. Flow observations from schlieren photographs 19 b. Results of pressure measurements 19 c. Discussion of tests on concave biconic model H 20 d. Results and discussion of tests on concave
biconic model V 20
2. Results of experiments using the Aerotherm elliptic triconic model 2k a. Response characteristics of Kulite pressure
transducers 2k b. Observations of flow instability using Kulite
pressure transducers 29 c. Results from the high speed cin€ films 35
V. CONCLUSIONS
REFERENCES
kl kk
r j -i.; ■ • ' ■ .
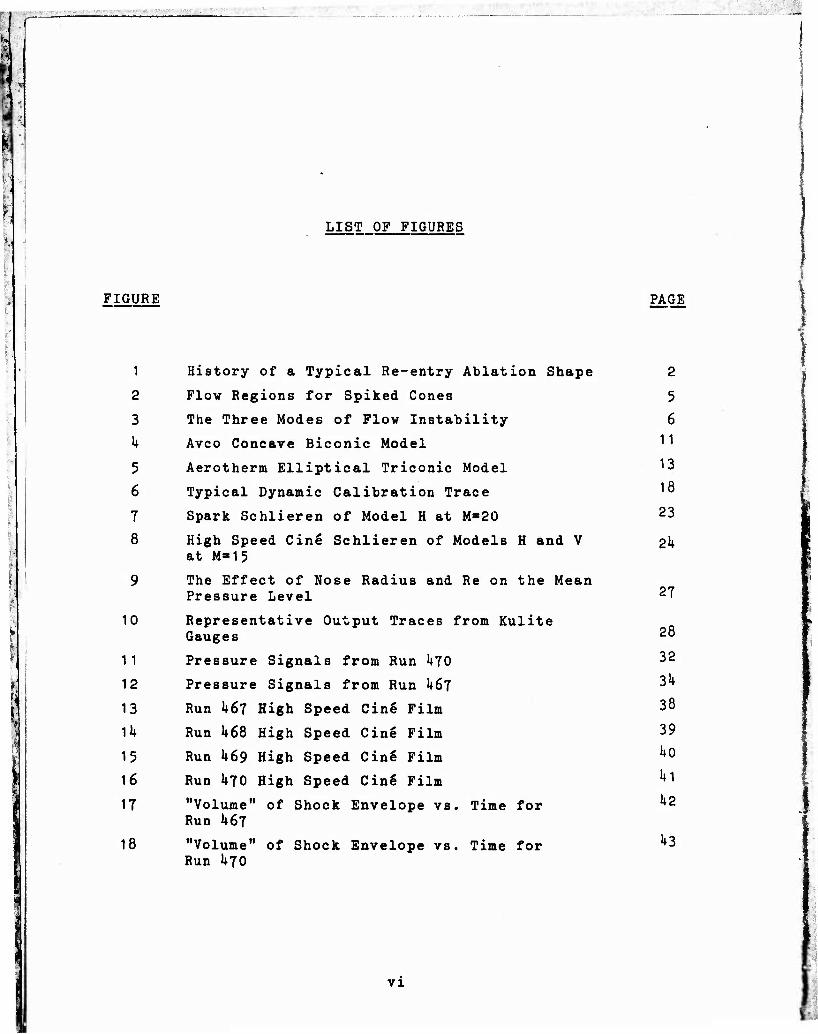
LIST OF FIGURES
FIGURE PAGE
1 History of a Typical Re-entry Ablation Shape
2 Flow Regions for Spiked Cones
3 The Three Modes of Flow Instability
k Avco Concave Biconic Model
5 Aerotherm Elliptical Triconic Model
6 Typical Dynamic Calibration Trace
7 Spark Schlieren of Model H at M«20
8 High Speed Cin6 Schlieren of Models H and V at M»15
9 The Effect of Nose Radius and Re on the Mean Pressure Level
10 Representative Output Traces from Kulite Gauges
11 Pressure Signals from Run kfO
12 Pressure Signals from Run k6l
13 Run 1*67 High Speed Cing Film
1U Run I468 High Speed Cing Film
15 Run U69 High Speed Cin6 Film
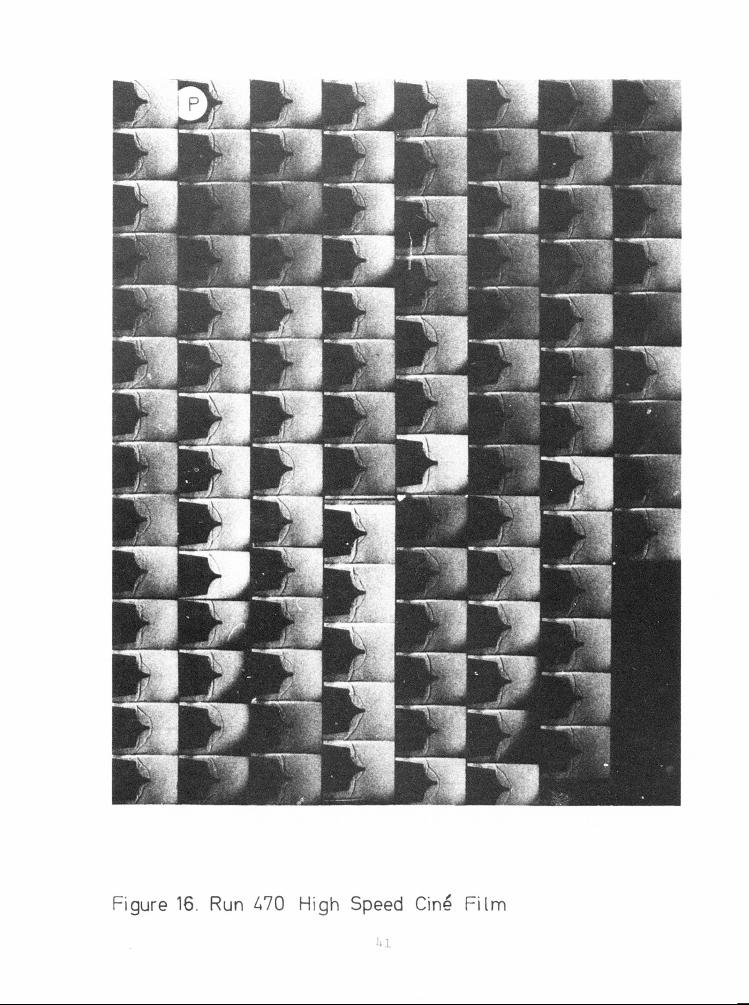
16 Run 1*70 High Speed Cing Film
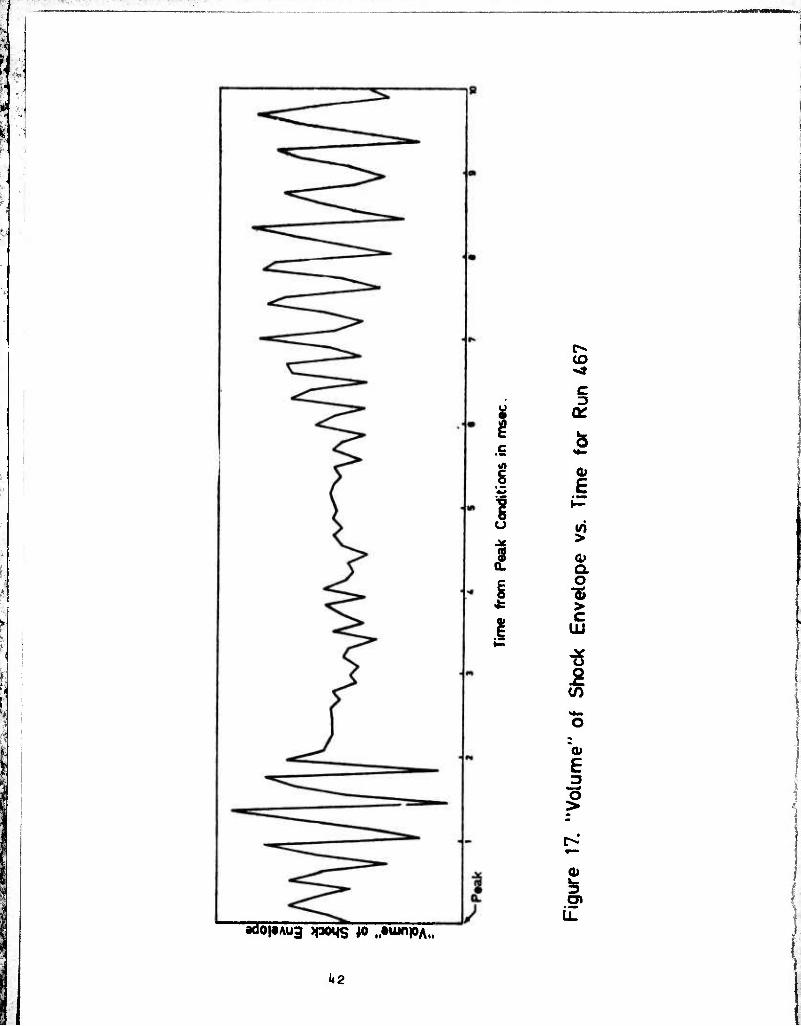
17 "Volume" of Shock Envelope vs. Time for Run U67
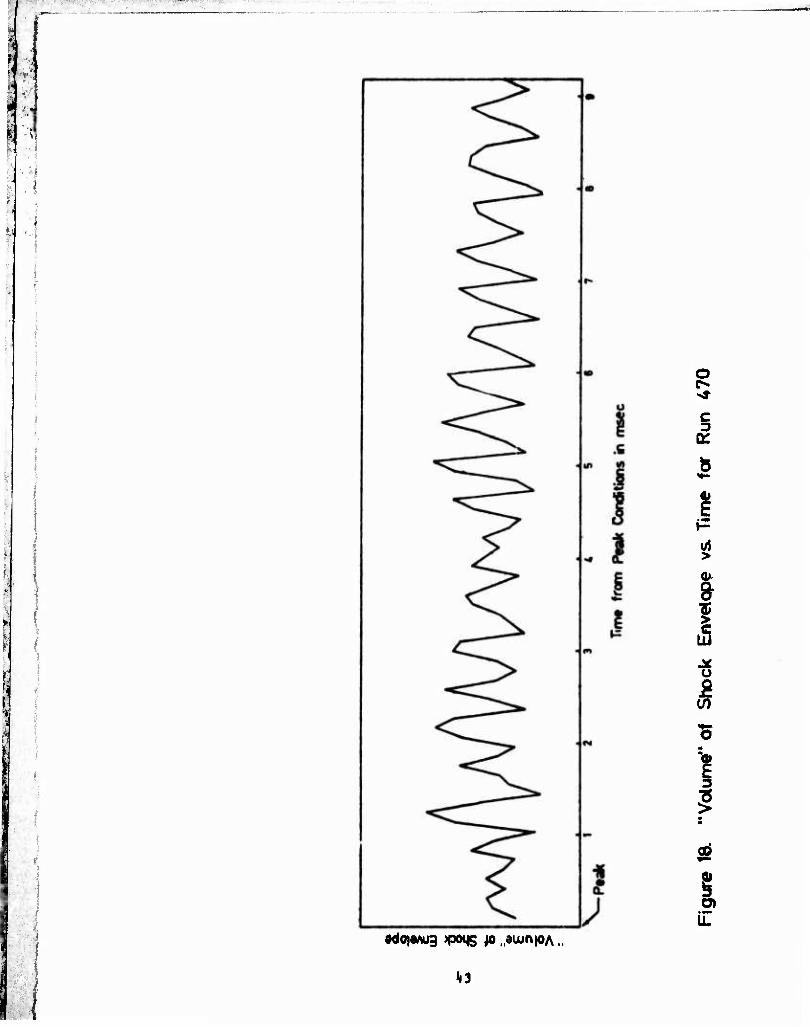
18 "Volume" of Shock Envelope vs. Time for Run U70
2
5
6 11
13
18
23
2k
27
28
32
3h
38
39
1*0
m 1*2
k3
VI
LIST OF TABLES
I TABLE PAGE
Test Matrix 20
vii
PRBCIDIIO PAGE BLAMURDT f UMBD
SECTION I
INTRODUCTION
The problem of predicting the behaviour of ablative thermal protection components on re-entry vehicles is very- complex. In addition to the problem of understanding the inter- action between chemical and aerodynamic processes inherent on any ablative surface, there has arisen evidence that flow instabilities occur on a certain family of ablation shapes (i.e. those with concave conical forebodies).
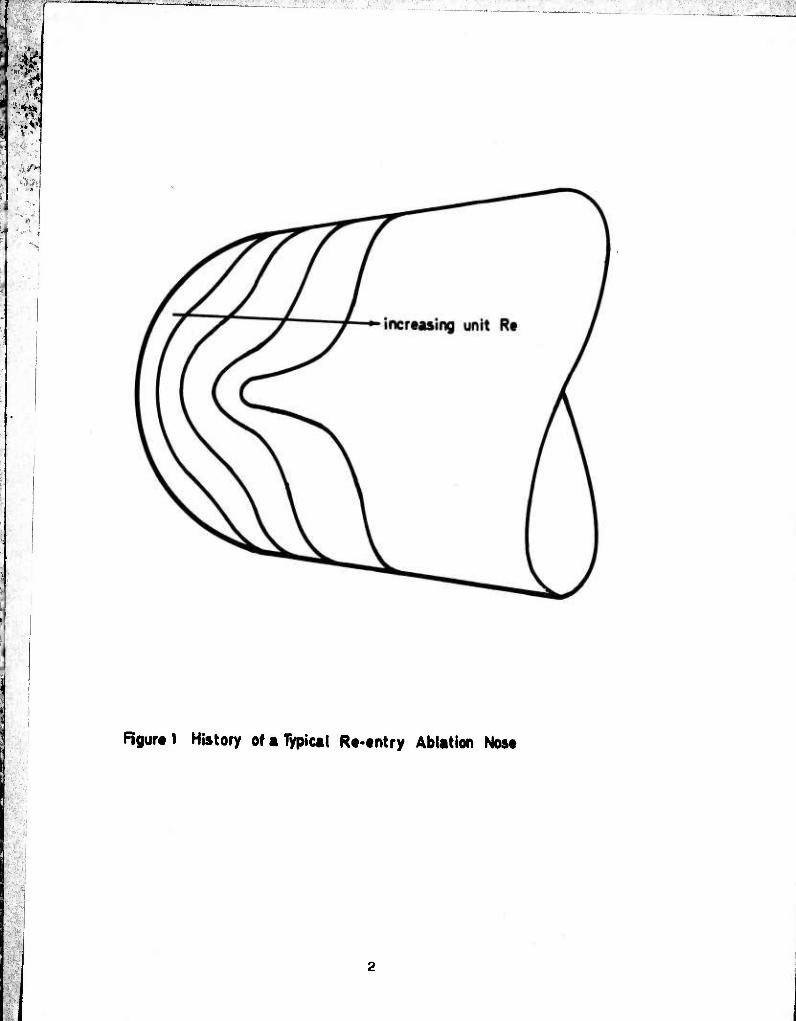
These particular shapes are formed during the high Reynolds number portion of re-entry when the boundary layer on the forebody is turbulent. Then the peak heat transfer and hence, peak mass transfer rate takes place away from the stagnation point. The shape which is thus generated from an initially hemispherical forebody has this concave form which resembles the spiked blunt body of classic gasdynamics (Figure
1).
The purpose of the present investigation was to mea- sure, at realistic re-entry Mach and Reynolds numbers, frequen- cies and pressure levels of fluctuating phenomena on two specific concave geometries. One model was the AVCO Concave Biconic Model used in an earlier study (Reference 1) for primarily heat transfer measurements, when the flow was then tentatively classified as stable. The model was re-instrumented with BBN fast response pressure sensors to look more closely for the possible existence of the less violent flow instabili- ties.
———■■ ■ ■• : J ■■■
1 »SA
Figur« 1 History of a Typical Re-entry Ablation Nose
■■■■■ ■ ■■- ^ ;■:■ ' " ■
The other model was Aerotherm's Tricouic Model which was instrumented with fast response Kulite pressure transducers
Before presenting the results of this study a review of investigations made into flow instabilities over spiked cones is made. This is considered useful since a large body of research exists on spiked bodies, due to the early interest in their apparent ability to alleviate high total heating rates and reduce the drag of high speed vehicles (e.g. Allen and Eggers, Reference 2 and Moeckel, Reference 3).

SECTION II
BRIEF REVIEW OF RESEARCH ON INSTABILITIES ON SPIKED BLUNT BODIES
1 . INTRODUCTION
Early in the research on spiked blunt hoides flow
instabilities were observed. Mair (Reference h), Beastall and
Turner (Reference 5), Bogdonoff and Vas (Reference 6), Maull
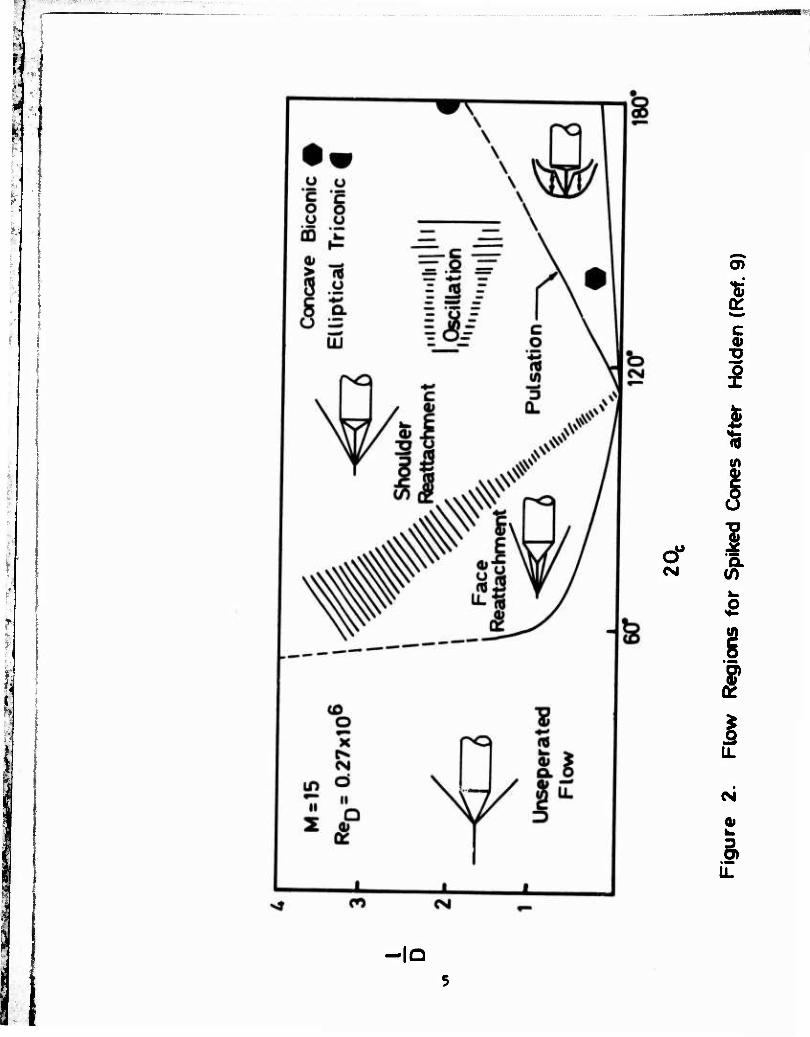
(Reference 7)» Wood (Reference 8) and Holden (Reference 9) sho-
ved that for a given Mach number, M, cone half angle 6 , and
shoulder radius r, there exists a range of values of the ratio
of spike length 1, to body diameter, D, such that the flow is
unstable (as illustrated in Figure 2). For example, at M>6.8
for a flat-faced (6 "90°) square shouldered body (r»0) it was
found by Maull (Reference 7) that the flow was unstable for
0.25 * l/D i 2.5.
2. DESCRIPTION OF MODELS OF INSTABILITY
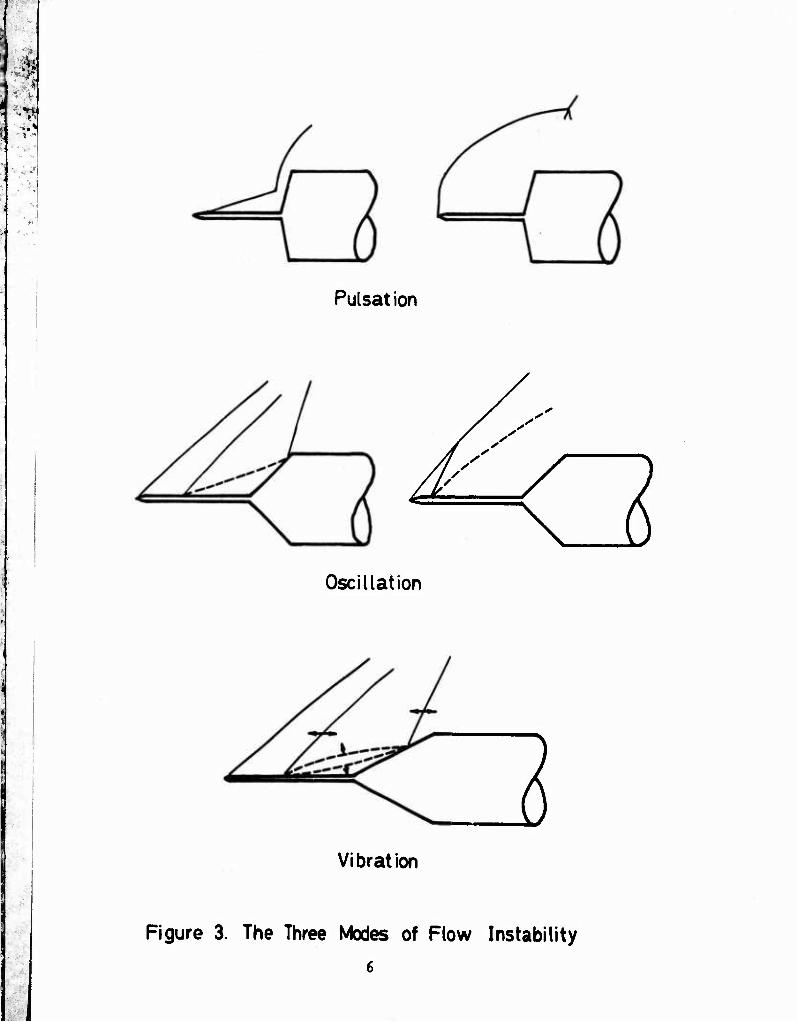
There have been observed basically three modes of
instability as illustrated in Figure 3> "he manifestation of
the first is a dramatic excursion betveen two very different
shock envelopes. The first envelope consists of a conical
oblique shock emanating from the spike tip intersecting a
bow shock created by the blunt body. The second consists of
a shock passing through the spike tip as though mass was
being blown from the face of the blunt body. In fact, Maull
(Reference 7) obtained this latter shock pattern by simply
injecting gas through a tube pointing into a hypersonic free-
stream. This mode of instability is known as pulsation and
occurs at the lower end of the unstable range of l/D depending
nMHmnMMMMBH
I" i
0* eg
a
i
M
3.
-ID
- * ■■
Pulsat ion
r/ Oscillation
Vibration
Figure 3. The Three Modes of Flow Instability
6
^v^,.-^.;^-;^---"- -■
■■v
on free stream conditions. The other two modes are less
dramatic in that the two shock systems remain in evidence
at all times.
The second mode, as illustrated in Figure 3 and
called "oscillation", involves both changes in the inflec-
tion of the conical shock and in the volume of the conical
shock region.
The third mode called "vihration", not seen hy all
investigators (see Kabelitz, Reference 9)» involves just a
change in inflection of the dividing streamline and small
vibrations of the shock waves.
Both of these latter models of instability occur
at the larger values of 1/D.
The occurrence of these tvo particular modes
depends apparently on the cone half angle ; the smaller
cone half angles causing vibration and larger cone half
angles causing oscillation.
3. FLOW MODELS USED
Some flow models for one or all of the modes of
instability have been suggested by various researchers.
For example Maull (Reference 7) describes the instability
with a model involving mass addition to the originally
conical separated flow region due to an imbalance of pres-
sures behind the intersection of the conical foreshock
and the near-normal aftershock. As the separated region
broadens, pressure equilibrium is obtained and the separa-
tion-bubble collapses.
Another model suggested by Kabelitz (Reference 10)
involves the response of the closed separated region to perturbations. That is, small fluctuations in the freestream
amplify themselves for certain geometrical and flow configu- rations. Another is the piston model which considers an
approximately normal shock moving toward the blunt body compressing the air. Finally this high density air strikes the body creating a reflection which in turn merges with the
original normal shock causing a rapid expansion or explosion
This expansion continues until equilibrium is reached with the freestream and then collapses to begin the compression
cycle again (Reference 11).
It. DISCUSSION
1
Despite the relatively large amount of data that
exists to date on flow instabilities on spiked blunt bodies»
many uncertainties still exist. These concern mainly the definition of the mechanism of the flow instability and the
prediction of the conditions under which they occur. It is
clear that there is a very strong interaction between the inviscid and viscous flows involved. Parameters of interest in applying experience of flows over spiked blunt bodies to
those over concave conic shapes associated with re-entry shapes include Mach number, Reynolds number, 1/D, nose blunt- ness, shoulder radius, spike-to-body fairing, wall tempera-
ture, surface roughness, etc. These parameters will further-
more affect the nature of the viscous flow (e.g. concerning whether laminar* transitional or turbulent flow is present;
concerning the resistance of the boundary layer to separation,
etc.). Also the flow will have mixed subsonic and supersonic
regions. As will be seen insection h of this report, the results from concave conic sections are extremely difficult
8
f
•^
i to analyse with such uncertainties present. An indication of the errors that may be incurred in applying spiked tlunt body data to understanding flows over concave conic shapes
\ is illustrated in the results of this present study. Section k describes how the flow over the Concave Biconic Model
I mostly appears stable (i.e. pulsation mode absent) while the Elliptic Triconic is mainly unstable (i.e. pulsation mode present). The shape of the models defined in terms of repre- sentative values of l/D and 2B plotted in Figure 2 illustra- te that the reverse behaviour would be expected. It is recommended then that a well planned series of experiments
i backed up by flow analysis calculations be carried out using the spiked cone configuration as a basis to provide a better understanding of the topic.
SECTION III
EXPERIMENTAL APPARATUS AND PROCEDURE
1 . TEST FACILITY
The von Karman Institute Longshot test facility was
used for this program, Longshot differs from a conventional
gun tunnel in that a heavy piston is used to compress the
nitrogen test gas to very high pressures and temperatures
(reference 12). The test gas is then trapped in a reservoir
at peak conditions by the closing of a system of check
valves. The flow conditions decay monotonically during 10
to 20 milliseconds running times as the nitrogen trapped in
the reservoir flows through the 6° half-angle conical nozzle
into the pre-evacuated open jet test chamber. The maximum
supply conditions used in these tests are approximately kOOO
atmospheres at 2000oK to 2lt00oK, These provide unit Reynolds
numbers of 8.5 x 10⁶ and 2 x 10⁶ per ft. at nominal Mach
numbers of 15 and 20. The two Mach numbers were ottained at
the lit in. diameter nozzle exit plane by using throat inserts
with different diameters.
2. MODELS
a. Concave Biconic Model
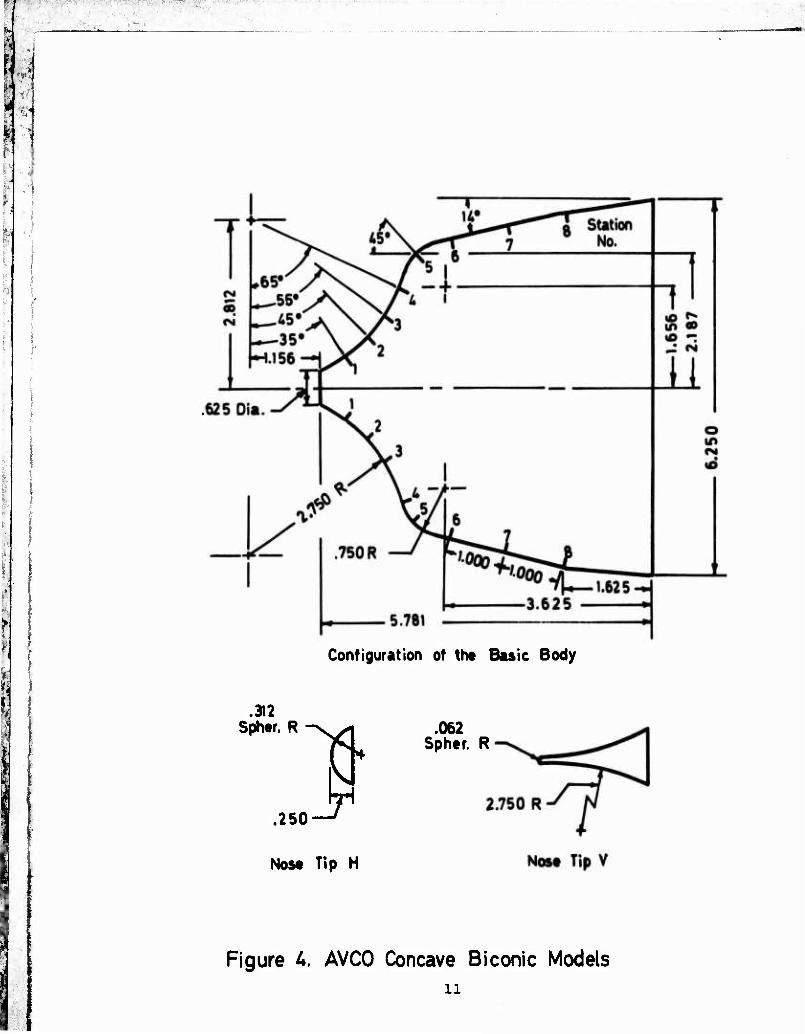
The Concave Biconic Model supplied by AVCO Systems
Division, consisted of a convex forebody which is smoothly
faired into lU0 half-angle conical after body which has a
base diameter of 6.25 in. (see pig^re k).
10
Configuration of the Basic Body
.312 Sphor. R
1 .250
Nose Tip H
.062 Spher. R
Figure A. AVCO Concave Biconic Models ii
> ■ " " .:■
'*
■■:'V
The model radius at the forebody-afterbody junction (referred
to later as the model -shoulder) was 2.187 in. The radius of the generator defining the concave forebody was 2.75 in. giving
a surface angle change from 2k0 to 70° to the model axis.
Two interchangable nose tips were used. One» supplied
by AVCO, was a 0.312 inch hemisphere j the other, manufactured
at VKI, was simply a continuation of the circular concave sec- tion until the body surface ingle was at zero incidence with the freestream and hemispherically capped. See figure k.
The first configuration was designated model H and referred to
descriptively as the blunt biconic model. The second configu- ration was designated model V and also referred to as the sharp
biconic model.
Tne model was equipped with 8 wall pressure taps loca-
ted along a single meridian. However, only stations 2, 3, and k as illustrated in figure 1 were instrumented. Steady pressure
measurements were made using a Hidyne pressure transducer at station 2 only. Unsteady pressure measurements were made using BBN type 377 piezoelectric pressure sensors at stations 3 and k. Details for both types of instrumentation are given in
Section III.3.b.
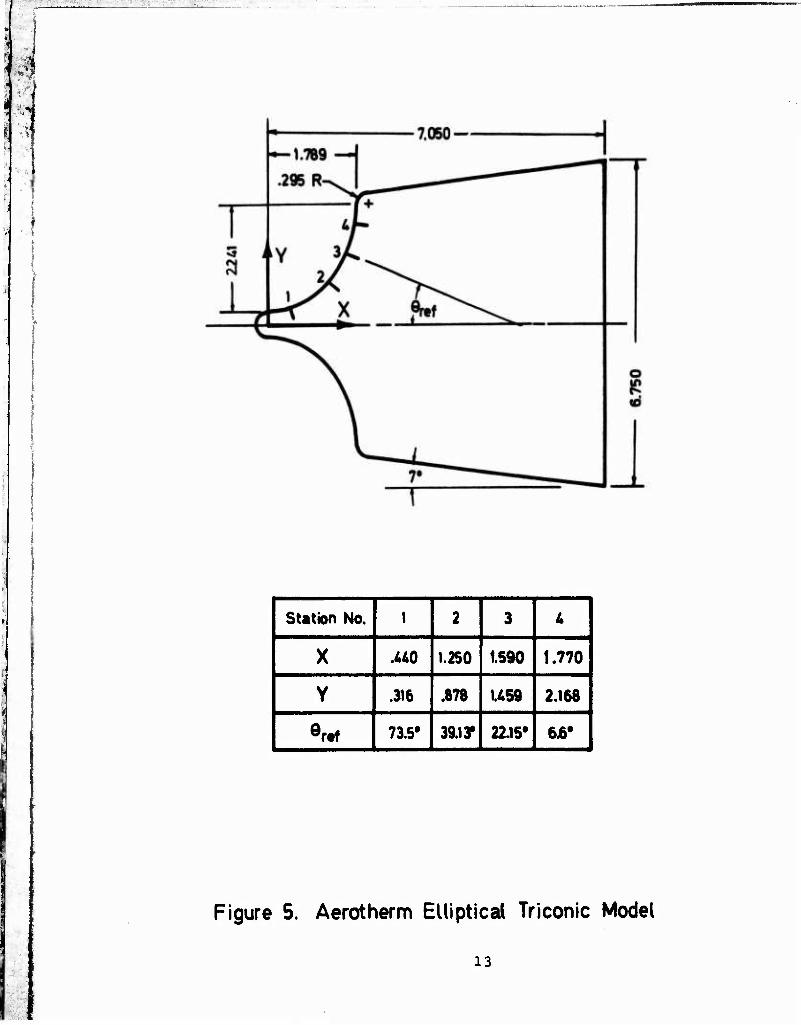
b. Elliptical Triconic Model
This model supplied by Aerotherm, was similar to the
Concave Biconic Model except the concave pjrtion of the fore- body was generated by an ellipse with the major axis perpen-
dicular to the model axis (see figure 5)« The surface angle of the concave surface referenced to the model axis changed
from 0° to 90°.
12
■_. ■■;
Station No. i \ 2 3 4 1
1 X .UO 1.250 1.S90 1.770 |
1 Y .316 .878 U59 2.168 1
1 ert 73.5* 39.iy 22.15• 6j6, 1
Figure 5. Aerotherm Elliptical Triconic Model
13
This model was supplied with four interchangable
nose tips. Two were hemispherically shaped with 0.2i> in
radii, one having a smooth surface and the other having
a surface roughness of approximately O.OOl* in average ele-
ment height caused by a chem-etching process. The other two
tips were similar except the hemispherical sections were
placed at the end of 0.25 in radius cylindrical extensions
of 0.50 in length.
Four pressure taps were placed axially along the
elliptical section of the forebody. Details of the Kulite
pressure sensors used are given in section lll,3.c.
3. PRESSURE INSTRUMENTATION
a. Hidyne variable reluctance gauges
Steady pressure measurements on the Concave Biconic
models H and V were measured using Hidyne variable reluctance
transducers. A description of them, their calibration and
application is given in Reference 13.
b. BBN piezo-electr ic transducers type 377
For measuring the expected fluctating pressures on
the Concave Biconic model surfaces, BBN type 377 piezo-elec-
tric pressure sensors with an internal impedance matching
circuit (FET) were used. Thetotal dimension of these sensors
(including FET circuit) are 0.11 in diameter by 0.75 in long;
the sensing diameter is 0.08 in. Their sensitivity is about
100 mV/psi over a frequency range from 50 Hz to beyond 200kHz;
resonance frequency is above 250 kHz. The transducers were
excited by BBN battery operated power supplies and the signals
were recorded on Tektronix type 502 A oscilloscopes with a
11*
Polaroid camera, or on a CEC type ultra-violet oscillograph using CEC type T-36l galvanometers with frequency response
up to 5 kHz. The dynamic calibration curves of these trans- ducers was supplied by BBN. In three tests, two of these
transducers were mounted flush with the surface of model H at stations 3 and k as defined in figure k. The installed sensors were covered with an RTV layer, smoothed to the sur-
face contours. This technique has been used in the past,
showing no evidence of deterioration in sensor performance. These transducers have been used successfully before in the Longshot tunnel for measuring fluctuation pressures as des- cribed in Reference lU.
c. Kulite piezo-resistive gauges type XTEL-190-100
The transducers used for measuring fluctuating as
well as steady pressures on the Elliptic Triconic Model
were Kulite piezo-resistive gauges type XTEL-190-100. The pressure sensitive component of these transducers which have pressure ratings of 100 psi consisted of a fully active four
arm Wheatstone bridge diffused on a silicon diaphragm and included temperature compensation. The dimensions of these
sensors are 0.1^0 in diameter by 0.6l in length with a pres- sure sensing area of 0.085 in diameter. Their nominal sensi-
tivity is 0.75 mV/psi using a d.c. excitation voltage of 5 volts, over a frequency range from 0 to approximately 100 kHz
(their natural frequency being greater than 100 kHz).
The transducers were excited by battery operated 5 volts rating power supplies fabricated by VKI. The signals
were amplified using d.c. amplifiers (again fabricated by
VKI) with a flat frequency response beyond 100 kHz and record- ed simultaneously in three different modes. The output from
15
the amplifier was recorded on Tectronix 502 A oscilloscopes
in filtered and unfiltered modes. The R-C filters used had
flat responses to 1 kHz, 3dB down at 7kHz and with a 9dB/oc-
tave attenuation cut off beyond 15 to 20 kHz. The filters
were used to remove unwanted very high frequency signals
caused by wind tunnel background noise and vibrations. The
signals were also recorded on the CEC ultra-violet oscillo-
graph recorder described earlier, which also caused the sig-
nals to be filtered at frequencies above 5 kHz.
Four of these transducers provided the sole instru-
mentation used on the Elliptical Triconic model as shown in
igure 5» The Kulite gauges were mounted in a ported confi-
guration (diameter of port 0.06 in., length of port 0.10 in.).
Tests carried out by Aerotherm in a shock tube indicated that
this was a suitable geometry for fluctuating pressure measure-
ments in that oscillations were damped out twice as fast as
in a flush-mounted configuration.
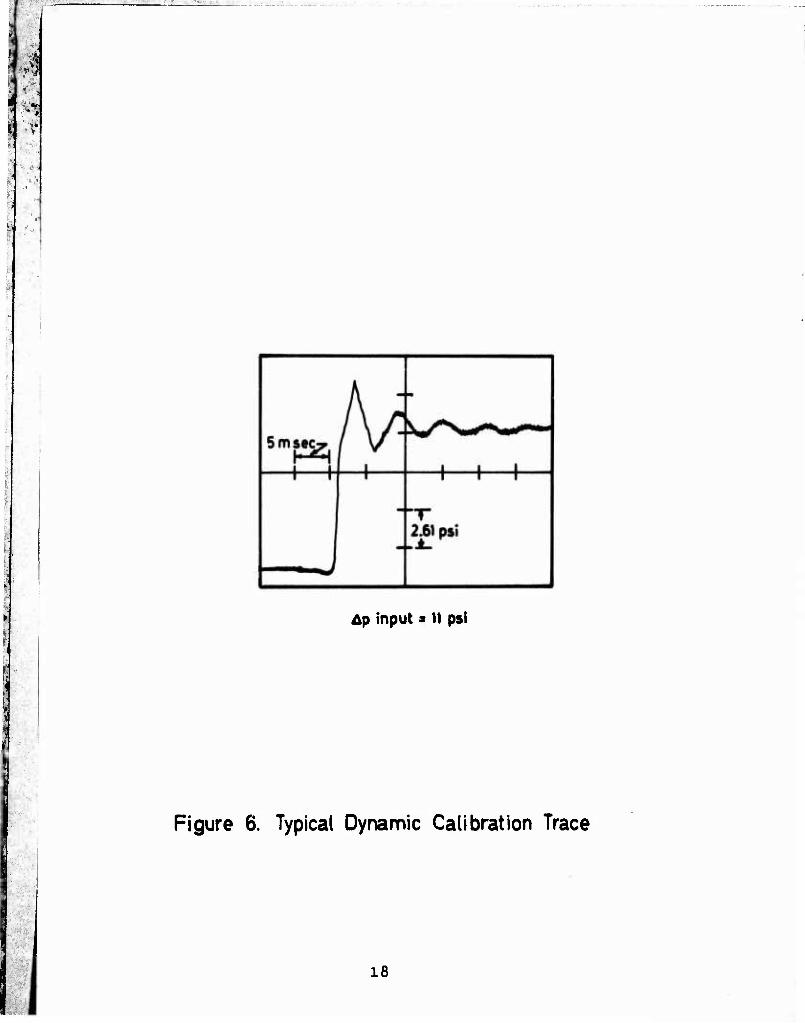
k. DYNAMIC CALIBRATION OF KULITE GAUGES
A dynamic calibrator has been fabricated at VKI,
which can supply pressure steps of up to 2 atmospheres in a
rise time of about 1 msec . The calibrator is similar to
that described in Reference 15. The transducers were cali-
brated while installed in the model and connected to the
instrumentation used in the tests. The pressure was applied
to the pressure taps through an adaptor. Sealing was obtained
by hand pressing the adapter fitted with an 0-ring seal to
the model surface. A flexible tube was used to connect the
adaptor to the calibrator. The connecting passage had an
approximate internal diameter of 0.06 in and an overall length
16
of 15 in. A typical calibration trace is seen in figure 6.
The damped oscillation is caused by the "organ pipe" effect
created by the use of a long tube. The result shows that the
transducer responds to both the d-c and a-c modes of the
applied pressure variation. All four transducers responded
identically except regarding the overall sensitivity. The
pressures calculated from the steady part of the trace were
generally h % below that monitored. This was ascribed to
difficulties in scaling caused by applying the adaptor to
curved surfaces.
5. SCHLIEREN PHOTOGRAPHY
An 18 in. conventional single pass Toepler schlieren
system equipped with high quality optical components is used.
With the exception of one 2^ in. diameter plane mirror to
bend the light 90° (due to the vicinity of a wall near the
test section) the light beam takes a Z-shaped path. A single
spark light source with a spark duration of 1 usec is used in
one test to record the visualization of the flow on 3 I/1* x
k "l/h in sheet film. In the remaining tests high speed cin6
schlieren photographs were taken using 16 mm Kodak cine
camera. Framing rates of 10,000 per second were achieved
during the running time by operating the camera without the
rotating prism shutter and exposing the film to appropriate-
ly sequenced multiple sparks of approximately 1 ^sec duration.
6. TEST MATRIX
The test conditions obtained were computed using the
Longshot data reduction program as outlined in Reference 13«
Measured reservoir conditions and Pitot pressure are given in
17
■ .3— - -i- , :--l..-:.;■ ,-
Lp input » 11 psi
Figure 6. Typical Dynamic Calibration Trace
18
Table 1 followed by the Mach and Reynolds numbers calculated
in the section. Also noted is the model configuration.
? The Concave Biconic Model was tested at generally
the lower Reynolds numbers, i.e. Mach 20 with a unit Reynolds
number of 3.1 x 10⁶/ft and Mach 15 at k.S x 106/ft. The
Elliptical Triconic Model was subjected to the latter flow
for only one test with the remaining tests in the Mach 15
flow with a unit Reynolds number of 8.7 x 10⁶/ft.
19
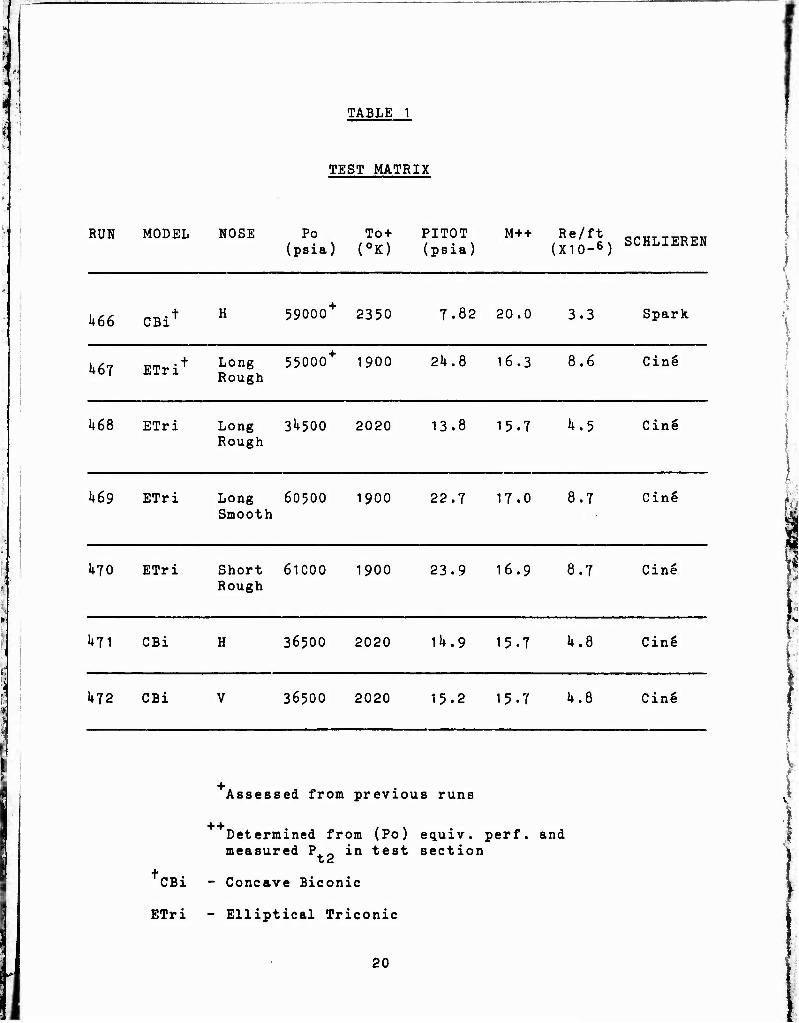
TABLE 1
TEST MATRIX
RUN MODEL NOSE Po To+ PITOT M++ Re/ft 0p„T TT,D1?W (psia) (0K) (psia) (X10-«) SCHLIEREN
1+66 CBi t H 59000 2350 7.82 20.0 3.3 Spark
t Long 5500O+ 1900 2U.8 16.3 8.6 Ging U67 ETri Rough
U68 ETri Long 3^500 2020 Rough
13.8 15.7 ^.5 Cin6
1+69 ETri Long 60500 1900 22.7 17.0 8.7 Smooth
Gine
1+70 ETri Short 61000 Rough
1900 23.9 16.9 8.7 Gin^
1+71 CBi H 36500 2020 lU.9 15.7 k.B GinS
1+72 CBi 36500 2020 15.2 15.7 k.Q Gin6
Assessed from previous runs
Determined from (Po) equiv. perf. and measured P.p in test section
t . . . CBi - Concave Biconic
ETri - Elliptical Triconic
20
-,-- ,
j
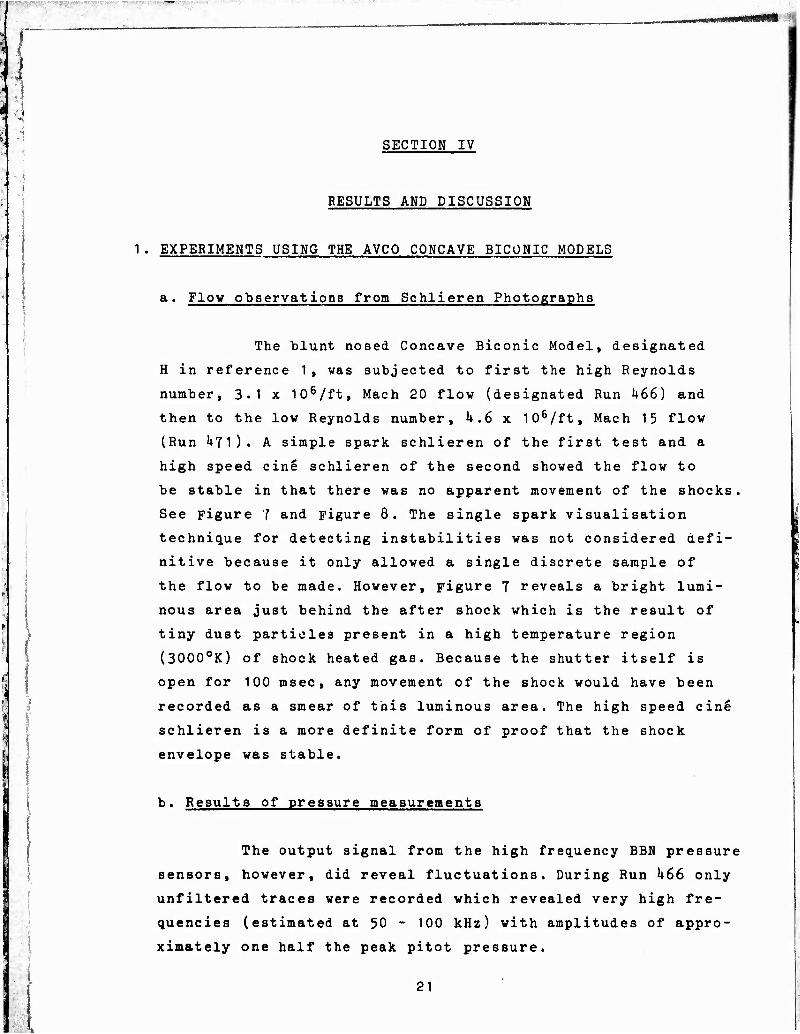
SECTION IV
RESULTS AND DISCUSSION
1 . EXPERIMENTS USING THE AVCO CONCAVE BICONIC MODELS
a. Flov observations from Schlieren Photographs
The blunt nosed Concave Biconic Model, designated
H in reference 1, was subjected to first the high Reynolds
number, 3.1 x 10⁶/ft, Mach 20 flow (designated Run k66) and
then to the low Reynolds number, U.6 x 106/ft, Mach 15 flow
(Run i+71)« A simple spark schlieren of the first test and a
high speed cin§ schlieren of the second showed the flow to
be stable in that there was no apparent movement of the shocks.
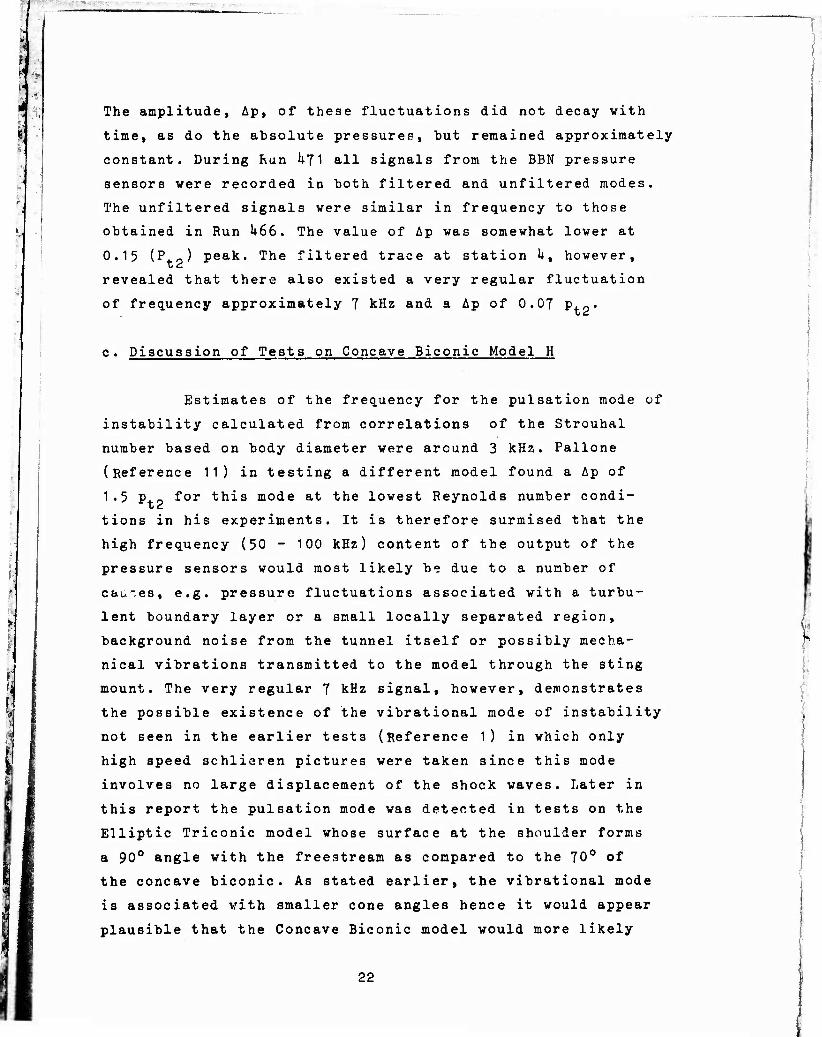
See Figure J and Figure 8. The single spark visualisation
technique for detecting instabilities was not considered defi-
nitive because it only allowed a single discrete sample of
the flow to be made. However, Figure 7 reveals a bright lumi-
nous area just behind the after shock which is the result of
tiny dust particles present in a high temperature region
(3000oK) of shock heated gas. Because the shutter itself is
open for 100 msec, any movement of the shock would have been
recorded as a smear of this luminous area. The high speed cin^
schlieren is a more definite form of proof that the shock
envelope was stable.
b. Results of pressure measurements
The output signal from the high frequency BBN pressure
sensors, however, did reveal fluctuations. During Run k66 only
unfiltered traces were recorded which revealed very high fre-
quencies (estimated at 50 - 100 kHz) with amplitudes of appro-
ximately one half the peak pitot pressure.
21
'■'■*.1:'r.'r
The amplitude, Ap, of these fluctuations did not decay with
time, as do the absolute pressures, hut remained approximately
constant. During Ran hfl all signals from the BBN pressure
sensors were recorded in both filtered and unfiltered modes.
The unfiltered signals were similar in frequency to those
obtained in Run U66. The value of Ap was somewhat lower at
0.15 (P+o^ peak. The filtered trace at station U, however,
revealed that there also existed a very regular fluctuation
of frequency approximately T kHz and a Ap of 0.0T Pto'
c. Discussion of Tests on Concave Biconic Model H
Estimates of the frequency for the pulsation mode of
instability calculated from correlations of the Strouhal
number based on body diameter were around 3 kHz. Pallone
(Reference 11) in testing a different model found a Ap of
1•5 P+0 for this mode at the lowest Reynolds number condi-
tions in his experiments. It is therefore surmised that the
high frequency (50 - 100 kHz) content of the output of the
pressure sensors would most likely be due to a number of
cau-es, e.g. pressure fluctuations associated with a turbu-
lent boundary layer or a small locally separated region,
background noise from the tunnel itself or possibly mecha-
nical vibrations transmitted to the model through the sting
mount. The very regular T kHz signal, however, demonstrates
the possible existence of the vibrational mode of instability
not seen in the earlier tests (Reference 1) in which only
high speed schlieren pictures were taken since this mode
involves no large displacement of the shock waves. Later in
this report the pulsation mode was detected in tests on the
Elliptic Triconic model whose surface at the shoulder forms
a 90° angle with the freestream as compared to the 70° of
the concave biconic. As stated earlier, the vibrational mode
is associated with smaller cone angles hence it would appear
plausible that the Concave Biconic model would more likely
22
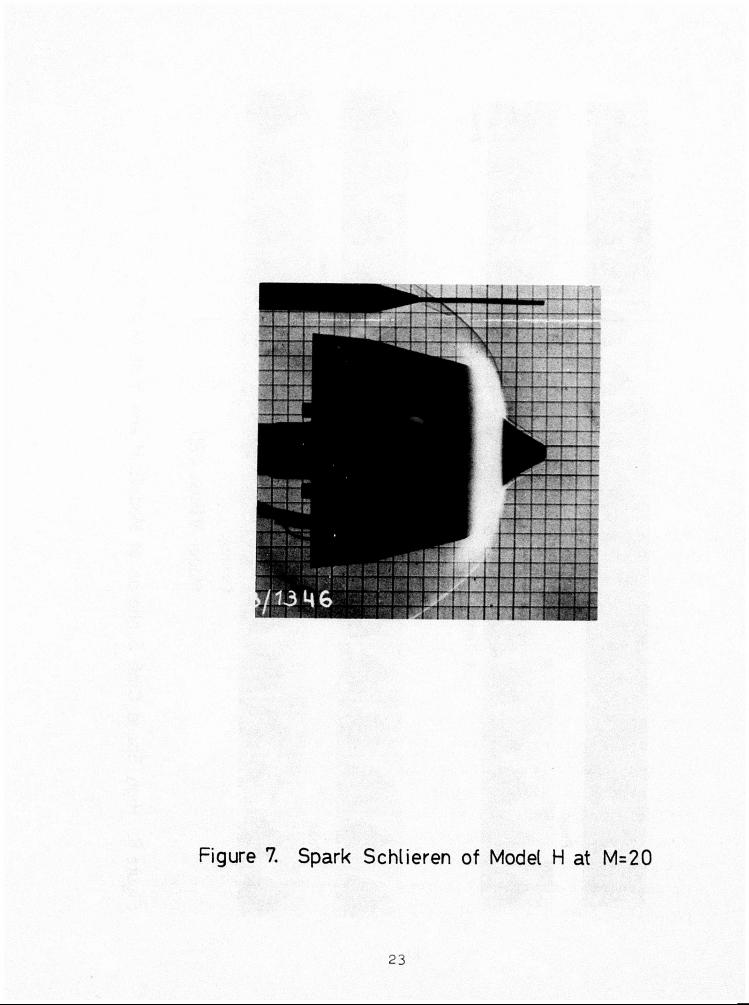
Figure 7. Spark Schlieren of Model H at M=20
23
'•ISSTvT"
r-« c cc
0) T3 O
10
m n
05 >
T ) C CO
1/1 ~a> "D O
c a> L_ Qi
O CO •\a> c b "8 Q; CL
CO
-C en
CD a; w_ 13 CT)
LL
2 k
1
1 support this particular mode.
d. Results and discussion of Tests on Concave Biconic Model V
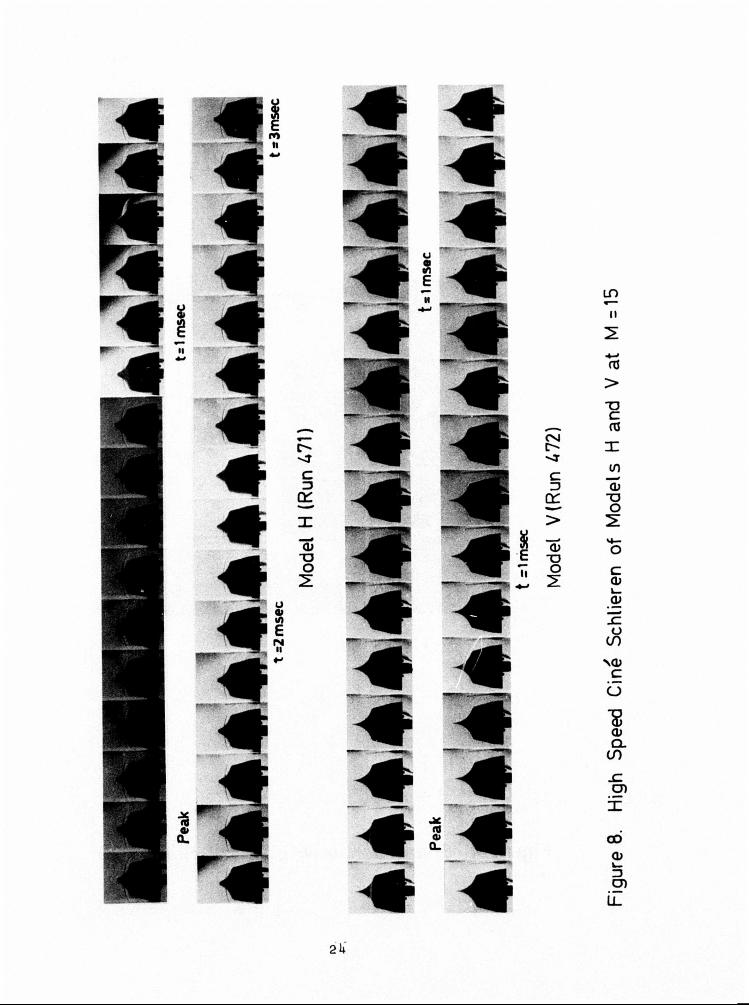
The results of a third test employing the Concave
Biconic Model V appeared very different from previous tests in
that two types of flow behaviour were detected with hoth the
pressure transducers and cine photographs. For the first milli-
second the flow resembled quite closely the flow patterns des-
cribed in the preceding paragraphs in which the existence of
"vibrational" instability was suggested. A foreshock emanated
from the nose tip and developed very close to the tody until
it intersected the aftershock. The aftershock itself was very
nearly normal at the point of intersection and appears as a
bow wave associated with a blunt body. In fact, the shock stand-
off distance from the shoulder was the same as the hlunt nose
configuration to within the resolution of the photographs. It
had been determined in the earlier investigation (Reference 1)
that this stand-off distance was independent of nose configu-
ration. Within the time between two sparks (i.e. 100 ysec)
this shock envelope changed to a large angled conical shock
which again emanated from the tip and encompassed nearly the
entire forebody forcing the aftershock further downstream.
This remained the flow field until the end of the test. See
figure 8.
This abrupt change in flow field was also reflected
in the pressure traces. At one millisecond after the peak the
mean pressure level as recorded by a Hidyne gauge at station
2 showed a drop to less than half its initial value and also
an attenuation of the superimposed pressure fluctuations.
Although the output of the BBN pressure sensors as recorded
on the oscilloscopes are difficult to interpret, they are in
agreement qualitatively with the Hidyne traces.
25
On re-examination of the previous tests of Reference
1, it was found that this phenomenon was present in every
case, but overlooked due to the fact it took place between
15 and 23 msec after the peak, a time at which the temperature
of the flow is so low that test gas condensation is considered
to have occur red.This discontinuity is tentatively concluded
to be a result of the reduction of Reynolds number during the
test to such a value that the flow can no longer negotiate
the pressure gradient produced by the isentropic compression.
The result is that the extent of the separated region increa-
ses substantially. The high speed cine schlieren substantiate
this since as described earlier the foreshock angle is greatly
enlarged after this supposed "critical" Reynolds number is
reached. With this rapid increase in separated length the very
efficient isentropic compression mechanism occurring early on
the forebody surface is destroyed causing the drop in pressure.
The relatively noise free-signal found after the pressure drop
indicates that the flow in the separated region is steady.
Since this test and those of Reference 1 were not
carried out at the same initial conditions and that conden-
sation was present, it is not feasible at this point to cal-
culate the values of these "critical" Reynolds numbers. How-
ever, there appears to be a trend that this Reynolds number
decreases with increasing nose radius. See Figure 9- It should
be noted that researches at Langley (Reference 16) observed
similar but not identical trends at Mach 8.8 on tension shell
shapes.
2. RESULTS OF EXPERIMENTS USING THE AEROTHERM ELLIPTICAL TRICONIC MODEL
a. Response characteristics of Kulite pressure transducers
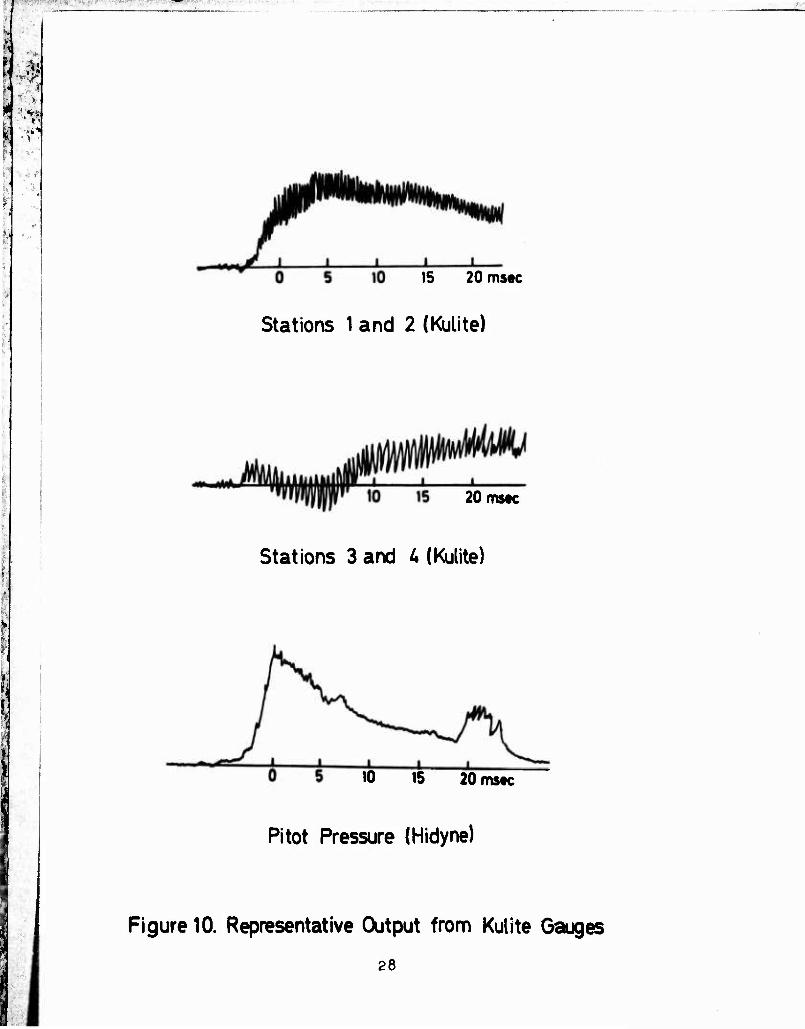
It is seen in figure 10 two markedly different signal
characteristics obtained from the Kulite transducers during
26

I f
■, s
Model H. Peak Unit Re =4.6x10^
Run^T^y
Model V. Peak Unit Re=4.6xl0/ft
20 msec
Model H. Peak Unit Re= S.TxIO/ft
Modell, Peak Unit Re=a7xl0/ft
Figure 9. Effect of Nose Radius and Re on the Mean Pressure Level
27
m
15 20 msec
Stations 1 and 2 (Kulite)
20mstc
Stations 3 and A (Kulite)
10 15 20 mstc
Pitot Pressure (Hidyne)
Figure 10. Representative Output from Kulite Gauges
28
.•^_:L._, .■.,:■ „.
this phase of the investigation. A pitot pressure trace has been
included in this figure to act as a time reference. Although
four identical transducers were used, the results consistently
yielded traces nearly identical to the upper sketch in Figure
10 at stations 1 and 2 and to the middle sketch at stations 3
and k.
These signals can be considered as providing both mean
and fluctuating pressure data. It is thus observed that the
sample trace from stations 1 and 2 rises more slowly to a mean
pressure level than does the pitot pressure despite the fact
that the former system has an inherently better time response.
However, once a maximum value of the mean pressure is reached,
typically 5 msec after the pitot pressure peak, the d.c. com-
ponent decays approximately the same as does the pitot trace
characteristic of Longshot operation.
The recorded signal representing stations 3 and k
exhibited a very different trend. The mean pressure level,
which should represent an absolute pressure (in that the re-
ference pressure is vacuum) is negative from just after the
pitot peak until k msec into the run. The time that the signal
remained negative varied depending on the run and station-posi-
tion, but the shape was similar in all cases. The d.c. compo-
nent then increased from zero until approximately 10 msec into
the run and remained constant for more than 50 msec .
\ Between tests each gauge was calibrated dynamically I ....
as described in section III-u to check that the measuring
systems were functioning properly and each responded as ex-
pected of gauges with the given makers specifications. In a
subsequent test series (Reference 17) these same Kulite pres-
sure transducers were installed on a convex model. The output
traces obtained were identical to those obtained from Hidyne l
gauges with somewhat better response. These observations indi-
29
/,
■:.V
i i
cated that under normal test conditions the gauges were func-
tioning correctly. It was noted also that the fluctuating
signals recorded were quite similar to those obtained by
Pallone (Reference 11).
The cause for the anomolous mean pressure levels was
believed to be due to spurious signals caused by either acce-
lerations due to steady or unsteady forces on the model or
temperature effects due to exposure to the hot gas (2500oK)
behind the aftershock. It is felt that these effects would
be most pronounced at the rear stations due to their location
and orientation in the flow. That is, the gauges at station
3 and k are located behind a normal or nearly normal shock
virtually at all times and are hence at higher pressure levels
and in a hotter environment than stations 1 and 2. According
to the manufacturers specifications the Kulite gauges are an
order of magnitude more sensitive to acceleration in the axial
direction than in the transverse direction. Figure 5 illus-
trates that at stations 3 and h the gauges axes are nearly
parallel to the flow direction. It is likely that the instabi-
lity process observed as described in later sections would
cause the largest effect in the freestream direction and hence,
would inceract more strongly with the gauges mounted at these
positions .
A final factor to consider is the time to establish
the flow in a separated region. The following two examples
taken from the literature give a rough idea of the times ex-
pected. Holden in a study on separation (Reference 18) presents
a simple correlation of the establishment time for the wake
flow of spheres in hypersonic flow. This correlation and the
equivalent parameters of this study yields a flow establishment
time of 2.0 msec for the present test. According to Needham
(reference 19) the flow establishment for a hypersonic laminar
separated region in a compression corner is somewhat less than
1 msec.
30
_
■■*)
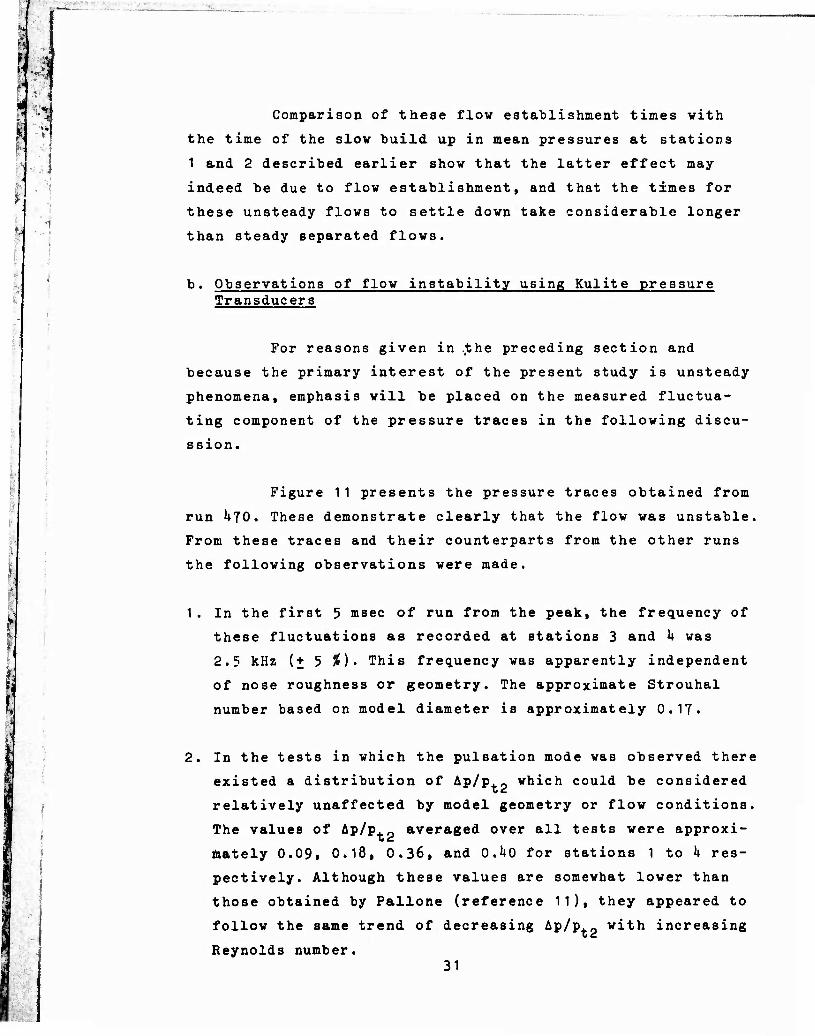
Comparison of these flow establishment times with
the time of the slow build up in mean pressures at stations
1 and 2 described earlier show that the latter effect may
indeed be due to flow establishment, and that the times for
these unsteady flows to settle down take considerable longer
than steady separated flows.
b. Observations of flow instability using Kulite pressure Transducers
For reasons given in ..the preceding section and
because the primary interest of the present study is unsteady
phenomena, emphasis will be placed on the measured fluctua-
ting component of the pressure traces in the following discu-
ssion.
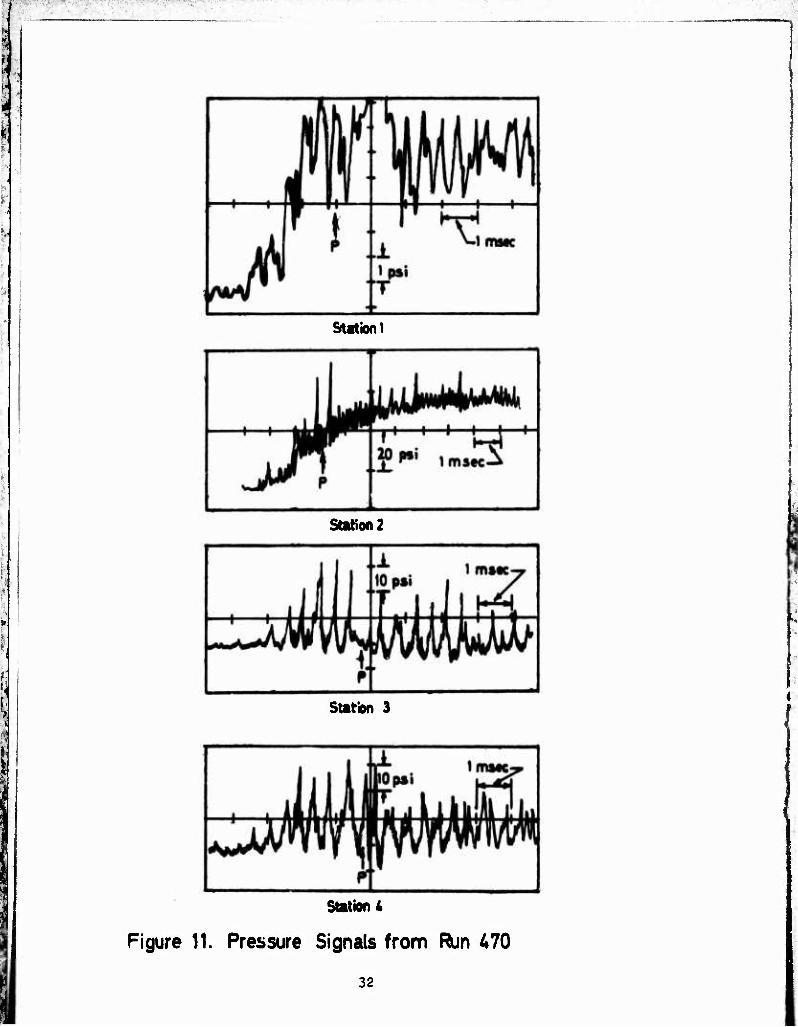
Figure 11 presents the pressure traces obtained from
run kTO. These demonstrate clearly that the flow was unstable.
From these traces and their counterparts from the other runs
the following observations were made.
1. In the first 5 msec of run from the peak, the frequency of
these fluctuations as recorded at stations 3 and k was
2.5 kHz (+ 5 %)• This frequency was apparently independent
of nose roughness or geometry. The approximate Strouhal
number based on model diameter is approximately 0.1T«
In the tests in which the pulsation mode was observed there
existed a distribution of Ap/p.« which could be considered
relatively unaffected by model geometry or flow conditions.
The values of Ap/p.p averaged over all tests were approxi-
mately 0.09, 0.18, 0.36, and O.Uo for stations 1 to k res-
pectively. Although these values are somewhat lower than
those obtained by Pallone (reference 11), they appeared to
follow the same trend of decreasing Ap/p - with increasing
Reynolds number. 31
Station 1
Station 2
Station 3
Station 4
Figure 11. Pressure Signals from Run 470
32
3. The characteristic wave-form of the fluctuation is more easily
seen at stations 3 and k than at stations 1 and 2 (see Figure 11,
on this figure the time at which peak freestream conditions occur
is denoted hy the letter "P") • At the earlier stations there was
little similarity between consecutive pulses or sequences of pul-
ses. Furthermore many of the larger pulses appear to contain a
number of intermediate frequencies (between U.5 and 7 kHz) pro-
bably due to the dynamic impulsive nature of the growth behaviour
of the foreshock. For these reasons it is difficult to determine
the dominating frequency of the instability from traces obtained
at the earlier stations.
h. There appeared to be some correlation between the pressure
histories of stations 3 and k. However, there was some attenua-
tion and phase shift occurring along the model which indicated
large and changing pressure gradients on the body surface. This
illustrates that it will be difficult to obtain any information
from synchronisation of pressure traces and photographs of shock
envelopes .
5. It was observed from the traces recorded on the oscillograph
that the frequency of the instability decreased approximately
20 % after 20 msec from peak conditions. This is expected since
for a constant Strouhal number the frequency will decrease with
decreasing velocity as occurs with increasing time during a test
in Longshot.
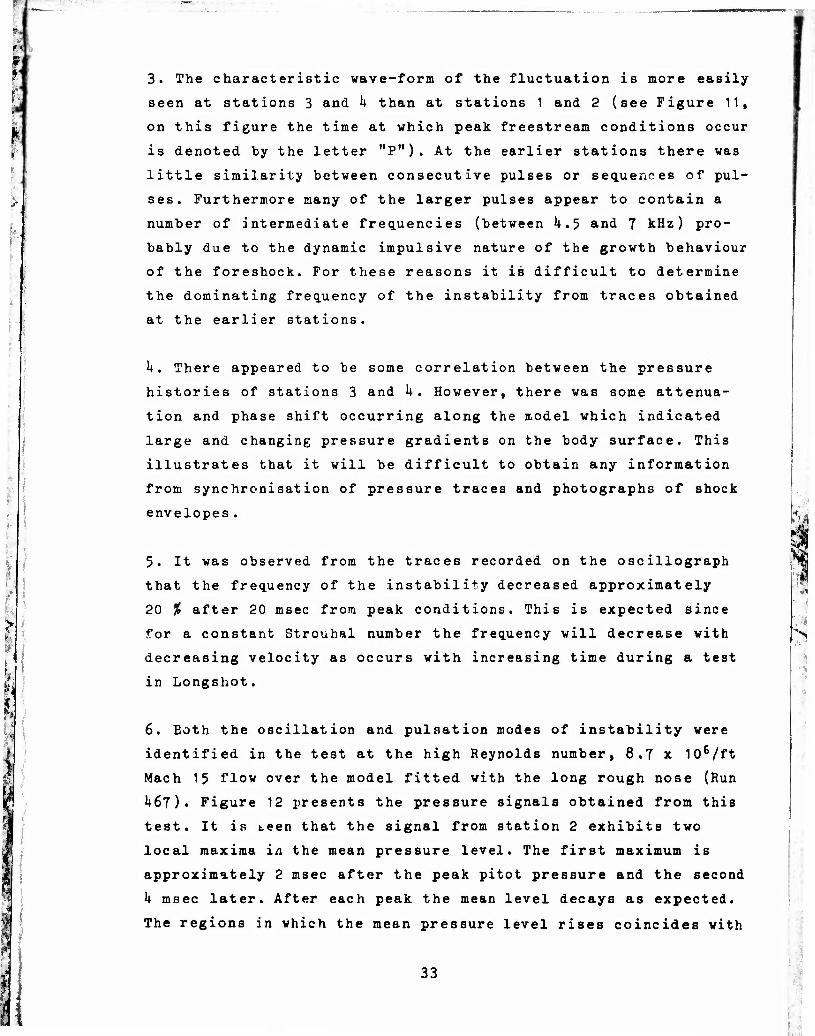
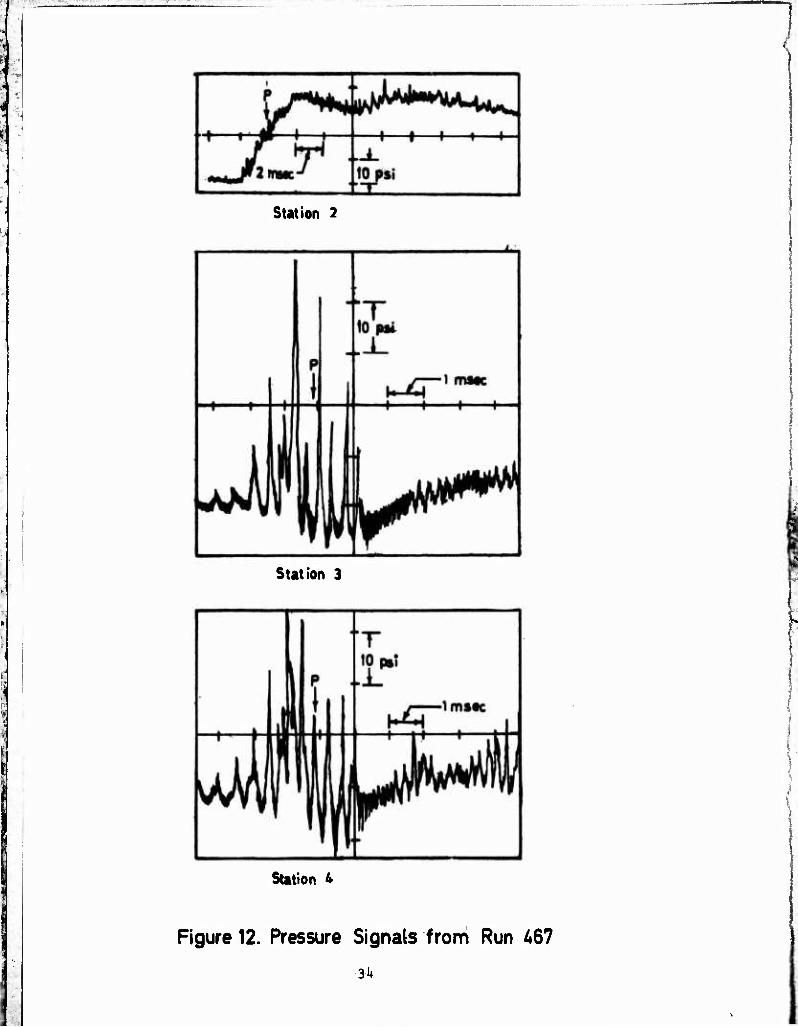
6. Both the oscillation and pulsation modes of instability were
identified in the test at the high Reynolds number, 8.7 x 10⁶/ft
Mach 15 flow over the model fitted with the long rough nose (Run
U67). Figure 12 presents the pressure signals obtained from this
test. It is teen that the signal from station 2 exhibits two
local maxima in the mean pressure level. The first maximum is
approximately 2 msec after the peak pitot pressure and the second
k msec later. After each peak the mean level decays as expected.
The regions in which the mean pressure level rises coincides with
33
'"■,;. --^"»«.^"'T^i •■''-■■... ■••
Station 2
Station 3
Station 4
Figure 12. Pressure Signals from Run 467
31*
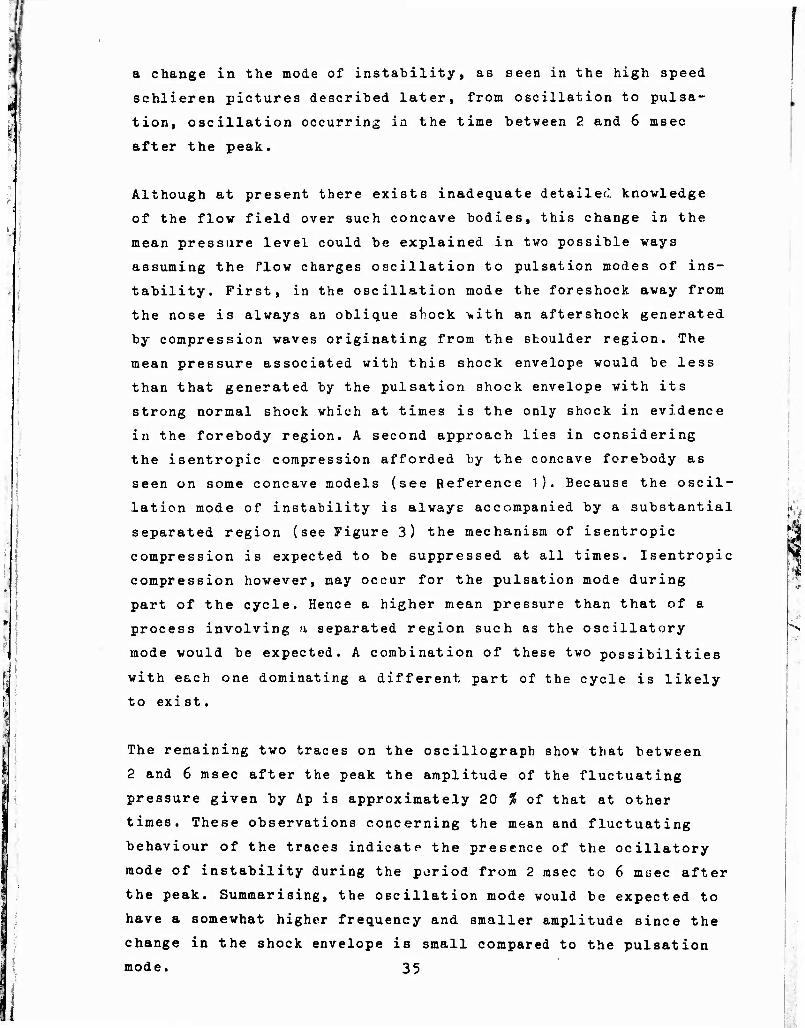
I a change in the mode of instability, as seen in the high speed
schlieren pictures described later, from oscillation to pulsa-
tion, oscillation occurring in the time between 2 and 6 msec
after the peak.
Although at present there exists inadequate detailed knowledge
of the flow field over such concave bodies, this change in the
mean pressure level could be explained in two possible ways
assuming the flow charges oscillation to pulsation modes of ins-
tability. First, in the oscillation mode the foreshock away from
the nose is always an oblique s^ock with an aftershock generated
by compression waves originating from the shoulder region. The
mean pressure associated with this shock envelope would be less
than that generated by the pulsation shock envelope with its
strong normal shock which at times is the only shock in evidence
in the forebody region. A second approach lies in considering
the isentropic compression afforded by the concave forebody as
seen on some concave models (see Reference 1). Because the oscil-
lation mode of instability is always accompanied by a substantial
separated region (see Figure 3) the mechanism of isentropic
compression is expected to be suppressed at all times. Isentropic
compression however, may occur for the pulsation mode during
part of the cycle. Hence a higher mean pressure than that of a
process involving a separated region such as the oscillatory
mode would be expected. A combination of these two possibilities
with each one dominating a different part of the cycle is likely
to exi st.
The remaining two traces on the oscillograph show that between
2 and 6 msec after the peak the amplitude of the fluctuating
pressure given by Ap is approximately 20 % of that at other
times. These observations concerning the mean and fluctuating
behaviour of the traces indicate the presence of the ocillatory
mode of instability during the period from 2 msec to 6 maec after
the peak. Summarising, the oscillation mode would be expected to
have a somewhat higher frequency and smaller amplitude since the
change in the shock envelope is small compared to the pulsation
mode. 35

f. The oscillation mode of instability occurred only during the
test on the model fitted with the long rough tip at bigh Reynolds number i.e. conditions that produced the highest possibility of
boundary layer transition. Similar to results found on the Concave Biconic model this suggests again that there exists a "critical" Reynolds number above which, in this case, the flow is of the oscillation mode and below which it is of the pulsation mode of
instability. The hypothesis of a critical Reynolds number is fur-
ther born out since this same model, when tested at a lower cri-
tical Reynolds number, exhibited only the pulsation mode.
Referring again to figure 12, it is seen that there was pulsation during the first 1 or 2 msec of run. This was attributed to
transients remaining after the flow passed through lower Reynolds number conditions in the build up to peak conditions early in the
test.
c. Results from the high speed cine schlieren
The high speed cine schlieren films from runs k60 to
1*70, presented in figures 13 through 16, illustrate clearly an unstable flow field over the Elliptical Triconic model. In each
figure, the frame coinciding with the peak condition is marked with a letter P.
The predominant form of instability seen in these figures is the pulsation mode using the spiked blunt body termi- nology given in the Introduction. It is seen to be a regular
process. For example, in Figure 1 •♦ the first frame after the peak conditions of Run k66 illustrates that a nearly conical
shock created by the nose exists. In the next two frames this conical shock expands to a spherical shape until the aftershock
originating from the blunt afterbody of the model is displaced.
By the following frame (i.e. 100 ysec later) this bubble-like
shock has collapsed leaving what appears to be some highly mixed
36
W.l ■-:■■■■',■■ ■ ■■ ■ -■,
flow on the forebody and a very veak conical shock emanating from the tip. The process then repeats itself.
In Figures 17 and 18 plots of the "volume" of the conical foreshock versus time are given. The quantity plotted along the ordinate to illustrate the volume is the diameter of this shock measured at right angles to the model axis at an arbitrary distance from the tip. Even though these plots are built up from information measured at discrete times they yield frequencies with approximately the same values as those obtained from the pressure signals (see section IV2b).
Of special interest is the period between 2 and 6 msec after the peak in run 1*67 (Figure 17)- This agrees well with findings from pressure traces of this run discussed in the previous section. During this period the foreshock is a relati- vely large angle conical shock which oscillates between slightly concave and slightly convex dispositions. Its frequency is diffi- cult to determine since its apparent value is a large fraction of the framing rate (i.e. k-5 kHz compared to 10,000 frames per sec). This frequency as well as the others are also in agreement with those obtained from the pressure traces.
37
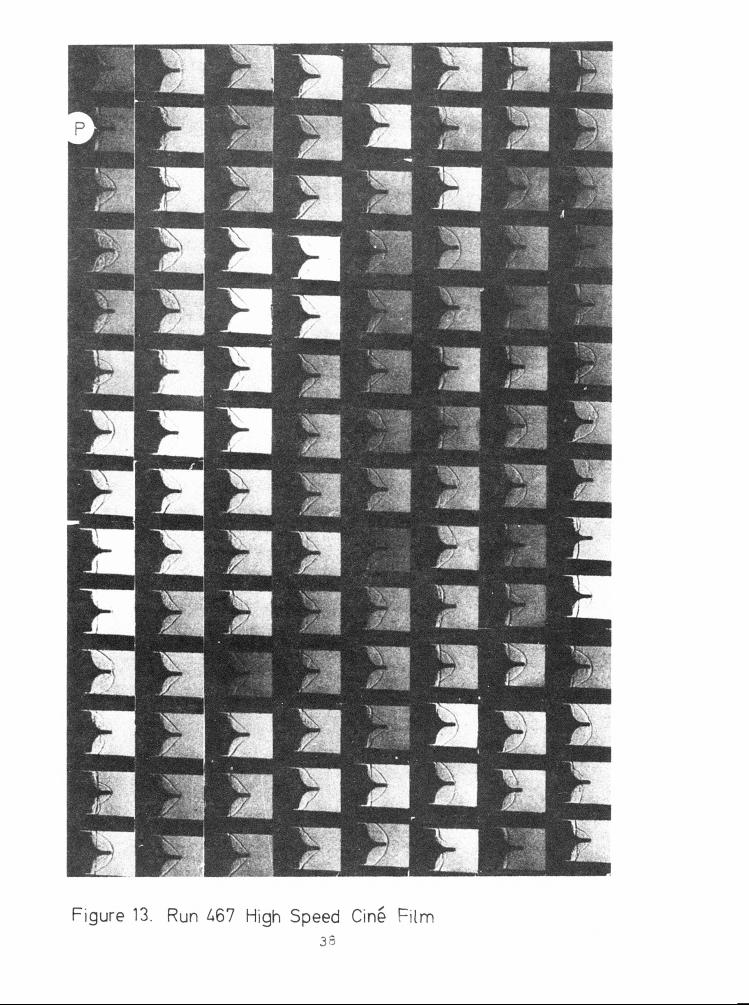
Figure 13. Run £67 High Speed Cine Film 35
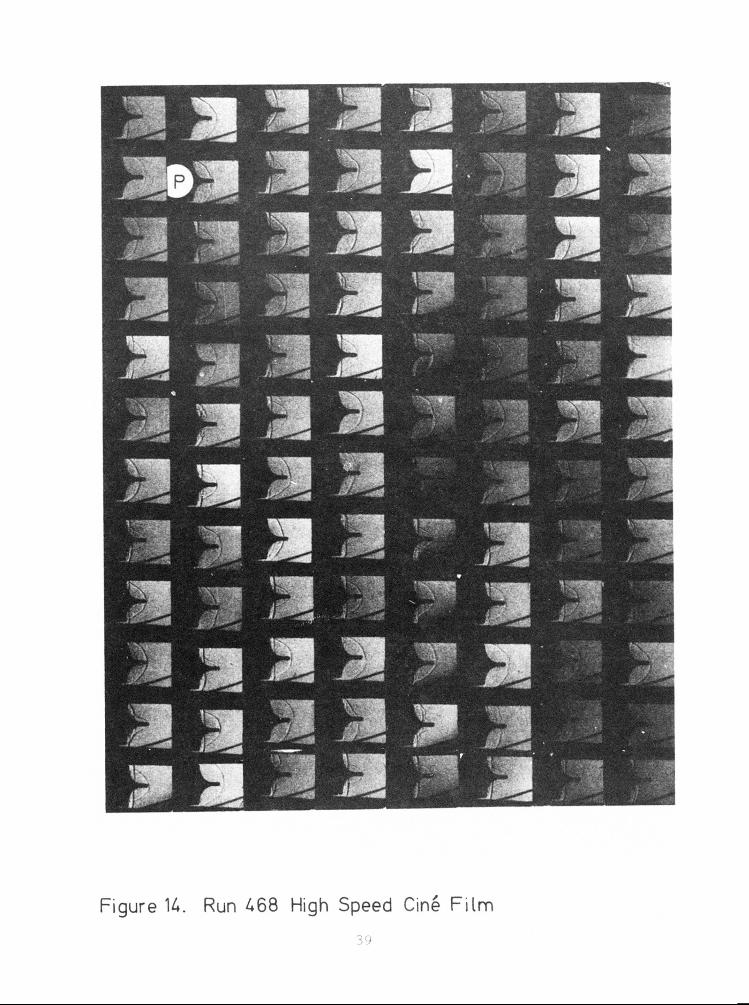
Figure \U. Run 468 High Speed Cine F i lm
39
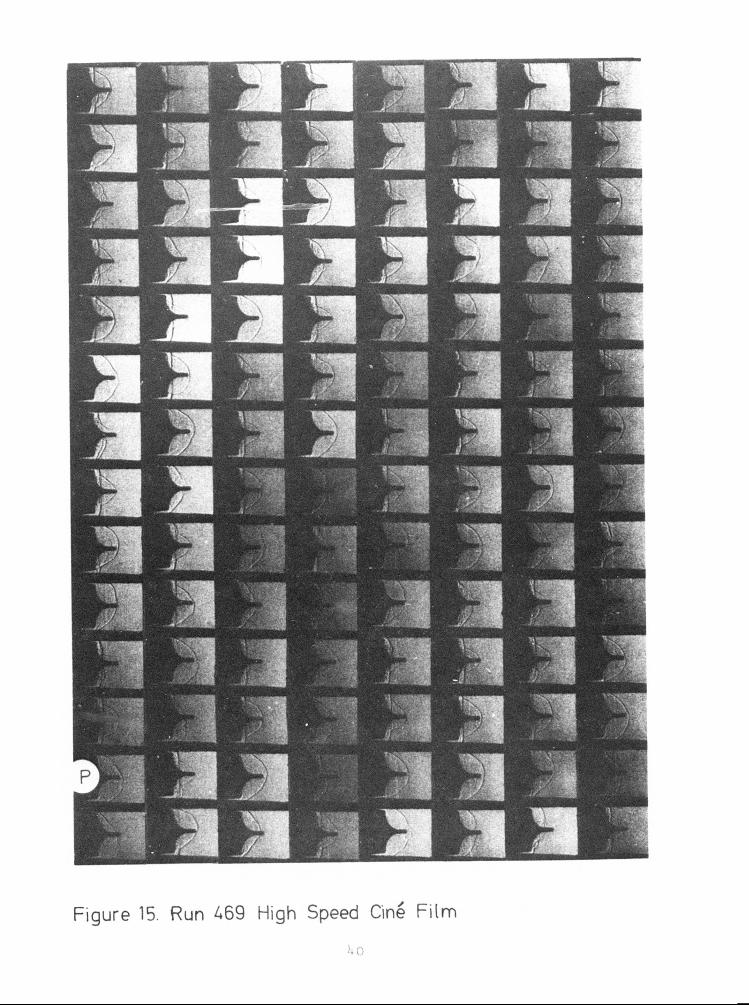
Figure 15. Run A69 High Speed Cine Film
u o
— ifcHi
Figure 16. Run A70 High Speed Cine Film
U1
I
adO|«AU3 )poMS *o ..•wnpAll
CD
or
I 5 o o. o % > c
Hi
E
ü.
1*2
. ■■—■. ■ ■ ■
»1
1
o
§
5 I >
I
■g
5 ^
»i3
\
SECTION V
CONCLUSIONS
A study of the unsteady flow over concave conic shapes
has been made using a high speed cine photograph technique and
fast response instrumentation in the flow in the VKI Longshot
windtunnel, simulating the high Reynolds number high Mach number
phase of re-entry flight. The results have hinted that other
than the pulsation mode of instability, two other modes of ins-
tability flow associated with spiked blunt bodies were present
under certain conditions.
A. regular T ItHz (equivalent to fD/u ■ 0.1+) pressure
signal sensed on the Concave Biconic model at a high Reynolds
number condition was ascribed to the pressure of the "vibratio-
nal" instability mode. The expected shock movement was too small
to be seen in the photographs. At lower Reynolds numbers large,
but fairly stable separate regions were found to be present.
The oscillation mode was observed on the Elliptic
Triconic model at such conditions that transitional or turbulent
flow was most likely to have occured on the concave surface.
The frequency of the fluctuation was approximately U to 5 kHz
i.e. fD/u ■ 0.2T to 0.33. At all other conditions the pulsation mode was found to exist occurring always at a frequency of
approximately 2.5 kHz (i.e. fD/u «• 0.17). The amplitudes of
pressure fluctuations sensed on the concave surface in ehe
"pulsation" unstable mode had the highest values seen during
the test which varied from 0.09 Ptp near the nose to O.UO p.-
near the shoulder.
hk
E '^SSyti^/f-r' is -ff^mf^lff^Kyi: w
The above conclusions are considered somewhat tentative in the light of the present know-how ahout these flow instabili- ties. It is recommended that a well-planned study he carried out to understand the flow process involved in the instability over spiked cones and their derivatives and to define further the boundaries within which they exist.
U5

.- ■ ..
REFERENCES
1) B.E. Richards, and M.A. Kenworthy, "Steady Hypersonic Flow
over Axisymmetric Concave Conic Shapes" Interim Scientific
Report, Grant AF0ER-T2-222T. Jan. 197^. AFML-TR-T5-137.
2) H.J. Allen, and A.J. Eggers, Jr., "A Study of the Motion and
Aerodynamic Heating of Missiles entering the Earth's Atmosphere
at High Supersonic Speeds." NACA TN kohl, 1957.
3) W.F. Moeckel, "Flow Separation ahead of Blunt Bodies at Super-
sonic Speeds." NACA TN 2^18, 1951.
1+) W.A. Mair, "Experiments on Separation of Boundary Layers on
Frohes in front of Blunt Hosed Bodies in a Supersonic Air
Stream." The Phil. Mag., July 1952.
5) D. Beastall, and J. Turner, "The Effect of a Spike Protruding
in front of a Bluff Body at Supersonic Speeds." ARC, R & M
No 3007, 1957.
6) S.M. Bogdonoff, and I.E. Vas, "Preliminary Investigations of
Spiked Bodies at Hypersonic Speeds." Princeton U. Report
No Ul2, 1958.
7) D.J. Maull, "Hypersonic Flow over Axially Symmetric Spiked
Bodies." JFM Vol. 8, I960.
8) C.J. Wood, "Hypersonic Flow over Spiked Cones." JFM Vol. 12
Pt. k, 1961.
9) M.S. Holden, "Experimental Studies of Separated Flows at
Hypersonic Speeds." Part I : Separated Flows over Axisymmetric
Bodies. AIAA J., Vol. k, 1966, pp. 591-599-
U6
" ■ ■——^» ■■■
10) H.P. Kabelitz, "Zur Stabilität geschlossener Grenzschicht-
ablösegebiete an konischen Drehkörpern bei Hyperschall-
anstromung." DLR FB 71-77. 1971.
11) A. Pallone (private communication), 1973.
12) B.E. Richards, and K.R. Enkenhus, "Hypersonic Testing in
VKI Longshot Piston Tunnel." AIAA Journal, Vol. 8, No 6,
June 1970.
13) B.E. Richards, S. Culotta, and J. Siechten, "Heat Transfer
and Pressure on Re-entry Nose Shapes in the VKI Longshot
Hypersonic Tunnel." AFML-TR-71-200, Wright Patterson AFB,
Ohio, June 1971•
14) H.H. Heller, and A.R. Clemente, "Unsteady Aerodynamic Loads
on Slender Cone/Flat Base Configurations at Free-stream
Mach Numbers from 0 to 22." AIAA Paper 73-998, presented at
AIAA Aero Acoustic Specialist Conference, Seattle, U.S.A.,
Oct. 1973.
15) R.J. Pallant, "A Note on the Design and Construction of a
Low Pressure Calibrator and a Comparison with Shock Tube
and Static Calibration Methods." British A.R.C. CP 9^7, 1966.
16) R.A. Jones, D.M. Bushnell, and J.L. Hunt, "Experimental Flow
Field and Heat Transfer Investigation of Several Tension
Shell Configuration at a Mach Number of 8." NASA TN-D-38OO,
Jan. 1967.
17) B.E. Richards, and M.A. Kenworthy, "Pressure Measurements on
a Convex Biconic Model in a Mach 15 Flow." Test Report 8I4,
Grant AFOSB 72-2227, March 197'+.
U7
* m
k «•••<
18) M.S. Holden, "Experimental Studies of Shock Wave -
Boundary Layer Interaction", VKI Short Course, Lecture
Series 62, Jan. I97I*.
19; D.A. Needham, "Laminar Separation in Hypersonic Flow"
Ph.D. Thesis submitted to the university of London,
Aug. 1965.
1*8 il U.S. GOVERNMENT PRINTING OfFICE: 1976 — 65'-6i0/316
Related Documents