A Study of the Fundamental Relationships between Deformation-Induced Surface Roughness and Strain Localization in AA5754 M.R. STOUDT, J.B. HUBBARD, M.A. IADICOLA, and S.W. BANOVIC Three-dimensional, matrix-based statistical analysis methods were developed and integrated with high-resolution topographical imaging, to assess how microstructural changes influence the evolution of plastic deformation and strain localization in a commercial AA5754-O aluminum sheet in three in-plane strain modes. Analysis of the raw surface data revealed that the general composition of the surface roughness was highly sensitive to strain mode and strain level. The microstructural conditions that promote strain localization were assessed by extending a profile- based surface roughness parameter (Rt) to matrix form. Both analyses revealed that different strain modes produce characteristic dissimilarities in the deformation at the grain level. The localization data can be well characterized with a two-parameter Weibull distribution, sug- gesting that strain localization is a stochastic process that can be modeled reliably with Weibull statistics. This study clearly demonstrates that an accurate and straightforward probabilistic expression that captures the microstructural subtleties produced by plastic deformation can be developed from rigorous analyses of raw topographic data. Because variations in surface morphology profoundly influence the reliability of the numerical models used to predict strain localization, incorporating expressions of this type could greatly enhance the accuracy of these models. DOI: 10.1007/s11661-009-9881-6 Ó The Minerals, Metals & Materials Society and ASM International 2009 I. INTRODUCTION THE introduction of new alloys into the automobile body is an expensive and time-consuming process. For this reason, numerical predictions of the formability of metal sheet have become integral components in the automotive design process, generating a strong demand for accurate and reliable predictions of mechanical behavior under a wide range of deformation conditions. The inability to reliably model the evolution of the surface inhomogeneities produced during sheet metal forming creates a significant obstacle that impedes the widespread incorporation of these alloys. One of the most common approaches to assessing the formability, and thus the suitability, of an alloy for a particular application is the forming limit diagram. It is well known that macroscopic deformation in a typical metal stamping occurs through a combination of strain modes, or paths (e.g., biaxial, uniaxial, and plane strain). Considering that a combination of strain modes will likely promote failure at an overall strain that is lower than would be expected if the deformation occurred in a single strain mode, it is essential that the relative influence of each component of the macroscopic strain combination be properly identified and accurately assessed. Such a characterization is a complicated process requiring numerous high-resolution measure- ments of the deformation under each strain mode. [1] Consequently, the limiting strains in a typical stamping are most often estimated via numerical simulations specifically designed to predict the onset of macroscopic, or gross, strain localization. These complex simulations are usually based on phenomenological constitutive relations that assume a homogeneous response to an imposed macroscopic strain at the microstructural level until the onset of localization. [2] Accordingly, significant deviations from the homogeneous response are then considered to indicate the onset of a critical localization event (i.e., a direct precursor to failure such as the formation of cracks or splits, necks, etc.). [3] Even though models based on this approach tend to correctly indicate the general trends, they often fail to consistently predict the precise strains at which locali- zation occurs. [4] The addition of revised plasticity and kinematic hardening models and the results from studies of the influence of various material parameters (such as grain size and grain orientation effects, surface rough- ening effects, and other damage mechanisms) on strain localization have enhanced the reliability of the numer- ical models. [5–12] Despite the significant improvements that have been made to these models, inconsistencies still exist between the mechanical behavior that is predicted and the behavior that is observed experimen- tally. One possible source for these discrepancies is that the models used to predict the mechanical behavior are M.R. STOUDT, M.A. IADICOLA and S.W. BANOVIC, Materials Research Engineers, and J.B. HUBBARD, Research Associate, are with the NIST Center for Metal Forming, Materials Science and Engineering Laboratory, National Institute of Standards and Technol- ogy, Gaithersburg, MD 20899. Contact e-mail: [email protected] Manuscript submitted October 22, 2008. U.S. GOVERNMENT WORK NOT PROTECTED BY U.S. COPYRIGHT METALLURGICAL AND MATERIALS TRANSACTIONS A

Welcome message from author
This document is posted to help you gain knowledge. Please leave a comment to let me know what you think about it! Share it to your friends and learn new things together.
Transcript

A Study of the Fundamental Relationships betweenDeformation-Induced Surface Roughness and StrainLocalization in AA5754
M.R. STOUDT, J.B. HUBBARD, M.A. IADICOLA, and S.W. BANOVIC
Three-dimensional, matrix-based statistical analysis methods were developed and integratedwith high-resolution topographical imaging, to assess how microstructural changes influence theevolution of plastic deformation and strain localization in a commercial AA5754-O aluminumsheet in three in-plane strain modes. Analysis of the raw surface data revealed that the generalcomposition of the surface roughness was highly sensitive to strain mode and strain level. Themicrostructural conditions that promote strain localization were assessed by extending a profile-based surface roughness parameter (Rt) to matrix form. Both analyses revealed that differentstrain modes produce characteristic dissimilarities in the deformation at the grain level. Thelocalization data can be well characterized with a two-parameter Weibull distribution, sug-gesting that strain localization is a stochastic process that can be modeled reliably with Weibullstatistics. This study clearly demonstrates that an accurate and straightforward probabilisticexpression that captures the microstructural subtleties produced by plastic deformation can bedeveloped from rigorous analyses of raw topographic data. Because variations in surfacemorphology profoundly influence the reliability of the numerical models used to predict strainlocalization, incorporating expressions of this type could greatly enhance the accuracy of thesemodels.
DOI: 10.1007/s11661-009-9881-6� The Minerals, Metals & Materials Society and ASM International 2009
I. INTRODUCTION
THE introduction of new alloys into the automobilebody is an expensive and time-consuming process. Forthis reason, numerical predictions of the formability ofmetal sheet have become integral components in theautomotive design process, generating a strong demandfor accurate and reliable predictions of mechanicalbehavior under a wide range of deformation conditions.The inability to reliably model the evolution of thesurface inhomogeneities produced during sheet metalforming creates a significant obstacle that impedes thewidespread incorporation of these alloys. One of themost common approaches to assessing the formability,and thus the suitability, of an alloy for a particularapplication is the forming limit diagram. It is wellknown that macroscopic deformation in a typical metalstamping occurs through a combination of strain modes,or paths (e.g., biaxial, uniaxial, and plane strain).Considering that a combination of strain modes willlikely promote failure at an overall strain that is lowerthan would be expected if the deformation occurred in asingle strain mode, it is essential that the relativeinfluence of each component of the macroscopic strain
combination be properly identified and accuratelyassessed. Such a characterization is a complicatedprocess requiring numerous high-resolution measure-ments of the deformation under each strain mode.[1]
Consequently, the limiting strains in a typical stampingare most often estimated via numerical simulationsspecifically designed to predict the onset of macroscopic,or gross, strain localization. These complex simulationsare usually based on phenomenological constitutiverelations that assume a homogeneous response to animposed macroscopic strain at the microstructural leveluntil the onset of localization.[2] Accordingly, significantdeviations from the homogeneous response are thenconsidered to indicate the onset of a critical localizationevent (i.e., a direct precursor to failure such as theformation of cracks or splits, necks, etc.).[3]
Even though models based on this approach tend tocorrectly indicate the general trends, they often fail toconsistently predict the precise strains at which locali-zation occurs.[4] The addition of revised plasticity andkinematic hardening models and the results from studiesof the influence of various material parameters (such asgrain size and grain orientation effects, surface rough-ening effects, and other damage mechanisms) on strainlocalization have enhanced the reliability of the numer-ical models.[5–12] Despite the significant improvementsthat have been made to these models, inconsistenciesstill exist between the mechanical behavior that ispredicted and the behavior that is observed experimen-tally. One possible source for these discrepancies is thatthe models used to predict the mechanical behavior are
M.R. STOUDT,M.A. IADICOLA and S.W. BANOVIC,MaterialsResearch Engineers, and J.B. HUBBARD, Research Associate,are with the NIST Center for Metal Forming, Materials Science andEngineering Laboratory, National Institute of Standards and Technol-ogy, Gaithersburg, MD 20899. Contact e-mail: [email protected]
Manuscript submitted October 22, 2008.
U.S. GOVERNMENT WORK
NOT PROTECTED BY U.S. COPYRIGHT
METALLURGICAL AND MATERIALS TRANSACTIONS A

fundamentally deterministic and they simply cannotaccount for all of the variability that is possible in everymicrostructural component involved in the plasticdeformation process of a polycrystalline material. Inmany cases, the complexity of the microstructural effectsis often greatly simplified, to reduce the requiredcomputational time.
Clearly, plastic deformation in a polycrystalline alloyis extremely complex and the evolved surface is theresult of many factors.[13] Most mechanical deformationmodels incorporate microstructural and surface rough-ness effects to some extent, as a means of estimating thelocal deformation conditions that promote strain local-ization. Unfortunately, the fidelity of the roughness dataused in these models is questionable, given that thesedata are routinely based on the erroneous assumption ofa linear relationship between the surface roughness andthe plastic strain.[11,14,15] The literature also indicatesthat the strain mode has little or no influence on themeasurable surface roughness, if the grain size isconstant.[16]
The results of a recent evaluation of deformation-induced surface roughness with plastic strain plainlydemonstrated that the linear relationship between thesurface root-mean-squared (RMS) roughness (Sq) andthe plastic strain reported in the literature is a statisticalartifact resulting from inadequate sampling.[17] That is,such a simple expression relating strain and deforma-tion-induced surface roughness does not accuratelyreflect the true deformation behavior of the free surfaceof a polycrystalline material. The findings of thisstudy[17] also reveal that the linear relationship betweensurface roughness and strain is a consequence of themethods used to acquire and analyze the roughnessdata. The assessments of the roughening behavior in theliterature are largely derived from sets of linear profiles;they express the surface roughness as the simple averageof a single scalar roughness parameter that describes thedispersion of heights within the profiles about the mean(e.g., Ra, the arithmetic average roughness, or Rq, theRMS average roughness). The character of the entiresurface at a particular strain level (i.e., XRq) is thenrepresented by this ‘‘average’’ roughness parameter.When it is calculated from the mean of individualprofiles, the ‘‘roughness’’ becomes highly sensitive to thesampling conditions and to the influence of the naturalordering (i.e., sequences or correlations) present in theprofile data.[18] In addition, this approach generates anensemble of Rq distributions in which each sample in theensemble has its own mean and variance. The totalnumber of possible ensembles and the magnitude of thestatistical uncertainty associated with each ensemblethen become a function of the sampling parameters.(That is, XRq 6¼ Sq, under these sampling conditions.)
If one considers a deformed surface as a compositeconsisting of the topographical characteristics producedby each mechanism that was active during the deforma-tion process, it then becomes reasonable to assert thatintegrating high-resolution topographical measurementsand analysis methods that minimize the statistical uncer-tainty will improve our understanding of how changesin microstructure influence the evolution of plastic
deformation and, ultimately, critical strain localization.This then raises the following question: Can carefullydesigned surface topography measurements be used toreliably predict critical strain localization? Such a pre-diction is predicated on accurate assessments, or maps, ofthe morphological conditions that promote strain local-ization. These maps must be derived frommultiple sets ofsurface roughness data scrupulously acquired from arange of deformation conditions that capture the scope ofthe microstructural variations and minimize the statisti-cal uncertainty in the roughness data.This article presents a study of strain localization
behavior in three in-plane strain modes for a commercialAA5754-O aluminum sheet, as determined from detailedtopographic analyses. The motivation for this research isthe concept of mapping microstructural changes thatoccur as a function of plastic deformation, such as hasbeen shown by Frost and Ashby,[19] Greenwood,[20] andMohamed and Langdon.[21] The measurement andsampling protocols used in this study are based onhigh-resolution topographical imaging techniques andrigorous matrix-based, three-dimensional statisticalanalysis methods. This article is part of a larger effortdesigned to understand and predict the factors thatdetermine the multiaxial flow surface for automotivealloys. This more general study includes detailed char-acterizations of the relative changes that occur in thecrystallographic texture with strain level in the samethree in-plane strain modes,[22] the parametric analysesof the relative influences of strain with the strainmode,[1] and the evolution of multiaxial flow surfaces.[23]
The relationships among the individual elements of thisgeneral study will be presented in future studies.
II. EXPERIMENTAL
A. Material
The aluminum alloy selected for this study, AA5754-O, was developed primarily for automotive applications.Like most alloys in the 5xxx series, AA5754 is substi-tutionally strengthened and demonstrates good overallformability. It also exhibits discontinuous yielding of thePortevin-Le Chatlelier (PLC) type (i.e., PLC banding)that has been characterized in the literature.[23–26] Asreported by The Aluminum Association (Arlington,VA), AA5754 typically contains 2.8 pct mass fractionMg for solid-solution strengthening and approximately0.5 pct mass fraction Mn for grain refinement andstability.[27] Metallographic examination revealed thatthe grain structure was relatively equiaxed in the rollingplane and slightly elongated along the rolling direction(RD) of the sheet. This is indicative of the recrystallizedmicrostructure normally associated with the O-temper.The mean grain size for this alloy was approximately40 ± 20 lm.[22]
B. Generation of Surface Roughness
A set of 30 9 30 cm (12 9 12 in.) blanks was shearedfrom 1-mm-thick sheet stock for testing. When the
METALLURGICAL AND MATERIALS TRANSACTIONS A
tensile axis of rolled sheet specimens lies in the trans-verse orientation to the RD, the evolved surfaceroughness tends to be slightly more severe than whenthe tensile axis is parallel to the RD.[17] Therefore, thescope of this study focused on samples deformed in thetransverse direction.
Industry customarily uses aluminum sheet stock in theas-received condition, O-temper, with a specified maxi-mum acceptable initial surface roughness that varies withthe particular application. While it is important torepresent actual forming conditions, the mill scalepresent on most commercial aluminum alloys completelyobscures the fine surface features that evolve during theinitial stages of the deformation process, thereby makinghigh-resolution measurements of these characteristicsextremely difficult. As such, the specimens in thisevaluation were polished to reveal the surface characterat low strains and to produce more consistent surfaceroughness measurements. Preparation consisted ofmechanically polishing one side to a 6-lm diamondfinish using a metallographic polishing technique thatwas based on standard metallurgical procedure.[28]
After polishing, the blanks were deformed in threein-plane strain modes defined in terms of the in-plane
principal true strain ratio q ¼ e2e1
� �. The first strain ratio
was q = 1 (hereafter referred to as equibiaxial); thesecond strain ratio was q = �0.5 (hereafter referred toas uniaxial); and the third strain ratio was q = 0(hereafter referred to as plane strain). The uniaxialsamples were machined to an ASTM E08-91 standard-sheet-type tensile specimen geometry. The specimenswere then strained according to standard test meth-ods[29] at a constant displacement rate that produced astrain rate of 6 9 10�4 s�1 to nominal true strain valuesof 5, 10, and 15 pct. Both the equibiaxial and planestrain deformations were imposed using an augmenta-tion[30] of the Marciniak flat-bottom ram test.[3] Sampleswere strained in equibiaxial tension using a typical strainrate of 5 9 10�4 s�1 to nominally 5, 10, 15, and 20 pcttrue first-principal strain (e1). A third set of samples wasstrained to similar true strain levels in the plane straincondition. Additionally, one sample was taken to failurein each strain mode. Note that, for purposes of thisstudy, ‘‘failure’’ refers to the maximum uniform strainoutside of the region in which gross localizationoccurred. Therefore, the surface roughness data acquiredat this condition establish the maximum uniform surfaceroughness obtainable for the AA5754-O alloy in eachstrain mode. Coupons were cut from the center of eachdeformed specimen for topographic analysis.
C. Surface Roughness Measurements
The surface topography was quantified for each strainlevel in each strain mode with scanning laser confocalmicroscopy (SLCM). Each measurement in this evalu-ation consisted of five well-spaced SLCM images takenfrom the specimen surface. The imaging conditions werethe same for each evaluation; they consisted of anobjective lens (10 times) and a nominal total z-scandepth of approximately 40 lm. These parameters
generated sets of 640 9 512-pixel intensity images with12-bit resolution. The spacing between sampling pointsin the (x, y) plane was fixed by the objective lens at1.56 lm; the spacing between the focal planes withineach image was approximately 100 nm. This producesimages with nominal physical dimensions (x, y, z) of1000 9 800 9 40 lm. The SLCM stores each topo-graphic image data as a raw tagged image file format(TIFF) depth map that contains the full set of imagingparameters and binary pixel values. A computer codewas developed that uses the format standards within aTIFF image to convert the bit values into a simplenumerical matrix of surface heights. The resultingmatrix was then trimmed to a square 512 9 512-pixel(800 9 800-lm) 262,144-element array, to facilitate thematrix-based mathematical operations.[17]
After conversion, the extreme values (taken to bevalues in the height data greater than ±6r, where r isthe standard deviation for all the heights in that matrix)were filtered from the data sets. This step was necessarybecause some of the statistical parameters used tointerpret the surface data are highly sensitive to outlierdata points. Filtering consisted of setting the magnitudeof any extreme value equal to the mean for thatparticular surface. Note that the number of affecteddata points for a given surface was typically fewer than20 points (i.e., <0.008 pct of the total number of datapoints). The residual matrix was used as the source forall subsequent assessments of the surface character. Itwas essential for these images to be well separated, toensure that the surface data contained in each image wasstatistically independent (i.e., no overlapping imagedata) and that the data properly represented the fullrange of surface characteristics.
III. RESULTS
A. Analysis of Topographic Data
The evolution of surface deformation is presented inFigure 1 as a function of the strain mode and strain level.The scanning laser confocal micrographs shown in thisfigure reveal the complexity of the surface features that areproduced by the deformation process in a polycrystallinealloy.When viewed along the columns, the representativemicrographs in this figure exhibit the evolution of surfacedeformation (i.e., at 5 pct nominal true strain, 10 pctnominal true strain, and at the ‘‘failure’’ strain) in theequibiaxial, uniaxial, and plane strain modes. The esti-mated true strain levels for the failure condition are 30, 19,and 18 pct for the equibiaxial, uniaxial, and plane strainconditions, respectively. When viewed across the rows,themicrographs reveal the influence of the strainmode onthe evolved surface at each strain level. The RD andtensile axis for the uniaxial and plane strain conditions arealso indicated in each figure. Note that the 6-lmdiamondsurface contains scratches and other small remnants fromthe polishing procedure that may not be consistent withthe directions indicated.Probability density functions (PDFs) were calculated
for each set of raw height data by extracting theindividual data points from the five matrices acquired at
METALLURGICAL AND MATERIALS TRANSACTIONS A

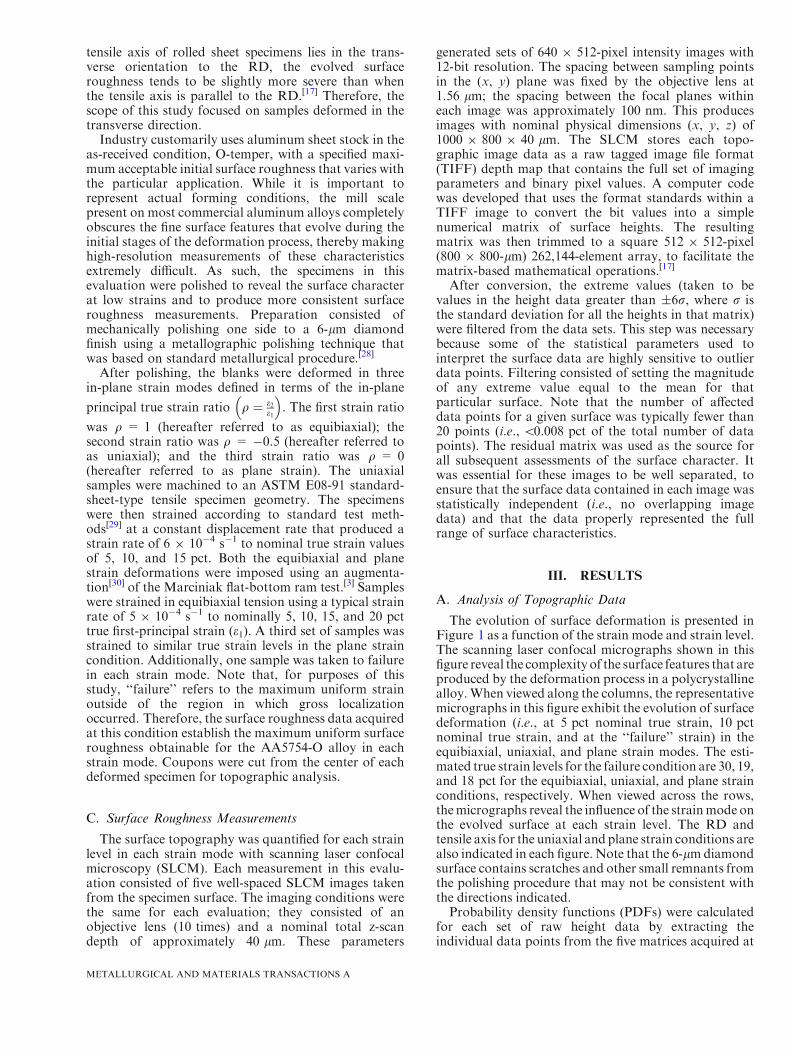
each strain condition. An example of this construction isshown in Figure 2 for the data in the failure condition.The failure condition was selected for this plot becausethe variations among the individual data sets weregenerally larger at the higher strain levels. The envelopesin this figure are the upper and lower bounds of the PDFrange for the five sets of surface height data acquired ineach strain mode. As such, these envelopes reflect themagnitude of the variability in the raw surface height
data for each strain mode. Because the areas of eachenvelope are the same, the differences in the shapes ofthe envelopes also graphically illustrate the influence ofthe strain mode on the dispersion of heights about themean (Sq).The results of an analysis of the surface height data
are shown in Table I. Note that this table contains boththe true strain and the effective strain values. While theresults of these analyses are expressed in terms of a true
Fig. 1—Scanning laser confocal micrographs showing the surface structure of AA5754-O at three strain levels and in three strain modes. Images(a) through (c) are in equibiaxial strain; (d) through (f) are in uniaxial strain; and (g) through (i) are in plane strain. Images (a), (d), and (g)show the surfaces after 5 pct nominal true strain; (b), (e), and (h) show the surfaces after 10 pct nominal true strain; and (c), (f), and (i) showthe surfaces at the maximum uniform strain.
METALLURGICAL AND MATERIALS TRANSACTIONS A
strain level as a function of the strain mode, to facilitatea direct comparison of the influence of the strain modeon localization, a comparison of the localization behav-ior in terms of a normalized (i.e., von Mises) uniaxialstrain[31] can be achieved with the effective strain values.Note that analyses based on these two strains will notnecessarily produce identical results. As shown inReferences 17 and 32, the standard deviation r andhigher statistical moments can be determined directlyfor any matrix. Because the topographical matrices wereleveled, the mean for each matrix is zero. The Sq valuesare consistent with other observations,[13,33] in that theyexhibit a proportional response to an increase in theplastic strain. While this proportionality is present in
each strain mode, the Sq magnitude appears to reach asaturation value in the equibiaxial and plane strainconditions.The surface skew Ssk (or third moment, r3) is a
measure of the overall symmetry of the distribution ofthe raw height data about the mean plane; because it isnormalized by the standard deviation, it is a dimension-less quantity. For a Gaussian distribution, Ssk = 0 and,as shown in Table I, the skew values are all slightlynegative, indicating that a valley is somewhat moreprobable than a peak. Unlike the Sq values, the skewsdo not appear to reflect any systematic change withstrain level or strain mode. The surface kurtosis Sku (orfourth moment, r4) is a measure of the overall shape ofthe height distribution about the mean plane and, likethe skew, it is also normalized by the standard deviationand is dimensionless. For a Gaussian distribution,Sku = 3, and the Sku values shown in Table I are allsomewhat greater than 3. This indicates that the rawheight distributions have slightly sharper central peaksand longer tails than would occur if the distributionwere Gaussian. As was the case with the skew values, nosystematic change with strain is apparent in the kurtosisdata.
B. Analysis of Localization Data
Analyses of all of the values contained within each setof raw height data provide details about the evolvedsurfaces with respect to the strain mode. They alsoreveal generalities about the relative trends resultingfrom the plastic deformation specific to a particularstrain mode. However, these data cannot quantify themagnitude of a specific feature within the data. Quan-tification of the relationship between the surface rough-ness and strain localization requires an analysis that isbased on a measure that describes the relative changes inthe local surface heights. Data of this type can beobtained via a roughness parameter that is sensitive tothe changes in the peaks and valleys on the surface. Onesuch parameter is the maximum height of a profile Rt,
Table I. Analysis of Raw Surface Height Data
Strain PathTrueStrain
EffectiveStrain
Mean(lm)
Uncertainty*(lm)
Sq(lm)
Uncertainty(lm) Skew� Uncertainty Kurtosis Uncertainty
As polished 0.00 0.00 �8.26 9 10�9 1.38 9 10�8 0.921 0.027 �0.234 0.021 3.468 0.155Equibiaxial 0.05 0.10 1.79 9 10�8 2.00 9 10�8 1.308 0.055 �0.338 0.075 4.004 0.194
0.10 0.21 1.95 9 10�8 3.84 9 10�8 2.136 0.102 �0.465 0.055 4.149 0.1630.15 0.28 �1.23 9 10�8 7.98 9 10�8 2.606 0.078 �0.305 0.043 4.203 0.1490.20 0.41 �5.11 9 10�8 3.90 9 10�8 3.611 0.039 �0.291 0.058 4.164 0.1310.30 0.62 �1.19 9 10�7 1.04 9 10�7 3.886 0.180 �0.060 0.121 3.720 0.165
Uniaxial(RD ^)
0.05 0.05 1.21 9 10�9 2.04 9 10�8 0.927 0.039 �0.375 0.022 3.783 0.1140.10 0.12 3.74 9 10�9 5.89 9 10�8 1.619 0.101 �0.563 0.101 4.289 0.2660.15 0.17 �8.62 9 10�9 6.27 9 10�8 2.320 0.117 �0.673 0.040 4.794 0.1520.19 0.20 3.51 9 10�8 6.85 9 10�8 3.137 0.647 �0.385 0.105 4.560 0.341
Plane strain(RD ^)
0.05 0.07 1.22 9 10�8 2.15 9 10�8 0.952 0.052 �0.298 0.054 3.737 0.3470.10 0.11 4.50 9 10�8 3.70 9 10�8 1.455 0.053 �0.509 0.064 4.298 0.1270.15 0.17 2.67 9 10�8 6.27 9 10�8 2.510 0.520 �0.456 0.134 4.258 0.6660.18 0.19 1.17 9 10�8 5.28 9 10�8 2.304 0.272 �0.330 0.101 4.409 0.281
*Refers to the statistical uncertainty.�The skew and kurtosis for a Gaussian distribution are normalized by the standard deviation and are dimensionless.
0
0.03
0.06
0.09
0.12
0.15
-25 -20 -15 -10 -5 0 5 10 15 20 25
Pro
ba
bili
ty D
en
sity
Uniaxial
Equi-biaxial
PlaneStrain
Surface Height, µm
Fig. 2—Range of probability density distributions constructed frommaximum and minimum raw height data values contained in the fivetopographies acquired at maximum uniform strain in each strainmode.
METALLURGICAL AND MATERIALS TRANSACTIONS A

which is defined as the vertical distance between thehighest and lowest points of a profile within a particularevaluation length.[14] That is:
Rt ¼ Rpþ Rv ½1�
where Rp is the distance between the highest point of theprofile and the mean line and Rv is the distance betweenthe lowest point of the profile and the mean line within aparticular evaluation length. (Note that heights lowerthan the mean plane are traditionally considered nega-tive.) The Rt parameter is ideal for characterizing thesurface conditions that promote critical strain localiza-tion and for quantifying the magnitudes of those surfaceconditions for several reasons. (1) This parameter ishighly sensitive to a local change in the surface heightand it is acquired through a straightforward calculation.(2) The length of the profile over which Rt is determinedcan range from a few data points within a profile to theentire profile, so the Rt parameter can track the changesin the surface height on a local or overall basis. (3) Themagnitudes of the local surface extremes will changewith strain to the point at which they reach a value thatcorrelates with the onset of critical strain localization.(4) The Rt parameter can be easily determined for anytwo points within a particular region during a numericalsimulation, thereby making changes in the local surfaceconditions directly integrable into formability models.
The statistical uncertainty associated with profile-based analysis can be minimized by extending the Rtparameter to a matrix form.[17] This is accomplished bycreating a Euclidean distance matrix.[35] The construc-tion of this matrix required subdividing a 512-row 9512-column source matrix into smaller matrices consist-ing of 64 element cells (8 pixels/row 9 8 pixels/column).This created a differential matrix consisting of 4096elements (i.e., 64 9 64 cells). The maximum differencein the surface height for a given cell, Rt(i,j), wasdetermined from the 64 values contained within thatcell. For this reason, Rt(i,j) is the maximum displacementnormal to the mean plane in the source matrix at thecoordinates of that cell. Because the matrix formatpreserves all of the spatial coordinates for an Rt cell byconstruction, both the magnitude and the location ofeach Rt(i,j) value are quantified by this method. Conse-quently, this technique links any feature in the sourceimage to the corresponding change in magnitude of thelocal surface height and the level of resolution can easilybe adjusted by altering the cell dimensions. Given thatthe mean grain size of this alloy is 40 lm, the 12.5 912.5-lm cell used in this assessment was an acceptablelevel of resolution.
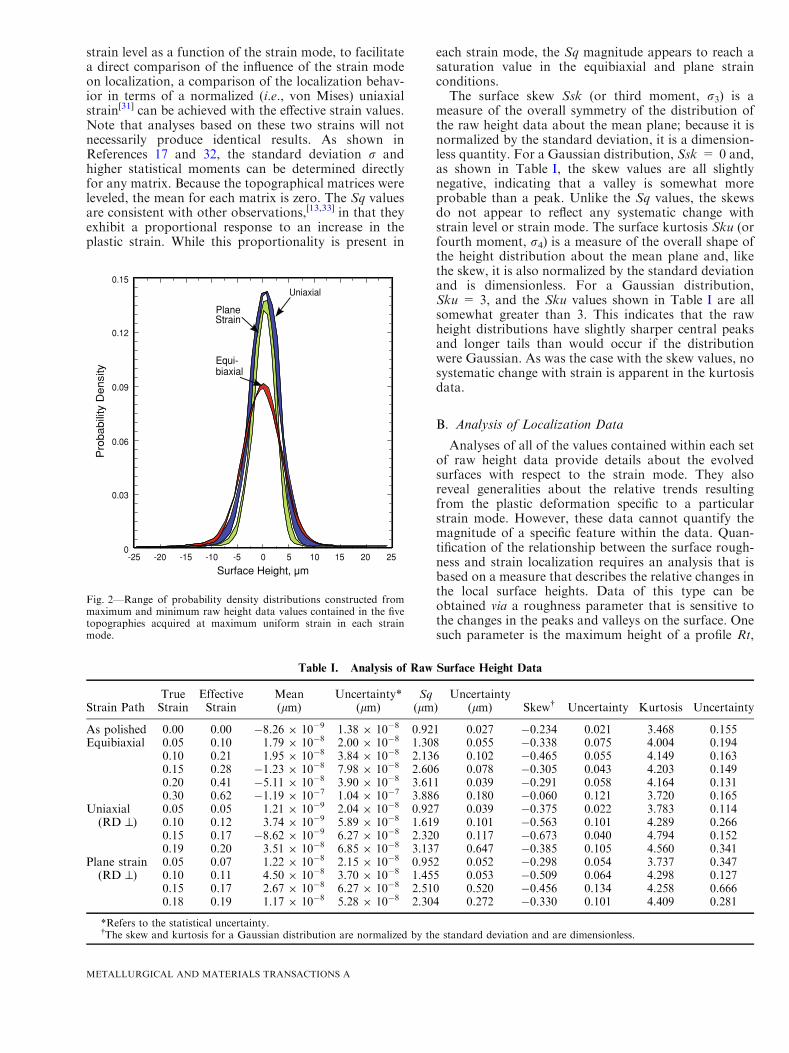
The results of the Rt matrix constructions are shownin Figure 3. The data used to construct the maps inFigure 3 are identical to those presented as images inFigure 1. The main distinction between Figures 3 and 1is the change in resolution resulting from the Rt cellconstruction. The range of Rt magnitudes was mappedinto a standard 8-bit color scale in which blue is low andred is high, so that the color of an individual cell directlyreflects the local magnitude of Rt. The maps shown inFigure 3 exhibit the variations in Rt intensity produced
by the different strain conditions in exactly the samemanner as in Figure 1. That is, when viewed across therows, the maps reveal the local Rt intensity as a functionof the strain mode at three different strain levels and,when viewed down the columns, the maps reveal thechanges in the local Rt intensity as a function of thestrain level for the three strain modes. While it differswith the strain mode, the number of high-intensity Rtcells increases progressively with the strain level, withthe highest number of these cells occurring in the failurecondition. Note that the scales for the Rt maps aredifferent for each strain path and the significance of thisdifference will be addressed later in this article.Upper- and lower-bound probability density enve-
lopes were constructed for the Rt data in the samemanner as was used for the height data (Figure 2).Again, the data for the failure condition are shown.There are two distinct differences between the PDFenvelopes shown in Figures 4 and 2. First, the overallwidths of the PDF envelopes are substantially greaterfor the Rt data than for the height data. This indicates ahigher variability within the individual Rt data. Second,and more important, the overall shapes of the distribu-tions are markedly different. The PDF envelopes shownin Figure 4 all exhibit a comparatively shorter left-handtail and a substantially longer right-hand tail than thoseshown in Figure 2, which denotes that any analysis ofthe Rt data that is based on Gaussian statistics wouldnot produce meaningful results.
C. Weibull Analysis
The general form in Figure 4 is consistent with that ofan extreme value distribution (i.e., the limiting distribu-tion for a maximum or minimum of a large collection ofrandom observations from the same distribution).[36]
Clearly, these data can be analyzed with several distri-butions,[37] but the Weibull distribution is one of themore well known[38,39] and was selected for this reason.Weibull statistics are used extensively in reliabilitypredictions to estimate failure, because such predictionsare concentrated on the incidence of statistically rareevents (i.e., the tail region). The Weibull distribution canbe used to describe a unimodal distribution that has onedisproportionally long tail, such as those shown inFigure 4.[40–42]
A Weibull distribution has two forms: a two-param-eter and a three-parameter distribution. Most Weibullanalyses are based on a two-parameter distribution,because the third parameter, a ‘‘guaranteed,’’ or thresh-old, value (i.e. a value after which no events occur) istypically not known a priori. The Weibull distribution iscontinuous and has a probability density function of theform:[42]
fPDF x; a; bð Þ ¼ ba
x
a
� � b�1ð Þ� �
e�xað Þ
b
½2�
In this equation, (x ‡ 0) and (fPDF(x; a, b) = 0 forx< 0). The two parameters, a, a scale parameter, andb, a shape parameter, must be real and >0. Because ofthe extensive use in reliability prediction, the Weibull
METALLURGICAL AND MATERIALS TRANSACTIONS A
distribution is more commonly expressed in terms ofthe cumulative distribution function (CDF):
fCDF x; a; bð Þ ¼ 1� e�xað Þ
b
½3�
Note that, for a given strain level, the CDF is theprobability P of the occurrence of an Rt magnitude thatis less than or equal to any given Rt (i.e.,fCDFðRtgivenÞ ¼ PðRt � RtgivenÞ). In addition, the CDF
is bounded by the following conditions: fCDF(0) = 0,and fCDF(¥) = 1.The five sets of Rt values acquired in each strain
condition were fitted with a Weibull distribution, usingcommercially available statistical software,[43] and themean a and b parameters for a given strain conditionwere determined from each set of a and b values usingregression analyses. The results of the Weibull analysisare shown in Table II. The a and b values are plotted as a
Fig. 3—Set of plots exhibiting the propensity for strain localization as a function of strain level and strain mode. Each plot is the Rt roughnessdata calculated for corresponding image shown in Fig. 1.
METALLURGICAL AND MATERIALS TRANSACTIONS A
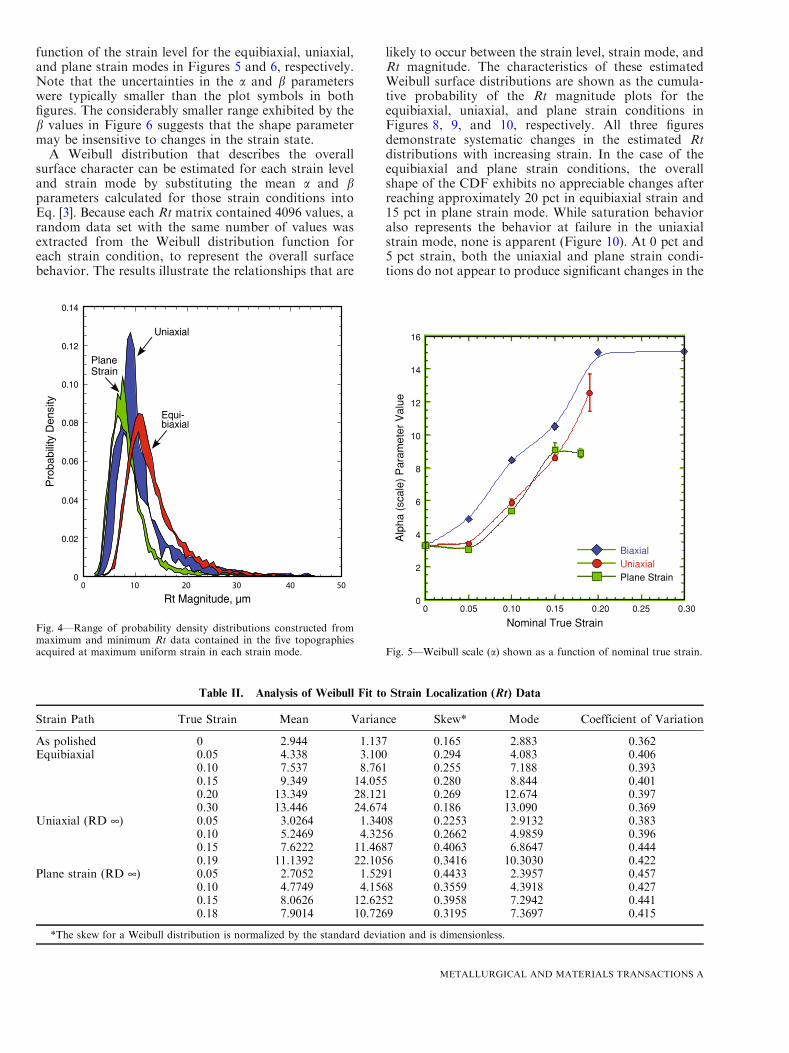
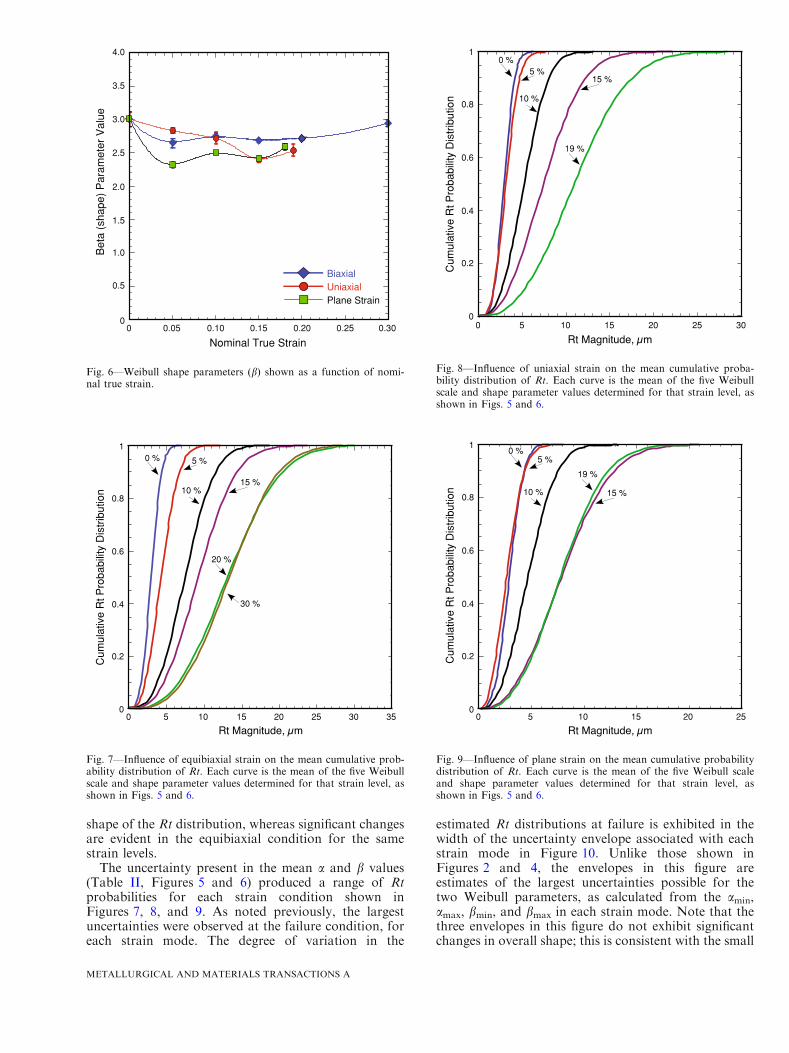
function of the strain level for the equibiaxial, uniaxial,and plane strain modes in Figures 5 and 6, respectively.Note that the uncertainties in the a and b parameterswere typically smaller than the plot symbols in bothfigures. The considerably smaller range exhibited by theb values in Figure 6 suggests that the shape parametermay be insensitive to changes in the strain state.
A Weibull distribution that describes the overallsurface character can be estimated for each strain leveland strain mode by substituting the mean a and bparameters calculated for those strain conditions intoEq. [3]. Because each Rt matrix contained 4096 values, arandom data set with the same number of values wasextracted from the Weibull distribution function foreach strain condition, to represent the overall surfacebehavior. The results illustrate the relationships that are
likely to occur between the strain level, strain mode, andRt magnitude. The characteristics of these estimatedWeibull surface distributions are shown as the cumula-tive probability of the Rt magnitude plots for theequibiaxial, uniaxial, and plane strain conditions inFigures 8, 9, and 10, respectively. All three figuresdemonstrate systematic changes in the estimated Rtdistributions with increasing strain. In the case of theequibiaxial and plane strain conditions, the overallshape of the CDF exhibits no appreciable changes afterreaching approximately 20 pct in equibiaxial strain and15 pct in plane strain mode. While saturation behavioralso represents the behavior at failure in the uniaxialstrain mode, none is apparent (Figure 10). At 0 pct and5 pct strain, both the uniaxial and plane strain condi-tions do not appear to produce significant changes in the
Rt Magnitude, µm
Uniaxial
Equi-biaxial
0
0.02
0.04
0.06
0.08
0.10
0.12
0.14
10 050403020
PlaneStrain
Pro
babi
lity
Den
sity
Fig. 4—Range of probability density distributions constructed frommaximum and minimum Rt data contained in the five topographiesacquired at maximum uniform strain in each strain mode.
Table II. Analysis of Weibull Fit to Strain Localization (Rt) Data
Strain Path True Strain Mean Variance Skew* Mode Coefficient of Variation
As polished 0 2.944 1.137 0.165 2.883 0.362Equibiaxial 0.05 4.338 3.100 0.294 4.083 0.406
0.10 7.537 8.761 0.255 7.188 0.3930.15 9.349 14.055 0.280 8.844 0.4010.20 13.349 28.121 0.269 12.674 0.3970.30 13.446 24.674 0.186 13.090 0.369
Uniaxial (RD ¥) 0.05 3.0264 1.3408 0.2253 2.9132 0.3830.10 5.2469 4.3256 0.2662 4.9859 0.3960.15 7.6222 11.4687 0.4063 6.8647 0.4440.19 11.1392 22.1056 0.3416 10.3030 0.422
Plane strain (RD ¥) 0.05 2.7052 1.5291 0.4433 2.3957 0.4570.10 4.7749 4.1568 0.3559 4.3918 0.4270.15 8.0626 12.6252 0.3958 7.2942 0.4410.18 7.9014 10.7269 0.3195 7.3697 0.415
*The skew for a Weibull distribution is normalized by the standard deviation and is dimensionless.
0
2
4
6
8
10
12
14
16
0 0.05 0.10 0.15 0.20 0.25 0.30
Alp
ha (
scal
e) P
aram
eter
Val
ue
Nominal True Strain
BiaxialUniaxialPlane Strain
Fig. 5—Weibull scale (a) shown as a function of nominal true strain.
METALLURGICAL AND MATERIALS TRANSACTIONS A
shape of the Rt distribution, whereas significant changesare evident in the equibiaxial condition for the samestrain levels.
The uncertainty present in the mean a and b values(Table II, Figures 5 and 6) produced a range of Rtprobabilities for each strain condition shown inFigures 7, 8, and 9. As noted previously, the largestuncertainties were observed at the failure condition, foreach strain mode. The degree of variation in the
estimated Rt distributions at failure is exhibited in thewidth of the uncertainty envelope associated with eachstrain mode in Figure 10. Unlike those shown inFigures 2 and 4, the envelopes in this figure areestimates of the largest uncertainties possible for thetwo Weibull parameters, as calculated from the amin,amax, bmin, and bmax in each strain mode. Note that thethree envelopes in this figure do not exhibit significantchanges in overall shape; this is consistent with the small
0 % 5 %
10 %15 %
20 %
30 %
0
0.2
0.4
0.6
0.8
1
0 5 10 15 20 25 30 35
Cum
ulat
ive
Rt P
roba
bilit
y D
istr
ibut
ion
Rt
Fig. 7—Influence of equibiaxial strain on the mean cumulative prob-ability distribution of Rt. Each curve is the mean of the five Weibullscale and shape parameter values determined for that strain level, asshown in Figs. 5 and 6.
0 %5 %
10 %
15 %
19 %
0
0.2
0.4
0.6
0.8
1
0 5 10 15 20 25 30
Cum
ulat
ive
Rt P
roba
bilit
y D
istr
ibut
ion
Rt
`
Fig. 8—Influence of uniaxial strain on the mean cumulative proba-bility distribution of Rt. Each curve is the mean of the five Weibullscale and shape parameter values determined for that strain level, asshown in Figs. 5 and 6.
0 %5 %
10 % 15 %
19 %
0
0.2
0.4
0.6
0.8
1
0 5 10 15 20 25
Cum
ulat
ive
Rt P
roba
bilit
y D
istr
ibut
ion
Rt
Fig. 9—Influence of plane strain on the mean cumulative probabilitydistribution of Rt. Each curve is the mean of the five Weibull scaleand shape parameter values determined for that strain level, asshown in Figs. 5 and 6.
Bet
a (s
hape
) P
aram
eter
Val
ue
0
4.0
3.5
3.0
2.5
2.0
1.5
1.0
0.5
0
Nominal True Strain0.3052.050.0 0.200.150.10
BiaxialUniaxialPlane Strain
Fig. 6—Weibull shape parameters (b) shown as a function of nomi-nal true strain.
METALLURGICAL AND MATERIALS TRANSACTIONS A

variations observed in the shape parameter b. For thisreason, variations in the scale parameter a have thegreatest influence on the probability distribution. Giventhat the CDFs shown in Figure 10 are the probable Rtvalues predicted by the estimated Weibull surfacedistributions at failure, each envelope in this figurereflects the probability that a critical strain localizationevent will occur for this alloy in that strain mode. Forexample, an Rt value with a magnitude of 15 lmsignifies that the probability for critical strain localiza-tion lies between approximately 60 and 68 pct inequibiaxial strain, 72 and 90 pct in uniaxial strain, and96 and 99 pct in plane strain. Similarly, a 90 pctprobability for critical strain localization correspondsto an approximate Rt value range between 11 and12.5 lm for equibiaxial strain, 15 and 19 lm foruniaxial strain, and 19.5 and 21 lm in plane strain.The probability distribution envelopes in Figure 10 are,therefore, the basis for the color maps used in Figure 3.That is, the maximum of the color range (i.e., the darkred) in Figure 3 corresponds to the magnitude of Rt onthe CDF (rounded to the nearest whole number) atwhich the lower bound of the probability envelopereached a value of 95 pct for each strain mode, that is,the minimum Rt value at which the probability of theoccurrence of a critical strain localization event isapproximately 95 pct. Similarly, the color of each cellin Figure 3 directly corresponds to the local probabilityfor critical strain localization.
IV. DISCUSSION OF RESULTS
The results of this study demonstrate that rigorous,matrix-based statistical analysis methods and appropriate
surface roughness parameters can be combined tocreate an effective technique for characterizing thesurface inhomogeneities generated by plastic deforma-tion. All of the topographic data acquired for thisevaluation had a measurement resolution sufficient toassess the morphological conditions that promote strainlocalization developed by the three strain modes shownin Figure 1. These high-resolution data were used tomap those morphological changes in two ways: onebased on the raw height data and one based on themagnitude of the local extremes within the height data,with the primary intent being to determine whethercarefully designed surface topography measurementscan be used to reliably predict critical strain localization.The matrix methods used throughout are designed tohandle large data sets efficiently. This enabled eachsurface condition to be based on five statisticallyindependent topographic images (each consisting of262,144 samples), as opposed to most traditional surfaceanalyses, which are based on the average of a few linearprofiles. This approach effectively maximized the statis-tical reliability of each surface characterization, result-ing in extremely accurate analyses of the surface dataand, because of this extraordinarily high number ofsamples, any differences between the individual data setswere directly attributed to variations in the surfacecharacter resulting from the local strain conditions, andnot to measurement error.The raw topographical maps reveal the relative
influences of strain level and strain mode on the overallcomposition of the surface morphology. Thoroughexamination of the metallurgical history of theAA5754-O alloy revealed that, while this alloy exhibitsPLC banding and some of the surface structure is likelydue to inhomogeneities resulting from this PLC behav-ior, the morphologies shown in Figure 1 were primarilygenerated by dissimilarities in the deformation at thegrain level. Because the deformed surfaces are highlysensitive to strain level and strain mode, the numericalresults from the topographical analysis (Table I) reflectthe variability in the local strain conditions produced bythe strain level and strain mode. At low levels of plasticstrain, the amount of deformation that occurs withineach grain depends on the individual orientation,[44,45]
the local Taylor factor,[46] and the constraints imposedby neighboring grains located at or just below thesurface.[47] That is, in those grains in which theorientation favors slip, the deformation occurs byprimary slip in the interior regions. Conversely, ingrains in which the slip conditions are not as favorable,the deformation tends to localize in the grain boundaryregions because of the additional shear displacementsrequired to produce grain rotation and maintaingrain-to-grain contiguity.[48] Recalling that the surfacetopography contains information about each activedeformation mechanism, the composition of the surfaceroughness must change accordingly with strain at thegrain level such that neighboring surface grains with thesame level of macroscopic strain can exhibit appreciablydifferent surface roughnesses. The higher dislocationdensities produced by localized work hardening makesdeformation by primary slip increasingly more difficult,
0
0.2
0.4
0.6
0.8
1
0 5 10 15 20 25 30 35
PlaneStrain
Uniaxial
Equi-Biaxial
Cum
ula
tive P
robabili
ty D
istr
ibutio
nfo
r C
ritic
al S
train
Loca
lizatio
n
Rt
Fig. 10—Influence of strain mode on the cumulative probability dis-tribution for critical strain localization. Each band is the maximumuncertainty envelope determined from the five Weibull scale andshape parameter values calculated at the maximum uniform strain ineach strain mode.
METALLURGICAL AND MATERIALS TRANSACTIONS A

with additional plastic strain resulting in the activationof additional deformation mechanisms. Furthermore,plastic deformation is a volume-conserving process, andeach strain mode in this evaluation imposes differentdegrees of freedom and effective levels of strain for thedeformation of the sheet.[31] Therefore, the local condi-tions required to activate a particular deformationmechanism must differ with the strain mode, therebydirectly influencing the composition of the measurablesurface roughness. For this reason, the micrographsshown in Figure 1 also exhibit the manner in which thephysical constraints imposed by the strain modesexacerbate the local differences in the plastic flow.
Considering that Rt is effectively the scalar projectionof the height gradient, the strain localization maps inFigure 3 reflect the magnitude of the changes in the localpeak-to-valley height for the surfaces shown in Figure 1.Furthermore, because it is based on a group and not onindividual pixels, an individual Rt cell is a coarse-grained measure of the differential topography on alocal level. In contrast to the maps based on the rawsurface data, the Rtmaps provide a basis for quantifyingthe magnitude of the microstructural dissimilarities thatpromote critical strain localization (e.g., cracks, splitsand tears, and necking).
These maps also tend to visually accentuate moremacroscopic surface features in the data, especially atthe failure condition in the uniaxial strain mode(Figure 3(f)), in which PLC banding may have had thestrongest effect on the surface character.[49] A discussionof the intricacies of PLC banding lies outside thisinvestigation; however, the aspect of this behavior thatis germane to this particular study is the evolution of themacroscopically scaled planar bands that emerge in aperiodic fashion on the specimen surface.[50,51] Eventhough recent research by Halim et al.[52] suggests thatfailure and PLC band formation may be independent, itis generally believed that PLC banding enhances strainlocalization by focusing deformation into the regionssurrounding the PLC bands.[53]
The different widths of the uncertainty envelopesassociated with the estimated Rt distributions inFigure 10 suggest that PLC banding may also havehad an influence on the variability of the predicted Rtbehavior by increasing the variability in the Weibullscale parameter a. In this figure, the envelopes associ-ated with the equibiaxial and plane strain conditions areconsiderably smaller with respect to the uniaxial condi-tion, which also exhibited the greatest range in a. This isconsistent with the literature that describes the relation-ship between PLC banding and strain mode.[54]
Numerous cells in Figure 3 exceeded the Rt magni-tude predicted by the Weibull analysis to producecritical localization in Figure 10, but failure did notoccur. This behavior implies that the simple occurrenceof an individual cell with a critical Rt magnitude isinsufficient for initiating critical strain localization. Thatis, failure may involve a threshold event or possibly anucleation and growth process involving several cellsthat exceed the critical Rt magnitude. Further examina-tion of Figure 3 revealed that, as the strain levelincreases, groups of cells with similar relative probabilities
for strain localization (i.e., structure), do appear to formwithin the Rt maps. Clearly, this structure is associatedwith the color scale used for this analysis; the existenceof this structure, however, cannot be assumed an artifacta priori. An assessment of the influence of the Rtstructure on strain localization requires detailed analy-ses of the spatial arrangements that may exist within theRt data. Research is in progress to determine whetherstructure is, indeed, present in the Rt data and whetheror not it has any influence on strain localization.
V. CONCLUSIONS
Rigorous three-dimensional matrix-based statisticalanalysis methods were developed and integrated withhigh-resolution topographical imaging to assess criticaldetails related to the way in which changes in micro-structure influenced the evolution of plastic deforma-tion and strain localization in a commercial AA5754-Oaluminum alloy sheet in three in-plane strain modes.The analysis of the surface data involved mapping thetopographic data in two distinctly different but com-plementary forms. The first examined the characteris-tics that were present in the raw surface data atdifferent strain levels in the three strain modes. Theresults revealed that the general composition of thesurface roughness was sensitive to the strain level andstrain mode. However, the evaluation of the rawsurface data did not reveal any substantive informationabout the propensity for strain localization in anystrain condition. The second extended a profile-basedsurface roughness parameter (Rt) to a matrix form,thus enabling a three-dimensional quantification of themicrostructural conditions that promote strain locali-zation. This calculation filtered the raw surface dataand accentuated more macroscopic features in thetopographies. In addition to revealing that the condi-tions for strain localization were sensitive to the strainmode, the results indicated that the Rt data couldbe well characterized with a two-parameter Weibulldistribution.The results from both analyses show that both the
raw and the filtered surface data exhibited dissimilaritiesin the deformation at the grain level that were producedby the individual strain modes. The influence of thestrain path was reflected in the widths of the envelopesassociated with the raw height distributions, the Rtdistributions, and the uncertainties associated withWeibull predictions of the probabilities for the onsetof strain localization in the three strain modes. Further-more, the widths of the uncertainty envelopes associatedwith the Rt distributions and the Weibull predictionsreflect a dependence on the strain mode that suggeststhat PLC banding might have had an influence on the Rtdata.The results of this evaluation clearly demonstrate that
the topographical conditions that promote critical strainlocalization can be assessed directly from rigorousanalyses of accurate surface roughness data and thatan accurate and straightforward probabilistic expressioncapturing the subtleties produced by these microstructural
METALLURGICAL AND MATERIALS TRANSACTIONS A

conditions can be developed from such an assessment.These results also suggest that the propensity for strainlocalization is a stochastic process that can be reliablypredicted with Weibull statistics. Numerous Rt cellsthat exceeded the predicted critical Rt magnitude were‘‘observed’’ in the Rt maps at strains at which failuredid not occur. This implies that failure could involve anucleation and growth process requiring several Rtcells that exceed the critical magnitude. As notedthroughout this article, local variations in surfacestructure are known to have a profound influence onthe reliability of the primarily deterministic numericalmodels used to predict the onset of localization.Therefore, the incorporation of a simple expressionthat reliably estimates the probability of critical strainlocalization (such as the one developed in this study)could greatly enhance the accuracy of these numericalmodels.
REFERENCES1. T. Foecke, M.A. Iadicola, A. Lin, and S.W. Banovic: Metall.
Mater. Trans. A, 2007, vol. 38A, pp. 306–13.2. T. Pardoen and Y. Brechet: Philos. Mag., 2004, vol. 84, pp. 269–
97.3. Z. Marciniak and K. Kuczynski: Int. J. Mech. Sci., 1967, vol. 9,
pp. 609–20.4. J.E. Bird and J.L. Duncan: Metall. Trans. A, 1981, vol. 12A,
pp. 235–41.5. F. Barlat, R.C. Becker, Y. Hayashida, Y. Maeda, M. Yanagawa,
K. Chung, J.C. Brem, D.J. Lege, K. Matsui, S.J. Murtha, andS. Hattori: Int. J. Plast., 1997, vol. 13, pp. 385–401.
6. A.J. Beaudoin, A. Acharya, S.R. Chen, D.A. Korzekwa, andM.G. Stout: Acta Mater, 2000, vol. 48, pp. 3409–23.
7. D. Rabbe, M. Sachtleber, H. Weiland, G. Scheele, and Z. Zhao:Acta Mater., 2003, vol. 51, pp. 1539–60.
8. R. Becker and O. Richmond: Modell. Simul. Mater. Sci. Eng.,1994, vol. 2, pp. 439–54.
9. H.A. Al-Quershi, A.N. Klein, and M.C. Fredel: J. Mater. Proc.Technol., 2005, vol. 170, pp. 204–10.
10. J. Savoie, M. Jain, A.R. Carr, P.D. Wu, K.W. Neale, Y. Zhou,and J.J. Jonas: Mater. Sci. Eng., A, 1998, vol. 257A, pp. 128–33.
11. P.D. Wu, D.J. Lloyd, M. Jain, K.W. Neale, and Y. Huang: Int. J.Plast., 2007, vol. 23, pp. 1084–1104.
12. W.B. Lievers, A.K. Pilkey, and D.J. Lloyd: Acta Mater., 2004,vol. 52, pp. 3001–07.
13. M.R. Stoudt and J.B. Hubbard: Acta Mater., 2005, vol. 53,pp. 4293–4304.
14. R. Becker: Acta Mater., 1998, vol. 46, pp. 1385–1401.15. Z. Zhao, R. Radovitzky, and A. Cuitino: Acta Mater., 2004,
vol. 52, pp. 5791–5804.16. K. Osakada and M. Oyane: Bull. JSME, 1971, vol. 14, pp. 171–77.17. M.R. Stoudt, J.B. Hubbard, and S.A. Janet: Mater. Sci. Technol.,
2008, vol. 24, pp. 253–60.18. M. Cai, M.R. Stoudt, L.E. Levine, and J.T. Dickinson: Philos.
Mag., 2007, vol. 87, pp. 907–24.19. H.J. Frost and M.F. Ashby: Deformation-Mechanism Maps: The
Plasticity and Creep of Metals and Ceramics, Pergamon Press,Oxford, United Kingdom, 1982.
20. G.W. Greenwood: Mater. Sci. Eng., A, 2005, vols. 410–411,pp. 12–15.
21. F.A. Mohamed and T.G. Langdon: Metall. Trans., 1974, vol. 5,pp. 2339–45.
22. S.W. Banovic, M.A. Iadicola, and T. Foecke: Metall. Mater.Trans. A, 2008, vol. 39A, pp. 2246–58.
23. M.A. Iadicola, T. Foecke, and S.W. Banovic: Int. J. Plast., 2008,vol. 24, pp. 2084–2101.
24. A.H. Cottrell: Philos. Mag., 1953, vol. 44, pp. 829–32.25. L.P. Kubin and Y. Estrin: Acta Metall. Mater., 1990, vol. 38,
pp. 697–708.26. P.G. McCormick: Acta Metall., 1971, vol. 19, pp. 463–71.27. Anonymous: Aluminum Standards and Data 2003, The Aluminum
Association, Washington, DC, 2003.28. G.F. VanderVoort: Metallography Principles and Practice, ASM
INTERNATIONAL, Materials Park, OH, 1999.29. Anonymous: 1993 Annual Book of ASTM Standards, Section 3,
Metals Test Methods and Analytical Procedures, ASTM, Phila-delphia, PA, 1993.
30. K.S. Raghavan: Metall. Mater. Trans. A, 1995, vol. 26A,pp. 2075–84.
31. G.E. Dieter: Mechanical Metallurgy, McGraw-Hill, New York,NY, 1986.
32. J.B. Hubbard, M.R. Stoudt, and L.E. Levine: J. Appl. Phys., 2007,vol. 102, pp. 1–10.
33. M.R. Stoudt, J.B. Hubbard, S.P. Mates, and D.E. Green: SAETrans. J. Mater. Manuf., 2006, vols. 114–115, pp. 183–90.
34. Anonymous: ASME Designation B46.1-2002: Surface Texture(Surface Roughness, Waviness and Lay), ASME, New York, NY,2002.
35. J. Dattorro: Convex Optimization & Euclidean Distance Geometry,MeBoo Publishing, Palo Alto, CA, 2005, pp. 219–314.
36. S. Kotz: Extreme Value Distributions: Theory and Applications,Imperial College Press, London, 2002.
37. N. Balakrishnan and V.B. Nevzorov: A Primer on StatisticalDistributions, J. Wiley & Sons, Hoboken, NJ, 2003.
38. J. Galambos, J. Lechner, and E. Simiu: Extreme Value Theory andApplications, Kluwer Academic Publishers, Dordrecht, TheNetherlands, 1994.
39. W. Weibull: J. Appl. Mech., 1951, vol. 18, pp. 293–97.40. J.E. Shigley and C.R. Mischke: Mechanical Engineering Design,
McGraw-Hill, New York, NY, 1989, pp. 165–71.41. K.C. Kapur: Reliability in Engineering Design, Wiley, New York,
NY, 1977.42. Anonymous: Weibull Distribution, Wikipedia, The Free Encyclo-
pedia, 2008.43. MATLAB version 7.4 (R2007a), The MathWorks. Inc, Natick,
MA, 2007.44. E.J. Moore: Doctoral Dissertation, University of Maryland,
Baltimore County, MD, 2006.45. E.J. Moore, M.R. Stoudt, and R.C. Reno: TMS Lett., 2005, vol. 2,
pp. 135–36.46. G.I. Taylor: J. Inst. Met., 1938, vol. 62, pp. 307–24.47. M.R. Stoudt and R.E. Ricker: Metall. Mater. Trans. A, 2002,
vol. 33A, pp. 2883–89.48. M.F. Ashby: Philos. Mag., 1970, vol. 21, pp. 399–424.49. J.D. Kang, D.S. Wilkinson, J.D. Embury, M. Jain, and A.J.
Beaudoin: Scripta Mater, 2005, vol. 53, pp. 499–503.50. A. Inagaki, T. Komatsubara, and H. Inagaki: Z. Metallkd., 1999,
vol. 90, pp. 427–33.51. P.J. Worthington and B.J. Brindley: Philos. Mag., 1969, vol. 19,
pp. 1175–78.52. H. Halim, D.S. Wilkinson, and M. Niewczas: Acta Mater., 2007,
vol. 55, pp. 4151–60.53. J.M. Robinson: Int. Mater. Rev., 1994, vol. 39, pp. 217–27.54. M. Li and D.J. Lege: J. Eng. Mater. Technol., 1998, vol. 120,
pp. 48–56.
METALLURGICAL AND MATERIALS TRANSACTIONS A
Related Documents