A STUDY OF THE FEASIBILITY OF TARGET MARKET EXPANSION AND RECOMMENDATIONS ON THE MARKETING-MIX OF KENTUCKY FRIED CHICKEN BY TANG MUI YIN, HELEN 鄧 妙 賢 WONG MAN-LAI, BRIDGET RESEARCH REPORT Present to The Graduate School In Partial Fulfilment of the requirement for the Degree of MASTER OF BUSINESS ADMINISTRATION TWO-YEAR MBA PROGRAM THE CHINESE UNIVERSITY OF HONG KONG May 1987 CONFIDENTIAL DR CHARLES F.STEILE 黃 文 麗

Welcome message from author
This document is posted to help you gain knowledge. Please leave a comment to let me know what you think about it! Share it to your friends and learn new things together.
Transcript

A STUDY OF THE FEASIBILITY
OF TARGET MARKET EXPANSION AND RECOMMENDATIONS
ON THE MARKETING-MIX OF KENTUCKY FRIED CHICKEN
BY
TANG MUI YIN, HELEN 鄧 妙 賢
WONG MAN-LAI, BRIDGET
RESEARCH REPORT
Present to
The Graduate School
In Partial Fulfilment
of the requirement for the Degree of
MASTER OF BUSINESS ADMINISTRATION
TWO-YEAR MBA PROGRAM
THE CHINESE UNIVERSITY OF HONG KONG
May 1987
CONFIDENTIAL
DR CHARLES F.STEILE
黃 文 麗


2
ABSTRACT
The fast food industry in Hong Kong has been growing
very rapidly in past several years. Many investors enter
into the market for gaining a profit by implementing
appealing and innovative marketing strategies. Returned to
Hong Kong after its failure in 1975, Kentucky Fried Chicken,
facing a competitive environment, targets at customers aged
20-39. Since young people aged under 19 are the heavy
consumers of fast food, it may be an opportunity for the
chain to expand its target market to this young age group.
This research is to study its potential to develop the
new market segment. The findings indicate that purchasing
fast food is part of the young people's life style. Western
food is popular and their purchasing power is high. In
addition, they have favorable attitudes to fried chicken.
With the potential to gain larger market share by.
exploring new segment, Kentucky Fried Chicken is recommended
to introduce more new food items at a more competitive
pricing, to strengthen its distribution network by opening
more branches at convenient location and to enhance its
product identity and awareness by promotion and advertising.
In the dynamic business environment, regular control and
appropriate modifications are necessary and essential. The
details are given in the report.

3Numerous problems may be met in the implementation of
the proposed strategic recommendations. Money may be the
most critical issue. If the management has the confidence
in Kentucky Fried Chicken's potential, it should see the
opportunity as a long term investment and thus act
aggressively to achieve excellent performance.

4
TABLE OF CONTENTS
iiABSTRACT
ivTABLE OF CONTENTS
viiLIST OF ILLUSTRATIONS
viiiLIST OF TABLES
ACKNOWLEDGEMENTS x
Chapter
1I. INTRODUCTION
3Problem Statement
Report organization 3
6II. MARKET PROFILE
6Outstanding Growth of Fast Food Sector
Market Size 910Market Segment
13Market Environment13Market Opportunities
14Market Threats15
Summary
17III.COMPETITORS PROFILE
IV. CUSTOMERS PROFILE 23
23Reasons for Visiting Fast Food Restaurants25
Life Style of Customers
25Summary
27V. COMPANY PROFILE
28Summary

5
VI. ME'T'HODOLOGY30
Definitions of Market Potential 30
31Areas of Investigation3131
General Market hicken
Kentucky Fried 3132Data Collection
Sources of Secondary Information 32
Primary Data Collection 32
34VII. FINDINGS& ANALYSIS 34
34Qualitative Research Findings34
General Market Environment
The Market Performance of35
Kentucky Fried Chicken36
New Ideas Generated from Brainstorming37
Findings of Quantitative Survey38
General Market Situation42Attitude to KFC's Attributes
Respondents Who Have Tried KFC 45
Respondents Who Have Heard But Never Tried KFC 50
Respondents Who Have Never Heard
51Nor Tried KFC
54VIII.SUMMARY OF RESEARCH FINDINGS
54Market Trend
Popularity of Fast Food 5555Purchasing Power
55Attitude Towards Chicken
Kentucky Fried Chicken's Existing56Customers Satisfaction
Potential among Non
Kentucky Fried Chicken Customers 5657Strengths of Kentucky Fried Chicken57
Weaknesses of Kentucky Fried Chickem
59IX. RECOMMENDATIONS
60Product and Pricing63
Distribution65Promotion71
Considerations in Promotion Planning72
Objectives73
Strategies
Summary 80
82Sales Force
84X. CONTROL
84Objectives
85Control Methods

6
86Conclusion
XI. LIMITATIONS OF THE RESEARCH 88
91APPENDIX
1. Existing Product Range of Kentucky Fried Chicken 92
2. Questionnaire( both English and Chinese Versions) 93
3. Field Work Report 100
1014. Computer Tabulations
BIBLIOGRAPHY 185

7
LIST OF ILLUSTRATI VS
GRAPH 1 SEMANTIC DIFFERENTIALS OF RESPONDENTS'............47
ATTITUDE TO SATED ASPECTS OF
KENTUCKY FRIED CHICKEN
CRAPN.q PRINT ADVERTISEMENTS OF KENTUCKY FRIED CHICKEN..............67
DURING 1985 AND 19862- 5

8
LIST OF TABLES
2.1 TRENDS OF ESTABLISHMENT NUMBER OF.......... 7
TOTAL FOOD AND RESTAURANT INDUSTRY
2.2 GROWTH OF SALES VOLUME INDEX OF.............. 8
FOOD AND RESTAURANT INDUSTRY BY SECTOR
2.3 FREQUENCY OF VISITS TO FAST FOOD STORE BY AGE.......... 10
2.4 SOCIOECONOMIC PROFILE OF CONSUMERS OF........12
FAST FOOD SERVICES
3.1 THE GROWTH OF FAST FOOD STORE IN.......... 19
TERMS OF NUMBER OF BRANCHES
3.2 THE CONSUMER PROFILE OF MCDONALD, CAFE DE CORAL,......... 22
CAFE DE FAI1 )OD AND MAXIM' S
7.1 FREQUENCY OF GOING TO FAST FOOD SHOP.......... 38
7.2 BRAND AWARENESS OF FAST FOOD SHOPS........... 39
7.3 FAST FOOD SHOP MOST OFTEN VISITED......... 39
7.4 MAIN REASONS FOR GOING TO A FAST FOOD SHOP.......... 40
7.5 COMMENTS ON FRIED CHICKEN AVAILABLE............. 41
IN FAST FOOD SHOP
7.6 GENERAL PROFILE OF RESPONDENTS.,....... 43
7.7 SPENDING PER VISIT TO FAST FOOD STORE OF......... 44
THE THREE GROUPS OF CUSTOMERS
7.8 FREQUENCY OF VISITS TO KENTUCKY FRIED CHICKEN............ 45

97.9 REASONS FOR VISITING KENTUCKY FRIED CHICKEN........... 46
7.10 ATTITUDE TO SELECTED ATTRIBUTES OF................... 48
KENTUCKY FRIED CHICKEN BY SEX, AGE INCOME
7.11 FOOD ITEMS EVER TRIED AND.......... 50
PREFERENCE RATED BY RESPONDENTS
7.12 COMMENTS TO KENTUCKY FRIED CHICKEN'S SHIED...... 52
ASPECTS BY RESPONDENTS WHO HAVE NEVER TRIED
NOR HEARD KENTUCKY FRIED CHICKEN
7.13 REASONS FOR RESPONDENTS' TENDENCY TO VISIT......... 52
KENTUCKY FRIED CHICKEN
7.14 REASONS FOR RESPONDENTS NOT GOING TO VISIT........ 53
KENTUCKY FRIED CHICKEN
9.1 A SUMMARY OF KENTUCKY FRIED CHICKEN'S........... 66
PROMOTIONAL EFFORTS FROM 1985 TO 1987
9.2 ADVERTISING CAMPAIGN AND SCHEDULE........... 76
9.3 TE[N]TATIVE SALE'S PROMOTIct CAMPAIGN............ 79

10ACIQKX+It,EDGFFIMES9TS
This research project would not have been carried out
successfully without the help of various parties and persons
to whom we would like to express our thanks.
We are greatly indebted to Dr. Charles F. Steilen, our
research supervisor, for his kind guidance in developing the
framework of this project and in giving valuable opinions to
us.
In our endeavor to conduct this project, we acknowledge
most gratefully the assistance of Swire Marketing Co. Ltd.
for giving us information about the fast food industry and
Kentucky Fried Chicken and for helping us conduct the
instore survey and the focus groups.
TANG MUI YIN
WONG MAN LAI

1
CHAPTER I
INTRODUCTION
In recent years, the fast food business has been growing
rapidly. Despite the increasing number of outlets, the sales figures
have also increased significantly. In the USA, the fast food
business accounts for about 40 percent of the total food and
restaurant industry sales. In Hong Kong, it is only 7 percent. The
average growth rate of the sales volume for fast food is 14.1 percent
whereas that for the total food and restaurant industry is only 8.4
1
percent. This reflects the fact that the fast food business has a
great market potential in Hong Kong.
Locally, the tast tooci business is very competitive. It is
divided into two types: local investment eg. Cafe de Coral and the
Maxim's groups and the international brand chain stores eg. McDonald
and Kentucky Fried Chicken (KFC). Since the 70's, many internatonal
chains have tried to establish their business in Hong Kong. Yet,
with the exception of the fantastic success of McDonald, many found
great constraints on further expansion. Some were even forced to
close down. (eg. Long John Silver in 1985, the White Castle and the
International Daily Queen)
1
經 濟 縱 橫'Fast Food Company Goes Public,' (September
1986), p.30

2Among them, Kentucky Fried Chicken is unusual. It was the first
international brand ever introduced into Hong Kong. It started in
1973. After opening 15 stores, it suddenly closed its business in
1975. The failure, to many experienced executives, was due to mis-
management, over-pricing and more important, the lack of appeal or
inducement of fried frozen chicken to Chinese people in Hong Kong.
Ten years later, in September 1985, Kentucky Fried Chicken
returned. It is desired to explore the impacts of KFC's previous
failure on its present strategies and on the consumers' perceptions
towards KFC. KFC's efforts on eliminating past weaknesses and
establishing a new image are certainly very interesting and thus
induce this study on Kentucky Fried Chicken.
From the discussion with KFC management people, it is learned
that KFC plans to have ten stores operating by the end of 1987. The
target market people are aged between 20 to 39 and they all have a
household income over $6,000 per month. Each store is decorated to
project an image of an up-scaled restaurant which offers a wide range
of KFC's packages and side items at high prices.
There are some reservations with respect to KFC's target market.
Firstly, it is not likely for high income Chinese people to have
lunch or dinner in fast food stores. It is rather their children who
enjoy the services of fast food stores. Children can be significant
influencers on adults' decision making. Teenagers from middle-class
or higher income family will have high purchasing power and may be
a great market for KFC.
Secondly, Survey Research (HK) Ltd.'s studies conclude that the
hard-core market for fast food are people from 12 to 39 years old.
It was also found in a survey that 50 percent of the respondents who
2
have visited a fast food store in one week were aged from 9 to 19.

3Thirdly, it is reasoned that KFC, to develop or expand on more
balanced ground, would gain much in expanding its target market to
teenagers and family groups as well. Kentucky Fried Chicken is also
looking for information on these areas.
Therefore, it is proposed to study the market potential of the
teenagers and family groups to KFC and to follow up with a set of
recommendations for KFC's marketing issues.
Problem Statement
Should Kentucky Fried Chicken expand its target market to people
aged from nine to nineteen?
Report Organization
To prepare a thorough report for KFC, this paper will be focused
on Four parts whcih are tightly linked to give a depth analysis on
the market conditions, the fast food business and the set of
marketing-mix recommended to KFC to develop the suggested target
market segment.
The first part will dicsuss the Four main profiles: market,
coupetitors, customers and the company. These will figure out the
fast food market and highlight the areas relevant for KFC's market
positioning. The reasoning behind our suggestion for target market
expansion would be elaborated in greater details. A summary
concluding these profiles would be put at the end. It would also
2
美 風 東 漸 , 發 展 迅 速 的 快 餐 業 Economic
Reporter, (November 1979), p.9.

4pinpoint the additional information required for KFC to further
consider the feasibility of target market expansion.
The second part would deal with the methodology employed in
collecting market information in considering the expansion
feasibility which, if truned out to be affirmative, the information
thus collected would be inputs for constructing the new marketing-mix
for the extended target market segment.
The third part is essentially a summary of the research findings.
The findings would be further refined to single out the important
aspects for planning KFC new marketing-mix.
The fourth, and the final part would be a detailed breakdown of
the recommended markeitng-mix which consists of Pricing, Product,
Distribution, Promotion and the Sales Force of the KFC. These
functional areas would be organized, coordinated to achieve the
objective of trapping the target market. To ensure the plans
implemented properly, a set of control mechanisms are also suggested
for the management people to review.
It is expected that through such an organization, readers can
efficiently follow the themes and reasoning of the report. This will
enable them having a better understanding of the fast food market and
catching the essential elements in building our recommendations and
implementing them.
To start with, the following four chapters would be the analysis
of the market profile, competitors profile, customers profile and the
company. These profile reports would help the readers to grasp the
characteristics of the present fast food market. These include the
market trend analysis, market opportunities and threats, conditions
of the competitors. These would help the management people to locate

5KFC's positioning in the market so as to achieve better performance.
The customers' life style and habits in visiting fast food store and
KFC's in strengths and weaknesses would also be imperative to study
in order to acquire sufficient and solid information to determine
other information needed in designing the new marketing mix for KFC.
6
CHAPTER II
MARKET PROFILE
Prior to exploring particular segments, it is first important to
provide an overview of the recent growth of the fast food sector, its
market size, market segments, customers studies and the opportunities
and threats to the fast food business.
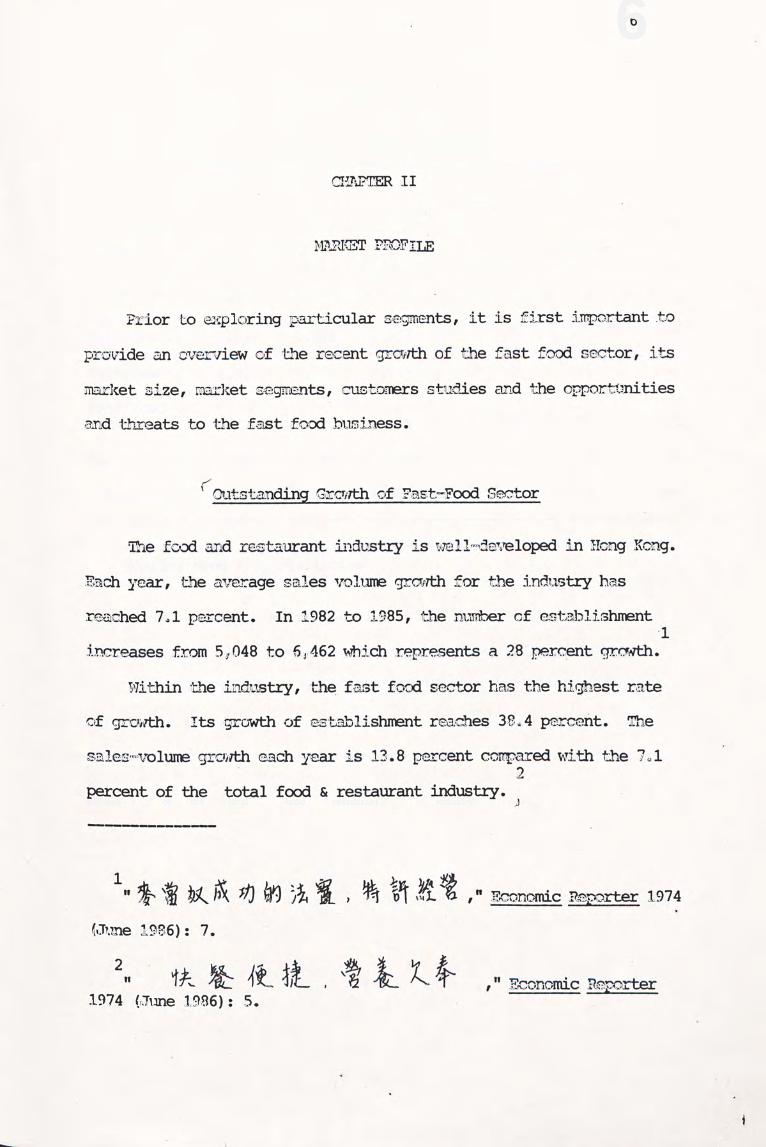
Outstanding Growth of Fast-Food Sector
The food and restaurant industry is well-developed in Hong Kong.
Each year, the average sales volume growth for the industry has
reached 7.1 percent. In 1982 to 1985, the number of establishment1
increases from 5,048 to 6,462 which represents a 28 percent growth.
Within the industry, the. fast food sector has the highest rate
of growth. Its growth of establishment reaches 38.4 percent. The
sales-volume growth each year is 13.8 percent compared with the 7.1
2
percent of the total food restaurant industry.
1
Economic Reporter 1974
(June 1986): 7.
2
Economic Reporter
1914 (June 1986): 5.
麥 當 奴 成 功 的 法 實 , 特 許 經 營
快 餐 便 捷 , 營 養 欠 奉

7TABLE 2.1
TRENDS OF ESTABLISHMENT
NUMBER OF TOTAL FOOD AND RESTAURANT INDUSTRY
LOCATIONYEARTYPE
Tsuen WanTST6/1986 Central19821979
Chinese
212 3371203,3342,5052,031Restaurants
1812152,045 97Restaurants 1,654 1,751
Fast Food
555662685495326Store
1754613387Bar 101
5905482986,462Others 4,312 5,048
Source: Hong Kong Statistics

8
TABLE 2.2
GRCI'H OF SALES VOLUME INDEX OF
FOOD AND RESTAURANT INDUSTRY BY SECTOR
Sales Volume Index in 1985Sector
($ 1.37 billion 7.3% of the total industry)Fast food
($0.9 billion and 6% in 1982)
150.9
122.9Chinese restaurants
126.5Restaurants
115.2Bar
117.0Others
Total 125.0
Source: Hong Kong Census and Statistics
Note: Take sales volume in 1982 as the base and set at 100.

9Market Size
From Survey Research (HK) syndicated studies, the size of people
visiting fast food store has been relatively stabilized but
maintained at a high percentage. From a survey with a base of
4,471,000, 81 percent of the respondents have accepted and
experienced fast-food services in the past 6 months. This figure
shows that the market size of fast-food sector is very large.
Moreover, the survey's respondents are limited to age over 14.
If we take also the population of children who are target groups of
some major fast-food chains into account, the size of customers for
the sector will be even greater.
Though the market size is relatively stabilized, the outstanding
13.8 percent growth in sales volume of fast-food sector reflected
that the customers are purchasing more services from the fast-food
sector. Firstly, they may have a higher frequency of visits. eg.
not limited to weekdays or lunch time but also at night and weekends.
Secondly, they may now visit fast food store on more different
occasions, eg. for breakfast or dinner as well as for lunch and
snack.
If one takes all these into account, it can be asserted that the
fast food market is a large and growing market but still with room to
explore. As such the possible sales achievable from this market are
growing favourably. These facts constitute great appeal to the fast-
food industry. To further understand the market conditions for fast,
food, the discussions on the general features of the fast-food
industry will be presented in next sections.

10Market Segment
The fast-food market is dominated by people aged from 9 to 24 as
revealed by their frequency of going to a fast-food store.
TABLE 2.3
FREQUENCY OF VISITS TO FAST-FOOD STORE BY AGE
9-14 15-24 25-44 45+AGE
EVERYDAY/
6 34AT-MOST EVERYDAY
AT LEAST ONCE
32232 31A WEEK
2-3 TIMES
320 1616A MONTH
517 1221ONCE A MONTH
38 332524LESS OFTEN
3 8 55NEVER 2
SASE: ALL AGED 9+= 4,471,000
Data expressed in percentage
SOURCE: SRH SYNDICATED STUDIES, 1984
If the respondents are divided into 3 groups:
1. Regular consumers (at least once a week)
2. Moderate consumers (once a month)
3. Light consumers (less often to never)
It is found that
1. People aged from 9 to 24 are the regular consumers of fast-food.
There are 73 percent of them enjoying fast-food service at least once
a month..

11
2. The higher income groups tend to consume fast-food services more
readily( 61 percent against 42 percent). This is in contrast witr
the general image of fast-food services as cheap and low-quality.
The phenomena may be explained by the greater concerns on time-
consciousness and demand for efficiency and standard food of the
higher income group.
3. Students (77 percent) are the primary customers for fast-food
services. The white collar market follows closely with 64 percent.
The housewives seem most uninterested in fast-food with only 22
percent using fast-food outlets.

12TABLE 2.4
SOCIOECONOMIC PROFILE OF CONSUMERS OF FAST-FOOD SERVICES
LIGHTMODERATEHEAVY
CONSUMERSCONSUMERSCONSUMERS
( IN%)(IN%)( IN%)
48SEX 2824MALE
542322FENIAIE
AGE 2737369-14
27373715-24
46282525-44
888345+
HOUSEHOLD
INCOME 5823195,000
3930315,000
OCCUPATION WHITE-
362136COLLAR
BLUE-
502922COLLAR
233740STUDENTS
HOUSE-
7417WIVES 9
BASE: ALL AGED+= 4,471,000
SOURCE: SRH SYNDICATED STUDIES, 1984

13Market Environment
Hong Kong has been a place of rapid growth for many industries.
This section will discuss the opportunities and threats derived from
the environmental conditions related to the growth of the fast food
market.
Market Opportunities
1. Changing eating habits of the people in Hong Kong
This is prompted by the westernization of the territory's social
environment and particularly the invasion of American fast food.
People are spending more money on eating out for breakfast, lunch and
even dinner. The money is being spent, however, not for a
traditional sit-down Chinese meal, but rather, for a burger, a piece
3
of chicken, or a pizza.
2. Increasing time consciousness of people in Hong Kong
It is well-accepted that Hong Kong is full of busy people. They
are working, doing things against time. They try to accomplish much
within a short time. The demand in effficiency and the resulted
increasing time consciousness has led to the growth of many different
businesses such as: Convenience store like 7-11, the one hour photo-
finishing and more obvious, the fast food business. The fast food
business provides food and services efficiently and saves customers
much time and effort. These merits would certainly appeal to the
4
busy people in Hong Kong.
3
"How The Colonel Sold More Chicken on and try,' Sout China MorningPost (October 1986)

14
3. The betterment of services and food variety of fast food stores
The fast food stores have evolved since the 70's. There are now
international brand chains and local chains whose services are under
strict control and supervision. Each sales person must go through
certain training to ensure courtesy and efficiency. The eating
environment is decorated with relaxing lighting and filled with light
music. These help to attract more people visiting the fast food
5
stores.
4. Limited Area of residential appartments
Hong Kong is densely populated. People tend to go out during
weekends or spare time. Going out would mean expenditure outside.
Many people would have snacks, lunch or even dinner at fast food
stores.
5. Technology betterment
There are advanced equipment and processing methods helping to
retain the freshness and nutrients of canned and frozen food.
Since most fast food products are prepared from canned and frozen
food, this technology betterment would certainly help to improve
public attitude to fast food.
Market Threats
1. Keen competition
There have been findings that the market size of the fast food
sector has been relatively stabilized. Moreover, the number of
4
Ibid.
5
快 餐 店 的 管 理 Economic Reporter
(November 1979)

15establishment of fast food services as well as other food and
restaurants have disproportionatly increased. Given these
conditions, we can understand that the competition in the market is
indeed very keen. Besides striving for survival aganst other fast
food stores, the fast food sector must also resist the competition
from other restaurants and Chinese restaurants. These harsh market
conditions make the fast food store operations, in particular the new
entries, very difficult. Many small scale fast food stores and even
some international chains were forced to close down due to the keen
competition and mistakes in launching the development plan.
2. Unfavourable attitude to fast food's nutritive values and freshness
Most people, especially the Chinese, regard fast food lacking in
taste culture, freshness and nutritive values. Fast food is
substantially made of canned or frozen materials whcih during
processing, have lost lots of nutritive elements. This attitude,
though somewhat suppressed by fast food's convenience and efficiency,
still in some ways restrain the further growth of the fast food
business.
summary
The fast food market has been growing rapidly and steadily. The
outstanding growth is substantially achieved through encouraging more
consumption on various occasions. The consumption now can be for
breakfast, lunch, afternoon tea and even for dinner.
People aged from 9- 24 are found to be the most regulare
consumers for fast food business. There exists many opportunities,
but competition has turned out to be the most important threat to the
fast food business.

16
In next chapter, we would study the competitors in greater
details to find out their strengths and threats to KFC in operating
the business.

17
CHAPTER II
COMPETITORS PROFILE
As mentioned in Chapter II, the market has been growing
rapidly in past few years and thus is profitable. Kentucky
Fried Chicken, as a new comer in the market, is able to gain
a larger share if can compete with its keen competitors such
as McDonald and Cafe De Coral. Thus the evaluation of
competitors cannot be neglected.
With a large market size, the Hong Kong fast food
industry has expectedly attracted numerous local and
overseas investors to enter the market for making profits.
According to statistics, there are about 600 fast food
stores in Hong Kong. Only about 100 are operated by the big
chains. The rest are owned by independent operators. Thus,
the market is increasingly competitive. Basically, the.
competitors can be divided into four sectors according to
their products, namely hamburger, pizza or spaghetti,
chicken and mixed variety. The major competitors in each
sector include the following:
Hamburger: McDonald, Burger King
Pizza or spaghetti: Pizza Hut, Spaghetti House, Chuck' N
Cheese.

18Chicken: Kentucky Fried Chicken
Mixed variety: Maxim's, Cafe De Coral, Cafe De Fairwood
Due to keen competition, many fast food shops closed
dawn in the 1970's and the 1980's. One of them is Kentucky
Fried Chicken which entered into Hong Kong market in 1974
but failed quickly in 1975. The major reason for its
failure is too rapid expansion. In 1985, Kentucky Fried
Chicken come back again and is managed by Swire Marketing &
Co. Ltd.. And now, Kentucky Fried Chicken is the only
chicken specialist in the chicken sector mentioned above.
Long John Silver, a seafood specialist, is another
unsuccessful example. Its failure is mainly due to the low
acceptability of fried seafood among Hong Kong Chinese.
What the Hong Kong people like to eat is steamed fresh
seafood but not fried frozen seafood. However, in Singapore
or in other places, Long John Silver is fairly successful
because its overseas customers welcome the fried seafood and
they like the taste.
The most recent well known failure is suffered by
Wendy's, the American fast-food restaurant chain which has
been successful in Europe, Japan, Korea and Taiwan but not
in Hong Kong. Managed by Wendicorp (Hong Kong) Ltd.,
Wendy's is ascribed the poor location to Tsim Sha Tsui East
where numerous restaurants are located. Another problem with
Wendy's is its limited food variety which is bound by the
franchise. Hamburger which is the major product it offers

19to its customers faces great threat from the keen
competitors, such as McDonald and Burger King.
Among the so many competitors, the top five outstanding
performers are McDonald, Cafe De Coral, Cafe De Fairwood,
Maxim's and Burger King. The common characteristics of
these five competitors is that they are store chains with a
strong distribution network which is a convenience to
customers. The fierce competition force the fast food shops
to set up more branches to gain a larger market share. The
development of chains for some large fast food stores is as
shown in the following table:
TABU 3.1
THE GROWTH OF FAST FOOD SHOP IN
TERMS OF NUMBER OF BRANCHES
. Year to Start No of shops (Years inFast Food Shop
Blanket)
1972Cafe De Coral 17(83) ,25 (85) ,35 (86)
1975McDonald 18(81) ,27 (85) .30 (86)
20(86)1972Cafe De Fairwood
16(86)1972Maxims
2(86.6),4(86.9)1985Kentucky Fried Chicken
1983Burger King 2 (86.6) ,4 (86.12)
Source: Economic Journal, 23 June, 1986, p. 5.
McDonald is a market leader which enjoys a lion market
share that can be indicated by the high unaided brand
awareness, unaided advertising awareness and large

20percentage of fast food shop last went in the Survey
Research Hongkong Fast Food Restaurant Survey 1984.
McDonald is successful that its hamburger is very popular.
Although its main target customers are young people, the
unaided brand and advertising awareness among the elder
people aged over 35 are not law at all. The reason for its
success is simple, that is McDonald's hamburger is popular.
However, it is not an easy task to make a Western food item
such popular and acceptable in a competitive environment.
Basically, the chain has four main principles to follow:
Q.S.C.V.. Q is quality of food, S is the staff's service, C
is the cleanliness of store and V is the value of food. In
other words, training, quality control, quality of food and
pricing structure are the four focus areas for the
management.
Cafe De Coral is in the second leading position and
followed by Cafe De Fairwood and Maxim's. These three shops
offering similar product range have very close market
position attracting similar target customers. Different
from McDonald, they attract the clients by wide food
variety, including western and Chinese food. Because of the
competitive environment, Cafe De Coral was the first one to
introduce hot-pot or dinner meal set at reasonable price to
the market in order to meet the customers' needs and
increases the sales in the dinner time. Cafe De Fairwood
and maxim's follow it immediately to gain more market share.
As the other fast food chains, Cafe De Coral increases the

21annual advertising expenses to maintain and improve its
competitiveness. "Achieving 100 marks for you!" is the
slogan of advertising for this store. Offering quality food
with wide variety at reasonable price is the primary
business strategy. Its annual business turnover is
increasing rapidly from HK$110 million in 1982/83 by 172.7
percent to HK$300 million in 1985/86, with a great net
profit of 15 to 17 percent of total sales.
Maxim's fast food shop is operated by Maxim Group which
aims at business diversification. Its advertising slogan is
"sincere and more variety". It offers more than 10
different types of beverage, 20 to 340 types of snacks and
more than 100 different choices of meal boxes. The chain
emphasizes very much on its services. Therefore, training
is very important. It has set up its in training center.
Before employment and promotion, each worker has to receive
a two-day training course in the center. Since 80 percent
of Maxim's staff are young people whose labor mobility is
relatively higher than the elder staff, the management
always organizes many social functions such as ball games,
swimming gala and party gatherings for them in their leisure
time to increase their sense of belonging to the company.
In regard to the customer profile of each competitors,
McDonald is the only chain that can attract not only young
people but also a substantial proportion of elder people
aged 45 or above.' The customer profiles of Cafe De Fairwood
and Maxim's are more skewed towards the elder group aged
between 25 and 44.

22TABLE 3.2
THE CONSUMER PROFILE OF MCDONALD, CAFE DE CORAL,
CAFE DE FAID AND MAXIM'S
McDonald Cafe De Coral Cafe De Fairwood Maxim'sAge
3.517.7 11.8 13.69-14
15-19 17.010.9 10.7 3.8
25.520-24 13.9 14.4 8.9
25-34 34.619.6 31.6 35.2
10.335-44 23.518.5 26.3
45+ 19.4 9.0 8.0 12.2
213Total 924 187 624
LAST WENT
Source: SRH Fast Food Restaurant Survey 1984,Table 2A.
In summary, the market environment is competitive as
more investors enter the market for gaining a profit. Some
entrants cannot survive because of the mismanagement as some
competitors achieve satisfactory performance with
outstanding marketing strategies. Understanding the
competitors' marketing to improve their performance in the
market, the consumer behavior and consumer profile are fully
analysed in the*next chapter.

23
CHAPTER IV
CUSTO ERS PROFILE
It is illustrated from previous two chapters that the fast food
market is very profitable and thus has attracted a large number of
entries. Competition is very keen, but opportunities still exist for
stores with good planning and positioning. To have a thorough
understanding on the fast food market, it is necessary to study the
customer profile as well. 'Why do people go to fast food stores?
What are their life styles? This chapter would focus on these two
areas and elaborate their significance to KFC's business.
The hard core market of fast food services are people from
nine to twenty-four. About 20 percent of the 4,471,000 respondents
in SRH syndicated studies visit a fast food restaurant at least once
a week. Only 19 percent of the people reported never visit a fast
food restaurant.
Reasons for Visiting Fast Food Restaurants
The top four reasons quoted by the respondents as the major
appeals of fast food services are:
1. speed, 55 percent,
2. convenience, 52 percent,
3. children enjoy it, 14 percent,
4. fun to eat there, 7 percent.
To different age groups, the appeals of these factors weigh

24differently. The people from 9-14 have less concerns on speed (40%)
and convenience (30%), but they have much greater weights on fun to
eat there (19%) and novelty (10%) compared with total respondents'
4 percent. This reflected that people of this age group consider
fast food as a kind of fashion. They are more prone to Western style
of life and new things.
For people aged from 15-24, they ranked speed (71%) and
convenience (62%) extraordinarily high. From Mr. Clint Laurent's
research on life style, people aged from 15-24 are grouped under
Immature Youth for male and Young Trendy for female. People. in these
categories prefer fashionable products and like to try new things.
They place more emphasis on 'Time Value' and 'Westernized products'
and tend to associate Western products with better quality. Mr.
Laurent concluded that these people would be great potential for
fast food services because fast food nowadays are designed and
packaged to fit their values and needs.
For the family groups, 'children enjoy it' is the major reason
for their going to fast food restaurants. This highlighted the high
influencing power of children over their parents or guardians.
Research findings state that children have a greater preference for
fast food than other types of food. They consider fast food
restaurants fun to eat and are impressed by the cartoon advertised by
some fast food restaurants.
Therefore haw to appeal to children so as to draw more family
group customers will be among the major tasks in expanding a fast
food business.

25Life Style of Customers
The life style of the population is becoming more Westernized
and more open than ever. People are now more willing to try new things
and have greater confidence and preference for Western food. The
younger age groups 15-24, as relected from life style studies, are on
the top of the westernization wave. Theyshow greater preference for
efficient and convenient services like fast food. In general, they
like fashionable goods, outings with friends, pop music and listening
to radio.
People in the middle age are more economic and realistic in
style. They show little preference for fast food. They prefer
Chinese food and consider fast food weak in nutrients and tastes
though the efficiency and convenience strengths are impressive. They
are more like the traditional Chinese who have a prejudice against canned
and frozen food. However, upon the westernization wave, they are
less stubborn as older people and tend to try new products especially
those items recommended by others.
.Summary
From the customer studies, the younger age groups, 9-24, are the
core market for fast food services. Children have strong influencing
power over their parents and guardians. On the other hand, people
aged from 30-60 are rather inert to the fast food services. These
data throw some light on KFC's positioning strategy. Since the age
group 30-40 are not fast food advocates, KFC, in allocating its
to twenty-four and family with children.
To plan for KFC's future marketing strategy for the core market,

26
it is imperative to study the present conditions and strategy of the
KFC. The company profile that immediately follows would provide a
better understanding of KFC's operations.

27CHAPTER V
COMPANY PROFILE
To plan for any future expected level of performance, a close
study of the present conditions of the concerned system is a pre-
requisite. The company profile would sum up KFC's present positioning
and its marketing mix in operations.
Kentucky Fried Chicken fastfood restaurants' operations in Hong
Kong are awned by Swire Marketing Ltd. It is based on a licence
contract between KFC International and the Swire Marketing.
The Swire Marketing has learned well from the last Waterloo in
1973 in launching the development plan for KFC in Hong Kong. Instead
of rapid expansion and extravagant expenditure on promotion, the
company adopted a realistic and adatptive approach.
At present, the company has opened five stores., The stores were
opened one by one with a reasonable amount of time in between so that
the human resources demanded would be under management. This gradual
development also allowed the management more time to analyse the
feedback from customers so as to modify and rearrange KFC's
positioning in the market. Also, to ensure each store getting
satisfactory sales volume, each store is located in commercial,
recreational and halfly residential areas where a high customer flow
rate is expected. This is a precious lesson learned from KFC's last
launching in Hong Kong.
The promotional efforts are divided into 4 phases which aim at
raising the awareness on KFC's re-entry, its fried chicken, side item:

28Products of KFC are substantially fried chicken and other items
typically served in a KFC store. Compared with the food menu of last
entry, the KFCs under Swire Marketing's planning, have succeeded to
diversify its food items to other snacks, desserts and drinks so as to
meet the various needs of customers.
To position KFC in the higher income class, each store is
decorated to provide a comfortable and relaxing environment for
customers enjoying KFC products. Salesforce are all young people who
are trained to provide friendly and detailed services.
Sunrary
From the profiles studies, it can be found that the fast food
market is very competitive despite its rapid and consistent growth in
these years. Many stores, due to mistakes of management people, have
suffered from losses and failure. There are many opportunities in the
market. For companies with good positioning and planning, the fast
food business can be very profitable with a high rate of return.
A good positioning and planning would involve appropriate
identification of target market and elaboration of excellent marketing
mix to appeal to the target market. From market segment and customers
studies, people from 9- 24 are found to be the most regular consumers
of fast food. They have more positive attitude to fast food and are
prone to fast food services. They may be very profitable target
market for KFC. Therefore, KFC should study the feasibility in
expanding the target market. This study should explore these
potential target customers' attitude towards fast food, fried chicken,
and the products and services of KFC, if any. The next chapters would

29further discuss the study and the methodology derived to tap this
information.

30
CHAPTER VI
METHODOLOGY
Based on the information analysis in the previous
chapters, the future of fast food industry in Hong Kong is
still promising. In order to survive in the competitive
environment, Kentucky Fried Chicken has to pay great
marketing efforts to explore its potential in the market.
The critical issue of this research is whether Kentucky
Fried Chicken has the potential to expand its target market
to children and teenagers. The following steps of research
are developed and applied to solve the research problem:
1. To define the market potential.
2. To identify the areas of investigation.
3. To work out the methodology to collect the required
information.
4.To analyze the data.
5. To make conclusions and offer recommendations.
Definition of Market Potential
Market potential is a function of market size,
people's attitudes to fast food services, purchasing power,

31behavioral pattern and the perception towards Kentucky Fried
Chicken.
Areas of Investigation
The areas of investigation fall into two categories,
general market and Kentucky Fried Chicken.
General Market
The general market section includes the frequency to
visit fast food shops, fast food shop liked most and
reasons, average spending per visit, occasions to go and
other general purchasing patterns.
Kentucky Fried Chicken
This section includes awareness of Kentucky Fried
Chicken store for all respondents and reasons for visit,
degree of satisfaction to pricing, menu variety, efficiency
of service, taste of chicken and tidiness of store, dislike
about Kentucky Fried Chicken store and likelihood of revisit
and reasons for those who have been ever visited a Kentucky
Fried Chicken store.
Those who are aware but never visited Kentucky Fried
Chicken are asked for reasons why not visiting.
The information on likelihood of ever visiting and

32reasons is collected among those who are not aware of
Kentucky Fried Chicken.
Data Collection
Both primary and secondary sources are used to collect
relevant information.
Sources of Secondary information
Secondary information is obtained from Hong Kong
Government publication such as Census Statistics Report,
the reports from research agencies such as Life Style Report
and the Chinese English newspapers & magazines and the
other publications.
Primary Data Collection
In-depth interviews are conducted with the management
of Kentucky Fried Chicken to understand its business
strategies, management philosophy and opinions on future
market trends and so on. The data collection methods are
different for the two target market groups aged 8 to 12 and
13 to 19. Qualitative focus group techniques are applied to
the younger group whereas the two quantitative surveys,
General Market and Instore Surveys are applied for the elder
age group. A total of four focus groups are carried out.

33Each group consists of six to eight respondents aged 8 to
12, of either sex. The taste trial test of Kentucky Fried
Chicken is also conducted within the group discussion.
One of the quantitative surveys, the General Market
Survey, is conducted among 200 respondents aged between 13
and 19, of either sex, but with the experience of having
visited any fast food shop. The respondents are selected
from the catchment areas of the existing stores, namely
Jordan, Central, Causeway Bay and Shatin. The catchment
area is referred to the geographic area around the store
that the customers come from. Face-to-face interviews are
taken place in two selected convenient spots in each
catchment area. The age and sex of the sample composition
are in proportion to the population statistics of the Census
and Statistics Department with assumption of even
distribution of population within the age group 13 to 19.
Since the incidence of ever visiting Kentucky Fried
Chicken is not high, a supplementary instore survey is also
carried out at New Town Plaza store in order to get a
sufficient data base for analysis. The sample includes 51
respondents aged 13 to 19, of either sex and with the fresh
experience-of making purchase in Kentucky Fried Chicken.
The details of samples are given in the Fieldwork
Report in the Appendix.
The findings are analysed and the results are given in
the next chapter.

34
CHAPTER VII
FINDING ANALYSIS
According to the methodology specified in the past
chapter, the qualitative research and quantitative surveys
are carried out to collect the relevant information for
analysis. This chapter summarized the findings in the
research.
Qualitative Research Findings
Your focus groups were conducted among children aged
between 8 and 12. The details of the respondents are given
in the fieldwork report in Appendix.
Generally speaking, the findings can be summarized in
the following three areas, general market environment,
market performance of Kentucky Fried Chicken and new ideas
generated from brainstorming.
General Market Environment
1. Going to a fast food shop is part of the children's life.

35They always go the fast food shops, especially the
weekends or on holidays, with their family or friends.
2. Expectedly, the level of awareness of most large
established fast food shops or chains, such as McDonald
and Cafe De Coral is extremely high. Conpared with the
competitors, the brand awareness level for Kentucky Fried
Chicken is not low. However, the advertising awareness
of Kentucky Fried Chicken is fairly poor.
3. Western food, such as French Fries, cold beverage and hot
dogs is very popular among the children. It may be a
very important factor why they are the frequent
customers. Most children like chicken more than
hamburger. Most children do not care so much about
heat which is a Chinese concept referred to the side
effects caused by eating too much fried food. However,
their parents may have great influential per to
discourage their children from eating fried chicken which
they themselves believe are heaty.
The Market Performance of
Kentucky Fried Chicken
1. Though most respondents have heard of Kentucky Fried
Chicken, most of them have never visited its stores. Not
knowing much about this chain and the store location are
their major reasons for never visiting. If the
management has decided to expand the customer base to
this teenage group, it must increase advertising and
promotion to reach them.

362. The results of the taste test of fried chicken are
favorable. The major positive comments include:
a. The skin of chicken is crispy.
b. The taste is good.
c. The chicken meat is tender.
d. The fried chicken is not heaty.
The only negative comments are
a. It is too salty.
b. The physical appearance is not attractive.
3. After the menu is shown, most respondents indicate that
they like most of the food items. The only less popular
item is biscuits. However, nearly everyone commented on
the high pricing which may discourage them from making a
purchase.
New Ideas Generated from Brainstorming
At the end of each focus group discussion, the children
are invited to give constructive suggestions on how Kentucky
Fried Chicken can attract them to make purchase. There are
four main areas for recommendation. Firstly, the children
recommend gift giving after every purchase. Some girls
mention that they like fancy stuffs. Secondly, most of the
respondents are ice cream lovers. Ice cream is a temptation
that cannot be resisted. Kentucky Fried Chicken store can
learn from the experience of Seven-Eleven which has been
very successful to boost up its sales volume by promoting

37soft ice cream as a marketing strategy. Reducing the price
from $2.50 to $1.50 and increasing the quantity from two
circles to three circles are the common strategies now being
used in its promotional campaigns.
The children say that they do not mind consuming ice
cream in cold days. It is always fun to have ice cream no
matter in winter or summer.
In addition, the children, especially the boys,
recommend Kentucky Fried Chicken offer lunch meal box which
includes chicken and rice or spaghetti. It is the rice,
spaghetti or the other cereal products that can fill their
stomachs full. Fourthly, the decoration that is attractive
to children is important. Some respondents said, I can see
interesting decorations like Uncle McDonald, pirates ships
or trams in McDonald's stores, whereas in Kentucky Fried
Chicken stores, the decoration is not attractive at all. I
will go to a Kentucky Fried Chicken store if the decoration
is funny."
Findings of Quantitative Survey
Two quantitative surveys, namely General Market Survey
and Instore Survey were carried out for collecting relevant
information for solving the research problem. The findings
of these surveys are analyzed and summarized below.

38General Market Situation
1. Fast food service is so popular that most respondents
aged 12 to 19 go to fast food shop at least once a week.
No one has never visited any fast food store.
TABLE 7.1
FREQUENCY OF GOING TO FAST FOOD SHOP
ba
isCISFrectuencv
64.6 68.6At least once a week
23.522.3Once every fortnight
5.96.4Once a month
7.0 2.0Less than once every 3 months
200 51Total All respondents
a General Market Survey
b Instore Survey
2. Among the so many competitors in the market, McDonald has
achieved the best performance, followed by Cafe De Coral in
terms of brand awareness and fast food shop went most.
There are still much room for Kentucky Fried Chicken to
improve.
% %

39TABLE 7.2
BRAND AWARENESS OF FAST FOOD SHOPS
ba
IsGMSBrand Awareness
100.098.0McDonald
98.097.5Cafe De Coral
96.195.0Cafe De Fairwood
98.094.6Maxim's
87.1 92.2Burger King
81.7 100.0Kentucky Fried Chicken
51200Total
a General Market Survey
b Instore Survey
TABLE 7.3
FAST FOOD SHOP MOST OFT12 VISITED
ISFast food Shop Most Often Visit GMS
b
58.863.9McDonald
19.622.8Cafe De Coral
13.75.4Cafe De Fairwood
3.93.5Maxim's
3.92.0Kentucky Fried Chicken
Burger King 0.5
51Total 200
a General Market Survey
b Instore Survey
a

403. No matter which fast food shop the teenagers go to most,
the main reasons for going include convenient location,
good taste, wide food variety and efficient service which
are the key words for success.
TABLE 7.4
MAIN REASONS FOR GOING TO A FAST FOOD SHOP
GMSReasons
80.6Convenient
32.3Good taste
29.4Efficient service
26.4Wide food variety
200Total
4. The average spending level per purchase is $12.0 for
General Market Survey and $12.90 for instore research.
5. Most young people have positive comments such as tender
meat and crispy skin of the fried chicken. The only
significant negative comment is heaty.
%

41TABLE 7.5
COMMENTS Cv FRIED CHICKEN AVAILABLE
IN FAST FOOD SHOP
ba
IsGMSPositive convents
43.837.4Crispy skin
35.420.0Tender meat
6.349.0Good taste
Negative comments
41.739.4Meaty
16.022.2Not too fresh
10.410.0Has frozen taste
48198Total
a General Market Survey
b Instore Survey

42Attitude to KFC's Attributes
The respondents are divided into three groups based on their
experience with KFC. They are people who:
1. have tried KFC products (gerenal market survey and instore survey
2. have heard but never tried KFC products
3 have never heard nor tried KFC.

43
Table 7.6
GENERAL PROFILE OF RESPONDENTS
a. General market survey
Tried KFC Heard but never tried Never heard/tried
Attributes
224143Sex: male
163842female
244644Age: 13-16
14334117-19
Hnusp-hold income
19306000 28
1235246000 10000
31423lUUUU
346977Status: student
3107worker
11others
38(18.8%)Total 79 (39.1%)85 (42.1%)
2. Instore Survey
25Sex: male
26female
22Age: 13-16
2917-19
Household income
156000
256000- 10000
1110000
40Status: student
11worker

Since KFC is set at a higher pricing strategy, it becomes
imperative to investigate the purchasing pcwer of the target
customers on fast food services.
It is found that over 50% of the respondents would spend about
$10 - $20 per visit to a fast food store. The influence of sex, ag
and household income on the spending is negligible.
TABLE 7.7
SPENDING PER VISIT TO FAST FOOD STOR]
OF THE THREE GROUPS OF CUSTOMERS
1. People who have tried KFC
Attributes Arro
Spending Male Female 13-16 17-1! 6000 6000-10000 VL000C
$5.0
$5.0 - $10.0
$10.1 - $15.0
$15.1 - $20.0
$20.1 - $25.0
over $25.0
1
12
21
4
1
5
11
21
8
1
1
9
23
5
2
4
14
19
7
1
1
10
11
3
21
5
11
A
5
18
Total 44 41 44 41 28 24 27
2. People who have heard but never tried KFC
Athributes Arrp
Spending Male Female 13-16 17-19 6000 6000-10000 10000
$5.0
$5.0 - $10.0
$10.1 - $15.0
$15.1 - $20.0
$20.1 - $25.0
Over $25.0
1
16
17
5
1
21
12
1
1
1
1
20
197
1
17
10
3
1
14
13
2
16
12
2
21
5
4
Total 40 36 44 33 30 33 11
Source: General Market Survey

45Respondents Who Have Tried KFC
Frequency of visits to KFC
TABU 7.8
FREQUENCY OF VISITS TO KFC
Instore SurveyGeneral Market Survey
Frequency ($ )($)
ors 116 (32)32 (37.3)
Two to Five Times 22 (44)35 (41.2)
More than Five Times 12 (24)18 (21.5)
Base 50 (100)85 (100
From all who have tried KFC services, about 63 percent of its
customers have repeatedly purchased services from KFC. This high
percentage indirectly implies KFC's strong potentials in attracting
customers' repeat purchases.
Reasons for visiting KFC

46
TABLE 7.9
REASONS FOR VISITING KFC
Instore SurveyGeneral Market Survey
No. %No. %Reasons
40.01931 41.3Like Chicken
41.72031 40.0Good Taste
23.01121 28.0Friends like KFC
23.01125.3Convenient Locations 19
35.41715 20.0KFC's Cleanliness
6.313.3 3Family Members like KFC 10
33.31610 13.3Efficient Services
10.3Stylistic Decorations 7 59.3
4.02Fair Pricing 6 8.5
75 48Base
KFC has succeeded to attract many customers who have preference
to chicken. The major merits customers find in KFC include: good
taste, convenient locations and cleanliness.
Reasons like 'Friends like it' and 'Family members like it' worth
attention. The respondents expressed the habits in having outings
with friends and the influence of peers is significant. If KFC can
project itself as a place of fun and relaxation for social gathering,
it would attract more youngsters.
From family member likes it KFC has gained certain family
customers. Efforts should be applied to reinforce KFC appeals to
them.
Fair pricing is ranked least important in both general market
and instore surveys. Yet, cautions should be taken in interpreting
the general suppressed weights on pricing in survey.

47Comment to KFC's selected attributes
GRAPH 1
SEMANTIC DIFFERENTIALS OF RESPONDENTS' ATTITUDE
TO SELECTED ASPECTS OF KFC
Very Highly
Dissatisfied Satisfied
5
Pricing
Food Variety
Efficiency
Taste of chicken
Cleanliness
Remarks:- General Market Survey--- Instore Survey
The values are calculated as the mean of the respondents' scores
1 being very dissatisfied and 5 stands for highly satisfied.
The responses from in-store survey are substantially more
positive to KFC.
Pricing is ranked neutrally, neither negative or positive.
Efficiency and cleanliness attributes of KFC have impressive effects
to customers.

TART.E 7_m
ATTITUDE TV) SRT.Fr.TED ATTRIBUTES OF KFC BY SEX. AGE INCOME
Attribute Total Sex Age Household Income
M F 13-16 17-19 6,000 6000-10,000 10,000
Pricing
Food
Effi¬
ciency
Taste
Clean-
Lines s
a
b
c
d
e
a
b
c
d
e
a
b
c
d
e
a
b
c
d
e
a
b
c
d
e
10
31
35
9
1
5
27
28
21
5
6
9
36
26
9
5
14
28
24
13
3
8
22
41
12
9
16
16
4
3
13
15
10
4
4
5
24
8
4
3
6
17
11
6
2
6
11
21
5
1
15
19
5
1
2
14
13
11
1
2
4
12
18
5
2
8
11
13
7
1
2
11
20
7
8
15
18
5
3
13
12
14
4
4
5
18
15
4
3
5
16
12
9
2
5
10
23
6
2
16
17
4
1
2
14
16
7
1
2
4
18
11
5
2
9
12
12
4
1
3
12
18
6
3
9
13
2
1
3
11
8
4
2
4
3
10
8
3
1
10
5
6
5
2
3
5
13
5
3
13
7
3
1
4
9
11
1
1
4
10
8
3
1
12
10
2
1
3
4
15
3
3
8
12
3
1
10
8
6
1
1
2
13
7
3
2
2
10
7
5
2
10
10
4
Remarks: Attribute score a - very dissatified
Attribute score e - very satisfied
Food items ever tried and
preference rated by Respondents
It is found that Kentucky Fried Chicken (92%), French Fries,

49Scone and Salad remained the top 4 food items tried by customers.
Kenthurger, though introduced recently, has induced a trial rate of
32.9 percent. Dessert, despite the efforts in promotion, has
achieved a relative low trial rate.
Feedback from customers, generally speaking, is quite
encouraging. Kentucky Fried Chicken, being the major food kind, has
only 8.7 percent of feedback falling in the Dislike Category. This
reflected the product has strong appeals to customers.
Despite the low trial rate, customers who have tried Kenthurger
showed preference (83.9%) on the item. Findings from the general
market and in-store survey are rather consistent on the side items,
the feedback are differentiated. French fries, a traditional item of
fast food, is well accepted. Other novel items like dessert, scone
and butter corn are distinguished from the food items offered by the
competitors. therefore, how people rate these products which are
exclusively offered by KFC would throw lights on later product and
promotion design.
It is interpreted from the findings that the customers, on the
whole, have different and even opposite attitudes to these side
items. The in-store surveys show a much more positive ratings on the
side items, especially on the Dessert which is 72.7 percent against
25.9 percent of the general market survey.
Therefore, feedback on the side items are quite inconclusive.
However, owing to the low trial rate and unfovored ratings, promotion
should be directed to encourage the trial rate of side items.
Product modifications are requested on scone, salad and dessert
items.

50
TABLE 7.11
FOOD ITEMS EVER TRIED AND PREFERENCE RATED BY RESPONDENTS
Never 'irieaDislikeFood-Items Tried Like Neutral
Kentucky
Fried-Chicken 92.0 8.0 45.0 46.2 8.7
(98.0) (2.0) (61.2) (36.7) (2.0)
Frenchfries 71.8 28.2 35.5 48.4 16.1
(76.0) (24.0) (38.5) (51.3) (10.3)
Scone 54.1 45.0 20.8 35.4 43.8
(38.0) (62.0) (50.0) (15.0) (35.0)
Salad 51.2 48.8 34.0 36.2 29.8
(48.0) (52.0) (42.3) (26.9) (30.8)
Dessert 27.1 72.9 25.9 51.9 22.2
(18.4) (81.6) (72.7) (18.2) (9.1)
Chicken-
Burger 32.9 67.1 35.5 48.4 16.1
(28.0) (72.0) (50.0) (37.5) (12.5)
Corn 31.8 68.2 36.7 43.3 20.0
(36.0) (64.0) (64.8) (17.6) (17.6)
Base: General market survey 85
In-store survey (51)
Remarks: All figures expressed in percentage
() data from in-store survey, the other from generalmarket survey
Respondents Who Have Heard But Never Visited KFC
48.2 percent of the respondents who have heard about KFC have
never visited the store. The main reasons are: inconvenient
locations (49.4%) and ignorant of store locations (24%) and finally
high pricing (22.8%).

51These reflected that KFC's distribution network should be
diffused to higher consumer flow areas. Promotion efforts should
make KFC store location eye-catching and easy to access. For the
high pricing issue, though it serves KFC positioning as an up-scale
restaurants, we consider the price range of products can be extended
to a lower starting price. Eg. $9 for an ordinary meal and $12 for
chicken meal including fried chicken, salad and drink. This can be
achieved through introducing new product lines to present services so
as to achieve the objective while avoiding inconsistent pricing and
unnecessary interference to the operations.
Respondents Who Have Never Heard Nor Visited KFC
Upon reading the brochure of KFC's products, the respondents gave
the following response on the following aspects of KFC.
Only 5.7 percent of the respondents who have been heard nor tried
KFC showed little interest in KFC's services. This shows KFC's
sercices have certain attractions appealed to general public. How to
manipulate these strengths eg. food variety and promote them to
initiate trial and repeat purchases from customers would be the foci
of the recommendations shortly followed in next chapters.

TABLE 7.12
COMMENTS TO KFC'S SELECTED ASPECTS
BY RESPONDENTS WHO HAVE NEVER HEARD NOR TRIED KFC
Attribute Sex
M F
Age
13-16 17-19
Mnncohnl H Trvnmp
6,000 6,000-10,000 10,000
Price
food
Nut¬
rient
Novel
-ty
a
b
c
d
e
a
b
c
d
e
a
b
c
d
e
a
b
c
d
e
7
2
10
1
1
1
4
5
9
2
3
2
11
4
1
3
5
7
4
2
2
3
5
2
2
2
4
5
2
1
4
6
2
3
3
5
2
5
3
7
3
3
5
4
8
3
2
2
7
6
3
2
3
4
8
3
4
2
8
1
1
5
6
1
1
1
8
4
1
5
6
1
1
4
1
8
3
2
3
4
8
3
2
1
6
7
2
1
6
4
4
3
2
3
4
1
2
4
3
1
1
5
3
1
1
4
4
1
1
2
2
1
2
1
1
Remarks: a - very dissatisfied, e- very satisfied.
TABLE 7.13
REASONS FOR RESPONDENTS' TENDENCY TO VISIT KFC
Reasons Number
Attraction of the food items
Convenient Locations
Fair pricing
13 (50%)
7 (29%)
6 (21%)

53
TABLF 7.14
REASONS FOR RESPONDENTS NOT GOING TO VISIT KFC
Number (%)Reasons
8 (61.5)Inconvenient locations
4 (30.8)Unfair pricing( 7.7)1Unattractive products
65.7 percent of this group of respondents consider that they have
great tendency to try KFC's products because of the strong
attractions of food items (50%), convenient locations (29%) and fair
pricing (21%).
The major reason quoted for not going to KFC is its inconvenient
locations.
These illustrated that in fast food services, convenience of
store locations is a very critical point. Many fast food stores have
suffered from poor location planning and resulted in Waterloo. KFC,
in its development plan, should never limit its focus on increasing
the number of retailing outlets only, the expected customer flow rate
and potential sales volume of a store location must always be
considered first.
The research findings in this chapter are summarized in the next
chapter.

54
CHAPTER VIII
SUMMARY OF RESEARCH FINDINGS
The key question to this research study is whether
Kentucky Fried Chicken has the potential to expand its
market to the young customers between the age of 8 and 19.
The literature review and the research findings can give
some indications to the market potential. Based on the
research surveys and focus group analysis, the findings are
summarized below.
Market Trend
The fast food market has increased by 17 percent in the
business turnover in 1985. It is expected that the growth
rate will last for several years. Mr Michael Chan, the
Director of Administration of Cafe De Coral said that fast
food was more acceptable these few years than ten to fifteen
years ago and the people did not just go for a quick lunch,
but also for breakfast and dinner too. This is a trend in
itself which follows the pattern of the industrialized
nations.

55Popularity of Fast Food
According to the research, everyone aged 8 to 19 has
made at least one purchase in any fast food shop. Since
Hong Kong is a Westernized city, fast food is very
acceptable to the population, especially to the young
people. It is part of the life style for the target group to
go to fast food frequently. The findings of the two
quantitative surveys illustrate that most of them go to a
fast food shop as frequently as at least once a week.
Convenience, popularity of Western food and good taste are
the main motivating forces to push them to consume fast
food.
Purchasing Power
The purchasing power of young people is also
unexpectedly great. Most hobbies they enjoy are expensive,
such as bawling, snooker and electronic computer games.
Although the McDonald's hamburger is expensive, it is
successful in targeting at its young customers. The average
spending for each purchase is $11.92 and $12.89 respectively
for the general market survey and the instore survey.
Attitudes Towards Chicken
Many potential target customers like to eat chicken
and, they have many positive con-ents towards fried chicken.

56Kentucky Fried Chicken's Existing
Customers Satisfaction
The customers' satisfaction can, to a certain extent,
be indicated by the most customers repurchase. If they do
not like Kentucky Fried Chicken, they would not make
repurchase. The excellent, delicious food taste is one of
the big attractions.
Potential among Non Kentucky
Fried Chicken Customers
The main reasons of non Kentucy Fried Chicken
customers for not going to Kentucky Fried Chicken are
inconvenient and unknown store location, not having a
negative comment about the store. The findings may indicate
that the likelihood of the target group to make first trial
in Kentucky Fried Chicken is high.
As a conclusion, it is an opportunity for the
management to expand the target market. The target
customers aged between 8 and 19, who are the core of market,
have even greater market potential than the existing
customers whose age is between 20 and 39.
Before the marketing strategies are proposed, the
management should have a full understanding of the Kentucky
Fried chicken's strengths and weaknesses as implicated in

57this research:
Strenciths of Kentucky Fried Chicken
1. The taste of food is good.
2. Its stores are tidy and clean.
3. The service is efficient.
4. The product range is unique as its main competitors are
specialized in products other than fried chicken.
5. The food offered is perceived to have good nutrition.
6. It has achieved a high awareness level in the target
group.
Weaknesses of Kentucky Fried Chicken
1. The pricing is a little too high.
2. The distribution network is not strong enough.
3. It has a smaller market share than most of its
competitors.
The fast food market is facing numerous threats that
should be taken into consideration for further business
development. The market has developed very rapidly in past
years, but it may stagnant in the near future. In addition,
the competition is fierce and increasingly keen. While
there are entrants in the market, there are also numerous
closures. It is not easy to survive.
As a summary, the children and teenagers are heavy

58consumers of fast food. With high purchasing power,
acceptance of Western food and popularity of fried chicken
among this group of consumers, Kentucky Fried Chicken
should make use of this good opportunity to strengthen
Kentucky Fried Chicken should try its best to improve some
areas including pricing and distribution network.

59
CHAPTER IX
RECOMMENDATIONS
According to the research findings, Kentucky Fried
Chicken has the potential to develop its target market
among children and teenagers aged 9 to 19.
Before the new marketing strategies are planned and
formulated, the business of Kentucky Fried Chicken should be
well defined. Its definition is stated as a chain of fast
food restaurants that offers its customers with efficient
services of specialized American styled fried chicken and a
wide variety of other food items. The general key
objectives of the management are to offer its customers with
good taste, nutritional food in enjoyable eating
environments and promote Kentucky Fried Chicken as a leader
in the fast food industry.
The two main goals of the Kentucky Fried Chicken that
have to be achieved are:
1. To increase its market share to 25% in coming 8 years.
2. To improve its store image as a specialized store of
fried chicken and a place for fun and delicious food.
After the market situation and internal characteristics
of the chain store are carefully analysed, the
recommendations on the marketing mix including pricing,
product, distribution, sales force and promotion are
proposed.

61$3.002. Soup
Two choices: pea sausage soup
Russian vegetable soup
3. New Specially for you set meal $10.90
One piece of chicken+
Small French fries/ small salad+
Small soft drink/coffee/tea
$4.504. Jelly Sundae (Vanilla)
$3.50Jelly only
Vanilla soft ice cream with chocolate dressing $4.00
5. Carlsberg Beer in can $4.00
The introduction of meal box during lunch time provides
convenience not only to the students with full-day schooling
but also to office workers. The meal box package can be
taken away for consumption. Kentucky Fried Chicken can also
gain more business without restricted by the limited store
space. Simultaneously, Kentucky Fried Chicken can gain the
market share from its competitors who are making great
profit from lunch-time business.
Excluding drinks, most present available set meals are
priced between $12.5 and $15.0. The pricing is above the
average of $12.0 among the target customers aged 8 to 19.
In order to keep this group of valuable customers,
Specially for you set meal including a drink and with
competitive price is proposed.

62From the focus-group findings and Seven-Eleven's
experience, ice cream is very welcome by children and
teenagers. This product does not only consist of the
popular soft ice cream but also the unique and special
jelly.
Since fried chicken is perceived to be heaty,
offering beer which is a Western herbal tea for individuals
aged above 15 is a good idea because the Chinese believe
that herbal tea can eliminate the side effect caused by-the
heat. About the package, can is the best choice due to easy
instore operations and carry-away convenience. It seems
that Carlsberg matches more with the high class store image
than the other brands like San Miguel. Thus, Carlsberg is
recommended.
In sumary, it is recommend to introduce more food
items at a more competitive pricing.

63Distribution
The main factor to prevent the people who are aware of
Kentucky Fried Chicken from ever visiting any Kentucky Fried
Chicken store is inconvenient and unknown location which may
be improved by effective advertising and strong distribution
network.
At present, there are four stores located at Jordan,
Causeway Bay, Central and Shatin respectively. A new store
will be opened in Tsim Sha Tsui very soon. In review of
these locations, the Kentucky Fried Chicken management has
already taken the major factors such as the accessibility by
traffic, pedestrian flow and purpose of land use into
consideration. These are also the significant selection
strategies for its competitors such as McDonald and Cafe De
Coral. After evaluation, the main problem may lie on the
small number of branches and insufficient advertising.
The insufficient advertising, in fact, can be improved
easily by placing some appealing advertising in the near by
area to indicate the location of store. For example, in. New
Town Plaza, advertising on light box can be placed near to
the junction between exit of Kowloon-Canton Railway station
and entrance of New Town Plaza to draw the people's
attention and awareness of that Kentucky Fried Chicken
store.
Regarding the distribution network, the number of
branches should be increased, but only with very careful
planning to avoid from the harmful effect of too rapid

64expansion. The satellite towns with rapid urban development
and increasing population may be feasible locations for new
stores. With the existing location selection criteria and
the satellite towns consideration, it is suggested that Tuen
Mum, Tuen Wan, Hung Hum, Kwai Chung and North Point be
advantageous location for future stores.
The newly developed towns where there is not very keen
competition from the other fast food shop yet should be
first priority for new openings than the well established
areas such as North Point.
The cost of hiring a store is also a constraint for
selecting site. It is easy to understand why the existing
stores located in town occupy two floors instead of one. In
fact, the stores located in satellite areas, if possible,
should occupy one floor which will facilitate easier
operations. A part of the store should be designed and
decorated as children's corner for birthday party or
youngsters' gatherings.
In simple words, the distribution network should be
strengthened by opening more branches in convenient
locations.

65Promotion
Promotion is one of the important tools to achieve target market
objectives. It is especially significant for KFC which is still in
the early development stage and has to strive for a higher awareness
level, arouse customers' interests so as to initiate more trial and
repeated purchases.
KFC's efforts in promotion in past years can be summarized in
Table 9.1 attached for reference.

TABLE 9.1
A SUMMARY OF KFC'S PROMOTIONAL EFFORTS FROM 1985 TO 1987
Stage Period Media Messacre
1 May, 86 Print media
(Ming Pao Weekly,
Metropolitan weekly
Yuk Long TV Week,
Fresh Weekly
TV Weekly)
Pressure Cooker
-stress the uniqueness
and specialty of
Kentucky Fried Chicken
2 May, 86 Print Media
(same as above)
Sufficient Ingredient
Kentucky Fried Chicken—no! i r«-i one snH rri env
3 September Print Media
(same as above)
11 Herbs Spices
- the uniqueness of
Kentucky Fried Chicken
cooked with 11 herbs
SDices— a taste one
won't forciet.
秦毳
4 October Print Media
(all of the above
and Ming Pao
TV Weekly)
Side Items (旎窆耋麓
KFC serves you with
a wide variety of food
5 December In-store Sales Free gifts of cups,
to initiate trial
visits and encouragereDeated consunrrtion
6 March, 87 TV Media, JADE Kentucky Fried ChickenPi nrraro Mi r«Vi rvr
Source: Swire Marketing

Graph 2
Fresh Weekly
(Jr. page colour]
Date
Mav 1428' 1986
PRESSURE COOKER
T Q Clio
255253
密密實實
fiUJi
美 ,圃肯槲基家鄕雞.採用密密
窠寅之特製高速氣壓瓯烹調而成,
每塊雞件均在氣壓下,以高溫悉心
烹製至外層金黄鬆軟,確保雞肉
外層甘香可口,內層鮮美多汁,
雞味液郁,香噴噴,熱辣辣,
啖啖眞滋味。
肯德基家鄕雞,精選
美國一級腠调上雞,
加入十一種香料,
4
首創之高速氣壓瓯秘方烹調,風味
雋永,爲你帶來前所未有的獨特
好享受。
團體預訂無任歡迎
II
肯襯基家鄕雞。
本餐窳特設電話預
訂服務,各款精美
食譜,即訂即做,
確保新鮮。詳慵
1
肯德基家鄉雞
甘香鮮美啱口味丨
九龍佐敦道金峰商钃地下
40
電話:
電話:
(Oolonel Sanders)
Kentucky Fried Chicken
3-687308
5-776917

Graph 3
Metropolitan Weekly
(Jr. page colour)
Date
May 1724, 1986
Issue
141142
fiTTFFTHTENT TNOREDIENTS
斤両十足
肯醒家鄉雞,糖選難
一級藤場上雞,以山德士上校
(Colonel Sanders) 獨特
秘方烹製,雞肉外層金黄
鬆軟,甘香可口,內靥
鮮美多汁,保持傳統 |
的肯德基風味,啖啖香
滑鮮美,件件斤両十足。
事寅上,每件肯德基
家鄕雞均遵照極嚴格的
烹調標準,以十一種香料
調味,並採用密密寅賁的高速
氣壓甑烹製,所以品質及水準
I
圜賭預訂無任歡迎
現在閣下更可於
地點享受到肯拥[基
I
1
‘糖美食譜,即訂即做費
確保新鮮。鲜楠脯與
本細接洽。
肯德基家鄕雞
I
九龍佐敦道金峰商埔地下
40
電話:
電話:
Kentucky Fried Chicken®
3-687308
5-776917

Graph if
11 HERBS + SPICES
陣陣飄香
69
十一種香料,遠照山德士上校
(Colonel Sanders) 首創
之獨特秘方烹明,香料
糖華盡滲入雞肉內履
而不失去其原有鮮味,
陣陣飄香,食趣無窮丨
拷德基家鄕雞,
I08 ―級農楊,襴
上雞,以密密寅實的
高速氣壓觚烹明,保持雞肉
外跚金黃鬆軟,甘香可口,內跚
09
96
現在閣下更可於任何
地黏享受到肯搞[基
家癤雞。本簧廳特股
電話預町級務,各献
補美食猫,即訂即做,
確保新鮮。詳慷拥與
本餐廳接洽。
肯德基家镅雜
甘香鮮美啱口味,
241-24311( 6
011146抬己灞镰鼸環800霤霱6
6
Kentucky Fried Chicken.
3-6873086-776917
6-241820

Graph 5
SIDE ITEMS
艟苗趣集
蒞 9你會有更多好選揮,因爲除镅有斤而
十足、陣陣覼香的拷德基家鄕雞外,
並有其他多軟美味食品,包括新鮮
爽口的菜絲沙雔、營養豐塞的薯仔
沙律、甘香鬆軟的炳鬆蝌、金黃鮮嫩
的香热栗米、想人垂涎的雞柳大漢运
V…18
阖直是黄金陣容。
3
69—
“I
6
保持.外層金黄鬆軟,內賺鮮美9890
團體頊訂無任歡迎30 ,1—1I 111丨||1| I I I I 2330014 !. 13 3
肯德基家螂雛。
!本簧廳特股電話
,9
食譜,即町即做,
確保新鮮。鲜镳0‘
Kentucky Fried Chicken«
肯籀基家級翔I :
4610401(1113;0“V 讀額
• AfilflAOPW%JPI: 6-776817

71Apart from the Print and TV Media, the Swire Marketing Company has
also made use of the Poster Ads of the MTR stations that fall within
the catchman area of each KFC store. The message on these Poster Ads
is mainly to reinforce the promotion theme in each stage.
To sum up, we find that the previous promotional efforts are
focused on the taste and strength of the products, especially the
Kentucky Fried Chicken. The carefully planned and decorated KFC
stores and the friendly and courteous sales people are ignored. The
latter can also be the strengths in attracting people who enjoy fast
and delicious fried chicken and appreciate the comfortable eating
environment and friendly services. Moreover, the advertisements did
not pinpoint the sites of the KFC stores in an eye-catching position.
This is undesirable because even the advertisement can initiate the
need of the audience, if they have no idea of the location, their
impulse to try KFC's products would be quickly resolved. Thus, in
arranging the future promotion activities, the good taste of KFC's
products, convenient locations, comfortable environment and friendly
salesforce must be stressed.
Considerations in Promotion Planning
In planning the future promotion strategy, we are concerned with
KFC's business nature, its development stage, the target market
segment and findings drawn from the surveys.
Firstly, Kentucky Fried Chicken, strictly speaking, is a new
product in the fast food industry. From the Product Life Cycle
perspective, it has undergone the most difficult and critical stage of
the embryonic stage. To enable the business to prosper, a more
diffusive and effective promotion campaign is recommended to arouse

72greater public interests in KFC services so as to initiate a higher
trial rate and to retain the market share presently held. A good
promotion campaign will provide KFC a mature base for the 'taking-off'
moment in its subsequent and rapid growing stage of the product life
cycle.
Secondly, marketing plans should be considered with attentions to
the needs and attributes of the target market. In expanding the
target markets to children and youngsters under 19, a special package
will be required. From various studies, children are found to have
great influential power over their parents or guardians. Teenagers
often visit fast food store with their companions and purchase their
own food. Efforts, therefore, should work direct to them: to
initiate their interests in KFC, to stimulate their desire and in turn
influence their parents or friends to purchase from KFC.
Finally, from our survey around the catchman area, it is found
that KFC has achieved 81 percent awareness level which was
substantially resulted from the various promotion efforts. About 50
percent of the respondents ever heard of KFC have not tried KFC
services. The major reasons for this are: 1. they are ignorant of the
store location, 2. they find the locations inconvenient-to them.
These highlighted that promotion campaigns should not only impress
people with its excellent products, the locations of each store should
also be stressed, in particular for those which are not located on the
main roads.
Objectives
The key objectives of the promotion are:
1. to raise the awareness level of KFC's products and store sites,
2. to strengthen KFC's image as a fast food store with rich food

73variety and an eating environment with fun, good taste and style,
3. to promote KFC's trade-mark for easy recognition and recalling,
4. to establish a Public Relations Ambassador to attract the
children customers, and
5. to stimulate first trial and encourage repeat consumption so as to
develop customers' preference to KFC.
The process of developing the market position through promotion
activities are summarized as follows:
Create awareness-- Arouse interests- Stimulate first trial
-- Encourage repeat consumption- Develop Preference to KFC
Strategies
The strategies employed in achieving the objectives can be
categorized into three types namely: advertising, public relations and
sales promotion.
Advertising
Objectives
1. To raise the public awareness level on KFC's products and locations
2. To inform the public with the seasonal sales promotion in stores
3. To outstand the uniqueness and good taste of Kentucky Fried Chicken
4. To impress the target market customers with the friendly,
comfortable environment in each KFC store and its efficient services
Audience
All individual in the target market.

74Messages
The messages of the advertisements would be differentiated in
different media. The major media are TV as one type and print and
poster ads of the MTR stations as another type. The TV ads would be
designed to figure out the strengths of KFC such as its decoration,
excellent services and good taste of the food. In print media, only
one very particular aspect of KFC would be emphasized, and to avoid
the diminishing impressive effects of print media, we suggest KFC
prepare print advertisement of different themes and promote them at
scheduled plan.
A. TV advertisement
Themes: 1. Kentucky Fried Chicken--- it tastes so good that you
just can't resist the fashion in Fingers Nicking Good
2. Seasonal brief: for every big festival events,
advertisements should be seasonalized to cope with the in-store sales
promotion functions such as gift-giving, photo-taking'and etc. These
advertisements should focus on conveying the various sales promotion
incentives to public to induce trial and repeat purchase.
Background: A corner in a KFC store with sort luting, Jagnt music,
comfortable seating and friendly salespeople serving customers with
delicious Kentucky Fried Chicken food items. A group of customers
would be focused and showed their satisfaction with the food and
services. The advertisement slogan would be read out and printed at
the end. To complement, people of different age segments would act as
the focused customers in turn.

75Briefs: Prepare advertisement briefs to draw attention to the
locations of the KFC stores and the sales promotions implemented.
B. Print advertisment
The themes would be focused on: 1. KFC's special and novel'
taste-Fingers Nicking Good, 2. KFC's food variety -Rich in
Nutrients, Fun and Taste, 3. KFC's packaged Party Full Services -A
call would be all that needs 4. KFC's birthday party at store
Kentucky wish you a Happy Birthday.
The advertisements of these themes would be exposed at different
phase of the promotion campaign.
Campaign period
April 1987 to March 1988.
Media
TV, magazines and MTR/KCR stations' poster ads are effective media
to reach the target groups. The media schedule is proposed as:

TABLE 9.2
ADVERTISING CAMPAIGN AND SCHEDULE
Type Name Schedule
TV Jade From April 1 to April 15
June 10 to June 20
July 5 to July 20
August 5 to August 20
October 10 to October 20
December 1 to December 10
February 1 to February 15
A total of three to four spots (20 sec.
each) between 16:00 to 18:30 and 19:30
to 21:00 on each alternate weekdays.
A total of 3-4 spots between 10:00 to
12:00 and 15:00 to 18:00 on Saturday and
Sunday per week.
Magazines Yuk Long TV
Ming Pao TV
Ming Pao Weekly
Children Garden
Idol magazine
From April to May
July to August
December to January 88
Newspaper Teens Weekly From April to August
Poster Ads MTRKCR stations All year round
Advertising schedule:
Apr May Jun Jul Aug Sep Oct Nov Dec Jan Feb Mar
TV
Maga¬
zine
news¬
paper
MTR
KCR

77Advertising Agents
The fully packaged services of the TV channel are the economic and
effective means to achieve the advertising programs. Yet, to ensure
good quality products, the marketing officers must clarify the themes
of the advertisements during design and keep tight supervision on the
processing.
The present relationships with agents in the photos-taking and
leaflet and brochure designs would be reinforced. There would be more
new posters and leaflets designed to meet the promotion themes.
Contacts between the advertising designer and scripts-underwriter and
the marketing officer would increase to ensure that products would
net the required standards and timing.
Budgeting
Around $4,000,000 are allocated to support the program.
Public Relations
The public relations section would help to outstared the symbol and
identity of KFC. Customers from 9 to 19 have preference to try new
and interesting products. Their loyalty to purchase or consumption
would develop from their identification to KFC. To establish the point
of identification, a cartoon-like idol' Colonel Fried Chicken'
would be created as the Public Relations Ambassador. HE
would appear in the advertisement and participate actively in the
seasonal sales promotion functions which include photo-taking, sending
greeting cards and etc.
For the long term development consideration and to ensure the
promotion efforts an integrated series, a co-ordination officer would
燒 雞 將 軍

78
be employea.
Post: Coordination Officer
Qualifications: Post secondary or tertiary education with 1-2
years working experience in marketing
administration
1. To coordinate the activities of different sections tcDuties:
implement the promotion campaigns.
2. To liaise with promotion media on the contents and
release of the advertisements.
3. To arrange Colonel Fried Chicken visiting KFC stores
during seasonal promotions.
4. To keep good relations with print media and arrangE
sponsorships in terms of Coupons so as to initiate
trial visits.
Salary: 3,000 to 3,500 per month,
sales promotion
The advertisement and public relations can arouse public interests
in KFC. The sales promotion in each store would, if properly managed,
attract customers from nearby geographical areas and consolidate their
impulse and intentions to try and repurchase from KFC.
Objectives
1. To keep sales promotion in pace with the themes of advertisements.
2. To seasonalize the sales promotion activities with appropriate
decorations and gift-givings so as to initiate new feelings and
impulses from customers to purchase from KFC.
3. To distribute coupons in form of sponsorships for some students
organizations and activities to develop KFC's image to young people.
4. To encourage first trial and repeated consumptions from customers.
Strategies
1. Seasonalize the sales promotion activities.

79
The young people and children, as already discussed, like trying
new things and appreciate changes that bring them new feelings and a
sense of fashion. Therefore, the sales promotion must be designed
with the seasonal mood. These would include in-store decoration,
gift-givings, fun activities and others. The following is the
tentative sales promotion activities to be held on some big holidays.
TABU 9.3
TENTATIVE SALES PROMOTION CAMPAIGN
Period Activities
Children's Day gift-givings: stationery like pencil, rubber
April 4 and 5 upon purchase of a set meal or Jelly Sundae.
Easter Holiday
April 10 to 20 distribute seasonal greeting cards to all
customers upon purchase of a set meal
April 17 to 20 Colonel Fried Chicken would visit each KFC
store to take picture with children and sign
his name on the KFC's greeting cards.
The visiting hours for Colonel Fried Chicken
would be: 11:30- 14:30 and 16:30- 18:30
with one session in each store each day.
April 5 to 20 Store decorations with Easter spirits
Summer Vacations Free soft drink upon purchase of a set meal
July to August Discount on dessert items
Christmas Holiday
December 1 to 31 distribute greeting cards decorate stores
December 23 to 27 Colonel Fried Chicken dressed like Santa
Clause visits each store and take photos with
the children and sign on the cards.
Sponsorships to student organizations and activities
The company can offer some coupons to the Students Travel Bureau.

80
to stimulate the trial and repeat purchase from students. These
coupons would define the type of free services and the expiration date
so that the management people can manipulate the promotion thrusts and
controls.
Valid duringCoupon Items
soft drinks May
July and AugustJelly Sundae
from September to December 15.Soup
3. Reinforce the awareness level on KFC store locations
Since the survey findings reflected that many people, though
showed some interests in KFC's products, have little information on
KFC's store locations. Therefore, KFC should strengthen public
awareness on its store locations. Besides selecting busy sites for
store locations, it should also erect eye-catching road sign with
KFC's international trade mark and infloresent lightings on the main
roads to attract and direct potential customers to visit KFC.
Budgeting
Around one million dollars would be allocated on the sales
promotion.
Summary
In the whole marketing plan, promotion is the area which requires
the largest amount of fund five million dollars. The money would
be worthwhile. In implementing the promotion campaign properly, the
advertisement, public relations and seasonalized sales promotion would
effectively raise the public awareness level on KFC and induce their
interests to try and continue the repeated purchases.

81Yet, promotion is most effective in inducing customers' interests
and desire to buy from KFC. Whether they can be turned into loyal
customers of KFC, it depends heavily on KFC's products and services.
There is no doubt on KFC's high quality and delicious products. The
other area that marketing people now should focus is rendering better
services. How to train KFC people up to serve customers with
excellent manners is the key to success and this will be discussed in
the next section.

82Sales Force
The main business of Kentucky Fried Chicken is made
through retailing. Thus, the sales force focuses on the
sales staff in the stores. Strategies for sales force
should concentrate on improving the quality of staff through
training.
The quality of staff can be measured by their working
efficiency and working attitudes (including punctuality,
absenteeism, diligence and willingness to learn). The
training on courtesy and selling techniques should be taken
place in the initial employment of all sales staff including
the part time workers. Besides smiles and politeness,
active selling techniques is also important training
courses. For example, when a lady comes in to order for a
meal box in lunch time. The sales staff can politely ask
whether she would like to order a drink which costs her only
$1.00 more as special offer. The sales staff should take
initiative to both concern and serve the customers.
However, over enthusiasms should be avoided.
It is not easy to maintain the quality of staff without
enough job motivation which can be achieved by developing a
Kentucky Fried Chicken culture and incentive system. The
staff will have a higher moral if all of them can gain a
commission level though the amount is small after achieving
the sales target of that store. To develop a play hard,
work hard culture can help the staff work happily and thus

83reduce the labor mobility. In order not to project a
high-labor-mobility image to Kentucky Fried Chicken, it is
suggested that the employment advertising be better placed
in mass media than placed outside the store.
The main constraint for expanding retail business is
the limited resources including staff and size of store. It
may be a good idea for the management to consider to boost
up the hot-line business when the competition is not so
keen. That is, a central telephone hot-line system is set
up for both accepting orders and arranging delivery for the.
clients. When delivery is necessary, the extra traveling
expenses will be charged.
As a summary, the main strategy on sales force is to
improve the quality of sales people to attract more
business.

84
CHAPTER X
CONTROL
Since the marketing environment is dynamic and competitive,
regular management review is definitely necessary. The entry of any.
new brand, the price reduction and strategies of competitors, the
change in consumption pattern of consumers and the other external
factors are uncontrollable variables which lead to uncertainty.
Therefore, the proposed marketing plan is flexible and subject to
modification when necessary.
The control job provides the feedback that leads to modifying
marketing strategies. Control plays an important role to guide the
direction of marketing plan and the whole marketing process.
Modification or readjustments should be made as soon as possible when
the progress of the plan is unsatisfactory and, or if market
conditions that form threats or opportunities to the business are
identified.
Objectives
1. To create channels to collect information on market conditions
and feedback from customers and salespeople.
2. To provide means to evaluate the effectiveness of the marketing
programs.
3. To keep informed of the market conditions so as to arrange
modifications in marketing programs for better results.

85
4. To make the marketing programs responsive and flexible to meet
market conditions.
Control Methods
The methods by which marketing programs can be controlled include
the following:
1. Marketing research
KFC should contract outside research company to conduct some
small scale marketing research surveys used to measure the change in
customer's attitudes to KFC, marketing performance of KFC and the
advertising effectiveness. The change in product image can be
quantified in the pre and post advertising tests.
2. Information of market conditions
Syndicated studies on the fast-food industry should be purchased
for reference. These studies would provide data on general market
conditions and compositions of the cored customers. Information on
these areas would shed some lights on the opportunities and
positioning of KFC and is imperative for reference in effective
marketing planning.
3. Feedback from customers and salesforce
Each store should install a suggestion box through which customers
may express their comments, feelings and suggestions to KFC's
services. The salespeople are also requested to report the sales
performance and customers' feedback. An evaluation meeting should be
held fortnightly to analyse the feedback from all sources to assess
the process performance and propose modifications where appropriate.
5. Marketing cost analysis
Regular analysis of expenses and profits on monthly basis is

86required to provide a control to the marketing plan. The data shoulc
be broken down into different accounts to analyse the profitability
which provides a basic ground for the formulation of future plan:
and strategies.
6. Standing committee meeting
A standing committee should hold meeting monthly. The comittee
members should include representatives of each store, the public
relations section and the marketing section. The members would
analyse the feedback and progress of the marketing strategies so as
to recommend modifications in the marketing plan.
Conclusion
There are many supportive findings from researches that KFC has
much potential to expand its target market to people from 9- 19 so
as to enhance profitability.
Such an expansion would demand marketing people to re-orientate
KFC marketing plan to attract new target customers visiting KFC.
From the research findings, we recommend KFC a new'marketing -mix
with: expanded menu variety, extended price range, more diffusive
distribution network, more diffusive promotion campaigns and more
courteous sales services. These are so arranged to achieve the
business objectives of KFC in acquiring more market share, building
up KFC's image and keeping up with the long-term development plan.
It is understood that market conditions are changing
continuously. Planning based on today's information may turn
ineffective tomorrow once market situations differ. Therefore, a
control system is imposed to keep the marketing people informed of
the update infromation and thus, respond to changes effectively to

87achieve the marketing objectives. KFC, in developing its business
healthily, should always be responsive to market conditions and adopt
an on-going and flexible approach in planning its strategies to
attract the target market segment as customers.

88
CHAPTER XI
LIMITATIONS OF THE RESEARCH
The methodology applied to study the present research
is not perfect with the given constraints and limited
resources available. The goal to strive for perfection in
research is never attained. As the others researches, this
research has its own limitations which are analysed as
follows:
1. The small sample size of the two quantitative surveys may
affect the sampling error. However, because of the
limited manpower and time, the proposed sample size is
the maximum attainable limit that can achieved.
2. The selection of samples is limited by the number and
location of the spots where the interviews are taken
place.
3. Because of the younger age, the children aged between 8
and 12 cannot be asked very complicated and sophisticatec
quantitative questions, which in fact may provide useful
information for analysis.
4. Children aged under 8 are also potential customers who
should have been interviewed. However, since they are
too young, conduction of surveys or focus groups among
them is not feasible.

89
5. The information on the influence of children or teenagers
on their parents' purchasing decision is beyond the scope
of this research. Further research is advised to
interview the parents for the youngsters' influential
power.
In addition, certain problems will be met in the
understanding of and in the execution of our strategic
recommendations. These are summarized below:
1. Product
The introduction of new products such as lunch boxes and
soup must be approved by the franchiser in the United
States. However, some of these products are very
localized and Chinese style that they may not be so
easily accepted by the franchiser as the new products may
affect the image of the whole chain under the
multinational business operation.
As more products will be introduced in the store. the
operations management will be more complicated. Better
planning is required, otherwise the efficient service
will be affected.
2. Distribution
It is a problem of cost versus benefit. It is
desirable to set up more branches at convenient and
accessible location, but it may not be so easy to afford
such a high rental expense. Cost is normally positively
corelated with the accessibility of location. The better
the location, the more expensive the rental cost or land

90value the store will be. A less convenient store may
cost less, but the sales turnover may not be so
desirable.
3. Sales forces
As in the other fast food shops, recruitment and training
are problems if the labor mobility is high due to the
foreseeable prospect available in the coriany. It is not
easy to create high loyalty to the store among the sales
forces.
4. Promotion advertising
Again, budgeting is a problem. Promotion and advertising
are very effective but extremely expensive. A total of
$5,000,000 is required to fulfill the proposed plans
given in this report.
Generally speaking, money is the basic problem of the
strategic recommendations. Both people's efforts and money
are the key factors for the successful execution of the
marketing plan. If the management can make full devotion to
Kentucky Fried Chicken store and has full confidence in its
potential in its potential in the domestic market, the.
company should act aggressively to make its dreams come true
and achieve its excellent performance. The outlook of
Kentucky Fried Chicken is promising if the management is
willing to invest in its future development.

91
APPENDIX

ig
jgsrawi
E
Hamas!
KiwiKiwiinPT»R?y{i
BnSfslsBfgWs
eHE®
51
8519908831863
01
813
65102680
I 1—1
180110153882X29X189191

93QUESTIONNAIRE
AGE (13- 19)
Hi, we are the MBA students of the Chinese University o
Hong Kong. We are conducting a research on fast food shop whit
provides self-serviced food to the customers. Please fill ou
the following questionnaire for us. All information will be kep
confidential. Thank you.
1. Which fast food shops have you heard of before?
McDonald Hamburger 1
Cafe de Coral 2
Cafe de Fairwood 3
Burger King 4
Kentucky Fried Chicken 5
Maxim's Fast Food 6
Others (PLEASE SPECIFY)
2. Haw frequent do you go to a fast food shop?
At least once a week 1
2At least once two weeks
At least once a month 3
4At least once 3 months
Less frequent 5
6Never
3a. Which fast food shop do you go most? (SINGLE ANSWER)
1McDonald Hamburger
2Cafe de Coral
3Cafe de Fairwood
4Burger King
5Kentucky Fried Chicken
6Maxim's Fast Food
Others (PLEASE SPECIFY)
3b. Why do you go to (ANSWER IN 3a) most? Any other reasons?
Convenient location 1
2Wide menu variety
3Reasonable pricing4Delicious food
5Tidy. place6Efficient service
Others (PLEASE SPECIFY)

94
'4. What is the average spending per visit in a fast food shop?
1Under$ 5.00
2$ 5.00- $10.003$10.10- $15.00
4$15.10- $20.005$20.10- $25.00
6More than $25.00
5.) What do you think about fried frozen chicken?
Unfavourable CommentsFavourable Comments
4Too heety1Delicious
5Has frozen taste2Meat is tender
6Not fresh3Crispy skin
Others (Pls. specify)Others (Pls. specify)
If you have heard of Kentucky Fried chicken in Q1, please answer
Q6 to Q12, otherwise go to Q13- Q16
6. Have you ever been to any Kentucky Fried Chicken Store which
is opened last year?
YES- Go to Q8.- Q12
NO- Go to Q7'
7. Why have you never been to Kentucky Fried Chicken Store?
1Location not convenient
2Limited menu variety
3Dislike chicken(
4Priced too high
5Food not delicious
6Crowded environment/not enough seats
Others (PLEASE SPECIFY)
8. How many times have.. you ever been to Kentucky Fried Chicken
Store?
1Once
22 to 5 times
3More than 5 times
9. Why do you go to Kentucky Fried Chicken Store?
(Note: you can have more than one answer)
1Convenient location
2Reasonable pricing3Tasty food
4I like chicken
5Efficient service
6Place is tidy
7Comfortable seats
8Classy store decoration
9Recommended by family members
10Recommended by companions
Others (PLEASE SPECIFY)

10. Please indicate your opinion on the following attributes of
Kentucky Fried Chicken Store on a 5-point scale.
1 - very dissatisfied
5 - very satisfied
Pricing
Menu variety
Efficient service
Taste of chicken
Tidiness of store
1
1
1
1
1
2
2
2
2
2
3
3
3
3
3
4
4
4
4
4
5
5
5
5
5
(i±) Have you ever tried the following food items offered in
Kentucky Fried Chicken? If yes, please indicate your
preference.
TRIED
BEFORE
NEVER
TRIED
LIKE AVERAGE DISLIKE
Fried chicken
French fries
Biscuit
Salad
Dessert
Chicken fillet
1
1
1
1
1
2
2
2
2
2
1
1
1
1
1
2
2
2
2
2
3
3
3
3
3
burger
Corn
1
1
2
2
1
1
2
2
3
3
12. What don't you like about Kentucky Fried Chicken?
If you have not heard of Kentucky Fried Chicken in Ql, please
read the KFC's brochure and answer 013 - 016.
13. Please indicate your opinion on the following attributes of
Kentucky Fried Chicken Store on a 5-point scale.
1 - very dissatisfied
5 - very satisfied
Pricing
Menu variety
Nutrition
Special food
1
1
1
1
2
2
2
2
3
3
3
3
4
4
4
4
5
5
5
5
14. Now, you have been told that there is Kentucky Fried Chicken
Store, do you think you will make purchase in this store?
Very likely
Quite likely
Quite unlikely
Very unlikely
Go to Q15
Go to Q15
Go to Q16
Go to Q16
1
2
3
4
15. Why do you want to make purchase in Kentucky Fried Chicken?
Reasonable pricing
I like chicken
Convenient location
Menu variety is attractive
Others (PLEASE SPECIFY)
1
2
' 3
4

9616. Why don't you want to make purchase in Kentucky Fried
Chicken?
1Priced too high
2Inconvenient location
3I don't like chicken
4Menu variety limited
Others (PLEASE SPECIFY)
CLASSIFICATION DATA
HOUSEHOLD INCOMESEX11 Under $6,000M22 $6,000- $10,000F
3Above $10,000
AGE
113 16
217 19
NAME OF SCHOOL:
PLACE OF RESIDENCE
KOWIO EHONG KONG
21Shatin11TsimShaTsui01Sheung Wan
/ Yaumatei
Others12Shamshuipo02Sai Ying Poor
BMongkok03Midlevel
14Wong Tai Sir04Central
15Ngau Tau Kok05Peak
16Kwun Tong06Wanchai
17Homantin07Causeway Bay
08 OthersHappy Valley
09North Point
10Shau Ki Wan
Others
NT

I
⑷ 1 “5
4 2…,
各’名爲泰上姆辦!
II4
垮‘选-他誉雀〉
意务吹大大
名改筧孓溆奴
X
定处汾列吸
4 一处设夕座说,
一雯如,攻办从上
I 侧1
吵嚴工冯,乂
11
那- 070
穿
X !耗
2
患外嗜体么(叙“幻省?)蟲多咬,’
卜 1I
I
〈赁錄含杜一
4
地《磺;?、-
恢成
1 ( )
以《味彡扃,务灼匆-次瑪今夕錢?7
fo?)y n'tb NoZ
1
2
5 a.
k
RAJ-dCr
2-
3
.,
5
6
z
3
t
£
6
2
J
-t
. s
jC
I
z
3
t
5
L
%$'0
Ps-o
SlO'l-
|5-J-zo..
f0-0
fiS'O
$2O'O
. %2S0
plS-0,
(
z
3
4-
5
£

472
古翁氛
4
01
1 ;省妓乂、續言夂泔紐二钱考益
11133
1 ‘-4 1
知间遂钱众, I
‘众慨糾)1 考“右,
I “1
1|-) 4I
焚馱孓便,
I
〈贡轉 I
似例聞广
11 “44
-攻…
二 I.
含遏‘〉之
II ?
[ -他考凄)
娜?⑷泛一,
44…
4 二 1 办
I 紹
邶秸依逸-
姊今丨自沒
I
4
昶言“名釭式―,
冯10 1’44 I]
似, 代客寸会 ; |—1
1 祥類
II
众如浼
十务孓‘滿食、 I
童I主度1I凑凡着1:
3V
1-1
維
卿碲舲得5
絶
妙做?
5.
W
I
1
C
II
_
Z
3
4
jr
i
' - J2
tb - li
ft —I z-J
ic $
2
SH
2-
3
f
f
2.
3
-01
02
OS
Of
05
06
.01
?s
.°1
JO
I-5
,r 5'
I
I
t
I
I
2
2
Z
2
2
3
3
5
3
f
4-
f
f
4-
5
5
5
5
c
i
I
I
I
z
2.
z
2
.
z
2
Z
z
3
3
3
3
I
I
2
Z
2
I
I
2
7~
2
3
J
3

1'’11 乂? 4
0,
4II‘
均,一泛
― V| , ,,,,胃, ,, , 、 琴, 、 二~~~~
V “44
48
4 I
七、々:查 1
41
VI
賴
、十会“
夯今身穷一
6
+ 衾 110 省 ]
1,
11 -侦譬遂)2—
I1 一
钬黔他一…
食夂種
广妙省弓鉍爹式‘ 炎扣 11 1 081
1 I 哀脚私唯:
44 1
1
4
I “ ] 0
他人
仙
爻必入
7
I
IV
修
上?[;.
苹丄么…
中球―一―
山分
1.
士匕矣飞厂-
1 11-
觀…等
1.
0160羞年51
知審 。;少阳
i
l5-L
1. -.
i
!
I
I
2
z
z
2
m
3
3
3
4
4
4
5
5
5
5
1'
I' 15
A
z
.3
4
ti
.
2
-
.4
h
i
ZL
Z
4
2
12,-16
11-11
I
. Z
$i00i
$ 1,000
$10,00
_tmnr.
1
2
3
Oi
. 0
-03
.Of
05
'01
0 7
Of
-01
-10
I
_z
.3
-f
.4
6
7
I

100
FIELD WORK REPORT
The primary data for the research are collected through both
qualitative and quantitative field work. These works tap the
relevant market information concerning the target market segment.
The time, locations and the respondents' composition in terms
of sex and age are summarized in the following.
A. Qualitative Survey
Number of Groups: Four
Size of Groups: Eight children in each group
Composition: Two groups in boys and two groups in girlsThe children are aged from 8 to 12
Each child can know no more than one
member of the same group.
Time: January 5- 16, 1987.
Locations: Classroom of the group's school
Duration: One hour
B. Quantitative Survey
General Market Survey
Sampling Size: 202
Composition: 106 boys and 96 girls114 aged from 13- 16 and 88 from 17- 19
Time: December 20- 29, 1986.
Locations: MTR and busy sites that fall into each
Kentucky Fried Chicken shop catchman area
Instore Survey
Sampling Size 51
Composition: 25 boys and 26 girls22 aged from 13 -16 and 29 from 17 -19
Time: January 15- 18, 1987.
Location: Kentucky Fried Chicken Shatin Shop

101
APPENDIX 4
COMPUTER TABULATIONS

102
GENERAL MARKET SURVEY'

VARIA3lc LABELS H6AR01 EViiR HcARO OF MCDONALDH EAR02 'EVER HEARD OF CAFE D6 CORALHEAR03 'cVtR HEARu GF CAFE Oc FAIRWGGQH cARD4~ EVER HEARD OF' oLiftGEPXINGr —
HEAR05 'EVER HEARD GF KENTUCKY FRIED CHICKENHEARD6 'EVER HEARD GF MAXIM '
FREV 'FREQUENCY GF VISITING FAST FOOD T n R f •
FFSV FAST FOOD STORE MOST GFIcN VISll-O'RQFVI R EASQN 1 FOR VISITING THE FAVORITE STOREROFV2 'REASON 2 FOR VISITING THE FAVORITE STORER0FV3 REASON 3 FOR VISITING THE FAVGRITF STDRF•
TTOFV4 REASQN~~ 4~~FOR VTSTTTNG~TTTE~FAYURTTE STORE 'SPV 'SPENDING PER VISIT TO FAST FOOD STOREFTOCI FEELING I TO FRIED CHICKENFTOC2 'FEELING 2 TO FRIED CHICKENFTGC3 Fb-LING 3 TO FRIED CHICKENFTQC 4 'FEELING 4 TO FRIED CHICKENIFVK EVER VISITED KENTUCKY FRIED CHICKEN OR NOT
Ins i
CHINESE UN IV • OF HONG KONG IBM 4381 MVSSP R3.8
WNOT1 REASON 1 FOR BEING HEARD BUT NOT VISITED KFC IWN0T2 REASON 2 FOR BEING HEARD BUT NOT VISITED KFC
f_vxsii s__ev_er made to kfc IWVIST1 'REASON I FOR VISITING KFCIWVIST2 'REASON 2 FOR VISITING KFCWVIST3 'REASON 3 FOR VISITING KFC
WIST 'REASON 4 FOR VISITING KFC'PRICt 'COMMENT TG KFC PRICINGFOOD COMMENT TO THE FOOD VARIETY IN KFCEFFIC COMMENT TO KFC EFFICIENCY OF SERVICES
— TASTE COMMENT TO THE TASTE OF KENTUCKY FRIFD CHICK FN
CLEAN COMMENT TO KFC STORE CLEANLINESSCHICK1 IF EVER TRIED KENTUCKY FRIED CHICKENCHICK2 COMMENT TO KENTUCKY FRIED CHICKEN
FRIESI TF EVER TRIED KENTUCKY FRENCH FRIFS'FRI6S2 'COMMENT TO KENTUCKY FRENCH FRIESCAKE 1 IF EVER TRIED KENTUCKY CAKECAKE2 COMMENT TG KENTUCKY CAKE
SALAD1 'IF EVER TRIED KENTUCKY SAI AD'SALAD2 COMMENT TO KENTUCKY SALADDESSERTI IF EVER TRIED KENTUCKY DESSERTDESS5RT2 'COMMENT TO KENTUCKY OESSERT
KENCH1 'IF FVFR TRTFO KENTUCKY f.HIf.KFN HAMRURSFRKENCH2 'COMMENT TO KENTUCKY CHICKEN HAMBURGERCORNI IF EVER TRIED KENTUCKY CORNCORN2 COMMENT TO KENTUCKY CORN
NQPRICE 'COMMENT ON KFC PRICING BY PEOPLE IGNORANT QFKFC'
NOFOOD 'COMMENT ON KFC FOOD BY PEOPLE IGNORANT QFKFCNONUT COMMENT ON KFC NUTRITIONBY PEOPLE IGNORANT OF KFC
NOSPE COMMENT ON KFC MENU APPEALSfiQNQT 'IF PFOP1 F IGNORANT OF KFC WOUID GO AFTFRWARDS'—
WHYGOI REASON I FOR PEOPLE IGNORANT OF KFC VISIT KFCWHYG02 REASON 2 FOR PEOPLE IGNORANT OF KFC VISIT KFCWHYN°T •REASON OF PEOPLE IGNORANT OF KFC NOT VISIT KFCRESA RESIDENTIAL ARFA OF RFSPflNnFwT
MISSING VALUES HEARD1 TO WVIST3 (9)WIST (99)PRICE TO STATUS (9)RFSA (99)
BEGIN OATA

CON T ll§LL fn 6 ~STATUS
r~ n JLtMJ CTAIT TY- rr On T T B U C A« V T i
PRIC
i
m
ll.I
jO«
=5
3.
8.
COLUMrthtai
26 23 2;
[ 1K
77
CHI-SQUARE
6.75518
I 1 I M L t I • J
0.319 15 ( 60.0%
LAMBDAUNCE RTAINTY CUEFFICIEN1
SOME RS• DFT A
0.126V0.QA1V
0.121950.03906
ftNU CJMJ_
0.13030.0A-20
STAT 1ST TC
0.21529
CRAM ER S VCONTINGENCY COEFFICIENTKENDALL'S TAU BKENDALL'S TAU CPEARSON'S R
0.216590.29287
-0.001-0.00174-n.nna?7
—crvwrs—n _ L.a~KU
05 FEB 87viI If 12 •fcx III
RR4

77 T v .• rxyxr l r Arr c zr 11At t is s~t r iynAr v da t om a 2 o j utc n d 3 . a
ronc.craiij a r r n w n 1TAZTC . rnuuctjr rn rue tactc nc irfjr i ir u v co Ten r nv r Mrnw
CONT ROLL'IMp.FOR . IS A I f IC —
INCOME'
ScbuNTROW
TASTE1 1 '
1 1 1 7 A
2 o
3
-A
A
A
12
ft
10
«;5 1 5
912.9
2637.1
7 n
28.6
1 11 C 7
+ + +
COLUMN 25 22 23 70TOTAL 35.7 31.A 32.9 100.0
CHI-SQUARE
2 5.0600 A
D.F, S IGNIFICANCE MIN E.F. r CI I C UTTU C C c;
ft n . n m 5 1-757 9 OF
WITH INCOMEWITH TASTEn c ocuncMTSTATIST IC cvmmcto rr
LAMB0AUNCERTAINTY COEFFICIENTSOME RS' 0ETA
STATISTIC
0.179780.16038
0.113640.14112
0VT26T2
T R AM FR f ?
CONTINGENCY COEFFICIENTKENDALL'S TAU BKENDALL'S TAU CPEARSON'S RGAMMA -
J AI (IF
0.423080.51344O.I2Tm~0.126730.124510.16547
Q TCW T F IT ANT F
0.244440.18572
757TT4Sr_n Q7 1
0.12200.12200.1522
i _

—» — M ff £S I J |
TASTE COMMENT TO THE TASTE OF KENTUCKY FRI ED Ccontrolling; fort;
STATUS
U L A T I C
~rrccoMF~COUN
TASTE i
3
A
1
1
ROW
3
I14-3
rA 1 O
COLUMN,TOTAL
228.6
__2._78.6
3,.5 . Q
I-
Ii n n _ n
CHI-SQUAR.I n _ it _ S Tfi N T FTTANr F
6.22222 4 0.1832 O - 286 q nc
ST AT 1ST IC CVMMCTOTfWITH TASTE WITH INCOME
LAMBOAUNCERTAINTY COEFFICIENTSOME RS• 0
ETA ...
0.500000.51210O.00000
0.500000.531160.00000
0.500000.494360.000000.56011
STATISTIC VALUE
W t V V I A. V
; TGNTF Tr AMf.P
CRAMER'S VCONTINGENCY COEFFICIENT
I KENDALL'S TAU BJKEND_ALL! S TAU. C
PEAR SON' S RUGAMMA
0.666670.685990.00000
. 0.00000__0.000000.00000
0.5000

TACTE-------------- C R a S S T
r nuu r~ r. i r m t ur t rr r nc v r - mt » » • tra r r- ri 1 I A T T i
—CONTROLLING FOPSTATUS
uY IhLL
COUNINCUMb
ROW
TASTEc
•I-I ]t inn _ r
COLUMhrnTAi
+
1i nn _ r
+
]
i w i nu w v « w A w v » v
NUMBER OF MISSING OBSERVATIONS = 1 ?A

RR4• ;» • ' , -'' : .i V-i
------------- r r r
CLEAN ClrriMToni i tkip cno
J L AT I 0
,4'1.
ROW
31 wW-
8
13
36
10
rni iimn 2 23 23
U
72
r PI I S UTTH P -P- q
11 Ul 13 I 73T3TT

PRICECONT ROLLING FOR
INCOME
COMMENT TO KFC PRICING BY AGE
VALUE = I.
COUNTAGE
PRICE
ROWTOTAL
1
2
3
Jk
5
3
1Q«JL
932.1
46.4
2L_7.1
1
3_._6_
28100.0
1 2
1
6
7
1
2
6
3
2
COLUMN 13 15TOTAL 46.4 53.6
CHI-SQUARE O.F.
A.2 892 8 4
S IGNIFICANCE MIN E.F.
0.3683
SJAXISXTC
fLAMBOA'UNCERTAINTY COEFFICIENTISOMERS D
STATISTIC
OKv vCRAMER'S VCONTINGENCY COEFFICIENTKfcND'ALL S TAU B
KENOALL'S TAU Cfee ARSON'S R'MAMMA
0.464 8 OF To ( 80•OX)
WITH AGEDEPENDENT
WITH PRICEDEPENDENTSYMMETRIC
0.107140.09942
-0.05714
0.00000
0.07679 _-0.06667
0.00853
0.230770.14098
-0.050000.39139
SIGNIFICANCEVALUE
0.391390.36447
-0.05774-0.06633-0.00853-0.09774
U.3738T-0.37380.4828
XR4iTHE CHINESE UN IV
n c unwr.-Kniurr .£ rm •MVSSP R3.R
CELLS WITH E•F• 5

•-v-----.
WUN
AGE
ROWT n T .
1
2
3
3
7 I 1350.C
4 1 T7 5-Q
__1 7 3.
COLUMNTFIT Af
15«;7 - 7
11
I L • 5h
26
CHI-SQUARE
3.00895
D.F.
3
SIGNIFICANCE
n a on 1 _ 9 AC
STATISTIC
i t cu7 g
WITH PRICE
8 ( 75.0
WITH AGE
LAMBDA x._UNCERTAINTY COEFFICIENTSOMERS' 0ETA
Q.Q4J.670 .08393n _ ? y i
__ 0.00000_0.065S20.26061
0.09091_0.115770. 1955
TiTTTTr —VTAi lie
Um£ DtJUU
f R AM FR S V
CONTINGENCY COEFFICIENTKENDALL'S TAU BKENDALL'S TAU CPEARSOfL!_S R
G'AHHA
0.3A0190.322060.225690.2 54-0.25800
mrrmr
0.11360.1136
05 FEB 87,;00?Sfrs50
RR4i V? i,Pll
ronCCTAttlll ATTHM HP

PRICE COMMENT TO KFC PRICINGCONTROLLING FOR•
INCOME
PRIC E
COUNT~7VGE~
RONTOTAL~
1
2
~T~
4
2
5
JLI
1
3
2
3
115
830 • 8
TZ~46.2
311.
COLUMNTOTAL
1557 ml
1142. 3
261000
CHI-SQUARE O.F • SIGNIFICANCE MIN E.F. CELLS WITH E.F. 5
090606 3 0.8240 1.269 6 OF 8 C 75.0%)
STATISTIC SYMMETRIC_WJJLH PRICE,
OEPENOENT_WITH_.AGE
DEPENDENT
LAMB DAUNCERTAINTYSOME RS• DETA
COEFFICIENT0.040000.018270.13846
0.0QQ_QQ_0.014240.163640.15327
n.09091
0.025460.120000.18668
SIGNIFICANCEVALUESTATISTIC
CRAMER'S VCONTINGENCY COEFFICIENTKENDALL'S TAU BKENDALL'S TAU CPEARSON'S R .....
GAMMA
0.186680.183510.140130.159760.153270.24324
0.22640.2264
jQ.-Z2_7it_
NUMBER OF MISSING OBSERVATIONS = 122

05 FEB 8 7I a !?? 4Ti i rr iT Aft c -
ROOD CO MM ICONS ROLLING FOR .
V ft I ! IF = 1.
a r r
ROW
1
2
~T
_4
~T
1
-r
y
-
3
II39.3
ar28.6
4_
2
COLUMNTOTAL
13 15
»
28mn.n
MIN F - F- CELLS WITH E•F. 5
0-626 8 OF 10 ( 80.0%
WITH FOOC WITH AGEOFP FMHFNT
LAMBDAUNCERTAINTY COEFFICIENTSOME R5f ~D
0.166670.05250
—rrrriTTTTT
0.117650.038920.10252
0.230770.080640.070180.32864
crr.MTcrfuiri:
CRAMER'S VCONTINGENCY C0EFFICIEN1K E N D ALIT S~T AU ~BKENDALL'S TAU CPEARSON'S R
0.328640.31221
~D.UBW0.102040.054930. 13514
0.3HTB0.31480.3906

FOOD .... COMMJENJL .CONTROLLING FOR.
INCOME
COUNT
FOOD1
2
3
5
1
2
3
fl
1
2
6
3
I3.B
15.
93.6
1 1
2.3
1
COLUMNTOTAL
1557.1
1142.3
26100.0
CHI-SQUARE O.F. SIGNIFICANCE MIN E.F. CELLS WITH E.F. 5
•77025 0.3117 0.23 8 OF 10 I 80.0%)
STATISTIC SYMMETRICWITH FOOOOFPFNDENT
WITH AGEDEPENDENT
LAMBDA . 'UNCERTAINTY COEFFICIENT
SOWERS'? 0
ETAm
0.230770.10906
0.200000.08379
0.272730.15617
-0.21883. -0.26061; 0.1695
-0.188600.283
cjBBwKfiiyJp.| ?T|T''T'S|W'fcrffi LVALUE- SICNTFTCANCF
XRAKS!t£SgH|':
K E NO ALL SifARSON'S RGAMMA
ffiss JfrT: jr ., 'YCTSe
eeiits-0.1695?:-0-3613
bH720.11720.200
05 FEB 87 RR00:5:50 THE CHINESE UNIV. OF HONG KONG.IBM 381.
V-'
MVSSP R3.0_.—--,—«..au.«v.•—...•—A%4

NC0M6
COUNT
1
2
~T
4
5
1
4
T
4
1
7
6
~3
2
13.8
1038.5
W30.8
67371
13.8
COLUMNTOTAL
1557.7
1142.3
26100.0
D.F. SIGNIFICANCE MIN E.F. CELLS WITH E.F. 5
3.02283 4 0.5540 n .423 9 OF 10 C 90.0%)
STATISTIC SYMMFTRICWITH FOODn FPFNnPNT
WITH AGEnCDCMnCMT
LAH30AaggrgOTATMTY f flFFFT C T FNT
0.11111,_a.0.7_L95_
-0.17910
0.06250__CL.X 5 4 5A-0.21818
n.18943
0.18182Q«JJ35_6A_-0.15190
n-3409 7
STATISTIC- VALUE crr.HTCTf Awrc
CRAMER'S V •
XQNLINGECX-CQ EFFICIENT-KENDALL'S TAU BKENDALL'S TAU CPEARSON'S RGAMMA
0.34097_Q_.32273-0.18205-0.21302-0.18943-n-
0. 16280.16280.1770

00 0 00 0 7aa:S4:50
000rur= rt-t .
ivV FFFfC CilMMf
.» HULLING FUR . «
INCOME
C0UN1A b E
1 2
ROWT nr ai
4
310.7
—nr~35.7
828.6
310.7
1
2
~3~
4
5
COLUMN 13 15 28TOTAL 46.4 53.6 100.0
2 2
12
4 6
4
1 2
CELLS WITH E.F. 5MIN E.F.SIGNIFICANCE
0.9204 I.393 9 OF 10 C 90.0£)
WITH EFFICOEPENOENT
WITH AGEDEPENDENTSYMMETRIC
4
D.F.5oh£-square
€092855
STATISTIC
i LAMBDAUNCERTAINTY COEFFICIENTSOME RS • oeta
STATISTIC
-CRAMERS V
iLLSCTAS°§FFICIENTKENDALL S TAU CPEAR SON S R
JGAMI1A
0.182110.179160.071120.086730.084870«11565
V A L UE
0.032260._01144l_0.06967
0.00000_0_.01L32L
0.087180.08487
SIGNIFICANCE
0.07692Q...Q.242 9„0.058020.18211
0.34210.34210.3338

EFFIC COMMENT TO KFCONTROL L IMG FUn V
INCOME
COUNT
EFFI (1
2
5
4
5
m—-
1
3
6
tx.
1
1
4
L.
2
13,8
415.4
H5—385
830.8
311.5
COLUMN 15 11 26TOTAL 57.7 42.3 100.0
CHI-SQUARE
2.16929
O.F • SIGNIFICANCE
0.7047
MIN E.F.
0.423
r CM C UTTU c c c
o nc i n t on n v 1
STATISTIC symmetricWITH EFFICnppPMnPNT
WITH AGEOFPFNDFNT
LAMBDAIN C P RT A T NT Y CflFFFT CTFNT
SOME RS Ov. ; VETA
0.037040.04743_0.24510
0.00000Q.Q3532_0.303030.28399
0.09091i). 072190.205760.28885
STATJStilC VALUE q mM t p rCAMf p
;0«?77«n
teilfi
0.08690.08690.0799

-------------------- CROSSTABULA T I O N OFOOD COMMENT TO THE FOOD VARIETY IN KFC BY INCOME
CONTROLLING FOR..STATUS VALUE = • 1.
r Mr n m p
countROW
FOOD1
2
~3
_4
5
3
1 2
1(
I
3
1
7
fl 8
II
2 1 i
5
2027.8
2331.9
27.8
4C_ A
COLUMN 26 23 23 72TOTAL 36.1 31.9 31.9 100.0
CHI-SQUARE D.F.
8.31921 8
SIGNIFICANCE
0.4029
MIN E.F.
1 .278
r ci i c uttu ;
f f)F THE i 7To—o V 1—
STATISTIC SYMMETRICWITH FOOCnPPPNDPNI
WITH INCOME
LAMBDAUNCERTAINTY COEFFICIENTSOME AS DETA
0.126320.04718
0.10242
0.102040.04179
OVIoTBT17
0.152170.054170.09754
STATISTIC VAI IIP SIGNIFICANCE
CRAM ER S VCONTINGENCY COEFFICIENT
KHNITALL'S TAU BKENOALL S TAU C
fcPEAR SON SJfr'feCAMH A
0.240360.321830.102350.107640.113530.14396
0.15840.15840.1712
MVSCP o_«

00:5501 THE CHINESE UNIVm OF HONG KONG IBM 43 81 Ml:? ft - ft
FOOD CCIMMFNT TO THE FOOD VARIETY IN KFC BY INCOMECONT RULLTNGUrR
STATUS VALUE = 2.
INCOME-COUNT
ROWTflTAI
F0002
3
4
T
I
I
~2
1
T
-J
3 571.4
I14.3
]—
14.3
—COLUMN.TOTAL
228.6
22EV6
3_42 • 9 100.0
CHI-SQUARE D.F. SIGNIFICANCE MIN E.F. CELLS WITH E.F. 5
5.60000 4 0.2311 0.286 9 OF 9 (100.0%)
STATISTIC SYMMETRICWTTfl FOOD
DEPENOENTWITH INCOMEDEPENOENT
LAMB OAUNCERTAINTY COEFFICIENTSOME RS 0ETA
0.333330.42684
-0.37037
0.000000.50260
-0.31250n- «:;71 77
0.500000.37093
-0.45455
STATISTIC VALUE SIGNIFICANCE
CRAMER'S VCONTINGENCY COEFFICIENTKENDALL'S TAU BKENDALL'S JAU_.CPEARSON'S RGAMMA
0.632t60.66667
-0.37689
-i5. 30612_-0.33634-0.55556
0.2304

7 ??4)! • C C»l I T i-J C LJ T HJ CZ C£T A f t D C 1_~I A? DA? T a JLt A. ZZ Q 1 AffC CD D 2 O
Fnnn commfnt rn thf Fnnn varifty tm kff ry tnitimf
CONTROLLING FOFSTATUS VAI HP = -
F000
COUNTINLUHt
ROWTOT Al
3 I
a
1inn.n
COLUMNTOTAL
I100.0
I1 00.0
ess STATIS TICS C ANNU1 BE CUM FUTCD WHbN I Hb NUMBER Uh NUN-bMP IY KUWS UR CULTJM NS IS UNb »
NUMBER OF MISSING OBSERVATIONS = 122

HfiplCULKV4. r • .cC- rwfLtrv u A LVCy £?• j c4 _
«?• ---------- CROSSTABULA T I ON O
TMT nw
2
c
5
j
c
d n
8ii i
T
li
8
COLUMNTOTAL
26-1
231.
2331.9
lit.
7;i nn i
CHI-SQUARE O.F. c ir.Nt p tr antp
5729 431 ~5~ ~TiTmr7—
STATISTIC
JL • 7 1 I
WITH EFFIC
15 ( 60.01
LAMBDAUNCERTAI NT Y COEFFICIENTSOMERS DPTA
STATISTIC
CRAMER'S V, CONTINGENCY COEFFICIENT
iRfcNU ALL'S ! AU~BfefcENDALL'S TAU C$ffEARSON' S R
1£mma_II
0.046510.02977
VA1 IK
0.191740.261720.114U f0.117480.15396
0.000000.02653n. 1 1 7AH—
U.I54:b
U. 13320.1332n-OQ83
0.086960.033920.11057

COUNTINCOME
ROWXOTAL
EFFI C
COLUMNTOTAL
CHI-SQUARE D.F. SIGNIFICANCE MIN E« F. CELLS WITH E.F. 5
6. 12 500 6 0.4093 0.286 12 OF
WITH EFFIC
12 C100.0%)
WITH INCOMESTATISTIC SYMMETRIC DEPENDENT DEPENDENT
0-28571 n-nnono Q.5QQQQLAMBDAUNCERTAINTY C0EFFICIEN1SOME RSf DETA
0.43433-0.70968
0.42026-0.68750
0.73449
0.44937-0.73333
0.76696
STAT I5TIC VALUE SIGNIFICANCE
CRAM ER1S—VCONT INGENCY COEFFICIENTKEND ALL f S TAU BKEND ALL•S TAU CPEAR SON S RGAMMA
0.66144
0.68313-0.71005-0.67347-0.72334-1.00000
0.0331
05 FEB 8700:5 5:02
RR 4THE CHINESE UNIV. OF HONG KONG IBM 4381 MVSSP R3.8

05 FEB 3700:55: OZ_
' i. 2- yRR4 , . 1 7THE CHINESE UNIV« 7F HONG KONG IBM 4331
r v ' 'lllCCD D
y • ':X1 , ; _ . '------ - - -- -- -- -- -- - uk u a
FFFTC mMMFMT Tfl KFf FFFff rFWfY OP SPPtTrPV t;« I X u
nv . rurriMF
CONTROLLING FOR.STATUS
A? ' 'VALUE =
COUNT—[INCOME
ROWTOTAL
EFFIC—Z
1 1L 1[ 100.0
COLUMNTOTAL
1100.0
I100.0
STTrrrsnrrcs lannui be cumhuieu when ihl numblk uf non-emptt rows uk columns is one —
NUMBER OF MISSING OBSERVATIONS 122

w — r- Coo:5 50
FFFff r n MMcr r l V w-CONTROLLINGFOR
INC (IMF
ft r c
COUNT
FFF I C
ROWTOTAI
I
T
I 13.8
2
3 ~T~
2 277
A 1350.0
A c: 2 7
25.9
5 2 1 3115
COLUMNTOTAL
1557.7
II42.3
26100.0
CHI-SQUARE n-F- SIGNIFICANCE MIN E.F. CELLS WITH E.F. 5
~£TT7Frr~ ~zr 0.3923 0.423 8 OF 10 t ao.o
STATISTIC SYMMETRICWITH EFFICOEPENOENT
WITH AGEDEPENDENT
LAMBDAUNCERTAINTY COEFFICIENTSOME RS ' Ufta
0.083320.104 11
-0.19121
0.000000.07994
-0.224240. 15339
0.I 81 8 20.149220.166 670.40094
STAT 1ST IC _ VALUE SIGNIFICANCE
CRAMER'S VCONTINGENCY COEFFICIENTKEND AULA'S TAU BKENDALL'S TAU CPEARSON'S RGAMMA
0.400940.37214
-0.19332-0.21893-0.15339
-0.3333 3_
0. 14950. 14950.2272

05 FEO Q 7 RR400:5 4:50 T HE CH L Nt V t i •„„ OF HONG nOG IBM 4 3 8 »
T
CDNT ,
I?.
.
CO?'-FOR •
COUNTAGE
ROWTOTAL
TAST E1 1
2
13.7
4 6 1037 -
~3
4
3
_2
-
A.
318.3
622.2~
54
3 1 2 518.5
COLUMNTOTAL
1348.1
1451.9
r
21100.0
CHI-SQUARE O.F. SIGNIFICANCE MIN E.F. CELLS WITH E•F• 5
2.43297 4 0.6567 0.481 9 OF— 10 90.01
STATISTIC SYMMETRIC
WITH TASTE
..DEPENDENT
WITH AGEDEPENDENT
LAMBDAUNCE RIAINJ_Y_X.O£FLEJLC JLEJNTSOMERS' DETA
0.100000.04903
-0.00883
0.00000Q.Q3623
—0.010990.00454
0.230770.0758 0__
-0.007380.30018
STATISTIC. VALUE S I GN I FICANCE
CRAMER'S VCONT INGE-NCJLX-Qi:FFIC LE.NJKENDALL'S TAU BKENDALL'S TAU CPEARSON'S RGAMMA . ...
0.30018
0.975 1-0.00901-0.01097-0.00454
0 .01449
0.47990.47990.4910

CONTASTE
IT PULL INIncomf
rnuN
TAST E
AGE
. . C OHM EGa Faa_ _
R 0 WT t T A •
i
3 I A
4 6
C
1
.0_
1248.0
JO40.0
2_8.0
25100.0
COLUMNTOTAL
14-D
11
CHI-SOUARE O.F. s TfiNrf rr antf
7.40R01 3 n.4Q71
St ATTS T T f cvuucfoT_ W LIH—IASTJEr r—o r~ m. » r • T
b i 6L • I)
WITH AQE
LAMBDAUNCERTAINTY COEFFICIENTSOMERS' 0ETA
Q«16661.0.064240.26316
_Qjfc 153850.053110.29221
0.081270.23936
STATIST TC AA3 13F rcw re tt a wrc
CRAMER'S VCONTINGENCY COEFFICIENTKENOALL'S TAU BKENDALL'S TAU CPEARSON'S RGAMMA
0.110360.296410.264470.208000.27195
0.08770.0877

05 FEB 700:54:50
RR. 4THE CHINESE U h HONG K (INC. I tiM 4 3 8 i
I. i U } U llT A S T F rnMMFiMi . i , .. f A s T F HP RFNTllfKY PPTPfl f RV
CONTROL: FOPINCUMfc VALUE =
COUNTAGE
ROWTflTAl
TASTE~rr 2T
1
2
3
4
5
1 I
2
4 6
?
5
27.7
27.7
FD38 - 5
7
26.9
519.2
COLUMNTOTAL
1557.7
1142.3
26100.0
CHI-SQUARE D.F. SIGNIFICANCE MIN E.F. CELLS WITH E.F. 5
8.26597 ~4 0.0823 0 • 846 9~~0F 10 I 90.03
STATISTIC SYMMETRICWITH TASTE WITH AGEDFPFNDF NT DEPENDENT
LAMBDA_ UNCE BLA.INTJLJuHEJEJEJ JCJUELNi
SOMERS' DETA
0.18519019683
-0.45631
0.06250Q.14522
-0.569700.46441
0.363640.30535
-0.380570.56385
.STATISTIC. VALUI SIGNIFICANCE
CRAMER'S VCONTINGENCY COEFFICIENTKEND ALL TATTBKENDALL'S TAU CPEARSON'S RGAMMA
0.56385n AO1 1q
~0. 46563-0.55621-0.46441
_-0.72308_
0.00540.00540.0084

»
05 f?fJ t 7 ??4
— — — — — — — — — — —— — - »( -i s -j ; A J N OFCLEAN _ COMMENT TO , uKL: t •, ioS di
CONTROLLING FUR..INCOME VALUE = I.
AGP
C0UN1
CLEAN
ROW
2
310.7
517.9
13
5
1
«
C
2
l
D
I A.
COLUMNTOTAL
13AG .
1553.6
28mn.n
CHI-SQUARE D.F. S IGNIFICANCE
P.H 9 7 S 7 —ZT ~fT7r7n
STATISTICCVMMCTD T r
WITH CLEAN WITH AGE
LAMBDAUNCERTAINTYSOME RS' DFT A
rncccrrtpm0.1071A0.05168
TT-OA P AA
0.000000.038590.05128
0.230770.078200.03671Tn_ 71 a q
STATISTIC
W W W • f
f R AM FR• S V
CONTINGENCY COEFFICIENTKENO ALLT3 TAU ITKENDALL'S TAU CPEARSON'S RGAMM A
0.321690.30623
—0~i 03 1 10.051020.02751n- mnu?
U.AU350 • A 0 3 50.67

05 FEB 8 700:54:50
RR4
TJM-QJJ1_NCS $r R3»e
— ~ — ~ - — — V. K
CLEAN COMMENT TO KFC STORE CLE A ML I NESSCONTROLLING FUR..
INCOME
f R D S S T A R U ! A T T n N n F
i i T~r L—
VALUE =
COUNT~age
ROWTOTAI
CLEAN1 I i
3 .8
2 3 311.5
3 1 3 415.4
__A 8 7 L5_57.7
5 2 1 3_1JL.5_
COLUMNTOTAL
1557.7
1142.3
k
26100.0
CHI-SQUARE O.F. SIGNIFICANCE MIN E.F. CELLS WITH E•F• 5
4.90060 4 0.2976 0.423 8 OF 10 ( 80.021
STATISTIC. SYMMETRIC
WITH CLEANDFPFNDFNT
1U I ou • u
WITH AGEDFP FNOFNT
LAMBDAUNCERTAINTY COEFFICIENTSOMERS' 0ETA
0.090910.12847.0.08579
0.00000__0.09984:
0.09697n.iftnifl
0.18182_0.18011„._
0.076920.43415
STATISTIC_ VALUE SIGNIFICANCE
CRAMER'S VCONTINGENCY COEFFICIENTKENDALL'S TAU BKENDALL'S TAU CPEARSON'S RGAMMA
0.434150.3_982_40.086370.094670.180180.15385
0.32150.32150. 1892

05 FEB Q 7 RR400:54:50 THE
COMMENT TO KFC STORE CLEANLINESSCLEANCONTROLLING
INCOMEFORi
COUNTAGE
CLEAN
ROWTOTAL
CROSSTAB U ! A r I 0 M 0 F
VALUE
27.7
1038.5
IT)30.5
415. 4~
26100.0
2
3
T
5
~T Z
1
55
I
A
I3
COLUMN 15 11TOTAL 57.7 42.3
CHI-SQUARE D.F. S IGNIFICANCE MIN E.F.
0.80364 3 0.9486 0.846 6 OF 8 ( 75.0%)
CELLS WITH E.F. 5
WITH AGEDEPENDENT
WITH CLEANDEPENDENTSYMMETRIC
0.062500 • 0 13 10
-0.181820. 16483
__0. Q0_0000.02347
-0.131580.17581
SIGNIFICANCE
.. 0.03704 _0.01682
-0.15267
~TATUE~
0.20380.20380.2105
__0. 175810.17315
-0.15467-0.17751
STAT 1STIC
LAMBDAUNCERTAINTY COEFFICIENTSOME RS• DETA
STATISTIC
CRAMER'S .Y_CONTINGENCY COEFFICIENTKENDALL'S TAU BKENDALL'S TAU C
.PEAR SO NTS RGAMMA
NUMBER OF MISSING OBSERVATIONS = 122

05 FEB 8?01:23: LEt.
RR6... THE . CHINESE l'?' T OF. HnNC y ONG J VH... 4 3..0 I R3m 8
NOPRICE COMMENT UN KFC PRICING BY PEOPLE IGNGRAN ... . _ BY STATUS..
STATUS
COUNT
NOPRICEI
_2_
3
4
5
0
1
I
9
12
3
3
2
JL
2
ROWTOTAL
925.7
5_14.3
15_42._9
38.6
38.6
COLUMNTOTAL
12.9
3188.6
30.6
_35100.0
CHI-SQUARE . D.F._. SIGNIFICANCE. MIN E.F. CELLS WITH E.F. 5
4.16487 8 0.8419 0.086 13 OF 15 ( 86.7%)
STATISTIC SYMMETRICWITH NOPRICEDEPEN06NT
WITH STATUSDEPENDENT
LAMBDAUNCERTAINTY COEFFICIENTSOME RS • DETA
0.000000.08645
-0.01062
0.000000.05607
-0.023620.06058 _
0.000000.18860
-0.006850.19803 __
STATISTIC VALUE SIGNIFICANCE
CRAM ER S VCONTINGENCY COEFFICIENTKENDALL S TAU BKEND ALL•S TAU CPEAR SON S Rfi A MMA
0.243920.32610
-0.01272-0.00735-0.01429-0.03529
0.46740.46740.4675
NUMBER OF MISSING OBSERVATIONS 167

CS f tzJ 7 KKCfOl : 2 3; 1 5 THE CH
wncnnn rnm
r m if
NOFOOf
_
2.
~ 17 •
26.
1-T JL• 4
7
+ + + +
COLUMN I 3Q 3 33
CH f-SOUAR n.P .
A.ins;(
;t at t qt r r
LAMB OAUNCERTAINTY COEFFICIENSOME RS• 0PTA
QT AT T'vT IT
U•Ll
—uttu wncnrif
15 C 80.0%]
0.08333O.1O01S
0.1000C0.0709C
0.000000.22822
CRAMER'S VCONTINGENCY COEFFICIENTKENOALL'S TAU DKE NO ALL' 3_TAU_CPEARSON'S RC. A Mi MA
0.30A510.395520.00000 0.5000
NUMBER OF MISSING OBSERVATIONS = 160
0.07681

05 F= E3 3Ol:23:JL5 __
RRTHL r~t~i r aj£= cr a ri n c k riKirz tum a si MX c CP PI.
- -• A A 'AJ «• J « • tfM. « . «------- - ---------- ~ c R O S S T A a U L A T I 0
NONUT COMMENT ON KrC NUTRITIGNBY PEOPLE iGNORA BY STATUS
COUN1STATUS
NONU ]
RTJW~TOTAL
T
2
(
—ra. A
3 13 2
j—or
15
4 1 9 10
5 ~y —iO Q
34TTHT-TS
COLUMNTOTAL
J2.
30a n. 2
3
CHI-SQUARE D.F . S TGNTF If.ANCF
6.46000 8 0-5958
STATIST IC QVMMCTD TTWI TH no nut WITH STATUS
LAMBDAUNCERTAINTY COEFFICIENTSOME RS DETA
0•043480.11535
-0.20571
0.052630.07579
-0.43902
0.000000.24127
-0.13433
STATISTIC VAI f IP
V.W.4. W.J-JkA.
CRAMER'S VCONTINGENCY COEFFICIENTKENDALL'S TAU BKENDALL'S TAU CPEARSON'S RGAMMA
0.308220.39958
-0.24284-0.14014-0.20526-n.A?7Ql
0.0631_Q • u 6il_n - i
NUMBER OF MISSING OBSERVATIONS .= 16_8_

e- _____? - —,-
vos
A CAJft , , _
COUN
C T A T! I
NOSPE
» nu
1
2
2
A
5
1
r
6_
8
9
. _-_
1_
2
388
8~~2375
10
29«4
9265
A
COLUMNTOTAL
1 305T5 T
3
I 1.8»
CHI-SQUARE D.F
6.68666 R
STAT 1STIC
0.088 12
WITH NUSPF—
16 ( 80.0%]
I I I f U g T A TIM
LAMBDAUNCERTAINTY COEFFICIENTSOMERS' 0ETA
0.071470.11107
-0.02120
0.073330.07120
0T000000.25236
TATT:TTr
0.20619
TRAM PR • V
CONTINGENCY COEFFICIENTKENDALL'S TAU BKENDALL'S TAU CPEAR 50ffT3~R
0.317380.40540
-0.02570-0.01557-0.01339
0.43450.4345
NUMBER OF MISS ING OBS ERVAT IONS
iojoJ

05 FEB 8701 : 2 3: Id
886Tf-iF ruTMFCF I !M T1_ FIF HflMZ KHMF. T AM A 3
NQPRTCE COMMENT ON KFC PRICING BY PEOPLE IGNGRAN
r .» ,- -j «• » r s t T v n 11 nU L A J 10
v x niGmir
T NCDMF
COUNT
NRPRTGF
RxrarT n T A I
f22.6
~T7-y
14
3
3Q - T
COLUMN 1 8 i n
TOTAL 58.1 —rn 9TT —i n n—rr~
fHT —SOUARF n-F . c mMTC rr awtc MIN F.F.
6.45423 8 O « S 965 0.290 I . nc i c m i v i
STAT I ST Tf SYMMFTR TFWI TH NUPRlCfcn FPFMnFMT
WITH INCOME
LAMBDAUNCERTAINTY COEFFICIENTSOMERS' DF T A
0.066670.10790
_ r l 7 tz o i
0.0OOZJD0.00861
-0.20076
0 • iTJH 50.13793
-0.15543
STAT 1ST IC V A I l IF
CRAMER'S VCONTINGENCY COEFFICIENTKENDALL'S TAU BKENPALL!_S_JLAU__CPEARSON'S RGAMMA
0.322650.41512
-0.17664
-0.17633-n„28042
0.1372
0.lTl3
NUMBER OF MISSING OBSERVATIONS ~


05 FE8 87_JU:23:l 8 __
RR6THE_ CHINES E .UNI V_ OF . HPNG__K ONG 13H 4 33J.
NOFOO
ronccTAnni a t t n ki nt
COMMENT ON KFC FOOD RY PFOPI F fCNORANT O RY T NCOMF
INCOME
JNOFO 00
COUNT
2
__3.
4
5
II 21 3
—RW~TOTAI
2
4 _4
8 3 2
I
516.7
a26.7
13
43.3
413.3
COLUMNTOTAL
186n.n
1C33.2
26.7
30lfin.n
CHI-SQUARE d.f; SIGNIFICANCE CELLS WITH E.F« 5
4.13077 6 0.6590 n . ?A7 ii nc
STATISTIC SYMMETRICWITH NOFOOODEPENDENT
WITH INCOMEnCDCMnCMT
LAMBOAUNCERTAINTY COEFFICIENTS0MERS.'__ DETA
0.034480.07527
0.058820.06268
-0._012il3.
0.000000.09418
uQQ543JLn i c 7 o n
STATISTIC VALUE SIGNIFICANCE
CRAMER'S VCONTINGENCY COEFFICIENT
_KENDALL'S TAU _B.KENDALL'S TAU CPEARSON'S RGAMMA
0.262390.34789
_-Q • 06233_-0.05667-0.02731-0.10303
_0 .3 5430.35430.4430
NUMBER OF MISSING OBSERVATIONS

Ol:£3:iO THE CHINESE UNIV. OF HONG KONG IBM 4381 MVSSP R3.8
C R 0 S S TAB U L A T I O'N 0 F
.NQNUT COMMENT ON KFC NUTRIT J ONBY PEOPLE IGNGRA ' BY INCOME
COUNTINCOME
RUWTOTAL
. nonut__~T
2
3
4
5
I I 21 31
7
l
6
7
2
I
5
3
I
76,7
26-7
1343,3
1033,3
310,0
30
2
2101 ftr 0 L U MN
TOTAL 60,0 33.3 6.7 100.0
CHI-SUUARE
4.75535
D . F .
8
SIGNIFICANCE
0.7834
MIN E.F.
0. 133
CELLS WITH E.F. 5
13 OF 15 I 86.7%)
STATISTIC
LAMBDAUNCERTAINTY COEFFICIENTSOME RS 0ETA ....
SYMMETRIC
0.0344F0.09302
-0.08840
WITH NONUTDEPENDENT
cf.o5wr0.07658
-0.10169_0.09645
WITH INCOMEDEPENDENT
0.000000.1184 6
-0.078180.35324
STATISTIC
CRAMER'S VCONTINGENCY COEFFICIENTKENDALL'S TAU BKE ND AIL1S_JA U._CPEARSON'S RGAMMA
NUMB ER OF MISS I NG OBSERVAT IONS.. =
VALUE
0.281530.36990
-0.00916
-zmm--0.15000
SIGNIFICANCE
0.29760.2976
TT. 473 5


05 FEB 8 701 :z3:18
RR6THE._CHIHESE_.UN_Iv- OF HONG KONG IBM 4381 HVSSP R3.8
NOSPE COMMENT ON KFC MENU APPEALSCROSSTABULATI ON OF
BY INCOME..
INCOME
_ COUNT
NOSPE
ROWTOTAL
II 21 31
I r_3.3
2 (?_ 1 I_ 826.7
3 4 4 I 9
_3.Q_._0_
4 4 4 826.7
5 y~ ~T~ 413.3
COLUMNtotal
1360.0
1033.3
-mmwmam»
22T.7
30~rw.cr
CHI-SQUARE_ O.F. SIGNIFICANCE MIN E.F. CELLS WITH E.F 5
5.21296 8 0.7346 0.067 14 OF 15 f 93.3%)
STAT ISTIC SYMMETRIC
WITH NOSPEDEPENDENT
WITH INCOMEDEPENDENT
LAMBDAUNCERTAINTY COEFFICIENTSOMERS' DETA
0.060610.093650.04887
0.095240.074410.05932
_ ..0-2.410.6_
0.000000.126300.04154
__..0 .2 7093.
STATISTIC VALUE SIGNIFICANCE
«
CRAMER'S VCONTINGENCY COEFFICIENTKENDALL'S TAU BKENDALL'S TAU CPEARSON'S RGAMMA
0.294760.384760.04964
. 0.04667__._.0.010010.07778
0.38 17_ 0 .381.7
0.4791
NUMBER OF MISSING ODSEE_V.A_LI.QWS_ JLJL2

05 FEB 87 RR5fll :nn:?7 THF CHTMFSF IIMTV. n F HOMO KHNf. T RM 43H1 MV88P RA.A
GROUP 1 - HEARD5 EQ TT~GROUP 2 - HEARD5 EO 2. nnn« cn uao tamp ' ccttlat:
VARIABLE ~ NUMBER STANDARD STANDARDOF CASES MEAN DEVIATION ERROR
F 2-TATIVAI I IF PROA
VWWL. WWS- ~ Af 1 l V-. L_« • r-%W
T DEGREESOr 2-TAI1
jbPA-. Al h VA I ANLc ESIlMAIt
~ T ~ TVF7VR FFS ~CF 2;rTATL
S£GROUP 1 175 1.4848 57517 0-039
GROUP 2 37 1.4324 0.502 0.0831.00 0.944 0.57 200 0.56d 0.57 53.30 0.568
AGnonnp l us i .isis n.iQQ n.no
GROUP 2 37 1.3514 0.484 0.080
INCOME IEGROUP 1 157 1.8662 0.777 0-062
GROUP 2 32 1-5313 0.671 0.1191.34 0.341 2.27 187 0.024 3.50 46.51 0.016
STATUSSGROUP 1 165 1.1152 0.339 0.026
GROUP 2 37 7 1T054T 07329 0.0541.06 0.865 1.00 200 0.320 1.0? 84.46 0.314

05 FEB a01 :0 0:2S
RR5TNP I If • I 1 — oc UHMf! VllMf. 1 ftM L 1 fi
GROUP 1 - IF VGROUP 2 - I F V
ECEC
17
VARIA8L NUMBEFOF CASE MCA
stanDar sTa'noarSi_ r ZTAI
r r u kj u i
r t~
u VMr;
hpTrpp C ~r
c 5 I I MAI SEPAP iTE VARIANCE ESTIMA1
SE'GROUP
GROUP
T
7
nwr
1.L.A1
o.5o:
n. so
005
n r c
AGIGROUP 85 i - u fl? n c r i
GROUP 7s 1.4171 n _ a o TT77TZ
TNf.DHGROUP
GROUP ;
V
It
179873
1.750C
0.34(
0.69!
0.09
o. oar
STATEGROUP 1 85 1.1059 O- -KUh
GROUP 2 79 —TTTZS5 (TTTTTfi
«
i;(
rh
Cth
IsXuuJF-
3gOZC
ISc
toa
•I zc
£§- X
c
r2oro
CCrrf arrc
crfr
r
iI•I II
•!II
gn
— o22£n
r-.
J O
•IO2C
wou - -
8
05 FEB 8701 J Q.Q13JJ
RR5THE CHINESE UNIV. OF HONG KONG IBM A361
PRECEDING TASK REQUIRED n in ornni.nc- mil T T u r •
7 5 Cf T-TEST
U • 1 1 OCLUIHJZ V- r u I X ' I V
r.Jiii irc - c c v a~d t 4Ri'«; PR T C F TO~C1 FAN
THERE ARE 501200 BYTES CF MEMORY AVAILABLE.THE LARGEST CONTIGUOUS AREA HAS 501200 BYTES.i- n' VJ L o i v- u » » i 7_Juy J M _ M i IM J -w w.. — ——
T-TEST PROBLEM REQUIRES 3A'f BYTES. OF WORKSPACE OOP
«
— 2O-i iEH3 '
„ rO
mJ—
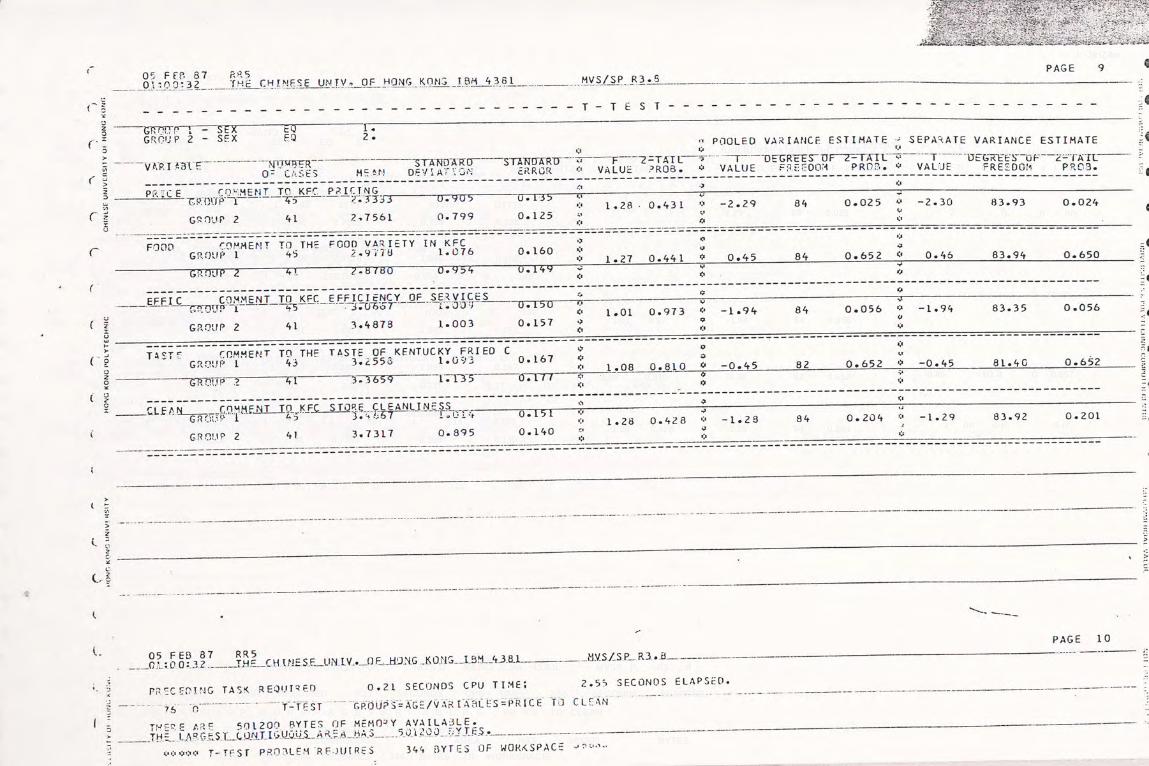
05 FEB 87 RR501:00:32 THE CHINESE UNIV. OF HONG KONG IBM 4361 MVSSP R3.S
GRWP~T ~=n?FX rG.GROUP 2 - SEX EQ 2.
.i:'-Jj:I'iZ-lhw
.• r . n r r t i % r f a 11 r rTTtiATr . r- r » r. » . -
V A RT ABLE MUMB1ER-DCr A c c c MP ANSTANDTTRQ
ncVT ATT ON5TA7TD7TRTJ F 2-TAIL
rUULtU VAb 1 AiiLt to I iflA I t
f D FGRFFS U F 2- IAXL
o c r m m i c VAK1 ANLt tbllMAIt
T FTi_ i_ v: nC v i a—rr —
c •x•2
cl
r-V
r s2u
r |
( i3C.u-
(I2C
I 2cI
-VMiZDazocz2
odttc rn.MucMT rn wcr o:rf imp.c uunncn i i u i r l. r ri i h it u—GROUP 1 45 2TTTT3 0TW5 UTTT5
GROUP 2 41 2.7561 0.799 0.125i to r . i i
r-2.29 84 0.025 — 2 - f) n no.
FOOD COMMENT TO THE FOOD VARIETY IN KFCGROUP 1 45 2.9778 1.076 0.160
GROUP I 41 Z7BTBT5 0.954 u. 149
V u i •i c i i I I u » u c rr i u i c i i ur oca v ilcoGR'DUP I 45 IT.0 66 i rOD9~ 0. 130
GROUP 2 41 3.4873 1.003 0.1571.01 0.97: -1.94 84 0.056
TASTE COMMENT TO THE TASTE OF KENTUCKY FRIED CGROUP 1 43 3.2558 1.093 0.167
GROUP-2 41 ~ 3.3659 I7TT5 0.17 I1.08 0.810 -0.45 82 0.652 -0.45 B1.4 G 0.657
_CLLAN COMMENT TO'kFC STORE CLEANLINESSGROUP 1 45 3.4 667 L. 014 0.151
GROUP 2 41 3.7317 0.395 0.1401.28 0.428 -1.28 84 0.204 _ 1 on o-jr- -3-ri
y'
01 :0 0?32 7 THF CHINE SE_U.NL1V-._0F. HU.N.G -K0.NG_JL3M__43.8JL MVSS P__ R3. .8
PAGE 10
PRECEDING TASK REQUIRED 0.21 SECONDS CPU TIME; 2.55 SECONDS ELAPSED.
76 o T-TEST G P. 0 U P S = A G E V A R I A B L E S = PR ICE TO CLEAN
THERE ARE 501200 BYTES OF MEMO-' Y AVAILABLE.TH=,_kA35EST CONTIGUOUS AREA HAS 501200 BYTES.
T-TESI PROBLEM REQUIRES 344 BYTES OF WORKSPACE

_05 FEB 8dlT0TQ3
RR5THE CHINESE UNIV. OF HONG KONG IBM 381 VMCCO D 2 U
~ GEDU'PT'TGTTGROUP 2 - AGE
ETtrEO
rr?.
n o ( v o i r r via « t Ati r r~ o t t vi a r -» c i rv a j a t r % a fi t a a « r % v lj a i ?
VARIABLE fTOMEEfTOF CASES MF AN
STA7TDARCDFVIAT TON
STAWARD E 2TATLV A I IIP PRHR-
r DEGREES OF2-T7rr CCDCcnnu t D n p
~7 DEGREES OF 2-I AIL
PRICI fflMMPNT TFI KPT PRTfTMr,ERODE T
GROUP 2
4~5
AO
77E3W
2.6500
0.9TO
0. 834
0. 1T4
0. 1321.15 0.577 -1.14 84 0.259 -1.14 RR. 7 ft 0.256
F000 COMMENT TO THE FOOD VARIETY IN KFCGROUP 1 46 3.0652 1. 104 0.163
GROUP 2 ~4ir 2.7750 0.891 0.141
_EFFIC rnMMPWT m KPT FPFTT TPMrv HP CPVTTP:GROUP T
GROUP 2
46
40
~3.2T7r
3.3250
1T05 2
0. 997
~0i TEE
n . l r a1 . 11 0.735 - n . 4 r 84 0.62 5 P 1 A
TAST6 rnuuCMT to tuc tactc nc vc mt i i rvv coicn rGROUP 1
i u45 3.422,
lm r r1.138 0.170
i i - n .71 cGROUP 2 39 3.1795 1.073 nTT7T
. CLEAN rriMMFMT rn KFf TnSF flFAMlTNFSRGROUP I
GROUP 2
46
40
3.5652
3.6250
1.003
0.925
0.148
0.1461.18 0.60 8 -0.29 P.4 0. 776 —n _ ?o
—2O•Hd
—o?2PTn
-- r-Cc
c2m3iC-
- ?or~Hn
- n2nnC2cHrnnmZ
zL.-Hz—
•N-' —
X'-nc
zcr.
_ c22mn
- r-
r~

05 FEB 8701:2 3:20 THE CHINESE UNIV. OF HONG KONG IBM 4381 My s s p p r r
GROUP 1GROUP 2
S EXSEX
EOEO
1.2 .
POOLEDVARIANCE F ST T MA T F SFPA-iATF VARIANCE ESTIMATE
VARIABLE NUMBEROF CASES MEAN
STANDARDDEVIATION
STANOARUERROR
F 2-TAILVALUE PROS.
TVALUE
DEGREES OF 2-TAILFREEDOM P RO B•
TVALUE
DEGREES QFFREEDOM
2- T A ILPR03.
NOPR ICE COMMENT ON KFC PRICING BY PEOPLE IGNORANGROUP T
GROUP 2
2 I
14
2.3810
2.9286
1 • L 61
1.269
0.253
0.3391 .19 0.700 -1.32 33 0. 197 -1.29 26.25 0.207
NOFOOD COMMENT ON KFC POOn RY PFOPIE TCNCIRANT OGROUP 1 21 3.3333 1.065 0.232
i_9i n . 7Rn _ r c C n c i c _ n CoGROUP 2 13 3.5335 0.967 0.268
NONUT C OMMPMTDM lpr MIIT3 r T rn.MRV PPOPf E TO NO PAGROUP 1
GROUP 2
21
13
2.9048
3.6923
1.044
0.855
0.228
0.2371 .49 0.481 -2.28 32 0.029 -2.39 29.37 0.023
NOSPE COMMENT ON KFC MENU APPEALSGROUP I 21 2.3571 1. 195 0.261
i . -x n r, . a7 _ i c n n i . . _ 1 c c r l i -
GROUP 2 13 3.4615 1.050 0.291
2o-i-ngro?r130
- r~C01m
C2_ n
—Hn01
—2°orHm
—o2Ono
—ocHr—33n—n2r-
2OnO2rnnr
rCr

0 5 FEB 8 7_01 :2.3: 23.
R-VATHE CHINESE UN IV- OF HONG KONG IBM 4 381 MVSRP R3-R
GKOUPGROUP ;
AGEAGE
EOEO
1 .2 .
POOLED VARIANCE ESTIMATE CrDAL'ATC W A D T A M T C CCTTMATA
VAR IABL NUMBEROF CASES MEAN
STANDARDDEVIATION
STANDARLERROR
FVALUE
2-TAILPR03.
TVA I UP
DEGREES OF 2-TAILFREEDOM PROB-
TVAl IIP
DEGREES OFp c p p n n m
2-TAILd 2 n «
NOPR IFF FOMMFNT DM KPT PoTf TNG RY PFOPIF T FN OR A NGROUP I
GROUP 2
21
14
2-0095
2-2657
T.~365~
0-914
0V2 98
0.2442.23 0-141 1 .26 33 0.217 1 .36 0. 1 83
NOFOOD mHMPNT nn kpt pnnn hy pphpi p Tr,MnwANT nCROUP 1
GROUP 2
20
14
3- A 500
3 - 3 571
1 .05 0
1. 00 8
0.235
2691.09 ...0-90 1. 0.2 6.... ...3 2. 0_- 7.9.6 0.26 28.85 0 . 797
_NONUC FflMMPNT I1M KPf ro: ITR T T rnM3Y PFOPI P TOMHRAGROUP 1
GROUP 2
20
14
3.3000
3-0714
L. 174
0- 829
0.263
0.2212.01 0.202 0.63 32 0.536 n a ~7 3 1 - QQ O- S1 1
NOSPE COMMENT ON KFC MENU APPEALSGROUP I 20 3.3500 1.226 0.774
i . p? n _ a a pGROUP 2 14 2.7 143 0. 994 0.266
- zcnO33
•?r-n
- r-C
c
rn3-—«n'1
- JCCr-Hn
- nzr,no
- 2vC—rnm2
)_zw.
I c
•A.Li
Zcn
- C22
nr»
rCn

INSTORE SURVEY

05 FED Q7 INS ITUP TUT MP c P i im T f n p urn kit ts tikit t ou .not MVSSP R3.8
™ P5,ICf,COMMENT TO KFC PRICINGCONTROLLING FUR. .
VALUE = 1 •
no rr r
r ni imtArt:
ROWX n T A I
1
2
3
5
3
7
—1
1
3
4
123n - ft
TO51.3
c
I
COLUMr 22 17 39l nn _ n
c rrwrcifMrc MTN F - F - CELLS WITH E • F • 5
n . o R 3 n . 4 3 6 flF 10 60.01
m ••• A v WITH PRICEr r ncMnrkiT
WITH AGEn P D L'M n C M T
LAMBDAUNCERTAINTY COEFFICIENSOMERS' D
0.222220.13060
D.1RH7S
0.10526Q-1Q31JL
0.205880.12172
0.35290..L783S
0.1610ic
S TGNT FICAWn«
CRAMER'S VCONTINGENCY COEFFICIENKENDALL'S TAU BKENDALL'S TAU CPEARSON'S Rrv a • • t A
0.4611(0. '188(
0. 18210.2025(0.1217«n~ 3 i) u 1
0.1160.1160.2302

.... - PRICE camZNimjcEc EHCUNT ROLLING FOR
STATUS VALUE = 2.
PRICE
COUNTROW
TOTAL
2
3
V
5_
2
3
2
X
1
337 « 5
2250
X250
1_12.5
COLUMNTOTAL
8100.0
8100.0
STATISTICS CANNOT BE COMPUTED WHEN THE NUMBER OF NON-EMPTY ROWS OR COLUMNS IS ONE
NUMBER OF MISSING OBSERVATIONS = 2

05 FEB 8 7 INS I
02:3 7_:±3 THE CHINESE UNIV. OF HONG KONG I OH 4 381 MVSSP R3.0
~ - CROSSTABULATION OFFOOD _COMMENT TO THE FOOO VARIETY IN KFC BY AGE
CONTROLLING FOR..STATUS VALUE = 1.
FOOD
COUNT
2
3
4
_5_
~AGF~
i:
A
8
8
2.
2;
4
9
4
ROWTOTAL.
8?n. s
17436
1 c30.8
25.1
COLUMNTOTAL..
22 17 3956.4 43.6 JLOO . 0.
CHI-SOUAR E D.F. SIGNIFICANCE MIN E.F. CELLS WITH E.F. 5
2.79711 3 0.4240 0.872 4 OF 8 C 50.0%)
. WIIfcLJiQQQ H.UH__AG.E__STATISTIC SYMMETRIC DEPENOENT DEPENDENT
LAMBDAUNCERTAINTY COEFFICIENTSOMERS' DETA
STATISTIC
CRAMERES.VCONTINGENCY COEFFICIENTKEND ALL S TAU BKENDALL'S TAU CPEARSON'S R .
GAMMA
...
Q.0Z5640.04821
-0.19457
VALUE
_Q ..26J310.25869
-0. 1.9691-0.22617-0® 21933-0•33858
_Q.OOQOQ0.03784
-0.229950.21933
SIGNIFICANCE
0.09710.09710 . 0 0. 95
0.05822—0.06641
-0.168630.2678 I

err02:37:43 THF= CH T tof=F= tlMTlS- flf= HHNfZ K flMfZ T fM Z A I MlCCP
r n ri c r r 4 n i i i ir r n m n r
mors rhmmfnt xn thp pnnn var t fty in kif 'U k f 3 1
t i V A r- c
~UDNTtfUtLING FOFSTATUS
FOOD
COUNT%
ROW
COLUMNTOTSU
;TATTTTr; tammot rp rriMPiiTpn whpn thp nmmrpr np nhn-pmpty rows nR rni umns ts dnf
RTJMB ER UF MISSING UBSfcKVAI IUN5—
cn . n
225.0
z—25.0
a A
LOO.O i nn.n

05 F EfJ d 7n 7 • 7 7 t 7
J VJ 1THE CHTNFSF UNTV- OF HDNfl KflNfl I R!A U 1P ? KVSSP R3.a
CROSSTAB U I ATTON OFFccif COMMENT TO KFC EFFICIENCY OF SERVICES BY AGEl-l I A ... Wl
r nwr roi i tmi: furQT A lift
VALUE = I
AGFCOUNT
ROWTOTAL
EFFI C
~ i 2
l I 1 251
2 ? I 37.7
3 4 3 717.9
. 7 l n LI43 .6
5 n 2 1025 - A
COLUMNTOTAL
2256.4
1743.6
39i nn.n
ruT—cmiADC D.F. SIGNIFICANCE MIN E.F. CELLS WITH E.F. 5
4.03083 4 0.4018 0.872 7 OF 10 ( 70.0ST
ct at t:t t r SYMMETRICWITH EFFICDEPENDENT
WITH AGEDFPFNDFNT
LrtnDUrtI IM f C DT A TMTV f OP C C T f T P W TcnwcoCi rs
FT A
0.102560.05278
-0.12541
0.045450.03959
_--0.T524r~0.10006
0.176470.07913
F.1065 40.32149
CTATTCTTFVALUE SIGNIFICANCE
CRAMER'S VCONTINGENCY COEFFICIENTKEND ALL 5 S TAU BKENDALL'S TAU CPEARSON'S Ra a M M A
0.321490.30606
-0.12743-0.14990-0 10006-o.2na 7 9
0.196T~0.1967u.2722

• « r ; 1 «• • • . ,,, -iw». •• •! —. ?2«?V ••- irsitj-- -' •;t-: tr.t ;rTcsrLf-ri?0''o p-? nf'cj; ,? F -• «' v ' ' T ~w - -j. •'•- -v' -:. • vv% AEFFIC
— —- » «i I W '» —
COMMENT 70 KFC 'EFFICIENCY OFCONT Rorc imr'rmv:
STATU S
COUNT~~7TF~
ROWTOTAL
c r r i c2
4
5
~T
I
4
3
I
_LZ®_5__
450.0
337.5
COLUMN 8 ft
TOTAL 100.0 100.0
STATISTICS CANNOT BE COMPUTEO WHEN THE NUMBER OF NON-EMPTY ROWS OR COLUMNS IS ONI
NUMBER OF MISSING OBSERVATIONS

05 E EB 3iOP: 3 7:44
svsiri~ja e~u r ac o c iaj r t nc unmts nin r an . -3 a 1
T A S T F— — — — — — — — — — — — — U f «J O O ! .fflMMFMT TH THF TASTF OF KFf'JT! if K V Ff? TfTi C
J L. f ! in -j ,rc
CONTROLLING TORSTATUS VALUE = 1
TASTE
COUNTXGTE
ROWTnTAl
1
2
6_
5
~]
I
1
3
_1
10
V
A
6
6
I
17.7
513.5
—rr29 7
O
TaTT
II?Q . -7
COLUMNTOTAL
2056.1
IT65.9
371000
CHI-SQUARE O.F. S IGNIFICANCE M T M F.F» r ci i c u ttu c c y c
I 1.0861 7 V 00256 rv . K a A HP i n r ao,n1
STATISTIC svmmftp rrWITH TASTE WITH AGE
LAMBDAUNCERTAINTY COEFFICIENTSOME RS DFT A
0279070.16203
-0.33612
0.19231012001
—0.617630 » 3 6 Q i 9
0.61176QZ6933_-0.27863
0.56733
STATISTIC .VALUE SIGNIFICANCE
CRAMER'S VCONTINGENCY COEFFICIENTKENDALL'S TAU BKENDALL'S TAU CPEAR SUN'S R
.GAHM A -
0.567330.68012-
-0.36101-0.61690-0. 360 19- 0 510 7 9
0.012500125f j 0 ? 9 7

05 FEB 97 INS ITHE CHtmSE UNIV_QjE_.Jtf.PNG. XWG ism 43 ai__ _m'S._5iP_R3_s_8_
c r n s 5; r a r u 1 a t r n n of
-CQHET TO LB£ASJJE.„.gfyLLy_,fiaxkQ_C.. BY AGE
VALUE = 2.
fY - ... -• »•. » « ~1?T-'Y 5Cuil BULLING FOP. . .- , .»•-r «.4• £-i -• w
COUNTAGE
ROW
TOIAL_
T £ r c? 4 5 L2
3
4~
__5_
21-H1 1
J„«j
2 1]
44 I
I4
1 i
1125
22 50
450-0
iJ 2.5
COLUMN 8 8TOTA! inn.o 100-0
STAT IS TICS CANNOT BE COMPUTE! WHEN THE NUMBER OF MnMCLJOTV D DLIC r D mi IIMMC fC HKIC
NUMBEROFMISSING OBSERVATION!

CLEAN.jr n - ? v c roo«•»WVj ? Jf ; -rj- ;.. it- '» Of v
S r A : US•V 4 Lm W
r n m m f tj t r a k re s r n ? e r ! r a m j ? m r- s
a— as=zs'? 7- A ry 7Arcr 7 A ri 7 r V77AT r?A r a k a 27 i MVS SSR R3 m 3
It A I I Id —
COUNT~7v?EE
ROWT FIT A S
CLEAN1
2
3
4
5
1 2
i
I
2 2
o a
11 Q
I; 6
126
410 ® 3
LJ33 3
2C_5i-J
COLUMNTOTAL
2256.4
17436
39100.0
CHI-SQUARE 0 F « S IGNXFICANCE MIN E t Fi fF! IS WITH F»F» 5
3 B 5 4 n -- 4© - NT S 4 0.4718 n fi36 A flP in f AO.nxi
STATrsi ir SYMMETRICWITH CLEANn PPPMHF hi T
WITH AGE
I AMB DA_ UN C L.RIAI NIX. C.0EJEEI.C.IJE.NX
S J ME R3 DL; A
005556CL« 0603il_-004994
0-00000Q.Q45Q2_-0-05615
n .ise; n 2
0.11765a£6jQj5i_-0o04497
. nn s 20
5IAIJSXJUL _.VALU.(L .simic.iCALCa
CRAMER'S VCONE rr-vGENcy. COEF.fxcien.ILKENDALL'S TAU (3fc?JU'Ai.LT» A U CPEARSON'S RGAMMA
0.30129
_ 0 . 2 8Q4CL-0050 25-005523-0.15502-n ono-2 A
0.37190.37190.1730

CLE A A COMMEVT TO K EC STORE C LEA NL I NESS«.
BY AGECUNT ROLLING FOR• •£- a » -j j
VALUE ~
AGFCOUNT
f r~- a mv ••'A -%•t
Rn ? »:Fif€-V-v-y-v c5 0 I hL
3
4
~T~
1125
675«0
r~12 « 5
8TfTrmi
COLUMNTOTAL
_ _ 0IDOoO
STATISTICS CANNOT BE COMPUTED WHEN THE NUMBER OF NON-EMPTY ROWS OR COLUMNS IS ONE
mimm~w missing observations ~2~
05 FEB 8702:3 7: A
INS ITHE -CU.INESE.-UNIY«__DF_HQNG__K_QNG LBM.JT381 . M V S S P.. R 3 n

rTe tsvr v - rif= nnvrz Knvtz r nM 4 n 1 msz sm p n 1 _
fl • T ». fi 1 f S T T P, s. ? r~ r-
pa r r r- cummput tn icrr va r r tk;;U L AT I Uir-t k « c. •- r« i:
CONT ROiL t ING FOR eC - T I C. » i 1 ? u
i » i i. r» »
? v
COUNT
PR TC C
ROWV.'t 3CIE
1
2
3
L.
5
l
2
7
1
1
7
1 1
I
1
' t3
3
4
12n.. fi
—
5i.:
s i
1—
t « Vr n« r f mm is c 1
totai s «n i ? - a ion~ o
r n r — : n J ? a ?? p n P - IfJJT P T r Af-JfP _? r m n r: i e A | y E A r v f
7.0790 5 8 0.5281 n.i?n i? dp is f an-nss
STAT 1STIC SYMME TP. TCWITH PRICEn r n r m n c kit
WITH INCOME
lambdaUNCE BT A IN!._Y_ COEEEIO£HISuMERS' 0E I A
0.03100_£.D_92A3
-001520
0.05263
__Q CL83XL_-0.01580
rt i . j o :
O.lll II
Q.®J..0JQ9--0.01464
: r a t r q r r r A f ur- p T r t f r T r Ki f (
CRAMER'S VCUNT £NGCNCY CQI.FFXCI£NJ_KENDALL'S TAU BKt NDALL 6 ! AU CPEARSON'S RGAMMA
0-30126
039]95- 0 . 015 21-0.01361
0.03389 r »~ i '.? yc r
0 .450 70.456 i0.4189

05 EEB 3 7_a,e'j7'AZ
IVS1THE CHTHESF UN TV- flf= HflMrZ KflNa T RM it Ft 1
f'.ICE COMMENT TO KFC PR ! C INGCO NT -'LI! N n siTrr.T
? f i« v 4. u . f A f I ! C —
PR ! C E
CGUN1TT4CUMTT
2
3
T
»»—
ROWT- AT A 1
T1
i
7ii
1
I
i
—'—1TC
2
1
I
33 T C
225.0
225.0
__ 1.1 7 S
COLUMNt n a •,
1j ? » r»
37 7 S
4n ~ n
0i nfLO
;»? « o;' A q pV « 'fc ». w r •« % L OsFi S TO NT F TCANCF MI M E F . TPIfC U T T11 r s
02222 2 6 0.2223r i 3 r. I ? i ? ?i nn.ni:!
~n v a t i m i r1,3 3 £. « V cy'?MPTRT fuiy.u p R r r £. . -4. • » .-I. A-. .'v. w.to0 i£ P L N 0 L N T
_va TIL. IN COMEnpprNnrrjT
?ij • ' r V«-r v r p rrr p f4T?Jc. w ? • ,;- o i i wC. ? . v I CnL' -u c -3 • •?S 'J i ' L 1 ,3 LVJ'f ;f.« r V
0,222220v 3 3 001
-0,42657
Q 2.0 0 Q.CL0-29454
-0473600 „ 6 il 1 7 5
Q.2 5.Q£UL0.39930
-039X30rv v t a r. x
r X r r c rrr% ! » t 3 J. VALUE SIGNIFICANCE,
__.0 7.16 P 6...; V »C«' e I o. '
- 0 4 3 0 5 3- 0 « V 2 i n 6
—0 . 5 75 5 ? ...
•~ 0 6u000f AI- •.'
AT F 0NS'ft
i-i .1 A 7 Li

F-4 F rfit CHINSE UNIV QfL HUNG. KONG IBM 43 81 MVSSP R3~8
_ _ „ „. „ _ _ _ € R 0 S S T A D U L A T I 0 N 0 F- 6Ut)D _._.CO.«HJE_Xa.THE FOOD VARIETY XN RFC BY INCOMECUNT RCt I IN G FUR « • — —
SlAfUS VAX OF = ] _
COUNT
ROWr 0 T A L
i~TT XT
2 3 4
Hi W «S
1 0? n - s
3 7 9 1 I TA 44 3 - 6
«t 2 ~y~: f-T~
30 vOv
9 r.'0 rs- 1 1jl_ 'J4j i.
COLUMNT 0 T AL
! T1 J_ I
. A
219 3, n
4» «. «r-w -• vtt w?9
5
_ 12»Q
39
1000
rijS cr| i ftp a-»•wwa»•«-»'W-»JJ-uW-•V
1 rv ji 1
OiF«-r
A
S IGNIFICANCE MI N F » F» CELLS WITH E F 5
0 - 6 9 2 8 0236 9 OF
WfTH FOODOr AC NT) EFT
12 ( 15.0%)
WITH INCOMEOTPFTDF NT '
A V ?'-nrT5~xr fA-T _—
•»•V« «»,»«»-Vy««•«-
» « t I « Ff A
uHCl aVAIMTY C0 E FFFCTETFT•y r -1 f o os -»' w• • i- • • Lc % «
_0 05 000OeOVM60 1 '061
009091'3V0H5-V0-1512C - 12 11 0
0000000.055600 1313 7030R 00
— ?TITI TTT r —vat nc
—»• •—- » ' •-
~y v' irAMiT
CRAM CRTS VC 0 w I ! w G i; NIY C 0 C F F f C 'I C N TKCMO ,-T.L ' S TAU (3KENDALJ S TAU CPL AR :;UT! S RGAA' -' A
n ~ ?»n A
Of 300;'j v0 f I A 0 9 60.? 32 I 50 1«? 7 5 9
Ft 3 ifL' » «. i. c.
0 I 6 6 50 o 16 6 r
.TL. .2 3 0.2..

CfiCJSrSi£3Ci.A r £ CJ S CJ = ____________S? FOOD _ COMMENT TO THE FOOD VARIETY IN KFC BY INCOME
0 CONT ROI L TNG FOR « » ~
-T STATUS VALUE ~ 2
If—» pr-J j - m- ' - - - . .-J J —-- «-V% I lj -
COUNT II KMW? ?VS.4
_ J . J )Tsi1 J i i } I • • » «»• :» « '• •«» ««•- IW «V~' « —»v -T» -jrm J--» •»»• UH 3 «--« ant w «• . .%
' 2 1 II II 2 1 6
r | ?_ I.. g; Q » o.sr»•»»-•»«•»'J»»»'i3»««»«,»•uw««•«»••»»a-•-»«•u«w•«»tatha,
3 r T - ? i i ? 7•Z s-v S, i -U Ji. tu JZIII! 250
~~T t' P i 2 1 t 2 ' '
I I X I 25.0• £ 8 E-Oe»i=»» «r. «?•»warm-'»«•wr«v-»».»a«sar«»• «»•««••«•-it ',a»
COlAJml 1 3l Jl_P! L) r At 12 5 3 («5 50 0 10 0 „ 0 »t' ,.
CHI -SQ'; AR£ 0E.»_.„ S IGNl FTCAN.CE KIN £-£ CEILS WITH E«F» 5V-J
I 3 3 3 3 3 't 00 5 5 7 0.250 9 OF 9 UG0.0S!
~ If!Til T'O fill WITH INCOMES ! A T r A ' 1 ~ S V H M LIR X C 0, i' £ t to C ; F 0 C P E N 0 E f
' — mi nr -» -r- .m ». « v» -w v- t-». -or- ,rw» -»w- r(W -- w »' -« • —v • r- ••«- »» -a «s -t»» •».- :wr «« w« v « .«• -»»
i amuoa ~ oToouoo oTooooo 000000UMCr 3f. ' AT Y r 0 E F FICXENT 0 . 1 0 7 i 3 0 . 1 Q 3 16 01 1073A.; ;,•' AS i) 0 ., I 02 36 0 ~ 10526 010000LAaI C 3 69.27. a.2.29h±
CT 7 V y p 5 1 ? • ; rT O T ' ' ? ;'7 T f . f- 52v,.» a 7 • v A . A. - V w v2 i V - ' .. Vur '•» V. C«Ne- V - J' aw « —• »' •»• -s ,r
tA. ,»H :.T- 3 V 0 2 fi u Alr ' t '-Tr - v r n c n r ? r ? r ?j r r! . a ? 7 u ai. 'J vi , ; -v. L s A.« 5 L VJ f f St. i L ! i f O » 3 i i ' «.»
r A .• f, r ? • f -7 r i O O P -. f'3v j •- » L7 k i.„ v.. 3? A - -3 , - A K.9 JCC it» »; ; « « 4 f ir l A, J s - ' 11 2 ) ' 1; I
-'A;; • R ' S 0 162h 6 0 735'03A A 3? i A 0 16667
A J r- n r UJSSJHG ..OO-SCSI-'MIQG. - A
J-
05 FEB 87 INS102:3 7:4 7 THE CHINESE UNIV. OF HONG KONG IBM »381 MVSSP R38 ..._

05 FEB B 7 INS 102:3 7 Z't7 THE CHINESE UNIV0 OF HONG KQNG_IBM„ $381 MVSSP R38
%
„ .« _ _ C R 0 -S S T A 13 U t. A T I 0 N 'OF — — —
_ rrrxc; ._ cqmhfnt TO kfc EFFICJCNCV OF siRV;Cts BY INCOMEi»'. ?;« 5 S'f !'•' C I If FLfI? » »
5LUUS . VALUE - I
.T - ---• -V-. • JL' '«S%.r'-?_rnMMT ' - f •' ••'V' • -•-v15• j -5. ; . • i :
; ' J RQWV T : , ' T Q T A I
• a . ' . i I~ 2T~ 3 F£ J - jr f r« r » ..VM) •««.. X1 a «£• »i»-, -tv -= »»- -~u» »~Var,« -co:' -» -»»»» « 1 - -m —••» -m 3ft «
It ' V f •; V- If 1 T I 2 ' ''-V . v i-Jul -. .« «. -- A A. t-• ' . l- - r y T q , i
_ , X _ _ JL _L X __v: v-if vT-'.- »•'»'-•«-. -5 «-««•-v «•».n» -c »T- -«fc»«•»»»»•—L'
2 I • I 3 1 I 3• X - ' I X 17.7
w»,JO«.-«_-»-»»..»«-.-so.r»s-a«-(»X-CSKi» irSt s». W»i
I ~ T f~~t - r r r s 7 9A • i. -U « '
-f-- —- ~ • - 4 ~ - - - ~ -$- ' '
$ I ' 6 I 10I I I .t 1 7ill I v ; u oiru 2 i»- -¥»• -4M •»s a. v«» -r
5 i A I 7 1 2 1 10
_ I I I I 2569 rr J-.J—» .«•%•-..mntr~ v »» -»v « J -.» • -»•——r —•»« - - -
COLUMN 3 ;M A 9TOTAL. 333 533 O ; . i00-0
r If J-SQUARE D»F S f GfJI FJCAN'CE M1 M E F CELLS WITH E,F. 5... «, . •« -C ar .-»- » .»» -»- «, ..W i., !-• W- -w ~w -5= -«- »»• »» VT' -..-Wfcw--.. •.-•« --.-r
6FT B~r~lt 8 0»6261 oVy?'6 12 Of- 15 ( Q0Zd% f~~
WHO G F f ? C WITH INCOME
STAT 1ST I.C.... oYMUiC fiVIC U.EU.3;;UX OERLROcUI ...w ... ..,„ ,r rM .v» •.» v-. c-r .-. . v .• • • •-•- — -v. « -«• «• «-.' •-» -.»• - — —» '' -«•-» — •« —
{ SHn CIA 0.0 2 500 0-0 SO A 5 0-00000
uuctAiu.r.y. cur.ejExci.LNi u-cu2.uf.1x p0.6.0$3.. jo«.o.2JL8.~ 0 - 01 5 ' V. ) ? 2 • ~ 0 • 0 5 o 0 f
'(t A ' ' 0,131 U!I8
_.S f A T.IS T I c VALUE ___ , 0 ? C : J ~S C AN f l».. ,s,. %Jt.. .. ,»«r_ —J •«. »— • - — •' '•' - ' tl
r R .'.! 1 f i? 5 A v 0 - 3 n A 3ex ; )r'U ur.y coueElCxmi ™ 0 3f,03K b N U A L L L : A U 0 - 0 U 6 ' 6 2 0.3 3 3 oU £ HP Af i S TAU C -005917 0 33 36p f n ; 0 Vj e 5 | - o « 0 31 2 t f.) - 5«' : 2i;f ' ' ,:•• __ . ]_ _ ~-o ou S3.-' ..... .' -
A '«Ar . ' ' U '•••y.- % f -•; ••• i ' -V • '•'•';• .V • .. : ' • . i .£ 'iU. r . • ' i f. ,f;'3 er.'i f. - . I ''-${ v s ' • • • -r A

' :''V : IBM 4381 _ _ MVSS P_ «3_._S' V ' - -' ' • • ' - '. ' - - ''•- Kij:'ze-.
. ' . • -- • 7 - '.,. 33vp'' ?1.'
- . .....AO ~ - CROSST ADULATION .OF
•:WiS£l€i£NCY OF SERVICES BY INCOME .... .
V VALUE = Z— » •
'' 1
- • f-4 f•! 3:;-' .-. •- ij'• '_J. _ _ . _ ._ f U ? AL _'i Ii 21 31
z i i i II ij J £ 1fi i i•» -WWrvv- v» 1 w ~V-» «ri rJC -cr -j .» - «» ? : %« ••r-. ,•«
4 i i I 1 3 1 4r i i x 5 o o3v«n»•_«»—«»-•»».=»-4-•«.-»«4TTm••»'••—p-«•!»--»»-Wr»-»'VJ---J-V--V
;.„.. _ r 1 I 2 I £ 3I I I. a 3 7 3
' «• « ;-« »ry -Lr- -m»it --a -to- -••» »«» •» »ro- -» »« w »-.-• «- to «»I «.» t«.i» f.' ?«
COLUMN x i A • „.8I J I A L 1.? 3 3 7 „ 5 3 0 ' , v •..:, 0
L HI SQUARE 0 .- « $ IGMI Vl CAN CO _.. .... H10 E U. LOLLS. UI JH_E .F. ._ .5 ......» -»r. .m ». «T .» -c»»» -»=• -»» «• .»»» -ir« •• t»» «.« ~cr -.f -w . w. ... .»• -v-. • a- •—«• -A— it' '« « •-•w •«»». «m to»
r. - •- o - a n , 407 p • o nr q f i on.I. I v y 4 ? ff L. . t s s L f? 4. - 4-1 7 ; L U w V s
S r A! ST I C SVM;i•; I .C :.. ::•••.-• «: ; ?»0B Gr,!0Ff4T
( L'ji' f;A 0 330000 oQTocQjo oT5ooooUO C I- '. A I 'TV r o r- r r r f ff m ?' 0 - ' 6 A 4 (:• - A 66 •? 4 0 4 66 , 'rv p 3: ;': '' ;) -- 0 7 ; 3 3-'« - 0 »1 0 U : - 0 « 7 36 8 4
[O CLi.Otn.7 3 Q„»2.2Jj3.Q
: - • r r c: i »vAf ':r r 3 3 ' ' ? r ''OF »-., i. -• . i '.i t t 3. w» w i •-.-.• • »«. TO «A. W .« 4 4 • » ' • •••- • — - ''-i - -» -
'• } V ~ 0l 5 R' r )l $
fO • ; •.!»!- v C0f: FF I C I FNT 0» 6 7 ,• •'•0; •' : '• ! AU '. 'J i A-I _-N ' T -- Ifr , • 1 ,V f ; ' , ' : I __
. . : . : A -• 'A1 ' '•• . . J ?~ ' r 1 : f -
4« ; .. , i i. 2 ••vt 0 •
r.i(; ?1 ; p, () r: [ r c f.pQ OJiSE PV AT ~ Z

fx f THE CHINESE UNIV OF HONG KONG IBM +3 61 MVSSSP R39
CROSSTABULATTTASTE COMMENT TO THE TASTE OF KENTUCKY FRIED C BY INCOME
CON? ROLLING FOR..STATUS VALUE =
INCUMECOUNT
ROWTOTAL
TASTETT
X..~ZT~~ 5 1
4.
1
2
~T~
4
5
1
2
r1
z
5
3
~5~
_2_
3
~~2~~
3
12.7
513.5
—IT29.7
924.3
1129.7
COLUMNTOTAL
1232. 4
2054.1
513.5
37100.0
CHI-SQUARE D.F. SIGNIFICANCE MIN E.F. CELLS WITH E.F. 5
7.93320 8 0.4400 0.135 13 OF 15 ( 86.7%)
STATISTIC— _SYMjiEJBJLC_
WITH TASTE
jDLE££ND£M:
WITH INCOME
_D_ER.EMIEjNI
LAMBDA_ UN C EiSIAlNDL X 0 E FJ=LCIENI
SOMERS DETA
0.13953Q«JL 12 74-0.00220
0.153850.09445
-0.002500.26111
0.11765_Qj» I 3982-0.00196
0.15460
STATISTIC VALUE SIGNIFICANCE
TRAM FR f V
-»ig»wFFICIENTKENDALL•S TAU CPEAR SON S R
_GA14MA
0.327420.42018
-0.00221-0.00219
0.02004- 0 . 0-03-2 8
0.4939—0.49390.4532
a
'§X(JE -XULo
h -COacU1
Z3 .uitoUJz
5 _
uzXup -
u2ozo
azoX
HCOXUi
ZDOzo
o
s
$

0-3 7- r'ft 'chf IMES E LVIV m OF HONG KONG IBM 43 31 MVSXSP R.3.8
CROSSTABULATION OFTASTF
----- L- K U O O I A L U L A | 1 U
_COMMENT TO THE TASTE OF KENTUCKY FRIED C BY I_NCOME_TONTfiOLLlNG FOR.
STATUS VALUE = 2.
INLUMb
TASTE
COUNTROW
TOTAL
2
~~7 ~T
3
1
2
4
5 1
11 2.5
225.0
450.0
1
12.5
COLUMNTOTAL
112.5
337.5
450.0
8100.0
CHI-SQUARE D.F • SIGNIFICANCE MIN E.F. CELLS WITH E.F. 5
1 1.33333 6 0.0786 0.125 12 OF 12 C100.01
WITH TASTE WITH INCOME
STATISTIC SYMMETRIC DEPENDENT DEPENDENT
AMR DA 0.37500 n.?snnn 0.5 QOOO
UNCERTAINTY COEFFICIENTSOME RS DETA
0.57398-0.35000
0.51751-0.36842
0.61310
0.64429-0.33333
• 0.86136
STATISTIC VALUE SIGNIFICANCE
CRAM FR • S V
CONTINGENCY COEFFICIENTKENDALL'S TAU BKENDALL'S TAU CPEARSON'S R
0.841630.76564
-0.35044-0.32813-n.q?Q7 O.1678
GAMMA -0.46667
NUMBER OF MISSING OBSERVATIONS =

zn-__
3 7: 4 7
U L A T I CBY 3
i
t
OTAL
__2J
2.
J
10
1 -
33.
I 1I 51.+
2
'tot 33.3 53.8 3.8 10(
:hi-squaf ).F
.61912 TO 0.126
U T TU r I C J
LAMBDA
5rnnciK
0.0001 0.0000.065
rrrrrw)o.I A 1 Jji I T_UJfcs • n U • U tU C ;
0.2 553c
1. J 1 OUiO'
WITH INCOfncncMncMT
0.0000C0.076340.085650-211S4
STATISTIC
CRAMER'S VCONTINGENCY COEFFICIEKFNDALLT TAU ~BicKtn ai i • c t a 11 r
VALL
0.2430. 3250.080.07E
OTZTn - 71

05 FEB 8702:3 7:47
IHS1 ?
THE CHINESE UNIV. OF RONS IBM 4381; ?i
• %-yv-s ;• •. . . • -
MVSSP R3«8
£;; • •«£ y •' ;• . k r ....iC mo S S T! A B'U L A T I ON OF- LRH
CI PAN rnMMFNT TR IfFf ITnQP r I FAMI tMCCC BY INCOMETTJFiTROiXmG FOR..
statusVALUE = 2m
h«
INCOMECOUNT
CLEAN
4
5
~n
IT
21 ~T
1
2
1
• .- ' , • V.
ROWTOTAL
1
1215
675.0
1125
COLUMNTOTAL
!•
'•• T-12.54 .•
3~
37 • 5
t4
50.0A '
a_100.0
CHI—SQUARE D.F, SIGNIFICANCE MIN E.F.
.v?4 v
CELLS WITH E,F. 5
2-66667 4
' ' A
0.6151 0. 125 9 OF 9nJ IdOOiOtl. J • 4 . . •
STATISTIC
r '' • . « ..» a.I llll ! I I I I 1 I. I »
'SYMMETRICWITH CLEANDEPENDENT
lit WITH iNCdMtDEPENDENT
, x
LAMBDAUNCERTAINTY COEFFICIENTSOME RS' DFT A
'! '
0.166670.25236o.ooooo::
0.00000, 0.29331
0.00000Q-QQQQQ
i
0.25000, 0.22145
0.000000.51848
STATISTIC VALUE SIGNIFICANCE
r Q AW CD « C 7
CONTINGENCY COEFFICIENTKENDALL'S TAU BKENDALL 'S TAU CPEARSON'S R : sGAMMA
P
0.40825 F0.500000.00000
0.000000.00000
0.5000... '•
NUHBER OF MISSING OBSERVATIONS = 2
o
M
oZ -o
ywo
tZ3
IzD .
8
•i
•I UiH
bo™ Q.
ozo
s'01
acUJ
zi 3CzoyOz01

i 7 J-? ry f- ~r~ r pjf- r fjris- ri x= v1 Ajrz tcnvrz r fim ?7i mitcp x? - _ ft
CROSSTAnillATrON OFPRICE COMMENT TO KFC PRICING
CONTROLLING F0RT7INCOME VALUE = 1 •
PR IC E
COUNTAGE
ROWTOTAL
321.4
214.3
750.0
L~T7T
17.1
COLUMNTOTAL
750.0
750.0
14100.0
CHI-SQUARE O.F. S IGNIFICANCE MIN E.F. CELLS WITH E.F. 5
2.47619 0.6489 0.500 10 OF 10 1100.0%)
STATISTIC .. 1YMMFTRITWITH PRICEHFPFNOFNT
WITH AGEDEPENDENT
LAMBDAUNCERTAlNt-Y.XQFFFTf.IFNT-SOMERS' DETA
0.142860.114850.13913
0.000000.087320.163270.19325
0.285710.16775-0.121210.42056
STATISXIC— __VAUJLE_ SIGNIFICANCE
r R AM FR • S V
CONIINGENC-Y—CHFFFI C. IFNTKENDALL'S TAU BKENDALL'S TAU CPEARSON'S RGAMMA
0.420560.387670.140680.163270. 193250-23529
0.29140.29140.2540

05 FEn 37 INS L02:3 7:36 THE CELLNELSE UNT V. OF HQ NO KONG I RM 4381 M VSASP Rl-fl
PRICE COMMENT TO KFC PRICINCONTROLLING FOR..
INCOMF
CROSST ABULATION OFBY AGE
1 AI IIP - 1 _
PRICE
COUNAgT
]
4
C
1
5
3
L
I
3
9
L
ROWTHT A
1
42
833.3
1250.0
28.3
I
COLUMN II 13 24TOTAL 45.8 54.2 100.0
CHI-SQUARE O.F SIGNIFICANCE MIN E.F.
5.37062 4 n oci V
__.STAT.IS_T.IC -SYMMETRIC
y • T vj
WITH PRICEDFPFNDFNT
1U I oU tU J
WITH AGE
LAMBDAUNCERTAINTY COEFFICIENTSOMERS' DETA
0.260870.13895
0.19753
0.16667_a.io?92_
0.22378
0.363640. J.J38 8 10.176 80
STATISTIC VALUE SIGNIFICANCE
f R AM FR • S V
CONTINGENCY COEFFICIENTKENDALL'S TAU BKENDALL'S TAU CPEARSON'S RGAMMA .
0.47305. 0.42742
0.198900.222220. 12607n. 3?onn
0.15570. 1557C 77 Q L

25= yS~» - 2 7 24 THf CH r NFZ F UN T V (1 F= HflNtZ K flNfZ f RM MVSSP R3.8
.. - PRICE C.PMME|iT_IP_ KFC PRIJLINGCONTROLLING FOR..
INCOME
BY AGF
VALUE = 3.
PR rr F
COUNT
2
3
4
i
i
2
2
f
ROWTflTAI
5
333.3
r~11.1
COLUMN-TflTAI
4... :_5- A
9_l nn.n
mtm c: - c- TFIIC UTTH F - F-
n - a «a n 0 • 444 6 OF 6 (100.0%)
QYMMFTBTf'~T7TTH~FRITTE
D F PFNDFNTwith ageDEPENDENT
LAMB DAUNCERTAINTY COEFFICIENTSOME RS' D
0.125000.124270.37209
0.000000.107690.40000n- looni
0.250000.146870.34783n-innnn
CTAT TCTTr J A I 11F SIGNIFICANCE
CRAM ER S VCONTINGENCY COEFFICIEN1KENDALL'S TAU 0KENDALL'S TAU CPEARSON'S R
0.4000C0.3713;0.3730C
___ 0.3950.60.39901O - AAAA7
0.1437
KIIIMQ CD nC UTCCTMr ODCCDI AT T flMC —

05 FEB 3 702:3 7:36
INS LT H.E—CJtLLNE.S £ UN IV. OF HONG KONG IBM A381 MVSSP R3.8
FOOO _ _COMM ENT TQ THE FOOO VARIETY IN KFCCONTROLLING FOR..
INCOME VALUE = I.
FOOO
COUNT7TCF
2
3
A
__5__
I
1
A
i
JL
2
3
3
1
ROWTOTAL
A28.6
750.0
21A • 3
17.1
COLUMNTOTAL
750.0
750.0
1A100.0.
CHI -S'JUARE O.F. SIGNIFICANCE MIN E.F. CELLS WITH E.F. 5
2.1A286 3 0.5A33 0.500 8 OF 8 C100.0%)
STAT 1STIC SYMMETRICWITH FOOD _DEPENDENT
_HlXfcL.AGEDEPENDENT
LAMB OAUNCERTAINTY COEFFICIENTSOMERS' DETA
Q-. 1 A 2 Q 6_0.09871
-0.30357
Q-._Q-QQ-Q.Q_0.07857
-0.3A69A0.33806
Q.285710. 132 7 A
-0.2690A0.39123
STATISTIC VAlUE SIGNIFICANCE
CRAMER'S-VCONTINGENCY COEFFICIENTKENDALL'S TAU BKENDALL'S TAU CPEARSON'S RGAMMA
0 .3 912 3-0.36A3A
-0.30597-0.3A69A-0.33806--0.51515
0.11980.1198
0•1186_

-------------------- CROSSTA3ULA T [ O N OFFOOD CQtlMEAI_TO_ THE FOOD VARIETY IN KFC BY AGE
CONTROLLING FOR..
INCOME _ VALUE = . 2.
FOOD
COUNTAGfT
ROWTOTAL
2
3
~T~
5
~ I•MPMBMPP»•
3
3
MNBMMPMPBP__
•MMBMMMP1
2
7
_
520.8
1041 .7
833.3
L__4.2
COLUMN II 13 24TUTAL 45.8 5 4.2 100.0
CHI-SUUARE 0 • F • SIGNIFICANCE MIN E.F. CELLS WITH E.F. 5
2.65175 3 0.4485 0.458 7 OF 8 ( 87.5%)
STATISTIC SYMMETRICWITH FOODDEPENDENT
WITH AGEDEPENDENT
0.18182~ 0.TT9763 ~
-0.051810.33240
0.071430.07 3g~
-0.069930.07264
0.120000.06797
-0.05952
LAMBDAUNCERTAINTY COEFFICIENTS0MERS' 0ETA
STATTSTTC- VALUE SIGNIFICANCE
CRAMER'S VC0NT INGENCY COEFFICIENTKENDALL'S TAU BKENDALL'S TAU C
PEAR SON'S RGAMMA
0.332400.3T547~
-0.06019-0.06944-0.07264-0.10000
0.37390.37890.3679
02:37?36? . ...THE CH INESE UN IV .,,_0F „ HUNG_KQNG, IBM 4381 _MVSSP R3.8

05 FEB 6 7 INS I02:3 7:3.6. THE.CHINESE UNIV. UF HONG KONG IBM 4381 MVSSP R3.6
FOODCONT ROLLING
INCOME
CROSST ABULATION OFIN KFC BY AGE...COMMENT TO THE FOOD VARIETY
FOR • •
VALUE = 3•
FOOD
COUNT
2
3
4
. COLUMN,TOTAL
asf~
11
1
3
4._44.4
2
3
1
......i
ROW__t_otj?l_
333 m 3
222.2
444.4
5_53.6
9_100.0
CHI-SUUARE D.F. SIGNIFICANCE. MIN E.F.. _.C ELLS _ WITH E . F. 5
3.93750 2 0.1396 0.889 6 OF 6 (100.0%)
STAT 1STIC SYMMETRICWITH FOOODEPENDENT
WITH AGEDEPENDENT
LAMB DAUNCE RTA INTYSOMERS' DETA
COEFFICIENT0.444440.32383
-0.60870
0.400000.26677
-0.700000.65316
0.500000.411960.53846Q.66144
STAT ISTIC VALUE SIGNIFICANCE
CRAMER'S VCONTINGENCY COEFFICIENTKENDALL'S TAU BKENDALL'S TAU CPEARSON'S RGAMMA
0.661440.551680.613940 . 6 9136.0.653160.87500
0.0282
NUMBER.OF MISSING OBSERVATIONS . 2

EFFIC COMMENT TO KFC EFFICIENCY OF SERVICESCONTROLLING FUR'.V
INCOME
U L « I J
U Al tic - l
EFFI C
COUNTAGE
I
3
_ 3
11,1i
I
~3
3
4
I
I
~3
_2
ROWX OX At
I7 - 1
214-3
542.9
T5.
COLUMNTOTAL
7- n
7Rn.n
14i nn _ n
CHI-SQUARE D.F. S TGNT FICANCF MIN E.F. rciie uttu i: _ c . c
1.20000 3 0.7530 n - «;nr fl DF Q ii no _ ny 1
STAT ISTIC SYMMFTRICWITH EFFICDEPENOENT
WITH AGE1 —-i- .t ;
LAMBDAUNCERTAINTY COEFFICIENTSOMERS' DETA
0.06662_0.05999
-0.19298
0.00QQQ_0.04736
-0.22449n - - A7 - A
__Q..JLA2L06_0.08180
-0.16923n o o - i ~r
ST AT ISTHT VAI IIP tGN t F rr ANr r
CRAM ER' S _VCONTINGENCY COEFFICIENTKENDALL'S TAU BKENDALL'S TAU C
.REARSON'S RGAMMA
____0.29227_0.28098
-0.19491-0.22449-0.26726-0.33333
0.22650.2265n - i 7 7 ft

05 Fen 3702:3 7:3 6_
INS IrHE-CH.LNESEUJN.LV_.__QF HONG KONG IBM 4181 _MV£A££_GL3l£_
EFFICEFr I L LCONTROLLING FOR
INCOME
COMMENT TO KFC EFFICIENCY..OF _SERVICES- ...
CROSSTABULATION OF
BY AGE
VALUE = 2.
COUNTAGE
ROW_TOT_AL_
EFFI C1 2 i
I2
I
2 1
3 a
3 3
I
2
3
4
5
COLUMNTOTAL
II45.0
1354.2
I
42
312.5
312.5
1 1
45.8
625.0
24100.0
CHI-SQUARE
3.7991 1
D.F.
4
SIGNIFICANCE
0.4339
MIN E.F.
0.458
CELLS WITH E.F. 5
8 OF 10 ( 80.031
WITH AGEDEPENDENT
WITH EFFIC
_QfJlENQ£JNJSYMMETRICSTAT ISXIC__
LAMBDAUNCERTAINTY COEFFICIENTSOMERS' DFT A
STATISTIC
CRAMER'S VCONT INGENCY.COEFFICIENTKENDALL'S TAU BKENDALL'S TAU CPEARSON'S RGAMMA _ _
0.125000.086700.17493
_YALU_E
0•397860369680.177390.208330.24940
__a.2.8iCL2
0.00000_ 0 • 0_6 539
0.209790.24940
SIGNIFICANCE
0.17790.17790.1199
0.272730.128600.150000.39786

- CROSST ABULATION OFEFF.I.C... COMMENT TO KFC EFFICIENCY OF SERVICES BY AGEr rUlT Of ii i T M r fCr-iflf —-
TMfnMP value 3.
rniiNT
EFFI C
AGE
2
3
~T ~7
ROWTflTAI
I 1
JLIjlI
222 • 2
444.4
222.2
9inn.n
4
_5_
I i
~TI
COLUMN 4 5TOTAI 44-4 SS.A
rm -soi i AP r 0 • F •
3-93750
SIGNIFICANCE
n. ? 683
MIN E.F.
0.444
CELLS WITH E.F. 5
8 OF 8 1100.0%)
ST ATT ST Tf SYMMETRICWITH EFFICDEPENDENT
WITH AGEDEPENDENT
LAM8DA _UNCERTAINTY COEFFICIENTSOME RS• Df T A
.0.333330.28878
-0.41667
_ _0.200000.22231
-0.50000n-4An?ft
_ 0.5.00000.41196
-0.357140.66144
STATISTIC VALUE SIGNIFICANCE
CRAMER'S VCONTINGENCY COEFFICIENTKENDALL'S TAU BKENDALL'S TAU CPEARSON'S R£AMMA
0.66140.55168
-0.42258-0.49383-0.46098 0. 1059
NUMBER OF MISSING OBSERVATIONS 2
OS FEB A 7 TNS1

05 FEB 8 7 INS I
02-3 7:36 THE. CHINESE UNIV. OF HONG KONG IBM 4381 MVSSP R3.8
r R n 5 T A R 11 I A T t n M npTASTF
CONTROLLING FOR,INCOME
COMMENT TO THE TASTE OF KENTUCKY FRIED C RY A F
VALUE
COUNTAGF
ROWTOTAL
TAST E2
1 7
2 215 • A
3 1 2 323.1
A
3_
7
i
Z15. A
46 . 7
COLUMNTOTAL
646. 2
753.8
13100.0
CHI-SQUARE D.F. SIGNIFICANCE MIN E.F. CELLS WITH E.F. 5
6.96429 3 0.0730 0 .923 8 OF 8 (100.0%)
STATISTIC SYMMETRICwith_tasxeDEPENDENT
WITH AGE_nFPFNnFNT
LAMB DAUNCE RTAINT Y C0EFFICIEN1SOMERS' DETA
0.384620.341950.58000
JU 14286-0.26381
•0.690480.60338
jOl. 6i6ii0.48588
0.500000.73193
StAT 1STIC VALUE SIGNIFICANCE
CRAMER'S-VCONTINGENCY COEFFICIENTKENDALL'S TAU BKENDALL'S TAU CPEARSON'S RGAMMA
-0.X3193.0.590620.58757
0.686390.6033B
0.82857
0.01390.0139
,0.0143

5? -.S- CROSSTA8ULATION 01
jL'Il'. I.Srf J.4jg°tHaiTTO THE TASTE OF KENTUCKY FRIED C BY AGEPiiMT DTI I I rtlCvClDt A • -
INCOME VALUE =
COUNTr- t.
TOE
ROWTOTAL
TASTE-?«»'» r1 1
2
T
5-i .
T
1
1
T
2
T
3
T
A.
1
1
4«3
4 :.'
(17.4;
; ; 626.lv
iAr. v.'•••Q.%
I 39.1V i •C• . •'}._-
»av-
'v TOTAt? - 43.5yVC-56 •5HTOOtO• .. - I • V' i « - .. •
CHI-SQUARE J 0F.- SIGNIFICANCE V'MIN'E.F.V;: ©CELLS WITH E.F. 5
2.99295 4 0.5540 r ' :0.435 •? OF .10 ( 90.0V
statistic SYMMETRIC •WITH TAST6DEPENDENT ;V
WITH AGEDEPENDENT
•
LAMBDA
MNCERTAINTCdEEETIENT, Some us
niiriZTXvxv—8-Cr. JCiMaiS»i4ii'a 3 C
«|og« So.20000 .f0mO795i
0.02073v
mmsm
STATISTIC .VALufeS
fe0,36a.73:£0.33933.
0025 E®i
i|||l
; 05'FEB 87. . V«tSl£
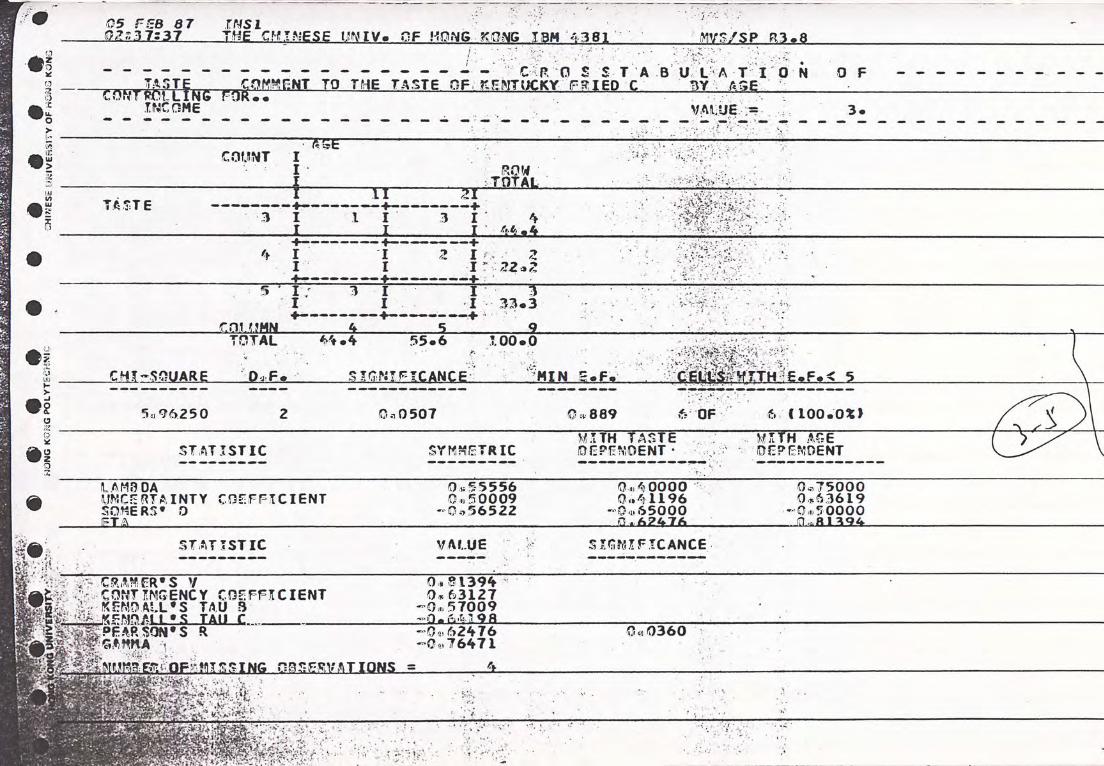
05 FEB 6 702137:37
INS ITHE CHINESE UNIV. OF HONG KONG IBM 4381 MVSSP R3.8
TASTEC R 0 S S T A B U LA T I 0 N O F
COMMENT TO THE TASTE OF KENTUCKY FRIED C BY AGECONTROLLING FOR
INCOME VALUE - 3
COUNTAGE-
TASTE
ROWTOTAL
3
4
5
I
I
3
2
3
2
444.4
222 e 2
3333
COLUMN 4 5 9TOTAL 44 4 55.6 1000
CHI-SQUARE PF SIGNIFICANCE MIN EF. HITH IE • F 5
5.96250 2 00507 0889 6 OF 6 11000%)
STATISTIC SYMMETRICWITH TASTEDEPENDENT•
WITH AGEDEPENDENT
LAMBOAUNCERTAINTY COEFFICIENTSOME RS DFT A
0.55556050009
-0.56522
040000041196
-0650000.7476
0750000.63619
-0.50000n-ftI94
STATISTIC VALUE SIGNIFICANCE
CRAMER'S VCONTINGENCY COEFFICIENTKENOALL'S TAU BKENDAtt'S TAU C
;PEARSON'S RGAMMA t'-...t£.• . J• •
0.813940.63127
-0.57009-»0 ftAI9ft
-0.62476-0.76471
00360
NUMBER-OF HISSING OBSERVATIONS = 4
o
)o
oz0t
KCOfiC
2DLU
1SI
6
O) 2Z(JUJ
1
2O
oz

wHRTANTiSiSiiSiSBiiiB: SMiS®olf8986 '
ETA .- 'ff _;,- -t TiATf IT t-'1'' TWifai8lglf9fMi«;ifltt«MwW8BBBMBPiBteri«BsMM8BBMBHMHMBit£ .
- •••• . -•?
CRAMER'S V . ;--«9!i£C' J,,?
, •.- KEND ALt'«TAJKBter; MM$ 1®

;;r CHI-square DF. ;:i:£-., .F. 5
W: 4.80000 4 ~ •n-0»30a|ii:agj|p,»»58iBoy« 90.0X1

05 FEB 87ftj a 7 17
INS1THE. CHINESE UNIV. OF HONG KONG IBM 4381 MVSSP R38
• • «• «£$M A ftl , J
i.IIN| Hni
•iMeofifei
T I 0 N OFCOHftEMr .TO, KFC S TOR E.C LEANLINESSv; BVage
3.
vv VSVBSBCV.v nun|B«|t~ •
CLEAN
iV '
ROW SiTOTAj.rk_ r. . • •' -
3W-'
•
4
T~
T -ri$21
rrr,;I-
1
~T
v•'2
TT-v.-••
•.-:-- • ..•p %. «4•X;'
r- •
3?-33V3i
na
ftwr%1•'«i. .4 '' I
•kfi' .•
55dhf.- 4? » 100.6' jiJij Lrfft -••'
.!•
JO:•'
I:,s
2D .UJ)1112
s
liXaUl .
.1O2 .O
IgX
1III
2
1x
1
. ;•
CHI-SQUARE
r.v
PEtaTT' SIGNIPlCAHfiv
•. '•
HINF.ui: - iyt
'•CELli'S WITH E.F» 5.''-»1-•
144000 •- v -
T
2 •4860 6 11000%)—ll HI. 0 !! I III
H
I » «v,. -. sv. •,' ,
•sHii£feWinfMEAN|OEPEllOCNFr
WITH AGEw OEPENOENTrv,
LAMBDAUNCERTAINTY COEFFICIENTSOME RS 0FT A
o120%0.124271:
—037209-•_ r • »• '
«kmm
0.00000010769
-040000-0W399Q1
0250000.14687
-034783040000
STATISTIC
i [
VALUE SIGNIFICANCE
CRAM ER S VCONTINGENCY COEFFICIENTKENDALL'S TAU B
ETOWi £'u c —
GAMMA
0.40000
037139i -0.37300
igilfBI mm
NUMBER OFHISSING OBSERVATIONS _£!

05 FEB 87 INS2—Q2_L3_8JL2_4t_ THF CHTNFSF UNIV. OF HONG KONG IBM 43 8 1 MVSSP R3.T~
T TEST
GROUP 1 - HEARD5 EQGROUP 2 - HEAR05 EO
1.2.
VARIABLE NUMBEROF CASES MEAN
STANDARDDEVIATION
STANDAROERROR
F2-TAILVALUE PROB.
POOLEO VARIANCE ESTIMATE SEPARATE VARIANCE ESTIMATE.5
TOEGREES OF 2-TAILVALUE FREEOOM PROB.
T DEGREES OF 2-TAILVALUE FREEDOM PROB.
:p
AGE
INCOMF
STATUS
GROUP 1
GROUP 2
GROUP 1
GROUP 2
GROUP 1
GROUP 2
GROUP 1
Group 2
48
0
48
0
48
0
48
0
1.4792
0.0000
1.5417
0.0000
1.8750
0.0000
1.1667
0.0000
0. 505
0.000
0.504
0.000
0.703
0.000
0.377
0.000
0.073
0.000
0.073
0.000
0. 102
0.000
0.054
0.000
0.00 1.000
0.00 1.000
0.00 1.000
0.00 1.000
20.30 48 0.000
21.21 48 0.000
18.47 48 0.000
21 .46 48 0.000
20.30 47.00 0.000
21.21 47.00 0.000
18.47 47.00 0.000
21.46 47.00 0.000
05 FEB 87 INS2_0 2:3 8;?5 THE CHINESE UNIV. OF HONG KQNG IBM 4361 MVSSP R3.8
PRECEDING TASK REQUIRED 0.11 SECONDS CPU TIME?
74 0 T-TETf
THERE ARE 501200 BYTES OF MEMORY AVAILABLE.THE LARGEST CONTIGUOUS AREA HAS 5-01200 BYTES.
_GUFS=IFW7VARIABLESSEX TO STATUS
2.02 SECONDS ELAPSED.
PAGE 6

05 FEB 87 INS2A d m T • J P P I i X A a P P r fill Til O P ft I P A I P 1 O k IP T n ft J P 1 liii rs %
rflflllfl—1 Z TTTTTP E7t 1
onni cr» UAotiurc cctiuatc a ecmn irr i. . n . . J
NUHBTR 5 IANOARU 5TSNUARC F 2-IAIL T DbGKbbS UF 2-I A1L I UbGRbbS OF 2-1 AILVALUE FREEDOM PROB.
GROUP I ~T6~ 1.4 83 U. 505
n 7H70.04
n.snni . QA . n_ 7 -0.06 46 0.953 -0.04 1.04 0.972
_1 7 1 A A A 1 A 3 -A.k? A.;_nn n.nnnorjur i to 1«DlI f U« PUD UU i 7
EGROUP 1 ~T5 1.9130 0.694 0.102
rPflilP ? ? 1 .nnnn n.nnn n aaa 0.00 1.000 1.84 46 0.072 8.93 45.00 0.000
STATUS ~ ~
n.AA itA n.s?p 3.08 45.00 0.004GROUP I 46 1.1739 0.383 0.057
(TrTTTTp ? 7 l .nnnn n. nnn n. nnn
05 FEB 87 INS2. Vir- -u V j i- f f T i r 1 ft i4 A
« _ . - .a - i i r rr ,-inrr r i » n r r nPRECEDING TASK REQUIRED 0.11 SECONDS CPU TIMES 2.11
75_~o f-tes'T g ro up s=s e WarTa B L E S = PRICE 'TO C LEAN-
THERE ARE 501200 BYTES OF MEMORY AVAILABLE.
PAGE

OS FEB 87 INS 202:38:29 THE CHINESE UNIV. OF HONG KONG IBM 4381 MVSSP R3.8
GROUP 1 - SEXGROUP 2 - SEX
EOEQ
I .2.
VARIABLE NUMBEROF CASES MEAN
STANOARODEVIATION
STANDARDERROR
PRIC F COMMFNT TO KFC PRICINGGROUP 1
GROUP 2
25
22
2.7600
2.5909
0.663
1.11
0. 133
0.243
FOOD COMMENT TO THE FOOD VARIETY IN KFCGROUP 1 25 3.2400 0.879 0.176
GROUP 2 22 3.0000 0.816 0.174
,EFFIC COMMFNT TO KFC F FF TFT FNf Y OF SERVICESGROUP 1 25 3.8000 0.957 0.191
GROUP 2 22 3.8636 1.207 0.257
TASTE COMMENT TO THE TASTE OF KENTUCKY FRIED CGROUP 1 23 3.6522 0.982 0.205
GROUP 2 22 3.6364 1.217 0.259
CI FAN COMMENT TO KFC STORF CLEANLINESSGROUP 1 25 4.2400 0.879 0.176
GROUP 2 22 4.2273 0.922 0.197
T - T E S T
POOLED VARIANCE ESTIMATE SEPARATE VARIANCE ESTIMATE
F 2-TAILVALUE PROB.
T DEGREES OF 2-TAILVALUE FREEDOM PROB.
T DEGREES OF 2-TAILVALUE FREEDOM PROB.
2.96 • 0.012 0.63 45 0.532 0.61 32.82 0.546
1.16 0.736 0.97 45 0. 340 0.97 44.86 D.337
1.59 0.274 -0.20 45 0.841 -0.20 39.97 0.844
1.54 n.3?5 n.ni 43 n.QA? 0-08 AO-3A O.Q6?
1.10 0.816 0.05 45 0.962 0.05 43.62 0.962
zcMTcano22rrr,rCv.rr
CZma—imV)-oor-Hm01zooo233c-4rraomZHrr
zcr.
ZC—jTcX2(A
zono
rnr
rCm

ooozoXu.o-
KUJzDuitouZXa
05 FEB 87 INS2tup rnTNiP;p iintv hp Hnwr. khnc trm UWCCO D a Q PAGE 11
GROUP 1 - AGE EO 1.GROUP 2 - AGE EQ 2.
VARIABLE NUMBER STANDARO STANDARDOF GASPS M F AN OF VI AT T DN FRROR
F 2-TAILVALUE PROB.
T DEGREES OF 2-TAIlVAI tIF FRFFOOM PROB.
T DEGREES OF ZTATLVALUE FREEDOM PROB.
GROUP 1 22 2.5000 1.012 0.216
GROUP 7 75 7-ft4nn n.Ann n.un
POOLED VARIANCE ESTIMATE SEPARATE VARIANCE ESTIMATE
uzXuUJh--Jo6.azoxoz0
FOOO COMMENT TO THE FOOD VARIETY IN KFCGROUP I 22 3.3636 0-902 0.192
1.60 • 0.267 -1.29 45 0.205 -1.27 39.90 0.213
1 _ 1 D .A 1 A 1.83 45 0.074 1.81 41.30 0.078CD Dl ID 5 5 ? _ o onn r 7 ca r» i c t
PPPTr rnmucmt rn vcr ccctf rcwrv nc ccowrrccwwnriuii.i lu—rtr u—l. i I xu a t !.u i wi w m if ivl JGROUP I 22 3.8636 1.167 0.249
GROUP 2 25 3.8000 1.000 0.2001.36 0.464 0.20 45 0.841 0.20 41.68 0.843
TASTE COMMENT TO THE TASTE OF KENTUCKY FRIED CGROUP 1 20 4.0000 1.214 0.271
GROUP 2 25 3.3600 0.907 0.1811.79 O.17 ft 7.07 A3 n.nAQ 1.96 34.35 0.058
riCAkf rnuuciir to vcr cmrc ri cami tmcccLS vvynt'i T ud clcv v v f „ , ,
GROUP 1 22 4.40910.6660.142
GROUP 2 75 4.0800 1.038 0.20B2.43 0.044 1.27 45 0.209 1.31 41.37 0.196

BIBLIOGRAPHY
Enalish Periodicals
Hong Kong Census Statistics Department. Hong Kong Monthly
Digest of Statistics. Hong Kong : Government, August 1986.
Survey Research Hongkong Ltd. Fast Food Restaurant Survey
(Eating-Out).March 1984.
Laurent, Clint. Hong Kong Life Styles Main Report. Hong
Kong : AGB McNair Hongkong Ltd, 1986.
Resnick, Jon. The Fast Food Express. Hong Kong City 4 June
1986) :39-43.
Big Profits in Burger Battle. Asian Business 15 September
1979) : 58-63.
Gigot, Pan. Feeding a Dynamic New Market. Far East
Economic Review 106 (November 1979) : 60-61.
Quick, I'm in a Hurry. The Asia Magazine, 11 November
1979, p.14-16.
Enalish Ncwsnat»rs
HK Sinks Its Teeth into the Fast -Food Market. The South
China Morning Post, 7 April 1986.
Ko, Monica. Slew Sales at Fast -Food Shop. The South China
Morning Post, 7 April 1986.

186Leung, Carolyn. "Cafe De Coral Set to Taste the Big Time."
The South China Morning Post, 18 May 1986.
Mulcahy, John. "Tasty Prospects at Cafe De Coral." The South
China Morning Post, 24 June 1986.
Montilla, Dende. "Stars Join Cafe De Coral's Feast." The
South China Morning Post, 27 June 1986.
"Dim Sum Bows down to Chicken and Chips." The South China
Morning Post, 21 July 1986.
"Fast Food Chain Changes Tack." The South China Morning
Post, 20 September 1986.
"How the Colonel Sold More Chicken on the Second Try."
The South China Morning Post, 21 November, 1986.

|3,
7|
I“” ‘
0+“|7030
+0
I… 3
中女利咏輪泛、
I ?屋絜参,〈拳窖处,逢扣铴堑靳浅處噠
…-“9II-
IV,[,I
1+5
47
I,I62 8 ,繁千一 5 7
‘,46
”7 6 06,‘ 7 〉
VI“0
”116 7
认评後,〈’、鄉級”在浼讀 11
鄭,巧“卑“ “曰,第?炱。

,17
I“,1 1
! 4
(“’3-37 !,
4’“”
巧只”已。 X
0'
350 ’


Related Documents