Page 1 A RESEARCH REPORT ON “A STUDY OF FACILITIES GIVEN BY CANTEEN IN COLLEGES-SPECIAL REFERENCE TO PRADHIKARAN” BY KADAM SADHANA SHAMRAO-69 GHOLAP RITESH MALHARI-79 MURLIDHAR KUMAR-89 MANALI KULKARNI-99 HULDAH JAMES-109 NIKHIL NAIKPAWAR-119 (BATCH 2014-2016) UNDER THE GUIDANCE OF PROF. AMITABH PATNAIK SUBMITTED TO DR. D. Y. PRATISHTAN’S PADMASHREE DR. D. Y. PATIL INSTITUTE OF MANAGEMENT STUDIES, AKURDI, PUNE- 411044.

a study of the facilities given by the canteens and its efect on student satiscation
Jul 20, 2015
Welcome message from author
This document is posted to help you gain knowledge. Please leave a comment to let me know what you think about it! Share it to your friends and learn new things together.
Transcript

Page 1
A
RESEARCH REPORT
ON
“A STUDY OF FACILITIES GIVEN BY CANTEEN IN COLLEGES-SPECIAL
REFERENCE TO PRADHIKARAN”
BY
KADAM SADHANA SHAMRAO-69
GHOLAP RITESH MALHARI-79
MURLIDHAR KUMAR-89
MANALI KULKARNI-99
HULDAH JAMES-109
NIKHIL NAIKPAWAR-119
(BATCH 2014-2016)
UNDER THE GUIDANCE OF
PROF. AMITABH PATNAIK
SUBMITTED TO
DR. D. Y. PRATISHTAN’S
PADMASHREE DR. D. Y. PATIL INSTITUTE OF MANAGEMENT STUDIES,
AKURDI, PUNE- 411044.
Page 2
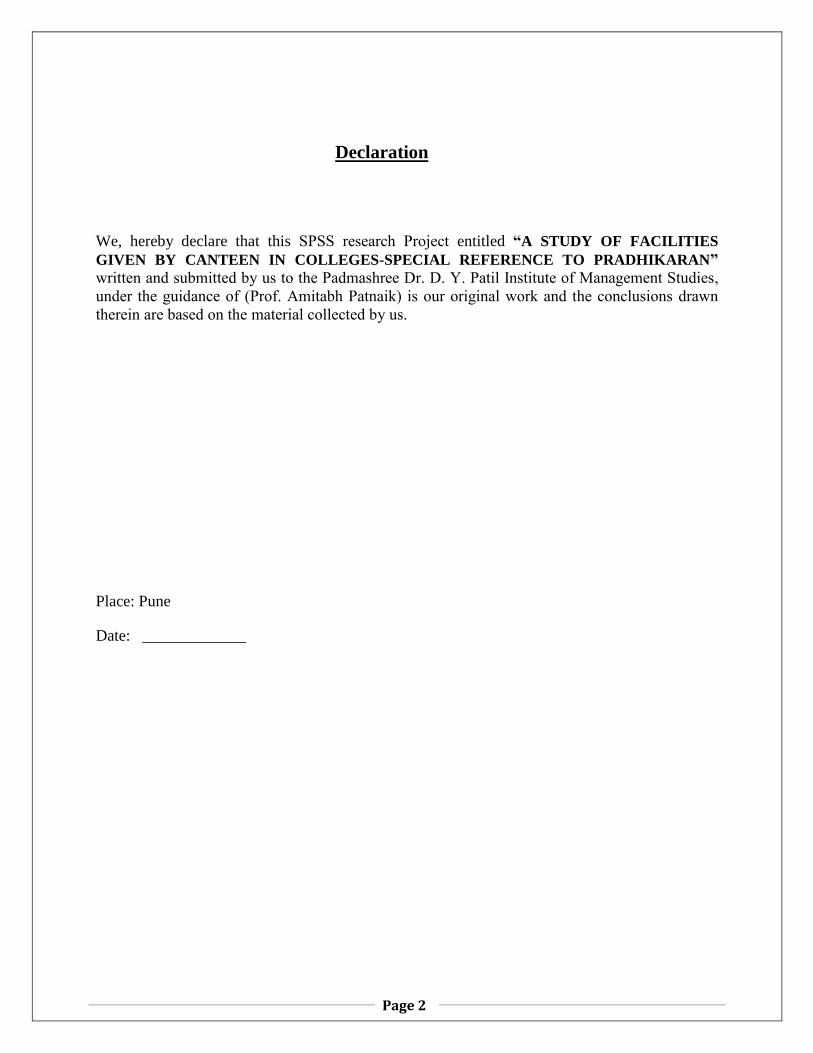
Declaration
We, hereby declare that this SPSS research Project entitled “A STUDY OF FACILITIES
GIVEN BY CANTEEN IN COLLEGES-SPECIAL REFERENCE TO PRADHIKARAN” written and submitted by us to the Padmashree Dr. D. Y. Patil Institute of Management Studies,
under the guidance of (Prof. Amitabh Patnaik) is our original work and the conclusions drawn
therein are based on the material collected by us.
Place: Pune
Date: _____________

Page 3
ACKNOWLEDGEMENT
We express our deep sense of indebtedness and sincere gratitude to the Director, Dr. Rajesh
Arora for having allowed us to undertake the project work. Our warmest thanks to the Prof.
Amitabh Patnaik (Internal Guide) for valuable guidance and generous support he has given us all
through the tenure of our project.
Page 4
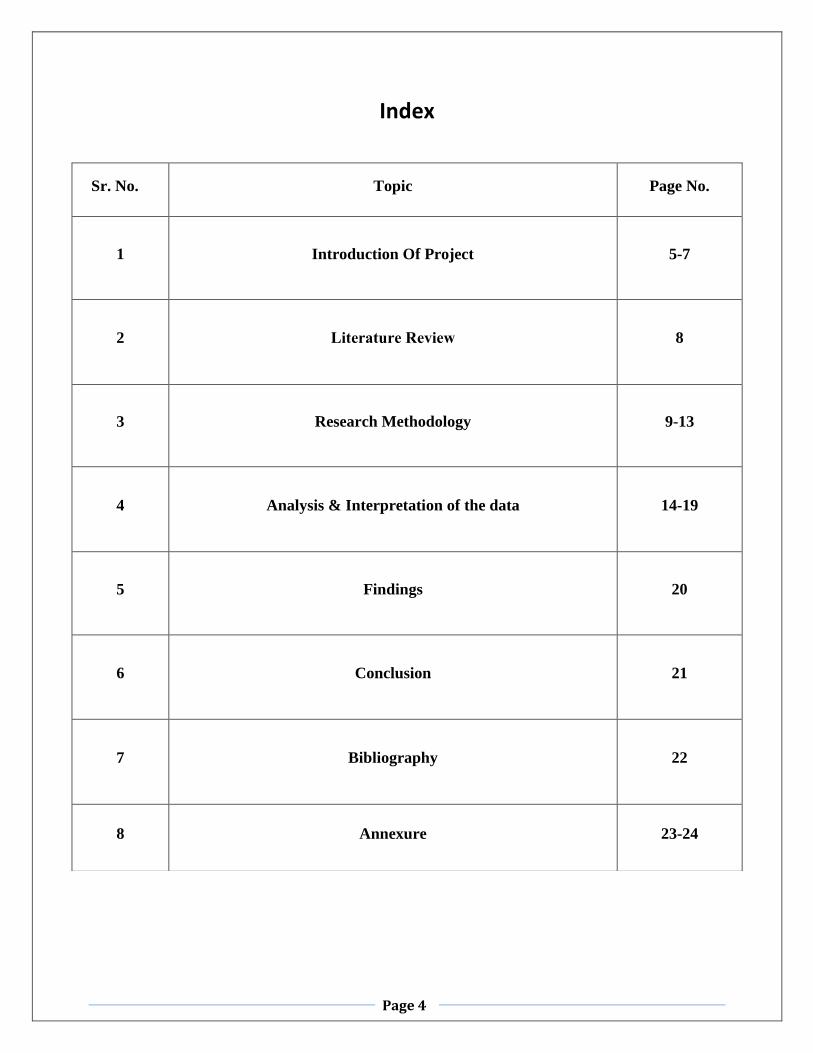
Index
Sr. No. Topic Page No.
1 Introduction Of Project 5-7
2 Literature Review 8
3 Research Methodology 9-13
4 Analysis & Interpretation of the data 14-19
5
Findings
20
6 Conclusion 21
7 Bibliography 22
8 Annexure 23-24

Page 5
Introduction of project
Canteen is a very important facility for the students through which a better standard of
food and refreshments can be obtained, when compare to the make shift hotels that spring up
around colleges. Moreover, through these canteens wholesome food and refreshments can be
provided to the students at reasonable prices so as to make available to them a balanced sand
hygienic food. This is likely to improve their health and efficiency. Canteens also serve as
places where students can meet informally and refresh themselves by a relaxing conversation.
The canteens are also an instruments of social change, as the students belonging to different
castes will have to sit at the same tables and take their food. Thus, a canteen can help in
improving the morale of the students. Further, the availability of the food stuffs within the
college area reduces the botheration and saves time of the students, otherwise they will have to
go out of the college. In this context the Colleges in Nigdi Pradhikaran area are observed.
“Besides good environment and ventilation, adequate dining accommodation is also an essential
requirement for the students. It is necessary that such accommodation should be more ample for
students.”
.

Page 6
Project Title:
“A STUDY OF FACILITIES GIVEN BY CANTEEN IN COLLEGES-SPECIAL
REFERENCE TO PRADHIKARAN.”
Objectives of the Study
Research Objectives
The research objectives were discovered through the conversation that canteens are most
important part in college life.
Finding thus, based on the additional conversation, the research questions were converted into
the following primary objectives:
When primary objectives were achieved, a clearer picture was established about the how
canteen facilities effect on students.
Primary Objective
1. To study the student satisfaction level about the canteen facilities
Secondary Objectives
1. To understand the canteen facilities for the suggestion.
2. To examine the extent of students towards canteens in colleges.
This allows the researcher to make recommendations that students and canteens find
relevant, useful and possible to implement, or to be used as a base for further research.
Why you have chosen this company & this project
As in India peoples’ approach towards education is increasing day by day. Therefore it is
mandatory for educational institutions to look forward about the canteen facilities provided by
them and maintain a clean and hygiene ambience.

Page 7
Location
Nigdi Pradhikaran Area.
Duration of project-
The Duration of our project was 1 months. Total duration ( 30 days).
How did We carry out this project.
We had prepared a questionnaire for the Research that questionnaire helped us to understand the
canteen facilities and satisfaction of students. The survey reflects the satisfaction of the students
and facilities provided by canteens.

Page 8
Literature Review
(Bell and Swinburn 2004).
College canteens are an important influence on Student’s diets as they can be the source of a substantial
proportion of Student’s daily nutrition on school days.
(Kanarek 1997)
As a result, the food products sold in canteens can directly influence weight outcomes as well as have an
impact on school performance through students’s energy levels and ability to concentrate.
(Bell and Swinburn 2005)
The provision of unhealthy foods in canteens leads stundent to believe that these products are appropriate
for daily consumption.
In this area there was no research conducted before. So we don’t have any secondary data to work on it.
Significance of the Research
Canteen is not just the place where we go to eat. Especially in colleges and institutes of
education this place is an open arena for debate, argumentative sessions on different issues,
passing of love-letters, cracking gossips, kidding and having loads of fun with tea, coffee and
coke in between as gap fillers.
It is the force of double 'f' that drives us to come to a canteen as often as we can. Food and
friends- both initiate with 'f' and canteen is the union zone for the two. College canteens build up
an ambience of rendezvous where we would love to spend all day with pals keeping away all
hassles of mundane living.
Canteen can be otherwise referred to be a cafeteria. Rush to it after the class gets over and it's not
like taking a diet conscious meal. Rather we would love to take the bite of some handsome
snacks. Tits and bits and something that our mamma will scold of are things we really love to
have in the canteens. Chips and soft drinks we begin with and then it can be sizzlers, potato
fingers, fish rolls, sometimes Chinese cuisine and chocolate drinks. Countless cups of tea and
coffee and the counter boy get paid at the end of the day.
Moreover the whole canteen session is fun because it's much related with sharing and caring. In
most cases it has been seen that a collective fund is raised for tea and snacks where each one has
a weekly or monthly contribution. Therefore canteen is something that brings we close. We can
shed off your depressions and frustrations when we are around the college canteen because it's a
land of charm, rejoice and always in motion. The drabbest may sound the brightest in the canteen
premises.

Page 9
Research Methodology
RESEARCH PROCESS
Research exercise may take many forms but systematic enquiry is features common to all such
forms. Being a systematic enquiry, it requires careful planning of the orderly investigation
process.
STAGES IN THE RESEARCH PROCESS
In planning and designing a specific research project, it is necessary to anticipate all the steps
that must be undertaken if the project is to be successful in collecting valid and reliable
information.
The steps of research process are highlighted in the following flow diagram.
Defining
Problem Extensive
Literature
survey
Planning
Research
Design
Collect the
data
Analyze
the data Formulation
of conclusion Prepare
and present
the report
Sample
Design
Sample
Design

Page 10
RESEARCH DESIGN IS CLASSIFIED AS FOLLOWS
Research Type
The type of research conducted for this SPSS Research project is Descriptive Research.
Descriptive Research Design:
It includes surveys and fact finding enquiries of different kinds. It is a fact- finding
investigation with interpretation. It is the simplest type of research, and is more specific than an
exploratory study, as it focuses on particular aspects of the problem being studied, so research
design used for this project was descriptive research design.
Descriptive research method was the best method applicable to the existing problem mentioned
in this project report.
RESEARCH DESIGN
EXPLORATORY DESCRIPTIVE CASUAL /
EXPERIMENTAL

Page 11
1. Sample Design
Sampling
An integral component of a research design is sampling plan. Specifically, it addresses three
questions:
1) Whom to survey (the sample unit)?
2) How many to survey (the sample size)? &
3) How to select them (the sampling procedure)
Making the entire universe will be impossible on the account of limitation of time and money.
Hence sampling becomes inevitable. A sample is only a portion of the universe of population.
According to Yule, “The object of sampling to get maximum information about the parent
population with minimum efforts. Properly done procedures are the representative data of the
entire population”.
Sampling Unit
A decision has to be taken concerning a sample unit before selecting sample. Sample unit
may be geographical one such as State, District and Village etc. The researcher will have to
decide one or more unit that has to select for his study
Sampling Methods
Probability sampling is known as random sampling or chance sampling. Under this sampling
design every item of the universe has equal chance or probability.
Sample random sampling
Systematic sampling
Stratified sampling
Cluster and Area sampling
Sequential sampling
Multi stage sampling
Non Probability Sampling is also known as deliberate sampling, purposive and judgmental
sampling. Non probability samplings are those that do not provide every item in the universe
with a known chance of being include in the sample. Non probabilities are of following types:
Convenience sampling
Quota sampling
Judgemental sampling
Panel sampling

Page 12
2. Collecting the data
The data collection process follows the information of research design including the sample plan.
Data, which can be secondary or primary, can be collect using variety of tools. These tools are
classified into two broad categories, the observation method and the survey methods, all of
which have inherent advantages and limitations.
a) Primary Data
In most research areas, field survey is commonly used to collect primary data from the
respondents. Surveys can be
1) Personal Interview
2) Questionnaire
It is common practice to use structured questionnaires prepared in advanced, to elicit the
necessary from the respondents. Whether it is personal or mail survey, it is necessary to design
suitable questionnaire, conduct a pilot survey and undertake a pre-testing of the questionnaire.
In this project report, primary data is collected through questionnaire by personal
interaction method
b) Secondary Data
Secondary data means data that are already available, it means which have already been
collected and analysed by someone else. When research utilizes secondary data, research has to
look into various sources from where researcher can obtain data; usually data published is
available in
a. Technical & trade journals;
b. Books, magazines and newspapers;
c. Reports and publications of various associations connected with
Business and industry;

Page 13
In this project report, the secondary data is collected external sources such as Books,
Magazines.
Research step Related to the project
Define research & formulate problem Student satisfaction about the canteen
facilities
Research Design Descriptive Research
Determining sample design
Location – Nigdi Pradhikaran
Sample unit – College Students
Sample Size – 60 respondent
Sampling Method – Simple Random
Sampling
Collect
The
Data
Primary data-
collection
Primary data is collected through
questionnaire by personal interaction
method
Secondary data Website & reference book, from various
newspapers to analyze data.
Analysis of collected data Through tabulation and chart by using
SPSS to analyze data
Generalization & interpretation Interpretation of data is done after question
in this project
Preparation of report Prepare the final report

Page 14
Data Analysis & Interpretation
Linear Regression
Descriptive Statistics
Mean
Std.
Deviation N
Overall Satisfaction 2.3500 .91735 60
Variety,Quality,Quantity,
Healthy,Taste 2.7833 .66617 60
Hygiene,Capacity,Amenit
ies, Ambience 2.9333 .48246 60
Value for money,
Affordablity,Credit
Facility
2.3333 .89569 60
Hospitality,Delivary
Time,Hygiene of Staff,
Nature of staff
2.9667 .75838 60
Model Summary
Model R R Square
Adjusted R
Square
Std. Error of
the Estimate
1 .785a .617 .589 .58813
Page 15
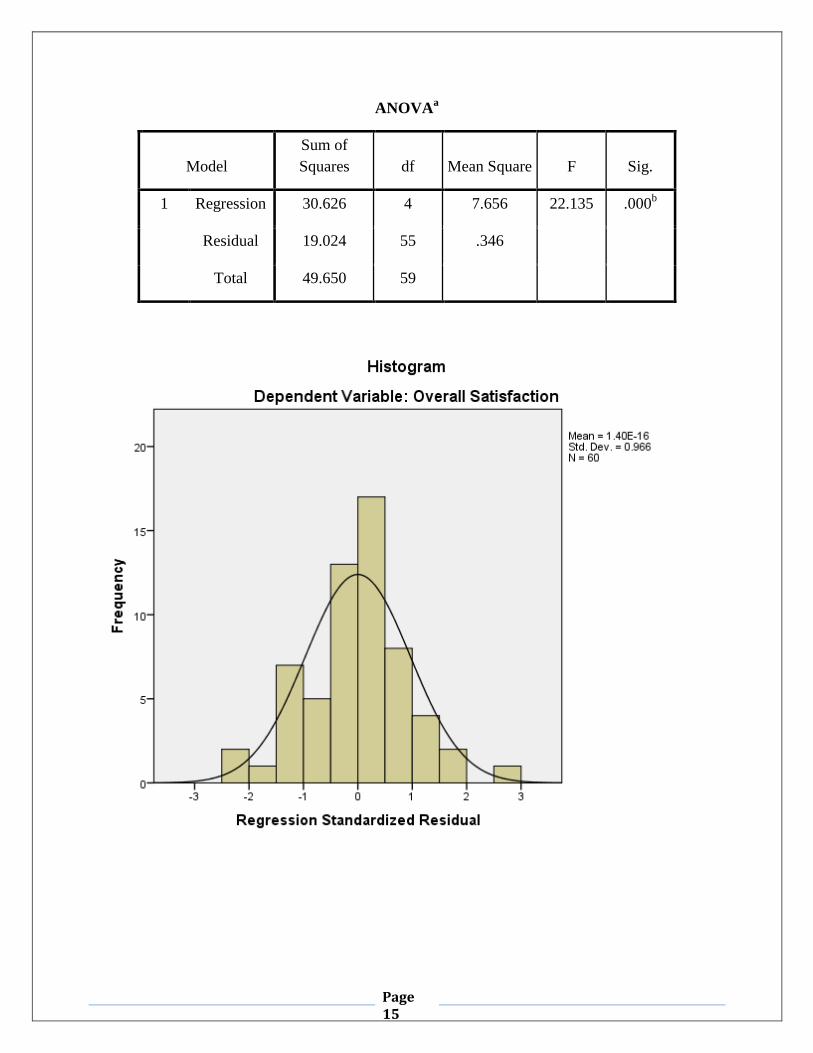
ANOVAa
Model
Sum of
Squares df Mean Square F Sig.
1 Regression 30.626 4 7.656 22.135 .000b
Residual 19.024 55 .346
Total 49.650 59

Page 16
Overall Satisfaction
Food
* Variety, Quality, Quantity, Healthy, Taste
Variety, Quality,
Quantity, Healthy,
Taste
Mean N Average Std. Error of
Mean Variance
Strongly Satisfied 1.0000 1 1.666667 . .
Satisfied 2.3889 18 30 .21601 .840
Nor satisfied Nor
Dissatisfied 2.1471 34 56.66667 .13439 .614
Dissatisfied 3.4286 7 11.66667 .29738 .619
Total 2.3500 60 100 .11843 .842
Interpretation
In above pie chart, we can see 1.6% respondents are Strongly satisfied, 30% respondents are
satisfied, 56.6% respondents are Nor satisfied nor dissatisfied, 11% respondents are Dissatisfied
and 0% respondents are strongly dissatisfied
2%
30%
56%
12%
0%
Responds
Strongly Satisfied
Satisfied
Nor Satisfied Nor Dissatisfied
Dissatisfied
Strongly Disatisfied

Page 17
Overall Satisfaction
Place
* Hygiene, Capacity, Amenities, Ambience
Hygiene,Capacity,Ame
nities,Ambience Mean N Average
Std. Error of
Mean Variance
Strongly Satisfied 1.0000 1 1.66667 . .
Satisfied 1.8333 6 10 .16667 .167
Nor Satisfied Nor
Dissatisfied 2.2857 49 81.66667 .11294 .625
Dissatisfied 4.2500 4 6.66667 .25000 .250
Total 2.3500 60 0 .11843 .842
Interpretation
In above pie chart, we can see 1.6% respondents are Strongly satisfied, 10% respondents are
satisfied, 81.6% respondents are Nor satisfied nor dissatisfied, 6.6% respondents are Dissatisfied
and 0% respondents are strongly dissatisfied
2%
10%
81%
7%
0%
Responds
Strongly Satisfied
Satisfied
Nor Satisfied Nor Dissatisfied
Dissatisfied
Strongly Disatisfied

Page 18
Overall Satisfaction
Price
* Value for money, Affordability, Credit Facility
Value for money,
Affordablity, Credit
Facility
Mean N Average Std. Error of
Mean Variance
Strongly Satisfied 1.7000 10 16.66667 .21344 .456
Satisfied 1.9231 26 43.33333 .12308 .394
Nor Satisfied Nor
Dissatisfied 2.8947 19 31.66667 .15092 .433
Dissatisfied 3.5000 4 6.666667 .28868 .333
Strongly dissatisfied 5.0000 1 1.666667 . .
Total 2.3500 60 100 .11843 .842
Interpretation
In above pie chart, we can see 16.6% respondents are Strongly satisfied, 43.3% respondents are
satisfied, 31.6% respondents are Nor satisfied nor dissatisfied, 6.6% respondents are Dissatisfied
and 1.6% respondents are strongly dissatisfied
16%
43%
32%
7%
2%
Responds
Strongly Satisfied
Satisfied
Nor Satisfied Nor Dissatisfied
Dissatisfied
Strongly Disatisfied

Page 19
Overall Satisfaction
Service
* Hospitality, Delivery Time, Hygiene of Staff, Nature of Staff
Hospitality, Delivery
Time, Hygiene of Staff,
Nature of staff
Mean N Average Std. Error of
Mean Variance
Strongly Satisfied 2.0000 1 1.666667 . .
Satisfied 1.6923 13 21.66667 .23709 .731
Nor Satisfied Nor
Dissatisfied 2.4000 35 58.33333 .13720 .659
Dissatisfied 2.7778 9 15 .22222 .444
Strongly Dissatisfied 4.0000 2 3.333333 1.00000 2.000
Total 2.3500 60 100 .11843 .842
Interpretation
In above pie chart, we can see 1.6% respondents are Strongly satisfied, 21.6% respondents are
satisfied, 58.3% respondents are Nor satisfied nor dissatisfied, 15% respondents are Dissatisfied
and 3.3% respondents are strongly dissatisfied
2%
22%
58%
15%
3%
Responds
Strongly Satisfied
Satisfied
Nor Satisfied Nor Dissatisfied
Dissatisfied
Strongly Disatisfied
Page 20
FINDINGS
1. Students have very positive attitudes toward green Canteen Facilities. Lifestyles of Indian
Students are changing and, given the increased interest in quality, service is likely to be well
received by Students.
2. Students considered that all the canteens are not equally capable of contributing to the overall
facilities because of their varied natures.
3. The importance of quality to students must never be forgotten while giving facilities to them. If
students believe that a college canteen has reduced the quality of the products they receive, they
will not accept the foods and facilities.
4. As research reveals, Students are present in the colleges and they would like to have a food in
their premises as well. Researcher wants to identify them as the satisfied consume. As they are
more in numbers prospects are quite positive for canteens in Nigdi Pradhikaran area.

Page 21
Conclusion
As the students attitude towards education has changing, colleges and their canteens must provide
healthy and quality food to students.
If the students are satisfied about quality, variety and environment of the canteens then they will not
go anywhere out of the college premise to get their food. Ultimately Canteens requires that Students want a quality food, environment and are willing to "pay"
for it, possibly through higher priced foods, until this occurs it will be difficult for canteens to get
benefit.

Page 22
BIBLIOGRAPHY
Books 1. Deepak Chawala, Neena Sondhi. “Research Methodology-Concepts and Cases
1st edition VIKAS publishing house pvt.ltd.
Websites 1. www.google.com
2. www.wikipedia.org
Online Journels 1. Shodhganga
2. Jgateplus

Page 23
ANNEXURE
Questionnaire
(Note: In following questions 1-Strongly Satisfied, 2-satisfied, 3-Nor satisfied nor
dissatisfied, 4-Dissatisfied, 5-Strongly Dissatisfied)
1) How do you rate the food facilities in your canteen with reference to following
criteria?
1 2 3 4 5
Variety
Quality
Quantity
Healthy
Taste
2) How do you like the canteen Premise with reference to following criteria?
1 2 3 4 5
Hygiene
Capacity
Amenities
Ambience
3) What do you think about the Prices with reference to following criteria?
1 2 3 4 5
Value for Money
Affordability
Credit Facility

Page 24
4) How do you find the service of staff with reference to following criteria?
1 2 3 4 5
Hospitality
Delivery time
Hygiene of staff
Nature of staff
5) Name :_____________________________________________
6) Education:______________
7) Institute: i) DYPIMS
ii) DYP
iii) PCCOE
8) Age:
9) Sex: Male Female
---------------------------------------------------------------------------------------------------------------------
Related Documents