A Study of Social Desirability Bias in the Russian Presidential Elections, 2012 Kirill Kalinin * Department of Political Science University of Michigan 18.07.2015 Abstract In authoritarian regimes election polls can be vastly polluted by measurement error, namely the social desirability bias, which can contribute to substantial infla- tion in the publicized estimates of an autocrat’s electoral support and voter turnout. This study provides an in-depth analysis of the magnitude of social desirability bias in polling estimates released before and after the 2012 Russian presidential elec- tions by focusing on the implications of Noelle-Neumann’s “spiral of silence” theory. The empirical data analysis is based on list experiments from four data samples collected during the Russian presidential campaign. The estimated magnitude of the social desirability bias in Putin’s electoral support is statistically significant and reaches approximately 20%, for the voter turnout, however, my findings are somewhat mixed. My main conclusions are further validated by an alternative urns experiment conducted by one of the national pollsters. The detection of significant social desirability bias in the Russian presidential campaign brings forth the issue of survey research quality in authoritarian regimes and its effect on election outcomes. * Doctoral Candidate, Department of Political Science, University of Michigan. The author is thankful to Walter Mebane for his useful advice and suggestions, the editor and three anonymous reviewers for their important insights, and the Department of Political Science (University of Michigan) for funding the fieldwork stage of this project.

Welcome message from author
This document is posted to help you gain knowledge. Please leave a comment to let me know what you think about it! Share it to your friends and learn new things together.
Transcript

A Study of Social Desirability Bias in the RussianPresidential Elections, 2012
Kirill Kalinin ∗
Department of Political ScienceUniversity of Michigan
18.07.2015
Abstract
In authoritarian regimes election polls can be vastly polluted by measurementerror, namely the social desirability bias, which can contribute to substantial infla-tion in the publicized estimates of an autocrat’s electoral support and voter turnout.This study provides an in-depth analysis of the magnitude of social desirability biasin polling estimates released before and after the 2012 Russian presidential elec-tions by focusing on the implications of Noelle-Neumann’s “spiral of silence” theory.The empirical data analysis is based on list experiments from four data samplescollected during the Russian presidential campaign. The estimated magnitude ofthe social desirability bias in Putin’s electoral support is statistically significantand reaches approximately 20%, for the voter turnout, however, my findings aresomewhat mixed. My main conclusions are further validated by an alternative urnsexperiment conducted by one of the national pollsters. The detection of significantsocial desirability bias in the Russian presidential campaign brings forth the issue ofsurvey research quality in authoritarian regimes and its effect on election outcomes.
∗Doctoral Candidate, Department of Political Science, University of Michigan. The author is thankfulto Walter Mebane for his useful advice and suggestions, the editor and three anonymous reviewers fortheir important insights, and the Department of Political Science (University of Michigan) for fundingthe fieldwork stage of this project.

Introduction
The 2012 Russian presidential elections were marked by the spread of massive protests
associated with growing public awareness of election fraud allegations. Numerous election
forecasts produced by major national polling organizations claimed Putin’s overwhelming
lead in the electoral ratings also matched the official elections results within the margin
of survey error (Enikolopov et al., 2013; Kalinin and Shpilkin, 2012; Kalinin and Mebane,
2013; Shpilkin, 2011). This paper addresses a key question: if election and survey results
are roughly similar, and we know the former are artificially heightened, then what is
pushing the survey results artificially upward? The observed “nonsensitivity of polling
estimates to election fraud could be attributed to the inflation of electoral ratings caused
by the social desirability bias.
The proposed theory rests on the notion of the “matching game”, as well as Noelle-
Neumann’s seminal work on the “spiral of silence”. It shows that when an individual feels
unsafe about expressing ideas contrary to official policy or fears isolation, she will most
likely hide her private preferences and display public preferences in favor of a candidate
she thinks is most accepted by the general public. This observation relates especially
well to the general climate of the 2012 Russian presidential elections, in which extensive
media propaganda and the abuse of administrative resources by the incumbent made clear
that Vladimir Putin was the most socially desirable candidate. The resulting inflation
in forecasts of the election outcome contrasted against lower observed electoral figures
could have motivated election administrators to organize election fraud designed to cover
up for the discrepancy.
The phenomenon of social desirability bias has been studied with respect to a wide
range of issues in both autocracies (Geddes and Zaller, 1989; Bischoping and Schuma,
1992; Anderson, 1994; Beltran and Valdivia, 1999; Sieger, 1990), as well as democracies
(Belli et al., 2001; Karp and Brockington, 2005; Holbrook and Krosnick, 2010b). Accord-
ing to Presser (1990); Traugott (2008), over-reporting of voting has been found in every
major validation study. In this paper social desirability bias is understood as the differ-
ence in the probability of the socially desirable response and the honest response, where
anonymity is strictly guaranteed. This becomes possible through the use of the list ex-
periment or item count technique (ICT) (Miller, 1984), which over the years has become
a popular tool providing a reliable control of the social desirability bias (Tsuchiya, 2005;
Chaudhuri and Christofides, 2007; Glynn, 2013; Corstange, 2009; Imai, 2011; Green and
Kern, 2012).
In contrast to previous work, this paper makes three novel contributions. First, it
1

claims that the social desirability bias is a key factor explaining the close match between
falsified official electoral results and election polling results on both the incumbent’s
electoral support and turnout. Second, unlike the political science literature focusing
on exploration of desirability bias with respect to turnout, this study concentrates on
the incumbent’s electoral support, rather than voter turnout. Third, within the context
of my theory, the computed estimate of the social desirability bias can be treated as
a proxy measure of election fraud. By and large, this study helps to bridge the gap
between election forensics and survey methodology in the developing world and helps to
validate the techniques which proved to be efficient in the developed world. In a broader
perspective, it adds leverage to our understanding of how the study of election polls can
complement the field of election forensics.
The structure of this paper is as follows. Section 1 lays out Noelle-Neumann’s
“spiral of silence” theory and offers a set of key hypotheses for testing. Section 2 dis-
cusses the analytic strategy. Section 3 describes the political context of the 2012 Russian
presidential election. Sections 4 and 5 provide description of the data and results of
my empirical analysis. In the final part I draw conclusions based on these findings and
discuss prospects of future research.
Theory and Hypotheses
Authoritarian regimes, with high cohesion or compliance of the state apparatus and
control over the mass media, enable autocrats to effectively manage the public sentiment
towards the regime. When the regime dominates public political discourse, a “spiral of
silence” is likely to emerge, where citizens conceal their private preferences and instead
report socially desirable preferences (Noelle-Neumann, 1984). Therefore, the autocrat is
always concerned about the possibility of social desirability bias and tries to keep herself
informed of the private preferences of constituencies by withholding and manipulating
polling data (Otava, 1988). This is especially true for election polls, which demonstrate
respondent’s compliance with the regime. Key questions, such as a voters decision to
participate in an election or to vote for the autocrat, are almost always perceived as
politically sensitive by the respondents, who are then more likely to falsify their answers.
These questions are therefore most troubling for the autocrat as well. For instance, social
desirability bias and low response rates have been attributed to mail surveys in the USSR,
since Soviet citizens refrained from giving sincere responses even to officially approved
questions (Kaplowitz and Shlapentokh, 1982).
While the presence of a close match between inflated polling estimates and official
2

electoral results guarantees the most desirable outcome for the autocrat, the occurrence of
a discrepancy can trigger allegations of election fraud and mass protests. For instance, the
autocrat’s inflated support in pre-election polls followed by clean and fair election would
most likely end up in a serious mismatch between both figures, indicating autocrat’s lower
public support than otherwise expected by the citizenry, and thus potentially triggering
collective action with relatively high costs for the autocrat. Another potential setback
for the autocrat can be due to unbiased polling estimates, creating an expectation of
incumbent’s relatively low public support, and thus making election fraud also easily
detectable by the voters, consequentially raising probability for mass protests. Indeed,
the importance of matching outcomes vs. mismatching outcomes between the election
results and election polls can by described by a simple “matching pennies” game, in which
matched pennies result in a win of one player (the autocrat), and unmatched pennies
contribute to a win of the other player (the voters). Unsurprisingly, any information
leading voters to conclude a “mismatched” outcome has occurred and the consequent
possibility of protest activities, incentivizes the autocrat to repress various information
channels designed to provide the opposition and the citizenry with information on the
true popularity of the incumbent and untie her hands for voter fraud (Wintrobe, 1998;
Egorov et al., 2009). Therefore even though autocracies and democracies can share
relatively similar levels of social desirability bias in the polling estimates, the social
desirability bias in autocracies can be much more consequential: matched outcomes in
autocracies due to election fraud, and unmatched outcomes in democracies due to its
absence.
Noelle-Neumann’s seminal work on the “spiral of silence” helps us to explore the
mechanism by which social desirability evolves in autocracies, such as Russia (Noelle-
Neumann, 1984). It implies that when one faction in society possesses total public
visibility while the other has been completely marginalized, the individual will assess the
political climate personally or through the media. This assessment impacts the public
behavior of an individual and her intention of revealing her private political preferences.
In particular, the revelation of her private preferences is less likely when an individual
feels unsafe about expressing ideas contrary to official policy, or has a fear of isolation.
Under these circumstances she will be inclined to falsify her political preferences in favor
of those she thinks are acceptable to the public, or simply withdraw from discussion
(Noelle-Neumann, 1984, 5) For instance, the general setting of the Russian presidential
elections 2012 with the incumbent’s dominant position was likely to trigger sensitivity
to questions related to his electoral support; supporters of political opposition, being
in the minority, would feel pressured to remain silent or to falsify their preferences in
3

favor of the incumbent. A somewhat similar mechanism can be helpful in explaining the
predicted turnout rates: the individual’s open response not to vote negative response
can be perceived as her reluctance to support the regime, therefore the turnout figures
has been inflated by the social desirability bias. As a matter of fact, to match real voter
turnout and survey predictions over the years a wide range of methods for boosting voter
turnout figures have been used by Kremlin. These have involved propaganda, increased
levels of “controlled” voting, wide-scale organization of precincts at railway stations and
hospitals, as well as open falsifications designed to simultaneously increase the number
of votes and the number of voters, which have been implemented by stuffing ballot boxes
or adding figures to protocols.
This research will be primarily focused on testing the central implication of the “spi-
ral of silence” theory: on inflation in the estimates of the incumbent’s electoral support
and turnout. In the social sciences, the individual’s inclination to falsify her preferences
is referred to as social desirability bias, and in political science as preference falsification
(Kuran, 1991). The concept implies that polled individuals may give dishonest answers
to conform with societal norms and so as not to be embarrassed by their responses,
thus contributing to an increase in response bias and measurement error. According to
Tourangeau et al. (2000, 257) the “notion of sensitive questions presupposes that re-
spondents believe there are defining desirable attitudes and behaviors, and that they
are concerned enough about these norms to distort their answers to avoid presenting
themselves in an unfavorable light”. According to Kuran, preference falsification “is the
act of misrepresenting one’s genuine wants under perceived social pressures” (Kuran,
1991, 37-57). Social desirability and self-censoring can substantially affect respondents’
responses due to social sanctions and risks arising from the respondent’s decision to voice
her support for the opposition or contentious opinions (Tourangeau et al., 2000). When
there is almost no benefit in answering the questions truthfully, the individual would be
more likely to subscribe to this strategy (Corstange, 2009, 2-3).
With respect to voting and voter turnout, social desirability has been explored in
the works of Streb et al. (2008), Belli et al. (2001), Holbrook and Krosnick (2010a,b),
Comsa and Postelnicu (2012). In their cross-national study of turnout in several democ-
racies, Karp and Brockington (2005) find that in national settings with higher levels
of participation, the tendency to over-report turnout is greater than in settings with
low participation levels. There are several studies focused on survey experiments in an
authoritarian setting. Weghorst (2011) in his paper on support for opposition violence
against an incumbent party shows the difference between the results from direct and in-
direct self-reporting. Gonzalez-Ocantos et al. (2011) provide evidence showing that after
4

the 2008 Nicaraguan municipal elections, a direct question on vote buying, compared
with responses from a survey experiment, clearly underestimated the proportion of those
who reported this behavior.
How much social desirability bias would we expect to find in our study? In their
research Karp and Brockington (2005) by comparing official voting records with survey
responses on turnout from several democracies conclude that voter turnout that the
social desirability bias in democracies not only positively correlates with the turnout
rate, but also demonstrates high levels reaching 27% for Britain, 26% for Sweden and for
40% for the US. High over-reported turnout in democracies is different from incumbents
inflated support. For instance, if in the U.S. presidential election there appears little
bias, reaching 1.5%, for the House of Representatives 4% and U.S. Senate races, for
gubernatorial races and 4.7% for the 1952-1988 (Wright, 1993, 295). Both follow-up
studies of Atkeson (1999) and Mattei (1998) in their two separate pieces on congressional
and presidential elections, show that the advantage of the leading candidates in the polls
has a strong and systematic bias averaging about 10% and 13% (Mattei, 1998; Atkeson,
1999). These findings are also supported by Traugott (2008). While in democracies the
social desirability bias is elevated, in autocracies such as Russia, the magnitude of the
social desirability bias with respect to both turnout and incumbent’s electoral support
is expected to be significantly higher, i.e. exceeding 30% and 13%, respectively. Hence,
the first Hypothesis tested here can be stated as:
H1 Due to social desirability effects, Russian presidential elections in 2012 were charac-
terized by a substantial inflationary bias in the estimates for incumbent and voter
turnout, exceeding the democratic benchmark of 13% for the incumbent’s support
and 30% for turnout.
Another question of interest is related to the variability of the social desirability
bias across different demographic subgroups. Individuals displaying high levels of social
desirability bias are those who are relatively isolated, with weaker self-confidence, less
interest in politics, and fear disrespect or unpopularity. Among those most disposed
to speaking out publicly are rather men than women, younger people than older ones,
those belonging to a higher social strata than those from lower strata (Noelle-Neumann,
1984, 24). Yet a number of studies have also found that individuals most likely to
overreport voting have the same characteristics as those likely to vote: those who are
highly educated, supportive of the regime, higher-status individuals are most likely to
falsify their preferences in a survey (Bernstein et al., 2001; Silver et al., 1986). They are
more likely trying to create a good impression on the interviewer and feel pressured to
5

vote, leading to a greater desire to falsify their responses (Bernstein et al., 2001; Silver
et al., 1986). Those respondents for whom the norm of voting is most salient will be most
likely to overreport their preferences. Hence, here I formulate two alternative hypotheses:
H2.1 The social desirability bias in estimates for an incumbent’s electoral support and
for voter turnout is expected to vary across different social groups: women, the
elderly, persons with low education and the poor are expected to exhibit greater
levels of misreporting compared to men, the young, those with higher education
and the wealthy.
H2.2 Overreporting individuals with respect to incumbent’s electoral support and voter
turnout are expected to have the same demographic characteristics as the likely
voters, i.e. those individuals who openly reveal their voting preferences.
The next question is related to the temporal persistence of preference falsification
throughout the electoral campaign. According to Noelle-Neumann (1984, 31) one might
expect a recognizable pre-election tendency of people claiming they are going to vote
for the incumbent, but a post-election tendency to claim support for the incumbent
can be even more salient, with a greater proportion of people falsifying their preferences.
This comes as no surprise, especially, when the autocrat has managed to manufacture the
majority of her official electoral support, thus creating the illusion of enormous popularity
contrasted with the chronic weakness of political opposition (Simpser, 2013). If, however,
the autocrat did worse in the elections than pre-election polls reported, the magnitude of
social desirability bias would most likely decrease and contribute to the growth of public
opposition (Kuran, 1991, 18). Since Putin’s official results matched public expectations
quite well, I expect the presence of temporal persistence of preference falsification to be
without any significant changes between pre- and post-electoral periods.
H3 For pre-election and post-election polls, one can expect the presence of temporally
persistent social desirability bias for both voter turnout and incumbent’s electoral
support.
Analytic strategy
Social desirability bias can be simply understood as the difference in the probability
of the socially desirable response and the honest response, where anonymity is strictly
guaranteed. While the socially desirable response is measured by direct questioning
technique, the honest response is measured by indirect techniques. My analytic strategy
6

employs both types of techniques, making it possible to measure the magnitude of the
social desirability bias.
Indirect questioning techniques are specifically designed to offer respondents an
opportunity to answer truthfully without a fear of retribution. A list experiment or item
count technique (ICT), which is a type of indirect questioning technique, uses random
assignment of respondents to treatment and control groups(Miller, 1984). Both of groups
receive the same number of non-sensitive items, and the treatment group receives an extra
item of a sensitive nature. The respondents are asked to provide the number of items
they agree with. The estimated true proportion of respondents supporting the sensitive
item is computed as the difference between the average number of statements reported
by the treatment group and the average number of statements reported by the control
group.
Many studies have shown that ICT provides a reliable control of the social desir-
ability bias (Tsuchiya, 2005; Chaudhuri and Christofides, 2007; Glynn, 2013; Corstange,
2009; Imai, 2011; Green and Kern, 2012). Nonetheless, the technique has several estab-
lished limitations. For instance, Kiewiet and Nickerson (2014) illustrate that ICT can
provide extremely conservative estimates of high incidence behaviors; Glynn (2013) men-
tions its relative inefficiency and its failure to provide individual-level measures for the
sensitive item. Moreover, the anonymity condition can be violated due to a ceiling effect
(when all of the statements are chosen by a respondent) or a floor effect (when none of
the statements is chosen), which can be partly overcome by increasing the length of the
list (Tsuchiya et al., 2007; Holbrook and Krosnick, 2010a). While the core assumptions
of the technique hold, list experiments can generate valid estimates of social desirability
bias. However, violations of these assumptions can substantially undermine the validity
of obtained results.
In the present study I have conducted two list experiments designed to measure
genuine electoral preferences for Putin and voter turnout:
7

Here is the list of four/five assertions. Please, listen to them all and then tell
me how many you agree with. Do not tell me which assertion you agree or
disagree with, just give me the total estimate.
• I usually read at least one newspaper or magazine a week;
• I want to see Russia as a country with high-living standards;
• I can recall the name of the head of Russian Constitutional Court;
• I will vote [voted for] Vladimir Putin in the upcoming/most
recent Presidential elections (March 4);
• I am satisfied with the level of my income.
I agree with (number of assertions)
Here is the list of four/five assertions. Please, listen to them all and then tell
me how many you agree with. Do not tell me which assertion you agree or
disagree with, just give me the total estimate.
• My family has a car;
• I can recall the name of the head of the Federation Council;
• I watch TV daily;
• I’ll vote [I voted] in the upcoming/most recent Presidential
elections (March 4);
• The level of pension in our country is quite high.
I agree with (number of assertions)
Context
The Russian presidential campaign 2012 was given a jumpstart when then-President
Medvedev proposed then-Prime Minister Vladimir Putin run for a third term in the fall
2011. This pre-arranged move ignited widespread public discontent and set the tone for
both the upcoming parliamentary and presidential elections. Since numerous election
fraud allegations at the parliamentary elections held in December 2011 provoked the rise
of massive protests in Moscow and St. Petersburg, the Kremlin urgently launched a
series of reforms aimed to provide electoral transparency of the forthcoming presidential
elections, such as installation of transparent ballot boxes and web cameras in every
polling station across the country. Procedural transparency was overshadowed by the
incumbent’s excessive use of media and state resources. Some radio and television media
outlets allocated 90% of programming to favorable stories about Putin (OSCE, 2012).
In addition to this, the incumbent’s heavy reliance on the use of the state apparatus,
namely local political machines, enabled him to secure an electoral victory by using
a wide range of legal and illegal techniques (Kalinin and Mebane, 2013). Numerous
8

instances of electoral violations and election fraud, reported by election observers and
election forensics specialists, provide enough evidence to conclude that elections were far
from being clean and fair. For example, according to some of the studies, election fraud
amounted to 5% and 10% of Putin’s electoral support and turnout, respectively (Kalinin
and Shpilkin, 2012); other studies provide the estimated proportion of precincts with
the election fraud, about 40% (Klimek et al., 2012). Surprisingly, however, all national
pollsters demonstrated close proximity of the election forecasts (FOM: 58.7%, VCIOM:
59.9% , Levada-Center: 66.0%) to official statistics 63.6%.
Data
The fieldwork stage of the project was conducted over a period of two months between
early February and early April 2012. Three surveys have been collected by Levada-
Center (Omnibus/Courier Study, February 17-20 and 24-27; March 2012), and one by
the Demoscope (Russian Election Study, March-April 2012) with 1500-1600 respondents
sampled for each survey (Colton et al., 2014). The major characteristics of the surveys
can be found in Table A1 of the Appendix. First, the sampling design employed by
Levada-Center is typically utilized by the majority of national survey organizations. It
is based on a proportional stratified sampling with the selection of households completed
by the random route method and the selection of respondents by using quota sampling.
In contrast, Demoscope’s sample is based on the multistage probability sample with re-
spondents selected by the nearest birthday method. All the surveys encompass both
direct and indirect (ICT or list experiment) questions on Putin’s electoral support and
turnout, thus making an estimation of social desirability bias possible. The ICT exper-
iment was preceded by direct question asked 5-10 minutes earlier as in Droitcour et al.
(1991), because of concerns on the part of the pollsters about the unforeseen effects of
list experiments on the estimates derived from the direct question. Moreover, the ICT
experiment on turnout preceded the experiment on voting, being 5-6 questions apart
from the latter.
Table 1 contains a summary of weighted demographic characteristics across four
surveys. By and large, the collected data samples illustrate the absence of large differences
across key demographic indicators, with the exception of wealthy/poor and rural/urban
category for the post-electoral dataset. In order to simplify subsequent empirical analysis,
I resort to data pooling, first by producing pre-electoral and post-electoral datasets, and
second, by producing one single dataset from all of the data.
9

Table 1: Demographic Characteristics of Respondents from Four Surveys, in percentages
Survey 1 Survey 2 Survey 3 Survey 4 Survey 5Gender
Male 46.3 46.3 46.3 44.6 45.0Female 53.7 53.7 53.7 55.4 55.0Missing 0.0 0.0 0.0 0.0 0.0
Total 100.0 100.0 100.0 100.0 100.0Age
18-24 13.9 13.9 13.9 15.0 13.525-34 21.0 19.8 20.1 17.9 19.635-44 16.3 18.3 15.8 17.3 17.145-54 18.6 17.9 20.0 18.0 18.355-64 16.6 17.8 18.0 16.7 17.065-74 9.0 8.4 8.7 9.1 9.375 and older 4.5 3.9 3.5 6.0 5.2Missing 0.0 0.0 0.0 0.0 0.0
Total 100.0 100.0 100.0 100.0 100.0Education
High school 70.7 70.7 70.7 67.6 69.25College 29.3 29.3 29.3 31.6 30.61Missing 0.0 0.0 0.0 0.8 0.14
Total 100.0 100.0 100.0 100.0 100.0Well-being
Wealthy 21.4 26.1 26.0 14.4 21.5Poor 78.2 73.7 73.6 84.6 77.9Missing 0.4 0.2 0.4 1.0 0.6
Total 100.0 100.0 100.0 100.0 100.0Residence
Urban 51.4 51.1 50.0 70.0 55.7Rural 48.6 48.9 50.0 30.0 44.3Missing 0.0 0.0 0.0 0.0 0.0
Total 100.0 100.0 100.0 100.0 100.0Sample size 1601 1601 1633 1682 6517
Notes: Survey 1 – Levada(17-20 Feb.), Survey 2 – Levada(24-27 Feb.), Survey 3 – Lev-ada(March), Survey 4 – Demoscope(March-April), Survey 5 –Pooled data.
In both cases my data pooling has been justified by a statistical testing procedure
equivalent to a likelihood ratio test for the pooled and unpooled data samples. All the
missing values in the independent variables have been replaced with the medians or
10

means.
In their methodological study Blair and Imai (2012) list three identification as-
sumptions for an ICT to be met: a) randomization of the treatment, i.e. randomization
of respondents into the treatment and control groups; b) no design effect, i.e. the pres-
ence of the sensitive item in the list doesn’t affect the way the respondent thinks about
the control items; c) no liars, i.e. respondents share their truthful answers when asked
an ICT question. Any violation of these assumptions can potentially lead to the failure
of the list experiment, and thus distort the estimates. The overall quality of designed
experiments is assessed on the basis of whether all three assumptions were satisfied.
For determining the overall validity of the conducted ICT experiment, I test the
presence of any apparent violations in the key ICT assumptions, such as randomization of
treatment and the absence of liars. The randomization assumption is tested by regressing
treatment assignment on covariates using both pre-electoral and post-electoral datasets.
Almost all of the covariates are statistically insignificant, which is indicative of successful
randomization of the treatment (Table A3). However, it has been impossible to achieve
completely balanced treatment assignments. In both regressions one of the covariates
turns out to be statistically significant: “Sex” in the case of the pre-electoral dataset,
and “Wealth” in our post-electoral data. The assumption that the presence of floor and
ceiling effects compromises anonymity has been also satisfied. According to Table A4,
depicting the frequencies of item counts for voting and turnout, this problem has been
minimized by the proper pre-selection of non-sensitive items, which reduced the frequency
with which 0s and 5s appear in the data. Finally, since it is impossible to empirically
test the design effect assumption in my experimental setting, I am forced to make strong
assumption about the absence of design effect in my analysis.
Results
My initial findings with respect to the means for direct and indirect ICT self-reporting
(ICT) as well as the difference between them, i.e. social desirability bias (∆) and as-
sociated bootstrapped standard errors are presented in Table 2. One of the potential
challenges when using the ICT measures is the loss in efficiency of the estimator, i.e.
computed standard errors for the list experiment are four times larger than for the direct
self-report. In spite of this fact, the presence of a strong statistically significant social
desirability effect is observed in both pre-electoral and post-electoral settings. The differ-
ence in means estimator (DIM section of the table) shows the percentage of pre-electoral
support for Putin among the participants reaching 47.2%, with s.e. 4.2%, while the direct
11
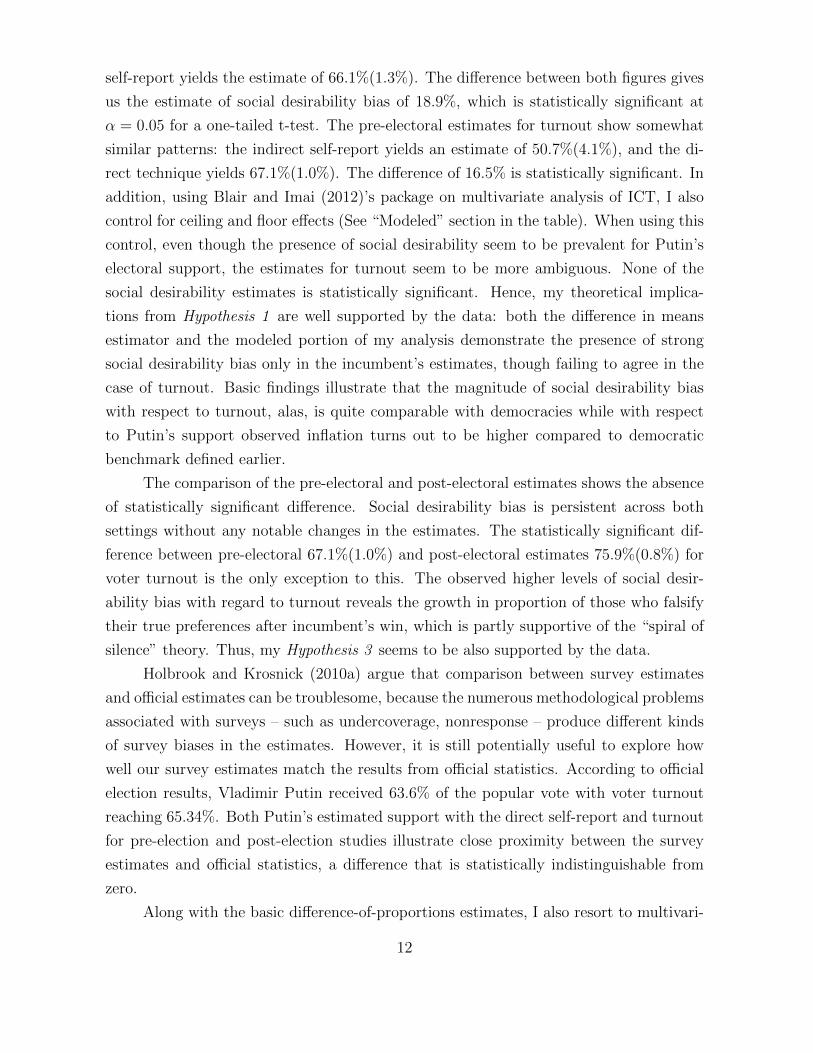
self-report yields the estimate of 66.1%(1.3%). The difference between both figures gives
us the estimate of social desirability bias of 18.9%, which is statistically significant at
α = 0.05 for a one-tailed t-test. The pre-electoral estimates for turnout show somewhat
similar patterns: the indirect self-report yields an estimate of 50.7%(4.1%), and the di-
rect technique yields 67.1%(1.0%). The difference of 16.5% is statistically significant. In
addition, using Blair and Imai (2012)’s package on multivariate analysis of ICT, I also
control for ceiling and floor effects (See “Modeled” section in the table). When using this
control, even though the presence of social desirability seem to be prevalent for Putin’s
electoral support, the estimates for turnout seem to be more ambiguous. None of the
social desirability estimates is statistically significant. Hence, my theoretical implica-
tions from Hypothesis 1 are well supported by the data: both the difference in means
estimator and the modeled portion of my analysis demonstrate the presence of strong
social desirability bias only in the incumbent’s estimates, though failing to agree in the
case of turnout. Basic findings illustrate that the magnitude of social desirability bias
with respect to turnout, alas, is quite comparable with democracies while with respect
to Putin’s support observed inflation turns out to be higher compared to democratic
benchmark defined earlier.
The comparison of the pre-electoral and post-electoral estimates shows the absence
of statistically significant difference. Social desirability bias is persistent across both
settings without any notable changes in the estimates. The statistically significant dif-
ference between pre-electoral 67.1%(1.0%) and post-electoral estimates 75.9%(0.8%) for
voter turnout is the only exception to this. The observed higher levels of social desir-
ability bias with regard to turnout reveals the growth in proportion of those who falsify
their true preferences after incumbent’s win, which is partly supportive of the “spiral of
silence” theory. Thus, my Hypothesis 3 seems to be also supported by the data.
Holbrook and Krosnick (2010a) argue that comparison between survey estimates
and official estimates can be troublesome, because the numerous methodological problems
associated with surveys – such as undercoverage, nonresponse – produce different kinds
of survey biases in the estimates. However, it is still potentially useful to explore how
well our survey estimates match the results from official statistics. According to official
election results, Vladimir Putin received 63.6% of the popular vote with voter turnout
reaching 65.34%. Both Putin’s estimated support with the direct self-report and turnout
for pre-election and post-election studies illustrate close proximity between the survey
estimates and official statistics, a difference that is statistically indistinguishable from
zero.
Along with the basic difference-of-proportions estimates, I also resort to multivari-
12

Table 2: Electoral Support using Direct and Indirect Self-report (percent)
Pre-electoral period Post-electoral period
DIM
direct indirect ∆ direct indirect ∆Incumbent(All) 45.3 28.5 16.8 47.8 34.6 13.2
(1.1) (3.7) (3.7) (0.9) (3.2) (3.2)Incumbent(Voted) 66.1 47.2 18.9 68.8 52.1 16.7
(1.3) (4.2) (4.3) (1.0) (3.4) (3.6)Turnout(All) 67.1 50.7 16.4 75.9 55.3 20.6
(1.0) (4.1) (4.0) (0.8) (3.7) (3.7)
Modeled
Incumbent(All) 67.1 42.2 24.9 68.6 36.7 31.9(6.5) (16.3) (16.2) (7.9) (16.0) (11.5)
Turnout(All) 72.9 64.7 8.2 75.6 72.6 3.0(6.4) (24.5) (19.5) (10.7) (24.5) (15.3)
Sample size 3202 3315
Notes: DIM – estimates computed with standard difference in means estimator(weighted); Modeled – estimates computed using multivariate regression analysis withlist() package. Incumbent(All) – percentage of Putin’s supporters among all respondents;Incumbent(Voted) – percentage of Putin’s supporters among those who intend to vote[voted]; Turnout – percentage of those who will vote [voted]. Monte Carlo standarderrors are in parentheses. According to official election results, Putin received 63.6% ofthe popular vote, turnout reached 65.34%.
ate analysis to test the hypotheses about the levels of bias across different subgroups. This
is done by regressing the answers to the direct questions on the set of socio-demographic
covariates using the binary logit, as well as regressing the answers to the list experiment
on assignment to the treatment condition, the set of socio-demographic covariates, and
interactions between assignment and these covariates (Holbrook and Krosnick, 2010a;
Kiewiet, 2015). I further implement the list-experiment models using the Blair and Imai
(2012) maximum likelihood estimator, which enables me to obtain more efficient esti-
mates of the social desirability bias. The set of predictors included in the model is as
follows: sex, age, education, a measure of subjective well-being of an individual (also
termed as wealth or rich vs. poor in the text) and type of residence (rural/urban).
Table 3 illustrates the estimated treatment effect (Treatment) in bold, i.e. the
magnitude of social desirability bias (∆) after the inclusion of demographic regressors and
interaction terms. The Models 2 and 6 based on the list experiment show the estimated
share of genuine support for the incumbent reaching 0.31(0.18) before the elections, and
0.42(0.18) after the elections; as far as turnout is concerned, the estimates for models 4,
8 are 0.43(0.19) and −0.19(0.19), respectively.
13

Tab
le3:
Eff
ects
ofD
emog
raphic
Var
iable
son
Incu
mb
ent’
sE
lect
oral
Supp
ort
and
Turn
out
Am
ong
All
Res
pon
den
ts(w
eigh
ted)
Pre
-ele
ctor
alp
erio
d(F
ebru
ary,
2012
)P
ost-
elec
tora
lp
erio
d(M
arch
-Apri
l,20
12)
(1)
(2)
(3)
(4)
(5)
(6)
(7)
(8)
Inte
rcep
t1.
363?
??
0.70
6???
-0.1
270.
886?
??
1.99
9???
0.77
7???
−1.
351?
??
1.22
0???
(0.3
76)
(0.1
25)
(0.3
76)
(0.1
33)
(0.4
23)
(0.1
25)
(0.4
23)
(0.1
33)
Treatm
ent
0.314?
0.432??
0.424??
-0.194
(0.176)
(0.188)
(0.178)
(0.191)
Sex
−0.
520?
??
0.00
1-0
.105
0.02
4−
0.47
4???
0.09
6??
-0.1
700.
139?
??
(0.1
25)
(0.0
42)
(0.1
25)
(0.0
44)
(0.1
32)
(0.0
42)
(0.1
32)
(0.0
45)
Age
−0.
008?
?0.
006?
??
0.01
9???
-0.0
010.
002
0.00
7???
0.03
4???
0.00
1(0
.004
)(0
.001
)(0
.004
)(0
.001
)(0
.004
)(0
.001
)(0
.004
)(0
.001
)E
duca
tion
−0.
105?
0.05
9???
-0.0
400.
088?
??
−0.
197?
??
0.08
9???
0.19
9???
0.06
2???
(0.0
63)
(0.0
21)
(0.0
63)
(0.0
22)
(0.0
69)
(0.0
21)
(0.0
69)
(0.0
23)
Wea
lth
0.09
40.
162?
??
0.10
10.
186?
??
-0.0
420.
090?
??
0.20
6???
0.08
4???
(0.0
75)
(0.0
25)
(0.0
75)
(0.0
27)
(0.0
78)
(0.0
24)
(0.0
78)
(0.0
26)
Urb
an-0
.184
−0.
089?
?-0
.164
-0.0
49−
0.35
5??
-0.0
34−
0.39
4??
-0.0
33(0
.130
)(0
.043
)(0
.130
)(0
.046
)(0
.137
)(0
.043
)(0
.137
)(0
.046
)T
reat
men
t:Sex
-0.0
520.
005
−0.
154?
??
-0.0
89(0
.059
)(0
.063
)(0
.059
)(0
.064
)T
reat
men
t:A
ge0.
002
0.00
30.
002
0.00
5??
(0.0
02)
(0.0
02)
(0.0
02)
(0.0
02)
Tre
atm
ent:
Educa
tion
0.02
00.
006
-0.0
140.
095?
??
(0.0
30)
(0.0
31)
(0.0
29)
(0.0
32)
Tre
atm
ent:
Wea
lth
-0.0
40-0
.029
0.04
30.
110?
??
(0.0
36)
(0.0
38)
(0.0
34)
(0.0
36)
Tre
atm
ent:
Urb
an0.
050
0.04
0-0
.196
−0.
180?
??
(0.0
61)
(0.0
65)
(0.0
60)
(0.0
65)
Nsa
mple
2478
3130
2478
3134
2268
3260
2268
3260
Notes:
Sig
nifi
can
cele
vels
:?p≤
0.1,
??p≤
0.0
5,???p≤
0.01
.Models:
(1),
(5)
–d
irec
tse
lf-r
eport
for
voti
ng;
(2),
(6)
–in
dir
ect
self
-rep
ort
for
voti
ng;
(3),
(7)
–d
irec
tse
lf-r
epor
tfo
rtu
rnou
t;(4
),(8
)–
ind
irec
tse
lf-r
epor
tfo
rtu
rnou
t.
14

Although the regression results exhibit the failure of post-electoral estimates to
demonstrate statistical significance, in general, this analysis provides us with a more
solid evidence about the presence of social desirability bias by controlling for socio-
demographic imbalances between our two groups.
More importantly, Table 3 also displays socio-demographic profile of Putin’s sup-
porters. Specifically, when all other variables are held constant at their mean values for
both pre- and post-electoral models, the probability of Putin’s direct support increases if
the respondent is a woman, younger and less educated. Putin’s indirect support, however,
shows quite different patterns. Individuals most likely to vote for Putin are older, better
educated, wealthier, living in rural areas. Regarding turnout, the post-electoral surveys
indicate that respondents most likely to vote are older, better educated, wealthier and
live in rural areas; participation measured by indirect technique indicates that women,
better educated and wealthy individuals are most likely to attend elections.
Since the OLS estimates can be inefficient when dealing with the list experiments,
I also apply an alternative estimation procedure using Blair and Imai (2012)’s linear and
non-linear least square estimators as well as two models using a maximum likelihood
estimators. My findings from this auxiliary analysis demonstrate moderate consistency
in the direction of the demographic effects between the direct and indirect questions (See
Table A5 in Appendix).
In order to make the results more readily interpretable, in the next stage I re-
sort to computation individual-level measures of social desirability bias by finding the
differences in predicted probabilities for direct (the binary logit model) and indirect re-
sponses(maximum likelihood estimator, as suggested by Blair and Imai (2012)). All
measures have been aggregated up to the level of social groups by computing corre-
sponding means and standard errors. Figures 1(a,b) depict the means as filled circles
and 95% confidence intervals as solid lines for all three computed measures. The direc-
tion of social desirability bias is marked as upper/lower triangle characters, depending on
the sign of obtained bias. The estimates of bias for each subgroups can be found in the
Appendix (Table A6). Figure 1(a) illustrates that almost all of the estimated proportions
are bounded between zero and one (with the exception of the rich category), which is
consistent with our expectations. Specifically, Putin’s public support is in line with the
previous work, indicating that he is more likely to be publicly supported by richer than
poorer, rural than urban residents (Rose et al., 2011).
Indeed, the social desirability bias is not evenly distributed across the sample pop-
ulation. All social groups demonstrate high and statistically significant levels of social
desirability bias in the direction predicted by one of the alternative theories: the rich,
15

Figure 1: Estimated Proportions for Voting and Turnout by Subgroups
Est
imat
ed P
ropo
rtio
n ●
●
●
●
●
●
●
●
●
●
●
●
●
●
●
●
●
●
●
●
Age
(<=
35)
Age
(>=
60)
Mal
e
Fem
ale
Edu
catio
n(L)
Edu
catio
n(H
)
Urb
an
Rur
al
Poo
r
Ric
h
−0.
8−
0.5
−0.
20.
10.
40.
71.
01.
3
directindirectdifference
(a)E
stim
ated
Pro
port
ion
●
●
●●
●
●
●
●
●
● ●
●
●
●
●
●●
●
●
●
Age
(<=
35)
Age
(>=
60)
Mal
e
Fem
ale
Edu
catio
n(L)
Edu
catio
n(H
)
Urb
an
Rur
al
Poo
r
Ric
h
−0.
8−
0.5
−0.
20.
10.
40.
71.
01.
3
directindirectdifference
(b)
young and female demonstrate the highest values of social desirability bias while the
poor, old, uneducated demonstrate the lowest. The younger age group is likely to inflate
their electoral support of Putin by 22%, and the old, by 17%. Men are likely to falsify
incumbent support by about 19%, and women, by 21%. Those with higher education
contribute to inflation by about 20%, and those with lower education, by about 18%.
The poor seem to be least biased overreporting at only 13%, while the rich are the most
biased, inflating support by 31%. Finally, a small and insignificant distinction in the
levels of the social desirability bias is observed between urban and rural residents. Fig-
ure 1(b) representing turnout depicts less statistically significant effects. Specifically, for
young cohorts, the estimated bias is 18%; for men, 17%; for urban residents, 14%; and
finally, no visible distinction between groups is observed for education and well-being.
Since for Putin’s electoral support, the likely voters – women, rural residents and the rich
– seem to demonstrate maximum (although not statistically significant) bias, hypothesis
H2.2 is better confirmed than H2.1, derived from the Noelle-Neumann’s theory.
In order to gain greater confidence in the result of the list experiment, I refer to an
additional external validity check by utilizing an urns experiment, organized by one of the
national pollsters (VCIOM) prior to the 2012 elections. The experiment is a street survey
based on non-probability sampling design: on the first day a randomly chosen respondent
is directly asked by the interviewer about her electoral preferences, while on the second
day a randomly chosen respondent fills out a questionnaire by herself and drops it into
16

an urn, thus ensuring anonymity of response. The geography of the experiment included
four Russian regions (Moscow, St.Petersburg, Sverdlovskiy region and Altaiskii region),
each containing four primary sampling units. The declared response rate is in the range
of 54-68%.
Table 4: External Validity Check of Putin’s electoral support (rounded percentages)
Urns Experiment ICT ExperimentRegions Official Means Mean differences Model-based
Direct Indirect Direct Indirect Direct IndirectMoscow 47 56 51 46 42 49 61
(52; 60) (49; 53) (29; 62) (25; 58) (30; 68) (31; 90)St.Petersburg 59 64 51 59 36 67 63
(61; 67) (48, 54) (34; 85) (11; 62) (38; 97) (35; 90)Altaiskii region 57 50 44 63 57 67 95
(48, 52) (42, 46) (33; 92) (28; 87) (48; 85) (63; 129)Sverdlovskii region 65 72 59 52 13 62 88
(70; 74) (57; 61) (8; 96) (-31; 57) (36; 87) (26; 151)
Notes: Numbers in parentheses are 95% confidence intervals. Sample sizes for the urns experi-ment: Moscow(direct: 675, indirect: 2283) St.Petersburg(direct: 1284, indirect: 927), Altaiskiiregion(direct: 2299, indirect: 2208), Sverdlovskii region (direct: 2346, indirect: 1578). Samplesizes for the pooled dataset: Moscow(direct: 346, indirect: 534), St.Petersburg(direct: 146, indi-rect: 218), Altaiskii region(direct: 146, indirect: 205), Sverdlovskii region (direct: 68, indirect:105).
The results of this analysis are presented in Table 4. The mean estimates for
indirect self-reporting between the urns experiment and ICT mean differences are con-
sistently lower than for direct self-reporting, which is supportive of my earlier findings.
Moreover, in the urns experiments, in three regions out four, observed differences are
statistically significant. In contrast, the model-based estimates show greater levels of
bias and inefficiency. While the official results seem to lie outside of the confidence in-
tervals built for direct estimates in VCIOM’s experiment, the confidence intervals built
for direct estimates from my surveys illustrate the absence of any significant difference.
Unfortunately, wide confidence intervals for direct and indirect self-reporting in the case
of ICT, prevent us from making stronger conclusions regarding the presence of social
desirability bias. However, the estimates based on the mean differences formula seem
to largely agree with VCIOM’s: almost all of the confidence intervals for the ICT-based
measures overlap with the confidence intervals computed for the urns. Thus, the results
from the urns experiment support my main findings from the list experiments.
17

Conclusion
A study of social desirability bias in authoritarian regimes helps to structure and recon-
cile many of the diverse arguments and contradictory interpretations about the role of
survey research in the electoral politics in those regimes. Even though the majority of
the previous research has been focused on understanding the sources of misprediction of
electoral outcomes by pollsters, oftentimes due to the inflationary or deflationary effects
of the social desirability bias (Bischoping and Schuma, 1992; Bodor, 2012), this research
has taken a different approach by originating from a striking observation that the election
polls in authoritarian regimes are accurate even though the validity of official results is
seriously questioned by the presence of blatant election fraud. In this case, the observed
close congruence between the figures of official electoral support and the polling esti-
mates can contribute to well-grounded suspicions concerning the compromised quality of
election polls.
Based on anecdotal evidence from election observers and extensive scholarly re-
search on this topic, this paper argues that in the 2012 Russian presidential elections
the estimates released by Russian national polling organizations contain a substantial
degree of inflationary bias with respect to Putin’s electoral support and voter turnout,
which has been persistent throughout the electoral campaign. While the fact that the
magnitude of the social desirability bias in turnout is comparable to that in democracies
jeopardizes my findings with regard to the “spiral of silence” explanation, the inflation of
Putin’s electoral support seems to be excessive. The results of the multivariate regression
analysis are supportive of my theory. The estimated prevalence of the social desirability
bias with respect to the incumbent’s electoral support reaches at most 20%, which is
consistently supported by the difference-in-means as well model-based estimators. While
the magnitude of observed inflation can be suggestive of the comparable level of election
fraud performed by election administrators, the estimated inflationary bias once com-
pared with the democratic benchmark for incumbents would provide us with an even
more conservative estimate of 7%. The latter figure is seem to be supported by election
forensics researchers.
My analysis demonstrates that the distribution of the social desirability bias is not
even across the sample population, yet all social groups demonstrate high and statistically
significant levels of social desirability bias in direction predicted by the theory. With
regard to Putin’s support, the rich, the young and women demonstrate the highest values
of social desirability bias. The social desirability estimates for turnout exhibit somewhat
weaker findings: the rich, men and urban residents contribute to most inflation.
18

Hence, this paper by addressing theoretical implications from Noelle-Neumann’s
seminal work on the “spiral of silence” has partly shown that when an individual feels
unsafe about expressing ideas contrary to official policy or having a fear of isolation,
she will most likely hide her private preferences in favor of an incumbent she thinks is
most accepted by the general public. My theory suggests that the social desirability bias,
inflating the autocrat’s support, can be viewed as a valuable source of manipulation: with
the “spiral of silence” being effectively installed, the general public can remain loyal and
election fraud preserved at levels necessary to match the inflationary gap. If, however,
the autocrat fails to prove the match, that might contribute to informational shock
among the voters and could potentially trigger an unfavorable outcome for the autocrat.
The regularly observed discrepancy by electoral officials between pre-electoral polls and
genuine electoral preferences helps to mobilize the local elites and test the efficiency of
their local political machines. The observed inflation in election ratings forces election
administrators by hook or by crook to deliver the results predicted by polls, in order to
match the outcome desired by the autocrat.
While this research reveals the presence of significant social desirability bias in the
Russian public opinion polls, on a broader scale, it poses the problem of the persistence
of biased responses and survey errors in authoritarian regimes for a large number of
politically sensitive questions. My basic findings are also supported by an alternative urns
experiment conducted during the period of the study, providing us with more concrete
evidence of the vulnerability of electoral polling in authoritarian regimes.
19
References
Leslie Anderson. Neutrality and Bias in the 1990 Nicaraguan Preelection Polls: A Com-
ment on Bischoping and Schuman. American Journal of Political Science, 38(2):486–
494, 1994.
Lonna Rae Atkeson. “Sure, I Voted For the Winner!” Overreport of the Primary Vote
for the Party Nominee in the National Election Studies. Political Behavior, 21(3),
1999.
Robert F. Belli, Michael W. Traugott, and Matthew N. Beckmann. What Leads to
Voting Overreports? Contrasts of Overreporters to Validated Voters and Admitted
Nonvoters in the American National Election Studies. Journal of Official Statistics, 4
(17):479–498, 2001.
Ulises Beltran and Marcos Valdivia. Accuracy and Error in Electoral Forecasts: The Case
of Mexico. International Journal of Public Opinion Research, 11(2):115–134, 1999.
Robert Bernstein, Anita Chadha, and Robert Montjoy. Overreporting Voting: Why It
Happens and Why It Matters. The Public Opinion Quarterly, 65(1):22–44, 2001.
Katherine Bischoping and Howard Schuma. Pens and Polls in Nicaragua: An Analysis of
the 1990 Preelection Surveys. American Journal of Political Science, 36:331–50, 1992.
Graeme Blair and Kosuke Imai. Statistical Analysis of List Experiments. Political Anal-
ysis, 20(1):47–77, 2012.
Tamas Bodor. Hungary’s ”Black Sunday” of Public Opinion Research: The Anotamy of
a Failed Election Forecast. International Journal of Public Opinion Research, 24(4):
450–471, 2012.
Arijit Chaudhuri and Tasos C. Christofides. Item Count Technique is Estimating the Pro-
portion of People with Sensitive Feature. Journal of Statistical Planning and Inference,
(137):589–593, 2007.
Timothy J. Colton, Henry E. Hale, Mikhail Kosolapov, Elena Tonis, and
Anna Prudnikova. Russian post-presidential election survey in 2012. Tech-
nical report, Harvard University, 2014. http://dx.doi.org/10.7910/DVN/24202
UNF:5:QgdZMJsagudKfmUflZSmdA== Harvard Dataverse Network [Distributor] V1
[Version].
20

Mircea Comsa and Camil Postelnicu. Measuring Social Desirability Effects on Self-
Reported Turnout Using the Item Count Technique. International Journal of Public
Opinion Research, 2012. doi:10.1093/ijpor/eds019.
Daniel Corstange. Sensitive Questions, Truthful Answers? Modeling the List Experiment
Multivariately with LISTIT. Political Analysis, 17:45–63, 2009.
Judith Droitcour, Rachel A. Caspar, Michael L. Hubbard, Teresa L. Parsley, Wedy Viss-
cher, and Trena M. Ezzati. The Item Count Technique as a Method of Indirect Ques-
tioning: A Review of Its Development and a Case Study Application. In Paul Biemer,
Robert M. Groves, Lars E. Lyberg, Nancy A. Mathiowetz, and Seymour Sudman,
editors, Measurement Errors in Surveys. John Wiley & Sons, New York,, 1991.
Georgy Egorov, Sergei Guriev, and Konstantin Sonin. Why Resource-poor Dictators
Allow Freer Media: A Theory and Evidence from Panel Data. American Political
Science Review, 103(4):645–668, 2009.
Ruben Enikolopov, Vasily Korovkin, Maria Petrova, Konstantin Sonin, and Alexei Za-
kharov. Field Experiment Estimate of Electoral Fraud in Russian Parliamentary Elec-
tions. Proceedings of the National Academy of Sciences of the United States of America,
110(2):448452, 2013.
Barbara Geddes and John Zaller. Sources of Popular Support for Authoritarian Regimes.
American Journal of Political Science, 33(2):319–347, 1989.
Adam N. Glynn. What Can We Learn With Statistical Truth Serum? Design and
Analysis of the List Experiment and Analysis of the List Experiment. Public Opinion
Quarterly, (77):159–172, 2013.
Ezequiel Gonzalez-Ocantos, Chad Kiewiet de Jonge, Carlos Melendez, Javier Osorio, and
David Nickerson. Vote Buying and Social Desirability Bias: Experimental Evidence
from Nicaragua. American Journal of Political Science, 56(1):202217, 2011.
Donald P. Green and Holger L. Kern. Modeling Heterogeneous Treatment Effects in Sur-
vey Experiments with Bayesian Additive Regression Trees. Public Opinion Quarterly,
(76):491–511, 2012.
Allyson Holbrook and Jon A. Krosnick. Social Desirability Bias in Voter Turnout Re-
ports: Tests Using the Item Count Technique. Public Opinion Quarterly, 74(1):36–67,
2010a.
21

Allyson Holbrook and Jon A. Krosnick. Measuring Voter Turnout by Using the Ran-
domized Response Technique: Evidence Calling into Question the Method’s Validity.
Public Opinion Quarterly, 74(2):328–343, 2010b.
Kosuke Imai. Multivariate Regression Analysis for the Item Count Technique. Journal
of the American Statistical Association, 106(494):407–416, 2011.
Kirill Kalinin and Walter Mebane. Understanding Electoral Frauds through Evolution
of Russian Federalism: the Emergence of Signaling Loyalty. Paper prepared for the
Annual Meeting of Midwest Political Science Association, Chicago., March 2013.
Kirill Kalinin and Sergey Shpilkin. Kompleksnaya diagnostika falsifikatcii na
rossiskih prezidentskih vyborah 2012 g. online, 3 2012. URL http://trv-
science.ru/2012/03/27/shpilkin-kalinin/.
Stan Kaplowitz and Vladimir Shlapentokh. Possible Falsification of Survey Data: An
Analysis of a Mail Survey in the Soviet Union. The Public Opinion Quarterly, 46(1):
1–23, 1982.
Jeffrey A. Karp and David Brockington. Social Desirability and Response Validity: A
Comparative Analysis of Overreporting Voter Turnout in Five Countries. The Journal
of Politics, 67(3):825–840, 2005.
Chad P. Kiewiet. Who Lies About Electoral Gifts? Experimental Evidence From Latin
America. Public Opinion Quarterly, 2015. doi: doi:10.1093/poq/nfv024.
Chad P. Kiewiet and David W. Nickerson. Artificial Inflation or Deflation? Assessing the
Item Count Technique in Comparative Surveys. Political Behavior, 36:659682, 2014.
Peter Klimek, Yuri Yegorov, Rudolf Hanel, and Stefan Thurner. Statistical Detection of
Systematic Election Irregularities. Proceedings of the National Academy of Sciences of
the United States of America, 109(41):16469–16473, 2012.
Timur Kuran. Now Out of Never: The Element of Surprise in the East European Revo-
lution of 1989. World Politics, 44:7–48, 1991.
Franco Mattei. Winning at the Polls and in the Polls: the Incumbency Advantage in
Surveys of U.S. House Voters. Electoral Studies, 17(4), 1998. doi: 10.1016/S0261-
3794(98)00012-2.
Judith Miller. A New Survey Technique for Studying Deviant Behavior. PhD thesis, The
George Washington University, 1984.
22

Elisabeth Noelle-Neumann. The Spiral of Silence. A Theory of Public Opinion – Our
Social Skin. University of Chicago Press, 1984.
OSCE. Election Observation Mission Final Report: Russian Presidential Election 4
March 2012. Technical report, OSCE, 2012.
Jiri Otava. Public Opinion Research in Czechoslovakia. Social Research, 55:249, Spring-
Summer 1988.
Stanley Presser. Can Changes in Context Reduce Vote Overreporting in Surveys? Public
Opinion Quarterly, 54:586–593, 1990.
Richard Rose, William Mishler, and Neil Munro. Popular Support for An Undemocratic
Regime: the Changing Views of Russians. Cambridge University Press,, Cambridge,
New York, 2011.
Sergei Shpilkin. Statistika issledovala vybory, 2011. URL
http://www.gazeta.ru/science/2011/12/10 a 3922390.shtml.
Karin Sieger. Opinion Research in East Germany: A Challenge to Professional Standards.
International Journal of Public Opinion Research, 2(4):323–344, 1990.
Brian D. Silver, Barbara A. Anderson, and Paul R. Abramson. Who Overreports Voting?
American Political Science Review, 80(2):613–624, 1986.
Alberto Simpser. Why Governments and Parties Manipulate Elections. Cambridge Uni-
versity Press, 2013.
Matthew J. Streb, Barbara Burrel, Brian Frederick, and Michael A. Genovese. Social
Desirability Effects and Support for a Female American President. Public Opinion
Quarterly, (72):76–89, 2008.
Roger Tourangeau, Lance J. Rips, and Kenneth Rasinski. The Psychology of Survey
Response. Cambridge University Press, 2000.
Michael W. Traugott. 37 Validation Studies, pages 408–417. SAGE Publications Ltd, 0
edition, 2008. doi: http://dx.doi.org/10.4135/9781848607910.
Takashiro Tsuchiya. Domain Estimators of the Item Count Technique. Survey Method-
ology, 1(31):41–51, 2005.
Takashiro Tsuchiya, Yoko Kirai, and Shigeru Ono. A Study of the Properties of the Item
Count Technique. Public Opinion Quarterly, (71):253–272, 2007.
23

Kieith Weghorst. Political Attitudes and Response Bias in Semi-Democratic Regimes:
A Survey Experiment Comparing the List Experiment and Randomized Response in
Tanzania. Working Paper, May 2011.
Ronald Wintrobe. The political economy of dictatorship. Cambridge University Press,
Cambridge, UK; New York, NY, 1998.
Gerald C. Wright. Errors in Measuring Vote Choice in the National Election Studies,
1952-88. American Journal of Political Science, (37):291–316, 1993.
24

A Online Appendix: Tables and Figures
Table A1: Characteristics of the Surveys
Sampling Mode RR RR* WeightsLevada-Center (Feb.17-20) Quota Face-to-Face — — PostratificationLevada-Center (Feb.24-27) Quota Face-to-Face — — PostratificationLevada-Center (March) Quota Face-to-Face — — PostratificationDemoscope (March-April) Multi-stage prob. Face-to-Face 35.8 42.1 Postratification
Notes: Sampling frame wasn’t not available for any of the surveys. RR – response rate, RR* – refusalrate.
Table A2: Variable Codings
Variables Type CodingDirect Putin dummy 1 – voted for Putin; 0 – voted for another candidateDirect Turnout dummy 1 – participated; 0 – didn’t participateIndirect Putin categorical list experiment (0-5)Indirect Turnout categorical list experiment (0-5)Sex dummy 1 – male, 0 – femaleAge interval 18-96Education categorical 1 – low education, 5 – high educationWealth categorical 1 – poor, 6 – richUrban categorical 1 – urban residence , 0 – rural residence
25
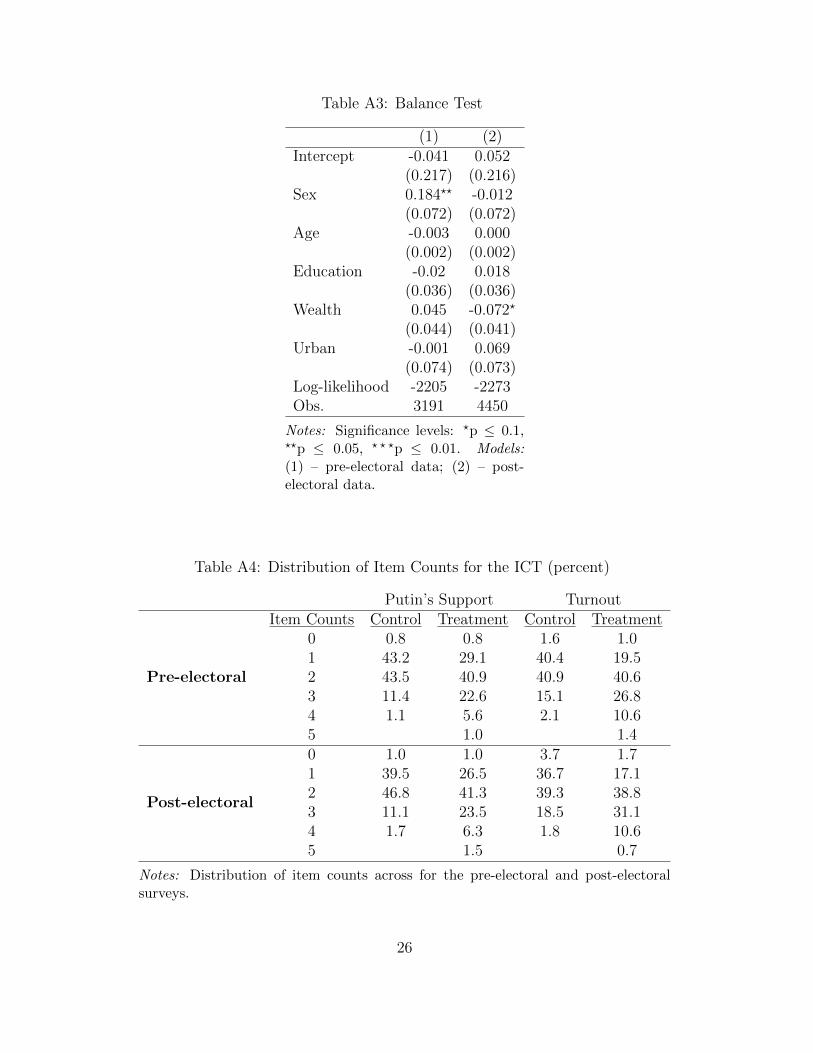
Table A3: Balance Test
(1) (2)Intercept -0.041 0.052
(0.217) (0.216)Sex 0.184?? -0.012
(0.072) (0.072)Age -0.003 0.000
(0.002) (0.002)Education -0.02 0.018
(0.036) (0.036)Wealth 0.045 -0.072?
(0.044) (0.041)Urban -0.001 0.069
(0.074) (0.073)Log-likelihood -2205 -2273Obs. 3191 4450
Notes: Significance levels: ?p ≤ 0.1,??p ≤ 0.05, ? ? ?p ≤ 0.01. Models:(1) – pre-electoral data; (2) – post-electoral data.
Table A4: Distribution of Item Counts for the ICT (percent)
Putin’s Support TurnoutItem Counts Control Treatment Control Treatment
Pre-electoral
0 0.8 0.8 1.6 1.01 43.2 29.1 40.4 19.52 43.5 40.9 40.9 40.63 11.4 22.6 15.1 26.84 1.1 5.6 2.1 10.65 1.0 1.4
Post-electoral
0 1.0 1.0 3.7 1.71 39.5 26.5 36.7 17.12 46.8 41.3 39.3 38.83 11.1 23.5 18.5 31.14 1.7 6.3 1.8 10.65 1.5 0.7
Notes: Distribution of item counts across for the pre-electoral and post-electoralsurveys.
26

Tab
leA
5:E
ffec
tsof
Dem
ogra
phy
onIn
cum
ben
t’s
Supp
ort
and
Turn
out
Am
ong
All
Res
pon
den
ts(l
ist
pac
kage
)
Puti
n’s
Supp
ort
Turn
out
(1)
(2)
(3)
(4)
(5)
(6)
(7)
(8)
Pre
Inte
rcep
t0.
360?
?-0
.534
1.13
51.
167
0.41
3??
-0.3
22-0
.402
0.90
4(0
.173
)(0
.739
)(1
.612
)(1
.224
)(0
.188
)(0
.768
)(1
.409
)(1
.202
)Sex
-0.0
50-0
.209
-0.7
85-0
.196
-0.0
22-0
.100
0.15
9-0
.015
(0.0
59)
(0.2
50)
(0.5
30)
(0.3
85)
(0.0
62)
(0.2
55)
(0.4
85)
(0.4
06)
Age
0.00
10.
006
0.00
40.
000
0.00
30.
015
0.07
5???
0.04
7???
(0.0
02)
(0.0
08)
(0.0
16)
(0.0
13)
(0.0
02)
(0.0
08)
(0.0
19)
(0.0
15)
Educa
tion
0.02
50.
105
0.22
0-0
.047
0.01
50.
058
-0.2
320.
042
(0.0
29)
(0.1
24)
(0.3
02)
(0.2
09)
(0.0
30)
(0.1
25)
(0.2
41)
(0.2
20)
Wea
lth
-0.0
42-0
.178
−0.
697?
??
-0.3
61-0
.025
-0.1
11-0
.437
-0.8
31???
(0.0
36)
(0.1
53)
(0.2
61)
(0.2
45)
(0.0
38)
(0.1
56)
(0.2
77)
(0.2
84)
Urb
an0.
034
0.10
3-0
.094
0.30
50.
012
0.04
20.
254
0.00
1(0
.060
)(0
.257
)(0
.550
)(0
.427
)(0
.065
)(0
.267
)(0
.505
)(0
.414
)S
ampl
eS
ize
3202
3202
Post
Inte
rcep
t0.
348?
-0.6
25-0
.839
0.28
8-0
.051
−2.
408?
??
−3.
351?
?−
3.31
6???
(0.1
84)
(0.8
04)
(1.6
20)
(1.1
55)
(0.1
90)
(0.8
96)
(1.4
91)
(1.3
38)
Sex
−0.
115?
−0.
489?
-0.7
78-0
.435
-0.0
94-0
.432
−1.
391?
??
−1.
272?
??
(0.0
61)
(0.2
68)
(0.5
14)
(0.3
98)
(0.0
65)
(0.2
91)
(0.5
02)
(0.4
24)
Age
0.00
20.
010
0.01
40.
005
0.00
4??
0.01
9??
0.06
3???
0.04
2???
(0.0
02)
(0.0
08)
(0.0
16)
(0.0
12)
(0.0
02)
(0.0
09)
(0.0
16)
(0.0
13)
Educa
tion
-0.0
07-0
.023
-0.0
16-0
.056
0.08
2??
0.34
8??
0.42
4?0.
403?
?
(0.0
31)
(0.1
32)
(0.2
64)
(0.1
91)
(0.0
32)
(0.1
48)
(0.2
50)
(0.1
89)
Wea
lth
0.03
70.
145
0.24
00.
020
0.09
5???
0.43
5??
0.59
0??
0.60
6??
(0.0
37)
(0.1
61)
(0.2
97)
(0.2
18)
(0.0
36)
(0.1
75)
(0.2
83)
(0.2
46)
Urb
an−
0.13
7??
−0.
579?
?−
1.13
6??
-0.5
00−
0.20
2???
−0.
883?
??
−1.
562?
??
−1.
116?
??
(0.0
62)
(0.2
64)
(0.5
36)
(0.3
89)
(0.0
66)
(0.3
11)
(0.5
68)
(0.4
42)
Sam
ple
Siz
e31
8831
88
Notes:
Sig
nifi
can
cele
vels
:?p≤
0.1,
??p≤
0.05
,???p≤
0.01
.Models:
(1),
(5)
–li
nea
rm
od
el,
(2),
(6)
–n
on
lin
ear
mod
el,
(3),
(7)
–M
LE
mod
el(c
onst
rain
ed),
(4),
(8)
–M
LE
mod
el(u
nco
nst
rain
ed).
27

Table A6: Social Desirability Bias By Subgroups
Electoral Support Turnoutdirect indirect ∆ direct indirect ∆
Age(<=35) 0.671??? 0.452??? 0.219??? 0.653??? 0.47??? 0.183???
(0.067) (0.058) (0.037) (0.052) (0.098) (0.051)Age(>=60) 0.697??? 0.531??? 0.166??? 0.85??? 0.801??? 0.049
(0.067) (0.059) (0.032) (0.029) (0.061) (0.035)Male 0.615??? 0.426??? 0.189??? 0.717??? 0.547??? 0.169??
(0.038) (0.041) (0.04) (0.085) (0.141) (0.059)Female 0.729??? 0.522??? 0.207??? 0.764??? 0.677??? 0.087
(0.032) (0.043) (0.038) (0.077) (0.128) (0.052)Education(L) 0.752??? 0.574??? 0.178??? 0.82??? 0.744??? 0.076
(0.052) (0.055) (0.033) (0.077) (0.135) (0.061)Education(H) 0.651??? 0.45??? 0.202??? 0.741??? 0.619??? 0.122
(0.064) (0.056) (0.041) (0.077) (0.137) (0.064)Urban 0.655??? 0.46??? 0.196??? 0.725??? 0.581??? 0.144?
(0.064) (0.06) (0.041) (0.085) (0.148) (0.067)Rural 0.706??? 0.504??? 0.203??? 0.764??? 0.666??? 0.099
(0.06) (0.06) (0.038) (0.077) (0.135) (0.062)Poor 0.68??? 0.548??? 0.132??? 0.714??? 0.598??? 0.116
(0.068) (0.054) (0.023) (0.094) (0.159) (0.068)Rich 0.696??? 0.385??? 0.31??? 0.805??? 0.688??? 0.117
(0.067) (0.05) (0.026) (0.065) (0.121) (0.06)
Notes: Significance levels: ?p ≤ 0.5, ??p ≤ 0.01, ? ? ?p ≤ 0.001.
28
Related Documents