From control to constraint: a study of reproduction in the eusocial honey bee and the solitary red mason bee Jens Van Eeckhoven Submitted in accordance with the requirements for the degree of Doctor of Philosophy The University of Leeds School of Biology March, 2020

Welcome message from author
This document is posted to help you gain knowledge. Please leave a comment to let me know what you think about it! Share it to your friends and learn new things together.
Transcript

From control to constraint: a study of reproduction in the
eusocial honey bee and the solitary red mason bee
Jens Van Eeckhoven
Submitted in accordance with the requirements for the degree of
Doctor of Philosophy
The University of Leeds
School of Biology
March, 2020


I
The candidate confirms that the work submitted is his own, except where work
which has formed part of jointly-authored publications has been included. The
contribution of the candidate and the other authors to this work has been
explicitly indicated below. The candidate confirms that appropriate credit has
been given within the thesis where reference has been made to the work of
others.
Jointly-authored publication:
Van Eeckhoven, J., Duncan, E.J., 2020. Mating status and the evolution of
eusociality: Oogenesis is independent of mating status in the solitary bee
Osmia bicornis. J. Insect Physiol. 121, 104003.
Contributorship (following CRediT: Allen et al., 2019):
Jens Van Eeckhoven: Conceptualization, Methodology, Data acquisition,
Formal analysis, Investigation, Writing - original draft, Writing - review &
editing, Visualization.
Elizabeth J. Duncan: Conceptualization, Resources, Writing - review & editing,
Visualization, Funding acquisition, Supervision, Project administration.
This copy has been supplied on the understanding that it is copyright material
and that no quotation from the thesis may be published without proper
acknowledgement.
© 2020 The University of Leeds and Jens Van Eeckhoven

II
Never underestimate the simplicity,
inherent to complexity
© Tal, with permission — Chantal Maas; [email protected]
III
Acknowledgements
Believe it or not, the University actually provides a template for the
acknowledgements section.
‘This research has been carried out by a team which has included (name the individuals). My own contributions, fully and explicitly indicated in the thesis, have been......(please specify) The other members of the group and their contributions have been as follows: (please specify).’
We can only guess at whether these words were carefully crafted by a
dispassionate bureaucrat, some cold-hearted and bitter academic, or by Hades
himself who subsequently whispered them into the ears of an unsuspecting and
innocent mortal. But now that I have displayed those words here, I hope to be in
line with whatever University policy may or may not outline them. So now we
can safely commit them to the void that is amnesia, where such unfeeling things
belong. Indeed any and all acknowledgements I have ever read, both within and
outside this University, have been cheesy without fail. As well they should be.
So I will endeavour to do the same here. For the Odyssean nature of doing a
PhD, has left me enlisting, recruiting, conscripting and consigning all of the
varying modes and degrees of support known to mankind. And I am grateful to
them all.
And I would like to start with, Liz, the epitome of a good supervisor. She
managed to get a stats and theory nerd interested in molecular biology. From
doing the first stainings and showing me the pretty images that can stem from
them, she slowly ‘Mr Miyagied’ me; to the point where my dry and philosophical
self ended up caring about germline stem cells and molecular pathways. Even
before coming to Leeds, I had heard and become aware of horror stories
surrounding PhD-supervision. Being the sensitive soul that I am, I really don’t
think I would have survived under another’s guidance. And while my love for
science has often stood at odds with conventions and practices within
academia; Liz’s level of supervision stands testament to how it can and should
be done, and as such leaves me with some hope for academia still.
I would also like to thank Andrew Peel and William Kunin for their co-
supervision, and Amanda Bretman serving in the capacity of assessor in
addition to providing an excellent and memorable journal club. Further thanks
go to the team at NBAF in Sheffield: Terence Burke, Deborah Dawson, Gavin
Horsburgh, Kathryn Maher, Rachel Tucker and Paul Parsons for their training,
help, and advice during my time there working on microsatellites. I should also
thank various unnamed academics at the University of Leeds for the use of
IV
laboratory equipment, and particular thanks in this regard go out to Sally Boxall
for her enduring help with the slidescanner and the use of the bio-imaging
facilities (facilitated by the Wellcome Trust; WT104918MA). Lastly, I’d like to
thank Chantal Maas for providing exquisite front matter artwork; and the
hardworking postgraduate reception team for their unfailing logistical support.
Even though I started as Liz’s first student in Leeds, I’ve had the privilege
of seeing her lab grow. And so I would like to thank all my labmates: Rollsie with
the easy laughs (yes I will be using our ‘breadnames’ for this), Myloaf with the
chillest of demeanours, Britta Bread whom should never be referred to as
Bready Britt, NorNaan with the silliest of games, an at times slightly boozy
Cakey Kane, and Mackenzie. I was also delighted to work with and alongside
various MBiol students and wish to thank: Vanessa Barlow for opening up an
inordinate amount of cocoons, as well as Emily Birch, Flora Whiting-Fawcett,
Lois Gaden, and Amy Wells.
A different endeavour, entailed rolling the boulder that is my conscience,
onto the hill that should have been my sanity. As it turns out, it was a rather
steep hill, and a rather smooth boulder as well. However, contrary to King
Sisyphus, I was fortunate that a great many people, have spent a great deal of
time and effort helping me repeatedly rolling that boulder back onto that
stubborn hill. These people include the many friends I have made during my
time here at Leeds. The OGs are of course: both bee-Tom and fly-Tom, Laurin
me-Scottish-lass, Katy my bestest man-woman, Myrna my ‘Hi friend!’, Sir
Nicholas, Sil who-lies-like-the-best-or-worst-of-them, and James who-actually-
has-a-heart-of-gold-no-matter-how-desperately-he-tries-to-pretend-otherwise.
The people I met outside of work tried to impress upon me that there is life
outside of a PhD. My heartfelt thanks: Alaa, Alice, Dimi, Hannah, Jackie,
Louise, Pablo, Pascale, and Pauline. Then there are my Belgian friends, who as
few others know the depths of me. Your advice, laughs, compassion and
unrelenting faith in me have been a balm upon my soul. For reminding me, time
and again, of who I am, thank you; Gert-Jan, Sebastjen, Nathalie, Elyssa, Lars,
Sharon; I could not have done this without any of you. And though I’ve never
met them: Robin Hobb I thank for her wisdom, and Van Morrison and Florence
Welch I thank for the best soundtrack any student could wish for.
Finally, I’d like to thank my mother, for always having pushed me, for
better or for worse. And my dad, for providing the counterweight, telling me he’s
proud of me no matter what.
Sadly at the time of writing, I remain unconvinced of this. Time will tell.

V
Abstract
The major evolutionary transition from solitary to eusocial living is
hallmarked by the reproductive division of labour. I investigated mechanisms
underlying reproductive control in a solitary bee (Osmia bicornis), with the aim
of informing how and why such mechanisms were co-opted into reproductively
constraining workers in a eusocial species (Apis mellifera, mrca 95 mya; Peters
et al., 2017). I start out by introducing the problems of reproductive constraint
and the evolution of eusociality (Chapter 1).
In order to test functional links and perform manipulation, it is imperative
to establish a reference species within the laboratory. To address the lack of a
temperate European solitary model species, I attempted to establish O. bicornis
in a laboratory environment (Chapter 3). Preliminary erratic successes of
nesting and egg-laying behaviour were achieved, and future recommendations
were laid out. To further facilitate O. bicornis as a model species; microsatellite
markers were mined, designed, tested and validated in collaboration with the
NERC Biomolecular analysis facility in Sheffield (Chapter 4). The broad
applicability of these markers is discussed.
The capricious nature of laboratory egg-laying necessitated appraising
reproductive control directly. To enable assaying oogenesis, I performed the
first microstructural study of the O. bicornis ovary (Chapter 5). Since mating
plays an important role in the ovary activation of eusocial queens and other
insect species, I concurrently examined the effect of mating status on the ovary
of O. bicornis (Chapter 5) — with special reference to the potential role of
mating status in reproductive constraint. Finally, I investigated how a known
mechanism of reproductive constraint (Duncan et al., 2016) operates in the
related solitary bee, to ascertain its ancestral role (Chapter 6).The mechanism
was found to be reversed in O. bicornis.
Chapter 7 places the overall findings within their wider context, and
outlines future avenues of research.
VI
Table of Contents
Acknowledgements .................................................................................... III
Abstract ....................................................................................................... V
Table of Contents....................................................................................... VI
List of Figures ............................................................................................. X
List of Tables ............................................................................................. XII
Abbreviations ........................................................................................... XIII
Chapter 1 General introduction ............................................................. - 1 -
1.1 Historic overview: outlining the underlying problem ..................... - 4 -
1.2 Genes underlying altruism ........................................................... - 8 -
1.2.1 The reproductive groundplan hypothesis (RGPH) ............. - 8 -
1.2.1.1 Hormonal signalling cascades .................................... - 9 -
1.2.2 Sociogenomics ................................................................. - 11 -
1.2.3 Organisation through caste development ......................... - 13 -
1.2.4 Reversible adult reproductive constraint .......................... - 14 -
1.2.5 Swindling bees ................................................................. - 19 -
1.2.5.1 Anarchy .................................................................... - 19 -
1.2.5.2 Thelytoky .................................................................. - 19 -
1.3 Study species ............................................................................ - 20 -
1.3.1 The eusocial honey bee, A. mellifera ............................... - 20 -
1.3.2 The solitary red mason bee, Osmia bicornis .................... - 21 -
1.4 Aims .......................................................................................... - 24 -
1.5 Outline of thesis ......................................................................... - 25 -
Chapter 2 General Methods ................................................................. - 27 -
2.1 Husbandry ................................................................................. - 27 -
2.1.1 Apis mellifera ................................................................... - 27 -
2.1.2 Osmia bicornis ................................................................. - 27 -
2.2 Microdissection and tissue processing ...................................... - 27 -
2.3 RNA extraction .......................................................................... - 28 -
2.4 cDNA synthesis ......................................................................... - 29 -
2.5 Primer design in situ hybridisation probes ................................. - 29 -
2.6 Polymerase chain reaction (PCR) ............................................. - 30 -
2.7 Cloning ...................................................................................... - 31 -
2.8 RNA probe synthesis ................................................................. - 32 -
2.9 Whole-Mount In Situ Hybridisation (ISH) ................................... - 33 -
VII
2.10 Immunohistochemistry (IHC) ..................................................... - 34 -
Chapter 3 Establishing Osmia bicornis as a laboratory model ........ - 35 -
3.1 Summary ................................................................................... - 35 -
3.2 Introduction ................................................................................ - 35 -
3.2.1 Life history of O. bicornis .................................................. - 36 -
3.2.2 Previous work ................................................................... - 40 -
3.3 Methods ..................................................................................... - 41 -
3.3.1 Factors underlying species ecology ................................. - 41 -
3.3.2 Measurements ................................................................. - 45 -
3.3.3 Statistical analysis ............................................................ - 47 -
3.4 Results and discussion .............................................................. - 48 -
3.4.1 Sex, diapause and emergence ......................................... - 49 -
3.4.2 Foraging ........................................................................... - 53 -
3.4.3 Nesting ............................................................................. - 61 -
3.4.4 Environment ..................................................................... - 64 -
3.5 Concluding remarks................................................................... - 67 -
Chapter 4 Validation of microsatellite markers in O. bicornis .......... - 69 -
4.1 Summary ................................................................................... - 69 -
4.2 Introduction ................................................................................ - 69 -
4.3 Materials and methods .............................................................. - 73 -
4.3.1 Trap-nesting ..................................................................... - 73 -
4.3.2 Commercial nest tubes .................................................... - 74 -
4.3.3 DNA extraction ................................................................. - 75 -
4.3.4 PCR — Cytochrome oxidase subunit I ............................. - 76 -
4.3.1 Microsatellites .................................................................. - 77 -
4.3.2 PCR — Microsatellite ....................................................... - 79 -
4.3.3 Genotyping ....................................................................... - 79 -
4.3.4 Preliminary analysis ......................................................... - 80 -
4.4 Results ...................................................................................... - 80 -
4.4.1 Fieldwork .......................................................................... - 80 -
4.4.2 Validation of extraction method ........................................ - 81 -
4.4.3 Marker validation .............................................................. - 81 -
4.4.4 Multiplex design ............................................................... - 84 -
4.5 Discussion ................................................................................. - 85 -
4.5.1 Trap nesting ..................................................................... - 85 -
4.5.2 Microsatellites .................................................................. - 86 -
VIII Chapter 5 Ovarian microstructure, oogenesis and mating ............... - 89 -
5.1 Summary ................................................................................... - 89 -
5.2 Introduction ............................................................................... - 89 -
5.3 Materials and methods .............................................................. - 91 -
5.3.1 Husbandry and experimental design ................................ - 91 -
5.3.2 Staining and microscopy .................................................. - 93 -
5.3.3 Morphological measurements .......................................... - 94 -
5.3.4 Statistical analysis ............................................................ - 94 -
5.4 Results ...................................................................................... - 95 -
5.4.1 Overview of the O. bicornis ovary .................................... - 95 -
5.4.2 Microstructural comparison of ovarioles ........................... - 99 -
5.4.3 Oogenesis in O. bicornis ................................................ - 103 -
5.4.4 Effect of mating on oogenesis in O. bicornis .................. - 105 -
5.5 Discussion ............................................................................... - 109 -
5.5.1 The ovarian microstructure of O. bicornis ...................... - 109 -
5.5.2 Mating and oogenesis .................................................... - 110 -
Chapter 6 Notch signalling ................................................................ - 114 -
6.1 Summary ................................................................................. - 114 -
6.2 Introduction ............................................................................. - 115 -
6.3 Materials and methods ............................................................ - 118 -
6.3.1 ISH ................................................................................. - 118 -
6.3.2 Repressing oogenesis in O. bicornis .............................. - 120 -
6.3.3 Repressing oogenesis in queenless A. mellifera ............ - 122 -
6.3.4 Staining and microscopy ................................................ - 123 -
6.3.5 Statistical analysis .......................................................... - 124 -
6.4 Results .................................................................................... - 126 -
6.4.1 Germarial Notch signalling in O. bicornis ....................... - 128 -
6.4.2 Repressing oogenesis in O. bicornis .............................. - 131 -
6.4.3 Repressing oogenesis post ovary activation .................. - 137 -
6.5 Discussion ............................................................................... - 142 -
Chapter 7 General discussion ........................................................... - 149 -
7.1 The use of O. bicornis ............................................................. - 150 -
7.2 Reproductive constraint from reproductive control .................. - 152 -
7.2.1 Irreversible reversibility .................................................. - 155 -
7.2.2 Origin or elaboration?..................................................... - 157 -
7.2.3 The multifactorial nature of reproductive constraint ....... - 159 -

IX
7.3 Concluding remarks................................................................. - 165 -
X
List of Figures
Figure 1.1: Phylogenetic relationships within the Hymenoptera.. ...... - 3 -
Figure 1.2: Relatedness skew within Hymenoptera. ............................ - 6 -
Figure 1.3: Schematic of a queenless honey bee worker ovariole. .. - 17 -
Figure 1.4: Two main components of QMP. ....................................... - 18 -
Figure 1.5: Abridged Gadagkar (1996) model. .................................... - 24 -
Figure 3.1: Life cycle of O. bicornis. ................................................... - 39 -
Figure 3.2: Example of setup in trials 7 and 8. ................................... - 45 -
Figure 3.3: Nesting activity of O. bicornis females during trials. ..... - 48 -
Figure 3.4: Example of artificial catkins and flowers used. .............. - 49 -
Figure 3.5: Sex-specific cocoon weight. ............................................. - 50 -
Figure 3.6: Sex specific diapause and emergence. ........................... - 52 -
Figure 3.7: Factor analysis for sugar solutions. ................................ - 54 -
Figure 3.8: Floral colour preference of O. bicornis females. ............ - 59 -
Figure 3.9: Masonry in O. bicornis. ..................................................... - 61 -
Figure 3.10: Nest preference in O. bicornis. ....................................... - 64 -
Figure 3.11: Abiotic environmental factors of trials T7-8. ................. - 65 -
Figure 4.1: Trap-nest locations. ........................................................... - 74 -
Figure 4.2: The nest tube as a family unit. .......................................... - 75 -
Figure 4.3: Unidentifiable trap nested individual. .............................. - 76 -
Figure 4.4: Designed and validated multiplexes. ............................... - 84 -
Figure 5.1: Overview experimental design O. bicornis. ..................... - 92 -
Figure 5.2: Overview of the O. bicornis ovary. ................................... - 96 -
Figure 5.3: Actin bundles in O. bicornis nurse cells.......................... - 97 -
Figure 5.4: Oocyte F-actin during oogenesis in O. bicornis. ............ - 98 -
Figure 5.5: Terminal filament and germarial microstructure. ......... - 101 -
Figure 5.6: pHH3 in O. bicornis and A. mellifera. .............................. - 102 -
Figure 5.7: Overview of ovarian dynamics in O. bicornis. .............. - 103 -
Figure 5.8: Ovarioles of wild mated and free living O. bicornis. ..... - 104 -
Figure 5.9: Ovary activation of queenless A. mellifera workers. .... - 106 -
Figure 5.10: Mated and virgin O. bicornis ovarioles. ....................... - 107 -
Figure 5.11: The rate of oogenesis in O. bicornis. ........................... - 108 -
Figure 6.1: Identification and orthology of Ob_E(spl)-C genes. ..... - 119 -
Figure 6.2: Phenotypes in trials. ........................................................ - 124 -
Figure 6.3: Ovarian expression of Ob_Neuralised. .......................... - 127 -

XI Figure 6.4: Notch signalling in the active O. bicornis ovary. .......... - 129 -
Figure 6.5: Ovarian expression of Notch ligands in O. bicornis. .... - 130 -
Figure 6.6: Estimated sucrose solution intake in trials. .................. - 132 -
Figure 6.7: Germarial oocyte counts for respective trials. .............. - 134 -
Figure 6.8: Survival of A. mellifera under laboratory condition. ..... - 138 -
Figure 6.9: Cox proportional hazard model of A. mellifera in trials.- 140 -
Figure 6.10: Caged A. mellifera worker food intake. ........................ - 141 -
Figure 6.11: Proportions of ovary scores of A. mellifera trials. ...... - 142 -
Figure 6.12: Suggested experimental design. .................................. - 148 -
Figure 7.1: Full factorial design. ........................................................ - 155 -
Figure 7.2: A hypothetical multifactorial origin of QMP-mediated adult reproductive constraint. ............................................................. - 163 -

XII
List of Tables
Table 1.1: Categorisation of (pairwise) social behaviours in nature (Gardner and West, 2010). ............................................................. - 4 -
Table 1.2: Reproductive constraints as characterised by Khila and Abouheif (2010). ............................................................................ - 15 -
Table 2.1: Standard PCR conditions. .................................................. - 30 -
Table 3.1: Summary of relevant ecological aspects of O. bicornis. . - 42 -
Table 3.2: Summary of relevant ecological aspects of O. bicornis (continued). ................................................................................... - 43 -
Table 3.3: Overview of the set-up of each trial. .................................. - 44 -
Table 3.4: The complexity of (bee) pollinator-plant visual cues. ...... - 57 -
Table 4.1: Thermocycling conditions for COI. .................................... - 77 -
Table 4.2: 20 Microsatellite markers tested. ....................................... - 78 -
Table 4.3: Microsatellite marker thermocycling conditions. ............. - 79 -
Table 6.1: Oligonucleotide sequences used to clone O. bicornis Notch related genes for in situ hybridisation probes. ........................ - 120 -
Table 6.2: Overview of results for the O. bicornis trials. ................. - 136 -
Table B.1: Specific trap-nesting sites in the greater Leeds area. ... - 180 -
Table C.1: Relatedness matrix (Kalinowski et al., 2006) for the North Shropshire subpopulation. ........................................................ - 181 -
Table C.2: Relatedness matrix (Kalinowski et al., 2006) for the Surrey subpopulation. ............................................................................ - 181 -
Table C.3: Relatedness matrix (Kalinowski et al., 2006) for the first German subpopulation. ............................................................. - 182 -
Table C.4: Relatedness matrix (Kalinowski et al., 2006) for the second German subpopulation. ............................................................. - 183 -
Table C.5: Absence of linkage disequilibrium between markers in the overall population. ...................................................................... - 184 -
Table C.6: Linkage disequilibrium by marker & subpopulation. .... - 187 -
Table C.7: Hard-Weinberg equilibrium probability tests by subpopulation and marker. ........................................................ - 199 -
Table C.8: Marker statistics by subpopulation. ................................ - 200 -
Table D.1 Log - link models ............................................................... - 208 -
Table D.2 Modeling results for all ovariole measurements. ............ - 208 -
XIII
Abbreviations
anti-DIG AP —fragments from polyclonal anti-digoxigenin antibodies,
conjugated to alkaline phosphatase
AP — alkaline phosphatase
BCIP — 5-bromo-4-chloro-3'-indolyphosphate p-toluidine salt
CBF — complete bee food
cDNA — complementary DNA
csd — complementary sex determiner locus
DAPI — 4′,6-diamidino-2-phenylindole
ddH2O — double distilled water
DEPC — 0.1% diethylpyrocarbonate
DMSO — dimethyl sulfoxide
DNA — deoxyribonucleic acid
DoL — division of labour
EDF — extended depth of focus
EtOH — ethanol
HWE — Hardy-Weinberg equilibrium
IHC — immunohistochemistry
IIS — insulin/insulin-like signalling
ISH — in situ hybridisation
JH — juvenile hormone
LB — lysogeny broth (Luria broth, Lennox broth, or Luria-Bertani medium)
LD — linkage or gametic disequilibrium
MeOH — methanol
MIP — maximum intensity projection
mrca — most recent common ancestor
MRJP1 — major royal jelly protein 1 precursor
my — million years
mya — million years ago
NBAF — NERC Biomolecular analysis facility
XIV
NBT — nitro-blue tetrazolium chloride
NERC — Natural Environment Research Council
PBS — phosphate buffered saline
PMT — photon multiplier tube
pHH3 — phospho histone H3
QLW — queenless worker
QMP — queen mandibular pheromone
QRW — queenright worker
QTL — quantitative trait locus
RA — royal actin
RCF — relative centrifugal force (with: g or xg ; 'gravity' or 'times gravity'
respectively)
RGPH — reproductive ground plan hypothesis
RJ — royal jelly
RNA — ribonucleic acid
RPGH — reproductive ground plan hypothesis
Rpm — rotations per minute
RT — room temperature
RT — reverse transciptase
SOB — super optimal broth
SOC — super optimal broth with catabolite repression
SSC — saline-sodium citrate
ssDNA — single-stranded DNA
Tor — target of rapamycin
tRNA — transfer RNA
Vg — vitellogenin
Apparent from context.
- 1 -
Chapter 1 General introduction
‘I will not here enter on these several cases, but will confine myself to one special difficulty, which at first appeared to me insuperable, and actually fatal to my whole theory.’ — Darwin (1859)
The evolution of eusociality, poses a problem within the general theory of
evolution by natural selection, due to its defining feature of reproductive altruism
(Darwin, 1859). The problem the so called ‘neuter’ insects pose to Darwin’s
theory of evolution by natural selection is self-evident. How can an adaption
arise through variation, inheritance and selection when the adaptation itself
precludes inheritance? Eusocial evolution has therefore drawn substantial
attention and interest over the past 161 years, and is considered a major
transition in evolution (Smith and Szathmary, 1995). Consequently,
understanding this phenomenon is implicitly important with regard to our
general understanding of evolution.
Eusociality is traditionally defined by several characteristics. Individuals
must share a common nest site, must cooperate in caring for young,
reproductive division of labour (castes) must be present and an overlap of
generations must occur (Wilson, 1971)1. This higher level of social organisation
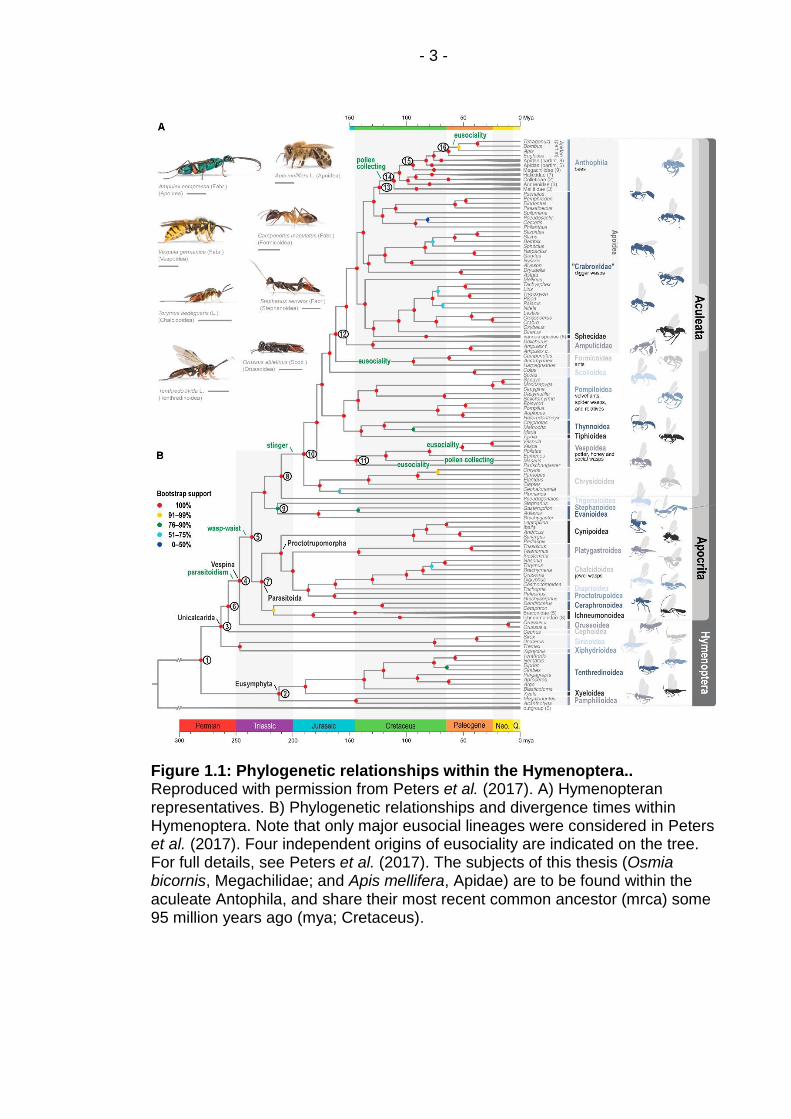
is found mainly within the Hymenoptera (Figure 1.1), where there may have
been up to nine independent origins of eusociality (see Hughes et al., 2008 and
references therein). Eusociality is also sparsely found outside of the
Hymenoptera, namely: in the Isoptera (Wilson, 1975), the Hemiptera (Stern,
1994), the Coleoptera (Smith et al., 2009), the Thysanoptera (Gadagkar, 1993;
Kranz et al., 1999), Decapods (Duffy, 1996) and even farther removed from the
Insecta; in the naked mole-rat, a vertebrate species (Jarvis, 1981).
1 While the exact definitions of eusociality and superorganismality have both narrowed
and expanded over time; both terminology and etymology fall outside the remit of the current work, and the reader is referred to the comprehensive work by Boomsma and Gawne (2018).

- 2 -
Accordingly, with their eleven independent origins (Wilson and
Holldobler, 2005), the eusocial insects remain highly studied. This level of study
follows in large part from the abundance and key roles of eusocial insects in
ecosystems. Many bee species are pollinators and have an impact on the
conservation of plant species on a landscape scale, in addition to providing a
pivotal ecosystem service (Klein et al., 2007). Other eusocial insects,
predominantly ants and termites, act as bioturbators providing soil turnover
(Debruyn and Conacher, 1990), and serve as ecosystem engineers (Fox-Dobbs
et al., 2010). Indeed, the eusocial insects2 are known to be both ecologically
successful and dominant (Wilson, 1990; or see Parr et al., 2016 for a functional
example).
2 The terms social and eusocial are used interchangeably throughout this thesis.
Concordantly; solitary is taken to mean non-eusocial.
- 3 -
Figure 1.1: Phylogenetic relationships within the Hymenoptera.. Reproduced with permission from Peters et al. (2017). A) Hymenopteran representatives. B) Phylogenetic relationships and divergence times within Hymenoptera. Note that only major eusocial lineages were considered in Peters et al. (2017). Four independent origins of eusociality are indicated on the tree. For full details, see Peters et al. (2017). The subjects of this thesis (Osmia bicornis, Megachilidae; and Apis mellifera, Apidae) are to be found within the aculeate Antophila, and share their most recent common ancestor (mrca) some 95 million years ago (mya; Cretaceus).
- 4 -
1.1 Historic overview: outlining the underlying problem
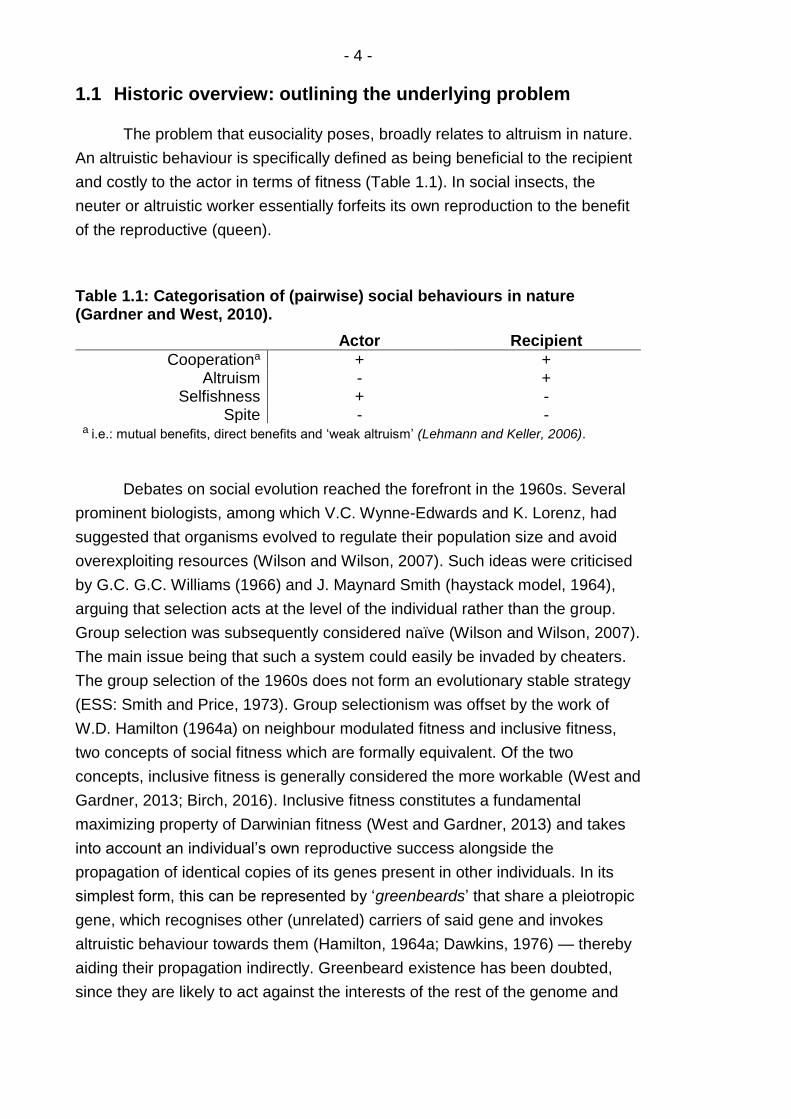
The problem that eusociality poses, broadly relates to altruism in nature.
An altruistic behaviour is specifically defined as being beneficial to the recipient
and costly to the actor in terms of fitness (Table 1.1). In social insects, the
neuter or altruistic worker essentially forfeits its own reproduction to the benefit
of the reproductive (queen).
Table 1.1: Categorisation of (pairwise) social behaviours in nature (Gardner and West, 2010).
Actor Recipient
Cooperationa + + Altruism - +
Selfishness + - Spite - -
a i.e.: mutual benefits, direct benefits and ‘weak altruism’ (Lehmann and Keller, 2006).
Debates on social evolution reached the forefront in the 1960s. Several
prominent biologists, among which V.C. Wynne-Edwards and K. Lorenz, had
suggested that organisms evolved to regulate their population size and avoid
overexploiting resources (Wilson and Wilson, 2007). Such ideas were criticised
by G.C. G.C. Williams (1966) and J. Maynard Smith (haystack model, 1964),
arguing that selection acts at the level of the individual rather than the group.
Group selection was subsequently considered naïve (Wilson and Wilson, 2007).
The main issue being that such a system could easily be invaded by cheaters.
The group selection of the 1960s does not form an evolutionary stable strategy
(ESS: Smith and Price, 1973). Group selectionism was offset by the work of
W.D. Hamilton (1964a) on neighbour modulated fitness and inclusive fitness,
two concepts of social fitness which are formally equivalent. Of the two
concepts, inclusive fitness is generally considered the more workable (West and
Gardner, 2013; Birch, 2016). Inclusive fitness constitutes a fundamental
maximizing property of Darwinian fitness (West and Gardner, 2013) and takes
into account an individual’s own reproductive success alongside the
propagation of identical copies of its genes present in other individuals. In its
simplest form, this can be represented by ‘greenbeards’ that share a pleiotropic
gene, which recognises other (unrelated) carriers of said gene and invokes
altruistic behaviour towards them (Hamilton, 1964a; Dawkins, 1976) — thereby
aiding their propagation indirectly. Greenbeard existence has been doubted,
since they are likely to act against the interests of the rest of the genome and
- 5 -
are prone to evolutionary invasion by ‘falsebeards’, yet some examples do exist
(see: Gardner and West, 2010; Madgwick et al., 2019).
Generally, inclusive fitness refers to related individuals. Hamilton (1964a)
made use of Wright’s coefficient of relationship (r; Wright, 1922; Orlove and
Wood, 1978; Bennett, 1987; Pamilo, 1990) to quantify the probability of a
replica gene occurring in a related individual. This r is generally referred to as
relatedness, and individuals are argued to maximise their inclusive fitness
following Hamilton’s rule: C < r B, where C equals the cost of the behaviour to
the actor, and B equals the benefit to the recipient (Hamilton, 1964a)3,4. Altruism
then occurs when the costs of helping a relative are outweighed by the benefits
accrued by helping related genes propagate. A train of thought that was
already adopted by R.A. Fisher (1930), J.B.S. Haldane (Dugatkin, 2007) and
arguably C.R. Darwin (1859; p. 237) himself, but it was succinctly formalized by
Hamilton. The specific case of helping relatives at one’s personal expense was
further coined kin selection (Maynard Smith and Wynne-Edwards, 1964), and is
embedded within the broader inclusive fitness theory.
Hamilton (1964b) further advanced the specific case of the
Hymenoptera, in what is known as the ‘haplodiploid hypothesis’. In essence:
relatedness among sisters is inflated (Figure 1.2) within the haplodiploid sex
determining system (assuming monogamy). Hamilton himself called the idea in
itself ‘thoroughly naïve’ (Hamilton, 1964b, p. 29), as further skews in sex ratios
would be required (Trivers and Hare, 1976). Yet, the multiple origins of
eusociality within the Hymenoptera hint at the importance of haplodiploidy
(Gardner et al., 2012; Gardner and Ross, 2013). The Hymenopteran sex
determining system has further implications to for instance conservation
genetics as well. This since it can exacerbate population bottlenecks where
increased inbreeding leads to the production of generally sterile or subfertile
diploid males, increasing extinction proneness (Packer and Owen, 2001; Zayed
and Packer, 2005; Zayed, 2009). With regard to the overall importance of
relatedness to Hymenopteran evolution and conservation, Chapter 4 outlines
the development of microsatellite markers for O. bicornis. These allow for
estimating relatedness in the absence of pedigree information (Queller and
Goodnight, 1989).
3 The original formulation in Hamilton (1964a) being:
- K > 1/r, where K can be equated to -B/C.
4 Altruism between unrelated individuals was later explained through the use of game theoretic models (e.g. reciprocal altruism; Trivers, 1971).

- 6 -
Figure 1.2: Relatedness skew within Hymenoptera. Male individuals develop from unfertilised eggs, whereas females develop from fertilised eggs. Relatedness coefficients by pedigree (r; Wright, 1922) for family members of a haplodiploid species following a single monogamous mating in the parental generation (P) are displayed. The direction of the arrow indicates the direction of relationship the relatedness coefficient refers to. Arrows and coefficients in red indicate relatedness from the point of view of a focal daughter (e.g. honey bee worker), showing a clear skew in relatedness towards sisters (r = 0.75). The grey two way arrow indicates mating between unrelated individuals. Black dotted arrows indicate male (haploid) points of view, black full arrows indicate the remaining viewpoints. (F1 = first generation, F2 = second generation, ♂ = male, ♀
= female, and ☿ = virgin female/worker)
Meanwhile, group selection has seen some revival under the
denomination ‘multi-level selection’ (Wilson and Wilson, 2007). It posits that
altruism (including eusociality) has evolved in those instances where between-
group selection was greater than within-group selection. Just as inclusive
fitness theory partitions selection into direct and indirect components, so does
multi-level selection partition it into within and between group components
(Marshall, 2011). Both concepts have received considerable attention in
mathematical modelling (for an overview of models, see Lehmann and Keller,
2006).
The debate surrounding inclusive fitness and multilevel selection has
been re-ignited for some time, in a push for the multi-level selection perspective
predominantly led by E.O. Wilson (Wilson, 2005; Wilson and Holldobler, 2005;

- 7 -
Fletcher et al., 2006; Foster et al., 2006a; Foster et al., 2006b; Wilson and
Wilson, 2007; Wilson, 2008; Nowak et al., 2010; Abbot et al., 2011; Boomsma
et al., 2011; Strassmann et al., 2011; Ferriere and Michod, 2011; Herre and
Wcislo, 2011; Nowak et al., 2011; Bourke, 2011). Yet, it has been well
established that inclusive fitness and multi-level selection are formally
equivalent (Grafen et al., 1984; Lehmann et al., 2007; Marshall, 2011;
Lehtonen, 2016; Rubin, 2018), with only a single notable opponent (van Veelen
et al., 2012). Both perspectives are not mutually exclusive, and ultimately,
eusocial insects constitute groups of closely related kin. Nonetheless, the
inclusive fitness approach offers a more tangible design principle or maximand
(West and Gardner, 2013; Pernu and Helantera, 2019). This leaves inclusive
fitness as more applicable, as it is both causal and generates readily testable
hypotheses (Abbot et al., 2011; West and Gardner, 2013; Marshall, 2016; Pernu
and Helantera, 2019).
Nowak et al. (2010) in particular, caused substantial controversy within
the field. However, they did correctly emphasise the need for certain pre-
adaptations and requirements necessary for the evolution of eusociality. Such
preadaptations include: ancestral monogamy (Hughes et al., 2008; Boomsma,
2009), population viscosity (Hamilton, 1964a, b), kinship (Hamilton, 1964a, b;
Trivers and Hare, 1976), nest construction and defence (Wilson and Holldobler,
2005; Nowak et al., 2010), overlapping generations (Hunt and Amdam, 2005;
Santos et al., 2019), and parental care (e.g. progressive provisioning; Queller,
1994; Wilson and Holldobler, 2005; Nowak et al., 2010)5.
This historic overview demonstrates a breadth and depth of theoretical
work. Yet, this theoretical work is mainly a paradigm of genes, whereas
frameworks of how these are linked to form are largely underdeveloped
(Pigliucci, 2007) — with the exception of M. J. West- Eberhard, whom has
created a framework for the synthesis of genes, phenotype and development
(West-Eberhard, 2003). Current empirical work however, might help bridge this
gap.
5 The evolution of maternal care is also thought to be more likely to evolve under the
haplodiploid system (Wade, 2001).
- 8 -
1.2 Genes underlying altruism
Development of theory (section 1.1) makes profuse use of mathematical
models which serve as ‘proofs-of-concept’ (Servedio et al., 2014). However, the
actual genes and pathways underlying eusociality have yet to be identified.
Hence, Thompson et al. (2013) suggested certain intuitive criteria for genes
underlying (reproductive) altruism. They should satisfy Hamilton’s rule (i), be
environmentally sensitive (ii), increase in both number and complexity (iii),
should co-evolve or be dependent on genes underlying recognition (iv), may
reside in regions of low-recombination (v), be partially additive (vi), and exhibit
strong pleiotropy (vii) (Thompson et al., 2013). Nevertheless, ‘uncovering genes
underlying eusociality’ in itself may be a somewhat misleading statement. It is
the sort of wording that implies outdated conceptualisations: that the evolution
of eusociality progressed in a sequential and stepwise manner towards an
hypothetical ‘eusocial end goal’, that the evolution of eusociality proceeded in a
single and fixed manner in all lineages, and that there is a single or that there
are several linked genes underlying eusociality. Not only is the concept of a
goal inherently at odds with the theory of evolution by means of natural
selection (Darwin, 1859), but eusociality also exists along multiple traits that are
themselves part of a continuum/spectrum (Sherman et al., 1995; Linksvayer
and Johnson, 2019). Consequently, the evolution of eusociality can be
considered to be anything but a ‘social ladder’ (Linksvayer and Johnson, 2019).
1.2.1 The reproductive groundplan hypothesis (RGPH)
In spite of these considerations, convergent evolution does appear to
exist with regard to eusociality. Many conserved pathways consistently
reappear, and regulate the same or similar underlying processes of eusociality
(Woodard et al., 2011; Berens et al., 2015; Warners et al., 2019; Linksvayer and
Johnson, 2019). The repeated use of similar processes along independent
origins, indicate that a suite of reproductive and behavioural traits were likely
linked and co-opted into the reproductive division of labour. Hence, built upon
the foundational conceptualisation and work by M.J. West-Eberhard on
heterochrony and heterotopy6 (West-Eberhard, 1987, 2003; West-Eberhard,
2005), the importance of an underlying reproductive groundplan (RGPH) has
been stressed and become a central paradigm in the field (Amdam et al., 2003;
Linksvayer and Wade, 2005; Amdam et al., 2006; Page et al., 2009; Kapheim,
2016; Warners et al., 2019). Under the RGPH, reproductive traits and traits
6 Heterochrony = a difference in timing and/or duration of a developmental stage or
process over evolutionary time. Heterotopy = a spatial change of developmental processes during evolutionary time.
- 9 -
underlying maternal care (e.g. provisioning) are thought to have been de-
coupled. While not all work supports this, this may be down methodology and a
neglect of complexity (e.g. non-tissue and timing specific comparisons:
Kapheim, 2016). Naturally, the differences in ancestral life history traits and
ecological niches across the multiple origins of eusociality complicate things
further, as they have resulted in different eusocial ‘routes’ being taken and
underscore the importance of lineage specific differences (Kapheim, 2016;
Linksvayer and Johnson, 2019).
1.2.1.1 Hormonal signalling cascades
Cogent explanations for convergent evolution and the RGPH specifically,
could reasonably be found within the broader aspects of insect oogenesis and
reproduction. In female insect oogenesis and reproduction are controlled
through a combination of nutrient-signalling pathways (insulin signalling and
target of rapamycin signalling as systemic nutrient sensing pathways),
hormones (juvenile hormone and 20-hydroxyecdysone), and peptides (male
accessory gland secretions or sex peptides, adipokinetic hormone) and
neuropeptides (neuroparsins, neuropeptide F)7 (Roy et al., 2018; Lenaerts et
al., 2019b). Of these, historically, juvenile hormone (JH) and 20-
hydroxyecdysone (ecdysterone or 20E) have been considered the main
regulators of insect reproduction and oogenesis (Riddiford, 2012). Canonically,
JH and 20E are thought to have antagonistic roles (e.g.: Masner and
Hangartner, 1973; Masner et al., 1975; Lezzi and Wyss, 1976; Liu et al., 2018).
This is due to — as their respective names indicate — JH maintaining larval (or
juvenile) stages during development, up to the critical weight of the larva, after
which a spike of 20E causes moulting (Belles and Piulachs, 2015; Jindra et al.,
2015).
7 Note that these denominations are somewhat arbitrary, particularly the distinction
between ‘peptide’ and ‘hormone’, as insulin and adipokinetic hormone are both considered ‘peptide hormones’ for instance.
- 10 -
Some work has been carried out on JH within the Hymenoptera. This
because, there seems to have been a rewiring of the endocrine network in
eusocial insects (Robinson and Vargo, 1997), or a shift in the timing of
hormonal spikes (Page et al., 2009).However, as Robinson and Vargo (1997)
put it:
‘Because of the pervasive role of JH in insect reproduction, social insect biologists have looked to this hormone to provide clues to the physiology of reproductive division of labor. Rather than trying to elucidate hormone regulation in social insects for its own sake, the primary goal of this research has been to use endocrine approaches to gain insight into the behavioral and/or pheromonal mechanisms by which the queen‘s status as dominant reproductive is established and maintained. Otherwise, the methods used to study the gonadotropic role of JH in the social Hymenoptera are the same as those used to study endocrine regulation of reproduction in other insect orders: studies correlating ovary development with either JH titers or rates of biosynthesis, and studies showing the effect of exogenous hormonal treatment on ovary development and egg-laying behavior.’
Fortunately, recent progress has been made outside the field of eusocial
research. The receptor for JH has been discovered through a strain of
Drosophila melanogaster that were resistant to the JH analog methoprene
(Jindra et al., 2015). The JH receptor, named Methoprene-resistant (Met), has
been characterised (Charles et al., 2011), and consequently the JH pathway
has become fairly well understood (Jindra et al., 2015). The synthesis of JH
occurs in the corpus allatum and correlates to input of nutritional signals,
mediated by insulin signalling (ISS). JH will subsequently be transported by the
haemolymph to all tissues, and carry out its signalling function by entering cells.
It possibly does so through a suspected but currently unknown transporter. Heat
shock protein 83 (Hsp83) will then chaperone JH into the nucleus where it will
form a complex with Met and Taiman (a transcriptional co-activator). This
complex will then promote transcription of target genes. For instance Krüppel-
homolog 1 (Kr-h1) and early-trypsin. (Jindra et al., 2015)
Likewise, 20E has become more well-studied. 20E forms a complex with
the Ecdysone receptor (EcR) and Ultraspiracle (Usp) in the nucleus (Hodin and
Riddiford, 1998; Roy et al., 2018), similar to JH. While the roles for JH and 20E
in development are relatively straightforward across the insect phylogenetic
spectrum, their specific roles in reproduction and oogenesis tend to vary
slightly. JH is the main hormone regulating female reproduction in most hemi-
and holometabolous insects, whereas 20E is known to be the main regulator of
female reproduction in lepidopterans, most dipterans, and some
hymenopterans. (Roy et al., 2018)

- 11 -
The advances made for JH and 20E, elucidating not only their
mechanisms, but also their cross-talk with the insulin signalling pathway and
others (Roy et al., 2018) — might facilitate further investigation of their role in
the RGPH (Page et al., 2009). For instance, JH is difficult to measure directly,
yet our current knowledge allows us to investigate differences in the levels of
transcription of JH associated elements of biosynthesis as a proxy (e.g.: Met
and Kr-h1 as in, Lenaerts et al., 2019a; Lenaerts et al., 2019b). JH possesses a
gonadotropic function in both solitary bees as well as primitively eusocial
species, yet seems to have lost this role in more advanced social species (Roy
et al., 2018). Vitellogenin production has seemingly uncoupled from JH, and the
regulatory hormonal role may have been taken over by 20E in these species
(Roy et al., 2018). This situation seems to mirror the evolutionary transition from
dynamic and aggressive reproductive conflict in smaller colonies, towards the
pheromonal control of reproduction in larger colonies (Robinson and Vargo,
1997). These advances in insect hormonal signalling merit an in depth re-
visitation of the earlier work.
1.2.2 Sociogenomics
Whereas direct investigations of hormonal signalling waned, the advent
of more widespread genomic tools and resources, has led to an increase in
differential gene expression studies. For instance, in the honey bee alone,
differential gene expression studies in relation to caste differentiation (Evans
and Wheeler, 1999, 2001; Lago et al., 2016), worker egg laying (Thompson et
al., 2006), and reproductive division of labour (Grozinger et al., 2007) have
been carried out. Such studies emphasise the importance of changes in gene
regulation (Kapheim, 2016). Changes in gene regulation in both time
(heterochrony) and space (heterotropy) can allow for phenotypic novelty —
referred to as evolutionary co-option — to arise, as it is not always maladaptive
(West-Eberhard, 2003). Overall, there has been an increase in genomic
resources and tools available, and these have powered a surge in
sociogenomics research (1.2.2; Kapheim, 2016). In the remainder of this
chapter, I lay out contemporary efforts in uncovering genes underlying altruism,
with special reference to A. mellifera as it is the most best-studied species to
date, and is the subject of comparison in this thesis.
A traditional approach to researching the evolution of eusociality, is the
use of phylogenetic analysis (e.g. ancestral monogamy in eusocial lineages:
Hughes et al., 2008). Phylogenetic studies are still used, but tend to be
combined with genomic and bioinformatic tools (phylogenomics) to further the
study on the origin and evolution of eusociality. A. mellifera, being a model
- 12 -
organism already, entrenched its role further in this respect when it was the first
eusocial species to have its genome sequenced (Weinstock et al., 2006). Two
notable phylogenetic studies making use of genomic resources are outlined
here (Woodard et al., 2011; Kapheim et al., 2015b), since they both include A.
mellifera.
Woodard et al. (2011), sequenced ten transcriptomes (pooled tissues
and stages) spanning three independent origins of eusociality. Orthologue
sequence alignments were produced, and differences in the rate of evolution8
were characterised between eusocial and non-eusocial species. Additionally,
they performed two separate tests, with ‘primitively’ and ‘highly’ eusocial
species each being tested versus the remaining pool of species. Subsequently,
gene ontologies (GO) were constructed for genes with signatures of accelerated
rates of evolution. They found that genes relating to gland development
(secretions in hive, pheromones, etc.), signal transduction (changes in
behaviour) and carbohydrate metabolism (processed honeys) evolved rapidly in
eusocial lineages. They also discovered a signature of accelerated evolution in
brain-related GOs for primitively eusocial species, but not highly eusocial
species. Woodard et al. (2011) argued that primitively eusocial species might
face greater socio-cognitive challenges than highly eusocial species (e.g.
learning of signature CHC mixes, as in the model for queen pheromone
evolution proposed by Smith and Liebig, 2017).
In a similar study, Kapheim et al. (2015b) sequenced the genomes of ten
related species. With a phylogeny spanning two independent origins of
eusociality and two independent ‘elaborations’ of eusociality (i.e. increases in
social complexity, typically caste polymorphism and colony size; Bourke, 1999).
In their comparison, they found that with increasing social complexity there was
an increase in the capacity for gene regulation. This was evidenced by: more
cis transcription factor binding sites (scanned from known D. melanogaster
binding sites), more DNA methylation (lower CpGo/e), and enriched GO terms
for gene regulation (making use of dN/dS as in Woodard et al., 2011). This was
offset by the constrained evolution of neural and endocrine-related genes (lower
dN/dS). When regarding both origins of eusociality, genes showed common
patterns but had lineage specific differences (i.e. different genes/pathways, but
with similar GO enrichment). For instance, concurrent with Woodard et al.
(2011), they found that signal transduction was important. Finally, next to no
shared enriched GO terms were found for the eusocial elaborations. Indicating
that eusocial elaborations ‘do not necessarily involve common molecular
8 Non-synonymous to synonymous nucleotide substitutions; dN/dS.
- 13 -
pathways’ (Kapheim et al., 2015b), possibly due to lineage specific differences
in ecology and social organisation being exacerbated.While these types of
studies (Weinstock et al., 2006; Woodard et al., 2011; Kapheim et al., 2015b)
offer a plethora of information, they should be treated with care. They are
explorative in their disposition. For instance, many of the differential gene
expression studies mentioned (at the start of section 1.2) largely ignored: castes
(reproductive vs. non-reproductive), developmental stage (larvae vs. adult) and
age class (Kapheim, 2016). Likewise, the above studies (Woodard et al., 2011;
Kapheim et al., 2015b) represent great data-mining techniques, and suggest
new avenues of research. Yet, trends in the transitions to eusociality will prove
inadequate on their own, and experimental work with functional verification
remain pivotal to our understanding of its evolution.
1.2.3 Organisation through caste development
In contrast to sociogenomic studies, differential gene expression studies
provide a higher resolution albeit on a smaller scale. Larval developmental
stages between queen and worker destined larvae (Barchuk et al., 2007;
Cameron et al., 2013a, b) are well studied for instance.
Adult A. mellifera queens and workers differ markedly in their
morphology (as in many advanced eusocial species). Queens are larger,
possess notched mandibulae, lack corbiculae (pollen baskets), have unbarbed
stingers, and have more ovarioles (an average range of 5-12 in a worker's
ovaries vs. 150-180 in a queen's ovary; Winston, 1991). Queen destined larvae
(QDL) also have: a higher metabolism, a shorter developmental time, and with
the resultant queens also have a longer lifespan (1-3 years; Winston, 1991).
These differences reflect their role inside the hive, with queens serving as egg-
laying machines whereas workers forage (pollen basket or corbicula) and need
to mould wax (flat mandibulae) among other tasks. These differences are
established in early larval development through differential feeding of a
substance called royal jelly (RJ). Differences in gene expression as early as six
hours after hatching have been found (with RJ being presented to queen
destined larvae within this time; Cameron et al., 2013a). Such changes will then
lead on to, for instance, a pulse in juvenile hormone (JH) in queen-destined
larvae and increased developmental cell-death in the ovary anlagen of worker
destined larvae (Hartfelder and Steinbruck, 1997; Reginato and Cruz-Landim,
2001; Reginato and Da Cruz-Landim, 2002; Tanaka et al., 2006; Dallacqua and
Bitondi, 2014), giving rise to the diminished worker ovaries (Winston, 1991).
JH is pivotal to caste differentiation. Topical application of JH can make
larvae acquire queen fate or ‘rescue’ knockouts (e.g.: Mutti et al., 2011). JH
- 14 -
titres are known to increase from 3th instar larvae onwards, peaking at the 4th
instar, when extensive growth takes place (de Azevedo and Hartfelder, 2008).
The role of JH also ties into the RGPH. West-Eberhard (1996) suggested that
JH not only underlay physiological maturation, but also directed the behavioural
changes in solitary progressively provisioning ancestors. JH is then thought to
have become uncoupled in queens and workers during social evolution (e.g. no
longer matures worker ovaries due to nutritional status), but further retained its
role in controlling behavioural changes (i.e. age polyethism; Robinson and
Vargo, 1997).
The uncoupled action of JH might for instance be regulated through
epigenetic changes. DNA methylation, for instance, is known to lead to
differential gene expression across A. mellifera castes (Elango et al., 2009).
Kucharski et al. (2008) further found that silencing DNA methyltransferase
(Dnmt3; using siRNA) resulted in queen phenotypes in worker destined larvae.
Hence, diphenic caste development (in A. mellifera) is currently thought to be
the complex product of nutritional and hormonal signalling, in conjunction with
epigenetic changes.
1.2.4 Reversible adult reproductive constraint
The reproductive division of labour is not exclusively regulated through
developmental mechanisms and caste however. Reproductive constraint may
constitute any process — from behaviour, to physiology and morphology — that
reduces the ability of the non-reproductive caste to reproduce (Khila and
Abouheif, 2010). Behavioural traits are generally considered more
phenotypically plastic than are morphological or physiological traits. From the
perspective of phyletic gradualism, behaviour is also more inclined to have
preceded (or even led to) evolutionary novelties in morphology and physiology
(Price et al., 2003; West-Eberhard, 2005). A common behavioural constraint is
for instance worker policing (e.g. Wenseleers and Ratnieks, 2006) in the
presence of a queen. Physiological reproductive constraints are typically
initiated developmentally however. Khila and Abouheif (2010) classified
developmental reproductive constraints for ant species (Table 1.2). The
reproductive constraints characterised (Khila and Abouheif, 2010; Table 1.2)
indicate that they can be both non-absolute9 and reversible, as in many species
workers can start reproducing in the absence of the queen. For instance, the
first and second constraint allow for the production of trophic eggs by
queenright workers in Aphaenogaster rudis, while queenless workers may
consequently produce more viable eggs (Khila and Abouheif, 2008). The
9 I.e. lead to subfertility as opposed to complete sterility.
- 15 -
combinations of these constraints may signify different trade-offs in the ecology
of these species.
The honey bee worker possesses at least two of the reproductive
constraints characterised by Khila and Abouheif (2010). The absence of a
spermatheca in honey bee workers (constraint 3 - Table 1.2; Winston, 1991;
Gotoh et al., 2013; with the exception of certain Apis mellifera capensis
females) and a reduction in ovariole number (constraint 4 - Table 1.2; Winston,
1991; Tanaka et al., 2006) are both evident. Non-reproductives often lack
spermatheca. Due to the relatedness skew in Hymenopterans (Figure 1.2),
worker policing of female offspring is predicted to occur more frequently than is
policing of male offspring (Bourke, 1999). The greater selective pressure
levelled against fertilised worker offspring therefore likely explains the frequent
absence of spermatheca in non-reproductives across eusocial evolution
(Bourke, 1999). The possible role of mechanisms controlling oogenesis with
regard to mating are discussed in further detail in Chapter 5. Constraints 1 and
2 may also exist in A. mellifera, given that: the maternal determinant Nanos is
not localised in vitellogenic oocytes of (queenless) workers (constraint 1 - Table
1.2; Dearden, 2006— i.e. the vitellarium, see Figure 1.3)10, and that queen
ovarioles are substantially larger than those of workers (constraint 2 - Table 1.2;
Winston, 1991, p. 42). Yet these remain to be tested explicitly in A. mellifera.
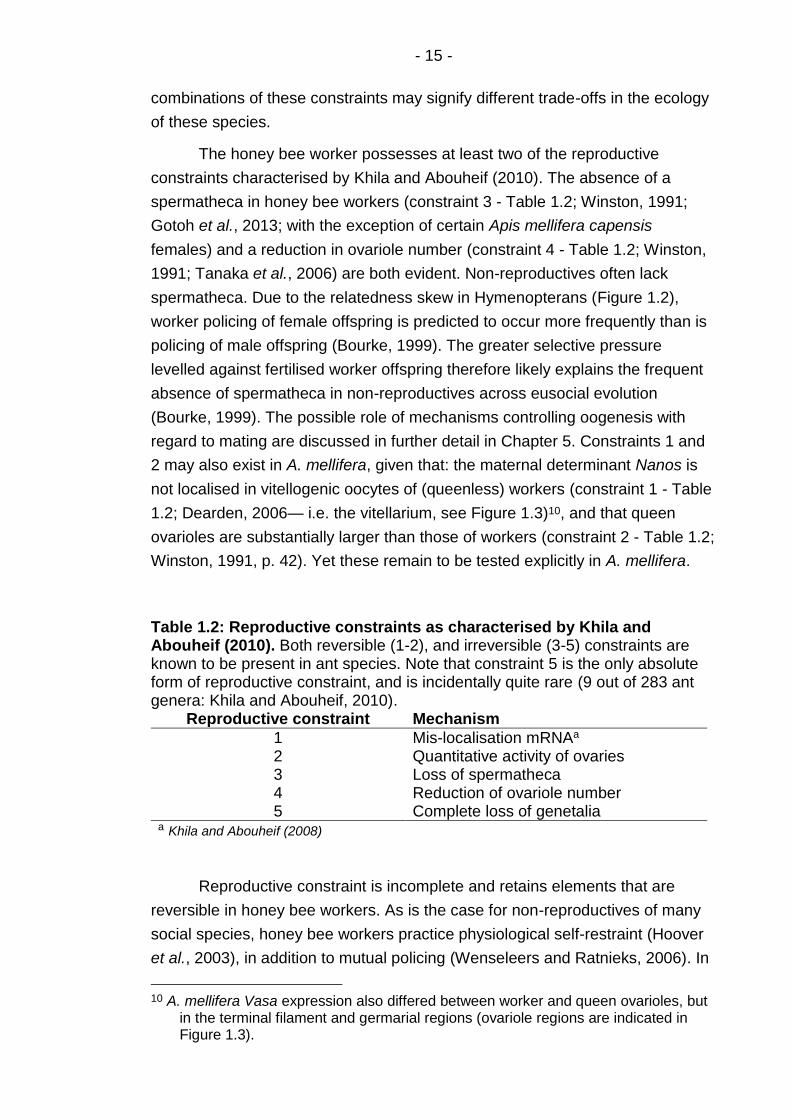
Table 1.2: Reproductive constraints as characterised by Khila and Abouheif (2010). Both reversible (1-2), and irreversible (3-5) constraints are known to be present in ant species. Note that constraint 5 is the only absolute form of reproductive constraint, and is incidentally quite rare (9 out of 283 ant genera: Khila and Abouheif, 2010).
Reproductive constraint Mechanism
1 Mis-localisation mRNAa
2 Quantitative activity of ovaries 3 Loss of spermatheca 4 Reduction of ovariole number 5 Complete loss of genetalia
a Khila and Abouheif (2008)
Reproductive constraint is incomplete and retains elements that are
reversible in honey bee workers. As is the case for non-reproductives of many
social species, honey bee workers practice physiological self-restraint (Hoover
et al., 2003), in addition to mutual policing (Wenseleers and Ratnieks, 2006). In
10 A. mellifera Vasa expression also differed between worker and queen ovarioles, but
in the terminal filament and germarial regions (ovariole regions are indicated in Figure 1.3).

- 16 -
other words: worker ovaries are kept in an inactivated state under queenright11
conditions, through queen mandibular pheromone (QMP) and brood pheromone
(Jay, 1972; Mohammedi et al., 1998; Hoover et al., 2003; Tanaka and
Hartfelder, 2004). Oocyte development is supressed at an early stage in these
queenright honey bee workers (Tanaka and Hartfelder, 2004; Duncan et al.,
2016). Specifically, cystocyte clusters do not progress beyond the germarium
(region indicated in Figure 1.3), where oocytes and nurse cells are specified
(Tanaka and Hartfelder, 2004; Ronai et al., 2015; Duncan et al., 2016).
Curiously, germarial disorganisation is similar to the situation seen in queens of
A. mellifera kept virgin for an extended duration (Berger and Abdalla, 2005).
This, in conjunction with the absence of spermatheca in A. mellifera workers
(constraint 3 - Table 1.2; Winston, 1991). This raises the interesting possibility
of adult reproductive constraint being evolutionary ancestral to mating status —
a hypothesis which is further explored in Chapter 5.
Duncan et al. (2016) showed that active Notch signalling in the
germarium (Figure 1.3) is associated with inactive ovaries in queenright
workers. Notch is known to form and maintain the germline stem cell niche in
the D. melanogaster germarium (Song et al., 2007). Through the use of a Notch
inhibitor, Duncan et al. (2016) managed to increase ovary activation in both the
presence and absence of QMP — categorically demonstrating that germarial
Notch signalling regulates QMP mediated adult reproductive constraint.
Another, possibly related aspect of this mechanism, has been germarial
apoptosis (Tanaka and Hartfelder, 2004; Ronai et al., 2015). Since programmed
cell death is already associated with several checkpoints in the ovary of D.
melanogaster (McCall, 2004; Pritchett et al., 2009), and since oocyte abortion
inherently needs to be ‘cleaned up’, this makes intuitive sense. The suggested
germarial checkpoint (Ronai et al., 2015) is responsive to starvation in D.
melanogaster at least (Drummond-Barbosa and Spradling, 2001). Notch
signalling is likewise responsive to starvation in D. melanogaster (Bonfini et al.,
2015), and Notch is generally known as an ‘arbiter of differentiation and death’
(Miele and Osborne, 1999). Hence it may be that Notch amalgamates multiple
identified pathways within its signalling function.
11 Queenright = under queen presence; queenless = under queen absence.
- 17 -
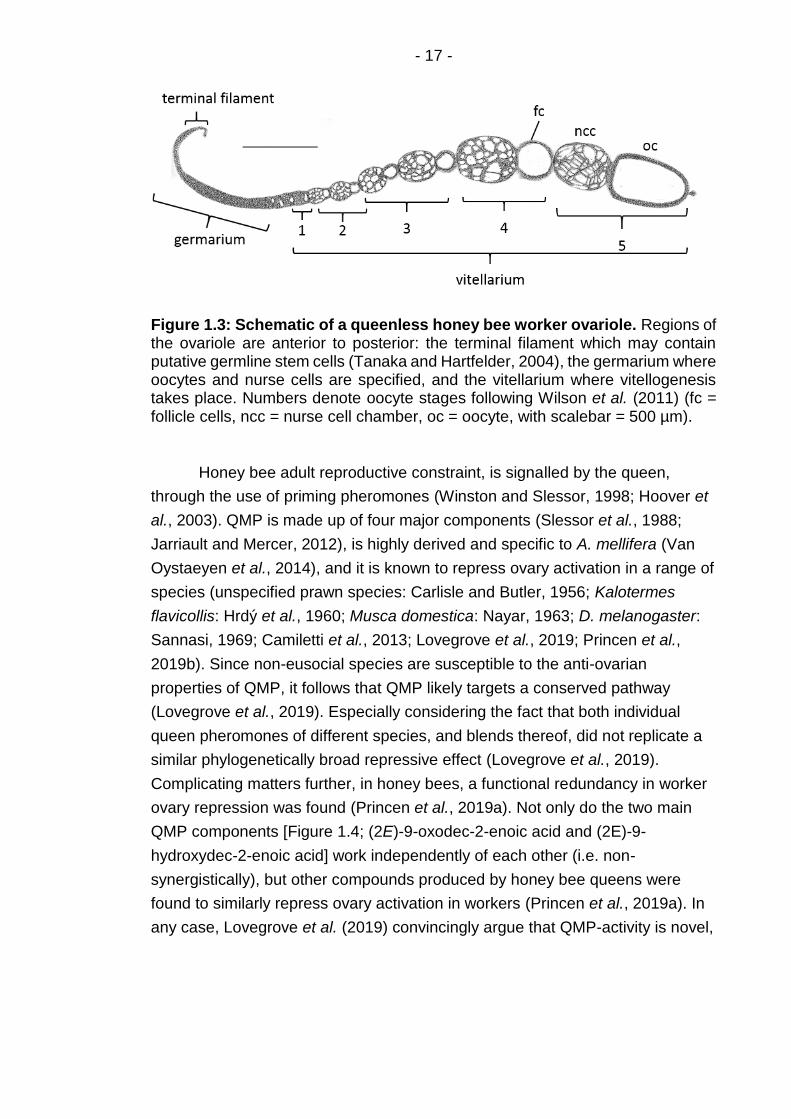
Figure 1.3: Schematic of a queenless honey bee worker ovariole. Regions of the ovariole are anterior to posterior: the terminal filament which may contain putative germline stem cells (Tanaka and Hartfelder, 2004), the germarium where oocytes and nurse cells are specified, and the vitellarium where vitellogenesis takes place. Numbers denote oocyte stages following Wilson et al. (2011) (fc = follicle cells, ncc = nurse cell chamber, oc = oocyte, with scalebar = 500 µm).
Honey bee adult reproductive constraint, is signalled by the queen,
through the use of priming pheromones (Winston and Slessor, 1998; Hoover et
al., 2003). QMP is made up of four major components (Slessor et al., 1988;
Jarriault and Mercer, 2012), is highly derived and specific to A. mellifera (Van
Oystaeyen et al., 2014), and it is known to repress ovary activation in a range of
species (unspecified prawn species: Carlisle and Butler, 1956; Kalotermes
flavicollis: Hrdý et al., 1960; Musca domestica: Nayar, 1963; D. melanogaster:
Sannasi, 1969; Camiletti et al., 2013; Lovegrove et al., 2019; Princen et al.,
2019b). Since non-eusocial species are susceptible to the anti-ovarian
properties of QMP, it follows that QMP likely targets a conserved pathway
(Lovegrove et al., 2019). Especially considering the fact that both individual
queen pheromones of different species, and blends thereof, did not replicate a
similar phylogenetically broad repressive effect (Lovegrove et al., 2019).
Complicating matters further, in honey bees, a functional redundancy in worker
ovary repression was found (Princen et al., 2019a). Not only do the two main
QMP components [Figure 1.4; (2E)-9-oxodec-2-enoic acid and (2E)-9-
hydroxydec-2-enoic acid] work independently of each other (i.e. non-
synergistically), but other compounds produced by honey bee queens were
found to similarly repress ovary activation in workers (Princen et al., 2019a). In
any case, Lovegrove et al. (2019) convincingly argue that QMP-activity is novel,
- 18 -
and that it likely specifically targets conserved mechanisms (e.g. Notch
signalling: Duncan et al., 2016)12.
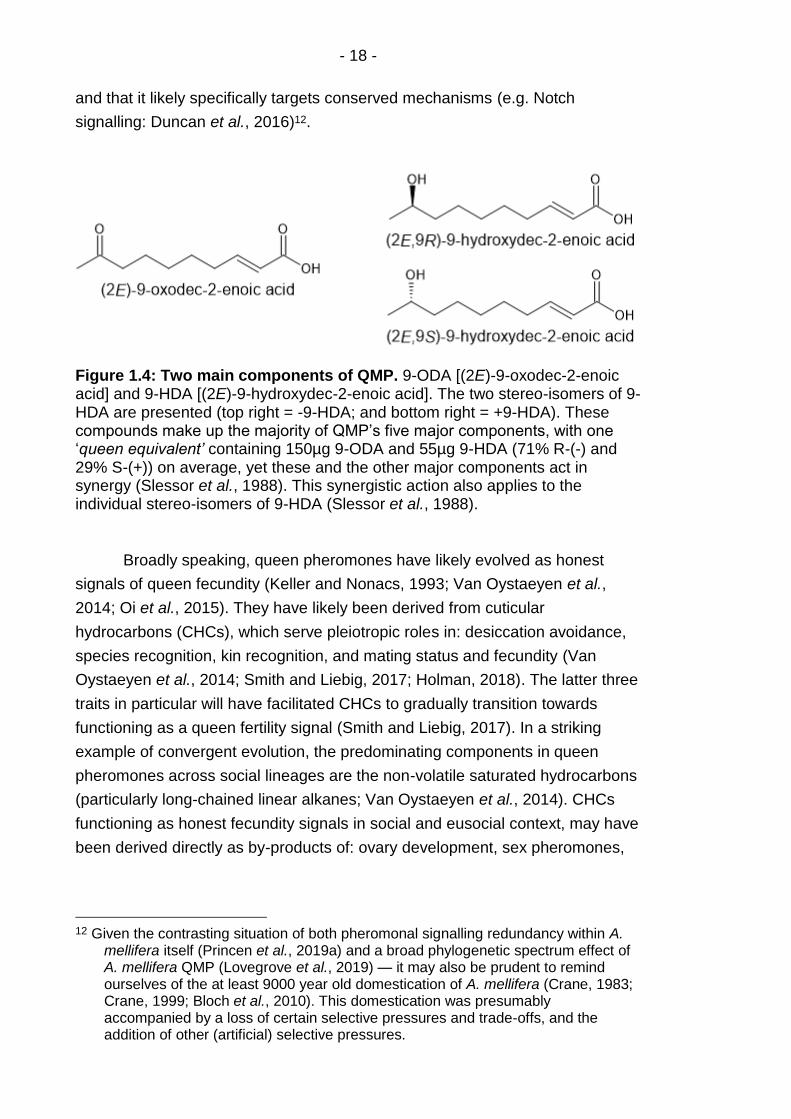
Figure 1.4: Two main components of QMP. 9-ODA [(2E)-9-oxodec-2-enoic acid] and 9-HDA [(2E)-9-hydroxydec-2-enoic acid]. The two stereo-isomers of 9-HDA are presented (top right = -9-HDA; and bottom right = +9-HDA). These compounds make up the majority of QMP’s five major components, with one ‘queen equivalent’ containing 150µg 9-ODA and 55µg 9-HDA (71% R-(-) and 29% S-(+)) on average, yet these and the other major components act in synergy (Slessor et al., 1988). This synergistic action also applies to the individual stereo-isomers of 9-HDA (Slessor et al., 1988).
Broadly speaking, queen pheromones have likely evolved as honest
signals of queen fecundity (Keller and Nonacs, 1993; Van Oystaeyen et al.,
2014; Oi et al., 2015). They have likely been derived from cuticular
hydrocarbons (CHCs), which serve pleiotropic roles in: desiccation avoidance,
species recognition, kin recognition, and mating status and fecundity (Van
Oystaeyen et al., 2014; Smith and Liebig, 2017; Holman, 2018). The latter three
traits in particular will have facilitated CHCs to gradually transition towards
functioning as a queen fertility signal (Smith and Liebig, 2017). In a striking
example of convergent evolution, the predominating components in queen
pheromones across social lineages are the non-volatile saturated hydrocarbons
(particularly long-chained linear alkanes; Van Oystaeyen et al., 2014). CHCs
functioning as honest fecundity signals in social and eusocial context, may have
been derived directly as by-products of: ovary development, sex pheromones,
12 Given the contrasting situation of both pheromonal signalling redundancy within A.
mellifera itself (Princen et al., 2019a) and a broad phylogenetic spectrum effect of A. mellifera QMP (Lovegrove et al., 2019) — it may also be prudent to remind ourselves of the at least 9000 year old domestication of A. mellifera (Crane, 1983; Crane, 1999; Bloch et al., 2010). This domestication was presumably accompanied by a loss of certain selective pressures and trade-offs, and the addition of other (artificial) selective pressures.
- 19 -
oviposition deterring pheromones, or a combination thereof (Oi et al., 2015).
This point will be expounded on in Chapter 5.
1.2.5 Swindling bees
As stated earlier (1.1), altruistic systems can be susceptible to invasion
by cheaters (Maynard Smith and Wynne-Edwards, 1964). Cheating phenotypes
have been identified within A. mellifera, and present interesting opportunities to
study ‘genes underlying altruism’.
1.2.5.1 Anarchy
Oldroyd et al. (1994) found drone comb above a queen excluder;
implying worker laid drones under queenright conditions. Further paternity
analysis (microsatellite markers) showed that the drones were laid by three to
four patrilineal workers (Oldroyd et al., 1994). Workers of this anarchistic strain
of honey bees showed increased rates of ovary development, increased
tolerance to QMP, and increased survival rates of worker laid eggs (Oldroyd
and Osborne, 1999; Oldroyd and Ratnieks, 2000). Using backcrosses, Oxley et
al. (2008) tried to identify specific genes underlying the phenomenon, and
managed to find four quantitative trait loci (QTLs; explaining only 25% of
variance) associated with the phenotype. Ronai et al. (2016a) further
investigated one QTL regions, and focussed on a candidate gene dubbed
Anarchy (PMP34; a peroxisomal ATP transporter: Visser et al., 2002) which
was the best predictor of ovary state among four shortlisted candidate genes.
They further found it to be associated with Buffy, a mitochondrial inducer of
apoptosis (Tanner et al., 2011; Dallacqua and Bitondi, 2014). Anarchy mRNA
localised to degenerating oocytes and nurse cells in queenright worker ovaries,
localised around the germinal vesicle of maturing oocytes in queenless worker
ovaries, and was differentially expressed between queenless and queenright
workers (Ronai et al., 2016a). Whether and how PMP34 is regulated by QMP,
and how it functions to regulate oogenesis are all questions that remain to be
addressed.
1.2.5.2 Thelytoky
Onions (1912) discovered that some workers of Apis mellifera capensis
(South African Cape honey bee) can produce diploid females through
parthenogenesis (thelytoky), due to an abnormal meiosis (spindle rotation
failure; Lattorff and Moritz, 2013). These thelytokous workers activate their
ovaries in the presence of the queen, develop queen-like traits and produce
queen-like QMP (Lattorff and Moritz, 2013). These workers can function as
social parasites to the related Apis mellifera scutellata (East African lowland
- 20 -
honey bee) by killing their queen and exploiting the colony (the 'capensis
calamity'; Lattorff et al., 2007; Lattorff and Moritz, 2013 and references therein).
Lattorff et al. (2005) found a recessive inheritance pattern of thelytoky in
worker offspring when backcrossing with both Apis mellifera carnica (Carniolan
honey bee) and A. mellifera capensis. The subsequently uncovered recessive
allele thelytoky (th), was shown to increase 9-ODA synthesis and social
parasitism (Lattorff et al., 2007). Jarosch et al. (2011) traced th to a single locus
homologous to gemini (gem)13 in D. melanogaster (Hoskins et al., 2007).
Jarosch et al. (2011) proposed a model where alternative splicing of two exon
cassettes caused the phenotype. This was later contested in a study using
backcrosses with Apis mellifera scutellata (Chapman et al., 2015), but may be
inconclusive. Thelytokous workers inherently skew reproduction by being
queenlike (inherently inhibiting the egg-laying of regular workers: Lattorff et al.,
2007), thereby making it hard to quantify arrhenotokous laying to compare with
in backcrosses. Additionally, only ten microsatellite markers were used in
Chapman et al. (2015; five of which were linked); which could be considered
doubly inadequate given the extremely high recombination rate of A. mellifera
(Weinstock et al., 2006; Beye et al., 2006). To date, the debate surrounding the
genetic underpinnings of thelytoky remains unsettled (Wallberg et al., 2016;
Aumer et al., 2017; Aumer et al., 2019; Christmas et al., 2019), and further
research is still required.
1.3 Study species
In order to study the evolution of adult reproductive constraint, I made
use of two species. By comparing a highly eusocial and well-studied species to
a related solitary species using molecular techniques, I aimed to gain insights
into the mechanisms underlying the evolution adult reproductive constraint.
1.3.1 The eusocial honey bee, A. mellifera
A. mellifera is very widespread and relatively easy to maintain, making
them a model system (Dearden et al., 2009b). The reproductive division of
labour of the honey bee consists of a single multiply mated queen, functionally
sterile female workers and fertile males (drones). The queen is essentially an
egg laying machine, living longer than both workers and drones. Workers care
for eggs laid by the queen, feed larvae, clean and maintain the nest, attend the
queen, collect and store pollen, collect and process nectar, and guard the nest.
These (summer) tasks are roughly associated with age (i.e. age polyethism),
with tasks further away from both queen and hive carried out by older workers. 13 Gemini = ‘genitalia missing’.
- 21 -
Drones are usually only born in spring, during the swarming season, when an
old queen and the aerial part of the workforce14 look for a new place to nest and
found a new colony (i.e. colony reproduction; when the old colony has grown
large enough)15. During the swarming season, new queens will mate multiply
(with thirteen males on average; Estoup et al., 1994) during a mating flight.
(Winston, 1991)
A honey bees’ role within the colony thus depends on both its sex as well
as its division into either the reproductive caste (queen) or the non-reproductive
caste (worker). The former is genetically modulated through the complementary
sex determiner locus (csd; Gempe and Beye, 2009) — with heterozygotes
becoming females and hemizygotes resulting in male offspring. Meanwhile
caste differentiation is phenotypically plastic (discussed in section 1.2.3).
Exactly when a new queen is raised, depends mainly on current queen
presence or absence. Alternately, queen destined larvae may also be raised in
order to replace the old queen (supersedure). Queen presence is signalled
through QMP which is produced in her mandibular gland (see section 1.2.4;
Naumann et al., 1991). It is licked off of her by queen retinue workers, and
subsequently spread throughout the colony via trophallaxis and incorporation
into the secreted wax nesting material (Naumann et al., 1991).
1.3.2 The solitary red mason bee, Osmia bicornis
Studies on facultative eusocial bees exist (Ceratina japonica; Maeta et
al., 1993; Sakagami et al., 1993). Since group living is artificially inducible in
such species, they seem ideal to test hypotheses like the RGPH. However,
such species are only secondarily solitary, and the reproductive plasticity they
exhibit is likely of a vestigial nature (Kapheim, 2019). Recently, direct tests of
the RGPH using solitary bees have become more numerous (Euodynerus
foraminatus — N-American wasp: Tibbetts et al., 2013; Nomia melanderi — arid
N-American bee: Kapheim and Johnson, 2017b; Kapheim and Johnson, 2017a;
Synagris cornuta — tropical African wasp: Kelstrup et al., 2018; Euglossa
dilemma — C-American bee: Saleh and Ramirez, 2019). However, the species
used in these studies, are almost exclusively American and African. Indeed, the
most suitable species tend to be tropical, which is no coincidence. The lack of
seasonal winter in tropical climates precludes the need for hibernation, with
implications for diapause. Subsequently, a tropical climate allows for
14 Young nurse bees are yet incapable of flight. 15 While swarming behaviour and mechanisms are fairly well-studied, the exact
‘releaser conditions’ for both rearing new queens, as well as swarming by the old queen remain unknown (Visscher and Camazine, 1999; Seeley and Buhrman, 1999).
- 22 -
progressive provisioning, multivoltinism and facultative diapause, communal
nesting and nest construction to evolve. These traits are considered pre-
adaptations to eusociality, and are typically lacking in temperate solitary bees
(e.g. O. bicornis; Raw, 1972). It is unlikely to be a coincidence that highly
eusocial species are likewise predominantly tropical and subtropical (Roubik,
1992, p. 380-389).
Consequently, there is a distinct lack of a European and temperate
model solitary bee species to compare the well-studied ‘model social insect
species’ A. mellifera and B. terrestris to. Hence, in order to conduct a cross-
species comparison of the reproductive biology of the highly eusocial honey
bee, we elected to use the solitary red mason bee, Osmia bicornis (syn. Osmia
rufa, L. 1758; Hymenoptera, Megachilidae). This species was favoured over
species more closely related to A. mellifera (i.e. favoured over other solitary
Apidae more closely related to A. mellifera; Peters et al., 2017) due to its
commercial availability as a supplementary pollinator (Dr Schubert plant
breeding; Landsberg, Germany), the fact that it is a well-studied species (for a
full overview, see Chapter 3), and its potential to be reared in the laboratory
(Sandrock et al., 2014; see Chapter 3 for a full discussion). Furthermore, crucial
to molecular studies, O. bicornis has also recently had an annotated genome
published (Beadle et al., 2019), as well as having global DNA methylation data
available (Strachecka et al., 2017).
Not only is O. bicornis a common solitary bee in the UK (Falk, 2015), it
also possesses at least several traits considered pre-adaptations to the
evolution of eusociality. These are: suspected monogamy (Seidelmann, 2014a,
2015), population viscosity (gregarious nesting: O'Toole, 2000; degree of nest-
site fidelity: Steffan-Dewenter and Schiele, 2004), the potential for kin
recognition (Raw, 1992), nest construction and defence (Seidelmann, 2006,
1999a), and maternal care (Seidelmann, 2006; Ivanov, 2006).
Additionally, O. bicornis retains adult (pupal) diapause, rather than a
developmental (larval) diapause (Raw, 1972). This is also significant towards
evolving eusociality, for a less obvious and more complicated reason. Adult
diapause is prerequisite towards evolving mated female hibernation, which in
turn is required to facilitate (partial) bivoltinism (Quinones and Pen, 2017).
Within the sex determining system of the Hymenoptera, bivoltinism leads to
temporally biased sex-ratios (Seger, 1983). I.e. spring generations are male-
biased and summer generations are generally female-biased (Seger, 1983;
Quinones and Pen, 2017). Hence, in a bivoltine Hymenopteran, where sex is
biased towards females in the summer generation, female helping is promoted
in that generation, since helpers can capitalise on the relatedness asymmetry

- 23 -
outlined in Figure 1.2 (Trivers and Hare, 1976)16. Using ancestral state
reconstruction, it has been shown that adult diapause is ancestral to lineages of
bees that have evolved eusociality (Santos et al., 2019).
For all the reasons outlined above, O. bicornis lends itself to be
established as a European solitary model species. Furthermore, the caveats
initially outlined are not insurmountable(e.g. bivoltinism and diapause refer to
hypotheses in wasps specifically; Hunt and Amdam, 2005; Hunt et al., 2007). I
would argue that the very nature of investigating conserved mechanisms or
genetic toolkits (Kapheim, 2016), such as the conserved Notch signalling
pathway (Duncan and Dearden, 2010), should be inherently amenable to study
using a more distantly related cousin species. Particularly when studying QMP
mediated adult reproductive constraint in A. mellifera, with its phylogenetically
broad repressive effects (Lovegrove et al., 2019).
The full life-history of O. bicornis will be further discussed in Chapter 3,
alongside attempts of establishing this species in a laboratory setting.
16 Under equal sex-ratios, the inclusive fitness gained by rearing female siblings that
are more related (r = 3/4) is cancelled out through the rearing of male brood (brothers; r = 1/4). Consequently, the capitalising on the relatedness asymmetry requires the preferential rearing of sisters over brothers, biased sex-ratios (spatially or temporally), or both (Trivers and Hare, 1976).
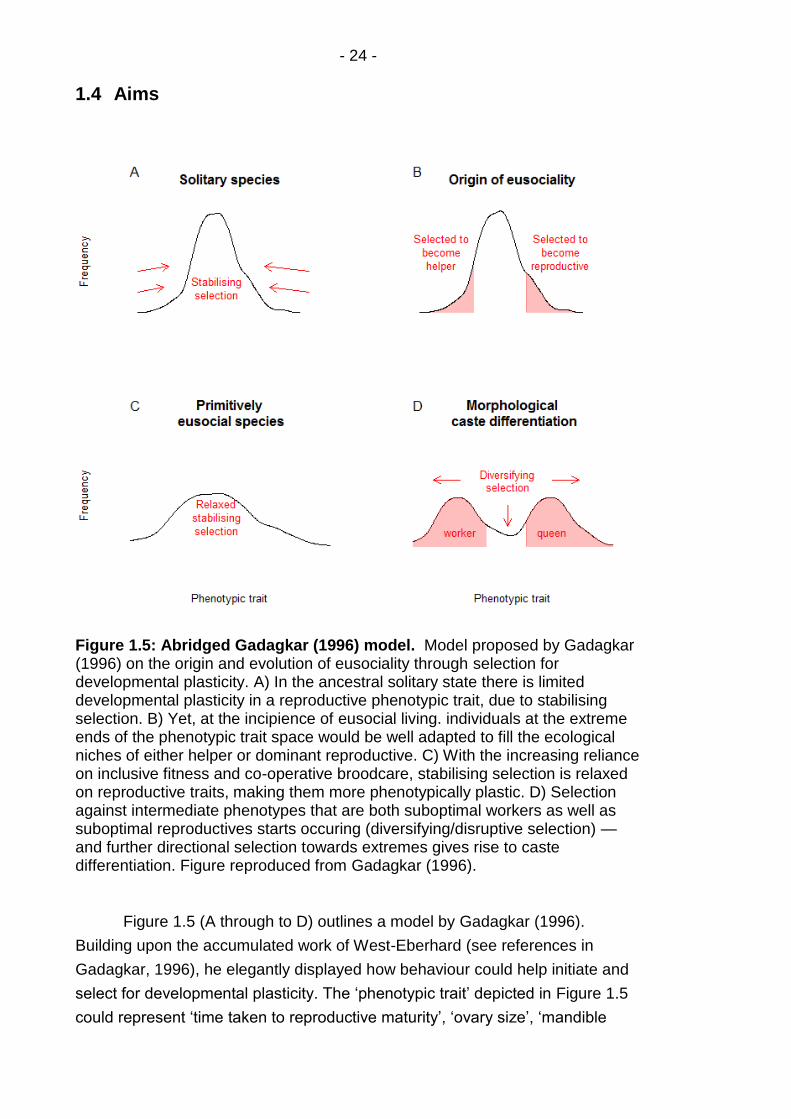
- 24 -
1.4 Aims
Figure 1.5: Abridged Gadagkar (1996) model. Model proposed by Gadagkar (1996) on the origin and evolution of eusociality through selection for developmental plasticity. A) In the ancestral solitary state there is limited developmental plasticity in a reproductive phenotypic trait, due to stabilising selection. B) Yet, at the incipience of eusocial living. individuals at the extreme ends of the phenotypic trait space would be well adapted to fill the ecological niches of either helper or dominant reproductive. C) With the increasing reliance on inclusive fitness and co-operative broodcare, stabilising selection is relaxed on reproductive traits, making them more phenotypically plastic. D) Selection against intermediate phenotypes that are both suboptimal workers as well as suboptimal reproductives starts occuring (diversifying/disruptive selection) — and further directional selection towards extremes gives rise to caste differentiation. Figure reproduced from Gadagkar (1996).
Figure 1.5 (A through to D) outlines a model by Gadagkar (1996).
Building upon the accumulated work of West-Eberhard (see references in
Gadagkar, 1996), he elegantly displayed how behaviour could help initiate and
select for developmental plasticity. The ‘phenotypic trait’ depicted in Figure 1.5
could represent ‘time taken to reproductive maturity’, ‘ovary size’, ‘mandible
- 25 -
size’, or any other caste related trait. In solitary species, less developmental
phenotypic plasticity is thought to exist, but it is still present (Figure 1.5A).
Changes in behaviour, in conjunction with inclusive fitness benefits,
subsequently drive selection (Price et al., 2003) for individuals at the extremes.
Individuals at the extremes are those best suited to be either helpers or
reproductives (Figure 1.5B-C). Ultimately — stemming from selection for
increased developmental plasticity (Figure 1.5C) — specialised diphenic castes
arise from the same genome (Figure 1.5D).
In this work, in essence, I will attempt to compare plastic control of
reproduction in a solitary bee (Figure 1.5A), to that of a eusocial worker (Figure
1.5D). While Figure 1.5 (Gadagkar, 1996) specifically refers to developmental
plasticity, I will be focusing on reversible mechanisms of adult reproductive
control (solitary), and constraint (eusocial worker; such as constraint 1 and 2 in
Table 1.2). This because under the RGPH, mechanisms of adult reproductive
constraint are predicted to be rooted in conserved and environmentally
controlled pathways (sections 1.2.3 and 1.2.4).
1.5 Outline of thesis
The general goal of this thesis was thus to analyse the molecular and
physiological basis of these constraints on worker reproduction, to attempt to
directly link them to the environmental factors that originally controlled them
(e.g. nutrition or mating); to elucidate what factors and mechanisms may have
been at play during the evolution of honey bee eusociality. Additionally, I aimed
to establish O. bicornis as a model species for the future study of bee social
evolution.
In Chapter 3 I discuss attempts to get O. bicornis females to reproduce
naturally in a laboratory environment, precisely with the above aim of
establishing this species as a future model in mind. This is important, since it
would allow the most direct and explicit test of reproductive success. I discuss
future directions for maintaining solitary pollinators in a laboratory setting, and
provide proof of concept to the viability of behavioural assays with respect to
foraging in a caged environment.
In Chapter 4, I try and root O. bicornis as a model species further, by
testing microsatellite markers mined from the annotated genome (Beadle et al.,
2019). Where previous work has made use of partial genomic libraries
(Neumann and Seidelmann, 2006), the use of a larger amount of markers is
more informative, and provides a foundation for future genetic work in O.
bicornis. I outline future applications for these markers.
- 26 -
In Chapter 5, I further aimed to establish O. bicornis as a model species,
by providing a microstructural study of the ovary. I compare the O. bicornis
ovary to that of the eusocial A. mellifera worker. This is central to further
compare the use of conserved pathways in the reproductively constrained
honey bee worker (e.g. germarial Notch signalling, section 1.2.4, and Chapter
6). I studied ovary structure in conjunction to the context of social environment,
specifically mating status. This because reproduction and mating are
intertwined in insects overall (Gillott, 2003; Colonello and Hartfelder, 2005; Avila
et al., 2011), as well as in queens of social species in particular (Patricio and
Cruz-Landim, 2002; Tanaka and Hartfelder, 2004; de Souza et al., 2007; Shukla
et al., 2013; Peso et al., 2013). Furthermore, mating affects queen fertility
signalling (Slessor et al., 1990; Richard et al., 2007; Oppelt and Heinze, 2009;
Nino et al., 2013; Jansen et al., 2016), and queen pheromones may have been
derived from sex pheromones (Oi et al., 2015). Taken together with the fact that
A. mellifera workers are reproductively constrained by a lack of spermatheca
(constraint 3 - Table 1.2; Winston, 1991; Khila and Abouheif, 2010) — it raises
the possibility that mechanisms associated with virginity underly QMP-mediated
adult reproductive constraint in workers.
In Chapter 6, I demonstrate a robust optimisation of the in situ
hybridisation technique in the ovary of O. bicornis17 . I use this technique to
investigate germarial Notch signalling in the O. bicornis ovary, and discuss its
relevance with respect to QMP-mediated reproductive restraint in A. mellifera
workers (Duncan et al., 2016). I attempt to establish a functional link between
germarial Notch signalling and the early control of oogenesis in O. bicornis,
using a Notch inhibitor. Subsequently, I try to repress early oogenesis in
O.bicornis through the use of both starvation (Drummond-Barbosa and
Spradling, 2001; Bonfini et al., 2015) and QMP (Lovegrove et al., 2019). Finally,
I test the effectiveness of QMP in repressing oogenesis in A. mellifera workers
post-ovary activation to assess the reversibility of this phenotypically plastic
repression.
Finally, in Chapter 7, I contextualise the overall results within the wider
literature, and I suggest future avenues of research. I also propose a conceptual
model for the evolutionary co-option of germarial Notch signalling into adult
reproductive constraint of the honey bee, A. mellifera.
17 Full protocols can be found in Chapter 2 (General methods)

- 27 -
Chapter 2 General Methods
2.1 Husbandry
2.1.1 Apis mellifera
A. mellifera workers were retrieved from a commercial stock which was
kept according to standard practices (Dearden et al., 2009b) in British National
hives. Colonies were assessed weekly for egg-laying, queen cups, food stores
and parasites. Supplementary feeding was supplied regularly. Queenless
workers were obtained by placing frames of brood with several workers into a
standard nucleus box, which typically activate their ovaries after two to four
weeks in the absence of QMP (Duncan et al., 2016). A queenless hive was
considered reproductively active once 30% of dissected bees showed ‘stage 3’
ovaries (Duncan et al., 2016).
2.1.2 Osmia bicornis
O. bicornis is commercially available as a supplementary pollinator, and
as a pollinator in greenhouses and orchards. The O. bicornis in this study were
mainly obtained as cocoons from a commercial supplier (Dr Schubert plant
breeding; Landsberg, Germany). While being a well-studied species, this
species has typically been studied and kept in field or semi-field conditions. To
date only a single study has managed to induce the complete set of foraging
and reproductive behaviours, and facilitated a complete reproductive cycle in a
full laboratory setting (Sandrock et al., 2014). Chapter 3 deals with attempts to
replicate the laboratory rearing of O. bicornis, and consequently aspects of
husbandry for this species are treated in depth in Chapter 3.
2.2 Microdissection and tissue processing
Individuals were narcotised on ice, or at 4°C for 30 minutes since carbon
dioxide narcosis is known to affect transcription (Koywiwattrakul et al., 2005;
whole abdomen RNA extractions). Ovaries were dissected using fine forceps in
cold phosphate buffered saline (PBS). For O. bicornis females, the intima and
ovariole sheath were removed using fine forceps to improve staining and image
quality for microscopy samples. For A. mellifera females, large ovarioles from
queen-less workers (QLW) were stripped similarly, while small ovarioles from
queen-right workers (QRW) were individualised using fine forceps. All
dissections were carried out within 20 minutes to limit degradation of nucleic

- 28 -
acids. For RNA extractions, tissue was placed on dry ice immediately after
dissection and subsequently stored at -80°C.
Samples for immunohistochemistry (IHC) or in situ hybridisation (ISH)
were placed in 400 μl PBS on ice. 100 μl of 40% formaldehyde and 500 μl
heptane were added, and tissue was fixed on a nutating mixer at room
temperature (RT). For IHC of A. mellifera ovaries, this was done for seven
minutes for QRW, and ten to fifteen minutes for QLW. For O. bicornis ovaries,
fixation was optimised as part of this study at twenty minutes for IHC (following
honey bee queens: Dearden et al., 2009a), and at one hour for ISH. Samples
for ISH were rinsed three times with ice cold methanol (MeOH) and stored at -
20°C.
2.3 RNA extraction
Tissue was weighed on a pre-cooled (dry ice) weighing boat and divided
into pieces using a scalpel. The tissue was subsequently homogenised in Trizol
(Invitrogen; 1ml reagent per 50 mg tissue) for 20-40 seconds at RT, and left to
incubate for five minutes. Samples were placed on ice, and 200 µl of chloroform
(Sigma-Aldrich) per 1 ml Trizol was added. Samples were vortexed for fifteen
seconds and left to stand at RT for five minutes, after which they were
centrifuged at a relative centrifugal force (RCF) of 12,000 g, at 4°C for ten
minutes. 175µl of the aqueous upper phase (containing both RNA and DNA)
was transferred, taking care not to touch the interphase and lower
phenol:chloroform phase containing leftover tissue contaminants (proteins and
lipids respectively).
RNA was subsequently purified using RNeasy (Qiagen) according to the
manufacturer’s instructions. 175 µl of 70% ethanol (EtOH) was added to
dehydrate nucleic acids. The whole volume was pipetted onto the RNeasy mini
column and centrifuged for fifteen seconds at 10,000 rotations per minute (rpm)
at RT, precipitating both DNA and RNA onto the column. Salts were washed off
using 350µl of the proprietary wash buffer and centrifuging for fifteen seconds at
10,000 rpm at RT. 80 µl of DNAse I was made up in buffer and added onto the
membrane, and left to incubate for fifteen minutes at RT, after which it was
washed off using 350 µl of wash buffer spun at 10,000 rpm for fifteen seconds
at RT. The column bearing RNA was transferred to a collection tube, where 500
µl of a mild wash buffer was added and centrifuged for two minutes at 10,000
rpm to remove trace salts. This was performed twice, after which the column
was transferred to a fresh microcentrifuge tube. The RNA on the column was
eluted in 30 µl elution buffer and taken off the column by centrifugation at
10,000 rpm for one minute. 1.5 µl of sample was subsequently measured on a

- 29 -
spectrophotometer (NanoDrop 2000) to determine sample concentration and
possible contamination. RNA was stored at -80°C.
2.4 cDNA synthesis
cDNA synthesis was performed using the Revert Aid first strand cDNA
synthesis kit (Thermo Scientific) according to the manufacturer’s instructions. 5
µg of RNA sample was placed in a thermal cycling tube on ice, and total volume
was brought to 12 µl using nuclease free water (UltraPure, Invitrogen). 1x
reaction buffer, 1 U of Ribolock RNase inhibitor, 1 mM dNTP mix, 5 µM random
hexamer primer mix and 10 U of RevertAid M-MulV reverse transcriptase (RT)
were added and the reaction mix was inverted gently and spun down briefly.
Samples were incubated in a thermal cycler for five minutes at 25°C (annealing)
and 60 minutes at 42°C (reverse transcription). The reaction was subsequently
terminated at 70°C for five minutes. Resultant complementary DNA (cDNA) was
stored at -20°C.
2.5 Primer design in situ hybridisation probes
Sequences were obtained from an unassembled O. bicornis
transcriptome dataset, assembled by Dr E.J. Duncan using Trinity (Grabherr et
al., 2011; Haas et al., 2013). Genes of interest were identified in the A. mellifera
and Megachile rotundata (Megachilidae) genomes from previously published
data (e.g. Duncan et al., 2016) or by making use of the Drosophila sequence
(Thurmond et al., 2018). O. bicornis orthologs were identified within the de novo
transcriptome using basic local alignment search tool (BLAST; Altschul et al.,
1990; Madden, 2013), and verified using reciprocal BLAST protein sequences
to A. mellifera and M. rotundata (Megachilidae). This because M. rotundata is a
more closely related species to O. bicornis with an available genome (accession
number: PRJNA66515), and A. mellifera is subject to comparison in this thesis,
in addition to having its genome well annotated (Weinstock et al., 2006).
Alignments were examined for assembly errors, and primer positions were
selected outside of conserved and motif regions. Primers were designed with
Primer3plus (Rozen and Skaletsky, 2000; Untergasser et al., 2012), and
devised to attain a product size of 800-1200 basepairs. Specificity was checked
through Primer-BLAST (Ye et al., 2012) to A. mellifera and M. rotundata.
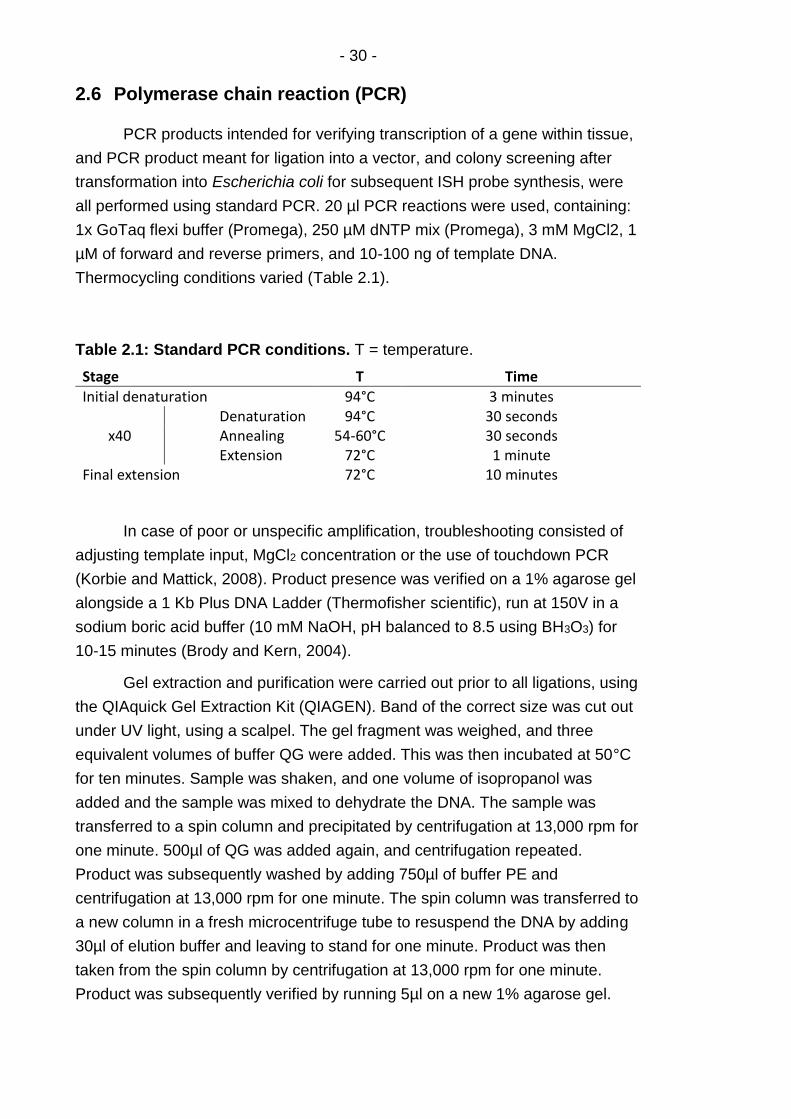
- 30 -
2.6 Polymerase chain reaction (PCR)
PCR products intended for verifying transcription of a gene within tissue,
and PCR product meant for ligation into a vector, and colony screening after
transformation into Escherichia coli for subsequent ISH probe synthesis, were
all performed using standard PCR. 20 µl PCR reactions were used, containing:
1x GoTaq flexi buffer (Promega), 250 µM dNTP mix (Promega), 3 mM MgCl2, 1
µM of forward and reverse primers, and 10-100 ng of template DNA.
Thermocycling conditions varied (Table 2.1).
Table 2.1: Standard PCR conditions. T = temperature.
Stage T Time
Initial denaturation 94°C 3 minutes
x40 Denaturation Annealing Extension
94°C 30 seconds 54-60°C 30 seconds
72°C 1 minute Final extension 72°C 10 minutes
In case of poor or unspecific amplification, troubleshooting consisted of
adjusting template input, MgCl2 concentration or the use of touchdown PCR
(Korbie and Mattick, 2008). Product presence was verified on a 1% agarose gel
alongside a 1 Kb Plus DNA Ladder (Thermofisher scientific), run at 150V in a
sodium boric acid buffer (10 mM NaOH, pH balanced to 8.5 using BH3O3) for
10-15 minutes (Brody and Kern, 2004).
Gel extraction and purification were carried out prior to all ligations, using
the QIAquick Gel Extraction Kit (QIAGEN). Band of the correct size was cut out
under UV light, using a scalpel. The gel fragment was weighed, and three
equivalent volumes of buffer QG were added. This was then incubated at 50°C
for ten minutes. Sample was shaken, and one volume of isopropanol was
added and the sample was mixed to dehydrate the DNA. The sample was
transferred to a spin column and precipitated by centrifugation at 13,000 rpm for
one minute. 500µl of QG was added again, and centrifugation repeated.
Product was subsequently washed by adding 750µl of buffer PE and
centrifugation at 13,000 rpm for one minute. The spin column was transferred to
a new column in a fresh microcentrifuge tube to resuspend the DNA by adding
30µl of elution buffer and leaving to stand for one minute. Product was then
taken from the spin column by centrifugation at 13,000 rpm for one minute.
Product was subsequently verified by running 5µl on a new 1% agarose gel.
- 31 -
2.7 Cloning
Sticky end ligation or cloning was performed using the pEASY-T3 cloning
kit (TransGen Biotech) following manufacturer’s instructions. 2 µl of gel-purified
PCR product was placed in a thermocycling tube along with 0.5 µl of pEASY-T3
cloning vector. This was incubated at RT for 30 minutes and subsequently
placed on ice. Transformation was performed using sterile technique where
appropriate. 50 µl of Subcloning Efficiency™ DH5α Competent Cells
(Invitrogen; E. coli) was placed on ice in a culture tube and 0.85 μl of β-
mercaptoethanol was added. Cells were incubated on ice for ten minutes,
gently disturbing the mixture of cells every 2 minutes. 2.5 µl ligation mix was
added, and mixture was left to incubate on ice for 30 minutes. The vector
containing PCR product was then transformed into the competent cells by
heatshocking at 42°C for 45 seconds. Mixture was then incubated on ice for
another two minutes. 950 µl of pre-heated (42°C) super optimal broth with
catabolite repression (SOC; 1 mM MgCl2, 1 mM MgSO4, 200 mM glucose in
super optimal broth [SOB]) was then added to the cell mixture, and incubated at
37°C shaking at 220 rpm for one hour. 100 µl of the mixture was then plated
onto a lysogeny broth agar plate (LB-agar) containing 50 µg/ml ampicillin. The
LB-agar plate was then incubated at 37°C overnight. Individual colonies were
screened by patch plating and PCR verification (section 2.6; Tm = 55°C; M13
primers).
Colonies containing a product of the right size were cultured in 3 ml LB
containing 50 µg/ml ampicillin overnight at 37°C shaking at 220 rpm. The
bacterial cultures were pelleted by centrifugation at 13,000 rpm for 30 seconds.
Plasmid purification was then performed using a Plasmid Miniprep Kit
(Monarch, New England Biolabs). Cultures were resuspended by vortexing
pellets in 200 µl of resuspension buffer. Cells were lysed by adding 200 µl lysis
buffer and inverting gently and leaving to incubate at RT for one minute.
Plasmids were then renatured by adding 400 µl of neutralisation buffer (which
also contains RNase A) and inverting gently and incubating at RT for two
minutes. Contaminants were subsequently pelleted through centrifugation at
13,000 rpm for five minutes. The supernatant was transferred to a spin column
and plasmid DNA was pelleted in the spin column through centrifugation at
13,000 rpm for one minute. Pellets were washed using the two separate wash
buffers and centrifugation at 13,000 rpm for one minute once more. The spin
column was transferred to a clean microcentrifuge tube and plasmid DNA was
re-eluted by incubation in 30 µl elution buffer for one minute at RT. The sample
was then centrifuged at 13,000 rpm for one minute. DNA concentration and
possible contamination were then checked on a spectrophotometer. All samples
- 32 -
were sent for sequencing (M13 primers) by Eurofins Genomics, to verify the
sequence and it’s orientation in the plasmid.
2.8 RNA probe synthesis
Acquired sequences (section 2.7) were edited to contain only the ligated
product using BioEdit (v 7.2; Hall, 1999). Edited sequences were put through a
endonuclease restriction site mapper (http://restrictionmapper.org/) to select
appropriate restriction enzymes that do not show any activity within the insert. 1
µg of plasmid was subsequently digested in 1x endonuclease specific buffer,
using 0.2 U endonuclease in a total reaction volume of 50 µl. The digestion was
incubated at 37°C for one hour. These reactions were done for both the
antisense and sense directions18. Digestion was verified by running 5µl on a 1%
agarose gel. The digested plasmid was then phenol:chloroform extracted by
first adding 155 µl ddH2O and 200 µl of phenol:chloroform:isoamyl alcohol
(25:24:1). Samples were vortexed and centrifuged at 13,300 rpm for five
minutes. 175 µl of the aqueous phase was then transferred into a sterile
microcentrifuge tube without any carry-over from the lower- and interphase. 200
µl of chloroform was added, the sample was vortexed and the previous step
repeated, this time transferring 150 µl of the aqueous phase.
The cut plasmid was then precipitated by dehydration by adding 15 µl of
3M sodium acetate (NaAc, pH 5.2) and vortexing briefly. Subsequently, 375µl of
icecold 100% EtOH was added and left at -20°C overnight. Samples were then
pelleted by centrifuging at 13,300 rpm for 20 minutes at RT and supernatant
was decanted. The pellet was subsequently washed with 200 µl of 70% EtOH
(RNAse free) and centrifugation at 13,300 rpm for five minutes. Supernatant
was decanted and DNA was left to airdry. The pellet was then resuspended in
30 µl nuclease free water, left to stand for 5 minutes. Concentrations were
measured and contamination checked using 1.5µl of sample by
spectrophotometry.
Digoxigenin-labeled (DIG) RNA probes were transcribed in vitro in a 50
µl reaction containing 1x transcription buffer, 2 µl DIG RNA labelling mix
(Roche), 80 U Ribolock RNAse inhibitor (ThermoFisher Scientific), and 40 U of
18 Antisense probes are ‘treatment’ probes, as the antisense (reverse complement)
should bind specifically to the sense direction mRNA present in the tissue. Sense direction probes are a commonly used negative control, which should show little to no staining, and will help check for probe trapping inside the tissue. Other negative controls are typically a ‘no probe controls’ or a ‘scrambled probe controls’. In the latter, the antisense sequence is scrambled (completely synthetic sequence) which can be used instead of sense controls when gene regulation by antisense RNA is suspected (Green et al., 1986), and antisense strands are present in tissue.
- 33 -
the relevant T7 or SP6 RNA polymerase (ThermoFisher Scientific). The
transcription reaction was incubated at 37°C for four hours, after which 1 U of
DNAse I (ThermoFisher Scientific) was added and left to incubate for fifteen
minutes at 37°C to degrade the template DNA. RNA probes were then
precipitated by adding 5 µl of 3M NaAc (pH 5.2) and vortexing briefly, and
subsequently adding 125 µl of icecold 100% EtOH and incubating at -20°C
overnight. RNA was then pelleted by centrifuging at 10,000 rpm for 30 minutes
at 4°C. The supernatant was removed and the pellet washed twice with 200 µl
of 70% EtOH (RNAse free) by centrifugation at 10,000 rpm for five minutes at
4°C. After decanting the supernatant, the pellet was resuspended in 10 µl of
nuclease free water. 1 µl of the sample was diluted 1:10 to be analysed using
spectrophotometry and running on a 1% agarose gel to verify the product. 50 µl
of hybridisation buffer was added to the remaining undiluted product which was
stored at -20°C.
2.9 Whole-Mount In Situ Hybridisation (ISH)
Tissue samples (section 2.2) were rehydrated in MeOH and 0.1% Tween
20 (Sigma-Aldrich) in PBS (PTw). This was done gradually over a MeOH and
PTw series (3:1, 1:1, and 1:3), each step nutated for five minutes at RT.
Samples were then washed three times in PTw for five minutes nutating at RT.
Proteinase K was added to 0.02 mg/ml, and samples were left to incubate at RT
for 20 minutes to puncture cell membranes. Samples were then re-fixed in a 4%
formaldehyde:PTw solution by nutating for fifteen minutes at RT. Samples were
rinsed six times in PTw and placed in 1 ml of hybridisation buffer (50%
deioinised formamide, 4 × SSC buffer, 1 × Denhardt’s solution, 250 µg / ml
tRNA, 250 µg / ml boiled ssDNA, 50 µg / ml heparin, 0.1% Tween 20, and 5%
dextran sulfate in DEPC treated water). Samples were then pre-hybridised for at
least four hours at 52°C, to prevent non-specific binding of the probe. Optimal
probe concentration was determined empirically for each gene, and optimised
for the signal to noise ratio. Generally, 0.5 to 4 µl of (undigested) probe (section
2.8) was added to the tissue samples. Probe annealing was incubated overnight
at 52°C. Samples were subsequently washed seven times at 52°C using wash
buffer (50% formamide, 2 × SSC buffer, and 0.1% Tween 20) for set periods of
time (2x 5 minutes, 10 minutes, 15 minutes, 30 minutes and 2x one hour,
followed by an overnight wash) following Dearden et al. (2009c) to reduce
background staining (removing unbound probe).
Samples were rinsed three times in PTw, and subsequently nutated in
PTw with 0.1% bovine serum albumin (PBTw; made fresh) at RT for at least two
hours to block (i.e. prevent non-specific binding of the antibody). This PBTw

- 34 -
was then replaced with a 1:2000 anti-DIG AP antibody (Roche) solution in
PBTw, and incubated for at least four hours at RT. Samples were rinsed three
times, and subsequently washed for ten, fifteen and thirty minutes, and one
hour in PTw by nutating at RT. Samples are then washed twice in alkaline
phosphatase buffer (AP buffer; 100mM Tris pH 9.5, 100 mM NaCl, 50 mM
MgCl2, and 0.1% Tween 20) nutating for five minutes at RT, after which tissue is
transferred to a staining dish. 20 µl of NBT/BCIP solution (Sigma-Aldrich;
solution of 18.8 mg/ml nitro-blue tetrazolium chloride and 9.4 mg/ml 5-bromo-4-
chloro-3’-indolylphosphate toluidine salt in 67% DMSO) was added to 500 µl of
AP buffer. This mixture was added to the samples in the staining dish, initiating
staining. The staining reaction was stopped when the stain had developed to
satisfaction by rinsing in PTw three times. Tissue was destained in 100% MeOH
until the tissue looked clean and staining had transformed from a purple to a
blue colour. Tissue was then transferred to a microcentrifuge tube and
rehydrated by nutating for five minutes in 1:1 MeOH:PTw. Tissue was rinsed
four times in PTw, stained in the dark with 1 µl DAPI (5 mg/ml; 4′,6-diamidino-2-
phenylindole; Invitrogen ThermoFisher Scientific) for ten minutes, and washed
twice in PTw for five minutes. Samples were then incubated in 80% glycerol
overnight and mounted on microscopic slides.
2.10 Immunohistochemistry (IHC)
Freshly, fixed tissue (section 2.2) was rinsed three times in PBS with
0.1% Triton X-100 (PTx; Sigma-Aldrich) and left nutating for two hours at RT to
permeabilise the tissue facilitating antibody penetration. Samples were blocked
PBTx for one hour at RT while nutating. PBTx was replaced, and between 1:20
– 1:200 primary antibody was added, and left to incubate overnight at 4°C.
Tissue was washed four times in PTx while nutating for thirty minutes at RT.
Tissue was blocked once more in PBTx for one hour while nutating.
Subsequently PBTx was replaced with a 1:20 - 1:1000 dilution of the secondary
antibody and incubated in the dark at 4°C overnight. Samples were washed four
times in PTx while nutating at RT for 30 minutes to reduce background staining.
Both DAPI and phalloidin were used as counterstains. 0.33 μM Phalloidin
Dylight 488 (Thermo Fisher Scientific) was incubated for three hours in the dark,
followed by three five minute nutating washes in PTx. Then 1 µl DAPI (5 mg/ml,
Invitrogen ThermoFisher Scientific) was added and incubated in the dark for ten
minutes. Samples were washed three times for five minutes in PTx whilst
nutating once more. Samples were then incubated in 80% glycerol overnight,
and mounted and imaged the next day.
- 35 -
Chapter 3 Establishing Osmia bicornis as a laboratory model
3.1 Summary
Valid empirical tests of the reproductive ground plan hypothesis (RGPH)
require a solitary species as a reference point. Hence, the absence of a solitary
model species that is tractable in a laboratory environment — particularly within
the European temperate climate — is limiting to investigations into the RGPH.
In this chapter I attempt to replicate a 2014 study, in order to try and reliably
establish O. bicornis in a controlled laboratory environment. I first outline the
life-history of O. bicornis, explore previous attempts at accomplishing this, and
identify the specific challenges surrounding the use of a solitary pollinator in the
laboratory. Informed by the general ecology of O. bicornis and the wider plant-
pollinator literature, I trialled numerous set-ups to induce egg laying within flight
cages. Using behavioural observations of small preliminary successes, I refined
parts of the set-up. My results indicate the difficulty of utilising a pollinator with a
complex life-cycle in a laboratory. I provide proof of concept for some
behavioural assays that may be possible in future for this species in the lab.
Finally, I identify major pitfalls and lay out future recommendations for further
establishing the species within the laboratory.
3.2 Introduction
In order to facilitate a cross-species comparison of the reproductive
biology of A. mellifera workers and O. bicornis females, it is imperative to
establish the O. bicornis in a laboratory setting. This would allow for
experimental manipulation; RNAi feeding for instance, could allow for functional
tests through gene-knockdown; (e.g.: Maleszka et al., 2007; Marco Antonio et
al., 2008; Hunter et al., 2010; Jarosch and Moritz, 2011, 2012; Garbian et al.,
2012). Not only has A. mellifera been domesticated for some 9000 years
(Crane, 1983; Bloch et al., 2010), it has also emerged as a model organism
(e.g.: Dearden et al., 2009b; Williams et al., 2013). Osmia have likewise
enjoyed extensive study as they have attracted substantial interest for their
potential as a commercial pollinator for use in greenhouses and with fruit crop
(e.g.: Holm, 1974; Roth, 1990; van der Steen and Ruiter, 1991; Krunić et al.,
1995; Bosch and Kemp, 2002; Teper and Bilinski, 2009; Gruber et al., 2011;
Fliszkiewicz et al., 2011b; Hansted et al., 2014; Ahrenfeldt et al., 2019; Ryder et
al., 2019). However, O. bicornis has typically been studied in field (e.g.: Ryder
et al., 2019; Ahrenfeldt et al., 2019) or semi-field conditions (e.g.: Dietzsch et
al., 2015; Dietzsch et al., 2019; Strobl et al., 2019) precisely because of its
- 36 -
promise in commercial pollination. Other studies have examined the effects of
pesticides on Osmia (Sandrock et al., 2014; Beadle et al., 2019; Azpiazu et al.,
2019; Sgolastra et al., 2019), and the species’ general ecology (Raw, 1972;
Seidelmann, 1995; Ivanov, 2006; Fliszkiewicz et al., 2015; Giejdasz et al., 2016;
Coudrain et al., 2016; Persson et al., 2018; Filipiak, 2019).
Some experiments have been performed in laboratory environments on
O. bicornis, typically pertaining to a single aspect of its ecology (generally,
mating: Fliszkiewicz et al., 2013; Seidelmann, 2015; Conrad and Ayasse, 2019;
or diapause and emergence: van der Steen and Ruiter, 1991; Krunić and
Stanisavljević, 2006; Wasielewski et al., 2011a; Fliszkiewicz et al., 2012a;
Dmochowska et al., 2013; Giejdasz and Fliszkiewicz, 2016; Strachecka et al.,
2017; Beer et al., 2019).These types of studies involve either bringing adults
into the lab (from nest trapped cocoons in established populations or
commercially bought cocoons), or manipulations and measurements on
overwintering nest trapped bees (from established populations). Raw (1972),
van der Steen (1997) and Sandrock et al. (2014) are the only studies to date,
that attained a full life cycle in a laboratory set-up. Securing offspring within the
confines of a controlled laboratory setting, would provide future experiments
with a direct and powerful measure of reproductive success, by being able to
assess egg to adult survival of said offspring (as in Sandrock et al., 2014), free
from environmental variation.
3.2.1 Life history of O. bicornis
Model organisms typically have a relatively short life cycles (e.g.
Drosophila melanogaster), and are therefore often easy to maintain. Indeed, in
insects many model species are also pest species, e.g.: Tribolium castaneum,
Acyrthosiphon pisum, and Schistocerca gregaria). O. bicornis on the other hand
— while being a common and generalist pollinator (Falk, 2015) —has an annual
life cycle and a more particular life-history and niche (Figure 3.1).
In spring, adult O. bicornis emerge from their pupae. Males can hatch
one to two weeks prior to females. During this time they will forage (nectar and
pollen), search for females around nesting and foraging sites (Raw, 1976;
Seidelmann, 1999b), and overnight in vacant nest sites or other small cavities
(O'Toole, 2000). Females emerge from their pupae,generally around the
beginning of May, though dates will shift with both region and year (Netherlands
and Germany, mid April - start May: Vleugel, 1952; UK, start - mid May: Raw,
1972). Adult females typically survive four to six weeks, while males will only
survive three to four weeks due to intense competition for mates (O'Toole,
2000). During the week following hatching, females fly around to look for

- 37 -
cavities that serve as both shelter and nest sites, forage, and a mate (van der
Steen, 1997; O'Toole, 2000). After this period females start building and
provisioning inside their respective nests (May-June; Raw, 1972). Nests are
made in holes and crevices in walls, in reed stems and bee hotels19 (Raw,
1972). The provisioning female first creates a smooth hemispherical layer of
mud at the end of her elongate nest, to line it (Figure 3.1; Ivanov, 2006). She
will then build the outline of the first septum (Fabre's threshold, Figure 3.1;
Ivanov, 2006; Raw, 1972). She will gather pollen, predominantly Ranunculus
and Quercus, although she is polylectic (Raw, 1974; Teper, 2007). Nectar is
acquired alongside pollen and mixed in the nest to create pollen loaves. An egg
is then oviposited on top of the pollen loaf, after which the septum is completed.
Approximately one egg is provisioned and oviposited per day in this way (Raw,
1972). The amount of provisioning will determine the size of the offspring
(Seidelmann, 2006; Seidelmann et al., 2010; Seidelmann, 2014b), and the
provisioning efficiency of a female will in turn increase with its body size
(Seidelmann et al., 2010).
The amount of provisioning also decreases when building cells closer
towards the cells at the entrance of the nest (with a steep decline from female to
male). By placing male offspring — who require less provisioning — closest to
the nest entrance, females reduce the time spent away from the unguarded
nest (Seidelmann, 2006). Females rest in their nest facing the entrance when
not foraging; to guard against parasitoids and kleptoparasites (Krombein, 1967;
Brechtel, 1986; Westrich, 1989), as well as nest take-overs by conspecifics
(Raw, 1972; Strohm et al., 2002; with the possibility of both the nest and its
provisioning being commandeered). Hence, males are thought to be placed last
in the nest to counteract parasitism. Provisioning efficiency also declines with
maternal age and thus nest progression, leaving males to be deposited nearer
nest entrances (Raw, 1972; Ivanov, 2006; Seidelmann, 2006). While the weight
of provisions declines closer to the nest entrance, the weight of the mud
partitions increases (Ivanov, 2006), further corroborating the role of parasitism
avoidance to male placement in the nest. An additional contributing factor to the
order in the nest, may be that males emerge from pupae earlier than do
females. Ultimately a vestibulum and terminal plug secure the finished nest
completely (Figure 3.1; Seidelmann, 1999a). During summer, the eggs hatch,
and larvae start feeding on the provisions. These then spin their cocoons which
19 A bee hotel is a manmade insect hotel, aimed specifically at pollinators such as
solitary bees and wasps to nest and shelter in. They usually comprise collected reed stems in a half-open container (Fabre’s hive) or wood with drilled holes. The specificity of the insect hotel refers to the dimensions of the cavities.

- 38 -
will contain adults by the end of September (Raw, 1972). The pupae enter
diapause and emerge the following spring.
The purpose of this chapter was acclimate O. bicornis to a laboratory
environment, to allow for experimental studies and to acquire a direct measure
of reproductive success (i.e. number of offspring and their survival). This, with
the aim of determining what environmental factors govern the control of
reproduction in this species, and whether and how the mechanisms controlling
reproduction relate to QMP mediated adult reproductive constraint in the
eusocial honey bee.
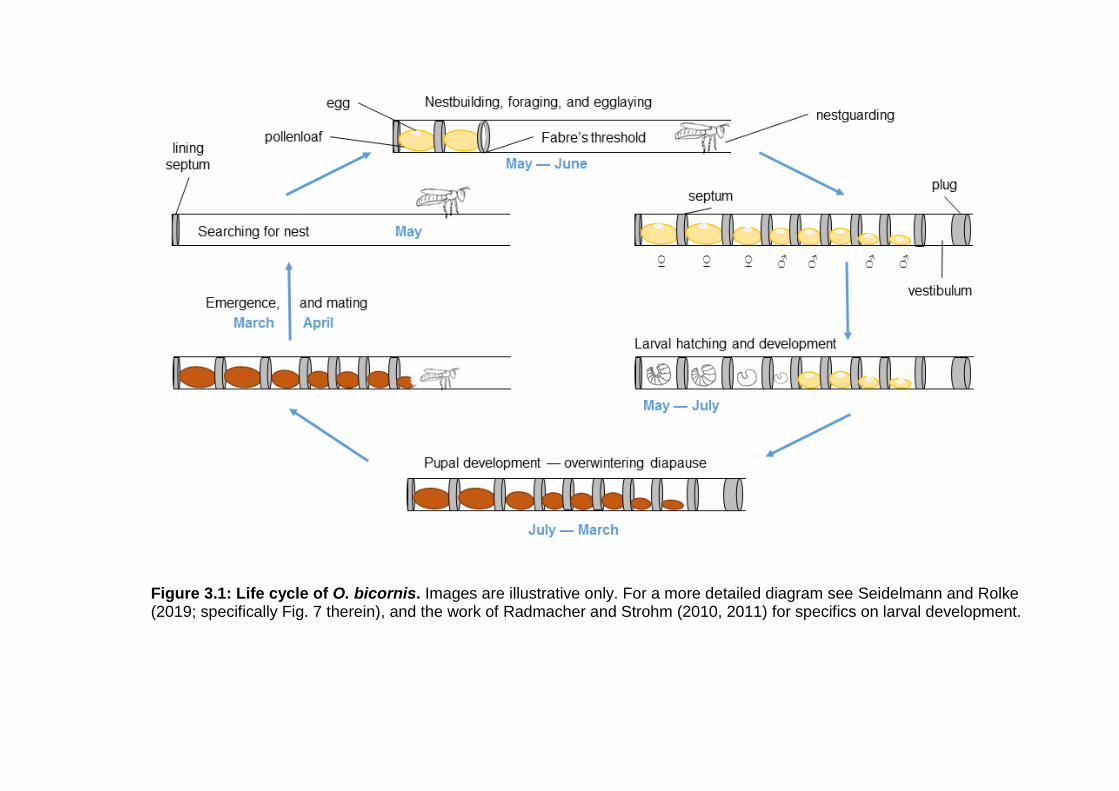
Figure 3.1: Life cycle of O. bicornis. Images are illustrative only. For a more detailed diagram see Seidelmann and Rolke (2019; specifically Fig. 7 therein), and the work of Radmacher and Strohm (2010, 2011) for specifics on larval development.

- 40 -
3.2.2 Previous work
To attempt a laboratory set-up, I contacted various people in the
community working on and with O. bicornis. These personal communications
(PC) are provided as supplementary material (Appendix A) and may be referred
to throughout this chapter.
As mentioned earlier, only three studies have managed to achieve egg
laying in a laboratory set-up to date (Raw, 1972; van der Steen, 1997; Sandrock
et al., 2014). Raw (1972) managed to get nesting in an insectary ‘simulating
natural conditions’ (paraphrased). Further descriptions of the insectary are
lacking, but given the dimensions it is presumed to have been inside a
greenhouse. Within the insectary he maintained an additional three cages with
one individual in each. The egg laying success of these individually caged bees
was not reported on, but females in the insectary managed to lay eighteen eggs
on average (Raw, 1972). A different approach was used by van der Steen
(1997), whom provided O. bicornis with gelatin capsules filled with a pollen
paste. Additionally, van der Steen (1997) provided very fine and dry pollen,
which females used to dust the pollen paste, after which they laid their eggs
upon it (PC van der Steen). Out of 263 females, 131 females were actively
flying around, and 113 capsules contained eggs (reported as 0.9 eggs per
active female, over a period of three weeks: van der Steen, 1997). In contrast,
Sandrock et al. (2014) managed to get females completing whole nest-tubes in
their experiment. For treatment groups of 125 females each, they managed to
get 151 completed nests in neonicotinoid treated females, and 194 completed
nests in their control group. Considering a median of four eggs per nest tube (as
in Fig. 3 in Sandrock et al., 2014), this equates to roughly 6.2 eggs laid per
female in their control group, over a period of four weeks.
While Raw (1972) attained the highest reproductive success (18
egg/female) of these three studies, the set-up of Sandrock et al. (2014) was
trialled here. This given the level of detail provided in the study, the lack of an
insectary at my disposal (as in Raw, 1972), and the fact that it provided better
and more consistent egg-laying than the van der Steen (1997) study. Indeed,
the Sandrock et al. (2014) study demonstrated the feasibility of studying
reproductive success with their method. Hence I mainly attempted to replicate
their results, though van der Steen’s (1997) method was also briefly trialled.

- 41 -
3.3 Methods
3.3.1 Factors underlying species ecology
Tables 3.1 and 3.2 summarise the various aspects of the ecology of O.
bicornis relevant to establishing the species in the laboratory. Even under the
naive assumption that there are only nine dichotomous and relevant aspects to
be investigated, it would take considerable time testing each individually whilst
keeping all other components constant. Given that few of these ecological
aspects are actually dichotomous (e.g. the complexity of natural light alone:
dominant wavelength, polarisation20 and intensity all change throughout the
day), and given that O. bicornis further possesses an annual life cycle with a
limited flight season (Raw, 1972); tackling each aspect of its ecology separately
was deemed unfeasible. Furthermore, as long as females did not display certain
(nesting) behaviours that could be consistently recorded and/or measured,
there is a reduced capacity for discerning preferences.
Therefore several trials (mainly 2016-2017) were performed in sequence,
and more than one aspect was changed between these trials based on limited
behavioural observations, as well as literature reviewed. Changes to the setup
were sometimes even made during the trials due to the constraint of time. The
trials and their set-ups were focused on those aspects of Table 3.1 and 3.2 that
were within my control. The setup of the individual trials is summarised in Table
3.3, and an example of the last setup used is depicted in Figure 3.2. Trials
mainly consisted of providing variations on the following themes: pollen and
how it is presented, sugar solutions and how they were presented, the provision
of different nesting materials (mud and nesting tubes), cage dimensions, light
sources and light dark cycles. For all these trials and further laboratory
experiments in later chapters, O. bicornis were obtained as cocoons from a
commercial supplier (Dr Schubert plant breeding; Landsberg, Germany).
20 E.g. the Rayleigh sky model with changing degrees and angles of polarisation.
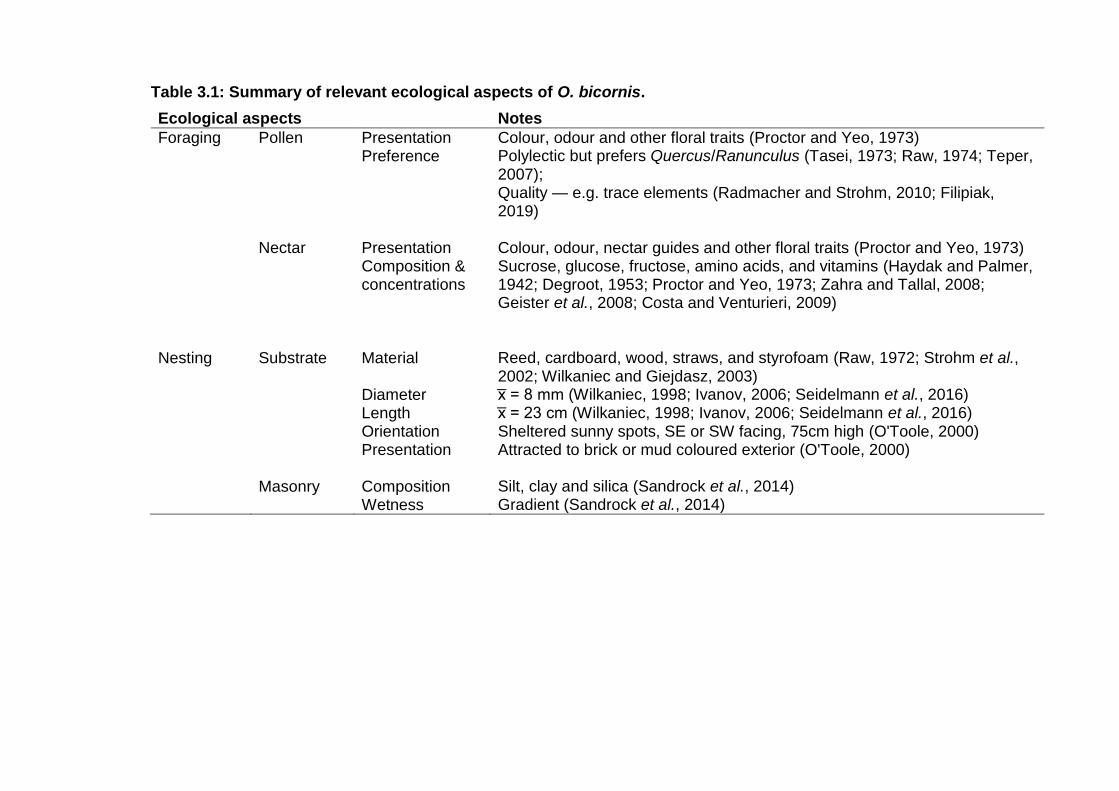
Table 3.1: Summary of relevant ecological aspects of O. bicornis.
Ecological aspects Notes
Foraging Pollen Presentation Preference
Colour, odour and other floral traits (Proctor and Yeo, 1973) Polylectic but prefers Quercus/Ranunculus (Tasei, 1973; Raw, 1974; Teper, 2007); Quality — e.g. trace elements (Radmacher and Strohm, 2010; Filipiak, 2019)
Nectar
Presentation Composition & concentrations
Colour, odour, nectar guides and other floral traits (Proctor and Yeo, 1973) Sucrose, glucose, fructose, amino acids, and vitamins (Haydak and Palmer, 1942; Degroot, 1953; Proctor and Yeo, 1973; Zahra and Tallal, 2008; Geister et al., 2008; Costa and Venturieri, 2009)
Nesting
Substrate Masonry
Material Diameter Length Orientation Presentation Composition Wetness
Reed, cardboard, wood, straws, and styrofoam (Raw, 1972; Strohm et al., 2002; Wilkaniec and Giejdasz, 2003) x̅ = 8 mm (Wilkaniec, 1998; Ivanov, 2006; Seidelmann et al., 2016) x̅ = 23 cm (Wilkaniec, 1998; Ivanov, 2006; Seidelmann et al., 2016) Sheltered sunny spots, SE or SW facing, 75cm high (O'Toole, 2000) Attracted to brick or mud coloured exterior (O'Toole, 2000) Silt, clay and silica (Sandrock et al., 2014) Gradient (Sandrock et al., 2014)
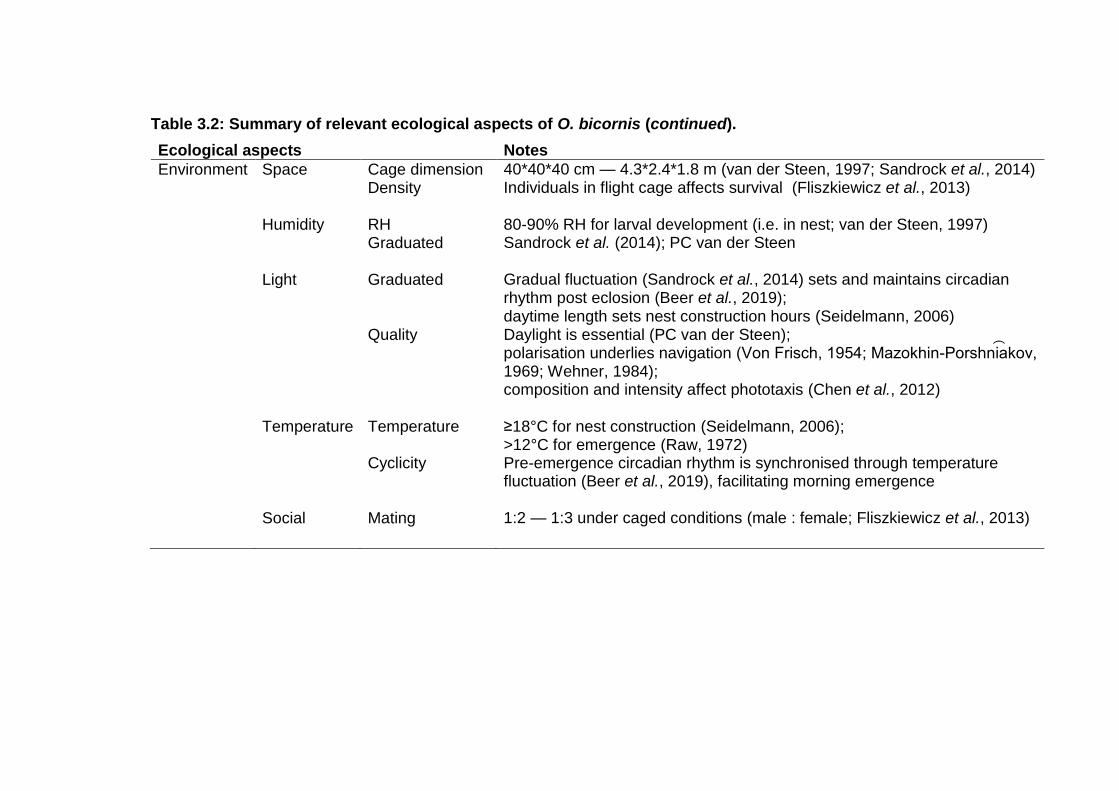
Table 3.2: Summary of relevant ecological aspects of O. bicornis (continued).
Ecological aspects Notes
Environment
Space Humidity Light Temperature
Cage dimension Density RH Graduated Graduated Quality Temperature Cyclicity
40*40*40 cm — 4.3*2.4*1.8 m (van der Steen, 1997; Sandrock et al., 2014) Individuals in flight cage affects survival (Fliszkiewicz et al., 2013) 80-90% RH for larval development (i.e. in nest; van der Steen, 1997) Sandrock et al. (2014); PC van der Steen Gradual fluctuation (Sandrock et al., 2014) sets and maintains circadian rhythm post eclosion (Beer et al., 2019); daytime length sets nest construction hours (Seidelmann, 2006) Daylight is essential (PC van der Steen); polarisation underlies navigation (Von Frisch, 1954; Mazokhin-Porshni︠ a︡kov, 1969; Wehner, 1984); composition and intensity affect phototaxis (Chen et al., 2012) ≥18°C for nest construction (Seidelmann, 2006); >12°C for emergence (Raw, 1972) Pre-emergence circadian rhythm is synchronised through temperature fluctuation (Beer et al., 2019), facilitating morning emergence
Social
Mating
1:2 — 1:3 under caged conditions (male : female; Fliszkiewicz et al., 2013)
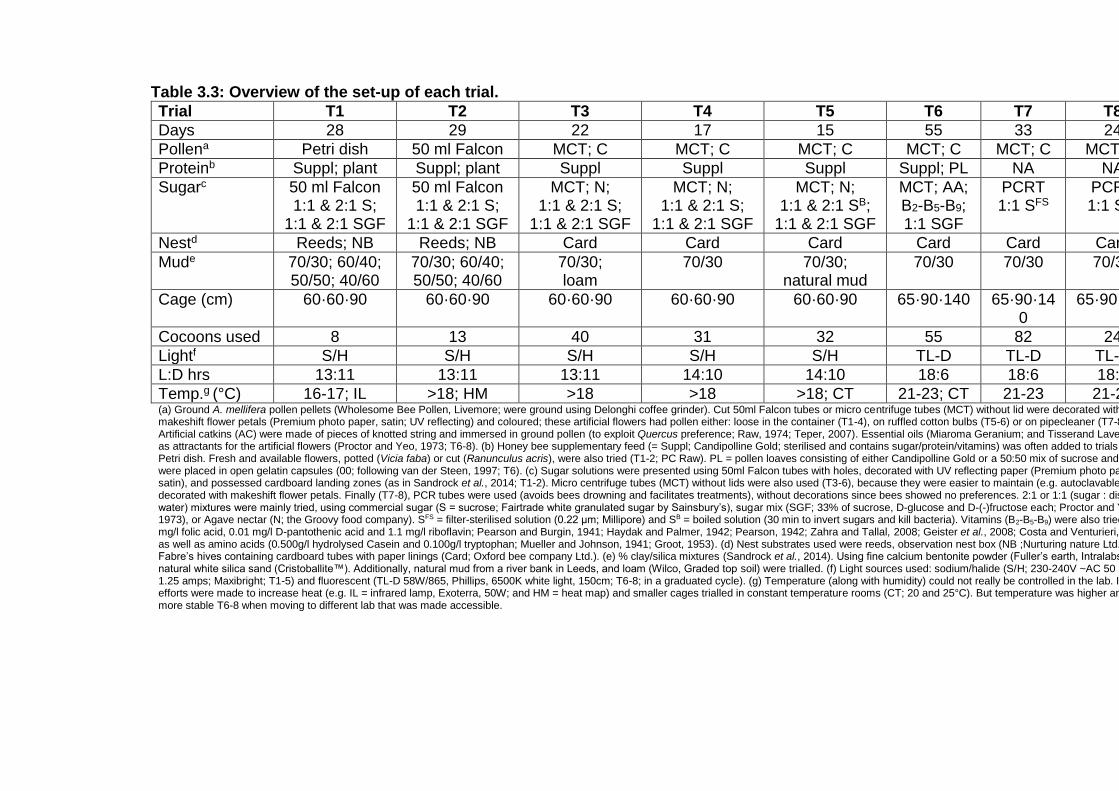
Table 3.3: Overview of the set-up of each trial.
Trial T1 T2 T3 T4 T5 T6 T7 T8
Days 28 29 22 17 15 55 33 24
Pollena Petri dish 50 ml Falcon MCT; C MCT; C MCT; C MCT; C MCT; C MCT; C
Proteinb Suppl; plant Suppl; plant Suppl Suppl Suppl Suppl; PL NA NA
Sugarc 50 ml Falcon
1:1 & 2:1 S; 1:1 & 2:1 SGF
50 ml Falcon 1:1 & 2:1 S;
1:1 & 2:1 SGF
MCT; N; 1:1 & 2:1 S;
1:1 & 2:1 SGF
MCT; N; 1:1 & 2:1 S;
1:1 & 2:1 SGF
MCT; N; 1:1 & 2:1 SB;
1:1 & 2:1 SGF
MCT; AA; B2-B5-B9; 1:1 SGF
PCRT 1:1 SFS
PCRT 1:1 SFS
Nestd Reeds; NB Reeds; NB Card Card Card Card Card Card
Mude 70/30; 60/40; 50/50; 40/60
70/30; 60/40; 50/50; 40/60
70/30; loam
70/30 70/30; natural mud
70/30 70/30 70/30
Cage (cm) 60·60·90 60·60·90 60·60·90 60·60·90 60·60·90 65·90·140 65·90·140
65·90·140
Cocoons used 8 13 40 31 32 55 82 24
Lightf S/H S/H S/H S/H S/H TL-D TL-D TL-D
L:D hrs 13:11 13:11 13:11 14:10 14:10 18:6 18:6 18:6
Temp.g (°C) 16-17; IL >18; HM >18 >18 >18; CT 21-23; CT 21-23 21-23 (a) Ground A. mellifera pollen pellets (Wholesome Bee Pollen, Livemore; were ground using Delonghi coffee grinder). Cut 50ml Falcon tubes or micro centrifuge tubes (MCT) without lid were decorated with makeshift flower petals (Premium photo paper, satin; UV reflecting) and coloured; these artificial flowers had pollen either: loose in the container (T1-4), on ruffled cotton bulbs (T5-6) or on pipecleaner (T7-8). Artificial catkins (AC) were made of pieces of knotted string and immersed in ground pollen (to exploit Quercus preference; Raw, 1974; Teper, 2007). Essential oils (Miaroma Geranium; and Tisserand Lavender) as attractants for the artificial flowers (Proctor and Yeo, 1973; T6-8). (b) Honey bee supplementary feed (= Suppl; Candipolline Gold; sterilised and contains sugar/protein/vitamins) was often added to trials in a Petri dish. Fresh and available flowers, potted (Vicia faba) or cut (Ranunculus acris), were also tried (T1-2; PC Raw). PL = pollen loaves consisting of either Candipolline Gold or a 50:50 mix of sucrose and pollen were placed in open gelatin capsules (00; following van der Steen, 1997; T6). (c) Sugar solutions were presented using 50ml Falcon tubes with holes, decorated with UV reflecting paper (Premium photo paper, satin), and possessed cardboard landing zones (as in Sandrock et al., 2014; T1-2). Micro centrifuge tubes (MCT) without lids were also used (T3-6), because they were easier to maintain (e.g. autoclavable), and decorated with makeshift flower petals. Finally (T7-8), PCR tubes were used (avoids bees drowning and facilitates treatments), without decorations since bees showed no preferences. 2:1 or 1:1 (sugar : distilled water) mixtures were mainly tried, using commercial sugar (S = sucrose; Fairtrade white granulated sugar by Sainsbury’s), sugar mix (SGF; 33% of sucrose, D-glucose and D-(-)fructose each; Proctor and Yeo, 1973), or Agave nectar (N; the Groovy food company). SFS = filter-sterilised solution (0.22 μm; Millipore) and SB = boiled solution (30 min to invert sugars and kill bacteria). Vitamins (B2-B5-B9) were also tried (0.17 mg/l folic acid, 0.01 mg/l D-pantothenic acid and 1.1 mg/l riboflavin; Pearson and Burgin, 1941; Haydak and Palmer, 1942; Pearson, 1942; Zahra and Tallal, 2008; Geister et al., 2008; Costa and Venturieri, 2009), as well as amino acids (0.500g/l hydrolysed Casein and 0.100g/l tryptophan; Mueller and Johnson, 1941; Groot, 1953). (d) Nest substrates used were reeds, observation nest box (NB ;Nurturing nature Ltd.), and Fabre’s hives containing cardboard tubes with paper linings (Card; Oxford bee company Ltd.). (e) % clay/silica mixtures (Sandrock et al., 2014). Using fine calcium bentonite powder (Fuller’s earth, Intralabs) and natural white silica sand (Cristoballite™). Additionally, natural mud from a river bank in Leeds, and loam (Wilco, Graded top soil) were trialled. (f) Light sources used: sodium/halide (S/H; 230-240V ~AC 50 Hz, 1.25 amps; Maxibright; T1-5) and fluorescent (TL-D 58W/865, Phillips, 6500K white light, 150cm; T6-8; in a graduated cycle). (g) Temperature (along with humidity) could not really be controlled in the lab. In T1-5 efforts were made to increase heat (e.g. IL = infrared lamp, Exoterra, 50W; and HM = heat map) and smaller cages trialled in constant temperature rooms (CT; 20 and 25°C). But temperature was higher and more stable T6-8 when moving to different lab that was made accessible.
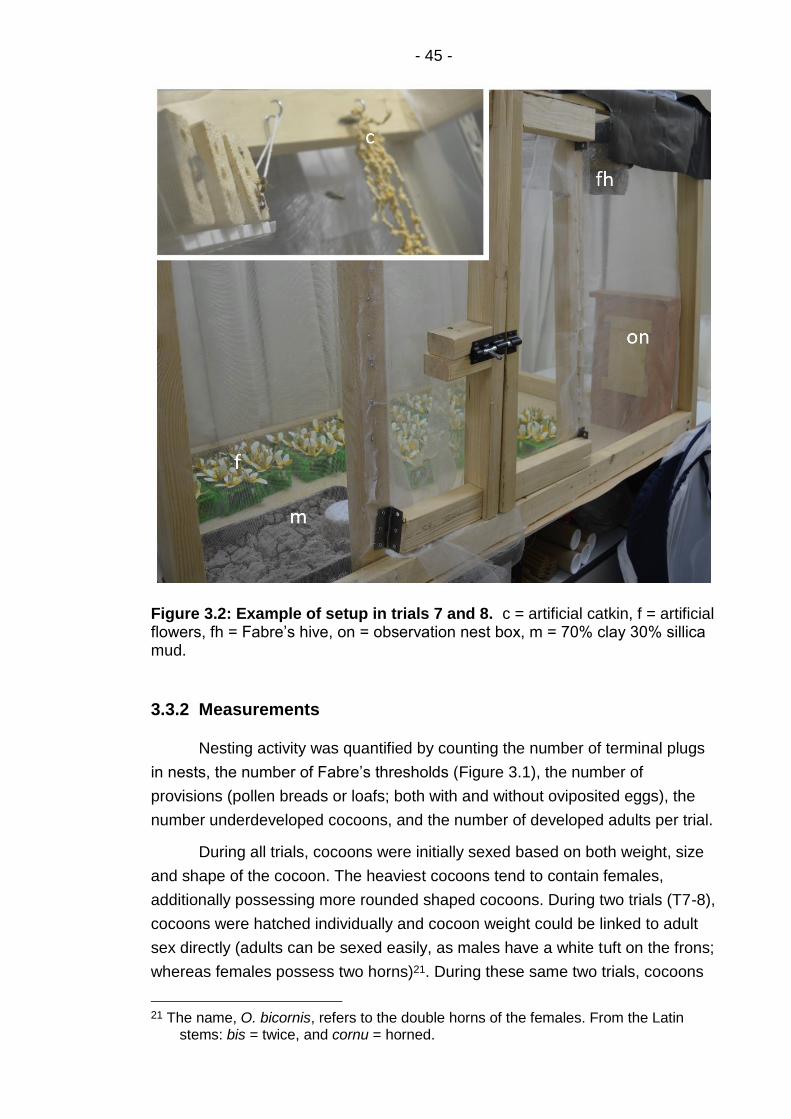
- 45 -
Figure 3.2: Example of setup in trials 7 and 8. c = artificial catkin, f = artificial flowers, fh = Fabre’s hive, on = observation nest box, m = 70% clay 30% sillica mud.
3.3.2 Measurements
Nesting activity was quantified by counting the number of terminal plugs
in nests, the number of Fabre’s thresholds (Figure 3.1), the number of
provisions (pollen breads or loafs; both with and without oviposited eggs), the
number underdeveloped cocoons, and the number of developed adults per trial.
During all trials, cocoons were initially sexed based on both weight, size
and shape of the cocoon. The heaviest cocoons tend to contain females,
additionally possessing more rounded shaped cocoons. During two trials (T7-8),
cocoons were hatched individually and cocoon weight could be linked to adult
sex directly (adults can be sexed easily, as males have a white tuft on the frons;
whereas females possess two horns)21. During these same two trials, cocoons
21 The name, O. bicornis, refers to the double horns of the females. From the Latin
stems: bis = twice, and cornu = horned.
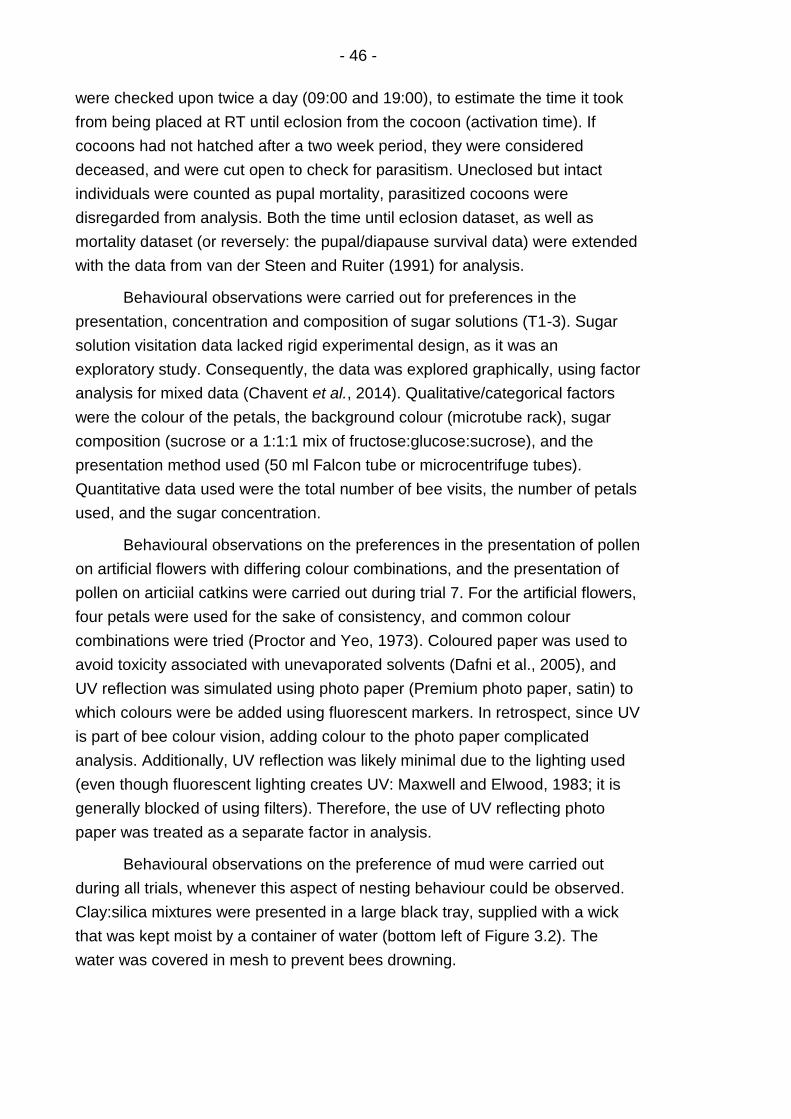
- 46 -
were checked upon twice a day (09:00 and 19:00), to estimate the time it took
from being placed at RT until eclosion from the cocoon (activation time). If
cocoons had not hatched after a two week period, they were considered
deceased, and were cut open to check for parasitism. Uneclosed but intact
individuals were counted as pupal mortality, parasitized cocoons were
disregarded from analysis. Both the time until eclosion dataset, as well as
mortality dataset (or reversely: the pupal/diapause survival data) were extended
with the data from van der Steen and Ruiter (1991) for analysis.
Behavioural observations were carried out for preferences in the
presentation, concentration and composition of sugar solutions (T1-3). Sugar
solution visitation data lacked rigid experimental design, as it was an
exploratory study. Consequently, the data was explored graphically, using factor
analysis for mixed data (Chavent et al., 2014). Qualitative/categorical factors
were the colour of the petals, the background colour (microtube rack), sugar
composition (sucrose or a 1:1:1 mix of fructose:glucose:sucrose), and the
presentation method used (50 ml Falcon tube or microcentrifuge tubes).
Quantitative data used were the total number of bee visits, the number of petals
used, and the sugar concentration.
Behavioural observations on the preferences in the presentation of pollen
on artificial flowers with differing colour combinations, and the presentation of
pollen on articiial catkins were carried out during trial 7. For the artificial flowers,
four petals were used for the sake of consistency, and common colour
combinations were tried (Proctor and Yeo, 1973). Coloured paper was used to
avoid toxicity associated with unevaporated solvents (Dafni et al., 2005), and
UV reflection was simulated using photo paper (Premium photo paper, satin) to
which colours were be added using fluorescent markers. In retrospect, since UV
is part of bee colour vision, adding colour to the photo paper complicated
analysis. Additionally, UV reflection was likely minimal due to the lighting used
(even though fluorescent lighting creates UV: Maxwell and Elwood, 1983; it is
generally blocked of using filters). Therefore, the use of UV reflecting photo
paper was treated as a separate factor in analysis.
Behavioural observations on the preference of mud were carried out
during all trials, whenever this aspect of nesting behaviour could be observed.
Clay:silica mixtures were presented in a large black tray, supplied with a wick
that was kept moist by a container of water (bottom left of Figure 3.2). The
water was covered in mesh to prevent bees drowning.
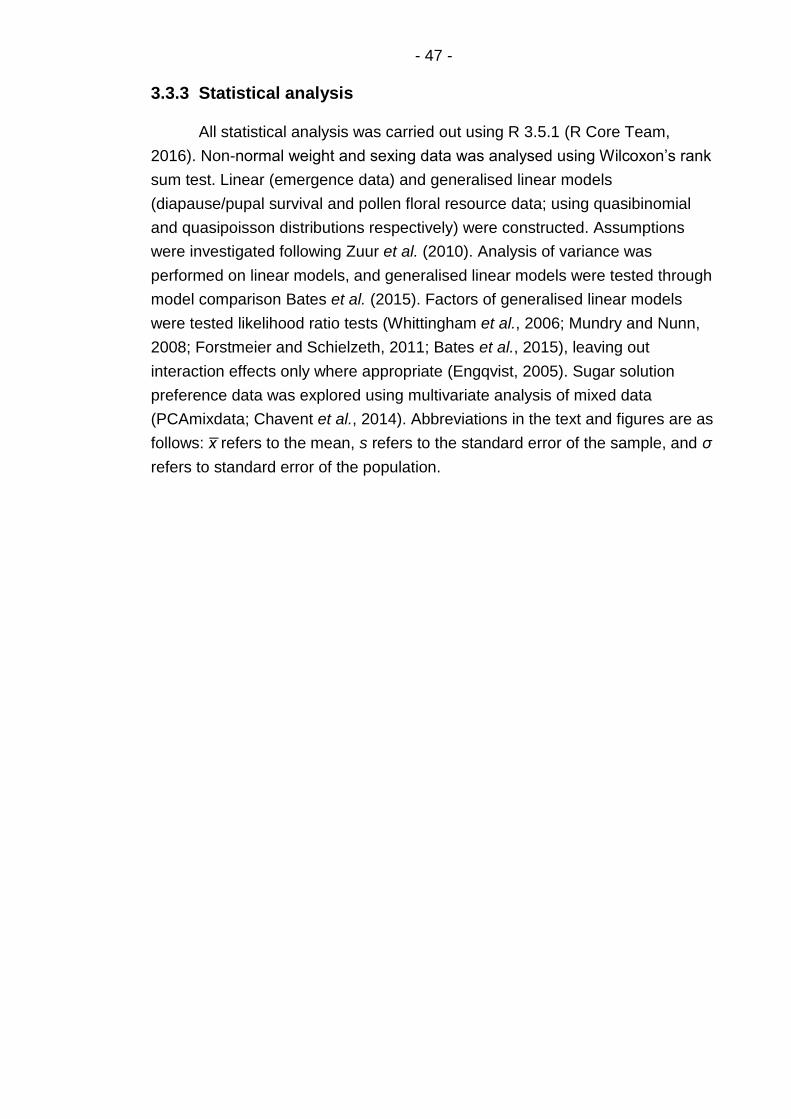
- 47 -
3.3.3 Statistical analysis
All statistical analysis was carried out using R 3.5.1 (R Core Team,
2016). Non-normal weight and sexing data was analysed using Wilcoxon’s rank
sum test. Linear (emergence data) and generalised linear models
(diapause/pupal survival and pollen floral resource data; using quasibinomial
and quasipoisson distributions respectively) were constructed. Assumptions
were investigated following Zuur et al. (2010). Analysis of variance was
performed on linear models, and generalised linear models were tested through
model comparison Bates et al. (2015). Factors of generalised linear models
were tested likelihood ratio tests (Whittingham et al., 2006; Mundry and Nunn,
2008; Forstmeier and Schielzeth, 2011; Bates et al., 2015), leaving out
interaction effects only where appropriate (Engqvist, 2005). Sugar solution
preference data was explored using multivariate analysis of mixed data
(PCAmixdata; Chavent et al., 2014). Abbreviations in the text and figures are as
follows: x̅ refers to the mean, s refers to the standard error of the sample, and σ
refers to standard error of the population.

- 48 -
3.4 Results and discussion
Figure 3.3: Nesting activity of O. bicornis females during trials. Counts indicating nesting activity of the overall trial are presented in sequence. Masonry: thresholds = Fabre’s thresholds (outline future septa), septa = cell walls, plug = terminal septum. Provision = the presence of a pollen loaf (usually containing at least an egg outline). Development: larva = developing or petrified larvae, cocoon = undeveloped cocoon, adult = cocoon with a pharate. Note: trials T4-5 were arrested prematurely due to exceptionally low activity; T7-8 were pooled since nest tubes were not swapped out.

- 49 -
Figure 3.3 shows the increase in nesting activity throughout the trials.
Masonry was easily elicited within the laboratory. Oddly, in T1, many reeds
were plugged off with mud, without any other sign of cells being built. In T2 mud
was provided with variations in sand and clay composition, resulting in Fabre’s
thresholds appearing. In T3 the use of artificial catkins (Figure 3.4) elicited the
first provisioning and egg laying in a female. Nesting activity seen in T7-8,
corresponds to several changes, mainly: a switch in laboratory with a higher
and more consistent
ambient temperature,
diffuse and partially
graduated lighting,
use of a larger cage,
and an increase of
floral and nesting
resources. In what
follows, preferences
on the basis of
behavioural
observations are
presented and
discussed. It should
be noted that in any
one trial; no more than
five females were
active at any one time.
Additionally, individual
marking was
abandoned to avoid
chilling (Giejdasz et al., 2016) and handling stress. Consequently, statistical
tests shown are naive, without a repeated measurements structure. Sample
sizes are thus inflated, and tests should be treated with circumspection.
3.4.1 Sex, diapause and emergence
O. bicornis can generally be sexed from the size or weight of their
cocoons, because females are provisioned more than are males (Raw, 1972;
Seidelmann, 1995; O'Toole, 2000; Ivanov, 2006). This facilitates control over
sex ratio when setting out cocoons for emergence in for instance greenhouses
or a laboratory environments (e.g.: van der Steen and Ruiter, 1991,
Figure 3.4: Example of artificial catkins and flowers used.
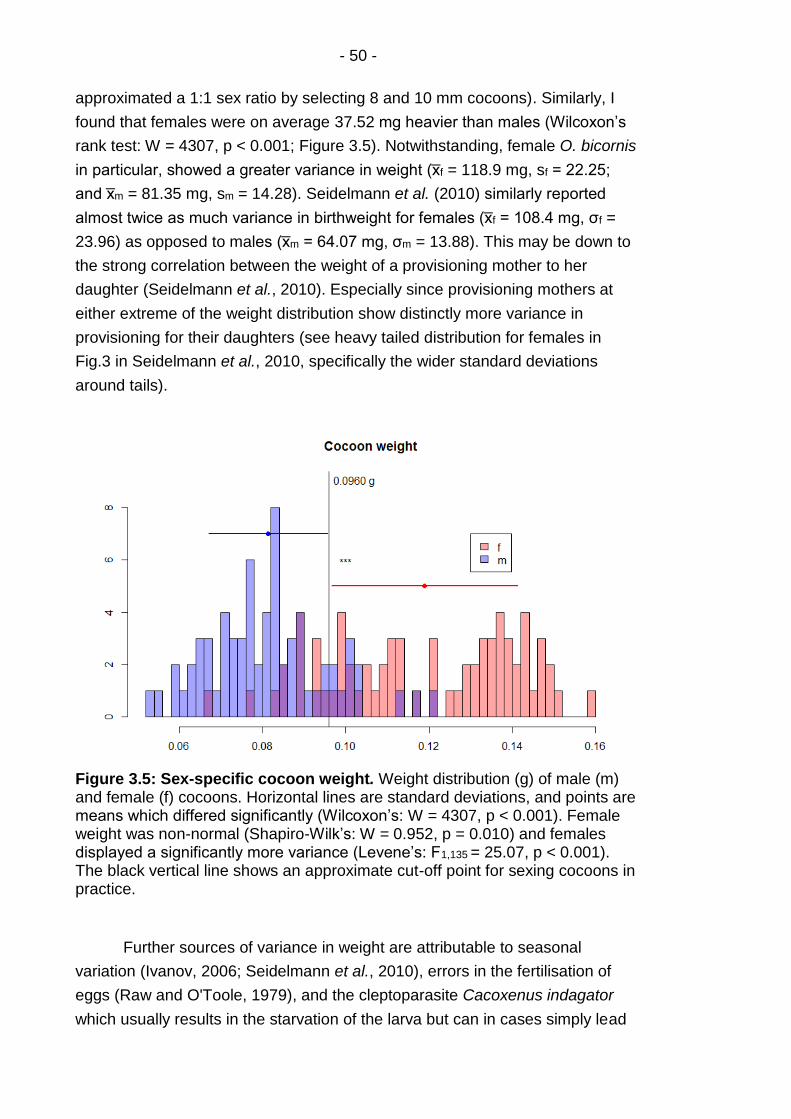
- 50 -
approximated a 1:1 sex ratio by selecting 8 and 10 mm cocoons). Similarly, I
found that females were on average 37.52 mg heavier than males (Wilcoxon’s
rank test: W = 4307, p < 0.001; Figure 3.5). Notwithstanding, female O. bicornis
in particular, showed a greater variance in weight (x̅f = 118.9 mg, sf = 22.25;
and x̅m = 81.35 mg, sm = 14.28). Seidelmann et al. (2010) similarly reported
almost twice as much variance in birthweight for females (x̅f = 108.4 mg, σf =
23.96) as opposed to males (x̅m = 64.07 mg, σm = 13.88). This may be down to
the strong correlation between the weight of a provisioning mother to her
daughter (Seidelmann et al., 2010). Especially since provisioning mothers at
either extreme of the weight distribution show distinctly more variance in
provisioning for their daughters (see heavy tailed distribution for females in
Fig.3 in Seidelmann et al., 2010, specifically the wider standard deviations
around tails).
Figure 3.5: Sex-specific cocoon weight. Weight distribution (g) of male (m) and female (f) cocoons. Horizontal lines are standard deviations, and points are means which differed significantly (Wilcoxon’s: W = 4307, p < 0.001). Female weight was non-normal (Shapiro-Wilk’s: W = 0.952, p = 0.010) and females displayed a significantly more variance (Levene’s: F1,135 = 25.07, p < 0.001). The black vertical line shows an approximate cut-off point for sexing cocoons in practice.
Further sources of variance in weight are attributable to seasonal
variation (Ivanov, 2006; Seidelmann et al., 2010), errors in the fertilisation of
eggs (Raw and O'Toole, 1979), and the cleptoparasite Cacoxenus indagator
which usually results in the starvation of the larva but can in cases simply lead

- 51 -
to underweight adults developing (Raw, 1972). Consequently, care should be
taken when sexing by weight. Individual hatching might be considered, since
individuals can be sexed after hatching, and female virginity can be assured if
needed (e.g. Chapter 5). Do note that females are most attractive to males
when newly eclosed, and lose their attractiveness within three days
(Seidelmann, 2014a).
Furthermore, diapause and emergence have been studied extensively in
this species (van der Steen and Ruiter, 1991; Wasielewski et al., 2011a;
Wasielewski et al., 2011b; Dmochowska et al., 2012, 2013; Fliszkiewicz et al.,
2012a; Giejdasz and Fliszkiewicz, 2016; Schenk et al., 2018a; Schenk et al.,
2018b; Beer et al., 2019) and other Osmia (Bosch and Kemp, 2004; Krunić and
Stanisavljević, 2006). This mainly with a view to pollination in greenhouses and
orchards. A mismatch between bee emergence and inflorescences could for
instance lead to bees emigrating from the orchard they were set out in (foraging
range 500-600m: Rathjen, 1994; Gathmann, 1998; Gathmann and Tscharntke,
2002; Everaars et al., 2011), or bees could simply starve under greenhouse or
semi-field conditions (e.g. Schenk et al., 2018a).
The heavier females take longer to eclose from their cocoons than do the
lighter males. In line with Holm (1974) I found that this effect is not likely to be
driven by weight itself and is purely sex-specific (when tracking individual
females: F1,30 = 2.819, p = 0.103; and males: F1,28 = 0.651, p = 0.427; Figure
3.6A). The main factors driving emergence time seem to be sex and days spent
in diapause (Holm, 1974; van der Steen and Ruiter, 1991). Extending the
dataset from van der Steen and Ruiter (1991) with my own, I found no
interaction effect between time spent in diapause and sex (F1,30 = 1.351, p =
0.254), and can only corroborate the independent effects of sex (F1,30 = 7.011, p
= 0.013) and diapause length (F1,30 = 78.79, p < 0.001; Figure 3.6B). When
extending van der Steen and Ruiter’s (1991) pupal survival data with my own, I
could likewise not find an interaction effect of sex and diapause length (𝜒1,302 =
1.6644, p = 0.825), nor an effect of the study (𝜒1,312 = 1.524, p = 0.829), nor of
sex (𝜒1,312 = 48.14, p = 0.224), nor of diapause length (𝜒1,31
2 = 61.51, p = 0.169)
on pupal survival (i.e. proportion eclosed; Figure 3.6B). The pupal survival data,
like the emergence time data, is largely in agreement with my own, apart from a
plummet in diapause survival at 192 and 210 days in the van der Steen and
Ruiter (1991) dataset (these were their final datapoints). When combining this
last dataset, I made the assumption that their sexing of cocoons by length (8
mm = male and 10 mm = female) was correct since sex specific eclosion was
not reported. Yet, the overall emergence was likewise low (30 and 48%
respectively), and no increased levels of parasitism were recorded for these

- 52 -
cocoons (1 and 4% respectively). Without these outliers — which cannot be
explained away and therefore cannot be removed — there may have been an
effect of time. Additionally, since the diapause survival data here extends
beyond 210 days, male survival can also be seen to trail off before that of
females (Figure 3.6B).
Figure 3.6: Sex specific diapause and emergence. A) individual weight did not explain days to emergence in females (F1,30 = 2.819, p = 0.103), nor males (F1,28 = 0.651, p = 0.427). B) combined data from this study and van der Steen and Ruiter (1991) showing time to eclosion in relation to the length of diapause (error bars = s; female points were shifted right by two days to avoid overlap). C) combined data from this study and van der Steen and Ruiter (1991) showing survival with diapause length. The proportion eclosed data van der Steen and Ruiter (1991) was assumed to have even sex ratios. Survival plummeted around 200 diapause days in van der Steen and Ruiter (1991), contrary to the present study. Diapause days = days from November 9 (as in van der Steen and Ruiter, 1991).
Overall, the individuals used here, could diapause late into summer when
kept at 5°C. It should be noted that, as reported in van der Steen and Ruiter
(1991), females diapausing for such a long period also suffered increased
mortality and decreased vitality. It is for this reason that an increasing amount of
cocoons was often set-out for trials that occurred later in the year (Table 3.3).
Finally, the duration of the summer dormancy (pre-winter diapause) affects
diapause in O. cornuta and O. lignaria (Sgolastra et al., 2010). Hence, if full life

- 53 -
cycles are attained in a laboratory environment, more control could be exerted
over diapause. For instance, placing developing brood at fluctuating
temperatures accelerates development, and using lower temperatures should
reduce adult mortality (Radmacher and Strohm, 2011).
3.4.2 Foraging
With regard to floral resources, Raw (PC) stressed using freshly cut
flowers, while Sandrock (PC) initially planned for the use of potted poppies
which the bees ended up destroying the plants by biting/cutting them. Since O.
bicornis is polylectic (Tasei, 1973; Raw, 1974; Teper, 2007), Vicia faba (T1) and
cut Ranunculus acris (T2; O. bicornis prefers Ranunculus Table 3.1) were
trialled, but the bees showed little interest. This may have been due to other
conditions in those initial trials. But their use was also considered impractical,
since O. bicornis also tend to aquire pollen and nectar from separate species
(Tasei, 1973). Hence, all further trials maintained artificial floral resources
exclusively.
Sugar solutions easily attracted the interest of females. Record was
made of visits to sugar resources during three trials (T1-3; with different choices
available). Visits were infrequent, and bees mostly frequented the same sugar
resources. Given the sparsity of data and lack of experimental design, no tests
were performed and an exploratory technique was used (factor analysis for
mixed data; FAMD; Figure 3.7A,B). The floral visits seemed to mostly
correspond to sugar composition, with most total visits in favour of sucrose (S)
only solutions as opposed to fructose/glucose/sucrose solutions (FGS; note that
both types of solutions were always offered in equal measure in all early trials;
Figure 3.7C).
The number of visits with regard to the number of flower petals also
stood out (Figure 3.7D; although the number of petals on display was not
consistent among trials). Tasei (1973) recorded nectar visits to: Pulmonaria sp.
(5 fused petals), Glechoma hederacea (6 fused and modified purple petals),
Ajuga reptans (6 fused and modified blue-purple petals), Onobrychis sativa (4
fused and modified pink petals), Medicago sativa (4 fused and modified purple
petals), and Hyacinthoides non-scripta (formerly Endymion nutans; 5 fused and
modified blue-purple petals). Given those recordings, and the data here, 4-6
blue-purple flower petals seem evident to make sugar solutions more attractive.
Another method that has been suggested to help feed bees treatments involves
simply placing ampules inside flowers (Ladurner et al., 2003).
- 54 -
Figure 3.7: Factor analysis for sugar solutions. A) The number of visitations (vis) shows little variance (limited dataset); but seems to correlate mostly to the sugar concentration (prop; numerical) and sugar composition/content (cont; categorical; sucrose only versus fructose:glucose:sucrose). Colour (col and col2) seemed to matter little with regard to bee preference, nor did the mount (50ml Falcon tube versus microcentrifuge tube), nor the number of petals (pet) used. Do note that this is based on a limited dataset. B) Regarding the numerical variables separately, further illustrates the importance of sugar concentration (prop) over petal number (pet) with regard to preference (vis; number of visits). C) The sucrose only composition (S) of sugar solution appeared to be the most robust over concentrations. The composite sugar solution (FGS; fructose:glucose:sucrose) at high concentrations (2:1) seemed particularly ill-favoured. D) The petal numbers used, when regarded separately did seem to have had some effect on preference. Makeshift flowers with six petals were favoured, regardless of their respective sugar concentration (1:1 or 2:1).
Finally, thermocycling tubes were used without further stimuli. Since,
regardless of their level of nesting activity, bees survived and always had
sucrose solution in their crop upon dissection. Indicating that bees had no
trouble locating sugar resources in the flight cage. Further considerations were
again mostly practical. PCR tubes are ideal since the smaller volumes can save

- 55 -
on costly chemicals in treatment groups (sugar solutions go off after roughly two
days), bees would often drown in open microcentrifuge tubes (especially when
not filled regularly, even though Osmia are long tongued: Proctor and Yeo,
1973), and falcon tubes needed to be suspended (clamp stand) and suffered
spillage. During T3, an embryo was found, yet it was found to be developing
abnormally (observation Dr E. Duncan), hence boiled sucrose solution was
briefly trialled, but not favoured by bees (boiling inverts sugars, but also forms
hydroxymethylfurfural, which is toxic to bees). Agave nectar was also briefly
trialled but not favoured. Finally, 50% (or ‘1:1’) filter sterilised sucrose solution
(as is the case in nectar: Schoonhoven et al., 2005; 0.6148 mg/µl sugar: Dafni
et al., 2005; stored frozen) was used in trials T7-8 where full development to
adults was achieved. Overall, presenting sugar resources was robust, and no
amino acids or vitamins (T6) needed to be added to induce egg-laying (proline,
glycine and phenylalanine in nectar are attractive: Nicolson, 2011). O. bicornis
likely retrieves nutrients and trace elements through pollen (pollen consist of 15-
60% protein and other essential elements: Schoonhoven et al., 2005), as is the
case in Osmia californica (Cane, 2016). The eliciting of pollen collection was
further considered the more limiting step towards achieving nesting and
oviposition in a laboratory environment (the majority of nesting activity
comprises mud and pollen collection: Raw, 1972).
For practical purposes, Apis pollen pellets (Wholesome Bee Pollen,
Livemore) were ground using a coffee grinder, and presented on artificial floral
resources. This not only provides more control, but the amount of pollen needed
for finishing a single pollen loaf is substantial, and it follows that the number of
cut or potted flowers needed should be substantial (PC Sandrock). The fineness
and dryness of the pollen seemed important as suggested by van der Steen
(PC), and pollen pellets need to be ground using a coffee grinder for a at least
five minutes (mortar and pestle were insufficient). This is not only necessary for
females to be able to collect the pollen, since pollen is compacted somewhat to
stick in-between scopa (O'Toole, 2000; and hairs are unbranched: Proctor and
Yeo, 1973), but just before ovipositing the pollen loaf is also dusted with a layer
of very fine pollen (van der Steen, 1997). The quality of pollen — the presence
of trace elements in pollen differs between plant species for instance— might
also be important with regard to larval diet (Filipiak, 2019), and larval
development by extension (Filipiak, 2019).
With the use of unsterilized ground Apis pollen pellets I managed to
acquire fully developed adults (T7-8). It should be noted that commercial Apis
- 56 -
pollen pellets may vary seasonally in their composition, and no palynological22
analyses were carried out here. Apis pollen pellets may furthermore contain
unwanted traces of pesticides (Chauzat et al., 2006; Škerl et al., 2009; Bernal et
al., 2010; Kasiotis et al., 2014; Calatayud-Vernich et al., 2018). With the above
considerations in mind: if Quercus is bountiful and in bloom (as preferred by O.
bicornis: Tasei, 1973; Raw, 1974; Teper, 2007), pollen might easily be
collected23 by placing plastic bags over branches with inflorescences and
subsequently shaking. Or by fitting a vacuum cleaner with filters of differing
mesh sizes (King and Ferguson, 1991; Johnson‐Brousseau and McCormick,
2004). Manually collecting pollen in this way should eliminate the need for
grinding pellets and should provide finer pollen. In addition, providing O.
bicornis with its preferred pollen resource may elicit more nesting behaviour in
more females. It should further eliminate unwanted variation in pollen
composition within experiments or across replicates, as well as reduce the
possibility of trace pesticides. While I think this is a worthwhile avenue to
pursue, possible downsides are the amount of pollen that can be acquired at
any one time, and the possibility of an unbalanced larval diet (Filipiak, 2019).
From behavioural observations I mainly found that the presentation of
pollen matters substantially. I was unable to replicate previous successes made
with simply presenting pollen on a Petridish (van der Steen, 1997; Sandrock et
al., 2014). Provisioning first started when presenting artificial catkins comprised
of knotted string (Figure 3.4) to exploit O.bicornis’ Quercus preference (Tasei,
1973; Raw, 1974; Teper, 2007). A female could be seen ‘abdominal drumming’
(actively placing pollen on her scopa; Cane, 2016) quite quickly. When
presenting pollen on these catkins24 — as well as on flowers with stamen being
mimicked by ruffled out cotton bulbs or pipecleaner25 — it increases surface
area. This prevents the clumping together of pollen, as it does in petridishes, left
pollen to dry (ground pollen was stored in batches at -20°C), and made it easier
to collect for the bees overall (personal observation). Dafni et al. (2005) states
that while there is no strict need to emulate floral organs, doing so does
increase the likeliness of an species to visit without training. Indeed many
species require training before they visit an artificial flower (Dafni et al., 2005;
Ladurner et al., 2005).
22 Referring here to the study of pollen specifically. I.e. pollen was not analysed
microscopically, genomically (barcoding), nor chemically (e.g. trace elements) in the current study.
23 Quercus are anemophilic species, with consequently high pollen production. 24 Catkins were thoroughly rinsed with tap water, dried in a drying over overnight and
subsequently autoclaved for reuse between trials. 25 Pipecleaner being seemingly the most effective (personal observation).
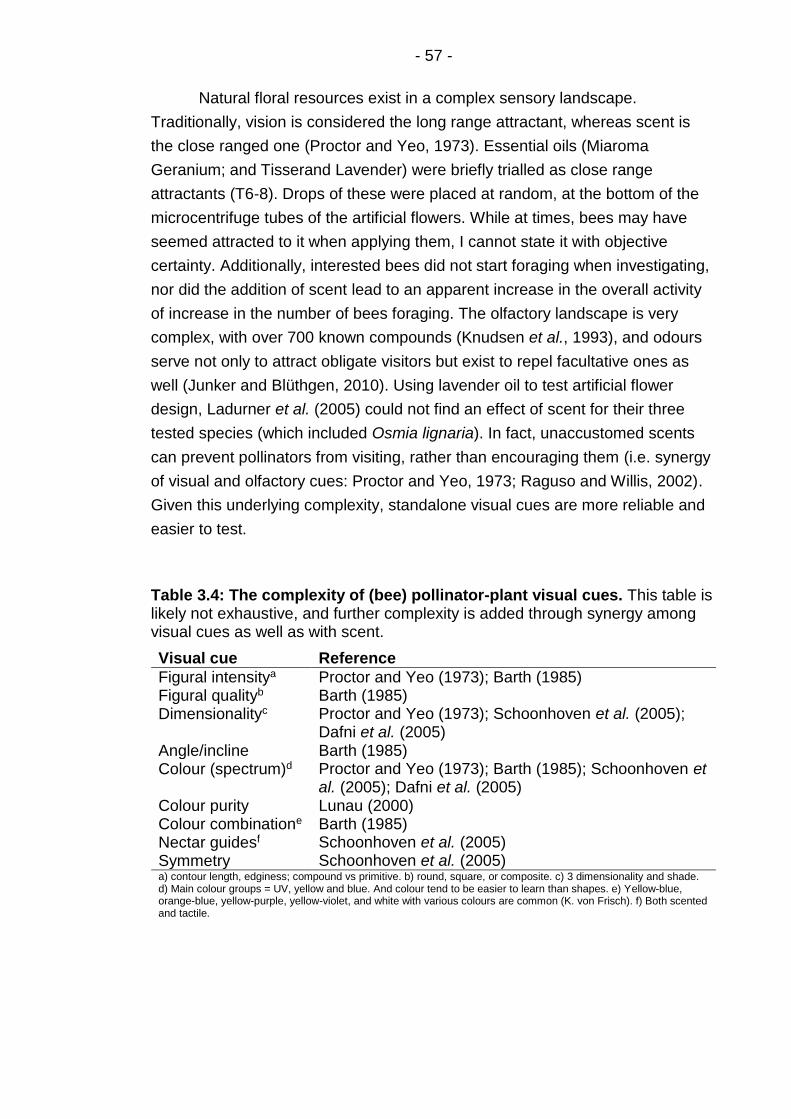
- 57 -
Natural floral resources exist in a complex sensory landscape.
Traditionally, vision is considered the long range attractant, whereas scent is
the close ranged one (Proctor and Yeo, 1973). Essential oils (Miaroma
Geranium; and Tisserand Lavender) were briefly trialled as close range
attractants (T6-8). Drops of these were placed at random, at the bottom of the
microcentrifuge tubes of the artificial flowers. While at times, bees may have
seemed attracted to it when applying them, I cannot state it with objective
certainty. Additionally, interested bees did not start foraging when investigating,
nor did the addition of scent lead to an apparent increase in the overall activity
of increase in the number of bees foraging. The olfactory landscape is very
complex, with over 700 known compounds (Knudsen et al., 1993), and odours
serve not only to attract obligate visitors but exist to repel facultative ones as
well (Junker and Blüthgen, 2010). Using lavender oil to test artificial flower
design, Ladurner et al. (2005) could not find an effect of scent for their three
tested species (which included Osmia lignaria). In fact, unaccustomed scents
can prevent pollinators from visiting, rather than encouraging them (i.e. synergy
of visual and olfactory cues: Proctor and Yeo, 1973; Raguso and Willis, 2002).
Given this underlying complexity, standalone visual cues are more reliable and
easier to test.
Table 3.4: The complexity of (bee) pollinator-plant visual cues. This table is likely not exhaustive, and further complexity is added through synergy among visual cues as well as with scent.
Visual cue Reference
Figural intensitya Proctor and Yeo (1973); Barth (1985) Figural qualityb Barth (1985) Dimensionalityc Proctor and Yeo (1973); Schoonhoven et al. (2005);
Dafni et al. (2005) Angle/incline Barth (1985) Colour (spectrum)d Proctor and Yeo (1973); Barth (1985); Schoonhoven et
al. (2005); Dafni et al. (2005) Colour purity Lunau (2000) Colour combinatione Barth (1985) Nectar guidesf Schoonhoven et al. (2005) Symmetry Schoonhoven et al. (2005) a) contour length, edginess; compound vs primitive. b) round, square, or composite. c) 3 dimensionality and shade. d) Main colour groups = UV, yellow and blue. And colour tend to be easier to learn than shapes. e) Yellow-blue, orange-blue, yellow-purple, yellow-violet, and white with various colours are common (K. von Frisch). f) Both scented and tactile.
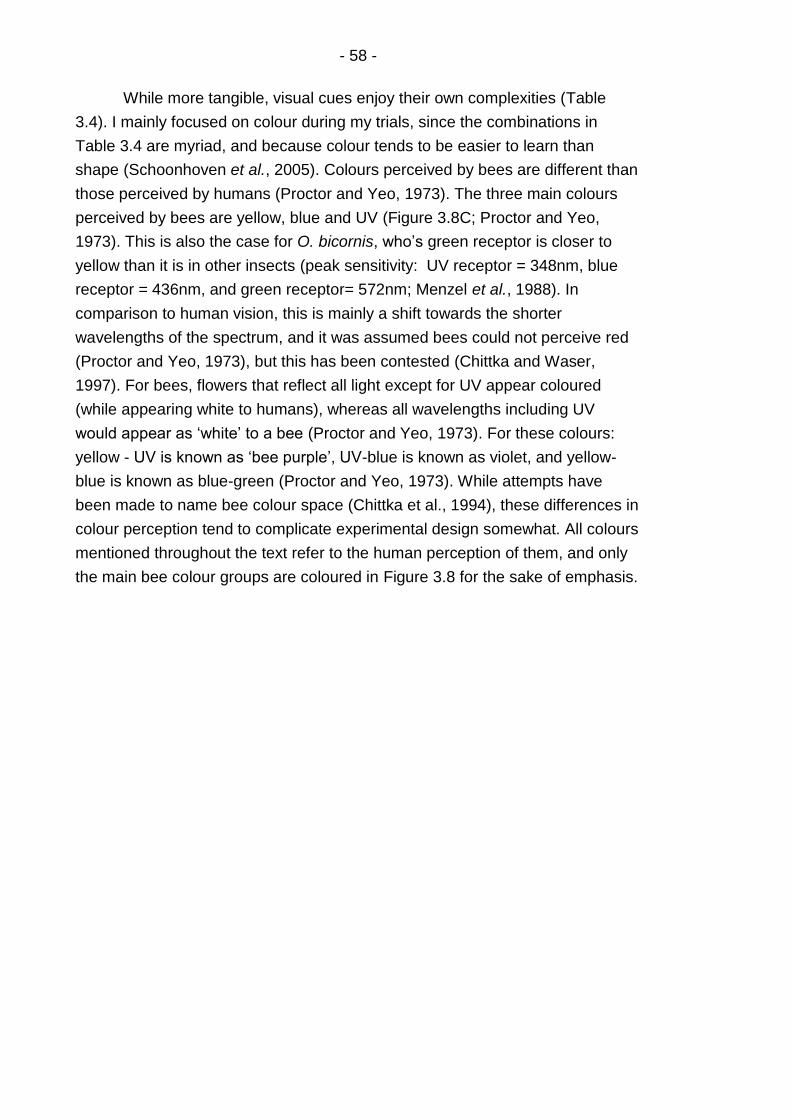
- 58 -
While more tangible, visual cues enjoy their own complexities (Table
3.4). I mainly focused on colour during my trials, since the combinations in
Table 3.4 are myriad, and because colour tends to be easier to learn than
shape (Schoonhoven et al., 2005). Colours perceived by bees are different than
those perceived by humans (Proctor and Yeo, 1973). The three main colours
perceived by bees are yellow, blue and UV (Figure 3.8C; Proctor and Yeo,
1973). This is also the case for O. bicornis, who’s green receptor is closer to
yellow than it is in other insects (peak sensitivity: UV receptor = 348nm, blue
receptor = 436nm, and green receptor= 572nm; Menzel et al., 1988). In
comparison to human vision, this is mainly a shift towards the shorter
wavelengths of the spectrum, and it was assumed bees could not perceive red
(Proctor and Yeo, 1973), but this has been contested (Chittka and Waser,
1997). For bees, flowers that reflect all light except for UV appear coloured
(while appearing white to humans), whereas all wavelengths including UV
would appear as ‘white’ to a bee (Proctor and Yeo, 1973). For these colours:
yellow - UV is known as ‘bee purple’, UV-blue is known as violet, and yellow-
blue is known as blue-green (Proctor and Yeo, 1973). While attempts have
been made to name bee colour space (Chittka et al., 1994), these differences in
colour perception tend to complicate experimental design somewhat. All colours
mentioned throughout the text refer to the human perception of them, and only
the main bee colour groups are coloured in Figure 3.8 for the sake of emphasis.
- 59 -
Figure 3.8: Floral colour preference of O. bicornis females. Behavioural observations of O. bicornis females alighting artificial flowers (T7). Data were normalised by the number of artificial flowers available of that type. All colour combinations are presented in (A). This same data is further presented by primary floral colour (B), and secondary floral colour (D), for ease of view. Primary colours (B) refer to the colour used closest to the makeshift ‘stamen’ (pipe cleaner). Secondary colours refer to the colours used on the distal side of the petals (outermost colours). Both primary and secondary colour indicated a preference for yellow, suggesting a general prediliction for yellow. C) Provides an overview of the bee-colour spectrum following Proctor and Yeo (1973), with the main colours (UV, blue and yellow; which correspond to their relative photoreceptors: Menzel et al., 1988) being coloured in for emphasis.
Bees are exceptionally sensitive to UV (Proctor and Yeo, 1973).
Additionally, UV is the most attractive colour to bees in general (Barth, 1985). In
spite of this, UV-reflecting photo paper used on the outer parts of the petals had
no discernible effect on the number of visitations (𝜒1,52 = 90.98, p = 0.095). A
likely explanation for these results is that while fluorescent lamps give off UV
radiation (Maxwell and Elwood, 1983), it is usually blocked off by filters on the
- 60 -
lamp (as was the case here; ~20 µW x 5 nm-1 x lm-1 at ~360nm)26. In addition to
the apparent indifference to UV, no significant effect of primary colour could be
find either (i.e. colour used closest to the stamen; 𝜒3,72 = 247.49, p = 0.056;
Figure 3.8B). Only the colour used furthest away from the emulated stamen
seemed to matter (i.e. secondary colour; 𝜒4,82 = 495.5, p = 0.004; Figure 3.8D).
The individual colour combinations could not be tested, due to a lack of
statistical power (even with already inflated sample sizes due to disregarding
repeated measurements). Nor were colour combinations deemed important
here, since the aim was not to investigate pollinator behaviour and colour
synergy in depth, but simply optimise a laboratory design. Statistical
considerations aside, both Figure 3.8 C and D show a distinct preference for
yellow in flowers, for those bees that foraged in my setup. This is in line with
canonical visual cues for pollen (Lunau, 2000). Pollen is predominantly yellow,
and the colour patterns of flowers reflect this (e.g. yellow flower centres, shorter
wavelengths on petal perifery for contrast, and increasing colour purity moving
centripetally: Lunau, 2000). Pollen also possesses protective UV-absorbing
(poly)phenolics (Torabinejad et al., 1998; Rozema et al., 2001), which make
pollen contrast with UV reflection on petal periphery, creating an ultraviolet
bull's-eye (Lunau, 2000). UV- free spaces are also known to initiate head
proboscis reactions (Barth, 1985).
Most striking is the agreement between the top left graph in Figure 3.8
here with Fig. 3 in Tasei (1973), with ‘catkins’ and ‘yellow – yellow’ representing
Quercus and Ranunculus pollen collection respectively. In order to increase
nesting in future setups, the Quercus and Ranunculus preference might be
exploited further (e.g. 5 petals with more accurate dimensions could be used;
and if UV light is present, UV reflecting patterns for Ranunculus may be found in
Fig. 1 of Koski and Ashman, 2014). A further consideration may be the amount
of floral resources presented to the cage bees, as both Cane (2016) and
Sandrock (PC) noted pollen depletion as problematic. Regardless of pollen
being refreshed daily, resources perceived by the bee (and perceived
competition) may be important.
26 LDPO_TL-D8G_865-Spectral power distribution on the datasheet shows low
emission in the UV region (10-380 nm); https://www.assets.signify.com/is/content/PhilipsLighting/fp927983286536-pss-global; last updated 13/12/2019; access date 31/01/2020
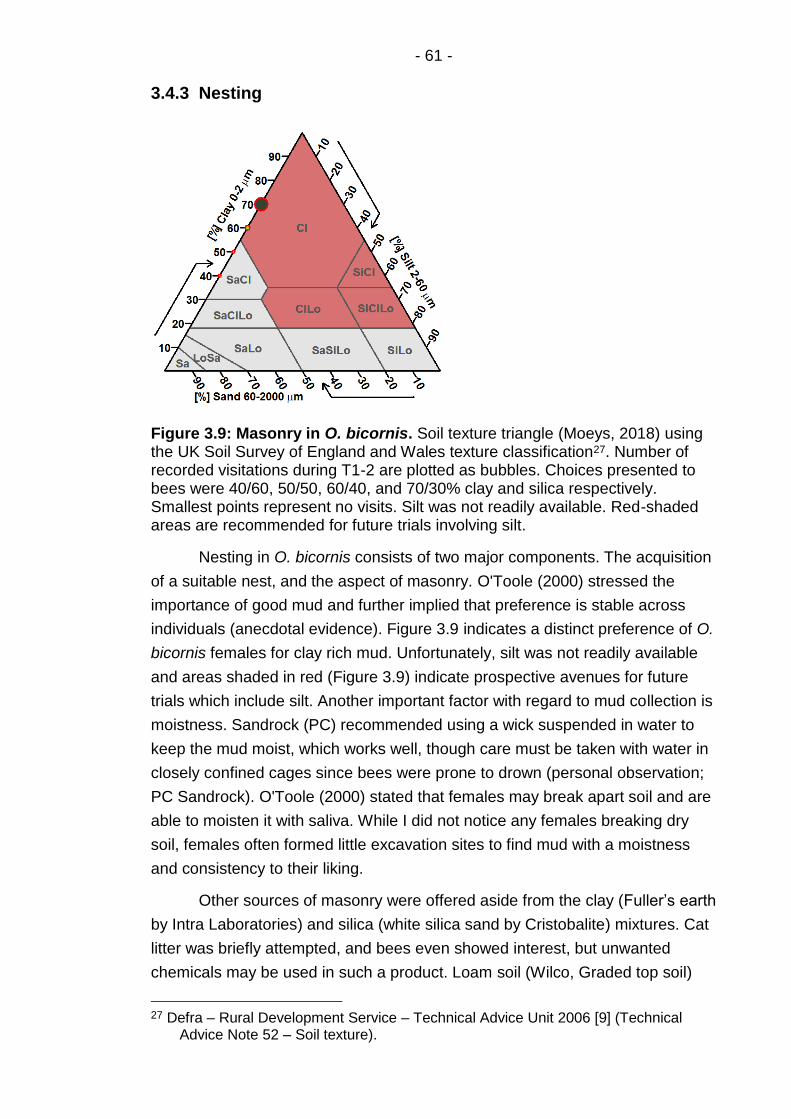
- 61 -
3.4.3 Nesting
Figure 3.9: Masonry in O. bicornis. Soil texture triangle (Moeys, 2018) using the UK Soil Survey of England and Wales texture classification27. Number of recorded visitations during T1-2 are plotted as bubbles. Choices presented to bees were 40/60, 50/50, 60/40, and 70/30% clay and silica respectively. Smallest points represent no visits. Silt was not readily available. Red-shaded areas are recommended for future trials involving silt.
Nesting in O. bicornis consists of two major components. The acquisition
of a suitable nest, and the aspect of masonry. O'Toole (2000) stressed the
importance of good mud and further implied that preference is stable across
individuals (anecdotal evidence). Figure 3.9 indicates a distinct preference of O.
bicornis females for clay rich mud. Unfortunately, silt was not readily available
and areas shaded in red (Figure 3.9) indicate prospective avenues for future
trials which include silt. Another important factor with regard to mud collection is
moistness. Sandrock (PC) recommended using a wick suspended in water to
keep the mud moist, which works well, though care must be taken with water in
closely confined cages since bees were prone to drown (personal observation;
PC Sandrock). O'Toole (2000) stated that females may break apart soil and are
able to moisten it with saliva. While I did not notice any females breaking dry
soil, females often formed little excavation sites to find mud with a moistness
and consistency to their liking.
Other sources of masonry were offered aside from the clay (Fuller’s earth
by Intra Laboratories) and silica (white silica sand by Cristobalite) mixtures. Cat
litter was briefly attempted, and bees even showed interest, but unwanted
chemicals may be used in such a product. Loam soil (Wilco, Graded top soil)
27 Defra – Rural Development Service – Technical Advice Unit 2006 [9] (Technical
Advice Note 52 – Soil texture).
- 62 -
supplemented with clay was also trialled with no preference shown. Finally,
natural mud from the bank of a stream in Leeds was collected and placed inside
the cage in a transparent container, but bees showed no interest. Additionally,
bringing mud with high organic content into an environment of 23°C was not
ideal and quickly turned foul. The 70/30% clay/silica mixture presented seemed
sufficient for the bees to carry out their nest building, and was preferred to the
50/50 mixture used in Sandrock et al. (2014; mixture composition not mentioned
in paper, but in PC). The lack of organic content also made it a practically
sustainable source of mud. Fungal growth occurred frequently when pollen was
spilt on the provided mud, but is easily scraped off, and mud was generally
replaced every 1-2 weeks.
O. bicornis also shows certain preferences when it comes to nesting
substrates. These are better studied fortunately. Females nest in various
cavities, including beetle borings in wood, cut reeds, cardboard tubes, plastic
straws, and styrofoam (even in glass tubes, although this does not come
recommended: Raw, 1972; Strohm et al., 2002; Wilkaniec and Giejdasz, 2003).
Nest tube diameter and length are both known to affect reproductive output
(Wilkaniec, 1998; Ivanov, 2006; Seidelmann et al., 2016). Both parameters
mainly matter with regard to sex ratio. Larger tube diameters will facilitate more
daughters, since these require more provisioning and will be broader (Ivanov,
2006; Seidelmann et al., 2016). Ivanov (2006) found that once tube diameter
exceeded 7 mm, male bias disappeared and the sex ratio averaged out (Fig. 14
in Ivanov, 2006). Seidelmann et al. (2016) considered tube diameters of 8-10
mm to be ideal, with wider diameters increasing the costs associated with both
masonry and parasitism. Ivanov (2006) sometimes found that nests with
diameters wider than 12 mm, cells would sometimes lie in two rows instead of
one. Tube length affects the total number of cells that can be made, and since
females are preferentially placed at the back of the nest; longer tubes lead to
more daughters being produced (Ivanov, 2006; Seidelmann et al., 2016).
In trials T1-2, I used reeds provided by the supplier of the bees. During
T2 I recorded inspections to these reeds, as well as occupancy at the end of the
trial (i.e. whether a female was present; Figure 3.10A). While the same reeds
were inspected several times, there seemed to be no clear pattern. Several
tubes of 6.5 mm diameter were inspected frequently (Figure 3.10A), but were
not found to be occupied at the end of the trial (Figure 3.10C). During a later
trial (T6-7) where cardboard tubes (Fabre’s hives; Oxford bee company) were
used and occupancy was similarly investigated (tubes were not marked and
hence no nest inspections were recorded for this trial; Figure 3.10D). Similarly
no clear pattern could be discerned.
- 63 -
Trap nests such as those used here, are generally designed with the
intention of getting clear and unbiased ecological estimates (e.g. of sex ratios or
parasitism: Seidelmann et al., 2016; Staab et al., 2018). But such studies do not
necessarily reflect the preference of the bees themselves, which relate more to
their own body size (e.g. with respect to nest defence: MacIvor, 2017).
Wilkaniec and Giejdasz (2003) recorded a 100% acceptance rate for reed
nesting substrates over two years, even though reeds did not always provide
the highest reproductive success. With the aim of getting females to nest in a
laboratory environment, it may be better to provide reed sources, however
much they may vary in diameter and length. Additionally, it is recommended to
provide multiple sources of nesting material, of varying diameters and lengths.
In other words, saturating the bees with opportunities for nesting may be ideal,
even if it leads to a loss in standardisation. The objective may be to decrease
competition over nesting resources (competition over nests is known to exist:
Strohm et al., 2002). For instance, during experiments relating to Chapter 6,
smaller cages with fewer tubes were used — yet the number of cardboard tubes
present still greatly outnumbered the number of females — and up to three
bees were regularly found in single tubes while many others were left vacant.
van der Steen (PC) also stressed supplying sufficient nesting substrate. Another
observation concerns paper linings in the cardboard tubes (Oxford bee
company). These are used to be able to remove cells and cocoons from the
nest tubes without destroying the cardboard tube itself. Bees often destroyed
the paper by chewing holes in it. Whether this was behaviour related to stress,
or a removal of ill-favoured material is unclear. Finally, a pheromonal spray28
which was developed for use in agricultural settings to prevent Osmia from
searching out new nests after emerging from cocoons, was also tried (applied to
nest entrances as per instruction; T7-8), but elicited no discernable increase in
nesting activity.
28 Invitabee PLUS+ mason bee attractant; no peer reviewed or other documentation
could be found; https://portal.nifa.usda.gov/web/crisprojectpages/0222890-development-of-a-nest-attractant-for-the-blue-orchard-bee.html; last updated: could not be accessed; access date: 31/01/2020

- 64 -
Figure 3.10: Nest preference in O. bicornis. A-B) Behavioural observations of nest inspections by females, during T2 did not show any clear patterns in nest preference for tube diameter (A), nor tube length (B). A select few nest tubes received the bult of the visitations. C-D) The nest tube occupancy at the end of T2 (C) and T6-7 (D), likewise did not indicate any patterns of preference for tube diameter.
3.4.4 Environment
Environmental cues are likely to be important in the establishing of O.
bicornis in a laboratory environment, and abiotic factors seem to matter more
than biotic ones. The optimal conditions for mating in the lab have already been
studied (Fliszkiewicz and Wilkaniec, 2009; Fliszkiewicz et al., 2011a;
Fliszkiewicz et al., 2013). From personal observation, I would add that males
could be removed to prevent harassment of females by males (though this may
depend on the size of the flight cage). Ideally after three days, since females
become unattractive and unreceptive after this time, regardless of already
having mated (Seidelmann, 2014a). The importance of mating to reproduction
in females is further discussed in Chapter 4. The density of bees is also relevant
(competition). The flight cage should not be made too crowded (PC van der
Steen; roughly 20 females at a time).

- 65 -
Figure 3.11: Abiotic environmental factors of trials T7-8. Graphs showing temperature A), relative humidity (B) and light intensity (C) fluctuations in T7-8 of the present study (black) and in the climate controlled rooms in Sandrock et al. (2014). Neither temperature, nor relative humidity could be controlled in the present study, though temperature was stable. Light intensity was measured using a light intensity meter (Skye) at various positions inside the cage (black points; high measurements are at the top inside the cage). These measurements in W x m-2 were converted to µmoles x m-2 x s-1 by multiplying by 4.59 , assuming ‘cool white fluorescent light’. This to facilitate comparison with Sandrock et al. (2014). Black stepwise curve represents the mean for the individual measurements at the five light intensity settings available (0%, 25%, 50%, 75%, and 100%).
Abiotic environmental factors are displayed in Figure 3.11. Neither
temperature nor relative humidity could be controlled, though temperature
remained stable throughout the study. Relative humidity is rarely deemed as
important as temperature when it comes to foraging (Dafni et al., 2005). Bees
will also prefer sunlit flowers where radiation helps them keep warm (Dafni et
al., 2005). Relative humidity is considered important for the development of O.
bicornis (van der Steen, 1997; Giejdasz and Wilkaniec, 2002), as is temperature
(van der Steen, 1997; Giejdasz and Wilkaniec, 2002; Radmacher and Strohm,
2010, 2011; Giejdasz and Fliszkiewicz, 2016). From these manipulative studies,
it seems that development is quite robust to changes in temperature, though
less is known of humidity. Figure 3.3 shows only several finished nests, with two
fully developed adults. It is therefore speculated here that relative humidity may
be quite stable within finished cells.
- 66 -
Relative humidity (Figure 3.11B) was considerably less stable, as well as
lower overall than in Sandrock et al. (2014). Consequently, there may have
been dehydration present in the current study. Non decorated PCR tubes with
autoclaved (but non-distilled) water could therefore be trialled in future, such
that bees can drink (without drowning) to rehydrate. This if relative humidity
cannot be controlled. The lack of fluctuation in temperature is also of concern.
O. bicornis time their emergence through temperature fluctuations (Beer et al.,
2019), and time their emergence to morning hours (10:00-12:00: Holm, 1974;
Beer et al., 2019). In the current study, cocoons were taken from 4°C and
placed in the cages directly (similar to van der Steen and Ruiter, 1991 who
placed cocoons in an incubator at 20°C). This was done with little regard for the
time of day. Without temperature fluctuation, O. bicornis likely start out stressed
post-eclosion, and need to adjust their circadian clock through light cycles (Beer
et al., 2019).
On average, light intensity (Figure 3.11C) reached the same levels as it
did in Sandrock et al. (2014). In their study, they used a ‘sunlight simulation
system’, though no further information is provided. Light quality may be
important. My initial use of a sodium/halide lamp (S/H; 230-240V ~AC 50 Hz,
1.25 amps; Maxibright; T1-5) left many bees perpetually flying towards the light
(phototaxis; Chen et al., 2012). The complexity of natural light has briefly been
touched upon before (dominant wavelength, polarisation and intensity; all
changing gradually throughout the day). I think there is a case to be made for
light being a major factor in getting O. bicornis to oviposit. van der Steen (1997)
managed 0.9 eggs per active female using daylight from a window
supplemented by a 80W light. Sandrock et al. (2014) managed roughly 6.2 eggs
per female using a sunlight simulation system. Holm (1974) achieved 2.2-3.6
eggs using a cold greenhouse, while reporting 4.6-6.6 eggs in the wild.
Fliszkiewicz et al. (2015) reported between 3 - 4.8 in the wild. The main outlier
is Raw (1972) with ~18 eggs using an insectary (presumably a greenhouse).
While matters are further complicated through various other differences
between studies — in addition to studies reporting reproductive success in
different ways — all successes seem to be consistently associated with the use
of natural light (or the simulation thereof). Light used in this study, while
matching Sandrock et al. (2014) in intensity; lacked UV (one could argue this
leaves bees one third colour blind: Figure 3.8C), lacked polarisation (navigation
and orientation; Von Frisch, 1954; Mazokhin-Porshni︠ a︡kov, 1969; Wehner, 1984)
and differed in composition to natural light (constantly white instead of varying
across the visible spectrum: red-blue-red).
- 67 -
A final consideration was available space. Placing individuals in small
cages in constant temperature rooms (Table 3.3: T5-6) yielded no activity
whatsoever (bees also lacked purchase in these plastic cages). After acquiring
a nesting substrate, bees are also known to perform an orientation flight (Holm,
1974) by flying in an expanding figure of eight (O'Toole, 2000). This behaviour
was never observed in any of my set-ups. This may again be down to the
polarisation of light, but the flight cages used in this study were likely too small
as well. Sandrock et al. (2014) for instance used climate chambers spanning
4.3 x 2.4 x 1.8 m (18.6 m3), whereas the largest flight cage utilised here
spanned only 0.65 x 0.9 x 0.14 m (0.0819 m3). A lack of flight space is also a
likely stressor.
3.5 Concluding remarks
Raw (1972) netted bees while flying with mud pellets. These bees lost
their pellets, but upon release, continued to fly back to the nest and started nest
building even though it had nothing to add. After a few seconds the bee would
fly out to collect mud again. Holm (1974) also noted empty nest cells occurring
under greenhouse conditions. These nest tubes likewise contained only mud
partitions. Such nest tubes were not encountered in the wild however. I
consistently found unfinished Fabre’s thresholds in early trials, and empty nests
in later trials (no pollen loafs, but finished septa). These sort of observations are
reminiscent of fixed action patterns (Lorenz, 2013). As such, they give the
impression that if the right ‘trigger’ could be found, oviposition could be elicited.
While such single-trigger-threshold models are tempting, the various degrees in
which various authors have accomplished O. bicornis egg laying argue against
the idea that the change in one key variable would make the majority or all
females complete full sequences of nesting behaviour.
That being said, some variables may be more important than others. I
have personally stressed the importance of light and pollen, and offered various
suggestions on these and other factors throughout this chapter. But I would
finally like to argue against a ’threshold model’, and in favour of a ‘holistic
model’. Discovering and refining all preferences with regard to the aspects
outlined in Table 3.1 and 3.2 may all aid in inducing laboratory egg laying.
Another consideration, not previously mentioned, is the vitality of the bees (PC
Whittles). Many of the studies mentioned (e.g. Raw, 1972; van der Steen, 1997;
Sandrock et al., 2014) sourced their bees from different places.
’It is a very ambitious attempt to set up a laboratory culture of a solitary bee. Many researchers tried this before, but to my knowledge, all failed.’ — K. Seidelmann (PC)

- 68 -
I maintain that establishing O. bicornis in a laboratory environment
remains possible. Sandrock et al. (2014) managed to do so with astounding
success. The results here, while not yet allowing a full experimental set-up, are
promising. Especially considering that the few females that did lay eggs, did so
well past their normal diapause period. This is also why establishing bees in a
controlled environment is so appealing, it would allow for experiments outside of
the flight season. I also hope I provided a proof of concept for behavioural
assays within a controlled setting for solitary bees. Building on the work here,
my main recommendations for future endeavours at establishing solitary bees in
a controlled environment are:
The use of a greenhouse if possible. And the establishment of a local
nearby population (as done by most research groups), by setting out
bees near nesting substrates and abundant floral resources (taking care
not to introduce parasites; possibly by eclosing individuals inside the
laboratory)29.
A saturation of both floral resources, and nesting resources. And a
refinement of both (e.g. the use of reeds, and more representative flower
mimics; sugar solutions should ideally also not be ignored in this
respect).
The addition of UV to the light used. In combination with Ranunculus
mimics that reflect UV this may lead to a significant increase in the
number of individuals foraging.30 The polarisation of light may prove
more difficult (polarisation filters also reduce light intensity).
More precarious practices for emerging the bees may be beneficial
(fluctuating temperature).
Climate controlled rooms with sunlight simulation are likely not
economically viable for many research groups. Hence it is my hope that these
recommendations and efforts facilitate the use of O. bicornis and other solitary
pollinators inside laboratories.
29 This allows for ecological and behavioural studies, albeit mainly within the flight
season, but also provide a backup and easy access to more individuals. Note also that studies in greenhouses are still susceptible to at least some weather conditions (e.g. clouding).
30 Simply fitting fluorescent lights, without UV filters may easily accomplish this. Though health and safety measures would need to be put in place depending on the level of UV radiation.
- 69 -
Chapter 4 Validation of microsatellite markers in O. bicornis
4.1 Summary
In this chapter, I further establish O. bicornis as a model species through
the development and validation of new microsatellite markers. Microsatellite
markers and other genetic resources like them find their use from evolutionary
analysis to ecology and conservation. In collaboration with NBAF (NERC
Biomolecular analysis facility) Sheffield microsatellite markers were mined from
the O. bicornis genome (Beadle et al., 2019) and designed, and subsequently
tested and validated. Of the initial twenty microsatellites, seventeen were
amplifiable and informative. By adding seventeen new markers to six previously
published ones (Neumann and Seidelmann, 2006), I extend the base for
genetic studies. In this species, in particular to hereafter address whether this
species is truly monandrous or whether females display low levels of extra-pair
paternity, as this is relevant in directing future research into the evolution of
eusociality in this species, as well as having conservation genetic implications.
In addition, the markers may be used to assess possible levels of inbreeding in
at least commercially and voluntarily managed populations of O. bicornis.
Finally, in order to use the markers to assess gene flow, monandry and
population dynamics of natural populations of O. bicornis in future, I attempt to
enhance local populations through trap nesting. I discuss how future efforts at
trap nesting O. bicornis may be made more efficient.
4.2 Introduction
Relatedness, is paramount to inclusive fitness theory (Hamilton, 1964a,
b), and consequently the study of the evolution of eusociality (Pernu and
Helantera, 2019; section 1.1). An immediate way of estimating relatedness is
through the use of microsatellite markers (Queller and Goodnight, 1989; Blouin
et al., 1996), and this approach has been applied in numerous studies of social
insects. For example, genotyping individuals through microsatellites has
facilitated direct tests of inclusive fitness hypotheses (Paxton et al., 1996;
Chapman and Crespi, 1998; Paxton et al., 2002). In A. mellifera microsatellite
markers have further been used to test relatedness (Baudry et al., 1998),
mating frequency (Tarpy et al., 2015) and mating range (Jensen et al., 2005),
sperm admixture (Franck et al., 1999), investigating worker laid brood
(Neumann et al., 1999), and the creation of linkage maps (Solignac et al., 2003;

- 70 -
Solignac et al., 2004; Solignac et al., 2007). Such examples illustrate the broad
utility of microsatellite markers, and their implicit value to eusocial research.
Monogamy is considered ancestral to eusocial lineages (Hughes et al.,
2008; Boomsma, 2009), precisely because it facilitates higher relatedness and
the evolution of helping behaviour (section 1.1 and references therein). O.
bicornis females are considered to be monogamous, a belief which is grounded
in behavioural assays and observations (Seidelmann, 2015, 2014a). This
assumed monogamy seems to be predominantly driven by males through:
extensive mate guarding (Seidelmann, 1995), an elusive anti-aphrodisiac31
(Ayasse and Dutzler, 1998; Seidelmann, 2014a; Seidelmann and Rolke, 2019),
and a male mating plug (Seidelmann, 2015). These behavioural adaptations
make sense in light of a scramble competition polygyny (Seidelmann, 1999b).
Given that females use various and spread out resources (i.e. floral, mud, and
nest resources), it does not pay off for males to defend territories in order to
gain access to females. Instead, males wait for females to emerge at nest sites
or search for females at foraging sites (Raw, 1976; Seidelmann, 1999b).
Mechanisms such as: a mating plug (Seidelmann, 2015) and induced female
unreceptivity (Seidelmann, 2014a) make more sense in light of assuring
paternity. The O. bicornis mating system has thus been described as a
‘searching for mates’ type scramble competition (Seidelmann, 1999b). Yet it
should be noted that Raw (1976) did observe aggressive behaviour among
males searching for females by nest sites, even if Seidelmann (1999b) did not.
Inconsistencies like these, are perhaps the first indication towards the
inadequacy in ascertaining mating systems from behavioural observations.
From the female’s perspective, mating multiply should not increase her
reproductive success in a direct and linear manner (Bateman, 1948), this is also
predicted to be the case where high maternal investment is present (Arnold and
Duvall, 1994). Indirect benefits could be accrued by polyandrous females
however (Zeh and Zeh, 2001). Moreover, post-copulatory mechanisms such as
a mating plug (Seidelmann, 2015) and mate guarding (Seidelmann, 1995) can
be considered costly in terms of both time and energy invested. Hence, if no
selection pressure were to be maintained on these mechanisms, one would
expect them to erode over evolutionary time. This raises the question of
whether low-levels of polyandry occur in wild populations of O. bicornis. As
stated above, behavioural observations indicate that O. bicornis is monandrous
31 Female unreceptivity is initiated by a male post-copulatory display(Seidelmann,
2014a), yet the application of a male produced anti-aphrodisiac during this display has been subject of debate with contradicting lines of evidence(Ayasse and Dutzler, 1998; Seidelmann and Rolke, 2019). The issue remains unresolved to date.
- 71 -
(Seidelmann, 2014a, 2015), yet behavioural observations of mating frequency
have been shown to be unreliable (e.g. the case in birds; Griffith et al., 2002)
and it is therefore important to verify mating frequencies using genetic
resources (Bretman and Tregenza, 2005), i.e. microsatellite markers.
Neumann and Seidelmann (2006) identified and validated six
microsatellite markers to interrogate population structure in O. bicornis. These
were isolated using an enrichment protocol for partial genomic libraries, and
consisted of five dinucleotide repeats and one trinucleotide repeat. Dinucleotide
repeats occur more frequently than others (Fan and Chu, 2007), making their
use innate and commonplace. Yet, tetranucleotide repeats, for instance, are
easier to score given the distance between alleles as they are less prone to the
artefacts common in dinucleotide repeats e.g. stutter and slippage. This in turn
leads to fewer human errors in genotype calling, which is considered the main
source of genotyping errors (Pompanon et al., 2005). For example, during
preliminary tests of microsatellite protocols performed by Dr Elizabeth Duncan
and Vanessa Barlow (data not shown), many of the markers presented by
Neumann and Seidelmann (2006) were difficult to score unambiguously due to
their dinucleotide nature. Furthermore, amplifying more loci and more variable
loci, is known to increase power more than increasing the number of individuals
does (Landguth et al., 2012). For instance, the OruS4 marker (Neumann and
Seidelmann, 2006) was found to be uninformative (no variation in our
populations) when tested. For this reason, the use of these six microsatellites
necessitates incredibly large sample sizes (e.g. Conrad et al., 2018 used 779
individuals in total).
From the recent publication of the O. bicornis genome (Beadle et al.,
2019) ensues the opportunity of mining and developing additional microsatellite
markers from it (Beier et al., 2017). The development of more markers would
increase power for inferring population structure (Landguth et al., 2012). This is
important, since knowledge on the genetic diversity of solitary bees lags behind
that of other pollinators (Packer and Owen, 2001). Moreover, Hymenopterans
habitually have brother-sister matings (Packer and Owen, 2001), and O.
bicornis likewise may not avoid inbreeding (Conrad et al., 2010; Conrad and
Ayasse, 2015; Conrad et al., 2018). In honey bees homozygosity at the csd
locus results in sterile male offspring (Gempe and Beye, 2009). A loss of
heterozygosity, as a result of a lack of inbreeding avoidance, could therefore
have profound consequences for solitary bees (Zayed and Packer, 2005).
Additional microsatellite markers will therefore play a pivotal role in conservation
genetics (Zayed, 2009), helping to inform decision making in the face of global
pollinator decline (Potts et al., 2010).
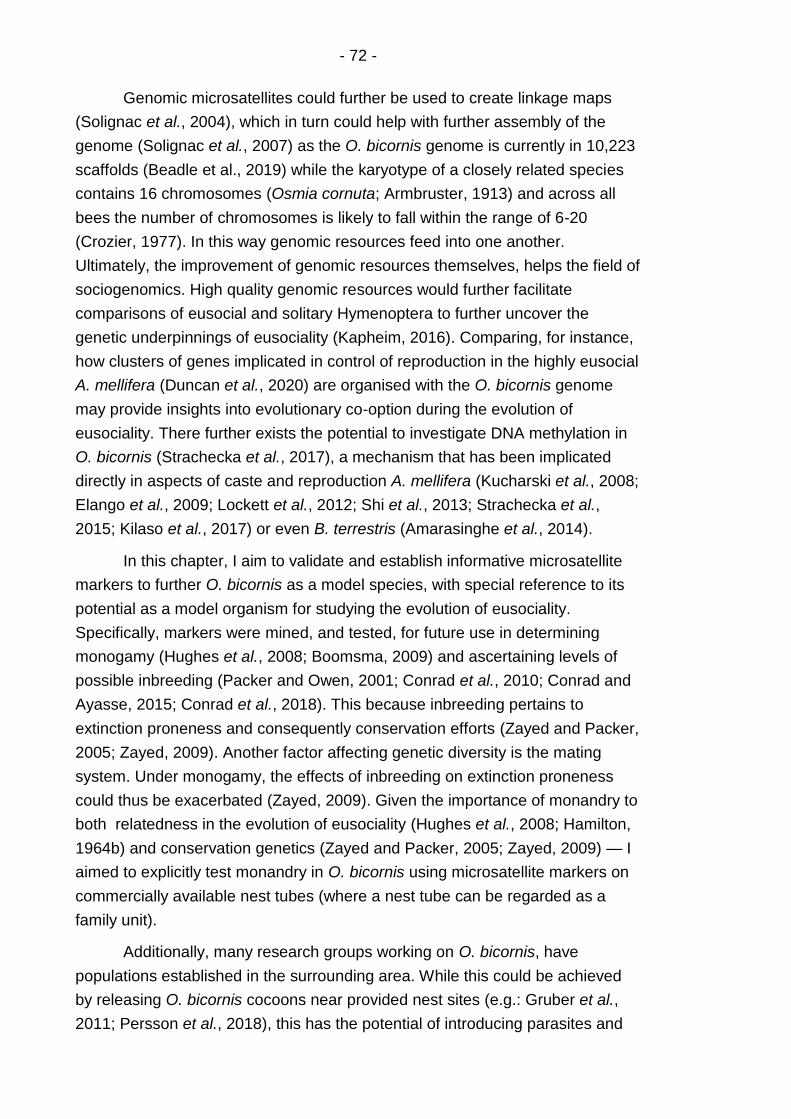
- 72 -
Genomic microsatellites could further be used to create linkage maps
(Solignac et al., 2004), which in turn could help with further assembly of the
genome (Solignac et al., 2007) as the O. bicornis genome is currently in 10,223
scaffolds (Beadle et al., 2019) while the karyotype of a closely related species
contains 16 chromosomes (Osmia cornuta; Armbruster, 1913) and across all
bees the number of chromosomes is likely to fall within the range of 6-20
(Crozier, 1977). In this way genomic resources feed into one another.
Ultimately, the improvement of genomic resources themselves, helps the field of
sociogenomics. High quality genomic resources would further facilitate
comparisons of eusocial and solitary Hymenoptera to further uncover the
genetic underpinnings of eusociality (Kapheim, 2016). Comparing, for instance,
how clusters of genes implicated in control of reproduction in the highly eusocial
A. mellifera (Duncan et al., 2020) are organised with the O. bicornis genome
may provide insights into evolutionary co-option during the evolution of
eusociality. There further exists the potential to investigate DNA methylation in
O. bicornis (Strachecka et al., 2017), a mechanism that has been implicated
directly in aspects of caste and reproduction A. mellifera (Kucharski et al., 2008;
Elango et al., 2009; Lockett et al., 2012; Shi et al., 2013; Strachecka et al.,
2015; Kilaso et al., 2017) or even B. terrestris (Amarasinghe et al., 2014).
In this chapter, I aim to validate and establish informative microsatellite
markers to further O. bicornis as a model species, with special reference to its
potential as a model organism for studying the evolution of eusociality.
Specifically, markers were mined, and tested, for future use in determining
monogamy (Hughes et al., 2008; Boomsma, 2009) and ascertaining levels of
possible inbreeding (Packer and Owen, 2001; Conrad et al., 2010; Conrad and
Ayasse, 2015; Conrad et al., 2018). This because inbreeding pertains to
extinction proneness and consequently conservation efforts (Zayed and Packer,
2005; Zayed, 2009). Another factor affecting genetic diversity is the mating
system. Under monogamy, the effects of inbreeding on extinction proneness
could thus be exacerbated (Zayed, 2009). Given the importance of monandry to
both relatedness in the evolution of eusociality (Hughes et al., 2008; Hamilton,
1964b) and conservation genetics (Zayed and Packer, 2005; Zayed, 2009) — I
aimed to explicitly test monandry in O. bicornis using microsatellite markers on
commercially available nest tubes (where a nest tube can be regarded as a
family unit).
Additionally, many research groups working on O. bicornis, have
populations established in the surrounding area. While this could be achieved
by releasing O. bicornis cocoons near provided nest sites (e.g.: Gruber et al.,
2011; Persson et al., 2018), this has the potential of introducing parasites and

- 73 -
diseases (or different strains thereof; Krunic et al., 2005; Fliszkiewicz et al.,
2012b) to local populations when using a commercial supplier. Additionally,
information on gene flow in this species is sparse (Conrad et al., 2018). Hence,
preliminary attempts were made to sample the local O. bicornis populations
through the provision of trap nests (e.g.: Tscharntke et al., 1998; an urban
example: Everaars et al., 2011). Through the use of trap nests, I also aimed to
ascertain the presence of monogamy and inbreeding in wild populations. This
because wild populations may differ from populations maintained for
commercial breeding in for instance density, which in turn might affect levels of
inbreeding and polyandry.
4.3 Materials and methods
4.3.1 Trap-nesting
Trap-nesting of O. bicornis in greater Leeds was attempted (Figure 4.1),
during both 2017 and 2018. Fabre’s hives with cardboard tubes (Oxford bee
company Ltd. ;Figure 4.1 inset) were fastened to wooden stakes impaled into
the soil, some 1-1.5m from the ground (Steffan-Dewenter and Schiele, 2008),
facing South to South-West. 32 nest traps were spread over as many locations
(Figure 4.1 and see Table B.1 for further details). In 2017, these trap nests were
placed in situ fairly late in the O. bicornis flight season (mid-May); in 2018 trap
nests were placed in situ before both male and female emergence (early April).

- 74 -
Figure 4.1: Trap-nest locations. Sites in the city of Leeds consisted of the canalside , the University of Leeds campus , and Sugarwell Hill Park — points not annotated on map. Sites in the greater Leeds area consisted of Kirkstall Valley Reserve , the Meanwood Valley trail , Temple Newsam and the Leeds University farm. Inset: Fabre’s hive with cardboard tubes (Oxford bee company Ltd.).
4.3.2 Commercial nest tubes
Intact nest tubes were provided by Dr Schubert plant breeding
(Landsberg, Germany; commercial breeder) from two localities in Germany 100
km apart (G1 and G2), totalling 24 nest tubes, containing 210 individuals.
Further nest tubes of O. bicornis were provided by MasonBees Ltd. (Shropshire,
UK; guardian scheme), from North Shropshire (NS) and Surrey (Su; ~ 240 km
apart) totalling 20 tubes, containing 166 individuals. The use of intact nest tubes
(Figure 4.2) should facilitate easy reconstruction of paternal and maternal
genotypes. Since males are haploid representations of the mother’s genotype.
Consequently, any nest usurpations by another female (Raw, 1972) can be
inferred from the genotypes of haploid sons directly. Furthermore, to address
the question of female polyandry, it is sufficient to detect more than a single
father to a nest. Given that maternal genotypes can be inferred unambiguously
(Figure 4.2) in our design; our power of inference with regard to detecting
polyandry should increase linearly with both the number of informative markers
used and the total number of nests used.

- 75 -
Figure 4.2: The nest tube as a family unit. An O. bicornis nest tube, with females (from fertilised eggs) positioned at the back and males (from unfertilised eggs) positioned at the front — was considered a family unit. In cases where an unfertilized male egg is laid in amongst females or vice versa; fertilisation errors (Raw and O'Toole, 1979) or fights and usurpation of nests (Raw, 1972; Strohm et al., 2002) may have occurred. This was a common feature, with 12 out of 24 nest tubes showing either males interspersed in between females or vice versa. In 10 out of 12 cases, the mismatch could be explained by only a single individual (male or female) disrupting the female-to-male order within the nest tube.
4.3.3 DNA extraction
DNA extractions were performed using hot sodium hydroxide and tris
(HotSHOT; Truett et al., 2000). An individual’s leg was removed using tweezers,
which were flamed and rinsed with 10% bleach in between use, to prevent
contamination. The leg was placed in a thermal cycling tube and 75 µl of
HotSHOT alkaline lysis buffer (25 mM NaOH, 0.2 M EDTA, pH 12) was added.
Samples were incubated at 95°C for 30 minutes and cooled to 4°C for three
minutes. 75 μl of HotSHOT neutralisation buffer (40 mM Tris-HCl, pH 5) was
added to neutralise pH. Samples were stored at -20°C and used within 3
months. Occasionally, no whole bees were found in one or several cells of a
nest tube. In these cases larvae were affected by chalkbrood (Ascosphaera
spp.; Krunic et al., 2005), cocoons contained larvae of Monodontomerus
obscurus (Krunic et al., 2005), or an empty cocoon was found where an
individual had already emerged and escaped.
In the case of chalkbrood (Krunic et al., 2005), an ammonium acetate
DNA extraction was performed. The sample was placed in a 1.5 ml
microcentrifuge tube, and 250 µl DIGSOL buffer (20 mmol/L edetic acid [EDTA],
50 mmol/L Tris [pH 7.5], 0.4 mol/L NaCl, 0.5% sodium dodecyl sulfate [SDS];
Lagisz et al., 2010) and 10 µl of 10 mg /ml proteinase K (Thermo Scientific)
were added. Sample was ground using a sterile pestle, and incubated at 55°C
for three hours (rotating). 300 µl 4M ammonium acetate was added, and
proteins were subsequently precipitated by vortexing the solution several times
over a period of fifteen minutes. Solution was centrifuged for ten minutes at
13,000 rpm, and supernatant was transferred to a fresh 1.5ml microcentrifuge
tube. 1 ml of a 100% ethanol was added to precipitate DNA (inverted several
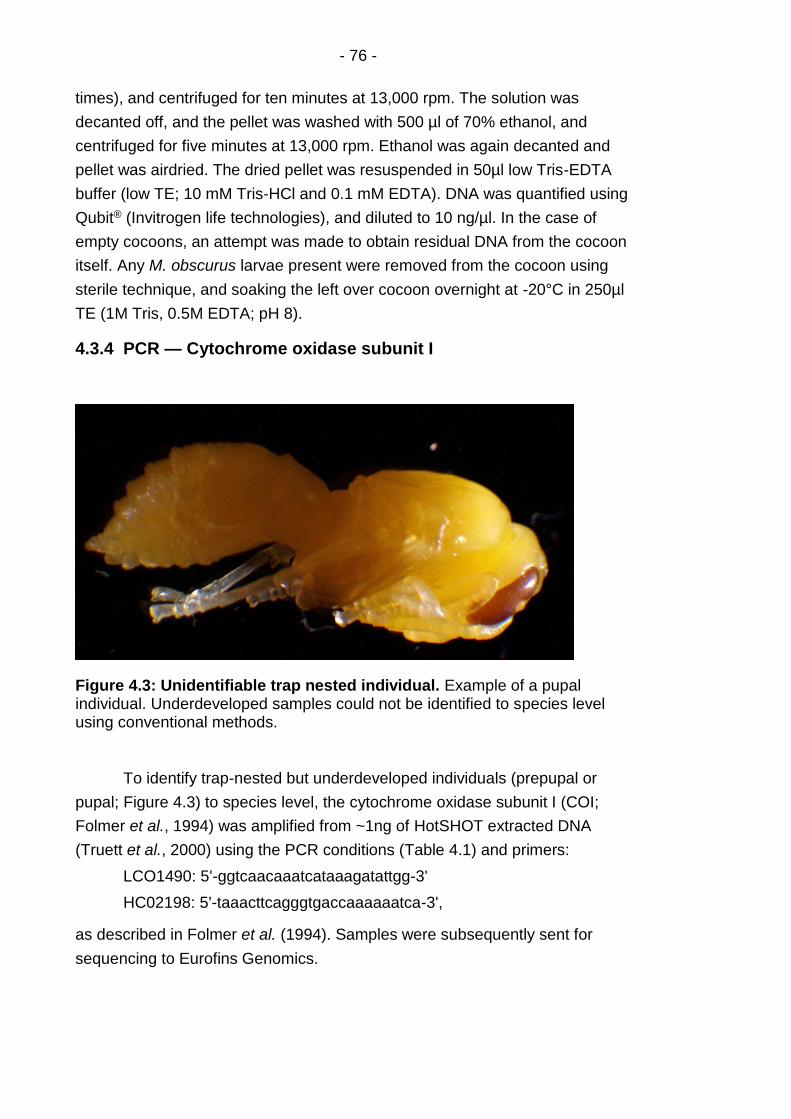
- 76 -
times), and centrifuged for ten minutes at 13,000 rpm. The solution was
decanted off, and the pellet was washed with 500 µl of 70% ethanol, and
centrifuged for five minutes at 13,000 rpm. Ethanol was again decanted and
pellet was airdried. The dried pellet was resuspended in 50µl low Tris-EDTA
buffer (low TE; 10 mM Tris-HCl and 0.1 mM EDTA). DNA was quantified using
Qubit® (Invitrogen life technologies), and diluted to 10 ng/µl. In the case of
empty cocoons, an attempt was made to obtain residual DNA from the cocoon
itself. Any M. obscurus larvae present were removed from the cocoon using
sterile technique, and soaking the left over cocoon overnight at -20°C in 250µl
TE (1M Tris, 0.5M EDTA; pH 8).
4.3.4 PCR — Cytochrome oxidase subunit I
Figure 4.3: Unidentifiable trap nested individual. Example of a pupal individual. Underdeveloped samples could not be identified to species level using conventional methods.
To identify trap-nested but underdeveloped individuals (prepupal or
pupal; Figure 4.3) to species level, the cytochrome oxidase subunit I (COI;
Folmer et al., 1994) was amplified from ~1ng of HotSHOT extracted DNA
(Truett et al., 2000) using the PCR conditions (Table 4.1) and primers:
LCO1490: 5'-ggtcaacaaatcataaagatattgg-3'
HC02198: 5'-taaacttcagggtgaccaaaaaatca-3',
as described in Folmer et al. (1994). Samples were subsequently sent for
sequencing to Eurofins Genomics.
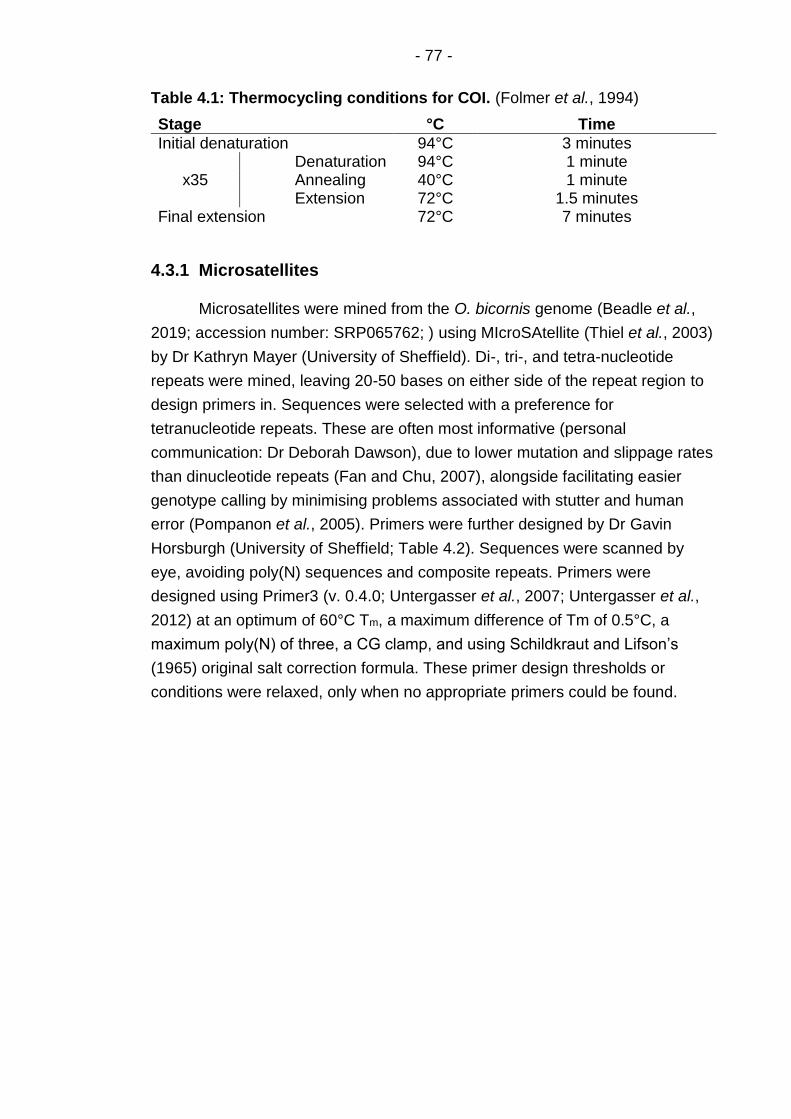
- 77 -
Table 4.1: Thermocycling conditions for COI. (Folmer et al., 1994)
Stage °C Time
Initial denaturation 94°C 3 minutes
x35 Denaturation Annealing Extension
94°C 1 minute 40°C 1 minute 72°C 1.5 minutes
Final extension 72°C 7 minutes
4.3.1 Microsatellites
Microsatellites were mined from the O. bicornis genome (Beadle et al.,
2019; accession number: SRP065762; ) using MIcroSAtellite (Thiel et al., 2003)
by Dr Kathryn Mayer (University of Sheffield). Di-, tri-, and tetra-nucleotide
repeats were mined, leaving 20-50 bases on either side of the repeat region to
design primers in. Sequences were selected with a preference for
tetranucleotide repeats. These are often most informative (personal
communication: Dr Deborah Dawson), due to lower mutation and slippage rates
than dinucleotide repeats (Fan and Chu, 2007), alongside facilitating easier
genotype calling by minimising problems associated with stutter and human
error (Pompanon et al., 2005). Primers were further designed by Dr Gavin
Horsburgh (University of Sheffield; Table 4.2). Sequences were scanned by
eye, avoiding poly(N) sequences and composite repeats. Primers were
designed using Primer3 (v. 0.4.0; Untergasser et al., 2007; Untergasser et al.,
2012) at an optimum of 60°C Tm, a maximum difference of Tm of 0.5°C, a
maximum poly(N) of three, a CG clamp, and using Schildkraut and Lifson’s
(1965) original salt correction formula. These primer design thresholds or
conditions were relaxed, only when no appropriate primers could be found.

- 78 - Table 4.2: 20 Microsatellite markers tested. Microsatellite markers mined from the O. bicornis genome by Dr Kathryn Mayer, alongside their forward (F) and reverse (R) primer sequences as designed by Dr Gavin Horsburgh. Tm = melting temperature, and Motif = motif of the repeat domain.
Marker F/R Primer sequence Tm Motif
Obic1 F CGGTTTATGGCAGGTAAACG 60.37 (ag)14
Obic1 R GTAGCAGCAGCCGGTGTATC 60.83 (ag)14
Obic113 F CTGCCCTCTCGTCTCTTCC 60.08 (ccag)7
Obic113 R AATTCGGGTTGAAACCTGTG 59.83 (ccag)7
Obic1176 F ACGCTTGTCGCTTTCAG 60.14 (tgta)8
Obic1176 R TTCTCGAACAGATGTCCTTGG 60.24 (tgta)8
Obic1181 F CTCGGGAATCCACCTTATTG 59.38 (cttt)13
Obic1181 R TGCCTAGCGAAAGAGGGTAG 59.61 (cttt)13
Obic1206 F CCAACCTTCCCACACCTAAC 59.3 (acct)9
Obic1206 R AACAGGACAAAGGAGCGAAG 59.47 (acct)9
Obic1238 F ACAATTTGTAGGGTGGACACG 59.77 (agca)13
Obic1238 R GCGATTCAACCTCCTTTCAC 59.68 (agca)13
Obic1252 F CCTTCCTATGTCGCTGCTG 59.56 (tttc)17
Obic1252 R TCCAAGTTCCTGTACCAATGTG 59.89 (tttc)17
Obic1344 F CTCAACGGTTTGCAGGTTTC 60.67 (ttcc)9
Obic1344 R GCATCGTAGATCTGTAAGCTTGTG 60.33 (ttcc)9
Obic1374 F CTATCCGGCACTCTTTCTCG 59.97 (gttc)9
Obic1374 R AAACGCGGAATGAGATATGC 60.07 (gttc)9
Obic168 F AGCCACGTTGAAGTTGTTGC 61.28 (ttc)10
Obic168 R GGGTTTCTCCGTTCTGCTG 60.79 (ttc)10
Obic220 F CTGCATCACCTACGCAACTG 60.47 (cgca)8
Obic220 R AACGCGCCAAGTAGAATCTG 60.41 (cgca)8
Obic415 F GAATGGGCAACGTCTATTTACAG 59.91 (caga)8
Obic415 R ATCCTTTGTTGCCGTTTGTC 59.98 (caga)8
Obic428 F GGGTAAAGGGTTAGGGAACTG 58.88 (tggc)6
Obic428 R AGCAAGGGTGGTAGTGAAGG 59.21 (tggc)6
Obic450 F TTGCCTTTCGAAATCAAGC 58.98 (gaag)6
Obic450 R CGACAGATCGAAACGTCATC 59.25 (gaag)6
Obic52 F GGCACCCAAACCATCAAC 59.74 (ac)19
Obic52 R CGATCTCGTGTTCACGGTAG 59.31 (ac)19
Obic629 F CTGCTTCGGCCTCTTTCTAC 59.22 (cttt)12
Obic629 R AAGTCGGTTCTTCGCATACC 59.2 (cttt)12
Obic73 F CCAATACCTCCCTCTTCTCCTC 60.44 (tcc)14
Obic73 R CCCACGTTCTGCCATTACTC 60.52 (tcc)14
Obic740 F AGTACGCGTCACGACAAAGAG 60.5 (aagg)17
Obic740 R GTACAACCGGCCATCGTATC 60.22 (aagg)17
Obic77 F GATCTCGTGTTCACGGTAGG 58.16 (gt)19
Obic77 R CTGCAGTTTCCTGGATCG 57.82 (gt)19
Obic95 F TTTAAGGAAACAGCCAGCAG 58.17 (ggaa)9
Obic95 R TTCATGAAGTATAAGAGGAAACGAC 58 (ggaa)9
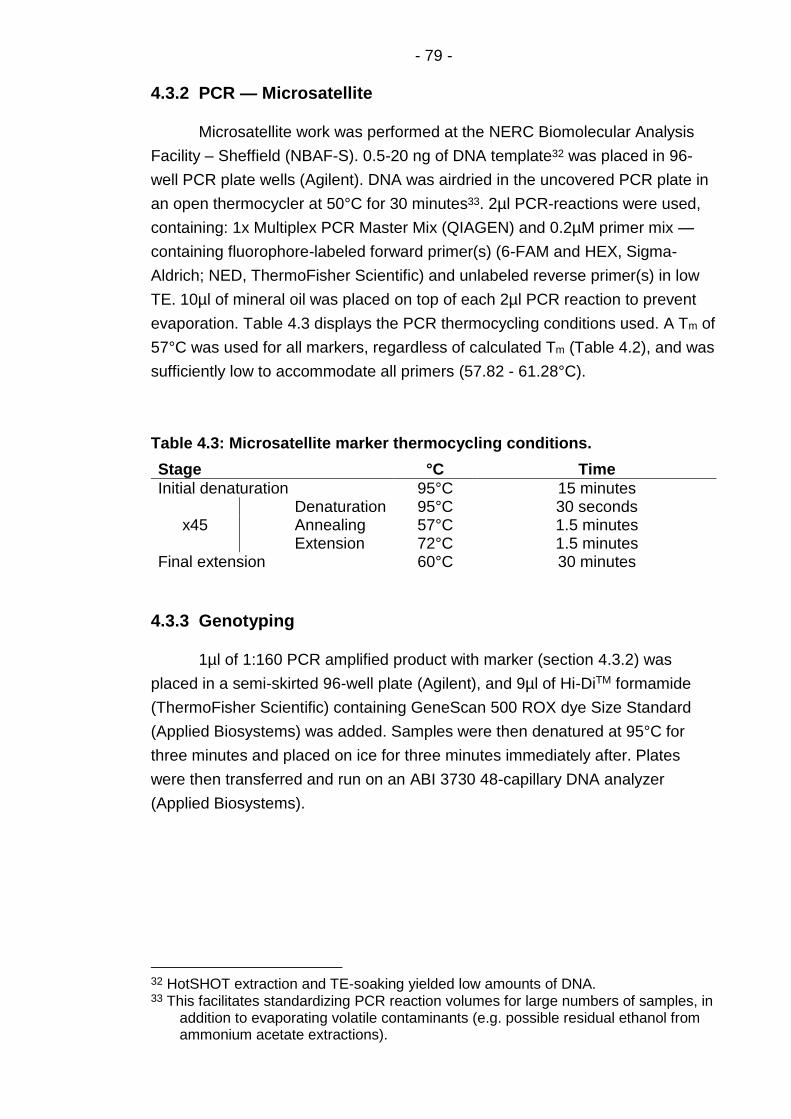
- 79 -
4.3.2 PCR — Microsatellite
Microsatellite work was performed at the NERC Biomolecular Analysis
Facility – Sheffield (NBAF-S). 0.5-20 ng of DNA template32 was placed in 96-
well PCR plate wells (Agilent). DNA was airdried in the uncovered PCR plate in
an open thermocycler at 50°C for 30 minutes33. 2µl PCR-reactions were used,
containing: 1x Multiplex PCR Master Mix (QIAGEN) and 0.2µM primer mix —
containing fluorophore-labeled forward primer(s) (6-FAM and HEX, Sigma-
Aldrich; NED, ThermoFisher Scientific) and unlabeled reverse primer(s) in low
TE. 10µl of mineral oil was placed on top of each 2µl PCR reaction to prevent
evaporation. Table 4.3 displays the PCR thermocycling conditions used. A Tm of
57°C was used for all markers, regardless of calculated Tm (Table 4.2), and was
sufficiently low to accommodate all primers (57.82 - 61.28°C).
Table 4.3: Microsatellite marker thermocycling conditions.
Stage °C Time
Initial denaturation 95°C 15 minutes
x45 Denaturation Annealing Extension
95°C 30 seconds 57°C 1.5 minutes 72°C 1.5 minutes
Final extension 60°C 30 minutes
4.3.3 Genotyping
1µl of 1:160 PCR amplified product with marker (section 4.3.2) was
placed in a semi-skirted 96-well plate (Agilent), and 9µl of Hi-DiTM formamide
(ThermoFisher Scientific) containing GeneScan 500 ROX dye Size Standard
(Applied Biosystems) was added. Samples were then denatured at 95°C for
three minutes and placed on ice for three minutes immediately after. Plates
were then transferred and run on an ABI 3730 48-capillary DNA analyzer
(Applied Biosystems).
32 HotSHOT extraction and TE-soaking yielded low amounts of DNA. 33 This facilitates standardizing PCR reaction volumes for large numbers of samples, in
addition to evaporating volatile contaminants (e.g. possible residual ethanol from ammonium acetate extractions).
- 80 -
4.3.4 Preliminary analysis
Genotypes were called using GeneMapper Software (v 3.7; Applied
biosystems). Allele frequencies, null allele frequencies, and expected and
observed heterozygosity were estimated using Cervus (v 3.0.7; Marshall et al.,
1998; Kalinowski et al., 2007); Hardy-Weinberg equilibrium (HWE) and linkage
disequilibrium (LD) were tested using GENEPOP (v 4.7; Raymond, 1995;
Rousset, 2008) and related individuals were identified using MLRelate (v 1.0;
Kalinowski et al., 2006). Multiplex Manager (v 1.2; Holleley and Geerts, 2009)
and AutoDimer (v 1.0; Vallone and Butler, 2004) were used to check for
overlaps in allelic ranges and primer dimerization during multiplex design.
4.4 Results
4.4.1 Fieldwork
Nest trapping in the greater Leeds area yielded 31 finished (end capped
with mud) nest tubes in 2017, and 24 tubes in 2018 for 14 localities in total.
These localities primarily comprised of acid heathland and grassland,
surrounded by woodland (for further details on the localities, see Appendix B).
Nest traps were collected at the end of September when individuals have
presumably fully developed into imagines. After collection from the field, nest
tubes were placed at -20°C for storage. Leafcutting species could easily be
distinguished by their leaf encased cells and were disregarded. Upon opening
of the nest tubes, some contained larvae in cells that possessed mud walls like
O. bicornis. While collection at the end of September should suffice for larvae to
have developed to imagines, development could still technically be underway
for offspring laid very late in the season (e.g. Fig. 7 in Seidelmann and Rolke,
2019).
To verify whether these larvae could indeed have been O. bicornis from
late in the previous season, DNA of one larva was HotSHOT extracted, PCR-
amplified for COI and sent for sequencing. Nucleotide to nucleotide BLAST
(NCBI; Altschul et al., 1990; Madden, 2013) generated a 99.84% identity to the
COI of Ancistrocerus trifasciatus (three-banded mason-wasp; accession:
JN934287.1). This wasp retains a flight season from June to August34, starting
around the time the O. bicornis flight season terminates. These underdeveloped
samples all originated from the same localities, and with the exception of two
pupal samples (Figure 4.3) they all constituted larvae which are put under the
34 BWARS;
https://www.bwars.com/wasp/vespidae/eumeninae/ancistrocerus-trifasciatus; accessed: 11/03/2020; last updated: 1998.
- 81 -
common denominator of early development here (regardless of instar).
Fliszkiewicz et al. (2012a) suggests that larval development should have
concluded by September. Given the cost of sequencing; the remaining samples
were assumed to be the same species and disregarded. This left a single nest
tube (2018; Meanwood Valley Trail; grassland surrounded by woodland) from
the trap nesting efforts, containing clear O. bicornis cocoons which were
identifiable upon opening of the pupal cases.
4.4.2 Validation of extraction method
The allelic dropout of specific alleles due to suboptimal PCR conditions,
or due to mutations in the primer binding site are commonly referred to as null
alleles (Selkoe and Toonen, 2006). The null allele frequency (Fnull) is important,
since the failure to amplify can make a heterozygote appear to be a
homozygote. Null alleles may be detected through statistical approaches
(Selkoe and Toonen, 2006). Yet, failure to amplify may also occur due to poor
DNA quality, hence it is important to exclude poor DNA quality prior to Fnull
analysis. To test whether the HotSHOT extraction method led to an increase in
allelic dropout, it was compared to the ammonium acetate extraction method
(side by side) for seven females. In only 1.59% (2/126) of cases was allelic
dropout detected for the HotSHOT method of extraction. Not only was the
detected dropout low, but in 3.17% (4/126) of cases there was allelic drop-out
using the ammonium-acetate extraction method. This illustrates that allelic
dropout occurs even from high quality DNA (Soulsbury et al., 2007). Hence,
given the presumed stochastic nature of allelic dropout (Navidi et al., 1992;
Taberlet et al., 1996); I argue that the extraction method is unlikely to have
posed a problem here.
4.4.3 Marker validation
Markers were expected to work, since they were not only mined from the
O. bicornis genome, but also because this genome was sequenced from a
single male originating from the same German supplier (Dr Schubert Plant
Breeding; Beadle et al., 2019). Preliminary tests of the HotSHOT extraction
method using previously published markers (Neumann and Seidelmann, 2006)
were performed by Dr Elizabeth Duncan and Vanessa Barlow at the University
of Leeds (data not shown). The twenty mined microsatellite markers (Table 4.2)
were first tested in singleplex (either Hex or 6FAM) on several expendable
samples (both female and male individuals). Of all the markers, only Obic1344
([ttcc]9) failed to amplify, this may have been due to the fact that the reverse
primer was situated immediately adjacent the repeat region.
- 82 -
Next, using preliminary allelic ranges, duplexes were created using
Multiplex Manager, and primer dimerisation was further checked against using
AutoDimer. Females from all localities were genotyped in duplex (Germany1 =
14, Germany2 = 11, MeanwoodValleyTrail11 = 1, NorthShropshire = 8, Surrey =
8). The genotypes of Obic77 and Obic52 overlapped each other completely.
BLASTing all markers against one another revealed that they were duplicates
(100% identity) rather than linked markers. Marker Obic52 was dropped, and
Obic77 was retained as it performed better. The seventeen remaining markers
preliminarily demonstrate 4.22 alleles on average, and possess an average
expected heterozygosity of 0.62.
Given the distances between localities, there exists the possibility of
population substructure (e.g. through isolation by distance: Conrad et al., 2018;
which may be reinforced through assortative mating with local males: Conrad
and Ayasse, 2015). Substructure, or the presence of subpopulation may skew
certain measures. For instance, the heterozygosity statistic reported earlier
(0.62) might be largely driven by a single population or a subset of the markers,
distorting the overall picture. Hence, for marker validation, localities were
considered as subpopulations. Another consideration is gametic or linkage
disequilibrium (LD). This occurs when two loci are more likely to be passed on
together than would be expected by chance. This can arise when loci are
present on the same chromosome, or when they are under joint selective
pressure (Selkoe and Toonen, 2006). Hence markers/loci were checked for LD.
I also checked whether markers/loci are within Hardy-Weinberg equilibrium
(HWE). I.e. whether the observed genotypes frequencies are as would be
expected in a population with: random mating, no mutation, no genetic drift and
no migration (Selkoe and Toonen, 2006). This is important, as deviations from
HWE (e.g. assortative mating, which is associated with a certain marker) would
overestimate the power of the markers and confound results in a naive analysis.
As with the possibility of population substructure, care must also be taken with
regard to relatedness. Incorporating related individuals in these preliminary
analyses will inflate/overestimate measures of LD and underestimate measures
of heterozygosity (inflating deviations from HWE). This is because related
individuals are disproportionately more likely to share alleles, making it appear
as if certain alleles are linked (LD) when they are not, and making it appear as if
there is less heterozygosity than expected (deviation from HWE). Even though
a single female was chosen from each nest tube/family unit (Figure 4.2),
relatedness of females within a locality was assessed using MLrelate (using all
seventeen markers). A single individual was removed from each related pair.
- 83 -
Only half-siblings were found (Tables C.1 to C.4), preliminarily indicating that all
commercially acquired nest tubes stem from different mothers.
Naively testing all markers together, across the meta population,
indicated no significant LD for the 136 pairwise marker comparisons (Table
C.5). Testing per locality, only two out of the 449 pairwise marker comparisons
showed a significant LD (Table C.6), likewise indicating that LD is not a problem
for the markers. In a similar vein, only 7 out of 66 instances showed a significant
deviation from HWE (Table C.7). Given that null alleles can lower observed
heterozygosity, they can affect tests for deviations from HWE (Selkoe and
Toonen, 2006). Fnull could only be tested for one German subpopulation, due to
low sample sizes (Table C.8). Only six out of the seventeen markers showed an
estimated null allele frequency greater than 10% in this locality (Table C.8).
Finally, in only eight of 68 instances (seventeen markers by four localities) did
the expected (He) and observed (Ho) heterozygosity differ by more than 20%
(Table C.8; ‘rule of thumb’, personal communication Dr D. Dawson).
The eventual low sample sizes (total = 33; with the subpopulations
Germany1 = 10, Germany2 = 9, North Shropshire = 7, and Surrey = 7),which
followed here from testing only unrelated individuals by their
subpopulations/localities, led to a decrease in power. Yet, p-values (LD and HW
tests) were not adjusted for multiple testing. Not correcting for multiple testing
inflates the chance of finding a significant result when in reality there is none35.
Since the paradigm here is reversed — i.e. significant results for LD and HW
tests are ‘unwanted’ — not correcting for multiple testing is the most
conservative approach. Additionally, significant LD and HW tests, as well as
heterozygosity and Fnull estimates did not occur consistently: across both
localities and markers. Deviations for markers generally occurred only once
within one locality. Finally, as stated previously, to address the main question of
female polyandry, no accurate estimates of parentage or underlying population
structure are required. It simply suffices to detect more than a single father to a
nest. Therefore, with the low number of significant deviations overall, in
conjunction to the considerations outlined, the remaining seventeen markers
were deemed adequate to perform parentage analysis in future.
35 I did not correct for multiple testing here since the paradigm is reversed — i.e the
“desired” outcome of a test in this case would be a non-significant result. In combination with the already low sample sizes this would reduce power massively. Additionally, it is unclear what the “family” of the family wise error rate should be in this case (e.g does one correct for multiple testing per marker, per subpopulation or both?).
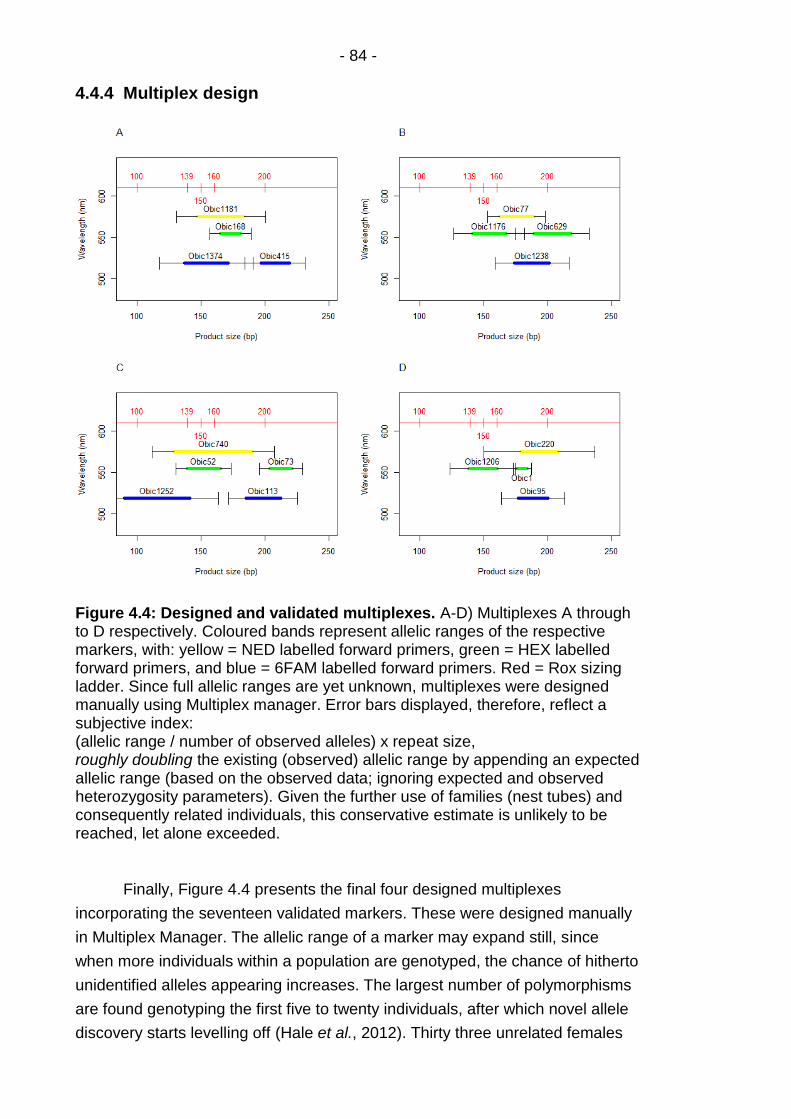
- 84 -
4.4.4 Multiplex design
Figure 4.4: Designed and validated multiplexes. A-D) Multiplexes A through to D respectively. Coloured bands represent allelic ranges of the respective markers, with: yellow = NED labelled forward primers, green = HEX labelled forward primers, and blue = 6FAM labelled forward primers. Red = Rox sizing ladder. Since full allelic ranges are yet unknown, multiplexes were designed manually using Multiplex manager. Error bars displayed, therefore, reflect a subjective index: (allelic range / number of observed alleles) x repeat size, roughly doubling the existing (observed) allelic range by appending an expected allelic range (based on the observed data; ignoring expected and observed heterozygosity parameters). Given the further use of families (nest tubes) and consequently related individuals, this conservative estimate is unlikely to be reached, let alone exceeded.
Finally, Figure 4.4 presents the final four designed multiplexes
incorporating the seventeen validated markers. These were designed manually
in Multiplex Manager. The allelic range of a marker may expand still, since
when more individuals within a population are genotyped, the chance of hitherto
unidentified alleles appearing increases. The largest number of polymorphisms
are found genotyping the first five to twenty individuals, after which novel allele
discovery starts levelling off (Hale et al., 2012). Thirty three unrelated females
- 85 -
were tested here, but this was done over four subpopulations (disregarding the
Leeds trap nest).Hence, given the low sample sizes of each subpopulation
(Germany1 = 10, Germany2 = 9, North Shropshire = 7, and Surrey = 7), one
could still expect novel alleles to be found (Hale et al., 2012). Regardless of this
consideration, the allelic ranges are not expected to expand by much where
related individuals are concerned (nest tubes are family members; Figure 4.2).
For further details on the criteria used to estimate allelic range expansion, see
the caption of Figure 4.4. Multiplexes, similar to the extraction method (section
4.4.2), were likewise investigated for possible increases in allelic dropout. Since
primer interactions may still occur in spite of performing checks using
bioinformatic tools (Multiplex Manager, and AutoDimer). Of 40 unrelated
females tested across the four multiplexes: 1.9% (13/67236) genotype calls were
found with a loss of heterozygosity, countermanded by a 3.1% (21/672) gain in
heterozygosity across genotyping calls. A further 3.4% (23/672) of PCR
amplifications failed completely, but these were chiefly concentrated along two
samples (9 of 23 failures) and one marker (12 of 23 failures; marker Obic 1176),
which may need its primer concentrations optimised within its multiplex
(multiplex B).
4.5 Discussion
4.5.1 Trap nesting
Trap nesting resulted in only one O. bicornis female creating a nest over
the two year sampling period. Trap nesting is generally intended to study
species diversity and abundance, community structure and trophic interactions,
and species ecology (Krombein, 1967; Gathmann et al., 1994; Tscharntke et al.,
1998; Steffan-Dewenter and Schiele, 2004; Staab et al., 2018). It is rarely used
to trap specific species. Studies showing specific O. bicornis trap nesting are
performed: where they are already abundant or have long been established
(Yoon et al., 2015; e.g.: Giejdasz et al., 2016; Seidelmann et al., 2016;
Coudrain et al., 2016), or nesting tubes and sites are seeded with cocoons
(e.g.: Everaars et al., 2011; Fliszkiewicz et al., 2015), or both (Steffan-Dewenter
and Schiele, 2004).
Urban trap nest colonisation of O. bicornis has been demonstrated
previously (Everaars et al., 2011; Yoon et al., 2015), and should be achievable.
Several factors are known to affect the nesting choice of O. bicornis, the main
36 Two wells in a 96-well plate, had their sizing ladder fail. Resulting in two multiplexes
for two samples that could not be scored. Bringing the total number of genotype calls down to 672 from 680 (i.e. 17 markers x 40 females).

- 86 -
factors are the type of nest trap used (Wilkaniec and Giejdasz, 2003), its
dimensions (Seidelmann et al., 2016), and the surrounding forage and
environment (Everaars et al., 2011; Persson et al., 2018), and sun exposure
(Everaars et al., 2011). Contrary to popular belief, nest orientation (Yoon et al.,
2015) and height (Everaars et al., 2011)37, may not matter much, at least in this
species. A main reason, for the very limited success in trap nesting O. bicornis
here, is that there may be a prevailing low population size based on longitude
(based on recordings from BWARS; data not shown). Yet very few O. bicornis
were spotted overall. Furthermore, given that 43.7% of trap nests did yield
occupation by other species, and that trap nesting sites were chosen
strategically (personal communication, Dr Thomas Dally), the trap nesting
method should in theory work.
The establishment of successful trap nesting may be a numbers game.
More trap nests, further spread out across the Leeds area may be beneficial.
Yet, while trap nests are a ‘passive method’, they are still relatively labour
intensive (Kessler et al., 2011). Hence, for non-ecology research groups, more
directed efforts to improve the trap nesting of O. bicornis may be considered.
For instance, the use of more sheltered traps to avoid moist and fungal growth
(wet cardboard tubes were a frequent problem in this study; MacIvor, 2017;
Staab et al., 2018), more sunlit locations (Everaars et al., 2011), and the use of
reeds (100% acceptance rate: Wilkaniec and Giejdasz, 2003, do note that
cardboard tubes as used here were not tested in their study). Furthermore, the
factor of time may be important. Populations may need to be enhanced
consistently over several years. Another indication of the importance of time, is
the preference of aged material, presumably due to natural nesting cavities
being located in dead plant material (Staab et al., 2018). Hence nest tubes
should likely be left out for several years (while still regularly checking up on
them; Staab et al., 2018), further necessitating durable material and moist
avoidance. Alternately, Staab et al. (2018) suggest the use of Phragmites
australis stems, that are several months aged (as cavity nesting Hymenoptera
avoid freshly harvested material).
4.5.2 Microsatellites
Even though the use of single nucleotide polymorphisms (SNP) is on the
rise as a molecular genotyping tool, microsatellite markers have repeatedly
proven their value, particularly with regard to relatedness (Morin et al., 2004;
37 Note that while Everaars et al. (2011) found no effect of height through their citizen
science approach, height was not explicitly measured, and the “minimum height requirement” of ~1.5m may still apply.

- 87 -
Städele and Vigilant, 2016; Flanagan and Jones, 2019) — owing to their faster
mutation rate and higher levels of polymorphism. Presented here was a
preliminary analysis aimed at marker validation. Due to external factors (Covid
19; Lancet, 2020) genotyping the samples from the commercial population in
full was not possible as of yet, and subsequently nor was testing monandry in
these samples.
I tested and validated twenty newly mined and designed microsatellite
markers for use in O. bicornis. I showed that seventeen of these markers, are
robust under both low and high quality DNA extraction, as well as robust in a
multiplex design. These seventeen markers preliminarily demonstrate 4.22
alleles on average and possess an average expected heterozygosity of 0.62.
This seems to be somewhat in line with Neumann and Seidelmann (2006), who
detected on average 4.18 alleles and an expected heterozygosity of 0.51 for
their six microsatellite markers. However, these estimates may be deceptive, as
it should be noted that the markers presented here were validated and tested
on roughly 40 individuals over four subpopulations (~ 10 per subpopulation).
Whereas the six microsatellite markers in Neumann and Seidelmann (2006)
were tested on 224 individuals over 10 subpopulations (~ 22 individuals per
subpopulation). This is important, since Hale et al. (2012) showed that:
‘The accuracy and precision of mean HE (across loci) increased with increasing sample size from 5 to 20 individuals, but increasing sample size beyond 20 individuals appeared to have little impact on the precision or accuracy of mean HE.’
Therefore, testing more individuals (across more subpopulations) might show
that the seventeen markers here are more informative than currently estimated.
In addition to an approximate 10% higher expected heterozygosity in these
markers, only two of the markers presented here are dinucleotide repeats. The
predominant use of tetranucleotide repeats (13 tetranucleotide; 2 trinucleotide)
should further reduce human error in genotype calling (Pompanon et al., 2005),
which is crucial when one considers that error rates of even 0.01 per allele can
have far-reaching consequences on a study (Hoffman and Amos, 2005). In
addition, the number of microsatellite markers validated here is more than
double those of Neumann and Seidelmann (2006), with further implications to
power in for instance gene flow inference (Landguth et al., 2012).
These microsatellites, will be used in future to test female monogamy in
this species, as it relates to the evolution of eusociality (Hughes et al., 2008;
Boomsma, 2009). While the supplied nest tubes may not accurately represent
circumstances in the wild (commercial breeder and managed population);
females are still freely mated. For the German populations in particular, large
- 88 -
aggregations of O. bicornis — as maintained by breeders — should yield higher
male-male competition. This in turn, increases the probability of detecting
female polyandry should it exist. Additionally, the lack of inbreeding avoidance
in Hymenoptera, creates the possibility of inbreeding (Packer and Owen, 2001).
In O. bicornis specifically, females are known to mate with males that are more
closely related (Conrad et al., 2010). Along with the relevance of inbreeding to
the evolution of eusociality (Hamilton, 1964b), inbreeding is known to reduce
fitness (Henter, 2003) and increases the odds of extinctions under haplodiploid
sex determination (Zayed and Packer, 2005). Hence levels of inbreeding will
also be investigated in future, using these validated microsatellite markers.
Finally, these markers could be used for further resolving outstanding
questions of geneflow in O. bicornis. For instance, Conrad et al. (2018) reported
‘only a weakly positive, non-significant trend’ for their test of isolation by
distance in O. bicornis, using the six microsatellites developed by Neumann and
Seidelmann (2006). They indicated that a low sample size might be the cause
of their results. I would argue that the microsatellite markers presented here
would greatly increase the power of inference. Additionally, the markers could
be used to test for any effects of the ‘commercial movements’ of O. bicornis
across Europe, on gene flow (Conrad et al., 2018). On a similar note, assessing
differences in genetic diversity between natural and commercially maintained
populations (along with associated fitness traits; Henter, 2003), could inform
future breeding practices. Natural populations can be assessed through a
combination of trap nesting (4.5.1), and non-lethal sampling (tarsal removal:
Holehouse et al., 2003; clipping of wingtip: Châline et al., 2004). Overall, these
markers are a useful resource for evolutionary, ecological and conservational
studies in O. bicornis and related species.

- 89 -
Chapter 5 Ovarian microstructure, oogenesis and mating
5.1 Summary
The reproductive ground plan hypothesis (RGPH) posits that
reproductive constraint evolved through the co-option of traits controlling
reproduction and maternal care in ancestrally solitary species. One way of
assessing hypotheses like the RGPH, is through cross-species comparisons.
Given the role of mating to activate or accelerate oogenesis in many insect
species, it can be seen as a controlling facet of reproduction. Mating status is
therefore a likely candidate for co-option into QMP-mediated reproductive
constraint. In order to investigate the potential co-option of mating status into
reproductive constraint — and in order to facilitate further cross-species
comparison — I present a microstructural study of the O. bicornis ovary in this
chapter. I hypothesised that young, virgin O. bicornis females’ ovaries would
resemble the quiescent ovaries of queenright A. mellifera workers. I compare
key stages of oogenesis to those of A. mellifera workers, and study oogenesis
with regard to age and mating status. I show that O. bicornis females eclose
with primed and active ovaries, with the rate of oogenesis increasing over time,
but that mating does not affect the reproductive physiology of O. bicornis in any
discernible manner. I then go on to conclude that QMP-mediated adult
reproductive constraint in the honey bee worker is unlikely to have been derived
from mating status.
5.2 Introduction
The reproductive ground plan hypothesis (RGPH; Amdam et al., 2006)
posits that the reproductive division of labour originated from a decoupling of
maternal behaviour (non-reproductive worker) and reproductive status
(reproductive queen). Consequently, ancestral mechanisms that controlled
reproduction in solitary individuals in response to environmental stimuli —
further referred to as reproductive control— are thought to have been de-
coupled from these environmental factors and co-opted into the social
environment (Amdam et al., 2006), where ultimately a queen reproductively
inhibits workers — further referred to as reproductive constraint. This social
environment is mainly signalled through queen pheromones (Winston, 1991).
Within the social hymenoptera, queen pheromones are thought to be
derived from cuticular hydrocarbons (CHC; Van Oystaeyen et al., 2014;
Holman, 2018). CHCs serve pleiotropic roles in insect communication. They

- 90 -
signal mating status, species recognition, colonial and/or kin recognition (Oi et
al., 2015). Honey bee queen mandibular pheromone (QMP) on the other hand,
was likely not derived from CHCs (Van Oystaeyen et al., 2014; Lovegrove et al.,
2019), although a redundant set of queen pheromones has also been found in
A. mellifera (Princen et al., 2019a). The current paradigm suggests that queen
pheromones act as conserved honest38 queen fecundity signals (Van
Oystaeyen et al., 2014; Oi et al., 2015). These honest fecundity signals are
thought to be: derived from fertility cues produced as by-products of ovarian
development39 , derived from contact sex pheromones, and/or derived from
oviposition deterring pheromones (Oi et al., 2015). In the species of study, O.
bicornis, female fecundity is thought to be signalled through CHCs (Seidelmann,
2014a; Seidelmann and Rolke, 2019).
Fecundity and insemination are closely linked in Hymenopteran queens.
Queen pheromones are known to change significantly with mating status (A.
mellifera: Slessor et al., 1990; Leptothorax gredleri: Oppelt and Heinze, 2009).
In advanced social species, mating is even necessary for queen ovary
activation (Melipona quadrifasciata anthidioides: Martins and Serrão, 2004a; de
Souza et al., 2007; Tanaka et al., 2009; A. mellifera: Tanaka and Hartfelder,
2004; Tanaka et al., 2006; Nino et al., 2013). The effects of mating have also
been shown to be important for the chemical profile of mandibular glands and
QMP in A. mellifera (Plettner et al., 1997; Richard et al., 2007) and CHC profiles
in Bombus terrestris (Jansen et al., 2016). Furthermore, A. mellifera workers
lack spermatheca (Winston, 1991; with the exception of the queen-like laying
workers of A. mellifera capensis: Anderson, 1963; Phiancharoen et al., 2010).
Indeed, a lack of mating and spermatheca in workers can also be considered a
facet of reproductive constraint (Khila and Abouheif, 2010).
Given the above links of mating status with: fecundity, ovary activation,
CHC (or QMP in the case of A. mellifera queens), and reproductive constraint
(non-reproductives often lacking spermatheca; Bourke, 1999) — it is plausible
for mating status to have been a precursor to QMP-mediated reproductive
constraint. As such, mating status may have had an ancestral role in
reproductive control in solitary bees (as it does in many diplo-diploid insects),
and may have been co-opted into QMP-mediated reproductive constraint.
In this chapter, I present a microstructural study of the O. bicornis ovary,
in order to facilitate further reproductive cross-species comparisons between A.
mellifera and O. bicornis in further chapters. Additionally, I hypothesised that
38 Honest signalling sensu Zahavi (1975). 39 Ovarian development causes changes in the CHC of many arthropods, including
solitary insects.
- 91 -
young, virgin O. bicornis females’ ovaries would resemble the quiescent ovaries
of queenright A. mellifera workers. This, since the ovaries of hibernating O.
bicornis are presumably in stasis over winter, and would require activation upon
female eclosion. I further hypothesised that oogenesis would remain inactive,
would not achieve full capacity over time, or would proceed at a slower pace in
females that retained their virginity as opposed to females that were mated. In
summary, I hypothesised that virginity would have an overall negative effect on
oogenesis in O. bicornis.
5.3 Materials and methods
5.3.1 Husbandry and experimental design
For a more exhaustive overview of O. bicornis husbandry see Chapter 3.
Briefly, bees were kept at 21-23˚C with a 18:6 h light: dark cycle. Bees were
supplied with: makeshift flowers and catkins with dusted with ground pollen,
50% sucrose solution (filter sterilised; 0.22 μm; Millipore), additional fondant
paste (Candipolline Gold), Fabre’s hives (Oxford bee company), and mud for
nest building (70% Fuller’s earth by Intra Laboratories and 30% white silica
sand by Cristobalite). Bees were fed ad libitum throughout the study.
Females were hatched in isolation in individual plastic containers in the
dark, and subsequently housed according to treatment for three days (mesh
cage; 60 x 60 x 90 cm). The mated group was kept in a in a 3:1 ratio (i.e. 9
females and 3 males; Fliszkiewicz et al., 2013), the unmated group contained
12 females and no males. Two one-hour observations were performed on the
same day to observe attempts at mating. Additionally, mating status was
confirmed upon dissection of the females by visual examination of the
spermathecae. Mating plugs were found rarely in our laboratory set-up (these
regress within a day: Seidelmann, 1995). Three days after the introduction of
males, mated females were marked red (Uni Posca marker) on the thorax, and
both mated and virgin females were subsequently transferred to a larger cage
(65 x 90 x 140 cm). Females were dissected for their ovaries at eight different
time points (Figure 5.1).
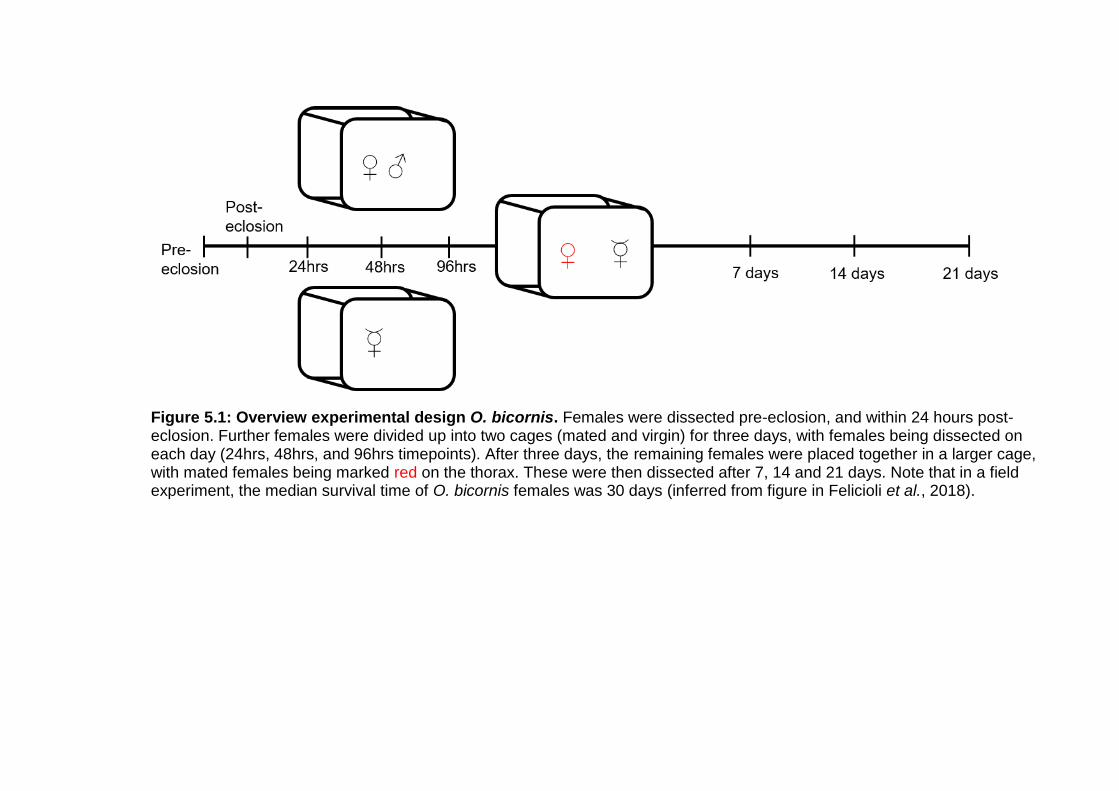
Figure 5.1: Overview experimental design O. bicornis. Females were dissected pre-eclosion, and within 24 hours post-eclosion. Further females were divided up into two cages (mated and virgin) for three days, with females being dissected on each day (24hrs, 48hrs, and 96hrs timepoints). After three days, the remaining females were placed together in a larger cage, with mated females being marked red on the thorax. These were then dissected after 7, 14 and 21 days. Note that in a field experiment, the median survival time of O. bicornis females was 30 days (inferred from figure in Felicioli et al., 2018).
- 93 -
A. mellifera mellifera workers were kept according to standard practices
in British National hives at the University of Leeds, School of Biology, Research
apiary. Colonies were assessed weekly for egg-laying, queen cells, food stores
and parasites. Queenless workers were obtained by placing frames of brood
and adult bees into a standard polystyrene nucleus box. Foraging bees typically
return to the parent colony, leaving the transferred frames with nurse bees and
emerging workers only. These typically activate their ovaries after 2-4 weeks in
the absence of a queen (Duncan et al., 2016). A queenless hive was
considered reproductively active once 30% of dissected bees showed stage 3
ovaries (Duncan et al., 2016). Classification of ovary state followed the modified
Hess scale as in Duncan et al. (2016). These four ovary states were taken to
represent ovaries activating over time.
5.3.2 Staining and microscopy
Microdissection, fixation and staining followed the protocol outlined in
Chapter 2 (sections 2.2 and 2.10). With the exception of phalloidin (actin) and
DAPI (nuclear counterstain) staining, which followed a modified protocol for IHC
(section 2.10). Tissue was fixed for only ten minutes and permeabilised for only
90 minutes, after which counterstains were applied immediately (i.e. omitting all
blocking and washing steps required for antibody staining). Confocal imaging
was performed on the following day using a Zeiss LSM 880 upright (2 PMTs)
using a 405 nm diode laser (DAPI) and a 488 nm argon laser (phalloidin).
Images were taken at x10 (EC Plan-Neofluor 10x/0.30) or at 20x for germarial
and terminal filament detail (Plan-Apochromat 20x/0.8). Images were acquired
and processed using Zen 2.3. Processing involved stitching image tiles
(normalised cross correlation coefficient = 0.9), maximal intensity projections of
z-stacks, and cropping of images. Z-stacks varied in thickness from 15 to 238
μm, with thickness averaging 100 μm for images at 10× magnification and 36
μm for images at 20× magnification. Only informative slices were used for
maximal intensity projections. Whether confocal images presented are
maximum intensity projections or single slices (i.e. ‘optical section’) is indicated
in the figure captions. Several O. bicornis females, considered outside of the
above experimental design, were dissected for IHC staining. IHC staining of
phospho-histone H3 (pHH3) was used as a marker of cell division (Hendzel et
al., 1997), with the germarium and terminal filament as regions of particular
interest (Tanaka and Hartfelder, 2004). Ovarian nomenclature follows Büning
(1994).
- 94 -
5.3.3 Morphological measurements
Measurements of O. bicornis ovarioles were taken dependent on tissue
sample quality (3-6 intact ovarioles per individual). Specifically, the transition
from terminal filament to germarium proved particularly fragile, leading to the
terminal filament regularly breaking off while removing the intima. To test for
quantitative differences between treatments in ovarian dynamics, I used ImageJ
to measure ovariole traits. The lengths of the terminal filament, the germarium
and vitellarium were measured to investigate egg limitation and ovariole growth.
The total number of oocytes, number of globular yellow bodies (i.e. corpora
lutea that consist of degenerating postovulatory follicle cells; Büning, 1994) and
number of mature oocytes (equivalent to stage 7 and 8 oocytes in Wilson et al.,
2011) were counted to investigate the onset of oogenesis. Mature oocytes were
(generally) not mounted on slides, and hence were not part of vitellarium length
measurements. Rate of oogenesis was approximated here, by first measuring
longitudinal and transverse sections of individual oocytes, and subsequently
calculating their volume as a prolate spheroid (similar to Cane, 2016):
𝑉𝑝𝑟𝑜𝑙𝑎𝑡𝑒 𝑠𝑝ℎ𝑒𝑟𝑜𝑖𝑑 = 4𝜋
3 𝑎2 𝑐 Equation 5.1
With a the polar radius and c the equatorial radius. By fitting these into a
model (Appendix D), ‘oogenesis rate within an ovariole’ was approximated.
Additionally, the number of cells in the terminal filament and the number of cells
until the first discernible oocyte in the germarium were counted. This was done
in ImageJ using the DAPI counterstain, and was semi-automated (Papadopulos
et al., 2007) to limit observer bias. Thresholding, and watershedding were
performed manually, after which cells were counted automatically.
5.3.4 Statistical analysis
For detailed information on statistical analysis performed along with all
results, see Appendix D. Briefly: statistical analysis was carried out using R
3.5.1 (R Core Team, 2016). Linear mixed models and generalised linear mixed
models were made using lme4 (Bates et al., 2015). Assumptions were
investigated following Zuur et al. (2010) and model tests were performed using
lmerTest for linear mixed models (Kuznetsova et al., 2016), or through log
likelihood-ratio tests for generalised linear mixed models (Bates et al., 2015).
Dependent variables were modelled with time (days) and an individual’s weight
as covariates, treatment (mated or virgin) as a fixed effect, and individual as a
random effect (and random slopes for oocyte maturation estimates). Degrees of
freedom presented throughout the text and in Table D.2 are Satterthwaite
approximations.
- 95 -
5.4 Results
5.4.1 Overview of the O. bicornis ovary
O. bicornis consistently possesses three ovarioles (Figure 5.2A) for each
of its two ovaries (Figure 5.2B; as in other Osmia, Maeta and Kurihara, 1971).
In between the ovarioles and the intima, corpora lutea Figure 5.2C; Büning
(1994) are shed from the mature egg (Figure 5.2D) as it leaves the lateral
oviduct (Figure 5.2B). These corpora lutea accumulate beside the ovarioles. For
the mature egg to pass into the median oviduct, it needs to pass by the
epithelial plug (Figure 5.2B), which consists of a population of cells that undergo
autolysis (Velthuis, 1970). The mature egg can then be fertilised in the median
oviduct, when sperm is released from the spermatheca (Figure 5.2B). A male
mating plug may also be present in the median oviduct shortly after mating
(Figure 5.2B; Seidelmann, 2015).
As in A. mellifera, the O. bicornis ovary is polytrophic and meroistic in
nature, where oocytes alternate with nurse cell chambers (Figure 5.2E). A nurse
cell chamber consists of up to 37 nurse cells (Figure 5.2F) and is in direct
contact with the developing oocyte. The individual ovarioles can further be
subdivided into: the terminal filament, the germarium which is the region of the
ovary where the nurse cells (trophocytes) and oocytes are specified, and the
vitellarium which contains nurse cell clusters and maturing oocytes covered in a
follicular epithelium (Figure 5.2G).
The nurse cells, along with the follicle cells, deposit RNAs and protein
into the developing oocyte, these RNAs are essential for maturation of the
oocyte and early development of the embryo. The nurse cell chamber is lined
with actin bundles (Figure 5.3A), presumably to facilitate cytoplasmic streaming
(Gutzeit and Koppa, 1982; Gutzeit, 1986a). Cytoplasmic streaming occurs when
the adjacent oocyte is almost fully mature. The actin bundles of the nurse cell
chamber will contract, which allows for the nurse cells to dump their remaining
cytoplasmic content into the oocyte via the increased number of ring canals,
and through the intermediate cell (Figure 5.3B, white arrow). The depleted
nurse cells will remain connected to the next maturing oocyte via the follicular
stalk (Figure 5.3B), while they degrade (Figure 5.3C). The follicle cells lining the
maturing oocyte meanwhile build actin fibres once choriogenesis is complete
(Zhang, 1992). These fibres are thought to facilitate ovulation (Zhang, 1992)
and will involute along with the follicle cells, leaving corpora lutea in the
ovariole.
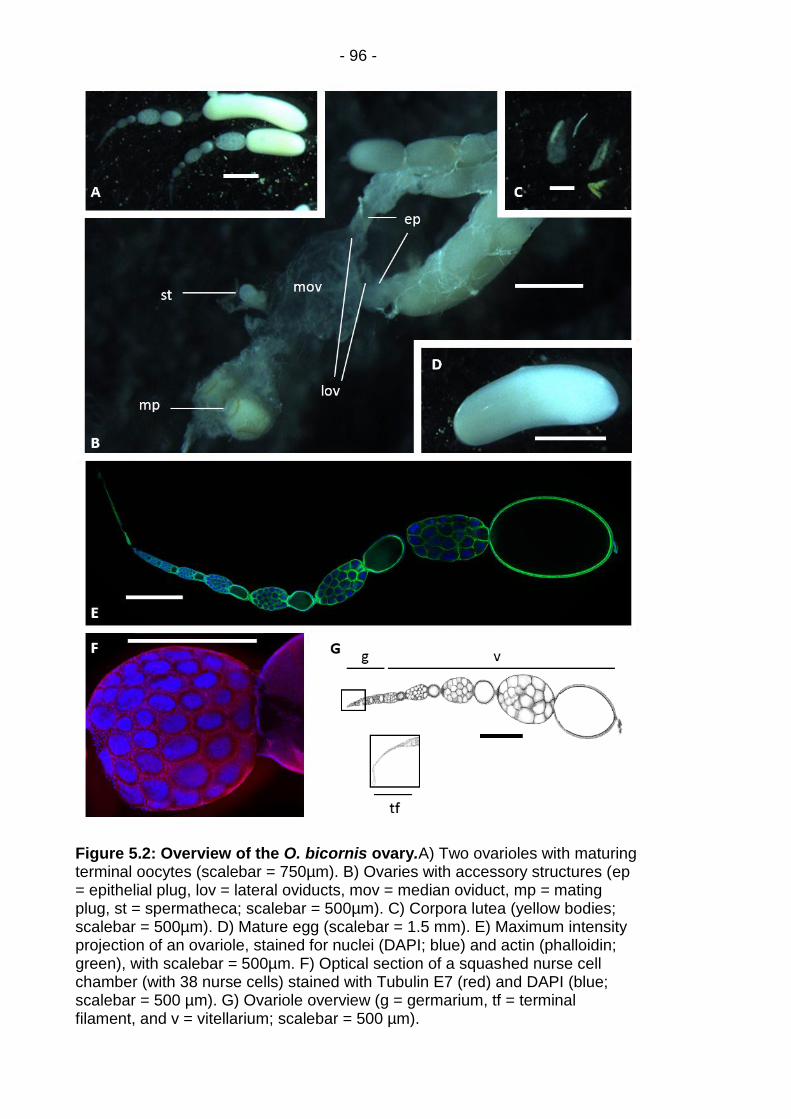
- 96 -
Figure 5.2: Overview of the O. bicornis ovary.A) Two ovarioles with maturing terminal oocytes (scalebar = 750µm). B) Ovaries with accessory structures (ep = epithelial plug, lov = lateral oviducts, mov = median oviduct, mp = mating plug, st = spermatheca; scalebar = 500µm). C) Corpora lutea (yellow bodies; scalebar = 500µm). D) Mature egg (scalebar = 1.5 mm). E) Maximum intensity projection of an ovariole, stained for nuclei (DAPI; blue) and actin (phalloidin; green), with scalebar = 500µm. F) Optical section of a squashed nurse cell chamber (with 38 nurse cells) stained with Tubulin E7 (red) and DAPI (blue; scalebar = 500 µm). G) Ovariole overview (g = germarium, tf = terminal filament, and v = vitellarium; scalebar = 500 µm).
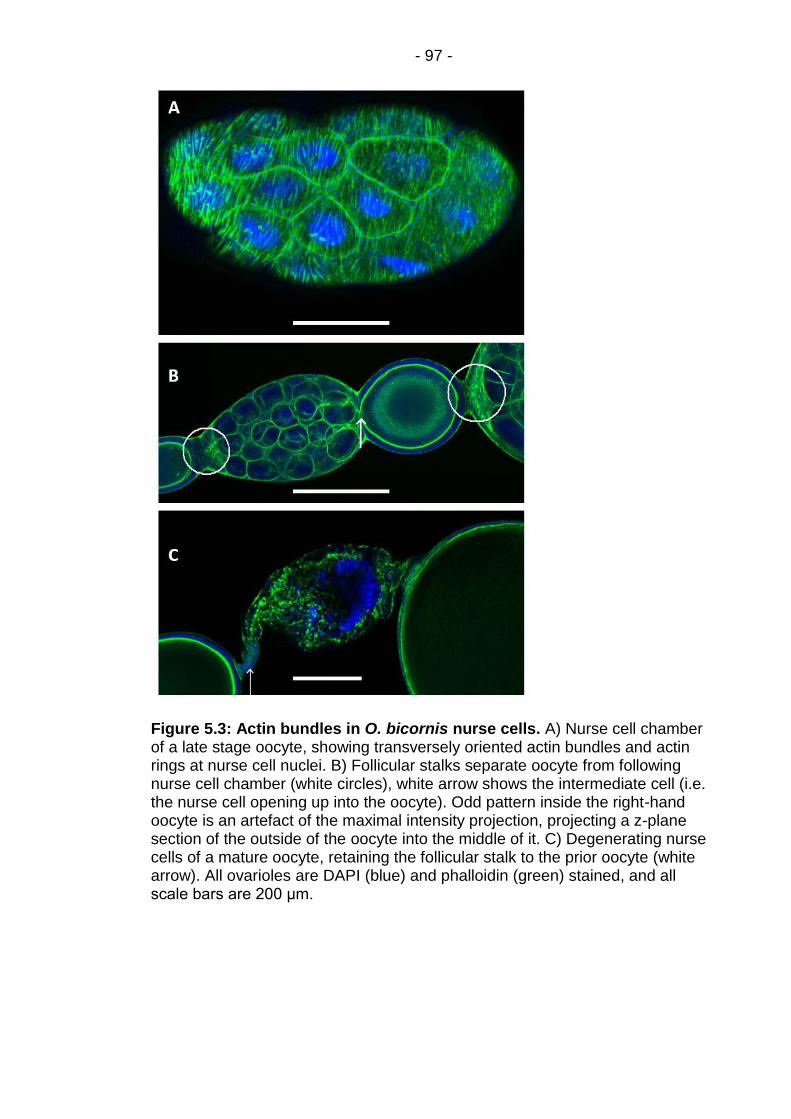
- 97 -
Figure 5.3: Actin bundles in O. bicornis nurse cells. A) Nurse cell chamber of a late stage oocyte, showing transversely oriented actin bundles and actin rings at nurse cell nuclei. B) Follicular stalks separate oocyte from following nurse cell chamber (white circles), white arrow shows the intermediate cell (i.e. the nurse cell opening up into the oocyte). Odd pattern inside the right-hand oocyte is an artefact of the maximal intensity projection, projecting a z-plane section of the outside of the oocyte into the middle of it. C) Degenerating nurse cells of a mature oocyte, retaining the follicular stalk to the prior oocyte (white arrow). All ovarioles are DAPI (blue) and phalloidin (green) stained, and all scale bars are 200 μm.
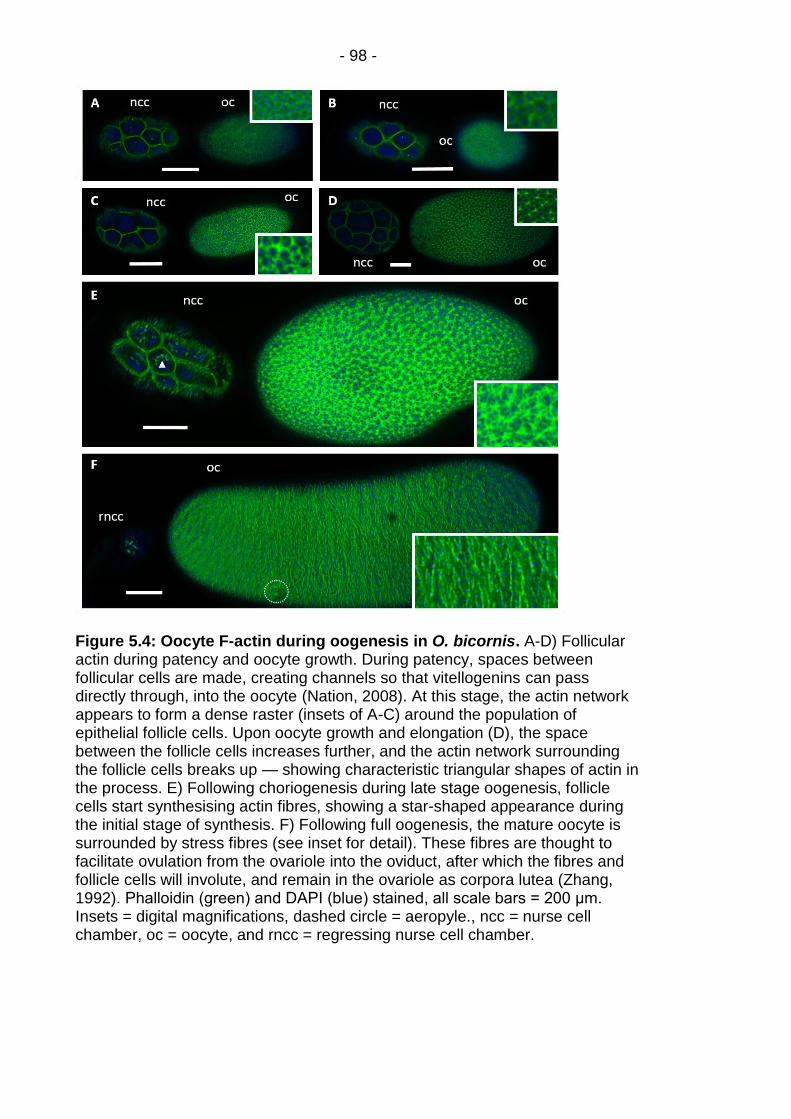
- 98 -
Figure 5.4: Oocyte F-actin during oogenesis in O. bicornis. A-D) Follicular actin during patency and oocyte growth. During patency, spaces between follicular cells are made, creating channels so that vitellogenins can pass directly through, into the oocyte (Nation, 2008). At this stage, the actin network appears to form a dense raster (insets of A-C) around the population of epithelial follicle cells. Upon oocyte growth and elongation (D), the space between the follicle cells increases further, and the actin network surrounding the follicle cells breaks up — showing characteristic triangular shapes of actin in the process. E) Following choriogenesis during late stage oogenesis, follicle cells start synthesising actin fibres, showing a star-shaped appearance during the initial stage of synthesis. F) Following full oogenesis, the mature oocyte is surrounded by stress fibres (see inset for detail). These fibres are thought to facilitate ovulation from the ovariole into the oviduct, after which the fibres and follicle cells will involute, and remain in the ovariole as corpora lutea (Zhang, 1992). Phalloidin (green) and DAPI (blue) stained, all scale bars = 200 μm. Insets = digital magnifications, dashed circle = aeropyle., ncc = nurse cell chamber, oc = oocyte, and rncc = regressing nurse cell chamber.
- 99 -
5.4.2 Microstructural comparison of ovarioles
The O. bicornis terminal filament (Figure 5.5A,C) lacks the characteristic
stack of coin organisation present in A. mellifera (Figure 5.5B,D) and other
insects (Büning, 1994). In A. mellifera, putative germline stem cell nests are
thought to be interspersed between these coin shaped cells (white circle Figure
5.5B,D; Tanaka and Hartfelder, 2004), which seemingly funnel out into the
germarium from the terminal filament (although the exact way that these cells
would enter the germarium is unknown; Tanaka and Hartfelder, 2004). O.
bicornis only possesses cell nuclei resembling those of the interspersed clusters
of putative germline stem cells in its actin enriched terminal filament (Figure
5.5A,C), with a distinct transverse septum marking the boundary between the
terminal filament and germarium. Presumptive germline stem cells then vacate
the terminal filament (red arrows, Figure 5.5C) to immediately form a cystocyte
cluster beyond the transverse septum (white arrow, Figure 5.5A).
The germarial cystocyte clusters contain the presumptive oocyte and a
set of sister cells which are destined to become nurse cells. In O. bicornis, the
cystocyte cluster (white circle, Figure 5.5E) will lose its dense clustering (white
arrow, Figure 5.5E), until ring canals are visible when oocyte and nurse cells
have been specified (white line, Figure 5.5E). In A. mellifera the presumptive
oocyte and nurse cells are connected by a distinct polyfusome (white arrows in
Figure 5.5F). Cells in this cystocyte cluster undergo successive rounds of cell-
division followed by incomplete cytokinesis while the cluster migrates
posteriorly. The fusome connects the cells of the cystocyte cluster acting as an
intracellular bridge. In D. melanogaster, the fusome has been shown to
contribute to oocyte specification and microtubule polarisation when it divides
assymmetrically (Greenbaum et al., 2011). Following specification of the oocyte
from the cystocyte cluster, the fusome will break up, giving rise to individual ring
canals which act as stable intracellular connections facilitating the flow of RNA
and protein from the nurse cells to the developing oocyte (white circle in Figure
5.5F). In O. bicornis the polyfusome is either lacking, or too transitive to be
observed. Instead, of a slow progression from polyfusome to cystocyte cluster
as is the case in A. mellifera; germaria were often found already containing a
cystocyte cluster immediately following the transverse septum (Figure
5.5A,E,G). This cluster will often already possess ring canals (e.g. white circle in
Figure 5.5G).
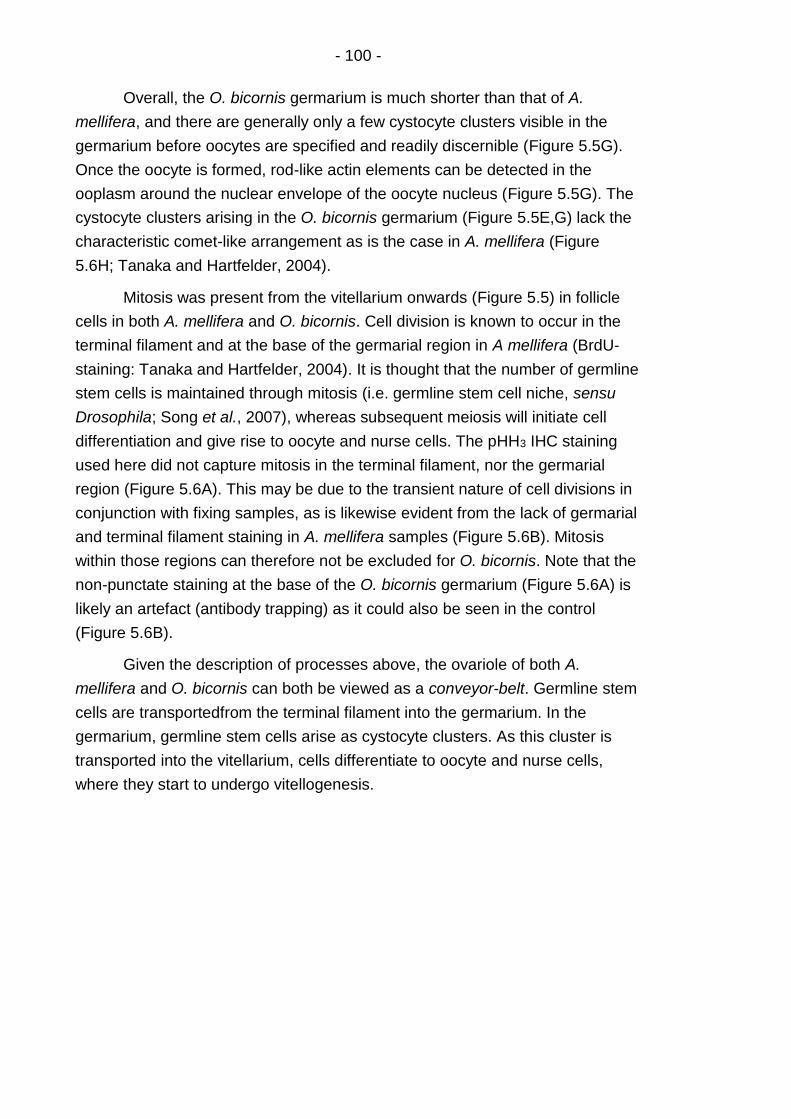
- 100 -
Overall, the O. bicornis germarium is much shorter than that of A.
mellifera, and there are generally only a few cystocyte clusters visible in the
germarium before oocytes are specified and readily discernible (Figure 5.5G).
Once the oocyte is formed, rod-like actin elements can be detected in the
ooplasm around the nuclear envelope of the oocyte nucleus (Figure 5.5G). The
cystocyte clusters arising in the O. bicornis germarium (Figure 5.5E,G) lack the
characteristic comet-like arrangement as is the case in A. mellifera (Figure
5.6H; Tanaka and Hartfelder, 2004).
Mitosis was present from the vitellarium onwards (Figure 5.5) in follicle
cells in both A. mellifera and O. bicornis. Cell division is known to occur in the
terminal filament and at the base of the germarial region in A mellifera (BrdU-
staining: Tanaka and Hartfelder, 2004). It is thought that the number of germline
stem cells is maintained through mitosis (i.e. germline stem cell niche, sensu
Drosophila; Song et al., 2007), whereas subsequent meiosis will initiate cell
differentiation and give rise to oocyte and nurse cells. The pHH3 IHC staining
used here did not capture mitosis in the terminal filament, nor the germarial
region (Figure 5.6A). This may be due to the transient nature of cell divisions in
conjunction with fixing samples, as is likewise evident from the lack of germarial
and terminal filament staining in A. mellifera samples (Figure 5.6B). Mitosis
within those regions can therefore not be excluded for O. bicornis. Note that the
non-punctate staining at the base of the O. bicornis germarium (Figure 5.6A) is
likely an artefact (antibody trapping) as it could also be seen in the control
(Figure 5.6B).
Given the description of processes above, the ovariole of both A.
mellifera and O. bicornis can both be viewed as a conveyor-belt. Germline stem
cells are transportedfrom the terminal filament into the germarium. In the
germarium, germline stem cells arise as cystocyte clusters. As this cluster is
transported into the vitellarium, cells differentiate to oocyte and nurse cells,
where they start to undergo vitellogenesis.

- 101 -
Figure 5.5: Terminal filament and germarial microstructure. (A-G) Maximum intensity projections and (H) optical section, with DAPI (blue) and phalloidin (green). Scale bars; (A-G) = 200 μm and (H) = 100µm. A) O. bicornis terminal filament with white arrow indicating a cystocyte cluster exiting the terminal filament into the germarium across the transverse septum. B) A. mellifera terminal filament, with distinct stack of coin organisation funneling out into the germarium, followed by the first polyfusome structures. White circle indicates clustered presumptive germline stemcells (Tanaka and Hartfelder, 2004). C) Terminal filament with transverse septum of O. bicornis, with red arrows indicating where presumptive germline stem cells vacated the terminal filament. D) A. mellifera terminal filament, with distinct stack of coin organisation funneling out into the germarium, followed by the first polyfusome structures. White circle indicates clustered presumptive germline stemcells (Tanaka and Hartfelder, 2004). E) O. bicornis germarium, with white circle showing first cystocyte cluster, losing its dense clustering (white arrow) until ring canals are visible when oocyte and nurse cells have been specified (white line). F) Polyfusomes (white arrows) connecting cystocyte clusters progressing along the germarium and dissipating into individual ring canals (white circle) connecting nurse cells and oocyte. G) Further detail of the O. bicornis germarium, containing cystocyte cluster (white circle) and rod like actin around the nuclear envelope (white arrows). H) Further detail of the A. mellifera germarium, showing typical comet-like appearance of the nurse cells (shape outlined by dashed lines; Tanaka and Hartfelder, 2004).

- 102 -
Figure 5.6: pHH3 in O. bicornis and A. mellifera. Maximum intensity projections with DAPI (blue), phalloidin (green), and pHH3 (red). Scale bars (A-C) = 200 μm and (D) = 500µm. A) O. bicornis ovary shows punctate pHH3 staining, marking dividing follicle cells that line the fast growing oocytes. For the terminal oocyte, these seem to be focused around the anterior and posterior pole of the oocyte. More frequent divisions of follicle cells around the poles of the oocyte may be related to oocyte elongation. Occasional staining of follicle cells on nurse cell chambers is also observed. Staining of germline cells was witnessed in neither the terminal filament, nor the germarium. B) Control staining for O. bicornis (secondary antibody only) showing only background staining. C) The same pattern is observed in A. mellifera as was with O. bicornis (A); with dividing follicle cells along the oocytes. D) Control staining for O. bicornis (secondary antibody only) showing little to no background staining.
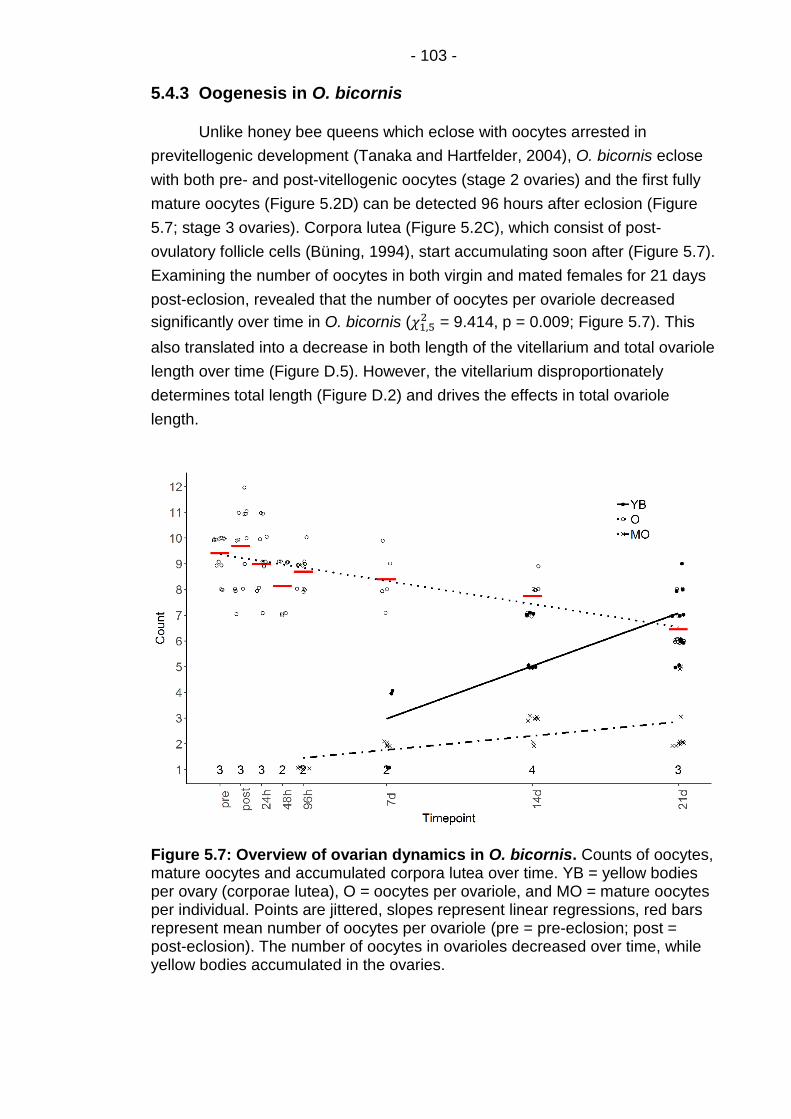
- 103 -
5.4.3 Oogenesis in O. bicornis
Unlike honey bee queens which eclose with oocytes arrested in
previtellogenic development (Tanaka and Hartfelder, 2004), O. bicornis eclose
with both pre- and post-vitellogenic oocytes (stage 2 ovaries) and the first fully
mature oocytes (Figure 5.2D) can be detected 96 hours after eclosion (Figure
5.7; stage 3 ovaries). Corpora lutea (Figure 5.2C), which consist of post-
ovulatory follicle cells (Büning, 1994), start accumulating soon after (Figure 5.7).
Examining the number of oocytes in both virgin and mated females for 21 days
post-eclosion, revealed that the number of oocytes per ovariole decreased
significantly over time in O. bicornis (𝜒1,52 = 9.414, p = 0.009; Figure 5.7). This
also translated into a decrease in both length of the vitellarium and total ovariole
length over time (Figure D.5). However, the vitellarium disproportionately
determines total length (Figure D.2) and drives the effects in total ovariole
length.
Figure 5.7: Overview of ovarian dynamics in O. bicornis. Counts of oocytes, mature oocytes and accumulated corpora lutea over time. YB = yellow bodies per ovary (corporae lutea), O = oocytes per ovariole, and MO = mature oocytes per individual. Points are jittered, slopes represent linear regressions, red bars represent mean number of oocytes per ovariole (pre = pre-eclosion; post = post-eclosion). The number of oocytes in ovarioles decreased over time, while yellow bodies accumulated in the ovaries.
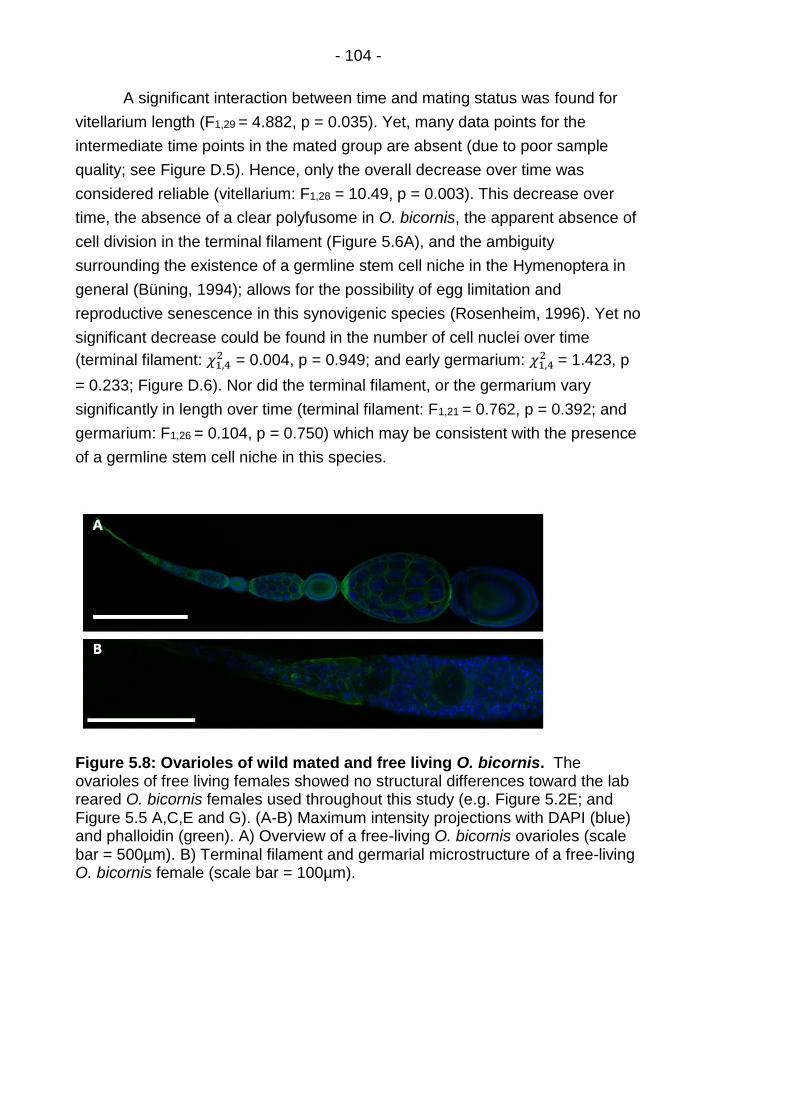
- 104 -
A significant interaction between time and mating status was found for
vitellarium length (F1,29 = 4.882, p = 0.035). Yet, many data points for the
intermediate time points in the mated group are absent (due to poor sample
quality; see Figure D.5). Hence, only the overall decrease over time was
considered reliable (vitellarium: F1,28 = 10.49, p = 0.003). This decrease over
time, the absence of a clear polyfusome in O. bicornis, the apparent absence of
cell division in the terminal filament (Figure 5.6A), and the ambiguity
surrounding the existence of a germline stem cell niche in the Hymenoptera in
general (Büning, 1994); allows for the possibility of egg limitation and
reproductive senescence in this synovigenic species (Rosenheim, 1996). Yet no
significant decrease could be found in the number of cell nuclei over time
(terminal filament: 𝜒1,42 = 0.004, p = 0.949; and early germarium: 𝜒1,4
2 = 1.423, p
= 0.233; Figure D.6). Nor did the terminal filament, or the germarium vary
significantly in length over time (terminal filament: F1,21 = 0.762, p = 0.392; and
germarium: F1,26 = 0.104, p = 0.750) which may be consistent with the presence
of a germline stem cell niche in this species.
Figure 5.8: Ovarioles of wild mated and free living O. bicornis. The ovarioles of free living females showed no structural differences toward the lab reared O. bicornis females used throughout this study (e.g. Figure 5.2E; and Figure 5.5 A,C,E and G). (A-B) Maximum intensity projections with DAPI (blue) and phalloidin (green). A) Overview of a free-living O. bicornis ovarioles (scale bar = 500µm). B) Terminal filament and germarial microstructure of a free-living O. bicornis female (scale bar = 100µm).
- 105 -
5.4.4 Effect of mating on oogenesis in O. bicornis
Firstly, I investigated whether lab reared O. bicornis were representative
of those reared in the wild, and could find no structural nor microstructural
differences between the ovarioles of either (Figure 5.8). To address the
hypothesis that reproductive constraint evolved from ancestral control of
reproduction in response to mating status I compared the stages of ovary
activation of queenless workers (QLW; Figure 5.9) with those of both virgin and
mated O. bicornis females (Figure 5.10). Activating ovaries of queenless A.
mellifera workers (Figure 5.10) showed a previtellogenic block on oogenesis at
the posterior germarium (QLW 0 — Figure 5.10A; as was shown in Tanaka and
Hartfelder, 2004), which once removed, allowed vitellogenesis to proceed (QLW
1-3 — Figure 5.9B,C,D). Such a block on oogenesis was not present at any
point in time, for neither mated nor virgin O. bicornis (Figure 5.10). Instead, O.
bicornis females eclosed from hibernation with primed ovarioles (Figure 5.10A)
in a presumed stasis. Nor was there any discernable structural difference
between ovarioles of hibernating, mated, and virgin females (Figure 5.10).
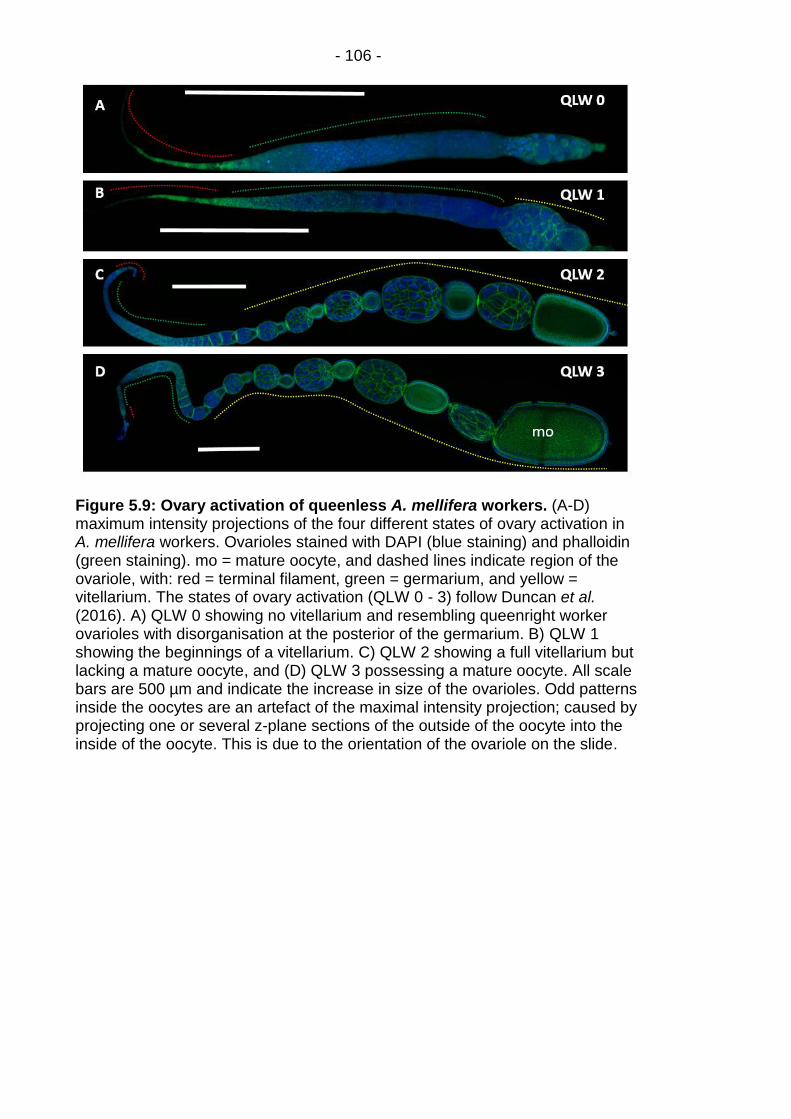
- 106 -
Figure 5.9: Ovary activation of queenless A. mellifera workers. (A-D) maximum intensity projections of the four different states of ovary activation in A. mellifera workers. Ovarioles stained with DAPI (blue staining) and phalloidin (green staining). mo = mature oocyte, and dashed lines indicate region of the ovariole, with: red = terminal filament, green = germarium, and yellow = vitellarium. The states of ovary activation (QLW 0 - 3) follow Duncan et al. (2016). A) QLW 0 showing no vitellarium and resembling queenright worker ovarioles with disorganisation at the posterior of the germarium. B) QLW 1 showing the beginnings of a vitellarium. C) QLW 2 showing a full vitellarium but lacking a mature oocyte, and (D) QLW 3 possessing a mature oocyte. All scale bars are 500 µm and indicate the increase in size of the ovarioles. Odd patterns inside the oocytes are an artefact of the maximal intensity projection; caused by projecting one or several z-plane sections of the outside of the oocyte into the inside of the oocyte. This is due to the orientation of the ovariole on the slide.
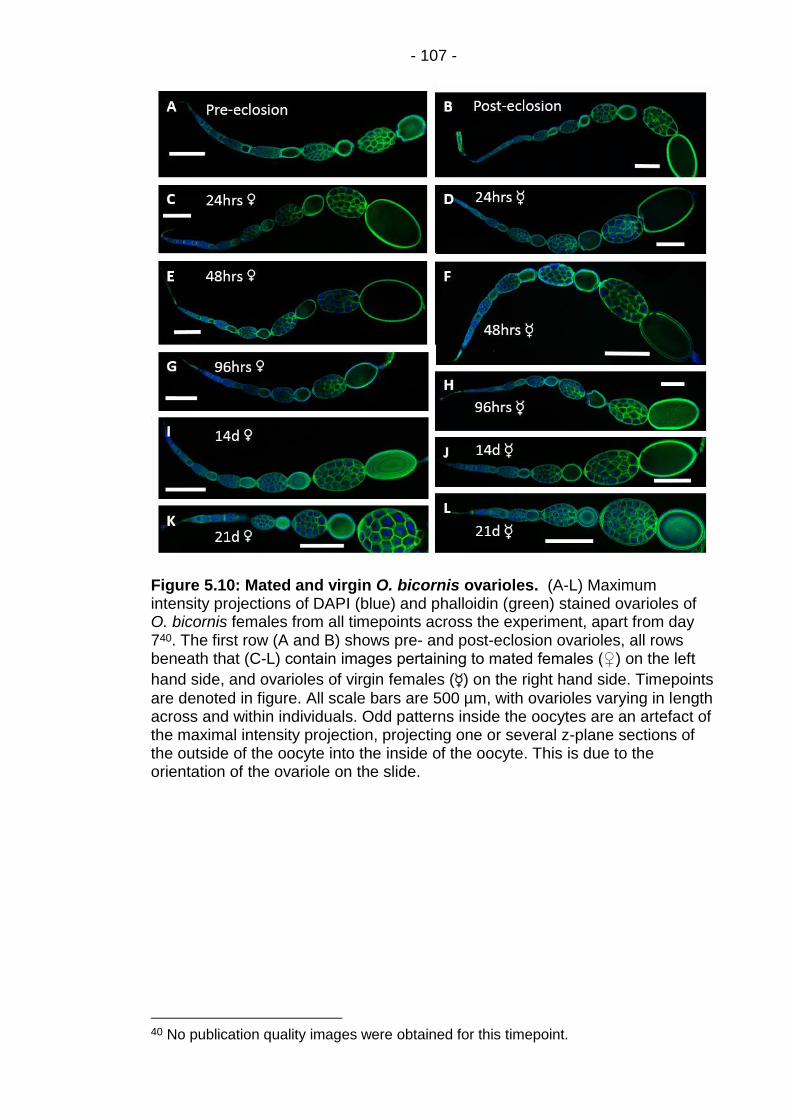
- 107 -
Figure 5.10: Mated and virgin O. bicornis ovarioles. (A-L) Maximum intensity projections of DAPI (blue) and phalloidin (green) stained ovarioles of O. bicornis females from all timepoints across the experiment, apart from day 740. The first row (A and B) shows pre- and post-eclosion ovarioles, all rows beneath that (C-L) contain images pertaining to mated females (♀) on the left
hand side, and ovarioles of virgin females (☿) on the right hand side. Timepoints
are denoted in figure. All scale bars are 500 µm, with ovarioles varying in length across and within individuals. Odd patterns inside the oocytes are an artefact of the maximal intensity projection, projecting one or several z-plane sections of the outside of the oocyte into the inside of the oocyte. This is due to the orientation of the ovariole on the slide.
40 No publication quality images were obtained for this timepoint.
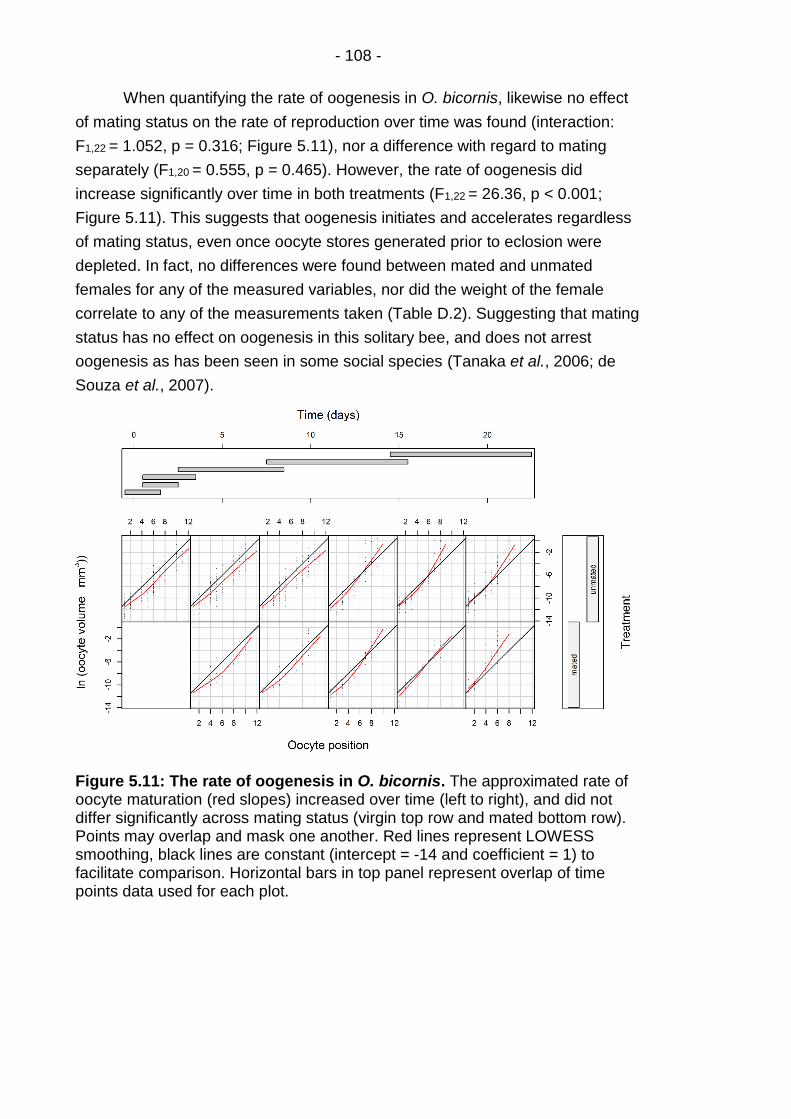
- 108 -
When quantifying the rate of oogenesis in O. bicornis, likewise no effect
of mating status on the rate of reproduction over time was found (interaction:
F1,22 = 1.052, p = 0.316; Figure 5.11), nor a difference with regard to mating
separately (F1,20 = 0.555, p = 0.465). However, the rate of oogenesis did
increase significantly over time in both treatments (F1,22 = 26.36, p < 0.001;
Figure 5.11). This suggests that oogenesis initiates and accelerates regardless
of mating status, even once oocyte stores generated prior to eclosion were
depleted. In fact, no differences were found between mated and unmated
females for any of the measured variables, nor did the weight of the female
correlate to any of the measurements taken (Table D.2). Suggesting that mating
status has no effect on oogenesis in this solitary bee, and does not arrest
oogenesis as has been seen in some social species (Tanaka et al., 2006; de
Souza et al., 2007).
Figure 5.11: The rate of oogenesis in O. bicornis. The approximated rate of oocyte maturation (red slopes) increased over time (left to right), and did not differ significantly across mating status (virgin top row and mated bottom row). Points may overlap and mask one another. Red lines represent LOWESS smoothing, black lines are constant (intercept = -14 and coefficient = 1) to facilitate comparison. Horizontal bars in top panel represent overlap of time points data used for each plot.

- 109 -
5.5 Discussion
5.5.1 The ovarian microstructure of O. bicornis
The ovaries of O. bicornis follow the general architecture of polytrophic
meroistic ovaries, as other Hymenopterans (Büning, 1994). Yet O. bicornis
females differed markedly in microstructure from A. mellifera workers. The
terminal filament in particular, lacks the typical ‘stack-of-coins’ cells prevalent in
A. mellifera (Tanaka and Hartfelder, 2004), Melipona quadrifasciata (Tanaka et
al., 2009) and other insects (Büning, 1994). These cells may have germ line
stem cells interspersed between them (Tanaka and Hartfelder, 2004; first
suggested by Gutzeit et al., 1993). Tanaka and Hartfelder (2004) also found
terminal filament cells to be mitotically active (BrdU labelling), in spite of their
apparent paucity in organelles. Another striking difference is the apparent lack
of a polyfusome in the germarium of O. bicornis (although it may be transiently
present and therefore hard to detect). The polyfusome generally marks the
cystocyte cluster. Not only that, but the asymmetrical breakup of the polyfusome
helps specify which cells of the cystocyte cluster will become nurse cells and
which will become the oocyte (Greenbaum et al., 2011). The lack of a distinct
polyfusome, in conjunction with the immediate appearance of cystocyte clusters
with ring canals behind the transverse septum; all argue the case that germline
stem cells may indeed be originating from the terminal filament, rather than a
germline stem cell niche being maintained in the germarium as is the case in
Drosophila melanogaster (Lin et al., 1994; Song et al., 2007). Germarial oocytes
also possessed rod-like actin associated with the nuclear envelope.
Speculatively, these may be remnant components of the microtubule mitotic
spindle, or they might possess a role in localisation or anchorage within the
oocyte. E.g.: the localisation of maternal determinants or a role in the anterior-
dorsal localisation and anchorage of the oocyte nucleus itself (Büning, 1994 p.
135).
Furthermore, early oocyte clusters did not possess the typical comet-like
appearance of the trophocytes as it does A. mellifera (Tanaka and Hartfelder,
2004), a trait that is less pronounced and polarised yet still present in M.
quadrifasciata (Tanaka et al., 2009) and has likewise not been found in other
solitary bees (Martins and Serrão, 2004b). These traits may be due to the
higher rates of egg production in social species; where the longer germarium
represents more cystocyte clusters being made and maintained, and the comet-
like appearance of these clusters implies a compacting of the egg-conveyer
belt.
- 110 -
The higher rates of egg production are particularly apparent in the
vitellarium, where A. mellifera strikingly possesses more oocytes than does the
solitary O. bicornis (compare Figure 5.9 with Figure 5.10). Finally, with respect
to the vitellarium: the number of nurse cells did not adhere to the ’(2n - 1) rule’
(Büning, 1994) in O. bicornis (e.g. 37 nurse cells in Figure 5.2F). A. mellifera
likewise does not adhere to this rule (possessing between 47 and 60 nurse
cells; Büning, 1994). This indicates that mitosis is not always performed by all
cystocyte descendants. The nutritive chamber also contained actin bundles
orientated transversally, as found in other species (Gutzeit, 1986b, 1990, 1991;
Fleig et al., 1991; Jablonska and Kisiel, 2002). These bundles are thought to
have originated from the follicle cells, and contract the nurse cells prior to their
apoptosis and degradation to initiate cytoplasmic streaming (Gutzeit and Koppa,
1982) of the remaining nurse cell content into the oocyte (Gutzeit, 1986a). This
function has been questioned in A. mellifera (Gutzeit et al., 1993). Gutzeit et al.
(1993) suggested the mechanical function in A. mellifera to be to ‘increase the
stiffness of the basal side of the cells and/or increase the cells' adhesiveness to
the basement membrane’. It seems reasonable to suggest that the apparent
loss of the cytoplasmic streaming function in A. mellifera may be due to both the
smaller egg size (fewer nutrients need to be pumped into the oocyte) and the
higher rate of egg laying (i.e. removing cytoplasmic streaming from oogenesis
speeds up oogenesis). The difference in both egg size and egg laying rate,
might in turn be attributable to the different selective pressures experienced by
social and solitary species. In any case, here, the occurrence of distinct actin
rings around the nurse cell nuclei and the pronounced nature of actin bundles
during late stage oogenesis, argue in favour of a contractile function and
cytoplasm streaming for O. bicornis.
5.5.2 Mating and oogenesis
In insects, mating is known to affect reproductive physiology in a variety
of ways. In diplo-diploid insects: mating plugs, seminal proteins, sex peptides,
and other male accessory gland products often accelerate if not outright
activate oogenesis and other aspects of ovarian physiology (Gillott and Friedel,
1977; Gillott, 2003; Colonello and Hartfelder, 2005; Avila et al., 2011). Under
the haplo-diploidy system, mating is not strictly necessary for females to be
reproductive. Yet the requirement of mating is still seen in many Hymenoptera.
In virgin A. mellifera queens, oogenesis is blocked at the initial stages of
vitellogenesis, just as it is in reproductively constrained workers (Tanaka et al.,
2006). Virgin queens of the eusocial Melipona quadrifasciata anthidioides
likewise show degenerated ovarioles (de Souza et al., 2007). In the primitively
eusocial wasp Ropalidia marginata, mating is not necessary for ovary
- 111 -
activation, and a virgin queen can hold a nest, yet she will show more resorbing
oocytes and lay fewer eggs (Shukla et al., 2013). Finally, in the parasitoid wasp
D. rapae, mating delay negatively affects female reproductive output which is
restored after mating (Kant et al., 2013). Across the Hymenoptera, the effects of
mating seemingly vary in queens and females along their level of social
complexity. I therefore hypothesised that mating status may have had an
ancestral role in reproductive control, and subsequently may have been co-
opted into reproductive constraint in eusocial insects like the honey bee.
Yet, I could not detect any response in the ovary with regard to mating in
solitary O. bicornis. Even after enough time had transpired for the initial oocyte
stores to be depleted, O. bicornis showed no quantitative differences in
oogenesis with regard to mating status. Likewise, no microstructural differences
could be discerned between virgin and mated females, in contrast to virgin A.
mellifera queens (Patricio and Cruz-Landim, 2002; Tanaka and Hartfelder,
2004) and virgin Melipona quadrifasciata queens (de Souza et al., 2007).
Indicating that mating status does not control reproduction in this solitary bee.
Egg laying was not measured in this study due to constraints in experimental
design (see provisional constraints on lab-rearing in Chapter 3). Hence virgin
females might yet show lower egg laying rates and higher rates of oocyte
resorption as is the case in D. rapea (Kant et al., 2013)41. Regardless, mating
status seemed to play no part in the onset nor rate of ovary activation in the
solitary bee O. bicornis. This stands in opposition to the situation in A. mellifera
queens, but is consistent with workers which cannot mate because they lack
spermatheca (which is in itself a form of reproductive constraint: Khila and
Abouheif, 2010). I therefore propose that the lack of dependence on mating
likely resembles the ancestral solitary state, and future work might further
ascertain this in other solitary Hymenoptera (e.g. for the Apidae: Eulaema
nigrita and Euglossa cordata, Woodard et al., 2011; and Habropoda laboriosa;
Kapheim et al., 2015b).
Consequently, the dependence on mating seen in queens of some
species may have evolved as a consequence of increased colony size, where
the queen-worker conflict has shifted towards brood composition (Bourke,
1999). A point which is further corroborated by the fact that workers under a
mated queens show lower ovary activation than do workers raised under
unmated queens (Peso et al., 2013). Overall, my data indicates that the
mechanisms underlying QMP-mediated adult reproductive constraint (Duncan
41 Egg degeneration and resorption occur naturally in Osmia species (Maeta and
Kurihara, 1971).
- 112 -
et al., 2016) were unlikely to have been co-opted from mechanisms underlying
mating status.
However, there are some important considerations with regard to the life
history traits of O. bicornis that need to be taken into account. O. bicornis
females have a limited flight season (May-June; Vleugel, 1952; Raw, 1972),
during which they are able to lay up to 27 eggs (Raw, 1972). To maximize
reproductive output, females prime oocytes during autumn and early spring (but
not during winter months; Wasielewski et al., 2011a). Females then mature
these primed oocytes shortly after eclosing and accelerate their rate of
oogenesis (Figure 5.11). Even with primed oocytes, it takes seven days or
fewer (given the time points used in this experiment) for corpora lutea to be
present and indicate fully matured eggs42. This is in line with van der Steen
(1997) who described a one to two week pre- oviposition period. Similarly, Cane
(2016) found that O. californica required a diet of daily pollen for the oocytes to
start swelling and maturing further, this over a period of ten days. O. bicornis
likely follows this anautogenuous strategy as well. Consequently, the number of
oocytes per ovariole dropped over time, as the primed oocytes were depleted
and the maturation rate started increasing steadily over time. Such life-history
constraints on oogenesis and flight season might make it unlikely for oogenesis
to be slowed or arrested.
A further life-history consideration is that little selective pressure may
have been maintained on female O. bicornis to acquire a mate. In aculeate
Hymenoptera there is a general asymmetry to female and male investment in
offspring (Seidelmann, 1999b; Ayasse et al., 2001). Females tend to invest
heavily in offspring (nest building, provisioning, etc.), while males contribute little
to nothing. This asymmetry leads to higher levels of both inter- and intrasexual
selection (i.e. female choice and male-male competition respectively). Given the
intense male-male competition over highly valuable females, males hatch up to
two weeks prior to females. Males then lie in wait for emerging females or seek
them out at feeding sites (Raw, 1976; Seidelmann, 1999b; Ayasse and Dutzler,
1998). This ’race for females’ (Seidelmann, 1999b) makes it unlikely for females
to end up without a mate. That virgin females become unattractive and
unreceptive to males through their CHC after only three days corroborates this
lack of selective pressure further (Seidelmann, 2014a). This type of initial and
brief receptivity is common in Hymenopterans and Dipterans (Ringo, 1996).
42 Corpora lutea are post-ovulatory follicle cells (Büning, 1994). Additionally, corpora
lutea are known to produce ecdysone to help maintain a high rate of oogenesis in D. melanogaster (Deady et al., 2015).

- 113 -
The dispensability of mating to ovary activation in conjunction with virgin
unattractiveness after three days (Seidelmann, 2014b) in this species is
inconsistent with the hypothesis that queen pheromones may have evolved
from sex pheromones (Oi et al., 2015). However, changes in the CHC-profile of
female O. bicornis, include a marked transition towards longer chained C27-
alkanes (Seidelmann and Rolke, 2019). This linear alkane stops workers in the
common wasp (Vespula vulgaris) and the desert ant (Cataglyphis iberica) from
reproducing (Van Oystaeyen et al., 2014). Furthermore, both the onset of
unattractiveness and the shift towards the C27-alkane coincides with the timing
of maturing oocytes appearing in our study. These observations are in line with
another hypothesis outlined by Oi et al. (2015): queen pheromones could be
derived from the fertility cues that are the by-products of ovary development.

- 114 -
Chapter 6 Notch signalling
6.1 Summary
Insect oogenesis is generally thought to be concomitant with
environmental conditions (food/protein availability, hibernation, nest availability,
and/or mating). Under the RGPH, conserved signalling pathways that link
environmental conditions to the ovarian response thereto, are predicted to have
been recruited into the social environment of eusocial species over evolutionary
time. Tackling the question of reproductive constraint from the perspective of
genetic co-option, allows functionally demonstrating how it may have arisen
over evolutionary time. Plastic ovary activation in A. mellifera is, at least
partially, regulated through germarial Notch signalling in the ovary. This well
conserved signalling pathway was likely co-opted into this function over
evolutionary time. By comparing germarial Notch signalling of A. mellifera with
that of the related solitary Osmia bicornis, its ancestral role in the control of
reproduction may be elucidated. Through the use of in situ hybridisation, I show
that germarial Notch signalling is reversed in the O. bicornis ovary with respect
to A. mellifera; in that active Notch signalling is associated with active
oogenesis in O. bicornis, and the Notch inhibitor Numb is concurrently not-
expressed in the germarium. Yet the expression patterns of the Notch ligands
(Serrate and Delta) are comparable to those of A. mellifera.
I subsequently attempt to repress germarial oocyte specification and
early oogenesis, in order to establish a direct functional link between germarial
Notch signalling and active reproduction in O. bicornis. To do this I used an
inhibitor of Notch signalling through feeding, secondly by limiting protein and
carbohydrate depletion, and finally by treating with QMP directly (through
feeding, topical application and injection) in O. bicornis. None of these
approaches were able to inhibit or limit oogenesis in O. bicornis.
Given that O. bicornis possess a limited flight season (May-June) in
which to mass provision for eggs; terminating early oogenesis might be a
physiological impossibility in this species, as it could preclude future
reproduction entirely. Alternately, activated ovaries may not be susceptible to
repression in Hymenoptera. In order to test the latter hypothesis, I subjected
adult A. mellifera workers with activated ovaries to QMP. This likewise did not
repress early oogenesis within the constraints of the experimental design. I
posit that ovary activation may not be reversible once oogenesis is underway,
and that early oogenesis is irreversible once underway.
- 115 -
6.2 Introduction
One of the key questions in sociogenomics remains: ‘Are conserved
genetic pathways repeatedly recruited into functional roles associated with
social traits?’ (Kapheim, 2016). QMP represses honey bee worker ovary
development (Hoover et al., 2003), and it does so through the highly conserved
Notch signalling pathway (Duncan and Dearden, 2010; Duncan et al., 2016).
Notch signalling essentially provides communication between two neighbouring
cells (Bray, 2006). A Notch ligand (either Delta or Serrate in insects) based on
the membrane of one cell, binds to the Notch receptor on an adjacent cell. This
leads to two proteolytic cleavage events (first by an ADAM-family
metalloprotease and subsequently by γ-secretase) that release the Notch
intracellular domain (NICD), which migrates to the nucleus (Bray, 2006). In the
nucleus it interacts with various transcription factors, and releases co-
repressors, and regulates the expression of target genes (typically upregulating
the enhancer of split genes: Bray, 2006). Notch signalling is active in many
developmental processes (cell-fate determination: Artavanis-Tsakonas et al.,
1999; Guruharsha et al., 2012). Various feedback mechanisms regulate Notch
signalling (e.g. the Notch inhibitor Numb; Bray, 2006; Guruharsha et al., 2012),
even cis-binding of Notch ligands with the Notch receptor (cis = both ligand and
receptor are on same cell; Sprinzak et al., 2010; Sprinzak et al., 2011).
Duncan et al. (2016) showed that in queenright A. mellifera workers,
Notch signalling is active in the germarium — i.e. the same region of the ovary
where oogenesis is repressed in queenright workers (Tanaka and Hartfelder,
2004). They then went on to show that in the absence of QMP, this signalling is
reversed completely. Finally, when workers were subjected to QMP in addition
to an inhibitor of Notch signalling (N-[N-(3,5-Difluorophenacetyl)-L-alanyl]-S-
phenylglycine t-butyl ester; DAPT), these (essentially queenright) workers
managed to activate their ovaries. This categorically implicated germarial Notch
signalling in regulating QMP-mediated adult reproductive constraint in the A.
mellifera worker. Further investigating how this mechanism may be controlled,
Duncan et al. (2016) looked for differential expression of the Notch ligands
Delta and Serrate. They found no evidence in the expression patterns of the
ligands within the germarium, indicating that the ligands were not responsible
for differentially regulating Notch signalling in the QMP-context. Instead,
Duncan et al. (2016) found that the Notch receptor itself, rather than its ligands,
was being degraded. The degradation of the Notch receptor further overlapped
both spatially and temporally with the expression of Numb, a known inhibitor of
Notch signalling (Bray, 2006). Hence, Duncan et al. (2016) posited a model
implicating the Notch inhibitor Numb, in differentiating between inactive and
- 116 -
active oogenesis (seemingly under a threshold model, since relative Numb
expression levelled off at the first sign of ovary activation).
That the Notch signalling pathway is an important mediator of adult
worker reproductive constraint may be unsurprising. Notch has been known to
have a role in D. melanogaster oogenesis for some time (Xu et al., 1992). In the
germarium of D. melanogaster, the Notch signalling pathway controls germline
stem cell niche formation and maintenance (Song et al., 2007). As such,
germarial Notch signalling is also known to respond to diet (Bonfini et al., 2015),
likely through the insulin pathway (Hsu and Drummond-Barbosa, 2011). Insulin
signalling is broadly implicated in insect reproduction (Badisco et al., 2013), and
is also known to have both priming and regulating roles in A. mellifera (DoL:
Ament et al., 2008; caste determination: Wheeler et al., 2006; de Azevedo and
Hartfelder, 2008; Mutti et al., 2011; Wolschin et al., 2011; Wheeler et al., 2014).
The environmental responsiveness of germarial Notch signalling (Bonfini et al.,
2015) through insulin signalling (Hsu and Drummond-Barbosa, 2011) in D.
melanogaster, taken together with its role in reproductive constraint in A.
mellifera (Duncan et al., 2016), could tie germarial Notch signalling into the
broader RGPH hypothesis (Amdam et al., 2006). Note that the molecular co-
option of germarial Notch signalling would imply a role reversal over
evolutionary time, since active germarial Notch signalling is associated with
active oogenesis in D. melanogaster (Song et al., 2007), whereas it is
associated with inactive oogenesis in A. mellifera (Duncan et al., 2016). Such a
role reversal is plausible given the divergence time between A. mellifera and D.
melanogaster (330 my; Misof et al., 2014).
Another mechanism often associated with A. mellifera worker sterility is
the occurrence of programmed cell death (apoptosis) in the ovary, both
reducing the number of ovarioles in worker destined larvae (Tanaka et al., 2006;
Hartfelder and Steinbruck, 1997), in aging workers (Ronai et al., 2017), as well
as regulating adult reproductive constraint directly (Tanaka and Hartfelder,
2004; Ronai et al., 2015; Ronai et al., 2016a; Duncan et al., 2016). With regard
to the role of apoptosis in adult reproductive constraint, it may simply imply that
germ cells and oocytes are not kept in a form of stasis, but rather that cell
proliferation and differentiation continuously proceed but fail to pass a certain
‘checkpoint’ (Pritchett et al., 2009). Nevertheless, Notch signalling has also
been implicated in autophagy in the ovary (D. melanogaster: Barth et al., 2011;
Barth et al., 2012), and is known to regulate proliferation, differentiation and
apoptosis depending on the cellular context (Miele and Osborne, 1999;
Schwanbeck et al., 2011). Strikingly, Notch regulated apoptosis has been
shown to operate through Numb (in D. melanogaster neuronal cells: Lundell et
- 117 -
al., 2003), the Notch inhibitor proposed by Duncan et al. (2016) to regulate adult
reproductive constraint. Because Notch signalling is influenced by many other
pathways and components, we are cautioned against describing it as a simple
linear model, and urged to regard it as a network (Artavanis-Tsakonas et al.,
1999). Yet, when the multiple modulators of Notch signalling are concatenated
and regarded as cellular context, Notch might be considered as a ‘master
switch’ for cell-fate (Miele and Osborne, 1999).
It is clear that multiple pathways may be at work in the honey bee ovary
with regard to reproductive constraint. But given its status as a master switch,
Notch signalling may very well be at the centre of a network that ties these
mechanisms together. Investigating proximate mechanisms may inform us of
ultimate causes, or succinctly put: ’phenotype is the link between cause and
consequence‘ (paraphrased from: Kapheim, 2019). Consequently, investigating
whether germarial Notch signalling controls oogenesis in the related solitary bee
O. bicornis, and with regard to what environmental cues it does so (e.g. diet),
can provide clues to what underlying mechanisms were co-opted to confer
reproductive constraint in response to QMP(e.g. parental manipulation: Ronai et
al., 2016b). Hence, in this chapter, I investigated germarial Notch signalling in
the O. bicornis ovary in relation to oogenesis. To this end I attempted to repress
early oogenesis in this solitary bee. I hypothesised that germarial Notch
signalling would mimic the situation found in A. mellifera (Duncan et al., 2016),
with active oogenesis being associated with inactive germarial Notch signalling.
I further hypothesised that germarial Notch signalling would respond to dietary
cues (as in D. melanogaster: Bonfini et al., 2015), as expected under the RGPH
where non-reproductives are thought to forage and feed mainly on nectar (Dunn
and Richards, 2003; Amdam et al., 2006).
- 118 -
6.3 Materials and methods
6.3.1 ISH
O. bicornis genes were initially identified by reciprocal BLAST (Altschul et
al., 1990) analysis of a de novo transcriptome assembly generated by Dr E.J.
Duncan from publically available RNA-seq data from adult female O. bicornis
(SRA accession numbers SRR2895245 and SRR2895246) using Trinity
(Grabherr et al., 2011; Haas et al., 2013) and default parameters. Sequences
were confirmed by RT-PCR (Jens Van Eeckhoven) and through bioinformatic
comparison with the O. bicornis genome (Beadle et al., 2019) when it was
published (performed by Dr E.J. Duncan). Orthology assignments were made
based on phylogenetic analysis (Figure 6.1A) and by comparison of genomic
architecture of the E(spl)-C in O. bicornis with other holometabolous insects
(Duncan and Dearden, 2010; Figure 6.1B).
Presence of Notch associated genes in O. bicornis ovaries was checked
using RNA extraction (section 2.3), cDNA synthesis (section 2.4) and
subsequent RT-PCR (section 2.6). PCR products were subsequently cloned
and sent for sequencing to verify the respective genes (section 2.7). Cloned
products were subsequently reverse transcribed (section 2.8) to generate ISH
probes of the Notch associated genes. ISH followed the overall protocol
presented in section 2.9, which I adapted and optimised for use in O. bicornis,
and originated from work carried out in A. mellifera (Dearden et al., 2009c).
Images presented are representative, and sense probes were used as negative
controls. Primers used to PCR genes, to subsequently clone, are presented in
Table 6.1. ISH related work (i.e. certain RNA probe extractions) was carried out
with assistance from Dr E. J. Duncan.
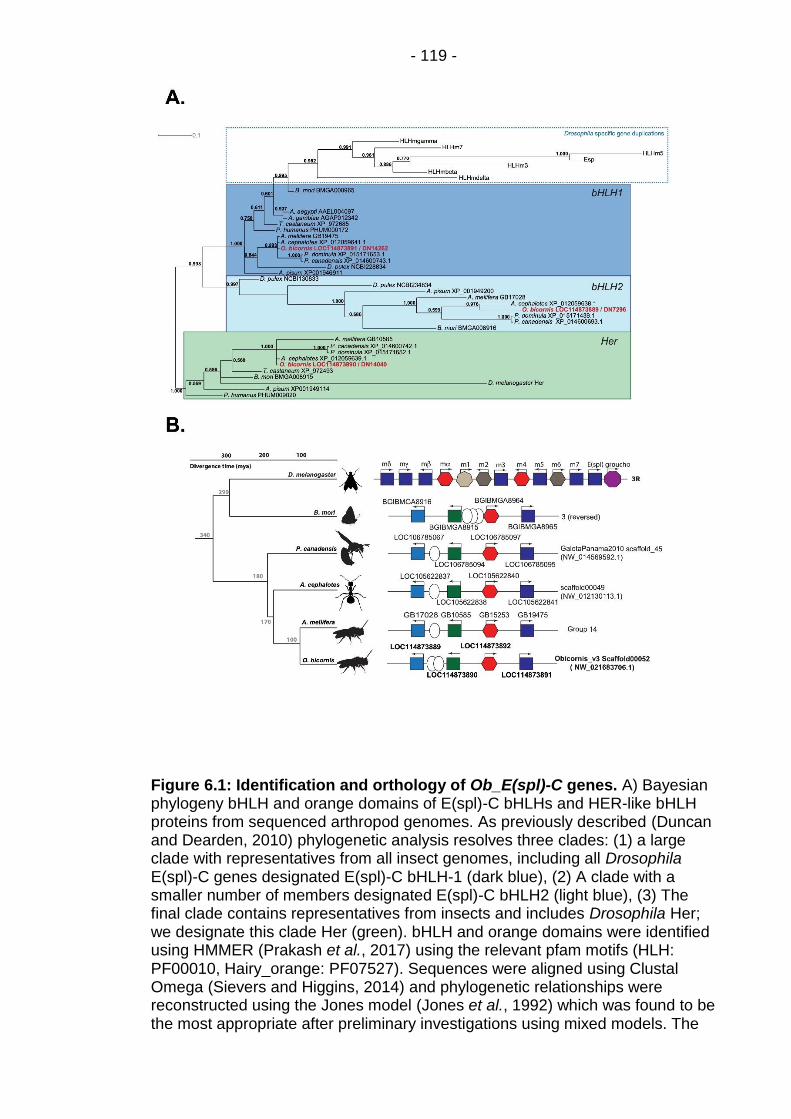
- 119 -
Figure 6.1: Identification and orthology of Ob_E(spl)-C genes. A) Bayesian phylogeny bHLH and orange domains of E(spl)-C bHLHs and HER-like bHLH proteins from sequenced arthropod genomes. As previously described (Duncan and Dearden, 2010) phylogenetic analysis resolves three clades: (1) a large clade with representatives from all insect genomes, including all Drosophila E(spl)-C genes designated E(spl)-C bHLH-1 (dark blue), (2) A clade with a smaller number of members designated E(spl)-C bHLH2 (light blue), (3) The final clade contains representatives from insects and includes Drosophila Her; we designate this clade Her (green). bHLH and orange domains were identified using HMMER (Prakash et al., 2017) using the relevant pfam motifs (HLH: PF00010, Hairy_orange: PF07527). Sequences were aligned using Clustal Omega (Sievers and Higgins, 2014) and phylogenetic relationships were reconstructed using the Jones model (Jones et al., 1992) which was found to be the most appropriate after preliminary investigations using mixed models. The
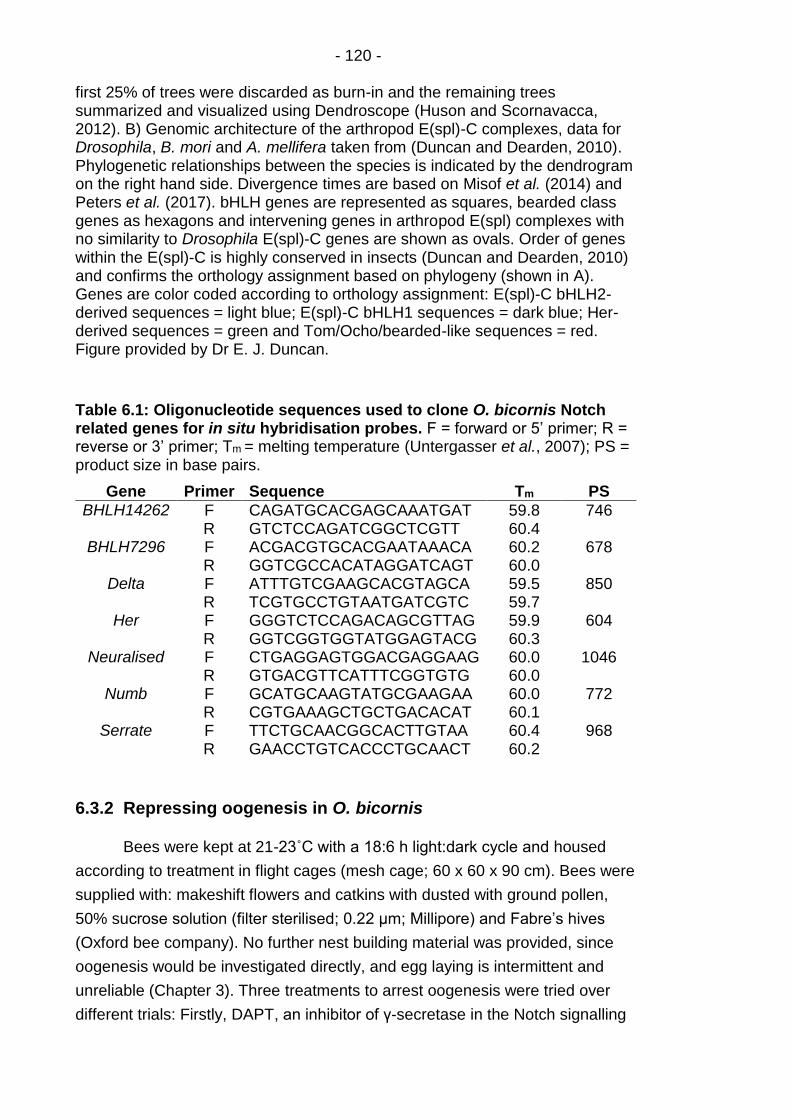
- 120 - first 25% of trees were discarded as burn-in and the remaining trees summarized and visualized using Dendroscope (Huson and Scornavacca, 2012). B) Genomic architecture of the arthropod E(spl)-C complexes, data for Drosophila, B. mori and A. mellifera taken from (Duncan and Dearden, 2010). Phylogenetic relationships between the species is indicated by the dendrogram on the right hand side. Divergence times are based on Misof et al. (2014) and Peters et al. (2017). bHLH genes are represented as squares, bearded class genes as hexagons and intervening genes in arthropod E(spl) complexes with no similarity to Drosophila E(spl)-C genes are shown as ovals. Order of genes within the E(spl)-C is highly conserved in insects (Duncan and Dearden, 2010) and confirms the orthology assignment based on phylogeny (shown in A). Genes are color coded according to orthology assignment: E(spl)-C bHLH2-derived sequences = light blue; E(spl)-C bHLH1 sequences = dark blue; Her-derived sequences = green and Tom/Ocho/bearded-like sequences = red. Figure provided by Dr E. J. Duncan.
Table 6.1: Oligonucleotide sequences used to clone O. bicornis Notch related genes for in situ hybridisation probes. F = forward or 5’ primer; R = reverse or 3’ primer; Tm = melting temperature (Untergasser et al., 2007); PS = product size in base pairs.
Gene Primer Sequence Tm PS
BHLH14262 F CAGATGCACGAGCAAATGAT 59.8 746 R GTCTCCAGATCGGCTCGTT 60.4
BHLH7296 F ACGACGTGCACGAATAAACA 60.2 678 R GGTCGCCACATAGGATCAGT 60.0
Delta F ATTTGTCGAAGCACGTAGCA 59.5 850 R TCGTGCCTGTAATGATCGTC 59.7
Her F GGGTCTCCAGACAGCGTTAG 59.9 604 R GGTCGGTGGTATGGAGTACG 60.3
Neuralised F CTGAGGAGTGGACGAGGAAG 60.0 1046 R GTGACGTTCATTTCGGTGTG 60.0
Numb F GCATGCAAGTATGCGAAGAA 60.0 772 R CGTGAAAGCTGCTGACACAT 60.1
Serrate F TTCTGCAACGGCACTTGTAA 60.4 968 R GAACCTGTCACCCTGCAACT 60.2
6.3.2 Repressing oogenesis in O. bicornis
Bees were kept at 21-23˚C with a 18:6 h light:dark cycle and housed
according to treatment in flight cages (mesh cage; 60 x 60 x 90 cm). Bees were
supplied with: makeshift flowers and catkins with dusted with ground pollen,
50% sucrose solution (filter sterilised; 0.22 μm; Millipore) and Fabre’s hives
(Oxford bee company). No further nest building material was provided, since
oogenesis would be investigated directly, and egg laying is intermittent and
unreliable (Chapter 3). Three treatments to arrest oogenesis were tried over
different trials: Firstly, DAPT, an inhibitor of γ-secretase in the Notch signalling

- 121 -
pathway (Geling et al., 2002), was added to the 50% sucrose solution on two
consecutive trials. Secondly, a treatment group was deprived of ground pollen
(protein) and given a lower concentration of sucrose solution in another trial (a
10% sucrose solution instead of 50%; i.e. 0.1038 mg/µl and 0.6148 mf/µl
respectively: Dafni et al., 2005). Sucrose solutions were provided ad libitum in
cages, and refreshed and measured daily, to provide an estimate of uptake per
bee per cage. Finally, QMP was administered in four more consecutive trials;
twice through oral exposure (mixed in with sucrose solution; QMP-trials 1 and
2), and through both injection and topical application (QMP-trial 3), and
repeated topical administration (QMP-trial 4). Sample sizes are displayed in
Table 6.2.
DAPT is highly soluble in DMSO (dimethyl sulfoxide), and somewhat less
soluble in EtOH. Furthermore its various manufacturers disagree on the
solubility in water, from being insoluble to <2.12 mg/mL (Adooq bioscience,
Selleckchem, Sigmaaldrich, APExBIO, Alfa Aesar). Dissolution with DMSO was
avoided (given its high toxicity), DAPT (Cell guidance systems) was first diluted
to 50mM in EtOH, and subsequently provided to bees in a 1mM concentration
(Duncan et al., 2016) in the sucrose solution. Given the presence of both
multiple solutes and multiple solvents — DAPT and sucrose, and EtOH and
water respectively — these interact and change each other’s solubility (often in
non-linear ways: Stumm and Morgan, 2012). Hence I did not manage to
dissolve DAPT, and it stayed emulsion (as in Williams et al., 2012). QMP (Intko
Supply Ltd, Canada ) was likewise dissolved in EtOH and subsequently diluted
into the sucrose solution for the feeding assays (QMP-trial 1: 0.050 eq/µl and
QMP-trial 2: 0.017 eq/µl), and similarly experienced solubility issues. For QMP-
trial 3, bees were sedated for at least 30 minutes on ice. Subsequently bees
were either: injected in between two sternal plates (between S3 and S4, or S4
and S5) with 10.69 µl of 0.145 eq QMP / µl EtOH using a Nanoliter 2010 injector
(World Precision Instruments), or exposed to 3µl of 1 eq QMP / µl acetone atop
the thorax. For QMP-trial 4, 3µl of 3 eq QMP / µl acetone were applied topically
over the course of 10 days (acetone is known to increase the penetrance of
pesticides: e.g. Kerkut and Gilbert, 1985; and is commonly used for the topical
application of methoprene: O'Donnell and Jeanne, 1993). All controls were
exposed to the equivalent amount of solvent in the relevant method of
administration. Trials lasted ten days on average, since ovaries are fully active
by this time (see Chapter 5).
- 122 -
6.3.3 Repressing oogenesis in queenless A. mellifera
Workers were housed together in cages (10cm x 10 cm x 5.5 cm; larger
bee study cage, Small-Life Supplies; 55-115 workers per cage) in an incubator
(Incu-160S, SciQuip), in total darkness at 35°C with relative humidity averaging
40%. Distilled water was provided for thermoregulation and homeostatic
balance, in a 15 ml polypropylene tube from the cage ceiling. 2-4 g of complete
bee food (CBF: 20 g pollen, 52 g sucrose, 18.8 g brewer’s yeast, and 9.2 g
lactalbumin; all ground and made to a paste using a minimal amount of honey:
Duncan et al., 2016) was provided in food caps on the side of the cage, and
refreshed daily. A microscope slide dotted with either 10 µl of 0.1 eq QMP/µl
EtOH (i.e. 1 eq of QMP) or 10 µl EtOH was placed in the centre of the cage and
replaced each day.
For details on overall honey bee husbandry, see section 2.1.1.
Queenless workers were taken from a queenless hive. A hive was considered
to have reproductively active workers once worker laid eggs were detected, and
a sufficient amount of brood had emerged over a sufficient amount of
time.Methods for maintaining A. mellifera workers caged in the laboratory are
well known (Williams et al., 2013). Adults can even survive for extended periods
in cages inside incubators (survival over 60 days has been reported: Evans et
al., 2009), yet they do so best when fed on a carbohydrate source exclusively
(Pirk et al., 2010; Paoli et al., 2014). The provision of a protein source enables
higher ovary activation, while simultaneously increasing mortality (Pirk et al.,
2010; Paoli et al., 2014). This is because workers do not defecate inside the
hive (a situation the cages inside incubators simulate), and the presence of
pollen or other protein will accelerate mortality by constipation. Given that
worker ovary activation and the duration until activation are both seasonal
(Velthuis, 1970; Hoover et al., 2006), exposing adult reproductive workers to
QMP therefore afforded several experimental difficulties. For these reasons:
food intake per cage was measured daily, through weighing of the CBF caps,
and deceased honey bees were removed and recorded daily.
Ovaries were scored based on a modified Hess scale (Hess, 1942),
identical to Duncan et al. (2016). Briefly, stage 0 ovaries resembled queenright
worker ovaries, stage 1 ovaries possessed signs of cell differentiation (typically
constrictions visible), stage 2 ovaries contained clearly defined oocytes with
deposited yolk, and stage 3 ovaries possessed at least on fully mature oocyte.
Workers from queenless hives were considered reproductively active when at
least 30% of workers possessed stage 2 and stage 3 ovaries. Caged workers
consisted of either: non-age matched workers captured at random from a
queenless hive and randomly attributed to cages (resulting in a homogenous
- 123 -
age-distribution in cages; Williams et al., 2013), or newly emerged workers that
were age marked and placed back into the queenless hive until reproductively
active (age-matched within cage and across treatment; between 18 and 21
days old). Newly emerged workers were also trialled, to see if workers could
activate their ovaries on time (within 5 days), to be able to survive another 5
days of QMP-treatment, given that caged honey bee workers generally did not
survive past 10-14 days. Ovaries of all trials were scored blind, by the most
experienced observer (Rosemary Knapp).
6.3.4 Staining and microscopy
At the end of each trial, O. bicornis females were sedated (at least 30
minutes on ice), weighed, ovaries were dissected out, individualised, and fixed
(1:1 heptane: 4% formaldehyde) nutating for 1hr at RT. Samples were
subsequently washed twice (PTx for 5 minutes), stained with 1 µl of 5 mg/ml
DAPI for 10 minutes at RT in darkness, washed twice more (PTx for 5 minutes),
cleared in glycerol, and mounted. Roughly half of all samples were imaged by
means of a slidescanner (AxioScan Z.1 Slidescanner; search and imaging
algorithm designed and optimised by Dr Sally Boxall), the remainder of samples
were imaged or scored by widefield microscopy (Axioplan Universal, Zeiss)
under a mercury bulb. Possible phenotypes (Figure 6.2) were tracked and
recorded, and the number of oocytes in the germarium was counted. The
germarium was considered to end when clearly defined follicle cells surrounded
the oocyte, and the oocyte was followed by a clear nutrient chamber with well-
developed nurse cells.
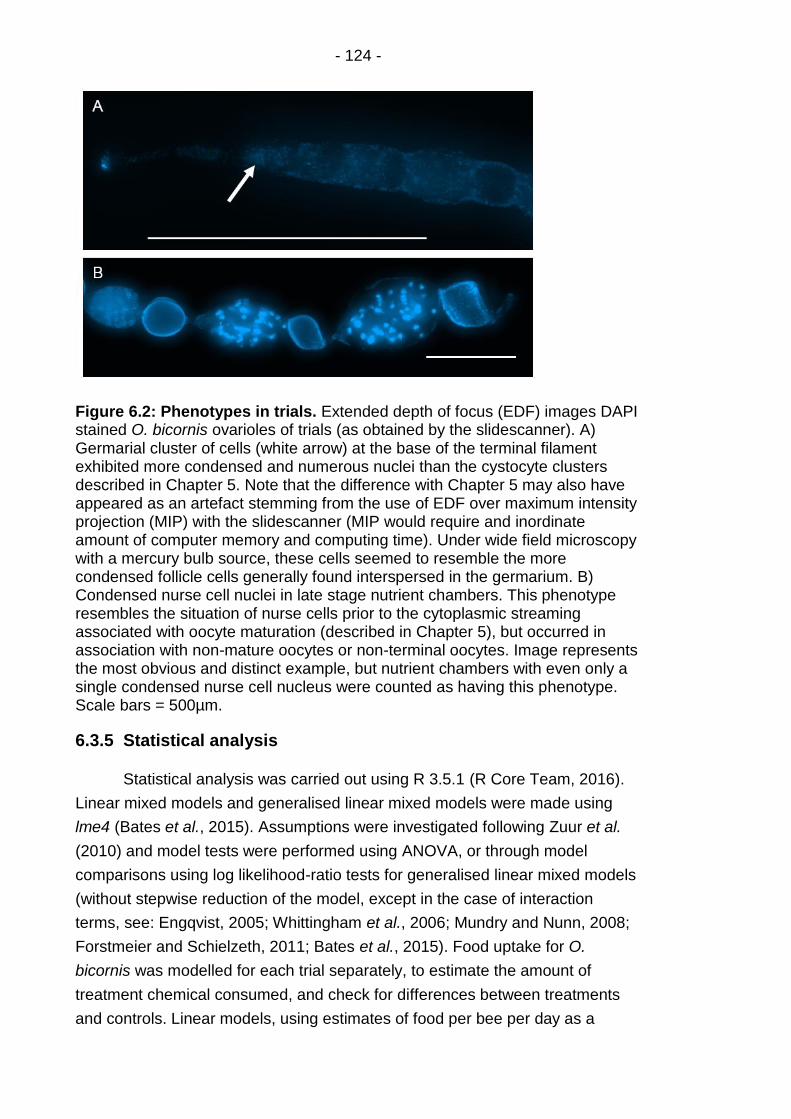
- 124 -
Figure 6.2: Phenotypes in trials. Extended depth of focus (EDF) images DAPI stained O. bicornis ovarioles of trials (as obtained by the slidescanner). A) Germarial cluster of cells (white arrow) at the base of the terminal filament exhibited more condensed and numerous nuclei than the cystocyte clusters described in Chapter 5. Note that the difference with Chapter 5 may also have appeared as an artefact stemming from the use of EDF over maximum intensity projection (MIP) with the slidescanner (MIP would require and inordinate amount of computer memory and computing time). Under wide field microscopy with a mercury bulb source, these cells seemed to resemble the more condensed follicle cells generally found interspersed in the germarium. B) Condensed nurse cell nuclei in late stage nutrient chambers. This phenotype resembles the situation of nurse cells prior to the cytoplasmic streaming associated with oocyte maturation (described in Chapter 5), but occurred in association with non-mature oocytes or non-terminal oocytes. Image represents the most obvious and distinct example, but nutrient chambers with even only a single condensed nurse cell nucleus were counted as having this phenotype. Scale bars = 500µm.
6.3.5 Statistical analysis
Statistical analysis was carried out using R 3.5.1 (R Core Team, 2016).
Linear mixed models and generalised linear mixed models were made using
lme4 (Bates et al., 2015). Assumptions were investigated following Zuur et al.
(2010) and model tests were performed using ANOVA, or through model
comparisons using log likelihood-ratio tests for generalised linear mixed models
(without stepwise reduction of the model, except in the case of interaction
terms, see: Engqvist, 2005; Whittingham et al., 2006; Mundry and Nunn, 2008;
Forstmeier and Schielzeth, 2011; Bates et al., 2015). Food uptake for O.
bicornis was modelled for each trial separately, to estimate the amount of
treatment chemical consumed, and check for differences between treatments
and controls. Linear models, using estimates of food per bee per day as a
- 125 -
response variable were made for each trial. Dependent variables were
treatment, day and their interaction; ANOVA was performed. Food intake in A.
mellifera trials was likewise modelled, jointly, to check if treatments differed
significantly in food uptake, and whether differences in survival could be related
to differences in food consumption. A linear mixed effects model (lme4; Bates et
al., 2015) was constructed with estimated food consumption per bee per hour
as the response variable, and treatment and age category (and their interaction)
as explanatory variables. Random slopes (food consumption over time) were
constructed per cage (substantially improving model fit: AIC score and
distribution of residuals). ANOVA was carried out using lmerTest (Kuznetsova
et al., 2016; Luke, 2017), and degrees of freedom represent Satterthwaite
approximations. Survival of caged A. mellifera workers — while illustrated
through Kaplan-Meier survival probability curves and Cox proportional hazard
ratios — was modelled using generalised linear mixed models with a logit link
function (i.e. binomial distribution; Bates et al., 2015). This because individual
deaths are not independent within cages (pseudoreplication: Pirk et al., 2013).
Consequently, proportional survival per cage was used as the response
variable, with random slopes constructed for survival over time by cage identity,
and treatment and age categories (and their interaction) as fixed effects.
For germarial oocyte counts in O. bicornis, generalised linear models
with a log link function were constructed. Treatment and bee weight were
treated as fixed factors, and bee identity nested in treatment was considered
the random factor. For QMP-trial 1, statistical power was inflated, since
individual bees were not kept separated and ovaries were pooled (standard
general linear model). For QMP-trial 3 the method of administration (topical or
injection) along with its interaction with bee weight were also included within the
model. Distinct phenotypes (Figure 6.2) were rare (i.e. highly zero inflated),
hence Fisher’s exact test was used to compare treatments. Finally, A. mellifera
workers’ ovary scores were modelled using mixed effects ordinal regression
(Christensen, 2015). Cage identity, nested within age matching category (non-
age matched, or aged matched; 18-21 days old), was considered the random
effect. Days until dissection also varied among cages (due to sudden mass
deaths in cages), but was not modelled to avoid overfitting the model, and any
variance attributable to it are assumed to co-vary with cage identity. Treatment
and age matching (and their interaction) were set as fixed effects. Data on
newly emerged workers (since they were not yet reproductively active workers)
were omitted from the above model, and analysed separately using one-sided
Fisher’s exact tests.

- 126 -
6.4 Results
I firstly attempted to assay Notch signalling in the ovary directly through
immunohistochemistry (IHC). Under active Notch signalling, the antibody raised
against D. melanogaster NICD (C17.9C6, Developmental Studies Hybridoma
Bank) should locate to the nucleus, rather than to the cell membrane as is the
case in the absence of active Notch signalling. While this antibody cross reacts
with A. mellifera NICD (Wilson et al., 2011; Duncan et al., 2016), preliminary
data (IHC; data not shown) suggested that it does not cross react with O.
bicornis NICD, as did the alignment of the NICD epitope in D. melanogaster and
A. mellifera to that of O. bicornis (Appendix E). Since raising an antibody
against O. bicornis NICD was outside of the scope of the current study, I used
ISH to look at the expression patterns of the relevant Notch responsive genes
instead (E(spl)-genes; Duncan et al., 2016).
While ISH can be used in any species, it first still needs to be optimised
and validated for this species and tissue, since this technique has not yet been
carried out before in O. bicornis. Existing protocols of A. mellifera were adapted
(Dearden et al., 2009a; Dearden et al., 2009c). The adaptations on the protocol
consisted of: removing the intima upon dissection of tissue, extending the tissue
fixation time to one hour, extending pre-hybridisation to at least four hours, and
extending antibody-blocking to at least two hours. Neuralised was opted for as a
positive control. This because Neuralised has a distinct stripe pattern, which
seems to be conserved from A. mellifera (Duncan et al., 2016) to Nasonia
vitripennis (fig. 5a in Pers et al., 2016 shows the residual and dissipitating stripe
pattern in a Nasonia embryo, and the striped pattern also appears in oocytes —
personal communication Dr Jeremy Lynch). Furthermore, Neuralised is known
to be a mediator of Notch signalling, where it activates the ligands (Serrate and
Delta), as well as marks them for endocytosis (Bray, 2006). Figure 6.3
corroborates the pattern in late stage oocytes in O. bicornis by showing a
distinct striped enrichment (Figure 6.3A white dashed oval; and Figure 6.3C), as
well as the more pronounced expression in nurse cells located posteriorly in the
nutrient chamber (Figure 6.3A black brace, and magnified in Figure 6.3C;
Duncan et al., 2016), validating the technique for further use in the O. bicornis
ovary.

- 127 -
Figure 6.3: Ovarian expression of Ob_Neuralised. Neuralised as a positive control for establishing ISH in the O. bicornis ovariole. A) Antisense staining. Note the enriched stripe pattern in the late stage oocyte (white dashed oval) and expression in the posterior nurse cells only (black brace). B) Sense staining was clear in both the terminal filament and germarium. C) Antisense stainingfurther further showed enrichment around the oocyte nucleus (inset).D) Sense staining was clear throughout the vitellarium, apart from some staining artifact in the terminal oocyte. The specific and distinct staining pattern of Neuralised matches that of A. mellifera (Duncan et al., 2016) and N. vitripennis (Pers et al., 2016).

- 128 -
6.4.1 Germarial Notch signalling in O. bicornis
Figure 6.4A-F shows the expression patterns with sense controls of the
E(spl)-genes (Ob_BHLH7296, Ob_BHLH14262, and Ob_Her) in O. bicornis
undergoing active oogenesis, and their expression patterns indicate active
Notch signalling in the germarial region of active ovaries. This is in direct
contrast to the situation in A. mellifera (Duncan et al., 2016), where queenless
workers as well as actively laying queens show inactive germarial Notch
signalling. The situation in O. bicornis, is more in line with the situation in D.
melanogaster where active germarial Notch signalling is required for the
maintenance of oogenesis and the germline stem cell niche (Xu et al., 1992;
Song et al., 2007). Duncan et al. (2016) also postulated a model suggesting
Numb, an inhibitor of Notch (Bray, 2006), might regulate germarial Notch
signalling in its social-reproductive context. I found Numb expression to be
absent in the germarium of the active O. bicornis ovariole (Figure 6.4G),
likewise counter to expectation. Taken together, these results imply that a
reversal in germarial Notch signalling function did not occur after the Diptera (D.
melanogaster) and Hymenoptera (A. mellifera) diverged (330 mya; Misof et al.,
2014). Indeed, the functional role reversal of germarial Notch occurred much
later; at least some time after the Megachilidae (O. bicornis) and Apidae (A.
mellifera) split (95 mya; Peters et al., 2017).
Also note that Ob_BHLH7296 and Ob_Her (corresponding to
Am_BHLH2 and Am_Her respectively; Figure 6.4A and E) showed the most
distinct staining as in Duncan et al. (2016), where they also predicted ovary
state most accurately. Given the role of Notch signalling in maintaining the
germline stem cell niche (Song et al., 2007), I further point out that the
expression of these two genes extends into the terminal filament (Figure 6.4),
lending further weight to the hypothesis of a germline stem cell niche within the
terminal filament (see Chapter 5; as proposed by Tanaka and Hartfelder, 2004
in the honey bee). The O. bicornis expression patterns for the Notch ligands
Serrate (Figure 6.5A-B) and Delta (Figure 6.5C-D) mirror their counterparts in
queenright A. mellifera (i.e. under active Notch signalling; Duncan et al., 2016).
In both O. bicornis and A. mellifera, Delta is transcribed in the germarium but
not the terminal filament (Figure 6.5C and inset; Duncan et al., 2016). Serrate
expression in O. bicornis is absent in both the terminal filament and the
germarium, and only starts occuring in the vitellarium (Figure 6.5A), as is the
case in queenright A. mellifera workers (Duncan et al., 2016).
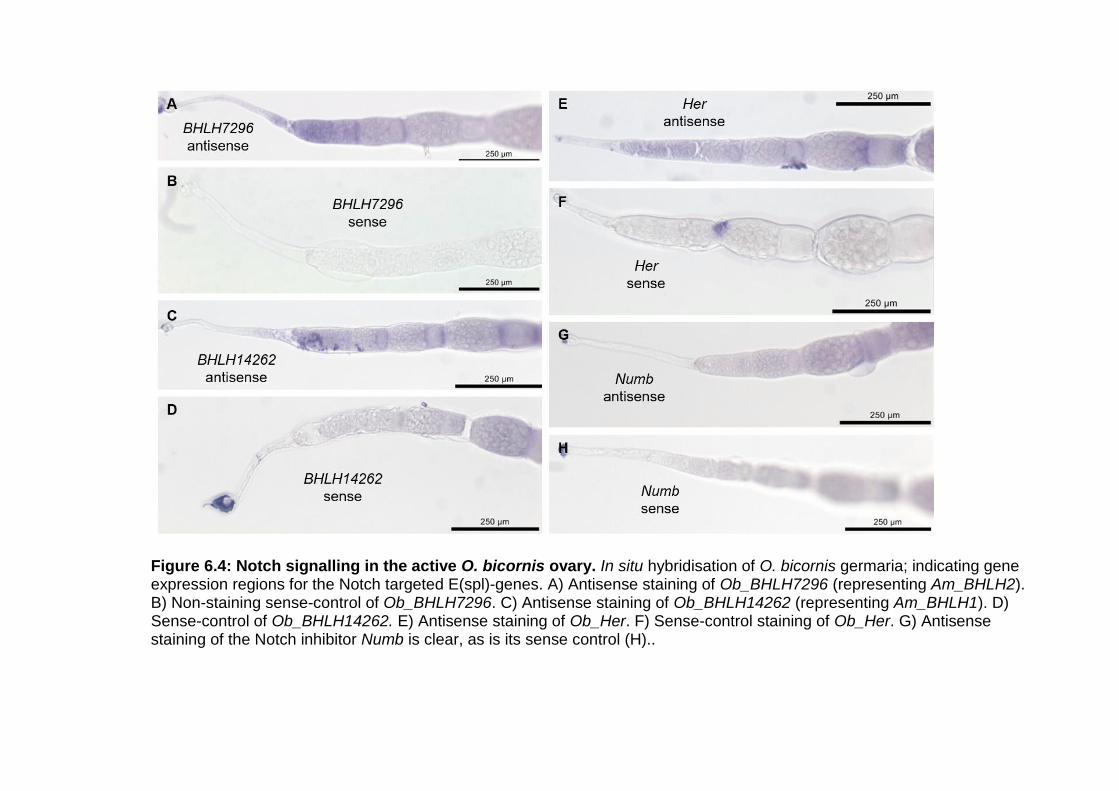
Figure 6.4: Notch signalling in the active O. bicornis ovary. In situ hybridisation of O. bicornis germaria; indicating gene expression regions for the Notch targeted E(spl)-genes. A) Antisense staining of Ob_BHLH7296 (representing Am_BHLH2). B) Non-staining sense-control of Ob_BHLH7296. C) Antisense staining of Ob_BHLH14262 (representing Am_BHLH1). D) Sense-control of Ob_BHLH14262. E) Antisense staining of Ob_Her. F) Sense-control staining of Ob_Her. G) Antisense staining of the Notch inhibitor Numb is clear, as is its sense control (H)..

- 130 -
Figure 6.5: Ovarian expression of Notch ligands in O. bicornis. A) Serrate expression in the O. bicornis ovary. Serrate expression occurs earlier on in stage 1 oocytes in A. mellifera (Wilson et al., 2011; Duncan et al., 2016). B) Ob_Serrate sense control. C) Ob_Delta antisense staining, with magnified germarial region in inset. O. bicornis Delta is expressed ubiquitously, as it is in the A. mellifera ovary (Duncan et al., 2016). D) Ob_Delta sense control.
- 131 -
6.4.2 Repressing oogenesis in O. bicornis
Given that: germarial Notch signalling represses oogenesis in the socio-
reproductive context in A. mellifera (Duncan et al., 2016), that this repressive
effect can be overcome by the Notch specific inhibitor DAPT (Duncan et al.,
2016), and that a reversed situation of Notch signalling is present in O. bicornis
(active oogenesis ~ active Notch signalling; 6.4.1) — I attempted to repress
oogenesis in O. bicornis by feeding them known amounts of that same Notch
inhibitor used in the Duncan et al. study; DAPT. This to ascertain directly
whether Notch signalling also serves a regulatory role in the related solitary bee
O. bicornis, and whether it is also required to maintain early oogenesis and the
germline stem cell niche as it does in D. melanogaster (Xu et al., 1992; Song et
al., 2007) and as suggested by the ISH experiments.
Duncan et al. (2016) successfully fed A. mellifera workers DAPT, hence
a similar approach was used here by mixing DAPT in with 50% sucrose
solution. For DAPT trial 1, solution uptake did not differ significantly between
DAPT-treated and control cages over time (interaction term: F1,12 = 0.083, p =
0.778), nor over time (F1,12 = 0.342, p = 0.569), but DAPT treated sucrose
solution was taken up significantly more on average (F1,12 = 9.495, p = 0.009;
Figure 6.6A). For the second DAPT feeding trial, which used the same
concentrations (1mM DAPT), no significant differences were found across the
board (interaction: F1,16 = 0.683, p = 0.421; time: F1,16 = 3.775, p = 0.070; and
treatment: F1,16 = 0.987, p = 0.335, Figure 6.6B).
These first feeding trials also contained evaporation controls, to check
whether sucrose solution was actually being taken up. When these data points
were included in the models, there was a consistent effect of treatment
(treatment; DAPT trial 1: F2,18 = 36.76, p < 0.001; and DAPT trial 2: F2,24 =
21.61, p < 0.001), with both DAPT treated and control groups being consistently
higher than the loss by evaporation alone (Figure 6.6A & B). The evaporation
control also provided a more accurate estimate of possible uptake of the solute
in these early feeding trials, and clearly illustrated that the majority of the
apparent variance in daily uptake was due to differences in ‘evaporation rate’
over time (i.e. there were no significant time and treatment interactions for
uptake, DAPT trial 1: F2,18= 1.618, p = 0.226; DAPT trial 2: F2,18= 1.848, p =
0.179; see also covariance of treatment and control with the evaporation control
over time in Figure 6.6A & B). The daily variation in evaporation rate was likely
due to fluctuations in relative humidity (Figure 3.11B), in addition to refreshment
of feed and measurements of uptake not always occurring at consistent times of
day.
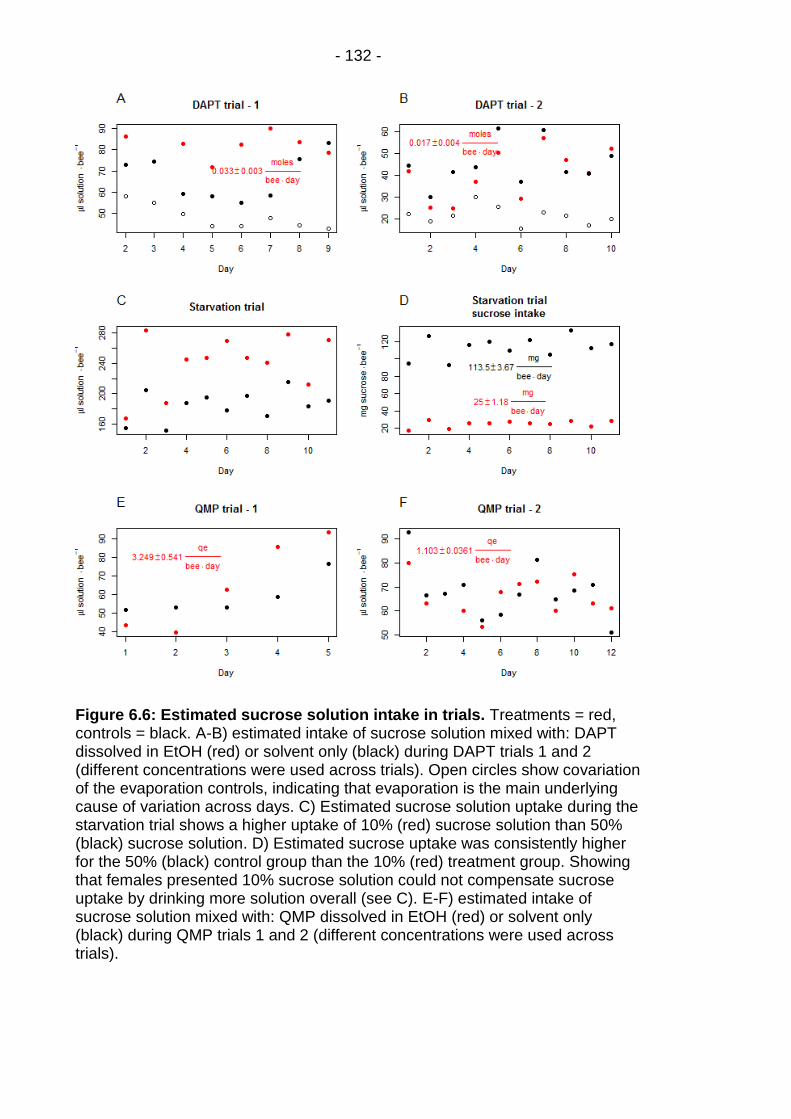
- 132 -
Figure 6.6: Estimated sucrose solution intake in trials. Treatments = red, controls = black. A-B) estimated intake of sucrose solution mixed with: DAPT dissolved in EtOH (red) or solvent only (black) during DAPT trials 1 and 2 (different concentrations were used across trials). Open circles show covariation of the evaporation controls, indicating that evaporation is the main underlying cause of variation across days. C) Estimated sucrose solution uptake during the starvation trial shows a higher uptake of 10% (red) sucrose solution than 50% (black) sucrose solution. D) Estimated sucrose uptake was consistently higher for the 50% (black) control group than the 10% (red) treatment group. Showing that females presented 10% sucrose solution could not compensate sucrose uptake by drinking more solution overall (see C). E-F) estimated intake of sucrose solution mixed with: QMP dissolved in EtOH (red) or solvent only (black) during QMP trials 1 and 2 (different concentrations were used across trials).
- 133 -
Notch signalling does not only maintain the germline stem cell niche in D.
melanogaster (Song et al., 2007), it is also known to be under reversible dietary
control (both protein and carbohydrate: Hsu and Drummond-Barbosa, 2011;
Bonfini et al., 2015), and dietary components have long been known to affect its
reproduction (Bownes et al., 1988; Badisco et al., 2013). Protein is implicitly
required for the production of vitellogenin. Consequently, an adult pollen diet is
essential to egg maturation in, at least one Osmia species (Osmia californica:
Cane, 2016). Furthermore, with respect to the RGPH (Amdam et al., 2006),
insulin signalling is thought to have been co-opted into division of labour in
honey bees (Ament et al., 2008), and is also considered an important mediator
of caste differentiation (Wheeler et al., 2006; de Azevedo and Hartfelder, 2008;
Mutti et al., 2011; Wolschin et al., 2011; Wheeler et al., 2014). Hence, in order
to try and repress oogenesis with respect to this context, a treatment group was
denied pollen, and fed a 10% sucrose solution, as opposed to the control group
with access to free to pollen and a 50% sucrose solution.
While there were no differences in uptake of solution with treatment over
time (interaction term: F1,18= 0.336, p = 0.569; Figure 6.6C), nor differences
over time alone (F1,18= 3.053, p = 0.098; Figure 6.6C), bees fed 10% sucrose
solution did attempt to compensate total sucrose intake by drinking more
solution overall (F1,18= 20.73, p < 0.001; Figure 6.6C). When subsequently
estimating actual sucrose intake, again no effects of treatment over time
(interaction term: F1,18= 0.619, p = 0.442; Figure 6.6D) nor time were found
(F1,18= 2.510, p = 0.131; Figure 6.6D). But bees fed 10% solution proved unable
to compensate their sucrose intake (F1,18= 557.3, p < 0.001; Figure 6.6D).
Consequently absolute sucrose intake was approximately four and a half times
lower than that of the control treatment, this illustrates that the use of lower
sucrose concentrations can be used as a robust way of mimicking starvation
conditions.
Given the role of QMP in repressing adult worker reproduction in honey
bees (Duncan et al., 2016) — and the fact that honey bee QMP is known to
repress reproduction in a variety of other species (prawns — species
unspecified: Carlisle and Butler, 1956; Kalotermes flavicollis: Hrdý et al., 1960;
Musca domestica: Nayar, 1963; D. melanogaster: Sannasi, 1969; B. terrestris:
Princen et al., 2019b) — I next applied QMP to O. bicornis through: feeding,
topical application and injection. This to try and repress oogenesis, once more
via Notch signalling (Duncan et al., 2016). Feeding differed significantly with
treatment over time in QMP trial 1 (interaction term: F1,6= 7.043, p = 0.038;
Figure 6.6E; likely due to the short trial duration variance did not even out). In
QMP trial 2 no such difference , nor any other difference could be found
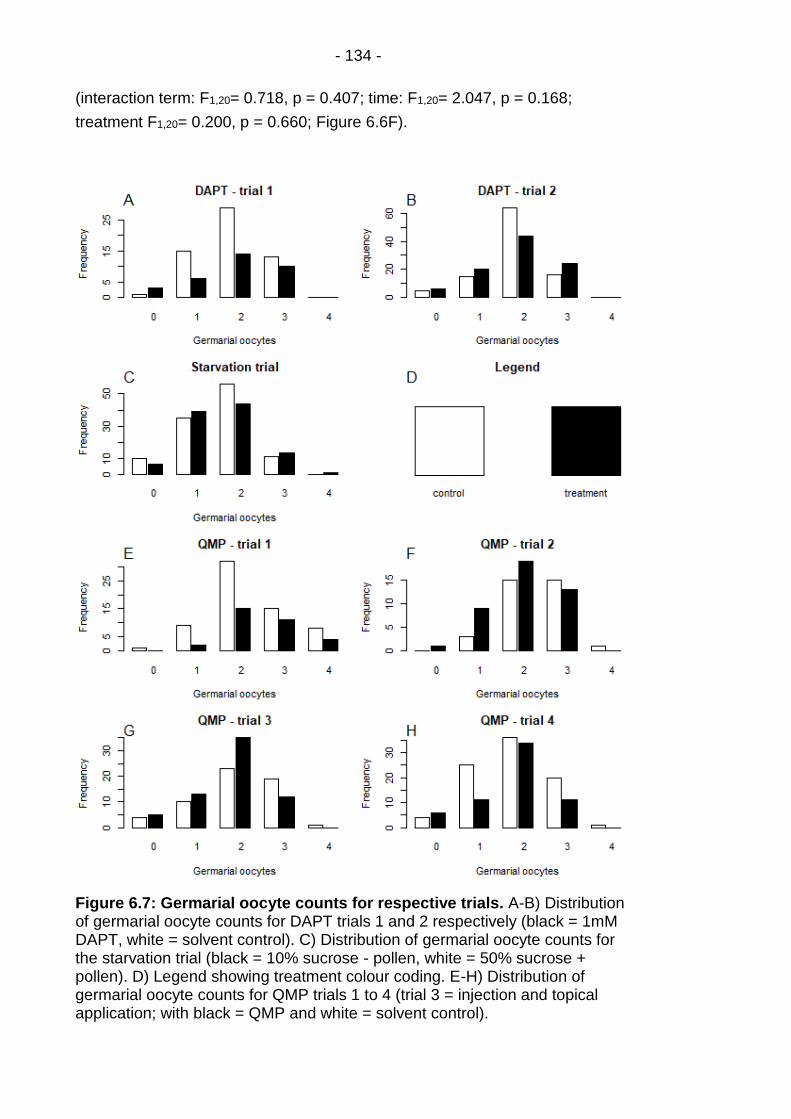
- 134 -
(interaction term: F1,20= 0.718, p = 0.407; time: F1,20= 2.047, p = 0.168;
treatment F1,20= 0.200, p = 0.660; Figure 6.6F).
Figure 6.7: Germarial oocyte counts for respective trials. A-B) Distribution of germarial oocyte counts for DAPT trials 1 and 2 respectively (black = 1mM DAPT, white = solvent control). C) Distribution of germarial oocyte counts for the starvation trial (black = 10% sucrose - pollen, white = 50% sucrose + pollen). D) Legend showing treatment colour coding. E-H) Distribution of germarial oocyte counts for QMP trials 1 to 4 (trial 3 = injection and topical application; with black = QMP and white = solvent control).

- 135 -
Finally it should be noted that, upon dissection, all bees consistently had
sucrose solution present in their crop, for any and all trials performed. Figure
6.7 shows the results for all O. bicornis trials performed, with the results of
statistical testing summarised in Table 6.2. In short: no significant differences
were found for any treatment or method in any of the trials; and the
disorganisational phenotypes illustrated in Figure 6.2 were either rare
pathophysiological phenomena or artefacts from dissection and fixation.
Other methods of analysis were briefly trialled (primarily using data of
QMP trial 2), which included looking at germarial length, and oocyte maturation
rate (as Chapter 4, but restricted to the germarium), to try and find even subtle
effects in the germarial region (data not shown) — where as outlined previously
one would mainly expect to find a phenotype. I also explored for subtle effects
in the late stage vitellarium, looking at the ultimate and penultimate oocytes and
their nurse cells. I modelled nurse cell chamber nuclei surface area (averaged
by number of visible nurse cells) to gauge for early stages of the phenotype
shown in Figure 6.2B (data not shown). I further modelled estimated nurse cell
chamber volume to oocyte volume — since oocyte stages are not yet described
and classified as they are in D. melanogaster (King, 1970) and A. mellifera
(Wilson et al., 2011) — to explore the possibility of terminal oocyte abortion.
None of these additional metrics yielded any results, nor were any other distinct
phenotypes observed.
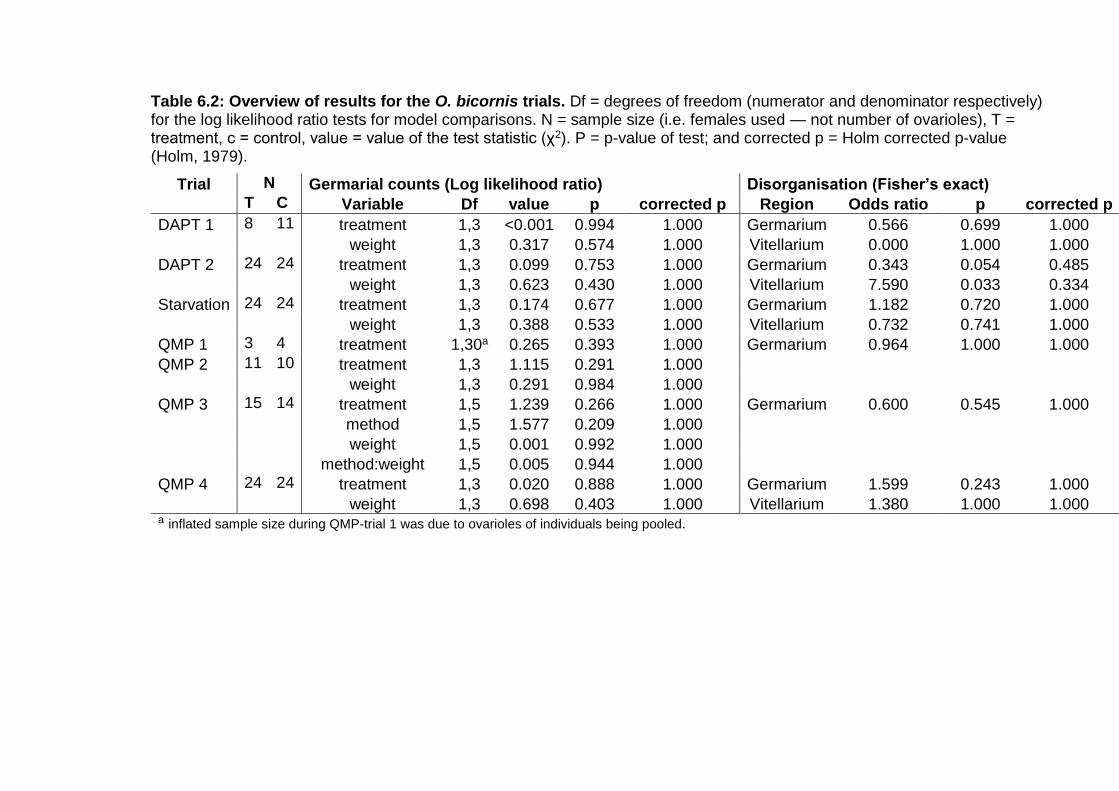
Table 6.2: Overview of results for the O. bicornis trials. Df = degrees of freedom (numerator and denominator respectively) for the log likelihood ratio tests for model comparisons. N = sample size (i.e. females used — not number of ovarioles), T = treatment, c = control, value = value of the test statistic (χ2). P = p-value of test; and corrected p = Holm corrected p-value (Holm, 1979).
Trial N Germarial counts (Log likelihood ratio) Disorganisation (Fisher’s exact)
T C Variable Df value p corrected p Region Odds ratio p corrected p
DAPT 1 8 11 treatment 1,3 <0.001 0.994 1.000 Germarium 0.566 0.699 1.000
weight 1,3 0.317 0.574 1.000 Vitellarium 0.000 1.000 1.000
DAPT 2 24 24 treatment 1,3 0.099 0.753 1.000 Germarium 0.343 0.054 0.485
weight 1,3 0.623 0.430 1.000 Vitellarium 7.590 0.033 0.334
Starvation 24 24 treatment 1,3 0.174 0.677 1.000 Germarium 1.182 0.720 1.000
weight 1,3 0.388 0.533 1.000 Vitellarium 0.732 0.741 1.000
QMP 1 3 4 treatment 1,30a 0.265 0.393 1.000 Germarium 0.964 1.000 1.000
QMP 2 11 10 treatment 1,3 1.115 0.291 1.000
weight 1,3 0.291 0.984 1.000
QMP 3 15 14 treatment 1,5 1.239 0.266 1.000 Germarium 0.600 0.545 1.000
method 1,5 1.577 0.209 1.000
weight 1,5 0.001 0.992 1.000
method:weight 1,5 0.005 0.944 1.000
QMP 4 24 24 treatment 1,3 0.020 0.888 1.000 Germarium 1.599 0.243 1.000
weight 1,3 0.698 0.403 1.000 Vitellarium 1.380 1.000 1.000 a inflated sample size during QMP-trial 1 was due to ovarioles of individuals being pooled.
- 137 -
6.4.3 Repressing oogenesis post ovary activation
The inability to repress oogenesis in O. bicornis, particularly the lack of
response to QMP, might suggest an inability to inhibit the ovary once it has
been activated. Adult queenright honey bee workers with inactive ovaries are
exposed to QMP since emergence (Winston, 1991), if not prior. QMP may
therefore have a preventative mode of action, rather than a direct one. Studies
that have shown a negative effect of QMP on reproduction in other species,
have typically done so prior to adulthood and full reproductive capacity (Carlisle
and Butler, 1956; Hrdý et al., 1960; Nayar, 1963; Sannasi, 1969; Galang et al.,
2019; Princen et al., 2019b). As illustrated in Chapter 5, O. bicornis emerges
from hibernation with primed ovarioles. In order to ascertain whether QMP can
elicit an effect post ovary maturation, I subjected queenless A. mellifera workers
to QMP.
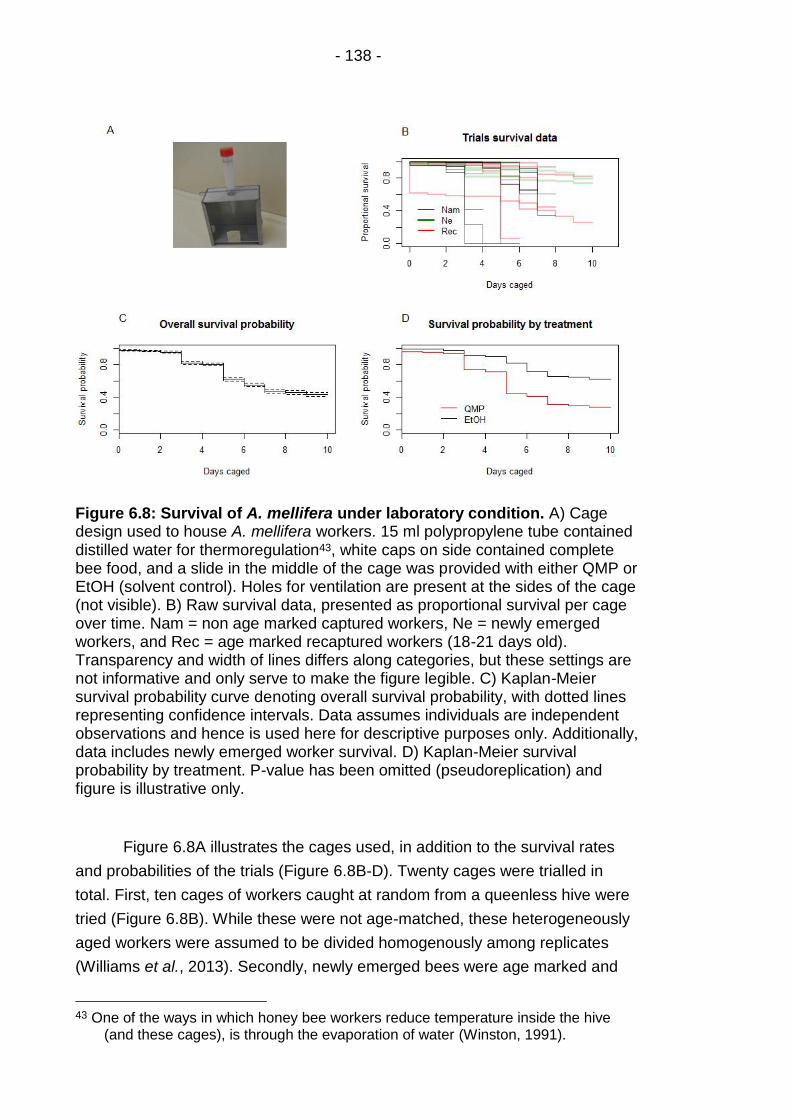
- 138 -
Figure 6.8: Survival of A. mellifera under laboratory condition. A) Cage design used to house A. mellifera workers. 15 ml polypropylene tube contained distilled water for thermoregulation43, white caps on side contained complete bee food, and a slide in the middle of the cage was provided with either QMP or EtOH (solvent control). Holes for ventilation are present at the sides of the cage (not visible). B) Raw survival data, presented as proportional survival per cage over time. Nam = non age marked captured workers, Ne = newly emerged workers, and Rec = age marked recaptured workers (18-21 days old). Transparency and width of lines differs along categories, but these settings are not informative and only serve to make the figure legible. C) Kaplan-Meier survival probability curve denoting overall survival probability, with dotted lines representing confidence intervals. Data assumes individuals are independent observations and hence is used here for descriptive purposes only. Additionally, data includes newly emerged worker survival. D) Kaplan-Meier survival probability by treatment. P-value has been omitted (pseudoreplication) and figure is illustrative only.
Figure 6.8A illustrates the cages used, in addition to the survival rates
and probabilities of the trials (Figure 6.8B-D). Twenty cages were trialled in
total. First, ten cages of workers caught at random from a queenless hive were
tried (Figure 6.8B). While these were not age-matched, these heterogeneously
aged workers were assumed to be divided homogenously among replicates
(Williams et al., 2013). Secondly, newly emerged bees were age marked and
43 One of the ways in which honey bee workers reduce temperature inside the hive
(and these cages), is through the evaporation of water (Winston, 1991).

- 139 -
released into a queenless hive to be recaptured once ovary activation was
sufficient (all cohorts were between 18 and 21 days old; six cages total). Finally,
newly emerged workers were trialled (four cages), to investigate the possibility
of initiating QMP exposure halfway through a trial. The social nature of A.
mellifera requires a minimum amount of workers to be present in a cage
(Rinderer and Baxter, 1978; Bosua et al., 2018; Abou-Shaara and Elbanoby,
2018) for it to survive. This is density dependent (i.e. group and cage size
dependent; Abou-Shaara and Elbanoby, 2018), which in the present study
equated to a minimum of 50 bees for the cages used (80-100 bees per cage
were used at the start of every experiment on average). Additionally, the
inability of caged workers to remove dead bees causes stress and may spread
disease. These factors may trigger mass deaths as illustrated for some cages in
Figure 6.8B. Mass and sudden deaths occurred exclusively for non-age marked
captured and age marked recaptured bees, presumably due to an increased
likelihood of death by constipation. Figure 6.8D and Figure 6.9 further illustrate
the increased mortality for caged workers exposed to QMP, and for captured
and recaptured bees. There was no significant interaction between age
matching categories and QMP treatments (χ2,9 = 0.004, p = 0.998), nor did the
increased mortality in captured bees (non-age marked and age marked) retain
significance (χ2,7 = 5.937, p = 0.051). Yet, QMP treated workers did show a
significant increase in mortality (χ1,7 = 7.633, p = 0.006; Figure 6.8D and Figure
6.9) under the binomial model; regardless of whether newly emerged workers
were excluded from analysis.
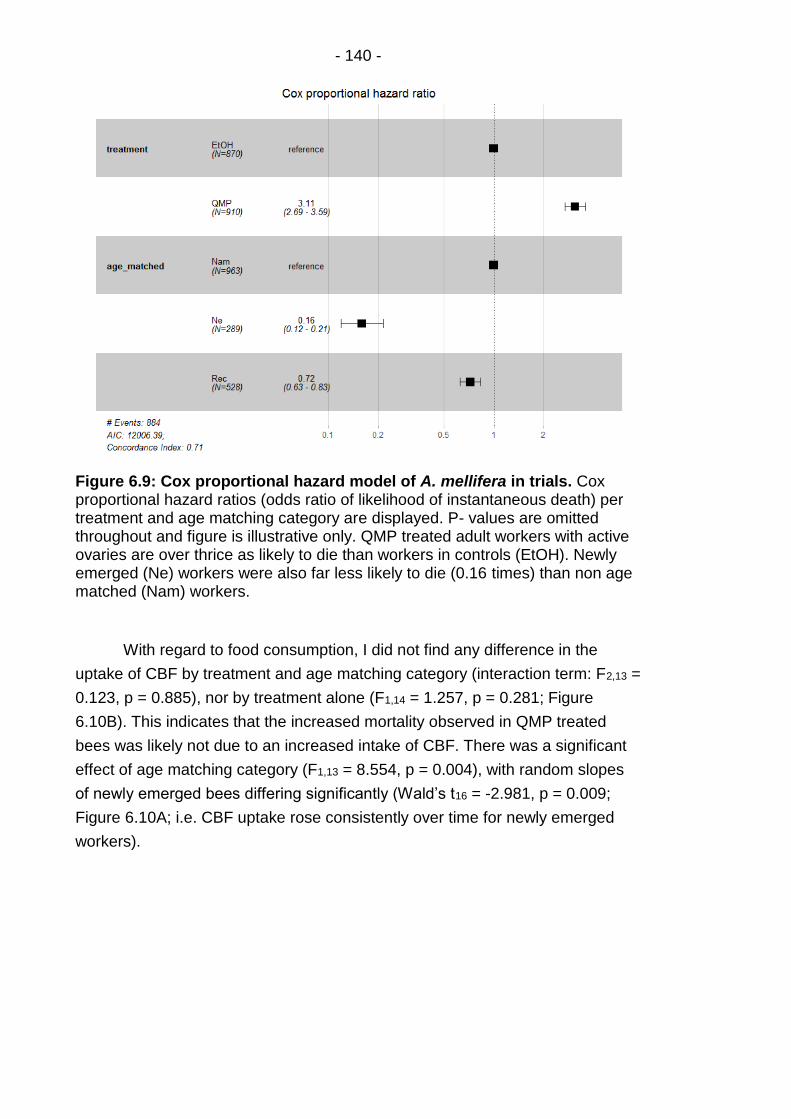
- 140 -
Figure 6.9: Cox proportional hazard model of A. mellifera in trials. Cox proportional hazard ratios (odds ratio of likelihood of instantaneous death) per treatment and age matching category are displayed. P- values are omitted throughout and figure is illustrative only. QMP treated adult workers with active ovaries are over thrice as likely to die than workers in controls (EtOH). Newly emerged (Ne) workers were also far less likely to die (0.16 times) than non age matched (Nam) workers.
With regard to food consumption, I did not find any difference in the
uptake of CBF by treatment and age matching category (interaction term: F2,13 =
0.123, p = 0.885), nor by treatment alone (F1,14 = 1.257, p = 0.281; Figure
6.10B). This indicates that the increased mortality observed in QMP treated
bees was likely not due to an increased intake of CBF. There was a significant
effect of age matching category (F1,13 = 8.554, p = 0.004), with random slopes
of newly emerged bees differing significantly (Wald’s t16 = -2.981, p = 0.009;
Figure 6.10A; i.e. CBF uptake rose consistently over time for newly emerged
workers).
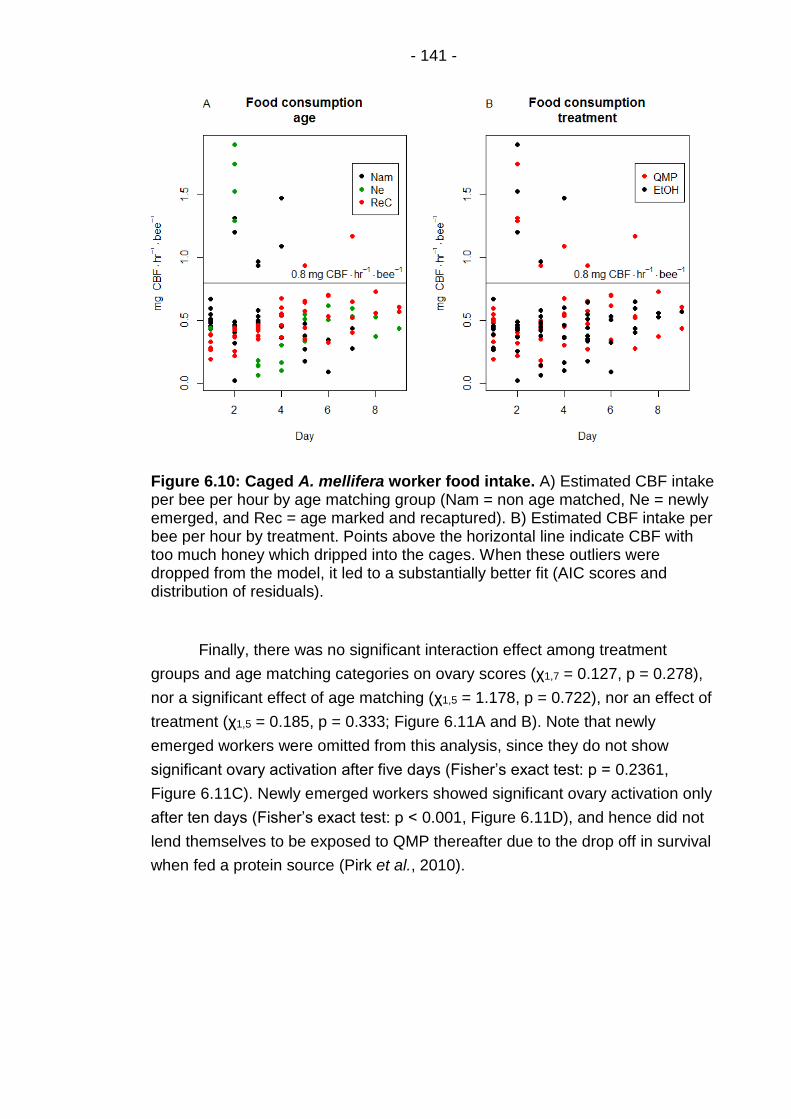
- 141 -
Figure 6.10: Caged A. mellifera worker food intake. A) Estimated CBF intake per bee per hour by age matching group (Nam = non age matched, Ne = newly emerged, and Rec = age marked and recaptured). B) Estimated CBF intake per bee per hour by treatment. Points above the horizontal line indicate CBF with too much honey which dripped into the cages. When these outliers were dropped from the model, it led to a substantially better fit (AIC scores and distribution of residuals).
Finally, there was no significant interaction effect among treatment
groups and age matching categories on ovary scores (χ1,7 = 0.127, p = 0.278),
nor a significant effect of age matching (χ1,5 = 1.178, p = 0.722), nor an effect of
treatment (χ1,5 = 0.185, p = 0.333; Figure 6.11A and B). Note that newly
emerged workers were omitted from this analysis, since they do not show
significant ovary activation after five days (Fisher’s exact test: p = 0.2361,
Figure 6.11C). Newly emerged workers showed significant ovary activation only
after ten days (Fisher’s exact test: p < 0.001, Figure 6.11D), and hence did not
lend themselves to be exposed to QMP thereafter due to the drop off in survival
when fed a protein source (Pirk et al., 2010).
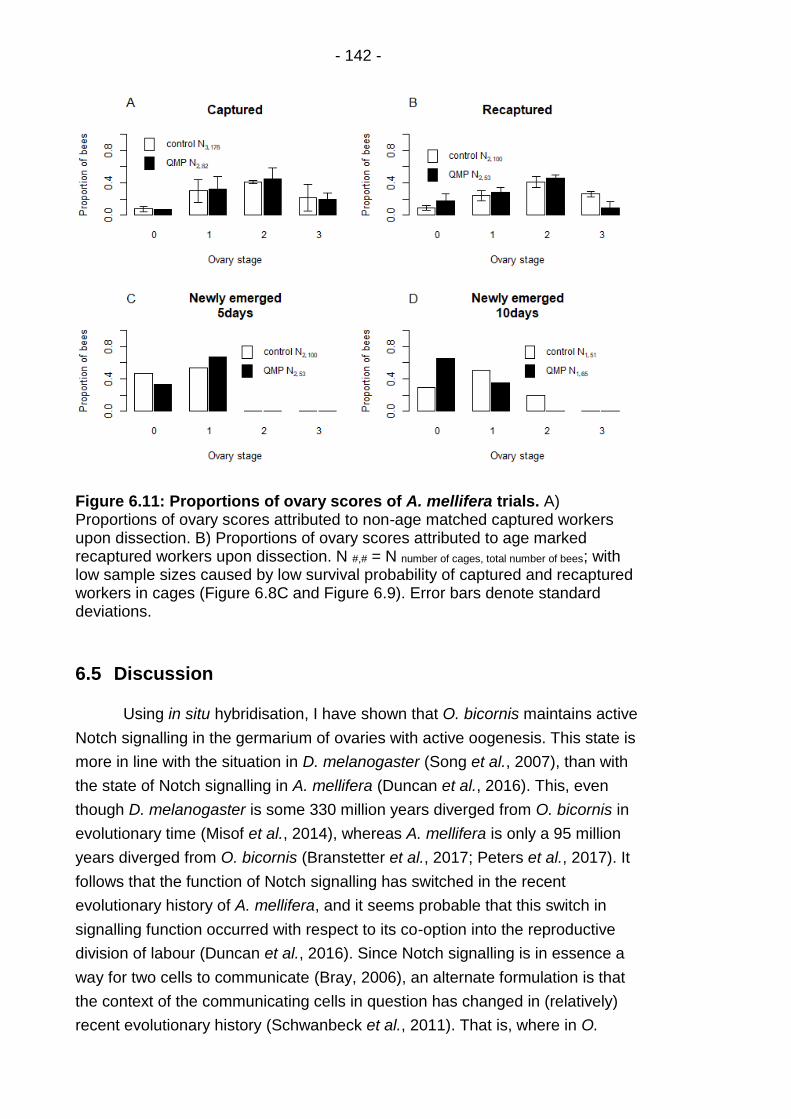
- 142 -
Figure 6.11: Proportions of ovary scores of A. mellifera trials. A) Proportions of ovary scores attributed to non-age matched captured workers upon dissection. B) Proportions of ovary scores attributed to age marked recaptured workers upon dissection. N #,# = N number of cages, total number of bees; with low sample sizes caused by low survival probability of captured and recaptured workers in cages (Figure 6.8C and Figure 6.9). Error bars denote standard deviations.
6.5 Discussion
Using in situ hybridisation, I have shown that O. bicornis maintains active
Notch signalling in the germarium of ovaries with active oogenesis. This state is
more in line with the situation in D. melanogaster (Song et al., 2007), than with
the state of Notch signalling in A. mellifera (Duncan et al., 2016). This, even
though D. melanogaster is some 330 million years diverged from O. bicornis in
evolutionary time (Misof et al., 2014), whereas A. mellifera is only a 95 million
years diverged from O. bicornis (Branstetter et al., 2017; Peters et al., 2017). It
follows that the function of Notch signalling has switched in the recent
evolutionary history of A. mellifera, and it seems probable that this switch in
signalling function occurred with respect to its co-option into the reproductive
division of labour (Duncan et al., 2016). Since Notch signalling is in essence a
way for two cells to communicate (Bray, 2006), an alternate formulation is that
the context of the communicating cells in question has changed in (relatively)
recent evolutionary history (Schwanbeck et al., 2011). That is, where in O.

- 143 -
bicornis and D. melanogaster an active germarial Notch signal facilitates oocyte
specification, in A. mellifera such a signal may prevent specification and oocyte
progression.
Consequently, as in Duncan et al. (2016), I used the Notch inhibitor
DAPT to try and provide a functional test of Notch signalling in oocyte
specification in this species. DAPT did not inhibit oocyte specification in O.
bicornis within my set-up. This may be due to a number of reasons. The dose
used (1mM DAPT as in Duncan et al., 2016) may not have been sufficient. Not
only do O. bicornis females and A. mellifera workers differ in body size, but the
active ovaries of O. bicornis are inherently substantially larger than the inactive
ovaries of newly emerged and queenright workers. Interspecific differences in
the uptake (gut) and distribution (haemolymph) of DAPT could further
complicate matters. To rule out such complications, the uptake, distribution and
stability of DAPT in the O. bicornis haemolymph could be assayed directly
through high performance liquid chromatography (HPLC).
In Duncan et al. (2016), DAPT was presented in solid food. Workers
were also kept in complete darkness — which was not the case for O. bicornis
here — and DAPT is known to be sensitive to light. A lack of uptake could
further also be attributable to the concerns raised surrounding solubility (Stumm
and Morgan, 2012; Williams et al., 2012). While effective uptake can be
assayed through HPLC; effective action of the inhibitor would need to be
verified through the use of RT-qPCR of Notch responsive genes (E(spl)) in
various tissues (e.g.: ovary, brain and fat body). Future trials could apply
different methods of administration for this chemical (e.g. injection and topical
application), as was performed for QMP here. Finally, it may be that DAPT did
not act on the ovaries directly in (Duncan et al., 2016). DAPT may have acted
on for instance specific neuronal networks in A. mellifera, after which signals
might be sent to the ovary. Hence, attempts could be made to cut out all
intervening and compromising steps (uptake and brain), and assay ovaries
directly. Tissue culture media exist, for at least A. mellifera ovaries (Rachinsky
and Hartfelder, 1998), and have been used for BrdU immunocytochemistry
previously (Tanaka and Hartfelder, 2004). If such a medium could be adapted
for O. bicornis (and DAPT is soluble and effective in such media) then ovaries
could be exposed and assayed directly. DAPT is generally considered a ‘highly
specific γ‐secretase inhibitor’ (Geling et al., 2002), which made it the preferred
candidate to investigate Notch signalling in the ovary here. Yet, following its lack
of response, I subsequently opted for less specific ways to try and repress
oocyte specification and oogenesis in O. bicornis.
- 144 -
Even with the denial of a protein source (pollen), I could not arrest
oogenesis in the germarium of O. bicornis. Cane (2016) similarly denied pollen
to O. californica females, and found that terminal oocytes did not grow44. He did
not investigate the germarial region, nor did he explicitly report any other
phenotypes. This implies, that while an adult pollen diet may be required to
further vitellogenesis post emergence, protein levels may not regulate germarial
Notch. However, this finding is still in line with the findings of Bonfini et al.
(2015) in D. melanogaster, where they found no increase in germline stem cell
niche size with yeast supplemented medium in comparison to standard
medium. Starvation treatments in Bonfini et al. (2015) on the other hand,
consisted of agar only (complete starvation), or glucose and protein depleted
media, which did show a decrease in germline stem cell niche size. Since
protein and glucose depletion were never regarded separately in their
experiments, it may be that germarial Notch is responsive to glucose only. Not
only is germarial Notch signalling known to be responsive to insulin signalling
(Hsu and Drummond-Barbosa, 2011), but insulin signalling is known to be
important to insect reproduction in general (Badisco et al., 2013). Furthermore,
insulin signalling has roles implicated for it in both the division of labour (Ament
et al., 2008) and caste differentiation of A. mellifera (Wheeler et al., 2006; de
Azevedo and Hartfelder, 2008; Mutti et al., 2011; Wolschin et al., 2011; Wheeler
et al., 2014).
During the starvation trial carried out here, I managed to decrease the
estimated sucrose uptake over fourfold (in conjunction to protein starvation). Yet
the disaccharide sucrose still breaks down into both glucose and fructose.
Hence, while my treatment will have decreased the amount of glucose available
(as in Bonfini et al., 2015 where glucose could only be derived from maize
starch and subsequently maltose), it may not have excluded glucose
sufficiently. A future approach may be to try and completely exclude glucose
(i.e. using fructose only, but also note that fructose impairs insulin signalling in
rats: Baena et al., 2016), to try and gauge the role of insulin signalling.
Additional trials or experiments, may involve: a further decrease in sugar
concentrations used (e.g. 2.5-5% treatment), temporary complete starvation (as
44 I did not investigate terminal oocyte volumes here, since this was not the primary
region of interest. Additionally, in order to clearly stain and image the germarium, ovarioles had to be individualised and peeled (removing the ovariole sheath and intima), and ovarioles had to be mounted on slides. Mature and terminal oocytes were often too large to mount, or were damaged and broken off during the peeling of the ovaries.
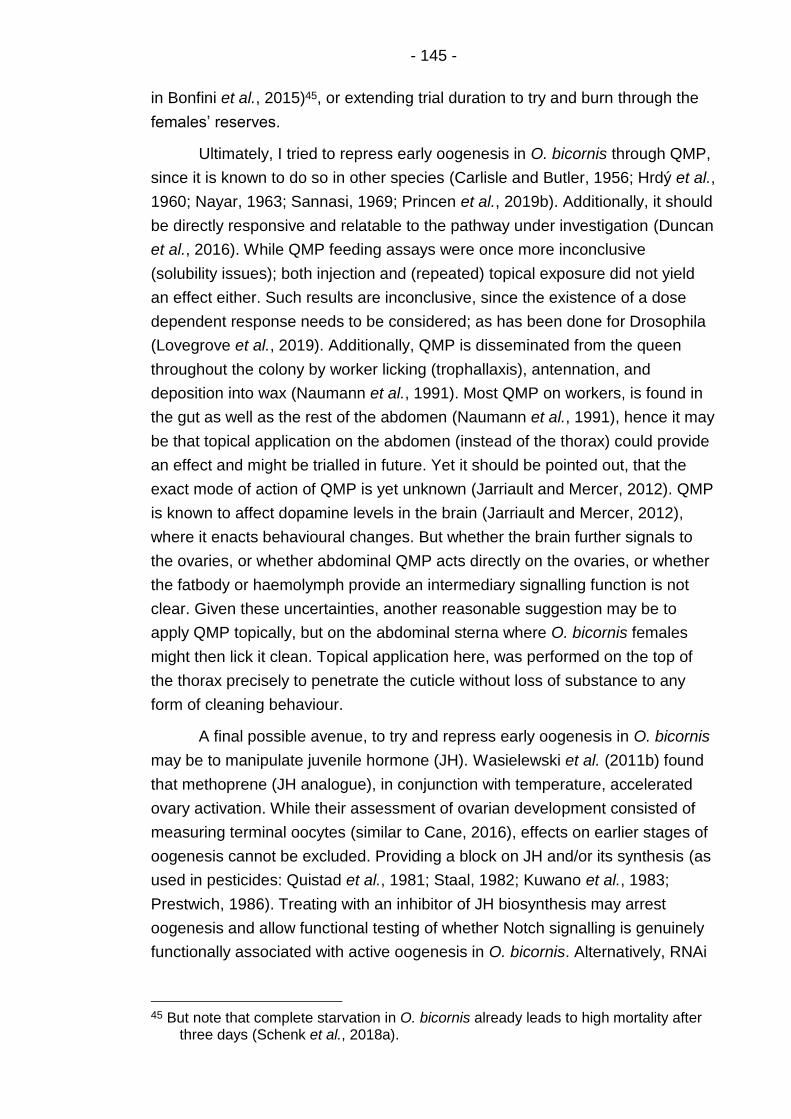
- 145 -
in Bonfini et al., 2015)45, or extending trial duration to try and burn through the
females’ reserves.
Ultimately, I tried to repress early oogenesis in O. bicornis through QMP,
since it is known to do so in other species (Carlisle and Butler, 1956; Hrdý et al.,
1960; Nayar, 1963; Sannasi, 1969; Princen et al., 2019b). Additionally, it should
be directly responsive and relatable to the pathway under investigation (Duncan
et al., 2016). While QMP feeding assays were once more inconclusive
(solubility issues); both injection and (repeated) topical exposure did not yield
an effect either. Such results are inconclusive, since the existence of a dose
dependent response needs to be considered; as has been done for Drosophila
(Lovegrove et al., 2019). Additionally, QMP is disseminated from the queen
throughout the colony by worker licking (trophallaxis), antennation, and
deposition into wax (Naumann et al., 1991). Most QMP on workers, is found in
the gut as well as the rest of the abdomen (Naumann et al., 1991), hence it may
be that topical application on the abdomen (instead of the thorax) could provide
an effect and might be trialled in future. Yet it should be pointed out, that the
exact mode of action of QMP is yet unknown (Jarriault and Mercer, 2012). QMP
is known to affect dopamine levels in the brain (Jarriault and Mercer, 2012),
where it enacts behavioural changes. But whether the brain further signals to
the ovaries, or whether abdominal QMP acts directly on the ovaries, or whether
the fatbody or haemolymph provide an intermediary signalling function is not
clear. Given these uncertainties, another reasonable suggestion may be to
apply QMP topically, but on the abdominal sterna where O. bicornis females
might then lick it clean. Topical application here, was performed on the top of
the thorax precisely to penetrate the cuticle without loss of substance to any
form of cleaning behaviour.
A final possible avenue, to try and repress early oogenesis in O. bicornis
may be to manipulate juvenile hormone (JH). Wasielewski et al. (2011b) found
that methoprene (JH analogue), in conjunction with temperature, accelerated
ovary activation. While their assessment of ovarian development consisted of
measuring terminal oocytes (similar to Cane, 2016), effects on earlier stages of
oogenesis cannot be excluded. Providing a block on JH and/or its synthesis (as
used in pesticides: Quistad et al., 1981; Staal, 1982; Kuwano et al., 1983;
Prestwich, 1986). Treating with an inhibitor of JH biosynthesis may arrest
oogenesis and allow functional testing of whether Notch signalling is genuinely
functionally associated with active oogenesis in O. bicornis. Alternatively, RNAi
45 But note that complete starvation in O. bicornis already leads to high mortality after
three days (Schenk et al., 2018a).
- 146 -
of the JH hormone receptor Methoprene-tolerant (Met) might be tried (as has
been performed in Schistocerca gregaria for instance; Gijbels et al., 2019).
The most convincing negative result for O. bicornis here, was the
absence of an effect of QMP injection in O. bicornis. Since this method has
been demonstrated in other species (single injection: Carlisle and Butler, 1956;
repeated injection: Sannasi, 1969). Yet, in all studies concerning QMP (old and
new), QMP is administered either before or during ovary development/activation
(Carlisle and Butler, 1956; Hrdý et al., 1960; Nayar, 1963; Sannasi, 1969;
Lovegrove et al., 2019; Galang et al., 2019; Princen et al., 2019b). Indeed,
Carlisle and Butler (1956) in particular, in their study using a single injection on
prawns, are very explicit with this in their methodology. They initiate ovary
activation by removing the eyestalks containing an ’ovary inhibiting hormone’,
and subsequently injected QMP. This then raised the question of whether ovary
activation can indeed be repressed once oogenesis is underway. Since O.
bicornis emerges with primed and active ovaries (see Chapter 4), this might
then elegantly explain why ovary repression is seemingly so difficult in this
species.
QMP is assured to work in A. mellifera workers, hence the ideal way to
test the effectiveness of QMP post ovary activation, was to subject
reproductively active workers to QMP. Such a design possesses its own
hurdles, considering worker survival (see 6.4.3). Yet, no effect of QMP post-
ovary activation could be detected. Once more, a dose-response argument
could be made for QMP (Lovegrove et al., 2019), albeit a nuanced one. It is
already known that workers possessing more ovarioles, are more resistant to
the repressive effects of QMP, and that they will activate their ovaries
disproportionately upon release from QMP (Amdam et al., 2006; Makert et al.,
2006; Traynor et al., 2014; Ronai et al., 2017)46. A straightforward explanation
for this phenomenon might be that the ‘excess’ or ‘surplus’ ovarian tissue in
these workers makes it harder for QMP to enact its role (assuming that every
worker, on average, takes up as much QMP as any other worker). Such a
hypothesis would elegantly explain why post ovary activation (and increased
ovarian mass) QMP becomes ineffective. The ovarian mass of O. bicornis
females upon emergence is likewise high, and might require a higher dose of
QMP to elicit an effect. Other considerations are: the limited duration of the A.
mellifera trials here (restricted by caged survival; 6.4.3), and a loss of QMP
46 Ronai et al. (2017) suggests that five ovarioles per ovary may be ideal for worker
ovary activation, but did not correct for the underlying distribution of ovariole numbers, which is not Gaussian (with a mode of 3-4 ovarioles; Velthuis, 1970) and the distribution is also known to vary among subspecies (Velthuis, 1970).

- 147 -
uptake by workers post-ovary activation (e.g. reduced worker trophallaxis in
queenless workers: Mayer et al., 1998). Finally, QMP might simply provide an
non-reversible plastic phenotype, suppressing early oogenesis exclusively prior
to tissue development.
The marked decrease in survival of A. mellifera workers exposed to QMP
was striking, and retained significance even under appropriate tests. This result
could not be explained by an increase in food uptake (Naumann and Laflamme,
1993). In fact, QMP is known to make workers more resistant to starvation
(Fischer and Grozinger, 2008). Paoli et al. (2014) even reported an increased
survival for caged workers subjected to QMP, compared to controls (regardless
of whether essential amino acids were added to the diet). The differential
survival presented here, might therefore make more sense in light of ovary
activation. A decrease in queen acceptance in queenless hives over time is well
known within the community47, even though no explicit studies are available.
Indeed, queen cells are known to be constructed within 48 hrs of queen loss
(Fell and Morse, 1984; Hatch et al., 1999), likely cued by the loss of QMP
(Melathopoulos et al., 1996). Subjecting the aged queenless workers to QMP
here, could be considered a simulation of presenting a new queen to a hive that
has been queenless for several weeks. Since workers could not remove the
QMP on the slide (i.e. equivalent to rejecting and killing the queen), it may have
caused stress. QMP might even be toxic to workers with activated ovaries, or
might direct aggression (from workers with stage 0 or 1 ovaries) towards
workers with fully activated ovaries (stage 2 or 3). It should be noted that
deceased bees were not dissected to check for possible biases in ovary
activation48.
With a view to bypass the issues surrounding A. mellifera worker survival
encountered here, it might be worthwhile to try feeding newly emerged caged
workers royal jelly. While royal jelly does not necessarily lead to increased
survival, Pirk et al. (2010) did find that it leads to higher levels of ovary
activation. Perhaps ovaries may also activate faster, which could facilitate a
design using newly emerged workers.49 If the further use of caged workers to
investigate the effects of QMP post ovary activation proves untenable, it may
prove fruitful to make use of the fruit fly instead. This since the survival of D.
melanogaster should not be limited in the same way as that of A. mellifera
47 E.g.: F. Ratnieks; http://www.lasiqueenbees.com/how-to/how-to-introduce-your-
queen-into-a-hive; last updated: July 2016; access date: 23/02/2020 48 This because incubating conditions facilitate rapid tissue degradation, and bees
were only checked on once per day to reduce handling stress. 49 Then again, the composition of RJ is rather complicated (Sabatini et al., 2006) and
may further confound results.
- 148 -
workers, while D. melanogaster is known to enjoy the priming effect of QMP
(Lovegrove et al., 2019). Survival, aggression, and secondary ovary regression
could all be investigated in D. melanogaster in a full factorial design, to
disentangle the priming and releasing effects of QMP, and perform a direct test
of the reversibility of the ovarian phenotype (Figure 6.12).
Figure 6.12: Suggested experimental design. Using virgin D. melanogaster
females (☿), the reversibility of QMP could be studied more easily. The use of virgins is standard in D. melanogaster QMP experiments (Lovegrove et al., 2019). The axes represent three (undefined) time periods.
- 149 -
Chapter 7 General discussion
Darwin’s (1859) special difficulty — the evolution of neuter castes —
continues to intrigue researchers. In the recent past, the RGPH has come to
prominence in the field, whose foundations were laid out by West-Eberhard
(1987; 1996; 2003; 2005). The RGPH broadly states that ‘reproductive
regulatory networks of solitary ancestors’ underlie the reproductive division of
labour in eusocial species (Page et al., 2009) — i.e. that there has been a
decoupling of reproductive and parental care traits. This general framework can
be further subdivided into more specific hypotheses and cases (e.g. within
forager specialisation; Oldroyd and Beekman, 2008). These different
hypotheses are not mutually exclusive and illustrate that multiple evolutionary
routes can lead to eusociality (Linksvayer and Johnson, 2019). For instance, in
Polistes wasps, it is thought that the regulatory network underlying diapause
(e.g. JH) — which is typified by prolonged development, prolonged lifespan,
cold-resistance, stress-resistance, nutrient storage, and delayed reproduction
— underlies the gyne (i.e. ‘queen’) phenotype (Hunt et al., 2007). Workers, in
turn, are thought to be derived from the non-diapausing phenotype, possessing
the reverse traits (Hunt et al., 2007). This regulatory network is then thought to
have been co-opted into nutritional pathways over evolutionary time, as parents
manipulated (Alexander, 1974; Craig, 1979) this regulatory network and the
resulting phenotypes through selective feeding of offspring (Hunt and Amdam,
2005; Hunt et al., 2007). In a striking example of convergent evolution, the
RGPH introduces how ‘a set of conserved genes or molecular pathways’ have
repeatedly been recruited into the underlying social structure of eusocial
societies (Bloch and Grozinger, 2011; Berens et al., 2015; Kapheim, 2016).
To validate this premise, cross-species comparisons across the eusocial spectrum are required:‘Comparative studies that include solitary insects will help fill gaps in our understanding of how developmental plasticity evolves in solitary ancestors, as well as how genes involved in other aspects of developmental plasticity may have been co-opted for social evolution. Additional research on solitary insects will also enable more complete tests of the hypothesis that social function emerged from standing genetic variation, and will help to identify the mechanisms that produce this variation. Comparative studies of selection patterns in closely related solitary and social species will also be necessary to evaluate the degree to which plasticity precedes social evolution.’ ~ Kapheim (2019)
- 150 -
7.1 The use of O. bicornis
Roubik (1992) pointed out that many advanced eusocial species are
tropical and subtropical, and further outlined several reasons why this might be.
It stands to reason that the most ideal candidates to become reference solitary
model species for cross-species comparisons would be found in tropical regions
— as they would be closely related to eusocial species, and possess many if
not all of the required pre-adaptations to eusociality (Chapter 1). Unfortunately,
tropical species are not accessible to all researchers, and for this reason I
exerted considerable effort to further O. bicornis as such a model species
(Chapter 3 and 4). Regardless of the shortcomings of a temperate species, O.
bicornis is still expected to be relevant when investigating aspects of the RGPH.
When conserved genetic toolkits (Kapheim, 2016) are of interest, the respective
importance of phylogenetic distance (95 my diverged from A. mellifera; Peters
et al., 2017) should be somewhat lessened. Indeed, D. melanogaster, some
330 my diverged from A. mellifera (Misof et al., 2014), has even been put
forward as a model of study in this regard (Camiletti and Thompson, 2016).
Another solitary bee was initially considered for as a model species here,
namely the alfalfa leafcutter bee (Megachile rotundata). Its most recent common
ancestor with A. mellifera likewise existed some 95 my ago (Peters et al., 2017)
as it is a member of the Megachilidae just as O. bicornis is. M. rotundata
possesses similar life-history traits to O. bicornis, with the notable exceptions of
using leaves to line cells and the possession of a partial bivoltine lifecycle
(Tepedino and Parker, 1988). Nevertheless, O. bicornis was elected over M.
rotundata, chiefly based on the 2014 study that managed to elicit a full life cycle
in a laboratory environment (Sandrock et al., 2014).
Sandrock et al. (2014) definitively proved the feasibility of fully
maintaining a solitary bee in an exclusively laboratory environment. I likewise
managed to elicit the full range of reproductive behaviours, but could only do so
with a small number of females at any one time. Based on personal
observation, recommendations (van der Steen; Raw), and an overview of the
literature; in Chapter 3 I laid out recommendations for future work. Specifically, I
noted the prevailing successes reported using greenhouses (Holm, 1974; Raw,
1972), in conjunction with the simulated light conditions in Sandrock et al.
(2014). Based on these I primarily emphasised the importance of natural light,
and secondarily the presence natural floral resources50. Even though I put these
50 Even though Sandrock et al.’s (2014) study indicated natural floral resources are not
strictly necessary, Raw emphasised their use, and I achieved additional gains in nesting and egg laying behaviours when preferred floral resources (Quercus and Ranunculus) were mimicked.
- 151 -
forward as key factors in establishing O. bicornis females in a laboratory
environment, I caution against ‘threshold model’–thinking, and argue that the
natural environment should be mimicked as much as possible.
Such and further recommendations in Chapter 3, will hopefully aid future
endeavours in establishing solitary bees in a laboratory environment. While
methods for observing the provisioning and egg laying behaviour of O. bicornis
are already present (e.g. Strohm et al., 2002), lab rearing allows for further
experimental control (e.g. behavioural manipulations, repeated injections, RNAi
feeding, and the potential for genetic modification using CRISPR/Cas9, etc.).
Combining these observation methods with laboratory maintenance would allow
for studying, for instance, the conditions under which the eating of eggs occurs
in this species (Strohm et al., 2002) with reference to behavioural co-option into
worker policing behaviour. Considering the difficulties in abating early
oogenesis in Chapters 5 and 6, reproductive control in O. bicornis might
predominantly be regulated during late stage oogenesis (e.g. Cane, 2016). Fully
maintaining O. bicornis in the laboratory would then also allow directly
measuring reproductive success (as in e.g.: Shukla et al., 2013; Kant et al.,
2013; Sandrock et al., 2014; Cane, 2016).
Another step undertaken to appropriate O. bicornis as a model species
with regard to eusocial research, was the development and validation of
microsatellite markers (Chapter 4). In future, these markers will be used to test
whether females are indeed monogamous in this species (wrt: Hughes et al.,
2008), by determining whether extra-pair paternity occurs and with what
frequency. Furthermore, Bretman and Tregenza (2005) point out that the
possibility of post-copulatory female choice51 can be an important factor
underlying the effective mating system. Hence, in future, multiple mating could
also be investigated by assaying spermatheca directly using the microsatellites
developed in this study (Chapter 4) as was done in crickets (Bretman and
Tregenza, 2005).
The microsatellite markers developed here may also advance the quality
of genomic resources of O. bicornis in future. As microsatellite markers can
further be used to create linkage maps for instance (Solignac et al., 2004).
While many more markers would be needed, these could likewise be mined
(Beier et al., 2017) from the O. bicornis genome (Beadle et al., 2019), avoiding
the labour intensive construction of genomic libraries (Ostrander et al., 1992;
51 Mechanisms of post-copulatory female choice consist of: preferential storage of
sperm or dumping of sperm from disfavoured males, or even egg-sperm interactions whereby certain sperm phenotypes are more probable to fertilise (Parker, 1970; Eberhard, 1996; Bretman et al., 2004).
- 152 -
Neumann and Seidelmann, 2006). Since inbreeding is known in Hymenoptera
(Packer and Owen, 2001), and possibly exists within O. bicornis (Conrad et al.,
2010; Conrad and Ayasse, 2015; Conrad et al., 2018), these markers can be
used to test for it. Under laboratory conditions, as examined in Chapter 3,
inbreeding avoidance and consequences to inbreeding could be ascertained
directly through mating assays (e.g. Conrad and Ayasse, 2015) and
reproductive success (e.g. Sandrock et al., 2014) respectively. Finally,
microsatellite markers such as these, can be used to asses gene-flow at
population scales (e.g.: Conrad and Ayasse, 2015; Conrad et al., 2018), and
subsequently inform conservation efforts (Packer and Owen, 2001; Zayed,
2009).
While the work in Chapters 3 and 4 purposefully addressed establishing
O. bicornis as a model species, Chapter 5 and 6 likewise contributed to this.
The adaptation of immunohistochemistry (IHC; Chapter 5) and in situ
hybridisation (ISH; Chapter 6) for ovarian tissue in this species, combined with
the microstructural study and description of the ovary, should also aid in the set-
up of O. bicornis as a model species. Overall, the work presented in this thesis
has established new tools and approaches towards advancing O. bicornis as a
model species for studying eusocial evolution
7.2 Reproductive constraint from reproductive control
The reproductive constraint suffered by adult honey bee workers, is both
incomplete and reversible. The physiological self-restraint practiced by workers
(Hoover et al., 2003) is reversed as soon as a reproductive queen has vacated
her throne. What is more, a single molecular switch can be overturned
(germarial Notch signalling), and honey bee workers can activate their ovaries,
even in the presence of QMP (Duncan et al., 2016). The molecular switch in
question is highly conserved (Duncan and Dearden, 2010) and is already
known to regulate reproduction through environmental signals in other species
(Xu et al., 1992; Drummond-Barbosa and Spradling, 2001; Hsu and Drummond-
Barbosa, 2011; Bonfini et al., 2015). It stands to reason, that it is a conserved
regulatory network that was recruited into the social context during the evolution
of eusociality in A. mellifera (Kapheim, 2016). Investigating how proximate
mechanisms work, can inform us on the causes of their ultimate evolution
(Mayr, 1961; Tinbergen, 1963). For example, environmental signals controlling
germarial Notch signalling in a hypothetical solitary ancestor of a eusocial
species, would instruct us on how those environmental signals were
commandeered by for instance, a dominant reproductive, to repress the
physiological reproductive machinery in early eusocial workers.

- 153 -
The early block on queenright oogenesis in honey bee workers is
morphologically similar to that of virgin queens (Tanaka and Hartfelder, 2004);
which prompted me to investigate whether mating status could be ancestral to
adult reproductive constraint. In Chapter 5 I established that mating status does
not exert any kind of effect on the ovaries of O. bicornis, contrary to the situation
in many other insects (Gillott and Friedel, 1977; Gillott, 2003; Colonello and
Hartfelder, 2005; Avila et al., 2011). This makes it extremely unlikely, for
instance, that this constraint in early honey bee workers evolved by dominant
reproductives monopolising access to mates. It is therefore probable, that both
loss of honey bee worker spermatheca (Winston, 1991) as well as the block on
oogenesis in queens (Patricio and Cruz-Landim, 2002; Tanaka and Hartfelder,
2004) evolved secondarily. That is to say, as colony size increases over
evolutionary time, the queen-worker conflict shifts. Due to the increased number
of workers, the probability succeeding the reproductive queen becomes ever
smaller, which makes conflict over reproduction switch towards brood
composition instead (e.g. sex ratio; Bourke, 1999). Consequently, no selective
pressure is maintained on honey bee workers to lay fertilised eggs at that point
(as workers are more related to their sons than they are to their daughters;
Bourke, 1999), and extensive selective pressure is predicted to be exerted on
queens by workers to be mated.
Negative results such as those found in Chapter 5, are typically difficult
to resolve. To date, little is known of the physiological response of female O.
bicornis to mating. The mating plug is thought to serve as an extra insurance to
paternity, but is not incorporated by the female nor influence her decision to
remate, and only serves as a physical block to future matings (Seidelmann,
2015). The post-copulatory display of the male is thought to prevent the female
from remating (Seidelmann, 2014a), but the application of a pheromone during
the display remains disputed (Ayasse et al., 2000; Seidelmann and Rolke,
2019). Whether the post-copulatory display has any effect on female physiology
in conjunction to its effect on behaviour is unknown. Consequently, current
evidence would indicate that mating status can roughly be considered a
Boolean trait52 in this species. Therefore, the absence of any effect of mating
status on the reproductive physiology of O. bicornis I demonstrated here can be
considered robust.
52 I.e. Boolean (true/false) in the sense that a female is either retained virginity or was
mated. This is only true however, when we assume that the full suite of male and female mating behaviours (Seidelmann, 1995) were always observed by mated females.

- 154 -
In Chapter 6, I showed that germarial Notch signalling in the O. bicornis
ovary is active when oogenesis is actively occurring, which stands in direct
contrast to the situation in queenless A. mellifera workers. This result was more
in line with the situation in D. melanogaster (Song et al., 2007), whose most
recent common ancestor with A. mellifera is some 235 my further removed than
the most recent common ancestor shared between A. mellifera and O. bicornis
(Misof et al., 2014; Peters et al., 2017). Given the role of germarial Notch
signalling in regulating oogenesis in both A. mellifera and D. melanogaster
(Song et al., 2007; Duncan et al., 2016), I subsequently set out to arrest
oogenesis at the germarial checkpoint (Pritchett et al., 2009) in O. bicornis.
Initially, given the functional switch of germarial Notch signalling, I used the
same Notch inhibitor used by Duncan et al. (2016) to try and achieve this. When
no phenotype could be discerned, I next attempted to deprive females of
nutrients (as in Bonfini et al., 2015; and Cane, 2016). Finally, when that failed, I
tried using QMP to arrest early oogenesis, as it is effective over a broad
phylogenetic range (see Lovegrove et al., 2019 and references therein).
None of these treatments had any success arresting early oogenesis in
O. bicornis. Particularly, QMP exposure through injection is known to work
(Nayar, 1963; Carlisle and Butler, 1956), yet did not yield a clear phenotype in
O. bicornis. This while QMP exposure seemingly disrupts oogenesis by
activating two ovarian checkpoints during D. melanogaster oogenesis
(Lovegrove et al., unpublished data). Such phenotypes (e.g. condensed nurse
cell nuclei during early vitellogenesis) were rarely observed in O. bicornis. There
may be numerous reasons for a lack of effect of QMP in O. bicornis.
Experiments in D. melanogaster have typically been performed on females that
are not yet reproductively mature (Camiletti et al., 2013; Lovegrove et al.,
2019)53, which could not be said of O. bicornis here54. Furthermore, the exact
mode of action of QMP remains largely unknown (Jarriault and Mercer, 2012).
Hence, unless it is known whether QMP affects the ovary directly, the lack of an
effect by QMP injection does not allow me to draw stringent conclusions. As
mentioned previously, demonstrating a negative claim is arduous, and
shortcomings in experimental design (dose-response, uptake and
administration, and time of dissection) further impede inference. Since, these
factors were discussed at length in Chapter 6, they will not be renewed here.
53 Ovaries of D. melanogaster are activated only within the first 60 hours after eclosion
(Galang et al., 2019). 54 An equivalent experiment in O. bicornis would not only require exposing larvae to
QMP, but also keeping overwintering pharates exposed to QMP throughout their diapause. This is arguably an unfeasible experiment, especially should oral uptake of QMP be required for overwintering pharates.
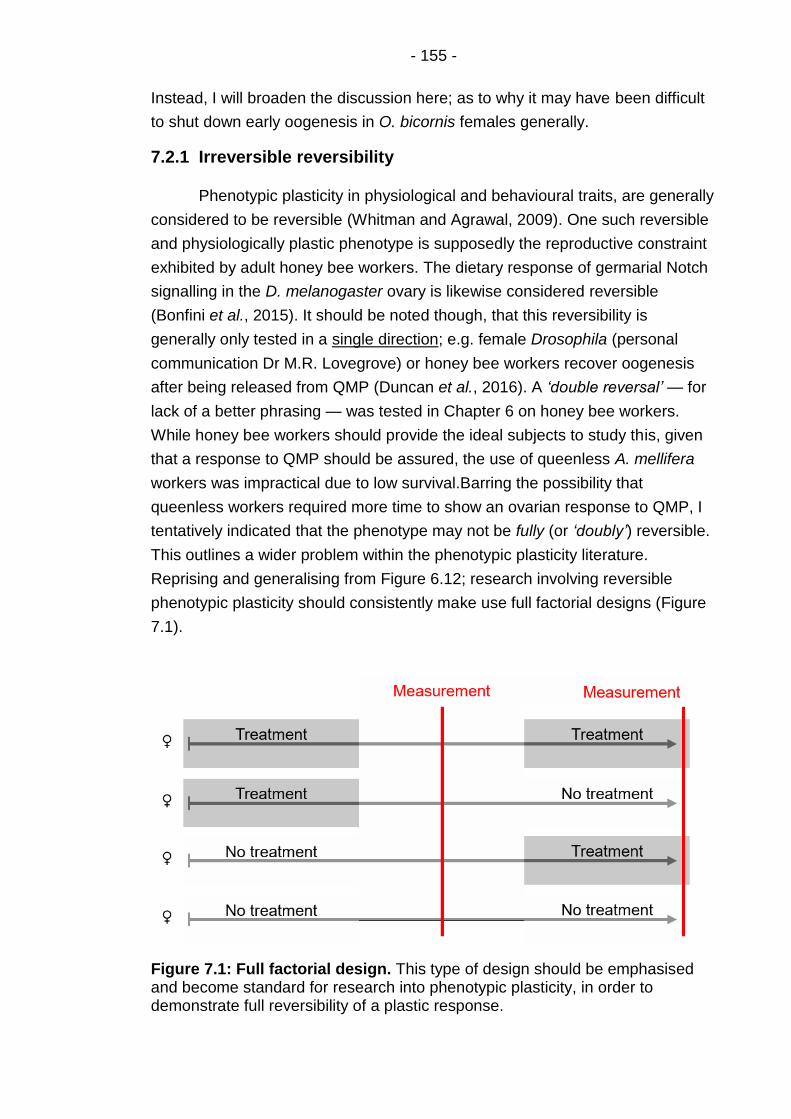
- 155 -
Instead, I will broaden the discussion here; as to why it may have been difficult
to shut down early oogenesis in O. bicornis females generally.
7.2.1 Irreversible reversibility
Phenotypic plasticity in physiological and behavioural traits, are generally
considered to be reversible (Whitman and Agrawal, 2009). One such reversible
and physiologically plastic phenotype is supposedly the reproductive constraint
exhibited by adult honey bee workers. The dietary response of germarial Notch
signalling in the D. melanogaster ovary is likewise considered reversible
(Bonfini et al., 2015). It should be noted though, that this reversibility is
generally only tested in a single direction; e.g. female Drosophila (personal
communication Dr M.R. Lovegrove) or honey bee workers recover oogenesis
after being released from QMP (Duncan et al., 2016). A ‘double reversal’ — for
lack of a better phrasing — was tested in Chapter 6 on honey bee workers.
While honey bee workers should provide the ideal subjects to study this, given
that a response to QMP should be assured, the use of queenless A. mellifera
workers was impractical due to low survival.Barring the possibility that
queenless workers required more time to show an ovarian response to QMP, I
tentatively indicated that the phenotype may not be fully (or ‘doubly’) reversible.
This outlines a wider problem within the phenotypic plasticity literature.
Reprising and generalising from Figure 6.12; research involving reversible
phenotypic plasticity should consistently make use full factorial designs (Figure
7.1).
Figure 7.1: Full factorial design. This type of design should be emphasised and become standard for research into phenotypic plasticity, in order to demonstrate full reversibility of a plastic response.
- 156 -
Throughout this work, the insect ovary was regarded as a ‘conveyer belt’
(5.4.1). This implies that any individual oocyte together with its associated nurse
and follicle cells, does not provide any kind of positive or negative feedback to
neighbouring oocytes and associated cells. This assumption of independence is
ingrained in the literature surrounding insect oogenesis, implicit in language as
oocyte stages (Wilson et al., 2011), checkpoints (Pritchett et al., 2009), and
rates of oogenesis and resorption (Richard and Casas, 2012). But as Richard
and Casas (2012) pointed out, different physiological processes are at work,
which likely influence one another55. For instance, while ecdysone (from the
prothoracic gland) is generally known to be a trigger for vitellogenin synthesis in
the fat body, and patency of the oocyte — the local ecdysone produced by the
follicle cells is directly incorporated into the oocyte (Lenaerts et al., 2019a).
Consequently, Deady et al. (2015) provided direct evidence of within ovary
dependence, by showing that corpora lutea56 produce ecdysone which aids
maintaining a high rate of oogenesis in the D. melanogaster ovary. If we
assume, that QMP operates on the ovary directly, then the putative evidence
presented in Chapter 6, indicating that the ovarian response to QMP may not be
fully reversible in honey bee workers, would similarly imply that processes
within the different regions of the ovary57 are not wholly independent of one
another.
If this is the case, QMP mediated adult reproductive constraint would
have to be considered a developmental constraint instead. As mentioned prior,
in Chapter 6, studies that demonstrate the broad phylogenetic range of QMP
without exception administer it either before or during ovary development
(Carlisle and Butler, 1956; Hrdý et al., 1960; Nayar, 1963; Sannasi, 1969;
Princen et al., 2019b; Galang et al., 2019). QMP might maintain a block on the
development of the ovarian tissue (i.e. organogenesis), instead of blocking early
oogenesis directly. This subtle distinction would place adult reproductive
constraint under the umbrella of developmental plasticity. The distinction is an
important and meaningful one, as it informs us towards its evolution. Co-option
of QMP mediated adult reproductive constraint might for instance be more firmly
grounded under parental manipulation instead (Alexander, 1974; Michener and
Brothers, 1974). Parental manipulation is known to be important in caste biasing
in facultatively eusocial species for instance (e.g. Kapheim et al., 2015a;
55 This is the case even within their model, where the speed at which the different
physiological ovarian processes occur, are treated as rates — i.e. constants or parameters, rather than variables which change over time.
56 Corpora lutea are former epithelial follicle cells, involuted from an ovulated mature egg.
57 Terminal filament, germarium, and vitellarium.

- 157 -
Lawson et al., 2017), and many studies have indicated the importance of larval
nutrition in caste biasing/determination overall (e.g. review in Vespida:
O'Donnell, 1998; the role of nutrition on honey bee caste is discussed in detail
in 1.2.2). This overview then tends to paint a picture where development is
exceedingly important, and where larval nutrient limitation through parental
manipulation58 may have presented the initial mechanism of achieving
subfertility in female offspring.
The above conjecture, is contingent on both the mode of action of QMP
(whether QMP acts on the ovary directly, without processing and signalling from
the brain), as well as the possibility of secondarily arresting early oogenesis
using QMP. The former remains enigmatic, and more work concerning the
physiological mechanism of the anti-ovarian response of QMP is needed. This
could be investigated by applying QMP directly to ovaries in culture media for
example, as was likewise suggested for DAPT in section 6.5. The latter might
be investigated through the use of D. melanogaster following the experimental
design suggested in Figure 6.12.
7.2.2 Origin or elaboration?
In section 1.2.1, I discussed two phylogenetically informed sociogenomic
studies that drew distinctions between ‘primitively’ and ‘highly’ eusocial species
(Woodard et al., 2011), or between ‘origins’ and ‘elaborations’ of eusociality
(Kapheim et al., 2015b)59. While these terms are subjective and may even differ
slightly between studies, their general overtone points towards an identical and
important consideration. That the selective pressures in small and incipient
social organisations may be very different than those suffered by increasingly
larger colonies (Bourke, 1999).
Primitive eusocial organisation is often regulated through dominance
hierarchies, where the primary reproductive eats eggs laid by helpers (Fletcher
and Ross, 1985). In small primitive social organisations headed by one or a few
dominant reproductives, it is more difficult to fully police and repress the egg
laying of helpers, in addition to any individual worker retaining a relatively high
chance of replacing/succeeding a reproductive (Bourke, 1999). In other words,
early on in eusocial evolution, reproductive conflict is dynamic. Under such
58 In larger colonies, manipulation of larvae would gradually be taken over by siblings,
as is the case for worker nursing bees in A. mellifera for instance. 59 Some authors even distinguish between three transitions (from subsocial to
incipiently social, to primitively eusocial, to advanced eusocial: Rehan and Toth, 2015). Terminology within sociobiology is notoriously confounded (e.g.: Costa et al., 1996; Costa and Fitzgerald, 2005) and further falls outside the remit of this thesis.
- 158 -
labile conditions, blocks on late oogenesis make more sense, as they allow for
a quicker turn around when social context changes. This would make oocyte
resorption, and the final checkpoint in oogenesis more susceptible to selective
pressures. Other studies on solitary bees (Richards, 1994; Cane, 2016;
Kapheim and Johnson, 2017a), tend to measure terminal oocyte length or
volume. Even studies making use of D. melanogaster to investigate the effects
of QMP, typically quantify the number of ovarioles, ovariole area or the number
of mature oocytes (e.g.: Camiletti et al., 2013; Lovegrove et al., 2019) — i.e.
measures which implicate either ovary development (organogenesis), late stage
oogenesis or both.
In contrast, I specifically investigated early oogenesis throughout this
work. This followed simply from the mechanism I studied (germarial Notch
signalling; Duncan et al., 2016), as well as from the inability to consistently
enable O. bicornis females to forage and lay in a laboratory setting (Chapter 3).
The lack of egg laying in the laboratory setup, disallowed determining how large
mature eggs are, as egg sizes could already be different for sons and daughters
for instance. More importantly however, no eggs were expected to reach full
maturity, as late stage oocyte abortion and resorption are inevitably expected
when females are reluctant to lay eggs. In Chapter 5, I largely circumvented this
issue by approximating oocyte maturation rate within individual ovarioles. Yet,
differences in actual egg laying and oocyte resorption cannot be excluded (as in
Kant et al., 2013; see section 5.5.2). This once more underlines the prudence of
fully establishing a solitary bee species in a laboratory environment.
In more advanced eusocial organisation, policing behaviour by dominant
reproductives is replaced by mutual worker policing (Ratnieks, 1988; Bourke,
1999). And morphological caste polyphenism is typically exacerbated, with
workers being even more subfertile than they are in more primitive and smaller
colonies (Bourke, 1999). The contrast between primitive and advanced eusocial
organisation (A. mellifera falling in the latter category: Woodard et al., 2011)
indicates that mechanisms blocking early oogenesis (e.g. germarial Notch;
Duncan et al., 2016) may have become more important during stages of social
‘elaboration’, with increasing colony size and decreasing worker fertility (Bourke,
1999). Referring to Figure 1.4 (Gadagkar, 1996), this would mean that with
increasing social complexity (and stability), the stabilising selection on early
oogenesis would be eroded (Figure 1.4C) by the complete and stable lack of
worker reproduction. Consequently, the phenotypic range of early oogenesis is
widened (i.e. increased phenotypic plasticity), which is further expanded by
diversifying selection on the individual castes (Figure 1.4D), but only when
eusociality has already been established. Such a hypothesis might elegantly
- 159 -
explain why early oogenesis appears so canalised and hard to shut down in O.
bicornis here.
To test the above hypothesis, it may be conducive to investigate how
mechanisms blocking oogenesis operate at varying degrees of social
complexity. This would preferably be carried out within a monophyletic clade
spanning all transitions (e.g. Xylocopinae or Vespidae), as suggested by Rehan
and Toth (2015)60. Another important addition to future research would include
more detailed measures, possibly considering multiple physiological processes
at play in the ovary (e.g. rate of oocyte determination, rate of vitellogenesis,
oocyte resorption, etc.). It may not always be feasible to measure all processes
and factors on the same tissue, since multiple techniques might be required
(e.g. IHC and confocal microscopy, vital stains, etc.). In consideration of this,
Richard and Casas (2012) provide a quantitative framework for ovarian
dynamics. Since, as Whitman and Agrawal (2009) eloquently stated, different
aspects of ovarian physiology will represent different underlying trade-offs,
which will vary along their respective capacity for phenotypic plasticity.
‘For example, some insects exhibit canalized egg size, and when confronted with poor nutrition or end of season, such insects maintain egg size, but express plasticity in clutch size or oocyte development rates (Chapter 11). In other species, clutch size or oocyte development may be canalized (Stearns 1992, Nylin and Gotthard 1998, Fox and Czesak 2000). Given trade-offs, and that particular traits can evolve to be plastic or canalized, the evolutionary outcome is presumably based on the relative advantages of different strategies in different habitats. Furthermore, what at first may appear to be a non-adaptive passive response (for example, lowered clutch size under poor nutrition), may in fact be an evolved plastic response to maintain egg size, oocyte development rate, or female survival.’ ~ Whitman and Agrawal (2009)
In conclusion: that which is measured, even within a single ovary, should be
chosen with care and deliberation.
7.2.3 The multifactorial nature of reproductive constraint
Mechanisms regulating reproductive constraint might be polygenic61. As
suggested in section 1.2.3, the various functions of Notch signalling, alongside
its numerous interactions with other signalling pathways (Schwanbeck et al.,
2011; Guruharsha et al., 2012), potentiate it to unify multiple mechanisms. For
example, not only has germarial Notch signalling been shown to regulate
60 However, as pointed out in section 7.1; this may not always be feasible to carry out
outside of tropical and subtropical climates (cf. Roubik, 1992, p. 380-389). 61 I.e. control of a single trait, or phenotype, by multiple genes. Or in what follows;
control of a phenotype by multiple pathways.
- 160 -
reproductive constraint in the honey bee directly (Duncan et al., 2016), it is also
responsive to other signalling pathways such as insulin signalling in D.
melanogaster (Drummond-Barbosa and Spradling, 2001) — leaving it sensitive
to dietary changes as well (Bonfini et al., 2015). The conserved pathway’s
multiple levels of signalling control, such as gene dosage sensitivity and cis and
trans regulation further indicate its polygenic potential (Guruharsha et al., 2012).
Moreover, Notch signalling is pleiotropic in nature. The cellular context under
which Notch is active determines its outcome: cell-fate specification, self-
renewal, differentiation, proliferation or apoptosis (Schwanbeck et al., 2011). It
is mainly the latter two functions that are of interest here. The role of Notch
signalling in mediating apoptosis (Miele and Osborne, 1999) would lend itself
towards explaining the germarial disorganisation and apoptosis seen in
queenright honey bee workers (Tanaka and Hartfelder, 2004). Specifically,
Numb/Notch is known to regulate apoptosis directly (Lundell et al., 2003). Numb
being the self-same Notch inhibitor that was posited to regulate QMP-mediate
adult reproductive constraint (Duncan et al., 2016).
Figure 7.2 displays a model for germarial Notch signalling that is both
polygenic (two regulators) and pleiotropic (two outcomes). The model is
informed by the traits of Notch signalling outlined in the previous paragraph, and
incorporates with it, the refinements of origin and elaboration delineated in the
previous section (7.2.2). In short, I make use of the reversal of the relationship
between juvenile hormone (JH) and vitellogenin (Vg) that occurred during the
evolutionary history of A. mellifera. JH production is negatively associated with
Vg in advanced eusocial species like the honey bee (Amdam et al., 2003),
contrary to the positive relation found in solitary and primitively eusocial species
(Robinson and Vargo, 1997; as well as other insects).
While we are currently unaware of the state of germarial Notch signalling
in primitively eusocial species, a functional reversal of germarial Notch from its
ancestral solitary state in O. bicornis to its state in the highly eusocial A.
mellifera (Duncan et al., 2016) has at least been demonstrated here (section
6.4.1). If we assume that the cellular context (Schwanbeck et al., 2011) that
informs Notch signalling is dependent upon JH62, then switching from blocking
oogenesis at a late stage towards blocking it at an early stage could be
explained by a single role reversal. This combined reversal in signalling
(germarial Notch and JH-Vg) can be argued to have occurred during the
elaboration of honey bee eusociality. This because workers in primitively
eusocial societies retain developed ovaries, and settle labile reproductive
62 Or in other words: if we assume the reversal of germarial Notch signalling was
enabled by the reversal of the JH-Vg axis.
- 161 -
conflict through dominance hierarchies (Fletcher and Ross, 1985). As colony
size increases, workers are less likely to become reproductives (Bourke, 1999),
and consequently: workers retaining active and vitellogenic ovaries are costly to
produce and selected against. Hence, during an elaboration of sociality (i.e.
increase in colony size), a putative pre-vitellogenic block on oogenesis is less
costly and therefore highly adaptive. Given the roles of JH and ecdysone in
triggering vitellogenin synthesis, patency and uptake in the oocyte across insect
taxa (Roy et al., 2018), leave both JH and ecdysone as likely suspects in
facilitating the shift in the block on oogenesis.
The early block on oogenesis would swiftly become fixed. Ultimately, the
early block on oogenesis is maintained by QMP, which has been found to be
highly derived (Van Oystaeyen et al., 2014), and its broad phylogenetic range
makes it likely that it targets a highly conserved yet presently unknown pathway
(Lovegrove et al., 2019). In honey bees, the ovarian QMP-response is regulated
by the Notch pathway via its inhibitor Numb (Duncan et al., 2016). Yet, QMP
mediation of Notch signalling may still have arisen gradually, as JH may have
already been responsive to the social environment in a hypothetical primitively
eusocial honey bee (as it is the case in the primitively eusocial B. terrestris for
instance; Amsalem et al., 2014; Shpigler et al., 2014). Even if JH is not
responsive to social environment in solitary bees (Kapheim and Johnson,
2017a).
The central assumption for this model would be that JH mediates at least
the cellular context with respect to germarial Notch signalling. This may be
possible, considering the prominent roles of both JH and Notch in oogenesis
(Xu et al., 1992; Robinson and Vargo, 1997). Galang et al. (2019) were unable
to rescue newly eclosed D. melanogaster females subjected to QMP with
pyriporixifen (a JH analogue). This indicates that QMP is likely not acting
directly upon JH (the same was true for ecdysone).
Note that this model mainly serves as an example. The situation is likely
far more complex. JH and the insulin signalling pathway are also known to
interact in mosquito vitellogenesis (Hansen et al., 2014; Perez-Hedo et al.,
2014), body size in D. melanogaster (Mirth and Shingleton, 2014; Mirth et al.,
2014)63, A. mellifera caste determination (Mutti et al., 2011) and queen longevity
(Corona et al., 2007), Pogonomyrmex rugosus caste determination (Libbrecht et
al., 2013) and vitellogenesis in Triboleum castaneum (Sheng et al., 2011).
Given the association between JH and insulin signalling (canonically insulin
63 Insulin signalling also has a role in vitellogenesis in D. melanogaster, but this role is
independent of JH (Richard et al., 2005).

- 162 -
signalling upregulates downstream JH production; Tatar et al., 2001), their
respective roles might even be opposite to those depicted in Figure 7.2. Insulin
signalling might provide cellular context, whilst JH titres provide a sustained
environmental signal. Furthermore, ecdysone, another important insect
hormone, was completely disregarded in Figure 7.2; and only a single tissue
(ovary) was considered.
The specifics of the presented model (Figure 7.2) are not the main point
here, nor are their associated semantics (context vs signal). What is important,
is the overarching message of interacting signalling networks, and how they
might come together to regulate reproductive constraint in adult honey bee
workers. Given the underlying complexity of the problem — with its multiple
independent origins and elaborations — it is unlikely that any single mechanism
will underlie reproductive constraint in its entirety, even within one species.

Figure 7.2: A hypothetical multifactorial origin of QMP-mediated adult reproductive constraint. An example of a conceptual model factoring in how different signalling pathways might interact in mediating reproductive constraint. In the hypothetical ancestral state (solitary or primitively eusocial), JH positively regulates Vg (Robinson and Vargo, 1997). During the elaboration of honey bee eusociality however, the probability of workers reproducing becomes perpetually smaller and more stable with increasing colony size (Bourke, 1999). Workers retaining active and vitellogenic ovaries are costly and selected against, hence a putative block earlier on in oogenesis is highly adaptive and quickly driven to fixation once it occurs. For the sake of simplicity in the model, we assume that the JH-vitellogenin axis provides the context for the germarial cells, upon which Notch signalling acts. Once the JH-Vg axis is reversed (Amdam et al., 2003), the end result of germarial Notch signalling is likewise reversed, leading to an early block on oogenesis. After which it could be recruited into reproductive constraint through the exploitation of an unknown conserved pathway by QMP (Duncan et al., 2016; Lovegrove et al., 2019). IRS = insulin receptor substrate, Tor = target of rapamycin, and QMP = queen mandibular pheromone.
- 164 -
The benefits of a model such as the one presented in Figure 7.2, is that it
generates testable hypotheses and clear experimental design. As the main
premise and auxilliary hypotheses can all be tested. For instance, a
phylogenetic analysis into the occurrence of the loss of JH’s gonadotropic role
(Robinson and Vargo, 1997), in association with the occurrence of early or late
repression of oogenesis. Functional tests could be performed using
combinations of starvation assays, QMP treatments, and fluoromevalonate or
precocene-I treatments (JH biosynthesis inhibitors; Quistad et al., 1981;
Amsalem et al., 2014). As stated earlier, under the model in Figure 7.2, QMP
treatment in conjunction with JH inhibition would be expected to repress early
oogenesis. Additionally, gene expression of insulin receptor substrate (IRS; or
insulin like peptide, ILP) and Notch associated genes (E(spl)-genes) could be
quantified. Further functional tests could be carried out in D. melanogaster as a
tractable genetic model (Camiletti and Thompson, 2016). This, to for example
overexpress germarial insulin receptors in combination with QMP treatment in
adults.
Multifactorial models will help refine hypotheses and define overarching
frameworks. They may help explain other outstanding questions, such as
whether and why honey bee queens themselves, are unaffected by QMP
(Jarriault and Mercer, 2012). For instance, are queens unaffected by their own
QMP due to their being mated? Is this why virgin honey bee queen ovaries
regress functionally? Or are queens unaffected by QMP due to their nutritional
reserves? As the field continues to grow, more interacting signalling pathways
may also be identified. Studies identifying gene clusters that are equipped to
respond plastically to environmental stimuli, like the one performed by Duncan
et al. (2020), will help identify even more networks and consequently
mechanisms to study in future.

- 165 -
7.3 Concluding remarks
Gadagkar (1996) made the specific case for developmental
morphological plasticity, yet the same principles should hold for reversible
physiological plasticity. As Gadagkar (1996) denoted, and as was depicted in
Figure 1.4; less phenotypic variation and consequently plasticity are expected
initially for reproductive traits in solitary ancestors (Figure 1.4A). In other words:
it is to be expected that levels of plasticity should be more rigid in a univoltine
solitary species such as O. bicornis. More work is of course needed to establish
a tractable solitary model species for use in the temperate regions of Europe.
As are more comprehensive and functional tests into reproductive constraint
needed. Such functional tests should acknowledge and incorporate multiple
signalling pathways. Finally, the broad phylogenetic range of QMP (Lovegrove
et al., 2019), should facilitate these studies in a broad range of species.
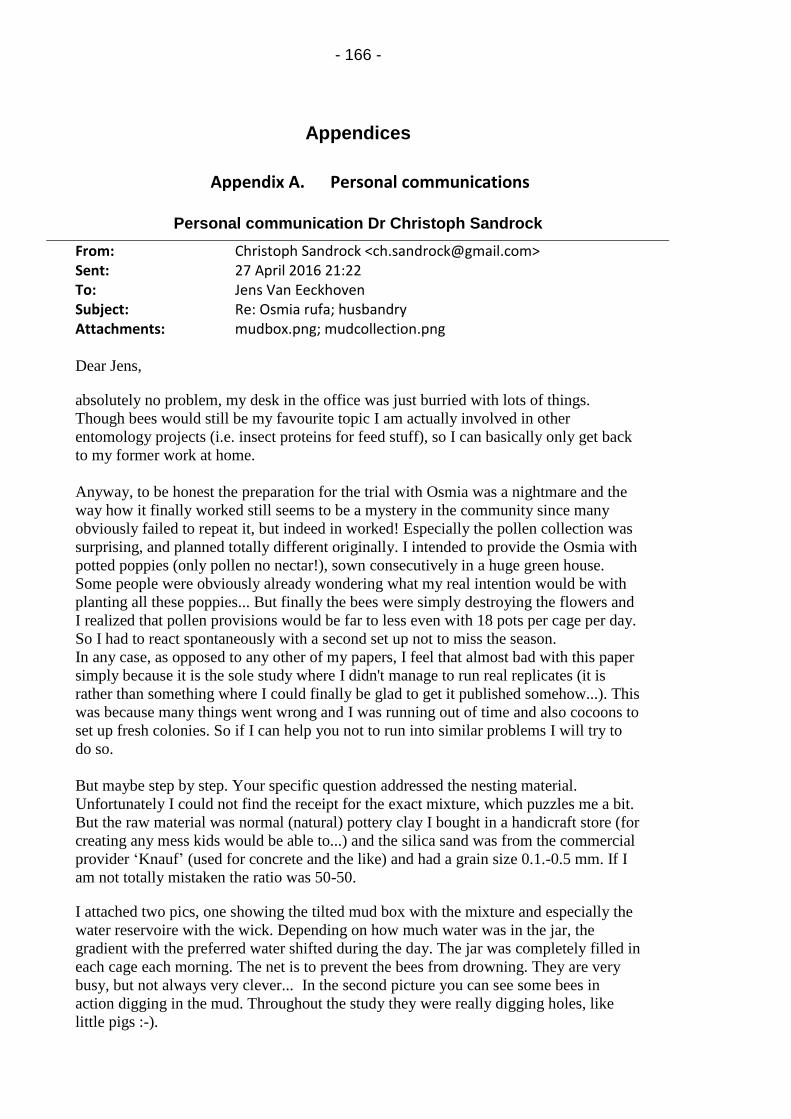
- 166 -
Appendices
Appendix A. Personal communications
Personal communication Dr Christoph Sandrock
From: Christoph Sandrock <[email protected]> Sent: 27 April 2016 21:22 To: Jens Van Eeckhoven Subject: Re: Osmia rufa; husbandry Attachments: mudbox.png; mudcollection.png
Dear Jens,
absolutely no problem, my desk in the office was just burried with lots of things.
Though bees would still be my favourite topic I am actually involved in other
entomology projects (i.e. insect proteins for feed stuff), so I can basically only get back
to my former work at home.
Anyway, to be honest the preparation for the trial with Osmia was a nightmare and the
way how it finally worked still seems to be a mystery in the community since many
obviously failed to repeat it, but indeed in worked! Especially the pollen collection was
surprising, and planned totally different originally. I intended to provide the Osmia with
potted poppies (only pollen no nectar!), sown consecutively in a huge green house.
Some people were obviously already wondering what my real intention would be with
planting all these poppies... But finally the bees were simply destroying the flowers and
I realized that pollen provisions would be far to less even with 18 pots per cage per day.
So I had to react spontaneously with a second set up not to miss the season.
In any case, as opposed to any other of my papers, I feel that almost bad with this paper
simply because it is the sole study where I didn't manage to run real replicates (it is
rather than something where I could finally be glad to get it published somehow...). This
was because many things went wrong and I was running out of time and also cocoons to
set up fresh colonies. So if I can help you not to run into similar problems I will try to
do so.
But maybe step by step. Your specific question addressed the nesting material.
Unfortunately I could not find the receipt for the exact mixture, which puzzles me a bit.
But the raw material was normal (natural) pottery clay I bought in a handicraft store (for
creating any mess kids would be able to...) and the silica sand was from the commercial
provider ‘Knauf’ (used for concrete and the like) and had a grain size 0.1.-0.5 mm. If I
am not totally mistaken the ratio was 50-50.
I attached two pics, one showing the tilted mud box with the mixture and especially the
water reservoire with the wick. Depending on how much water was in the jar, the
gradient with the preferred water shifted during the day. The jar was completely filled in
each cage each morning. The net is to prevent the bees from drowning. They are very
busy, but not always very clever... In the second picture you can see some bees in
action digging in the mud. Throughout the study they were really digging holes, like
little pigs :-).

- 167 - I would just like to ask you not to use the pictures for tallks or so, or at least not without
referring to me as a source.
I will prepare some more pictures, but to get a better feeling of what you may need for
information, I would be interested in whether you also plan to run an indoor-colony in a
climate chamber, or a kind of (semi-)field experiment?
I just ask to know better if the pictures of the climate chamber would also be useful for
you or whether you may prefer pics of the artificial flowers etc. Please let me know
what could help you most and I will work on some of the original (quite large) pictures
another evening (maybe when Norton is not paralysing my laptop with whatever so
important updates...).
By the way, who is your professor supervising your studies?
Hope this helps you already!
Cheers
Christoph
2016-04-26 17:32 GMT+02:00 Jens Van Eeckhoven <[email protected]>:
Dear Christoph,
I was wondering if you have had a chance to look into the request I sent you earlier. It would really be a great help to our project if you could provide us with any information you have to spare on setting up an Osmia bicornis culture.
I hope you do not think me incessant or annoying, I was merely worried you had forgotten.
With kind regards,
Jens
From: Christoph Sandrock <[email protected]> Sent: 18 April 2016 08:06 To: Jens Van Eeckhoven Subject: Re: Osmia rufa; husbandry Dear Jens,
Thank you very much for your mail. I am very sorry for my late reply. Your request reached me right during some business trips.

- 168 -
I do not have the relevant data with me on my current laptop. But I will look it up asap when I get back home on Wednesday evening.
Best regards,
Christoph 2016-04-11 18:29 GMT+02:00 Jens Van Eeckhoven <[email protected]>:
Dear Dr. Sandrock,
I recently read your paper on sublethal neonicotinoid exposure in Osmia.
My professor and I are hoping to set up an Osmia culture of our own in the lab over the summer,
since we want to study reproduction in a solitary bee species (to compare with eusocial bees).
Hence I was wondering if you could maybe send some pictures of the set-up you used for Osmia. If it's not too much trouble of course.
I was also wondering about the clay and silica sand mixture you were using.
What was the ratio you used for that?
We would be very grateful for any tips or help you can provide.
With kind regards,
Jens Van Eeckhoven
PhD-candidate
Faculty of Biological Sciences University of Leeds Leeds LS2 9JT UK +447592296434
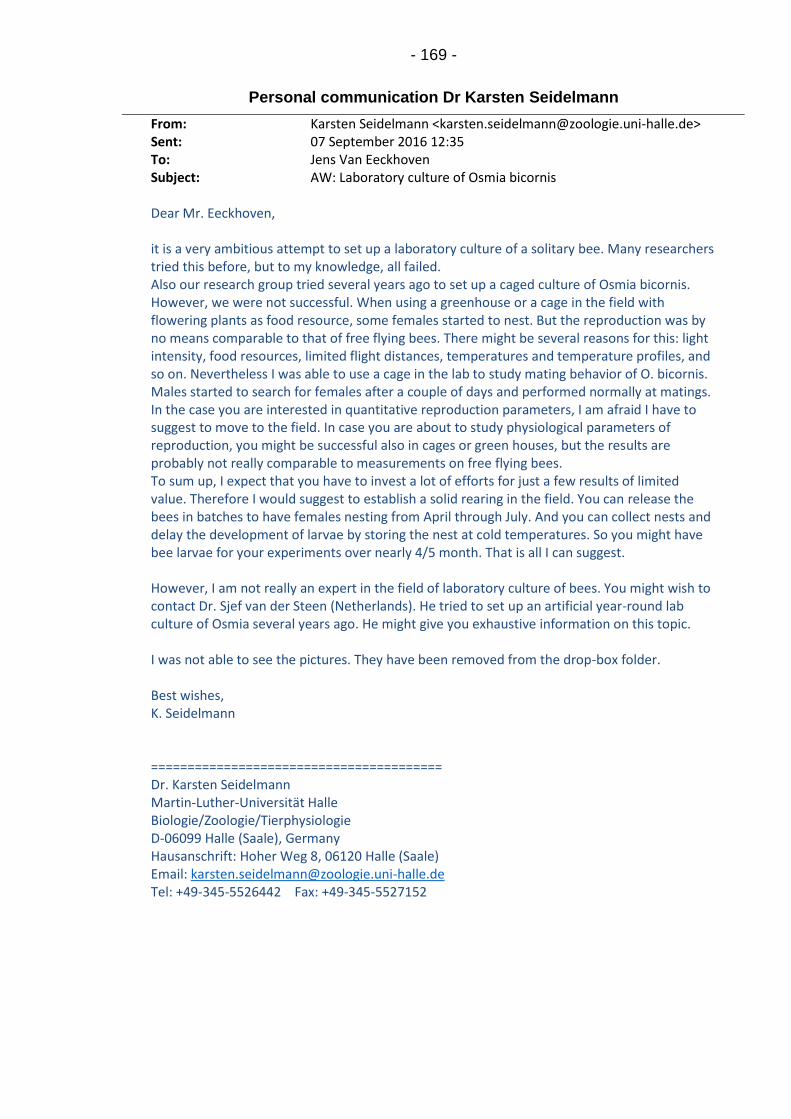
- 169 -
Personal communication Dr Karsten Seidelmann
From: Karsten Seidelmann <[email protected]> Sent: 07 September 2016 12:35 To: Jens Van Eeckhoven Subject: AW: Laboratory culture of Osmia bicornis Dear Mr. Eeckhoven, it is a very ambitious attempt to set up a laboratory culture of a solitary bee. Many researchers tried this before, but to my knowledge, all failed. Also our research group tried several years ago to set up a caged culture of Osmia bicornis. However, we were not successful. When using a greenhouse or a cage in the field with flowering plants as food resource, some females started to nest. But the reproduction was by no means comparable to that of free flying bees. There might be several reasons for this: light intensity, food resources, limited flight distances, temperatures and temperature profiles, and so on. Nevertheless I was able to use a cage in the lab to study mating behavior of O. bicornis. Males started to search for females after a couple of days and performed normally at matings. In the case you are interested in quantitative reproduction parameters, I am afraid I have to suggest to move to the field. In case you are about to study physiological parameters of reproduction, you might be successful also in cages or green houses, but the results are probably not really comparable to measurements on free flying bees. To sum up, I expect that you have to invest a lot of efforts for just a few results of limited value. Therefore I would suggest to establish a solid rearing in the field. You can release the bees in batches to have females nesting from April through July. And you can collect nests and delay the development of larvae by storing the nest at cold temperatures. So you might have bee larvae for your experiments over nearly 4/5 month. That is all I can suggest. However, I am not really an expert in the field of laboratory culture of bees. You might wish to contact Dr. Sjef van der Steen (Netherlands). He tried to set up an artificial year-round lab culture of Osmia several years ago. He might give you exhaustive information on this topic. I was not able to see the pictures. They have been removed from the drop-box folder. Best wishes, K. Seidelmann ======================================== Dr. Karsten Seidelmann Martin-Luther-Universität Halle Biologie/Zoologie/Tierphysiologie D-06099 Halle (Saale), Germany Hausanschrift: Hoher Weg 8, 06120 Halle (Saale) Email: [email protected] Tel: +49-345-5526442 Fax: +49-345-5527152
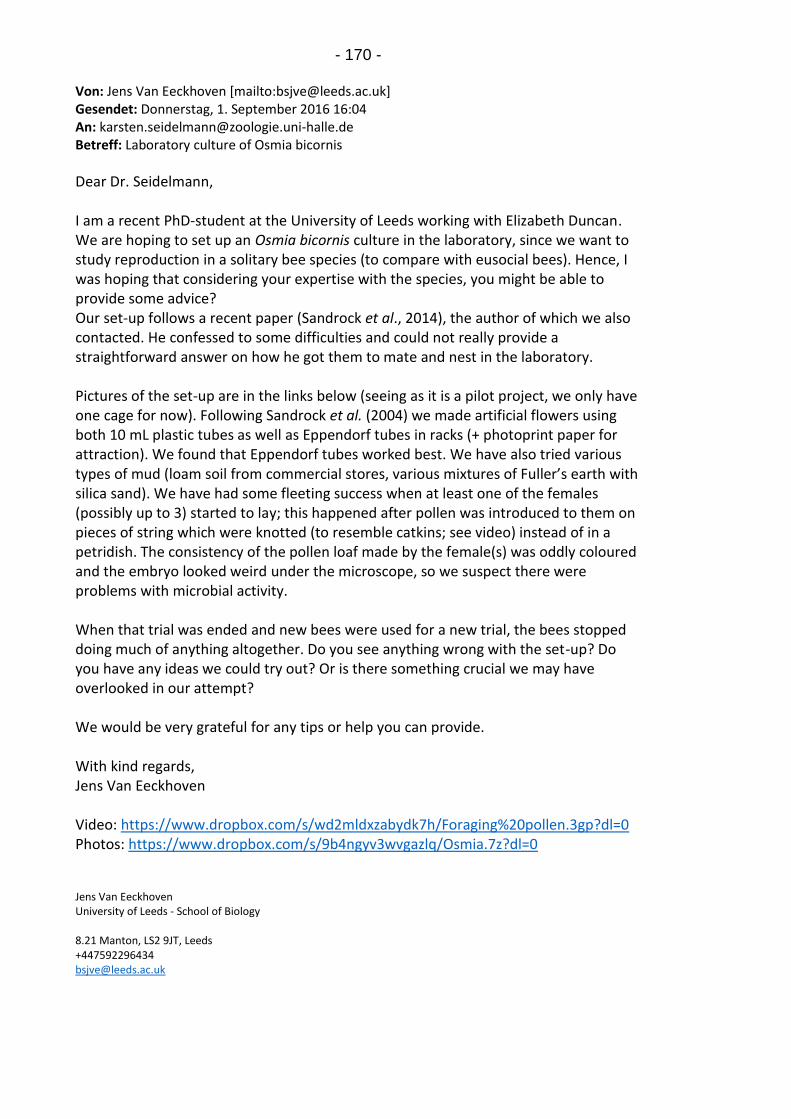
- 170 - Von: Jens Van Eeckhoven [mailto:[email protected]] Gesendet: Donnerstag, 1. September 2016 16:04 An: [email protected] Betreff: Laboratory culture of Osmia bicornis
Dear Dr. Seidelmann, I am a recent PhD-student at the University of Leeds working with Elizabeth Duncan. We are hoping to set up an Osmia bicornis culture in the laboratory, since we want to study reproduction in a solitary bee species (to compare with eusocial bees). Hence, I was hoping that considering your expertise with the species, you might be able to provide some advice? Our set-up follows a recent paper (Sandrock et al., 2014), the author of which we also contacted. He confessed to some difficulties and could not really provide a straightforward answer on how he got them to mate and nest in the laboratory. Pictures of the set-up are in the links below (seeing as it is a pilot project, we only have one cage for now). Following Sandrock et al. (2004) we made artificial flowers using both 10 mL plastic tubes as well as Eppendorf tubes in racks (+ photoprint paper for attraction). We found that Eppendorf tubes worked best. We have also tried various types of mud (loam soil from commercial stores, various mixtures of Fuller’s earth with silica sand). We have had some fleeting success when at least one of the females (possibly up to 3) started to lay; this happened after pollen was introduced to them on pieces of string which were knotted (to resemble catkins; see video) instead of in a petridish. The consistency of the pollen loaf made by the female(s) was oddly coloured and the embryo looked weird under the microscope, so we suspect there were problems with microbial activity. When that trial was ended and new bees were used for a new trial, the bees stopped doing much of anything altogether. Do you see anything wrong with the set-up? Do you have any ideas we could try out? Or is there something crucial we may have overlooked in our attempt? We would be very grateful for any tips or help you can provide. With kind regards, Jens Van Eeckhoven Video: https://www.dropbox.com/s/wd2mldxzabydk7h/Foraging%20pollen.3gp?dl=0 Photos: https://www.dropbox.com/s/9b4ngyv3wvgazlq/Osmia.7z?dl=0 Jens Van Eeckhoven University of Leeds - School of Biology 8.21 Manton, LS2 9JT, Leeds +447592296434 [email protected]
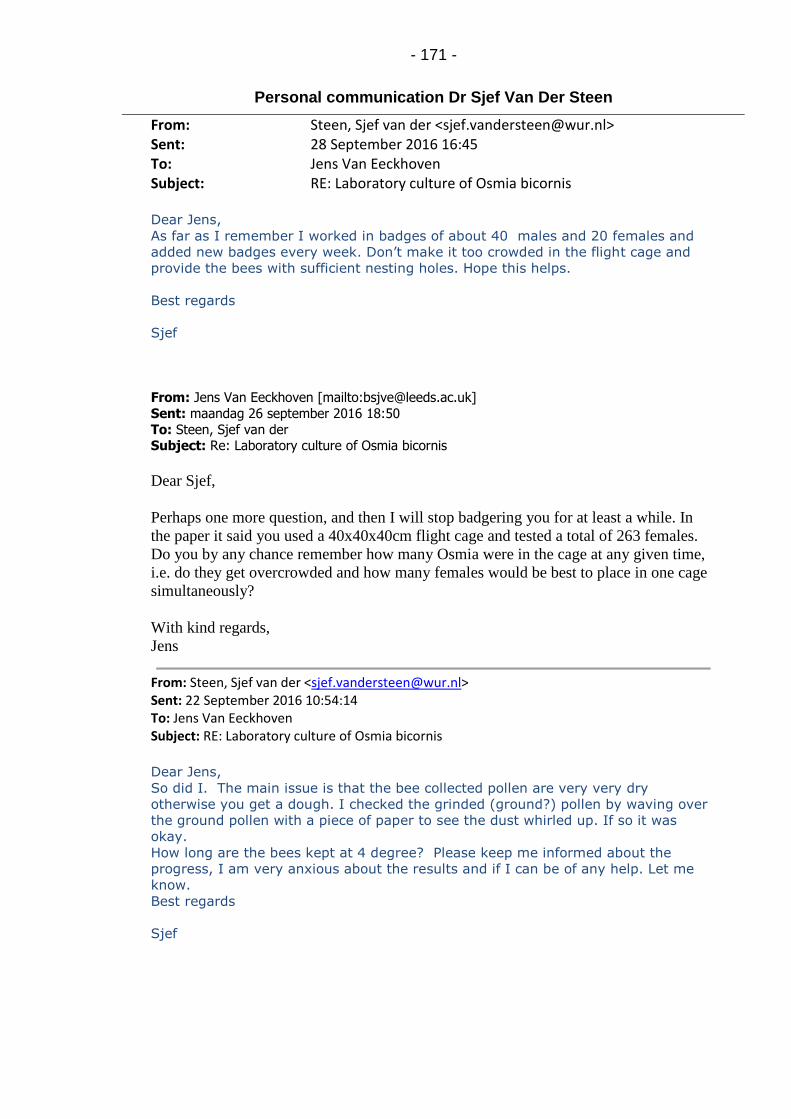
- 171 -
Personal communication Dr Sjef Van Der Steen
From: Steen, Sjef van der <[email protected]> Sent: 28 September 2016 16:45 To: Jens Van Eeckhoven Subject: RE: Laboratory culture of Osmia bicornis Dear Jens,
As far as I remember I worked in badges of about 40 males and 20 females and
added new badges every week. Don’t make it too crowded in the flight cage and
provide the bees with sufficient nesting holes. Hope this helps.
Best regards
Sjef
From: Jens Van Eeckhoven [mailto:[email protected]]
Sent: maandag 26 september 2016 18:50
To: Steen, Sjef van der Subject: Re: Laboratory culture of Osmia bicornis
Dear Sjef,
Perhaps one more question, and then I will stop badgering you for at least a while. In
the paper it said you used a 40x40x40cm flight cage and tested a total of 263 females.
Do you by any chance remember how many Osmia were in the cage at any given time,
i.e. do they get overcrowded and how many females would be best to place in one cage
simultaneously?
With kind regards,
Jens
From: Steen, Sjef van der <[email protected]> Sent: 22 September 2016 10:54:14 To: Jens Van Eeckhoven Subject: RE: Laboratory culture of Osmia bicornis
Dear Jens,
So did I. The main issue is that the bee collected pollen are very very dry
otherwise you get a dough. I checked the grinded (ground?) pollen by waving over
the ground pollen with a piece of paper to see the dust whirled up. If so it was
okay.
How long are the bees kept at 4 degree? Please keep me informed about the
progress, I am very anxious about the results and if I can be of any help. Let me
know.
Best regards
Sjef

- 172 - From: Jens Van Eeckhoven [mailto:[email protected]]
Sent: donderdag 22 september 2016 11:43 To: Steen, Sjef van der
Subject: Re: Laboratory culture of Osmia bicornis
Dear Sjef,
This has been a great help. I am very glad it has been done before and you have given
me many new things to contemplate. We indeed have cocoons now, kept at 4°C in the
fridge.
How did you get the pollen ground fine enough? We are currently using an electric
coffee grinder.
Many thanks and kind regards,
Jens
From: Steen, Sjef van der <[email protected]> Sent: 21 September 2016 14:10:38 To: Jens Van Eeckhoven Subject: RE: Laboratory culture of Osmia bicornis
Dear Jens,
Attached you will find the procedure i developed for the indoor rearing of Osmia.
The most important issue is to have the bee collected, dried pollen grinded as small
as possible as it appeared Osmia can (at least indoors) only collect the pollen that
whirled when the bees flew over it. Next daylight or artificial daylight is important
and of course vital males and females in the cocoons that merge in the flight
cage. Do you have male and female cocoons now?
Please check the protocol out and if you have any questions don’t hesitate to ask
me.
Good luck and all the best
Sjef
Dr Jozef J.M. (Sjef) van der Steen PRI, bijen@wur Postbus 16 6700 AA Wageningen Wageningen Campus, gebouw 107 (Radix) Droevendaalsesteeg 1, 6708 PB Wageningen tel. +31317-481331 tel. +31651015415 E-mail. [email protected] Website www.wageningenur.nl/bijen nieuwsbrief http://www.pri.wur.nl/NL/publicaties/nieuwsbrief-bijen/ http://www.disclaimer-nl.wur.nl/ http://www.disclaimer-uk.wur.nl/

- 173 - From: Jens Van Eeckhoven [mailto:[email protected]]
Sent: maandag 19 september 2016 13:57 To: Steen, Sjef van der
Subject: Re: Laboratory culture of Osmia bicornis
Dear Dr. van der Steen, I wrote you earlier about the indoor rearing of Osmia. I was wondering if you have given this any further thought? Any tips or help you could provide would be much appreciated. With kind regards, Jens Van Eeckhoven
From: Steen, Sjef van der <[email protected]> Sent: 09 September 2016 11:09:02 To: Jens Van Eeckhoven Subject: RE: Laboratory culture of Osmia bicornis
Dear jens, I will be back in the office next wednesday and answer your. I do think there are good
opportunities to establish a small indoor rearing of osmia
All the best
Sjef
Verzonden met mijn Windows Phone

- 174 - ________________________________
Van: Jens Van Eeckhoven<mailto:[email protected]>
Verzonden: 7-9-2016 16:09
Aan: Steen, Sjef van der<mailto:[email protected]>
Onderwerp: Laboratory culture of Osmia bicornis
Dear Dr. van der Steen,
I am a recent PhD-student at the University of Leeds working with Elizabeth Duncan. We are hoping to
set up an Osmia bicornis culture in the laboratory, since we want to study reproduction in a solitary bee
species (to compare with eusocial bees). Prof. Dr. Karsten Seidelmann pointed me in your direction,
saying that you have attempted something similar in the past. I was hoping that you could perhaps share
some of your experience on your attempt? Our set-up follows a recent paper (Sandrock et al., 2014), the
author of which we also contacted. He confessed to some difficulties and could not really provide a
straightforward answer on how he got them to mate and nest in the laboratory.
Pictures of the set-up are in the link below (seeing as it is a pilot project, we only have one cage for now).
Following Sandrock et al. (2004) we made artificial flowers using both 10 mL plastic tubes as well as
Eppendorf tubes in racks (+ photoprint paper for attraction). We found that Eppendorf tubes worked best
(for a while). We have also tried various types of mud (loam soil from commercial stores, various
mixtures of Fuller’s earth with silica sand). We have had some fleeting success when at least one of the
females (possibly up to 2-3) started to lay; this happened after pollen was introduced to them on pieces of
string which were knotted (to resemble catkins; see video) instead of in a petridish. The consistency of the
pollen loaf made by the female(s) was oddly coloured and the embryo looked weird under the
microscope, so we suspect there were problems with microbial activity.
When that trial was ended and new bees were used for a new trial, the bees stopped doing much of
anything altogether. Do you see anything wrong with the set-up? Do you have any ideas we could try out?
Or is there something crucial we may have overlooked in our attempt?
We would be very grateful for any tips or help you can provide.
With kind regards,
Jens Van Eeckhoven
Video and photos: https://www.dropbox.com/sh/8315mjitxlc9jb7/AACyPba6eEenKcfffkIaVNPza?dl=0
Jens Van Eeckhoven
University of Leeds - School of Biology
8.21 Manton, LS2 9JT, Leeds
+447592296434

- 175 -
Personal communication Prof Dr Anthony Raw64
Dear Prof. Dr. Raw,
I am a recent PhD-student at the University of Leeds working with Elizabeth Duncan. We are hoping to
set up an Osmia bicornis culture in the laboratory, since we want to study reproduction in a solitary bee
species (to compare with eusocial bees). Hence, I was hoping that considering your expertise with the
species, you might be able to provide some advice?
Our set-up follows a recent paper (Sandrock et al., 2014), the author of which we also contacted. He
confessed to some difficulties and could not really provide a straightforward answer on how he got
them to mate and nest in the laboratory.
Pictures of the set-up are in the links below (seeing as it is a pilot project, we only have one cage for
now). Following Sandrock et al. (2004) we made artificial flowers using both 10 mL plastic tubes as
well as Eppendorf tubes in racks (+ photoprint paper for attraction). We found that Eppendorf tubes
worked best. We have also tried various types of mud (loam soil from commercial stores, various
mixtures of Fuller’s earth with silica sand). We have had some fleeting success when at least one of
the females (possibly up to 3) started to lay; this happened after pollen was introduced to them on
pieces of string which were knotted (to resemble catkins; see video) instead of in a petridish. The
consistency of the pollen loaf made by the female(s) was oddly coloured and the embryo looked weird
under the microscope, so we suspect there were problems with microbial activity.
When that trial was ended and new bees were used for a new trial, the bees stopped doing much of
anything altogether. Do you see anything wrong with the set-up? Do you have any ideas we could try
out? Or is there something crucial we may have overlooked in our attempt?
We would be very grateful for any tips or help you can provide.
With kind regards,
Jens Van Eeckhoven
Video: https://www.dropbox.com/s/wd2mldxzabydk7h/Foraging%20pollen.3gp?dl=0
Photos: https://www.dropbox.com/s/9b4ngyv3wvgazlq/Osmia.7z?dl=0
64 No contact information could be found. This conversation was transcribed from ResearchGate.
Jens Van Eeckhoven Sep 1, 2016

- 176 -
Dear Jens
I'm not sure just what aspect of the bee's reproduction you want to study. I opened the video you, but
couldn't open the photographs.
I had mated females nesting in cages (50 cm x 50 cm and 60 cm high). I provided cut flowers of
wallflowers and Quercus.
I can see why you want to control the mating, but why not give them fresh flowers. I think you are trying
to change and control too many factors.
Dear Dr. Raw,
Thank you for your quick reply. I had archived the photos using 7zip on our old university computers,
which is probably why the file could not be opened. I attached the photos here should you still wish to
see them.
And indeed, we are attempting to control a lot of factors, and perhaps too many. We are looking to
compare orthologue genes of Apis using RNAi. This to find some of these genes' possible ancestral
functions in reproduction in the related solitary species Osmia bicornis.
Since the pupa are easily stored in the fridge, we were hoping this would allow us to perform
experiments some time outside of spring as well. This is why the set-up we are trying is so artificial. In
any case, thank you for your consideration. If our endeavours remain unsuccessful we will surely try
using actual flowers and catkins, unfortunately that would have to wait until next spring.
With kind regards,
Jens
The bees like Siberian wallflower (Cheiranthus allioni). The flowers supply pollen and nectar. If you
keep removing the dead flowers the plants continue to bloom in a cold greenhouse until October.
Anthony Raw Sep 2, 2016
Jens Van Eeckhoven Sep 5, 2016
Anthony Raw Sep 5, 2016

- 177 -
Personal communication Chris Whittles65
No detailed transcripts are available, as the majority of information was
provided over the phone.
From: Jens Van Eeckhoven Sent: 07 August 2017 21:10 To: MasonBees UK Cc: Elizabeth Duncan Subject: Re: Related individuals of Osmia bicornis
Dear Chris, Thank you again for all the information you passed on to me last Friday, to be fair it was quite illuminating. I also added my supervisor, Dr. Liz Duncan, in CC since we are both very excited to be working with you. I knocked up a quick experimental design and did a power calculation. Based on these we were thinking of ordering about 10 tubes per site, and this for three to four sites. This since you mentioned there were about that many sites for which you have consistently sent back cocoons (making them less artificial and genetically more uniform in a sense). These sites would be best suited for the experiments considering this. We are hoping to get about 2-4 females from each of the tubes, because you mentioned a tube might yield 9 individuals on average (and with a tendency towards male bias in the red mason bee, I'm hoping that that is not too optimistic a guesstimate). Ultimately the number of tubes will depend entirely upon your stock/yield this year (including parasite load, etc). We could also make do with less tubes originating from more/other sites, or simply do with less tubes altogether if that is not possible. We could then make it a preliminary analysis, but we would need at least 2 tubes from each site for the experiment we have in mind. We were also interested in acquiring some of the longer and better cardboard tubes and holders you told me about, if that is at all possible. Both for trying them out in the field, as well as in our laboratory set-up. Maybe about 4 to start with (depending on price as well)? Looking forward to hearing from you, with kind regards, Jens
65 Director of MasonBees Ltd; [email protected]

- 178 -
From: MasonBees UK <[email protected]> Sent: 03 August 2017 16:45:10 To: Jens Van Eeckhoven Subject: RE: Related individuals of Osmia bicornis
Dear Jens, Yes , any time after 1100hrs Kind Regards Chris From: Jens Van Eeckhoven [mailto:[email protected]] Sent: 03 August 2017 14:37 To: MasonBees UK <[email protected]> Subject: Re: Related individuals of Osmia bicornis
Dear Chris,
Thank you for your quick reply. And that sounds great! Unfortunately I am fairly busy
today, but would you have time to talk on the phone some time tomorrow?
Kind regards,
Jens
From: MasonBees UK <[email protected]> Sent: 03 August 2017 12:18:37 To: Jens Van Eeckhoven Subject: RE: Related individuals of Osmia bicornis Dear Jens, Your PhD sounds interesting. I think the way forward is to talk on the phone. I do not yet know how many cocoons I am going to have this year, as it has been another difficult year. If I can help I will but I need to understand your requirements. Kind Regards Chris Chris Whittles Director MasonBees Ltd 07774 733585

- 179 - From: Jens Van Eeckhoven [mailto:[email protected]] Sent: 03 August 2017 10:19 To: [email protected] Subject: Related individuals of Osmia bicornis
Dear Sir/Madam,
I am a PhD student at the University of Leeds working in the Duncan lab. We are
researching bees, amongst which the elegant Osmia bicornis (formerly Osmia rufa). I
was hoping to set up an experiment on kin recognition in this species, as well as
investigating population structure to an extent (commercial ones included).
For this purpose, I was wondering if it would be possible to order whole nests of red
mason bees instead of just loose cocoons? Since individuals within nests are
presumably related, except when nests are superseded of course (which will be
accounted for).
Additionally, I was wondering whether the red mason bees you keep are bred at
multiple locations, or whether they are plots close to one another? In the former
situation, I would be interested in acquiring several nests from each of these multiple
locations.
Nests, in all cases, would have to be chosen at random, but would preferably have a
sufficient diameter since we would want there to be females in each nest. There is
however no distinct need for you to part way with the nesting material, which you
presumably reuse. As long as cocoons are kept separated as distinct ‘nest’ or ‘family’
units when shipped (and identified by location), that would suffice.
If this is at all possible, would you mind sending some more information? I have yet to
work out sample sizes for the experiments, but in fairness this will in part depend on
your price (and the number of locations). Could you include a price estimate per nest?
Additionally, are the nests opened and mixed at the end of summer, or in other words,
what would be the deadline for ordering them as nests/’family units’?
With kind regards,
Jens Van Eeckhoven
Jens Van Eeckhoven Faculty of Biological Sciences University of Leeds Leeds LS2 9JT, UK Phone: +44 (0)7592296434
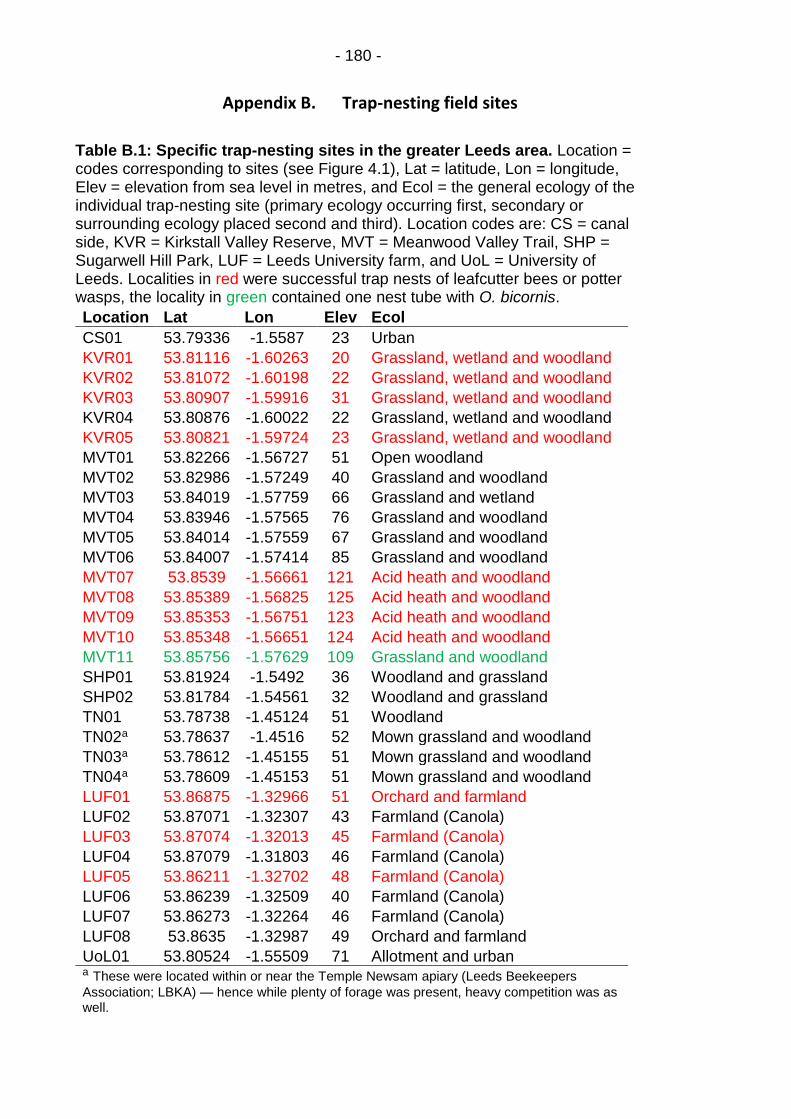
- 180 -
Appendix B. Trap-nesting field sites
Table B.1: Specific trap-nesting sites in the greater Leeds area. Location = codes corresponding to sites (see Figure 4.1), Lat = latitude, Lon = longitude, Elev = elevation from sea level in metres, and Ecol = the general ecology of the individual trap-nesting site (primary ecology occurring first, secondary or surrounding ecology placed second and third). Location codes are: CS = canal side, KVR = Kirkstall Valley Reserve, MVT = Meanwood Valley Trail, SHP = Sugarwell Hill Park, LUF = Leeds University farm, and UoL = University of Leeds. Localities in red were successful trap nests of leafcutter bees or potter wasps, the locality in green contained one nest tube with O. bicornis.
Location Lat Lon Elev Ecol
CS01 53.79336 -1.5587 23 Urban
KVR01 53.81116 -1.60263 20 Grassland, wetland and woodland
KVR02 53.81072 -1.60198 22 Grassland, wetland and woodland
KVR03 53.80907 -1.59916 31 Grassland, wetland and woodland
KVR04 53.80876 -1.60022 22 Grassland, wetland and woodland
KVR05 53.80821 -1.59724 23 Grassland, wetland and woodland
MVT01 53.82266 -1.56727 51 Open woodland
MVT02 53.82986 -1.57249 40 Grassland and woodland
MVT03 53.84019 -1.57759 66 Grassland and wetland
MVT04 53.83946 -1.57565 76 Grassland and woodland
MVT05 53.84014 -1.57559 67 Grassland and woodland
MVT06 53.84007 -1.57414 85 Grassland and woodland
MVT07 53.8539 -1.56661 121 Acid heath and woodland
MVT08 53.85389 -1.56825 125 Acid heath and woodland
MVT09 53.85353 -1.56751 123 Acid heath and woodland
MVT10 53.85348 -1.56651 124 Acid heath and woodland
MVT11 53.85756 -1.57629 109 Grassland and woodland
SHP01 53.81924 -1.5492 36 Woodland and grassland
SHP02 53.81784 -1.54561 32 Woodland and grassland
TN01 53.78738 -1.45124 51 Woodland
TN02a 53.78637 -1.4516 52 Mown grassland and woodland
TN03a 53.78612 -1.45155 51 Mown grassland and woodland
TN04a 53.78609 -1.45153 51 Mown grassland and woodland
LUF01 53.86875 -1.32966 51 Orchard and farmland
LUF02 53.87071 -1.32307 43 Farmland (Canola)
LUF03 53.87074 -1.32013 45 Farmland (Canola)
LUF04 53.87079 -1.31803 46 Farmland (Canola)
LUF05 53.86211 -1.32702 48 Farmland (Canola)
LUF06 53.86239 -1.32509 40 Farmland (Canola)
LUF07 53.86273 -1.32264 46 Farmland (Canola)
LUF08 53.8635 -1.32987 49 Orchard and farmland
UoL01 53.80524 -1.55509 71 Allotment and urban a These were located within or near the Temple Newsam apiary (Leeds Beekeepers
Association; LBKA) — hence while plenty of forage was present, heavy competition was as well.

- 181 -
Appendix C. Microsatellite marker validation
Table C.1: Relatedness matrix (Kalinowski et al., 2006) for the North Shropshire subpopulation. NS = North Shropshire, C-J = nest tube, f1-2 = position of female within the nest. U = unrelated, HS = half-sib. For each of the suspected related pairs (red), one individual was removed.
NS NSCf1 NSDf1 NSEf1 NSFf2 NSGf1 NSHf1 NSIf2 NSJf1
NSCf1 -
NSDf1 U -
NSEf1 U U -
NSFf2 U U U -
NSGf1 U U U U -
NSHf1 U U U U U -
NSIf2 U U U U U HS -
NSJf1 U U U U U U U -
Table C.2: Relatedness matrix (Kalinowski et al., 2006) for the Surrey subpopulation. Su = Surrey, A-J = nest tube, f1-2 = position of female within the nest. U = unrelated, HS = half-sib. For each of the suspected related pairs (red), one individual was removed.
Su SuAf1 SuBf1 SuDf1 SuEf1 SuFf2 SuGf2 SuIf1 SuJf2
SuAf1 -
SuBf1 U -
SuDf1 U U -
SuEf1 U U U -
SuFf2 U U U U -
SuGf2 U HS U U U -
SuIf1 U U U U U U -
SuJf2 U U U U U U U -

- 182 -
Table C.3: Relatedness matrix (Kalinowski et al., 2006) for the first German subpopulation. G1 = German location 1, A-N = nest tube, f1 = first female in the nest. U = unrelated, HS = half-sib. For each of the suspected related pairs (red), one individual was removed.
G1 G1Af1 G1Bf1 G1Cf1 G1Df1 G1Ef1 G1Ff1 G1Gf1 G1Hf1 G1If1 G1Jf1 G1Kf1 G1Lf1 G1Mf1 G1Nf1
G1Af1 -
G1Bf1 U -
G1Cf1 U U -
G1Df1 U U U -
G1Ef1 U U U U -
G1Ff1 U HS U U U -
G1Gf1 U U U U U U -
G1Hf1 U U U U U U U -
G1If1 U U U U U U U U -
G1Jf1 U U U U U U HS U U -
G1Kf1 U U U HS U U U U U U -
G1Lf1 U U U U U U U U U U U -
G1Mf1 U U U U U U U U U U U U -
G1Nf1 U U HS HS U U U U U U U U U -
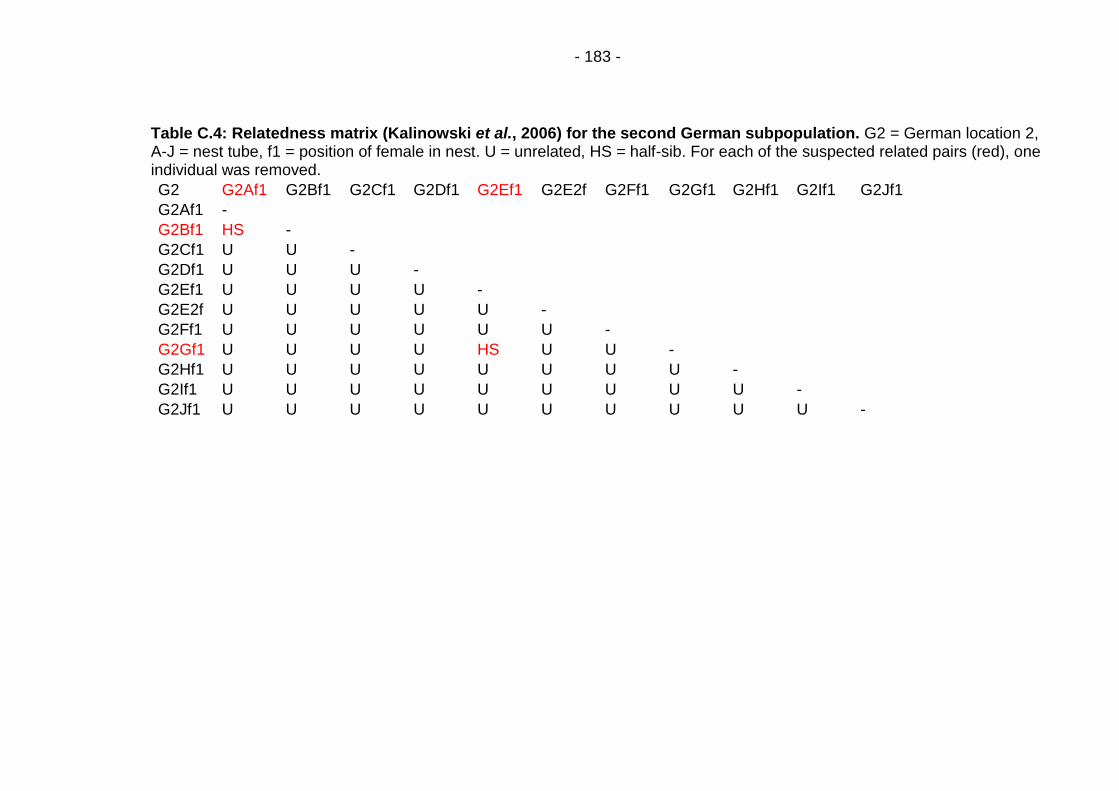
- 183 -
Table C.4: Relatedness matrix (Kalinowski et al., 2006) for the second German subpopulation. G2 = German location 2, A-J = nest tube, f1 = position of female in nest. U = unrelated, HS = half-sib. For each of the suspected related pairs (red), one individual was removed.
G2 G2Af1 G2Bf1 G2Cf1 G2Df1 G2Ef1 G2E2f G2Ff1 G2Gf1 G2Hf1 G2If1 G2Jf1
G2Af1 -
G2Bf1 HS -
G2Cf1 U U -
G2Df1 U U U -
G2Ef1 U U U U -
G2E2f U U U U U -
G2Ff1 U U U U U U -
G2Gf1 U U U U HS U U -
G2Hf1 U U U U U U U U -
G2If1 U U U U U U U U U -
G2Jf1 U U U U U U U U U U -
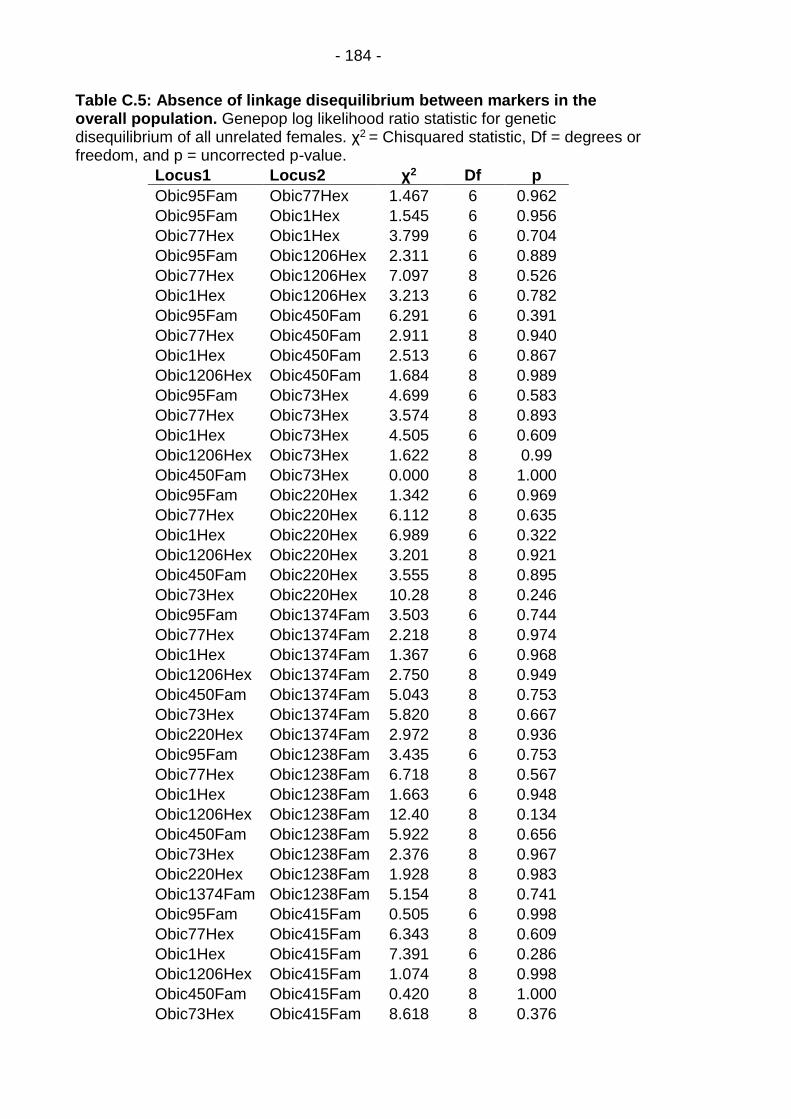
- 184 -
Table C.5: Absence of linkage disequilibrium between markers in the overall population. Genepop log likelihood ratio statistic for genetic disequilibrium of all unrelated females. χ2 = Chisquared statistic, Df = degrees or freedom, and p = uncorrected p-value.
Locus1 Locus2 χ2 Df p
Obic95Fam Obic77Hex 1.467 6 0.962
Obic95Fam Obic1Hex 1.545 6 0.956
Obic77Hex Obic1Hex 3.799 6 0.704
Obic95Fam Obic1206Hex 2.311 6 0.889
Obic77Hex Obic1206Hex 7.097 8 0.526
Obic1Hex Obic1206Hex 3.213 6 0.782
Obic95Fam Obic450Fam 6.291 6 0.391
Obic77Hex Obic450Fam 2.911 8 0.940
Obic1Hex Obic450Fam 2.513 6 0.867
Obic1206Hex Obic450Fam 1.684 8 0.989
Obic95Fam Obic73Hex 4.699 6 0.583
Obic77Hex Obic73Hex 3.574 8 0.893
Obic1Hex Obic73Hex 4.505 6 0.609
Obic1206Hex Obic73Hex 1.622 8 0.99
Obic450Fam Obic73Hex 0.000 8 1.000
Obic95Fam Obic220Hex 1.342 6 0.969
Obic77Hex Obic220Hex 6.112 8 0.635
Obic1Hex Obic220Hex 6.989 6 0.322
Obic1206Hex Obic220Hex 3.201 8 0.921
Obic450Fam Obic220Hex 3.555 8 0.895
Obic73Hex Obic220Hex 10.28 8 0.246
Obic95Fam Obic1374Fam 3.503 6 0.744
Obic77Hex Obic1374Fam 2.218 8 0.974
Obic1Hex Obic1374Fam 1.367 6 0.968
Obic1206Hex Obic1374Fam 2.750 8 0.949
Obic450Fam Obic1374Fam 5.043 8 0.753
Obic73Hex Obic1374Fam 5.820 8 0.667
Obic220Hex Obic1374Fam 2.972 8 0.936
Obic95Fam Obic1238Fam 3.435 6 0.753
Obic77Hex Obic1238Fam 6.718 8 0.567
Obic1Hex Obic1238Fam 1.663 6 0.948
Obic1206Hex Obic1238Fam 12.40 8 0.134
Obic450Fam Obic1238Fam 5.922 8 0.656
Obic73Hex Obic1238Fam 2.376 8 0.967
Obic220Hex Obic1238Fam 1.928 8 0.983
Obic1374Fam Obic1238Fam 5.154 8 0.741
Obic95Fam Obic415Fam 0.505 6 0.998
Obic77Hex Obic415Fam 6.343 8 0.609
Obic1Hex Obic415Fam 7.391 6 0.286
Obic1206Hex Obic415Fam 1.074 8 0.998
Obic450Fam Obic415Fam 0.420 8 1.000
Obic73Hex Obic415Fam 8.618 8 0.376
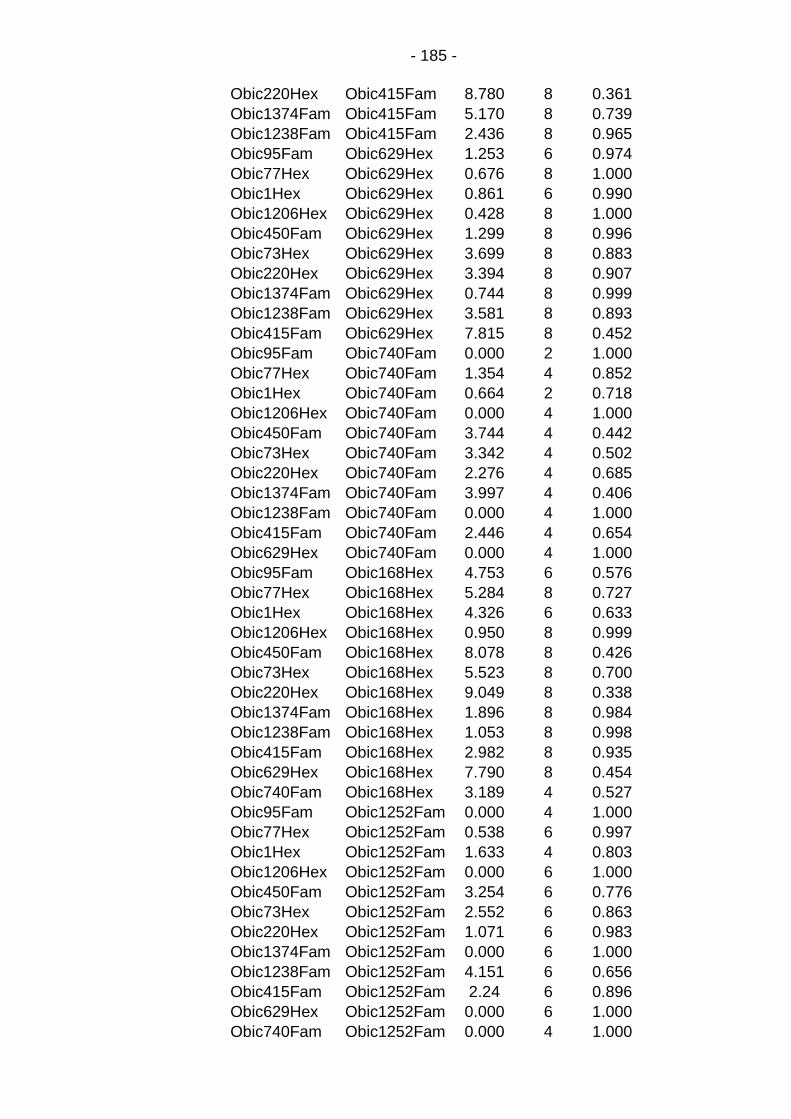
- 185 -
Obic220Hex Obic415Fam 8.780 8 0.361
Obic1374Fam Obic415Fam 5.170 8 0.739
Obic1238Fam Obic415Fam 2.436 8 0.965
Obic95Fam Obic629Hex 1.253 6 0.974
Obic77Hex Obic629Hex 0.676 8 1.000
Obic1Hex Obic629Hex 0.861 6 0.990
Obic1206Hex Obic629Hex 0.428 8 1.000
Obic450Fam Obic629Hex 1.299 8 0.996
Obic73Hex Obic629Hex 3.699 8 0.883
Obic220Hex Obic629Hex 3.394 8 0.907
Obic1374Fam Obic629Hex 0.744 8 0.999
Obic1238Fam Obic629Hex 3.581 8 0.893
Obic415Fam Obic629Hex 7.815 8 0.452
Obic95Fam Obic740Fam 0.000 2 1.000
Obic77Hex Obic740Fam 1.354 4 0.852
Obic1Hex Obic740Fam 0.664 2 0.718
Obic1206Hex Obic740Fam 0.000 4 1.000
Obic450Fam Obic740Fam 3.744 4 0.442
Obic73Hex Obic740Fam 3.342 4 0.502
Obic220Hex Obic740Fam 2.276 4 0.685
Obic1374Fam Obic740Fam 3.997 4 0.406
Obic1238Fam Obic740Fam 0.000 4 1.000
Obic415Fam Obic740Fam 2.446 4 0.654
Obic629Hex Obic740Fam 0.000 4 1.000
Obic95Fam Obic168Hex 4.753 6 0.576
Obic77Hex Obic168Hex 5.284 8 0.727
Obic1Hex Obic168Hex 4.326 6 0.633
Obic1206Hex Obic168Hex 0.950 8 0.999
Obic450Fam Obic168Hex 8.078 8 0.426
Obic73Hex Obic168Hex 5.523 8 0.700
Obic220Hex Obic168Hex 9.049 8 0.338
Obic1374Fam Obic168Hex 1.896 8 0.984
Obic1238Fam Obic168Hex 1.053 8 0.998
Obic415Fam Obic168Hex 2.982 8 0.935
Obic629Hex Obic168Hex 7.790 8 0.454
Obic740Fam Obic168Hex 3.189 4 0.527
Obic95Fam Obic1252Fam 0.000 4 1.000
Obic77Hex Obic1252Fam 0.538 6 0.997
Obic1Hex Obic1252Fam 1.633 4 0.803
Obic1206Hex Obic1252Fam 0.000 6 1.000
Obic450Fam Obic1252Fam 3.254 6 0.776
Obic73Hex Obic1252Fam 2.552 6 0.863
Obic220Hex Obic1252Fam 1.071 6 0.983
Obic1374Fam Obic1252Fam 0.000 6 1.000
Obic1238Fam Obic1252Fam 4.151 6 0.656
Obic415Fam Obic1252Fam 2.24 6 0.896
Obic629Hex Obic1252Fam 0.000 6 1.000
Obic740Fam Obic1252Fam 0.000 4 1.000
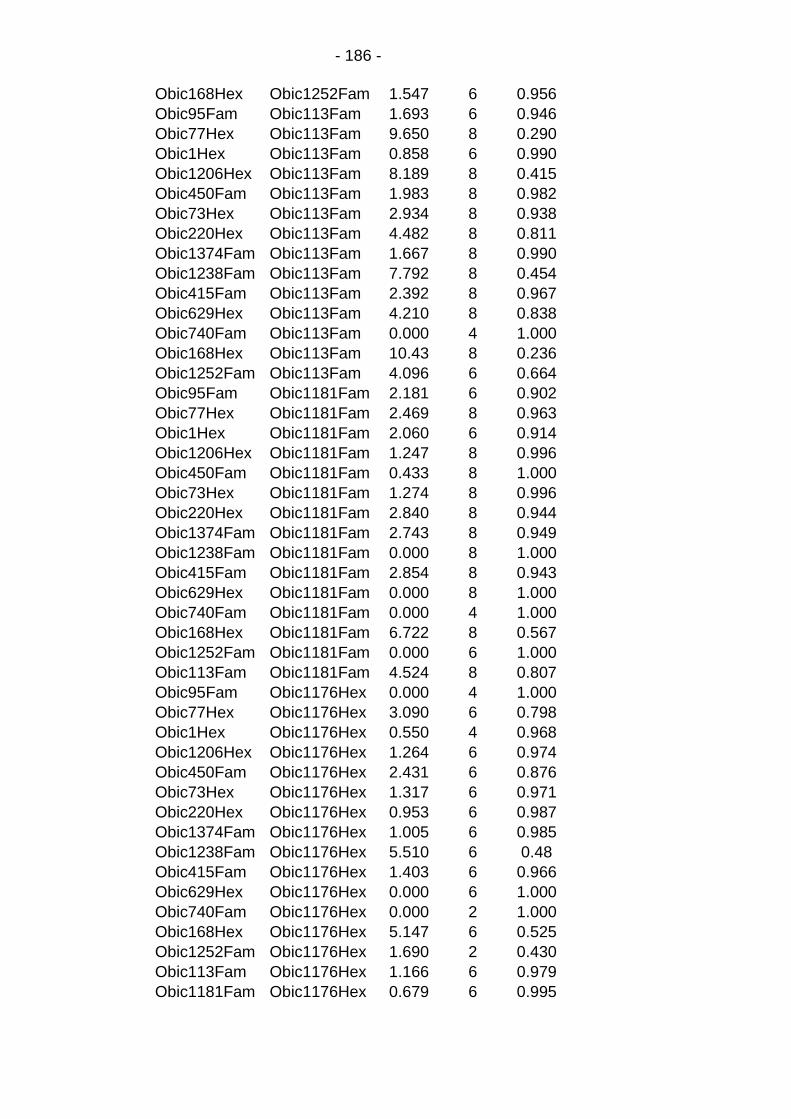
- 186 -
Obic168Hex Obic1252Fam 1.547 6 0.956
Obic95Fam Obic113Fam 1.693 6 0.946
Obic77Hex Obic113Fam 9.650 8 0.290
Obic1Hex Obic113Fam 0.858 6 0.990
Obic1206Hex Obic113Fam 8.189 8 0.415
Obic450Fam Obic113Fam 1.983 8 0.982
Obic73Hex Obic113Fam 2.934 8 0.938
Obic220Hex Obic113Fam 4.482 8 0.811
Obic1374Fam Obic113Fam 1.667 8 0.990
Obic1238Fam Obic113Fam 7.792 8 0.454
Obic415Fam Obic113Fam 2.392 8 0.967
Obic629Hex Obic113Fam 4.210 8 0.838
Obic740Fam Obic113Fam 0.000 4 1.000
Obic168Hex Obic113Fam 10.43 8 0.236
Obic1252Fam Obic113Fam 4.096 6 0.664
Obic95Fam Obic1181Fam 2.181 6 0.902
Obic77Hex Obic1181Fam 2.469 8 0.963
Obic1Hex Obic1181Fam 2.060 6 0.914
Obic1206Hex Obic1181Fam 1.247 8 0.996
Obic450Fam Obic1181Fam 0.433 8 1.000
Obic73Hex Obic1181Fam 1.274 8 0.996
Obic220Hex Obic1181Fam 2.840 8 0.944
Obic1374Fam Obic1181Fam 2.743 8 0.949
Obic1238Fam Obic1181Fam 0.000 8 1.000
Obic415Fam Obic1181Fam 2.854 8 0.943
Obic629Hex Obic1181Fam 0.000 8 1.000
Obic740Fam Obic1181Fam 0.000 4 1.000
Obic168Hex Obic1181Fam 6.722 8 0.567
Obic1252Fam Obic1181Fam 0.000 6 1.000
Obic113Fam Obic1181Fam 4.524 8 0.807
Obic95Fam Obic1176Hex 0.000 4 1.000
Obic77Hex Obic1176Hex 3.090 6 0.798
Obic1Hex Obic1176Hex 0.550 4 0.968
Obic1206Hex Obic1176Hex 1.264 6 0.974
Obic450Fam Obic1176Hex 2.431 6 0.876
Obic73Hex Obic1176Hex 1.317 6 0.971
Obic220Hex Obic1176Hex 0.953 6 0.987
Obic1374Fam Obic1176Hex 1.005 6 0.985
Obic1238Fam Obic1176Hex 5.510 6 0.48
Obic415Fam Obic1176Hex 1.403 6 0.966
Obic629Hex Obic1176Hex 0.000 6 1.000
Obic740Fam Obic1176Hex 0.000 2 1.000
Obic168Hex Obic1176Hex 5.147 6 0.525
Obic1252Fam Obic1176Hex 1.690 2 0.430
Obic113Fam Obic1176Hex 1.166 6 0.979
Obic1181Fam Obic1176Hex 0.679 6 0.995

- 187 - Table C.6: Linkage disequilibrium by marker & subpopulation. Genepop log likelihood ratio statistic for genetic disequilibrium of unrelated females. Sub = subpopulation (with: NS = North Shropshire, Su = Surrey, G1-2 = Germany 1 and 2), and p = uncorrected p-value. Significant p- values are in red, NAs are those instances where no contingency table could be drawn up (e.g. marker Obic740 only had one allele).
Sub Locus1 Locus2 p
G1 Obic95 Obic77 0.968
G1 Obic95 Obic1 0.834
G1 Obic77 Obic1 0.349
G1 Obic95 Obic1206 0.315
G1 Obic77 Obic1206 1.000
G1 Obic1 Obic1206 0.842
G1 Obic95 Obic450 0.525
G1 Obic77 Obic450 0.449
G1 Obic1 Obic450 1.000
G1 Obic1206 Obic450 1.000
G1 Obic95 Obic73 1.000
G1 Obic77 Obic73 0.682
G1 Obic1 Obic73 0.791
G1 Obic1206 Obic73 1.000
G1 Obic450 Obic73 1.000
G1 Obic95 Obic220 0.902
G1 Obic77 Obic220 0.109
G1 Obic1 Obic220 0.218
G1 Obic1206 Obic220 0.369
G1 Obic450 Obic220 0.533
G1 Obic73 Obic220 0.346
G1 Obic95 Obic1374 1.000
G1 Obic77 Obic1374 0.933
G1 Obic1 Obic1374 0.787
G1 Obic1206 Obic1374 1.000
G1 Obic450 Obic1374 0.817
G1 Obic73 Obic1374 1.000
G1 Obic220 Obic1374 0.291
G1 Obic95 Obic1238 1.000
G1 Obic77 Obic1238 0.467
G1 Obic1 Obic1238 0.791
G1 Obic1206 Obic1238 0.240
G1 Obic450 Obic1238 1.000
G1 Obic73 Obic1238 0.403
G1 Obic220 Obic1238 0.737
G1 Obic1374 Obic1238 1.000
G1 Obic95 Obic415 1.000
G1 Obic77 Obic415 0.079
G1 Obic1 Obic415 0.056
G1 Obic1206 Obic415 1.000
G1 Obic450 Obic415 0.810
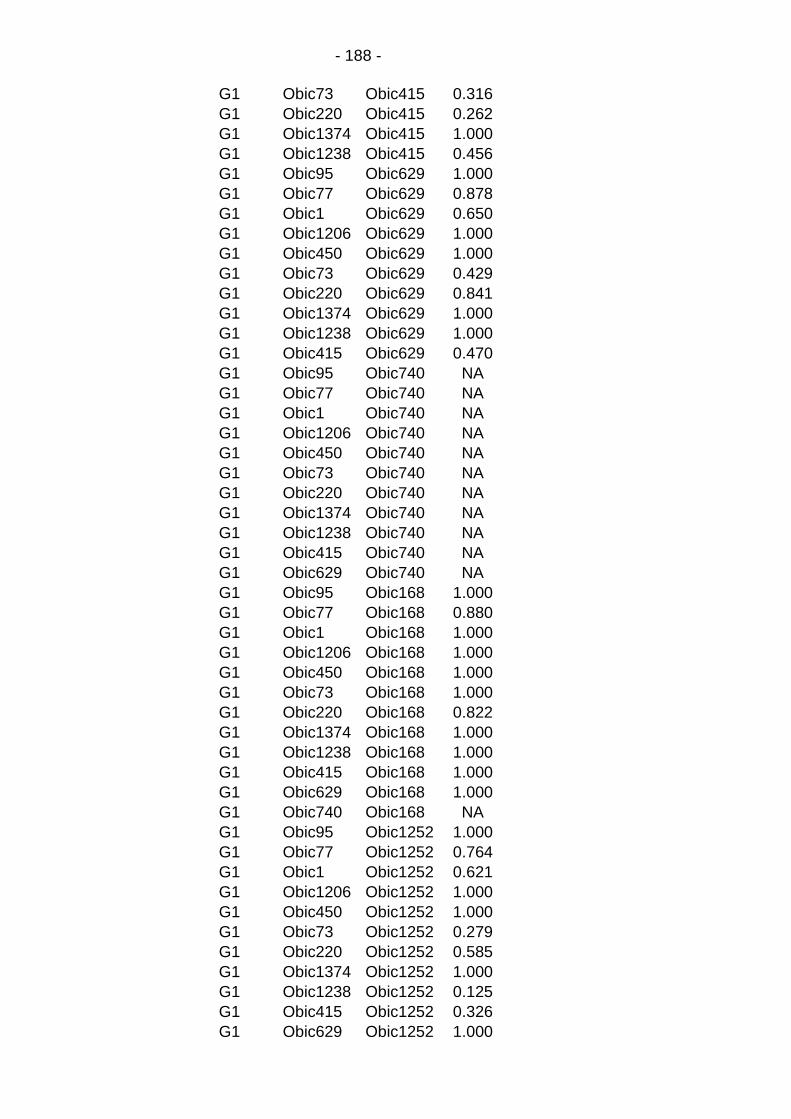
- 188 -
G1 Obic73 Obic415 0.316
G1 Obic220 Obic415 0.262
G1 Obic1374 Obic415 1.000
G1 Obic1238 Obic415 0.456
G1 Obic95 Obic629 1.000
G1 Obic77 Obic629 0.878
G1 Obic1 Obic629 0.650
G1 Obic1206 Obic629 1.000
G1 Obic450 Obic629 1.000
G1 Obic73 Obic629 0.429
G1 Obic220 Obic629 0.841
G1 Obic1374 Obic629 1.000
G1 Obic1238 Obic629 1.000
G1 Obic415 Obic629 0.470
G1 Obic95 Obic740 NA
G1 Obic77 Obic740 NA
G1 Obic1 Obic740 NA
G1 Obic1206 Obic740 NA
G1 Obic450 Obic740 NA
G1 Obic73 Obic740 NA
G1 Obic220 Obic740 NA
G1 Obic1374 Obic740 NA
G1 Obic1238 Obic740 NA
G1 Obic415 Obic740 NA
G1 Obic629 Obic740 NA
G1 Obic95 Obic168 1.000
G1 Obic77 Obic168 0.880
G1 Obic1 Obic168 1.000
G1 Obic1206 Obic168 1.000
G1 Obic450 Obic168 1.000
G1 Obic73 Obic168 1.000
G1 Obic220 Obic168 0.822
G1 Obic1374 Obic168 1.000
G1 Obic1238 Obic168 1.000
G1 Obic415 Obic168 1.000
G1 Obic629 Obic168 1.000
G1 Obic740 Obic168 NA
G1 Obic95 Obic1252 1.000
G1 Obic77 Obic1252 0.764
G1 Obic1 Obic1252 0.621
G1 Obic1206 Obic1252 1.000
G1 Obic450 Obic1252 1.000
G1 Obic73 Obic1252 0.279
G1 Obic220 Obic1252 0.585
G1 Obic1374 Obic1252 1.000
G1 Obic1238 Obic1252 0.125
G1 Obic415 Obic1252 0.326
G1 Obic629 Obic1252 1.000
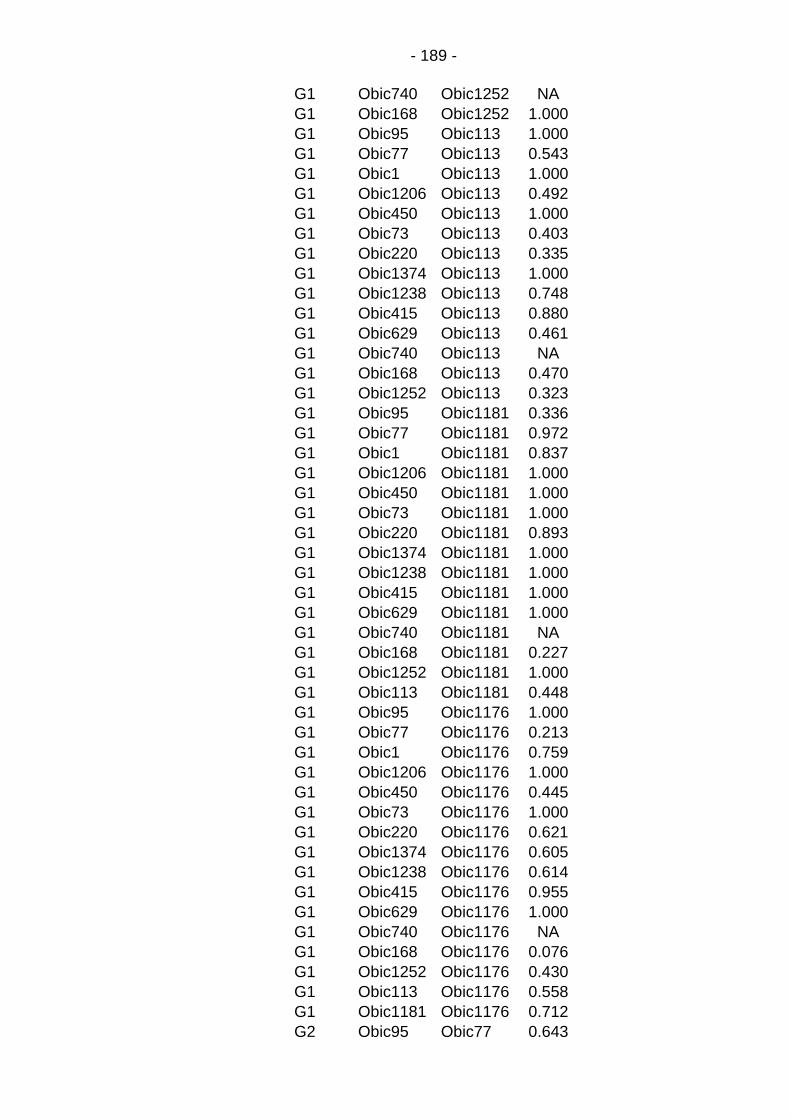
- 189 -
G1 Obic740 Obic1252 NA
G1 Obic168 Obic1252 1.000
G1 Obic95 Obic113 1.000
G1 Obic77 Obic113 0.543
G1 Obic1 Obic113 1.000
G1 Obic1206 Obic113 0.492
G1 Obic450 Obic113 1.000
G1 Obic73 Obic113 0.403
G1 Obic220 Obic113 0.335
G1 Obic1374 Obic113 1.000
G1 Obic1238 Obic113 0.748
G1 Obic415 Obic113 0.880
G1 Obic629 Obic113 0.461
G1 Obic740 Obic113 NA
G1 Obic168 Obic113 0.470
G1 Obic1252 Obic113 0.323
G1 Obic95 Obic1181 0.336
G1 Obic77 Obic1181 0.972
G1 Obic1 Obic1181 0.837
G1 Obic1206 Obic1181 1.000
G1 Obic450 Obic1181 1.000
G1 Obic73 Obic1181 1.000
G1 Obic220 Obic1181 0.893
G1 Obic1374 Obic1181 1.000
G1 Obic1238 Obic1181 1.000
G1 Obic415 Obic1181 1.000
G1 Obic629 Obic1181 1.000
G1 Obic740 Obic1181 NA
G1 Obic168 Obic1181 0.227
G1 Obic1252 Obic1181 1.000
G1 Obic113 Obic1181 0.448
G1 Obic95 Obic1176 1.000
G1 Obic77 Obic1176 0.213
G1 Obic1 Obic1176 0.759
G1 Obic1206 Obic1176 1.000
G1 Obic450 Obic1176 0.445
G1 Obic73 Obic1176 1.000
G1 Obic220 Obic1176 0.621
G1 Obic1374 Obic1176 0.605
G1 Obic1238 Obic1176 0.614
G1 Obic415 Obic1176 0.955
G1 Obic629 Obic1176 1.000
G1 Obic740 Obic1176 NA
G1 Obic168 Obic1176 0.076
G1 Obic1252 Obic1176 0.430
G1 Obic113 Obic1176 0.558
G1 Obic1181 Obic1176 0.712
G2 Obic95 Obic77 0.643
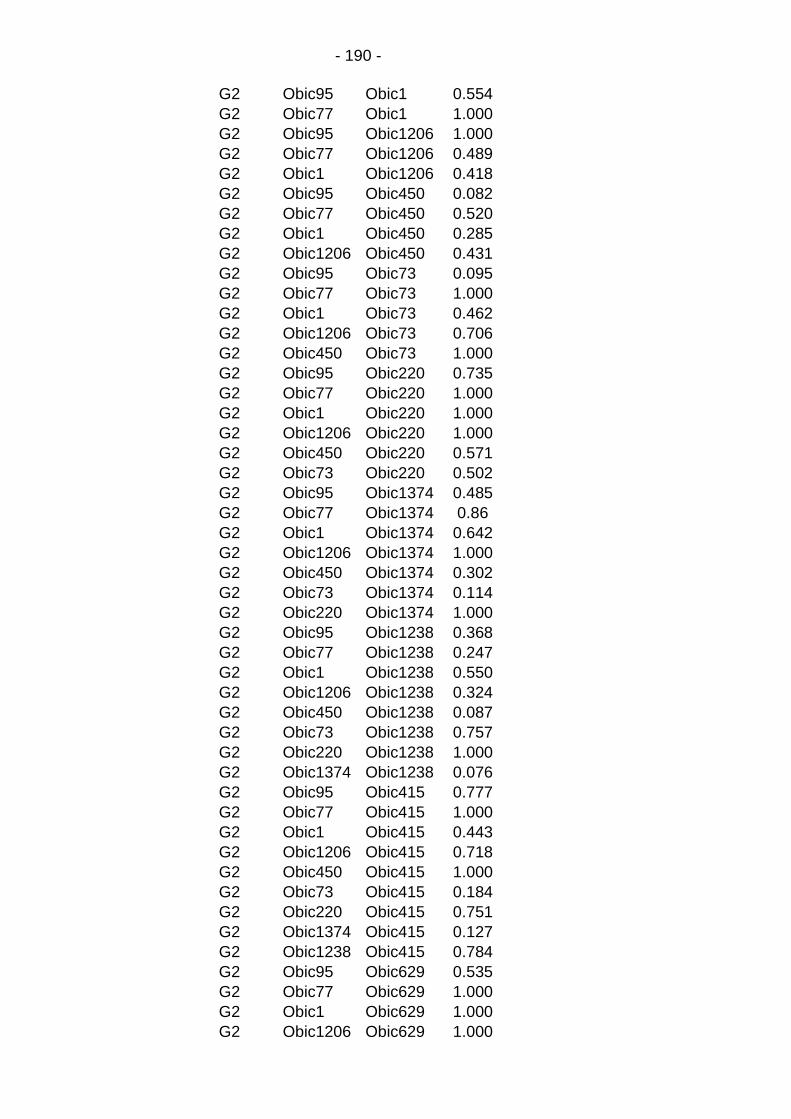
- 190 -
G2 Obic95 Obic1 0.554
G2 Obic77 Obic1 1.000
G2 Obic95 Obic1206 1.000
G2 Obic77 Obic1206 0.489
G2 Obic1 Obic1206 0.418
G2 Obic95 Obic450 0.082
G2 Obic77 Obic450 0.520
G2 Obic1 Obic450 0.285
G2 Obic1206 Obic450 0.431
G2 Obic95 Obic73 0.095
G2 Obic77 Obic73 1.000
G2 Obic1 Obic73 0.462
G2 Obic1206 Obic73 0.706
G2 Obic450 Obic73 1.000
G2 Obic95 Obic220 0.735
G2 Obic77 Obic220 1.000
G2 Obic1 Obic220 1.000
G2 Obic1206 Obic220 1.000
G2 Obic450 Obic220 0.571
G2 Obic73 Obic220 0.502
G2 Obic95 Obic1374 0.485
G2 Obic77 Obic1374 0.86
G2 Obic1 Obic1374 0.642
G2 Obic1206 Obic1374 1.000
G2 Obic450 Obic1374 0.302
G2 Obic73 Obic1374 0.114
G2 Obic220 Obic1374 1.000
G2 Obic95 Obic1238 0.368
G2 Obic77 Obic1238 0.247
G2 Obic1 Obic1238 0.550
G2 Obic1206 Obic1238 0.324
G2 Obic450 Obic1238 0.087
G2 Obic73 Obic1238 0.757
G2 Obic220 Obic1238 1.000
G2 Obic1374 Obic1238 0.076
G2 Obic95 Obic415 0.777
G2 Obic77 Obic415 1.000
G2 Obic1 Obic415 0.443
G2 Obic1206 Obic415 0.718
G2 Obic450 Obic415 1.000
G2 Obic73 Obic415 0.184
G2 Obic220 Obic415 0.751
G2 Obic1374 Obic415 0.127
G2 Obic1238 Obic415 0.784
G2 Obic95 Obic629 0.535
G2 Obic77 Obic629 1.000
G2 Obic1 Obic629 1.000
G2 Obic1206 Obic629 1.000
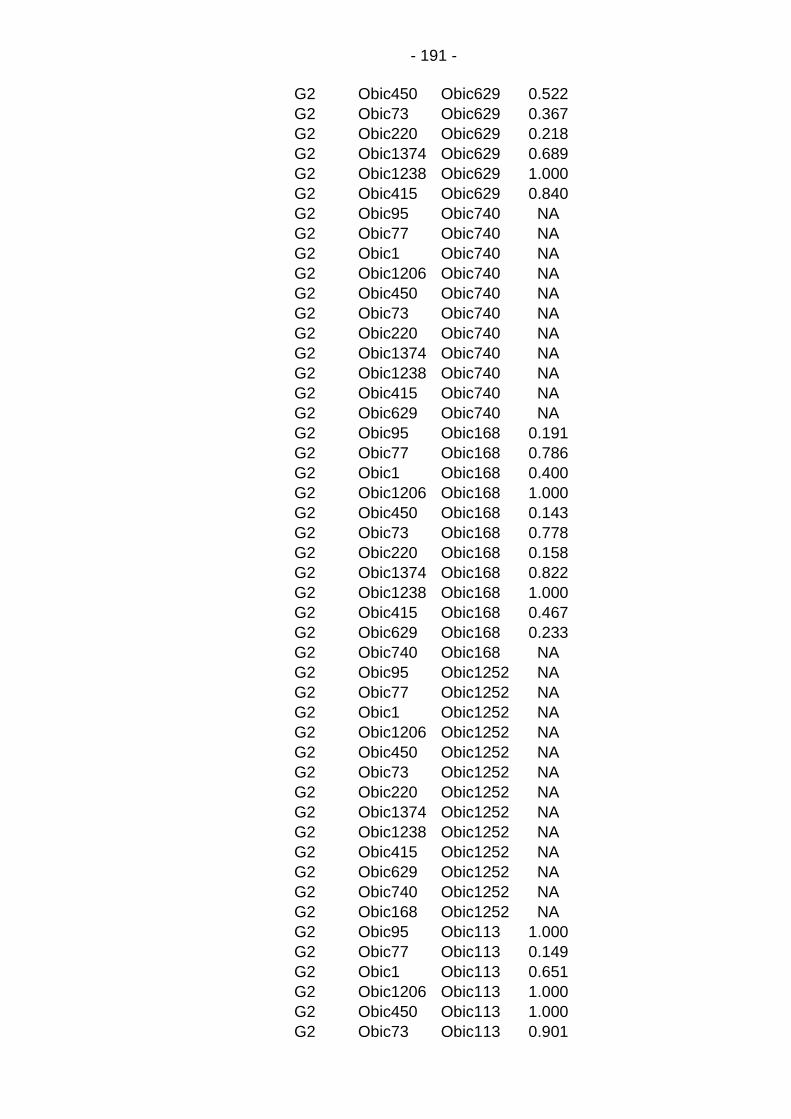
- 191 -
G2 Obic450 Obic629 0.522
G2 Obic73 Obic629 0.367
G2 Obic220 Obic629 0.218
G2 Obic1374 Obic629 0.689
G2 Obic1238 Obic629 1.000
G2 Obic415 Obic629 0.840
G2 Obic95 Obic740 NA
G2 Obic77 Obic740 NA
G2 Obic1 Obic740 NA
G2 Obic1206 Obic740 NA
G2 Obic450 Obic740 NA
G2 Obic73 Obic740 NA
G2 Obic220 Obic740 NA
G2 Obic1374 Obic740 NA
G2 Obic1238 Obic740 NA
G2 Obic415 Obic740 NA
G2 Obic629 Obic740 NA
G2 Obic95 Obic168 0.191
G2 Obic77 Obic168 0.786
G2 Obic1 Obic168 0.400
G2 Obic1206 Obic168 1.000
G2 Obic450 Obic168 0.143
G2 Obic73 Obic168 0.778
G2 Obic220 Obic168 0.158
G2 Obic1374 Obic168 0.822
G2 Obic1238 Obic168 1.000
G2 Obic415 Obic168 0.467
G2 Obic629 Obic168 0.233
G2 Obic740 Obic168 NA
G2 Obic95 Obic1252 NA
G2 Obic77 Obic1252 NA
G2 Obic1 Obic1252 NA
G2 Obic1206 Obic1252 NA
G2 Obic450 Obic1252 NA
G2 Obic73 Obic1252 NA
G2 Obic220 Obic1252 NA
G2 Obic1374 Obic1252 NA
G2 Obic1238 Obic1252 NA
G2 Obic415 Obic1252 NA
G2 Obic629 Obic1252 NA
G2 Obic740 Obic1252 NA
G2 Obic168 Obic1252 NA
G2 Obic95 Obic113 1.000
G2 Obic77 Obic113 0.149
G2 Obic1 Obic113 0.651
G2 Obic1206 Obic113 1.000
G2 Obic450 Obic113 1.000
G2 Obic73 Obic113 0.901

- 192 -
G2 Obic220 Obic113 0.826
G2 Obic1374 Obic113 1.000
G2 Obic1238 Obic113 1.000
G2 Obic415 Obic113 0.344
G2 Obic629 Obic113 1.000
G2 Obic740 Obic113 NA
G2 Obic168 Obic113 0.823
G2 Obic1252 Obic113 NA
G2 Obic95 Obic1181 1.000
G2 Obic77 Obic1181 1.000
G2 Obic1 Obic1181 1.000
G2 Obic1206 Obic1181 1.000
G2 Obic450 Obic1181 1.000
G2 Obic73 Obic1181 0.529
G2 Obic220 Obic1181 0.455
G2 Obic1374 Obic1181 0.254
G2 Obic1238 Obic1181 1.000
G2 Obic415 Obic1181 0.494
G2 Obic629 Obic1181 1.000
G2 Obic740 Obic1181 NA
G2 Obic168 Obic1181 0.448
G2 Obic1252 Obic1181 NA
G2 Obic113 Obic1181 1.000
G2 Obic95 Obic1176 1.000
G2 Obic77 Obic1176 1.000
G2 Obic1 Obic1176 1.000
G2 Obic1206 Obic1176 1.000
G2 Obic450 Obic1176 0.667
G2 Obic73 Obic1176 0.518
G2 Obic220 Obic1176 1.000
G2 Obic1374 Obic1176 1.000
G2 Obic1238 Obic1176 1.000
G2 Obic415 Obic1176 0.519
G2 Obic629 Obic1176 1.000
G2 Obic740 Obic1176 NA
G2 Obic168 Obic1176 1.000
G2 Obic1252 Obic1176 NA
G2 Obic113 Obic1176 1.000
G2 Obic1181 Obic1176 1.000
NS Obic95 Obic77 0.772
NS Obic95 Obic1 1.000
NS Obic77 Obic1 0.429
NS Obic95 Obic1206 1.000
NS Obic77 Obic1206 0.112
NS Obic1 Obic1206 0.570
NS Obic95 Obic450 1.000
NS Obic77 Obic450 1.000
NS Obic1 Obic450 1.000

- 193 -
NS Obic1206 Obic450 1.000
NS Obic95 Obic73 1.000
NS Obic77 Obic73 0.894
NS Obic1 Obic73 0.288
NS Obic1206 Obic73 0.629
NS Obic450 Obic73 1.000
NS Obic95 Obic220 0.772
NS Obic77 Obic220 0.433
NS Obic1 Obic220 0.139
NS Obic1206 Obic220 0.889
NS Obic450 Obic220 0.717
NS Obic73 Obic220 0.315
NS Obic95 Obic1374 0.358
NS Obic77 Obic1374 0.781
NS Obic1 Obic1374 1.000
NS Obic1206 Obic1374 0.484
NS Obic450 Obic1374 1.000
NS Obic73 Obic1374 0.479
NS Obic220 Obic1374 0.777
NS Obic95 Obic1238 0.488
NS Obic77 Obic1238 0.302
NS Obic1 Obic1238 1.000
NS Obic1206 Obic1238 0.109
NS Obic450 Obic1238 1.000
NS Obic73 Obic1238 1.000
NS Obic220 Obic1238 0.885
NS Obic1374 Obic1238 1.000
NS Obic95 Obic415 1.000
NS Obic77 Obic415 0.660
NS Obic1 Obic415 1.000
NS Obic1206 Obic415 1.000
NS Obic450 Obic415 1.000
NS Obic73 Obic415 0.231
NS Obic220 Obic415 0.110
NS Obic1374 Obic415 0.592
NS Obic1238 Obic415 0.828
NS Obic95 Obic629 1.000
NS Obic77 Obic629 1.000
NS Obic1 Obic629 1.000
NS Obic1206 Obic629 1.000
NS Obic450 Obic629 1.000
NS Obic73 Obic629 1.000
NS Obic220 Obic629 1.000
NS Obic1374 Obic629 1.000
NS Obic1238 Obic629 0.167
NS Obic415 Obic629 0.285
NS Obic95 Obic740 1.000
NS Obic77 Obic740 1.000

- 194 -
NS Obic1 Obic740 0.718
NS Obic1206 Obic740 1.000
NS Obic450 Obic740 0.469
NS Obic73 Obic740 0.188
NS Obic220 Obic740 0.320
NS Obic1374 Obic740 0.136
NS Obic1238 Obic740 1.000
NS Obic415 Obic740 0.294
NS Obic629 Obic740 1.000
NS Obic95 Obic168 0.485
NS Obic77 Obic168 0.309
NS Obic1 Obic168 0.288
NS Obic1206 Obic168 0.622
NS Obic450 Obic168 0.278
NS Obic73 Obic168 0.106
NS Obic220 Obic168 0.107
NS Obic1374 Obic168 0.471
NS Obic1238 Obic168 1.000
NS Obic415 Obic168 0.827
NS Obic629 Obic168 1.000
NS Obic740 Obic168 0.203
NS Obic95 Obic1252 1.000
NS Obic77 Obic1252 1.000
NS Obic1 Obic1252 0.711
NS Obic1206 Obic1252 1.000
NS Obic450 Obic1252 0.484
NS Obic73 Obic1252 1.000
NS Obic220 Obic1252 1.000
NS Obic1374 Obic1252 1.000
NS Obic1238 Obic1252 1.000
NS Obic415 Obic1252 1.000
NS Obic629 Obic1252 1.000
NS Obic740 Obic1252 1.000
NS Obic168 Obic1252 1.000
NS Obic95 Obic113 0.429
NS Obic77 Obic113 0.139
NS Obic1 Obic113 1.000
NS Obic1206 Obic113 0.047
NS Obic450 Obic113 1.000
NS Obic73 Obic113 1.000
NS Obic220 Obic113 0.717
NS Obic1374 Obic113 0.434
NS Obic1238 Obic113 0.051
NS Obic415 Obic113 1.000
NS Obic629 Obic113 0.480
NS Obic740 Obic113 1.000
NS Obic168 Obic113 0.570
NS Obic1252 Obic113 1.000
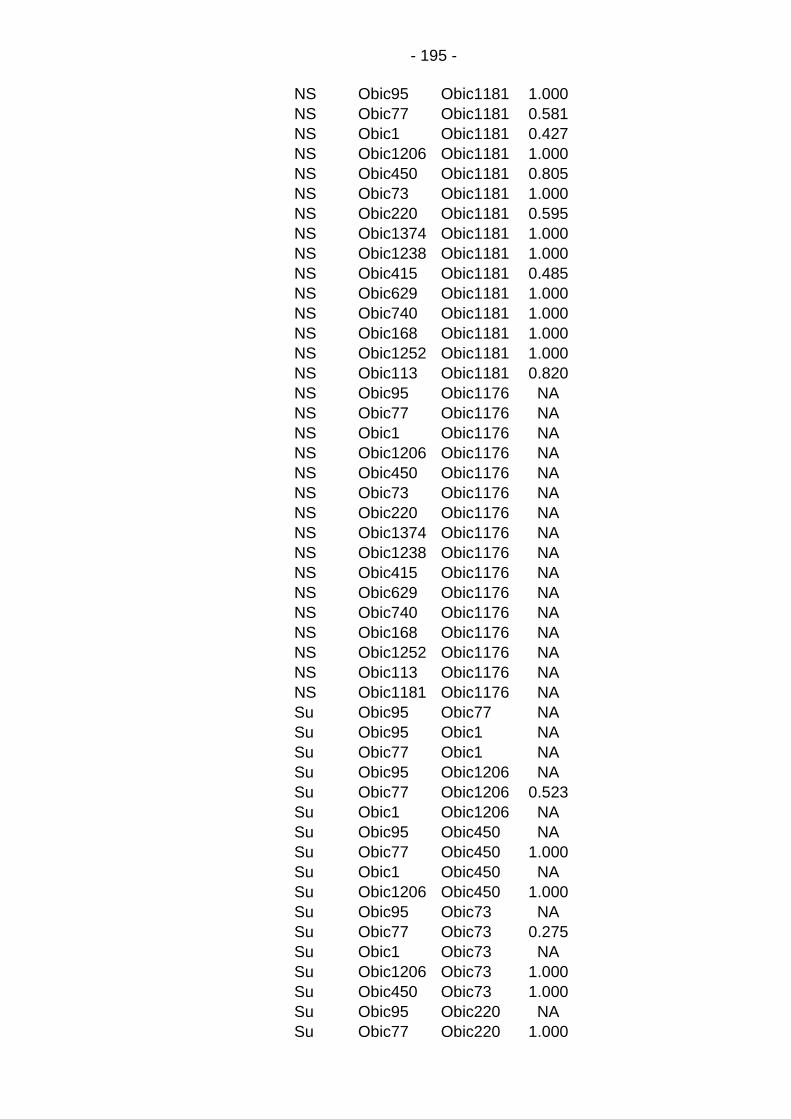
- 195 -
NS Obic95 Obic1181 1.000
NS Obic77 Obic1181 0.581
NS Obic1 Obic1181 0.427
NS Obic1206 Obic1181 1.000
NS Obic450 Obic1181 0.805
NS Obic73 Obic1181 1.000
NS Obic220 Obic1181 0.595
NS Obic1374 Obic1181 1.000
NS Obic1238 Obic1181 1.000
NS Obic415 Obic1181 0.485
NS Obic629 Obic1181 1.000
NS Obic740 Obic1181 1.000
NS Obic168 Obic1181 1.000
NS Obic1252 Obic1181 1.000
NS Obic113 Obic1181 0.820
NS Obic95 Obic1176 NA
NS Obic77 Obic1176 NA
NS Obic1 Obic1176 NA
NS Obic1206 Obic1176 NA
NS Obic450 Obic1176 NA
NS Obic73 Obic1176 NA
NS Obic220 Obic1176 NA
NS Obic1374 Obic1176 NA
NS Obic1238 Obic1176 NA
NS Obic415 Obic1176 NA
NS Obic629 Obic1176 NA
NS Obic740 Obic1176 NA
NS Obic168 Obic1176 NA
NS Obic1252 Obic1176 NA
NS Obic113 Obic1176 NA
NS Obic1181 Obic1176 NA
Su Obic95 Obic77 NA
Su Obic95 Obic1 NA
Su Obic77 Obic1 NA
Su Obic95 Obic1206 NA
Su Obic77 Obic1206 0.523
Su Obic1 Obic1206 NA
Su Obic95 Obic450 NA
Su Obic77 Obic450 1.000
Su Obic1 Obic450 NA
Su Obic1206 Obic450 1.000
Su Obic95 Obic73 NA
Su Obic77 Obic73 0.275
Su Obic1 Obic73 NA
Su Obic1206 Obic73 1.000
Su Obic450 Obic73 1.000
Su Obic95 Obic220 NA
Su Obic77 Obic220 1.000
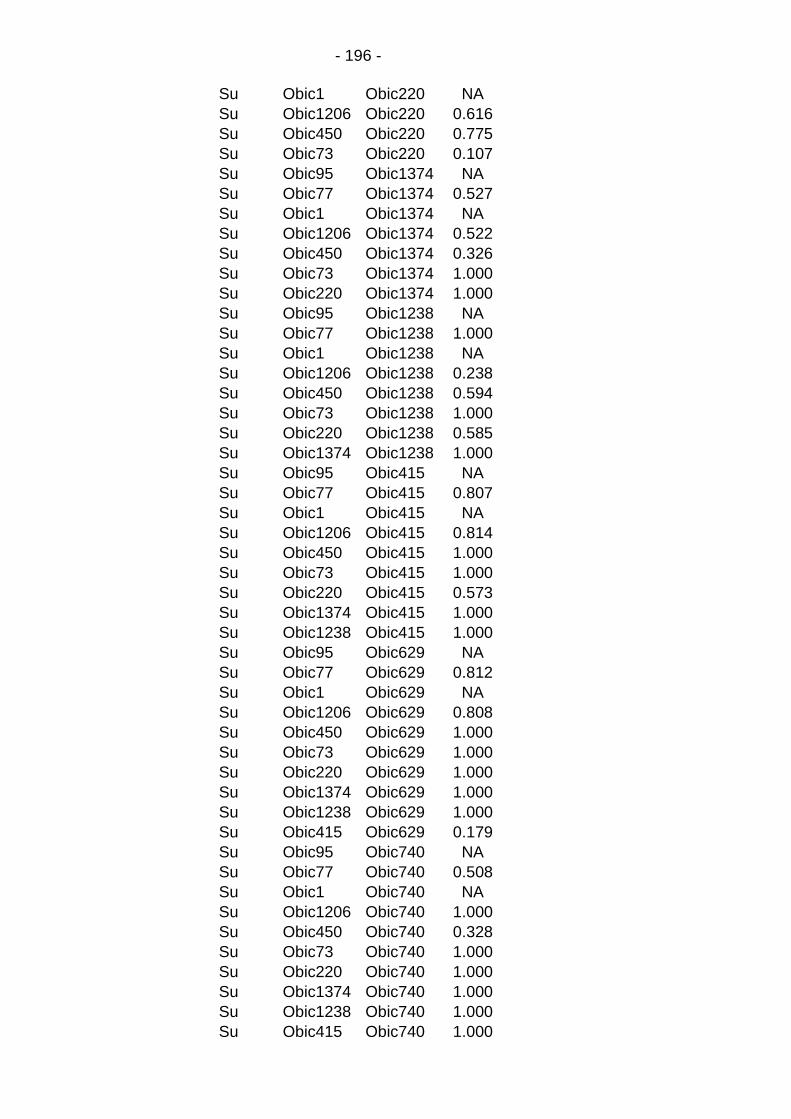
- 196 -
Su Obic1 Obic220 NA
Su Obic1206 Obic220 0.616
Su Obic450 Obic220 0.775
Su Obic73 Obic220 0.107
Su Obic95 Obic1374 NA
Su Obic77 Obic1374 0.527
Su Obic1 Obic1374 NA
Su Obic1206 Obic1374 0.522
Su Obic450 Obic1374 0.326
Su Obic73 Obic1374 1.000
Su Obic220 Obic1374 1.000
Su Obic95 Obic1238 NA
Su Obic77 Obic1238 1.000
Su Obic1 Obic1238 NA
Su Obic1206 Obic1238 0.238
Su Obic450 Obic1238 0.594
Su Obic73 Obic1238 1.000
Su Obic220 Obic1238 0.585
Su Obic1374 Obic1238 1.000
Su Obic95 Obic415 NA
Su Obic77 Obic415 0.807
Su Obic1 Obic415 NA
Su Obic1206 Obic415 0.814
Su Obic450 Obic415 1.000
Su Obic73 Obic415 1.000
Su Obic220 Obic415 0.573
Su Obic1374 Obic415 1.000
Su Obic1238 Obic415 1.000
Su Obic95 Obic629 NA
Su Obic77 Obic629 0.812
Su Obic1 Obic629 NA
Su Obic1206 Obic629 0.808
Su Obic450 Obic629 1.000
Su Obic73 Obic629 1.000
Su Obic220 Obic629 1.000
Su Obic1374 Obic629 1.000
Su Obic1238 Obic629 1.000
Su Obic415 Obic629 0.179
Su Obic95 Obic740 NA
Su Obic77 Obic740 0.508
Su Obic1 Obic740 NA
Su Obic1206 Obic740 1.000
Su Obic450 Obic740 0.328
Su Obic73 Obic740 1.000
Su Obic220 Obic740 1.000
Su Obic1374 Obic740 1.000
Su Obic1238 Obic740 1.000
Su Obic415 Obic740 1.000
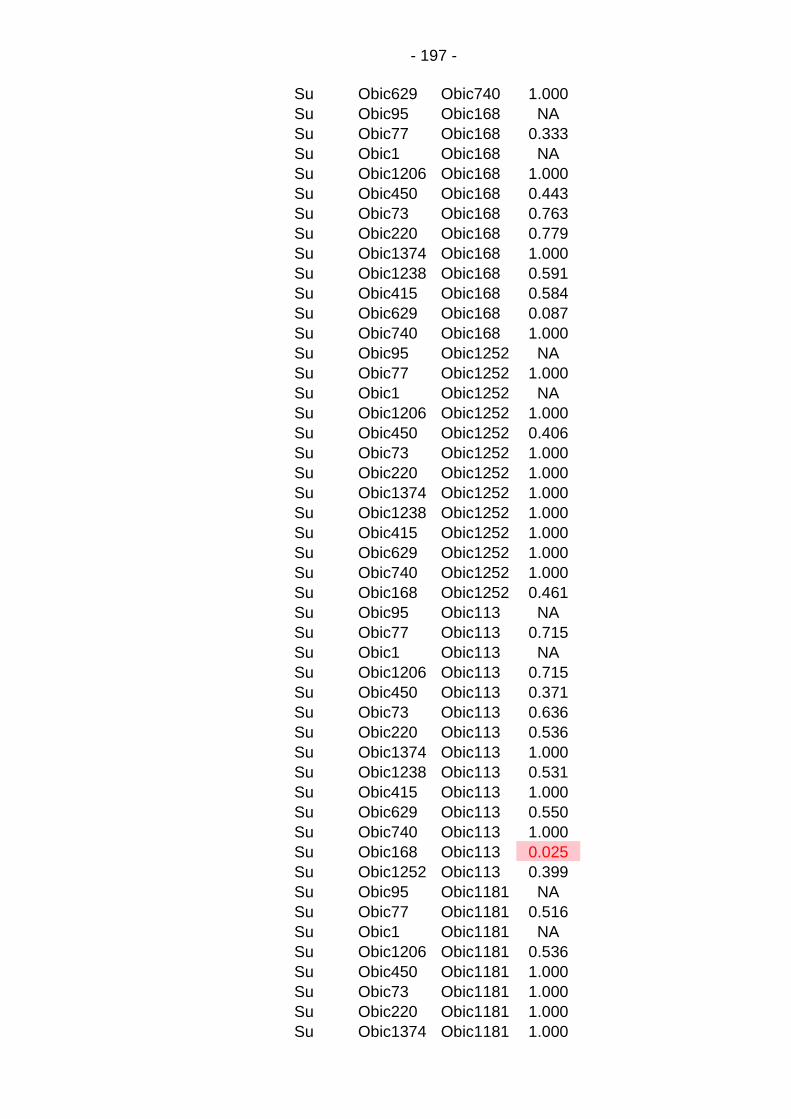
- 197 -
Su Obic629 Obic740 1.000
Su Obic95 Obic168 NA
Su Obic77 Obic168 0.333
Su Obic1 Obic168 NA
Su Obic1206 Obic168 1.000
Su Obic450 Obic168 0.443
Su Obic73 Obic168 0.763
Su Obic220 Obic168 0.779
Su Obic1374 Obic168 1.000
Su Obic1238 Obic168 0.591
Su Obic415 Obic168 0.584
Su Obic629 Obic168 0.087
Su Obic740 Obic168 1.000
Su Obic95 Obic1252 NA
Su Obic77 Obic1252 1.000
Su Obic1 Obic1252 NA
Su Obic1206 Obic1252 1.000
Su Obic450 Obic1252 0.406
Su Obic73 Obic1252 1.000
Su Obic220 Obic1252 1.000
Su Obic1374 Obic1252 1.000
Su Obic1238 Obic1252 1.000
Su Obic415 Obic1252 1.000
Su Obic629 Obic1252 1.000
Su Obic740 Obic1252 1.000
Su Obic168 Obic1252 0.461
Su Obic95 Obic113 NA
Su Obic77 Obic113 0.715
Su Obic1 Obic113 NA
Su Obic1206 Obic113 0.715
Su Obic450 Obic113 0.371
Su Obic73 Obic113 0.636
Su Obic220 Obic113 0.536
Su Obic1374 Obic113 1.000
Su Obic1238 Obic113 0.531
Su Obic415 Obic113 1.000
Su Obic629 Obic113 0.550
Su Obic740 Obic113 1.000
Su Obic168 Obic113 0.025
Su Obic1252 Obic113 0.399
Su Obic95 Obic1181 NA
Su Obic77 Obic1181 0.516
Su Obic1 Obic1181 NA
Su Obic1206 Obic1181 0.536
Su Obic450 Obic1181 1.000
Su Obic73 Obic1181 1.000
Su Obic220 Obic1181 1.000
Su Obic1374 Obic1181 1.000
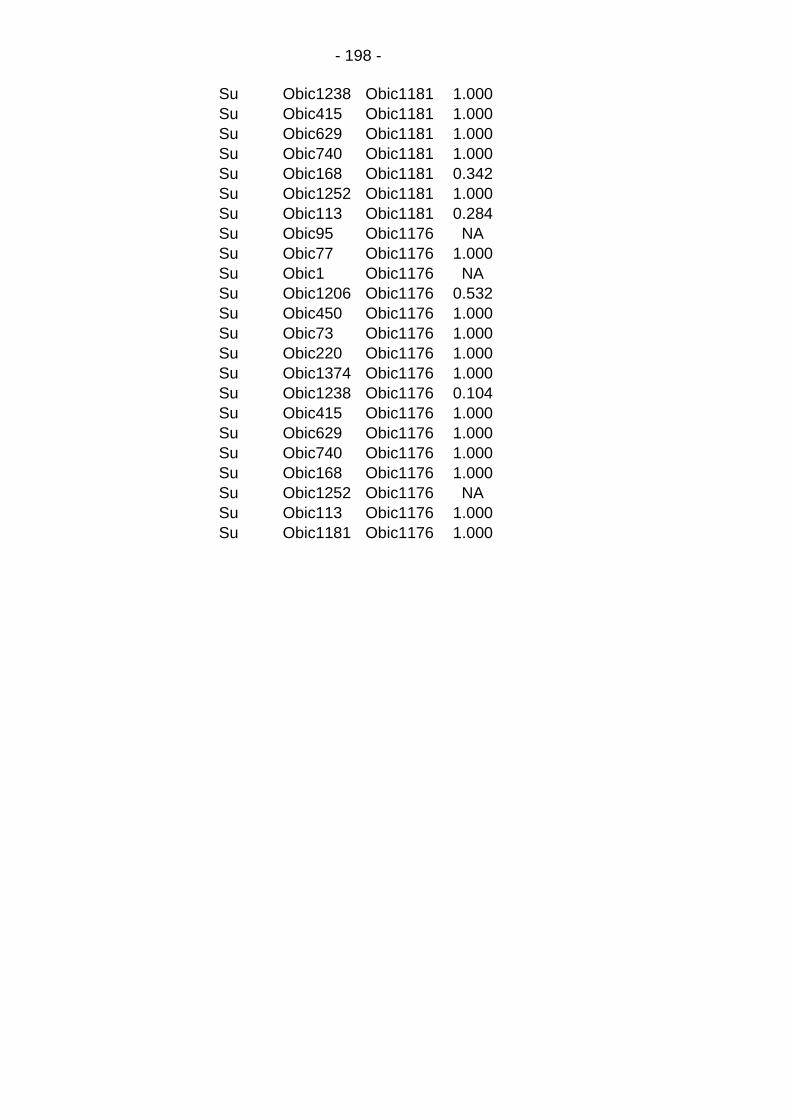
- 198 -
Su Obic1238 Obic1181 1.000
Su Obic415 Obic1181 1.000
Su Obic629 Obic1181 1.000
Su Obic740 Obic1181 1.000
Su Obic168 Obic1181 0.342
Su Obic1252 Obic1181 1.000
Su Obic113 Obic1181 0.284
Su Obic95 Obic1176 NA
Su Obic77 Obic1176 1.000
Su Obic1 Obic1176 NA
Su Obic1206 Obic1176 0.532
Su Obic450 Obic1176 1.000
Su Obic73 Obic1176 1.000
Su Obic220 Obic1176 1.000
Su Obic1374 Obic1176 1.000
Su Obic1238 Obic1176 0.104
Su Obic415 Obic1176 1.000
Su Obic629 Obic1176 1.000
Su Obic740 Obic1176 1.000
Su Obic168 Obic1176 1.000
Su Obic1252 Obic1176 NA
Su Obic113 Obic1176 1.000
Su Obic1181 Obic1176 1.000
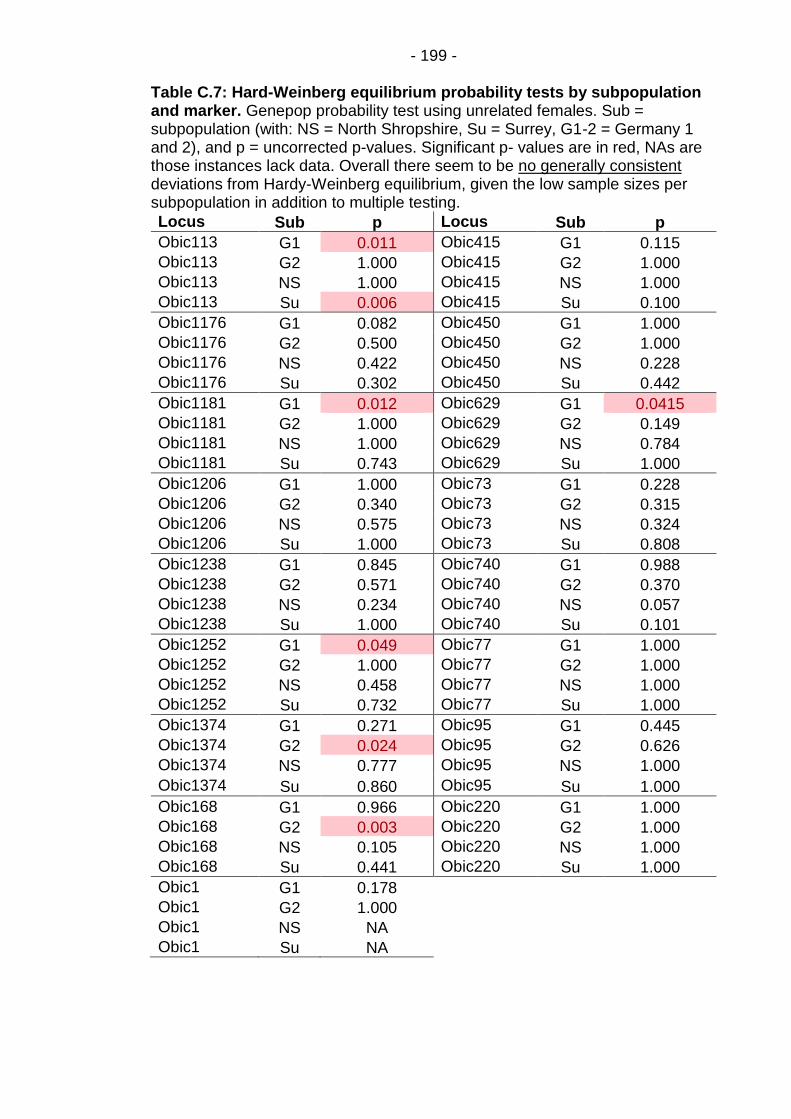
- 199 - Table C.7: Hard-Weinberg equilibrium probability tests by subpopulation and marker. Genepop probability test using unrelated females. Sub = subpopulation (with: NS = North Shropshire, Su = Surrey, G1-2 = Germany 1 and 2), and p = uncorrected p-values. Significant p- values are in red, NAs are those instances lack data. Overall there seem to be no generally consistent deviations from Hardy-Weinberg equilibrium, given the low sample sizes per subpopulation in addition to multiple testing.
Locus Sub p Locus Sub p
Obic113 G1 0.011 Obic415 G1 0.115
Obic113 G2 1.000 Obic415 G2 1.000
Obic113 NS 1.000 Obic415 NS 1.000
Obic113 Su 0.006 Obic415 Su 0.100
Obic1176 G1 0.082 Obic450 G1 1.000
Obic1176 G2 0.500 Obic450 G2 1.000
Obic1176 NS 0.422 Obic450 NS 0.228
Obic1176 Su 0.302 Obic450 Su 0.442
Obic1181 G1 0.012 Obic629 G1 0.0415
Obic1181 G2 1.000 Obic629 G2 0.149
Obic1181 NS 1.000 Obic629 NS 0.784
Obic1181 Su 0.743 Obic629 Su 1.000
Obic1206 G1 1.000 Obic73 G1 0.228
Obic1206 G2 0.340 Obic73 G2 0.315
Obic1206 NS 0.575 Obic73 NS 0.324
Obic1206 Su 1.000 Obic73 Su 0.808
Obic1238 G1 0.845 Obic740 G1 0.988
Obic1238 G2 0.571 Obic740 G2 0.370
Obic1238 NS 0.234 Obic740 NS 0.057
Obic1238 Su 1.000 Obic740 Su 0.101
Obic1252 G1 0.049 Obic77 G1 1.000
Obic1252 G2 1.000 Obic77 G2 1.000
Obic1252 NS 0.458 Obic77 NS 1.000
Obic1252 Su 0.732 Obic77 Su 1.000
Obic1374 G1 0.271 Obic95 G1 0.445
Obic1374 G2 0.024 Obic95 G2 0.626
Obic1374 NS 0.777 Obic95 NS 1.000
Obic1374 Su 0.860 Obic95 Su 1.000
Obic168 G1 0.966 Obic220 G1 1.000
Obic168 G2 0.003 Obic220 G2 1.000
Obic168 NS 0.105 Obic220 NS 1.000
Obic168 Su 0.441 Obic220 Su 1.000
Obic1 G1 0.178
Obic1 G2 1.000
Obic1 NS NA
Obic1 Su NA
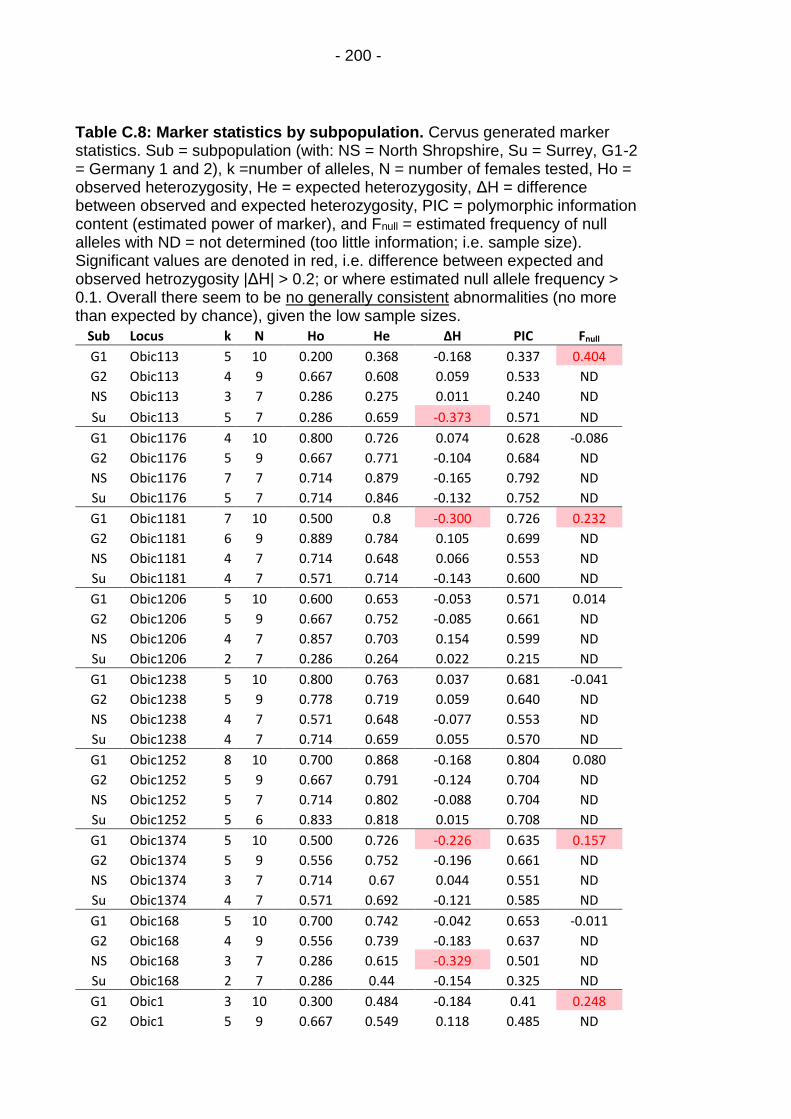
- 200 -
Table C.8: Marker statistics by subpopulation. Cervus generated marker statistics. Sub = subpopulation (with: NS = North Shropshire, Su = Surrey, G1-2 = Germany 1 and 2), k =number of alleles, N = number of females tested, Ho = observed heterozygosity, He = expected heterozygosity, ΔH = difference between observed and expected heterozygosity, PIC = polymorphic information content (estimated power of marker), and Fnull = estimated frequency of null alleles with ND = not determined (too little information; i.e. sample size). Significant values are denoted in red, i.e. difference between expected and observed hetrozygosity |ΔH| > 0.2; or where estimated null allele frequency > 0.1. Overall there seem to be no generally consistent abnormalities (no more than expected by chance), given the low sample sizes.
Sub Locus k N Ho He ΔH PIC Fnull
G1 Obic113 5 10 0.200 0.368 -0.168 0.337 0.404
G2 Obic113 4 9 0.667 0.608 0.059 0.533 ND
NS Obic113 3 7 0.286 0.275 0.011 0.240 ND
Su Obic113 5 7 0.286 0.659 -0.373 0.571 ND
G1 Obic1176 4 10 0.800 0.726 0.074 0.628 -0.086
G2 Obic1176 5 9 0.667 0.771 -0.104 0.684 ND
NS Obic1176 7 7 0.714 0.879 -0.165 0.792 ND
Su Obic1176 5 7 0.714 0.846 -0.132 0.752 ND
G1 Obic1181 7 10 0.500 0.8 -0.300 0.726 0.232
G2 Obic1181 6 9 0.889 0.784 0.105 0.699 ND
NS Obic1181 4 7 0.714 0.648 0.066 0.553 ND
Su Obic1181 4 7 0.571 0.714 -0.143 0.600 ND
G1 Obic1206 5 10 0.600 0.653 -0.053 0.571 0.014
G2 Obic1206 5 9 0.667 0.752 -0.085 0.661 ND
NS Obic1206 4 7 0.857 0.703 0.154 0.599 ND
Su Obic1206 2 7 0.286 0.264 0.022 0.215 ND
G1 Obic1238 5 10 0.800 0.763 0.037 0.681 -0.041
G2 Obic1238 5 9 0.778 0.719 0.059 0.640 ND
NS Obic1238 4 7 0.571 0.648 -0.077 0.553 ND
Su Obic1238 4 7 0.714 0.659 0.055 0.570 ND
G1 Obic1252 8 10 0.700 0.868 -0.168 0.804 0.080
G2 Obic1252 5 9 0.667 0.791 -0.124 0.704 ND
NS Obic1252 5 7 0.714 0.802 -0.088 0.704 ND
Su Obic1252 5 6 0.833 0.818 0.015 0.708 ND
G1 Obic1374 5 10 0.500 0.726 -0.226 0.635 0.157
G2 Obic1374 5 9 0.556 0.752 -0.196 0.661 ND
NS Obic1374 3 7 0.714 0.67 0.044 0.551 ND
Su Obic1374 4 7 0.571 0.692 -0.121 0.585 ND
G1 Obic168 5 10 0.700 0.742 -0.042 0.653 -0.011
G2 Obic168 4 9 0.556 0.739 -0.183 0.637 ND
NS Obic168 3 7 0.286 0.615 -0.329 0.501 ND
Su Obic168 2 7 0.286 0.44 -0.154 0.325 ND
G1 Obic1 3 10 0.300 0.484 -0.184 0.41 0.248
G2 Obic1 5 9 0.667 0.549 0.118 0.485 ND

- 201 -
NS Obic1 2 7 0.143 0.143 0.000 0.124 ND Su Obic1 1 7 0.000 0.000 0.000 0.000 ND
G1 Obic220 2 10 0.500 0.479 0.021 0.351 -0.047
G2 Obic220 3 9 0.556 0.542 0.014 0.426 ND
NS Obic220 2 7 0.571 0.527 0.044 0.370 ND
Su Obic220 2 7 0.571 0.527 0.044 0.370 ND
G1 Obic415 4 10 0.400 0.611 -0.211 0.535 0.157
G2 Obic415 5 9 0.444 0.405 0.039 0.368 ND
NS Obic415 3 7 0.571 0.473 0.098 0.386 ND
Su Obic415 4 7 0.429 0.714 -0.285 0.615 ND
G1 Obic450 2 10 0.500 0.395 0.105 0.305 -0.142
G2 Obic450 2 9 0.444 0.366 0.078 0.286 ND
NS Obic450 2 7 0.143 0.363 -0.220 0.280 ND
Su Obic450 2 7 0.286 0.440 -0.154 0.325 ND
G1 Obic629 6 10 0.500 0.800 -0.300 0.730 0.220
G2 Obic629 6 9 0.889 0.797 0.092 0.713 ND
NS Obic629 6 7 0.857 0.835 0.022 0.741 ND
Su Obic629 4 7 0.857 0.736 0.121 0.626 ND
G1 Obic73 5 10 0.700 0.695 0.005 0.611 -0.011
G2 Obic73 3 9 0.778 0.68 0.098 0.568 ND
NS Obic73 3 7 0.429 0.560 -0.131 0.464 ND
Su Obic73 3 7 0.714 0.703 0.011 0.580 ND
G1 Obic740 8 10 0.900 0.868 0.032 0.804 -0.041
G2 Obic740 8 9 0.667 0.856 -0.189 0.784 ND
NS Obic740 8 7 0.714 0.901 -0.187 0.818 ND
Su Obic740 7 7 0.714 0.879 -0.165 0.792 ND
G1 Obic77 3 10 0.300 0.279 0.021 0.247 -0.075
G2 Obic77 2 9 0.333 0.294 0.039 0.239 ND
NS Obic77 3 7 0.429 0.385 0.044 0.325 ND
Su Obic77 2 7 0.286 0.264 0.022 0.215 ND
G1 Obic95f 6 10 0.800 0.779 0.021 0.703 -0.031
G2 Obic95f 5 9 0.667 0.693 -0.026 0.603 ND
NS Obic95f 3 7 0.857 0.703 0.154 0.580 ND
Su Obic95f 5 7 0.714 0.758 -0.044 0.657 ND
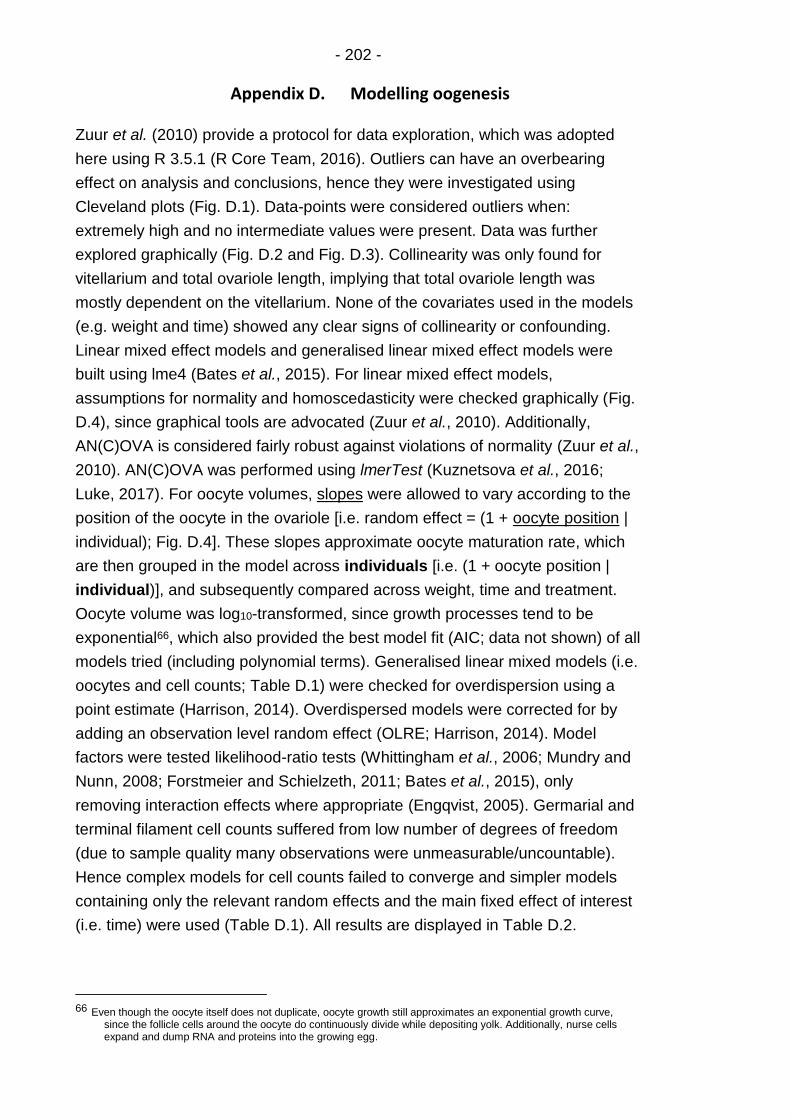
- 202 -
Appendix D. Modelling oogenesis
Zuur et al. (2010) provide a protocol for data exploration, which was adopted
here using R 3.5.1 (R Core Team, 2016). Outliers can have an overbearing
effect on analysis and conclusions, hence they were investigated using
Cleveland plots (Fig. D.1). Data-points were considered outliers when:
extremely high and no intermediate values were present. Data was further
explored graphically (Fig. D.2 and Fig. D.3). Collinearity was only found for
vitellarium and total ovariole length, implying that total ovariole length was
mostly dependent on the vitellarium. None of the covariates used in the models
(e.g. weight and time) showed any clear signs of collinearity or confounding.
Linear mixed effect models and generalised linear mixed effect models were
built using lme4 (Bates et al., 2015). For linear mixed effect models,
assumptions for normality and homoscedasticity were checked graphically (Fig.
D.4), since graphical tools are advocated (Zuur et al., 2010). Additionally,
AN(C)OVA is considered fairly robust against violations of normality (Zuur et al.,
2010). AN(C)OVA was performed using lmerTest (Kuznetsova et al., 2016;
Luke, 2017). For oocyte volumes, slopes were allowed to vary according to the
position of the oocyte in the ovariole [i.e. random effect = (1 + oocyte position |
individual); Fig. D.4]. These slopes approximate oocyte maturation rate, which
are then grouped in the model across individuals [i.e. (1 + oocyte position |
individual)], and subsequently compared across weight, time and treatment.
Oocyte volume was log10-transformed, since growth processes tend to be
exponential66, which also provided the best model fit (AIC; data not shown) of all
models tried (including polynomial terms). Generalised linear mixed models (i.e.
oocytes and cell counts; Table D.1) were checked for overdispersion using a
point estimate (Harrison, 2014). Overdispersed models were corrected for by
adding an observation level random effect (OLRE; Harrison, 2014). Model
factors were tested likelihood-ratio tests (Whittingham et al., 2006; Mundry and
Nunn, 2008; Forstmeier and Schielzeth, 2011; Bates et al., 2015), only
removing interaction effects where appropriate (Engqvist, 2005). Germarial and
terminal filament cell counts suffered from low number of degrees of freedom
(due to sample quality many observations were unmeasurable/uncountable).
Hence complex models for cell counts failed to converge and simpler models
containing only the relevant random effects and the main fixed effect of interest
(i.e. time) were used (Table D.1). All results are displayed in Table D.2.
66 Even though the oocyte itself does not duplicate, oocyte growth still approximates an exponential growth curve,
since the follicle cells around the oocyte do continuously divide while depositing yolk. Additionally, nurse cells expand and dump RNA and proteins into the growing egg.
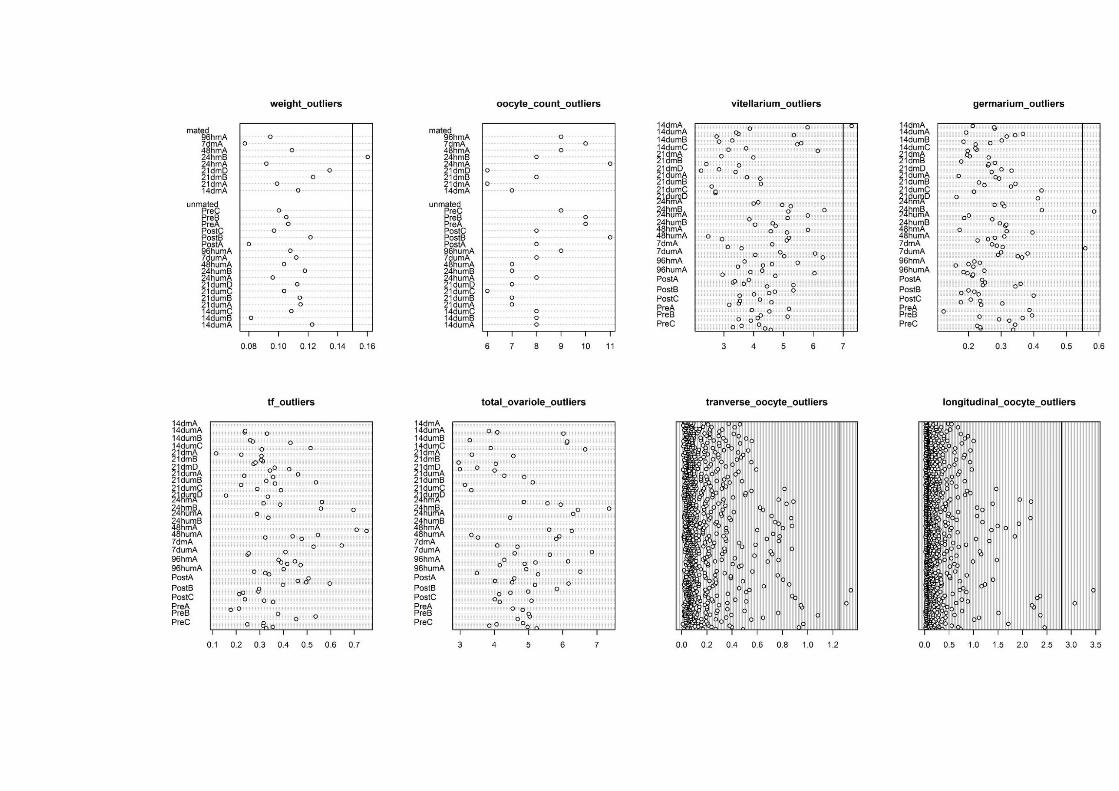

Fig. D.1 Cleveland plots for the detection of outliers. Data-points right of the vertical line were deemed outliers and removed prior to analysis.

- 205 -
Fig. D.2 Graphical exploration of ovariole lengths data. Mated and unmated females were plotted using different symbols, red lines represent LOWESS smoothing and diagonal histograms show raw data distributions. Weight = female weight (g); ooc = total number of discernible oocytes (includes data of poor samples with damaged tissue which were removed prior to analysis); vit_l = vitellarium length (mm); germ_l = germarium length (mm); tf_l = terminal filament (mm); ov_l = total ovariole length (mm); and time = time-point of the experiment (days). Only vitellarium and total ovariole length showed a clear and strong correlation, implying total ovariole length was mostly dependent on the vitellarium.
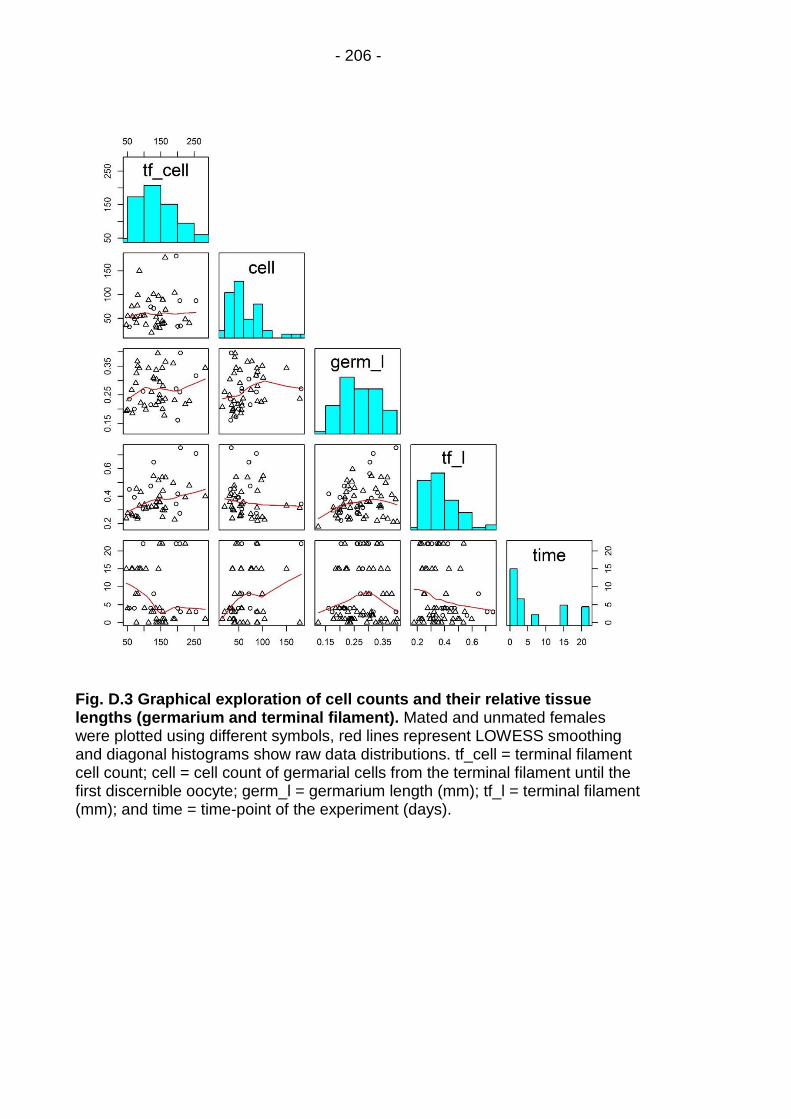
- 206 -
Fig. D.3 Graphical exploration of cell counts and their relative tissue lengths (germarium and terminal filament). Mated and unmated females were plotted using different symbols, red lines represent LOWESS smoothing and diagonal histograms show raw data distributions. tf_cell = terminal filament cell count; cell = cell count of germarial cells from the terminal filament until the first discernible oocyte; germ_l = germarium length (mm); tf_l = terminal filament (mm); and time = time-point of the experiment (days).
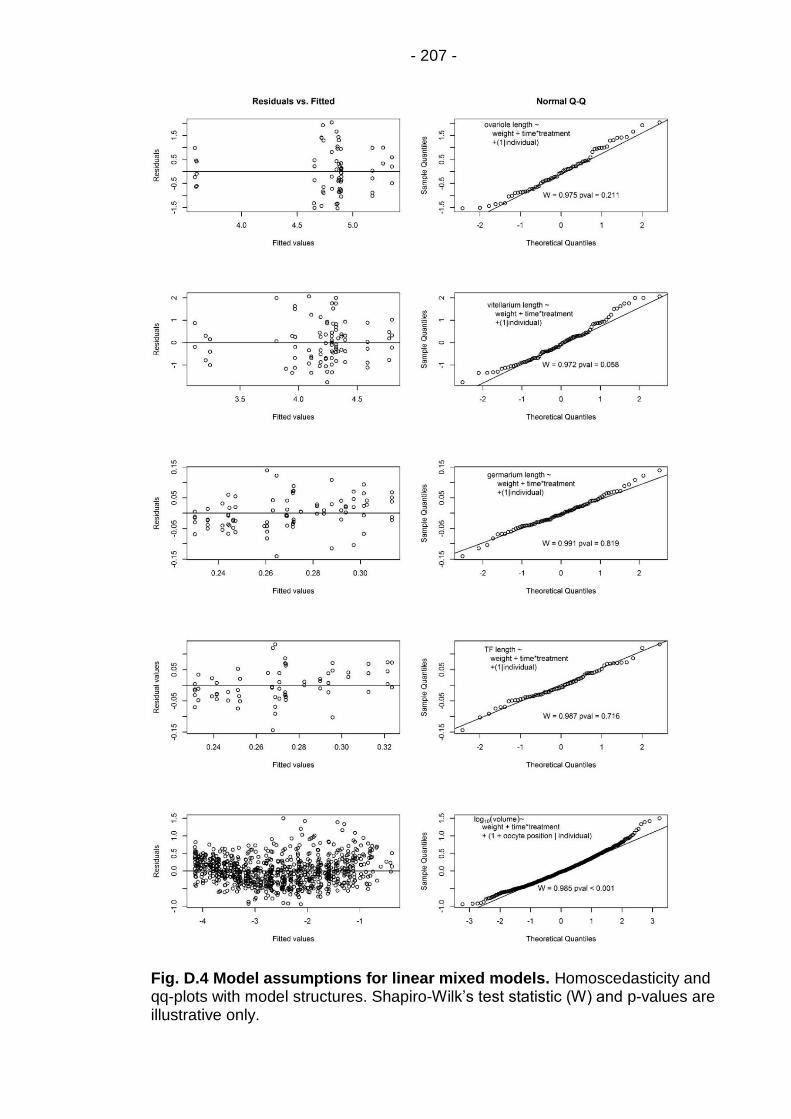
- 207 -
Fig. D.4 Model assumptions for linear mixed models. Homoscedasticity and qq-plots with model structures. Shapiro-Wilk’s test statistic (W) and p-values are illustrative only.

- 208 - Table D.1 Log - link models and their respective overdispersion parameter (OP) point estimate following Harrison (2014). Random effects are in brackets. Models with parameters > 1 were corrected by adding a observation level random effect (OLRE in red; Harrison, 2014).
Model OP
oocyte count ~ weight + time-point * treatment + (1|individual) 0.142 early germarial cell count ~ time-point + (1|individual) + (1|OLRE) 10.83 terminal filament cell count ~ time-point + (1|individual) + (1|OLRE) 7.476
Table D.2 Modeling results for all ovariole measurements. Model = independent variable of the model; factor = explanatory variables of the model (with treatment = mating status); d.f. = numerator and denominator degrees of freedom for the test statistic, acquired through Satterthwaite approximation and rounded to its integer; value = value of test statistic; and sig = significance levels (taken to be: p < 0.001 = ***; p < 0.01 = **; and P < 0.05 = *).
Model factor d.f. value p sign
Total ovariole lengtha Weight F1,61 0.002 0.962 Time F1,61 8.698 0.004 ** Treatment F1,61 2.711 0.105 Time * Treatment F1,61 6.349 0.024 *
Vitellarium lengtha Weight F1,19 0.329 0.573 Time F1,28 10.49 0.003 ** Treatment F1,20 3.242 0.087 Time * Treatment F1,29 4.882 0.035 *
Germarium lengtha Weight F1,22 1.506 0.233 Time F1,26 0.104 0.750 Treatment F1,22 0.136 0.715 Time * Treatment F1,27 0.268 0.609
Terminal filament lengtha
Weight F1,19 1.802 0.196 Time F1,21 0.762 0.392 Treatment F1,18 0.474 0.500 Time * Treatment F1,21 0.456 0.507
Log10 (oocyte volume)a,b
Weight F1,20 0.072 0.791 Time F1,22 26.36 < 0.001 *** Treatment F1,20 0.555 0.465 Time * Treatment F1,22 1.052 0.316
Oocyte countc Weight χ23,6 0.361 0.948
Time χ21,5 9.414 0.009 **
Treatment χ21,5 0.053 0.818
Time * Treatment χ21,5 0.599 0.807
Germarial cell countc Time χ21,4 1.423 0.233
Terminal filament cell countc
Time χ21,4 0.004 0.949
a linear mixed effect models (Gaussian; identity link function) b Oocyte maturation rate model: i.e. the slopes for log10(oocyte volume) ~ oocyte position in the ovariole, are compared across time and treatment c generalised linear mixed effect models (Poisson distributed; log link function)

- 209 -
Fig. D.5 Conditional plot of ovariole lengths. Detail of the ovariole lengths data, with treatments separated (mating status; left to right), showing missing intermediate data points in the mated group. Points were not jittered, hence may overlap and mask one another. Red lines represent LOWESS smoothing.
Fig. D.6 Cell counts showed no indication of reproductive senescence. Semi-automated cell counts (ImageJ) showed a highly variable number of presumptive germline stem cells, with no signs of decreasing cell populations. Points were not jittered, hence may overlap and mask one another. Red lines represent LOWESS smoothing.
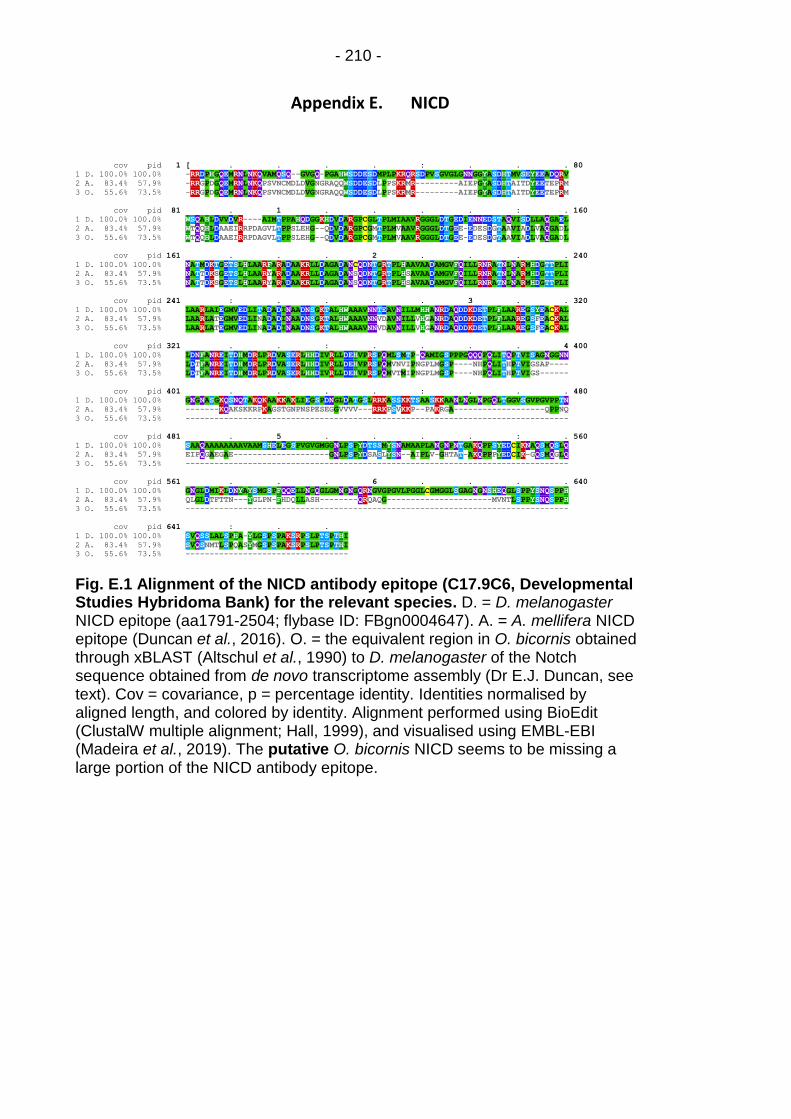
- 210 -
Appendix E. NICD
cov pid 1 [ . . . . : . . . 80
1 D. 100.0% 100.0% -RRDPHGQEMRNLNKQVAMQSQ--GVGQ-PGAHWSDDESDMPLPKRQRSDPVSGVGLGNNGGYASDHTMVSEYEEADQRV
2 A. 83.4% 57.9% -RRGPDGQEMRNLNKQPSVNCMDLDVGNGRAQQWSDDESDLPPSKRMR---------AIEPGYASDHTAITDYEETEPRM
3 O. 55.6% 73.5% -RRGPDGQEMRNLNKQPSVNCMDLDVGNGRAQQWSDDESDLPPSKRMR---------AIEPGYASDHTAITDYEETEPRM
cov pid 81 . 1 . . . . : . 160
1 D. 100.0% 100.0% WSQAHLDVVDVR----AIMTPPAHQDGGKHDVDARGPCGLTPLMIAAVRGGGLDTGEDIENNEDSTAQVISDLLAQGAEL
2 A. 83.4% 57.9% WTQQHLDAAEIRRPDAGVLTPPSLEHG--QDVDARGPCGMTPLMVAAVRGGGLDTGEE-EDESDGTAAVIADLVAQGADL
3 O. 55.6% 73.5% WTQQHLDAAEIRRPDAGVLTPPSLEHG--QDVDARGPCGMTPLMVAAVRGGGLDTGEE-EDESDGTAAVIADLVAQGADL
cov pid 161 . . . 2 . . . . 240
1 D. 100.0% 100.0% NATMDKTGETSLHLAARFARADAAKRLLDAGADANCQDNTGRTPLHAAVAADAMGVFQILLRNRATNLNARMHDGTTPLI
2 A. 83.4% 57.9% NATTDKSGETSLHLAARYARADAAKRLLDAGADANSQDNTGRTPLHSAVAADAMGVFQILLRNRATNLNARMHDGTTPLI
3 O. 55.6% 73.5% NATTDKSGETSLHLAARYARADAAKRLLDAGADANSQDNTGRTPLHSAVAADAMGVFQILLRNRATNLNARMHDGTTPLI
cov pid 241 : . . . . 3 . . 320
1 D. 100.0% 100.0% LAARLAIEGMVEDLITADADINAADNSGKTALHWAAAVNNTEAVNILLMHHANRDAQDDKDETPLFLAAREGSYEACKAL
2 A. 83.4% 57.9% LAARLATEGMVEDLINADADINAADNSGKTALHWAAAVNNVDAVNILLVHGANRDAQDDKDETPLFLAAREGSFEACKAL
3 O. 55.6% 73.5% LAARLATEGMVEDLINADADINAADNSGKTALHWAAAVNNVDAVNILLVHGANRDAQDDKDETPLFLAAREGSFEACKAL
cov pid 321 . . : . . . . 4 400
1 D. 100.0% 100.0% LDNFANREITDHMDRLPRDVASERLHHDIVRLLDEHVPRSPQMLSMTP-QAMIGSPPPGQQQPQLITQPTVISAGNGGNN
2 A. 83.4% 57.9% LDTFANREITDHMDRLPRDVASERLHHDIVRLLDEHVPRSPQMVNVIPNGPLMGSP----NHPQLITHPTVIGSAP----
3 O. 55.6% 73.5% LDTFANREITDHMDRLPRDVASERLHHDIVRLLDEHVPRSPQMVTMIPNGPLMGSP----NHPQLITHPTVIGS------
cov pid 401 . . . . : . . . 480
1 D. 100.0% 100.0% GNGNASGKQSNQTAKQKAAKKAKLIEGSPDNGLDATGSLRRKASSKKTSAASKKAANLNGLNPGQLTGGVSGVPGVPPTN
2 A. 83.4% 57.9% -------KQAKSKKRPKAGSTGNPNSPESEGGVVVV---RRKPSVKKP--PAKRGA-------------------QPPNQ
3 O. 55.6% 73.5% --------------------------------------------------------------------------------
cov pid 481 . 5 . . . . : . 560
1 D. 100.0% 100.0% SAAQAAAAAAAAVAAMSHELEGSPVGVGMGGNLPSPYDTSSMYSNAMAAPLANGNPNTGAKQPPSYEDCIKNAQSMQSLQ
2 A. 83.4% 57.9% EIPQGAEGAE--------------------GNLPSPYDSASLYSN--AIPLV-GHTAT-AKQPPPYEDCIK-GQSMQGLQ
3 O. 55.6% 73.5% --------------------------------------------------------------------------------
cov pid 561 . . . 6 . . . . 640
1 D. 100.0% 100.0% GNGLDMIKLDNYAYSMGSPFQQELLNGQGLGMNGNGQRNGVGPGVLPGGLCGMGGLSGAGNGNSHEQGLSPPYSNQSPPH
2 A. 83.4% 57.9% QLGLDTFTTN---YGLPN-FHDQLLASH--------QRQAQG----------------------MVNTLSPPYSNQSPPH
3 O. 55.6% 73.5% --------------------------------------------------------------------------------
cov pid 641 : . .
1 D. 100.0% 100.0% SVQSSLALSPHA-YLGSPSPAKSRPSLPTSPTHI
2 A. 83.4% 57.9% SVQSNMTLSPQASYMGSPSPAKSRPSLPTSPTHI
3 O. 55.6% 73.5% ----------------------------------
Fig. E.1 Alignment of the NICD antibody epitope (C17.9C6, Developmental Studies Hybridoma Bank) for the relevant species. D. = D. melanogaster NICD epitope (aa1791-2504; flybase ID: FBgn0004647). A. = A. mellifera NICD epitope (Duncan et al., 2016). O. = the equivalent region in O. bicornis obtained through xBLAST (Altschul et al., 1990) to D. melanogaster of the Notch sequence obtained from de novo transcriptome assembly (Dr E.J. Duncan, see text). Cov = covariance, p = percentage identity. Identities normalised by aligned length, and colored by identity. Alignment performed using BioEdit (ClustalW multiple alignment; Hall, 1999), and visualised using EMBL-EBI (Madeira et al., 2019). The putative O. bicornis NICD seems to be missing a large portion of the NICD antibody epitope.
- 211 -
References
Abbot, P., Abe, J., Alcock, J., Alizon, S., Alpedrinha, J. A. C., Andersson, M., Andre, J.-B., van Baalen, M., Balloux, F., Balshine, S., et al. 2011. Inclusive fitness theory and eusociality. Nature 471, E1-E4.
Abou-Shaara, H. F. & Elbanoby, M. I. 2018. Factors impacting survival of mature honey bee drones kept in small laboratory cages. Environ Exp Biol 16, 455-463.
Ahrenfeldt, E. J., Sigsgaard, L., Hansted, L., Jensen, A. C. & Toldam-Andersen, T. B. 2019. Forage quality and quantity affect red mason bees and honeybees differently in flowers of strawberry varieties. Entomologia Experimentalis Et Applicata, 11.
Alexander, R. D. 1974. The evolution of social behavior. Annual review of ecology and systematics, 325-383.
Allen, L., O’Connell, A. & Kiermer, V. 2019. How can we ensure visibility and diversity in research contributions? How the Contributor Role Taxonomy (CRediT) is helping the shift from authorship to contributorship. Learned Publishing 32, 71-74.
Altschul, S. F., Gish, W., Miller, W., Myers, E. W. & Lipman, D. J. 1990. Basic local alignment search tool. Journal of molecular biology 215, 403-410.
Amarasinghe, H. E., Clayton, C. I. & Mallon, E. B. 2014. Methylation and worker reproduction in the bumble-bee (Bombus terrestris). Proceedings of the Royal Society B-Biological Sciences 281, 6.
Amdam, G. V., Csondes, A., Fondrk, M. K. & Page, R. E., Jr. 2006. Complex social behaviour derived from maternal reproductive traits. Nature 439, 76-78.
Amdam, G. V., Norberg, K., Hagen, A. & Omholt, S. W. 2003. Social exploitation of vitellogenin. Proceedings of the National Academy of Sciences of the United States of America 100, 1799-1802.
Ament, S. A., Corona, M., Pollock, H. S. & Robinson, G. E. 2008. Insulin signaling is involved in the regulation of worker division of labor in honey bee colonies. Proc Natl Acad Sci U S A 105, 4226-4231.
Amsalem, E., Teal, P., Grozinger, C. M. & Hefetz, A. 2014. Precocene-I inhibits juvenile hormone biosynthesis, ovarian activation, aggression and alters sterility signal production in bumble bee (Bombus terrestris) workers. Journal of Experimental Biology 217, 3178-3185.
Anderson, R. H. 1963. The laying worker in the Cape honeybee, Apis mellifera capensis. Journal of Apicultural Research 2, 85-92.
Armbruster, L. 1913. Chromosomenverhältnisse bei der Spermatogenese solitärer Apiden (Osmia cornuta latr.): Beiträge zur Geschlechtsbestimmungsfrage und zum Reduktionsproblem, Wilhelm Engelmann.
Arnold, S. J. & Duvall, D. 1994. Animal mating systems: a synthesis based on selection theory. The American Naturalist 143, 317-348.
Artavanis-Tsakonas, S., Rand, M. D. & Lake, R. J. 1999. Notch signaling: Cell fate control and signal integration in development. Science 284, 770-776.
Assa-Kunik, E., Torres, I. L., Schejter, E. D., St Johnston, D. & Shilo, B.-Z. 2007. Drosophila follicle cells are patterned by multiple levels of Notch signaling and antagonism between the Notch and JAK/STAT pathways. Development 134, 1161-1169.
- 212 - Aumer, D., Allsopp, M. H., Lattorff, H. M. G., Moritz, R. F. & Jarosch-Perlow, A.
2017. Thelytoky in Cape honeybees (Apis mellifera capensis) is controlled by a single recessive locus. Apidologie 48, 401-410.
Aumer, D., Stolle, E., Allsopp, M., Mumoki, F., Pirk, C. W. & Moritz, R. F. 2019. A single SNP turns a social honey bee (Apis mellifera) worker into a selfish parasite. Molecular biology and evolution 36, 516-526.
Avila, F. W., Sirot, L. K., LaFlamme, B. A., Rubinstein, C. D. & Wolfner, M. F. 2011. Insect seminal fluid proteins: identification and function. Annual review of entomology 56, 21-40.
Ayasse, M. & Dutzler, G. 1998. The function of pheromones in the mating biology of Osmia bees (Hymenoptera: Megachilidae). Social insects at the turn of the Millenium XIII Int Congr IUSSI Flinders University Press, Adelaide 42.
Ayasse, M., Dutzler, G., Schiestl, F., Ibarra, F. & Francke, W. Identification of female and male sex pheromone in the solitary bee Osmia rufa Hymenoptera: Megachilidae). Proceedings of the XXI International Congress of Entomology and XVIII Brazilian Congress of Entomology (Chemistry and Physiological Ecology Symposium and Poster Session), Iguassu Falls, Brazil, 2000. 20-26.
Ayasse, M., Paxton, R. & Tengö, J. 2001. Mating behavior and chemical communication in the order Hymenoptera. Annual review of entomology 46, 31-78.
Azpiazu, C., Bosch, J., Vinuela, E., Medrzycki, P., Teper, D. & Sgolastra, F. 2019. Chronic oral exposure to field-realistic pesticide combinations via pollen and nectar: effects on feeding and thermal performance in a solitary bee. Scientific Reports 9, 11.
Badisco, L., Van Wielendaele, P. & Broeck, J. V. 2013. Eat to reproduce: a key role for the insulin signaling pathway in adult insects. Frontiers in Physiology 4.
Baena, M., Sangüesa, G., Dávalos, A., Latasa, M.-J., Sala-Vila, A., Sánchez, R. M., Roglans, N., Laguna, J. C. & Alegret, M. 2016. Fructose, but not glucose, impairs insulin signaling in the three major insulin-sensitive tissues. Scientific reports 6, 26149.
Barchuk, A. R., Cristino, A. S., Kucharski, R., Costa, L. F., Simoes, Z. L. P. & Maleszka, R. 2007. Molecular determinants of caste differentiation in the highly eusocial honeybee Apis mellifera. Biomed Central Developmental Biology 7.
Barth, F. G. 1985. Insects and flowers: the biology of a partnership, London, Allen and Unwin.
Barth, J. M., Hafen, E. & Köhler, K. 2012. The lack of autophagy triggers precocious activation of Notch signaling during Drosophila oogenesis. BMC Developmental Biology 12, 35.
Barth, J. M. I., Szabad, J., Hafen, E. & Köhler, K. 2011. Autophagy in Drosophila ovaries is induced by starvation and is required for oogenesis. Cell Death Differ 18, 915-924.
Bateman, A. J. 1948. Intra-sexual selection in Drosophila. Heredity 2, 349-368. Bates, D., Maechler, M., Bolker, B. & Walker, S. 2015. Fitting linear mixed-
effects models using lme4. Journal of Statistical Software 67 1-48. Baudry, E., Solignac, M., Garnery, L., Gries, M., Cornuet, J. & Koeniger, N.
1998. Relatedness among honeybees (Apis mellifera) of a drone congregation. Proceedings of the Royal Society of London Series B: Biological Sciences 265, 2009-2014.
- 213 - Beadle, K., Singh, K. S., Troczka, B. J., Randall, E., Zaworra, M., Zimmer, C. T.,
Hayward, A., Reid, R., Kor, L., Kohler, M., et al. 2019. Genomic insights into neonicotinoid sensitivity in the solitary bee Osmia bicornis. PLoS Genet 15, e1007903.
Beer, K., Schenk, M., Helfrich-Förster, C. & Holzschuh, A. 2019. The circadian clock uses different environmental time cues to synchronize emergence and locomotion of the solitary bee Osmia bicornis. Scientific reports 9, 1-11.
Beier, S., Münch, T., Scholz, U., Mascher, M. & Thiel, T. 2017. MISA-web: a web server for microsatellite prediction. Bioinformatics 33, 2583-2585.
Belles, X. & Piulachs, M.-D. 2015. Ecdysone signalling and ovarian development in insects: from stem cells to ovarian follicle formation. Biochimica et Biophysica Acta (BBA)-Gene Regulatory Mechanisms 1849, 181-186.
Bennett, B. 1987. Measures of Relatedness. Ethology 74, 219-236. Berens, A. J., Hunt, J. H. & Toth, A. L. 2015. Comparative transcriptomics of
convergent evolution: different genes but conserved pathways underlie caste phenotypes across lineages of eusocial insects. Molecular biology and evolution 32, 690-703.
Berger, B. & Abdalla, F. C. 2005. Programmed cell death during ovarian differentiation in queens of Apis mellifera Linne, 1758 (Hymenoptera, Apini). Brazilian Journal of Morphological Sciences 22, 1-4.
Bernal, J., Garrido-Bailón, E., Del Nozal, M., González-Porto, A., Martín-Hernández, R., Diego, J., Jiménez, J., Bernal, J. & Higes, M. 2010. Overview of pesticide residues in stored pollen and their potential effect on bee colony (Apis mellifera) losses in Spain. Journal of Economic Entomology 103, 1964-1971.
Beye, M., Gattermeier, I., Hasselmann, M., Gempe, T., Schioett, M., Baines, J. F., Schlipalius, D., Mougel, F., Emore, C., Rueppell, O., et al. 2006. Exceptionally high levels of recombination across the honey bee genome. Genome Res 16, 1339-1344.
Birch, J. 2016. Hamilton’s two conceptions of social fitness. Philosophy of Science 83, 848-860.
Bloch, G., Francoy, T. M., Wachtel, I., Panitz-Cohen, N., Fuchs, S. & Mazar, A. 2010. Industrial apiculture in the Jordan valley during Biblical times with Anatolian honeybees. Proceedings of the National Academy of Sciences 107, 11240-11244.
Bloch, G. & Grozinger, C. M. 2011. Social molecular pathways and the evolution of bee societies. Philosophical Transactions of the Royal Society B-Biological Sciences 366, 2155-2170.
Blouin, M., Parsons, M., Lacaille, V. & Lotz, S. 1996. Use of microsatellite loci to classify individuals by relatedness. Molecular ecology 5, 393-401.
Bonfini, A., Wilkin, M. B. & Baron, M. 2015. Reversible regulation of stem cell niche size associated with dietary control of Notch signalling. Bmc Developmental Biology 15, 14.
Boomsma, J. J. 2009. Lifetime monogamy and the evolution of eusociality. Philos Trans R Soc Lond B Biol Sci 364, 3191-3207.
Boomsma, J. J., Beekman, M., Cornwallis, C. K., Griffin, A. S., Holman, L., Hughes, W. O. H., Keller, L., Oldroyd, B. P. & Ratnieks, F. L. W. 2011. Only full-sibling families evolved eusociality. Nature 471, E4-E5.

- 214 - Boomsma, J. J. & Gawne, R. 2018. Superorganismality and caste differentiation
as points of no return: how the major evolutionary transitions were lost in translation. Biological Reviews 93, 28-54.
Bosch, J. & Kemp, W. P. 2002. Developing and establishing bee species as crop pollinators: the example of Osmia spp. (Hymenoptera : Megachilidae) and fruit trees. Bulletin of Entomological Research 92, 3-16.
Bosch, J. & Kemp, W. P. 2004. Effect of pre-wintering and wintering temperature regimes on weight loss, survival, and emergence time in the mason bee Osmia cornuta (Hymenoptera : Megachilidae). Apidologie 35, 469-479.
Bosua, H. J., Nicolson, S. W., Archer, C. R. & Pirk, C. W. W. 2018. Effects of cage volume and bee density on survival and nutrient intake of honeybees (Apis mellifera L.) under laboratory conditions. Apidologie 49, 734-746.
Bourke, A. F. G. 1999. Colony size, social complexity and reproductive conflict in social insects. Journal of Evolutionary Biology 12, 245-257.
Bourke, A. F. G. 2011. The validity and value of inclusive fitness theory. Proceedings of the Royal Society B-Biological Sciences 278, 3313-3320.
Bownes, M., Scott, A. & Shirras, A. 1988. Dietary-components modulate yolk protein gene-transcription in Drosophila melanogaster. Development 103, 119-128.
Branstetter, M. G., Danforth, B. N., Pitts, J. P., Faircloth, B. C., Ward, P. S., Buffington, M. L., Gates, M. W., Kula, R. R. & Brady, S. G. 2017. Phylogenomic Insights into the Evolution of Stinging Wasps and the Origins of Ants and Bees. Current Biology 27, 1019-1025.
Bray, S. J. 2006. Notch signalling: a simple pathway becomes complex. Nature Reviews Molecular Cell Biology 7, 678-689.
Brechtel, F. 1986. Die Stechimmenfauna des Bienwaldes und seiner Randbereiche (Südpfalz): unter besonderer Berücksichtigung der Ökologie kunstnestbewohnender Arten, Selbstverl. der Pollichia.
Bretman, A. & Tregenza, T. 2005. Measuring polyandry in wild populations: a case study using promiscuous crickets. Molecular Ecology 14, 2169-2179.
Bretman, A., Wedell, N. & Tregenza, T. 2004. Molecular evidence of post–copulatory inbreeding avoidance in the field cricket Gryllus bimaculatus. Proceedings of the Royal Society of London Series B: Biological Sciences 271, 159-164.
Brody, J. R. & Kern, S. E. 2004. Sodium boric acid: a Tris-free, cooler conductive medium for DNA electrophoresis. Biotechniques 36, 214-216.
Büning, J. 1994. The insect ovary: Ultrastructure, previtellogenic growth and evolution, London, Chapman & Hall.
Calatayud-Vernich, P., Calatayud, F., Simó, E. & Picó, Y. 2018. Pesticide residues in honey bees, pollen and beeswax: Assessing beehive exposure. Environmental Pollution 241, 106-114.
Cameron, R. C., Duncan, E. J. & Dearden, P. K. 2013a. Biased gene expression in early honeybee larval development. Biomed Central Genomics 14.
Cameron, R. C., Duncan, E. J. & Dearden, P. K. 2013b. Stable reference genes for the measurement of transcript abundance during larval caste development in the honeybee. Apidologie 44, 357-366.
- 215 -
Camiletti, A. L., Percival‐Smith, A. & Thompson, G. J. 2013. Honey bee queen mandibular pheromone inhibits ovary development and fecundity in a fruit fly. Entomologia Experimentalis et Applicata 147, 262-268.
Camiletti, A. L. & Thompson, G. J. 2016. Drosophila As a Genetically Tractable Model for Social Insect Behavior. Frontiers in Ecology and Evolution 4.
Cane, J. H. 2016. Adult pollen diet essential for egg maturation by a solitary Osmia bee. Journal of insect physiology 95, 105-109.
Carlisle, D. B. & Butler, C. G. 1956. The ‘Queen-Substance’of honeybees and the ovary-inhibiting hormone of crustaceans. Nature 177, 276.
Châline, N., Ratnieks, F. L., Raine, N. E., Badcock, N. S. & Burke, T. 2004. Non-lethal sampling of honey bee, Apis mellifera, DNA using wing tips. Apidologie 35, 311-318.
Chapman, N. C., Beekman, M., Allsopp, M. H., Rinderer, T. E., Lim, J., Oxley, P. R. & Oldroyd, B. P. 2015. Inheritance of thelytoky in the honey bee Apis mellifera capensis. Heredity (Edinb) 114, 584-592.
Chapman, T. W. & Crespi, B. 1998. High relatedness and inbreeding in two species of haplodiploid eusocial thrips (Insecta: Thysanoptera) revealed by microsatellite analysis. Behavioral Ecology and Sociobiology 43, 301-306.
Charles, J.-P., Iwema, T., Epa, V. C., Takaki, K., Rynes, J. & Jindra, M. 2011. Ligand-binding properties of a juvenile hormone receptor, Methoprene-tolerant. Proc Natl Acad Sci 108.
Chauzat, M.-P., Faucon, J.-P., Martel, A.-C., Lachaize, J., Cougoule, N. & Aubert, M. 2006. A survey of pesticide residues in pollen loads collected by honey bees in France. Journal of economic entomology 99, 253-262.
Chavent, M., Kuentz-Simonet, V., Labenne, A. & Saracco, J. 2014. Multivariate analysis of mixed data: The PCAmixdata R package. arXiv preprint arXiv:14114911 132.
Chen, Z., Kuang, R.-P., Zhou, J.-X. & Liu, X. 2012. Phototactic behaviour in Aphidius gifuensis (Hymenoptera: Braconidae). Biocontrol Science and Technology 22, 271-279.
Chittka, L. & Waser, N. M. 1997. Why red flowers are not invisible to bees. Israel Journal of Plant Sciences 45, 169-183.
Christensen, R. H. B. 2015. ordinal—regression models for ordinal data. R package version 28, 2015.
Christmas, M. J., Smith, N. M. A., Oldroyd, B. P. & Webster, M. T. 2019. Social Parasitism in the Honeybee (Apis mellifera) Is Not Controlled by a Single SNP. Molecular Biology and Evolution 36, 1764-1767.
Colonello, N. A. & Hartfelder, K. 2005. She’s my girl - male accessory gland products and their function in the reproductive biology of social bees. Apidologie 36, 231-244.
Conrad, T. & Ayasse, M. 2015. The Role of Vibrations in Population Divergence in the Red Mason Bee, Osmia bicornis. Current Biology 25, 2819-2822.
Conrad, T. & Ayasse, M. 2019. The differences in the vibrational signals between male O. bicornis from three countries in Europe. J Low Freq Noise Vib Act Control 38, 871-878.
Conrad, T., Paxton, R. J., Assum, G. & Ayasse, M. 2018. Divergence in male sexual odor signal and genetics across populations of the red mason bee, Osmia bicornis, in Europe. PloS one 13, e0193153.
Conrad, T., Paxton, R. J., Barth, F. G., Francke, W. & Ayasse, M. 2010. Female choice in the red mason bee, Osmia rufa (L.) (Megachilidae). J Exp Biol 213, 4065-4073.
- 216 - Corona, M., Velarde, R. A., Remolina, S., Moran-Lauter, A., Wang, Y., Hughes,
K. A. & Robinson, G. E. 2007. Vitellogenin, juvenile hormone, insulin signaling, and queen honey bee longevity. Proceedings of the National Academy of Sciences of the United States of America 104, 7128-7133.
Costa, J. T. & Fitzgerald, T. D. Social terminology revisited: Where are we ten years later? Annales Zoologici Fennici, 2005. JSTOR, 559-564.
Costa, J. T., Fitzgerald, T. D. J. T. i. E. & Evolution 1996. Developments in social terminology: semantic battles in a conceptual war. 11, 285-289.
Costa, L. & Venturieri, G. C. 2009. Diet impacts on Melipona flavolineata workers (Apidae, Meliponini). Journal of Apicultural Research 48, 38-45.
Coudrain, V., Rittiner, S., Herzog, F., Tinner, W. & Entling, M. H. 2016. Landscape distribution of food and nesting sites affect larval diet and nest size, but not abundance of Osmia bicornis. Insect Science 23, 746-753.
Craig, R. 1979. Parental manipulation, kin selection, and the evolution of altruism. Evolution, 319-334.
Crane, E. 1983. The archaeology of beekeeping, Duckworth. Crane, E. 1999. The world history of beekeeping and honey hunting, Routledge,
New York, Taylor & Francis. Crozier, R. 1977. Evolutionary genetics of the Hymenoptera. Annual review of
entomology 22, 263-288. Dafni, A., Kefan, P. G. & Husband, B. C. 2005. Practical pollination biology,
Cambridge, Ontario, Canada, Enviroquest, Ltd. Dallacqua, R. P. & Bitondi, M. M. 2014. Dimorphic ovary differentiation in
honeybee (Apis mellifera) larvae involves caste-specific expression of homologs of ark and buffy cell death genes. PLoS One 9, e98088.
Darwin, C. 1859. On The Origin of Species by Means of Natural Selection, or the Preservation of Favoured Races in the Struggle for Life, London, John Murray.
Dawkins, R. 1976. The Selfish Gene, Oxford, UK, Oxford Univeristy Press. de Azevedo, S. V. & Hartfelder, K. 2008. The insulin signaling pathway in honey
bee (Apis mellifera) caste development - differential expression of insulin-like peptides and insulin receptors in queen and worker larvae. Journal of Insect Physiology 54, 1064-1071.
de Souza, E. A., Neves, C. A., Campos, L. A. D., Zanuncio, J. C. & Serrao, J. E. 2007. Effect of mating delay on the ovary of Melipona quadrifasciata anthidioides (Hymenoptera : Apidae) queens. Micron 38, 471-477.
Deady, L. D., Shen, W., Mosure, S. A., Spradling, A. C. & Sun, J. 2015. Matrix metalloproteinase 2 is required for ovulation and corpus luteum formation in Drosophila. PLoS Genet 11, e1004989.
Dearden, P. K. 2006. Germ cell development in the Honeybee (Apis mellifera); Vasa and Nanos expression. Biomed Central Developmental Biology 6, 14.
Dearden, P. K., Duncan, E. J. & Wilson, M. J. 2009a. Fixation and storage of honeybee (Apis mellifera) tissues, Cold Spring Harbor protocols.
Dearden, P. K., Duncan, E. J. & Wilson, M. J. 2009b. The Honeybee Apis mellifera. In: PATEL, N. H. (ed.) Emerging Model Organisms. Cold Spring Harbor Laboratory Press.
Dearden, P. K., Duncan, E. J. & Wilson, M. J. 2009c. Whole-Mount In Situ Hybridisation of Honeybee (Apis mellifera) Tissues, Cold Spring Harbor protocols.

- 217 - Debruyn, L. A. L. & Conacher, A. J. 1990. The role of termintes and ants in soil
modification - a review. Australian Journal of Soil Research 28, 55-93. Degroot, A. P. 1953. Protein and Amino Acid requirements of the honeybee
(Apis mellifera L.). Physiologia comparata et oecologia 3, 197-285. Dietzsch, A. C., Kunz, N., Wirtz, I. P., Frommberger, M. & Pistorius, J. 2015.
Evaluating the feasibility of using the red mason bee (Osmia bicornis L.) in different experimental setups. In: OOMEN, P. A. & PISTORIUS, J. (eds.) Hazards of Pesticides to Bees: 12th International Symposium of the Icp-Pr Bee Protection Group. Berlin: Julius Kuhn-Inst.
Dietzsch, A. C., Kunz, N., Wirtz, I. P., Stahler, M., Heimbach, U. & Pistorius, J. 2019. Does winter oilseed rape grown from clothianidin-coated seeds affect experimental populations of mason bees and bumblebees? A semi-field and field study. J Consum Prot Food Saf 14, 223-238.
Dmochowska, K., Giejdasz, K., Fliszkiewicz, M. & Zoltowska, K. 2012. Changes in the antioxidative system of the red mason bee (Osmia rufa) (Hymenoptera: Megachilidae) induced by artificially elongated diapause. Journal of Apicultural Science 56, 99-106.
Dmochowska, K., Giejdasz, K., Fliszkiewicz, M. & Zoltowska, K. 2013. Prolonged postdiapause: Influence on some indicators of carbohydrate and lipid metabolism of the red mason bee, Osmia rufa. Journal of Insect Science 13, 12.
Drummond-Barbosa, D. & Spradling, A. C. 2001. Stem Cells and Their Progeny Respond to Nutritional Changes during Drosophila Oogenesis. Developmental Biology 231, 265-278.
Duffy, J. E. 1996. Eusociality in a coral-reef shrimp. Nature 381, 512-514. Dugatkin, L. A. 2007. Inclusive Fitness Theory from Darwin to Hamilton.
Genetics 176, 1375-1380. Duncan, E. J. & Dearden, P. K. 2010. Evolution of a genomic regulatory
domain: The role of gene co-option and gene duplication in the Enhancer of split complex. Genome Research 20, 917-928.
Duncan, E. J., Hyink, O. & Dearden, P. K. 2016. Notch signalling mediates reproductive constraint in the adult worker honeybee. Nature Communications 7, 10.
Duncan, E. J., Leask, M. P. & Dearden, P. K. 2020. Genome architecture facilitates phenotypic plasticity in the honeybee (Apis mellifera). Molecular Biology and Evolution.
Dunn, T. & Richards, M. H. 2003. When to bee social: interactions among environmental constraints, incentives, guarding, and relatedness in a facultatively social carpenter bee. Behavioral Ecology 14, 417-424.
Eberhard, W. 1996. Female control: sexual selection by cryptic female choice, Princeton University Press.
Elango, N., Hunt, B. G., Goodisman, M. A. D. & Yi, S. V. 2009. DNA methylation is widespread and associated with differential gene expression in castes of the honeybee, Apis mellifera. Proceedings of the National Academy of Sciences 106, 11206-11211.
Engqvist, L. 2005. The mistreatment of covariate interaction terms in linear model analyses of behavioural and evolutionary ecology studies. Animal Behaviour 70.
Estoup, A., Solignac, M. & Cornuet, J.-M. 1994. Precise assessment of the number of patrilines and of genetic relatedness in honeybee colonies. Proceedings of the Royal Society of London Series B: Biological Sciences 258, 1-7.
- 218 - Evans, J. D., Chen, Y. P., Prisco, G. d., Pettis, J. & Williams, V. 2009. Bee
cups: single-use cages for honey bee experiments. Journal of apicultural research 48, 300-302.
Evans, J. D. & Wheeler, D. E. 1999. Differential gene expression between developing queens and workers in the honey bee, Apis mellifera. Proceedings of the National Academy of Sciences of the United States of America 96, 5575-5580.
Evans, J. D. & Wheeler, D. E. 2001. Expression profiles during honeybee caste determination. Genome Biology 2.
Everaars, J., Strohbach, M. W., Gruber, B. & Dormann, C. F. 2011. Microsite conditions dominate habitat selection of the red mason bee (Osmia bicornis, Hymenoptera: Megachilidae) in an urban environment: A case study from Leipzig, Germany. Landscape and Urban Planning 103, 15-23.
Falk, S. 2015. Field Guide to the Bees of Great Britain and Ireland, UK, British Wildlife Publishing Ltd.
Fan, H. & Chu, J.-Y. 2007. A brief review of short tandem repeat mutation. Genomics, Proteomics & Bioinformatics 5, 7-14.
Felicioli, A., Sagona, S., Galloni, M., Bortolotti, L., Bogo, G., Guarnieri, M. & Nepi, M. 2018. Effects of nonprotein amino acids on survival and locomotion of Osmia bicornis. Insect Molecular Biology 27, 556-563.
Fell, R. & Morse, R. 1984. Emergency queen cell production in the honey bee colony. Insectes sociaux 31, 221-237.
Ferriere, R. & Michod, R. E. 2011. Inclusive fitness in evolution. Nature 471, E6-E8.
Filipiak, M. 2019. Key pollen host plants provide balanced diets for wild bee larvae: A lesson for planting flower strips and hedgerows. Journal of Applied Ecology 56, 1410-1418.
Fischer, P. & Grozinger, C. M. 2008. Pheromonal regulation of starvation resistance in honey bee workers (Apis mellifera). Naturwissenschaften 95, 723-729.
Fisher, R. A. 1930. The Genetical Theory of Natural Selection, Oxford, UK, The Clarendon Press.
Flanagan, S. P. & Jones, A. G. 2019. The future of parentage analysis: From microsatellites to SNPs and beyond. Molecular ecology 28, 544-567.
Fleig, R., Gutzeit, H. O. & Engels, W. 1991. Structural organization of ovarian follicle cells in the cotton bug (Dysdercus intermedius) and the honeybee (Apis mellifera). Cell and Tissue Research 265, 297-305.
Fletcher, D. J. C. & Ross, K. G. 1985. Regulation of reproduction in eusocial Hymenoptera. Annual Review of Entomology 30, 319-343.
Fletcher, J. A., Zwick, M., Doebeli, M. & Wilson, D. S. 2006. What's wrong with inclusive fitness? Trends Ecol Evol 21, 597-598; author reply 599-600.
Fliszkiewicz, M., Giejdasz, K., Wasielewski, O. & Krishnan, N. 2012a. Influence of Winter Temperature and Simulated Climate Change on Body Mass and Fat Body Depletion During Diapause in Adults of the Solitary Bee, Osmia rufa (Hymenoptera: Megachilidae). Environmental Entomology 41, 1621-1630.
Fliszkiewicz, M., Giejdasz, K. & Wilkaniec, Z. 2011a. The effect of diapause termination time on the successful insemination of Osmia rufa L. females. Journal of Apicultural Science 55, 79-84.
Fliszkiewicz, M., Giejdasz, K. & Wilkaniec, Z. 2011b. The importance of male red mason bee (Osmia rufa L.) and male bufftailed bumblebee (Bombus

- 219 -
terrestris L.) pollination in blackcurrant (Ribes nigrum L.). Journal of Horticultural Science & Biotechnology 86, 457-460.
Fliszkiewicz, M., Kusnierczak, A. & Szymas, B. 2012b. The accompanying fauna of solitary bee Osmia bicornis (L.) syn. Osmia rufa (L.) nests settled in different biotopes. Journal of Apicultural Science 56, 51-58.
Fliszkiewicz, M., Kusnierczak A. & B., S. 2015. Reproduction of the red mason solitary bee Osmia rufa (syn. Osmia bicornis) (Hymenoptera: Megachilidae) in various habitats. European Journal of Entomology 112, 100-105.
Fliszkiewicz, M., Langowska, A. & Tryjanowski, P. 2013. Effect of manipulated sex ratio on insemination of the red mason bee Osmia bicornis L. under net cage conditions. Journal of Apicultural Science 57, 73-79.
Fliszkiewicz, M. & Wilkaniec, Z. 2009. Potential possibilities of insemination of mason bee (Osmia rufa L.) females by a single male in laboratory conditions. Annals of Warsaw University of Life Science - SGGW, Animal Science 46, 51-58.
Folmer, O., Black, M., Hoeh, W., Lutz, R. & Vrijenhoek, R. 1994. DNA primers for amplification of mitochondrial cytochrome c oxidase subunit I from diverse metazoan invertebrates. Mol Mar Biol Biotechnol 3, 294-299.
Forstmeier, W. & Schielzeth, H. 2011. Cryptic multiple hypotheses testing in linear models: overestimated effect sizes and the winner's curse. Behavioral Ecology and Sociobiology 65, 47-55.
Foster, K. R., Wenseleers, T. & Ratnieks, F. L. 2006a. Kin selection is the key to altruism. Trends Ecol Evol 21, 57-60.
Foster, K. R., Wenseleers, T., Ratnieks, F. L. W. & Queller, D. C. 2006b. There is nothing wrong with inclusive fitness. Trends in Ecology & Evolution 21, 599-600.
Fox-Dobbs, K., Doak, D. F., Brody, A. K. & Palmer, T. M. 2010. Termites create spatial structure and govern ecosystem function by affecting N-2 fixation in an East African savanna. Ecology 91, 1296-1307.
Franck, P., Coussy, H., Le Conte, Y., Solignac, M., Garnery, L. & Cornuet, J. M. 1999. Microsatellite analysis of sperm admixture in honeybee. Insect Molecular Biology 8, 419-421.
Gadagkar, R. 1993. And now - Eusocial thrips. Current Science 64, 215-216. Gadagkar, R. 1996. The evolution of eusociality, including a review of the social
status of Ropalidia marginata, Oxford University Press, Walton Street, Oxford OX2 6DP, England; Oxford University Press, Inc., 200 Madison Avenue, New York, New York 10016, USA.
Galang, K., Croft, J., Thompson, G. & Percival‐Smith, A. 2019. Analysis of the Drosophila melanogaster anti‐ovarian response to honey bee queen mandibular pheromone. Insect molecular biology 28, 99-111.
Garbian, Y., Maori, E., Kalev, H., Shafir, S. & Sela, I. 2012. Bidirectional Transfer of RNAi between Honey Bee and Varroa destructor: Varroa Gene Silencing Reduces Varroa Population. Plos Pathogens 8, 9.
Gardner, A., Alpedrinha, J. & West, S. A. 2012. Haplodiploidy and the Evolution of Eusociality: Split Sex Ratios. American Naturalist 179, 240-256.
Gardner, A. & Ross, L. 2013. Haplodiploidy, Sex-Ratio Adjustment, and Eusociality. American Naturalist 181, E60-E67.
Gardner, A. & West, S. A. 2010. Greenbeards. Evolution 64, 25-38. Gathmann, A. 1998. Bienen, Wespen und ihre Gegenspieler in der
Agrarlandschaft: Artenreichtum und Interaktionen in Nisthilfen, Aktionsradien und Habitatbewertung, Cuvillier.

- 220 - Gathmann, A., Greiler, H.-J. & Tscharntke, T. 1994. Trap-nesting bees and
wasps colonizing set-aside fields: succession and body size, management by cutting and sowing. Oecologia 98, 8-14.
Gathmann, A. & Tscharntke, T. 2002. Foraging ranges of solitary bees. Journal of Animal Ecology 71, 757-764.
Geister, T. L., Lorenz, M. W., Hoffmann, K. H. & Fischer, K. 2008. Adult nutrition and butterfly fitness: effects of diet quality on reproductive output, egg composition, and egg hatching success. Frontiers in Zoology 5.
Geling, A., Steiner, H., Willem, M., Bally‐Cuif, L. & Haass, C. 2002. A γ‐secretase inhibitor blocks Notch signaling in vivo and causes a severe neurogenic phenotype in zebrafish. EMBO reports 3, 688-694.
Gempe, T. & Beye, M. 2009. Sex Determination in Honeybees [Online]. Available: http://www.nature.com/scitable/topicpage/sex-determination-in-honeybees-2591764.
Giejdasz, K. & Fliszkiewicz, M. 2016. Effect of temperature treatment during development of Osmia rufa L, on mortality, energence and longevity of adults. Journal of Apicultural Science 60, 221-232.
Giejdasz, K., Fliszkiewicz, M., Bednarova, A. & Krishnan, N. 2016. Reproductive potential and nesting effects of Osmia rufa (syn. bicornis)
female (Hymenoptera: Megachilidae). Journal of Apicultural Science 60, 75-85. Giejdasz, K. & Wilkaniec, Z. 2002. Individual development of the red mason bee
(Osmia rufa L., Megachilidae) under natural and laboratory conditions. Journal of Apicultural Science 46, 51-57.
Gijbels, M., Lenaerts, C., Broeck, J. V. & Marchal, E. 2019. Juvenile Hormone receptor Met is essential for ovarian maturation in the Desert Locust, Schistocerca gregaria. Scientific reports 9, 1-12.
Gillott, C. 2003. Male accessory gland secretions: modulators of female reproductive physiology and behavior. Annual Review of Entomology 48, 163-184.
Gillott, C. & Friedel, T. 1977. Fecundity enhancing and receptivity inhibiting substances produced by male insects: a review. Advances in invertebrate reproduction 1, 198-218.
Gotoh, A., Ito, F. & Billen, J. 2013. Vestigial spermatheca morphology in honeybee workers, Apis cerana and Apis mellifera, from Japan. Apidologie 44, 133-143.
Grabherr, M. G., Haas, B. J., Yassour, M., Levin, J. Z., Thompson, D. A., Amit, I., Adiconis, X., Fan, L., Raychowdhury, R. & Zeng, Q. 2011. Full-length transcriptome assembly from RNA-Seq data without a reference genome. Nature biotechnology 29, 644.
Grafen, A., Krebs, J. R. & Davies, N. B. 1984. Behavioural ecology: An evolutionary approach.
Green, P. J., Pines, O. & Inouye, M. 1986. The role of antisense RNA in gene regulation. Annual review of biochemistry 55, 569-597.
Greenbaum, M. P., Iwamori, T., Buchold, G. M. & Matzuk, M. M. 2011. Germ cell intercellular bridges. Cold Spring Harbor perspectives in biology 3, a005850.
Griffith, S. C., Owens, I. P. & Thuman, K. A. 2002. Extra pair paternity in birds: a review of interspecific variation and adaptive function. Molecular ecology 11, 2195-2212.
Groot, A. P. d. 1953. Protein and amino acid requirements of the honeybee (Apis mellifica L.).
- 221 - Grozinger, C. M., Fan, Y., Hoover, S. E. & Winston, M. L. 2007. Genome-wide
analysis reveals differences in brain gene expression patterns associated with caste and reproductive status in honey bees (Apis mellifera). Mol Ecol 16, 4837-4848.
Gruber, B., Eckel, K., Everaars, J. & Dormann, C. F. 2011. On managing the red mason bee (Osmia bicornis) in apple orchards. Apidologie 42, 564-576.
Guruharsha, K. G., Kankel, M. W. & Artavanis-Tsakonas, S. 2012. The Notch signalling system: recent insights into the complexity of a conserved pathway. Nature Reviews Genetics 13, 654-666.
Gutzeit, H. & Koppa, R. 1982. Time-lapse film analysis of cytoplasmic streaming during late oogenesis of Drosophila. Journal of Embryology and Experimental Morphology 67, 101-111.
Gutzeit, H., Zissler, D. & Fleig, R. 1993. Oogenesis in the honeybee Apis mellifera: cytological observations on the formation and differentiation of previtellogenic ovarian follicles. Roux's archives of developmental biology 202, 181-191.
Gutzeit, H. O. 1986a. The role of microfilaments in cytoplasmic streaming in Drosophila follicles. Journal of Cell Science 80, 159-169.
Gutzeit, H. O. 1986b. Transport of molecules and organelles in meroistic ovarioles of insects. Differentiation 31, 155-165.
Gutzeit, H. O. 1990. The microfilament pattern in the somatic follicle cells of mid-vitellogenic ovarian follicles of Drosophila. European Journal of Cell Biology 53, 349-356.
Gutzeit, H. O. 1991. Organization and in vitro activity of microfilament bundles associated with the basement membrane of Drosophila follicles. Acta Histochem Suppl 41, 201-210.
Haas, B. J., Papanicolaou, A., Yassour, M., Grabherr, M., Blood, P. D., Bowden, J., Couger, M. B., Eccles, D., Li, B., Lieber, M., et al. 2013. De novo transcript sequence reconstruction from RNA-seq using the Trinity platform for reference generation and analysis. Nature Protocols 8, 1494-1512.
Hale, M. L., Burg, T. M. & Steeves, T. E. 2012. Sampling for microsatellite-based population genetic studies: 25 to 30 individuals per population is enough to accurately estimate allele frequencies. PloS one 7, e45170.
Hall, T. A. BioEdit: a user-friendly biological sequence alignment editor and analysis program for Windows 95/98/NT. Nucleic acids symposium series, 1999. [London]: Information Retrieval Ltd., c1979-c2000., 95-98.
Hamilton, W. D. 1964a. Genetical evolution of social behaviour 1. Journal of Theoretical Biology 7, 1-16.
Hamilton, W. D. 1964b. Genetical evolution of social behaviour 2. Journal of Theoretical Biology 7, 17-52.
Hansen, I. A., Attardo, G. M., Rodriguez, S. D. & Drake, L. L. 2014. Four-way regulation of mosquito yolk protein precursor genes by juvenile hormone-, ecdysone-, nutrient-, and insulin-like peptide signaling pathways. Frontiers in physiology 5, 103.
Hansted, L., Grout, B. W. W., Toldam-Andersen, T. B. & Eilenberg, J. 2014. An assessment of Osmia rufa (syn. bicornis) as a pollinator of the sour cherry (Prunus cerasus) cv. Stevnsbaer in eastern Denmark. Journal of Apicultural Research 53, 177-182.
Harrison, X. A. 2014. Using observation-level random effects to model overdispersion in count data in ecology and evolution. PeerJ 2, e616.
- 222 - Hartfelder, K. & Steinbruck, G. 1997. Germ cell cluster formation and cell death
are alternatives in caste-specific differentiation of the larval honey bee ovary. Invertebr Reprod Dev 31, 237-250.
Hatch, S., Tarpy, D. & Fletcher, D. 1999. Worker regulation of emergency queen rearing in honey bee colonies and the resultant variation in queen quality. Insectes Sociaux 46, 372-377.
Haydak, M. H. & Palmer, L. S. 1942. Royal jelly and bee bread as sources of vitamins B-1, B-2, B-6, C, and nicotinic and pantothenic acids. Journal of Economic Entomology 35, 319-320.
Hendzel, M. J., Wei, Y., Mancini, M. A., Van Hooser, A., Ranalli, T., Brinkley, B., Bazett-Jones, D. P. & Allis, C. D. 1997. Mitosis-specific phosphorylation of histone H3 initiates primarily within pericentromeric heterochromatin during G2 and spreads in an ordered fashion coincident with mitotic chromosome condensation. Chromosoma 106, 348-360.
Henter, H. J. 2003. Inbreeding depression and haplodiploidy: experimental measures in a parasitoid and comparisons across diploid and haplodiploid insect taxa. Evolution 57, 1793-1803.
Herre, E. A. & Wcislo, W. T. 2011. In defence of inclusive fitness theory. Nature 471, E8-E9.
Hess, G. 1942. Über den Einfluß der Weisellosigkeit und des Fruchtbarkeitsvitamins E auf die Ovarien der Bienenarbeiterin.
Hodin, J. & Riddiford, L. M. 1998. The ecdysone receptor and ultraspiracle regulate the timing and progression of ovarian morphogenesis during Drosophila metamorphosis. Development Genes and Evolution 208, 304-317.
Hoffman, J. & Amos, W. 2005. Microsatellite genotyping errors: detection approaches, common sources and consequences for paternal exclusion. Molecular ecology 14, 599-612.
Holehouse, K., Hammond, R. & Bourke, A. 2003. Non-lethal sampling of DNA from bumble bees for conservation genetics. Insectes Sociaux 50, 277-285.
Holleley, C. E. & Geerts, P. G. 2009. Multiplex Manager 1.0: a cross-platform computer program that plans and optimizes multiplex PCR. BioTechniques 46, 511-517.
Holm, S. 1979. A simple sequentially rejective multiple test procedure. Scandinavian journal of statistics, 65-70.
Holm, S. N. 1974. Osmia rufa L.(Hym. Megachilidae) as a Pollinator of Plants in Greenhouses. Insect Systematics & Evolution 4, 217-224.
Holman, L. 2018. Queen pheromones and reproductive division of labor: a meta-analysis. Behavioral Ecology 29, 1199-1209.
Hoover, S. E. R., Higo, H. A. & Winston, M. L. 2006. Worker honey bee ovary development: seasonal variation and the influence of larval and adult nutrition. Journal of Comparative Physiology B-Biochemical Systemic and Environmental Physiology 176, 55-63.
Hoover, S. E. R., Keeling, C. I., Winston, M. L. & Slessor, K. N. 2003. The effect of queen pheromones on worker honey bee ovary development. Naturwissenschaften 90, 477-480.
Hoskins, R. A., Carlson, J. W., Kennedy, C., Acevedo, D., Evans-Holm, M., Frise, E., Wan, K. H., Park, S., Mendez-Lago, M. & Rossi, F. 2007. Sequence finishing and mapping of Drosophila melanogaster heterochromatin. Science 316, 1625-1628.
- 223 - Hrdý, I., Novák, V. & Škrobal, D. 1960. Influence of the queen inhibitory
substance of honeybee on the development of supplementary reproductives in the termite Kalotermes flavicollis. The Ontogeny of Insects (Acta Symposii de Evolutione Insectorum, Prague, 1959), 172-174.
Hsu, H.-J. & Drummond-Barbosa, D. 2011. Insulin signals control the competence of the Drosophila female germline stem cell niche to respond to Notch ligands. Developmental Biology 350, 290-300.
Hughes, W. O. H., Oldroyd, B. P., Beekman, M. & Ratnieks, F. L. W. 2008. Ancestral monogamy shows kin selection is key to the evolution of eusociality. Science 320, 1213-1216.
Hunt, J. H. & Amdam, G. V. 2005. Bivoltinism as an antecedent to eusociality in the paper wasp genus Polistes. Science 308, 264-267.
Hunt, J. H., Kensinger, B. J., Kossuth, J. A., Henshaw, M. T., Norberg, K., Wolschin, F. & Amdam, G. V. 2007. A diapause pathway underlies the gyne phenotype in Polistes wasps, revealing an evolutionary route to caste-containing insect societies. Proceedings of the National Academy of Sciences 104, 14020-14025.
Hunter, W., Ellis, J., Vanengelsdorp, D., Hayes, J., Westervelt, D., Glick, E., Williams, M., Sela, I., Maori, E., Pettis, J., et al. 2010. Large-Scale Field Application of RNAi Technology Reducing Israeli Acute Paralysis Virus Disease in Honey Bees (Apis mellifera, Hymenoptera: Apidae). Plos Pathogens 6, 10.
Huson, D. H. & Scornavacca, C. 2012. Dendroscope 3: an interactive tool for rooted phylogenetic trees and networks. Systematic biology 61, 1061-1067.
Ivanov, S. P. 2006. The nesting of (Osmia rufa L.) (Hymenoptera, Megachilidae) in the Crimea: Structure and composition of nests. Entomological Review 86, 524-533.
Jablonska, A. & Kisiel, E. 2002. Distribution of cytoskeletal elements in the ovarioles of Mutilla sp (Insecta, Hymenoptera). Folia Histochem Cytobiol 40, 223-224.
Jansen, J., Pokorny, T. & Schmitt, T. 2016. Disentangling the effect of insemination and ovary development on the cuticular hydrocarbon profile in the bumblebee Bombus terrestris (Hymenoptera: Apidae). Apidologie 47, 101-113.
Jarosch, A. & Moritz, R. F. A. 2011. Systemic RNA-interference in the honeybee Apis mellifera: Tissue dependent uptake of fluorescent siRNA after intra-abdominal application observed by laser-scanning microscopy. Journal of Insect Physiology 57, 851-857.
Jarosch, A. & Moritz, R. F. A. 2012. RNA interference in honeybees: off-target effects caused by dsRNA. Apidologie 43, 128-138.
Jarosch, A., Stolle, E., Crewe, R. M. & Moritz, R. F. A. 2011. Alternative splicing of a single transcription factor drives selfish reproductive behavior in honeybee workers (Apis mellifera). Proceedings of the National Academy of Sciences of the United States of America 108, 15282-15287.
Jarriault, D. & Mercer, A. R. 2012. Queen mandibular pheromone: questions that remain to be resolved. Apidologie 43, 292-307.
Jarvis, J. U. M. 1981. Eusociality in a mammal - cooperative breeding in naked mole-rat colonies. Science 212, 571-573.
- 224 - Jay, S. C. 1972. Oavry development of worker honeybees when separated from
worker brood by various methods. Canadian Journal of Zoology 50, 661-&.
Jensen, A. B., Palmer, K. A., Chaline, N., Raine, N. E., Tofilski, A., Martin, S. J., Pedersen, B. V., Boomsma, J. J. & Ratnieks, F. L. 2005. Quantifying honey bee mating range and isolation in semi-isolated valleys by DNA microsatellite paternity analysis. Conservation Genetics 6, 527-537.
Jindra, M., Bellés, X. & Shinoda, T. 2015. Molecular basis of juvenile hormone signaling. Current Opinion in Insect Science 11, 39-46.
Johnson‐Brousseau, S. A. & McCormick, S. 2004. A compendium of methods useful for characterizing Arabidopsis pollen mutants and
gametophytically‐expressed genes. The Plant Journal 39, 761-775. Jones, D. T., Taylor, W. R. & Thornton, J. M. 1992. The rapid generation of
mutation data matrices from protein sequences. Bioinformatics 8, 275-282.
Junker, R. R. & Blüthgen, N. 2010. Floral scents repel facultative flower visitors, but attract obligate ones. Annals of botany 105, 777-782.
Kalinowski, S. T., Taper, M. L. & Marshall, T. C. 2007. Revising how the computer program CERVUS accommodates genotyping error increases success in paternity assignment. Molecular ecology 16, 1099-1106.
Kalinowski, S. T., Wagner, A. P. & Taper, M. L. 2006. ML‐Relate: a computer program for maximum likelihood estimation of relatedness and relationship. Mol Ecol Notes 6, 576-579.
Kant, R., Minor, M., Sandanayaka, M. & Trewick, S. 2013. Effects of mating and oviposition delay on parasitism rate and sex allocation behaviour of Diaeretiella rapae (Hymenoptera: Aphidiidae). Biol Control 65, 265-270.
Kapheim, K. M. 2016. Genomic sources of phenotypic novelty in the evolution of eusociality in insects. Current opinion in insect science 13, 24-32.
Kapheim, K. M. 2019. Synthesis of Tinbergen's four questions and the future of sociogenomics. Behavioral Ecology and Sociobiology 73, 15.
Kapheim, K. M. & Johnson, M. M. 2017a. Juvenile hormone, but not nutrition or social cues, affects reproductive maturation in solitary alkali bees (Nomia melanderi). The Journal of Experimental Biology.
Kapheim, K. M. & Johnson, M. M. 2017b. Support for the reproductive ground plan hypothesis in a solitary bee: links between sucrose response and reproductive status. Proceedings of the Royal Society B: Biological Sciences 284.
Kapheim, K. M., Nonacs, P., Smith, A. R., Wayne, R. K. & Wcislo, W. T. 2015a. Kinship, parental manipulation and evolutionary origins of eusociality. Proceedings of the Royal Society B: Biological Sciences 282, 20142886.
Kapheim, K. M., Pan, H., Li, C., Salzberg, S. L., Puiu, D., Magoc, T., Robertson, H. M., Hudson, M. E., Venkat, A., Fischman, B. J., et al. 2015b. Genomic signatures of evolutionary transitions from solitary to group living. Science 348, 1139-1143.
Kasiotis, K. M., Anagnostopoulos, C., Anastasiadou, P. & Machera, K. 2014. Pesticide residues in honeybees, honey and bee pollen by LC–MS/MS screening: reported death incidents in honeybees. Science of the Total Environment 485, 633-642.
Keller, L. & Nonacs, P. 1993. The role of queen pheromones in social insects: queen control or queen signal? Animal Behaviour 45, 787-794.
Kelstrup, H. C., Hartfelder, K., Lopes, T. F. & Wossler, T. C. 2018. The Behavior and Reproductive Physiology of a Solitary Progressive Provisioning
- 225 -
Vespid Wasp: Evidence for a Solitary-Cycle Origin of Reproductive Castes. American Naturalist 191, E27-E39.
Kerkut, G. A. & Gilbert, L. I. 1985. Comprehensive Insect Physiology, Biochemistry, and Pharmacology: Insect control, Pergamon Press.
Kessler, M., Abrahamczyk, S., Bos, M., Buchori, D., Putra, D. D., Robbert Gradstein, S., Höhn, P., Kluge, J., Orend, F., Pitopang, R., et al. 2011. Cost-effectiveness of plant and animal biodiversity indicators in tropical forest and agroforest habitats. Journal of Applied Ecology 48, 330-339.
Khila, A. & Abouheif, E. 2008. Reproductive constraint is a developmental mechanism that maintains social harmony in advanced ant societies. Proceedings of the National Academy of Sciences of the United States of America 105, 17884-17889.
Khila, A. & Abouheif, E. 2010. Evaluating the role of reproductive constraints in ant social evolution. Philosophical Transactions of the Royal Society B-Biological Sciences 365, 617-630.
Kilaso, M., Remnant, E. J., Chapman, N. C., Oldroyd, B. P. & Chanchao, C. 2017. DNA methylation of Kr-h1 is involved in regulating ovary activation in worker honeybees (Apis mellifera). Insectes Sociaux 64, 87-94.
King, M. & Ferguson, A. 1991. Collection and use of dry pollen for pollination of kiwifruit. New Zealand Journal of Crop and Horticultural Science 19, 385-389.
King, R. C. 1970. Ovarian development in Drosophila melanogaster. Klein, A.-M., Vaissière, B. E., Cane, J. H., Steffan-Dewenter, I., Cunningham, S.
A., Kremen, C. & Tscharntke, T. 2007. Importance of pollinators in changing landscapes for world crops. Proceedings of the royal society B: biological sciences 274, 303-313.
Knudsen, J. T., Tollsten, L. & Bergström, L. G. 1993. Floral scents — a checklist of volatile compounds isolated by head-space techniques. Phytochemistry 33, 253-280.
Korbie, D. J. & Mattick, J. S. 2008. Touchdown PCR for increased specificity and sensitivity in PCR amplification. Nature Protocols 3, 1452-1456.
Koski, M. H. & Ashman, T. L. 2014. Dissecting pollinator responses to a ubiquitous ultraviolet floral pattern in the wild. Functional Ecology 28, 868-877.
Koywiwattrakul, P., Thompson, G. J., Sitthipraneed, S., Oldroyd, B. P. & Maleszka, R. 2005. Effects of carbon dioxide narcosis on ovary activation and gene expression in worker honeybees, Apis mellifera. Journal of Insect Science 5, 10.
Kranz, B. D., Schwarz, M. P., Mound, L. A. & Crespi, B. J. 1999. Social biology and sex ratios of the eusocial gall-inducing thrips Kladothrips hamiltoni. Ecological Entomology 24, 432-442.
Krombein, K. 1967. Trap-nesting Wasps and Bees: Life Histories and Nest Associates. Smithsonian, Washington, D C.
Krunić, M., Pinzauti, A., Felicioli, A. & Stanisavljević, L. j. 1995. Further observations on Osmia cornuta Latr. and O. rufa L. as alternative fruit pollinators, domestication and utilization. Archives Biological Sciences Belgrade 47, 59-66.
Krunić, M. & Stanisavljević, L. 2006. Supercooling points and diapause termination in overwintering adults of orchard bees Osmia cornuta and O. rufa (Hymenoptera: Megachilidae). Bulletin of entomological research 96, 323-326.

- 226 - Krunic, M., Stanisavljevic, L., Pinzauti, M. & Felicioli, A. 2005. The
accompanying fauna of Osmia cornuta and Osmia rufa and effective measures of protection. Bulletin of Insectology 58, 141-152.
Kucharski, R., Maleszka, J., Foret, S. & Maleszka, R. 2008. Nutritional control of reproductive status in honeybees via DNA methylation. Science 319, 1827-1830.
Kuwano, E., Takeya, R. & Eto, M. 1983. Terpenoid imidazoles: new anti-juvenile hormones. Agricultural and biological chemistry 47, 921-923.
Kuznetsova, A., Brockhoff, P. B. & Christensen, R. H. B. 2016. lmerTest: Tests in Linear Mixed Effects Models. R package version 2.0-33.
Ladurner, E., Bosch, J., Kemp, W. P. & Maini, S. 2005. Evaluation of a standard artificial flower design to feed individual bees known amounts of pesticides. Apidologie 36, 379-387.
Ladurner, E., Bosch, J., Maini, S. & Kemp, W. P. 2003. A method to feed individual bees (Hymenoptera : Apiformes) known amounts of pesticides. Apidologie 34, 597-602.
Lagisz, M., Port, G. & Wolff, K. 2010. A cost‐effective, simple and high‐throughput method for DNA extraction from insects. Insect science 17, 465-470.
Lago, D. C., Humann, F. C., Barchuk, A. R., Abraham, K. J. & Hartfelder, K. 2016. Differential gene expression underlying ovarian phenotype determination in honey bee, Apis mellifera L., caste development. Insect Biochemistry and Molecular Biology 79, 1-12.
Lancet, T. 2020. COVID-19: fighting panic with information. Lancet (London, England) 395, 537.
Landguth, E. L., Fedy, B. C., Oyler-McCance, S. J., Garey, A. L., Emel, S. L., Mumma, M., Wagner, H. H., Fortin, M. J. & Cushman, S. A. 2012. Effects of sample size, number of markers, and allelic richness on the detection of spatial genetic pattern. Molecular Ecology Resources 12, 276-284.
Lattorff, H. M., Moritz, R. F., Crewe, R. M. & Solignac, M. 2007. Control of reproductive dominance by the thelytoky gene in honeybees. Biology Letters 3, 292-295.
Lattorff, H. M., Moritz, R. F. & Fuchs, S. 2005. A single locus determines thelytokous parthenogenesis of laying honeybee workers (Apis mellifera capensis). Heredity (Edinb) 94, 533-537.
Lattorff, H. M. G. & Moritz, R. F. A. 2013. Genetic underpinnings of division of labor in the honeybee (Apis mellifera). Trends in Genetics 29, 641-648.
Lawson, S. P., Helmreich, S. L. & Rehan, S. M. J. J. o. E. B. 2017. Effects of nutritional deprivation on development and behavior in the subsocial bee Ceratina calcarata (Hymenoptera: Xylocopinae). 220, 4456-4462.
Lehmann, L. & Keller, L. 2006. The evolution of cooperation and altruism — a general framework and a classification of models. J Evol Biol 19, 1365-1376.
Lehmann, L., Keller, L., West, S. & Roze, D. 2007. Group selection and kin selection: two concepts but one process. Proc Natl Acad Sci U S A 104, 6736-6739.
Lehtonen, J. 2016. Multilevel Selection in Kin Selection Language. Trends in Ecology & Evolution 31, 752-762.
Lenaerts, C., Marchal, E., Peeters, P. & Broeck, J. V. 2019a. The ecdysone receptor complex is essential for the reproductive success in the female desert locust, Schistocerca gregaria. Scientific reports 9, 1-12.
- 227 - Lenaerts, C., Monjon, E., Van Lommel, J., Verbakel, L. & Broeck, J. V. 2019b.
Peptides in insect oogenesis. Current opinion in insect science 31, 58-64.
Lezzi, M. & Wyss, C. 1976. The antagonism between juvenile hormone and ecdysone. The juvenile hormones. Springer.
Libbrecht, R., Corona, M., Wende, F., Azevedo, D. O., Serrão, J. E. & Keller, L. 2013. Interplay between insulin signaling, juvenile hormone, and vitellogenin regulates maternal effects on polyphenism in ants. Proceedings of the National Academy of Sciences 110, 11050-11055.
Lin, H., Yue, L. & Spradling, A. C. 1994. The Drosophila fusome, a germline-specific organelle, contains membrane skeletal proteins and functions in cyst formation. Development 120, 947-956.
Linksvayer, T. A. & Johnson, B. R. 2019. Re-thinking the social ladder approach for elucidating the evolution and molecular basis of insect societies. Current Opinion in Insect Science 34, 123-129.
Linksvayer, T. A. & Wade, M. J. 2005. The evolutionary origin and elaboration of sociality in the aculeate hymenoptera: Maternal effects, sib-social effects, and heterochrony. Quarterly Review of Biology 80, 317-336.
Liu, S., Li, K., Gao, Y., Liu, X., Chen, W., Ge, W., Feng, Q., Palli, S. R. & Li, S. 2018. Antagonistic actions of juvenile hormone and 20-hydroxyecdysone within the ring gland determine developmental transitions in Drosophila. Proceedings of the National Academy of Sciences 115, 139-144.
Lockett, G. A., Kucharski, R. & Maleszka, R. 2012. DNA methylation changes elicited by social stimuli in the brains of worker honey bees. Genes Brain and Behavior 11, 235-242.
López-Schier, H. & Johnston, D. S. 2001. Delta signaling from the germ line controls the proliferation and differentiation of the somatic follicle cells during Drosophila oogenesis. Genes & development 15, 1393-1405.
Lorenz, K. 2013. The foundations of ethology, Springer Science & Business Media.
Lovegrove, M. R., Dearden, P. K. & Duncan, E. J. 2019. Ancestral hymenopteran queen pheromones do not share the broad phylogenetic repressive effects of honeybee queen mandibular pheromone. Journal of insect physiology 119, 103968.
Luke, S. G. 2017. Evaluating significance in linear mixed-effects models in R. Behavior research methods 49, 1494-1502.
Lunau, K. 2000. The ecology and evolution of visual pollen signals. Plant Systematics and Evolution 222, 89-111.
Lundell, M. J., Lee, H. K., Perez, E. & Chadwell, L. 2003. The regulation of apoptosis by numb/notch signaling in the serotonin lineage of Drosophila. Development 130, 4109-4121.
MacIvor, J. S. 2017. Cavity-nest boxes for solitary bees: a century of design and research. Apidologie 48, 311-327.
Madden, T. 2013. The BLAST sequence analysis tool. The NCBI Handbook [Internet]. 2nd edition. National Center for Biotechnology Information (US).
Madeira, F., Park, Y. M., Lee, J., Buso, N., Gur, T., Madhusoodanan, N., Basutkar, P., Tivey, A. R. N., Potter, S. C., Finn, R. D., et al. 2019. The EMBL-EBI search and sequence analysis tools APIs in 2019. Nucleic acids research 47, W636-W641.
Madgwick, P. G., Belcher, L. J. & Wolf, J. B. 2019. Greenbeard genes: theory and reality. Trends in ecology & evolution 34, 1092-1103.
- 228 - Maeta, Y. & Kurihara, M. 1971. Anatomical and histological studies on the
oogenesis and oosorption of terminal oocytes within the genus Osmia. Japanese Journal of Ecology 39, 138-158.
Maeta, Y., Saito, K. & Hyodo, K. 1993. Diapause and non-delayed eusociality in a univoltine and basically, solitary bee, Ceratina japonica (Hymenoptera, Anthophoridae): I. Diapause termination by cooling and application of juvenile hormone analog. Japanese Journal of Entomology 61, 203-211.
Makert, G. R., Paxton, R. J. & Hartfelder, K. 2006. Ovariole number - a predictor of differential reproductive success among worker subfamilies in queenless honeybee (Apis mellifera L.) colonies. Behavioral Ecology and Sociobiology 60, 815-825.
Maleszka, J., Foret, S., Saint, R. & Maleszka, R. 2007. RNAi-induced phenotypes suggest a novel role for a chemosensory protein CSP5 in the development of embryonic integument in the honeybee (Apis mellifera). Development Genes and Evolution 217, 189-196.
Marco Antonio, D. S., Guidugli-Lazzarini, K. R., do Nascimento, A. M., Simões, Z. L. P. & Hartfelder, K. 2008. RNAi-mediated silencing of vitellogenin gene function turns honeybee (Apis mellifera) workers into extremely precocious foragers. Naturwissenschaften 95, 953-961.
Marshall, J. A. 2011. Group selection and kin selection: formally equivalent approaches. Trends Ecol Evol 26, 325-332.
Marshall, J. A. R. 2016. What is inclusive fitness theory, and what is it for? Current Opinion in Behavioral Sciences 12, 103-108.
Marshall, T., Slate, J., Kruuk, L. & Pemberton, J. 1998. Statistical confidence for
likelihood‐based paternity inference in natural populations. Molecular ecology 7, 639-655.
Martins, G. F. & Serrão, J. E. 2004a. Changes in the reproductive tract of Melipona quadrifasciata anthidioides (Hymenoptera: Apidae, Meliponini) queen after mating. Sociobiology 44, 241-254.
Martins, G. F. & Serrão, J. E. 2004b. A comparative study of the ovaries in some Brazilian bees (Hymenoptera; Apoidea). Papéis Avulsos de Zoologia (São Paulo) 44, 45-53.
Masner, P. & Hangartner, W. 1973. Ecdysone: An antagonist of juvenile hormone in the control of cuticle synthesis in the German cockroach (Blattella germanica). Experientia 29, 1550-1552.
Masner, P., Hangartner, W. & Suchy, M. 1975. Reduced titres of ecdysone following juvenile hormone treatment in the German cockroach, Blattella germanica. Journal of Insect Physiology 21, 1755-1762.
Maxwell, K. & Elwood, J. M. 1983. UV radiation from fluorescent lights. Lancet (London, England) 2, 579.
Mayer, K. M., McNally, L. C. & Schneider, S. S. 1998. Ovarian development and trophallaxis in queenless colonies of the honey bee, Apis mellifera. Journal of Apicultural Research 37, 295-297.
Maynard Smith, J. & Wynne-Edwards, V. C. 1964. Group selection + Kin selection. Nature 201, 1145-&.
Mayr, E. 1961. Cause and effect in biology. Science 134, 1501-1506. Mazokhin-Porshni︠ a︡kov, G. A. 1969. Insect Vision: Translation Editor: Timothy
H. Goldsmith, Plenum Press. McCall, K. 2004. Eggs over easy: cell death in the Drosophila ovary.
Developmental Biology 274, 3-14. Melathopoulos, A., Winston, M., Pettis, J. & Pankiw, T. 1996. Effect of queen
mandibular pheromone on initiation and maintenance of queen cells in

- 229 -
the honey bee (Apis mellifera L.). The Canadian Entomologist 128, 263-272.
Menzel, R., Steinmann, E., Desouza, J. & Backhaus, W. 1988. Spectral sensitivity of photoreceptors and color-vision in the solitary bee, Osmia rufa. Journal of Experimental Biology 136, 35-52.
Michener, C. D. & Brothers, D. J. 1974. Were workers of eusocial Hymenoptera initially altruistic or oppressed? Proceedings of the National Academy of Sciences 71, 671-674.
Miele, L. & Osborne, B. 1999. Arbiter of differentiation and death: Notch signaling meets apoptosis. Journal of cellular physiology 181, 393-409.
Mirth, C. K. & Shingleton, A. W. 2014. The roles of juvenile hormone, insulin/target of rapamycin, and ecydsone signaling in regulating body size in Drosophila. Communicative & integrative biology 7, e971568.
Mirth, C. K., Tang, H. Y., Makohon-Moore, S. C., Salhadar, S., Gokhale, R. H., Warner, R. D., Koyama, T., Riddiford, L. M. & Shingleton, A. W. 2014. Juvenile hormone regulates body size and perturbs insulin signaling in Drosophila. Proceedings of the National Academy of Sciences 111, 7018-7023.
Misof, B., Liu, S. L., Meusemann, K., Peters, R. S., Donath, A., Mayer, C., Frandsen, P. B., Ware, J., Flouri, T., Beutel, R. G., et al. 2014. Phylogenomics resolves the timing and pattern of insect evolution. Science 346, 763-767.
Moeys, J. 2018. The soil texture wizard: R functions for plotting, classifying, transforming and exploring soil texture data. CRAN R-Project.
Mohammedi, A., Paris, A., Crauser, D. & Le Conte, Y. 1998. Effect of aliphatic esters on ovary development of queenless bees (Apis mellifera L.). Naturwissenschaften 85, 455-458.
Morin, P. A., Luikart, G. & Wayne, R. K. 2004. SNPs in ecology, evolution and conservation. Trends in ecology & evolution 19, 208-216.
Mueller, J. H. & Johnson, E. R. 1941. Acid hydrolysates of casein to replace peptone in the preparation of bacteriological media. Journal of Immunology 40, 33-38.
Mundry, R. & Nunn, C. L. 2008. Stepwise model fitting and statistical inference: turning noise into signal pollution. The American Naturalist 173, 119-123.
Mutti, N. S., Dolezal, A. G., Wolschin, F., Mutti, J. S., Gill, K. S. & Amdam, G. V. 2011. IRS and TOR nutrient-signaling pathways act via juvenile hormone to influence honey bee caste fate. Journal of Experimental Biology 214, 3977-3984.
Nation, J. L. 2008. Insect physiology and biochemistry, CRC press. Naumann, K. & Laflamme, P. H. 1993. Honeybee queen mandibular
pheromone does not increase rate of sugar syrup and pollen supplement uptake. American Bee Journal 133, 797-798.
Naumann, K., Winston, M. L., Slessor, K. N., Prestwich, G. D. & Webster, F. X. 1991. Production and transmission of honey bee queen (Apis mellifera L.) mandibular gland pheromone. Behavioral Ecology and Sociobiology 29, 321-332.
Navidi, W., Arnheim, N. & Waterman, M. 1992. A multiple-tubes approach for accurate genotyping of very small DNA samples by using PCR: statistical considerations. American journal of human genetics 50, 347.
Nayar, J. 1963. Effect of Synthetic ‘Queen Substance’(9-oxodec-trans-2-enoic acid) on Ovary Development of the House-fly, Musca domestica L. Nature 197, 923-924.
- 230 - Neumann, K. & Seidelmann, K. 2006. Microsatellites for the inference of
population structures in the Red Mason bee Osmia rufa (Hymenoptera, Megachilidae). Apidologie 37, 75-83.
Neumann, P., Moritz, R. F. & Mautz, D. 1999. Using DNA microsatellites for maternity testing in honeybees (Apis mellifera L.). Apidologie 30, 505-512.
Nicolson, S. W. 2011. Bee food: the chemistry and nutritional value of nectar, pollen and mixtures of the two. African Zoology 46, 197-204.
Nino, E. L., Tarpy, D. R. & Grozinger, C. M. 2013. Differential effects of insemination volume and substance on reproductive changes in honey bee queens (Apis mellifera L.). Insect Molecular Biology 22, 233-244.
Nowak, M. A., Tarnita, C. E. & Wilson, E. O. 2010. The evolution of eusociality. Nature 466, 1057-1062.
Nowak, M. A., Tarnita, C. E. & Wilson, E. O. 2011. Nowak et al. reply. Nature 471, E9-E10.
O'Donnell, S. 1998. Reproductive caste determination in eusocial wasps (Hymenoptera: Vespidae). Annual review of entomology 43, 323-346.
O'Donnell, S. & Jeanne, R. L. 1993. Methoprene accelerates age polyethism in workers of a social wasp (Polybia occidentalis). Physiological Entomology 18, 189-194.
O'Toole, C. 2000. The red mason bee: taking the sting out of bee-keeping, Banbury, Osmia Publications.
Oi, C. A., van Zweden, J. S., Oliveira, R. C., Van Oystaeyen, A., Nascimento, F. S. & Wenseleers, T. 2015. The origin and evolution of social insect queen pheromones: novel hypotheses and outstanding problems. BioEssays 37, 808-821.
Oldroyd, B. P. & Beekman, M. 2008. Effects of selection for honey bee worker reproduction on foraging traits. Public library of Science Biology 6, 463-470.
Oldroyd, B. P. & Osborne, K. E. 1999. The evolution of worker sterility in honeybees: the genetic basis of failure of worker policing. Proceedings of the Royal Society B-Biological Sciences 266, 1335-1339.
Oldroyd, B. P. & Ratnieks, F. L. W. 2000. Evolution of worker sterility in honey-bees (Apis mellifera): how anarchistic workers evade policing by laying eggs that have low removal rates. Behavioral Ecology and Sociobiology 47, 268-273.
Oldroyd, B. P., Smolenski, A. J., Cornuet, J.-M. & Crozler, R. H. 1994. Anarchy in the beehive. Nature 371, 749-749.
Onions, G. W. 1912. South African 'fertile-worker bees'. South African Agricultural Journal 1, 720-728.
Oppelt, A. & Heinze, J. 2009. Mating is associated with immediate changes of the hydrocarbon profile of Leptothorax gredleri ant queens. Journal of Insect Physiology 55, 624-628.
Orlove, M. J. & Wood, C. L. 1978. Coefficients of relationship and coefficients of relatedness in kin selection: A covariance form for the RHO formula. Journal of Theoretical Biology 73, 679-686.
Ostrander, E. A., Jong, P. M., Rine, J. & Duyk, G. 1992. Construction of small-insert genomic DNA libraries highly enriched for microsatellite repeat sequences. Proceedings of the National Academy of Sciences of the United States of America 89, 3419-3423.
- 231 - Oxley, P. R., Thompson, G. J. & Oldroyd, B. P. 2008. Four quantitative trait loci
that influence worker sterility in the honeybee (Apis mellifera). Genetics 179, 1337-1343.
Packer, L. & Owen, R. 2001. Population genetic aspects of pollinator decline. Conservation Ecology 5.
Page, R., Linksvayer, T. A. & Amdam, G. V. 2009. Social life from solitary regulatory networks: a paradigm for insect sociality. Organization of insect societies: from genomes to socio-complexity Harvard University Press, Cambridge, 357-376.
Pamilo, P. 1990. Comparison of Relatedness Estimators. Evolution 44, 1378-1382.
Paoli, P. P., Donley, D., Stabler, D., Saseendranath, A., Nicolson, S. W., Simpson, S. J. & Wright, G. A. 2014. Nutritional balance of essential amino acids and carbohydrates of the adult worker honeybee depends on age. Amino Acids 46, 1449-1458.
Papadopulos, F., Spinelli, M., Valente, S., Foroni, L., Orrico, C., Alviano, F. & Pasquinelli, G. 2007. Common tasks in microscopic and ultrastructural image analysis using ImageJ. Ultrastructural pathology 31, 401-407.
Parker, G. A. 1970. Sperm competition and its evolutionary consequences in the insects. Biological reviews 45, 525-567.
Parr, C., Eggleton, P., Davies, A., Evans, T. A. & Holdsworth, S. 2016. Suppression of savanna ants alters invertebrate composition and influences key ecosystem processes. Ecology 97, 1611-1617.
Patricio, K. & Cruz-Landim, C. 2002. Mating influence in the ovary differentiation in adult queens of Apis mellifera L. (Hymenoptera, Apidae). Brazilian Journal of Biology 62, 641-649.
Paxton, R., Thorén, P., Tengö, J., Estoup, A. & Pamilo, P. 1996. Mating structure and nestmate relatedness in a communal bee, Andrena jacobi (Hymenoptera, Andrenidae), using microsatellites. Molecular Ecology 5, 511-519.
Paxton, R. J., Ayasse, M., Field, J. & Soro, A. 2002. Complex sociogenetic organization and reproductive skew in a primitively eusocial sweat bee, Lasioglossum malachurum, as revealed by microsatellites. Molecular Ecology 11, 2405-2416.
Pearson, P. B. 1942. Pantothenic acid content of pollen. Proceedings of the Society for Experimental Biology and Medicine 51, 291-292.
Pearson, P. B. & Burgin, C. J. 1941. The pantothenic acid content of royal jelly. Proceedings of the Society for Experimental Biology and Medicine 48, 415-417.
Perez-Hedo, M., Rivera-Perez, C. & Noriega, F. G. 2014. Starvation increases insulin sensitivity and reduces juvenile hormone synthesis in mosquitoes. PLoS One 9.
Pernu, T. K. & Helantera, H. 2019. Genetic relatedness and its causal role in the evolution of insect societies. J Biosci 44, 12.
Pers, D., Buchta, T., Ozuak, O., Wolff, S., Pietsch, J. M., Memon, M. B., Roth, S. & Lynch, J. A. 2016. Global analysis of dorsoventral patterning in the wasp Nasonia reveals extensive incorporation of novelty in a regulatory network. BMC Biol 14, 19.
Persson, A. S., Mazier, F. & Smith, H. G. 2018. When beggars are choosers — How nesting of a solitary bee is affected by temporal dynamics of pollen plants in the landscape. Ecology and evolution 8, 5777-5791.
- 232 - Peso, M., Niño, E., Grozinger, C. M. & Barron, A. 2013. Effect of honey bee
queen mating condition on worker ovary activation. Insectes sociaux 60, 123-133.
Peters, R. S., Krogmann, L., Mayer, C., Donath, A., Gunkel, S., Meusemann, K., Kozlov, A., Podsiadlowski, L., Petersen, M., Lanfear, R., et al. 2017. Evolutionary History of the Hymenoptera. Curr Biol 27, 1013-1018.
Phiancharoen, M., Pirk, C. W. W., Radloff, S. E. & Hepburn, R. 2010. Clinal nature of the frequencies of ovarioles and spermathecae in Cape worker honeybees, Apis mellifera capensis. Apidologie 41, 129-134.
Pigliucci, M. 2007. Do we need an extended evolutionary synthesis? Evolution: International Journal of Organic Evolution 61, 2743-2749.
Pirk, C. W., Boodhoo, C., Human, H. & Nicolson, S. W. 2010. The importance of protein type and protein to carbohydrate ratio for survival and ovarian activation of caged honeybees (Apis mellifera scutellata). Apidologie 41, 62-72.
Pirk, C. W. W., de Miranda, J. R., Kramer, M., Murray, T. E., Nazzi, F., Shutler, D., van der Steen, J. J. M. & van Dooremalen, C. 2013. Statistical guidelines for Apis mellifera research. Journal of Apicultural Research 52, 24.
Plettner, E., Otis, G., Wimalaratne, P., Winston, M., Slessor, K., Pankiw, T. & Punchihewa, P. 1997. Species-and caste-determined mandibular gland signals in honeybees (Apis). Journal of Chemical Ecology 23, 363-377.
Pompanon, F., Bonin, A., Bellemain, E. & Taberlet, P. 2005. Genotyping errors: causes, consequences and solutions. Nature Reviews Genetics 6, 847-859.
Potts, S. G., Biesmeijer, J. C., Kremen, C., Neumann, P., Schweiger, O. & Kunin, W. E. 2010. Global pollinator declines: trends, impacts and drivers. Trends in Ecology & Evolution 25, 345-353.
Prakash, A., Jeffryes, M., Bateman, A. & Finn, R. D. 2017. The HMMER web server for protein sequence similarity search. Current protocols in bioinformatics 60, 3.15. 11-13.15. 23.
Prestwich, G. D. 1986. Fluorinated sterols, hormones and pheromones:
Enzyme‐targeted disruptants in insects. Pesticide science 17, 430-440. Price, T. D., Qvarnström, A. & Irwin, D. E. 2003. The role of phenotypic
plasticity in driving genetic evolution. Proceedings of the Royal Society of London Series B: Biological Sciences 270, 1433-1440.
Princen, S. A., Oliveira, R. C., Ernst, U. R., Millar, J. G., Zweden, J. S. v. & Wenseleers, T. 2019a. Honeybees possess a structurally diverse and functionally redundant set of queen pheromones. Proceedings of the Royal Society B: Biological Sciences 286, 20190517.
Princen, S. A., Van Oystaeyen, A., Petit, C., van Zweden, J. S. & Wenseleers, T. 2019b. Cross-activity of honeybee queen mandibular pheromone in bumblebees provides evidence for sensory exploitation. Behavioral Ecology.
Pritchett, T. L., Tanner, E. A. & McCall, K. 2009. Cracking open cell death in the Drosophila ovary. Apoptosis 14, 969.
Proctor, M. C. F. & Yeo, P. 1973. The pollination of flowers, London, Collins. Queller, D. C. 1994. Extended parental care and the origin of eusociality.
Proceedings of the Royal Society of London Series B: Biological Sciences 256, 105-111.
Queller, D. C. & Goodnight, K. F. 1989. Estimating relatedness using genetic-markers. Evolution 43, 258-275.
- 233 - Quinones, A. E. & Pen, I. 2017. A unified model of Hymenopteran
preadaptations that trigger the evolutionary transition to eusociality. Nature Communications 8, 13.
Quistad, G. B., Cerf, D. C., Schooley, D. A. & Staal, G. B. 1981. Fluoromevalonate acts as an inhibitor of insect juvenile hormone biosynthesis. Nature 289, 176-177.
R Core Team 2016. R: A language and environment for statistical computing. R Foundation for Statistical Computing, Vienna, Austria.
Rachinsky, A. & Hartfelder, K. 1998. In vitro biosynthesis of juvenile hormone in larval honey bees: Comparison of six media. In Vitro Cellular & Developmental Biology-Animal 34, 646-648.
Radmacher, S. & Strohm, E. 2010. Factors affecting offspring body size in the solitary bee Osmia bicornis (Hymenoptera, Megachilidae). Apidologie 41, 169-177.
Radmacher, S. & Strohm, E. 2011. Effects of constant and fluctuating temperatures on the development of the solitary bee Osmia bicornis (Hymenoptera: Megachilidae). Apidologie 42, 711-720.
Raguso, R. A. & Willis, M. A. 2002. Synergy between visual and olfactory cues in nectar feeding by naıve hawkmoths, Manduca sexta. Animal Behaviour 64, 685-695.
Rathjen, H. 1994. Neuere Aspekte zur Brutbiologie und zum Orientierungsvermögen von Osmia rufa (L.)(Hymenoptera, Megachilidae). Diploma Thesis, University of Bielefeld.
Ratnieks, F. L. W. 1988. Reproductive harmony via mutual policing by workers in eusocial Hymenoptera. American Naturalist 132, 217-236.
Raw, A. 1972. Biology of the solitary bee Osmia rufa (L) (Megachilidae). Transactions of the Royal Entomological Society of London 124, 213-229.
Raw, A. 1974. Pollen Preferences of Three Osmia Species (Hymenoptera). Oikos 25, 54.
Raw, A. 1976. Behavior of males of solitary bee Osmia rufa (Megachilidae) searching for females. Behaviour 56, 279-285.
Raw, A. 1992. Solitary bees Hymenoptera Megachilidae restricted to identical resources for nesting recognized their own nests — an example of genetically determined personal scents? Entomologist 111, 79-87.
Raw, A. & O'Toole, C. 1979. Errors in the sex of eggs laid by the solitary bee Osmia rufa (Megachilidae). Behaviour 70, 168-171.
Raymond, M. 1995. GENEPOP (version 1.2): population genetics software for exact tests and ecumenicism. J Hered 86, 248-249.
Reginato, R. D. & Cruz-Landim, C. 2001. Differentiation of the worker's ovary in Apis mellifera L. (Hymenoptera, Apidae) during life of the larvae. Invertebr Reprod Dev 39, 127-134.
Reginato, R. D. & Da Cruz-Landim, C. 2002. Morphological characterization of cell death during the ovary differentiation in worker honey bee. Cell Biol Int 26, 243-251.
Rehan, S. M. & Toth, A. L. 2015. Climbing the social ladder: the molecular evolution of sociality. Trends Ecol Evol 30, 426-433.
Richard, D. S., Rybczynski, R., Wilson, T. G., Wang, Y., Wayne, M. L., Zhou, Y., Partridge, L. & Harshman, L. G. 2005. Insulin signaling is necessary for vitellogenesis in Drosophila melanogaster independent of the roles of juvenile hormone and ecdysteroids: female sterility of the chico1 insulin signaling mutation is autonomous to the ovary. J Insect Physiol 51.

- 234 - Richard, F.-J., Tarpy, D. R. & Grozinger, C. M. 2007. Effects of insemination
quantity on honey bee queen physiology. PloS one 2, e980. Richard, R. & Casas, J. 2012. A quantitative framework for ovarian dynamics.
Functional Ecology 26, 1399-1408. Richards, K. W. 1994. Ovarian development in the alfalfa leafcutter bee,
Megachile rotundata. Journal of Apicultural Research 33, 199-203. Riddiford, L. M. 2012. How does juvenile hormone control insect
metamorphosis and reproduction? General and comparative endocrinology 179, 477-484.
Rinderer, T. E. & Baxter, J. R. 1978. Honey Bees: the Effect of Group Size on Longevity and Hoarding in Laboratory Cages. Annals of the Entomological Society of America 71, 732-732.
Ringo, J. 1996. Sexual receptivity in insects. Annual review of entomology 41, 473-494.
Robinson, G. E. & Vargo, E. L. 1997. Juvenile hormone in adult eusocial hymenoptera: Gonadotropin and behavioral pacemaker. Archives of Insect Biochemistry and Physiology 35, 559-583.
Ronai, I., Allsopp, M. H., Tan, K., Dong, S. H., Liu, X. W., Vergoz, V. & Oldroyd, B. P. 2017. The dynamic association between ovariole loss and sterility in adult honeybee workers. Proceedings of the Royal Society B-Biological Sciences 284.
Ronai, I., Barton, D. A., Oldroyd, B. P. & Vergoz, V. 2015. Regulation of oogenesis in honey bee workers via programed cell death. Journal of Insect Physiology 81, 36-41.
Ronai, I., Oldroyd, B. P., Barton, D. A., Cabanes, G., Lim, J. & Vergoz, V. 2016a. Anarchy Is a Molecular Signature of Worker Sterility in the Honey Bee. Molecular Biology and Evolution 33, 134-142.
Ronai, I., Vergoz, V. & Oldroyd, B. P. 2016b. The Mechanistic, Genetic, and Evolutionary Basis of Worker Sterility in the Social Hymenoptera. In: NAGUIB, M., MITANI, J. C., SIMMONS, L. W., BARRETT, L., HEALY, S. & ZUK, M. (eds.) Advances in the Study of Behavior, Vol 48. San Diego: Elsevier Academic Press Inc.
Rosenheim, J. A. 1996. An evolutionary argument for egg limitation. Evolution 50, 2089-2094.
Roth, E. 1990. Experiences in keeping and using Osmia rufa in cabbage pollination groups. Wissenschaftliche Zeitschrift Martin-Luther-Universitaet Halle-Wittenberg Mathematisch-Naturwissenschaftliche Reihe 39, 11-14.
Roubik, D. W. 1992. Ecology and natural history of tropical bees, Cambridge University Press.
Rousset, F. 2008. genepop’007: a complete re‐implementation of the genepop software for Windows and Linux. Molecular ecology resources 8, 103-106.
Roy, S., Saha, T. T., Zou, Z. & Raikhel, A. S. 2018. Regulatory pathways controlling female insect reproduction. Annual review of entomology 63, 489-511.
Rozema, J., Broekman, R. A., Blokker, P., Meijkamp, B. B., de Bakker, N., van de Staaij, J., van Beem, A., Ariese, F. & Kars, S. M. 2001. UV-B absorbance and UV-B absorbing compounds (para-coumaric acid) in pollen and sporopollenin: the perspective to track historic UV-B levels. Journal of Photochemistry and Photobiology B: Biology 62, 108-117.
- 235 - Rozen, S. & Skaletsky, H. 2000. Primer3 on the WWW for general users and for
biologist programmers. Methods in molecular biology (Clifton, NJ) 132, 365-386.
Rubin, H. 2018. The Debate over Inclusive Fitness as a Debate over Methodologies. Philosophy of Science 85, 1-30.
Ryder, J. T., Cherrill, A., Prew, R., Shaw, J., Thorbek, P. & Walters, K. F. A. 2019. Impact of enhanced Osmia bicornis (Hymenoptera: Megachilidae) populations on pollination and fruit quality in commercial sweet cherry (Prunus avium L.) orchards. Journal of Apicultural Research, 11.
Sabatini, A. G., Marcazzan, G. L., Caboni, M. F., Bogdanov, S. & de Almeida-Muradian, L. B. 2006. Quality and standardisation of Royal Jelly. Journal of ApiProduct and ApiMedical Science 1, 1-6.
Sakagami, S. F., Maeta, Y., Nagamori, S. & Saito, K. 1993. Diapause and non-delayed eusociality in a univoltine and basically solitary bee, Ceratina japonica (Hymenoptera, Anthophoridae): II. Non-delayed eusociality induced by juvenile hormone analog treatment. Japanese Journal of Entomology 61, 443-457.
Saleh, N. W. & Ramirez, S. R. 2019. Sociality emerges from solitary behaviours and reproductive plasticity in the orchid bee Euglossa dilemma. Proceedings of the Royal Society B-Biological Sciences 286, 10.
Sandrock, C., Tanadini, L. G., Pettis, J. S., Biesmeijer, J. C., Potts, S. G. & Neumann, P. 2014. Sublethal neonicotinoid insecticide exposure reduces solitary bee reproductive success. Agricultural and Forest Entomology 16, 119-128.
Sannasi, A. 1969. Inhibition of ovary development of the fruit-fly, Drosophila melanogaster by synthetic “Queen substance”. Life sciences 8, 785-789.
Santos, P. K. F., Arias, M. C. & Kapheim, K. M. 2019. Loss of developmental diapause as prerequisite for social evolution in bees. Biology Letters 15, 7.
Schenk, M., Krauss, J. & Holzschuh, A. 2018a. Desynchronizations in bee-plant interactions cause severe fitness losses in solitary bees. Journal of Animal Ecology 87, 139-149.
Schenk, M., Mitesser, O., Hovestadt, T. & Holzschuh, A. 2018b. Overwintering temperature and body condition shift emergence dates of spring-emerging solitary bees. PeerJ 6, 17.
Schildkraut, C. & Lifson, S. 1965. Dependence of the melting temperature of DNA on salt concentration. Biopolymers: Original Research on Biomolecules 3, 195-208.
Schoonhoven, L. M., van Loon, J. J. A. & Dicke, M. 2005. Insect-plant biology, Oxforrd, Oxford University Press.
Schwanbeck, R., Martini, S., Bernoth, K. & Just, U. 2011. The Notch signaling pathway: Molecular basis of cell context dependency. European Journal of Cell Biology 90, 572-581.
Seeley, T. D. & Buhrman, S. C. 1999. Group decision making in swarms of honey bees. Behavioral Ecology and Sociobiology 45, 19-31.
Seger, J. 1983. Partial bivoltinism may cause alternating sex-ratio biases that favor eusociality. Nature 301, 59-62.
Seidelmann, K. 1995. Untersuchungen zur Reproduktionsbiologie der Roten Mauerbiene, Osmia rufa (L.,1758). Dr PhD, Martin-Luther-Universitat Halle-Wittenberg.
Seidelmann, K. 1999a. The function of the vestibulum in nests of a solitary stem-nesting bee, Osmia rufa (L.). Apidologie 30, 19-29.
- 236 - Seidelmann, K. 1999b. The race for females: The mating system of the red
mason bee, Osmia rufa (L.) (Hymenoptera : Megachilidae). Journal of Insect Behavior 12, 13-25.
Seidelmann, K. 2006. Open-cell parasitism shapes maternal investment patterns in the Red Mason bee Osmia rufa. Behavioral Ecology 17, 839-848.
Seidelmann, K. 2014a. Behavioural induction of unreceptivity to mating from a post-copulatory display in the red mason bee, Osmia bicornis. Behaviour 151, 1687-1702.
Seidelmann, K. 2014b. Optimal progeny body size in a solitary bee, Osmia bicornis (Apoidea: Megachilidae). Ecological Entomology 39, 656-663.
Seidelmann, K. 2015. Double insurance of paternity by a novel type of mating plug in a monandrous solitary mason bee Osmia bicornis (Hymenoptera: Megachilidae). Biological Journal of the Linnean Society 115, 28-37.
Seidelmann, K., Bienasch, A. & Pröhl, F. 2016. The impact of nest tube dimensions on reproduction parameters in a cavity nesting solitary bee, Osmia bicornis (Hymenoptera: Megachilidae). Apidologie 47, 114-122.
Seidelmann, K. & Rolke, D. 2019. Advertisement of unreceptivity - Perfume modifications of mason bee females (Osmia bicornis and O. cornuta) and a non-existing antiaphrodisiac. Plos One 14, 14.
Seidelmann, K., Ulbrich, K. & Mielenz, N. 2010. Conditional sex allocation in the Red Mason bee, Osmia rufa. Behavioral Ecology and Sociobiology 64, 337-347.
Selkoe, K. A. & Toonen, R. J. 2006. Microsatellites for ecologists: a practical guide to using and evaluating microsatellite markers. Ecol Lett 9, 615-629.
Servedio, M. R., Brandvain, Y., Dhole, S., Fitzpatrick, C. L., Goldberg, E. E., Stern, C. A., Van Cleve, J. & Yeh, D. J. 2014. Not just a theory — the utility of mathematical models in evolutionary biology. PLoS biology 12, e1002017-e1002017.
Sgolastra, F., Bosch, J., Molowny-Horas, R., Maini, S. & Kemp, W. P. 2010. Effect of temperature regime on diapause intensity in an adult-wintering Hymenopteran with obligate diapause. Journal of Insect Physiology 56, 185-194.
Sgolastra, F., Hinarejos, S., Pitts-Singer, T. L., Boyle, N. K., Joseph, T., Luckmann, J., Raine, N. E., Singh, R., Williams, N. M. & Bosch, J. 2019. Pesticide Exposure Assessment Paradigm for Solitary Bees. Environmental Entomology 48, 22-35.
Sheng, Z., Xu, J., Bai, H., Zhu, F. & Palli, S. R. 2011. Juvenile hormone regulates vitellogenin gene expression through insulin-like peptide signaling pathway in the red flour beetle, Tribolium castaneum. Journal of Biological Chemistry 286, 41924-41936.
Sherman, P. W., Lacey, E. A., Reeve, H. K. & Keller, L. 1995. Forum: The eusociality continuum. Behavioral Ecology 6, 102-108.
Shi, Y. Y., Yan, W. Y., Huang, Z. Y., Wang, Z. L., Wu, X. B. & Zeng, Z. J. 2013. Genomewide analysis indicates that queen larvae have lower methylation levels in the honey bee (Apis mellifera). Naturwissenschaften 100, 193-197.
Shpigler, H., Amsalem, E., Huang, Z. Y., Cohen, M., Siegel, A. J., Hefetz, A. & Bloch, G. 2014. Gonadotropic and physiological functions of juvenile hormone in bumblebee (Bombus terrestris) workers. PLoS One 9.
- 237 - Shukla, S., Shilpa, M. C. & Gadagkar, R. 2013. Virgin wasps develop ovaries on
par with mated females, but lay fewer eggs. Insectes Sociaux 60, 345-350.
Sievers, F. & Higgins, D. G. 2014. Clustal Omega, accurate alignment of very large numbers of sequences. Multiple sequence alignment methods. Springer.
Škerl, M. I. S., Bolta, Š. V., Česnik, H. B. & Gregorc, A. 2009. Residues of pesticides in honeybee (Apis mellifera carnica) bee bread and in pollen loads from treated apple orchards. Bulletin of Environmental Contamination and Toxicology 83, 374-377.
Slessor, K. N., Kaminski, L.-A., King, G., Borden, J. H. & Winston, M. L. 1988. Semiochemical basis of the retinue response to queen honey bees. Nature 332, 354-356.
Slessor, K. N., Kaminski, L.-A., King, G. & Winston, M. L. 1990. Semiochemicals of the honeybee queen mandibular glands. Journal of Chemical Ecology 16, 851-860.
Smith, A. A. & Liebig, J. 2017. The evolution of cuticular fertility signals in eusocial insects. Current Opinion in Insect Science 22, 79-84.
Smith, J. M. & Price, G. R. 1973. The logic of animal conflict. Nature 246, 15-18. Smith, J. M. & Szathmary, E. 1995. The major transitions in evolution, Oxford
University Press. Smith, S. M., Beattie, A. J., Kent, D. S. & Stow, A. J. 2009. Ploidy of the
eusocial beetle Austroplatypus incompertus (Schedl) (Coleoptera, Curculionidae) and implications for the evolution of eusociality. Insectes Sociaux 56, 285-288.
Solignac, M., Mougel, F., Vautrin, D., Monnerot, M. & Cornuet, J. M. 2007. A third-generation microsatellite-based linkage map of the honey bee, Apis mellifera, and its comparison with the sequence-based physical map. Genome Biology 8, 14.
Solignac, M., Vautrin, D., Baudry, E., Mougel, F., Loiseau, A. & Cornuet, J.-M. 2004. A microsatellite-based linkage map of the honeybee, Apis mellifera L. Genetics 167, 253-262.
Solignac, M., Vautrin, D., Loiseau, A., Mougel, F., Baudry, E., Estoup, A., Garnery, L., Haberl, M. & Cornuet, J. M. 2003. Five hundred and fifty microsatellite markers for the study of the honeybee (Apis mellifera L.) genome. Mol Ecol Notes 3, 307-311.
Song, X., Call, G. B., Kirilly, D. & Xie, T. 2007. Notch signaling controls germline stem cell niche formation in the Drosophila ovary. Development 134, 1071-1080.
Soulsbury, C. D., Iossa, G., Edwards, K. J., Baker, P. J. & Harris, S. 2007. Allelic dropout from a high-quality DNA source. Conservation Genetics 8, 733-738.
Sprinzak, D., Lakhanpal, A., LeBon, L., Garcia-Ojalvo, J. & Elowitz, M. B. 2011. Mutual Inactivation of Notch Receptors and Ligands Facilitates Developmental Patterning. PLOS Computational Biology 7, e1002069.
Sprinzak, D., Lakhanpal, A., LeBon, L., Santat, L. A., Fontes, M. E., Anderson, G. A., Garcia-Ojalvo, J. & Elowitz, M. B. 2010. Cis-interactions between Notch and Delta generate mutually exclusive signalling states. Nature 465, 86-U95.
Staab, M., Pufal, G., Tscharntke, T. & Klein, A. M. 2018. Trap nests for bees and wasps to analyse trophic interactions in changing environments—A
- 238 -
systematic overview and user guide. Methods in Ecology and Evolution 9, 2226-2239.
Staal, G. B. 1982. Insect control with growth regulators interfering with the endocrine system. Entomologia experimentalis et Applicata 31, 15-23.
Städele, V. & Vigilant, L. 2016. Strategies for determining kinship in wild populations using genetic data. Ecology and Evolution 6, 6107-6120.
Steffan-Dewenter, I. & Schiele, S. 2004. Nest-site fidelity, body weight and population size of the red mason bee, Osmia rufa (Hymenoptera : Megachilidae), evaluated by Mark-Recapture experiments. Entomologia Generalis 27, 123-132.
Steffan-Dewenter, I. & Schiele, S. 2008. Do resources or natural enemies drive bee population dynamics in fragmented habitats? Ecology 89, 1375-1387.
Stern, D. L. 1994. A phylogenetic analysis of soldier evolution in the aphid family Hormaphididae. Proceedings of the Royal Society B-Biological Sciences 256, 203-209.
Strachecka, A., Chobotow, J., Paleolog, J., Los, A., Schulz, M., Teper, D., Kucharczyk, H. & Grzybek, M. 2017. Insights into the biochemical defence and methylation of the solitary bee Osmia rufa L.: A foundation for examining eusociality development. Plos One 12, 23.
Strachecka, A., Olszewski, K., Bajda, M. & Paleolog, J. D. 2015. Natural larval diet differently influences the pattern of developmental changes in DNA 5-methylcytosine levels in Apis mellifera queens as compared with workers and drones. Biochemistry-Moscow 80, 1019-1025.
Strassmann, J. E., Page, R. E., Jr., Robinson, G. E. & Seeley, T. D. 2011. Kin selection and eusociality. Nature 471, E5-E6.
Strobl, V., Albrecht, M., Radford, S., Wolf, S. & Neumann, P. 2019. A short note on extreme sex ratio in solitary bees Osmia cornuta in semi-field trials testing the impact of neonicotinoids. Journal of Apicultural Research 58, 469-470.
Strohm, E., Daniels, H., Warmers, C. & Stoll, C. 2002. Nest provisioning and a possible cost of reproduction in the megachilid bee Osmia rufa, studied by a new observation method. Ethology Ecology & Evolution 14, 255-268.
Stumm, W. & Morgan, J. J. 2012. Aquatic chemistry: chemical equilibria and rates in natural waters, John Wiley & Sons.
Taberlet, P., Griffin, S., Goossens, B., Questiau, S., Manceau, V., Escaravage, N., Waits, L. P. & Bouvet, J. 1996. Reliable genotyping of samples with very low DNA quantities using PCR. Nucleic acids research 24, 3189-3194.
Tanaka, E., Schmidt-Capella, I. & Hartfelder, K. 2006. Cell death in the germline-mechanisms and consequences for reproductive plasticity in social bees. Braz J Morph Sci 23, 15-26.
Tanaka, E. D. & Hartfelder, K. 2004. The initial stages of oogenesis and their relation to differential fertility in the honey bee (Apis mellifera) castes. Arthropod Structure & Development 33, 431-442.
Tanaka, E. D., Santana, W. C. & Hartfelder, K. 2009. Ovariole structure and oogenesis in queens and workers of the stingless bee Melipona quadrifasciata (Hymenoptera: Apidae, Meliponini) kept under different social conditions. Apidologie 40, 163-177.
- 239 - Tanner, E. A., Blute, T. A., Brachmann, C. B. & McCall, K. 2011. Bcl-2 proteins
and autophagy regulate mitochondrial dynamics during programmed cell death in the Drosophila ovary. Development 138, 327-338.
Tarpy, D. R., Delaney, D. A. & Seeley, T. D. 2015. Mating frequencies of honey bee queens (Apis mellifera L.) in a population of feral colonies in the northeastern United States. PLoS One 10.
Tasei, J. N. 1973. Le comportement de nidification chez Osmia (osmia) cornuta Latr. et Osmia (osmia) rufa L. (Hymenoptera Megachilidae). Apidologie 4, 195-225.
Tatar, M., Chien, S. A. & Priest, N. K. 2001. Negligible senescence during reproductive dormancy in Drosophila melanogaster. American Naturalist 158, 248-258.
Tepedino, V. J. & Parker, F. D. J. A. o. t. E. S. o. A. 1988. Alternation of sex ratio in a partially bivoltine bee, Megachile rotundata (Hymenoptera: Megachilidae). 81, 467-476.
Teper, D. 2007. Food plants of the red mason bee (Osmia rufa L.) determined based on a palynological analysis of faeces. Journal of Apicultural Science 51, 55-62.
Teper, D. & Bilinski, M. 2009. Red mason bee (Osmia rufa L.) as a pollinator of rape plantations. Journal of Apicultural Science 53, 115-120.
Thiel, T., Michalek, W., Varshney, R. & Graner, A. 2003. Exploiting EST databases for the development and characterization of gene-derived SSR-markers in barley (Hordeum vulgare L.). Theoretical and applied genetics 106, 411-422.
Thompson, G. J., Hurd, P. L. & Crespi, B. J. 2013. Genes underlying altruism. Biology Letters 9.
Thompson, G. J., Kucharski, R., Maleszka, R. & Oldroyd, B. P. 2006. Towards a molecular definition of worker sterility: differential gene expression and reproductive plasticity in honey bees. Insect Molecular Biology 15, 637-644.
Thurmond, J., Goodman, J. L., Strelets, V. B., Attrill, H., Gramates, L S., Marygold, S. J., Matthews, B. B., Millburn, G., Antonazzo, G., Trovisco, V., et al. 2018. FlyBase 2.0: the next generation. Nucleic Acids Research 47, D759-D765.
Tibbetts, E. A., Mettler, A. & Donajkowski, K. 2013. Nutrition-dependent fertility response to juvenile hormone in non-social Euodynerus foraminatus wasps and the evolutionary origin of sociality. Journal of Insect Physiology 59, 339-344.
Tinbergen, N. 1963. On aims and methods of ethology. Zeitschrift für tierpsychologie 20, 410-433.
Torabinejad, J., Caldwell, M. M., Flint, S. D. & Durham, S. 1998. Susceptibility
of pollen to UV‐B radiation: an assay of 34 taxa. American Journal of Botany 85, 360-369.
Traynor, K. S., Le Conte, Y. & Page, R. E. 2014. Queen and young larval pheromones impact nursing and reproductive physiology of honey bee (Apis mellifera) workers. Behavioral Ecology and Sociobiology 68, 2059-2073.
Trivers, R. L. 1971. The Evolution of Reciprocal Altruism. The Quarterly Review of Biology 46, 35-57.
Trivers, R. L. & Hare, H. 1976. Haplodiploidy and evolution of social insects. Science 191, 249-263.
- 240 - Truett, G., Heeger, P., Mynatt, R., Truett, A., Walker, J. & Warman, M. 2000.
Preparation of PCR-quality mouse genomic DNA with hot sodium hydroxide and tris (HotSHOT). Biotechniques 29, 52-54.
Tscharntke, T., Gathmann, A. & Steffan-Dewenter, I. 1998. Bioindication using trap-nesting bees and wasps and their natural enemies: community structure and interactions. Journal of Applied Ecology 35, 708-719.
Untergasser, A., Cutcutache, I., Koressaar, T., Ye, J., Faircloth, B. C., Remm, M. & Rozen, S. G. 2012. Primer3—new capabilities and interfaces. Nucleic acids research 40, e115-e115.
Untergasser, A., Nijveen, H., Rao, X., Bisseling, T., Geurts, R. & Leunissen, J. A. 2007. Primer3Plus, an enhanced web interface to Primer3. Nucleic acids research 35, W71-W74.
Vallone, P. M. & Butler, J. M. 2004. AutoDimer: a screening tool for primer-dimer and hairpin structures. Biotechniques 37, 226-231.
van der Steen, J. J. M. 1997. Indoor rearing of the solitary bee Osmia rufa L. Proceedings of the Section Experimental and Applied Entomology of the Netherlands Entomological Society, 81-84.
van der Steen, J. J. M. & Ruiter, A. d. 1991. The management of Osmia rufa L. for pollination of seed crops in greenhouses. Proceedings of the Section Experimental and Applied Entomology of the Netherlands Entomological Society 2, 137-141.
Van Oystaeyen, A., Oliveira, R. C., Holman, L., van Zweden, J. S., Romero, C., Oi, C. A., d'Ettorre, P., Khalesi, M., Billen, J., Wäckers, F., et al. 2014. Conserved class of queen pheromones stops social insect workers from reproducing. Science 343, 287-290.
van Veelen, M., Garcia, J., Sabelis, M. W. & Egas, M. 2012. Group selection and inclusive fitness are not equivalent; the Price equation vs. models and statistics. J Theor Biol 299, 64-80.
Velthuis, H. H. W. 1970. Ovarian development in Apis mellifera worker bees. Entomologia Experimentalis et Applicata 13, 377-394.
Visscher, P. K. & Camazine, S. 1999. The mystery of swarming honeybees: from individual behaviors to collective decisions. Information processing in social insects. Springer.
Visser, W., Van Roermund, C., Waterham, H. & Wanders, R. 2002. Identification of human PMP34 as a peroxisomal ATP transporter. Biochemical and biophysical research communications 299, 494-497.
Vleugel, P. A. 1952. Beobachtungen über den Revierbesitz bei der roten Mauerbiene (Osmia rufa). Trans 9th Int Cong Entomol 1, 402-408.
Von Frisch, K. 1954. The dancing bees: an account of the life and senses of the honeybee, London, Methuen & Co. Ltd.
Wade, M. J. 2001. Maternal effect genes and the evolution of sociality in haplo-diploid organisms. Evolution 55, 453-458.
Wallberg, A., Pirk, C. W., Allsopp, M. H. & Webster, M. T. 2016. Identification of multiple loci associated with social parasitism in honeybees. PLoS Genet 12.
Warners, M. R., Qiu, L. J., Holmes, M. J., Mikheyev, A. S. & Linksvayer, T. A. 2019. Convergent eusocial evolution is based on a shared reproductive groundplan plus lineage-specific plastic genes. Nature Communications 10, 11.
Wasielewski, O., Giejdasz, K., Wojciechowicz, T. & Skrzypski, M. 2011a. Ovary growth and protein levels in ovary and fat body during adult-wintering period in the red mason bee, Osmia rufa. Apidologie 42, 749-758.
- 241 - Wasielewski, O., Wojciechowicz, T., Giejdasz, K. & Krishnan, N. 2011b.
Influence of methoprene and temperature on diapause termination in adult females of the over-wintering solitary bee, Osmia rufa L. J Insect Physiol 57, 1682-1688.
Wehner, R. 1984. Astronavigation in insects. Annual review of entomology 29, 277-298.
Weinstock, G. M., Robinson, G. E., Gibbs, R. A., Worley, K. C., Evans, J. D., Maleszka, R., Robertson, H. M., Weaver, D. B., Beye, M., Bork, P., et al. 2006. Insights into social insects from the genome of the honeybee Apis mellifera. Nature 443, 931-949.
Wenseleers, T. & Ratnieks, F. 2006. Comparative Analysis of Worker Reproduction and Policing in Eusocial Hymenoptera Supports Relatedness Theory. The American Naturalist 168, E163-E179.
West-Eberhard, M. J. 1987. Flexible strategy and social evolution. Animal societies Theories and facts.
West-Eberhard, M. J. 1996. Wasp societies as microcosms for the study of development and evolution. In: TURILLAZZI, S. & WEST-EBERHARD, M. J. (eds.) Natural History and Evolution of Paper-Wasps. Oxford: Oxford University Press.
West-Eberhard, M. J. 2003. Developmental plasticity and evolution, Oxford University Press.
West-Eberhard, M. J. 2005. Phenotypic accommodation: adaptive innovation due to developmental plasticity. J Exp Zool B Mol Dev Evol 304, 610-618.
West, S. A. & Gardner, A. 2013. Adaptation and inclusive fitness. Curr Biol 23, R577-584.
Westrich, P. 1989. Die Wildbienen Baden-Württembergs. Eugen Ulmer Stuttgart, Germany.
Wheeler, D. E., Buck, N. & Evans, J. D. 2006. Expression of insulin pathway genes during the period of caste determination in the honey bee, Apis mellifera. Insect Molecular Biology 15, 597-602.
Wheeler, D. E., Buck, N. A. & Evans, J. D. 2014. Expression of insulin/insulin-like signalling and TOR pathway genes in honey bee caste determination. Insect Molecular Biology 23, 113-121.
Whitman, D. W. & Agrawal, A. A. 2009. What is phenotypic plasticity and why is it important. Phenotypic plasticity of insects: Mechanisms and consequences, 1-63.
Whittingham, M. J., Stephens, P. A., Bradbury, R. B. & Freckleton, R. P. 2006. Why do we still use stepwise modelling in ecology and behaviour? Journal of animal ecology 75, 1182-1189.
Wilkaniec, Z. 1998. The effect of differences in nest tube diameter on the settling of artificial nests by females of solitary bee Osmia rufa L. Pszczelnicze Zeszyty Naukowe 42.
Wilkaniec, Z. & Giejdasz, K. 2003. Suitability of nesting substrates for the cavity-nesting bee Osmia rufa. Journal of Apicultural Research 42, 29-31.
Williams, G. C. 1966. Adaptation and Natural Selection: A Critique of Some Current Evolutionary Thought, New Jersey, USA, Princeton University Press.
Williams, G. R., Alaux, C., Costa, C., Csaki, T., Doublet, V., Eisenhardt, D., Fries, I., Kuhn, R., McMahon, D. P., Medrzycki, P., et al. 2013. Standard

- 242 -
methods for maintaining adult Apis mellifera in cages under in vitro laboratory conditions. Journal of Apicultural Research 52, 35.
Williams, T., Blachuta, B., Hegna, T. A. & Nagy, L. M. 2012. Decoupling elongation and segmentation: notch involvement in anostracan crustacean segmentation. Evolution & development 14, 372-382.
Wilson, D. S. 2008. Social semantics: toward a genuine pluralism in the study of social behaviour. J Evol Biol 21, 368-373.
Wilson, D. S. & Wilson, E. O. 2007. Rethinking the theoretical foundation of sociobiology. Quarterly Review of Biology 82, 327-348.
Wilson, E. 1975. The insect societies. Belknap-Harvard, Cambridge, Mass. Wilson, E. O. 1971. The insect societies. Wilson, E. O. 1990. Success and dominance in ecosystems: the case of the
social insects, Ecology Institute Oldendorf/Luhe. Wilson, E. O. 2005. Kin selection as the key to altruism: its rise and fall. Social
research, 159-166. Wilson, E. O. & Holldobler, B. 2005. Eusociality: Origin and consequences.
Proceedings of the National Academy of Sciences of the United States of America 102, 13367-13371.
Wilson, M. J., Abbott, H. & Dearden, P. K. 2011. The evolution of oocyte patterning in insects: multiple cell-signaling pathways are active during honeybee oogenesis and are likely to play a role in axis patterning. Evolution & Development 13, 127-137.
Winston, M. L. 1991. The Biology of the Honeybee, Cambridge, Massachusetts, Harvard University Press.
Winston, M. L. & Slessor, K. N. 1998. Honey bee primer pheromones and colony organization: gaps in our knowledge. Apidologie 29, 81-95.
Wolschin, F., Mutti, N. S. & Amdam, G. V. 2011. Insulin receptor substrate influences female caste development in honeybees. Biology Letters 7, 112-115.
Woodard, S. H., Fischman, B. J., Venkat, A., Hudson, M. E., Varala, K., Cameron, S. A., Clark, A. G. & Robinson, G. E. 2011. Genes involved in convergent evolution of eusociality in bees. Proceedings of the National Academy of Sciences of the United States of America 108, 7472-7477.
Wright, S. 1922. Coefficients of inbreeding and relationship. American Naturalist 56, 330-338.
Xu, T., Caron, L. A., Fehon, R. G. & Artavanistsakonas, S. 1992. The involvement of the Notch locus in Drosophila oogenesis. Development 115, 913-922.
Ye, J., Coulouris, G., Zaretskaya, I., Cutcutache, I., Rozen, S. & Madden, T. L. 2012. Primer-BLAST: a tool to design target-specific primers for polymerase chain reaction. BMC bioinformatics 13, 134.
Yoon, H. J., Lee, K. Y., Kim, S. Y., Lee, Y. B., Kim, N. & Jin, B. R. 2015. Effects of location, direction, altitude, and placement of trap nests on the rate of trap-nesting of Osmia solitary bees. Journal of Asia-Pacific Entomology 18, 695-700.
Zahavi, A. 1975. Mate selection—a selection for a handicap. Journal of theoretical Biology 53, 205-214.
Zahra, A. & Tallal, M. 2008. Impact of pollen supplements and vitamins on the development of hypopharyngeal glands and on brood area in honey bees. Journal of Apicultural Science 52, 5-12.
Zayed, A. 2009. Bee genetics and conservation. Apidologie 40, 237-262.

- 243 - Zayed, A. & Packer, L. 2005. Complementary sex determination substantially
increases extinction proneness of haplodiploid populations. Proceedings of the National Academy of Sciences 102, 10742-10746.
Zeh, J. A. & Zeh, D. W. 2001. Reproductive mode and the genetic benefits of polyandry. Animal Behaviour 61, 1051-1063.
Zhang, Y. 1992. Program of F-actin in the follicular epithelium during oogenesis of the german cockroach, Blattella germanica. Tissue and Cell 24, 905-917.
Zuur, A. F., Ieno, E. N. & Elphick, C. S. 2010. A protocol for data exploration to avoid common statistical problems. Methods in Ecology and Evolution 1, 3-14.
Related Documents