A Study of Linear Piezoelectric Vibration Energy Harvesting Technique and Its Optimisation A thesis submitted in fulfilment of the requirements for the degree of Doctor of Philosophy Han Xiao Bachelor of Science in Photonic Science and Technology, Changchun University of Science and Technology, 2008 Master of Engineering in International Automotive Engineering, RMIT University, 2011 School of Aerospace Mechanical and Manufacturing Engineering College of Science Engineering and Health RMIT University March 2015

Welcome message from author
This document is posted to help you gain knowledge. Please leave a comment to let me know what you think about it! Share it to your friends and learn new things together.
Transcript
A Study of Linear Piezoelectric Vibration
Energy Harvesting Technique and Its
Optimisation
A thesis submitted in fulfilment of the requirements for the
degree of Doctor of Philosophy
Han Xiao
Bachelor of Science in Photonic Science and Technology, Changchun University of
Science and Technology, 2008
Master of Engineering in International Automotive Engineering, RMIT University,
2011
School of Aerospace Mechanical and Manufacturing Engineering
College of Science Engineering and Health
RMIT University
March 2015

ii
Declaration
I certify that except where due acknowledgement has been made, the work is that of the
author alone; the work has not been submitted previously, in whole or in part, to qualify
for any other academic award; the content of the thesis is the result of work which has
been carried out since the official commencement date of the approved research program;
any editorial work, paid or unpaid, carried out by a third party is acknowledged; and,
ethics procedures and guidelines have been followed.
Han Xiao
31 March 2015

iii
Acknowledgements
Foremost, I would like to express my sincere gratitude to my main supervisor Associate
Professor Xu Wang for his continuous, patience, and helpful guidance during my Ph.D.
study at RMIT University. Also my gratitude is to Professor Sabu John as the second
supervisor for his knowledge sharing. I would never have been accomplished my
dissertation without their advices and guidance.
I would like to thank Mr Peter Tkatchyk, Mr Julian Bradler, Mr Patrick Wilkins, and Mr
Don Savvides for their assistance in the Noise, Vibration and Harshness Lab and the
workshop. Also many thanks to Mrs Lina Bubic for her administration related support.
To all my colleagues: Jiajun Qin, Zamri Mohamed, and Laith Egab, thanks a lot for your
friendship and support at all times.
Last but not least, I would like to thank my parents for raising me up as the best they
could do, and their spiritual support throughout my life.
iv
Table of Contents
Declaration .................................................................................................. ii
Acknowledgements ................................................................................... iii
Table of Contents ...................................................................................... iv
List of Figures ........................................................................................... vii
List of Tables ........................................................................................... xvi
Nomenclature ........................................................................................ xviii
Abbreviation .......................................................................................... xxiv
Abstract ....................................................................................................... 1
Introduction ........................................................................... 2
1.1 Background ....................................................................................................... 2
1.2 Research motivation ......................................................................................... 3
1.3 Research scopes and objectives ........................................................................ 4
1.4 Outline .............................................................................................................. 4
1.5 List of publications ........................................................................................... 6
1.5.1 International Journal .................................................................................... 6
1.5.2 Conference ................................................................................................... 6
Literature Review .................................................................. 7
2.1 Introduction ....................................................................................................... 7
2.2 Linear piezoelectric vibration energy harvesting ........................................... 10
2.3 Nonlinear piezoelectric vibration harvesting .................................................. 21
2.4 Piezoelectric materials and electrical energy extraction and storage interface
circuits ............................................................................................................. 25
2.5 Large scale piezoelectric vibration energy harvesting .................................... 29
2.6 Conclusions ..................................................................................................... 30
v
Single Degree-of-freedom Piezoelectric Vibration Energy
Harvester Study and Experimental Validation .................................... 31
3.1 Introduction ..................................................................................................... 31
3.2 Analysis and simulation of the SDOF piezoelectric vibration energy harvester
....................................................................................................................... 33
3.3 Experimental Tests and Results ...................................................................... 55
3.4 Conclusion ...................................................................................................... 64
Single Degree-of-freedom Piezoelectric Vibration Energy
Harvester with Interface Circuits .......................................................... 66
4.1 Introduction ..................................................................................................... 66
4.2 Dimensionless analysis of SDOF piezoelectric vibration energy harvesters
connected with energy extraction and storage circuits ................................... 67
4.2.1 Standard interface circuit ........................................................................... 69
4.2.2 Synchronous electric charge extraction circuit .......................................... 72
4.2.3 Parallel switch harvesting on inductor circuit ............................................ 75
4.2.4 Series synchronous switch harvesting on inductor circuit ......................... 79
4.3 Dimensionless comparison and analysis of four different energy extraction
and storage interface circuits .......................................................................... 83
4.4 Conclusion ...................................................................................................... 91
Two Degree-of-freedom Piezoelectric Vibration Energy
Harvester and Experimental Validation ............................................... 93
5.1 Introduction ..................................................................................................... 93
5.2 Analysis and simulation of two degree-of-freedom piezoelectric vibration
energy harvester .............................................................................................. 95
5.2.1 Dimensionless analysis of a general coupled 2 DOF PVEH model ........ 100
5.2.2 Dimensionless analysis of a weakly coupled 2 DOF PVEH model ........ 105
5.3 Case study of a quarter vehicle suspension model and simulation ............... 108
5.4 Experimental validation ................................................................................ 129
5.5 Conclusion .................................................................................................... 132
vi
An Enhanced Two Degree-of-freedom Piezoelectric
Vibration Energy Harvesting System and Generalisation of MDOF
Piezoelectric Vibration Energy Harvester........................................... 135
6.1 Introduction ................................................................................................... 136
6.2 A 2 DOF piezoelectric vibration energy harvester inserted with two
piezoelectric patch elements ......................................................................... 138
6.3 A 3 DOF PVEH inserted with three piezoelectric patch elements ............... 155
6.4 The experimental validation of the analytical model of the 2 DOF PVEH .. 164
6.5 A generalised MDOF piezoelectric vibration harvester ............................... 169
6.6 Conclusion .................................................................................................... 174
Sensitivity Analysis of Performance of Piezoelectric
Vibration Energy Harvesters Using the Monte Carlo Simulation .... 176
7.1 Introduction ................................................................................................... 176
7.2 Sensitivity analysis of the performance of the SDOF piezoelectric vibration
energy harvester ............................................................................................ 177
7.3 Sensitivity analysis of the performance of a 2 DOF piezoelectric vibration
energy harvester with one piezoelectric insert .............................................. 185
7.4 Sensitivity analysis of performance of an enhanced 2 DOF piezoelectric
vibration energy harvester with two piezoelectric inserts. ........................... 192
7.5 Conclusion .................................................................................................... 202
Conclusions ........................................................................ 204
8.1 Research contribution ................................................................................... 204
8.2 Future work ................................................................................................... 206
Reference ................................................................................................ 207
vii
List of Figures
Figure 2.1: Illustration of piezoelectric mechanical to electrical energy conversion driven
by (a) direct force and (b) inertial force. ....................................................................... 10
Figure 2.2: Concept design of a 2 DOF piezoelectric vibration energy harvester [35]. 13
Figure 2.3: A piezoelectric vibration energy harvester with a multi-mode dynamic
magnifier [37]. .............................................................................................................. 14
Figure 2.4: Geometry of a novel and compact design of a 2 DOF piezoelectric vibration
energy harvester [40]. ................................................................................................... 15
Figure 2.5: A diagram of the self-tuning piezoelectric vibration energy harvester [42].
....................................................................................................................................... 16
Figure 2.6: Set-up diagram of a magnetically stiffened harvester [72]. ....................... 22
Figure 2.7: Geometry of the nonlinear 2 DOF harvester[74]. ...................................... 23
Figure 2.8: A nonlinear inverted beam harvester[75]. (a) Linear slider and the inverted
cantilever beam. (b) Base of the beam showing the Macro-Fiber Composite. (c) Tip mass
shown nearly vertical at the stable equilibrium. (d) Tip mass showing approximately 45°
end slope in a stable equilibrium. ................................................................................. 24
Figure 2.9: Schematic of negative capacitance. ............................................................ 26
Figure 3.1: A SDOF mechanical-electrical system connected to a single electric load
resistor. .......................................................................................................................... 34
Figure 3.2: Simulation diagram for Equation (3.13) with a sine wave base excitation
input and a sinusoidal voltage output at a given frequency. ......................................... 37
Figure 3.3: Output sinusoidal voltage signal from an excitation acceleration signal of a
root mean squared value of 1 g (9.8 m/s2) and a frequency of 274.9 Hz. ..................... 38
Figure 3.4: Output voltage amplitudes versus base excitation acceleration amplitude. 39
viii
Figure 3.5: Harvested resonant power versus base excitation acceleration amplitude. 40
Figure 3.6: Output voltage amplitudes versus mechanical damping. ........................... 40
Figure 3.7: Harvested resonant power versus mechanical damping. ............................ 41
Figure 3.8: Output voltage amplitudes versus electrical load resistance. ..................... 41
Figure 3.9: Harvested resonant power versus electrical load resistance. ...................... 42
Figure 3.10: Harvested resonant power versus electrical load resistance with the fine step
size of 2×10⁻⁶. ............................................................................................................... 45
Figure 3.11: Harvested resonant power and output voltage versus frequency. ............ 46
Figure 3.12: Harvested resonant power versus force factor. ........................................ 47
Figure 3.13: Dimensionless harvested resonant power versus normalised resistance and
normalised force factor for the SDOF system connected to a load resistor. ................. 49
Figure 3.14: Resonant energy harvesting efficiency versus normalised resistance and
force factor for the SDOF system connected to a load resistor. ................................... 52
Figure 3.15: A cantilevered bimorph beam clamped by washers with a nut mass glued at
the free end. ................................................................................................................... 57
Figure 3.16: The bimorph cantilevered beam set up on the shaker for lab testing. ...... 57
Figure 3.17: Polytec Laser Doppler vibrometer system display. .................................. 58
Figure 3.18: The measured vibration spectrum and first natural frequency of 24.375 Hz
for the cantilevered beam under a white noise random force excitation. ..................... 59
Figure 3.19: PZT-5H predicted voltage output vs. experimental measured voltage. ... 60
Figure 3.20: PZT-5H predicted and measured mean harvested power comparison. .... 61
Figure 3.21: PZT-5H predicted and measured resonant output voltage comparison for
variation of external electric load resistance. ................................................................ 62
Figure 3.22: PZT-5H predicted and measured resonant output voltage comparison for
variation of excitation acceleration amplitude. ............................................................. 63

ix
Figure 4.1: Extraction and storage interface circuits for vibration energy harvesters, (a)
standard; (b) SECE; (c) parallel SSHI; (d) series SSHI[115]. ...................................... 68
Figure 4.2: Working principle of a full cycle of bridge rectification. ........................... 68
Figure 4.3: The energy harvesting efficiency versus the normalised resistance and force
factor for the SDOF piezoelectric harvester connected to the four types of interface
circuits. .......................................................................................................................... 84
Figure 4.4: The dimensionless harvested power versus the normalised resistance and
force factor for the SDOF piezoelectric harvester connected to the four types of interface
circuits. .......................................................................................................................... 85
Figure 5.1: A two degree-of-freedom piezoelectric vibration energy harvesting system
model............................................................................................................................. 96
Figure 5.2: The dimensionless harvested power and harvesting efficiency versus various
mass ratios (MR=m2/m1). ............................................................................................. 106
Figure 5.3: The Dimensionless harvested power and harvested efficiency versus various
stiffness ratio (KR=k2/k1). ............................................................................................ 107
Figure 5.4: Case study of a quarter vehicle suspension model with piezoelectric element
inserter......................................................................................................................... 109
Figure 5.5: Simulation scheme for output voltage and harvested power. ................... 111
Figure 5.6: Output voltage for the acceleration excitation with the amplitude of 1g (9.80
m/s2). ........................................................................................................................... 112
Figure 5.7: Output power for the acceleration excitation with the amplitude of 1g (9.80
m/s2). ........................................................................................................................... 112
Figure 5.8: Displacement amplitude ratios of Mass 1 and Mass 2 with respect to the input
displacement amplitude versus frequency. ................................................................. 114
x
Figure 5.9: Output voltage and harvested power versus excitation acceleration amplitude.
..................................................................................................................................... 115
Figure 5.10: The output voltage and mean harvested power versus frequency. ......... 116
Figure 5.11: Output voltage and mean harvested power versus electric load resistance.
..................................................................................................................................... 117
Figure 5.12: Output voltage and harvested power versus wheel-tyre damping. ......... 118
Figure 5.13: Output voltage and mean harvested power versus suspension damping.119
Figure 5.14: Output voltage and mean harvested power versus the force factor. ....... 120
Figure 5.15: Output voltage of various wheel-tyre mass versus frequency. ............... 121
Figure 5.16: Output voltage of various quarter vehicle mass versus frequency. ........ 122
Figure 5.17: Output voltage of various wheel-tyre stiffness values versus frequency.
..................................................................................................................................... 124
Figure 5.18: Output voltage of various suspension stiffness values versus frequency.
..................................................................................................................................... 124
Figure 5.19: The dimensionless mean harvested power versus stiffness ratio ( 2 1/k k ).
..................................................................................................................................... 126
Figure 5.20: Output voltage of various wheel-tyre damping coefficients versus frequency.
..................................................................................................................................... 127
Figure 5.21: Output voltage of various suspension damping coefficients versus
frequency suspension damping coefficients. .............................................................. 127
Figure 5.22: Dimensionless mean harvested power versus damping ratio ( 1 2/c c ). .. 128
Figure 5.23: A 2 DOF piezoelectric vibration energy harvester attached on the shaker.
..................................................................................................................................... 129
Figure 5.24: The predicted and experimentally measured voltage output versus the
excitation frequency. ................................................................................................... 131
xi
Figure 5.25: The predicted and experimentally measured voltage output versus the
external electric load resistance .................................................................................. 132
Figure 6.1: A 2 DOF piezoelectric vibration energy harvester inserted with two
piezoelectric patch elements. ...................................................................................... 138
Figure 6.2: The difference of the two dimensionless resonant frequencies versus the mass
ratio M and frequency ratio Ω under the synchronous changes of the coupling strength
of the piezoelectric patch elements. ............................................................................ 146
Figure 6.3: The difference of the two dimensionless resonant frequencies versus the
ratios of M and Ω with the coupling strength changes of the primary and auxiliary
oscillator systems. ....................................................................................................... 147
Figure 6.4: The dimensionless harvested power of the 2 DOF PVEH versus the
dimensionless resonant frequency for different mass ratio (M). ................................ 149
Figure 6.5: The dimensionless harvested power of the 2 DOF PVEH versus the
dimensionless resonant frequency for different Ω. ..................................................... 150
Figure 6.6: Dimensionless harvested power of the 2 DOF PVEH versus Φ and ζ1.... 151
Figure 6.7: Dimensionless harvested power of the 2 DOF PVEH versus Φ and ζ2.... 152
Figure 6.8: The harvested efficiency of the first piezoelectric patch element versus Φ and
M for different coupling strengths. ............................................................................. 153
Figure 6.9: The harvested efficiency of the second piezoelectric patch element versus Φ
and M for different coupling strengths. ...................................................................... 154
Figure 6.10: A 3 DOF piezoelectric vibration energy harvester inserted with three
piezoelectric patch elements. ...................................................................................... 155
Figure 6.11: The dimensionless harvested power of the 3 DOF PVEH versus the
dimensionless resonant frequency for different mass ratio M. ................................... 158
xii
Figure 6.12: The dimensionless mean harvested power of the 3 DOF system versus the
dimensionless resonant frequency for different Ω1. .................................................... 160
Figure 6.13: Dimensionless mean harvested power of the 3 DOF PVEH versus Φ and ζ1.
..................................................................................................................................... 161
Figure 6.14: Dimensionless harvested power of 3 DOF PVEH versus Φ and ζ2. ...... 162
Figure 6.15: The harvested efficiency of the 3 DOF PVEH versus M and Φ. ........... 163
Figure 6.16: The experimental setup of the 2 DOF piezoelectric vibration energy
harvester built with two piezoelectric elements. ......................................................... 165
Figure 6.17: The isolated tests for the primary and auxiliary oscillators of the 2 DOF
PVEH. ......................................................................................................................... 167
Figure 6.18: The analytically predicted and experimentally measured voltage outputs of
the conventional 2 DOF PVEH with only one primary piezoelectric element versus the
excitation frequency. ................................................................................................... 168
Figure 6.19: The analytically predicted and experimentally measured voltage outputs of
the proposed 2 DOF PVEH versus the excitation frequency. ..................................... 169
Figure 6.20: A generalized MDOF piezoelectric vibration energy harvester inserted with
multiple pieces of piezoelectric elements. .................................................................. 170
Figure 6.21: The dimensionless harvested power and the harvested power density versus
the numbers of degree-of-freedom of PVEH. ............................................................. 174
Figure 7.1: The output voltage of the SDOF piezoelectric vibration energy harvester
versus frequency for the mass variation around its mean value with a ±10% standard
deviation. ..................................................................................................................... 179
Figure 7.2: The output voltage of the SDOF piezoelectric vibration energy harvester
versus frequency for the mechanical stiffness coefficient variation around its mean value
with a ±10% standard deviation. ................................................................................. 180
xiii
Figure 7.3: The output voltage of the SDOF piezoelectric vibration energy harvester
versus frequency for the damping coefficient variation around its mean value with a ±10%
standard deviation. ...................................................................................................... 181
Figure 7.4: The output voltage of the SDOF piezoelectric vibration energy harvester
versus frequency for the electrical resistance variation around its mean value with a ±10%
standard deviation. ...................................................................................................... 182
Figure 7.5: The output voltage of the SDOF piezoelectric vibration energy harvester
versus frequency for the force factor variation around its mean value with a ±10%
standard deviation. ...................................................................................................... 183
Figure 7.6: The output voltage of the SDOF piezoelectric vibration energy harvester
versus frequency for the capacitance variation around its mean value with a ±10%
standard deviation. ...................................................................................................... 184
Figure 7.7: The output voltage of the 2 DOF PVEH versus frequency for the variations
of m1 and m2 around their mean values with a ±10% standard deviation. .................. 186
Figure 7.8: The output voltage of the 2 DOF PVEH versus frequency for the variations
of the stiffness parameters k1 and k2 around their mean values with a ±10% standard
deviation. ..................................................................................................................... 187
Figure 7.9: The output voltage of the 2 DOF PVEH versus frequency for the variations
of c1 and c2 around their mean values with a ±10% standard deviation. .................... 188
Figure 7.10: The output voltage of the 2 DOF PVEH versus frequency for the variation
of the electrical resistance R around its mean value with a ±10% standard deviation.
..................................................................................................................................... 189
Figure 7.11: The output voltage of the 2 DOF PVEH versus frequency for the variation
of the force factor α around it mean value with a ±10% standard deviation. ............. 190
xiv
Figure 7.12: The output voltage of the 2 DOF PVEH versus frequency for variation of
the capacitance Cp around its mean value with a ±10% standard deviation. .............. 191
Figure 7.13: The output voltages of the two piezoelectric elements versus frequency for
the variation of the mass m1 around its mean value with a ±10% standard deviation. 193
Figure 7.14: The output voltage of the two piezoelectric elements versus frequency for
variation of mass m2 around its mean value with a ±10% standard deviation. ........... 194
Figure 7.15: The output voltages of the two piezoelectric elements versus frequency for
variation of mechanical stiffness k1 around its mean value with a ±10% standard
deviation. ..................................................................................................................... 195
Figure 7.16: The output voltages of the two piezoelectric elements versus frequency for
variation of mechanical stiffness k2 around its mean value with a ±10% standard
deviation. ..................................................................................................................... 195
Figure 7.17: The output voltages of the two piezoelectric elements versus frequency for
variation of damping coefficient c1 around its mean value with a ±10% standard
deviation. ..................................................................................................................... 196
Figure 7.18: The output voltages of the two piezoelectric elements versus frequency for
variation of damping coefficient c2 around its mean value with a ±10% standard
deviation. ..................................................................................................................... 197
Figure 7.19: The output voltages of the two piezoelectric elements versus frequency for
variation of the electrical resistance R1 around its mean value with a ±10% standard
deviation. ..................................................................................................................... 198
Figure 7.20: The output voltages of the two piezoelectric elements versus frequency for
variation of electrical resistance R2 around its mean value with a ±10% standard
deviation. ..................................................................................................................... 198
xv
Figure 7.21: The output voltages of the two piezoelectric elements versus frequency for
variation of the force factor α1 around its mean value with a ±10% standard deviation.
..................................................................................................................................... 199
Figure 7.22: The output voltages of the two piezoelectric elements versus frequency for
variation of the force factor α2 around its mean value with a ±10% standard deviation.
..................................................................................................................................... 200
Figure 7.23: The output voltages of the two piezoelectric elements versus frequency for
variation of capacitances Cp1 around its mean value with a ±10% standard deviation.
..................................................................................................................................... 201
Figure 7.24: The output voltages of the two piezoelectric elements versus frequency for
variation of capacitances Cp2 around its mean value with a ±10% standard deviation.
..................................................................................................................................... 201
xvi
List of Tables
Table 2.1: Power density of available energy sources[1]. .............................................. 8
Table 2.2: Magnitude and frequency of vibration acceleration of potential vibration
sources of common commercial devices[11]. ................................................................. 9
Table 2.3: Performance summary of reported piezoelectric vibration energy harvesters.
....................................................................................................................................... 20
Table 2.4: The power density of reported application, piezoelectric materials and their
categorisation. ............................................................................................................... 27
Table 2.5: Key properties of some common piezoelectric materials and nanowire(NW)
[86] . .............................................................................................................................. 28
Table 3.1: The identified SDOF mechanical-electrical system parameters[66]. .......... 36
Table 3.2: Piezoelectric vibration energy harvester property parameters. .................... 56
Table 4.1: Dimensionless harvested resonant power and energy harvesting efficiency of
a piezoelectric harvester of the four different interface circuits. .................................. 86
Table 4.2: Peak dimensionless harvested resonant power and resonant energy harvesting
efficiency of a piezoelectric harvester with four different interface circuits with varying
resistances. .................................................................................................................... 87
Table 4.3: Peak dimensionless harvested resonant power and resonant energy harvesting
efficiency of a piezoelectric harvester with four different interface circuits with varying
force factors. ................................................................................................................. 88
Table 5.1: Parameters of a quarter vehicle suspension model with piezoelectric
inserter[126]. ............................................................................................................... 109
Table 5.2: The parameters of a 2 DOF piezoelectric vibration energy harvester ....... 130
xvii
Table 6.1: The parameters of a 2 DOF piezoelectric vibration energy harvester with two
piezoelectric inserts[47]. ............................................................................................. 143
Table 6.2: The parameters of the 2 DOF PVEH identified by the experimental tests. 166
Table 6.3: Comparison of harvesting performance from 1 DOF to 5 DOF piezoelectric
vibration energy harvester ........................................................................................... 173
Table 7.1 A summary of sensitivity analysis of the SDOF piezoelectric vibration energy
harvester (1= least impact, 3 moderate impact, 5 strongest impact). .......................... 184
Table 7.2 A summary of sensitivity analysis of the 2 DOF piezoelectric vibration energy
harvester (1= least impact, 3 moderate impact, 5 strongest impact). .......................... 192
Table 7.3: A summary of sensitivity analysis of the enhanced 2 DOF piezoelectric
vibration energy harvester with two piezoelectric elements (1= least impact, 3 moderate
impact, 5 strongest impact). ........................................................................................ 202

xviii
Nomenclature
A the piezoelectric material insert disc surface area
L the thickness of the piezoelectric materials insert disc
e 2.718281828
33e the piezoelectric constant
33
S the piezoelectric permittivity
iQ the quality factor
nf the natural frequency
T the period of the excitation force signal
the excitation frequency
3.1415926
the delay phase angle of the response displacement to the
excitation force
0u the base excitation displacement
0u the base excitation velocity
0u the base excitation acceleration
0mA the base excitation displacement amplitude
1u the relative displacement of the 1st oscillator mass ( 1m )
with respect to the base

xix
1mU the amplitude of the relative displacement of the 1st
oscillator mass ( 1m ) with respect to the base
2u the relative displacement of the 2nd oscillator mass ( 2m )
with respect to the base
2mU the amplitude of the relative displacement of the 2nd
oscillator mass ( 2m ) with respect to the base
nu the relative displacement of the nth oscillator mass ( nm )
with respect to the base
nmU the amplitude of the relative displacement of the nth
oscillator mass ( nm ) with respect to the base
1m the 1st oscillator mass
2m the 2nd oscillator mass
nm the nth oscillator mass
k the open circuit stiffness coefficient between the base and
the oscillator ( m )
1k
the open circuit stiffness coefficient between the base and
the oscillator ( 1m )
2k
the open circuit stiffness coefficient between the 1m and
the 2m
nk
the open circuit stiffness coefficient between the 1nm
and the nm

xx
c the open circuit mechanical damping coefficient between
the base and the oscillator ( m )
1c
the open circuit mechanical damping coefficient between
the base and the oscillator ( 1m )
2c
the open circuit mechanical damping coefficient between
the 1m and the 2m
nc
the open circuit mechanical damping coefficient between
the 1nm and the nm
1pC the blocking capacity of the 1st piezoelectric patch
element
2pC the blocking capacity of the 2nd piezoelectric patch
element
pnC the blocking capacity of the nth piezoelectric patch
element
R the sum of the external load resistance and the
piezoelectric patch element resistance
1R the sum of the external load resistance and the 1st
piezoelectric patch element resistance
2R the sum of the external load resistance and the 2nd
piezoelectric patch element resistance
nR the sum of the external load resistance and nth
piezoelectric patch element resistance
NR the normalised resistance
xxi
the force factor of the piezoelectric material
1 the force factor of the 1st piezoelectric patch element
2 the force factor of the 2nd piezoelectric patch element
n the force factor of the nth piezoelectric patch element
N the normalised force factor
1V the output RMS voltage of the 1st piezoelectric patch
element
2V the output RMS voltage of the 2nd piezoelectric patch
element
nV the output RMS voltage of the nth piezoelectric patch
element
MV the output voltage amplitude of the SDOF system
0V the rectifier voltage amplitude
mV the piezoelectric voltage amplitude after the inversion
process
V the amplitude of the output voltage
1hP the harvested resonant power of the 1st piezoelectric
patch element
2hP the harvested resonant power of the 2nd piezoelectric
patch element
inP the input power
s the Laplace variable
xxii
i the square root of -1
the resonant energy harvesting efficiency
1 the resonant energy harvesting efficiency of 1st
piezoelectric patch element
2 the resonant energy harvesting efficiency of 2nd
piezoelectric patch element
n the resonant energy harvesting efficiency of nth
piezoelectric patch element
22
0
in
m
P
m A
c
dimensionless input power
22
0
h
m
P
m A
c
dimensionless harvested power
2
ek electromechanical coupling strength
2
1
1
electromechanical coupling strength of the 1st
piezoelectric patch element
2
2
2
electromechanical coupling strength of the 2nd
piezoelectric patch element
Subscripts
33 piezoelectric working mode have the same direction of
the loading and electric poles
c the damping dissipated
xxiii
e extracted vibration energy
eq equivalent
h harvested energy
m amplitude or before the inversion process
n nth
max the maximum
N normalised
Superscripts
the first differential
the second differential
1 inverse
S clamped
T transpose
* complex conjugate
time average
Special function
modulus or absolute value
time averaged
xxiv
Abbreviation
DOF degree-of-freedom
SDOF single degree-of-freedom
PVEH piezoelectric vibration energy harvester
MDOF multiple degree-of-freedom
MCS Monte Carlo Simulation
RMS root mean square
N/A not applicable
Para parallel
SL single load
SECE synchronous electric charge extraction
SSHI synchronous switch harvesting on inductor
Standard standard interface circuit
1
Abstract
The study is conducted to address the research questions proposed from the existing
research gaps through literature review. Firstly, a study of single degree-of-freedom
piezoelectric vibration energy harvesting model is carried out to provide a basic
guideline for further two degree-of-freedom and multiple degree-of-freedom
piezoelectric vibration energy harvester study. It is found that the harvested power of the
single degree-of-freedom piezoelectric vibration energy harvester is limited by the mass
and damping of the harvesting system, and the external excitation amplitude. The
harvested power limit is independent from the properties of piezoelectric materials. The
study of single degree-od-freedom piezoelectric vibration energy harvester connected
with four different energy extraction and storage circuits is performed. Both the
harvested resonant power and the energy harvesting efficiency have been normalised as
functions of dimensionless variables and compared for the harvester with the four
different circuits. Furthermore, the two degree-of-freedom and generalization of
multiple degree-of-freedom piezoelectric vibration energy harvesting models are studied.
A hybrid of the time and frequency domain analysis methods is developed and to provide
the tunning strategy for optimization of harvesting performance and harvesting
frequency bandwidth. The effect of the coupling coefficient between the electrical
system and mechanical system has been discussed and analysed, especially in that case
of the harvesting system connected with multiple electrical interface circuit systems
which are not studied in previous literatures. The results from the analysis method have
been validated by the simulation (Matlab Simulink) and the results obtained from
experimental tests. An enhanced piezoelectric vibration energy harvesting system is then
developed and studied. It is believed that the enhanced piezoelectric vibration energy
harvesting model can scavenge 9.78 times more energy than that of the conventional
system. It is also found out that the harvesting resonant frequency can be lowered by
increasing the number of degree-of-freedom of piezoelectric vibration energy harvester
without increasing the total mass of the system. Finally, the parameter uncertainty has
been investigated by the Monte Carlo Simulation on the single degree-of-freedom
piezoelectric vibration energy harvester, two degree-of-freedom piezoelectric vibration

2
energy harvester and the enhanced two degree-of-freedom piezoelectric vibration energy
harvester.
Introduction
1.1 Background
The applications of low-powered electronics such as wireless sensors and wearable
electronics have emerged over the last few decades and have grown explosively.
Batteries have been used as the remote power source to these devices for decades. The
energy harvesting technology has emerged to operate the low-powered electronics or to
charge the batteries to extend their usage. There are many methods of energy harvesting,
such as solar, vibration, acoustic noise, wind, heat (temperature variations)[1]. Among
all of the energy harvesting techniques, the piezoelectric vibration energy harvesting
technology is most applicable because of the following reasons:
1. Larger power densities. Despite the power density of mechanical vibration (300
µW/cm3) is not as high as the power density of outdoor solar energy (15,000
µW/cm3), the vibration energy sources are potentially sustainable and
perennial[1].
2. Ease of application. As the piezoelectric materials can be configured in different
ways and a wide range of scale.
The vibration energy harvesting research could be categorised into three disciplines:
1. Mechanical design.
2. Piezoelectric material science.
3. Electrical and control engineering.
The researchers have published enormous amount of literatures to contribute new
knowledge to these three disciplines. The summary of the published literatures is
presented in the next chapter. Despite that, there are still research gaps needed to be
addressed in the field of the piezoelectric vibration energy harvesting science. The
research gaps are given by
3
1. The researches in piezoelectric generators remain limited to very low power
domain, usually in the milliwatt range or below.
2. The most researches of piezoelectric energy harvesting applications are limited
to microscale or mesoscale. The reason could be that the piezoelectric generators
with low power level are still useful in the microscale or mesoscale applications.
3. Most researchers did not investigate the effects of the environment and climate
on the performance of piezoelectric vibration energy harvesters (PVEH) as the
vibration occurring environment and climate could be very extreme.
4. Most of researches were conducted on two degree-of-freedom (2 DOF) or
multiple degree-of-freedom (MDOF) vibration energy harvesting system where
the anticipated power output and harvesting efficiency for the harvesting system
were not produced. Furthermore, the harvesting frequency bandwidth tuning of
has not been discussed.
5. There are limited researches carried on the energy storing circuits of vibration
energy harvester. Since, the electric energy obtained from piezoelectric vibration
energy harvester is very small, it is necessary to develop the rectification and
energy storing circuits should to function efficiently under a low power condition.
1.2 Research motivation
The largest motivation that drives the energy harvesting research to grow so rapidly is
to convert a small amount of the ambient energy, which is otherwise wasted, into useful
electrical energy.It will allow the low power consuming devices to be autonomous
without the restriction of the batteries. Despite the research of vibration energy
harvesting technology has made incredible advances in the past few decades, the levels
of the power generation remain in the order of µW to mW. Another motivation of the
vibration energy harvesting is that costs nothing for the vibration sources to generate the
power through the vibration energy harvester. Furthermore, no carbon emissions are
generated during the processes of power generation. Therefore, vibration energy
harvesting is motivated by the desire to address the environmental issues such as battery
disposal, and global warming.

4
The motivation of this research is to enable the piezoelectric vibration energy harvester
as a potential power source rather than a way of energy saving or cost saving in the future
by the optimisation study proposed in the following chapters.
1.3 Research scopes and objectives
The scopes of the research are defined as the following
1. To study linear piezoelectric vibration energy harvester. Nonlinear piezoelectric
vibration energy harvesting technique will not be discussed in this research.
2. To study the harvesting frequency bandwidth of the piezoelectric vibration
energy harvester, and the parameter optimisation of the piezoelectric vibration
energy harvester from single degree-of-freedom to multiple degree-of-freedom
piezoelectric vibration energy harvesters.
3. To develop an effective piezoelectric energy harvesting model, and to validate
the theoretical analysis by experimental tests.
Throughout the literature review which is presented in Chapter 2, the research questions
are proposed as following:
1. How do the properties of piezoelectric materials affect the level of the harvested
power?
2. What are the tunning strategies for the optimal harvested power, energy
harvesting efficiency, and harvesting frequency bandwidth?
3. What is the effective way to increase the harvested power and to lower the natural
resonant frequency?
4. What is the effect of the electromechanical coupling strength on the harvested
power, harvesting efficiency and harvesting frequency bandwidth of a vibration
energy harvester built with multiple piezoelectric elements?
1.4 Outline
A comprehensive literature review (from the early 1990s to the very recent in the open
literatures) will be conducted in Chapter 2.
5
In Chapter 3, a hybrid time and frequency domain analysis method of a single degree-
of-freedom piezoelectric vibration energy harvester will be proposed. Furthermore, a
dimensionless analysis method will be developed to evaluate the performance of
piezoelectric vibration energy harvesters regardless of the size. Finally, these two
theoretical analysis methods will be validated by experimental tests.
In Chapter 4, the harvesting performance optimisation of a single degree-of-freedom
piezoelectric vibration energy harvester connected with different interface circuits will
be studied. Both the dimensionless harvested resonant power and the resonant energy
harvesting efficiency formulae will be normalised to contain only two normalised
variables in terms of dimensionless resistance and force factor. The peak amplitudes of
the dimensionless harvested resonant power and the resonant energy harvesting
efficiency for different energy extraction interface circuits will be identified and
summarised.
In Chapter 5, the dimensionless analysis will be conducted for the two degree-of-
freedom piezoelectric vibration energy harvester and followed by the case study of a
quarter vehicle suspension model and simulations. The bandwidth tuning of harvesting
frequency will be discussed from the results of the case study. Furthermore, a 2 DOF
piezoelectric vibration energy harvester will be built and experimentally tested. The
results obtained from the experimental tests will validate the theoretical analysis method.
Finally, the optimised stiffness ratio for the 2 DOF piezoelectric vibration energy
harvester will be identified to maximum the dimensionless harvested power.
In Chapter 6, an enhanced 2 DOF piezoelectric vibration energy harvesting model with
piezoelectric elements placed between two adjacent oscillators will be proposed and
studied. The effects of electromechanical coupling strength will be discussed. Based on
the theory of the 2 DOF PVEH, the generalisation of the MDOF PVEH with multiple
piezoelectric elements will be proposed. It is found out that the more number of degree-
of-freedom of PVEH with more additional piezoelectric elements inserted between
every two adjacent oscillators would enable the PVEH to harvest more energy, and to
have the lower natural resonant frequency.
In Chapter 7, the sensitivity analysis of a SDOF PVEH, a 2 DOF PVEH and the 2 DOF
PVEH with two piezoelectric inserts will be performed by the Monte Carlo simulation
method. The effect of parameter uncertainty on the harvesting performance of
6
abovementioned piezoelectric vibration energy harvester will also be investigated. The
sensitivity of each parameter on the performance and the tuning strategy for improving
the harvesting performance will be discussed.
Finally, the conclusions of this research will be presented in Chapter 8. A summary of
the key findings will be presented along with the recommendations for future work. A
list of the references is placed in the last pages.
1.5 List of publications
1.5.1 International Journal
1. Xiao, H., X. Wang, and S. John, A dimensionless analysis of a 2DOF
piezoelectric vibration energy harvester. Mechanical Systems and Signal
Processing, 2015. 58-59: p. 355-375.
2. Xiao, H., X. Wang, and S. John, A multi-degree of freedom piezoelectric
vibration energy harvester with piezoelectric elements inserted between two
nearby oscillators. Mechanical Systems and Signal Processing, 2016. 68-69: p.
138-154
3. Xiao, H. and X. Wang, A Review of Piezoelectric Vibration Energy Harvesting
Techniques. International Review of Mechanical Engineering, 2014. 8(3): p.
139-150.
4. Wang X., S. John, S. Watkins, X. Yu, H. Xiao, X. Liang, et al., "Similarity and
duality of electromagnetic and piezoelectric vibration energy harvesters,"
Mechanical Systems and Signal Processing, vol. 52-53, pp. 672-684, 2015.
5. Wang, X. and H. Xiao, Dimensionless Analysis and Optimization of
Piezoelectric Vibration Energy Harvester. International Review of Mechanical
Engineering, 2013. 7(4): p. 607-624.
1.5.2 Conference
1. B. Cojocariu, A. Hill, A. Escudero, H. Xiao, X. Wang (2012), “Device Design
and prototype - Energy Generation from Kinetic Vibrations” 2012 ASME IMECE.
2. Mohahammed Bawahab, Han Xiao, and Xu Wang (2015). A Study of Linear
Regenerative Electromagnetic Shock Absorber System, SAE 2015-01-0045, or
SAE SAEA-15AP-0045, APAC18, Melbourne, Australia, 10-12, March 2015.
7
Literature Review
In this chapter, the recently published literatures for vibration energy harvesting with
piezoelectric materials will be summarised. Linear and nonlinear vibration energy
harvesters, harvesting electrical circuits, the concepts of large scale vibration energy
harvesting will be studied. The review will be focus on linear multiple degree-of-freedom
of piezoelectric vibration energy harvesters. The chapter concludes with an overview of
vibration energy harvesting techniques that aim to maximise the extracted power and
the future utilisation of the vibration energy harvester. The contents of this chapter have
been published in the refereed journal by the thesis author[2].
2.1 Introduction
In the past few decades, the technology of energy harvesting from ambient natural
environment has received a wealth of interests and been investigated by many
researchers. The biggest motivation behind this is to power wireless sensors and to get
rid of the limitation of conventional energy sources such as batteries and electrical grid.
In the real life, various potential energy sources are available for energy harvesting, such
as vibration, solar, thermoelectric, and ocean wav. A comparison of these potential
energy sources and conventional energy sources was conducted by Roundy et.al [1], and
shown in Table 2.1. Radousky and Liang [3] conducted a study of various state-of-art
materials and devices converting the energy from the aforementioned potential energy
sources into useful electrical energy, including piezoelectric, electromagnetic,
photovoltaic, thermoelectric materials and devices. The emphasis of the materials study
was placed on nano-materials benefitting for vibration energy harvesting. Among these
potential energy sources, vibration energy attracted the most attentions in recent years
because of its omnipresent existence in the ambient environments. Some examples of
vibration energy sources often existing in our daily life are listed in Table 2.2. With the
rising demand for self-powered equipment, the required power consumption of
electronic devices is significantly reduced. The energy harvesting by converting waste
vibration energy into useful electrical energy has become a promising solution to replace
or to charge the batteries which are commonly used in these applications such as
8
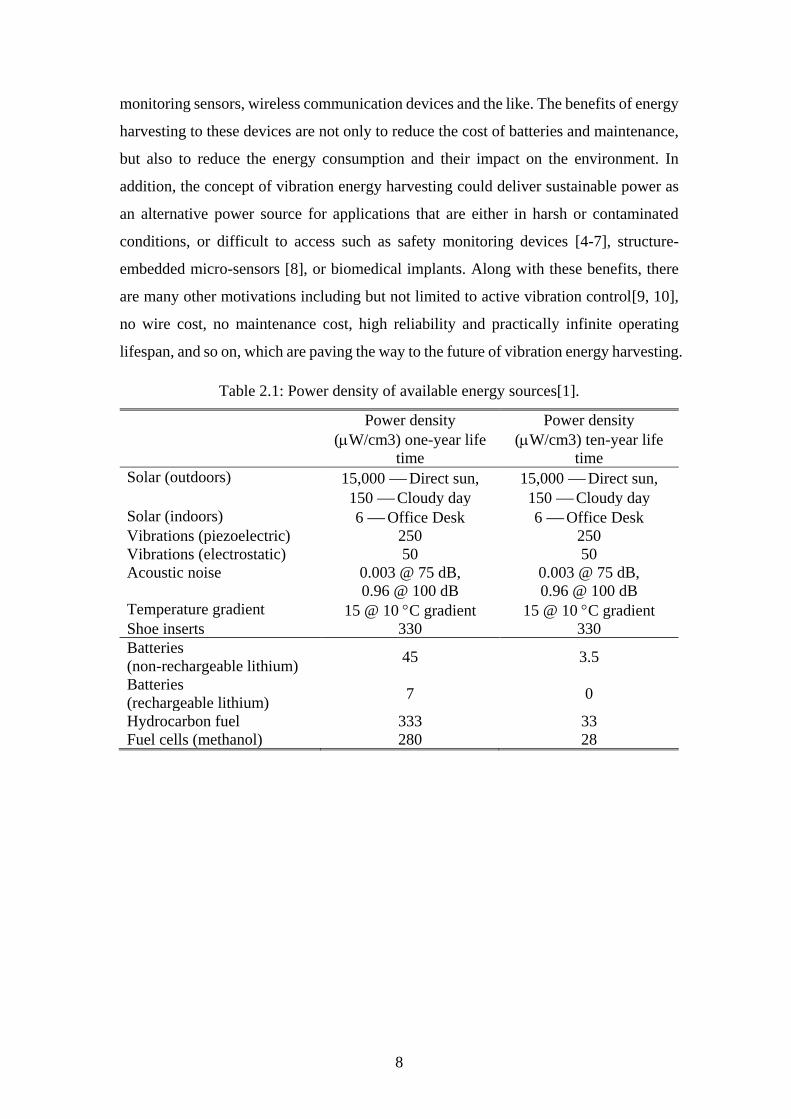
monitoring sensors, wireless communication devices and the like. The benefits of energy
harvesting to these devices are not only to reduce the cost of batteries and maintenance,
but also to reduce the energy consumption and their impact on the environment. In
addition, the concept of vibration energy harvesting could deliver sustainable power as
an alternative power source for applications that are either in harsh or contaminated
conditions, or difficult to access such as safety monitoring devices [4-7], structure-
embedded micro-sensors [8], or biomedical implants. Along with these benefits, there
are many other motivations including but not limited to active vibration control[9, 10],
no wire cost, no maintenance cost, high reliability and practically infinite operating
lifespan, and so on, which are paving the way to the future of vibration energy harvesting.
Table 2.1: Power density of available energy sources[1].
Power density
(W/cm3) one-year life
time
Power density
(W/cm3) ten-year life
time
Solar (outdoors) 15,000 Direct sun,
150 Cloudy day
15,000 Direct sun,
150 Cloudy day
Solar (indoors) 6 Office Desk 6 Office Desk
Vibrations (piezoelectric) 250 250
Vibrations (electrostatic) 50 50
Acoustic noise 0.003 @ 75 dB,
0.96 @ 100 dB
0.003 @ 75 dB,
0.96 @ 100 dB
Temperature gradient 15 @ 10 C gradient 15 @ 10 C gradient
Shoe inserts 330 330
Batteries
(non-rechargeable lithium) 45 3.5
Batteries
(rechargeable lithium) 7 0
Hydrocarbon fuel 333 33
Fuel cells (methanol) 280 28
9
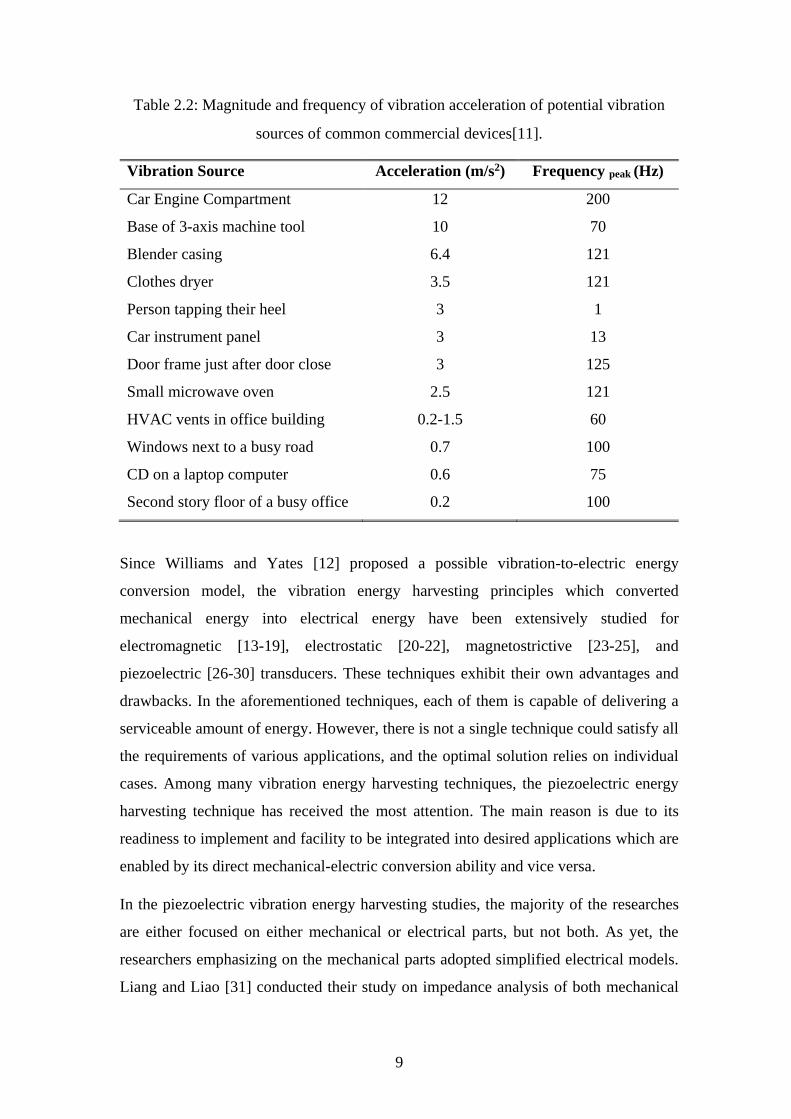
Table 2.2: Magnitude and frequency of vibration acceleration of potential vibration
sources of common commercial devices[11].
Vibration Source Acceleration (m/s2) Frequency peak (Hz)
Car Engine Compartment 12 200
Base of 3-axis machine tool 10 70
Blender casing 6.4 121
Clothes dryer 3.5 121
Person tapping their heel 3 1
Car instrument panel 3 13
Door frame just after door close 3 125
Small microwave oven 2.5 121
HVAC vents in office building 0.2-1.5 60
Windows next to a busy road 0.7 100
CD on a laptop computer 0.6 75
Second story floor of a busy office 0.2 100
Since Williams and Yates [12] proposed a possible vibration-to-electric energy
conversion model, the vibration energy harvesting principles which converted
mechanical energy into electrical energy have been extensively studied for
electromagnetic [13-19], electrostatic [20-22], magnetostrictive [23-25], and
piezoelectric [26-30] transducers. These techniques exhibit their own advantages and
drawbacks. In the aforementioned techniques, each of them is capable of delivering a
serviceable amount of energy. However, there is not a single technique could satisfy all
the requirements of various applications, and the optimal solution relies on individual
cases. Among many vibration energy harvesting techniques, the piezoelectric energy
harvesting technique has received the most attention. The main reason is due to its
readiness to implement and facility to be integrated into desired applications which are
enabled by its direct mechanical-electric conversion ability and vice versa.
In the piezoelectric vibration energy harvesting studies, the majority of the researches
are either focused on either mechanical or electrical parts, but not both. As yet, the
researchers emphasizing on the mechanical parts adopted simplified electrical models.
Liang and Liao [31] conducted their study on impedance analysis of both mechanical
10
and electrical parts. They illustrated the utilization of impedance method to obtain the
equivalent impedances of mechanical and electrical parts. An RLC circuit branch was
used to represent the oscillation mode equivalently in the electrical domain. The
experiments carried out by them demonstrated the optimised harvested power was well
predicted by the impedance analysis method.
This chapter will first review the linear and nonlinear vibration energy harvesting
techniques, and then review the current development of piezoelectric materials, devices
and harvesting circuits. Finally, a review of large scale piezoelectric harvesting
techniques will be included.
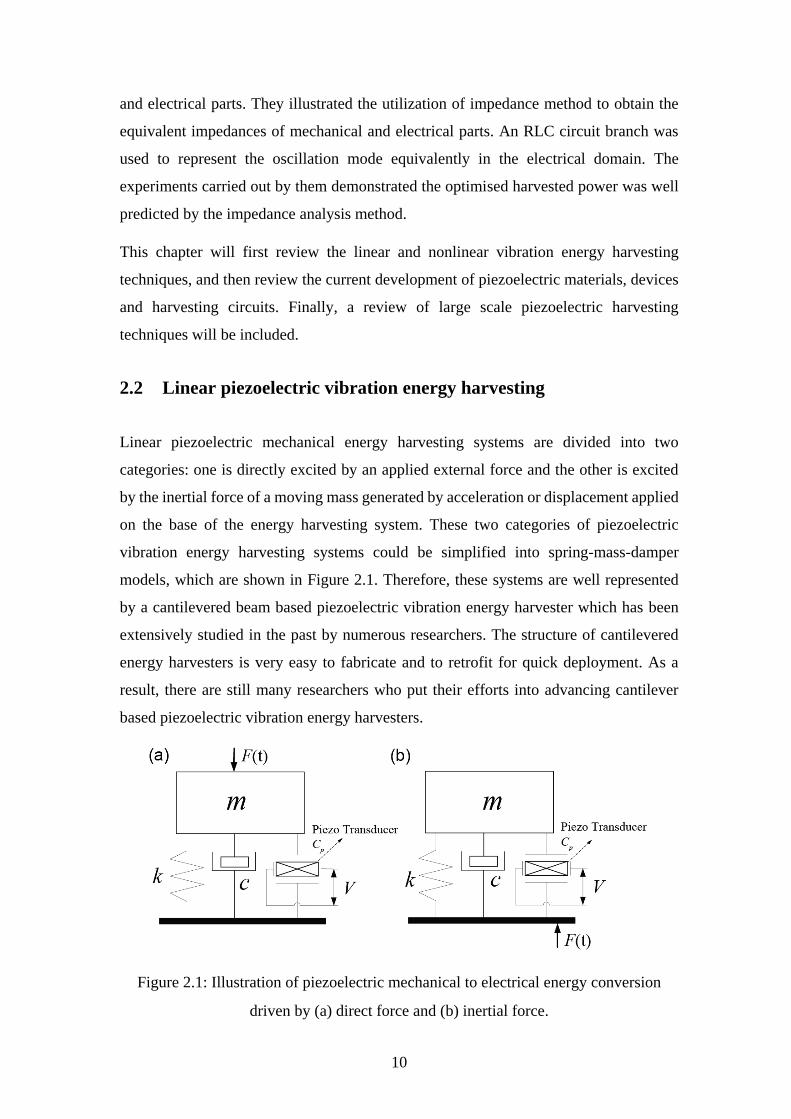
2.2 Linear piezoelectric vibration energy harvesting
Linear piezoelectric mechanical energy harvesting systems are divided into two
categories: one is directly excited by an applied external force and the other is excited
by the inertial force of a moving mass generated by acceleration or displacement applied
on the base of the energy harvesting system. These two categories of piezoelectric
vibration energy harvesting systems could be simplified into spring-mass-damper
models, which are shown in Figure 2.1. Therefore, these systems are well represented
by a cantilevered beam based piezoelectric vibration energy harvester which has been
extensively studied in the past by numerous researchers. The structure of cantilevered
energy harvesters is very easy to fabricate and to retrofit for quick deployment. As a
result, there are still many researchers who put their efforts into advancing cantilever
based piezoelectric vibration energy harvesters.
Figure 2.1: Illustration of piezoelectric mechanical to electrical energy conversion
driven by (a) direct force and (b) inertial force.
11
In micro-electro-mechanical systems (MEMS), cantilever beam structure is the most
common configuration for vibration based energy harvesting devices, as it is easy to
implement and fabricate. Most of the researchers in the earlier studies focused on the
piezoelectric composite beams and assumed the piezoelectric materials are bonded
perfectly with host structures. While in reality, the bonding conditions of two different
materials generate non-homogeneities or micro damages during the aging. To fill this
research gap, several researches were carried out to simulate the electromechanical
behaviours of piezoelectric materials by using the shear-lag model. Wang and Zou [32]
considered the effect of interfacial properties on the electromechanical behaviour of
beam-like energy harvester. Their study provides an analysis model for detecting
interfacial properties and accuracy prediction while compared with the ANSYS (FEM)
simulation, although it has not been verified by experiments yet.
In order to extract more power from ambient energy source, numerical models were
proposed to simulate the transduction process of vibration energy harvesting using
piezoelectric materials. Wang, and Wu [33] presented a theoretical model based on
Euler-Bernoulli beam and Timoshenko beam theory to investigate the effects of various
lengths and locations of piezoelectric patch on the harvesting efficiency of cantilever
beam energy harvesting device. In addition, it was pointed out by Stewart et al. [34] that
the maximum length of piezoelectric materials should cover less than 2/3 of the length
of the cantilever beam. Otherwise, power output could be reduced as a consequence of
the excess piezoelectric materials. Similarly, Abdelkefi et al. [35] investigated the effects
of the lengths of piezoelectric material on the behaviour and performance of the
cantilever beam harvester. It was found that the length of piezoelectric material was very
sensitive to the natural frequency in a certain range. The increased length of the
piezoelectric material resulted in increasing the natural resonant frequency, but the
natural resonant frequency is barely changed when the value of length is more than an
optimum value. For the power output, the harvester with longer piezoelectric material
has higher harvested power output as there are more piezoelectric materials which are
taken account in a harvesting process. The study is beneficial in managing the low-
frequency excitation of piezoelectric energy harvesters, and enhancing their
performance. Furthermore, the shapes of the beam play an important role in harvesting
more power. Dietl and Garcia [36] stated that the most power generation of a
piezoelectric bimorph energy harvesting system was limited by the system mass. Instead
12
of increasing tip mass to allow more strain to be delivered to the piezoelectric transducer,
they proposed a new optimisation method of beam shape harvester where Euler-
Bernoulli and Rayleigh-Ritz models were employed. The optimised beam harvester had
a power output of 33.35 mW, which could generate 0.52% more power than a
conventional rectangular beam harvester. In practice, to design a specific energy
harvester there may exist some limitations or requirements such as targeted natural
frequency, mass and dimension of the whole device. Shafer et al [37] proposed a design
method that could be applied in such case that maximize the power output by tuning the
thickness ratio of piezoelectric layers thickness and the entire beam thickness. It was
seen that the coupling coefficient should be maximized as a result of 50% reduction of
the piezoelectric material to produce a targeted power level. The main limits of a linear
resonant harvester reported in open literatures can be summarised as following:
1. Narrow harvesting bandwidth. It is only effective in a particular frequency range,
and the power falls significantly when ambient frequency shifts away from the
resonant frequency.
2. Lack of multi-functional to adapt variable vibration energy sources. The energy
harvester needs to be tuned precisely to match the ambient energy source.
3. Poor performance of the harvesters occurs in the conditions of small inertial mass,
low frequency and low excitation acceleration.
However, the linear resonant energy harvesting technique is still the optimal choice for
harvesting electrical energy from some vibration energy sources such as industry motor
or machine with known sufficient vibration level and repeatable and consistent
frequency range. In such circumstances, an advanced sole resonant frequency vibration
energy harvester is much preferred. Wang et al. [38] presented an accurate dynamic
analytical method for studying both mechanical and electrical characteristics of
piezoelectric stack transducers which was validated by experimental results.
Nevertheless, in practice, most vibration energy sources exist in a wide-range of
frequencies and a random form. As a result, a number of strategies have been pursued to
overcome these drawbacks of the linear resonant harvesters. These strategies include
using multi-frequency arrays, multiple degree-of-freedom energy harvester, passive and
13
active self-tuning resonant frequency and multifunctional vibration energy harvesting
technologies.
For multi-frequency arrays, the recent studies are focused on the harvesting electric
circuits interfaced with the array configuration of the vibration energy harvesters. Two
reviewed studies[39, 40] will be found in the next section: piezoelectric materials and
interface circuits.
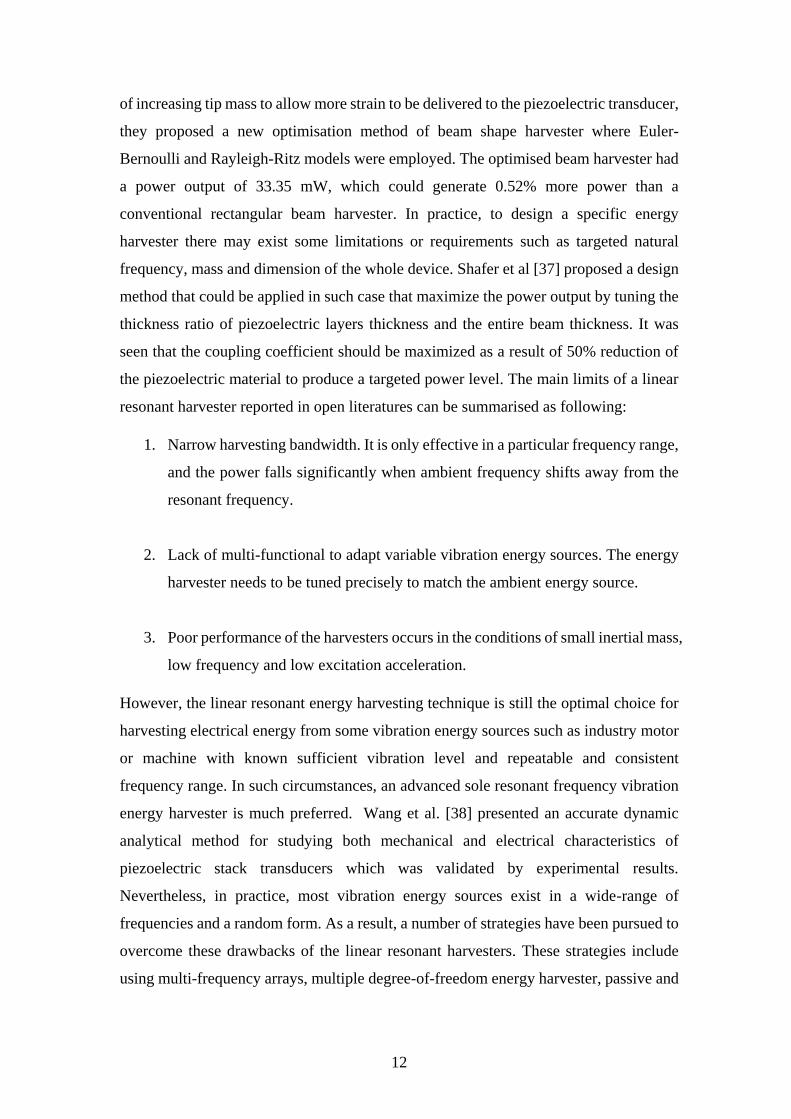
Figure 2.2: Concept design of a 2 DOF piezoelectric vibration energy harvester [35].
14
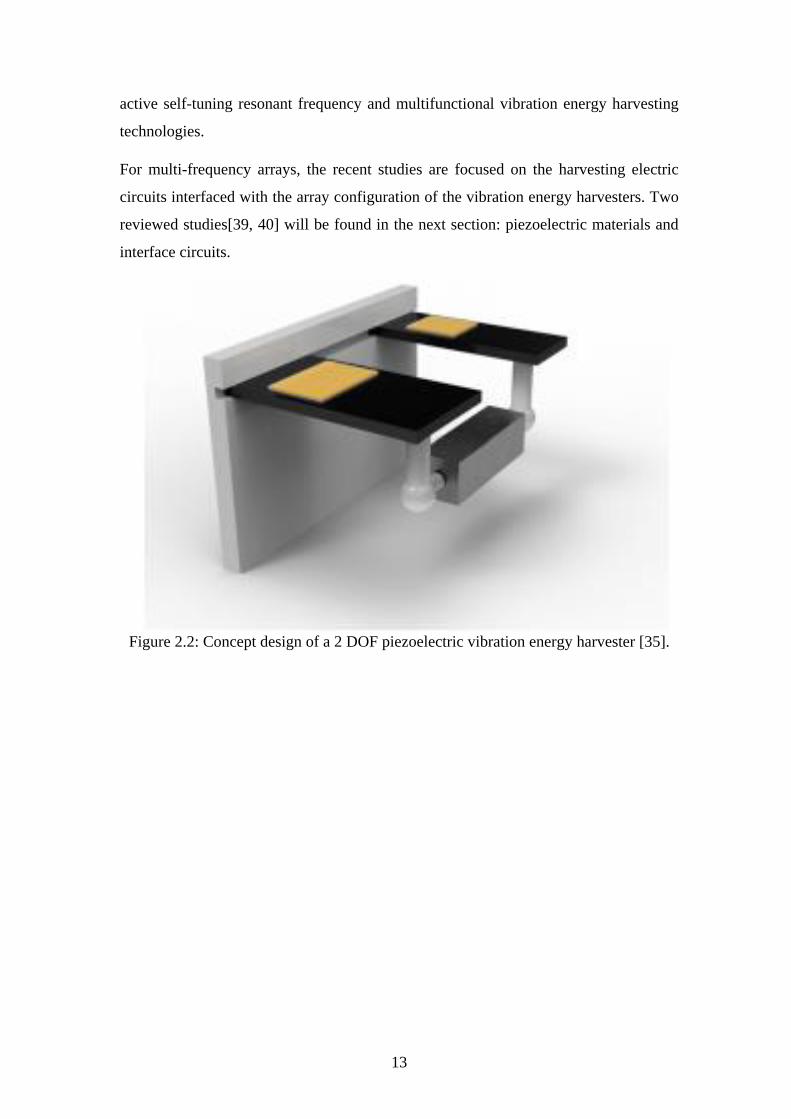
Figure 2.3: A piezoelectric vibration energy harvester with a multi-mode dynamic
magnifier [37].
The principle of multiple degree-of-freedom (MDOF) vibration energy harvesting
technique is to achieve wider harvesting frequency bandwidth through tuning two or
multiple resonant modes which not only have their modal natural frequencies to be close
to each other but also have significant magnitudes. Kim et al. [41] developed the concept
of a 2 DOF piezoelectric energy harvesting device which could gain two resonant modes
where their modal frequencies are close to each other. The device increased harvesting
frequency bandwidth by adopting two cantilever beams attached with one proof mass
which took account in both translational and rotational degree-of-freedom as shown in
Figure 2.2. It significantly increased power generation. However, this design increased
the volume and the complexity of the system, as the proof masses required to be attached
with two individual cantilever beams. Ou et al. [42] proposed an experimental study of
a 2 DOF piezoelectric vibration energy harvesting system where two masses were
attached onto one cantilever beam. Such a system could not be referred as broadband
15
vibration harvesting system since the two resonant modes obtained in their experiment
had a frequency difference of 300Hz.( the first modal resonant frequency is at about
50Hz and second modal resonant frequency is at 350 Hz). Similarly, Zhou et al. [43]
presented a multi-mode piezoelectric energy harvester with a tip mass called ‘dynamic
magnifier’, as shown in Figure 2.3. It is seen from the experimental data that multiple
resonant modes were obtained. They claimed that it could scavenge 25.5 times more
energy than a conventional cantilever harvester in the frequency range of 3-300 Hz.
Nevertheless, two resonant frequencies could not be tuned close to each other to achieve
a wider harvesting bandwidth. Furthermore, the study conducted by Aldraihem and Baz
[44] presented the same shortage in broadening the frequency bandwidth of vibration
energy harvester. Liu et al. [45] proposed a piezoelectric cantilever beam vibration
energy harvester attached with a spring and mass as oscillator. It enhanced almost four
times harvesting efficiency compared with a conventional type of vibration energy
harvester while operating at the first resonant frequency. According to the experimental
results, the two resonant frequencies were not tuned to be close to each other to broaden
the harvesting frequency bandwidth. It may require further increasing the mass of the
oscillator to achieve this goal which will result in size increasing.
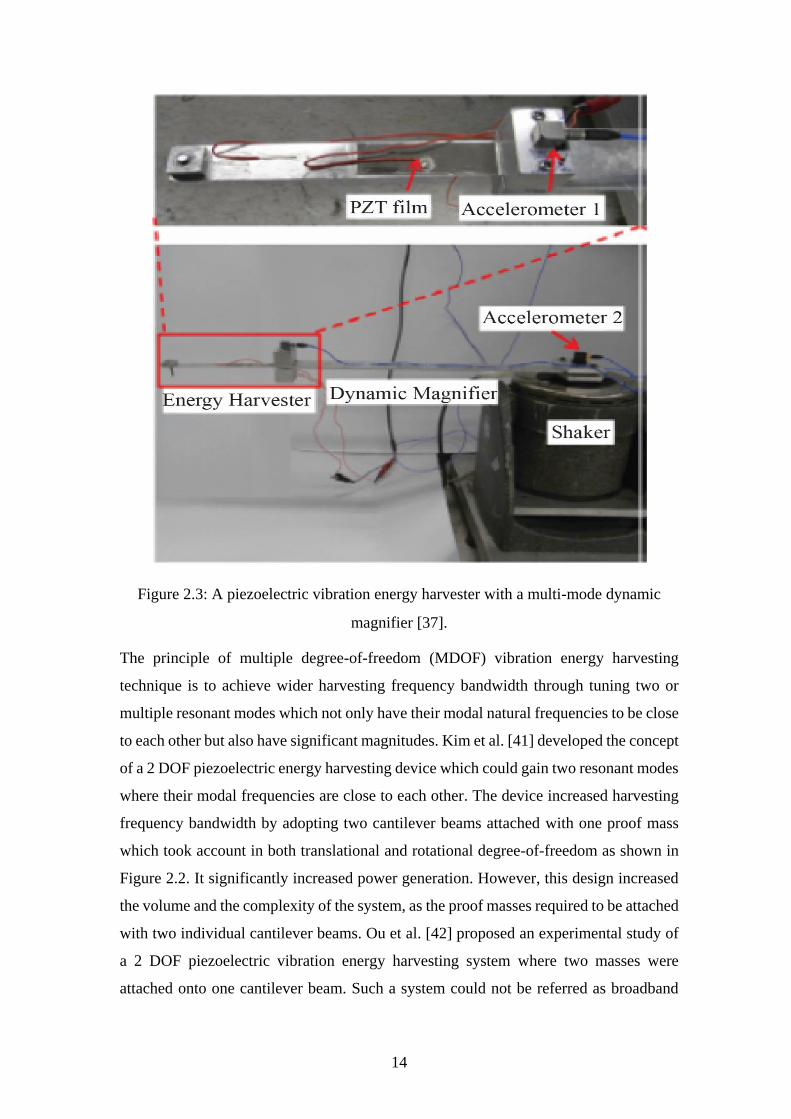
Figure 2.4: Geometry of a novel and compact design of a 2 DOF piezoelectric
vibration energy harvester [40].
16
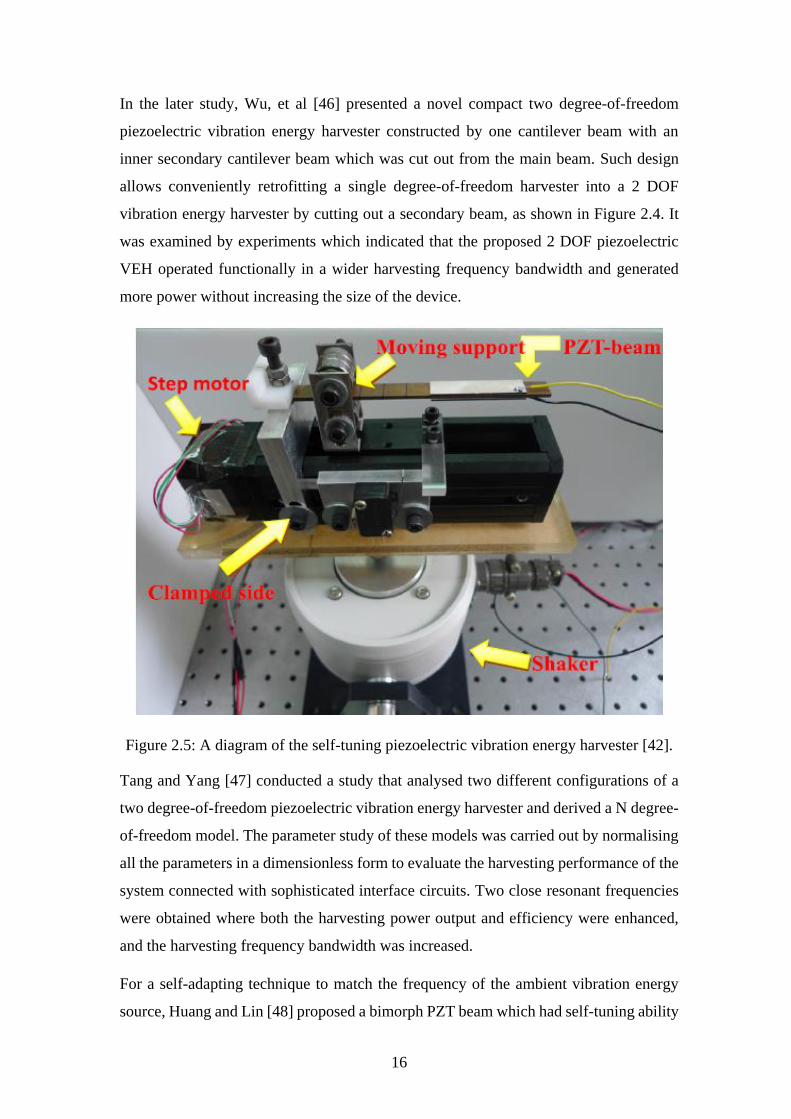
In the later study, Wu, et al [46] presented a novel compact two degree-of-freedom
piezoelectric vibration energy harvester constructed by one cantilever beam with an
inner secondary cantilever beam which was cut out from the main beam. Such design
allows conveniently retrofitting a single degree-of-freedom harvester into a 2 DOF
vibration energy harvester by cutting out a secondary beam, as shown in Figure 2.4. It
was examined by experiments which indicated that the proposed 2 DOF piezoelectric
VEH operated functionally in a wider harvesting frequency bandwidth and generated
more power without increasing the size of the device.
Figure 2.5: A diagram of the self-tuning piezoelectric vibration energy harvester [42].
Tang and Yang [47] conducted a study that analysed two different configurations of a
two degree-of-freedom piezoelectric vibration energy harvester and derived a N degree-
of-freedom model. The parameter study of these models was carried out by normalising
all the parameters in a dimensionless form to evaluate the harvesting performance of the
system connected with sophisticated interface circuits. Two close resonant frequencies
were obtained where both the harvesting power output and efficiency were enhanced,
and the harvesting frequency bandwidth was increased.
For a self-adapting technique to match the frequency of the ambient vibration energy
source, Huang and Lin [48] proposed a bimorph PZT beam which had self-tuning ability
17
to match the ambient vibration energy source frequency by a movable supporter, as
shown in Figure 2.5. They claimed that the tuneable frequency range is around 35% of
the resonant frequency, and it could prevent a 73% of voltage drop compared with a
conventional vibration energy harvester with ambient vibration energy source frequency
variation of a 5%. However, the auxiliary tuning mechanism needs additional power
supply to operate which prevents it to be implemented in self-powered devices because
of the size.
In order to increase the harvesting power, other than to widen the harvesting frequency
bandwidth, there is a multifunctional approach which enables the vibration energy
harvester to scavenge energy from multiple energy sources, He et al. [49] proposed a
low-frequency piezoelectric energy harvester which could scavenge both vibration
energy and wind energy at the same time. It was fabricated by using a micromachining
process to apply a 1.3 m thickness of piezoelectric layer onto the aluminium nitride
(AlN). The experimental results point out that, under the excitation of 0.1g (1g=9.8 m/s2)
harmonic acceleration, the optimal power output was 1.85 W with a power density of
6.3 mW/cm3∙g2. For the ability of wind energy harvesting, it only took effect when the
speed of the wind was larger than the critical wind speed which is between 12.7 m/s and
13.1 m/s. The power output is significantly increased when the wind speed increases
over the critical wind speed. However, the maximum power output was found to be 2.27
W under a circumstance of a wind speed of 16.3 m/s.
To investigate the performance of piezoelectric vibration energy harvester operating in
different environments such as in space, Lin and Wu [28] proposed a micro piezoelectric
energy harvester constructed by directly depositing a thick film of high-quality lead
zirconate titanate (PZT) onto a stainless-steel substrate using an aerosol deposition
method. The micro piezoelectric vibration energy harvester was tested in vacuum and
atmosphere conditions to study the impact of air damping on the harvesting power and
harvesting efficiency. It was found out that the power output under a vacuum (0.01 Torr)
condition was 1.2 times higher than that in normal condition (760 Torr) with 1.5g
(1g=9.8 m/s2) excitation. In contrast to the low amplitude excitation (0.05g), the
performance of piezoelectric energy harvester in a vacuum condition was 2-3 times
better than that in the atmosphere. It is reported that the maximum output power was
200.28 W at resonant frequency of 112.4 Hz under the excition of 1.5g acceleration in
18
atmosphere condition, and 214.60 W at resonant frequency of 104.4 Hz under same
level of excitation in vacuum (0.01 Torr) condition.
The characterization and modelling of MEMS energy harvesting have been well studied
and reported in numerous publications. The topic has received considerable worldwide
research efforts which are driven by the motivation of its potential to enable energy
harvesters to be integrated into sensors, wireless communication devices and other
components rather than altering the structures of their hosts such as requiring mounting
externally. Miller et al. [50] carried out a survey and pointed out that vibration energy
harvester must have the ability to scavenge energy from low frequency, low acceleration,
and often in the form of broadband vibration sources. While many novel MEMS energy
harvesters reported in publications are lacking practical features due to not considering
the conditions of the various ambient vibration sources [51-53]. However, there are some
researchers conducting their studies in the low frequency and random frequency
conditions. Pasquale et al. [54] introduced the design and manufacture of a vibration
energy harvester which could harvest energy from the human body motion. It also
compared piezoelectric vibration energy harvesting technique with magnetic inductive
one. It was found by experiments that the magnetic prototype was able to achieve 0.7
mW power output while the piezoelectric energy harvester device generated
approximately 0.22-0.33 W. Tang and Zuo [55] proposed a model consisting of dual
mass piezoelectric transducer connected in parallel with a spring. This model can
represent the regenerative vehicle suspensions and tall buildings with regenerative tuned
mass dampers (TMDs). It is concluded that the harvested power of the regenerative
vehicle suspension is only related to the tire stiffness and road vertical excitation
spectrum, and that the harvested power from buildings with regenerative TMDs only
depend on the building mass. Zhang and Cai [56] investigated a multi-impact harvester
which improved the overall performance of energy harvesting in low-frequency range.
The results show that the proposed harvester can produce three times more power and
has less size than the conventional single-impact cantilever generator. Gu[57] proposed
a compliant driving beam and two rigid generating piezoelectric beams which provided
a new solution for low-frequency piezoelectric energy harvester. It had the promising
93.2 W/cm3 power density and was able to generate average 1.53 mW power at 20.1
Hz under an excitation acceleration of 0.4 g which is 6.8 times greater than that of a
conventional bimorph cantilever beam (13.6 W/cm3). Moreover, it is well suitable to

19
be implemented in MEMS systems due to the compact design, as well as the high energy
conversion efficiency. The size could be further reduced by tuning the driving cantilever
beam which can be folded or serpentine. However, the durability of impact type
generators could be a concern as the driving beam continuously impacts the two rigid
piezoelectric generators. The performances of the aforementioned piezoelectric
vibration energy harvesters are summarised in Table 2.3.
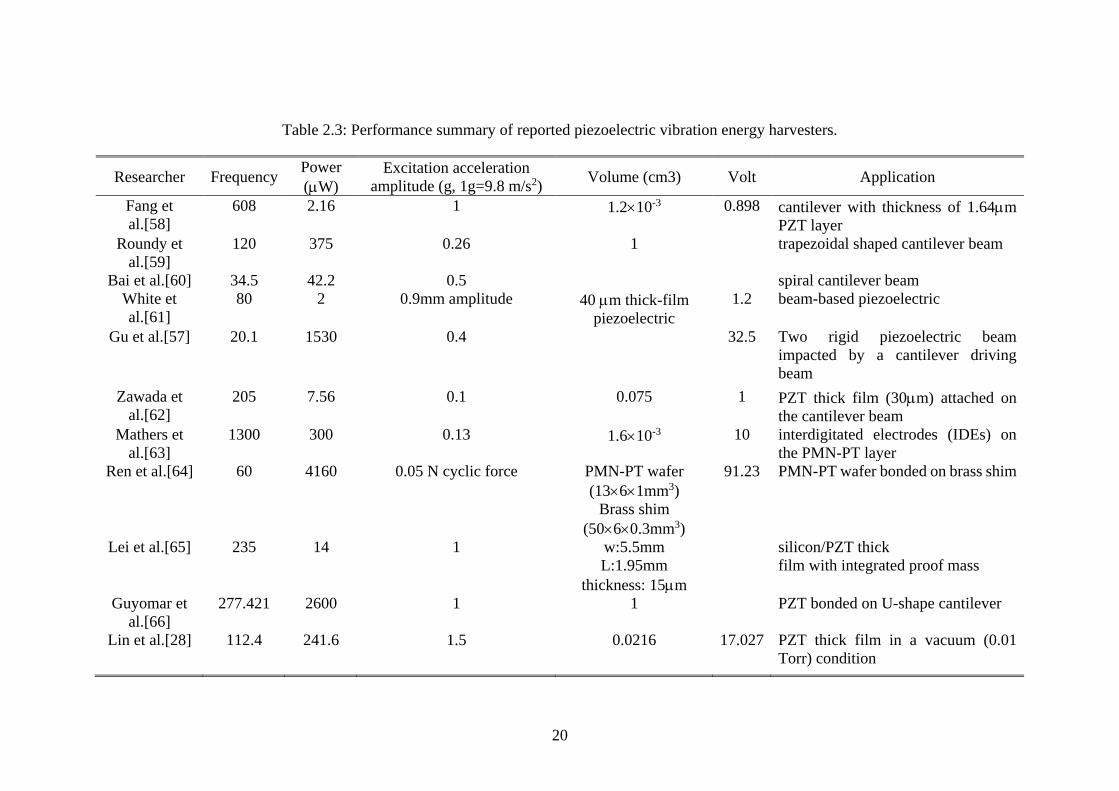
20
Table 2.3: Performance summary of reported piezoelectric vibration energy harvesters.
Researcher Frequency Power
(W)
Excitation acceleration
amplitude (g, 1g=9.8 m/s2) Volume (cm3) Volt Application
Fang et
al.[58]
608 2.16 1 1.210-3 0.898 cantilever with thickness of 1.64m
PZT layer
Roundy et
al.[59]
120 375 0.26 1 trapezoidal shaped cantilever beam
Bai et al.[60] 34.5 42.2 0.5 spiral cantilever beam
White et
al.[61]
80 2 0.9mm amplitude 40 m thick-film
piezoelectric
1.2 beam-based piezoelectric
Gu et al.[57] 20.1 1530 0.4 32.5 Two rigid piezoelectric beam
impacted by a cantilever driving
beam
Zawada et
al.[62]
205 7.56 0.1 0.075 1 PZT thick film (30m) attached on
the cantilever beam
Mathers et
al.[63]
1300 300 0.13 1.610-3 10 interdigitated electrodes (IDEs) on
the PMN-PT layer
Ren et al.[64] 60 4160 0.05 N cyclic force PMN-PT wafer
(1361mm3)
Brass shim
(5060.3mm3)
91.23 PMN-PT wafer bonded on brass shim
Lei et al.[65] 235 14 1 w:5.5mm
L:1.95mm
thickness: 15m
silicon/PZT thick
film with integrated proof mass
Guyomar et
al.[66]
277.421 2600 1 1 PZT bonded on U-shape cantilever
Lin et al.[28] 112.4 241.6 1.5 0.0216 17.027 PZT thick film in a vacuum (0.01
Torr) condition
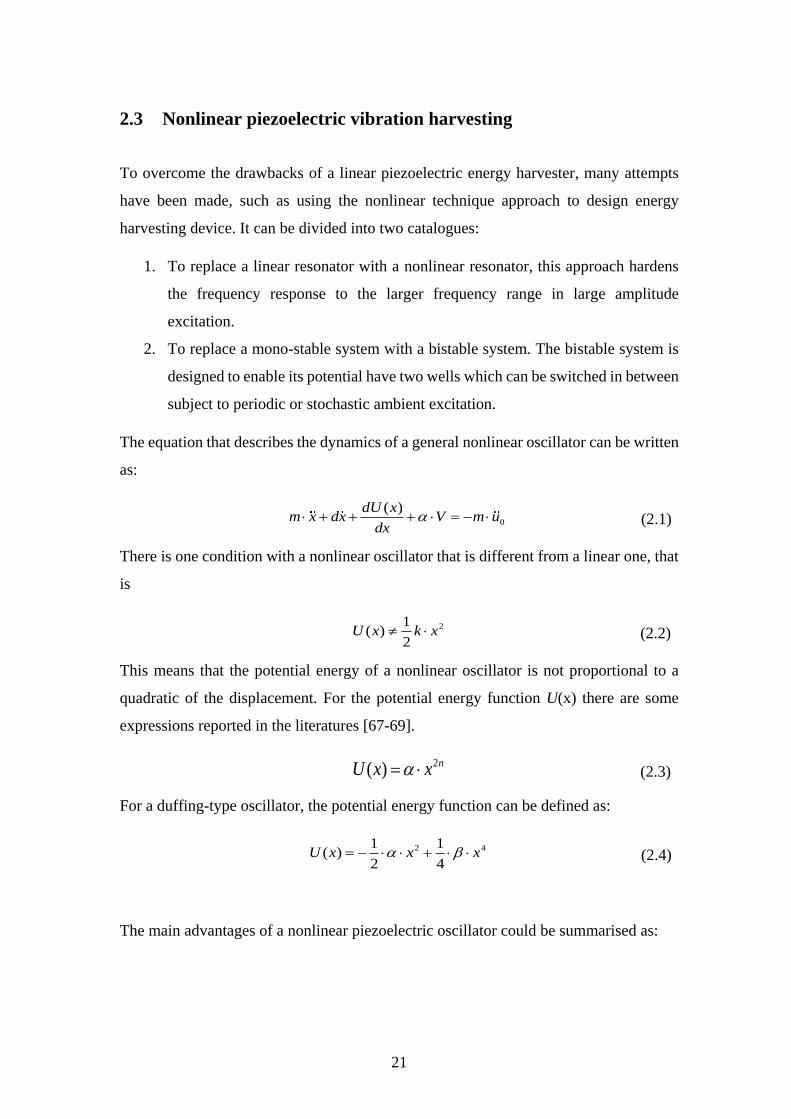
21
2.3 Nonlinear piezoelectric vibration harvesting
To overcome the drawbacks of a linear piezoelectric energy harvester, many attempts
have been made, such as using the nonlinear technique approach to design energy
harvesting device. It can be divided into two catalogues:
1. To replace a linear resonator with a nonlinear resonator, this approach hardens
the frequency response to the larger frequency range in large amplitude
excitation.
2. To replace a mono-stable system with a bistable system. The bistable system is
designed to enable its potential have two wells which can be switched in between
subject to periodic or stochastic ambient excitation.
The equation that describes the dynamics of a general nonlinear oscillator can be written
as:
0
( )dU xm x dx V m u
dx (2.1)
There is one condition with a nonlinear oscillator that is different from a linear one, that
is
21
( )2
U x k x (2.2)
This means that the potential energy of a nonlinear oscillator is not proportional to a
quadratic of the displacement. For the potential energy function U(x) there are some
expressions reported in the literatures [67-69].
2( ) nU x x (2.3)
For a duffing-type oscillator, the potential energy function can be defined as:
2 41 1
( )2 4
U x x x (2.4)
The main advantages of a nonlinear piezoelectric oscillator could be summarised as:
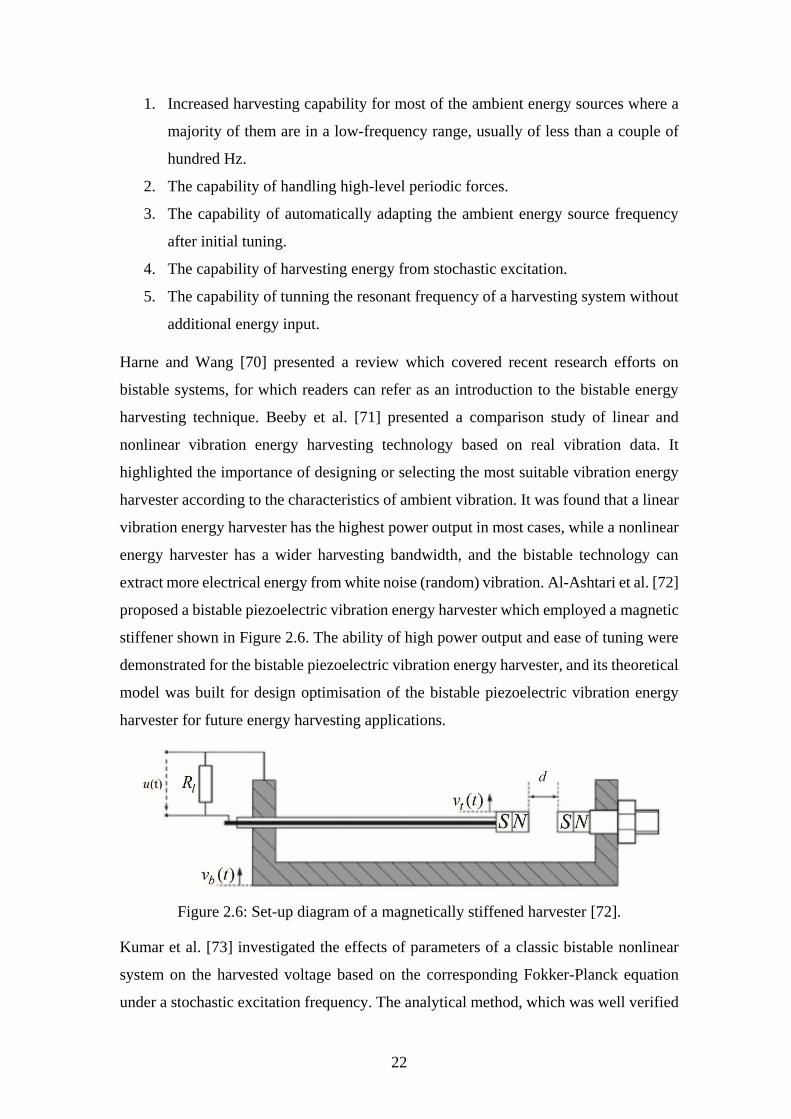
22
1. Increased harvesting capability for most of the ambient energy sources where a
majority of them are in a low-frequency range, usually of less than a couple of
hundred Hz.
2. The capability of handling high-level periodic forces.
3. The capability of automatically adapting the ambient energy source frequency
after initial tuning.
4. The capability of harvesting energy from stochastic excitation.
5. The capability of tunning the resonant frequency of a harvesting system without
additional energy input.
Harne and Wang [70] presented a review which covered recent research efforts on
bistable systems, for which readers can refer as an introduction to the bistable energy
harvesting technique. Beeby et al. [71] presented a comparison study of linear and
nonlinear vibration energy harvesting technology based on real vibration data. It
highlighted the importance of designing or selecting the most suitable vibration energy
harvester according to the characteristics of ambient vibration. It was found that a linear
vibration energy harvester has the highest power output in most cases, while a nonlinear
energy harvester has a wider harvesting bandwidth, and the bistable technology can
extract more electrical energy from white noise (random) vibration. Al-Ashtari et al. [72]
proposed a bistable piezoelectric vibration energy harvester which employed a magnetic
stiffener shown in Figure 2.6. The ability of high power output and ease of tuning were
demonstrated for the bistable piezoelectric vibration energy harvester, and its theoretical
model was built for design optimisation of the bistable piezoelectric vibration energy
harvester for future energy harvesting applications.
Figure 2.6: Set-up diagram of a magnetically stiffened harvester [72].
Kumar et al. [73] investigated the effects of parameters of a classic bistable nonlinear
system on the harvested voltage based on the corresponding Fokker-Planck equation
under a stochastic excitation frequency. The analytical method, which was well verified
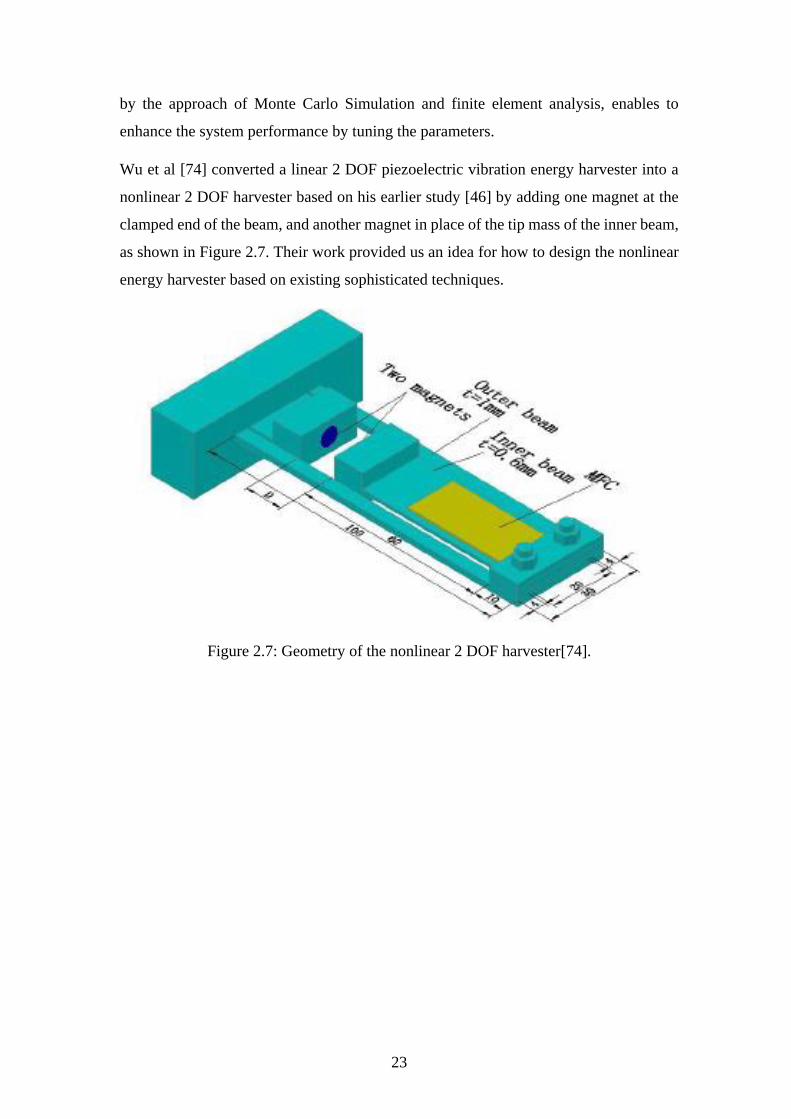
23
by the approach of Monte Carlo Simulation and finite element analysis, enables to
enhance the system performance by tuning the parameters.
Wu et al [74] converted a linear 2 DOF piezoelectric vibration energy harvester into a
nonlinear 2 DOF harvester based on his earlier study [46] by adding one magnet at the
clamped end of the beam, and another magnet in place of the tip mass of the inner beam,
as shown in Figure 2.7. Their work provided us an idea for how to design the nonlinear
energy harvester based on existing sophisticated techniques.
Figure 2.7: Geometry of the nonlinear 2 DOF harvester[74].
24
Figure 2.8: A nonlinear inverted beam harvester[75]. (a) Linear slider and the inverted
cantilever beam. (b) Base of the beam showing the Macro-Fiber Composite. (c) Tip
mass shown nearly vertical at the stable equilibrium. (d) Tip mass showing
approximately 45° end slope in a stable equilibrium.
There are also some other designs of the nonlinear piezoelectric vibration energy
harvesters instead of employing magnet, such as by setting up a mechanical stop to
piecewise the linear stiffness [76]. In the latter study [77], it was pointed out that the key
factors influencing the performance of energy harvesting are the stiffness ratio and the
impact velocity. It was also found out that the material nonlinearity is much more
important than the geometric nonlinearity. Unlike the aforementioned nonlinear
harvesting techniques, Friswell et al. [75] proposed a nonlinear piezoelectric vibration
energy harvesting system which employed an inverted elastic beam-mass structure. The
nonlinear piezoelectric vibration energy harvesting system enabled the feature of
scavenging vibration energy from low excitation frequency and high excitation
displacement, as shown in Figure 2.8[75]. The harvesting bandwidth of the proposed
energy harvesting device was believed to be up to twice of that of the linear system.
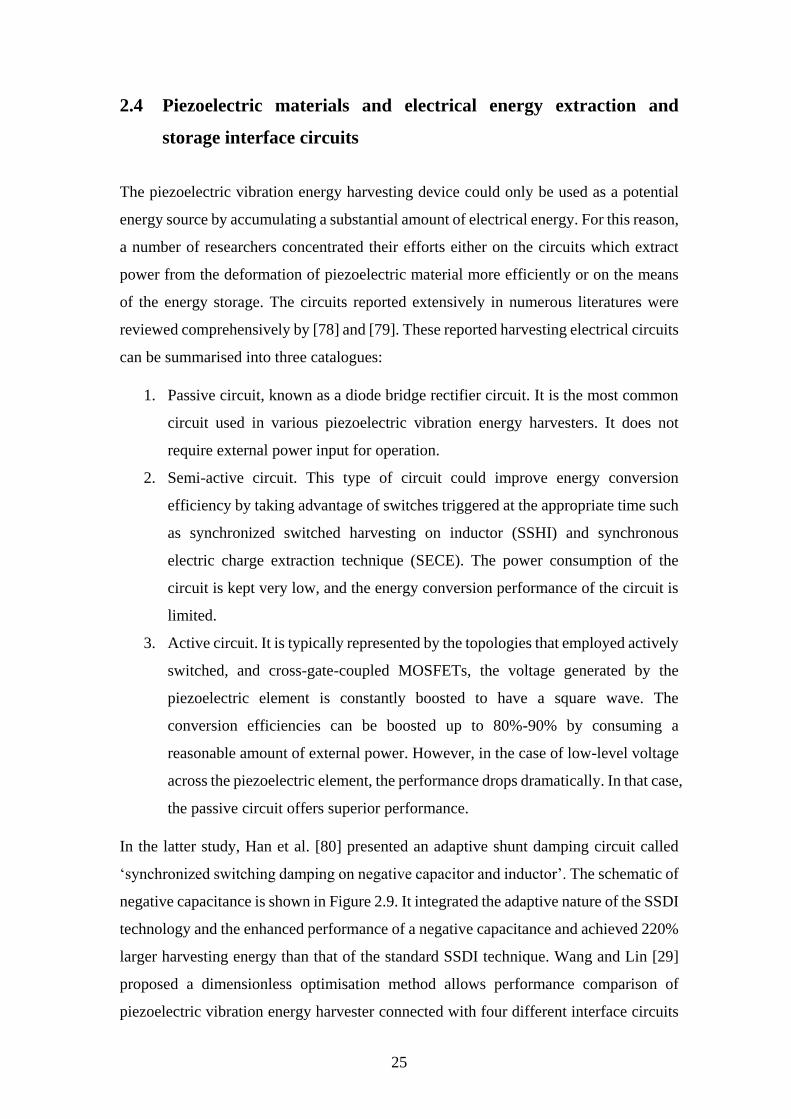
25
2.4 Piezoelectric materials and electrical energy extraction and
storage interface circuits
The piezoelectric vibration energy harvesting device could only be used as a potential
energy source by accumulating a substantial amount of electrical energy. For this reason,
a number of researchers concentrated their efforts either on the circuits which extract
power from the deformation of piezoelectric material more efficiently or on the means
of the energy storage. The circuits reported extensively in numerous literatures were
reviewed comprehensively by [78] and [79]. These reported harvesting electrical circuits
can be summarised into three catalogues:
1. Passive circuit, known as a diode bridge rectifier circuit. It is the most common
circuit used in various piezoelectric vibration energy harvesters. It does not
require external power input for operation.
2. Semi-active circuit. This type of circuit could improve energy conversion
efficiency by taking advantage of switches triggered at the appropriate time such
as synchronized switched harvesting on inductor (SSHI) and synchronous
electric charge extraction technique (SECE). The power consumption of the
circuit is kept very low, and the energy conversion performance of the circuit is
limited.
3. Active circuit. It is typically represented by the topologies that employed actively
switched, and cross-gate-coupled MOSFETs, the voltage generated by the
piezoelectric element is constantly boosted to have a square wave. The
conversion efficiencies can be boosted up to 80%-90% by consuming a
reasonable amount of external power. However, in the case of low-level voltage
across the piezoelectric element, the performance drops dramatically. In that case,
the passive circuit offers superior performance.
In the latter study, Han et al. [80] presented an adaptive shunt damping circuit called
‘synchronized switching damping on negative capacitor and inductor’. The schematic of
negative capacitance is shown in Figure 2.9. It integrated the adaptive nature of the SSDI
technology and the enhanced performance of a negative capacitance and achieved 220%
larger harvesting energy than that of the standard SSDI technique. Wang and Lin [29]
proposed a dimensionless optimisation method allows performance comparison of
piezoelectric vibration energy harvester connected with four different interface circuits
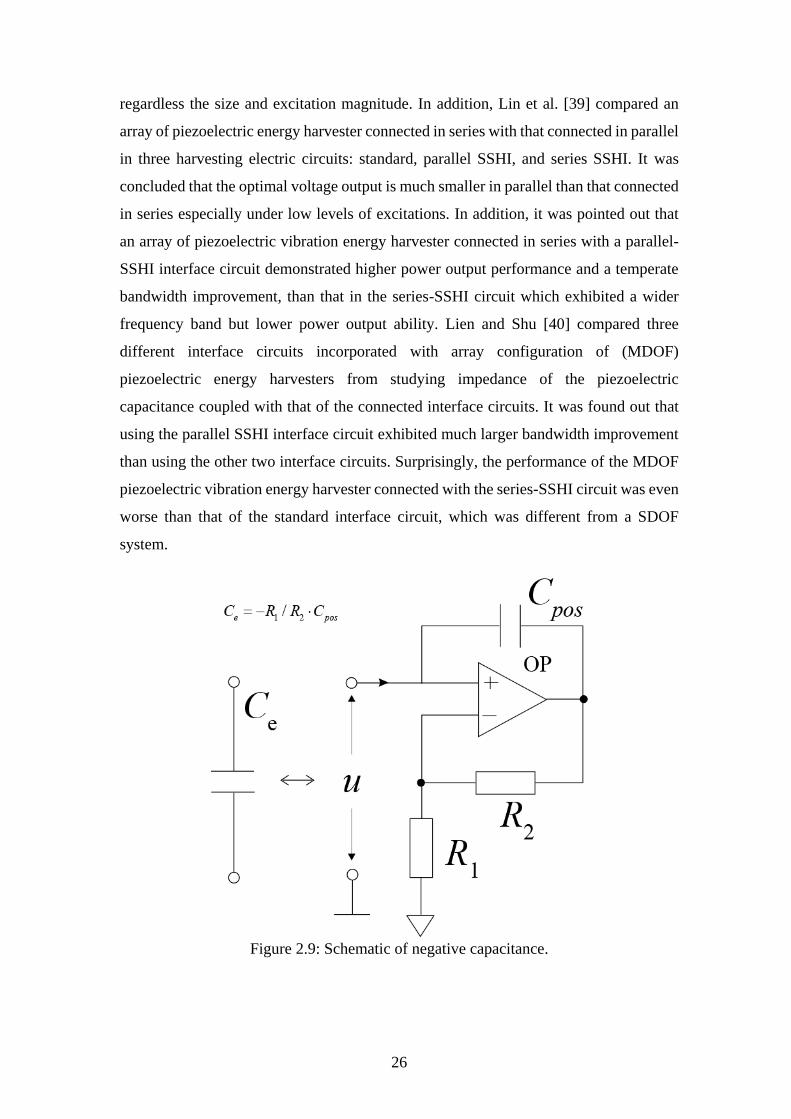
26
regardless the size and excitation magnitude. In addition, Lin et al. [39] compared an
array of piezoelectric energy harvester connected in series with that connected in parallel
in three harvesting electric circuits: standard, parallel SSHI, and series SSHI. It was
concluded that the optimal voltage output is much smaller in parallel than that connected
in series especially under low levels of excitations. In addition, it was pointed out that
an array of piezoelectric vibration energy harvester connected in series with a parallel-
SSHI interface circuit demonstrated higher power output performance and a temperate
bandwidth improvement, than that in the series-SSHI circuit which exhibited a wider
frequency band but lower power output ability. Lien and Shu [40] compared three
different interface circuits incorporated with array configuration of (MDOF)
piezoelectric energy harvesters from studying impedance of the piezoelectric
capacitance coupled with that of the connected interface circuits. It was found out that
using the parallel SSHI interface circuit exhibited much larger bandwidth improvement
than using the other two interface circuits. Surprisingly, the performance of the MDOF
piezoelectric vibration energy harvester connected with the series-SSHI circuit was even
worse than that of the standard interface circuit, which was different from a SDOF
system.
Figure 2.9: Schematic of negative capacitance.
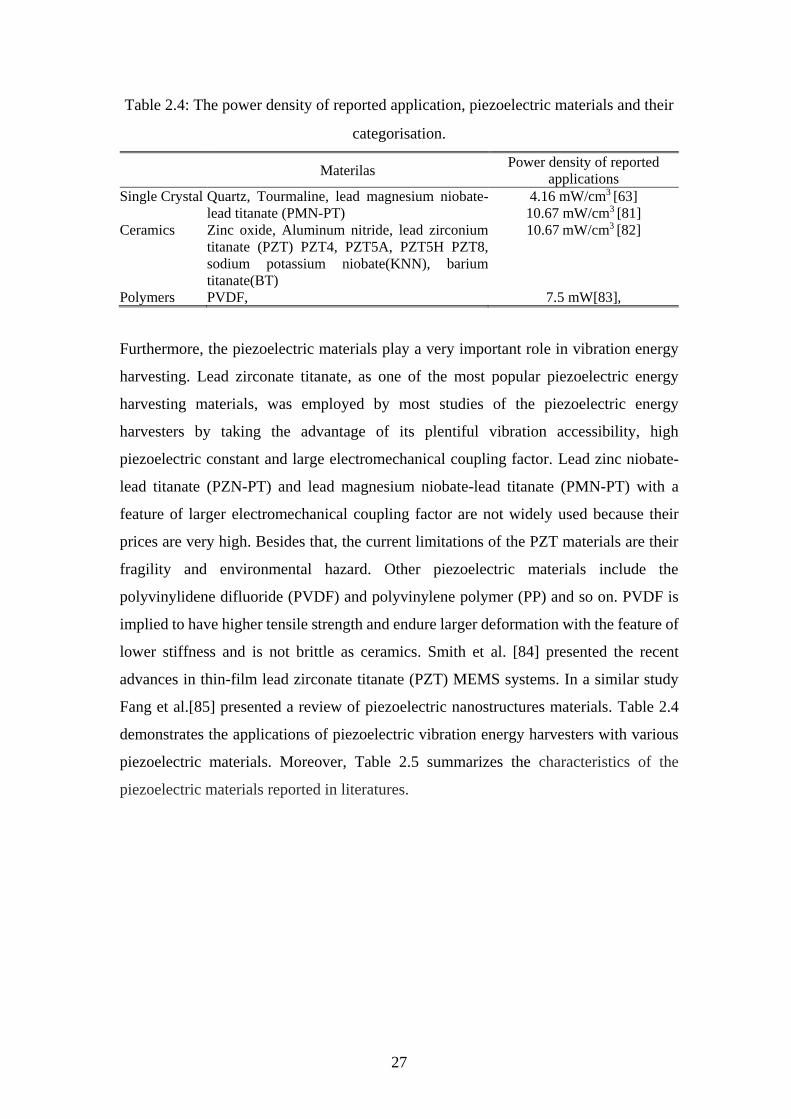
27
Table 2.4: The power density of reported application, piezoelectric materials and their
categorisation.
Materilas
Power density of reported
applications
Single Crystal Quartz, Tourmaline, lead magnesium niobate-
lead titanate (PMN-PT)
4.16 mW/cm3 [63]
10.67 mW/cm3 [81]
Ceramics Zinc oxide, Aluminum nitride, lead zirconium
titanate (PZT) PZT4, PZT5A, PZT5H PZT8,
sodium potassium niobate(KNN), barium
titanate(BT)
10.67 mW/cm3 [82]
Polymers PVDF, 7.5 mW[83],
Furthermore, the piezoelectric materials play a very important role in vibration energy
harvesting. Lead zirconate titanate, as one of the most popular piezoelectric energy
harvesting materials, was employed by most studies of the piezoelectric energy
harvesters by taking the advantage of its plentiful vibration accessibility, high
piezoelectric constant and large electromechanical coupling factor. Lead zinc niobate-
lead titanate (PZN-PT) and lead magnesium niobate-lead titanate (PMN-PT) with a
feature of larger electromechanical coupling factor are not widely used because their
prices are very high. Besides that, the current limitations of the PZT materials are their
fragility and environmental hazard. Other piezoelectric materials include the
polyvinylidene difluoride (PVDF) and polyvinylene polymer (PP) and so on. PVDF is
implied to have higher tensile strength and endure larger deformation with the feature of
lower stiffness and is not brittle as ceramics. Smith et al. [84] presented the recent
advances in thin-film lead zirconate titanate (PZT) MEMS systems. In a similar study
Fang et al.[85] presented a review of piezoelectric nanostructures materials. Table 2.4
demonstrates the applications of piezoelectric vibration energy harvesters with various
piezoelectric materials. Moreover, Table 2.5 summarizes the characteristics of the
piezoelectric materials reported in literatures.
28
Table 2.5: Key properties of some common piezoelectric materials and nanowire(NW) [86] .
Material GaN AlN CdS ZnO α-quartz BaTiO3
PZT-4
‘Hard
PZT.’
PZT-5H
‘Soft
PZT.’
PMN-
PT LiNbO3 PVDF
Piezoelectric
Pyroelectric
Ferroelectric
Const. strain
Rel. perm. (εS33)
11.2 10.0 9.53 8.84 4.63 910 635 1470 680 27.9 5-13
Const. strain
Rel. perm. (εT33)
11.9 10.33 11.0 4.63 1200 1300 3400 8200 28.7 7.6
d33 pCN-1 3.7 5 10.3 12.4 d11=2.3 149 289 593 2820 6 33
d31 pCN-1 -1.9 -2 5.18 -5.0 58 123 274 1330 1.0 21
d15 pCN-1 3.1 3.6 13.98 -8.3 d14=0.67 242 495 741 146 69 27
Mechanical
quality (Qm) 2800 2490 ~1000 1770 105-106 400 500 65 43-2050 104 3-10
Electromechanical
Coupling (k33) 0.23 0.26 0.48 0.1 0.49 0.7 0.75 0.94 0.23 0.19
Pyro.coeff.-p
(C m-2K-1) 4.8 6-8 4 9.4 200 260 260 1790 83 83
sE11 (pPa-1) 3.326 2.854 20.69 7.86 12.77 8.6 12.3 16.4 69.0 5.83 365
sE33 (pPa-1) 2.915 2.824 16.97 6.94 9.73 9.1 15.5 20.8 119.6 5.02 472
27
2.5 Large scale piezoelectric vibration energy harvesting
Piezoelectric vibration energy harvesting is mainly focussed on very small scale power
generation as aforementioned from 10 W to 100 mW. There are a wide variety of
vibration energy sources such as railways, ocean waves, skyscrapers, industry
machineries, and large bridges etc. The harvested power could be from 1 W to 100 kW
according to the recent study of the large-scale vibration energy harvesting conducted
by Zuo [87].
The ocean wave energy harvesters have been investigated for decades; they can provide
power scales on the order of 100Kw and beyond with the frequency range from 0.075-
0.2Hz. Recently, Xie et al. [88] proposed a vibration energy harvester can extract the
electrical energy from the longitudinal sea wave motion by using a cantilever substrate
attached with the piezoelectric element. Based on a linear wave theory and a classical
elastic beam model, the corresponding theoretical analysis model has been developed to
predict the output voltage generated by piezoelectric patches. According to their
simulation and theoretical analysis study, the proposed vibration energy harvester was
able to supply the power demand of several normal household appliances with the large
enough dimension and tip mass of the vibration energy harvester subjected to high
amplitude sea waves. In a related study, Xie et al. [88] developed a mathematical model
of ocean wave energy harvester using PVDF patch. According to their simulation results,
the harvester with dimension of 6m × 3m × 0.12m can generate 145W while the
excitation of the ocean wave has a height of 3 meters.
Xiang et al. [89] described a theoretical approach of piezoelectric energy harvesting from
vehicle vibration excited by pavements. The pavement was defined as an infinite
Bernoulli-Euler beam resting on a Winkler foundation. The behaviour of the pavement
was analysed and formulated. The theoretical model shows that when the vehicle
velocity was matched with critical velocity ( 4 24 /crv kEI ), the voltage and power
outputs significantly increased.
In an alternative way to harvest energy from vehicle vibration, Van den Ende et al. [90]
presented a study using direct strain energy harvesting in automobile tires using
piezoelectric PZT–polymer composites to power the monitor sensor. Wu et al [91]
proposed a cantilever beam with dimensions of 1.2m0.0125m0.15 attached with a
30
thickness of 0.2mm PZT4 to harvest energy from wind velocity of 9-10 m/s which was
capable of generating 2W electrical power when the vortex shedding frequency matched
the resonant frequency of the cantilever beam harvester.
Finally, in order to improve the performance of the vibration energy harvesters, it is
always the best way to test them in the field to tune the parameters of the device. Neri et
al.[92] proposed the idea of creating a real database for kinetic energy harvesting
applications which allow researchers to use these data to test the energy harvesters when
it is not possible to test them in the field.
2.6 Conclusions
This chapter has reviewed the recently published papers in piezoelectric vibration energy
harvesting. It has illustrated the research progress in the linear and nonlinear VEH
systems. The structure of harvesting device and piezoelectric materials are both the key
factors to improve the harvesting efficiency. Besides that, harvesting and storage circuits
need to be further studied for improvement in the future. Most of the harvesting circuits
were developed based on the periodic or harmonic excitations. It may not be applicable
to the piezoelectric vibration energy harvester designed to operate in random or
broadband excitation circumstances. The performance of the linear piezoelectric
vibration energy harvesters is summarised in Table 2.3. Nonlinear monostable and
bistable piezoelectric vibration energy harvesters might be better choices to broaden the
harvesting frequency bandwidth and enhance the performance of vibration energy
harvester under the random excitations of the ambient environment. The future
challenges to be addressed in this research field include improving the conversion
efficiency of the energy harvesting circuits and the way of storing the harvested energy.
In the large scale piezoelectric vibration energy harvesting, the materials need to be
further studied or enhanced for the durability of processing the large amount of stress.
31
Single Degree-of-freedom
Piezoelectric Vibration Energy
Harvester Study and
Experimental Validation
In this chapter, an analytical approach of single degree-of-freedom piezoelectric
vibration energy harvester will be proposed in combination with frequency analysis and
time domain integration. The main advantage of the approach is its capability to predict
harvested resonant power and energy harvesting efficiencies of mechanical systems with
built-in piezoelectric material from measured data of ambient vibration energy source.
It allows for a parameter study and optimisation of the single degree-of-freedom
piezoelectric vibration energy harvesters. Furthermore, the dimensionless analysis
method is developed to evaluate the performance of piezoelectric vibration energy
harvesters regardless of the size or type. The contents presented in this chapter have
been published by the thesis author in a refereed journal[93].
3.1 Introduction
Because of the ubiquitous existence of vibration, energy harvesting from ambient
vibration has attracted much attention in recent years. Researchers have been seeking
optimisation design methods to maximise the harvested energy. For example, Williams
and Yates[12] predicted that the maximum power generated by a single degree-of-
freedom vibration energy harvester was proportional to the cube of the resonance
frequency, and was proportional to the square of the displacement amplitude of the
oscillator. It was believed that the harvester was not well suited for applications with
very low resonance frequency. In order to maximize power generation, the vibration
deflection should be as large as possible. The mass should be as large as possible within
the available volume of the harvester. The spring should be designed so that the
resonance frequency of the harvester matches the excitation frequency of the application.
Unwanted damping should be minimized so that it does not affect electrical power
32
generation. However, the effects of the force factor of the piezoelectric material and
external electric load resistance on the harvested resonant power and energy harvesting
efficiency have not been studied. Poulin et al.[94] compared electromagnetic and
piezoelectric systems. The harvested resonant power and energy harvesting efficiency
of both the systems were studied. It was believed that with a high electrical power density,
the piezoelectric system is particularly well suited to micro-systems, in comparison with
the electromagnetic system which is recommended for medium scale applications.
However, the harvested resonant power was not normalised and expressed in a
dimensionless form in the previous literatures which can be found in Chapter 2. A
parametric study was not fully conducted to understand the effects of the parameters
such as force factor, damping, excitation amplitude, and resonance frequency, magnetic
losses, the density criterion (stop springs) and the ageing of the structures on vibration
energy harvesting power and efficiency.
Aiming to develop an effective tool for analysis and design of any degree-of-freedom
vibration energy harvester, a new approach with a hybrid of frequency analysis and time
domain integration will be proposed in this chapter. In order to illustrate the approach,
the frequency analysis and time domain integration are first conducted in a single degree-
of-freedom piezoelectric system, and output voltage and harvested resonant power will
be calculated for different system parameters or frequencies. The calculated output
voltage and harvested resonant power using the frequency analysis method will be
compared with those using the time domain integration method and validated by
experiment data. The mechanical-electrical system with built-in piezoelectric material
will be connected to a single load resistor and studied using the proposed analysis
approach. Finally, the analysis approach will be extended to a multi-degree-of-freedom
mechanical-electric system for a modal analysis.
Main contributions of this chapter are to propose the normalised calculation formulae of
the harvested resonant power and energy harvesting efficiency from the two
dimensionless variables of the normalised resistance and force factors, which are
independent of the sizes and configurations of piezoelectric vibration energy harvesters,
and to develop a novel analysis approach from a hybrid of the frequency analysis and
time domain integration for both single degree and multi-degree-of-freedom
mechanical-electric systems.
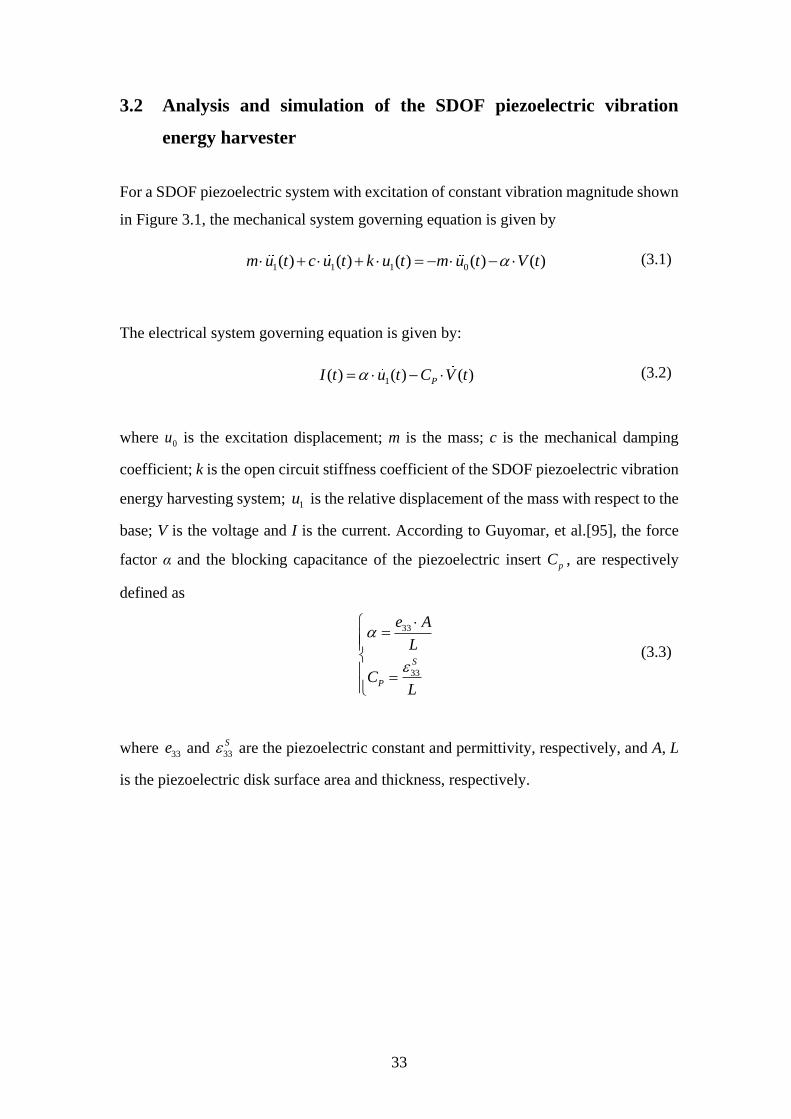
33
3.2 Analysis and simulation of the SDOF piezoelectric vibration
energy harvester
For a SDOF piezoelectric system with excitation of constant vibration magnitude shown
in Figure 3.1, the mechanical system governing equation is given by
1 1 1 0( ) ( ) ( ) ( ) ( )m u t c u t k u t m t tu V
(3.1)
The electrical system governing equation is given by:
1( ) ( ) ( )PI t u t C V t (3.2)
where 0u is the excitation displacement; m is the mass; c is the mechanical damping
coefficient; k is the open circuit stiffness coefficient of the SDOF piezoelectric vibration
energy harvesting system; 1u is the relative displacement of the mass with respect to the
base; V is the voltage and I is the current. According to Guyomar, et al.[95], the force
factor α and the blocking capacitance of the piezoelectric insert pC , are respectively
defined as
3
33
3
P
S
e A
L
CL
(3.3)
where 33e and 33
S are the piezoelectric constant and permittivity, respectively, and A, L
is the piezoelectric disk surface area and thickness, respectively.
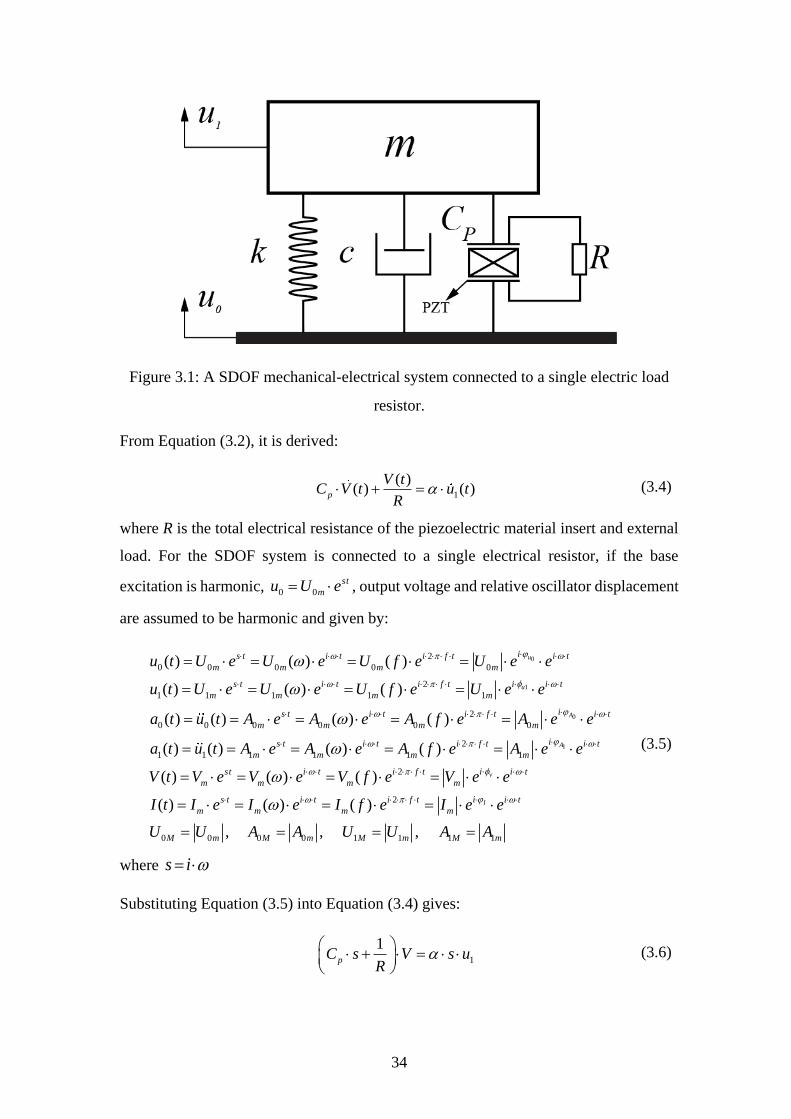
34
Figure 3.1: A SDOF mechanical-electrical system connected to a single electric load
resistor.
From Equation (3.2), it is derived:
1
( )( ) ( )p
V tC V t u t
R (3.4)
where R is the total electrical resistance of the piezoelectric material insert and external
load. For the SDOF system is connected to a single electrical resistor, if the base
excitation is harmonic, 0 0
st
mu U e , output voltage and relative oscillator displacement
are assumed to be harmonic and given by:
1
0
0
2
1 1 1
2
0 0 0 0 0
2
0 0 0 0 0
1 1
0
( ) ( ) ( )
( ) ( (
( ) ( ) ( ) (
) )
)
u
u
A
i
s
s t i t i f t i t
m m m m
is t i t i f t i t
m m
t i t i f t i i t
m
m
m
m
m m
u t U e U e U f e U e e
u t U e U U ee f eU
a t u t A e A e A f A e
e
e e
12
1 1 1 1
2
1 1
2
0 0 0
( ) ( ) ( ) ( )
( ) ( ( )
( ) ( ) ( )
,
)
A
I
vst i t i f t i i t
m m
is t i t i f t i t
m m m m
m
is t i t i f t i t
m m m m
m
M m M
e e e
a t u t A e A e A f e A e e
V t V e V V f e V
I t I e I e I f e I e e
U U A
0 1 1 1 1, ,m M m M mA U U A A
(3.5)
where s i
Substituting Equation (3.5) into Equation (3.4) gives:
1
1pC s V s u
R
(3.6)
35
This is, in fact, a Laplace transfer of Equation (3.4). The transfer function between the
relative oscillator displacement and output voltage is then derived and given by:
1
1 1
m
m pp
V s R s
U R C sC s
R
(3.7)
Substitution of Equations (3.5) and (3.7) into Equation (3.1) gives:
2
2 2
1 01
m m
p
R sk m s U m s U
R Cc s
s
(3.8)
This is a Laplace transfer of Equation (3.1). The transfer function between the base
excitation displacement and relative oscillator displacement is given by:
1
220
1p
u m
R suk m s
R sc
Cs
(3.9)
Rearranging Equation (3.9) gives:
1
2 230
pm
p pm p
m R C s mU
A R C m s R cC c m s R sC k R k
(3.10)
According to Equations (3.7), the transfer function between the base excitation
acceleration and output voltage is given by
1 1
0 01 0 1
m m m
mpm
m
m m
V V U UR s
A U A R C s A
(3.11)
Substitution of Equation (3.10) into Equation (3.11) gives:
2 23
0 pm
m
p p
V m R s
A R C m s R C cc m s R C k R ks
(3.12)
In order to compare the simulation results of Equation (3.12) with the experimental
results in [66], the SDOF mechanical-electrical system employed the same parameters
as those parameters in [66], except for a minor correction of the resonant frequency 274.9
Hz (from 277.4 Hz) and load resistance 30669.6 Ohm (from 30k Ohm) as shown in
Table 3.1.
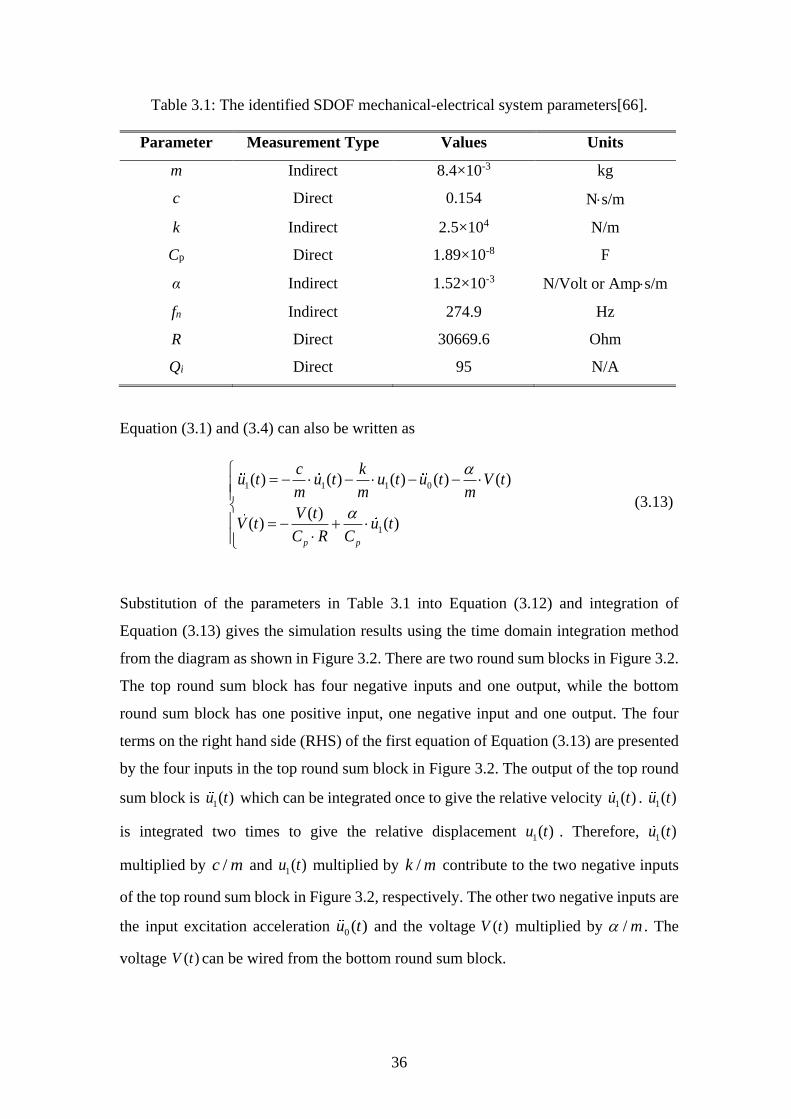
36
Table 3.1: The identified SDOF mechanical-electrical system parameters[66].
Parameter Measurement Type Values Units
m Indirect 8.4×10⁻³ kg
c Direct 0.154 Ns/m
k Indirect 2.5×10⁴ N/m
Cp Direct 1.89×10⁻⁸ F
α Indirect 1.52×10⁻³ N/Volt or Amps/m
fn Indirect 274.9 Hz
R Direct 30669.6 Ohm
Qi Direct 95 N/A
Equation (3.1) and (3.4) can also be written as
1 1 1 0
1
( ) ( ) ( ) ( )
( )
(
( ) ( )
)
p p
c ku t u t u t u t
m m m
V tV t u t
C R C
V t
(3.13)
Substitution of the parameters in Table 3.1 into Equation (3.12) and integration of
Equation (3.13) gives the simulation results using the time domain integration method
from the diagram as shown in Figure 3.2. There are two round sum blocks in Figure 3.2.
The top round sum block has four negative inputs and one output, while the bottom
round sum block has one positive input, one negative input and one output. The four
terms on the right hand side (RHS) of the first equation of Equation (3.13) are presented
by the four inputs in the top round sum block in Figure 3.2. The output of the top round
sum block is 1( )u t which can be integrated once to give the relative velocity 1( )u t . 1( )u t
is integrated two times to give the relative displacement 1( )u t . Therefore, 1( )u t
multiplied by /c m and 1( )u t multiplied by /k m contribute to the two negative inputs
of the top round sum block in Figure 3.2, respectively. The other two negative inputs are
the input excitation acceleration 0 ( )u t and the voltage ( )V t multiplied by / m . The
voltage ( )V t can be wired from the bottom round sum block.

37
The two terms on the right hand side of the second equation of Equation (3.13) are
presented by the two inputs in the bottom round sum block in Figure 3.2. The output of
the bottom round sum block is ( )V t which can be integrated once to give the voltage
( )V t . The relative velocity 1( )u t multiplied by / pC and ( )V t multiplied by 1
pC R are
the inputs for the bottom round sum block, respectively. The relative velocity 1( )u t can
be wired form the top round sum block.
A simulation was conducted using Matlab Simulink. The time domain integration
schedule was arranged to have a 274.9 Hz sine wave acceleration signal input. The input
acceleration sinusoidal signal with a root mean squared (RMS) value of 9.8 m/s2 was
passed through the transfer function which produced a sinusoidal output voltage signal.
The simulation results of Equation (3.13) are displayed in Figure 3.3.
Figure 3.2: Simulation diagram for Equation (3.13) with a sine wave base excitation
input and a sinusoidal voltage output at a given frequency.
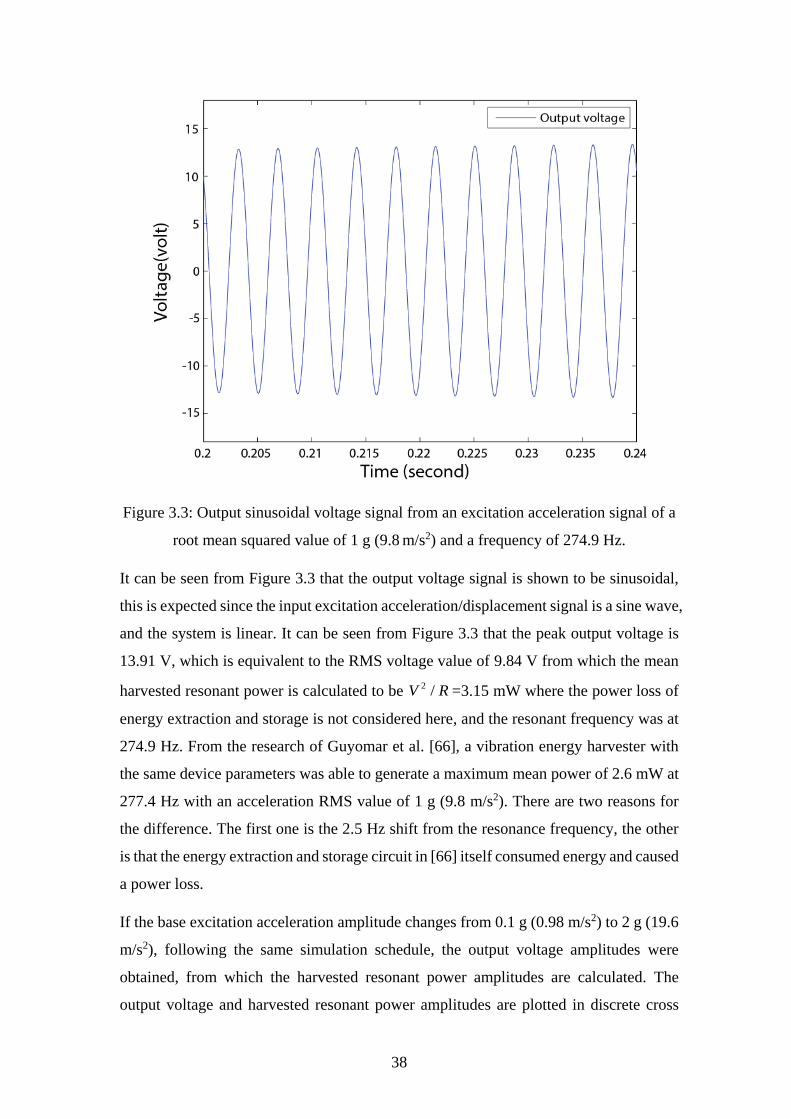
38
Figure 3.3: Output sinusoidal voltage signal from an excitation acceleration signal of a
root mean squared value of 1 g (9.8 m/s2) and a frequency of 274.9 Hz.
It can be seen from Figure 3.3 that the output voltage signal is shown to be sinusoidal,
this is expected since the input excitation acceleration/displacement signal is a sine wave,
and the system is linear. It can be seen from Figure 3.3 that the peak output voltage is
13.91 V, which is equivalent to the RMS voltage value of 9.84 V from which the mean
harvested resonant power is calculated to be 2 /V R =3.15 mW where the power loss of
energy extraction and storage is not considered here, and the resonant frequency was at
274.9 Hz. From the research of Guyomar et al. [66], a vibration energy harvester with
the same device parameters was able to generate a maximum mean power of 2.6 mW at
277.4 Hz with an acceleration RMS value of 1 g (9.8 m/s2). There are two reasons for
the difference. The first one is the 2.5 Hz shift from the resonance frequency, the other
is that the energy extraction and storage circuit in [66] itself consumed energy and caused
a power loss.
If the base excitation acceleration amplitude changes from 0.1 g (0.98 m/s2) to 2 g (19.6
m/s2), following the same simulation schedule, the output voltage amplitudes were
obtained, from which the harvested resonant power amplitudes are calculated. The
output voltage and harvested resonant power amplitudes are plotted in discrete cross
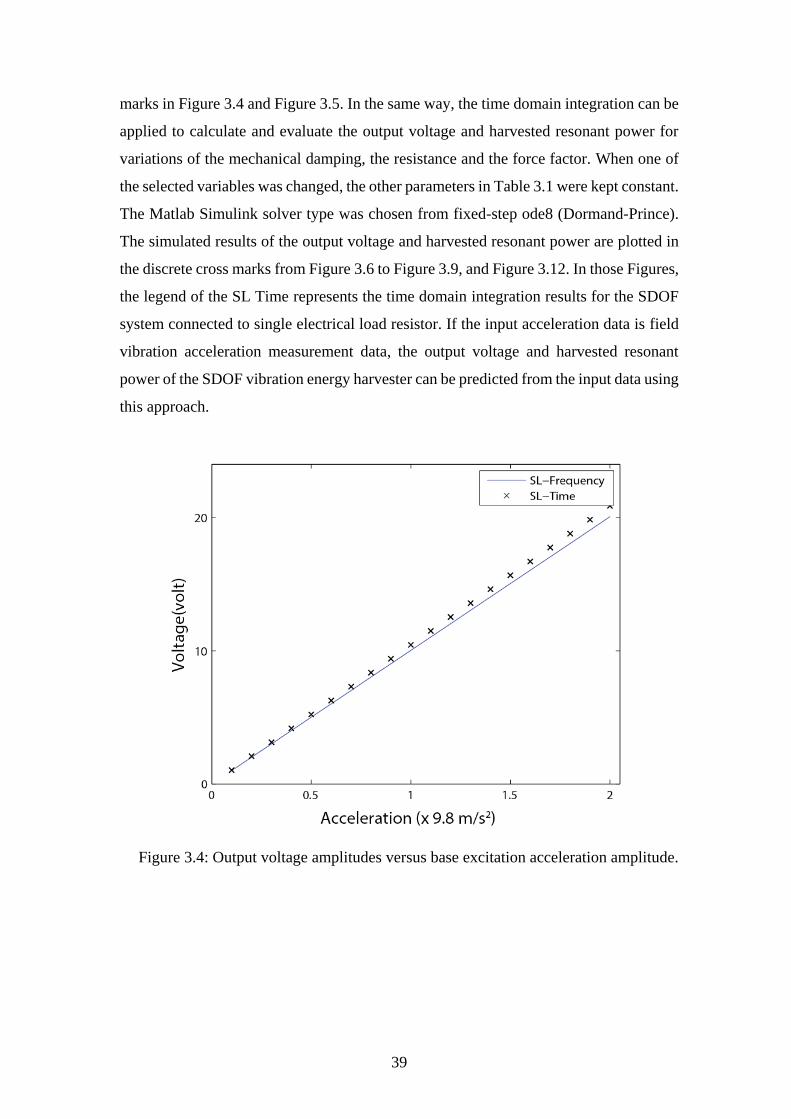
39
marks in Figure 3.4 and Figure 3.5. In the same way, the time domain integration can be
applied to calculate and evaluate the output voltage and harvested resonant power for
variations of the mechanical damping, the resistance and the force factor. When one of
the selected variables was changed, the other parameters in Table 3.1 were kept constant.
The Matlab Simulink solver type was chosen from fixed-step ode8 (Dormand-Prince).
The simulated results of the output voltage and harvested resonant power are plotted in
the discrete cross marks from Figure 3.6 to Figure 3.9, and Figure 3.12. In those Figures,
the legend of the SL Time represents the time domain integration results for the SDOF
system connected to single electrical load resistor. If the input acceleration data is field
vibration acceleration measurement data, the output voltage and harvested resonant
power of the SDOF vibration energy harvester can be predicted from the input data using
this approach.
Figure 3.4: Output voltage amplitudes versus base excitation acceleration amplitude.
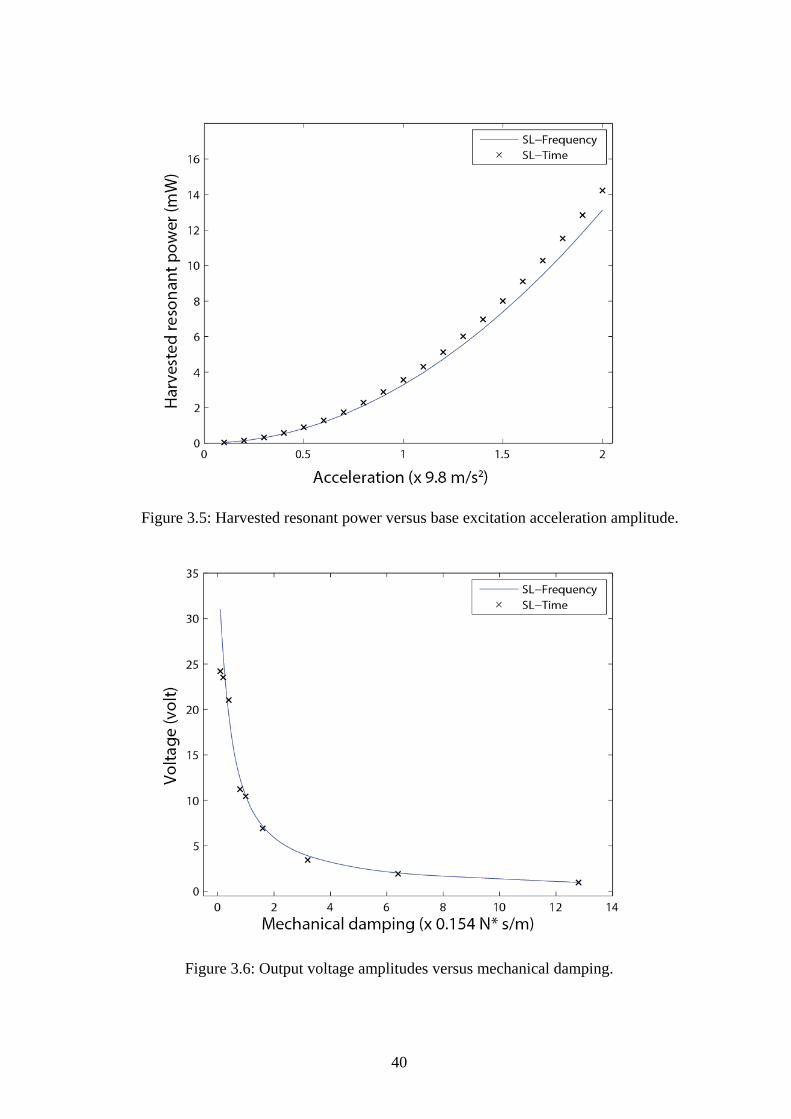
40
Figure 3.5: Harvested resonant power versus base excitation acceleration amplitude.
Figure 3.6: Output voltage amplitudes versus mechanical damping.
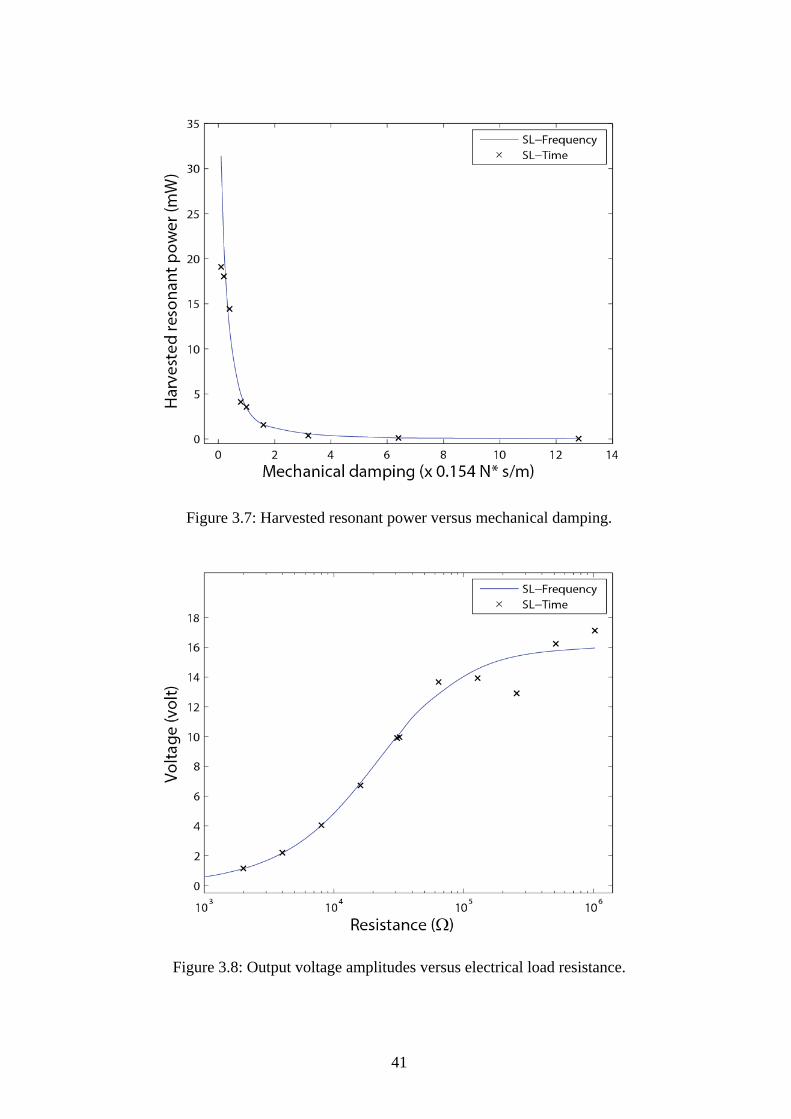
41
Figure 3.7: Harvested resonant power versus mechanical damping.
Figure 3.8: Output voltage amplitudes versus electrical load resistance.
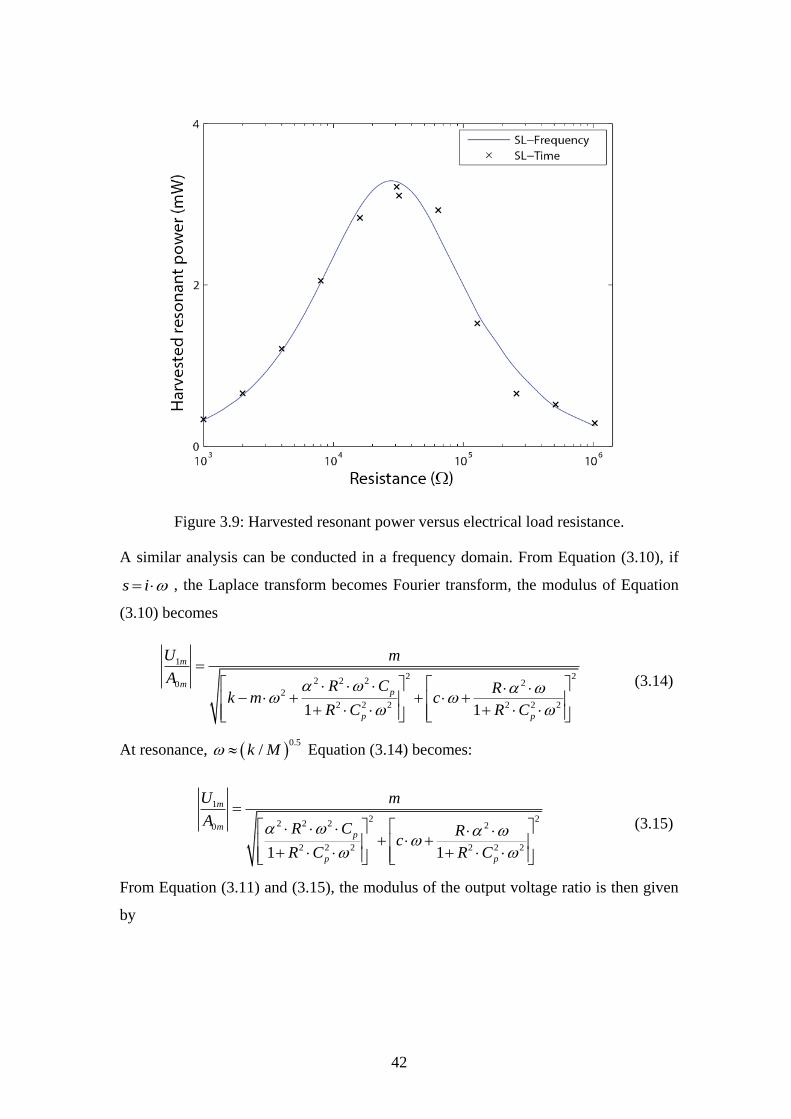
42
Figure 3.9: Harvested resonant power versus electrical load resistance.
A similar analysis can be conducted in a frequency domain. From Equation (3.10), if
s i , the Laplace transform becomes Fourier transform, the modulus of Equation
(3.10) becomes
2 22 2 2 20
2
2 2 2
1
2 2 21 1
m
mp
p p
U m
AR C R
k m cR C R C
(3.14)
At resonance, 0.5
/k M Equation (3.14) becomes:
2 22 2 2 20
2 2 2 2 2 2
1
1 1
mp
p
m
p
m
AR C R
cR
U
C R C
(3.15)
From Equation (3.11) and (3.15), the modulus of the output voltage ratio is then given
by
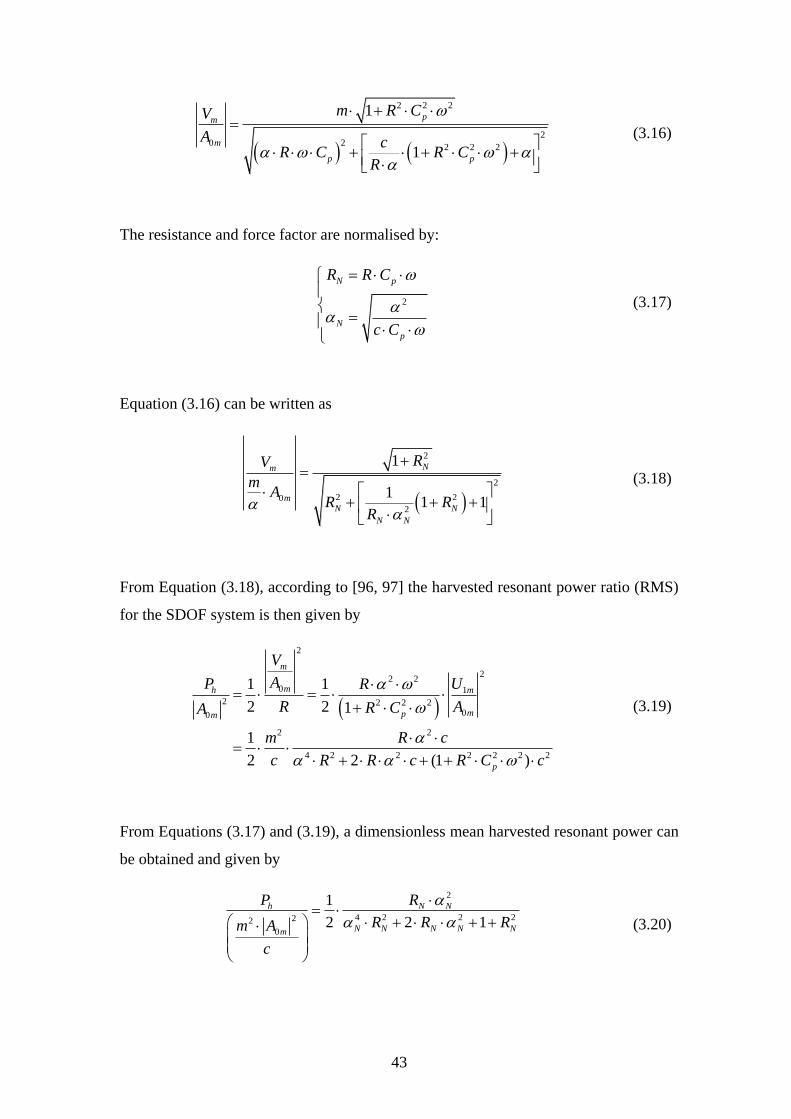
43
2 2 2
220
2 2 2
1
1
p
m
p p
mm R CV
A cR C R C
R
(3.16)
The resistance and force factor are normalised by:
2
N p
N
p
R R C
c C
(3.17)
Equation (3.16) can be written as
2
2
2 20
2
1
11 1
N
mN N
N N
mRV
mA
R RR
(3.18)
From Equation (3.18), according to [96, 97] the harvested resonant power ratio (RMS)
for the SDOF system is then given by
2
2
2 20
2 2 2 200
2 2
4 2 2 2 2 2
1
2
1 1
2 2 1
1
2 2 (1 )
m
mh
m
m
mp
p
V
AP UR
R AR CA
m R c
c R R c R C c
(3.19)
From Equations (3.17) and (3.19), a dimensionless mean harvested resonant power can
be obtained and given by
2
4 2 2 222
0
1
2 2 1
h N N
N N N N Nm
P R
R R Rm A
c
(3.20)
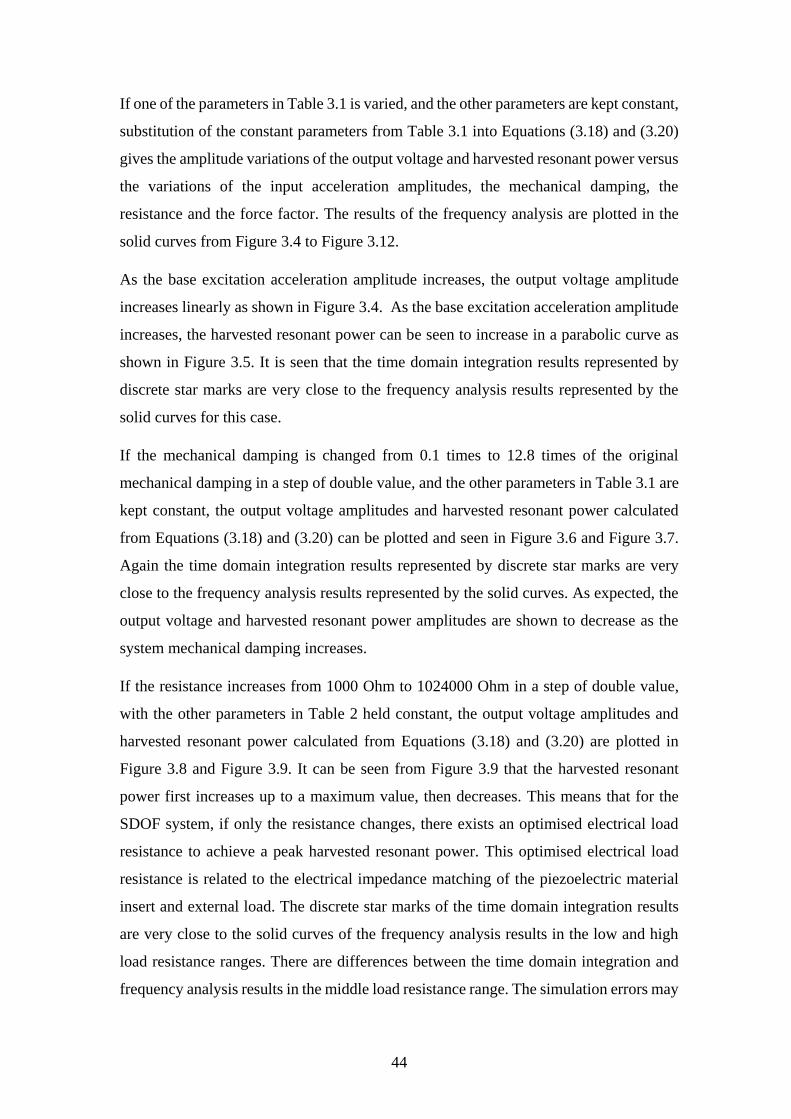
44
If one of the parameters in Table 3.1 is varied, and the other parameters are kept constant,
substitution of the constant parameters from Table 3.1 into Equations (3.18) and (3.20)
gives the amplitude variations of the output voltage and harvested resonant power versus
the variations of the input acceleration amplitudes, the mechanical damping, the
resistance and the force factor. The results of the frequency analysis are plotted in the
solid curves from Figure 3.4 to Figure 3.12.
As the base excitation acceleration amplitude increases, the output voltage amplitude
increases linearly as shown in Figure 3.4. As the base excitation acceleration amplitude
increases, the harvested resonant power can be seen to increase in a parabolic curve as
shown in Figure 3.5. It is seen that the time domain integration results represented by
discrete star marks are very close to the frequency analysis results represented by the
solid curves for this case.
If the mechanical damping is changed from 0.1 times to 12.8 times of the original
mechanical damping in a step of double value, and the other parameters in Table 3.1 are
kept constant, the output voltage amplitudes and harvested resonant power calculated
from Equations (3.18) and (3.20) can be plotted and seen in Figure 3.6 and Figure 3.7.
Again the time domain integration results represented by discrete star marks are very
close to the frequency analysis results represented by the solid curves. As expected, the
output voltage and harvested resonant power amplitudes are shown to decrease as the
system mechanical damping increases.
If the resistance increases from 1000 Ohm to 1024000 Ohm in a step of double value,
with the other parameters in Table 2 held constant, the output voltage amplitudes and
harvested resonant power calculated from Equations (3.18) and (3.20) are plotted in
Figure 3.8 and Figure 3.9. It can be seen from Figure 3.9 that the harvested resonant
power first increases up to a maximum value, then decreases. This means that for the
SDOF system, if only the resistance changes, there exists an optimised electrical load
resistance to achieve a peak harvested resonant power. This optimised electrical load
resistance is related to the electrical impedance matching of the piezoelectric material
insert and external load. The discrete star marks of the time domain integration results
are very close to the solid curves of the frequency analysis results in the low and high
load resistance ranges. There are differences between the time domain integration and
frequency analysis results in the middle load resistance range. The simulation errors may
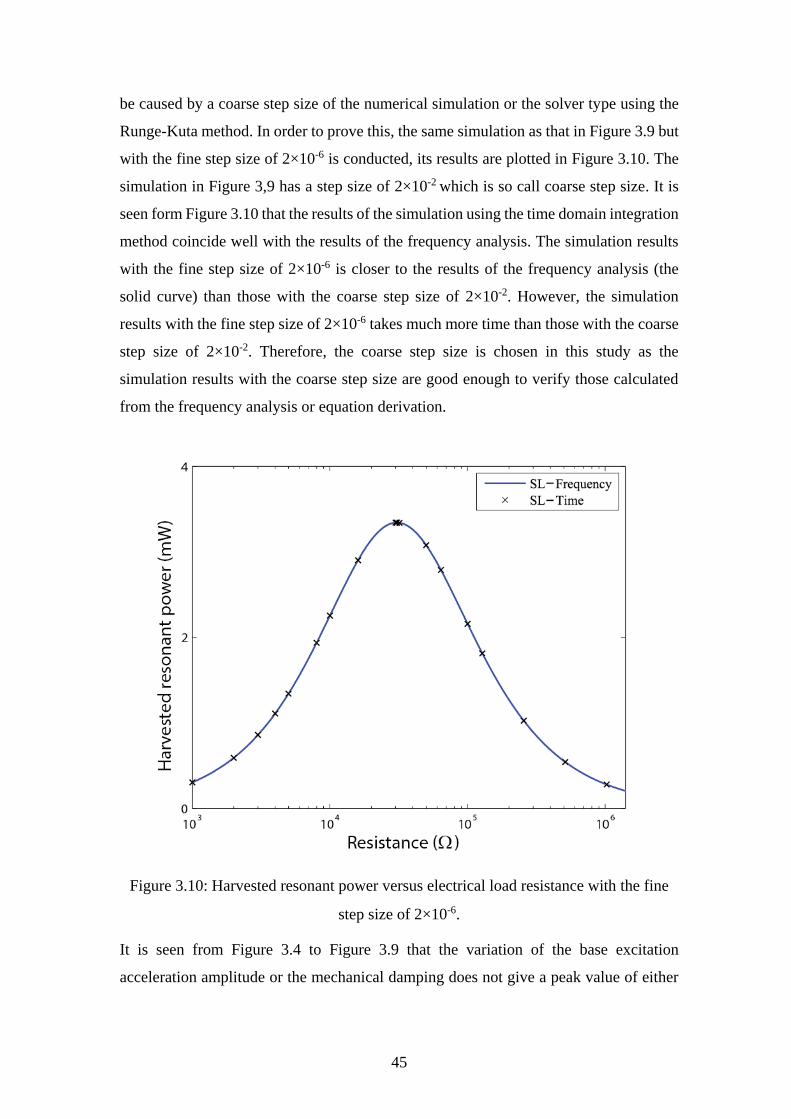
45
be caused by a coarse step size of the numerical simulation or the solver type using the
Runge-Kuta method. In order to prove this, the same simulation as that in Figure 3.9 but
with the fine step size of 2×10⁻⁶ is conducted, its results are plotted in Figure 3.10. The
simulation in Figure 3,9 has a step size of 2×10⁻² which is so call coarse step size. It is
seen form Figure 3.10 that the results of the simulation using the time domain integration
method coincide well with the results of the frequency analysis. The simulation results
with the fine step size of 2×10⁻⁶ is closer to the results of the frequency analysis (the
solid curve) than those with the coarse step size of 2×10⁻². However, the simulation
results with the fine step size of 2×10⁻⁶ takes much more time than those with the coarse
step size of 2×10⁻². Therefore, the coarse step size is chosen in this study as the
simulation results with the coarse step size are good enough to verify those calculated
from the frequency analysis or equation derivation.
Figure 3.10: Harvested resonant power versus electrical load resistance with the fine
step size of 2×10⁻⁶.
It is seen from Figure 3.4 to Figure 3.9 that the variation of the base excitation
acceleration amplitude or the mechanical damping does not give a peak value of either
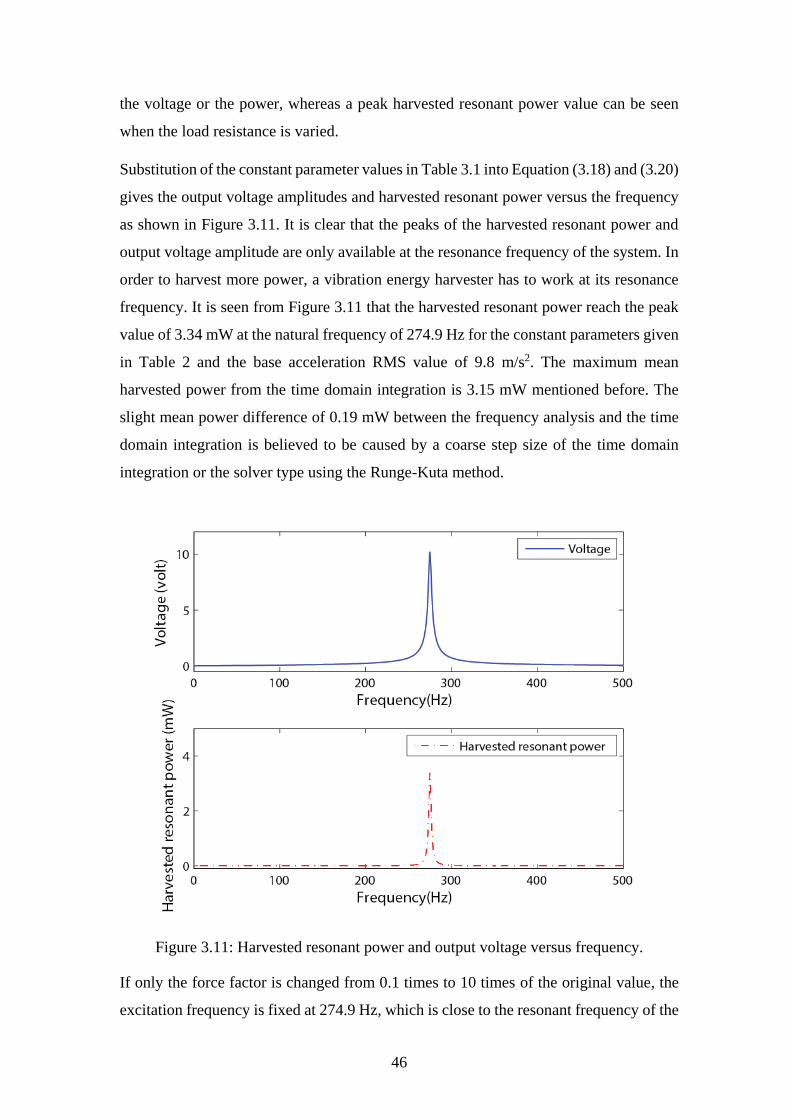
46
the voltage or the power, whereas a peak harvested resonant power value can be seen
when the load resistance is varied.
Substitution of the constant parameter values in Table 3.1 into Equation (3.18) and (3.20)
gives the output voltage amplitudes and harvested resonant power versus the frequency
as shown in Figure 3.11. It is clear that the peaks of the harvested resonant power and
output voltage amplitude are only available at the resonance frequency of the system. In
order to harvest more power, a vibration energy harvester has to work at its resonance
frequency. It is seen from Figure 3.11 that the harvested resonant power reach the peak
value of 3.34 mW at the natural frequency of 274.9 Hz for the constant parameters given
in Table 2 and the base acceleration RMS value of 9.8 m/s2. The maximum mean
harvested power from the time domain integration is 3.15 mW mentioned before. The
slight mean power difference of 0.19 mW between the frequency analysis and the time
domain integration is believed to be caused by a coarse step size of the time domain
integration or the solver type using the Runge-Kuta method.
Figure 3.11: Harvested resonant power and output voltage versus frequency.
If only the force factor is changed from 0.1 times to 10 times of the original value, the
excitation frequency is fixed at 274.9 Hz, which is close to the resonant frequency of the
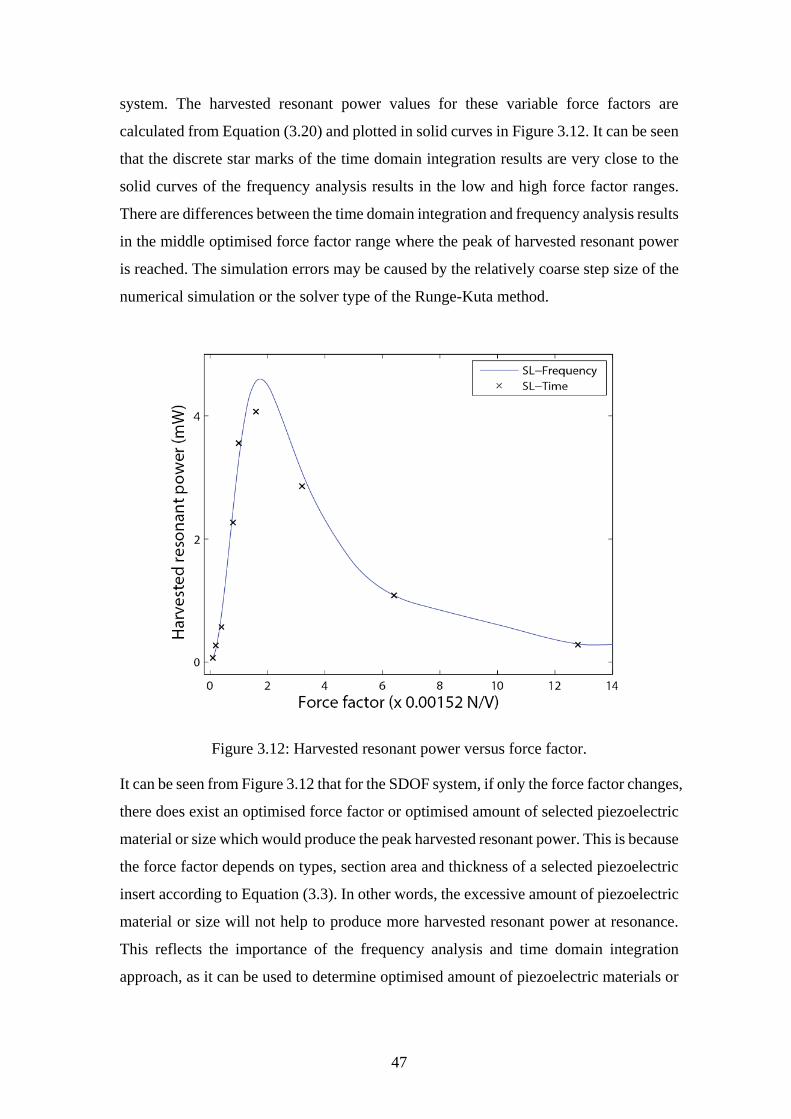
47
system. The harvested resonant power values for these variable force factors are
calculated from Equation (3.20) and plotted in solid curves in Figure 3.12. It can be seen
that the discrete star marks of the time domain integration results are very close to the
solid curves of the frequency analysis results in the low and high force factor ranges.
There are differences between the time domain integration and frequency analysis results
in the middle optimised force factor range where the peak of harvested resonant power
is reached. The simulation errors may be caused by the relatively coarse step size of the
numerical simulation or the solver type of the Runge-Kuta method.
Figure 3.12: Harvested resonant power versus force factor.
It can be seen from Figure 3.12 that for the SDOF system, if only the force factor changes,
there does exist an optimised force factor or optimised amount of selected piezoelectric
material or size which would produce the peak harvested resonant power. This is because
the force factor depends on types, section area and thickness of a selected piezoelectric
insert according to Equation (3.3). In other words, the excessive amount of piezoelectric
material or size will not help to produce more harvested resonant power at resonance.
This reflects the importance of the frequency analysis and time domain integration
approach, as it can be used to determine optimised amount of piezoelectric materials or
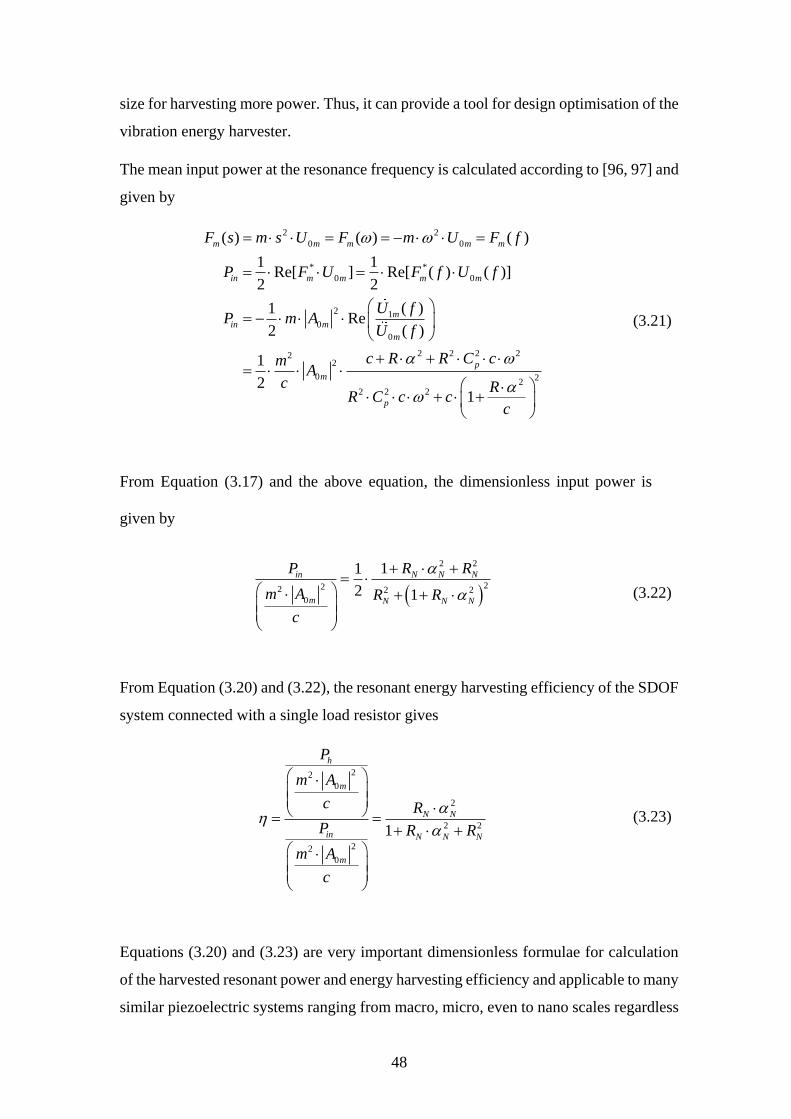
48
size for harvesting more power. Thus, it can provide a tool for design optimisation of the
vibration energy harvester.
The mean input power at the resonance frequency is calculated according to [96, 97] and
given by
2
0
* *
0 0
2
0
2
0
1
2 2 2 222
0 22
2
0
2 2
( ) ( ) ( )
1 1Re[ ] Re[ ( ) ( )]
2 2
( )1Re
2 ( )
1
21
m m m mm
in m m m m
in m
p
m
m
p
m
F s m s U F m U F f
P F U F f U f
U fP m A
U f
c R R C cmA
c RR C c c
c
(3.21)
From Equation (3.17) and the above equation, the dimensionless input power is
given by
2 2
222 2 2
0
11
2 1
in N N N
m N N N
P R R
m A R R
c
(3.22)
From Equation (3.20) and (3.22), the resonant energy harvesting efficiency of the SDOF
system connected with a single load resistor gives
22
0
2
2 2
22
0
1
h
m
N N
in N N N
m
P
m A
c R
P R R
m A
c
(3.23)
Equations (3.20) and (3.23) are very important dimensionless formulae for calculation
of the harvested resonant power and energy harvesting efficiency and applicable to many
similar piezoelectric systems ranging from macro, micro, even to nano scales regardless

49
of configurations, dimensions. For given normalised resistance and force factor, the
dimensionless harvested resonant power and energy harvesting efficiency of the systems
can be predicted.
If the normalised load resistance and force factor change from 0.0 to 10.0 in a step of
0.1, the dimensionless harvested resonant power as a function of the normalised
resistance and force factor can be plotted in Figure 3.13. It can be seen from Equation
(3.20) that when the normalised force factor and the normalised resistance tends to be
very large or zero, the dimensionless harvested resonant power tends to be zero. In the
specific example of the RC oscillation circuit at the resonance, if 1NR and 1N ,
then
22
0/ 0.1h
mm AP
c
. The dimensionless harvested resonant power is typically
about 0.1.
Figure 3.13: Dimensionless harvested resonant power versus normalised resistance and
normalised force factor for the SDOF system connected to a load resistor.
Using Equation (3.20) with only the normalised resistance being varied, in order to find
the peak value of the dimensionless harvested resonant power, the partial differential of
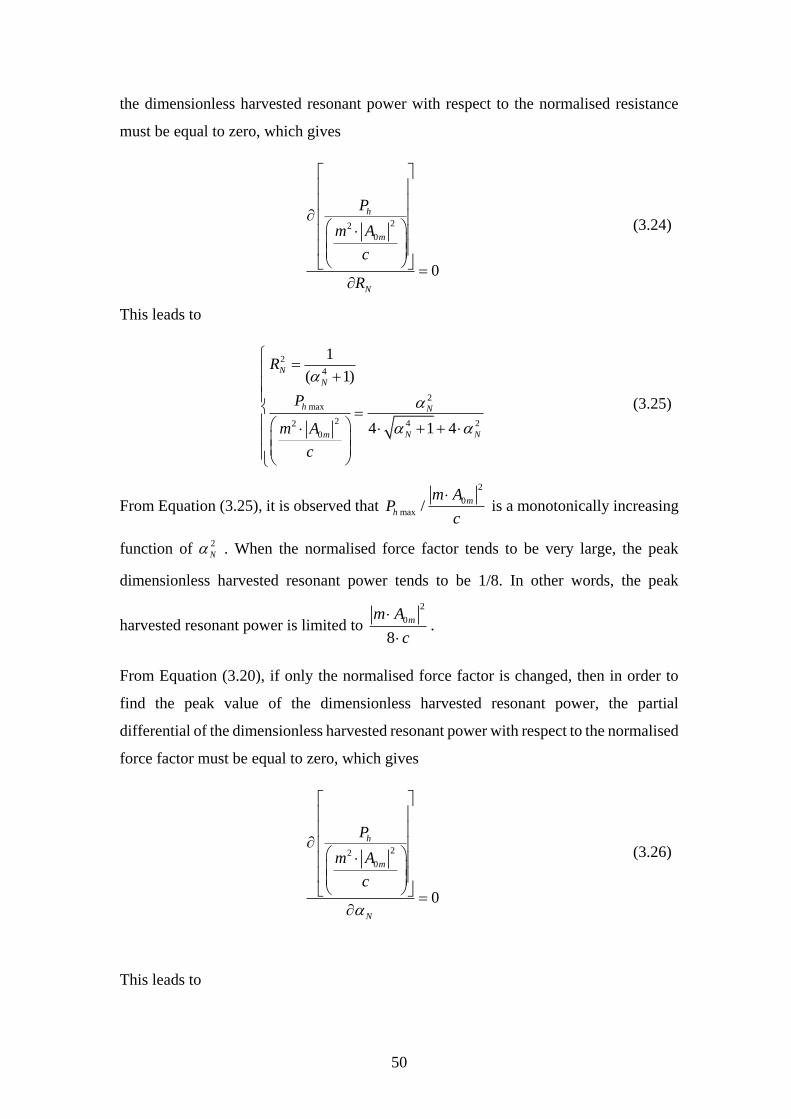
50
the dimensionless harvested resonant power with respect to the normalised resistance
must be equal to zero, which gives
22
0
0
h
m
N
P
m A
c
R
(3.24)
This leads to
2
4
2max
2 4 22
0
1
( 1)
4 1 4
N
N
h N
N Nm
R
P
m A
c
(3.25)
From Equation (3.25), it is observed that
2
0
max /m
h
m AP
c
is a monotonically increasing
function of 2
N . When the normalised force factor tends to be very large, the peak
dimensionless harvested resonant power tends to be 1/8. In other words, the peak
harvested resonant power is limited to
2
0
8
mm A
c
.
From Equation (3.20), if only the normalised force factor is changed, then in order to
find the peak value of the dimensionless harvested resonant power, the partial
differential of the dimensionless harvested resonant power with respect to the normalised
force factor must be equal to zero, which gives
22
0
0
h
m
N
P
m A
c
(3.26)
This leads to
51
24
2
max
2 22
0
(1 )
1
4 4 1
NN
N
h
Nm
R
R
P
Rm A
c
(3.27)
From Equation (3.27), it is observed that
2
0
max /m
h
m AP
c
is a monotonically decreasing
function of NR . When the normalised resistance tends to be zero, the peak dimensionless
harvested resonant power tends to be 1/8. In other words, the peak harvested resonant
power is limited to 0
2
mm A
8 c
. Under a small NR and substituting Equation (3.25) into
Equation (3.22) give the corresponding energy harvesting efficiency of 100%.
It is seen from Equations (3.25) and (3.27) that the peak harvested resonant power is
proportional to the squared magnitude of the applied force and inversely proportional to
the mechanical damping. It can be seen from Equation (3.20) that the partial differentials
of the dimensionless harvested resonant power with respect to mechanical damping are
not equal to zero. There does not exist a mechanical damping value of c , which produces
the peak harvested resonant power. This is shown by the results in Figure 3.7 where the
solid curves indicate that the harvested resonant power does not have any peak values.
There is no unique pair of normalised resistance and force factor which produces a peak
value of the dimensionless harvested resonant power across a full range of the two
variables. If variable range limits are specified for the normalised resistance and force
factor, the dimensionless harvested resonant power could reach its maximum value
within the range limits of the normalised resistance and force factor.
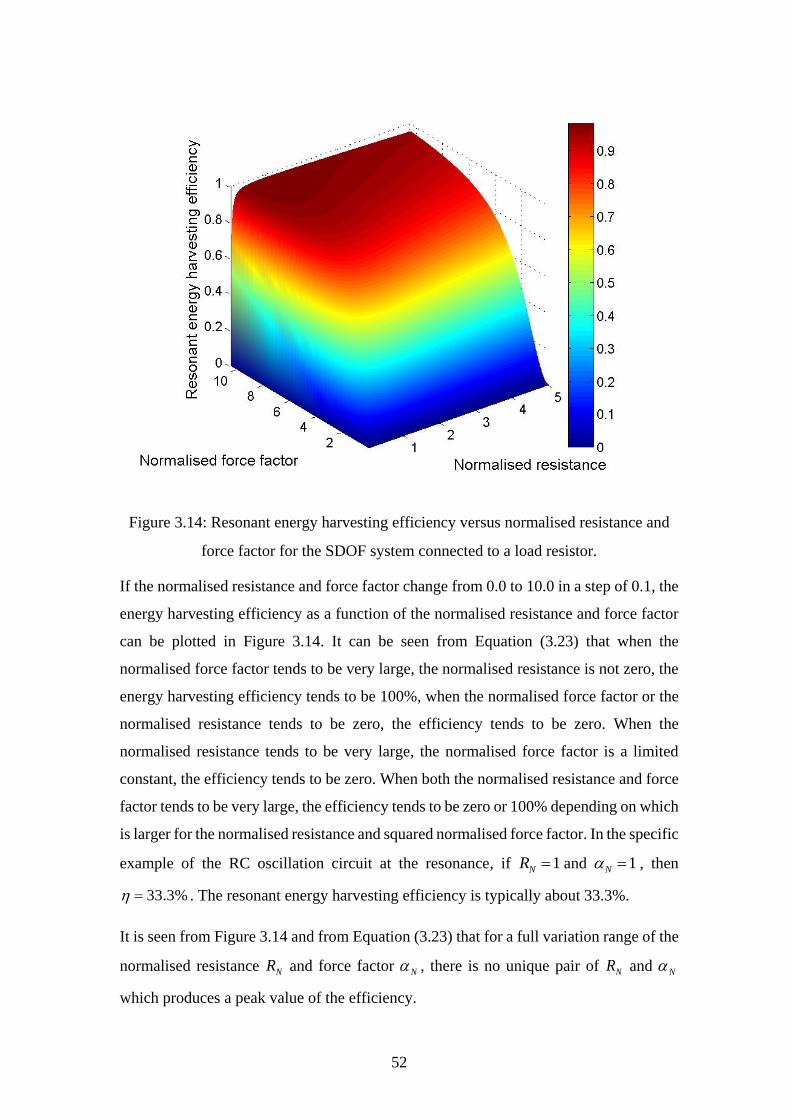
52
Figure 3.14: Resonant energy harvesting efficiency versus normalised resistance and
force factor for the SDOF system connected to a load resistor.
If the normalised resistance and force factor change from 0.0 to 10.0 in a step of 0.1, the
energy harvesting efficiency as a function of the normalised resistance and force factor
can be plotted in Figure 3.14. It can be seen from Equation (3.23) that when the
normalised force factor tends to be very large, the normalised resistance is not zero, the
energy harvesting efficiency tends to be 100%, when the normalised force factor or the
normalised resistance tends to be zero, the efficiency tends to be zero. When the
normalised resistance tends to be very large, the normalised force factor is a limited
constant, the efficiency tends to be zero. When both the normalised resistance and force
factor tends to be very large, the efficiency tends to be zero or 100% depending on which
is larger for the normalised resistance and squared normalised force factor. In the specific
example of the RC oscillation circuit at the resonance, if 1NR and 1N , then
33.3% . The resonant energy harvesting efficiency is typically about 33.3%.
It is seen from Figure 3.14 and from Equation (3.23) that for a full variation range of the
normalised resistance NR and force factor N , there is no unique pair of NR and N
which produces a peak value of the efficiency.
53
From Equation (3.23), if only the normalised resistance NR is changed, then in order to
find a peak value of the vibration energy harvesting efficiency, the partial differential of
the efficiency with respect to the normalised resistance NR must be set equal to zero,
which gives
0NR
(3.28)
which leads to
2
2
max 2
1
2
N
N
N
R
(3.29)
From Equation (3.29), it is observed that max is a monotonically increasing function of
2
N . As the 2
N tends to be very large, the peak energy harvesting efficiency tends to be
100%. In other words, the peak energy harvesting efficiency is limited to 100%.
From Equation (3.23), if only the normalised force factor is changed, it is observed that
the partial differential of the efficiency with respect to the normalised force factor is not
equal to zero, which means there does not exist a peak value of the resonant energy
harvesting efficiency when only the normalised force factor is changed.
The mean harvested resonant power can also be derived from Equations (3.20) and (3.23)
according to [96, 97] and given by
222
0 4 2 2 2
2 222
0 4 2 2 2
1
2 2 1
11
2 2 1
N Nh m
N N N N N
N N Nm
N N N N N
RmP A
c R R R
R RmA
c R R R
(3.30)
The mean input power can be derived from Equations (3.22) and (3.23) according to [96,
97] and given by
54
2 10
0
2 222
0 4 2 2 2
222
0 4 2 2 2
1Re
2
11
2 2 1
1 1
2 2 1
min m
m
N N Nm
N N N N N
N Nm
N N N N N
i UP m A
A
R RmA
c R R R
RmA
c R R R
(3.31)
This means for the SDOF system, given an excitation force amplitude and a mechanical
damping, input mechanical power and harvested resonant power depend on the resonant
energy harvesting efficiency, normalised resistance and normalised force factor. The
normalised resistance and force factor are related to the resistance, the resonance
frequency, blocking capacity and force factor of a piezoelectric insert.
Using Equation (3.31), the input power with and without a piezoelectric material insert
is considered. An equivalent damping reflecting the effect of the electrical load
resistance is given by
2
2 2
2
12
N N N
eq
N N
R Rc c
R
(3.32)
The coefficient in front of mechanical damping c in the RHS of Equation (3.32) reflects
the effect of modified system mechanical damping.
When the circuit is open, the coefficient becomes unity, the equivalent damping is equal
to the mechanical damping, and input power becomes the one of a mechanical system
without connection to the load resistor.
This SDOF vibration energy harvester with the constant vibration excitation magnitude
would be mainly applied to a machine or a vehicle at constant speeds to reduce vibration
similar to a dynamic absorber.
For example, a certain amount of selected piezoelectric material could be designed into
a harmonic balancer, thus converting a torsion vibration absorber into a vibration energy
harvester.
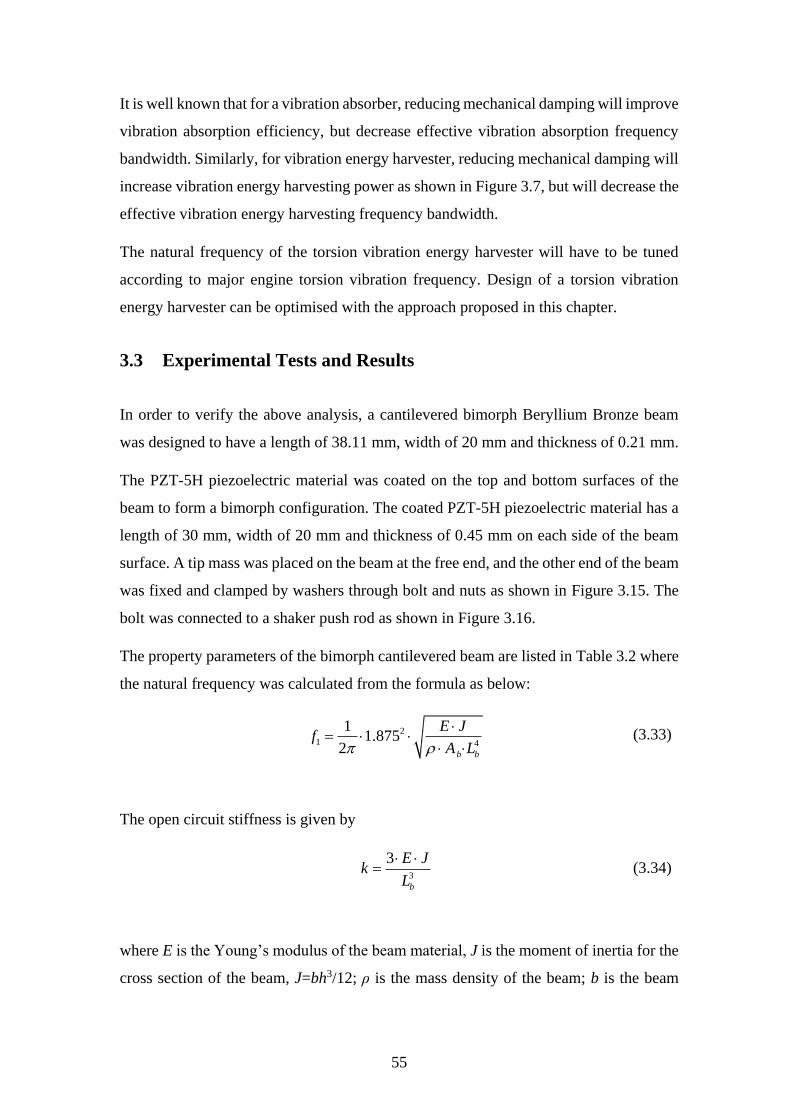
55
It is well known that for a vibration absorber, reducing mechanical damping will improve
vibration absorption efficiency, but decrease effective vibration absorption frequency
bandwidth. Similarly, for vibration energy harvester, reducing mechanical damping will
increase vibration energy harvesting power as shown in Figure 3.7, but will decrease the
effective vibration energy harvesting frequency bandwidth.
The natural frequency of the torsion vibration energy harvester will have to be tuned
according to major engine torsion vibration frequency. Design of a torsion vibration
energy harvester can be optimised with the approach proposed in this chapter.
3.3 Experimental Tests and Results
In order to verify the above analysis, a cantilevered bimorph Beryllium Bronze beam
was designed to have a length of 38.11 mm, width of 20 mm and thickness of 0.21 mm.
The PZT-5H piezoelectric material was coated on the top and bottom surfaces of the
beam to form a bimorph configuration. The coated PZT-5H piezoelectric material has a
length of 30 mm, width of 20 mm and thickness of 0.45 mm on each side of the beam
surface. A tip mass was placed on the beam at the free end, and the other end of the beam
was fixed and clamped by washers through bolt and nuts as shown in Figure 3.15. The
bolt was connected to a shaker push rod as shown in Figure 3.16.
The property parameters of the bimorph cantilevered beam are listed in Table 3.2 where
the natural frequency was calculated from the formula as below:
2
1 4
11.875
2 b b
E Jf
A L
(3.33)
The open circuit stiffness is given by
3
3
b
E Jk
L
(3.34)
where E is the Young’s modulus of the beam material, J is the moment of inertia for the
cross section of the beam, J=bh3/12; ρ is the mass density of the beam; b is the beam
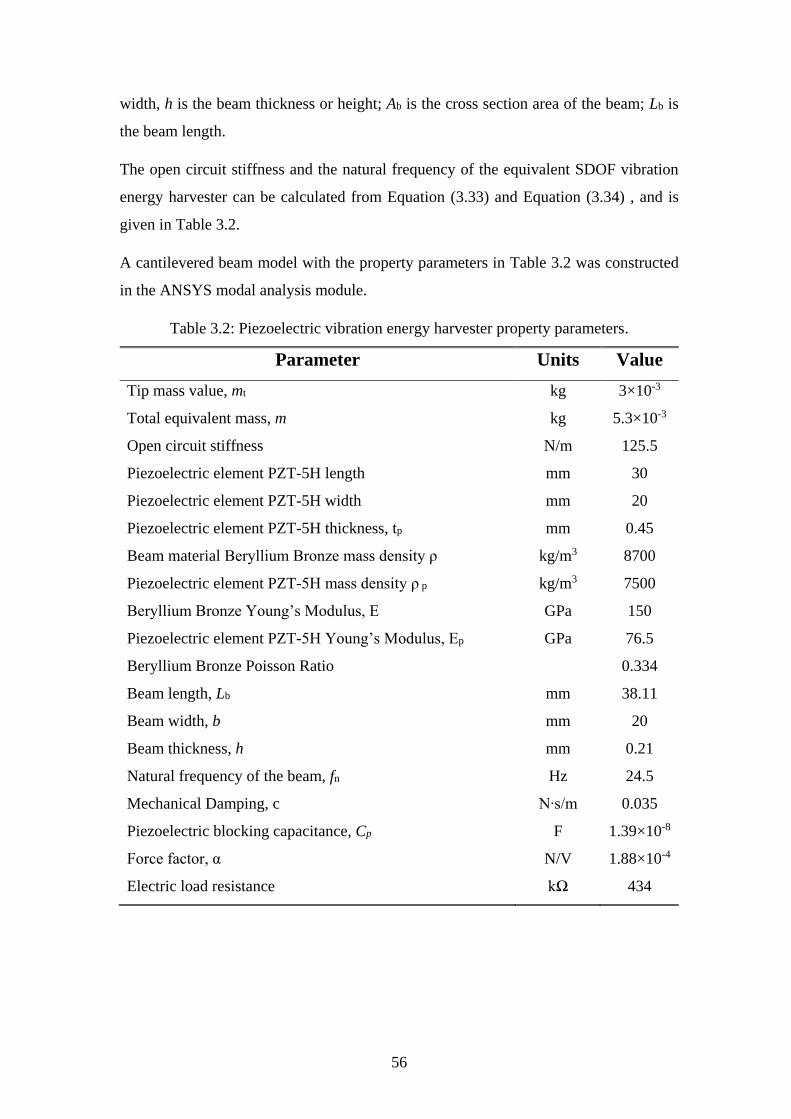
56
width, h is the beam thickness or height; Ab is the cross section area of the beam; Lb is
the beam length.
The open circuit stiffness and the natural frequency of the equivalent SDOF vibration
energy harvester can be calculated from Equation (3.33) and Equation (3.34) , and is
given in Table 3.2.
A cantilevered beam model with the property parameters in Table 3.2 was constructed
in the ANSYS modal analysis module.
Table 3.2: Piezoelectric vibration energy harvester property parameters.
Parameter Units Value
Tip mass value, mt kg 3×10⁻³
Total equivalent mass, m kg 5.3×10⁻³
Open circuit stiffness N/m 125.5
Piezoelectric element PZT-5H length mm 30
Piezoelectric element PZT-5H width mm 20
Piezoelectric element PZT-5H thickness, tp mm 0.45
Beam material Beryllium Bronze mass density ρ kg/m3 8700
Piezoelectric element PZT-5H mass density ρ p kg/m3 7500
Beryllium Bronze Young’s Modulus, E GPa 150
Piezoelectric element PZT-5H Young’s Modulus, Ep GPa 76.5
Beryllium Bronze Poisson Ratio 0.334
Beam length, Lb mm 38.11
Beam width, b mm 20
Beam thickness, h mm 0.21
Natural frequency of the beam, fn Hz 24.5
Mechanical Damping, c N∙s/m 0.035
Piezoelectric blocking capacitance, Cp F 1.39×10⁻⁸
Force factor, α N/V 1.88×10⁻⁴
Electric load resistance kΩ 434

57
Figure 3.15: A cantilevered bimorph beam clamped by washers with a nut mass glued
at the free end.
The first modal natural frequency was obtained to be 26.192 Hz, which is slightly
different from the calculated value of 24.5 Hz given in Table 3.2. The difference may be
caused by the simplification of the bimorph beam structure into a cantilevered beam of
mono Beryllium Bronze material of the same thickness.
Figure 3.16: The bimorph cantilevered beam set up on the shaker for lab testing.
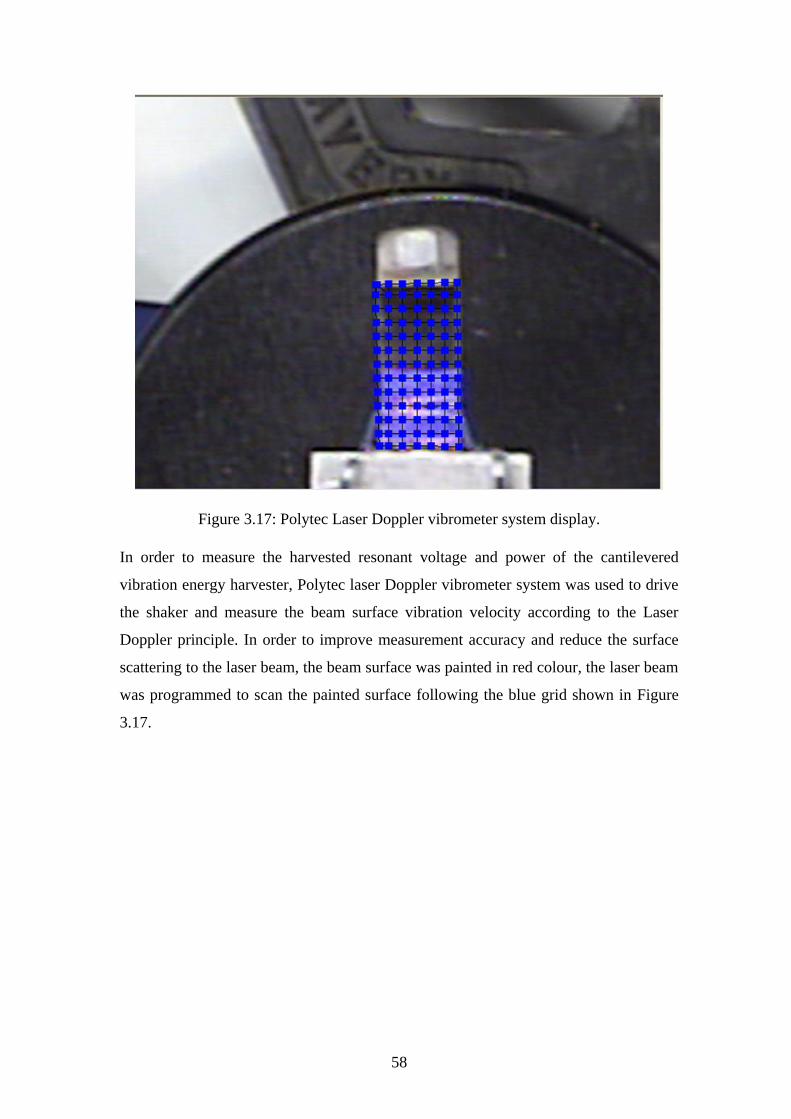
58
Figure 3.17: Polytec Laser Doppler vibrometer system display.
In order to measure the harvested resonant voltage and power of the cantilevered
vibration energy harvester, Polytec laser Doppler vibrometer system was used to drive
the shaker and measure the beam surface vibration velocity according to the Laser
Doppler principle. In order to improve measurement accuracy and reduce the surface
scattering to the laser beam, the beam surface was painted in red colour, the laser beam
was programmed to scan the painted surface following the blue grid shown in Figure
3.17.
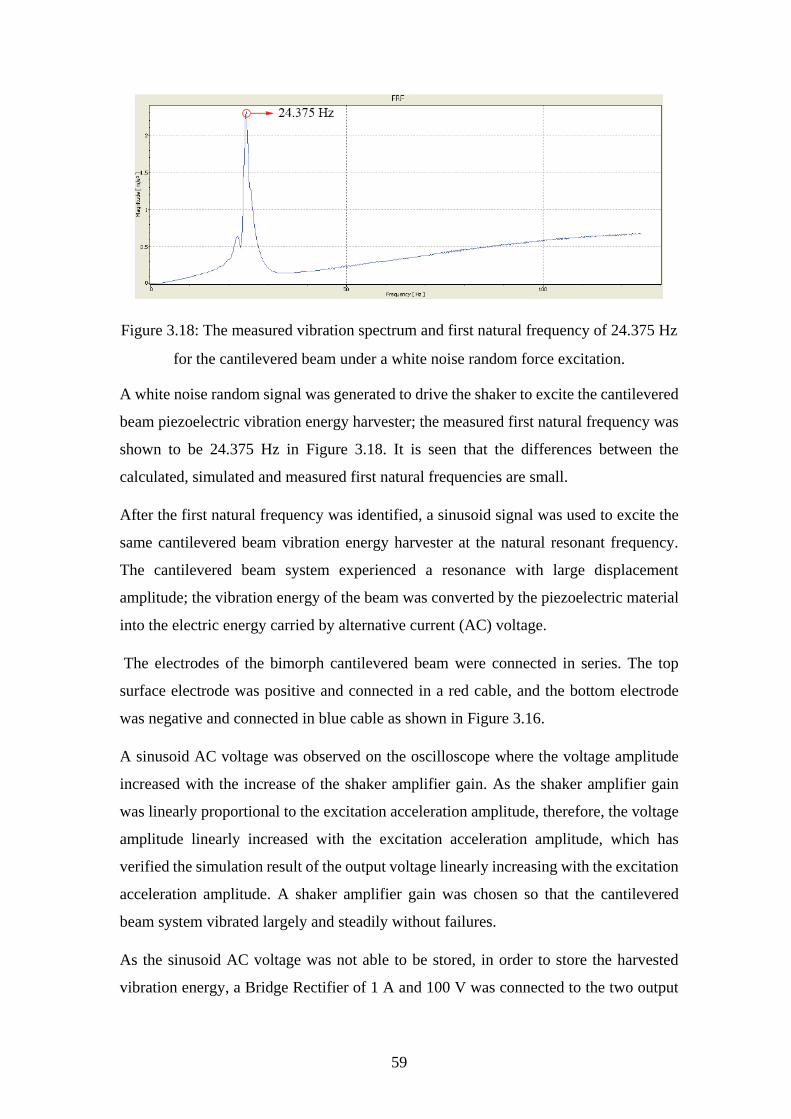
59
Figure 3.18: The measured vibration spectrum and first natural frequency of 24.375 Hz
for the cantilevered beam under a white noise random force excitation.
A white noise random signal was generated to drive the shaker to excite the cantilevered
beam piezoelectric vibration energy harvester; the measured first natural frequency was
shown to be 24.375 Hz in Figure 3.18. It is seen that the differences between the
calculated, simulated and measured first natural frequencies are small.
After the first natural frequency was identified, a sinusoid signal was used to excite the
same cantilevered beam vibration energy harvester at the natural resonant frequency.
The cantilevered beam system experienced a resonance with large displacement
amplitude; the vibration energy of the beam was converted by the piezoelectric material
into the electric energy carried by alternative current (AC) voltage.
The electrodes of the bimorph cantilevered beam were connected in series. The top
surface electrode was positive and connected in a red cable, and the bottom electrode
was negative and connected in blue cable as shown in Figure 3.16.
A sinusoid AC voltage was observed on the oscilloscope where the voltage amplitude
increased with the increase of the shaker amplifier gain. As the shaker amplifier gain
was linearly proportional to the excitation acceleration amplitude, therefore, the voltage
amplitude linearly increased with the excitation acceleration amplitude, which has
verified the simulation result of the output voltage linearly increasing with the excitation
acceleration amplitude. A shaker amplifier gain was chosen so that the cantilevered
beam system vibrated largely and steadily without failures.
As the sinusoid AC voltage was not able to be stored, in order to store the harvested
vibration energy, a Bridge Rectifier of 1 A and 100 V was connected to the two output
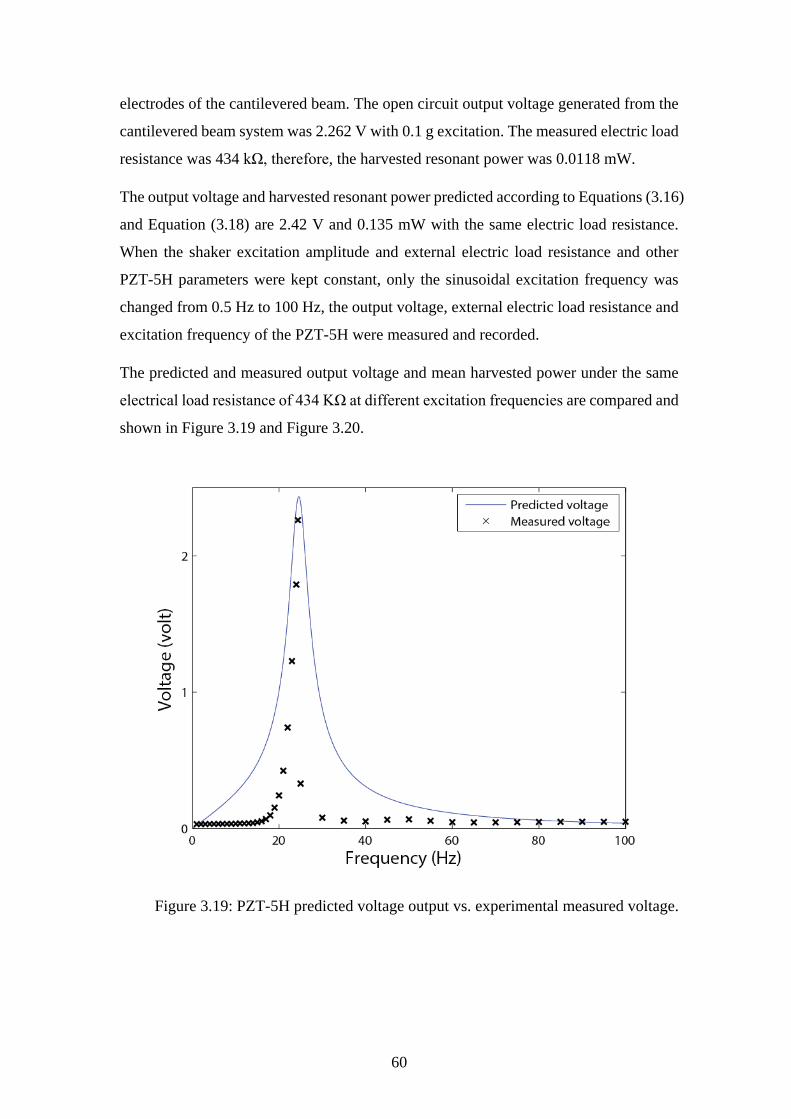
60
electrodes of the cantilevered beam. The open circuit output voltage generated from the
cantilevered beam system was 2.262 V with 0.1 g excitation. The measured electric load
resistance was 434 kΩ, therefore, the harvested resonant power was 0.0118 mW.
The output voltage and harvested resonant power predicted according to Equations (3.16)
and Equation (3.18) are 2.42 V and 0.135 mW with the same electric load resistance.
When the shaker excitation amplitude and external electric load resistance and other
PZT-5H parameters were kept constant, only the sinusoidal excitation frequency was
changed from 0.5 Hz to 100 Hz, the output voltage, external electric load resistance and
excitation frequency of the PZT-5H were measured and recorded.
The predicted and measured output voltage and mean harvested power under the same
electrical load resistance of 434 KΩ at different excitation frequencies are compared and
shown in Figure 3.19 and Figure 3.20.
Figure 3.19: PZT-5H predicted voltage output vs. experimental measured voltage.
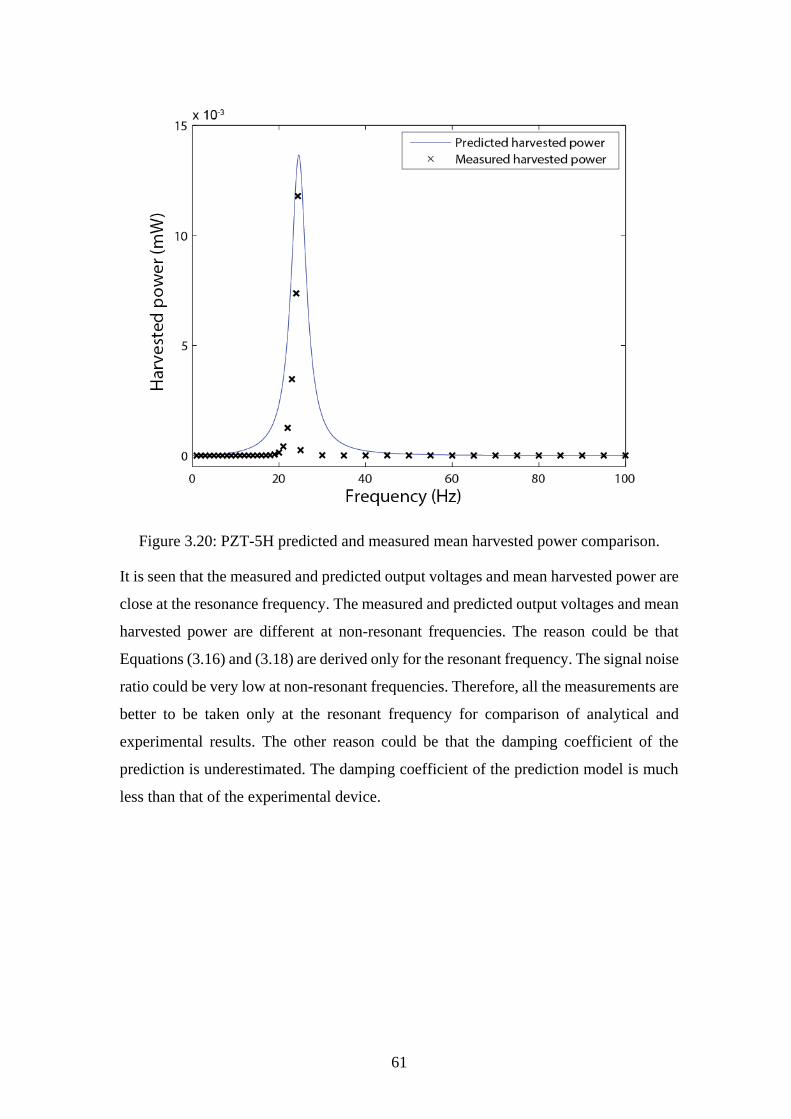
61
Figure 3.20: PZT-5H predicted and measured mean harvested power comparison.
It is seen that the measured and predicted output voltages and mean harvested power are
close at the resonance frequency. The measured and predicted output voltages and mean
harvested power are different at non-resonant frequencies. The reason could be that
Equations (3.16) and (3.18) are derived only for the resonant frequency. The signal noise
ratio could be very low at non-resonant frequencies. Therefore, all the measurements are
better to be taken only at the resonant frequency for comparison of analytical and
experimental results. The other reason could be that the damping coefficient of the
prediction is underestimated. The damping coefficient of the prediction model is much
less than that of the experimental device.

62
Figure 3.21: PZT-5H predicted and measured resonant output voltage comparison for
variation of external electric load resistance.
When the excitation frequency was fixed at the resonant frequency of 24.375 Hz, the
excitation amplitude was fixed at 0.1g and other PZT-5H parameters were kept constant,
only the external electric load resistance was changed from 434 k to 10 M, the output
voltage and external electric load resistance of the PZT-5H were measured and recorded.
The predicted and measured resonant output voltage under different external load
resistances are compared and shown in Figure 3.21. It is seen that the measured output
voltage at the resonant frequency is very close to the predicted output voltage under
different external load resistances.
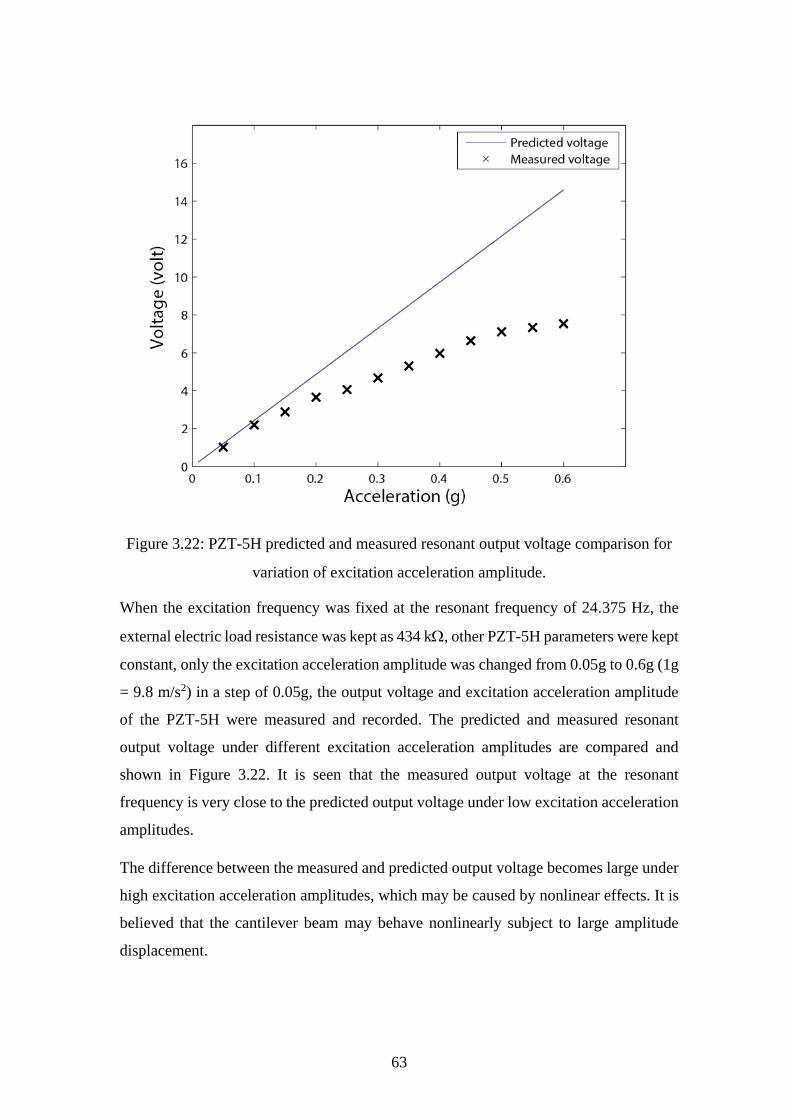
63
Figure 3.22: PZT-5H predicted and measured resonant output voltage comparison for
variation of excitation acceleration amplitude.
When the excitation frequency was fixed at the resonant frequency of 24.375 Hz, the
external electric load resistance was kept as 434 k, other PZT-5H parameters were kept
constant, only the excitation acceleration amplitude was changed from 0.05g to 0.6g (1g
= 9.8 m/s2) in a step of 0.05g, the output voltage and excitation acceleration amplitude
of the PZT-5H were measured and recorded. The predicted and measured resonant
output voltage under different excitation acceleration amplitudes are compared and
shown in Figure 3.22. It is seen that the measured output voltage at the resonant
frequency is very close to the predicted output voltage under low excitation acceleration
amplitudes.
The difference between the measured and predicted output voltage becomes large under
high excitation acceleration amplitudes, which may be caused by nonlinear effects. It is
believed that the cantilever beam may behave nonlinearly subject to large amplitude
displacement.
64
From comparison of the predicted and measured output voltage and mean harvested
power for variation of either the excitation frequencies, or the external electric load
resistances or the excitation acceleration amplitudes, it is seen that the theoretical
prediction results are very close to those of the experimental measurement. Therefore,
the experimental measurement has verified the theoretical prediction and analysis with
in ±8%.
3.4 Conclusion
Based on the Laplace and Fourier transfer method, a hybrid approach combining time
domain integration with frequency analysis has been proposed and illustrated in this
chapter. A SDOF vibration energy harvester connected to a single load resistor has been
analysed and investigated. The following conclusions have been reached:
By defining a normalised resistance and a normalised force factor, the harvested resonant
power and energy harvesting efficiency for a SDOF system connected to a load resistor
has been expressed in a dimensionless form. The dimensionless harvested resonant
power and resonant energy harvesting efficiency are extremely useful for evaluation of
performance of many similar vibration energy harvesters ranging from macro to micro,
even to nano scales. The most significant outcomes of this research are presented in
Figure 3.13 and Figure 3.14 which were plotted from Equation (3.20) and (3.23). The
dimensionless harvested resonant power and energy harvesting efficiency only depend
on the system resonance frequency, mechanical damping, load resistance, force factor
and blocking capacitance of the piezoelectric insert, and are independent of the
dimension of the harvesters.
If the variable ranges of the normalised resistance and force factor are not limited, it is
impossible to obtain a peak dimensionless harvested resonant power and peak energy
harvesting efficiency at one pair of the optimal normalised resistance and force factor.
If the variation limits of the normalised resistance and force factor are given, the
dimensionless harvested resonant power and energy harvesting efficiency may reach
their maximum values within the range limits of the normalised resistance and force
factor. If the normalised force factor is kept constant while the normalised resistance is
varied, the peak dimensionless harvested resonant power and the peak energy harvesting
efficiency occur at different normalised resistances.

65
If only the normalised force factor changes, there exists an optimised normalised force
factor for the SDOF system to reach a peak dimensionless harvested resonant power.
Also, only an optimised amount of piezoelectric material or size would produce the
maximum harvested resonant power. Excessive or under the amount of piezoelectric
material insert or size would decrease harvested resonant power. The proposed hybrid
approaches can be used to determine optimised amount of piezoelectric material or size
for harvesting more power. It acts as a tool for design optimisation of the vibration
energy harvester.
The peak harvested resonant power is limited to the squared magnitude of the applied
force divided by eight times of the mechanical damping.
As the mechanical damping increases, the output voltage and harvested resonant power
decrease. There is no peak value of the output voltage and harvested resonant power if
only the mechanical damping is unlimitedly varied. The piezoelectric material and the
resistance would add extra equivalent mechanical damping into the system in a form of
electrical shunting damping, which reduces the harvested resonant power from the
switching off to the switching on status of the load resistor.
If only the resistance is unlimitedly varied, there exists an optimised resistance for the
SDOF system to reach a peak harvested resonant power. This optimised resistance is
related to the electrical impedance matching of the piezoelectric material insert and the
external load.
As the base excitation acceleration increases, the output voltage and harvested resonant
power increase. There is no peak output voltage and harvested resonant power if only
the base excitation acceleration is unlimitedly varied.
The time domain integration results have well verified the frequency domain analysis
results; there are some discrepancies of the peak mean harvested power when the
resistance or the force factor is varied. The simulation errors could be caused by coarse
numerical step sizes or by the selected solver type of the Runge-Kuta method. This has
been illustrated in Figure 3.10.
66
Single Degree-of-freedom
Piezoelectric Vibration Energy
Harvester with Interface Circuits
In Chapter 3, both the harvested resonant power and the energy harvesting efficiency
have been studied based on a single degree-of-freedom weak electromechanical
coupling piezoelectric vibration energy harvester and have been normalised in a
dimensionless form. The main motivation behind this study is that the conversion of
mechanical vibration energy into electric energy could provide reliable and efficient
energy utilisation. Before the harvested energy can be used or stored, it requires
interface circuits for conversion. In this chapter, the performance optimisations of single
degree-of-freedom piezoelectric vibration energy harvester connected with four
different interface circuits have been conducted in terms of normalised harvested
resonant power and resonant energy harvesting efficiency to identify both qualitatively
and quantitatively the optimum energy extraction and storage interface circuit.
4.1 Introduction
Harvesting power from the environment is an attractive alternative to battery-operated
systems, especially for the long-term, low-power and self-sustaining electronic systems.
In addition to the energy generation apparatus, interface circuits are indispensable
elements in these energy harvesting systems to control and regulate the flows of
energy. Various different electric energy extraction and storage interface circuits have
been studied in the literatures to enhance the mean harvested power outputs of the energy
harvesters. These studies cover the following aspects: such as optimised power outputs
[37, 47, 66, 98-101], dimensionless power and energy efficiency investigations [31, 95,
102], single load resistor interface circuits [59, 103-106], standard interface circuits [42,
66, 95, 98, 107-114], synchronous electric charge extraction (SECE) interface circuits
[26, 115, 116], series or parallel ‘synchronous switch harvesting on inductor’ (SSHI)
circuits[103, 106, 108, 116, 117]. Among the abovementioned research papers, most of
these have discussed the optimisations of mean harvested power with the standard

67
interface circuits while issues of energy harvesting efficiency and dimensionless
analyses have only been addressed in limited studies.
However, none of them has simultaneously normalised and optimised both ‘harvested
resonant power’ and ‘energy harvesting efficiency’. Furthermore, none has used the
normalised resistance and normalised force factor in their analyses for optimised
harvested resonant power and energy harvesting efficiency. Previously, most reports
have focused on optimised power generation related only to electrical components. This
chapter adds the mechanical components in the analysis by using the force factor as an
optimisation element, as both electrical and mechanical components are critically related
to the harvested resonant power and efficiency. Since the normalised energy harvesting
efficiency provides important design guidelines for vibration-based energy harvesting
systems, dimensionless analyses and optimisations are the focuses of this chapter.
4.2 Dimensionless analysis of SDOF piezoelectric vibration energy
harvesters connected with energy extraction and storage circuits
Four types of energy extraction and storage circuits are commonly employed for energy
harvesting devices in the literatures: the standard energy extraction and storage interface
circuit as shown in Figure 4.1(a), the synchronous electric charge extraction (SECE)
circuit as shown in Figure 4.1(b), the parallel synchronous switch harvesting on inductor
(parallel SSHI) circuit as shown in Figure 4.1(c), and the series synchronous switch
harvesting on inductor (series SSHI) circuit as shown in Figure 4.1(d).
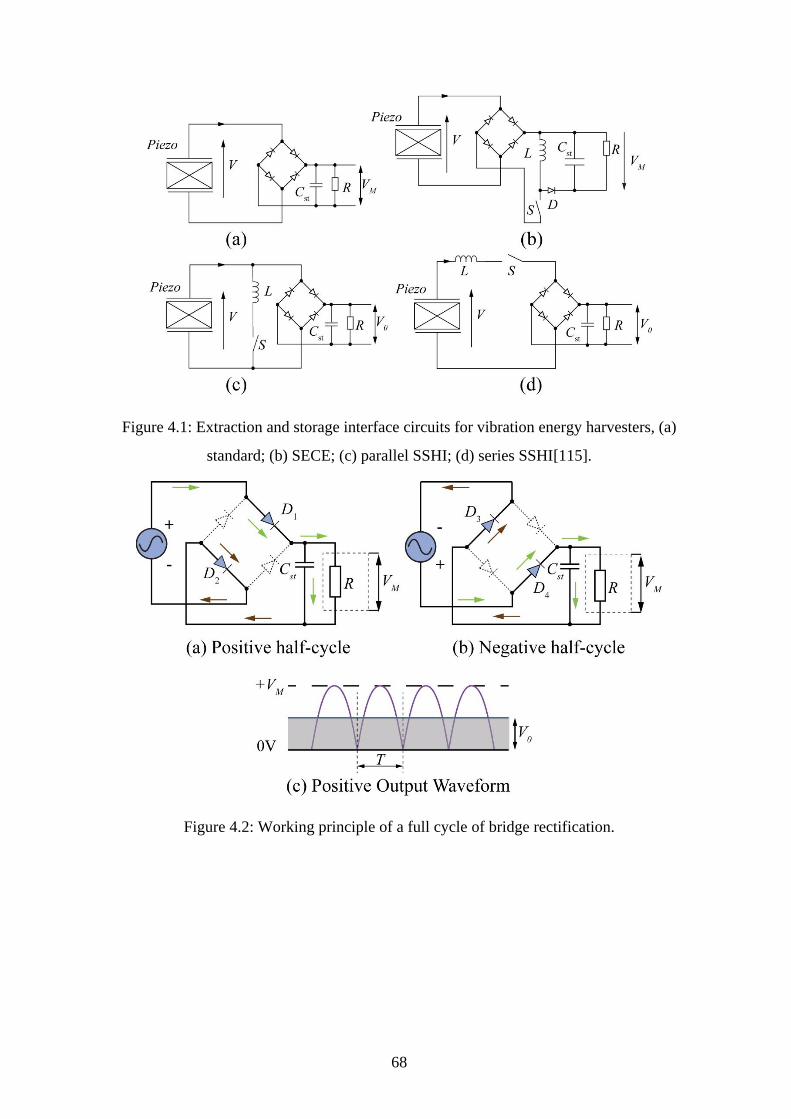
68
Figure 4.1: Extraction and storage interface circuits for vibration energy harvesters, (a)
standard; (b) SECE; (c) parallel SSHI; (d) series SSHI[115].
Figure 4.2: Working principle of a full cycle of bridge rectification.
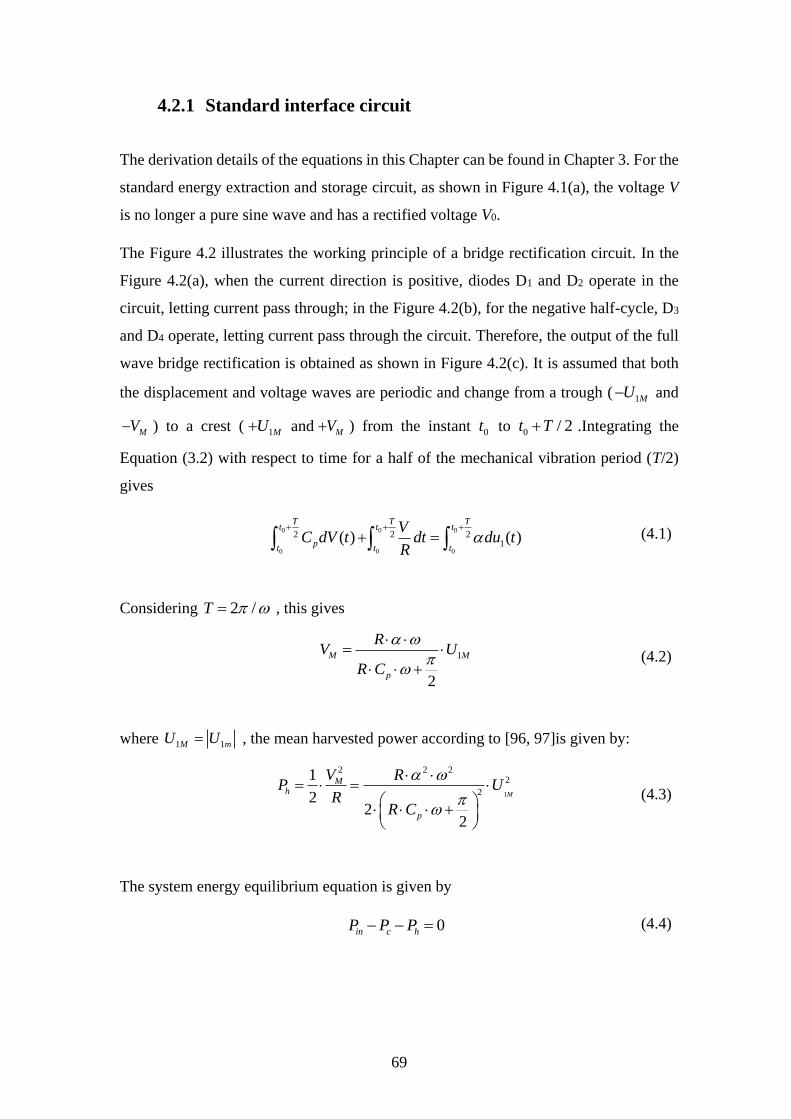
69
4.2.1 Standard interface circuit
The derivation details of the equations in this Chapter can be found in Chapter 3. For the
standard energy extraction and storage circuit, as shown in Figure 4.1(a), the voltage V
is no longer a pure sine wave and has a rectified voltage V0.
The Figure 4.2 illustrates the working principle of a bridge rectification circuit. In the
Figure 4.2(a), when the current direction is positive, diodes D1 and D2 operate in the
circuit, letting current pass through; in the Figure 4.2(b), for the negative half-cycle, D3
and D4 operate, letting current pass through the circuit. Therefore, the output of the full
wave bridge rectification is obtained as shown in Figure 4.2(c). It is assumed that both
the displacement and voltage waves are periodic and change from a trough ( 1MU and
MV ) to a crest ( 1MU and MV ) from the instant 0t to 0 / 2t T .Integrating the
Equation (3.2) with respect to time for a half of the mechanical vibration period (T/2)
gives
0 0 0
0 0 0
2 2 21( ) ( )
T T Tt t t
t t tp
VC dV t dt du t
R
(4.1)
Considering 2 /T , this gives
1
2
M M
p
RU
R C
V
(4.2)
where 1 1M mU U , the mean harvested power according to [96, 97]is given by:
1
2 2 22
2
1
2
22
Mh
p
M RU
RR C
VP
(4.3)
The system energy equilibrium equation is given by
0ci hnP P P
(4.4)
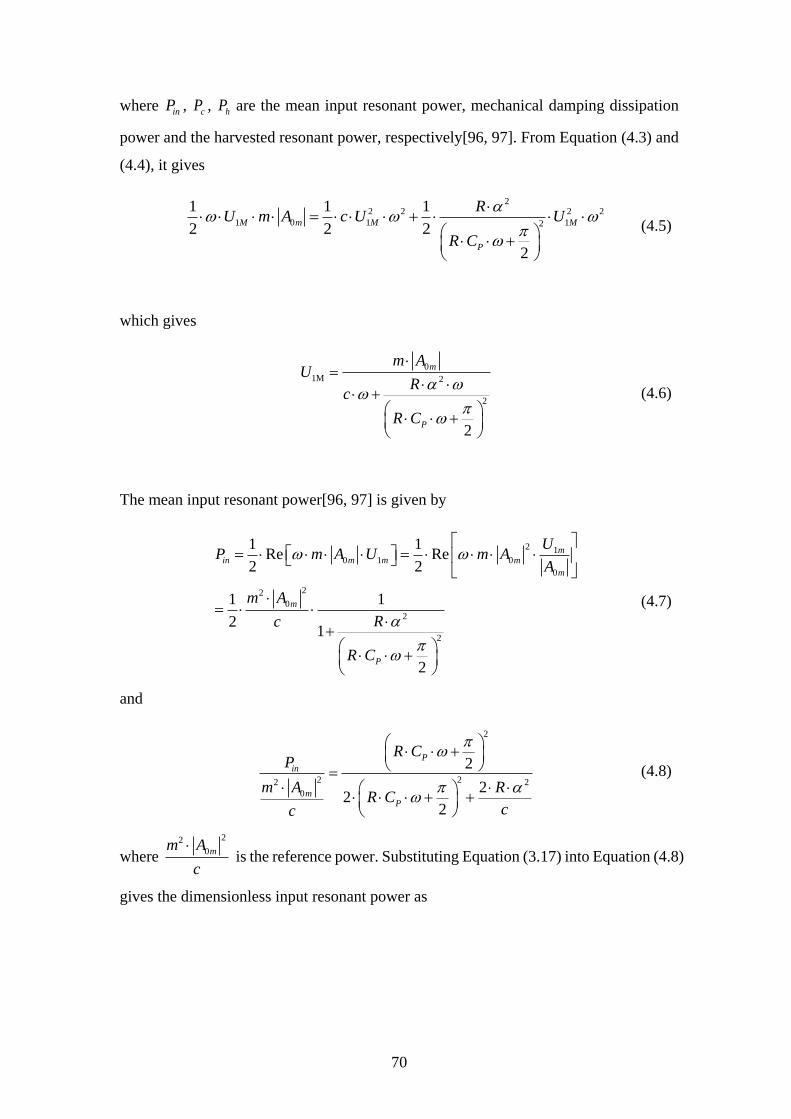
70
where inP , cP , hP are the mean input resonant power, mechanical damping dissipation
power and the harvested resonant power, respectively[96, 97]. From Equation (4.3) and
(4.4), it gives
22 2 2 2
1 1 120
1 1 1
2 2 2
2
M M M
P
m
RU m U U
R C
A c
(4.5)
which gives
0
1M 2
2
2
m
P
m
c
R C
AU
R
(4.6)
The mean input resonant power[96, 97] is given by
0 0
0
0
2 11
22
2
2
Re Re1 1
2 2
1
2
1 1
2
mm m m
m
m
in
P
UP m U m
m
R
R C
A AA
A
c
(4.7)
and
2
2 22 2
0
2
22
2
P
m
in
P
R CP
m RR C
A
cc
(4.8)
where 0
22
mm A
c
is the reference power. Substituting Equation (3.17) into Equation (4.8)
gives the dimensionless input resonant power as
71
2
0
2 222
2
2 22
N
in
N N Nm
RP
mR
AR
c
(4.9)
Substituting the Equation (4.6) into Equation (4.3) gives
22
2
2 2
2
0
2
2
2
2
1
2
1
m
h
P
P
m
RP
R C
R
cR
R C
A
c
(4.10)
From Equation (3.17), this gives the dimensionless harvested resonant power as
2
2
2 22 20 2
2
22
N N N
h
N N N
mA
R RP
mR R
c
(4.11)
The harvesting efficiency of the standard interface circuit at the resonance frequency is
derived from Equation (4.9) and Equation (4.11), and is given by
2
2
2
2
h N N
in
N N N
P R
PR R
(4.12)
In order to find the peak efficiency, the partial differential of the efficiency with respect
to the normalised resistance must be zero, which gives
2
max max2
2
, when , 12
N
NN
N
R
(4.13)
72
If the variation ranges of the normalised resistance and force factor are not limited, there
are no peak values of the efficiency. When the normalised force factor tends to a very
large value while the normalised resistance is kept constant, the efficiency will be 100%.
When the normalised resistance tends to a very large value, or when the normalised force
factor tends to zero, while the normalised resistance is kept constant, the efficiency tends
to zero. There is a special case of 2
N NR constant, where when the normalised force
factor tends to a very large value while the normalised resistance tends to a very small
value, the efficiency tends to a fixed constant value.
4.2.2 Synchronous electric charge extraction circuit
For the synchronous electric charge extraction (SECE) circuit as shown in Figure 4.1(b),
the charge extraction phase occurs when the electronic switch S is closed; the electrical
energy stored on the blocking capacitor Cp is then transferred into the inductor L. The
extraction instantare are triggered on the minima and maxima of the displacement u1,
synchronously with the mechanical vibration. The inductor L is chosen to get a charge
extraction phase duration much shorter than the vibration period. Apart from the
extraction phases, the rectifier is blocked and the outgoing current I is null. In this open
circuit condition, the mechanical velocity is related to the voltage by
1( ) ( )pt C V tu
(4.14)
Integration of Equation (4.14) with respect to time for the period between 0t to 0 / 2t T
gives
0 0
0 0
2 21( ) ( )
T
pt t
Tt t
tu dt C V t dt
(4.15)
This gives
1M M
p
V UC
(4.16)
The mean harvested resonant power[96, 97] is then given by

73
2 2
2
1
21 1
2 2
Mh
M
p
V UP
R R C
(4.17)
From Equation (4.4) and (4.17), the system energy equilibrium equation is given by
2 2
2 211 120
1 1 1
2 2 2
MM m M
p
UU m U
R CA c
(4.18)
Therefore, the relationship between vibration displacement amplitude and the excitation
force amplitude is derived, and given by
0
1 2M
2
m
p
Am
cC
U
R
(4.19)
The mean input resonant power[96, 97] is then given by
2
1M
0
0 2
2
1 1Re
2 2
m
min
p
mm
R C
AP A U
c
(4.20)
Moreover, the dimensionless mean input resonant power is given by
0
2 2
2 2
1 1
12
in
p
m
P
m A
c c R C
(4.21)
where 0
2
mm A
c
is the reference power, substituting Equation (3.17) into (4.21) gives
the normalised dimensionless input resonant power as:
0
2 2
1
2 N Nm
in NP
m
R
RA
c
(4.22)

74
From the Equation (4.17) and (4.19), the dimensionless harvested resonant power is then
given by
2
2
2 2
20
2 2
21
1 1
2
h
p
p
mc R C
P
A
c
m
c R C
(4.23)
Substituting Equation (3.17) into (4.23) gives the normalised dimensionless harvested
resonant power by
2
2
0
22
1
2
h N N
Nm N
P R
A R
c
m
(4.24)
The harvesting efficiency of the SECE circuit at the resonance frequency is derived from
the Equation (4.22) and (4.24), and is given by
2
2
N
N NR
(4.25)
If the variation ranges of the normalised resistance and force factor are not limited, there
are no peak values of the efficiency; however, there exists
max
0 or
1
N NR
(4.26)
When the normalised resistance is equal to zero or the normalised force factor tends to
a very large value, the efficiency will be 100%. When the normalised force factor tends
to zero, or the normalised resistance tends to a very large value, the efficiency tends to
zero.
75
4.2.3 Parallel switch harvesting on inductor circuit
For a parallel switch harvesting on inductor (parallel SSHI) circuit as shown in Figure
4.1(c), the inductor L is in series connected with an electronic switch S, and both the
inductor and the electronic switch are connected in parallel with the piezoelectric
element electrodes and the diode rectifier bridge. A small part of the energy may also be
dissipated in the mechanical system. The inversion losses are modelled by the electrical
quality factor Qi of the electrical oscillator. The relation between Qi and the voltage of
the piezoelectric element before and after the inversion process representing by VM and
V0, respectively, and is given by
2
0i
M
QV V e
(4.27)
The electric charge received by the terminal load equivalent resistor R during a half
mechanical period / 2T is calculated by
0 0
0 0
2 2 0( ) ( )2
T Tt t
St t
V TI t dt tI dt
R
(4.28)
The second integral on the left-hand side (LHS) of the Equation (4.28) corresponds to
the charge stored on the capacitor Cp before the voltage inversion plus the charge stored
on Cp after the inversion, whose expression is given by
0
0
20
2( ) 1 i
tT
Q
S pt
I t dt V eC
(4.29)
The piezoelectric outgoing current is integrated by
0 0 0
0 0 0
2 2 21( ) ( )
t t t
pt t t
T T T
I t dt t du C dVt
(4.30)
Substituting the Equation (4.29) and (4.30) into (4.28) gives
76
0 0
0 01
2 2 02
0( ) 12
i
T TQ
t t
p pt t
V Tt dt V e
Ru C dV C
(4.31)
Under a harmonic base excitation, it is assumed that both the displacement and voltage
waves are periodic and change from a trough ( 1MU and MV ) to a crest ( 1MU and MV )
from the instant 0t to 0 / 2t T . The Equation (4.31) becomes
01
2
0 12
2 i
M p
Q VVU C
Te
R
(4.32)
This leads to the expression of the load voltage V0 as a function of the displacement
amplitude U1M given by
2
1
1
2
i
M
Q
M
p
U R
C R
V
e
(4.33)
The mean harvested resonant power[96, 97] is then given by
2
0
2
2 2 2
1
2
1
2
1
4
iQ
Mh
p
R U
C R
VP
R
e
(4.34)
From Equation (4.4) and (4.34), the system energy equilibrium equation is given by
2 2 22 21
1 120
2
1 1 1
2 2 2
1
4
i
MM M
p
m
Q
R Um UA U c
eC R
(4.35)
From the Equation (4.35), the relationship between the vibration displacement amplitude
and the excitation force amplitude is established as
77
1 2
0
2
2
4
1 i
M
p
m
Q
AU
c
e
m
R
C R
(4.36)
From the Equation (3.17) and (4.36), the mean input resonant power [96, 97]is given by
0
2
1 2
2
2
0
1 1Re
42 2
1 i
m
min M
p
Q
mm
R
C R
AP A U
c
e
(4.37)
The dimensionless mean input resonant power is given by
2
2
2
2
22
0
11
24
1
i
i
Q
m
p
in
p
Q
C R
m RC
eP
Ae
c cR
(4.38)
where 0
2
mm A
c
is the reference power. Substituting Equation (3.17) into (4.38) givens
the normalised dimensionless mean input power as
2
0 2
2
2 2
2
11
2
4 1
i
i
Q
N
in
N N
Q
N
m
eP
Ae
R
mR R
c
(4.39)
Substituting Equation (4.36) into (4.34) gives

78
0
2
2
2
2 2
2 2
21
4
1
4i
i
h
p
m
Q
p
Q
mR
R
C R
C
A
ce
eR
P
(4.40)
Therefore, the dimensionless mean harvested resonant power is given by
2
2
2 2 2
2
02
2
1 1
2
11
1
4
4i
i
m
h
p
Q
p
Q
R
RmC R
C R
P c
Ae cc
e
(4.41)
Substituting Equation (3.17) into (4.41) gives the normalised dimensionless harvested
resonant power as
2
2 2
2
0
2
2
2 2
2 1
4 1
i
i
N
m
N
h
Q
N
N N N
Q
R R
m
eP
A
c R eR
(4.42)
The harvesting efficiency of the parallel SSHI circuit at the resonance frequency is
derived from Equation (4.39) and (4.42), and is given by
2
2
2
24
4 1 i
N
N
Q
N N
N
e
R
R R
(4.43)
79
For variation of the normalised resistance, in order to find the peak harvesting efficiency,
the partial differential of the harvesting efficiency with respect to the normalised
resistance must be zero, which gives
22
2
ma
2
x
max
1
1
when , 1
i
i
Q
N
N
N
N
Q
e
R
e
(4.44)
If the variation ranges of the normalised resistance and force factor are not limited, there
is no peak value of the harvesting efficiency. When the normalised force factor tends to
a very large value while the normalised resistance is kept constant, the efficiency tends
to 100%. When the normalised force factor tends to zero while the normalised resistance
is kept constant, or when the normalised resistance tends to zero while the normalised
force factor is kept constant, the efficiency tends to zero. When the normalised resistance
tends to a very large value, the efficiency tends to zero. There is a special case of
2
N NR a constant, where when the normalised resistance tends to zero while the
normalised force factor tends to a very large value, the efficiency tends to a fixed
constant value.
.
4.2.4 Series synchronous switch harvesting on inductor circuit
For a series synchronous switch harvesting on inductor (series SSHI) circuit as shown
in Figure 4.1(d), most of the time, the piezoelectric element is in open circuit
configuration. Each time the switch is on, a part of the energy stored in the blocking
capacitor Cp is transferred to the capacitor Cst through the rectifier bridge. At these
instants, the voltage inversions of V occur. The relation of the piezoelectric voltages VM
and Vm before and after the inversion process, the rectified voltage V0 and the electrical
quality factor Qi is given by
80
2
0 0i
M m
QV V e V V
(4.45)
Under a harmonic base excitation, it is assumed that both the oscillator displacement and
the output voltage waves are periodic and change from a trough ( 1MU and MV ) to a
crest ( 1MU and MV ) from the instant 0t to 0 / 2t T . Integrating the Equation (3.2)
with respect to time for a half of the mechanical vibration period ( / 2T ) gives
0 0 0
0 0 0
2 2 21( ) ( )
t t t
pt t t
T T T
I t dt t du C dVt
(4.46)
The open circuit evolution of the piezoelectric voltage V between two voltage inversions
gives another relation between VM and Vm as
1
1
0
or
2
2
M p m M
MM m
p
V
V
U C V
VU
C
(4.47)
Equality of the input energy of the rectified bridge and the energy consumed by the
equivalent load resistance R during a semi-period of vibration / 2T leads to
0
0
2
020 0( )
t
p m Mt
T
V VV
I t dt V VR
C
(4.48)
which leads to
2
0p m MC V
VV
R
(4.49)
Substituting the Equation (4.47) into (4.49) gives
0 1
2M
RV U
(4.50)
81
Therefore, the mean harvested power according to [96, 97]is given by
2 2 2
2012
1 2
2h M
VP U
R
R
(4.51)
From Equation (3.4) and Equation (4.51), the system energy equilibrium equation is
given by
2 2 2
2110
2
12
1 1
2 2
2m
MM MA U
Rm Uc
U
(4.52)
The relationship between the displacement amplitude and the excitation force amplitude
is then derived from Equation (4.52) as
0
1 2 2
2
4
m
M
AU
c
m
R
(4.53)
Substituting the Equation (4.53) into (4.51) gives the mean harvested resonant power as
2
0
2
2
22
2
4h
mAp
mR
cR
(4.54)
From Equation (3.17),the normalised dimensionless harvested resonant power is then
given by
0
2 2
2 22 2
2
4
h N
m
N
N N
R
m R
p
A
c
(4.55)
where
2
0mm
c
Ais the reference power. From Equation (3.21) and Equation (3.17),
according to[96, 97] the mean input resonant power is given by
82
2
2
0
2
4
1
2i
m
n
AP
m
cR
(4.56)
Substituting Equation (3.17) into (4.56) gives the normalised dimensionless input
resonant power as
0
2
2 2 2
1
2 4m
in
N NR
P
A
c
m
(4.57)
The harvesting efficiency of the series SSHI circuit is derived from Equation (4.57) and
(4.55) and is given by
2
2 2
4
4
N N
N N
R
R
(4.58)
If the variation ranges of the normalised resistance and force factor are not limited, there
are no peak values of the efficiency; there exists
max
or
1
N NR
(4.59)
When the normalised resistance tends to a very large value while the normalised force
factor is kept as a constant, or when the normalised force factor tends to a very large
value while the normalised resistance is kept constant, the efficiency tends to 100%.
When the normalised resistance tends to zero while the normalised force factor is kept
constant, or when the normalised force factor tends to zero while the normalised
resistance is kept as a constant, the efficiency tends to zero. There is a special case of
2
N NR a constant where when the normalised force factor tends to zero while the
resistance tends to a very large value.
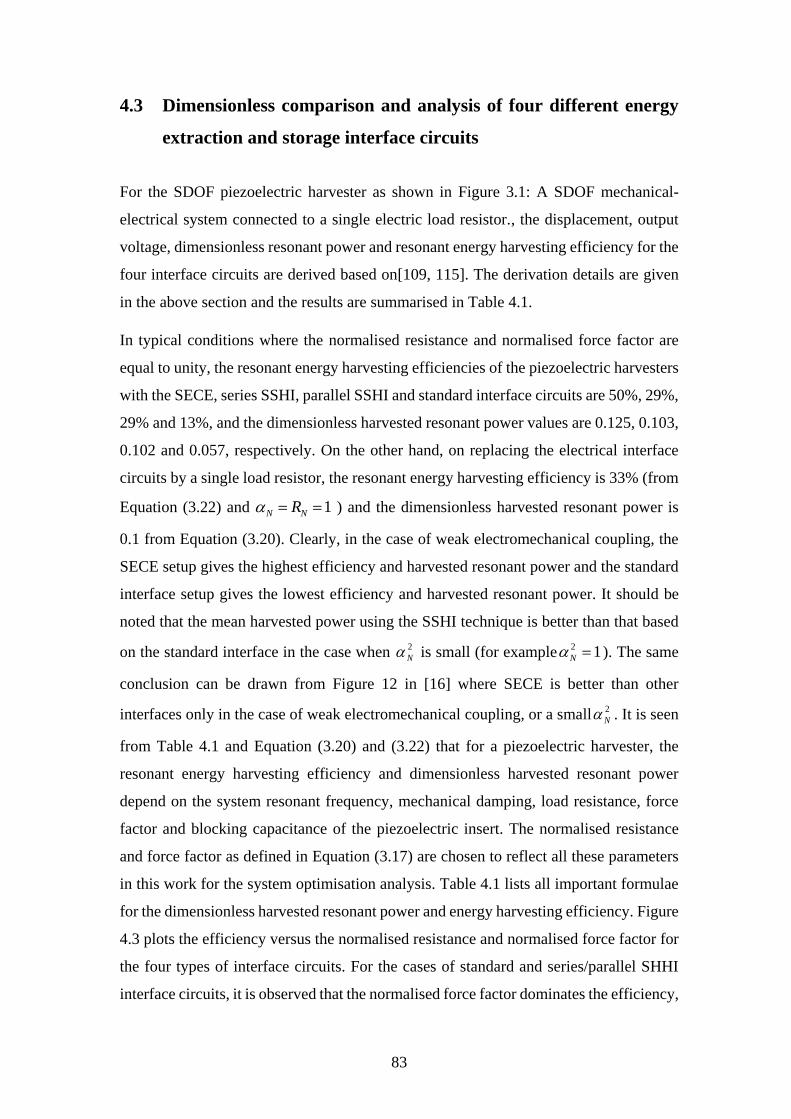
83
4.3 Dimensionless comparison and analysis of four different energy
extraction and storage interface circuits
For the SDOF piezoelectric harvester as shown in Figure 3.1: A SDOF mechanical-
electrical system connected to a single electric load resistor., the displacement, output
voltage, dimensionless resonant power and resonant energy harvesting efficiency for the
four interface circuits are derived based on[109, 115]. The derivation details are given
in the above section and the results are summarised in Table 4.1.
In typical conditions where the normalised resistance and normalised force factor are
equal to unity, the resonant energy harvesting efficiencies of the piezoelectric harvesters
with the SECE, series SSHI, parallel SSHI and standard interface circuits are 50%, 29%,
29% and 13%, and the dimensionless harvested resonant power values are 0.125, 0.103,
0.102 and 0.057, respectively. On the other hand, on replacing the electrical interface
circuits by a single load resistor, the resonant energy harvesting efficiency is 33% (from
Equation (3.22) and 1N NR ) and the dimensionless harvested resonant power is
0.1 from Equation (3.20). Clearly, in the case of weak electromechanical coupling, the
SECE setup gives the highest efficiency and harvested resonant power and the standard
interface setup gives the lowest efficiency and harvested resonant power. It should be
noted that the mean harvested power using the SSHI technique is better than that based
on the standard interface in the case when 2
N is small (for example2 1N ). The same
conclusion can be drawn from Figure 12 in [16] where SECE is better than other
interfaces only in the case of weak electromechanical coupling, or a small2
N . It is seen
from Table 4.1 and Equation (3.20) and (3.22) that for a piezoelectric harvester, the
resonant energy harvesting efficiency and dimensionless harvested resonant power
depend on the system resonant frequency, mechanical damping, load resistance, force
factor and blocking capacitance of the piezoelectric insert. The normalised resistance
and force factor as defined in Equation (3.17) are chosen to reflect all these parameters
in this work for the system optimisation analysis. Table 4.1 lists all important formulae
for the dimensionless harvested resonant power and energy harvesting efficiency. Figure
4.3 plots the efficiency versus the normalised resistance and normalised force factor for
the four types of interface circuits. For the cases of standard and series/parallel SHHI
interface circuits, it is observed that the normalised force factor dominates the efficiency,
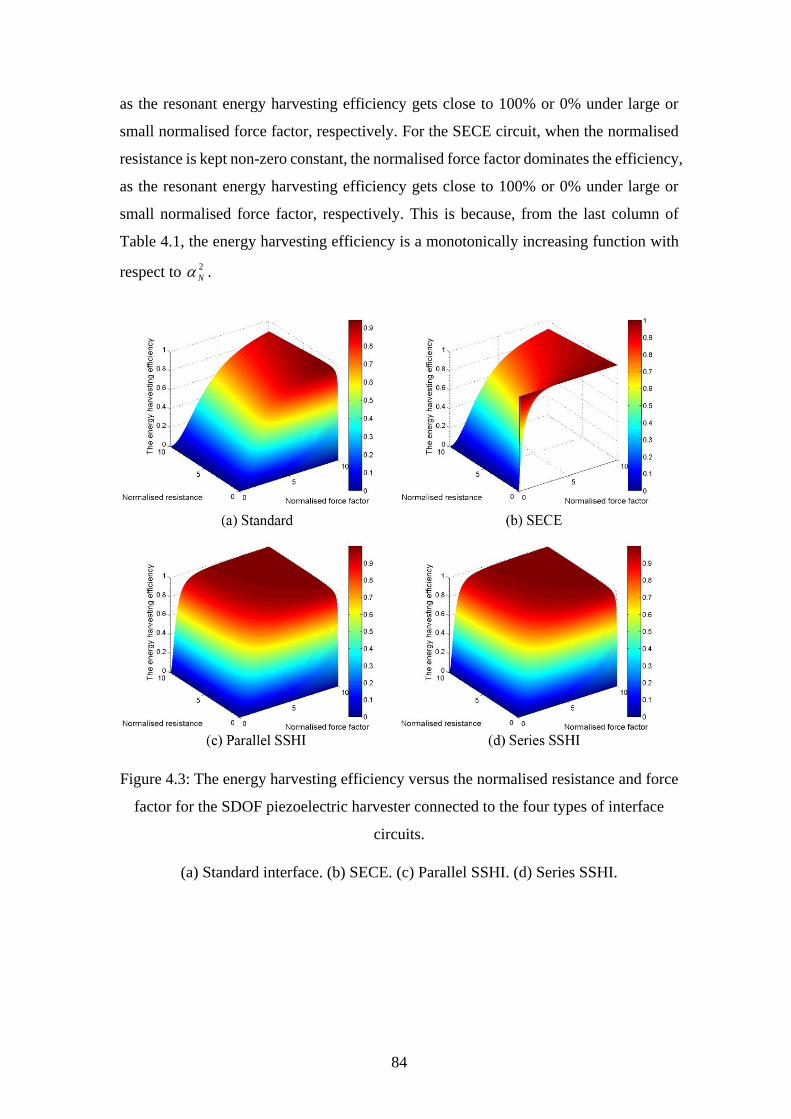
84
as the resonant energy harvesting efficiency gets close to 100% or 0% under large or
small normalised force factor, respectively. For the SECE circuit, when the normalised
resistance is kept non-zero constant, the normalised force factor dominates the efficiency,
as the resonant energy harvesting efficiency gets close to 100% or 0% under large or
small normalised force factor, respectively. This is because, from the last column of
Table 4.1, the energy harvesting efficiency is a monotonically increasing function with
respect to 2
N .
Figure 4.3: The energy harvesting efficiency versus the normalised resistance and force
factor for the SDOF piezoelectric harvester connected to the four types of interface
circuits.
(a) Standard interface. (b) SECE. (c) Parallel SSHI. (d) Series SSHI.
85
Figure 4.4: The dimensionless harvested power versus the normalised resistance and
force factor for the SDOF piezoelectric harvester connected to the four types of
interface circuits.
(a) Standard interface. (b) SECE. (c) Parallel SSHI. (d) Series SSHI.
On the other hand, Figure 4.4 illustrates the dimensionless harvested resonant power
versus the normalised resistance and normalised force factor for the four types of the
interface circuits. It is observed from Figure 4.4 that when the normalised force factor
becomes either very large or very small, while the normalised resistance is kept non-zero
constant, the dimensionless harvested power for the four interface circuits goes close to
zero. On the other hand, it is observed that when the normalised resistance becomes
small, while the normalised force factor is kept non-zero constant, the dimensionless
harvested power goes to close to zero. There is a special case in which 2
N NR
constant, where when the normalised resistance becomes very large or very small, or
when the normalised force factor becomes either very large or very small, the
dimensionless harvested power tends to a fixed constant value. This has been reported
in the previous study[118].
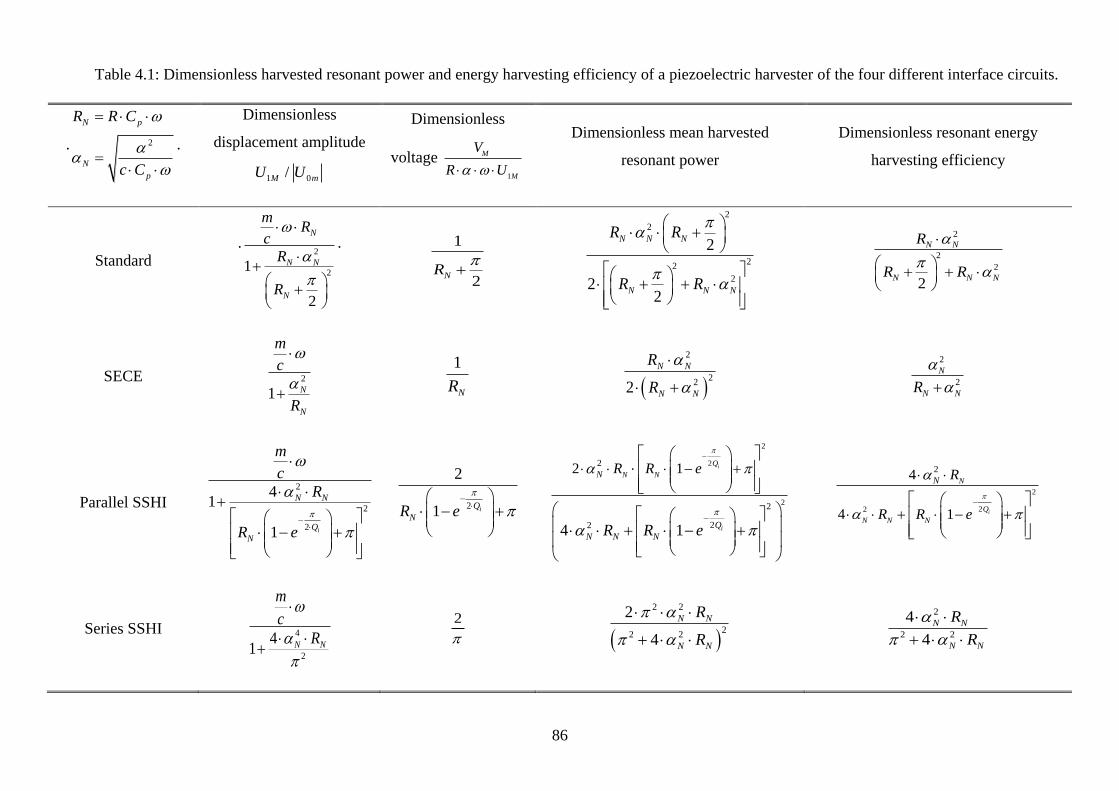
86
Table 4.1: Dimensionless harvested resonant power and energy harvesting efficiency of a piezoelectric harvester of the four different interface circuits.
. 2
N p
N
p
R R C
c C
.
Dimensionless
displacement amplitude
1 0/M mU U
Dimensionless
voltage 1
M
MU
V
R
Dimensionless mean harvested
resonant power
Dimensionless resonant energy
harvesting efficiency
Standard .
2
21
2
N
N N
N
mR
c
R
R
. 1
2NR
2
2
22
2
2
22
N N N
N N N
R R
R R
2
2
2
2
N N
N N N
R
R R
SECE 2
1 N
N
m
c
R
1
NR
2
222
N N
N N
R
R
2
2
N
N NR
Parallel SSHI
2
2
2
4
1
1
iQ
N N
N
m
c
R
R e
21
2
iQ
NR e
2
2
2
2
2
2 2
2 1
4 1
i
i
N N
Q
N
N N N
Q
eR R
eR R
2
2
2
24
4 1 i
N
N N N
Q
N R
R eR
Series SSHI 4
2
41 N N
m
c
R
2
2 2
22 2
2
4
N N
N N
R
R
2
2 2
4
4
N N
N N
R
R
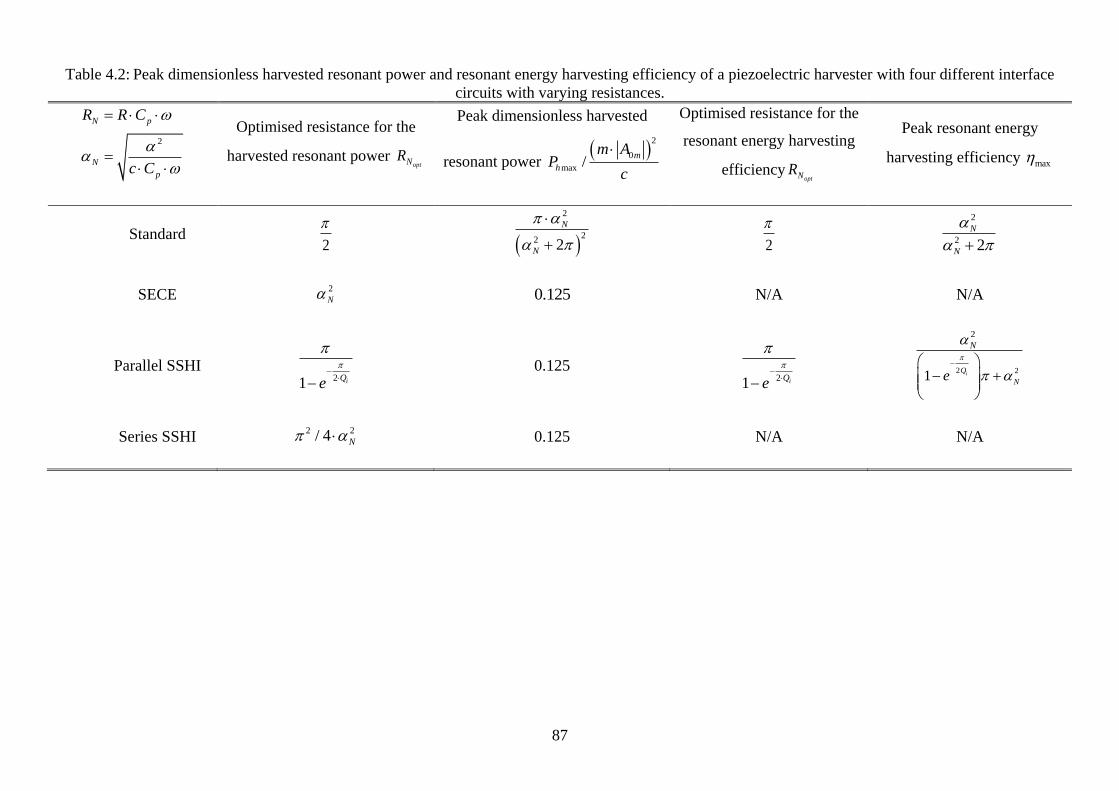
87
Table 4.2: Peak dimensionless harvested resonant power and resonant energy harvesting efficiency of a piezoelectric harvester with four different interface
circuits with varying resistances.
2
N p
N
p
R R C
c C
Optimised resistance for the
harvested resonant power optNR
Peak dimensionless harvested
resonant power
2
0
max /m
h
m AP
c
Optimised resistance for the
resonant energy harvesting
efficiencyoptNR
Peak resonant energy
harvesting efficiency max
Standard 2
2
22 2
N
N
2
2
2 2
N
N
SECE 2
N 0.125 N/A N/A
Parallel SSHI 2
1 iQe
0.125
21 iQ
e
2 2
2
1 iQ
N
N
e
Series SSHI 2 2/ 4 N 0.125 N/A N/A
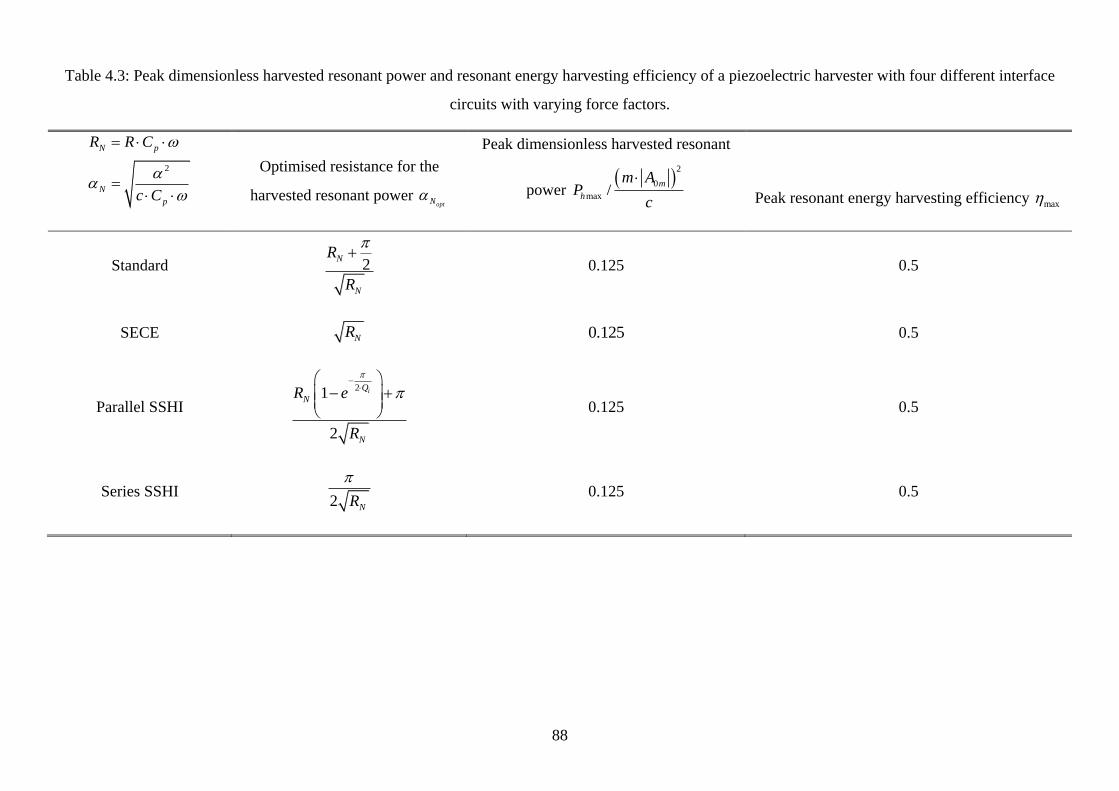
88
Table 4.3: Peak dimensionless harvested resonant power and resonant energy harvesting efficiency of a piezoelectric harvester with four different interface
circuits with varying force factors.
2
N p
N
p
R R C
c C
Optimised resistance for the
harvested resonant power optN
Peak dimensionless harvested resonant
power
2
0
max /m
h
m AP
c
Peak resonant energy harvesting efficiency max
Standard 2N
N
R
R
0.125 0.5
SECE NR 0.125 0.5
Parallel SSHI
2
2
1 i
N
N
QR
R
e
0.125 0.5
Series SSHI 2 NR
0.125 0.5
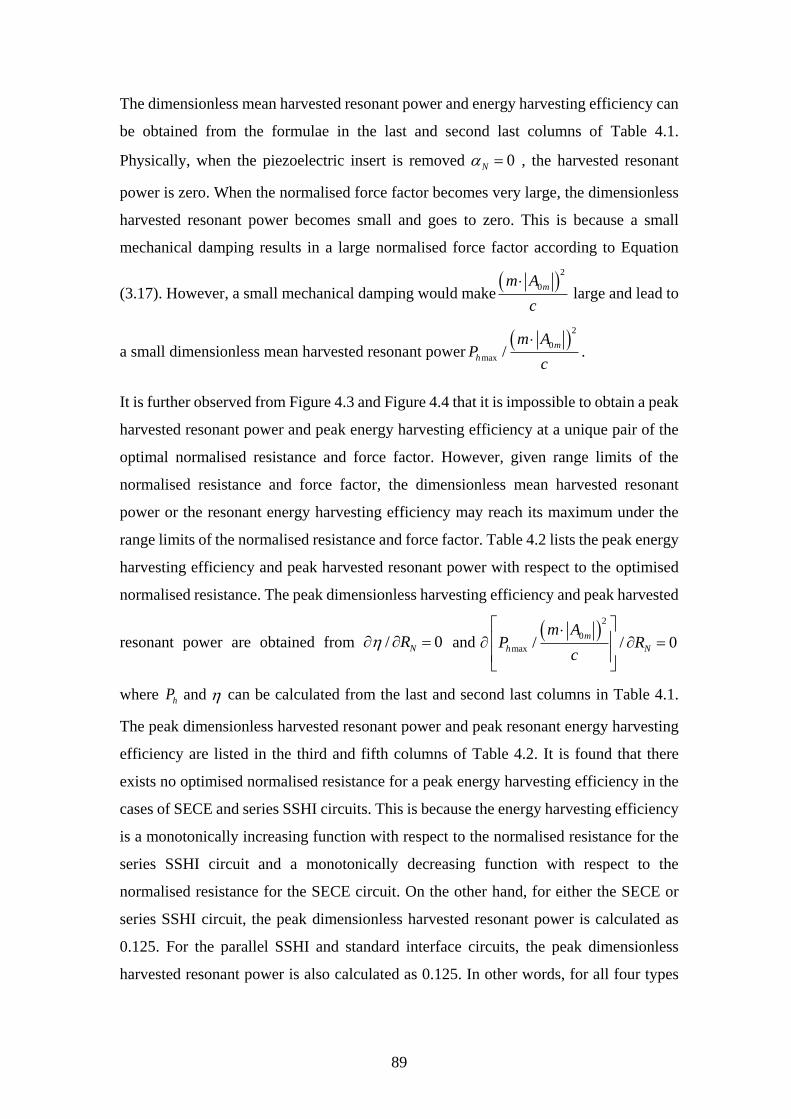
89
The dimensionless mean harvested resonant power and energy harvesting efficiency can
be obtained from the formulae in the last and second last columns of Table 4.1.
Physically, when the piezoelectric insert is removed 0N , the harvested resonant
power is zero. When the normalised force factor becomes very large, the dimensionless
harvested resonant power becomes small and goes to zero. This is because a small
mechanical damping results in a large normalised force factor according to Equation
(3.17). However, a small mechanical damping would make
2
0mm
c
A large and lead to
a small dimensionless mean harvested resonant power
2
0
max /m
h
m AP
c
.
It is further observed from Figure 4.3 and Figure 4.4 that it is impossible to obtain a peak
harvested resonant power and peak energy harvesting efficiency at a unique pair of the
optimal normalised resistance and force factor. However, given range limits of the
normalised resistance and force factor, the dimensionless mean harvested resonant
power or the resonant energy harvesting efficiency may reach its maximum under the
range limits of the normalised resistance and force factor. Table 4.2 lists the peak energy
harvesting efficiency and peak harvested resonant power with respect to the optimised
normalised resistance. The peak dimensionless harvesting efficiency and peak harvested
resonant power are obtained from / 0NR and
2
0
max / / 0m
h N
m AP R
c
where hP and can be calculated from the last and second last columns in Table 4.1.
The peak dimensionless harvested resonant power and peak resonant energy harvesting
efficiency are listed in the third and fifth columns of Table 4.2. It is found that there
exists no optimised normalised resistance for a peak energy harvesting efficiency in the
cases of SECE and series SSHI circuits. This is because the energy harvesting efficiency
is a monotonically increasing function with respect to the normalised resistance for the
series SSHI circuit and a monotonically decreasing function with respect to the
normalised resistance for the SECE circuit. On the other hand, for either the SECE or
series SSHI circuit, the peak dimensionless harvested resonant power is calculated as
0.125. For the parallel SSHI and standard interface circuits, the peak dimensionless
harvested resonant power is also calculated as 0.125. In other words, for all four types
90
of extraction circuits, the limit of the peak harvested resonant power is
2
00.125
mm A
c
.
This conclusion is consistent with previous work [95, 101, 109, 115, 116]. For the
harvester connected to a single load resistor, it is seen from Equation (3.24) that the peak
harvested resonant power is also
2
00.125
mm A
c
.Therefore, it is concluded that the
peak harvested resonant power is
2
00.125
mm A
c
in all five external interface circuits
analysed in this work. This implies that the peak harvested resonant power depends on
the excitation force magnitude 0mm A and the mechanical losses (c) in the structure
instead of other parameters.
Table 4.3 lists the peak energy harvesting efficiency and peak harvested resonant power
with respect to the optimised normalised force factor. The peak dimensionless harvested
resonant power and peak resonant energy harvesting efficiency are obtained from
/ 0N and
2
0
max / / 0m
h N
m AP
c
where hP and can be calculated
from the last and second last columns in Table 4.1. The peak dimensionless harvested
resonant power and its corresponding resonant energy harvesting efficiency are listed in
the second last and last columns of Table 4.3. It is seen from Table 4.3 that the peak
dimensionless harvested resonant power is 0.125 and the corresponding resonant energy
harvesting efficiency is 50% for all four interface circuits under different normalised
force factors. For the harvester connected to a single load resistor under different
normalised force factors, it is seen from Equation (3.27)Error! Reference source not
found. that the limit of the mean harvested resonant power maxhP is
2
00.125
mm A
c
and the corresponding energy harvesting efficiency for the single load resistor is 100%
instead of 50%. The difference could be the result of the bridge rectification in the four
types of energy extraction and storage interface circuits. Furthermore, it is observed that
the optimised normalised force factor for the cases of the SECE, series SSHI and parallel
SSHI interface circuits is much less than that for the case of the standard interface circuit.
This implies that nonlinear SECE and SSHI techniques could require less piezoelectric
material than the standard interface technique.
91
4.4 Conclusion
A SDOF piezoelectric vibration energy harvester connected to a single load resistor and
four types of electrical energy extraction and storage circuits has been studied and
investigated based on dimensionless analysis in the case of weak electromechanical
coupling. The following conclusions have been reached.
By defining a normalized resistance and a normalized force factor, the harvested
resonant power and resonant energy harvesting efficiency for the SDOF piezoelectric
harvester have been normalised and expressed in a dimensionless form. The
dimensionless harvested resonant power and energy harvesting efficiency are found to
depend on the harvester resonant frequency, mechanical damping, load resistance, force
factor and blocking capacitance of the piezoelectric insert.
There is no unique pair of solutions for the peak dimensionless harvested resonant power
and the peak energy harvesting efficiency with respect to a set of optimal normalised
resistance and force factor. If the lower and upper limits of the normalised resistance and
force factor are given, the dimensionless harvested resonant power and resonant energy
harvesting efficiency may have their local maximum values.
The harvested resonant power may reach a high value of
2
00.125
mm A
c
(one eighth
of the squared applied excitation force magnitude divided by the mechanical damping)
with a corresponding resonant energy harvesting efficiency of 50% for all four analysed
interface circuits and 100% for the case of a single load resistor. This is only valid in the
case of weak electromechanical coupling or a small2
N .
For the five types of interface circuits excited by a constant and non-optimal force factor,
there exists an optimised normalised resistance for an SDOF piezoelectric harvester to
reach the peak dimensionless harvested resonant power. For the cases of the standard
and parallel SSHI interface circuits under a constant and non-optimal force factor, there
exists an optimised normalised resistance for an SDOF piezoelectric harvester to reach
the peak energy harvesting efficiency. For the cases of the SECE and series SSHI
interface circuits under a constant and non-optimal force factor, there does not exist an
optimised normalised resistance for an SDOF piezoelectric harvester to reach the peak
energy harvesting efficiency. For the five types of interface circuit with a constant and
92
non-optimal load resistance, there exists an optimal force factor to reach the peak
harvested resonant power. However, there does not exist an optimised force factor to
reach the peak energy harvesting efficiency. Excessive or too small amount of
piezoelectric material insert or size would decrease the harvested resonant power.
When the normalized resistance and the normalized force factor are equal to one, the
dimensionless harvested resonant power and energy harvesting efficiency are largest for
the harvester connected with an SECE circuit and least for that with the standard
interface circuit. As such, in this case, it is recommended that the SECE circuit or SSHI
circuits should be used with piezoelectric vibration energy harvester instead of the
standard interface circuit.
93
Two Degree-of-freedom
Piezoelectric Vibration Energy
Harvester and Experimental
Validation
In this chapter, a dimensionless analysis method is proposed to predict the output
voltage and mean harvested power for a 2 DOF vibration energy harvesting system. This
method allows us to evaluate the harvesting power and efficiency of the 2 DOF vibration
energy harvesting system regardless of the sizes or scales. The analysis method is a
hybrid of time domain integration and frequency response analysis approaches, which
would be a useful tool for parametric study, design and optimisation of a 2 DOF
piezoelectric vibration energy harvester. In a case study, a quarter car suspension model
with a piezoelectric material insert is chosen to be studied. The 2 DOF vibration energy
harvesting system could potentially be applied in a vehicle to convert waste or harmful
ambient vibration energy into electrical energy for charging the battery. Especially for
its application in a hybrid vehicle or an electrical vehicle, the 2 DOF vibration energy
harvesting system could improve its charge mileage, comfort and reliability.
5.1 Introduction
The vibration energy harvesting technique using piezoelectric materials has been
intensively studied in the recent years. Conversion of ambient vibration energy into
electric energy provides an attractive alternative energy source. Despite the power
density of mechanical vibration (300 μ W /cm3) is not as high as the power density of
outdoor solar energy (15,000 μ W /cm3), the vibration energy sources are potentially
sustainable and perennial[1]. The piezoelectric vibration energy harvesting techniques
have been well developed, numerous studies have received the most attentions, because
the piezoelectric vibration harvesters are able to operate in a wide frequency range and
are easy to fabricate[30]. However, most of the researches were focused on a cantilever
beam attached with a piezoelectric element which was proved to be a promising energy
94
source to power MEMS devices [11, 99, 104, 119]. The cantilever beam piezoelectric
vibration energy harvester which has simplified as a single degree-of-freedom model has
many advantages such as ease of fabrication in micro scale, distributing stress more
evenly. However, the single degree-of-freedom (SDOF) piezoelectric vibration energy
harvester only works efficiently at a sole resonant frequency. Unfortunately, a majority
of potential vibration energy sources are in the form of variable or random frequencies.
Therefore, a major challenge is to improve the harvesting efficiency of piezoelectric
vibration energy harvester under various excitation frequencies in a practical
environment.
Several researches were carried out to modify the structure of vibration energy
harvesting device for tuning the resonant frequency to adapt the frequency of the ambient
vibration energy source. One of the approaches was active self-tuning structures
proposed by Wu and Roundy[120, 121]. Though these techniques increase mean
harvested power by 30%, they require more power to activate the resonant frequency
tuning structure than that the device can generate. On the other hand, passive or
intermittent tuning techniques were studied by Cornwell[122] representing as “Tuned
auxiliary structure”. However, it needs additional sensors or actuators to be added into
harvested structure which has significantly increased the size of the device and increased
the complexity of the mechanical structure. To widen the harvesting frequency
bandwidth of the energy harvester is another research aspect. There are two major kinds
of mechanical approaches. One is to attach multiple masses and springs to the harvesting
device which converts the device into a multi-degree-of-freedom system with multiple
resonant modes. Shahusz[123] proposed a multi-degree-of-freedom (MDOF)
piezoelectric vibration energy harvester which is constructed from many SDOF devices
in a serial connection. Similarly, Erturk[124] demonstrated an L-shaped and cantilevered
beam energy harvesting device which can operate in two modes of the resonant
frequency. In his research, two lumped masses are attached on the horizontal and vertical
beam respectively. Hence, in order to widen the frequency bandwidth of a vibration
energy harvester, the second resonant frequencies could be tuned not very far from the
first natural frequency by changing the ratio of the two lumped masses. Another
mechanical solution is to connect multiple cantilevered beams of different length.
Sari[17] introduced a device consisting of an array of 40 cantilevered beams of variable
length. It is useful as the vibration energy harvester works well in a wide frequency range
95
of ambient vibration energy source. Nevertheless, not all the cantilevered beams are
activated at the resonant frequency. However, the disadvantage of the array
configuration is that the size of vibration energy device increased significantly which is
not suitable for most of the MEMS applications. Wu et al.[46] presented a novel 2 DOF
piezoelectric vibration energy harvester which has the same size as a SDOF cantilever
beam configuration but has two close resonant frequencies. The device can be easily
converted from a SDOF cantilever beam energy harvester by cutting the inner beam
inside and attaching another proof mass. It is a novel design concept which is extremely
useful in practice and can be applied to a constrained space, especially in MEMS devices.
In despite of many solutions which are proposed to widen the harvesting frequency
bandwidth, they are all focused on the small scale or micro scale. As the piezoelectric
vibration energy harvesting devices produce larger output voltage or power under a large
working stress, it is difficult to increase the harvesting power levels which require to
increase the preload stress, because it is limited by the material’s mechanical strength in
small MEMS systems[125]. However it is easy to find large stresses in a large scale
vibration energy harvesting environment, which can boost the power output range from
10 mW – 100 mW to 1W-100 kW or more[87].
In this chapter, a new novel dimensionless analysis method will be proposed for
evaluating a 2 DOF system, for example, it could be a quarter vehicle suspension model
with built-in piezoelectric materials. It is also important to design a 2 DOF vibration
energy harvester against ambient vibration energy source. As the proposed theoretical
analysis method is in a dimensionless form, therefore it can be used as a tool to design a
2 DOF piezoelectric vibration energy harvester regardless of the geometries, size or scale.
5.2 Analysis and simulation of two degree-of-freedom piezoelectric
vibration energy harvester
A two degree-of-freedom piezoelectric vibration energy harvesting system model is built
and shown in Figure 5.1; the mechanical system governing equations are given by:
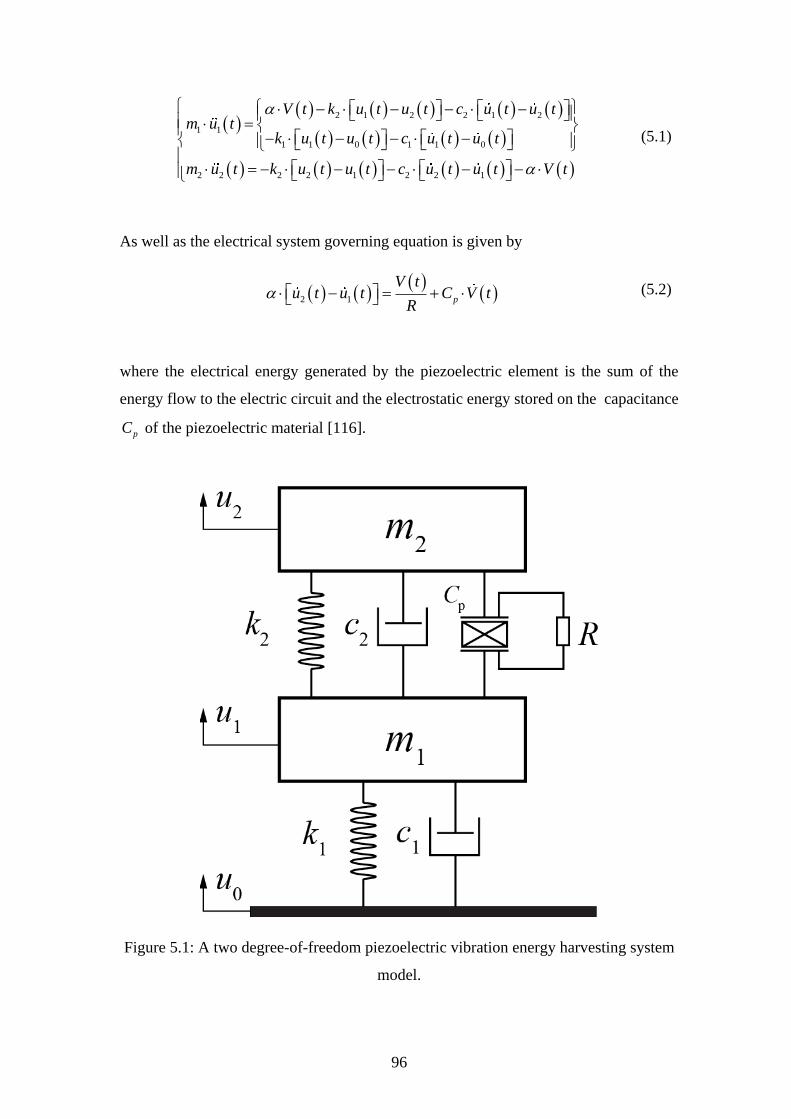
96
2 1 2 2 1 2
1
0 0
1
1 1 1 1
2 2 2 2 1 2 2 1
V t k u t u t c u t u tm u t
k u t u t c u t u t
m u t k u t u t c u t u t V t
(5.1)
As well as the electrical system governing equation is given by
2 1 p
V tu t u t C V t
R (5.2)
where the electrical energy generated by the piezoelectric element is the sum of the
energy flow to the electric circuit and the electrostatic energy stored on the capacitance
pC of the piezoelectric material [116].
Figure 5.1: A two degree-of-freedom piezoelectric vibration energy harvesting system
model.
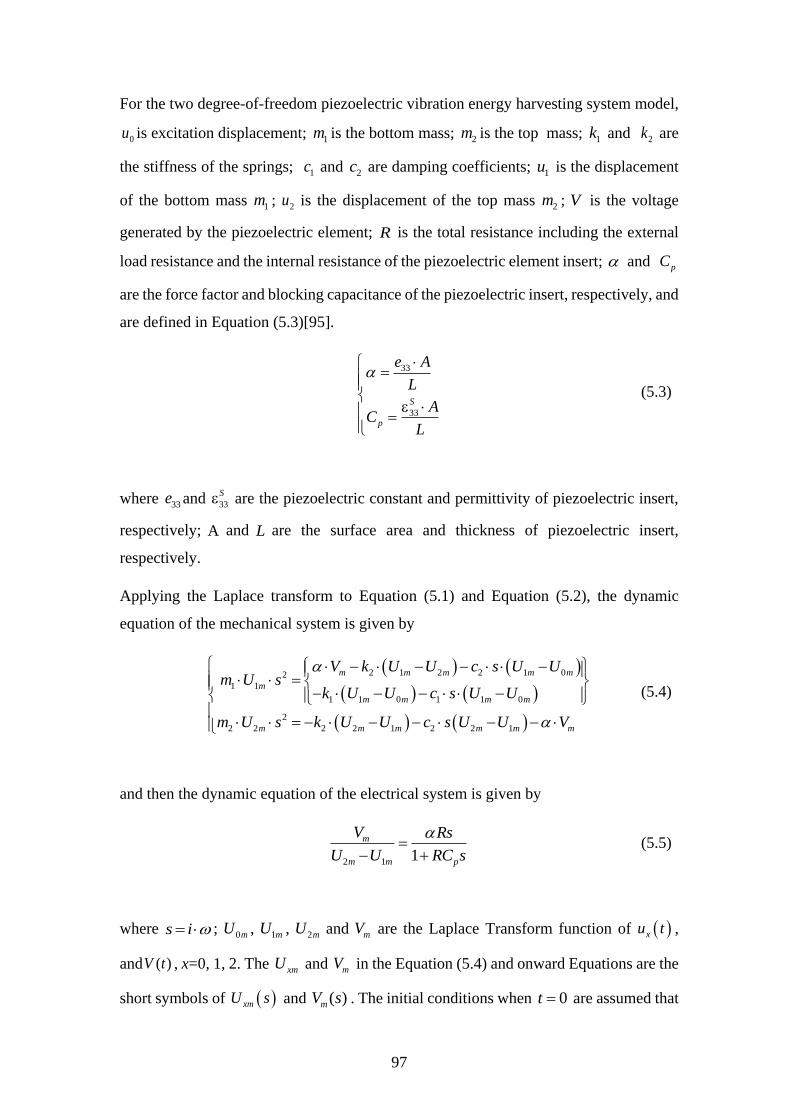
97
For the two degree-of-freedom piezoelectric vibration energy harvesting system model,
0u is excitation displacement; 1m is the bottom mass; 2m is the top mass; 1k and 2k are
the stiffness of the springs; 1c and 2c are damping coefficients; 1u is the displacement
of the bottom mass 1m ; 2u is the displacement of the top mass 2m ; V is the voltage
generated by the piezoelectric element; R is the total resistance including the external
load resistance and the internal resistance of the piezoelectric element insert; and pC
are the force factor and blocking capacitance of the piezoelectric insert, respectively, and
are defined in Equation (5.3)[95].
33
33
S
p
e A
L
AC
L
(5.3)
where 33e and 33
S are the piezoelectric constant and permittivity of piezoelectric insert,
respectively; A and L are the surface area and thickness of piezoelectric insert,
respectively.
Applying the Laplace transform to Equation (5.1) and Equation (5.2), the dynamic
equation of the mechanical system is given by
2 1 2 2 1 02
1 1
1 1 0 1 1 0
2
2 2 2 2 1 2 2 1
m m m m m
m
m m m m
m m m m m m
U U c s Um U s
k U c s U
m U s k U U c s U U
V k U
U U
V
(5.4)
and then the dynamic equation of the electrical system is given by
2 1 1
m
m m p
RV
U RC
s
U s
(5.5)
where s i ; 0mU , 1mU , 2mU and mV are the Laplace Transform function of xu t ,
and ( )V t , x=0, 1, 2. The xmU and mV in the Equation (5.4) and onward Equations are the
short symbols of xmU s and ( )mV s . The initial conditions when 0t are assumed that
98
0
0 0xm
xm
duu
dt and
00 0
m
m
dVV
dt . The transfer function equations
between the oscillator displacement and the excitation displacement are derived from
Equation (5.4) and Equation (5.5), and are given by:
2 2
1 1 2 2 2
2 2 2
1 1 1 2 2 2
2 2
2 2
1
0
2
2
1 1 2 2
2
1 1 1 2
2
20
1
1
1
1
p
p
p
p
m
m
m
m
k c s k c s m s R C s R sU
U m s k c s k c s m s R C s R s
k c s R C s R s m s
k c s k c s R C s R sU
U m s k c s k c
2 2
2
2 2
2 2 2
1
1
p
p
s m s R C s R s
k c s R C s R s m s
(5.6)
Therefore, the transfer function equation between the output voltage and excitation
displacement is given by:
2 1
2 1
3
2 1 1
222 2 21
21 1
2
0
2
2
0
2
2
1
1
m m
m m
m m
m m
p
p
V V U U
U U U U
m s k c s R
k c s m s R C sm s
k c s R s
k c s R C sm s
R s
(5.7)
For a harmonic excitation, the relationship between the excitation displacement and the
excitation acceleration can be described by
0
0
2
0 0 0 0 0
2
0 0 0 0 0 0
0 0 0 0
( ) ( ) ( )
( ) ( ) ( ) ( )
,
u
A
is t i t i f t i t
m m m m
is t i t i f t i t
m m m m
M m M m
u t U e U e U f e U e e
a t u t A e A e A f e A e e
U U A A
(5.8)
As a result, the output voltage subjected to the excitation acceleration is given by
99
2 1 1
2 22
0 22 22 1
22
1 1 2 2
11
1
m
m
pp
p
m k c s RsV
A m s RC s RsRC s k c s m sm s
k c s RC s k c sRs
(5.9)
As well as the equations described the output voltage magnitude and harvested power[96,
97] are given by
2 2 2
2 1 1
22 2 20
1 1 2 2 2 2
2
1 2 2 1 1 2 2 2 2
1 22 2
2 1 2 2
2 2 2
1 1 2 2 2 2
2 2 2
2 1 1 2
2 2
1 2 2 2
m
m
p
p
p
m R k cV
Ak m k m k m
k c k c m cRC c c R
m c m c
RC k m k m k m
c R k m m
c k m RC c
0.5
2
(5.10)
2
0
2
0
2 2 2 2 2 2
2 1 1
22 2 2
1 1 2 2 2 2
2
1 2 2 1 1 2 2 2 2
1 22 2
2 1 2 2
2 2 2
1 1 2 2 2 2
2 2 2
2 1 1 2
1
1
2
0.5
mh
m
p
p
mV
AP
A R
R m k c
k m k m k m
k c k c m cRC c c R
m c m c
RC k m k m k m
c R k m m
c k
2
2 2
2 2 2pm RC c
(5.11)
From Equation (5.10) and Equation (5.11), the output voltage and mean harvested power
of the 2 DOF spring-mass dashpot system can be simulated and calculated using a
Matlab code.
100
5.2.1 Dimensionless analysis of a general coupled 2 DOF PVEH
model
In this section, the dimensionless formulae of output voltage and mean harvested power
are developed. These formulae will allow the performance comparison of vibration
energy harvesters regardless the size or scale. The following dimensionless parameters
are introduced to simplify the analysis, and are defined by
1 2
1 211 22
1 1 2 2
2 2
1 2
1 211 22
1 2
11 221 2
2 2
1 1
,2 2
,
,
,
,
N N
p p
N p n
n n
R R
c c
k m k m
k C k C
R RC
k k
m m
m kM K
m k
(5.12)
where NR is the normalised resistance; 1N and
2N are the normalised force factor; 11
and 22 are the normalised damping coefficient; RM is the mass ratio and RK is the
stiffness ratio. Consider the case of a weak damping coupling ( 1 2 0c c )[29] at a
resonance, from Equations (5.10) and Equation (5.11), the natural frequency is solved
from the roots of the following equation:
2 2 2
1 1 2 2 2 2 0k m k m k m
(5.13)
Therefore, the natural frequencies of the 2 DOF system are given by
1
2
2 1 2 2 1 2 1 2
2 1 1 2 1 1 1 22
4
2n
k k k k k k k k
m m m m m m m m
(5.14)

101
2
2
2 1 2 2 1 2 1 2
2 1 1 2 1 1 1 22
4
2n
k k k k k k k k
m m m m m m m m
(5.15)
where the damped resonant frequency is approximately equal to the natural frequency
( n ). Substituting Equation (5.12) and Equation (5.13) into Equation (5.10) gives
the normalised dimensionless mean resonant output voltage as:
2
2
2
2 2 2 2
1 2 1 11
0.52
2 2
22 2 1
2 2 2
11 1 2 2
11 22 1 2
22 2
2 22 2 1
2
11 1 2 2
0
2 2
4
2 1
2
4
2 1
2 2 1
N N
R
N
N R
N N
m
R
N
m
RV
m AM
RM
R M
R
(5.16)
As well as substituting Equation (5.12) and Equation (5.13) into Equation (5.11) gives
the normalised dimensionless resonant harvested power as:
2
2
2
4 2 2 4 2 2
1 2 1 11
2 222
222 2 1
2
2 2 2
11 1 2 2
11 22 1 2
22 2
2 22 2 1
2
11 1 2 22 2
0
4
2 1
2
4
2 1
2 2 1
N Nh
R
N
N R
m
N N R
N
RP
m A MRR
M
R M
R
(5.17)
The piezoelectric vibration energy harvesting efficiency is defined by:
2
02
0
2
2
22
2
2
m
h
in
m
h
ni
P
m A
P RPP
m A
R
(5.18)
102
In order to investigate the harvesting efficiency, the equation representing mean input
power according to [96, 97] is given by
* *
1 1 2 20 0
1Re[( ) ( ) ] Re[( ) ( ) ]
2m m min mP m A i U m A i U
(5.19)
Considering the input is a harmonic excitation, and then the dimensionless input power
is given by
2
1 21 22 2 22
22
2
0 00
Re[ ] Re[ ]2 m mm
in m mP i U i URm m
m U Um A
R
(5.20)
where 0
1Re[ ]m
mi U
U
and
0
2Re[ ]m
mi U
U
can be derived by Equation (5.6), and then the
dimensionless mean input power is given by
2221 211 2
2 22
2 1 2 1 21 2 2
2 2
1 1 2 21
2 22
2 2 1 1 12 1
2
2
2
2 22
22 0
2
2
p
p
in
m
p
k c Rmc c R
m RC k k c cc k m
m c k mkRC
m k c m RC kc m
m
P R
mm A
R
2 2
1 21
2 2222 1 2 1 21 2 1 2
2 2
2 1 2 1 1 2 22
21 14
22 1 1 2
2
pp
p
c c Rm
km RC k c c kRC c c c
mm k k m k k m
ck m
m RC c mRm
22 2
1 1 2 2
2 22
1 1 2 22 2
2
1 2 2 1 2 2
2
1 2 22 2
1 1 22 2
2 1
2
2 2
2 2
1 2
p
p
k m k m
k m k mk mRC
k c k c k m
m c cRC k m m
m c R
m c
c c R
2
2
2 2
1 2 2 2pc k m RC c
(5.21)
103
By substituting the Equation (5.12) into Equation (5.21), then the normalised
dimensionless input power is given by
2
2
1
22 22 2 112
22
11 211 1 2
12 22
2
1
2
22 2
1 11
2 2
1 2
22
2
2
0
2
2 112 1
12
4
NN
N
R N
NN
R
N N
m
in
R
R
M R
RR
M
R
P
m A
R
2
2
2
1 2
11 22
22 1 11
2
2 1 2
11 2 22
22 1 2 11 1
2
11 1 2
1 2
1
2
2
1
2
2
2 1
2
N
N
N
N N
N
N
N
R
R
R
R
R
R
2
2
2
22
11 2 2
2
21 2
11
1
22 2
11
11 22 22
2
1 2 11
2
22 2
2 2
2
2
2
1
2 1
2
2
2
21
N N
NR
N
N N
N
R
N N
R
RM
R
R
MR
2
2
1
22
11
1 2
1
2NR
2
2
222
21 22 2
2122 2
2211 1 2 22 2
22 11 1 2 22 2
11 1 2 22 2
2 12
2 1 2
2 1 22 2
R
N N N
NN N
MR R
RR
(5.22)
Therefore, the normalised energy harvesting efficiency for the 2 DOF piezoelectric
vibration energy harvesting system can be derived by substituting Equation (5.11) into
Equation (5.21), and is given by
104
2 2 2 2 2 2
2 1 1
2
2 22
1 2 1 1 20 2 22
2
1 2 2
2 22 2
11 2
0 22
0 2 2
2
1 2
2
1 2 22
1
2
( )
p
m R k c
k mk k m
RC c c Rm
m ck m
cc RRC c
RC k m
c c R
c k mm
RC kc
2
1 2
2
2 2
1 22
0 21 1
2222
1 2
2 2
2
1 2
2
1 2 22
22
1 1
2 2
2
p
p
k c R
k mc
RC cm
c Rmk
RC k m
c c R
c k mm
RC k mc
m
2
1 2 2
2
2
1
2
2 2 22
1 1 21 2 2
22
2 1 2 22 2
120 21 1 2
2 0 1 22
2
p
p
p
c k RC c
c
k R
RC k
R k m m k k RC c
m c k m c Rc
RC kk mc RC c c
m
(5.23)
Substituting Equation (5.12) into Equation (5.22) gives the normalised harvesting
efficiency expression as
105
2
2
2
2 2 2 2
1 2 1 11
22 2 1 11
2
11 22 2 2
2 2
11 1 1
2 22 2
1 2221
22 2 11 22
1 11
4
2
2 111
2
11
2 2
N N
N
N N
N
N
NN R
N
R
R
R
RM R
RR MR
2
2
2
22 1 11
2
2 1 2
11 2 22
22 1 2 11 1
2
11 1 2
2
1 2 11 22 1 2
22 2
2 2
2
2
1
2
2
2 1
2 1
2 2
21
N
N N
N
N
N N
R
N
R
N
R
R
R
R
M
R
MR
2
2
2
11 2 22 2
2
1 11 2
22 2 1 11
2
11 22 2
2 22 1 11
1 2
2 1
2
2 1
2
N N
N
N
N N
N
R
R
R
R
R
(5.24)
5.2.2 Dimensionless analysis of a weakly coupled 2 DOF PVEH
model
Moreover, in a special condition, it is assumed that the 2 DOF PVEH system operates at
a resonant condition, and the damping of the system is ignored ( 1 2 0c c ). Therefore,
the dimensionless piezoelectric vibration energy harvesting power is given by:
1 2
4
1
2 22 22 1
2
0
0
1
h
R
c c
m
P
m A M
R
(5.25)
As well as the piezoelectric vibration energy harvesting efficiency is given by:
2
1
2 2
1 21 2 1 1
R
R R
M
M M
(5.26)
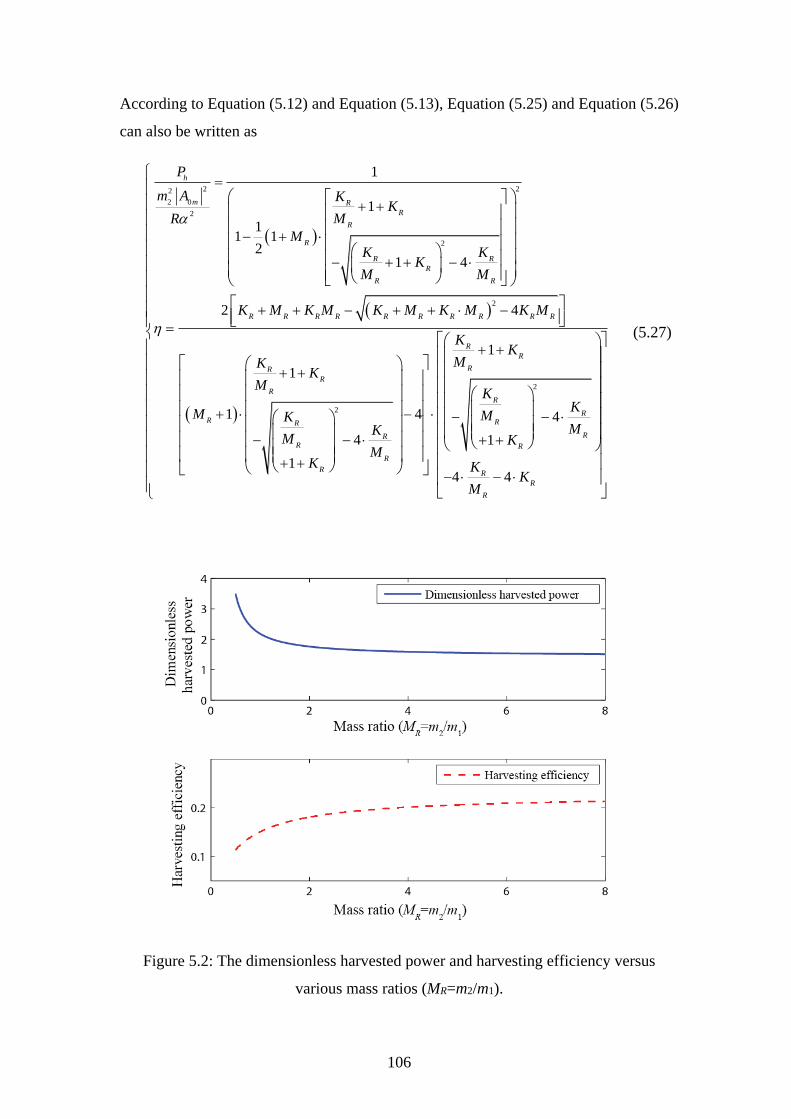
106
According to Equation (5.12) and Equation (5.13), Equation (5.25) and Equation (5.26)
can also be written as
2 22
2
2
2
2
2
0
1
1
11 1
21 4
2 4
1
1 4
4
1
h
R
R
R
R
R R
R
R R
R R R R R R R R R R
R
R
R
R R
RR
R
R
m
P
m A KK
MR
MK K
KM M
K M K M K M K M K M
KK
M
M KK
MM
K
2
1
4
1
4 4
R
R
R
R
RR
R
R
R
R
R
KK
M
KK
MM
K
KK
M
(5.27)
Figure 5.2: The dimensionless harvested power and harvesting efficiency versus
various mass ratios (MR=m2/m1).
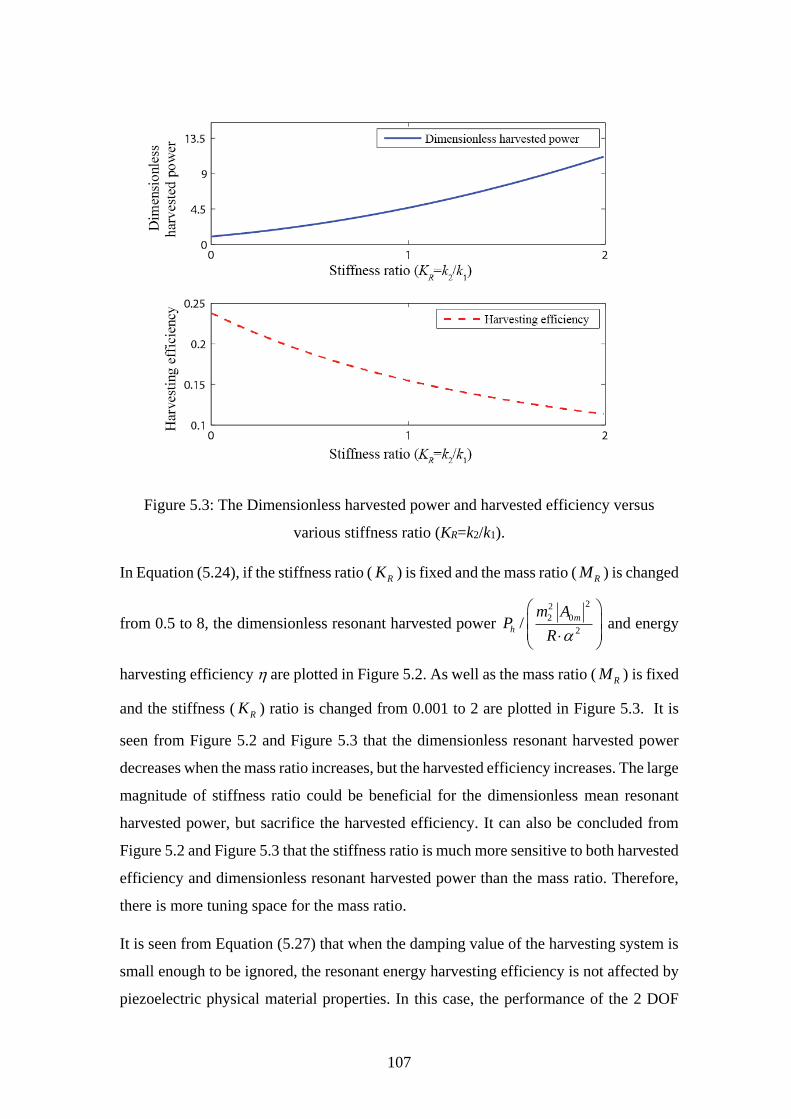
107
Figure 5.3: The Dimensionless harvested power and harvested efficiency versus
various stiffness ratio (KR=k2/k1).
In Equation (5.24), if the stiffness ratio ( RK ) is fixed and the mass ratio ( RM ) is changed
from 0.5 to 8, the dimensionless resonant harvested power
22
2
02/
m
h
m AP
R
and energy
harvesting efficiency are plotted in Figure 5.2. As well as the mass ratio ( RM ) is fixed
and the stiffness ( RK ) ratio is changed from 0.001 to 2 are plotted in Figure 5.3. It is
seen from Figure 5.2 and Figure 5.3 that the dimensionless resonant harvested power
decreases when the mass ratio increases, but the harvested efficiency increases. The large
magnitude of stiffness ratio could be beneficial for the dimensionless mean resonant
harvested power, but sacrifice the harvested efficiency. It can also be concluded from
Figure 5.2 and Figure 5.3 that the stiffness ratio is much more sensitive to both harvested
efficiency and dimensionless resonant harvested power than the mass ratio. Therefore,
there is more tuning space for the mass ratio.
It is seen from Equation (5.27) that when the damping value of the harvesting system is
small enough to be ignored, the resonant energy harvesting efficiency is not affected by
piezoelectric physical material properties. In this case, the performance of the 2 DOF
108
piezoelectric vibration energy harvester is only related to the mass ratio and the stiffness
ratio. Moreover, it is clearly shown in Equation (5.27) that the excitation amplitude,
force factor and external load resistance have no influences on the energy harvesting
efficiency.
5.3 Case study of a quarter vehicle suspension model and simulation
In this section, a quarter vehicle suspension built with piezoelectric element inserter, as
shown in Figure 5.4, has been chosen for a case study to perform parameter studies and
optimisation. The piezoelectric material can be mounted under a specific pre-load at the
shock tower between the body/chassis and suspension spring/shock absorber. The
vibrations generated by tyre-road interactions are transmitted through the suspension
generating strains on the piezoelectric material insert, which could be partly converted
into electrical energy. Without the piezoelectric material insert, the transmitted
mechanical vibration energy is usually dissipated into heat energy which is wasted. It is
because that the quarter vehicle suspension can be modelled as a 2 DOF piezoelectric
vibration energy harvester as mentioned above. Furthermore, a quarter of the vehicle
mass would be large enough and able to deliver a large amount of stress to the
piezoelectric materials. The parameters of the quarter vehicle suspension model are
given in Table 5.1[126].
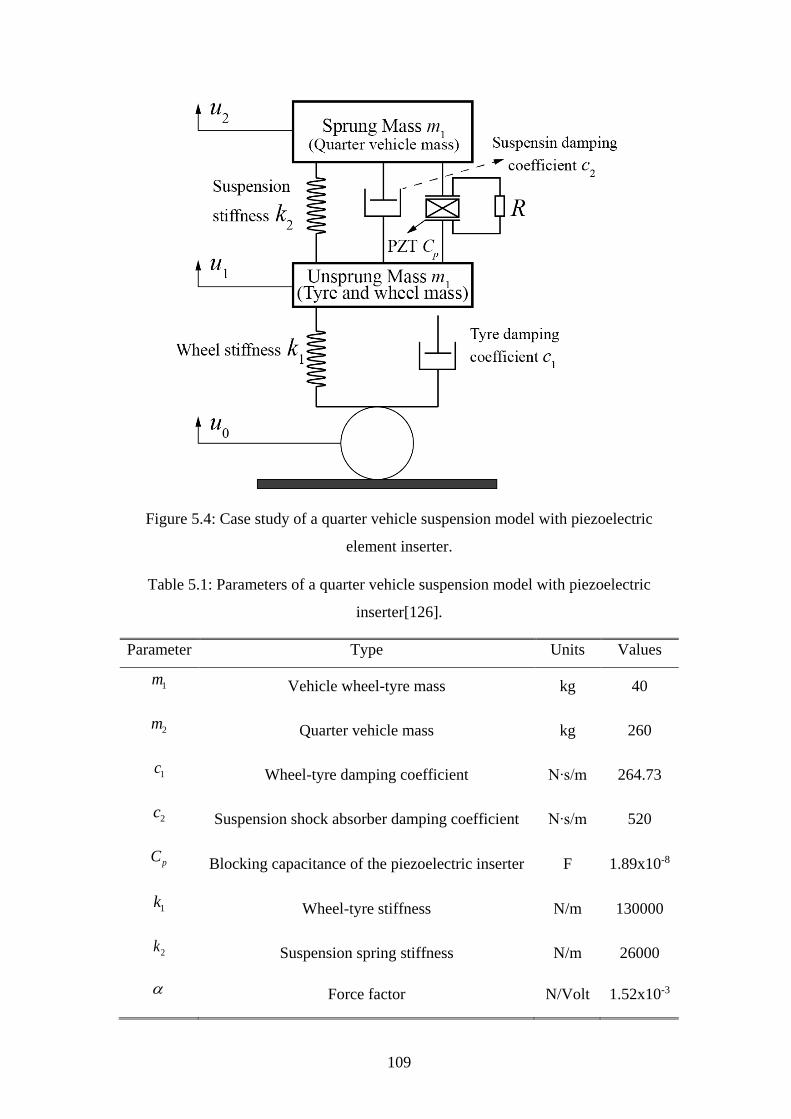
109
Figure 5.4: Case study of a quarter vehicle suspension model with piezoelectric
element inserter.
Table 5.1: Parameters of a quarter vehicle suspension model with piezoelectric
inserter[126].
Parameter Type Units Values
1m Vehicle wheel-tyre mass kg 40
2m Quarter vehicle mass kg 260
1c Wheel-tyre damping coefficient N∙s/m 264.73
2c Suspension shock absorber damping coefficient N∙s/m 520
pC Blocking capacitance of the piezoelectric inserter F 1.89x10⁻⁸
1k Wheel-tyre stiffness N/m 130000
2k Suspension spring stiffness N/m 26000
Force factor N/Volt 1.52x10⁻³
110
nf Natural frequency Hz 1.45
R Electrical resistance Ω 30455.3
For a “Vehicle Quarter Suspension Model” with piezoelectric material insert in place of
shock absorber, then 0u is the excitation displacement; 1m is the unsprung mass or the
mass of wheel and tyre of a quarter vehicle; 2m is the sprung mass or a quarter vehicle’s
mass; 1k is the wheel-tyre stiffness; 2k is the suspension spring stiffness; 1c is the
wheel-tyre damping coefficient; 2c is the suspension damping coefficient; 1u is the
displacement of the unsprung mass 1m ; 2u is the displacement of the sprung mass 2m ;
V is the voltage generated by the piezoelectric insert.
In order to verify the output voltage and power calculated using the above frequency
response analysis, Matlab Simulink was applied to conduct time domain integration for
the performance of the harvesting system. A simulation scheme is shown in Figure 5.5
where the parameters in Table 5.1 were substituted into Equations (5.10) and (5.11). The
harvested power was calculated by the squared voltage divided by the resistance. In the
simulation scheme, the excited acceleration was simulated by a sine wave acceleration
of 1g (9.80 m/s2) amplitude generated by a signal generator module in Matlab. The
excitation acceleration signal was passed through the Matlab Simulink wiring diagram
which calculated the output voltage and mean harvested power. The predicted output
voltage and harvested power using the time domain integration are displayed by the
scope modules in Matlab as shown in Figure 5.6 and Figure 5.7.
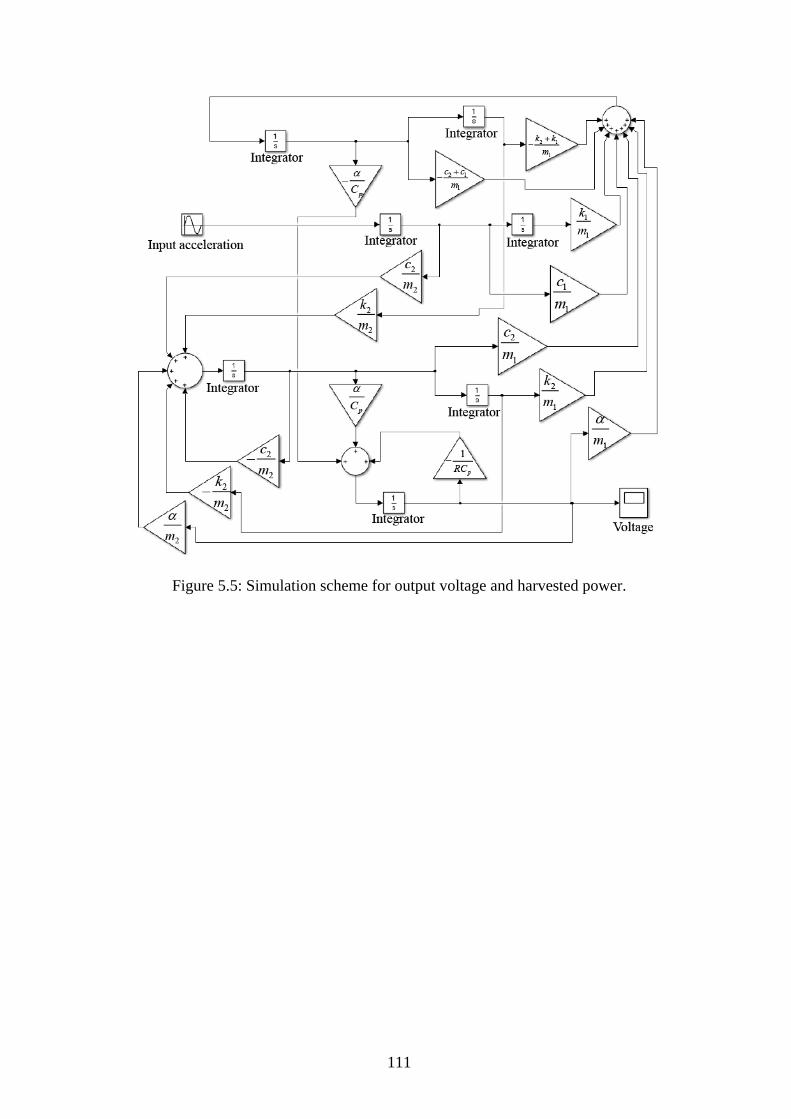
111
Figure 5.5: Simulation scheme for output voltage and harvested power.
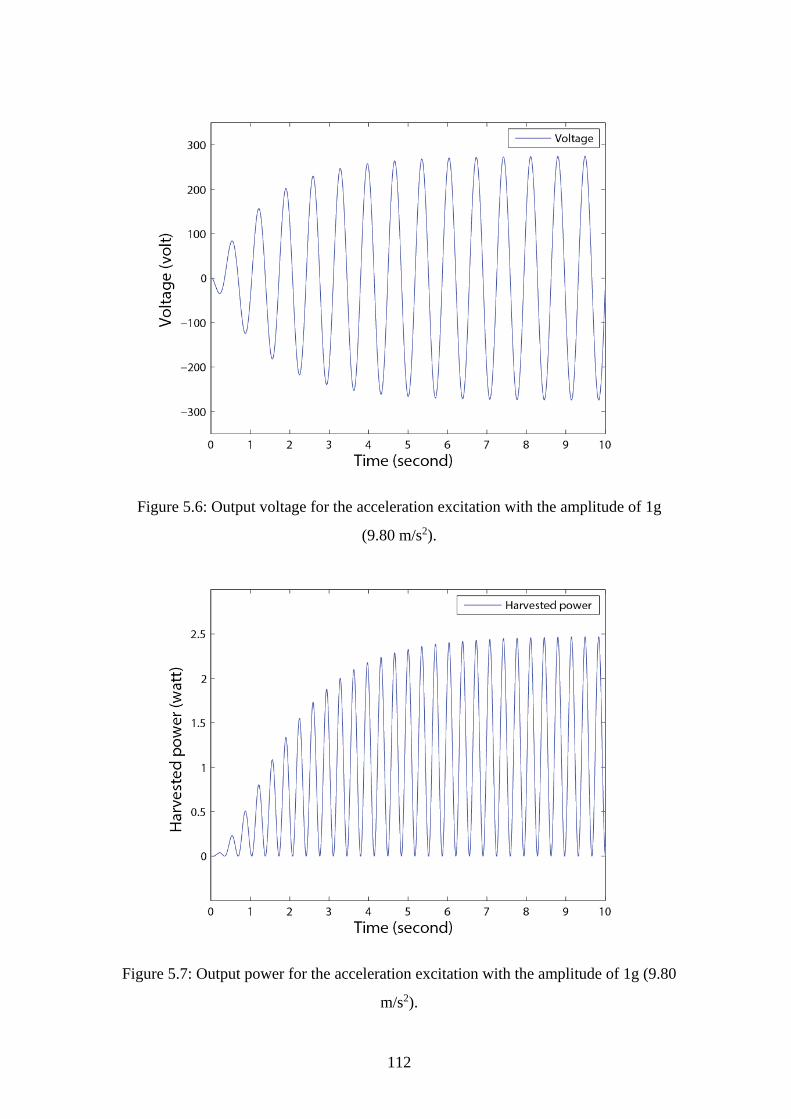
112
Figure 5.6: Output voltage for the acceleration excitation with the amplitude of 1g
(9.80 m/s2).
Figure 5.7: Output power for the acceleration excitation with the amplitude of 1g (9.80
m/s2).
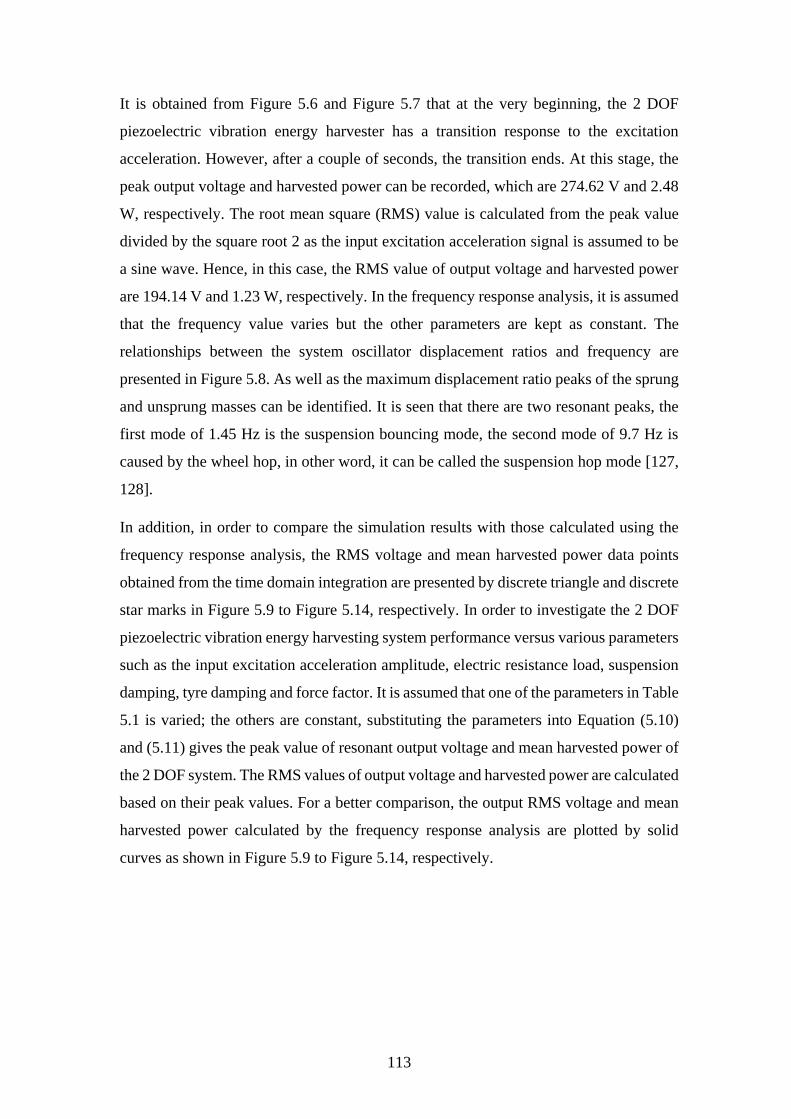
113
It is obtained from Figure 5.6 and Figure 5.7 that at the very beginning, the 2 DOF
piezoelectric vibration energy harvester has a transition response to the excitation
acceleration. However, after a couple of seconds, the transition ends. At this stage, the
peak output voltage and harvested power can be recorded, which are 274.62 V and 2.48
W, respectively. The root mean square (RMS) value is calculated from the peak value
divided by the square root 2 as the input excitation acceleration signal is assumed to be
a sine wave. Hence, in this case, the RMS value of output voltage and harvested power
are 194.14 V and 1.23 W, respectively. In the frequency response analysis, it is assumed
that the frequency value varies but the other parameters are kept as constant. The
relationships between the system oscillator displacement ratios and frequency are
presented in Figure 5.8. As well as the maximum displacement ratio peaks of the sprung
and unsprung masses can be identified. It is seen that there are two resonant peaks, the
first mode of 1.45 Hz is the suspension bouncing mode, the second mode of 9.7 Hz is
caused by the wheel hop, in other word, it can be called the suspension hop mode [127,
128].
In addition, in order to compare the simulation results with those calculated using the
frequency response analysis, the RMS voltage and mean harvested power data points
obtained from the time domain integration are presented by discrete triangle and discrete
star marks in Figure 5.9 to Figure 5.14, respectively. In order to investigate the 2 DOF
piezoelectric vibration energy harvesting system performance versus various parameters
such as the input excitation acceleration amplitude, electric resistance load, suspension
damping, tyre damping and force factor. It is assumed that one of the parameters in Table
5.1 is varied; the others are constant, substituting the parameters into Equation (5.10)
and (5.11) gives the peak value of resonant output voltage and mean harvested power of
the 2 DOF system. The RMS values of output voltage and harvested power are calculated
based on their peak values. For a better comparison, the output RMS voltage and mean
harvested power calculated by the frequency response analysis are plotted by solid
curves as shown in Figure 5.9 to Figure 5.14, respectively.
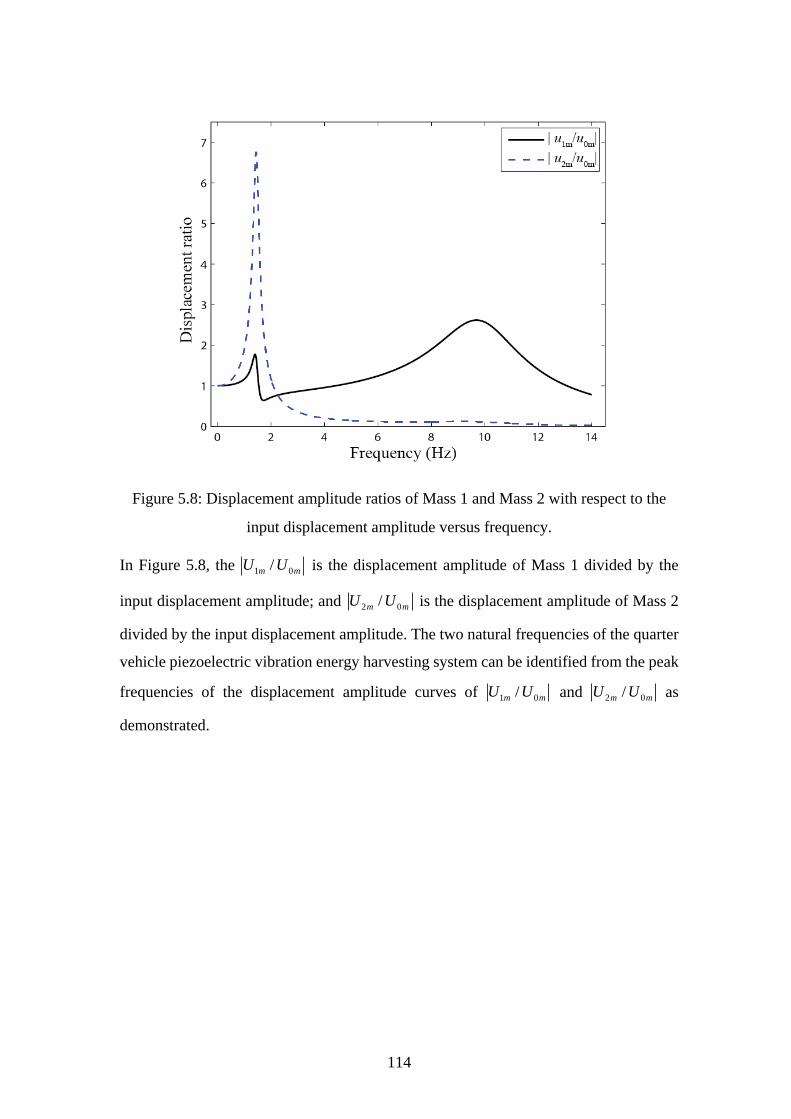
114
Figure 5.8: Displacement amplitude ratios of Mass 1 and Mass 2 with respect to the
input displacement amplitude versus frequency.
In Figure 5.8, the 1 0/m mU U is the displacement amplitude of Mass 1 divided by the
input displacement amplitude; and 2 0/m mU U is the displacement amplitude of Mass 2
divided by the input displacement amplitude. The two natural frequencies of the quarter
vehicle piezoelectric vibration energy harvesting system can be identified from the peak
frequencies of the displacement amplitude curves of 1 0/m mU U and 2 0/m mU U as
demonstrated.
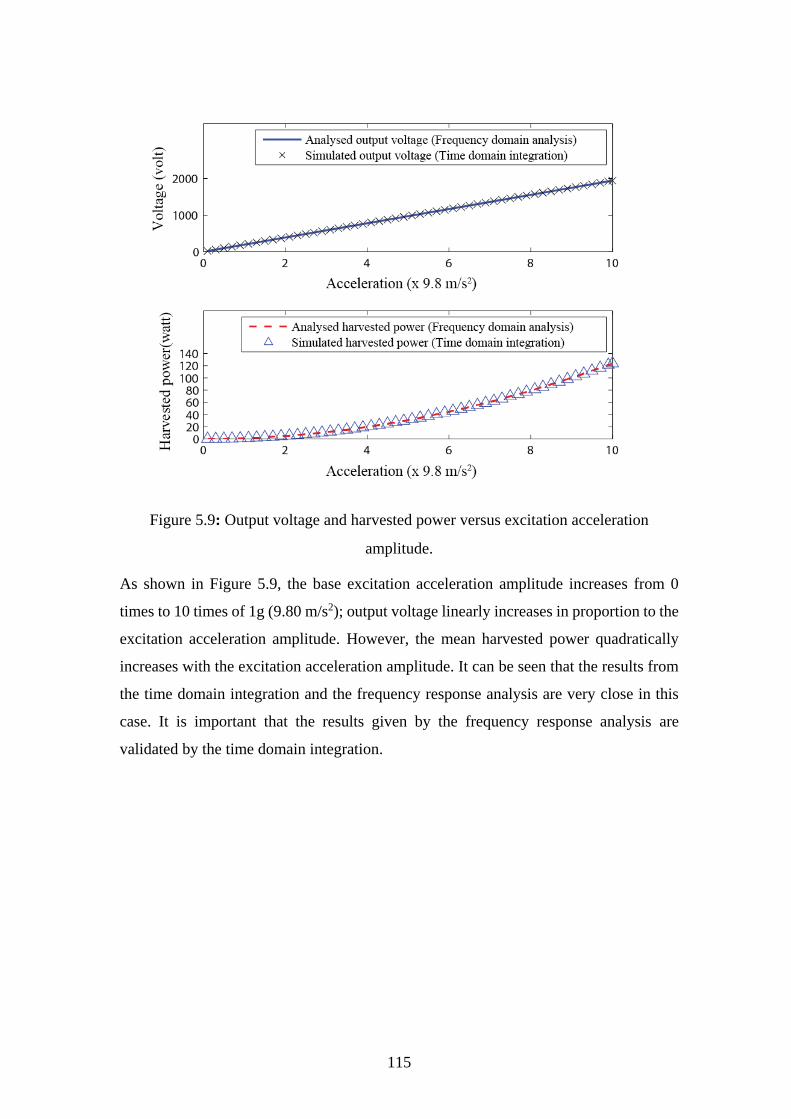
115
Figure 5.9: Output voltage and harvested power versus excitation acceleration
amplitude.
As shown in Figure 5.9, the base excitation acceleration amplitude increases from 0
times to 10 times of 1g (9.80 m/s2); output voltage linearly increases in proportion to the
excitation acceleration amplitude. However, the mean harvested power quadratically
increases with the excitation acceleration amplitude. It can be seen that the results from
the time domain integration and the frequency response analysis are very close in this
case. It is important that the results given by the frequency response analysis are
validated by the time domain integration.
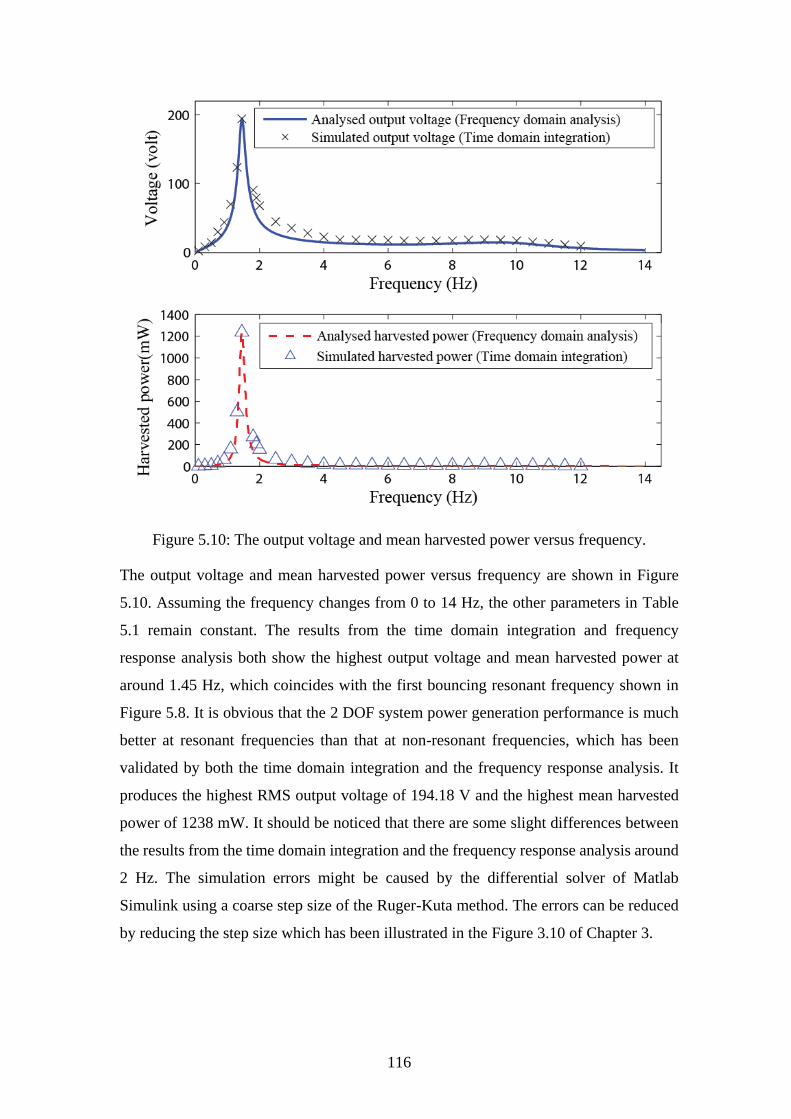
116
Figure 5.10: The output voltage and mean harvested power versus frequency.
The output voltage and mean harvested power versus frequency are shown in Figure
5.10. Assuming the frequency changes from 0 to 14 Hz, the other parameters in Table
5.1 remain constant. The results from the time domain integration and frequency
response analysis both show the highest output voltage and mean harvested power at
around 1.45 Hz, which coincides with the first bouncing resonant frequency shown in
Figure 5.8. It is obvious that the 2 DOF system power generation performance is much
better at resonant frequencies than that at non-resonant frequencies, which has been
validated by both the time domain integration and the frequency response analysis. It
produces the highest RMS output voltage of 194.18 V and the highest mean harvested
power of 1238 mW. It should be noticed that there are some slight differences between
the results from the time domain integration and the frequency response analysis around
2 Hz. The simulation errors might be caused by the differential solver of Matlab
Simulink using a coarse step size of the Ruger-Kuta method. The errors can be reduced
by reducing the step size which has been illustrated in the Figure 3.10 of Chapter 3.
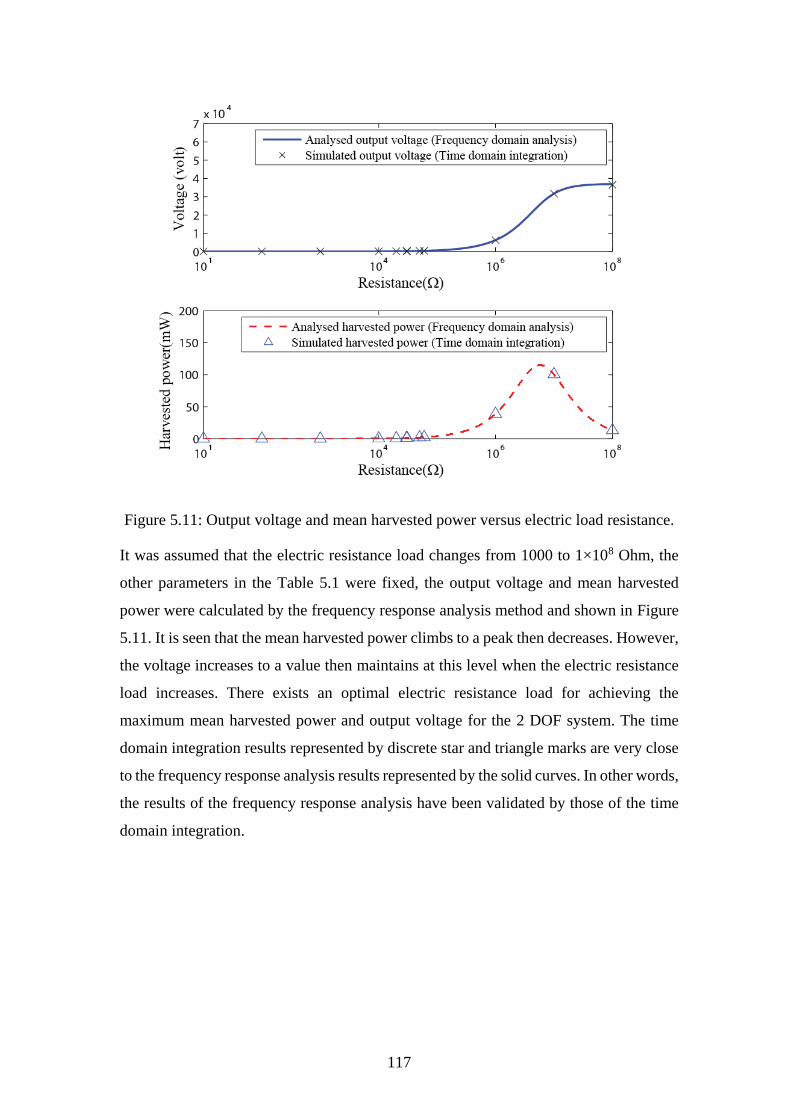
117
Figure 5.11: Output voltage and mean harvested power versus electric load resistance.
It was assumed that the electric resistance load changes from 1000 to 1×10⁸ Ohm, the
other parameters in the Table 5.1 were fixed, the output voltage and mean harvested
power were calculated by the frequency response analysis method and shown in Figure
5.11. It is seen that the mean harvested power climbs to a peak then decreases. However,
the voltage increases to a value then maintains at this level when the electric resistance
load increases. There exists an optimal electric resistance load for achieving the
maximum mean harvested power and output voltage for the 2 DOF system. The time
domain integration results represented by discrete star and triangle marks are very close
to the frequency response analysis results represented by the solid curves. In other words,
the results of the frequency response analysis have been validated by those of the time
domain integration.

118
Figure 5.12: Output voltage and harvested power versus wheel-tyre damping.
If the wheel-tyre damping value was changed from 0.01 times to 1000000 times of the
original value (264.73 N∙s/m), the other parameters were kept constant. It can be seen
from Figure 5.12 that the mean harvested power and output voltage decrease to a level
as the wheel-tyre damping increases. After reaching that bottom values, then, the mean
harvested power and output voltage slightly increase and then maintain at a certain level
when the wheel-tyre damping value further increases.
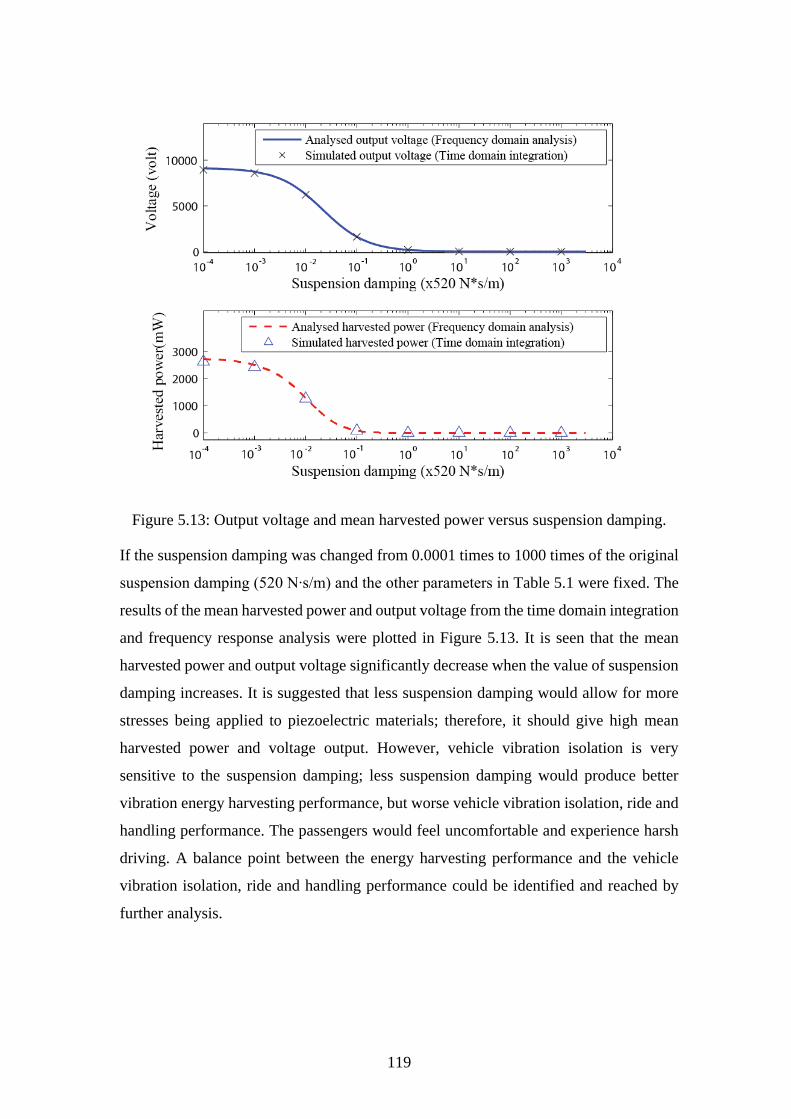
119
Figure 5.13: Output voltage and mean harvested power versus suspension damping.
If the suspension damping was changed from 0.0001 times to 1000 times of the original
suspension damping (520 N∙s/m) and the other parameters in Table 5.1 were fixed. The
results of the mean harvested power and output voltage from the time domain integration
and frequency response analysis were plotted in Figure 5.13. It is seen that the mean
harvested power and output voltage significantly decrease when the value of suspension
damping increases. It is suggested that less suspension damping would allow for more
stresses being applied to piezoelectric materials; therefore, it should give high mean
harvested power and voltage output. However, vehicle vibration isolation is very
sensitive to the suspension damping; less suspension damping would produce better
vibration energy harvesting performance, but worse vehicle vibration isolation, ride and
handling performance. The passengers would feel uncomfortable and experience harsh
driving. A balance point between the energy harvesting performance and the vehicle
vibration isolation, ride and handling performance could be identified and reached by
further analysis.
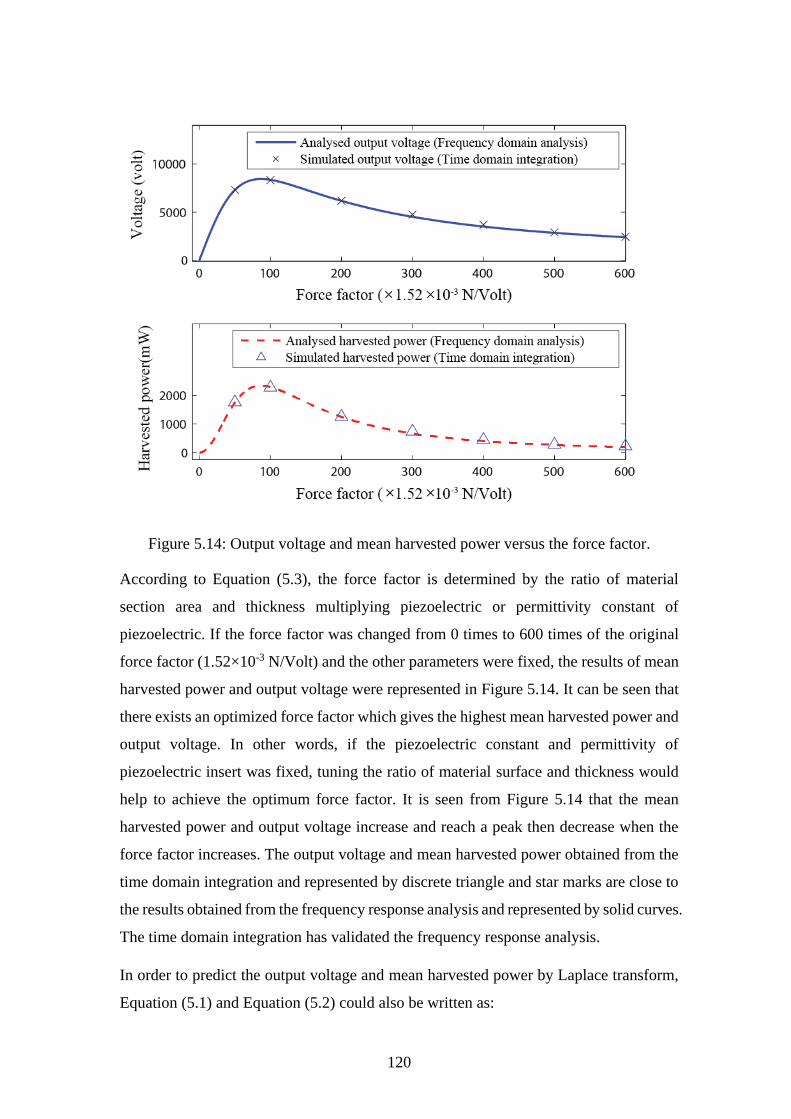
120
Figure 5.14: Output voltage and mean harvested power versus the force factor.
According to Equation (5.3), the force factor is determined by the ratio of material
section area and thickness multiplying piezoelectric or permittivity constant of
piezoelectric. If the force factor was changed from 0 times to 600 times of the original
force factor (1.52×10⁻³ N/Volt) and the other parameters were fixed, the results of mean
harvested power and output voltage were represented in Figure 5.14. It can be seen that
there exists an optimized force factor which gives the highest mean harvested power and
output voltage. In other words, if the piezoelectric constant and permittivity of
piezoelectric insert was fixed, tuning the ratio of material surface and thickness would
help to achieve the optimum force factor. It is seen from Figure 5.14 that the mean
harvested power and output voltage increase and reach a peak then decrease when the
force factor increases. The output voltage and mean harvested power obtained from the
time domain integration and represented by discrete triangle and star marks are close to
the results obtained from the frequency response analysis and represented by solid curves.
The time domain integration has validated the frequency response analysis.
In order to predict the output voltage and mean harvested power by Laplace transform,
Equation (5.1) and Equation (5.2) could also be written as:
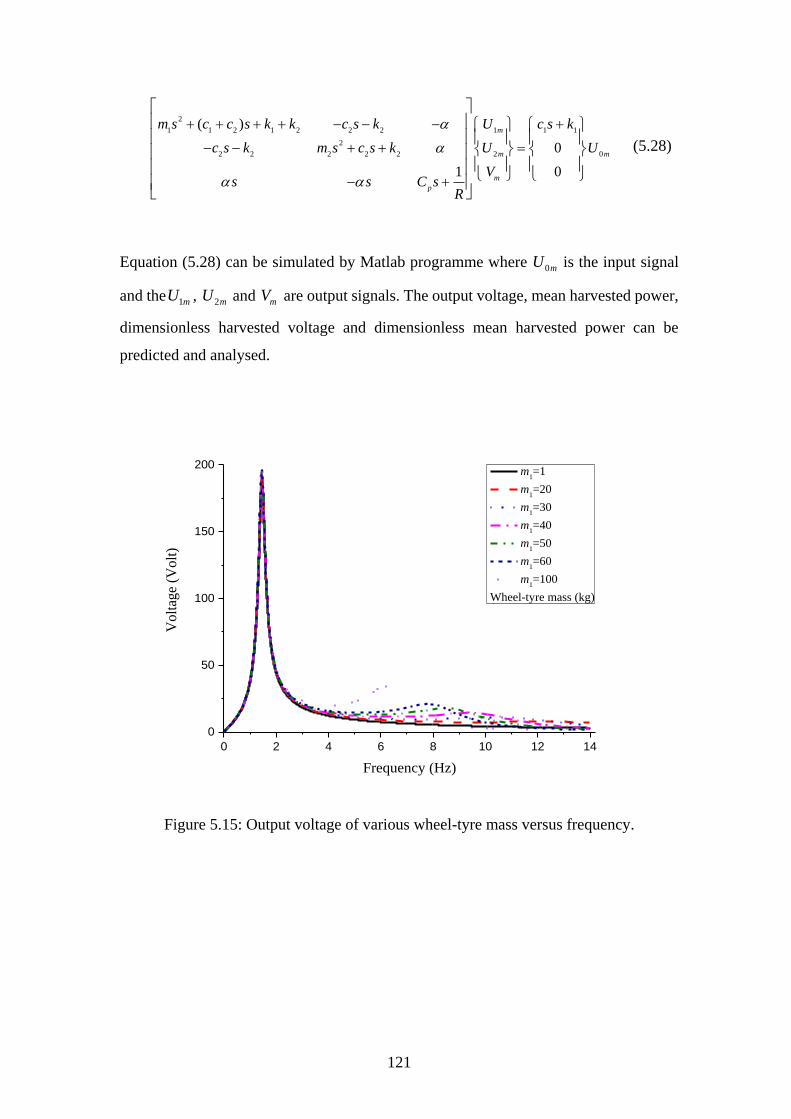
121
2
1 1 2 11 2 2 2 1 1
2
2 2 2 2 02 2
( )
0
1 0
m
m
p
m
m
m s c c s k k c s k U c s k
c s k m s c s k U U
Vs s C s
R
(5.28)
Equation (5.28) can be simulated by Matlab programme where 0mU is the input signal
and the 1mU , 2mU and mV are output signals. The output voltage, mean harvested power,
dimensionless harvested voltage and dimensionless mean harvested power can be
predicted and analysed.
0 2 4 6 8 10 12 14
0
50
100
150
200
Volt
age
(Volt
)
Frequency (Hz)
m1=1
m1=20
m1=30
m1=40
m1=50
m1=60
m1=100
Wheel-tyre mass (kg)
Figure 5.15: Output voltage of various wheel-tyre mass versus frequency.
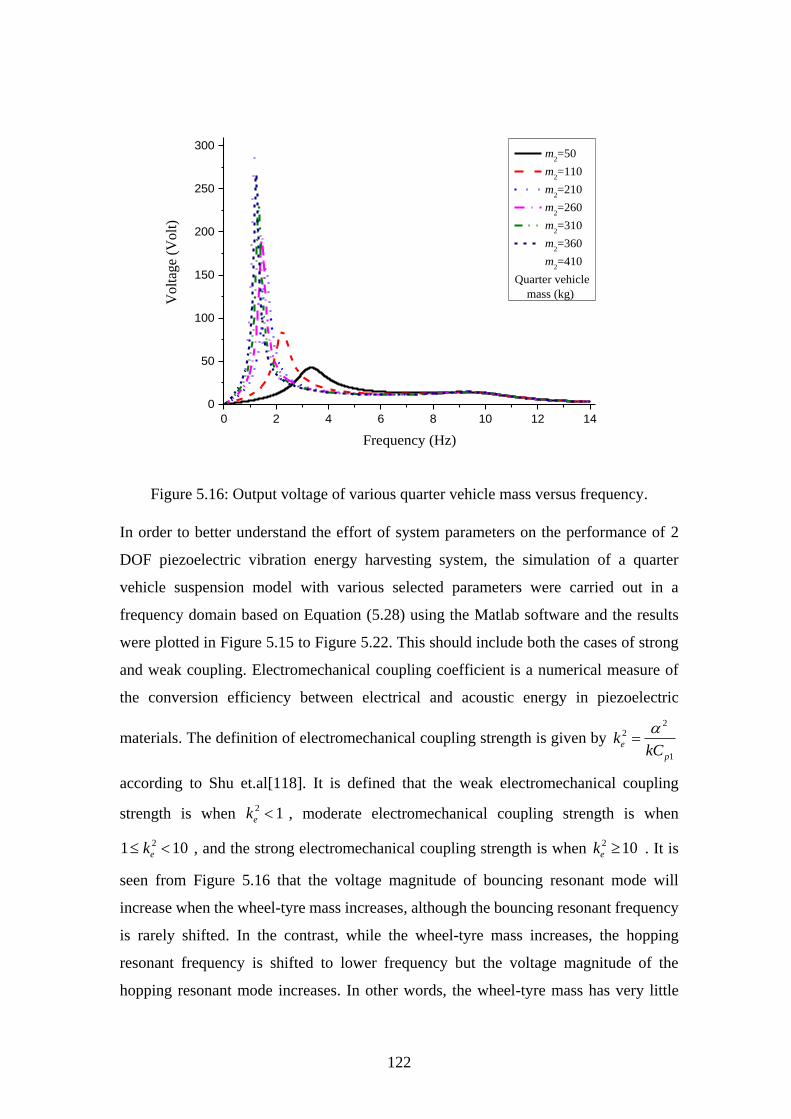
122
0 2 4 6 8 10 12 14
0
50
100
150
200
250
300
Volt
age
(Volt
)
Frequency (Hz)
m2=50
m2=110
m2=210
m2=260
m2=310
m2=360
m2=410
Quarter vehicle
mass (kg)
Figure 5.16: Output voltage of various quarter vehicle mass versus frequency.
In order to better understand the effort of system parameters on the performance of 2
DOF piezoelectric vibration energy harvesting system, the simulation of a quarter
vehicle suspension model with various selected parameters were carried out in a
frequency domain based on Equation (5.28) using the Matlab software and the results
were plotted in Figure 5.15 to Figure 5.22. This should include both the cases of strong
and weak coupling. Electromechanical coupling coefficient is a numerical measure of
the conversion efficiency between electrical and acoustic energy in piezoelectric
materials. The definition of electromechanical coupling strength is given by 2
1
2
e
p
kkC
according to Shu et.al[118]. It is defined that the weak electromechanical coupling
strength is when 2 1ek , moderate electromechanical coupling strength is when
21 10ek , and the strong electromechanical coupling strength is when 2 10ek . It is
seen from Figure 5.16 that the voltage magnitude of bouncing resonant mode will
increase when the wheel-tyre mass increases, although the bouncing resonant frequency
is rarely shifted. In the contrast, while the wheel-tyre mass increases, the hopping
resonant frequency is shifted to lower frequency but the voltage magnitude of the
hopping resonant mode increases. In other words, the wheel-tyre mass has very little
123
influence on the bouncing resonant frequency but has some influences on the bouncing
and hopping mean resonant harvested power magnitudes and the overall harvesting
frequency bandwidth. A larger wheel-tyre mass contributes to a larger bouncing mean
resonant harvested power and a larger harvesting frequency bandwidth. If the vehicle
mass is fixed, as the wheel-tyre mass increases, the mass ratio ( 2 1/RM m m ) decreases,
according to Figure 5.2, the dimensionless mean resonant harvested power
2
02 m
2
h 2
m AP /
R
increases therefore the resonant harvested power hP increases. The
result in Figure 5.2 has verified that shown in Figure 5.15.
It is seen from Figure 5.16 that when the vehicle mass increases, the bouncing resonant
frequency decreases, the bouncing resonant voltage magnitude or mean harvested power
increases. This result coincides with that in Figure 5.2 where the wheel tyre mass is
assumed to be fixed. When the vehicle mass increases, the mass ratio ( 2 1/RM m m )
increases, the dimensionless mean harvested power
2
02 m
2
h 2
m AP /
R
in Figure 5.2
therefore decreases. However, the mean harvested power Ph is proportional to the
dimensionless mean harvested power
2
02 m
2
h 2
m AP /
R
multiplied by the squared quarter
vehicle mass ( 2m ). When the vehicle mass increases, although the dimensionless mean
harvested power
2
02 m
2
h 2
m AP /
R
decreases, the harvested power hP will increase,
which corresponds to the increased output voltage amplitude in Figure 5.16.
The results in Figure 5.2, Figure 5.15 and Figure 5.16 reveal the effect of the vehicle
mass ( 2m ) and wheel-tyre mass ( 1m ) on the mean harvested power or voltage and energy
harvesting efficiency which is not clearly shown in Equation (5.27) and Equation (5.28).
The vehicle mass ( 2m ) has very little influence on the voltage magnitude of the hopping
resonant mode. A smaller vehicle mass contributes to a larger harvesting frequency
bandwidth. As the bouncing resonant voltage magnitude is much larger than the hopping
resonant voltage magnitude, the vehicle mass plays a more important role than the
wheel-tyre mass for the resonant output voltage magnitude.
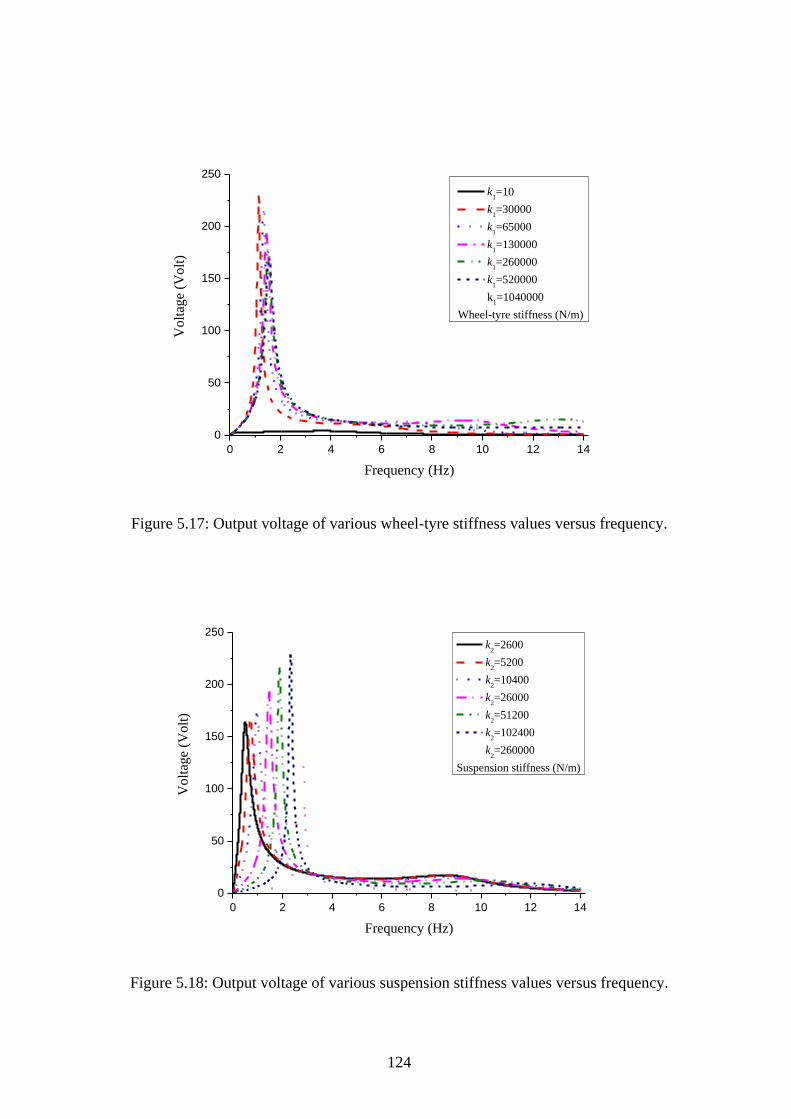
124
0 2 4 6 8 10 12 14
0
50
100
150
200
250V
olt
age
(Vo
lt)
Frequency (Hz)
k1=10
k1=30000
k1=65000
k1=130000
k1=260000
k1=520000
k1=1040000
Wheel-tyre stiffness (N/m)
Figure 5.17: Output voltage of various wheel-tyre stiffness values versus frequency.
0 2 4 6 8 10 12 14
0
50
100
150
200
250
Vo
ltag
e (V
olt
)
Frequency (Hz)
k2=2600
k2=5200
k2=10400
k2=26000
k2=51200
k2=102400
k2=260000
Suspension stiffness (N/m)
Figure 5.18: Output voltage of various suspension stiffness values versus frequency.
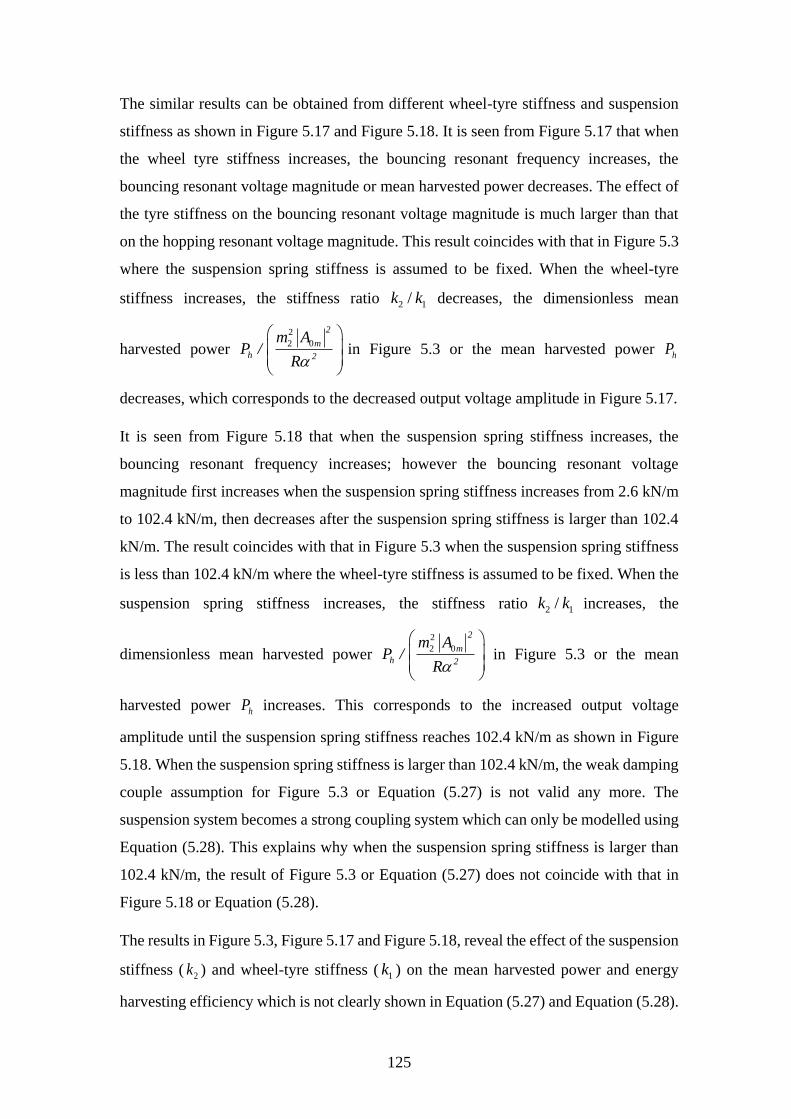
125
The similar results can be obtained from different wheel-tyre stiffness and suspension
stiffness as shown in Figure 5.17 and Figure 5.18. It is seen from Figure 5.17 that when
the wheel tyre stiffness increases, the bouncing resonant frequency increases, the
bouncing resonant voltage magnitude or mean harvested power decreases. The effect of
the tyre stiffness on the bouncing resonant voltage magnitude is much larger than that
on the hopping resonant voltage magnitude. This result coincides with that in Figure 5.3
where the suspension spring stiffness is assumed to be fixed. When the wheel-tyre
stiffness increases, the stiffness ratio 2 1/k k decreases, the dimensionless mean
harvested power
2
02 m
2
h 2
m AP /
R
in Figure 5.3 or the mean harvested power hP
decreases, which corresponds to the decreased output voltage amplitude in Figure 5.17.
It is seen from Figure 5.18 that when the suspension spring stiffness increases, the
bouncing resonant frequency increases; however the bouncing resonant voltage
magnitude first increases when the suspension spring stiffness increases from 2.6 kN/m
to 102.4 kN/m, then decreases after the suspension spring stiffness is larger than 102.4
kN/m. The result coincides with that in Figure 5.3 when the suspension spring stiffness
is less than 102.4 kN/m where the wheel-tyre stiffness is assumed to be fixed. When the
suspension spring stiffness increases, the stiffness ratio 2 1/k k increases, the
dimensionless mean harvested power
2
02 m
2
h 2
m AP /
R
in Figure 5.3 or the mean
harvested power hP increases. This corresponds to the increased output voltage
amplitude until the suspension spring stiffness reaches 102.4 kN/m as shown in Figure
5.18. When the suspension spring stiffness is larger than 102.4 kN/m, the weak damping
couple assumption for Figure 5.3 or Equation (5.27) is not valid any more. The
suspension system becomes a strong coupling system which can only be modelled using
Equation (5.28). This explains why when the suspension spring stiffness is larger than
102.4 kN/m, the result of Figure 5.3 or Equation (5.27) does not coincide with that in
Figure 5.18 or Equation (5.28).
The results in Figure 5.3, Figure 5.17 and Figure 5.18, reveal the effect of the suspension
stiffness ( 2k ) and wheel-tyre stiffness ( 1k ) on the mean harvested power and energy
harvesting efficiency which is not clearly shown in Equation (5.27) and Equation (5.28).
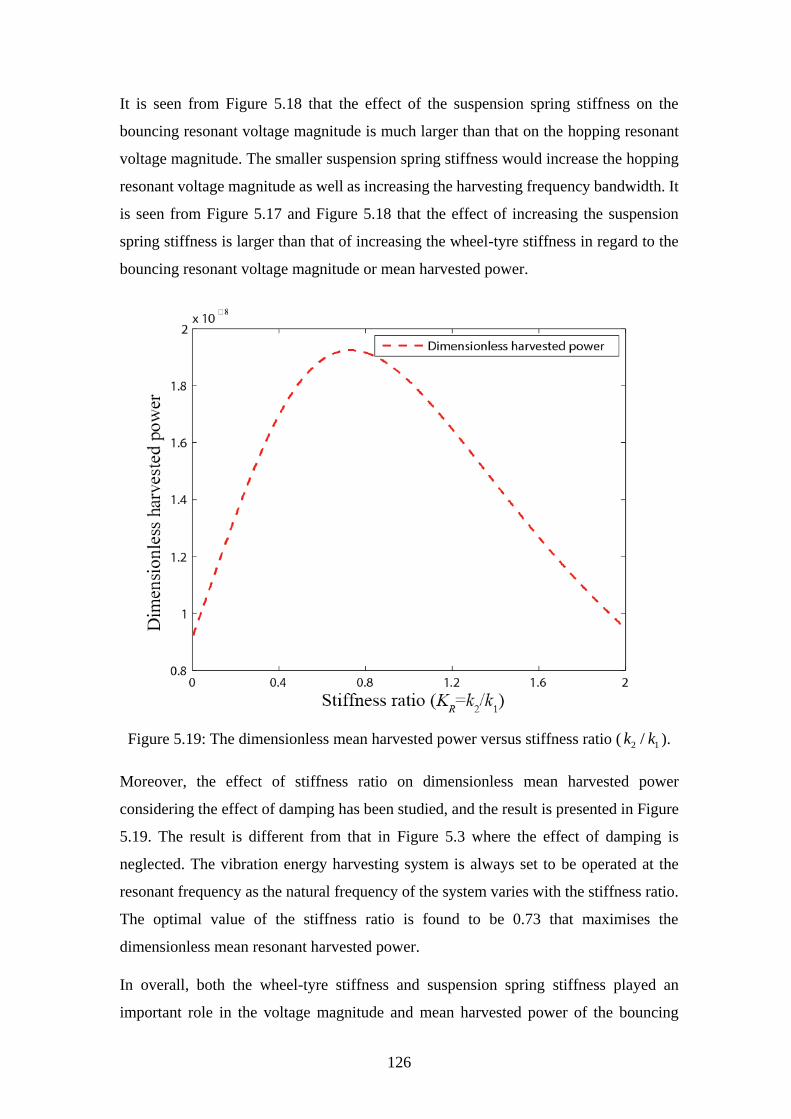
126
It is seen from Figure 5.18 that the effect of the suspension spring stiffness on the
bouncing resonant voltage magnitude is much larger than that on the hopping resonant
voltage magnitude. The smaller suspension spring stiffness would increase the hopping
resonant voltage magnitude as well as increasing the harvesting frequency bandwidth. It
is seen from Figure 5.17 and Figure 5.18 that the effect of increasing the suspension
spring stiffness is larger than that of increasing the wheel-tyre stiffness in regard to the
bouncing resonant voltage magnitude or mean harvested power.
Figure 5.19: The dimensionless mean harvested power versus stiffness ratio ( 2 1/k k ).
Moreover, the effect of stiffness ratio on dimensionless mean harvested power
considering the effect of damping has been studied, and the result is presented in Figure
5.19. The result is different from that in Figure 5.3 where the effect of damping is
neglected. The vibration energy harvesting system is always set to be operated at the
resonant frequency as the natural frequency of the system varies with the stiffness ratio.
The optimal value of the stiffness ratio is found to be 0.73 that maximises the
dimensionless mean resonant harvested power.
In overall, both the wheel-tyre stiffness and suspension spring stiffness played an
important role in the voltage magnitude and mean harvested power of the bouncing
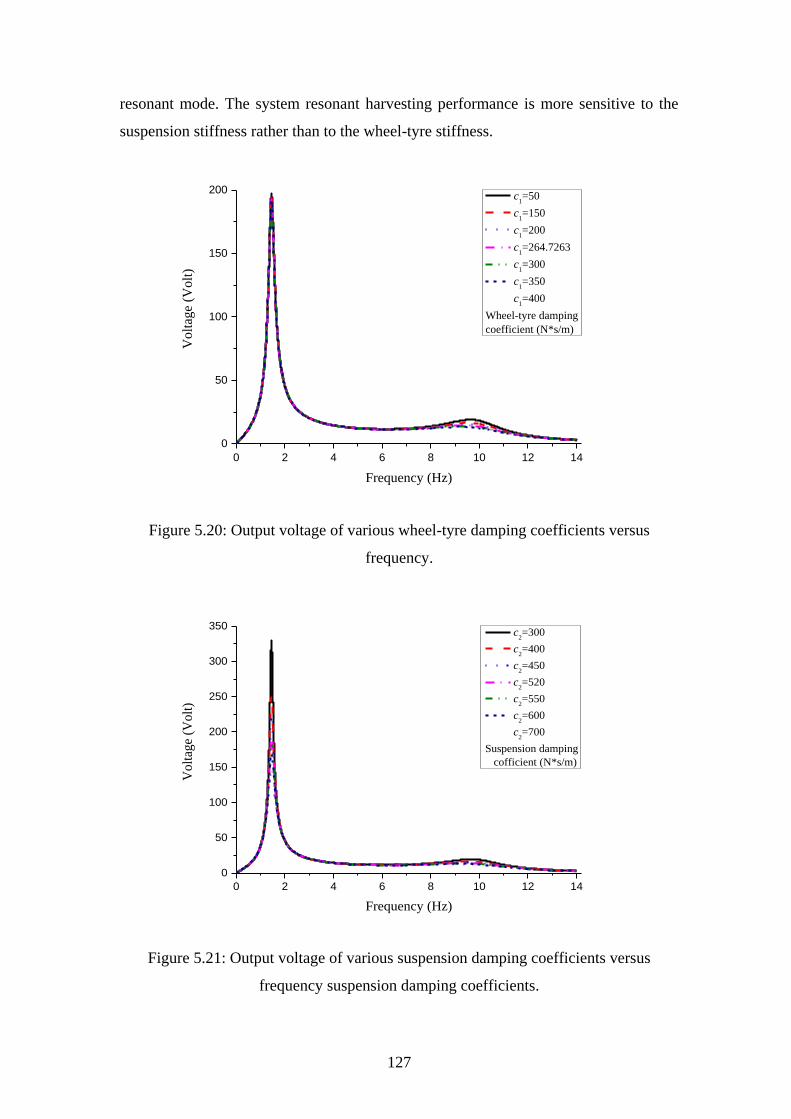
127
resonant mode. The system resonant harvesting performance is more sensitive to the
suspension stiffness rather than to the wheel-tyre stiffness.
0 2 4 6 8 10 12 14
0
50
100
150
200V
olt
age
(Volt
)
Frequency (Hz)
c1=50
c1=150
c1=200
c1=264.7263
c1=300
c1=350
c1=400
Wheel-tyre damping
coefficient (N*s/m)
Figure 5.20: Output voltage of various wheel-tyre damping coefficients versus
frequency.
0 2 4 6 8 10 12 14
0
50
100
150
200
250
300
350
Volt
age
(Volt
)
Frequency (Hz)
c2=300
c2=400
c2=450
c2=520
c2=550
c2=600
c2=700
Suspension damping
cofficient (N*s/m)
Figure 5.21: Output voltage of various suspension damping coefficients versus
frequency suspension damping coefficients.
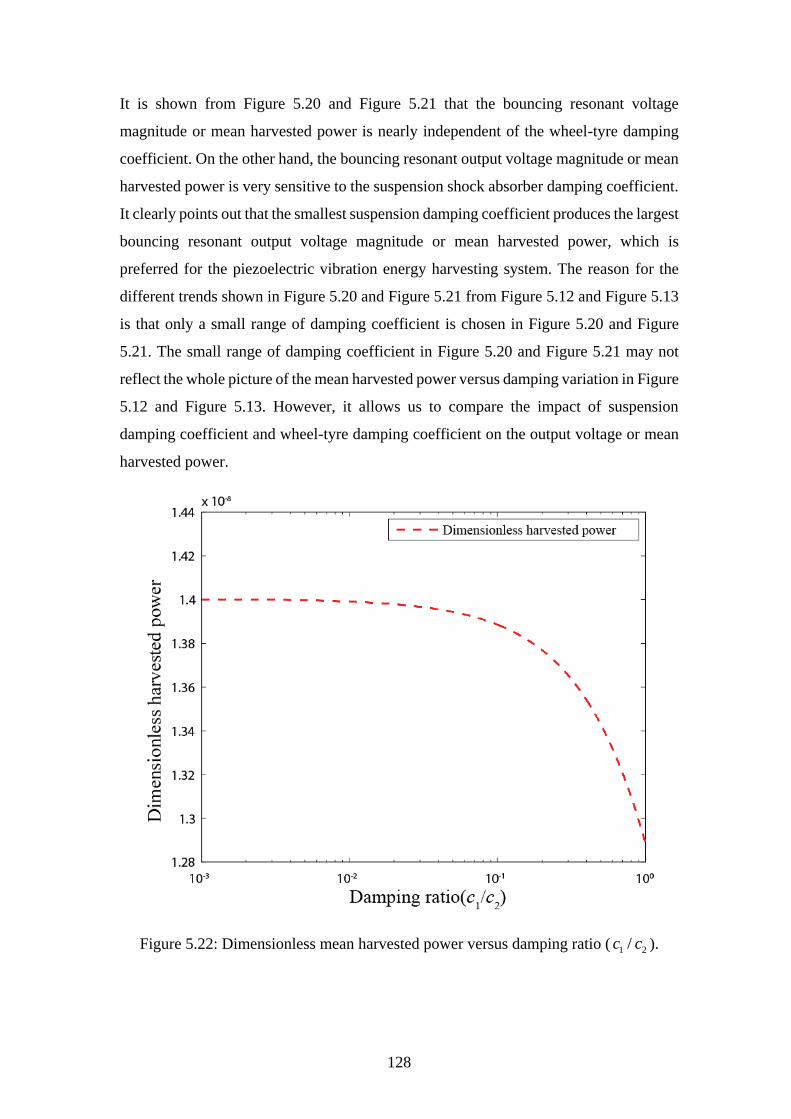
128
It is shown from Figure 5.20 and Figure 5.21 that the bouncing resonant voltage
magnitude or mean harvested power is nearly independent of the wheel-tyre damping
coefficient. On the other hand, the bouncing resonant output voltage magnitude or mean
harvested power is very sensitive to the suspension shock absorber damping coefficient.
It clearly points out that the smallest suspension damping coefficient produces the largest
bouncing resonant output voltage magnitude or mean harvested power, which is
preferred for the piezoelectric vibration energy harvesting system. The reason for the
different trends shown in Figure 5.20 and Figure 5.21 from Figure 5.12 and Figure 5.13
is that only a small range of damping coefficient is chosen in Figure 5.20 and Figure
5.21. The small range of damping coefficient in Figure 5.20 and Figure 5.21 may not
reflect the whole picture of the mean harvested power versus damping variation in Figure
5.12 and Figure 5.13. However, it allows us to compare the impact of suspension
damping coefficient and wheel-tyre damping coefficient on the output voltage or mean
harvested power.
Figure 5.22: Dimensionless mean harvested power versus damping ratio ( 1 2/c c ).

129
Furthermore, the effect of the damping ratio on the dimensionless mean resonant
harvested power is studied and plotted in Figure 5.22. It is seen from Figure 5.22 that
when the damping ratio ( 1 2/c c ) is larger than 0.25, the dimensionless mean resonant
harvested power will significantly decrease. Physically, when the damping ratio is larger
than 1/4, the amplitude of the relative displacement between the wheel and vehicle body
will become smaller which benefits the vehicle handling and comfort.
5.4 Experimental validation
In order to examine the accuracy of the theoretical analysis method, a 2 DOF
piezoelectric vibration energy harvester has been built and attached on the shaker for
testing as shown in Figure 5.23. There are three aluminium blocks which is
83mm×83mm, and the thickness is 10mm connected by the springs. The tipped mass is
placed on the first aluminium block, and the piezoelectric stack is inserted between the
first and the middle aluminium block.
Figure 5.23: A 2 DOF piezoelectric vibration energy harvester attached on the shaker.
The laser vibrometer is used to measure vibration frequency spectrum and identify the
resonant frequencies of the harvester device. The laser vibrometer is also used to
measure the velocity amplitude of the excitation that is generated by the shaker. The k1
is the sum of the stiffness values of the four springs located below the Mass 1, and the
k2 is the sum of the stiffness values of the four springs located below the Mass 2.
Moreover, the parameters of the 2 DOF piezoelectric vibration energy harvesting device
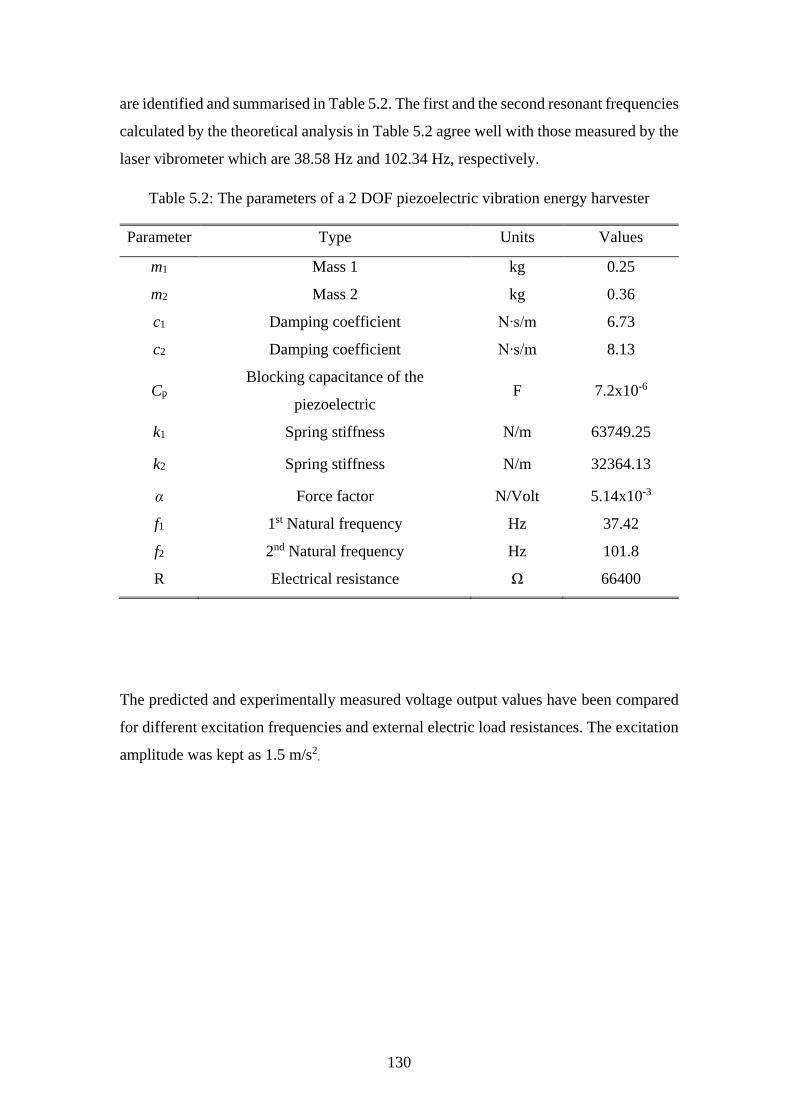
130
are identified and summarised in Table 5.2. The first and the second resonant frequencies
calculated by the theoretical analysis in Table 5.2 agree well with those measured by the
laser vibrometer which are 38.58 Hz and 102.34 Hz, respectively.
Table 5.2: The parameters of a 2 DOF piezoelectric vibration energy harvester
Parameter Type Units Values
m1 Mass 1 kg 0.25
m2 Mass 2 kg 0.36
c1 Damping coefficient N∙s/m 6.73
c2 Damping coefficient N∙s/m 8.13
Cp Blocking capacitance of the
piezoelectric F 7.2x10⁻⁶
k1 Spring stiffness N/m 63749.25
k2 Spring stiffness N/m 32364.13
α Force factor N/Volt 5.14x10⁻³
f1 1st Natural frequency Hz 37.42
f2 2nd Natural frequency Hz 101.8
R Electrical resistance Ω 66400
The predicted and experimentally measured voltage output values have been compared
for different excitation frequencies and external electric load resistances. The excitation
amplitude was kept as 1.5 m/s2.
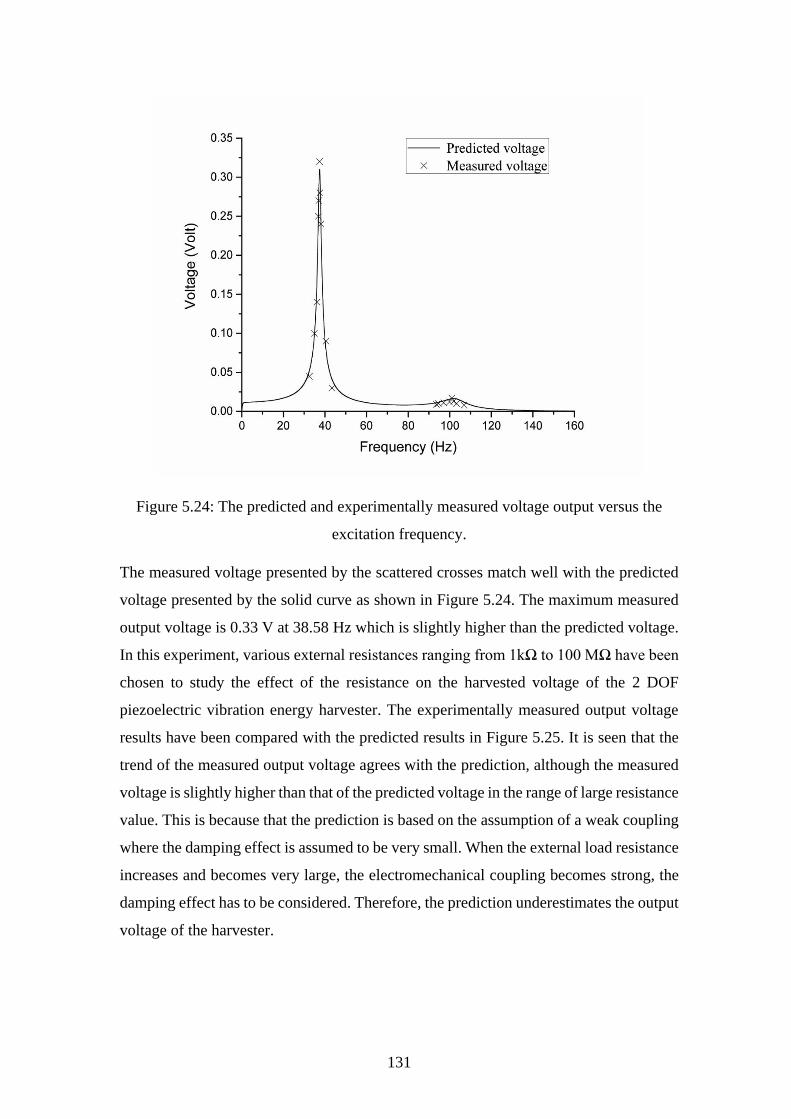
131
Figure 5.24: The predicted and experimentally measured voltage output versus the
excitation frequency.
The measured voltage presented by the scattered crosses match well with the predicted
voltage presented by the solid curve as shown in Figure 5.24. The maximum measured
output voltage is 0.33 V at 38.58 Hz which is slightly higher than the predicted voltage.
In this experiment, various external resistances ranging from 1kΩ to 100 MΩ have been
chosen to study the effect of the resistance on the harvested voltage of the 2 DOF
piezoelectric vibration energy harvester. The experimentally measured output voltage
results have been compared with the predicted results in Figure 5.25. It is seen that the
trend of the measured output voltage agrees with the prediction, although the measured
voltage is slightly higher than that of the predicted voltage in the range of large resistance
value. This is because that the prediction is based on the assumption of a weak coupling
where the damping effect is assumed to be very small. When the external load resistance
increases and becomes very large, the electromechanical coupling becomes strong, the
damping effect has to be considered. Therefore, the prediction underestimates the output
voltage of the harvester.
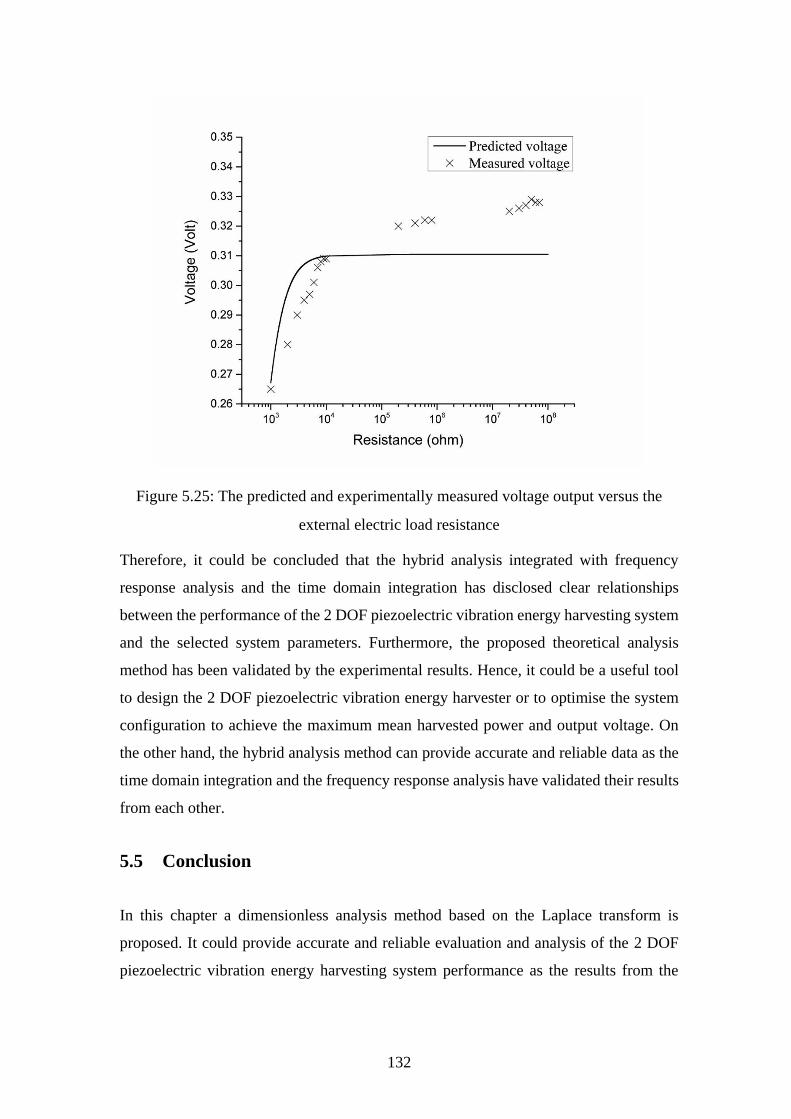
132
Figure 5.25: The predicted and experimentally measured voltage output versus the
external electric load resistance
Therefore, it could be concluded that the hybrid analysis integrated with frequency
response analysis and the time domain integration has disclosed clear relationships
between the performance of the 2 DOF piezoelectric vibration energy harvesting system
and the selected system parameters. Furthermore, the proposed theoretical analysis
method has been validated by the experimental results. Hence, it could be a useful tool
to design the 2 DOF piezoelectric vibration energy harvester or to optimise the system
configuration to achieve the maximum mean harvested power and output voltage. On
the other hand, the hybrid analysis method can provide accurate and reliable data as the
time domain integration and the frequency response analysis have validated their results
from each other.
5.5 Conclusion
In this chapter a dimensionless analysis method based on the Laplace transform is
proposed. It could provide accurate and reliable evaluation and analysis of the 2 DOF
piezoelectric vibration energy harvesting system performance as the results from the
133
time domain integration and frequency response analysis methods are able to verify each
other. The system parametric study has been conducted in the analysis approach.
Under the case of a small damping and a weak electromechanical coupling strength, it
has been proved that the dimensionless mean resonant harvested power and efficiency
only depends on the stiffness and mass of the two oscillators and have nothing to do with
the piezoelectric material property such as the force factor. When the mass ratio m2/m1
increases, the dimensionless mean resonant harvested power decreases, the resonant
energy harvesting efficiency increases. When the stiffness ratio 2 1/k k increases, the
dimensionless mean resonant harvested power increases, the energy harvesting
efficiency decreases. However, when the damping effect is considered, the optimal
stiffness ratio is found to be 0.73 for the maximum dimensionless mean resonant
harvested power. When the damping ratio ( 1 2/c c ) is greater than 0.25, the resonant
harvested voltage or power hP will significantly decrease.
If a vehicle quarter suspension system is simulated using the 2 DOF system model,
physically, when the wheel mass is fixed, increasing the vehicle mass will increase the
resonant output voltage or mean harvested power hP and increase the energy harvesting
efficiency. When the vehicle mass is fixed, increasing the wheel tyre mass would
decrease the mass ratio and therefore increase the mean resonant harvested power hP
and decrease the energy harvesting efficiency. When the wheel tyre stiffness is fixed,
increasing the suspension spring stiffness would increase the mean resonant harvested
power hP and decrease the resonant energy harvesting efficiency. When the suspension
spring stiffness is fixed, increasing the wheel tyre stiffness would decrease the stiffness
ratio, therefore decrease the mean harvested power hP , and increase the resonant energy
harvesting efficiency.
The simulation results from Equation (5.27) under the condition of a small damping and
weak coupling have been verified by those from Equation (5.28) under the condition of
general damping and coupling.
This novel analysis approach has been verified by the experimental test results. The
approach could be applied as a tool to design and to optimise the 2 DOF vibration energy
harvester performance regardless of its configuration and dimension. The effective

134
frequency bandwidth of the 2 DOF vibration energy harvester has been studied and
discussed in this chapter. The vibration energy harvesting frequency bandwidth can be
widened through design and optimisation of the mass and stiffness ratios of the
oscillators. Increasing the energy harvesting frequency bandwidth and improving the
vehicle vibration isolation can be achieved by optimising the damping 2c which in the
case study is the suspension damping coefficient but at a cost of scarifying the output
power and energy harvesting efficiency.
135
An Enhanced Two Degree-of-
freedom Piezoelectric Vibration
Energy Harvesting System and
Generalisation of MDOF
Piezoelectric Vibration Energy
Harvester
In this chapter, an enhanced piezoelectric vibration energy harvesting system is
proposed whose harvesting performance could be significantly enhanced by introducing
one or multiple additional piezoelectric elements placed between every two adjacent
oscillators. The proposed two degree-of-freedom piezoelectric vibration harvester
system is expected to extract 9.78 times more electrical energy than a conventional two
degrees of freedom harvester system with only one piezoelectric element inserted close
to the base. A parameter study of a multiple degree-of-freedom piezoelectric vibration
energy harvester system has been conducted to provide a guideline for tuning its
harvesting bandwidth and optimising its design. Based on the analysis method of the two
degrees of freedom piezoelectric vibration harvester system, a generalised MDOF
piezoelectric vibration energy harvester with multiple pieces of piezoelectric elements
inserted between every two adjacent oscillators is studied. The mean harvested power
values of the piezoelectric vibration energy harvesters of 1 to 5 degree-of-freedom have
been compared while the total mass and the mass ratio of the oscillators are kept as
constants. It is found that the more numbers of degree-of-freedom of PVEH with the
more additional piezoelectric elements inserted between every two adjacent oscillators
would enable to harvest more energy. The first mode resonant frequency will be shifted
to a low-frequency range when the number of degree-of-freedom increases.
136
6.1 Introduction
In the past few years, the technology of energy harvesting from ambient natural
environment has attracted a wealth of attentions and been well studied. The biggest
motivation behind the energy harvesting is to provide the promising energy for self-
powered wireless sensors or devices and to overcome the limitations imposed by the
traditional power sources such as batteries and the electrical grid. The most common
configuration of piezoelectric vibration energy harvester is the cantilevered beam
structure simplified as a one degree-of-freedom spring-mass-dashpot oscillator in the
literature [11, 129]. It is feasible and efficient in converting vibration energy into
electrical energy in some scenarios, such as industry motors, or machines with known
sufficient vibration levels and repeatable and consistent vibration frequency ranges.
Thus, the mean harvested power falls significantly when ambient excitation frequency
is different from the resonant frequency because the vibration energy harvester is only
efficient in a small bandwidth that around resonant frequency. Unfortunately, potential
ambient vibration energy sources exist in a wide-band of frequencies and in a random
form, which is a major challenge for the energy harvesting technology. As a result, a
number of approaches have been pursued to overcome this limitation. The approaches
include multi-frequency arrays [39, 40, 130], multi degrees of freedom energy harvester
which is also known as multifunctional energy harvesting technology [47, 131, 132],
passive and active self-resonant tuning technologies [114, 133-135].
For the multi-frequency arrays, the recent studies are focused on the effects of the
harvesting electrical circuits interfaced with the array configuration of the energy
harvesters to increase the mean harvested power. The principle of the multi-degree-of-
freedom energy harvesting technique is to achieve wider harvesting frequency
bandwidth through tuning two or multiple resonant frequencies close to each other where
the resonant response magnitudes are significant. Kim et al. [41] developed the concept
of a two degree-of-freedom (DOF) piezoelectric energy harvesting device which could
include two close resonant frequencies thus increasing the harvesting frequency
bandwidth. This is achieved by adopting two cantilever beams connected with one proof
mass, as this configuration took account in both translational and rotational degrees of
freedom. Ou et al. [42] presented an experimental study of a 2 DOF piezoelectric
vibration energy harvesting system attached with two masses on one cantilever beam to
137
achieve two close resonant frequencies. Zhou et al. [43] presented a multi-mode
piezoelectric energy harvester which comprised a tip mass called ‘dynamic magnifier’.
Liu et al. [45] proposed a piezoelectric cantilever beam energy harvester attached with a
spring and a mass as the oscillator. This type of the vibration energy harvester increased
almost four times harvesting efficiency compared with the vibration energy harvester
without being attached with the spring-mass oscillator while operating at the first
resonant frequency. However, according to the experimental results, the harvesting
frequency bandwidth did not increase because the two resonant frequencies of the
harvester were not tuned close enough to each other. The harvester may require further
tuning such as increasing the mass of the oscillator to achieve the pre-set goal but it may
result in a size increase. Wu et al. [46] presented a novel compact two degree-of-freedom
piezoelectric vibration energy harvester constructed by one cantilever beam with an
inner secondary cantilever beam which was cut out from the main beam. Such design
allows conveniently retrofitting a single degree-of-freedom harvester into a 2 DOF
energy harvester by cutting out a secondary beam. The harvester device was examined
by experiments that indicated the proposed 2 DOF piezoelectric vibration energy
harvester operated functionally in a wider harvesting frequency bandwidth and
generated more power without increasing the size of the original device.
However, in most of the above reported researches, the tuning strategy to obtain two or
multiple close resonant frequencies has not been studied. Thus, in this chapter, a tuning
strategy to achieve a wide harvesting frequency bandwidth will be studied. Besides, a
enhanced piezoelectric vibration energy harvester (PVEH) model comprised the
multiple inserted piezoelectric elements is proposed and analysed to enhance the
harvesting performance without increasing the size or the weight of a piezoelectric
vibration energy harvester. By so far in the existing published literatures, such a
configuration of piezoelectric vibration energy harvester has not been investigated yet.
Finally, a generalised multiple degree-of-freedom (MDOF) PVEH model with multiple
pieces of piezoelectric elements is introduced and analysed. By using the generalised
PVEH model, the harvesting performance comparison is conducted for the piezoelectric
energy harvesters from 1 DOF to 5 DOF. For a more sensible comparison, the total mass
and the mass ratio of the oscillators of the harvester system are kept constant.
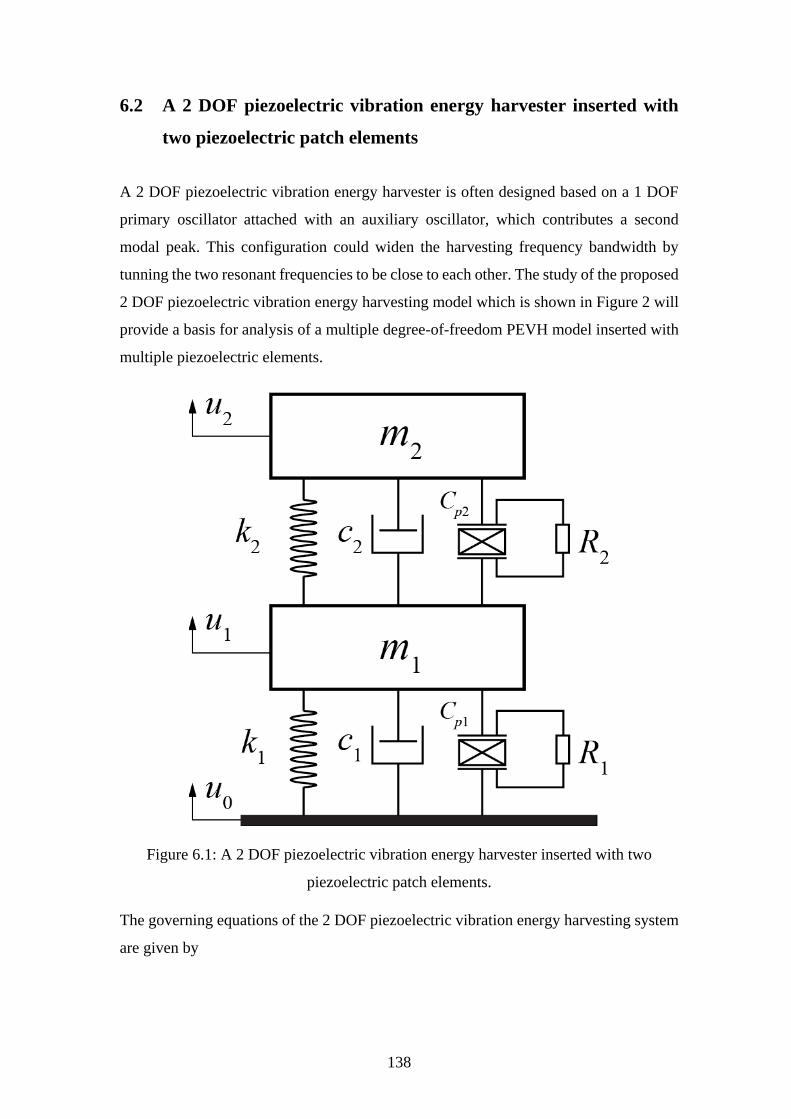
138
6.2 A 2 DOF piezoelectric vibration energy harvester inserted with
two piezoelectric patch elements
A 2 DOF piezoelectric vibration energy harvester is often designed based on a 1 DOF
primary oscillator attached with an auxiliary oscillator, which contributes a second
modal peak. This configuration could widen the harvesting frequency bandwidth by
tunning the two resonant frequencies to be close to each other. The study of the proposed
2 DOF piezoelectric vibration energy harvesting model which is shown in Figure 2 will
provide a basis for analysis of a multiple degree-of-freedom PEVH model inserted with
multiple piezoelectric elements.
Figure 6.1: A 2 DOF piezoelectric vibration energy harvester inserted with two
piezoelectric patch elements.
The governing equations of the 2 DOF piezoelectric vibration energy harvesting system
are given by
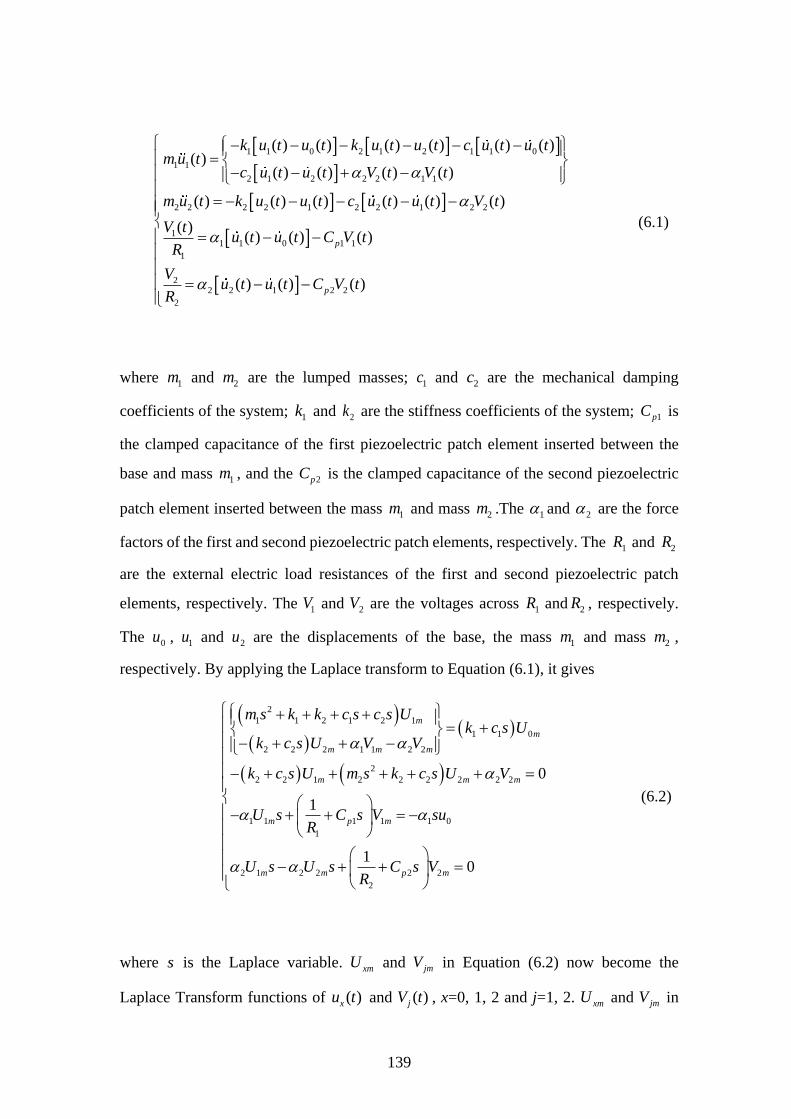
139
1 1 0 2 1 2 1 1 0
1 1
2 1 2 2 2 1 1
2 2 2 2 1 2 2 1 2 2
11 1 0 1 1
1
22 2 1 2
2
( ) ( ) ( ) ( ) ( ) ( )( )
( ) ( ) ( ) ( )
( ) ( ) ( ) ( ) ( ) ( )
( )( ) ( ) ( )
( ) ( )
p
p
k u t u t k u t u t c u t u tm u t
c u t u t V t V t
m u t k u t u t c u t u t V t
V tu t u t C V t
R
Vu t u t C
R
2 ( )V t
(6.1)
where 1m and 2m are the lumped masses; 1c and 2c are the mechanical damping
coefficients of the system; 1k and 2k are the stiffness coefficients of the system; 1pC is
the clamped capacitance of the first piezoelectric patch element inserted between the
base and mass 1m , and the 2pC is the clamped capacitance of the second piezoelectric
patch element inserted between the mass 1m and mass 2m .The 1 and 2 are the force
factors of the first and second piezoelectric patch elements, respectively. The 1R and 2R
are the external electric load resistances of the first and second piezoelectric patch
elements, respectively. The 1V and 2V are the voltages across 1R and 2R , respectively.
The 0u , 1u and 2u are the displacements of the base, the mass 1m and mass 2m ,
respectively. By applying the Laplace transform to Equation (6.1), it gives
2
1 1 2 1 2 1
1 1 0
2 2 2 1 1 2 2
2
2 2 1 2 2 2 2 2 2
1 1 1 1 1 0
1
2 1 2 2 2 2
2
0
1
10
m
m
m m m
m m m
m p m
m m p m
m s k k c s c s Uk c s U
k c s U V V
k U m k c s U V
U s C s V suR
U s U s C s VR
c s s
(6.2)
where s is the Laplace variable. xmU and jmV in Equation (6.2) now become the
Laplace Transform functions of ( )xu t and ( )jV t , x=0, 1, 2 and j=1, 2. xmU and jmV in
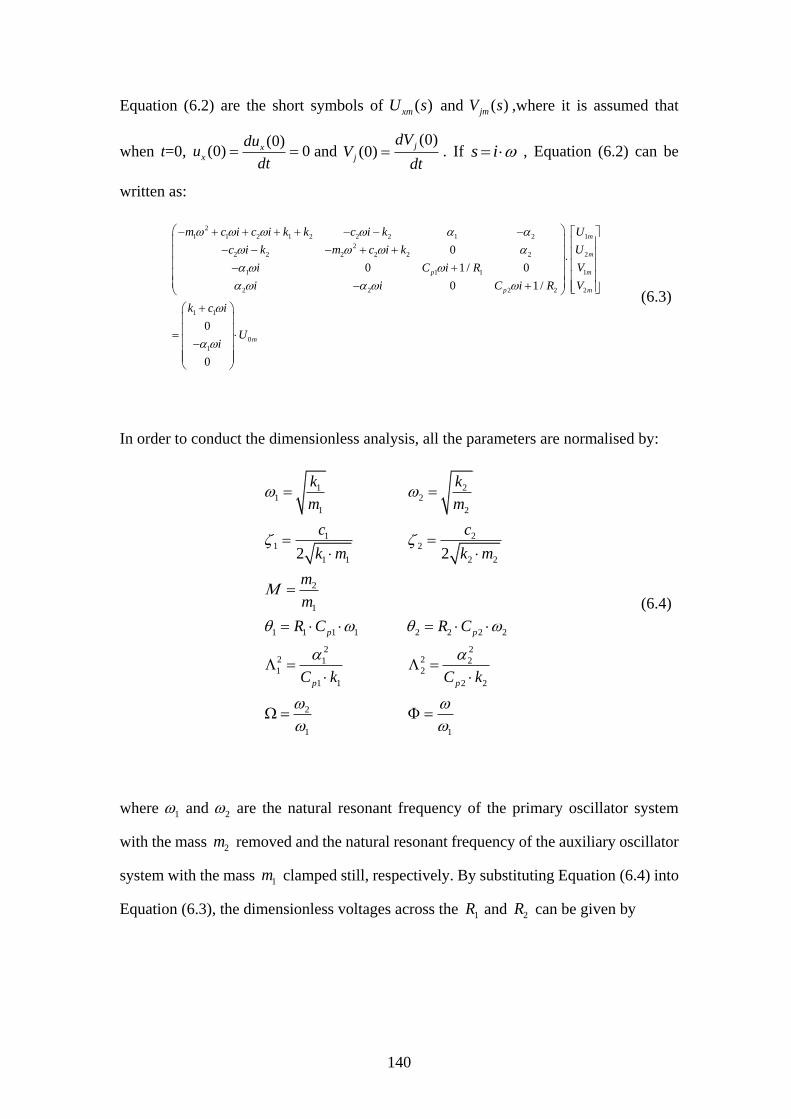
140
Equation (6.2) are the short symbols of ( )xmU s and ( )jmV s ,where it is assumed that
when t=0, (0)
(0) 0xx
duu
dt and
(0)(0)
j
j
dVV
dt . If s i , Equation (6.2) can be
written as:
2
1 1 2 1 2 2 2 1 2
2
2 2 2 2 2
11 1
1
22
1
22 2 2 2
1 1
0
1
0
0 1 / 0
0 1 /
0
0
mp
m
p
m
m
m
Um c i c i k k c i k
Uc i k m c i k
Vi C i R
Vi i C i R
k c i
Ui
(6.3)
In order to conduct the dimensionless analysis, all the parameters are normalised by:
1 21 2
1 2
1 21 2
1 1 2 2
2
1
1 1 1 1 2 2 2 2
2 22 21 21 2
1 1 2 2
2
1 1
2 2
p p
p p
k k
m m
c c
k m k m
m
m
R C R C
C k C k
(6.4)
where 1 and 2 are the natural resonant frequency of the primary oscillator system
with the mass 2m removed and the natural resonant frequency of the auxiliary oscillator
system with the mass 1m clamped still, respectively. By substituting Equation (6.4) into
Equation (6.3), the dimensionless voltages across the 1R and 2R can be given by
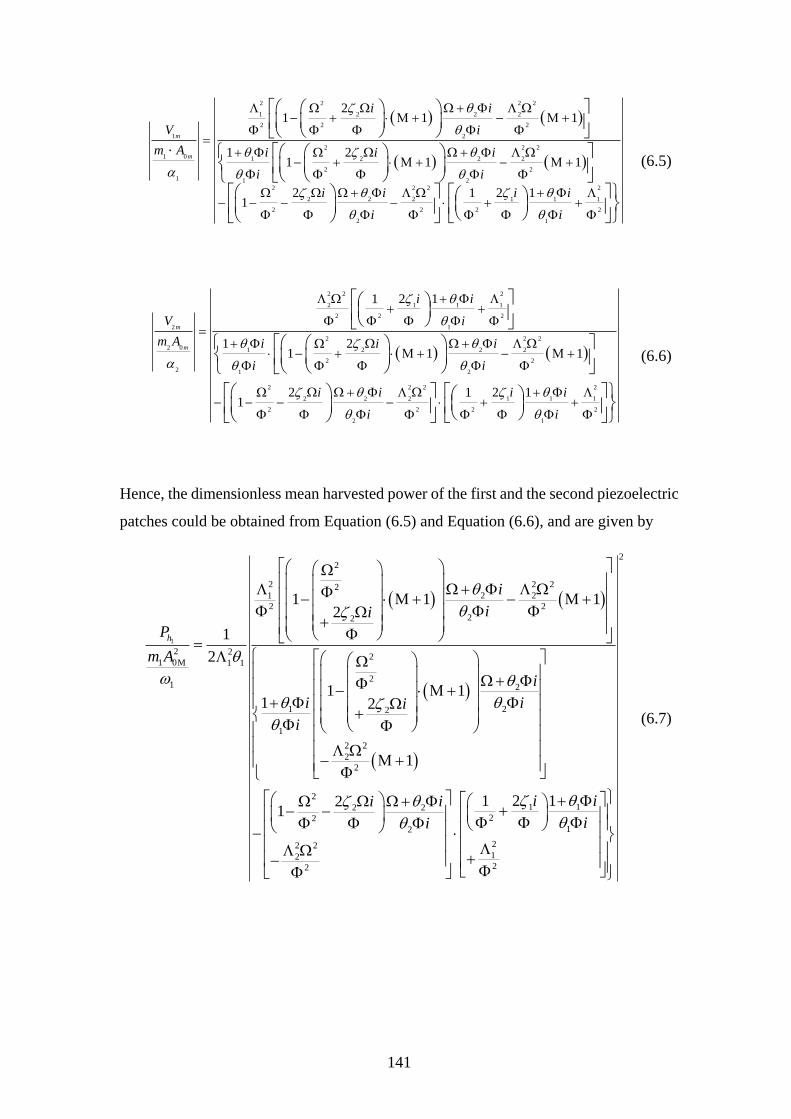
141
2 2 22
1 2 2 2
2 2 2
1 2
2 22
1 1 2 2 2
2 2
1 1 22 22
2 2 2
0
1
2 2 2
2
21 1 1
1 21 1 1
2 211
m
m
i i
V i
m A i i i
i i
i i i
i
2
1 1
2
1
1 i
i
(6.5)
2 2 2
2 1 1 1
2 2 2
2 1
2 22
2 1 2 2 2
2 2
2 1 2
2 2 22
2 2 2 1 1 1
2 2 2
2 1
0
2 11
1 21 1 1
2 2 111
m
m
i i
V i
m A i i i
i i
i i i i
i i
2
(6.6)
Hence, the dimensionless mean harvested power of the first and the second piezoelectric
patches could be obtained from Equation (6.5) and Equation (6.6), and are given by
1
2
2 2 221 2 2
2 2
22
2 22
1 0M 1 1
21 2
21 2
1
2 2
2
2
1 1 12
1
2
1 11 2
1
1
h
i
ii
P
m A
i
ii i
i
2
2
1 12 222
12
22 21222
2 112 i ii i
ii
(6.7)
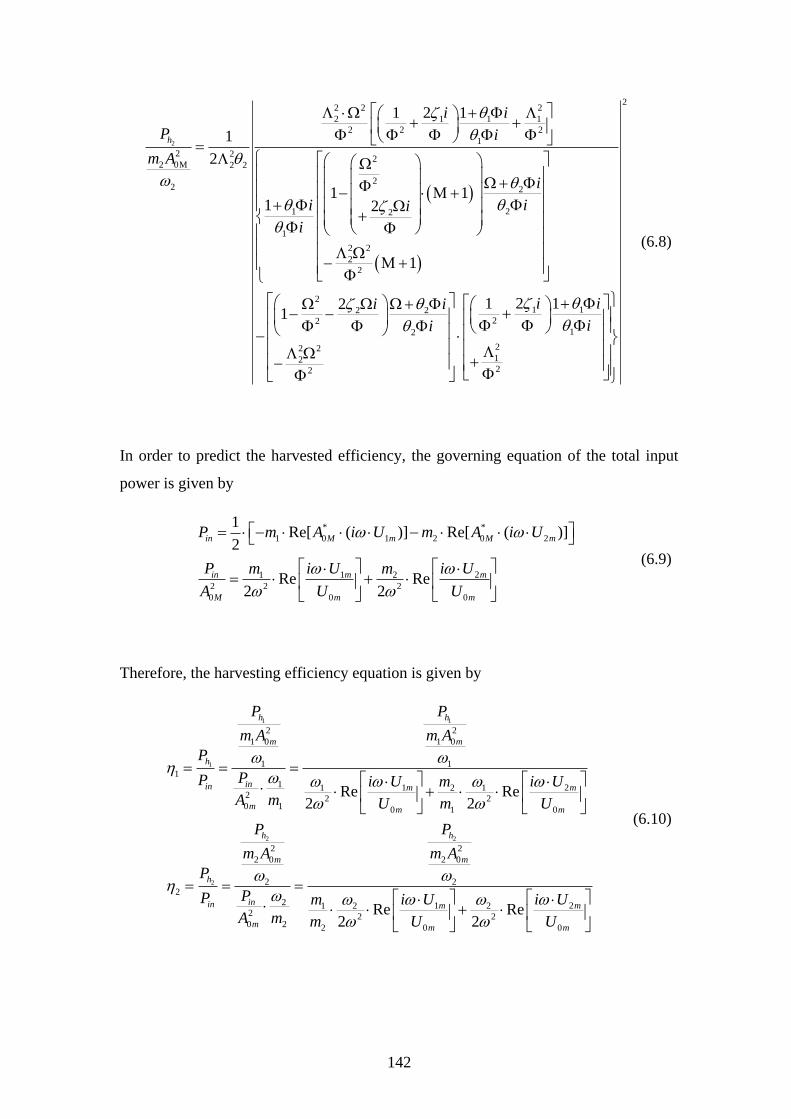
142
2
2 2 2
2 1 1 1
2 2 2
1
2 22
2 0M 2 2
22 2
21 2
1
2 2
2
2
2
2 2
2
2
2 2
2
2 11
1
2
1 11 2
1
21
h
i i
P i
m A
i
ii i
i
i i
i
2
1 1
2
1
2
1
22
2 11 i i
i
(6.8)
In order to predict the harvested efficiency, the governing equation of the total input
power is given by
* *
1 0 1 2 0 2
1 21 2
2 2 2
0 0 0
1Re[ ( )] Re[ ( )]
2
Re Re2 2
in M m M m
in m m
M m m
P m A i U m A i U
P i U i Um m
A U U
(6.9)
Therefore, the harvesting efficiency equation is given by
1 1
1
2 2
2
2 2
1 0 1 0
1 11
1 1 21 2 12 2 20 1 0 1 0
2 2
2 0 2 0
2 22
2 1 21 2 22 2 20 2 2 0 0
Re Re2 2
Re Re2 2
h h
m m
h
inin m m
m m m
h h
m m
h
inin m m
m m m
P P
m A m A
P
PP i U i Um
A m U m U
P P
m A m A
P
PP i U i Um
A m m U U
(6.10)
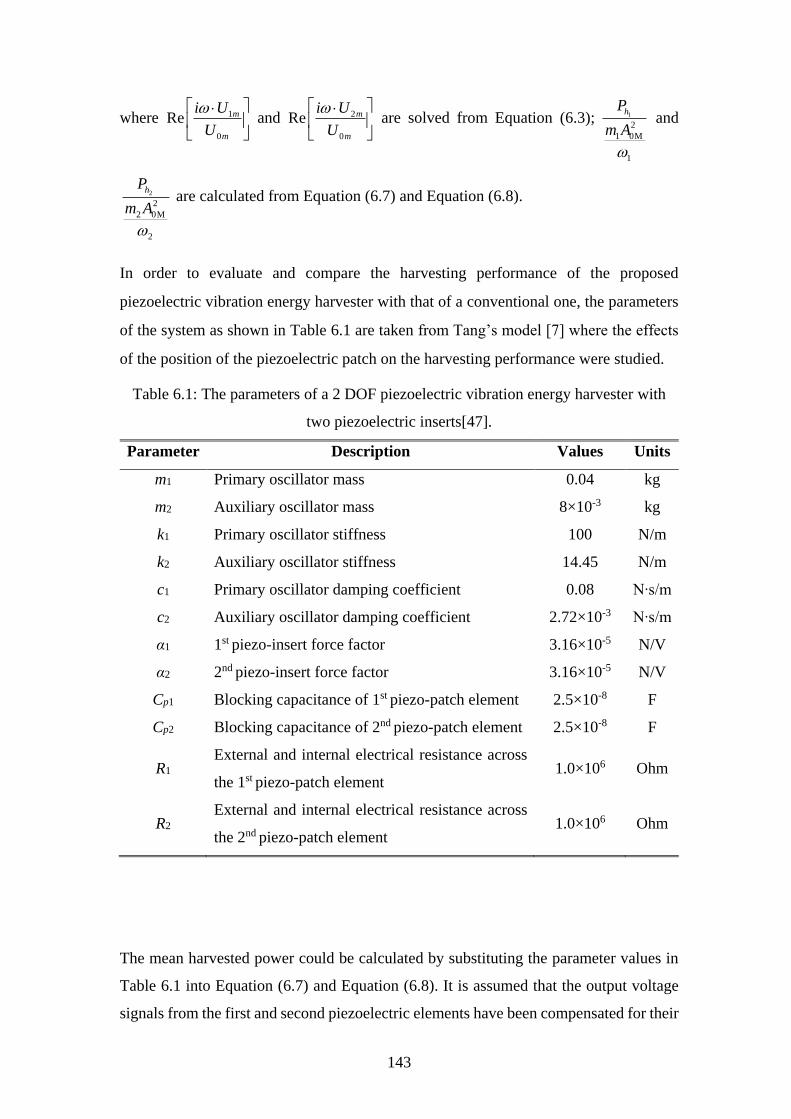
143
where 1
0
Re m
m
i U
U
and 2
0
Re m
m
i U
U
are solved from Equation (6.3); 1
2
1 0M
1
hP
m A
and
2
2
2 0M
2
hP
m A
are calculated from Equation (6.7) and Equation (6.8).
In order to evaluate and compare the harvesting performance of the proposed
piezoelectric vibration energy harvester with that of a conventional one, the parameters
of the system as shown in Table 6.1 are taken from Tang’s model [7] where the effects
of the position of the piezoelectric patch on the harvesting performance were studied.
Table 6.1: The parameters of a 2 DOF piezoelectric vibration energy harvester with
two piezoelectric inserts[47].
Parameter Description Values Units
m1 Primary oscillator mass 0.04 kg
m2 Auxiliary oscillator mass 8×10⁻³ kg
k1 Primary oscillator stiffness 100 N/m
k2 Auxiliary oscillator stiffness 14.45 N/m
c1 Primary oscillator damping coefficient 0.08 N∙s/m
c2 Auxiliary oscillator damping coefficient 2.72×10⁻³ N∙s/m
α1 1st piezo-insert force factor 3.16×10⁻⁵ N/V
α2 2nd piezo-insert force factor 3.16×10⁻⁵ N/V
Cp1 Blocking capacitance of 1st piezo-patch element 2.5×10⁻⁸ F
Cp2 Blocking capacitance of 2nd piezo-patch element 2.5×10⁻⁸ F
R1 External and internal electrical resistance across
the 1st piezo-patch element 1.0×10⁶ Ohm
R2 External and internal electrical resistance across
the 2nd piezo-patch element 1.0×10⁶ Ohm
The mean harvested power could be calculated by substituting the parameter values in
Table 6.1 into Equation (6.7) and Equation (6.8). It is assumed that the output voltage
signals from the first and second piezoelectric elements have been compensated for their
144
phase difference so that the two voltage signals are in phase and additive with each other.
As a result, the harvesting performance of the proposed 2 DOF PVEH model is predicted
to have the power output of 2.45 mW and the power density of 51.03 mW/kg. The
harvesting performance of the proposed harvesting model is 9.78 times more than that
of the original model reported in [47], whose power generation was 250.4 μW, and the
power density was 5.22 mW/kg. In this case, the entire system is not much changed, for
example, no extra mass is added or no structure complexity is increased, only one
additional piezoelectric element is added to achieve this performance enhancement.
Comparing to the conventional two or multi degree-of-freedom piezoelectric vibration
energy harvester with only one piezoelectric element inserted between the primary
oscillator the base, the proposed harvester introduced additional piezoelectric elements
between every two adjacent oscillators to maximise the scavenging of the kinetic energy
in the system rather than to dissipate the kinetic energy into waster heat energy. The
details of the parameter study will be presented in the following sections.
First of all, the principal advantage of the 2 DOF model is of a wider harvesting
frequency bandwidth than that of the 1 DOF model. To achieve the advantage, the effects
of the system parameters on the difference of the two resonant frequencies should be
investigated, as the investigation will provide a useful method to tune the two resonant
frequencies to be close to each other. Thus, from Equation (6.5) under the non-damped
and short-circuit condition, the two dimensionless resonant frequencies Φ1,2 are obtained
from solving the following equation:
2 2 2 2 22 2
2 2 1
2 2 2 2 2 2
11- 1 - 1- - 0
(6.11)
The discrepancy of the two dimensionless resonant frequencies versus the various ratios
of M and Ω is shown in Figure 6.2 where the coupling strengths of 2
1
1
and
2
2
2
are equal
to 0.02, 5, 10, and 40, respectively. According to [118] , the coupling strength values
represent the coupling conditions of the weak, medium, strong, and very strong which
influence the difference of the two dimensionless resonant frequencies. It is seen from
Figure 6.2 that the maximum dimensionless resonant frequency difference under the
strong coupling condition is larger than that under the weak coupling condition. The
145
strong coupling condition requires more tuning of the optimal ratios of Ω and M than
the weak coupling condition. In general, the maximum dimensionless resonant
frequency difference occurs with a large number of mass ratio M and the Ω, which is
highlighted in red. In addition, the difference of the two dimensionless resonant
frequencies increases when the coupling strength is increased from the weak to strong.
In Figure 6.2, there are boundary lines which pass the points of the optimal Ω equal to
one and the mass ratio equal to zero for as small as possible value of the dimensionless
resonant frequencies difference. The points reflect that the minimum resonant frequency
difference is close to zero and that the 2 DOF system degrades to the 1 DOF system. On
the left-hand side of the boundary lines, when the Ω increases, the dimensionless
resonant frequency difference increases. When the mass ratio increases, the
dimensionless resonant frequency difference increases. On the right-hand side of the
boundary lines, when the Ω increases, the dimensionless resonant frequency difference
decreases. However, when the mass ratio increases, the dimensionless resonant
frequency difference does not change much and have a flat trend.
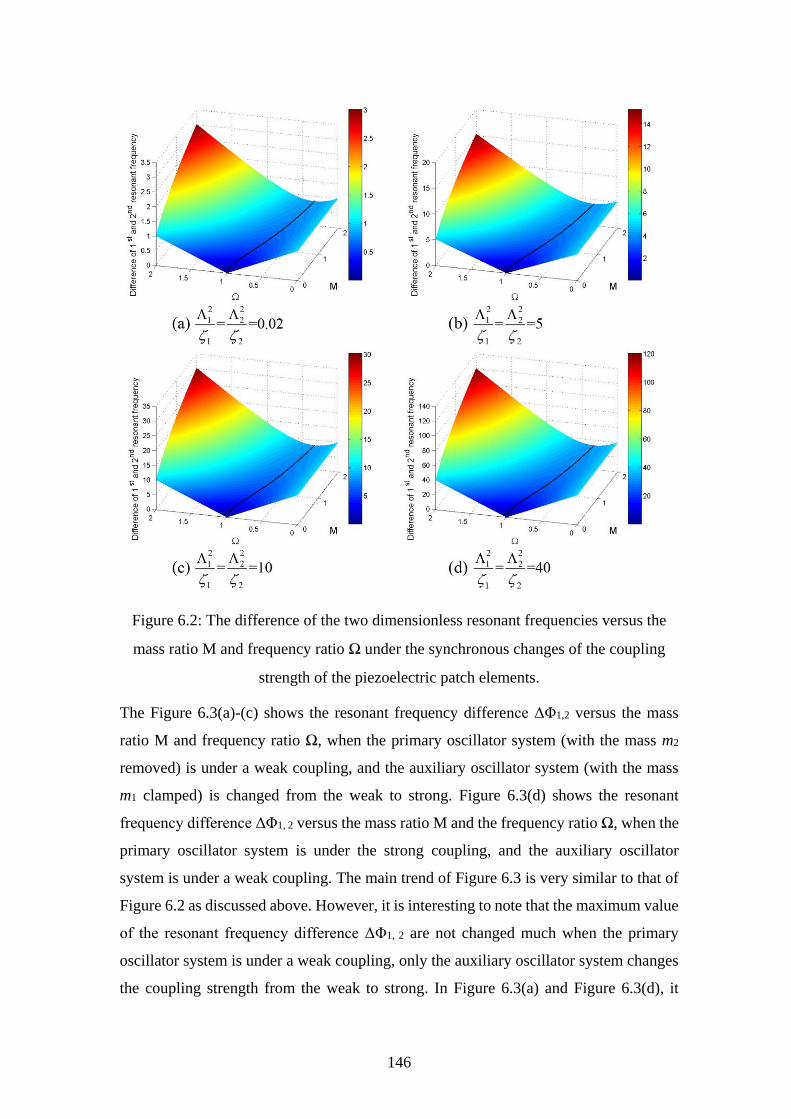
146
Figure 6.2: The difference of the two dimensionless resonant frequencies versus the
mass ratio M and frequency ratio Ω under the synchronous changes of the coupling
strength of the piezoelectric patch elements.
The Figure 6.3(a)-(c) shows the resonant frequency difference ΔΦ1,2 versus the mass
ratio M and frequency ratio Ω, when the primary oscillator system (with the mass m2
removed) is under a weak coupling, and the auxiliary oscillator system (with the mass
m1 clamped) is changed from the weak to strong. Figure 6.3(d) shows the resonant
frequency difference ΔΦ1, 2 versus the mass ratio M and the frequency ratio Ω, when the
primary oscillator system is under the strong coupling, and the auxiliary oscillator
system is under a weak coupling. The main trend of Figure 6.3 is very similar to that of
Figure 6.2 as discussed above. However, it is interesting to note that the maximum value
of the resonant frequency difference ΔΦ1, 2 are not changed much when the primary
oscillator system is under a weak coupling, only the auxiliary oscillator system changes
the coupling strength from the weak to strong. In Figure 6.3(a) and Figure 6.3(d), it
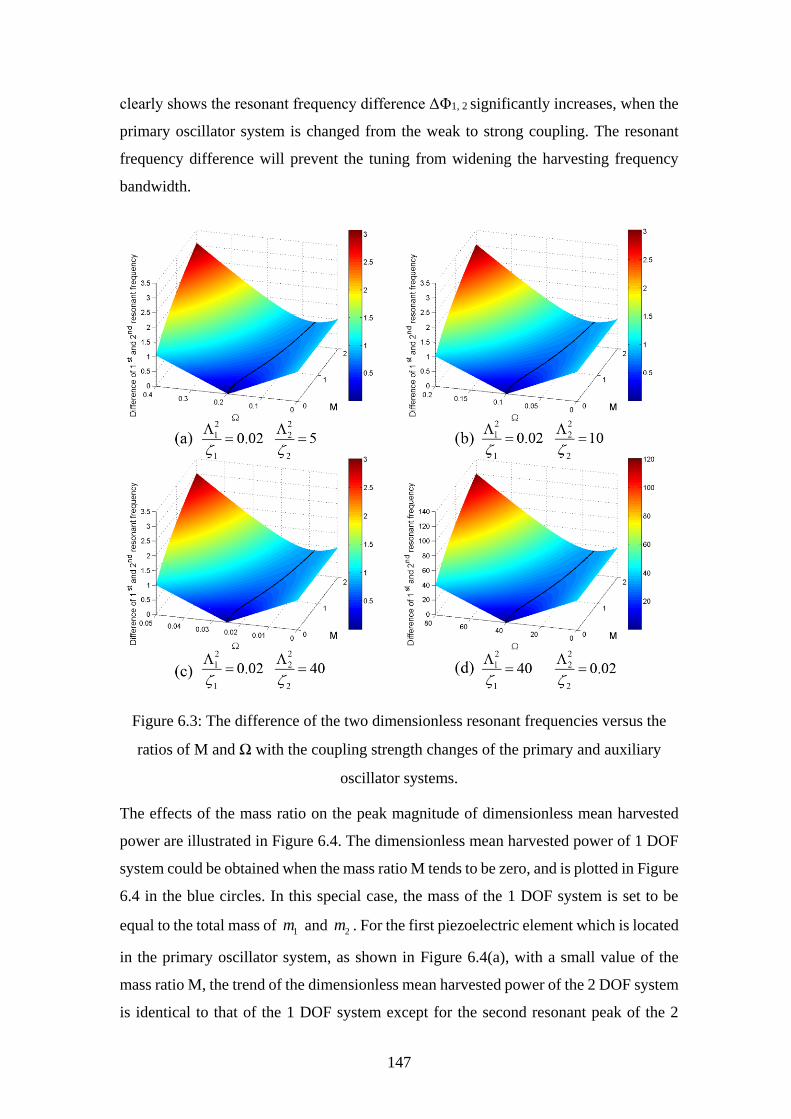
147
clearly shows the resonant frequency difference ΔΦ1, 2 significantly increases, when the
primary oscillator system is changed from the weak to strong coupling. The resonant
frequency difference will prevent the tuning from widening the harvesting frequency
bandwidth.
Figure 6.3: The difference of the two dimensionless resonant frequencies versus the
ratios of M and Ω with the coupling strength changes of the primary and auxiliary
oscillator systems.
The effects of the mass ratio on the peak magnitude of dimensionless mean harvested
power are illustrated in Figure 6.4. The dimensionless mean harvested power of 1 DOF
system could be obtained when the mass ratio M tends to be zero, and is plotted in Figure
6.4 in the blue circles. In this special case, the mass of the 1 DOF system is set to be
equal to the total mass of 1m and 2m . For the first piezoelectric element which is located
in the primary oscillator system, as shown in Figure 6.4(a), with a small value of the
mass ratio M, the trend of the dimensionless mean harvested power of the 2 DOF system
is identical to that of the 1 DOF system except for the second resonant peak of the 2
148
DOF system. However, the magnitude of the first resonant peak increases with the
increasing of the mass ratio, and the first resonant frequency is shifted to a lower
frequency. However, the magnitude of the second peak increases first and is then
remained at the same level as the mass ratio M increases. For the second piezoelectric
element which is placed in the auxiliary oscillator system, as shown in Figure 6.4(b), the
magnitude of the first peak first increases and then remains same when the mass ratio M
increases. On the other hand, the magnitude of the second resonant peak increases
slightly first, then decreases dramatically when the mass ratio increases. The two
resonant frequencies are decreased as the mass ratio increases, which is similar to both
the first and second piezoelectric patch elements.
The harvested energy is additive after the voltage signals are compensated for a phase
delay and become in phase. The result in Figure 6.4(c) shows that the total dimensionless
mean harvested power of the 2 DOF system can be tuned to achieve 85 times more than
that of the 1 DOF system.
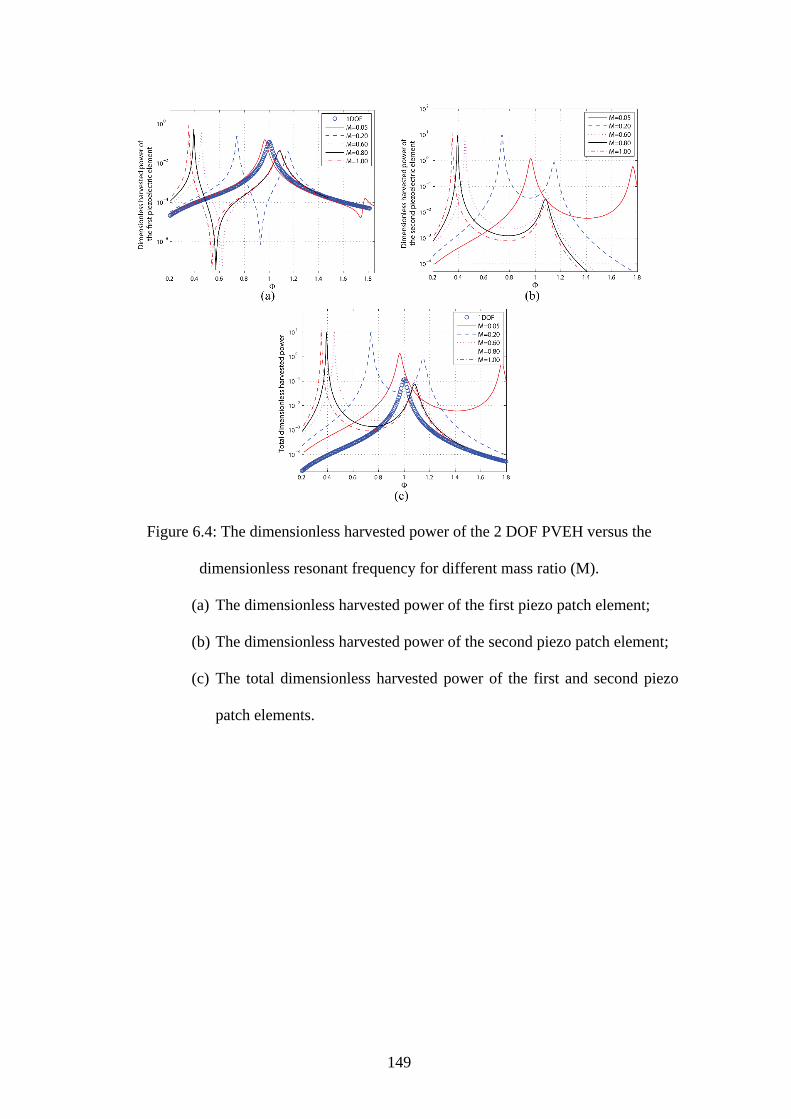
149
Figure 6.4: The dimensionless harvested power of the 2 DOF PVEH versus the
dimensionless resonant frequency for different mass ratio (M).
(a) The dimensionless harvested power of the first piezo patch element;
(b) The dimensionless harvested power of the second piezo patch element;
(c) The total dimensionless harvested power of the first and second piezo
patch elements.
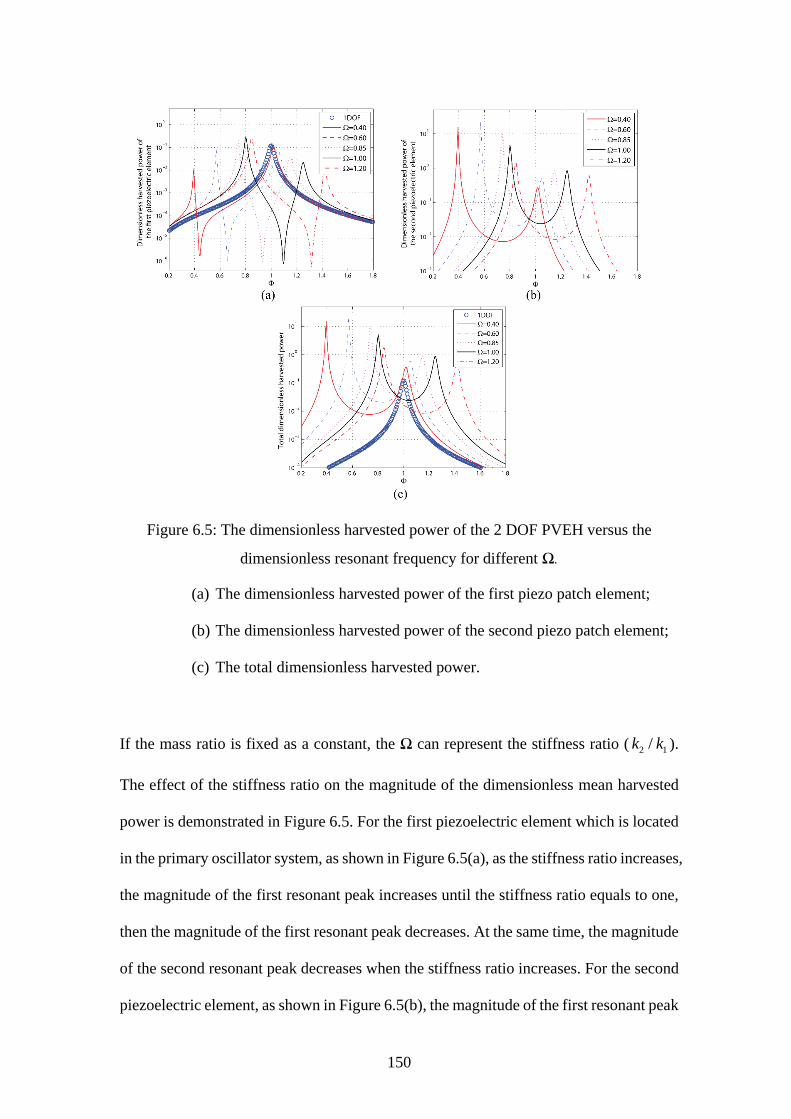
150
Figure 6.5: The dimensionless harvested power of the 2 DOF PVEH versus the
dimensionless resonant frequency for different Ω.
(a) The dimensionless harvested power of the first piezo patch element;
(b) The dimensionless harvested power of the second piezo patch element;
(c) The total dimensionless harvested power.
If the mass ratio is fixed as a constant, the Ω can represent the stiffness ratio ( 2 1/k k ).
The effect of the stiffness ratio on the magnitude of the dimensionless mean harvested
power is demonstrated in Figure 6.5. For the first piezoelectric element which is located
in the primary oscillator system, as shown in Figure 6.5(a), as the stiffness ratio increases,
the magnitude of the first resonant peak increases until the stiffness ratio equals to one,
then the magnitude of the first resonant peak decreases. At the same time, the magnitude
of the second resonant peak decreases when the stiffness ratio increases. For the second
piezoelectric element, as shown in Figure 6.5(b), the magnitude of the first resonant peak
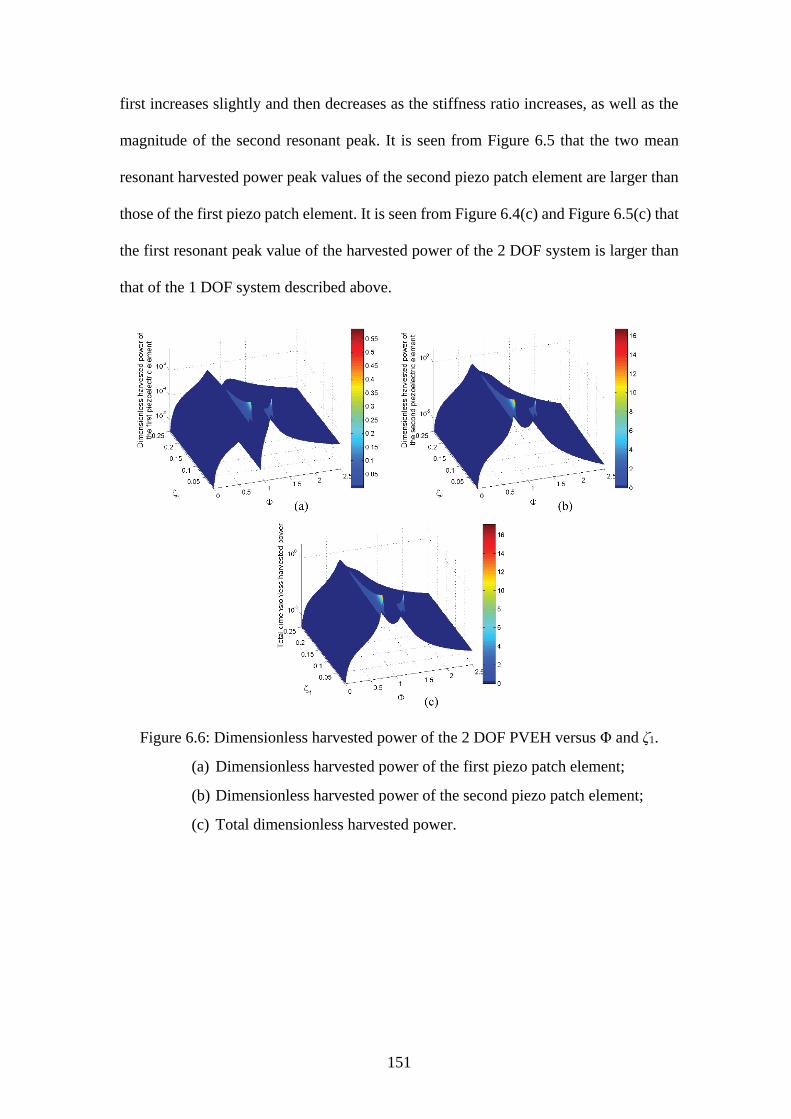
151
first increases slightly and then decreases as the stiffness ratio increases, as well as the
magnitude of the second resonant peak. It is seen from Figure 6.5 that the two mean
resonant harvested power peak values of the second piezo patch element are larger than
those of the first piezo patch element. It is seen from Figure 6.4(c) and Figure 6.5(c) that
the first resonant peak value of the harvested power of the 2 DOF system is larger than
that of the 1 DOF system described above.
Figure 6.6: Dimensionless harvested power of the 2 DOF PVEH versus Φ and ζ1.
(a) Dimensionless harvested power of the first piezo patch element;
(b) Dimensionless harvested power of the second piezo patch element;
(c) Total dimensionless harvested power.

152
Figure 6.7: Dimensionless harvested power of the 2 DOF PVEH versus Φ and ζ2.
(a) Dimensionless harvested power of the first piezo patch element;
(b) Dimensionless harvested power of the second piezo patch element;
(c) Total dimensionless harvested power.
Comparing Figure 6.6 with Figure 6.7, it is clearly shown that ζ2 has less effects on the
performance of the 2 DOF piezoelectric vibration energy harvester than ζ1 for both the
first and second piezoelectric patch element. As a result, a small value of ζ1 is much
preferred to enhance the performance when a 2 DOF PVEH is designed.
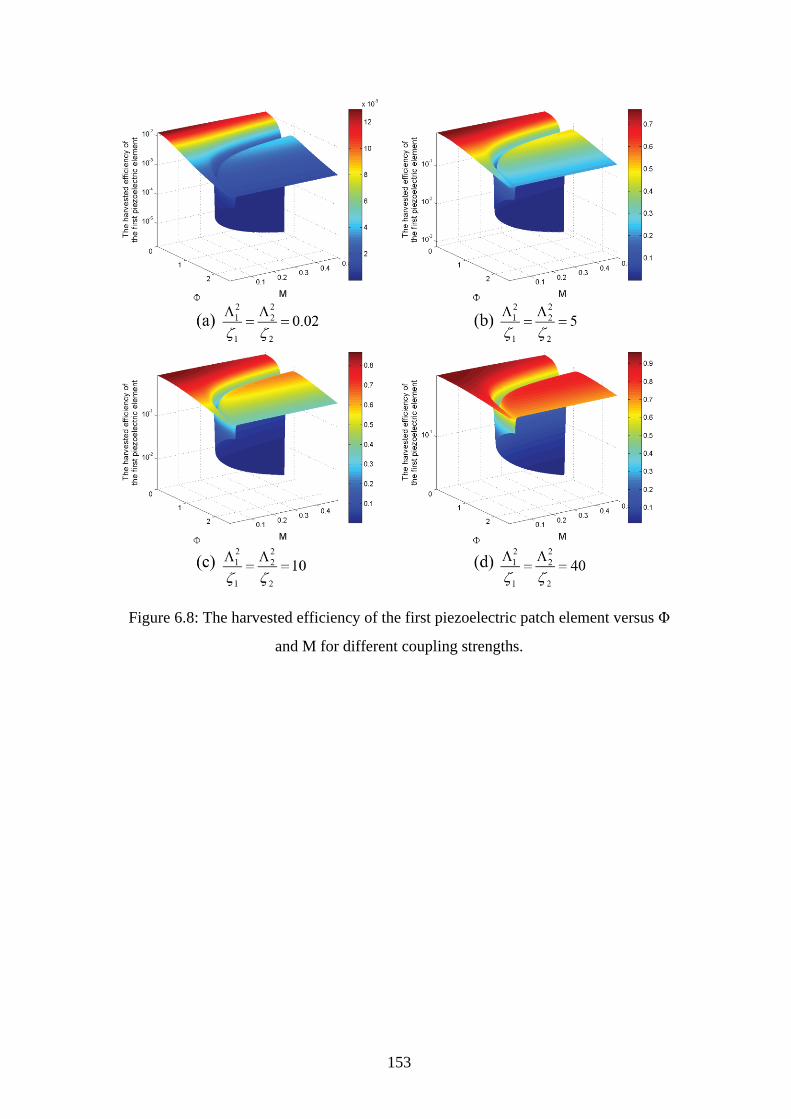
153
Figure 6.8: The harvested efficiency of the first piezoelectric patch element versus Φ
and M for different coupling strengths.
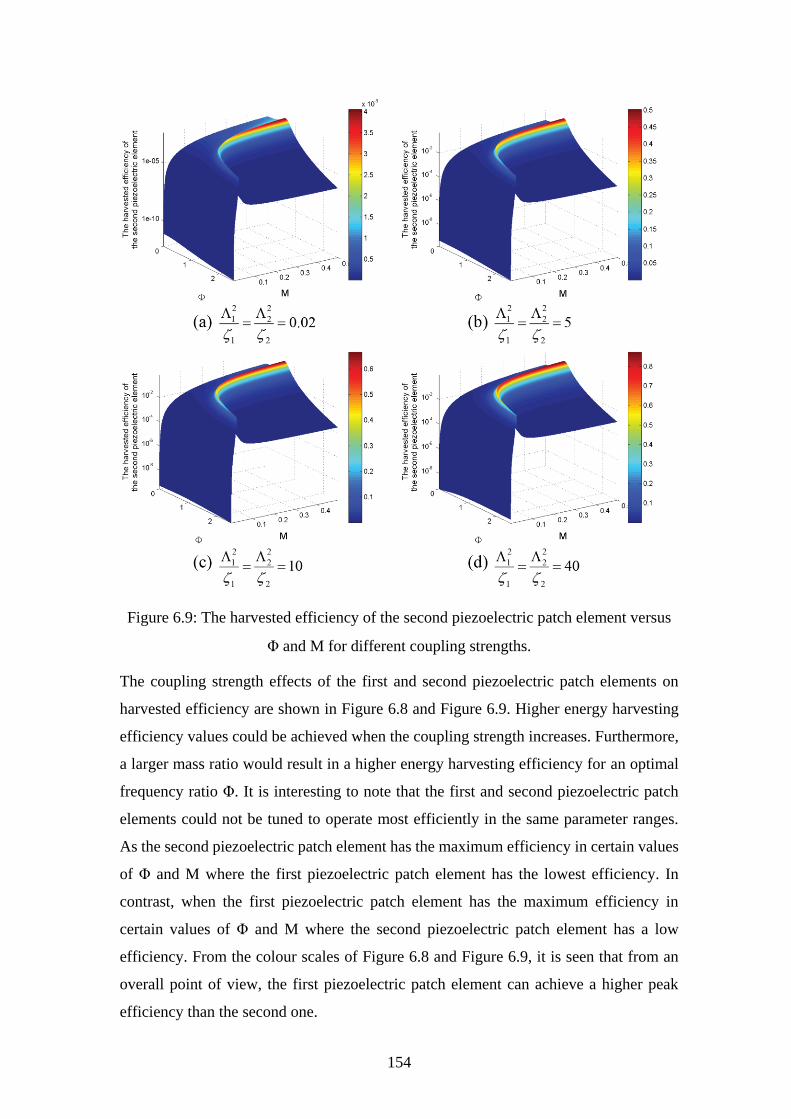
154
Figure 6.9: The harvested efficiency of the second piezoelectric patch element versus
Φ and M for different coupling strengths.
The coupling strength effects of the first and second piezoelectric patch elements on
harvested efficiency are shown in Figure 6.8 and Figure 6.9. Higher energy harvesting
efficiency values could be achieved when the coupling strength increases. Furthermore,
a larger mass ratio would result in a higher energy harvesting efficiency for an optimal
frequency ratio Φ. It is interesting to note that the first and second piezoelectric patch
elements could not be tuned to operate most efficiently in the same parameter ranges.
As the second piezoelectric patch element has the maximum efficiency in certain values
of Φ and M where the first piezoelectric patch element has the lowest efficiency. In
contrast, when the first piezoelectric patch element has the maximum efficiency in
certain values of Φ and M where the second piezoelectric patch element has a low
efficiency. From the colour scales of Figure 6.8 and Figure 6.9, it is seen that from an
overall point of view, the first piezoelectric patch element can achieve a higher peak
efficiency than the second one.
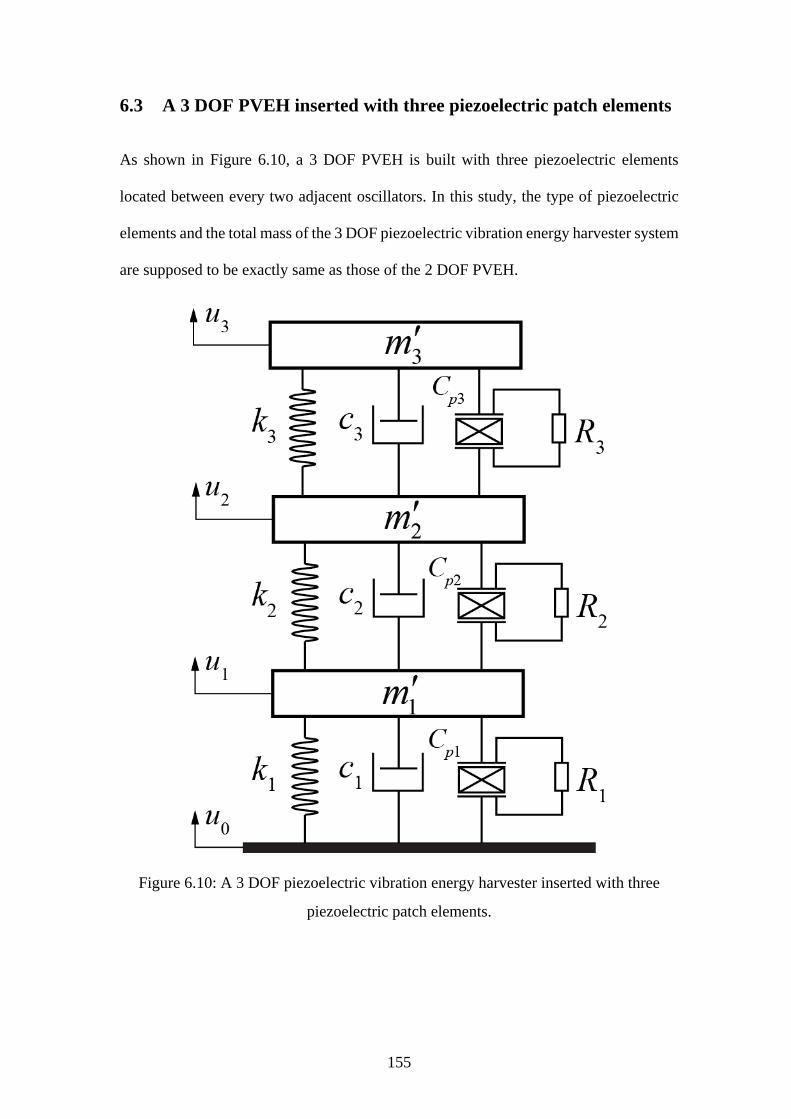
155
6.3 A 3 DOF PVEH inserted with three piezoelectric patch elements
As shown in Figure 6.10, a 3 DOF PVEH is built with three piezoelectric elements
located between every two adjacent oscillators. In this study, the type of piezoelectric
elements and the total mass of the 3 DOF piezoelectric vibration energy harvester system
are supposed to be exactly same as those of the 2 DOF PVEH.
Figure 6.10: A 3 DOF piezoelectric vibration energy harvester inserted with three
piezoelectric patch elements.
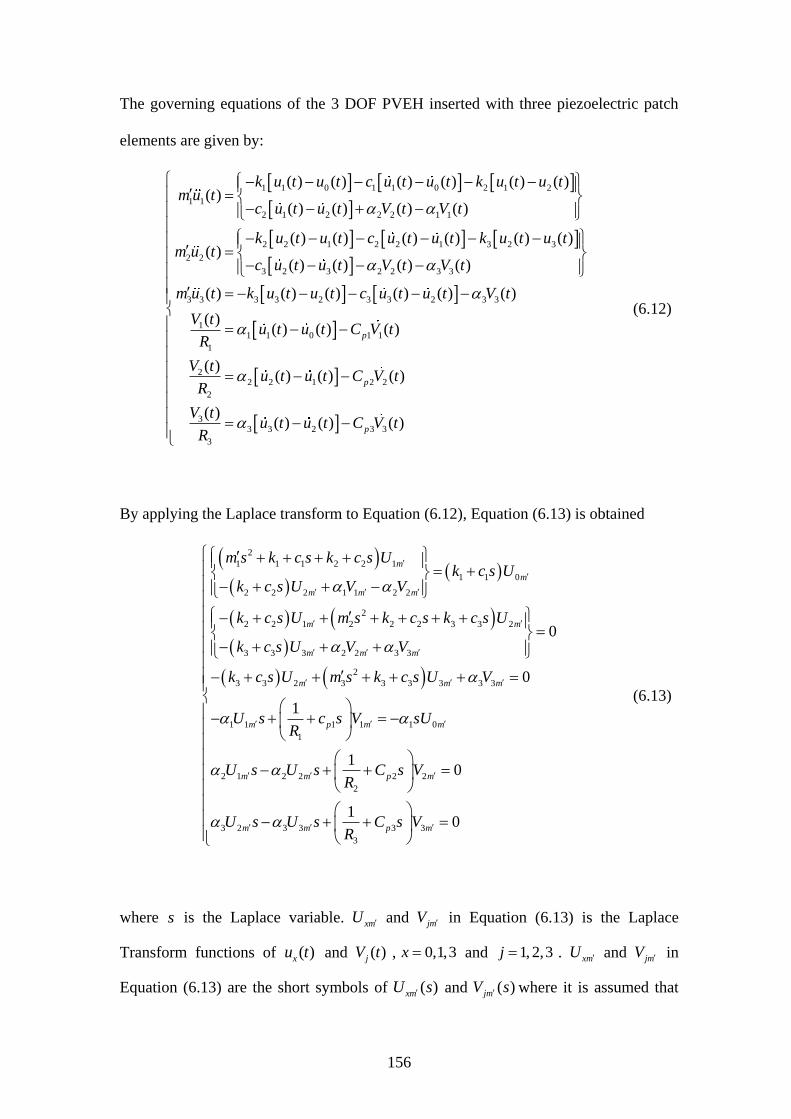
156
The governing equations of the 3 DOF PVEH inserted with three piezoelectric patch
elements are given by:
1 1 0 1 1 0 2 1 2
1 1
2 1 2 2 2 1 1
2 2 1 2 2 1 3 2 3
2 2
3 2 3 2 2 3 3
3
( ) ( ) ( ) ( ) ( ) ( )( )
( ) ( ) ( ) ( )
( ) ( ) ( ) ( ) ( ) ( )( )
( ) ( ) ( ) ( )
k u t u t c u t u t k u t u tm u t
c u t u t V t V t
k u t u t c u t u t k u t u tm u t
c u t u t V t V t
m u
3 3 3 2 3 3 2 3 3
11 1 0 1 1
1
22 2 1 2 2
2
33 3 2 3 3
3
( ) ( ) ( ) ( ) ( ) ( )
( )( ) ( ) ( )
( )( ) ( ) ( )
( )( ) ( ) ( )
p
p
p
t k u t u t c u t u t V t
V tu t u t C V t
R
V tu t u t C V t
R
V tu t u t C V t
R
(6.12)
By applying the Laplace transform to Equation (6.12), Equation (6.13) is obtained
2
1 1 1 2 2 1
1 1 0
2 2 2 1 1 2 2
2
2 2 1 2 2 2 3 3 2
3 3 3 2 2 3 3
2
3 3 2 3 3 3 3 3 3
1 1 1
1
0
0
1
m
m
m m m
m m
m m m
m m m
m p
m s k c s k c s Uk c s U
k c s U V V
k c s U m s k c s k c s U
k c s U V V
k c s U m s k c s U V
U s c sR
1 1 0
2 1 2 2 2 2
2
3 2 3 3 3 3
3
10
10
m m
m m p m
m m p m
V sU
U s U s C s VR
U s U s C s VR
(6.13)
where s is the Laplace variable. mxU and mjV in Equation (6.13) is the Laplace
Transform functions of ( )xu t and ( )jV t , 0,1,3x and 1, 2,3j . mxU and mjV in
Equation (6.13) are the short symbols of ( )xmU s and ( )jmV s where it is assumed that
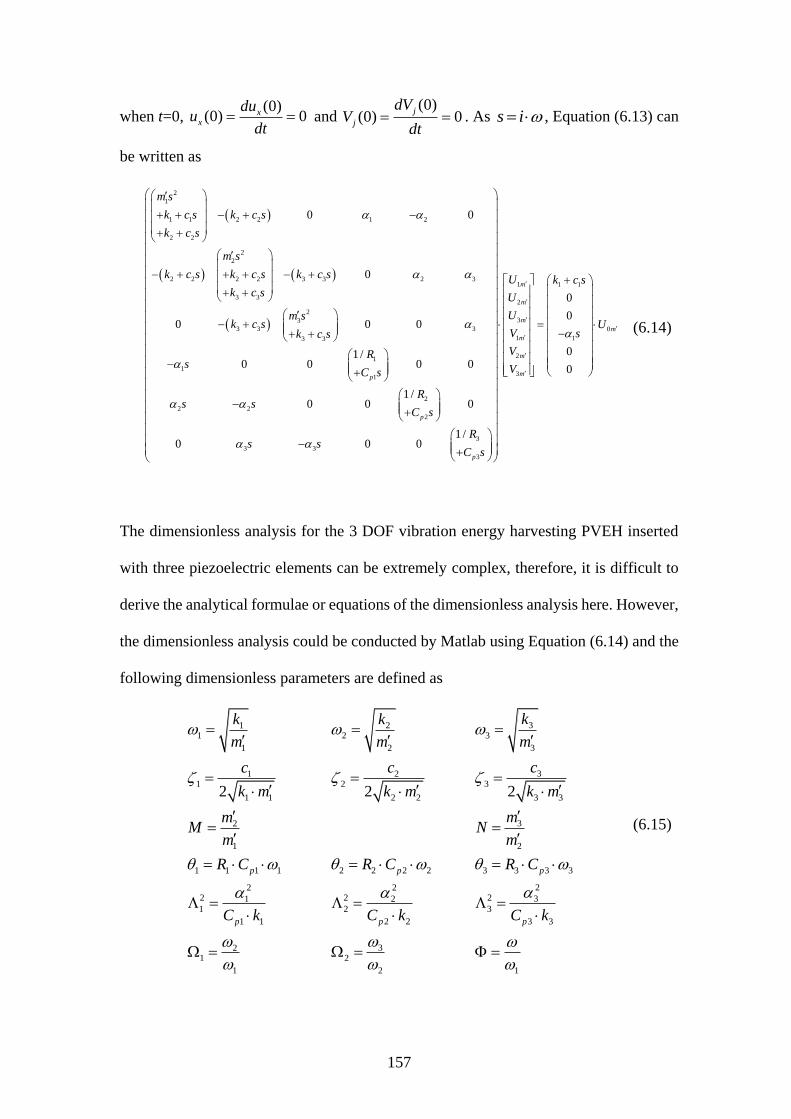
157
when t=0, (0)
(0) 0xx
duu
dt and
(0)(0) 0
j
j
dVV
dt . As s i , Equation (6.13) can
be written as
2
1
1 1 2 2 1 2
2 2
2
2
2 2 2 2 3 3 2 3
3 3
2
3
3 3 3
3 3
1
1
1
2
2 2
2
3
3 3
3
0 0
0
0 0 0
1 /0 0 0 0
1 /0 0 0
1 /0 0 0
p
p
p
m s
k c s k c s
k c s
m s
k c s k c s k c s
k c s
m sk c s
k c s
Rs
C s
Rs s
C s
Rs s
C s
1 1 1
2
3
0
1 1
2
3
0
0
0
0
m
m
m
m
m
m
m
U k c s
U
UU
V s
V
V
(6.14)
The dimensionless analysis for the 3 DOF vibration energy harvesting PVEH inserted
with three piezoelectric elements can be extremely complex, therefore, it is difficult to
derive the analytical formulae or equations of the dimensionless analysis here. However,
the dimensionless analysis could be conducted by Matlab using Equation (6.14) and the
following dimensionless parameters are defined as
31 21 2 3
1 2 3
31 21 2 3
1 1 2 2 3 3
32
1 2
1 1 1 1 2 2 2 2 3 3 3 3
22 22 2 2 31 21 2 3
1 1 2 2 3 3
321 2
1 2 1
2 2 2
p p p
p p p
kk k
m m m
cc c
k m k m k m
mmM N
m m
R C R C R C
C k C k C k
(6.15)

158
It is worth pointing out that the second auxiliary oscillator system (with the mass 1m and
mass 2m are clamped still) is identical and duplicated from the first auxiliary oscillator
system (with the mass 1m are clamped still and 3m are removed). For comparison of the
3 DOF PVEH with the 2 DOF PVEH, the damping ratios of the primary oscillator system
and the auxiliary oscillator systems are exactly same and equal to those of the 2 DOF
system shown in Table 6.1. Furthermore, the total mass of 3 DOF PVEH is set to be
same as that of the 2 DOF PVEH. In addition, the mass ratio (M) and stiffness ratio (Ω)
of the first auxiliary oscillator over the primary oscillator is equal to those of the second
auxiliary oscillator over the primary oscillator. In other words, the mass and stiffness of
the second auxiliary oscillator is equal to those of the first auxiliary oscillator.
Figure 6.11: The dimensionless harvested power of the 3 DOF PVEH versus the
dimensionless resonant frequency for different mass ratio M.
(a) Dimensionless harvested power of the first piezo patch element;
(b) Dimensionless harvested power of the second piezo patch element;
(c) Dimensionless harvested power of the third piezo patch element;
(d) Total dimensionless harvested power.
159
The effects of the mass ratio M on the mean harvested power of the 3 DOF PVEH are
demonstrated in Figure 6.11. As shown in Figure 6.11(a) and Figure 6.11(d), the blue
circle represents the dimensionless mean harvested power of the degraded 1 DOF model
described above. As shown in Figure 6.11(a), for the first piezoelectric element which is
located in the primary oscillator system, the magnitude of the first resonant peak
increases as the mass ratio M increases. As well as the mass ratio increase will result in
shifting the first resonant peak into a lower frequency range. As shown in Figure 6.11(b)
and Figure 6.11(c), for the second and third piezoelectric elements, the magnitude of the
first resonant frequency first slightly increases then stays at one level as the mass ratio
M increases. Furthermore, it is clearly shown in Figure 6.11(b) and Figure 6.11(c) that
the mass ratio increases would reduce the discrepancy of the three resonant peaks and
widen the effective harvesting frequency bandwidth.
If the mass ratio M is kept as a constant, the Ω1 can be considered as a stiffness ratio or
being proportional to a stiffness ratio. The effects of the stiffness ratio on the
dimensionless mean harvested power are illustrated in Figure 6.12. Therefore, as shown
in Figure 6.12(a), for the first piezoelectric patch element, the magnitude of first resonant
peak increases when the stiffness ratio increases. As shown in Figure 6.12(b) and Figure
6.12(c), for the second and third piezoelectric patch elements, the magnitude of the first
resonant peak initially increases then decreases as the stiffness ratio increases. However,
it is seen that the large values of the stiffness ratio results in a large discrepancy of the
three resonant peaks, which leads to a narrow effective harvesting frequency bandwidth.
Comparing Figure 6.11(d) with Figure 6.12(d), overall, no matter how the mass ratio or
the stiffness ratio changes, the first resonant peak value of the dimensionless mean
harvested power of the 3 DOF PVEH is much larger than that of the 1 DOF PVEH. It is
seen from Figure 6.11and Figure 6.12 that the three mean resonant harvested power peak
values of the second and third piezo patch elements are larger than those of the first piezo
patch element.
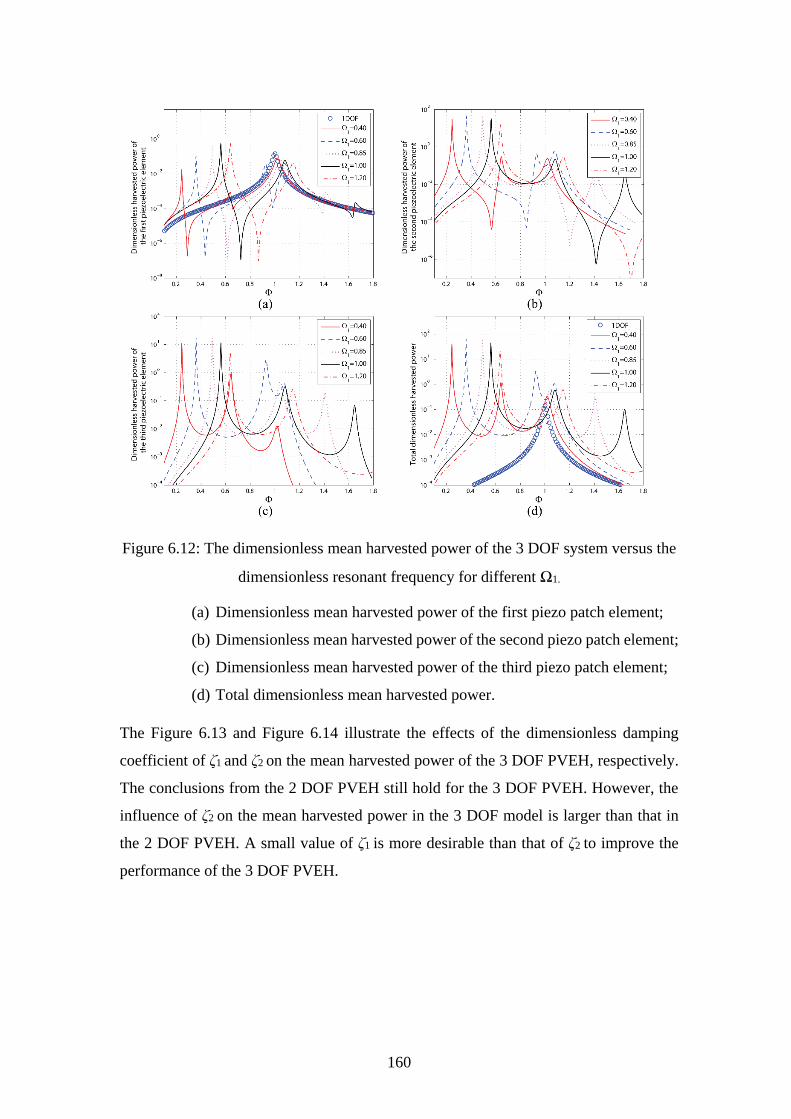
160
Figure 6.12: The dimensionless mean harvested power of the 3 DOF system versus the
dimensionless resonant frequency for different Ω1.
(a) Dimensionless mean harvested power of the first piezo patch element;
(b) Dimensionless mean harvested power of the second piezo patch element;
(c) Dimensionless mean harvested power of the third piezo patch element;
(d) Total dimensionless mean harvested power.
The Figure 6.13 and Figure 6.14 illustrate the effects of the dimensionless damping
coefficient of ζ1 and ζ2 on the mean harvested power of the 3 DOF PVEH, respectively.
The conclusions from the 2 DOF PVEH still hold for the 3 DOF PVEH. However, the
influence of ζ2 on the mean harvested power in the 3 DOF model is larger than that in
the 2 DOF PVEH. A small value of ζ1 is more desirable than that of ζ2 to improve the
performance of the 3 DOF PVEH.
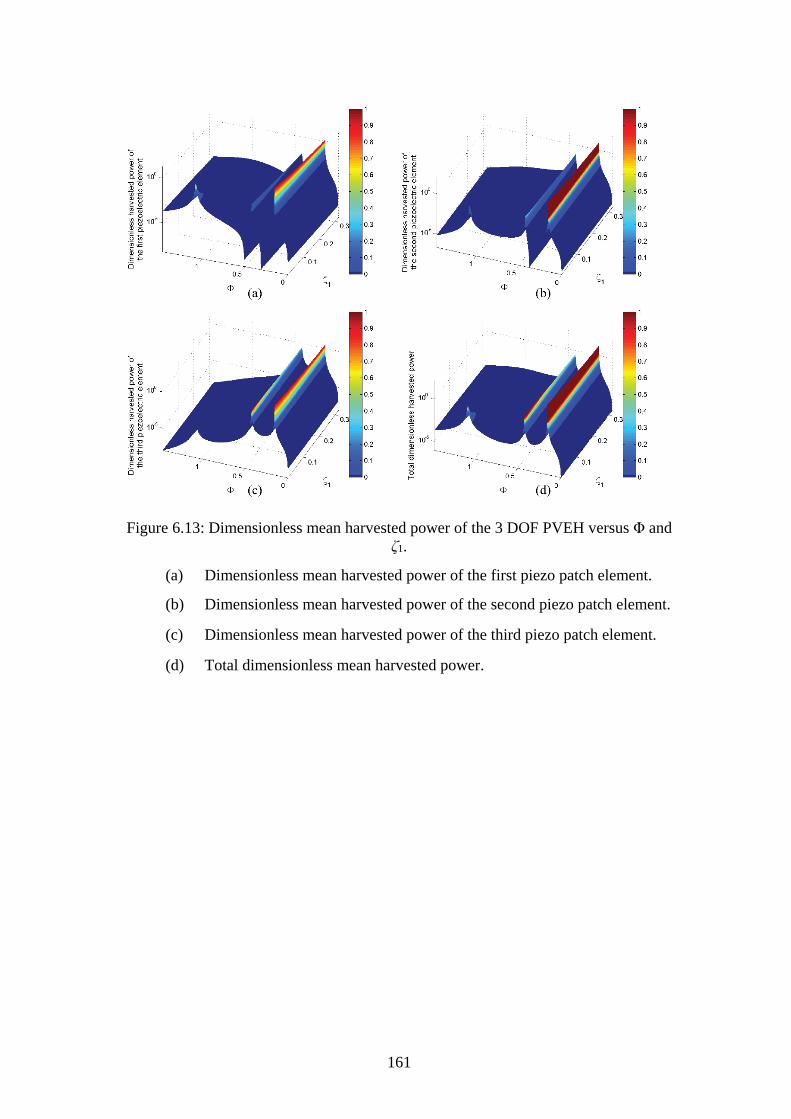
161
Figure 6.13: Dimensionless mean harvested power of the 3 DOF PVEH versus Φ and
ζ1.
(a) Dimensionless mean harvested power of the first piezo patch element.
(b) Dimensionless mean harvested power of the second piezo patch element.
(c) Dimensionless mean harvested power of the third piezo patch element.
(d) Total dimensionless mean harvested power.
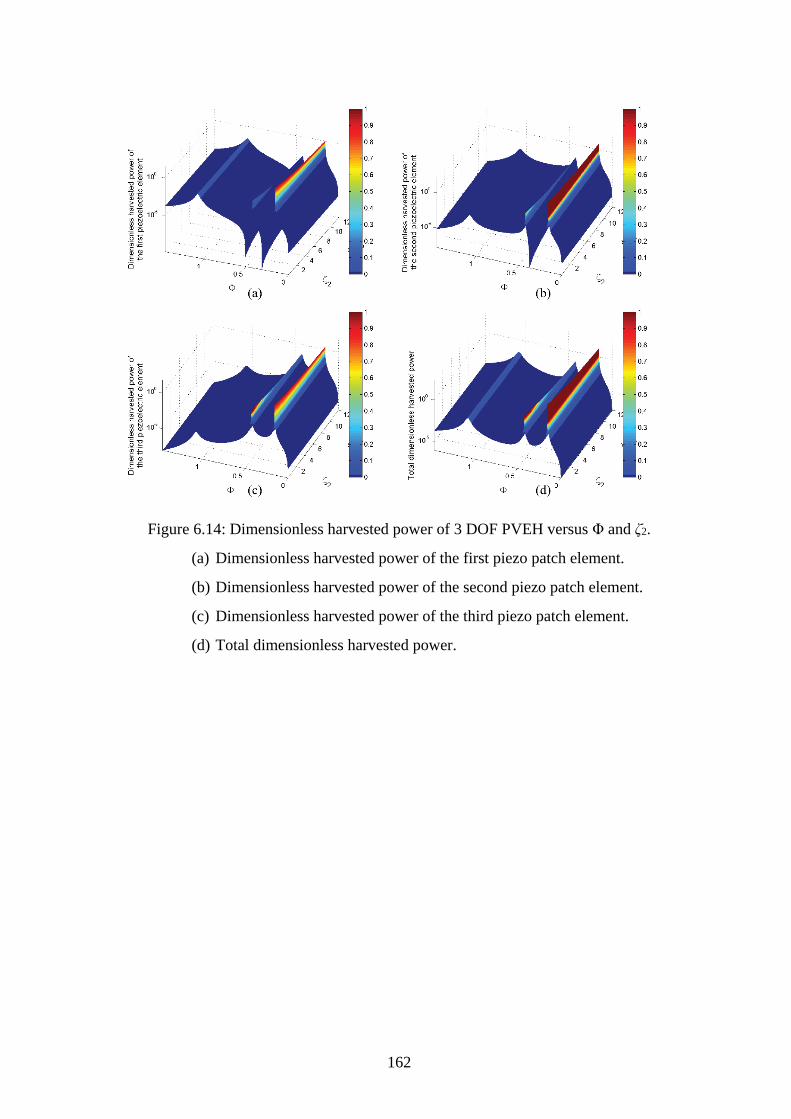
162
Figure 6.14: Dimensionless harvested power of 3 DOF PVEH versus Φ and ζ2.
(a) Dimensionless harvested power of the first piezo patch element.
(b) Dimensionless harvested power of the second piezo patch element.
(c) Dimensionless harvested power of the third piezo patch element.
(d) Total dimensionless harvested power.

163
Figure 6.15: The harvested efficiency of the 3 DOF PVEH versus M and Φ.
(a) The efficiency of the first piezo patch element.
(b) The efficiency of the second piezo patch element.
(c) The efficiency of the third piezo patch element.
(d) Total efficiency
The harvested efficiency of 3 DOF PVEH versus the mass ratio M and frequency ratio
Φ is illustrated in Figure 6.15. As shown in Figure 6.15(a), for the first piezoelectric
patch element, small mass and frequency ratios are preferred to achieve a high harvesting
efficiency, but the mass ratio only has limited influence on the energy harvesting
efficiency at the optimal Φ. On the other hand, as shown in Figure 6.15(b) and Figure
6.15(c), for the second and third piezoelectric patch elements, the energy harvesting
efficiency at the optimal Φ increases when the mass ratio increases. However, the
optimal Φ has a range of values for the third piezoelectric element when the mass ratio
M is optimized for a high energy harvesting efficiency. Figure 6.15(d) shows that the
maximum energy harvesting efficiency occurs when the mass ratio is large but the
frequency ratio is small.
164
6.4 The experimental validation of the analytical model of the 2 DOF
PVEH
The 2 DOF piezoelectric vibration energy harvester inserted with two piezoelectric
elements was constructed by three aluminium blocks with a dimension of 83 mm × 83
mm × 10 mm, and connected by two groups of springs and guides as shown in Figure
6.16. A tipped mass is attached on the top aluminium block. Moreover, the first
piezoelectric element is placed between the middle and bottom aluminium blocks and
the second piezoelectric element is placed between the top and middle aluminium blocks.
If the bottom aluminium block, the bottom group of springs & guides and the first
piezoelectric-patch element are removed, the top aluminium block is fixed onto the push
rod of the shaker, the top part of the 2 DOF PVEH is upside down and isolated as an
auxiliary oscillator. If the top aluminium block, the top group of springs & guides and
the second piezoelectric-patch element are removed, the bottom part of the 2 DOF PVEH
is formed and isolated as a primary oscillator. The top and bottom parts of the 2 DOF
PVEH are respectively tested to obtain the stiffness and damping coefficients of the
primary and auxiliary oscillators as illustrated in Figure 6.17 where the masses of the
three aluminium blocks can be weighted by a scale. The stiffness coefficients can be
calculated from the measured masses and identified modal resonant frequencies of the
primary and auxiliary oscillators. The damping coefficients can be calculated from the
measured masses, modal resonant frequencies and half power bandwidths of the modal
resonant peaks of the frequency response spectra of the primary and auxiliary oscillators.
Therefore, the parameters of the 2 DOF PVEH are summarised in Table 6.2.
.
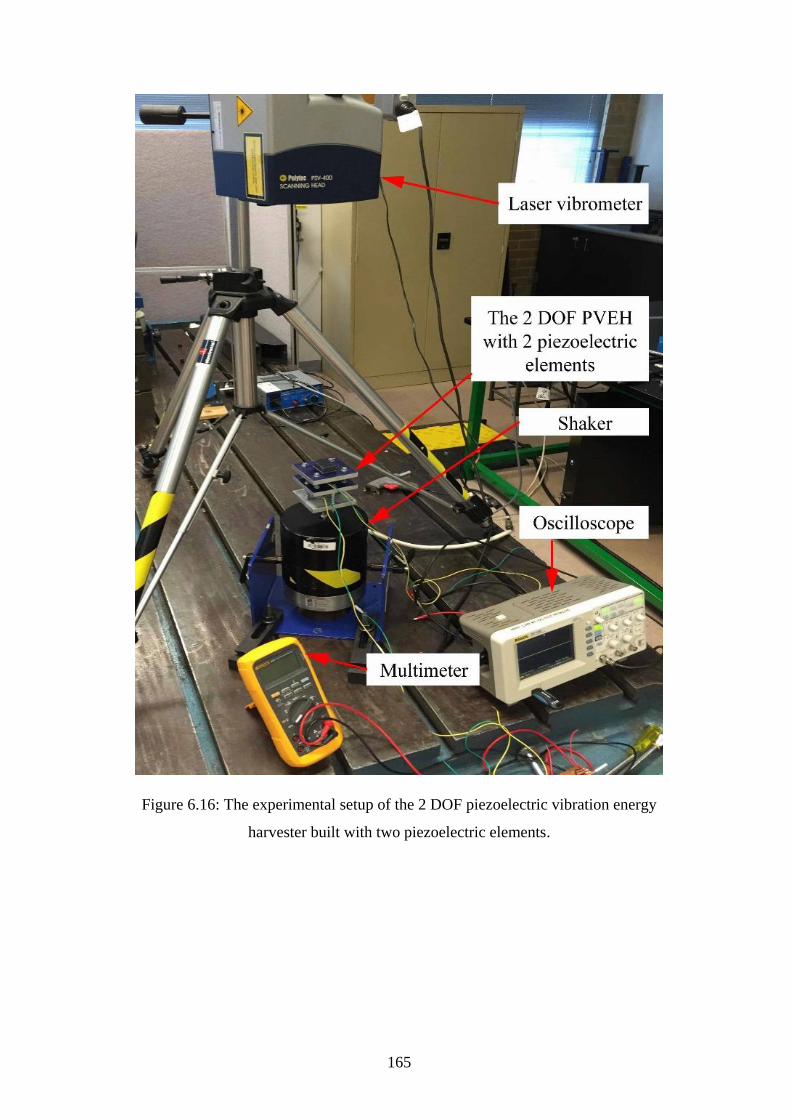
165
Figure 6.16: The experimental setup of the 2 DOF piezoelectric vibration energy
harvester built with two piezoelectric elements.
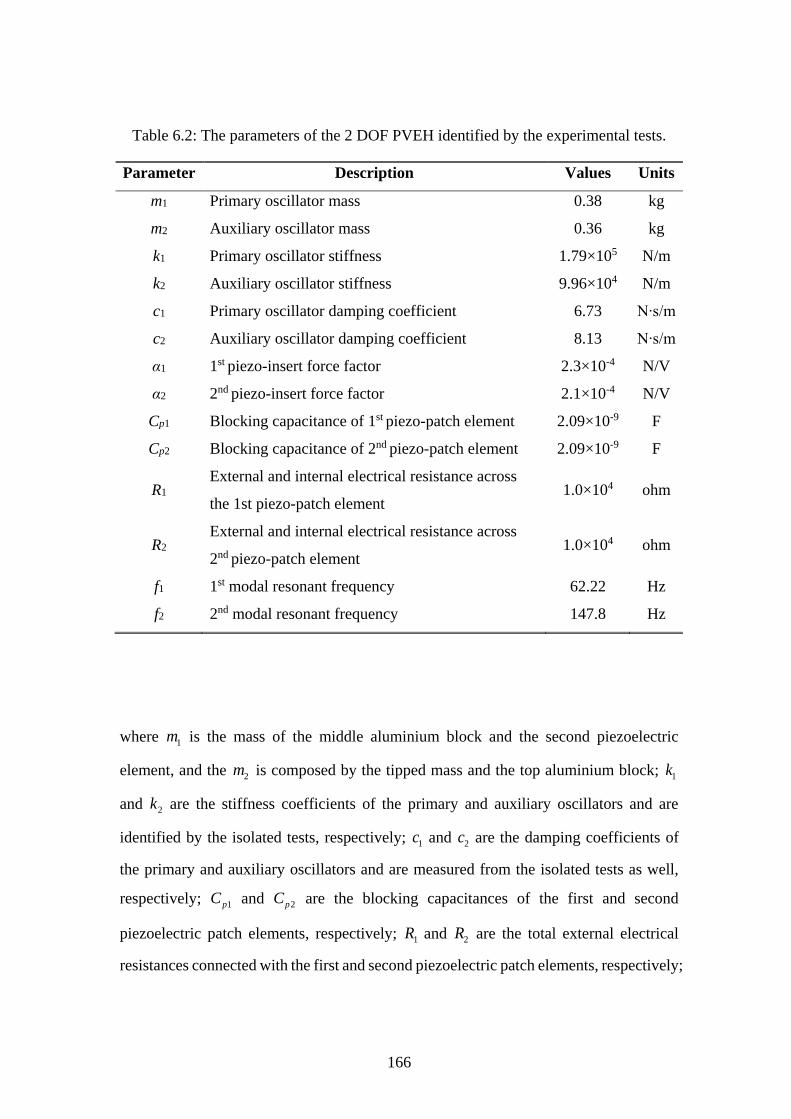
166
Table 6.2: The parameters of the 2 DOF PVEH identified by the experimental tests.
Parameter Description Values Units
m1 Primary oscillator mass 0.38 kg
m2 Auxiliary oscillator mass 0.36 kg
k1 Primary oscillator stiffness 1.79×10⁵ N/m
k2 Auxiliary oscillator stiffness 9.96×10⁴ N/m
c1 Primary oscillator damping coefficient 6.73 N∙s/m
c2 Auxiliary oscillator damping coefficient 8.13 N∙s/m
α1 1st piezo-insert force factor 2.3×10⁻⁴ N/V
α2 2nd piezo-insert force factor 2.1×10⁻⁴ N/V
Cp1 Blocking capacitance of 1st piezo-patch element 2.09×10⁻⁹ F
Cp2 Blocking capacitance of 2nd piezo-patch element 2.09×10⁻⁹ F
R1 External and internal electrical resistance across
the 1st piezo-patch element 1.0×10⁴ ohm
R2 External and internal electrical resistance across
2nd piezo-patch element 1.0×10⁴ ohm
f1 1st modal resonant frequency 62.22 Hz
f2 2nd modal resonant frequency 147.8 Hz
where 1m is the mass of the middle aluminium block and the second piezoelectric
element, and the 2m is composed by the tipped mass and the top aluminium block; 1k
and 2k are the stiffness coefficients of the primary and auxiliary oscillators and are
identified by the isolated tests, respectively; 1c and 2c are the damping coefficients of
the primary and auxiliary oscillators and are measured from the isolated tests as well,
respectively; 1pC and 2pC are the blocking capacitances of the first and second
piezoelectric patch elements, respectively; 1R and 2R are the total external electrical
resistances connected with the first and second piezoelectric patch elements, respectively;
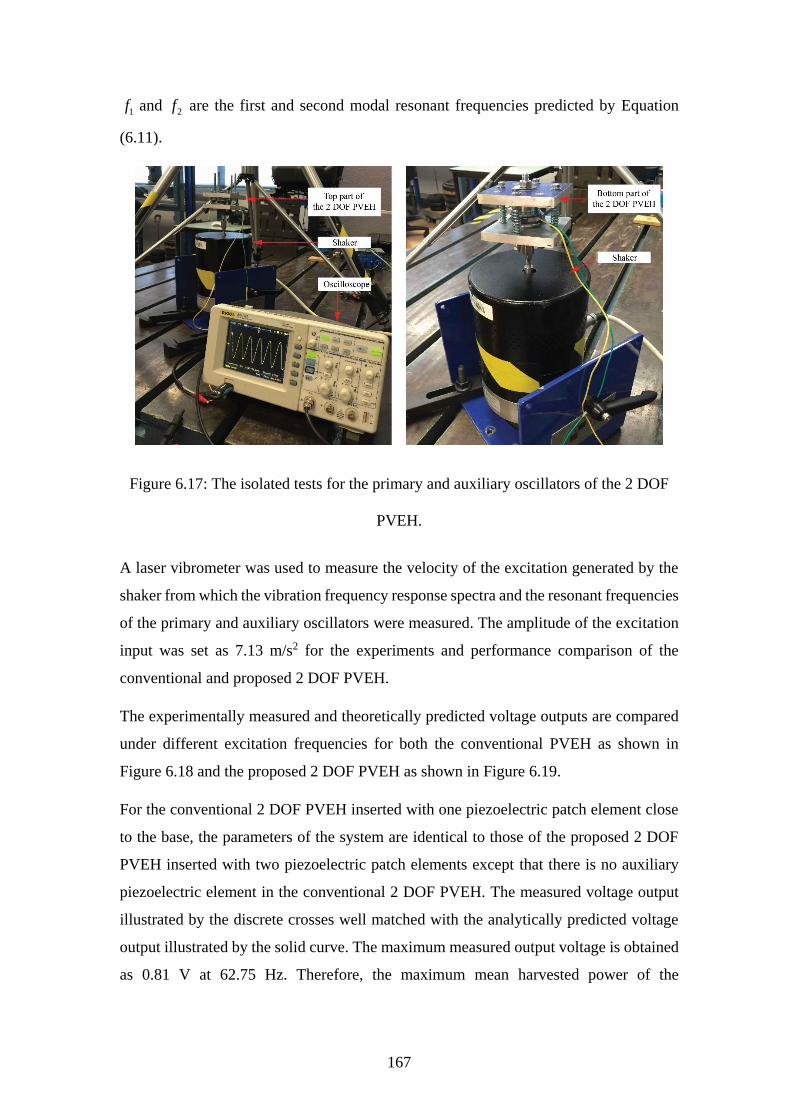
167
1f and 2f are the first and second modal resonant frequencies predicted by Equation
(6.11).
Figure 6.17: The isolated tests for the primary and auxiliary oscillators of the 2 DOF
PVEH.
A laser vibrometer was used to measure the velocity of the excitation generated by the
shaker from which the vibration frequency response spectra and the resonant frequencies
of the primary and auxiliary oscillators were measured. The amplitude of the excitation
input was set as 7.13 m/s2 for the experiments and performance comparison of the
conventional and proposed 2 DOF PVEH.
The experimentally measured and theoretically predicted voltage outputs are compared
under different excitation frequencies for both the conventional PVEH as shown in
Figure 6.18 and the proposed 2 DOF PVEH as shown in Figure 6.19.
For the conventional 2 DOF PVEH inserted with one piezoelectric patch element close
to the base, the parameters of the system are identical to those of the proposed 2 DOF
PVEH inserted with two piezoelectric patch elements except that there is no auxiliary
piezoelectric element in the conventional 2 DOF PVEH. The measured voltage output
illustrated by the discrete crosses well matched with the analytically predicted voltage
output illustrated by the solid curve. The maximum measured output voltage is obtained
as 0.81 V at 62.75 Hz. Therefore, the maximum mean harvested power of the
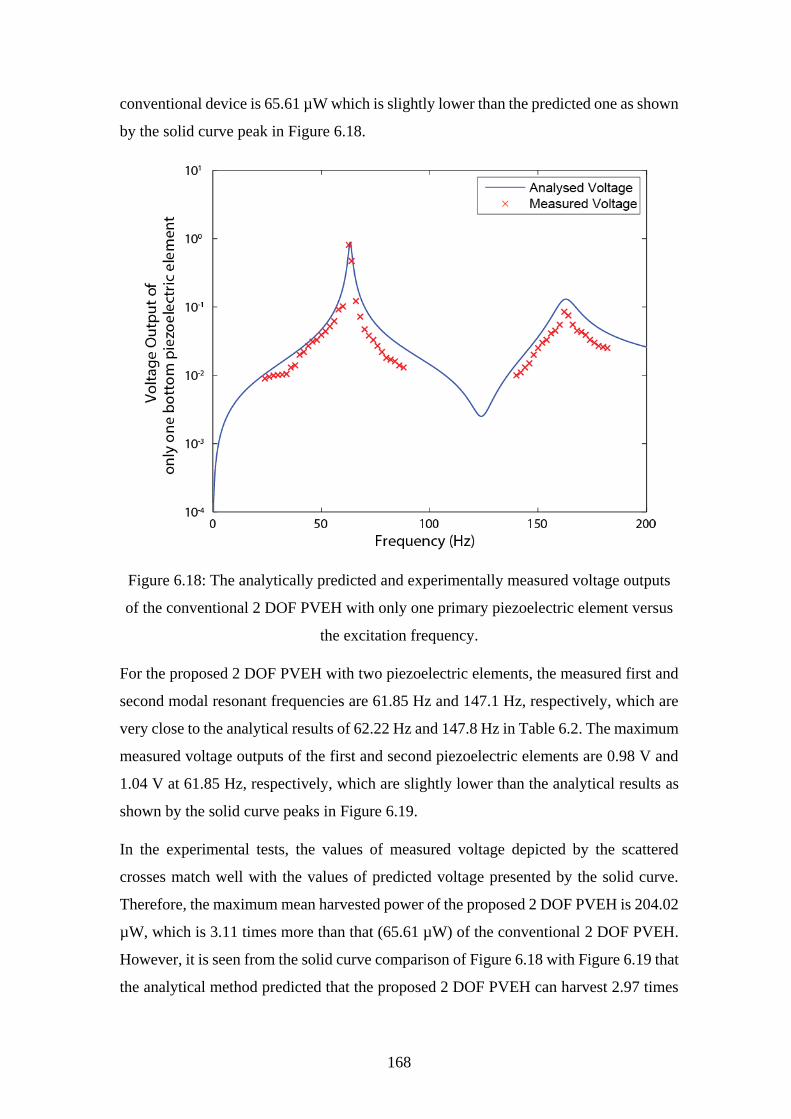
168
conventional device is 65.61 µW which is slightly lower than the predicted one as shown
by the solid curve peak in Figure 6.18.
Figure 6.18: The analytically predicted and experimentally measured voltage outputs
of the conventional 2 DOF PVEH with only one primary piezoelectric element versus
the excitation frequency.
For the proposed 2 DOF PVEH with two piezoelectric elements, the measured first and
second modal resonant frequencies are 61.85 Hz and 147.1 Hz, respectively, which are
very close to the analytical results of 62.22 Hz and 147.8 Hz in Table 6.2. The maximum
measured voltage outputs of the first and second piezoelectric elements are 0.98 V and
1.04 V at 61.85 Hz, respectively, which are slightly lower than the analytical results as
shown by the solid curve peaks in Figure 6.19.
In the experimental tests, the values of measured voltage depicted by the scattered
crosses match well with the values of predicted voltage presented by the solid curve.
Therefore, the maximum mean harvested power of the proposed 2 DOF PVEH is 204.02
µW, which is 3.11 times more than that (65.61 µW) of the conventional 2 DOF PVEH.
However, it is seen from the solid curve comparison of Figure 6.18 with Figure 6.19 that
the analytical method predicted that the proposed 2 DOF PVEH can harvest 2.97 times
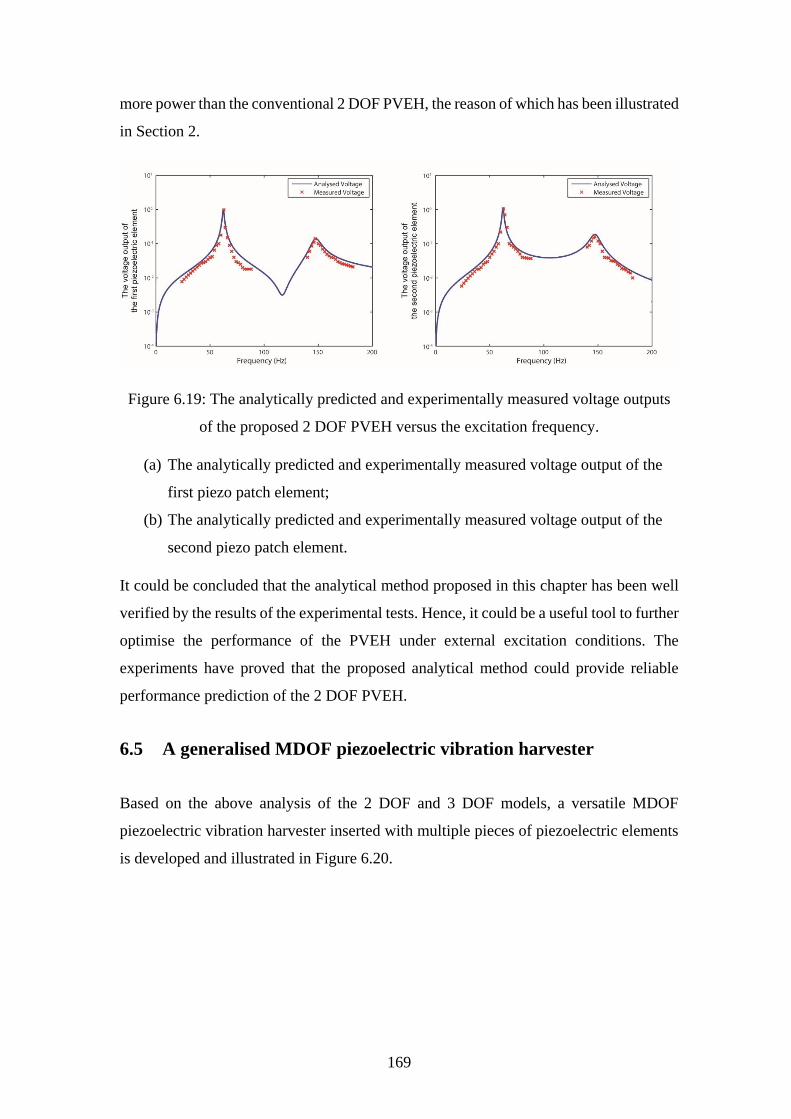
169
more power than the conventional 2 DOF PVEH, the reason of which has been illustrated
in Section 2.
Figure 6.19: The analytically predicted and experimentally measured voltage outputs
of the proposed 2 DOF PVEH versus the excitation frequency.
(a) The analytically predicted and experimentally measured voltage output of the
first piezo patch element;
(b) The analytically predicted and experimentally measured voltage output of the
second piezo patch element.
It could be concluded that the analytical method proposed in this chapter has been well
verified by the results of the experimental tests. Hence, it could be a useful tool to further
optimise the performance of the PVEH under external excitation conditions. The
experiments have proved that the proposed analytical method could provide reliable
performance prediction of the 2 DOF PVEH.
6.5 A generalised MDOF piezoelectric vibration harvester
Based on the above analysis of the 2 DOF and 3 DOF models, a versatile MDOF
piezoelectric vibration harvester inserted with multiple pieces of piezoelectric elements
is developed and illustrated in Figure 6.20.

170
Figure 6.20: A generalized MDOF piezoelectric vibration energy harvester inserted
with multiple pieces of piezoelectric elements.
The governing equations of the MDOF PVEH are given by:
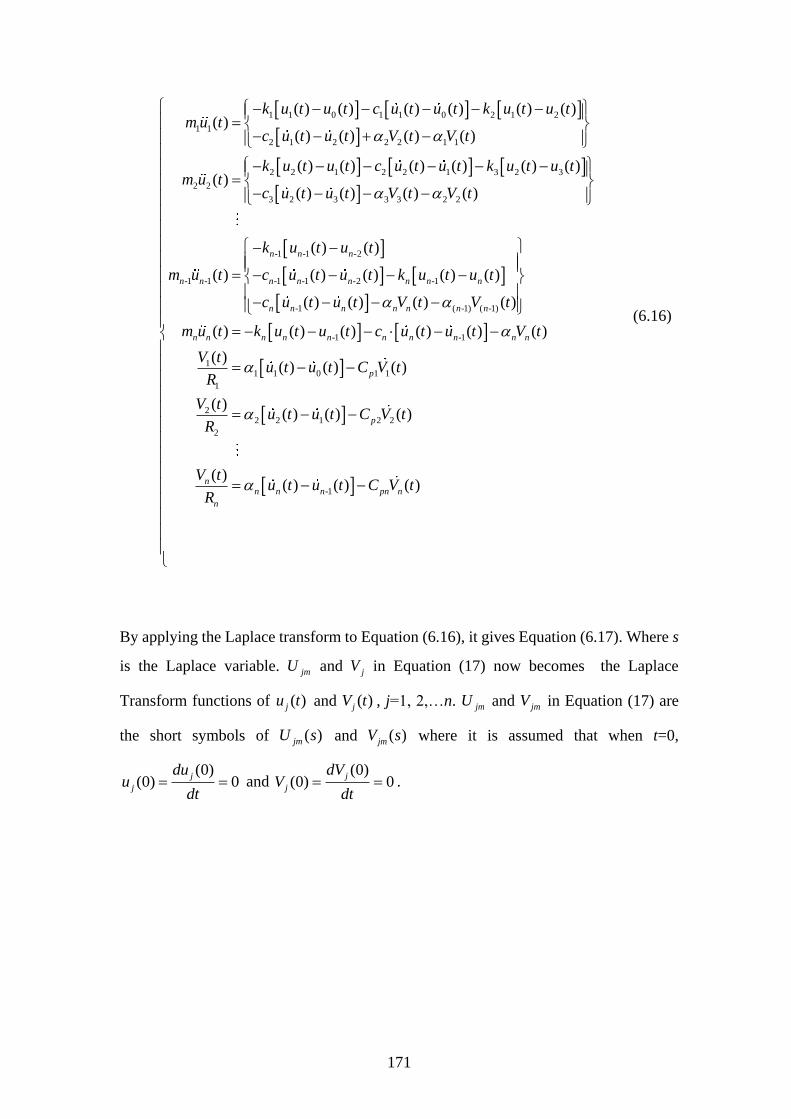
171
1 1 0 1 1 0 2 1 2
1 1
2 1 2 2 2 1 1
2 2 1 2 2 1 3 2 3
2 2
3 2 3 3 3 2 2
-1
( ) ( ) ( ) ( ) ( ) ( )( )
( ) ( ) ( ) ( )
( ) ( ) ( ) ( ) ( ) ( )( )
( ) ( ) ( ) ( )
n
k u t u t c u t u t k u t u tm u t
c u t u t V t V t
k u t u t c u t u t k u t u tm u t
c u t u t V t V t
m u
-1 -1 -2
-1 -1 -1 -2 -1
-1 ( -1) ( -1)
-1 -1
11 1 0
1
( ) ( )
( ) ( ) ( ) ( ) ( )
( ) ( ) ( ) ( )
( ) ( ) ( ) ( ) ( ) ( )
( )( ) ( )
n n n
n n n n n n n
n n n n n n n
n n n n n n n n n n
p
k u t u t
t c u t u t k u t u t
c u t u t V t V t
m u t k u t u t c u t u t V t
V tu t u t C
R
1 1
22 2 1 2 2
2
-1
( )
( )( ) ( ) ( )
( )( ) ( ) ( )
p
nn n n pn n
n
V t
V tu t u t C V t
R
V tu t u t C V t
R
(6.16)
By applying the Laplace transform to Equation (6.16), it gives Equation (6.17). Where s
is the Laplace variable. jmU and jV in Equation (17) now becomes the Laplace
Transform functions of ( )ju t and ( )jV t , j=1, 2,…n. jmU and jmV in Equation (17) are
the short symbols of ( )jmU s and ( )jmV s where it is assumed that when t=0,
(0)(0) 0
j
j
duu
dt and
(0)(0) 0
j
j
dVV
dt .
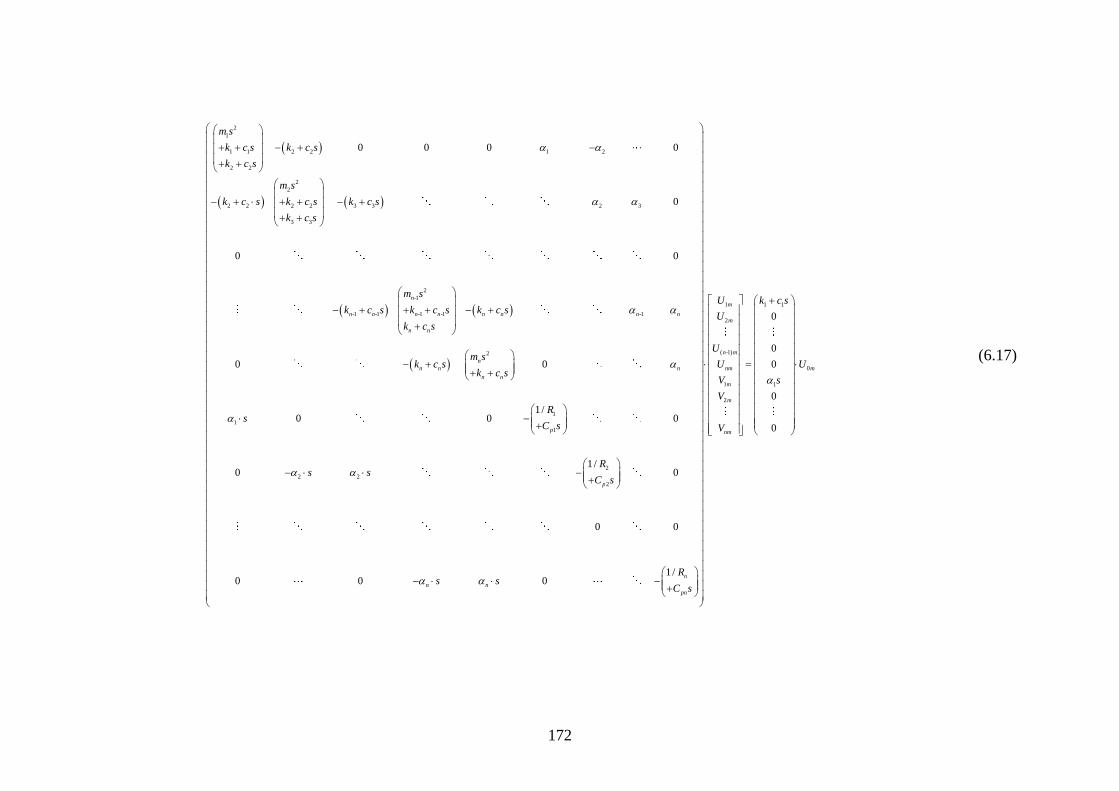
172
2
1
1 1 2 2 1 2
2 2
2
2
2 2 2 2 3 3 2 3
3 3
2
-1
-1 -1 -1 -1 -1
2
0 0 0 0
0
0 0
0 0
n
n n n n n n n n
n n
n
n n n
n n
m s
k c s k c s
k c s
m s
k c s k c s k c s
k c s
m s
k c s k c s k c s
k c s
m sk c s
k c s
1
1
1
2
2 2
2
1/0 0 0
1/0 0
0 0
1/0 0 0
p
p
n
n n
pn
Rs
C s
Rs s
C s
Rs s
C s
1 1
2
( -1)
0
1
1
1
2
0
0
0
0
0
m
n m
nm m
m
m
nm
mU k c s
U
U
U U
V s
V
V
(6.17)
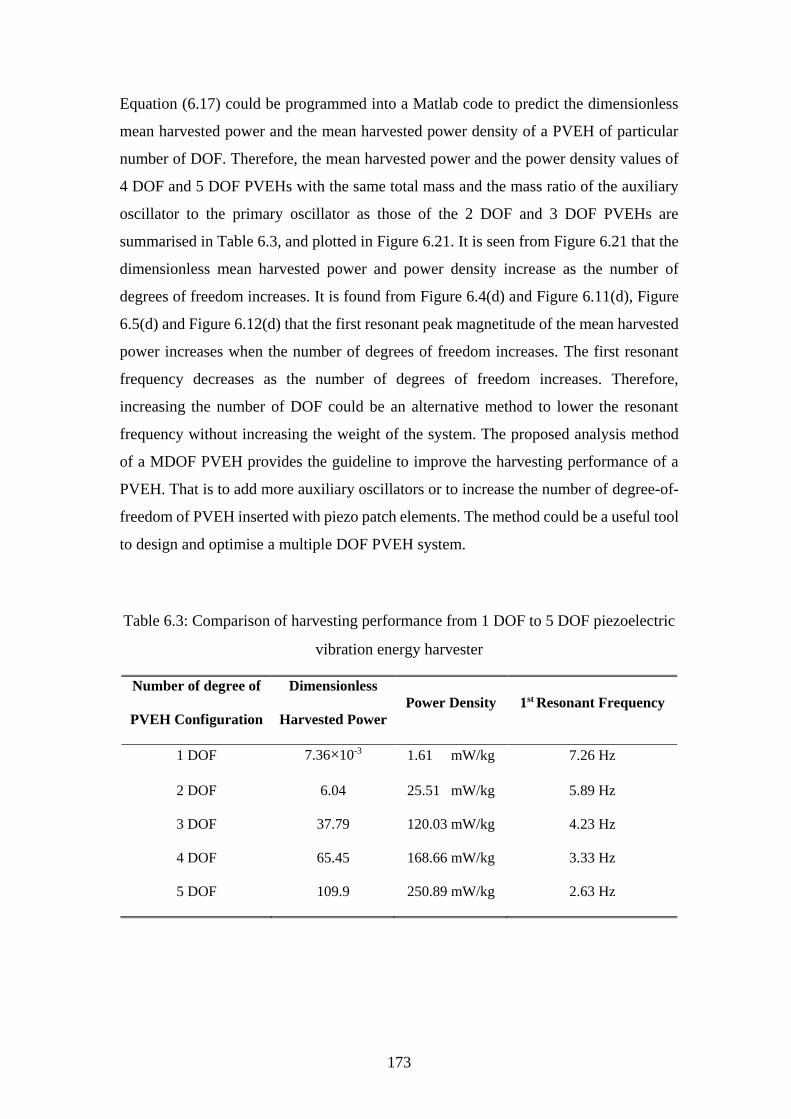
173
Equation (6.17) could be programmed into a Matlab code to predict the dimensionless
mean harvested power and the mean harvested power density of a PVEH of particular
number of DOF. Therefore, the mean harvested power and the power density values of
4 DOF and 5 DOF PVEHs with the same total mass and the mass ratio of the auxiliary
oscillator to the primary oscillator as those of the 2 DOF and 3 DOF PVEHs are
summarised in Table 6.3, and plotted in Figure 6.21. It is seen from Figure 6.21 that the
dimensionless mean harvested power and power density increase as the number of
degrees of freedom increases. It is found from Figure 6.4(d) and Figure 6.11(d), Figure
6.5(d) and Figure 6.12(d) that the first resonant peak magnetitude of the mean harvested
power increases when the number of degrees of freedom increases. The first resonant
frequency decreases as the number of degrees of freedom increases. Therefore,
increasing the number of DOF could be an alternative method to lower the resonant
frequency without increasing the weight of the system. The proposed analysis method
of a MDOF PVEH provides the guideline to improve the harvesting performance of a
PVEH. That is to add more auxiliary oscillators or to increase the number of degree-of-
freedom of PVEH inserted with piezo patch elements. The method could be a useful tool
to design and optimise a multiple DOF PVEH system.
Table 6.3: Comparison of harvesting performance from 1 DOF to 5 DOF piezoelectric
vibration energy harvester
Number of degree of
PVEH Configuration
Dimensionless
Harvested Power Power Density 1st
Resonant Frequency
1 DOF 7.36×10⁻³ 1.61 mW/kg 7.26 Hz
2 DOF 6.04 25.51 mW/kg 5.89 Hz
3 DOF 37.79 120.03 mW/kg 4.23 Hz
4 DOF 65.45 168.66 mW/kg 3.33 Hz
5 DOF 109.9 250.89 mW/kg 2.63 Hz
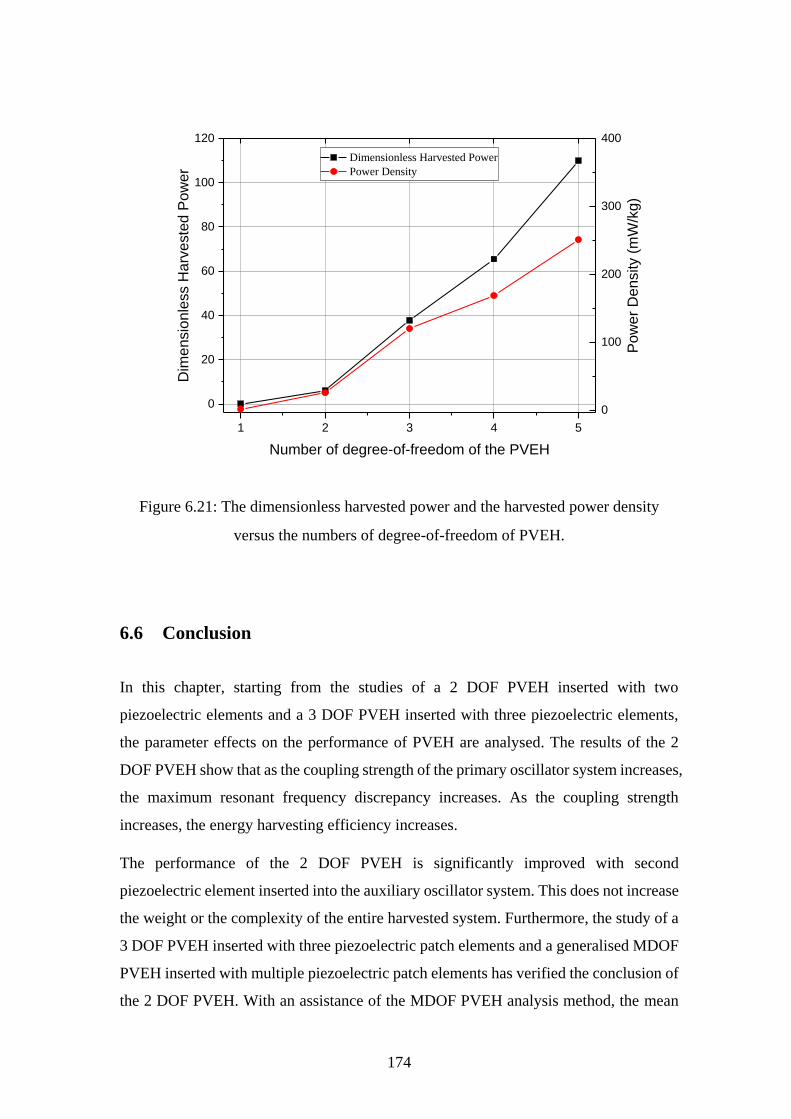
174
1 2 3 4 5
0
20
40
60
80
100
120
Dimensionless Harvested Power
Power DensityD
ime
nsio
nle
ss H
arv
este
d P
ow
er
Number of degree-of-freedom of the PVEH
0
100
200
300
400
Po
we
r D
en
sity (
mW
/kg)
Figure 6.21: The dimensionless harvested power and the harvested power density
versus the numbers of degree-of-freedom of PVEH.
6.6 Conclusion
In this chapter, starting from the studies of a 2 DOF PVEH inserted with two
piezoelectric elements and a 3 DOF PVEH inserted with three piezoelectric elements,
the parameter effects on the performance of PVEH are analysed. The results of the 2
DOF PVEH show that as the coupling strength of the primary oscillator system increases,
the maximum resonant frequency discrepancy increases. As the coupling strength
increases, the energy harvesting efficiency increases.
The performance of the 2 DOF PVEH is significantly improved with second
piezoelectric element inserted into the auxiliary oscillator system. This does not increase
the weight or the complexity of the entire harvested system. Furthermore, the study of a
3 DOF PVEH inserted with three piezoelectric patch elements and a generalised MDOF
PVEH inserted with multiple piezoelectric patch elements has verified the conclusion of
the 2 DOF PVEH. With an assistance of the MDOF PVEH analysis method, the mean
175
harvested power and the power density of the PVEH from the 1 DOF to 5 DOF are
compared. It is found that without additional weight being added to the system, the more
degrees of freedom the system is, the more energy it can harvest.
The first resonant frequency decreases as the number of degrees of freedom of a PVEH
system increases. As the number of degree-of-freedom increases, the discrepancy of the
model frequencies decreases. This would result in a wide and effective harvesting
frequency bandwidth. The resonant harvested power and efficiency from the piezo patch
elements of the auxiliary oscillator systems are larger than those of the primary oscillator
system. The maximum harvesting efficiencies of the piezo patch elements of the primary
and auxiliary oscillator systems have different system parameter ranges.
The analysis method presented in this chapter has been validated by the experimental
tests, which will enable to tune the piezoelectric vibration energy harvester toward the
larger mean harvested power, higher harvesting efficiency and wider harvesting
frequency bandwidth.
176
Sensitivity Analysis of
Performance of Piezoelectric
Vibration Energy Harvesters
Using the Monte Carlo Simulation
The theoretical analyses and simulations have been conducted on the SDOF, the 2 DOF,
the enhanced 2 DOF and the generalised MDOF piezoelectric vibration energy
harvesters in Chapter 3, Chapter 4, Chapter 5 and Chapter 6, respectively. The
experiments on the SDOF, the 2DOF, and the enhanced 2 DOF have been carried out
and verified these theoretical analyses. The performance optimisations of these
harvesting systems are performed on the parameters such as mass, damping coefficient,
force factor, stiffness, and electrical resistance based on the deterministic analysis
method. However, these harvesting systems have uncertainty which depends on the input
parameters such as material and manufacturing variations. Because of that, in this
Chapter, the investigation of the effect of parameter uncertainty on the harvested power
has been conducted using the Monte Carlo simulation. It also provides a visual tool to
optimise the parameters of the piezoelectric vibration energy harvester to enhance the
harvested power.
7.1 Introduction
Harvesting energy from the environment is an attractive alternative to battery-operated
systems for a power source, especially for the long-term, low-power consuming and self-
sustaining electronic systems. Among all of the harvesting techniques, the piezoelectric
vibration energy harvesting technology has received intensive attention. It has
potentially become a more realistic energy source as less and less power is required to
operate the electronic components. Therefore, the piezoelectric vibration energy
harvesting endows the low-power consumption system with the ‘self-powered’
capability. The energy harvested from the ambient vibration can be used directly or to
recharge the batteries which can reduce the maintenance cost of the operating system
177
and overcome the restrictions of electronic device relying on the electrical grid. Behind
this motivation, the energy harvesting has been studied by researchers and the review
literatures can be found in [2, 3, 11, 26, 27, 30, 70, 78, 85, 104, 136-143].
In order to enhance the harvested resonant power of the piezoelectric vibration energy
harvester, many studies have been conducted by the researchers. For example, the
advanced piezoelectric materials were developed to improve the perofrmance of the
energy harvesters, and were reported in [26, 86, 144]. The parameters of the vibration
energy harvesters were optimised for the maximum energy harvesting efficiency and
reported in literatures[31, 82, 102, 107, 145-147].
In these aforementioned studies, most of the analyses assumed the parameters of the
piezoelectric vibration energy harvesters are deterministic, and the excitation signals are
harmonic ones. Few studies have investigated the effect of parameters uncertainty on the
harvested resonant power of the piezoelectric vibration energy harvester[148]. In this
chapter, the parameters uncertainty are investigated using the Monte Carlo Simulation.
The theory developed in this chapter can also provide a visual tool for the parameter
optimisation to maximise the harvesting energy of the piezoelectric vibration energy
harvesters.
7.2 Sensitivity analysis of the performance of the SDOF piezoelectric
vibration energy harvester
The schematic of the single degree-of-freedom piezoelectric vibration energy harvester
can be found in the Chapter 3 Figure 3.1. The equations describing the SDOF
piezoelectric vibration energy harvester are also found in Chapter 3, from Equation (3.1)
to Equation (3.19). The parameters of the SDOF PVEH can be found in Table 3.1.
The equations have been programmed into Matlab software using Monte Carlo method
to investigate the parameter uncertainty of the SDOF piezoelectric vibration energy
harvester. The Matlab functions ‘unifrnd (A, B)’ and ‘normrnd (µ, σ)’ are used to
simulate the parameter uncertainty of the harvesting system. The function of ‘unifrnd (A,
B)’ is used to generate an array of random numbers from the continuous uniform
distributions with lower and upper endpoints specified by A and B, respectively. On the
other hand, the function of ‘normrnd (µ, σ)’ can generate random numbers from the
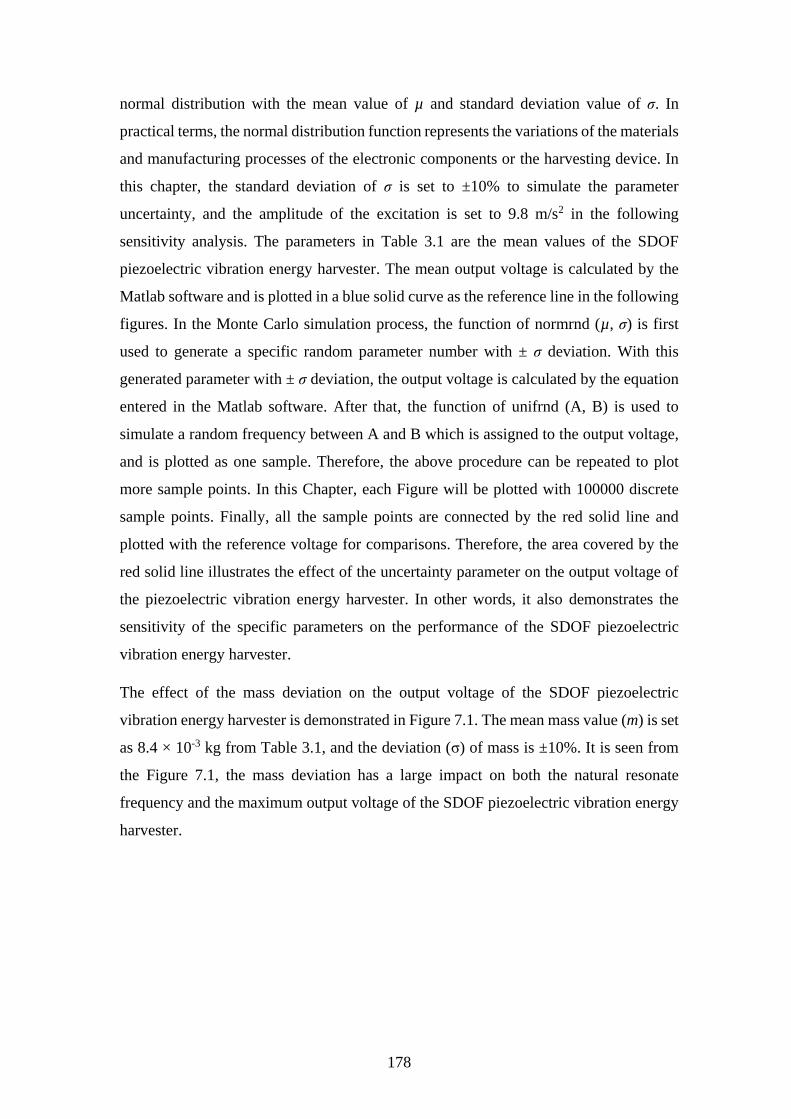
178
normal distribution with the mean value of µ and standard deviation value of σ. In
practical terms, the normal distribution function represents the variations of the materials
and manufacturing processes of the electronic components or the harvesting device. In
this chapter, the standard deviation of σ is set to ±10% to simulate the parameter
uncertainty, and the amplitude of the excitation is set to 9.8 m/s2 in the following
sensitivity analysis. The parameters in Table 3.1 are the mean values of the SDOF
piezoelectric vibration energy harvester. The mean output voltage is calculated by the
Matlab software and is plotted in a blue solid curve as the reference line in the following
figures. In the Monte Carlo simulation process, the function of normrnd (µ, σ) is first
used to generate a specific random parameter number with ± σ deviation. With this
generated parameter with ± σ deviation, the output voltage is calculated by the equation
entered in the Matlab software. After that, the function of unifrnd (A, B) is used to
simulate a random frequency between A and B which is assigned to the output voltage,
and is plotted as one sample. Therefore, the above procedure can be repeated to plot
more sample points. In this Chapter, each Figure will be plotted with 100000 discrete
sample points. Finally, all the sample points are connected by the red solid line and
plotted with the reference voltage for comparisons. Therefore, the area covered by the
red solid line illustrates the effect of the uncertainty parameter on the output voltage of
the piezoelectric vibration energy harvester. In other words, it also demonstrates the
sensitivity of the specific parameters on the performance of the SDOF piezoelectric
vibration energy harvester.
The effect of the mass deviation on the output voltage of the SDOF piezoelectric
vibration energy harvester is demonstrated in Figure 7.1. The mean mass value (m) is set
as 8.4 × 10⁻³ kg from Table 3.1, and the deviation (σ) of mass is ±10%. It is seen from
the Figure 7.1, the mass deviation has a large impact on both the natural resonate
frequency and the maximum output voltage of the SDOF piezoelectric vibration energy
harvester.
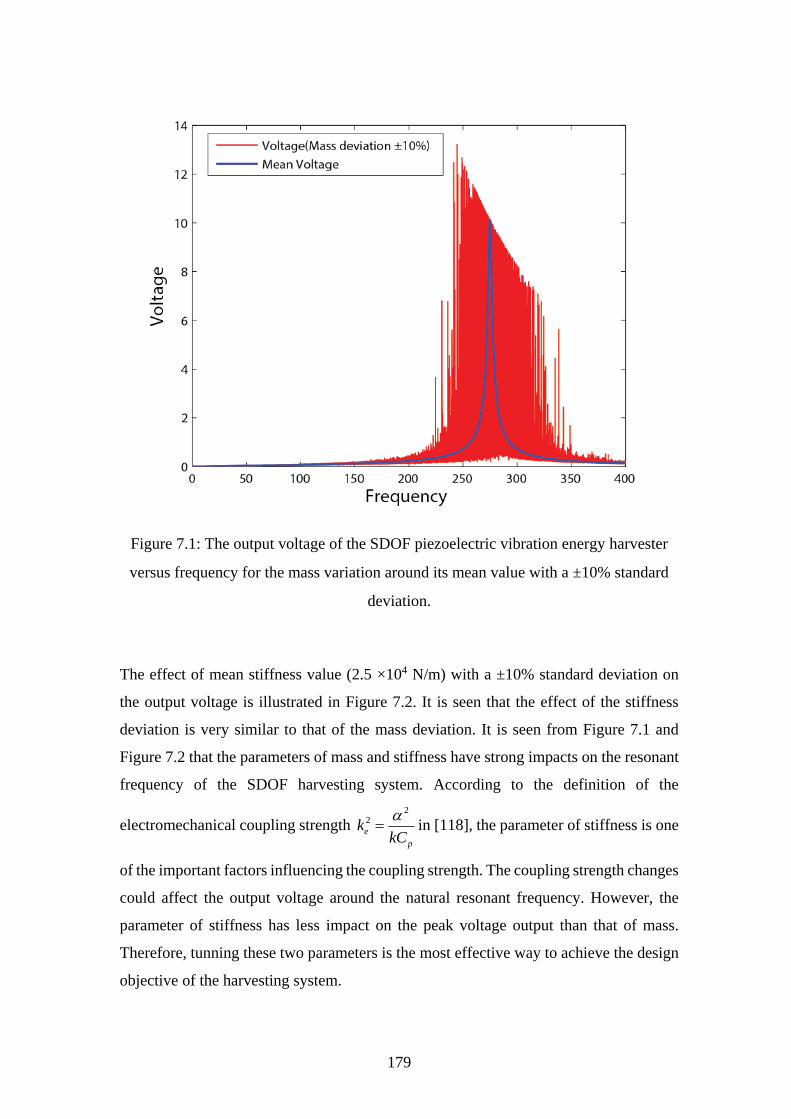
179
Figure 7.1: The output voltage of the SDOF piezoelectric vibration energy harvester
versus frequency for the mass variation around its mean value with a ±10% standard
deviation.
The effect of mean stiffness value (2.5 ×10⁴ N/m) with a ±10% standard deviation on
the output voltage is illustrated in Figure 7.2. It is seen that the effect of the stiffness
deviation is very similar to that of the mass deviation. It is seen from Figure 7.1 and
Figure 7.2 that the parameters of mass and stiffness have strong impacts on the resonant
frequency of the SDOF harvesting system. According to the definition of the
electromechanical coupling strength 2
2
e
p
kkC
in [118], the parameter of stiffness is one
of the important factors influencing the coupling strength. The coupling strength changes
could affect the output voltage around the natural resonant frequency. However, the
parameter of stiffness has less impact on the peak voltage output than that of mass.
Therefore, tunning these two parameters is the most effective way to achieve the design
objective of the harvesting system.
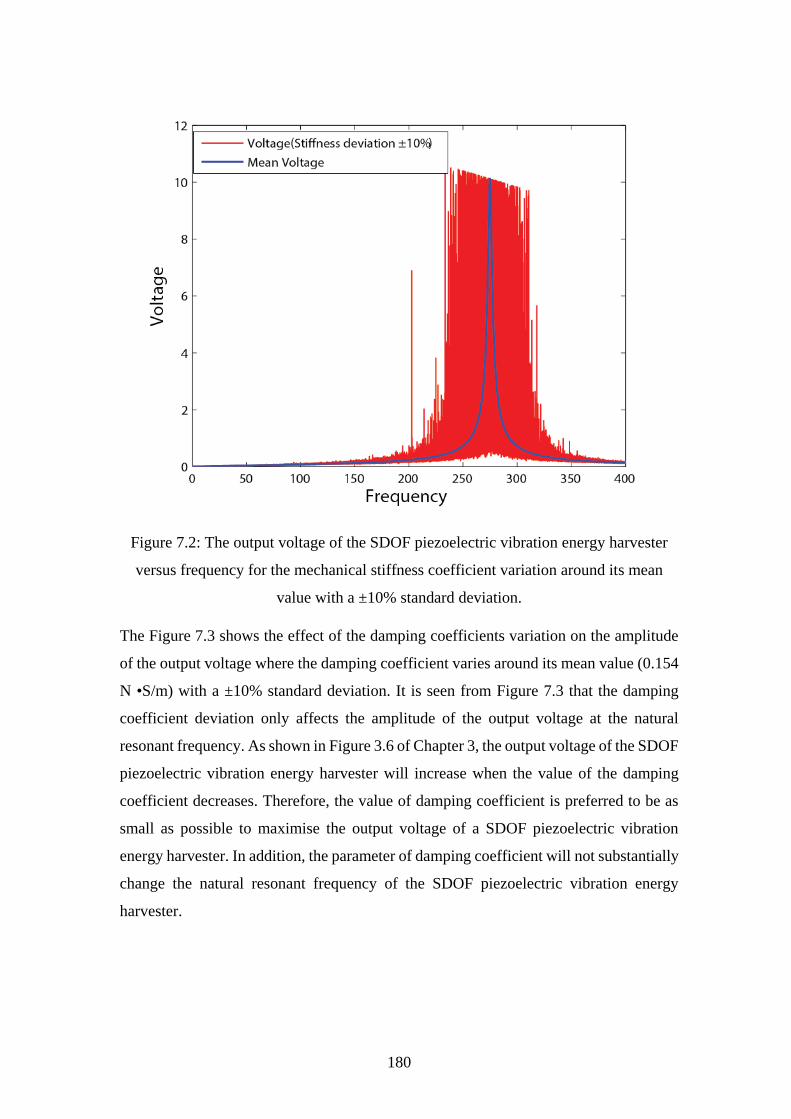
180
Figure 7.2: The output voltage of the SDOF piezoelectric vibration energy harvester
versus frequency for the mechanical stiffness coefficient variation around its mean
value with a ±10% standard deviation.
The Figure 7.3 shows the effect of the damping coefficients variation on the amplitude
of the output voltage where the damping coefficient varies around its mean value (0.154
N •S/m) with a ±10% standard deviation. It is seen from Figure 7.3 that the damping
coefficient deviation only affects the amplitude of the output voltage at the natural
resonant frequency. As shown in Figure 3.6 of Chapter 3, the output voltage of the SDOF
piezoelectric vibration energy harvester will increase when the value of the damping
coefficient decreases. Therefore, the value of damping coefficient is preferred to be as
small as possible to maximise the output voltage of a SDOF piezoelectric vibration
energy harvester. In addition, the parameter of damping coefficient will not substantially
change the natural resonant frequency of the SDOF piezoelectric vibration energy
harvester.
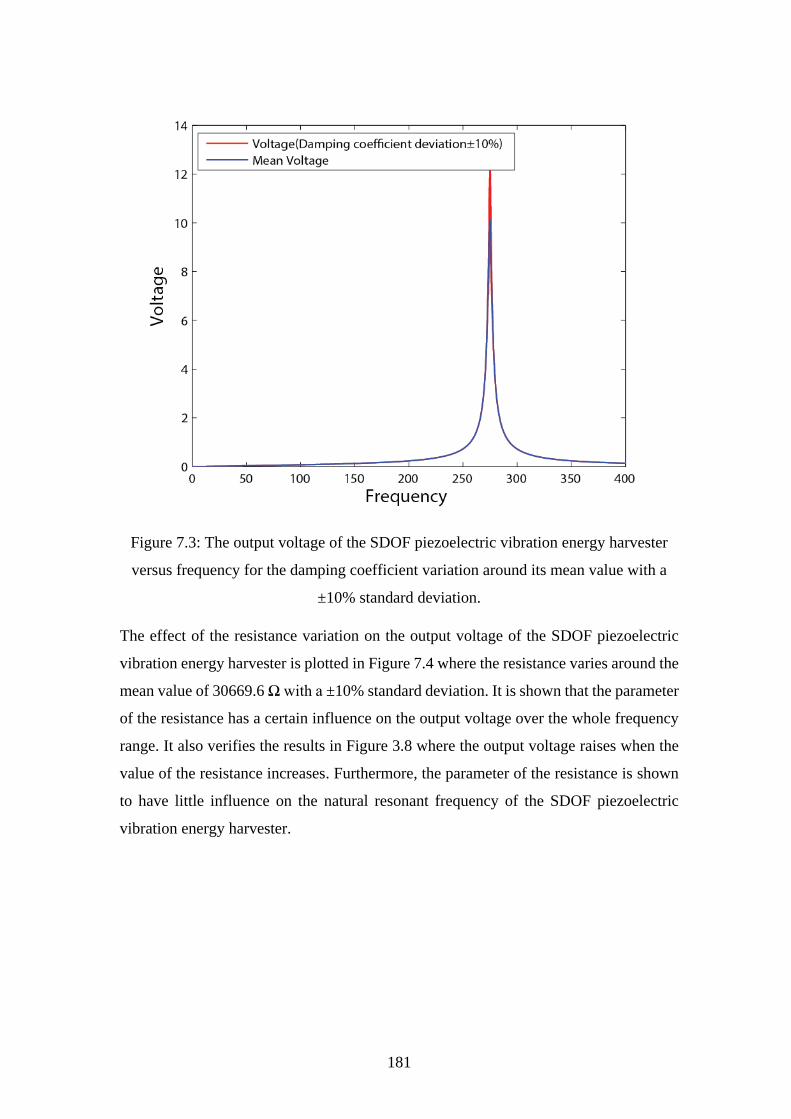
181
Figure 7.3: The output voltage of the SDOF piezoelectric vibration energy harvester
versus frequency for the damping coefficient variation around its mean value with a
±10% standard deviation.
The effect of the resistance variation on the output voltage of the SDOF piezoelectric
vibration energy harvester is plotted in Figure 7.4 where the resistance varies around the
mean value of 30669.6 Ω with a ±10% standard deviation. It is shown that the parameter
of the resistance has a certain influence on the output voltage over the whole frequency
range. It also verifies the results in Figure 3.8 where the output voltage raises when the
value of the resistance increases. Furthermore, the parameter of the resistance is shown
to have little influence on the natural resonant frequency of the SDOF piezoelectric
vibration energy harvester.
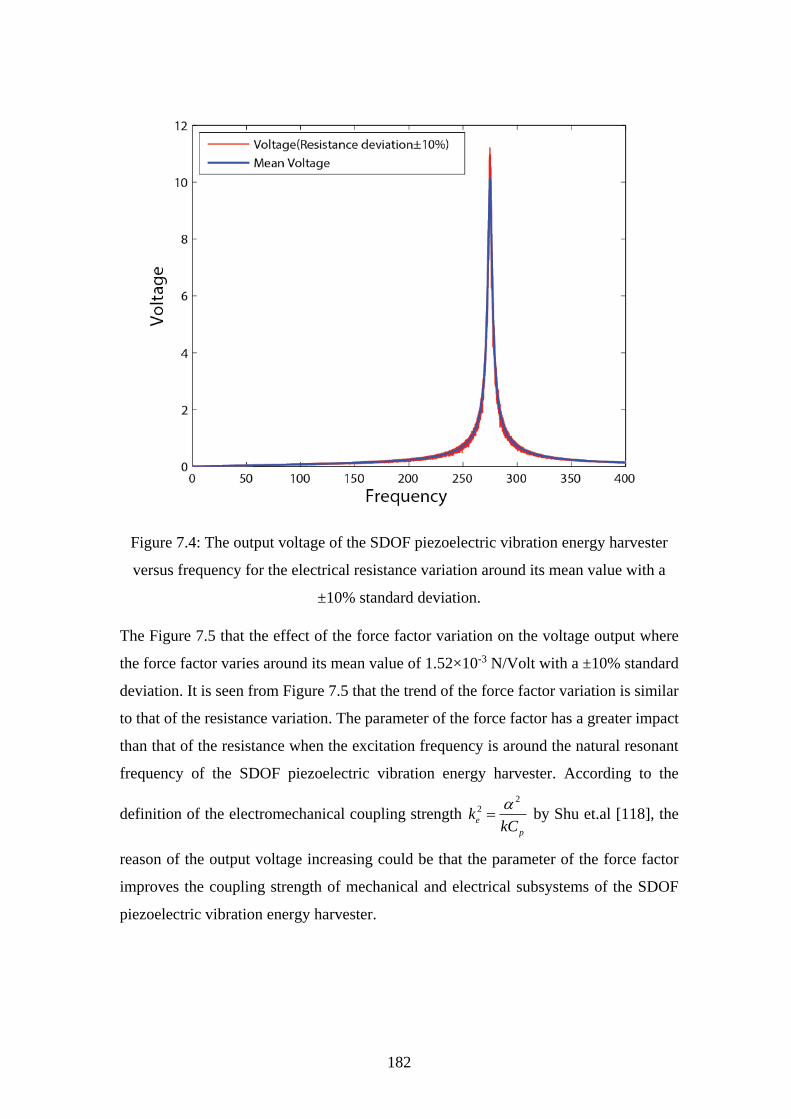
182
Figure 7.4: The output voltage of the SDOF piezoelectric vibration energy harvester
versus frequency for the electrical resistance variation around its mean value with a
±10% standard deviation.
The Figure 7.5 that the effect of the force factor variation on the voltage output where
the force factor varies around its mean value of 1.52×10⁻³ N/Volt with a ±10% standard
deviation. It is seen from Figure 7.5 that the trend of the force factor variation is similar
to that of the resistance variation. The parameter of the force factor has a greater impact
than that of the resistance when the excitation frequency is around the natural resonant
frequency of the SDOF piezoelectric vibration energy harvester. According to the
definition of the electromechanical coupling strength 2
2
e
p
kkC
by Shu et.al [118], the
reason of the output voltage increasing could be that the parameter of the force factor
improves the coupling strength of mechanical and electrical subsystems of the SDOF
piezoelectric vibration energy harvester.
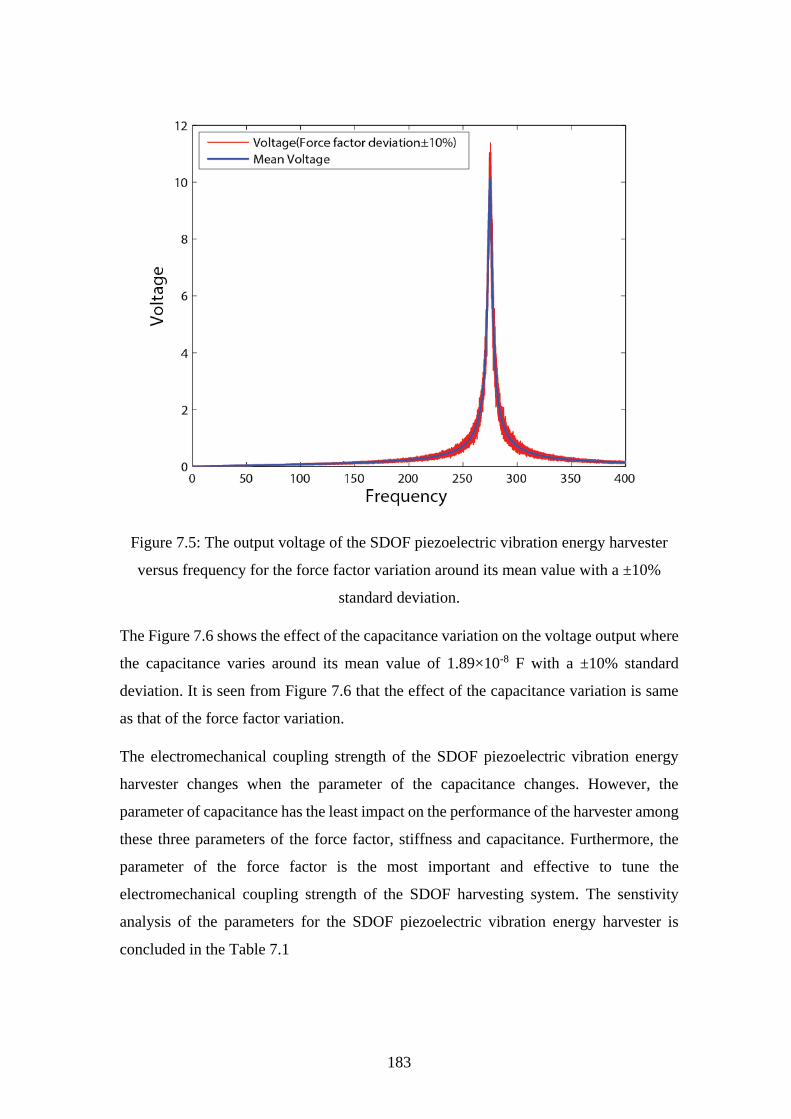
183
Figure 7.5: The output voltage of the SDOF piezoelectric vibration energy harvester
versus frequency for the force factor variation around its mean value with a ±10%
standard deviation.
The Figure 7.6 shows the effect of the capacitance variation on the voltage output where
the capacitance varies around its mean value of 1.89×10⁻⁸ F with a ±10% standard
deviation. It is seen from Figure 7.6 that the effect of the capacitance variation is same
as that of the force factor variation.
The electromechanical coupling strength of the SDOF piezoelectric vibration energy
harvester changes when the parameter of the capacitance changes. However, the
parameter of capacitance has the least impact on the performance of the harvester among
these three parameters of the force factor, stiffness and capacitance. Furthermore, the
parameter of the force factor is the most important and effective to tune the
electromechanical coupling strength of the SDOF harvesting system. The senstivity
analysis of the parameters for the SDOF piezoelectric vibration energy harvester is
concluded in the Table 7.1
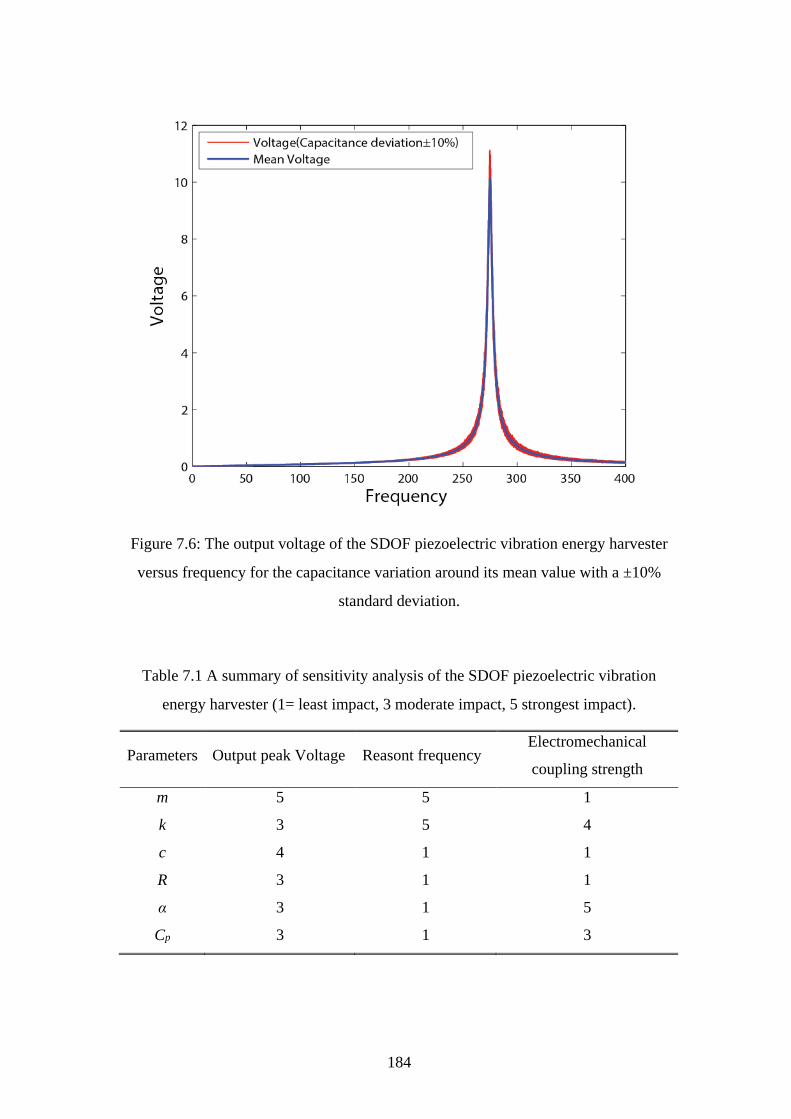
184
Figure 7.6: The output voltage of the SDOF piezoelectric vibration energy harvester
versus frequency for the capacitance variation around its mean value with a ±10%
standard deviation.
Table 7.1 A summary of sensitivity analysis of the SDOF piezoelectric vibration
energy harvester (1= least impact, 3 moderate impact, 5 strongest impact).
Parameters Output peak Voltage Reasont frequency Electromechanical
coupling strength
m 5 5 1
k 3 5 4
c 4 1 1
R 3 1 1
α 3 1 5
Cp 3 1 3
185
7.3 Sensitivity analysis of the performance of a 2 DOF piezoelectric
vibration energy harvester with one piezoelectric insert
In this section, the sensitivity analysis will be carried out for the 2 DOF piezoelectric
vibration energy harvester proposed in Chapter 5 as shown in Figure 5.1, and the
parameters of the systems for simulating the effects of each specific parameter on the
harvesting performance are taken from the case study of a quarter vehicle suspension
model in section 5.3 of Chapter 5, and as shown in Table 5.1.
The output voltage of the 2 DOF piezoelectric vibration energy harvester can be
calculated by using the Equation (5.10). The parameters in Table 5.1 are set as the mean
values. The effects of each parameter variation on the output voltage of the 2 DOF
piezoelectric vibration energy harvester are simulated by Monte Carlo Method using
Matlab software. The discrete sample points represent the output voltage of the 2 DOF
PVEH where a particular parameter varies around its mean value with a ±10% standard
deviation, while the other parameters are constant. All the dscrete sample points are
connected with red solid line and are compared with the blue solid line. The blue solid
line represents the mean output voltage of the 2 DOF piezoelectric vibration energy
harvester where all the parameters are equal to the mean value in Table 5.1. Therefore,
the area surrounded by the red line could be considered as the sensitivity of a particular
parameter on the harvesting performance of the 2 DOF PVEH.
The effects of the variations of the mass m1 and mass m2 on the output voltage of the 2
DOF piezoelectric vibration energy harvester are shown in Figure 7.7 where mass m1
and mass m2 vary around their means values of 40 kg and 260 kg with a ±10% standard
deviation, respectively. It is seen from Figure 7.7 that the parameter of m1 only has a
little impact on the output voltage around the second natural resonant frequency, and has
no effect on the peak output voltage around the first natural resonant frequency at all.
However, the parameter of m2 has a strong effect on peak output voltage of the 2 DOF
piezoelectric vibration energy harvester around the first natural resonant frequency,
while it has not effect on peak output voltage of the 2 DOF piezoelectric vibration energy
harvester around the second natural resonant frequency. Furthermore, the second natural
resonant frequency is not changed while parameter of m2 changes. This has verified the
results of Chapter 5 and Chapter 6 that the auxiliary oscillator mass has a larger influence
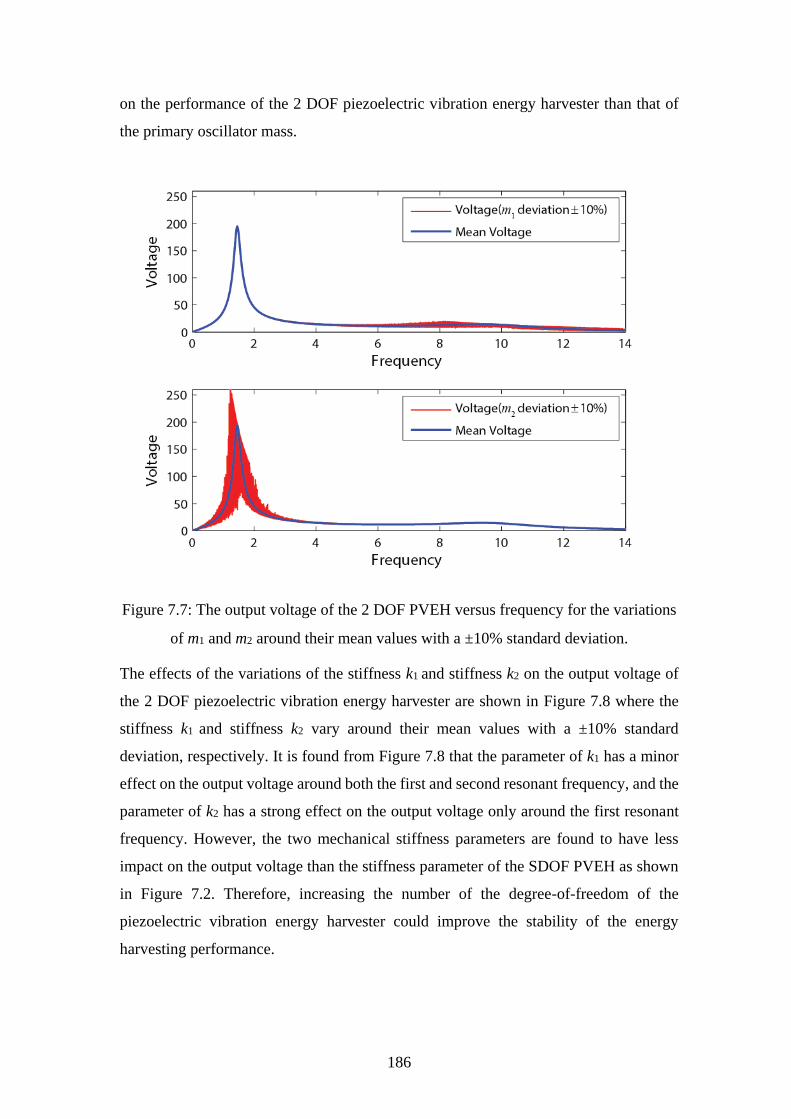
186
on the performance of the 2 DOF piezoelectric vibration energy harvester than that of
the primary oscillator mass.
Figure 7.7: The output voltage of the 2 DOF PVEH versus frequency for the variations
of m1 and m2 around their mean values with a ±10% standard deviation.
The effects of the variations of the stiffness k1 and stiffness k2 on the output voltage of
the 2 DOF piezoelectric vibration energy harvester are shown in Figure 7.8 where the
stiffness k1 and stiffness k2 vary around their mean values with a ±10% standard
deviation, respectively. It is found from Figure 7.8 that the parameter of k1 has a minor
effect on the output voltage around both the first and second resonant frequency, and the
parameter of k2 has a strong effect on the output voltage only around the first resonant
frequency. However, the two mechanical stiffness parameters are found to have less
impact on the output voltage than the stiffness parameter of the SDOF PVEH as shown
in Figure 7.2. Therefore, increasing the number of the degree-of-freedom of the
piezoelectric vibration energy harvester could improve the stability of the energy
harvesting performance.
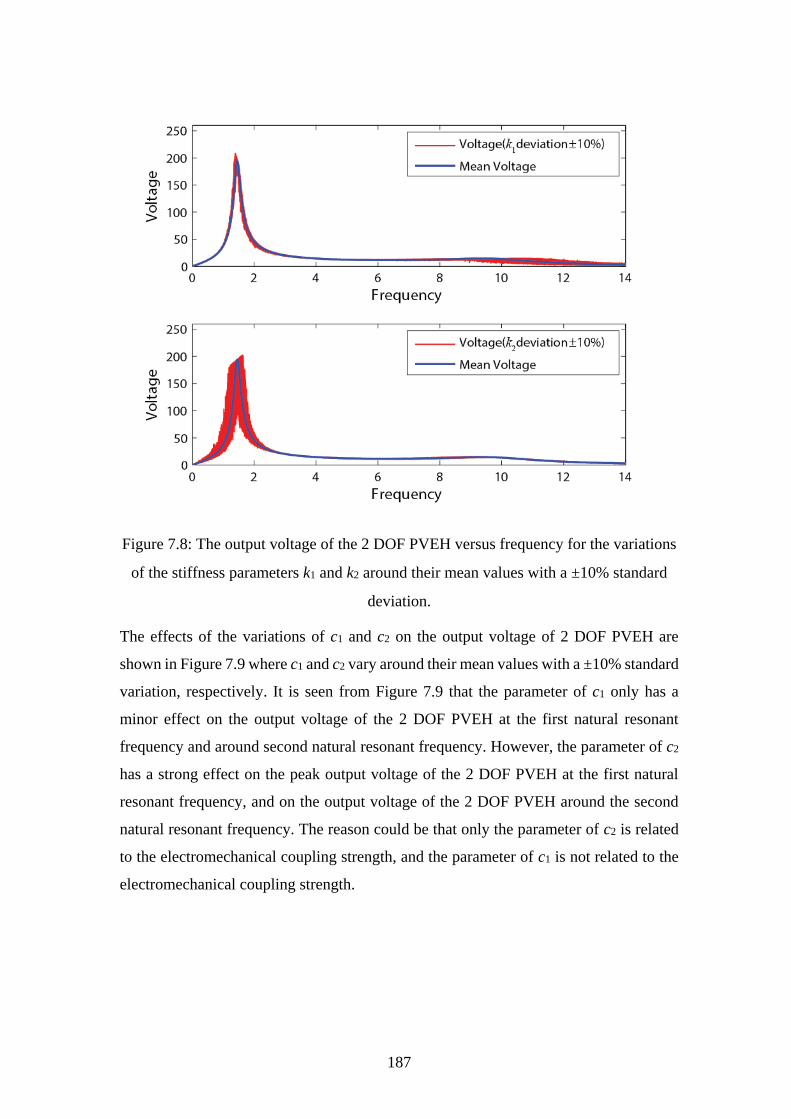
187
Figure 7.8: The output voltage of the 2 DOF PVEH versus frequency for the variations
of the stiffness parameters k1 and k2 around their mean values with a ±10% standard
deviation.
The effects of the variations of c1 and c2 on the output voltage of 2 DOF PVEH are
shown in Figure 7.9 where c1 and c2 vary around their mean values with a ±10% standard
variation, respectively. It is seen from Figure 7.9 that the parameter of c1 only has a
minor effect on the output voltage of the 2 DOF PVEH at the first natural resonant
frequency and around second natural resonant frequency. However, the parameter of c2
has a strong effect on the peak output voltage of the 2 DOF PVEH at the first natural
resonant frequency, and on the output voltage of the 2 DOF PVEH around the second
natural resonant frequency. The reason could be that only the parameter of c2 is related
to the electromechanical coupling strength, and the parameter of c1 is not related to the
electromechanical coupling strength.
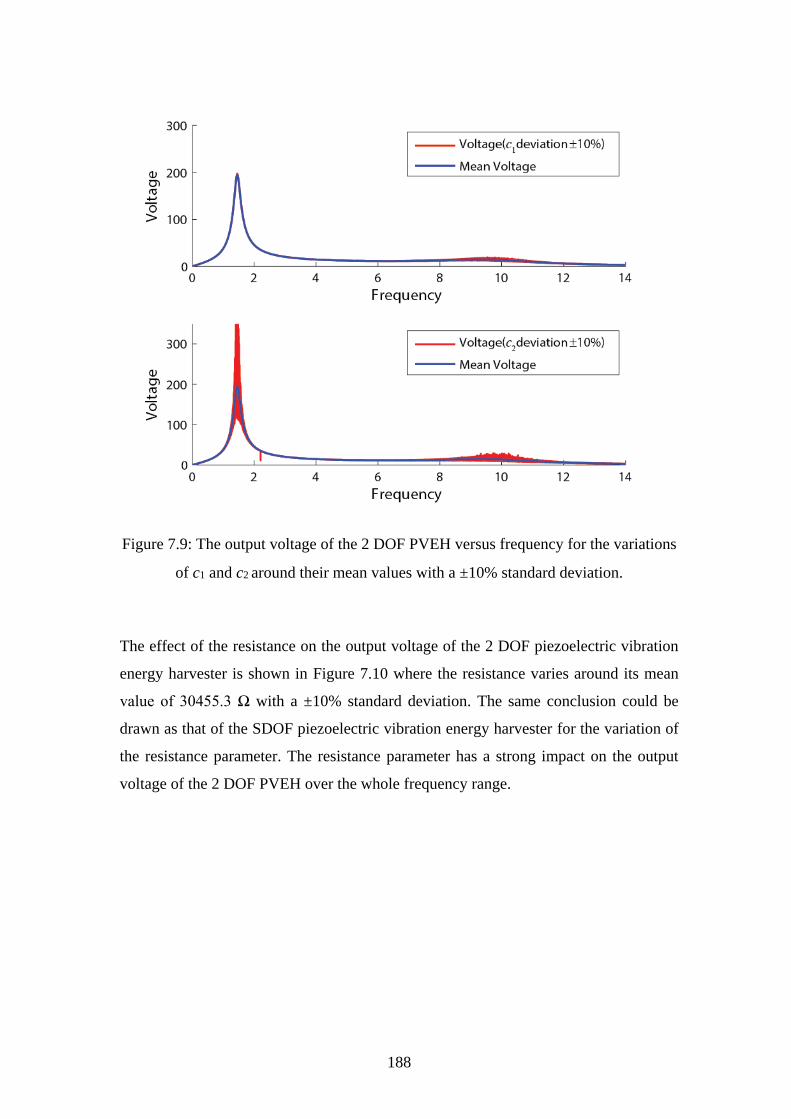
188
Figure 7.9: The output voltage of the 2 DOF PVEH versus frequency for the variations
of c1 and c2 around their mean values with a ±10% standard deviation.
The effect of the resistance on the output voltage of the 2 DOF piezoelectric vibration
energy harvester is shown in Figure 7.10 where the resistance varies around its mean
value of 30455.3 Ω with a ±10% standard deviation. The same conclusion could be
drawn as that of the SDOF piezoelectric vibration energy harvester for the variation of
the resistance parameter. The resistance parameter has a strong impact on the output
voltage of the 2 DOF PVEH over the whole frequency range.
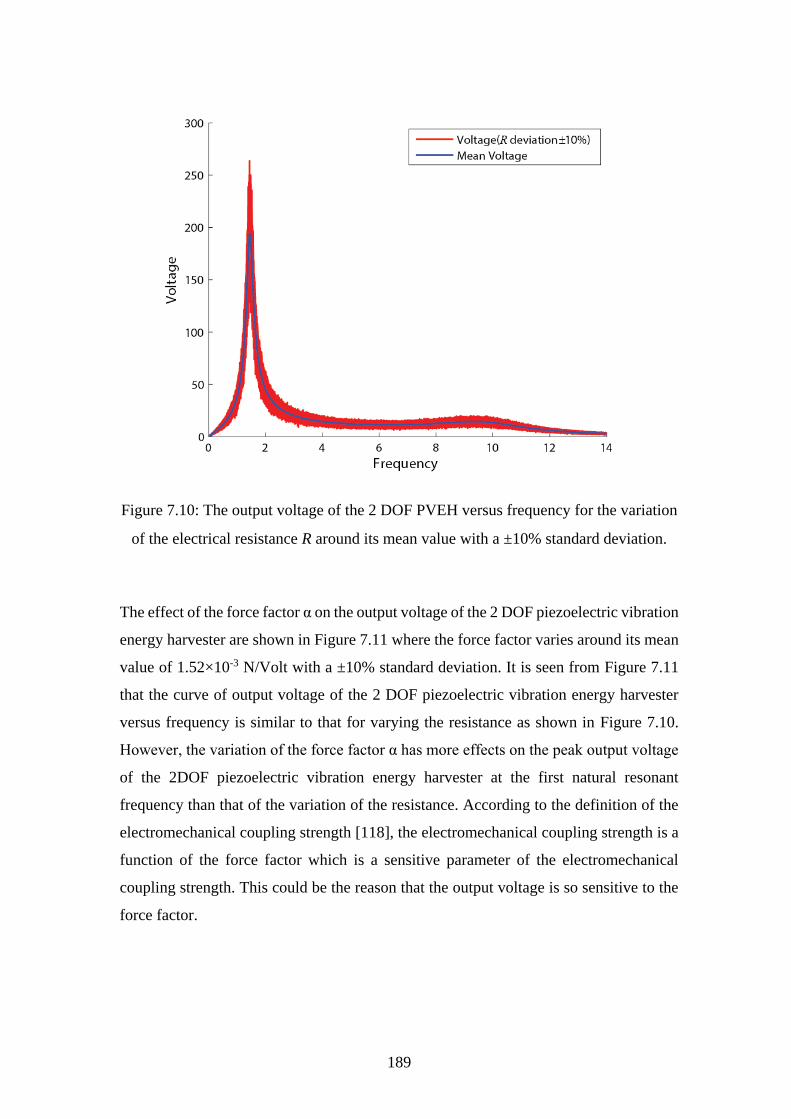
189
Figure 7.10: The output voltage of the 2 DOF PVEH versus frequency for the variation
of the electrical resistance R around its mean value with a ±10% standard deviation.
The effect of the force factor α on the output voltage of the 2 DOF piezoelectric vibration
energy harvester are shown in Figure 7.11 where the force factor varies around its mean
value of 1.52×10⁻³ N/Volt with a ±10% standard deviation. It is seen from Figure 7.11
that the curve of output voltage of the 2 DOF piezoelectric vibration energy harvester
versus frequency is similar to that for varying the resistance as shown in Figure 7.10.
However, the variation of the force factor α has more effects on the peak output voltage
of the 2DOF piezoelectric vibration energy harvester at the first natural resonant
frequency than that of the variation of the resistance. According to the definition of the
electromechanical coupling strength [118], the electromechanical coupling strength is a
function of the force factor which is a sensitive parameter of the electromechanical
coupling strength. This could be the reason that the output voltage is so sensitive to the
force factor.
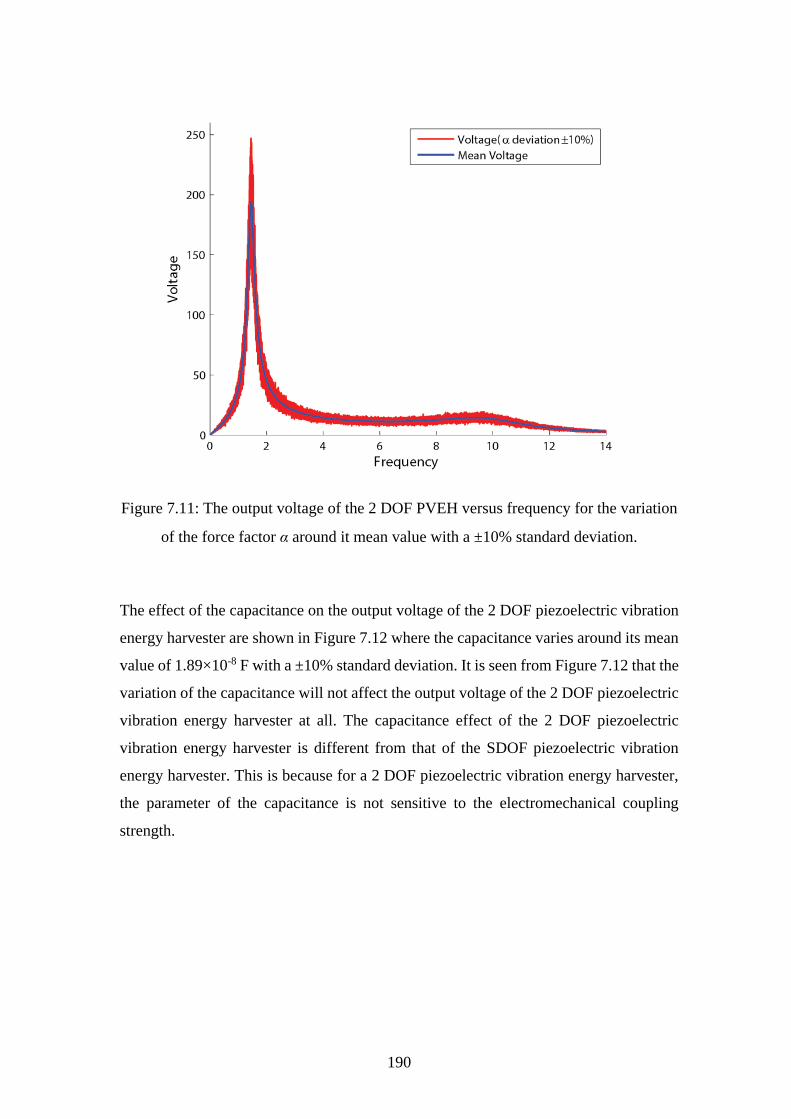
190
Figure 7.11: The output voltage of the 2 DOF PVEH versus frequency for the variation
of the force factor α around it mean value with a ±10% standard deviation.
The effect of the capacitance on the output voltage of the 2 DOF piezoelectric vibration
energy harvester are shown in Figure 7.12 where the capacitance varies around its mean
value of 1.89×10⁻⁸ F with a ±10% standard deviation. It is seen from Figure 7.12 that the
variation of the capacitance will not affect the output voltage of the 2 DOF piezoelectric
vibration energy harvester at all. The capacitance effect of the 2 DOF piezoelectric
vibration energy harvester is different from that of the SDOF piezoelectric vibration
energy harvester. This is because for a 2 DOF piezoelectric vibration energy harvester,
the parameter of the capacitance is not sensitive to the electromechanical coupling
strength.
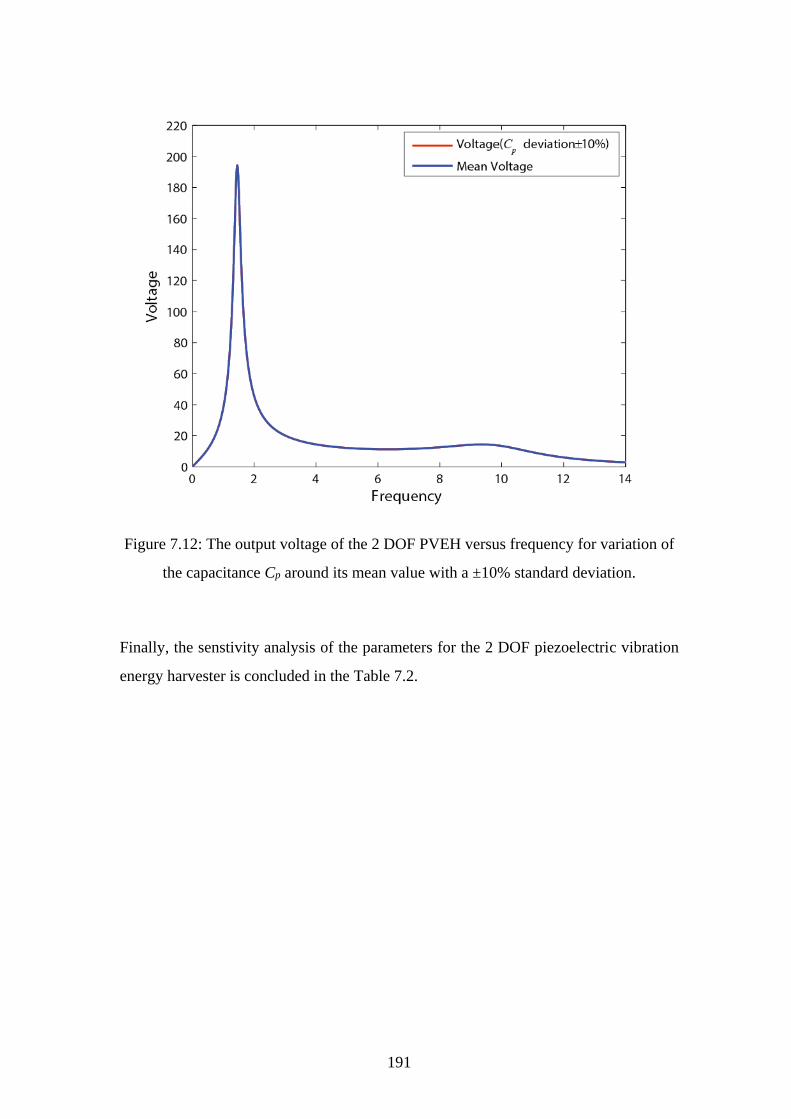
191
Figure 7.12: The output voltage of the 2 DOF PVEH versus frequency for variation of
the capacitance Cp around its mean value with a ±10% standard deviation.
Finally, the senstivity analysis of the parameters for the 2 DOF piezoelectric vibration
energy harvester is concluded in the Table 7.2.

192
Table 7.2 A summary of sensitivity analysis of the 2 DOF piezoelectric vibration
energy harvester (1= least impact, 3 moderate impact, 5 strongest impact).
Parameters Output Peak
Voltage Reasont frequency
Electromechanical
Coupling Strength
m1 1 1 1
m2 4 5 1
k1 2 1 1
k2 3 4 4
c1 1 1 1
c2 5 1 2
R 4 1 1
α 4 1 5
Cp 1 1 1
7.4 Sensitivity analysis of performance of an enhanced 2 DOF
piezoelectric vibration energy harvester with two piezoelectric
inserts.
In this section, the sensitivity analysis of system parameters on the output voltage is
conducted on the proposed enhanced 2 DOF piezoelectric vibration energy harvesting
model where two piezoelectric elements placed in the two adjacent oscillators as shown
in Figure 6.1 of Chapter 6. The parameters of the 2 DOF piezoelectric vibration energy
harvester with two piezoelectric elements can be found in Table 6.1 of Chapter 6.
The output voltage of the enhanced 2 DOF piezoelectric vibration energy harvester with
two piezoelectric elements can be calculated by using the Equation (6.5) and Equation
(6.6). The parameters in Table 6.1 are set to be the mean values. The simulation
procedues are same as that of the two above sensitivity analyses.
The effects of the mass m1 and the mass m2 on the output voltage of the enhanced 2 DOF
piezoelectric vibration energy harvester with two piezoelectric elements are plotted in
Figure 7.13 and Figure 7.14 where m1 and m2 vary around their mean values with a ±10%
standard deviation, respectively. The parameter of m1 has more effects on the output
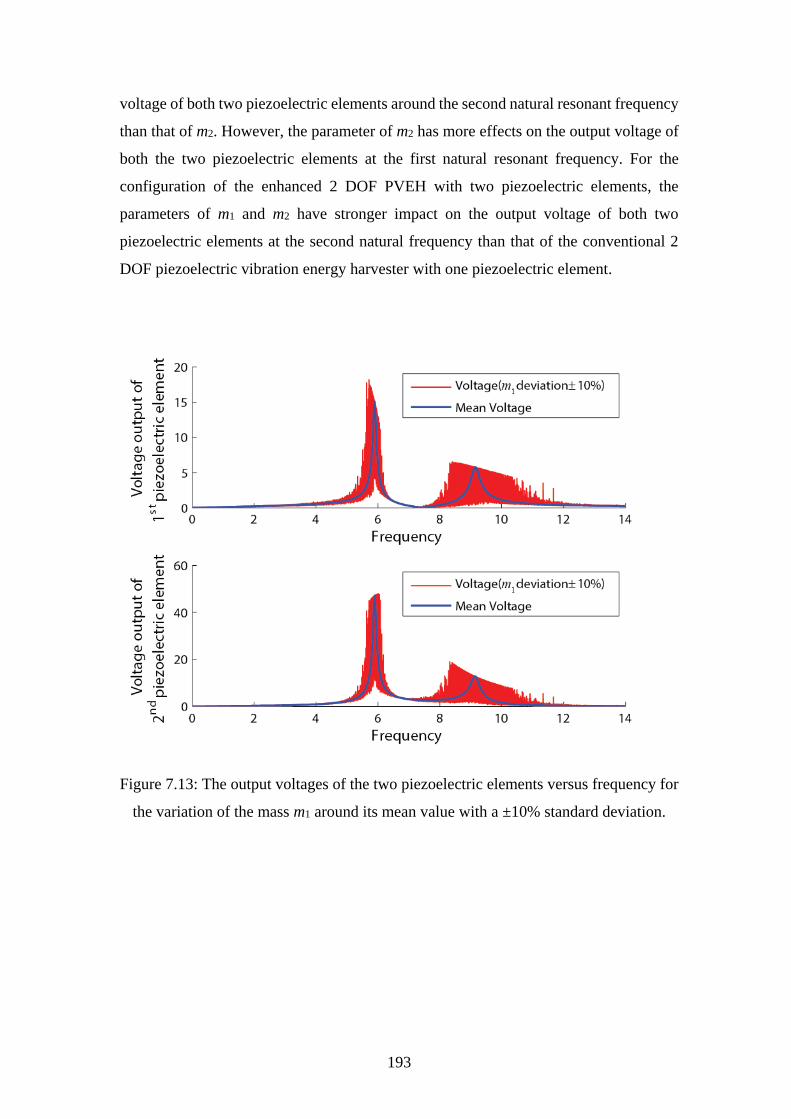
193
voltage of both two piezoelectric elements around the second natural resonant frequency
than that of m2. However, the parameter of m2 has more effects on the output voltage of
both the two piezoelectric elements at the first natural resonant frequency. For the
configuration of the enhanced 2 DOF PVEH with two piezoelectric elements, the
parameters of m1 and m2 have stronger impact on the output voltage of both two
piezoelectric elements at the second natural frequency than that of the conventional 2
DOF piezoelectric vibration energy harvester with one piezoelectric element.
Figure 7.13: The output voltages of the two piezoelectric elements versus frequency for
the variation of the mass m1 around its mean value with a ±10% standard deviation.
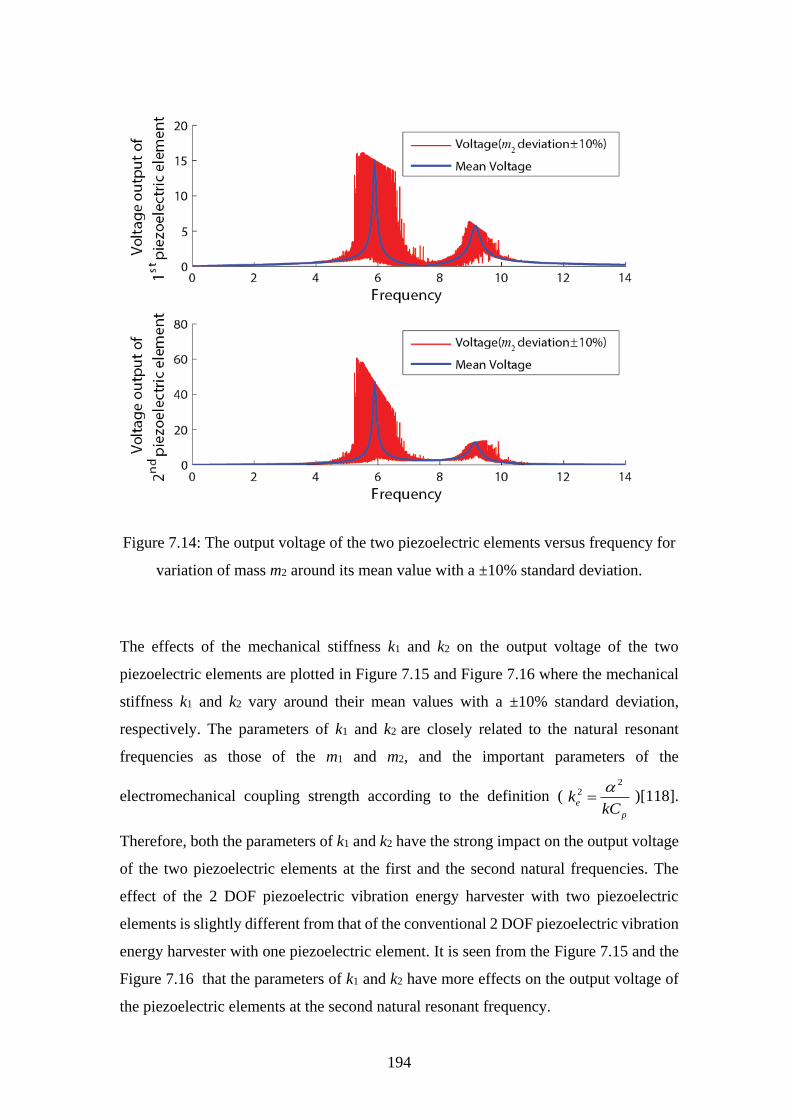
194
Figure 7.14: The output voltage of the two piezoelectric elements versus frequency for
variation of mass m2 around its mean value with a ±10% standard deviation.
The effects of the mechanical stiffness k1 and k2 on the output voltage of the two
piezoelectric elements are plotted in Figure 7.15 and Figure 7.16 where the mechanical
stiffness k1 and k2 vary around their mean values with a ±10% standard deviation,
respectively. The parameters of k1 and k2 are closely related to the natural resonant
frequencies as those of the m1 and m2, and the important parameters of the
electromechanical coupling strength according to the definition (2
2
e
p
kkC
)[118].
Therefore, both the parameters of k1 and k2 have the strong impact on the output voltage
of the two piezoelectric elements at the first and the second natural frequencies. The
effect of the 2 DOF piezoelectric vibration energy harvester with two piezoelectric
elements is slightly different from that of the conventional 2 DOF piezoelectric vibration
energy harvester with one piezoelectric element. It is seen from the Figure 7.15 and the
Figure 7.16 that the parameters of k1 and k2 have more effects on the output voltage of
the piezoelectric elements at the second natural resonant frequency.
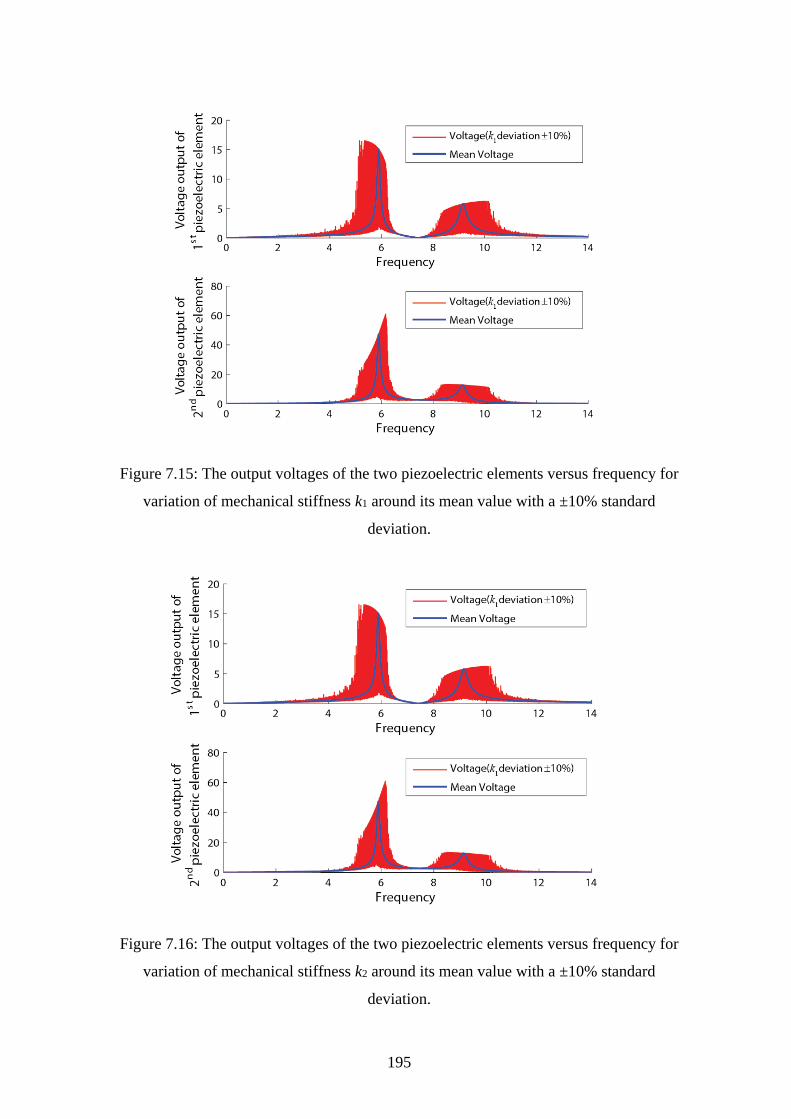
195
Figure 7.15: The output voltages of the two piezoelectric elements versus frequency for
variation of mechanical stiffness k1 around its mean value with a ±10% standard
deviation.
Figure 7.16: The output voltages of the two piezoelectric elements versus frequency for
variation of mechanical stiffness k2 around its mean value with a ±10% standard
deviation.
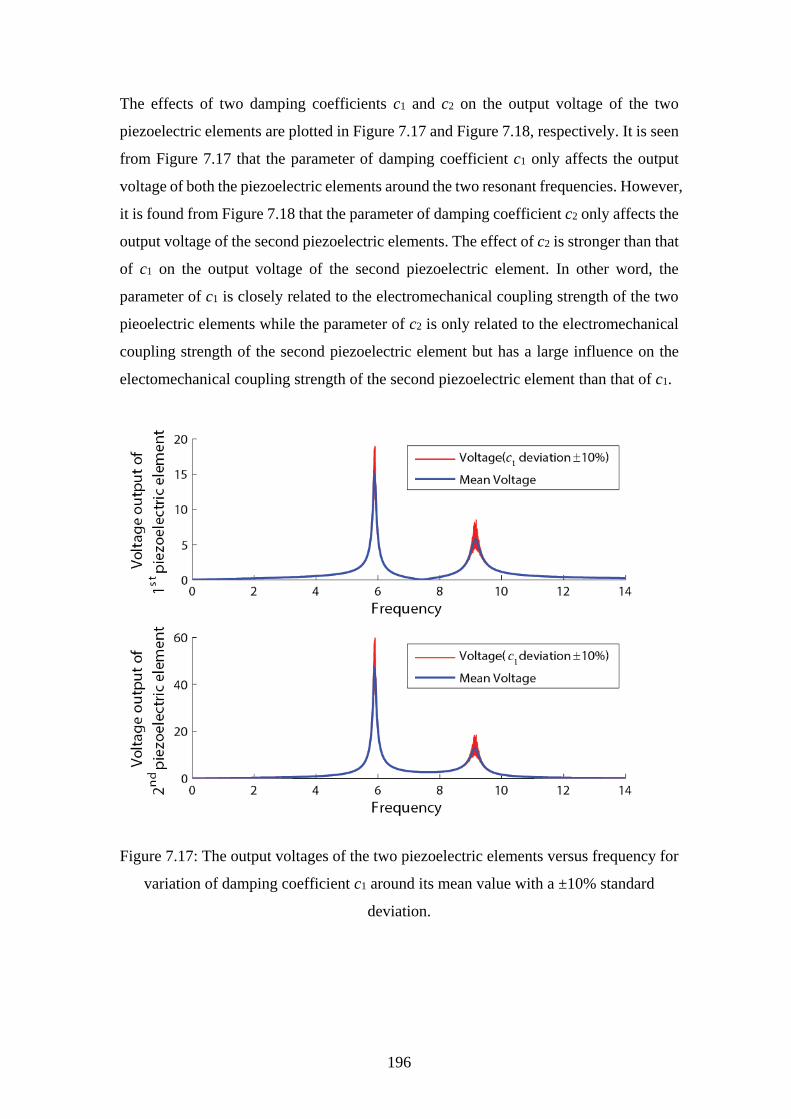
196
The effects of two damping coefficients c1 and c2 on the output voltage of the two
piezoelectric elements are plotted in Figure 7.17 and Figure 7.18, respectively. It is seen
from Figure 7.17 that the parameter of damping coefficient c1 only affects the output
voltage of both the piezoelectric elements around the two resonant frequencies. However,
it is found from Figure 7.18 that the parameter of damping coefficient c2 only affects the
output voltage of the second piezoelectric elements. The effect of c2 is stronger than that
of c1 on the output voltage of the second piezoelectric element. In other word, the
parameter of c1 is closely related to the electromechanical coupling strength of the two
pieoelectric elements while the parameter of c2 is only related to the electromechanical
coupling strength of the second piezoelectric element but has a large influence on the
electomechanical coupling strength of the second piezoelectric element than that of c1.
Figure 7.17: The output voltages of the two piezoelectric elements versus frequency for
variation of damping coefficient c1 around its mean value with a ±10% standard
deviation.
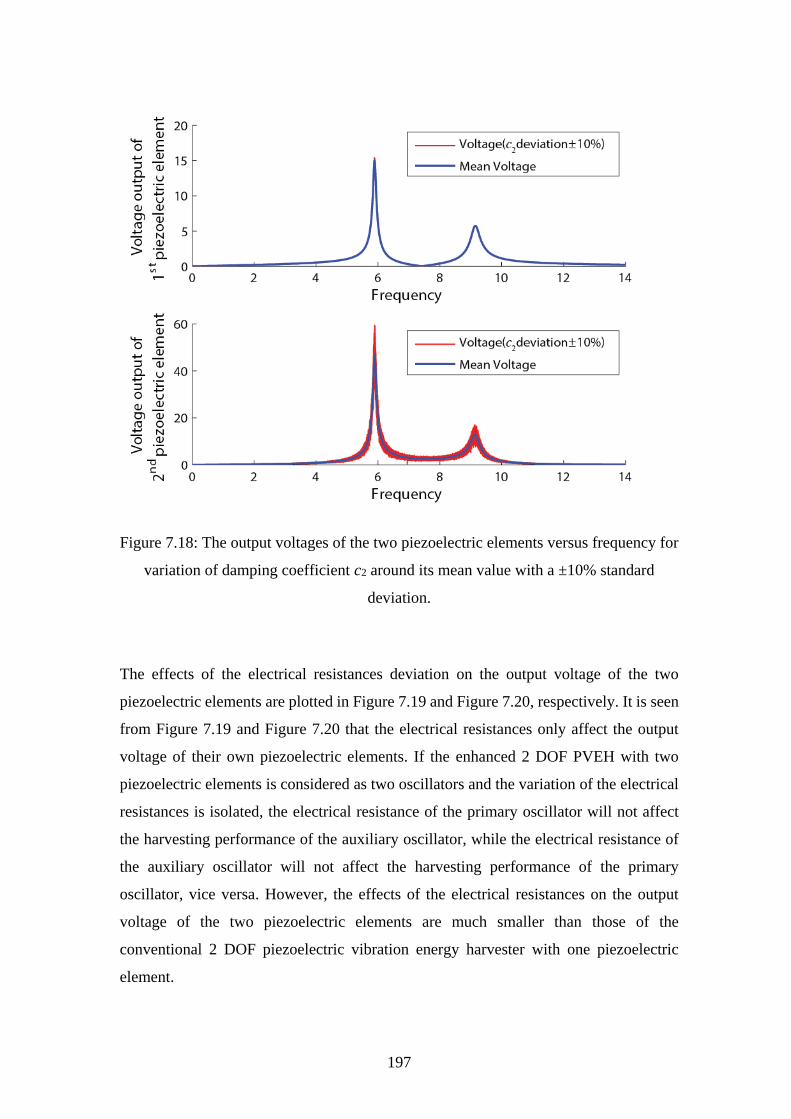
197
Figure 7.18: The output voltages of the two piezoelectric elements versus frequency for
variation of damping coefficient c2 around its mean value with a ±10% standard
deviation.
The effects of the electrical resistances deviation on the output voltage of the two
piezoelectric elements are plotted in Figure 7.19 and Figure 7.20, respectively. It is seen
from Figure 7.19 and Figure 7.20 that the electrical resistances only affect the output
voltage of their own piezoelectric elements. If the enhanced 2 DOF PVEH with two
piezoelectric elements is considered as two oscillators and the variation of the electrical
resistances is isolated, the electrical resistance of the primary oscillator will not affect
the harvesting performance of the auxiliary oscillator, while the electrical resistance of
the auxiliary oscillator will not affect the harvesting performance of the primary
oscillator, vice versa. However, the effects of the electrical resistances on the output
voltage of the two piezoelectric elements are much smaller than those of the
conventional 2 DOF piezoelectric vibration energy harvester with one piezoelectric
element.
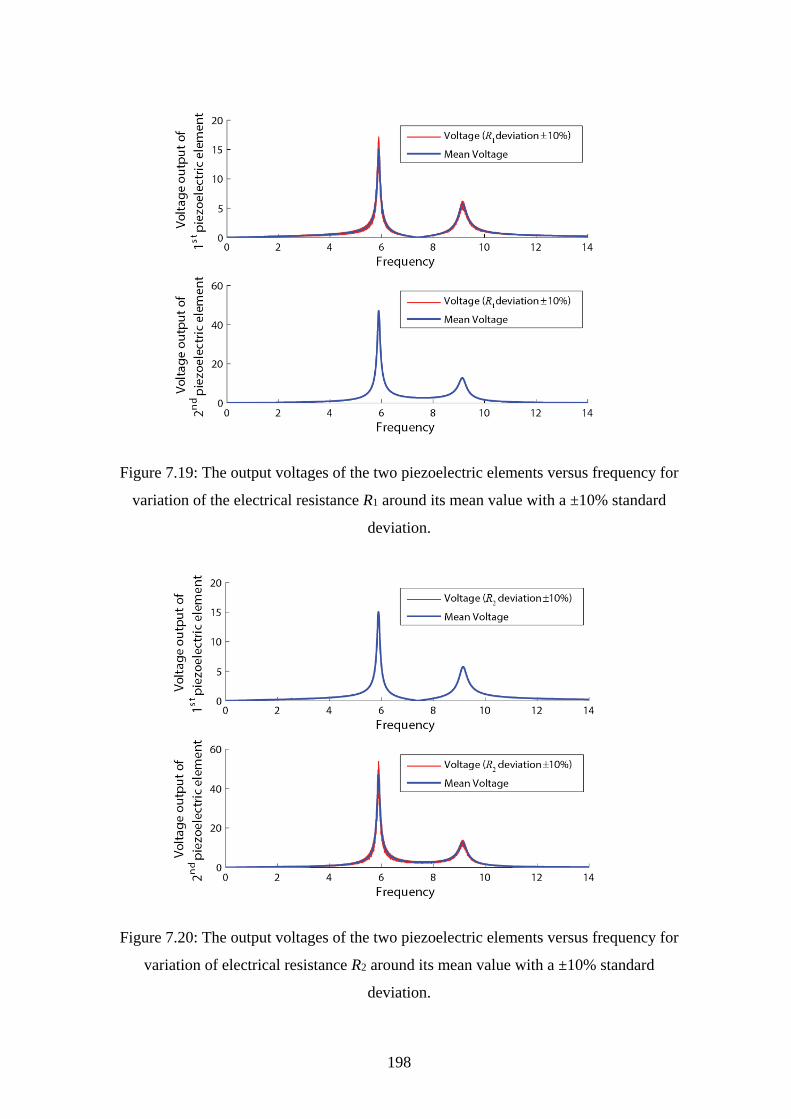
198
Figure 7.19: The output voltages of the two piezoelectric elements versus frequency for
variation of the electrical resistance R1 around its mean value with a ±10% standard
deviation.
Figure 7.20: The output voltages of the two piezoelectric elements versus frequency for
variation of electrical resistance R2 around its mean value with a ±10% standard
deviation.
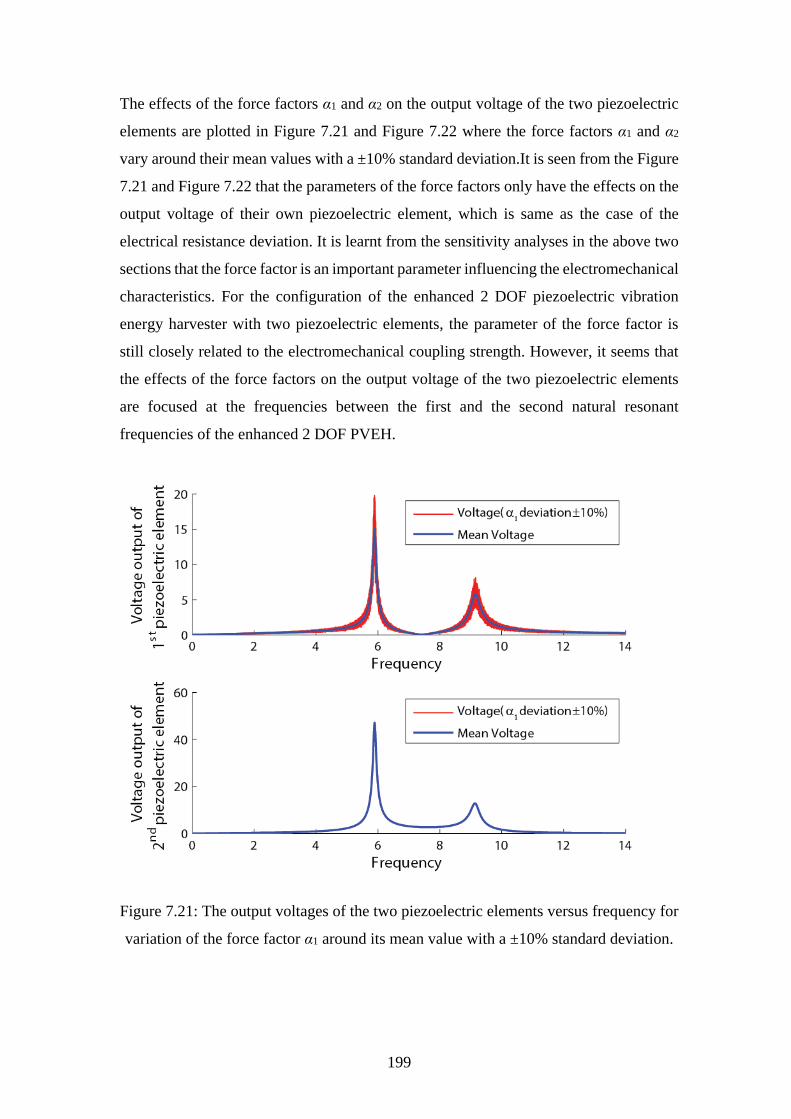
199
The effects of the force factors α1 and α2 on the output voltage of the two piezoelectric
elements are plotted in Figure 7.21 and Figure 7.22 where the force factors α1 and α2
vary around their mean values with a ±10% standard deviation.It is seen from the Figure
7.21 and Figure 7.22 that the parameters of the force factors only have the effects on the
output voltage of their own piezoelectric element, which is same as the case of the
electrical resistance deviation. It is learnt from the sensitivity analyses in the above two
sections that the force factor is an important parameter influencing the electromechanical
characteristics. For the configuration of the enhanced 2 DOF piezoelectric vibration
energy harvester with two piezoelectric elements, the parameter of the force factor is
still closely related to the electromechanical coupling strength. However, it seems that
the effects of the force factors on the output voltage of the two piezoelectric elements
are focused at the frequencies between the first and the second natural resonant
frequencies of the enhanced 2 DOF PVEH.
Figure 7.21: The output voltages of the two piezoelectric elements versus frequency for
variation of the force factor α1 around its mean value with a ±10% standard deviation.
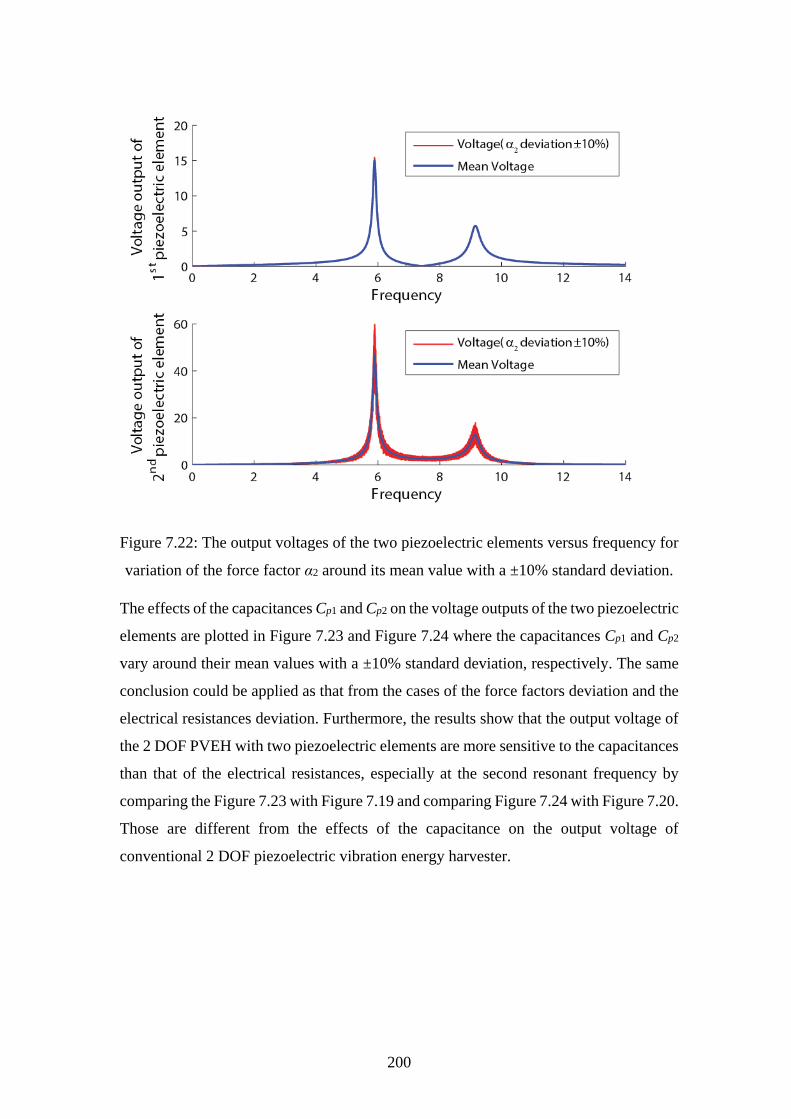
200
Figure 7.22: The output voltages of the two piezoelectric elements versus frequency for
variation of the force factor α2 around its mean value with a ±10% standard deviation.
The effects of the capacitances Cp1 and Cp2 on the voltage outputs of the two piezoelectric
elements are plotted in Figure 7.23 and Figure 7.24 where the capacitances Cp1 and Cp2
vary around their mean values with a ±10% standard deviation, respectively. The same
conclusion could be applied as that from the cases of the force factors deviation and the
electrical resistances deviation. Furthermore, the results show that the output voltage of
the 2 DOF PVEH with two piezoelectric elements are more sensitive to the capacitances
than that of the electrical resistances, especially at the second resonant frequency by
comparing the Figure 7.23 with Figure 7.19 and comparing Figure 7.24 with Figure 7.20.
Those are different from the effects of the capacitance on the output voltage of
conventional 2 DOF piezoelectric vibration energy harvester.
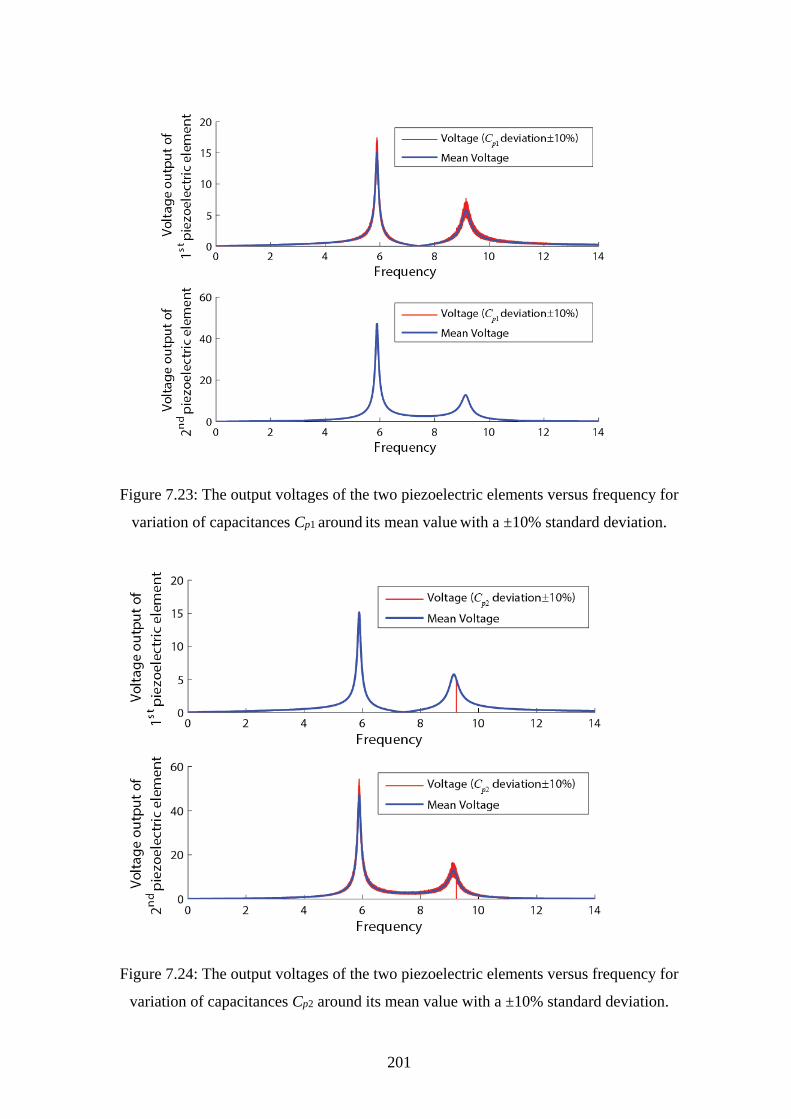
201
Figure 7.23: The output voltages of the two piezoelectric elements versus frequency for
variation of capacitances Cp1 around its mean value with a ±10% standard deviation.
Figure 7.24: The output voltages of the two piezoelectric elements versus frequency for
variation of capacitances Cp2 around its mean value with a ±10% standard deviation.
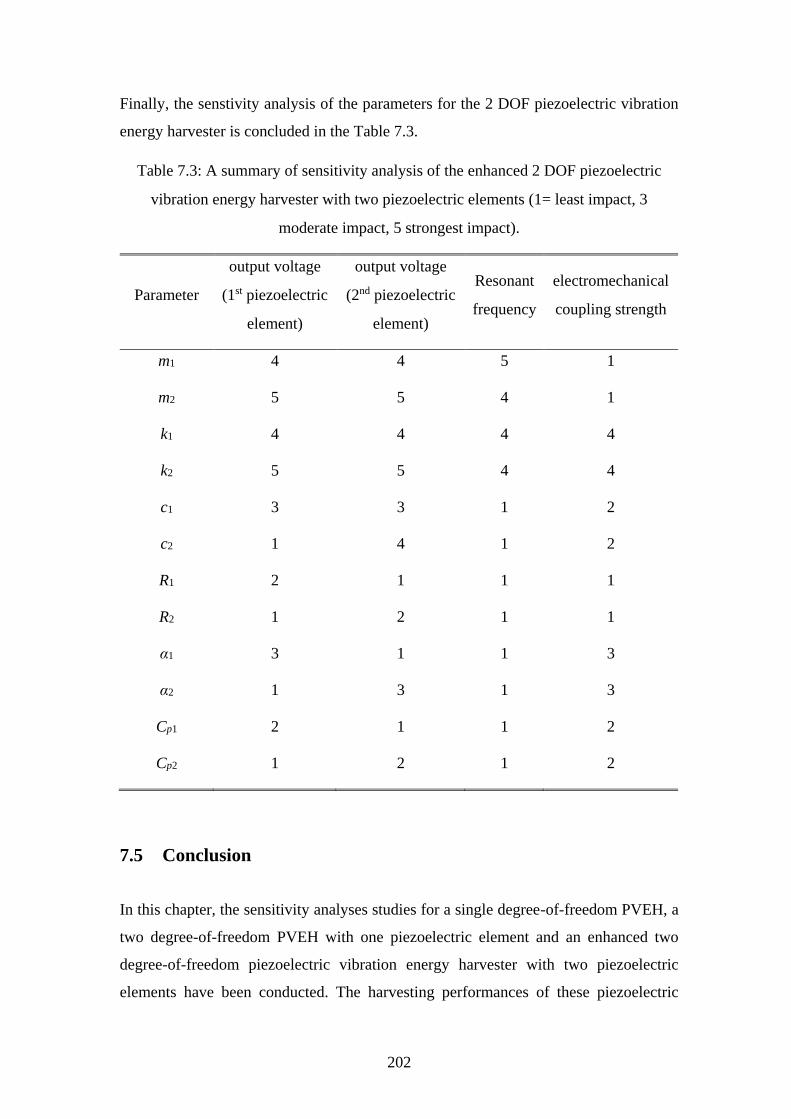
202
Finally, the senstivity analysis of the parameters for the 2 DOF piezoelectric vibration
energy harvester is concluded in the Table 7.3.
Table 7.3: A summary of sensitivity analysis of the enhanced 2 DOF piezoelectric
vibration energy harvester with two piezoelectric elements (1= least impact, 3
moderate impact, 5 strongest impact).
Parameter
output voltage
(1st piezoelectric
element)
output voltage
(2nd piezoelectric
element)
Resonant
frequency
electromechanical
coupling strength
m1 4 4 5 1
m2 5 5 4 1
k1 4 4 4 4
k2 5 5 4 4
c1 3 3 1 2
c2 1 4 1 2
R1 2 1 1 1
R2 1 2 1 1
α1 3 1 1 3
α2 1 3 1 3
Cp1 2 1 1 2
Cp2 1 2 1 2
7.5 Conclusion
In this chapter, the sensitivity analyses studies for a single degree-of-freedom PVEH, a
two degree-of-freedom PVEH with one piezoelectric element and an enhanced two
degree-of-freedom piezoelectric vibration energy harvester with two piezoelectric
elements have been conducted. The harvesting performances of these piezoelectric
203
vibration energy harvesters are investigated under the parameter variations using the
Monte Carlo Simulation. It is important to analyse the piezoelectric vibration energy
harvester when the parameters are varied as the parameter variation or uncertainty could
not be avoided in practice. For example, the parameter deviation or uncertainty could be
caused by variations of the manufacturing processes, the operating environment
conditions, or by material aging after a long-term usage and so on.
For a single degree-of-freedom piezoelectric vibration energy harvester, the parameters
of mass, stiffness and the force factor have more influence on the harvesting performance
than the other parameters. However, for a two degree-of-freedom piezoelectric vibration
energy harvester, only the auxiliary oscillator mass has the impact on the harvesting
performance. It is found from the Figure 7.6 and Figure 7.12 that the capacitance has no
impact on the output voltage of the 2 DOF piezoelectric vibration energy harvester with
one piezoelectric element, which is different from that of the SDOF piezoelectric
vibration energy harvester. For the 2 DOF piezoelectric vibration energy harvester with
two piezoelectric elements, the parameter of capacitance has a minor impact on the
output voltage of the piezoelectric vibration energy harvester which is similar to that of
the SDOF piezoelectric vibration energy harvester. However, the resistance has less
influence on the output voltage than that of the SDOF or 2 DOF piezoelectric vibration
energy harvester with one piezoelectric element.
The main contribution of this chapter is to propose an analysis method to evaluate the
harvesting performance of the piezoelectric vibration energy harvester when the
parameters are uncertain. It is also found that the performance of a two degree-of-
freedom piezoelectric vibration energy harvester is more stable than that of a single
degree-of-freedom piezoelectric vibration energy harvester.
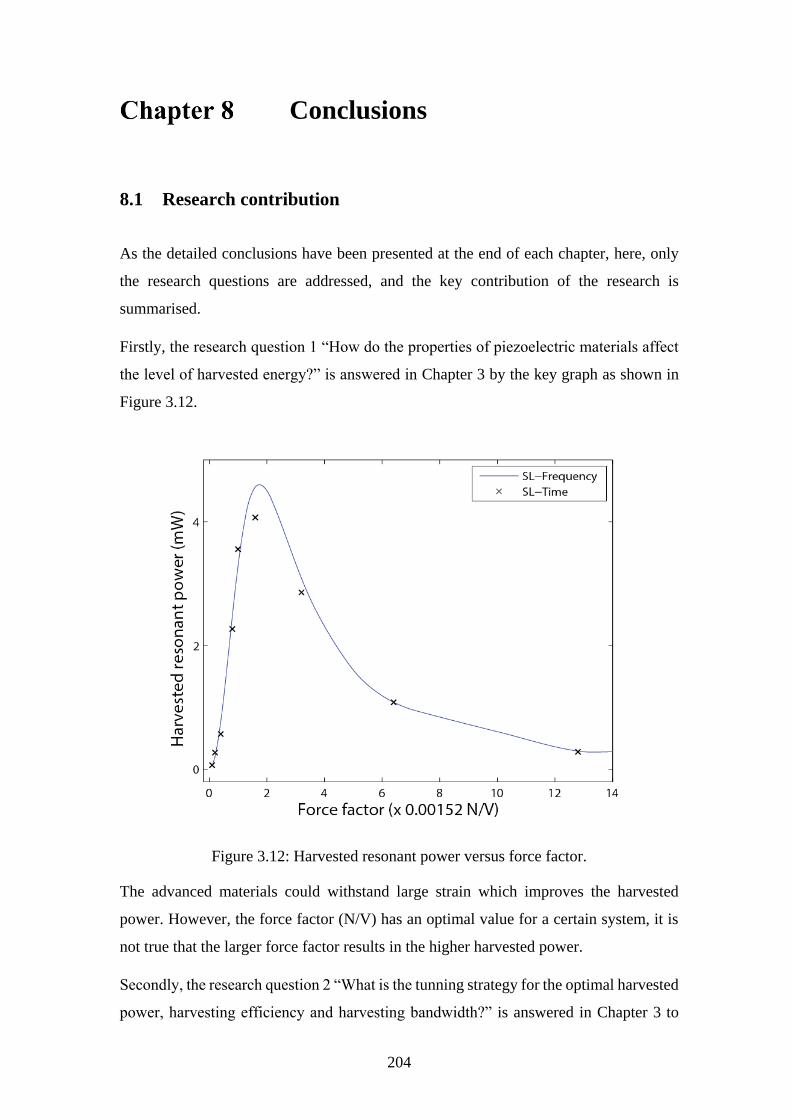
204
Conclusions
8.1 Research contribution
As the detailed conclusions have been presented at the end of each chapter, here, only
the research questions are addressed, and the key contribution of the research is
summarised.
Firstly, the research question 1 “How do the properties of piezoelectric materials affect
the level of harvested energy?” is answered in Chapter 3 by the key graph as shown in
Figure 3.12.
Figure 3.12: Harvested resonant power versus force factor.
The advanced materials could withstand large strain which improves the harvested
power. However, the force factor (N/V) has an optimal value for a certain system, it is
not true that the larger force factor results in the higher harvested power.
Secondly, the research question 2 “What is the tunning strategy for the optimal harvested
power, harvesting efficiency and harvesting bandwidth?” is answered in Chapter 3 to
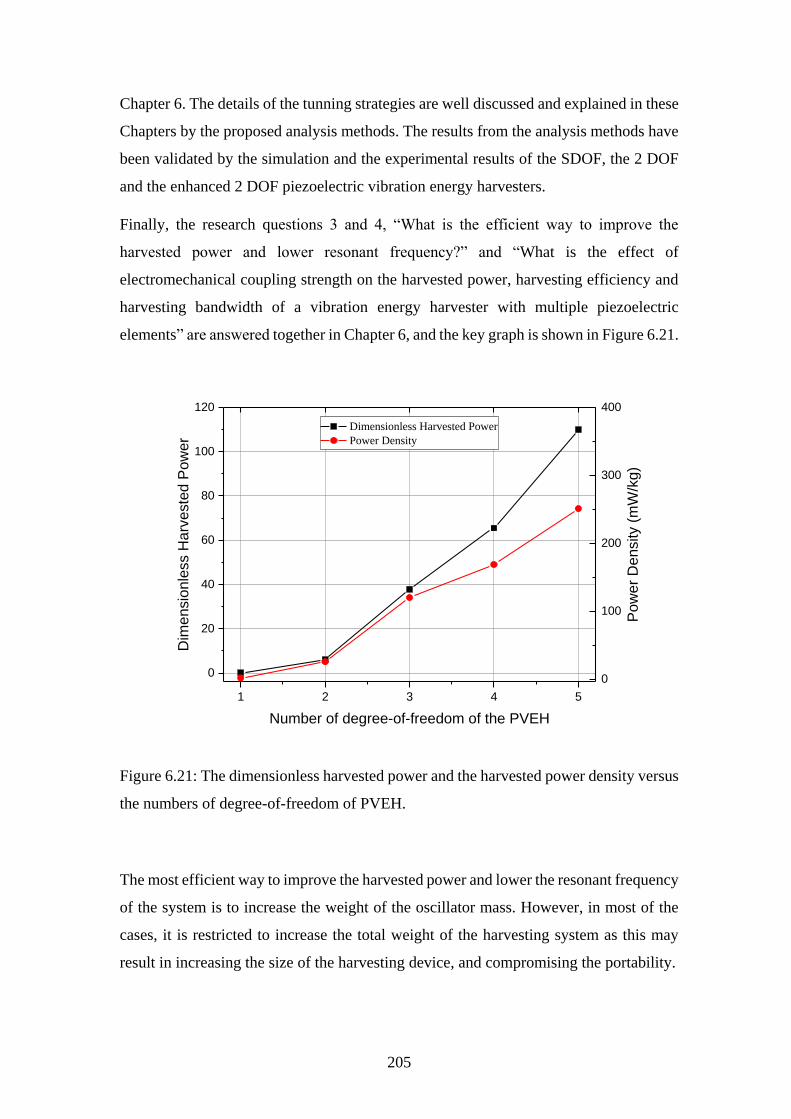
205
Chapter 6. The details of the tunning strategies are well discussed and explained in these
Chapters by the proposed analysis methods. The results from the analysis methods have
been validated by the simulation and the experimental results of the SDOF, the 2 DOF
and the enhanced 2 DOF piezoelectric vibration energy harvesters.
Finally, the research questions 3 and 4, “What is the efficient way to improve the
harvested power and lower resonant frequency?” and “What is the effect of
electromechanical coupling strength on the harvested power, harvesting efficiency and
harvesting bandwidth of a vibration energy harvester with multiple piezoelectric
elements” are answered together in Chapter 6, and the key graph is shown in Figure 6.21.
1 2 3 4 5
0
20
40
60
80
100
120
Dimensionless Harvested Power
Power Density
Dim
ensio
nle
ss H
arv
este
d P
ow
er
Number of degree-of-freedom of the PVEH
0
100
200
300
400
Po
we
r D
en
sity (
mW
/kg)
Figure 6.21: The dimensionless harvested power and the harvested power density versus
the numbers of degree-of-freedom of PVEH.
The most efficient way to improve the harvested power and lower the resonant frequency
of the system is to increase the weight of the oscillator mass. However, in most of the
cases, it is restricted to increase the total weight of the harvesting system as this may
result in increasing the size of the harvesting device, and compromising the portability.
206
According to the generalisation of MDOF equations, the first resonant frequency could
be decreased when the numbers of the degree-of-freedom are increased. For a 2 DOF or
MDOF piezoelectric energy harvester, the harvested power could be significantly
increased by introducing the additional piezoelectric elements inserted between the two
adjacent oscillators. The details discussion of the effects of electromechanical coupling
strength on the harvested power, harvesting efficiency and harvesting bandwidth can be
found in Chapter 6.
Therefore, the key contributions to the new knowledge of this research is summarised as
the following:
An enhanced piezoelectric vibration energy harvesting model has been proposed and
studied. It is able to scavenge 9.78 times more energy than a conventional model, and to
lower the first resonant frequency of the piezoelectric vibration energy harvester without
a major modification. The harvested energy could be improved further by the parameters
optimisation strategy proposed in this research.
The effect of the electromechanical coupling strength on the harvested power, harvesting
efficiency and the harvesting bandwidth has been disclosed in Figure 6.2, Figure 6.3,
Figure 6.8 and Figure 6.9.
8.2 Future work
As the current experimental researches are focused on the small or micro scale
piezoelectric vibration energy harvester, the experiments on large scale of piezoelectric
vibration energy harvesters have been rarely carried out. However, it may not be able
to generate the sufficient and useful amount of power by employing only one energy
harvesting technology. As all sorts of energy harvesting techniques have been
extensively studied in last two years, but the new question “How to integrate two or more
energy harvesting technologies together to boost the power generation” needs to be
addressed in the future.
For my personal research interests, I will focus on integrating piezoelectric and
electromagnetic vibration energy harvesting technologies into vehicle suspension
system if I would have the opportunity in the near future.
207
Reference
1. Roundy, S., P.K. Wright, and J. Rabaey, A study of low level vibrations as a
power source for wireless sensor nodes. Computer Communications, 2003.
2. Xiao, H. and X. Wang, A Review of Piezoelectric Vibration Energy Harvesting
Techniques. International Review of Mechanical Engineering, 2014. 8(3): p.
139-150.
3. Radousky, H.B. and H. Liang, Energy harvesting: an integrated view of
materials, devices and applications. Nanotechnology, 2012. 23(50): p. 502001.
4. Zhang, Y., S.C. Cai, and L. Deng, Piezoelectric-based energy harvesting in
bridge systems. Journal of Intelligent Material Systems and Structures, 2013.
5. Taylor, S.G., et al., Diagnostics for piezoelectric transducers under cyclic loads
deployed for structural health monitoring applications. Smart Materials and
Structures, 2013. 22(2): p. 025024.
6. Arsenault, T.J., et al., Development of a FBG based distributed strain sensor
system for wind turbine structural health monitoring. Smart Materials and
Structures, 2013. 22(7): p. 075027.
7. Wischke, M., et al., Vibration harvesting in traffic tunnels to power wireless
sensor nodes. Smart Materials and Structures, 2011. 20(8): p. 085014.
8. Park, G., et al., Energy harvesting for structural health monitoring sensor
networks. Journal of Infrastructure Systems, 2008. 14(1): p. 64-79.
9. Sarangi, S.K. and B. Basa, Active vibration control of smart composite shells.
International Review of Mechanical Engineering, 2013. 7(7): p. 1392-1401.
10. Gudarzi, M., A. Oveisi, and M.M. Mohammadi, Robust active vibration control
of a rectangular piezoelectric laminate flexible thin plate: An LMI-based
approach. International Review of Mechanical Engineering, 2012. 6(6): p. 1217-
1227.
11. Cook-Chennault, K.A., N. Thambi, and A.M. Sastry, Powering MEMS portable
devices—a review of non-regenerative and regenerative power supply systems
with special emphasis on piezoelectric energy harvesting systems. Smart
Materials and Structures, 2008. 17(4): p. 043001.
12. Williams, C.B. and R.B. Yates, Analysis of a micro-electric generator for
microsystems. Sensors and Actuators A: Physical, 1996. 52(1-3): p. 8-11.
13. Elvin, N.G. and A.A. Elvin, An experimentally validated electromagnetic energy
harvester. Journal of Sound and Vibration, 2011. 330(10): p. 2314-2324.
14. Harne, R.L., Modeling and analysis of distributed electromagnetic oscillators for
broadband vibration attenuation and concurrent energy harvesting. Applied
Mathematical Modelling, 2013. 37(6): p. 4360-4370.
15. Foisal, A.R.M., C. Hong, and G.-S. Chung, Multi-frequency electromagnetic
energy harvester using a magnetic spring cantilever. Sensors and Actuators A:
Physical, 2012. 182: p. 106-113.
16. Wischke, M., et al., Electromagnetic vibration harvester with piezoelectrically
tunable resonance frequency. Journal of Micromechanics and Microengineering,
2010. 20(3): p. 035025.
17. Sari, I., T. Balkan, and H. Kulah, An electromagnetic micro power generator for
wideband environmental vibrations. Sensors and Actuators A: Physical, 2008.
145-146: p. 405-413.
208
18. Beeby, S.P., et al., A micro electromagnetic generator for vibration energy
harvesting. Journal of Micromechanics and Microengineering, 2007. 17(7): p.
1257-1265.
19. Bisegna, P., G. Caruso, and G. Vairo, Coupled optimization of tuned-mass
energy harvesters accounting for host structure dynamics. Journal of Intelligent
Material Systems and Structures, 2013.
20. Le, C.P., et al., Microscale electrostatic energy harvester using internal impacts.
Journal of Intelligent Material Systems and Structures, 2012. 23(13): p. 1409-
1421.
21. Kiziroglou, M.E., C. He, and E.M. Yeatman, Rolling Rod Electrostatic
Microgenerator. IEEE TRANSACTIONS ON INDUSTRIAL ELECTRONICS,
2009. 56(4): p. 1101-1008.
22. Ahmad, M.R., et al., Fabrication and characterization of the electrets material
for electrostatic energy harvester. Journal of Physics: Conference Series, 2013.
476: p. 012120.
23. Adly, A., et al., Experimental tests of a magnetostrictive energy harvesting
device toward its modeling. Journal of Applied Physics, 2010. 107(9): p. 09A935.
24. Wang, L. and F.G. Yuan, Vibration energy harvesting by magnetostrictive
material. Smart Materials and Structures, 2008. 17(4): p. 045009.
25. Berbyuk, V. and J. Sodhani, Towards modelling and design of magnetostrictive
electric generators. Computers & Structures, 2008. 86(3-5): p. 307-313.
26. Anton, S.R. and H.A. Sodano, A review of power harvesting using piezoelectric
materials (2003–2006). Smart Materials and Structures, 2007. 16(3): p. R1-R21.
27. Sodano, H.A., D.J. Inman, and G. Park, A Review of Power Harvesting from
Vibration Using Piezoelectric Materials. The Shock and Vibration Digest, 2004.
36(3): p. 197-205.
28. Lin, S.-C. and W.-J. Wu, Piezoelectric micro energy harvesters based on
stainless-steel substrates. Smart Materials and Structures, 2013. 22(4): p. 045016.
29. Wang, X. and L. Lin, Dimensionless optimization of piezoelectric vibration
energy harvesters with different interface circuits. Smart Materials and
Structures, 2013. 22(8): p. 085011.
30. Saadon, S. and O. Sidek, A review of vibration-based MEMS piezoelectric energy
harvesters. Energy Conversion and Management, 2011. 52(1): p. 500-504.
31. Liang, J.R. and W.H. Liao, Impedance Modeling and Analysis for Piezoelectric
Energy Harvesting Systems. Mechatronics, IEEE/ASME Transactions on, 2012.
17(6): p. 1145-1157.
32. Wang, H. and L. Zou, Interfacial effect on the electromechanical behaviors of
piezoelectric/elastic composite smart beams. Journal of Intelligent Material
Systems and Structures, 2012. 24(4): p. 421-430.
33. Wang, Q. and N. Wu, Optimal design of a piezoelectric coupled beam for power
harvesting. Smart Materials and Structures, 2012. 21(8): p. 085013.
34. Stewart, M., P.M. Weaver, and M. Cain, Charge redistribution in piezoelectric
energy harvesters. Applied Physics Letters, 2012. 100(7): p. 073901.
35. Abdelkefi, A., et al., Modeling, validation, and performance of low-frequency
piezoelectric energy harvesters. Journal of Intelligent Material Systems and
Structures, 2013.
36. Dietl, J.M. and E. Garcia, Beam Shape Optimization for Power Harvesting.
Journal of Intelligent Material Systems and Structures, 2010. 21(6): p. 633-646.

209
37. Shafer, M.W., M. Bryant, and E. Garcia, Designing maximum power output into
piezoelectric energy harvesters. Smart Materials and Structures, 2012. 21(10): p.
109601.
38. Wang, J., Z. Shi, and Z. Han, Analytical solution of piezoelectric composite stack
transducers. Journal of Intelligent Material Systems and Structures, 2013. 24(13):
p. 1626-1636.
39. Lin, H.C., et al., Analysis of an array of piezoelectric energy harvesters
connected in series. Smart Materials and Structures, 2013. 22(9): p. 094026.
40. Lien, I.C. and Y.C. Shu, Array of piezoelectric energy harvesting by the
equivalent impedance approach. Smart Materials and Structures, 2012. 21(8): p.
082001.
41. Kim, I.-H., et al., Broadband energy-harvesting using a two degree-of-freedom
vibrating body. Applied Physics Letters, 2011. 98(21): p. 214102.
42. Ou, Q., et al., An experimentally validated double-mass piezoelectric cantilever
model for broadband vibration-based energy harvesting. Journal of Intelligent
Material Systems and Structures, 2012. 23(2): p. 117-126.
43. Zhou, W., G.R. Penamalli, and L. Zuo, An efficient vibration energy harvester
with a multi-mode dynamic magnifier. Smart Materials and Structures, 2012.
21(1): p. 015014.
44. Aldraihem, O. and A. Baz, Energy Harvester with a Dynamic Magnifier. Journal
of Intelligent Material Systems and Structures, 2011. 22(6): p. 521-530.
45. Liu, H., et al., Enhancing output power of a piezoelectric cantilever energy
harvester using an oscillator. Smart Materials and Structures, 2012. 21(6): p.
065004.
46. Wu, H., et al., A novel two-degrees-of-freedom piezoelectric energy harvester.
Journal of Intelligent Material Systems and Structures, 2012. 24(3): p. 357-368.
47. Tang, L. and Y. Yang, A multiple-degree-of-freedom piezoelectric energy
harvesting model. Journal of Intelligent Material Systems and Structures, 2012.
23(14): p. 1631-1647.
48. Huang, S.-C. and K.-A. Lin, A novel design of a map-tuning piezoelectric
vibration energy harvester. Smart Materials and Structures, 2012. 21(8): p.
085014.
49. He, X., et al., A micromachined low-frequency piezoelectric harvester for
vibration and wind energy scavenging. Journal of Micromechanics and
Microengineering, 2013. 23(12): p. 125009.
50. Miller, L.M., et al., Modeling and experimental verification of low-frequency
MEMS energy harvesting from ambient vibrations. Journal of Micromechanics
and Microengineering, 2011. 21(4): p. 045029.
51. Elfrink, R., et al., Vibration energy harvesting with aluminum nitride-based
piezoelectric devices. Journal of Micromechanics and Microengineering, 2009.
19(9): p. 094005.
52. Shen, D., et al., The design, fabrication and evaluation of a MEMS PZT
cantilever with an integrated Si proof mass for vibration energy harvesting.
Journal of Micromechanics and Microengineering, 2008. 18(5): p. 055017.
53. Kuehne, I., et al., Power MEMS—A capacitive vibration-to-electrical energy
converter with built-in voltage. Sensors and Actuators A: Physical, 2008. 142(1):
p. 263-269.
54. Pasquale, G.D., A. Somà, and F. Fraccarollo, Comparison between piezoelectric
and magnetic strategies for wearable energy harvesting. Journal of Physics:
Conference Series, 2013. 476: p. 012097.
210
55. Tang, X. and L. Zuo, Vibration energy harvesting from random force and motion
excitations. Smart Materials and Structures, 2012. 21(7): p. 075025.
56. Zhang, Y. and C.S. Cai, A retrofitted energy harvester for low frequency
vibrations. Smart Materials and Structures, 2012. 21(7): p. 075007.
57. Gu, L., Low-frequency piezoelectric energy harvesting prototype suitable for the
MEMS implementation. Microelectronics Journal, 2011. 42(2): p. 277-282.
58. Fang, H.-B., et al., Fabrication and performance of MEMS-based piezoelectric
power generator for vibration energy harvesting. Microelectronics Journal, 2006.
37(11): p. 1280-1284.
59. Roundy, S., et al., Improving power output for vibration-based energy
scavengers. Pervasive Computing, IEEE, 2005. 4(1): p. 28-36.
60. Bai, X., et al., Multi-resonant vibration energy harvester using a spiral
cantilever beam, in Ultrasonics Symposium (IUS). 2012, IEEE International. . p.
1-4.
61. White, N.M., P. Glynne-Jones, and S.P. Beeby, A novel thick-film piezoelectric
micro-generator. Smart Materials and Structures, 2001. 10(4): p. 850-852.
62. Zawada, T., et al., High-performance piezoelectric thick film based energy
harvesting micro-generators for MEMS. Procedia Engineering, 2010. 5: p. 1164-
1167.
63. Mathers, A., K.S. Moon, and J. Yi, A Vibration-Based PMN-PT Energy
Harvester. IEEE SENSORS JOURNAL, 2009. 9(7): p. 731-739.
64. Ren, B., et al., Piezoelectric energy harvesting using shear mode
0.71Pb(Mg1/3Nb 2/3 )O 3–0.29PbTiO 3 single crystal cantilever. Applied
Physics Letters, 2010. 96(8): p. 083502.
65. Lei, A., et al., MEMS-based thick film PZT vibrational energy harvester, in IEEE
24th International Conference on. 2011, Micro Electro Mechanical Systems
(MEMS).
66. Guyomar, D., G. Sebald, and H. Kuwano, Energy Harvester of 1.5 cm3 Giving
Output Power of 2.6 mW with Only 1 G Acceleration. Journal of Intelligent
Material Systems and Structures, 2010. 22(5): p. 415-420.
67. Vocca, H. and F. Cottone, Kinetic Energy Harvesting, in ICT - Energy - Concepts
Towards Zero - Power Information and Communication Technology, G. Fagas,
et al., Editors. 2014. p. 25-48.
68. Cottone, F., et al., Piezoelectric buckled beams for random vibration energy
harvesting. Smart Materials and Structures, 2012. 21(3): p. 035021.
69. Vocca, H., et al., A comparison between nonlinear cantilever and buckled beam
for energy harvesting. The European Physical Journal Special Topics, 2013.
222(7): p. 1699-1705.
70. Harne, R.L. and K.W. Wang, A review of the recent research on vibration energy
harvesting via bistable systems. Smart Materials and Structures, 2013. 22(2): p.
023001.
71. Beeby, S.P., et al., A comparison of power output from linear and nonlinear
kinetic energy harvesters using real vibration data. Smart Materials and
Structures, 2013. 22(7): p. 075022.
72. Al-Ashtari, W., et al., Increasing the power of piezoelectric energy harvesters by
magnetic stiffening. Journal of Intelligent Material Systems and Structures, 2013.
24(11): p. 1332-1342.
73. Kumar, P., et al., Fokker–Planck equation analysis of randomly excited
nonlinear energy harvester. Journal of Sound and Vibration, 2014. 333(7): p.
2040-2053.
211
74. Wu, H., et al. Broadband energy harvesting using nonlinear 2-DOF
configuration. in Proceedings of SPIE. 2013.
75. Friswell, M.I., et al., Non-linear piezoelectric vibration energy harvesting from
a vertical cantilever beam with tip mass. Journal of Intelligent Material Systems
and Structures, 2012. 23(13): p. 1505-1521.
76. Mak, K.H., et al., Performance of a cantilever piezoelectric energy harvester
impacting a bump stop. Journal of Sound and Vibration, 2011. 330(25): p. 6184-
6202.
77. Mak, K.H., A.A. Popov, and S. McWilliam, Experimental model validation for
a nonlinear energy harvester incorporating a bump stop. Journal of Sound and
Vibration, 2012. 331(11): p. 2602-2623.
78. Szarka, G.D., B.H. Stark, and S.G. Burrow, Review of Power Conditioning for
Kinetic Energy Harvesting Systems. IEEE TRANSACTIONS ON POWER
ELECTRONICS, 2012. 27(2): p. 803-815.
79. Scruggs, J.T., I.L. Cassidy, and S. Behrens, Multi-objective optimal control of
vibratory energy harvesting systems. Journal of Intelligent Material Systems and
Structures, 2012. 23(18): p. 2077-2093.
80. Han, X., M. Neubauer, and J. Wallaschek, Improved piezoelectric switch shunt
damping technique using negative capacitance. Journal of Sound and Vibration,
2013. 332(1): p. 7-16.
81. Zhou, L., et al., A model for the energy harvesting performance of shear mode
piezoelectric cantilever. Sensors and Actuators A: Physical, 2012. 179: p. 185-
192.
82. Yu, H., et al., A vibration-based MEMS piezoelectric energy harvester and
power conditioning circuit. Sensors (Basel), 2014. 14(2): p. 3323-41.
83. Churchill, D.L., et al., Strain energy harvesting for wireless sensor networks, in
International Society for Optics and Photonics. 2003, Smart Structures and
Materials. p. 319-327.
84. Smith, G.L., et al., PZT-Based Piezoelectric MEMS Technology. Journal of the
American Ceramic Society, 2012. 95(6): p. 1777-1792.
85. Fang, X.Q., J.X. Liu, and V. Gupta, Fundamental formulations and recent
achievements in piezoelectric nano-structures: a review. Nanoscale, 2013. 5(5):
p. 1716-26.
86. Bowen, C.R., et al., Piezoelectric and ferroelectric materials and structures for
energy harvesting applications. Energy & Environmental Science, 2014. 7(1): p.
25.
87. Zuo, L. and X. Tang, Large-scale vibration energy harvesting. Journal of
Intelligent Material Systems and Structures, 2013. 24(11): p. 1405-1430.
88. Xie, X.D., Q. Wang, and N. Wu, Potential of a piezoelectric energy harvester
from sea waves. Journal of Sound and Vibration, 2014. 333(5): p. 1421-1429.
89. Xiang, H.J., et al., Theoretical analysis of piezoelectric energy harvesting from
traffic induced deformation of pavements. Smart Materials and Structures, 2013.
22(9): p. 095024.
90. van den Ende, D.A., et al., Direct strain energy harvesting in automobile tires
using piezoelectric PZT–polymer composites. Smart Materials and Structures,
2012. 21(1): p. 015011.
91. Wu, N., Q. Wang, and X. Xie, Wind energy harvesting with a piezoelectric
harvester. Smart Materials and Structures, 2013. 22(9): p. 095023.

212
92. Neri, I., et al., A real vibration database for kinetic energy harvesting application.
Journal of Intelligent Material Systems and Structures, 2012. 23(18): p. 2095-
2101.
93. Wang, X. and H. Xiao, Dimensionless Analysis and Optimization of
Piezoelectric Vibration Energy Harvester. International Review of Mechanical
Engineering, 2013. 7(4): p. 607-624.
94. Poulin, G., E. Sarraute, and F. Costa, Generation of electrical energy for portable
devices. Sensors and Actuators A: Physical, 2004. 116(3): p. 461-471.
95. Guyomar, D., et al., Energy Harvesting from Ambient Vibrations and Heat.
Journal of Intelligent Material Systems and Structures, 2008. 20(5): p. 609-624.
96. Goyder, H.G.D. and R.G. White, VIBRATIONAL POWER FLOW FROM
MACHINES INTO BUILTUP STRUCTURES, PART I: INTRODUCTION AND
APPROXIMATE ANALYSES OF BEAM AND PLATE-LIKE FOUNDATIONS.
Journal of Sound and Vibration, 1980. 68(1): p. 59-75.
97. Wang, X. and L.L. Koss, FREQUENCY RESPONSE FUNCTIONS FOR
POWER, POWER TRANSFER RATIO AND COHERENCE. Journal of Sound
and Vibration, 1992. 155(1): p. 55-73.
98. Benasciutti, D., L. Moro, and M. Gallina, On the optimal bending deflection of
piezoelectric scavengers. Journal of Intelligent Material Systems and Structures,
2012. 24(5): p. 627-639.
99. Ralib, A.A.M., A.N. Nordin, and H. Salleh, A comparative study on MEMS
piezoelectric microgenerators. Microsystem Technologies, 2010. 16(10): p.
1673-1681.
100. Tang, L. and Y. Yang, Analysis of synchronized charge extraction for
piezoelectric energy harvesting. Smart Materials and Structures, 2011. 20(8): p.
085022.
101. Wu, Y., et al., Piezoelectric vibration energy harvesting by optimized
synchronous electric charge extraction. Journal of Intelligent Material Systems
and Structures, 2012. 24(12): p. 1445-1458.
102. Shu, Y.C. and I.C. Lien, Efficiency of energy conversion for a piezoelectric
power harvesting system. Journal of Micromechanics and Microengineering,
2006. 16(11): p. 2429-2438.
103. Adhikari, S., M.I. Friswell, and D.J. Inman, Piezoelectric energy harvesting from
broadband random vibrations. Smart Materials and Structures, 2009. 18(11): p.
115005.
104. Beeby, S.P., M.J. Tudor, and N.M. White, Energy harvesting vibration sources
for microsystems applications. Measurement Science and Technology, 2006.
17(12): p. R175-R195.
105. Dutoit, N.E., B.L. Wardle, and S.-G. Kim, Design Considerations for Mems-
Scale Piezoelectric Mechanical Vibration Energy Harvesters. Integrated
Ferroelectrics, 2005. 71(1): p. 121-160.
106. Renno, J.M., M.F. Daqaq, and D.J. Inman, On the optimal energy harvesting
from a vibration source. Journal of Sound and Vibration, 2009. 320(1-2): p. 386-
405.
107. Badel, A., Efficiency Enhancement of a Piezoelectric Energy Harvesting Device
in Pulsed Operation by Synchronous Charge Inversion. Journal of Intelligent
Material Systems and Structures, 2005. 16(10): p. 889-901.
108. Chen, Y.Y., et al., Study of a piezoelectric switching circuit for energy harvesting
with bistable broadband technique by work-cycle analysis. Journal of Intelligent
Material Systems and Structures, 2012.
213
109. Guyomar, D., et al., Toward Energy Harvesting Using Active Materials and
Conversion Improvement by Nonliner Processing. IEEE Transactions on
Ultrasonics, Ferroelectrics, and Frequency Control, 2005. 52(4): p. 584-595.
110. Khaligh, A., P. Zeng, and C. Zheng, Kinetic Energy Harvesting Using
Piezoelectric and Electromagnetic Technologies—State of the Art. IEEE
TRANSACTIONS ON INDUSTRIAL ELECTRONICS, 2010. 57(3): p. 850-
860.
111. Liu, J.-Q., et al., A MEMS-based piezoelectric power generator array for
vibration energy harvesting. Microelectronics Journal, 2008. 39(5): p. 802-806.
112. Wickenheiser, A. and E. Garcia, Design of energy harvesting systems for
harnessing vibrational motion from human and vehicular motion. 2010. 7643: p.
76431B-76431B-13.
113. Wickenheiser, A.M., Design Optimization of Linear and Non-Linear
Cantilevered Energy Harvesters for Broadband Vibrations. Journal of Intelligent
Material Systems and Structures, 2011. 22(11): p. 1213-1225.
114. Wickenheiser, A.M. and E. Garcia, Power Optimization of Vibration Energy
Harvesters Utilizing Passive and Active Circuits. Journal of Intelligent Material
Systems and Structures, 2010. 21(13): p. 1343-1361.
115. Lefeuvre, E., et al., Piezoelectric Energy Harvesting Device Optimization by
Synchronous Electric Charge Extraction. Journal of Intelligent Material Systems
and Structures, 2005. 16(10): p. 865-876.
116. Lefeuvre, E., et al., A comparison between several vibration-powered
piezoelectric generators for standalone systems. Sensors and Actuators A:
Physical, 2006. 126(2): p. 405-416.
117. Shu, Y.C., I.C. Lien, and W.J. Wu, An improved analysis of the SSHI interface
in piezoelectric energy harvesting. Smart Materials and Structures, 2007. 16(6):
p. 2253-2264.
118. Shu, Y.C. and I.C. Lien, Analysis of power output for piezoelectric energy
harvesting systems. Smart Materials and Structures, 2006. 15(6): p. 1499-1512.
119. Choi, W.J., et al., Energy harvesting MEMS device based on thin film
piezoelectric cantilevers. Journal of Electroceramics, 2006. 17(2-4): p. 543-548.
120. Roundy, S. and Y. Zhang. Toward self-tuning adaptive vibration based micro-
generators. in Smart Materials, Nano- and Micro-Smart Systems. 2005. Sydney.
121. Wu, W.-J., et al. Tunable resonant frequency power harvesting devices. in Proc.
Smart Structures and Materials Conf.; Proc. 2006.
122. Cornwell, P.J., et al., Enhancing Power Harvesting using a Tuned Auxiliary
Structure. Journal of Intelligent Material Systems and Structures, 2005. 16(10):
p. 825-834.
123. Shahruz, S.M., Design of mechanical band-pass filters for energy scavenging.
Journal of Sound and Vibration, 2006. 292(3-5): p. 987-998.
124. Erturk, A., J.M. Renno, and D.J. Inman, Modeling of Piezoelectric Energy
Harvesting from an L-shaped Beam-mass Structure with an Application to UAVs.
Journal of Intelligent Material Systems and Structures, 2008. 20(5): p. 529-544.
125. Tadesse, Y., Z. Shujun, and S. Priya, Multimodal Energy Harvesting System:
Piezoelectric and Electromagnetic. Journal of Intelligent Material Systems and
Structures, 2008. 20(5): p. 625-632.
126. Happian-Smith, J., An Introduction to Modern Vehicle Design. 2001:
Butterworth-Heinemann.

214
127. Yagiz, N., Y. Hacioglu, and Y. Taskin, Fuzzy Sliding-Mode Control of Active
Suspensions. IEEE TRANSACTIONS ON INDUSTRIAL ELECTRONICS,
2008. 55(11).
128. Thite, A., Development of a Refined Quarter Car Model for the Analysis of
Discomfort due to Vibration. Advances in Acoustics and Vibration, 2012. 2012.
129. Calio, R., et al., Piezoelectric energy harvesting solutions. Sensors, 2014. 14(3):
p. 4755-90.
130. Wen, Z., et al., Improving voltage output with PZT beam array for MEMS-based
vibration energy harvester: theory and experiment. Microsystem Technologies,
2014.
131. Ashraf, K., et al., Improved energy harvesting from low frequency vibrations by
resonance amplification at multiple frequencies. Sensors and Actuators A:
Physical, 2013. 195: p. 123-132.
132. Sodano, H.A., I.C. Lien, and Y.C. Shu, Multiple piezoelectric energy harvesters
connected to different interface circuits. 2012. 8341: p. 83410X-83410X-8.
133. Takezawa, A., et al., Layout optimization methodology of piezoelectric
transducers in energy-recycling semi-active vibration control systems. Journal
of Sound and Vibration, 2014. 333(2): p. 327-344.
134. Deterre, M., E. Lefeuvre, and E. Dufour-Gergam, An active piezoelectric energy
extraction method for pressure energy harvesting. Smart Materials and
Structures, 2012. 21(8): p. 085004.
135. Acar, M.A. and C. Yilmaz, Design of an adaptive–passive dynamic vibration
absorber composed of a string–mass system equipped with negative stiffness
tension adjusting mechanism. Journal of Sound and Vibration, 2013. 332(2): p.
231-245.
136. Chen, Z., et al., Metamaterials-based enhanced energy harvesting: A review.
Physica B: Condensed Matter, 2014.
137. Chopra, I., Review of State of Art of Smart Structures and Integrated Systems.
Journal of AIAA, 2002. 40(11).
138. Chou, S.K., et al., Development of micro power generators – A review. Applied
Energy, 2011. 88(1): p. 1-16.
139. Kim, H.S., J.-H. Kim, and J. Kim, A review of piezoelectric energy harvesting
based on vibration. International Journal of Precision Engineering and
Manufacturing, 2011. 12(6): p. 1129-1141.
140. Matiko, J.W., et al., Review of the application of energy harvesting in buildings.
Measurement Science and Technology, 2014. 25(1): p. 012002.
141. Migliorato, M.A., et al., A review of non linear piezoelectricity in semiconductors.
2014: p. 32-41.
142. Yan, Z. and Q. He, A Review of Piezoelectric Vibration Generator for Energy
Harvesting. Applied Mechanics and Materials, 2010. 44-47: p. 2945-2949.
143. Zhu, D., M.J. Tudor, and S.P. Beeby, Strategies for increasing the operating
frequency range of vibration energy harvesters: a review. Measurement Science
and Technology, 2010. 21(2): p. 022001.
144. Babu, I., M.M.R.M. Hendrix, and G. de With, PZT-5A4/PA and PZT-5A4/PDMS
piezoelectric composite bimorphs. Smart Materials and Structures, 2014. 23(2):
p. 025029.
145. Renaud, M., et al., Optimum power and efficiency of piezoelectric vibration
energy harvesters with sinusoidal and random vibrations. Journal of
Micromechanics and Microengineering, 2012. 22(10): p. 105030.

215
146. Yamada, K., H. Matsuhisa, and H. Utsuno, Improvement of efficiency of
piezoelectric element attached to beam based on mechanical impedance
matching. Journal of Sound and Vibration, 2014. 333(1): p. 52-79.
147. Yamada, K., H. Matsuhisa, and H. Utsuno, Enhancement of efficiency of
vibration suppression using piezoelectric elements and LR circuit by
amplification of electrical resonance. Journal of Sound and Vibration, 2014.
333(5): p. 1281-1301.
148. Ali, S.F., M.I. Friswell, and S. Adhikari, Piezoelectric energy harvesting with
parametric uncertainty. Smart Materials and Structures, 2010. 19(10): p. 105010.
Related Documents