University of Tennessee, Knoxville University of Tennessee, Knoxville TRACE: Tennessee Research and Creative TRACE: Tennessee Research and Creative Exchange Exchange Doctoral Dissertations Graduate School 12-2014 A Study of Espoused Corporate Cultural Factors and Their A Study of Espoused Corporate Cultural Factors and Their Relationship with Business Success Relationship with Business Success Tonya Denise Brown University of Tennessee - Knoxville, [email protected] Follow this and additional works at: https://trace.tennessee.edu/utk_graddiss Part of the Industrial Engineering Commons, and the Organizational Behavior and Theory Commons Recommended Citation Recommended Citation Brown, Tonya Denise, "A Study of Espoused Corporate Cultural Factors and Their Relationship with Business Success. " PhD diss., University of Tennessee, 2014. https://trace.tennessee.edu/utk_graddiss/3112 This Dissertation is brought to you for free and open access by the Graduate School at TRACE: Tennessee Research and Creative Exchange. It has been accepted for inclusion in Doctoral Dissertations by an authorized administrator of TRACE: Tennessee Research and Creative Exchange. For more information, please contact [email protected].

Welcome message from author
This document is posted to help you gain knowledge. Please leave a comment to let me know what you think about it! Share it to your friends and learn new things together.
Transcript
University of Tennessee, Knoxville University of Tennessee, Knoxville
TRACE: Tennessee Research and Creative TRACE: Tennessee Research and Creative
Exchange Exchange
Doctoral Dissertations Graduate School
12-2014
A Study of Espoused Corporate Cultural Factors and Their A Study of Espoused Corporate Cultural Factors and Their
Relationship with Business Success Relationship with Business Success
Tonya Denise Brown University of Tennessee - Knoxville, [email protected]
Follow this and additional works at: https://trace.tennessee.edu/utk_graddiss
Part of the Industrial Engineering Commons, and the Organizational Behavior and Theory Commons
Recommended Citation Recommended Citation Brown, Tonya Denise, "A Study of Espoused Corporate Cultural Factors and Their Relationship with Business Success. " PhD diss., University of Tennessee, 2014. https://trace.tennessee.edu/utk_graddiss/3112
This Dissertation is brought to you for free and open access by the Graduate School at TRACE: Tennessee Research and Creative Exchange. It has been accepted for inclusion in Doctoral Dissertations by an authorized administrator of TRACE: Tennessee Research and Creative Exchange. For more information, please contact [email protected].

To the Graduate Council:
I am submitting herewith a dissertation written by Tonya Denise Brown entitled "A Study of
Espoused Corporate Cultural Factors and Their Relationship with Business Success." I have
examined the final electronic copy of this dissertation for form and content and recommend
that it be accepted in partial fulfillment of the requirements for the degree of Doctor of
Philosophy, with a major in Industrial Engineering.
James Simonton, Janice Tolk, Major Professor
We have read this dissertation and recommend its acceptance:
Joe Stainback, Andrew Yu
Accepted for the Council:
Carolyn R. Hodges
Vice Provost and Dean of the Graduate School
(Original signatures are on file with official student records.)
A Study of Espoused Corporate Cultural Factors and Their Relationship with Business Success
A Dissertation Presented for the Doctor of Philosophy
Degree The University of Tennessee, Knoxville
Tonya Denise Brown December 2014

ii
Copyright © 2014 by Tonya Denise Brown All rights reserved.
iii
DEDICATION
I am thankful that my Mom's love transcends space and time and my Dad’s
laughter is always near. Olivia and Joseph Brown, I dedicate this book to you, my loving
parents. I will meet you again in heaven one day; thanks to the grace and mercy of
Jesus Christ, my savior.
To Finbarr Sheehan, who has served as my mentor and guiding light through
many storms in business and the world, you have never stopped encouraging me about
reaching my goal of attaining a PhD.
To my friends and family without your support and endless prayers, I would not
be here.
Thank you,
Tonya Denise
iv
ACKNOWLEDGEMENTS
Thanks to my personal coach, Carmella Granado for your ever present wise
counsel.
Thanks to my entire dissertation committee for your support and advice:
Dr. Joseph Stainback
Dr. Andrew Yu
Dr. James Simonton, Chair
Dr. Janice Tolk, Co-Chair
A special thanks to Dr. James Simonton I appreciate your positive and
encouraging attitude. Thanks for all your support and feedback over the last few
months.
Dr. Janice Tolk thank you for your personal guidance through this process,
without your step-by-step coaching style I would not be proud of the research I have
completed.
v
ABSTRACT
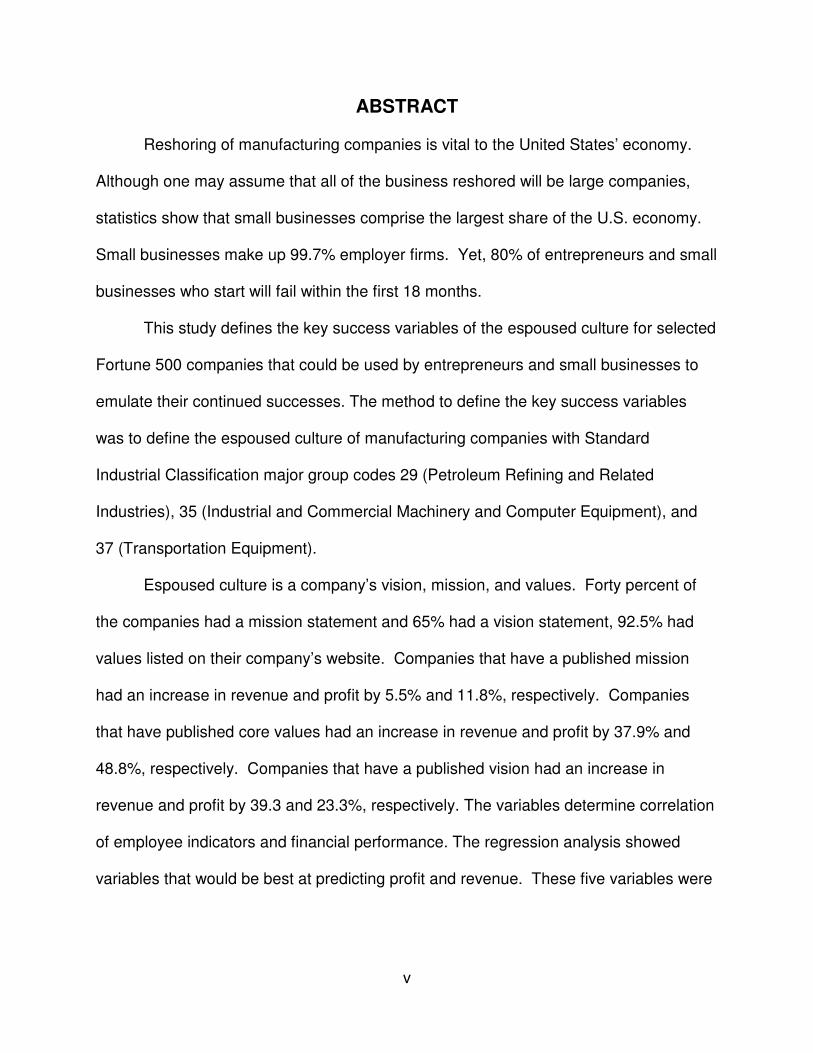
Reshoring of manufacturing companies is vital to the United States’ economy.
Although one may assume that all of the business reshored will be large companies,
statistics show that small businesses comprise the largest share of the U.S. economy.
Small businesses make up 99.7% employer firms. Yet, 80% of entrepreneurs and small
businesses who start will fail within the first 18 months.
This study defines the key success variables of the espoused culture for selected
Fortune 500 companies that could be used by entrepreneurs and small businesses to
emulate their continued successes. The method to define the key success variables
was to define the espoused culture of manufacturing companies with Standard
Industrial Classification major group codes 29 (Petroleum Refining and Related
Industries), 35 (Industrial and Commercial Machinery and Computer Equipment), and
37 (Transportation Equipment).
Espoused culture is a company’s vision, mission, and values. Forty percent of
the companies had a mission statement and 65% had a vision statement, 92.5% had
values listed on their company’s website. Companies that have a published mission
had an increase in revenue and profit by 5.5% and 11.8%, respectively. Companies
that have published core values had an increase in revenue and profit by 37.9% and
48.8%, respectively. Companies that have a published vision had an increase in
revenue and profit by 39.3 and 23.3%, respectively. The variables determine correlation
of employee indicators and financial performance. The regression analysis showed
variables that would be best at predicting profit and revenue. These five variables were

vi
Customer Focus; Benefits and People; External Focus and Shareholders; Value,
Financial, and Profits; and lastly Innovations, Learning, and Technologies.
From the espoused culture, culture types defined as Clan, Adhocracy, Market, or
Hierarchy were identified. Any mix of culture can have success in revenue and profit.
Yet, not all culture types lead to success in employee morale. From the culture
analysis, companies that had a Market culture had the lowest leadership measurement
and employee indicators. A Clan blend culture had the highest employee morale and
leadership measurement. This research has discovered the impact of many variables
and their correlation to company success.
vii
TABLE OF CONTENTS
CHAPTER I Introduction ................................................................................................ 1
How Outsourcing Started and Why.............................................................................. 2
How Outsourcing Started with Ford, GM, and Chrysler ........................................... 2
Automotive Suppliers Start Outsourcing .................................................................. 4
The Effects of Outsourcing ....................................................................................... 6
From Outsourcing to Reshoring ................................................................................... 8
Advantages of Reshoring ............................................................................................ 9
Disadvantages and Limitations of Reshoring ........................................................... 9
Reshoring Initiatives ............................................................................................... 10
Background ............................................................................................................... 12
The Role of Small Businesses in the Economy ...................................................... 12
Issues for Entrepreneurs and Small Business Failures .......................................... 13
Why Small Businesses Fail .................................................................................... 14
Why Businesses are Successful ............................................................................ 17
Problem Statement ................................................................................................ 18
Definitions .............................................................................................................. 18
Abbreviations ......................................................................................................... 19
Delimitations........................................................................................................... 20
Assumptions .......................................................................................................... 20
Main Research Question ........................................................................................ 20
Hypotheses ............................................................................................................ 21
Contribution ............................................................................................................ 21
CHAPTER II Literature Review .................................................................................... 23
Organizational Culture ............................................................................................... 24
Defining Organizational Culture ............................................................................. 24
Organizational Culture and Communications ............................................................ 27
The Elements of Organization Culture ................................................................... 27
Company Communication of Culture Elements...................................................... 29
Companies that define their culture ........................................................................ 29
Where they define their culture .............................................................................. 30
The content of the culture ...................................................................................... 30
The Website Content and Audiences Addressed by a Company’s Website .......... 30
Types of Organizational Culture ................................................................................ 39
Organizational Culture and Leadership ..................................................................... 44
Effects of Leadership on Culture ............................................................................ 44
Organizational Culture and Business Success .......................................................... 50
Culture and Company Effectiveness ...................................................................... 50
Specific Company Examples ................................................................................. 56
Key Gaps in Previous Research ............................................................................ 58
CHAPTER III Materials and Methods ............................................................................ 62
Conceptual Overall Approach ................................................................................ 63
Samples ................................................................................................................. 63
Employee Metrics ................................................................................................... 68
Financial metrics .................................................................................................... 69
viii
Leadership metrics ................................................................................................. 69
Hypothesis Method ................................................................................................ 78
CHAPTER IV Results and Discussion .......................................................................... 89
Results ....................................................................................................................... 89
Hypothesis 1 .............................................................................................................. 89
Hypothesis 2 .............................................................................................................. 96
Hypothesis 3 ............................................................................................................ 102
Financial Metrics .................................................................................................. 102
Employee Metrics and Leadership Metrics .......................................................... 107
Hypothesis 4 ............................................................................................................ 110
Summary of the Hypotheses Statement ............................................................... 130
CHAPTER V Conclusions and Recommendations..................................................... 132
Opportunities for Future Research........................................................................... 136
LIST OF REFERENCES .......................................................................................... 139
APPENDICES ............................................................................................................. 154
Appendix A .............................................................................................................. 155
SIC Codes ............................................................................................................ 155
Appendix B .............................................................................................................. 156
Ranking, Revenue, and Profit .............................................................................. 156
Appendix C .............................................................................................................. 158
Employee metrics and Leadership metrics .......................................................... 158
Appendix D .............................................................................................................. 161
Vision Mission and Values for each Company Website ....................................... 161
Appendix E .............................................................................................................. 222
Content by Variable Code .................................................................................... 222
Appendix F .............................................................................................................. 256
Content by Variable Code and Culture Type ........................................................ 256
Vita .............................................................................................................................. 298

ix
LIST OF TABLES Table 1. Wages and Productivity for Manufacturing in 1999 ........................................... 6
Table 2. Employer Firm Births and Deaths .................................................................... 13
Table 3. Summary of the Studies for Organizational Culture ........................................ 26
Table 4. Highest Performing Fortune Firms in 2006 ...................................................... 31
Table 5. Mission Statement Content for Top Fortune Firms .......................................... 31
Table 6. Top Concepts in Mission Statements .............................................................. 32
Table 7. Primary Audiences Addressed by Websites .................................................... 37
Table 8. Summary of Organizational Culture and Communications .............................. 38
Table 9. Summary of Types of Organizational Culture .................................................. 43
Table 10. Summary of Organizational Cultural and Leadership .................................... 49
Table 11. Financial Results over Eleven-Year Period ................................................... 50
Table 12. Summary of Organizational Culture and Business Success ......................... 59
Table 13. Companies in Study ...................................................................................... 66
Table 14. Companies with or without Mission, Vision, and Values ................................ 73
Table 15. Example of Content analysis ......................................................................... 75
Table 16. Variables for Content Analysis ...................................................................... 76
Table 17. Content from Company and Variable Code ................................................... 78
Table 18. Coloring for Pie Charts Variables .................................................................. 79
Table 19. Culture Types, Leader type, Value Drivers, and Theory of Effectiveness ..... 83
Table 20. Culture Type for Company X ........................................................................ 84
Table 21. Sum of Content by Culture Type ................................................................... 85
Table 22. Count on content by Culture Type ................................................................. 87
Table 23. Data and Source Location ............................................................................. 88
Table 24. Variables Codes used in Minitab ................................................................... 90
Table 25. Percentage of Variables stated by each company ........................................ 94
Table 26. Test and Confidence Internal for One Proportion: 1, 2, 3, 4, 5, 6, 7, 8, ... ..... 94
Table 27. Top variables from Statically Test ................................................................. 95
Table 28. Regression Analysis: Average Revenue versus 1, 3, 6, 9, 10, 12 ................. 97
Table 29. Relationship between Espoused Culture and Financial Outcome .............. 102
Table 30. Difference of having or not having a Mission, Values, or Vision Statement in Profit ..................................................................................................................... 103
Table 31. Correlation of Employee Metrics and Leadership Metrics with Variables .... 109
Table 32. Company and Culture Type......................................................................... 110
Table 33. Cluster Number and Color ........................................................................... 111
Table 34. One way ANOVA Cluster and Glassdoor Metrics ........................................ 113
Table 35. Significant Glassdoor metric for Cluster 1 ................................................... 113
Table 36. Significant Glassdoor metric for Cluster 2 ................................................... 117
Table 37. Significant Glassdoor metric for Cluster 4 and 7 ......................................... 121
Table 38. Significant Glassdoor metric for Cluster 3 ................................................... 124
Table 39. Significant Glassdoor metric for Cluster 5, 8, and 6 .................................... 127
Table 40. Summary of Hypothesis Statements ........................................................... 130
Table 41. SIC Code for Manufacturing ........................................................................ 155
Table 42. Average Ranking, Revenue, Profits 2009-2013 .......................................... 156
Table 43. Glassdoor Indicators ................................................................................... 158

x
LIST OF FIGURES Figure 1. Culture-centric Inputs ..................................................................................... 28
Figure 2. Percentages of Mission Statements Containing the Following Words ........... 34
Figure 3. Correlation between performance & the 12 Indices for U.S p<.05 ................. 55
Figure 4. Pareto Chart for Manufacturing SIC Codes revenue ...................................... 64
Figure 5. Meta-analysis data sources ............................................................................ 67
Figure 6. Method for Research ...................................................................................... 72
Figure 7. Pie Chart AGCO to Dana ............................................................................... 80
Figure 8. Pie Chart Deere to Honeywell ........................................................................ 80
Figure 9. Pie Chart Illinois Tool Works to Tenneco ....................................................... 81
Figure 10. Pie Chart Terex to Xerox .............................................................................. 81
Figure 11. Autoliv Cultural Shape .................................................................................. 85
Figure 12. Pareto Chart of Variables ............................................................................ 91
Figure 13. Pareto Chart of Variables for Vision, Mission, and Values ........................... 92
Figure 14. Percent (%) of variables used by companies ............................................... 93
Figure 15. Best fit regression analysis ........................................................................... 97
Figure 16. Multiple Regression for Average Revenue ................................................... 98
Figure 17. Revenue Residuals versus Fitted Values ..................................................... 99
Figure 18. Multiple Regression for Average Profit ....................................................... 100
Figure 19. Profit Residuals versus Fitted Values ......................................................... 101
Figure 20. Main effects Plot for Average Revenue ...................................................... 103
Figure 21. Main effects Plot for Average Profit ............................................................ 104
Figure 22. Main Effects Plot for Average Revenue and Profit with % of Variables ...... 105
Figure 23. Main Effects Plot for Average Revenue and Variables Present ................. 105
Figure 24. Main Effects Plot for Average Profit and Variables Present ....................... 106
Figure 25. Dendrogram of all Companies .................................................................... 112
Figure 26. Dendrogram of Cluster 1 ............................................................................ 114
Figure 27. Cluster 1 Company Culture Graphs with Similarities .................................. 116
Figure 28. Dendrogram of Cluster 2 ............................................................................ 118
Figure 29. Cluster 2 Company Culture Graphs with Similarities part 1 ....................... 119
Figure 30. Cluster 2 Company Culture Graphs with Similarities part 2 ....................... 120
Figure 31. Dendrogram of Cluster 4 and 7 .................................................................. 122
Figure 32. Cluster 4 Company Culture Graphs with Similarities .................................. 123
Figure 33. Cluster 7 Company Culture Graphs with Similarities .................................. 123
Figure 34. Dendrogram of Cluster 3 ............................................................................ 125
Figure 35. Cluster 3 Company Culture Graphs with Similarities .................................. 126
Figure 36. Dendrogram of Cluster 5, 8 and 6 .............................................................. 128
Figure 37. Cluster 5 Company Culture Graphs with Similarities .................................. 129
Figure 38. Cluster 8 Company Culture Graphs with Similarities .................................. 129
Figure 39. Cluster 6 Company Culture Graphs with Similarities .................................. 129
Figure 40. Summary of H4 Cluster Analysis ................................................................ 131
Figure 41. Implementation Steps for ESB owners ...................................................... 134
1
CHAPTER I
INTRODUCTION
The early American economy consisted of several local markets in the center of
a large town and was mainly an agricultural economy through the 19th century
(Goodson, 2014 and Johnson, 2012). The railroad industry helped with commercial
agriculture in its expansion of 430 million acres coming under cultivation between the
years of 1860 to 1900 by allowing goods to be shipped all over the country. The
railroad industry, called the first “big business,” was the largest single employer of labor
in the United States (Goodman, 2014).
The U.S. economy changed dramatically during the latter part of the 19th century
as the country transformed from a rural agricultural country to one that was leading in
manufacturing throughout the world. The change started with the railroad in the late
1800s connecting the country together into one national market with the ability to ship
goods across the country. The railroads provided for economic growth around the
nation (Goodman, 2014).
Technology began to transform America and its economy in the late 19th century
with the rush of inventions. Up to 1860, the government had issued 36,000 patents,
with 440,000 patents issued from 1860 to 1890. Mass production in the U.S. began in
1913 when Henry Ford installed the world’s first assembly line. The assembly line
provided dramatic results in the reduction in cycle time; it went from a total of 12 hours
down to 1.5 hours to assemble the Model-T (Goodman, 2014).
America was an industrial powerhouse during the late 19th and early
20th centuries (Johnson, 2012). From 1943 to1944, factories were working overtime to

2
build ships, tanks, and planes needed in World War II. Manufacturing at that time
accounted for four out of ten jobs in the U.S. (Crutsinger, 2007). Until the end of World
War II in 1945, America’s economy was almost completely self-sufficient. Everything it
used, it also produced (Tseng, 2011). Manufacturing employees made up 39% of the
total U.S workforce (Colvin, 2011). The period right after 1945 was the peak of
manufacturing and it has been declining ever since (Crutsinger, 2007).
The peak of manufacturing stayed that way until the late 1970s when the United
States first lost its competitive advantage to the Japanese and Chinese. Presently, due
to outsourcing, America produces more services than goods (Johnson, 2012). By the
1980s, manufacturing made up approximately 25% of United States labor. The
manufacturing industry has fallen to 12% in recent years as technological advances
have reduced the time of transportation and communication, making it cheaper to
operate outside the United States (Tseng, 2011).
Between 1990 and 2007, manufacturing continued to decline as a percentage of
the work force in 48 states, Nevada’s percentage stayed the same and only North
Dakota showed an increase. In 2002, China exploded onto the global scene affecting
every economy on the planet as each country began to lose jobs to China (Crutsinger,
2007).
How Outsourcing Started and Why
How Outsourcing Started with Ford, GM, and Chrysler
The Ford, General Motors (GM), and Chrysler (Big Three) sales combined had
fallen by 9.8% during the start of the model year in 2001, which forced them to slash
their production schedules. Pickups and minivans were fading in popularity for certain
3
makes including Mercury, Cadillac, Land Rover and Dodge; they were all trying to
ensure that their market demand stayed stable. The Big Three’s major competitors
were Toyota, Honda, and BMW at that time. These competitors had ventured in the
market and there was rapid growth in foreign car sales in 2001. Honda, Toyota, and
BMW were dominating the luxury car market and gaining ground in the pickup and SUV
markets with imports sales increasing by 13.6% in 2000 and 2001. Simply put, survival,
itself, was at stake. The big question was could the North American market continue to
support over 18 automakers with 35 brands? The mix of vehicles added up to roughly
225 vehicles (Priddle, Sotddard, and Zoia, 2001). Susan Jacob, President of Jacob’s &
Associates, stated that many adjustments had come through the Big Three. She went
on to state that any competition from the Japanese or the Germans against the Big
Three would be detrimental to the Big Three as they “will lose because they do not have
the cost structure or cachet in the brands nor a reputation for quality and reliability"
(Priddle, Sotddard, and Zoia, 2001, p.32).
One of the Big Three, Chrysler, took a major loss in the calendar year 2000. In
the final two quarters, it lost over 1.8 billion dollars. Their sales, despite huge rebates
and incentives programs, dropped over 4.4% while the overall industry sales climbed by
2.7% (Smith, 2001). The light vehicle sales were off by 17.7% and small car sales
shrank by 13.1%. Dodge and Jeep’s sales were both down more than 15%; they did
not have any unique new models and their trucks were nearing the end of their product
lifecycles (Priddle, Sotddard, and Zoia, 2001). Chrysler's market share fell to 14.5% in
2000, down from 15.6% the previous year. As a result, approximately 26,000 hourly
and 6,000 salaried employee layoffs were under way. In addition to the layoffs, six

4
plants closed and product programs decreased or were eliminated (Smith, 2001). In
March of 2001, over 17,500 workers were laid off because of the merger with Daimler-
Benz. Daimler-Chrysler reported record losses of $715 to $893 million (Priddle,
Sotddard, and Zoia, 2001).
Chrysler had the best supplier relations in the industry and it was financially
beneficial for both Chrysler and their suppliers. After Daimler took over Chrysler the
opposite was true as they demanded price reductions from all suppliers (Smith, 2001).
The new group’s top management demanded 5% price cuts prompting threats of mutiny
in some suppliers (Smith, 2001).
As Chrysler consolidated, their suppliers were discovering how difficult it is to
emerge profitable. Suppliers have felt the pain of Daimler-Chrysler’s three-year 15%
price cut that started in 2001. Schrempp, Chairman of Daimler-Chrysler AG, kept his
job despite the calls for his dismissal in April of 2001 at an annual shareholder meeting
in Germany. He talked them into his 3.9 billion dollar recovery plan. Schrempp said
they would achieve their targeted cost reduction in 2001 and they would make money in
2002 with a 4% profit margin for 2003 (Priddle, 2001). Chrysler pushed their suppliers
to cut prices drastically for the next three years (Priddle, Sotddard, and Zoia, 2001).
Automotive Suppliers Start Outsourcing
Automotive assemblers’ global sourcing strategy pushed suppliers to have an
equally strong global presence. Until the end of the eighties, competition between
major international automakers was mostly within their respective regions, with
American automakers dominating the U.S. market and the Japanese in the Asian
market.
5
Starting in the nineties, the picture dramatically changed. Organizations were
operating on a world scale and running supply bids for suppliers around the globe. In
the past, only large firms with strong technological capabilities went global or
outsourced. Beginning in 1985, small companies or individual plants were deciding to
move overseas searching for more competitive pricing which could include labor and/or
materials.
Pressure of price and quality often prevented automakers and suppliers from
reaching any market share goals. These issues led to major outsourcing of auto
components. From 1985 to 2000, the steady increase in outsourcing resulted in an
increase from 50% to 75% of all auto parts made overseas (Veloso, Henry, and Roth,
2001).
In June of 1997, auto and steel managers discussed which methods were the
best ways to lower the cost of steel and deliver on time: using competitive materials
(aluminum and magnesium), standardization and common steel specifications,
improving operational efficiencies, or overseas plants. AK Steel Corporation manager
Tyger said; “Manufacturing is one of the primary areas to reduce cost for automotive –
steel application” (Ninneman and Berry, 1997 p.54). Peterson, the Director at U.S.
Steel, said “steel companies are shipping 12 million tons a year to auto-makers, but if
they did not generate so much scrap, they would save 1.8 million tons a year”
(Ninneman and Berry, 1997 p.57). The steel industry is not good with just-in-time
inventory and that can cause inventory and costs to go up. When the steel suppliers
asked the representatives from the Big Three about supplying new North American
6
plants, the Big Three were looking at other possibilities with the Japanese and the
Koreans (Ninneman and Berry, 1997).
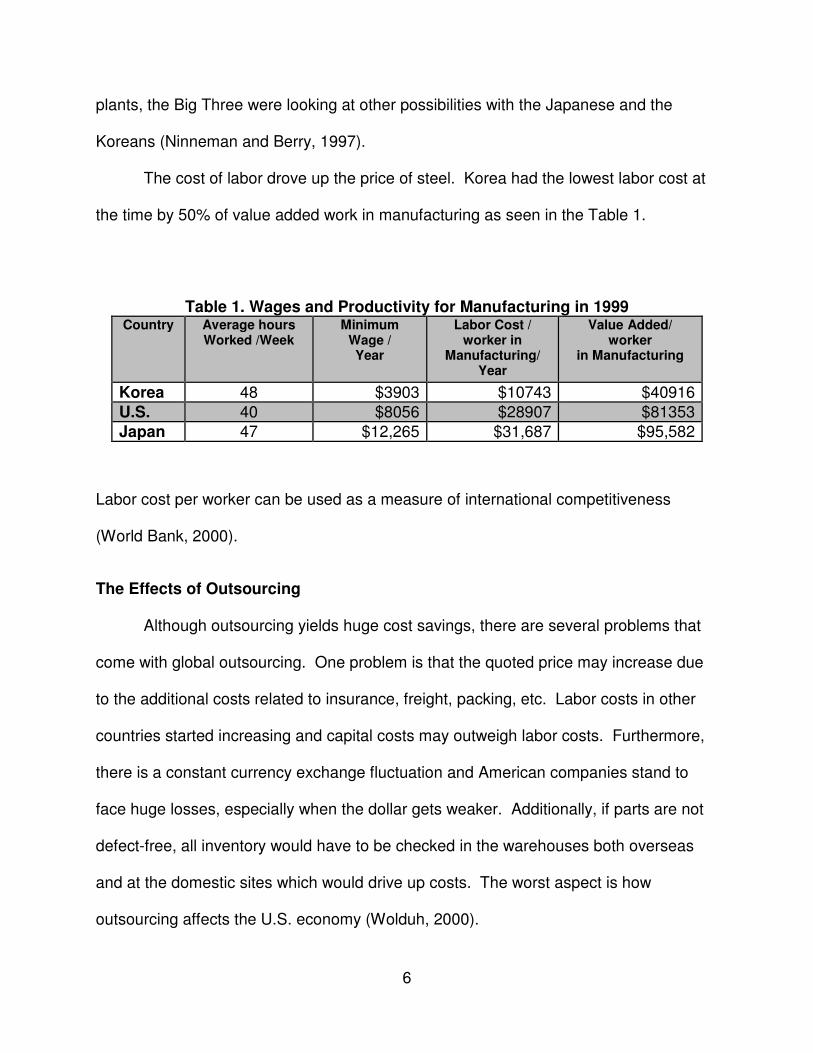
The cost of labor drove up the price of steel. Korea had the lowest labor cost at
the time by 50% of value added work in manufacturing as seen in the Table 1.
Table 1. Wages and Productivity for Manufacturing in 1999
Labor cost per worker can be used as a measure of international competitiveness
(World Bank, 2000).
The Effects of Outsourcing
Although outsourcing yields huge cost savings, there are several problems that
come with global outsourcing. One problem is that the quoted price may increase due
to the additional costs related to insurance, freight, packing, etc. Labor costs in other
countries started increasing and capital costs may outweigh labor costs. Furthermore,
there is a constant currency exchange fluctuation and American companies stand to
face huge losses, especially when the dollar gets weaker. Additionally, if parts are not
defect-free, all inventory would have to be checked in the warehouses both overseas
and at the domestic sites which would drive up costs. The worst aspect is how
outsourcing affects the U.S. economy (Wolduh, 2000).
Country Average hours Worked /Week
Minimum Wage / Year
Labor Cost / worker in
Manufacturing/ Year
Value Added/ worker
in Manufacturing
Korea 48 $3903 $10743 $40916 U.S. 40 $8056 $28907 $81353 Japan 47 $12,265 $31,687 $95,582

7
The impact of outsourcing of the U.S. economy is significant. Cost reductions
have continued to drive manufacturing employment down. Large proportions of the
‘lost’ manufacturing jobs were due to outsourcing to Mexico and overseas. Lastly, a
combination of poor quality control, a weakening dollar, and increased foreign
competition in the early 1970s caused significant harm to the US manufacturing industry
as described in the next section (LaHue, 2000).
A total of 3.2 million, roughly one in six, factory jobs have disappeared from the
United States since the start of the year 2000 (Crutsinger, 2007). The central issue with
the loss in American manufacturing jobs is that its trade deficit continued to grow as
America increasingly imported more of the products that used to be made in America.
A trade deficit happens when the imports are higher than the exports. When the
economy starts producing more domestic products versus importing products, the trade
deficit will decrease (Gupta, 2014).
The U.S. Labor Department’s Bureau of Labor Statistics calculated that each
dollar in manufacturing sales results in an output of $1.40 in the economy in other
sectors (Kaslow, 2012). A closer examination of that statistic shows that manufacturing
has an even greater effect on the Gross Domestic Product. For this reason, the effects
of outsourcing (aside from a price decrease) should be more thoroughly examined as
manufacturing has historically held the central position of our nation's economic growth
(LaHue, 2000). Andrew Cummins stated it best, “Those who are more focused on
shareholder value than strategic capital investment in emerging markets may miss the
future completely” (Cummins, 2000, p.7).
8
From 2000 to 2010, nearly six million U.S jobs went overseas and manufacturing
employment shrank from 17.3 million to 11.4 million employees (Bartash, 2013). The
number of high-tech manufacturing jobs lost was 687,000, resulting in a 28% decrease
in American-based and talent-capable jobs since 2000 (Kaslow, 2012).
Could jobs be America’s next big import from China? There are many definitions
for bringing work back into the U.S.: insourcing, onshoring, or reshoring all define “Made
in America”. President Obama stated, “I don’t want America to be a nation that’s
primarily known for financial speculation and racking up debt buying stuff from other
nations. I want us to be known for making and selling products all over the world
stamped with three proud words: ‘Made in America’ (Remarks, n.d.)” The Democrats
and Republicans seem to agree on at least this one thing; jobs are America’s number
one issue (Colvin, 2011). The Boston Consulting Group projects that one hundred
billion dollars in goods produced in other countries can be returned to the United States
which would reduce unemployment rate by 1.5% over the next 10 years (Roth and
Gross 2012).
From Outsourcing to Reshoring
U.S. companies currently hold more than one trillion dollars in profits overseas
(Censky, 2012). In January of 2012, President Obama held a forum that addressed
insourcing jobs with the executives from fourteen top companies (Censky, 2012).
President Obama further pointed out that bringing businesses back to America is “how
we’ll rebuild an economy where hard work pays off and responsibility is rewarded---and
re-emerge as nation where those are values we live on” (Censky, 2012). He
9
communicated, “Our first priority is making America a magnet for new jobs and
manufacturing” (Bartash, 2013).
Advantages of Reshoring
Joseph Carson, an economist with Alliance Bernstein, quantified several reasons
why America is a much better place to start up manufacturing operations now versus
ten years ago. The cost of labor is competitive and costs of key raw materials like
natural gas have fallen. Other experts noted that the wages in China and other
countries have increased in the past decade narrowing the gap with the U.S workers
(Bartash, 2013). Analysts also noted that the total cost of doing business including the
following: productivity of U.S. workers, transportation costs, supply chain risk and other
costs are making America just as attractive as other parts of the world ("FACT SHEET:
AN UPDATE ON BRINGING JOBS BACK TO THE UNITED STATES," 2012).
Shipping costs from China have risen as much as 71% because of higher oil
prices. Still other issues within the supply chain had risen. For example, the
earthquake and Tsunami in Japan of 2011 (notwithstanding the human tragedy caused
by the disaster) disrupted the global supply chain leaving many companies like Boeing,
Caterpillar, and General Motors without critical components (Tseng, 2011). Due to
many factors, the cost advantages of offshoring have minimized in the past ten years,
thus providing incentives to bring jobs back to the U.S.
Disadvantages and Limitations of Reshoring
There are some concerns with reshoring products to the U.S. American
companies often struggle to find qualified candidates because their training efforts are
not keeping pace with the current technology (Censky, 2012; Bartash, 2013). If the
10
absence of a qualified pool of domestic workers continues, firms will continue to
outsource where skilled labor is abundant.
Taxes, in general, for a large cooperation are 35%, one of the highest in the
industrialized world. One of the main reasons why manufacturers have chosen to have
companies overseas is that they do not have to pay such a high tax rate on profits
outside the United States (Censky, 2012; Bartash, 2013). Even though some
manufacturing is returning to the United States, labor-intensive sectors such as apparel
and textiles are likely to continue to be made overseas (Tseng, 2011). Some of these
matters are in the reshoring initiatives explained in the next section.
Reshoring Initiatives
The best information on jobs returning to the U.S is the Reshoring Initiative, a
new organization that encourages U.S. businesses to return manufacturing back home.
The Reshoring Initiative is a non-profit company supported by 27 companies and trade
associations. The organization helps manufacturers become aware of the profit
potential by using local sourcing and production as well as the critical role
manufacturers can play in strengthening the nation's economy (Moser, 2014). Some
groups have been making considerable progress with reshoring. Carmakers and parts
dealers have hired 125,000 workers since the end of 2010, accounting for one-quarter
of all new manufacturing jobs (Bartash, 2013).
The College of Nanoscale Science and Engineering at the University of New
York is dedicated to preparing the next generation of scientists to highlight insourcing,
making the connection between education, innovation and manufacturing as an
investment in bringing jobs back to America ("FACT SHEET: AN UPDATE ON
11
BRINGING JOBS BACK TO THE UNITED STATES," 2012). President Obama laid out
a Blueprint for an America Built to Last.
• The first initiative is to do away with tax deductions for companies shipping
jobs overseas and providing new incentives for bringing those jobs back to
America.
• The second is to provide a domestic production incentive for manufacturers
who create jobs in the United States and doubling the tax deduction for
advanced manufacturing.
• The third incentive is to introduce a new manufacturing community’s tax credit
to boost funds in communities affected by job loss ("FACT SHEET:
PRESIDENT OBAMA’S BLUEPRINT TO SUPPORT U.S. MANUFACTURING
JOBS, DISCOURAGE OUTSOURCING, AND ENCOURAGE INSOURCING,"
2012). The administration is also trying to push for a two billion a year tax
credit for manufacturers who invest in these communities (Roth and Gross,
2012).
• The fourth is to provide temporary tax credits to drive clean energy
manufacturing.
• The fifth is to allow businesses to expense the full cost of their investment in
equipment.
• The last incentive is to close the loophole that allows companies to shift
profits overseas. ("FACT SHEET: PRESIDENT OBAMA’S BLUEPRINT TO
SUPPORT U.S. MANUFACTURING JOBS, DISCOURAGE OUTSOURCING,
AND ENCOURAGE INSOURCING," 2012).
12
President Obama supported manufacturing in the FY13 budget: offering one
billion dollars in investments to catalyze a National Network for Manufacturing
Innovation (NNMI) ("FACT SHEET: AN UPDATE ON BRINGING JOBS BACK TO THE
UNITED STATES," 2012). The National Additive Manufacturing Innovation Institute
(now known as America Makes) was launched in August 2012 as the NNMI pilot hub.
Now a 94-member association that includes manufacturers, universities, community
colleges, and non-profit organizations, America Makes is devoted to helping the U.S.
grow its capabilities.
The Generation Power Electronics Manufacturing Innovation Institute,
headquartered at North Carolina State University, launched on January 15, 2014 with
25 members, started with the NNMI funding. President Obama also announced in
February of 2014 that the Digital Manufacturing and Design Innovation Institute,
headquartered in Chicago, and the Lightweight and Modern Metals Manufacturing
Innovation Institute also started with the NNMI funding (Snapshot, 2014).
Accenture completed a survey of manufacturing executives, which concluded
that 61% of them said they would consider matching their supplier locations with their
demand locations by reshoring manufacturing (Tseng 2011).
Background
The Role of Small Businesses in the Economy
Although one may assume that all of the business reshored will be large
companies, statistics show that small businesses comprise the largest share of the U.S.
economy. Small businesses make up 99.7% employer firms, 37% of high-tech
employment, 98% of firms exporting goods and 33% of exported products by value.

13
The Office of Advocacy, the independent voice in the Federal Government and the
source of small business statistics, defines a small business as an independent
business having fewer than 500 employees. In 2011, there were a total of 28.2 million
small businesses and 17,700 firms with more than 500 employees. Small businesses
accounted for 63% (14.3 million) of the net new jobs created in the United States from
1993 to the middle of 2013. Small businesses are great innovators; they produced, on
average, 16 times more patents per employees than large innovation firms (SBA, 2012).
Small businesses have a better tax rate than larger businesses, which is about 15.1%
for a sole proprietorship to the highest of 31.6% for S corporations (SBA, 2012). S
corporations are corporations that elect to pass corporate income, losses, deductions,
and credits on to their shareholders for federal tax purposes (IRS, 2014). Because of
the significant roles of the small business sector on the domestic economy, failure can
be very costly in terms of the economic impact (Watson and Everett, 1993; Wagner,
2013). The US needs to reshore manufacturing, but almost as many new businesses
die as are born each year. Therefore, we will never make substantial gain on the
reshoring initiative if we do not discover ways to increase the number of new
businesses that live. What can an entrepreneur do to increase their chance of
success?
Issues for Entrepreneurs and Small Business Failures
Table 2. Employer Firm Births and Deaths
Years 2008 2009 2010 2011
Births 481,985 410,038 389,774 409,040 Deaths 407,947 508,668 446,944 470,736

14
The Small Businesses Advocacy publishes information on the birth of small
businesses and death of small businesses as seen in a Table 2 (SBA, 2012). . The
Small Business Advocacy stated that 10% to 12% of firms open each year and about
10% to 12% close each year. The number of bankruptcies filed by small businesses in
2013 was an astounding 33,212. Included in the number of firms’ deaths were also
personal bankruptcies (SBA, 2012).
Why Small Businesses Fail
Fortune 500 gives five reasons why small businesses fail. One is that small
business owners do not make sufficient efforts to understand their customer’s
requirements. Secondly, their product line has no real differentiation in the market or a
lack of unique value propositions. The third reason is that they fail to effectively
communicate their value proposition in a clear and compelling way to their market. The
fourth reason is that the founder is dysfunctional and there are usually other leadership
breakdowns at the top (Wagner, 2013). In an article in The Academy of Management
Journal, written by Kazanjian, he stated that, “As a business progresses through its life
cycle the management aptitude becomes more important than the entrepreneur’s skill.”
The Journal of High Technology Management Research argued that, “During the life
cycle of any business the entrepreneurs reach their ‘executive limit’ at which time their
inability to manage the firm becomes detrimental to the success” (Zacharakis, Meyer,
and Decastro, 1999). The last reason given is the inability to secure a profitable
business model with proven revenue streams (Wagner, 2013).
The U.S Small Business Administration also gives some major reasons why
small businesses fail: lack of experience, insufficient capital, poor location, poor
15
inventory management, over investment in fixed assets, poor credit arrangement
management, personal use of business funds, and unexpected growth (Ames, 2014).
When asked why companies fail, CEOs and owners answered: a bad economy, market
turbulence, a weak year, hundred-year floods, the perfect storm, competitive
subterfuge, and forces that were outside their control. The truth is, besides acts of God,
most companies fail because of managerial error and factors unique to a company’s
own industry or culture (Charan and Useem 2002).
One entrepreneur stated, “Just a plain lack of knowledge on my part inhibited our
success.” Another one stated, “We assembled an inadequate management team and
we were late on taking corrective actions” (Zacharakis, Meyer, and Decastro, 1999).
The Turnaround Management Society is the only international non-profit
association dedicated to corporate renewal and turnaround management. Their
members share a common interest in strengthening the economy through the
restoration of corporate values. The society asked 405 managers and restructuring
experts why companies fail. They had many answers, including statements that most
crises are caused by the mistakes of top management and leadership. Also included
was: 54.6% of the time the strategy was no longer working, 52.6% of them did not adapt
to their customers’ needs, and 51.4% of management had lost its vision. Internal
communication played a big part in many of the crises. Education in business matters
of the teams accounted for 30.3% of the failures. Human resources reported that the
workforce had the wrong and or no goals (15.1%) resulting in poor performance by the
employee. The bottom line of the research was that top management caused an
internal crisis 87.88% of the time (Lymbersky, 2014).

16
Research on new venture failures has been limited for a variety of reasons.
Sometime it is very difficult, if not impossible, to complete a financial analysis on failed
new ventures because their financial data is typically not public. Zacharaskis, Meyer,
and DeCatro did a study in late 1999 and asked entrepreneurs and venture capitalists
why they thought their businesses failed. They identified an interesting list of internal
and external reasons. The entrepreneurs stated that external factors included:
• poor external market conditions,
• poor suppliers and vendor relations,
• poor venture capitalist and shareholder cooperation, and
• low funding availability.
Some of the internal issues mentioned were:
• poor management strategy,
• lack of capitalization,
• incompetence of key people,
• lack of management skills,
• lack of management vision,
• poor product design,
• failed implementation, and
• lack of technical capabilities.
When they asked the venture capitalists, their list of external issues only consisted of
one thing: poor external market conditions.
Their list of internal issues included:
• lack of management skill,
17
• poor product timing,
• poor management strategy,
• lack of capitalization, and
• failed implementations.
Considering their own businesses as well as others, they were asked, in general, why
businesses failed, and their top answers matched: lack of management skill, poor
management strategy, and lack of capitalization. Hambrick and Crozier in their article
“Stumblers and Stars in the Management of Rapid Growth” said that entrepreneurs, like
everyone else, frequently fail to recognize their limitations (Zacharakis, Meyer, and
Decastro, 1999).
Why Businesses are Successful
What differentiates extraordinarily successful companies from other companies
that have failed? How did Wal-Mart take on Sears and K-Mart, the two largest retailers,
and almost drive them out of business? How did Southwest Airlines thrive when several
of its strongest competitors: Eastern, Pan-Am, TWA, Texas Air, and People Express
went out of business? The key ingredient in every case is something less tangible but
more powerful than the market factors themselves. “The major distinguishing feature of
these companies, and likely their most important competitive advantage, (a key factor
that they each highlight as a critically important ingredient to their success) is the
organizational culture” (Cameron 2004). Organizational culture has long been regarded
as an important influence on organizational effectiveness (Deal and Kennedy, 1982,
Peters, and Waterman, 1982, Schein, 1992; Wilkins and Ouchi, 1983) and financial
performance (Denison and Mishra, 1995; Kotter and Heskett, 1992).
18
America was once an industrial powerhouse. Outsourcing has dramatically
reduced manufacturing. Once any country starts to lose certain industries, they lose the
innovation and leadership from those sectors. America has the ability to reduce the
trade deficit by reshoring manufacturing and regaining the innovation and technology in
manufacturing.
Small businesses play a major role in the U.S. economy’s success. It is vital that
they are provided with more tools that will reduce their failure rate. Defining culture from
successful manufacturing companies is one of those tools.
Problem Statement
Reshoring of manufacturing companies is vital to the United States’ economy.
Eighty percent of entrepreneurs and small businesses who start up in this economy fail
within the first 18 months (Wagner, 2013). The presence of a well-defined
organizational culture provides an increase in organizational effectiveness (Deal and
Kennedy, 19982, Peters, and Waterman, 1982, Schein, 1992; Wilkins and Ouchi, 1983).
However, cultural elements specifically believed to contribute to successful businesses,
have not been categorically recommended for use by entrepreneurs and small
businesses as a pathway to similar outcomes.
Definitions
This research will use the following terms. Congruence – the extent to which the culture in one part of the organization is congruent with the culture in another part of the organizations (Cameron, 2004)
CEO – Chief Executive Officer is the highest-ranking corporate officer.

19
Division D Manufacturing – The manufacturing division includes establishments engaged in the mechanical or chemical transformation of materials or substances into new products (SIC Division Structure, n.d.). Espoused Culture – published values, mission, and vision statements not derived from surveys. Gross Domestic Product -- the output of goods and services produced by labor and property located in the United States (News Release, n.d.). Insourcing – same as onshoring, or reshoring: those efforts to bring jobs back to the United States from another country (Colvin, 2011) Key performance indicators for this research are employee metrics, financial metrics, and leadership metrics. Mission statement - define the organization reason for being (David, 2009). Strength is a measure of the culture, which evaluates the cultures’ internal consistency and influence on the organization’s associates (Deal and Kennedy 1982; and Kotter and Heskett, 1992.) Standard Industrial Classifications codes are four digit numerical codes assigned by the U.S. government to business establishments to identify the primary business of the establishment (SIC Division Structure, n.d.). Vision - the vision reflects management’s ambition for the company and a panoramic view of “where they are going.” The vision is a long-term definition that molds the identity and sets directions (Thompson and Strickland, 2000). Values - values offer a set of guidelines on the behaviors and mindsets needed to achieve that vision (Colman, 2013).
Abbreviations
SIC is an abbreviation used for Standard Industrial Classification codes. NNMI is an abbreviation used for National Network for Manufacturing Innovation. CEO is an abbreviation used for Chief Executive Officer. EBIT is an abbreviation of Earning before Interest and Taxes earnings. ESB is an abbreviation used for entrepreneurs and small business owners. KPI is an abbreviation for Key Performance Indicators.
20
PC is an abbreviation used for Pearson correlation.
Delimitations
This research will define espoused culture for manufacturing companies to help
entrepreneurs and small business emulate their cultures. The following delimitations
apply:
1. This study will only include United States for-profit companies, publicly traded companies. 2. This study will only include companies on the Fortune 500 U.S. list sustained for five years: 2013, 2012, 2011, 2010, and 2009. 3. This study will only include Division D Manufacturing companies as define by SIC codes 29, 37 and 35. 4. This study will not define the congruence of a culture. 5. This research does not attempt to define the strength of a culture. 6. This research will not delve into the characteristics of leadership. 7. This research study will only use leadership metrics, employee metrics and financial metrics as KPI.
Assumptions
The following assumptions apply to this research: 1. The espoused culture (vision, mission, and values) statements can be obtained through the companies’ web sites.
Main Research Question
What are the key success variables of the espoused culture for selected Fortune 500
companies that could be used by entrepreneurs and small businesses to emulate their
continued successes?

21
Hypotheses
H1. Successful companies have significant variables that differentiate them from
other companies and these variables can be identified and categorized from the
company’s espoused culture.
H2. The identified significant variables have different levels of contributions to the
success of the company as represented by an equation to model revenue and profit.
H3. Corporate success can be measured by relationships between key performance
indicators and a company’s espoused culture.
H4. Espoused Culture can be used to show distinctive and different types of
organizational cultures using the Competing Values Framework.
Contribution
This research’s contribution is to convey contemporary perspectives on corporate
culture by conducting an in depth study of company missions, visions, and values and
how they are used to define company culture and culture type using the Competing
Values Framework. This work will examine certain financial metrics by industry, in this
case: 1) revenue and 2) profits (within US-based Fortune 500 companies) and derive a
relationship with espoused culture in the manufacturing industry.
Most studies on corporate culture consist of surveying employees or external
members of the company and then defining the company’s culture from a sample. This
study presents a comprehensive study of an espoused company’s culture. This
research takes a bold approach by reviewing the successes of manufacturing
companies listed among the most successful by Fortune 500 for the last five years and
examining the variables in their espoused cultures and financial effectiveness. This
research was supported by comparative data taken from each company’s web site with
22
Standard Industrial Classification (SIC) major group codes 29 (Petroleum Refining and
Related Industries), 35 (Industrial and Commercial Machinery and Computer
Equipment), and 37 (Transportation Equipment). Once defined, the cultural variables
could be emulated by entrepreneurs and small businesses as a pathway to possible
similar scalable outcomes.
23
CHAPTER II
LITERATURE REVIEW
This literature review includes five sections: Organizational Culture,
Organizational Culture and Communications, Types of Organizational Culture,
Organizational Culture and Leadership, and Organizational Culture and Business
Success. The literature review defines culture and provides techniques, methodology,
and tools that will be used in this research. Organizational Culture provides a general
overview to define organizational culture and its correlation with efficiency.
Organizational Culture and Communications describes the methodology used to
address how companies communicate their organizational culture via documentation
and websites and lastly whom they are communicating with. Types of Organizational
Culture address studies on the different types of culture and describes them in a
quantitative way. Organizational Culture and Leadership shows how leaders engage
the workers and empower them to work and instill the culture. This section defines the
leaders’ roles in creating, and maintaining organizational culture. The last section is
Organizational Culture and Business Success, which reviews how metrics correlate to
business results. At the end of each section is a table that summarizes the major
findings from the studies along with its significance to this research. Each section
summarizes how this research is different from previous research efforts and how
previous research findings were used.

24
Organizational Culture
Defining Organizational Culture
Robbins and Coulter describe organizational culture as shared values, beliefs or
perceptions held by the employees within an organization or an organizational unit
(Robbins and Coulter, 2005). Denison describes organizational culture as the
“underlying values, beliefs, and principles that serve as a foundation for the
organization’s management system as well as the set of management practices and
behaviors that both exemplify and reinforce those basic principles” (Denison, 1990,
p25.). Placed into context, culture serves as a symbolic entity that functions as an
implicit model in the minds of its members and those models are culturally determined
(Luthans, 2003). Employees see culture as a set of standards, which they accept and
exert to maintain. An organization’s culture is a reflection of the underlying assumption
about the way work is completed, rejected or accepted, and the encouraged or
discouraged behaviors and actions (Campbell, 2002 and Atkinson, 1990). Klein, Masi,
and Weidner (1995) state that organizational culture is at the heart of an organization’s
endeavors to improve its overall effectiveness and the quality of all its products and/or
services. Organizational culture consists of patterns of basic assumptions discovered
or developed by a given group as it learns to cope with its problems. These problems
could be of external adaptation and internal integration that has worked well enough to
be considered valid and then shared to a new member as the correct way to perceive,
think, and feel in relation to those problems (Schein, 1985).
Organizational culture in its full richness can be analyzed using three different
analytical levels: artifacts, values, and basic assumptions. Artifacts are visible
25
organizational structures and processes and are hard to decipher. Values reflect beliefs
and behaviors of an organization (Schein, 1995). Basic assumptions are unconscious
habits or perceptions, thoughts and feelings, and ultimately the sources of actions
(Schultz, 1995). Artifacts attempt to give newcomers some of the key elements of the
organization’s culture and verifies one’s hypotheses about basic assumptions (Schein,
1995).
The first of two scales used to ‘measure’ culture is strength (Deal and Kennedy,
1982 and Kotter and Heskett, 1992), which evaluates the cultures’ internal consistency
and influence on the organization’s associates. The second is efficiency (Peters and
Waterman, 1982; Denison, 1990) which evaluates the culture in relation to fulfillment of
goals and objectives, ability to be innovative, and strategic capacity.
Another way to define a culture is the type – the specific kind of culture that the
organization reflects (Cameron, 2004). Cameron and Ettington (1988) found that the
effectiveness of the organization is more closely associated with the types of culture
present than with the congruence or the strength of a culture. Table 3 summarizes how
this research is different from previous research efforts and how previous research
findings were used.

26
Table 3. Summary of the Studies for Organizational Culture Author, Year Major Finding Significance of this
study to this research Value add of this
research
Luthans, 2003 Organizational culture is described as shared values, beliefs, or perceptions
Used to define espoused culture
The term ‘Values’ will be used in the Espoused Culture definition
Robbins and Coulter, 2005
Organizational culture as shared values, beliefs or perceptions
Used to define espoused culture
The term ‘Values’ will be used in the Espoused Culture definition
Denison, 1990, Underlying values, beliefs, and principles that serve as a foundation for the organization’s management system
Organization culture is the foundation for the organization management system
Culture is a part of a management system therefore can be emulated by the ESB
Campbell, 2002 and Atkinson, 1990
Organization’s culture is a reflection of the underlying assumption about the way work is completed, rejected or accepted
Work is effective by organizational culture
Defined culture for ESB and the significant cultural variables
Klein, Masi, and Weidner, 1995
Organizational Culture is at the heart of an organization’s endeavors to improve its overall effectiveness and the quality of all its products and/or services
Culture leads to quality and effectiveness
Defined the significant cultural variables that were used in the regressing equation
Schein, 1985 Organizational culture consists of patterns of basic assumptions discovered or developed by a given group as it learns to cope with its problems
Coping skill Organizational culture is vital success tool for ESB
Deal and Kennedy, 1982 and Kotter and Heskett, 1992 Peters and Waterman, 1982 Denison, 1990
Culture can be measured based on strength, which evaluates the cultures’ internal consistency and influence on the organization’s associates. Culture can be measured based on efficiency; i.e., the fulfillment of goals and objectives:
Espoused culture cannot define strength or culture Assuming culture leads to goal attainment
Delimitations for study Defined the significant cultural variables that were used in the regressing equation
Cameron, 2004 Type defines a specific organizational culture.
There are different culture types
Defining culture types from Espoused Culture for ESB to define leadership type
Cameron and Ettington, 1988
Effectiveness of the organization is more closely associated with the types of culture
Culture types can effect KPI
Defining culture types from Espoused Culture for ESB to define leadership type
27
Organizational Culture and Communications
The Elements of Organization Culture
A vision statement is a future-oriented declaration of the company’s purpose and
aspirations. The vision statement defines what they want to become and where the
organization is going. Both the mission and vision provide a guide for the strategy. The
strategy provides a specific guide to the goals and objectives. Goals measure the
success or failure of the strategy and satisfaction of the objective statements in the
mission (Mason C., Bauer T., Erdogan B., 2014).
One fundamental truth is that an organization must have a committed set of
values without hidden agendas or special circumstances in order to establish its culture
(Warda, 2009). These values cannot be temporary or fleeting in nature, nor can they be
so abstract that members within an organization cannot readily identify with them.
Culture is the organization’s DNA; it is not what a company does, but who they are
(Warda, 2009).
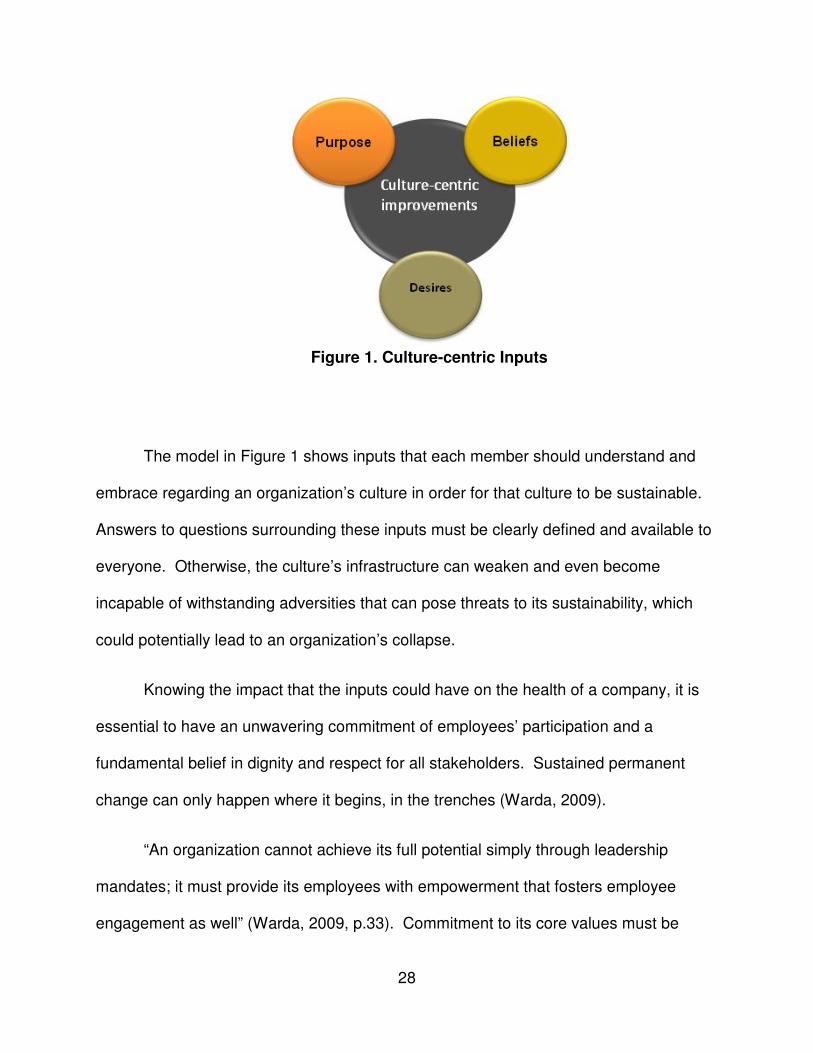
The Culture-centric Inputs Model (Warda, 2009) below depicts the essential
components of any culture and how each component relates to development and
improvements of that culture. When defining culture, answers to questions regarding its
essential elements should provide a relationship to the Culture-centric Inputs Model as
described below:
• Mission: Who are they? What is their purpose?
• Values: What does the organization believe in?
• Vision: Where does the organization desire to be?
28
The model in Figure 1 shows inputs that each member should understand and
embrace regarding an organization’s culture in order for that culture to be sustainable.
Answers to questions surrounding these inputs must be clearly defined and available to
everyone. Otherwise, the culture’s infrastructure can weaken and even become
incapable of withstanding adversities that can pose threats to its sustainability, which
could potentially lead to an organization’s collapse.
Knowing the impact that the inputs could have on the health of a company, it is
essential to have an unwavering commitment of employees’ participation and a
fundamental belief in dignity and respect for all stakeholders. Sustained permanent
change can only happen where it begins, in the trenches (Warda, 2009).
“An organization cannot achieve its full potential simply through leadership
mandates; it must provide its employees with empowerment that fosters employee
engagement as well” (Warda, 2009, p.33). Commitment to its core values must be
Figure 1. Culture-centric Inputs
29
more than pretense for an organization. Commitment must be the embodiment of each
encounter and all interactions with its customers and its employees. For an
organization to establish its culture, it must have a universally agreed upon and
committed set of values. These values must include the people working in the trenches
(employees) and leadership and be customer focus (Warda, 2009). Warda summarizes
the major elements of culture as vision, mission and values. Companies can
communicate their culture in different ways which could be verbally, written and/or
through media.
Company Communication of Culture Elements
The Center for Effective Organization at the University at Southern California
refers to a concept called ‘corporate philosophies’, which could be in their values, vision
statement, mission statement, credo, purpose or other documents (Ledford, Strahley,
and Wendenhof, 1995). If an organization wants to increase their productivity and
ensure alignment of goals, they must provide their members with a clear understanding
of “who they are, where they are going and how they are going to get there” (Falsey,
1989 p.3).
Companies that define their culture
A study by a consulting firm, Bain and Company, reported that 90% of the 500
firms surveyed has some form of mission and vision statements (Bart and Baetz, 1998).
Firms with clearly communicated, widely understood, and collectively shared mission
and vision perform better than those without them; This is with the stipulation that the
mission statements related to effectiveness are aligned with the strategy, goals and
objectives (Bart, and Bontis, 2001).
30
Where they define their culture
Jones, Little, and Blankenship (2007) completed a study on the Fortune 500
companies in 2007. 415 or 83% of these companies had a mission statement on their
website. The mission statements were predominantly (60%) under the ‘About the
Company’ caption on the website. The remaining 40% listed the mission statement
under other corporate information (Jones, Little, and Blankenship, 2007). One of the
main reasons the internet is used is because it conveys large amounts of information at
lower cost with faster speed than traditional media. The internet has changed the
dynamics of communication and has become a crucial tool for many organizations
(Kent, Taylor, and White, 2001).
The content of the culture
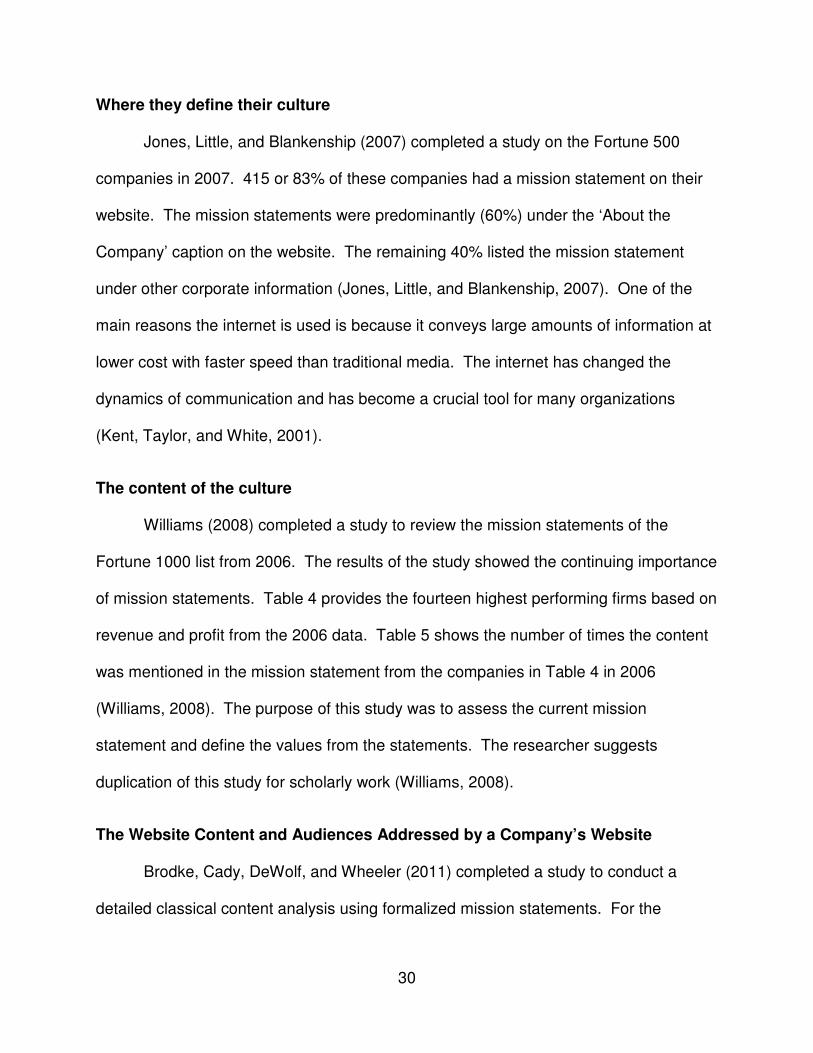
Williams (2008) completed a study to review the mission statements of the
Fortune 1000 list from 2006. The results of the study showed the continuing importance
of mission statements. Table 4 provides the fourteen highest performing firms based on
revenue and profit from the 2006 data. Table 5 shows the number of times the content
was mentioned in the mission statement from the companies in Table 4 in 2006
(Williams, 2008). The purpose of this study was to assess the current mission
statement and define the values from the statements. The researcher suggests
duplication of this study for scholarly work (Williams, 2008).
The Website Content and Audiences Addressed by a Company’s Website
Brodke, Cady, DeWolf, and Wheeler (2011) completed a study to conduct a
detailed classical content analysis using formalized mission statements. For the
31
Table 4. Highest Performing Fortune Firms in 2006
Table 5. Mission Statement Content for Top Fortune Firms
purpose of their study, the definition of ‘concept’ means an idea, expression, or unique
thought to communicate explicitly or implicitly information about their organization. The
data is from “The Mission Statement Book” written by Abrahams in 1999. The sources
of the companies included Fortune 2000, Forbes 200, and The 100 Best Companies to
Work for in America. A classical content analysis was employed using mission and 489
distinct statements were coded. The top titles for mission statement by frequency was:
Ranking Company
1 Exxon Mobil 2 Wal-Mart Stores
4 Chevron 5 Ford Motor 6 ConocoPhillips
7 General Electric 8 Citigroup 11 Hewlett-Packard
12 Bank of America Corporation 14 Home Depot 15 Valero Energy
17 J P Morgan Chase & Co. 18 Verizon Communications
Content Frequency of Content
Excellence 14 Integrity 9 Innovation 7
Respect 8 Leadership 4 Diversity 8
Responsibility 8 Citizenship 10 Teamwork 10
Safety 4

32
216 Mission, 78 Vision, 45 Values, 23 Principles, 20 Strategy, and 13 titled Purpose.
Table 6 contains the concepts used most frequently. Although this research provides
good empirical data to understand the concepts that companies are communicating,
there is significant room for additional studies on formalized company’s statements
(Brodke, Cady, DeWolf, and Wheeler, 2011).
Table 6. Top Concepts in Mission Statements
Mission statements are a critical piece of business communication from an
organization to its stakeholders including customers, employees, investors and
stockholders (Case, King, and Premo, 2008; Mason, Bauer, and Erdogan, 2014). The
mission statement can be short or expanded into a few paragraphs. The authors state
that the mission should communicate the organizations values, purpose, identity and
primary business goals (Case, King, and Premo, 2008). Fred David states that a
Concepts Frequency
Shareholder return / value 255
Quality-General /TQM 230 Customer Needs/Expectations Met/Exceeded 211 Financial Performance/Profitably 210
Integrity/Ethics 197 Innovation/Creativity 196 Community Focus/Involvement 193
Employee Training / Development /Growth 144 Market Position/Leadership/Reputation 141 Business Expansion/Growth 137
Continuous Improvement 116 Quality Product & Services 116 Value/Affordability/Low Price 114
Excellence 105 Customer Service 104 Employee Respect Dignity 101
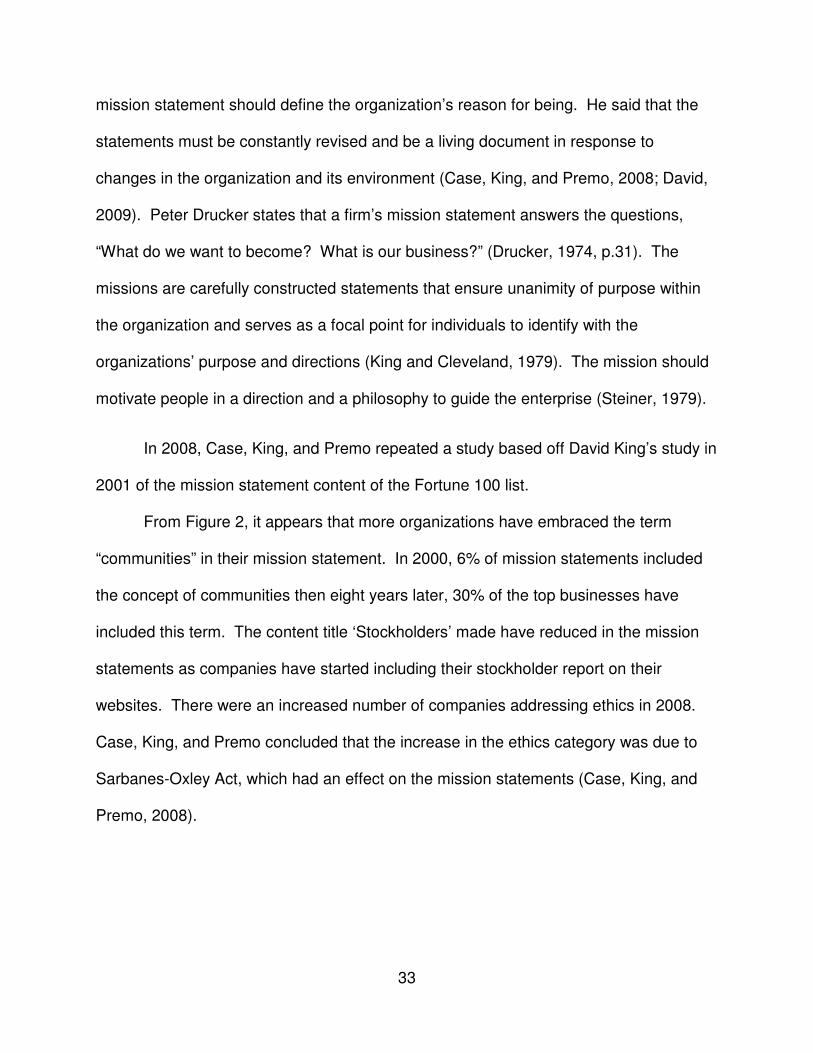
33
mission statement should define the organization’s reason for being. He said that the
statements must be constantly revised and be a living document in response to
changes in the organization and its environment (Case, King, and Premo, 2008; David,
2009). Peter Drucker states that a firm’s mission statement answers the questions,
“What do we want to become? What is our business?” (Drucker, 1974, p.31). The
missions are carefully constructed statements that ensure unanimity of purpose within
the organization and serves as a focal point for individuals to identify with the
organizations’ purpose and directions (King and Cleveland, 1979). The mission should
motivate people in a direction and a philosophy to guide the enterprise (Steiner, 1979).
In 2008, Case, King, and Premo repeated a study based off David King’s study in
2001 of the mission statement content of the Fortune 100 list.
From Figure 2, it appears that more organizations have embraced the term
“communities” in their mission statement. In 2000, 6% of mission statements included
the concept of communities then eight years later, 30% of the top businesses have
included this term. The content title ‘Stockholders’ made have reduced in the mission
statements as companies have started including their stockholder report on their
websites. There were an increased number of companies addressing ethics in 2008.
Case, King, and Premo concluded that the increase in the ethics category was due to
Sarbanes-Oxley Act, which had an effect on the mission statements (Case, King, and
Premo, 2008).
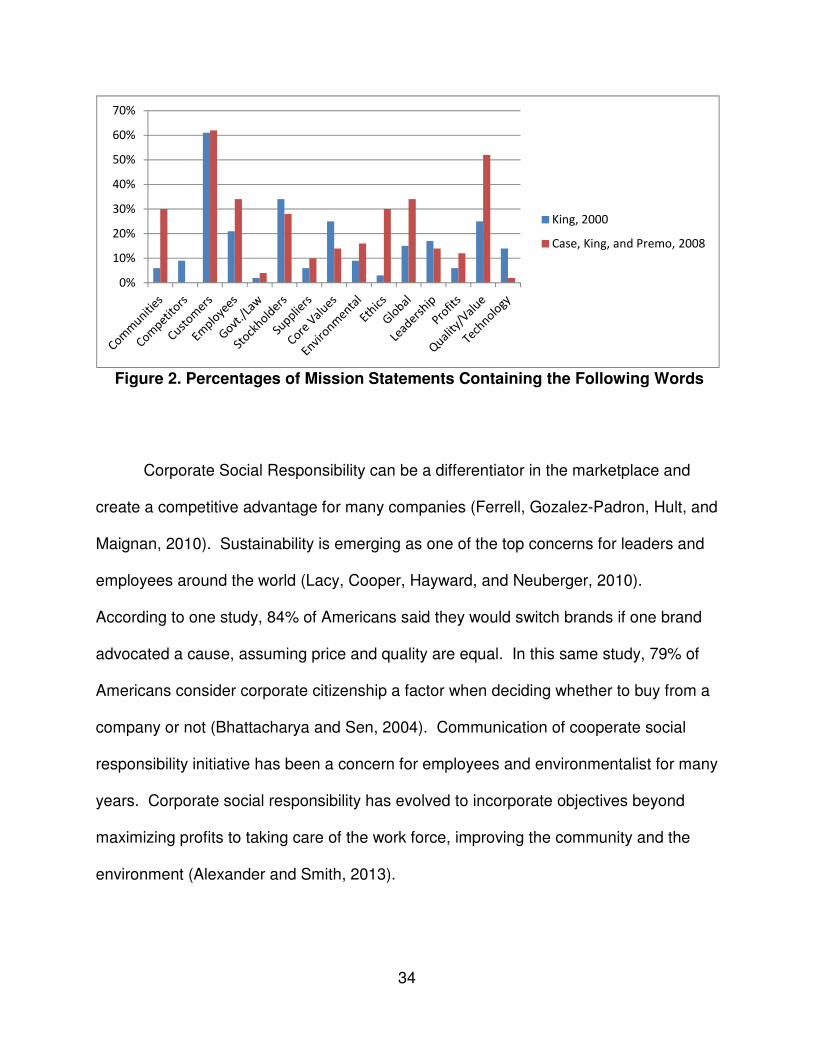
34
Figure 2. Percentages of Mission Statements Containing the Following Words
Corporate Social Responsibility can be a differentiator in the marketplace and
create a competitive advantage for many companies (Ferrell, Gozalez-Padron, Hult, and
Maignan, 2010). Sustainability is emerging as one of the top concerns for leaders and
employees around the world (Lacy, Cooper, Hayward, and Neuberger, 2010).
According to one study, 84% of Americans said they would switch brands if one brand
advocated a cause, assuming price and quality are equal. In this same study, 79% of
Americans consider corporate citizenship a factor when deciding whether to buy from a
company or not (Bhattacharya and Sen, 2004). Communication of cooperate social
responsibility initiative has been a concern for employees and environmentalist for many
years. Corporate social responsibility has evolved to incorporate objectives beyond
maximizing profits to taking care of the work force, improving the community and the
environment (Alexander and Smith, 2013).
0%
10%
20%
30%
40%
50%
60%
70%
King, 2000
Case, King, and Premo, 2008
35
Personnel in public relations spend a substantial amount of time and resources
to improve communications. Because of its public nature, online communication
provides an excellent opportunity to complete an analysis of various communications in
an organization. Previous research investigated how companies used their website to
identify stakeholders and their message content of the Fortune 500 companies (Kim,
Park, and Wertz, 2010). The article classified stakeholders into two different types,
primary and secondary. Primary stakeholders included employees, investors,
customers, other resource suppliers, community residents and the natural environment.
The primary stakeholders are essential to the success of a corporation. Secondary
stakeholders included media, activists and competitors; they influence the corporation
but are not considered a crucial group (Clarkson, 1995, and Donaldson & Preston,
1995).
Kim, Park, and Wertz, completed a study to answer the following three questions:
Which stakeholder’s needs are most frequently addressed by the web site? Among
these stakeholders what need is addressed by the website? Are there any differences
by industry type? They reviewed the three different areas of the web site: the company
overview, corporate information, and facts about the company. The coding procedure
included: financial report, stock information, stockholder services for shareholders,
community environment protection, fair labor and employment practices, community
services activities for community members, environmental regulation compliance, fair
labor regulation, and public health regulation for government. The activists’ messages
were reviewed for general messages, proactive messages, and reactive messages
(Kim, Park, and Wertz, 2010).
36
Two scales were used in the procedure. The first scale was either a zero or one,
to minimize possible subjective decisions made by the coder. The second scale was
the degree of emphasis for an indicator with the scale going from one (being the low
emphasis) to three (being the highest emphasis).
Ninety-two percent of Fortune 500 websites address all three shareholder’s
targets (stockholder services, financial report, and stock information). Based on the
results of the study, the Fortune 500 companies consider the shareholders most often in
their communications. The top 100 companies in the Fortune 500 tended to address
more of all five stakeholder’s needs by employing more target message components
than the bottom 100 companies This research shows that online communication
provides an excellent opportunity to reach all stakeholders and communicate a specific
message to each group. The internet has changed the power dynamics of
communication and has become a crucial tool for organizations (Kim, Park, and Wertz,
2010).
Much like a company’s logo, a company’s web site has become an iconic
representation of the corporation. Websites disseminate messages like other media, or
like a survey, it targets an audience and monitor public opinion on issues of interest to
an organization. Unlike traditional mass media channels, a single website can have
multiple sections; each targets a different audience, like customers, government
officials, employees, dealers, suppliers, and activists. A study by Esrock and Leichty
(2000) on the Fortune 500 companies to review the presence or absence of 58
characteristics. These characteristics included whether or not content areas were
covered such as, news release, annual reports, multimedia formats, site maps, online
37
surveys, search engines interactive features like email links. The specific audience type
addressed (that was also coded) included: customer/customer service, dealers/retailers,
employees, prospective employees (employment opportunities), the press, and
investors/shareholder/financial community. Social responsibility content was analyzed
for the presence of social responsibility and was addressed by 44% of the companies.
Table 7 provides the primary audiences addressed by websites.
Table 7. Primary Audiences Addressed by Websites
This study only looked at active hyperlinks and /or the content on the site’s home
page. The conclusion focused on websites that had the corporate name and thus
represented the corporation as whole (Esrock and Leichty, 2000). Therefore, this
research shows that a company’s websites are legitimate sources of data for this
research. The research also addressed all the stakeholders in different web pages by
using hyperlinks to guide then to the information for their group. Table 8 summarizes
how this research is different from previous research efforts and how previous research
findings will be used.
Audience % Addressed by Websites
Shareholder/ investors 68% Prospective employees 68% Customers/ Customer services 51%
Media 22% Dealers and retailers 8% Current employees 3%

38
Table 8. Summary of Organizational Culture and Communications Author, Year Major Finding Significance of this
study to this research Value add of this
research
Warda, 2009 Mission: who are we? Values: What do we believe in? Vision: where do we desire to be?
Used in the definition of espoused culture
Used to define ‘Espoused Culture’ as a company’s Vision, Mission & Values
Mason C., Bauer T., Erdogan B., 2014
Vision defines what they want to become, Mission and vision provide a guide for the strategy
Used in the definition of espoused culture
Used to define ‘Espoused Culture’ as a company’s Vision, Mission and Values
Ledford, Strahley, and Wendenhof, 1995
Corporate philosophies, are: values, vision statement, mission statement, credo, purpose
States that corporate philosophies are documented
Espoused Cultures can be obtained from some companies
Bart and Baetz, 1998 Mission & vision both relate to an organization’s purpose. Typically communicated by the company in some written form
States that mission, vision, & philosophies are documented by 90% of 500 firms
Espoused Cultures can be obtained from most companies
Jones, Little, and Blankenship, 2007
83% of companies had a mission statement on their website
Mission can be found on a company’s website
Espoused Cultures can be obtained from a company’s website
Williams, 2008 Integrity, Innovation, Respect, Leadership, Diversity, Responsibility, Citizenship, Teamwork, example of content found in Mission Statement
Content Analysis was completed on the Mission Statements
Used in the search method to perform the content analysis
Brodke, Cady, DeWolf, and Wheeler, 2011
The top 80% of the titles for the mission was as follows: Missions, Values, Vision, Principles, Purpose & Strategies.
Mission encompasses more than just the Mission Statement Example of a content analysis study
Used in the search method to perform the content analysis
Case, King, and Premo, 2008
Content analysis on Mission Statements
Content analysis study w/ focus on ethics category
Used in the search method to perform the content analysis
Alexander, and Smith, 2013
Content analysis on of websites with heading for Corporate Social Responsibility
Content analysis for Manufacturing companies
Used in the search method to perform the content analysis
Kim, Park, and Wertz, 2010
92% of Fortune 500 websites address all three shareholders
Internet has changed the power dynamics of communication;
Espoused culture can be obtained from a company’s website
Esrock and Leichty, 2000
Audiences addressed in Websites: shareholder, investors, customer, media, dealers, retailers and current and prospective employees
Websites represent the company as a whole
Espoused Culture can be obtained from a company’s website
39
Types of Organizational Culture In order to identify a corporate culture, we must be able to use measurements
that help place it into a certain context. Measuring Organizational Cultures: a
Qualitative and Quantitative Study across Twenty Cases by Hofststede, Neuijen,
Ohayv, and Sanders (1985) reviews the construction of organizational culture.
Organizational Culture has fundamentally become “corporate culture” as it is known
today. Weick argued that “culture” and “strategy” are partly overlapping concepts in
their study of 1985, "The significance of corporate culture".
A theory formed around whether organizational cultures could be measured
quantitatively or describes qualitatively found six dimensions of perceived practices, P1
through P6.
1. P1 = Process-oriented vs. Results-oriented;
2. P2 = Employee-oriented vs. Job-oriented;
3. P3 = Parochial vs. Professional;
4. P4 = Open system vs. Closed system;
5. P5 = Loose vs. Tight control and;
6. P6 = Normative vs. Pragmatic.
These dimensions developed a checklist for practical cultural differences among
organizations. This multidimensional model, derived from the study of various cultures
did not support the perception that any position of the six dimensions would be
fundamentally good or bad. The research decided that finding a position on the
dimension scales as more or less desirable would be contingent upon a matter of
40
strategic choice, which could also be influenced by industry types (Hofststede, Neuijen,
Ohayv, and Sanders, 1985).
In a Systematic Approach for Making Innovation a Core Competency, by John C.
Timmerman (2009), he defines the innovation process by studying a hotel. Ritz –
Carlton, the five star hotel chain famous for its luxurious accommodations, must be agile
in responding to its evolving customer base and the never-ending introduction of
competing brands. Nevertheless, they continue to use proven practices from
benchmarking studies of external organizations that have exhibited well-established
core competencies of innovation. Companies such as Disney, Corning Incorporated
and Cisco Systems are among the list of those studied. These practices consist of a
four-step innovation process designed with environmental factors at the core of the
model.
The Key Methods for the Innovation Model are:
Step 1 & 2
• Inspiring a vision and fostering an environment for innovation
• A shared purpose is a critical factor in employee motivation.
• Benchmarking opportunity for innovation through their own eyes and then
translating it to the context of their work processes.
Step 3 & 4: Stimulate and test Ideas (The Science of Ideation)
• Start the planning, growing, and harvesting of idea from the fertile grounds
created in the first two steps (Timmerman, 2009).

41
The steps show how a company uses it vision to create a specific environment to
achieve goals and objectives by the employees.
Organizations must create a balanced focus. Principles, 9, 10, and 11 in the
book, The Toyota Way: 14 Management Principles from the World's Greatest
Manufacturer by Jeffrey Liker (Vincent, 2009), focuses on adding value to an
organization by developing not only people, but partners as well.
• Principle Nine focuses on growing leaders who thoroughly understand the work,
live the philosophy and are willing to teach it to others.
• Principle Ten is about the development of exceptional people and teams who
follow their company’s philosophy
• Principle Eleven explores respect for the extended network of partners and
suppliers by challenging them and helping them to improve an ideology of long-
term sustainability that local communities seek and embrace in an organization.
Whenever a community feels that it can depend on an organization to provide
jobs and commerce, it attempts to cultivate a partnership with the organization
and will be more willing to work with that business (Vincent, 2009). Leadership
develops the mission of the company; leaders teach it to their employees while
working in teams is one of the principles addressed above. Toyota works with
their suppliers and partners to instill their mission and principles.
Quinn and McGrath (2009) identified four types of organizational culture.
Rational Culture is an organization whose behavior seeks efficiency and productivity to
realize the maximum performance. Ideological Culture is an organization that asks for
social support to expand their capability when faced with growth and competition.
42
Coordinated Culture is an organization that emphasizes participation of internal
activities with intent of maintaining a harmonious operation. Hierarchical Culture is an
organization in which the power is held by a few people and where others receive
guidance by formal regulations (Quinn and McGrath 2009).
Cameron, Quinn and DeGraff reviewed their model for a competing values
framework. The model consists of four values labeled with an action verb (collaborate,
create, compete, and control) which are used to describe the orientation of the leader.
Four types of cultures have been identified through their value creation process. Clan
Culture (Cameron and Quinn, 1999; Ouchi, 1981) is family-like and focuses on
mentoring, participation, consensus, and teambuilding. Adhocracy Oriented Cultures
(Cameron and Quinn, 1999; Mintzberg and McHugh, 1985) emphasize innovation and
having an entrepreneurial spirit. Cameron, Quinn and DeGraff envision changes that
produce effectiveness. Market Oriented Cultures (Cameron and Quinn, 1999;
Williamson, 1975) tend to be competitive with a focus on producers, goal achievement
and profits. Hierarchy Oriented Cultures (Cameron and Quinn, 1999; Weber, 1947)
focus on controlled and efficient processes with consistency and uniformity. The
general view of this model as explained in the book is that no company will be able to
succeed in a noticeable way over a long period of time without attention to the
placement of the four cultures in its organizational model (Cameron, Quinn, DeGraff and
Thakor, 2006).
Table 9 summarizes how this research is different from previous research efforts
and how previous research findings will be used.
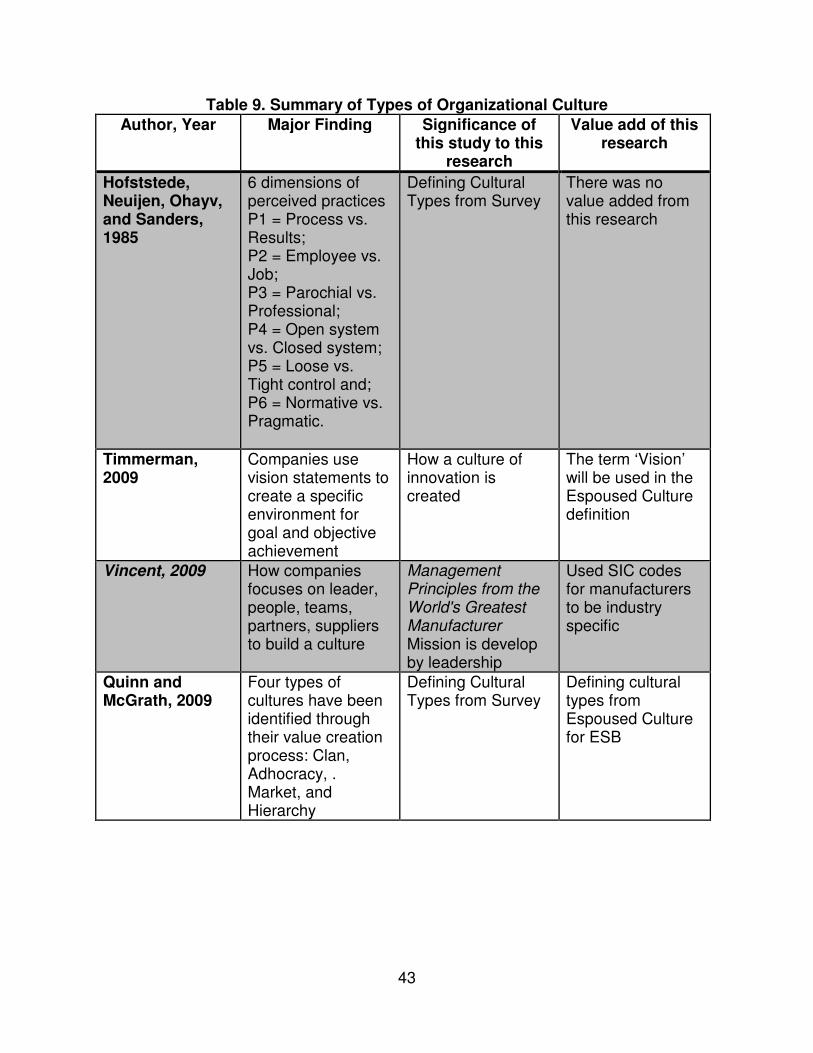
43
Table 9. Summary of Types of Organizational Culture
Author, Year Major Finding Significance of this study to this
research
Value add of this research
Hofststede, Neuijen, Ohayv, and Sanders, 1985
6 dimensions of perceived practices P1 = Process vs. Results; P2 = Employee vs. Job; P3 = Parochial vs. Professional; P4 = Open system vs. Closed system; P5 = Loose vs. Tight control and; P6 = Normative vs. Pragmatic.
Defining Cultural Types from Survey
There was no value added from this research
Timmerman, 2009
Companies use vision statements to create a specific environment for goal and objective achievement
How a culture of innovation is created
The term ‘Vision’ will be used in the Espoused Culture definition
Vincent, 2009 How companies focuses on leader, people, teams, partners, suppliers to build a culture
Management Principles from the World's Greatest Manufacturer Mission is develop by leadership
Used SIC codes for manufacturers to be industry specific
Quinn and McGrath, 2009
Four types of cultures have been identified through their value creation process: Clan, Adhocracy, . Market, and Hierarchy
Defining Cultural Types from Survey
Defining cultural types from Espoused Culture for ESB
44
Organizational Culture and Leadership
Effects of Leadership on Culture
Historical Studies
Michigan Leadership Studies (Luthans, 2003) of 1940-1950, conducted on the
prudential Insurance Company, compared employee satisfaction to productivity to
determine the effect that the relationship would have on one or the other. The studies
showed that supervisors of a high productivity section were more employee-centered
while supervisors of lower productivity groups were more job/task centered. This study
concluded that employee satisfaction is indirectly proportional to productivity.
Traditional Theories of Leadership
• Trait theories tried to settle debates of whether people were born to be
leaders and whether intelligence/emotional intelligence were traits of an
effective leader. The traits theory also answered questions regarding abilities
and methods of learning to become effective leaders. In the end, the study
revealed consistent patterns of common skills that were apparent among
successful leaders. The theory also showed that similar personality traits
were consistently present among focus groups from one century to the next
(Luthans, 2003).
• Group and Exchange Theories highlight what impact followers have on their
leaders. This theory showed that subordinates affect leaders as much as
leaders affect their followers. In contrast to the Ohio State Leadership Study,
it claims that group productivity has a greater impact on the style of
leadership used than its leader has on the productivity of the group.
45
• Fiedler’s Contingency Model (Luthans, 2003) of Leadership Effectiveness
asserted that there was a relationship between leadership styles and the
favorability of situational outcomes. The model showed that a leader’s
situational favorableness would be high in cases where the members
respected, trusted and liked the leader. On the other hand, in cases where
the expectations of the task were unclear and not well understood by the
members, the leadership effectiveness was not as favorable.
There have been debates about the difference between leading and managing
and the relative importance of the roles of success of an organization (Yukl and
Lepsinger, 2005). Studies agree that all organizational change require leadership and
owners. Culture change does not occur randomly or inadvertently in any organization
and it requires leaders who are consciously and consistently directing this process
(Cameron, 2004). Although many cultures tend to be conservative in adopting changes,
it is believed that all cultures change over time; no culture is perfectly static (O’Neil,
2006). Cultural change is very complex and can have far ranging causes and effects
(Makarevicius, 2014).
Successful leaders also have the ability to change a culture as Rex Campbell
states in has book Getting it Done (1997). They influence people and companies to
follow paths that help them realize significant achievements in their endeavors or
industries. Two such leaders are Dr. Martin Luther King, Jr. and Apple Corporation’s
former Chairman, Steve Jobs.
Dr. King’s leadership style, largely based on the non-violence teachings of
Mahatma Gandhi, ultimately placed him as a world leader inciting the Civil Rights
46
Movement among an entire race of people. His leadership did more for the
acknowledgement of racially based injustices in America than any other civic leader
known to history (Brown-Nagin, 2014). His leadership is important because he defines
an innate shared vision that all men and women have the right to freedom and liberty.
Both the mission and goals are clearly stated.
Likewise, Steve Jobs’ leadership helped pioneer the personal computer as we
know it today. His leadership further helped to sustain Apple as a computer
manufacturer and service provider that has maintained a position in the forefront of the
computer industry for over thirty years. Because of the culture that these types of
leaders were able to develop and sustain, the world truly is immeasurably better
(Vincent, 2009). Steve Jobs did not change or manage the culture into which he was
hired; he started a culture and maintained his vision as the founder of Apple. Some
other examples of these dramatic cultures created by the initial founders of the firm are
Disney and Microsoft (Cameron, 2004).
In a first generation company, crisis will expose profound assumptions of the
founder. For example, during a poor economic situation, one founder might lay off
people, even his closest colleagues, and another founder might place everyone on part-
time work, suggesting that he values his people more and want to retain as many of
them as possible (Schein, 1995).
Founders usually have a great influence on how a group defines and solves
external and internal problems, so “one cannot separate the process of leadership from
the process of building culture” (Schein, 1995, p.171). One of the most decisive

47
functions of leadership is the creation and management of these organizational cultures
(Schein, 1985).
Nine Keys to a Good Leader (Campbell, 2002) defines the following nine
leadership skills and abilities to develop to achieve organizational purpose:
1. Vision – establish the general tone and direction of the organization.
2. Management – focus resources to achieve specific goals.
3. Empowerment – select and develop subordinates who are committed to the
organization’s goals.
4. Diplomacy – forge a coalition with important internal and external
constituencies: i.e., peers, superiors, subordinates, potential organizational
allies, and other important outside decision makers.
5. Feedback – observe and listen carefully to clients, customers, voters,
employees, students and team members, and then share the resulting
information in a manner those affected can accept as beneficial.
6. Entrepreneurialism – find future opportunities and strategically create new
and differentiated beneficial endeavors such as increased revenues,
expanded markets, enhanced asset utilization, or a higher probability of
sustained desired outcomes.
7. Personal style – by personal example set an overall organizational tone of
competence, optimism, integrity, and inspiration.
8. Personal energy – live a disciplined wholesome lifestyle that provides the
necessary energy and durability to handle the physical demands of
48
leadership: long hours, stressful decisions, conflicts, resolutions, and
wearying travel.
9. Multicultural awareness - be experienced and comfortable working with
individuals managing the organization across different demographics and
cultural borders (Campbell, 2002).
Yafang, Wu, and Chung (2009), identified and researched three main types of
leadership styles. Charismatic Leaders communicate high performance expectations to
their followers, take risks that oppose the status quo, and articulate a vision and
collective identity to the organization. Transformational leaders emphasize productivity
by motivating their followers. They proclaim their vision and their style of leadership
through works done to transform their teams. Somewhat similarly, Transactional
Leaders focus on task completion and employee compliance. This style of leadership
utilizes rewards as well as punishment to drive employee performance in meeting their
goals (Tsai, Wu, & Chung, 2009).
When the company is small, everyone knows everyone else. The leader has
direct contact with most of the employees. Using these contacts, leaders can quickly
get across their priorities, values and assumptions by consistently linking rewards and
punishments to behavior and their concerns. Leaders should pay attention to measures
and controls and how they react to critical incidents by modeling, teaching, and
coaching (Schein, 1992).
A leader of a small business will need to change and/or establish their culture to
match their mission, vision, and values; some will have the opportunity to start a new
firm and create a specific culture and some will be sustaining what is there.
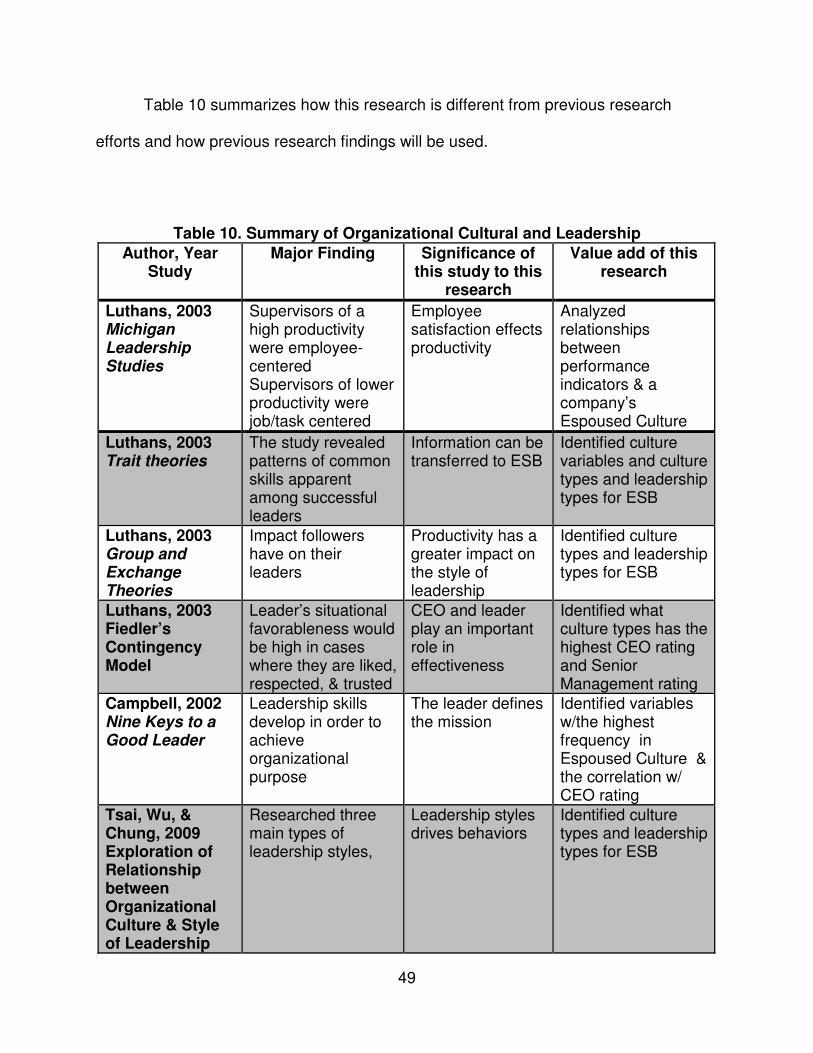
49
Table 10 summarizes how this research is different from previous research
efforts and how previous research findings will be used.
Table 10. Summary of Organizational Cultural and Leadership
Author, Year Study
Major Finding Significance of this study to this
research
Value add of this research
Luthans, 2003 Michigan Leadership Studies
Supervisors of a high productivity were employee-centered Supervisors of lower productivity were job/task centered
Employee satisfaction effects productivity
Analyzed relationships between performance indicators & a company’s Espoused Culture
Luthans, 2003 Trait theories
The study revealed patterns of common skills apparent among successful leaders
Information can be transferred to ESB
Identified culture variables and culture types and leadership types for ESB
Luthans, 2003 Group and Exchange Theories
Impact followers have on their leaders
Productivity has a greater impact on the style of leadership
Identified culture types and leadership types for ESB
Luthans, 2003 Fiedler’s Contingency Model
Leader’s situational favorableness would be high in cases where they are liked, respected, & trusted
CEO and leader play an important role in effectiveness
Identified what culture types has the highest CEO rating and Senior Management rating
Campbell, 2002 Nine Keys to a Good Leader
Leadership skills develop in order to achieve organizational purpose
The leader defines the mission
Identified variables w/the highest frequency in Espoused Culture & the correlation w/ CEO rating
Tsai, Wu, & Chung, 2009 Exploration of Relationship between Organizational Culture & Style of Leadership
Researched three main types of leadership styles,
Leadership styles drives behaviors
Identified culture types and leadership types for ESB

50
Organizational Culture and Business Success
Culture and Company Effectiveness
Senior management often have different views of how to assess financial
performance: debt/equity ratios, return on sales, return on investment, stock price and
other indicators. The debate is whether financial criteria should override criteria such as
customer satisfaction or employee morale (Schein, 1995).
In 1992, Professor James Heskett completed a research project detailing the
corporate cultures of 200 companies and how each company’s culture affected its long-
term economic performance. The main argument was that strong corporate cultures
that facilitate adaptation to change were associated with strong financial performance.
The culture placed a high value on employees, customers, and owners. These firms
also encouraged leadership from everyone. The measures of success were revenue
growth, employment growth, stock price growth, and net income growth. Table 11
shows the results over 11 years between 12 companies with a performance- enhancing
culture and 20 companies that did not have a performance- enhancing culture.
Table 11. Financial Results over Eleven-Year Period
KPI Average Increase of KPI for 12 Firms with
Performance- Enhancing Cultures
Average Increase of KPI for 20 Firms without
Performance- Enhancing Cultures
Revenue Growth 682% 166%
Employment Growth 282% 36% Stock Price Growth 901% 74% Net Income Growth 756% 1%
51
The article highlighted the significance of the strength of a company’s culture with
respect to financial outcome (International, 2011).
Eric Falmholtz from the University of California (2001) completed a study on
medium sized parts manufactured for trucks and other automotive businesses to define
the relationship between corporate culture and financial performance. The study looked
at a supplier for Ford, Navistar, and Dana Corporation. The goals were to (1) develop a
culture or set of values for the desired culture, (2) measure the extent to which people
agreed with the proposed culture (3) measure the actual behavior to the stated culture
and (4) design strategies to increase the desired culture (Falmholtz, 2001).
They developed explicit statements of the culture and sent out questionnaires to
the employees. The response rate was 78% and 96% of those who responded agreed
with the stated or ideal culture. They measured the effects of culture on the financial
performance and found that 46% of EBIT (earnings before interest and taxes) was
explained by the variable ‘corporate culture’. Based on the findings, the corporation
added an ‘effective culture management’ as a key result of the divisional performance
management system. This meant that the general managers were held responsible for
measurable improvements in reducing the gap between the desired culture and the
actual divisional culture (Falmholtz, 2001).
The Denison model (Denison, 2011) is based on the following four cultural traits
of effective organization:
• Involvement - Companies that empower their people build teams and develop
human capability at all levels. Employees are committed to their work and
feel that they have ownership at all levels of the organization. They have
52
input into decisions that affect their work and are connected to goals in the
organizations. The three indexes to involvement are capability development,
team orientation, and empowerment.
• Consistency – Consistent cultures are well-coordinated and integrated at all
levels of the organization. Behavior is rooted in a set of core values. This
consistency is the source of stability and internal integration with the
company. The three indexes to consistency are coordination/integration,
agreement, and core values.
• Adaptability – Customer’s needs drive adaptable organizations. Adaptable
organizations take risks, learn from their mistakes and have the ability to
create change. The three indexes to adaptability are creating change,
customer focus, and organizational learning.
• Mission – Any successful organization must have a clear sense of purpose
and direction that defines the companies’ goals, strategic objectives, and
vision. The three indexes to mission are strategic directions, goals and
objectives, and vision.
The Denison model is often used as part of a diagnostic process to profile
specific organizational strengths and weaknesses of their culture and suggest ways in
which the organization’s culture may influence its effectiveness.
Denison and Mishra in 1995 answered the question of how involvement,
consistency, adaptability, and a sense of mission or long-term vision positively relates to
effectiveness. Survey data was gathered from SIC codes of five major industries:
manufacturing, business services, finance insurance and real estate, retail, and
53
wholesale. The survey asked top executives from 764 organizations to compare a set
of effective measures including subjective and objective measure of profitability, quality,
sales growth, satisfaction and overall effectiveness. The results were strong predictors
of quality, employee satisfaction, and overall performance, and weak predictors for
sales growth and profits. The data supports the idea that different cultural traits are
related to different criteria of effectiveness. The data shows that profitability criteria is
best predicted by the mission and consistency, while sales growth is best predicted by
involvement and adaptability (Denison and Mishra, 1995).
Kotrba, Gillespie, Schmidt, Smerek, Ritchie, and Denison (2012) completed
another study using Denison’s Model, also including market-to-book ratios, sales
growth, and return-on-assets. The results showed an interaction with cultural
consistency and the other three traits of involvement, adaptability and mission.
Involvement showed the greatest effect on ‘market-to-book ratios’. The effects of
consistency on performance varied in scale and direction as a function of the other main
culture traits. This highlights the need to study the combination of cultural traits when
considering cultural creation. This study extends previous research in the links between
organizational culture and financial performance.
Carmeli and Tishler completed a study on the relationships between intangible
organization elements and organizational performance. The study used quantitative
empirical methods to test six intangible elements and their effects on performance:
management capabilities, human capital, perceived organization reputation, internal
auditing, labor relations and organizational culture. The financial performance measure
was income. Organizational culture was based on Denison’s model (Denison, 2011):
54
• Involvement and participation of the organization’s members.
• Consistency of which the organization’s members understand and hold a
shared system of belief, values, and symbols.
• Adaptability of the organization’s ability to perceive the external and internal
environment and respond to it,
• Mission: the degree to which the organization’s members hold the definition of
its function and purpose of the organization and its members (Carmeil and
Tishler, 2004).
The methods used were mailing surveys with questions and using data from the
Fortune annual corporate reputation survey. The effects of the six organizational
elements and their interaction on organizational performance was 24% for
organizational culture, 23% for perceived organizational reputation, 18% for labor
relations and human capital, 17% for internal auditing and lastly 16% for managerial
capabilities. The study clearly showed that six intangible elements are critical for the
organization to attain its goals, with organizational culture having the highest
percentage in this study of 24%, second to perceived organizational reputation of 23%.
(Carmeil and Tishler, 2004).
Culture can be a complex phenomenon ranging from underlying beliefs and
assumptions to visible structures and company practices. A study completed by
Denison, Goelzer, and Haaland in 2003 answered the question, “Are there cross-
cultural differences in the relationship between organizational culture and
effectiveness?” (Denison, Goelzer, and Haaland, 2003). Forty eight percent of the
sample for the study where in the Forbes Global 1000 list. The second sample was

from 2162 employees for independently owned local grocery stores. The method was
to mail out 6736 surveys and the response ra
indices of organizational culture categories, five questions in each section for a total of
60 questions. The results for the correlations between dimension of corporate culture
and overall effectiveness for the Uni
Figure 3. Correlation between performance & the 12 Indices for U.S p<.05
Empowerment had the greatest contribution on performance, then goals and
objectives as seen in Figure 3. The purpose of the study was to help understand the
impact that organizational culture has on organizational effectiveness (Denison,
Goelzer, and Haaland, 2003).
55
from 2162 employees for independently owned local grocery stores. The method was
to mail out 6736 surveys and the response rate was 42%. The survey measured twelve
indices of organizational culture categories, five questions in each section for a total of
60 questions. The results for the correlations between dimension of corporate culture
and overall effectiveness for the United States was the following:
. Correlation between performance & the 12 Indices for U.S p<.05
Empowerment had the greatest contribution on performance, then goals and
objectives as seen in Figure 3. The purpose of the study was to help understand the
impact that organizational culture has on organizational effectiveness (Denison,
and, 2003).
from 2162 employees for independently owned local grocery stores. The method was
te was 42%. The survey measured twelve
indices of organizational culture categories, five questions in each section for a total of
60 questions. The results for the correlations between dimension of corporate culture
. Correlation between performance & the 12 Indices for U.S p<.05
Empowerment had the greatest contribution on performance, then goals and
objectives as seen in Figure 3. The purpose of the study was to help understand the
impact that organizational culture has on organizational effectiveness (Denison,
56
Specific Company Examples
Denison and Mishra (1995) asked what other characteristics of organizational
cultures may be related to effectiveness. They collected survey data from 34
companies between 1968 and 1980, and matched it with performance data for the five
years after the survey. They completed the actual study on five companies. They also
used publicly available sources such as annual reports, the popular press and business
histories. They interviewed knowledgeable outsiders who provided insight about the
firms. The also interviewed the CEO along with the top executives of each firm. From
the interviews, they defined the organization’s culture and core values. The companies
in the study were Medtronics, People Express Airlines, Detroit Edison, Procter and
Gamble and Texas Commerce Bancshares.
• Medtronics is driven by an explicit humanistic vision that goes beyond economic
rationale. Medtronics did not just have a mission; it lived it out. They understood
involvement is a cultural trait that relates to effectiveness. They drive
volunteerism, commitment, and identification with the humanistic mission. They
created unity of purpose by creating meaningful work for individuals and a sense
of direction for the organization as a whole. The business goals and mission
appeared consistent.
• People Express Airlines’ plan was to create a highly democratic organizational
culture and implement many innovative human resource practices. They trained
all new employees to work in teams. They also believed in self-management and
autonomy. They wanted to unleash the power of the individual. From the
beginning, they created a powerful cultural system based on shared values, a
powerful vision, involvement and empowerment of their employees.
57
• Detroit Edison’s organizational culture was like a family with a highly stable work
force. They had well defined authorities and jobs. The mission was to create
safe and efficient options in power plants for their consumers. They valued
authority, predictability, and technical skills. Involvement was secondary to
stability and consistency.
• Procter and Gamble is well known for being innovators in areas such as brand
management, profit sharing, advertising, and promotions. When making
decisions in the company, knowledge of the numbers was vital. New employees
in the brand management would see peer competition and cooperation as a real
source of learning and motivation. There was a strong emphasis on written
communication.
• Texas Commerce Bancshares has an emphasis on marketing and managing by
the numbers. Leadership comes from the top down and respect for authority is
high. The culture is influenced by the strong regional culture of Texas and much
of their work is done in large committees. Because of their structure, they have a
high level of normative integration and consistency.
For all of the companies, the importance of its mission to culture and
effectiveness was closely related. The research observed that when the mission was
changed, it coincided with significant losses of momentum and effectiveness (Denison
and Mishra, 1995).
Zappos, an online shoe and clothing shop, takes its corporate culture very
seriously. They have weekly office parades to help institutionalize their corporate

58
values. They state, “We’ve aligned the entire organization around one mission: to
provide the best customer service possible” (International, 2011, p.1).
A PowerPoint deck went viral and was viewed more than five million times on the
web. The document explained how Netflix shaped its culture and motivated
performance. During 2010, Netflix stock more than tripled, it won three Emmy awards,
and its U.S. subscriber base grew to nearly 29 million. The company’s expense policy
is just five words, “Act in Netflix’s best interest”. Some of their practices include workers
being allowed to take whatever vacation time they feel is appropriate. They also let
their employee choose what percentage of stock options will be in their compensation
package. They believe 97% of employees will do the right thing (McCord, 2014).
Table 12 summarizes how this research is different from previous research
efforts and how previous research findings will be used.
Key Gaps in Previous Research
The following gaps were identified from the previous research and scholarly studies:
• The research performed surveys and correlated survey findings to
performance indicators without performing other statistical test to validate the
results. The method was to ask executives to compare cultural traits to
financial performance. This data was not checked against the actual metrics.
The only information provided from the literature review was the responder’s
opinion of the independent variable to the correlations to the dependent
variable.
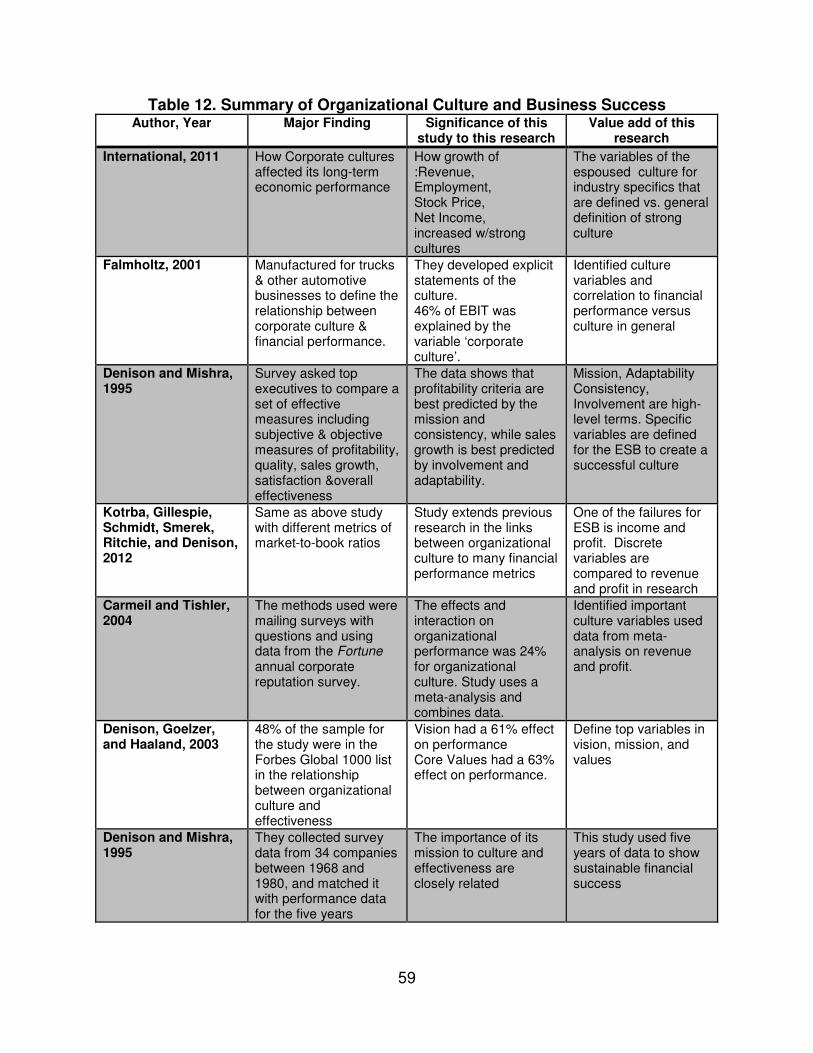
59
Table 12. Summary of Organizational Culture and Business Success Author, Year
Major Finding Significance of this
study to this research Value add of this
research
International, 2011 How Corporate cultures affected its long-term economic performance
How growth of :Revenue, Employment, Stock Price, Net Income, increased w/strong cultures
The variables of the espoused culture for industry specifics that are defined vs. general definition of strong culture
Falmholtz, 2001 Manufactured for trucks & other automotive businesses to define the relationship between corporate culture & financial performance.
They developed explicit statements of the culture. 46% of EBIT was explained by the variable ‘corporate culture’.
Identified culture variables and correlation to financial performance versus culture in general
Denison and Mishra, 1995
Survey asked top executives to compare a set of effective measures including subjective & objective measures of profitability, quality, sales growth, satisfaction &overall effectiveness
The data shows that profitability criteria are best predicted by the mission and consistency, while sales growth is best predicted by involvement and adaptability.
Mission, Adaptability Consistency, Involvement are high-level terms. Specific variables are defined for the ESB to create a successful culture
Kotrba, Gillespie, Schmidt, Smerek, Ritchie, and Denison, 2012
Same as above study with different metrics of market-to-book ratios
Study extends previous research in the links between organizational culture to many financial performance metrics
One of the failures for ESB is income and profit. Discrete variables are compared to revenue and profit in research
Carmeil and Tishler, 2004
The methods used were mailing surveys with questions and using data from the Fortune annual corporate reputation survey.
The effects and interaction on organizational performance was 24% for organizational culture. Study uses a meta-analysis and combines data.
Identified important culture variables used data from meta-analysis on revenue and profit.
Denison, Goelzer, and Haaland, 2003
48% of the sample for the study were in the Forbes Global 1000 list in the relationship between organizational culture and effectiveness
Vision had a 61% effect on performance Core Values had a 63% effect on performance.
Define top variables in vision, mission, and values
Denison and Mishra, 1995
They collected survey data from 34 companies between 1968 and 1980, and matched it with performance data for the five years
The importance of its mission to culture and effectiveness are closely related
This study used five years of data to show sustainable financial success

60
• Surveys were given to a sample of employees to determine the culture, but
the data is not publicly available for ESB.
• The data from content analysis studies combined all companies; therefore,
there is a lack of research on manufacturing culture or industry specific
culture.
• In the studies from the Literature Review, culture is described as strong or
enhancing but no details are provided about the culture (i.e. what are the
significant variables that describe the culture).
Justification for the Research
Many of the studies completed on organizational culture have employees
complete a survey to define the company culture. Other studies involve interviewing
members of the company and external members of the company to define the culture.
The sub culture, functional culture, and /or the occupation culture can be described by
these surveys. “Explicit statements of creeds, philosophies, and charters make the
espoused message explicit, reflecting the leader’s intention to get a certain message
across” (Schein, 1995, p.126). Leaders and leadership and what they desire to display
define the culture. It is the leader’s job to instill the vision, mission, and goals.
Groups and organizations within a society also develop cultures that affect how
the members think, feel, and act (Schein, 1985). With very few exceptions, practically
every firm has developed a unique culture that is clearly identifiable by its key
stakeholders (Cameron, 2004). A strongly holistic approach to studying and
understanding culture can prove to be even more beneficial in helping us to understand
the phenomena of culture and its impact on the organizations of today (O’Neil, 2006).
61
Some of the studies look at parts of the espoused culture like the mission
statement, social responsibility, the stakeholders, or only web links on the site instead of
the total content. They provide lists with no explanation of how it affects the company.
Culture itself is an organic whole consisting of interdependent components (O’Neil,
2006). The term- organizational culture- has been defined in various ways. For this
research, the Culture Centric Model will be used along with the company’s published
vision, mission, and values statements. This will define the ‘Espoused Culture’ for each
company studied.
Denison and Mishra compare organizational cultures for all industries together in
all studies rather than focusing what the culture is in a specific industry. Although some
culture traits should be common among successful companies, industry-specific
research has some value. Less effort has gone into describing the actual cultural
content of a given industry versus general organization culture for all industries. In
particular, there is a lack of information on the content of culture of different kinds of
business organization and a lack of the theoretical categories for analyzing such content
(Schein, 1995). This study looks at the espoused culture of specific manufacturing
industries and relates the espoused culture to financial results, CEO rating, and
employee satisfactions. The study uses the espoused culture to define the types of
culture using the Denison model incorporated with the Competing Framework Model.
62
CHAPTER III
MATERIALS AND METHODS
How do companies make more money and increase profits and revenue? The
answers to these fundamental questions are the basis to discovering the bottom line for
all profit-seeking companies. This chapter begins by looking at the agenda of a board
meeting. This company, in particular, held a strategic planning meeting during which it
reviewed its current condition by utilizing an analysis report based on the answers to
five key questions.
I. How well are the present strategies working?
II. What are the company’s strengths and weaknesses in resources and what are its
external opportunities and threats?
III. Are the company’s prices and costs competitive with the rest of the industry?
IV. How strong is the company’s competitive position?
V. What strategic issues do the company face based on this analysis? (Thompson,
2000)
Mike McNamara, CEO for Flextronics Corporation, stated, “Culture is the only
sustainable competitive advantage” (McNamara, 2014 and Barney, 1986). It is within a
culture where people get the work done and culture supports the way that the work is
completed. One essential action resulting from that strategic planning meeting was an
immediate evaluation of steps that the company would take in order to improve its
organizational culture. This action helped the managers solidify and explain how and to
what extent the elements of culture should be supported and developed within the
organization.
63
Conceptual Overall Approach
This research identifies and defines variables within a company’s espoused
culture that correlate with employee metrics, financial metrics, and leadership metrics.
Several categories of internal and external data inputs serve as the foundation for this
research. Internal data was provided expressly from the company’s website and
external data was received from published resources outside of the company.
Samples
Every spring since 1955, Fortune magazine has published a list, by revenues, of
the largest public companies. The Fortune 500 companies have various numbers of
employees ranging from 189 to over two million employees. The current Fortune 500
companies were founded from 1773 to 2011. Thirty-eight of the states in the US have a
Fortune 500 headquarters in their state. Some companies do not have any Fortune 500
companies headquarters located in their state; they are Alaska, Hawaii, Maine,
Mississippi, Montana, New Hampshire, New Mexico, North Dakota, South Dakota
Wyoming, Vermont, and West Virginia. Age of the company, location, and the size of
the companies were not included as variables in this research. The literature review in
previous research did not show these variables relate to organizational culture and
effectiveness.
One significant feature of the Fortune 500 list is annual turnover. While most of
the companies remain stable from year to year, a small group of different companies
fade away each year. Companies drop off the Fortune 500 list for many reasons.
Some companies filed for bankruptcy. Others underwent mergers, acquisitions,
privatization, or simply falling below the rank of 500 relative to the performance of other

64
companies (Stangler and Arbesman, 2012). To make sure the companies studied had
sustainable success, only those that were consistently on the list from 2009 through
2013 were used.
Manufacturing companies are the focus of this research (SIC codes for
manufacturing are 20-39, as seen in Appendix A). The manufacturing companies were
ranked in a Pareto chart as seen in Figure 4. The goal of the study was to examine
50% of the manufacturing companies. From the Pareto Chart below SIC codes 29, 37,
and 35 represent the top 50% of the manufacturing companies by the sum their of
revenue from years 2009-2013.
Figure 4. Pareto Chart for Manufacturing SIC Codes revenue
Su
m o
f R
ev
en
ue
fo
r 2009-2
013 (
$ M
illio
ns)
Pe
rce
nt
SIC CodeCount
Percent 25.3 15.0 11.9 10.9 8.1 8.0 5.6 15.3
Cum %
5229133
25.3 40.3 52.2 63.0 71.2 79.2 84.7 100.0
3096459 2460225 22469001680620 1651834 1150392 3155804Other38362028353729
20000000
15000000
10000000
5000000
0
100
80
60
40
20
0
Pareto Chart of SIC Code
65
Table 13 is the list of companies by SIC code; these companies will serve as the
samples for this research. Two companies, Apple and Harley Davidson, will be omitted
from the Results section, as they did not explicitly state their mission, vision, or value
statements. These companies were contacted by email to ask them where this
information could be located on their web pages and neither of the companies
responded to the request.
Data Collection and Prepartation
A meta-analysis was used for this study. Meta-analysis is a statistical method
that can be used to quantitatively review the outcomes of multiple studies (Lipsey and
Wilson, 2000; Crombie and Davis, 2009). The advantage of a meta-analysis is the
ability to summarize large bodies of data and the relationships not explored in the
original primary studies (Lipsey & Wilson, 2000).
The financial performance data of revenue and profit were consistent with the
criteria for ranking by Fortune. Since leaders instill culture and employees are both the
recipients and carriers of culture, leadership metrics and employee metrics are also
included in the analysis. The meta-analysis data is leadership metrics, financial metrics,
and employee metrics as seen in Figure 5.

66
Table 13. Companies in Study
Company SIC codes
Chevron 29
Conoco Phillips 29 Exxon 29 Holly Frontier 29
Tesoro 29 Valero 29 Western Refining 29
AGCO 35 Baker Hughes 35 Cameron 35
Caterpillar 35 Cummins 35 Deere 35
Dover 35 EMC 35 Hewlett-Packard 35
Illinois Tool Works 35 Intel 35 National Oilwell Varco 35
NCR 35 Terex 35 Western Digital 35
Xerox 35 Autoliv 37 Boeing 37
Dana 37 Ford 37 General Dynamics 37
General Motors 37 Honeywell 37 Lear 37
Lockheed Martin 37 Navistar 37 Oshkosh 37 Paccar 37
Tenneco 37 Textron 37 TRW 37
United Technologies Corporation 37 Visteon 37

67
Meta-analysis data
LeadershipMetrics
Employee Metrics
FinancialMetrics
Revenue ProfitsCEO Rating
Senior Management
OverallRating
Culture and Values
Work/life Balance
Compensations and Benefits
CareerOpportunities
Figure 5. Meta-analysis data sources
68
Employee Metrics
Employee responses included feedback from the employees on their perception
of the company’s culture. Employee’s opinion provides insight into how they feel about
the leadership in those companies. Glassdoor was used as the source for the meta-
analysis data.
Glassdoor is recognized as the world's most transparent career community.
Glassdoor was chosen as the source data because Forbes, CNN, The Washington
Post, and The Huffington Post use Glassdoor data to rank CEO and employee
satisfaction. Glassdoor is a continuously growing database currently consisting of over
6 million company reviews, CEO approval ratings, salary reports, interview reviews,
office photos and more. Those who know a company best, the employees, provided the
information (Glassdoor, 2013).
Current or former employees rate companies on a scale of one to five for the
following factors:
• Overall rating
• Culture and values
• Work/life balance
• Senior management
• Compensation and benefits
• Career opportunities
• Percentage of employees who recommend this company to a friend: (Glassdoor,
2013).
69
Financial metrics
Revenue is a company’s gross revenue including consolidated subsidiaries after
adjustments made by exclude the impact of excise taxes (CNN Money, 2014). The
revenue numbers used in this study were averaged over the last five years (2009 –
2013).
Profits are after-tax profits, calculated before preferred dividends include
extraordinary credits or charges, cumulative effects of accounting changes, and non-
controlling interests (CNN Money 2011). The profit numbers used in this study were
averaged over the last five years (2009 – 2013).
Leadership metrics
• The CEO rating is derived from a yes or no question, “Do you approve of the
CEO?” (Glassdoor, 2013, p1).
• Senior management is measured by an employee approval rating on a scale
of one to five.
In summary, the external data for the meta-analysis was overall ranking, culture
and values, work/life balance, compensation and benefits, career opportunities,
employee metrics of recommending the company to a friend (employee metrics),
revenue and profit (financial metrics), and CEO rating and senior management rankings
(leadership metrics).
The method was developed for this research by combining techniques and tools
from other research methods into the process as seen in Figure 5, Meta-Analysis Data
Sources and Figure 6, Method for Research. Espoused culture was defined from the
literature research from Warda’s study in 2009. Espoused culture for this research is a
70
company’s vision, mission and value statements found on the specific company’s
website. A content analysis was completed using Krippendorff (2004) method to derive
the cultural variables from the espoused culture. Brodke, Cady, DeWolf, and Wheeler
(2011) and Williams (2008) also completed content analysis of company’s mission
statement. The cultural variables and the content analysis were used to complete the
four hypotheses test. The hypothesis testing was completed using many statistical
tools: Pareto charts confidence intervals, best fit analysis, regression analysis, Pearson
correlation, and main effect plots. The graphical representation of the culture types
used the Competing Value Framework (Cameron and Quinn, 1999). The method for
this research is shown with an example from one of the companies in this research,
Autoliv, in steps 1 – 3.
Step 1. Collect the Espoused culture data - A systematic review of each
company’s website defined the company’s current espoused culture. No other source
was used. The following key words were used to search the corporate website for their
espoused culture.
• About our company
• Our company
• Our Mission
• Mission Statement
• Mission
• Vision
• Vision Statement
• Our Future

71
• Core Values
• Values
• We believe
Summary of Step 1: Copy the content from the company’s web page for the following:
mission, vision, and values. Table 14 shows, which companies had a mission, vision,
and values recorded on their website by a check mark. Forty percent of the companies
had a mission statement and 65% had a vision statement. Some of the companies
(7.5%) combined their mission and vision stated together under the same heading. A
few companies stated their values with terminology other than the word ‘value.’ For
example, AGCO used the term “Business, Brand, and Core Values”; Exxon used the
term “Our Guiding Principles;” and Honeywell used the term “Our Twelve Behaviors”.
Ninety-two and half percent had values listed on their company website.
Step 2: Content analysis – Content analysis is a research technique for making
valid inferences from text to concepts. An attribution analysis procedure was used for
this research (Krippendorff, 2004). The content analysis reviewed key content
expressed in a single word, phrase or sentence (as seem in red below). If the concept
appeared in separate sections of a statement or in a slightly different context, it was
coded again (Cady, Wheeler, DeWolf, and Brodke, 2011).
An example of the content analysis is provided using data from Autoliv.

Figure
Step 1
Step 2
Step 3
72
Figure 6. Method for Research

73
Table 14. Companies with or without Mission, Vision, and Values
Company Mission Vision Values
AGCO Business Values, Brand Values, & Core Values
Apple
Autoliv � � � Baker Hughes � �
Boeing � � Cameron � �
Caterpillar � �
Chevron � �
Conoco Phillips � �
Dana �
Cummins � � � Deere � � Dover �
EMC � �
Exxon Our guiding principles
Ford Same�
General Dynamics �
General Motors � �
Harley Davidson
Hewlett-Packard X
Holly Frontier � �
Honeywell Same� Our Twelve Behaviors
Illinois Tool Work �
Intel � �
Lear � � �
Lockheed Martin � �
National Oilwell Varco �
Navistar �
NCR Same �
Oshkosh � �
Paccar � �
Tenneco � � �
Terex � � �
Tesoro � �
Textron � �
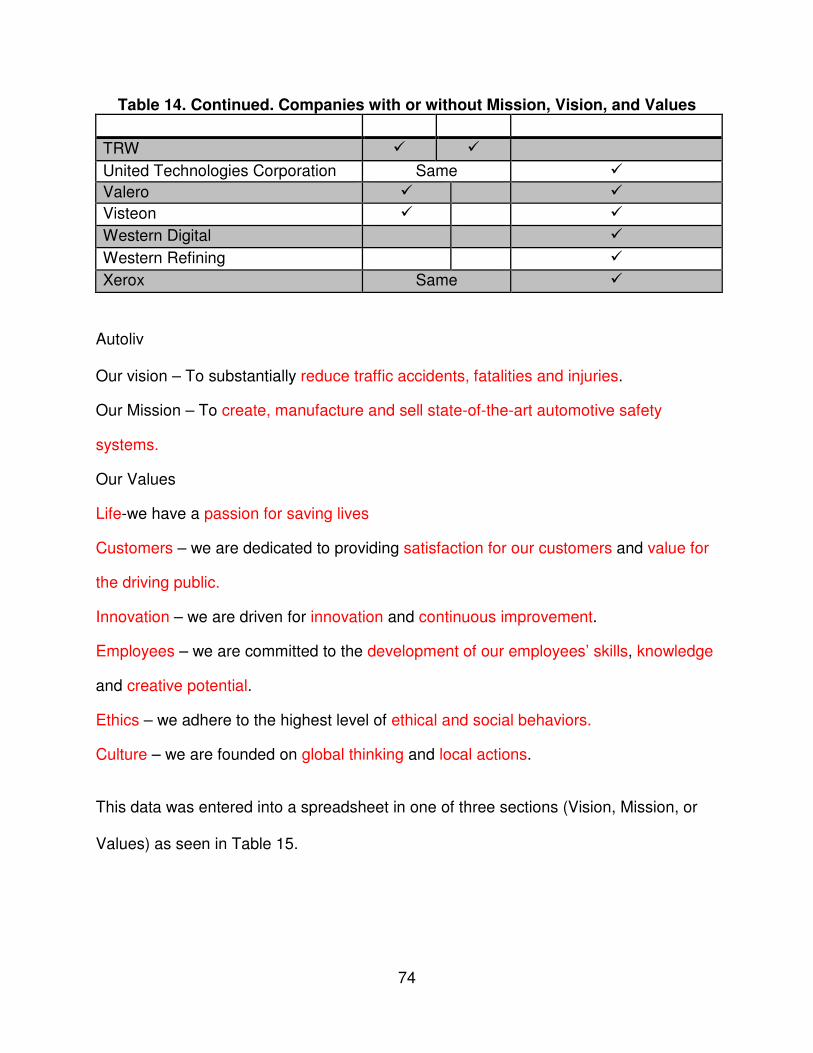
74
Table 14. Continued. Companies with or without Mission, Vision, and Values
TRW � �
United Technologies Corporation Same �
Valero � �
Visteon � �
Western Digital �
Western Refining �
Xerox Same �
Autoliv Our vision – To substantially reduce traffic accidents, fatalities and injuries.
Our Mission – To create, manufacture and sell state-of-the-art automotive safety
systems.
Our Values
Life-we have a passion for saving lives
Customers – we are dedicated to providing satisfaction for our customers and value for
the driving public.
Innovation – we are driven for innovation and continuous improvement.
Employees – we are committed to the development of our employees’ skills, knowledge
and creative potential.
Ethics – we adhere to the highest level of ethical and social behaviors.
Culture – we are founded on global thinking and local actions.
This data was entered into a spreadsheet in one of three sections (Vision, Mission, or
Values) as seen in Table 15.
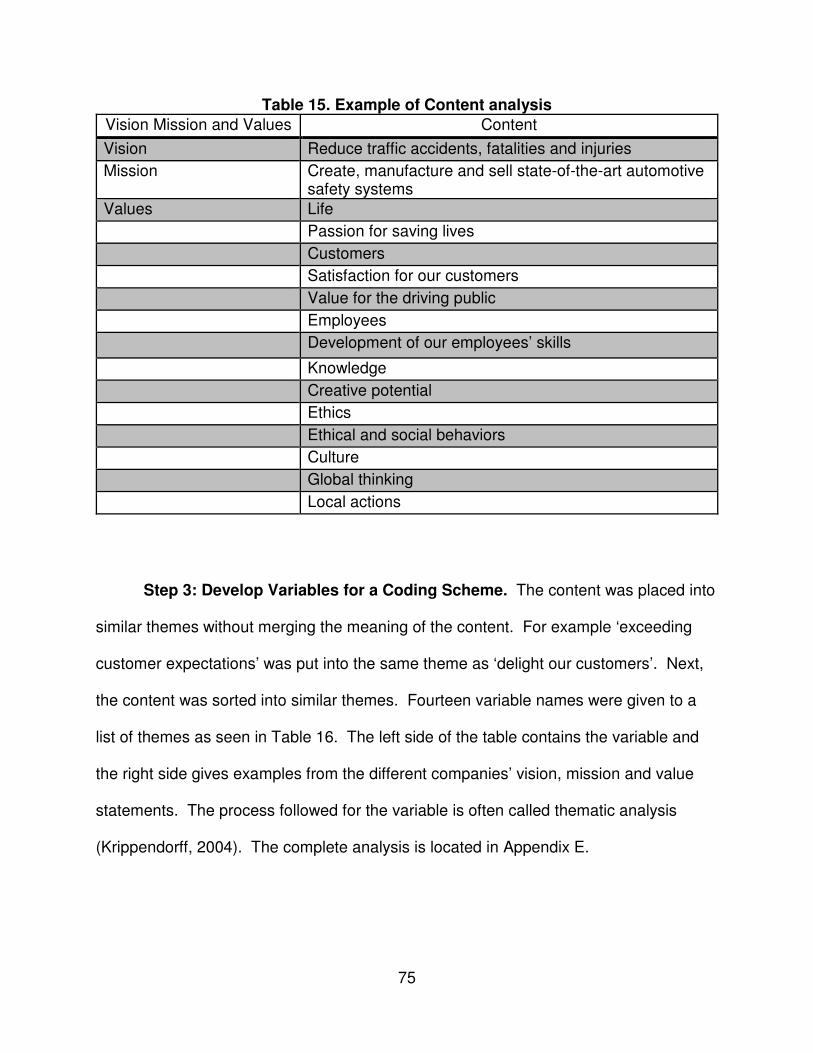
75
Table 15. Example of Content analysis
Step 3: Develop Variables for a Coding Scheme. The content was placed into
similar themes without merging the meaning of the content. For example ‘exceeding
customer expectations’ was put into the same theme as ‘delight our customers’. Next,
the content was sorted into similar themes. Fourteen variable names were given to a
list of themes as seen in Table 16. The left side of the table contains the variable and
the right side gives examples from the different companies’ vision, mission and value
statements. The process followed for the variable is often called thematic analysis
(Krippendorff, 2004). The complete analysis is located in Appendix E.
Vision Mission and Values Content
Vision Reduce traffic accidents, fatalities and injuries
Mission Create, manufacture and sell state-of-the-art automotive safety systems
Values Life
Passion for saving lives
Customers
Satisfaction for our customers
Value for the driving public
Employees
Development of our employees’ skills
Knowledge
Creative potential
Ethics
Ethical and social behaviors
Culture
Global thinking
Local actions
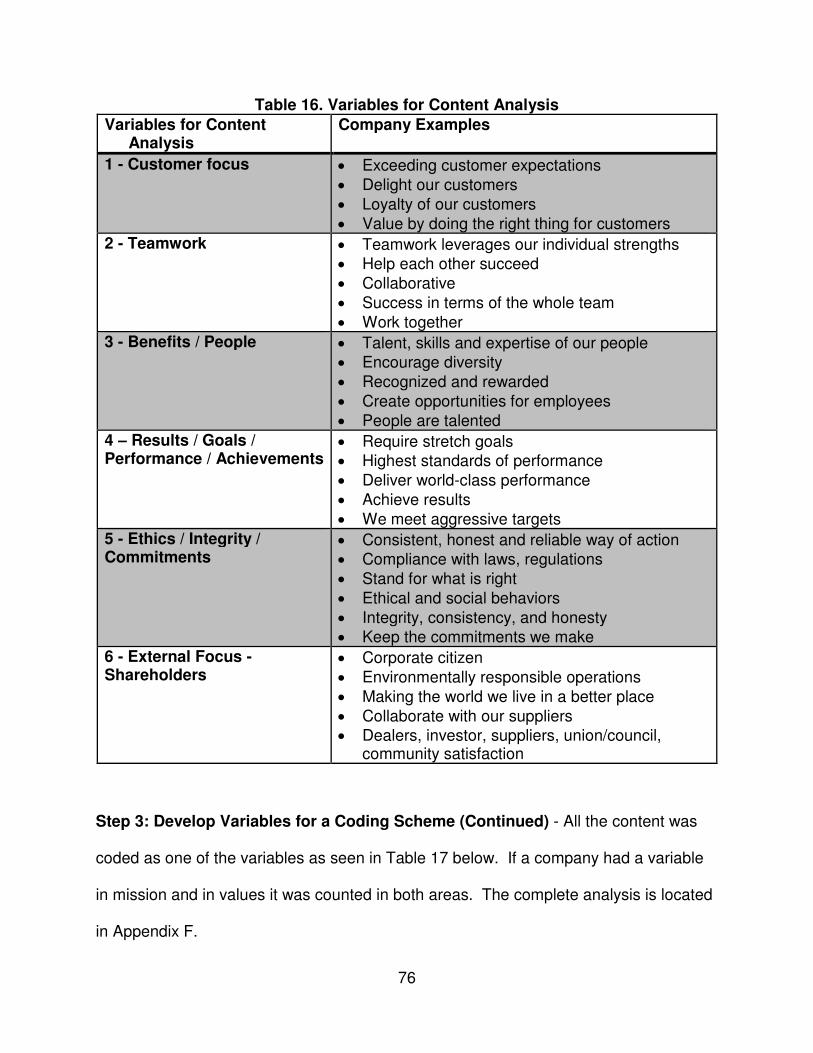
76
Table 16. Variables for Content Analysis
Step 3: Develop Variables for a Coding Scheme (Continued) - All the content was
coded as one of the variables as seen in Table 17 below. If a company had a variable
in mission and in values it was counted in both areas. The complete analysis is located
in Appendix F.
Variables for Content Analysis
Company Examples
1 - Customer focus • Exceeding customer expectations • Delight our customers • Loyalty of our customers • Value by doing the right thing for customers
2 - Teamwork • Teamwork leverages our individual strengths • Help each other succeed • Collaborative • Success in terms of the whole team • Work together
3 - Benefits / People • Talent, skills and expertise of our people • Encourage diversity • Recognized and rewarded • Create opportunities for employees • People are talented
4 – Results / Goals / Performance / Achievements
• Require stretch goals • Highest standards of performance • Deliver world-class performance • Achieve results • We meet aggressive targets
5 - Ethics / Integrity / Commitments
• Consistent, honest and reliable way of action • Compliance with laws, regulations • Stand for what is right • Ethical and social behaviors • Integrity, consistency, and honesty • Keep the commitments we make
6 - External Focus - Shareholders
• Corporate citizen • Environmentally responsible operations • Making the world we live in a better place • Collaborate with our suppliers • Dealers, investor, suppliers, union/council,
community satisfaction
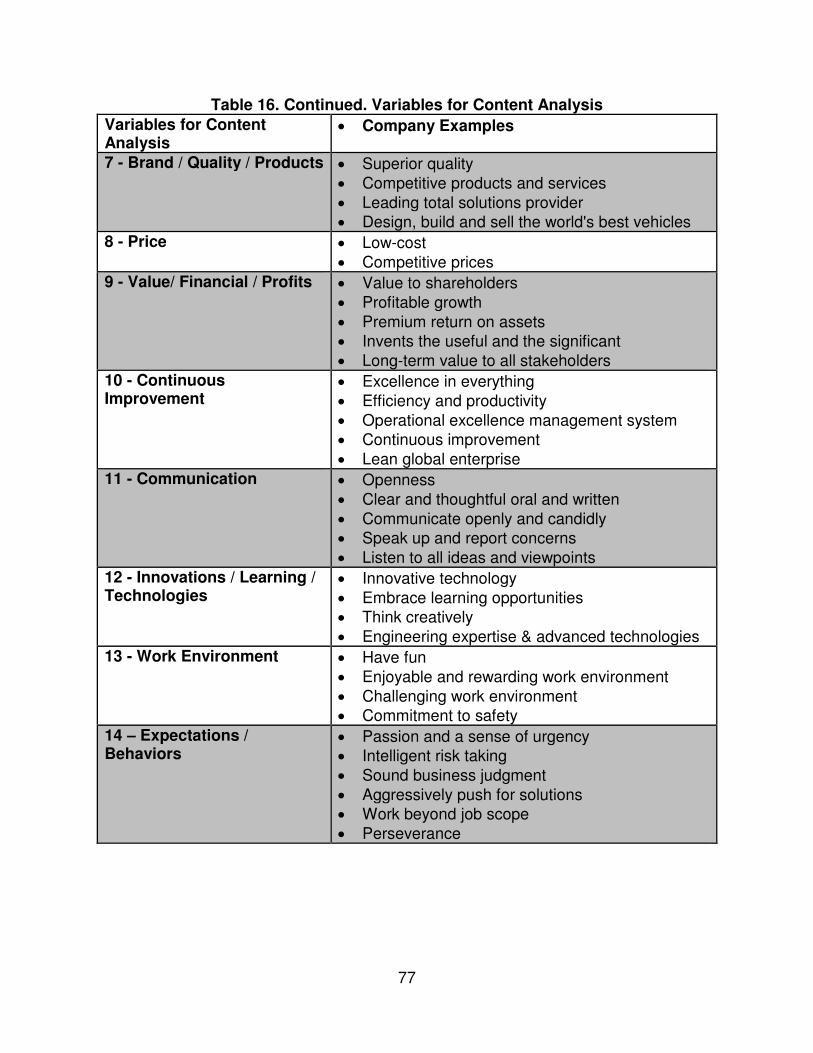
77
Table 16. Continued. Variables for Content Analysis
Variables for Content Analysis
• Company Examples
7 - Brand / Quality / Products • Superior quality • Competitive products and services • Leading total solutions provider • Design, build and sell the world's best vehicles
8 - Price • Low-cost • Competitive prices
9 - Value/ Financial / Profits • Value to shareholders • Profitable growth • Premium return on assets • Invents the useful and the significant • Long-term value to all stakeholders
10 - Continuous Improvement
• Excellence in everything • Efficiency and productivity • Operational excellence management system • Continuous improvement • Lean global enterprise
11 - Communication • Openness • Clear and thoughtful oral and written • Communicate openly and candidly • Speak up and report concerns • Listen to all ideas and viewpoints
12 - Innovations / Learning / Technologies
• Innovative technology • Embrace learning opportunities • Think creatively • Engineering expertise & advanced technologies
13 - Work Environment • Have fun • Enjoyable and rewarding work environment • Challenging work environment • Commitment to safety
14 – Expectations / Behaviors
• Passion and a sense of urgency • Intelligent risk taking • Sound business judgment • Aggressively push for solutions • Work beyond job scope • Perseverance
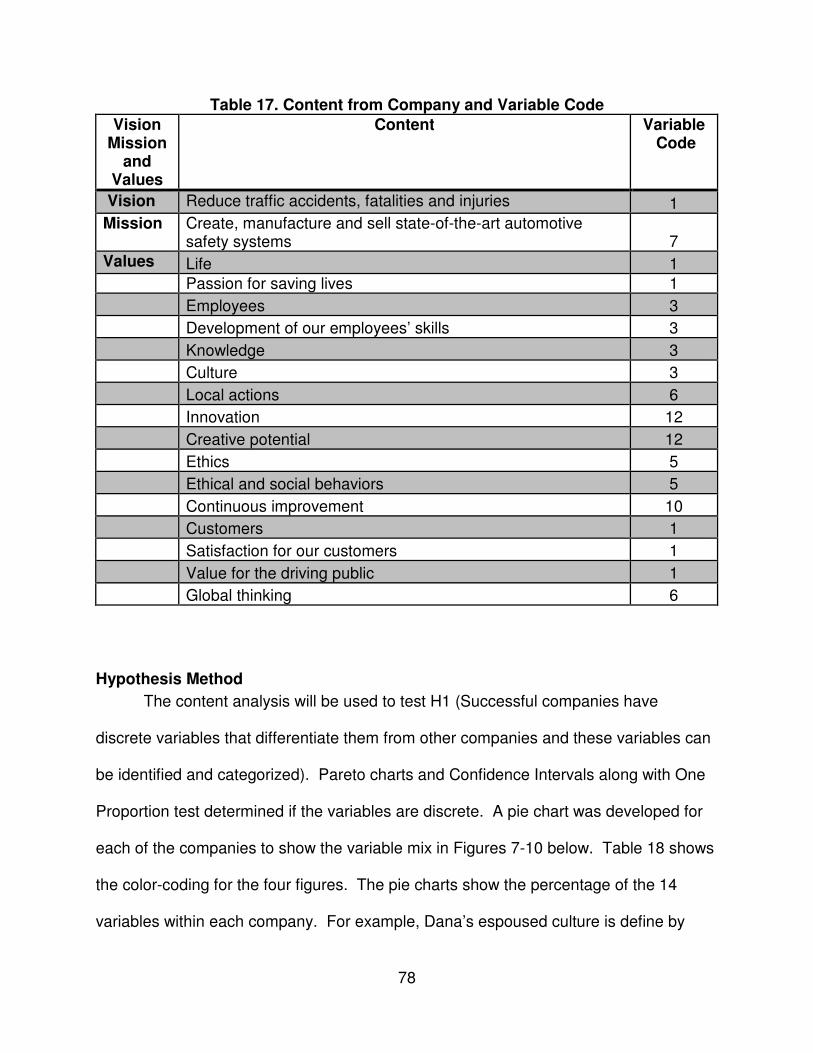
78
Table 17. Content from Company and Variable Code
Hypothesis Method
The content analysis will be used to test H1 (Successful companies have
discrete variables that differentiate them from other companies and these variables can
be identified and categorized). Pareto charts and Confidence Intervals along with One
Proportion test determined if the variables are discrete. A pie chart was developed for
each of the companies to show the variable mix in Figures 7-10 below. Table 18 shows
the color-coding for the four figures. The pie charts show the percentage of the 14
variables within each company. For example, Dana’s espoused culture is define by
Vision Mission
and Values
Content Variable Code
Vision Reduce traffic accidents, fatalities and injuries 1 Mission Create, manufacture and sell state-of-the-art automotive
safety systems 7 Values Life 1 Passion for saving lives 1 Employees 3 Development of our employees’ skills 3 Knowledge 3 Culture 3
Local actions 6 Innovation 12
Creative potential 12 Ethics 5 Ethical and social behaviors 5
Continuous improvement 10 Customers 1
Satisfaction for our customers 1 Value for the driving public 1 Global thinking 6

79
Customer Focus and Brand/Quality/Products. Over fifty percent of Conoco Phillips
Variables are Ethics / Integrity / Commitments, External Focus / Shareholders, and
Benefits / People. Autoliv’s top percentage is Customer Focus. The largest variable by
percentage is External Focus for Cameron and Cummins. .
Table 18. Coloring for Pie Charts Variables
The variable data was used to develop a regression analysis to define equations
to predict revenue and profit in H2 (The identified discrete variables have different levels
of contributions to the success of the company as represented in an equation, which
represents how each input was calculated as an isolated part of the whole).
The variable data was also used to create main effects plots and correlations
studies using the meta-analysis data in H3 (Corporate success can be measured by
relationships between key performance indicators and a company’s culture).
Variable Code in Minitab
1 - Customer focus
2 – Teamwork
3 - Benefits / People
4 – Results / Goals / Performance / Achievements
5 - Ethics / Integrity / Commitments
6 - External Focus / Shareholders
7 - Brand / Quality / Products
8 – Price
9 - Value/ Financial / Profits
10 - Continuous Improvement
11 – Communication
12 - Innovations / Learning / Technologies
13 - Work Environment
14 – Expectations / Behaviors
11111111
11112222
11113333
11114444
1111
2222
3333
4444
5555
6666
7777
9999
11110000

80
Figure 7. Pie Chart AGCO to Dana
Figure 8. Pie Chart Deere to Honeywell
AAAAGGGGCCCCOOOO AAAAuuuuttttoooolllliiiivvvv BBBBaaaakkkkeeeerrrr HHHHuuuugggghhhheeeessss BBBBooooeeeeiiiinnnngggg
CCCCaaaammmmeeeerrrroooonnnn CCCCaaaatttteeeerrrrppppiiiillllllllaaaarrrr CCCChhhheeeevvvvrrrroooonnnn CCCCoooonnnnooooccccoooo PPPPhhhhiiiilllllllliiiippppssss
CCCCuuuummmmmmmmiiiinnnnssss DDDDaaaannnnaaaa
11111111
11112222
11113333
11114444
1111
2222
3333
4444
5555
6666
7777
9999
11110000
Category
DDDDeeeeeeeerrrreeee DDDDoooovvvveeeerrrr EEEEMMMMCCCC EEEExxxxxxxxoooonnnn
FFFFoooorrrrdddd GGGGeeeennnneeeerrrraaaallll DDDDyyyynnnnaaaammmmiiiiccccssss GGGGeeeennnneeeerrrraaaallll MMMMoooottttoooorrrrssss HHHHeeeewwwwlllleeeetttttttt---- PPPPaaaacccckkkkaaaarrrrdddd
HHHHoooollllllllyyyy FFFFrrrroooonnnnttttiiiieeeerrrr HHHHoooonnnneeeeyyyywwwweeeellllllll
11110000
11111111
11112222
11113333
11114444
1111
2222
3333
4444
5555
6666
7777
8888
9999
CCCCaaaatttteeeeggggoooorrrryyyy

81
Figure 9. Pie Chart Illinois Tool Works to Tenneco
Figure 10. Pie Chart Terex to Xerox
IIII lllllllliiiinnnnooooiiiissss TTTToooooooollll WWWWoooorrrrkkkkssss IIIInnnntttteeeellll LLLLeeeeaaaarrrr LLLLoooocccckkkkhhhheeeeeeeedddd MMMMaaaarrrrttttiiiinnnn
NNNNaaaattttiiiioooonnnnaaaallll OOOOiiiillllwwwweeeellllllll VVVVaaaarrrrccccoooo NNNNaaaavvvviiiissssttttaaaarrrr NNNNCCCCRRRR OOOOsssshhhhkkkkoooosssshhhh
PPPPaaaaccccccccaaaarrrr TTTTeeeennnnnnnneeeeccccoooo
11110000
11111111
11112222
11113333
11114444
1111
2222
3333
4444
5555
6666
7777
8888
9999
CCCCaaaatttteeeeggggoooorrrryyyy
TTTTeeeerrrreeeexxxx TTTTeeeessssoooorrrroooo TTTTeeeexxxxtttt rrrroooonnnn TTTTRRRRWWWW
UUUUnnnniiiitttteeeedddd TTTTeeeecccchhhhnnnnoooollllooooggggiiiieeeessss CCCCoooorrrrppppoooorrrraaaatttt iiiioooonnnn VVVVaaaarrrrlllleeeerrrroooo VVVViiiisssstttteeeeoooonnnn WWWWeeeesssstttteeeerrrrnnnn DDDDiiiiggggiiiittttaaaallll
WWWWeeeesssstttteeeerrrrnnnn RRRReeeeffffiiiinnnniiiinnnngggg XXXXeeeerrrrooooxxxx
11111111
11112222
11113333
11114444
1111
2222
3333
4444
5555
6666
7777
9999
11110000
CCCCaaaatttteeeeggggoooorrrryyyy
82
The Competing Values Framework was used to define the company’s culture
type i.e., Clan, Adhocracy, Hierarchy or Market as seen in Table 19 (Cameron and
Quinn, 1999).
The content from Step 3 was categorized into the four culture types, which also
defines the type of leadership, value drivers, and theory of effectiveness (Cameron and
Quinn, 1999). The content from the vision, mission, and values was matched to a
category. For example, all content referring to communication was categorized as Clan.
All content referring to market share, or goal achievement was categorized as Market as
seen in Table 20. The complete list can be seen in Appendix F.
The culture type was then graphed to define the culture quadrants by summing
the culture type as seen in Table 21. For example, Customers, Satisfaction for our
customers, Value for the driving public and Global thinking are in cultural code 4
(Market), there are four entries so the sum is four. This data is used to test H4, (The
discrete variables from H1 can be used to show distinctive and different types of
organizational cultures using the competing values framework).
The culture type was then graphed to define the culture quadrants by summing
the culture type as seen in Table 21. For example, Customers, Satisfaction for our
customers, Value for the driving public and Global thinking are in cultural code 4
(Market), there are four entries so the sum is four. This data is used to test H4, (The
discrete variables from H1 can be used to show distinctive and different types of
organizational cultures using the competing values framework
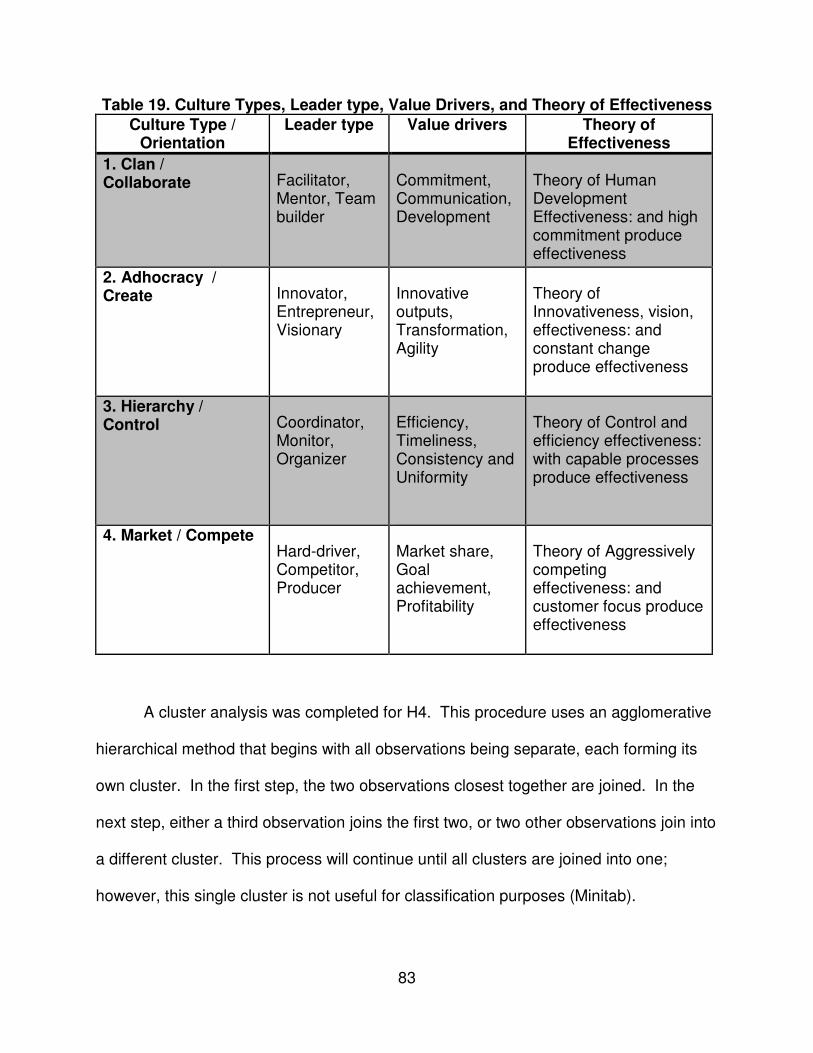
83
Table 19. Culture Types, Leader type, Value Drivers, and Theory of Effectiveness
A cluster analysis was completed for H4. This procedure uses an agglomerative
hierarchical method that begins with all observations being separate, each forming its
own cluster. In the first step, the two observations closest together are joined. In the
next step, either a third observation joins the first two, or two other observations join into
a different cluster. This process will continue until all clusters are joined into one;
however, this single cluster is not useful for classification purposes (Minitab).
Culture Type / Orientation
Leader type Value drivers Theory of Effectiveness
1. Clan / Collaborate Facilitator,
Mentor, Team builder
Commitment, Communication, Development
Theory of Human Development Effectiveness: and high commitment produce effectiveness
2. Adhocracy / Create
Innovator, Entrepreneur, Visionary
Innovative outputs, Transformation, Agility
Theory of Innovativeness, vision, effectiveness: and constant change produce effectiveness
3. Hierarchy / Control
Coordinator, Monitor, Organizer
Efficiency, Timeliness, Consistency and Uniformity
Theory of Control and efficiency effectiveness: with capable processes produce effectiveness
4. Market / Compete Hard-driver, Competitor, Producer
Market share, Goal achievement, Profitability
Theory of Aggressively competing effectiveness: and customer focus produce effectiveness
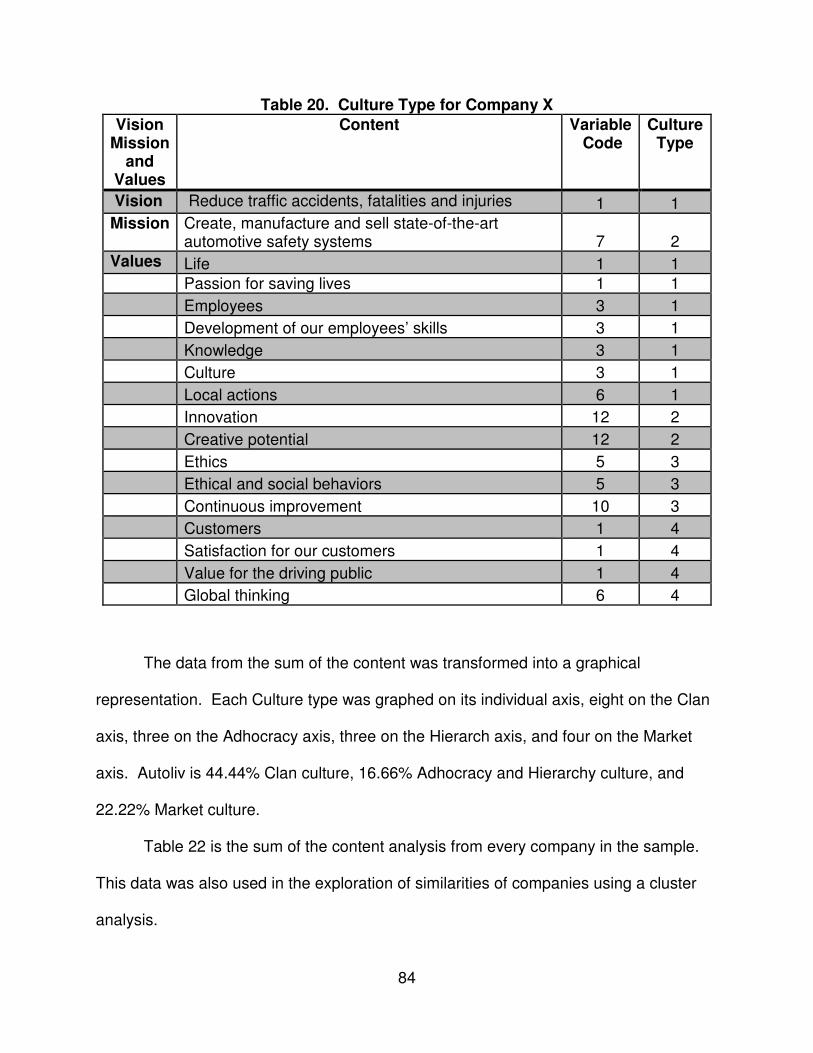
84
Table 20. Culture Type for Company X
The data from the sum of the content was transformed into a graphical
representation. Each Culture type was graphed on its individual axis, eight on the Clan
axis, three on the Adhocracy axis, three on the Hierarch axis, and four on the Market
axis. Autoliv is 44.44% Clan culture, 16.66% Adhocracy and Hierarchy culture, and
22.22% Market culture.
Table 22 is the sum of the content analysis from every company in the sample.
This data was also used in the exploration of similarities of companies using a cluster
analysis.
Vision Mission
and Values
Content Variable Code
Culture Type
Vision Reduce traffic accidents, fatalities and injuries 1 1 Mission Create, manufacture and sell state-of-the-art
automotive safety systems 7 2 Values Life 1 1 Passion for saving lives 1 1 Employees 3 1 Development of our employees’ skills 3 1 Knowledge 3 1 Culture 3 1
Local actions 6 1 Innovation 12 2
Creative potential 12 2 Ethics 5 3 Ethical and social behaviors 5 3
Continuous improvement 10 3 Customers 1 4
Satisfaction for our customers 1 4 Value for the driving public 1 4 Global thinking 6 4
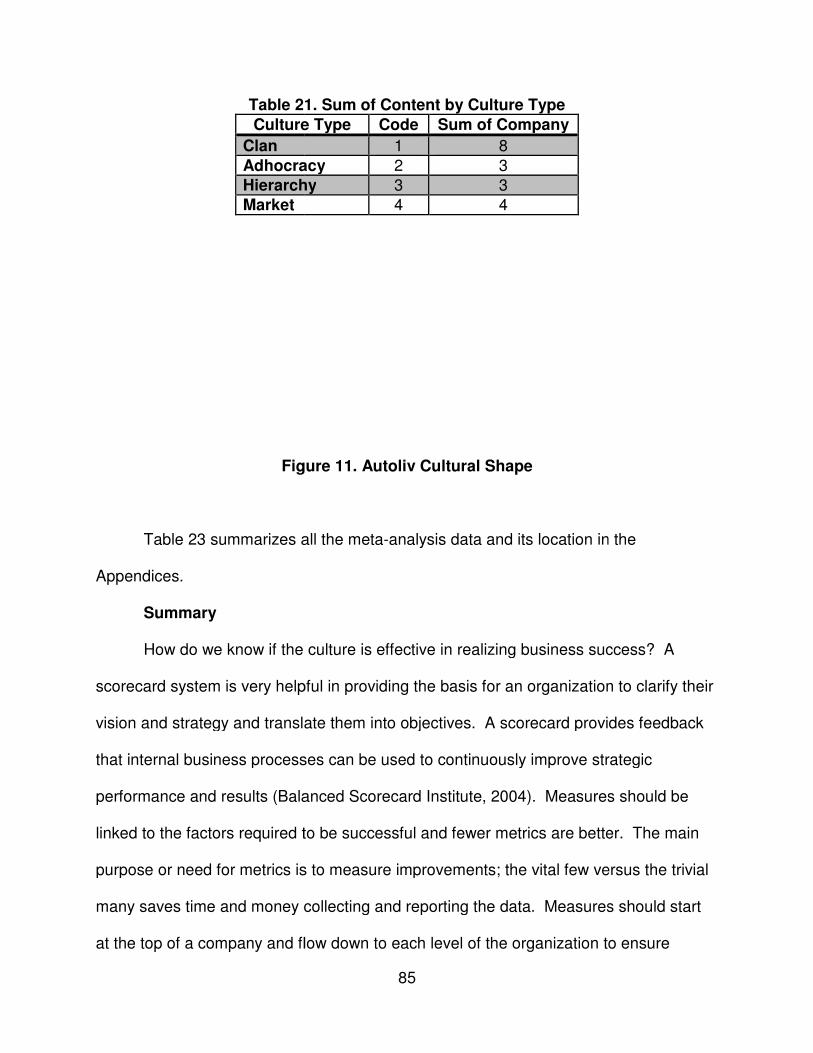
Table 21
Figure
Table 23 summarizes all the meta
Appendices.
Summary
How do we know if the culture is effective in realizing business success? A
scorecard system is very helpful in providing the basis for an organization to clarify their
vision and strategy and translate them into objectives. A scorecard provides
that internal business processes can be used to continuously improve strategic
performance and results (Balanced Scorecard Institute, 2004). Measures should be
linked to the factors required to be successful and fewer metrics are better. The mai
purpose or need for metrics is to measure improvements; the vital few versus the trivial
many saves time and money collecting and reporting the data. Measures should start
at the top of a company and flow down to each level of the organization to ensure
Culture Type
Clan
Adhocracy
Hierarchy
Market
85
21. Sum of Content by Culture Type
Figure 11. Autoliv Cultural Shape
Table 23 summarizes all the meta-analysis data and its location in the
How do we know if the culture is effective in realizing business success? A
scorecard system is very helpful in providing the basis for an organization to clarify their
vision and strategy and translate them into objectives. A scorecard provides
that internal business processes can be used to continuously improve strategic
performance and results (Balanced Scorecard Institute, 2004). Measures should be
linked to the factors required to be successful and fewer metrics are better. The mai
purpose or need for metrics is to measure improvements; the vital few versus the trivial
many saves time and money collecting and reporting the data. Measures should start
at the top of a company and flow down to each level of the organization to ensure
Culture Type Code Sum of Company
1 8
Adhocracy 2 3 Hierarchy 3 3
4 4
analysis data and its location in the
How do we know if the culture is effective in realizing business success? A
scorecard system is very helpful in providing the basis for an organization to clarify their
vision and strategy and translate them into objectives. A scorecard provides feedback
that internal business processes can be used to continuously improve strategic
performance and results (Balanced Scorecard Institute, 2004). Measures should be
linked to the factors required to be successful and fewer metrics are better. The main
purpose or need for metrics is to measure improvements; the vital few versus the trivial
many saves time and money collecting and reporting the data. Measures should start
at the top of a company and flow down to each level of the organization to ensure
86
inclusion of all employees. The next chapter will look at results of how the cultural
variables affect the meta-analysis data chosen for this research in the four hypothesis
statements.

87
Table 22. Count on content by Culture Type
Company Clan Adhocracy Hierarch Market
AGCO 19 5 22 17
Autoliv 8 3 3 4
Baker Hughes 18 2 15 7
Boeing 20 2 17 10
Cameron 7 7 9
Caterpillar 11 16 11
Chevron 20 7 21 11
Conoco Phillips 25 9 18 1
Cummins 9 4 5 8
Dana 1 1
Deere 14 5 10 13
Dover 3 2 2
EMC 9 5 11 8
Exxon 14 4 14 11
Ford 4 1 1 6
General Dynamics 5 8 2
General Motors 1 1 3
Hewlett-Packard 7 1 4 2
Holly Frontier 10 4 15 6
Honeywell 14 5 12 7
Illinois Tool Works 4 11 4
Intel 14 4 15 16
Lear 19 1 8 7
Lockheed Martin 7 1 6 4
National Oilwell Varco 7 2 5 8
Navistar 4 6 4 7
NCR 17 9 17 15
Oshkosh 9 23 2
Paccar 1 1 1
Tenneco 11 4 9 9
Terex 13 2 13 14
Tesoro 1 4
Textron 2 3 2
TRW 1 3 3
United Technologies Corporation 12 6 8 12
Valero 16 7 9
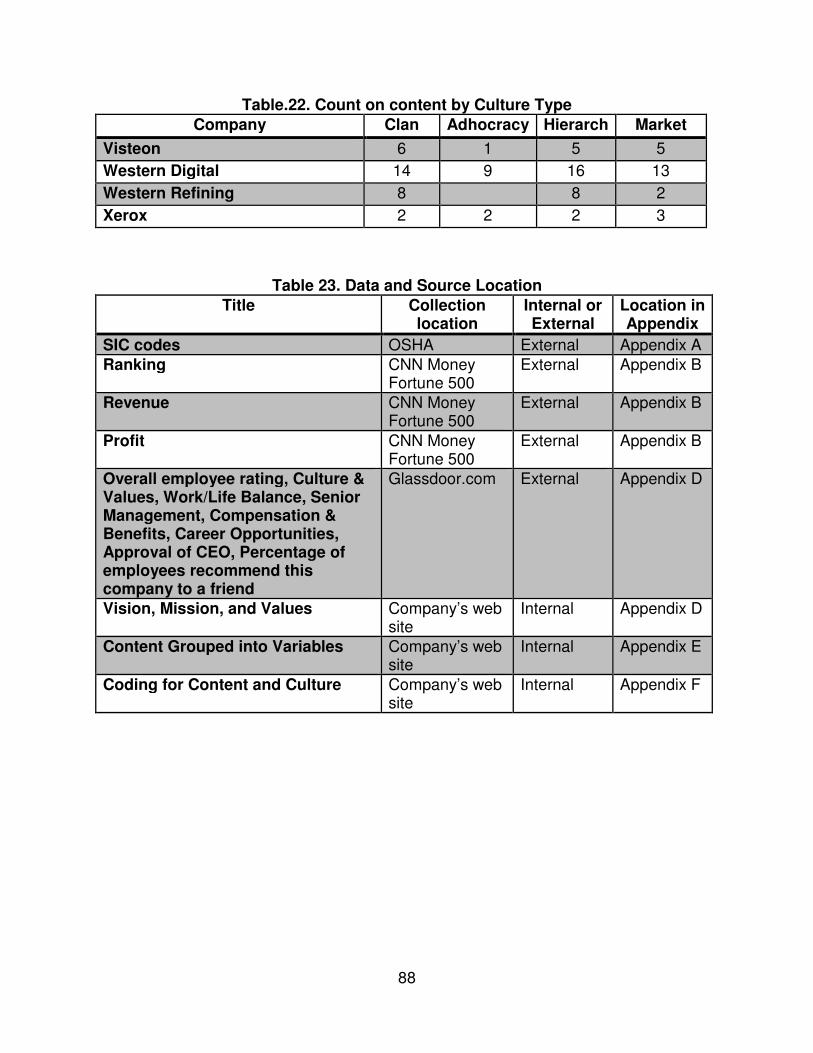
88
Table.22. Count on content by Culture Type
Table 23. Data and Source Location
Company Clan Adhocracy Hierarch Market
Visteon 6 1 5 5
Western Digital 14 9 16 13
Western Refining 8 8 2
Xerox 2 2 2 3
Title Collection location
Internal or External
Location in Appendix
SIC codes OSHA External Appendix A Ranking CNN Money
Fortune 500 External Appendix B
Revenue CNN Money Fortune 500
External Appendix B
Profit CNN Money Fortune 500
External Appendix B
Overall employee rating, Culture & Values, Work/Life Balance, Senior Management, Compensation & Benefits, Career Opportunities, Approval of CEO, Percentage of employees recommend this company to a friend
Glassdoor.com External Appendix D
Vision, Mission, and Values Company’s web site
Internal Appendix D
Content Grouped into Variables Company’s web site
Internal Appendix E
Coding for Content and Culture Company’s web site
Internal Appendix F
89
CHAPTER IV
RESULTS AND DISCUSSION
Would a company add or change desired behaviors by choosing and defining
vision, mission, and goals if it led to increased profits, employee satisfaction, and CEO
approval? The ability to analyze cultural data can provide important insight into
identifying those behaviors for new company start-up or a small business owner’s
organizational changes.
The framework of a workplace culture will determine how employees behave and
complete their work. Setting a clear vision and mission is the backbone of
organizational behaviors. The decisions that a company will focus on and the way work
is completed can be an important part of every manager’s job. The success of these
decisions relies on many things, such as the company history, leadership skills,
personal and company beliefs, and information from financial key performance
indicators. The results of the research are discussed in this chapter. Results were
based on using the Fortune 500 company comparison of the organization culture and its
success using quantitative and qualitative data.
Results
Hypothesis 1
Forty companies’ content analysis were coded into 14 variables as listed in Table
24 below. A total of 1136 individual phrases and words were coded from the company’s
espoused culture. The complete coding for every company is in Appendix E.
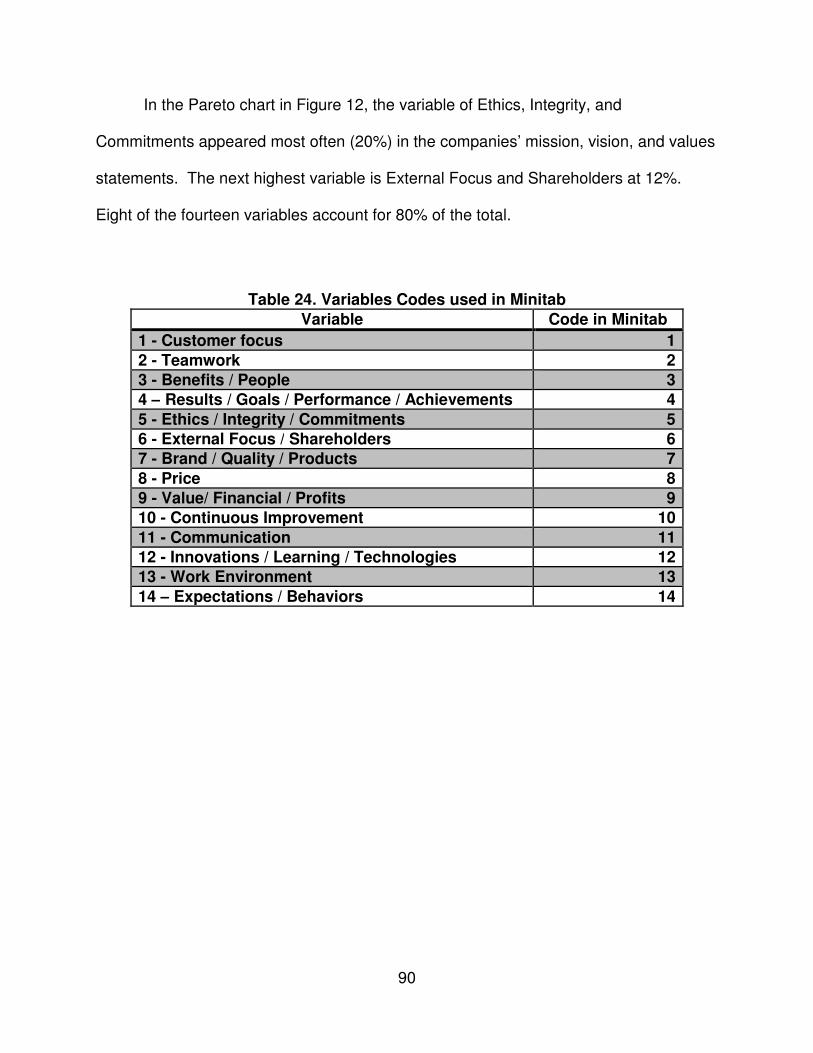
90
In the Pareto chart in Figure 12, the variable of Ethics, Integrity, and
Commitments appeared most often (20%) in the companies’ mission, vision, and values
statements. The next highest variable is External Focus and Shareholders at 12%.
Eight of the fourteen variables account for 80% of the total.
Table 24. Variables Codes used in Minitab
Variable Code in Minitab
1 - Customer focus 1
2 - Teamwork 2
3 - Benefits / People 3
4 – Results / Goals / Performance / Achievements 4
5 - Ethics / Integrity / Commitments 5
6 - External Focus / Shareholders 6
7 - Brand / Quality / Products 7
8 - Price 8
9 - Value/ Financial / Profits 9
10 - Continuous Improvement 10
11 - Communication 11
12 - Innovations / Learning / Technologies 12
13 - Work Environment 13
14 – Expectations / Behaviors 14
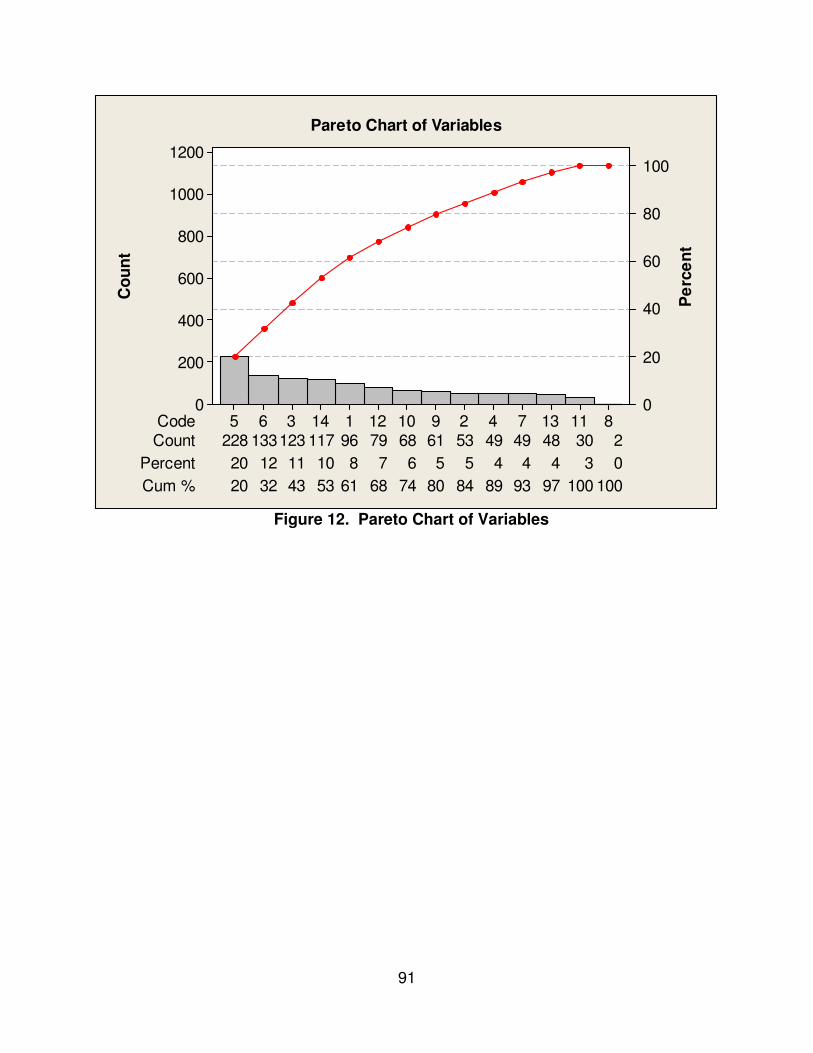
91
Figure 12. Pareto Chart of Variables
Co
un
t
Pe
rce
nt
CodeCount 53 49 49 48 30 2
Percent 20 12 11
228
10 8 7 6 5 5 4 4 4 3
133
0
Cum % 20 32 43 53 61 68 74 80
123
84 89 93 97 100 100
117 96 79 68 618111374291012114365
1200
1000
800
600
400
200
0
100
80
60
40
20
0
Pareto Chart of Variables

92
Figure 13. Pareto Chart of Variables for Vision, Mission, and Values
Figure 14 shows the distribution of espoused culture variables for all of the
companies studied. For example, 12.5% (5 companies) of the companies used up to
25% of the fourteen variables in their mission, vision, and values statements, 22.5% (9
companies) used between 26% and 50%, 22.5% (9 companies) used between 51% and
75%, and 42.5% (17 companies) used between 75% and 100% of the fourteen
variables in their mission, vision, and values statements.
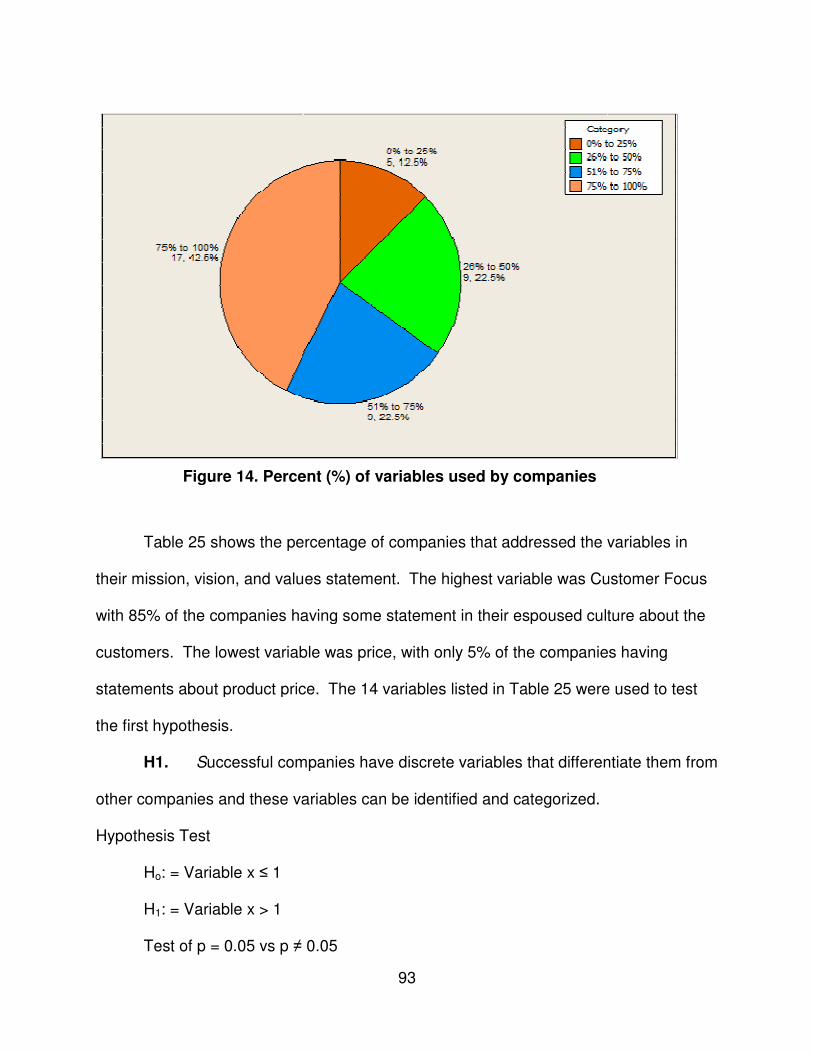
Table 25 shows the percentage of
their mission, vision, and values statement
with 85% of the companies having some statement in their espoused culture about the
customers. The lowest variable was price, with only 5% of the companies having
statements about product price. The 14 variables
the first hypothesis.
H1. Successful companies have discrete variables that differentiate them from
other companies and these variables can be identified and categorized.
Hypothesis Test
Ho: = Variable x ≤ 1
H1: = Variable x > 1
Test of p = 0.05 vs p ≠ 0.05
Figure 14. Percent (
93
percentage of companies that addressed the variables in
values statement. The highest variable was Customer Focus
with 85% of the companies having some statement in their espoused culture about the
customers. The lowest variable was price, with only 5% of the companies having
statements about product price. The 14 variables listed in Table 25 were
companies have discrete variables that differentiate them from
other companies and these variables can be identified and categorized.
≠ 0.05
Percent (%) of variables used by companies
addressed the variables in
Customer Focus
with 85% of the companies having some statement in their espoused culture about the
customers. The lowest variable was price, with only 5% of the companies having
25 were used to test
companies have discrete variables that differentiate them from
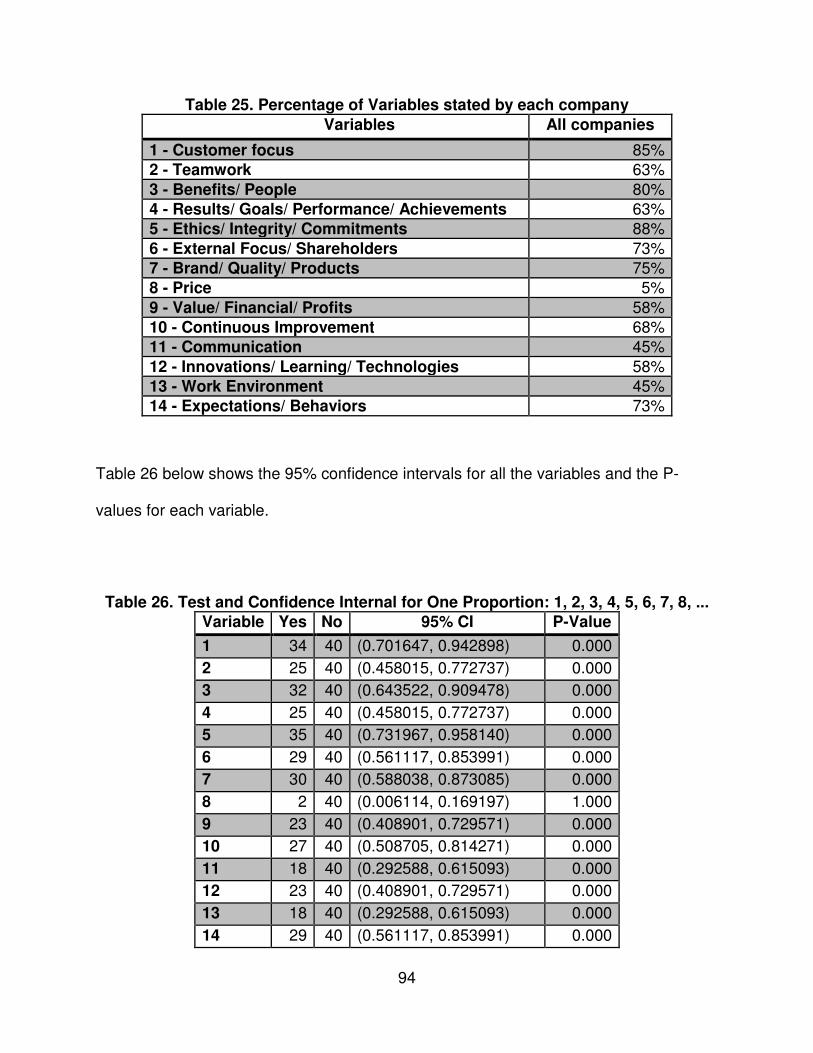
94
Table 25. Percentage of Variables stated by each company
Table 26 below shows the 95% confidence intervals for all the variables and the P-
values for each variable.
Table 26. Test and Confidence Internal for One Proportion: 1, 2, 3, 4, 5, 6, 7, 8, ...
Variable Yes No 95% CI P-Value
1 34 40 (0.701647, 0.942898) 0.000
2 25 40 (0.458015, 0.772737) 0.000
3 32 40 (0.643522, 0.909478) 0.000
4 25 40 (0.458015, 0.772737) 0.000
5 35 40 (0.731967, 0.958140) 0.000
6 29 40 (0.561117, 0.853991) 0.000
7 30 40 (0.588038, 0.873085) 0.000
8 2 40 (0.006114, 0.169197) 1.000
9 23 40 (0.408901, 0.729571) 0.000
10 27 40 (0.508705, 0.814271) 0.000
11 18 40 (0.292588, 0.615093) 0.000
12 23 40 (0.408901, 0.729571) 0.000
13 18 40 (0.292588, 0.615093) 0.000
14 29 40 (0.561117, 0.853991) 0.000
Variables All companies
1 - Customer focus 85% 2 - Teamwork 63%
3 - Benefits/ People 80% 4 - Results/ Goals/ Performance/ Achievements 63% 5 - Ethics/ Integrity/ Commitments 88%
6 - External Focus/ Shareholders 73% 7 - Brand/ Quality/ Products 75% 8 - Price 5%
9 - Value/ Financial/ Profits 58% 10 - Continuous Improvement 68% 11 - Communication 45%
12 - Innovations/ Learning/ Technologies 58% 13 - Work Environment 45% 14 - Expectations/ Behaviors 73%
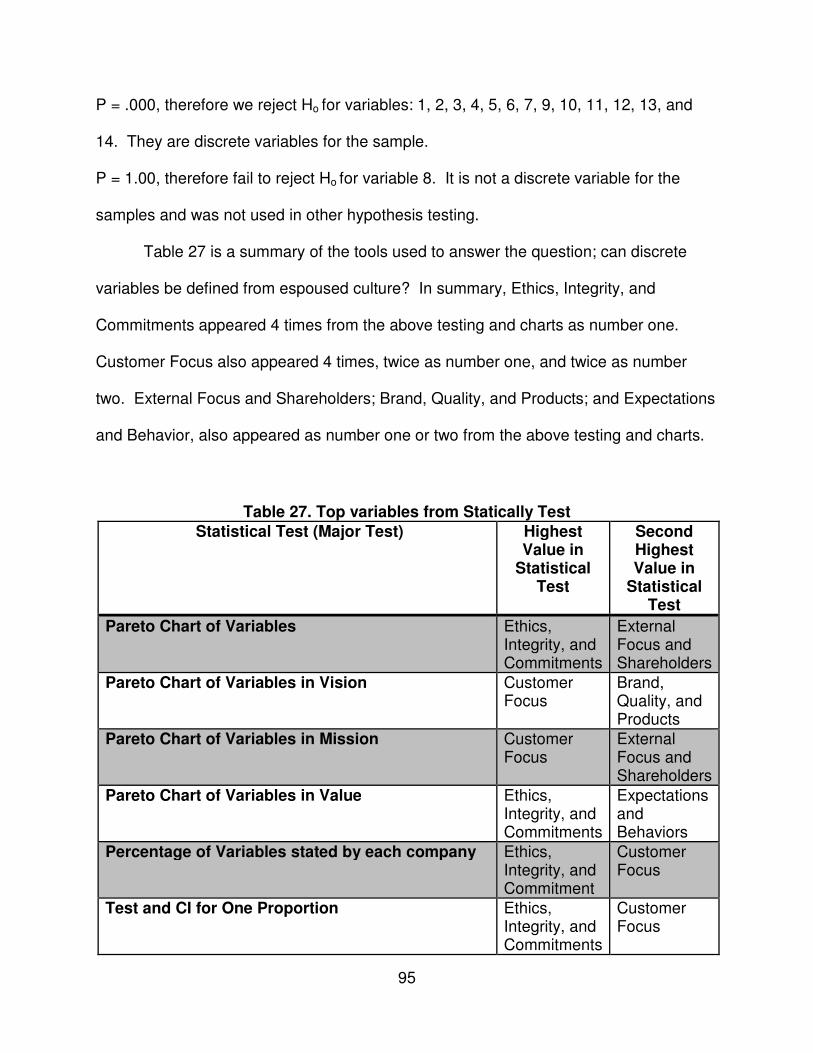
95
P = .000, therefore we reject Ho for variables: 1, 2, 3, 4, 5, 6, 7, 9, 10, 11, 12, 13, and
14. They are discrete variables for the sample.
P = 1.00, therefore fail to reject Ho for variable 8. It is not a discrete variable for the
samples and was not used in other hypothesis testing.
Table 27 is a summary of the tools used to answer the question; can discrete
variables be defined from espoused culture? In summary, Ethics, Integrity, and
Commitments appeared 4 times from the above testing and charts as number one.
Customer Focus also appeared 4 times, twice as number one, and twice as number
two. External Focus and Shareholders; Brand, Quality, and Products; and Expectations
and Behavior, also appeared as number one or two from the above testing and charts.
Table 27. Top variables from Statically Test
Statistical Test (Major Test) Highest Value in
Statistical Test
Second Highest Value in
Statistical Test
Pareto Chart of Variables Ethics, Integrity, and Commitments
External Focus and Shareholders
Pareto Chart of Variables in Vision Customer Focus
Brand, Quality, and Products
Pareto Chart of Variables in Mission Customer Focus
External Focus and Shareholders
Pareto Chart of Variables in Value Ethics, Integrity, and Commitments
Expectations and Behaviors
Percentage of Variables stated by each company Ethics, Integrity, and Commitment
Customer Focus
Test and CI for One Proportion Ethics, Integrity, and Commitments
Customer Focus
96
Hypothesis 2 H2. The identified discrete variables have different levels of contributions to the
success of the company as represented in an equation, which represents how each
input is calculated as an isolated part of the whole.
A Best Fit regression analysis was completed in Minitab as shown in Figure 17
below. The first iteration of the Best Fit model tested Benefits/ People with an r-squared
value of 17.1. The second iteration of the Best Fit model tested Value/ Financial /
Profits with an r-squared value of 12.9. The third iteration of the Best Fit model tested
two variables, Customer Focus and Benefits/ People with an r-squared values of 26.8.
The eleventh iteration used with the first highest r-squared value of 45. The following
variables were used in the next step of a regression analysis for revenue and profit as
highlighted with the green line in the below figure.
1 - Customer focus,
3 - Benefits/ People,
6 - External Focus/ Shareholders,
9 - Value/ Financial / Profits,
10 - Continuous Improvement, and
12 - Innovations/ Learning/ Technologies.
The results from the regression analysis are shown in Table 28. Variable six and
ten were removed from the equation, as they did not show significance. Their p-values
are higher than 0.05 as indicated in red.
The final iteration of the model is shown in Figure 16 and Figure 17. Figure 16
shows that R-squared is 58.27%. The regression model in equation 1 can explain
58.37% of the variation in the revenue.
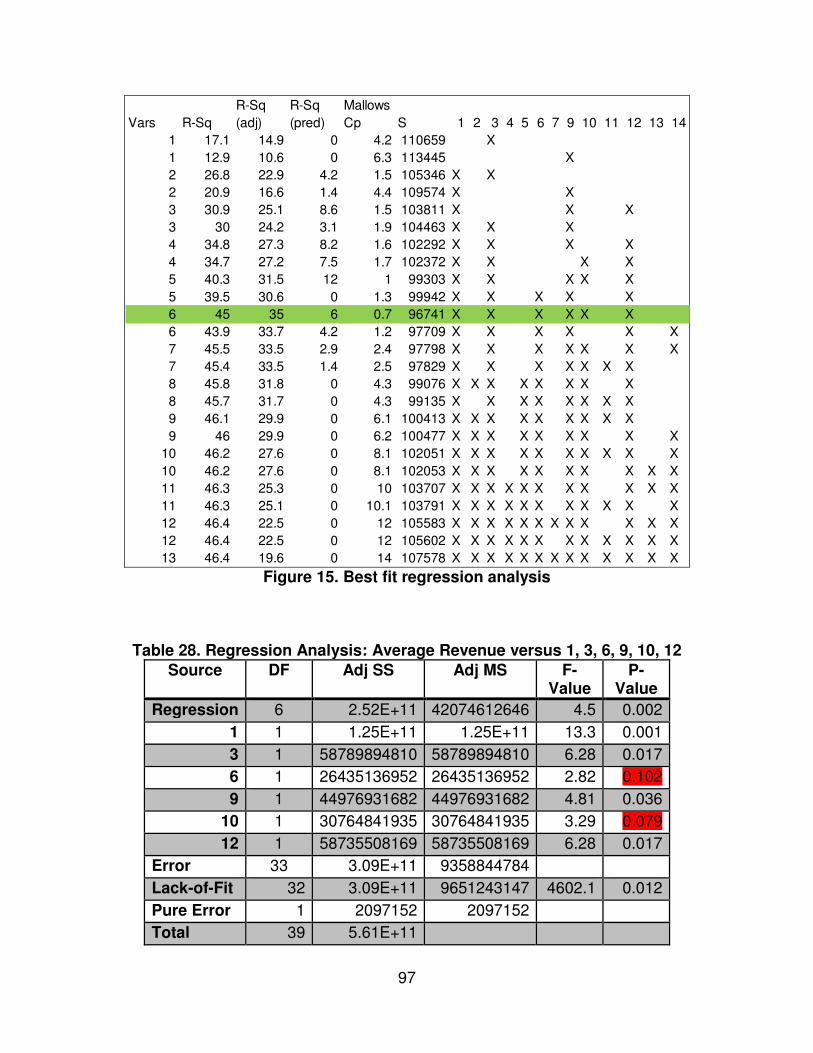
97
Figure 15. Best fit regression analysis
Table 28. Regression Analysis: Average Revenue versus 1, 3, 6, 9, 10, 12
Source DF Adj SS Adj MS F-Value
P-Value
Regression 6 2.52E+11 42074612646 4.5 0.002
1 1 1.25E+11 1.25E+11 13.3 0.001
3 1 58789894810 58789894810 6.28 0.017
6 1 26435136952 26435136952 2.82 0.102
9 1 44976931682 44976931682 4.81 0.036
10 1 30764841935 30764841935 3.29 0.079
12 1 58735508169 58735508169 6.28 0.017
Error 33 3.09E+11 9358844784
Lack-of-Fit 32 3.09E+11 9651243147 4602.1 0.012
Pure Error 1 2097152 2097152
Total 39 5.61E+11
R-Sq R-Sq Mallows
Vars R-Sq (adj) (pred) Cp S 1 2 3 4 5 6 7 9 10 11 12 13 14
1 17.1 14.9 0 4.2 110659 X
1 12.9 10.6 0 6.3 113445 X
2 26.8 22.9 4.2 1.5 105346 X X
2 20.9 16.6 1.4 4.4 109574 X X
3 30.9 25.1 8.6 1.5 103811 X X X
3 30 24.2 3.1 1.9 104463 X X X
4 34.8 27.3 8.2 1.6 102292 X X X X
4 34.7 27.2 7.5 1.7 102372 X X X X
5 40.3 31.5 12 1 99303 X X X X X
5 39.5 30.6 0 1.3 99942 X X X X X
6 45 35 6 0.7 96741 X X X X X X
6 43.9 33.7 4.2 1.2 97709 X X X X X X
7 45.5 33.5 2.9 2.4 97798 X X X X X X X
7 45.4 33.5 1.4 2.5 97829 X X X X X X X
8 45.8 31.8 0 4.3 99076 X X X X X X X X
8 45.7 31.7 0 4.3 99135 X X X X X X X X
9 46.1 29.9 0 6.1 100413 X X X X X X X X X
9 46 29.9 0 6.2 100477 X X X X X X X X X
10 46.2 27.6 0 8.1 102051 X X X X X X X X X X
10 46.2 27.6 0 8.1 102053 X X X X X X X X X X
11 46.3 25.3 0 10 103707 X X X X X X X X X X X
11 46.3 25.1 0 10.1 103791 X X X X X X X X X X X
12 46.4 22.5 0 12 105583 X X X X X X X X X X X X
12 46.4 22.5 0 12 105602 X X X X X X X X X X X X
13 46.4 19.6 0 14 107578 X X X X X X X X X X X X X
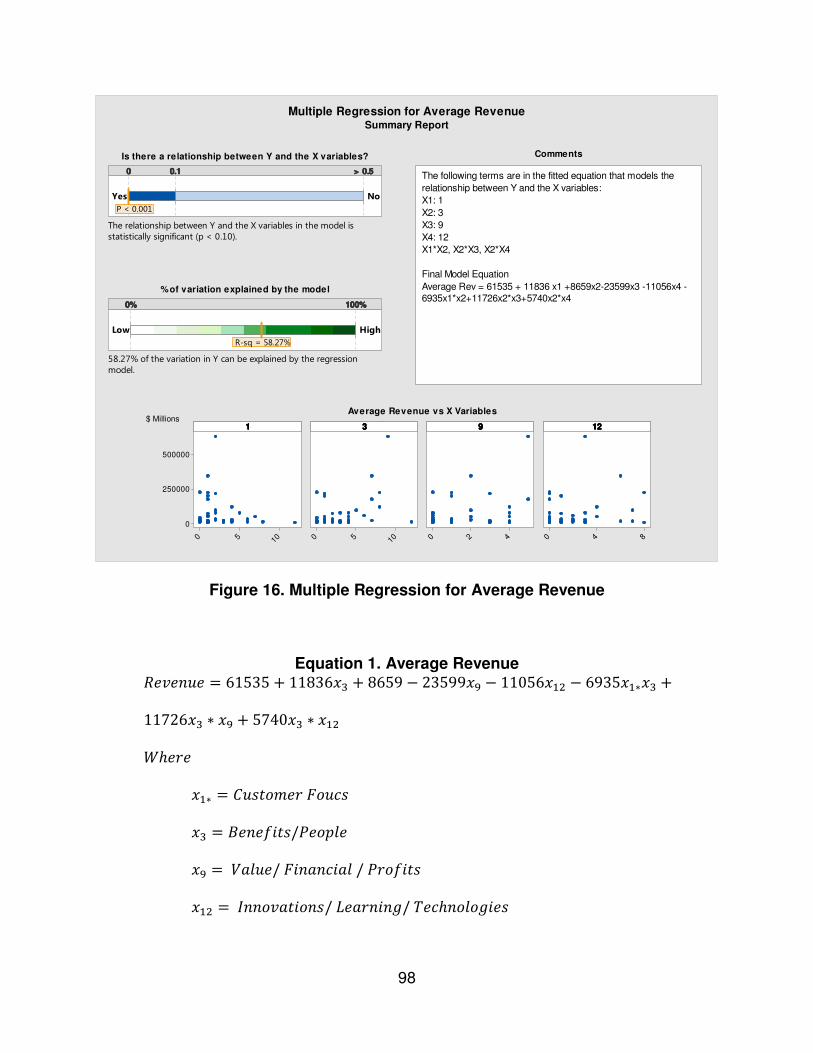
98
Figure 16. Multiple Regression for Average Revenue
Equation 1. Average Revenue
������� � 61535 � 11836 � � 8659 � 23599 � � 11056 �� � 6935 �� � �
11726 � � � � 5740 � � ��
�����
�� � ���� !�� " �#�
� � $���%&��/(� )*�
� � +,*��/ "&�,�#&,* / (� %&��
�� � -�� �,�& ��/ .�,��&�// 0�#�� * /&��
statistically significant (p < 0.10).The relationship between Y and the X variables in the model is
Yes No
0000 0000....1111 >>>> 0000....5555
P < 0.001
model.58.27% of the variation in Y can be explained by the regression
Low High
0000%%%% 111100000000%%%%
R-sq = 58.27%
6935x1*x2+11726x2*x3+5740x2*x4Average Rev = 61535 + 11836 x1 +8659x2-23599x3 -11056x4 -
Final Model Equation
X1*X2, X2*X3, X2*X4
X4: 12
X3: 9
X2: 3
X1: 1
relationship between Y and the X variables:
The following terms are in the fitted equation that models the
1050
500000
250000
0
1050 420 840
1111 3333 9999 11112222
Is there a relationship between Y and the X variables? Comments
Average Revenue vs X Variables
Multiple Regression for Average RevenueSummary Report
% of variation explained by the model
$ Millions
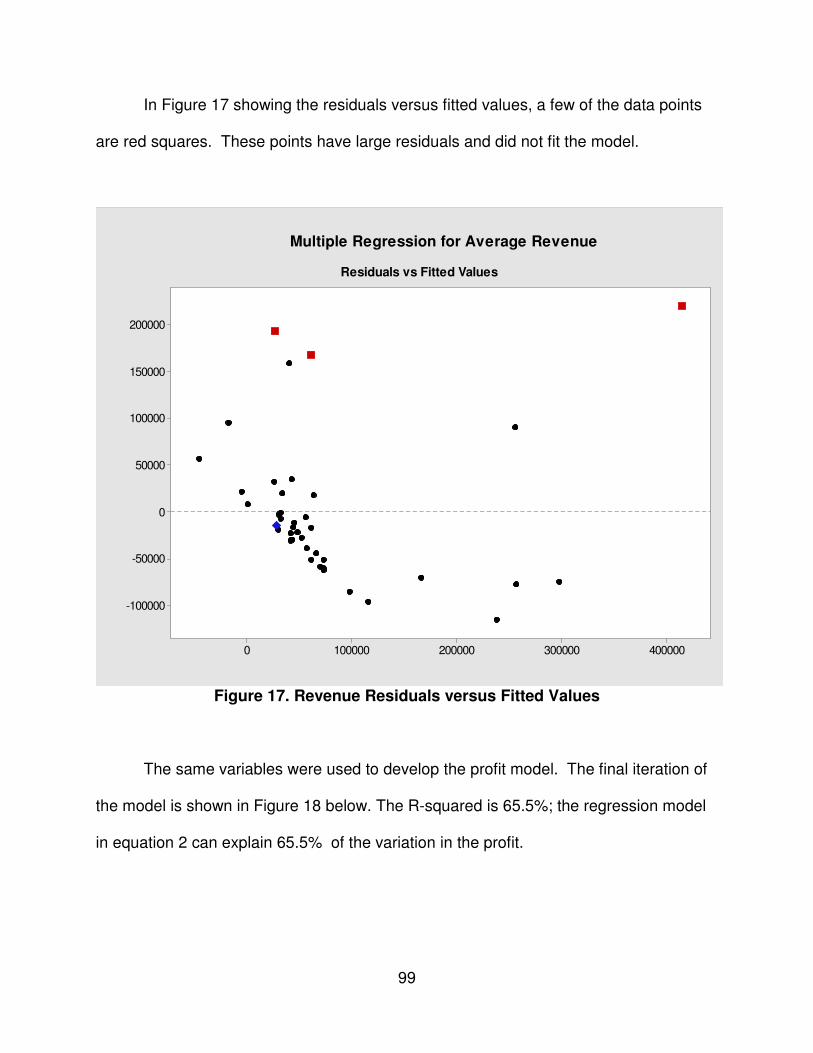
99
In Figure 17 showing the residuals versus fitted values, a few of the data points
are red squares. These points have large residuals and did not fit the model.
Figure 17. Revenue Residuals versus Fitted Values
The same variables were used to develop the profit model. The final iteration of
the model is shown in Figure 18 below. The R-squared is 65.5%; the regression model
in equation 2 can explain 65.5% of the variation in the profit.
$ Millions
$ Millions
4000003000002000001000000
200000
150000
100000
50000
0
-50000
-100000
Residuals vs Fitted Values
Multiple Regression for Average Revenue
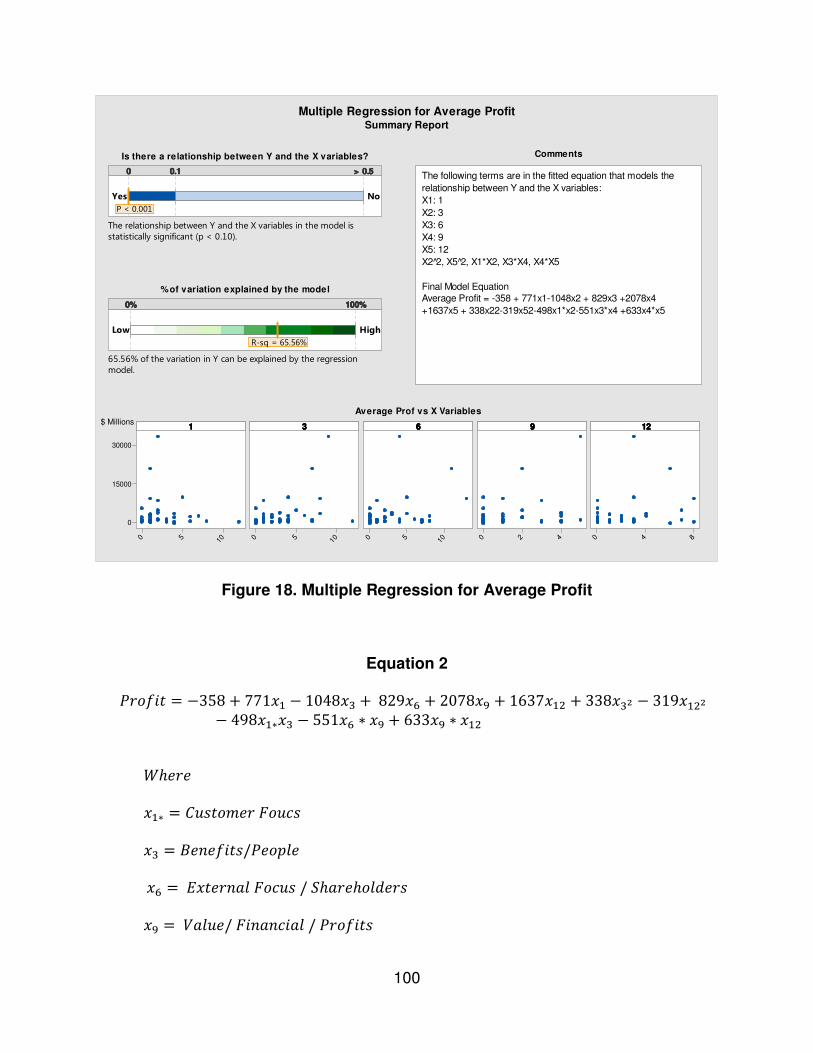
100
Figure 18. Multiple Regression for Average Profit
Equation 2
(� %&� � �358 � 771 � � 1048 � � 829 1 � 2078 � � 1637 �� � 338 �2 � 319 ��2
� 498 �� � � 551 1 � � � 633 � � ��
�����
�� � ���� !�� " �#�
� � $���%&��/(� )*�
1 � 3 ����,* " #�� / 4�,��� *5���
� � +,*��/ "&�,�#&,* / (� %&��
statistically significant (p < 0.10).The relationship between Y and the X variables in the model is
Yes No
0000 0000....1111 >>>> 0000....5555
P < 0.001
model.65.56% of the variation in Y can be explained by the regression
Low High
0000%%%% 111100000000%%%%
R-sq = 65.56%
+1637x5 + 338x22-319x52-498x1*x2-551x3*x4 +633x4*x5
Average Profit = -358 + 771x1-1048x2 + 829x3 +2078x4Final Model Equation
X2 2̂, X5 2̂, X1*X2, X3*X4, X4*X5
X5: 12
X4: 9
X3: 6
X2: 3
X1: 1
relationship between Y and the X variables:
The following terms are in the fitted equation that models the
1050
30000
15000
0
1050 1050 420 840
1111 3333 6666 9999 11112222
Is there a relationship between Y and the X variables? Comments
Average Prof vs X Variables
Multiple Regression for Average ProfitSummary Report
% of variation explained by the model
$ Millions
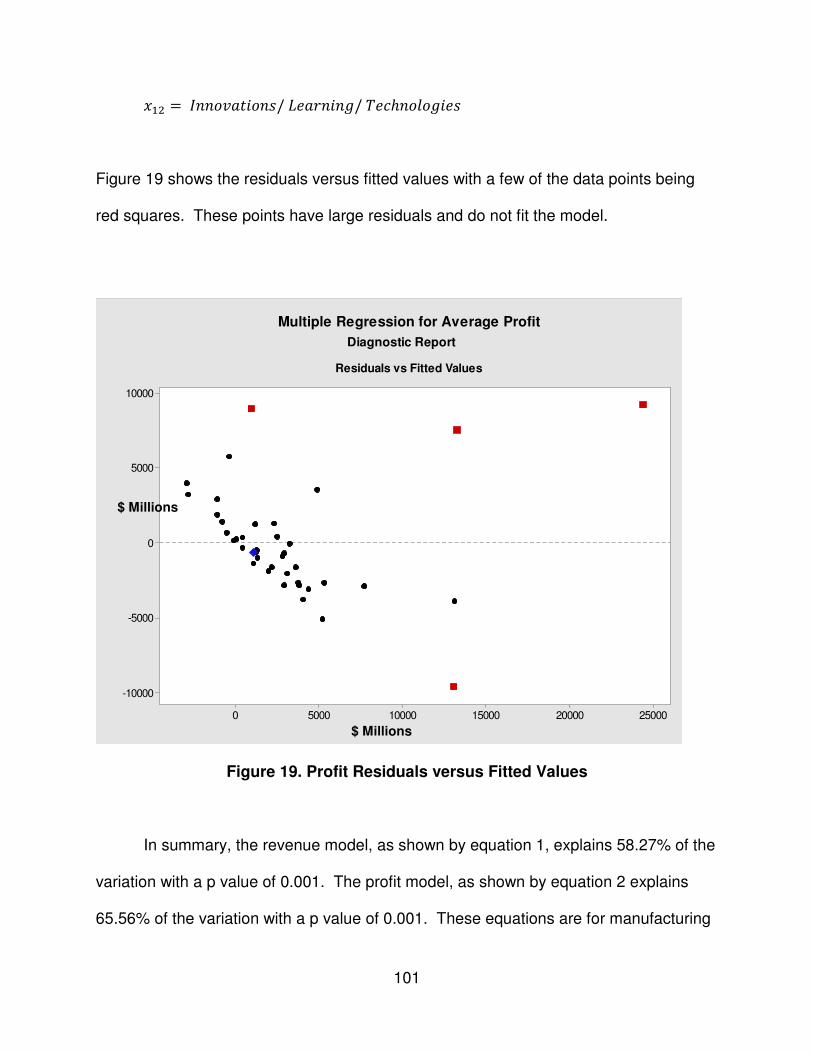
101
�� � -�� �,�& ��/ .�,��&�// 0�#�� * /&��
Figure 19 shows the residuals versus fitted values with a few of the data points being
red squares. These points have large residuals and do not fit the model.
Figure 19. Profit Residuals versus Fitted Values
In summary, the revenue model, as shown by equation 1, explains 58.27% of the
variation with a p value of 0.001. The profit model, as shown by equation 2 explains
65.56% of the variation with a p value of 0.001. These equations are for manufacturing
2500020000150001000050000
10000
5000
0
-5000
-10000
Residuals vs Fitted Values
Look for patterns, such as strong curvature or clusters, that may indicate problems with the
Multiple Regression for Average Profit
Diagnostic Report
$ Millions
$ Millions
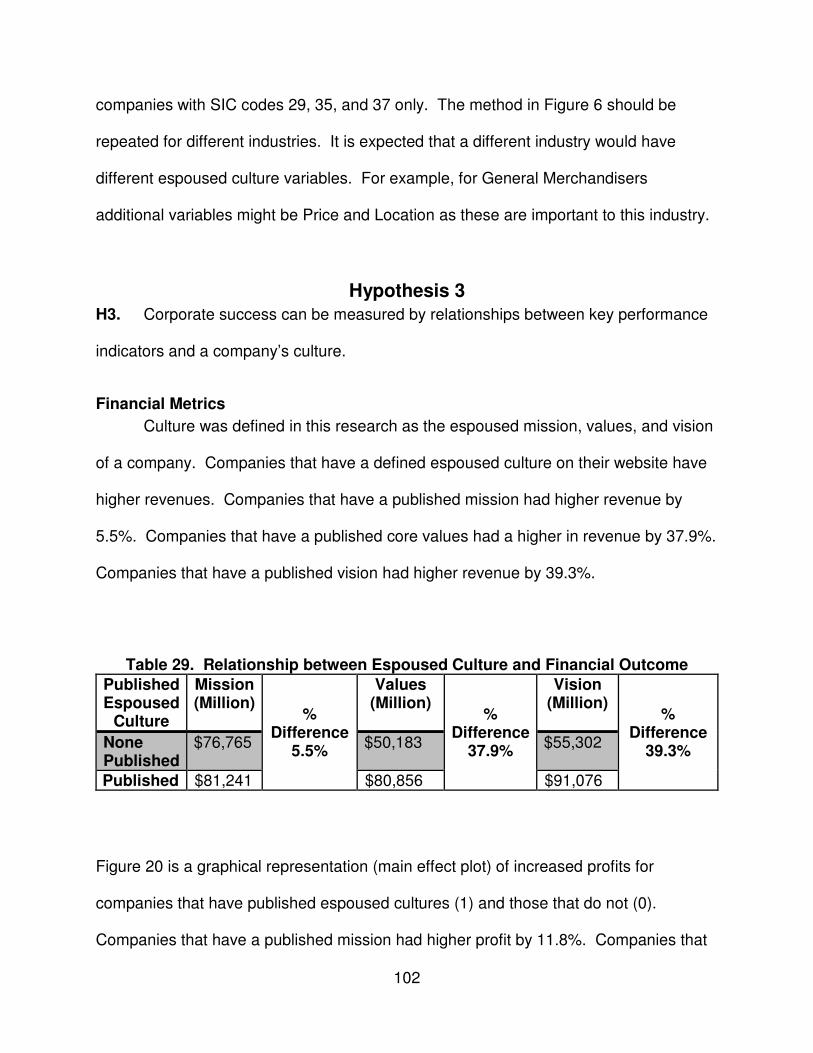
102
companies with SIC codes 29, 35, and 37 only. The method in Figure 6 should be
repeated for different industries. It is expected that a different industry would have
different espoused culture variables. For example, for General Merchandisers
additional variables might be Price and Location as these are important to this industry.
Hypothesis 3 H3. Corporate success can be measured by relationships between key performance
indicators and a company’s culture.
Financial Metrics
Culture was defined in this research as the espoused mission, values, and vision
of a company. Companies that have a defined espoused culture on their website have
higher revenues. Companies that have a published mission had higher revenue by
5.5%. Companies that have a published core values had a higher in revenue by 37.9%.
Companies that have a published vision had higher revenue by 39.3%.
Table 29. Relationship between Espoused Culture and Financial Outcome
Figure 20 is a graphical representation (main effect plot) of increased profits for
companies that have published espoused cultures (1) and those that do not (0).
Companies that have a published mission had higher profit by 11.8%. Companies that
Published Espoused
Culture
Mission (Million)
% Difference
5.5%
Values (Million)
% Difference
37.9%
Vision (Million)
% Difference
39.3% None Published
$76,765 $50,183 $55,302
Published $81,241 $80,856 $91,076
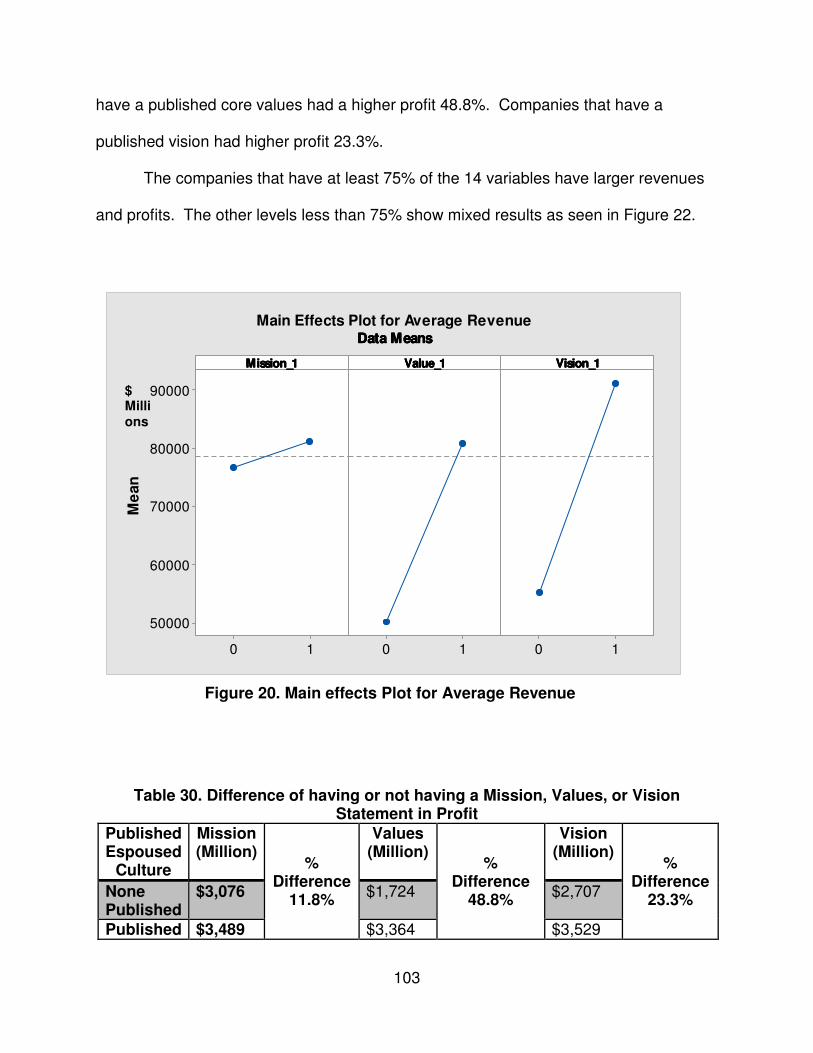
103
have a published core values had a higher profit 48.8%. Companies that have a
published vision had higher profit 23.3%.
The companies that have at least 75% of the 14 variables have larger revenues
and profits. The other levels less than 75% show mixed results as seen in Figure 22.
Table 30. Difference of having or not having a Mission, Values, or Vision Statement in Profit
Published Espoused
Culture
Mission (Million)
% Difference
11.8%
Values (Million)
% Difference
48.8%
Vision (Million)
% Difference
23.3% None Published
$3,076 $1,724 $2,707
Published $3,489 $3,364 $3,529
10
90000
80000
70000
60000
50000
10 10
MMMMiiiissssssssiiiioooonnnn____1111
Me
an
VVVVaaaalllluuuueeee____1111 VVVViiiissssiiiioooonnnn____1111
Main Effects Plot for Average RevenueDDDDaaaattttaaaa MMMMeeeeaaaannnnssss
Figure 20. Main effects Plot for Average Revenue
$ Millions
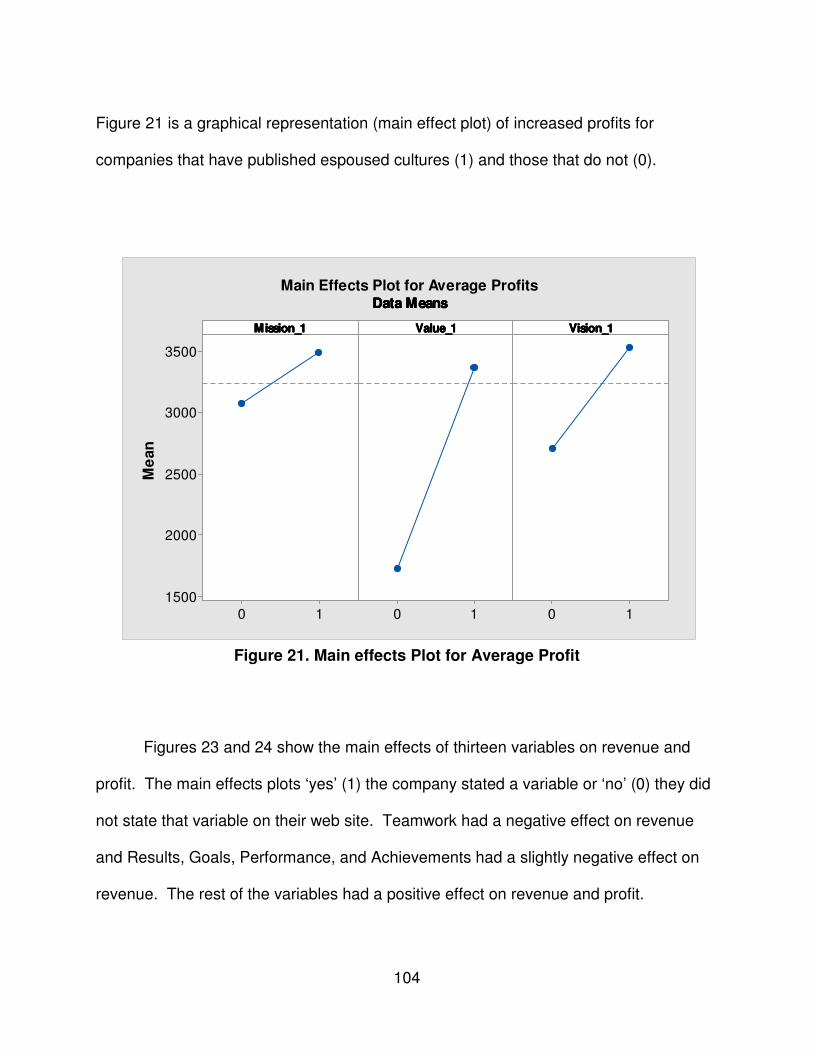
104
10
3500
3000
2500
2000
150010 10
MMMMiiiissssssssiiiioooonnnn____1111
Me
an
VVVVaaaalllluuuueeee____1111 VVVViiiissssiiiioooonnnn____1111
Main Effects Plot for Average ProfitsDDDDaaaattttaaaa MMMMeeeeaaaannnnssss
Figure 21 is a graphical representation (main effect plot) of increased profits for
companies that have published espoused cultures (1) and those that do not (0).
Figure 21. Main effects Plot for Average Profit
Figures 23 and 24 show the main effects of thirteen variables on revenue and
profit. The main effects plots ‘yes’ (1) the company stated a variable or ‘no’ (0) they did
not state that variable on their web site. Teamwork had a negative effect on revenue
and Results, Goals, Performance, and Achievements had a slightly negative effect on
revenue. The rest of the variables had a positive effect on revenue and profit.
$

Figure 22. Main Effects Plot for Average Revenue and Profit with % of
10
100000
80000
60000
40000
10
10
100000
80000
60000
40000
10
1111yyyynnnn
Me
an
2222yyyynnnn
9999yyyynnnn 11110000yyyynnnn
Main Effe
Figure 23. Main Effects Plot for Average Rev
105
. Main Effects Plot for Average Revenue and Profit with % of Variables
10 10 10 10 0
10 10 10 10
3333yyyynnnn 4444yyyynnnn 5555yyyynnnn 6666yyyynnnn 7777yyyynnnn
11111111yyyynnnn 11112222yyyynnnn 11113333yyyynnnn 11114444yyyynnnn
ects Plot for Average RevenueDDDDaaaattttaaaa MMMMeeeeaaaannnnssss
. Main Effects Plot for Average Revenue and Variables Present
. Main Effects Plot for Average Revenue and Profit with % of
1
enue and Variables Present

106
Figure 24. Main Effects Plot for Average Profit and Variables Present
A positive correlation for twelve of the variables to revenue and profit was
expected. One of the reasons that small businesses failed from the literature review
was a deficiency on customer expectations. Therefore focusing on the customer’s need
will increase profit and revenue. Thompson and Strickland (2000) state that to get
employees to sustain an energetic commitment, management has to be resourceful in
designing motivational incentives both monetary and non-monetary which shows in the
positive correlation of Benefits and People. The ability to trust is the foundational
principal of ethics. Sarbanes–Oxley Act was designed to protect investors from un-
ethical behavior by requiring companies to have reliable, truthful, and accurate
corporate disclosure for their finances, thus the positive correlation with Ethics, Integrity,
and Commitments. Stakeholders include suppliers, dealers, the community and
10
5000
4000
3000
2000
1000
10 10 10 10 10 10
10
5000
4000
3000
2000
1000
10 10 10 10 10
1111yyyynnnn
Me
an
2222yyyynnnn 3333yyyynnnn 4444yyyynnnn 5555yyyynnnn 6666yyyynnnn 7777yyyynnnn
9999yyyynnnn 11110000yyyynnnn 11111111yyyynnnn 11112222yyyynnnn 11113333yyyynnnn 11114444yyyynnnn
Main Effects Plot for Average ProfitsDDDDaaaattttaaaa MMMMeeeeaaaannnnssss
$ Millions

107
shareholder. Primary stakeholders are essential to the success of the corporation; as a
result, External Focus and Shareholders show a positive correlation to revenue and
profit. The literature review section titled ‘Organizational Culture and Business Success’
reviews how metrics correlate to business results therefore it was likely for Value,
Financial and Profits; Expectations and Behaviors would have a positive correlation to
business success. The goal of Continuous Improvement is to increase profit by
reducing waste. A company must install information communication and operation
systems that enable company personnel to better carry out their roles (Thompson and
Strickland 2000). Building an organization with the competencies, capabilities, and
resource strengths is needed for a successful strategy execution hence a positive
correlation with driving Innovations, Learning and Technologies. The last variable was
anticipated to also have a positive correlation between revenue and profit of a safe and
positive Work Environment for employees.
Employee Metrics and Leadership Metrics
Hypothesis Test Ho: = There is a correlation between the employee metrics and leadership metric and the significant variables. H1: = There is not a correlation between the employee metrics and leadership metric and the significant variables. α = 0.10
Table 31 shows the correlation between the Employee Metrics and Leadership
Metrics and the 13 variables. The top number is the Pearson Correlation (PC), and the
bottom number is the p-value. For any p-value (green) ≤ .10, we reject Ho. There is a
significant different between these employee metrics and leadership metrics and the
108
significant variables. The smaller the p-value, the stronger the evidence is in favor of
the variable have correlation with the metrics. There is a positive correlation with all the
metrics and variable 3, Benefits and People, and a stronger correlation with variable 6,
External Focus and Shareholders, as the p-values are very low. There was also a
positive correlation of Value, Financial, and Profits for all the Glassdoor Indicators
except Recommend to a Friend.
In summary companies that have a mission, vision, and values have increased
revenue and profits over those that don’t have published mission, vision, and values
statements as evidenced by their web sites. Companies that had 75% of the variables
demonstrated higher revenues and profits over companies with fewer variables.
Customer focus, Benefits and People; Ethics, Integrity and Commitments; External
Focus and Shareholders; Brand, Quality and Products; Value, Financial, and Profits;
Continuous Improvement; Communication; Innovations, Learning and Technologies;
Work Environment; Expectations and Behaviors all showed higher revenue and profit.

109
Table 31. Correlation of Employee Metrics and Leadership Metrics with Variables Variable Culture &
Values Work /Life
Balance
Senior Management
Comp & Benefit
Career Opportunity
Recommend to a friend
Approval of CEO
1 PC 0.042 0.144 0.092 0.059 0.028 0.110 -0.051 P-value 0.799 0.377 0.574 0.717 0.863 0.498 0.754
2 PC 0.040 0.121 0.109 0.101 0.089 0.057 0.041 P-value 0.806 0.458 0.503 0.534 0.583 0.726 0.802
3 PC 0.268 0.311 0.289 0.373 0.372 0.335 0.275 P-value 0.095 0.051 0.071 0.018 0.018 0.035 0.086
4 PC 0.131 0.126 0.151 0.228 0.202 0.109 0.028 P-value 0.419 0.438 0.352 0.158 0.212 0.503 0.863
5 PC 0.031 0.003 0.041 0.353 0.124 0.036 -0.019 P-value 0.851 0.987 0.803 0.025 0.446 0.824 0.905
6 PC 0.525 0.432 0.501 0.533 0.570 0.447 0.472 P-value 0.001 0.005 0.001 0.000 0.000 0.004 0.002
7 PC 0.059 0.164 0.055 -0.038 0.089 0.113 -0.088 P-value 0.720 0.313 0.735 0.814 0.583 0.486 0.591
9 PC 0.291 0.276 0.336 0.277 0.302 0.263 0.293 P-value 0.069 0.085 0.034 0.084 0.058 0.102 0.066
10 PC 0.170 0.188 0.169 0.212 0.180 0.154 0.070 P-value 0.295 0.246 0.298 0.190 0.267 0.342 0.667
11 PC -0.211 -0.215 -0.223 -0.054 -0.177 -0.188 -0.125 P-value 0.191 0.183 0.166 0.743 0.275 0.245 0.443
12 PC 0.003 0.145 0.069 0.129 0.027 0.039 -0.082 P-value 0.983 0.371 0.671 0.427 0.869 0.809 0.613
13 PC 0.291 0.152 0.176 0.359 0.280 0.207 0.284 P-value 0.069 0.349 0.277 0.023 0.080 0.199 0.076
14 PC -0.081 0.070 -0.026 0.003 -0.044 -0.031 0.007 P-value 0.618 0.669 0.872 0.988 0.789 0.849 0.966
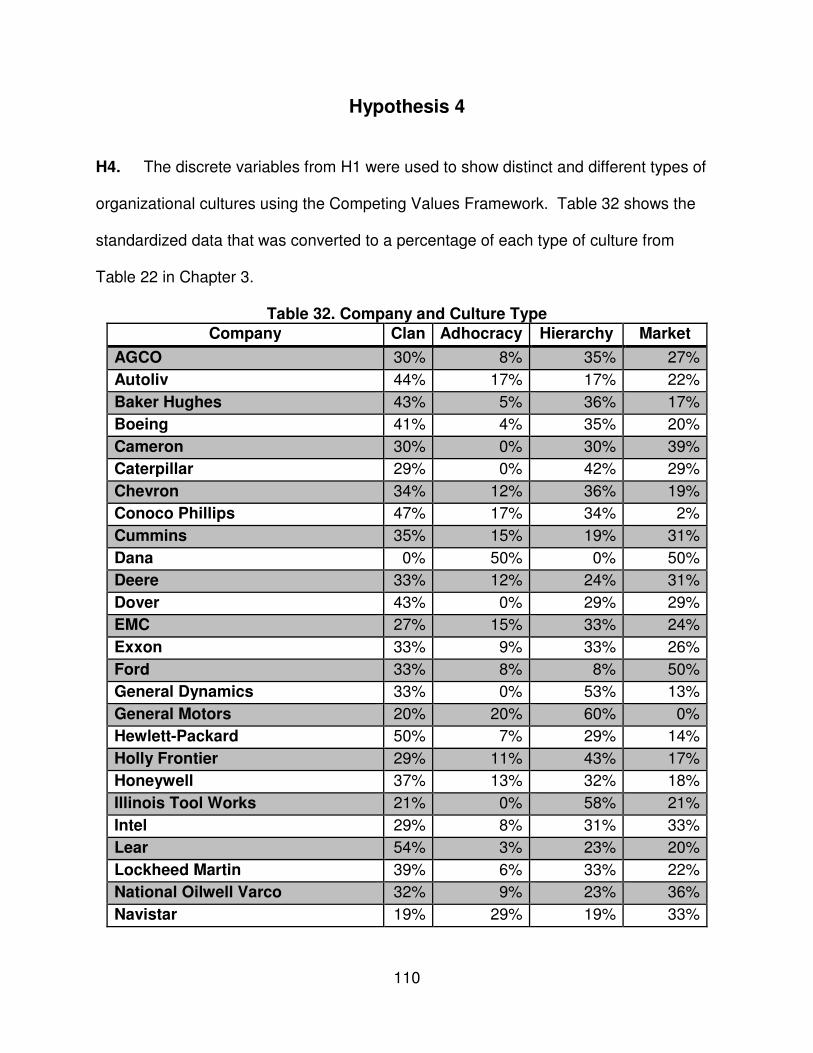
110
Hypothesis 4
H4. The discrete variables from H1 were used to show distinct and different types of
organizational cultures using the Competing Values Framework. Table 32 shows the
standardized data that was converted to a percentage of each type of culture from
Table 22 in Chapter 3.
Table 32. Company and Culture Type
Company Clan Adhocracy Hierarchy Market
AGCO 30% 8% 35% 27%
Autoliv 44% 17% 17% 22%
Baker Hughes 43% 5% 36% 17%
Boeing 41% 4% 35% 20%
Cameron 30% 0% 30% 39%
Caterpillar 29% 0% 42% 29%
Chevron 34% 12% 36% 19%
Conoco Phillips 47% 17% 34% 2%
Cummins 35% 15% 19% 31%
Dana 0% 50% 0% 50%
Deere 33% 12% 24% 31%
Dover 43% 0% 29% 29%
EMC 27% 15% 33% 24%
Exxon 33% 9% 33% 26%
Ford 33% 8% 8% 50%
General Dynamics 33% 0% 53% 13%
General Motors 20% 20% 60% 0%
Hewlett-Packard 50% 7% 29% 14%
Holly Frontier 29% 11% 43% 17%
Honeywell 37% 13% 32% 18%
Illinois Tool Works 21% 0% 58% 21%
Intel 29% 8% 31% 33%
Lear 54% 3% 23% 20%
Lockheed Martin 39% 6% 33% 22%
National Oilwell Varco 32% 9% 23% 36%
Navistar 19% 29% 19% 33%
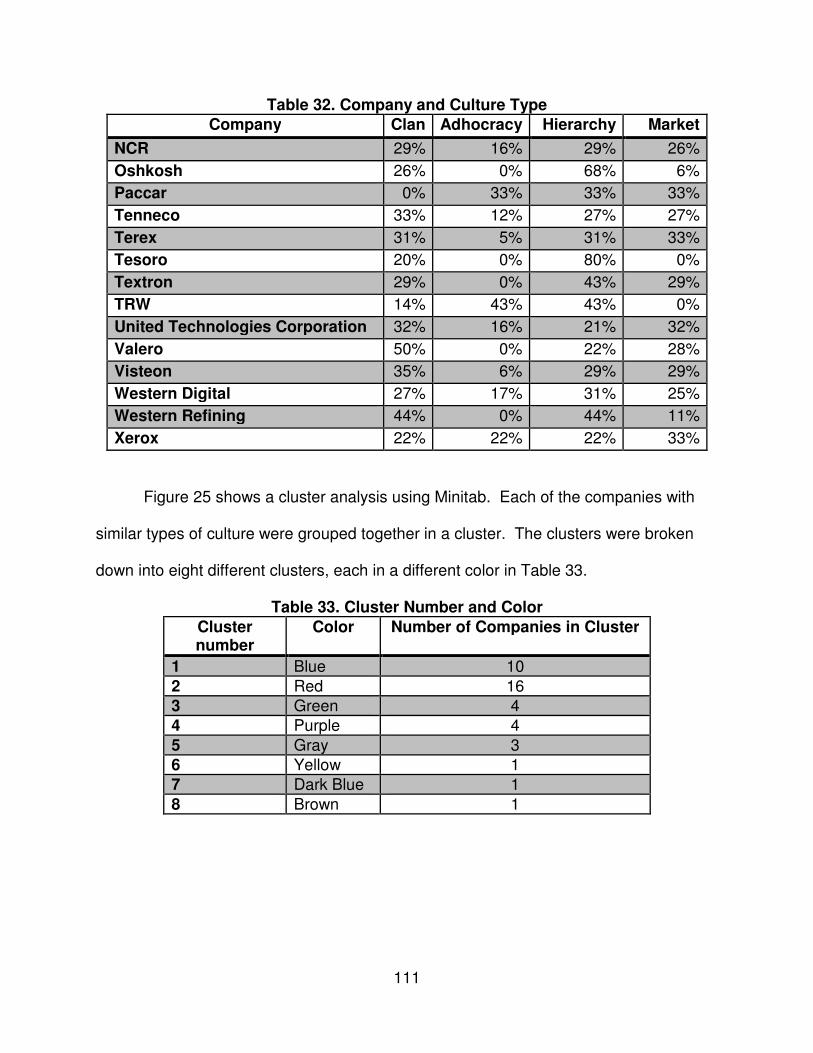
111
Table 32. Company and Culture Type
Company Clan Adhocracy Hierarchy Market
NCR 29% 16% 29% 26%
Oshkosh 26% 0% 68% 6%
Paccar 0% 33% 33% 33%
Tenneco 33% 12% 27% 27%
Terex 31% 5% 31% 33%
Tesoro 20% 0% 80% 0%
Textron 29% 0% 43% 29%
TRW 14% 43% 43% 0%
United Technologies Corporation 32% 16% 21% 32%
Valero 50% 0% 22% 28%
Visteon 35% 6% 29% 29%
Western Digital 27% 17% 31% 25%
Western Refining 44% 0% 44% 11%
Xerox 22% 22% 22% 33%
Figure 25 shows a cluster analysis using Minitab. Each of the companies with
similar types of culture were grouped together in a cluster. The clusters were broken
down into eight different clusters, each in a different color in Table 33.
Table 33. Cluster Number and Color
Cluster number
Color Number of Companies in Cluster
1 Blue 10
2 Red 16 3 Green 4 4 Purple 4
5 Gray 3 6 Yellow 1 7 Dark Blue 1
8 Brown 1

112
Figure 25. Dendrogram of all Companies
A one way ANOVA test was completed to see if the means were equal for the
Glassdoor indicators in Table 34.
Ho: = All means are equal
H1: = All means are not equal
α = 0.05
Da
na
T
RW
P
acca
r N
avista
r X
ero
x
Illino
is To
ol W
orks
Ge
ne
ral M
oto
rs O
shko
sh
Te
soro
F
ord
A
uto
liv
Do
ve
r L
ea
r V
ale
ro
Te
xtro
n
Ca
terp
illar
Ca
me
ron
N
atio
na
l Oilw
ell V
arc
oT
en
ne
co
D
ee
re
Un
ited
Te
ch
no
log
ies C
orp
ora
tion
Cu
mm
ins
We
stern
Dig
ital
NC
R
EM
C
Viste
on
T
ere
x
Inte
l A
GC
O
Exxo
n
He
wle
tt-Pa
cka
rd
Co
no
co
Ph
illips
Ge
ne
ral D
yn
am
ics
We
stern
Re
finin
gH
olly
Fro
ntie
r L
ockh
ee
d M
artin
B
oe
ing
B
ake
r Hu
gh
es
Ho
ne
yw
ell
Ch
evro
n
0.00
33.33
66.67
100.00
Sim
ilari
tyDendrogram
Complete Linkage, Euclidean Distance
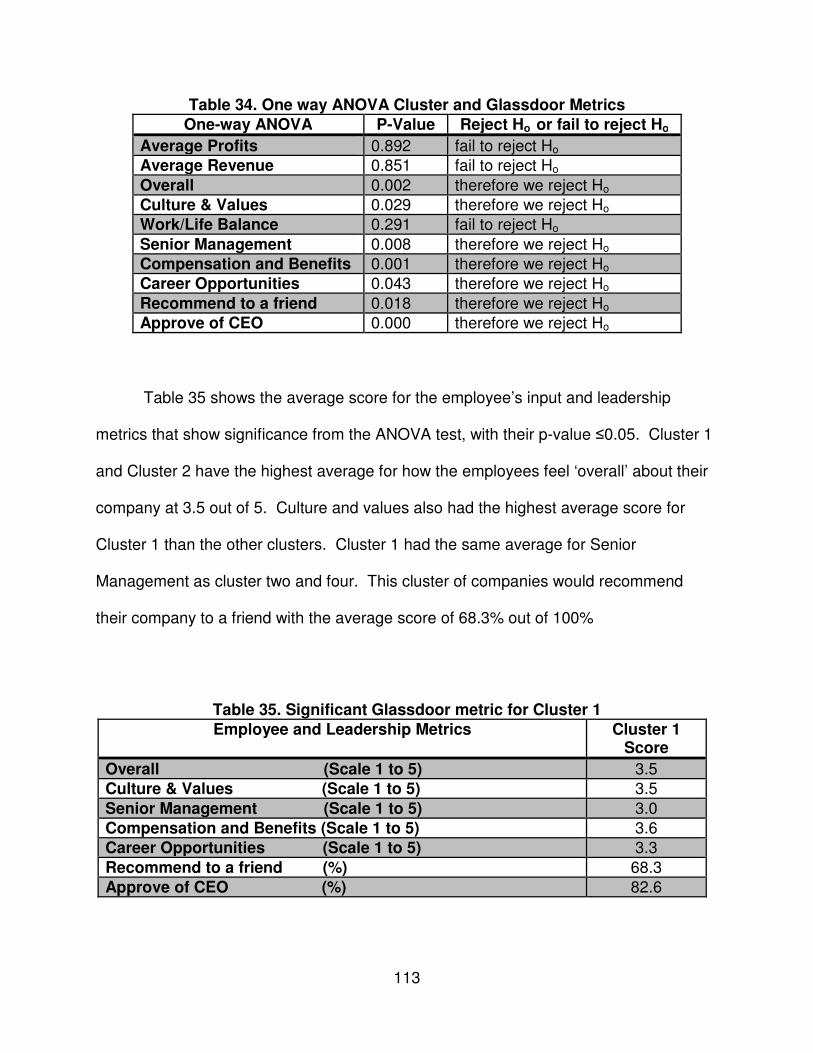
113
Table 34. One way ANOVA Cluster and Glassdoor Metrics
One-way ANOVA P-Value Reject Ho or fail to reject Ho
Average Profits 0.892 fail to reject Ho Average Revenue 0.851 fail to reject Ho
Overall 0.002 therefore we reject Ho Culture & Values 0.029 therefore we reject Ho Work/Life Balance 0.291 fail to reject Ho
Senior Management 0.008 therefore we reject Ho Compensation and Benefits 0.001 therefore we reject Ho Career Opportunities 0.043 therefore we reject Ho
Recommend to a friend 0.018 therefore we reject Ho Approve of CEO 0.000 therefore we reject Ho
Table 35 shows the average score for the employee’s input and leadership
metrics that show significance from the ANOVA test, with their p-value ≤0.05. Cluster 1
and Cluster 2 have the highest average for how the employees feel ‘overall’ about their
company at 3.5 out of 5. Culture and values also had the highest average score for
Cluster 1 than the other clusters. Cluster 1 had the same average for Senior
Management as cluster two and four. This cluster of companies would recommend
their company to a friend with the average score of 68.3% out of 100%
Table 35. Significant Glassdoor metric for Cluster 1
Employee and Leadership Metrics Cluster 1 Score
Overall (Scale 1 to 5) 3.5 Culture & Values (Scale 1 to 5) 3.5
Senior Management (Scale 1 to 5) 3.0 Compensation and Benefits (Scale 1 to 5) 3.6 Career Opportunities (Scale 1 to 5) 3.3
Recommend to a friend (%) 68.3 Approve of CEO (%) 82.6

114
Figure 26 shows a dendrogram of the companies that have similar culture types.
• Cluster 1 companies are a blend of clan and hierarchy culture.
• The orientation of the work place is collaborating with control.
• The leaders are mentors that monitor and organize.
• Some of the value drivers are efficiency, timeliness, and commitment.
• The theory of effectiveness is focus on the human development and
product effectiveness through processes (Cameron and Quinn, 1999).
Figure 26. Dendrogram of Cluster 1
Hew
lett-
Packa
rd
Conoc
o Phil
lips
Gen
eral D
ynam
ics
Wes
tern
Ref
ining
Holly
Frontier
Lock
heed
Mar
tin
Boeing
Baker
Hug
hes
Honey
well
Chevr
on
0.00
33.33
66.67
100.00
Sim
ilari
ty
DendrogramComplete Linkage, Euclidean Distance

115
Figure 27 is a graphical representation of the cultural shapes for each company.
Each company is closest to a company with a similar culture type from the dendrogram.
For example, Lockheed Martin and Boeing are 97% similar in their espoused cultural
types. Boeing and Conoco Phillips had the highest total content count in their vision,
mission, and values as seen in Appendix E. Content count is the total statements
coded in each company’s espoused culture. A statement from Boeing that supports
their cultural blend of clan and hierarchy is they support volunteers and financially
support education of their employees. Conoco Phillips stated that their people are their
most important asset. They have robust operating standards and procedures, which is
a hierarchy culture trait and the focus on their people is a clan trait.
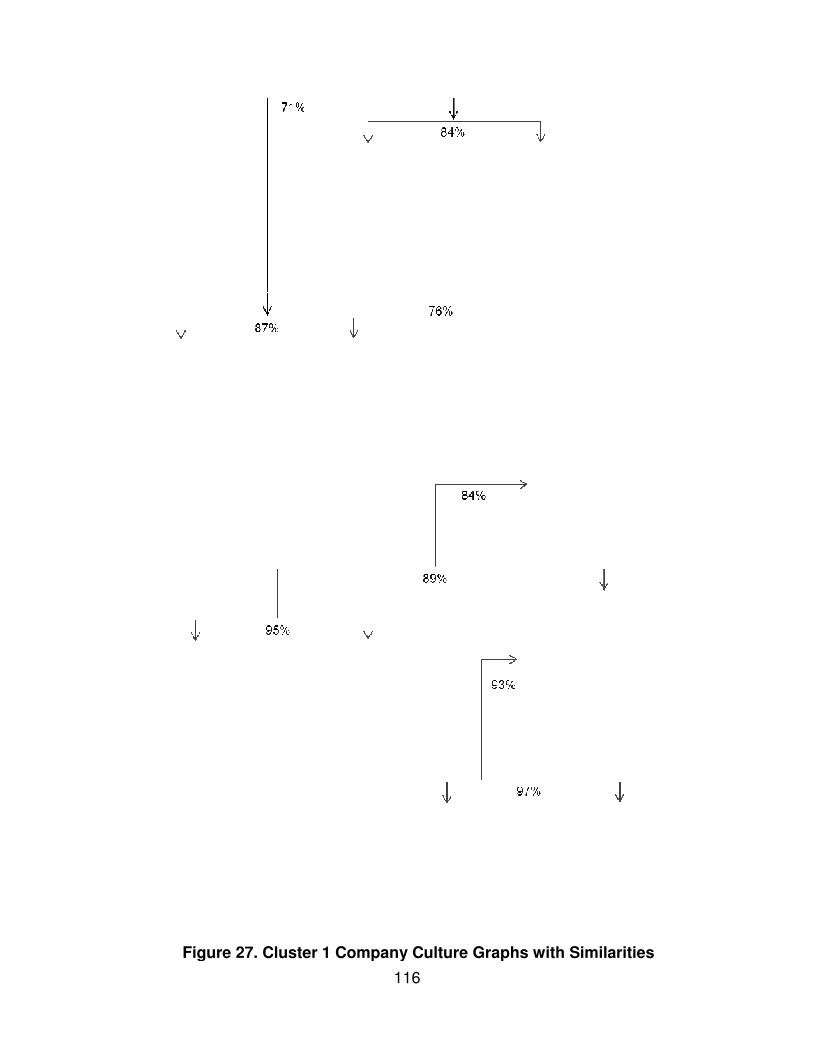
Figure 27. Cluster 1 Company Culture Graphs with Similarities
116
. Cluster 1 Company Culture Graphs with Similarities
. Cluster 1 Company Culture Graphs with Similarities
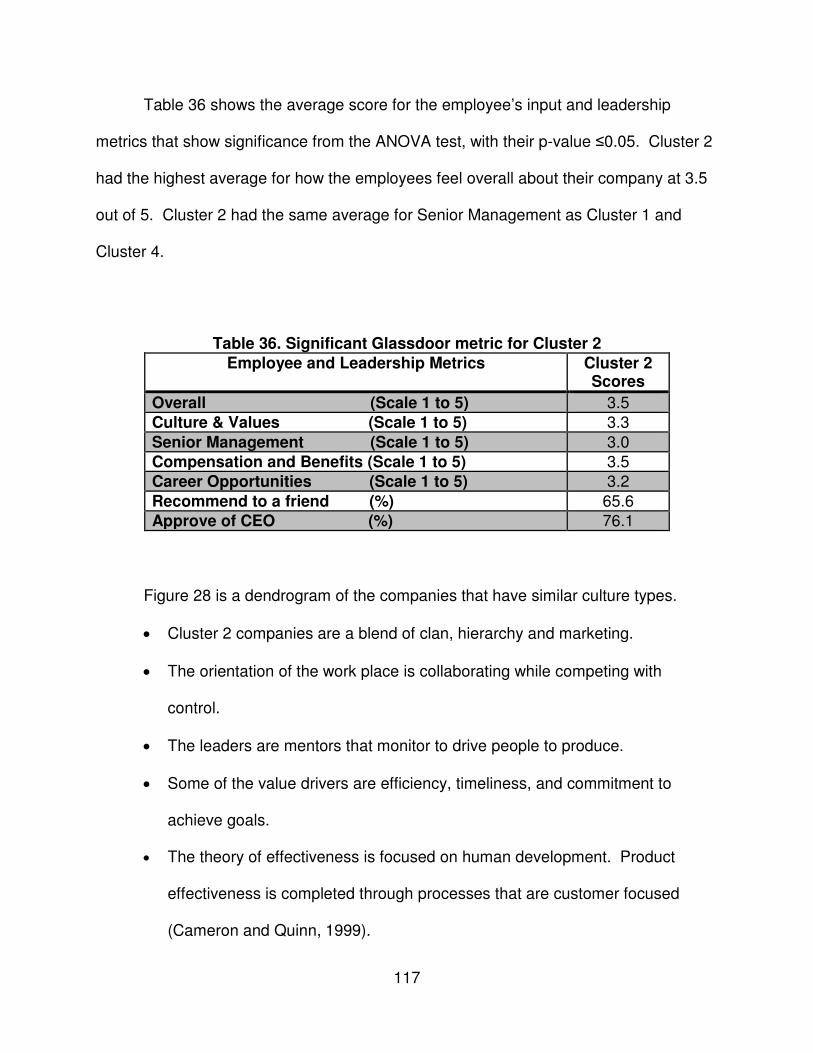
117
Table 36 shows the average score for the employee’s input and leadership
metrics that show significance from the ANOVA test, with their p-value ≤0.05. Cluster 2
had the highest average for how the employees feel overall about their company at 3.5
out of 5. Cluster 2 had the same average for Senior Management as Cluster 1 and
Cluster 4.
Table 36. Significant Glassdoor metric for Cluster 2
Employee and Leadership Metrics Cluster 2 Scores
Overall (Scale 1 to 5) 3.5 Culture & Values (Scale 1 to 5) 3.3
Senior Management (Scale 1 to 5) 3.0 Compensation and Benefits (Scale 1 to 5) 3.5 Career Opportunities (Scale 1 to 5) 3.2
Recommend to a friend (%) 65.6 Approve of CEO (%) 76.1
Figure 28 is a dendrogram of the companies that have similar culture types.
• Cluster 2 companies are a blend of clan, hierarchy and marketing.
• The orientation of the work place is collaborating while competing with
control.
• The leaders are mentors that monitor to drive people to produce.
• Some of the value drivers are efficiency, timeliness, and commitment to
achieve goals.
• The theory of effectiveness is focused on human development. Product
effectiveness is completed through processes that are customer focused
(Cameron and Quinn, 1999).
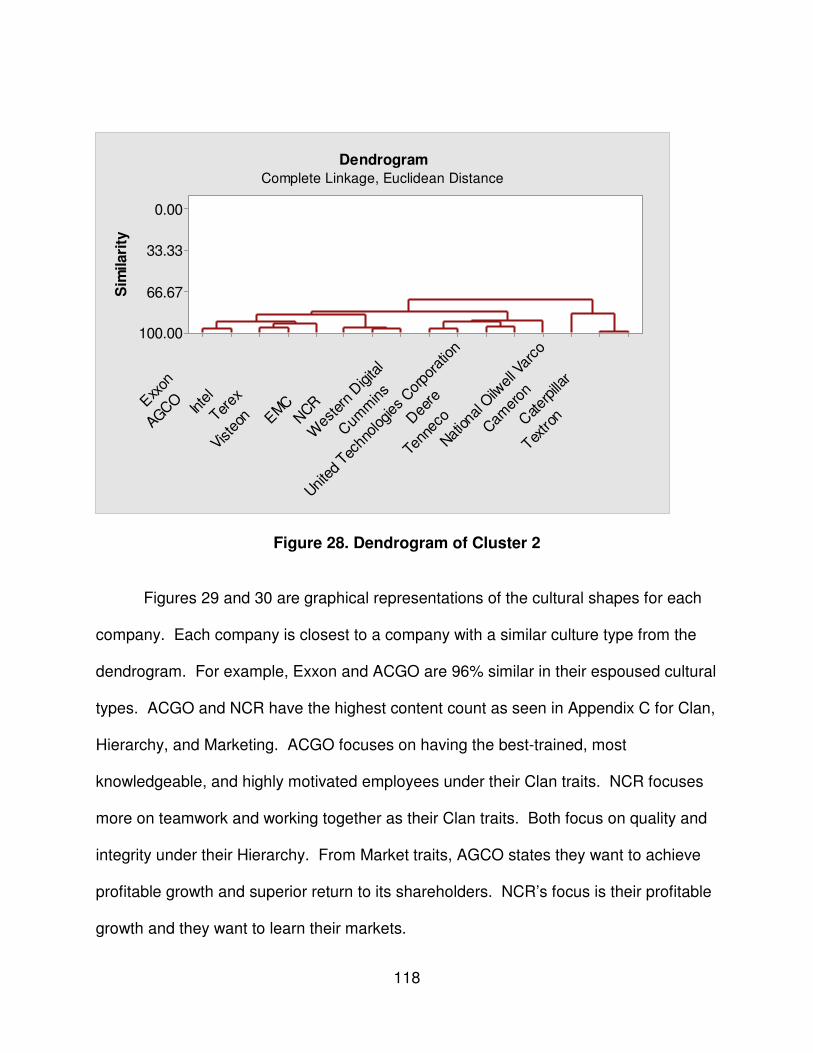
118
Figure 28. Dendrogram of Cluster 2
Figures 29 and 30 are graphical representations of the cultural shapes for each
company. Each company is closest to a company with a similar culture type from the
dendrogram. For example, Exxon and ACGO are 96% similar in their espoused cultural
types. ACGO and NCR have the highest content count as seen in Appendix C for Clan,
Hierarchy, and Marketing. ACGO focuses on having the best-trained, most
knowledgeable, and highly motivated employees under their Clan traits. NCR focuses
more on teamwork and working together as their Clan traits. Both focus on quality and
integrity under their Hierarchy. From Market traits, AGCO states they want to achieve
profitable growth and superior return to its shareholders. NCR’s focus is their profitable
growth and they want to learn their markets.
Textro
n
Cater
pillar
Cam
eron
Nation
al O
ilwell V
arco
Tenn
eco
Dee
re
Unite
d Tec
hnolog
ies
Cor
pora
tion
Cum
mins
Wes
tern
Digi
tal
NCR
EMC
Viste
on
Terex
Inte
l
AGCO
Exx
on
0.00
33.33
66.67
100.00
Sim
ilari
ty
DendrogramComplete Linkage, Euclidean Distance

119
97%
96%
96%
93%
96%
91%
Figure 29. Cluster 2 Company Culture Graphs with Similarities part 1
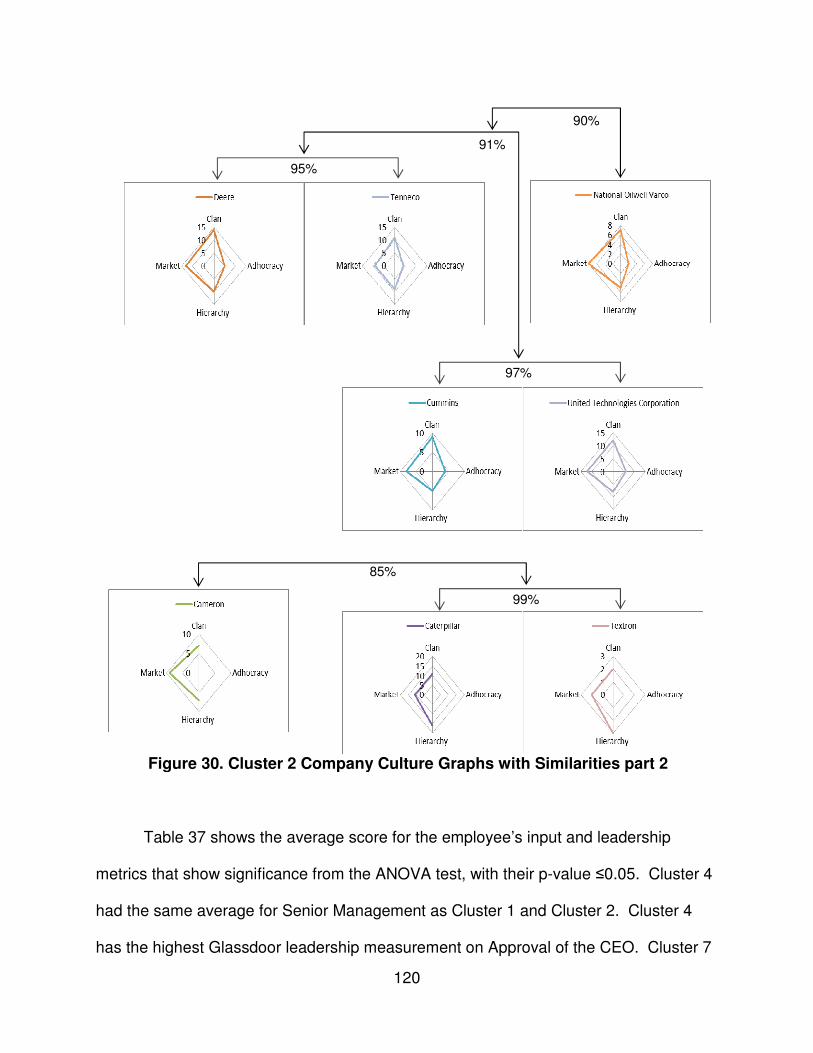
120
Table 37 shows the average score for the employee’s input and leadership
metrics that show significance from the ANOVA test, with their p-value ≤0.05. Cluster 4
had the same average for Senior Management as Cluster 1 and Cluster 2. Cluster 4
has the highest Glassdoor leadership measurement on Approval of the CEO. Cluster 7
99%
85%
97%
95%
91%
90%
Figure 30. Cluster 2 Company Culture Graphs with Similarities part 2
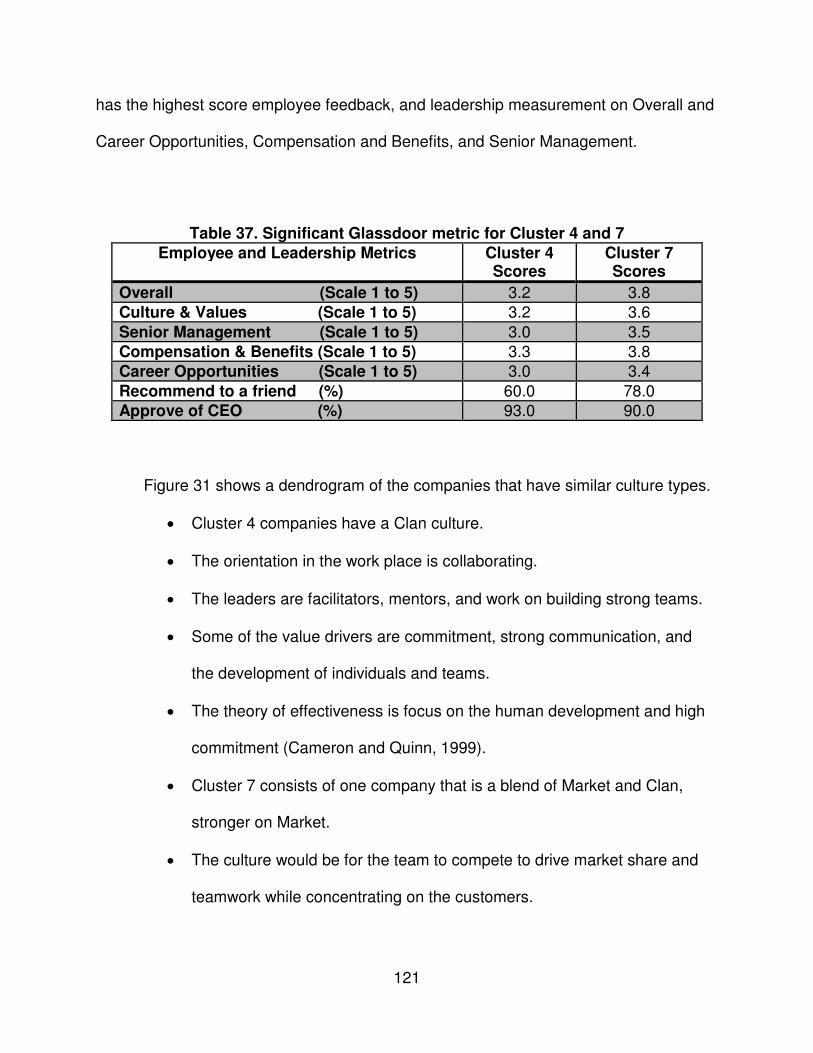
121
has the highest score employee feedback, and leadership measurement on Overall and
Career Opportunities, Compensation and Benefits, and Senior Management.
Table 37. Significant Glassdoor metric for Cluster 4 and 7
Employee and Leadership Metrics Cluster 4 Scores
Cluster 7 Scores
Overall (Scale 1 to 5) 3.2 3.8 Culture & Values (Scale 1 to 5) 3.2 3.6
Senior Management (Scale 1 to 5) 3.0 3.5 Compensation & Benefits (Scale 1 to 5) 3.3 3.8 Career Opportunities (Scale 1 to 5) 3.0 3.4
Recommend to a friend (%) 60.0 78.0 Approve of CEO (%) 93.0 90.0
Figure 31 shows a dendrogram of the companies that have similar culture types.
• Cluster 4 companies have a Clan culture.
• The orientation in the work place is collaborating.
• The leaders are facilitators, mentors, and work on building strong teams.
• Some of the value drivers are commitment, strong communication, and
the development of individuals and teams.
• The theory of effectiveness is focus on the human development and high
commitment (Cameron and Quinn, 1999).
• Cluster 7 consists of one company that is a blend of Market and Clan,
stronger on Market.
• The culture would be for the team to compete to drive market share and
teamwork while concentrating on the customers.

122
Figure 31. Dendrogram of Cluster 4 and 7
Figures 32 and 33 are graphical representations of the cultural shapes for each
company. Each company is closest to a company with a similar culture type from the
dendrogram. For example, Valero and Lear are 91% similar in their espoused cultural
types. Lear’s culture is more than 50% Clan. They state that their employees are their
most important resource. They want them to reach their full potential through education
and provide all employees with career opportunities. They treat all individuals with
dignity and respect. They focus on long tern relationships. Cluster 7 has one company
(Ford), which is a blend of Clan and Market. Ford’s motto is ‘One Team’. People work
together to improve their balance sheet and attain profitable growth.
Ford
Auto
liv
Dover
Lear
Valero
0.00
33.33
66.67
100.00
Sim
ilari
tyDendrogram
Complete Linkage, Euclidean Distance

Table 38 shows the average score for the employee’s input and
metrics that show significance from the ANOVA test, with the
has the highest average scores in three areas
Opportunities and CEO Approval.
91%
Figure 32. Cluster 4 Company
Figure 33. Cluster 7 Company Culture Graphs with Similarities
123
shows the average score for the employee’s input and leadership
that show significance from the ANOVA test, with their p-value ≤0.05. Cluster 3
has the highest average scores in three areas, Compensation and Benefits, Career
Opportunities and CEO Approval.
91%
86%
67%
Company Culture Graphs with Similarities
Company Culture Graphs with Similarities
leadership
≤0.05. Cluster 3
Compensation and Benefits, Career
Company Culture Graphs with Similarities
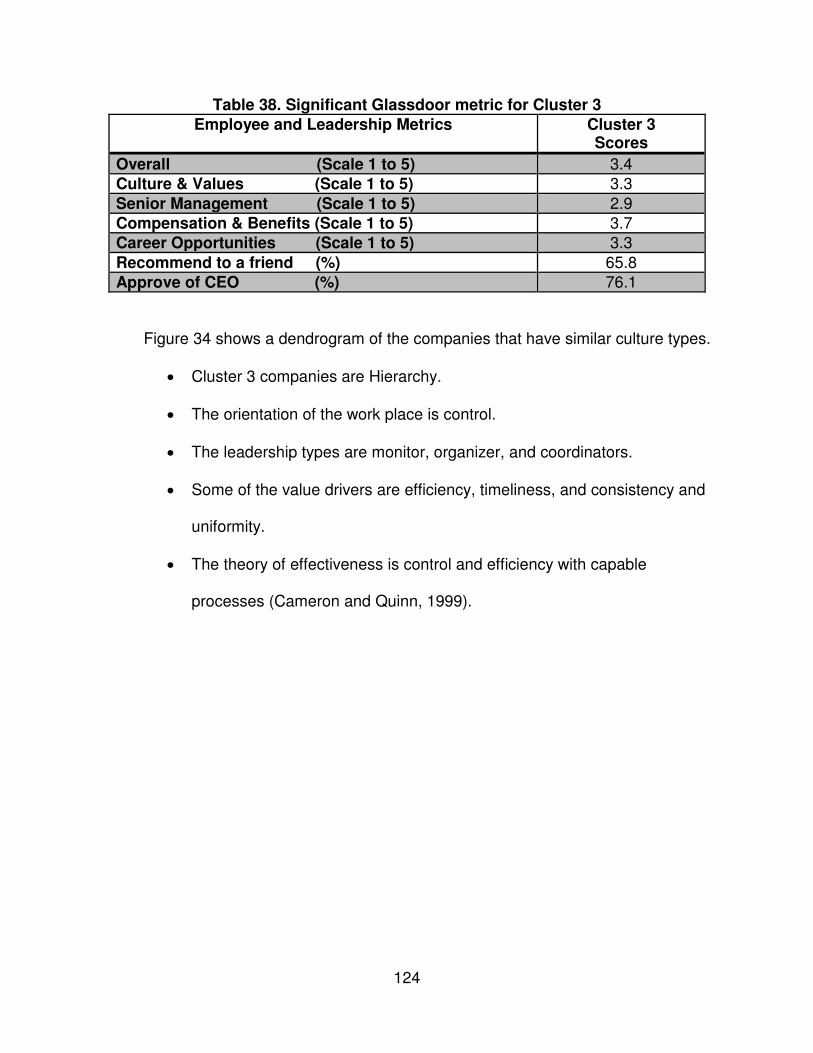
124
Table 38. Significant Glassdoor metric for Cluster 3
Employee and Leadership Metrics Cluster 3 Scores
Overall (Scale 1 to 5) 3.4 Culture & Values (Scale 1 to 5) 3.3
Senior Management (Scale 1 to 5) 2.9 Compensation & Benefits (Scale 1 to 5) 3.7 Career Opportunities (Scale 1 to 5) 3.3
Recommend to a friend (%) 65.8 Approve of CEO (%) 76.1
Figure 34 shows a dendrogram of the companies that have similar culture types.
• Cluster 3 companies are Hierarchy.
• The orientation of the work place is control.
• The leadership types are monitor, organizer, and coordinators.
• Some of the value drivers are efficiency, timeliness, and consistency and
uniformity.
• The theory of effectiveness is control and efficiency with capable
processes (Cameron and Quinn, 1999).

125
Figure 34. Dendrogram of Cluster 3
Figure 37 is a graphical representation of the cultural shapes for each company.
Each company is closest to a company with a similar culture type from the dendrogram.
For example, Tesoro and Oshkosh are 86% similar in their espoused cultural types. For
the companies in Cluster 3, the culture type is Hierarchy. Each company addresses
integrity, safety, and the environment. Oshkosh states they want to be a workplace
without fear of retribution and obey the letter and spirit of all laws.
Illino
is T
ool W
orks
Gen
eral M
otor
s
Osh
kosh
Teso
ro
0.00
33.33
66.67
100.00
Sim
ilari
tyDendrogram
Complete Linkage, Euclidean Distance
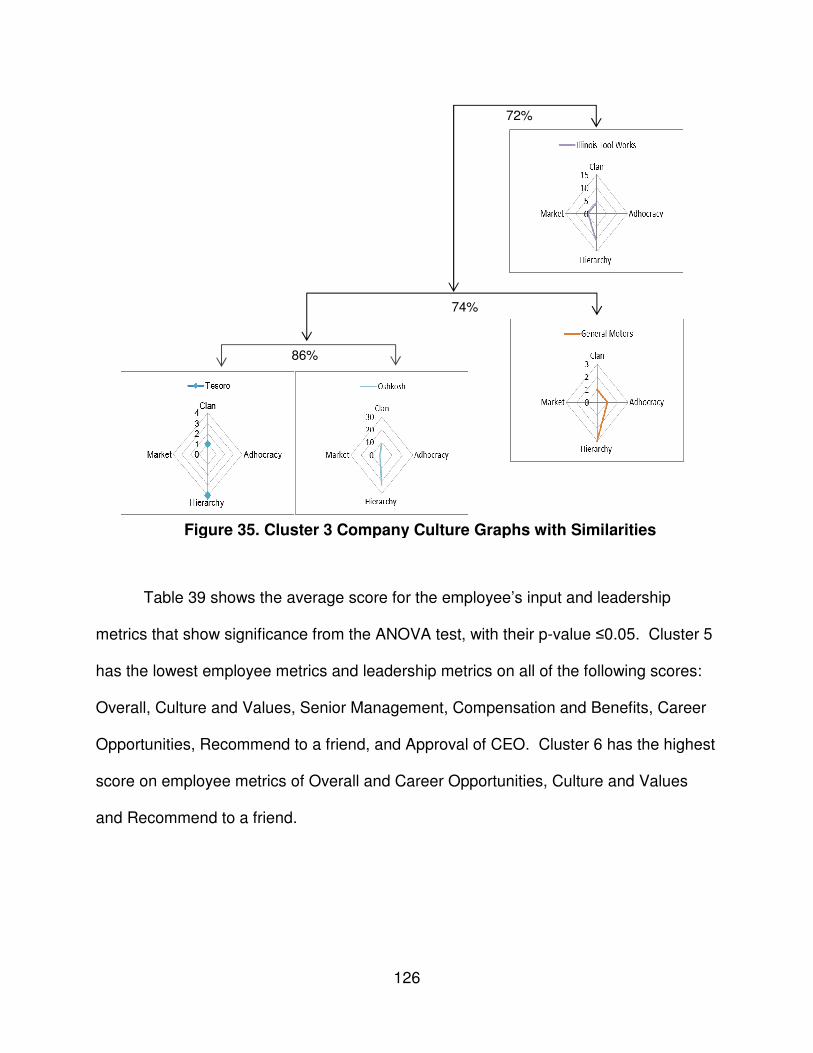
126
Table 39 shows the average score for the employee’s input and leadership
metrics that show significance from the ANOVA test, with their p-value ≤0.05. Cluster 5
has the lowest employee metrics and leadership metrics on all of the following scores:
Overall, Culture and Values, Senior Management, Compensation and Benefits, Career
Opportunities, Recommend to a friend, and Approval of CEO. Cluster 6 has the highest
score on employee metrics of Overall and Career Opportunities, Culture and Values
and Recommend to a friend.
86%
74%
72%
Figure 35. Cluster 3 Company Culture Graphs with Similarities
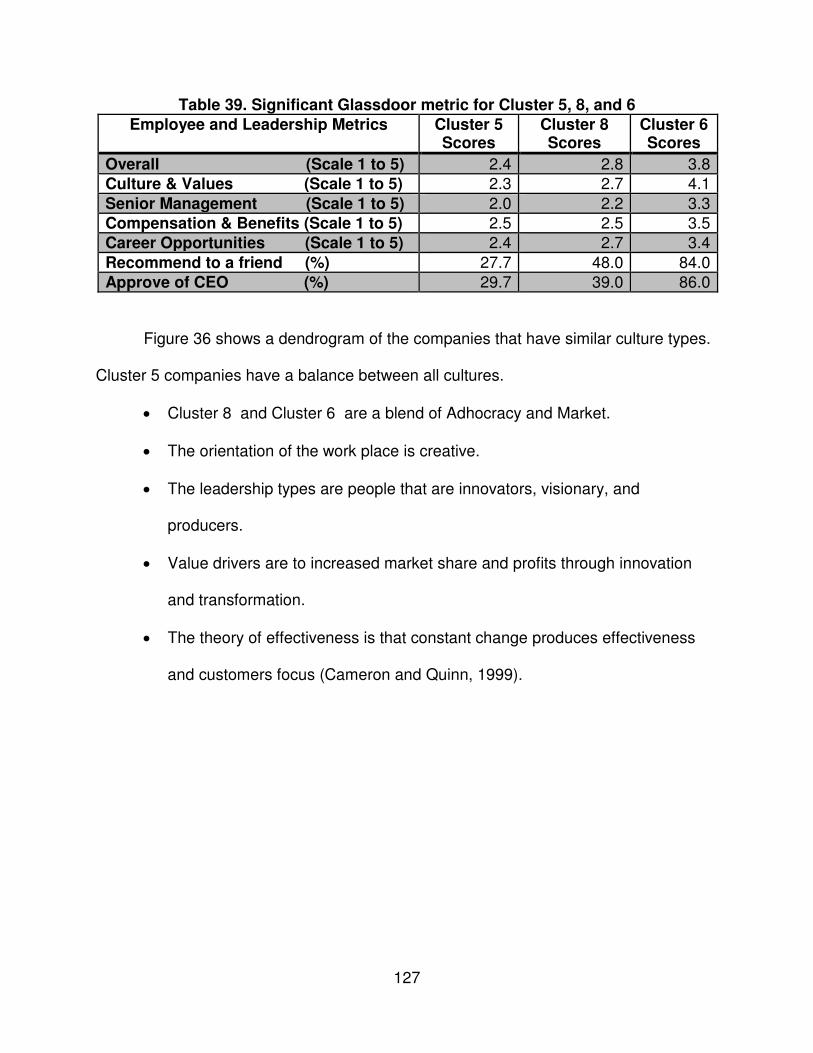
127
Table 39. Significant Glassdoor metric for Cluster 5, 8, and 6
Employee and Leadership Metrics Cluster 5 Scores
Cluster 8 Scores
Cluster 6 Scores
Overall (Scale 1 to 5) 2.4 2.8 3.8 Culture & Values (Scale 1 to 5) 2.3 2.7 4.1
Senior Management (Scale 1 to 5) 2.0 2.2 3.3 Compensation & Benefits (Scale 1 to 5) 2.5 2.5 3.5 Career Opportunities (Scale 1 to 5) 2.4 2.7 3.4
Recommend to a friend (%) 27.7 48.0 84.0 Approve of CEO (%) 29.7 39.0 86.0
Figure 36 shows a dendrogram of the companies that have similar culture types.
Cluster 5 companies have a balance between all cultures.
• Cluster 8 and Cluster 6 are a blend of Adhocracy and Market.
• The orientation of the work place is creative.
• The leadership types are people that are innovators, visionary, and
producers.
• Value drivers are to increased market share and profits through innovation
and transformation.
• The theory of effectiveness is that constant change produces effectiveness
and customers focus (Cameron and Quinn, 1999).

128
Figure 36. Dendrogram of Cluster 5, 8 and 6
Figure 37 is a graphical representation of the cultural shapes for each company.
Each company is closest to a company with a similar culture type from the dendrogram.
For example, Xerox and Navistar are 93% similar in their espoused cultural types.
Xerox under Clan traits values their employees. Technology to develop market
leadership is their focus under Adhocracy. They want to deliver quality under the
Hierarchy culture and their Market focus is premium returns. Navistar states that they
want to help America's workers as their Clan traits. Pioneer technologies are their focus
under Adhocracy. They drive for relentless pursuit of quality under the Hierarchy and
their Market focus is customer focus. Cluster 8 and Cluster 6 only have one company
their traits can be seen in Appendix F.
Dan
a
TRW
Pacca
r
Navista
r
Xerox
0.00
33.33
66.67
100.00
Sim
ilari
tyDendrogram
Complete Linkage, Euclidean Distance

In Figures 38 and 39 TRW and Dana are in their individual cluster as their
similarities to the other companies are very different. Dana is similar to TRW with a
score of 37.
TRW has a similarity to cluster 5 of 54%.
93%
Figure 38. Cluster 8 Company Culture Graphs with Similarities
Figure 37. Cluster 5 Company Culture Graphs with Similarities
Figure 39. Cluster 6 Company Culture Graphs with Similarities
129
TRW and Dana are in their individual cluster as their
similarities to the other companies are very different. Dana is similar to TRW with a
TRW has a similarity to cluster 5 of 54%.
93%
75%
Company Culture Graphs with Similarities
. Cluster 5 Company Culture Graphs with Similarities
. Cluster 6 Company Culture Graphs with Similarities
TRW and Dana are in their individual cluster as their
similarities to the other companies are very different. Dana is similar to TRW with a
. Cluster 5 Company Culture Graphs with Similarities
. Cluster 6 Company Culture Graphs with Similarities

130
Figure 40 shows the summary of Hypothesis 4.
Summary of the Hypotheses Statement
This section defines whether this research accepted or reject the hypothesis
statements and a belief summary of the justification.
Table 40. Summary of Hypothesis Statements
Summary of Hypothesis statements
Accept or Reject
Justification for Acceptance or Rejection
H1–Significant variables
Accept 13 of the 14 variables are Significant 1 - Customer focus 2 - Teamwork 3 - Benefits / People 4 - Results / Goals / Performance / Achievements 5 - Ethics / Integrity / Commitments 6 - External Focus / Shareholders 7 - Brand / Quality / Products 9 - Value/ Financial / Profits 10 - Continuous Improvement 11 - Communication 12 - Innovations / Learning / Technologies 13 - Work Environment 14 – Expectations / Behaviors
H2 – Prediction Equations for Revenue and Profit
Accept Revenue - R-squared is 58.27% Profit - R-squared is 65.5%
H3 – Correlation Accept Financial Metrics Companies with Vision, Mission and Value Statement have increased Profit and Revenue Employee Metrics and Leadership Metrics Have a positive correlations with: Benefits / People External Focus / Shareholders Value/ Financial / Profits
H4 – Espoused Culture can define culture types
Accept Graphical Representation for all companies

131
Figure 40. Summary of H4 Cluster Analysis
26383533231729345272414316371110193613391222201540211883162287432259301Cluster 6 & 8
Adhocracy and Market
Cluster 1 Clan and Hierarchy
10 Companies High Scores
Culture Values Overall
Recommend to a Friend Senior Management
Cluster 2 Clan, Hierarchy, Market
16 Companies High Scores
Overall Senior Management
Cluster 7 Market and Clan
Cluster 4 Clan
4 Companies High Scores
Approval of the CEO. Senior Management
Cluster 5 Market
4 Companies Lowest Scores
Approval of the CEO. Career Opportunities
Compensation Benefits Culture Values
Overall Recommend to a Friend
Senior Management
Cluster 3 Hierarchy
4 Companies High Scores
Career Opportunities Compensation Benefits

132
CHAPTER V
CONCLUSIONS AND RECOMMENDATIONS
The purpose of this research was to define the cultural variables specifically
believed to contribute to successful businesses as measured by defined performance
indicators, profit and revenue. Once defined, the cultural variables could be emulated
by entrepreneurs and small businesses as a pathway to possible similar scalable
outcomes.
This study is of interest due to its context for small business as it relates to
culture, which has been proven to affect business success. Success is defined as
financial performance in this reference (i.e. revenue and profit). This study adds value
by defining the significant variables and their correlation, models, and culture types that
can lead an organization to achieve their primary goals from their espoused culture.
The results are also beneficial for leaders to compare their cultures to the attributes of
the cultures with the best outcomes measured and align them accordingly
To address the reshoring initiative, manufacturing companies from the Fortune
500 list with sustainable success and assigned SIC codes of 29, 35, and 37 were used.
The term “sustainable” was defined as companies identified on the Fortune 500 list
consistently from 2009 through 2013. These companies’ espoused cultures, defined by
their vision, mission, and values statements were sorted into themes. These themes
were given titles and used as variables for the analysis. This research data was from
companies with sustained performance (on the Fortune list from 2009 – 2013). This
indicates they are mature companies; however, the results of the research targets
entrepreneurs and small business owners.

133
There are four stages to a business life cycle: startup, growth, maturity and
decline (Thompson and Strickland 2000). The companies in this study are in the
maturity phase and the entrepreneurs and small business owners may be in the first two
phases of their business life cycle. The recommendation is for entrepreneurs and small
business owners to emulate the steps in Figure 41 until their businesses are
established, and reinforce them continuously until the business is mature.
1. All companies should have a published vision, mission and value statement.
Companies that have a defined espoused culture on their website have higher
profit and revenues. Companies that have a published mission had higher revenue and
profit by 5.5% and 11.8%, respectively. Companies that have a published core values
had a higher in revenue and profit by 37.9% and 48.8%, respectively. Companies that
have a published vision had higher revenue and profit by 39.3 and 23.3%, respectively.
Companies which possess 75% of the variables had the highest profit and revenue in
this study.
The regression analysis showed variables that would best predict profit and
revenue.
2. The ESB should focus first on developing these five variables: Customer
Focus; Benefits and People; External Focus and Shareholders; Value,
Financial, and Profits; and lastly Innovations, Learning, and Technologies.

Figure 41. Implementation Steps for ESB owners
134
. Implementation Steps for ESB owners

135
3. After these five variables are institutionalized within the culture, then the other
13 of 14 significant variables should be added.
a. The vision statement should include the following variables: Customer
Focus; Brand, Quality and Products; Innovations, Learning, and
Technologies; Ethics, Integrity, and Commitments; Values, Financial,
and Profits; set Expectations and Behaviors; and Work Environment.
b. The mission statements should include the following variables:
Customer Focus; External Focus and Shareholders; Value, Financial,
and Profits; Benefits and People; Brand, Quality, and Products; and
Continuous Improvement.
c. The core values should include the following variables: Ethics,
Integrity, and Commitments; Expectations and Behaviors; Benefits and
People; Expectations and Behaviors; Innovations, Learning, and
Technologies; Customer Focus; Continuous Improvement; and
Communication.
4. The company owners need to survey the employees and other stakeholders
to see if they are accomplishing their espoused culture. The ESB can do this
by looking at the Glassdoor metrics, using employee and customer surveys,
and holding leaderships responsible for representing their espoused culture.
The research shows that any mix of culture (Clan, Adhocracy, Market, or
Hierarchy) can have success in revenue and profit. Yet, not all culture types lead to
success in employee morale.

136
According to the culture analysis, companies that had a Market culture had the
lowest leadership measurement and employee indicators. A Clan blend culture had the
highest employee morale and leadership measurement. The Clan culture is more
family oriented and employee focused, while the Market culture is more focused on goal
achievement and profit. A Market culture can be confrontational and challenging for
employees. Cluster 4, as shown in Figure 42, has the highest rated Clan culture and
has the highest CEO rating. This finding was expected as these types of leaders are
mentors.
It is recommended that ESB establish cultures that have a higher blend on the
Clan culture to increase employee satisfaction. This research has discovered the
impact of many variables and their correlation to company success.
Opportunities for Future Research Although this work was limited to specific SIC codes, the study methods could be
used to better define espoused culture in other industries. Other industries could use
this simple method to understand espoused culture in their emerging markets and
understand which espoused culture variables correlate to higher profit and revenue.
In addition to the vision, mission and values, other parts of a management system
could be included in a study:
a. Belief – “Assumptions and/or convictions that are held to be true, by an individual
or a group, regarding concepts, events, people, and things” as defined by
Business Dictionary (2014).
b. Culture - Culture is the environment in which employees are surrounded by daily.

137
c. Goals – “something that you are trying to do or achieve” (Webster, 2014).
d. Philosophy - a system of principles for guidance in practical affairs (Dictionary,
2014).
e. Strategy – activities for achieving a particular goal usually over a long period of
time (Webster, 2014).
Adding these 5 factors could provide the ESB more information on what influences
successful companies.
During the beginning of this research, additional factors were reviewed as
independent variables: the age of a company, culture as defined on a company’s
website, number of employees, location, and industry as defined by Fortune. Additional
research can be completed to increase the predictability of revenue and profit. The
additional research could answer the questions, ‘Is location important to specific
industries?’ ‘Do certain industries need a minimum amount of employees to increase
revenue and profit?’ This information could enhance the success of ESB owners.
Further studies could be conducted by researching companies that have
completed Competing Values Framework assessment. The study could would entail a
comparison of the culture shapes of the espoused culture to the assessment. If the
espoused culture correlations with the research company this could be another way or
achieving the same results.
Factors such as mergers and acquisitions could be opportunities for the future
research. It is important during the acquisition process to define the espoused culture
of both companies. This research could be used to develop a blend of the two cultures
138
and define any conflicts between the cultures and be used as a tool to share the
espoused cultures with each other.
U.S. based companies were reviewed in this study. Another study would be to
review the Fortune 500 Global list and repeat the method to see if the global influence
would change the variables. If the variables are the same, do the variables have the
same influence of the financial metrics, leadership metrics and employee metrics?
This research used data from companies with sustained superior performance.
This study could be repeated on companies that have a specific decline in their revenue
and profit. This data could lead to the variables that define unsuccessful companies.
This study is an effort to present new knowledge and a deeper understanding by
thoroughly analyzing available data found to be influential and supportive of cultures
that enable companies to succeed. This research can be used again in many
applications for new companies and existing companies.

139
LIST OF REFERENCES
140
2013 Corporate Responsibility eReport. (n.d.). Retrieved October 8, 2014, from http://viewer.epaperflip.com/Viewer.aspx?docid=922fdaf9-c74f-4315-a995-a30600c6e7e1 About GM. (n.d.). Retrieved October 8, 2014, from http://gmsustainability.com/fancybox/approach_aboutGM.html#sthash.YSyCkeZW.dpuf About Us. (n.d.). Retrieved October 8, 2014, from http://www.boeing.com/boeing/aboutus/culture/index.page?#vision Adams, S. (2014, March 21). America's Favorite Bosses. Retrieved August 19, 2014, from http://www.forbes.com/sites/susanadams/2014/03/21/americas-favorite-bosses/
AGCO - Your Agriculture Company. (n.d.). Retrieved October 8, 2014, from
http://www.agcocorp.com/company/vision_mission_values.aspx
Ames, M. (2014). What are the major reasons for small business failure? The U.S.
Small Business Administration. SBA.gov. Retrieved August 9, 2014, from
http://www.sba.gov/content/what-are-major-reasons-small-business-failure
Atkinson, P. (1990). Creating Cultural Change. Management Services, 34(7), 6- 10.
Autoliv. (n.d.). Retrieved October 8, 2014, from
http://www.autoliv.com/AboutUs/Pages/Businessmodel/MissionVisionandBusinessidea.
aspx
Barney, J. B. (1986). Organizational culture: can it be a source of sustained competitive
advantage? Academy of Management Review, 11(3), 656–665.
Bart, C. K., & Baetz, M. C. (1998). The relationship between mission statements & firm
performance: An exploratory study. Journal of Management Studies, 35, 823–853.
Bart, C. K., Bontis, N., & Taggar, S. (2001). A model of the impact of mission
statements on firm performance. Management Decision, 39(1), 19–35.
Bartash, J. (2013, 02). Bringing U.S. manufacturing jobs back home, Industry rebirth
could use Washington’s help, but that’s a big if. MarketWatch.com.
Beenen, G., & Pinto, J. (2009). Resisting organizational-level corruption: An interview
with Enron Whistle-Blower Sherron Watkins. Academy of Management Learning &
Education, 8(2), 275–289.
141
Bhattacharya, C. B., & Sen, S. (2004). Doing better at doing good: When, why, & how
consumers respond to corporate social initiatives. California Management Review, 7(1),
9-24.
Brown-Nagin, T. (2014). The Civil Rights Canon: Above and Below. Yale Law Journal,
123(8), 2717-2721. Retrieved from http://www.yalelawjournal.org/pdf/2698.Brown-
Nagin.2739_z4n69s93.pdf
Cady, S. H., Wheeler J., DeWolf J., Brodke, M. (2011). Mission, Vision, & Values: What
Do They Say? Organization Development Journal, 29(1), 63-78.
Cameron, (n.d.). Retrieved October 8, 2014, from http://www.c-a-
m.com/Common/PDF/Cameron_Overview.pdf
Cameron, K. (2008). A process for changing organization culture. Handbook of
organizational development, 429-445.
Cameron, K.S. & Ettington, D.R. (1988). The conceptual foundations of organizational
culture. Higher Education: Handbook of Theory & Research, (356-396). New York:
Agathon.
Cameron, K. S., & Quinn, R. E. (1999). Diagnosing & changing organizational culture.
Reading: Addison-Wesley.
Campbell, D. (2002). Nine keys to good leadership. The CCL guide to leadership in
action: How managers & organizations can improve the practice of leadership. San
Francisco: Jossey-Bass.
Carmeli, A., & Tishler, A. (2004). The relationships between intangible organizational
elements & organizational performance. Strategic Management Journal, 25(13), 1257-
1278. doi: 10.1002/smj.428
Carpenter, M. A., Bauer, T., & Erdogan, B. (2009). Principles of management. Flat
World Knowledge.
Caterpillar, (n.d.). Retrieved October 8, 2014, from
http://s7d2.scene7.com/is/content/Caterpillar/C10211355
Censky, A. (2012, 01). Obama to business: Bring jobs home. CNN Wire.
Charan , R. & Useem, J. Reporter Associate Ann Harrington. (2002). Why Companies
Fail: CEOs offer every excuse but the right one: Their own errors. Here are ten mistakes
to avoid.(Features/Cover Story). Fortune, (11), 50.
142
Clarkson, M. B. E. (1995). A stakeholder framework for analyzing & evaluating
corporate social performance. The Academy of Management Review, 20(1), 92–117.
CNN Money Fortune. (2014). Fortune 500 2013. Retrieved July, 6, 2014, from http://fortune.com/fortune500/2013/wal-mart-stores-inc-1/ CNN Money Fortune. (2013). Fortune 500 2012. Retrieved July, 6, 2014, from http://fortune.com/fortune500/2012/exxon-mobil-corporation-1/ CNN Money Fortune. (2014). Fortune 500 2011. Retrieved July, 6, 2014, from http://fortune.com/fortune500/2011/wal-mart-stores-inc-1/ CNN Money Fortune. (2014). Fortune 500 2010. Retrieved July, 6, 2014, from http://fortune.com/fortune500/2010/exxon-mobil-corporation-1/ CNN Money Fortune. (2014). Fortune 500 2009. Retrieved July, 6, 2014, from http://fortune.com/fortune500/2009/exxon-mobil-corporation-1/ CNN Money Fortune. (2013). FAQ Definitions & Explanations. Retrieved November, 16, 2014, from http://money.cnn.com/magazines/fortune/fortune500/2011/faq Charan , R. and Useem, J. Reporter Associate Ann Harrington. (2002). Why Companies Fail: CEOs offer every excuse but the right one: Their own errors. Here are ten mistakes to avoid.(Features/Cover Story). Fortune, (11), 50. Coleman, J. (2013, May 6). Six Components of a Great Corporate Culture. Retrieved August 28, 2014, from http://blogs.hbr.org/2013/05/six-components-of-culture/ Collins, J. D., Uhlenbruck, K., & Rodriguez, P. (2009). Why firms engage in corruption:
A top management perspective. Journal of Business Ethics, 87(1), 89–108.
Colvin, G. (2011, September 19). Obama: Looking for jobs in all the wrong places.
Retrieved June 19, 2014, from http://fortune.com/2011/09/19/obama-looking-for-jobs-in-
all-the-wrong-places/
Commitment to Excellence. (n.d.). Retrieved October 8, 2014, from
http://www.valero.com/OurBusiness/Pages/CommitmenttoExcellence.aspx
Core Values. (n.d.). Retrieved October 8, 2014, from
http://www.bakerhughes.com/company/about/core-values
Corporate-responsibility. (n.d.). Retrieved October 8, 2014, from
http://www.bakerhughes.com/regions/europe-africa-russia-caspian/africa/corporate-
responsibility
Crombie, I. K., & Davies, H. T. (2009). What is meta-analysis. What is, 1-8.
143
Crutsinger, M. (2007, April 20). Factory jobs: 3 million lost since 2000 -
USATODAY.com. Retrieved June 16, 2014.
Cummins. (n.d.). Retrieved October 8, 2014, from
http://www.cummins.com/cmi/navigationAction.do?nodeId=6&siteId=1&nodeName=Our
Vision, Mission and Values&menuId=1000
Cummins, A. (2000, August). Downturn - What's Up With That?. Automotive Industries.
p. 7.
Dana. (n.d.). Retrieved October 8, 2014, from
http://www.dana.com/wps/wcm/connect/6b7262804d458c3dafacff80a93c73f5/dext2-
2014FactSheet.pdf?MOD=AJPERES&CONVERT_TO=url&CACHEID=6b7262804d458
c3dafacff80a93c73f5
David, F.R. (2009). Strategic Management: Concepts & Cases (Twelfth Edition).
Upper Saddle River, NJ: Pearson Prentice Hall.
Deal, T.E. & Kennedy, A. (1982): Corporate Culture, Reading, Mass., Addison Wesley.
Deere. (n.d.). Retrieved October 8, 2014, from
http://www.deere.com/en_US/docs/Corporate/investor_relations/pdf/corporategovernan
ce/guidingprinciples/guidingprinciples_english.pdf
Denison, D.R. (2011, May 1). Introduction to the Denison Model. Retrieved October 27,
2014, from
http://www.denisonconsulting.com/sites/default/files/documents/resources/rn-2011-
denison-model-overview_0.pdf
Denison, D.R. (1990): Corporate Culture & Organizational Effectiveness. Wiley: New
York.
Denison, D. R. (1984). Bringing corporate culture to the bottom line. Organizational
Dynamics, 13(2), 5-22. doi: http://dx.doi.org/10.1016/0090-2616(84)90015-9
Denison, D. R., Haaland, S., Goelzer, P. (2004). Corporate Culture & Organizational
Effectiveness: Is Asia Different From the Rest of the World? Organizational
Dynamics, (1), 98-109.
Denison, D. R., & Mishra, A. (1995). Toward a Theory of Organizational Culture &
Effectiveness. Organization Science, (2), 204-223.
144
Diversity & Inclusion: Our shared values | HP® Official Site. (n.d.). Retrieved October 8,
2014, from http://www8.hp.com/us/en/hp-information/about-hp/diversity/shared-
values.html?jumpid=reg_r1002_usen_c-001_title_r0004
Donaldson, T., & Preston, L. E. (1995): The stakeholder theory of the corporation:
Concepts, evidence, & implications. Academic of Management Review, 20(1), 65–91.
Dover Corporation. (n.d.). Retrieved October 8, 2014, from
http://www.dovercorporation.com/globalnavigation/about-dover/our-values
Drucker, P. (1974). Management: Tasks, Responsibilities, & Practices. New York, NY:
Harper & Roe.
EMC. (n.d.). Retrieved October 8, 2014, from
http://www.emc.com/collateral/brochure/h8629-2010-emc-sustainability-report-br.pdf
Esrock, S. L., Leichty, G.B. (2000). Organization of corporate web pages: Publics &
functions. Public Relations Review, (3), 327-344.
Ethical Business Conduct. (n.d.). Retrieved October 8, 2014, from
http://gmsustainability.com/fancybox/approach_ethicalBusinessConduct.html#sthash.R3
abwCNQ.dpuf
FACT SHEET: AN UPDATE ON BRINGING JOBS BACK TO THE UNITED STATES.
(2012).
FACT SHEET: PRESIDENT OBAMA'S BLUEPRINT TO SUPPORT U.S.
MANUFACTURING JOBS, DISCOURAGE OUTSOURCING, & ENCOURAGE
INSOURCING. (2012).
Ferrell, O. C., Gozalez-Padron, T., Hult, G. T. M., & Maignan, I. (2010). From market
orientation to stakeholder orientation. Journal of Public Policy & Marketing, 29(1), 93-96.
Flamholtz, E. (2001). Corporate culture & the bottom line. European Management
Journal, 19(3), 268-275. doi: http://dx.doi.org/10.1016/S0263-2373(01)00023-8
Glassdoor. (2013). Write a survey. Retrieved December 10, 2013, from
http://www.glassdoor.com/survey/employer/collectReview_input.htm?initiatedFromStart
Survey=false&newUser=&applySuccess=false&uploadSuccess=false&completedAction
=NO_ACTION&appliedToEmpName=&prevCompletedAction=&jl=&redirectURL=&over
allRating=&utm_source=&utm_medium=&utm_term=&utm_content=&utm_campaign=&
salaryReviewId=
145
General Dynamics. (n.d.). Retrieved October 8, 2014, from
http://investorrelations.gd.com/phoenix.zhtml?c=85778&p=irol-govconduct
Get to Know PACCAR. (n.d.). Retrieved October 8, 2014, from
http://www.paccar.com/about-us/get-to-know-paccar/
Goodson, S. (2014). Handout 1: Late Nineteenth- & Early Twentieth-Century Economic
Trends [Class Handout]. History Department, University of West Georgia, Carrollton,
GA.
Gordon, G. G. (1985), "The Relationship of Corporate Culture to Industry Sector &
Corporate Performance," in R. H. Kilman, M. J. Saxton, R. Serpa & Associates
(Eds.), Gaining Control of the Corporate Culture, San Francisco, CA: Jossey-Bass.
Gupta, A.D. Is Trade Deficit good or bad for an economy? Published: Monday, June 16,
2014, 15:23 [IST] http://www.goodreturns.in/classroom/2014/06/is-trade-deficit-good-or-
bad-an-economy-273643.html
Henri, J.-F. (2006). Organizational culture & performance measurement systems.
Accounting, Organizations & Society, 31(1), 77-103. doi:
http://dx.doi.org/10.1016/j.aos.2004.10.003
Hofstede, G., Neuijen, B., Ohayv, D. D., & Sanders, G. (1990). Measuring
organizational cultures: A qualitative & quantitative study across twenty
cases. Administrative science quarterly, 286-316.
Honeywell. (n.d.). Retrieved October 8, 2014, from
http://www51.honeywell.com/hrsites/neo/documents/Vision_Statement.ppt&sa=U&ei=5_
0MVITqDoadygT-9IKAAg&ved=0CAYQFjAB&client=internal-uds-
cse&usg=AFQjCNHZNaqFuuPxtrhKzW8zLS6x0VKMvw
Honeywell Career Center. (n.d.). Retrieved October 8, 2014, from
http://www.careersathoneywell.com/en/workingathoneywell
Innovation. (n.d.). Retrieved October 8, 2014, from http://www.conocophillips.com/who-
we-are/our-company/spirit-values/innovation/Pages/default.aspx
Integrity. (n.d.). Retrieved October 8, 2014, from http://www.conocophillips.com/who-
we-are/our-company/spirit-values/integrity/Pages/default.aspx
Intel. (n.d.). Retrieved October 8, 2014, from
http://www.intel.com/content/dam/doc/report/corporate-responsibility-2001-report.pdf
146
International, K. (2011, February 10). Does corporate culture drive financial
performance? Retrieved August 8, 2014, from
http://www.forbes.com/sites/johnkotter/2011/02/10/does-corporate-culture-drive-
financial-performance/
IRS. (2013, November 19). S Corporations. Retrieved June 10, 2014, from
http://www.irs.gov/Businesses/Small-Businesses-&-Self-Employed/S-Corporations
Johnston, L. (2012, February 22). History lessons: Understanding the decline in
manufacturing. Retrieved June 10, 2014, from http://www.minnpost.com/macro-micro-
minnesota/2012/02/history-lessons-underst&ing-decline-manufacturing
Jones, I.S., D.L. Little & D. Blankenship (2007). Mission Statements on Fortune 500
Web Sites: A Descriptive Analysis. Journal of Business & Behavioral Sciences, Fall
2007, 74-84.
Junni, P., Sarala, R. M., Taras, V., & Tarba, S. Y. (2013). Organizational Ambidexterity
& Performance: A Meta-analysis. Academy Of Management Perspectives, 27(4), 299-
312. doi:10.5465/amp.2012.0015
Kaslow. (2012, July 25). How to secure America’s future in manufacturing. Retrieved
June 19, 2014, http://fortune.com/2012/07/25/how-to-secure-americas-future-in-
manufacturing/
Kim S. Cameron (2008) “A process for changing organizational culture.” In Thomas G.
Cummings (Ed.) Handbook of Organizational Development, (pages 429-445) Thousand
Oaks, CA: Sage.
Kim, S., Park, J.-H., & Wertz, E. K. (2010). Expectation gaps between stakeholders &
web-based corporate public relations efforts: Focusing on Fortune 500 corporate web
sites. Public Relations Review, 36(3), 215-221. doi: 10.1016/j.pubrev.2010.04.001
King, D.L. (2001). Mission Statement Content Analysis. Academy of Managerial
Communications Journal, 5(1-2), 75-100.
King, D. L., Case, C.J., Premo, K.M. (2010). Current mission statement emphasis: Be
ethical & go global. Academy of Strategic Management Journal, (2), 71-87.
King, W.R. & D.I. Cleland (1979). Strategic Planning & Policy. New York, NY:
Reinhold Publishing.
147
Klein AS, Masi RJ, Weidner II CK. 1995. Organization culture, distribution & amount of
control, & perceptions of quality: an empirical study of linkages. Group & Organization
Management 20(2): 122–148.
Kotrba, L. M., Gillespie, M. A., Schmidt, A. M., Smerek, R. E., Ritchie, S. A., & Denison,
D. R. (2012). Do consistent corporate cultures have better business performance?
Exploring the interaction effects. Human Relations, 65(2), 241-262. doi:
10.1177/0018726711426352
Kotter, J & Heskett, J (1992): Corporate Culture & Performance, Net York, The Free
Press.
Krippendorff, K. (2012). Content analysis: An introduction to its methodology. Sage.
Lacy, P., Cooper, T., Hayward, R., & Neuberger, L. (2010, June). A new era of
sustainability: UN Global Compact-Accenture CEO Study 2010. Retrieved from
http://accentureoutsourcing.ie/SiteCollectionDocuments/PDF/Accenture_A_New_Era_of
_Sustainability_CEO_Study.pdf
LaHue D. (2000). Manufacturing Matters! [Class Handout]. Bottom Line, Cumberland
County Public Library & Information Center, Fayetteville, NC.
Learn about ExxonMobil's guiding principles. (n.d.). Retrieved October 8, 2014, from
http://corporate.exxonmobil.com/en/company/about-us/guiding-principles/our-guiding-
principles?parentId=9d0ed0ac-4f85-4578-8c18-4ed13f4aff74
Lear. (n.d.). Retrieved October 8, 2014, from
http://www.lear.com/user_area/content_media/Vision%20&%20Mision%20Statement.pd
f
Ledford, G. E., Jr., Wendenhof, J. R., Strahley, J. T. (1995). Realizing a corporate
philosophy. Organizational Dynamics, 23 (3), 5-19.
Life at Intel United States: Our Values. (n.d.). Retrieved October 8, 2014, from
http://www.intel.com/content/www/us/en/jobs/life-at-intel/usa/our-
values.html?wapkw=values
Lipsey, M. W., & Wilson, D. (2000). Practical meta-analysis (applied social research
methods).
Lockheed Martin. (n.d.). Retrieved October 8, 2014, from
http://www.lockheedmartin.com/us/who-we-are/ethics.html

148
Mason C., Bauer T., Erdogan B. (2014). Principles of Management, v. 1.0. Flat World
Education, Inc.
McCord, P. (2014). How Netflix reinvented HR. Harvard Business Review: HBR, 92(1),
71-76.
McGregor, J. (2014, March 21). These are America’s best-rated CEOs, according to
their employees. Retrieved August 19, 2014 from
http://www.washingtonpost.com/blogs/on-leadership/wp/2014/03/21/these-are-
americas-best-rated-ceos-according-to-their-employees/
McNamara, M. (2014). “Objective of CEO.” 2014. Retrieved January 5, 2014 from
http://www.flextronics.com/careers/default.aspx
Menu. (n.d.). Retrieved October 8, 2014, from http://tsocorp.com/about-tesoro/
Mintzberg, H., & McHugh, A. (1985). Strategy Formation in an Adhocracy.
Administrative Science Quarterly, 30(2), 160-197.
Mission & Values. (n.d.). Retrieved October 8, 2014, from
http://www.hollyfrontier.com/mission-values/
Moser, H. (2014) Reshoring captures White House Attention.
http://www.reshorenow.org/news/successStories.cfm
National Oilwell Varco. (n.d.). Retrieved October 8, 2014, from
http://nov.com/aboutnov.aspx?id=5228
Navistar - Who We Are - Our Vision. (n.d.). Retrieved October 8, 2014, from
http://www.navistar.com/navistar/whoweare/ourvision#
Navistar - Careers - Culture. (n.d.). Retrieved October 8, 2014, from
http://www.navistar.com/navistar/careers/culture
NCR. (n.d.). Retrieved October 8, 2014, from http://a4a0f6939b58c150df1e-
8685fe7e4e24133c371aae6679c184ac.r40.cf1.rackcdn.com/v3/:original/2014_Code_of
_Conduct_AMENDED_7_22_14.pdf/790ea870168611e4a2683b15f4167557/2014_Cod
e_of_Conduct_AMENDED_7_22_14.pdf
News Release: Gross Domestic Product. (n.d.). Retrieved October 29, 2014, from
http://www.bea.gov/newsreleases/national/gdp/gdpnewsrelease.htm
Ninneman, P., Berry, B.(1997). Opportunities for growth in automotive steel. New steel,
13(6), 47-62.
149
One Ford Mission and Vision. (n.d.). Retrieved October 8, 2014, from
http://corporate.ford.com/our-company/our-company-news-detail/one-ford
Oshkosh. (n.d.). Retrieved October 8, 2014, from
http://www.oshkoshcorporation.com/about/index.html
Oshkosh Corporation - Corporate Governance Policies and Guidelines. (n.d.). Retrieved
October 8, 2014, from
http://www.oshkoshcorporation.com/about/corporategovernance~policiesguidelines.html
Our Commitments. (n.d.). Retrieved October 8, 2014, from http://www.utc.com/Our-
Company/Our-Commitments/Pages/default.aspx
Our Leadership. (n.d.). Retrieved October 8, 2014, from
http://www.textron.com/about/leadership/
Our Operating System. (n.d.). Retrieved October 8, 2014, from http://www.utc.com/Our-
Company/Our-Operating-System/Pages/default.aspx
Our Values - Terex Corporation. (n.d.). Retrieved October 8, 2014, from
http://www.terex.com/en/about-terex/our-values/index.htm
Our Vision. (n.d.). Retrieved October 8, 2014, from http://www.ncr.com/about-ncr/our-
vision
Ouchi, William G. (1981) Theory Z: How American Business Can Meet the Japanese
Challenge. Reading, MA: Addison-Wesley.
Paccar. (n.d.). Retrieved October 8, 2014, from http://www.paccar.com/about-us/environmental-leadership/ Palis, C. (2013, March 30). The Top 9 Tech CEOs Of 2012, As Rated By Employees.
Retrieved August 19, 2014 from http://www.huffingtonpost.com/2012/03/30/top-tech-
ceos-2012-glassdoor_n_1389378.html
Pascale, R. & Athos A. (1981). The Art of Japanese Management. New York: Simon
& Schuster.
People. (n.d.). Retrieved October 8, 2014, from http://www.conocophillips.com/who-we-
are/our-company/spirit-values/Pages/people.aspx
Peters, T. & Waterman, R.H. (1982): In Search of Excellence, New York, Harper &
Row.
150
Priddle, A., (2001). Sweet-talking Schrempp- WrapUp. Ward’s Auto World, (5).
Priddle, A., Stoddard, H., & Zoia, D. (2001). WHO'S NEXT?. Ward's Auto World, 37(5),
32-37.
Purpose, Mission & Values - Terex Corporation. (n.d.). Retrieved October 8, 2014, from
http://www.terex.com/en/about-terex/sustainability/purpose-mission-values/
Remarks by the President on Insourcing American Jobs. (n.d.). Retrieved November 13,
2014, from http://www.whitehouse.gov/the-press-office/2012/01/11/remarks-president-
insourcing-american-jobs
Responsibility. (n.d.). Retrieved October 8, 2014, from
http://www.conocophillips.com/who-we-are/our-company/spirit-
values/responsibility/Pages/default.aspx
Robbins S. P., Coulter M (2005). Management. Upper Saddle River, NJ: Pearson
Prentice Hall.
Roth, Z., & Gross, D. (2012, 2). Yahoo! Finance Show, President Obama Touts
‘Onshoring’: Is made in Americas.
SBA. Frequently Asked Questions about Small Business. (2014, March 1). Retrieved
June 10, 2014, from
http://www.sba.gov/sites/default/files/advocacy/FAQ_March_2014_0.pdf
Schein, E.H. (1992) Organizational Culture & Leadership, 2nd edn. San Francisco, CA:
Jossey-Bass.
Schein, E. H. (1983). The role o f the founder in creating organizational culture.
Organizational Dynamics, 12(1), 13-28. doi: http://dx.doi.org/10.1016/0090-
2616(83)90023-2
Schultz, M. (1995): On studying organizational Cultures – Diagnosis & Understanding,
New York, Water de Gruyter.
SIC Directory. (n.d.). Retrieved August 21, 2014, from
http://siccode.com/en/siccode/list/directory/code/3900/alias/miscellaneous-
manufacturing-industries
SIC Division Structure. (n.d.). Retrieved October 20, 2014, from
https://www.osha.gov/pls/imis/sic_manual.display?id=4&tab=division
151
Smith, D. C. (2001). Stevie Sometimes Makes You Wonder. Ward's Auto World, 37(5),
116.
Smith, K. T., & Alexander, J. J. (2013). Which CSR-Related Headings Do Fortune 500
Companies Use on Their Websites? Business Communication Quarterly, 76(2), 155-
171. doi: 10.1177/1080569912471185
Snapshot: National Network for Manufacturing Innovation (NNMI). (n.d.). Retrieved August 11, 2014.
Stangler, D., & Arbesman, S. (2012). What Does Fortune 500 Turnover Mean?.
Available at SSRN 2078162.
Steiner, G. (1979). Strategic Planning: What Every Manager Must Know. New York,
NY: The Free Press.
Taylor, M., Kent, M. L., &White, W. J. (2001). How activist organizations are using the
Internet to build relationships. Public Relations Review, 27(3), 263–284.
Teamwork. (n.d.). Retrieved October 8, 2014, from http://www.conocophillips.com/who-we-are/our-company/spirit-values/teamwork/Pages/default.aspx
Tenneco. (n.d.). Retrieved October 8, 2014, from http://www.tenneco.com/assets/1/7/Tenneco2002AnnualReport.pdf
Textron. (n.d.). Retrieved October 8, 2014, from http://www.textron.com/resources/textron_business_conduct_04.pdf
Timmerman, John C. (2009). A systematic approach for making innovation a core
competency. The Journal for Quality & Participation, (4), 4.
TRW. (n.d.). Retrieved October 8, 2014, from
http://files.shareholder.com/downloads/TRW/3437709812x0x136594/af197465-728a-
4b22-b166-39cd120ba071/StandardsConductPolicy.pdf
Tsocorp. (n.d.). Retrieved October 8, 2014, from http://tsocorp.com/wp-
content/uploads/2013/11/Social-Responsibility-Report-2012.pdf
The Chevron Way. (n.d.). Retrieved October 8, 2014, from
http://www.chevron.com/about/chevronway/
Thompson, A., & Strickland, A. (2000). Strategic Management: Concepts & Cases
(Revised/Exp&ed ed.). Chicago: Irwin.
152
Tseng,N.H. (2011, June 29). Obama: Looking for jobs in all the wrong places. Retrieved
June 19, 2014, from http://fortune.com/2011/06/29/made-again-in-the-usa-the-return-of-
american-manufacturing-2/
Trevin˜o, L. K., Butterfield, K. D., & McCabe, D. L. (2001). The ethical context in
organizations: Influences on employee attitudes & behaviors. Business Ethics
Quarterly, 8(3), 301–337.
Valero. (n.d.). Retrieved October 8, 2014, from
http://www.valero.com/InvestorRelations/Documents/AnnualReport2009/pdf/annualRep
ort.pdf
Value Statements. (n.d.). Retrieved October 8, 2014, from
http://www.lear.com/user_area/content_media/Lear%20Value%20Statement.PDF
Vision & Values. (n.d.). Retrieved October 8, 2014, from
http://www.conocophillips.com/sustainable-development/our-approach/living-by-our-
principles/Pages/vision-values.aspx
Vision and Values. (n.d.). Retrieved October 8, 2014, from
http://www.tenneco.com/overview/vision_and_values/
Visteon Corporation: Profile. (n.d.). Retrieved October 8, 2014, from
http://www.visteon.com/company/profile.html
Veloso, F., Henry, C., & Roth, R. (2000). Can Small Firms Leverage Global
Competition? Evidence from the Portuguese & Brazilian Automotive Supplier Industries.
In Brazilian Automotive Supplier Industries. Fourth International Conference on
Technology Policy & Innovation.
Wagner, E. (2013, September 12). Five Reasons 8 Out Of 10 Businesses Fail.
Retrieved August 9, 2014, from http://www.forbes.com/sites/ericwagner/2013/09/12/five-
reasons-8-out-of-10-businesses-fail/
Watson, J., & Everett, J. (1993). Defining Small Business Failure. International Small
Business Journal, 11(3), 35-48. doi: 10.1177/026624269301100302
Weber, M. (1947) The Theory of Social & Economic Reform. (Henderson & Parsons,
translators). New York: Free Press.
Western Digital. (n.d.). Retrieved October 8, 2014, from
http://www.wdc.com/wdproducts/library/company/globalcitizenship/CorporateSocialRes
ponsibilityReport2011HR.pdf
153
Western Refining. Core Values. (n.d.). Retrieved October 8, 2014, from
http://jobs.wnr.com/core-Values
Why Do Companies Fail Survey Results. Published by Dr. Christoph Lymbersky of the
Turnaround Management Society. (2014, 02). PRWeb Newswire.
Wilkins, A.L., & Ouchi W.G. (1983) Efficient cultures: Exploring the relationship between
culture & organizational performance. Administrative Science Quarterly 28(3): 468–
481.
Williams, S. L. (2008). The Mission Statement: A Corporate Reporting Tool With a Past,
Present, & Future. Journal of Business Communication, 45(2), 94-119. doi:
10.1177/0021943607313989
Williamson, O. (1975) Markets & Hierarchies: Analysis & Antitrust Implications. New
York: Free Press.
World Bank. (2000). World development indicators 2000. Washington: The World Bank.
Wolduh, H. (2000). Chapter 19 Global operation Management Theme [Class Handout]. School of Management, University of Texas, Dallas, TX.
Xerox at a Glance. (n.d.). Retrieved October 8, 2014, from http://www.xerox.com/about-
xerox/company-facts/enus.html
Yilmaz, C., & Ergun, E. (2008). Organizational culture & firm effectiveness: An
examination of relative effects of culture traits & the balanced culture hypothesis in an
emerging economy. Journal of World Business, 43(3), 290-306. Doi:
http://dx.doi.org/10.1016/j.jwb.2008.03.019
Yukl, G., & Lepsinger, R. (2005). Why Integrating the Leading & Managing Roles Is
Essential for Organizational Effectiveness. Organizational Dynamics, 34(4), 361-375.
Doi: http://dx.doi.org/10.1016/j.orgdyn.2005.08.004
Zacharakis, A. L. Meyer, G. D, & Decastro, J. (1999). Differing perceptions of new
venture failure: A matched exploratory study of venture capitalists &
entrepreneurs. Journal of Small Business Management, (3), 1.
Zheng, W., Yang, B., & McLean, G. N. (2010). Linking organizational culture, structure,
strategy, & organizational effectiveness: Mediating role of knowledge management.
Journal of Business Research, 63(7), 763-771. doi:
http://dx.doi.org/10.1016/j.jbusres.2009.06.005

154
APPENDICES
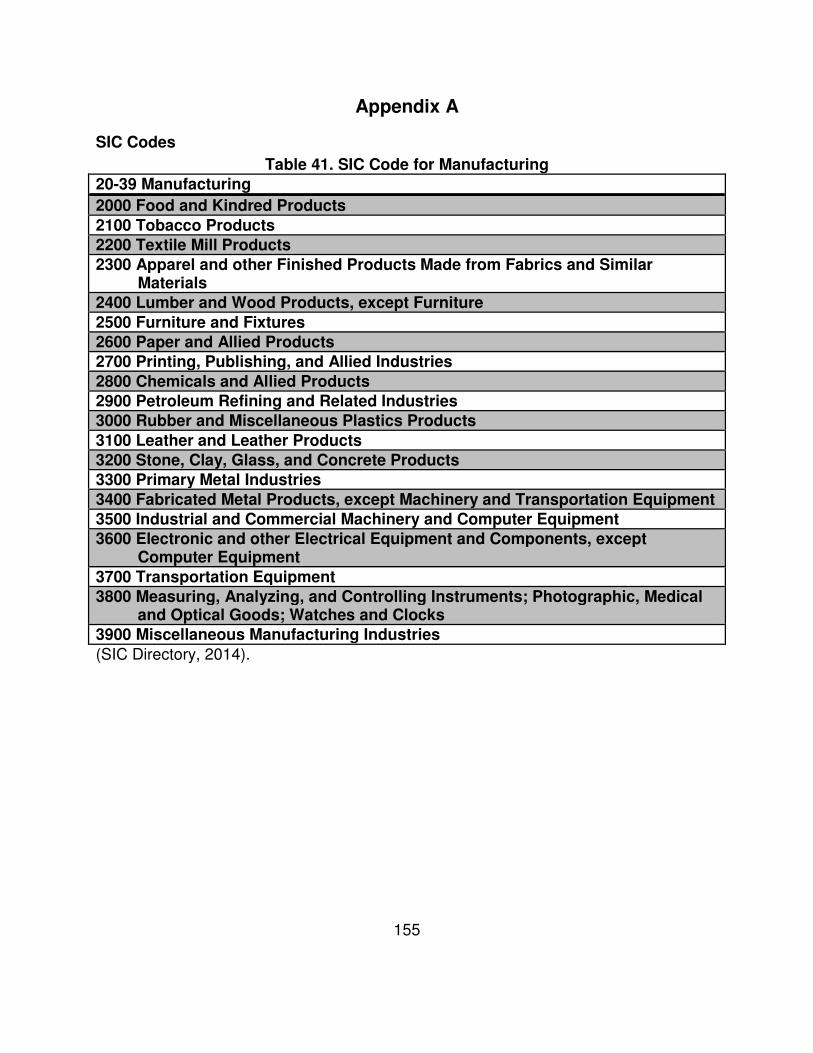
155
Appendix A
SIC Codes
Table 41. SIC Code for Manufacturing
20-39 Manufacturing
2000 Food and Kindred Products
2100 Tobacco Products
2200 Textile Mill Products
2300 Apparel and other Finished Products Made from Fabrics and Similar Materials
2400 Lumber and Wood Products, except Furniture
2500 Furniture and Fixtures
2600 Paper and Allied Products
2700 Printing, Publishing, and Allied Industries
2800 Chemicals and Allied Products
2900 Petroleum Refining and Related Industries
3000 Rubber and Miscellaneous Plastics Products
3100 Leather and Leather Products
3200 Stone, Clay, Glass, and Concrete Products
3300 Primary Metal Industries
3400 Fabricated Metal Products, except Machinery and Transportation Equipment
3500 Industrial and Commercial Machinery and Computer Equipment
3600 Electronic and other Electrical Equipment and Components, except Computer Equipment
3700 Transportation Equipment
3800 Measuring, Analyzing, and Controlling Instruments; Photographic, Medical and Optical Goods; Watches and Clocks
3900 Miscellaneous Manufacturing Industries
(SIC Directory, 2014).
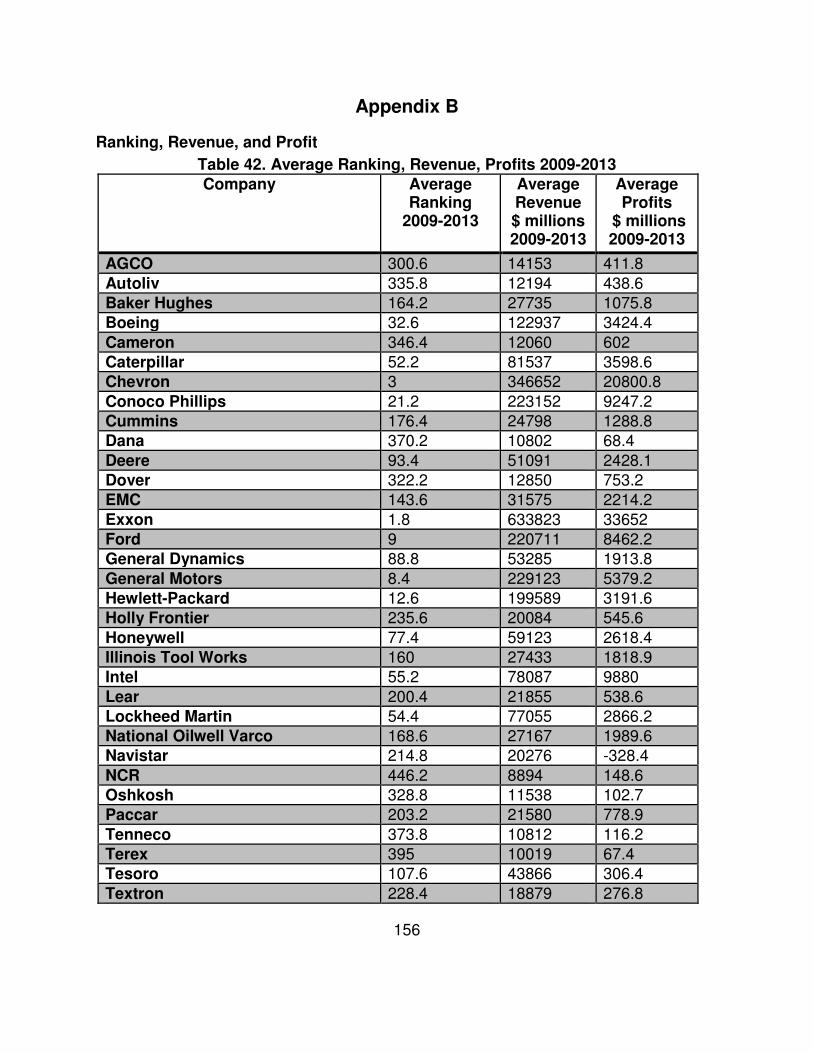
156
Appendix B
Ranking, Revenue, and Profit
Table 42. Average Ranking, Revenue, Profits 2009-2013
Company Average Ranking
2009-2013
Average Revenue $ millions 2009-2013
Average Profits
$ millions 2009-2013
AGCO 300.6 14153 411.8
Autoliv 335.8 12194 438.6 Baker Hughes 164.2 27735 1075.8 Boeing 32.6 122937 3424.4
Cameron 346.4 12060 602 Caterpillar 52.2 81537 3598.6 Chevron 3 346652 20800.8
Conoco Phillips 21.2 223152 9247.2 Cummins 176.4 24798 1288.8 Dana 370.2 10802 68.4
Deere 93.4 51091 2428.1 Dover 322.2 12850 753.2 EMC 143.6 31575 2214.2
Exxon 1.8 633823 33652 Ford 9 220711 8462.2 General Dynamics 88.8 53285 1913.8
General Motors 8.4 229123 5379.2 Hewlett-Packard 12.6 199589 3191.6 Holly Frontier 235.6 20084 545.6
Honeywell 77.4 59123 2618.4 Illinois Tool Works 160 27433 1818.9 Intel 55.2 78087 9880
Lear 200.4 21855 538.6 Lockheed Martin 54.4 77055 2866.2 National Oilwell Varco 168.6 27167 1989.6 Navistar 214.8 20276 -328.4
NCR 446.2 8894 148.6 Oshkosh 328.8 11538 102.7 Paccar 203.2 21580 778.9
Tenneco 373.8 10812 116.2 Terex 395 10019 67.4 Tesoro 107.6 43866 306.4
Textron 228.4 18879 276.8
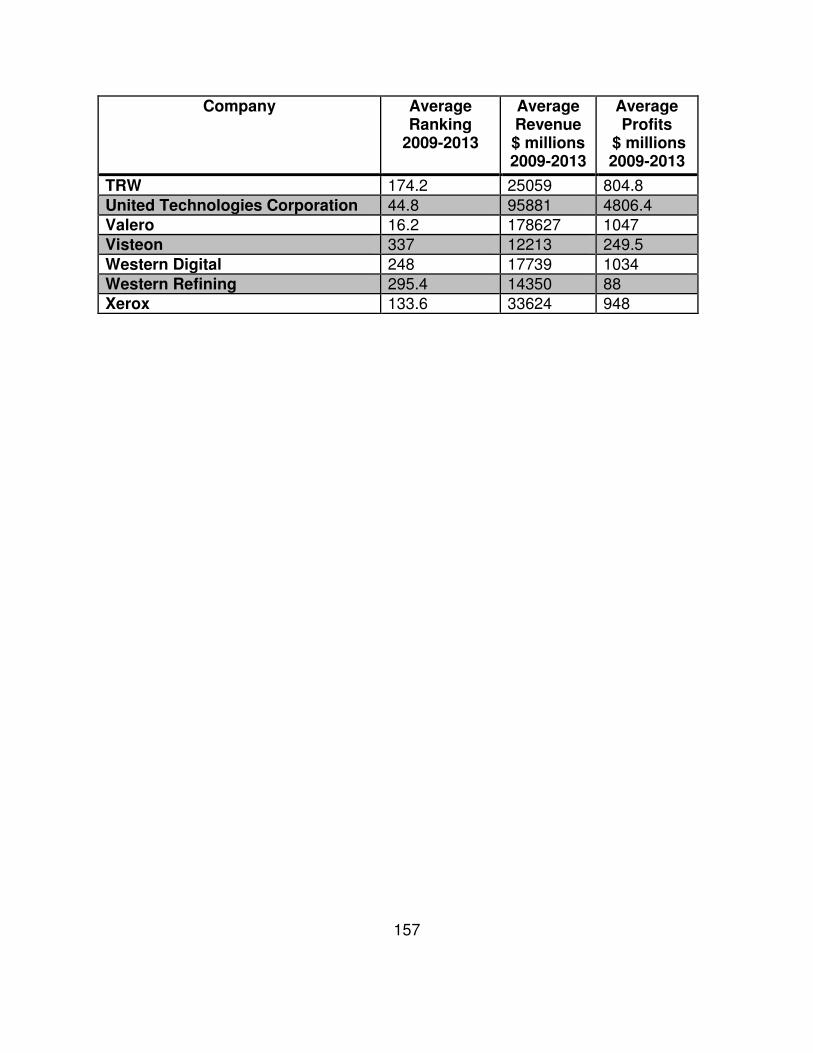
157
Company Average Ranking
2009-2013
Average Revenue $ millions 2009-2013
Average Profits
$ millions 2009-2013
TRW 174.2 25059 804.8
United Technologies Corporation 44.8 95881 4806.4 Valero 16.2 178627 1047 Visteon 337 12213 249.5
Western Digital 248 17739 1034 Western Refining 295.4 14350 88 Xerox 133.6 33624 948
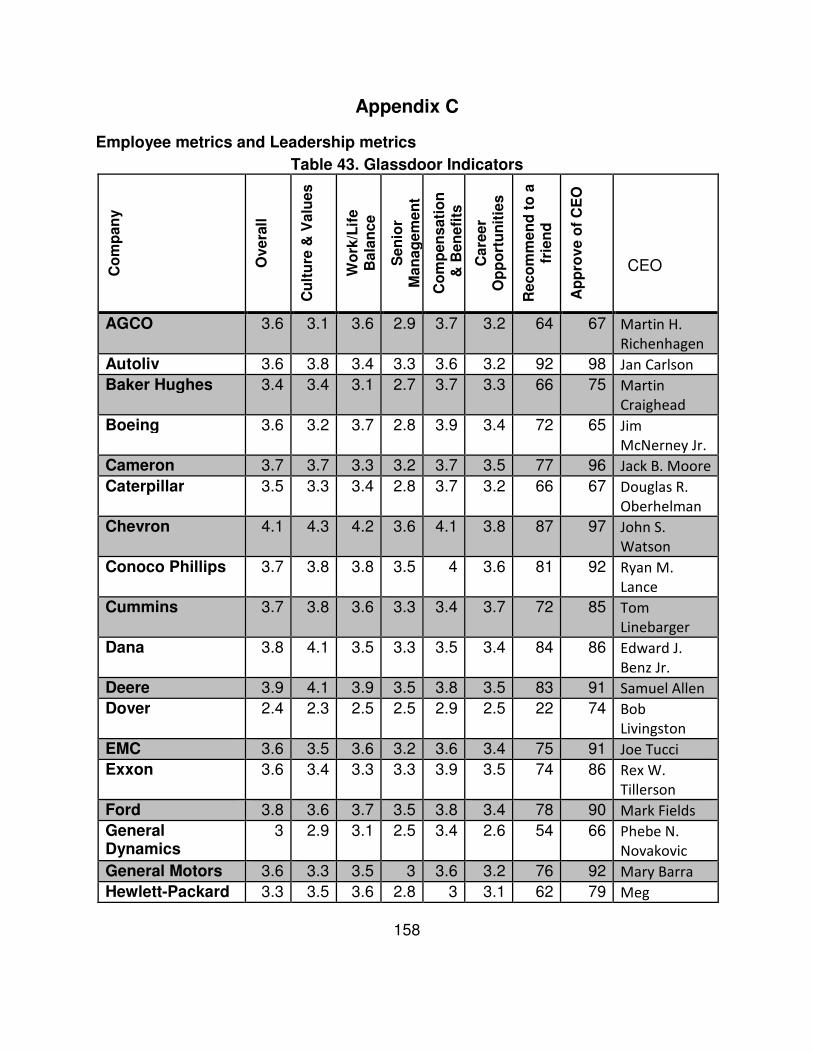
158
Appendix C
Employee metrics and Leadership metrics
Table 43. Glassdoor Indicators
Co
mp
an
y
Overa
ll
Cu
ltu
re &
Valu
es
Wo
rk/L
ife
Bala
nce
Sen
ior
Man
ag
em
en
t
Co
mp
en
sati
on
&
Ben
efi
ts
Care
er
Op
po
rtu
nit
ies
Reco
mm
en
d t
o a
fr
ien
d
Ap
pro
ve o
f C
EO
CEO
AGCO 3.6 3.1 3.6 2.9 3.7 3.2 64 67 Martin H.
Richenhagen
Autoliv 3.6 3.8 3.4 3.3 3.6 3.2 92 98 Jan Carlson
Baker Hughes 3.4 3.4 3.1 2.7 3.7 3.3 66 75 Martin
Craighead
Boeing 3.6 3.2 3.7 2.8 3.9 3.4 72 65 Jim
McNerney Jr.
Cameron 3.7 3.7 3.3 3.2 3.7 3.5 77 96 Jack B. Moore
Caterpillar 3.5 3.3 3.4 2.8 3.7 3.2 66 67 Douglas R.
Oberhelman
Chevron 4.1 4.3 4.2 3.6 4.1 3.8 87 97 John S.
Watson
Conoco Phillips 3.7 3.8 3.8 3.5 4 3.6 81 92 Ryan M.
Lance
Cummins 3.7 3.8 3.6 3.3 3.4 3.7 72 85 Tom
Linebarger
Dana 3.8 4.1 3.5 3.3 3.5 3.4 84 86 Edward J.
Benz Jr.
Deere 3.9 4.1 3.9 3.5 3.8 3.5 83 91 Samuel Allen
Dover 2.4 2.3 2.5 2.5 2.9 2.5 22 74 Bob
Livingston
EMC 3.6 3.5 3.6 3.2 3.6 3.4 75 91 Joe Tucci
Exxon 3.6 3.4 3.3 3.3 3.9 3.5 74 86 Rex W.
Tillerson
Ford 3.8 3.6 3.7 3.5 3.8 3.4 78 90 Mark Fields
General Dynamics
3 2.9 3.1 2.5 3.4 2.6 54 66 Phebe N.
Novakovic
General Motors 3.6 3.3 3.5 3 3.6 3.2 76 92 Mary Barra
Hewlett-Packard 3.3 3.5 3.6 2.8 3 3.1 62 79 Meg
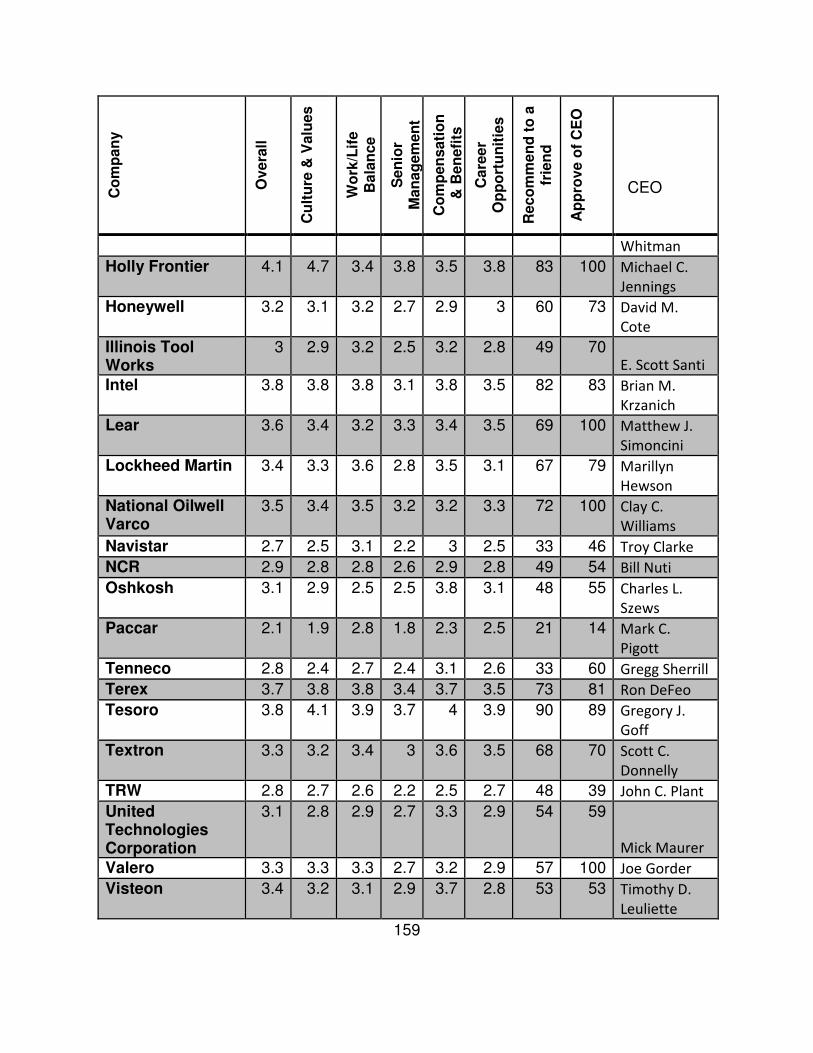
159
Co
mp
an
y
Overa
ll
Cu
ltu
re &
Valu
es
Wo
rk/L
ife
Bala
nce
Sen
ior
Man
ag
em
en
t
Co
mp
en
sati
on
&
Ben
efi
ts
Care
er
Op
po
rtu
nit
ies
Reco
mm
en
d t
o a
fr
ien
d
Ap
pro
ve o
f C
EO
CEO
Whitman
Holly Frontier 4.1 4.7 3.4 3.8 3.5 3.8 83 100 Michael C.
Jennings
Honeywell 3.2 3.1 3.2 2.7 2.9 3 60 73 David M.
Cote
Illinois Tool Works
3 2.9 3.2 2.5 3.2 2.8 49 70 E. Scott Santi
Intel 3.8 3.8 3.8 3.1 3.8 3.5 82 83 Brian M.
Krzanich
Lear 3.6 3.4 3.2 3.3 3.4 3.5 69 100 Matthew J.
Simoncini
Lockheed Martin 3.4 3.3 3.6 2.8 3.5 3.1 67 79 Marillyn
Hewson
National Oilwell Varco
3.5 3.4 3.5 3.2 3.2 3.3 72 100 Clay C.
Williams
Navistar 2.7 2.5 3.1 2.2 3 2.5 33 46 Troy Clarke
NCR 2.9 2.8 2.8 2.6 2.9 2.8 49 54 Bill Nuti
Oshkosh 3.1 2.9 2.5 2.5 3.8 3.1 48 55 Charles L.
Szews
Paccar 2.1 1.9 2.8 1.8 2.3 2.5 21 14 Mark C.
Pigott
Tenneco 2.8 2.4 2.7 2.4 3.1 2.6 33 60 Gregg Sherrill
Terex 3.7 3.8 3.8 3.4 3.7 3.5 73 81 Ron DeFeo
Tesoro 3.8 4.1 3.9 3.7 4 3.9 90 89 Gregory J.
Goff
Textron 3.3 3.2 3.4 3 3.6 3.5 68 70 Scott C.
Donnelly
TRW 2.8 2.7 2.6 2.2 2.5 2.7 48 39 John C. Plant
United Technologies Corporation
3.1 2.8 2.9 2.7 3.3 2.9 54 59
Mick Maurer
Valero 3.3 3.3 3.3 2.7 3.2 2.9 57 100 Joe Gorder
Visteon 3.4 3.2 3.1 2.9 3.7 2.8 53 53 Timothy D.
Leuliette
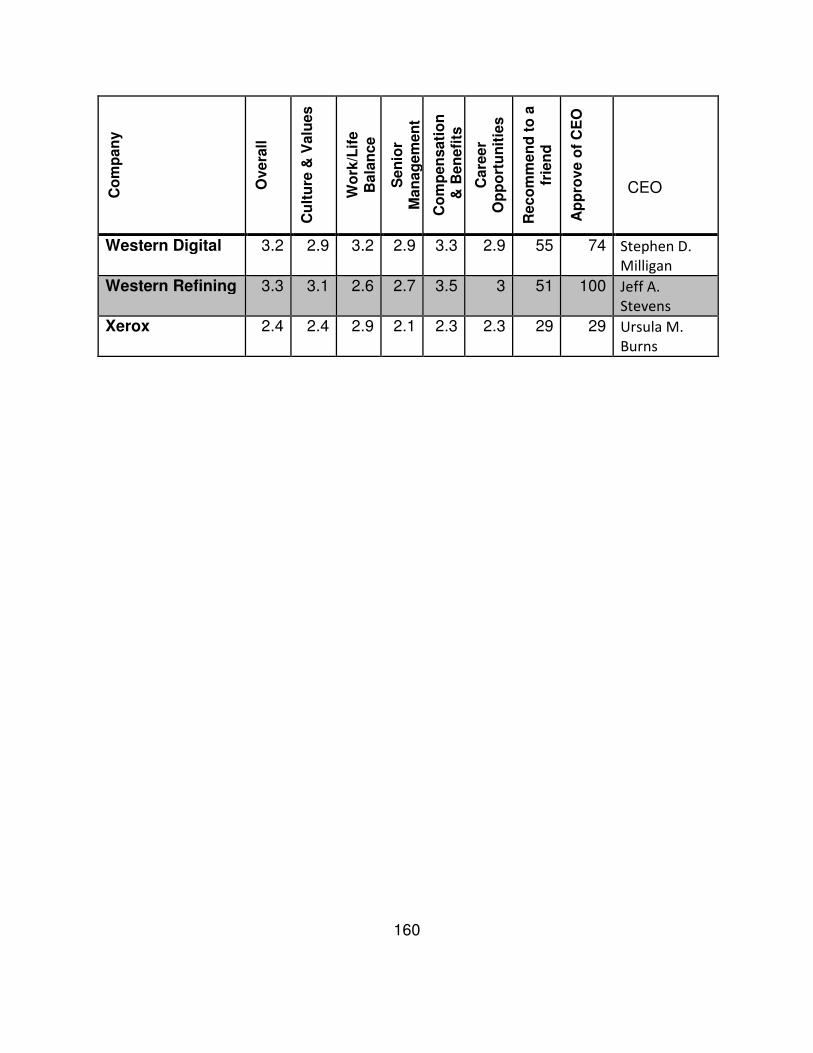
160
Co
mp
an
y
Overa
ll
Cu
ltu
re &
Valu
es
Wo
rk/L
ife
Bala
nce
Sen
ior
Man
ag
em
en
t
Co
mp
en
sati
on
&
Ben
efi
ts
Care
er
Op
po
rtu
nit
ies
Reco
mm
en
d t
o a
fr
ien
d
Ap
pro
ve o
f C
EO
CEO
Western Digital 3.2 2.9 3.2 2.9 3.3 2.9 55 74 Stephen D.
Milligan
Western Refining 3.3 3.1 2.6 2.7 3.5 3 51 100 Jeff A.
Stevens
Xerox 2.4 2.4 2.9 2.1 2.3 2.3 29 29 Ursula M.
Burns

161
Appendix D
Vision Mission and Values for each Company Website
AGCO
A. Vision
High–tech solutions for professional farmers feeding the world.
B. Mission
Profitable growth through superior customer service, innovation, quality and
commitment.
C. Values
BUSINESS VALUES
Customer Focus
We create excellent solutions for our customers by carefully listening to their needs and
exceeding their expectations.
Dealer Focus
We realize that dealer profitability is instrumental to our success and expect to be the
preferred supplier.
Human Dimensions
We value our employees.
We expect to be the preferred employer in our industry.
We expect to create highly motivated employees who are the most knowledgeable and
best trained in the industry.
By continually enhancing the leadership, business and people management skills of our
current and potential managers, we expect to have employees who can provide the
necessary process improvements to achieve corporate goals.
We develop employee’s skills and qualifications.
We expect our leaders to be proactive and show the way.
162
We expect our leaders to influence and set the rules.
Using speed, quality, and innovative behavior we expect to achieve competitive
advantage
#1 in Customer Perceived Quality
More than just delivering highest quality of product and services, we expect to be
recognized by our customers and users as such.
Ethical Standards
We will conduct ourselves in an ethical manner and act as a good corporate citizen in all
communities in which the Company operates.
We care about the natural environment.
In all our activities we wish to protect the environment from harmful influences, conserve
natural resources and promote environmental awareness.
Brand Values
We recognize the tradition and value of brands, the loyalty of our customers and the
identification of our dealers.
AGCO’s multi-brand strategy maintains brand value.
Create Shareholder Value
We expect to achieve profitable growth.
AGCO will manage the business in order to provide superior return to its shareholders.
CORE VALUES
Accountability
We will take responsibility for our area of influence as if this is our enterprise. We will
commit to excellence.
Integrity
We will walk the talk. We will be committed to a consistent, honest and reliable way of
action.
Respect
163
We appreciate other individuals with their own cultural identities. We embrace
differences.
Team Spirit
We actively contribute to overcome challenges as a team.
Transparency
We will provide full information required. We will communicate openly and sincerely. We
appreciate feedback (AGCO, n.d.)

164
Apple
A. Vision – not stated
B. Mission – not stated
C. Values – not stated
165
Autoliv
A. Vision
Our vision – To substantially reduce traffic accidents, fatalities and injuires.
B. Mission
Our Mission – To create, manufacture and sell state-of-the-art automotive safety
systems.
C. Values
Our Values
Life-we have a passion for saving lives
Customers – we are dedicated to providing satisfaction for our customers and value for
the driving public.
Innovation – we are driven for innovation and continuous improvement.
Employees – we are committed to the development of our employees’ skills, knowledge
and creative potential.
Ethics – we adhere to the highest level of ethical and social behaviors.
Culture – we are founded on global thinking and local actions (Autoliv, n.d.).

166
Baker Hughes
A. Vision – not stated
B. Mission
Our mission is to be the best possible business and social partner, creating value for
our customers and improving the lives of the countries’ resident (Corporate-
responsibility, n.d.).
C. Values
Integrity
We believe integrity is the foundation of our individual and corporate actions that drives
an organization of which we are proud.
We are a responsible corporate citizen committed to the health and safety of people,
protection of the environment, and compliance with laws, regulations, and company
policies
We are honest, trustworthy, respectful, and ethical in our actions
We honor our commitments
We are accountable for our actions, successes, and failures
Teamwork
We believe teamwork leverages our individual strengths.
We are committed to common goals
We expect everyone to actively participate on the Baker Hughes team
We openly communicate up, down, and across the organization
We value the diversity of our workforce
We willingly share our resources
Performance
We believe performance excellence will drive the results that differentiate us from our
competitors.

167
We focus on what is important
We establish and communicate clear expectations
We relentlessly pursue success
We strive for flawless execution
We work hard, celebrate our successes, and learn from our failures
We continuously look for new ways to improve our products, services, and processes
Learning
We believe a learning environment is the way to achieve the full potential of each
individual and the company.
We expect development throughout each individual’s career by a combination of
individual and company commitment
We learn from sharing past decisions and actions, both good and bad, to continuously
improve performance
We improve by benchmarking and adopting best practices
Courage
We believe courage empowers us to lead boldly and act decisively.
We stand for what is right and support others who do so
We imagine and pursue new possibilities for our future
We take ownership of challenges, even those that appear insurmountable
We embrace change, both collectively and individually (Core Values, n.d.).
168
Boeing
A. Vision
Vision is: People working together as a global enterprise for aerospace
industry leadership. How will we get there?
Operate as One Boeing
Deliver customer value
Lead with innovation
Fuel growth through productivity
Leverage global strength
In order to realize our vision, we consider where we are today and where we would like
to be tomorrow. There are certain business imperatives on which Boeing places a very
strong emphasis.
Detailed customer knowledge and focus
Technical and functional excellence
Large-scale systems integration
Lifecycle solutions
Lean global enterprise
B. Mission – not stated
C. Values
At Boeing, we are committed to a set of core values that not only define who we are, but
also serve as guideposts to help us become the company we would like to be. And we
aspire to live these values every day.
We take the high road by practicing the highest ethical standards and honoring our
commitments. We take personal responsibility for our own actions.
We strive for first-time quality and continuous improvement in all that we do to meet or
exceed the standards of excellence stakeholders expect of us.
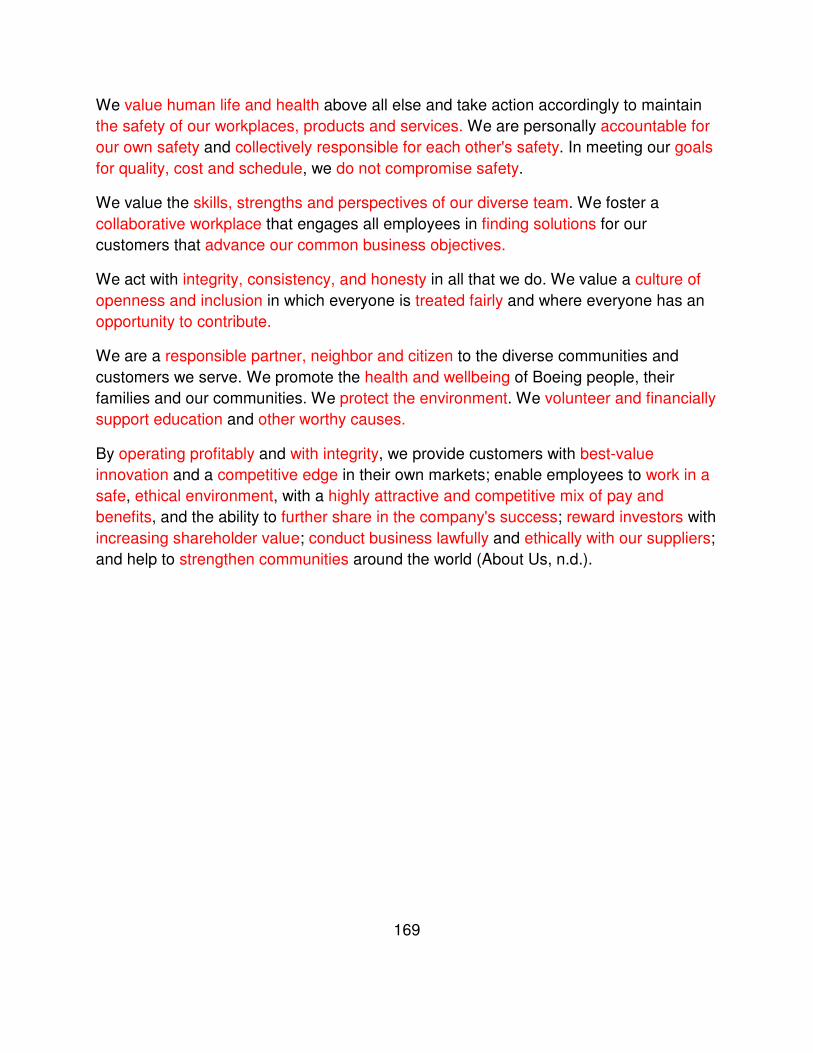
169
We value human life and health above all else and take action accordingly to maintain
the safety of our workplaces, products and services. We are personally accountable for
our own safety and collectively responsible for each other's safety. In meeting our goals
for quality, cost and schedule, we do not compromise safety.
We value the skills, strengths and perspectives of our diverse team. We foster a
collaborative workplace that engages all employees in finding solutions for our
customers that advance our common business objectives.
We act with integrity, consistency, and honesty in all that we do. We value a culture of
openness and inclusion in which everyone is treated fairly and where everyone has an
opportunity to contribute.
We are a responsible partner, neighbor and citizen to the diverse communities and
customers we serve. We promote the health and wellbeing of Boeing people, their
families and our communities. We protect the environment. We volunteer and financially
support education and other worthy causes.
By operating profitably and with integrity, we provide customers with best-value
innovation and a competitive edge in their own markets; enable employees to work in a
safe, ethical environment, with a highly attractive and competitive mix of pay and
benefits, and the ability to further share in the company's success; reward investors with
increasing shareholder value; conduct business lawfully and ethically with our suppliers;
and help to strengthen communities around the world (About Us, n.d.).
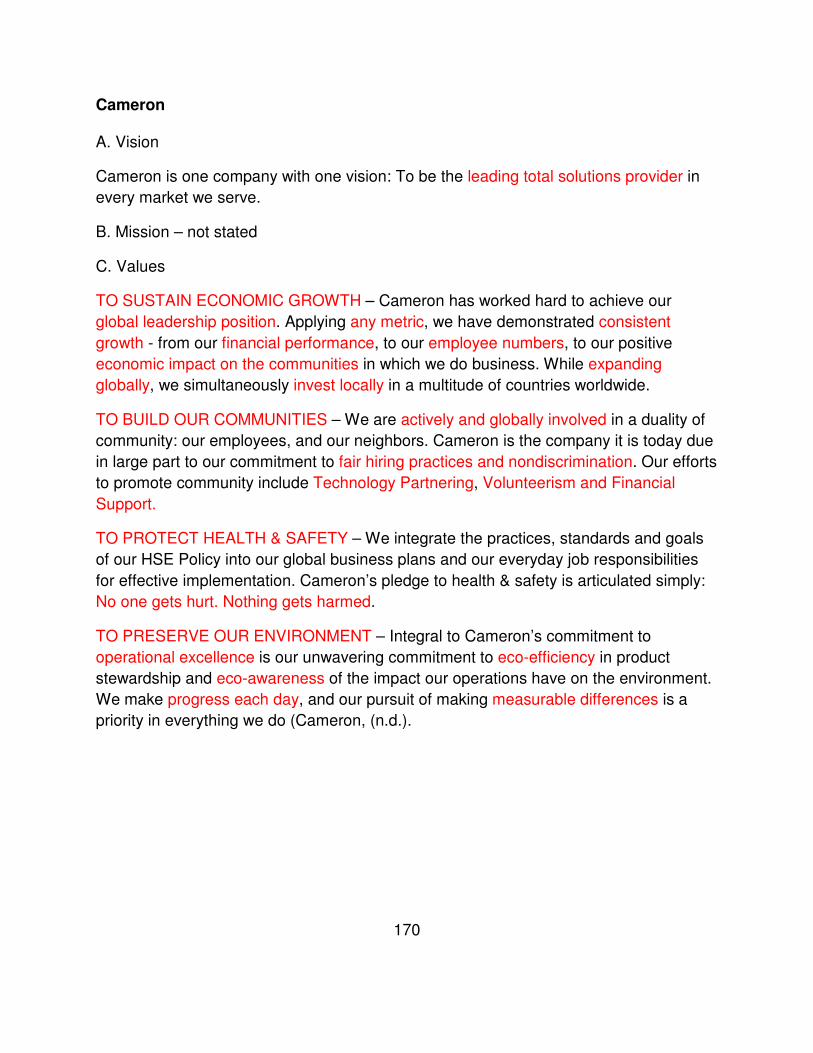
170
Cameron
A. Vision
Cameron is one company with one vision: To be the leading total solutions provider in
every market we serve.
B. Mission – not stated
C. Values
TO SUSTAIN ECONOMIC GROWTH – Cameron has worked hard to achieve our
global leadership position. Applying any metric, we have demonstrated consistent
growth - from our financial performance, to our employee numbers, to our positive
economic impact on the communities in which we do business. While expanding
globally, we simultaneously invest locally in a multitude of countries worldwide.
TO BUILD OUR COMMUNITIES – We are actively and globally involved in a duality of
community: our employees, and our neighbors. Cameron is the company it is today due
in large part to our commitment to fair hiring practices and nondiscrimination. Our efforts
to promote community include Technology Partnering, Volunteerism and Financial
Support.
TO PROTECT HEALTH & SAFETY – We integrate the practices, standards and goals
of our HSE Policy into our global business plans and our everyday job responsibilities
for effective implementation. Cameron’s pledge to health & safety is articulated simply:
No one gets hurt. Nothing gets harmed.
TO PRESERVE OUR ENVIRONMENT – Integral to Cameron’s commitment to
operational excellence is our unwavering commitment to eco-efficiency in product
stewardship and eco-awareness of the impact our operations have on the environment.
We make progress each day, and our pursuit of making measurable differences is a
priority in everything we do (Cameron, (n.d.).
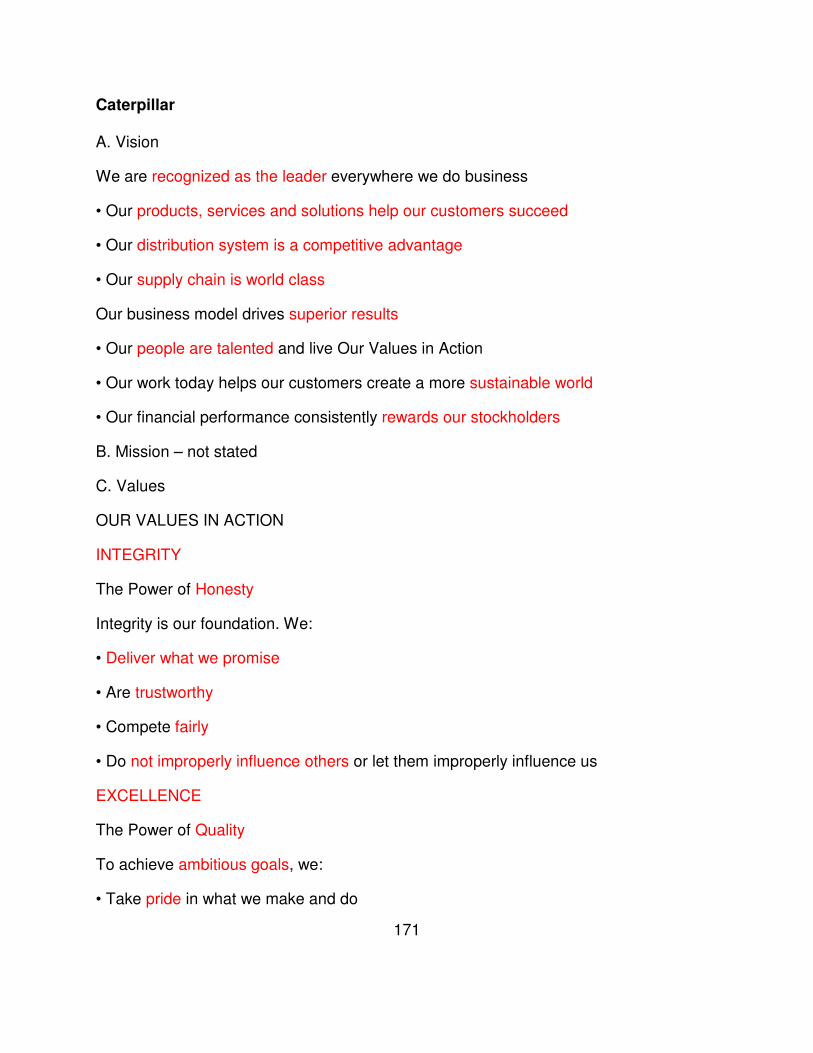
171
Caterpillar
A. Vision
We are recognized as the leader everywhere we do business
• Our products, services and solutions help our customers succeed
• Our distribution system is a competitive advantage
• Our supply chain is world class
Our business model drives superior results
• Our people are talented and live Our Values in Action
• Our work today helps our customers create a more sustainable world
• Our financial performance consistently rewards our stockholders
B. Mission – not stated
C. Values
OUR VALUES IN ACTION
INTEGRITY
The Power of Honesty
Integrity is our foundation. We:
• Deliver what we promise
• Are trustworthy
• Compete fairly
• Do not improperly influence others or let them improperly influence us
EXCELLENCE
The Power of Quality
To achieve ambitious goals, we:
• Take pride in what we make and do
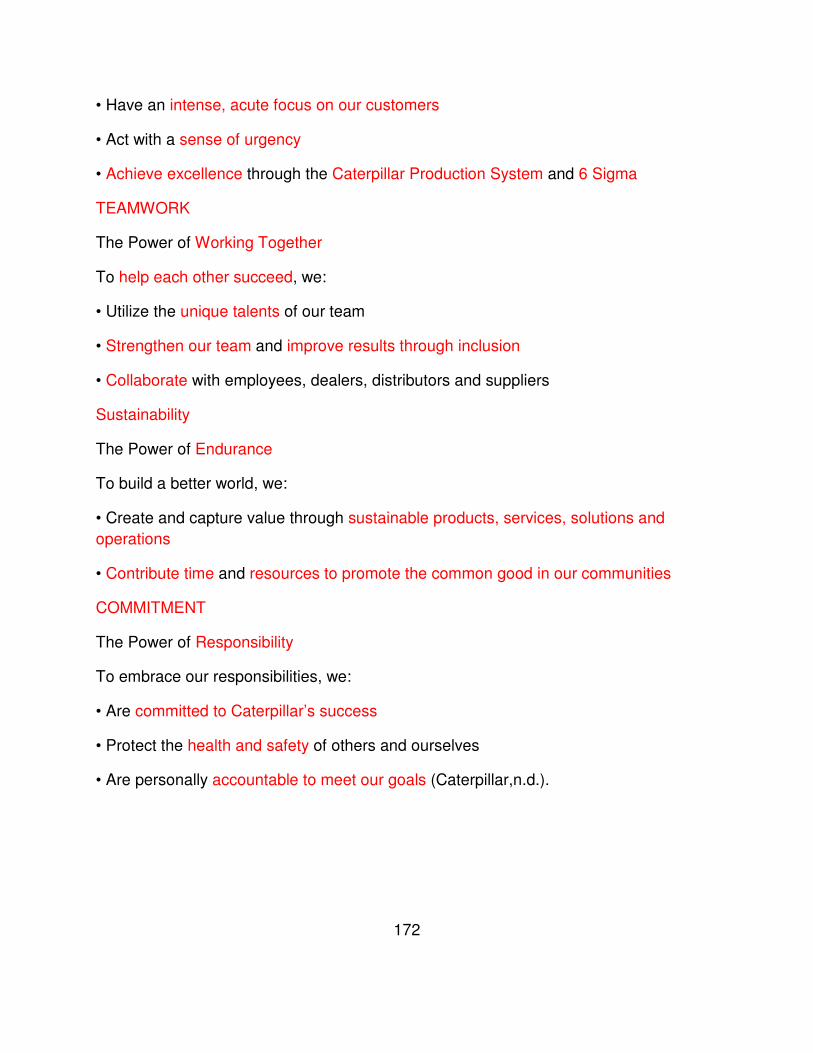
172
• Have an intense, acute focus on our customers
• Act with a sense of urgency
• Achieve excellence through the Caterpillar Production System and 6 Sigma
TEAMWORK
The Power of Working Together
To help each other succeed, we:
• Utilize the unique talents of our team
• Strengthen our team and improve results through inclusion
• Collaborate with employees, dealers, distributors and suppliers
Sustainability
The Power of Endurance
To build a better world, we:
• Create and capture value through sustainable products, services, solutions and
operations
• Contribute time and resources to promote the common good in our communities
COMMITMENT
The Power of Responsibility
To embrace our responsibilities, we:
• Are committed to Caterpillar’s success
• Protect the health and safety of others and ourselves
• Are personally accountable to meet our goals (Caterpillar,n.d.).

173
Chevron
A. Vision
At the heart of The Chevron Way is our vision ... to be the global energy company most
admired for its people, partnership and performance.
Our vision means we:
safely provide energy products vital to sustainable economic progress and human
development throughout the world;
are people and an organization with superior capabilities and commitment;
are the partner of choice; earn the admiration of all our stakeholders – investors,
customers, host governments, local communities and our employees – not only for the
goals we achieve but how we achieve them;
deliver world-class performance.
B. Mission – not stated
C. Values
Our company's foundation is built on our values, which distinguish us and guide our
actions. We conduct our business in a socially responsible and ethical manner. We
respect the law, support universal human rights, protect the environment and benefit the
communities where we work.
Integrity
We are honest with others and ourselves. We meet the highest ethical standards in all
business dealings. We do what we say we will do. We accept responsibility and hold
ourselves accountable for our work and our actions.
Trust
We trust, respect and support each other, and we strive to earn the trust of our
colleagues and partners.
Diversity
We learn from and respect the cultures in which we work. We value and demonstrate
respect for the uniqueness of individuals and the varied perspectives and talents they
174
provide. We have an inclusive work environment and actively embrace a diversity of
people, ideas, talents and experiences.
Ingenuity
We seek new opportunities and out-of-the-ordinary solutions. We use our creativity to
find unexpected and practical ways to solve problems. Our experience, technology, and
perseverance enable us to overcome challenges and deliver value.
Partnership
We have an unwavering commitment to being a good partner focused on building
productive, collaborative, trusting and beneficial relationships with governments, other
companies, our customers, our communities and each other.
Protecting People and the Environment
We place the highest priority on the health and safety of our workforce and protection of
our assets and the environment. We aim to be admired for world-class performance
through disciplined application of our Operational Excellence Management System.
High Performance
We are committed to excellence in everything we do, and we strive to continually
improve. We are passionate about achieving results that exceed expectations – our own
and those of others. We drive for results with energy and a sense of urgency (The
Chevron Way, n.d.)..
175
Conoco Phillips
A. Vision
Our vision is to be the E&P company of choice for all stakeholders by pioneering a new
standard of excellence (Vision & Values, n.d.)..
B. Mission – Not stated
C. Values
People
Our people are our most important asset and the key to our success. That’s why we
respect one another, and consistently demonstrate honesty and commitment in our
words and actions. We believe in creating an environment of trust, and giving people
access to learning opportunities and challenging work assignments, so they can realize
their true potential as individuals and contribute to the company’s progress (People,
n.d.)..
Integrity
We aim to be the preferred and trusted partner of choice for our stakeholders and to
operate in an ethical and trustworthy manner. By demonstrating visible and active
leadership in communities where we operate, ConocoPhillips creates and maintains
inclusive, honest, and mutually-beneficial relationships with those who are impacted by
our business or who have the ability to impact our business. Our goal is to create and
maintain long-term relationships (Integrity, n.d.)..
Responsibility
We are accountable for our actions. As a good neighbor and civic partner we strive to
make a positive impact in communities where we operate through charitable efforts and
volunteer commitments. We are committed to conducting our business in a manner that
promotes a healthy environment while thoughtfully preparing for the future by pursuing
lower carbon energy sources. We adhere to robust operating standards and procedures
and have a proven track record of responsible operations. We use technological
advances to minimize our environmental footprint; resource development, safety and
environmental stewardship can and must be achieved together (Responsibility, n.d.)..
.
Innovation
176
We have an uncommon ability to unlock the potential in our people, technologies, and
the world’s energy resources. Developing and applying innovative technology is a key
component of our future success and social license to operate. As an independent
company we focus on applying the most leveraging technologies where they can create
the most value, anticipating change and responding with creative solutions. We are
agile and responsive to the changing needs of stakeholders and embrace learning
opportunities from our experience around the world (Innovation, n.d.)..
Teamwork
We work together, building strong partnerships and relationships with our colleagues, as well as all people impacted by or interested in our activities. We believe in proactively seeking out different perspectives, breaking down silos and communicating the “why” behind the decisions we make, and looking beyond the events of today to help our company succeed in the future (Teamwork, n.d.).
177
Cummins
A. Vision Our Vision Making people's lives better by unleashing the Power of Cummins.
B. Mission
Our Mission
Motivating people to act like owners working together.
Exceeding customer expectations by always being first to market with the best products.
Partnering with our customers to make sure that they succeed.
Demanding that everything we do leads to a cleaner, healthier, safer environment.
Creating wealth for all stakeholders.
C. Values
Our Values
Integrity. Strive to do what is right and do what we say we will do.
Innovation. Apply the creative ingenuity necessary to make us better, faster, first.
Delivering Superior Results. Exceed expectations, consistently.
Corporate Responsibility. Serve and improve the communities in which we live.
Diversity. Embrace the diverse perspectives of all people and honor with both dignity
and respect.
Global Involvement. Seek a world view and act without boundaries (Cummins, n.d.).

178
Dana
A. Vision
Dana’s vision is to be the global technology leader in efficient power conveyance and
energy management solutions that enable our customers to achieve their sustainability
objectives (Dana, n.d.).
B. Mission – not stated
C. Values – not stated
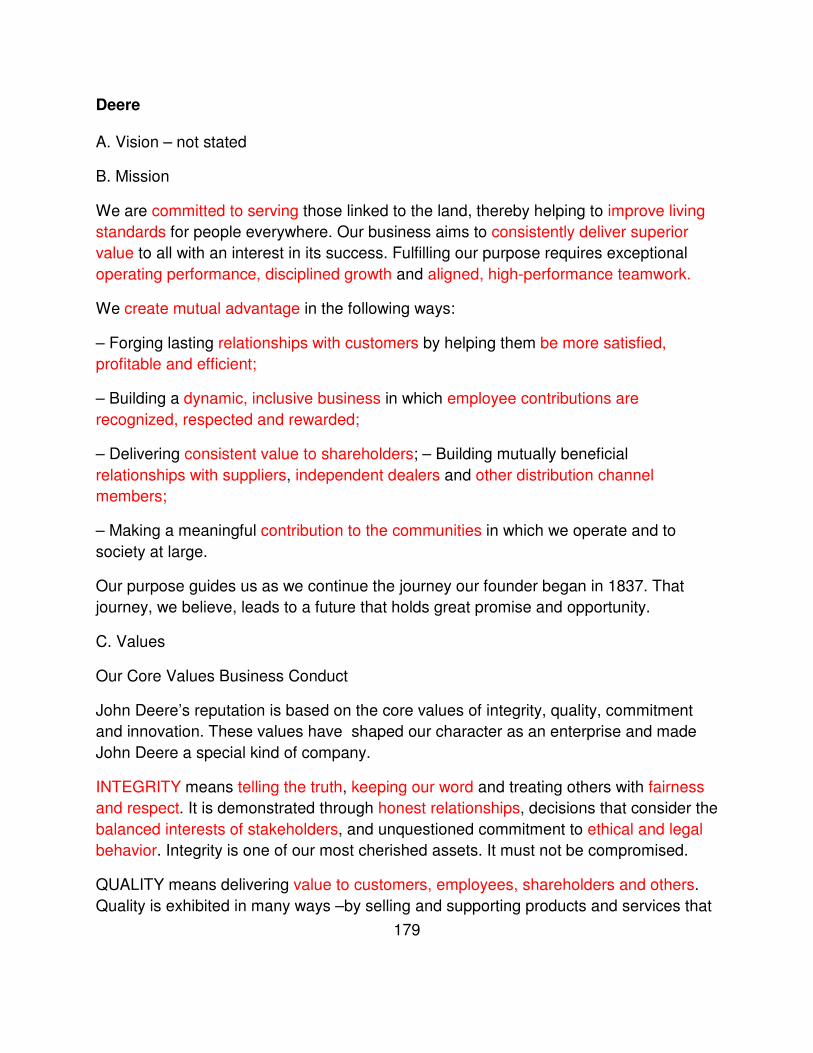
179
Deere
A. Vision – not stated
B. Mission
We are committed to serving those linked to the land, thereby helping to improve living
standards for people everywhere. Our business aims to consistently deliver superior
value to all with an interest in its success. Fulfilling our purpose requires exceptional
operating performance, disciplined growth and aligned, high-performance teamwork.
We create mutual advantage in the following ways:
– Forging lasting relationships with customers by helping them be more satisfied,
profitable and efficient;
– Building a dynamic, inclusive business in which employee contributions are
recognized, respected and rewarded;
– Delivering consistent value to shareholders; – Building mutually beneficial
relationships with suppliers, independent dealers and other distribution channel
members;
– Making a meaningful contribution to the communities in which we operate and to
society at large.
Our purpose guides us as we continue the journey our founder began in 1837. That
journey, we believe, leads to a future that holds great promise and opportunity.
C. Values
Our Core Values Business Conduct
John Deere’s reputation is based on the core values of integrity, quality, commitment
and innovation. These values have shaped our character as an enterprise and made
John Deere a special kind of company.
INTEGRITY means telling the truth, keeping our word and treating others with fairness
and respect. It is demonstrated through honest relationships, decisions that consider the
balanced interests of stakeholders, and unquestioned commitment to ethical and legal
behavior. Integrity is one of our most cherished assets. It must not be compromised.
QUALITY means delivering value to customers, employees, shareholders and others.
Quality is exhibited in many ways –by selling and supporting products and services that
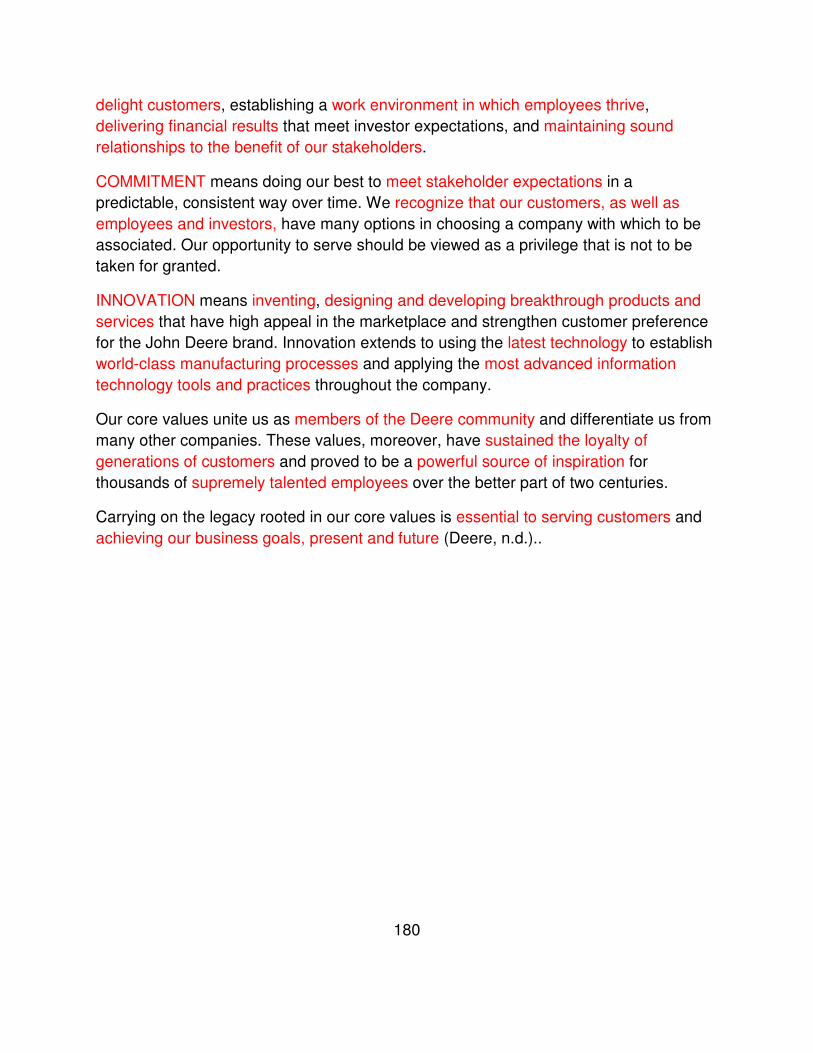
180
delight customers, establishing a work environment in which employees thrive,
delivering financial results that meet investor expectations, and maintaining sound
relationships to the benefit of our stakeholders.
COMMITMENT means doing our best to meet stakeholder expectations in a
predictable, consistent way over time. We recognize that our customers, as well as
employees and investors, have many options in choosing a company with which to be
associated. Our opportunity to serve should be viewed as a privilege that is not to be
taken for granted.
INNOVATION means inventing, designing and developing breakthrough products and
services that have high appeal in the marketplace and strengthen customer preference
for the John Deere brand. Innovation extends to using the latest technology to establish
world-class manufacturing processes and applying the most advanced information
technology tools and practices throughout the company.
Our core values unite us as members of the Deere community and differentiate us from
many other companies. These values, moreover, have sustained the loyalty of
generations of customers and proved to be a powerful source of inspiration for
thousands of supremely talented employees over the better part of two centuries.
Carrying on the legacy rooted in our core values is essential to serving customers and
achieving our business goals, present and future (Deere, n.d.)..
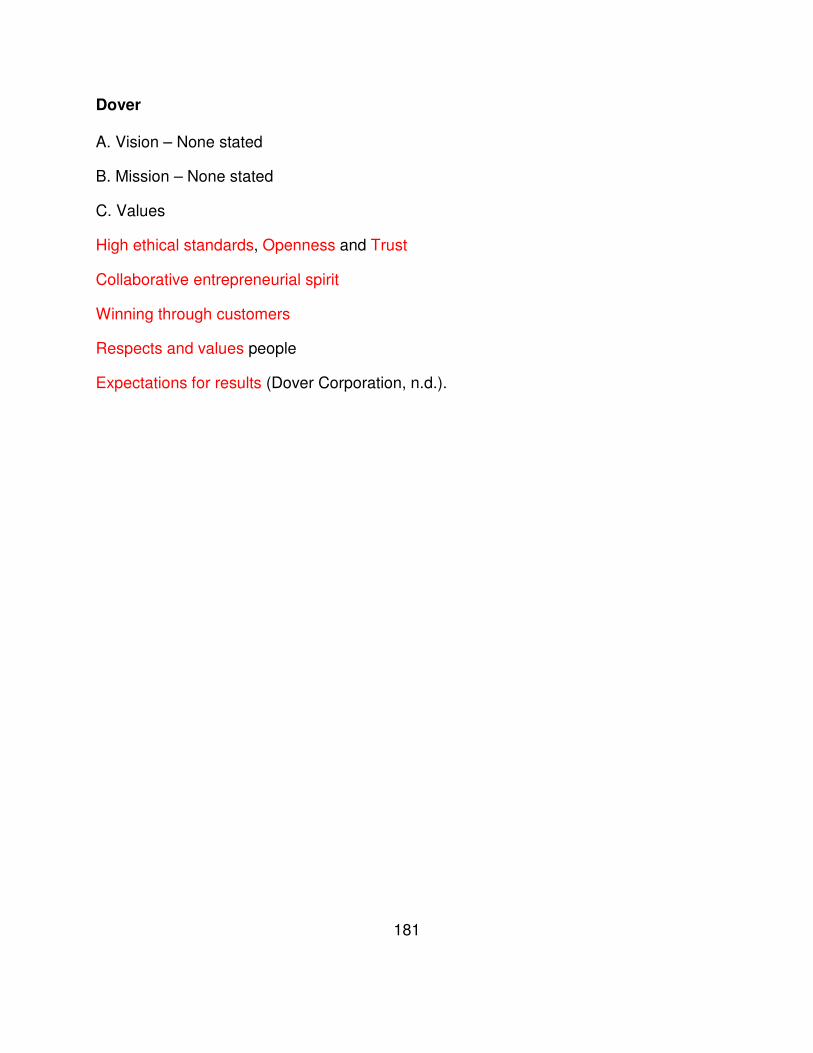
181
Dover
A. Vision – None stated
B. Mission – None stated
C. Values
High ethical standards, Openness and Trust
Collaborative entrepreneurial spirit
Winning through customers
Respects and values people
Expectations for results (Dover Corporation, n.d.).
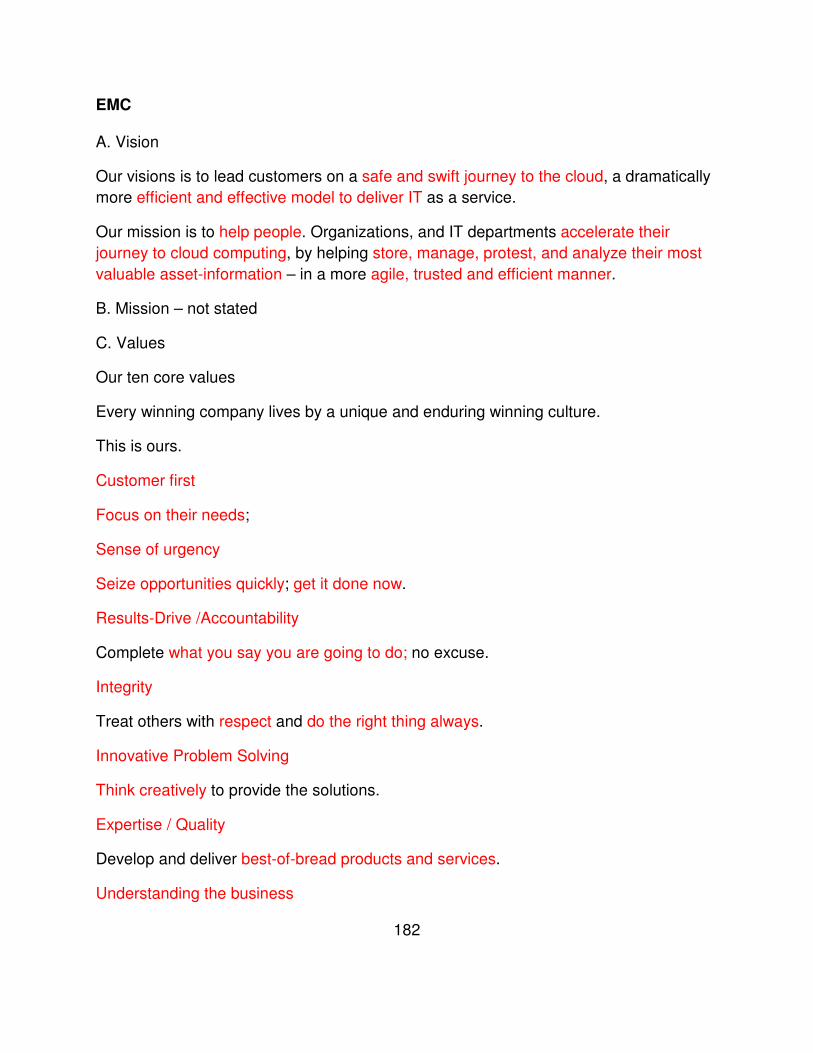
182
EMC
A. Vision
Our visions is to lead customers on a safe and swift journey to the cloud, a dramatically
more efficient and effective model to deliver IT as a service.
Our mission is to help people. Organizations, and IT departments accelerate their
journey to cloud computing, by helping store, manage, protest, and analyze their most
valuable asset-information – in a more agile, trusted and efficient manner.
B. Mission – not stated
C. Values
Our ten core values
Every winning company lives by a unique and enduring winning culture.
This is ours.
Customer first
Focus on their needs;
Sense of urgency
Seize opportunities quickly; get it done now.
Results-Drive /Accountability
Complete what you say you are going to do; no excuse.
Integrity
Treat others with respect and do the right thing always.
Innovative Problem Solving
Think creatively to provide the solutions.
Expertise / Quality
Develop and deliver best-of-bread products and services.
Understanding the business

183
Know how we provide real value to our customers.
Teamwork
Collaborate smoothly with others; leverage our diversity.
Communication
Maintain open, honest interactions; build relationships on trust.
Adaptability
Stay flexible; adapt as circumstances change (EMC, n.d.).

184
Exxon
A. Vision – not stated
B. Mission – not stated
C. Values
Our guiding principles
Exxon Mobil Corporation is committed to being the world's premier petroleum and
petrochemical company. To that end, we must continuously achieve superior financial
and operating results while simultaneously adhering to high ethical standards.
The following principles guide our relationships with our shareholders, customers,
employees, and communities:
Shareholders
We are committed to enhancing the long-term value of the investment dollars entrusted
to us by our shareholders. By running the business profitably and responsibly, we
expect our shareholders to be rewarded with superior returns. This commitment drives
the management of our Corporation.
Customers
Success depends on our ability to consistently satisfy ever changing customer
preferences. We commit to be innovative and responsive, while offering high quality
products and services at competitive prices.
Employees
The exceptional quality of our workforce provides a valuable competitive edge. To build
on this advantage, we will strive to hire and retain the most qualified people available
and to maximize their opportunities for success through training and development. We
are committed to maintaining a safe work environment enriched by diversity and
characterized by open communication, trust, and fair treatment.
Communities
We commit to be a good corporate citizen in all the places we operate worldwide. We
will maintain high ethical standards, obey all applicable laws, rules, and regulations, and
respect local and national cultures. Above all other objectives, we are dedicated to
running safe and environmentally responsible operations.
Exxon Mobil Corporation aspires to be at the leading edge of competition in every
aspect of our business. That requires the Corporation's resources — financial,
185
operational, technological, and human — to be employed wisely and evaluated
regularly.
While we maintain flexibility to adapt to changing conditions, the nature of our business
requires a focused, long-term approach. We will consistently strive to improve efficiency
and productivity through learning, sharing, and implementing best practices. We will be
disciplined and selective in evaluating the range of capital investment opportunities
available to us. We will seek to develop proprietary technologies that provide a
competitive edge.
We aspire to achieve our goals by flawlessly executing our business plans and by
adhering to these guiding principles and the foundation policies that follow (Learn about
ExxonMobil's guiding principles, n.d.).
186
Ford
Mission and Vision
One Team – People working together as a lean, global enterprise for automotive
leadership, as measured by: Customer, Employees, Dealers, Investor, Suppliers,
Union/Council and Community Satisfaction One Plan
One Plan
Aggressively restructure to operator profitably at the current demand and changing
model mix
Accelerate development for new products our customers want and values
Finance our plan and improve our balance sheet
Work together effectively as one team
One Goal – An exciting viable Ford Delivering profitable growth for all (One Ford
Mission and Vision, n.d.).
C. Values - Not listed

187
General Dynamics
A. Vision – not stated
B. Mission – not stated
C. Values
General Dynamics' ethos - our distinguishing moral nature - is rooted in five values:
Honesty: We tell the truth to ourselves and to others. Honesty breeds transparency.
Trust: We trust each other to do the right thing.
Humanity: We are compassionate and empathetic. We respect the dignity, rights and
autonomy of others.
Alignment: We are united in our commitment to our values.
Value Creation: We create value by doing the right thing for our shareholders, our
customers, our employees and our communities 9 (General Dynamics, n.d.).

188
General Motors
A. Vision
Design, Build and Sell the World's Best Vehicles (About GM, n.d.).
B. Mission – not stated
C. Values
It starts with our core values, especially the values of Integrity, Individual Respect,
Responsibility, Transparency and Accountability (Ethical Business Conduct. (n.d.)..

189
Harley Davidson
A. Vision – Not stated
B. Mission – Not Stated
C. Values – Not stated

190
Hewlett-Packard
A. Vision – not stated
B. Mission – not stated
C. Values
Our shared values
The way we get things done
Trust and respect for individuals
We work together to create a culture of inclusion built on trust, respect and dignity for
all.
Achievement and contribution
We strive for excellence in all we do; each person's contribution is key to our success.
Results through teamwork
We effectively collaborate, always looking for more efficient ways to serve our
customers.
Meaningful innovation
We are the technology company that invents the useful and the significant.
Uncompromising integrity
We are open, honest and direct in our dealings 9 Diversity & Inclusion: Our shared
values | HP® Official Site, n.d.).
191
Holly Frontier
A. Vision – not stated
B. Mission
Our Mission
Our mission is to be the premier U.S. petroleum refining, pipeline and terminal company as measured by superior financial performance and sustainable, profitable growth.
We seek to accomplish this by:
• Operating in a safe, reliable and environmentally responsible manner,
• Efficiently operating our existing assets,
• Offering our customers superior products and services, and
• Growing both organically and through strategic acquisitions.
We strive to outperform our competition through the quality and development of our employees and assets. We endeavor to maintain an inclusive and stimulating work environment that enables each employee to fully contribute to and participate in our Company's success.
C. Values
Our Values
Health & Safety
We put health and safety first. We conduct our business with primary emphasis on the health and safety of our employees, contractors and neighboring communities. We continuously strive to raise the bar, guided by our health and safety performance standards.
Environmental Stewardship
We care about the environment. We are committed to minimizing environmental impacts by reducing wastes, emissions and other releases. We understand that it is a privilege to conduct our business in the communities where we operate.
Corporate Citizenship
We obey the law. We are committed to promoting sustainable social and economic benefits wherever we operate.
192
Honesty & Respect
We tell the truth and respect others. We uphold high standards of business ethics and integrity, enforce strict principles of corporate governance and support transparency in all our operations. One of our greatest assets is our reputation for behaving ethically in the interests of employees, shareholders, customers, business partners and the communities in which we operate and serve.
Continuous Improvement
We continually improve. Innovation and high-performance are our way of life. Our culture creates a fulfilling environment which enables employees to reach their potential. We believe in creating our own destiny and that a constructive attitude toward change is essential (Mission & Values, n.d.).
193
Honeywell
A. Vision & B. Mission
We are a premier provider of solutions and services in Defense and Space. We deliver
on our commitments to ensure our customers are Mission Ready. Together, we are
partners in the relentless pursuit of success (Honeywell, n.d.).
C. Values
Our Twelve Behaviors
Gets Results requires consistently meeting commitments to the business and to others.
Quickly translate business requirements into actions by defining "who does what by
when" to ensure plans are executed.
Makes People Better encourages excellence in peers, subordinates, and/or managers.
Be a positive influence in the development of others.
Champions Change drives continuous improvement and fosters a Six Sigma mindset to
make decisions that are in the best interests of customers, shareowners, and the
organization. It reflects a constant commitment to do things better. Champions Change
ensures the long-term strength of the company regardless of personal impact.
Fosters Teamwork and Diversity defines success in terms of the whole team.
Employees must understand and capitalize on the fact that Honeywell's workforce is
composed of individuals who represent a great diversity of values, opinions,
backgrounds, cultures, and goals. Effective team leaders not only meet the expectations
of their role as leaders, but they also set and meet the expectations for team members.
Global Mindset is viewing the business from all relevant perspectives and seeing the
world in terms of integrated value chains.
Intelligent Risk Taking recognizes that generating greater returns requires taking greater
risks. An intelligent risk taker uses sound business judgment, and has the courage to
take action where outcomes are uncertain but where potential rewards are great.
Business decisions often need to be made based on incomplete information.
Self-Aware/Learner individuals recognize their behaviors and how they affect those
around them. Employees must accurately assess their own strengths and weaknesses
and take action to improve.
194
Effective Communicator means providing timely and concise information to others, and
using clear and thoughtful oral and written communication to influence, negotiate, and
collaborate effectively. Leaders and employees need to appreciate that effective
communication is about listening and being listened to but is not always about agreeing.
Integrative Thinker decides and takes action by applying intuition, experience, and
judgment to the data available. They demonstrate an ability to assimilate various and
conflicting information or opinions into a well-considered decision. They understand the
implications of individual actions or recommendations on other systems, markets,
processes, and functions.
Technical or Functional Excellence means being capable and effective in a particular
area of expertise. Employees must remain aware of advances and current thinking in
their fields and look for ways to apply the latest technologies to their work (Honeywell
Career Center, n.d.).
195
Illinois Tool Works
A. Vision – not stated
B. Mission – not stated
C. Values
CORE VALUES
The company’s values support ITW’s differentiated business model and create a
culture that enables leaders and employees to succeed.
ITW
Integrity – Suppliers and customers who work with ITW know they can expect the same
treatment no matter where they are: honesty, transparency and a company that always
aims to do what’s right.
Respect – ITW respects employee insights at all levels and expects the diverse
workforce to be embraced with respect and dignity and all views to be recognized.
Trust – The company trusts that all ITW colleagues will operate with the highest
professional standards and in the best interests of the company at all times.
Shared Risk – ITW encourages well-reasoned, prudent risk-taking in an environment
where challenges are discussed openly. At ITW, all employees work as a team, sharing
responsibility for the outcomes of individual risks and decisions.
Simplicity – ITW keeps things simple by focusing on the essential core of any business
opportunity, challenge, issue or problem (2013 Corporate Responsibility eReport, n.d.).

196
Intel
A. Vision - not stated
B. Mission
Intel’s Mission
To do a great job for our customers, employees and stockholders by being the
preeminent building block supplier to the worldwide Internet economy (Intel, n.d.).
C. Values
Our Values
At the heart of who we are
Our values define who we are and how we act as employees and as a company. More
than simply words, they are something we live by each day. They speak to everyone
within our diverse workforce.
These are our ideals, the Intel Values.
Customer Orientation
We strive to listen and respond to our customers, suppliers, and stakeholders; clearly
communicate mutual intentions and expectations; deliver innovative and competitive
products and services; make it easy to work with us; and be a vendor of choice.
Discipline
We strive to conduct business with uncompromising integrity and professionalism;
ensure a safe, clean, and injury-free workplace; make and meet commitments; properly
plan, fund, and staff projects; and pay attention to detail.
Quality
We strive to achieve the highest standards of excellence; do the right things right;
continuously learn, develop, and improve; and take pride in our work.
Risk Taking

197
We strive to foster innovation and creative thinking, embrace change and challenge the
status quo, listen to all ideas and viewpoints, learn from our successes and mistakes,
and encourage and reward informed risk taking.
Great Place to Work
We strive to be open and direct, promote a challenging work environment that develops
our diverse workforce, work as a team with respect and trust for each other, win and
have fun, recognize and reward accomplishments, manage performance fairly and
firmly, and be an asset to our communities worldwide.
Results Training
We strive to set challenging and competitive goals, focus on output, assume
responsibility, constructively confront and solve problems, and execute flawlessly (Life
at Intel United States: Our Values, n.d.).

198
Lear
A. Vision
To be consistently recognized by our:
• customers
• employees
• shareholders
• suppliers
• and the communities where we do business as a leader and the Company of first
choice
B. Mission
MISSION STATEMENT
Exceed our customers’ needs and expectations by:
• delivering the highest quality products and services
• providing low-cost and high-value added solutions
• continually improving our operating efficiency
• conducting our business with integrity
Provide our employees, our most valuable resource, with an environment that:
• values each employee’s unique experience, diversity and contribution
• treats all individuals with dignity and respect
• allows everyone to reach their full potential
• encourages inclusion and active participation
• nurtures the ‘can-do’ spirit of the Lear team
Maximize value for our shareholders
Treat our suppliers with respect and foster mutually beneficial relationships

199
Support the communities where we do business and protect the environment (Lear,
n.d.).
C. Values
VALUE STATEMENTS
We will:
• Treat all individuals with dignity and respect,
• Conduct our business ethically, and
• Continually strive for excellence.
We will continually focus on our customers’ needs and expectations.
We will provide our employees, our most important resource, with an environment that:
• Allows individuals to reach their full potential through education and career
opportunities,
• Encourages active participation, and
• Is safe and clean.
We will treat our suppliers with respect and encourage long-term relationships.
We will be good corporate citizens, value the environment and actively participate in our
community.
We will balance resources to maximize shareholders’ return on investment (Value
Statements, n.d.).

200
Lockheed Martin
A. Vision
Lockheed Martin's Vision:
Be the global leader in supporting our customers to strengthen global security, deliver
citizen services and advance scientific discovery (Lockheed Martin, n.d.).
B. Mission – not stated
C. Values
Our Values Statement:
Do What's Right
We are committed to the highest standards of ethical conduct in all that we do. We
believe that honesty and integrity engender trust, which is the cornerstone of our
business. We abide by the laws of the United States and other countries in which we do
business, we strive to be good citizens and we take responsibility for our actions.
Respect Others
We recognize that our success as an enterprise depends on the talent, skills and
expertise of our people and our ability to function as a tightly integrated team. We
appreciate our diversity and believe that respect - for our colleagues, customers,
partners, and all those with whom we interact - is an essential element of all positive
and productive business relationships.
Perform With Excellence
We understand the importance of our missions and the trust our customers place in us.
With this in mind, we strive to excel in every aspect of our business and approach every
challenge with a determination to succeed (Lockheed Martin, n.d.).
201
National Oilwell Varco
A. Vision – not stated
B. Mission – not stated
C. Values
SHARED VALUES
The National Oilwell Varco Shared Values are the basis for establishing a common
culture for NOV.
Our Shared Values are: Integrity, Customer Focus, Enthusiasm, Stakeholder Value
Creation, Performance Driven Results, Teamwork, and Citizenship.
Integrity: We say what we mean, our actions reflect our words, and we honor our
commitments.
Customer Focus: Our customers are our number one priority and we consistently meet
or exceed their expectations.
Enthusiasm: We are passionate about our work and take pride in designing quality into
the products, services and solutions that we provide.
Stakeholder Value Creation: We employ creativity and initiative in the creation of
stakeholder value and are recognized and rewarded for it.
Performance Driven Results: We create our future through our choices and actions
today.
Teamwork: We collaborate with our suppliers, our customers and each other to optimize
the sum of all individual efforts.
Citizenship: We honor the culture and laws of all areas in which we participate and
demonstrate respect for all (National Oilwell Varco, n.d.).
202
Navistar
A. Vision
Our Vision
It takes more than just a mission to succeed. It takes perseverance. It takes courage.
And it takes drive. At Navistar we believe the world is propelled forward by new ideas,
brave inventors and bold thinkers. That's why we're committed to giving our customers
our best every day. We find new ways to help America's workers go that extra mile. We
pioneer technologies that burn cleaner fuel. And we use the latest innovations to protect
our troops, so they ride more safely into conflict - and back home. Pushing our industry
forward is more than just our passion. It's our drive to deliver (Navistar,.n.d.).
B. Mission – not stated
C. Values
Here’s what we value:
• Respect for People
• Customer Focus
• Relentless Pursuit of Quality
• Speed, Simplicity and Agility
• Innovation
• Accountability
• Communication (Navistar - Careers - Culture, n.d.).

203
NCR
A. Vision and B. Mission
Vision Our Mission
Provide our customers with the next generation of productivity gains and customer
experience innovation through our deep knowledge of the changing global consumer
and technology (Our Vision, n.d.).
C. Values
NCR SHARED VALUES
NCR Shared Values form the foundation of our business relationships with each other,
our customers, strategic partners and suppliers. They define a global, consistent
framework for conducting business.
We use NCR Shared
Values to direct our behavior and guide our decisions as we drive to achieve our
business objectives.
INTEGRITY: Highest Standards of Integrity
We must act legally, ethically and with courage, fairness and honesty in all our business
dealings. We must keep our commitments, admit our mistakes and learn from our
experiences. We are accountable for what we achieve and how we achieve it. We know
our reputation is directly affected by the conduct of each and every employee and we
strive to ensure the NCR name remains worthy of trust.
PERFORMANCE: Commitment to Performance Excellence
We commit to high performance in all functions. We must take personal ownership for
the success of our company and work together to continuously improve and achieve
best-in-class performance. We must deliver the highest quality products and services to
our internal and external customers. And we realize that profitable growth is the means
to develop new business solutions for our customers and create opportunities for
employees, as well as reward the trust of our shareowners and the performance of
employees.
CUSTOMER DEDICATION: Passion for Our Customers and Their Success

204
We genuinely care about our customers and are dedicated to serving them well. We
learn their markets, understand their specific goals and objectives, and develop
solutions that deliver business value. We must build teams with each other and with our
customers to maximize our ability to deliver the highest possible value. We must always
respond with a sense of urgency. And we must strive to develop long-term customer
relationships by consistently delivering quality, innovation, and business value that meet
or exceed our customers’ expectations – with no surprises.
INNOVATION: Pursuit of Innovation
We must be in constant pursuit of innovation – both process and technology innovation.
Throughout our history, NCR’s ability to harness the power of new ideas and put them
to work for our customers in the real world has defined our company and fueled our
leadership. From the way we search for new and more effective ways to run our
business to the dynamic new technologies we deliver to our customers, innovation
powers the engine that drives our success now and in the future.
RESPECT & TEAMWORK: Respect for Each Other, Work as a Team
We base our working relationships upon trust and respect and recognize the
contributions of every member of the NCR team. We value the unique qualities, abilities
and perspectives each person brings to a challenge or opportunity, and we also know
that as a team we can achieve together what would remain out of reach for us
individually. And we communicate openly and candidly with each other and extend our
respect and team spirit to customers, partners, suppliers and the communities in which
we live and work (NCR, n.d.).
205
Oshkosh
A. Vision – Not stated
B. Mission
Oshkosh Corporation’s mission is to “partner with customers to deliver superior
solutions that safely and efficiently move people and materials at work, around the
globe and around the clock” (Oshkosh, n.d.).
C. Values
Oshkosh Corporation takes nothing for granted. Like the vehicles we produce, we hold
our organization to the highest standards of performance. That includes the
comprehensive policies and procedures that govern the people of this company and
how we choose to conduct business. Oshkosh Corporation's values are clearly
understood and internalized by all employees. Our five compass points of honesty,
integrity, accountability, respect and citizenship have remained as the foundation of our
business. They are the basis for The Oshkosh Way, our code of ethics, and for our
Corporate Governance Guidelines.
Honesty - We are always true to others. We are truthful in all our endeavors. We are
honest and forthright with everyone. We say what we mean, and do what we say.
Integrity - We are true to ourselves, our own moral principles, and our corporate values.
We do the right thing even when nobody is watching. We make genuine promises, and
our actions to fulfill them are honorable. We stand for what is right.
Accountability - We honor our obligations and keep the commitments we make. We
speak up and report concerns in the workplace without fear of retribution. We seek
clarification and guidance whenever we have questions. We don’t seek to blame, but
seek the truth to be able to improve all that we do.
Respect - We treat others with dignity and fairness. We are polite and courteous to one
another under all circumstances. We appreciate the diversity of our workforce and our
world. We celebrate the uniqueness of each person.
Citizenship - We obey the letter and spirit of all laws of all the countries where we do
business. We do our part to make our communities, and our world, better places to live.
We respect our environment (Oshkosh Corporation, n.d).
Paccar
206
A. Vision – not stated
B. Mission
PACCAR is a global technology leader in the design, manufacture and customer
support of high-quality premium trucks (Get to Know PACCAR, n.d.).
C. Values
Environmental responsibility is one of PACCAR’s core values (Paccar, n.d.).

207
Tenneco
A. Vision
Our Vision...
Pioneering global ideas for cleaner air, and smoother, quieter and safer transportation
(Vision and Values, n.d.).
B. Mission
Tenneco Automotive’s mission is to delight our customers as the number-one
technology-driven, global manufacturer and marketer of value-differentiated ride control,
emission control and elastomer products and systems. We will strengthen our leading
position through a shared-value culture of employee involvement, where an intense
focus on continued improvement delivers shareholder value in everything we do
(Tenneco, n.d.).
C. Values
Our Values...
Accountability - Accepting responsibility.
Health & Safety - Committed to a healthy and safe work environment for all employees.
Innovation - Discovering new solutions using engineering expertise and advanced
technologies.
Integrity - Being honest, fair and never compromising our ethics.
Passion and a Sense of Urgency - A consuming desire to win now.
Perseverance - Resolute and unyielding; the unrelenting pursuit of a goal.
Results Oriented - Taking authority; driving to achieve and meet commitments.
Teamwork - Seamless collaboration.
Transparency - Raising issues; being forthcoming and open.
Trust - Relying on and having faith in one another (Vision and Values, n.d.).

208
Terex
A. Vision
Our Vision
• Customer - to be the most customer responsive company in the industry as
determined by our customers
• Financial - to be the most profitable company in the industry as measured by ROIC
• Team Member - to be the best place to work in the industry as determined by our team
members
B. Mission
Our Mission
To provide solutions to our Machinery and Industrial Product customers that yield
superior productivity and return on investment (Purpose, Mission & Values, n.d.).
C. Values
Our Values - The Terex Way
Integrity: We never sacrifice integrity for profit. We are transparent in all our business
dealings. We are accountable to our team members, customers and shareholders for
achieving our goals while protecting our reputation and assets.
Respect: We provide a safe and healthy environment for our team members. We treat
all people with dignity and respect. We value the differences in people’s thinking,
backgrounds and cultures. We are committed to team member development.
Improvement: We continuously search for new and better ways of doing things,
eliminating waste and continually improving. We challenge the status quo and require
stretch goals. We work in teams across boundaries to achieve common goals.
Servant Leadership: We work to serve the needs of our customers, investors and team
members. We nurture a culture of “chain of support” versus “chain of command.” We
ask what we can do to help.
Courage: We have the personal and professional courage to do the right thing and take
risks that may cause us to win as well as to fail periodically. We make decisions and
take action. We don’t admonish failure, only failure to learn.

209
Citizenship: We’re good global, local and national citizens. We’re good stewards of the
environment and the communities where we live. We participate in making the world we
live in a better place (Our Values , n.d).

210
Tesoro
A. Vision
Vision Statement
Every day we create a safer and cleaner future as efficient providers of reliable
transportation fuel solutions. (Menu, n.d.).
B. Mission – not stated
Our Core Values are reflected in the way we run our business, with commitment to
integrity, respect, the environment and safety (Tsocorp, n.d.).

211
Textron
A. Vision
Our senior leaders - from our directors to our corporate officers - share an unrelenting
focus on Textron's vision to become the premier multi-industry company in the world
(Our Leadership, n.d.).
B. Mission – not stated
C. Values
OUR VALUES:
At Textron we are committed to the values of Integrity, respect, trust and pursuit of
excellence in all relationships with customers, employees, business partners, suppliers,
shareholders, the community and the environment (Textron, n.d.).
212
TRW
A. Vision
Achieving our vision to be the global leader in active and passive safety systems is
built on a foundation of trust – trust in our products, our people and their integrity.
B. Mission
TRW's mission is to be the global leader in automotive safety. The company has the
broadest portfolio of active and passive safety systems of any global supplier (TRW,
n.d.).
C. Values – not stated
.
213
United Technologies Corporation
A. Vision and B. Mission
UTC fosters a culture of continuous improvement. We use our ACE operating system to
achieve the highest levels of performance in everything we do, from developing new
products to finding better ways to serve to our customers (Our Operating System, n.d.).
C. Values
Our Commitments define who we are, how we work, our priorities and our values.
PERFORMANCE
Our customers have a choice, and how we perform determines whether they choose us.
We aim high, set ambitious goals and deliver results, and we use customer feedback to
recalibrate when necessary. We move quickly and make timely, well-reasoned
decisions because our future depends on them. We invest authority where it needs to
be, in the hands of the people closest to the customer and the work.
INNOVATION
We are a company of ideas that are nurtured by a commitment to research and
development. The achievements of our founders inspire us to reach always for the next
innovative and powerful and marketable idea. We seek and share ideas openly, and
encourage diversity of experience and opinion.
OPPORTUNITY
Our employees' ideas and inspiration create opportunities constantly, and without limits.
We improve continuously everything we do, as a company and as individuals. We
support and pursue lifelong learning to expand our knowledge and capabilities and to
engage with the world outside UTC. Confidence spurs us to take prudent risks, to
experiment, to cooperate with each other and, always, to learn from the consequences
of our actions.
RESPONSIBILITY
Successful businesses improve the human condition. We maintain the highest ethical,
environmental and safety standards everywhere, and we encourage and celebrate our
employees' active roles in their communities.

214
RESULTS
We are a preferred investment because we meet aggressive targets whatever the
economic environment. We communicate honestly and forthrightly to investors, and
deliver consistently what we promise. We are a company of realists and optimists, and
we project these values in everything we do (Our Commitments, n.d.).
215
Valero
A. Vision
We are committed to our vision to be a world-class competitor in the global energy
business, generating industry-leading returns on investments in an employee-focused,
socially conscious, community-minded, safe, reliable and environmentally responsible
way (Valero, n.d.).
B. Mission – not stated
C. Values
Commitment to Safety
The safety of our employees, operations and immunities is our highest priority.
Commitment to Our Stakeholders
We are committed to delivering long-term value to all stakeholders – our employees,
investors, customers and suppliers – by pursuing profitable, value-enhancing strategies
with a focus on world-class operations.
Commitment to Our Employees
Our employees are our No. 1 asset. We are committed to providing a challenging,
enjoyable and rewarding work environment, which fosters respect, dedication, integrity,
open communication, customer service, generosity and opportunity for individual
professional growth and development.
Commitment to the Environment
We are committed to producing environmentally clean products, while striving to
improve and enhance the environmental quality of our operations within our local
communities.
Commitment to Our Communities
We are committed to taking a leadership role in the communities where we live and
work by providing company support and encouraging employee involvement
(Commitment to Excellence, n.d.).
216
Visteon
A. Vision
We aspire to be the best in the world at partnering with our customer to provide
innovative, high-quality products that deliver exceptional value
B. Mission – not stated
C. Values
We always …
Act with Integrity
Do what is right
Respect Others
Treat others as you would like to be treated
Put Customers First
Make every effort to exceed our customers’ expectations
Deliver on our Commitments
Willingly take responsibility for decisions, actions and results
Work Together and Communicate
Work with others to achieve results
Aggressively Drive Continuous Improvement
Strive for excellence in everything we do (Visteon Corporation, n.d.).

217
Western Digital
A. Vision – not stated
B. Mission – not stated
C. Values
Core Values
WD employees know the values and behaviors that combine to create a culture in which
all of us can thrive. It is a culture that allows us to focus on doing our best work and that
leads to high-quality, innovative products, exceptional customer service and operational
excellence. Our core values are Passion, Action, Productivity, Perseverance, Integrity,
Innovation and Teamwork.. This is what our values mean to us:
Passion
We have a passion for:
• The people we work with
• The products we produce
• The customers we serve
• The suppliers who serve us
Innovation
We constantly look for new ways to improve technology, products, processes, systems
and people.
• We have good judgment about which creative ideas and suggestions will work,
and are good at bringing these ideas to market
• We show intellectual curiosity and the continuing desire to learn, seeking
improvements, even in the face of success
• We take diverse priorities and multiple opportunities, and find new ways of
creating long-term success
• We work hard to support an environment where people look for creative ways to
benefit the business
218
• We take constructive risks and remove barriers getting in the way of achieving
excellence
Action
We have a bias towards action.
• We seize opportunities
• We aggressively push for solutions
• We are problem-solvers
• We enjoy working hard
Productivity
We expect the best from our people, and they deliver.
• We are productive, efficient and effective in planning and executing our work
• We consistently raise the bar to increasingly higher levels of productivity and
performance
• We seek to outperform other companies with our ability to execute
Perseverance
We pursue our work with energy, drive and a need to win.
• We never give up, especially in the face of resistance or overwhelming odds
• We take charge
• We push hard
• We stand strong
Teamwork
Working together, we outperform.
• We support others without being asked
• We first seek to understand before being understood
• We adapt interaction style to work effectively with others

219
• We assess the impact on others before taking action
• We take accountability for team results
• We work to achieve win-win solutions and results with others
• We actively look for ways to build strong working partnerships with other
functions, reducing silos
• We work beyond job scope to support team goals
Integrity
We respect ourselves and others.
• We are open and direct
• We present the unvarnished truth in an appropriate and helpful manner
• We can be counted on to keep confidences and admit our mistakes
• We do not misrepresent ourselves for personal gain (Western Digital, n.d.).
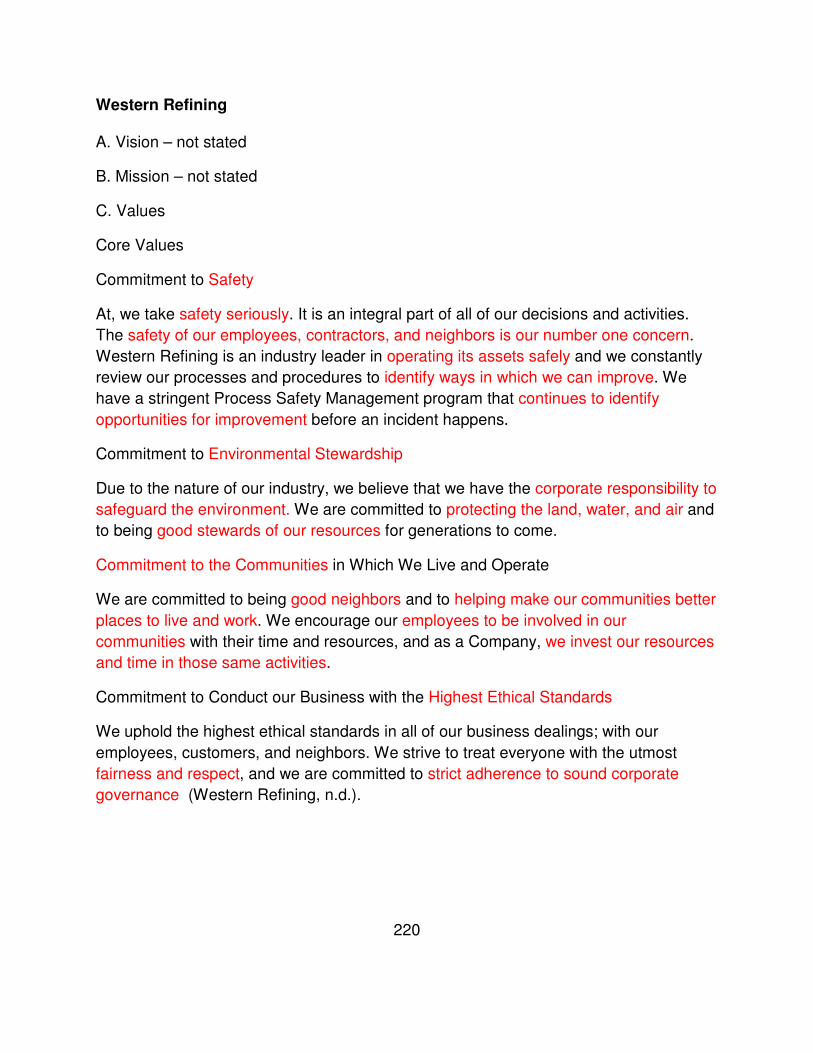
220
Western Refining
A. Vision – not stated
B. Mission – not stated
C. Values
Core Values
Commitment to Safety
At, we take safety seriously. It is an integral part of all of our decisions and activities.
The safety of our employees, contractors, and neighbors is our number one concern.
Western Refining is an industry leader in operating its assets safely and we constantly
review our processes and procedures to identify ways in which we can improve. We
have a stringent Process Safety Management program that continues to identify
opportunities for improvement before an incident happens.
Commitment to Environmental Stewardship
Due to the nature of our industry, we believe that we have the corporate responsibility to
safeguard the environment. We are committed to protecting the land, water, and air and
to being good stewards of our resources for generations to come.
Commitment to the Communities in Which We Live and Operate
We are committed to being good neighbors and to helping make our communities better
places to live and work. We encourage our employees to be involved in our
communities with their time and resources, and as a Company, we invest our resources
and time in those same activities.
Commitment to Conduct our Business with the Highest Ethical Standards
We uphold the highest ethical standards in all of our business dealings; with our
employees, customers, and neighbors. We strive to treat everyone with the utmost
fairness and respect, and we are committed to strict adherence to sound corporate
governance (Western Refining, n.d.).

221
Xerox
A. Vision and B. Mission
Xerox Mission and Vision
Xerox Mission Statement
Through the world's leading technology and services in business process and document
management, we're at the heart of enterprises small to large, giving our clients the
freedom to focus on what matters most: their real business.
C. Values
Core Values
One thing that never changes is our core values.
We succeed through satisfied customers.
We deliver quality and excellence in all we do.
We require premium return on assets.
We use technology to develop market leadership.
We value our employees.
We behave responsibly as a corporate citizen (Xerox at a Glance, n.d.).

222
Appendix E
Content by Variable Code
Customer focus Code
Superior customer service 1
Best possible business partner 1
Creating value for our customers 1
Exceeding customer expectations 1
Partnering with our customers 1
They succeed 1
Relationships with customers 1
Be more satisfied 1
Profitable and efficient 1
Customers superior products and services 1
Great job for our customers 1
Customers’ needs and expectations 1
Partner with customers to deliver superior solutions 1
Customer support 1
Delight our customers 1
Satisfy our customers 1
Customer focus 1
Listening to their needs 1
Exceeding their expectations 1
Expect to be the preferred supplier 1
#1 in customer perceived quality 1
Expect to be recognized by our customers 1
Loyalty of our customers 1
Life 1
Passion for saving lives 1
Customers 1
Satisfaction for our customers 1
Value for the driving public 1
Meet or exceed the standards of excellence 1
Advance our common business objectives 1
Intense, acute focus on our customers 1
Aim to be the preferred and trusted partner of choice 1
Value to customers and others 1
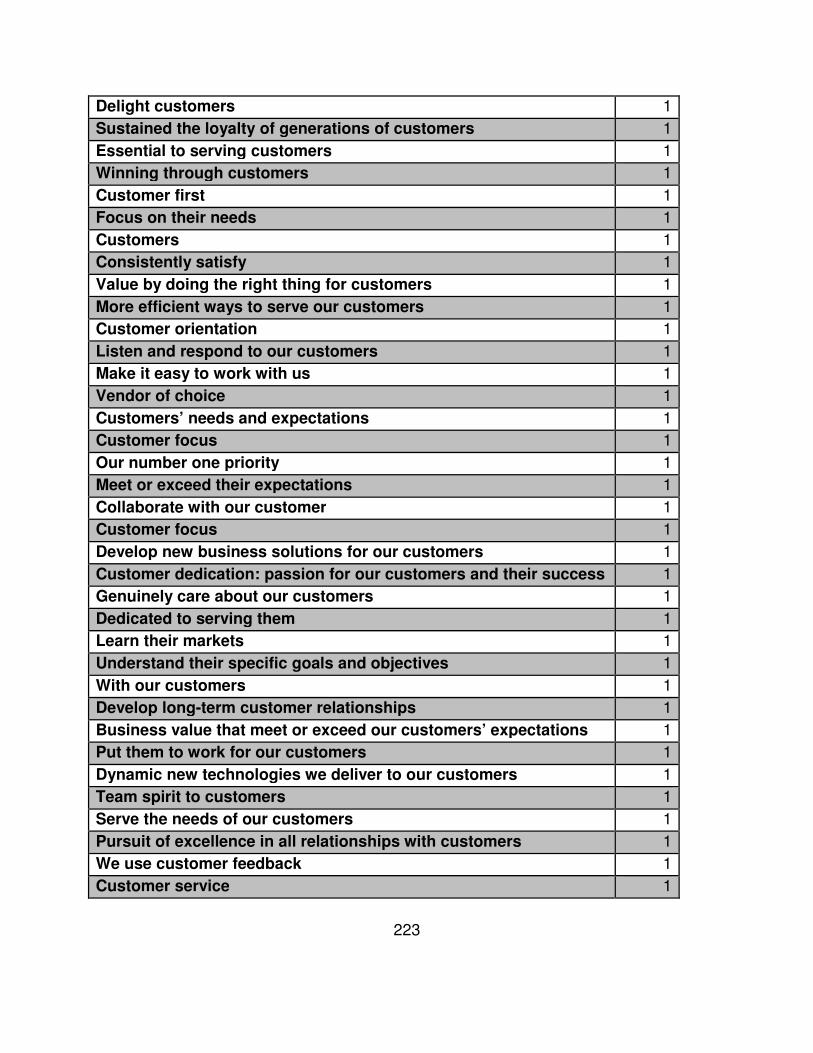
223
Delight customers 1
Sustained the loyalty of generations of customers 1
Essential to serving customers 1
Winning through customers 1
Customer first 1
Focus on their needs 1
Customers 1
Consistently satisfy 1
Value by doing the right thing for customers 1
More efficient ways to serve our customers 1
Customer orientation 1
Listen and respond to our customers 1
Make it easy to work with us 1
Vendor of choice 1
Customers’ needs and expectations 1
Customer focus 1
Our number one priority 1
Meet or exceed their expectations 1
Collaborate with our customer 1
Customer focus 1
Develop new business solutions for our customers 1
Customer dedication: passion for our customers and their success 1
Genuinely care about our customers 1
Dedicated to serving them 1
Learn their markets 1
Understand their specific goals and objectives 1
With our customers 1
Develop long-term customer relationships 1
Business value that meet or exceed our customers’ expectations 1
Put them to work for our customers 1
Dynamic new technologies we deliver to our customers 1
Team spirit to customers 1
Serve the needs of our customers 1
Pursuit of excellence in all relationships with customers 1
We use customer feedback 1
Customer service 1
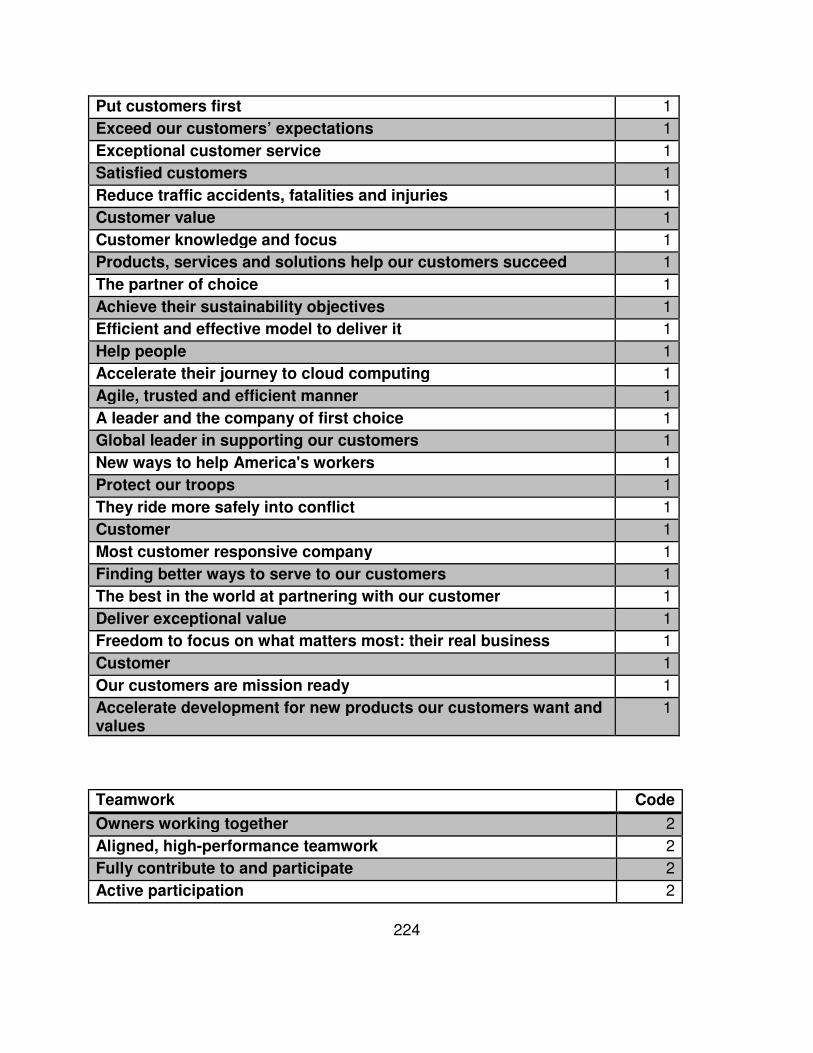
224
Put customers first 1
Exceed our customers’ expectations 1
Exceptional customer service 1
Satisfied customers 1
Reduce traffic accidents, fatalities and injuries 1
Customer value 1
Customer knowledge and focus 1
Products, services and solutions help our customers succeed 1
The partner of choice 1
Achieve their sustainability objectives 1
Efficient and effective model to deliver it 1
Help people 1
Accelerate their journey to cloud computing 1
Agile, trusted and efficient manner 1
A leader and the company of first choice 1
Global leader in supporting our customers 1
New ways to help America's workers 1
Protect our troops 1
They ride more safely into conflict 1
Customer 1
Most customer responsive company 1
Finding better ways to serve to our customers 1
The best in the world at partnering with our customer 1
Deliver exceptional value 1
Freedom to focus on what matters most: their real business 1
Customer 1
Our customers are mission ready 1
Accelerate development for new products our customers want and values
1
Teamwork Code
Owners working together 2
Aligned, high-performance teamwork 2
Fully contribute to and participate 2
Active participation 2
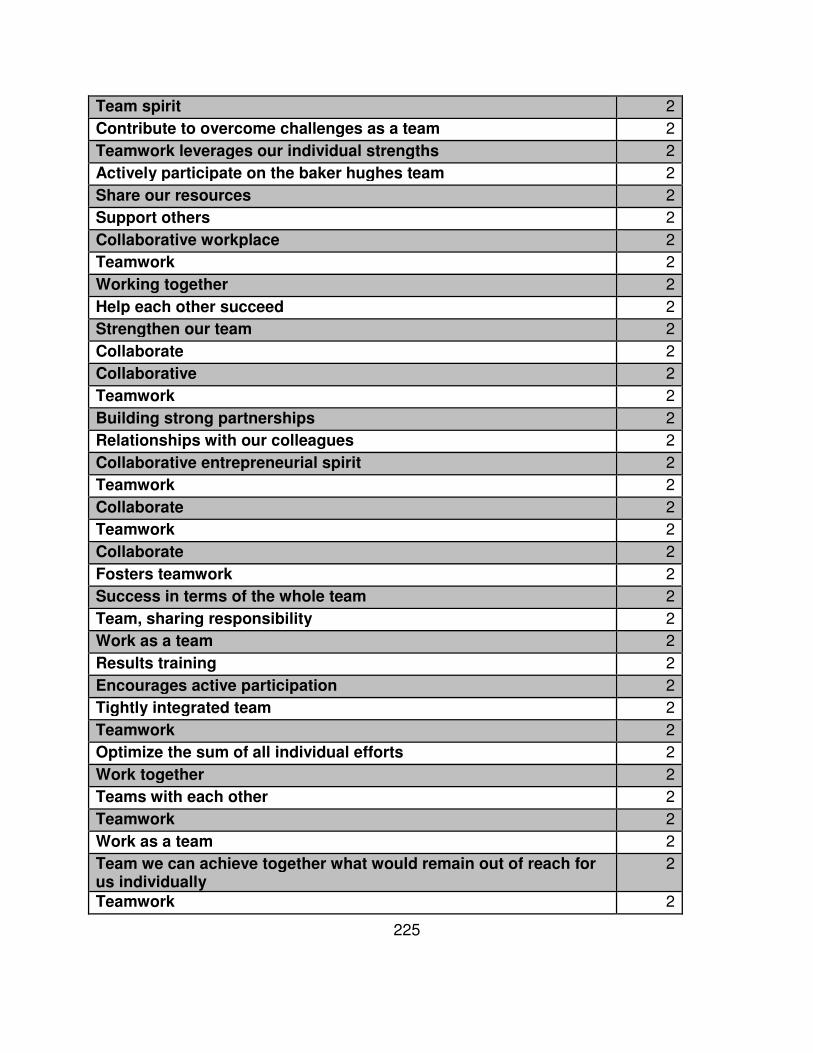
225
Team spirit 2
Contribute to overcome challenges as a team 2
Teamwork leverages our individual strengths 2
Actively participate on the baker hughes team 2
Share our resources 2
Support others 2
Collaborative workplace 2
Teamwork 2
Working together 2
Help each other succeed 2
Strengthen our team 2
Collaborate 2
Collaborative 2
Teamwork 2
Building strong partnerships 2
Relationships with our colleagues 2
Collaborative entrepreneurial spirit 2
Teamwork 2
Collaborate 2
Teamwork 2
Collaborate 2
Fosters teamwork 2
Success in terms of the whole team 2
Team, sharing responsibility 2
Work as a team 2
Results training 2
Encourages active participation 2
Tightly integrated team 2
Teamwork 2
Optimize the sum of all individual efforts 2
Work together 2
Teams with each other 2
Teamwork 2
Work as a team 2
Team we can achieve together what would remain out of reach for us individually
2
Teamwork 2
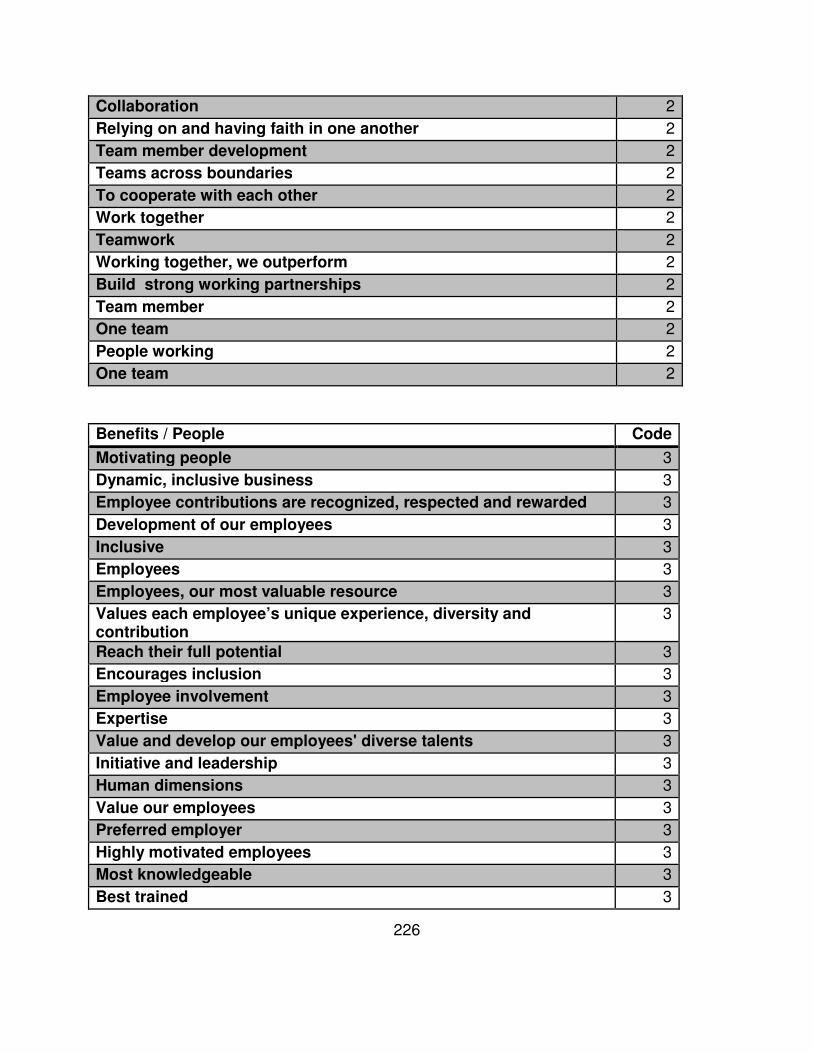
226
Collaboration 2
Relying on and having faith in one another 2
Team member development 2
Teams across boundaries 2
To cooperate with each other 2
Work together 2
Teamwork 2
Working together, we outperform 2
Build strong working partnerships 2
Team member 2
One team 2
People working 2
One team 2
Benefits / People Code
Motivating people 3
Dynamic, inclusive business 3
Employee contributions are recognized, respected and rewarded 3
Development of our employees 3
Inclusive 3
Employees 3
Employees, our most valuable resource 3
Values each employee’s unique experience, diversity and contribution
3
Reach their full potential 3
Encourages inclusion 3
Employee involvement 3
Expertise 3
Value and develop our employees' diverse talents 3
Initiative and leadership 3
Human dimensions 3
Value our employees 3
Preferred employer 3
Highly motivated employees 3
Most knowledgeable 3
Best trained 3
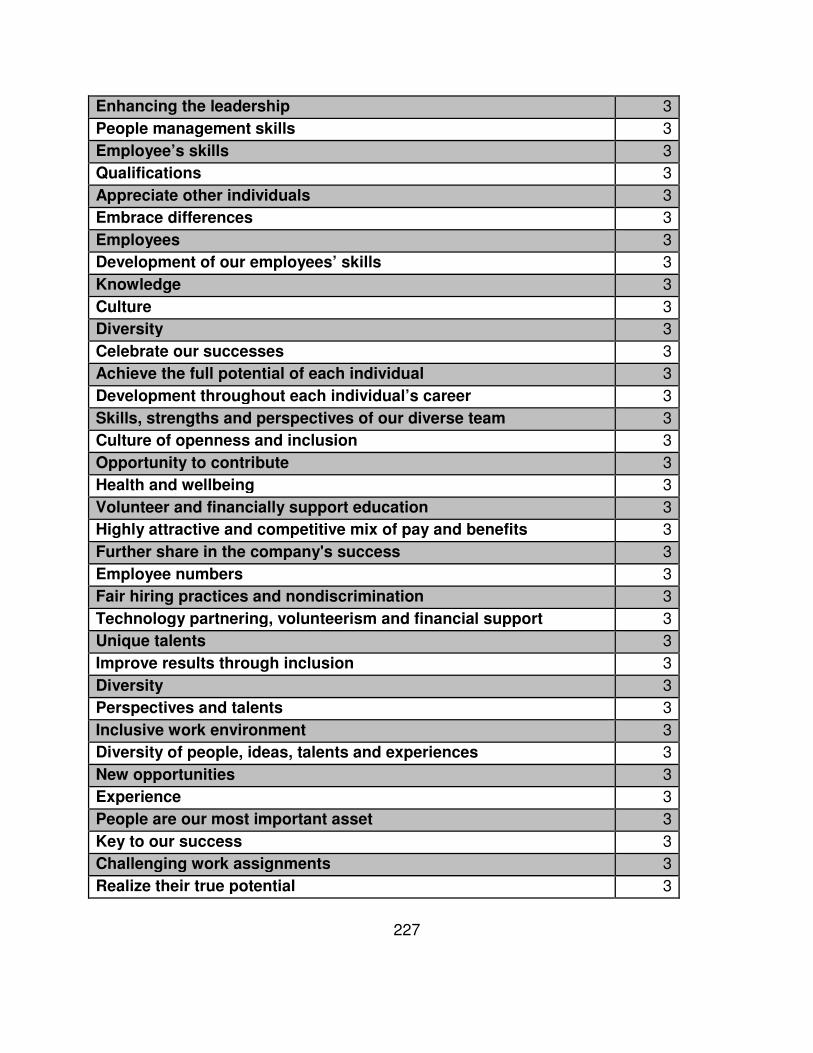
227
Enhancing the leadership 3
People management skills 3
Employee’s skills 3
Qualifications 3
Appreciate other individuals 3
Embrace differences 3
Employees 3
Development of our employees’ skills 3
Knowledge 3
Culture 3
Diversity 3
Celebrate our successes 3
Achieve the full potential of each individual 3
Development throughout each individual’s career 3
Skills, strengths and perspectives of our diverse team 3
Culture of openness and inclusion 3
Opportunity to contribute 3
Health and wellbeing 3
Volunteer and financially support education 3
Highly attractive and competitive mix of pay and benefits 3
Further share in the company's success 3
Employee numbers 3
Fair hiring practices and nondiscrimination 3
Technology partnering, volunteerism and financial support 3
Unique talents 3
Improve results through inclusion 3
Diversity 3
Perspectives and talents 3
Inclusive work environment 3
Diversity of people, ideas, talents and experiences 3
New opportunities 3
Experience 3
People are our most important asset 3
Key to our success 3
Challenging work assignments 3
Realize their true potential 3
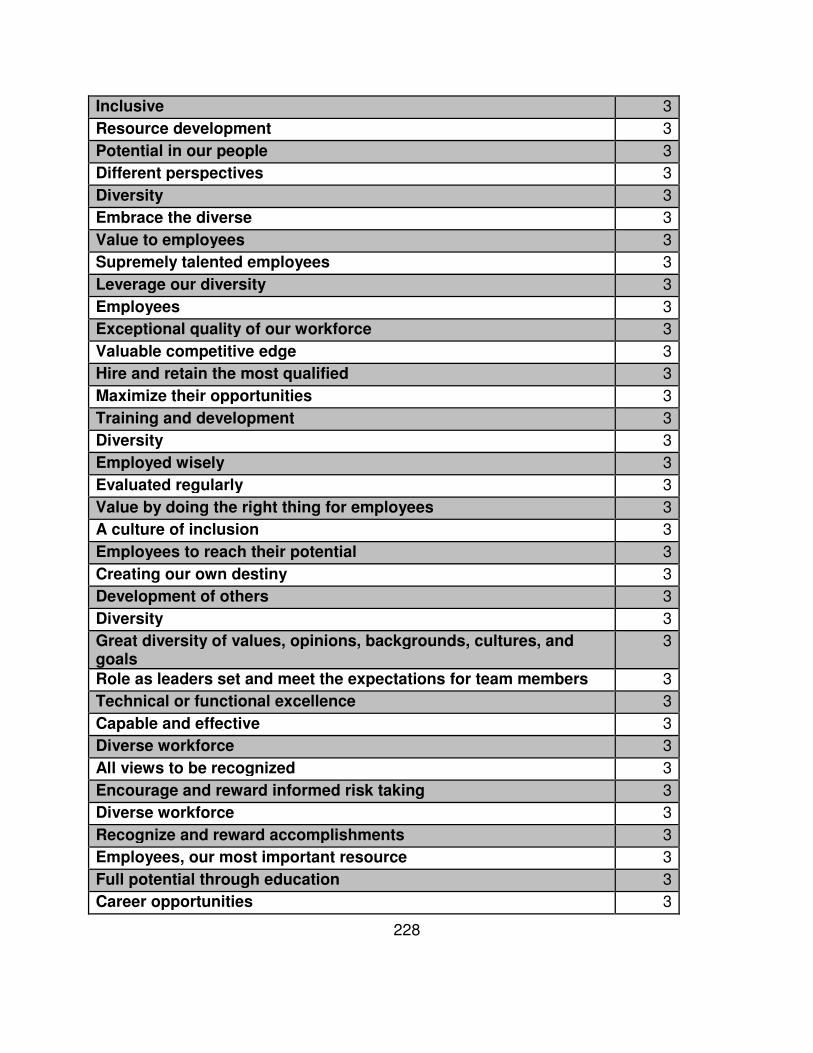
228
Inclusive 3
Resource development 3
Potential in our people 3
Different perspectives 3
Diversity 3
Embrace the diverse 3
Value to employees 3
Supremely talented employees 3
Leverage our diversity 3
Employees 3
Exceptional quality of our workforce 3
Valuable competitive edge 3
Hire and retain the most qualified 3
Maximize their opportunities 3
Training and development 3
Diversity 3
Employed wisely 3
Evaluated regularly 3
Value by doing the right thing for employees 3
A culture of inclusion 3
Employees to reach their potential 3
Creating our own destiny 3
Development of others 3
Diversity 3
Great diversity of values, opinions, backgrounds, cultures, and goals
3
Role as leaders set and meet the expectations for team members 3
Technical or functional excellence 3
Capable and effective 3
Diverse workforce 3
All views to be recognized 3
Encourage and reward informed risk taking 3
Diverse workforce 3
Recognize and reward accomplishments 3
Employees, our most important resource 3
Full potential through education 3
Career opportunities 3

229
Talent, skills and expertise of our people 3
Diversity 3
Recognized and rewarded 3
Create opportunities for employees 3
Performance of employees 3
Recognize the contributions of every member 3
Unique qualities, abilities and perspectives each person 3
Diversity of our workforce 3
Celebrate the uniqueness 3
Value the differences in people’s thinking, backgrounds and cultures
3
Servant leadership 3
Serve the needs of our team members 3
Pursuit of excellence in all relationships with employee 3
Encourage diversity 3
Opportunity 3
Employees' ideas and inspiration create opportunities 3
Knowledge and capabilities 3
Encourage and celebrate our employees' active roles in their communities
3
Commitment to our employees 3
Employees are our no. 1 asset 3
Generosity 3
Opportunity for individual professional growth and development 3
Leadership role in the communities 3
Providing company support and encouraging employee involvement
3
Employees to be involved in our communities 3
We invest our resources and time in those same activities 3
Value our employees 3
Technical and functional excellence 3
People are talented 3
Superior capabilities commitment 3
Trust in our people 3
Employee-focused 3
Employees 3

230
Results/ Goals/ Performance/ Achievements Code
First to market 4
Achieve corporate goals 4
Committed to common goals 4
Performance excellence will drive the results 4
Any metric 4
Measurable differences 4
Ambitious goals 4
Committed to caterpillar’s success 4
High performance 4
Achieving results 4
Drive for results with energy 4
Delivering superior results 4
Delivering financial results 4
Achieving our business goals, present and future 4
Expectations for results 4
Results-drive 4
Operating results 4
High-performance 4
Gets results 4
Quickly translate business requirements 4
Properly plan, fund, and staff projects 4
Balance resources 4
Performance driven results 4
Commit to high performance 4
Achieve best-in-class performance 4
Highest standards of performance 4
Unrelenting pursuit of a goal 4
Results oriented 4
Achieving our goals 4
Require stretch goals 4
Performance 4
Set ambitious goals 4
Deliver results 4
Results 4
Achieve results 4
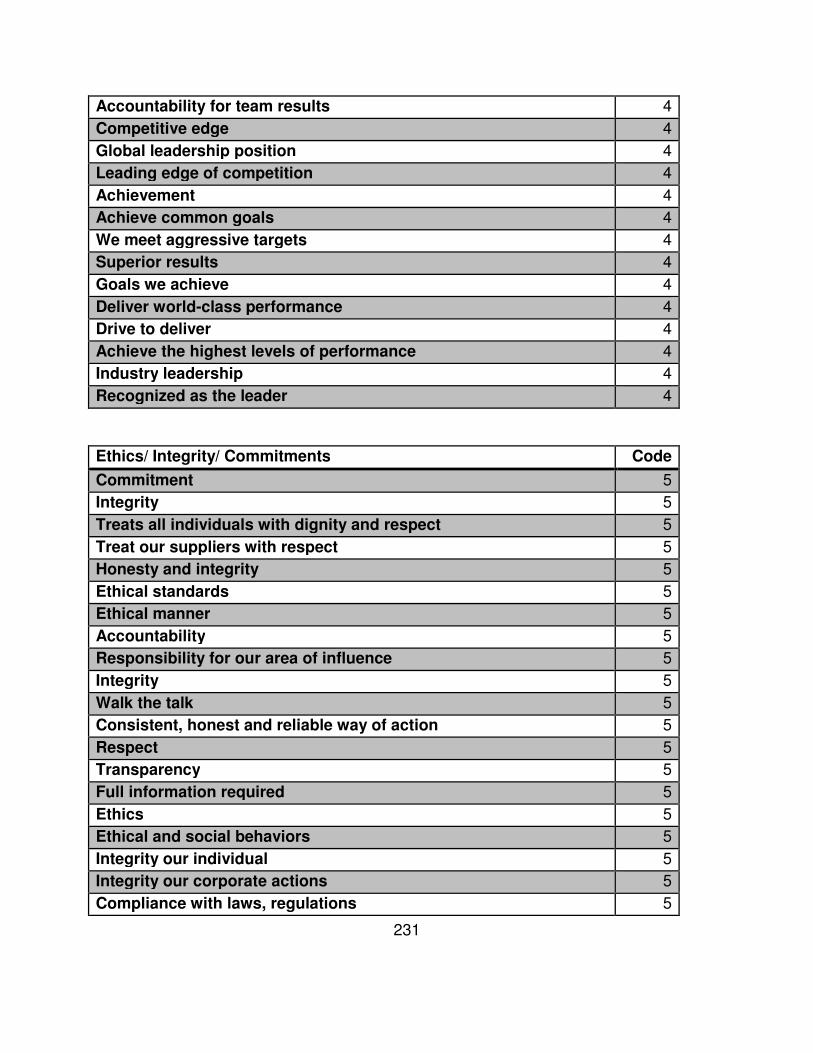
231
Accountability for team results 4
Competitive edge 4
Global leadership position 4
Leading edge of competition 4
Achievement 4
Achieve common goals 4
We meet aggressive targets 4
Superior results 4
Goals we achieve 4
Deliver world-class performance 4
Drive to deliver 4
Achieve the highest levels of performance 4
Industry leadership 4
Recognized as the leader 4
Ethics/ Integrity/ Commitments Code
Commitment 5
Integrity 5
Treats all individuals with dignity and respect 5
Treat our suppliers with respect 5
Honesty and integrity 5
Ethical standards 5
Ethical manner 5
Accountability 5
Responsibility for our area of influence 5
Integrity 5
Walk the talk 5
Consistent, honest and reliable way of action 5
Respect 5
Transparency 5
Full information required 5
Ethics 5
Ethical and social behaviors 5
Integrity our individual 5
Integrity our corporate actions 5
Compliance with laws, regulations 5
232
Honest, trustworthy, respectful, and ethical 5
Honor our commitments 5
Accountable for our actions 5
Stand for what is right 5
Highest ethical standards 5
Honoring our commitments 5
Responsibility for our own actions 5
Integrity, consistency, and honesty 5
Treated fairly 5
With integrity 5
Ethical environment 5
Conduct business lawfully 5
Ethically with our suppliers 5
Integrity 5
Honesty 5
Deliver what we promise 5
Trustworthy 5
Fairly 5
Not improperly influence others 5
Commitment 5
Responsibility 5
Accountable to meet our goals 5
Ethical manner 5
Respect the law 5
Integrity 5
Honest 5
The highest ethical standards 5
What we say we will do 5
Accept responsibility 5
Accountable 5
Trust 5
Respect and support 5
Respect the cultures 5
Respect for the uniqueness 5
Respect one another 5
Honesty 5
233
Commitment in our words and actions 5
Trust 5
Integrity 5
Ethical 5
Trustworthy 5
Honest 5
Responsibility 5
Accountable 5
Responsible operations 5
Integrity 5
Do what is right 5
Do what we say we will do 5
Honor with both dignity and respect 5
Integrity 5
Telling the truth 5
Keeping our word 5
Fairness and respect 5
Honest relationships 5
Ethical and legal behavior 5
Commitment 5
High ethical standards 5
Trust 5
Respects and values 5
Accountability 5
What you say you are going to do 5
Integrity 5
Respect 5
Do the right thing always 5
Honest interactions 5
Build relationships on trust 5
Adhering to high ethical standards 5
Responsibly 5
Trust 5
Fair treatment 5
High ethical standards 5
Obey all applicable laws, rules, and regulations 5
234
Respect local and national cultures 5
Honesty 5
We tell the truth 5
Honesty breeds transparency 5
Trust 5
To do the right thing 5
Respect the dignity, rights and autonomy of others 5
Commitment to our values 5
Integrity 5
Individual respect 5
Responsibility 5
Transparency and accountability 5
Trust and respect 5
Trust, respect and dignity 5
Uncompromising integrity 5
Obey the law 5
Honesty & respect 5
Truth and respect 5
Ethics and integrity 5
Support transparency 5
Reputation for behaving ethically 5
Consistently meeting commitments 5
Positive influence 5
Implications of individual actions 5
Integrity 5
Honesty 5
Transparency 5
Aims to do what’s right 5
Respect 5
Respects employee insights 5
Respect and dignity 5
Trust 5
Highest professional standards 5
Uncompromising integrity and professionalism 5
Make and meet commitments 5
Do the right things right 5
235
Take pride in our work 5
Respect and trust 5
Manage performance fairly and firmly 5
Assume responsibility 5
Treat all individuals with dignity and respect 5
Business ethically 5
Suppliers with respect 5
Do what's right 5
Highest standards of ethical conduct 5
Honesty and integrity engender trust 5
Abide by the laws 5
Take responsibility for our actions 5
Respect others 5
Respect 5
Integrity 5
Say what we mean 5
Actions reflect our words 5
Honor our commitments 5
Honor the culture and laws 5
Respect for all 5
Respect for people 5
Accountability 5
Integrity 5
Highest standards of integrity 5
Act legally 5
Ethically 5
Fairness 5
Honesty 5
Keep our commitments 5
Admit our mistakes and learn from our experiences 5
Accountable 5
Worthy of trust 5
Personal ownership 5
Reward the trust of our shareowners 5
No surprises 5
Respect 5
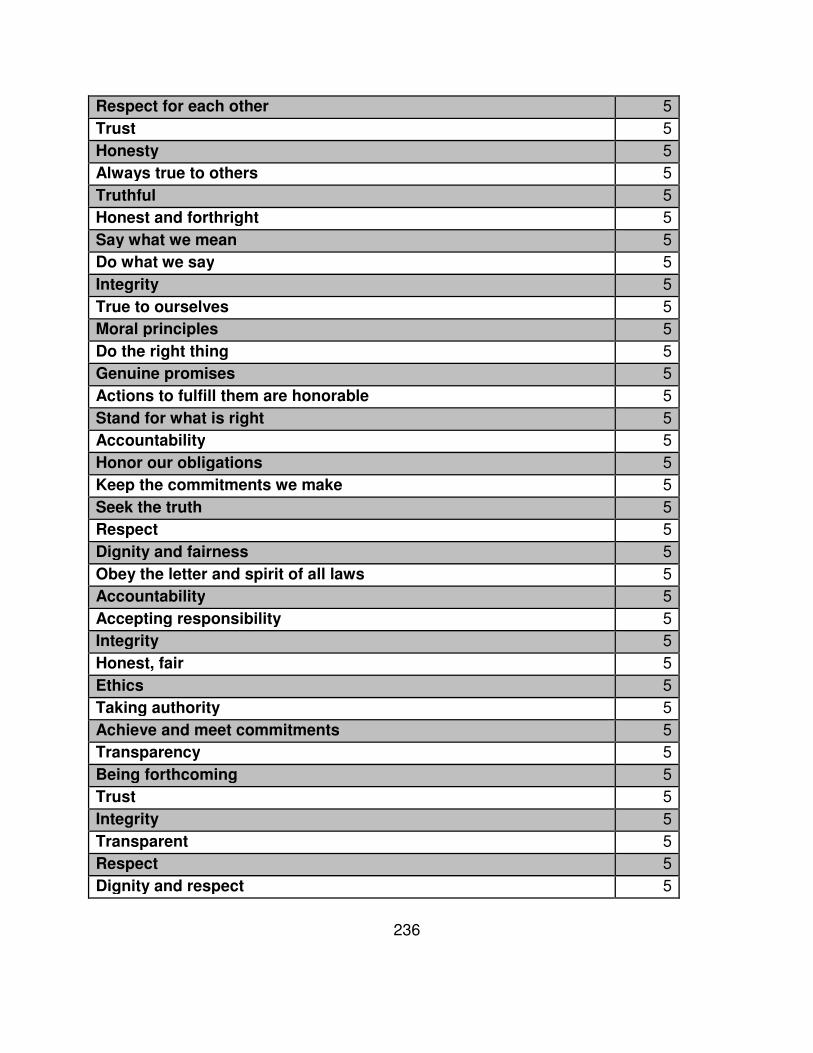
236
Respect for each other 5
Trust 5
Honesty 5
Always true to others 5
Truthful 5
Honest and forthright 5
Say what we mean 5
Do what we say 5
Integrity 5
True to ourselves 5
Moral principles 5
Do the right thing 5
Genuine promises 5
Actions to fulfill them are honorable 5
Stand for what is right 5
Accountability 5
Honor our obligations 5
Keep the commitments we make 5
Seek the truth 5
Respect 5
Dignity and fairness 5
Obey the letter and spirit of all laws 5
Accountability 5
Accepting responsibility 5
Integrity 5
Honest, fair 5
Ethics 5
Taking authority 5
Achieve and meet commitments 5
Transparency 5
Being forthcoming 5
Trust 5
Integrity 5
Transparent 5
Respect 5
Dignity and respect 5

237
Do the right thing 5
Integrity 5
Respect 5
Integrity 5
Respect 5
Trust 5
Responsibility 5
Highest ethical 5
Deliver consistently what we promise 5
Respect 5
Integrity 5
Act with integrity 5
Do what is right 5
Respect others 5
Treat others as you would like to be treated 5
Deliver on our commitments 5
Willingly take responsibility for decisions, actions and results 5
Integrity 5
Respect ourselves and others 5
Present the unvarnished truth 5
Keep confidences 5
Admit our mistakes 5
Do not misrepresent ourselves 5
Highest ethical standards 5
Fairness and respect 5
Strict adherence to sound corporate governance 5
Respecting the ability of future generations 5
How we achieve them 5
Trust 5
Their integrity 5
External Focus/ Shareholders Code
Best possible social partner 6
Improving the lives 6
Leads to a cleaner, healthier, safer environment 6
Committed to serving 6

238
Improve living standards 6
Create mutual advantage 6
Relationships 6
Contribution to the communities 6
Environmentally responsible manner 6
Stockholders 6
Preeminent building block supplier 6
Foster mutually beneficial relationships 6
Support the communities 6
Protect the environment 6
Safely and efficiently move people and materials at work 6
Social and physical environment 6
Dealer focus 6
Act as a good corporate citizen 6
Care about the natural environment 6
Protect the environment 6
Conserve natural resources 6
Promote environmental awareness 6
Identification of our dealers 6
Superior return to its shareholders 6
Global thinking 6
Local actions 6
Corporate citizen 6
Protection of the environment 6
Value human life and health 6
Responsible partner, neighbor and citizen 6
Protect the environment 6
Other worthy causes 6
Strengthen communities 6
Economic impact on the communities 6
Expanding globally 6
Invest locally 6
To build our communities 6
Actively and globally involved 6
Nothing gets harmed 6
To preserve our environment 6

239
Eco-awareness 6
Sustainability 6
Contribute time and resources to promote the common good in our communities
6
Socially responsible 6
Support universal human rights 6
Protect the environment 6
Benefit the communities 6
Partnership 6
Unwavering commitment to being a good partner 6
Trusting and beneficial relationships 6
The environment 6
Active leadership in communities 6
Mutually-beneficial relationships 6
Create and maintain long-term relationships 6
A good neighbor 6
Civic partner 6
Positive impact in communities 6
Charitable efforts 6
Volunteer commitments 6
A healthy environment 6
Preparing for the future by pursuing lower carbon energy 6
Minimize our environmental footprint 6
Safety and environmental stewardship 6
People impacted by or interested in our activities 6
Corporate responsibility 6
Serve and improve the communities 6
Global involvement 6
Seek a world view 6
Balanced interests of stakeholders 6
Maintaining sound relationships to the benefit of our stakeholders 6
Serve should be viewed as a privilege 6
Shareholders 6
Communities 6
Corporate citizen 6
Environmentally responsible operations 6
Humanity 6

240
Value by doing the right thing for our communities 6
Health & safety 6
Healthy and safety of our contractors and neighboring communities
6
Environmental stewardship 6
Minimizing environmental impacts 6
Corporate citizenship 6
Sustainable social and economic benefits 6
Listen and respond to our suppliers 6
Listen and respond to our stakeholders 6
Asset to our communities worldwide 6
Encourage long-term relationships 6
Good corporate citizens 6
Value the environment 6
Actively participate in our community 6
Good citizens 6
Collaborate with our suppliers 6
Citizenship 6
Team spirit to partners, suppliers and the communities 6
Citizenship 6
Do our part to make our communities, and our world, better places to live
6
We respect our environment 6
Environmental responsibility 6
Safe and healthy environment 6
Serve the needs of our investors 6
Citizenship 6
Global, local and national citizens 6
Good stewards of the environment 6
The communities 6
Making the world we live in a better place 6
Environment and safety 6
Pursuit of excellence in all relationships with business partners, suppliers, shareholders, the community and the environment
6
Engage with the world outside UTC 6
Environmental and safety standards 6
Commitment to our stakeholders 6
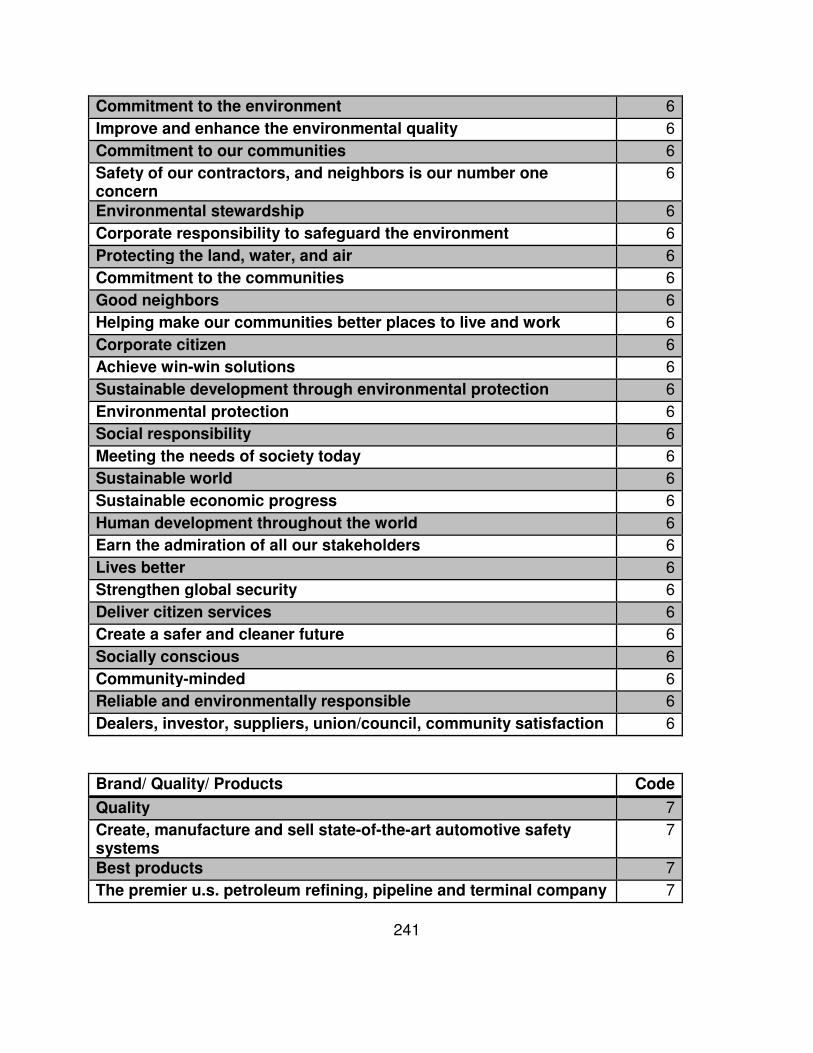
241
Commitment to the environment 6
Improve and enhance the environmental quality 6
Commitment to our communities 6
Safety of our contractors, and neighbors is our number one concern
6
Environmental stewardship 6
Corporate responsibility to safeguard the environment 6
Protecting the land, water, and air 6
Commitment to the communities 6
Good neighbors 6
Helping make our communities better places to live and work 6
Corporate citizen 6
Achieve win-win solutions 6
Sustainable development through environmental protection 6
Environmental protection 6
Social responsibility 6
Meeting the needs of society today 6
Sustainable world 6
Sustainable economic progress 6
Human development throughout the world 6
Earn the admiration of all our stakeholders 6
Lives better 6
Strengthen global security 6
Deliver citizen services 6
Create a safer and cleaner future 6
Socially conscious 6
Community-minded 6
Reliable and environmentally responsible 6
Dealers, investor, suppliers, union/council, community satisfaction 6
Brand/ Quality/ Products Code
Quality 7
Create, manufacture and sell state-of-the-art automotive safety systems
7
Best products 7
The premier u.s. petroleum refining, pipeline and terminal company 7
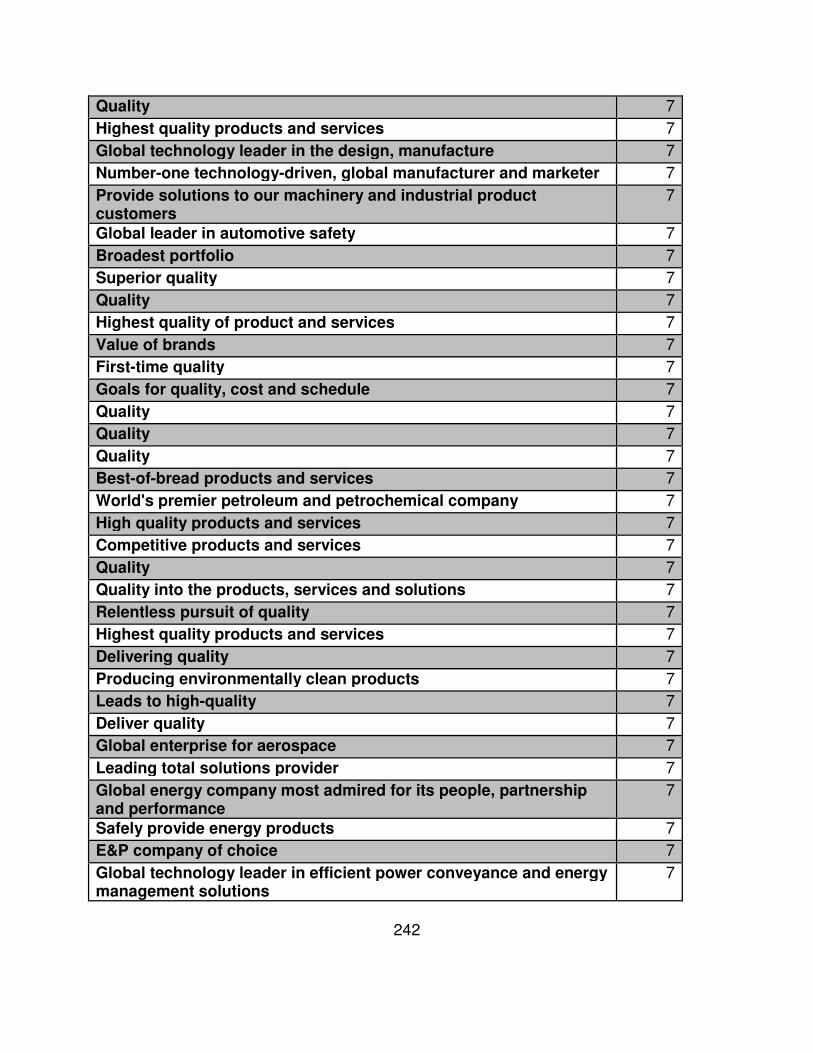
242
Quality 7
Highest quality products and services 7
Global technology leader in the design, manufacture 7
Number-one technology-driven, global manufacturer and marketer 7
Provide solutions to our machinery and industrial product customers
7
Global leader in automotive safety 7
Broadest portfolio 7
Superior quality 7
Quality 7
Highest quality of product and services 7
Value of brands 7
First-time quality 7
Goals for quality, cost and schedule 7
Quality 7
Quality 7
Quality 7
Best-of-bread products and services 7
World's premier petroleum and petrochemical company 7
High quality products and services 7
Competitive products and services 7
Quality 7
Quality into the products, services and solutions 7
Relentless pursuit of quality 7
Highest quality products and services 7
Delivering quality 7
Producing environmentally clean products 7
Leads to high-quality 7
Deliver quality 7
Global enterprise for aerospace 7
Leading total solutions provider 7
Global energy company most admired for its people, partnership and performance
7
Safely provide energy products 7
E&P company of choice 7
Global technology leader in efficient power conveyance and energy management solutions
7
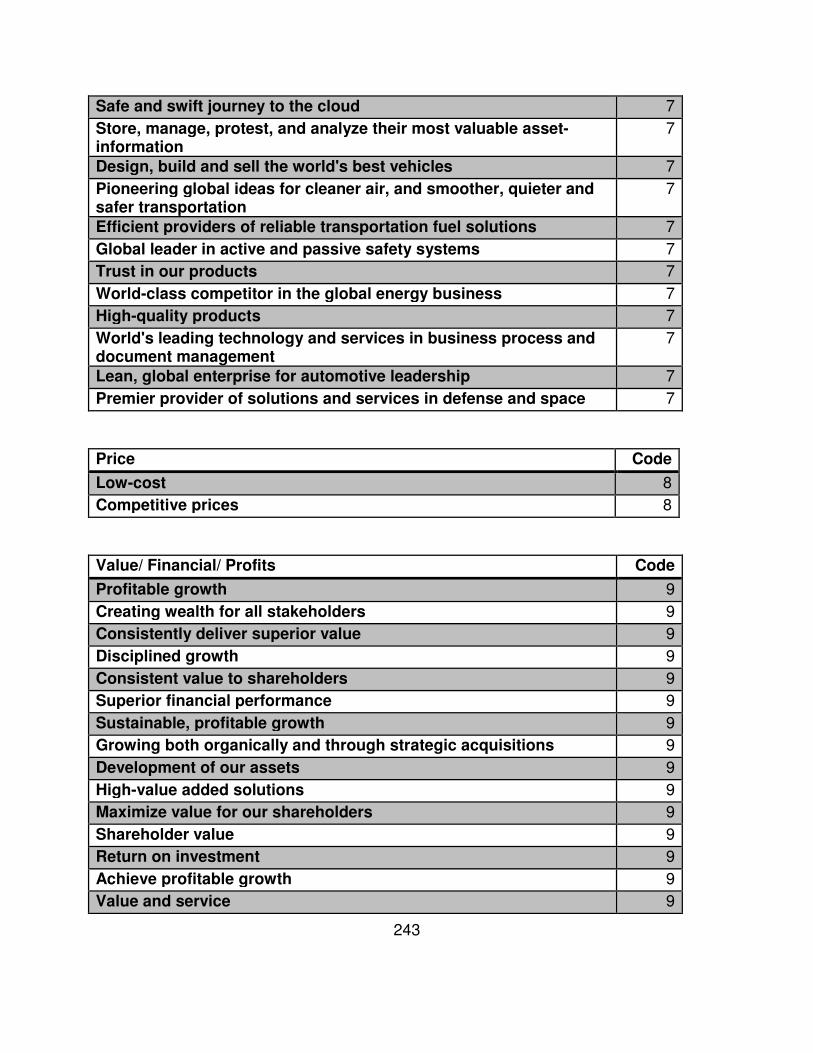
243
Safe and swift journey to the cloud 7
Store, manage, protest, and analyze their most valuable asset-information
7
Design, build and sell the world's best vehicles 7
Pioneering global ideas for cleaner air, and smoother, quieter and safer transportation
7
Efficient providers of reliable transportation fuel solutions 7
Global leader in active and passive safety systems 7
Trust in our products 7
World-class competitor in the global energy business 7
High-quality products 7
World's leading technology and services in business process and document management
7
Lean, global enterprise for automotive leadership 7
Premier provider of solutions and services in defense and space 7
Price Code
Low-cost 8
Competitive prices 8
Value/ Financial/ Profits Code
Profitable growth 9
Creating wealth for all stakeholders 9
Consistently deliver superior value 9
Disciplined growth 9
Consistent value to shareholders 9
Superior financial performance 9
Sustainable, profitable growth 9
Growing both organically and through strategic acquisitions 9
Development of our assets 9
High-value added solutions 9
Maximize value for our shareholders 9
Shareholder value 9
Return on investment 9
Achieve profitable growth 9
Value and service 9
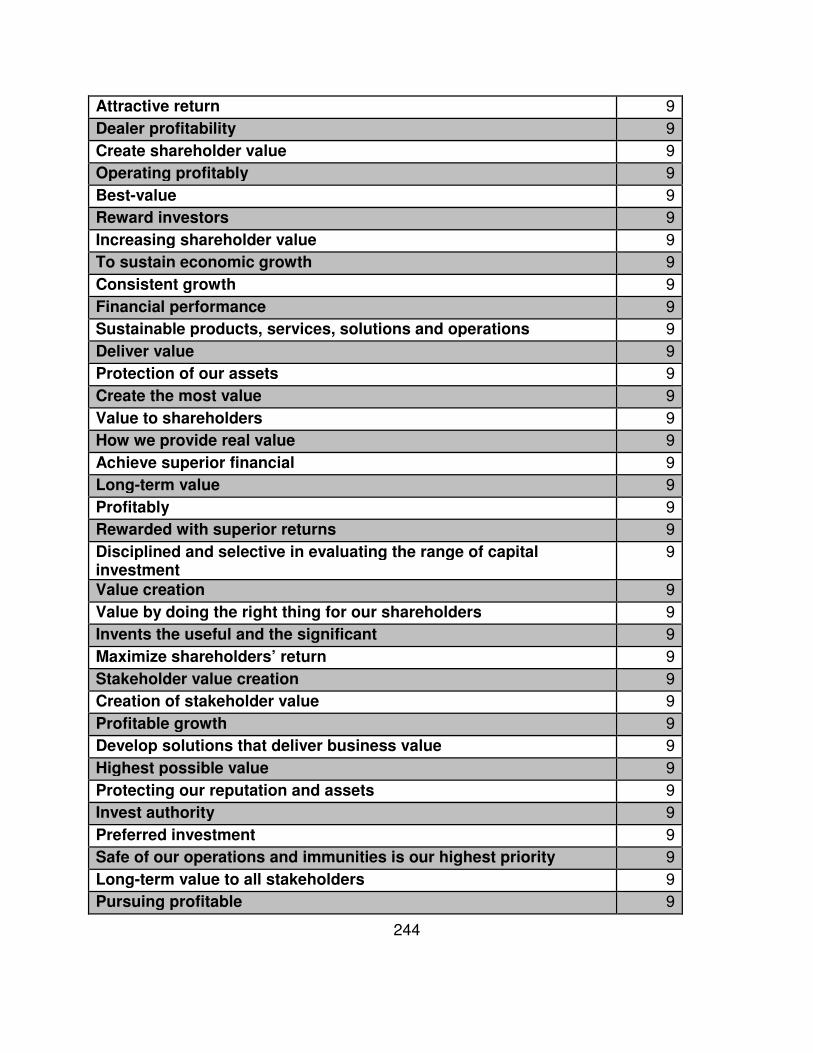
244
Attractive return 9
Dealer profitability 9
Create shareholder value 9
Operating profitably 9
Best-value 9
Reward investors 9
Increasing shareholder value 9
To sustain economic growth 9
Consistent growth 9
Financial performance 9
Sustainable products, services, solutions and operations 9
Deliver value 9
Protection of our assets 9
Create the most value 9
Value to shareholders 9
How we provide real value 9
Achieve superior financial 9
Long-term value 9
Profitably 9
Rewarded with superior returns 9
Disciplined and selective in evaluating the range of capital investment
9
Value creation 9
Value by doing the right thing for our shareholders 9
Invents the useful and the significant 9
Maximize shareholders’ return 9
Stakeholder value creation 9
Creation of stakeholder value 9
Profitable growth 9
Develop solutions that deliver business value 9
Highest possible value 9
Protecting our reputation and assets 9
Invest authority 9
Preferred investment 9
Safe of our operations and immunities is our highest priority 9
Long-term value to all stakeholders 9
Pursuing profitable 9

245
Value-enhancing strategies 9
Good stewards of our resources 9
Premium return on assets 9
Economic progress 9
Distribution system is a competitive advantage 9
Supply chain is world class 9
Rewards our stockholders 9
Financial 9
Most profitable company 9
Returns on investments 9
Operator profitably 9
Improve our balance sheet 9
Profitable growth 9
Continuous Improvement Code
Exceptional operating performance 10
Efficiently operating 10
Continually improving 10
Continued improvement 10
Superior productivity 10
Process improvements 10
Commit to excellence 10
Continuous improvement 10
Improve our products, services, and processes 10
Continuously improve performance 10
Continuous improvement 10
Progress each day 10
Excellence 10
Achieve excellence 10
Caterpillar production system and 6 sigma 10
Building productive 10
World-class performance 10
Operational excellence management system 10
Excellence in everything 10
Continually improve 10
Better, faster, first 10
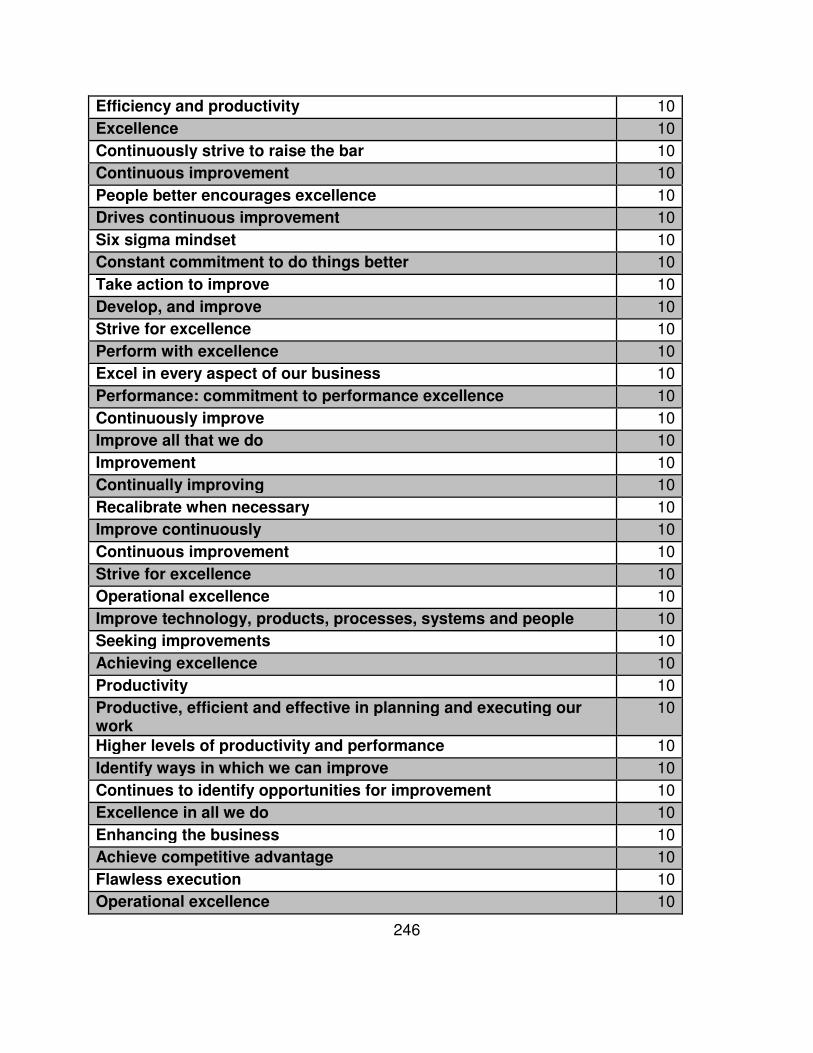
246
Efficiency and productivity 10
Excellence 10
Continuously strive to raise the bar 10
Continuous improvement 10
People better encourages excellence 10
Drives continuous improvement 10
Six sigma mindset 10
Constant commitment to do things better 10
Take action to improve 10
Develop, and improve 10
Strive for excellence 10
Perform with excellence 10
Excel in every aspect of our business 10
Performance: commitment to performance excellence 10
Continuously improve 10
Improve all that we do 10
Improvement 10
Continually improving 10
Recalibrate when necessary 10
Improve continuously 10
Continuous improvement 10
Strive for excellence 10
Operational excellence 10
Improve technology, products, processes, systems and people 10
Seeking improvements 10
Achieving excellence 10
Productivity 10
Productive, efficient and effective in planning and executing our work
10
Higher levels of productivity and performance 10
Identify ways in which we can improve 10
Continues to identify opportunities for improvement 10
Excellence in all we do 10
Enhancing the business 10
Achieve competitive advantage 10
Flawless execution 10
Operational excellence 10
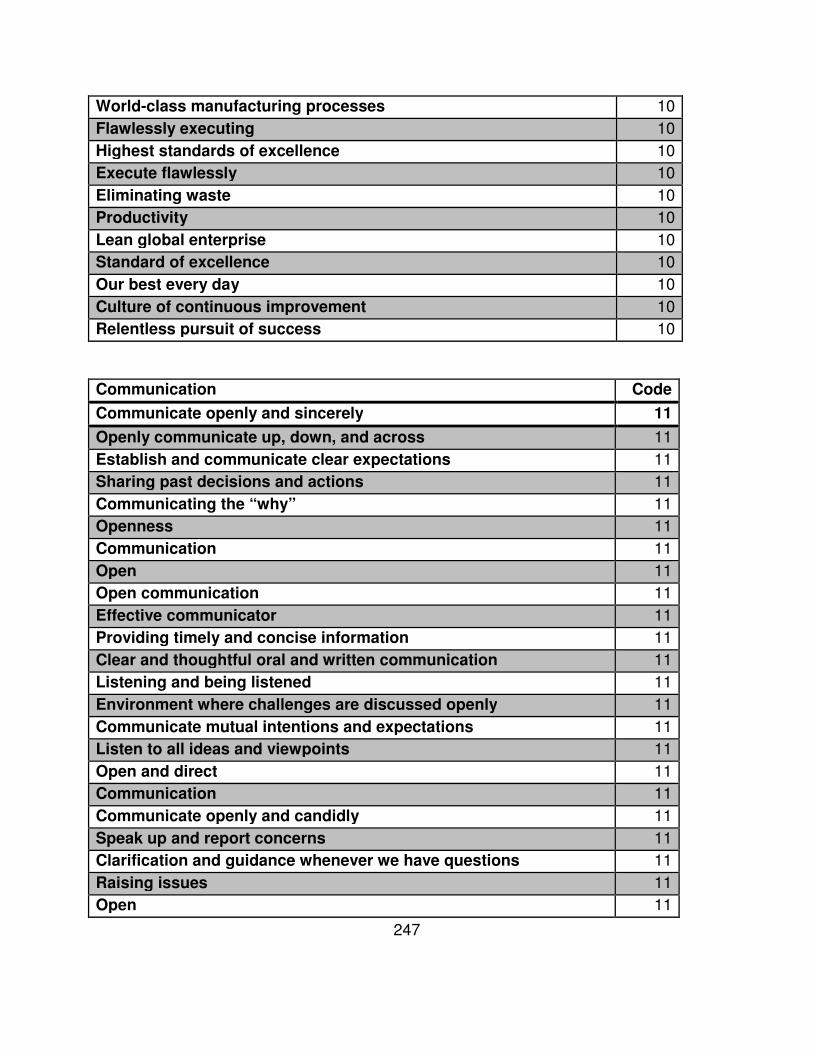
247
World-class manufacturing processes 10
Flawlessly executing 10
Highest standards of excellence 10
Execute flawlessly 10
Eliminating waste 10
Productivity 10
Lean global enterprise 10
Standard of excellence 10
Our best every day 10
Culture of continuous improvement 10
Relentless pursuit of success 10
Communication Code
Communicate openly and sincerely 11
Openly communicate up, down, and across 11
Establish and communicate clear expectations 11
Sharing past decisions and actions 11
Communicating the “why” 11
Openness 11
Communication 11
Open 11
Open communication 11
Effective communicator 11
Providing timely and concise information 11
Clear and thoughtful oral and written communication 11
Listening and being listened 11
Environment where challenges are discussed openly 11
Communicate mutual intentions and expectations 11
Listen to all ideas and viewpoints 11
Open and direct 11
Communication 11
Communicate openly and candidly 11
Speak up and report concerns 11
Clarification and guidance whenever we have questions 11
Raising issues 11
Open 11

248
Seek and share ideas openly 11
Communicate honestly 11
Open communication 11
Communicate 11
Seek to understand before being understood 11
Open and direct 11
Open, honest and direct 11
Innovations/ Learning/ Technologies Code
Innovation 12
Innovative technology 12
Innovative 12
Innovation 12
Creative potential 12
Benchmarking 12
Adopting best practices 12
Imagine and pursue new possibilities 12
Innovation 12
Learn from the culture 12
Ingenuity 12
Out-of-the-ordinary solutions 12
Creativity 12
Unexpected and practical ways to solve problems 12
Technology 12
Learning opportunities 12
Technological advances 12
Innovation 12
Technologies 12
Innovative technology 12
Leveraging technologies 12
Responding with creative solutions 12
Embrace learning opportunities 12
Innovation 12
Creative ingenuity 12
Innovation 12
Inventing, designing and developing breakthrough products and 12
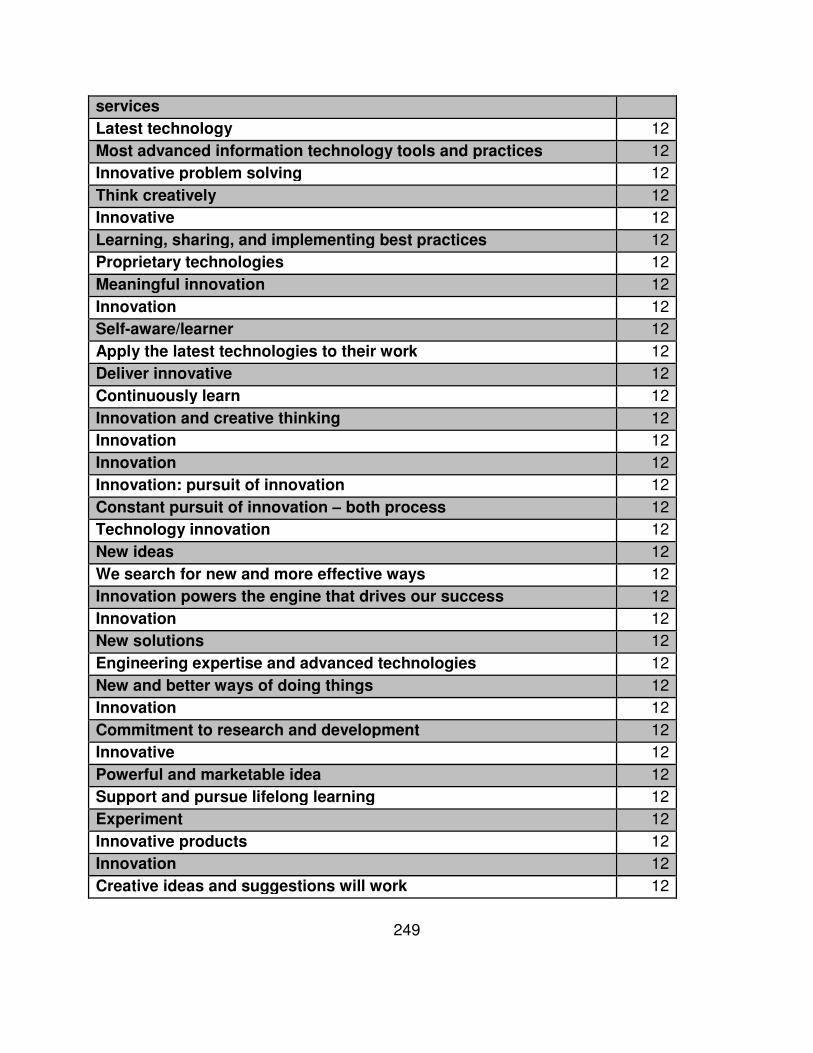
249
services
Latest technology 12
Most advanced information technology tools and practices 12
Innovative problem solving 12
Think creatively 12
Innovative 12
Learning, sharing, and implementing best practices 12
Proprietary technologies 12
Meaningful innovation 12
Innovation 12
Self-aware/learner 12
Apply the latest technologies to their work 12
Deliver innovative 12
Continuously learn 12
Innovation and creative thinking 12
Innovation 12
Innovation 12
Innovation: pursuit of innovation 12
Constant pursuit of innovation – both process 12
Technology innovation 12
New ideas 12
We search for new and more effective ways 12
Innovation powers the engine that drives our success 12
Innovation 12
New solutions 12
Engineering expertise and advanced technologies 12
New and better ways of doing things 12
Innovation 12
Commitment to research and development 12
Innovative 12
Powerful and marketable idea 12
Support and pursue lifelong learning 12
Experiment 12
Innovative products 12
Innovation 12
Creative ideas and suggestions will work 12

250
Bringing these ideas to market 12
Intellectual curiosity 12
Continuing desire to learn 12
Creative ways to benefit the business 12
Technology to develop market leadership 12
High–tech solutions 12
Innovation 12
Systems integration 12
Lifecycle solutions 12
Advance scientific discovery 12
Brave inventors 12
Bold thinkers 12
New ideas 12
Pioneer technologies 12
Latest innovations 12
Developing new products 12
Innovative 12
Innovation 12
Work Environment Code
Operating in a safe, reliable 13
Stimulating work environment 13
Shared-value culture 13
Work environment in which employees thrive 13
The health and safety of people 13
Learn from our failures 13
Learning environment 13
The safety of our workplaces, products and services 13
Accountable for our own safety 13
Collectively responsible for each other's safety 13
Do not compromise safety 13
Work in a safe 13
To protect health & safety 13
No one gets hurt 13
Health and safety 13
Protecting people 13
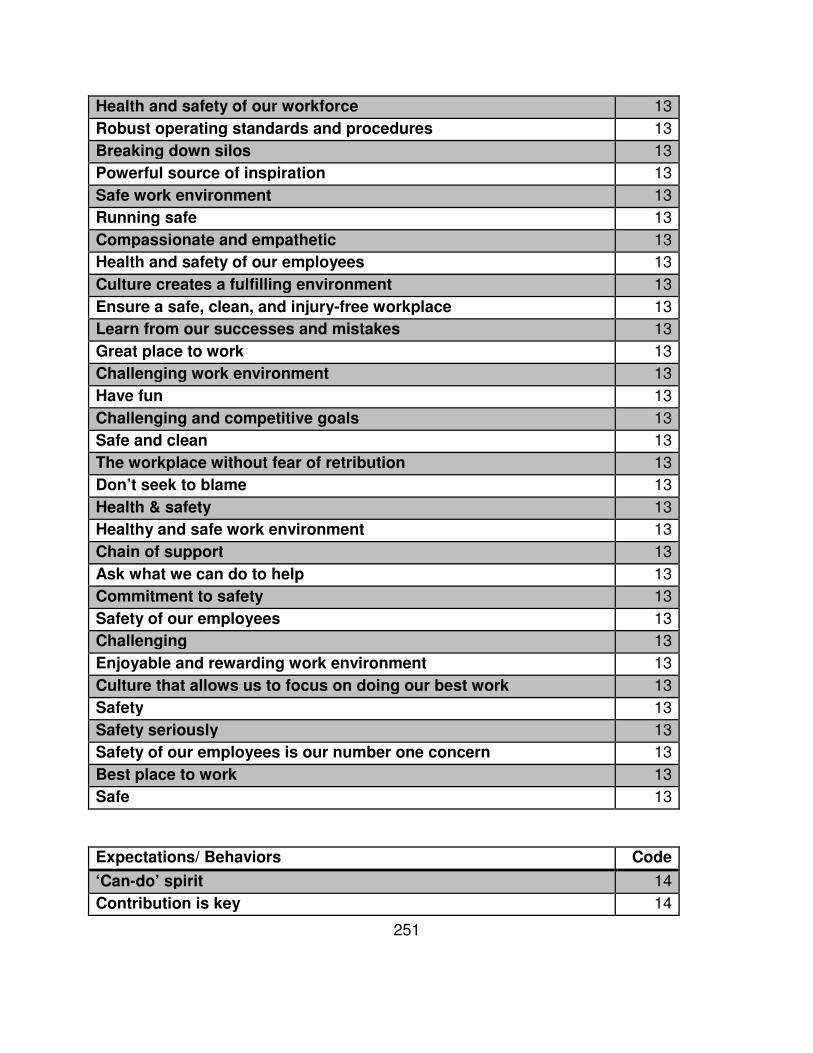
251
Health and safety of our workforce 13
Robust operating standards and procedures 13
Breaking down silos 13
Powerful source of inspiration 13
Safe work environment 13
Running safe 13
Compassionate and empathetic 13
Health and safety of our employees 13
Culture creates a fulfilling environment 13
Ensure a safe, clean, and injury-free workplace 13
Learn from our successes and mistakes 13
Great place to work 13
Challenging work environment 13
Have fun 13
Challenging and competitive goals 13
Safe and clean 13
The workplace without fear of retribution 13
Don’t seek to blame 13
Health & safety 13
Healthy and safe work environment 13
Chain of support 13
Ask what we can do to help 13
Commitment to safety 13
Safety of our employees 13
Challenging 13
Enjoyable and rewarding work environment 13
Culture that allows us to focus on doing our best work 13
Safety 13
Safety seriously 13
Safety of our employees is our number one concern 13
Best place to work 13
Safe 13
Expectations/ Behaviors Code
‘Can-do’ spirit 14
Contribution is key 14
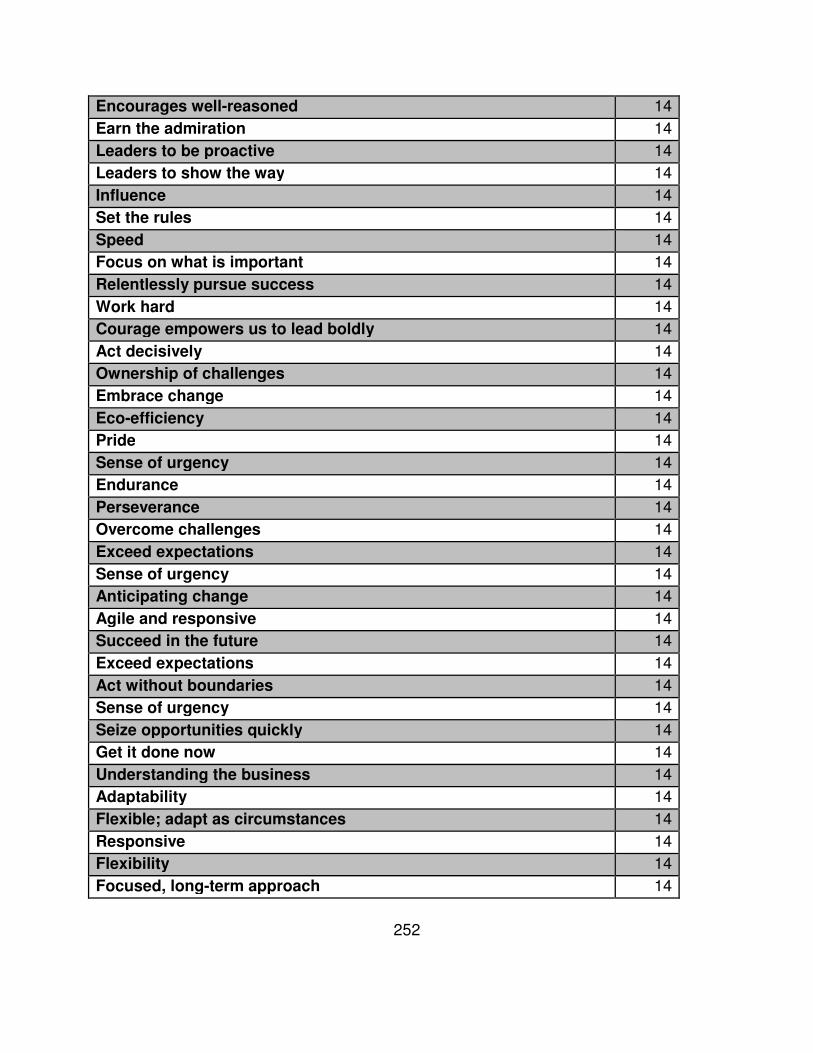
252
Encourages well-reasoned 14
Earn the admiration 14
Leaders to be proactive 14
Leaders to show the way 14
Influence 14
Set the rules 14
Speed 14
Focus on what is important 14
Relentlessly pursue success 14
Work hard 14
Courage empowers us to lead boldly 14
Act decisively 14
Ownership of challenges 14
Embrace change 14
Eco-efficiency 14
Pride 14
Sense of urgency 14
Endurance 14
Perseverance 14
Overcome challenges 14
Exceed expectations 14
Sense of urgency 14
Anticipating change 14
Agile and responsive 14
Succeed in the future 14
Exceed expectations 14
Act without boundaries 14
Sense of urgency 14
Seize opportunities quickly 14
Get it done now 14
Understanding the business 14
Adaptability 14
Flexible; adapt as circumstances 14
Responsive 14
Flexibility 14
Focused, long-term approach 14
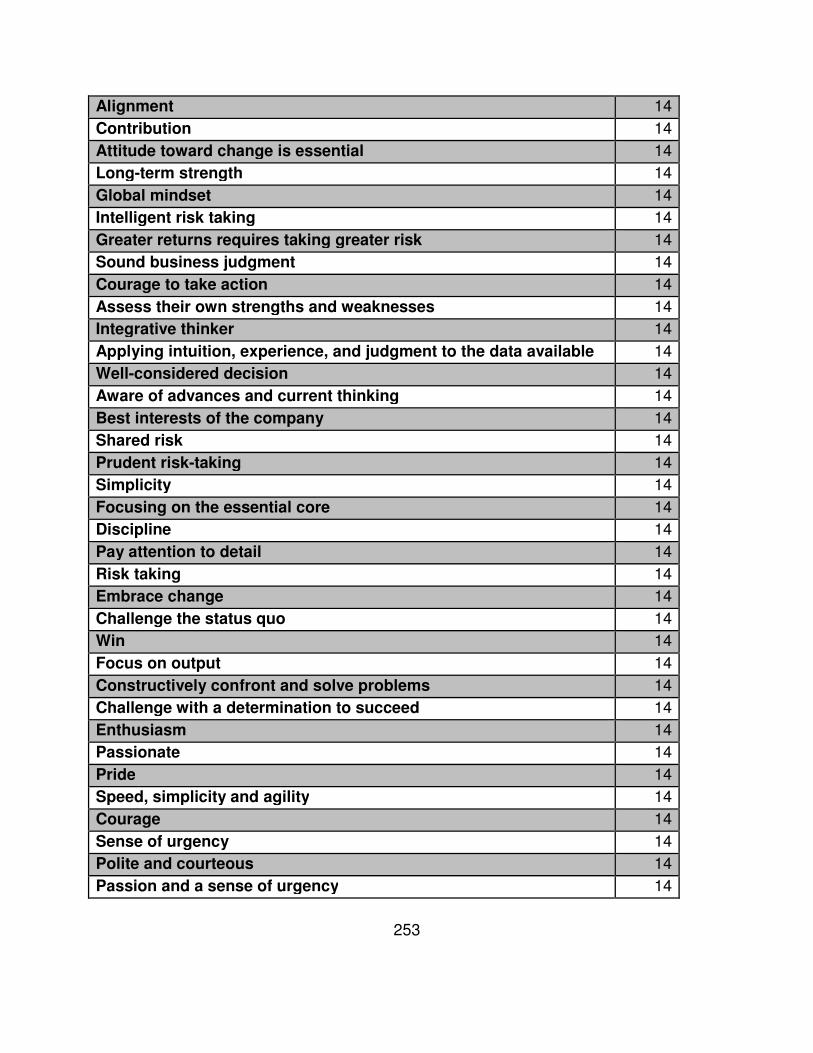
253
Alignment 14
Contribution 14
Attitude toward change is essential 14
Long-term strength 14
Global mindset 14
Intelligent risk taking 14
Greater returns requires taking greater risk 14
Sound business judgment 14
Courage to take action 14
Assess their own strengths and weaknesses 14
Integrative thinker 14
Applying intuition, experience, and judgment to the data available 14
Well-considered decision 14
Aware of advances and current thinking 14
Best interests of the company 14
Shared risk 14
Prudent risk-taking 14
Simplicity 14
Focusing on the essential core 14
Discipline 14
Pay attention to detail 14
Risk taking 14
Embrace change 14
Challenge the status quo 14
Win 14
Focus on output 14
Constructively confront and solve problems 14
Challenge with a determination to succeed 14
Enthusiasm 14
Passionate 14
Pride 14
Speed, simplicity and agility 14
Courage 14
Sense of urgency 14
Polite and courteous 14
Passion and a sense of urgency 14
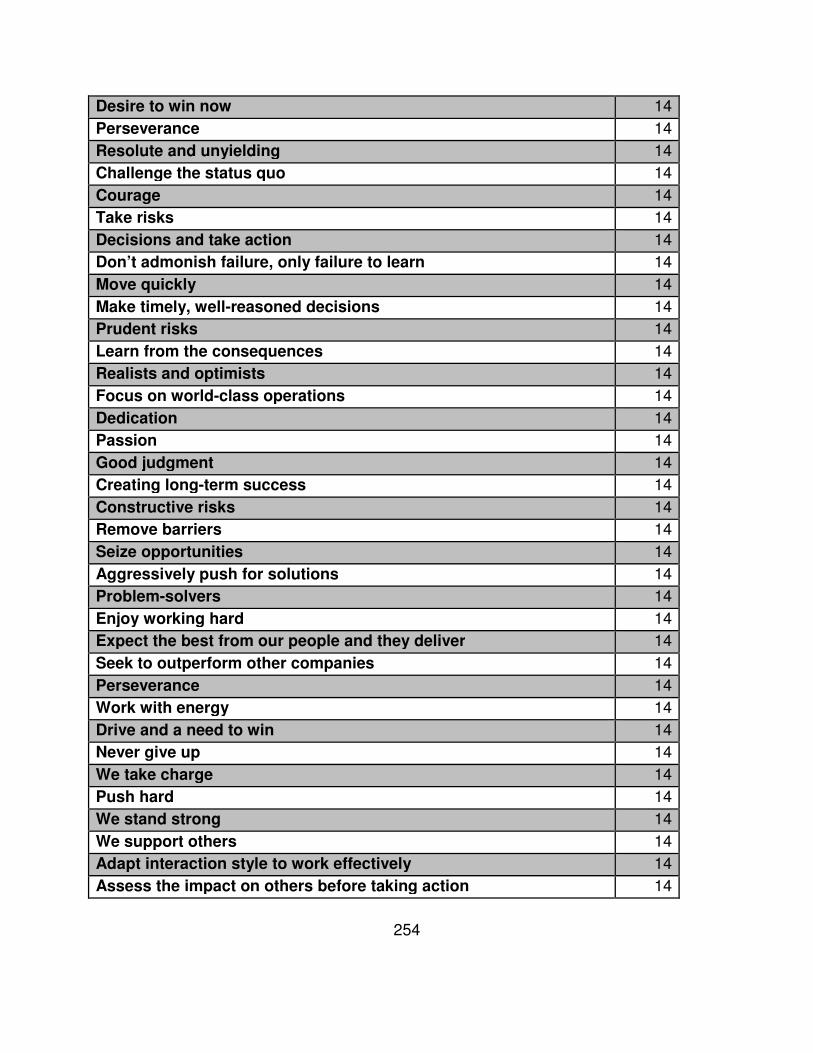
254
Desire to win now 14
Perseverance 14
Resolute and unyielding 14
Challenge the status quo 14
Courage 14
Take risks 14
Decisions and take action 14
Don’t admonish failure, only failure to learn 14
Move quickly 14
Make timely, well-reasoned decisions 14
Prudent risks 14
Learn from the consequences 14
Realists and optimists 14
Focus on world-class operations 14
Dedication 14
Passion 14
Good judgment 14
Creating long-term success 14
Constructive risks 14
Remove barriers 14
Seize opportunities 14
Aggressively push for solutions 14
Problem-solvers 14
Enjoy working hard 14
Expect the best from our people and they deliver 14
Seek to outperform other companies 14
Perseverance 14
Work with energy 14
Drive and a need to win 14
Never give up 14
We take charge 14
Push hard 14
We stand strong 14
We support others 14
Adapt interaction style to work effectively 14
Assess the impact on others before taking action 14
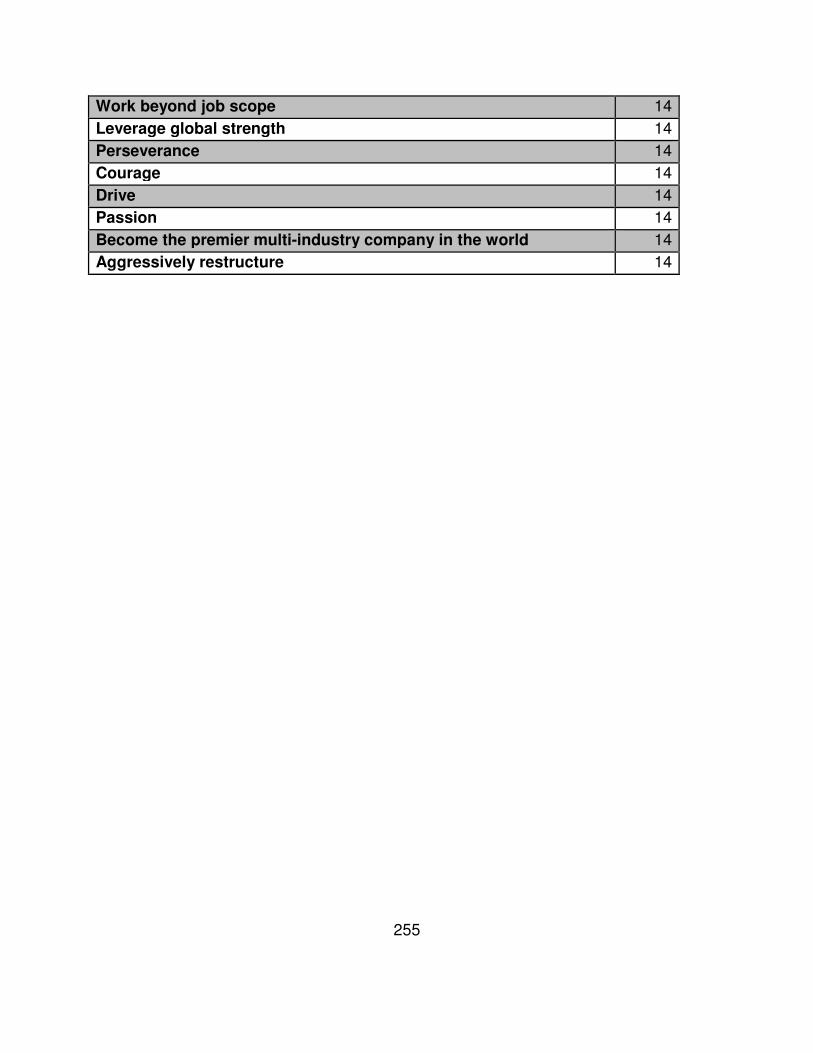
255
Work beyond job scope 14
Leverage global strength 14
Perseverance 14
Courage 14
Drive 14
Passion 14
Become the premier multi-industry company in the world 14
Aggressively restructure 14
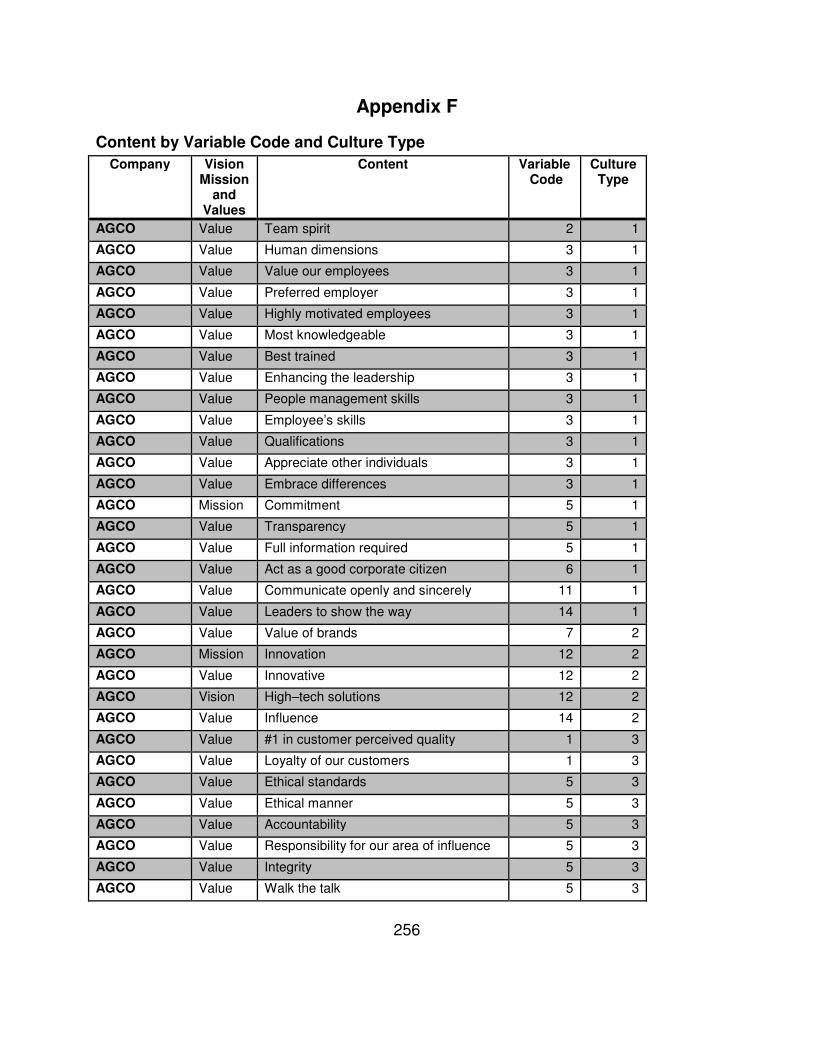
256
Appendix F
Content by Variable Code and Culture Type
Company Vision Mission
and Values
Content Variable Code
Culture Type
AGCO Value Team spirit 2 1
AGCO Value Human dimensions 3 1
AGCO Value Value our employees 3 1
AGCO Value Preferred employer 3 1
AGCO Value Highly motivated employees 3 1
AGCO Value Most knowledgeable 3 1
AGCO Value Best trained 3 1
AGCO Value Enhancing the leadership 3 1
AGCO Value People management skills 3 1
AGCO Value Employee’s skills 3 1
AGCO Value Qualifications 3 1
AGCO Value Appreciate other individuals 3 1
AGCO Value Embrace differences 3 1
AGCO Mission Commitment 5 1
AGCO Value Transparency 5 1
AGCO Value Full information required 5 1
AGCO Value Act as a good corporate citizen 6 1
AGCO Value Communicate openly and sincerely 11 1
AGCO Value Leaders to show the way 14 1
AGCO Value Value of brands 7 2
AGCO Mission Innovation 12 2
AGCO Value Innovative 12 2
AGCO Vision High–tech solutions 12 2
AGCO Value Influence 14 2
AGCO Value #1 in customer perceived quality 1 3
AGCO Value Loyalty of our customers 1 3
AGCO Value Ethical standards 5 3
AGCO Value Ethical manner 5 3
AGCO Value Accountability 5 3
AGCO Value Responsibility for our area of influence 5 3
AGCO Value Integrity 5 3
AGCO Value Walk the talk 5 3
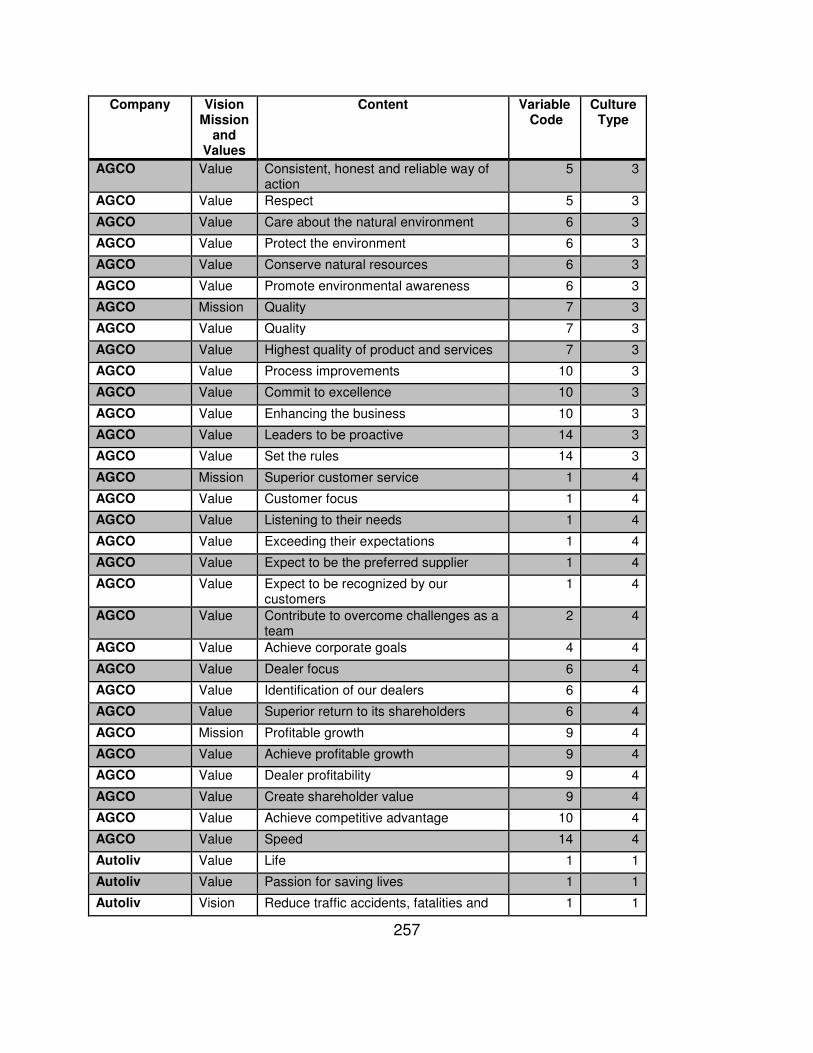
257
Company Vision Mission
and Values
Content Variable Code
Culture Type
AGCO Value Consistent, honest and reliable way of action
5 3
AGCO Value Respect 5 3
AGCO Value Care about the natural environment 6 3
AGCO Value Protect the environment 6 3
AGCO Value Conserve natural resources 6 3
AGCO Value Promote environmental awareness 6 3
AGCO Mission Quality 7 3
AGCO Value Quality 7 3
AGCO Value Highest quality of product and services 7 3
AGCO Value Process improvements 10 3
AGCO Value Commit to excellence 10 3
AGCO Value Enhancing the business 10 3
AGCO Value Leaders to be proactive 14 3
AGCO Value Set the rules 14 3
AGCO Mission Superior customer service 1 4
AGCO Value Customer focus 1 4
AGCO Value Listening to their needs 1 4
AGCO Value Exceeding their expectations 1 4
AGCO Value Expect to be the preferred supplier 1 4
AGCO Value Expect to be recognized by our customers
1 4
AGCO Value Contribute to overcome challenges as a team
2 4
AGCO Value Achieve corporate goals 4 4
AGCO Value Dealer focus 6 4
AGCO Value Identification of our dealers 6 4
AGCO Value Superior return to its shareholders 6 4
AGCO Mission Profitable growth 9 4
AGCO Value Achieve profitable growth 9 4
AGCO Value Dealer profitability 9 4
AGCO Value Create shareholder value 9 4
AGCO Value Achieve competitive advantage 10 4
AGCO Value Speed 14 4
Autoliv Value Life 1 1
Autoliv Value Passion for saving lives 1 1
Autoliv Vision Reduce traffic accidents, fatalities and 1 1
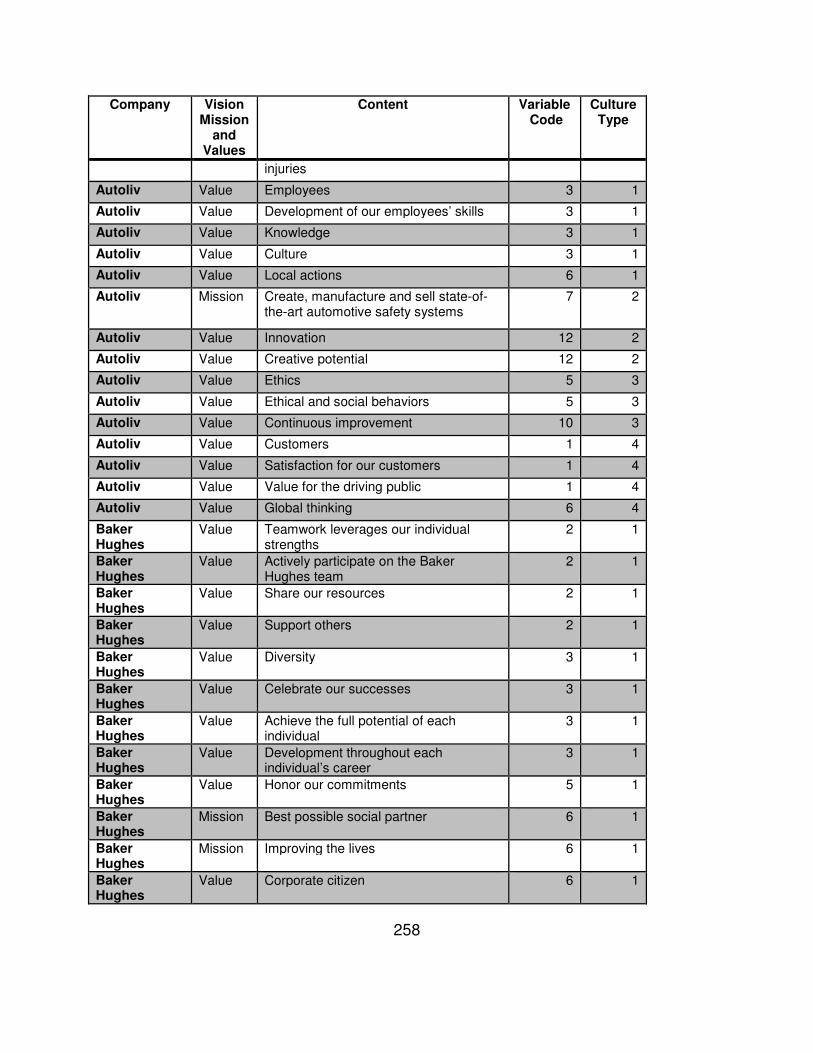
258
Company Vision Mission
and Values
Content Variable Code
Culture Type
injuries
Autoliv Value Employees 3 1
Autoliv Value Development of our employees’ skills 3 1
Autoliv Value Knowledge 3 1
Autoliv Value Culture 3 1
Autoliv Value Local actions 6 1
Autoliv Mission Create, manufacture and sell state-of-the-art automotive safety systems
7 2
Autoliv Value Innovation 12 2
Autoliv Value Creative potential 12 2
Autoliv Value Ethics 5 3
Autoliv Value Ethical and social behaviors 5 3
Autoliv Value Continuous improvement 10 3
Autoliv Value Customers 1 4
Autoliv Value Satisfaction for our customers 1 4
Autoliv Value Value for the driving public 1 4
Autoliv Value Global thinking 6 4
Baker Hughes
Value Teamwork leverages our individual strengths
2 1
Baker Hughes
Value Actively participate on the Baker Hughes team
2 1
Baker Hughes
Value Share our resources 2 1
Baker Hughes
Value Support others 2 1
Baker Hughes
Value Diversity 3 1
Baker Hughes
Value Celebrate our successes 3 1
Baker Hughes
Value Achieve the full potential of each individual
3 1
Baker Hughes
Value Development throughout each individual’s career
3 1
Baker Hughes
Value Honor our commitments 5 1
Baker Hughes
Mission Best possible social partner 6 1
Baker Hughes
Mission Improving the lives 6 1
Baker Hughes
Value Corporate citizen 6 1
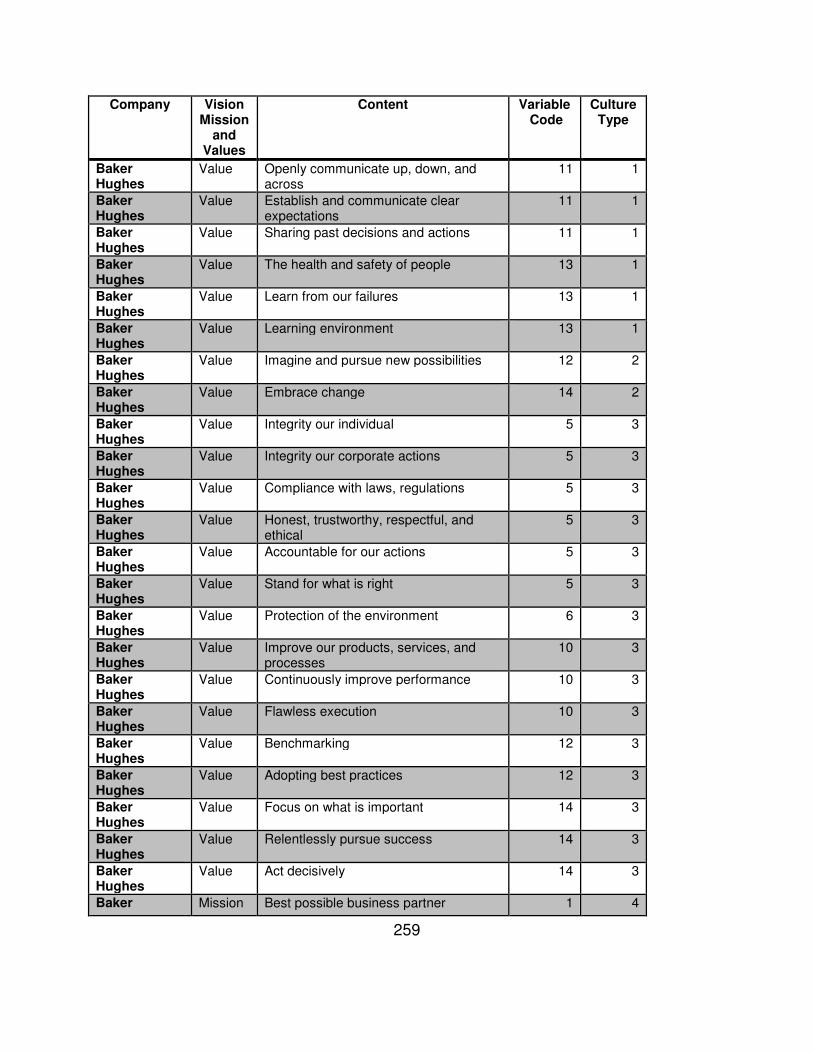
259
Company Vision Mission
and Values
Content Variable Code
Culture Type
Baker Hughes
Value Openly communicate up, down, and across
11 1
Baker Hughes
Value Establish and communicate clear expectations
11 1
Baker Hughes
Value Sharing past decisions and actions 11 1
Baker Hughes
Value The health and safety of people 13 1
Baker Hughes
Value Learn from our failures 13 1
Baker Hughes
Value Learning environment 13 1
Baker Hughes
Value Imagine and pursue new possibilities 12 2
Baker Hughes
Value Embrace change 14 2
Baker Hughes
Value Integrity our individual 5 3
Baker Hughes
Value Integrity our corporate actions 5 3
Baker Hughes
Value Compliance with laws, regulations 5 3
Baker Hughes
Value Honest, trustworthy, respectful, and ethical
5 3
Baker Hughes
Value Accountable for our actions 5 3
Baker Hughes
Value Stand for what is right 5 3
Baker Hughes
Value Protection of the environment 6 3
Baker Hughes
Value Improve our products, services, and processes
10 3
Baker Hughes
Value Continuously improve performance 10 3
Baker Hughes
Value Flawless execution 10 3
Baker Hughes
Value Benchmarking 12 3
Baker Hughes
Value Adopting best practices 12 3
Baker Hughes
Value Focus on what is important 14 3
Baker Hughes
Value Relentlessly pursue success 14 3
Baker Hughes
Value Act decisively 14 3
Baker Mission Best possible business partner 1 4
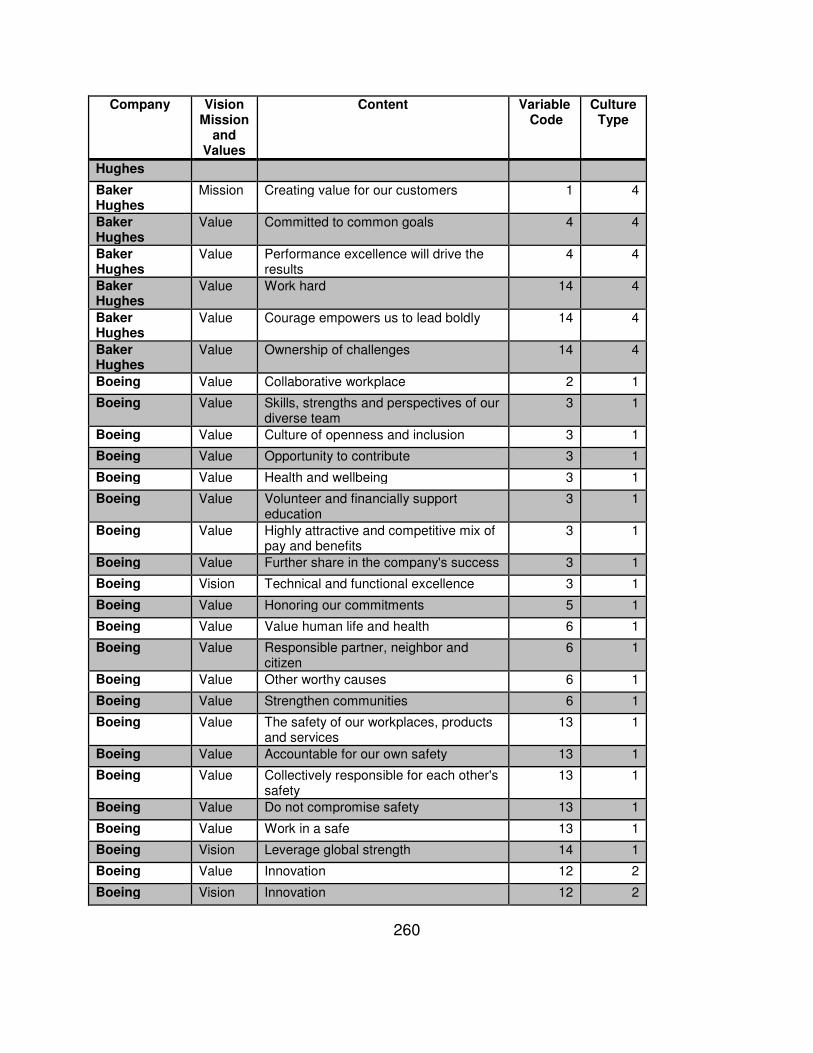
260
Company Vision Mission
and Values
Content Variable Code
Culture Type
Hughes
Baker Hughes
Mission Creating value for our customers 1 4
Baker Hughes
Value Committed to common goals 4 4
Baker Hughes
Value Performance excellence will drive the results
4 4
Baker Hughes
Value Work hard 14 4
Baker Hughes
Value Courage empowers us to lead boldly 14 4
Baker Hughes
Value Ownership of challenges 14 4
Boeing Value Collaborative workplace 2 1
Boeing Value Skills, strengths and perspectives of our diverse team
3 1
Boeing Value Culture of openness and inclusion 3 1
Boeing Value Opportunity to contribute 3 1
Boeing Value Health and wellbeing 3 1
Boeing Value Volunteer and financially support education
3 1
Boeing Value Highly attractive and competitive mix of pay and benefits
3 1
Boeing Value Further share in the company's success 3 1
Boeing Vision Technical and functional excellence 3 1
Boeing Value Honoring our commitments 5 1
Boeing Value Value human life and health 6 1
Boeing Value Responsible partner, neighbor and citizen
6 1
Boeing Value Other worthy causes 6 1
Boeing Value Strengthen communities 6 1
Boeing Value The safety of our workplaces, products and services
13 1
Boeing Value Accountable for our own safety 13 1
Boeing Value Collectively responsible for each other's safety
13 1
Boeing Value Do not compromise safety 13 1
Boeing Value Work in a safe 13 1
Boeing Vision Leverage global strength 14 1
Boeing Value Innovation 12 2
Boeing Vision Innovation 12 2

261
Company Vision Mission
and Values
Content Variable Code
Culture Type
Boeing Value Highest ethical standards 5 3
Boeing Value Responsibility for our own actions 5 3
Boeing Value Integrity, consistency, and honesty 5 3
Boeing Value Treated fairly 5 3
Boeing Value With integrity 5 3
Boeing Value Ethical environment 5 3
Boeing Value Conduct business lawfully 5 3
Boeing Value Ethically with our suppliers 5 3
Boeing Value Protect the environment 6 3
Boeing Value First-time quality 7 3
Boeing Value Goals for quality, cost and schedule 7 3
Boeing Vision Global enterprise for aerospace 7 3
Boeing Value Continuous improvement 10 3
Boeing Vision Productivity 10 3
Boeing Vision Lean global enterprise 10 3
Boeing Vision Systems integration 12 3
Boeing Vision Lifecycle solutions 12 3
Boeing Value Meet or exceed the standards of excellence
1 4
Boeing Value Advance our common business objectives
1 4
Boeing Vision Customer value 1 4
Boeing Vision Customer knowledge and focus 1 4
Boeing Value Competitive edge 4 4
Boeing Vision Industry leadership 4 4
Boeing Value Operating profitably 9 4
Boeing Value Best-value 9 4
Boeing Value Reward investors 9 4
Boeing Value Increasing shareholder value 9 4
Cameron Value Employee numbers 3 1
Cameron Value Technology partnering, volunteerism and financial support
3 1
Cameron Value Economic impact on the communities 6 1
Cameron Value To build our communities 6 1
Cameron Value Actively and globally involved 6 1
Cameron Value To protect health & safety 13 1
Cameron Value No one gets hurt 13 1
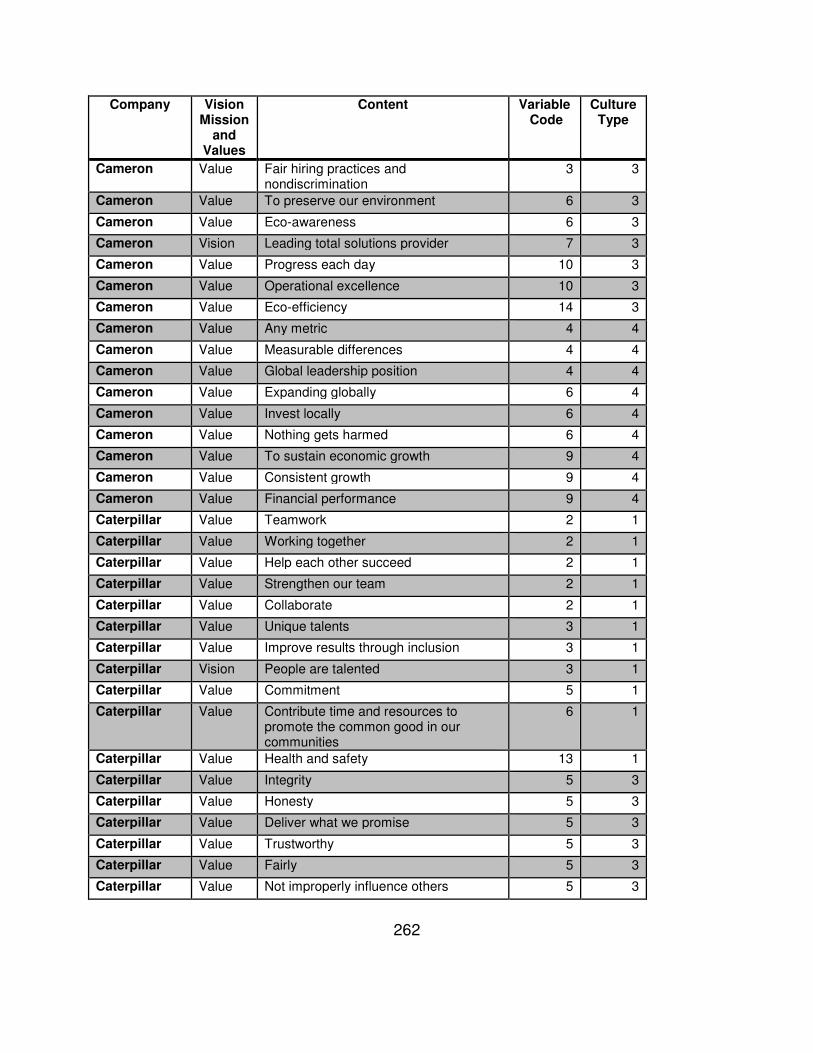
262
Company Vision Mission
and Values
Content Variable Code
Culture Type
Cameron Value Fair hiring practices and nondiscrimination
3 3
Cameron Value To preserve our environment 6 3
Cameron Value Eco-awareness 6 3
Cameron Vision Leading total solutions provider 7 3
Cameron Value Progress each day 10 3
Cameron Value Operational excellence 10 3
Cameron Value Eco-efficiency 14 3
Cameron Value Any metric 4 4
Cameron Value Measurable differences 4 4
Cameron Value Global leadership position 4 4
Cameron Value Expanding globally 6 4
Cameron Value Invest locally 6 4
Cameron Value Nothing gets harmed 6 4
Cameron Value To sustain economic growth 9 4
Cameron Value Consistent growth 9 4
Cameron Value Financial performance 9 4
Caterpillar Value Teamwork 2 1
Caterpillar Value Working together 2 1
Caterpillar Value Help each other succeed 2 1
Caterpillar Value Strengthen our team 2 1
Caterpillar Value Collaborate 2 1
Caterpillar Value Unique talents 3 1
Caterpillar Value Improve results through inclusion 3 1
Caterpillar Vision People are talented 3 1
Caterpillar Value Commitment 5 1
Caterpillar Value Contribute time and resources to promote the common good in our communities
6 1
Caterpillar Value Health and safety 13 1
Caterpillar Value Integrity 5 3
Caterpillar Value Honesty 5 3
Caterpillar Value Deliver what we promise 5 3
Caterpillar Value Trustworthy 5 3
Caterpillar Value Fairly 5 3
Caterpillar Value Not improperly influence others 5 3
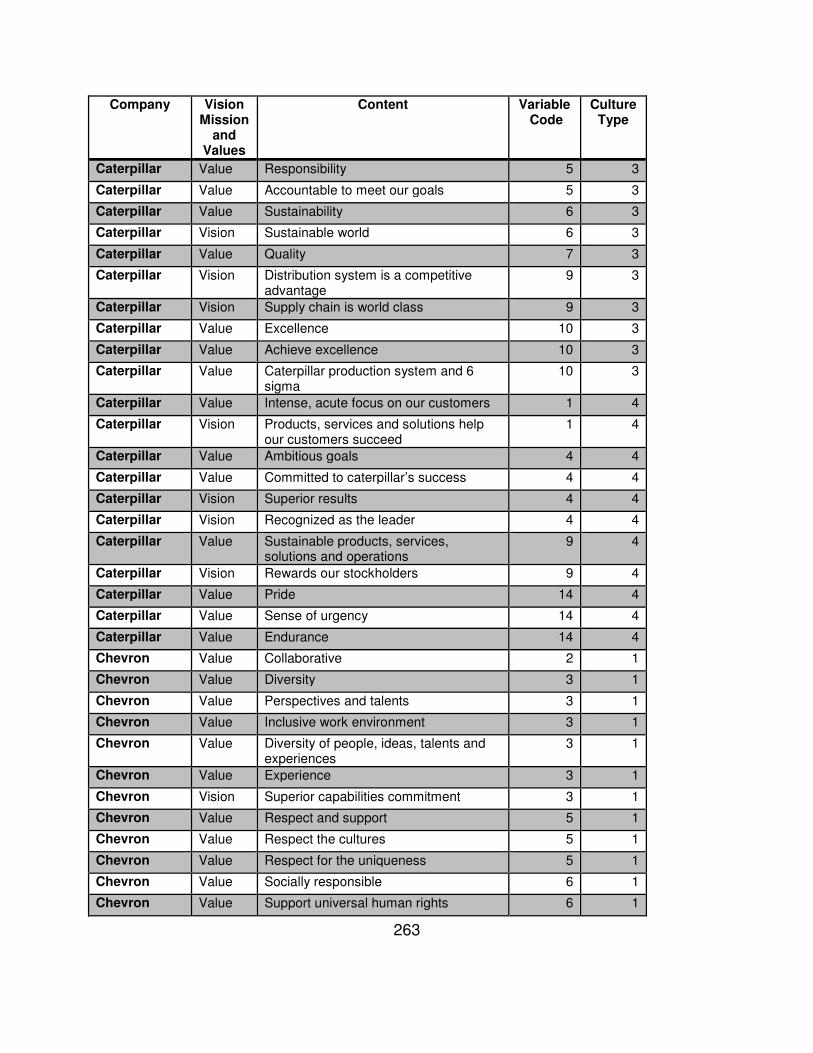
263
Company Vision Mission
and Values
Content Variable Code
Culture Type
Caterpillar Value Responsibility 5 3
Caterpillar Value Accountable to meet our goals 5 3
Caterpillar Value Sustainability 6 3
Caterpillar Vision Sustainable world 6 3
Caterpillar Value Quality 7 3
Caterpillar Vision Distribution system is a competitive advantage
9 3
Caterpillar Vision Supply chain is world class 9 3
Caterpillar Value Excellence 10 3
Caterpillar Value Achieve excellence 10 3
Caterpillar Value Caterpillar production system and 6 sigma
10 3
Caterpillar Value Intense, acute focus on our customers 1 4
Caterpillar Vision Products, services and solutions help our customers succeed
1 4
Caterpillar Value Ambitious goals 4 4
Caterpillar Value Committed to caterpillar’s success 4 4
Caterpillar Vision Superior results 4 4
Caterpillar Vision Recognized as the leader 4 4
Caterpillar Value Sustainable products, services, solutions and operations
9 4
Caterpillar Vision Rewards our stockholders 9 4
Caterpillar Value Pride 14 4
Caterpillar Value Sense of urgency 14 4
Caterpillar Value Endurance 14 4
Chevron Value Collaborative 2 1
Chevron Value Diversity 3 1
Chevron Value Perspectives and talents 3 1
Chevron Value Inclusive work environment 3 1
Chevron Value Diversity of people, ideas, talents and experiences
3 1
Chevron Value Experience 3 1
Chevron Vision Superior capabilities commitment 3 1
Chevron Value Respect and support 5 1
Chevron Value Respect the cultures 5 1
Chevron Value Respect for the uniqueness 5 1
Chevron Value Socially responsible 6 1
Chevron Value Support universal human rights 6 1
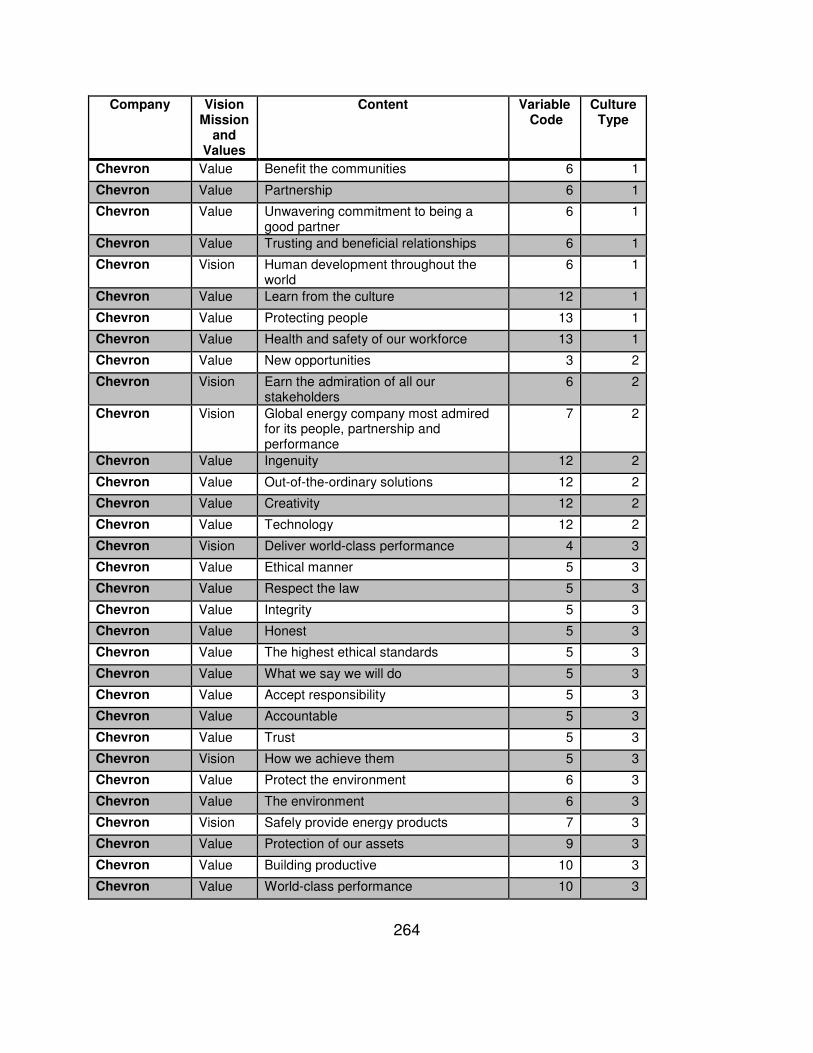
264
Company Vision Mission
and Values
Content Variable Code
Culture Type
Chevron Value Benefit the communities 6 1
Chevron Value Partnership 6 1
Chevron Value Unwavering commitment to being a good partner
6 1
Chevron Value Trusting and beneficial relationships 6 1
Chevron Vision Human development throughout the world
6 1
Chevron Value Learn from the culture 12 1
Chevron Value Protecting people 13 1
Chevron Value Health and safety of our workforce 13 1
Chevron Value New opportunities 3 2
Chevron Vision Earn the admiration of all our stakeholders
6 2
Chevron Vision Global energy company most admired for its people, partnership and performance
7 2
Chevron Value Ingenuity 12 2
Chevron Value Out-of-the-ordinary solutions 12 2
Chevron Value Creativity 12 2
Chevron Value Technology 12 2
Chevron Vision Deliver world-class performance 4 3
Chevron Value Ethical manner 5 3
Chevron Value Respect the law 5 3
Chevron Value Integrity 5 3
Chevron Value Honest 5 3
Chevron Value The highest ethical standards 5 3
Chevron Value What we say we will do 5 3
Chevron Value Accept responsibility 5 3
Chevron Value Accountable 5 3
Chevron Value Trust 5 3
Chevron Vision How we achieve them 5 3
Chevron Value Protect the environment 6 3
Chevron Value The environment 6 3
Chevron Vision Safely provide energy products 7 3
Chevron Value Protection of our assets 9 3
Chevron Value Building productive 10 3
Chevron Value World-class performance 10 3
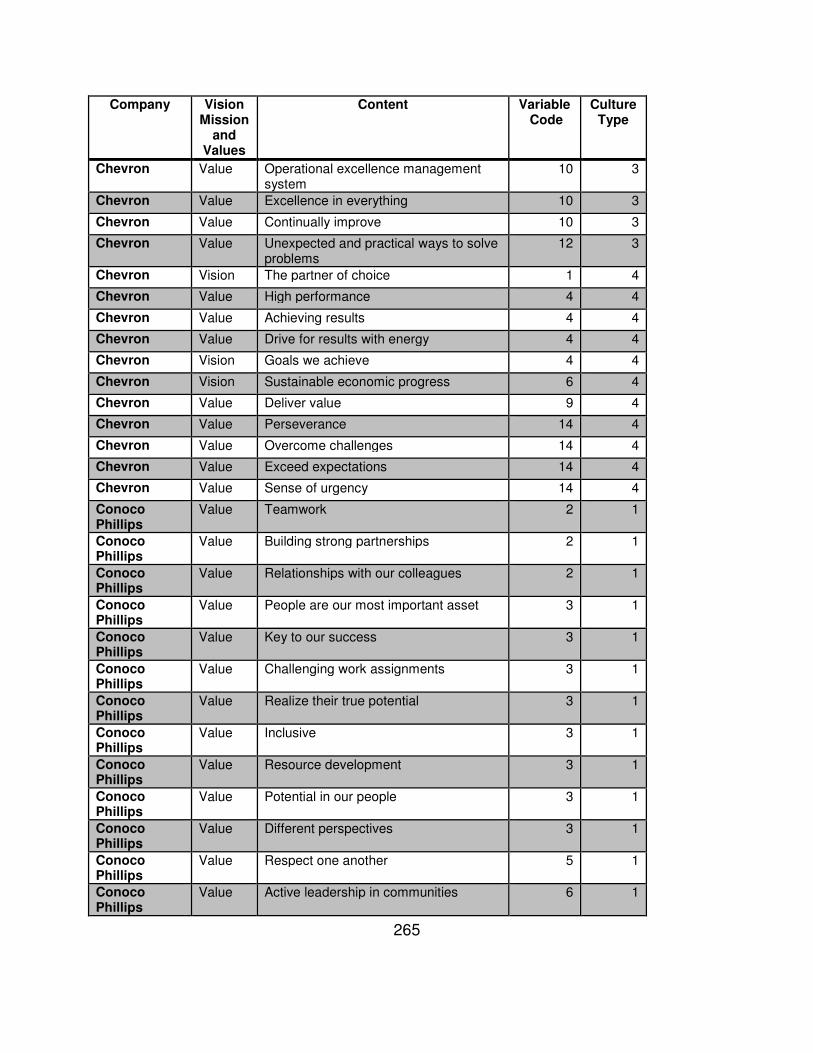
265
Company Vision Mission
and Values
Content Variable Code
Culture Type
Chevron Value Operational excellence management system
10 3
Chevron Value Excellence in everything 10 3
Chevron Value Continually improve 10 3
Chevron Value Unexpected and practical ways to solve problems
12 3
Chevron Vision The partner of choice 1 4
Chevron Value High performance 4 4
Chevron Value Achieving results 4 4
Chevron Value Drive for results with energy 4 4
Chevron Vision Goals we achieve 4 4
Chevron Vision Sustainable economic progress 6 4
Chevron Value Deliver value 9 4
Chevron Value Perseverance 14 4
Chevron Value Overcome challenges 14 4
Chevron Value Exceed expectations 14 4
Chevron Value Sense of urgency 14 4
Conoco Phillips
Value Teamwork 2 1
Conoco Phillips
Value Building strong partnerships 2 1
Conoco Phillips
Value Relationships with our colleagues 2 1
Conoco Phillips
Value People are our most important asset 3 1
Conoco Phillips
Value Key to our success 3 1
Conoco Phillips
Value Challenging work assignments 3 1
Conoco Phillips
Value Realize their true potential 3 1
Conoco Phillips
Value Inclusive 3 1
Conoco Phillips
Value Resource development 3 1
Conoco Phillips
Value Potential in our people 3 1
Conoco Phillips
Value Different perspectives 3 1
Conoco Phillips
Value Respect one another 5 1
Conoco Phillips
Value Active leadership in communities 6 1
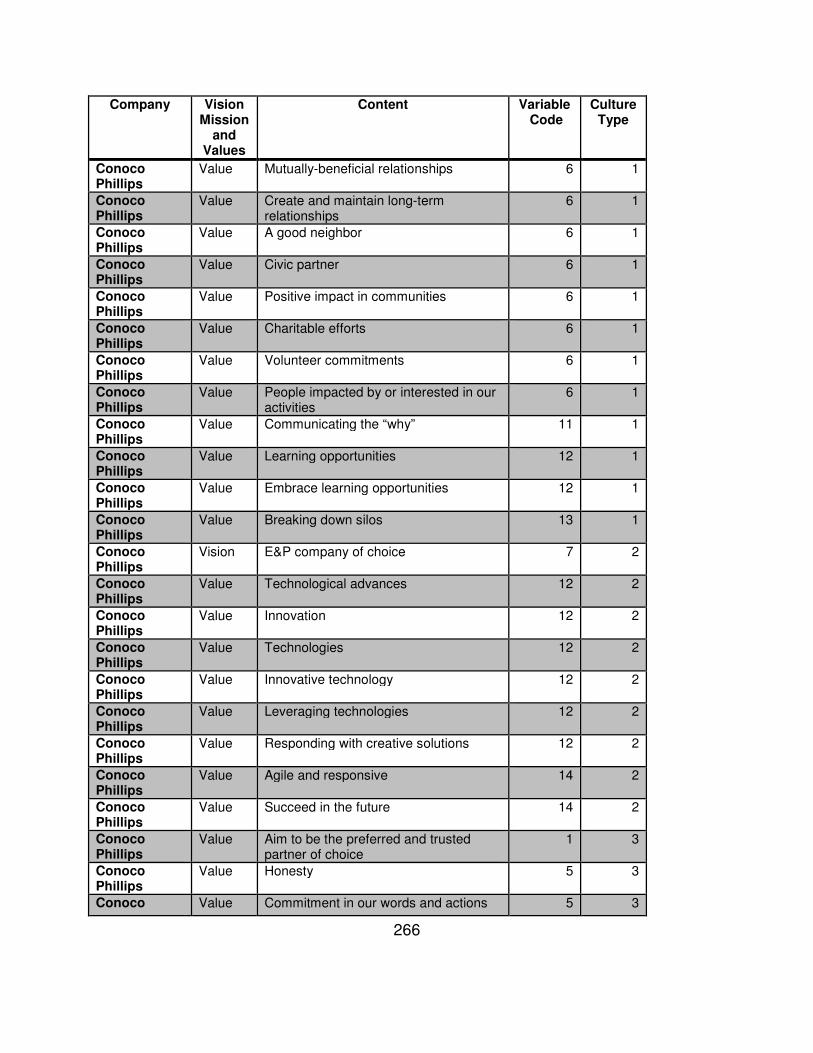
266
Company Vision Mission
and Values
Content Variable Code
Culture Type
Conoco Phillips
Value Mutually-beneficial relationships 6 1
Conoco Phillips
Value Create and maintain long-term relationships
6 1
Conoco Phillips
Value A good neighbor 6 1
Conoco Phillips
Value Civic partner 6 1
Conoco Phillips
Value Positive impact in communities 6 1
Conoco Phillips
Value Charitable efforts 6 1
Conoco Phillips
Value Volunteer commitments 6 1
Conoco Phillips
Value People impacted by or interested in our activities
6 1
Conoco Phillips
Value Communicating the “why” 11 1
Conoco Phillips
Value Learning opportunities 12 1
Conoco Phillips
Value Embrace learning opportunities 12 1
Conoco Phillips
Value Breaking down silos 13 1
Conoco Phillips
Vision E&P company of choice 7 2
Conoco Phillips
Value Technological advances 12 2
Conoco Phillips
Value Innovation 12 2
Conoco Phillips
Value Technologies 12 2
Conoco Phillips
Value Innovative technology 12 2
Conoco Phillips
Value Leveraging technologies 12 2
Conoco Phillips
Value Responding with creative solutions 12 2
Conoco Phillips
Value Agile and responsive 14 2
Conoco Phillips
Value Succeed in the future 14 2
Conoco Phillips
Value Aim to be the preferred and trusted partner of choice
1 3
Conoco Phillips
Value Honesty 5 3
Conoco Value Commitment in our words and actions 5 3
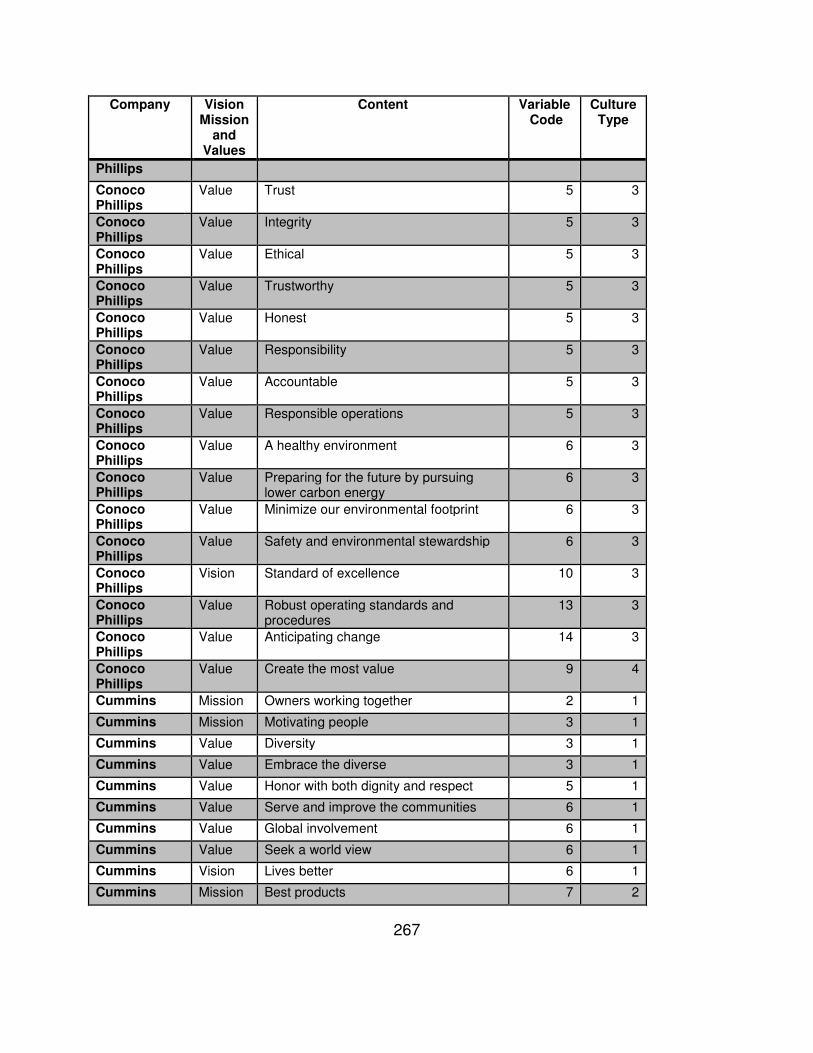
267
Company Vision Mission
and Values
Content Variable Code
Culture Type
Phillips
Conoco Phillips
Value Trust 5 3
Conoco Phillips
Value Integrity 5 3
Conoco Phillips
Value Ethical 5 3
Conoco Phillips
Value Trustworthy 5 3
Conoco Phillips
Value Honest 5 3
Conoco Phillips
Value Responsibility 5 3
Conoco Phillips
Value Accountable 5 3
Conoco Phillips
Value Responsible operations 5 3
Conoco Phillips
Value A healthy environment 6 3
Conoco Phillips
Value Preparing for the future by pursuing lower carbon energy
6 3
Conoco Phillips
Value Minimize our environmental footprint 6 3
Conoco Phillips
Value Safety and environmental stewardship 6 3
Conoco Phillips
Vision Standard of excellence 10 3
Conoco Phillips
Value Robust operating standards and procedures
13 3
Conoco Phillips
Value Anticipating change 14 3
Conoco Phillips
Value Create the most value 9 4
Cummins Mission Owners working together 2 1
Cummins Mission Motivating people 3 1
Cummins Value Diversity 3 1
Cummins Value Embrace the diverse 3 1
Cummins Value Honor with both dignity and respect 5 1
Cummins Value Serve and improve the communities 6 1
Cummins Value Global involvement 6 1
Cummins Value Seek a world view 6 1
Cummins Vision Lives better 6 1
Cummins Mission Best products 7 2
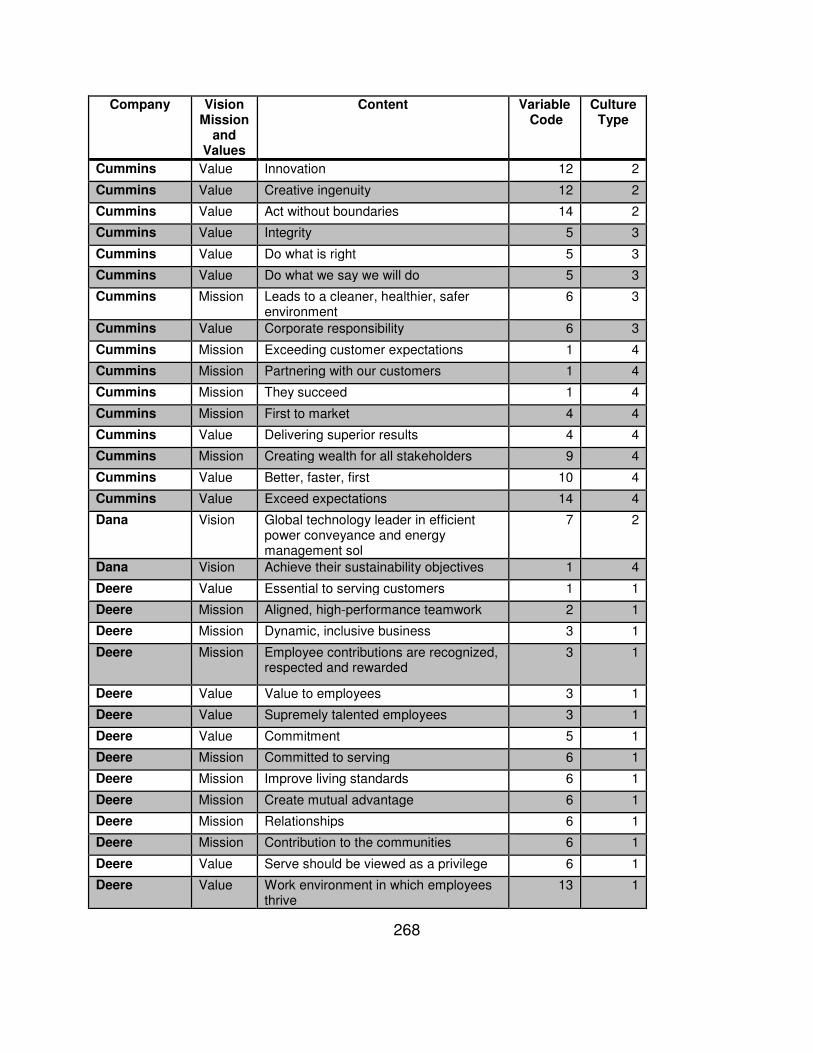
268
Company Vision Mission
and Values
Content Variable Code
Culture Type
Cummins Value Innovation 12 2
Cummins Value Creative ingenuity 12 2
Cummins Value Act without boundaries 14 2
Cummins Value Integrity 5 3
Cummins Value Do what is right 5 3
Cummins Value Do what we say we will do 5 3
Cummins Mission Leads to a cleaner, healthier, safer environment
6 3
Cummins Value Corporate responsibility 6 3
Cummins Mission Exceeding customer expectations 1 4
Cummins Mission Partnering with our customers 1 4
Cummins Mission They succeed 1 4
Cummins Mission First to market 4 4
Cummins Value Delivering superior results 4 4
Cummins Mission Creating wealth for all stakeholders 9 4
Cummins Value Better, faster, first 10 4
Cummins Value Exceed expectations 14 4
Dana Vision Global technology leader in efficient power conveyance and energy management sol
7 2
Dana Vision Achieve their sustainability objectives 1 4
Deere Value Essential to serving customers 1 1
Deere Mission Aligned, high-performance teamwork 2 1
Deere Mission Dynamic, inclusive business 3 1
Deere Mission Employee contributions are recognized, respected and rewarded
3 1
Deere Value Value to employees 3 1
Deere Value Supremely talented employees 3 1
Deere Value Commitment 5 1
Deere Mission Committed to serving 6 1
Deere Mission Improve living standards 6 1
Deere Mission Create mutual advantage 6 1
Deere Mission Relationships 6 1
Deere Mission Contribution to the communities 6 1
Deere Value Serve should be viewed as a privilege 6 1
Deere Value Work environment in which employees thrive
13 1

269
Company Vision Mission
and Values
Content Variable Code
Culture Type
Deere Value Innovation 12 2
Deere Value Inventing, designing and developing breakthrough products and services
12 2
Deere Value Latest technology 12 2
Deere Value Most advanced information technology tools and practices
12 2
Deere Value Powerful source of inspiration 13 2
Deere Value Sustained the loyalty of generations of customers
1 3
Deere Value Integrity 5 3
Deere Value Telling the truth 5 3
Deere Value Keeping our word 5 3
Deere Value Fairness and respect 5 3
Deere Value Honest relationships 5 3
Deere Value Ethical and legal behavior 5 3
Deere Value Quality 7 3
Deere Mission Exceptional operating performance 10 3
Deere Value World-class manufacturing processes 10 3
Deere Mission Relationships with customers 1 4
Deere Mission Be more satisfied 1 4
Deere Mission Profitable and efficient 1 4
Deere Value Value to customers and others 1 4
Deere Value Delight customers 1 4
Deere Value Delivering financial results 4 4
Deere Value Achieving our business goals, present and future
4 4
Deere Value Balanced interests of stakeholders 6 4
Deere Value Maintaining sound relationships to the benefit of our stakeholders
6 4
Deere Mission Consistently deliver superior value 9 4
Deere Mission Disciplined growth 9 4
Deere Mission Consistent value to shareholders 9 4
Deere Value Value to shareholders 9 4
Dover Value Collaborative entrepreneurial spirit 2 1
Dover Value Respects and values 5 1
Dover Value Openness 11 1
Dover Value High ethical standards 5 3
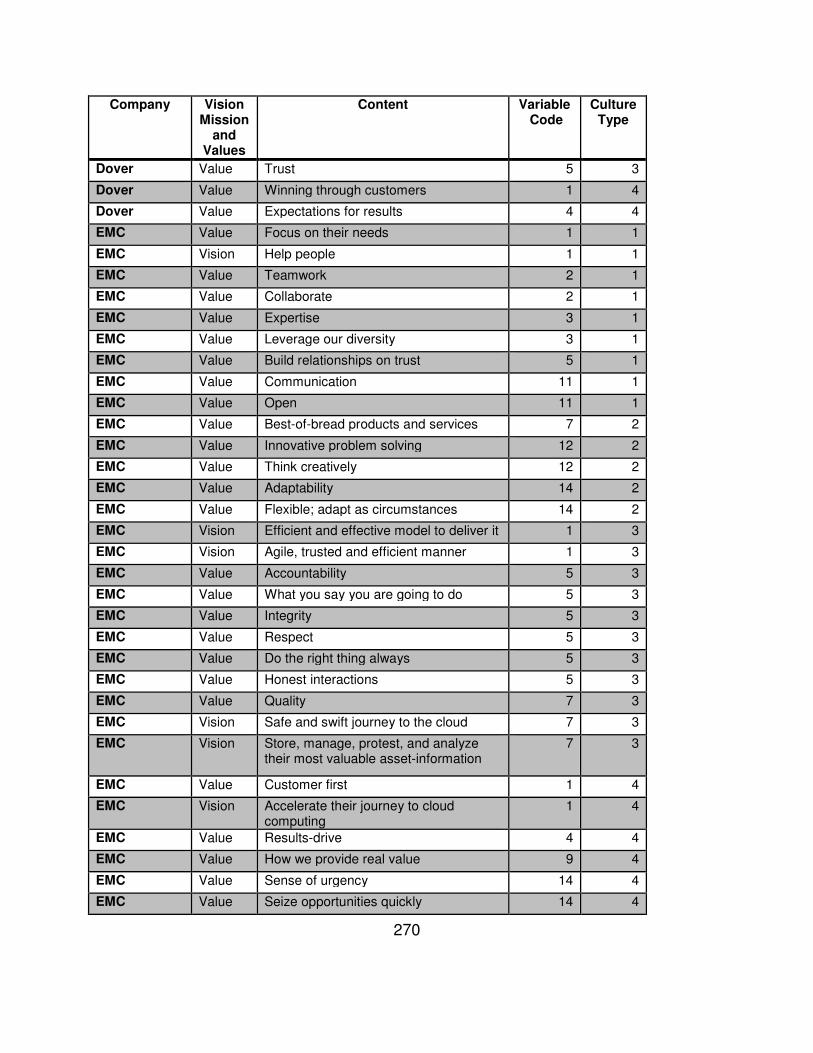
270
Company Vision Mission
and Values
Content Variable Code
Culture Type
Dover Value Trust 5 3
Dover Value Winning through customers 1 4
Dover Value Expectations for results 4 4
EMC Value Focus on their needs 1 1
EMC Vision Help people 1 1
EMC Value Teamwork 2 1
EMC Value Collaborate 2 1
EMC Value Expertise 3 1
EMC Value Leverage our diversity 3 1
EMC Value Build relationships on trust 5 1
EMC Value Communication 11 1
EMC Value Open 11 1
EMC Value Best-of-bread products and services 7 2
EMC Value Innovative problem solving 12 2
EMC Value Think creatively 12 2
EMC Value Adaptability 14 2
EMC Value Flexible; adapt as circumstances 14 2
EMC Vision Efficient and effective model to deliver it 1 3
EMC Vision Agile, trusted and efficient manner 1 3
EMC Value Accountability 5 3
EMC Value What you say you are going to do 5 3
EMC Value Integrity 5 3
EMC Value Respect 5 3
EMC Value Do the right thing always 5 3
EMC Value Honest interactions 5 3
EMC Value Quality 7 3
EMC Vision Safe and swift journey to the cloud 7 3
EMC Vision Store, manage, protest, and analyze their most valuable asset-information
7 3
EMC Value Customer first 1 4
EMC Vision Accelerate their journey to cloud computing
1 4
EMC Value Results-drive 4 4
EMC Value How we provide real value 9 4
EMC Value Sense of urgency 14 4
EMC Value Seize opportunities quickly 14 4

271
Company Vision Mission
and Values
Content Variable Code
Culture Type
EMC Value Get it done now 14 4
EMC Value Understanding the business 14 4
Exxon Value Employees 3 1
Exxon Value Exceptional quality of our workforce 3 1
Exxon Value Valuable competitive edge 3 1
Exxon Value Hire and retain the most qualified 3 1
Exxon Value Maximize their opportunities 3 1
Exxon Value Training and development 3 1
Exxon Value Diversity 3 1
Exxon Value Employed wisely 3 1
Exxon Value Respect local and national cultures 5 1
Exxon Value Communities 6 1
Exxon Value Corporate citizen 6 1
Exxon Value Open communication 11 1
Exxon Value Safe work environment 13 1
Exxon Value Running safe 13 1
Exxon Value World's premier petroleum and petrochemical company
7 2
Exxon Value Innovative 12 2
Exxon Value Proprietary technologies 12 2
Exxon Value Flexibility 14 2
Exxon Value Evaluated regularly 3 3
Exxon Value Operating results 4 3
Exxon Value Adhering to high ethical standards 5 3
Exxon Value Responsibly 5 3
Exxon Value Trust 5 3
Exxon Value Fair treatment 5 3
Exxon Value High ethical standards 5 3
Exxon Value Obey all applicable laws, rules, and regulations
5 3
Exxon Value Environmentally responsible operations 6 3
Exxon Value High quality products and services 7 3
Exxon Value Efficiency and productivity 10 3
Exxon Value Flawlessly executing 10 3
Exxon Value Learning, sharing, and implementing best practices
12 3
Exxon Value Responsive 14 3

272
Company Vision Mission
and Values
Content Variable Code
Culture Type
Exxon Value Customers 1 4
Exxon Value Consistently satisfy 1 4
Exxon Value Leading edge of competition 4 4
Exxon Value Shareholders 6 4
Exxon Value Competitive prices 8 4
Exxon Value Achieve superior financial 9 4
Exxon Value Long-term value 9 4
Exxon Value Profitably 9 4
Exxon Value Rewarded with superior returns 9 4
Exxon Value Disciplined and selective in evaluating the range of capital investment
9 4
Exxon Value Focused, long-term approach 14 4
Ford Vision and Mission
One team 2 1
Ford Vision and Mission
People working 2 1
Ford Vision and Mission
One team 2 1
Ford Vision and Mission
Employees 3 1
Ford Vision and Mission
Accelerate development for new products our customers want and values
1 2
Ford Vision and Mission
Lean, global enterprise for automotive leadership
7 3
Ford Vision and Mission
Customer 1 4
Ford Vision and Mission
Dealers, investor, suppliers, union/council, community satisfaction
6 4
Ford Vision and Mission
Operator profitably 9 4
Ford Vision and Mission
Improve our balance sheet 9 4

273
Company Vision Mission
and Values
Content Variable Code
Culture Type
Ford Vision and Mission
Profitable growth 9 4
Ford Vision and Mission
Aggressively restructure 14 4
General Dynamics
Value Respect the dignity, rights and autonomy of others
5 1
General Dynamics
Value Commitment to our values 5 1
General Dynamics
Value Humanity 6 1
General Dynamics
Value Value by doing the right thing for our communities
6 1
General Dynamics
Value Compassionate and empathetic 13 1
General Dynamics
Value Value by doing the right thing for customers
1 3
General Dynamics
Value Value by doing the right thing for employees
3 3
General Dynamics
Value Honesty 5 3
General Dynamics
Value We tell the truth 5 3
General Dynamics
Value Honesty breeds transparency 5 3
General Dynamics
Value Trust 5 3
General Dynamics
Value To do the right thing 5 3
General Dynamics
Value Alignment 14 3
General Dynamics
Value Value creation 9 4
General Dynamics
Value Value by doing the right thing for our shareholders
9 4
General Motors
Value Individual respect 5 1
General Motors
Vision Design, build and sell the world's best vehicles
7 2
General Motors
Value Integrity 5 3
General Motors
Value Responsibility 5 3
General Motors
Value Transparency and accountability 5 3
Hewlett- Value More efficient ways to serve our 1 1

274
Company Vision Mission
and Values
Content Variable Code
Culture Type
Packard customers
Hewlett-Packard
Value Teamwork 2 1
Hewlett-Packard
Value Collaborate 2 1
Hewlett-Packard
Value A culture of inclusion 3 1
Hewlett-Packard
Value Open, honest and direct 11 1
Hewlett-Packard
Value Contribution is key 14 1
Hewlett-Packard
Value Contribution 14 1
Hewlett-Packard
Value Meaningful innovation 12 2
Hewlett-Packard
Value Trust and respect 5 3
Hewlett-Packard
Value Trust, respect and dignity 5 3
Hewlett-Packard
Value Uncompromising integrity 5 3
Hewlett-Packard
Value Excellence 10 3
Hewlett-Packard
Value Achievement 4 4
Hewlett-Packard
Value Invents the useful and the significant 9 4
Holly Frontier Mission Fully contribute to and participate 2 1
Holly Frontier Mission Development of our employees 3 1
Holly Frontier Mission Inclusive 3 1
Holly Frontier Value Employees to reach their potential 3 1
Holly Frontier Value Creating our own destiny 3 1
Holly Frontier Value Support transparency 5 1
Holly Frontier Value Corporate citizenship 6 1
Holly Frontier Mission Operating in a safe, reliable 13 1
Holly Frontier Value Health and safety of our employees 13 1
Holly Frontier Value Culture creates a fulfilling environment 13 1
Holly Frontier Mission The premier U.S. petroleum refining, pipeline and terminal company
7 2
Holly Frontier Value Innovation 12 2
Holly Frontier Mission Stimulating work environment 13 2
Holly Frontier Value Attitude toward change is essential 14 2

275
Company Vision Mission
and Values
Content Variable Code
Culture Type
Holly Frontier Value Obey the law 5 3
Holly Frontier Value Honesty & respect 5 3
Holly Frontier Value Truth and respect 5 3
Holly Frontier Value Ethics and integrity 5 3
Holly Frontier Value Reputation for behaving ethically 5 3
Holly Frontier Mission Environmentally responsible manner 6 3
Holly Frontier Value Health & safety 6 3
Holly Frontier Value Healthy and safety of our contractors and neighboring communities
6 3
Holly Frontier Value Environmental stewardship 6 3
Holly Frontier Value Minimizing environmental impacts 6 3
Holly Frontier Value Sustainable social and economic benefits
6 3
Holly Frontier Mission Quality 7 3
Holly Frontier Mission Efficiently operating 10 3
Holly Frontier Value Continuously strive to raise the bar 10 3
Holly Frontier Value Continuous improvement 10 3
Holly Frontier Mission Customers superior products and services
1 4
Holly Frontier Value High-performance 4 4
Holly Frontier Mission Superior financial performance 9 4
Holly Frontier Mission Sustainable, profitable growth 9 4
Holly Frontier Mission Growing both organically and through strategic acquisitions
9 4
Holly Frontier Mission Development of our assets 9 4
Honeywell Value Fosters teamwork 2 1
Honeywell Value Success in terms of the whole team 2 1
Honeywell Value Development of others 3 1
Honeywell Value Diversity 3 1
Honeywell Value Great diversity of values, opinions, backgrounds, cultures, and goals
3 1
Honeywell Value Technical or functional excellence 3 1
Honeywell Value Consistently meeting commitments 5 1
Honeywell Value Positive influence 5 1
Honeywell Value People better encourages excellence 10 1
Honeywell Value Constant commitment to do things better
10 1
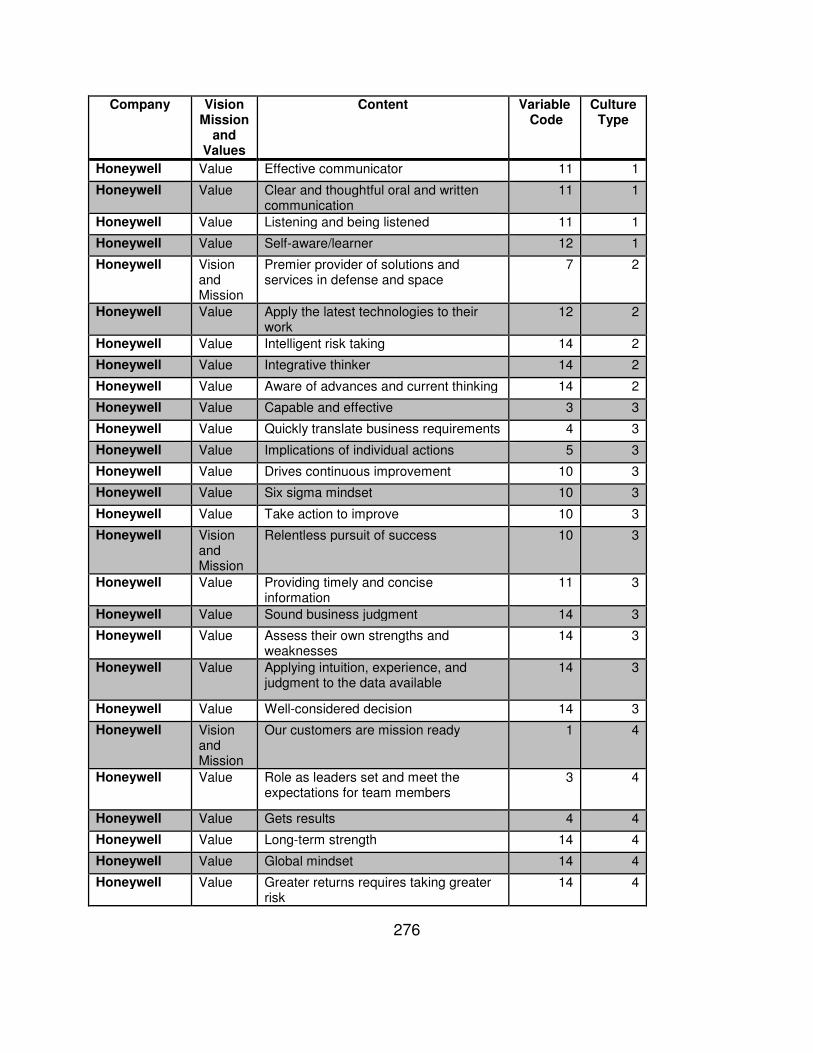
276
Company Vision Mission
and Values
Content Variable Code
Culture Type
Honeywell Value Effective communicator 11 1
Honeywell Value Clear and thoughtful oral and written communication
11 1
Honeywell Value Listening and being listened 11 1
Honeywell Value Self-aware/learner 12 1
Honeywell Vision and Mission
Premier provider of solutions and services in defense and space
7 2
Honeywell Value Apply the latest technologies to their work
12 2
Honeywell Value Intelligent risk taking 14 2
Honeywell Value Integrative thinker 14 2
Honeywell Value Aware of advances and current thinking 14 2
Honeywell Value Capable and effective 3 3
Honeywell Value Quickly translate business requirements 4 3
Honeywell Value Implications of individual actions 5 3
Honeywell Value Drives continuous improvement 10 3
Honeywell Value Six sigma mindset 10 3
Honeywell Value Take action to improve 10 3
Honeywell Vision and Mission
Relentless pursuit of success 10 3
Honeywell Value Providing timely and concise information
11 3
Honeywell Value Sound business judgment 14 3
Honeywell Value Assess their own strengths and weaknesses
14 3
Honeywell Value Applying intuition, experience, and judgment to the data available
14 3
Honeywell Value Well-considered decision 14 3
Honeywell Vision and Mission
Our customers are mission ready 1 4
Honeywell Value Role as leaders set and meet the expectations for team members
3 4
Honeywell Value Gets results 4 4
Honeywell Value Long-term strength 14 4
Honeywell Value Global mindset 14 4
Honeywell Value Greater returns requires taking greater risk
14 4

277
Company Vision Mission
and Values
Content Variable Code
Culture Type
Honeywell Value Courage to take action 14 4
Illinois Tool Works
Value Team, sharing responsibility 2 1
Illinois Tool Works
Value Diverse workforce 3 1
Illinois Tool Works
Value All views to be recognized 3 1
Illinois Tool Works
Value Transparency 5 1
Illinois Tool Works
Value Integrity 5 3
Illinois Tool Works
Value Honesty 5 3
Illinois Tool Works
Value Aims to do what’s right 5 3
Illinois Tool Works
Value Respect 5 3
Illinois Tool Works
Value Respects employee insights 5 3
Illinois Tool Works
Value Respect and dignity 5 3
Illinois Tool Works
Value Trust 5 3
Illinois Tool Works
Value Highest professional standards 5 3
Illinois Tool Works
Value Encourages well-reasoned 14 3
Illinois Tool Works
Value Simplicity 14 3
Illinois Tool Works
Value Focusing on the essential core 14 3
Illinois Tool Works
Value Environment where challenges are discussed openly
11 4
Illinois Tool Works
Value Best interests of the company 14 4
Illinois Tool Works
Value Shared risk 14 4
Illinois Tool Works
Value Prudent risk-taking 14 4
Intel Value Listen and respond to our customers 1 1
Intel Value Make it easy to work with us 1 1
Intel Value Work as a team 2 1
Intel Value Results training 2 1
Intel Mission Employees 3 1
Intel Value Diverse workforce 3 1
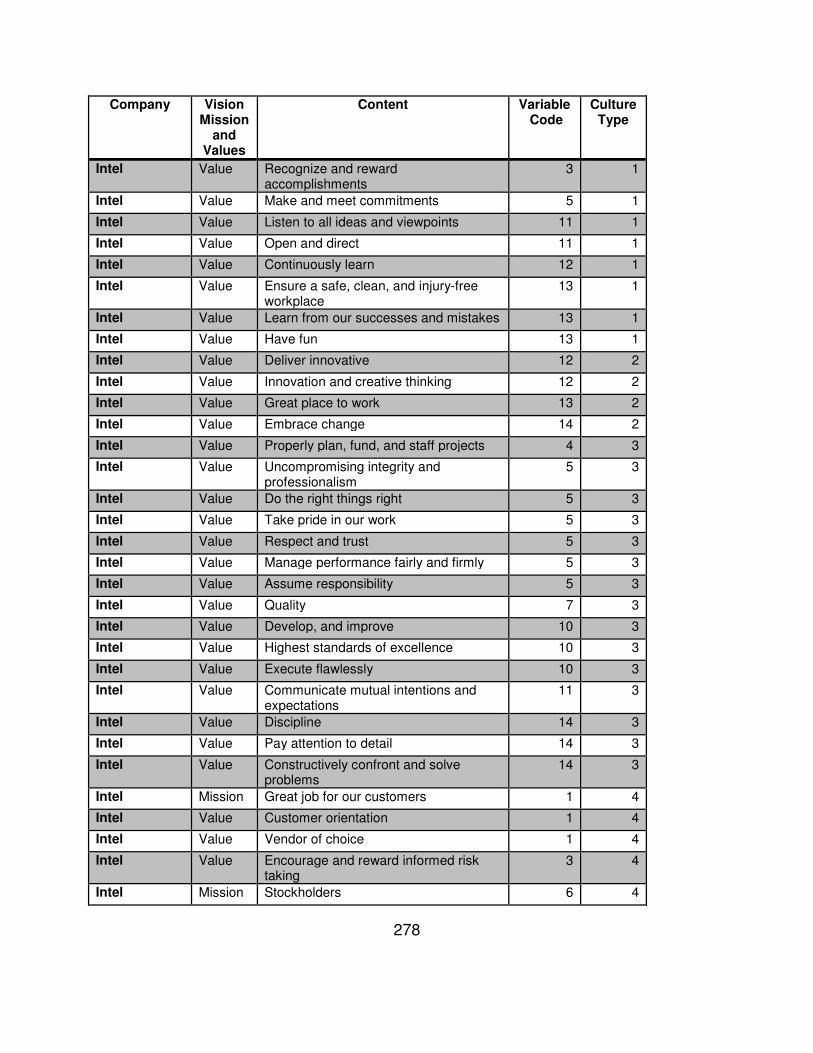
278
Company Vision Mission
and Values
Content Variable Code
Culture Type
Intel Value Recognize and reward accomplishments
3 1
Intel Value Make and meet commitments 5 1
Intel Value Listen to all ideas and viewpoints 11 1
Intel Value Open and direct 11 1
Intel Value Continuously learn 12 1
Intel Value Ensure a safe, clean, and injury-free workplace
13 1
Intel Value Learn from our successes and mistakes 13 1
Intel Value Have fun 13 1
Intel Value Deliver innovative 12 2
Intel Value Innovation and creative thinking 12 2
Intel Value Great place to work 13 2
Intel Value Embrace change 14 2
Intel Value Properly plan, fund, and staff projects 4 3
Intel Value Uncompromising integrity and professionalism
5 3
Intel Value Do the right things right 5 3
Intel Value Take pride in our work 5 3
Intel Value Respect and trust 5 3
Intel Value Manage performance fairly and firmly 5 3
Intel Value Assume responsibility 5 3
Intel Value Quality 7 3
Intel Value Develop, and improve 10 3
Intel Value Highest standards of excellence 10 3
Intel Value Execute flawlessly 10 3
Intel Value Communicate mutual intentions and expectations
11 3
Intel Value Discipline 14 3
Intel Value Pay attention to detail 14 3
Intel Value Constructively confront and solve problems
14 3
Intel Mission Great job for our customers 1 4
Intel Value Customer orientation 1 4
Intel Value Vendor of choice 1 4
Intel Value Encourage and reward informed risk taking
3 4
Intel Mission Stockholders 6 4
279
Company Vision Mission
and Values
Content Variable Code
Culture Type
Intel Mission Preeminent building block supplier 6 4
Intel Value Listen and respond to our suppliers 6 4
Intel Value Listen and respond to our stakeholders 6 4
Intel Value Asset to our communities worldwide 6 4
Intel Value Competitive products and services 7 4
Intel Value Challenging work environment 13 4
Intel Value Challenging and competitive goals 13 4
Intel Value Risk taking 14 4
Intel Value Challenge the status quo 14 4
Intel Value Win 14 4
Intel Value Focus on output 14 4
Lear Mission Active participation 2 1
Lear Value Encourages active participation 2 1
Lear Mission Employees, our most valuable resource 3 1
Lear Mission Values each employee’s unique experience, diversity and contribution
3 1
Lear Mission Reach their full potential 3 1
Lear Mission Encourages inclusion 3 1
Lear Value Employees, our most important resource
3 1
Lear Value Full potential through education 3 1
Lear Value Career opportunities 3 1
Lear Mission Treats all individuals with dignity and respect
5 1
Lear Mission Treat our suppliers with respect 5 1
Lear Value Treat all individuals with dignity and respect
5 1
Lear Value Suppliers with respect 5 1
Lear Mission Foster mutually beneficial relationships 6 1
Lear Mission Support the communities 6 1
Lear Value Encourage long-term relationships 6 1
Lear Value Good corporate citizens 6 1
Lear Value Actively participate in our community 6 1
Lear Value Safe and clean 13 1
Lear Mission ‘Can-do’ spirit 14 2
Lear Value Balance resources 4 3
Lear Mission Integrity 5 3

280
Company Vision Mission
and Values
Content Variable Code
Culture Type
Lear Value Business ethically 5 3
Lear Mission Protect the environment 6 3
Lear Value Value the environment 6 3
Lear Mission Highest quality products and services 7 3
Lear Mission Continually improving 10 3
Lear Value Strive for excellence 10 3
Lear Mission Customers’ needs and expectations 1 4
Lear Value Customers’ needs and expectations 1 4
Lear Vision A leader and the company of first choice
1 4
Lear Mission Low-cost 8 4
Lear Mission High-value added solutions 9 4
Lear Mission Maximize value for our shareholders 9 4
Lear Value Maximize shareholders’ return 9 4
Lockheed Martin
Value Tightly integrated team 2 1
Lockheed Martin
Value Talent, skills and expertise of our people
3 1
Lockheed Martin
Value Diversity 3 1
Lockheed Martin
Value Respect others 5 1
Lockheed Martin
Value Respect 5 1
Lockheed Martin
Value Good citizens 6 1
Lockheed Martin
Vision Deliver citizen services 6 1
Lockheed Martin
Vision Advance scientific discovery 12 2
Lockheed Martin
Value Do what's right 5 3
Lockheed Martin
Value Highest standards of ethical conduct 5 3
Lockheed Martin
Value Honesty and integrity engender trust 5 3
Lockheed Martin
Value Abide by the laws 5 3
Lockheed Martin
Value Take responsibility for our actions 5 3
Lockheed Martin
Value Perform with excellence 10 3
Lockheed Vision Global leader in supporting our 1 4

281
Company Vision Mission
and Values
Content Variable Code
Culture Type
Martin customers
Lockheed Martin
Vision Strengthen global security 6 4
Lockheed Martin
Value Excel in every aspect of our business 10 4
Lockheed Martin
Value Challenge with a determination to succeed
14 4
National Oilwell Varco
Value Collaborate with our customer 1 1
National Oilwell Varco
Value Teamwork 2 1
National Oilwell Varco
Value Optimize the sum of all individual efforts 2 1
National Oilwell Varco
Value Recognized and rewarded 3 1
National Oilwell Varco
Value Honor our commitments 5 1
National Oilwell Varco
Value Respect for all 5 1
National Oilwell Varco
Value Citizenship 6 1
National Oilwell Varco
Value Enthusiasm 14 2
National Oilwell Varco
Value Passionate 14 2
National Oilwell Varco
Value Integrity 5 3
National Oilwell Varco
Value Say what we mean 5 3
National Oilwell Varco
Value Actions reflect our words 5 3
National Oilwell Varco
Value Honor the culture and laws 5 3
National Oilwell Varco
Value Quality into the products, services and solutions
7 3
National Oilwell Varco
Value Customer focus 1 4

282
Company Vision Mission
and Values
Content Variable Code
Culture Type
National Oilwell Varco
Value Our number one priority 1 4
National Oilwell Varco
Value Meet or exceed their expectations 1 4
National Oilwell Varco
Value Performance driven results 4 4
National Oilwell Varco
Value Collaborate with our suppliers 6 4
National Oilwell Varco
Value Stakeholder value creation 9 4
National Oilwell Varco
Value Creation of stakeholder value 9 4
National Oilwell Varco
Value Pride 14 4
Navistar Vision New ways to help America's workers 1 1
Navistar Vision They ride more safely into conflict 1 1
Navistar Value Respect for people 5 1
Navistar Value Communication 11 1
Navistar Value Innovation 12 2
Navistar Vision New ideas 12 2
Navistar Vision Pioneer technologies 12 2
Navistar Vision Latest innovations 12 2
Navistar Value Speed, simplicity and agility 14 2
Navistar Vision Passion 14 2
Navistar Vision Protect our troops 1 3
Navistar Value Accountability 5 3
Navistar Value Relentless pursuit of quality 7 3
Navistar Vision Our best every day 10 3
Navistar Value Customer focus 1 4
Navistar Vision Drive to deliver 4 4
Navistar Vision Brave inventors 12 4
Navistar Vision Bold thinkers 12 4
Navistar Vision Perseverance 14 4
Navistar Vision Courage 14 4
Navistar Vision Drive 14 4
NCR Value Genuinely care about our customers 1 1

283
Company Vision Mission
and Values
Content Variable Code
Culture Type
NCR Value Dedicated to serving them 1 1
NCR Value Develop long-term customer relationships
1 1
NCR Value Team spirit to customers 1 1
NCR Value Work together 2 1
NCR Value Teams with each other 2 1
NCR Value Teamwork 2 1
NCR Value Work as a team 2 1
NCR Value Team we can achieve together what would remain out of reach for us individually
2 1
NCR Value Create opportunities for employees 3 1
NCR Value Performance of employees 3 1
NCR Value Recognize the contributions of every member
3 1
NCR Value Unique qualities, abilities and perspectives each person
3 1
NCR Value Keep our commitments 5 1
NCR Value Respect 5 1
NCR Value Respect for each other 5 1
NCR Value Communicate openly and candidly 11 1
NCR Value Develop new business solutions for our customers
1 2
NCR Value Dynamic new technologies we deliver to our customers
1 2
NCR Value Innovation 12 2
NCR Value Innovation: pursuit of innovation 12 2
NCR Value Constant pursuit of innovation – both process
12 2
NCR Value Technology innovation 12 2
NCR Value New ideas 12 2
NCR Value Innovation powers the engine that drives our success
12 2
NCR Vision and Mission
Innovation 12 2
NCR Value Integrity 5 3
NCR Value Highest standards of integrity 5 3
NCR Value Act legally 5 3
NCR Value Ethically 5 3
284
Company Vision Mission
and Values
Content Variable Code
Culture Type
NCR Value Fairness 5 3
NCR Value Honesty 5 3
NCR Value Admit our mistakes and learn from our experiences
5 3
NCR Value Accountable 5 3
NCR Value Worthy of trust 5 3
NCR Value Personal ownership 5 3
NCR Value Reward the trust of our shareowners 5 3
NCR Value No surprises 5 3
NCR Value Trust 5 3
NCR Value Highest quality products and services 7 3
NCR Value Delivering quality 7 3
NCR Value Continuously improve 10 3
NCR Value We search for new and more effective ways
12 3
NCR Value Customer dedication: passion for our customers and their success
1 4
NCR Value Learn their markets 1 4
NCR Value Understand their specific goals and objectives
1 4
NCR Value With our customers 1 4
NCR Value Business value that meet or exceed our customers’ expectations
1 4
NCR Value Put them to work for our customers 1 4
NCR Value Commit to high performance 4 4
NCR Value Achieve best-in-class performance 4 4
NCR Value Team spirit to partners, suppliers and the communities
6 4
NCR Value Profitable growth 9 4
NCR Value Develop solutions that deliver business value
9 4
NCR Value Highest possible value 9 4
NCR Value Performance: commitment to performance excellence
10 4
NCR Value Courage 14 4
NCR Value Sense of urgency 14 4
Oshkosh Value Diversity of our workforce 3 1
Oshkosh Value Celebrate the uniqueness 3 1

285
Company Vision Mission
and Values
Content Variable Code
Culture Type
Oshkosh Value Always true to others 5 1
Oshkosh Value Keep the commitments we make 5 1
Oshkosh Value Citizenship 6 1
Oshkosh Value Do our part to make our communities, and our world, better places to live
6 1
Oshkosh Value Speak up and report concerns 11 1
Oshkosh Value Clarification and guidance whenever we have questions
11 1
Oshkosh Value Polite and courteous 14 1
Oshkosh Value Honesty 5 3
Oshkosh Value Truthful 5 3
Oshkosh Value Honest and forthright 5 3
Oshkosh Value Say what we mean 5 3
Oshkosh Value Do what we say 5 3
Oshkosh Value Integrity 5 3
Oshkosh Value True to ourselves 5 3
Oshkosh Value Moral principles 5 3
Oshkosh Value Do the right thing 5 3
Oshkosh Value Genuine promises 5 3
Oshkosh Value Actions to fulfill them are honorable 5 3
Oshkosh Value Stand for what is right 5 3
Oshkosh Value Accountability 5 3
Oshkosh Value Honor our obligations 5 3
Oshkosh Value Seek the truth 5 3
Oshkosh Value Respect 5 3
Oshkosh Value Dignity and fairness 5 3
Oshkosh Value Obey the letter and spirit of all laws 5 3
Oshkosh Mission Safely and efficiently move people and materials at work
6 3
Oshkosh Value We respect our environment 6 3
Oshkosh Value Improve all that we do 10 3
Oshkosh Value The workplace without fear of retribution 13 3
Oshkosh Value Don’t seek to blame 13 3
Oshkosh Mission Partner with customers to deliver superior solutions
1 4
Oshkosh Value Highest standards of performance 4 4
Paccar Mission Global technology leader in the design, 7 2

286
Company Vision Mission
and Values
Content Variable Code
Culture Type
manufacture
Paccar Value Environmental responsibility 6 3
Paccar Mission Customer support 1 4
Tenneco Value Teamwork 2 1
Tenneco Value Collaboration 2 1
Tenneco Value Relying on and having faith in one another
2 1
Tenneco Mission Employee involvement 3 1
Tenneco Value Achieve and meet commitments 5 1
Tenneco Value Transparency 5 1
Tenneco Value Raising issues 11 1
Tenneco Value Open 11 1
Tenneco Mission Shared-value culture 13 1
Tenneco Value Health & safety 13 1
Tenneco Value Healthy and safe work environment 13 1
Tenneco Mission Number-one technology-driven, global manufacturer and marketer
7 2
Tenneco Vision Pioneering global ideas for cleaner air, and smoother, quieter and safer transpo
7 2
Tenneco Value Innovation 12 2
Tenneco Value New solutions 12 2
Tenneco Value Accountability 5 3
Tenneco Value Accepting responsibility 5 3
Tenneco Value Integrity 5 3
Tenneco Value Honest, fair 5 3
Tenneco Value Ethics 5 3
Tenneco Value Being forthcoming 5 3
Tenneco Value Trust 5 3
Tenneco Mission Continued improvement 10 3
Tenneco Value Engineering expertise and advanced technologies
12 3
Tenneco Mission Delight our customers 1 4
Tenneco Value Unrelenting pursuit of a goal 4 4
Tenneco Value Results oriented 4 4
Tenneco Value Taking authority 5 4
Tenneco Mission Shareholder value 9 4

287
Company Vision Mission
and Values
Content Variable Code
Culture Type
Tenneco Value Passion and a sense of urgency 14 4
Tenneco Value Desire to win now 14 4
Tenneco Value Perseverance 14 4
Tenneco Value Resolute and unyielding 14 4
Terex Value Serve the needs of our customers 1 1
Terex Value Team member development 2 1
Terex Value Teams across boundaries 2 1
Terex Vision Team member 2 1
Terex Value Servant leadership 3 1
Terex Value Serve the needs of our team members 3 1
Terex Value Citizenship 6 1
Terex Value Global, local and national citizens 6 1
Terex Value The communities 6 1
Terex Value Making the world we live in a better place
6 1
Terex Value Chain of support 13 1
Terex Vision Best place to work 13 1
Terex Value Don’t admonish failure, only failure to learn
14 1
Terex Value Value the differences in people’s thinking, backgrounds and cultures
3 2
Terex Value New and better ways of doing things 12 2
Terex Value Integrity 5 3
Terex Value Transparent 5 3
Terex Value Respect 5 3
Terex Value Dignity and respect 5 3
Terex Value Do the right thing 5 3
Terex Value Safe and healthy environment 6 3
Terex Value Good stewards of the environment 6 3
Terex Mission Superior productivity 10 3
Terex Value Improvement 10 3
Terex Value Continually improving 10 3
Terex Value Eliminating waste 10 3
Terex Value Ask what we can do to help 13 3
Terex Value Decisions and take action 14 3
Terex Vision Customer 1 4
288
Company Vision Mission
and Values
Content Variable Code
Culture Type
Terex Vision Most customer responsive company 1 4
Terex Value Achieving our goals 4 4
Terex Value Require stretch goals 4 4
Terex Value Achieve common goals 4 4
Terex Value Serve the needs of our investors 6 4
Terex Mission Provide solutions to our machinery and industrial product customers
7 4
Terex Mission Return on investment 9 4
Terex Value Protecting our reputation and assets 9 4
Terex Vision Financial 9 4
Terex Vision Most profitable company 9 4
Terex Value Challenge the status quo 14 4
Terex Value Courage 14 4
Terex Value Take risks 14 4
Tesoro Value Respect 5 1
Tesoro Value Integrity 5 3
Tesoro Value Environment and safety 6 3
Tesoro Vision Create a safer and cleaner future 6 3
Tesoro Vision Efficient providers of reliable transportation fuel solutions
7 3
Textron Value Pursuit of excellence in all relationships with employee
3 1
Textron Value Respect 5 1
Textron Value Integrity 5 3
Textron Value Trust 5 3
Textron Value Pursuit of excellence in all relationships with business partners, suppliers, sh
6 3
Textron Value Pursuit of excellence in all relationships with customers
1 4
Textron Vision Become the premier multi-industry company in the world
14 4
TRW Vision Trust in our people 3 1
TRW Mission Global leader in automotive safety 7 2
TRW Mission Broadest portfolio 7 2
TRW Vision Global leader in active and passive safety systems
7 2
TRW Vision Trust 5 3
TRW Vision Their integrity 5 3
289
Company Vision Mission
and Values
Content Variable Code
Culture Type
TRW Vision Trust in our products 7 3
United Technologies Corporation
Value We use customer feedback 1 1
United Technologies Corporation
Vision Finding better ways to serve to our customers
1 1
United Technologies Corporation
Value To cooperate with each other 2 1
United Technologies Corporation
Value Encourage diversity 3 1
United Technologies Corporation
Value Opportunity 3 1
United Technologies Corporation
Value Knowledge and capabilities 3 1
United Technologies Corporation
Value Encourage and celebrate our employees' active roles in their communities
3 1
United Technologies Corporation
Value Engage with the world outside UTC 6 1
United Technologies Corporation
Value Seek and share ideas openly 11 1
United Technologies Corporation
Value Communicate honestly 11 1
United Technologies Corporation
Value Support and pursue lifelong learning 12 1
United Technologies Corporation
Value Learn from the consequences 14 1
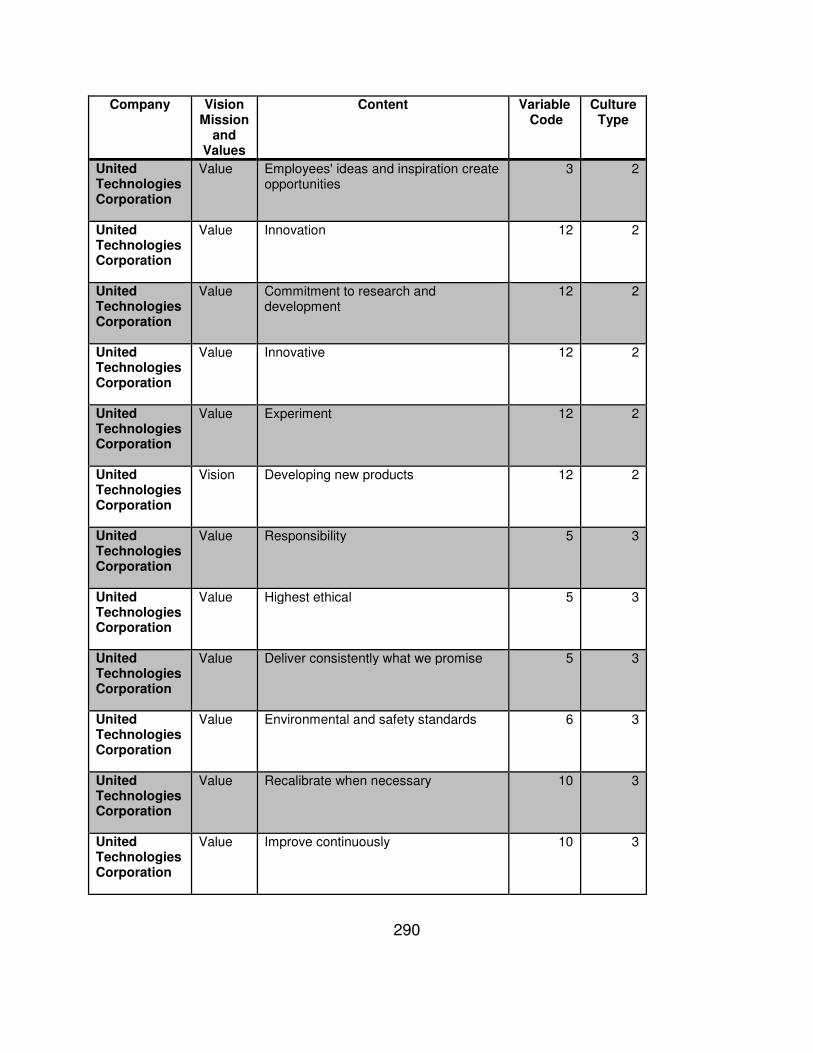
290
Company Vision Mission
and Values
Content Variable Code
Culture Type
United Technologies Corporation
Value Employees' ideas and inspiration create opportunities
3 2
United Technologies Corporation
Value Innovation 12 2
United Technologies Corporation
Value Commitment to research and development
12 2
United Technologies Corporation
Value Innovative 12 2
United Technologies Corporation
Value Experiment 12 2
United Technologies Corporation
Vision Developing new products 12 2
United Technologies Corporation
Value Responsibility 5 3
United Technologies Corporation
Value Highest ethical 5 3
United Technologies Corporation
Value Deliver consistently what we promise 5 3
United Technologies Corporation
Value Environmental and safety standards 6 3
United Technologies Corporation
Value Recalibrate when necessary 10 3
United Technologies Corporation
Value Improve continuously 10 3
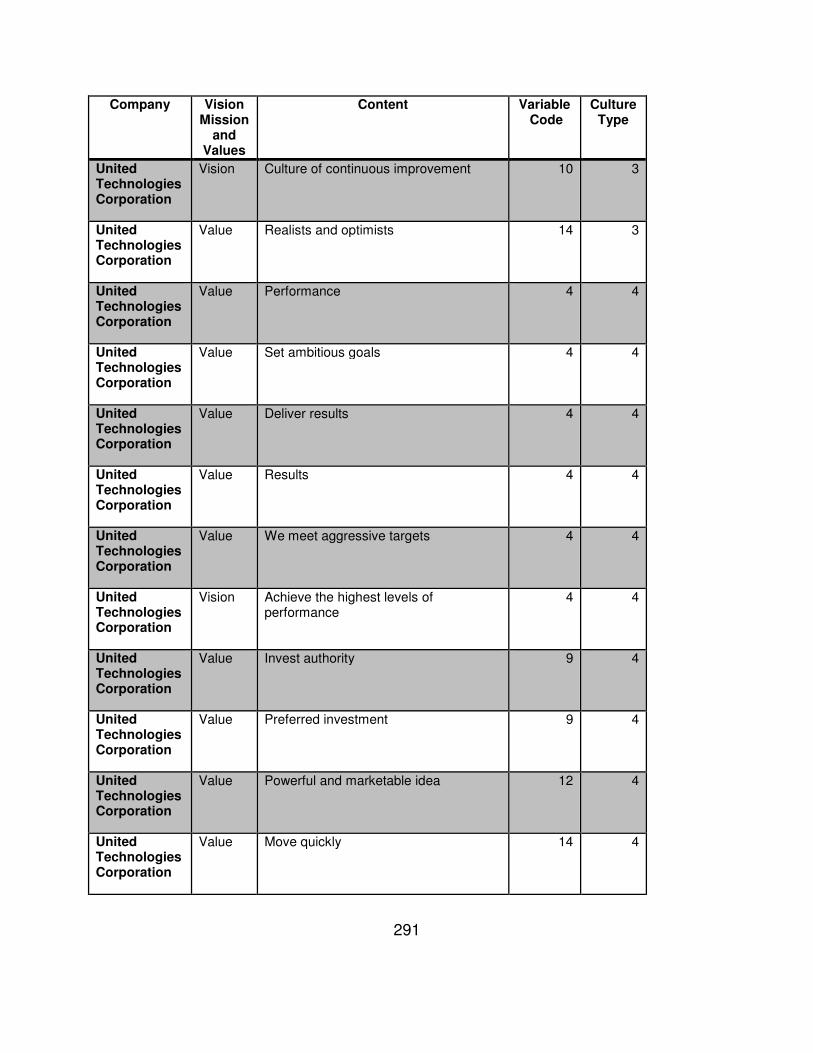
291
Company Vision Mission
and Values
Content Variable Code
Culture Type
United Technologies Corporation
Vision Culture of continuous improvement 10 3
United Technologies Corporation
Value Realists and optimists 14 3
United Technologies Corporation
Value Performance 4 4
United Technologies Corporation
Value Set ambitious goals 4 4
United Technologies Corporation
Value Deliver results 4 4
United Technologies Corporation
Value Results 4 4
United Technologies Corporation
Value We meet aggressive targets 4 4
United Technologies Corporation
Vision Achieve the highest levels of performance
4 4
United Technologies Corporation
Value Invest authority 9 4
United Technologies Corporation
Value Preferred investment 9 4
United Technologies Corporation
Value Powerful and marketable idea 12 4
United Technologies Corporation
Value Move quickly 14 4
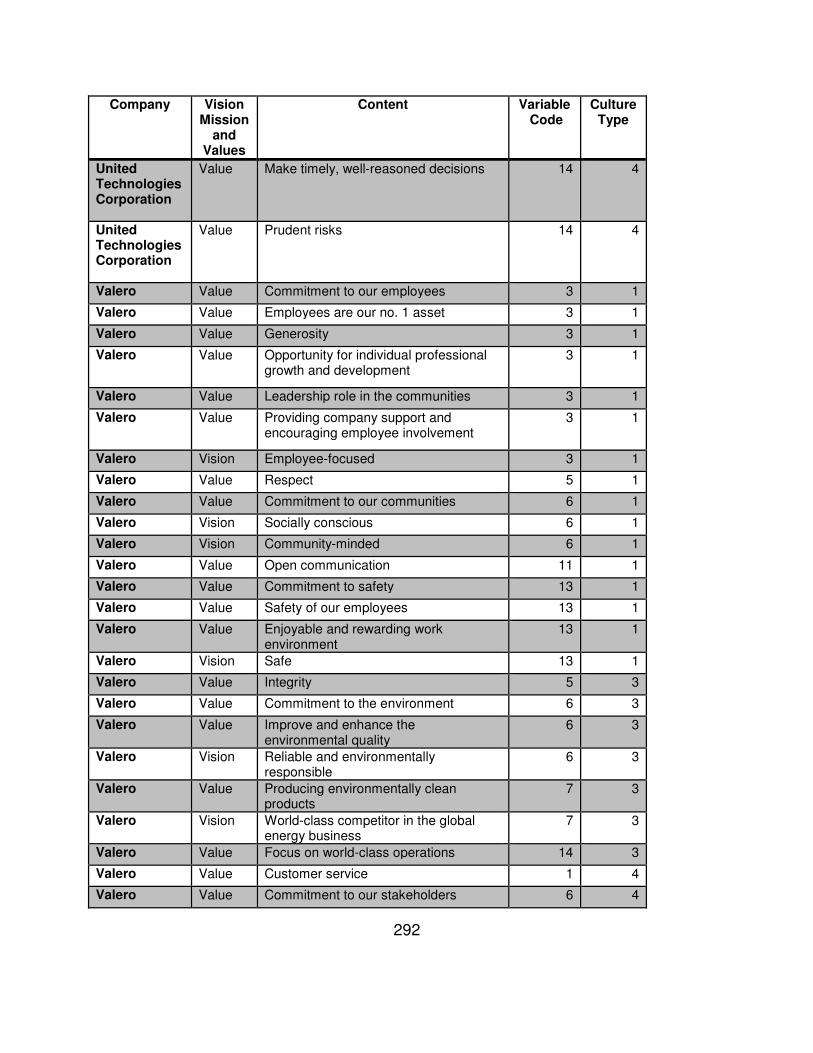
292
Company Vision Mission
and Values
Content Variable Code
Culture Type
United Technologies Corporation
Value Make timely, well-reasoned decisions 14 4
United Technologies Corporation
Value Prudent risks 14 4
Valero Value Commitment to our employees 3 1
Valero Value Employees are our no. 1 asset 3 1
Valero Value Generosity 3 1
Valero Value Opportunity for individual professional growth and development
3 1
Valero Value Leadership role in the communities 3 1
Valero Value Providing company support and encouraging employee involvement
3 1
Valero Vision Employee-focused 3 1
Valero Value Respect 5 1
Valero Value Commitment to our communities 6 1
Valero Vision Socially conscious 6 1
Valero Vision Community-minded 6 1
Valero Value Open communication 11 1
Valero Value Commitment to safety 13 1
Valero Value Safety of our employees 13 1
Valero Value Enjoyable and rewarding work environment
13 1
Valero Vision Safe 13 1
Valero Value Integrity 5 3
Valero Value Commitment to the environment 6 3
Valero Value Improve and enhance the environmental quality
6 3
Valero Vision Reliable and environmentally responsible
6 3
Valero Value Producing environmentally clean products
7 3
Valero Vision World-class competitor in the global energy business
7 3
Valero Value Focus on world-class operations 14 3
Valero Value Customer service 1 4
Valero Value Commitment to our stakeholders 6 4

293
Company Vision Mission
and Values
Content Variable Code
Culture Type
Valero Value Safe of our operations and immunities is our highest priority
9 4
Valero Value Long-term value to all stakeholders 9 4
Valero Value Pursuing profitable 9 4
Valero Value Value-enhancing strategies 9 4
Valero Vision Returns on investments 9 4
Valero Value Challenging 13 4
Valero Value Dedication 14 4
Visteon Vision The best in the world at partnering with our customer
1 1
Visteon Value Work together 2 1
Visteon Value Respect others 5 1
Visteon Value Treat others as you would like to be treated
5 1
Visteon Value Deliver on our commitments 5 1
Visteon Value Communicate 11 1
Visteon Vision Innovative 12 2
Visteon Value Act with integrity 5 3
Visteon Value Do what is right 5 3
Visteon Vision High-quality products 7 3
Visteon Value Continuous improvement 10 3
Visteon Value Strive for excellence 10 3
Visteon Value Put customers first 1 4
Visteon Value Exceed our customers’ expectations 1 4
Visteon Vision Deliver exceptional value 1 4
Visteon Value Achieve results 4 4
Visteon Value Willingly take responsibility for decisions, actions and results
5 4
Western Digital
Value Teamwork 2 1
Western Digital
Value Build strong working partnerships 2 1
Western Digital
Value Accountability for team results 4 1
Western Digital
Value Respect ourselves and others 5 1
Western Digital
Value Achieve win-win solutions 6 1
Western Digital
Value Seek to understand before being understood
11 1
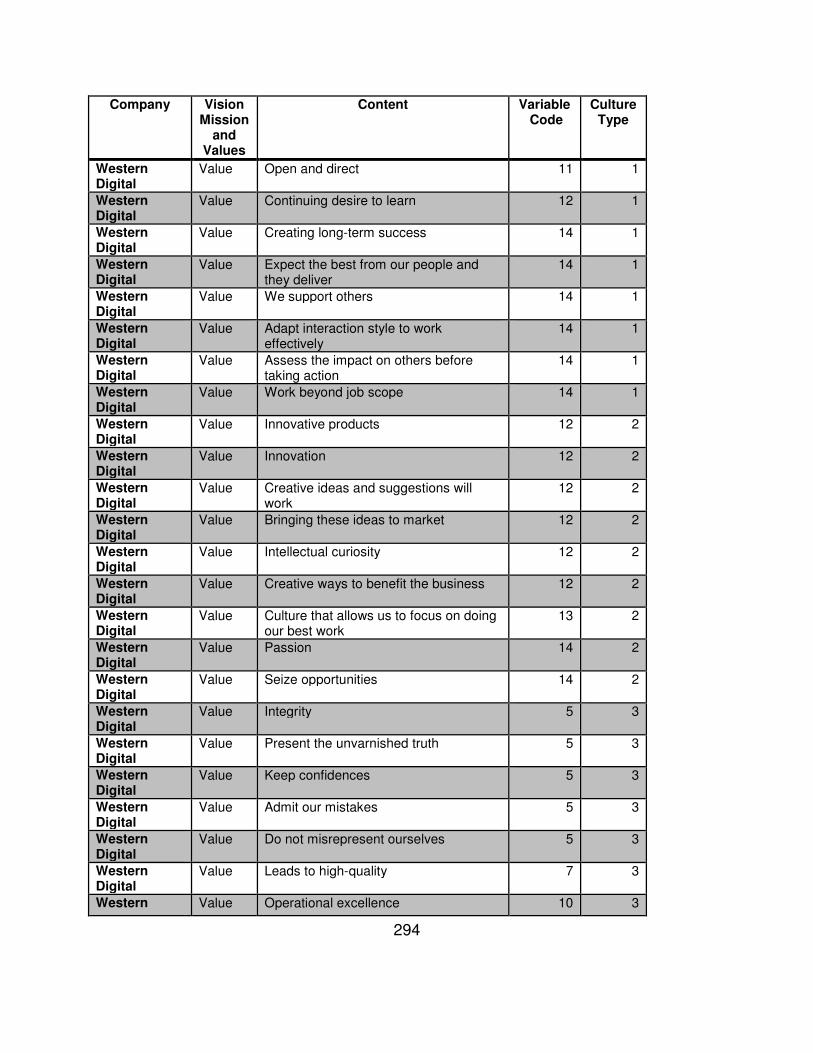
294
Company Vision Mission
and Values
Content Variable Code
Culture Type
Western Digital
Value Open and direct 11 1
Western Digital
Value Continuing desire to learn 12 1
Western Digital
Value Creating long-term success 14 1
Western Digital
Value Expect the best from our people and they deliver
14 1
Western Digital
Value We support others 14 1
Western Digital
Value Adapt interaction style to work effectively
14 1
Western Digital
Value Assess the impact on others before taking action
14 1
Western Digital
Value Work beyond job scope 14 1
Western Digital
Value Innovative products 12 2
Western Digital
Value Innovation 12 2
Western Digital
Value Creative ideas and suggestions will work
12 2
Western Digital
Value Bringing these ideas to market 12 2
Western Digital
Value Intellectual curiosity 12 2
Western Digital
Value Creative ways to benefit the business 12 2
Western Digital
Value Culture that allows us to focus on doing our best work
13 2
Western Digital
Value Passion 14 2
Western Digital
Value Seize opportunities 14 2
Western Digital
Value Integrity 5 3
Western Digital
Value Present the unvarnished truth 5 3
Western Digital
Value Keep confidences 5 3
Western Digital
Value Admit our mistakes 5 3
Western Digital
Value Do not misrepresent ourselves 5 3
Western Digital
Value Leads to high-quality 7 3
Western Value Operational excellence 10 3
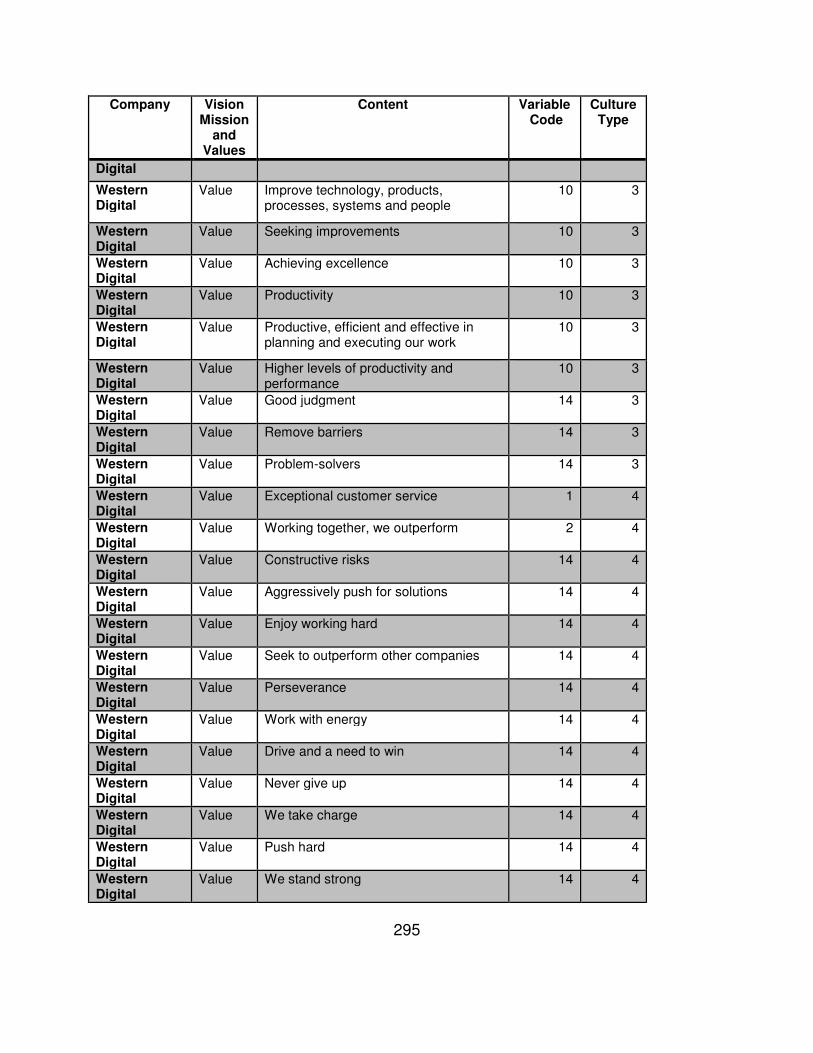
295
Company Vision Mission
and Values
Content Variable Code
Culture Type
Digital
Western Digital
Value Improve technology, products, processes, systems and people
10 3
Western Digital
Value Seeking improvements 10 3
Western Digital
Value Achieving excellence 10 3
Western Digital
Value Productivity 10 3
Western Digital
Value Productive, efficient and effective in planning and executing our work
10 3
Western Digital
Value Higher levels of productivity and performance
10 3
Western Digital
Value Good judgment 14 3
Western Digital
Value Remove barriers 14 3
Western Digital
Value Problem-solvers 14 3
Western Digital
Value Exceptional customer service 1 4
Western Digital
Value Working together, we outperform 2 4
Western Digital
Value Constructive risks 14 4
Western Digital
Value Aggressively push for solutions 14 4
Western Digital
Value Enjoy working hard 14 4
Western Digital
Value Seek to outperform other companies 14 4
Western Digital
Value Perseverance 14 4
Western Digital
Value Work with energy 14 4
Western Digital
Value Drive and a need to win 14 4
Western Digital
Value Never give up 14 4
Western Digital
Value We take charge 14 4
Western Digital
Value Push hard 14 4
Western Digital
Value We stand strong 14 4
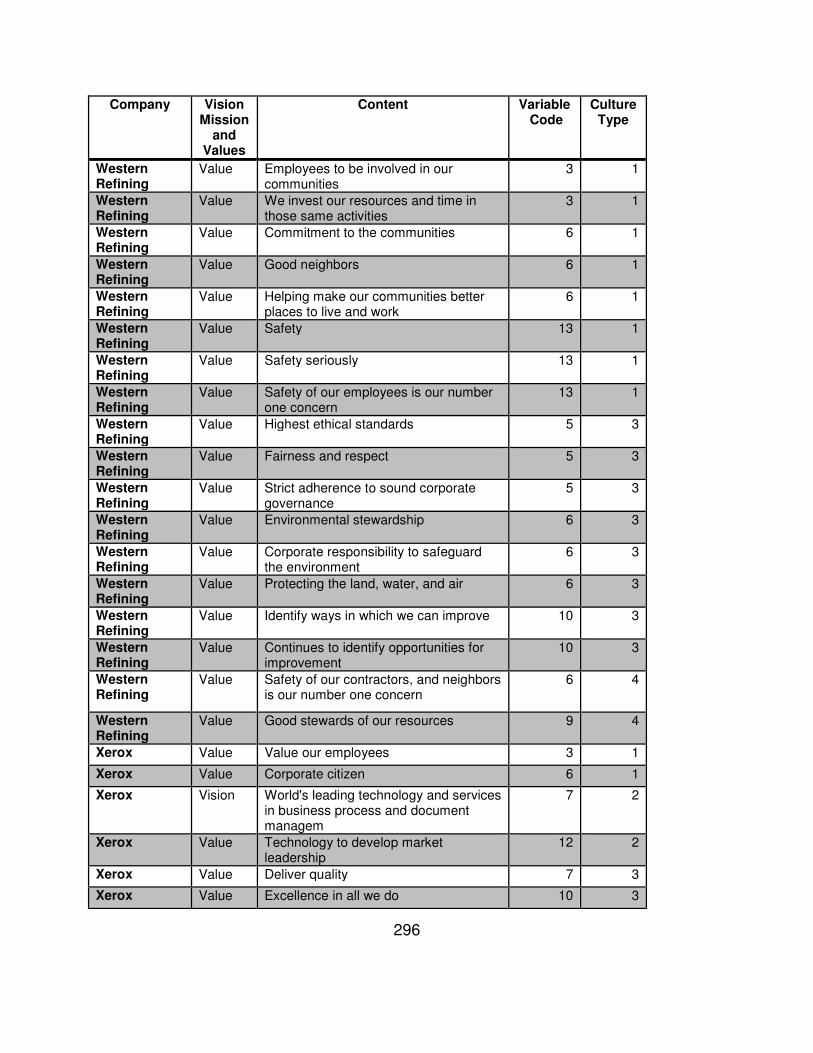
296
Company Vision Mission
and Values
Content Variable Code
Culture Type
Western Refining
Value Employees to be involved in our communities
3 1
Western Refining
Value We invest our resources and time in those same activities
3 1
Western Refining
Value Commitment to the communities 6 1
Western Refining
Value Good neighbors 6 1
Western Refining
Value Helping make our communities better places to live and work
6 1
Western Refining
Value Safety 13 1
Western Refining
Value Safety seriously 13 1
Western Refining
Value Safety of our employees is our number one concern
13 1
Western Refining
Value Highest ethical standards 5 3
Western Refining
Value Fairness and respect 5 3
Western Refining
Value Strict adherence to sound corporate governance
5 3
Western Refining
Value Environmental stewardship 6 3
Western Refining
Value Corporate responsibility to safeguard the environment
6 3
Western Refining
Value Protecting the land, water, and air 6 3
Western Refining
Value Identify ways in which we can improve 10 3
Western Refining
Value Continues to identify opportunities for improvement
10 3
Western Refining
Value Safety of our contractors, and neighbors is our number one concern
6 4
Western Refining
Value Good stewards of our resources 9 4
Xerox Value Value our employees 3 1
Xerox Value Corporate citizen 6 1
Xerox Vision World's leading technology and services in business process and document managem
7 2
Xerox Value Technology to develop market leadership
12 2
Xerox Value Deliver quality 7 3
Xerox Value Excellence in all we do 10 3
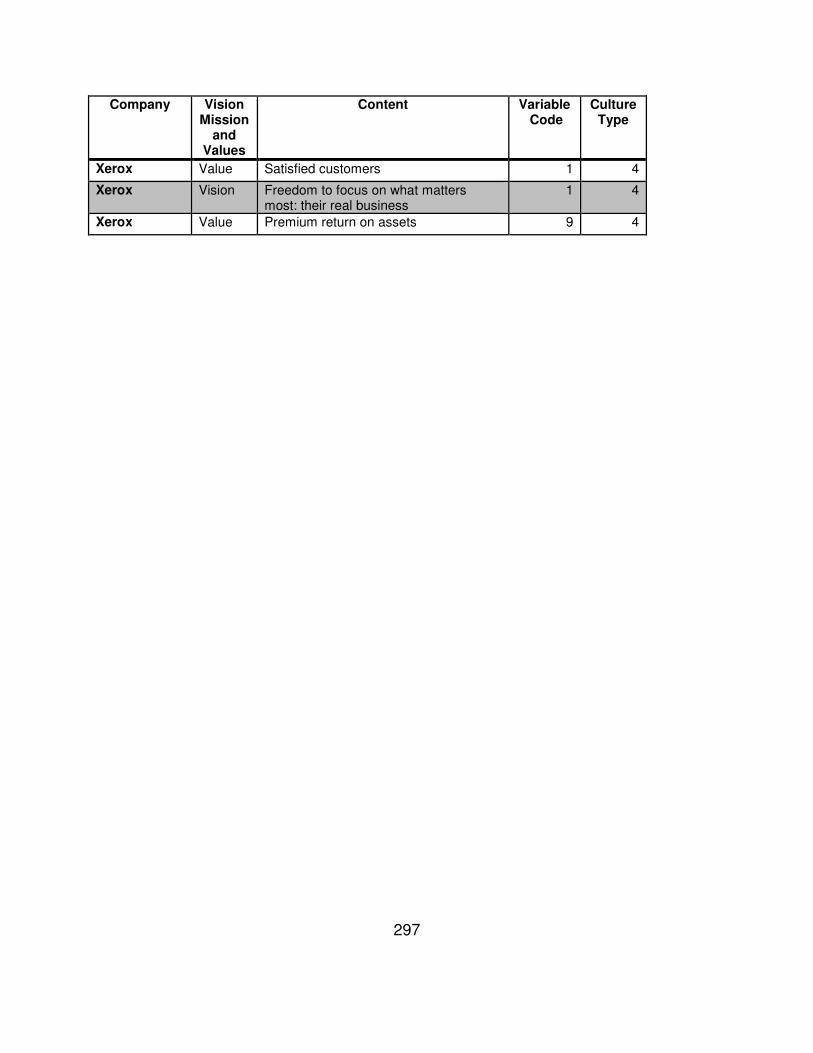
297
Company Vision Mission
and Values
Content Variable Code
Culture Type
Xerox Value Satisfied customers 1 4
Xerox Vision Freedom to focus on what matters most: their real business
1 4
Xerox Value Premium return on assets 9 4
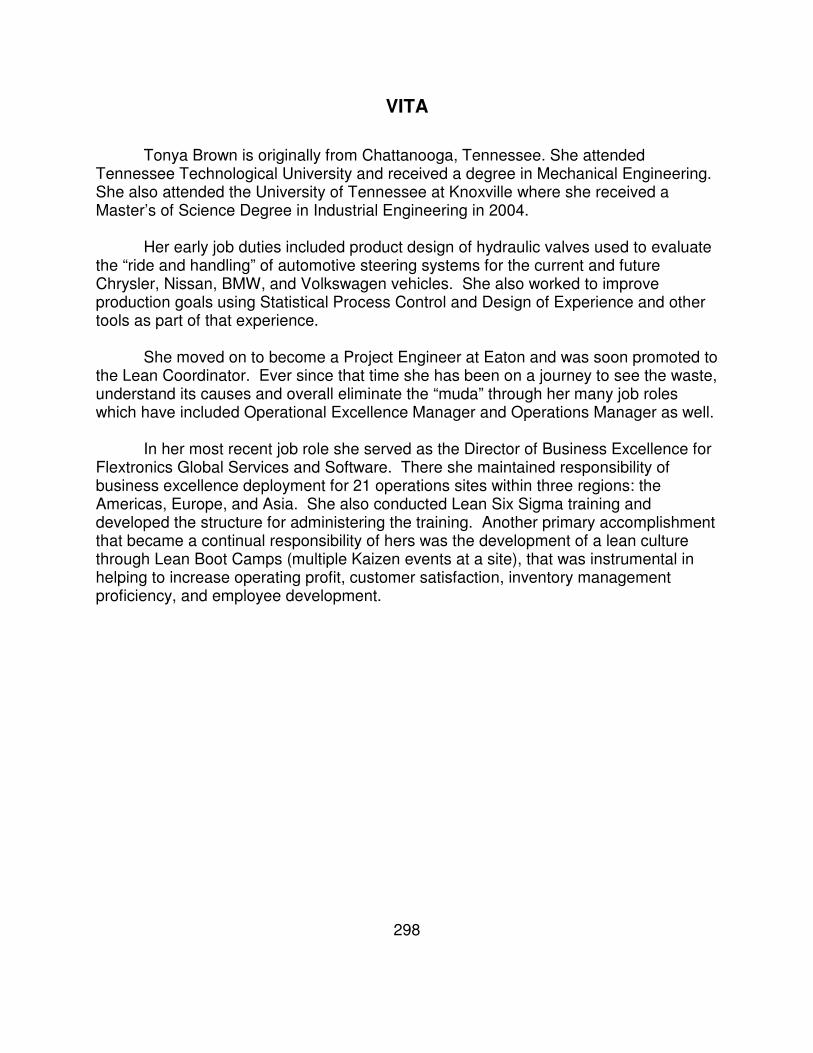
298
VITA
Tonya Brown is originally from Chattanooga, Tennessee. She attended
Tennessee Technological University and received a degree in Mechanical Engineering. She also attended the University of Tennessee at Knoxville where she received a Master’s of Science Degree in Industrial Engineering in 2004.
Her early job duties included product design of hydraulic valves used to evaluate the “ride and handling” of automotive steering systems for the current and future Chrysler, Nissan, BMW, and Volkswagen vehicles. She also worked to improve production goals using Statistical Process Control and Design of Experience and other tools as part of that experience.
She moved on to become a Project Engineer at Eaton and was soon promoted to the Lean Coordinator. Ever since that time she has been on a journey to see the waste, understand its causes and overall eliminate the “muda” through her many job roles which have included Operational Excellence Manager and Operations Manager as well.
In her most recent job role she served as the Director of Business Excellence for Flextronics Global Services and Software. There she maintained responsibility of business excellence deployment for 21 operations sites within three regions: the Americas, Europe, and Asia. She also conducted Lean Six Sigma training and developed the structure for administering the training. Another primary accomplishment that became a continual responsibility of hers was the development of a lean culture through Lean Boot Camps (multiple Kaizen events at a site), that was instrumental in helping to increase operating profit, customer satisfaction, inventory management proficiency, and employee development.
Related Documents