A study of development and maintenance in Norway: assessing the efficiency of information systems support using functional maintenance K.K. Holgeid a , J. Krogstie a,b, * , Dag I.K. Sjøberg c a Andersen Consulting, Drammensvn. 165, N-0212, Norway b Department of Informatics, NTNU, N-7491 Trondheim, Norway c Department of Informatics, University of Oslo, Blindern, N-0316 Oslo, Norway Received 18 November 1999; received in revised form 20 March 2000; accepted 20 March 2000 Abstract The large amount of work on information systems being taken up by maintenance activities has been one of the arguments of those speaking about a ‘software crisis’. We have investigated the applicability of this statement, and propose instead to look at the percentage of work being done on functional maintenance to assess the efficiency of the information systems support in an organisation. This paper presents the main results from a survey investigation performed in Norwegian organisations within the area of software development and main- tenance. The results are based on responses from 53 Norwegian organisations. The investigation is compared with other investigations, both those performed in Norway where a similar investigation was conducted in 1994 and investigations performed in other countries. Similar to the investigation from 1994, the situation is better when looking at the situation from a functional point of view rather than using the traditional maintenance measures. Somewhat surprisingly, the amount of both traditional and functional maintenance work are significantly higher than in the similar investigation done five years earlier. It is also significantly higher than what was found in earlier investigations carried out in the USA and in other countries. One reason for this seems to be the extra maintenance and replacement-oriented work necessary to deal with the Y2K-problem. Even when considering this, too much of the scarce IT-personnel spent their time on tasks that do not add value for the users of the systems. q 2000 Elsevier Science B.V. All rights reserved. Keywords: Software maintenance; Functional maintenance; Survey investigation; Year 2000 1. Introduction A modern society is completely dependent on computers, and the resources used on information technology are increasing steadily. Whereas worldwide system develop- ment costs in 1987 were estimated to around $140 billion [1], a conservative estimate for the worldwide software costs in 1998 is $600–800 billion [2]. The problem of too few systems developers compared with the opportunities and problem of information systems both, in Norway and the rest of the western world is widely acknowledged. Considering this, it is very important that present resources are used efficiently to provide valuable solutions to problems and opportunities. Information systems are valuable when they provide information in a manner that enables people to meet their objectives more effectively [2]. Many have claimed that the large amount of system work that goes into mainte- nance is a sign on poor use of resources to meet these demands. On the other hand, as stated in Ref. [3], it is one of the essential difficulties with information systems that they are under a constant pressure of change. Given the intrinsic evolutionary nature of the sources of system specifications, it should come as no surprise that specifica- tions and the related information system must evolve as well [4]. Thus, all successful computerised information systems are changed; there is nothing detrimental about this. Talking about having a high percentage of main- tenance work being done using the traditional definition of maintenance as a measure of information system support efficiency can be highly misleading. The goal of main- tenance is to keep the overall information system support of the organisation relevant. Owing to the ever-changing needs that information systems must serve, this means that the systems will have to change, the alternative is that the systems are replaced with a new system. A large proportion of the ‘new’ systems being developed are so-called replacement systems, mostly replacing the existing systems Information and Software Technology 42 (2000) 687–700 0950-5849/00/$ - see front matter q 2000 Elsevier Science B.V. All rights reserved. PII: S0950-5849(00)00111-7 www.elsevier.nl/locate/infsof * Corresponding author. Department of Informatics, NTNU, N-7491 Trondheim, Norway. Tel.: 147-2212-7000; fax: 147-2212-6000. E-mail address: [email protected] (J. Krogstie)

Welcome message from author
This document is posted to help you gain knowledge. Please leave a comment to let me know what you think about it! Share it to your friends and learn new things together.
Transcript
A study of development and maintenance in Norway: assessing theefficiency of information systems support using functional maintenance
K.K. Holgeida, J. Krogstiea,b,* , Dag I.K. Sjøbergc
aAndersen Consulting, Drammensvn. 165, N-0212, NorwaybDepartment of Informatics, NTNU, N-7491 Trondheim, Norway
cDepartment of Informatics, University of Oslo, Blindern, N-0316 Oslo, Norway
Received 18 November 1999; received in revised form 20 March 2000; accepted 20 March 2000
Abstract
The large amount of work on information systems being taken up by maintenance activities has been one of the arguments of thosespeaking about a ‘software crisis’. We have investigated the applicability of this statement, and propose instead to look at the percentage ofwork being done on functional maintenance to assess the efficiency of the information systems support in an organisation. This paper presentsthe main results from a survey investigation performed in Norwegian organisations within the area of software development and main-tenance. The results are based on responses from 53 Norwegian organisations. The investigation is compared with other investigations, boththose performed in Norway where a similar investigation was conducted in 1994 and investigations performed in other countries. Similar tothe investigation from 1994, the situation is better when looking at the situation from a functional point of view rather than using thetraditional maintenance measures. Somewhat surprisingly, the amount of both traditional and functional maintenance work are significantlyhigher than in the similar investigation done five years earlier. It is also significantly higher than what was found in earlier investigationscarried out in the USA and in other countries. One reason for this seems to be the extra maintenance and replacement-oriented worknecessary to deal with the Y2K-problem. Even when considering this, too much of the scarce IT-personnel spent their time on tasks that donot add value for the users of the systems.q 2000 Elsevier Science B.V. All rights reserved.
Keywords: Software maintenance; Functional maintenance; Survey investigation; Year 2000
1. Introduction
A modern society is completely dependent on computers,and the resources used on information technology areincreasing steadily. Whereas worldwide system develop-ment costs in 1987 were estimated to around $140 billion[1], a conservative estimate for the worldwide softwarecosts in 1998 is $600–800 billion [2]. The problem of toofew systems developers compared with the opportunitiesand problem of information systems both, in Norway andthe rest of the western world is widely acknowledged.Considering this, it is very important that present resourcesare used efficiently to provide valuable solutions toproblems and opportunities.
Information systems are valuable when they provideinformation in a manner that enables people to meet theirobjectives more effectively [2]. Many have claimed that
the large amount of system work that goes into mainte-nance is a sign on poor use of resources to meet thesedemands. On the other hand, as stated in Ref. [3], it isone of the essential difficulties with information systemsthat they are under a constant pressure of change. Giventhe intrinsic evolutionary nature of the sources of systemspecifications, it should come as no surprise that specifica-tions and the related information system must evolve aswell [4]. Thus, all successful computerised informationsystems are changed; there is nothing detrimental aboutthis. Talking about having a high percentage of main-tenance work being done using the traditional definitionof maintenance as a measure of information system supportefficiency can be highly misleading. The goal of main-tenance is to keep the overall information system supportof the organisation relevant. Owing to the ever-changingneeds that information systems must serve, this means thatthe systems will have to change, the alternative is that thesystems are replaced with a new system. A large proportionof the ‘new’ systems being developed are so-calledreplacement systems, mostly replacing the existing systems
Information and Software Technology 42 (2000) 687–700
0950-5849/00/$ - see front matterq 2000 Elsevier Science B.V. All rights reserved.PII: S0950-5849(00)00111-7
www.elsevier.nl/locate/infsof
* Corresponding author. Department of Informatics, NTNU, N-7491Trondheim, Norway. Tel.:147-2212-7000; fax:147-2212-6000.
E-mail address:[email protected] (J. Krogstie)

without adding much to what the end-users can do with theinformation system.
Based on this argument we have devised the conceptfunctional maintenanceas a more meaningful high-levelmeasure to evaluate to what extent an organisation is ableto evolve their application system portfolio efficiently. Howfunctional maintenance is different from traditional main-tenance is described later.
In this paper, we present the main results from a survey-investigation performed in Norwegian organisations duringthe autumn of 1998. The investigation had two mainmotivations:
1. Comparing the current development and maintenancesituation in Norway with what has been reported insimilar investigations in Norway and abroad earlier.
2. Comparing the current situation regarding functionalmaintenance with what has been reported in similarinvestigations in Norway earlier.
A more comprehensive report from the investigation can befound in Ref. [5].
1.1. Outline of the paper
We will first give definitions of some of the main termsused within software development and maintenance, includ-ing the terms functional development and functional main-tenance. We then describe the research method and the mainhypotheses investigated. The main results are thenpresented. The last section summarises our results andpresents ideas for further work.
2. Basic concepts
Maintenance has traditionally been divided into threetypes: corrective, adaptive and perfective [6].
1. Corrective maintenance:performed to identify andcorrect processing failures, performance failures andimplementation failures.
2. Adaptive maintenance:performed to adapt software tothe changes in the technical environment of the applica-tion system.
3. Perfective maintenance:performed to enhance perfor-mance, change or add new program features, or improvefuture maintainability of the program. Perfective main-tenance has been divided into functional and non-functional perfective maintenance. Functional perfectivemaintenance implies changes and additions to thefunctions offered by the system. Non-functional perfec-tive maintenance implies improvements to the qualityfeatures of the information system and other featuresbeing important for the developer and maintainer of thesystem, such as modifiability. Non-functional perfectivemaintenance thus includes what is often termed preven-tive maintenance.
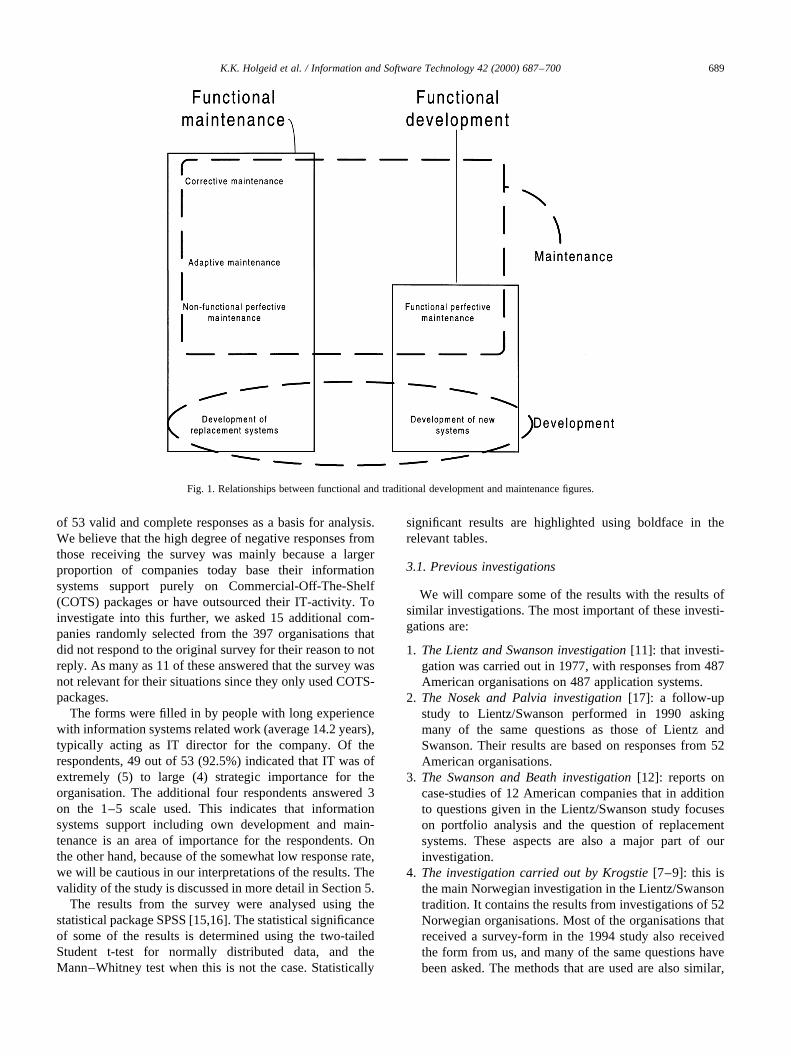
In addition to the traditional temporal distinction betweendevelopment and maintenance, there are also the conceptsof functional maintenance and functional development,as illustrated in Fig. 1. These concepts were originallyintroduced in Ref. [7].
1. Functional development:development or maintenancewhere changes in the application increase the functionalcoverage of the total information systems portfolio of theorganisation. This includes development of new systemsthat cover areas, which are not covered earlier by othersystems in the organisation, and functional perfectivemaintenance.
2. Functional maintenance:work made to keep up thefunctional coverage of the information system portfolioof the organisation. This includes the other three types ofmaintenance and the development of replacementsystems.
As argued above, this distinction is used because we believeit gives a better indication of the efficiency of the informa-tion systems support in an organisation than the traditionaldistinction between development and maintenance. Adeeper discussion around the distinction between functionalmaintenance and functional development is given in Ref.[8].
3. Research method
The survey form was distributed by mail to 494Norwegian organisations. The organisations were takenfrom the list of member organisations of DnD (TheNorwegian Computer Society).
The form contained 40 questions, many with sub-questions. The contents of the form [5] were based onprevious investigations within this area; especially thosedescribed in Refs. [9–12]. The main questions from thesurvey can be found in Appendix A.
As far as the questions were concerned, we were inter-ested in the quality of the answers, recognising that some ofthe information called for might not be easily obtainable.There was also room for issuing open-ended remarks onmost questions.
Galtung [13] regards that the least size that is meaningfulin a survey is 40 units. Since survey-investigations in thearea of development of information systems toward thesame population earlier had given a response rate of about22% [9,14] and the response rate of similar surveys has beenaround 20–25% (e.g. Ref. [11]), an answer ratio of approxi-mately 20% was expected. This would have resulted in 100responses. About 97 responses (written or by telephone)were returned, giving a response rate of 20%. Quite a fewof the responses were negative, replying that the organisa-tion was not doing work of the sort that was queried about.In addition, several of the returned forms had to bedismissed because they were incomplete, giving us a total
K.K. Holgeid et al. / Information and Software Technology 42 (2000) 687–700688
of 53 valid and complete responses as a basis for analysis.We believe that the high degree of negative responses fromthose receiving the survey was mainly because a largerproportion of companies today base their informationsystems support purely on Commercial-Off-The-Shelf(COTS) packages or have outsourced their IT-activity. Toinvestigate into this further, we asked 15 additional com-panies randomly selected from the 397 organisations thatdid not respond to the original survey for their reason to notreply. As many as 11 of these answered that the survey wasnot relevant for their situations since they only used COTS-packages.
The forms were filled in by people with long experiencewith information systems related work (average 14.2 years),typically acting as IT director for the company. Of therespondents, 49 out of 53 (92.5%) indicated that IT was ofextremely (5) to large (4) strategic importance for theorganisation. The additional four respondents answered 3on the 1–5 scale used. This indicates that informationsystems support including own development and main-tenance is an area of importance for the respondents. Onthe other hand, because of the somewhat low response rate,we will be cautious in our interpretations of the results. Thevalidity of the study is discussed in more detail in Section 5.
The results from the survey were analysed using thestatistical package SPSS [15,16]. The statistical significanceof some of the results is determined using the two-tailedStudent t-test for normally distributed data, and theMann–Whitney test when this is not the case. Statistically
significant results are highlighted using boldface in therelevant tables.
3.1. Previous investigations
We will compare some of the results with the results ofsimilar investigations. The most important of these investi-gations are:
1. The Lientz and Swanson investigation[11]: that investi-gation was carried out in 1977, with responses from 487American organisations on 487 application systems.
2. The Nosek and Palvia investigation[17]: a follow-upstudy to Lientz/Swanson performed in 1990 askingmany of the same questions as those of Lientz andSwanson. Their results are based on responses from 52American organisations.
3. The Swanson and Beath investigation[12]: reports oncase-studies of 12 American companies that in additionto questions given in the Lientz/Swanson study focuseson portfolio analysis and the question of replacementsystems. These aspects are also a major part of ourinvestigation.
4. The investigation carried out by Krogstie[7–9]: this isthe main Norwegian investigation in the Lientz/Swansontradition. It contains the results from investigations of 52Norwegian organisations. Most of the organisations thatreceived a survey-form in the 1994 study also receivedthe form from us, and many of the same questions havebeen asked. The methods that are used are also similar,
K.K. Holgeid et al. / Information and Software Technology 42 (2000) 687–700 689
Fig. 1. Relationships between functional and traditional development and maintenance figures.
enabling us to present a ‘longitudinal survey study’ ofthis area, although the overlap among respondents islimited to six organisations.
3.2. Hypotheses
The following main hypotheses were formulated to inves-tigate the development of the different measures for distri-bution of work. We divide the hypotheses in inter-investigational hypotheses, comparing our results withresults reported in previous investigations, and intra-inves-tigational hypotheses, looking at correlations within ourdata.
3.2.1. Inter-investigational hypotheses
• H1: there is no difference between the percentage ofmaintenance time in our survey and what are reportedin previous surveys.
Rationale: when comparing the percentage of timeused for maintenance activities in organisationsearlier, we have found this to be stable on around 40percent of the overall time in investigations both in theseventies, eighties, and nineties in both USA andNorway. We would not expect this to be different inthis survey.
• H2: there is no difference between the percentage ofdevelopment time in our survey and what are reportedin previous surveys.
Rationale: when comparing the percentage of timeused for development activities in organisationsearlier, we have found this to be decreasing whencomparing our study in 1994 with earlier studies.Whereas maintenance activity is held mostly constant,the amount of time used for user-support and systemoperations have grown since the seventies, probablymainly since end-users have much more advancedmachines (PCs vs. dumb terminals). We would thusexpect this trend to continue.
• H3: there is no difference between the distribution ofwork among maintenance and development in our surveyand what is reported in previous surveys when disregard-ing other work than development and maintenance.
Rationale:since the amount of other work than devel-opment and maintenance is taking up more time nowthan earlier, we found it beneficial also in the survey in1994 to look at only the proportion between develop-ment and maintenance time. Interestingly, the amountof time used for maintenance has shown to be stable on60% (vs. 40% for development) in investigations bothin the seventies, eighties, and nineties, across countries(and not increasing to take up a larger and larger partof the work, which many claimed would happen).Thus, we did not expect any change on this figure inthis survey.
• H4: there is no difference between the distribution of
functional maintenance and functional development inour survey and what are reported in previous surveys.
Rationale:since these numbers had been investigatedonly once before, we were eager to find if also they hadthe same stable distribution as the maintenance figure.Similarly to above, we did not expect any change onthese figures in this survey.
3.2.2. Intra-investigational hypotheses
• H5: there is no difference between the amount of workspent on functional maintenance and traditional mainte-nance when we disregard other work than developmentand maintenance.
Rationale:we have argued above that functional main-tenance gives a better indication than the traditionalmaintenance figure on information systems support inorganisations. We would expect these figures to bedifferent, but would like to confirm this (as we did in1994) to ensure that the figure we now will use bringsnew information.
• H6: there is no difference between the amount of workspent on functional development and traditional develop-ment when we disregard other work than developmentand maintenance.
Rationale:same as for H5• H7: there is no difference between the amount of work
spent on functional development and functional mainte-nance when disregarding other work than developmentand maintenance.
Rationale: a similar test was done in 1994, and wewould like to confirm that a majority of the develop-ment and maintenance work is actually functionaldevelopment (as found in 1994), giving an oppositepicture on the state of information system support effi-ciency than the one you get using the traditional main-tenance figures. We did thus expect this to be rejected.
4. Results
First, we present some of the overall demographics anddescriptive data of the survey. Similar results from ourprevious survey conducted in 1994 are included in parenth-esis where the numbers are comparable.
The respondents to our survey were in:
• manufacturing and industry—11;• service/consulting—11;• telecommunication and IT—9;• insurance and banking—9;• trade—6;• other areas—13.
43% of the organisations had a yearly data processingbudget above 10 million NKr (approximately $1.3 million),
K.K. Holgeid et al. / Information and Software Technology 42 (2000) 687–700690

and the average number of employees among the respond-ing organisations was 656 (2347). The average number offull-time personnel in the IS-organisations reported on was10.9 (24.3), whereas the average number of full-time appli-cation programmer and/or analysts was 4.6 (9.5). As we see,the responding companies and their IS departments aregenerally smaller in our new survey. The average experi-ence in the local IS-department was 6.3 years, similar towhat was found in Ref. [9] (average total experience was8.3 years). The education level was somewhat lower in theorganisations in our investigations. The average number offull-time hired IS consultants were 2.7, which means 0.6 IS-consultants per application programmer.
4.1. Portfolio analysis and replacement systems
The number of systems in the organisations rangedbetween one and 100, with a mean of 9.6 (10.3) and amedian of 4 (5) systems. The user population of thesesystems ranged between 3 and 5400, with a mean of 498(541) and a median of 15 (250). The age distribution of thesystems in our study, the Krogstie study and the Swanson/Beath study is illustrated in Fig. 2. The average age of thesystems was 5.0 years. The average age of systems in ourstudy from 1994 was 4.6 years, and in the Swanson/Beathinvestigation 6.6 years.
In Ref. [9], 58% of the systems were developed by the IS-organisation, and only one percent was developed in theuser organisation. In our study, however, 27% of thesystems were developed by the IS-organisation and 27%as custom systemsin the user organisation. The percentage
of systems developed by outside firms is higher (22% vs.12% vs. 15% in Swanson/Beath). The percentage of systemsdeveloped based on packages with small or large adjust-ments is slightly smaller (24% vs. 28% vs. 2% in Swan-son/Beath). The new category we used, component-baseddevelopment only amounted to 0.4% of the total systems.
About 60% of the systems relied on other systems fortheir input data. In Krogstie’s investigation the same percen-tage was 74 and in Swanson/Beath 56. The organisationsalso usually supported several technical configurations(mean 3, median 2). The average number of differentprogramming languages in use was 2.5 (median 2). This issimilar to Krogstie’s investigation in 1994. Table 1 providesan overview of the percentage of systems reported beingdeveloped using the different programming languages.Even if COBOL is still used for most of the applications,the language that is used in most organisation, apart fromdifferent 4GL languages (66.7%), is C11 (42%), whichwas barely included in the last investigation. The percentageof organisations reporting to have COBOL applications hasdecreased from 73% in 1994 to 26% in 1998. C and RPG areused by around 28% of the organisations, which is similar tothe numbers from 1994.
About 84 new systems were currently being developed,and 48 of these systems (57%) were regarded as replace-ment systems. In Krogstie’s investigation 48 of 100 systems(48%) under development were replacement systems; inSwanson/Beath 58 of 117 reported new systems (49%)were replacement systems. The portfolio of the respondingorganisations contained 510 systems, meaning that 9% ofthe current portfolio were being replaced. The similar
K.K. Holgeid et al. / Information and Software Technology 42 (2000) 687–700 691
Fig. 2. Age distributions of systems in years.
Table 1Percentages of systems developed using different programming languages
Language Own (%) Krogstie (%) Swanson/Beath (%) Nosek/Palvia (%) Lientz/Swanson (%)
COBOL 32.6 49 63 51 51.6Different 4GL 16.9 24 8C 15.4 4 3C11 15.1RPG 12.9 4 2 10 22.4Java 2Assembler 0.9 3 8 11.9Fortran 0.6 4 2 7 2.4PASCAL 0.3 2PL/1 0.3 2 25 3.2Other 2.6 6 21 7.7

number from Krogstie was 11%, and from Swanson/Beath10%. The age distribution for systems to be replaced in ourinvestigation is shown in Fig. 3. The average age of systemsto be replaced was 10.5 years (8.5), and the average age forall systems was 5.4 years (4.7).
Table 2 summarises reasons for the replacements, whichhave slightly changed from earlier investigations. Theimportant reasons for replacement are partly a need forstandardisation and integration with other systems. Theburden to maintain is still an important issue in manycases. A majority of those indicating that burden to maintainwas an extremely important reason, said that this was causedby Y2K-oriented problems.
Both the systems average age (5.4) and the average in-house experience of the system developers (5.6) are lowercompared with the average age of systems being replaced(10.5). Only in three of the responding organisations, the
system developers had longer in-house experience than theaverage age of systems being replaced. As indicated in Ref.[9], this might influence the pattern of reuse. About 74% ofthe organisations only reused minor junks of code whiledeveloping replacement systems. Reuse of specificationand design is more common, but still 53% of the organisa-tions reused no—or reused to a small degree—specificationand design when creating replacement systems.
4.2. Use of organisational controls and methodology
By ‘organisational controls’ we mean procedures andfunctions that are intended to control different aspects ofthe maintenance process. Use of organisational controlsconcerning software maintenance has been reported inseveral studies [9,11,12,17].
The use of organisational controls and a comparison withprevious investigations are given in Table 3. A negativeD -value indicates that a smaller percentage of the organis-ations in our last investigation have this control in use.The majority of the organisations document user requests,classify change requests and re-test changes in theirsystems.
An assumption concerning use of organisational controlsis that there always is a potential for improvement of the
K.K. Holgeid et al. / Information and Software Technology 42 (2000) 687–700692
Fig. 3. Age distribution of replacement systems.
Table 2Reasons for replacement
Factor Investigation Extremeimportance(%)
Substantialimportance(%)
Moderateimportance(%)
Slightimportance(%)
Noimportance(%)
Meana
Standardisation Own 20 50 3,3 6.7 20 3.4Krogstie 16.7 29.2 25 0 29.2 3.0
Integration of systems Own 23.3 40 0 10 26.7 3.2Krogstie 32 40 20 0 8 3.9
Burden to maintain Own 30 13.3 13.3 20 23.3 3.1Krogstie 44.8 20.7 10.4 10.4 13.8 3.7Swanson/Beath 3.8
HW/SW changes Own 26.7 23.3 6.7 3.3 40 2.9Krogstie 34.5 24.1 20.7 17.2 3.5 3.7
Burden to operate Own 0 13.3 33.3 26.7 26,7 2.3Krogstie 8 16 32 16 28 2.6Swanson/Beath 2.8
Burden to use Own 0 16.7 10 43.3 30 2.1Krogstie 20 12 32 16 28 3.0Swanson/Beath 3.8
Package alternative Own 6.7 13.3 13.3 16.7 50 2.1Krogstie 8.7 21.7 13 17.4 39.1 2.4Swanson/Beath 1.9
Generator alternative Own 0 6.7 13.3 16.7 63.3 1.6Krogstie 0 5 25 15 55 1.8Swanson/Beath 1.3
a The use of a mean value here is only to have the possibility to get a crude comparison with the investigation by Swanson/Beath, which did not report thedistribution. This number has been calculated by giving the value 5 to extreme importance, 4 for substantial importance etc. Formally, the scale usedhere isneither a ratio nor an interval scale, thus it is really not very meaningful to use the mean value for further analysis.

IS-system portfolio. Usually the amount of change requestsexceeds the capacity of the IS-organisation. Based on this itseems reasonable to prioritise change requests and performcost-benefit analysis. Among the responding organisations,however, 64% did not perform analysis of consequencesrelated to changes and requests were not cost-justified.
The use of organisational controls reported in our study issomewhat different compared with earlier investigations.Whereas, we on many of the areas in our investigationhave a lower score, batching of changes in periodic releasesseem to be better taken care of by the responding organisa-tions in our investigation compared with the earlier studies.
As for the use of methodology, as many as 34% of theorganisations respond that they have no methodology inplace at all. As for the use of methodology within differentareas of development and maintenance, the numbers were:Planning (34%), Analysis (30.2%), Requirements specifica-tion (50.9%), Design (39.6%), Implementation/Coding(43.4%), Testing (34%), Conversion and rollout (26.4%),Operations (32.1%), Maintenance (30.2%), Project manage-ment (41.5%). Only 25% of the organisations have an esti-mation model for development activities; 17% of theorganisations have an estimation model for maintenanceactivities.
As for the use of comprehensive system developmenttools (CASE), only 13.2% (27.1%) use such tools for devel-opment, and 11.3% (10.6%) use such tools for maintenance.The tools are primarily used in analysis, requirement
specification, design and implementation. The averageexperience with the tools was 3.1 year (2.8 year), and theorganisations have only on average 2 (2) systems supportedby the tools. This shows that the use of advanced systemdevelopment tools still makes a very limited impact on theoverall information systems support of organisations.
4.3. Distribution of work
Work on information systems was divided into six cate-gories in the survey, similarly to how the area is divided inthe introduction. The same categories were also used in1994. We also asked for the time used for user-supportand for systems operations, which took up the additionaltime for the work in the IS departments.
Table 4 shows the major results on distribution of work inprevious investigations, listing the percentage of mainte-nance work, the study reported, and the year of the study.The variance in the figures is partially due to the type ofsoftware being studied, sampling error and measurementproblems. Another reason is that different definitions havebeen used. For example, both Dekleva [21] and Yip [20]
K.K. Holgeid et al. / Information and Software Technology 42 (2000) 687–700 693
Table 3Comparisons on use of organisational controls
Controla Own (%) Krogstie (D) (%) Lientz/Swanson (D ) (%) Nosek/Palvia (D) (%)
(a) User requests logged 59 218 220 230(b) Classification of CR 59 21 N/A N/A(e) Changes are re-tested 59 220 0 5(d) Changes documented 51 216 226 232(f) Changes are batched 51 11 18 23(h) Users kept informed 51 228 N/A N/A(i) Equal routines for all 40 218 N/A N/A(c) Requests cost-justified 36 218 3 21(g) Acceptance testing of doc. 28 3 N/A N/A(j) Periodic formal audits 17 9 215 222(k) Equipment charge-back 15 225 219 24(l) Personnel charge-back 13 218 218 212
a A longer description of what is meant with each control is given in question 30 in Appendix A.
Table 4Previous investigations on maintenance
Maintenance Investigation Year
49 Lientz and Swanson [11] 198056 Jørgensen [18] 199458 Nosek and Palvia [17] 199059 Krogstie [9] 199463 Martinussen [19] 199666 Yip [20] 199566 Dekleva [21] 1990
Table 5Distribution of the work done by IS-departments
Category Mean Median SD
Corrective maintenance 12.7 10.0 12.5Adaptive maintenance 8.2 5.5 7.7Functional perfectivemaintenance
15.2 10.0 18.1
Non-functional perfectivemaintenance
5.4 5.0 5.6
Total amount of maintenance 41.4 40.0 20.6Replacement 7.7 5.0 10.1New development 9.5 8.5 13.3
Total amount of development 17.1 18.0 17.1Technical operation 23.0 25.0 14.4User support 18.6 20.0 12.9Other 0.0 0.0 0.0

include user-support as maintenance, time that is notincluded as part of maintenance in other investigations. Inmost investigations, between 50% to 60% of the effort isdone to enhance systems in operation.
Table 5 summarises the descriptive results on the distri-bution of work in the categories in our investigation, givingthe median and mean value with accompanying standarddeviation for the different categories.
About 41.4% of the total work among the respondingorganisations is maintenance activities, and 17.1% is devel-opment activities. When disregarding work other thandevelopment and maintenance of information systems, thepercentages are as follows: maintenance activities: 72.9%,development activities: 27.1%. This is a remarkable shiftfrom the situation in 1994 where the corresponding percen-tages were: maintenance activities: 58.6%, developmentactivities: 41.4%. Maintenance work in organisations thatprimarily were developing and maintaining IS systemsaccounts for 50% of total effort, and development activitiesin these organisations represent 24.3% of the total work.62.3% of development and maintenance work was func-tional maintenance, and 37.7 was functional development.This is also a dramatic change from the situation in 1994where functional maintenance- and functional developmentrespectively amounted to 44% and 56% of the work. Furthercomparisons of descriptive results between different studiesare presented in Table 6. The first column lists the category,whereas the other columns list the numbers from our inves-tigation, the Krogstie investigation, the Lientz/Swansoninvestigation and the Nosek/Palvia investigation. The firstset of numbers compare the numbers for development,
maintenance and other work. The amount ofother workreported in our investigations is much larger than in theAmerican investigations. Therefore, in the second set offigures, we compare the data without considering otherwork. For the categories functional development and func-tional maintenance, we only have numbers from our owninvestigations.
Before looking for significant relationships, the figureswere tested for normality as illustrated in Table 7. Thisdoes not give us any reason to reject the null-hypothesisthat the numbers are normally distributed, except numbersfor traditional maintenance from 1998, since both theShapiro–Wilks (S–W Sign) and the Kolmogorov–Smirnov(Lilliefors-Sign) significance levels are higher than 0.05.None of the numbers is perfectly normal though, since thekurtosis and skewness are different from zero, but this is tobe expected also from a sample from a normally distributedpopulation. This is further illustrated in the box-plots inFig. 4. Where we have used the assumption of normal distri-bution in the tests below, we have also checked the signifi-cant results using non-parametric tests, which have providedthe samep-values in the relevant cases.
We tested H1, H2, H3 and H4 by comparing with ourprevious survey as summarised in Table 8. We list thenumber of cases, the mean and the standard deviation forall relevant figures to test the four hypotheses, having thenumbers from 1994 on the left and those from 1998 on theright. D is the increase in the mean from the 1994 study tothe 1998 study, andp is the probability for erroneouslyrejecting the equality of means. H1 is not rejected, whereasH2 is rejected, since the percentage on work done on
K.K. Holgeid et al. / Information and Software Technology 42 (2000) 687–700694
Table 6Comparisons of maintenance figures with previous investigations
Category Own (Mean) Krogstie (Mean) Lientz/Swanson (Mean) Nosek/Palvia (Mean)
Percentage of all workDevelopment 17 30 43 35Maintenance 41 40 49 58Other work 42 30 8 7
Disregarding other work than development and maintenanceDevelopment 27 41 47 38Maintenance 73 59 53 62
Functional effort, disregarding other work than development and maintenanceFunctional development 38 56 N/A N/AFunctional maintenance 62 44 N/A N/A
Table 7Test for normality of maintenance figures
Figure Skewness Kurtosis Shapiro–Wilks S–W sign (p) Kolmogorov–Smirnov sign (p)
Maintenance 1994 20.1111 20.8133 0 0.9559 0.1386 0.0706 . 0.200Functional maintenance 1994 0.9728 0.4770 0.0701 . 0.200
Maintenance 1998 20.573 0.045 2 – 0.199 , 0.0005Functional maintenance 1998 20.222 20.363 – – 0.081 0.200

development is significantly less (and also less than what isfound in the American investigations), due to an increase inthe amount of other work. Based on the results presented inTable 8, H3 is rejected because the amount of maintenancehas increased significantly. H4 is also rejected since theamount of functional development is significantly lower,and thus the amount of functional maintenance is signifi-cantly higher.
The tests of the intra-investigational hypotheses H5, H6and H7 are presented in Table 9. We also list here thenumber of cases, the mean and the standard deviation forall relevant figures to test the three hypotheses.D is thedifference in the mean value between to two figures beingcompared, andp is the probability for erroneously rejectingthe equality of means. Based on this we reject H5, H6 andH7.
The more the number of tests performed on the same dataset, the more likely it is that one will find significant resultsoccurring by chance (what is called the problem of multi-plicity [22]). To address this we have adjusted thea -values(the probability error rate, i.e. the probability of making atleast one type I error, judging a relationship to be significanteven if it is not) to make the tests more stringent in order to
make allowance for such ‘chance’ significant results. Manypropose to use the Bonferroni Adjustment in this case,which basically says that if you have, e.g. ten test, youwould need to adjust your significance-level from, e.g.0.05–0.005 on all tests. The Bonferroni Adjustment is ratherconservative, since it ignores the correlation between tests.Holm [23] suggests ordering thep-values of the Khypotheses asp1 # p2 # … # pK and comparing to a pre-describeda-level. Then one can show thatai ; for i � 1…K;must be set equal toa=�K 2 i 1 1�: That meansp1, thesmallestp-value must be compared witha1 � a=K etc. upto pK being compared withak � a:
An overview of performing this adjustment on the seventests that we have presented here is given in Table 10. Thefirst column is the hypothesis in question. Thep-value forthis test is found in the second column. Thea-value is set to0.05 and the fifth column contains the adjusted level for thistest. As illustrated in the last column, we get the same resultsas we had before doing the adjustment, and thus keep theresults from our tests reported above.
5. Validity of the study
The results of our study should be interpretedcautiously as there are several threats to its validity. The
K.K. Holgeid et al. / Information and Software Technology 42 (2000) 687–700 695
Fig. 4. Box-plots of maintenance variables.
Table 8Tests of inter-investigational hypotheses
1994 1998N Mean SD N Mean SD D p
Maintenance, percentage of all work (vs. H1)48 40.4 23,7 52 41.1 20,6 0.7 0.645
Development, percentage of all work (vs. H2)48 29.6 20.3 52 17.1 17.1 12.5 0.001
Maintenance, disregarding other work (vs. H3)48 58.6 24.2 52 72.9 23.9 14.3 0.007
Functional development (vs. H4)46 56.1 17.9 52 37.7 23.4 18.4 0.001
Table 9Test of intra-investigational hypotheses
N Mean SD N Mean SD D p
Functional maintenance vs. traditional maintenance (vs. H5)52 62.3 23.4 52 72.9 23.9 210.6 0.015
Functional development vs. traditional development (vs. H6)52 37.7 23.4 52 27.1 23.9 10.6 0.015
Functional development vs. functional maintenance (vs. H7)52 37.7 23.4 52 62.3 23.4 224.6 0.001

discussion below is based on recommendations given inRefs. [18,24].
5.1. Population
The sample of our study was initially intended torepresent the population of Norwegian companies ororganisations with own development and maintenancework. However, since a substantial number of the majorNorwegian IT companies are members of The NorwegianComputer Society, we pragmatically chose the 800 membercompanies with three or more employee-members in DnDas our population. We distributed our survey forms to arandom selection of 500 of those 800 companies. (Six ofthe forms were returned because relevant people had quit.)Other studies also use member lists as a source of subjects,e.g. Ref. [11]. In particular, the same source of subjects wasused in the similar study in 1994 [9].
5.2. Response rate
Both the response rate of 20% and the final sample of11% are rather low. We experienced the same problem inthe 1994 study. A problem with a low response rate is thatthe respondents may not be representative of the population,that is, the companies may be particularly mature, have lesspressure (they have time to answer survey forms), etc.However, the same selection mechanism was used in the1994 study, so a comparison between those two studiesshould be fair.
5.3. Respondents
Most of the persons who responded were IT managers inthe company. They may have different views of the realitythan developers and maintainers. For example, Jørgensen[18] found that manager estimates of the proportion of effortspent on corrective maintenance were biased towards toohigh values when based on bust guesses instead of gooddata. We could also find a slight tendency in this directionjudging from the quality of the data (see later), but thisdifference was not significant. There might be biases inour study, but they may not affect the comparison with the1994 study as the survey forms of that study were also filledin by IT managers.
5.4. Understanding of concepts
Achieving consistent answers requires that the respondentshave a common understanding of the basic concepts of thesurvey form. This may be difficult to achieve in practice. Forexample, Jørgensen [18] found that the respondents used theirown definition of, for example, “software maintenance” eventhough the term was defined at the beginning of the ques-tionnaire. We conducted a pilot study in a few companies todetect unclear questions, and whether the time for filling-inwas reasonable. We also got comments from several collea-gues concerning clarity of questions. The forms were thenrefined. Moreover, for 10 of the valid responses of the mainstudy where we believed that there had been misunderstand-ings, a separate follow-up interview was conducted. For mostquestions, there was room to issue comments. This possibilitytogether with the possibility to crosscheck numbers betweendifferent questions was the main mechanisms used to identifypossible misunderstanding among the respondents.
5.5. Biased questions
Among the risks when designing survey forms are lead-ing or sensitive questions, resulting in biased or dishonestanswers. We believe that we have mostly avoided thisproblem. One exception may be question 3 (whether IT isof strategic importance). It may be difficult for IT managersto admit that IT is of little strategic importance to theircompany. Nevertheless, we promised and effectuated fullconfidentiality.
5.6. Quality of data
On some of the questions, we were interested in the qual-ity of the answers, recognising that some of the informationcalled for might not be easily obtainable. Answers of someof the quantitative questions were checked against eachother for control. The remarks made on the questions gavemore insight into the answers. We qualified for instance alldata regarding distribution of work both in our study and thestudy in 1994, without finding significant differences on thevariables we have used in the hypothesis testing betweenthose reporting having good data and those coming withqualified guesses [5,8].
6. Conclusion and further work
Revisiting our hypotheses, we conclude the following:
• H1: there is no difference between the percentage ofmaintenance time in our survey and what are reportedin previous surveys.
Not rejected:the overall time used for maintenancetasks is also in our investigation around 40%.
• H2: there is no difference between the percentage ofdevelopment time in our survey and what are reportedin previous surveys.
K.K. Holgeid et al. / Information and Software Technology 42 (2000) 687–700696
Table 10Results from using Holms method to deal with multiplicity
Hypothesis p a i a=7 2 i 1 1 Rejection
H2 0.001 0.05 1 0.007 YesH4 0.001 0.05 2 0.008 YesH7 0.001 0.05 3 0.010 YesH3 0.007 0.05 4 0.013 YesH5 0.015 0.05 5 0.017 YesH6 0.015 0.05 6 0.025 YesH1 0.645 0.05 7 0.050 No

Rejected:the amount of work related to developmentactivities has declined from 30% in Krogstie’s inves-tigation in 1994 to 17% in our investigation. In ourstudy, the total amount of development and mainte-nance activity adds up to 58%. Technical operationand user support account for 42% of the total workin the IS departments of the responding organisations.Compared with Krogstie’s study and the earlier studiesin the US, it seems like the amount of work related totechnical operation and support of users has increasedon expense of time left to new development. This wasas expected.
• H3: there is no difference between the distribution ofwork among maintenance and development in our surveyand what is reported in previous surveys when disregard-ing other work than development and maintenance.
Rejected:when disregarding other work than main-tenance and development activities, the differencewas remarkable (and unexpected); 73% in our studyand 59% in Krogstie’s investigation. We discusspossible explanations to this further below.
• H4: there is no difference between the distribution offunctional maintenance and functional development inour survey and what are reported in previous surveys.
Rejected:62.3% of development and maintenancework was functional maintenance; and 37.7% wasfunctional development. This is a dramatic changefrom the situation in 1994 where functional main-tenance- and functional development respectivelyamounted to 44% and 56% of the work. The study in1994 [8] indicated that larger data departments have amore widespread use of organisational controls andmethodology, and thus perform better regarding func-tional maintenance. This pattern is more pronouncedin the survey from 1994 than in the one from 1998 [5]though, which appears to have been influenced by thespecific situation in connection to Y2K (see later).Although one might expect that smaller organisationscould get by with a more loosely formalised develop-ment and maintenance behaviour with just as goodresult, this appears not to be the case. The results inthe 1994 investigation are in step with the result ofDekleva [21], which showed that there is no conclu-sive evidence that organisations using modern devel-opment methods use less time on maintenanceactivities. On the other hand, they spend a largerproportion of the time onfunctional perfectivemain-tenance, which decreases the amount of functionalmaintenance. The average size of the organisationsand IT-departments are smaller in the last studycompared with the one reported in 1994. This mayinfluence the amount of functional maintenance (andtraditional maintenance). When we have looked intothis in more detail, we got indications (although notsignificant results) that this might explain some of theobserved difference.
Some indications were given that the amount ofY2K-oriented work had a significant impact on theresult, such as the number of replacement systemsthat were Y2K-oriented. Y2K-work affected both themaintenance figures (when existing systems werekept) and functional maintenance figures (whensystems were replaced, or maintenance budget wereused up for Y2K-fixes instead of being used for addingnew functionality to existing systems). We have inves-tigated this further in several organisations. Many ofthose used more than 10 percent of the budget fordevelopment and maintenance on Y2K fixes or repla-cements in 1998. If this trend were general, it wouldexplainsomeof the difference, but not all of it.
• H5: there is no difference between the amount of workspent on functional maintenance and traditional main-tenance when we disregard other work than developmentand maintenance.
Rejected:this is a further confirmation on the func-tional maintenance figure brings new information.
• H6: there is no difference between the amount of workspent on functional development and traditional develop-ment when we disregard other work than developmentand maintenance.
Rejected:this is a further confirmation that the func-tional development figure brings new information.
• H7: there is no difference between the amount of workspent on functional development and functional main-tenance when disregarding other work than developmentand maintenance.
Rejected:although the difference is in the oppositedirection than what we had in 1994 (see discussionunder H4).
6.1. Future work
Several of our results have spurred new areas that couldbe interesting to follow up in further investigations, either inthe form of further surveys, or more likely by developingseveral detailed case studies. To come up with better empiri-cal data, on to what extent the information systems supportin an organisation is efficient would take a new investiga-tion, surveying the whole portfolio of the organisation, andgetting more detailed data on the amount of the work that islooked upon as giving the end-user improved support, andhow efficiently this improved support was provided. Thisshould include the views of the users of the informationsystems portfolio in addition to those of the IS-managersand developers. We would also like to investigate moreclosely the reasons for more or less efficient informationsystems support in an organisation, taking into accountnewer theories on system evolution [25].
A long-term plan is to do a similar investigation in four tofive years, when hopefully the effects of special situationssuch as the millennium shift will have less impact.
K.K. Holgeid et al. / Information and Software Technology 42 (2000) 687–700 697

Acknowledgements
We would like to thank all the participants of the survey-investigation for their effort in filling in the forms. Wewould also like to thank all those who helped us in thepiloting and refinement of the questionnaire, and DnDrepresented by Bjørn Embretsen and Anne-Grethe Pracekfor practical and financial support in the arrangement of thesurvey. Magne Jørgensen and Barbara Kitchenham havegiven useful inputs for the development of Section 5.Finally, we thank the anonymous referees for their invalu-able comments.
Appendix A. Contents of the survey form
Below are listed the main questions from the surveyform. This is not an exact copy of the form used. Forreasons of brevity, we have only included the questionsrelevant to the results presented in the paper. We havechanged the layout and removed most of the room forgiving additional information and qualifying theanswers. We have neither included the additional materialexplaining the format and vocabulary used in the form. Thesurvey form has also been translated into English fromNorwegian.
K.K. Holgeid et al. / Information and Software Technology 42 (2000) 687–700698

K.K. Holgeid et al. / Information and Software Technology 42 (2000) 687–700 699

References
[1] B. Boehm, Improving Software Productivity, IEEE Computer 20 (9)(1987) 43–57.
[2] B. Boehm, K. Sullivan, Software economics: status and prospect,Information and Software Technology 41 (14) (1999) 937–946.
[3] F.P. Brooks, No silver bullet. Essence and accidents of softwareengineering, IEEE Computer 20 (4) (1987) 10–19.
[4] D.E. Perry, Dimensions of software evolution, in: H. Muller, M.Georges (Eds.), Proceedings of the International Conference on Soft-ware Maintenance (ICSM’94), 19–23 September, IEEE ComputerSociety Press, Victoria, Canada, 1994, pp. 296–303.
[5] K.K. Holgeid, Utvikling og vedlikehold av IT-systemer i norskebedrifter, (in Norwegian), MSc thesis, Department of Informatics,University of Oslo, Spring, 1999.
[6] E.B. Swanson, The dimensions of maintenance, Proceedings of theSecond International Conference on Software Engineering, SanFrancisco, USA, August 1976, pp. 492–497.
[7] J. Krogstie, A. Sølvberg, Software maintenance in Norway: a surveyinvestigation, in: H. Muller, M. Georges (Eds.), Proceedings of theInternational Conference on Software Maintenance (ICSM’94),19–23 September, IEEE Computer Society Press, Victoria, Canada,1994, pp. 304–313.
[8] J. Krogstie, On the distinction between functional development andfunctional maintenance, Journal of Software Maintenance 7 (1995)383–403.
[9] J. Krogstie, Survey investigation: development and maintenance ofinformation systems in Norway, Technical Report, IDT, NTH,Trondheim, Norway, July 1994.
[10] B.P. Lientz, E.B. Swanson, G.E. Tompkins, Characteristics ofapplication software maintenance, Communications of the ACM 21(6) (1978) 466–471.
[11] B.P. Lientz, E.B. Swanson, Software Maintenance Management,Addison Wesley, Reading, MA, 1980.
[12] E.B. Swanson, C.M. Beath, Maintaining Information Systems in
Organizations, Wiley Series in Information Systems, Wiley, NewYork, 1989.
[13] J. Galtung, Theory and Method of Social Research, Universitets-forlaget, Oslo, Norway 1967.
[14] L. Bergersen, Prosjektadministrasjon i systemutvikling: Aktiviteter iplanleggingsfasen som pa˚virker suksess (in Norwegian), PhD thesis,ORAL, NTH, Trondheim, Norway 1990.
[15] M.J. Norusis, SPSS for Windows: Professional Statistics, SPSS Inc.,Chicago, Illinois, USA, 1997.
[16] M.J. Norusis, SPSS for Windows: Base System User’s Guide, SPSSInc., Chicago, Illinois, USA, 1997.
[17] J.T. Nosek, P. Palvia, Software maintenance management: changes inthe last decade, Journal of Software Maintenance 2 (1990) 157–174.
[18] M. Jørgensen, Empirical studies of software maintenance, PhD thesis,University of Oslo, Research Report. 188, ISBN 82-7368-098-3,1994.
[19] J.P. Martiniussen, Vedlikehold av programvare – Hypoteser testet i etstørre programvarehus, (in Norwegian), MSc thesis, Department ofInformatics, University of Oslo, 1996.
[20] S.W.L. Yip, Software maintenance in Hong Kong, in: G. Caldiera, K.Bennett (Eds.), Proceedings of the International Conference on Soft-ware Maintenance (ICSM’95), 17–20 October, IEEE ComputerSociety Press, Nice, France, 1995, pp. 88–97.
[21] S.M. Dekleva, Software maintenance: status, Journal of SoftwareMaintenance 4 (1992) 233–247.
[22] W.F. Rosenberger, Dealing with multiplicities in pharmacoepidemio-logical studies, Pharmacoepedimiology and Drug Safety 5 (1996)95–100.
[23] S. Holm, A simple sequentially rejective multiple test procedure,Scandinavian Journal of Statistics 6 (1979) 65–70.
[24] B.A. Kitchenham, S.L. Pfleeger, L.M. Pickard, P.W. Jones, J. Rosen-berg, D.C. Hoaglin, Guidelines for empirical research in softwareengineering, submitted for publication.
[25] M.M. Lehman, J.F. Ramil, P. Wernick, The influence of global factorson software system evolution, Report 98/11, Department of Comput-ing, Imperial College, London, October 1998.
K.K. Holgeid et al. / Information and Software Technology 42 (2000) 687–700700
Related Documents