A STUDY OF CONSUMER BEHAVIOR AND LOYALTY IN THE CHANGING MARKET SCENARIO OF THE OPEN ACCESS POLICY WITH SPECIAL REFERENCE TO MSEDCL CONSUMERS IN THE PUNE REGION A THESIS SUBMITTED TO TILAK MAHARASHTRA VIDYAPEETH, PUNE For the Degree of Doctor of Philosophy (Ph. D) in Management Submitted By Patki Sudhanva Yashwant under the Guidance of Dr. Rajashree Shinde August 2015

Welcome message from author
This document is posted to help you gain knowledge. Please leave a comment to let me know what you think about it! Share it to your friends and learn new things together.
Transcript

A STUDY
OF CONSUMER BEHAVIOR AND LOYALTY
IN THE CHANGING MARKET SCENARIO
OF THE OPEN ACCESS POLICY
WITH SPECIAL REFERENCE
TO MSEDCL CONSUMERS IN THE PUNE REGION
A THESIS SUBMITTED TO
TILAK MAHARASHTRA VIDYAPEETH, PUNE
For the Degree of Doctor of Philosophy (Ph. D)
in
Management
Submitted By
Patki Sudhanva Yashwant
under the Guidance of
Dr. Rajashree Shinde
August 2015

CERTIFICATE
This is to certify that the Thesis entitled “A Study of Consumer Behavior and
Loyalty in the Changing Market Scenario of the Open Access Policy with Special
Reference to MSEDCL Consumers in the Pune Region” which is being submitted
herewith for the award of the Degree in Philosophy(Ph.D) in Management Department of
Tilak Maharashtra Vidyapeeth, Pune is the result of original research work
completed by Shri. Patki Sudhanva Yashwant under my supervision and guidance. To
the best of my knowledge and belief the work incorporated in this thesis has not formed
the basis for the award of any Degree or similar title of this or any other University or
examining body upon him.
Dr. Rajashree Shinde,
Research Guide.
Place: Pune.
Date:

DECLARATION
I hereby declare that the Thesis entitled “A Study of Consumer Behavior and
Loyalty in the Changing Market Scenario of the Open Access Policy with Special
Reference to MSEDCL Consumers in the Pune Region”, completed and written by
me has not previously formed the basis for the award of any Degree or other similar title
upon me of this or any other University or examining body.
Sudhanva Patki,
Research Student.
(PRN15811001346)
Place: Pune.
Date:

Acknowledgements
We owe a lot to everyone who has contributed to the Research in the field of
Services Marketing. The pioneering efforts lay the foundation for advance research in the
unexplored sectors like Power Distribution.
I express my gratitude to the Tilak Maharashtra Vidyapeeth, Pune for giving me
an Opportunity to make a modest endeavor in the field of Management Research. The
facility provided by the University made the Research journey pleasurable and effortless.
With all sincerity and intimacy, I owe more than I express to my Research Guide
Dr. Rajashree Shinde for her untiring support, which was the continual source of
inspiration throughout the Study. Her insight, thoughtful suggestions and constructive
comments outlined the Study in to a meaningful Research.
My earnest thanks to Dr. Roshan Kazi for his guidance in conducting the Data
Analysis. His advice helped me to decode the exact information, masked in the Consumer
responses.
I cannot forget to thank all the eligible Open Access Consumers in the Pune
Region for their honest responses to the questionnaire and valuable feedbacks which
made the Research pragmatic.
A special gratitude towards my Organization for giving me permission to
undertake this Research Work. I am also indebted to my Superiors, Subordinates,
Colleagues and Friends for the assistance, during the field work.
Last but not the least, my gratitude towards my affectionate parents, my wife and
son who set this research work in such an agreeable format.
Sudhanva Patki

Abstract
The power sector is going through a transformational phase after enactment of
Electricity Act 2003. The Regulatory Commissions have started to initiate necessary
steps for making the Power Sector competitive. It is emphasized in the research that the
Distribution Utilities need to understand the changing environment and device strategies
to retain the Consumer base. The Consumer segment that has been targeted in the study is
the eligible Open Access Consumers, as they are high consumption; high revenue earning
consumers contributing to the financial viability of the Distribution Companies. The
Sustainability and Universal Service Obligation for the Government Owned Distribution
Companies like the Maharashtra State Electricity Distribution Company Ltd (MSEDCL)
would be possible, only if the described Consumer Segment guarantees Loyalty with
them. This quantitative study endeavors to understand in depth and breadth, the
Consumer Behavior and Loyalty of the targeted Consumer Segment.
Conceptually, the Research considers Satisfaction, Perceived Value, Brand Image,
Role of Switching Barriers and the Consumer Loyalty as the basic variables of the study.
The Consumer Culture that envelops the Conceptual Model is also studied during the
course. The Data Collection is achieved through Survey Questionnaires. The population
includes the Four Hundred Eighteen number of eligible Open Access consumers scattered
in and around the Pune City and the Sample includes One Hundred Forty Consumers that
represent various Tariff categories and Sectors. The Data Analysis for evaluating present
level of Satisfaction, factorizing Perceived Value, determining the strength of correlation
along with the causal relationship between the Basic Variables, understanding the
moderating role of Switching Barriers and testing of the Consumer Retention Model is
done, having used Statistical Software-SPSS and Structural Equation Modeling.
The research tells that the Consumers at present prefer to stay Loyal with the
MSEDCL, but if provided with better alternatives in future, then they may switch over to
other Service Providers. The findings provide vital inputs to all the Stakeholders and
anticipate a healthy competitive environment for the Power Consumers in future.

Contents
Chapter
No Details
Page
No.
Acknowledgements
Abstract
Contents
List of Annexure i
List of Figures ii
List of Graphs and Pie Charts iii
List of Histograms V
List of Tables viii
Abbreviations x
1 Introduction
1.1 The Background 1
1.2 Defining the Problem 2
1.3 The Research Objectives 4
1.4 The Research Hypotheses 5
1.5 Scope and Limitations 5
2 The Review of Literature
2.1 The Beginnings 7
2.2 Competition Policy in the Electricity Sector: A Global
Outlook
8
2.3 Electricity Act 2003: An initiative to transform the
Power Sector
13
2.4 Maharashtra State Electricity Regulatory
Commission: Steps taken to promote Open Access in
Power Distribution
19
2.5 Fortune for Power Distribution Companies in the
Competitive Environment
25
3 The Conceptual Framework
3.1 Overview 29
3.2 Consumer Satisfaction 32
3.3 Consumer Perceived Value 34
3.4 Brand Image 35
3.5 Consumer Culture 37
3.6 Role of Switching Barriers 40

Chapter
No
Details Page
No.
4 The Research Blueprint
4.1 Significance of Methodology 43
4.2 The Nature of the Study 44
4.3 The Research Design 45
5 Exploring and Investigating the Data
5.1 Experience on field while Data Collection 68
5.2 Selecting the Appropriate Sample 69
5.3 Measurement Scale and Statistical Treatment 71
5.4 The Data Preparation 72
5.5 The Reliability Test 72
5.6 The Test of Normality 74
5.7 The Descriptive Statistics, Frequency Tables and
Histograms
82
5.8 To Determine the Factors Contributing to ‘Consumer
Perceived Value’
158
5.9 Ascertaining the Relationships between Variables:
Testing the Hypotheses
163
5.10 Studying the Moderating Role of the Switching
Barriers on the Relationship between Perceived
Value/Satisfaction and Consumer Loyalty: Testing the
Hypotheses
169
5.11 Sector wise Analysis 212
5.12 Circle wise Analysis 227
5.13 Testing the Consumer Retention Model 238
6 Harvesting the Objectives -
Findings, Suggestions and Conclusions
6.1 The Purpose 249
6.2 Reaching the Objectives 249
6.3 Conclusion 270
7 Plausible Outcome of the Research 273
Annexure 275
Bibliography 331

i
List of Annexure
Annexure Description Page
1 Sample Frame (List of eligible OA Consumers) 275-302
2 Annexure 2 - Survey Questionnaire 303-311
3 Codification of the Questionnaire 312-315
4 List of Eligible OA Consumers Surveyed 316-329
5 Map of the Pune City 330

ii
List of Figures
Figure
Number
Description Page
3.1 The Conceptual Framework of the Research Study 41
4.1 Hierarchical form of Organization Structure in the MSEDCL 46
4.2 Constructs and Variables Contributing the Concept of
Consumer Satisfaction
52
4.3 The Dimensions of Consumer Perceived Value 54
4.4 Basis for Consumer Loyalty 56
4.5 Attributes for Measuring Consumer Culture 59
4.6 Traits for Measuring Brand Image 61
5.1 Blueprint of the Hypothetical Model 239
5.2 Blueprint of the CFA Model 242
6.1 Strength of Relationship between Variables: Satisfaction,
Value, Brand Image and Loyalty
262
6.2 Probable Paths in the Model that Lead Consumer Loyalty 268
6.3 Results of SEM showing the Predictor Relationship between
Variables of the Model
269
6.4 Diagrammatic Representation of Value Chain 270

iii
List of Graphs & Pie Charts
List of Graphs
Graph
Number
Description Page
5.1 Scree Plot for Factorizing Consumer Perceived Value
161
5.2 Group Plot for Moderating Role of Switching Cost on Value -
Loyalty Relationship
173
5.3 Group Plot for Moderating Role of ‘Time & Effort’ on Value
- Loyalty Relationship
176
5.4 Group Plot for Moderating Role of ‘Cultivating New
Relationship’ on Value - Loyalty Relationship
179
5.5 Group Plot for Moderating Role of ‘Few Alternatives’ on
Value - Loyalty Relationship
182
5.6 Group Plot for Moderating Role of ‘Lack of Better
Alternatives’ on Value - Loyalty Relationship
185
5.7 Group Plot for Moderating Role of ‘Compassion with Present
Service Provider’ on Value - Loyalty Relationship
188
5.8 Group Plot for Moderating Role of ‘Loyalty with the Present
Service Provider’ on Value - Loyalty Relationship
191
5.9 Group Plot for Moderating Role of ‘Switching Cost’ on
Satisfaction – Loyalty Relationship
194
5.10 Group Plot for Moderating Role of ‘Time & Effort’ on
Satisfaction – Loyalty Relationship
197
5.11 Group Plot for Moderating Role of ‘Cultivating New
Relationship’ on Satisfaction – Loyalty Relationship
200
5.12 Group Plot for Moderating Role of ‘Few Alternatives’ on
Satisfaction – Loyalty Relationship
203
5.13 Group Plot for Moderating Role of ‘Lack of Better
Alternatives’ on Satisfaction – Loyalty Relationship
206

iv
Graph
Number
Description Page
5.14 Group Plot for Moderating Role of ‘Compassion with the
Present Service Provider’ on Satisfaction – Loyalty
Relationship
209
5.15 Group Plot for Moderating Role of ‘Loyalty with the Present
Service Provider’ on Satisfaction – Loyalty Relationship
212
5.16 Graphical Representation of the Sector wise Mean for
‘Satisfaction’
216
5.17 Graphical Representation of the Sector wise Mean for ‘Brand
Image’
218
5.18 Graphical Representation of the Sector wise- Mean for
‘Quality Consciousness with respect to Cost’
224
5.19 Graphical Representation of the Sector wise Mean for ‘Risk
Taking Ability’
226
5.20 Graphical Representation of the Circle wise Mean for
‘Satisfaction’
229
5.21 Graphical Representation of the Circle wise Mean for ‘Brand
Image’
231
5.22 Graphical Representation for Circle wise Mean for ‘Quality
Consciousness with respect to Cost’
235
5.23 Graphical Representation for Circle wise Mean for ‘Risk
Taking Ability’
237
List of Pie Charts
Pie Chart
Number
Description Page
5.1 The Sample Representation – Sector wise
213
5.2 The Sample Representation - Circle wise 227
v
List of Histograms
Histogram
Number
Description Page
5.1 ‘Supply Quality’ Offered by the MSEDCL
83
5.2 ‘Minimum Supply Interruptions’ as Related to the MSEDCL
Service
85
5.3 ‘Outage Management’ of the MSEDCL
87
5.4 ‘Load Shedding’ Problem Associated with the MSEDCL
Service
89
5.5 Approachability to the MSEDCL Employees in Case of a
Problem
90
5.6 Comfort in Approaching the MSEDCL Staff in Case of a
Problem
92
5.7 Accessibility and Convenient Location of the MSEDCL
Offices
95
5.8 ‘Time and Effort’ Needed in Resolving a Complaint with the
MSEDCL Services
96
5.9 Problem Associated with the MSEDCL Service and
Confidence that the Problem would be solved with Ease
98
5.10 Convenient Working Hours of the MSEDCL Company
100
5.11 Special Efforts taken by the MSEDCL Company to provide
with or maintain for Uninterrupted Power Supply during
Power Scarcity Situations
102
5.12 Risk Associated in Transactions with the MSEDCL is least
104
5.13 Quality of Services Offered by MSEDCL has Improved
significantly Over last Few Years
105
5.14 Present Service Provider (MSEDCL) has Better Staff with
Adequate Knowledge to Handle Consumer Complaints
107

vi
Histogram
Number
Description Page
5.15 Present Service Provider (MSEDCL) has Better Infrastructure
as Compared to its Competitors
109
5.16 Services Offered by MSEDCL to its Consumers is at a
Cheaper Cost
110
5.17 Business Practices of MSEDCL are Ethical and Transparent
113
5.18 MSEDCL is the Most Trusted Service Provider as Compared
to its Competitors
114
5.19 MSEDCL is a Government Owned Company and has Social
Obligations to Fulfill and does not Work Only to Gain Profits
116
5.20 MSEDCL Company has taken necessary efforts to Improve
its Infrastructure to Provide Quality Power to its Consumers
118
5.21 MSEDCL has Capabilities to Face Challenges of Competitive
Environment Due to Open Access Policy
120
5.22 The Business Transactions with MSEDCL are Very Fair and
Even if Provided with a Choice to Select Service Provider, I /
We Prefer to be Associated with the MSEDCL
122
5.23 We Feel Proud in Being Associated with MSEDCL as their
Consumer
124
5.24 We have a Genuine Relationship with MSEDCL as a
Consumer
126
5.25 Majority of Neighboring Consumers, Friends and Relatives
etc Avail the Services of MSEDCL
128
5.26 I Convey Positive 'Word of Mouth' Publicity about my
Present Service Provider-MSEDCL
129
5.27 I Recommend the Services of the Present Service Provider
(MSEDCL), if Someone Seeks my Suggestion
131
5.28 The Financial Cost Associated with the Switching is
Considerable (CSS, Transmission Charges, Wheeling
Charges, Metering Cost, Additional Surcharge etc)
133
vii
Histogram
Number
Description Page
5.29 The Effort Involved in Searching for a New Service Provider
is High and Time Consuming
135
5.30 It Will Also Take Much Time in Learning about or
Understanding the New Service Provider or Develop New
Relationship
137
5.31 Few Alternatives to Provide for Services in Power
Distribution Sector
138
5.32 Lack of Better Alternatives to Provide Services
140
5.33 Consumer Feeling Embarrassed to Inform Current Service
Provider about Discontinuation of Services in Near Future
142
5.34 Sense of Loyalty with the Existing Service Provider
144

viii
List of Select Tables
Table
No.
Description Page
1.1 Contribution to Sales by Eligible/Non-eligible Open Access
Consumers in the Pune Zone
3
4.1 Tariff wise Count of Consumers Included in the Sample Frame
48
4.2 Survey Questions to Measure the Concept of Consumer Satisfaction
53
4.3 Survey Questions to Measure the Concept of Consumer Perceived
Value
54
4.4 Formulation of Survey Questions for Consumer Loyalty
57
4.5 Survey Questions for Measuring Consumer Culture
59
4.6 Formulation of Survey Questions for Brand Image
61
4.7 Formulation of Survey Questions for Consumer Concern
62
4.8 Formulation of Survey Questions Considering the Constructs and
Variables Contributing to the Concept of Service Quality
63
5.1 Tariff wise Count of Consumers Included in the Sample and their
Representation in the Population
70
5.2 Objective and the Statistical Treatment Chosen
71
5.3 Reliability Statistics
73
5.4 The Statistics for Normality
74
5.194 Criteria Employed to Assess the SEM Model
247
5.196 Concluding the Predictors
248
6.1 Result Summary of Service Quality Analysis
253
6.2 Respondent’s Opinion about the Variables of Consumer Perceived
Value
258

ix
Table
No.
Description Page
6.3 Strength of Relationship between the Variables: Satisfaction, Value,
Brand Image and Loyalty
261
6.4 Moderating Role of Switching Barriers on Value - Loyalty and
Satisfaction – Loyalty Relationship
264

x
Abbreviations
ABBR. EXPANSION
ABT Availability Based Tariff
APM Automated Payment Machines
CD Contract Demand.
CEA Central Electricity Authority
CEO Chief Executive Officer
CFA Confirmatory Factor Analysis
CSS Cross Subsidy Surcharge
FMCG Fast Moving Consumer Goods
HT High Tension
HUL Hindustan Unilever Limited
IEX Indian Energy Exchange
IIM Indian Institute of Management
IT Information Technology
KV Kilo Volt
KVA Kilo Volt Amps
KWh Kilo Watt Hour
LIC Life Insurance Corporation of India
LT Low Tension
MERC Maharashtra Electricity Regulatory Commission.
MNC Multi National Company
MSEB Maharashtra State Electricity Board
MSEDCL Maharashtra State Electricity Distribution Company Ltd.
MSETCL Maharashtra State Electricity Transmission Company Limited
MVA Mega Volt Amps
MW MW – Mega Watts
NCAER National Council of Applied and Economic Research
NGO Non Government Officials
OECD Organizations for Economic Cooperation and Development
R-Infra D Reliance Infra-Distribution
SEM Structural Equation Modeling
SPSS Statistical Package for Social Sciences
TPC-D Tata Power Company-Distribution

Chapter 1
Introduction

1
1.1 The Background
The power sector is one of the important sectors contributing to the economic
development in India. The sector, till the beginning of 21st Century was administered by
laws which were framed many decades ago and had less relevance with the existing
problems. The enactment of Electricity Act 20031 has laid the foundation for the
development of power sector in our country. Prior to this act, the sector was mainly
governed by the Electricity Supply Act 1948. The economic reforms in India were
initiated in 1991, but it took ample time to infuse the reform process in the electricity
sector, as it comes under the concurrent list. India’s dream of double digit economic
growth will come true only if it is fueled by the growth in the power sector. The purpose
of the Act 2003 is to rejuvenate the sector by upgrading the existing technology,
promoting competition, rationalization of tariff and protecting the interests of the
Consumer.
The enactment of the Act has initiated measures to transform the monopolistic
environment of the sector into a competitive one. The business environment for Power
Sector not only in India, but also across the globe was highly monopolistic and it was
characterized by Vertical Integration, that is to say, the three wings in the supply chain,
namely Generation, Transmission and Distribution belonged to a single parent Company.
After the enactment of the Electricity Act 2003, the power sector environment is
undergoing a transformational phase. The purpose of the act is to promote healthy
Competition and safeguard the Consumer’s Interest. The implementation of the
Electricity Act 2003 has forced the State Electricity Boards to unbundle their Operations
and create separate entities for Generation, Transmission and Distribution. The formation
of separate entities intends to bring forth Accountability, Transparency and Efficiency in
the sector. The introduction of competition in this sector will mainly impact Generation
and the Distribution wings. Especially, the Distribution wing which is the terminal point
of the supply chain thus making it prone to Consumer grievances. The inefficiencies in
any wing of the supply chain are finally reflected upon the Distribution side. It may be
Chapter 1
Introduction

2
presumed that other two wings should coordinate with the Distribution wing as a part of
organism in spite of their severance from one another. What is expected is synergies of
all three wings in the sector to make ‘Open Access’, a success. The Distribution wing in
the supply chain acts as a ‘touch point’ in evaluating the performance parameters like
Consumer Satisfaction, Consumer Perceived Value, Consumer Loyalty and the Brand
Image of the Company. In view of the above it becomes imperative for the Distribution
Companies in the Power Sector to design strategies that help to maximize the Consumer
Interest at large. Even today, the growth of the sector is handicapped by some of the
unique issues like huge gap in Supply-Demand of electricity, inefficient capacity for
generation, shortages in coal supplies, deteriorated distribution network, significant
commercial losses, lack of finances, unskilled human resource, ageing line staff etc. But
despite the problems mentioned above, the provisions in the Electricity Act 2003
envisage that the Power Consumers in near future will have the choice to select their
Service Provider amongst the Multiple Service Providers. The growth in the Telecom
sector supports the proposition.
1.2 Defining the Problem
Prior to Electricity Act 2003,all the Electricity Consumers were at the mercy of
the State Electricity Boards, but the Act has paved in a way for ‘OPEN ACCESS’, thus
enabling some of its Consumers to select their Service Provider. Previously the
Consumer categorization in power sector was based on ‘Purpose of Supply’, whether a
consumer is Residential, Commercial, Industrial or Agricultural, but the introduction of
Open Access has forced the Distribution Utilities to segment its Consumers on a new
criterion of Consumption pattern and Revenue potential. The Maharashtra Electricity
Regulatory Commission (MERC), Distribution Open Access Regulations provide
Consumers having Contract Demand2 of 1 MVA(Mega Volt Amp) or more, with choice
to select their Service Provider. The Consumers with Contract Demand (CD) of 1 MVA
or more are high consumption, high revenue consumers for the Distribution Utilities.

3
The table below depicts the potential of Open Access Consumers in the Pune Zone.
Table 1.1: Contribution to Sales by Eligible/Non-eligible Open Access Consumers in
the Pune Zone
Category No of
Consumers
Sale in
Million
Units(MU’s)
% of
Total
Sales
High Tension(HT) Consumers eligible for Open
Access ( CD ≥ 1 MVA) 418 310 32 %
High Tension(HT) Consumers not eligible for
Open Access ( CD < 1 MVA) 2,969 192 20 %
Low Tension(LT) Consumers
(Not eligible for Open Access) 19,94,000 464 48 %
Source:- MSEDCL IT Centre ,Pune Zone, Pune .
From the above table it is clear that the eligible 418 Nos of Open Access
Consumers in Pune Zone contribute almost 32% of the total sales. These Consumers are
handful in numbers, but offer immense potential for revenue generation. The aim of the
Research is to develop a model to retain these Consumers.
The 10th
and 11th
five year plans have already promoted the private players in
generation. The CEA (Central Electricity Authority) annual reports for the year 2007-08
and 2012-13 reveal that the total Generating Capacity Addition during the 10th
five year
plan is 21332 MW out of which the Private Sector contribution is 3034 MW and for the
11th
five year plan the total Generating Capacity Addition is 54963 MW out of which
23962 MW is added by the Private Sector. Therefore, the eligible Open Access
Consumers in near future may switch over to other Service Providers or may directly tie
up with Private Generators for better services at affordable prices. In such a situation, the
State Owned Companies like MSEDCL (Maharashtra State Electricity Distribution
Company Ltd) will be left only with low consumption low revenue consumers. Despite
the provisions in the Electricity Act 2003, due to Social and Political reservations , the

4
present tariff structure is non-uniform and highly subsidized, thus the revenue earned by
the state owned companies from the high paying and high consumption consumers help
to serve the low consumption and low paying consumers. The social obligation of the
state owned companies is at the cost of high revenue generating consumers. If such
consumers switch over to private service providers, the state owned companies may not
be in a position to offer services to the low consumption , low revenue generating
consumers. Hence, the MSEDCL must realize the importance of retaining high revenue
generating consumers for their survival in future. In this context, the research aims at
evaluating present level of Consumer Satisfaction, understand the meaning of Consumer
Perceived Value and find out ways to improve Brand Image of the Company and enhance
Consumer Loyalty of eligible Open Access Consumers in the Pune Region. The
moderating role of Switching Cost on Consumer Retention will also be studied during the
process.
1.3 The Research Objectives
The focus of the research will be on the high revenue generating consumers
eligible for Open Access as per the provisions in the Electricity Act 2003 and the study
will be restricted to the region of Pune. The Research Objectives are as follows.
1. To determine the present level of Consumer Satisfaction.
2. To understand the concept of ‘Value Proposition’ for the Consumers and to find
out the factors contributing to Consumer Perceived Value.
3. To determine the relationships between Consumer Loyalty, Consumer Perceived
Value, Consumer Satisfaction, Brand Image.
4. To study the moderating role of Switching Cost on Consumer Loyalty.
5. To develop a Consumer Retention Model.

5
1.4 The Research Hypotheses
The Independent variables in the research are Consumer Perceived Value and
Consumer Satisfaction, whereas Consumer Loyalty will be the dependent variable. In
view of the above discussion, following hypotheses will be tested.
1) Consumer Perceived Value and Consumer Satisfaction positively affect the
Consumer Loyalty.
2) Switching Cost moderates the relationship between Consumer Loyalty and
Consumer Perceived Value & Consumer Satisfaction.
3) Consumer Perceived Value and Consumer Satisfaction have strong positive
relationship.
1.5 Scope and Limitations
The Consumer Satisfaction and Consumer Perceived Value as Independent
variables and Consumer Loyalty as the Dependent variable are the basic parameters
for the study. The research aims at evaluating the present level of Consumer
Satisfaction and Brand Image of the MSEDCL for the eligible Open Access
Consumers. The nature and strength of the relationship amongst the selected variables
will be ascertained and the role of Switching Cost would also be studied considering
the relationship between the Independent and Dependent variables. The overall
intention is to develop a Consumer Retention Model by exploring the concepts of
Consumer Satisfaction, Consumer Perceived Value for Electricity Consumers. The
study would be restricted to the existing MSEDCL Consumers in the Pune Region,
eligible for Open Access.

6
References:
1 - In exercise of powers conferred by clause(k), clause(n), clause(p), clause(q) and clause(zp) of subsection (2) of
Section 181 read with subsection(47) of Section 2,sub clause(ii) of clause(d) of subsection(2) of Section 39, sub
clause(ii) of clause(c) of Section 40 and subsection(2), subsection(3) and subsection(4) of Section 42 of the Electricity
Act 2003(36 of 2003), the MERC has made regulations for introduction of Open Access in the Distribution System of
the State.
2 – Contract Demand(CD) means demand in Kilo Volt Amps(KVA) or Mega Volt Amps(MVA) as entered in to in the
agreement of supply of electricity or use of Distribution Systems or any other written Communication.

Chapter 2
The Review of
Literature

7
2.1 The Beginnings
The introduction of the ‘Open Access’ scheme in power sector not only empowers
the consumers by providing choice to select their Service Providers but also safeguard
their interest. The new act may carve out the future for power sector in India, but the
actual implementation of the provisions in the act to make ‘Open Access’ a reality is a
tough goal. Electricity as a commodity is characterized by some unique attributes namely,
inconvenience in storage of power; simultaneity in nature of supply and demand, its flow
that follows the least resistance path in the network, hence posing challenges to its
controllability and transportability. In manufacturing sector the finished goods produced
at the plant can be transported to a specific market place by way of Rail, Road or any
other mode of transport. For example, finished goods manufactured at Delhi can be
transported to an exact market point in Mumbai, but this cannot be accomplished so
easily in case of power transmission, as the grid operation is complex and the flow of
electricity takes a path in the Grid that offers least resistivity. Therefore, it is very
uncertain that the electrical energy injected into the Grid at Delhi would reach the desired
point of Consumer usage in Mumbai. Considering the above facts and in order to achieve
the benefits of economies of scale, optimal utilization of available resources it is prudent
to monitor and synchronize all the activities in the supply chain by a single establishment
and hence the Industry under study is believed to be a natural Monopoly1. Further, the
activities associated with Generation, Transmission and Distribution of electricity are
highly capital intensive, thus forcing the nature of the business environment to a
Monopolistic kind.
Till now, the development of the sector needed enormous funds and hence the
sector was administered by the government in order to set huge generation capacities
along with pervasive transmission and distribution networks. The State Electricity Boards
Chapter 2
The Review of Literature

8
were formed with an intention of social obligation to provide electricity for all and
commercial interest was considered to be secondary. It must also be noted, that the
development in technologies, especially over last three decades led to a meteoric growth
of Industrialization followed by Information era. The electricity sector which was
supposed to power the economic development suddenly became the ‘Achilles heel’ in the
country’s economic growth due to power deficit situation, poor financial condition of
State Electricity Boards and the lack of policy reforms to safeguard the interest of
Consumers. The enactment of the Electricity Act 2003 has created provisions to initiate
competition in this sector, but their implementations see a bumpy road ahead. The
turnaround in the sector is possible only with a change in the mindset of Employees and
Consumers. In view of the above discussion it would be interesting to review the
implementation of competition policy in some foreign countries.
2.2 Competition Policy in the Electricity Sector: A Global Outlook
The subject of ‘Open Access’ in the Indian Power Sector is very recent and
further its implementation is challenging as the business environment related to power
industry in the country is highly monopolistic. In the Global context, the liberalization of
the sector is at the most two decades old. The relevant literature available on this topic is
handful; of course the search on Google provides some information. The Electricity Act
2003 mentions the provisions in the Act related to Open Access, but it is important to
understand the practical hurdles during the actual execution of these provisions. In the
above context the OECD Competition Committee published “Competition Policy in the
Electricity Sector”(1997)2, a document comprising proceedings in original language of a
Round table on application of Competition Policy to the Electricity Sector. The OECD
Competition Committee debated the application of Competition Policy to the Electricity
Sector in 1996. The committee came out with the document that includes written
submissions from Australia, Belgium, Canada, the Czech Republic, the European
Commission, Finland, Germany, Hungary, Italy, Japan, New Zealand, Norway, Poland,
the Slovak Republic, Spain, Sweden, the United Kingdom and the United States. The
document talks about the various aspects such as, need for Structural Changes necessary

9
for liberalization, whether privatization is an important step in competition or whether
corporatization is sufficient, whether the tariff has declined due to competition or better
regulation, how the issue of Stranded Cost3 be dealt with during the process of
liberalization.( OECD Competition Committee defines Stranded Cost as, “the
unamortized costs of prior investments that are scheduled for recovery through regulated
monopoly rates but would not be recovered under competition”. For example, if a
generation company is assured by the regulator for some fixed profit over cost, but due to
implementation of competition in the sector would not help the company earn the desired
returns, as the pricing will be competitive instead of cost plus, this scenario would bring
the company in financial problem. Hence it is necessary to deal with the issues of
Stranded Cost judiciously in view of changing business environment in order to avoid
financial bankruptcy of existing firms and preserve the confidence of future investors in
the sector.) All the above mentioned factors are significant in executing the competition
policy and need special attention for its success.
The review of the Competition Policy helps understand the common
characteristics of power sector across the globe, the hurdles and the key issues while
transition from Monopoly to Competition, analyzing the impact of competition policy
considering the benefits to the Consumers.
Considering the business environment of power sector in the Indian context and
some of the common features across the foreign countries as covered in the document of
Competition Policy is mentioned below. These features are prior to execution of
Competition Policy.
1. The power sector is dominated by Vertical Integration, which means, all the
three wings in the supply chain are monitored by a single business entity.
2. Government owned monopoly utilities.
3. Over all inefficiency in the Industry and the lack of Consumer focus.
4. Political influence4 in decision making related to addition of generation
capacities, tariff fixation.
5. Subsidized tariff structure.

10
It becomes apparent from the reviewed literature that the problems common to
Indian Power Sector are prevalent even in foreign countries. But, there are some
distinguishing points that we need to consider while comparing the Indian Power
Sector with respect to foreign countries.
In most of the foreign countries the generation capacity during the
implementation of competition policy was in excess5 and in few countries like New
Zealand, Norway, Canadian British Columbia Utility, the generation of electricity
was mainly hydro based6. Thus, the issues like energy security, sustainability and
affordability become insignificant, as hydro power generation offers a cheapest
option for electricity production.
Today, the Indian Power Sector is paralyzed by shortage of supply. Although
the generation capacity has been acute, to some extent the capacity addition during
the 10th
and 11th
plans gives some hope for the sector. But the only addition of
generation capacity would not serve the purpose. Because the basic problem
concerned with generation of electricity is also linked with quality and supply of
Coal. A report on, “Operational Performance of Generating Stations in the Country
during the Year 2011-127, as published by Central Electricity Authority on its
website highlights that the loss of thermal electricity generation was also
contributed by poor quality of Coal, shortage of gas and Coal supply. The poor
quality of Coal also adds to maintenance problems of the generating stations which
increase the operational expenses and as a result the overall cost of supply to
Distribution Utilities and in turn to the end users of electricity. Because of these
adverse situations, the implementation of competition in Indian Power Sector
becomes a challenging task.
In almost all the countries as mentioned in the OECD Competition Policy, the
reforms were initiated during the period 1990 to 1996. The major steps taken to
bring forth competition are as follows.
1.Operational unbundling8 or the idea of disintegration of vertically integrated industry
cause to form three separate wings namely Generation, Transmission and

11
Distribution. It is interesting to note that disintegration of Industry in Spain led to
formation of three separate companies, but cross ownership of shares in Generation
and Distribution was allowed so as to ensure transparency in the system. The
documents also expressed the critical view about joint ownership in companies in
Swedish9 context. The joint ownership owns a risk of competing companies
operating in a way detrimental to the interest of Consumers. Especially this will be
interesting, if a single person holds important decision making position in two
competing companies. Hence the role of the regulator and issues related to corporate
governance in this sector are very sensitive and need special attention.
2. Separation of Wire and Supply Business. The primary intention is to ring fence
distribution activities from the retail activities.
3. The OECD document on Competition Policy emphasizes the development of
Trading Markets10 for success of liberalization in the sector and considering the
benefits to the end users of electricity in real sense. The development of efficient
Trading Market will increase the competition amongst the generators thus providing
incentive for efficient operations. The market arrangements will provide multiple
options to the Consumers at competitive prices and the efficient Trading Market
arrangement will ensure benefits to the consumers by providing improved service
through innovative ways like multiple tariff structures, etc. But it is also necessary to
have a perfect balance between the short term and the long term contracts signed by
the distribution utilities. Because, the spot market trading may benefit the Consumers,
but add risk to the generators and block the future investments in the sector. The
OECD document mentions that development of efficient Power Trading mechanism
is a challenging task.
4. In order to successfully implement Competition Policy, the issue of Cross
Subsidization across Consumer categories becomes significant. The experience from
the markets such as Telecom, Rail Transport that were deregulated in Sweden11 shows
that the cross subsidization issue should be meticulously dealt with for successful
transition of a sector from the Monopolistic environment to a Competitive one. The
OECD document on Competition Policy, in context with the reform process in Spain12,
12
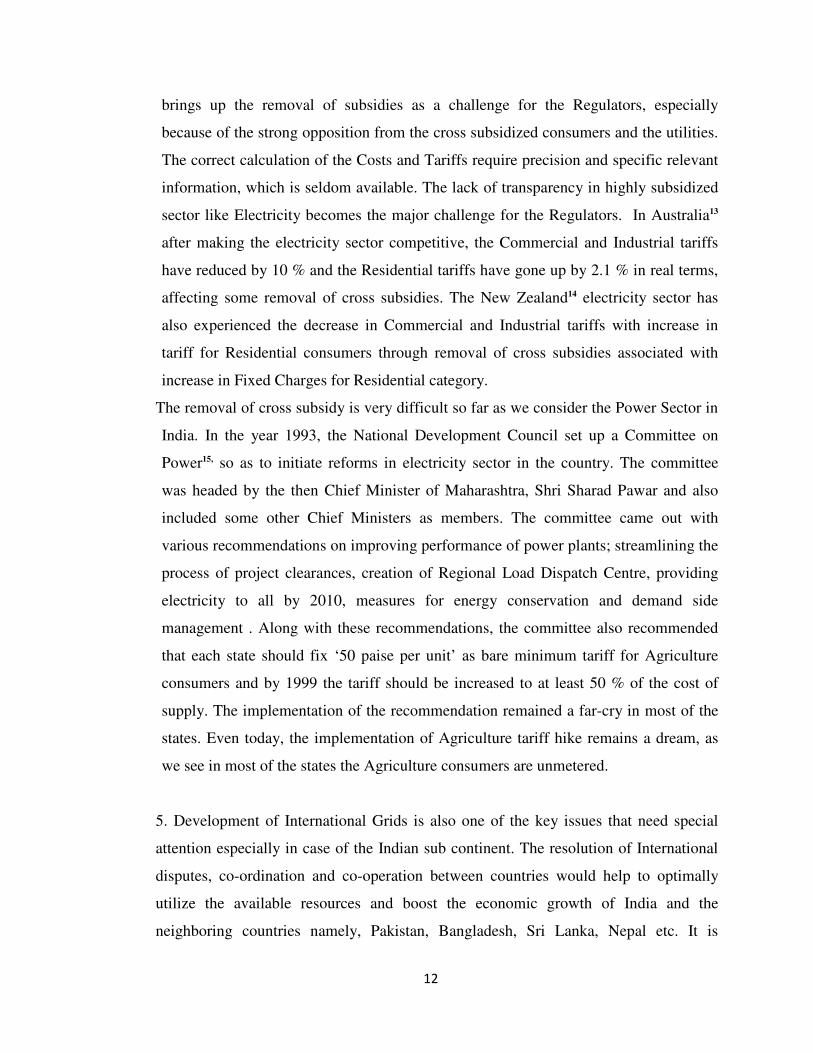
brings up the removal of subsidies as a challenge for the Regulators, especially
because of the strong opposition from the cross subsidized consumers and the utilities.
The correct calculation of the Costs and Tariffs require precision and specific relevant
information, which is seldom available. The lack of transparency in highly subsidized
sector like Electricity becomes the major challenge for the Regulators. In Australia13
after making the electricity sector competitive, the Commercial and Industrial tariffs
have reduced by 10 % and the Residential tariffs have gone up by 2.1 % in real terms,
affecting some removal of cross subsidies. The New Zealand14 electricity sector has
also experienced the decrease in Commercial and Industrial tariffs with increase in
tariff for Residential consumers through removal of cross subsidies associated with
increase in Fixed Charges for Residential category.
The removal of cross subsidy is very difficult so far as we consider the Power Sector in
India. In the year 1993, the National Development Council set up a Committee on
Power15, so as to initiate reforms in electricity sector in the country. The committee
was headed by the then Chief Minister of Maharashtra, Shri Sharad Pawar and also
included some other Chief Ministers as members. The committee came out with
various recommendations on improving performance of power plants; streamlining the
process of project clearances, creation of Regional Load Dispatch Centre, providing
electricity to all by 2010, measures for energy conservation and demand side
management . Along with these recommendations, the committee also recommended
that each state should fix ‘50 paise per unit’ as bare minimum tariff for Agriculture
consumers and by 1999 the tariff should be increased to at least 50 % of the cost of
supply. The implementation of the recommendation remained a far-cry in most of the
states. Even today, the implementation of Agriculture tariff hike remains a dream, as
we see in most of the states the Agriculture consumers are unmetered.
5. Development of International Grids is also one of the key issues that need special
attention especially in case of the Indian sub continent. The resolution of International
disputes, co-ordination and co-operation between countries would help to optimally
utilize the available resources and boost the economic growth of India and the
neighboring countries namely, Pakistan, Bangladesh, Sri Lanka, Nepal etc. It is

13
interesting to note that the document on Competition Policy published by the OECD
has highlighted the importance of International Power Grids. On January 1, 1996,
Sweden decided to replicate the electricity reforms in Norway, thus opening borders for
a joint Norwegian Swedish16 electricity markets. The document also cites that the joint
market will be further extended to include Finland. Norway and Sweden have cables
for power exchange with Denmark and are planning to develop cable networks for
power exchange with Netherlands. The benefits of developing an International
Electricity Grid are enormous, but with the development of International Grids, the
regulatory problems tend to be more complex.
In the context of Indian Power Scenario it is necessary to develop trade relationship
with Nepal and Bangladesh17, keeping in view the Hydro potential in Nepal and gas
availability in Bangladesh. The Ministry of Power has initiated necessary steps through
the Ministry of External Affairs to ensure healthy ties with these countries. The
implementation of competition in our country will be possible only if the power deficit
situation is eliminated. At present the supply shortages are not because of insufficient
generation capacities, but are mainly due to non availability or poor quality of fuel. In
spite of this, it would be interesting to see the developments of TAPI(Turkmenistan-
Afghanistan-Pakistan-India) Gas line that offers cheapest source of Gas from
Turkmenistan to fuel power stations in India.
2.3 Electricity Act 2003: An Initiative to Transform the Power Sector
The sector prior to the enactment of Electricity Act 2003 was managed by the laws which
had little relevance with the burning issues in the Power Sector. The sector was mainly
governed by The Electricity Act – 1910, The Indian Electricity Supply Act – 1948 and
the latest Electricity Regulatory Committee Act – 1998. The basic problems associated
with the sector were financial viability of the State Electricity Boards and higher growth
rate in the sector that boosts the overall economic growth of our country. It would be
inappropriate to say that the sector did not grow over last few decades. The sector grew
from mere 1500 MW18 installed capacity in 1950 to about hundred thousand MW by the
year 2000. The per capita consumption also increased from 15 KWh to 500 KWh during

14
the corresponding period. The achievements made so far surely deserve appreciation, but
considering the global scenario the country had enough scope for growth and
improvement. About a Century ago, people were scared of using electricity because of
safety concerns and lack of knowledge with the use of commodity. The primary aim was
to instill confidence amongst masses to use the commodity without any fear. But with the
development of Domestic technologies, the dependency on electricity increased many
folds and everyone started using electricity liberally. The fear about the usage of
commodity altered in to greed thus encouraging usage of the commodity through unfair
means. Theft of electricity was the major concern especially with the Distribution Wings
of the State Electricity Boards and the prevailing laws hardly had any provisions to deal
with it. The loop holes in the current system failed not only in promoting the sustainable
growth of the sector but also in safeguarding the interest of honest Consumers.
The power deficit situation in the country, deteriorated networks, old and
inefficient technologies was the problem area in the sector. Hence a need was felt to
formulate a comprehensive legislation which could suffice the higher growth rate of the
sector as well as could also address the Consumer concerns. In the year 2000, the
Government realized the urgency to draft a comprehensive Electricity Bill and entrusted
the responsibility to National Council of Applied and Economic Research (NCAER)19.
The National Council of Applied and Economic Research submitted its recommendations
to the Ministry of Power which initiated another round of consultation process. The
representations and suggestions made by various agencies like Industry Bodies,
Consultants, Utilities, State Governments and NGO’s were scrutinized and the necessary
amendments incorporated in the draft submitted by the NCAER, before the Bill was
tabled in the Parliament in August- 2001 for further debate and its approval. The
Parliament referred the bill to the Standing Committee of Parliament on Energy. The
Committee after having discussions with various stake holders, namely, the State
Governments, Public and Private Sector Utilities, Industry Bodies, Federation of Unions
and Association of Employees, Academic and Consultants scrutinized the representations
and made necessary changes in the original Bill. The committee incorporated almost
eighty suggestions and recommendations and forwarded the report to the Parliament in
December 2002. The report submitted by the Committee was a comprehensive report of

15
600 pages that not only picked up the view points of all the stake holders but also
analyzed the implications of various suggestions and finally gave its recommendations
and suggestions. The Ministry of Power processed all the recommendations and
suggestions made by the Committee. The Bill with official amendments proposed was
deliberated for several hours in the Lok Sabha . A number of amendments as proposed by
the members were considered and finally the bill was passed in the Lok Sabha. The ruling
NDA Government did not have the necessary majority in the Rajya Sabha , but there was
a common understanding within the political parties to clear the Bill passed by Lok Sabha
and even in the Rajya Sabha subsequently. Yet the Rajya Sabha suggested amendments
in the provisions of the Bill that related to issues of Multiple licensees in the same area of
supply, specific time bound provisions in the Act to implement Open Access,
Superintendence and control of Appellate Tribunals over Regulators Commissions and
more importantly editorial changes in the sections related to theft of electricity in order to
avoid ambiguity. The concern of Members of the Rajya Sabha was to open up the sector
to competition and ensure that the related provisions are not too restrictive in promoting
competition and should mainly consider the parameters like capital adequacy, credit
worthiness and code of conduct of the Company. Finally the bill was unanimously passed
even in the Rajya Sabha and the Electricity Act 2003 became effective from June – 2003.
The Electricity Act – 2003 has Consumer at its focal point and the Act mainly
focuses on the following points.
1. Development of Electricity Industry
2. Promoting Competition
3. Safeguard the Interest of Consumers
4. Supply of electricity to all areas
5. Transparent policies regarding subsidies
6. Promotion of efficient and environmentally benign policies
In view of the Research topic, the major focus of discussion will be related with
sections regarding promotion of competition in Distribution. The Electricity Act – 2003
in real sense empowers the Consumers by transforming the monopolistic environment
into a competitive one, thus offering a choice to Consumers through multiple service

16
providers. The sections that relate to the introduction of competition in power sector are
briefed as below.
1) Section (9) , Sub Section (2) :- The section (9),sub section (2) of the electricity act
2003, mentions that the Captive generating plants shall have the right to Open Access, to
transmit electricity from captive generating station to the destination of their use. The
Open Access will be subject to availability of adequate transmission facility, which
would be decided by the Central Transmission Utility or the State Transmission Utility,
whatever the case may be. The sub section also tells that the disputes related to
availability of transmission facility will be resolved by the Appropriate Commission.
2) Section (38), Sub Section (2)(d) :- The section(38) , sub section (2) (d) makes
mandatory for the transmission utilities to provide non discriminatory open access to use
the transmission system by any licensee or generating company on payment of
transmission charges and by any consumer eligible for Open Access as per the sub
section (2) of section (42) of the electricity act 2003 after payment of transmission
charges and cross subsidy surcharge. The section (38), sub section (2)(d) relates to the
functions of Central Transmission Utility .
3) Section (39), Sub Section (2) (d):- This section is similar to the section (38) sub
section (2)(d) as mentioned above . But section (39), sub section (2)(d) relates to the
functions of State Transmission Utility.
4) Section 40 (c) :- This section is similar to the section (38), sub section(2)(d) and
section (39), sub section (2)(d) , but the provisions relate to the duties of transmission
licensee .
5) Section (42), sub section (2):- The section (42), subsection (2) of the electricity act
2003 is the most important one as this section is about the duties of Distribution
licensees related to Open Access. The section mentions that the State Commission will
be responsible for introduction of open access in phased manner. The issues related to
Wheeling Charges, Cross subsidy surcharge and other operational constraints should be
handled by the State Commission. The cross subsidy surcharge is the surcharge paid by
the Open Access consumer to meet the current levels of cross subsidy within the area of
the distribution licensee. The onus of progressively reducing the cross subsidy lies with
the State Commission and the cross subsidy surcharge will be recovered from the

17
eligible Consumers opting for Open Access , unless the cross subsidies are totally
eliminated .But the sections 38,39,40,42,61,178 & 181 of the Electricity Act 2003
mention the reduction and elimination of cross subsidies. Much concern has been
expressed regarding the feasibility to eliminate cross subsidies in present scenario.
Hence, it is proposed to amend the said sections and keep aside elimination of cross
subsidy and continue with reduction of subsidy. The Cross Subsidy Surcharge is
applicable to eligible Open Access Consumers sourcing power from alternate Service
Providers or directly from Generating Stations or through Open Market Power Trading.
However the Captive generating stations will not have to pay the cross subsidy
surcharge and will be granted open access after having considered the adequacy of
network and payment of transmission and wheeling charges.
The above discussed sections in the Electricity Act 2003 are very specific to the
Open Access in Power Sector. But the section 49 of the electricity act 2003 mentions that
the Consumer who have been granted Open Access vide section (42), subsection (2) and
notwithstanding the provisions of clause(d) of subsection(1) of section(62) may enter an
agreement with any person for purchase or sale of electricity on terms and conditions
(including tariff ) as may be agreed by the interested parties.
The subsection(1) of section(62) is related to determination of tariff regarding
supply of electricity by a generating company to a distribution licensee along with
transmission charges, wheeling charges and retail sale of electricity. But it is interesting
to note that the distribution of electricity within an area, if served by two or more
distribution licensees then the Appropriate Commission may fix maximum ceiling on
tariff for retail sale of electricity in order to promote competition. In this context it must
be noted that in near future we may see two or more distribution licensees offering
services to Consumers in a common area.
The Maharashtra State Electricity Regulatory Commission (MERC), with
assistance from CRISIL Infrastructure Advisory has already initiated necessary steps by
publishing a Final Discussion Paper on Operating Parallel Distribution Licensees in the
State of Maharashtra on dated 04 May 2010. The main point of discussion is about
development of an efficient mechanism that promotes competition to serve power

18
consumers located in a common area. It is essential to separate the supply and wire
business to ensure multiple service providers working in a common area. The role of
technology especially in the Metering Technology will be significant for success of
parallel licensing. The distribution licensees have the option to develop their own
infrastructure in order to serve the consumers but doing this will replicate the distribution
network and the added cost of new infrastructure may neither help the licensees nor the
consumers. In view of the problem, the MERC issued an interim order dated October 15,
2009 in Case No 50 of 2009 under section 94(2) of the electricity act 2003, enabling
common consumers of TPC-D(Tata Power Company-Distribution) and R Infra-
D(Reliance Infra-Distribution) to changeover from one Distribution licensee to another
using the distribution infrastructure of the existing or old distribution licensee. The
intention of the MERC to facilitate such smooth changeover of Consumers is to promote
long term objective of introducing competition and ensure cheaper supply of electricity to
consumers situated in licensee area common to TPC-D and R Infra-D.
In this context it is important to refer to the MERC press note on the Order dated
22.08.2012 in Case 151 of 2011. The note puts forth the disputes between R Infra- D and
TPC-D where the R Infra-D has filed a petition before the Commission alleging that
TPC-D is cherry picking the consumers by selectively developing its network to offer
services to high end subsidizing consumers and not complying with its Universal Supply
Obligation. The commission after reviewing the matter has clarified that TPC-D has to
set up its own infrastructure to serve the consumers in the Common area as present usage
of existing distribution network of R Infra-D is only an interim solution. The commission
has given directives to the TPC-D, not to develop infrastructure on selective basis but to
ensure that TPC-D fulfils the Universal Supply Obligation.
The above discussion clearly illustrates that the distribution sector in power sector
will be highly competitive and the Consumers will have the choice of Multiple Service
Providers. We would see a cut throat competition amongst the Service Providers to
capture the market share and offer quality services to consumers at an affordable cost.
The role of regulator in maintaining a balance between profitability of Licensees and
safeguarding the interest of consumers will be critical to watch in near future. The

19
regulator will have to develop necessary benchmarking standards, mechanism to speedily
resolve disputes and performance evaluation of Licensees for sustainability of the
competitive environment in the power sector.
2.4 Maharashtra State Electricity Regulatory Commission: Steps taken
to promote Open Access in Power Distribution
The Maharashtra State Electricity Regulatory Commission (MERC), in accordance with
the provisions in the Electricity Act 2003 has published and amended time to time its
Draft Regulations, since 2005 for providing necessary guidelines to promote Open
Access in Power Distribution. The latest copy of Draft Regulations20 published in 2013
on the MERC’s official website comes in a handy way and provides relevant information
to all the interested parties. The draft mainly focuses on the eligibility criteria, procedures
and processing of applications, grant of connectivity to Open Access Consumers, Open
Access charges, general and specific provisions related to Open Access in power
distribution in the state of Maharashtra. The Standards of Performance are clearly
mentioned in the draft regulation, it provides not only the application formats that are
necessarily to be filled in by the eligible Consumers opting for Open Access, but also
endeavors to explore all the questions related to it. It helps an eligible Open Access
consumer understand the advantages, disadvantages and risk associated in switching from
one service provider to another. In view of the above discussion, the main risks
associated in switching over from one service provider to another are briefly discussed
below.
The main risk for a consumer, while switching over from the existing service
provider to a new one, is primarily concerned with availability of power. The availability
of uninterrupted power depends on various factors like ample transmission and/or
wheeling capacity of the transmission and distribution lines respectively,
healthiness/congestion of the transmission and distribution networks, reliability and
quality of the power being provided by the New Service Provider, Generator or Power
Exchange. The regulations clearly point out that in case of shortage of power or

20
constraints due to network congestion, the top priority for allocation of available power
will be set for distribution licensees followed by long term, medium term and finally the
short term open access Consumers. Needless to say, the open access Consumers have to
be very flexible in adjusting with such adverse situations. If the demand projected by an
open access consumer is more than the availability and the said consumer is not able to
restrict his requirement as per the actual availability then the consumer with next lower
priority will be considered for allotment. The above point emphasizes the importance of
precise demand forecasting for the eligible consumers choosing for Open Access. The
consumer must also plan for alternate sources to power its requirement, especially during
the exigent times.
Apart from availability of power, affordability is also one of the major factors that
influence the decision of a Consumer, while switching over from one service provider to
another. The draft regulations published by the MERC provide information regarding the
cost associated in switching. The basic requisite for the Open Access Consumers opting
for new service providers is the installation of Special Energy Meters. These meters must
have the facility to record the energy utilized in fifteen minutes time block, data storage
capacity of not less than 45 days and should have communication facility online and/or
real time. The meters should be fixed at the Injection and Withdrawal points as agreed
upon by the Consumer, Generator/New Service Provider and the Network Distribution
Company. Here the network distribution company means the distribution company to
whose network the Consumer is connected. As per the regulations, the fifteen minutes
time block readings captured at the Injection and Withdrawal point will be tallied to
ensure that the demand of Open Access Consumer is being met by the new generator. If
the data is not made available then the Consumer will be charged as per the tariff of
Network Distribution Utility. The cost of providing Special Energy Meters should be
borne by the Consumer willing to switch over from the existing service provider to a new
one.
The Special Energy Meters will measure the electricity utilized by the Consumer.
The Supplier will raise electricity bill as per the energy consumed and the rate decided as
per mutual understanding between the Supplier and the Open Access Consumer. Apart

21
from the energy consumption charges the Consumer will also have to bear charges for
Transmission and Wheeling of electricity, Cross Subsidy Surcharge, Additional
Surcharge and Standby Charges.
Transmission charges are the charges for utilization of Transmission Networks for
transmitting the electricity utilized by the Consumer. Where the transmission charges are
included in the billing, it is obvious that the Consumer or Supplier is connected to
Transmission network at a voltage level higher than 66KV (66,000 Volts). It may also
happen that both the Supplier and Consumer are connected to the Transmission Network.
Similarly, when a Supplier or a Consumer are connected to the Distribution Network at a
voltage level below 33 KV ( 33,000 Volts ) then the Wheeling charges are the part of
Consumer billing as the Distribution Network is being utilized in transmitting the
electricity utilized by the Consumer. Hence it is apparent that the Transmission and
Wheeling charges may be the part of Consumer bill, if applicable. The applicability of
these charges depends upon the actual connectivity of the Supplier and the Consumer to
the Transmission or Distribution Network.
Cross Subsidy Surcharge (CSS) is applicable to all the Consumers who have been
granted Open Access, in accordance with the MERC regulations. The surcharge is
payable to the Distribution licensee to whose system the Consumer is connected. The
Cross Subsidy Surcharge is the charge to be paid by the Open Access Consumer in order
to make up for the Cross Subsidy that the Distribution Licensee would have earned, if the
Consumer had stayed with it. The formula for determination of CSS as per the Regulation
17 in Distribution Open Access Regulations 2013 is as below.
S = T – [C (1 + L/100) + D]
Where S = Surcharge for Cross Subsidy to be paid by Open Access Consumer.
T = Tariff payable by the relevant category of Consumer.
C = Weighted average cost of power purchase of top 5% at the margin excluding
liquid fuel based generation and renewable power.
D = Wheeling charge in KWh basis

22
L = Loss in %, of the Distribution System as per the applicable voltage level and
as specified by the State Commission.
If the above formula gives a negative value then the surcharge payable is Zero.
From the above formula it is interesting to note that the Distribution Licensee can ensure
that the Consumers will pay more surcharges, if the weighted cost of power purchase,
system losses and wheeling charges are kept low by efficient operation of the network
and meticulous decisions in purchase of power. The Distribution Licensees need to
emphasize more on decisions related to power purchase as the measure per unit cost
component in delivering services to Consumers is contributed by power purchase cost.
The Open Access Consumer may also need to bear the additional surcharge on the
wheeling charges, if the Network Distribution Licensee has to bear fixed cost arising due
to its obligations to supply electricity as per sub section (4) of section 42 of the Electricity
Act 2003. However, it must be noted that the fixed cost related to network assets will be
recovered through wheeling charges only. These additional surcharges would be mainly
associated with the power purchase contracts of the Distribution Licensee keeping in
view that the demand of the Consumer is to be met in future and the Consumer prefers to
stay with the Distribution Licensee.
The basic risk or the fear in the minds of Consumers opting to switch over from
one Service Provider to another is about availability of uninterrupted power supply from
the selected Supplier. It may be possible that the Supplier would terminate the contract
with the Open Access Consumer to supply power because of various reasons like non
availability of resources, shut down of the generating stations or any other reason. In such
a situation the Consumer may need to procure power from the Network Distribution
Licensee by paying Standby charges. The Consumer may avail the standby supply with
day ahead request to the Distribution Licensee. The favor made by the Distribution
Licensee to meet the Open Access Consumer’s load demand comes at an extra premium
called Standby charges. These charges are either due to unscheduled Interchange or
because of the System Marginal Charge under the Interstate ABT mechanism or the
temporary charge of the Network Distribution Licensee, whichever is higher. The ABT is

23
the Availability Based Tariff, and its tariff value remains volatile, with respect to time,
based on the economics of Supply and Demand of the power in the grid.
Apart from all the above charges discussed which are the part of billing, the Open
Access Consumer is also supposed to pay Security Deposit which is an amount equal to
the one month bill that covers transmission & wheeling charges, cross subsidy surcharge
and additional surcharge. In case of the Short term Open Access, the Consumer has to
pay Security Deposit adequate or matching with the duration of open access instead of
one month billing as per the provisions of regulation no. 20, in the Distribution Open
Access Regulations – 2013.
The main aspect to note about the Open Access is monitoring of energy flow at
Injection and Withdrawal points, in real time, by installing the special purpose meters.
The monitoring of energy flow in real time forms the basis of billing for Open Access
Consumers/Suppliers. The Imbalance of energy injected and energy withdrawn also
becomes clear through the real time monitoring of energy flow in the network. It is
interesting to learn from the Distribution Open Access Regulations that the
Consumer/Supplier is penalized for not following the declared schedule. For example, if
an Open Access Consumer withdraws more energy in comparison with the injected
energy, the Consumer has to pay by higher applicable tariff as per the regulations for the
extra quantum of energy withdrawn, but if the Consumer withdraws less quantum of
energy in comparison with the injected energy , the extra quantum of energy in the
network which is not withdrawn will be treated as lapsed energy and the Consumer will
not be paid for it , but on the other hand, if the under drawl of energy by the Consumer
causes any disturbance to the Grid , the Consumer would be penalized as per the Grid
Code. Similarly for under or over Injection of energy, the Supplier or the Generator is
liable for penalties in case of any violation of Grid Norms, but they may not get the
returns of injecting more energy in to the Grid. So, it must be noted that the coordination
between the Supplier and the Consumer must be precise. The margin for error is going to
be thin, so the Consumers will have to observe the declared schedule strictly and hence,
they would need advance tools to predict their future load demand.

24
The connectivity of the Supplier and the Consumer to the network also needs a
special attention while discussing the risks associated with the Open Access. The
generating stations willing to inject power in the grid will need to pay a non refundable
fee of Rupees Two Lakhs with its application. The Renewable energy based generating
stations are supposed to pay a non refundable fee of Rupees One Lac. The cost of
connection with the existing network will be borne by the Generating Station. The
regulation no. 5 of the distribution open access 2013 mentions all the details related to
connectivity of generating stations to the network/grid.
Hence, it is imperative that the Electricity Act 2003 provides options to the certain
segment of consumers to choose their Service Providers amongst Multiple Service
Providers, but this benefit comes at a cost of some uncertainties and risks, which have
been discussed so far. To be specific in this regard, the various charges like Transmission
& Wheeling, Cross Subsidy Surcharge, Additional Surcharge, Standby Charges, cost
associated with Installation of Special Purpose Meters and Cost related to Connectivity;
act as major barriers to switch from existing Service Provider to a new one. Therefore, it
would be necessary to investigate what impact the Switching Cost has on the relationship
of Consumer Loyalty and Consumer Satisfaction. It may happen that the Consumers of
the existing service provider may be dissatisfied with the services offered, but may still
prefer to maintain their loyalty with them considering the various costs, risk and
uncertainty in availing of the option of Open Access. The role of the regulator will be
crucial in the success of Open Access, because finally the viability and growth of the
sector depends on the judicious decisions taken by the regulators that are conducive to the
long term growth of the sector.
As per the guidelines from the MERC, the MSEDCL has come out with its
Circulars for implementation of Open Access as per the provisions in the Electricity Act
2003.The Circulars are made available to all the interested parties on its official website,
www.mahadiscom.in. The Commercial Circular Nos
147,154,155,169,174,185,190,194,198 are all related to Open Access in Power
Distribution. The discussion points mentioned above in the MERC Draft Regulation are
briefed in the Circulars mentioned above. The procedures, responsibilities of the

25
concerned staff, various charges like processing fee, administrative charges, transmission
& wheeling charges , cross subsidy surcharge etc are mentioned in these circulars. The
commercial circular no. 194 supersedes the circular no 147 and 155.
2.5 Fortune for Power Distribution Companies in the Competitive
Environment
It is obvious that the enactment of Electricity Act 2003 and the implementation of
various provisions made in the act have transformed the business environment of the
power distribution sector from monopolistic to a competitive one. The distribution
utilities will be forced to segment their existing consumer base in order to make the
operations sustainable. At present, the Consumers are categorized based on the tariff i.e
the purpose of supply. But the Utilities need to think beyond this differentiation. They
need to segment Consumers as High Revenue earning eligible Open Access Consumers
and Low Revenue earning Non Open Access Consumers. The radical change in the tariff
structure and elimination of subsidies appears to be a rare possibility in near future in the
power sector; however the Utilities also have to fulfill the obligation of Universal Service
Provider. The law does not give the liberty to the Power Distribution Companies to
cherry pick the lucrative Consumers. Hence, it becomes essential for the Distribution
Companies to introspect the Consumer base, understand the potential of each segment of
the consumers and realize which segment of Consumers would help them sustain the
business operations over a longer run.
The business idea put forth by the Visionary Management Scientist, late Dr. C K
Pralhad was praised across the globe. The idea emphasized on improving profitability of
the Companies by serving the poor class of Consumers which is generally ignored by the
MNC’s. The idea was projected with an intention to alleviate poverty of the poor and also
make the business profitable. It is really appreciable that the idea projected by the
Visionary Management Scientist, abounded in benefits for Companies like HUL. The
poor who were deprived of many quality products, because of the cost, were able to
consume them as the Companies came out with small packages at an affordable price.

26
The idea not only benefitted the Consumers, but also helped the Companies increase their
sales volumes and thus the overall revenues. The working paper21 on “Fortune at the
Bottom of the Pyramid: An Alternate Prospective”, as published by IIM, Ahmedabad
and authored by Anand Kumar Jaiswal also needs special attention, in connection with
the above discussion. The critical analysis of the business idea portrayed by Dr.
C.K.Pralhad throws some light on the aspects that need to consider, while implementing
strategies to achieve the desired objectives set by the Companies. The paper mentions the
contrary aspect i.e “Small Isn’t Always Beautiful”. The view point of the author is to
illustrate that the strategy associated with a particular product may not work out with
some other product. The strategy to sell Shampoo or Razor blades in small sachets may
be successful, but it would not work out with products like Biscuits, Jam, Washing
Powder, Milk Powder, Sanitary Napkins etc as for these products the smallest available
packages are not the largest contributors to the total Sales Volumes.
In assessing the above discussion, the contrary view point to the theory set by Dr
C K Pralhad also holds true with the Power Distribution Business. Of course Dr. C K
Pralhad’s theory changed the marketing concepts all over the globe. It also suggests that
the Small Consumers should not be ignored by the Companies, because it may happen
that the contribution made by the Small Consumers to the overall Sales Volume may be
significant.The revolutionary theory prompted Companies to concentrate on Small
Consumers and Companies came out with small packages at affordable prices to serve
their products to the poor. But, in case of power distribution business the theory of
‘Bottom of Pyramid’ may not hold equally true. Electricity as a commodity has some
unique features such as generation and consumption occur simultaneously, for electricity
cannot be inventoried. The gap between supply and demand is widening, huge resource
constraints, the issues of sustainability and environment are of prime importance. Further,
the political patronage of the thefts, cross subsidies and lack of modern technologies add
to the problems in power distribution sector. Hence, in view of above mentioned points it
becomes imperative for distribution companies to retain high consumption , high
revenue earning consumers in order to fulfill the Universal Service Obligation to serve
the low consumption , low revenue earning consumers. Considering the above discussion
and the data summarized in the Table 1.1 of Chapter. 1, it is clear that almost 52 % of the

27
sales are contributed by Three Thousand Three Hundred Eighty Seven number of High
Tension Consumers and the 48 % of the sales being contributed by Nineteen Lacs Ninety
Four Thousand of Low Tension Consumers in Pune Zone. The comparison of revenue
earned by both the segments and the quantum of efforts needed to offer services; make it
obvious that the fortune for power distribution companies is in offering services to
consumers at the top of the pyramid. But it would be wise to say that the fortune for
Distribution Companies is in understanding the needs specific to the segment. The point
of interest in the above discussion is about devising new strategies by power distribution
companies in order to serve the poor consumers too. Due to scarcity of resources the
power sector is compelled to use de-marketing strategies. The technological
developments will help to convert the primitive grids into Smart Grids. Sustainability and
Cost Competitiveness will be the future for power distribution sector in India.

28
References:-
1 – Organizations for Economic Cooperation and Development. Competition Policy in the Electricity Sector.France,
Paris: OECD, 1997: p 140.
2 – Vide Organizations for Economic Cooperation and Development. Competition Policy in the Electricity
Sector.France, Paris: OECD, 1997.PDF file
3 – ibid. p. 148.
4 – ibid. pp. 7, 49, 76, 96,103, 185.
5 – ibid. pp 7, 15, 97,103.
6 – ibid. pp 31, 89, 91.
7 – http://www.cea.nic.in/reports_yearly.PDF. Central Electricity Authority.p 14, 01.05.2013.
8 – Organizations for Economic Cooperation and Development. Competition Policy in the Electricity Sector.France,
Paris: OECD, 1997:pp 42, 58, 118,145.
9 – ibid. p 123.
10 – ibid. pp 10,12,28,77,95,118,157.
11 –ibid. p 128.
12 – ibid. p 119.
13 – ibid. p 10.
14 – ibid. p 79.
15 – Shahi R V.Towards Powering India:Policy Initiatives and Implementation Strategies.New Delhi:Excel
Books,2007.Print.p 24.
16 – Organizations for Economic Cooperation and Development. Competition Policy in the Electricity Sector.France,
Paris: OECD, 1997:p 105.
17 – Shahi R V.Towards Powering India:Policy Initiatives and Implementation Strategies.New Delhi:Excel
Books,2007.Print. p 49.
18 – ibid. p. 61.
19 – ibid.p. 61.
20 – http://www.mercindia.org.in/orders.PDF. Maharashtra Electricity Regulatory Commission. 24.06.2013.
21 – Anand Kumar Jaiswal. Fortune at the Bottom of the Pyramid : An Alternate Prospective. Indian Institute of
Management, Ahmedabad,2007.http://www.iimahd.ernet.in/publications/data/2007-07-13Jaiswal.pdf.

Chapter 3
The Conceptual
Framework

29
3.1 Overview
A conceptual framework is the necessary part in conducting a research study,
because it helps not only to develop a visual model that is empirical, but also makes the
research process comprehensible. A conceptual framework is like a runway that helps to
take off or land a plane smoothly.
The research study emphasizes on the learning of Consumer Behavior and
Loyalty. The power distribution sector was highly monopolistic prior to enactment of
Electricity Act – 2003. The Electricity Act has provisions to promote competition and
protect consumer interest, but even after a decade after its enactment, the power /
electricity consumers have hardly any choice. The problems associated with power sector
are unique, like shortage of electricity, limited availability of natural resources, the
capital intensive nature of the power industry, etc. These unique problems create barriers
to the new entrants and promotion of competition gets tougher. Moreover, the decisions
related to tariff fixation are not market driven. Further, the political interference and
patronage of theft of electricity add to the challenges in the sector. Nevertheless, these
barriers cannot hold back the competition for a longer period. The development of metro
rail in Mumbai with entire contribution from a private company like Reliance gives some
ray of hope for the future of power sector in India.
The services being characterized by simultaneity, perishability, intangibility and
heterogeneity and when we deal a service industry which has a commodity like electricity
the challenges become even worst, because electricity is a commodity which cannot be
inventoried, as the generation and consumption happen simultaneously. Because of all
the above mentioned factors, the research in service industry like power distribution
becomes interesting. Hence, the conceptualization of framework keeping in view the
Research Objectives is an important step in conducting a Research study.
Chapter 3
The Conceptual Framework

30
The societal marketing concept1 suggests that consumers may on occasion;
respond to their immediate needs or wants, while overlooking what is in effect on their
own or family or national interest, over a longer run. However, it is interesting to see that
these concepts, which may hold true for other services, may not hold true for power
sector services. Just because Supply – Demand gap still prevails and again for the same
reasons of political interference in tariff fixation, availability of few options, etc.
The consumer behavior is the behavior of a consumer in Searching, Purchasing,
Using, Evaluating and Disposing the products and services, while fulfilling their needs.
Although, considering the existing situation in the power sector and the unique feature of
electricity as a commodity, the power consumers hardly have any options available at
hand. Therefore, the point to emphasize in this regard is that the aspect of ‘Searching’ is
totally inapplicable in the context of Indian Power Sector. The Act has made provisions
to promote competition and provide with a number of alternatives to power users, but we
are still in premature stages when we think of competition in the Power Sector.
Another important aspect in consumer behavior is ‘Purchasing’. Generally in
products from FMCG Sector, the consumers have numerous options. Just think of FMCG
products like Soaps, Deodorants, Shampoos, Electronic goods, etc. The
consumers/customers get confused as the options available are numerous, we may say it
is a buyer’s market and discount, special offers are always given by the manufacturers to
attract more customers. In this regard, it may be specifically mentioned that the recent
decision made by the MERC, not to give permission to the eligible Open Access
Consumer to switch to Indian Energy Exchange from existing service provider, that is the
MSEDCL. The commission fears that the switching of eligible Open Access consumers
to the energy exchange would disturb the financial stability of the MSEDCL, thus
jeopardizing the Company’s Universal Service Obligation to provide power to all. The
commission rejected the request of twenty nine industries, applying for sourcing power
directly from Indian Energy Exchange (IEX). The commission mentioned that it needs to
verify, does the Act have any provisions for eligible Open Access consumer to source
power directly from exchanges. So, these hurdles hamper the consumers bargaining
power. It is supposed that at least for eligible open access consumers the tariff should be

31
market driven, so the second aspect in consumer behavior i.e. ‘Purchasing’ also does not
find space in the study of Consumer Behavior as specific to the power sector.
The concept of Consumer Behavior is very complex, because the elements that
contribute to this concept are very volatile. It would be wise to say that study of
Consumer Behavior basically envelops the study of Consumer Satisfaction, Consumer
Perceived Value, Consumer Loyalty and also the Brand Image at the back of the mind of
the Consumer. The Consumer Satisfaction and Perceived Value form the intrinsic factors
whereas the Consumer Loyalty and Brand Image are the extrinsic factors of the study. To
be more specific, the Consumer Satisfaction and Perceived Value are factors in
Consumer’s mind which are not easy to evaluate, understand or interpret. These intrinsic
factors are highly volatile because they not only depend upon consumer need, but are
highly susceptible to a particular situation faced by the consumer. To elaborate this, an
example is quoted in which the consumer is offered the best service for last 6 months by
a Power Utility. The consumer has experienced uninterrupted power supply for a
considerable period, but say at some particular time very important to the consumer; the
supply interruption just for few minutes irritates the Consumer and takes away the whole
credit from the Power Utility for maintaining uninterrupted power supply in the past.
Hence, chance and situation play a major role and adversely affect the perception of the
Consumers. Generally we see that many industries complaint against the higher tariff rate
for electricity unit. So, while evaluating Consumer Perceived Value, the dominant factor
is not the benefits, being received by consumers, conversely it is the Cost of Supply
incurred by him. On the other hand, suppose a manufacturing industry receives an
overseas consignment in which the quality of the product is of prime importance to the
client of the industry then the same company would change its perception about ‘Value’.
The industry would agree to pay higher tariff, but would not compromise with the
benefits or the quality of power supply. Therefore, we envisage that situation plays a
major role in defining the Perceived Value.
However, Consumer Loyalty and Brand Image of the company are extrinsic
factors, because they are visible while studying the concept of Consumer Behavior. The
Consumer Loyalty factor needs to be defined precisely when we learn Consumer

32
Behavior in Power Distribution Sector. For the reason, ‘Consumer Loyalty’ is generally
misinterpreted as ‘Loyal Consumer’. Loyal Consumers in power distribution are those
Consumers who abide by the rules and regulations of the Distribution Company and have
affinity with it, pay their electricity bills within time and never indulge in the activities of
misuse or pilferage of electricity. Because, we know the power utilities financial position
is cramped by theft of electricity and non-payment of electricity dues by their Consumers.
Consequently, ‘Consumer Loyalty’ in our study related to Consumer Behavior is
associated with the Consumers’ intention to maintain relationship with the distribution
company. As the study of Consumer Behavior in this research is for the eligible Open
Access Consumer in the Pune Region, the aim of the study is not only to evaluate
Consumer Satisfaction level or understand the Perceived Value from the Consumers view
point but it also aims at predicting whether the Consumers of the MSEDCL are willing to
maintain relationship with it even in future. The ‘Consumer Loyalty’, an extrinsic factor
is considered the most important one, because it finally impacts the profitability and the
revenue of the Company. It is presumed that the Brand Image of the company depends on
the Consumer Satisfaction and the Consumer Perceived Value. Even if, the present
environment in the Power Distribution Sector is not competitive, but in near future, as the
environment turns out more competitive, the Brand Image of the company will have
greater significance and would finally decide the Consumer Loyalty.
3.2 Consumer Satisfaction
Consumer Satisfaction is the perception of the consumer about a product or a
service, as against the expectations. Earlier, consumer’s had few expectations about the
services offered by the Power Distribution Companies. The economic reforms in the
1991, which liberalized many Sectors and made the doors open to foreign companies to
the Indian market.
Electricity which is a significant input in most of the processes, manufacturing or
service industry became important, keeping in view, the quality of products/services and
it’s Cost. The Indian companies were forced to compete with Global Companies, thus
making it mandatory for them to observe Global Quality Standards, in order to capture or
retain the market share. Today, Companies keep a close watch on the ‘Interruptions and

33
Quality’ of the power supply provided by the Distribution Companies as the information
is available to the Consumers at a mouse click. Consumer Satisfaction in power
distribution sector depends on several factors like, quality of power supply, number of
interruptions, cost of service, billing system of the distribution company and the
Employee/Staff behavior with the Consumers. As a result of these factors, evaluation of
Consumer Satisfaction becomes a difficult task. Moreover, a single adverse instance may
make a Consumer unhappy. Besides, the geographical area covered by the Distribution
Utilities is generally vast and so keeping the Consumers always satisfied is a tough task.
In addition, Power Distribution is a service industry, in which the quality of supply is
sometimes beyond the control of distribution companies, as in many cases, power
interruptions are not due to faults of a distribution company, but due the faults at
Generation/Transmission. In urban areas or metro cities, the distribution of power is
mainly through underground cable system and because of lack of proper co-ordination
between various Agencies, Local Bodies, many problems emerge. For example,
excavation of roads carried out by Municipal Corporations or Telecom departments are
the main reason for damage of underground cables of the MSEDCL, thus interrupting the
power supply to its consumers for prolonged hours. Even these problems are
acknowledged by the Consumers, they finally blame the power distribution companies
for all the interruptions. So, creating a delighted Consumer is a difficult aspect for Power
Distribution Companies.
All the above discussion shows the significance of Consumer Satisfaction while
studying Consumer Behavior. Further, when we link Consumer Satisfaction with
Consumer Behavior, then the Consumers may be classified into three levels, namely,
Positive Consumers, Neutral Consumers and Negative Consumers. The positive
consumers may be called ‘Favorable Consumers’ who are satisfied with the service
quality of the company and are willing to continue business with the Distribution
company. Whereas, Negative consumers may be termed ‘Adverse Consumers’, who are
dissatisfied with the quality of service offered by the Distribution Company. They
generally share negative experiences encountered with the Distribution utilities and
compare their existing service provider with its competitors. And Neutral consumers are
those who don’t fall in any of the above mentioned categories. These consumers may also

34
not express their true perception about their service provider. Hence, considering the
three levels or categories of consumers, the distribution companies may design strategies
to focus only on negative consumers. Nevertheless, distribution companies should not fail
to understand the expectations of the Neutral consumers. The Neutral consumers may
have higher probability of turning into Negative consumers. No doubt, focusing on
Negative consumer is of prime importance, but being deaf to the Voice of Neutral
Consumers may increase the number of Negative consumers exponentially. Hence, the
strategy of the Distribution Company should ensure that maximum consumers should fall
under the category of ‘Favorable or Positive’ Consumers.
The Consumer Satisfaction is the important aspect in this research study. The
evaluation of Satisfaction is difficult; nonetheless, the expectations and perception about
the service offered by the MSEDCL would be understood by framing a questionnaire
based on various parameters of ‘Service Quality’ viz. Tangibles, Responsiveness,
Reliability, Assurance and Empathy. The evaluation and the details about measuring
Consumer Satisfaction are elaborately discussed in Chapter. 4.
3.3 Consumer Perceived Value
Consumers experience Satisfaction only when they feel that the Service Provider
has honestly delivered Value for whatever Cost is paid. So, it is necessary to understand
the relationship between the Consumer Perceived Value and the Consumer Satisfaction.
The Service Provider must have a clear understanding of the Value proposition to its
Consumers. The concept of Consumer Perceived Value is two dimensional and the two
dimensions are ‘Cost’ and ‘Value’. Cost represents the input, whereas, Value stands for
the output. Generally the Cost factor is considered only in monetary terms; however, it
would not be wise to consider only the tangible aspect, because the intangible aspect of
Cost such as psychological cost is equally important. Similarly, the benefits received by
the Consumer should not be restricted only to the Quality of Service or Monetary benefits
received, but along with it, the Social and Special benefits equally play a vital role. It is
necessary to understand that the situation too plays an important role, while evaluating
Consumer Perceived Value. Because, during certain situations the Perceived Value may
be derived by a consumer not on benefits received, but mainly on the Cost incurred. Thus

35
it would be wise to say that the Perceived Value depends on the consumer focus on a
particular situation. The detailed questions on measuring ‘Consumer Perceived Value’
are discussed in Chapter.4.
3.4 Brand Image
“Brand Image2 is the perception and beliefs held by Consumer, as reflected in the
associations held in Consumer memory”.
Therefore, it is very clear that Brand Image is of the character that is intangible in
form and psychological in nature. The intangible form is made physical through offerings
made by the company. An offering includes product, services, experiences made by a
consumer during his encounter. As per the definition, Brand Image is about the
perception and belief. Consequently, in Service industries like Power Distribution, it is
very essential that the perception of consumers should be good. Perception can be good,
only if the service offering is of high quality. In Power Distribution Sector, perception
will be positive, only when the psychological benefits delivered by the Company are
recognized by the Consumer.
Companies that can provide service assurance to the consumers will definitely
ensure positive perceptions about the offered services, it is also important to understand
that the Beliefs developed by Consumers depend on the past experience and these beliefs
finally create a Brand Value in the minds of Consumer. Generally, branding is difficult
for companies associated with services as against products, because the amount of efforts
needed to make each service encounter favorable are significant. It should be noted that
generally unfavorable incidences find a permanent place in Consumer’s mind as
compared to favorable ones, thus creating challenges for branding in Service Sector.
When we specifically speak of the Brand Image of the MSEDCL, it is very
difficult to envisage what Consumers think about a Government Owned Company. Is it
the behavior of the employees, social obligations towards the company or something else
that gets associated with the Company? Recently, the concept of Brand Image has gained
importance even in the Power Sector, as the environment is changing from Monopolistic
to a Competitive one. The best Brand Image a company may hold is to make the Business

36
synonymous to the Company name. For e.g. ‘Photo Copy’ is called ‘Xerox’, Life
Insurance Policies are generally recognize as LIC(Life Insurance Corporation of India).
Xerox or LIC are the names of companies that offer service to the consumer, but these
services have taken the Company name because of the efficient performance they offer to
the Clientele. Companies that convert business transaction into a long term relationship,
develop trust with the Consumers, ultimately creating a favorable Brand Image that helps
them to survive even in a Competitive environment. The Life Insurance Corporation of
India is the greatest example in Indian context when it comes to Branding.
Brand Image of a Company plays a vital role, because it is how a Company is
recognized by its Consumers. In Power Distribution sector, after enactment of the
Electricity Act 2003, almost all the State Electricity Boards are converted into
independent Companies, namely, Transmission, Distribution and Generation. Even in the
State of Maharashtra, the then MSEB (Maharashtra State Electricity Board) is trifurcated
into three separate companies, namely, Mahagenco, Mahatransco, and Mahadiscom /
Mahavitaran. But even today, we see that the distribution wing of the MSEB i.e.
Mahadiscom is being recognized by the old name MSEB. After trifurcation of MSEB,
the MSEDCL Company has given emphasis even on the tangible aspects like, renovating
and maintaining Offices, providing facilities to consumers, etc. thus endeavoring to
change its Image from a State Electricity Board to a Socio-Commercial Distribution
Company. Even the objectives have changed, since its inception in the year 2006. Earlier
the main objective of distribution wing of the State Electricity Board was to electrify
villages and maintain uninterrupted power supply to them. The target setting was also on
the basis of extending distribution network to the smallest and the farthest place. But at
present, it is not only mandatory to provide uninterrupted power supply to the
Consumers, but also to recover outstanding dues from them. The target setting is based
on parameters like Billing and Collection efficiency, so as to reduce distribution losses
and maximize revenues. The company has set APM (Automated Payment Machines),
modernized its distribution system and designed a website to provide information/online
bill payment facility, etc, in order to offer better services to its Consumers. Of course,
these activities are being implemented, because of the provisions in the Electricity Act
2003 that was forced into practice by the State Electricity Regulator (MERC). Finally, all

37
these activities will help the distribution company to create an Image which has
‘Consumer Centric’ attitude.
3.5 Consumer Culture
“Culture3 is the complex whole that includes knowledge, beliefs, art, law, morals,
customs and any other capabilities and habits acquired by humans as members of
society”.
So in general we may say that Culture is acquired from the Society which
influences an Individual’s thought process. Even in advertisements, we see the influence
of Culture. The advertisement of ‘Diary Milk’ chocolates featuring Amitabh Bachan as
its ambassador and delivering the punch ‘line’ Kuch Metha Hojaye’. Generally, in Indian
culture, ‘Metha’ or sweet is symbolic to some auspicious occasion. Traditional sweets are
laddu, pedha, Barfi, etc, but in the advertisement ‘Dairy Milk’ is treated synonymous to
all these sweets and the Company endeavors to replace the traditional sweets by its
chocolate products. Years ago, ‘Paan Parag’ was one of a Tobacco product which also
used the Indian Culture to its benefit. The advertisement starred ‘Shammi Kapoor’ and
his dialogue in the advertisement, “Bus hame aur khuch nahi chahiye, Hum sirf itna
chahate hai, baratiyoon ka swagat paan parag se hona chahiye”. In Indian wedding
ceremonies, the bridegroom and his relatives/friends have special respect and they are to
be treated with dignity. The Paan Parag Company made an attempt to penetrate its sales
to such ceremonial functions. India is a country having many festivals; therefore, these
companies target their prospective Consumers, especially during festive occasions like
Diwali, Dasherra, and Eid. Hence, we may say that Culture plays a major role and
influences the thought process of Individual & Groups in selecting or purchasing a
product. Culture does not mean rules of the society; however, it means norms or a way of
things accepted easily and followed by the members of the Society.
The role of Culture is not only associated with Products, but also with Services.
For example, in food industry we see many restaurants making use of Culture to their
benefits. In Maharashtra we see restaurants that offer Rajasthani, Gujrathi, Punjabi or
South Indian food. The location of such hotels is generally associated with the Culture of

38
the people staying in the area. To make the point clear, a Panjabi restaurant may have to
shut down its business in loss, if it is opened in a Jain or Gujarati community. Because,
Punjabi cuisine is a mix of Veg / Non Veg and the food preparation is mainly spicy with
use of garlic. We know Jain’s do not use garlic in their food. So, we have many Fast-
Food restaurants that offer ‘Jain Pav Bhaji’. Even the restaurant names are dominated by
the culture, for example Peshwai, Mughlai, Maharaja, etc. In many restaurants we see
waiters and the serving staff dressed in traditional dresses like wearing Rajastani Pagdi,
Gandhi topi, Mavale topi or Dhoti - Kurta. Therefore, the role of culture is significant,
when it comes to marketing a Service or a Product. Except, the perception of the Culture
changes, when it is about Power Distribution Services. The culture to be studied in this
regard is mainly about the aspects viz. Values, Awareness and Knowledge of the
members in the Society. In metro cities, we see very few people get indulged in the
activities of mis-using electricity or pilferage of electricity. But, the situation is almost
reverse, when we go to rural areas; we envisage Industrial or Commercial establishments
in urban areas are very honest and ethical whereas, most of the Agriculture Consumers
directly hook to the distribution lines and pilferage electricity. Across the state of
Maharashtra, we observe adversities in the Consumer Culture especially while comparing
different regions, namely, the Marathwada , the Vidharbha and the Western Maharashtra.
Of course, it must be noted that the resource availability, economics, political will,
growth potential dominate in carving the Culture of a region. The loss levels in the
Marathwada or the Vidharbha are high and the revenue collection efficiency is low, as
compared to the Western Maharashtra. It is interesting to note that Western Maharashtra
is gifted by ample water, huge local markets and hence the Agriculture Consumers prefer
to adhere by the laws, rules and regulations. However, in this regard it must be also noted
that the Agriculture in the regions of the Marathwada or the Vidharbha is mainly
dependent on the rainfall, whereas the Agriculture land in the Western part of the
Maharashtra is much irrigated. In short, all the factors mentioned above define the Socio-
Economic scenario and finally the Culture of a Region.
Another aspect of the Consumer Culture that needs to be understood is the
alertness and awareness of the Consumers in understanding their rights and duties. In
metro cities, Consumers are ready to pay for better services, but they are highly

39
demanding and are also aware about their rights. Consumers in metro cities may also
demand compensation, if the services are not delivered as per the standards applicable to
the services, delivered by a Distribution Company. The mega townships in developing
cities offer many amenities to the residents like Swimming pools, Elevators, etc making
the life dependent on electricity and hence, a Consumer staying in such sophisticated
area may be ready to pay a higher electricity tariff, but would demand better quality of
service.
Technology is also one of the most important aspects, when we study Consumer
Culture associated with Power distribution. Power Distribution companies can deliver
quality services, only if the services are technology assisted. The Urban consumers may
welcome and adopt new technologies to their advantage, on the contrary, the rural
consumers may offer resistance to it or may not appreciate or use the latest technological
advances offered by their Service Provider. In such cases, the investment made in new
technologies by the Distribution companies may go waste. The inaccessibility of
Telecommunications infrastructure in remote or rural areas may also provide limitations
in providing with technologically assisted services to the Consumers.
The research targets the Consumers with Contract Demand more than 1000 KVA.
These consumers are mainly Industrial or Commercial ones and acceptance of latest
technologies or their adaptability to it may not be a hurdle to such Consumers. Although,
the interesting aspect of the Culture to be studied is, “Are the target Consumers willing to
pay more for better services?”. The answer to this question is difficult and deriving an
equilibrium point for ‘least Cost of Service’ and utmost ‘Consumer Satisfaction’ which is
going to be a challenging task for the Distribution companies in near future.
In recent times, we observe Consumers fulfilling their needs on their own. Many
Industries instead of relying on other external sources for the input material prefer to
manufacture the Input material requirement by backward or vertical integration of the
business. In many Processes, Steel Industries the requirements of electricity as well as
heat energy in the form of Steam are equal. Such Plants or Industries have to generate
steam for their process requirements. The low pressure steam is then used for running the
alternators to generate electricity. Therefore, in many Sugar Plants we have co-generation

40
systems installed. Hence, during the study of Consumer Culture it would be interesting to
see whether Consumers are ‘Prosumers’. PROSUMER is a blended form of Producer and
Consumer of a Service or a Product. The various hurdles in the power sector may force
consumers to be Prosumers.
Culture is an important external factor that guides the behavior of a Consumer. It
is one of major influencing factors and hence, the study of Consumer Culture is a must
for any Organization. Understanding the Consumer Culture would help companies’
device strategies that would really address the basic problems of the Consumers
effectively and efficiently.
3.6 Role of Switching Barriers
In the discussion so far on various aspects of Consumer Behavior the basic
variable that is at focal point is to understand Consumer needs and device strategies that
please them with greater Satisfaction, generate Value for every penny being paid and
ensure a long term association with them.
The association of a consumer may not depend totally on the quality of services
offered by its Service Provider. But, external factors also play an important role in
influencing the Consumers relationship with his Service Provider. If a consumer
maintains his alliance with a Service Provider, then it does not mean that the Consumer is
happy with the services offered by his Service Provider as the consumer may maintain his
association, for various reasons like, less number of choices available, time and effort
needed to search and get acquainted with the New Service Provider, risk in switching to
another Service Provider, cost while switching from one service provider to another, etc.
The consumer may also perceive that the competitors may not have desired infrastructure
and above all the switching from existing service provider to the new one should not
worsen the situation.
Hence the point to be emphasized is that even if the consumers are dissatisfied or
do not find any Value with the service being availed, the consumer would stay with the
existing Service Provider just because, the cost of switching to another service provider

41
may be significant. Generally the consumers may not be bothered of the financial cost; on
the other hand psychological cost associated with the switching cannot be overlooked.
As per the Open Access Draft Regulations, specified by the MERC, the switching
cost associated are Cross Subsidy Surcharge, Transmission charges, Wheeling charges,
Metering cost and Additional surcharge. These costs are already discussed in details in
Chapter. 2. Therefore, it would be interesting to study the Impact of Switching Barriers
on the relationships Consumer Satisfaction / Consumer Perceived Value – Consumer
Loyalty.
Hence, considering the above discussion on basic variables of the study, namely,
Consumer Satisfaction, Consumer Perceived Value, Consumer Loyalty, Brand Image and
role of Switching Cost, the conceptual model of the research may be graphically
represented as below.
Figure 3.1: The Conceptual Framework of the Research Study
Brand
Image
Consumer Loyalty
Consumer Satisfaction Consumer Perceived Value
Switching Barriers Switching Barriers

42
References:-
1 - Leon G Schiffman,Leslie.Lazar Kanuk, S. Ramesh Kumar, Consumer Behavior.New Delhi:Dorling Kindersley(India)
Pvt Ltd ,2010.Tenth Edition.p 7.
2 - Philip Kotler et al, Marketing Management. Delhi:Dorling Kindersley(India) Pvt Ltd ,2009.Thirteenth Edition.p
glossary.
3 - Leon G Schiffman,Leslie.Lazar Kanuk, S. Ramesh Kumar, Consumer Behavior.New Delhi:Dorling Kindersley(India)
Pvt Ltd ,2010.Tenth Edition.p 42.

Chapter 4
The Research
Blueprint

43
4.1 Significance of Methodology
The Consumer Research has gained enough significance over last couple of
decades. Consumers a few decades ago had less option and were forced to choose the
available option despite of their specific needs. In early 1980’s, they used to book Bajaj
Scooter and wait for at least a year for the product to be delivered to them. The
environment that time was less competitive and the manufacturing technology had
limitations, but with the advent of improved technology in manufacturing and better
management techniques, the companies in almost all the sectors have taken advantage of
economies of scale, thus changing the supply shortage scenario to supply surplus. Today,
the Customers have numerous choices and the products are available for immediate
delivery in Showrooms or Go-downs. The Customers have become demanding and
expect value for every penny being paid by them. The environment in the power sector is
not that competitive, but still the consumers are very much aware of their rights and
expect better services from the distribution utilities. Hence, like other sectors the
consumer research has also gained significance in power distribution. The enactment of
Electricity Act 2003 and the provisions in it will force the Power Distribution Companies
to take instant steps in conducting consumer research. The transition of existing
consumers to other service providers will definitely impact the financial status and may
endanger the future of distribution companies into dark, if immediate attention is not paid
to the Consumer needs and demand.
The Consumer research will yield necessary benefits only if the methodology and
research design are appropriate. The research objectives are clearly set in Chapter. 1,
which will help in selecting appropriate methodology and research design, so as to attain
the desired goals of the study. The research problem, purpose of the study, the target
consumers and geographical area being covered during the study are made clear in
Chapter. 1 of the thesis, thus making it simple in identifying exact methodology, deriving
Chapter 4
The Research Blueprint

44
the sample size, selecting the appropriate sample, proper instrument to collect the data
from the respondents and finally analyzing the data collected with the help of statistical
software. In short, this chapter may give a clear road map in reaching the destination
point, effectively and efficiently.
4.2 The Nature of the Study
The research objectives are to evaluate the present level of consumer satisfaction,
to find out factors contributing to the ‘value proposition’, determine the relationship
between Consumer Loyalty, Consumer Perceived Value, Consumer Satisfaction, Brand
Image and to study the moderating role of Switching Cost on Consumer Loyalty of the
eligible open access consumers of the MSEDCL in the Pune region. Therefore,
considering the above objectives, the study is descriptive as well as analytical in nature.
The descriptive nature is concerned with the evaluation of the present level of consumer
satisfaction, brand image of the MSEDCL as perceived by the Consumers and the
factorization of the concept of Consumer Perceived Value, whereas the analytical nature
of the study is about understanding the nature of relationship between the Consumer
Loyalty, Consumer Satisfaction and Consumer Perceived Value and also the moderating
role of the Switching Cost on the relationship mentioned above.
The nature of the study points out that the character of the data collected should
be quantitative one. It is known that the qualitative data helps to explore and find out
several variables that contribute in understanding a concept. But considering the
objectives of the research the qualitative data would not help to attain the desired goals.
This does not mean that the qualitative data is of no use in a research study, but in the
underlying research the quantitative data would help to retrieve specific information from
the consumers and the analysis of the data collected would help to ascertain the
relationships and test the research hypothesis. In context of the above study, as a
researcher, it is necessary to disclose that I have experience of 17 years in power
distribution, so the variables that need to be considered for the study are well
acknowledged. The exploration would not help much in discovering new variables but
the collection of the data specific to the variables considered would help to attain the

45
desired goals. My work experience in the power sector is mainly connected in delivering
services to the Consumers and Complaint solicitation. The academic qualifications in
management gained over last couple of years and practical experience on the field will
definitely help to seek bias free information to study the problem in depth and perhaps
leave any of the areas undiscovered.
4.3 The Research Design
The Research Design is the key part in the overall research process. The research
design is the blue print that helps a researcher to attain the objectives effectively and
efficiently. The design is mainly concerned about Data Collection, Sampling and the
Instruments to be used to collect accurate and bias free information specific to the
research study. The parameters that need to be considered while tailoring a research
design are the type and purpose, time frame, environment and scope of the research
study. With specific mention to the underlying research, the type of the research is going
to be descriptive and analytical as held earlier and the purpose of the study is to develop
a Consumer Retention Model. The scope of the research is restricted to the eligible open
access consumers of the MSEDCL in the Pune Region and the purpose to restrict the
study to eligible open access consumers is mentioned in the Chapter.1 of the thesis. The
time frame in the study is cross-sectional as the data will be collected once during the
study. The instrument used for collection of data is survey questionnaires. As mentioned
in the above section the research type is descriptive in nature so the data to be collected
will be quantitative in nature. The reasons for the collection of the quantitative data are
also elaborated in the section above. The decision to collect quantitative data sets the
platform for Sampling Design and the Development of proper Instrument for pertinent
Data collection. The Sampling Design and Development of the Instrument for Data
collection are discussed below in detail.
4.3.1 The Sampling Design
The relevant data collection from the desired respondents will yield accurate results.
If the sample chosen is wrong then the data collection would not yield the true results
and it would be waste of time, efforts and money. To select appropriate sample it is
necessary to understand the population. The idea about ‘characteristics of the
population’ would help in selecting the appropriate sample, because we have number of

46
techniques that may be selected to collected data, but collecting data using a particular
technique will only help to attain the objectives of the research. Therefore, it is essential
to use appropriate sampling technique so that the sample collected truly represents the
population and also helps to collect accurate and pertinent information with greater
speed at minimal cost.
The population in the study comprises all the eligible open access MSEDCL
consumers (i.e. Contract Demand > 1000 KVA) in the Pune Region and includes
MSEDCL Consumers Four Hundred and Eighteen in number as on June 2012. The list
of all such consumers is enclosed in Annexure 1 which forms the sample frame of the
research study. The Pune Region geographically covers almost the Pune District which
has three Circles namely Rastapeth Urban, Ganeshkhind Urban and Pune Rural Circle.
The Circle Offices are instrumental in monitoring all the activities related to HT
Consumers. Before referring to the population of the research study it is necessary to
understand the organizational structure of the MSEDCL. The Organizational Structure
of MSEDCL is Divisional; the Hierarchical form of the Structure is diagrammatically
depicted below.
Figure 4.1: Hierarchical form of Organization Structure in the MSEDCL
In the underlying study whenever it is mentioned the consumers of the Pune
Region, it means the Consumers under the Pune Zone. As mentioned above, the Pune
SECTION OFFICE
SUB DIVISION OFFICE
DIVISION OFFICE
ZONE OFFICE
CIRCLE OFFICE
HEAD OFFICE
REGIONAL OFFICE

47
Zone includes Three Circle Offices which further cover Twelve Divisions and Forty
Three Sub Divisions. In MSEDCL, the Sub Divisions are the important Unit in the
Organizational Structure because these Offices look after the billing activities of Low
Tension (LT) consumers and are responsible for field billing activities related to High
Tension(HT) Consumers like Meter Readings , Assessment of Bills to HT Consumers in
case of Metering problems etc. The Section Offices that work under the Sub Divisions
are mainly concerned with providing uninterrupted power supply to the Consumers,
maintenance of distribution network and disconnection of Consumers for non-payment of
electricity charges and prevent use of electricity through unfair means. This indicates that
the Section and Sub Division Offices are the touch points for the Consumers. It is
necessary to note that unlike the LT Consumers the billing of the HT Consumers is
carried out by the Circle Offices in co-ordination with the Information Technology (IT)
Department of the MSEDCL.
A clear understanding of the population characteristics will help in selecting
appropriate sample. So the important characteristic associated with the population is the
billing tariff applicable to a consumer. Tariff is the Rate at which the Consumer is billed
for the Consumption of Energy and its unit is in Rs per Unit (Rs/KWh). Every consumer
is assigned a particular tariff based on the purpose for which the supply is being
consumed. The tariff categories based on the purpose of supply are namely HT I –
Industrial, HT II – Commercial , HT III – Railway Traction , HT IV – Public Water
Works and Sewage Treatment Plants , HT V – Agriculture , HT VI – Bulk Power ( Group
Housing Society and Commercial Complex ) , HT VIII – Temporary Connection, HT IX
– Public Services and the newly introduced HT X – Ports. The LT Consumer tariff is
different from that of the HT tariff and has an additional category for Residential usage
which is a dominant category. The various HT tariff categories are only mentioned above
because the Sample frame of this research includes four hundred and eighteen eligible
Open Access Consumers in Pune which are billed under HT category. The sample frame
is covered by the consumers under the three Circles and forty three Sub Divisions. It may
please be noted that the Sample Frame in our case is equal to the population as the
population is finite. The tariff wise count of consumers is tabulated below.

48
Table 4.1: Tariff wise Count of Consumers Included in the Sample Frame
Sr
No. HT Tariff Category
No. of
Consumers in
the Sample
Frame
% of the total
consumers in
Sample Frame.
1 HT I – Industrial 299 71.53 %
2 HT II – Commercial 98 23.44 %
3 HT IV – Public Water Works and
Sewage Treatment Plants 14 3.35 %
4 HT V – Agriculture 1 0.24 %
5 HT VI – Bulk Power ( Group Housing
Society and Commercial Complex ) 2 0.48 %
6 HT VIII – Temporary Connection 1 0.24 %
7 SP – I 3 0.72 %
Total for all the Categories 418 100.00 %
The table above clearly reveals that the consumers in the sample frame fall under
various Tariff categories1 and these consumers are geographically distributed across the
area of Pune Zone. It should also be noted that a particular tariff category covers
industries falling in various sectors. To make the point clear, consider the HT I Industrial
tariff, which is applicable to various industries like IT & IT enabled services, Engineering
workshop, Sewage treatment plants, Garment Manufacturing Units, etc. So the above
representation makes it clear that the consumers in the sample are distributed across the
geographical area of the Pune Zone and based on their location these consumers are
linked to a particular Section/Sub Division/Division/Circle Office situated in the vicinity
of the Consumer location. If a particular Sub Division, Division or Circle is selected for
sampling, it may be assumed that these groups are heterogeneous in nature as the
consumers that would fall under each of them would be from different sectors and tariff
categories. The selection of samples based on the location of Offices may not truly
represent the population, but the tabulation of consumers in the sample frame as done in
the table above, divides the population into sub populations which are more

49
homogeneous in character. In short, the population is divided into strata based on the
tariff applicable to the consumer, which specifies ‘Stratified Sampling’ as the natural
choice for sampling in the research study. The stratified sampling would help to collect
reliable and detailed information. The various Industries in and around Pune are
concentrated at particular areas sector-wise. For example, the IT & IT enabled services
are concentrated in Hinjewadi, Magarpatta Industrial areas, the Auto/Manufacturing
Industries in the outskirts of the City at Chakan Industrial Area whereas the Hospitality
Industry is mainly concentrated in the Pune City Area. The various Sub Divisions while
sampling will be selected randomly with due consideration to the various industries
concentrated in the specific areas mentioned above, so that the selected samples truly
represent the population. Therefore, it may be justified that the most appropriate sampling
technique to be used in the research is ‘Stratified Random Sampling’.
After deciding the sampling technique the next important question to be answered
is the sample size to be selected for the research study. The population includes Four
Hundred and Eighteen eligible Open Access Consumers. The survey of all the consumers
is difficult and would demand contribution of more resources in collecting the data. It
would be not smart to survey all the consumers when the branch of statistics offers us
optimal solutions in arriving at the exact sample size that will yield almost the same
results as by conducting census survey. The formula for selecting sample size from a
finite population is as below.
n = Z2
x S2
e2
Where n = Sample Size, , e = acceptable error, Z = Standard score associated with chosen level of
confidence ( 95 % in case of this Study, therefore Z= 1.96).
The above formula for determining the Sample Size is based on Mean Method as most of
the variables are measured using Interval scale. The interval scale used is a five point
likert scale with response options 1 to 5. (‘1’= Strongly Disagree. ‘2’= Disagree, ‘3’=
Neutral, ‘4’= Agree and ‘5’= Strongly Agree).

50
In the above formula ‘S’ is the variability in the data set. ‘S’ is computed as ratio of
‘Range’ to ‘Six Standard Deviations (6σ)’
Therefore S = Range / Six Std. Deviations = (5-1)/6 = 4/6 = 0.66.
The formula as per the Mean Method for sample size determination is
n = Z2
x S2
e2
Now considering the tolerable error e = 11 % , Z= 1.96 and S = 0.66 , the sample size is
calculated below.
n = (1.96)2 x (0.66)
2 = 142.
(11/100)
2
Two hundred Survey Questionnaires were distributed but the total forms responded and
received are One Hundred and Forty.
4.3.2 Instrument Development
The sample size determination is one of the major tasks under Sampling Design.
Once the exercise of arriving at sample size and the sampling procedure is complete, then
the next step in the research study is to collect data from the respondents. The collection
of data is about measurement of population parameters through specific samples.
Measurement2 in research consists of assigning numbers to empirical events, objects or
properties, or activities in compliance with a set of rules. So to collect data or measure the
desired population parameters it is necessary to develop appropriate Instrument. The type
of instrument to be used, various parameters to be measured for the study and
measurement scale should be justified. The data analysis work depends on the Instrument
being used for measurement of population parameters, therefore a proper instrument will
only help to seek desired information with greater validity and the analysis of the
collected data would yield the desired results.

51
The data for research can be collected via personal interviews, focused group
interviews, surveys or through observations. But the specific way of collecting data
should be chosen keeping in mind the type of research, research objectives, nature of
population, available resources and the time constraints. In this study, keeping in mind
the type of research and research objectives, survey questionnaires will be the instrument
for data collection. The instrument used will help to collect data at a greater speed and
accuracy with maximum reliability and validity.
In Chapter.3 of the thesis, the conceptual framework is discussed in details and
the necessary model is also put in place for its empirical testing. The main concepts
discussed are Consumer Satisfaction, Consumer Perceived Value, Brand Image,
Consumer Loyalty, Consumer Culture and the Role of Switching Barriers, while
switching from one particular service provider to another. The discussion on these
concepts makes it easy to develop research questions that are to be included in the survey
questionnaires. Cracking the ‘concept’, into ‘constructs’ and identifying suitable
‘variables’ contributing each construct will help to frame correct research questions. The
formulation of the research questions for each concept is discussed below in details.
Identification of exact variables to formulate investigative questions is very vital, but
use of appropriate language, accurate wording and proper syntax will be the key in
framing the research questions. Each question will be followed by a measurement scale,
so that the respondents can easily and conveniently record their bias free response. The
research study is descriptive in nature so the survey questionnaire method is the most
appropriate technique for collecting the desired quantitative data. The questions included
in the survey will be structured or closed ended thus offering less flexibility in responding
and therefore increasing the reliability of the data collected. All the questions to be asked
in the questionnaire are huddled together like playing cards in a set and they lay muffled
up in such a way that conceals their intention or purpose. Each question will be followed
by a likert scale which will generate ordinal data. The scale of measurement is of prime
importance because it decides the statistical treatment to be applied to the data collected.
The type of scale and the statistical treatment applied will be discussed in details during
the data analysis part.

52
Measuring Consumer Satisfaction:
The survey questions for measurement of various population parameters are discussed
below. The concept of ‘Consumer Satisfaction’ is considered first. The constructs that
contribute to Consumer Satisfaction are Reliability and Availability of Supply,
Accessibility to Staff and Comfortability in dealing with them in case of emergency or a
problem. Considering the above constructs the variables contributing each construct
should be identified so as to formulate survey questions that will help us measure the
concept of Consumer Satisfaction. The diagrammatic representation below gives idea
about the variables that have been considered in formulating the survey questions.
Figure 4.2: Constructs and Variables Contributing the Concept of Consumer
Satisfaction
So considering the variables mentioned above the survey questions are prepared for
evaluating the present satisfaction level of the eligible open access MSEDCL consumers
in Pune Region. The Availability of power is an external factor to the distribution utilities
and therefore is beyond their control, so in the above figure the Availability is coded with
red color whereas the other constructs are coded in green. The detailed questionnaire is
attached in Annexure 2 but the tabulation of the survey questions in accordance with the
figure above is given so as to get a snap shot of the idea behind development of the
survey questionnaire considering the constructs and the variables contributing it.
Availability
1. Power Shortages
Reliability
1. Supply Interruptions
2. Outage Management
3. Supply Quality
Accessibility
1. Comfortability with
Employees in case of a
problem
2. Employee
Approachability
Consumer
Satisfaction

53
Table 4.2: Survey Questions to Measure the Concept of Consumer Satisfaction
Construct No
.
Survey Question considering the associate
Variable
Q. No in the
Questionnaire
Reliability
1 I am happy with the 'Supply Quality' offered by
the MSEDCL. 1
2 The Supply Provided by MSEDCL is with
minimum interruptions. 2
3 The Outage Management is Satisfactory and
Consumers are made aware of the outages taken
by MSEDCL for maintenance.
3
Availability 4 'Load Shedding', is not a problem associated
with MSEDCL Services. 5
Accessibility
5 It is easy to approach or contact the MSEDCL
Staff/Engineers in case of emergency or a
problem.
11
6 I feel comfortable in approaching the MSEDCL
staff in case of any problem. 44
The tabulation of the survey question will also help during the data analysis.
Because it would be interesting see the summated results for each construct and the
concept as a whole instead of viewing the scores marked by the respondents for
individual questions.
Measuring Consumer Perceived Value:
The concept of Consumer Perceived Value is also significant along with the
Consumer Satisfaction. Consumer Perceived Value3 is mainly represented by two
dimensions, one is the ‘Cost’ and another is ‘Value’. The cost includes Monetary as well
as Non Monetary Cost, whereas the benefits cover Special and Confidence Benefits. It
may be noted here that the Non Monetary Cost are generally related to the psychological
cost, i.e. delay in solving the complaint or time and effort spent by the Consumer in
solving the grievances, etc. The concept of Consumer Perceived Value is already
discussed in details in Chapter.3, so in this part the focus will be on developing survey
questions that help to measure the underlying concept. The Value is said to be positive if
the benefits exceed the Cost or else it will be considered negative or adverse. The
pictorial representation of the concept of Consumer Perceived Value is given below.

54
Figure 4.3:- The Dimensions of Consumer Perceived Value
The two dimensions and the sub dimensions as displayed in the figure above will
be used to develop Survey Questions on the Concept. The survey questions considering
the above aspects are tabulated below. The detailed questionnaire is attached in Annexure
2.
Table 4.3: Survey Questions to Measure the Concept of Consumer Perceived Value
Dimension No. Survey Question considering the
associate Variable
Q. No in the
Questionnaire
C
O
S
T
Monetary
Cost 1 The Services Offered by MSEDCL to its
Consumers is at a Cheaper Cost. 6
Consumer
Perceived
Value
Benefits Costs
Monetary Costs
Non Monetary Costs Confidence Benefits
Special Benefits

55
Dimension No. Survey Question considering the
associate Variable
Q. No in the
Questionnaire
Non-
Monetary
Cost
2 The time and effort needed in resolving
a complaint with MSEDCL services is
less or adequate.
45
Non-
Monetary
Cost
3
Even if in case of any problem associated
with the MSEDCL service, we are not
panic and we feel assured that the
problem would be resolved with ease.
46
B
E
N
E
F
I
T
S
Confidence
Benefits 4
The quality of services offered by
MSEDCL has improved significantly
over last few years.
58
Confidence
Benefits 5
The present service provider(MSEDCL)
has better staff with adequate knowledge
to handle Consumer Complaints.
54
Confidence
Benefits 6
The present Service Provider (MSEDCL)
has better infrastructure as compared to
its Competitors.
55
Confidence
Benefits 7 The risk associated in transactions with
MSEDCL is least. 42
Special
Benefits 8
Even in case of Power Scarcity Situation,
the MSEDCL company takes special
efforts to provide with or maintain for
uninterrupted power supply to its
Consumers.
41
Special
Benefits 9
The working hours of MSEDCL
Company are as per the Consumer
convenience.
31
Special
Benefits 10
The MSEDCL Offices and Fuse Call
Centres are located at convinient places
and are easily accessible
10
The above survey questions on Consumer Perceived Value will help to measure
the two basic dimensions i.e Cost and Benefits to Consumers. The Consumer value the
services favorable only if the benefits received are considerable as compared to the cost.
Measuring Consumer Loyalty:
The intention of this study is to retain the existing eligible Open Access
Consumers of the MSEDCL. So measurement of Consumer Loyalty is of prime
importance in the study, but actually identifying the factors that retain the existing

56
consumers is a difficult task. While designing the survey questions on Consumer Loyalty
along with the affirmatory factors an emphasis has to be given on those factors that are
associated with the Switching Barriers4. The Affirmatory factors are Confidence and
Social Bond with the present service provider, whereas Switching Costs, Time & Effort
in searching a New Service Provider, Availability of Alternatives and Emotional Bonds
are the main Switching Barriers. The two factors mentioned above are the primary
reasons behind the Consumer Loyalty. In most of the cases, the consumer loyalty is less
due to the affirmatory factors and more due to the barriers in switching from one service
provider to another. The time & effort needed to search and develop relationship with the
new service provider, emotional bonding with the existing service provider, less
alternatives offering the desired service and the cost of switching are the main hurdle for
the Consumer to transit from existing service provider to a new one. The diagrammatic
representation of the concept considering the above discussion is as below.
Figure 4.4: Basis for Consumer Loyalty
The affirmatory factors in the above figure are placed in green box, whereas the
Switching Barriers are placed in the red box, as these factors may hold a Consumer to the
Affirmatory
Factors
Social Bonds
Service Recovery
Confidence
Switching
Barriers
Switching Costs
Time & Effort
Alternatives
Emotional Bonds
C O N S U M E R
L O Y A L T Y

57
existing service provider despite the poor services. To determine the Consumer Loyalty
the survey questions can be prepared considering the Affirmatory Factors and Switching
Barriers. The questions related to Switching Barriers can also be used to study the role of
switching cost on the relationship between Consumer Loyalty – Consumer Satisfaction
and Consumer Loyalty – Consumer Perceived Value. The survey questions with respect
to Consumer Loyalty are tabulated below.
Table 4.4: Formulation of Survey Questions for Consumer Loyalty
Factor No Survey Question considering the
associate Variable
Q. No in the
Questionnaire
A
F
F
I
R
M
A
T
O
R
Y
Social
Bonds 1 We feel proud in being associated with
MSEDCL as their Consumer 33
Social
Bonds 2
Majority of neighboring Consumers,
Friends and Relatives etc avail the services
of MSEDCL.
57
Emotional
Bonds 3 We have a genuine relationship with
MSEDCL as a Consumer 35
Confidence 4 I convey positive 'word of mouth' publicity
about my present Service Provider
(MSEDCL).
59
Confidence 5 I recommend the services of the present
service provider (MSEDCL), if someone
seeks my suggestion.
60
B
A
R
R
I
E
R
S
Switching
Costs 6
The financial cost associated with the
Switching is considerable(CSS,
Transmission Charges, Wheeling Charges ,
Metering Cost, Additional Surcharge, etc. )
53
Time and
Effort 7
The effort involved in searching for a New
Service Provider is high and time
consuming.
47
Time and
Effort 8
It will also take much time in learning
about or understanding the New Service
Provider or develop new relationship.
48
Alternatives 9 There are few alternatives to provide for
Services in Power Distribution Sector. 49
Alternatives 10 We don’t find a better alternative that can
provide Services to us.
50

58
Factor No Survey Question considering the
associate Variable
Q. No in the
Questionnaire
B
A
R
R
I
E
R
S
Emotional
Bonds 11
We feel embarrassed to inform our current
Service Provider (MSEDCL) that we will
be discontinuing the services in near future.
51
Emotional
Bonds 12 I have a sense of loyalty with my existing
service provider that is MSEDCL. 52
Measuring Consumer Culture:
The Satisfaction, Perceived Value and Loyalty are being studied for the eligible open
access consumers in the Pune Region, but during the study it is also essential to
understand the associated culture. The various variables considered are Quality
consciousness, Awareness & Knowledge, Adaptability to new technologies, Risk Taking
Ability and Prosumeristic Attitude i.e fulfilling their needs on own. Today the power
shortage is acute, so some industries especially Sugar, Steel, Cement which require
‘Steam’ as well as ‘Electricity’ may think of cogeneration and thus satisfy their needs on
their own. The pictorial representation is shown on the next page.

59
Figure 4.5: Attributes for Measuring Consumer Culture
The tabulation of the Survey Questions for understanding Consumer Culture considering
the variables in the figure is as below.
Table 4.5: Survey Questions for Measuring Consumer Culture
Attributes No Survey Question considering the associate
Variable
Q. No in the
Questionnaire
Quality
Consciousness 1
The Electricity Consumers would not really
mind paying more for Reliable and Quality
Services.
61
Awareness &
Knowledge 2
We keep ourselves updated regarding the
latest tariff applicable and other relevant
information.
62
Consumer
Culture
Quality
Conscious
ness
Awareness
&
Knowledge
Risk
Taking
Ability
Adaptability
Prosumer

60
Attributes No Survey Question considering the associate
Variable
Q. No in the
Questionnaire
Adaptability 3
With the latest developments in the power
sector technologies like Smart Grids, Smart
Metering, etc the Consumers will be able to
cope well with it.
63
Risk Taking
Ability 4
The Open Access policy offers choice to the
Electricity Consumers to select their Service
Provider. So, I /We would definitely avail of
this facility and plan to switch over to a New
Service Provider.
64
Prosumer 5 Instead of Sourcing power from Distribution
Utilities, Our Company would prefer to
generate electricity on our own.
65
The above survey questions will help to understand the Consumer Culture.
Understanding the Consumer Culture will bring the Distribution Utilities closer to the
consumer expectation and thus making the perception favorable.
Measuring the Brand Image:
The concept of Brand Image is already discussed in Chapter III. This concept like all the
above concepts is also difficult to measure due to its intangible form and psychological
nature. Branding is more about personification, hence the traits like Social Image,
Progressiveness, Capability and Trustworthiness can be used to measure the concept
effectively. The study of Consumer Behavior remains incomplete without considering the
concept of Brand Image. The pictorial representation and the tabulation of survey
questions are as below.

61
Figure 4.6: Traits for Measuring Brand Image
Table 4.6: Formulation of Survey Questions for Brand Image
Trait No Survey Question considering the associate
Variable
Q. No in the
Questionnaire
Social Image
1
MSEDCL is a Government Owned Company
and has Social Obligations to fulfill and does
not work only to gain profits.
66
Progressiveness
2
The MSEDCL company has taken necessary
efforts to improve its infrastructure to
provide quality power to its Consumers.
67
Capability
3
Although, with the introduction of Open
Access Policy the Power Distribution Sector
has become very competitive, the MSEDCL
has the capability to face the future
challenges.
68
TRAITS OF BRANDING
S
O
C
I
A
L
I
M
A
G
E
P
R
O
G
R
E
S
S
I
V
E
N
E
S
S
C
A
P
A
B
I
L
I
T
Y
T
R
U
S
T
W
O
R
T
H
I
N
E
S
S
BBRRAANNDD IIMMAAGGEE

62
Trait No Survey Question considering the associate
Variable
Q. No in the
Questionnaire
Trustworthiness
4
The Business transactions with MSEDCL are
very fair and even if provided with a choice
to select service provider, I / We prefer to be
associated with the MSEDCL.
69
5 The Business Practices of MSEDCL are
Ethical and Transparent. 17
Measuring the Consumer Concern:
The survey questionnaire intends to measure Satisfaction, Value, Brand Image,
Loyalty and Consumer Culture. Along with all the above constructs it is important to
measure the MSEDCL’s Concern for its Consumer, because the research aims at
retaining the existing consumer base. Measuring consumer concern may help MSEDCL
understand the dark areas in the Service Delivery and provide them an opportunity to
improve and be sensible to the Consumers. The survey questions for measuring consumer
concern are tabulated below.
Table 4.7: Formulation of Survey Questions for Consumer Concern
Sr
No
Survey Question Q. No in the
Questionnaire
1 The MSEDCL Company understands our specific needs and
the MSEDCL staff pay attention to it. 36
2 In case of payment default, the MSEDCL company is more
likely to understand our problem and would agree to give grace
period for clearance of dues without disconnecting our supply.
37
3 In case of any Supply problem associated with the Consumer
side, the MSEDCL Employees would be flexible (generous) in
extending necessary support and help to solve the problem.
38
4 The MSEDCL Company is always ready and prompt in
passing on the Incentives/Benefits to the Consumers. 39
5 The MSEDCL is never harsh or unjust in imposing
penalties/charges to the Consumers.
40

63
Measuring Service Quality:
The study of Consumer Behavior is partial unless the determinants of Service
Quality are not explored. The Basic Determinants of Service Quality5 like Tangibles,
Responsiveness, Reliability, Empathy and Assurance need to be accessed so as to get the
exact idea about the service delivery. The questionnaire used to measure these variables
is tabulated below.
Table 4.8: Formulation of Survey Questions Considering the Constructs and
Variables Contributing to the Concept of Service Quality
Construct No Survey Question considering the associate
Variable
Q. No in the
Questionnaire
Tangibles
1 The MSEDCL Offices are Well Furnished, Clean
and Well Maintained. 12
2 The MSEDCL Electricity Bills are well structured
and the Consumers understand it easily. 14
3 The MSEDCL website is well designed and user
friendly. 21
4 The MSEDCL Employees are Well Dressed and
appear neat. 30
Reliability
5 The Consumers are informed of the supply
interruptions in advance. 4
6 The Consumers are made aware by the MSEDCL,
regarding the changes in Policies through its
Circulars.
13
7
The MSEDCL Electricity Bills are delivered in
time and give ample duration for the Consumers to
clear the outstanding amounts before due dates as
mentioned in the bill.
15
8 The Electricity Bills provided by the MSEDCL are
accurate and free from errors. 16
9 The problem communicated to the MSEDCL is
solved at the first time and generally does not
repeat in future.
20
10 The MSEDCL website provides with relevant and
accurate information to its Consumers.
22
11
The MSEDCL website offers a safe and secured
option for payment of electricity bills for its
Consumers.
23

64
Construct No Survey Question considering the associate
Variable
Q. No in the
Questionnaire
Responsiv
eness
12 The MSEDCL employees are quick in attending
the Consumer Complaints. 7
13 The MSEDCL employees listen carefully to the
grievances raised by the Consumer and understand
the Consumer problems.
8
14 The MSEDCL Employees show keen interest and
take up the responsibility in solving the Consumer
Complaints.
24
15 The MSEDCL Employees are never too busy to
respond to the Consumer requests. 27
Empathy
16 The MSEDCL Employees have caring attitude
towards their Consumers. 9
17 The MSEDCL understands the needs of its
Consumer . 18
18 The MSEDCL Company believes in keeping the
'Consumer Interest' as its top priority. 29
Assurance
19
The MSEDCL agrees to provide compensation to
its Consumers if the services are not delivered as
per the 'Standards of Performance ', stipulated by
the MERC.
19
20 The MSEDCL Employees are adequately trained
to solve the Consumer’s Complaint. 25
21 The MSEDCL Employees / Staff are well behaved
and well mannered. 28
22 The MSEDCL Company keeps its promise of
fulfilling the Consumer demand in time. 26
The success of the research study depends solely on how well the research
questions are translated into the survey questions. The research objectives will be
achieved only if the survey collects the data that is valid and reliable. In the research, the
instrument development is conducted systematically with due consideration of all the
variables and keeping focus on the conceptual framework of the study, the survey
questionnaire has sixty nine questions followed by Likert scale to measure all the
concepts discussed above. Prior to these questions, four multiple choice questions are
also included in the questionnaire. These questions help to seek information related to
Mode of Payment opted by the Consumers, by what name do the Consumers recognize

65
the service provider (i.e MSEB, Maha-Vitaran or MSEDCL), Awareness and Knowledge
of various Switching Costs in Open Access, Perception in the Consumer Minds related to
Importance of the five basic service parameters viz. Tangibles, Promptness, Employee
Behavior, Accuracy and Cost of Service. The answer related to mode of payments tells
whether the consumer opt traditional ways of bill payment or is ‘Tech Savvy’ in choosing
to pay through internet. The question on rating the switching cost will help to understand
if the consumers are really aware about the policies and subtleties in Open Access. The
recognition of the Consumers as MSEB or MSEDCL or Maha-Vitaran will help to judge
the brand perception. The above four multiple choice questions are numbered A, B, C &
D in the questionnaire and these questions precede the sixty nine survey questions based
on likert scale. The said sequencing is intended to consider the convenience of
respondents, while answering the questionnaire. The mixing up of these questions may
disturb the rhythm of the respondents, while answering the questionnaire. The likert scale
based survey questions are framed in affirmative language so as to seek bias free
information from the respondents; the necessary care is taken in sequencing these
questions so that the respondents reveal true responses. The deliberation behind
sequencing the questions is to make consumer think while responding the survey and
stimulate them to disclose true responses. The double barreling of questions is avoided,
specific words are appropriately used and the sentence length is kept to minimum as
possible as to avoid any confusion in understanding a question. The necessary
instructions and the discloser related to the privacy of data are also mentioned in the
survey questionnaire. The survey questionnaire includes ten pages in all; the first page
starts with the Researcher’s discloser about the purpose of the data collection and
assurance about the data privacy. It includes fields about basic information related to the
respondents like Name & Location of the Company, Designation of the respondents,
Sector to which the Company of the respondent belongs, number of working shifts,
employee strength, contract demand in KVA, tariff applicable to the Consumer,
approximate monthly electricity bill in Rs. Lacs, approximate electricity expenditure as
percentage of total expenditure and annual revenue turnover of the Company. The last
field i.e. annual revenue turnover was not mandatory because of the unwillingness of the
respondents in sharing the particular information being anticipated.

66
4.3.3 Method of Data Collection
The Sampling Design and the Instrument Development sets the road map for data
collection. It will be appropriate to presume that, if sampling design and instrument
development are science in research, then actual collection of data using the designed tool
is an art of research. The sampling design and instrument development are technical in
nature and require thorough understanding of research methodology, whereas collection
of data requires planning, perseverance, constructive approach and hard work.
Annexure -1 includes the list of all such consumers in the Pune Zone who are
eligible for Open Access as per the provisions in the electricity act 2003. So considering
the research topic and the scope of the study the count of Four Hundred and Eighteen
number of Consumers in Annexure-1 is the population, which being finite is also the
sample frame for the study. The respondents selected will be the Head of the Electrical
Departments of the Client Company’s and it will be ensured that the respondent is aware
about the provisions in Electricity Act 2003 related to the implementation of Open
Access policy in Power Distribution. The consumers will be randomly selected as per the
sampling design and the data has been collected through the survey questionnaires.
Today, technology has shrunk the world the world by offering various ways of
communication like emails etc. So the distribution of survey forms will also be done via
emails by telephonically contacting the respondents. The survey form will also be
uploaded on the Google drive thus providing making it convenient for the respondents to
mouse-click, the preferred option. The responses will be simultaneously gathered in
numerical form in the excel response sheet which will be further used for data analysis.
But in the present age of ‘e-world’, consumers are bombarded by many such survey
questionnaires by various companies which the consumers do not take seriously. So, it
will be interesting to see whether consumers respond to the survey on email and provide
factual data. The emphasis will be given on data collection by visiting the consumer
premises, meeting the respondents, briefing out the survey form and disclosing the
purpose of study. The respondents in our study will be the owner of the company or an
employee of the company, whoever holds a responsible position and co-ordinates with
the MSEDCL on behalf of the Company. The significance of honest response will be

67
convinced to the respondents and adequate time will be given for responding the
questionnaires. The follow up will be maintained with the respondents for collection of
the responded survey forms. It is anticipated that a period of 6-8 months will be needed to
collect the data considering the sample size as derived in the sampling design.
References:-
1 - http://www.mahadiscom.in/consumer/Comm_circular_5sept12/Comm_Cir_175.pdf.pp 12-17.
2 - Donald R Cooper, Pamela S Schindler. Business Research Methods.New Delhi:Tata Mcgraw Hill Publishing Co.
Ltd ,2008.Seventh Reprint.p 309.
3- Philip Kotler et al, Marketing Management. Delhi:Dorling Kindersley(India) Pvt Ltd ,2009.Thirteenth Edition.p 117. 4- Leon G Schiffman,Leslie.Lazar Kanuk, S. Ramesh Kumar, Consumer Behavior.New Delhi:Dorling Kindersley(India)
Pvt Ltd ,2010.Tenth Edition.p 224.
5 -James A. Fitzsimmons, Mona J. Fitzsimmons, Service Management.New Delhi: Tata Mcgraw Hill Publishing Co. Ltd, 2006.Fifth Edition.p-129.

Chapter 5
Exploring and
Investigating the Data

68
5.1 Experience on Field While Data Collection
The research design provides the necessary blueprint for conducting the study.
The experience of data collection was laborious and involved continual follow-up with
the respondents. The data collection method is already discussed in details in Chapter. 4,
but the actual experience while data collection needs to be revealed prior to exploration
and investigation of the data. The data collection work was started in October 2013 and
continued till June 2014. The sampling is done having considered the random stratified
technique, but the coverage of samples truly representing the population was the main
goal. The various consumers with different HT Billing tariff are scattered
heterogeneously in various sub divisions and the stratified random sampling in the study
is also based on tariff applicable to the consumer, but along with consideration of tariff, it
was decided that almost all the sectors in Industry are also covered within the sample. For
the achievement of above objective it was mandatory to cover some industrial pockets in
and around Pune like Magarpatta, Hinjewadi, Chakan, Pune City etc (Please refer
Annexure 5), because the IT and IT enabled service industries are mostly located in
Hinjewadi and Magarpatta, where as the Auto/Manufacturing and Hospitality Industry
are concentrated in Chakan and Pune City areas respectively. Therefore, to gather
maximum quality sample within minimum time, the focus was initially on the areas
mentioned above and hence, Sub Divisions like Sanghvi, Chakan and Hadapsar were
selected. The Magarpatta area is at present allotted to a franchisee, but previously it was
fraction of the Hadapsar I Sub Division. The franchisee is also a part of the MSEDCL, as
it runs the business on behalf of it. Hence, the collection of data from the franchisee area
will give a holistic approach to sampling and thus, hardly leaving any of the aspect
unexplored. Apart from this, the remaining Sub Divisions in the Pune Zone were selected
randomly for collecting the required sample. Annexure 4, includes the list of Consumers
surveyed.
Chapter 5
Exploring and Investigating the Data

69
The Survey Forms were also loaded on Google, so that the respondents may
respond the survey conveniently by mouse clicking the preferred options. The Sample
Frame list as per the MSEDCL IT Department is attached in Annexure-1, for some
consumers the contact details are also available in the database. So using this information
the Companies were contacted and after necessary dialogue with the concerned company
person, the Google survey forms were emailed to the respondents (Company
Representatives). But it was unfortunate that on most of the company email websites the
Google forms failed to open, thus making it difficult for the respondents to answer the
survey. The Survey Forms in MS Word format were sent to such respondents and it was
suggested to mark the preferred option with red color. The data collection Certificates
were also sent along with the Survey Forms and it was requested to send a scan copy of
the signed Certificate along with the Responded Questionnaire. The use of emails was
made for data collection, but the emphasis for data collection was by actually visiting the
company premises by taking prior appointments of the concern company representative. I
am also grateful to all the field staff that cooperated with me for conducting the survey
work. The Staff at the Sub Division and the Section Offices is in direct touch with the
Consumers and their catalytic role during the vital phase of the research needs a special
declaration. The support from the Field Staff made it convenient to approach the concern
Company Employee, thus saving time and making the survey work easy. Except a few
exceptions, the response from the Companies throughout the survey was very positive.
During the interaction, in most of the cases the consumers were surprised that the
MSEDCL has shown interest in hearing the ‘Voice of Consumers’. After responding the
questionnaire, most of the respondents expressed satisfaction about the questions being
inquired and also pointed out that they never expected receiving such a survey form from
the MSEDCL.
5.2 Selecting the Appropriate Sample
The sample size determination and the exact sampling method to be used are already
discussed in details in Chapter. 4. From Table 4.1 in Chapter. 4, it is clear that Ninety
Five percent of the respondents in the sample frame have contributed by HT-I (Industrial)
and HT-II (Commercial) category. The HT-I (Industrial) Consumers is the dominant
tariff category contributing 71.53% of the sample frame followed by HT-II (Commercial)

70
category with a share of 23.44%. The Public Water Works and Sewage Treatment tariff
i.e. HT-IV tariff category finds third position representing 3.35% of the respondents in
the sample frame. Therefore, it is imperative that the sample selected should cover these
dominant categories so as to truly represent the population. The table below shows the
tariff wise break up of respondents selected as sample and their representation in the
population. The basic aim is to reduce the sampling error and ensure accurate results at
the expense of minimum resources.
Table No.5.1: Tariff wise Count of Consumers Included in the Sample and their
Representation in the Population
Sr
No. HT Tariff Category
Consumers/Respondents
in the Sample Frame
Consumers/Respondents
in the Selected Sample
No % No %
1 HT I – Industrial 299 71.53 % 100 71.43 %
2 HT II – Commercial 98 23.44 % 33 23.57 %
3
HT IV – Public Water
Works and Sewage
Treatment Plants
14 3.35 % 5 3.57 %
4 HT V – Agriculture 1 0.24 %
0 0%
5
HT VI – Bulk Power (
Group Housing Society
and Commercial
Complex )
2 0.48 % 0 0%
6 HT VIII – Temporary
Connection 1 0.24 % 1 0.7%
7 SP – I 3 0.72 % 1 0.7%
Total for all the
Categories 418 100.00 % 140 100.00 %
Hence, it may be concluded that the sample selected truly represents the Population and
would ensure better accuracy in the results after conducting data analysis. The Population

71
is finite hence the Sample Frame includes the complete Population of 418 No. of eligible
Open Access Consumers.
5.3 Measurement Scale and Statistical Treatment
The formulation of survey questions have been discussed in details in Chapter. 4
under the sub topic ‘Instrument Development’. The questions have been prepared to
measure the various constructs like Consumer Satisfaction, Value, Brand Image,
Consumer Concern, Consumer Culture, Loyalty and Service Quality. These questions are
followed by five point Likert scale with options Strongly Disagree, Disagree, Neutral,
Agree and Strongly Agree. Likert Scale always invites debate whether the Scale type is
‘Ordinal’ or ‘Interval’. But it is very common to use five point Likert scales and give
statistical treatment considering the scale type as ‘Interval’. Likert Scales are ordinal data,
but are commonly used for Interval procedures, provided the scale items have at least ‘5’
or preferably ‘7’ categories. In this regard, Jaccard and Wan1(1996, p.4) concluded, “for
many statistical tests, rather severe departures(from Intervalness) do not seem to affect
Type I and Type II errors dramatically, especially if a ‘5’or ‘7’ point scale is used”.
Therefore, considering the Likert scale as Interval type and keeping in mind the
Research Objectives following statistical treatment will be given to the data collected.
The statistical treatment chosen and the purpose are tabulated below.
Table 5.2: Objective and the Statistical Treatment Chosen
Sr
No.
Statistical
Treatment Objective
1 Descriptive Statistics
To analyze individual questions in the survey and to
check for any violation of assumptions underlying the
statistical technique.
2 Friedman Chi square
Test
To determine the factors contributing to ‘Consumer
Perceived Value’
3 Bi-variate Correlation
To ascertain strength of relationship between variables
viz; Consumer Satisfaction, Consumer Perceived Value,
Brand Image and Consumer Loyalty.

72
Sr
No.
Statistical
Treatment Objective
4 Regression Analysis
To study moderating role of ‘Switching Cost’ on
relationship between ‘Satisfaction’/ ‘Value’ and
‘Loyalty’.
5 One Way ANOVA /
Kruskal Wallis Test
Circle wise and Sector wise analysis of Satisfaction,
Value, Brand Image, Loyalty, Quality Consciousness and
Risk Taking Ability of Consumers.
6 Structural Equation
Modeling
To test the Consumer Retention Model.
5.4 The Data Preparation
The data analysis is being done using SPSS Software. The data collected through
survey questionnaires needs to be converted into numeric codes so that the data
analysis may be performed using the software. The survey questionnaire along with
the survey questions has some preliminary information about the respondent which is
required while analyzing the data. The general information includes the Type of
Industry, Name of the Circle under which the Consumer is billed, No. of Shifts in the
Industry, Tariff category etc. The above information needs to be coded in numeric to
enable the software conduct data analysis. The Likert scale used in the questionnaire
has five response options, namely, Strongly Disagree, Disagree, Neutral, Agree and
Strongly Agree. These response options are also converted into numeric values. The
data sheet accepted in the SPSS Software is excel sheet. The details of codes used for
various variables and responses are mentioned in the Annexure 3. The Reliability
Test, Normality Test and other statistical treatments given to the data are discussed in
details in the proceeding sub topics of this Chapter.
5.5 The Reliability Test
The Reliability Test refers to the accuracy of measurement and the repeatability of
results, if the same measurements are taken again and again. In our case, the

73
questionnaire is used to measure various concepts like Consumer Satisfaction,
Consumer Perceived Value, Brand Image, Consumer Loyalty, Switching Barriers,
Consumer Concern, Service Quality and Consumer Culture. The reliability test helps
us ensure the usefulness of the questionnaire in measuring the desired items. The
Cronbach’s Alpha test of reliability is a model for verifying internal consistency and
the model is based on average inter-item correlation. The reliability test helps to
ascertain the extent to which the items in the questionnaire are interrelated. The test
gives overall index for the repeatability of the scale as a whole and also identifies the
problem items that should be excluded from the scale. The basic intention of
conducting this test is to ensure that the experimental error is minimal and the data
collected is bias free. The items for which the reliability test is conducted are
tabulated below with associated remarks based on the Cronbach Alpha value. A value
of 0.7 and above for Cronbach Alpha means the reliability is good, a value between
0.6 and 0.7 means the reliability is marginally met and value below 0.5 indicates poor
reliability.
Table 5.3: Reliability Statistics
Sr.
No
Reliability Variable No. of Items Cronbach’s
Alpha Result
1 Satisfaction 7 0.745 Reliability Met
2 Value 9 0.795 Reliability Met
3 Brand Image 6 0.811 Reliability Met
4 Loyalty 5 0.785 Reliability Met
5 Consumer Concern 5 0.726 Reliability Met
6 Tangibles 4 0.501 Poor Reliability
7 Reliability 7 0.615 Reliability
Marginally Met
8 Responsiveness 4 0.763 Reliability Met
9 Empathy 3 0.774 Reliability Met
10 Assurance 4 0.789 Reliability Met

74
Sr.
No
Reliability Variable No. of Items Cronbach’s
Alpha Result
11 Culture 5 0.272 Poor Reliability
12 Barriers 7 0.648 Reliability
Marginally Met
From the table above, except for ‘Culture’ and ‘Tangibles’ the Scale Reliability is found
to be satisfactory. The variables like ‘Satisfaction’, ‘Value’, ‘Brand Image’, ‘Loyalty’
and ‘Barriers’ have met the reliability and these variables are major, as they are the part
of conceptual framework in the Research study.
5.6 The Test of Normality
The criterion of ‘Normality’, as suggested by George and Mallery(2003) tells that
a Variable with Skewness & Kurtosis value between -1 to +1 indicates Normality. If the
values fall outside the band, then the assumption of Normality for that variable is
violated. The Statistics for all the variables along with the remarks are tabulated below.
Table 5.4: The Statistics for Normality
Sr . Variable Description Skewness
Statistics
Kurtosis
Statistics
Normality
Met (Yes/No)
Variables for ‘Satisfaction’
1 I am happy with the 'Supply
Quality' offered by the
MSEDCL.
-1.331 1.168 No
2
The Supply Provided by
MSEDCL is with minimum
interruptions.
-.690 -.738 Yes
3
The Outage Management is
Satisfactory and Consumers are
made aware of the outages taken
by MSEDCL for maintenance.
-.477 -.935 Yes

75
Sr . Variable Description Skewness
Statistics
Kurtosis
Statistics
Normality
Met (Yes/No)
4 'Load Shedding', is not a
problem associated with
MSEDCL Services.
-.204 -1.163 No
5 It is easy to approach or contact
the MSEDCL Staff/Engineers in
case of emergency or a problem.
-1.026 .166 No
6 I feel comfortable in
approaching the MSEDCL staff
in case of any problem.
-1.002 .622 Yes
Variables for ‘Value’
7 The Services Offered by
MSEDCL to its Consumers is at
a Cheaper Cost.
.182 -1.208 No
8
The MSEDCL Offices and Fuse
Call Centers are located at
convenient places and are easily
accessible.
-.716 -.322 Yes
9
The time and effort needed in
resolving a complaint with
MSEDCL services is less or
adequate.
-.777 -.807 Yes
10
Even if in case of any problem
associated with the MSEDCL
service, we are not panic and we
feel assured that the problem
would be resolved with ease.
-1.663 1.569 No
11 The working hours of MSEDCL
Company are as per the
Consumer convenience.
-.819 -.547 Yes
12
Even in case of Power Scarcity
Situation, the MSEDCL
company takes special efforts to
provide with or maintain for
uninterrupted power supply to
its Consumers.
-.701 -.417 Yes

76
Sr . Variable Description Skewness
Statistics
Kurtosis
Statistics
Normality
Met (Yes/No)
13 The risk associated in
transactions with MSEDCL is
least.
-.781 1.434 No
14 The quality of services offered
by MSEDCL has improved
significantly over last few years.
-1.419 3.740 No
15
The present service provider
(MSEDCL) has better staff with
adequate knowledge to handle
Consumer Complaints.
-.853 .621 Yes
16
The present Service Provider
(MSEDCL) has better
infrastructure as compared to its
Competitors.
-.251 -.547 Yes
Variables for ‘Brand Image’
17 The Business Practices of
MSEDCL are Ethical and
Transparent.
-.615 -.161 Yes
18 MSEDCL is the most trusted
Service provider as compared to
its Competitors.
-.400 .267 Yes
19
MSEDCL is a Government
Owned Company and has Social
Obligations to fulfill and does
not work only to gain profits.
-.874 .506 Yes
20
The MSEDCL company has
taken necessary efforts to
improve its infrastructure to
provide quality power to its
Consumers.
-.914 .527 Yes
21
Although, with the introduction
of Open Access Policy the
Power Distribution Sector has
become very competitive, the
MSEDCL has the capability to
face the future challenges.
-.460 -.172 Yes

77
Sr . Variable Description Skewness
Statistics
Kurtosis
Statistics
Normality
Met (Yes/No)
22
The Business transactions with
MSEDCL are very fair and even
if provided with a choice to
select service provider, I / We
prefer to be associated with the
MSEDCL.
-.866 1.715 No
Variables for ‘Loyalty’
23 We feel proud in being
associated with MSEDCL as
their Consumer.
-1.109 1.692 No
24 WE have a genuine relationship
with MSEDCL as a Consumer. -1.134 1.685 No
25
Majority of neighboring
Consumers, Friends and
Relatives etc avail the services
of MSEDCL.
-.230 .920 Yes
26
I convey positive 'word of
mouth' publicity about my
present Service Provider
(MSEDCL).
-1.386 3.828 No
27
I recommend the services of the
present service provider
(MSEDCL), if someone seeks
my suggestion.
-1.172 2.203 No
Variables for ‘Barriers’
28
The financial cost associated
with the Switching is
considerable(CSS, Transmission
Charges, Wheeling Charges,
Metering Cost, Additional
Surcharge etc )
-.215 .395 Yes
29
The effort involved in searching
for a New Service Provider is
high and time consuming.
-.421 -.094 Yes

78
Sr . Variable Description Skewness
Statistics
Kurtosis
Statistics
Normality
Met (Yes/No)
30
It will also take much time in
learning about or understanding
the New Service Provider or
develop new relationship.
-.473 .180 Yes
31 There are few alternatives to
provide for Services in Power
Distribution Sector.
-.691 .675 Yes
32 We don't find a better alternative
that can provide Services to us. -.149 -.890 Yes
33
We feel embarrassed to inform
our current Service Provider
(MSEDCL) that we will be
discontinuing the services in
near future.
-.164 -.616 Yes
34 I have a sense of loyalty with
my existing service provider that
is MSEDCL.
-1.011 1.364 No
Variables for ‘Consumer Concern’
35
The MSEDCL Company
understands our specific needs
and the MSEDCL staff pay
attention to it.
-.631 -.285 Yes
36
In case of payment default , the
MSEDCL company is more
likely to understand our problem
and would agree to give grace
period for clearance of dues
without disconnecting our
supply.
-.415 -.578 Yes
37
In case of any Supply problem
associated with the Consumer
side, the MSEDCL Employees
would be flexible (generous) in
extending necessary support and
help to solve the problem.
-.723 -.439 Yes

79
Sr . Variable Description Skewness
Statistics
Kurtosis
Statistics
Normality
Met (Yes/No)
38
The MSEDCL Company is
always ready and prompt in
passing on the
Incentives/Benefits to the
Consumers.
-.774 -.139 Yes
39
The MSEDCL is never harsh or
unjust in imposing
penalties/charges to the
Consumers.
-.549 -.449 Yes
Variables for ‘Tangibles’
40 The MSEDCL Offices are Well
Furnished, Clean and Well
Maintained.
.080 -1.339 No
41 The MSEDCL Electricity Bills
are well structured and the
Consumers understand it easily.
-1.116 .450 No
42 The MSEDCL website is well
designed and user friendly. -.769 .340 Yes
43 The MSEDCL Employees are
Well Dressed and appear neat. -.950 -.479 Yes
Variables for ‘Reliability’
44
The Consumers are informed of
the supply interruptions in
advance.
.030 -1.375 No
45
The Consumers are made aware
by the MSEDCL, regarding the
changes in Policies through its
Circulars.
-.118 -1.305 No
46
The MSEDCL Electricity Bills
are delivered in time and give
ample duration for the
Consumers to clear the
outstanding amounts before due
dates as mentioned in the bill.
-.768 -.557 Yes

80
Sr . Variable Description Skewness
Statistics
Kurtosis
Statistics
Normality
Met (Yes/No)
47 The Electricity Bills provided by
the MSEDCL are accurate and
free from errors.
-1.083 .806 No
48
The problem communicated to
the MSEDCL is solved at the
first time and generally does not
repeat in future.
-.182 -1.426 No
49 The MSEDCL website provides
with relevant and accurate
information to its Consumers.
-1.307 1.515 No
50
The MSEDCL website offers a
safe and secured option for
payment of electricity bills for
its Consumers.
-.115 -.116 Yes
Variables for ‘Responsiveness’
51 The MSEDCL employees are
quick in attending the Consumer
Complaints.
-.969 -.038 Yes
52
The MSEDCL employees listen
carefully to the grievances raised
by the Consumer and understand
the Consumer problems.
-.985 .022 Yes
53
The MSEDCL Employees show
keen interest and take up the
responsibility in solving the
Consumer Complaints.
-.543 -.811 Yes
54 The MSEDCL Employees are
never too busy to respond to the
Consumer requests.
-.471 -.810 Yes
Variables for ‘Empathy’
55 The MSEDCL Employees have
caring attitude towards their
Consumers.
-.841 -.250 Yes
56 The MSEDCL understands the
needs of its Consumer .
-.786 -.451 Yes

81
Sr . Variable Description Skewness
Statistics
Kurtosis
Statistics
Normality
Met (Yes/No)
57
The MSEDCL Company
believes in keeping the
'Consumer Interest' as its top
priority.
-.380 -.655 Yes
Variables for ‘Assurance’
58
The MSEDCL agrees to provide
compensation to its Consumers
if the services are not delivered
as per the 'Standards of
Performance ', stipulated by the
MERC.
-.209 -.716 Yes
59 The MSEDCL Employees are
adequately trained to solve the
Consumer's Complaint.
-.977 .775 Yes
60 The MSEDCL Employees /
Staff are well behaved and well
mannered.
-1.207 .423 No
61 The MSEDCL Company keeps
its promise of fulfilling the
Consumer demand in time.
-.105 -1.073 No
Variables for ‘Culture’
62
The Electricity Consumers
would not really mind paying
more for Reliable and Quality
Services.
-.655 -.358 Yes
63
We keep ourselves updated
regarding the latest tariff
applicable and other relevant
information.
-1.164 .825 No
64
With the latest developments in
the power sector technologies
like Smart Grids , Smart
Metering etc the Consumers will
be able to cope well with it.
-.085 -.363 Yes

82
Sr . Variable Description Skewness
Statistics
Kurtosis
Statistics
Normality
Met (Yes/No)
65
The Open Access policy offers
choice to the Electricity
Consumers to select their
Service Provider. So, I /We
would definitely avail of this
facility and plan to switch over
to a New Service Provider.
-.729 1.139 No
66
Instead of Sourcing power from
Distribution Utilities, Our
Company would prefer to
generate electricity on our own.
.330 -.907 Yes
5.7 The Descriptive Statistics, Frequency Tables and Histograms
The Descriptive Statistics calculate the Sample Size, Missing Values, Mean,
Minimum Value and Maximum Value, Kurtosis, Skewness ,Standard errors
associated with Skewness and Kurtosis for each variable. The statistics summarize
and analyze data that help us to draw meaningful inferences and improve the decision
making. The skewness tells how the data distribution is and its value reaffirms the
meaningfulness of the mean. The frequency table provides information related to the
‘Number of Observations’ or Frequency assigned to each group. If the statistics are
not sufficient to interpret data meaningfully then the interpretation is based on
Frequency Tables. The Frequency Table displays Frequency, Percentage, Valid
Percent and Cumulative Percent for each group. A Histogram displays the data
graphically showing the shape, centre and spread of the distribution. The factors that
are considered in the study are Satisfaction, Perceived Value, Brand Image, Loyalty,
Switching Barriers, Consumer Concern, Tangibles, Reliability, Responsiveness,
Assurance, Empathy and Consumer Culture. The descriptive statistics, frequency
tables and histograms for each of the mentioned factors are displayed and interpreted
below.

83
5.7.1 The Descriptive Statistics, Frequency Tables and Histograms for Consumer
Satisfaction
The First Variable under Consumer Satisfaction is - I am happy with the 'Supply
Quality' offered by the MSEDCL. The Statistics Table and the Histogram for the variable
are as below.
Table 5.5: Statistics for ‘Supply Quality’
Variable I am happy with the 'Supply Quality' offered by the
MSEDCL
Details Sample N :- Valid – 140; Missing – 0
Mean 3.7571 Kurtosis 1.168
Std. Deviation 1.02397 Std. Error of Kurtosis .407
Skewness -1.331 Minimum 1.00
Std.Error of Skewness .205 Maximum 5.00
Histogram 5.1: ‘Supply Quality’ Offered by the MSEDCL

84
The above table for statistics and the histogram show frequency distribution for the
satisfaction variable: (I am happy with the 'Supply Quality' offered by the MSEDCL).
From the table above it may be said that the Mean = 3.7571 and the Standard Deviation =
1.02397 which is less than one third of the mean i.e. 1.2523. Therefore, ‘Mean’ is the
meaningful value. The skewness is negative with the value of -1.331 showing the curve
left skewed and the data piled on the right side thus reaffirming the meaningfulness of the
‘Mean’. Hence, it may be concluded that the respondents are happy with the ‘Supply
Quality’ offered by the MSEDCL. The Frequency Table for the selected Variable is as
below.
Table 5.6: Frequency Table for ‘Supply Quality’
Group/Class Frequency Percent Valid Percent Cumulative
Percent
Strongly Disagree 7 5.0 5.0 5.0
Disagree 17 12.1 12.1 17.1
Neutral 1 .7 .7 17.9
Agree 93 66.4 66.4 84.3
Strongly Agree 22 15.7 15.7 100.0
Total 140 100.0 100.0
From the above frequency table the count for the groups ‘Strongly Disagree’, ‘Disagree’,
‘Neutral’, ‘Agree’ and ‘Strongly Agree’ are 7, 17, 1, 93 and 22 respectively. The
combine percentage for ‘Agree’ and ‘Strongly Agree’ is 82.1 % which also points out
that the ‘Supply Quality’ offered by the MSEDCL is satisfactory.
The Second Variable under Consumer Satisfaction is - The Supply Provided by
MSEDCL is with minimum interruptions. The Statistics Table and Histogram for the
variable are as below.

85
Table 5.7: Statistics for ‘Minimum Supply Interruptions’
Variable The Supply Provided by MSEDCL is with minimum
interruptions
Details Sample N :- Valid – 140; Missing – 0
Mean 3.4786 Kurtosis -.738
Std. Deviation 1.12184
Std. Error of
Kurtosis .407
Skewness -.690 Minimum 1.00
Std.Error of
Skewness .205 Maximum 5.00
Histogram 5.2: ‘Minimum Supply Interruptions’ as Related to the Service
The above table for statistics and histogram show frequency distribution for the
satisfaction variable: The Supply Provided by MSEDCL is with minimum interruptions.
From the table above it may be said that the Mean = 3.4786 and the Standard Deviation =
1.12184 which is less than one third of the mean i.e. 1.1595. Therefore, ‘Mean’ is the
meaningful value. The skewness is negative with the value of -0.690 showing the curve

86
left skewed and the data piled on the right side thus reaffirming the meaningfulness of the
‘Mean’. Hence, it may be concluded that the supply provided by the MSEDCL is with
minimum interruptions. The Frequency Table for the selected Variable is as below.
Table 5.8: Frequency Table for ‘Minimum Supply Interruptions’
Group/Class Frequency Percent Valid Percent Cumulative
Percent
Strongly
Disagree 6 4.3 4.3 4.3
Disagree 35 25.0 25.0 29.3
Neutral 2 1.4 1.4 30.7
Agree 80 57.1 57.1 87.9
Strongly Agree 17 12.1 12.1 100.0
Total 140 100.0 100.0
From the above frequency table the count for the groups ‘Strongly Disagree’, ‘Disagree’,
‘Neutral’, ‘Agree’ and ‘Strongly Agree’ are 6, 35, 2, 80 and 17 respectively. The
combine percentage for ‘Agree’ and ‘Strongly Agree’ is 69.2 % which also points out
that the Supply provided by the MSEDCL is with minimum interruptions.
The Third Variable under Consumer Satisfaction is - The Outage Management is
Satisfactory and Consumers are made aware of the outages taken by MSEDCL for
maintenance. The Statistics Table and histogram for the variable are as below.
Table 5.9: Statistics for ‘Outage Management’
Variable The Outage Management is Satisfactory and Consumers are
made aware of the outages taken by MSEDCL for
maintenance
Details Sample N :- Valid – 140; Missing – 0
Mean 3.2500 Kurtosis -.935
Std. Deviation 1.13242 Std. Error of Kurtosis .407
Skewness -.477 Minimum 1.00
Std.Error of Skewness .205 Maximum 5.00

87
Histogram 5.3: ‘Outage Management’ of the MSEDCL
The above table for statistics and histogram show frequency distribution for the
satisfaction variable: The Outage Management is Satisfactory and Consumers are made
aware of the outages taken by MSEDCL for maintenance. From the table above it may be
said that the Mean = 3.25 and the Standard Deviation = 1.13242 which is greater than one
third of the mean i.e. 1.0833. Therefore, ‘Mean’ is not the meaningful value to make any
interpretation. Hence, the interpretation will be based on the frequency table. The
Frequency Table for the selected Variable is shown on the next page.

88
Table 5.10: Frequency Table for ‘Outage Management’
Group/Class Frequency Percent Valid Percent Cumulative
Percent
Strongly
Disagree 10 7.1 7.1 7.1
Disagree 35 25.0 25.0 32.1
Neutral 16 11.4 11.4 43.6
Agree 68 48.6 48.6 92.1
Strongly Agree 11 7.9 7.9 100.0
Total 140 100.0 100.0
From the above frequency table the count for the groups ‘Strongly Disagree’, ‘Disagree’,
‘Neutral’, ‘Agree’ and ‘Strongly Agree’ are 10, 35, 16, 68 and 11 respectively. The
combine percentage for ‘Agree’ and ‘Strongly Agree’ is 56.5 % which notifies that the
Outage Management of the MSEDCL is marginally towards satisfaction.
The Fourth Variable under Consumer Satisfaction is - 'Load Shedding', is not a problem
associated with MSEDCL Services. The Statistics Table and the Histogram for the
variable are as below.
Table 5.11: Statistics for ‘Load Shedding’
Variable 'Load Shedding', is not a problem associated with MSEDCL
Services
Details Sample N :- Valid – 140; Missing – 0
Mean 3.2429 Kurtosis -1.163
Std. Deviation 1.20474 Std. Error of Kurtosis .407
Skewness -.204 Minimum 1.00
Std.Error of Skewness .205 Maximum 5.00

89
Histogram 5.4: ‘Load Shedding’ Problem Associated with the MSEDCL Service
The above table for statistics and histogram show frequency distribution for the
satisfaction variable: 'Load Shedding', is not a problem associated with MSEDCL
Services. From the table above it may be said that the Mean = 3.2429 and the Standard
Deviation = 1.20474 which is greater than one third of the Mean i.e. 1.0809. Therefore,
‘Mean’ is not the meaningful value to make any interpretation. Hence, the interpretation
will be based on the Frequency Table. The Frequency Table for the selected Variable is
as below.
Table 5.12: Frequency Table for ‘Load Shedding’.
Group/Class Frequency Percent Valid Percent Cumulative
Percent
Strongly Disagree 9 6.4 6.4 6.4
Disagree 41 29.3 29.3 35.7
Neutral 17 12.1 12.1 47.9
Agree 53 37.9 37.9 85.7
Strongly Agree 20 14.3 14.3 100.0
Total 140 100.0 100.0

90
From the above frequency table the count for the groups ‘Strongly Disagree’, ‘Disagree’,
‘Neutral’, ‘Agree’ and ‘Strongly Agree’ are 9, 41, 17, 53 and 20 respectively. The
combine percentage for ‘Agree’ and ‘Strongly Agree’ is 52.2 % which notifies that the
respondents are marginally satisfied with the problem associated to ‘load shedding’.
The Fifth Variable under Consumer Satisfaction is - It is easy to approach or
contact the MSEDCL Staff/Engineers in case of emergency or a problem. The Statistics
Table and the Histogram for the variable are as below.
Table 5.13: Statistics for Ease of Approaching the MSEDCL Staff in Case of a
Problem
Variable It is easy to approach or contact the MSEDCL
Staff/Engineers in case of emergency or a problem
Details Sample N :- Valid – 140; Missing – 0
Mean 3.7429 Kurtosis .166
Std. Deviation .90061 Std. Error of Kurtosis .407
Skewness -1.026 Minimum 2.00
Std.Error of Skewness .205 Maximum 5.00
Histogram 5.5: Approachability to the MSEDCL Employees in Case of a Problem

91
The above table for Statistics and Histogram show frequency distribution for the
Satisfaction variable: It is easy to approach or contact the MSEDCL Staff/Engineers in
case of emergency or a problem. From the table above it may be said that the Mean =
3.7429 and the Standard Deviation = 0.90061 which is less than one third of the mean i.e.
1.2476. Therefore, ‘Mean’ is the meaningful value for interpretation. The skewness is
negative with the value of -1.026 showing the curve left skewed and the data piled on the
right side thus reaffirming the meaningfulness of the ‘Mean’. Hence, it may be concluded
that the respondents agree that the approach to MSEDCL Staff/Engineers in case of
emergency or a problem is with ease. The Frequency Table for the selected Variable is as
below.
Table 5.14: Frequency Table for Ease of Approaching the MSEDCL Staff in Case of
a Problem
Group/Class Frequency Percent Valid
Percent
Cumulative
Percent
Strongly Disagree 0 0 0 0.0
Disagree 26 18.6 18.6 18.6
Neutral 1 .7 .7 19.3
Agree 96 68.6 68.6 87.9
Strongly Agree 17 12.1 12.1 100.0
Total 140 100.0 100.0
From the above frequency table the count for the groups ‘Strongly Disagree’, ‘Disagree’,
‘Neutral’, ‘Agree’ and ‘Strongly Agree’ are 0, 26, 1, 96 and 17 respectively. The
combine percentage for ‘Agree’ and ‘Strongly Agree’ is 80.7 % which tells that the
Approach to the MSEDCL Staff/Engineers in case of Emergency or a Problem is with
ease.
The Sixth Variable under Consumer Satisfaction is - I feel comfortable in
approaching the MSEDCL staff in case of any problem. The Statistics Table and the
Histogram for the variable are given on the next page.

92
Table 5.15: Statistics for Comfort in Approaching the MSEDCL Staff
Variable I feel comfortable in approaching the MSEDCL staff in case
of any problem
Details Sample N :- Valid – 140; Missing – 0
Mean 3.8000 Kurtosis .622
Std. Deviation .93069 Std. Error of Kurtosis .407
Skewness -1.002 Minimum 1.00
Std.Error of
Skewness .205 Maximum 5.00
Histogram 5.6: Comfort in Approaching the MSEDCL Staff in Case of a Problem

93
The above table for Statistics and Histogram show frequency distribution for the
satisfaction variable: I feel comfortable in approaching the MSEDCL staff in case of any
problem. From the table above it may be said that the Mean = 3.80 and the Standard
Deviation = 0.93069 which is less than one third of the Mean i.e. 1.2666. Therefore,
‘Mean’ is the meaningful value for interpretation. The skewness is negative with the
value of -1.002 showing the curve left skewed and the data piled on the right side thus
reaffirming the meaningfulness of the ‘Mean’. Hence, it may be concluded that the
respondents agree that they are Comfortable in Approaching the MSEDCL Staff in case
of any Problem. The Frequency Table for the selected Variable is as below.
Table 5.16: Frequency Table for Comfort in Approaching the MSEDCL Staff
Group/Class Frequency Percent Valid
Percent
Cumulative
Percent
Strongly Disagree 2 1.4 1.4 1.4
Disagree 18 12.9 12.9 14.3
Neutral 11 7.9 7.9 22.1
Agree 84 60.0 60.0 82.1
Strongly Agree 25 17.9 17.9 100.0
Total 140 100.0 100.0
From the above Frequency Table the count for the groups ‘Strongly Disagree’,
‘Disagree’, ‘Neutral’, ‘Agree’ and ‘Strongly Agree’ are 2, 18, 11, 84 and 25 respectively.
The combine percentage for ‘Agree’ and ‘Strongly Agree’ is 77.9 % which notifies that
the Consumers are Comfortable in approaching the MSEDCL Staff in case of any
Problem.
So, considering the analysis of the six variables above it may be concluded that
the Consumer Satisfaction is good. The Consumers are satisfied with the ‘Supply
Quality’ and ‘Minimum Interruptions’ with the power supply from the MSEDCL but the
Consumers are marginally satisfied with the ‘Outage Management’ and ‘Load Shedding’
free supply. The satisfaction related to ‘Outage Management’ can be improved only

94
through proper Coordination and Communication with the Consumers by the Employees
of the MSEDCL. To some extent, the ‘Load Shedding’ problem is outside the control of
the organization but still the efforts on Load Demand Forecasting and encouraging
Consumers for efficient use of available electricity would help to some level. The
Consumer’s Satisfaction related to Approachability to Employees in case of a Problem or
Emergency is very favorable and the consumers are also comfortable in approaching the
Staff of the MSEDCL, this is a positive aspect in the service offered by the MSEDCL as
it indicates the sensitivity of the MSEDCL Employees in dealing with Consumer
problems. Therefore, it may be concluded that the Consumers are Satisfied with the
services of the MSEDCL.
5.7.2 The Descriptive Statistics, Frequency Tables and Histograms for Consumer
Perceived Value
The First Variable under ‘Consumer Perceived Value’ is - (The MSEDCL Offices
and Fuse Call Centers are located at convenient places and are easily accessible). The
Statistics Table and the Histogram for the variable are as below.
Table 5.17: Statistics for Accessibility and Convenient Location of MSEDCL Offices
Variable The MSEDCL Offices and Fuse Call Centers are located at
convenient places and are easily accessible
Details Sample N :- Valid – 140; Missing – 0
Mean 3.5286 Kurtosis -.322
Std. Deviation .94025 Std. Error of Kurtosis .407
Skewness -.716 Minimum 1.00
Std.Error of Skewness .205 Maximum 5.00

95
Histogram 5.7: Accessibility and Convenient Location of the MSEDCL Offices
The above table for Statistics and Histogram show frequency distribution for the ‘Value’
variable: The MSEDCL Offices and Fuse Call Centers are located at convenient places
and are easily accessible. From the table above, it may be said that the Mean = 3.5286
and the Standard Deviation = 0.94025 which is less than one third of the Mean i.e 1.1762.
Therefore, ‘Mean’ is the meaningful value. The skewness is negative with the value of -
0.716 showing the curve left skewed and the data piled on the right side thus reaffirming
the meaningfulness of the ‘Mean’. Hence, it may be concluded that the respondents feel
that the MSEDCL Offices and Fuse Call Centers are located at Convenient places and
easily Accessible. The Frequency Table for the selected Variable is as below.
Table 5.18: Frequency Table for Accessibility and Convenient Location of the
MSEDCL Offices
Group/Class Frequency Percent Valid
Percent
Cumulative
Percent
Strongly Disagree 2 1.4 1.4 1.4
Disagree 26 18.6 18.6 20.0
Neutral 20 14.3 14.3 34.3
Agree 80 57.1 57.1 91.4
Strongly Agree 12 8.6 8.6 100.0
Total 140 100.0 100.0

96
From the above Frequency Table the count for the groups ‘Strongly Disagree’,
‘Disagree’, ‘Neutral’, ‘Agree’ and ‘Strongly Agree’ are 2, 26, 20, 80 and 12 respectively.
The combine percentage for ‘Agree’ and ‘Strongly Agree’ is 65.7 % which notifies that
the respondents agree that the MSEDCL Offices and Fuse Call Centers are located at
convenient places.
The Second Variable under ‘Consumer Perceived Value’ is - The time and effort
needed in resolving a complaint with MSEDCL services is less or adequate. The
Statistics Table and the Histogram for the variable are as below.
Table 5.19: Statistics for Time and Effort Needed in Resolving a Complaint with the
MSEDCL Services
Variable The time and effort needed in resolving a complaint with
MSEDCL services is less or adequate
Details Sample N :- Valid – 140; Missing – 0
Mean 3.3786 Kurtosis -.807
Std. Deviation .97056 Std. Error of Kurtosis .407
Skewness -.777 Minimum 1.00
Std.Error of Skewness .205 Maximum 5.00
Histogram 5.8: ‘Time and Effort’ Needed in Resolving a Complaint with the
MSEDCL Services

97
The above table for Statistics and Histogram show frequency distribution for the ‘Value’
variable: The time and effort needed in resolving a complaint with MSEDCL services is
less or adequate. From the table above it may be said that the Mean = 3.3786 and the
Standard Deviation = 0.97056 which is less than one third of the Mean i.e.1.1262.
Therefore, ‘Mean’ is the meaningful value. The skewness is negative with the value of -
0.777 showing the curve left skewed and the data piled on the right side thus reaffirming
the meaningfulness of the ‘Mean’. Hence, it may be concluded that the respondents feel
that the Time and Effort needed to resolve a Complaint is less or adequate. The
Frequency Table for the selected Variable is as below.
Table 5.20: Frequency Table for Time and Effort Needed in Resolving a Complaint
with the MSEDCL Services
Group/Class Frequency Percent Valid
Percent
Cumulative
Percent
Strongly Disagree 3 2.1 2.1 2.1
Disagree 36 25.7 25.7 27.9
Neutral 10 7.1 7.1 35.0
Agree 87 62.1 62.1 97.1
Strongly Agree 4 2.9 2.9 100.0
Total 140 100.0 100.0
From the above frequency table the count for the groups ‘Strongly Disagree’, ‘Disagree’,
‘Neutral’, ‘Agree’ and ‘Strongly Agree’ are 3, 36, 10, 87 and 4 respectively. The
combine percentage for ‘Agree’ and ‘Strongly Agree’ is 65.0 % which reports that the
respondents agree, the Time and Effort needed to resolve the Complaint with MSEDCL
Services is less or adequate.
The Third Variable under ‘Consumer Perceived Value’ is - Even if in case of any
problem associated with the MSEDCL service, we are not panic and we feel assured that
the problem would be resolved with ease. The Statistics Table and the Histogram for the
Variable are as shown on the next page.

98
Table 5.21: Statistics for Problem Associated with the MSEDCL Service and
Confidence that the Problem would be solved with Ease
Variable Even if in case of any problem associated with the MSEDCL
service, we are not panic and we feel assured that the
problem would be resolved with ease
Details Sample N :- Valid – 140; Missing – 0
Mean 3.6357 Kurtosis 1.569
Std. Deviation .79757 Std. Error of Kurtosis .407
Skewness -1.663 Minimum 1.00
Std.Error of Skewness .205 Maximum 5.00
Histogram 5.9: Problem Associated with the MSEDCL Service and Confidence that
the Problem would be solved with Ease
The above table for statistics and histogram show frequency distribution for the ‘Value’
variable: (Even if in case of any problem associated with the MSEDCL service, we are
not panic and we feel assured that the problem would be resolved with ease). From the
table above it may be said that the Mean = 3.6357 and the Standard Deviation = 0.79757
which is less than one third of the Mean i.e.1.2119. Therefore, ‘Mean’ is the meaningful
value. The skewness is negative with the value of -1.663 showing the curve left skewed

99
and the data piled on the right side thus reaffirming the meaningfulness of the ‘Mean’.
Hence, it may be concluded that the respondents feel that even in case of any problem the
Consumers are not panic and are assured of the resolution of the problem with ease. The
Frequency Table for the selected Variable is as below.
Table 5.22: Frequency Table for Problem Associated with the MSEDCL Service and
Confidence that the Problem would be solved with Ease
Group/Class Frequency Percent Valid
Percent
Cumulative
Percent
Strongly Disagree 2 1.4 1.4 1.4
Disagree 20 14.3 14.3 15.7
Neutral 7 5.0 5.0 20.7
Agree 109 77.9 77.9 98.6
Strongly Agree 2 1.4 1.4 100.0
Total 140 100.0 100.0
From the above frequency table the count for the groups ‘Strongly Disagree’, ‘Disagree’,
‘Neutral’, ‘Agree’ and ‘Strongly Agree’ are 2, 20, 7, 109 and 2 respectively. The
combine percentage for ‘Agree’ and ‘Strongly Agree’ is 79.3 % which points out that the
respondents agree; even in case of any problem with MSEDCL Services the Consumers
are assured that the problem will be solved with ease.
The Fourth variable under ‘Consumer Perceived Value’ is - The working hours of
MSEDCL Company are as per the Consumer convenience. The Statistics Table and the
Histogram for the Variable are displayed on the next page.

100
Table 5.23: Statistics for Convenient Working Hours of the MSEDCL Company
Variable The working hours of MSEDCL Company are as per the
Consumer convenience
Details Sample N :- Valid – 140; Missing – 0
Mean 3.3571 Kurtosis -.547
Std. Deviation .97502 Std. Error of Kurtosis .407
Skewness -.819 Minimum 1.00
Std.Error of
Skewness .205 Maximum 5.00
Histogram 5.10: Convenient Working Hours of the MSEDCL Company
The above table for Statistics and Histogram show frequency distribution for the ‘Value’
variable: The working hours of MSEDCL Company are as per the Consumer
convenience. From the table above it may be said that the Mean = 3.3571 and the
Standard Deviation = 0.97502 which is less than one third of the mean i.e.1.1190.
Therefore, ‘Mean’ is the meaningful value. The skewness is negative with the value of -
0.819 showing the curve left skewed and the data piled on the right side thus reaffirming
the meaningfulness of the ‘Mean’. Hence, it may be concluded that the working hours of
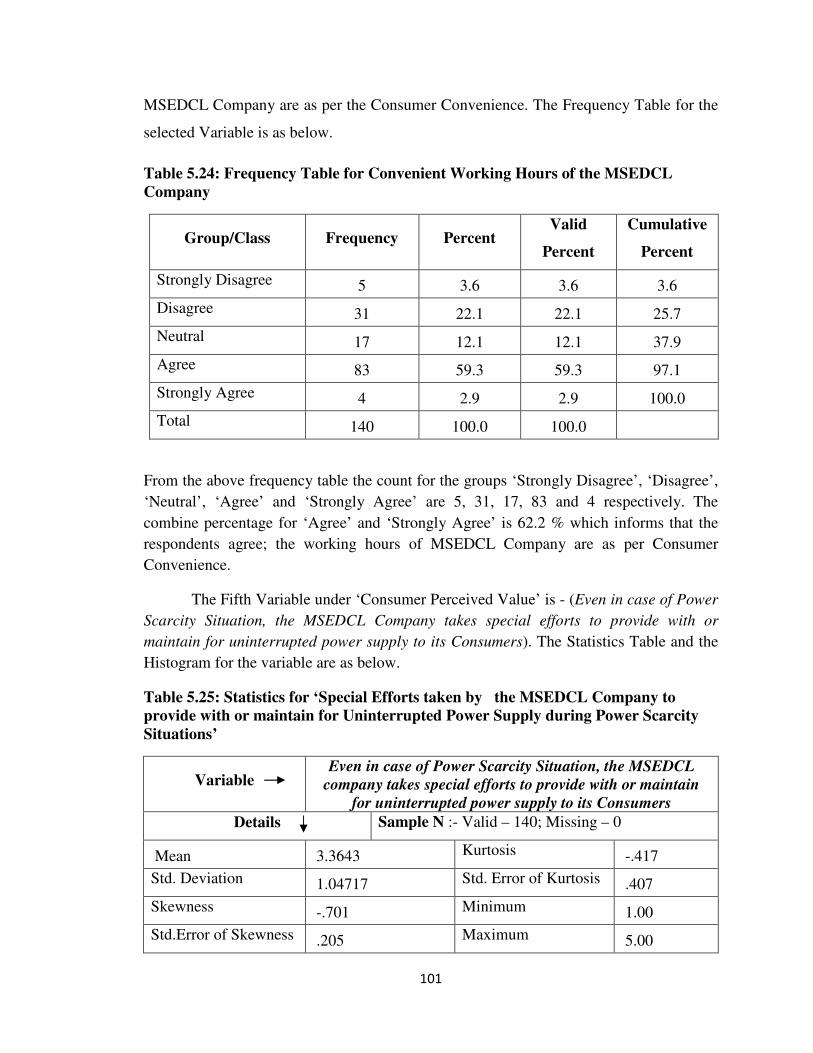
101
MSEDCL Company are as per the Consumer Convenience. The Frequency Table for the
selected Variable is as below.
Table 5.24: Frequency Table for Convenient Working Hours of the MSEDCL
Company
Group/Class Frequency Percent Valid
Percent
Cumulative
Percent
Strongly Disagree 5 3.6 3.6 3.6
Disagree 31 22.1 22.1 25.7
Neutral 17 12.1 12.1 37.9
Agree 83 59.3 59.3 97.1
Strongly Agree 4 2.9 2.9 100.0
Total 140 100.0 100.0
From the above frequency table the count for the groups ‘Strongly Disagree’, ‘Disagree’,
‘Neutral’, ‘Agree’ and ‘Strongly Agree’ are 5, 31, 17, 83 and 4 respectively. The
combine percentage for ‘Agree’ and ‘Strongly Agree’ is 62.2 % which informs that the
respondents agree; the working hours of MSEDCL Company are as per Consumer
Convenience.
The Fifth Variable under ‘Consumer Perceived Value’ is - (Even in case of Power
Scarcity Situation, the MSEDCL Company takes special efforts to provide with or
maintain for uninterrupted power supply to its Consumers). The Statistics Table and the
Histogram for the variable are as below.
Table 5.25: Statistics for ‘Special Efforts taken by the MSEDCL Company to
provide with or maintain for Uninterrupted Power Supply during Power Scarcity
Situations’
Variable Even in case of Power Scarcity Situation, the MSEDCL
company takes special efforts to provide with or maintain
for uninterrupted power supply to its Consumers
Details Sample N :- Valid – 140; Missing – 0
Mean 3.3643 Kurtosis -.417
Std. Deviation 1.04717 Std. Error of Kurtosis .407
Skewness -.701 Minimum 1.00
Std.Error of Skewness .205 Maximum 5.00

102
Histogram 5.11: Special Efforts taken by the MSEDCL Company to provide with
or maintain for Uninterrupted Power Supply during Power Scarcity Situations
The above table for statistics and histogram show frequency distribution for the ‘Value’
variable: (Even in case of Power Scarcity Situation, the MSEDCL Company takes special
efforts to provide with or maintain for uninterrupted power supply to its Consumers).
From the table above it may be said that the Mean = 3.3643 and the Standard Deviation =
1.04717 which is less than one third of the mean i.e.1.1214. Therefore, ‘Mean’ is the
meaningful value. The skewness is negative with the value of -0.701 showing the curve
left skewed and the data piled on the right side thus reaffirming the meaningfulness of the
‘Mean’. Hence, it may be concluded that even in case of power scarcity situation the
MSEDCL Company takes special efforts to provide with or maintain un-interrupted
power supply to its consumers. The Frequency Table for the selected Variable is shown
on the next page.
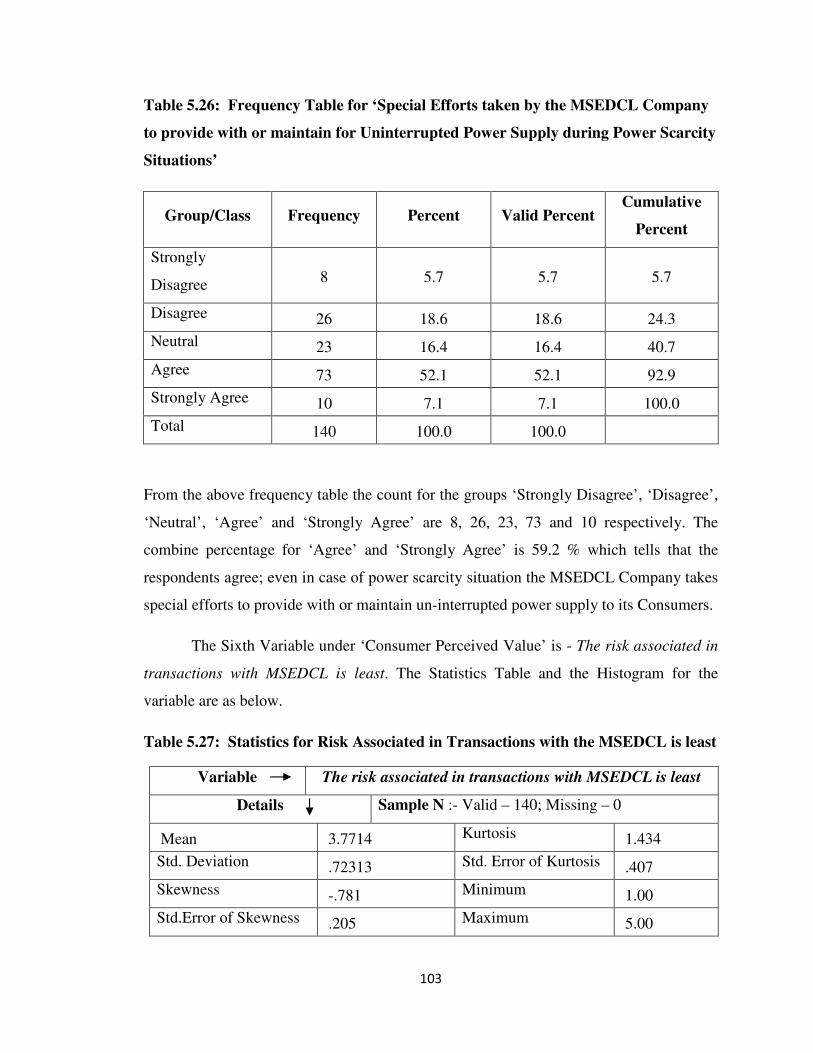
103
Table 5.26: Frequency Table for ‘Special Efforts taken by the MSEDCL Company
to provide with or maintain for Uninterrupted Power Supply during Power Scarcity
Situations’
Group/Class Frequency Percent Valid Percent Cumulative
Percent
Strongly
Disagree 8 5.7 5.7 5.7
Disagree 26 18.6 18.6 24.3
Neutral 23 16.4 16.4 40.7
Agree 73 52.1 52.1 92.9
Strongly Agree 10 7.1 7.1 100.0
Total 140 100.0 100.0
From the above frequency table the count for the groups ‘Strongly Disagree’, ‘Disagree’,
‘Neutral’, ‘Agree’ and ‘Strongly Agree’ are 8, 26, 23, 73 and 10 respectively. The
combine percentage for ‘Agree’ and ‘Strongly Agree’ is 59.2 % which tells that the
respondents agree; even in case of power scarcity situation the MSEDCL Company takes
special efforts to provide with or maintain un-interrupted power supply to its Consumers.
The Sixth Variable under ‘Consumer Perceived Value’ is - The risk associated in
transactions with MSEDCL is least. The Statistics Table and the Histogram for the
variable are as below.
Table 5.27: Statistics for Risk Associated in Transactions with the MSEDCL is least
Variable The risk associated in transactions with MSEDCL is least
Details Sample N :- Valid – 140; Missing – 0
Mean 3.7714 Kurtosis 1.434
Std. Deviation .72313 Std. Error of Kurtosis .407
Skewness -.781 Minimum 1.00
Std.Error of Skewness .205 Maximum 5.00

104
Histogram 5.12: Risk Associated in Transactions with the MSEDCL is least
The above table for statistics and histogram show frequency distribution for the ‘Value’
variable: The risk associated in transactions with MSEDCL is least. From the table above
it may be said that the Mean = 3.7714 and the Standard Deviation = 0.72313 which is less
than one third of the Mean i.e. 1.2571. Therefore, ‘Mean’ is the meaningful value. The
skewness is negative with the value of -0.781 showing the curve left skewed and the data
piled on the right side thus reaffirming the meaningfulness of the ‘Mean’. Hence, it may
be concluded that the risk associated with MSEDCL transactions is least. The Frequency
Table for the selected Variable is as below.
Table 5.28: Frequency Table for Risk Associated in Transactions with the
MSEDCL is least
Group/Class Frequency Percent Valid
Percent
Cumulative
Percent
Strongly Disagree 1 .7 .7 .7
Disagree 6 4.3 4.3 5.0
Neutral 32 22.9 22.9 27.9
Agree 86 61.4 61.4 89.3
Strongly Agree 15 10.7 10.7 100.0
Total 140 100.0 100.0

105
From the above frequency table the count for the groups ‘Strongly Disagree’, ‘Disagree’,
‘Neutral’, ‘Agree’ and ‘Strongly Agree’ are 1, 6, 32, 86 and 15 respectively. The
combine percentage for ‘Agree’ and ‘Strongly Agree’ is 72.1 % which reports that the
respondents agree; the risk associated with the MSEDCL transactions is least.
The Seventh Variable under ‘Consumer Perceived Value’ is - The quality of
services offered by MSEDCL has improved significantly over last few years. The
Statistics Table and the Histogram for the variable are as below.
Table 5.29: Statistics for ‘Quality of Services Offered by MSEDCL has Improved
significantly Over last Few Years’
Variable The quality of services offered by MSEDCL has improved
significantly over last few years
Details Sample N :- Valid – 140; Missing – 0
Mean 3.9929 Kurtosis 3.740
Std. Deviation .75385 Std. Error of Kurtosis .407
Skewness -1.419 Minimum 1.00
Std.Error of Skewness .205 Maximum 5.00
Histogram 5.13: Quality of Services Offered by MSEDCL has Improved
significantly Over last Few Years

106
The above table for statistics and histogram show frequency distribution for the ‘Value’
variable: (The quality of services offered by MSEDCL has improved significantly over
last few years). From the table above it may be said that the Mean = 3.9929 and the
Standard Deviation = 0.75385 which is less than one third of the mean i.e. 1.3309.
Therefore, ‘Mean’ is the meaningful value. The skewness is negative with the value of -
1.419 showing the curve left skewed and the data piled on the right side thus reaffirming
the meaningfulness of the ‘Mean’. Hence, it may be concluded that the quality of services
offered by MSEDCL has improved significantly over last few years. The Frequency
Table for the selected Variable is as below.
Table 5.30: Frequency Table for ‘Quality of Services Offered by MSEDCL has
Improved significantly Over last Few Years’
Group/Class Frequency Percent Valid
Percent
Cumulative
Percent
Strongly Disagree 2 1.4 1.4 1.4
Disagree 6 4.3 4.3 5.7
Neutral 10 7.1 7.1 12.9
Agree 95 67.9 67.9 80.7
Strongly Agree 27 19.3 19.3 100.0
Total 140 100.0 100.0
From the above frequency table the count for the groups ‘Strongly Disagree’, ‘Disagree’,
‘Neutral’, ‘Agree’ and ‘Strongly Agree’ are 2, 6, 10, 95 and 27 respectively. The
combine percentage for ‘Agree’ and ‘Strongly Agree’ is 87.2 % which informs that the
respondents agree; the quality of services offered by MSEDCL has improved
significantly over last few years.
The Eighth Variable under ‘Consumer Perceived Value’ is – The present service
provider (MSEDCL) has better staff with adequate knowledge to handle Consumer
Complaints. The Statistics Table and the Histogram for the variable are on the next page.

107
Table 5.31: Statistics for ‘The Present Service Provider (MSEDCL) has Better Staff
with Adequate Knowledge to Handle Consumer Complaints’
Variable The present service provider (MSEDCL) has better staff
with adequate knowledge to handle Consumer Complaints
Details Sample N :- Valid – 140; Missing – 0
Mean 3.6500 Kurtosis .621
Std. Deviation .79499 Std. Error of Kurtosis .407
Skewness -.853 Minimum 1.00
Std.Error of Skewness .205 Maximum 5.00
Histogram 5.14: Present Service Provider (MSEDCL) has Better Staff with
Adequate Knowledge to Handle Consumer Complaints
The above table for statistics and histogram show frequency distribution for the ‘Value’
variable: (The present service provider (MSEDCL) has better staff with adequate
knowledge to handle Consumer Complaints). From the table above it may be said that the
Mean = 3.65 and the Standard Deviation = 0.79499 which is less than one third of the
mean i.e.1.2166. Therefore, ‘Mean’ is the meaningful value. The skewness is negative
with the value of -0.853 showing the curve left skewed and the data piled on the right
side thus reaffirming the meaningfulness of the ‘Mean’. Hence, it may be concluded that

108
the MSEDCL has better staff with adequate knowledge to handle Consumer Complaints.
The Frequency Table for the selected Variable is as below.
Table 5.32: Frequency Table for ‘The Present Service Provider (MSEDCL) has
Better Staff with Adequate Knowledge to Handle Consumer Complaints’
Group/Class Frequency Percent Valid
Percent
Cumulative
Percent
Strongly Disagree 1 .7 .7 .7
Disagree 14 10.0 10.0 10.7
Neutral 29 20.7 20.7 31.4
Agree 85 60.7 60.7 92.1
Strongly Agree 11 7.9 7.9 100.0
Total 140 100.0 100.0
From the above frequency table the count for the groups ‘Strongly Disagree’, ‘Disagree’,
‘Neutral’, ‘Agree’ and ‘Strongly Agree’ are 1, 14, 29, 85 and 11 respectively. The
combine percentage for ‘Agree’ and ‘Strongly Agree’ is 68.6 % which notifies that the
respondents agree; MSEDCL has better staff with adequate knowledge to handle
Consumer Complaints.
The Ninth Variable under ‘Consumer Perceived Value’ is - The present Service
Provider (MSEDCL) has better infrastructure as compared to its Competitors. The
Statistics Table and the Histogram for the Variable are as below.
Table 5.33: Statistics for ‘The Present Service Provider (MSEDCL) has Better
Infrastructure as Compared to its Competitors’
Variable The present Service Provider (MSEDCL) has better
infrastructure as compared to its Competitors
Details Sample N :- Valid – 140; Missing – 0
Mean 3.5286 Kurtosis -.547
Std. Deviation .92482 Std. Error of Kurtosis .407
Skewness -.251 Minimum 1.00
Std.Error of Skewness .205 Maximum 5.00

109
Histogram 5.15: Present Service Provider (MSEDCL) has Better Infrastructure as
Compared to its Competitors
The above table for statistics and histogram show frequency distribution for the ‘Value’
variable: (The present Service Provider (MSEDCL) has better infrastructure as compared
to its Competitors). From the table above it may be said that the Mean = 3.5286 and the
Standard Deviation = 0.92482 which is less than one third of the mean i.e. 1.1762.
Therefore, ‘Mean’ is the meaningful value. The skewness is negative with the value of -
0.251 showing the curve left skewed and the data piled on the right side thus reaffirming
the meaningfulness of the ‘Mean’. Hence, it may be concluded that the MSEDCL has
better infrastructure as compared to its Competitors. The Frequency Table for the
selected Variable is as below.
Table 5.34: Frequency Table for ‘The present Service Provider (MSEDCL) has
Better Infrastructure as Compared to its Competitors’
Group/Class Frequency Percent Valid
Percent
Cumulative
Percent
Strongly Disagree 1 .7 .7 .7
Disagree 20 14.3 14.3 15.0
Neutral 42 30.0 30.0 45.0
Agree 58 41.4 41.4 86.4
Strongly Agree 19 13.6 13.6 100.0
Total 140 100.0 100.0

110
From the above frequency table the count for the groups ‘Strongly Disagree’, ‘Disagree’,
‘Neutral’, ‘Agree’ and ‘Strongly Agree’ are 1, 20, 42, 58 and 19 respectively. The
combine percentage for ‘Agree’ and ‘Strongly Agree’ is 55 % which tells that the
respondents agree; MSEDCL has better infrastructure as compared to its Competitors.
The Tenth Variable under ‘Consumer Perceived Value’ is - The Services Offered
by MSEDCL to its Consumers is at a Cheaper Cost. The Statistics Table and the
Histogram for the Variable are as below.
Table 5.35: Statistics for ‘The Services Offered by MSEDCL to its Consumers is at a
Cheaper Cost’
Variable The Services Offered by MSEDCL to its Consumers is at a
Cheaper Cost
Details Sample N :- Valid – 140; Missing – 0
Mean 2.6286 Kurtosis -1.208
Std. Deviation 1.16510 Std. Error of Kurtosis .407
Skewness .182 Minimum 1.00
Std.Error of Skewness .205 Maximum 5.00
Histogram 5.16: Services Offered by MSEDCL to its Consumers is at a Cheaper
Cost

111
The above table for statistics and histogram show frequency distribution for the ‘Value’
variable: (The Services Offered by MSEDCL to its Consumers is at a Cheaper Cost).
From the table above it may be said that the Mean = 2.6286 and the Standard Deviation =
1.16510 which is greater than one third of the mean i.e. 0.8762. Therefore, ‘Mean’ is not
the meaningful value for interpretation. The skewness is positive with the value of 0.182
showing the curve right skewed and the data piled on the left side. Hence, the
interpretation will be based on frequency table. The Frequency Table for the selected
Variable is as below.
Table 5.36: Frequency Table for ‘The Services Offered by MSEDCL to its
Consumers is at a Cheaper Cost’
Group/Class Frequency Percent Valid
Percent
Cumulative
Percent
Strongly Disagree 25 17.9 17.9 17.9
Disagree 51 36.4 36.4 54.3
Neutral 19 13.6 13.6 67.9
Agree 41 29.3 29.3 97.1
Strongly Agree 4 2.9 2.9 100.0
Total 140 100.0 100.0
From the above frequency table the count for the groups ‘Strongly Disagree’, ‘Disagree’,
‘Neutral’, ‘Agree’ and ‘Strongly Agree’ are 25, 51, 19, 41 and 4 respectively. The
combine percentage for ‘Agree’ and ‘Strongly Agree’ is 45 % and the combine
percentage of ‘Strongly Disagree’ and ‘Disagree’ is 54.3 % which notifies that the
respondents disagree; the Services Offered by MSEDCL to its Consumers is at a
Cheaper Cost.
The ‘Value’ factor depends on the ‘Benefits’ availed by a Consumers against the
‘Cost’ incurred. Generally, the ‘Value’ is positive if the ‘Benefits’ received by a
Consumer exceed the ‘Cost’ borne by him to avail a Service or a Product. The benefits
associated with the services of the MSEDCL like convenient location of Offices, working
hours of the Company as per the consumer convenience, better Employees/Staff and

112
Infrastructure as compared to its competitors, special efforts of the MSEDCL in dealing
with power scarcity situations and provide un-interrupted power supply to its consumers,
improvement in the services over last couple of years and the least risk associated in the
transactions with the MSEDCL are appreciated by the Consumers. The consumers also
feel that the non monetary cost in availing the services of the MSEDCL is less as they
experience the time required to resolve a complaint is adequate and Consumers are not
panic in case of any problem associated with the service but when it comes to the
monetary cost the Consumers disagree that the services offered by the MSEDCL are at a
cheaper cost. Even if, the Consumers realize the benefits associated with the ‘Service’,
the opinion related to the ‘Cost of Service’ is adverse. Hence, it may be said that the
consumers don’t find ‘Value’ in the service provided by the Company. The MSEDCL
Company should take necessary steps in bringing down the ‘Cost of Service’ in order to
improve the ‘Perceived Value’.
5.7.3 The Descriptive Statistics, Frequency Tables and Histograms for Brand Image
The First Variable under ‘Brand Image’ is - The Business Practices of MSEDCL
are Ethical and Transparent. The Statistics Table and the Histogram for the Variable are
as below.
Table 5.37: Statistics for ‘The Business Practices of MSEDCL are Ethical and
Transparent’
Variable The Business Practices of MSEDCL are
Ethical and Transparent
Details Sample N :- Valid – 140; Missing – 0
Mean 3.4500 Kurtosis -.161
Std. Deviation .86769 Std. Error of Kurtosis .407
Skewness -.615 Minimum 1.00
Std.Error of Skewness .205 Maximum 5.00

113
Histogram 5.17: Business Practices of MSEDCL are Ethical and Transparent
The above table for statistics and histogram show frequency distribution for the ‘Brand
Image’ variable: (The Business Practices of MSEDCL are Ethical and Transparent).
From the table above it may be said that the Mean = 3.45 and the Standard Deviation =
0.86769 which is less than one third of the Mean i.e. 1.15. Therefore, ‘Mean’ is the
meaningful value. The skewness is negative with the value of -0.615 showing the curve
left skewed and the data piled on the right side thus reaffirming the meaningfulness of the
‘Mean’. Hence, it may be concluded that the respondents feel that the Business Practices
of MSEDCL are Ethical and Transparent. The Frequency Table for the selected Variable
is as below.
Table 5.38: Frequency Table for ‘The Business Practices of MSEDCL are Ethical
and Transparent’
Group/Class Frequency Percent Valid
Percent
Cumulative
Percent
Strongly Disagree 2 1.4 1.4 1.4
Disagree 21 15.0 15.0 16.4
Neutral 37 26.4 26.4 42.9
Agree 72 51.4 51.4 94.3
Strongly Agree 8 5.7 5.7 100.0
Total 140 100.0 100.0

114
From the above frequency table the count for the groups ‘Strongly Disagree’, ‘Disagree’,
‘Neutral’, ‘Agree’ and ‘Strongly Agree’ are 2, 21, 37, 72 and 8 respectively. The
combine percentage for ‘Agree’ and ‘Strongly Agree’ is 57.1 % which reports that the
respondents agree that the Business Practices of MSEDCL are Ethical and Transparent.
The Second Variable under ‘Brand Image’ is - MSEDCL is the most trusted
Service provider as compared to its Competitors. The Statistics Table and the Histogram
for the Variable are as below.
Table 5.39: Statistics for ‘MSEDCL is the Most Trusted Service Provider as
Compared to its Competitors’
Variable MSEDCL is the most trusted Service provider
as compared to its Competitors
Details Sample N :- Valid – 140; Missing – 0
Mean 3.4929 Kurtosis .267
Std. Deviation .94066 Std. Error of Kurtosis .407
Skewness -.400 Minimum 1.00
Std.Error of Skewness .205 Maximum 5.00
Histogram 5.18: MSEDCL is the Most Trusted Service Provider as Compared to its
Competitors

115
The above table for statistics and histogram show frequency distribution for the ‘Brand
Image’ variable: (MSEDCL is the most trusted Service provider as compared to its
Competitors). From the table above it may be said that the Mean = 3.4929 and the
Standard Deviation = 0.94066 which is less than one third of the Mean i.e. 1.1643.
Therefore, ‘Mean’ is the meaningful value. The skewness is negative with the value of -
0.400 showing the curve left skewed and the data piled on the right side thus reaffirming
the meaningfulness of the ‘Mean’. Hence, it may be concluded that MSEDCL is the most
trusted Service provider as compared to its Competitors. The Frequency Table for the
selected Variable is as below.
Table 5.40: Frequency Table for ‘MSEDCL is the Most Trusted Service Provider as
Compared to its Competitors’
Group/Class Frequency Percent Valid
Percent
Cumulative
Percent
Strongly Disagree 5 3.6 3.6 3.6
Disagree 10 7.1 7.1 10.7
Neutral 55 39.3 39.3 50.0
Agree 51 36.4 36.4 86.4
Strongly Agree 19 13.6 13.6 100.0
Total 140 100.0 100.0
From the above frequency table the count for the groups ‘Strongly Disagree’, ‘Disagree’,
‘Neutral’, ‘Agree’ and ‘Strongly Agree’ are 5, 10, 55, 51 and 19 respectively. The
combine percentage for ‘Agree’ and ‘Strongly Agree’ is 50 %, combined percentage of
‘Strongly Disagree’ and ‘Disagree’ is 10.7 % and % of “Neutral’ is 39.3 % which notifies
that the respondents moderately agree that MSEDCL is the most trusted Service
provider as compared to its Competitors.
The Third Variable under ‘Brand Image’ is - MSEDCL is a Government Owned
Company and has Social Obligations to fulfill and does not work only to gain profits. The
Statistics Table and the Histogram for the Variable are as below.

116
Table 5.41: Statistics for ‘MSEDCL is a Government Owned Company and has
Social Obligations to Fulfill and does not Work Only to Gain Profits’
Variable MSEDCL is a Government Owned Company and has Social
Obligations to fulfill and does not work only to gain profits
Details Sample N :- Valid – 140; Missing – 0
Mean 3.6571 Kurtosis .506
Std. Deviation .82035 Std. Error of Kurtosis .407
Skewness -.874 Minimum 1.00
Std.Error of Skewness .205 Maximum 5.00
Histogram 5.19: MSEDCL is a Government Owned Company and has Social
Obligations to Fulfill and does not Work Only to Gain Profits
The above table for statistics and histogram show frequency distribution for the ‘Brand
Image’ variable: (MSEDCL is a Government Owned Company and has Social
Obligations to fulfill and does not work only to gain profits). From the table above it may
be said that the Mean = 3.6571 and the Standard Deviation = 0.82035 which is less than
one third of the mean i.e.1.2190. Therefore, ‘Mean’ is the meaningful value. The
skewness is negative with the value of -0.874 showing the curve left skewed and the data

117
piled on the right side thus reaffirming the meaningfulness of the ‘Mean’. Hence, it may
be concluded that MSEDCL is a Government Owned Company and has Social
Obligations to fulfill and does not work only to gain profits. The Frequency Table for the
selected Variable is as below.
Table 5.42: Frequency Table for ‘MSEDCL is a Government Owned Company and
has Social Obligations to Fulfill and does not Work Only to Gain Profits’
Group/Class Frequency Percent Valid
Percent
Cumulative
Percent
Strongly Disagree 1 .7 .7 .7
Disagree 16 11.4 11.4 12.1
Neutral 25 17.9 17.9 30.0
Agree 86 61.4 61.4 91.4
Strongly Agree 12 8.6 8.6 100.0
Total 140 100.0 100.0
From the above frequency table the count for the groups ‘Strongly Disagree’, ‘Disagree’,
‘Neutral’, ‘Agree’ and ‘Strongly Agree’ are 1, 16, 25, 86 and 12 respectively. The
combine percentage for ‘Agree’ and ‘Strongly Agree’ is 70 % which tells that the
respondents agree that MSEDCL is a Government Owned Company and has Social
Obligations to fulfill and does not work only to gain profits.
The Fourth Variable under ‘Brand Image’ is - The MSEDCL Company has taken
necessary efforts to improve its infrastructure to provide quality power to its Consumers.
The Statistics Table and the Histogram for the Variable are as below.

118
Table 5.43: Statistics for ‘The MSEDCL Company has taken necessary efforts to
Improve its Infrastructure to Provide Quality Power to its Consumers’
Variable The MSEDCL company has taken necessary efforts
to improve its infrastructure to provide quality power
to its Consumers
Details Sample N :- Valid – 140; Missing – 0
Mean 3.6643 Kurtosis .527
Std. Deviation .97899 Std. Error of Kurtosis .407
Skewness -.914 Minimum 1.00
Std.Error of Skewness .205 Maximum 5.00
Histogram 5.20: MSEDCL Company has taken necessary efforts to Improve its
Infrastructure to Provide Quality Power to its Consumers
The above table for statistics and histogram show frequency distribution for the ‘Brand
Image’ variable: The MSEDCL Company has taken necessary efforts to improve its
infrastructure to provide quality power to its Consumers. From the table above it may be
said that the Mean = 3.6643 and the Standard Deviation = 0.97899 which is less than one
third of the mean i.e. 1.2214. Therefore, ‘Mean’ is the meaningful value. The skewness is

119
negative with the value of -0.914 showing the curve left skewed and the data piled on the
right side thus reaffirming the meaningfulness of the ‘Mean’. Hence, it may be concluded
that MSEDCL Company has taken necessary efforts to improve its infrastructure to
provide quality power to its Consumers. The Frequency Table for the selected Variable is
as below.
Table 5.44: Frequency Table for ‘The MSEDCL Company has taken necessary
efforts to improve its infrastructure to provide quality power to its Consumers’
Group/Class Frequency Percent Valid
Percent
Cumulative
Percent
Strongly Disagree 5 3.6 3.6 3.6
Disagree 15 10.7 10.7 14.3
Neutral 23 16.4 16.4 30.7
Agree 76 54.3 54.3 85.0
Strongly Agree 21 15.0 15.0 100.0
Total 140 100.0 100.0
From the above frequency table the count for the groups ‘Strongly Disagree’, ‘Disagree’,
‘Neutral’, ‘Agree’ and ‘Strongly Agree’ are 5, 15, 23, 76 and 21 respectively. The
combine percentage for ‘Agree’ and ‘Strongly Agree’ is 69.3 % which tells that the
respondents agree that MSEDCL Company has taken necessary efforts to improve its
infrastructure to provide quality power to its Consumers.
The Fifth Variable under ‘Brand Image’ is - Although, with the introduction of
Open Access Policy the Power Distribution Sector has become very competitive, the
MSEDCL has the capability to face the future challenges. The Statistics Table and the
Histogram for the Variable are as below.

120
Table 5.45: Statistics for ‘MSEDCL has Capabilities to Face Challenges of
Competitive Environment Due to Open Access Policy’
Variable Although, with the introduction of Open Access Policy the
Power Distribution Sector has become very competitive, the
MSEDCL has the capability to face the future challenges
Details Sample N :- Valid – 140; Missing – 0
Mean 3.3214 Kurtosis -.172
Std. Deviation .99110 Std. Error of Kurtosis .407
Skewness -.460 Minimum 1.00
Std.Error of Skewness .205 Maximum 5.00
Histogram 5.21: MSEDCL has Capabilities to Face Challenges of Competitive
Environment Due to Open Access Policy
The above table for statistics and histogram show frequency distribution for the ‘Brand
Image’ variable: Although, with the introduction of Open Access Policy the Power
Distribution Sector has become very competitive, the MSEDCL has the capability to face
the future challenges. From the table above it may be said that the Mean = 3.3214 and the
Standard Deviation = 0.99110 which is less than one third of the mean i.e.1.1071.
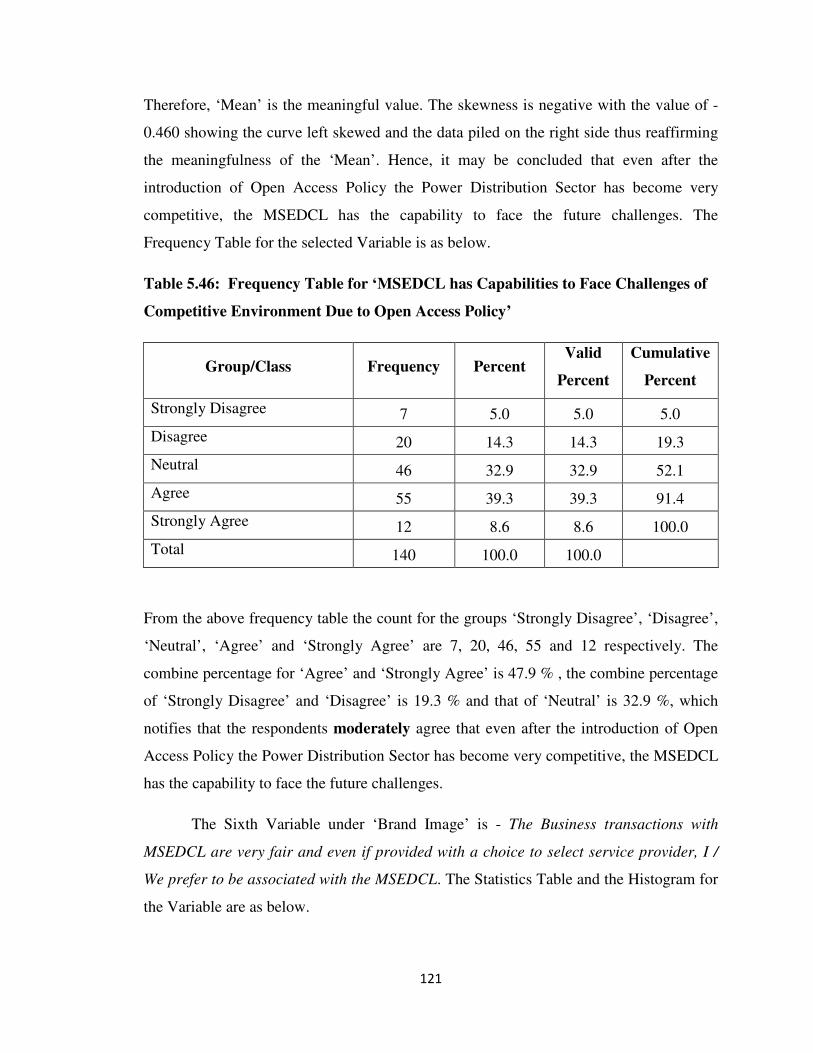
121
Therefore, ‘Mean’ is the meaningful value. The skewness is negative with the value of -
0.460 showing the curve left skewed and the data piled on the right side thus reaffirming
the meaningfulness of the ‘Mean’. Hence, it may be concluded that even after the
introduction of Open Access Policy the Power Distribution Sector has become very
competitive, the MSEDCL has the capability to face the future challenges. The
Frequency Table for the selected Variable is as below.
Table 5.46: Frequency Table for ‘MSEDCL has Capabilities to Face Challenges of
Competitive Environment Due to Open Access Policy’
Group/Class Frequency Percent Valid
Percent
Cumulative
Percent
Strongly Disagree 7 5.0 5.0 5.0
Disagree 20 14.3 14.3 19.3
Neutral 46 32.9 32.9 52.1
Agree 55 39.3 39.3 91.4
Strongly Agree 12 8.6 8.6 100.0
Total 140 100.0 100.0
From the above frequency table the count for the groups ‘Strongly Disagree’, ‘Disagree’,
‘Neutral’, ‘Agree’ and ‘Strongly Agree’ are 7, 20, 46, 55 and 12 respectively. The
combine percentage for ‘Agree’ and ‘Strongly Agree’ is 47.9 % , the combine percentage
of ‘Strongly Disagree’ and ‘Disagree’ is 19.3 % and that of ‘Neutral’ is 32.9 %, which
notifies that the respondents moderately agree that even after the introduction of Open
Access Policy the Power Distribution Sector has become very competitive, the MSEDCL
has the capability to face the future challenges.
The Sixth Variable under ‘Brand Image’ is - The Business transactions with
MSEDCL are very fair and even if provided with a choice to select service provider, I /
We prefer to be associated with the MSEDCL. The Statistics Table and the Histogram for
the Variable are as below.

122
Table 5.47: Statistics for ‘The Business Transactions with MSEDCL are Very Fair
and Even if Provided with a Choice to Select Service Provider, I / We Prefer to be
Associated with the MSEDCL’
Variable The Business transactions with MSEDCL are very fair and
even if provided with a choice to select service provider,
I / We prefer to be associated with the MSEDCL
Details Sample N :- Valid – 140; Missing – 0
Mean 3.8071 Kurtosis 1.715
Std. Deviation .77642 Std. Error of Kurtosis .407
Skewness -.866 Minimum 1.00
Std.Error of
Skewness .205 Maximum 5.00
Histogram 5.22: The Business Transactions with MSEDCL are Very Fair and Even
if Provided with a Choice to Select Service Provider, I / We Prefer to be Associated
with the MSEDCL
The above table for statistics and histogram show frequency distribution for the ‘Brand
Image’ variable: The Business transactions with MSEDCL are very fair and even if
provided with a choice to select service provider, I / We prefer to be associated with the
MSEDCL. From the table above it may be said that the Mean = 3.8071 and the Standard
Deviation = 0.77642 which is less than one third of the Mean i.e. 1.2690. Therefore,

123
‘Mean’ is the meaningful value. The skewness is negative with the value of -0.866
showing the curve left skewed and the data piled on the right side thus reaffirming the
meaningfulness of the ‘Mean’. Hence it may be concluded that the Business transactions
with MSEDCL are very fair and even if provided with a choice to select service provider,
I / We prefer to be associated with the MSEDCL. The Frequency Table for the selected
Variable is as below.
Table 5.48: Frequency Table for ‘The Business transactions with MSEDCL are very
fair and even if provided with a choice to select service provider, I / We prefer to
be associated with the MSEDCL’
Group/Class Frequency Percent Valid
Percent
Cumulative
Percent
Strongly Disagree 2 1.4 1.4 1.4
Disagree 5 3.6 3.6 5.0
Neutral 31 22.1 22.1 27.1
Agree 82 58.6 58.6 85.7
Strongly Agree 20 14.3 14.3 100.0
Total 140 100.0 100.0
From the above frequency table the count for the groups ‘Strongly Disagree’, ‘Disagree’,
‘Neutral’, ‘Agree’ and ‘Strongly Agree’ are 2, 5, 31, 82 and 20 respectively. The
combine percentage for ‘Agree’ and ‘Strongly Agree’ is 72.9 % which tells that the
respondents agree that the Business transactions with MSEDCL are very fair and even if
provided with a choice to select service provider, I / We prefer to be associated with the
MSEDCL.
The Social Image of the MSEDCL Company is favorable and the Consumers
believe that the MSEDCL has social Obligations to fulfill and does not work only to gain
profits. The Consumers recognize the Company’s attitude in developing Infrastructure so
as to deliver quality services and also admit that the business practices with the Company
are Ethical and Transparent. In present situation, the Consumer prefer to maintain trust
with the MSEDCL by continuing to avail the services from the Company but with the
introduction of Open Access policy the Consumers moderately agree about the

124
Capabilities of the MSEDCL in facing the future challenges. The Consumers are also
modest in conveying that the MSEDCL Company is the most trusted Service Provider as
compared to its competitors. Thus it may be concluded that the ‘Social Image’ of the
MSEDCL is favorable and the ‘Consumer Trust’ would be sustained only if the company
ensures its capability to face the future challenges in the competitive market.
5.7.4 The Descriptive Statistics, Frequency Tables and Histograms for Loyalty
The First Variable under ‘Loyalty’ is - We feel proud in being associated with
MSEDCL as their Consumer. The Statistics Table and the Histogram for the Variable are
as below.
Table 5.49: Statistics for ‘We feel proud in being associated with MSEDCL as their
Consumer’
Variable We feel proud in being associated with MSEDCL
as their Consumer
Details Sample N :- Valid – 140; Missing – 0
Mean 3.7857 Kurtosis 1.692
Std. Deviation .87971 Std. Error of Kurtosis .407
Skewness -1.109 Minimum 1.00
Std.Error of Skewness .205 Maximum 5.00
Histogram 5.23: ‘We Feel Proud in Being Associated with MSEDCL as their
Consumer’

125
The above table for statistics and histogram show frequency distribution for the ‘Loyalty’
variable: (We feel proud in being associated with MSEDCL as their Consumer). From the
table above it may be said that the Mean = 3.7857 and the Standard Deviation = 0.87971
which is less than one third of the mean i.e. 1.2619, Therefore, ‘Mean’ is the meaningful
value. The skewness is negative with the value of -1.109 showing the curve left skewed
and the data piled on the right side thus reaffirming the meaningfulness of the ‘Mean’.
Hence, it may be concluded that the Consumers feel proud in being associated with
MSEDCL. The Frequency Table for the selected Variable is as below.
Table 5.50: Frequency Table for ‘We feel proud in being associated with MSEDCL
as their Consumer’
Group/Class Frequency Percent Valid
Percent
Cumulative
Percent
Strongly Disagree 4 2.9 2.9 2.9
Disagree 8 5.7 5.7 8.6
Neutral 24 17.1 17.1 25.7
Agree 82 58.6 58.6 84.3
Strongly Agree 22 15.7 15.7 100.0
Total 140 100.0 100.0
From the above frequency table the count for the groups ‘Strongly Disagree’, ‘Disagree’,
‘Neutral’, ‘Agree’ and ‘Strongly Agree’ are 4, 8, 24, 82 and 22 respectively. The
combine percentage for ‘Agree’ and ‘Strongly Agree’ is 74.3 % which reports that the
respondents agree that Consumers feel proud in being associated with MSEDCL.
The Second Variable under ‘Loyalty’ is - We have a genuine relationship with
MSEDCL as a Consumer. The Statistics Table and the Histogram for the Variable are as
below.

126
Table 5.51: Statistics for ‘We have a genuine relationship with MSEDCL as a
Consumer’
Variable We have a genuine relationship with MSEDCL
as a Consumer
Details Sample N :- Valid – 140; Missing – 0
Mean 3.8429 Kurtosis 1.685
Std. Deviation .83340 Std. Error of Kurtosis .407
Skewness -1.134 Minimum 1.00
Std.Error of Skewness .205 Maximum 5.00
Histogram 5.24: ‘We have a Genuine Relationship with MSEDCL as a Consumer’
The above table for statistics and histogram show frequency distribution for the ‘Loyalty’
variable: (We have a genuine relationship with MSEDCL as a Consumer). From the table
above it may be said that the Mean = 3.8429 and the Standard Deviation = 0.83340 which
is less than one third of the mean i.e. 1.2809. Therefore, ‘Mean’ is the meaningful value.
The skewness is negative with the value of -1.134 showing the curve left skewed and the
data piled on the right side thus reaffirming the meaningfulness of the ‘Mean’. Hence, it

127
may be concluded that the Consumers feel they have genuine relationship with the
MSEDCL. The Frequency Table for the selected Variable is as below.
Table 5.52: Frequency Table for ‘We have a genuine relationship with MSEDCL as
a Consumer’
Group/Class Frequency Percent Valid
Percent
Cumulative
Percent
Strongly Disagree 2 1.4 1.4 1.4
Disagree 11 7.9 7.9 9.3
Neutral 16 11.4 11.4 20.7
Agree 89 63.6 63.6 84.3
Strongly Agree 22 15.7 15.7 100.0
Total 140 100.0 100.0
From the above frequency table the count for the groups ‘Strongly Disagree’, ‘Disagree’,
‘Neutral’, ‘Agree’ and ‘Strongly Agree’ are 2, 11, 16, 89 and 22 respectively. The
combine percentage for ‘Agree’ and ‘Strongly Agree’ is 79.3 % which informs that the
respondents agree that, Consumers feel they have genuine relationship with the
MSEDCL.
The Third Variable under ‘Loyalty’ is - Majority of neighboring Consumers,
Friends and Relatives etc avail the services of MSEDCL. The Statistics Table and the
Histogram for the Variable are as below.
Table 5.53: Statistics for ‘Majority of neighboring Consumers, Friends and
Relatives etc avail the services of MSEDCL’
Variable Majority of neighboring Consumers, Friends and
Relatives etc avail the services of MSEDCL
Details Sample N :- Valid – 140; Missing – 0
Mean 4.1000 Kurtosis .920
Std. Deviation .57901 Std. Error of Kurtosis .407
Skewness -.230 Minimum 2.00
Std.Error of Skewness .205 Maximum 5.00

128
Histogram 5.25: ‘Majority of Neighboring Consumers, Friends and Relatives etc
Avail the Services of MSEDCL’
The above table for statistics and histogram show frequency distribution for the ‘Loyalty’
variable: (Majority of neighboring Consumers, Friends and Relatives etc avail the
services of MSEDCL). From the table above it may be said that the Mean = 4.10 and the
Standard Deviation = 0.57901 which is less than one third of the Mean i.e. 1.3666.
Therefore, ‘Mean’ is the meaningful value. The skewness is negative with the value of -
0.230 showing the curve left skewed and the data piled on the right side thus reaffirming
the meaningfulness of the ‘Mean’. Hence, it may be concluded that the Majority of
neighboring Consumers, Friends and Relatives etc avail the services of MSEDCL. The
Frequency Table for the selected Variable is as below.
Table 5.54: Frequency Table for ‘Majority of neighboring Consumers, Friends and
Relatives etc avail the services of MSEDCL’
Group/Class Frequency Percent Valid
Percent
Cumulative
Percent
Strongly Disagree 0 0.0 0.0 0.0
Disagree 1 .7 .7 .7
Neutral 14 10.0 10.0 10.7
Agree 95 67.9 67.9 78.6
Strongly Agree 30 21.4 21.4 100.0
Total 140 100.0 100.0

129
From the above frequency table the count for the groups ‘Strongly Disagree’, ‘Disagree’,
‘Neutral’, ‘Agree’ and ‘Strongly Agree’ are 0, 1, 14, 95 and 30 respectively. The
combine percentage for ‘Agree’ and ‘Strongly Agree’ is 89.3 % which notifies that the
respondents agree that, Majority of neighboring Consumers, Friends and Relatives etc
avail the services of MSEDCL.
The Fourth Variable under ‘Loyalty’ is - I convey positive 'word of mouth'
publicity about my present Service Provider-MSEDCL. The Statistics Table and the
Histogram for the Variable are as below.
Table 5.55: Statistics for ‘I convey positive 'word of mouth' publicity about my
present Service Provider-MSEDCL’
Variable I convey positive 'word of mouth' publicity about my present
Service Provider-MSEDCL
Details Sample N :- Valid – 140; Missing – 0
Mean 3.8929 Kurtosis 3.828
Std. Deviation .71667 Std. Error of Kurtosis .407
Skewness -1.386 Minimum 1.00
Std.Error of Skewness .205 Maximum 5.00
Histogram 5.26: ‘I Convey Positive 'Word of Mouth' Publicity about my Present
Service Provider-MSEDCL’

130
The above table for statistics and histogram show frequency distribution for the ‘Loyalty’
variable: I convey positive 'word of mouth' publicity about my present Service Provider-
MSEDCL. From the table above it may be said that the Mean = 3.8929 and the Standard
Deviation = 0.71667 which is less than one third of the mean i.e. 1.2976. Therefore,
‘Mean’ is the meaningful value. The skewness is negative with the value of -1.386
showing the curve left skewed and the data piled on the right side thus reaffirming the
meaningfulness of the ‘Mean’. Hence, it may be concluded that the Consumers convey
positive 'word of mouth' publicity about their present Service Provider-MSEDCL. The
Frequency Table for the selected Variable is as below.
Table 5.56: Frequency Table for ‘I convey positive 'word of mouth' publicity about
my present Service Provider-MSEDCL’
Group/Class Frequency Percent Valid
Percent
Cumulative
Percent
Strongly Disagree 2 1.4 1.4 1.4
Disagree 5 3.6 3.6 5.0
Neutral 17 12.1 12.1 17.1
Agree 98 70.0 70.0 87.1
Strongly Agree 18 12.9 12.9 100.0
Total 140 100.0 100.0
From the above frequency table the count for the groups ‘Strongly Disagree’, ‘Disagree’,
‘Neutral’, ‘Agree’ and ‘Strongly Agree’ are 2, 5, 17, 98 and 18 respectively. The
combine percentage for ‘Agree’ and ‘Strongly Agree’ is 82.9 % which tells that the
respondents agree that, the Consumers convey positive 'word of mouth' publicity about
their present Service Provider-MSEDCL.
The Fifth Variable under ‘Loyalty’ is - I recommend the services of the present
service provider (MSEDCL), if someone seeks my suggestion. The Statistics Table and
the Histogram for the variable are as below.

131
Table 5.57: Statistics for ‘I recommend the services of the present service provider
(MSEDCL), if someone seeks my suggestion’
Variable I recommend the services of the present service provider
(MSEDCL), if someone seeks my suggestion
Details Sample N :- Valid – 140; Missing – 0
Mean 3.7071 Kurtosis 2.203
Std. Deviation .78196 Std. Error of Kurtosis .407
Skewness -1.172 Minimum 1.00
Std.Error of Skewness .205 Maximum 5.00
Histogram 5.27: ‘I Recommend the Services of the Present Service Provider
(MSEDCL), if Someone Seeks my Suggestion’
The above table for statistics and histogram show frequency distribution for the ‘Loyalty’
variable: (I recommend the services of the present service provider (MSEDCL), if
someone seeks my suggestion). From the table above it may be said that the Mean =
3.7071 and the Standard Deviation = 0.78196 which is less than one third of the mean i.e.
1.2357. Therefore, ‘Mean’ is the meaningful value. The skewness is negative with the
value of -1.172 showing the curve left skewed and the data piled on the right side thus
reaffirming the meaningfulness of the ‘Mean’. Hence, it may be concluded that the

132
Consumers recommend the services of the present service provider (MSEDCL), if
someone seeks their suggestion. The Frequency Table for the selected Variable is as
below.
Table 5.58: Frequency Table for ‘I recommend the services of the present service
provider (MSEDCL), if someone seeks my suggestion’
Group/Class Frequency Percent Valid
Percent
Cumulative
Percent
Strongly Disagree 3 2.1 2.1 2.1
Disagree 7 5.0 5.0 7.1
Neutral 30 21.4 21.4 28.6
Agree 88 62.9 62.9 91.4
Strongly Agree 12 8.6 8.6 100.0
Total 140 100.0 100.0
From the above frequency table the count for the groups ‘Strongly Disagree’, ‘Disagree’,
‘Neutral’, ‘Agree’ and ‘Strongly Agree’ are 3, 7, 30, 88 and 12 respectively. The
combine percentage for ‘Agree’ and ‘Strongly Agree’ is 71.5 % which reports that the
respondents agree that, the Consumers recommend the services of the present service
provider (MSEDCL), if someone seeks their suggestion.
The analysis of all the Variables related to ‘Loyalty’ wrap ups that the Consumers
are loyal to the MSEDCL Company. The Social bonding factor is dominant and goes in
favor of the Company as the Consumers admit that the majority of Friends, Neighbors
and Relatives avail the Services of the MSEDCL. The Consumers disclose that they have
genuine relationship and feel proud in being associated with the MSEDCL.
5.7.5 The Descriptive Statistics, Frequency Tables and Histograms for Barriers to
Switch
The First Variable under ‘Barriers to Switch’ is - The financial cost associated
with the Switching is considerable ( CSS , Transmission Charges, Wheeling Charges ,

133
Metering Cost , Additional Surcharge etc )). The Statistics Table and the Histogram for
the variable are as below.
Table 5.59: Statistics for ‘The financial cost associated with the Switching is
considerable (CSS, Transmission Charges, Wheeling Charges, Metering Cost,
Additional Surcharge etc)’
Variable The financial cost associated with the Switching is
considerable ( CSS , Transmission Charges, Wheeling
Charges , Metering Cost , Additional Surcharge etc )
Details Sample N :- Valid – 140; Missing – 0
Mean 3.2857 Kurtosis .395
Std. Deviation .88379 Std. Error of Kurtosis .407
Skewness -.215 Minimum 1.00
Std.Error of Skewness .205 Maximum 5.00
Histogram 5.28: ‘The Financial Cost Associated with the Switching is Considerable
(CSS, Transmission Charges, Wheeling Charges, Metering Cost, Additional
Surcharge etc)’
The above table for statistics and histogram show frequency distribution for the ‘Barriers
to Switch’ variable: The financial cost associated with the Switching is considerable (

134
CSS , Transmission Charges, Wheeling Charges , Metering Cost , Additional Surcharge
etc ). From the table above it may be said that the Mean = 3.2857 and the Standard
Deviation = 0.88379 which is less than one third of the mean i.e. 1.0952. Therefore,
‘Mean’ is the meaningful value. The skewness is negative with the value of -0.215
showing the curve left skewed and the data piled on the right side thus reaffirming the
meaningfulness of the ‘Mean’. Hence, it may be concluded that the financial cost
associated with the Switching is considerable. The Frequency Table for the selected
Variable is as below.
Table 5.60: Frequency Table for ‘The financial cost associated with the Switching is
considerable (CSS, Transmission Charges, Wheeling Charges, Metering Cost,
Additional Surcharge etc)’
Group/Class Frequency Percent Valid
Percent
Cumulative
Percent
Strongly Disagree 5 3.6 3.6 3.6
Disagree 14 10.0 10.0 13.6
Neutral 68 48.6 48.6 62.1
Agree 42 30.0 30.0 92.1
Strongly Agree 11 7.9 7.9 100.0
Total 140 100.0 100.0
From the above frequency table the count for the groups ‘Strongly Disagree’, ‘Disagree’,
‘Neutral’, ‘Agree’ and ‘Strongly Agree’ are 5, 14, 68, 42 and 12 respectively. The
combine percentage for ‘Agree’ and ‘Strongly Agree’ is 37.9 % , the combine percentage
of ‘Strongly Disagree’ and ‘Disagree’ is 13.6 % and that of ‘Neutral’ is 48.6 %, thus
making it difficult to interpret as the count of ‘Neutral is substantial. So considering the
above facts it would be wise to say that the respondents are undecided about the
financial cost associated with the Switching.
The Second Variable under ‘Barriers to Switch’ is - The effort involved in
searching for a New Service Provider is high and time consuming. The Statistics Table
and the Histogram for the Variable are as below.

135
Table 5.61: Statistics for ‘The effort involved in searching for a New Service
Provider is high and time consuming’
Variable The effort involved in searching for a New Service Provider
is high and time consuming
Details Sample N :- Valid – 140; Missing – 0
Mean 3.4357 Kurtosis -.094
Std. Deviation .85840 Std. Error of Kurtosis .407
Skewness -.421 Minimum 1.00
Std.Error of Skewness .205 Maximum 5.00
Histogram 5.29: ‘The Effort Involved in Searching for a New Service Provider is
High and Time Consuming’
The above table for statistics and histogram show frequency distribution for the ‘Barriers
to Switch’ variable: The effort involved in searching for a New Service Provider is high
and time consuming. From the table above it may be said that the Mean = 3.4357 and the
Standard Deviation = 0.85840 which is less than one third of the mean i.e. 1.1452.
Therefore, ‘Mean’ is the meaningful value. The skewness is negative with the value of -
0.421 showing the curve left skewed and the data piled on the right side thus reaffirming
the meaningfulness of the ‘Mean’. Hence, it may be concluded that the effort involved in
searching for a New Service Provider is high and time consuming. The Frequency Table
for the selected Variable is as below.

136
Table 5.62: Frequency Table for ‘The effort involved in searching for a New Service
Provider is high and time consuming’
Group/Class Frequency Percent Valid
Percent
Cumulative
Percent
Strongly Disagree 2 1.4 1.4 1.4
Disagree 18 12.9 12.9 14.3
Neutral 47 33.6 33.6 47.9
Agree 63 45.0 45.0 92.9
Strongly Agree 10 7.1 7.1 100.0
Total 140 100.0 100.0
From the above frequency table the count for the groups ‘Strongly Disagree’, ‘Disagree’,
‘Neutral’, ‘Agree’ and ‘Strongly Agree’ are 2, 18, 47, 63 and 10 respectively. The
combine percentage for ‘Agree’ and ‘Strongly Agree’ is 52.2 %, which points out that the
respondents moderately agree, the effort involved in searching for a New Service
Provider is high and time consuming.
The Third Variable under ‘Barriers to Switch’ is - It will also take much time in
learning about or understanding the New Service Provider or develop new relationship.
The Statistics Table and the Histogram for the variable are as below.
Table 5.63: Statistics for ‘It will also take much time in learning about or
understanding the New Service Provider or develop new relationship’
Variable It will also take much time in learning about or
understanding the New Service Provider or develop new
relationship
Details Sample N :- Valid – 140; Missing – 0
Mean 3.5000 Kurtosis .180
Std. Deviation .88554 Std. Error of Kurtosis .407
Skewness -.473 Minimum 1.00
Std.Error of Skewness .205 Maximum 5.00

137
Histogram 5.30: ‘It Will Also Take Much Time in Learning about or Understanding
the New Service Provider or Develop New Relationship’
The above table for statistics and histogram show frequency distribution for the ‘Barriers
to Switch’ variable: (It will also take much time in learning about or understanding the
New Service Provider or develop new relationship). From the table above it may be said
that the Mean = 3.50 and the Standard Deviation = 0.88554 which is less than one third
of the mean i.e. 1.1666. Therefore, ‘Mean’ is the meaningful value. The skewness is
negative with the value of -0.473 showing the curve left skewed and the data piled on the
right side thus reaffirming the meaningfulness of the ‘Mean’. Hence, it may be concluded
that it takes much time in learning about or understanding the New Service Provider or
develop new relationship. The Frequency Table for the selected Variable is as below.
Table 5.64: Frequency Table for ‘It will also take much time in learning about or
understanding the New Service Provider or develop new relationship’
Group/Class Frequency Percent Valid
Percent
Cumulative
Percent
Strongly Disagree 3 2.1 2.1 2.1
Disagree 14 10.0 10.0 12.1
Neutral 47 33.6 33.6 45.7
Agree 62 44.3 44.3 90.0
Strongly Agree 14 10.0 10.0 100.0
Total 140 100.0 100.0
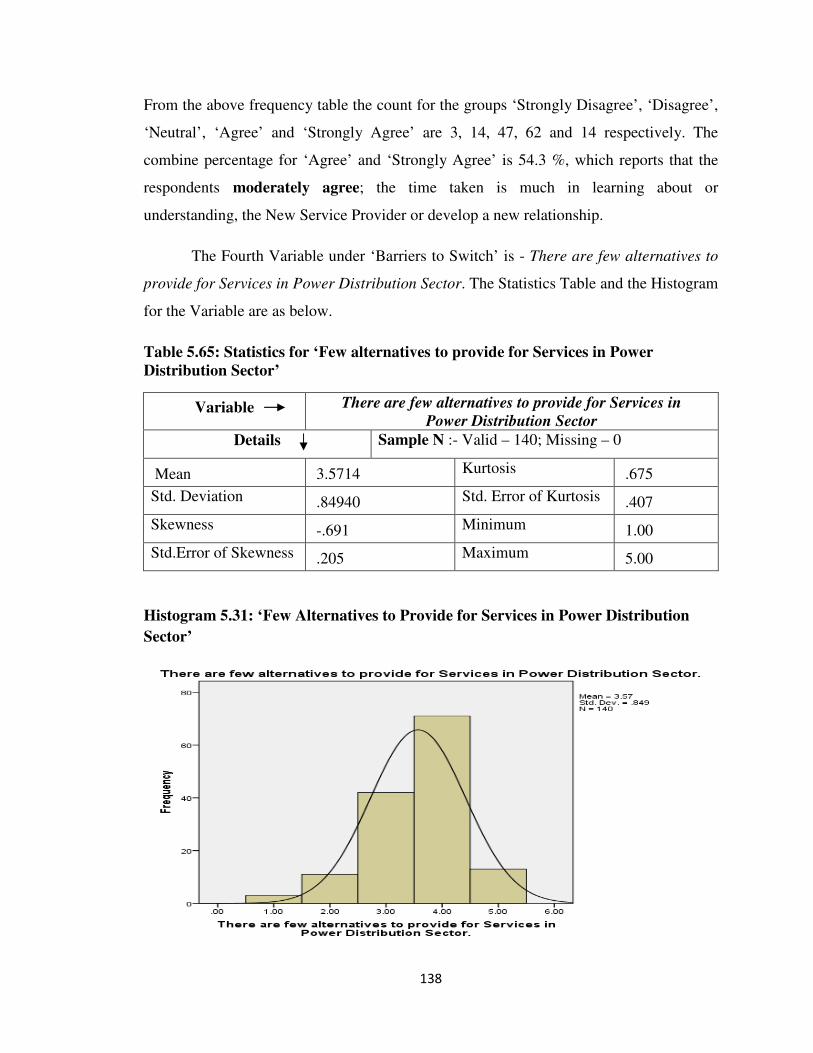
138
From the above frequency table the count for the groups ‘Strongly Disagree’, ‘Disagree’,
‘Neutral’, ‘Agree’ and ‘Strongly Agree’ are 3, 14, 47, 62 and 14 respectively. The
combine percentage for ‘Agree’ and ‘Strongly Agree’ is 54.3 %, which reports that the
respondents moderately agree; the time taken is much in learning about or
understanding, the New Service Provider or develop a new relationship.
The Fourth Variable under ‘Barriers to Switch’ is - There are few alternatives to
provide for Services in Power Distribution Sector. The Statistics Table and the Histogram
for the Variable are as below.
Table 5.65: Statistics for ‘Few alternatives to provide for Services in Power
Distribution Sector’
Variable There are few alternatives to provide for Services in
Power Distribution Sector
Details Sample N :- Valid – 140; Missing – 0
Mean 3.5714 Kurtosis .675
Std. Deviation .84940 Std. Error of Kurtosis .407
Skewness -.691 Minimum 1.00
Std.Error of Skewness .205 Maximum 5.00
Histogram 5.31: ‘Few Alternatives to Provide for Services in Power Distribution
Sector’

139
The above table for statistics and histogram show frequency distribution for the ‘Barriers
to Switch’ variable: (There are few alternatives to provide for Services in Power
Distribution Sector). From the table above it may be said that the Mean = 3.5714 and the
Standard Deviation = 0.84940 which is less than one third of the mean i.e. 1.1904.
Therefore, ‘Mean’ is the meaningful value. The skewness is negative with the value of -
0.691 showing the curve left skewed and the data piled on the right side thus reaffirming
the meaningfulness of the ‘Mean’. Hence, it may be concluded that the alternatives to
provide for Services in Power Distribution Sector are few. The Frequency Table for the
selected Variable is as below.
Table 5.66: Frequency Table for ‘Few alternatives to provide for Services in Power
Distribution Sector’
Group/Class Frequency Percent Valid
Percent
Cumulative
Percent
Strongly Disagree 3 2.1 2.1 2.1
Disagree 11 7.9 7.9 10.0
Neutral 42 30.0 30.0 40.0
Agree 71 50.7 50.7 90.7
Strongly Agree 13 9.3 9.3 100.0
Total 140 100.0 100.0
From the above frequency table the count for the groups ‘Strongly Disagree’, ‘Disagree’,
‘Neutral’, ‘Agree’ and ‘Strongly Agree’ are 3, 11, 42, 71 and 13 respectively. The
combine percentage for ‘Agree’ and ‘Strongly Agree’ is 60.0 %, which informs that the
respondents agree; the alternatives to provide for Services in Power Distribution Sector
are few.
The Fifth Variable under ‘Barriers to Switch’ is - We don't find a better
alternative that can provide Services to us. The Statistics Table and the Histogram for the
variable are as below.

140
Table 5.67: Statistics for ‘Lack of Better Alternatives to provide Services’
Variable We don't find a better alternative that can provide
Services to us
Details Sample N :- Valid – 140; Missing – 0
Mean 3.3357 Kurtosis -.890
Std. Deviation 1.00080 Std. Error of Kurtosis .407
Skewness -.149 Minimum 1.00
Std.Error of Skewness .205 Maximum 5.00
Histogram 5.32: ‘Lack of Better Alternatives to Provide Services’
The above table for statistics and histogram show frequency distribution for the ‘Barriers
to Switch’ variable: We don't find a better alternative that can provide Services to us.
From the table above it may be said that the Mean = 3.3357 and the Standard Deviation =
1.0008 which is less than one third of the mean i.e. 1.1119. Therefore, ‘Mean’ is the
meaningful value. The skewness is negative with the value of -0.149 showing the curve
left skewed and the data piled on the right side thus reaffirming the meaningfulness of the
‘Mean’. Hence, it may be concluded that the consumers don’t find a better alternative that
can provide Services to them. The Frequency Table for the selected Variable is as below.

141
Table 5.68: Frequency Table for ‘Lack of Better Alternatives to provide Services’
Group/Class Frequency Percent Valid
Percent
Cumulative
Percent
Strongly Disagree 2 1.4 1.4 1.4
Disagree 33 23.6 23.6 25.0
Neutral 36 25.7 25.7 50.7
Agree 54 38.6 38.6 89.3
Strongly Agree 15 10.7 10.7 100.0
Total 140 100.0 100.0
From the above frequency table the count for the groups ‘Strongly Disagree’, ‘Disagree’,
‘Neutral’, ‘Agree’ and ‘Strongly Agree’ are 2, 33, 36, 54 and 15 respectively. The
combine percentage for ‘Agree’ and ‘Strongly Agree’ is 49.3 % , the combine percentage
of ‘Strongly Disagree’ and ‘Disagree’ is 25.0 % and that of ‘Neutral’ is 25.7 %, which
makes it obscure to interpret as the count of ‘Neutral may deviate either side. So
considering only the ‘Agree’ and ‘Disagree’ percentages it may be said that the
respondents moderately agree; the consumers don’t find a better alternative that can
provide Services to them.
The Sixth Variable under ‘Barriers to Switch’ is - We feel embarrassed to inform
our current Service Provider (MSEDCL) that we will be discontinuing the services in
near future. The Statistics Table and the Histogram for the variable are as below.
Table 5.69: Statistics for ‘Consumer Feeling embarrassed to inform current Service
Provider about discontinuation of Services in near future’
Variable We feel embarrassed to inform our current Service Provider
(MSEDCL) that we will be discontinuing
the services in near future
Details Sample N :- Valid – 140; Missing – 0
Mean 2.9786 Kurtosis -.616
Std. Deviation 1.08268 Std. Error of Kurtosis .407
Skewness -.164 Minimum 1.00
Std.Error of Skewness .205 Maximum 5.00

142
Histogram 5.33: ‘Consumer Feeling Embarrassed to Inform Current Service
Provider about Discontinuation of Services in Near Future’
The above table for statistics and histogram show frequency distribution for the ‘Barriers
to Switch’ variable: We feel embarrassed to inform our current Service Provider
(MSEDCL) that we will be discontinuing the services in near future. From the table
above it may be said that the Mean = 2.9786 and the Standard Deviation = 1.0826 which
is greater than one third of the mean i.e. 0.9928. Therefore, ‘Mean’ is not the meaningful
value. Hence, the interpretation should be done based on frequency table. The Frequency
Table for the selected Variable is as below.
Table 5.70: Frequency Table for ‘Consumer Feeling embarrassed to inform current
Service Provider about discontinuation of Services in near future’
Group/Class Frequency Percent Valid
Percent
Cumulative
Percent
Strongly Disagree 15 10.7 10.7 10.7
Disagree 29 20.7 20.7 31.4
Neutral 49 35.0 35.0 66.4
Agree 38 27.1 27.1 93.6
Strongly Agree 9 6.4 6.4 100.0
Total 140 100.0 100.0

143
From the above frequency table the count for the groups ‘Strongly Disagree’, ‘Disagree’,
‘Neutral’, ‘Agree’ and ‘Strongly Agree’ are 15, 29, 49, 38 and 9 respectively. The
combine percentage for ‘Agree’ and ‘Strongly Agree’ is 33.5 % , the combine percentage
of ‘Strongly Disagree’ and ‘Disagree’ is 31.4 % and that of ‘Neutral’ is 35.0 %, which
makes it ambiguous to interpret as the data is uniformly distributed. So, it may be
concluded that the consumers neither agree nor disagree about how they feel to inform
the current Service Provider (MSEDCL), that they will be discontinuing the services in
near future.
The Seventh Variable under ‘Barriers to Switch’ is - I have a sense of loyalty with
my existing service provider that is MSEDCL. The Statistics Table and the Histogram for
the variable are as below.
Table 5.71: Statistics for ‘Sense of Loyalty with the existing Service Provider’
Variable I have a sense of loyalty with my existing
service provider that is MSEDCL
Details Sample N :- Valid – 140; Missing – 0
Mean 3.7571 Kurtosis 1.364
Std. Deviation .76686 Std. Error of Kurtosis .407
Skewness -1.011 Minimum 1.00
Std.Error of Skewness .205 Maximum 5.00

144
Histogram 5.34: ‘Sense of Loyalty with the Existing Service Provider’
The above table for statistics and histogram show frequency distribution for the ‘Barriers
to Switch’ variable: I have a sense of loyalty with my existing service provider that is
MSEDCL. From the table above it may be said that the Mean = 3.7571 and the Standard
Deviation = 0.76686 which is less than one third of the mean i.e. 1.2523. Therefore,
‘Mean’ is the meaningful value. The skewness is negative with the value of -1.011
showing the curve left skewed and the data piled on the right side thus reaffirming the
meaningfulness of the ‘Mean’. Hence, it may be concluded that the consumers have a
sense of loyalty with the existing service provider that is MSEDCL. The Frequency Table
for the selected Variable is as below.
Table 5.72: Frequency Table for ‘Sense of Loyalty with the existing Service
Provider’
Group/Class Frequency Percent Valid
Percent
Cumulative
Percent
Strongly Disagree 1 .7 .7 .7
Disagree 11 7.9 7.9 8.6
Neutral 23 16.4 16.4 25.0
Agree 91 65.0 65.0 90.0
Strongly Agree 14 10.0 10.0 100.0
Total 140 100.0 100.0

145
From the above frequency table the count for the groups ‘Strongly Disagree’, ‘Disagree’,
‘Neutral’, ‘Agree’ and ‘Strongly Agree’ are 1, 11, 23, 91 and 14 respectively. The
combine percentage for ‘Agree’ and ‘Strongly Agree’ is 75.0 %, which point outs that the
respondents agree; the consumers have a sense of loyalty with the existing service
provider that is MSEDCL.
The statistical analysis of the Variables associated with ‘Barriers to Switch’
enfolds that the Consumers agree that they have sense of loyalty with the existing service
provider, but also have the Opinion that the Alternatives to offer Services in Power
Distribution Sector are few. The Consumers are having modest opinion about the time
and effort involved in searching and understanding about a New Service Provider and
humbly agree that they don’t find a better alternative to provide services. The Consumers
are not clear about the Cost associated in Switching from one Service Provider to another
and are reserved in expressing how they feel in informing the present Service Provider
that, ‘they would be discontinuing the services in near future’.
5.7.6 The Descriptive Statistics and Frequency Table for Service Quality
The basic determinants of Service Quality namely Tangibles, Reliability,
Responsiveness, Assurance and Empathy are also analyzed to evaluate the Quality of
Service offered by the MSEDCL. The analysis is tabulated in the table below considering
Mean, Standard Deviation and respondents response to the questionnaire on a Likert
scale having classes ‘Strongly Disagree’, ‘Disagree’, ‘Neutral’, ‘Agree’ and ‘Strongly
Agree’.
Analyzing Tangibles
Table 5.73: Statistics for Tangible Variable 1 - The MSEDCL Offices are well
Furnished, Clean and Well Maintained.
Mean Standard
Deviation
Strongly
Disagree Disagree Neutral Agree
Strongly
Agree
No % No % No % No % No %
2.76 1.045 12 8.6 60 42.9 19 13.6 48 34.3 1 0.7
Conclusion Not Satisfied, 51.5 % ( 8.6 % + 42.9 % ) Disagree

146
Table 5.74: Statistics for Tangible Variable 2 - The MSEDCL Electricity Bills are
well structured and the Consumers understand it easily
Mean Standard
Deviation
Strongly
Disagree Disagree Neutral Agree
Strongly
Agree
No % No % No % No % No %
3.71 1.029 5 3.6 23 16.4 1 .7 90 64.3 21 15.0
Conclusion Satisfied, 79.3 % ( 64.3 % + 15.0 % ) Agree
Table 5.75: Statistics for Tangible Variable 3 - The MSEDCL website is well designed
and user friendly.
Mean Standard
Deviation
Strongly
Disagree Disagree Neutral Agree
Strongly
Agree
No % No % No % No % No %
3.69 0.767 0 0.0 14 10.0 27 19.3 87 62.1 12 8.6
Conclusion Satisfied, 70.7 % ( 62.1 % + 8.6 % ) Agree
Table 5.76: Statistics for Tangible Variable 4 - The MSEDCL Employees are well
Dressed and appear neat.
Mean Standard
Deviation
Strongly
Disagree Disagree Neutral Agree
Strongly
Agree
No % No % No % No % No %
3.38 0.941 4 2.9 31 22.1 14 10.0 89 63.6 2 1.4
Conclusion Satisfied, 65 % ( 63.6 % + 1.4 % ) Agree

147
The above statistical analysis reveals that the Tangible aspects related to Structure
of Electricity Bills, Design of the Company Website and appearance and neatness of the
Employees is satisfactory, but the Tangible aspect related to cleanliness and maintenance
of MSEDCL Offices is not satisfactory.
Analyzing Reliability
Table 5.77: Statistics for Reliability Variable 1 - The Consumers are informed of the
supply interruptions in advance.
Mean Standard
Deviation
Strongly
Disagree Disagree Neutral Agree
Strongly
Agree
No % No % No % No % No %
2.95 1.259 16 11.4 53 37.9 6 4.3 52 37.1 13 9.3
Conclusion Neutral. Because, the % of ‘Favorable’ and ‘Adverse’ Opinions
is almost same.
Table 5.78: Statistics for Reliability Variable 2- The Consumers are made aware by
the MSEDCL, regarding the changes in Policies through its Circulars.
Mean Standard
Deviation
Strongly
Disagree Disagree Neutral Agree
Strongly
Agree
No % No % No % No % No %
2.85 1.209 22 15.7 41 29.3 18 12.9 53 37.9 6 4.3
Conclusion Neutral. Because, the % of ‘Favorable’ and ‘Adverse’ Opinions
is almost same.

148
Table 5.79: Statistics for Reliability Variable 3 - The MSEDCL Electricity Bills are
delivered in time and give ample duration for the Consumers to clear the outstanding
amounts before due dates as mentioned in the bill.
Mean Standard
Deviation
Strongly
Disagree Disagree Neutral Agree
Strongly
Agree
No % No % No % No % No %
3.45 1.189 12 8.6 26 18.6 7 5.0 76 54.3 19 13.
6
Conclusion Satisfied. Because, the % of ‘Favorable’ Opinions is
67.9 % (54.3% + 13.6%).
Table 5.80: Statistics for Reliability Variable 4 - The Electricity Bills provided by the
MSEDCL are accurate and free from errors.
Mean Standard
Deviation
Strongly
Disagree Disagree Neutral Agree
Strongly
Agree
No % No % No % No % No %
3.74 0.962 4 2.9 17 12.1 12 8.6 85 60.7 22 15.7
Conclusion Satisfied. Because, the % of ‘Favorable’ Opinions is
76.4 % (60.7% + 15.7%).
Table 5.81: Statistics for Reliability Variable 5 - The problem communicated to the
MSEDCL is solved at the first time and generally does not repeat in future.
Mean Standard
Deviation
Strongly
Disagree Disagree Neutral Agree
Strongly
Agree
No % No % No % No % No %
3.07 1.050 5 3.6 53 37.9 13 9.3 65 46.4 4 2.9
Conclusion Moderately Satisfied. Because, the % of ‘Favorable’ Opinions is
49.3 % (46.4% + 2.9%).

149
Table 5.82: Statistics for Reliability Variable 6 - The MSEDCL website provides with
relevant and accurate information to its Consumers.
Mean Standard
Deviation
Strongly
Disagree Disagree Neutral Agree
Strongly
Agree
No % No % No % No % No %
3.58 0.830 4 2.9 13 9.3 26 18.6 91 65.0 6 4.3
Conclusion Satisfied. Because, the % of ‘Favorable’ Opinions is
69.3 % (65.0% + 4.3%).
Table 5.83: Statistics for Reliability Variable 7 - The MSEDCL website offers a safe
and secured option for payment of electricity bills for its Consumers.
Mean Standard
Deviation
Strongly
Disagree Disagree Neutral Agree
Strongly
Agree
No % No % No % No % No %
3.85 0.667 0 0.0 2 1.4 37 26.4 81 57.9 20 14.3
Conclusion Satisfied. Because, the % of ‘Favorable’ Opinions is
72.2 % (57.9% + 14.3%).
The above statistical analysis points out that the respondents hold neutral opinion about
the information dissemination related to Supply Interruptions and Changes in MSEDCL
Circulars and Policies. The Opinion related to the Reliability of overall Billing System
and the Website facility for payment and Information Disclosure is favorable.

150
Analyzing Responsiveness
Table 5.84: Statistics for Responsiveness Variable 1 - The MSEDCL employees are
quick in attending the Consumer Complaints.
Mean Standard
Deviation
Strongly
Disagree Disagree Neutral Agree
Strongly
Agree
No % No % No % No % No %
3.51 1.082 9 6.4 23 16.4 9 6.4 85 60.7 14 10.
0
Conclusion Satisfied. Because, the % of ‘Favorable’ Opinions is
70.7 % (60.7% + 10.0%).
Table 5.85: Statistics for Responsiveness Variable 2 - The MSEDCL employees listen
carefully to the grievances raised by the Consumer and understand the Consumer
problems.
Mean Standard
Deviation
Strongly
Disagree Disagree Neutral Agree
Strongly
Agree
No % No % No % No % No %
3.47 1.055 9 6.4 22 15.7 13 9.3 85 60.7 11 7.9
Conclusion Satisfied. Because, the % of ‘Favorable’ Opinions is
68.6 % (60.7% + 7.9%).
Table 5.86: Statistics for Responsiveness Variable 3 - The MSEDCL Employees show
keen interest and take up the responsibility in solving the Consumer Complaints.
Mean Standard
Deviation
Strongly
Disagree Disagree Neutral Agree
Strongly
Agree
No % No % No % No % No %
3.27 1.053 7 5.0 34 24.3 20 14.3 71 50.7 8 5.7
Conclusion Satisfied. Because, the % of ‘Favorable’ Opinions is
56.4 % (50.7% + 5.7%).

151
Table 5.87: Statistics for Responsiveness Variable 4 - The MSEDCL Employees are
never too busy to respond to the Consumer requests.
Mean Standard
Deviation
Strongly
Disagree Disagree Neutral Agree
Strongly
Agree
No % No % No % No % No %
3.26 1.029 6 4.3 34 24.3 25 17.9 67 47.9 8 5.7
Conclusion Moderately Satisfied. Because, the % of ‘Favorable’ Opinions is
53.6 % (47.9% + 5.7%).
From the above statistical data it is clear that the Employee Interest, Quickness
and over all Responsiveness to Consumer Complaints is rated favorable.
Analyzing Empathy
Table 5.88: Statistics for Empathy Variable 1 - The MSEDCL Employees have caring
attitude towards their Consumers.
Mean Standard
Deviation
Strongly
Disagree Disagree Neutral Agree
Strongly
Agree
No % No % No % No % No %
3.40 1.058 9 6.4 24 17.1 18 12.9 79 56.4 10 7.1
Conclusion Satisfied. Because, the % of ‘Favorable’ Opinions is
63.5 % (56.4% + 7.1%).
Table 5.89: Statistics for Empathy Variable 2 - The MSEDCL understands the needs
of its Consumer.
Mean Standard
Deviation
Strongly
Disagree Disagree Neutral Agree
Strongly
Agree
No % No % No % No % No %
3.33 1.049 9 6.4 27 19.3 19 13.6 78 55.7 7 5.0
Conclusion Satisfied. Because, the % of ‘Favorable’ Opinions is
60.7 % (55.7% + 5.0%).

152
Table 5.90: Statistics for Empathy Variable 3 - The MSEDCL Company believes in
keeping the 'Consumer Interest' as its top priority.
Mean Standard
Deviation
Strongly
Disagree Disagree Neutral Agree
Strongly
Agree
No % No % No % No % No %
3.27 1.025 6 4.3 30 21.4 34 24.3 59 42.1 11 7.9
Conclusion Moderately Satisfied. Because, the % of ‘Favorable’ Opinions is
50.0 % (42.1% + 7.9%).
The statistical analysis above notifies that the Employees have an Empathetic
attitude in dealing with the Consumers.
Analyzing Assurance
Table 5.91: Statistics for Assurance Variable 1 - The MSEDCL agrees to provide
compensation to its Consumers if the services are not delivered as per the 'Standards of
Performance ', stipulated by the MERC.
Mean Standard
Deviation
Strongly
Disagree Disagree Neutral Agree
Strongly
Agree
No % No % No % No % No %
2.78 0.879 10 7.1 42 30.0 56 40.0 32 22.9 0 0.0
Conclusion Not Satisfied. Because, the % of ‘Adverse’ Opinions is
37.1 % (7.1% + 30.0%). The % of ‘Neutral’ is also considerable
i.e. 40%.
Table 5.92: Statistics for Assurance Variable 2 - The MSEDCL Employees are
adequately trained to solve the Consumer's Complaint.
Mean Standard
Deviation
Strongly
Disagree Disagree Neutral Agree
Strongly
Agree
No % No % No % No % No %
3.53 0.900 5 3.6 14 10.0 32 22.9 79 56.4 10 7.1
Conclusion Satisfied. Because, the % of ‘Favorable’ Opinions is
63.5 % (56.4% + 7.1%).

153
Table 5.93: Statistics for Assurance Variable 3 - The MSEDCL Employees / Staff are
well behaved and well mannered.
Mean Standard
Deviation
Strongly
Disagree Disagree Neutral Agree
Strongly
Agree
No % No % No % No % No %
3.60 0.829 1 0.7 23 16.4 12 8.6 99 70.7 5 3.6
Conclusion Satisfied. Because, the % of ‘Favorable’ Opinions is
74.3 % (70.7% + 3.6%).
Table 5.94: Statistics for Assurance Variable 4 - The MSEDCL Company keeps its
promise of fulfilling the Consumer demand in time.
Mea
n
Standard
Deviation
Strongly
Disagree Disagree Neutral Agree
Strongly
Agree
No % No % No % No % No %
3.07 1.036 6 4.3 45 32.1 29 20.7 53 37.9 7 5.0
Conclusion
Neutral. Because, the % of ‘Favorable’ Opinions 42.9%
(37.9%+5%) is not very high as compared to ‘Adverse’ Opinions
36.4% (4.3%+32.1%).
The Consumers are assured about the skills and the behavior of the employees of the
MSEDCL but bear adverse Opinion when it is about giving compensation due to failure
in Service Delivery as per the Standards of Performance. The Consumers remain Neutral
in expressing about the Company fulfilling its promises to meet the Consumer Demands
in time.

154
5.7.7 The Descriptive Statistics and Frequency Table for Consumer Concern
Table 5.95: Statistics for Consumer Concern Variable 1 - The MSEDCL Company
understands our specific needs and the MSEDCL staff pay attention to it.
Mean Standard
Deviation
Strongly
Disagree Disagree Neutral Agree
Strongly
Agree
No % No % No % No % No %
3.47 0.948 3 2.1 24 17.1 28 20.0 73 52.1 12 8.6
Conclusion Satisfied. Because, the % of ‘Favorable’ Opinions is
60.7 % (52.1% + 8.6%).
Table 5.96: Statistics for Consumer Concern Variable 2 - In case of payment
default, the MSEDCL Company is more likely to understand our problem and
would agree to give grace period for clearance of dues without disconnecting our
supply.
Mean Standard
Deviation
Strongly
Disagree Disagree Neutral Agree
Strongly
Agree
No % No % No % No % No %
3.32 1.054 7 5.0 27 19.3 34 24.3 58 41.4 14 10.0
Conclusion Moderately Satisfied. Because, the % of ‘Favorable’ Opinions is
51.4 % (41.4% + 10.0%).
Table 5.97: Statistics for Consumer Concern Variable 3 - In case of any Supply
problem associated with the Consumer side, the MSEDCL Employees would be
flexible (generous) in extending necessary support and help to solve the problem.
Mean Standard
Deviation
Strongly
Disagree Disagree Neutral Agree
Strongly
Agree
No % No % No % No % No %
3.27 1.125 15 10.7 19 13.6 28 20.0 68 48.6 10 7.1
Conclusion Satisfied. Because, the % of ‘Favorable’ Opinions is
55.7 % (48.6% + 7.1%).

155
Table 5.98: Statistics for Consumer Concern Variable 4 - The MSEDCL
Company is always ready and prompt in passing on the Incentives/Benefits to the
Consumers.
Mean Standard
Deviation
Strongly
Disagree Disagree Neutral Agree
Strongly
Agree
No % No % No % No % No %
3.59 0.981 3 2.1 24 17.1 17 12.1 79 56.4 17 12.1
Conclusion Satisfied. Because, the % of ‘Favorable’ Opinions is
68.5 % (56.4% + 12.1%).
Table 5.99: Statistics for Consumer Concern Variable 5 - The MSEDCL is never
harsh or unjust in imposing penalties/charges to the Consumers.
Mean Standard
Deviation
Strongly
Disagree Disagree Neutral Agree
Strongly
Agree
No % No % No % No % No %
3.44 0.961 3 2.1 26 18.6 29 20.7 70 50.0 12 8.6
Conclusion Satisfied. Because, the % of ‘Favorable’ Opinions is
58.6 % (50.0% + 8.6%).
The above data analysis indicates that the Consumer Concern is at focal point for
the MSEDCL whether it is about understanding needs specific to Consumers, Solving
Consumer Complaints and imposing Penalties to Consumers or passing on Incentives or
Benefits to the Consumers.

156
5.7.8 The Descriptive Statistics and Frequency Table for Consumer Culture
Table 5.100: Statistics for Consumer Culture Variable 1 - The Electricity Consumers
would not really mind paying more for Reliable and Quality Services.
Mean Standard
Deviation
Strongly
Disagree Disagree Neutral Agree
Strongly
Agree
No % No % No % No % No %
3.40 1.117 11 7.9 20 14.3 28 20.0 64 45.7 17 12.
1
Conclusion Agree. Because, the % of ‘Favorable’ Opinions is
57.8 % (45.7% + 12.1%).
Table 5.101: Statistics for Consumer Culture Variable 2 - We keep ourselves
updated regarding the latest tariff applicable and other relevant information.
Mean Standard
Deviation
Strongly
Disagree Disagree Neutral Agree
Strongly
Agree
No % No % No % No % No %
3.73 0.792 0 0.0 19 13.6 10 7.1 100 71.4 11 7.9
Conclusion Agree. Because, the % of ‘Favorable’ Opinions is
79.3 % (71.4% + 7.9%).
Table 5.102: Statistics for Consumer Culture Variable 3 - With the latest
developments in the power sector technologies like Smart Grids, Smart Metering etc
the Consumers will be able to cope well with it.
Mean Standard
Deviation
Strongly
Disagree Disagree Neutral Agree
Strongly
Agree
No % No % No % No % No %
3.82 0.719 0 0.0 3 2.1 41 29.3 73 52.1 23 16.
4
Conclusion Agree. Because, the % of ‘Favorable’ Opinions is
68.5 % (52.1% + 16.4%).

157
Table 5.103: Statistics for Consumer Culture Variable 4 - The Open Access
policy offers choice to the Electricity Consumers to select their Service Provider.
So, I /We would definitely avail of this facility and plan to switch over to a New
Service Provider.
Mean Standard
Deviation
Strongly
Disagree Disagree Neutral Agree
Strongly
Agree
No % No % No % No % No %
3.32 0.789 5 3.6 9 6.4 66 47.1 56 40.0 4 2.9
Conclusion Neutral. Because, the % of ‘Favorable’ Opinions is
42.9 % (40.0% + 2.9%) and that of ‘Neutral’ is 47.1%.
Table 5.104: Statistics for Consumer Culture Variable 5 - Instead of Sourcing
power from Distribution Utilities, Our Company would prefer to generate electricity
on our own.
Mean Standard
Deviation
Strongly
Disagree Disagree Neutral Agree
Strongly
Agree
No % No % No % No % No %
2.53 1.041 20 14.3 61 43.6 25 17.9 32 22.9 2 1.4
Conclusion Disagree. Because, the % of ‘Adverse’ Opinions is 57.9 %
(14.3% + 43.6%).
The statistical analysis of the Variables on Consumer Culture reveals that the
Consumers are ready to pay more for better Quality of Services. The Variable 2 above
tells that the Awareness of the Consumers is high and they keep themselves updated,
Variable 3 above points out that the Consumers are Tech Savvy and they have no
problem in accepting new technologies. The Variable 4 above is about the Consumers’
Risk Taking Ability and the opinion of the respondents is Neutral. The Variable 5 above
is about ‘PROSUMERISM’, i.e. do the Consumers prefer to meet the Power demand on
their own. The response to the Variable 5 is adverse which means the consumers would
prefer to fulfill their Electricity demand from the Distribution Companies instead of
generating on their own.

158
5.8 To Determine the Factors Contributing to ‘Consumer Perceived
Value’
Purpose of the Study: - To find out if there is any difference in the perception of Value
across various Value Prepositions.
Statistical Test: - Friedman Chi-Square test.
Variables and Measurement:- The respondents were presented with following ten value
prepositions.
Table 5.105: Variables to Measure ‘Consumer Perceived Value’
Item No. Item Description
1 The MSEDCL Offices and Fuse Call Centers are located at convenient
places and are easily accessible.
2 The Services Offered by MSEDCL to its Consumers is at a Cheaper Cost.
3 The time and effort needed in resolving a complaint with MSEDCL services
is less or adequate.
4 Even if in case of any problem associated with the MSEDCL service, we are
not panic and we feel assured that the problem would be resolved with ease.
5 The working hours of MSEDCL Company are as per the Consumer
convenience.
6 Even in case of Power Scarcity Situation, the MSEDCL company takes
special efforts to provide with or maintain for uninterrupted power supply to
its Consumers.
7 The risk associated in transactions with MSEDCL is least.
8 The quality of services offered by MSEDCL has improved significantly over
last few years.
9 The present service provider (MSEDCL) has better staff with adequate
knowledge to handle Consumer Complaints.
10 The present Service Provider (MSEDCL) has better infrastructure as
compared to its Competitors.
Each Variable is measured on a five point Likert scale (‘1’= Strongly Disagree. ‘2’=
Disagree, ‘3’= Neutral, ‘4’= Agree and ‘5’= Strongly Agree).

159
Null Hypothesis H0:- There is no difference in perception of ‘Value’ across various Value
Prepositions.
Alternate Hypothesis H1:- There is significant difference in perception of ‘Value’ across
various Value Prepositions.
Level of Significance:- α = 0.05.
Table 5.106: Test Statisticsa
for Friedman Test
N 140
Chi-Square 186.517
Df 9
Asymp. Sig. .000
a. Friedman Test
Observations: - Chi-Square χ2 (
Degrees of freedom df = 9), Sample Size N = 140,
p-value=0.000.
From the above observations as the p-value is less than α (0.05), the Null Hypothesis H0
is rejected. Therefore it may be concluded that there is significant difference in
perception of ‘Value’ across various Value Prepositions. The Ranks Table given on the
next page, points out where the difference lies.

160
Table 5.107: Ranks Table for Variables of Consumer Perceived Value
Description of the Variable Mean Rank
The MSEDCL Offices and Fuse Call Centers are located at convenient
places and are easily accessible. 5.57
The time and effort needed in resolving a complaint with MSEDCL
services is less or adequate. 5.18
Even if in case of any problem associated with the MSEDCL service,
we are not panic and we feel assured that the problem would be
resolved with ease.
5.89
The working hours of MSEDCL Company are as per the Consumer
convenience. 5.24
Even in case of Power Scarcity Situation, the MSEDCL company takes
special efforts to provide with or maintain for uninterrupted power
supply to its Consumers.
5.20
The risk associated in transactions with MSEDCL is least. 6.24
The quality of services offered by MSEDCL has improved significantly
over last few years. 7.03
The present service provider(MSEDCL) has better staff with adequate
knowledge to handle Consumer Complaints. 5.84
The present Service Provider ( MSEDCL ) has better infrastructure as
compared to its Competitors. 5.47
The Services Offered by MSEDCL to its Consumers is at a Cheaper
Cost. 3.36
From the Mean Ranks table above it may concluded that the ‘Quality of Services Offered
by MSEDCL has improved significantly over last few years’ tops the table with a value
of 7.03 and the variable ‘Services Offered by the MSEDCL to its Consumers is at a
Cheaper Cost’ bottoms the table with a value of 3.36.

161
The total variance table indicates that there are two components which explain 48.959 %
of total variance cumulatively. The Total Variance Explained table is also displayed
below.
Table 5.108: Total Variance Explained for Factorizing Consumer Perceived Value
Total Variance Explained
Component
Initial Eigen values Extraction Sums of Squared
Loadings
Total % of
Variance
Cumulative
% Total
% of
Variance
Cumulative
%
1 3.679 36.786 36.786 3.679 36.786 36.786
2 1.217 12.173 48.959 1.217 12.173 48.959
3 .980 9.803 58.761
4 .789 7.891 66.652
5 .707 7.069 73.721
6 .648 6.480 80.201
7 .584 5.840 86.041
8 .518 5.182 91.223
9 .470 4.698 95.921
10 .408 4.079 100.000
Graph 5.1: Scree Plot for Factorizing Consumer Perceived Value

162
The Rotated Component Matrix tells us which of the Individual Variables falls under
each of the two components. The Table is displayed below.
Table 5.109: Rotated Component Matrixa
for Factorizing Value
Description of the Variable
Component
Name of the
Component 1 2
The present Service Provider (MSEDCL) has better
infrastructure as compared to its Competitors. .742
Assurance in
Service
Delivery.
The quality of services offered by MSEDCL has
improved significantly over last few years. .687
The risk associated in transactions with MSEDCL is
least. .659
Even in case of Power Scarcity Situation, the MSEDCL
company takes special efforts to provide with or
maintain for uninterrupted power supply to its
Consumers.
.632
The present service provider (MSEDCL) has better staff
with adequate knowledge to handle Consumer
Complaints.
.595
The MSEDCL Offices and Fuse Call Centers are located
at convenient places and are easily accessible. .464
Even if in case of any problem associated with the
MSEDCL service, we are not panic and we feel assured
that the problem would be resolved with ease.
.717
Cost of
Service.
The time and effort needed in resolving a complaint with
MSEDCL services is less or adequate. .706
The working hours of MSEDCL Company are as per the
Consumer convenience. .698
The Services Offered by MSEDCL to its Consumers is at
a Cheaper Cost. .676

163
Therefore, we may conclude that the two components associated with Consumer
Perceived Value are ‘Assurance in Service Delivery’ and ‘Cost of Service’ The Cost of
Service includes Time, Psychological as well as Monetary Cost factors.
5.9 Ascertaining the Relationships between Variables: Testing the
Hypothesis
5.9.1 Correlation between Consumer Perceived Value and Consumer Satisfaction
Purpose: - To Study whether there is any relation between ‘Consumer Perceived Value’
and ‘Consumer Satisfaction’.
Statistical Test: - Bi-Variate Correlation
Variables and Measurement: - Both the variables ‘Consumer Perceived Value’ and
‘Consumer Satisfaction’ are metric scale variables measured on a five point scale (‘1’=
Strongly Disagree. ‘2’= Disagree, ‘3’= Neutral, ‘4’= Agree and ‘5’= Strongly Agree)
Null Hypothesis H0: There is no relation between ‘Perceived Value’ and ‘Satisfaction’ i.e.
(r = 0)
Alternate Hypothesis H1: There is significant relation between ‘Perceived Value’ and
‘Satisfaction’ i.e. (r ≠ 0)
Level of Significance (α = 0.05)
Table 5.110: Correlation between ‘Satisfaction’ and ‘Value’
Correlations
Satisfaction Value
Satisfaction
Pearson
Correlation 1 .485
**
Sig. (2-tailed) .000
N 140 140
Value
Pearson
Correlation .485
** 1
Sig. (2-tailed) .000
N 140 140

164
Observations: Pearson Correlation( r ) = 0.485 , p = 0.000, N = 140.
Conclusion: - Since (p = 0.000) is less than ( α = 0.05) the Null Hypothesis H0 is
rejected. Therefore, it is concluded that there is significant relationship between ‘Value’
and ‘Satisfaction’. The positive value of ‘r’ suggests that there is a direct relation between
the variables ‘Value’ and ‘Satisfaction’, which means if ‘Value’ increases, ‘Satisfaction’
increases or vice-versa. Based on the value of r = 0.485, it may be further said that the
relation between the two variables is Moderate.
5.9.2 Correlation between Consumer Satisfaction and Consumer Loyalty
Purpose: - To Study whether there is any relation between ‘Satisfaction’ and ‘Loyalty’.
Statistical Test: - Bi-Variate Correlation.
Variables and Measurement :- Both the variables ‘Consumer Satisfaction’ and ‘Consumer
Loyalty’ are metric scale variables measured on a five point scale ( ‘1’= Strongly
Disagree. ‘2’= Disagree, ‘3’= Neutral, ‘4’= Agree and ‘5’= Strongly Agree)
Null H0: There is no relation between ‘Satisfaction’ and ‘Loyalty’ i.e. (r = 0)
Alternate H1: There is significant relation between ‘Satisfaction’ and ‘Loyalty’ i.e. (r ≠ 0)
Level of Significance ( α = 0.05)
Table 5.111: Correlation between ‘Satisfaction’ and ‘Loyalty’
Correlations
Satisfaction Loyalty
Satisfaction
Pearson
Correlation 1 .525
**
Sig. (2-tailed) .000
N 140 140
Loyalty
Pearson
Correlation .525
** 1
Sig. (2-tailed) .000
N 140 140
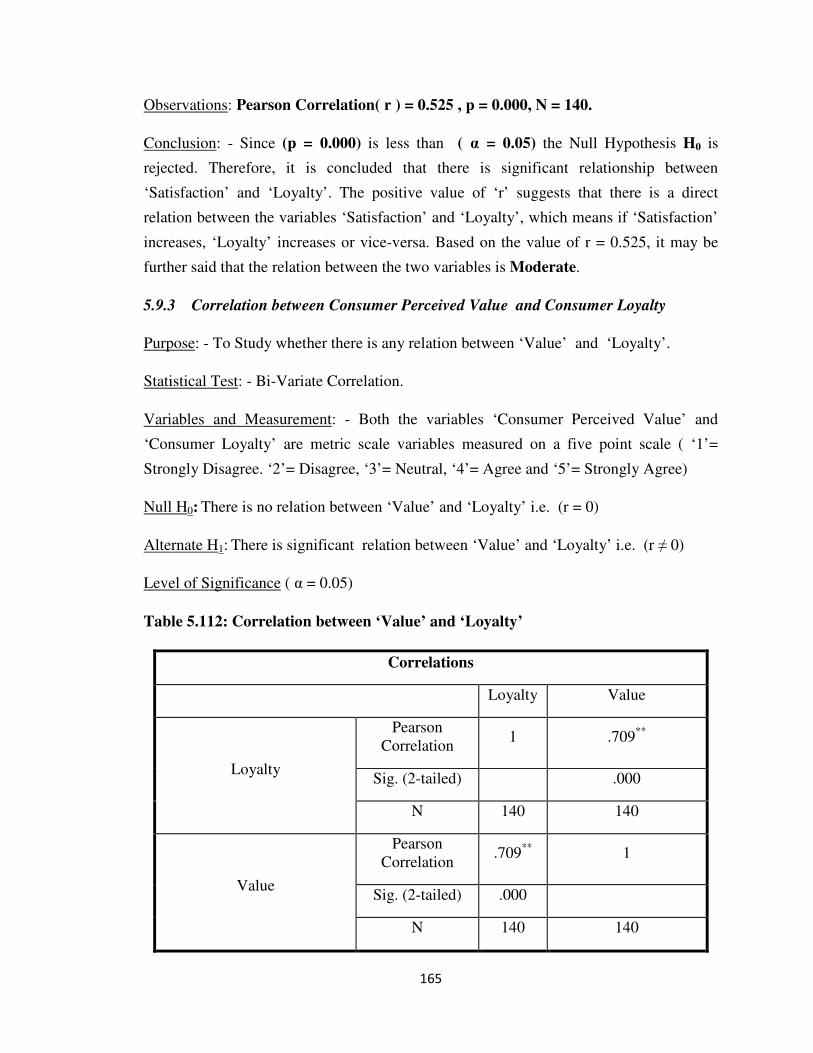
165
Observations: Pearson Correlation( r ) = 0.525 , p = 0.000, N = 140.
Conclusion: - Since (p = 0.000) is less than ( α = 0.05) the Null Hypothesis H0 is
rejected. Therefore, it is concluded that there is significant relationship between
‘Satisfaction’ and ‘Loyalty’. The positive value of ‘r’ suggests that there is a direct
relation between the variables ‘Satisfaction’ and ‘Loyalty’, which means if ‘Satisfaction’
increases, ‘Loyalty’ increases or vice-versa. Based on the value of r = 0.525, it may be
further said that the relation between the two variables is Moderate.
5.9.3 Correlation between Consumer Perceived Value and Consumer Loyalty
Purpose: - To Study whether there is any relation between ‘Value’ and ‘Loyalty’.
Statistical Test: - Bi-Variate Correlation.
Variables and Measurement: - Both the variables ‘Consumer Perceived Value’ and
‘Consumer Loyalty’ are metric scale variables measured on a five point scale ( ‘1’=
Strongly Disagree. ‘2’= Disagree, ‘3’= Neutral, ‘4’= Agree and ‘5’= Strongly Agree)
Null H0: There is no relation between ‘Value’ and ‘Loyalty’ i.e. (r = 0)
Alternate H1: There is significant relation between ‘Value’ and ‘Loyalty’ i.e. (r ≠ 0)
Level of Significance ( α = 0.05)
Table 5.112: Correlation between ‘Value’ and ‘Loyalty’
Correlations
Loyalty Value
Loyalty
Pearson
Correlation 1 .709
**
Sig. (2-tailed) .000
N 140 140
Value
Pearson
Correlation .709
** 1
Sig. (2-tailed) .000
N 140 140

166
Observations: Pearson Correlation(r) = 0.709 , p = 0.000, N = 140.
Conclusion: - Since (p = 0.000) is less than (α = 0.05) the Null Hypothesis H0 is rejected.
Therefore, it is concluded that there is significant relationship between ‘Value’ and
‘Loyalty’. The positive value of ‘r’ suggests that there is a direct relation between the
variables ‘Value’ and ‘Loyalty’, which means if ‘Value’ increases, ‘Loyalty’ increases or
vice-versa. Based on the value of r = 0.709, it may be further said that the relation
between the two variables is Strong.
5.9.4 Correlation between Brand Image and Consumer Loyalty
Purpose: - To Study whether there is any relation between ‘Brand Image’ and ‘Loyalty’.
Statistical Test: - Bi-Variate Correlation.
Variables and Measurement :- Both the variables ‘Brand Image’ and ‘Consumer Loyalty’
are metric scale variables measured on a five point scale ( ‘1’= Strongly Disagree. ‘2’=
Disagree, ‘3’= Neutral, ‘4’= Agree and ‘5’= Strongly Agree)
Null H0: There is no relation between ‘Brand Image’ and ‘Loyalty’ i.e. (r = 0)
Alternate H1: There is significant relation between ‘Brand Image’ and ‘Loyalty’ i.e.(r ≠ 0)
Level of Significance ( α = 0.05)
Table 5.113: Correlation between ‘Brand Image’ and ‘Loyalty’
Correlations
Brand Image Loyalty
Brand Image
Pearson
Correlation 1 .751
**
Sig. (2-tailed) .000
N 140 140
Loyalty
Pearson
Correlation .751
** 1
Sig. (2-tailed) .000
N 140 140

167
Observations: Pearson Correlation( r ) = 0.751 , p = 0.000, N = 140.
Conclusion: - Since (p = 0.000) is less than ( α = 0.05) the Null Hypothesis H0 is
rejected. Therefore, it is concluded that there is significant relationship between ‘Brand
Image’ and ‘Loyalty’. The positive value of ‘r’ suggests that there is a direct relation
between the variables ‘Brand Image’ and ‘Loyalty’, which means if ‘Brand Image’
increases, ‘Loyalty’ increases or vice-versa. Based on the value of r = 0.751, it may be
further said that the relation between the two variables is Strong.
5.9.5 Correlation between Consumer Perceived Value and Brand Image
Purpose: - To Study whether there is any relation between ‘Value’ and ‘Brand Image’.
Statistical Test: - Bi-Variate Correlation.
Variables and Measurement: - Both the variables ‘Consumer Perceived Value’ and
‘Brand Image’ are metric scale variables measured on a five point scale (‘1’= Strongly
Disagree. ‘2’= Disagree, ‘3’= Neutral, ‘4’= Agree and ‘5’= Strongly Agree)
Null H0: There is no relation between ‘Value’ and ‘Brand Image’ i.e. (r = 0)
Alternate H1: There is significant relation between ‘Value’ and ‘Brand Image’ i.e. (r ≠ 0)
Level of Significance ( α = 0.05)
Table 5.114: Correlation between ‘Value’ and ‘Brand Image’
Correlations
Brand Image Value
Brand Image
Pearson
Correlation 1 .697
**
Sig. (2-tailed) .000
N 140 140
Value
Pearson
Correlation .697
** 1
Sig. (2-tailed) .000
N 140 140

168
Observations: Pearson Correlation( r ) = 0.697 , p = 0.000, N = 140.
Conclusion: - Since (p = 0.000) is less than (α = 0.05) the Null Hypothesis H0 is rejected.
Therefore, it is concluded that there is significant relationship between ‘Value’ and
‘Brand Image’. The positive value of ‘r’ suggests that there is a direct relation between
the variables ‘Value’ and ‘Brand Image’, which means if ‘Value’ increases, ‘Brand
Image’ increases or vice-versa. Based on the value of r = 0.697, it may be further said
that the relation between the two variables is Strong.
5.9.6 Correlation between Consumer Satisfaction and Brand Image
Purpose:- To Study whether there is any relation between ‘Satisfaction’ and ‘Brand
Image’.
Statistical Test: - Bi-Variate Correlation.
Variables and Measurement :- Both the variables ‘Consumer Satisfaction’ and ‘Brand
Image’ are metric scale variables measured on a five point scale ( ‘1’= Strongly Disagree.
‘2’= Disagree, ‘3’= Neutral, ‘4’= Agree and ‘5’= Strongly Agree)
Null H0: There is no relation between ‘Satisfaction’ and ‘Brand Image’ i.e. (r = 0)
Alternate H1: There is significant relation between ‘Satisfaction’ and ‘Brand Image’ i.e.
(r ≠ 0)
Level of Significance ( α = 0.05)
Table 5.115: Correlation between ‘Satisfaction’ and ‘Brand Image’
Correlations
Brand Image Satisfaction
Brand Image
Pearson Correlation 1 .618**
Sig. (2-tailed) .000
N 140 140
Satisfaction
Pearson Correlation .618**
1
Sig. (2-tailed) .000
N 140 140

169
Observations: Pearson Correlation( r ) = 0.618 , p = 0.000, N = 140.
Conclusion: - Since (p = 0.000) is less than (α = 0.05) the Null Hypothesis H0 is rejected.
Therefore, it is concluded that there is significant relationship between ‘Satisfaction’ and
‘Brand Image’. The positive value of ‘r’ suggests that there is a direct relation between
the variables ‘Satisfaction’ and ‘Brand Image’, which means if ‘Satisfaction’ increases,
‘Brand Image’ increases or vice-versa. Based on the value of r = 0.618, it may be further
said that the relation between the two variables is Strong.
5.10 Studying the Moderating Role of the Switching Barriers on the
Relationship between Perceived Value/Satisfaction and Consumer
Loyalty: Testing the Hypothesis
It is already ascertained that a direct relationship exists between ‘Consumer Perceived
Value’ and ‘Consumer Loyalty’, ‘Consumer Satisfaction’ and ‘Consumer Loyalty’. The
relationship between Satisfaction-Loyalty is Moderate whereas the relationship between
Perceived Value-Loyalty is Strong. Now it is important to analyze the role of Switching
Barriers on these relationships. The various switching barriers considered in the study are
tabulated as below.
Table 5.116: List of Switching Barriers with Short Names
Sr. Details of the Switching Barrier Short Name for the
Barrier
1
The financial cost associated with the Switching is
considerable( CSS , Transmission Charges, Wheeling
Charges , Metering Cost , Additional Surcharge etc )
Switching Cost
2
The effort involved in searching for a New Service
Provider is high and time consuming.
Time & Effort
3
It will also take much time in learning about or
understanding the New Service Provider or develop new
relationship.
Cultivating New
Relationship

170
Sr. Details of the Switching Barrier Short Name for the
Barrier
4 There are few alternatives to provide for Services in
Power Distribution Sector. Few Alternatives
5 We don't find a better alternative that can provide
Services to us.
Lack of Better
Alternative
6 We feel embarrassed to inform our current Service
Provider (MSEDCL) that we will be discontinuing the
services in near future.
Compassion with
present Service
Provider
7 I have a sense of loyalty with my existing service
provider that is MSEDCL.
Loyalty with present
Service Provider
Considering the above seven Switching Barriers, it would be interesting to understand
their effect on the relationship of Satisfaction and Perceived Value with Loyalty. One by
one the effect of each barrier on the relationship between Satisfaction and Loyalty, Value
and Loyalty is described below.
5.10.1 Effect of Switching Cost on relationship between Consumer Perceived Value
and Consumer Loyalty.
Research Question: Whether ‘Switching Cost’ has a moderating role on the relationship
between ‘Perceived Value’ and ‘Loyalty’?
Statistical Test: Regression Analysis for Moderating Effect.
Variables and Measurement: Independent Variable – ‘Value’,
Dependent Variable – ‘Loyalty’, Moderator Variable – ‘Switching Cost’
Hypothesis H0: ‘Switching Cost’ does not influence the relationship between ‘Value’ and
‘Loyalty’
Hypothesis H1: ‘Switching Cost’ influences the relationship between ‘Value’ and
‘Loyalty’

171
The statistical analysis tables considering the underlying variables are displayed below.
Table 5.117: Model Summary for Moderating Role of Switching Cost on Value -
Loyalty Relationship
Model R R Square Adjusted R
Square Std. Error of the Estimate
1 .729a .532 .521 .38832
a. Predictors: (Constant), Value_Brr1, Value, The financial cost associated with the Switching is
considerable (CSS, Transmission Charges, Wheeling Charge, Metering Cost, Additional Surcharge etc )
Table 5.118: ANOVAa
for Moderating Role of Switching Cost on Value -
Loyalty Relationship
Model Sum of
Squares df
Mean
Square F Sig.
1
Regression 23.288 3 7.763 51.480 .000b
Residual 20.507 136 .151
Total 43.795 139
a. Dependent Variable: Loyalty
b. Predictors: (Constant), Value_Brr1, Value, The financial cost associated with the Switching is considerable
( CSS , Transmission Charges, Wheeling Charges , Metering Cost , Additional Surcharge etc )

172
Table 5.119: Coefficientsa for Moderating Role of Switching Cost on Value -
Loyalty Relationship
Model
Unstandardized
Coefficients
Standardized
Coefficients t Sig.
B Std. Error Beta
1
(Constant) .288 .491 .587 .558
Value .972 .150 .946 6.470 .000
The financial cost
associated with the
Switching is
considerable (CSS ,
Transmission Charges,
Wheeling Charges ,
Metering Cost ,
Additional Surcharge
etc )
.410 .158 .646 2.595 .010
Value_Brr1 -.099 .046 -.697 -2.169 .032
a. Dependent Variable: Loyalty
From the above statistical table it may be inferred that ‘Value’ has significant impact on
‘Loyalty’. ( t = 6.47 , B = 0.972, p-value = 0.000).
‘Switching Cost’ has significant impact on ‘Loyalty’. ( t = 2.595 , B = 0.410, p-value =
0.010).
Interaction of ‘Value’ & ‘Switching Cost’ also has significant effect on ‘Loyalty’. ( t = -
2.169 , B = -0.099, p-value = 0.032).
In the above table, ‘t’ is Test of Significance and ‘B’ is Regression in Weight.
Since the two variables interact we conclude that there is moderation effect. In order to
verify if the relationship between ‘Value’ and ‘Loyalty’ is different across the different
levels of ‘Switching Cost’, the interval scale variable is converted in to categorical
variable with two response options ‘Agree’ and ‘Disagree’. A group plot is constructed to
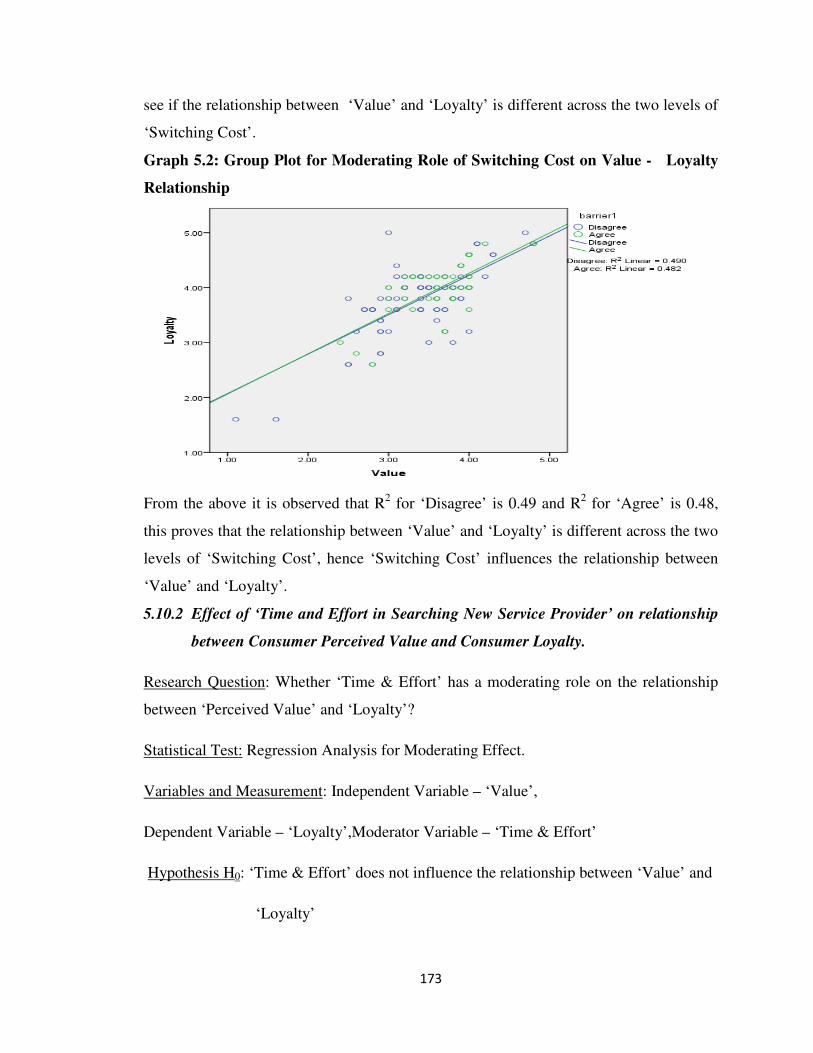
173
see if the relationship between ‘Value’ and ‘Loyalty’ is different across the two levels of
‘Switching Cost’.
Graph 5.2: Group Plot for Moderating Role of Switching Cost on Value - Loyalty
Relationship
From the above it is observed that R2 for ‘Disagree’ is 0.49 and R
2 for ‘Agree’ is 0.48,
this proves that the relationship between ‘Value’ and ‘Loyalty’ is different across the two
levels of ‘Switching Cost’, hence ‘Switching Cost’ influences the relationship between
‘Value’ and ‘Loyalty’.
5.10.2 Effect of ‘Time and Effort in Searching New Service Provider’ on relationship
between Consumer Perceived Value and Consumer Loyalty.
Research Question: Whether ‘Time & Effort’ has a moderating role on the relationship
between ‘Perceived Value’ and ‘Loyalty’?
Statistical Test: Regression Analysis for Moderating Effect.
Variables and Measurement: Independent Variable – ‘Value’,
Dependent Variable – ‘Loyalty’,Moderator Variable – ‘Time & Effort’
Hypothesis H0: ‘Time & Effort’ does not influence the relationship between ‘Value’ and
‘Loyalty’

174
Hypothesis H1: ‘Time & Effort’ influences the relationship between ‘Value’ and
‘Loyalty’
The statistical analysis tables considering the underlying variables are displayed below.
Table 5.120: Model Summary for Moderating Role of ‘Time & Effort’ on Value -
Loyalty Relationship
Model R R Square Adjusted R
Square Std. Error of the Estimate
1 .742a .551 .541 .38017
a. Predictors: (Constant), Value_Brr2, Value, The effort involved in searching for a New Service Provider
is high and time consuming.
Table 5.121: ANOVA for Moderating Role of ‘Time & Effort’ on Value - Loyalty
Relationship
ANOVAa
Model Sum of
Squares df Mean Square F Sig.
1
Regression 24.140 3 8.047 55.675 .000b
Residual 19.656 136 .145
Total 43.795 139
a. Dependent Variable: Loyalty
b. Predictors: (Constant), Value_Brr2, Value, The effort involved in searching for a New Service Provider is high
and time consuming.

175
Table 5.122: Coefficients for Moderating Role of ‘Time & Effort’ on Value -
Loyalty Relationship
Coefficientsa
Model
Unstandardized
Coefficients
Standardized
Coefficients t Sig.
B Std. Error Beta
1
(Constant) 1.009 .966 1.045 .298
Value .675 .280 .657 2.415 .017
The effort involved in
searching for a New
Service Provider is high
and time consuming.
.135 .261 .206 .518 .605
Value_Brr2 .003 .075 .023 .045 .964
a. Dependent Variable: Loyalty
From the above statistical table it may be inferred that ‘Value’ has significant impact on
‘Loyalty’. ( t = 2.415 , B = 0.675, p-value = 0.017).
‘Time & Effort’ does not have significant impact on ‘Loyalty’. ( t = 0.518 , B = 0.135, p-
value = 0.605).
Interaction of ‘Value’ & ‘Time & Effort’ also does not have significant effect on
‘Loyalty’. ( t = 0.045 , B = 0.003, p-value = 0.964).
In the above table, ‘t’ is Test of Significance and ‘B’ is Regression in Weight.
Since the two variables do not interact we conclude that there is no moderation effect. In
order to verify if the relationship between ‘Value’ and ‘Loyalty’ is different across the
different levels of ‘Time & Effort’, the interval scale variable is converted in to
categorical variable with two response options ‘Agree’ and ‘Disagree’. A group plot is
constructed to see if the relationship between ‘Value’ and ‘Loyalty’ is different across
the two levels of ‘Time & Effort’.

176
Graph 5.3: Group Plot for Moderating Role of ‘Time & Effort’ on Value - Loyalty
Relationship
From the above it is observed that R2 for ‘Disagree’ is 0.309 and R
2 for ‘Agree’ is 0.638,
but the interaction effect of ‘Time & Effort’ and ‘Value’ on ‘Loyalty’ is insignificant,
therefore the above graph does not have any relevance.
5.10.3 Effect of ‘Cultivating Relationship with New Service Provider’ on correlation
between Consumer Perceived Value and Consumer Loyalty.
Research Question: Whether ‘Cultivating New Relationship’ has a moderating role on the
relationship between ‘Perceived Value’ and ‘Loyalty’?
Statistical Test: Regression Analysis for Moderating Effect.
Variables and Measurement: Independent Variable – ‘Value’,
Dependent Variable – ‘Loyalty’, Moderator Variable – ‘Cultivating New Relationship’
Hypothesis H0: ‘Cultivating New Relationship’ does not influence the relationship
between ‘Value’ and ‘Loyalty’
Hypothesis H1: ‘Cultivating New Relationship’ influences the relationship between
‘Value’ and ‘Loyalty’

177
The statistical analysis tables considering the underlying variables are displayed below.
Table 5.123: Model Summary for Moderating Role of ‘Cultivating New
Relationship’ on Value - Loyalty Relationship
Model R R Square Adjusted R
Square Std. Error of the Estimate
1 .713a .508 .497 .39798
a. Predictors: (Constant), Value_Brr3, It will also take much time in learning about or understanding the
New Service Provider or develop new relationship., Value
Table 5.124: ANOVA for Moderating Role of ‘Cultivating New Relationship’ on
Value - Loyalty Relationship
ANOVAa
Model Sum of
Squares df Mean Square F Sig.
1
Regression 22.255 3 7.418 46.836 .000b
Residual 21.541 136 .158
Total 43.795 139
a. Dependent Variable: Loyalty
b. Predictors: (Constant), Value_Brr3, It will also take much time in learning about or understanding the New
Service Provider or develop new relationship., Value

178
Table 5.125: Coefficients for Moderating Role of ‘Cultivating New Relationship’ on
Value - Loyalty Relationship
Coefficientsa
Model
Unstandardized
Coefficients
Standardized
Coefficients t Sig.
B Std. Error Beta
1
(Constant) 1.252 .250 4.998 .000
Value .690 .102 .672 6.798 .000
It will also take much
time in learning about
or understanding the
New Service Provider
or develop new
relationship.
.049 .040 .077 1.234 .219
Value_Brr3 .003 .014 .021 .216 .829
a. Dependent Variable: Loyalty
From the above statistical table it may be inferred that ‘Value’ has significant impact on
‘Loyalty’. ( t = 6.798 , B = 0.690, p-value = 0.000).
‘Cultivating New Relationship’ does not have significant impact on ‘Loyalty’. ( t = 1.234
, B = 0.049, p-value = 0.219).
Interaction of ‘Value’ & ‘Cultivating New Relationship’ also does not have significant
effect on ‘Loyalty’. ( t = 0.216 , B = 0.003, p-value = 0.829).
In the above table, ‘t’ is Test of Significance and ‘B’ is Regression in Weight.
Since the two variables do not interact we conclude that there is no moderation effect. In
order to verify if the relationship between ‘Value’ and ‘Loyalty’ is different across the
different levels of ‘Cultivating New Relationship’, the interval scale variable is converted
in to categorical variable with two response options ‘Agree’ and ‘Disagree’. A group plot
is constructed to see if the relationship between ‘Value’ and ‘Loyalty’ is different across
the two levels of ‘Cultivating New Relationship’.

179
Graph 5.4: Group Plot for Moderating Role of ‘Cultivating New Relationship’ on
Value - Loyalty Relationship
From the above it is observed that R2 for ‘Disagree’ is 0.297 and R
2 for ‘Agree’ is 0.620,
but the interaction effect of ‘Cultivating New Relationship’ and ‘Value’ on ‘Loyalty’ is
insignificant, therefore the above graph does not have any relevance.
5.10.4 Effect of ‘Availability of few Alternatives to provide services’ on relationship
between Consumer Perceived Value and Consumer Loyalty.
Research Question: Whether ‘Few Alternatives’ has a moderating role on the relationship
between ‘Perceived Value’ and ‘Loyalty’?
Statistical Test: Regression Analysis for Moderating Effect.
Variables and Measurement: Independent Variable – ‘Value’,
Dependent Variable – ‘Loyalty’, Moderator Variable – ‘Few Alternatives’
Hypothesis H0: ‘Few Alternatives’ does not influence the relationship between ‘Value’
and ‘Loyalty’
Hypothesis H1: ‘Few Alternatives’ influences the relationship between ‘Value’ and
‘Loyalty’

180
The statistical analysis tables considering the underlying variables are displayed below.
Table 5.126: Model Summary for Moderating Role of ‘Few Alternatives’ on
Value - Loyalty Relationship
Model R R Square Adjusted R
Square Std. Error of the Estimate
1 .736a .541 .531 .38444
a. Predictors: (Constant), Value_Brr4, Value, There are few alternatives to provide for Services in
Power Distribution Sector.
Table 5.127: ANOVA for Moderating Role of ‘Few Alternatives’ on Value -
Loyalty Relationship
ANOVAa
Model Sum of
Squares df Mean Square F Sig.
1
Regression 23.695 3 7.898 53.441 .000b
Residual 20.100 136 .148
Total 43.795 139
a. Dependent Variable: Loyalty
b. Predictors: (Constant), Value_Brr4, Value, There are few alternatives to provide for Services in Power
Distribution Sector.

181
Table 5.128: Coefficients for Moderating Role of ‘Few Alternatives’ on Value -
Loyalty Relationship
coefficientsa
Model
Unstandardized
Coefficients
Standardize
d
Coefficients t Sig.
B Std. Error Beta
1
(Constant) -.737 .714 -1.031 .304
Value 1.245 .203 1.211 6.127 .000
There are few
alternatives to provide
for Services in Power
Distribution Sector.
.628 .205 .951 3.062 .003
Value_Brr4 -.158 .058 -1.049 -2.738 .007
a. Dependent Variable: Loyalty
From the above statistical table it may be inferred that ‘Value’ has significant impact on
‘Loyalty’. ( t = 6.127 , B = 1.245, p-value = 0.000).
‘Few Alternatives’ has significant impact on ‘Loyalty’. ( t = 3.062 , B = 0.628, p-value =
0.003).
Interaction of ‘Value’ & ‘Few Alternatives’ also has significant effect on ‘Loyalty’. ( t = -
2.738 , B = -0.158, p-value = 0.007).
In the above table, ‘t’ is Test of Significance and ‘B’ is Regression in Weight.
Since the two variables interact we conclude that there is moderation effect. In order to
verify if the relationship between ‘Value’ and ‘Loyalty’ is different across the different
levels of ‘Few Alternatives’, the interval scale variable is converted in to categorical
variable with two response options ‘Agree’ and ‘Disagree’. A group plot is constructed to
see if the relationship between ‘Value’ and ‘Loyalty’ is different across the two levels of
‘Few Alternatives’.

182
Graph 5.5: Group Plot for Moderating Role of ‘Few Alternatives’ on Value -
Loyalty Relationship
From the above it is observed that R2 for ‘Disagree’ is 0.630 and R
2 for ‘Agree’ is 0.392,
this proves that the relationship between ‘Value’ and ‘Loyalty’ is different across the two
levels of ‘Few Alternatives’, hence ‘Few Alternatives’ influences the relationship
between ‘Value’ and ‘Loyalty’.
5.10.5 Effect of ‘Lack of Better Alternatives to provide Services’ on relationship
between Consumer Perceived Value and Consumer Loyalty.
Research Question: Whether ‘Lack of Better Alternatives’ has a moderating role on the
relationship between ‘Perceived Value’ and ‘Loyalty’?
Statistical Test: Regression Analysis for Moderating Effect.
Variables and Measurement: Independent Variable – ‘Value’,
Dependent Variable – ‘Loyalty’, Moderator Variable – ‘Lack of Better Alternatives’
Hypothesis H0: ‘Lack of Better Alternatives’ does not influence the relationship between
‘Value’ and ‘Loyalty’

183
Hypothesis H1: ‘Lack of Better Alternatives’ influences the relationship between ‘Value’
and ‘Loyalty’
The statistical analysis tables considering the underlying variables are displayed below.
Table 5.129: Model Summary for Moderating Role of ‘Lack of Better
Alternatives’ on Value - Loyalty Relationship
Model R R Square Adjusted R
Square Std. Error of the Estimate
1 .746a .557 .547 .37783
a. Predictors: (Constant), Value_Brr5, Value, We don't find a better alternative that can provide
Services to us.
Table 5.130: ANOVA for Moderating Role of ‘Lack of Better Alternatives’ on
Value - Loyalty Relationship
ANOVAa
Model Sum of
Squares df Mean Square F Sig.
1
Regression 24.381 3 8.127 56.930 .000b
Residual 19.414 136 .143
Total 43.795 139
a. Dependent Variable: Loyalty
b. Predictors: (Constant), Value_Brr5, Value, We don't find a better alternative that can provide Services to us.

184
Table 5.131: Coefficients for Moderating Role of ‘Lack of Better Alternatives’ on
Value - Loyalty Relationship
Coefficientsa
Model
Unstandardized
Coefficients
Standardized
Coefficients t Sig.
B Std.
Error Beta
1
(Constant) -.846 .640 -1.322 .188
Value 1.275 .181 1.241 7.029 .000
We don't find a better
alternative that can
provide Services to us.
.736 .199 1.312 3.690 .000
Value_Brr5 -.186 .055 -1.415 -3.355 .001
a. Dependent Variable: Loyalty
From the above statistical table it may be inferred that ‘Value’ has significant impact on
‘Loyalty’. ( t = 7.029 , B = 1.275, p-value = 0.000).
‘Lack of Better Alternatives’ has significant impact on ‘Loyalty’. ( t = 3.690 , B = 0.736,
p-value = 0.000).
Interaction of ‘Value’ & ‘Lack of Better Alternatives’ also has significant effect on
‘Loyalty’. ( t = -3,355 , B = -0.186, p-value = 0.001).
In the above table, ‘t’ is Test of Significance and ‘B’ is Regression in Weight.
Since the two variables interact we conclude that there is moderation effect. In order to
verify if the relationship between ‘Value’ and ‘Loyalty’ is different across the different
levels of ‘Lack of Better Alternatives’, the interval scale variable is converted in to
categorical variable with two response options ‘Agree’ and ‘Disagree’. A group plot is
constructed to see if the relationship between ‘Value’ and ‘Loyalty’ is different across the
two levels of ‘Lack of Better Alternatives’.

185
Graph 5.6: Group Plot for Moderating Role of ‘Lack of Better Alternatives’ on
Value - Loyalty Relationship
From the above it is observed that R2 for ‘Disagree’ is 0.604 and R
2 for ‘Agree’ is 0.342,
this proves that the relationship between ‘Value’ and ‘Loyalty’ is different across the two
levels of ‘Lack of Better Alternatives’, hence ‘Lack of Better Alternatives’ influences the
relationship between ‘Value’ and ‘Loyalty’.
5.10.6 Effect of ‘Compassion with present Service Provider’ on relationship between
Consumer Perceived Value and Consumer Loyalty
Research Question: Whether ‘Compassion with present Service Provider’ has a
moderating role on the relationship between ‘Perceived Value’ and ‘Loyalty’?
Statistical Test: Regression Analysis for Moderating Effect.
Variables and Measurement: Independent Variable – ‘Value’,
Dependent Variable – ‘Loyalty’, Moderator Variable – ‘Compassion with present
Service Provider’
Hypothesis H0: ‘Compassion with present Service Provider’ does not influence the
relationship between ‘Value’ and ‘Loyalty’

186
Hypothesis H1: ‘Compassion with present Service Provider’ influences the relationship
between ‘Value’ and ‘Loyalty’
The statistical analysis tables considering the underlying variables are displayed below.
Table 5.132 : Model Summary for Moderating Role of ‘Compassion with present
Service Provider’ on Value - Loyalty Relationship
Model R R Square Adjusted R
Square Std. Error of the Estimate
1 .791a .626 .618 .34711
a. Predictors: (Constant), Value_Brr6, We feel embarrassed to inform our current Service Provider
(MSEDCL) that we will be discontinuing the services in near future., Value
Table 5.133: ANOVA for Moderating Role of ‘Compassion with present
Service Provider’ on Value - Loyalty Relationship
ANOVAa
Model Sum of
Squares df Mean Square F Sig.
1
Regression 27.410 3 9.137 75.832 .000b
Residual 16.386 136 .120
Total 43.795 139
a. Dependent Variable: Loyalty
b. Predictors: (Constant), Value_Brr6, We feel embarrassed to inform our current Service Provider (MSEDCL)
that we will be discontinuing the services in near future., Value

187
Table 5.134: Coefficients for Moderating Role of ‘Compassion with present Service
Provider’ on Value - Loyalty Relationship
Coefficientsa
Model
Unstandardized
Coefficients
Standardized
Coefficients t Sig.
B Std. Error Beta
1
(Constant) 2.095 .224 9.332 .000
Value .178 .099 .173 1.803 .074
We feel
embarrassed to
inform our current
Service Provider
(MSEDCL) that we
will be
discontinuing the
services in near
future.
-.034 .030 -.066 -1.152 .251
Value_Brr6 .093 .014 .663 6.670 .000
a. Dependent Variable: Loyalty
From the above statistical table it may be inferred that ‘Value’ has no significant impact
on ‘Loyalty’. ( t =1.803 , B = 0.178, p-value = 0.074).
‘Compassion with present Service Provider’ also has no significant impact on ‘Loyalty’.
(t = -1.152 , B = -0.034, p-value = 0.251).
Interaction of ‘Value’ & ‘Compassion with present Service Provider’ has significant
effect on ‘Loyalty’. ( t = 6.670 , B = 0.093, p-value = 0.000).
In the above table, ‘t’ is Test of Significance and ‘B’ is Regression in Weight.
Since the two variables interact we conclude that there is moderation effect. In order to
verify if the relationship between ‘Value’ and ‘Loyalty’ is different across the different
levels of ‘Compassion with present Service Provider’, the interval scale variable is
converted in to categorical variable with two response options ‘Agree’ and ‘Disagree’. A

188
group plot is constructed to see if the relationship between ‘Value’ and ‘Loyalty’ is
different across the two levels of ‘Compassion with present Service Provider’.
Graph 5.7: Group Plot for Moderating Role of ‘Compassion with Present Service
Provider’ on Value - Loyalty Relationship
From the above it is observed that R2 for ‘Disagree’ is 0.343 and R
2 for ‘Agree’ is 0.648,
this proves that the relationship between ‘Value’ and ‘Loyalty’ is different across the two
levels of ‘Compassion with present Service Provider’, hence ‘Compassion with present
Service Provider’ influences the relationship between ‘Value’ and ‘Loyalty’.
5.10.7 Effect of ‘Loyalty with the present Service Provider’ on correlation between
Consumer Perceived Value and Consumer Loyalty.
Research Question: Whether ‘Loyalty with the present Service Provider’ has a
moderating role on the relationship between ‘Perceived Value’ and ‘Loyalty’?
Statistical Test: Regression Analysis for Moderating Effect.

189
Variables and Measurement: Independent Variable – ‘Value’,
Dependent Variable – ‘Loyalty’, Moderator Variable – ‘Loyalty with the present Service
Provider’
Hypothesis H0: ‘Loyalty with the present Service Provider’ does not influence the
relationship between ‘Value’ and ‘Loyalty’
Hypothesis H1: ‘Loyalty with the present Service Provider’ influences the relationship
between ‘Value’ and ‘Loyalty’
The statistical analysis tables considering the underlying variables are displayed below.
Table 5.135: Model Summary for Moderating Role of ‘Loyalty with the present
Service Provider’ on Value - Loyalty Relationship
Model R R Square Adjusted R
Square Std. Error of the Estimate
1 .731a .535 .524 .38707
a. Predictors: (Constant), Value_Brr7, Value, I have a sense of loyalty with my existing service provider
that is MSEDCL.
Table 5.136: ANOVA for Moderating Role of ‘Loyalty with the present Service
Provider’ on Value - Loyalty Relationship
ANOVAa
Model Sum of
Squares Df Mean Square F Sig.
1
Regression 23.420 3 7.807 52.107 .000b
Residual 20.376 136 .150
Total 43.795 139
a. Dependent Variable: Loyalty
b. Predictors: (Constant), Value_Brr7, Value, I have a sense of loyalty with my existing service provider that is MSEDCL.

190
Table 5.137: Coefficients for Moderating Role of ‘Loyalty with the present Service
Provider’ on Value - Loyalty Relationship
Coefficientsa
Model
Unstandardized
Coefficients
Standardize
d
Coefficients t Sig.
B Std.
Error Beta
1
(Constant) .919 .604 1.521 .131
Value .682 .193 .664 3.524 .001
I have a sense of
loyalty with my
existing service
provider that is
MSEDCL.
.232 .165 .317 1.409 .161
Value_Brr7 -.023 .048 -.162 -.465 .643
a. Dependent Variable: Loyalty
From the above statistical table it may be inferred that ‘Value’ has significant impact on
‘Loyalty’. ( t = 3.524 , B = 0.682, p-value = 0.001).
‘Loyalty with the present Service Provider’ does not have significant impact on
‘Loyalty’. ( t = 1.409 , B = 0.232, p-value = 0.161).
Interaction of ‘Value’ & ‘Loyalty with the present Service Provider’ also does not have
significant effect on ‘Loyalty’. ( t = -0.465 , B = -0.023, p-value = 0.643).
In the above table, ‘t’ is Test of Significance and ‘B’ is Regression in Weight.
Since the two variables do not interact we conclude that there is no moderation effect. In
order to verify if the relationship between ‘Value’ and ‘Loyalty’ is different across the
different levels of ‘Loyalty with the present Service Provider’, the interval scale variable
is converted in to categorical variable with two response options ‘Agree’ and ‘Disagree’.
A group plot is constructed to see if the relationship between ‘Value’ and ‘Loyalty’ is
different across the two levels of ‘Loyalty with the present Service Provider’.

191
Graph 5.8: Group Plot for Moderating Role of ‘Loyalty with the Present Service
Provider’ on Value - Loyalty Relationship
From the above it is observed that R2 for ‘Disagree’ is 0.388 and R
2 for ‘Agree’ is 0.513,
but the interaction effect of ‘Loyalty with the present Service Provider’ and ‘Value’ on
‘Loyalty’ is insignificant, therefore the above graph does not have any relevance.
5.10.8 Effect of Switching Cost on relationship between Consumer Satisfaction and
Consumer Loyalty
Research Question: Whether ‘Switching Cost’ has a moderating role on the relationship
between ‘Satisfaction’ and ‘Loyalty’?
Statistical Test: Regression Analysis for Moderating Effect.
Variables and Measurement: Independent Variable – ‘Satisfaction’,
Dependent Variable – ‘Loyalty’, Moderator Variable – ‘Switching Cost’
Hypothesis H0: ‘Switching Cost’ does not influence the relationship between
‘Satisfaction’ and ‘Loyalty’

192
Hypothesis H1: ‘Switching Cost’ influences the relationship between ‘Satisfaction’ and
‘Loyalty’
The statistical analysis tables considering the underlying variables are displayed below.
Table 5.138: Model Summary for Moderating Role of ‘Switching Cost’ on
Satisfaction – Loyalty Relationship
Model R R Square Adjusted R
Square Std. Error of the Estimate
1 .632a .400 .386 .43968
a. Predictors: (Constant), sat_brr1, Satisfaction, The financial cost associated with the Switching is
considerable (CSS, Transmission Charges, Wheeling Charges, Metering Cost, Additional Surcharge etc)
Table 5.139: ANOVA for Moderating Role of ‘Switching Cost’ on Satisfaction –
Loyalty Relationship
ANOVAa
Model Sum of
Squares df Mean Square F Sig.
1
Regression 17.504 3 5.835 30.182 .000b
Residual 26.291 136 .193
Total 43.795 139
a. Dependent Variable: Loyalty
b. Predictors: (Constant), sat_brr1, Satisfaction, The financial cost associated with the Switching is considerable(
CSS , Transmission Charges, Wheeling Charges , Metering Cost , Additional Surcharge etc )

193
Table 5.140: Coefficients for Moderating Role of ‘Switching Cost’ on Satisfaction –
Loyalty Relationship
Coefficientsa
Model
Unstandardized
Coefficients
Standardized
Coefficients t Sig.
B Std.
Error Beta
1
(Constant) 1.032 .467 2.211 .029
Satisfaction .659 .142 .938 4.655 .000
The financial cost
associated with the
Switching is
considerable( CSS ,
Transmission Charges,
Wheeling Charges ,
Metering Cost ,
Additional Surcharge
etc )
.528 .142 .831 3.708 .000
sat_brr1 -.102 .043 -.748 -2.401 .018
a. Dependent Variable: Loyalty
From the above statistical table it may be inferred that ‘Satisfaction’ has significant
impact on ‘Loyalty’. ( t = 4.655 , B = 0.659, p-value = 0.000).
‘Switching Cost’ has significant impact on ‘Loyalty’. ( t = 3.708 , B = 0.528, p-value =
0.000).
Interaction of ‘Satisfaction’ & ‘Switching Cost’ also has significant effect on ‘Loyalty’. (
t = -2.401 , B = -0.102, p-value = 0.018).
In the above table,’t’ is Test of Significance and ‘B’ is Regression in Weight.
Since the two variables interact we conclude that there is moderation effect. In order to
verify if the relationship between ‘Satisfaction’ and ‘Loyalty’ is different across the

194
different levels of ‘Switching Cost’, the interval scale variable is converted in to
categorical variable with two response options ‘Agree’ and ‘Disagree’. A group plot is
constructed to see if the relationship between ‘Satisfaction’ and ‘Loyalty’ is different
across the two levels of ‘Switching Cost’.
Graph 5.9: Group Plot for Moderating Role of ‘Switching Cost’ on Satisfaction –
Loyalty Relationship
From the above it is observed that R2 for ‘Disagree’ is 0.272 and R
2 for ‘Agree’ is 0.303,
this proves that the relationship between ‘Satisfaction’ and ‘Loyalty’ is different across
the two levels of ‘Switching Cost’, hence ‘Switching Cost’ influences the relationship
between ‘Satisfaction’ and ‘Loyalty’.
5.10.9 Effect of ‘Time and Effort in Searching New Service Provider’ on relationship
between Consumer Satisfaction and Consumer Loyalty
Research Question: Whether ‘Time & Effort’ has a moderating role on the relationship
between ‘Satisfaction’ and ‘Loyalty’?
Statistical Test: Regression Analysis for Moderating Effect.
Variables and Measurement: Independent Variable – ‘Satisfaction’,
Dependent Variable – ‘Loyalty’, Moderator Variable – ‘Time & Effort’

195
Hypothesis H0: ‘Time & Effort’ does not influence the relationship between
‘Satisfaction’ and ‘Loyalty’
Hypothesis H1: ‘Time & Effort’ influences the relationship between ‘Satisfaction’ and
‘Loyalty’
The statistical analysis tables considering the underlying variables are displayed below.
Table 5.141: Model Summary for Moderating Role of ‘Time & Effort’ on
Satisfaction – Loyalty Relationship
Model R R Square Adjusted R
Square Std. Error of the Estimate
1 .614a .376 .363 .44812
a. Predictors: (Constant), sat_brr2, Satisfaction, The effort involved in searching for a New Service
Provider is high and time consuming.
Table 5.142: ANOVA for Moderating Role of ‘Time & Effort’ on Satisfaction –
Loyalty Relationship
ANOVAa
Model Sum of
Squares df Mean Square F Sig.
1
Regression 16.486 3 5.495 27.365 .000b
Residual 27.310 136 .201
Total 43.795 139
a. Dependent Variable: Loyalty
b. Predictors: (Constant), sat_brr2, Satisfaction, The effort involved in searching for a New Service Provider is
high and time consuming.

196
Table 5.143: Coefficients for Moderating Role of ‘Time & Effort’ on Satisfaction –
Loyalty Relationship
Coefficientsa
Model
Unstandardized
Coefficients
Standardiz
ed
Coefficient
s t Sig.
B Std.
Error Beta
1
(Constant) 2.186 .635 3.444 .001
Satisfaction .279 .186 .398 1.504 .135
The effort involved in
searching for a New
Service Provider is high
and time consuming.
.132 .179 .203 .742 .459
sat_brr2 .023 .052 .166 .433 .665
a. Dependent Variable: Loyalty
From the above statistical table it may be inferred that ‘Satisfaction’ has no significant
impact on ‘Loyalty’. ( t = 1.504 , B = 0.279, p-value = 0.135).
‘Time & Effort’ does not have significant impact on ‘Loyalty’. ( t = 0.742 , B = 0.132,
p-value = 0.459).
Interaction of ‘Satisfaction’ & ‘Time & Effort’ also does not have significant effect on
‘Loyalty’. ( t = 0.433 , B = 0.023, p-value = 0.665).
In the above table, ‘t’ is Test of Significance and ‘B’ is Regression in Weight.
Since the two variables do not interact we conclude that there no moderation effect. In
order to verify if the relationship between ‘Satisfaction’ and ‘Loyalty’ is different across
the different levels of ‘Time & Effort’, the interval scale variable is converted in to
categorical variable with two response options ‘Agree’ and ‘Disagree’. A group plot is
constructed to see if the relationship between ‘Satisfaction’ and ‘Loyalty’ is different
across the two levels of ‘Time & Effort’.

197
Graph 5.10: Group Plot for Moderating Role of ‘Time & Effort’ on Satisfaction –
Loyalty Relationship
From the above it is observed that R2 for ‘Disagree’ is 0.237 and R
2 for ‘Agree’ is 0.358,
but the interaction effect of ‘Time & Effort’ and ‘Satisfaction’ on ‘Loyalty’ is
insignificant, therefore the above graph does not have any relevance.
5.10.10Effect of ‘Cultivating Relationship with New Service Provider’ on correlation
between Consumer Satisfaction and Consumer Loyalty
Research Question: Whether ‘Cultivating New Relationship’ has a moderating role on the
relationship between ‘Satisfaction’ and ‘Loyalty’?
Statistical Test: Regression Analysis for Moderating Effect.
Variables and Measurement: Independent Variable – ‘Satisfaction’,
Dependent Variable – ‘Loyalty’, Moderator Variable – ‘Cultivating New Relationship’
Hypothesis H0: ‘Cultivating New Relationship’ does not influence the relationship
between ‘Satisfaction’ and ‘Loyalty’
Hypothesis H1: ‘Cultivating New Relationship’ influences the relationship between
‘Satisfaction’ and ‘Loyalty’

198
The statistical analysis tables considering the underlying variables are displayed below.
Table 5.144: Model Summary for Moderating Role of ‘Cultivating New
Relationship’ on Satisfaction – Loyalty Relationship
Model R R Square Adjusted R
Square Std. Error of the Estimate
1 .574a .329 .314 .46487
a. Predictors: (Constant), sat_brr3, Satisfaction, It will also take much time in learning about or
understanding the New Service Provider or develop new relationship.
Table 5.145: ANOVA for Moderating Role of ‘Cultivating New Relationship’ on
Satisfaction – Loyalty Relationship
ANOVAa
Model Sum of
Squares df Mean Square F Sig.
1
Regression 14.405 3 4.802 22.220 .000b
Residual 29.390 136 .216
Total 43.795 139
a. Dependent Variable: Loyalty.
b. Predictors: (Constant), sat_brr3, Satisfaction, It will also take much time in learning about or
understanding the New Service Provider or develop new relationship.

199
Table 5.146: Coefficients for Moderating Role of ‘Cultivating New Relationship’
on Satisfaction – Loyalty Relationship
Coefficientsa
Model
Unstandardized
Coefficients
Standardized
Coefficients t Sig.
B Std. Error Beta
1
(Constant) 2.355 .651 3.617 .000
Satisfaction .291 .186 .414 1.565 .120
It will also take much
time in learning
about or
understanding the
New Service
Provider or develop
new relationship.
.081 .178 .127 .454 .650
sat_brr3 .019 .050 .148 .381 .704
a. Dependent Variable: Loyalty
From the above statistical table it may be inferred that ‘Satisfaction’ has no significant
impact on ‘Loyalty’. (t = 1.565, B = 0.291, p-value = 0.120).
‘Cultivating New Relationship’ does not have significant impact on ‘Loyalty’. (t =
0.454, B = 0.081, p-value = 0.650).
Interaction of ‘Satisfaction’ & ‘Cultivating New Relationship’ also does not have
significant effect on ‘Loyalty’. ( t = 0.381 , B = 0.019, p-value = 0.704).
In the above table, ‘t’ is Test of Significance and ‘B’ is Regression in Weight.
Since the two variables do not interact we conclude that there is no moderation effect. In
order to verify if the relationship between ‘Satisfaction’ and ‘Loyalty’ is different across
the different levels of ‘Cultivating New Relationship’, the interval scale variable is
converted in to categorical variable with two response options ‘Agree’ and ‘Disagree’. A

200
group plot is constructed to see if the relationship between ‘Satisfaction’ and ‘Loyalty’ is
different across the two levels of ‘Cultivating New Relationship’.
Graph 5.11: Group Plot for Moderating Role of ‘Cultivating New Relationship’ on
Satisfaction – Loyalty Relationship
From the above it is observed that R2 for ‘Disagree’ is 0.224 and R
2 for ‘Agree’ is 0.336,
but the interaction effect of ‘Cultivating New Relationship’ and ‘Satisfaction’ on
‘Loyalty’ is insignificant, therefore the above graph does not have any relevance.
5.10.11Effect of ‘Availability of few Alternatives to provide services’ on relationship
between Consumer Satisfaction and Consumer Loyalty
Research Question: Whether ‘Few Alternatives’ has a moderating role on the relationship
between ‘Satisfaction’ and ‘Loyalty’?
Statistical Test: Regression Analysis for Moderating Effect.
Variables and Measurement: Independent Variable – ‘Satisfaction’,
Dependent Variable – ‘Loyalty’, Moderator Variable – ‘Few Alternatives’
Hypothesis H0: ‘Few Alternatives’ does not influence the relationship between
‘Satisfaction’ and ‘Loyalty’

201
Hypothesis H1: ‘Few Alternatives’ influences the relationship between ‘Satisfaction’ and
‘Loyalty’
The statistical analysis tables considering the underlying variables are displayed below.
Table 5.147: Model Summary for Moderating Role of ‘Few Alternatives’ on
Satisfaction – Loyalty Relationship
Model R R Square Adjusted R
Square Std. Error of the Estimate
1 .569a .323 .308 .46677
a. Predictors: (Constant), sat_brr4, There are few alternatives to provide for Services in Power
Distribution Sector., Satisfaction
Table 5.148: ANOVA for Moderating Role of ‘Few Alternatives’ on Satisfaction –
Loyalty Relationship
ANOVAa
Model Sum of
Squares df Mean Square F Sig.
1
Regression 14.164 3 4.721 21.670 .000b
Residual 29.631 136 .218
Total 43.795 139
a. Dependent Variable: Loyalty
b. Predictors: (Constant), sat_brr4, There are few alternatives to provide for Services in Power
Distribution Sector., Satisfaction

202
Table 5.149: Coefficients for Moderating Role of ‘Few Alternatives’ on Satisfaction
– Loyalty Relationship
Coefficientsa
Model
Unstandardized
Coefficients
Standardized
Coefficients t Sig.
B Std. Error Beta
1
(Constant) 1.152 .579 1.989 .049
Satisfaction .708 .176 1.008 4.010 .000
There are few
alternatives to
provide for Services
in Power Distribution
Sector.
.431 .164 .653 2.639 .009
sat_brr4 -.102 .050 -.736 -2.056 .042
a. Dependent Variable: Loyalty
From the above statistical table it may be inferred that ‘Satisfaction’ has significant
impact on ‘Loyalty’. (t = 4.010, B = 0.708, p-value = 0.000).
‘Few Alternatives’ has significant impact on ‘Loyalty’. (t = 2.639, B = 0.431, p-value =
0.009).
Interaction of ‘Satisfaction’ & ‘Few Alternatives’ also has significant effect on
‘Loyalty’. (t = -2.056, B = -0.102, p-value = 0.042).
In the above table, ‘t’ is Test of Significance and ‘B’ is Regression in Weight.
Since the two variables interact we conclude that there is moderation effect. In order to
verify if the relationship between ‘Satisfaction’ and ‘Loyalty’ is different across the
different levels of ‘Few Alternatives’, the interval scale variable is converted in to
categorical variable with two response options ‘Agree’ and ‘Disagree’. A group plot is
constructed to see if the relationship between ‘Satisfaction’ and ‘Loyalty’ is different
across the two levels of ‘Few Alternatives’.

203
Graph 5.12: Group Plot for Moderating Role of ‘Few Alternatives’ on Satisfaction –
Loyalty Relationship
From the above it is observed that R2 for ‘Disagree’ is 0.287 and R
2 for ‘Agree’ is 0.259,
this proves that the relationship between ‘Satisfaction’ and ‘Loyalty’ is different across
the two levels of ‘Few Alternatives’, hence ‘Few Alternatives’ influences the relationship
between ‘Satisfaction’ and ‘Loyalty’.
5.10.12Effect of ‘Lack of Better Alternatives to provide Services’ on relationship
between Consumer Satisfaction and Consumer Loyalty
Research Question: Whether ‘Lack of Better Alternatives’ has a moderating role on the
relationship between ‘Satisfaction’ and ‘Loyalty’?
Statistical Test: Regression Analysis for Moderating Effect.
Variables and Measurement: Independent Variable – ‘Satisfaction’,
Dependent Variable – ‘Loyalty’, Moderator Variable – ‘Lack of Better Alternatives’
Hypothesis H0: ‘Lack of Better Alternatives’ does not influence the relationship between
‘Satisfaction’ and ‘Loyalty’

204
Hypothesis H1: ‘Lack of Better Alternatives’ influences the relationship between
‘Satisfaction’ and ‘Loyalty’
The statistical analysis tables considering the underlying variables are displayed below.
Table 5.150: Model Summary for Moderating Role of ‘Lack of Better
Alternatives’ on Satisfaction – Loyalty Relationship
Model R R Square Adjusted R
Square Std. Error of the Estimate
1 .598a .357 .343 .45494
a. Predictors: (Constant), sat_brr5, Satisfaction, We don't find a better alternative that can provide Services to us.
Table 5.151: ANOVA for Moderating Role of ‘Lack of Better Alternatives’ on
Satisfaction – Loyalty Relationship
Model Sum of
Squares df
Mean
Square F Sig.
1
Regression 15.648 3 5.216 25.202 .000b
Residual 28.148 136 .207
Total 43.795 139
a. Dependent Variable: Loyalty
b. Predictors: (Constant), sat_brr5, Satisfaction, We don't find a better alternative that can provide
Services to us.

205
Table 5.152: Coefficients for Moderating Role of ‘Lack of Better Alternatives’ on
Satisfaction – Loyalty Relationship
Coefficientsa
Model
Unstandardized
Coefficients
Standardized
Coefficients t Sig.
B Std. Error Beta
1
(Constant) .878 .526 1.669 .097
Satisfaction .777 .156 1.106 4.963 .000
We don't find a better
alternative that can
provide Services to
us.
.548 .155 .977 3.538 .001
sat_brr5 -.130 .045 -1.057 -2.871 .005
a. Dependent Variable: Loyalty
From the above statistical table it may be inferred that ‘Satisfaction’ has significant
impact on ‘Loyalty’. ( t = 4.963 , B = 0.777, p-value = 0.000).
‘Lack of Better Alternatives’ has significant impact on ‘Loyalty’. ( t = 3.538 , B = 0.548,
p-value = 0.001).
Interaction of ‘Satisfaction’ & ‘Lack of Better Alternatives’ also has significant effect on
‘Loyalty’. ( t = -2.871 , B = -0.130, p-value = 0.005).
In the above table, ‘t’ is Test of Significance and ‘B’ is Regression in Weight.
Since the two variables interact we conclude that there is moderation effect. In order to
verify if the relationship between ‘Value’ and ‘Loyalty’ is different across the different
levels of ‘Lack of Better Alternatives’, the interval scale variable is converted in to
categorical variable with two response options ‘Agree’ and ‘Disagree’. A group plot is
constructed to see if the relationship between ‘Satisfaction’ and ‘Loyalty’ is different
across the two levels of ‘Lack of Better Alternatives’.

206
Graph 5.13: Group Plot for Moderating Role of ‘Lack of Better Alternatives’ on
Satisfaction – Loyalty Relationship
From the above it is observed that R2 for ‘Disagree’ is 0.309 and R
2 for ‘Agree’ is 0.232,
this proves that the relationship between ‘Satisfaction’ and ‘Loyalty’ is different across
the two levels of ‘Lack of Better Alternatives’, hence ‘Lack of Better Alternatives’
influences the relationship between ‘Satisfaction’ and ‘Loyalty’.
5.10.13Effect of ‘Compassion with present Service Provider’ on relationship between
Consumer Satisfaction and Consumer Loyalty
Research Question: Whether ‘Compassion with present Service Provider’ has a
moderating role on the relationship between ‘Satisfaction’ and ‘Loyalty’?
Statistical Test: Regression Analysis for Moderating Effect.
Variables and Measurement: Independent Variable – ‘Satisfaction’,
Dependent Variable – ‘Loyalty’, Moderator Variable – ‘Compassion with present Service
Provider’
Hypothesis H0: ‘Compassion with present Service Provider’ does not influence the
relationship between ‘Satisfaction’ and ‘Loyalty’

207
Hypothesis H1: ‘Compassion with present Service Provider’ influences the relationship
between ‘Satisfaction’ and ‘Loyalty’
The statistical analysis tables considering the underlying variables are displayed below.
Table 5.153: Model Summary for Moderating Role of ‘Compassion with the
present Service Provider’ on Satisfaction – Loyalty Relationship
Model R R Square Adjusted R
Square Std. Error of the Estimate
1 .540a .292 .276 .47750
a. Predictors: (Constant), sat_brr6, Satisfaction, We feel embarrassed to inform our current Service
Provider (MSEDCL) that we will be discontinuing the services in near future.
Table 5.154: ANOVA for Moderating Role of ‘Compassion with the present
Service Provider’ on Satisfaction – Loyalty Relationship
Model Sum of
Squares df
Mean
Square F Sig.
1
Regression 12.787 3 4.262 18.694 .000b
Residual 31.009 136 .228
Total 43.795 139
a. Dependent Variable: Loyalty
b. Predictors: (Constant), sat_brr6, Satisfaction, We feel embarrassed to inform our current
Service Provider (MSEDCL) that we will be discontinuing the services in near future.

208
Table 5.155: Coefficients for Moderating Role of ‘Compassion with the Present
Service Provider’ on Satisfaction – Loyalty Relationship
Coefficientsa
Model
Unstandardized
Coefficients
Standardize
d
Coefficients t Sig.
B Std.
Error Beta
1
(Constant) 2.686 .464 5.794 .000
Satisfaction .286 .133 .408 2.150 .033
We feel embarrassed to
inform our current
Service Provider
(MSEDCL) that we
will be discontinuing
the services in near
future.
-.003 .148 -.007 -.024 .981
sat_brr6 .020 .041 .180 .491 .624
a. Dependent Variable: Loyalty
From the above statistical table it may be inferred that ‘Satisfaction’ has significant
impact on ‘Loyalty’. ( t =2.150 , B = 0.286, p-value = 0.033).
‘Compassion with present Service Provider’ has no significant impact on ‘Loyalty’. (t =
-0.024 , B = -0.003, p-value = 0.981).
Interaction of ‘Satisfaction’ & ‘Compassion with present Service Provider’ has no
significant effect on ‘Loyalty’. ( t = 0.491 , B = 0.020, p-value = 0.624).
In the above table, ‘t’ is Test of Significance and ‘B’ is Regression in Weight.
Since the two variables do not interact we conclude that there is no moderation effect. In
order to verify if the relationship between ‘Satisfaction’ and ‘Loyalty’ is different across
the different levels of ‘Compassion with present Service Provider’, the interval scale
variable is converted in to categorical variable with two response options ‘Agree’ and

209
‘Disagree’. A group plot is constructed to see if the relationship between ‘Satisfaction’
and ‘Loyalty’ is different across the two levels of ‘Compassion with present Service
Provider’.
Graph 5.14: Group Plot for Moderating Role of ‘Compassion with the Present
Service Provider’ on Satisfaction – Loyalty Relationship
From the above it is observed that R2 for ‘Disagree’ is 0.147 and R
2 for ‘Agree’ is 0.451,
but the interaction effect of ‘Compassion with present Service Provider’ and
‘Satisfaction’ on ‘Loyalty’ is insignificant, hence the above graph has no relevance.
5.10.14Effect of ‘Loyalty with the present Service Provider’ on correlation between
Consumer Satisfaction and Consumer Loyalty
Research Question: Whether ‘Loyalty with the present Service Provider’ has a
moderating role on the relationship between ‘Satisfaction’ and ‘Loyalty’?
Statistical Test: Regression Analysis for Moderating Effect.
Variables and Measurement: Independent Variable – ‘Satisfaction’,
Dependent Variable – ‘Loyalty’, Moderator Variable – ‘Loyalty with the present Service
Provider’

210
Hypothesis H0: ‘Loyalty with the present Service Provider’ does not influence the
relationship between ‘Satisfaction’ and ‘Loyalty’
Hypothesis H1: ‘Loyalty with the present Service Provider’ influences the relationship
between ‘Satisfaction’ and ‘Loyalty’
The statistical analysis tables considering the underlying variables are displayed below.
Table 5.156: Model Summary for Moderating Role of ‘Loyalty with the present
Service Provider’ on Satisfaction – Loyalty Relationship
Model R R Square Adjusted R
Square Std. Error of the Estimate
1 .636a .404 .391 .43800
a. Predictors: (Constant), sat_brr7, I have a sense of loyalty with my existing service provider that is
MSEDCL., Satisfaction
Table 5.157: ANOVA for Moderating Role of ‘Loyalty with the present Service
Provider’ on Satisfaction – Loyalty Relationship
ANOVAa
Model Sum of
Squares
df Mean
Square
F Sig.
1
Regression 17.705 3 5.902 30.764 .000b
Residual 26.090 136 .192
Total 43.795 139
a. Dependent Variable: Loyalty
b. Predictors: (Constant), sat_brr7, I have a sense of loyalty with my existing service provider that is
MSEDCL., Satisfaction

211
Table 5.158: Coefficients for Moderating Role of ‘Loyalty with the present Service
Provider’ on Satisfaction – Loyalty Relationship
Coefficientsa
Model
Unstandardized
Coefficients
Standardized
Coefficients t Sig.
B Std. Error Beta
1
(Constant) 1.351 .548 2.468 .015
Satisfaction .437 .175 .623 2.498 .014
I have a sense of
loyalty with my
existing service
provider that is
MSEDCL.
.454 .147 .620 3.079 .003
sat_brr7 -.053 .044 -.443 -1.195 .234
a. Dependent Variable: Loyalty
From the above statistical table it may be inferred that ‘Satisfaction’ has significant
impact on ‘Loyalty’. ( t = 2.498 , B = 0.437, p-value = 0.014).
‘Loyalty with the present Service Provider’ also has significant impact on ‘Loyalty’. (t
= 3.079 , B = 0.454, p-value = 0.003).
Interaction of ‘Satisfaction’ & ‘Loyalty with the present Service Provider’ does not have
significant effect on ‘Loyalty’. (t = -1.195 , B = -0.053, p-value = 0.234).
In the above table, ‘t’ is Test of Significance and ‘B’ is Regression in Weight.
Since the two variables do not interact we conclude that there is no moderation effect. In
order to verify if the relationship between ‘Satisfaction’ and ‘Loyalty’ is different across
the different levels of ‘Loyalty with the present Service Provider’, the interval scale
variable is converted in to categorical variable with two response options ‘Agree’ and
‘Disagree’. A group plot is constructed to see if the relationship between ‘Satisfaction’
and ‘Loyalty’ is different across the two levels of ‘Loyalty with the present Service
Provider’.

212
Graph 5.15: Group Plot for Moderating Role of ‘Loyalty with the Present Service
Provider’ on Satisfaction – Loyalty Relationship
From the above it is observed that R2 for ‘Disagree’ is 0.333 and R
2 for ‘Agree’ is 0.202,
but the interaction effect of ‘Loyalty with the present Service Provider’ and ‘Satisfaction’
on ‘Loyalty’ is insignificant, therefore the above graph does not have any relevance.
5.11 Sector wise Analysis
The sector wise analysis is conducted so as to understand the variation of Satisfaction,
Perceived Value, Loyalty, Brand Image, Risk taking ability and Quality consciousness
with respect to Cost. So considering each of the variables mentioned above, the analysis
is carried out to verify whether the variation is across the sectors and if the answer is yes,
then what the variation is? Before going in to the detailed analysis, the sector wise
breakup for the sample is represented below.
Table 5.159: Sector wise Breakup for the Sample
Sr Sector Frequency Percent Cumulative
%
1 Process 7 5.0 5.0
2 Chemical 1 .7 5.7
3 IT Services 47 33.6 39.3
4 Manufacturing 22 15.7 55.0
5 Auto 22 15.7 70.7

213
Sr Sector Frequency Percent Cumulative
%
6 Other Services 1 .7 71.4
7 Education 2 1.4 72.9
8 Construction 8 5.7 78.6
9 Health 1 .7 79.3
10 Public Services 5 3.6 82.9
11 Hospitality 7 5.0 87.9
12 Textile 1 .7 88.6
13 Shopping Mall 11 7.9 96.4
14 Research & Testing 3 2.1 98.6
15 Defense 1 .7 99.3
16 Pharmacy 1 .7 100.0
17 Total 140 100.0
From the above table it is clear that the IT, Auto, Manufacturing and Shopping Malls
are the top four sectors which constitute 72.9 % of the sample and with individual %
representation as 33.6%, 15.7%, 15.7 % & 7.9 % respectively. So these fours sectors will
be considered for analysis and the remaining sectors with be grouped combine under
‘Others’. Therefore the analysis will be amongst five groups namely IT, Auto,
Manufacturing, Shopping Malls and Others. The sector wise breakup points out that the
Industry in and around Pune are dominated by IT Sector followed by Auto &
Manufacturing Sector. The pie chart for the five sectors is displayed below.
Pie Chart 5.1: The Sample Representation – Sector wise
33%
16%16%
8%
27%
Sector
IT
Auto
Manufacturing
Shopping Malls
Others

214
The sector wise analysis for the variables Satisfaction, Perceived Value, Brand Image,
Loyalty, Risk taking ability and Quality consciousness with respect to Cost is as below.
Sector wise analysis for ‘Satisfaction’
Purpose: - To study the sectors IT , Manufacturing, Auto, Others and Shopping Mall
differ over ‘Satisfaction’.
Statistical Tool for Analysis: - One Way ANOVA.
Variables for Measurement: -
Independent Variable: - Industry type i.e. ‘Sector’ is the Independent Variable (I.V.) with
five response options namely IT, Manufacturing, Auto, Shopping Malls and Others.
Dependent Variable: - ‘Satisfaction’ is originally measured using following six items.
Table 5.160: Items considered for measuring ‘Satisfaction’
Item
No. Item Description
1 I am happy with the 'Supply Quality' offered by the MSEDCL.
2 The Supply Provided by MSEDCL is with minimum interruptions.
3 The Outage Management is Satisfactory and Consumers are made aware
of the outages taken by MSEDCL for maintenance.
4 'Load Shedding', is not a problem associated with MSEDCL Services.
5 It is easy to approach or contact the MSEDCL Staff/Engineers in case of
emergency or a problem.
6 I feel comfortable in approaching the MSEDCL staff in case of any
problem.
The above six items are converted in a single item scale using transform – Recode –
Different Variable command in SPSS software.
The Null Hypothesis and the Alternate Hypothesis are mentioned below.
Ho: The five industry groups do not differ over ‘Satisfaction’.
H1: At least one of the groups is different from the rest.
Level of Significance α = 0.05.

215
The tabulation of the SPSS results for One Way ANOVA is as below.
Table 5.161: Results of One-Way ANOVA for analyzing ‘Satisfaction’ Sector wise
Industry Type
(Sector) Mean
Std.
Dev.
Levene
Statistic F
P -
Value Result
IT 3.6223 .74795
L = ( 4, 135)
= 0.751
F =
(4, 135)
= 3.20
0.015 Significant
Manufacturing 2.9205 .86735
Auto 3.4545 .81517
Others 3.5000 .79483
Shopping
Malls 3.3636 .47911
Total 3.4321 .79953
The result in the above table is ‘Significant’, which means the Alternate Hypothesis
H1, is accepted i.e. the ‘Satisfaction’ is different in at least one of the groups. From the
above table it is clear that the ‘Mean’ for IT Sector is the highest with a value of 3.6223.
the ‘Mean’ values for ‘Auto’, ‘Others’ is above average value of ‘Mean’ i.e. 3.4321 and
‘Mean’ value for ‘Shopping Mall’ is 3.3636 which is also close to the average value of
the Mean which indicates that the ‘Satisfaction’ for IT, Auto, Others and Shopping Malls
is favorable. The ‘Mean’ value for ‘Manufacturing’ sector in the above table is 2.9205,
which points out that the ‘Satisfaction’, in this sector is adverse.
The table below also tells that the ‘Mean’ value of IT and Manufacturing differ
considerably and thus fall in different subsets. The values are marked in red color.
Table 5.162: Hochberg Homogeneous Subsets (Satisfaction)
Industry type N Subset for alpha = 0.05
1 2
Manufacturing 22 2.9205
Shopping Malls 11 3.3636 3.3636
Auto 22 3.4545 3.4545
Others 38 3.5000 3.5000
IT 47 3.6223
Sig. .138 .956

216
Graph 5.16: Graphical Representation of the Sector wise Mean for ‘Satisfaction’
Sector wise analysis for ‘Brand Image’
Purpose: - To study the sectors IT , Manufacturing, Auto, Others and Shopping Mall
differ over ‘Brand Image’.
Statistical Tool for Analysis: - One Way ANOVA.
Variables for Measurement: -
Independent Variable: - Industry type i.e. ‘Sector’ is the Independent Variable (I.V.) with
five response options namely IT, Manufacturing, Auto, Shopping Malls and Others.
Dependent Variable: - ‘Brand Image’ is originally measured using following six items.
Table 5.163: Items Considered for Measuring ‘Brand Image’
Item
No. Item Description
1 The Business Practices of MSEDCL are Ethical and Transparent.
2 MSEDCL is the most trusted Service provider as compared to its
Competitors.
3 MSEDCL is a Government Owned Company and has Social Obligations to
fulfill and does not work only to gain profits.
4 The MSEDCL company has taken necessary efforts to improve its
infrastructure to provide quality power to its Consumers.
3.62
2.92
3.45 3.363.5
1
1.5
2
2.5
3
3.5
4
4.5
5
IT Manufacturing Auto Shopping Malls Others

217
Item
No. Item Description
5 Although, with the introduction of Open Access Policy the Power
Distribution Sector has become very competitive, the MSEDCL has the
capability to face the future challenges.
6 The Business transactions with MSEDCL are very fair and even if provided
with a choice to select service provider, I / We prefer to be associated with
the MSEDCL.
The above six items are converted in a single item scale using transform – Recode –
Different Variable command in SPSS software.
The Null Hypothesis and the Alternate Hypothesis are mentioned below.
Ho: The five industry groups do not differ over ‘Brand Image’.
H1: At least one of the groups is different from the rest.
Level of Significance α = 0.05.
The tabulation of the SPSS results for One Way ANOVA is as below.
Table 5.164: Results of One-Way ANOVA for analyzing ‘Brand Image’ Sector wise
Industry Type
(Sector) Mean
Std.
Dev.
Levene
Statistic F
P -
Value Result
IT 3.8050 .55747
L =
( 4, 135) =
0.545
F =
(4, 135)
= 5.166
0.001 Significant
Manufacturing 3.1818 .55135
Auto 3.7273 .73920
Others 3.3904 .60562
Shopping
Malls 3.5909 .66818
Total 3.5655 .64525
The result in the above table is ‘Significant’, which means the Alternate Hypothesis
H1, is accepted i.e. the ‘Brand Image’ is different in at least one of the groups. From the
above table it is clear that the ‘Mean’ for IT Sector is the highest with a value of 3.8050.
The ‘Mean’ values for ‘Auto’, ‘Shopping Malls’ is above average value of ‘Mean’ i.e.
3.5655 and ‘Mean’ value for ‘Others’ and ‘Manufacturing’ are 3.3904 and 3.1818
respectively are lesser than the average value of the Mean which indicates that the ‘Brand

218
Image’ for IT, Auto, ‘Others’ and ‘Shopping Malls’ is favorable. The ‘Mean’ value for
‘Manufacturing’ sector in the above table is 3.1818, which points out that the ‘Brand
Image’, in this sector is moderately favorable.
The table below also tells that the ‘Mean’ values of IT & Auto are displayed in one
subset whereas the ‘Mean’ value of Manufacturing is being displayed in other subset. The
values are marked in red color.
Table 5.165: Hochberg Homogeneous Subsets (Brand Image)
Industry type N Subset for alpha = 0.05
1 2
Manufacturing 22 3.1818
Others 38 3.3904 3.3904
Shopping Malls 11 3.5909 3.5909
Auto 22 3.7273
IT 47 3.8050
Sig. .247 .232
Graph 5.17: Graphical Representation of the Sector wise Mean for ‘Brand Image’
3.8
3.18
3.723.59
3.39
1
1.5
2
2.5
3
3.5
4
4.5
5
IT Manufacturing Auto Shopping Malls Others

219
Sector wise analysis for ‘Loyalty’
Purpose: - To study the sectors IT , Manufacturing, Auto, Others and Shopping Mall
differ over ‘Loyalty’.
Statistical Tool for Analysis: - Kruskal Wallis Test (As the Data Distribution is not
Normal).
Variables for Measurement: -
Independent Variable: - Industry type i.e. ‘Sector’ is the Independent Variable ( I.V.)
with five response options namely IT, Manufacturing, Auto, Shopping Malls and Others.
Dependent Variable: - ‘Loyalty’ is originally measured using following Five items.
Table 5.166: Items Considered for Measuring ‘Loyalty’
Item
No. Item Description
1 We feel proud in being associated with MSEDCL as their Consumer.
2 We have a genuine relationship with MSEDCL as a Consumer.
3 Majority of neighboring Consumers, Friends and Relatives etc avail the
services of MSEDCL.
4 I convey positive 'word of mouth' publicity about my present Service
Provider (MSEDCL).
5 I recommend the services of the present service provider (MSEDCL), if
someone seeks my suggestion.
The above five items are converted in a single item scale using transform – Recode –
Different Variable command in SPSS software.
The Null Hypothesis and the Alternate Hypothesis are mentioned below.
Ho: The five industry groups do not differ over ‘Loyalty’.
H1: At least one of the groups is different from the rest.
Level of Significance α = 0.05.

220
Table 5.167: Kruskal Wallis Test Results for Sector wise Analysis of ‘Loyalty’
Industry Type
(Sector) Mean
Std.
Dev. Chi Square df
P -
Value Result
IT 3.9617 .50843
5.745 4 0.219 Insignificant
Manufacturing 3.7455 .61468
Auto 3.9818 .58849
Others 3.7737 .55832
Shopping
Malls 3.7818 .60962
Total 3.8657 .56132
The result in the above table is ‘Insignificant’, which means the Null Hypothesis H0,
is retained i.e. the ‘Loyalty’ is almost same in all the groups. From the above table it is
clear that the ‘Mean’ for ‘Auto’ Sector is the highest with a value of 3.9818. The ‘Mean’
values for ‘IT’ is 3.9617 and again the ‘Mean’ value for ‘Manufacturing’ is lowest
amongst all the groups’ i.e. 3.7455. But it must be noted that the ‘Mean’ for Loyalty for
all the sectors is favorable.
Sector wise analysis for ‘Perceived Value’
Purpose: - To study the sectors IT , Manufacturing, Auto, Others and Shopping Mall
differ over ‘Perceived Value’.
Statistical Tool for Analysis: - Kruskal Wallis Test (As the Data Distribution is not
Normal).
Variables for Measurement: -
Independent Variable: - Industry type i.e. ‘Sector’ is the Independent Variable ( I.V.)
with five response options namely IT, Manufacturing, Auto, Shopping Malls and Others.
Dependent Variable: - ‘Perceived Value’ is originally measured using following Ten
items. The table is displayed below.

221
Table 5.168: Items Considered for Measuring ‘Value’
Item
No. Item Description
1 The MSEDCL Offices and Fuse Call Centers are located at convenient
places and are easily accessible.
2 The Services Offered by MSEDCL to its Consumers is at a Cheaper Cost.
3 The time and effort needed in resolving a complaint with MSEDCL
services is less or adequate.
4 Even if in case of any problem associated with the MSEDCL service, we
are not panic and we feel assured that the problem would be resolved with
ease.
5 The working hours of MSEDCL Company are as per the Consumer
convenience.
6 Even in case of Power Scarcity Situation, the MSEDCL company takes
special efforts to provide with or maintain for uninterrupted power supply to
its Consumers.
7 The risk associated in transactions with MSEDCL is least.
8 The quality of services offered by MSEDCL has improved significantly over
last few years.
9 The present service provider (MSEDCL) has better staff with adequate
knowledge to handle Consumer Complaints.
10 The present Service Provider (MSEDCL) has better infrastructure as
compared to its Competitors.
The above ten items are converted in a single item scale using transform – Recode –
Different Variable command in SPSS software.
The Null Hypothesis and the Alternate Hypothesis are mentioned below.
Ho: The five industry groups do not differ over ‘Perceived Value’.
H1: At least one of the groups is different from the rest.
Level of Significance α = 0.05.

222
Table 5.169: Kruskal Wallis Test Results for Sector wise Analysis of ‘Value’
Industry Type
(Sector) Mean Std. Dev. Chi
Square df
p -
Value Result
IT 3.6362 .49757
7.483 4 0.112 Insignificant
Manufacturing 3.3091 .51354
Auto 3.5682 .50463
Others 3.3868 .61564
Shopping Malls 3.3455 .51839
Total 3.4836 .54622
The result in the above table is ‘Insignificant’, which means the Null Hypothesis H0,
is retained i.e. the ‘Perceived Value’ is almost same in all the groups. From the above
table it is clear that the ‘Mean’ for ‘IT’ Sector is the highest with a value of 3.6362. The
‘Mean’ values for ‘Auto’ is 3.5682 and again the ‘Mean’ value for ‘Manufacturing’ is
lowest amongst all the groups’ i.e. 3.3091. But it must be noted that the ‘Mean’ for
‘Perceived Value’ for all the sectors is favorable.
Sector wise analysis for ‘Quality Consciousness with respect to Cost’
Purpose: - To study the sectors IT , Manufacturing, Auto, Others and Shopping Mall
differ over ‘Quality Consciousness with respect to Cost’.
Statistical Tool for Analysis: - One Way ANOVA.
Variables for Measurement: -
Independent Variable: - Industry type i.e. ‘Sector’ is the Independent Variable ( I.V.)
with five response options namely IT, Manufacturing, Auto, Shopping Malls and Others.
Dependent Variable: - ‘Quality Consciousness with respect to Cost’ is originally
measured using following the item.
Table 5.170: Item Considered for Measuring ‘Quality Consciousness with respect to
Cost’
No. Item Description
1 The Electricity Consumers would not really mind paying more for Reliable
and Quality Services.

223
The Null Hypothesis and the Alternate Hypothesis are mentioned below.
Ho: The five industry groups do not differ over ‘Quality Consciousness with respect to
Cost’.
H1: At least one of the groups is different from the rest.
Level of Significance α = 0.05.
Table 5.171: Results of One-Way ANOVA for Analyzing ‘Quality Consciousness
with respect to Cost’ Sector wise
Industry Type
(Sector) Mean
Std.
Dev.
Levene
Statistic F
p -
Value Result
IT 3.5745 1.19318
L = ( 4,
135) =
0.506
F =
(4,
135) =
2.213
0.071 Insignificant
Manufacturing 3.2273 1.10978
Auto 3.7727 1.15189
Others 3.0263 .99964
Shopping
Malls 3.5455 .82020
Total 3.4000 1.11755
The result in the above table is ‘Insignificant’, which means the Null Hypothesis H0,
is retained i.e. the ‘Quality Consciousness with respect to Cost’ is same amongst all the
groups. From the above table it is clear that the ‘Mean’ for ‘Auto’ Sector is the highest
with a value of 3.7727. The ‘Mean’ value for ‘Others’ is the lowest with a value of
3.0263 which tells that the consumers are ‘Neutral’ or ‘Undecided’ about the underlying
factor, ‘Quality Consciousness with respect to Cost’. The ‘Mean’ value for remaining
sectors is above ‘Three’ and may be considered favorable, i.e. the consumers would
agree to pay a premium for quality services.
The table below also tells that the ‘Mean’ value of all the five sectors fall under one
subset. This further confirms the above interpretation of the data.

224
Table 5.172: Hochberg Homogeneous Subsets (Quality Consciousness with respect
to Cost)
Industry type N Subset for alpha = 0.05
1
Others 38 3.0263
Manufacturing 22 3.2273
Shopping Malls 11 3.5455
IT 47 3.5745
Auto 22 3.7727
Sig. .233
Graph 5.18: Graphical Representation of the Sector wise- Mean for ‘Quality
Consciousness with respect to Cost’
3.57
3.22
3.773.54
3.02
1
1.5
2
2.5
3
3.5
4
4.5
5
IT Manufacturing Auto Shopping Malls Others

225
Sector wise analysis for ‘Risk Taking Ability’
Purpose: - To study the sectors IT , Manufacturing, Auto, Others and Shopping Mall
differ over ‘Risk Taking Ability’.
Statistical Tool for Analysis: - One Way ANOVA.
Variables for Measurement: -
Independent Variable: - Industry type i.e. ‘Sector’ is the Independent Variable ( I.V.)
with five response options namely IT, Manufacturing, Auto, Shopping Malls and Others.
Dependent Variable: - ‘Risk Taking Ability’ is originally measured using following the
item.
Table 5.173: Item Considered for Measuring ‘Risk Taking Ability’
Item
No. Item Description
1 The Open Access policy offers choice to the Electricity Consumers to
select their Service Provider. So, I /We would definitely avail of this
facility and plan to switch over to a New Service Provider.
The Null Hypothesis and the Alternate Hypothesis are mentioned below.
Ho: The five industry groups do not differ over ‘Risk Taking Ability’.
H1: At least one of the groups is different from the rest.
Level of Significance α = 0.05.
Table 5.174: Results of One-Way ANOVA for Analyzing ‘Risk Taking Ability’
Sector wise
Industry Type
(Sector) Mean
Std.
Dev.
Levene
Statistic F
p -
Value Result
IT 3.3191 .78315
L = ( 4, 135)
= 2.712
F =
(4, 135)
= 0.919
0.455 Insignificant
Manufacturing 3.2727 .76730
Auto 3.5455 .85786
Others 3.3158 .84166
Shopping
Malls 3.0000 .44721
Total 3.3214 .78902

226
The result in the above table is ‘Insignificant’, which means the Null Hypothesis H0,
is retained i.e. the ‘Risk Taking Ability’ is same amongst all the groups. From the above
table it is clear that the ‘Mean’ for ‘Auto’ Sector is the highest with a value of 3.5455.
The ‘Mean’ value for ‘Shopping Malls’ is the lowest with a value of 3.0000 which tells
that the consumers are ‘Neutral’ or ‘Undecided’ about the underlying factor, ‘Risk
Taking Ability’. The ‘Mean’ value for remaining sectors is above ‘Three’ and may be
considered towards favorable, i.e. the consumers may plan to switch over to another
service provider by availing the option of Open Access Policy.
The table below also tells that the ‘Mean’ value of all the five sectors fall under one
subset. This further confirms the above interpretation of the data.
Table 5.175: Hochberg Homogeneous Subsets (Risk Taking Ability)
Industry type N Subset for alpha = 0.05
1
Shopping Malls 11 3.0000
Manufacturing 22 3.2727
Others 38 3.3158
IT 47 3.3191
Auto 22 3.5455
Sig. .215
Graph 5.19: Graphical Representation of the Sector wise Mean for ‘Risk Taking
Ability’
3.32 3.27
3.54
3
3.31
1
1.5
2
2.5
3
3.5
4
4.5
5
IT Manufacturing Auto Shopping Malls Others

227
5.12 Circle wise Analysis
The Circle wise analysis is conducted so as to understand the variation of
Satisfaction, Perceived Value, Loyalty, Brand Image, Risk taking ability and Quality
consciousness with respect to Cost. So considering each of the variables mentioned
above, the analysis is carried out to verify whether the variation is across the Circles
and if the answer is yes, then what the variation is? Before going in to the detailed
analysis, the Circle wise breakup for the sample is represented below. The Pune Zone
has three Circles namely the Rastapeth, the Ganeshkhind and the Pune Rural. The
Rastapeth and the Ganeshkhind are urban circles. The Rastapeth Circle caters to
Consumers falling under the limits of Pune Municipal Corporation, the Ganeshkhind
Circle mainly caters the load demand of Consumers falling under the limits of Pimpri
Chinchwad Municipal Corporation and the Pune Rural Circle caters the demand of
Consumers in the outskirts of Pune like Chakan, Alandi, Talegaon, Mulshi etc. The
circle wise count of Consumers in the sample under the Rastapeth, the Ganeshkhind
and the Pune Rural Circle are fifty five, fifty one and thirty four respectively. The pie
chart of % consumers represented under three Circles is displayed below.
Pie Chart 5.2: The Sample Representation - Circle wise
39%
37%
24%
Circles
Urban Rastapeth
Urban Ganeshkhind
Rural Pune

228
The Circle wise analysis will help to determine the relative positions of the circles
considering the above mentioned variables. Understanding the relative position of the
Circles will help the MSEDCL to focus its attention on specific areas.
Circle wise analysis for ‘Satisfaction’
Purpose: - To study the Circles Urban Rastapeth, Urban Ganeshkhind and Rural Pune,
differ over ‘Satisfaction’.
Statistical Tool for Analysis: - One Way ANOVA.
Variables for Measurement: -
Independent Variable: - ‘Circle’ is the Independent Variable ( I.V.) with three response
options namely Urban Rastapeth, Urban Ganeshkhind and Rural Pune.
Dependent Variable: - ‘Satisfaction’ is originally measured using six items displayed in
the Table 5.160. These Six Items are converted in a single item scale using Transform –
Recode – Different Variable command in SPSS software.
The Null Hypothesis and the Alternate Hypothesis are mentioned below.
Ho: The three Circles do not differ over ‘Satisfaction’.
H1: At least one of the Circles is different from the rest.
Level of Significance α = 0.05.
The tabulation of the SPSS results for One Way ANOVA is as below.
Table 5.176: Results of One-Way ANOVA for Analyzing ‘Satisfaction’ Circle wise
Name of the
Circle Mean
Std.
Dev.
Levene
Statistic F
P -
Value Result
Urban
Rastapeth 3.4091 .71259
L = ( 2, 137)
= 0.337
F =
(2, 137)
= 1.18
0.311 Insignificant Urban
Ganeshkhind 3.5539 .82510
Rural Pune 3.2868 .88577
Total 3.4321 .79953
The result in the above table is ‘Insignificant’, which means the Null Hypothesis H0,
is retained i.e. three Circles do not differ over ‘Satisfaction’. From the above table it is
clear that the ‘Mean’ for Urban Ganeshkhind Circle is the highest with a value of 3.5539
and the Mean value for Rural Pune Circle is the lowest at 3.2868. The value of the

229
‘Mean’ in the table above indicates that the ‘Satisfaction’ for the three Circles is
favorable. The table below also tells that the ‘Mean’ value of all the Circles falls under
one subset. This further confirms the above interpretation.
Table 5.177: Hochberg Homogeneous Subsets (Circle wise - Satisfaction)
Name of the Circle N Subset for alpha = 0.05
1
Rural Pune 34 3.2868
Urban Rastapeth 55 3.4091
Urban Ganeshkhind 51 3.5539
Sig. .308
Graph 5.20: Graphical Representation of the Circle wise Mean for ‘Satisfaction’
3.553.4
3.28
1
1.5
2
2.5
3
3.5
4
4.5
5
Ganeshkhind Urban Rastapeth Urban Pune Rural

230
Circle wise analysis for ‘Brand Image’
Purpose: - To study the Circles Urban Rastapeth, Urban Ganeshkhind and Rural Pune,
differ over ‘Brand Image’.
Statistical Tool for Analysis: - One Way ANOVA.
Variables for Measurement: -
Independent Variable: - ‘Circle’ is the Independent Variable ( I.V.) with three response
options namely Urban Rastapeth, Urban Ganeshkhind and Rural Pune.
Dependent Variable: - ‘Brand Image’ is originally measured using six items displayed in
the Table 5.163. These Six Items are converted in a single item scale using Transform –
Recode – Different Variable command in SPSS software.
The Null Hypothesis and the Alternate Hypothesis are mentioned below.
Ho: The three Circles do not differ over ‘Brand Image’.
H1: At least one of the Circles is different from the rest.
Level of Significance α = 0.05.
The tabulation of the SPSS results for One Way ANOVA is as below.
Table 5.178: Results of One-Way ANOVA for Analyzing ‘Brand Image’ Circle wise
Name of the
Circle Mean
Std.
Dev.
Levene
Statistic F
P -
Value Result
Urban
Rastapeth 3.5394 .56197
L = ( 2, 137)
= 3.267
F =
(2, 137)
= 3.016
0.052 Significant Urban
Ganeshkhind 3.7190 .56617
Rural Pune 3.3775 .82297
Total 3.5655 .64525
The result in the above table is ‘Significant’, which means the Alternate Hypothesis
H1, is accepted i.e. at least one of the three Circles differs over ‘Brand Image’. From the
above table it is clear that the ‘Mean’ for Urban Ganeshkhind Circle is the highest with a
value of 3.719 and the Mean value for Rural Pune Circle is the lowest at 3.3775. The
value of the ‘Mean’ in the table above indicates that the ‘Brand Image’ for the three
Circles is favorable.

231
The table below also tells that the ‘Mean’ value of Rural Pune and Urban
Ganeshkhind falls under two different subsets. The values are highlighted in the red.
Thus the Mean values of Brand Image for Rural Pune and Urban Ganeshkhind Circles are
different. This further confirms the above interpretation.
Table 5.179: Hochberg Homogeneous Subsets (Circle wise - Brand Image)
Name of the
Circle N
Subset for alpha = 0.05
1 2
Rural Pune 34 3.3775
Urban Rastapeth 55 3.5394 3.5394
Urban
Ganeshkhind 51 3.7190
Sig. .544 .456
Graph 5.21: Graphical Representation of the Circle wise Mean for ‘Brand Image’
3.723.54
3.38
1
1.5
2
2.5
3
3.5
4
4.5
5
Ganeshkhind Urban Rastapeth Urban Pune Rural

232
Circle wise analysis for ‘Loyalty’
Purpose: - To study the Circles Urban Rastapeth, Urban Ganeshkhind and Rural Pune,
differ over ‘Loyalty’.
Statistical Tool for Analysis: - Kruskal Wallis Test (As the Data Distribution is not
Normal).
Variables for Measurement: -
Independent Variable: - ‘Circle’ is the Independent Variable ( I.V.) with three response
options namely Urban Rastapeth, Urban Ganeshkhind and Rural Pune.
Dependent Variable: - ‘Loyalty’ is originally measured using Five items as revealed in
the Table 5.166.These five items are converted in a single item scale using Transform –
Recode – Different Variable command in SPSS software.
The Null Hypothesis and the Alternate Hypothesis are mentioned below.
Ho: The three ‘Circles’ do not differ over ‘Loyalty’.
H1: At least one of the Circles is different from the rest.
Level of Significance α = 0.05.
The tabulation of the SPSS results for Kruskal Wallis Test is as below.
Table 5.180: Kruskal Wallis Test Results for Circle wise Analysis of ‘Loyalty’
Name of the
Circle Mean
Std.
Dev. Chi Square df
P -
Value Result
Urban
Rastapeth 3.8400 .50976
3.957 1 0.047 Significant Urban
Ganeshkhind 3.9686 .47222
Rural Pune 3.7529 .73039
Total 3.8657 .56132
The result in the above table is ‘Significant’, which means the Null Hypothesis H0, is
not retained i.e. the ‘Loyalty’ is not same in all the groups. From the above table it is
clear that the ‘Mean’ for ‘Ganesh Khind Urban’ Circle is the highest with a value of
3.9686. The ‘Mean’ values for ‘Rastapeth Urban Circle’ is 3.84 and the ‘Mean’ value for
‘Pune Rural Circle’ is lowest amongst all the groups’ i.e. 3.7529. But it must be noted
that the ‘Mean’ for Loyalty for all the Circles is favorable.

233
Sector wise analysis for ‘Perceived Value’
Purpose: - To study the Circles Urban Rastapeth, Urban Ganeshkhind and Rural Pune,
differ over ‘Perceived Value’.
Statistical Tool for Analysis: - Kruskal Wallis Test (As the Data Distribution is not
Normal).
Variables for Measurement: -
Independent Variable: - ‘Circle’ is the Independent Variable ( I.V.) with three response
options namely Urban Rastapeth, Urban Ganeshkhind and Rural Pune.
Dependent Variable: - ‘Perceived Value’ is originally measured using Ten items already
shown in the Table 5.168. These Ten items are converted in a single item scale using
Transform – Recode – Different Variable command in SPSS software.
The Null Hypothesis and the Alternate Hypothesis are mentioned below.
Ho: The three ‘Circles’ do not differ over ‘Perceived Value’.
H1: At least one of the Circles is different from the rest.
Level of Significance α = 0.05.
The tabulation of the SPSS results for Kruskal Wallis Test is as below.
Table 5.181: Kruskal Wallis Test Results for Circle wise Analysis of ‘Value’
Name of the
Circle Mean
Std.
Dev. Chi Square df
p –
Value Result
Urban
Rastapeth 3.4164 .57535
7.535 1 0.006 Significant Urban
Ganeshkhind 3.6176 .39684
Rural Pune 3.3912 .65753
Total 3.4836 .54622
The result in the above table is ‘Insignificant’, which means the Null Hypothesis H0,
is not retained i.e. the ‘Perceived Value’ is different in all the groups. From the above
table it is clear that the ‘Mean’ for ‘Urban Ganeshkhind’ Circle is the highest with a value
of 3.6176. The ‘Mean’ values for ‘Urban Rastapeth’ is 3.4164 and the ‘Mean’ value for

234
‘Rural Pune’ is lowest amongst all the groups’ i.e. 3.3912. But it must be noted that the
‘Mean’ for ‘Perceived Value’ for all the Circles is moderately favorable.
Circle wise analysis for ‘Quality Consciousness with respect to Cost’
Purpose: - To study the Circles Urban Rastapeth, Urban Ganeshkhind and Rural Pune,
differ over ‘Quality Consciousness with respect to Cost’.
Statistical Tool for Analysis: - One Way ANOVA.
Variables for Measurement: -
Independent Variable: - ‘Circle’ is the Independent Variable ( I.V.) with three response
options namely Urban Rastapeth, Urban Ganeshkhind and Rural Pune.
Dependent Variable: - ‘Quality Consciousness with respect to Cost’ is originally
measured using the item revealed in the Table 5.170.
The Null Hypothesis and the Alternate Hypothesis are mentioned below.
Ho: The three Circles do not differ over ‘Quality Consciousness with respect to Cost’.
H1: At least one of the Circles is different from the rest.
Level of Significance α = 0.05.
The tabulation of the SPSS results for One Way ANOVA is as below.
Table 5.182: One Way ANOVA Results for Circle wise Analysis of ‘Quality
Consciousness with respect to Cost’
Name of the
Circle Mean
Std.
Dev.
Levene
Statistic F
P –
Value Result
Urban
Rastapeth 3.0182 1.06268
L = ( 2, 137)
= 0.063
F =
(2, 137)
= 5.731
0.004 Significant Urban
Ganeshkhind 3.6863 1.06752
Rural Pune 3.5882 1.13131
Total 3.4000 1.11755
The result in the above table is ‘Significant’, which means the Alternate Hypothesis
H1, is accepted i.e. at least one of the three Circles differs over ‘Quality Consciousness
with respect to Cost’. From the above table it is clear that the ‘Mean’ for Urban
Ganeshkhind Circle is the highest with a value of 3.6863 and the Mean value for Urban

235
Rastapeth Circle is the lowest at 3.0182. The value of the ‘Mean’ in the table above
indicates that the ‘Quality Consciousness with respect to Cost’ for the Urban
Ganeshkhind and Rural Pune Circles is more.
The table below also tells that the ‘Mean’ value of Rural Pune and Urban
Ganeshkhind falls under one subset and the value of Urban Rastapeth Circle falls under
other subset. The values are highlighted in the red. This further confirms the above
interpretation.
Table 5.183: Hochberg Homogeneous Subsets (Circle wise - Quality Consciousness
with respect to Cost)
Name of the
Circle N
Subset for alpha = 0.05
1 2
Urban Rastapeth 55 3.0182
Rural Pune 34 3.5882
Urban
Ganeshkhind 51 3.6863
Sig. 1.000 .963
Graph 5.22: Graphical Representation for Circle wise Mean for ‘Quality
Consciousness with respect to Cost’
3.69
3.02
3.59
1
1.5
2
2.5
3
3.5
4
4.5
5
Ganeshkhind Urban Rastapeth Urban Pune Rural

236
Circle wise analysis for ‘Risk Taking Ability’
Purpose: - To study the Circles Urban Rastapeth, Urban Ganeshkhind and Rural Pune,
differ over ‘Risk Taking Ability’.
Statistical Tool for Analysis: - One Way ANOVA.
Variables for Measurement: -
Independent Variable: - ‘Circle’ is the Independent Variable ( I.V.) with three response
options namely Urban Rastapeth, Urban Ganeshkhind and Rural Pune.
Dependent Variable: - ‘Risk Taking Ability’ is originally measured using the item
displayed in the Table 5.173.
The Null Hypothesis and the Alternate Hypothesis are mentioned below.
Ho: The three Circles do not differ over ‘Risk Taking Ability’.
H1: At least one of the Circles is different from the rest.
Level of Significance α = 0.05.
The tabulation of the SPSS results for One Way ANOVA is as below.
Table 5.184: One Way ANOVA Results for Circle wise Analysis of ‘Risk Taking
Ability’
Name of the
Circle Mean
Std.
Dev.
Levene
Statistic F
P –
Value Result
Urban
Rastapeth 3.1455 .80319
L = ( 2, 137)
= 4.696
F =
(2, 137)
= 3.717
0.027 Significant Urban
Ganeshkhind 3.5490 .54088
Rural Pune 3.2647 .99419
Total 3.3214 .78902
The result in the above table is ‘Significant’, which means the Alternate Hypothesis
H1, is accepted i.e. at least one of the three Circles differs over ‘Risk Taking Ability’.
From the above table it is clear that the ‘Mean’ for Urban Ganeshkhind Circle is the
highest with a value of 3.5490 and the Mean value for Urban Rastapeth Circle is the
lowest at 3.1455. The value of the ‘Mean’ in the table above indicates that the ‘Risk
Taking Ability’ in switching from one Service Provider to the other for the Urban
Ganeshkhind and Rural Pune Circles is more.

237
The table below also tells that the ‘Mean’ value of Urban Ganeshkhind falls under
one subset and the value of Urban Rastapeth Circle under other subset. The values are
highlighted in the red. This further confirms the above interpretation.
Table 5.185: Hochberg Homogeneous Subsets (Circle wise- Risk Taking Ability)
Name of the
Circle N
Subset for alpha = 0.05
1 2
Urban Rastapeth 55 3.1455
Rural Pune 34 3.2647 3.2647
Urban
Ganeshkhind 51 3.5490
Sig. .848 .233
Graph 5.23: Graphical Representation for Circle wise Mean for ‘Risk Taking
Ability’
3.55
3.153.26
1
1.5
2
2.5
3
3.5
4
4.5
5
Ganeshkhind Urban Rastapeth Urban Pune Rural

238
5.13 Testing the Consumer Retention Model
The basic aim of the research is to come up with a Consumer Retention Model. The
conceptual model is already discussed in the Chapter Three of the Thesis, the testing of
model using Structural Equation Modeling would examine if the sample data fits the
theoretical model. If the sample data fits the theoretical model then it may be said that the
Model sustains in the field conditions. The Strength of relationships between various
variables of model i.e. Perceived Value, Satisfaction, Brand Image and Loyalty are
already derived in the Section 5.9 of this Chapter, but the strength of relationship does
not tell anything about the cause – effect relationship between the variables. The test
conducted below would also bring to light the predictors of Satisfaction, Brand Image
and Loyalty.
Purpose: To study the predictors of Consumer Loyalty
Statistical Test: Confirmatory factor analysis and Structural Equation Modeling
The Hypothetical Model
The model consisted of one exogenous variable (Perceived value) and three endogenous
variables (Loyalty, Brand Image, and Satisfaction)
The hypothetical paths are given below
1. Perceived value is a positive predictor of Brand Loyalty
2. Perceived value is a positive predictor of Brand Image
3. Perceived value is a positive predictor of Satisfaction
4. Satisfaction is a positive predictor of Brand Image
5. Satisfaction is a positive predictor of Consumer Loyalty
6. Brand Image is positive predictor Consumer Loyalty

239
Figure 5.1: Blueprint of the Hypothetical Model
A two-step Structural Equation Modeling strategy using IBM SPSS Amos 20; a full
information maximum likelihood procedure was employed in estimating the parameters.
Measurement model was tested before the assessment of structural model. Although the
measurement model provides an assessment of convergent validity and discriminant
validity of the latent factors, the measurement model in conjunction with the structural
model enables a comprehensive assessment of the full latent model.
Variables and Measurement:
The exogenous variable “Perceived value” was measured using a 10-item inventory as
shown below. Also the three endogenous variables namely, Brand Image, Satisfaction
and Loyalty are also tabulated below.

240
Table 5.186: Items for Measuring Exogenous Variable ‘Perceived Value’
Item
No. Item Description
1 The MSEDCL Offices and Fuse Call Centers are located at convenient
places and are easily accessible.
2 The Services Offered by MSEDCL to its Consumers is at a Cheaper Cost.
3 The time and effort needed in resolving a complaint with MSEDCL
services is less or adequate.
4 Even if in case of any problem associated with the MSEDCL service, we
are not panic and we feel assured that the problem would be resolved with
ease.
5 The working hours of MSEDCL Company are as per the Consumer
convenience.
6 Even in case of Power Scarcity Situation, the MSEDCL company takes
special efforts to provide with or maintain for uninterrupted power supply
to its Consumers.
7 The risk associated in transactions with MSEDCL is least.
8 The quality of services offered by MSEDCL has improved significantly
over last few years.
9 The present service provider (MSEDCL) has better staff with adequate
knowledge to handle Consumer Complaints.
10 The present Service Provider (MSEDCL) has better infrastructure as
compared to its Competitors.
Table 5.187: Items for Measuring Endogenous Variable ‘Brand Image’
Latent
construct Brand image
Item 1 (BIM1) The Business Practices of MSEDCL are Ethical and Transparent.
Item 2 (BIM2) MSEDCL is the most trusted Service provider as compared to its
Competitors.
Item 3 (BIM3) MSEDCL is a Government Owned Company and has Social
Obligations to fulfill and does not work only to gain profits.
Item 4 (BIM4) The MSEDCL company has taken necessary efforts to improve its
infrastructure to provide quality power to its Consumers.
Item 5 (BIM5) Although, with the introduction of Open Access Policy the Power
Distribution Sector has become very competitive, the MSEDCL
has the capability to face the future challenges.
Item 6 (BIM6) The Business transactions with MSEDCL are very fair and even if
provided with a choice to select service provider, I / We prefer to
be associated with the MSEDCL.

241
Table 5.188: Items for Measuring Endogenous Variable ‘Satisfaction’
Latent
construct Satisfaction
Item 1 (Sat1) I am happy with the 'Supply Quality' offered by the MSEDCL.
Item 2 (Sat2) The Supply Provided by MSEDCL is with minimum interruptions.
Item 3 (Sat3) The Outage Management is Satisfactory and Consumers are made
aware of the outages taken by MSEDCL for maintenance.
Item 4 (Sat4) 'Load Shedding', is not a problem associated with MSEDCL
Services.
Item 5 (Sat5) It is easy to approach or contact the MSEDCL Staff/Engineers in
case of emergency or a problem.
Item 6 (Sat6) I feel comfortable in approaching the MSEDCL staff in case of
any problem.
Table 5.189: Items for Measuring Endogenous Variable ‘Loyalty’
Latent
construct Loyalty
Item 1 (Loy1) We feel proud in being associated with MSEDCL as their
Consumer.
Item 2 (Loy2) We have a genuine relationship with MSEDCL as a Consumer.
Item 3 (Loy3) Majority of neighboring Consumers, Friends and Relatives etc avail
the services of MSEDCL.
Item 4 (Loy4) I convey positive 'word of mouth' publicity about my present
Service Provider (MSEDCL).
Item 5 (Loy5) I recommend the services of the present service provider
(MSEDCL), if someone seeks my suggestion.
Confirmatory Factor Analysis
Confirmatory factor analysis is a way of testing how well the indicators of a construct
represent the construct. SEM involves testing two models: measurement model and
structural model. CFA is used to validate the measurement model. The researcher’s
hypothesized model included 4 latent construct (Perceived Value, Brand Image,
Satisfaction and Loyalty).
Confirmatory analysis was used to validate the following structure (measurement model)
using IBM Amos.

242
Figure 5.2: Blueprint of the CFA Model
The CFA model was assessed using IBM SPSS Amos 20. Review of the modification
indexes led to re-specifying the model. The re-specified model achieved significant chi-
square of 499.62, df = 214, p = 0.000, which indicates a poor fitting model, however
these results may be ignored since chi-square test is data sensitive and may produce
significant result for very minor difference if sample size is large. Hence most researchers
and experts suggest CMIN/DF as an alternative.
Other fit indices used to assess mode fit are GFI, NFI, CFI and RMSEA. Results of these
model fit indices are given in the table below

243
Table 5.190: Results of Model Fit Indices (SEM)
Fit Indices Observed Criteria of
Acceptable Fit Result
CMIN/DF (Minimum
discrepancy as
indexed chi-square )
2.335 Less than 5 Accepted fit
CFI (Comparative fit
index) 0.820
More than 0.9 for
good fit, between
0.9 to 0.8 for
borderline fit
Borderline fit
PNFI(Parsimonious
Normal fit) 0.616 More than 0.5
Accepted fit
Marginally
RMSEA (Root Mean
Square error of
approximation)
0.09
Less than 0.08 for
adequate fit,
between 0.08 and
less than .1
borderline fit
Borderline fit
The three indices suggest an acceptable weak fit between the sample data and the
hypothesized model.
Construct Validity and Reliability
Construct validity is the extent to which a set of measured items actually reflect the
theoretical latent construct they are designed to measure. It includes (1) Convergent
validity (Factor loadings, Average Variance extracted (AVE), Composite Reliability); (2)
Discriminant Validity)
Factor Loading
The size of factor loading is an important indicator of convergent validity. Factor
loadings that are significant with loading values above 0.5 indicate convergent validity.
The following table shows construct, items of construct and their loading values. Note
that loading of all constructs are above the threshold mark of 0.5. Except for Sat2, Sat 5,

244
Val 1, Val2 , Val7 and Val10.The factor loadings with value less than 0.5 are highlighted
with red.
Table 5.191: Factor Loading of Items of Constructs(SEM)
Construct Item Factor
Loading
F1
Satisfaction
Sat1:- I am happy with the 'Supply Quality' offered by
the MSEDCL. 0.609
Sat2:- The Supply Provided by MSEDCL is with
minimum interruptions. 0.480
Sat3:- The Outage Management is Satisfactory and
Consumers are made aware of the outages taken by
MSEDCL for maintenance.
--
Sat4:- 'Load Shedding', is not a problem associated
with MSEDCL Services. --
Sat5:- It is easy to approach or contact the MSEDCL
Staff/Engineers in case of emergency or a problem. 0.481
Sat6:- I feel comfortable in approaching the MSEDCL
staff in case of any problem. 0.781
F2
Perceived
value
Val1:- The MSEDCL Offices and Fuse Call Centers
are located at convenient places and are easily
accessible.
0.443
Val2:- The Services Offered by MSEDCL to its
Consumers is at a Cheaper Cost. 0.433
Val3:- The time and effort needed in resolving a
complaint with MSEDCL services is less or adequate. 0.664
Val4:- Even if in case of any problem associated with
the MSEDCL service, we are not panic and we feel
assured that the problem would be resolved with ease.
0.680
Val5:- The working hours of MSEDCL Company are as
per the Consumer convenience. 0.531
Val6:- Even in case of Power Scarcity Situation, the
MSEDCL company takes special efforts to provide with
or maintain for uninterrupted power supply to its
Consumers.
0.572
Val7:- The risk associated in transactions with
MSEDCL is least. 0.451
Val8:- The quality of services offered by MSEDCL has
improved significantly over last few years. 0.610
Val9:- The present service provider (MSEDCL) has
better staff with adequate knowledge to handle
Consumer Complaints.
0.637
Val10:- The present Service Provider (MSEDCL) has
better infrastructure as compared to its Competitors.
0.462

245
Construct Item Factor
Loading
F3
Brand
Image
Bim1:- The Business Practices of MSEDCL are Ethical
and Transparent. 0.534
Bim2:- MSEDCL is the most trusted Service provider
as compared to its Competitors. 0.820
Bim3:- MSEDCL is a Government Owned Company
and has Social Obligations to fulfill and does not work
only to gain profits.
--
Bim4:- The MSEDCL company has taken necessary
efforts to improve its infrastructure to provide quality
power to its Consumers.
0.663
Bim5:- Although, with the introduction of Open Access
Policy the Power Distribution Sector has become very
competitive, the MSEDCL has the capability to face the
future challenges.
0.542
Bim6:- The Business transactions with MSEDCL are
very fair and even if provided with a choice to select
service provider, I / We prefer to be associated with the
MSEDCL.
0.762
F4
Loyalty
Loy1:- We feel proud in being associated with
MSEDCL as their Consumer. 0.825
Loy2:- We have a genuine relationship with MSEDCL
as a Consumer. 0.625
Loy3:- Majority of neighboring Consumers, Friends and
Relatives etc avail the services of MSEDCL. --
Loy4:- I convey positive 'word of mouth' publicity
about my present Service Provider (MSEDCL). 0.792
Loy5:- I recommend the services of the present service
provider (MSEDCL), if someone seeks my suggestion. 0.682
Average Variance Extracted (AVE)
Average variance extracted is another important indicator of construct validity. As a rule
of thumb AVE of 0.5 or higher suggest adequate convergence.
Construct Validity (Composite Reliability)
Composite reliability is an indicator of reliability of construct. Coefficient alpha is very
commonly used technique of reliability; however, it may underestimate reliability. Thus

246
other techniques are recommended for assessing internal consistency of a measure.
Values above 0.6 indicate adequate reliability.
Cronbach’s Alpha
Cronbach’s alpha is one of the most widely used measures of internal consistency. If
items correlate well they are said to be measuring the same construct. Alpha value above
0.7 indicates adequate reliability for a construct. Table 5.192 shows that alpha values for
all constructs are above the threshold mark of 0.7. Composite Reliability is an
alternative to Cronbach’s alpha, since alpha is said to underestimate reliability. The
values of Composite Reliability for all constructs are also above the threshold value of
0.6, as displayed in the table below.
Table 5.192: Composite Reliability and Cronbach’s Alpha
Construct No.
Items
Construct
Validity
(Composite
Reliability)
Chronbach’s
Alfa Avg.
F1
Satisfaction 4 0.683 0.72 0.587
F2
Perceived Value 10 0.81 0.79 0.548
F3
Brand Image 6 0.80 0.81 0.664
F4
Loyalty 4 0.717 0.785 0.731
Discriminant Validity
Construct of model should be unrelated. Discriminant validity assesses the extent to
which a construct is truly distinct from the other constructs in the model. High
discriminant validity provides evidence that a construct is unique and different from the
rest and have phenomenon that other measures do not. Discriminant validity exists, if
average of Variance Extracted is greater than r2
between two constructors said in other
words; the square root of AVE should be larger than the correlations between constructs.
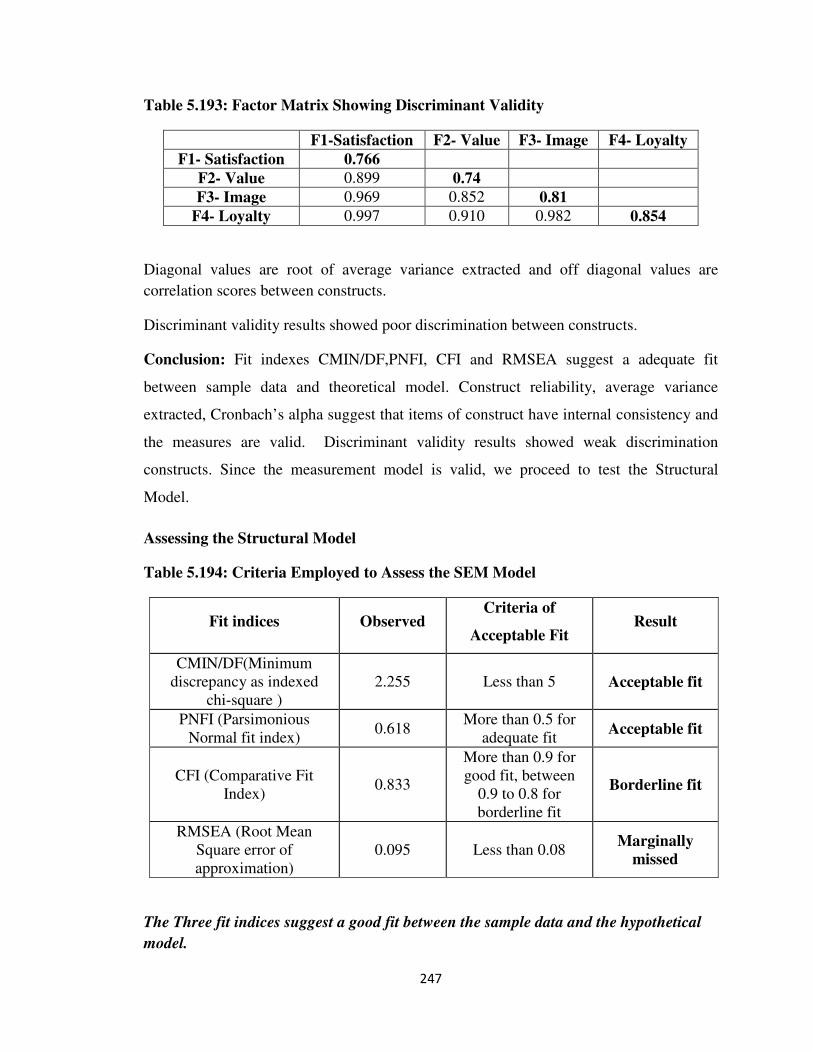
247
Table 5.193: Factor Matrix Showing Discriminant Validity
F1-Satisfaction F2- Value F3- Image F4- Loyalty
F1- Satisfaction 0.766
F2- Value 0.899 0.74
F3- Image 0.969 0.852 0.81
F4- Loyalty 0.997 0.910 0.982 0.854
Diagonal values are root of average variance extracted and off diagonal values are
correlation scores between constructs.
Discriminant validity results showed poor discrimination between constructs.
Conclusion: Fit indexes CMIN/DF,PNFI, CFI and RMSEA suggest a adequate fit
between sample data and theoretical model. Construct reliability, average variance
extracted, Cronbach’s alpha suggest that items of construct have internal consistency and
the measures are valid. Discriminant validity results showed weak discrimination
constructs. Since the measurement model is valid, we proceed to test the Structural
Model.
Assessing the Structural Model
Table 5.194: Criteria Employed to Assess the SEM Model
Fit indices Observed Criteria of
Acceptable Fit Result
CMIN/DF(Minimum
discrepancy as indexed
chi-square )
2.255 Less than 5 Acceptable fit
PNFI (Parsimonious
Normal fit index) 0.618
More than 0.5 for
adequate fit Acceptable fit
CFI (Comparative Fit
Index) 0.833
More than 0.9 for
good fit, between
0.9 to 0.8 for
borderline fit
Borderline fit
RMSEA (Root Mean
Square error of
approximation)
0.095 Less than 0.08 Marginally
missed
The Three fit indices suggest a good fit between the sample data and the hypothetical
model.

248
Assessing the Significance of Paths
Strength and significance of the paths were assessed using standardized regression
weights and p value. Following table shows the results for relationship between
exogenous and endogenous variables.
Table 5.195: Assessing the Significance of Paths
Path Standardized
regression weight P value Result
Perceived value →
Consumer loyalty -0.079 0.887 Not supported
Perceived value →
Brand image -0.131 0.768 Not Supported
Perceived value →
Satisfaction 0.903 0.000 Supported
Satisfaction →
Brand image 1.06 0.034 Supported
Satisfaction →
Consumer loyalty 1.150 0.393 Not supported
Brand image →
Consumer loyalty -0.042 0.961 Not supported
Conclusion: From the Table 5.195 the Predictors are tabulated as below.
Table 5.196: Concluding the Predictors
Inference Drawn Values
B p
Perceived value is a not a significant predictor of
Consumer loyalty -0.079 0.887
Perceived Value is a not a significant predictor of Brand
Image -0.131 0.768
Perceived Value is a significant positive predictor of
Satisfaction 0.903 0.000
Satisfaction is a significant positive predictor of Brand
Image 1.06 0.034
Satisfaction is a not a significant predictor of Consumer
Loyalty 1.15 0.393
Brand Image is a not a significant predictor of Consumer
Loyalty - 0.042 0.961

Chapter 6
Harvesting the
Objectives -
Findings, Suggestions
and Conclusions

249
6.1 The Purpose
Chapter.5 in the report deals with the thorough investigation of the data collected
using the statistical software. The statistical analysis provides a scientific way to slice up
the data and decode the information collected through the survey questionnaire. The data
is given statistical treatment such as Descriptive Statistics, Friedman Test, One Way
ANOVA/Kruskal Wallis Test, Bivariate-Correlation and Regression Analysis, so as to
throw light upon all facets of the data. The individual aspects of the data analysis have
been summated in this chapter, to expound the findings and recommend solutions to the
underlying problems and serve the Objectives of the Research study. The chapter
endeavors to act in accordance with the Research Objectives defined in the study. In the
next section of the chapter, the research objectives are taken up, one by one, and the
findings along with probable suggestions have been described.
6.2 Reaching the Objectives
Evaluating Consumer Satisfaction, determining factors contributing to Consumer
Perceived Value, finding out strength of relationship between variables viz. Satisfaction,
Value, Brand Image and Loyalty, studying the moderating role of Switching Cost on
Value/Satisfaction - Loyalty relationship and testing the Consumer Retention Model are
the fundamental objectives of the Study. Therefore, considering each objective and the
data analysis specific to the selected objective, the findings and suggestions are dealt
with in this section.
6.2.1 Evaluating Consumer Satisfaction
The Findings:- The basic variables selected for evaluating Consumer Satisfaction are
‘Supply Quality’, ‘Supply Interruptions’, ‘Outage Management’, ‘Load Shedding’,
‘Staff approachability during emergency’ and ‘Comfortability in approaching staff in
Chapter 6
Harvesting the Objectives -
Findings, Suggestions and Conclusions

250
case of a problem’. The results reveal that the Consumers are fairly satisfied over Supply
Quality and Minimum Interruptions in supply provided by the MSEDCL. However, the
Consumers are marginally satisfied over ‘Outage Management’ and ‘Load Shedding free
supply’. The outage management can be improved by communicating and coordinating
with the concern company staff. The MSEDCL already has a system set up for Outage
Management. The concern electrical department of the Client Company is not only
informed about the scheduled maintenance outage, on the other hand, the outage on
proposed feeders is taken only after consent from the client company. Therefore, the
outage management is not a problem for Consumers being fed by dedicated/express
feeders from the Sub Stations. The consumers connected to a common feeder may face
problems related to Outage Management, because it is merely impossible for MSEDCL
to plan an outage on the feeder considering the consent of all the consumers to it. The
Consumers have expressed satisfaction on the Company’s supply with minimum
interruptions, but the sudden momentary interruptions on feeders add to the
dissatisfaction of the Consumers. In this regard, an incidence may be cited that happened
with a software firm. During data collection, the incidence was shared by the respondent
of a Client Company, with a condition to maintain privacy of the information. The
Company is a reputed global software firm and has an express feeder feeding their
business premises. Express feeders are dedicated feeders to a particular consumer and
the power from the sub stations is directly delivered to the consumer premises as the
feeder has no other consumers or installations connected to it. So, it may be said that
express feeder is a dedicated feeder to the consumers, which is supposed to deliver
quality power at higher reliability. The Consumer fetching power from express feeder
has to pay a premium for the reliable power supply, as this feeder is also exempted from
load shedding schedules. Now, coming back to the Consumer, who is availing of such a
facility of express feeder originating from an Extra High Voltage Sub Station, the CEO
of the Client Company had scheduled a visit on the Business Premises. Unfortunately,
the supply tripped during the meeting and even the backup generators failed to provide
necessary power. The interruption was hardly for 10-15 minutes, but this incidence was
a blot on the MSEDCL’s service delivery. The CEO was unhappy with the interruption
and the concern Electrical Head of the company was interrogated after the event. The

251
Electrical Head had no justification for the momentary interruption of power and the
premium paid by the company for availing the facility of express feeder. Therefore, it is
essential for MSEDCL to note such incidences and empathetically think about the
Consumers. The coordination with the Consumer as well as the MSETCL (Transmission
Wing) is very much needed, because even if the failure of supply is due to some fault at
Transmission Unit, finally the blame of the consumer accounts to the poor service
delivery by the MSEDCL.
As we know, the Urban and Industrial areas are excluded from load shedding
schedules; still the MSEDCL has to inculcate confidence amongst
Industrial/Commercial consumers about providing of uninterrupted power supply. The
organization has already adopted the policy of implementing load shedding for non-
paying and high loss areas. The feeders are identified based on poor billing and
collection efficiency and such feeders find a place in load shedding list during power
scarcity situations.
The study also reveals the consumer’s satisfaction related to “approachability to
employees in case of a problem or emergency” and the opinion in this regard is very
favorable and the consumers also feel comfortable in approaching the Staff of the
Company. This is a positive aspect in the service offered by the MSEDCL, as it
indicates the sensitivity of its Employees in dealing with Consumer problems. During
data collection, most of the respondents expressed satisfaction about the responsiveness
of the Field Engineers in attending the consumer problems, especially during
emergencies. The respondents also said that in most of the cases, the problems are
beyond the control of field staff. Nevertheless, the response to the consumers during
such situations soothes the consumer dissatisfaction to a greater extent.
The eligible Open Access Consumers in the Pune Zone are geographically
spread over a large area and the area is divided into three Circles, namely, the Rastapeth
Urban, the Ganeshkhind Urban and the Pune Rural. The eligible open access consumers
also belong to various sectors like IT, Auto, Manufacturing, Shopping Malls etc, so it
would be essential to discuss the ‘Consumer Satisfaction’ on Sector and Circle level.
The sections 5.11 and 5.12 in Chapter.5, deal with the Sector wise and Circle wise

252
analysis respectively. The sector wise analysis reveals that the consumers in IT Sector
are relatively more satisfied, whereas the consumers in the Manufacturing sector are
least satisfied. The satisfaction of consumers on ‘Auto’, ‘Shopping Malls’ and ‘Others’
is average. This signifies that the MSEDCL has to concentrate on manufacturing sector.
The manufacturing sector also includes small industries, as against branded companies
in IT sector. Therefore, the organization must listen to the voice of such consumers. The
dissatisfaction amongst the consumers in the manufacturing sector may provide
opportunity to the competitors in near future. Keeping in mind that the power
distribution sector is undergoing a transition phase from monopolistic environment to a
competitive one, the MSEDCL also needs to pay attention to consumers in ‘Auto’ and
‘Shopping Mall’ sectors. The power supply interruptions may not affect the quality of
output in IT Industry or Shopping Malls, but supply interruptions may certainly affect
the quality of product in the ‘Auto’ & ‘Manufacturing’ Industry. Hence, these two
sectors need a special attention, when it is about supply quality and providing of
uninterrupted power supply.
The Circle wise analysis discloses that the ‘Satisfaction’ does not vary across the
three Circles and the ‘Satisfaction’ may be said to be favorable in all the Circles,
although figures also reveal that relatively ‘Satisfaction’ is the highest in the
Ganeshkhind Circle, followed by the Rastapeth Circle and the lowest in the Pune Rural
Circle.
The Consumer Satisfaction is discussed considering the parameters like ‘Supply
Quality’, ‘Supply Interruptions’, ‘Outage Management’, ‘Load Shedding’, ‘Staff
approachability during emergency’ and ‘Comfortability in approaching staff in case of a
problem’. But the discussion on Consumer Satisfaction would be incomplete, if the
concept of ‘Service Quality’ is not reviewed. The section 5.7.6 covers the Descriptive
Statistics and Frequency Tables on Service Quality. The evaluation of Service Quality is
based on the basic determinants, Viz. Tangibles, Responsiveness, Reliability, Assurance
and Empathy and the survey questionnaire related to Service Quality is already
conferred in Chapter.4 of the Thesis. The result summary of the data analysis for Service
Quality is tabulated as below.

253
Table 6.1: Result Summary of Service Quality Analysis
Sr
No
Determinant of
Service Quality Variable describing the Determinant Result
I Tangibles
1.Appearance of MSEDCL Offices,
Cleanliness, etc Not Satisfied
2.Structure of Electricity Bills and its
understandability to Consumers Satisfied
3.Website Design and its User
friendliness Satisfied
4.Dressing and Neatness of MSEDCL
Employees Satisfied
Sr
No
Determinant of
Service Quality Variable describing the Determinant Result
II Reliability
Informing Consumers in Advance about
Supply Interruptions. Neutral
Making Consumers aware of the changes
in Policies through its Circulars. Neutral
Delivery of Electricity Bills to Consumers
within time. Satisfied
Providing accurate and error free
Electricity Bills to Consumers. Satisfied
Fixing the Consumer problem first time
and avoiding recurrence of a problem in
future.
Moderately
Satisfied
Relevance and accuracy of information to
Consumers via Website.
Satisfied
MSEDCL website as a safe and secure
payment option for payment of Electricity
Bills.
Satisfied

254
Sr
No
Determinant of
Service Quality Variable describing the Determinant Result
III Responsiveness
MSEDCL Employee quickness in
attending Consumer Complaints. Satisfied
Understanding and listening to Consumer
problems. Satisfied
Employee interest and keenness in
solving consumer grievances Satisfied
Employee response to Consumer requests
Moderately
Satisfied
IV Empathy
Caring attitude of Employees towards
Consumers. Satisfied
Understanding Consumer Needs
Satisfied
Keeping Consumer Interest as Top
Priority
Moderately
Satisfied
V Assurance
Providing compensation to Consumers if
the services are not delivered as per
‘Standards of Performance’
Not Satisfied
Adequately trained Employees to solve
Consumer Complaints Satisfied
Well Behaved and Well mannered
MSEDCL Staff Satisfied
MSEDCL Company keeping its promise
to fulfill Consumer Demand in time. Neutral
From the above table, the overall Satisfaction as regards ‘Service Quality’
offered by the MSEDCL looks to be favorable. However, the Company must improve
the tangibles related to the Offices located at Field, ensure reliability in disseminating

255
information about supply outages in advance and also communicate the latest circulars
to the Consumers, assure Consumers of guaranteed Service and provide
compensation in case of failure to deliver the services on time. Along with the overall
Satisfaction over Service Quality, the descriptive statistics and frequency tables in the
Section 5.7.7 also advocates favorable Satisfaction on MSEDCL’s ‘Concern for
Consumers’.
The Suggestions: - In accordance with the findings cited in the above section, the
suggestions for improving the Satisfaction are mentioned below.
� The findings point out that ‘Outage Management’ is a grey area in ‘Consumer
Satisfaction’. The dissatisfaction is about the momentary tripping of power supply and
not about the planned outages, because the outages taken by MSEDCL are given due
publicity in advance in the Local Newspapers. In order to deal with this issue, it is
necessary for the organization to maintain a database of such consumers at Substations.
The database must include Mobile Numbers of all VIP consumers. Even if the supply is
to be tripped for a moment for a certain reason at the substation, the concern operator
must send a group SMS (Short Messaging Service) to all such VIP consumers
connected on the particular feeder. Such intimations at a short notice will definitely
make the Consumers aware of momentary tripping of supply from the feeder. Even
during faults, the group messaging to the VIP consumers about the happenings at Site
and probable time needed to restore the supply can be shared. This measure comes at a
low cost and only requires honest and sincere efforts from the Operators at the
Substation. Such subtle measures will definitely create favorable perception amongst
the Consumers and improve the Satisfaction to a greater extent.
� The Consumers also feel that they are not made aware of the latest policies and
circulars of MSEDCL. In the present information age it is very easy, convenient and
economical to circulate information. The Company should have email IDs of all the
eligible Open Access consumers and whenever a circular related to Consumers is
published by the Head Office a soft copy of the same should be sent to all the eligible
open access consumers. The billing activity of all HT Consumers is carried out at Circle
Office; therefore, the Circle Office should take up the responsibility of creating a group

256
email for all such VIP consumers and should email relevant circulars as and when
published by the Head Office. The tariff copy approved by the MERC is made available
on the MSEDCL’s website, even then it should be emailed to the VIP Consumers. This
will definitely create a favorable perception about the Company’s Service Quality in
the minds of Consumer.
� The Consumers may compromise with the tangible aspect of the MSEDCL
Offices, but as regards reliable and quality power supply Consumers would not
negotiate, because it is the most desired aspect of Service Quality. The Zone of
tolerance between the accepted and desired service as regards supply quality is narrow.
Realizing this, the Company has to ensure uninterrupted power supply with higher
reliability to keep the Consumers satisfied. The findings above make it evident that the
Consumers are annoyed with momentary tripping; so it is essential for MSEDCL to pay
attention to minimize such tripping and assure uninterrupted power supply. In this
regard, it would be wise for the Organization to adopt best practices and make use of
‘Quality Tools’ like Pareto Analysis to minimize interruptions and improve the quality
of supply being delivered to the Consumers. Pareto Analysis uses Pareto Charts1, which
orders problems by their relative frequency in a descending bar graph to focus efforts
on the problem that offers the greatest potential for improvement. Pareto Analysis
follows the basic principle of 80/20 rule. Vilfredo Pareto, a 19th
Century Italian
Economist observed that usually a few factors account for a large percentage of total
cases e.g. 80% interruptions on a feeder are due to 20% of problems. Consequently
focusing on the 20% problems would clear 80 % of the interruptions on a feeder, thus
offering maximum benefits with minimum effort. The MSEDCL has good Training
Infrastructure and it should be used effectively to impart training on such topics that
provide solutions to practical problems. Interruptions on each feeder can be taken up as
a case study, Applying little bit of research and proven techniques like Pareto Analysis,
Standard Templates can be prepared and shared within the organization. The
improvement in the quality of supply to the consumers will surely boost the satisfaction
level of the Consumers.
� Various Infra Projects are implemented for strengthening the Infrastructure and
offer quality power to the Consumers. Such developmental schemes would reap more

257
benefits to the Company, if the selection of locations is being made, considering the
future potential revenue return to the Organization. The findings point out that the
Satisfaction in Pune Rural Circle is relatively least, besides this, the analysis of survey
data reveals that the Satisfaction is relatively poor amongst Manufacturing & Auto
Industry; therefore, such areas should get priority, while implementing Infra Projects.
At present, the power distribution sector is still monopolistic in nature as the
Consumers have few alternatives available. But in future, if the competition intensifies
and Consumers have better options available, it would be very difficult for MSEDCL to
get back the lost Consumers, because the cost of bringing them back2 is higher than
retaining the existing ones.
� Nowadays, mobile network service providers offer value added services to their
consumers, so as to differentiate their service from the Competitors. Similarly, the
MSEDCL has well qualified engineers who have acquired professional qualifications
like Energy Auditor / Energy Manager certified by Bureau of Energy Efficiency. A
pool of such engineers can be selected to offer consultancy to the VIP consumers by
conducting energy audit of their manufacturing units and give necessary tips on saving
energy usage. These efforts will surely provide delight for the Consumers and create a
positive brand image for the organization.
� The MSEDCL must understand that consumers are no longer loyal. They want
returns for every penny being paid by them. The Consumers also feel, they need to be
thanked for their patronage. So, it would be wise for the Organization to express
gratitude to such high end users or VIP consumers by greeting wishes, especially on
special occasions like Diwali, New Year, etc. Expressing gratitude would be a great
surprise to the Consumers and doing this would instill confidence amongst them about
Company’s change in attitude from Monopolistic to Consumer Centric.
� The implementation of all the suggestions would be smooth and will offer
desired benefits, only if the top management extends support to the Operating Staff.
The approach of the Top Management should be corrective and not punitive in nature;
the Management must encourage culture of smart work and promote innovative ideas
by motivating employees to think creative and take away the fear of failure, while
implementing new ideas.

258
6.2.2 Factorizing Consumer Perceived Value
The Findings: -The Consumer Perceived Value is one of the important aspects in the
study of Consumer Behavior. The value of a Service is said to be positive, if the benefits
received by a Consumer exceed the cost incurred. If the benefits received are less as
against the cost being paid, then the Value is said to be negative. The section 5.7.2 deals
with Descriptive Statistics, Frequency Tables and Histograms for all the variables
selected for Perceived Value. The summary at a glance for all the variables is tabulated
below.
Table 6.2: Respondent’s Opinion about the Variables of Consumer Perceived
Value
Sr
No.
Variable Selected for Measurement
(Brief description of the Question representing the
Variable)
Respondents
Opinion
1 Ease in Accessibility and convenient location of MSEDCL
Offices Favorable
2 Resolution of Complaints in less or adequate time Favorable
3
Assurance with the present Service Provider that the
problem will be solved with ease and without any panic to
Consumer
Very Favorable
4 Working Hours of MSEDCL as per Consumer convenience Favorable
5 Special Efforts to maintain Uninterrupted power supply Favorable
6 Minimum Risk in transactions with the MSEDCL Favorable
7 Improvement in Quality of Services offered by MSEDCL
over last couple of years Very Favorable
8 MSEDCL having better staff with adequate working
knowledge to solve Consumer complaints Favorable
9 MSEDCL having better infrastructure as compared to its
competitors
Moderately
Favorable
10 MSEDCL offering its Services to Consumers at a Cheaper
Cost Adverse

259
The above ten variables make an effort to weigh up the benefits received and
cost incurred by the Consumer while availing of the MSEDCL services. The above table
indicates that the Consumers find value, because the services offered by the Company
have improved over last couple of years, the psychological cost in availing of the service
is also less, as the Consumers are not panic in case of a problem and feel assured that the
problem will be fixed up with ease. Nonetheless, the consumers have adverse opinion
about the Monetary Cost associated with the Company services and feel that the services
offered are not at a cheaper cost. The adverse opinion about the Monetary Cost fades the
overall Consumer Perception concerning the ‘Perceived Value’.
The ten variables selected for measuring Perceived Value help to conduct
microanalysis, but in order to shrink the number of variables associated with Perceived
Value, Friedman Test and Factor analysis are conducted and discussed in details in
Section 5.8. The section reveals that the two components associated with Consumer
Perceived Value are ‘Assurance in Service Delivery’ and ‘Cost of Service’ The Cost
of Service includes time, psychological as well as monetary cost factors.
The sector wise and circle wise analysis of ‘Perceived Value’ is dealt with in
Section 5.11 and Section 5.12 of Chapter.5 respectively. The sector wise analysis reveals
that the ‘Value’ is almost same and favorable across all the sectors, viz IT, Auto,
Manufacturing, Shopping Malls and Others. The Value perception is highest in the IT
sector followed by Auto and is lowest in the Manufacturing sector. The Circle wise
analysis mentions that the perception about Value is different across the three Circles.
The Consumers rank the Ganeshkhind Urban Circle first and the Pune Rural Circle
again finds third place with the lowest value among the three Circles. The Rastapeth
Urban Circle is ranked second, though it has a marginal edge over the Rural Circle, even
then necessary efforts should be initiated to improve the Value perception amongst the
consumers in the Circle.
Finally, it would be interesting to notice Consumer perception about ‘Value’ is
not just low pricing. On the contrary, the data analysis of ‘Variable 1’ in Section 5.7.8
enlightens the fact that Consumers are ready to pay more, if the quality of services is
improved. This implies ‘Value is not about Low pricing’, but ‘it is about What

260
Consumer get for what they pay’. The sector wise analysis in Section 5.11 tells that
the Auto Industry tops the sector list in displaying readiness to pay more for reliable and
better quality of services followed by IT Sector and Shopping Malls respectively. The
Manufacturing Sector is modest over the underlying factor. The Circle wise analyses in
Section 5.12 over the same parameter further exposes that the ‘Quality consciousness
with respect to Cost’ is higher in Ganeshkhind Urban & Pune Rural Circles as compared
to Rastapeth Circle, which means the Consumers in Rastapeth Urban Circle are not
willing to pay extra for reliable and improved service quality as against the opinion of
Consumers in the remaining two Circles.
The Suggestions: - The MSEDCL has to focus on the Monetary Cost aspect of service as
the opinion associated with it is adverse. Further, the monetary cost is a dominant factor
and impacts the behavior of Consumer adversely. The monetary cost associated with the
service can be brought down by reducing losses in the distribution and improving the
revenue collection. The billing and collection efficiency measure the loss and revenues
recovered respectively and these two parameters are aligned with performance of the
Business Units as well as the Employees. The Company needs to focus its attention on
power purchase as the major part of expenditure is associated with it. Therefore, the
MSEDCL has to device techniques and explore procedures that would reduce the power
purchase cost and help to bring down the ‘Cost of Service’. Accurate Demand
forecasting and meticulously executing long term power purchase agreements would
suffice the purpose. The proposed topic is very broad and needs thorough investigation,
in-depth study and commitment from the top management.
6.2.3 Ascertaining Strength of Relationship amongst Consumer Satisfaction,
Consumer Perceived Value, Brand Image and Consumer Loyalty
The research study spotlights the conceptual framework with Consumer
Satisfaction, Consumer Perceived Value, Brand Image and Consumer Loyalty as the
main variables of interest. It becomes indispensable to understand the strength of
relationship between the underlying variables, while studying each of the variables
individually. The Section 5.9 deals with the statistical part of the analysis. The Bi-
variate Correlation test is used to determine the strength of relationship. The value of

261
Pearson correlation(r), decides the strength of relationship. The value ranges 0.0 to 1.0
and the categorization of the strength is as follows(r = 0 to 0.2 – Very Poor
Relationship, r = 0.2 to 0.4 – Poor, r = 0.4 to 0.6 – Moderate, r = 0.6 to 0.8 – Strong, r =
0.8 to 1.0 – Very Strong Relationship). A positive value indicates direct relationship
and a negative sign associated with the Pearson correlation(r) signifies an indirect
relationship between the variables. The summary of the results is tabulated below.
Table 6.3: Strength of Relationship between the Variables: Satisfaction, Value,
Brand Image and Loyalty
Sr
No Variables
Pearson
Correlation Strength of Relation
1 Value – Satisfaction 0.485 Moderate
2 Satisfaction – Loyalty 0.525 Moderate
3 Value – Loyalty 0.709 Strong
4 Brand Image – Loyalty 0.751 Strong
5 Value – Brand Image 0.697 Strong
6 Satisfaction – Brand Image 0.618 Strong
The above summary data considering the conceptual model of the Research is
graphically shown on the next page.

262
Figure 6.1: Strength of Relationship between Variables: Satisfaction, Value, Brand
Image and Loyalty
In the above diagram, the lines in ‘Yellow’ indicate Moderate strength of relationship
between the variables and the ‘Green’ line indicates Strong relationship between the
two variables. The line color would have been ‘Red’ had any of the relationship been
‘Very Poor’ or ‘Poor’, which is not the case in our study.
The Findings: The above representation shows that relatively the relationship between
Value and Satisfaction is the weakest and the relationship between Brand Image and
Loyalty is the strongest one. The relationships mentioned above only point out the
strength and does not show any cause effect relation between the variables. As
stipulated, the relationship between Brand Image and Loyalty is relatively the strongest
one and thus invites attention on the analysis related to these variables. The Section
5.7.3 & 5.7.4 have thrown light upon the detailed analysis of Brand Image and Loyalty
respectively. The consumers perceive ‘Brand Image’ to be Socio-Ethical, as the
Business practices with the Company are ethical and transparent; the Consumers also
recognize MSEDCL as a government owned Company having social obligations to
fulfill and it does not work only to earn profits. The Social Image is rated favorable by
Moderate Relationship
Brand
Image
0.751
0.697 0.618
Consumer Loyalty
Consumer Satisfaction Consumer Perceived Value
0.525 0.709
0.485
Strong Relationship

263
the consumers, but in connection with the Open Access policy, the Consumers
moderately agree that MSEDCL has capabilities to face future challenges and preserve
the same attitude in conveying trustworthiness about the Company as compared with
competitors. Thus, it may be said that the Social Image of MSEDCL is favorable, but
the Company may gain Consumer Trust, only if it positively faces out the challenges of
competitive market in near future, assuring quality services and better value to its
Consumers.
The analysis of ‘Loyalty’ in the Section 5.7.4 discloses that the Consumers hold
genuine relationship and feel proud in being associated with MSEDCL. The social
bonding factor is again dominant as the Consumers agree that majority of their Friends,
Relatives and Neighbors avail of MSEDCL services.
The relationship between ‘Brand Image’ and ‘Loyalty’ is strong and is directly
proportional i.e. if one variable increases/decreases the other variable does so. It may be
said that forming a favorable ‘Brand Image’ may help MSEDCL inspire ‘Loyalty’
amongst its consumers, yet this discussion does not claim that ‘Brand Image’ is the
causal variable for ‘Consumer Loyalty’.
The observation of Pearson correlation values in the table above also point out
that the relationship of ‘Value’ with the variables Loyalty & Brand Image is stronger in
comparison with the relationship between ‘Satisfaction’ and Loyalty & Brand Image.
Hence, it may be understood that ‘Value’ becomes significant variable as compared to
‘Satisfaction’, when the Brand Image of the Company and Consumer Loyalty are being
inspected.
The Suggestions: The strength of relation is highest for Brand Image – Loyalty, followed
by Value – Loyalty and Value – Brand Image relationships. Therefore, it is imperative
that ‘Brand Image’ and ‘Value’ receive special consideration as the focus of the study is
on Consumer Loyalty. The enhancement of ‘Value’ as mentioned in the Section 6.2.2
above is possible mainly by making the cost of services cheaper. The necessary
suggestions regarding the same are mentioned in the section. Ensuring value to the
Consumers will improve the Brand Image of the MSEDCL and instill confidence among

264
the Consumers regarding the Company’s capabilities to face the challenges in a
competitive environment and thus enabling to sustain its Social Image. The Sector wise
analysis in Section 5.11 signifies the favorable ‘Brand Image’ of the MSEDCL in IT,
Auto and Shopping Mall Sector, but its Image is not so favorable in Manufacturing
Sector. Similarly, the Circle wise analysis in Section 5.12 over Brand Image discloses
the ranking of Circles in the descending order as the Ganeshkhind Urban, Rastapeth
Urban followed by the Pune Rural Circle at the bottom. It is made clear that MSEDCL
would be in a position to serve the public better, only if the high consumption; high
revenue consumers maintain association with the Company in future.
6.2.4 Moderating role of the Switching Barriers on the relationship between
Perceived Value/Satisfaction and Consumer Loyalty
The Section 6.2.3 above has surveyed the strength of relationships amongst the
variables. The ‘Consumer Loyalty’ variable is of prime importance and hence its
relationship with Consumer Perceived Value and Consumer Satisfaction with
‘Switching Barriers’ as the moderating variable is conferred in Section 5.10. The
Switching Barriers include elements like Switching Cost, Time and Effort in searching
New Service Provider, cultivating relationship with New Service Provider, availability
of Few Alternatives, lack of Better Alternatives, compassion and Loyalty with the
Present Service Provider. As mentioned in the above section, the relationship between
‘Value’ and ‘Loyalty’ is strong and the relationship between ‘Satisfaction’ and ‘Loyalty’
is moderate. The moderating role of the Switching barriers on the said relationships is
summarized in the table below.
Table 6.4: Moderating Role of Switching Barriers on Value - Loyalty and
Satisfaction – Loyalty Relationship
Sr
No
Switching Barrier
( Moderating Variable)
Effect of Switching Barrier on Relationship
Value - Loyalty Satisfaction – Loyalty
1 Switching Cost Moderating Effect Moderating Effect
2
Time & Effort in searching
New Service Provider
No Effect No Effect

265
Sr
No
Switching Barrier
( Moderating Variable)
Effect of Switching Barrier on Relationship
Value - Loyalty Satisfaction –
Loyalty
3 Cultivating relationship with
New Service Provider No Effect No Effect
4 Availability of Few
Alternatives Moderating Effect Moderating Effect
5 Lack of Better Alternatives Moderating Effect Moderating Effect
6 Compassion with the
Present Service Provider Moderating Effect No Effect
7 Loyalty with the Present
Service Provider No Effect No Effect
The Findings: The Switching Barriers have the same impact on both the relationships
except for the Barrier, Compassion with the Present Service Provider. This barrier has
influence on the Value – Loyalty relation, but does not influence Satisfaction – Loyalty
relation, thus restating the sensitivity of the Variable ‘Value’ as compared to
‘Satisfaction’. The descriptive statistics about all the Switching Barriers mentioned
above is referred to in the Section 5.7.5. The barrier ‘Compassion with the Present
Service Provider’ is regarding the Consumers’ embarrassment informing the present
Service Provider about the discontinuation in service in near future. The descriptive
statistics about the variable in section 5.7.5 also divulges that the Consumers are not
clear about their feelings informing the present Service Provider about the
discontinuation of services in near future.
Cultivating relationship and the Time and Effort in searching new Service
Provider are also non-influencing Barriers regarding the relationships Value – Loyalty
and Satisfaction – Loyalty. The descriptive statistics tells that Consumers agree
moderately upon, Time & Effort needed in Searching and Cultivating relationship with
New Service Provider is considerable.

266
The barriers that influence the relationships under study are ‘Switching Cost’,
‘Availability of Few Alternatives’ and ‘Lack of Better Alternatives’. The descriptive
statistics in the Section 5.7.5 point out that the Alternatives available at present are few
and Consumers do not find a better alternative than MSEDCL to provide for services to
them. The above findings notify the monopolistic environment of Power Distribution
Sector. The ‘Switching Cost’ acts as an influencing barrier on the relationships, although
the descriptive statistics alarms at the consumers ambiguity in understanding the
financial implications of the Switching Cost.
The Consumers at present have a sense of loyalty towards MSEDCL, but the
above said barrier does not influence the relationships under study. Considering all the
aspects mentioned above it may be said that at present Consumers are loyal with
Company, probably because of non availability of alternatives or lack of better
alternatives. The consumers are not clear about the financial impact of Switching Cost
and therefore, considering all these factors, Consumers prefer to stay loyal with the
MSEDCL. The analysis of Variable 4 in Section 5.7.8 is about Consumer choice to
switch over to another Service Provider and the frequency table highlights that most of
the Consumers are ‘Neutral’ or ‘Undecided’ over this. This demonstrates the ‘Risk
Taking Ability’ of most of the eligible Open Access Consumers in switching over to
another Service Provider is less, thus emphasizing the statement made above on present
Loyalty of Consumers with the MSEDCL.
The Suggestions: - The present loyalty of the Consumers with the MSEDCL should not
be taken for granted, because the Power Distribution Sector is still monopolistic and
hence, consumers have very few options or do not find a better alternative. The Open
Access in Distribution is in a premature stage at present and the Power Distribution
Company has some time to improve the quality of services delivered to its Consumers.
In this regard, it becomes essential to open up a dedicated Open Access Unit in the
Organization at Zone Level that handles grievances of eligible open access consumers
through its website or by email Communication. The Company website provides
sufficient information to its Consumers, the Low Tension (LT) consumers have the
facility to view and pay the bills on Company website, It is surprising that the High

267
Tension (HT) consumers are kept away from this facility. The HT Consumers have high
consumption pattern, thus making the amount payable considerably large, these
consumers have willingness to promptly pay the bills due, so as to avail of the prompt
payment discounts. In some cases the non receipt of the bills hinders the Consumer from
availing of prompt payment discount. For this reason the HT Consumers demand
availability of Bills on MSEDCL website like the LT Consumers. The HT Consumers
pay Electricity Bills in Lakhs / Crores and thus the prompt payment discount is in
Thousands / Lakhs. Understanding specific needs of these VIP Consumers will create a
favorable perception about Company services, enhance Value, improve satisfaction and
will help retain the Consumers in future. Today, we see many financial institutions
offering door step services to its prospective Consumers. Nowadays, availing of Home
or a Car loan, opening a new account with a Bank is just at a Call/SMS to the toll free
Number. The Organization needs to sense the transforming nature of the Sector and
should offer such services to HT Consumers. The preparation and sanctioning of
technical estimates and signing of agreement with the prospective HT Consumers should
be at Applicants door step. The MSEDCL is already having ‘Connection on Call’
mechanism operational for LT Consumers, but it would be prudent to concentrate more
on services to the HT Consumers. The awareness amongst the MSEDCL employees
about the retention of HT Consumers, offering value to the Consumers and
differentiating the service delivered would create barriers to new entrants in the
Distribution Sector, thus mitigating the risk of Consumers switching to other Service
Providers in near future.
A favorable Brand Image supplements Consumer Loyalty, so considering the
sector and circle wise analysis in Section 5.11 and 5.12 respectively; it would be wise to
take efforts in consolidating the Company’s Brand Image in Pune Rural Circle with
special focus on Manufacturing Sector in all the three Circles.
6.2.5 The Consumer Retention Model
The Section 5.13 in Chapter.5 of the Thesis has tested the Consumer Retention Model
and the outcome of the test demonstrates that the sample data fits the theoretical model.

268
It may be concluded that the conceptual model comes out successful as the field sample
data fits the theoretical model.
The Findings: The prime variable of interest is Consumer Loyalty in the model. The
strength of relationships between various variables of the model is conversed in the
Section 6.2.3 of this Chapter, now it would be interesting to understand the paths in the
model that finally lead to Consumer Loyalty. The model below shows the probable paths
that may lead to Consumer Loyalty.
Figure 6.2: Probable Paths in the Model that Lead Consumer Loyalty
The above figure suggests four paths that finally lead to Loyalty.
Path 1: Perceived Value → Loyalty.
Path 2: Satisfaction → Loyalty.
Path 3: Perceived Value → Satisfaction → Brand Image → Loyalty.
Path 4: Perceived Value → Brand Image → Loyalty.
Path 4
Brand
Image
Path 3
Path 4 Path 3
Consumer Loyalty
Consumer Satisfaction Consumer Perceived Value
Path 2 Path 1
Path 3

269
The Path 3 above is the longest route to Loyalty, implying ‘Value’ leading to
‘Satisfaction’, ‘Satisfaction’ leading to ‘Brand Image’ and finally ‘Brand Image’ leading
to Loyalty. The results in the analysis conducted in Section 5.13 show the path that
holds true. The graphical representation is given below.
Figure 6.3: Results of SEM Showing the Predictor Relationship between Variables
of the Model
The above figure illustrates that the Path 3 mentioned above is partially approved. The
‘Value’ is predictor of ‘Satisfaction’, ‘Satisfaction’ is predictor of ‘Brand Image’, but
‘Brand Image’ is not a predictor of ‘Loyalty’. The predictor relationship is shown in
solid arrow, whereas the remaining relationships in the figure are indicated with dotted
line. From the above it is clear that ‘Loyalty’ has no predictor, which may be the
result of the power distribution sector still being monopolistic and at present, As such
Consumers hardly have options to switch over to alternate Service Provider.
Strong Relationship
Moderate Relationship
Brand
Image
0.751
0.697 0.618
Consumer Loyalty
Consumer Satisfaction Consumer Perceived Value
0.525 0.709
0.485

270
The Value chain partially approved in the analysis is graphically represented below.
Figure 6.4: Diagrammatic Representation of Value Chain
6.3 Conclusion
The desired objectives of the study encompassing Evaluation of Consumer
Satisfaction for eligible Open Access Consumers in the Pune Region, understanding
Value Preposition and factorizing Consumer Perceived Value, ascertaining relationship
between the basic variables, understanding the moderating role of Switching Barriers
and testing of the Consumer Retention Model are completely met in the Research work.
The study endeavors to bring to light the present environment of the Power Sector,
Consumer Culture and perception regarding the underlying variables concerning the
Sectors and Circles. Apart from achievement of the Objectives, the research work has
investigated and put forth new aspects of Consumer Behavior in Power Distribution
Sector. Some of the major conclusions are briefed below.
1. The research has emphasized the importance of a particular consumer segment for
power distribution utilities in order to tackle the competitive environment in future.
2. It has been statistically verified that the fundamental factors contributing to
‘Perceived Value’ are ‘Assurance in Service Delivery’ and ‘Cost of Service’.
3. The research exemplifies that Value is not about Low Pricing; but it is about What
Consumers get for what they pay. The Auto Industry has shown utmost interest for
this feature followed by IT Sector and Shopping Malls respectively.
4. The Power Consumers are not willing to be ‘PROSUMERS’ i.e. at present the
Consumers prefer to source their electricity demand from Service Providers, instead
of generating it on their own. Conversely, it may be anticipated, any technological
Perceived Value
Satisfaction
Brand Image

271
advancement in near future as regards ‘Solar Energy’ would change the Consumers’
view point.
5. The acceptance of ‘Consumer Retention Model’ based on the conceptual framework
is statistically proved in the Research.
6. The strength of relationships between various variables is ascertained and it has been
statistically supported that the relationship, Brand Image - Loyalty is the strongest,
whereas the relationship, Perceived Value – Satisfaction is relatively the weakest one.
7. The causal variables of Brand Image, Satisfaction and Perceived Value are found out
in the research; however the study illustrates no causal variable for Loyalty.
8. The Time and Effort related to the barriers ‘Searching’ and ‘Cultivating relationship’
with New Service Provider do not influence the Value/Satisfaction – Loyalty
relationships. These relationships are influenced by the barriers ‘Switching Cost’,
‘Availability of Few Alternatives’ and ‘Lack of Better Alternatives’. The availability
of few and lack of better alternatives demonstrates the monopolistic nature of the
power distribution sector. As regards ‘Switching Cost’, the Consumers are not clear
about the financial implications while switching from one service provider to another.
9. The present environment of Power Distribution sector is still monopolistic. Even then
the study intended to focus on Loyalty, because the Sector is going through a
transformational phase and in near future the Consumers may find better options than
the present Service Provider. Nevertheless, the study has laid the foundation for
concentration on ‘Loyalty’ in Power Distribution, prior to the environment becoming
competitive, thus, illustrating the foresight of the Research.
10. The detailed Sector wise and Circle wise analysis of variables in the study has
pin pointed ‘Manufacturing’ Sector and the ‘Pune Rural’ Circle as the areas needing
immediate attention and improvement.
Therefore, the research study wraps up the achievement of the desired objectives.
The objectives of the Study are in alignment with the Electricity Act 2003,
considering the recent amendments in the Act as per the Electricity Amendment Bill3,
2014, introduced in ‘Lok Sabha’ which aims at Promoting Competition, Efficiency in
Operations and Improvement in Quality of Supply of Electricity. The salient features
in the amendment include Enhancing Grid Safety and Security, Promotion of
272
Renewable Energy, Rationalization of Tariff and Separation of Carriage & Content
in the Distribution Sector. The concept of separation of Carriage and Content
proposes the multiple supply licensees in which the Content of Distribution Sector
will be separated from the Carriage (i.e. Distribution Network). The Carriage will
continue to be a regulated activity, while the determination of tariff would be based
on market principles. In order to protect the interest of Consumers, the retail sale of
electricity is proposed to be capped through the Regulator. One of the Supply
Licensees is proposed to be a Government controlled company. Finally, it may be
said that the findings in the study will benefit all the Stakeholders in the Distribution
Sector and envisions a healthy competitive environment for the Power Consumers.
References:-
1 - James A. Fitzsimmons, Mona J. Fitzsimmons, Service Management.New Delhi: Tata Mcgraw Hill Publishing Co.
Ltd, 2006.Fifth Edition. p-177.
2 – Kumar Alok, Sinha Chhabi and Sharma Rakesh.Customer Relationship Management: Concepts &
Applications.New Delhi:biztantra,2008. p 4.
3 - http://pib.nic.in/newsite/PrintRelease.aspx?relid=113779 19.12.2014.

Chapter 7
Plausible Outcome of
the Research

273
The environment in the Power Distribution Sector is changing from monopolistic
to a competitive one and at this juncture the research offers a stitch in time for
Distribution Companies by targeting the significant Consumer Segment, during the
transforming state of affairs. The study would not only assist the Government Owned
Power Distribution Companies to combat with the future challenges, but would also
provide vital inputs for the Regulators to understand the Consumer needs and Interest,
thus, enabling them to frame rules in alignment with it. The study has kept ‘Consumer’ at
its focal point and the detailed discussion about the Open Access in Power Distribution
would enable Consumers understand the threats associated while switching from a
Service Provider to another. The study intends to benefit all the stakeholders and
envisages a healthy viable ambiance in future, for the Power Consumers. Some
reasonable effects of the Research Study are briefed as below.
1. The study may lend a hand to understand the Consumer needs as it has probed to
identify the Service Delivery aspects that would offer ‘Value’ for the Power
Consumers. The coverage of subtle issues related to Service Delivery and
microanalysis of the allied variables will help the MSEDCL understand the reasons for
Service Failures and plan strategies for Service Recovery. This will help the MSEDCL
face the future challenges in competitive environment.
2. Having considered the Consumer’s Voice, the discussion of basic variables in the
research provides platform for the MSEDCL as well as the Regulator (MERC), to
design Service Standards in accordance with Consumer needs and Interest.
3. It should be noted by eligible Open Access Consumers that a hasty decision, without
understanding the ‘Consumption Pattern’, financial implications of switching and
related terms and conditions of the agreement with the new Service Provider, would
make the situation even worst for them. The research study has covered all the finest
Chapter 7
Plausible Outcome of the Research

274
issues linked to Open Access; as a consequence, the report would operate to provide
guidelines to the eligible Open Access Consumers, while switching over to another
Service Provider. Apart from understanding the financial implications, related to
switching, the detailed questionnaire in the Research would offer a readymade
checklist of various parameters that an eligible Open Access Consumer must look for,
while changing the existing Service Provider.
4. The study carves new gaps for further Research. The Employee side, related to
implementation of Open Access policy remains concealed, so also are the problems
associated with the Regulator in amending the existing rules and regulations for
making the objective pragmatic and extending the advantages of competition to the
Society at large.
The Research work is just a handful contribution to the implementation of Open
Access in Distribution Sector and it may be treated as baby step taken so as to ignite
the topic and fuel more discussion on it in future.

Annexure

275
Annexure 1: Sample Frame (List of eligible OA Consumers, Source: IT Centre, Pune)
Sr CONSUMER
NUMBER CONSUMER_NAME ADDRESS CD
(KVA) TARIFF
1 170019040980
M/S. CITY REALITY
DEVELOPMENT PVT.
LTD.,
EB - 02 A, S. NO. 181,
TOWN
CENTER,AMANORA PARK
TOWN, HADAPSAR,PUNE.
1495 HT-II E I
2 170019038890 M/S. CITY
CORPORATION LTD.
S.NO.181, MALWADI
ROAD,SADESATARANALI,
HADAPSAR,PUNE
1315 HT-II N
II
3 170019034430 M\S MANJRI STUD
FARM PVT LTD.
S.P. INFOCITY SASWAD
ROADHADAPSAR
FURSUNGIPUNE
2000 HT-I C
4 170019029940
M\S PATNI
COMPUTERS SYSTEM
LTD.
WING A+B UPPAR
GROUND LEVEL LEVEL
I&IICIBER CITY TOWN II
MAGARPATTAHADAPSAR
PUNE
2400 HT-I N
5 170019028140
M\S AMDOCS
DEVELOPMENT
CENTER
CYBERCITY TOWER II
6TH 7 TH
FLOORMAGARPATTA
CITY HADAPSARPUNE
2600 HT-I N
6 170019030120 M/S JOHN DEERE
INDIA PVT LTD
CYBER CITY TOWER - 14
MAGARPATTA
CITYHADAPSARPUNE
1739 HT-I N
7 170019026760
EXL SERVICE COM
(INDIA) PRIVATE
LIMITED
CIBERCITY PHASE I
MAGARPETTAHADAPSAR
PUNE
1200 HT-I N
8 170019026770 THE MANAGING
DIRECTOR
MAGARPATTA TOWNSHIP
DEVLEPMENT &
CONSTRUCTION CO
LHADAPSARPUNE
1700 HT-I N
9 170019028580
WNS GLOBAL
SERVICES PRIVATE
LIMITED
TOWER I 5TH,6TH 7TH
CYBERCITY PHASE
IMAGARPATHA
CITYHADAPSAR PUNE
1184 HT-I N
10 170019031540
M\S ELECTRONIC
DATA SYSTEM
(INDIA)PVT LTD/
CYBER-CITY TOWER-4
MAGAR-
PATTAHADAPSARPUNE
3557 HT-I C
11 170019031390 M\S ACCENTURE
SERVICE PVT LTD.
CYBER CITY TOWER 5
LEVEL 6&7MAGARPATTA
CITY HADAPSARPUNE
1849 HT-I C
12 170019036870
M\S BNY MELLON
INTERNATIONAL
OPERATIONAL(INDIA)P
VT
CYBERCITY TOWER-
S3,LEVEL
03,04,05,06,07MAGARPATT
A CITY HADAPSARPUNE
1412 HT-I N
13 170019034850 M\S CAPITA INDIA PVT
LTD.
CYBERCITY TOWER-10
LEVEL -2 & 3
MAGARPATTA
CITYHADAPSARPUNE
1232 HT-I N

276
Sr CONSUMER
NUMBER CONSUMER_NAME ADDRESS CD
(KVA) TARIFF
14 170019036390
M\S MAGARPATTA
TOWNSHIP DEV. &
CONST CO LTD.
CRBERCITY TOWER-7,8,9,
MAGERPATTA
CITYHADAPSARPUNE
1111 HT-II N
II
15 170019032050
M/S. AMDOCS
DEVELOPMENT
CENTER INDIA LTD
LEVEL 0 & 1 CYBERCITY
TOWER-XIIMAGARPATTA
CITY, HADAPSARPUNE
1287 HT-I N
16 170019034530 M\S JOHN DEER INDIA
PVT LTD.
CYBERCITY TOWER-11
LEVEL O & 1
MAGARPATTA
CITYHADAPSARPUNE
1115 HT-I N
17 170019033800
M\S MAGARPATTA
TOWNSHIP DEV. &
CONST.CO.LTD.
CYBERCITY TOWER-11
LEVEL3 & 4
MAGARPATTA
CITYHADAPSARPUNE
2764 HT-I N
18 170019031090
M\S OPTION ONE
MORTGAGE
CORPORATION
(INDIA)PVT LTD
LEVEL 3,4 & 5 TOWER-6,
BERCITYMAGARPATTA
CITY
CYBERCITYHADAPSAR
PUNE
1000 HT-I N
19 170019035550
BNY MELLON
INTERNATIONAL
OPERATION(INDIA)PVT
LTD.
CYBERCITY TOWER-6
LEVEL-2 & 5
MAGARPATTACITYHADA
PSARPUNE
1291 HT-I N
20 170019037500
M/S. AMDOCS
DEVELOPMENT
CENTER INDIA
PVT.LTD
SEZ, TOWER-7, LEVEL-7,
MAGARPATTACITY,
HADAPSARPUNE
1272 HT-I N
21 170019033770 M\S ACCETURE
SERVICE PVT LTD.
MAGARPATTA CITY SEZ
TOWER-B-1
MAGARPATTA CITY
VILLAGE-HADAPSAR
2409 HT-I N
22 170019038680
M/S. ASHTON REAL
ESTATE
DEVELOPMENT
PVT.LTD
S.NO.207/1A, 207B, 207/2,
LOHAGAONAt
Wadgaonsheri, Viman
NagarPUNE
2500 HT-II E
II
23 170019038770
M/S. ALLIANCE
HOSPITALITY
SERVICES PVT.LTD
S.No.207/1,207B,207/2,Lohag
aon,S.No.33/2A/2,33/2B/2 at
Wadgaon Sheri,Viman
NagarPUNE
2500 HT-II E
II
24 170019038700 M/S. VAMONA
DEVELOPERS PVT.LTD
S.NO.207/1A, 207B, 207/2,
LOHGAONAt Wadgaonsheri,
Viman NagarPUNE
2917 HT-II E
II
25 170019038690 M/S. TRINITY
VENTURES
S.NO.207/1A,207B, 207/2,
LOHAGAONAt.
Wadgaonsheri, Viman
NagarPUNE
2500 HT-II N
II
26 170019038430 MR. ABDUL HAMID
JAFARI
CTS NO. 8 = 9, BUND
GARDEN ROADOPP.
POONA CLUB,PUNE
1350 HT-II N
II
27 170019009401 M/S BRAMHA BAZAZ
HOTEL LTD.
RAJA BAHADUR
MILLBEHIND PUNE
RLY.STATIONPUNE 411001
1184 HT-II N
II

277
Sr CONSUMER
NUMBER CONSUMER_NAME ADDRESS CD
(KVA) TARIFF
28 170019029690 M\S PANTALOON
RETAIL (I) LTD.
S.NO.364 CTS NO 1/1
F.P.NO 256,BOAT CLUB
ROADPUNE
1450 HT-II N
II
29 170019026500
M/S. SATYAM
COMPUTER SERVICES
LTD.
CTS 18-18/1 O.P.BO. 250,
F.P.NO. 246BAND GARDEN
ROAD,PUNE
1100 HT-I N
30 170019025550
THE COMMISSIONER
PUNE MUNICIPAL
CORPORATION
SHIVAJINAGARPUNEPUN
E 1900 HT-IV E
31 170019036270 M\S CLASSIC CITI
INVESTMENT PVT LTD.
S.NO 36 H.NO
3(PT)GHORPADIPUNE 4400
HT-II N
II
32 170019033920 M\S JEWEL
DEVELOPPERS
CTS NO 15 A-
15/7+15/8+15/9, S.NO
479,480 A\1koregaon
parkPUNE
1005 HT-II N
II
33 170019027720 SAVILLE ESTATE PVT
LTD
S.NO 471 CTS NO 21/6OPP
SUN N SAND BUND
GARDEN ROAD NEAR
ANJUMAN ISLAMHIGH
SCHOOL
1250 HT-I N
34 170019007807 M\S CLASSIC CITY
INVESTMENT PVT LTD.
262 B & CBUND GARDEN
ROAD PUNEP U N E 411001 1000
HT-II N
II
35 170019027370
M\S GODREJ
PROPERTIES &
INVESTMENT LTD
3RD TO 8TH
FLOORGODREJ
CASTLEMAINENEXT TO
RUBY HALL PUNE
1591 HT-II E
II
36 170019031790 M\S VERITAS
SOFTWARE(I)PVT LTD.
3RD & 8TH FIOOR,GODREJ
CASTLEMAINB.G.ROAD
NEXT TO RUBY
HALLPUNE
1500 HT-I C
37 170019002821
MANAGING TRUSTEE
GRANT MEDICAL
FOUNDATION
RUBY HALL CLINIC 40,
SASSON ROADPUNEPUNE 1500 HT-II E I
38 170019030970 M\S ONE STOP SHOP
INDIA PVT LTD.
CTS NO 1
WESTWINGCHIRCHROAD
PUNE
1265 HT-II N
II
39 170019027210
M/S PRIDE PARMAR
GALAXY
CONDOMINIUM
CT5 NO 10 SADHU
WASWANI CHOWKPUNE 1153 HT-I N
40 170019039130 ANNUTAM
DEVELOPERS PVT.LTD
037 HISSA NO.412,
GHORPADINR,. ABC
FARM, KOREGAON PARK
RDPUNE
4995 HT-II N
II
41 170019003674
M/S ASSISTANT
ENGINEER TRUNK
MAINTENANCE
PUNE TELEPHONE
PUNEMAHADAJI SHINDE
BHAVAN NR POONA
CLUBPUNE
2800 HT-I N
42 170019023800
M/S RUSTOM
NANABHOY
JEEJEABHOY
VILLOO VILLA 1 CHURCH
ROAD,CAMP PUNEPUNE 1310
HT-II N
II

278
Sr CONSUMER
NUMBER CONSUMER_NAME ADDRESS CD
(KVA) TARIFF
43 170019032530 M\S KROME PLANET
INRETIORS PVT LTD.
S.NO 80/A 2 & S NO 32/1,2
WANAWARIHADAPSARP
UNE
1302 HT-II N
II
44 170019000543
M/S KIRLOSKAR
PNEUMATIC
COMPANY LTD
HADAPSAR INDUSTRIAL
ESTATEPUNEHADAPSAR 2700 HT-I C
45 170019000616
M/S KIRLOSKAR
PNEUMATIC
COMPANY LTD
HADAPSAR INDUSTRIAL
ESTATEPUNEHADAPSAR 1290 HT-I C
46 170019005669 M/S HONEYWELL
AUTOMATION (I) LTD
53TO57 HADAPSAR
INDUSTRIALESTATE
PUNEHADAPSAR
2538 HT-I N
47 170019034380
M\S DEPUTY CITY
ENGINEER(SEWAGE
PROJECT)
TILAK ROAD OFFICE
PUNE MUNICIPAL
CORPORATIONS.NO
3A/12/13/14 MUNDHWA
HADAPSARPUNE
1460 HT-IV N
48 170019036050 GATPRIYA
PROPERTISE PVT LTD.
S.NO 17 HISSA NO 1A
1B,6A &
2/1MUNDHWAPUNE
1300 HT-II N
II
49 170019032520
M\S PANCHASHIL
INFRASTRUCTURE
HOLIDING PVT LTD
S.NO 81 MUNDHWA
ROADPUNE 1500
HT-II N
II
50 170019031510 M\S SHIRKE CONST
EQUIPMENT PVT LTD
S.NO 72/76
MUNDHWAPUNE 1200 HT-I N
51 170019002163 M/S SIPOREX INDIA
PVT LTD
72/76 MUNDHWA
PUNE0000000000000000000
0000000MUNDHWA
1013 HT-I N
52 170019005677
M/S KALYANI
THERMAL SYSTEM
LTD
PRIVATE LIMITEDS NO 72-
76 MUNDHAWA
PUNEMUNDHAWA
2490 HT-I N
53 170019000438 M/S BHARAT FORGE
LTD
POST BOX NO 57
PUNE0000000000000000000
0000000MUNDHAWA
4865
3 HT-I C
54 170019002848
M/S KALYANI
CARPENTER SPECIAL
STEELS LTD.
MUNDHWA
PUNE0000000000000000000
0000000MUNDHWA
3283
4 HT-I C
55 170019033570 M\S SUZLON ENERGY
LTD.
One Earth, S No 170/1 To 8
Village SadeSatra Nali,
Hadapsar,opp. Magarpatta
CityPUNE
2000 HT-II N
II
56 170019026240 M/S SHAPOORJI
PALLONI & CO. LTD.
MANJARI STUD
FARMPHURSUNGI
SASWAD ROAD
HADAPSARPUNE
4990 HT-I C
57 170019027730 M\S K.F.BIOPLANTS
S.NO 129 1+3C/1
MANJARI(BK)TQ HAVALI
DIST PUNEPUNE
1960 SP-I

279
Sr CONSUMER
NUMBER CONSUMER_NAME ADDRESS CD
(KVA) TARIFF
58 170019036990 M\S SERUM INSTITUTE
OF INDIA LTD. 212/2 HADAPSARPUNE
1500
0 HT-I C
59 170019024890 M\S BHARTI
CELLULAR LTD.
"O" VEGA
CENTRESHANKARSHET
ROADSWARGATE PUNE
1100 HT-II N
II
60 170019032540 M\S IDEA CELLULAR
LTD.
BLDG "B" VEGA CENTRE
SWARGATESHANKAR
SHETH ROADPUNE
1016 HT-I N
61 170019003691
M/S SHARDA
CONSTRUCTION &
INVESTMENT CO.
685/2-C SATARA ROAD
PUNENEAR BAJAJ AUTO
SHOW ROOM
"ASHWAMEDH"PUNE
1123 HT-II N
II
62 170019004174 M/S PADMAWATI
WATER WORKS
C/O PARWATI WATER
WORKS123 SINHAGAD
ROAD
PUNEPADAMAWATI
2300 HT-IV E
63 170019033680 KUMAR COMPANY
KUMAR PACIFIC,
L.S.NO.42+43F.P. NO 387
GULTEKADI, SHANKAR
SHET ROADPUNE
2000 HT-II N
II
64 170019031640
M\S DEVELOPMENT
ENGINEER WATER
WORKS SULLPY
PROJEC
PMC KATRAJ
GARDENRAJIV GANDHI
UDYANPUNE
1150 HT-IV E
65 170019034820
M\S NATIONAL
HIGHWAY AUTHORITY
OF INDIA
JAMBULWADIPUNE 1000 HT-II N
II
66 170019034830
M\S NATIONAL
HIGHWAY AUTHORITY
OF INDIA
SHINDWADIPUNE 1000 HT-II N
II
67 170019033970 M\S DY CITY
ENFINEER
PMC KAMALA NEHRU
HOSPITALPUNE 1250 HT-II E I
68 170019004344 M/S GARRISON
ENGINEER SOUTH
NO1 GENERAL BHAGAT
MARGCOMMAND
HOSPITAL SC PUNEPUNE
1495 HT-II E
II
69 170019000306 M/s Dy. City Engineer,
POONA CANTONMENT
WATER
WORKS,P.M.C.PUNE
4600 HT-IV E
70 170019000659 M/S GARISSON
ENGINEER SOUTH
STAVELY ROAD
PUNE0000000000000000000
000000000000000000000
1800 HT-II N
II
71 170019034060 M\S DEVELOPMENT
ENGINEERING
WATER SUPPLY
PROJECTCANTONMENT
WATER WORKS.PUNE
MUNICIPAL
CORPOTATION PUNE
3200 HT-IV E
72 170019030550
RASIKLAL
MANIKCHAND
DHARIWAL
FUN-N-SHOP S.NO.17/A/1-2
& 1-3WANWADI FATIMA
NAGAR PUNEWANWADI
PUNE
1106 HT-II N
II

280
Sr CONSUMER
NUMBER CONSUMER_NAME ADDRESS CD
(KVA) TARIFF
73 170019009044 M/S ADDL CITY
ENGINEER PARVATI
RAW WATER PUMPING
STATIONNR OLD
PARVATI SUB-STATION
PUNE
1350 HT-IV E
74 170019000969
M/S CITY ENGINEER
PARVATI WATER
WORKS
PUNE SINHAGAD ROAD
PUNE0000000000000000000
0000000PARVATI
2000 HT-IV E
75 170019002546
M/S CITY ENGINEER
PARWATI WATER
WORKS
PUNE SINHAGAD ROAD
PUNEPARWATI W WORK 3500 HT-IV E
76 170019040360 BHIDE GADGIL
ASSOCIATES
S.NO.59/1 C 2ND
FLOORWADGAON (BK)
SINHGAD ROADPUNE -41
1000 HT-II N
II
77 170019031750 YASHGANGA STONE
COMPANY
AT S.NO.36/1
DHAYARIPUNE 1490 HT-I N
78 170019031330 M\S SUNNY UDYOG S.NO 78/6 RAIKAR
MALADHAYARIPUNE 1450 HT-I N
79 170019000551 M/S GARRISON
ENGINEER P I R AND D
C/O GARRISON ENGINEER
(I)R & D GIRINAGAR
PUNEKHADAKWASLA
1000 HT-II N
II
80 170019001710
M/S CENTRAL WATER
AND POWER
RESEARCH
STATION
KHADAKWASLA000000000
00000000000000000KHADA
KWASLA
1200 HT-II E
II
81 170019031630
DEVELOPMENT
ENGINEER WATER
SUPPLY PROJECT PMC.
S.NO 43/44 WADGAON
(BK)TUKAI NAGARPUNE 2290 HT-IV E
82 170019000250 M/S GARRISON
ENGINEER(CENTRAL)
RANGE HILLS ROAD C W
ECOMPOND KHADAKI
PUNE 3KHADAKI
1590 HT-II N
II
83 170019035830 K RAHEJA CORP PVT
LTD
Bldg.No.1 Common Zone
S.No 144 & 145SAMARAT
ASHOKA PATH
YERAWADAPUNE
1400 HT-I C
84 170019035750 M/S.MUKUND BHAVAN
TRUST
COMMER ZONE,
K.RAHEJA CORP.PVT.LTD
BLDG.NO2,144 & 145
SAMRATHASHOKA
PATH,YERAWADA
1400 HT-I C
85 170019035030 M\S K RAHEJA CORP
PVT LTD
S.NO 144-145 SAMRAT
ASHOKA
PATHYERAWADAPUNE
1400 HT-I C
86 170019035700
M/S. K. RAHEJA
CORP.PVT.LTD.
(BUILD.NO.4)
COMMER ZONE S.NO.144
% 145SAMRAT ASHOKA
PATH, YERAWADAPUNE
1400 HT-I C
87 170019000063 M/S GENERAL
MANAGER
VIDESH SANCHAR NIGAM
LTDT T D C DIGHIDIGHI 1050
HT-II N
II
88 170019041010 M/S K.RAHEJA CORP
PVT.LTD
COMMERZONE
DIVISION144/145 SAMRAT
ASHOKPATH YERAWADA
PUNE
1400 HT-I C

281
Sr CONSUMER
NUMBER CONSUMER_NAME ADDRESS CD
(KVA) TARIFF
89 170019035310
M\S TATA
COMMUNICATIONS
LTD.
PUNE-ALANDI
ROADDIGHIPUNE 3000 HT-I N
90 170019008331 M/S YERROWDA
INVESTMENT LTD
PL NO 190&192 PART
YERROWDA SHASTRI
NAGAR PUNEPUNE 411006
1184 HT-I N
91 170019032460 M\S JAIN
CONSTRUCTION
S.NO 103 PLOT NO
123YERWADEPUNE 2900 HT-I C
92 170019000012 M/S GARRISON
ENGINEER AIR FORCE
LOHGAON PUNE
320000000000000000000000
0000LOHGAON
1500 HT-II N
II
93 170019006819
M\S AIRPORT
DIRECTOR.AIRPORT
AUTHORITY OF INDIA.
NATIONAL AIRPORT
AUTHORITYCIVIL
AIRTERMINAL
LOHAGAONPUNE 411032
1200 HT-II N
II
94 170019024050 GESCO CORPORATION
LTD.,
CTS 130/1, COMMERCIAL
COMPLEX,AIRPORT
ROAD, YERAWADA,PUNE
1100 HT-II N
II
95 170019031650 M\S PANCHSHEEL
TECH PARK PVT LTD.
S.NO 191/A/2/A/1/2
YERWADENEAR DON
BOSCO SCHOOLPUNE
1000 HT-I C
96 170019038020 M/S. ZERO
G.APARTMENT (P) LTD
S.NO. 199, P.NO. 204, 206,
209,VIMAN NAGARPUNE 1250
HT-II N
II
97 170019031050 M/S. WEIKFIELD IT CITI
INFO PARK
30/3 + 31/1,
WADGAONSHERIWADGA
ONSHERIPUNE
1486 HT-I N
98 170019031160 M\S KOLTE PATIL
DEVELOPERS LTD.
S.NO 198/1B BUILDING NO
DELTA-1GIGA SPACE
VIMANNAGARPUNE
1500 HT-I C
99 170019038730
M/S. HSBC SOFTWARE
DEVELOPMENT INDIA
PVT.LTD
S.NO. 222/1,
KALYANINAGARPUNEPU
NE
1400 HT-I N
100 170019030170 M/S HSDI S.NO.222/1 KALYANI-
NAGARPUNE 1400 HT-I N
101 170019025560
M\S HSBC SOFTWARE
DEVELOPMENT
(INDIA)LTD.
RAHEJA WOOLS
BUILDING NO4 PLOT NO
25S.NO222/9 KALANI
NAGERPUNE
1700 HT-I N
102 170019032550 M\S N.V. REALITY PVT
LTD.
S.NO 30/3, 31/1 2A
WEIKFIELD
ESTATENAGAR
ROADPUNE
1485 HT-I N
103 170019034280 M\S MAHANTESH MALI S.NO 30/3,31/1 & 2A
VIMANGARPUNE 1486
HT-II N
II
104 170019034270 M\S PRAKASH
MHATRE
S.NO 30/3,31/1 &
2AVIMANGARPUNE 1486
HT-II N
II
105 170019035720 M/S. BAJAJ FINSERV
LTD
S.NO.208/1B,
LOHAGAONVIMAN
NAGARPUNE
1400 HT-II N
II

282
Sr CONSUMER
NUMBER CONSUMER_NAME ADDRESS CD
(KVA) TARIFF
106 170019035320 ASCENT HOTELS
PRIVATE LIMITED
S.NO 32/1 A+B
WADGAONSHERIPUNE 3000
HT-II E
II
107 170019033630 M\S WNS GLOBAL
SERVICES
AT S.NO 30/3,31/3 & 2A
NAGAR ROADWEIKFIELD
ESTATE "C" BLOCKPUNE
3500 HT-I C
108 170019033150
M\S DEEPAK
FERTILIZERS &
PETROCHEMICALS
AT S.NO190(P)"ISHANYA"
OPP GOLF
COURSEYERWADEPUNE
3930 HT-II E
II
109 170019035120 SOFOTEL INFRA
PRIVATE LIMITED
192 A VILLAGE YERWADA
SHASTRINAGARYERWAD
APUNE
2000 HT-I N
110 170019037740 M/S. G CORP.
PROPERTIES PVT.LTD
S.NO. 206, A/1,NEXT TO
AGAKHAN
PALACEYERAWADAPUNE
2000 HT-II E
II
111 170019037770 M/S. IHHR
HOSPITALITY
CTS NO.
2134,2735,2136,2137,2140,21
42FINAL P.NO.88, NAGAR
ROADPUNE
1600 HT-II E
II
112 170019036220
M/S. DUET INDIA
HOTEL (PUNE)
PVT.LTD
S.NO. 197/3-5, VIMAN
NAGARPUNE 1275
HT-II N
II
113 170019000047 M/S GARRISON ENGR
AIR FORCE
LOHGAON PUNE
320000000000000000000000
0000LOHGAON
3000 HT-II E
II
114 170019029560 M\S VENTURA (I) PVT
LTD.
S.NO 15 MARIGOLD
PREMISESWADGAONSHE
RIPUNE
1480 HT-I N
115 170019031920 M\S LIFE STYLE PVT
LTD.
NEAR VENTURA D.NO
15WADGAON SHERIPUNE 1017
HT-II N
II
116 170019027460 M\S E 2 E SERWIZ
SOLUTIONS LTD.
WEST WING MARISOFT-
III15 MARIGOLD
PREMISES NAGAR
ROADWADGAONSHERI
PUNE
1485 HT-I N
117 170019028380 M/S MARIGOLD
PREMISES
ZAST WING , MARIGOLD
PREMISESS.NO.15,
WADGAON SHERIPUNE
1495 HT-I N
118 170019026750 PTC SOFTWARE
(INDIA)PVT.LTD
MARISOFT II MARY GOLD
PREMISESS.NO 15 15/6
KALYANI NAGARPUNE
1408 HT-I N
119 170019024780 M\S M SOURCE INDIA
PVT LTD
S.N.15VADGAONSHERIPU
NE 1040 HT-I N
120 170019034660 M\S SUKUMAR ENVIRO
FARMS PVT LTD
S.NO 13/B 1+2 & BLDG B-2
5TH FLOORCEREBRUM
KALYANI NAGARPUNE
1250 HT-II N
II
121 170019033350 M\S CYBAGE
SOFTWARE PVT LTD.
AT S.NO 13A/1+2+3
MULIKNAGARWADGAON
SHERIPUNE
3000 HT-I C

283
Sr CONSUMER
NUMBER CONSUMER_NAME ADDRESS CD
(KVA) TARIFF
122 170019031320 M\S KUMAR HOUSEING
CORPORATION LTD
CEREBRUM I.T.
PARKSR.NO13B,1=2=3
WADGAONSHERIPUNE
1450 HT-I N
123 170019037350 M/S. TRION
PROPERTIES PVT.LTD
S.NO. 35, NAGAR ROAD,
WADGAONSHERIWADGA
ONSHERIPUNE
4950 HT-II E
II
124 170019031560 M\S NYATI BUILDERS
PVT LTD.(WING A)
TECH PARK S.NO 9/1,
10/2WADGAONSHERIPUN
E
1500 HT-I N
125 170019036040 M/S. CALISTA
PROPERTIES PVT LTD
S.NO 8/1 B 1/A NEAR
BALAJI
PALACEKHARADIPUNE
1000 HT-II N
II
126 170019002422 M/S KRAN RADAR LTD
29/1 KHARADI
VILLAGENAGAR RD PUNE
14KHARADI
1800 HT-I N
127 170019035800 M\S BHARATI AIRTEL
LTD.
S.NO 3/1 KHARADI
KNOWLEDGE
PARKKHARADIPUNE
2500 HT-I N
128 170019031660
M\S EON KHARADI
INFRASTRUCTURE PVT
LTD.
AT PLOT NO 01,S.NO
77KHARADIPUNE 4500 HT-I N
129 170019028200 ZENSAR
TECHNOLOGIES LTD
PLOT NO 4
MIDCKHARADIPUNE 3777 HT-I N
130 170019041070
P-ONE
INFRASTRUCTURE
PVT.LTD
S.NO.1,H.NO.1B/2B,KHARA
DI PUNE.14. 2000
HT-II N
II
131 170149071790 THE EXECUTIVE
ENGINEER(ELECT)
P.C.M.C. AT 40MLD
SEWAGE TREATMENT
PLANTKASARWADIPUNE
1243 HT-IV N
132 170019000039 M/S GARRISON
ENGINEER CME
KHADAKI PHUGEWADI
PUNEPUNE 411012 1700
HT-II N
II
133 170019000853 M/S ATLAS
COPCO(INDIA) LTD
BOMBAY PUNE RD
SEVANAGARDAPODIDAP
ODI
1130 HT-I N
134 170019000152 M/S SANDVIK ASIA
PVT LTD
POST BOX NO 40 PUNE
1FUGEWADI 4991 HT-I N
135 170019000845 M/S ALFA
LAVAL(INDIA) LTD
BOMBAY PUNE ROAD
DAPODIPUNE 12DAPODI 2050 HT-I N
136 170149001339
M/S INDIAN CARD
CLOTHING COMPANY
LTD
PUNE - MUMBAI ROAD
NEAR
H.A.FACTORYPIMPRIPIMP
RI
1400 HT-I N
137 170149072480 M/S. DEVI
CONSTRUCTION CO.
ICC DEVI GAURAV TECH
PARKS.NO. 191 / 192
(PART), PIMPRI,PUNE
1150 HT-I C
138 170149001410 M/S PREMIER LIMITED
MACHINE TOOL
DIVISIONCHINCHWAD
PUNE 411019CHINCHWAD
1600 HT-I N
139 170149072000
M\S PRIME PROPERTY
DEVELOPMENT
CORPORATION LTD.
S.NO 31,32 CTS NO
5860MUMBAI-PUNE ROAD
PIMPRIPUNE
1600 HT-II N
II

284
Sr CONSUMER
NUMBER CONSUMER_NAME ADDRESS CD
(KVA) TARIFF
140 170149003919
M/S VICKERS SYSTEM
INTERNATIONAL
LIMITED
BOMBAY PUNE
ROADPUNEPUNE 1250 HT-I N
141 170149001363 M/S GKN SINTERE
METAL LIMITED PIMPRI PUNEPIMPRIPUNE 1890 HT-I N
142 170149001592
M/S PMT MACHINERY
TOOLS AUTOMATICS
PLTD
PO PIMPRI PF PB NO2
PIMPRIPUNEPIMPRI 1300 HT-I N
143 170149001452
M/S KSB PUMPS LTD
MILE STONE
BOMBAYPUNE
PIMPRIPUNEPIMPRI 2000 HT-I N
144 170149001321 M/S THYSSENKRUP
INDUSTRIES PVT. LTD
P O BAG NO 22PIMPRI
PUNEPIMPRI 1518 HT-I N
145 170149001347 M/S FINOLEX CABLES
LIMITED
26/27 BOMBAY POONA
RDPIMPRIPUNE 2434 HT-I C
146 170149001631
M/S CHIEF ENGINEER
HINDUSTAN
ANTIBIOTIC
BOMBAY PUNE ROAD
PIMPRI000000000000000000
00000000PIMPRI
3000 HT-I C
147 170149001631
M/S CHIEF ENGINEER
HINDUSTAN
ANTIBIOTIC
BOMBAY PUNE ROAD
PIMPRI000000000000000000
00000000PIMPRI
3000 HT-I C
148 170149065330
M\S AUTO CLUSTER
DEVELOPMENT &
RESEARCH INSTITUTE
H BLOCK PLOT NO
181CHINCHWADPUNE 1200 HT-I N
149 170149025340 HYT INOVATIVE
PROJECTS PVT. LTD.
PLOT NO 138 &b-21 "H"
BLOCKMIDC PIMPRIPUNE 1200 HT-I N
150 170149007302 M/S PUDUMJEE
INDUSTRIES LTD
S.NO. 25/26
THERGAONCHINCHWAD
PUNE 411033 CHINCHWAD
4950 HT-I C
151 170149001771 M/S PUDUMJI PULP
AND PAPER MILLS LTD
THERGAONPUNETHERGA
ON
1041
2 HT-I C
152 170149001550 M/S SKF BEARING
INDIA LIMITED
CHINCHWAD
GAONCHINCHWAD PUNE
411033CHINCHWAD
5983 HT-I C
153 170149072070 M\S ALUMINIUM
FOUNDRY DIVISION
C\O TATA MOTORS
LTD.CHINCHWDGAONPU
NE
4980 HT-I C
154 170149001401 M/S TATA MOTORS
LTD
CHINCHAWAD
PUNE0000000000000000000
0000000CHINCHAWAD
1584
1 HT-I C
155 170149028130 M\S GENNOVA BIO
PHARMACITICAL LTD
PL.NO 1 PHASE
IIINFOTECH PARK
HINJWADI MULSHIPUNE
2500 HT-I C
156 170149066990 M\S ACORIS
RESEARCH LTD.
PLOT NO 3A 2nd PHASE
BIOTECH
PARKHINJEWADIPUNE
1000 HT-I N

285
Sr CONSUMER
NUMBER CONSUMER_NAME ADDRESS CD
(KVA) TARIFF
157 170149060780 M\S INTERNATIONAL
BIOTECH PARK
PHASE-II RAJIVE GANDHI
BIOTECH PARKMIDC
HINJAWADIPUNE
1475 HT-II N
II
158 170149062690
M/S. CENTAUR
PHARMACEUTICALS
PVT.LTD.
PLOT NO. 4, RGIP, PH-
II,HINJAWADIPUNE 1350 HT-I N
159 170149027940 M/S. SCIGEN
BIOPHARMA PVT LTD.
PLOT NO. 18, IT PARK
HINJAWADI PHASE
IINEAR EMCURE
INDUSTRIAL, TAL.
MULSHI, DIST. PUNEPUNE
1490 HT-I N
160 170149026900
M\S ADITYA BIRLA
FOUNDATION PUBLIC
TRUST
S.NO.31 NR NEW MORYA
MANGAL
KARYALATHERGAON
CHANCHWADPUNE
1500 HT-II N
I
161 170149069200 M\S DLF AKRUDI
BLOCK NO 4 PLOT NO 28
& 29MIDC PH-II
RGIPHINJAWADI PUNE
2500 HT-I C
162 170149065830 M\S DLF AKRUTI
INFOPARK(PUNE)LTD.
BLOCK 1 PLOT NO 28,29
&PL2T RGIP
HINJWADIPUNE
1518 HT-I C
163 170149066730 M\S DLF AKRUDI INFO
PARK
BLOCK NO 2 PLOT NO 28
& 29RGIP PH-II
HINJAWADIPUNE
1100 HT-I C
164 170149066720 M\S DLF AKRUDI INFO
PARK
BLOCK NO 1 & 2 PLOT NO
28 & 29RGIP PH-II
HINJAWADIPUNE
1500 HT-I C
165 170149069210 M\S DLF AKRUDI
BLOCK NO 3 PLOT NO 28
&29 PL-2MIDC PH-11
RGIPHINJAEADI PUNE
2200 HT-I C
166 182939021940
M/S TATA TOYO
REDIATORS PRIVATE
LTD
GAT NO 235 AT
HINJAWADITAL MULSHI
DIST PUNEHINJAWADI
1600 HT-I N
167 182939031570
M/S TATA AUTO
PLASTIC SYSTEMS
LIMITED
SR. NO. 235-245 AT
HINJEWADITAL MULASHI
DIST. PUNEPUNE
3500 HT-I N
168 170149061160 M\S 3DPLM SOFTWARE
SOLUTIONS LTD.
PLOT NO 15 INFOTECH
PARKHINJAWADIPUNE 1000 HT-I N
169 170019063990 M\S ISH INFORECH
PLOT NO P-1/4 PHASE -
IIRGIP MIDC
HINJAWADIPUNE
1400 HT-I N
170 170149062660 M\S PERSISTENT
SYSTEM LTD.
PLOT NO 39-PH-
1.RGIPHINJAWADIPUNE 1500 HT-I N
171 170149065920 M/S. AZTEC DISHA
TECHNOLOGIES LTD
P.NO.37, RAJIV GANDHI
INFOTECHPARK,
HINJAWADIPUNE
1000 HT-I N
172 170149065350
M\S ASMITA
INTERNATIONAL &
INFRASTRUCTURE
PVT.LTD
INFOTECH PARKPHASE-I
HINJAWADIPUNE 1200
HT-II N
II

286
Sr CONSUMER
NUMBER CONSUMER_NAME ADDRESS CD
(KVA) TARIFF
173 170149071050 M\S SHREE BALAJI
VENTURES
AT S.NO
249/250WAKADPUNE 1200
HT-II N
II
174 170149028520 M/S. INFOSYS LIMITED.
PL.NO. 24, RAJIV GANDHI
INFOTECH PARKPHASE II
VILLAGE MAN, TAL
MULSHIHINJAWADI PUNE
5000 HT-I N
175 170149062110
M\S TATA BIUESCOPE
STEEL BUILDING
SOLUTION
S.NO 250,247
HINJAWADITAL
MUSHILPUNE
1200 HT-I N
176 170149066080 M\S DYNASTY
DEVELOPERS (P)LTD.
PLOT NO 3
RGIPHINJAWADIPUNE 3350 HT-I C
177 170149062620 M\S WIPRO LTD. PLOT NO 2 MIDCRGIP
HINJAWADIPUNE 5000 HT-I C
178 170149009518 M/S INFOSYS LIMITED
PLOT NO 1 PUNE
INFOTECHPARK M.I.D.C.
HINJAWADIPUNE 411027
3250 HT-I N
179 170149024530 M\S COGNIZANT
TECHNOLOGY
PLOT NO 26,27 INFOTECH
PARKHINJWADIDIST
PUNE
3000 HT-I C
180 170149023940 M/S. WIPRO LTD.
PLOT NO. 2, INFOTECH
PARK,HINJAWADI, TAL.
MULSHI,
DIST:PUNEHINJAWADI
5000 HT-I N
181 170149028010 M\S KPIT CUMMINS
INFOSYSTEMS LTD
PLOT NO 35/36 INFOTECH
PARKHINJAWADI TAL
MULSHIPUNE
2309 HT-I N
182 170149070550
M/S.FLAGSHIP
INFRASTRUCTURE
PVT.LTD
S.NO.154,
HINJAWADIPUNEPUNE 4900 HT-I N
183 170149064430
M\S FLAGSHIP
INFRASSTRUCRE PVT
LTD
S.NO 153/2 & 157/3
HINJAWADITAL
MULSHIDIST PUNE
3000 HT-VIII
184 170149070440 M\S INFOSYS
LIMITED.(SEZ)
PLOT NO 24 RGIP PH-
IIHINJAWADIPUNE 7000 HT-I C
185 170149070660 M\S EON HINJAWADI
INFRASTRUCRE P.LTD.
PLOT NO 20 S.NO 19/20
OPP
H.P.PUMPHINJAWADIPUN
E
1073 HT-II N
II
186 170149025190 M\S TATA
TECHNOLOGIES LTD
PLOT NO25 INFOTECH
PARKMIDC
HINJWADIPUNE
1750 HT-I N
187 170149066600
M/S. EON HINJAWADI
INFRASTRUCTURE
P.LTD
S.NO.20, HINJAWADITAL
MULSHIPUNE 1850 HT-I N
188 170149068650 M\S IDEA CELLULAR
LIMITED
PLOT NO 19/20(IBM) IDEA
SOFTWARE)HINJAWADIP
UNE
3000 HT-I N
189 170149061250
M\S EMITECH
EMISSION CONTROL
TECHNOLOGIES INDIA
LT
S.NO 282/1 AT VILLAGE
MANNTAL MULSHIPUNE 1976 HT-I N

287
Sr CONSUMER
NUMBER CONSUMER_NAME ADDRESS CD
(KVA) TARIFF
190 170149061220 M\S TATA AUTO
PLASTIC SYSTEM
A DIVISION OF TATA
AUTO COMP SYSTEM
LTD.S.NO280&281
RAISONIC IND.PARK
AREAVILLAGE MANN
TAL MULSHI PUNE
2500 HT-I N
191 170149064560
M/S.VISTEON
TECHNICAL &
SERVICES CENTRE
PVT.LTD
S.NO. 279, VILLAGE
MANNTAL. MULSHI, DIST.
PUNEMANN
1500 HT-I N
192 171199035380
M/S. VISTEON
AUTOMOTIVE SYSTEM
(I) PVT.LT
PL.NO. III, S.NO. 283/2,
RAISONI IND.
PARKMANN, TAL.
MULSHI, DIST.
PUNEMANN
1200 HT-I N
193 170149072250 M/S. TECH MAHINDRA
RGIP PH-II,
HINJAWADIVILLAGE
MANN, TAL.
MULSHI,PUNE
4500 HT-I C
194 170149072800 M/S. DYNASTY
DEVELOPERS P.LTD
P.NO.3, RGUP PH-
IIHINJAWADIPUNE 4800 HT-I C
195 170149073440
M/S. TATA
CONSULTANCY
SERVICES LTD
P.NO. 2 & 3 RGIP PHASE -
IIIMIDC HINJAWADIPUNE 5000 HT-I C
196 170149025940
EMCURE
PHARMACEUTICALS
LTD
PLOT NO P2 PHASE II
ADDITIONAL INFOTECH
AREAHINJWADIPUNE
4200 HT-I C
197 170019029090 THE GODREJ
PROPERTISE LTD.
DAGADI BUNGLOW NO 3
WAKADWADIMIMBAI
PUNE ROAD
SHIVAJINAGARPUNE
1500 HT-II N
II
198 170019069370 M\S L & T INFOTECH
LTD.
GODREJ ELERNIA " A" ,
4th TO 9th FLOORAT OLD
PUNE-MUMBAI
ROADWAKADEWADI
PUNE
1000 HT-I N
199 170019067350 M\S VODAPHONE
ESSAR LTD.
S.NO 21/4
F.P.NO.27METROPOLITION
IIND FLOORMUMBAI-
PUNE ROAD
WAKADEWADI PUNE
1800 HT-I C
200 170019067100 M\S LEON REALTORS
PRIVATE LIMITED
B WING PLOT NO 64,4,
SANGAMWADIMUMBAI
PUNE ROADPUNE
1960 HT-II E
II
201 170019071670 M/S. EMERSON
EXPORT
ENGINEERING CENTRE,
PL.NO.
6414,SANGAMWADIPUNE
1000 HT-I C

288
Sr CONSUMER
NUMBER CONSUMER_NAME ADDRESS CD
(KVA) TARIFF
202 170019072710 M/S. BAJAJ AUTO LTD.
CTS NO.12B + 315
PL.NO.38BHAMBURDA,
OLD MUMBAI-PUNE
RDPUNE
2000 HT-I C
203 170019028660 M\S AMEYA
DEVELOPERS
38/2, BAVDHAN (kh)NEAR
AMROSIA RESORTPUNE 2200 HT-I N
204 170019069260
M\S REAL TIME
ESTATE MANAGMENT
PVT LTD.
S.NO 322A,323A, MUMBA-
BENGLORE HIGHWAYAT
LALANI QUANTUM
P.LTDPUNE
1128 HT-II N
II
205 170019061390 M\S ICC REALITY (I)
PVT LTD.
504 CORPORATE
PLAZA106
A.S.B.ROADPUNE
2000 HT-I C
206 170019062440 M\S I.C.C.REALITY (I)
PVT LTD.
403/A PLOT "C" S.NO
985S.B.ROADPUNE 2000 HT-I C
207 170019062430 M\S I.C.C.REALITY
(I)PVT LTD.
403/A2 PLOT NO
'A"SHIVAJI HSG
SOCITYPUNE
1000 HT-II E
II
208 170019068310 M\S ICC REALITY PVT
LTD.
ICC MERRIOTT PLOT NO 1
BS.NO 985
SHIVAJINAGARPUNE
3000 HT-II E
II
209 170019006223
M/S DIRECTOR
NATIONAL INSTITUTE
OF
VIROLOGY 20-A DR
AMBEDKARROAD POST
BOX NO 11 PUNE 1PUNE
411001
1100 HT-II N
II
210 170019026230 M\S MUTHA
ASSOCIATES
S.NO 106 A\1
BHAMBURDAS.B. ROAD
GANESHKHINDPUNE
1575 HT-I N
211 170019062680 M\S SIPOREX INDIA
LTD.
CTS NO 1086 F.P.NO
466GANESHKHIND
ROADPUNE
1200 HT-II E
II
212 170019000748
M/S GARRISON
ENGINEER ERDL/ARDL
SDO B/R
M I S PASHAN
PUNEPASHAN 3000
HT-II E
II
213 170019004573
M/S DIRECTOR
NATIONAL
INFORMATIC CENTRE
GOVT OF INDIA
WESTERNREGION VDYOG
BHAVAN
PUNEGANESHKHIND RD
2000 HT-II E
II
214 170019069220 M\S KAKADE
DEVELOPERS PVT LTD.
"KAKADE CENTRE PORT"
NEAR E-AQUARE
THEATRE268+ B
SHIVAJINAGARPUNE
2000 HT-II N
II
215 170019070720 M/S. NVIDIA GRAPHICS
PVT LTD.
94/16 BUTE PATIL
CLASSICNEAR RAHUL
THEATRE G'KHIND
ROADSHIVAJINAGAR
PUNE
2800 HT-I N
216 170019001019 M/S DIRECTOR
NATIONAL CHEMICAL
LABORATORYPASHAN
PUNEPASHAN 1200
HT-II E
II

289
Sr CONSUMER
NUMBER CONSUMER_NAME ADDRESS CD
(KVA) TARIFF
217 170019004778
M/S DIRECTOR
NATIONAL CHEMICAL
LABORATOR
Y NCL PREMISES DR
HOMI BHABHA PATH
PUNEPASHAN
1200 HT-II E
II
218 170019005111 M/S DIRECTOR OF
INDIAN INSTITUTE
TROPICAL METROLOGY
PASHAN(I. I. T. M.)
DR.HOMI BHABHA
ROADPASHAN
2500 HT-II E I
219 170019007912
M/S DIRECTOR
NATIONAL CENTRE
FOR CELL
SCIENCE UNIVERSITY
CAMPUSGANESHKHIND
PUNEPUNE
1400 HT-II E
II
220 170019000861 M/S REGISTRAR PUNE
UNIVERSITY
C/O ESTATE MANAGER
ELEC &GEN-UNIVERSITY
OF POONAGANESHKHIND
1935 HT-II E I
221 170019006932 M/S DIRECTOR OF
SPORTS & YOUTH
SERVICES
MAHARASHTRA
STATEBALAWADI
MAHALUNGE
PUNEBALEWADI-PUNE
1500 HT-II E
II
222 170019067730
M\S B.W.HIGHWAY
STAR PRIVATE
LIMITED
S.NO 26/B SHI
CHATARAPATI SPORTS
COMPLEXBALEWADIPUN
E
2000 HT-II E
II
223 170019069730
M/S. B.W.HIGHWAY
STAR PRIVATE
LIMITED
S.NO 26/B
SHIVCHATRAPATI SPORT
COMPLEXBALEWADIPUN
E
2500 HT-II E
II
224 170019029010 MILLENNIA REALTORS
PVT LTD.
S.NO H.NO 8 &12 PLOT
NOA BANER ROADPUNE 4500 HT-I C
225 170019070420 M\S MILENNIA
RELTORS P LTD.
BLOCKNO B.S.NO 3 H.NO
8,12PLOT A BANERPUNE 2000 HT-I C
226 170019067920
M\S SYMPHONY
SERVICES PUNE PVT
LTD.
S.NO 1/3 A, H.NO 1/3 A TO
14BANERPUNE 2000 HT-I N
227 170019065210 THE ACCORD REALTY
PVT LTD.
S.NO 3 H.NO
611BANERPUNE 1305 HT-I N
228 170019064040 M\S PRITAM
CONSTRUCTIONS
AMAR ARMA
GENESISS.NO 21^2/2
BANERPUNE
1539 HT-I N
229 170019026790 M/S. MILLENNIA
REALTORS PVT.LTD.
RMZ WESTEND SECTION
NO. 2S.NO. 169/1 OPP. CITY
INTERNATIONAL
SCHOOLD.P ROAD,
AUNDH, PUNE
1404 HT-I N
230 170019073530
M/S SUNGARD
SOLUTIONS INDIA PVT
LTD
AT S.NO.169/1 SECTOR -
IIBLDG - B , AUNDHPUNE 1800 HT-I C
231 170019068580 M\S CHITRALI
PROPERTIES P LTD.
SECTOR -II BUILDING
"B"S.NO 169/1 D.P.
ROADAUNDH PUNE
2900 HT-II E
II

290
Sr CONSUMER
NUMBER CONSUMER_NAME ADDRESS CD
(KVA) TARIFF
232 170019063160 M\S CHITRALI
PROPERTIES PVT LTD.
BUILDING D AT S.NO
169/1D.P. ROAD
AUNDHPUNE
1580 HT-I N
233 170019066910 M\S N.S. GAIKWAD S.NO 127/1 A TO 1E PLOT
NO 8AUNDHPUNE 2000
HT-II N
II
234 170019068760
M\S PRITAM
CONSTRUCTION PVT
LTD.
(AMAR MEGAPLEX) 2ND
FLOOR TO 7TH FLOOR
ONLYS.NO 106
BANERPUNE
1200 HT-II N
II
235 170019068600 M\S VIORICA
PROPERTIES(P) LTD.
"HOLIDAY INN" S.NO 9/9/1
MHALUNGEPUNE 1000
HT-II N
II
236 170019000136 M/S KIRLOSKAR OIL
ENGINES LTD
13
LAXMANRAOKIRLOSKAR
ROADKHADAKIKHADAKI
4981 HT-I C
237 170019063720 M/S. GARRISON
ENGINEER (PROJECT)
MILLITARY
HOSPITALKIRKEEPUNE 1000 HT-II E I
238 170019024280 M\S VANSUM
INDUSTRIES
34 AUNDH ROAD
BOPADIBHAU PATIL
ROADPUNE 3
2500 HT-I C
239 170019000055
M/S SUPRINTENDENT
AMMUNATION
FACTORY
KHADAKI PUNE
3KHADAKI 5000 HT-I C
240 170019001175
M/S ASSISTANT
GARRISON ENGINEER
(INDEP)
C#O
G.E.(CENTRAL)RANGE
HILLS ROAD,
KHADKIKIRKEE
4000 HT-I C
241 170019000217 M/S KIRLOSKAR OIL
ENGINES LTD
13 LAXMANRAO
KIRLOSKARROAD
KHADAKI PUNE
3KHADAKI
1000 HT-I N
242 170019060690 M\S PERSISTENT
SYSTEM LTD.
FP NO9 A\12 CTS NO
12A\12ERANDVANE NEAR
PADALE PLACE OPP
SHARDA CENTREPUNE
1700 HT-I N
243 170019023310 M\S TECH MAHINDRA
LTD.
SHARDA CENTREOFF
KARVE ROAD ,
S.NO.91.ERANDVANE
D.GYMKHANA .PUNE
2145 HT-I N
244 170019068570 M\S SUMA SHILP LTD.
"DOWN TOWN"
SOFTWARE , 5TH TO 8TH
FLOORS.NO 8+13 NEAR
MHATRE
BRIDGEERANDWANE
PUNE
1400 HT-II E
II
245 170019071820
M\S PRANJAPE
SCHEMES
CONSTRUCTION LTD.
CTS NO 25/20 F.P.NO 25
C+24AERANDWANEPUNE 1400
HT-II E
II
246 170149028720 SHRI ASHOK S.
BEHARAY & OTHERS
S.NO 20/2 PLOT NO
CC3NEAR CITY PRIDE
KOTHRUDPUNE
1000 HT-II N
II

291
Sr CONSUMER
NUMBER CONSUMER_NAME ADDRESS CD
(KVA) TARIFF
247 170019002945
M/S AUTOMOTIVE
RESEARCH
ASSOCIATION OF
M\S AUTOMOTIVE
RESEARCH ASS.OF
INDIAVETAL TEKDI POUD
RD KOTHRUDKOTHRUD
PUNE
1500 HT-II N
II
248 170019002902
M/S CITY ENGINEER
PARWATI WATER
WORKS
PUNE SINHAGAD
ROAD0000000000000000000
0000000SNDT PUMPING
1200 HT-IV N
249 170019000519 M\S CUMMINS INDIA
LTD.
KOTHRUD
PUNE0000000000000000000
0000000KOTHRUD
4975 HT-I C
250 170019000314 M/S GARRISON
ENGINEER
NATIONAL DEFENCE
ACADEMYKHADAKWASL
AN D A PUNE
2400 HT-VI
251 170019029590
THE DEVELOPMENT
ENGINEER(WATER
SUPPLY)
S.NO 16 WARJE JAKAT
NAKANEAR KAKADE
CITYPUNE
3000 HT-IV E
252 170149002556 M/S TRINITY
ENGINEERING
14-2-1 MIDC
PUNE0000000000000000000
0000000CHINCHAWAD
4350 HT-I N
253 170149003269 M/S THERMAX LTD
D-13 M I D
CCHINCHAWAD
PUNECHINCHAWAD
2036 HT-I N
254 170149001568 M\S FORCE MOTORS AKURDI00000000000000000
000000000AKURDI 6428 HT-I C
255 170149001541 M/S JAYA HIND
INDUSTRIES LTD
AKURDI00000000000000000
000000000AKURDI 1100 HT-I C
256 170149002661 M/S GARWARE WALL
ROPES
D-11 PL NO 11
MIDC0000000000000000000
0000000AKURDI PUNE
2160 HT-I N
257 170149002173
M/S SPACO
TECHNOLOGIES (I) PVT
LTD
PL NO 13 BOMBAY PUNE
ROADCHINCHAWAD
PUNECHINCHAWAD
1130 HT-I N
258 170149006101 M/S GARWARE WALL
ROPES LIMITED
GWR FIBRE
DIVISIONMIDC PLOT NO
11 BLOCK D
1CHINCHWAD PUNE
1224 HT-I N
259 170149001975 M/S ATLAS
CASTALLOY LTD.
D2 LINK RD
NOIIMIDCCHINCHWADCH
INCHWAD
1200 HT-I N
260 170149007949 M\S FORCE MOTORS
(TRACTER DIV)
OFF OLD BOMBAY PUNE
RDAKURDI PUNEAKURDI
411035
4260 HT-I C

292
Sr CONSUMER
NUMBER CONSUMER_NAME ADDRESS CD
(KVA) TARIFF
261 170149001398 M/S GREAVES LTD
CHINCHAWAD
PUNE0000000000000000000
0000000CHINCHAWAD
1200 HT-I N
262 170149001436
M\S PREMIUM
ENGERGY
TRANSMISSION LTD.
CHINCHAWAD
PUNE0000000000000000000
0000000CHINCHAWAD
1470 HT-I N
263 170149001789 M/S MATHER AND
PLATT PUMPS LTD.
CHINCHWADPUNECHINC
HWAD 4500 HT-I N
264 170149004851 M/S GREAVES LTD
(DIESEL ENGINE UNIT
PLANT IIICHINCHWAD
PUNEPUNE 411019 2248 HT-I N
265 170149001444 M/S BAJAJ AUTO LTD AKURDIPUNEAKURDI 8000 HT-I C
266 170149004206 M/S FINOLEX
INDUSTRIES LTD
BLOCK D1 PNO10 MIDC
AREACHINCHWAD
POONAPUNE 411019
2100 HT-I C
267 170149004168 M/S AMFORGE
INDUSTRIES LTD
PL NO 32/D-2 BLOCK
MIDCCHINCHWADCHINC
HWAD
2415 HT-I N
268 170149008953
M/S REGIONAL
TELECOM TRAINING
CENTRE
PLOT NO 121 122 "G"
BLOCKM.I.D.C.
CHINCHWADPUNE 411019
1200 HT-I N
269 170149001991 M/S EXIDE INDUSTRIES
L.T.D. CHINCHWAD
D2 MIDC IND
ESTATECHINCHWAD
POONA 411019
4900 HT-I N
270 170149028640 M\S SUBU CHEM PVT
LTD.
G.NO 673,
KUDALWADICHIKHALIPU
NE
1400 HT-I N
271 170149075160 M/S SUBU CHEM PVT.
LTD. (UNIT-II)
AT GAT.NO.671 , KUDAL-
WADI,CHIKHALIPUNE. 1000 HT-I C
272 170149001878 M/S TATA MOTORS
LTD PIMPRIPUNEPIMPRI
5537
2 HT-I C
273 170149001673
M/S MAHINDRA
HINODAY INDUSTRIES
LTD.
BHOSARI INDUSTRIES
ESTATEBHOSARI
PUNEBHOSARI
4500 HT-I N
274 170149002998 M\S SAINT GOBAIN
SEKURIT (INDIA)LTD.
M I D CBHOSARI
PUNEBHOSARI 2500 HT-I N
275 170149076820 M/S. ARTEMIS
PROPERTIES PVT. LTD
PLOT NO. T-187'T' BLOCK
MIDCNEAR CIRT
SWITCHING STN.
BHOSARI.
1500 HT-II N
II
276 170149001967 M/S KORES (INDIA)
LTD
PEFCO FOUNDRY
DIVISION E-14 BHOSARI
IND. AREAPUNE 411026
2850 HT-I N
277 170149024940 M\S RELIANCE
COMMUNICATION LTD
T-23 MIDC
BHOSARITELCO
ROADPUNE
1100 HT-I N

293
Sr CONSUMER
NUMBER CONSUMER_NAME ADDRESS CD
(KVA) TARIFF
278 170149003412 M/S K S B PUMPS
POWER PROJECT
CHINCHAWADMIDC
PUNECHINCHAWAD
3200 HT-I N
279 170149004257
M/S SONA OKEGAWA
PRECISION FORGINGS
LTD.
T-46 MIDC
BHOSARIPUNEBHOSARI 1300 HT-I N
280 170149002009 M/S CENTURY ENKA
LTD BHOSARIPUNEPUNE 7680 HT-I C
281 170149026060 BHARUCHA STONE &
SAND WORKS
S.NO.80, CHAROLI TQ
HAVELI DIST
PUNECHAROLIPUNE
1100 HT-I N
282 170149061280
M\S SYNTEL
INTERNATIONAL PVT
LTD.
PL NO B-1 MIDC
SOFTWARE TECHLOGY
PVT
LTD.TALAWADEPUNE
2750 HT-I C
283 170149068520
M\S SYNTEL
INTERNATIONAL PVT
LTD.
SYNTEL SEZ PLOT NO B1
& B2TALAWADE
SOFTWARE
TECHNOLOGY
PARKDEHU-ALANDI
ROAD PUNE
1800 HT-I C
284 170149005865 M/S ADMINISTRATOR,
P.C.M.C.
RAW WATER PUMPING
STATION.AT.RAVET.DIST.
PUNE.PIMPRI 411018
6500 HT-IV E
285 170149005831
M/S PROJECT OFFICER
PYROTECHNIC
PROJECT
POST ORDNANCE
FACTORY ESTTAL
MAVAL DIST
PUNEDEHUROAD412113
1340 HT-I N
286 170149022970 M/S GARRISON
ENGINEER
M E S DEHU ROADTAL
MAVAL DIST PUNEPUNE 2000 HT-VI
287 170149005857
M/S EXECUTIVE
ENGINEER MIDC
CHICHWAD
MIDC DIVISION
CHINCHWADPUNERAVET
411019
1300 HT-I C
288 170149005849
M/S EXECUTIVE
ENGINEER
M.I.D.C.CHINCHWAD
MIDC DIVISION
CINCHWADPUNERAVET
411019
1600 HT-I C
289 170149069360 M\S S.BALAN I.T. UNIT
I.T.UNIT PLOT NO A-6
SOFTWARE PARKM.I.D.C.
TALAWADEPUNE
2300 HT-II N
II
290 171379020223 M/S CAPGEMINI (I)
INDIA PVT LTD
TALAWADE
TAL.HAWELIDIST. PUNE
TALWADETALAWADE
1250 HT-I N
291 170149024190 M/s CAPGEMINI INDIA
PVT LTD
A12 SOFTWARE
TECHNOLOGY
PARKTALWADE MIDC
PUNEPUNE
1500 HT-I N
292 170149061970 M/S CAPGEMINI INDIA
PVT LTD
PLOT NO 4-2 & A-
3TALAWADE SOFTWARE
PARKVILLAGE
TALAWADE MIDC
1250 HT-II N
II

294
Sr CONSUMER
NUMBER CONSUMER_NAME ADDRESS CD
(KVA) TARIFF
293 170149076830 M/S CAPGEMINI INDIA
PVT.LTD.
PLOT NO. A-2/A-
3,TECHNOLOGY
PARK,TALAWADE
1500 HT-I N
294 170149026940
M\S FUJITSU
CONSULTING INDIA
PVT.LTD.
PLOT NO A-15 SOFTWARE
TECHNOLOGY
PARKTALWADEPUNE
2272 HT-I N
295 170229042960 M/S. SAKAL PAPERS
PVT LTD
GAT NO. 159, 160
URULIDEVACHITAL.
HAVELI. DIST.
PUNEURULIDEVACHI
1830 HT-I C
296 171579051910 HYVA INDIA PVT LTD
GAT NO.185 PART,186
PART,
PHULGAONGLOBAL
RAISONI IND. PARK, TAL.
HAVELI,DIST.PUNEPHULG
AON
1272 HT-I N
297 171179051950 OM SHREE SAI INFRA GAT NO. 70BHAVADITAL
HAVELI 1260 HT-I N
298 170529045690
M/S.VMR
INFRASTRUCTURE
PVT.LTD.
GAT NO.595, 602,
LONIKAND,TAL-HAVELI,
DIST.PUNELONIKAND
1104 HT-I N
299 171339021634 M/S WEIKFIELD FOODS
PVT. LTD.
WEIKFIELD
ESTATE,NAGAR ROAD,
PUNEPUNE
1529 SP-I
300 170899032910
M/S. WIKA
INSTRUMENTS INDIA
PVT.LTD.
GAT NO. 94, & 100 AT-
KESNAND,TAL. HAVELI,
DIST.PUNEKESNAND
1050 HT-I N
301 183099032810 M/S. LUPIN LTD.
GAT NO. 46A/47A AT
VILLAGE NANDE,TAL.
MULSHI, DIST.
PUNENANDE
2382 HT-I N
302 182859041600
M/S. LAVASA
CORPORATION
LIMITED
AT DASVETAL. MULSHI,
DIST. PUNEDASVE 4500
HT-II E
II
303 182919044340 M/S LUPIN LIMITED
GAT NO 1156
GHOTAWADETAL
MULISHI DIST
PUNEGHOTAWADE
1600 HT-I N
304 182859032360 M\S KLAUS UNION
ENGINNER PVT LTD
GAT NO 1197 AT
PIRANGUTTAL MULSHI
DIS PUNEPIRANGUT
1592 HT-I N
305 182929001258 M/S INDO SCHOTTLE
AUTO PARTS PVT.LTD.
105/1 MUKTA
APARTMENTSUNDERRAO
REGE MARG
PUNEERANDWANE PUNE
1800 HT-I C
306 182929031640
MS/. BRINTONS
CARPETS ASIA PVT
LTD.
PL. NO. 414/415/416
URWADETAL. MULSHI
DIST. PUNEPUNE
1400 HT-I C
307 182859020454
M/S HINDUSTAN
COCA-COLA
BEVERAGES PVT.LTD.
AT POST PIRANGUTTAL
MULSHI DIST
PUNEPIRANGUT
2200 HT-I C

295
Sr CONSUMER
NUMBER CONSUMER_NAME ADDRESS CD
(KVA) TARIFF
308 182859038690 THE DIRECTOR
SYMBIOSIS
G.NO. 1154 LAWALETAL.
MULSHI, DIST.
PUNELAWALE
1100 HT-I C
309 183099036960 M/S. AAMBY VALLEY
LTD.
AMBY VALLY SAHARA
LAKE CITYTAL. MULSHI,
DIST. PUNESAHARA
5000 HT-II E
II
310 170319021682 M/S SHOGINI
TECHNOARTS PVT LTD
GAT NO 788 KHED
SHIVAPURTAL HAVELI
DIST PUNEKHED
SHIVAPUR
1900 HT-I N
311 179419021695
M/S MAGNUM FORGE
& MACHINE WORKS
PVT LTD
GAT NO 777 NR
SHINDEWADIAT VELU
TAL BHOR DIST
PUNEVELU
1900 HT-I N
312 179419040260 M/S. VIKRAM IRON &
STEEL CO.LTD
G.NO.141, HISSA NO. 3,
SHIVARETAL. BHOR,
DIST. PUNESHIVARE
2975 HT-I C
313 170259046670
M/S DSK GLOBLE
EDUCATION &
RESEARCH PVT LTD
S. NO 53,54,55,KADAM
WAKVASTIPUNE
SOLAPUR RD TAL-
HAVELI,PUNEKADAMWA
KVASTI
1572 HT-II N
I
314 170019000136
M/S HINDUSTAN
PETROLIUM
CORPORATION LTD
B P P L PROJECT
LONIKALBHOR PUNE
PUNE
2100 HT-I N
315 170259000028 M/S RAMA KRISHI
RASAYAN LTD
POST
LONIKALBHORTALUKA
HAVELI DIST PUNEAT
LONIKALBHOR
1250 HT-I N
316 170259031610 M/S PHILIPS INDIA
LTD.
GAT NO. 125 LONI-
KALBHORTAL. HAVELI
DIST. PUNEPUNE
1100 HT-I N
317 170259000010
M/S VISHAY
COMPONENTS INDIA
PVT.LTD.
TALUKA HAVELIDIST
PUNEAT LONIKALBHOR 4500 HT-I N
318 170259040780 M/S. RISE n SHINE
BIOTECH PVT.LTD
S.NO. 875, THEURTAL.
HAVELI, DIST.
PUNETHEUR
1500 SP-I
319 170429001555 M/S POONA ROLLER
FLOUR MILLS PVT LTD
PLOT NO 103/104
HDAPSAR
IND.ESTATEHADAPSARPU
NE
1100 HT-I N
320 170279037830
M/S. EX-ENGINEER
MINOR IRRIGATION
DN.I SWARGATE
DN. I SWARGATE (AT SITE
SHINDAVANE)PUNEPUNE
2089
4 HT-V
321 181019030096 M/S LARSEN &
TOUBRO LTD
AT TUNGARLI
LONAWALATAL MAVAL
DIST PUNELONAVALA
1000 HT-II N
II
322 181019002475
M/S PERFECT
ENGINEERING
PRODUCTS PVT LTD
172, TUNGARLI,
LONAVALATALUKA-
MAVAL,DIST.PUNELONA
WALA
1200 HT-I N

296
Sr CONSUMER
NUMBER CONSUMER_NAME ADDRESS CD
(KVA) TARIFF
323 181019002441 M/S ASSTT GARRISON
ENGINEER I
M E S KURAWANDE
LONAWALADIST
PUNELONAWALA
1800 HT-II E
II
324 181029035950 M/S. JCB INDIA LTD.
PL.NO. A/A MIDC
TALEGAONTAL. MAVAL,
DIST. PUNETALEGAON
4990 HT-I N
325 181029040130 M/S.TRACTOR
ENGINEERS LIMITED
P.NO. A-8,
TALEGAONTAL. MAWAL,
DIST.PUNETALEGAON
1400 HT-I N
326 181029038130 M/S. INA BEARING
INDIA PVT.LTD
AT P. NO. A-3, MIDC
TALEGAONTAL. MAVAL,
DIST. PUNETALEGAON
2000 HT-I N
327 181029043610
M/S. MAXTECH
SINTERED PRODUCTS
PVT.LTD
G.NO. 127, MANGRULTAL.
MAVAL, DIST.
PUNEMANGRUL
1000 HT-I N
328 181029045650 M/S.DONGSHIN
MOTECH PVT.LTD.
PLOT NO.19, MIDC
TALEGAON
DABHADE,TAL-MAVAL,
DIST.PUNETALEGAON
DABHADE
1000 HT-I N
329 181029043720 M/S. KAKADE STONE
CRUSHER
G.NO. 216 & 221
MANGARULTAL. MAVAL,
DIST. PUNEMANGARUL
2500 HT-I N
330 181029042400
M/S. SHRINIWAS
ENGINEERING
AUTOCOMP PVT.LTD
GAT NO. 492, NAWALAKH
UMBRETAL. MAVAL,
DIST. PUNENAWALAKHA
UMBRE
9000 HT-I C
331 181029002040 M/S CADBURY INDIA
LIMITED
AT INDURI,
P.O.TALEGAONDABHADE,
TAL-
MAVAL,DT.PUNEINDURI
2200 HT-I N
332 181019044010 M/S.ESSAR STEEL
LTD.SERVICE CENTRE
GAT NO.437, 442,AMBI
GOLEGAONTAL-MAVAL,
DIST.PUNEAMBI
GOLEGAON
2000 HT-I N
333 181029046890 M/S.AAKAR FOUNDRY
PVT.LTD.
S.NO.341/2,
TALEGAON,TAL-MAVAL,
DIST.PUNETALEGAON
1000 HT-I C
334 181029039800
M/S. GENERAL
MOTORS INDIA
PVT.LTD
A-16 MIDC AMBI
(NAVLAKH UMBRE)TAL.
MAVAL, DIST.
PUNETALEGAON
2000
0 HT-I C
335 181029039390 M/S. BERICAP INDIA
PVT.LTD
A-6, MIDC
TALEGAONTAL. MAVAL,
DIST. PUNETALEGAON
1950 HT-I C
336 176349002834 M/S BILCARE LIMITED 253,NARAYAN PETH
LAXMI RDPUNEPUNE 1200 HT-I C
337 177529040200 M/S. PARKSONS
PACKAGING LTD.
G.NO.357,
KHARABWADITAL. KHED,
DIST. PUNEKHARABWADI
1200 HT-I C

297
Sr CONSUMER
NUMBER CONSUMER_NAME ADDRESS CD
(KVA) TARIFF
338 176119002720 M/S L'OREAL INDIA
PVT. LTD
GUT NO 426 AT &P
MAHALUNGEINGALE TAL
KHED DIST
PUNEMAHALUNGE
2500 HT-I C
339 176029030058 M/S MAHINDRA
FORGINGS LTD
P-857-860,CHAKAN
AMBETHANROAD,TAL
KHED, DIST
PUNECHAKAN
1600
0 HT-I C
340 176029035760 M/S. LUMAX
INDUSTRIES LTD
608, CHAKAN TALEGAON
ROAD, MAHALUNGETAL.
KHED, DIST.
PUNECHAKAN
1300 HT-I N
341 176099030837 M/S SEMCO ELECTRIC
PVT..LTD.
G.N.154/1,MAHALUNGE-
CHAKANTALUKA-KHED,
DIST-PUNEMAHALUNGE
1050 HT-I N
342 176029033000 M/S. SEMCO ELECTRIC
PVT.LTD
PLT NO. A-2, MIDC
CHAKAN,TAL. KHED,
DIST. PUNECHAKAN
1100 HT-I C
343 176099053460 M/S BANSAL PLASTO
PA PVT. LTD.
G NO 216 TO 219 ,
MAHALUNGETAL-
KHEDDIST-PUNE
1510 HT-I N
344 176029035720
M/S. PRECI FORGE &
GEARS (DN. OF
JAGADAMBA AUTO )
GAT NO. 150/2 CHAKAN,
TALEGAON
RD.MAHALUNGE, TAL.
KHED, DIST.
PUNECHAKAN
1250 HT-I C
345 176099053450 M/S PRADEEP
POLYFLEX PVT. LTD.
G. NO. 216 TO 219,
MAHALUNGETAL-
KHEDDIST-PUNE
1510 HT-I N
346 176099030420
M/S KORES (INDIA)
LTD CHAKAN
FOUNDRY DN
G.N.149,CHAKAN
TALEGAON RD.
TAL.KHED, DIST-
PUNEMAHALUNGE
6340 HT-I N
347 176029032090 M/S KEIHIN FIE PVT.
LTD.
ROAD NO 3, CHAKEN
M.I.D.C.TAL KHED DIST
PUNECHAKEN
1000 HT-I C
348 176029046440 M/S.PLASTIC OMNIUM
VARROC PVT.LTD.
AT-PLOT NO.B-14, MIDC,
CHAKANTAL-KHED,
DIST.PUNECHAKAN
2250 HT-I N
349 176099033680 M/S. RINDER INDIA
PVT.LTD.
GAT NO. 148,
MAHALUNGE,
CHAKAN,TAL. KHED,
DIST. PUNEMAHALUNGE
1500 HT-I N
350 176029003301 M/S AHMEDNAGAR
FORGING LTD
GAT NO 2787
CHAKANTAL KHED DIST
PUNEAT CHAKAN
2460 HT-I N
351 176029033450 M/S. BADVE AUTO
COMPS PVT.LTD.
PLOT NO. A-3, MIDC,
CHAKAN,TAL. KHED,
DIST. PUNE CHAKAN
1500 HT-I N

298
Sr CONSUMER
NUMBER CONSUMER_NAME ADDRESS CD
(KVA) TARIFF
352 176029030376 M/S BOSCH CHASSIS
SYSTEMS INDIA LTD.
G.N.306, AT-
NANEKARWADITAL-
KHED, DIST-
PUNENANEKARWADI
2500 HT-I N
353 177529033980 M/S. RIJ ENGINEERING
PVT.LTD
S.NO. 378, KHARABWADI,
CHAKAN-TALEGAON
RD.TAL. KHED, DIST.
PUNEKHARABWADI
2331 HT-I N
354 176089030448 M/S HIGHTEMP
FURNACES LIMITED
GAT NO.615,AT-
KURULITALUKA-
KHED,DIST.PUNEKURULI
2000 HT-I N
355 176029033790
M/S. KSH
INTERNATIONAL
PVT.LTD.
GAT NO. 11/2/2A & 11/2 AT
BIRDWADE,CHAKAN,
TAL. KHED,
DIST;PUNEBIRDWADE
1515 HT-I N
356 176089031880 M/S SKS FASTENERS
LTD.
G.NO.1990, CHAKEN
AMBETHAN ROADTAL
KHED DIST PUNECHAKAN
1450 HT-I N
357 177769030414
M/S AUTOMOTIVE
STAMPINGS AND
ASSEMBLIES LTD
G-71/2, M.I.D.C.
BHOSARIBHOSARI,T-
HAVELI,D-PUNEPUNE
2000 HT-I N
358 176029031020 M/S ALPHA FOAM
LIMITED
GAT 310 NANEKARWADI
CHAKANTAL KHED DIST
PUNENANEKARWADI
1800 HT-I N
359 176089045810
M/S.MAGNETI
MARELLI MOTHERSON
AUTO SYSTEM LTD.
GAT NO.148-150,
AMBETHANTAL-KHED,
DIST.PUNECHAKAN
2000 HT-I C
360 176029046110
M/S MOTHERSON
AUTOMOTIVE
TECHNOLOGIES &
ENGINEERIN
GAT NO 150
,AMBETHANTAL- KHED
DIST- PUNECHAKAN
2000 HT-I C
361 176099047840 M/S.ATTITUDE
PLASTIC PVT.LTD.,
G.NO.200,
BHAMBOLI,TAL-KHED,
DIST.PUNEBHAMBOLI
1500 HT-I N
362 176869053310 M/S. BRIDGESTONE
INDIA PVT. LTD.
P. NO. A-43MIDC CHAKAN
PH-IITAL. KHED 5000
HT-II N
I
363 176029046830
M/S HYUANDAI
CONSTRUCTION
EQUIPMENT INDIA PVT
LTD
PLOT NO.A-2,CHAKAN
MIDC,PHASE-IITAL-KHED,
DIST.PUNECHAKAN
2928 HT-I N
364 176099054370
M/S PHILIPS
ELECTRONICS INDIA
LTD.
P. NO. B - 79, MIDC
CHAKAN,TAL KHED,DIST
- PUNE
2150 HT-I N
365 176089030570 M/S AHMEDNAGAR
FORGINGS LTD
GAT NO 614 AT
KURULITAL KHED DIST
PUNEKURULI
7750 HT-I C
366 170149024740 M\S INDRAYANI
FERROCAST (P) LTD
GET NO 225 DHAMORE
VILLAGEALANDI-
MANKAL ROADPUNE
9900 HT-I N
367 170149024740 M\S INDRAYANI
FERROCAST (P) LTD
GET NO 225 DHAMORE
VILLAGEALANDI-
MANKAL ROADPUNE
9900 HT-I N

299
Sr CONSUMER
NUMBER CONSUMER_NAME ADDRESS CD
(KVA) TARIFF
368 170149023090 M/S RAVIN CBALES
LIMITED
G NO. 2270230 ALANDI
MARKAL RD.TAL KHED
DIST PUNEPUNE
1200 HT-I N
369 170149037860 M/S. MAASS FLANGE
INDIA PVT.LTD
PL.NO. A, MARKAL-
UDYOGNAGAR
MARKALTAL. KHED,
DIST. PUNEMARKAL
1189 HT-I N
370 170149023050 M/S PUSHPAK STEEAL
INDUSTIES LTD.
GAT 119. ALANDI
MARKAL ROADDHANORI
TAL KHED DIST
PUNEDHANORI
2750 HT-I N
371 170149022800
M\S AMCOR RIGID
PLASTICS INDIA PVT.
LTD.
GAT NO 119-123 ALANDI
MARKAL RDTAL KHED
DIST PUNEDHANORE
2000 HT-I C
372 170149038380 M/S. SILVER STAR
ALLOYS PVT.LTD.
G.NO. 398 DHANORETAL.
KHED, DIST.
PUNEDHANORE
4800 HT-I C
373 170149046290
M/S PARTHSARATHI
STEEL ALLOYS PVT
LTD
GAT NO 128/1&2
DHANORETAL- KHED
DIST- PUNEDHANORE
4900 HT-I N
374 176029031820 M/S BAJAJ AUTO LTD.
P-A/1 M.I.D.C.
MAHALUNGETAL KHED
DIST PUNEMAHALUNGE
7500 HT-I C
375 170149022850
M/S SANT
DYANESHWAR STEEL
PVT LTD
GAT NO 1076/1077ALANDI
MARKAL ROAD TAL
KHED DIST
PUNEMARKAL
3700 HT-I N
376 170149022910 M/S SOHN STEEL
PRIVATE LIMITIED
GAT NO. 1252 TO 1261
ALANDI MARKAT RD.TAL
KHED DIST PUNEPUNE
6000 HT-I C
377 176029038790 M/S.MINDA
CORPORATION LTD.
G.NO. 307, H.NO. 1,2,3 AT
NANEKARWADITAL.
KHED, DIST.
PUNENANEKARWADI
1350 HT-I N
378 176029031267 M/S GANAGE
PRESSINGS LIMITED
G NO 228 AT
NANEKARWADITAL
KHED DIST
PUNENANEKARWADI
1200 HT-I N
379 176029042090 M/S. BREMBO BRAKE
INDIA PVT.LTD
AT GAT NO. 307,
NANEKARWADI,
CHAKANTAL. KHED,
DIST. PUNECHAKAN
1600 HT-I N
380 176029043740 M/S. MERCEDES BENZ
INDIA PVT.LTD
AT P. NO. E-3,PH.III,MIDC
CHAKANTAL. KHED,DIST.
PUNECHAKAN
2500 HT-I C
381 176089037450 M/S. ENDURANCE
TECHNOLOGIES LTD.
B-22, MIDC CHAKANTAL.
KHED, DIST.
PUNECHAKAN
1500 HT-I C
382 176029033990 M/S. ENDURANCE
TECHNOLOGIES LTD
B-20, MIDC CHAKAN, TAL.
KHEDDIST. PUNECHAKAN 2000 HT-I C

300
Sr CONSUMER
NUMBER CONSUMER_NAME ADDRESS CD
(KVA) TARIFF
383 176029035740 M/S. ENDURANCE
TECHNOLOGIES LTD.
PLOT NO. B-1/3 MIDC
CHAKANMAHALUNGE,
TAL. R'NAGAR, DIST.
PUNECHAKAN
2850 HT-I C
384 176029036410
M/S. ENDURANCE
MAGNETI MARELLI
SHOCK ABSO(I)PVT.LT
PL.NO. B-23, MIDC
CHAKAN,TAL.
RAJGURUNAGAR, DIST.
PUNECHAKAN
3700 HT-I C
385 176029036490 M/S. THAI SUMMIT
NEEL AUTO PVT.LTD.
P.No. C-1/1, MIDC
CHAKANTAL. KHED,
DIST.PUNECHAKAN
1200 HT-I N
386 176029037130
M/S. FLASH
ELECTRONICS (I)
PVT.LTD
P.NO. A-4, MIDC
CHAKAN,TAL. KHED,
DIST. PUNECHAKAN
1950 HT-I N
387 176029039710 M/S. MINDA
INDUSTRIES LTD
P.NO. B-1/5, MIDC
CHAKANTAL. KHED.
DIST. PUNECHAKAN
1461 HT-I N
388 176029036100
M/S. SANSERA
ENGINEERING
PVT.LTD.
B-18, CHAKAN
MIDCTAL.KHED, DIST.
PUNECHAKAN
1500 HT-I N
389 176099036240
M/S. SUZLON
GENERATORS
PVT.LTD.
G.NO. 339/3,
MAHALUNGETAL. KHED,
DIST. PUNEMAHALUNGE
1700 HT-I N
390 176089030430 M/S BHARAT FORGE
LTD.,M.C.D.DIVISION
G.NO.635,VILLAGE-
KURULITALUKA-KHED,
DIST.PUNEKURULI
2400 HT-I C
391 176089043760
M/S. KALYANI
LEMMERZ LTD
(CARWHEEL UNIT)
G.NO. 635/1, KURULITAL.
KHED, DIST. PUNEKURULI 2500 HT-I C
392 176029003638 M/S KALYANI
LEMMERZ LIMITED
G.NO.635,AT-
KURULI,CHAKANTALUKA
-KHED,DIST.PUNEKURULI
4900 HT-I C
393 176089030332 M/S GABRIEL INDIA
LIMITED
S.NO.625, VILLAGE-
KURULITAL-KHED, DIST-
PUNEKURULI
2000 HT-I C
394 176029003859 M/S SPICER INDIA LTD
GAT NO 626&622
KURULITAL KHED DIST
PUNEKURULI
2500 HT-I C
395 176089039370 M/S. BEHR INDIA
LTD.(UNIT II)
29th Mile Stone Pune_Nashik
Highway,KuruliTAL. KHED,
DIST. PUNEKURULI
1100 HT-I C
396 176089030235 M/S SAINT GOBAIN
SEKURIT (I) LIMITED
S.NO.617,AT
KURULI,BEHINDNTB,CHA
KAN,TAL-KHED,D-
PUNEKURULI
2990 HT-I C
397 176029046470
M/S.SANY HEAVY
INDUSTRY INDIA
PVT.LTD.
PLOT NO.4, PHASE-III,
M.I.D.C.CHAKAN,TAL-
KHED,
DIST.PUNECHAKAN.
3000 HT-I C

301
Sr CONSUMER
NUMBER CONSUMER_NAME ADDRESS CD
(KVA) TARIFF
398 176029046280
M/S.GESTAMP
AUTOMOTIVE INDIA
PVT.LTD.
PL. NO.E-1, PHASE-III,
MIDC, CHAKAN,TAL-
KHED,
DIST.PUNECHAKAN
2000 HT-I C
399 176029042850 M/S. VOLKSWAGEN
INDIA PVT.LTD
P.NO. E-1, PH. III, MIDC
CHAKANTAL. KHED,
DIST. PUNECHAKAN
1500
0 HT-I C
400 176029043730
M/S.MAHINDRA
VEHICLE
MANUFACTURERS
LTD.
P.NO.A-1, MIDC
CHAKANTAL. KHED,
DIST. PUNECHAKAN
1895
0 HT-I C
401 181209042640 M/S. FINOLEX
INDUSTRIES LTD
G NO. 399, URSETAL.
MAVAL, DIST. PUNEURSE 3000 HT-I C
402 170019003747 M/S FINOLEX PLASSON
INDUSTRIES PVT. LTD
AT URSE AT POST URSE
TALMAVAL DIST
PUNEURSE
1200 HT-I C
403 181999052060 M/S. ACE AGRO
INDUSTRIES PVT. LTD.
GAT NO. 446, POST -
JAMBHU KANHATAL
MAVAL, DIST.
PUNEJAMBHU KANHA
1100 HT-I N
404 181139002185 M/S MAHINDRA UGINE
STEEL CO. LTD.
AT&POST KANHE TAL
MAVALDIST PUNEKANHE 1100 HT-I N
405 181739047280
M/S.SUNGWOO
AUTOMOTIVE INDIA
PVT.LTD.,
G.NO.374,518,519,520,
TAKWE BK.,TAL-MAVAL,
DIST.PUNETAKWE BK.
2400 HT-I N
406 181139002673 M/S SUPREME
INDUSTRIES LIMITED
AT POST KANHETALUKA
MAVAL,
DIST.PUNEKANHE
2000 HT-I N
407 181739031530 M/S VARROC
POLYMER PVT.LTD.
GAT 390 AT TAKVE
BUDRUKTAL MAVAL
DIST PUNETAKVE (BK)
1910 HT-I C
408 181739030301 M/S ENDURANCE
TECHNOLOGIES LTD.
GAT NO.416, AT-
TAKVEBUDRUK TAL-
MAVAL, DT PUNETAKVE
BUDRUK
2250 HT-I C
409 181209030548
M/S. MAHINDRA
HINODAY INDUSTRIES
LTD.
GAT NO.318,AT POST-
URSETALUKA-
MAVAL,DIST.PUNEURSE
2500
0 HT-I C
410 181209040720 M/S. SUPREME
INDUSTRIES
G.NO. 420, AT URSETAL.
MAVAL, DIST.PUNEURSE 1400 HT-I N
411 181199002761 M/S TATA MOTORS
LTD.
MAVAL FOUNDRY, P-
BEBEDOHOLTAL-
MAVAL,DIST.PUNEBEBED
OHOL
6000 HT-I N
412 181209002919 M/S FINOLEX CABLES
LIMITED
26-27 BOMBAY-PUNE
ROAD,PIMPARI,PUNEPUN
E
3976 HT-I N
413 181199038230 M/S. GANGA PAPERS
INDIA LTD
BEBEDOHALTAL.
MAWAL, DIST.
PUNEBEBEDOHAL
1750 HT-I N

302
Sr CONSUMER
NUMBER CONSUMER_NAME ADDRESS CD
(KVA) TARIFF
414 181279002771 M/S VENKATESHWARA
HATCHERIES P LTD
GAT NO 163 144-B & 121
ATBAUR TAL MAVAL
DIST PUNEBAUR
1750 HT-I N
415 181209030599 M/S JAYA HIND
INDUSTRIES LIMITED
GAT NO.350/351, AT-
URSETALUKA-
MAVAL,DIST-PUNEURSE
4800 HT-I N
416 181409047020
M/S.MAHINDRA
HOLIDAYS & RESORTS
INDIA LTD.
G.NO.375,379,380,385TO395
,401,402,TUNGI,TAL -
MAVAL, DIST.PUNETUNGI
1450 HT-II N
II
417 172939030617 M/S PARAG MILK
FOODS PVT.LTD.
43/1-A, AWASARI
PHATATAL-AMBEGAON,
DIST-PUNEAWASARI-
KHURD
1450 HT-I C
418 172039003380 M/S MORDE FOODS
PVT.LTD
AT POST MANCHARTAL
AMBEGAON DIST.
PUNEAT MANCHAR
1450 HT-I C

303
Annexure 2 - Survey Questionnaire
The data is being collected for academic purpose. The confidentiality of the data will be
maintained. It is requested that the respondents provide correct and honest information to
all the questions mentioned below.
Basic Information:-
Name of your Company:-
Location of the Company:-
Designation of the Respondent:-
To which Sector does your Company belong, please tick the correct option below:-
Process Industry / Chemical / IT Services / Manufacturing / Auto / Other Services /
Educational Institute / Construction / Hospital / Telecom / Public Services /
Any Other (Please Specify ___________________________ )
No. of Shifts Working:-
No. of Employees in your Company: - ____________ No.s
Contract Demand: - _____________ KVA .
Tariff Applicable (As on Bill):- __________
Approx. Monthly Electricity Bill: - Rs Lacs ______________
Electricity Expenditure as % of Total Expenditure: - ________ % (Approx)
Annual Revenue Turnover: - __________ Rs Crs ( Not Mandatory )
1 2 3

304
Please tick your choice for the questions mentioned below :-
A. We recognize our electricity Service Provider by the name.
1. MSEDCL
2. Maha Vitaran
3. MSEB
B. The mode of payment for Electricity Bills is
1. MSEDCL Cash Collection Centres
2. Online through Internet / Net Banking
3. Others , Banks / Private Cash Collection Centres
C. Please rate the following Switching cost, 1 to 5. '1' being the highest significant and '5'
being the lowest significant.
1. Cross Subsidy Surcharge
2. Metering Cost
3. Transmission Charges
4. Wheeling Charges
5. Additional Surcharge
6. Not aware about the above charges
D. Please mark 1 to 5 for service quality parameters mentioned below. '1' being the highest
significant and '5' being the lowest significant.
1. Corporate Look of MSEDCL Offices
2. Promptness in Service
3. MSEDCL Employee / Staff Behavior
4. Accuracy in Service
5. Cost of Service

305
Below are questions followed by Likert Scale . Please mark your honest response in the
appropriate box. Please mark only one choice for each question.
1 I am happy with the 'Supply Quality' offered by the MSEDCL.
i.Strongly Disagree ii.Disagree iii.Don’t Know iv.Agree v.Strongly Agree
2 The Supply Provided by MSEDCL is with minimum interruptions.
i.Strongly Disagree ii.Disagree iii.Don’t Know iv.Agree v.Strongly Agree
3 The Outage Management is Satisfactory and Consumers are made aware of the outages
taken by MSEDCL for maintenance.
i.Strongly Disagree ii.Disagree iii.Don’t Know iv.Agree v.Strongly Agree
4 The Consumers are informed of the supply interruptions in advance.
i.Strongly Disagree ii.Disagree iii.Don’t Know iv.Agree v.Strongly Agree
5 'Load Shedding', is not a problem associated with MSEDCL Services.
i.Strongly Disagree ii.Disagree iii.Don’t Know iv.Agree v.Strongly Agree
6 The Services Offered by MSEDCL to its Consumers is at a Cheaper Cost.
i.Strongly Disagree ii.Disagree iii.Don’t Know iv.Agree v.Strongly Agree
7 The MSEDCL employees are quick in attending the Consumer Complaints.
i.Strongly Disagree ii.Disagree iii.Don’t Know iv.Agree v.Strongly Agree
8 The MSEDCL employees listen carefully to the grievances raised by the Consumer and
understand the Consumer problems.
i.Strongly Disagree ii.Disagree iii.Don’t Know iv.Agree v.Strongly Agree
9 The MSEDCL Employees have caring attitude towards their Consumers.
i.Strongly Disagree ii.Disagree iii.Don’t Know iv.Agree v.Strongly Agree
10 The MSEDCL Offices and Fuse Call Centers are located at convenient places and are easily
accessible.
i.Strongly Disagree ii.Disagree iii.Don’t Know iv.Agree v.Strongly Agree

306
11 It is easy to approach or contact the MSEDCL Staff/Engineers in case of emergency or a
problem.
i.Strongly Disagree ii.Disagree iii.Don’t Know iv.Agree v.Strongly Agree
12 The MSEDCL Offices are Well Furnished, Clean and Well Maintained.
i.Strongly Disagree ii.Disagree iii.Don’t Know iv.Agree v.Strongly Agree
13 The Consumers are made aware by the MSEDCL, regarding the changes in Policies through
its Circulars.
i.Strongly Disagree ii.Disagree iii.Don’t Know iv.Agree v.Strongly Agree
14 The MSEDCL Electricity Bills are well structured and the Consumers understand it easily.
i.Strongly Disagree ii.Disagree iii.Don’t Know iv.Agree v.Strongly Agree
15 The MSEDCL Electricity Bills are delivered in time and give ample duration for the
Consumers to clear the outstanding amounts before due dates as mentioned in the bill.
i.Strongly Disagree ii.Disagree iii.Don’t Know iv.Agree v.Strongly Agree
16 The Electricity Bills provided by the MSEDCL are accurate and free from errors.
i.Strongly Disagree ii.Disagree iii.Don’t Know iv.Agree v.Strongly Agree
17 The Business Practices of MSEDCL are Ethical and Transparent.
i.Strongly Disagree ii.Disagree iii.Don’t Know iv.Agree v.Strongly Agree
18 The MSEDCL understands the needs of its Consumer.
i.Strongly Disagree ii.Disagree iii.Don’t Know iv.Agree v.Strongly Agree
19 The MSEDCL agrees to provide compensation to its Consumers if the services are not
delivered as per the 'Standards of Performance ‘, stipulated by the MERC.
i.Strongly Disagree ii.Disagree iii.Don’t Know iv.Agree v.Strongly Agree
20 The problem communicated to the MSEDCL is solved at the first time and generally does
not repeat in future.
i.Strongly Disagree ii.Disagree iii.Don’t Know iv.Agree v.Strongly Agree

307
21 The MSEDCL website is well designed and user friendly.
i.Strongly Disagree ii.Disagree iii.Don’t Know iv.Agree v.Strongly Agree
22 The MSEDCL website provides with relevant and accurate information to its Consumers.
i.Strongly Disagree ii.Disagree iii.Don’t Know iv.Agree v.Strongly Agree
23 The MSEDCL website offers a safe and secured option for payment of electricity bills for its
Consumers.
i.Strongly Disagree ii.Disagree iii.Don’t Know iv.Agree v.Strongly Agree
24 The MSEDCL Employees show keen interest and take up the responsibility in solving the
Consumer Complaints.
i.Strongly Disagree ii.Disagree iii.Don’t Know iv.Agree v.Strongly Agree
25 The MSEDCL Employees are adequately trained to solve the Consumer’s Complaint.
i.Strongly Disagree ii.Disagree iii.Don’t Know iv.Agree v.Strongly Agree
26 The MSEDCL Company keeps its promise of fulfilling the Consumer demand in time.
i.Strongly Disagree ii.Disagree iii.Don’t Know iv.Agree v.Strongly Agree
27 The MSEDCL Employees are never too busy to respond to the Consumer requests.
i.Strongly Disagree ii.Disagree iii.Don’t Know iv.Agree v.Strongly Agree
28 The MSEDCL Employees / Staff are well behaved and well mannered.
i.Strongly Disagree ii.Disagree iii.Don’t Know iv.Agree v.Strongly Agree
29 The MSEDCL Company believes in keeping the 'Consumer Interest' as its top priority.
i.Strongly Disagree ii.Disagree iii.Don’t Know iv.Agree v.Strongly Agree
30 The MSEDCL Employees are Well Dressed and appear neat.
i.Strongly Disagree ii.Disagree iii.Don’t Know iv.Agree v.Strongly Agree
31 The working hours of MSEDCL Company are as per the Consumer convenience.
i.Strongly Disagree ii.Disagree iii.Don’t Know iv.Agree v.Strongly Agree

308
32 We as Consumers are well recognized by the MSEDCL Staff/Employees.
i.Strongly Disagree ii.Disagree iii.Don’t Know iv.Agree v.Strongly Agree
33 We feel proud in being associated with MSEDCL as their Consumer.
i.Strongly Disagree ii.Disagree iii.Don’t Know iv.Agree v.Strongly Agree
34 The MSEDCL Staff give importance and make us feel that we are their esteemed
Consumers.
i.Strongly Disagree ii.Disagree iii.Don’t Know iv.Agree v.Strongly Agree
35 We have a genuine relationship with MSEDCL as a Consumer.
i.Strongly Disagree ii.Disagree iii.Don’t Know iv.Agree v.Strongly Agree
36 The MSEDCL Company understands our specific needs and the MSEDCL staff pay attention
to it.
i.Strongly Disagree ii.Disagree iii.Don’t Know iv.Agree v.Strongly Agree
37 In case of payment default, the MSEDCL company is more likely to understand our
problem and would agree to give grace period for clearance of dues without disconnecting
our supply.
i.Strongly Disagree ii.Disagree iii.Don’t Know iv.Agree v.Strongly Agree
38 In case of any Supply problem associated with the Consumer side, the MSEDCL Employees
would be flexible (generous) in extending necessary support and help to solve the
problem.
i.Strongly Disagree ii.Disagree iii.Don’t Know iv.Agree v.Strongly Agree
39 The MSEDCL Company is always ready and prompt in passing on the Incentives/Benefits to
the Consumers.
i.Strongly Disagree ii.Disagree iii.Don’t Know iv.Agree v.Strongly Agree
40 The MSEDCL is never harsh or unjust in imposing penalties/charges to the Consumers.
i.Strongly Disagree ii.Disagree iii.Don’t Know iv.Agree v.Strongly Agree
41 Even in case of Power Scarcity Situation, the MSEDCL company takes special efforts to
provide with or maintain for uninterrupted power supply to its Consumers.

309
i.Strongly Disagree ii.Disagree iii.Don’t Know iv.Agree v.Strongly Agree
42 The risk associated in transactions with MSEDCL is least.
i.Strongly Disagree ii.Disagree iii.Don’t Know iv.Agree v.Strongly Agree
43 MSEDCL is the most trusted Service provider as compared to its Competitors.
i.Strongly Disagree ii.Disagree iii.Don’t Know iv.Agree v.Strongly Agree
44 I feel comfortable in approaching the MSEDCL staff in case of any problem.
i.Strongly Disagree ii.Disagree iii.Don’t Know iv.Agree v.Strongly Agree
45 The time and effort needed in resolving a complaint with MSEDCL services is less or
adequate.
i.Strongly Disagree ii.Disagree iii.Don’t Know iv.Agree v.Strongly Agree
46 Even if in case of any problem associated with the MSEDCL service, we are not panic and
we feel assured that the problem would be resolved with ease.
i.Strongly Disagree ii.Disagree iii.Don’t Know iv.Agree v.Strongly Agree
47 The effort involved in searching for a New Service Provider is high and time consuming.
i.Strongly Disagree ii.Disagree iii.Don’t Know iv.Agree v.Strongly Agree
48 It will also take much time in learning about or understanding the New Service Provider or
develop new relationship.
i.Strongly Disagree ii.Disagree iii.Don’t Know iv.Agree v.Strongly Agree
49 There are few alternatives to provide for Services in Power Distribution Sector.
i.Strongly Disagree ii.Disagree iii.Don’t Know iv.Agree v.Strongly Agree
50 We don’t find a better alternative that can provide Services to us.
i.Strongly Disagree ii.Disagree iii.Don’t Know iv.Agree v.Strongly Agree
51 We feel embarrassed to inform our current Service Provider (MSEDCL) that we will be
discontinuing the services in near future.
i.Strongly Disagree ii.Disagree iii.Don’t Know iv.Agree v.Strongly Agree

310
52 I have a sense of loyalty with my existing service provider that is MSEDCL.
i.Strongly Disagree ii.Disagree iii.Don’t Know iv.Agree v.Strongly Agree
53 The financial cost associated with the Switching is considerable( Cross Subsidy Surcharge ,
Transmission Charges, Wheeling Charges , Metering Cost , Additional Surcharge etc )
i.Strongly Disagree ii.Disagree iii.Don’t Know iv.Agree v.Strongly Agree
54 The present service provider (MSEDCL) has better staff with adequate knowledge to
handle Consumer Complaints.
i.Strongly Disagree ii.Disagree iii.Don’t Know iv.Agree v.Strongly Agree
55 The present Service Provider (MSEDCL) has better infrastructure as compared to its
Competitors.
i.Strongly Disagree ii.Disagree iii.Don’t Know iv.Agree v.Strongly Agree
56 The association with the present service provider (MSEDCL) is convenient and less risky.
i.Strongly Disagree ii.Disagree iii.Don’t Know iv.Agree v.Strongly Agree
57 Majority of neighboring Consumers, Friends, and Relatives etc avail the services of
MSEDCL.
i.Strongly Disagree ii.Disagree iii.Don’t Know iv.Agree v.Strongly Agree
58 The quality of services offered by MSEDCL has improved significantly over last few years.
i.Strongly Disagree ii.Disagree iii.Don’t Know iv.Agree v.Strongly Agree
59 I convey positive 'word of mouth' publicity about my present Service Provider (MSEDCL).
i.Strongly Disagree ii.Disagree iii.Don’t Know iv.Agree v.Strongly Agree
60 I recommend the services of the present service provider (MSEDCL), if someone seeks my
suggestion.
i.Strongly Disagree ii.Disagree iii.Don’t Know iv.Agree v.Strongly Agree
61 The Electricity Consumers would not really mind paying more for Reliable and Quality
Services.
i.Strongly Disagree ii.Disagree iii.Don’t Know iv.Agree v.Strongly Agree
62 We keep ourselves updated regarding the latest tariff applicable and other relevant
information.
i.Strongly Disagree ii.Disagree iii.Don’t Know iv.Agree v.Strongly Agree

311
63 With the latest developments in the power sector technologies like Smart Grids , Smart
Metering etc the Consumers will be able to cope well with it.
i.Strongly Disagree ii.Disagree iii.Don’t Know iv.Agree v.Strongly Agree
64 The Open Access policy offers choice to the Electricity Consumers to select their Service
Provider. So, I /We would definitely avail of this facility and plan to switch over to a New
Service Provider.
i.Strongly Disagree ii.Disagree iii.Don’t Know iv.Agree v.Strongly Agree
65 Instead of Sourcing power from Distribution Utilities, Our Company would prefer to
generate electricity on our own.
i.Strongly Disagree ii.Disagree iii.Don’t Know iv.Agree v.Strongly Agree
66 MSEDCL is a Government Owned Company and has Social Obligations to fulfill and does
not work only to gain profits.
i.Strongly Disagree ii.Disagree iii.Don’t Know iv.Agree v.Strongly Agree
67 The MSEDCL company has taken necessary efforts to improve its infrastructure to provide
quality power to its Consumers.
i.Strongly Disagree ii.Disagree iii.Don’t Know iv.Agree v.Strongly Agree
68 Although, with the introduction of Open Access Policy the Power Distribution Sector has
become very competitive, the MSEDCL has the capability to face the future challenges.
i.Strongly Disagree ii.Disagree iii.Don’t Know iv.Agree v.Strongly Agree
69 The Business transactions with MSEDCL are very fair and even if provided with a choice to
select service provider, I / We prefer to be associated with the MSEDCL.
i.Strongly Disagree ii.Disagree iii.Don’t Know iv.Agree v.Strongly Agree
Thanks for sharing your valuable time to answer this Questionnaire.

312
Annexure 3 - Codification of the Questionnaire
Note: This is a document with details of codification as generated by the SPSS
Software
Variable Information:
Name Position
IND Type of Industry 1
Measurement level: Nominal
Format: F8 Column Width: 8 Alignment: Right
Value Label
1 Process
2 Chemical
3 IT Services
4 Manufacturing
5 Auto
6 Other Services
7 Education
8 Construction
9 Health
10 Telecom
11 Public Services
12 Hospitality
13 Textile
14 Shopping Mall
15 Research & Testing
16 Defence
17 Pharma
SHIFTS No of Shifts working 2
Measurement level: Nominal
Format: F8 Column Width: 8 Alignment: Right
Value Label
1 One Shift
2 Two Shifts
3 Three Shifts
EMPLYS No of Employees in the Company 3
Measurement level: Scale
Format: F8 Column Width: 8 Alignment: Right
Missing Values: 99

313
Name Position
CONDMD Contract Demand in KVA 4
Measurement level: Scale
Format: F8 Column Width: 8 Alignment: Right
TARIF Tariff Applicable for Billing 5
Measurement level: Nominal
Format: F8 Column Width: 8 Alignment: Right
Value Label
1 HTI-C Ind_Exp
2 HTI-N Ind_NonExp
3 HTII-E Comm_Exp
4 HTII-N Comm_NonExp
5 HTIV-E PWW_STP_Exp
6 HTIV N PWW_STP_NonExp
7 HTV Agriculture
8 HTVI_Grp Hsg and Comm Complex
9 HTVIII Temporary
10 SP-I
BILLAMT Approx Monthly Elect_Bill in Rs Lacs 6
Measurement level: Scale
Format: F8 Column Width: 8 Alignment: Right
Missing Values: 99
NAMEIDFN Recognition of Service Provider by Name 7
Measurement level: Nominal
Format: F8 Column Width: 8 Alignment: Right
Value Label
1 MSEDCL
2 Maha - Vitaran
3 MSEB
PAYMODE Mode of Payment 8
Measurement level: Nominal
Format: F8 Column Width: 8 Alignment: Right
Value Label
1 MSEDCL Cash Centres
2 Online_Net Banking
3 Others_Private Cash Collection Centres
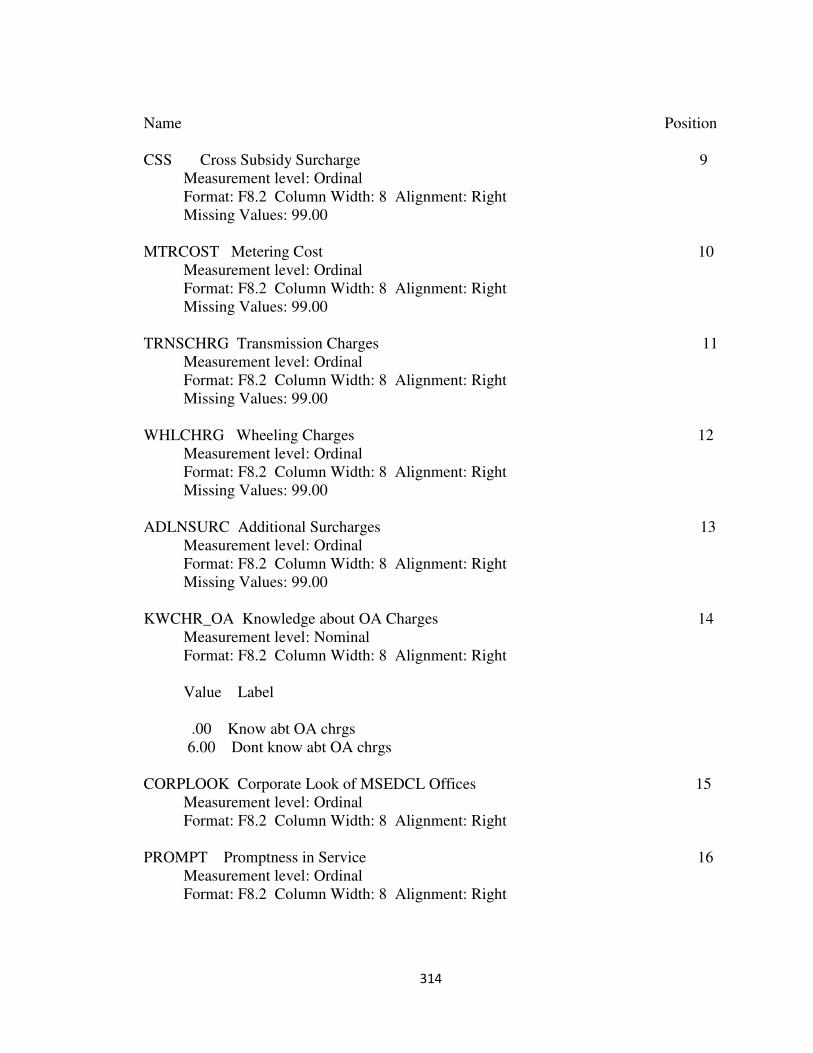
314
Name Position
CSS Cross Subsidy Surcharge 9
Measurement level: Ordinal
Format: F8.2 Column Width: 8 Alignment: Right
Missing Values: 99.00
MTRCOST Metering Cost 10
Measurement level: Ordinal
Format: F8.2 Column Width: 8 Alignment: Right
Missing Values: 99.00
TRNSCHRG Transmission Charges 11
Measurement level: Ordinal
Format: F8.2 Column Width: 8 Alignment: Right
Missing Values: 99.00
WHLCHRG Wheeling Charges 12
Measurement level: Ordinal
Format: F8.2 Column Width: 8 Alignment: Right
Missing Values: 99.00
ADLNSURC Additional Surcharges 13
Measurement level: Ordinal
Format: F8.2 Column Width: 8 Alignment: Right
Missing Values: 99.00
KWCHR_OA Knowledge about OA Charges 14
Measurement level: Nominal
Format: F8.2 Column Width: 8 Alignment: Right
Value Label
.00 Know abt OA chrgs
6.00 Dont know abt OA chrgs
CORPLOOK Corporate Look of MSEDCL Offices 15
Measurement level: Ordinal
Format: F8.2 Column Width: 8 Alignment: Right
PROMPT Promptness in Service 16
Measurement level: Ordinal
Format: F8.2 Column Width: 8 Alignment: Right

315
Name Position
STAF_BHR Staff Behavior 17
Measurement level: Ordinal
Format: F8.2 Column Width: 8 Alignment: Right
ACCURACY Accuracy in Service 18
Measurement level: Ordinal
Format: F8.2 Column Width: 8 Alignment: Right
COST_SER Cost of Service 19
Measurement level: Ordinal
Format: F8.2 Column Width: 8 Alignment: Right
Q1 to Q69 * No label * 20 to 88
Measurement level: Scale
Format: F8.2 Column Width: 8 Alignment: Right
Value Label
1.00 Strongly Disagree
2.00 Disagree
3.00 Neutral
4.00 Agree
5.00 Strongly Agree

316
ANNEXURE 4 - LIST OF ELIGIBLE OA CONSUMERS SURVEYED
Sr Consumer
Number
Consumer
Name Address
Contract
Demand
(KVA)
Name of
the
Contact
Person
Contact No
1 170149001401 M/s TATA
MOTORS LTD
CHINCHWAD,
PUNE . 15841
Mr
Kumbhar 8605011985
2 170149028130
M\S GENNOVA
BIO
PHARMACITIC
ALS Ltd
Plot No 1, Infotech
Park , Hinjwadi,
Mulshi,Pune.
2500 Mr.
Sanjay 9011551198
3 170149066990
M\S ACORIS
RESEARCH
LTD.(HIKAL)
PLOT NO 3A 2nd
PHASE BIOTECH
PARKHINJEWADI
PUNE
1000
Mr
Sandeep
Gahivad
9765558203
4 170149060780
M\S
INTERNATION
AL BIOTECH
PARK(TCG)
PHASE-II RAJIV
GANDHI
BIOTECH PARK
MIDC
HINJAWADIPUNE
1475 Mr
Shinde 9823770629
5 170149062690
M/S. CENTAUR
PHARMACEUT
ICALS
PVT.LTD.
PLOT NO. 4, RGIP,
PH-
II,HINJAWADIPU
NE
1350
Mr
Nagesh
Pandit
9527733394
6 170149027940
M/S. SCIGEN
BIOPHARMA
PVT LTD.
PLOT NO. 18, IT
PARK
HINJAWADI
PHASE II, TAL.
MULSHI, DIST.
PUNE
1490 Mr Mali 9373322313
7 170149069200 M\S DLF
AKRUDI
BLOCK NO 4
PLOT NO 28 &
29MIDC PH-II
RGIP HINJAWADI
PUNE
2500 Mr
Singhal 9823440848
8 170149065830
M\S DLF
AKRUTI
INFOPARK
(PUNE)LTD.
BLOCK 1 PLOT
NO 28,29 &PL2T
RGIP HINJWADI
PUNE
1518 Mr
Singhal 9823440848
9 170149066730
M\S DLF
AKRUDI INFO
PARK
BLOCK NO 2
PLOT NO 28 &
29RGIP PH-II
HINJAWADI
PUNE
1100 Mr
Singhal 9823440848
10 170149066720
M\S DLF
AKRUDI INFO
PARK
BLOCK NO 1 & 2
PLOT NO 28 &
29RGIP PH-II
HINJAWADI
PUNE
1500 Mr
Singhal 9823440848

317
Sr Consumer
Number
Consumer
Name Address
Contract
Demand
(KVA)
Name of
the
Contact
Person
Contact No
11 170149069210 M\S DLF
AKRUDI
BLOCK NO 3
PLOT NO 28 &29
PL-2MIDC PH-11
RGIPHINJAEADI
PUNE
2200 Mr
Singhal 9823440848
12 182939021940
M/S TATA
TOYO
REDIATORS
PRIVATE LTD
GAT NO 235 AT
HINJAWADI TAL
MULSHI DIST
PUNE
1600
Mr
Shashidh
aran/ Mr
Gaikwad
7875440283/
9689942910
13 182939031570
M/S TATA
AUTO
PLASTIC
SYSTEMS
LIMITED
SR. NO. 235-245
AT
HINJEWADITAL
MULASHI DIST.
PUNE
3500
Mr
Chandras
hekhar
9881724696
14 170149061160
M\S 3DPLM
SOFTWARE
SOLUTIONS
LTD.
PLOT NO 15
INFOTECH PARK
HINJAWADIPUNE
1000
Mr
Ghodeka
r
9766313243
15 170149028520 M/S. INFOSYS
LIMITED.
PL.NO. 24, RAJIV
GANDHI
INFOTECH
PARKPHASE II
VILLAGE MAN,
TAL MULSHI
HINJAWADI
PUNE
5000
Mr
Prakash
More
9881728702
16 170149066080
M\S DYNASTY
DEVELOPERS
(P)LTD.
PLOT NO 3 RGIP
HINJAWADI
PUNE
3350
Mr
Ganesh
Kulkarni
9225637759
17 170149062620 M\S WIPRO
LTD.
PLOT NO 2 MIDC
RGIP
HINJAWADIPUNE
5000 Mr
Sawarkar 9823384770
18 170149009518 M/S INFOSYS
LIMITED
PLOT NO 1 PUNE
INFOTECHPARK
M.I.D.C.
HINJAWADI
PUNE 411027
3250
Mr
Prakash
More
9881728702
19 170149023940 M/S. WIPRO
LTD.
PLOT NO. 2,
INFOTECH PARK,
HINJAWADI, TAL.
MULSHI,
DIST:PUNE
5000 Mr
Sawarkar 9823384770
20 170149028010
M\S KPIT
CUMMINS
INFOSYSTEMS
LTD
PLOT NO 35/36
INFOTECH PARK
HINJAWADI TAL
MULSHI PUNE
2309 Mr
Santosh 9922994709

318
Sr Consumer
Number
Consumer
Name Address
Contract
Demand
(KVA)
Name of
the
Contact
Person
Contact No
21 170149070550
M/S.FLAGSHIP
INFRASTRUCT
URE PVT.LTD
S.NO.154,
HINJAWADIPUNE
PUNE
4900 Mr Garje 9975573805
22 170149064430
M\S FLAGSHIP
INFRASSTRUC
RE PVT LTD
S.NO 153/2 & 157/3
HINJAWADI TAL
MULSHI DIST
PUNE
3000 Mr Garje 9975573805
23 170149070440 M\S INFOSYS
LIMITED.(SEZ)
PLOT NO 24 RGIP
PH-IIHINJAWADI
PUNE
7000
Mr
Prakash
More
9881728702
24 170149025190
M\S TATA
TECHNOLOGI
ES LTD
PLOT NO25
INFOTECH PARK
MIDC HINJWADI
PUNE
1750 Mr
Swapnil 8975137600
25 170149061250
M\S EMITECH
EMISSION
CONTROL
TECHNOLOGI
ES INDIA LT
S.NO 282/1 AT
VILLAGE
MANNTAL
MULSHIPUNE
1976 Mr
Shimbre 9881498682
26 170149061220
M\S TATA
AUTO
PLASTIC
SYSTEM
A DIVISION OF
TATA AUTO
COMP SYSTEM
LTD.S.NO280&281
RAISONIC
IND.PARK
AREAVILLAGE
MANN TAL
MULSHI PUNE
2500 Mr Katta 8805002576
27 170149064560
M/S.VISTEON
TECHNICAL &
SERVICES
CENTRE
PVT.LTD
S.NO. 279,
VILLAGE
MANNTAL.
MULSHI, DIST.
PUNEMANN
1500
Mr
Vivek
Munot
9850001479
28 171199035380
M/S. VISTEON
AUTOMOTIVE
SYSTEM (I)
PVT.LT
PL.NO. III, S.NO.
283/2, RAISONI
IND. PARK
MANN, TAL.
MULSHI, DIST.
PUNEMANN
1200 Mr K.
Shaktivel 9881125632
29 170149072800
M/S. DYNASTY
DEVELOPERS
P.LTD
P.NO.3, RGUP PH-
II HINJAWADI
PUNE
4800
Mr
Ganesh
Kulkarni
9225637759
30 170149073440
M/S. TATA
CONSULTANC
Y SERVICES
LTD
P.NO. 2 & 3 RGIP
PHASE –III MIDC
HINJAWADI
PUNE
5000 Mr Amol 9881155407/
7276097413

319
Sr Consumer
Number
Consumer
Name Address
Contract
Demand
(KVA)
Name of
the
Contact
Person
Contact No
31 170149025940
EMCURE
PHARMACEUT
ICALS LTD
PLOT NO P2
PHASE II
ADDITIONAL
INFOTECH AREA
HINJWADI PUNE
4200 Mr
Pawar 9372270967
32 170019061390
M\S ICC
REALITY (I)
PVT LTD.
504 CORPORATE
PLAZA 106
A.S.B.ROAD
PUNE
2000
Mr
Tayade/
Mr Hood
9764999228/
9823213025
33 170019062440
M\S
I.C.C.REALITY
(I) PVT LTD.
403/A PLOT "C"
S.NO
985S.B.ROAD
PUNE
2000 7798983358
34 170019062430
M\S
I.C.C.REALITY
(I)PVT LTD.
403/A2 PLOT NO
'A"SHIVAJI HSG
SOCIETY PUNE
1000
Mr
Tayade/
Mr Hood
9764999228/
9823213025
35 170019068310
M\S ICC
REALITY PVT
LTD.
ICC MERRIOTT
PLOT NO 1 BS.NO
985
SHIVAJINAGAR
PUNE
3000 7798983358
36 170019069220
M\S KAKADE
DEVELOPERS
PVT LTD.
"KAKADE
CENTRE PORT"
NEAR E-SQUARE
THEATRE 268+ B
SHIVAJINAGAR
PUNE
2000
Mr
Sachin
Kapre
9823395832
37 170019002945
M/S
AUTOMOTIVE
RESEARCH
ASSOCIATION
OF
M\S
AUTOMOTIVE
RESEARCH
ASS.OF INDIA
VETAL TEKDI
POUD RD
KOTHRUDKOTHR
UD PUNE
1500
Mr
Ardhapur
kar
9975492650
38 170019002902
M/S CITY
ENGINEER
PARWATI
WATER
WORKS
PUNE SINHAGAD
ROAD,SNDT
PUMPING
1200 Mr
Jadhav 9689931173
39 170019000519 M\S CUMMINS
INDIA LTD. KOTHRUD PUNE. 4975
Mr
Shrikant
Ghule
9850830002
40 170019029590
THE
DEVELOPMEN
T
ENGINEER(WA
TER SUPPLY)
S.NO 16 WARJE
JAKAT NAKA
NEAR KAKADE
CITY PUNE
3000 Mr
Kalekar 9689931848
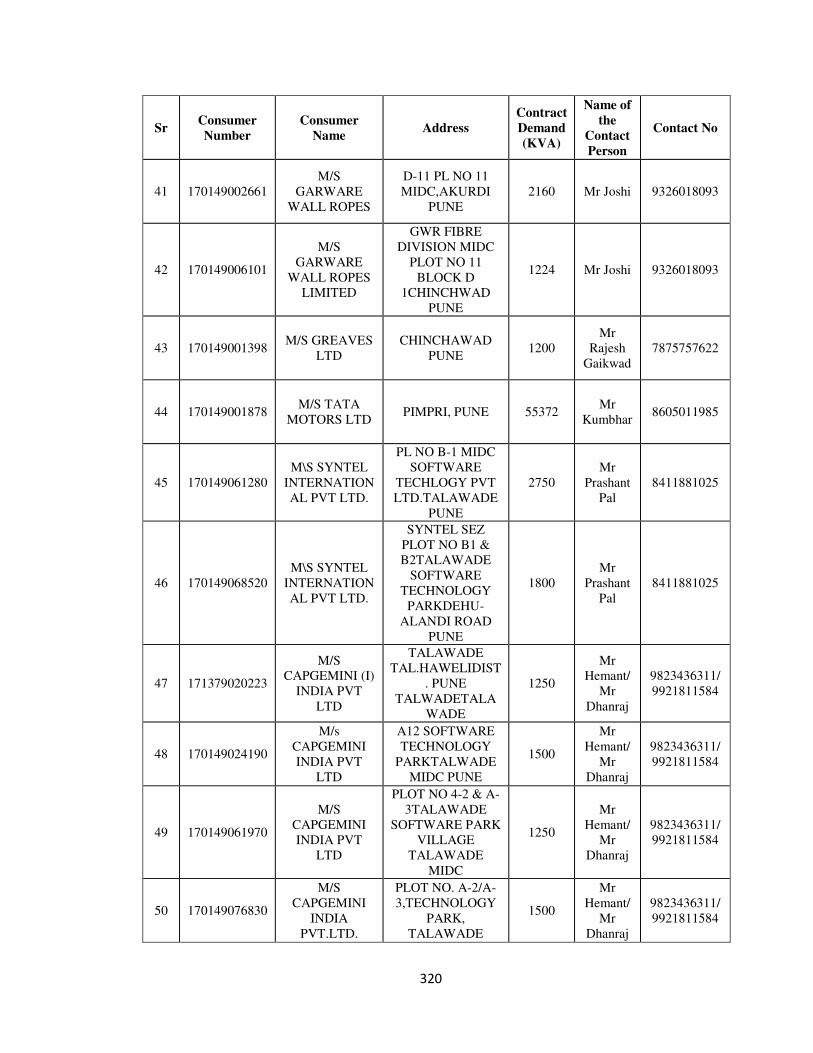
320
Sr Consumer
Number
Consumer
Name Address
Contract
Demand
(KVA)
Name of
the
Contact
Person
Contact No
41 170149002661
M/S
GARWARE
WALL ROPES
D-11 PL NO 11
MIDC,AKURDI
PUNE
2160 Mr Joshi 9326018093
42 170149006101
M/S
GARWARE
WALL ROPES
LIMITED
GWR FIBRE
DIVISION MIDC
PLOT NO 11
BLOCK D
1CHINCHWAD
PUNE
1224 Mr Joshi 9326018093
43 170149001398 M/S GREAVES
LTD
CHINCHAWAD
PUNE 1200
Mr
Rajesh
Gaikwad
7875757622
44 170149001878 M/S TATA
MOTORS LTD PIMPRI, PUNE 55372
Mr
Kumbhar 8605011985
45 170149061280
M\S SYNTEL
INTERNATION
AL PVT LTD.
PL NO B-1 MIDC
SOFTWARE
TECHLOGY PVT
LTD.TALAWADE
PUNE
2750
Mr
Prashant
Pal
8411881025
46 170149068520
M\S SYNTEL
INTERNATION
AL PVT LTD.
SYNTEL SEZ
PLOT NO B1 &
B2TALAWADE
SOFTWARE
TECHNOLOGY
PARKDEHU-
ALANDI ROAD
PUNE
1800
Mr
Prashant
Pal
8411881025
47 171379020223
M/S
CAPGEMINI (I)
INDIA PVT
LTD
TALAWADE
TAL.HAWELIDIST
. PUNE
TALWADETALA
WADE
1250
Mr
Hemant/
Mr
Dhanraj
9823436311/
9921811584
48 170149024190
M/s
CAPGEMINI
INDIA PVT
LTD
A12 SOFTWARE
TECHNOLOGY
PARKTALWADE
MIDC PUNE
1500
Mr
Hemant/
Mr
Dhanraj
9823436311/
9921811584
49 170149061970
M/S
CAPGEMINI
INDIA PVT
LTD
PLOT NO 4-2 & A-
3TALAWADE
SOFTWARE PARK
VILLAGE
TALAWADE
MIDC
1250
Mr
Hemant/
Mr
Dhanraj
9823436311/
9921811584
50 170149076830
M/S
CAPGEMINI
INDIA
PVT.LTD.
PLOT NO. A-2/A-
3,TECHNOLOGY
PARK,
TALAWADE
1500
Mr
Hemant/
Mr
Dhanraj
9823436311/
9921811584

321
Sr Consumer
Number
Consumer
Name Address
Contract
Demand
(KVA)
Name of
the
Contact
Person
Contact No
51 170149026940
M\S FUJITSU
CONSULTING
INDIA
PVT.LTD.
PLOT NO A-15
SOFTWARE
TECHNOLOGY
PARK TALWADE
PUNE
2272
Mr
Sanjay
Sapkale
9765400155
52 171339021634
M/S
WEIKFIELD
FOODS PVT.
LTD.
WEIKFIELD
ESTATE,NAGAR
ROAD, PUNE
1529 9225545340
53 183099032810 M/S. LUPIN
LTD.
GAT NO. 46A/47A
AT VILLAGE
NANDE,TAL.
MULSHI, DIST.
PUNE
2382 Mr
Pagare 9765800440
54 182919044340 M/S LUPIN
LIMITED
GAT NO 1156
GHOTAWADE
TAL MULISHI
DIST PUNE
1600 Mr
Pagare 9765800440
55 182929031640
MS/.
BRINTONS
CARPETS ASIA
PVT LTD.
PL. NO.
414/415/416
URWADE TAL.
MULSHI DIST.
PUNE
1400
Mr
Jayesh
Jagtap
9657723980
56 182859038690
THE
DIRECTOR
SYMBIOSIS
G.NO. 1154
LAWALE TAL.
MULSHI, DIST.
PUNE
1100 Col.
Atholi 9371010467
57 170259046670
M/S DSK
GLOBLE
EDUCATION &
RESEARCH
PVT LTD
S. NO
53,54,55,KADAM
WAK VASTI
PUNE SOLAPUR
RD TAL-
HAVELI,PUNE
1572
Mr
Prasad
Kulkarni
9881498296
58 181029046890
M/S.AAKAR
FOUNDRY
PVT.LTD.
S.NO.341/2,
TALEGAON,TAL-
MAVAL,
DIST.PUNE
1000 Mr Sunil
Nair
9850835283
7387002038
59 176119002720
M/S L'OREAL
INDIA PVT.
LTD
GUT NO 426 AT
&P MAHALUNGE
INGALE TAL
KHED DIST PUNE
2500 Mr Joshi 9960658399
60 176029003301
M/S
AHMEDNAGA
R FORGING
LTD
GAT NO 2787
CHAKANTAL
KHED DIST
PUNEAT
CHAKAN
2460 Mr
Gadak 9923207406

322
Sr Consumer
Number
Consumer
Name Address
Contract
Demand
(KVA)
Name of
the
Contact
Person
Contact No
61 176089031880
M/S SKS
FASTENERS
LTD.
G.NO.1990,
CHAKEN
AMBETHAN
ROAD TAL KHED
DIST PUNE
1450 Mr
Dalmia 9370659646
62 176029046110
M/S
MOTHERSON
AUTOMOTIVE
TECHNOLOGI
ES &
ENGINEERIN
GAT NO 150
,AMBETHAN
TAL- KHED DIST-
PUNE
2000 Mr Nitin
Sohony 8796424761
63 176089030570
M/S
AHMEDNAGA
R FORGINGS
LTD
GAT NO 614 AT
KURULI TAL
KHED DIST PUNE
7750 Mr
Gadak 9923207406
64 170149023090
M/S RAVIN
CBALES
LIMITED
G NO. 2270230
ALANDI
MARKAL RD.TAL
KHED DIST PUNE
1200
Mr
Vivek
Choudha
ri
9370986327
65 170149022910
M/S SOHN
STEEL
PRIVATE
LIMITIED
GAT NO. 1252 TO
1261 ALANDI
MARKAT RD.TAL
KHED DIST PUNE
6000 Mr Joshi 9850984930
66 176029038790
M/S.MINDA
CORPORATIO
N LTD.
G.NO. 307, H.NO.
1,2,3 AT
NANEKARWADI
TAL. KHED, DIST.
PUNE
1350 Mr
Kinikar 9850098419
67 176029042090
M/S. BREMBO
BRAKE INDIA
PVT.LTD
AT GAT NO. 307,
NANEKARWADI,
CHAKAN TAL.
KHED, DIST.
PUNE
1600 Mr Sunil
Kawade 9881743697
68 176089037450
M/S.
ENDURANCE
TECHNOLOGI
ES LTD.
B-22, MIDC
CHAKAN TAL.
KHED, DIST.
PUNE
1500 Mr Wani 9764772327
69 176029033990
M/S.
ENDURANCE
TECHNOLOGI
ES LTD
B-20, MIDC
CHAKAN, TAL.
KHED DIST. PUNE
2000
Mr
Khandel
wal
9765402138
70 176029035740
M/S.
ENDURANCE
TECHNOLOGI
ES LTD.
PLOT NO. B-1/3
MIDC CHAKAN
MAHALUNGE,
TAL. R'NAGAR,
DIST. PUNE
2850
Mr
Deepak
Kulkarni
9765402366

323
Sr Consumer
Number
Consumer
Name Address
Contract
Demand
(KVA)
Name of
the
Contact
Person
Contact No
71 176029036410
M/S.
ENDURANCE
MAGNETI
MARELLI
SHOCK
ABSO(I)PVT.L
T
PL.NO. B-23,
MIDC
CHAKAN,TAL.
RAJGURUNAGAR
, DIST. PUNE
3700
Mr Ajit
Deshpan
de
9765410198
72 176029039710
M/S. MINDA
INDUSTRIES
LTD
P.NO. B-1/5, MIDC
CHAKAN TAL.
KHED. DIST.
PUNE
1461 Mr
Kinikar 9850098419
73 176029036100
M/S. SANSERA
ENGINEERING
PVT.LTD.
B-18, CHAKAN
MIDC TAL.KHED,
DIST. PUNE
1500 Mr
Pawar 9860090192
74 176089030332
M/S GABRIEL
INDIA
LIMITED
S.NO.625,
VILLAGE-
KURULI TAL-
KHED, DIST-
PUNE
2000 Mr
Bhosle 9922993280
75 176029003859 M/S SPICER
INDIA LTD
GAT NO 626&622
KURULI TAL
KHED DIST PUNE
2500 Mr
Nikam 9604400396
76 176089039370
M/S. BEHR
INDIA
LTD.(UNIT II)
29th Mile Stone
Pune_Nashik
Highway,Kuruli
TAL. KHED, DIST.
PUNE
1100 Mr
Bhende 9922409502
77 176089030235
M/S SAINT
GOBAIN
SEKURIT (I)
LIMITED
S.NO.617,AT
KURULI,BEHIND
NTB,CHAKAN,
TAL-KHED,PUNE
2990 Mr
Agrawal 9960729015
78 176029046280
M/S.GESTAMP
AUTOMOTIVE
INDIA
PVT.LTD.
PL. NO.E-1,
PHASE-III, MIDC,
CHAKAN, TAL-
KHED, DIST.PUNE
2000
Mr
Yogesh
Patil
9673337707
79 176029042850
M/S.
VOLKSWAGE
N INDIA
PVT.LTD
P.NO. E-1, PH. III,
MIDC CHAKAN
TAL. KHED, DIST.
PUNE
15000 Mr
Bendale 9765567589
80 176029043730
M/S.MAHINDR
A VEHICLE
MANUFACTUR
ERS LTD.
P.NO.A-1, MIDC
CHAKAN TAL.
KHED, DIST.
PUNE
18950
Mr
Sanjay
Kulkarni
7387000805
81 181739030301
M/S
ENDURANCE
TECHNOLOGI
ES LTD.
GAT NO.416, AT-
TAKVEBUDRUK
TAL-MAVAL, DT
PUNETAKVE
BUDRUK
2250
Mr
Deepak
Kulkarni
9765402366

324
Sr Consumer
Number
Consumer
Name Address
Contract
Demand
(KVA)
Name of
the
Contact
Person
Contact No
82 181199002761 M/S TATA
MOTORS LTD.
MAVAL
FOUNDRY, P-
BEBEDOHOL
TAL-MAVAL
,DIST.PUNE
6000 Mr Sunil
Salgarkar 9922950973
83 172939030617
M/S PARAG
MILK FOODS
PVT.LTD.
43/1-A, AWASARI
PHATA TAL-
AMBEGAON,
DIST-PUNE
1450 Mr
Yadav 9890700657
84 170019040980
M/S. CITY
REALITY
DEVELOPMEN
T PVT. LTD.,
EB - 02 A, S. NO.
181, TOWN
CENTER
,AMANORA PARK
TOWN,
HADAPSAR,PUNE
.
1495
Mr
Vivek
Kulkarni
9860799726
85 170019038890
M/S. CITY
CORPORATIO
N LTD.
S.NO.181,
MALWADI
ROAD,SADESATA
RANALI,
HADAPSAR,PUNE
1315
Mr
Vivek
Kulkarni
9860799726
86 170019029940
M\S PATNI
COMPUTERS
SYSTEM LTD.
WING A+B
UPPAR GROUND
LEVEL CITY
TOWN II
MAGARPATTA
HADAPSAR PUNE
2400
Mr
Nimbalk
ar
9850985681
87 170019028140
M\S AMDOCS
DEVELOPMEN
T CENTER
CYBERCITY
TOWER II 6TH 7
TH FLOOR
MAGARPATTA
CITY HADAPSAR
PUNE
2600 Mr
Suralkar 7798582296
88 170019030120
M/S JOHN
DEERE INDIA
PVT LTD
CYBER CITY
TOWER - 14
MAGARPATTA
CITY HADAPSAR
PUNE
1739 9673008449
89 170019026760
EXL SERVICE
COM (INDIA)
PRIVATE
LIMITED
CIBERCITY
PHASE I
MAGARPETTA
HADAPSAR PUNE
1200
Mr
Nimbalk
ar
9850985681
90 170019026770
THE
MANAGING
DIRECTOR
MAGARPATTA
TOWNSHIP
DEVLEPMENT &
CONSTRUCTION
CO
LHADAPSARPUN
E
1700 Mr
Ingole 9422006861

325
Sr Consumer
Number
Consumer
Name Address
Contract
Demand
(KVA)
Name of
the
Contact
Person
Contact No
91 170019031390
M\S
ACCENTURE
SERVICE PVT
LTD.
CYBER CITY
TOWER 5 LEVEL
6&7
MAGARPATTA
CITY HADAPSAR
PUNE
1849
Mr
Badruva
han
8806665843
92 170019036870
M\S BNY
MELLON
INTERNATION
AL
OPERATIONAL
(INDIA)PVT
CYBERCITY
TOWER-S3,LEVEL
03,04,05,06,07
MAGARPATTA
CITY HADAPSAR
PUNE
1412 Mr Vijay
Singh 9921881898
93 170019036390
M\S
MAGARPATTA
TOWNSHIP
DEV. & CONST
CO LTD.
CRBERCITY
TOWER-7,8,9,
MAGERPATTA
CITY HADAPSAR
PUNE
1111 Mr
Ingole 9422006861
94 170019032050
M/S. AMDOCS
DEVELOPMEN
T CENTER
INDIA LTD
LEVEL 0 & 1
CYBERCITY
TOWER-XII
MAGARPATTA
CITY, HADAPSAR
PUNE
1287 Mr
Suralkar 7798582296
95 170019034530
M\S JOHN
DEER INDIA
PVT LTD.
CYBERCITY
TOWER-11 LEVEL
O & 1
MAGARPATTA
CITY HADAPSAR
PUNE
1115 9673008449
96 170019033800
M\S
MAGARPATTA
TOWNSHIP
DEV. &
CONST.CO.LT
D.
CYBERCITY
TOWER-11
LEVEL3 & 4
MAGARPATTA
CITY HADAPSAR
PUNE
2764 Mr
Ingole 9422006861
97 170019031090
M\S OPTION
ONE
MORTGAGE
CORPORATIO
N (INDIA)PVT
LTD
LEVEL 3,4 & 5
TOWER-6,
MAGARPATTA
CITY CYBER
CITY HADAPSAR
PUNE
1000 Mr
Deokar 9767100903
98 170019035550
BNY MELLON
INTERNATION
AL
OPERATION(I
NDIA)PVT
LTD.
CYBERCITY
TOWER-6 LEVEL-
2 & 5
MAGARPATTA
CITY HADAPSAR
PUNE
1291 Mr Vijay
Singh 9921881898

326
Sr Consumer
Number
Consumer
Name Address
Contract
Demand
(KVA)
Name of
the
Contact
Person
Contact No
99 170019037500
M/S. AMDOCS
DEVELOPMEN
T CENTER
INDIA
PVT.LTD
SEZ, TOWER-7,
LEVEL-7,
MAGARPATTA
CITY, HADAPSAR
PUNE
1272 Mr
Suralkar 7798582296
100 170019033770
M\S
ACCETURE
SERVICE PVT
LTD.
MAGARPATTA
CITY SEZ
TOWER-B-1
MAGARPATTA
CITY VILLAGE-
HADAPSAR
HAVELI PUNE
2409
Mr
Badruva
han
8806665843
101 170019038680
M/S. ASHTON
REAL ESTATE
DEVELOPMEN
T PVT.LTD
S.NO.207/1A,
207B, 207/2,
LOHAGAON At
Wadgaonsheri,
Viman Nagar PUNE
2500 Mr Darp 9923150014
102 170019038770
M/S.
ALLIANCE
HOSPITALITY
SERVICES
PVT.LTD
S.No.207/1,207B,20
7/2,Lohagaon,S.No.
33/2A/2,33/2B/2 at
Wadgaon Sheri,
Viman Nagar PUNE
2500 Mr Darp 9923150014
103 170019038700
M/S. VAMONA
DEVELOPERS
PVT.LTD
S.NO.207/1A,
207B, 207/2,
LOHGAON At
Wadgaonsheri,
Viman Nagar PUNE
2917 Mr Darp 9923150014
104 170019038690 M/S. TRINITY
VENTURES
S.NO.207/1A,207B,
207/2,
LOHAGAON At.
Wadgaonsheri,
Viman Nagar PUNE
2500 Mr Darp 9923150014
105 170019038430
MR. ABDUL
HAMID
JAFARI ( Life
Style Mall)
CTS NO. 8 = 9,
BUND GARDEN
ROADOPP.
POONA
CLUB,PUNE
1350 Mr Isak
Shaikh 9967852081
106 170019009401
M/S BRAMHA
BAZAZ HOTEL
LTD.( Le
Meridian)
RAJA BAHADUR
MILL BEHIND
PUNE
RLY.STATION
PUNE 411001
1184
107 170019029690
M\S
PANTALOON
RETAIL (I)
LTD.
S.NO.364 CTS NO
1/1 F.P.NO
256,BOAT CLUB
ROAD PUNE
1450 Mr
Singh 7498070077

327
Sr Consumer
Number
Consumer
Name Address
Contract
Demand
(KVA)
Name of
the
Contact
Person
Contact No
108 170019007807
M\S CLASSIC
CITY
INVESTMENT
Hotel Sun n
Sand.
262 B & C BUND
GARDEN ROAD
PUNE 411001
1000
Mr
Agnihotr
i
9673025333
109 170019002821
MANAGING
TRUSTEE
GRANT
MEDICAL
FOUNDATION
RUBY HALL
CLINIC 40,
SASSON
ROADPUNEPUNE
1500
Mr
Naik/Mr
Kadam
9970026262/
9890300516
110 170019030970
M\S ONE STOP
SHOP INDIA
(Nucleus Mall).
CTS NO 1 WEST
WING CHIRCH
ROAD PUNE
1265 Mr
Shinde 9167093039
111 170019032530
M\S KROME
PLANET
INRETIORS
PVT LTD.
S.NO 80/A 2 & S
NO 32/1,2
WANAWARI
HADAPSAR PUNE
1302
Mr
Nandu
Nagesh
9822088828
112 170019000543
M/S
KIRLOSKAR
PNEUMATIC
COMPANY
LTD
HADAPSAR
INDUSTRIAL
ESTATEPUNEHA
DAPSAR
2700 Mr
Marathe 9881495491
113 170019000616
M/S
KIRLOSKAR
PNEUMATIC
COMPANY
LTD
HADAPSAR
INDUSTRIAL
ESTATE PUNE
1290 Mr
Marathe 9881495491
114 170019031510
M\S SHIRKE
CONST
EQUIPMENT
PVT LTD
S.NO 72/76
MUNDHWA PUNE 1200
Mr
Shelar 9049004191
115 170019002163
M/S SIPOREX
INDIA PVT
LTD
72/76 MUNDHWA
PUNE 1013
Mr
Gosavi 8380022501
116 170019005677
M/S KALYANI
THERMAL
SYSTEM LTD
PRIVATE
LIMITEDS NO 72-
76 MUNDHAWA
PUNE
2490 Mr
Baravkar 9881728345
117 170019000438 M/S BHARAT
FORGE LTD
POST BOX NO
57,MUNDHAWA,
PUNE.
48653
Mr
Dharurka
r
9850877562
118 170019009044
M/S ADDL
CITY
ENGINEER
PARVATI
RAW WATER
PUMPING
STATIONNR OLD
PARVATI SUB-
STATION PUNE
1350 Mr
DyEE 9689931318
119 170019000969
M/S CITY
ENGINEER
PARVATI
WATER
WORKS
PARVATI,
SINHAGAD ROAD
PUNE.
2000 Mr
DyEE 9689931318

328
Sr Consumer
Number
Consumer
Name Address
Contract
Demand
(KVA)
Name of
the
Contact
Person
Contact No
120 170019002546
M/S CITY
ENGINEER
PARWATI
WATER
WORKS
PUNE SINHAGAD
ROAD 3500
Mr
DyEE 9689931318
121 170019000551
M/S
GARRISON
ENGINEER P I
R AND D
C/O GARRISON
ENGINEER (I)
R & D
GIRINAGAR
PUNE
KHADAKWASLA
1000 Mr
Kochar 9604947701
122 170019001710
M/S CENTRAL
WATER AND
POWER
RESEARCH
STATION
KHADAKWASLA,
Pune
1200 Mr
Swain 9403133224
123 170019031650
M\S
PANCHSHEEL
TECH PARK
PVT LTD.
S.NO 191/A/2/A/1/2
YERWADENEAR
DON BOSCO
SCHOOLPUNE
1000 Mr
Chavan 9764314062
124 170019038020
M/S. ZERO
G.APARTMEN
T (P) LTD
S.NO. 199, P.NO.
204, 206,
209,VIMAN
NAGARPUNE
1250
Mr
Shashika
nt
Thakare
9158005313
125 170019031050
M/S.
WEIKFIELD IT
CITI INFO
PARK
30/3 + 31/1,
WADGAONSHERI
PUNE
1486
Mr
Dattaray
a
Gaikwad
8805001744
126 170019038730
M/S. HSBC
SOFTWARE
DEVELOPMEN
T INDIA
PVT.LTD
S.NO. 222/1,
KALYANINAGAR
PUNE
1400 Mr
Sarade 9011431200
127 170019030170 M/S HSDI
S.NO.222/1
KALYANI-
NAGAR PUNE
1400 Vinod
Singh 9923244019
128 170019025560
M\S HSBC
SOFTWARE
DEVELOPMEN
T (INDIA)LTD.
RAHEJA WOOLS
BUILDING NO4
PLOT NO
25S.NO222/9
KALANI NAGER
PUNE
1700 Mr
Sarade 9011431200
129 170019032550
M\S N.V.
REALITY PVT
LTD.
S.NO 30/3, 31/1 2A
WEIKFIELD
ESTATE NAGAR
ROAD PUNE
1485
Mr
Dattaray
a
Gaikwad
8805001744
130 170019034280
M\S
MAHANTESH
MALI
S.NO 30/3,31/1 &
2A VIMANGAR
PUNE
1486
Mr
Dattaray
a
Gaikwad
8805001744

329
Sr Consumer
Number
Consumer
Name Address
Contract
Demand
(KVA)
Name of
the
Contact
Person
Contact No
131 170019034270 M\S PRAKASH
MHATRE
S.NO 30/3,31/1 &
2A VIMAN
NAGAR PUNE
1486
Mr
Dattaray
a
Gaikwad
8805001744
132 170019035720 M/S. BAJAJ
FINSERV LTD
S.NO.208/1B,
LOHAGAONVIMA
N NAGARPUNE
1400
Mr
Kishor
Jadhav
7387000285
133 170019037740
M/S. G CORP.
PROPERTIES
PVT.LTD
S.NO. 206,
A/1,NEXT TO
AGAKHAN
PALACEYERAWA
DAPUNE
2000
Mr
Kumar
Kirolkar
9960923337
134 170019037770 M/S. IHHR
HOSPITALITY
CTS NO.
2134,2735,2136,213
7,2140,2142FINAL
P.NO.88, NAGAR
ROADPUNE
1600 Mr
Bhargav 7798889763
135 170019036220
M/S. DUET
INDIA HOTEL
(PUNE)
PVT.LTD
S.NO. 197/3-5,
VIMAN
NAGARPUNE
1275 Mr S
Gupta 8600700502

330
Annexure 5: Map of the Pune City
Source: www.mapsofindia.com.
Shows locations concentrated by eligible Open Access Consumers

References

331
Bibliography
1. Aczel Amir D and Sounderpandian. (2008) Complete Business Statistics. 6th
ed.
New Delhi: Tata McGraw Hill.
2. Besterfield Dale H et al.(2008) Total Quality Management. 3rd
ed. New Delhi:
Dorling Kindersley (India) Pvt. Ltd. , licensees of Pearson Education in South
Asia.
3. Cooper Donald R and Schindler Pamela S. (2008) Business Research Methods. 9th
ed. New Delhi: Tata McGraw Hill.
4. Cunningham James B and Aldrich James O. (2012) USING SPSS: An Interactive
Hands-On Approach. New Delhi: SAGE Publications.
5. Fitzsimmons James A and Fitzsimmons Mona J. (2006) Service Management. 5th
ed. New Delhi: Tata McGraw Hill.
6. Gaur Ajai S and Gaur Sanjaya S.(2006) Statistical Methods for Practice and
Research. New Delhi: SAGE Publications.
7. Gupte A K. (2008) Electricity Laws in Maharashtra. 2nd
ed. Pune: Hind Law
Publications.
8. Hawkins Del I, Best J Roger and Coney Kenneth A. (2002) Consumer Behavior.
8th
ed. New Delhi: Tata McGraw Hill.
9. Kothari C R. (2011) Research Methodology: Methods and Techniques. 2nd
ed.
New Delhi: NEW AGE INTERNATIONAL(P) LIMITED.
10. Kotler Philip et al (2009) Marketing Management. 13th
ed. New Delhi: Dorling
Kindersley (India) Pvt. Ltd. , licensees of Pearson Education in South Asia.
11. Kumar Alok, Sinha Chhabi and Sharma Rakesh. (2008) Customer Relationship
Management: Concepts & Applications. New Delhi:biztantra.

332
12. Pallant Julie. (No Date) SPSS Survival Manual. 3rd
ed. McGraw Hill.
13. Schiffman Leon G et al. (2010) Consumer Behavior. 10th
ed. New Delhi: Dorling
Kindersley (India) Pvt. Ltd. , licensees of Pearson Education in South Asia.
14. Shahi R V. (2007) Towards Powering India: Policy Initiatives and
Implementation Strategy. New Delhi: Excel Books.
15. Zeithaml Valarie A and Bitner Mary Jo. (2006) Services Marketing: Integrating
Customer Focus Across the Firm. 3rd
ed. New Delhi: Tata McGraw Hill.
16. Organizations for Economic Cooperation and Development. Competition Policy
in the Electricity Sector.France, Paris: OECD, 1997.PDF file.
Websites 1. http://www.cea.nic.in
2. http://www.cercind.gov.in
3. http://www.mahadiscom.in
4. http://www.mercindia.org
5. http://www.dissertationrecipes.com
Related Documents