“A STUDY OF BANKRUPTCY POSITION OF ALOK INDUSTRIES LTD.” Project Report submitted to UNIVERSITY OF CALICUT In partial fulfillment of the requirement for the award of the degree of BACHELOR OF COMMERCE (PROFESSIONAL) Submitted by ASWATHI RAJEEVU (CCASBCP027) Under the supervision of Ms. TEENA THOMAS DEPARTMENT OF COMMERCE CHRIST COLLEGE (AUTONOMOUS), IRINJALAKUDA MARCH 2021

Welcome message from author
This document is posted to help you gain knowledge. Please leave a comment to let me know what you think about it! Share it to your friends and learn new things together.
Transcript
“A STUDY OF BANKRUPTCY POSITION OF ALOK
INDUSTRIES LTD.”
Project Report submitted to
UNIVERSITY OF CALICUT
In partial fulfillment of the requirement for the award of the degree of
BACHELOR OF COMMERCE (PROFESSIONAL)
Submitted by
ASWATHI RAJEEVU
(CCASBCP027)
Under the supervision of
Ms. TEENA THOMAS
DEPARTMENT OF COMMERCE
CHRIST COLLEGE (AUTONOMOUS), IRINJALAKUDA
MARCH 2021
CHRIST COLLEGE (AUTONOMOUS), IRINJALAKUDA
CALICUT UNIVERSITY
DEPARTMENT OF COMMERCE
CERTIFICATE
This is to certify that the project report entitled “A STUDY OF
BANKRUPTCY POSITION OF ALOK INDUSTRIES LTD.” is a bonafide
record of project done by ASWATHI RAJEEVU, Reg. No. CCASBCP027,
under my guidance and supervision in partial fulfillment of the requirement for
the award of the degree of BACHELOR OF COMMERCE (PROFESSIONAL)
and it has not previously formed the basis for any Degree, Diploma and
Associateship or Fellowship.
PROF. K.O.FRANCIS Ms. TEENA THOMAS
Co-ordinator Project Guide
DECLARATION
I, ASWATHI RAJEEVU, hereby declare that the project work entitled
“A STUDY OF BANKRUPTCY POSITION OF ALOK INDUSTRIES LTD.”
is a record of independent and bonafide project work carried out by me under the
supervision and guidance of Ms. Teena Thomas, Assistant Professor,
Department of Commerce, Christ College, Irinjalakuda.
The information and data given in the report is authentic to the best of my
knowledge. The report has not been previously submitted for the award of any
Degree, Diploma, Associateship or other similar title of any other university or
institute.
Place: Irinjalakuda Aswathi Rajeevu
Date: CCASBCP027
ACKNOWLEDGEMENT
I would like to take the opportunity to express my sincere gratitude to all people
who have helped me with sound advice and able guidance.
Above all, I express my eternal gratitude to the Lord Almighty under whose
divine guidance; I have been able to complete this work successfully.
I would like to express my sincere obligation to Rev.Dr. Jolly Andrews,
Principal-in-Charge, Christ college Irinjalakuda for providing various facilities.
I am thankful to Prof. K.O.Francis, Co-ordinator of B.Com (Professional), for
providing proper help and encouragement in the preparation of this report.
I am thankful to Ms. Teena Thomas, Class teacher for her cordial support,
valuable information and guidance, which helped me in completing this task
through various stages.
I express my sincere gratitude to Ms. Teena Thomas, Assistant Professor, whose
guidance and support throughout the training period helped me to complete this
work successfully.
I would like to express my gratitude to all the faculties of the Department for
their interest and cooperation in this regard.
I extend my hearty gratitude to the librarian and other library staffs of my college
for their wholehearted cooperation.
I express my sincere thanks to my friends and family for their support in
completing this report successfully.
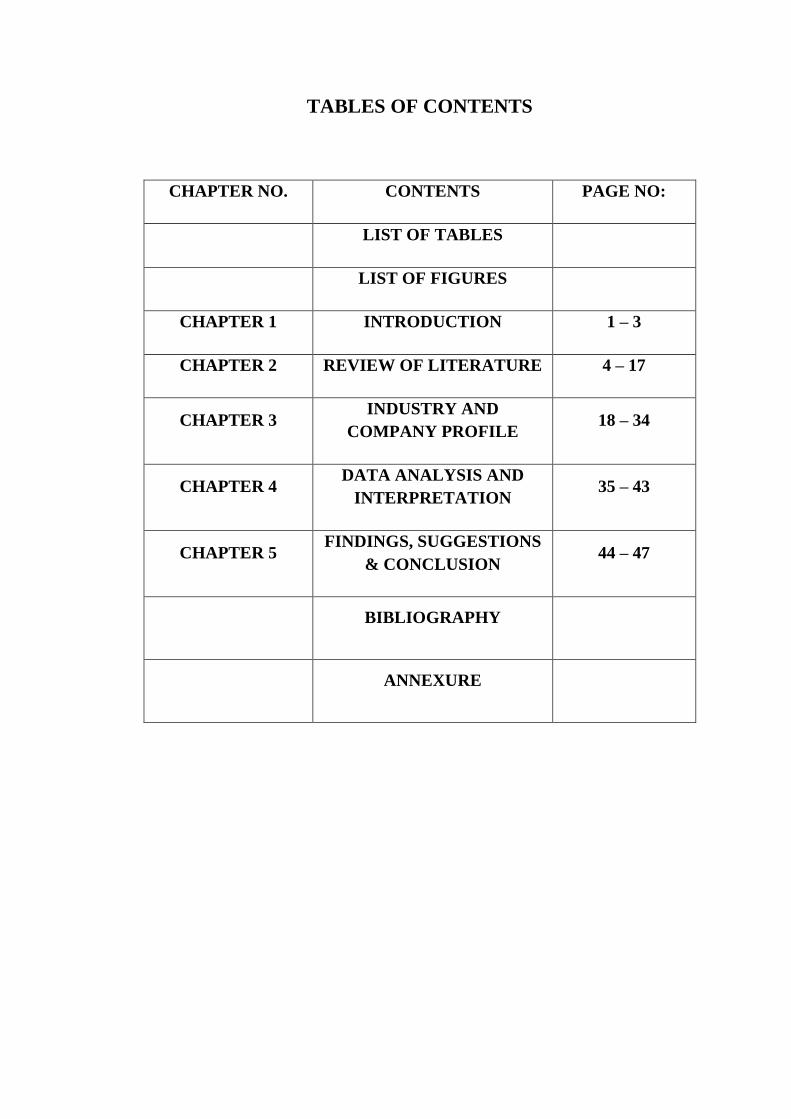
TABLES OF CONTENTS
CHAPTER NO. CONTENTS PAGE NO:
LIST OF TABLES
LIST OF FIGURES
CHAPTER 1 INTRODUCTION 1 – 3
CHAPTER 2 REVIEW OF LITERATURE 4 – 17
CHAPTER 3 INDUSTRY AND
COMPANY PROFILE 18 – 34
CHAPTER 4 DATA ANALYSIS AND
INTERPRETATION 35 – 43
CHAPTER 5 FINDINGS, SUGGESTIONS
& CONCLUSION 44 – 47
BIBLIOGRAPHY
ANNEXURE
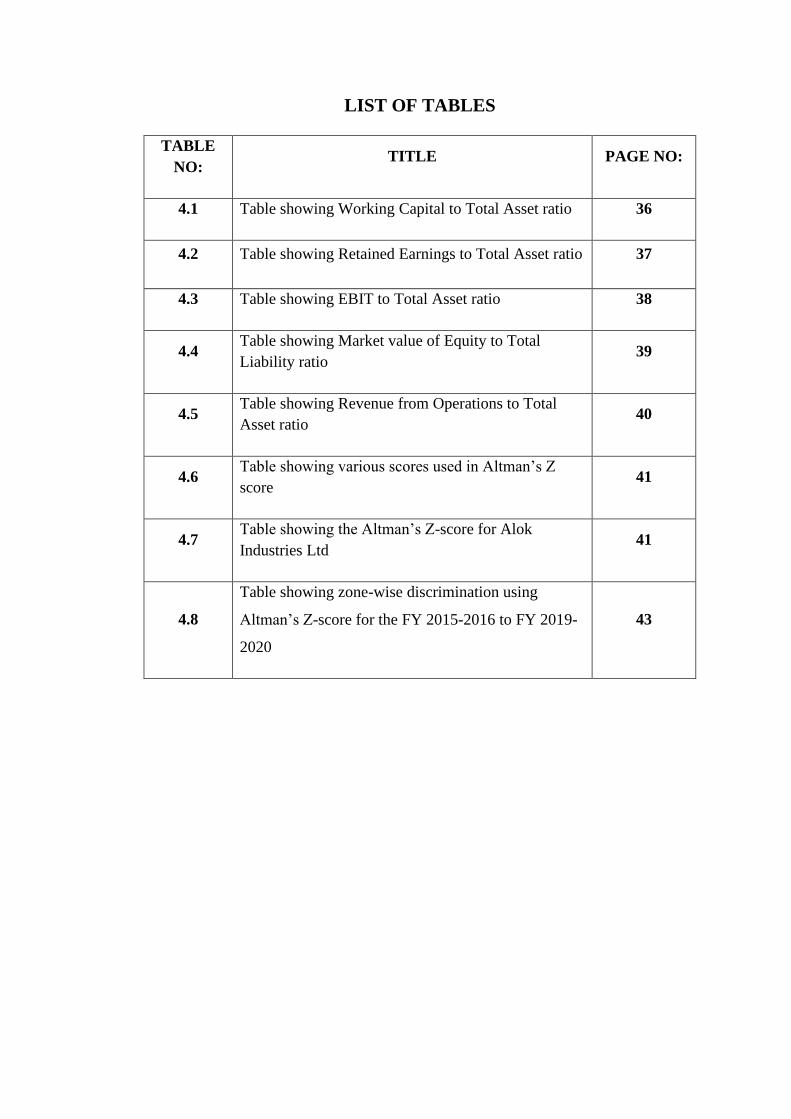
LIST OF TABLES
TABLE
NO: TITLE PAGE NO:
4.1 Table showing Working Capital to Total Asset ratio 36
4.2 Table showing Retained Earnings to Total Asset ratio 37
4.3 Table showing EBIT to Total Asset ratio 38
4.4 Table showing Market value of Equity to Total
Liability ratio 39
4.5 Table showing Revenue from Operations to Total
Asset ratio 40
4.6 Table showing various scores used in Altman’s Z
score 41
4.7 Table showing the Altman’s Z-score for Alok
Industries Ltd 41
4.8
Table showing zone-wise discrimination using
Altman’s Z-score for the FY 2015-2016 to FY 2019-
2020
43
LIST OF FIGURES
FIGURE
NO: TITLE PAGE NO:
4.1 Figure showing working capital to total asset ratio 36
4.2 Figure showing Retained Earnings to Total Asset ratio 37
4.3 Figure showing EBIT to Total Assets ratio 38
4.4 Figure showing Market value of Equity to Total
Liability 39
4.5 Figure showing Revenue from operations to Total
Asset Ratio 40
4.6 Figure showing the Altman’s Z- score for Alok
Industries Ltd 42
CHAPTER Ⅰ
INTRODUCTION
1
1.1 Introduction
Most of the organizations exist with an objective of profit maximization. To
achieve profit maximization objective, firm needs strong internal & external
support. The failure of internal support system such as effective utilization of
funds, labour, material etc & external support system such as economic, political
& socio-cultural conditions results in Bankruptcy of the organization.
Bankruptcy is a situation where the firm’s total liabilities exceed total assets.
The real net worth of the firm is, therefore negative. This leads to reduced sales,
increased cost & losses, ineffective competition etc. Ultimately firm will be
under distress stage. Under such situations it becomes difficult for investors &
lenders to analyze the financial performance of the organization.
Financial longevity of a business is a concern to internal and external
stakeholders. Internal stakeholders might be interested in whether skills are
transferable, while external stakeholders might be concerned directly with their
investment or profits. Predicting if a Business will do well or go bankrupt has
led to propagation of various theories. Knowing how to determine the financial
health of a company is a vital business skill. Having a clear picture of financial
health can help in making more informed decisions about an organization’s
direction and how resources are allocated. Similarly, if a company plan to attract
investors or seek financing, one needs to speak up and present the business’s
financial health. Financial health of a company or a firm plays a pivotal role in
every organization in the world.
Several bankruptcy models for example, logit analysis, recursive portioning
algorithm and neural networks are available but still Altman’s model is
considered to be superior and pervasively applied by researchers all over the
world in the present days. This study is an attempt to examine the bankruptcy
position of Alok Industries Ltd using Altman’s Z-score.
2
1.2 Statement of Problem
Financial Risks show the possibility of losses arising from the failure to achieve
financial objectives. These risks are not necessarily independent of each other.
The importance of these risks will vary from one company to another in relation
to the company’s size, nature, functional sector etc. The main aim of this study
is to test and understand the bankruptcy position of the chosen company.
1.3 Scope of study
The project is conducted in order to know the bankruptcy position of the Alok
Industries Ltd. It helps in understanding and evaluating bankruptcy position of
the company.
1.4 Significance of study
Financial distress is a global phenomenon that affects companies across all
sectors of the economy .The significance of predicting bankruptcy is
fundamental in assessing the financial condition of a company and prospects in
its operations. This study offers a better insight into the bankruptcy position of
the sample company.
1.5 Objectives of the Study
• To analyse ratios such as working capital to total assets, retained
earnings to total assets, EBIT, market value of equity to total liabilities
and sales to total assets.
• To examine the bankruptcy position of Alok Industries Ltd.
• Improve the knowledge of bankruptcy prediction of companies.
1.6 Research Design
1.6.1 Nature of Study
The study is Analytical in nature.
3
1.6.2 Nature of Data
The study mainly uses secondary data. It includes financial variables and
accounting information such as ratios including working capital to total assets,
retained earnings to total assets, EBIT, market value of equity to total liabilities
and sales to total assets.
1.6.3 Sources of Data
The study uses secondary data. Secondary sources include annual reports,
official websites of the chosen companies, a number of research papers including
Asian Journal of Management Research, International Journal of Advanced
Science and Technology, working papers and financial dailies.
1.6.4 Period of Study
The period of study is from 2015 to 2020.
1.7 Tool for Analysis
Altman’s Z-Score
1.8 Chapterization
Chapter 1: Introduction
Chapter 2: Review of Literature
Chapter 3: Industry Profile and Company Profile
Chapter 4: Data Analysis and Interpretation
Chapter 5: Finding Conclusion and Suggestions
CHAPTER Ⅱ
REVIEW OF LITERATURE
4
2.1 Introduction
This section deals with review of literature which is divided into two parts
namely, Conceptual and Empirical Literature. Conceptual Literature includes
various theories and concepts used in the study. Empirical Literature mainly
includes reviews on earlier studies.
2.2 Conceptual Review
2.2.1 Meaning of Bankruptcy
The word bankruptcy is derived from Italian banca rotta, literally meaning
"broken bench" but more idiomatically "broken bank", since bankers
traditionally dealt from wooden benches. A folk etymology alleges that Italian
bankers' benches were smashed if they defaulted on payment, but this is often
dismissed as a legend.
A legal declaration that one is unable to pay one's debts and thus needs to have
debts forgiven or reorganized. That is, bankruptcy is a legal proceeding in whic
h a person or corporation has become insolvent, and therefore cannot pay his/h
er/its obligations. Most of the time, the person or corporation files this declarati
on with a bankruptcy court, though in some cases the creditors may do so them
selves.
2.2.2 Bankruptcy in India
The Parliament of India in the first week of May 2016 passed Insolvency and
Bankruptcy Code 2016 (New Code). Earlier a clear law on corporate bankruptcy
did not exist, even though individual bankruptcy laws have been in existence
since 1874. The earlier law in force was enacted in 1920 called the Provincial
Insolvency Act.
The legal definitions of the terms bankruptcy, insolvency, liquidation and
dissolution are contested in the Indian legal system. There is no regulation or
5
statute legislated upon bankruptcy which denotes a condition of inability to meet
a demand of a creditor as is common in many other jurisdictions.
Winding up of companies was in the jurisdiction of the courts which can take a
decade even after the company has actually been declared insolvent. On the other
hand, supervisory restructuring at the behest of the Board of Industrial and
Financial Reconstruction is generally undertaken using receivership by a public
entity.
2.2.3 Salient Features of Insolvency and Bankruptcy Code 2016
1. Resolution of Insolvency:
The Insolvency and Bankruptcy Code, 2016 lays down the separate insolvency
resolving procedures for companies, individuals as well as partnership
companies. It is possible to initiate the procedure either by the creditors or the
debtors. The code lays down a maximum time period for completing the
insolvency resolution procedure for individuals and corporates. In the case of a
company, the procedure must be fully completed in one hundred and eighty days,
which can later be stretched by ninety days only when a large percentage of
creditors permit or agree. On the other hand, in the case of start-ups (aside to the
partnership companies), small organizations as well as other organizations
(having less than Rs 1 crore worth of assets), the resolution procedure would be
fulfilled within a period of ninety days of initiating the required that can be
further stretched by as many as 45 days.
2. Regulator of Insolvency:
The Code lays down that the Insolvency and Bankruptcy Board of India shall
oversee the proceedings related to insolvency in the nation and also regulate all
the organizations that have been registered by the board. The Insolvency and
Bankruptcy Board shall consist of ten members, which would also include the
6
representatives of the Law and Finance ministries as well as the RBI (Reserve
Bank of India).
3. Licensed Insolvency Professionals:
The management of insolvency procedure shall be done by licensed insolvency
professionals. They would also exercise control on the debtor’s assets at the time
of the insolvency procedure.
4. Insolvency and Bankruptcy Adjudicator:
The Code has introduced two distinct tribunals for overseeing the procedure
resolving insolvency, for companies and individuals. These are (i) the National
Company Law Tribunal for organizations and Limited Liability Partnership
companies; as well as (ii) the Debt Recovery Tribunal for overseeing insolvency
resolution for individuals as well as partnership firms.
5. Procedure:
An insolvency plea is given to the authority that adjudicates (in corporate
debtor’s case it is NCLT) by operation or financial creditors or the corporate
debtor. The plea can be accepted or rejected in a maximum time period of
fourteen days. In case the plea gets acceptance then the tribunal will have to
quickly appoint an IRP or Insolvency Resolution Professional for drafting a plan
of resolution within a period of 180 days (that can be extended by ninety days).
Following this, the court would initiate the process of resolving corporate
insolvency. For that particular period, the company’s directors shall remain
suspended whereas the promoters shall have no say in the company management.
The Insolvency Resolution Professional can seek help of the management of the
company for handling everyday operations. In case the CIRP is unable to revive
the organization, then the process of liquidation shall be initiated.
7
6. Amendments:
Certain individuals are prohibited from providing any plan of resolution in case
there are any defaults. Hence, wilful defaulters, management or promoters of
company in case there is any non-performing outstanding debt for more than a
year, as well as directors who have been disqualified cannot submit any plan.
Apart from this, the bill also places a restriction on the selling of a defaulter’s
property to any such individuals at the time of liquidation.
2.2.4 Causes of Bankruptcy
1. Market Conditions
Poor conditions in overall economy and the specific market in which a business
operates are common causes of bankruptcy. The economy tends to follow a
boom and bust cycle of rapid expansion followed by lulls or recessions. During
bust periods, consumer confidence and spending tend to decline, which can
lead to low revenue. Companies involved in specific niche markets can also be
susceptible to shifts in consumer preferences. For example, a small business
owner that owns a music store might be forced to close shop if customers start
buying digital downloads instead of CDs. Competition from larger companies
is another market factor that can cut into the revenue of small companies and
lead to bankruptcy.
2. Financing
Financing is one of the primary challenges that small businesses face. Many
business owners take out loans to help finance their operations. If a business
struggles, his lender may not be willing to grant additional funding, which
could lead to bankruptcy. Even if an owner can secure more financing to keep
his company afloat in the short-term, high debt makes it more difficult for a
company to be profitable because it has to pay interest on the debt.
8
3. Poor Decision Making
Lack of planning and level-heading thinking can lead to hasty decisions and
business failure. For example, a business owner might spend time and money
developing a product that she believes in without surveying customers and
studying production costs to gauge whether the product could be profitable.
Even if the product is useful, it might not be financially viable from a business
standpoint. Lack of education and experience in finance and management can
increase the likelihood of poor decisions, but no company is immune to making
mistakes.
4. Other Causes
Bankruptcy can result from a host of other underlying problems that inhibit
profitability. Some other factors that can contribute to bankruptcy include poor
business location, loss of key employees, lawsuits raised by competitors and
personal issues like illness or divorce. Unforeseen disasters and criminal
activity like floods, storms, fires, theft and fraud can also cause hardships that
lead to bankruptcy.
2.2.5 Procedure for Bankruptcy
A plea for insolvency is submitted to the adjudicating authority (NCLT in case
of corporate debtors) by financial or operation creditors or the corporate debtor
itself. The maximum time allowed to either accept or reject the plea is 14 days.
If the plea is accepted, the tribunal has to appoint an Interim Resolution
Professional (IRP) to draft a resolution plan within 180 days (extendable by 90
days). following which the Corporate Insolvency Resolution process is initiated
by the court. For the said period, the board of directors of the company stands
suspended, and the promoters do not have a say in the management of the
company. The IRP, if required, can seek the support of the company's
management for day-to-day operations. If the CIRP fails in reviving the company
the liquidation process is initiated.
9
Insolvency and bankruptcy code bill was introduced in the Indian parliament by
the NDA government in 2015 but got final clearance in May 2016 parliament
session. It was believed that this bill will resolve all the banking issues present
in the economy. The main reason to introduce this bill was to fasten up the long
insolvency process which it did. After this bill, the insolvency process for the
company is 180 days with an extension of 90 days, and for startups and small
companies, it is 90 days with an extension of 45 days. The question is will it
resolve all banking issues and the answer is no, as India's banking industry is
going through a very difficult phase. Banks are merging up due to bad loans and
all this hustle can't be simplified with this bill. IBC will only bad debts that are
disclosed. Undisclosed bad loans or bad loans that get disclosed after the victim
absconds remain untouched. And there are many incidents in past years in which
creditors flew away from the country after being unable to pay off the loan that
they took. But, the IBC did improve the economic system and the impact can be
seen - the economy is clearly stabler
2.2.6 Meaning of Altman’s Z score
Altman Z score, is a tool that helps to measure the financial distress or
bankruptcy. It was published by Edward I Altman in the year 1968. Altman’s
idea of developing a formula for predicting bankruptcy started at the time of
the Great Depression when businesses experienced a sharp rise in incidences of
default. The Z score model is mainly designed to measure the financial health of
the company in terms of financial distress or bankruptcy. The model uses the
formulae based on the information found in the profit and loss account and
balance sheet of the organization.
2.2.7 History of the Altman Z-Score
NYU Stern Finance Professor Edward Altman developed the Altman Z-score
formula in 1967, and it was published in 1968. Over the years, Altman has
continued to revaluate his Z-score over the years. From 1969 until 1975, Altman
looked at 86 companies in distress, then 110 from 1976 to 1995, and finally 120
10
from 1996 to 1999, finding that the Z-score had an accuracy of between 82% and
94%.
In 2012, he released an updated version called the Altman Z-score Plus that one
can use to evaluate public and private companies, manufacturing and non-
manufacturing companies, and U.S. and non-U.S. companies. One can use
Altman Z-score Plus to evaluate corporate credit risk. The Altman Z-score has
become a reliable measure of calculating credit risk.
2.2.8 Components of Altman’s Z-score
Altman’s Z-score model combines five financial ratios to predict the probability
of a company becoming insolvent in the next two years.
The following are the key financial ratios that make up the Z-score model:
1. Working Capital to Total Assets
Working capital is the difference between the current assets of a company and
its current liabilities. The value of a company’s working capital determines its
short-term financial health. A positive working capital means that a company
can meet its short-term financial obligations, and still make funds available to
invest and grow. In contrast, negative working capital means that a company will
struggle to meet its short-term financial obligations because there are inadequate
current assets.
X1 = working capital
total assets
2. Retained Earnings to Total Assets
The retained earnings/total assets ratio shows the amount of retained earnings or
losses in a company. If a company reports low retained earnings to total assets
ratio, it means that the company is financing its expenditure using borrowed
funds rather than funds from its retained earnings. It increases the probability of
11
a company going bankrupt. On the other hand, a high retained earnings to total
assets ratio shows than a company uses its retained earnings to fund capital
expenditure. It shows that the company achieved profitability over the years, and
it does not need to rely on borrowings.
X2 = retained earnings
total assets
3. Earnings Before Interest and Tax to Total Assets
EBIT, a measure of a company’s profitability, refers to the ability of a company
to generate profits solely from its operations. The EBIT/Total Assets ratio
demonstrates a company’s ability to generate enough revenues to stay profitable
and fund ongoing operations and make debt payments.
X3 = earnings before interest and taxes
total assets
4. Market Value of Equity to Total Liabilities
The market value, also known as market capitalization, is the value of a
company’s equity. It is obtained by multiplying the number of outstanding shares
by the current price of stocks. The market value of the equity/total liabilities ratio
shows the degree to which a company’s market value would decline when it
declares bankruptcy before the value of liabilities exceeds the value of assets in
the balance sheet. A high market value of equity to total liabilities ratio can be
interpreted to mean high investor confidence in the company’s financial strength.
X4 = market value of equity
total liabilities
12
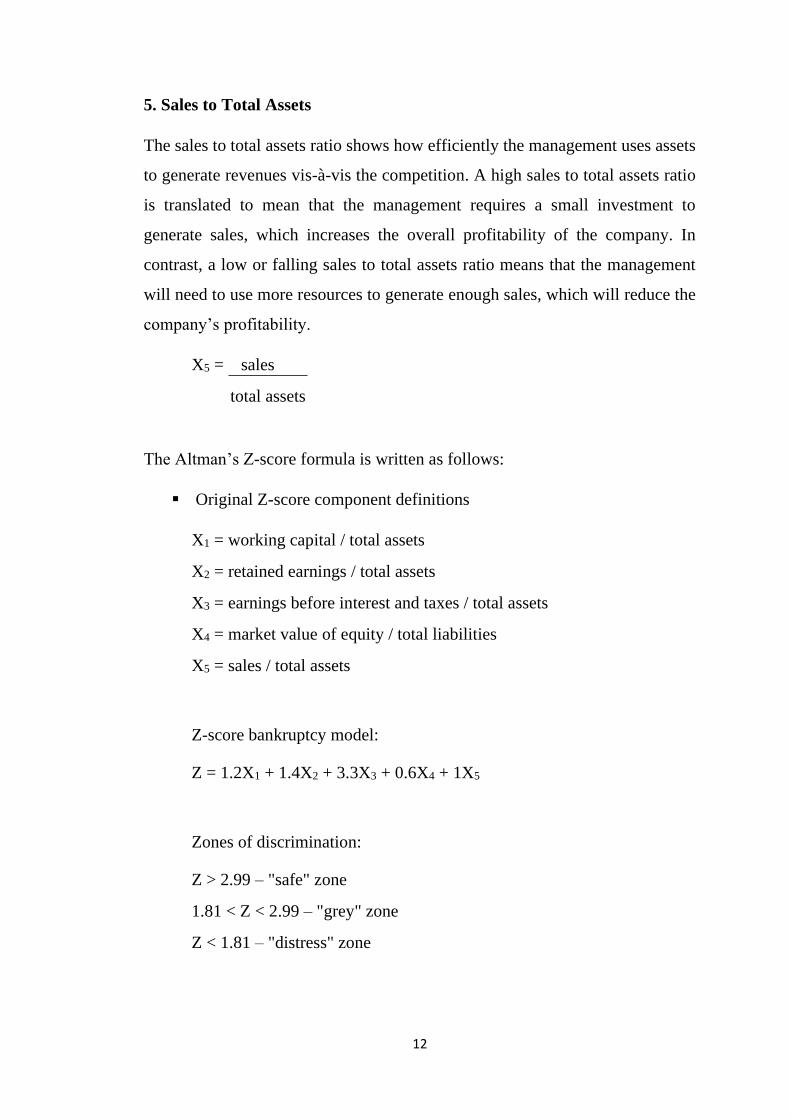
5. Sales to Total Assets
The sales to total assets ratio shows how efficiently the management uses assets
to generate revenues vis-à-vis the competition. A high sales to total assets ratio
is translated to mean that the management requires a small investment to
generate sales, which increases the overall profitability of the company. In
contrast, a low or falling sales to total assets ratio means that the management
will need to use more resources to generate enough sales, which will reduce the
company’s profitability.
X5 = sales
total assets
The Altman’s Z-score formula is written as follows:
▪ Original Z-score component definitions
X1 = working capital / total assets
X2 = retained earnings / total assets
X3 = earnings before interest and taxes / total assets
X4 = market value of equity / total liabilities
X5 = sales / total assets
Z-score bankruptcy model:
Z = 1.2X1 + 1.4X2 + 3.3X3 + 0.6X4 + 1X5
Zones of discrimination:
Z > 2.99 – "safe" zone
1.81 < Z < 2.99 – "grey" zone
Z < 1.81 – "distress" zone
13
2.2.9 Advantages
• The Z Score highlights factors contributing to a company’s financial
health and uncovers emerging trends that indicate improvements or
deterioration in financial condition.
• The Z Score is a critical tool business managers use to assess financial
health.
• It helps managers align business strategies with capital allocation
decisions and provide transparency of financial condition to lenders and
equity capital providers.
• The Z Score is an effective tool to demonstrate credit worthiness to
bankers and soundness of business model to investors.
• The scoring system uses fives financial ratios that are calculated on the
basis of even financial data which is easily available from the balance
sheet and income statement of any company.
• It is a quantitative model that can be mapped with the credit scoring model
which is more of a mix of quantitative and qualitative measures.
• Being a quantitative model, it is very easy to draw insights from the
outcome.
• Investors usually use it to measure the solvency of a company in order to
decide whether to invest or not in that company.
2.2.10 Disadvantages
• One of the major disadvantages of the model is that it can only forecast
the likelihood of failure; only if the company is comparable to its
database. For instance, a restaurant typically exhibits a negative working
capital cycle and as such the model may end up indicating high
bankruptcy risk which is not true.
• The scoring system does not work well for new or emerging companies
as their earnings are too low and will end up indicating high risk.
14
• The model fails to incorporate the benefits of good cash flow
management.
• A misleading company financial will result in misleading Z score.
15
2.3 Empirical Literature
John Stephen Grice and Robert Wingram(2001). This study examines three
research questions using recent sample data: (1) Is Altman's original model as
useful for predicting bankruptcy in recent periods as it was for the periods in
which it was developed and tested by Altman? (2) Is the model as useful for
predicting bankruptcy of non-manufacturing firms as it is for predicting
bankruptcy of manufacturing firms? (3) Is the model as useful for predicting
financial stress conditions other than bankruptcy as it is for predicting
bankruptcy? The results are consistent with negative answers to questions one
and two and a positive answer to question three.
Hayes et al. (2010). As a result of the findings, the suggestion is that further
exploration of Altman’s Z score, and alternative formulas, is necessary to refine
this potentially useful tool in order to develop a predictive collection of tools
useful in predicting not only bankruptcy, but financial distress in a variety of
firms in a variety of contexts.
Gnyana Ranjan Bal(2015) The paper applied Altman’s Z-score to predict
corporate bankruptcy of select FMCG Companies. By applying Z-score and
select liquidity ratios the study concludes that the investors can use this model to
analyze financial position of the companies. In case of the select data, Z-score of
all companies for current year shows sound financial position and less chances
of bankruptcy in near future.
Lubawa, G. & Louangrath, P. (2016). The study used the Altman Z-score for
the privately held firms as the standard for evaluation. Multiple loans have
theoretical support in the literature. This paper claims that lenders stands to gain
more in case of default when there are multiple lenders.
16
Manjusha Senapati and Saptarshi Ghosa (2016) The model was tested for
some stressed industries/companies and was found to capture the underlying
distress. Distressed bank debt for the sample companies was found to be
increasing since 2011-12.
Soumya Agarwal and Guru Gobind Singh (2018). The empirical results
suggest the Z” Score model is a reliable predictor of current position of Top 5
Public Sectors Banks in India. The Z” Score has predicted the banking failures
successfully but a number of factors could suggest that the analysis was
somewhat biased. The Z” Score is only valid five years prior to bankruptcy.
Panigrahi Ashok(2019).This study uses Altman's 'Z' Score Model to test the
financial distress of a few selected pharmaceutical companies. This model has
been applied in several financial distress and bankruptcy studies with satisfactory
results.The result shows that the average Z-Score of the pharmaceutical industry
is 5.90 during the period of study. It clearly indicates that the pharmaceutical
industry has a healthy financial position because Z-Score is much above the cut-
off scores i.e. 1.8.
Apoorva D.and, Sneha Prasad Curpod(2019).Seven companies have been
selected to check the efficiency and accuracy of this model. As per this model,
bankruptcy of these companies could be predicted three years prior to the
occurring of the event in India. In conclusion, Altman Z score can be applied for
Indian companies; however the same is not 100% accurate.
Bracegirdle, Stewart.(2019).The Altman z-score bankruptcy model is used as
the statistical tool for determination of bankruptcy in the sample of independent
17
oil and gas companies. It was found that for the most part, the larger companies
did indeed experience less risk of bankruptcy, but the findings were inconclusive.
Prof. Vandana Samba and Dr. Vani Harpanahalli. (2020). The research paper
focuses on four financial ratio’s indicators of Altman Z-score in order to predict
or ascertain the financial distress and the bankruptcy position of the company.
By observing the Z-score model for prediction of bankruptcy resulted in “Grey
Zone” which means the company is almost near bankruptcy.
CHAPTER Ⅲ
INDUSTRY AND COMPANY
PROFILE
18
3.1 Introduction
This chapter deals with Industry Profile and Company Profile of Alok Industries
Ltd.
3.2 Industry Profile of Alok Industries Ltd.
3.2.1 Textile industry
The textile industry is primarily concerned with the design, production and
distribution of yarn, cloth and clothing. The raw material may be natural, or
synthetic using products of the chemical industry.The textile industry in India
traditionally, after agriculture, is the only industry that has generated huge
employment for both skilled and unskilled labour in textiles. The textile industry
continues to be the second-largest employment generating sector in India. It
offers direct employment to over 35 million in the country. India is first in global
jute production and shares 63% of the global textile and garment market. India
is second in global textile manufacturing and also second in silk and cotton
production. 100% FDI is allowed via automatic route in textile sector. Rieter,
Trutzschler, Saurer, Soktas, Zambiati, Bilsar, Monti, CMT, E-land, Nisshinbo,
Marks & Spencer, Zara, Promod, Benetton, and Levi’s are some of the foreign
textile companies invested or working in India.India’s textiles sector is one of
the oldest industries in the Indian economy, dating back to several centuries.
The industry is extremely varied, with hand-spun and hand-woven textiles
sectors at one end of the spectrum, while the capital-intensive sophisticated mills
sector on the other end. The decentralised power looms hosiery and knitting
sector forms the largest component in the textiles sector. The close linkage of
textiles industry to agriculture (for raw materials such as cotton) and the ancient
culture and traditions of the country in terms of textiles makes it unique in
comparison to other industries in the country. India’s textiles industry has a
capacity to produce wide variety of products suitable for different market
segments, both within India and across the world.
19
India is among the world's largest producers of Textiles and Apparel.The
domestic textiles and apparel industry contributes 2% to India’s GDP, 7% of
industry output in value terms and 12% of the country’s export earnings.The
textiles and apparel industry in India is the second-largest employer in the
country providing direct employment to 45 million people and 60 million people
in allied industries.India has also become the second-largest manufacturer of
PPE in the world. More than 600 companies in India are certified to produce
PPEs today, whose global market worth is expected to be over $92.5 bn by 2025,
up from $52.7 bn in 2019.
3.2.2 Industry Scenario
• FDI in the textiles and apparel industry has reached up to $3.45 bn
during 2020
• Exports in the textiles and apparel industry are expected to reach $300
bn by 2024-25 resulting in a tripling of Indian market share from 5% to
15%.
• The textiles and apparel industry can be broadly divided into two
segments - yarn and fibre and processed fabrics and apparel. The domestic
textiles and apparel market was estimated at US$ 100 billion in FY19.
The textile industry has around 4.5 crore workers including 35.22 lakh
handloom workers all over the country. In FY19, growth in private
consumption was expected to create strong domestic demand for textiles.
Growth in demand is expected to continue at 12% CAGR to reach US$
220 billion by 2025.
• Cotton production in India reached 36.04 million bales in FY20. During
FY19, production of fibre in India stood at 1.44 million tonnes (MT) and
reached 1.60 MT in FY20 (till January 2020), while that for yarn, the
production stood at 4,762 million kgs during same period.
20
• India is the world's second largest exporter of textiles and clothing.
Increased penetration of organised retail, favourable demographics, and
rising income level are likely to drive demand for textiles. Cloth
production stood at 63.34 billion square meters in FY20 (till January
2020).
• India’s textiles and apparel export is expected to increase to US$ 82.00
billion by 2021 from US$ 22.95 billion in FY20 (till November 2019).
• Rising Government focus and favourable policies is leading to growth
in the textiles and clothing industry. The Ministry of Textiles is
encouraging investment through increasing focus on schemes such as
Technology Up-gradation Fund Scheme (TUFS). In Union Budget 2020-
21, the Government has allocated Rs. 761.90 crore (US$ 109.01 million)
for Amended Technology Upgradation Fund Scheme (A-TUFS). The
Cabinet Committee on Economic Affairs (CCEA), Government of India
has approved a new skill development scheme named 'Scheme for
Capacity Building in Textile Sector (SCBTS)'. The Government
announced a special package to boost export by US$ 31 billion, create
one crore job opportunities and attract investment worth Rs. 80,000 crore
(US$ 11.93 billion) during 2018-2020. Cumulative FDI (Foreign Direct
Investment) inflow in the textiles sector stood at over US$ 3.45 billion
between April 2000 to June 2020.
• In Union Budget 2020-21, the Government of India has allocated around
Rs. 3,515 crore (US$ 502.93 million) to the Ministry of Textiles and Rs.
80 crore (US$ 11.45 million) for the scheme on Integrated Textile Parks.
The Ministry of Textiles has announced Rs. 690 crore (US$ 106.58
million) for setting up 21 readymade garment manufacturing units in
seven states for development and modernisation of Indian textile sector.
National Technical Textiles Mission is proposed for a period from 2020-

21
21 to 2023-24 at an estimated outlay of Rs. 1,480 crore (US$ 211.76
million).
• The National Handloom Development Programme has been allocated
Rs. 388.21 crore (US$ 55.55 million), whereas, the Integrated Processing
Development Scheme has received Rs. 50 crore (US$ 7.15 million) in
Union Budget 2020-21.
• On July 17, 2020, Khadi and Village Industries Commission (KVIC)
inaugurated the first-of-its-kind footwear training center in Delhi to train
the marginalized community of leather artisans.
• In May 2020, the Ministry of Textiles urged textile entrepreneurs to
reorient themselves and diversify their manufacturing skills to suit the
global demand amid the coronavirus pandemic.
3.2.3 Government Initiatives
Indian government has come up with several export promotion policies for the
textiles sector. It has also allowed 100% FDI in the sector under the automatic
route.
Initiatives taken by Government of India are:
• Defence Research and Development Organisation (DRDO) is helping
the Indian textile industry to produce yarns and eliminate dependence
on import of Chinese and other foreign clothing for military uniforms.
• In October 2020, the Cabinet Committee on Economic Affairs chaired
by Mr. Narendra Modi approved mandatory packaging of 100% food
grains and 20% sugar in jute bags. Under the Jute Packaging Materials
(Compulsory Use in Packing Commodities) Act, 1987, the
government is required to consider and provide for the compulsory
use of jute packaging materials for supply.
22
• Government launched production linked incentive scheme to provide
incentives for manufacture and export of specific textile products
made of man-made fibre.
• On September 2, 2020, the Union Cabinet approved signing an MOU
between textile committee, India and M/s Nissenken Quality
Evaluation Centre, Japan, for improving quality and testing Indian
textiles and clothing for the Japanese market. This India-Japan pact on
cooperation in textiles will facilitate Indian exporters to meet the
requirements of Japanese importers as per the latter’s technical
regulations.
• Under Union Budget 2020-21, a National Technical Textiles Mission
is proposed for a period from 2020-21 to 2023-24 at an estimated
outlay of Rs. 1,480 crore (US$ 211.76 million).
• In 2020, New Textiles Policy 2020 is expected to be released by the
Ministry of Textiles.
• The Directorate General of Foreign Trade (DGFT) has revised rates
for incentives under the Merchandise Exports from India Scheme
(MEIS) for two subsectors of Textiles Industry - readymade garments
and made-ups - from 2% to 4%.
• The Government of India has taken several measures including
Amended Technology Up-gradation Fund Scheme (A-TUFS),
estimated to create employment for 35 lakh people and enable
investment worth Rs. 95,000 crore (US$ 14.17 billion) by 2022.
• Integrated Wool Development Programme (IWDP) was approved by
Government of India to provide support to the wool sector, starting
from wool rearer to end consumer, with an aim to enhance quality and
increase production during 2017-18 and 2019-20.
23
3.2.4 Market Size
India’s textiles industry contributed 7% of the industry output (in value terms)
in FY19. It contributed 2% to the GDP of India and employed more than 45
million people in FY19. The sector contributed 15% to India’s export earnings
in FY19.
Textiles industry has around 4.5 crore employed workers including 35.22 lakh
handloom workers across the country.The domestic textiles and apparel market
stood at an estimated US$ 100 billion in FY19.
The production of raw cotton in India is estimated to have reached 36.04 million
bales in FY20. During FY19, production of fibre in India stood at 1.44 million
tonnes (MT) and reached 1.60 MT in FY20 (till January 2020), while that for
yarn, the production stood at 4,762 million kgs during same period.
3.2.5 Production Overview
India is the second largest producer of fibre in the world and the major fibre
produced is cotton. Other fibres produced in India include silk, jute, wool,
and man-made fibers. 60% of the Indian textile Industry is cotton based. The
strong domestic demand and the revival of the Economic markets by 2009 has
led to huge growth of the Indian textiles industry. In December 2010, the
domestic cotton price was up by 50% as compared to the December 2009 prices.
The causes behind high cotton price are due to the floods in Pakistan and China
. India projected a high production of textile (325 lakh bales for 2010 -11). There
has been increase in India's share of global textile trading to seven percent in five
years. The rising prices are the major concern of the domestic producers of the
country.
• Man Made Fibres: This includes manufacturing of clothes
using fibre or filament synthetic yarns. It is produced in the
large power loom factories. They account for the largest sector
of the textile production in India. This sector has a share of 62%
24
of the India's total production and provides employment to
about 4.8 million people.
• The Cotton Sector: It is the second most developed sector in
the Indian Textile industries. It provides employment to a huge
number of people but its productions and employment is
seasonal depending upon the seasonal nature of the production.
• The Handloom Sector: It is well developed and is mainly
dependent on the SHGs for their funds. Its market share is
13% of the total cloth produced in India.
• The Woolen Sector: India is the 7th largest producer of the
wool in the world. India also produces 1.8% of the world's total
wool.
• The Jute Sector: The jute or the golden fibre in India is mainly
produced in the Eastern states of India like Assam and West
Bengal. India is the largest producer of jute in the world.
• The Sericulture and Silk Sector: India is the second largest
producer of silk in the world. India produces 18% of the world's
total silk. Mulberry, Eri, Tasar, and Muga are the main types of
silk produced in the country. It is a labour-intensive sector.
25
3.3 Company Profile of Alok Industries Ltd.
3.3.1 History and Evolution
Alok was established in 1986 as a private limited company, with our first
polyester texturising plant being set up in 1989. We became a public limited
company in 1993. Over the years, we have expanded into weaving, knitting,
processing, home textiles and garments. And to ensure quality and cost
efficiencies we have integrated backward into cotton spinning and
manufacturing partially oriented yarn through the continuous polymerisation
route. We also provide embroidered products through Grabal Alok Impex Ltd.,
our associate company. That is how Alok evolved into a diversified manufacturer
of world-class home textiles, garments, apparel fabrics and polyester yarns,
selling directly to manufacturers, exporters, importers, retailers and to some of
the world’s top brands.
Alok has a strong foothold in the domestic retail segment through a wholly
owned subsidiary, Alok H&A Limited, under the cash & carry model that offer
garments and home textiles at attractive price points.Alok also has an
international presence in the retail segment through its associate concern, Grabal
Alok (UK) Limited. This entity owns more than 200 outlets across England,
Scotland and Wales vending value for money ranges for menswear,
womenswear, childrenwear, footwear, homeware and accessories.In addition,
Alok has also invested in premium commercial/residential projects across
Mumbai through its wholly owned subsidiaries.
3.3.2 Vision
To be the world's best integrated textile enterprise, driven by research &
innovation, with a leadership position across products & markets, while
exceeding customer & stakeholder expectations.
26
3.3.3 Mission
• Be a knowledge leader & an innovator in our business
• Maximise people :development initiatives
• Optimise use of all resources
• Become a process driven organisation
• Exceed compliance and global quality standards
• Actively explore potential market & products
• Offer innovative, customised and value-added services to our customers
• Be an ethical, transparent and responsible global organization
3.3.4 Values
1. Customer Satisfaction
We will be attuned to market needs; wherever possible, we will anticipate market
needs; we will respond quickly to changes in customer requirements; we will be
completely focused on quality; we will keep delivery commitments on time and
every time; we will develop new products and processes that will go beyond
customer satisfaction to achieve customer delight.
2. Passionate About Excellence
Excellence is non-negotiable in every aspect of our business process. Superior
quality of performance is critical to our business growth and success. We will
constantly strive to exceed expectations: be it internal or external.
3. Develop Human Capital
We will empower, energise and inspire our people to perform beyond their best;
we will create empowered teams that take informed decisions; we will recognise
and leverage skills and strengths of various teams; we will enable sharing of
knowledge; we will create an adequate 'bench strength' that will take care of
changes in business scenarios.
27
4. Fair To All
All our actions will be determined by fairness; we shall be fair to our
customers, vendors, shareholders, all our business partners and society at large.
Fairness is not just sticking to the letter of the law or the contract but
appreciating its spirit and basing all our actions on being fair to the spirit of that
understanding.
5. Concern For The Environment And The Community
We will take the utmost care of our environment and the communities in which
we operate; we shall nurture our environment and its natural resources and shall
ensure that none of our actions deplete or pollute them; we will encourage
initiatives that create environmental sustainability and help in community
development
6. Safety And Health
We will provide a safe workplace. We will promote the health and well-being of
our people and their families. We will encourage healthy work habits and a
'work-life' balance. We believe that working safely and protecting the health of
our people is 'working smart' and creates greater and more sustainable wealth.
7. Responsible Corporate Citizen
We recognise that we have our responsibilities towards the society in which we
operate. We commit ourselves to be a responsible corporate citizen; our
activities should not only create shareholder.
3.3.5 Human Resource
At Alok, the role of the HR team is structured to meet the needs of the
organization. As a successful organization, Alok is becoming more adaptive,
resilient, quick to change direction and customer-centered. Within this
28
environment, the HR team is a strategic partner, an employee sponsor or
advocate and a change mentor.
1. Strategic Partner:
In the role as a strategic partner, the HR team contributes to the development of
and the accomplishment of the organization-wide business plan and objectives.
The HR business objectives are established to support the attainment of the
overall strategic business plan and objectives. This strategic partnership impacts
HR services such as the design of work positions; hiring; reward, recognition
and strategic pay; performance development and appraisal systems; career and
succession planning; and employee development.
2. Employee Advocate:
As an employee sponsor or advocate, the HR function plays an integral role in
organizational success via knowledge about and advocacy of people. This
advocacy includes expertise in how to create a work environment in which
people will choose to be motivated, contributing, and happy.
3. Change Champion:
The constant evaluation of the effectiveness of the organization results in the
need for the HR team to frequently champion change. Both knowledge about and
the ability to execute successful change strategies makes the HR team a key
catalyst to bring about change in the organization. This a critical attribute to
minimize employee dissatisfaction and resistance to change.
29
3.3.6 Corporate Social Responsibility(Sustainable Growth)
Alok Industries' focus on activities related to sustainability is at the core of its
long term goal of being a leader in providing sustainable and integrated textile
solutions. The sustainability programmes includes interventions in prevention of
environmental degradation, promotion of energy conservation and stress on
community development.
Environment
On the environment protection front the thrust is on green development. This
includes promoting green procurement to minimize environmental degradation
through mitigation of environmental impact on Climate Change and pollution of
Air, Water and Soil. At Alok, waste recycling is actively pursued across all its
processes by establishing long term contractual relations with vendors,
contractors and agencies with established credentials on waste recycling. The
endeavour is to demonstrate environmental leadership and influence the industry
and citizens at large to encourage use of environmental friendly products,
processes and services. The Company is emerging as a model in the region for
Waste management by supporting innovation, development of new technologies
and creation of demand in the mainstream society for environmental friendly
products and services.
The Company increasingly uses ethical fibres like Organic cotton (cotton grown
without the use of external synthetic agricultural inputs like fertilizers and
pesticides and helps conserve the environment from the harmful effects of the
use of hazardous agro chemicals) and Better cotton from Better Cotton Initiative
(BCI) (involves educating the cotton growers to adopt the Best Management
Practices in cotton cultivation). This is not only leading to helping conserve the
fragile environment threatened today by indiscriminate use of agro chemicals
and pesticides but will also help farmers get a decent farm earnings sustain their
livelihoods.
30
In addition, the Company has 'best in class' ETP system established for primary,
secondary and tertiary treatment of effluents and reverse osmosis plant to
optimize water conservation. It also has "Green Zones" around all facilities and
encourages planting of saplings to conserve ecological balance. The Company
has strived to minimize air pollution from its plants and units by installing
Selective Catalytic Reduction (SCR) systems in the exhaust of the DG sets which
reduce oxides of Nitrogen. Alok encourages the use of recycled products and has
set up a recycled polyester unit with an initial 10 tons per day of capacity to
recycle polyester and polyester yarn waste, flakes and PET bottles to produce
100% recycled polyester fibre.
Energy Management
Alok is committed to:
• Achieve the lowest Specific Energy Consumption per unit of product,
thereby minimizing Greenhouse emissions, solid waste and water
pollution.
• Attain sustainable development by continuously improving Energy
Conservation and Energy efficiency throughout the production cycle.
• Prevent wastage of energy in any mode - steam, water, air or power - by
efficient and most optimal use of resources.
• Comply with all applicable legislations, and best practices on Energy
Management Community Development
Alok is a Fair Trade (FLO) certified company and value the fair price concept
across the value chain. Since the textile chains have resource poor growers as the
weak link at the far end of the chain, Alok initiated and has been instrumental in
31
few of the well known Organic & Fair Trade cotton projects in India and abroad
where in a premium is paid to the marginal Organic and Fair Trade cotton
growers. Alok buys back their farm produce to enable them effectively integrate
with the market and remain sustainable in a highly volatile cotton business. Alok
partnered with Zameen Organic in an effort to form a golden textile value chain
which included a farmer owned Organic & Fair Trade Company.
Similarly, cotton made in Africa (CMiA) is another important variant of
sustainable cotton type Alok is into and supplies its quality products to
sophisticated markets in parts of Europe. Alok has been playing a key role in a
very ambitious Organic & Fair Trade cotton project in West Africa which has
the world's top lingerie brand on board.Corporate Social Responsibility (CSR)
initiatives are integral to operations at the plants. Alok has started a public school
with CBSE Board in Silvassa. It employs tribal women on weaving looms and
garment/made up stitching machines after intensive training and orientation. The
Company has a Private Public Partnership with Silvassa Administration for
converting the Government owned Industrial Training Institute into a centre of
excellence.
3.3.7 Group Companies
In April 2007, Alok acquired 60% of the equity of Mileta a.s, a ‘top of the line’
integrated textile entity situated in the Czech Republic; subsequently, Alok has
raised its stake in the company to 79.80%. Mileta is one of the premium textile
enterprises in Europe, manufacturing handkerchiefs, shirting fabrics, table linen,
bed linen and other premium products. Mileta exports most of its production to
Europe, North and South America, Africa, Middle East, Far East and
Australia.The Mileta acquisition brings significant synergies to both entities.
While Alok has access to Mileta’s premium-product technology and penetrates
deeper into high-end European markets, Mileta now has a strong support base
and easy access to India.Mileta’s brands – Mileta, Erba, Cottonova, Lord Nelson
and Wall Street – have high recall. Alok has launched some of these brands –
32
Erba (for handkerchiefs) and Lord Nelson (for premium shirting) – in the Indian
market. Cottonova bed linen is now also being manufactured in Alok’s plants
and being exported.
3.3.8 Board Of Directors
1. Siddharth Achuthan, Chairman of the Board (Non-Executive,
Independent Director)
Siddharth Achuthan (DIN: 00016278) is a Commerce and Law graduate from
the Mumbai University, a fellow member of the Institute of Chartered
Accountants of India and an associate member of the Institute of Company
Secretaries of India. Mr. Siddharth Achuthan was associated with Deloitte,
Haskins & Sells for over 4 decades and served as Partner for 33 years. He has
vast and varied experience in the field of Audit of domestic as well as
multinational companies in sectors such as Manufacturing, Hospitality,
Technology and Non-Banking Financial Services. Presently, he is on the Board
of M/s. Reliance Industrial Infrastructure Limited and M/s. Indiabulls Housing
Finance Limited.
2. Anil Rajbanshi (Non-Executive, Non Independent Director)
Anil Rajbanshi (DIN: 03370674) is the Member of the National Committee of
Textiles of CII and FICCI. He represents Reliance and SRTEPC in Textiles
Committee and represents Reliance Industries Limited at Sasmira. He has many
years of experience of working with major fibre producers and has been involved
with the Indian Man-made fibre textiles industry since 1989. Mr. Anil Rajbanshi,
is the Ex-Chairman of The Synthetic & Rayon Textiles Export Promotion
Council and is a long Standing Member of Committee of Administration of the
Council (SRTEPC).He is the Senior Executive Vice President & Head Corporate
Affairs of PETCHEM at M/s. Reliance Industries Limited. He is the Director of
Recron (Malaysia) Sdn Bhd, a Reliance Group company that operates world’s
largest integrated textile complex. He was knighted by Government of Malaysia
in 2008.
33
3. Hemant Desai (Non-Executive, Non Independent Director)
Hemant Desai (DIN: 00008531) is a Member of Board of Governors, Auro
University, a deemed University in Surat, Gujarat. Mr. Hemant Desai is
Managing Director, Gujarat Chemical Port Ltd. (GCPL), a joint venture of
Reliance Industries Limited (RIL) and Six PSUs of Govt. of Gujarat. GCPL has
modern port infrastructure and facilities for handling 5 MMTPA of liquid
hydrocarbons, cryogenic petrochemicals and chemicals.He is part of the core
leadership team at RIL for the past more than three decades. He is Advisor and
Mentor, Reliance Group leading diverse corporate initiatives of Petrochemicals
Complex at Hazira and Dahej, Man-made fibres business, Jamnagar Refinery
and SEZ, its related industrial infrastructure of Power, Ports, Petroleum and Gas
Pipelines, Petro-Retail outlets. He is also actively involved with RIL’s fast
growing Consumer businesses of Retail, Jio 4G and Broadband .He is
spearheading various business and public institutions as Chairman of: Hazira
Area Industries Association (HAIA) (Hazira has attracted investments worth
US$ 27 Bn), Board of Management of Hazira Notified Area and Gujarat Captive
Jetty Association.
4. Venkataraman Ramachandran (Non-Executive, Non Independent
Director)
Venkataraman Ramachandran (DIN: 02032853) is a Commerce graduate from
the Bharathiar University and an associate member of the Institute of Chartered
Accountants of India, the Institute of Cost Accountants of India and the Institute
of Company Secretaries of India. He has over 25 years of work experience in
audit, accounting, finance, taxation and corporate law functions across various
sectors such as manufacturing, telecommunications, technology and
infrastructure. He has been associated with the Reliance group since 2004.
34
5. Samir Chawla (Non-Executive, Non Independent Director)
Samir Chawla (DIN: 03499851) holds PGDM from IIM Calcutta and B.Tech.
from IIT Kanpur. Mr. Samir Chawla has over 26 years of experience in Banking
and Financial Services Sector and is associated with JM Financial Asset
Reconstruction Company Limited (JMFARC) since October 2017. Prior to
JMFARC, for 4 years, he had a venture which helped companies in
restructurings.
6. Rahul Dutt (Non-Executive, Independent Director)
Rahul Dutt (DIN: 08872616) is a legal professional with bachelor’s degree in
Law from the Government Law College, Mumbai (2000). He has a master’s
degree with distinction in Law from the UK (University of Leicester, 2001). He
is a member of the Bar Council of Maharashtra & Goa, and a partner in the
Mumbai office of the law firm M/s. Khaitan & Co. He was recognized as a
Notable Practitioner for expertise in Corporate M&A by Asia Law Profile.He
has over 15 years' work experience with focus on mergers and acquisitions, joint
ventures, infrastructure, technology licensing and business contracts across
various sectors such as petrochemicals, petro-marketing, telecommunications,
retail, and sports.
7. Mumtaz Bandukwala (Non-Executive, Independent Director)
Mumtaz Bandukwala (DIN: 07129301) is commerce and law Graduate and has
been a practicing Solicitor since the last almost 30 years. Her specialization has
mainly been in Companies Act and Securities laws. She has handled several
mergers and private equity investments in companies in India. She has also
handled arbitrations and property matters. Presently, she is practicing as a partner
of M/s. Junnarkar & Associates, Advocates, Solicitors and Notary.
CHAPTER Ⅳ
DATA ANALYSIS AND
INTERPRETATION
35
4.1 Introduction
This chapter consists of ratio analysis, calculation of Z-score, comparing
discriminations and data interpretation.
4.2 Research Methodology
This study is analytical in nature and the sample selected for the study is that of
Alok Industries Ltd. Secondary data have been used to conduct the respective
study. The data for the analysis was largely collected from the annual reports of
the sample company. Annual Reports were downloaded from the official website
of Alok Industries Ltd. Data from the financial year 2015-16 to 2019-20 were
analyzed and Altman’s Z score was applied to arrive at the respective
interpretation and analysis.
Following ratios have been used for analysis:
1. Working Capital to Total Assets
X1 = working capital
total assets
2. Retained Earnings to Total Assets
X2 = retained earnings
total assets
3. Earnings Before Interest and Tax to Total Assets
X3 = earnings before interest and taxes
total assets
4. Market Value of Equity to Total Liabilities
X4 = market value of equity
total liabilities
5. Sales to Total Assets
X5 = sales
total assets
36
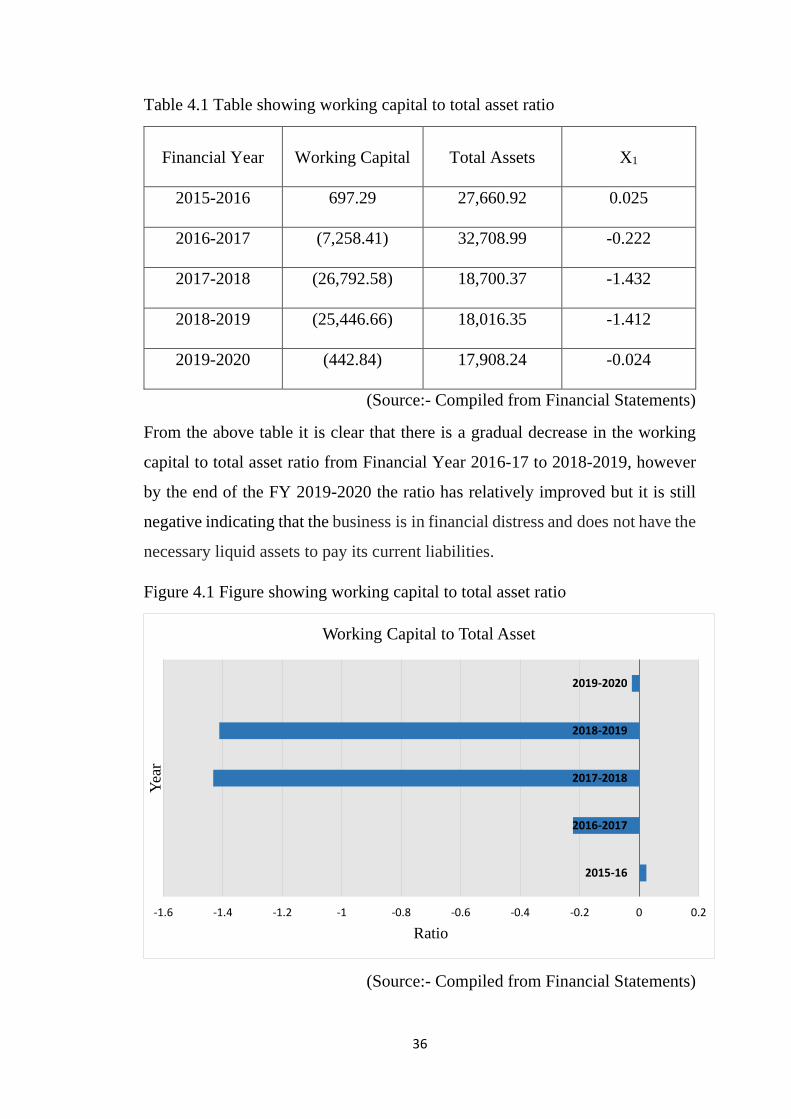
Table 4.1 Table showing working capital to total asset ratio
Financial Year
Working Capital
Total Assets
X1
2015-2016
697.29
27,660.92
0.025
2016-2017 (7,258.41)
32,708.99
-0.222
2017-2018 (26,792.58)
18,700.37
-1.432
2018-2019 (25,446.66)
18,016.35
-1.412
2019-2020 (442.84)
17,908.24
-0.024
(Source:- Compiled from Financial Statements)
From the above table it is clear that there is a gradual decrease in the working
capital to total asset ratio from Financial Year 2016-17 to 2018-2019, however
by the end of the FY 2019-2020 the ratio has relatively improved but it is still
negative indicating that the business is in financial distress and does not have the
necessary liquid assets to pay its current liabilities.
Figure 4.1 Figure showing working capital to total asset ratio
(Source:- Compiled from Financial Statements)
-1.6 -1.4 -1.2 -1 -0.8 -0.6 -0.4 -0.2 0 0.2
2015-16
2016-2017
2017-2018
2018-2019
2019-2020
Ratio
Yea
r
Working Capital to Total Asset
37
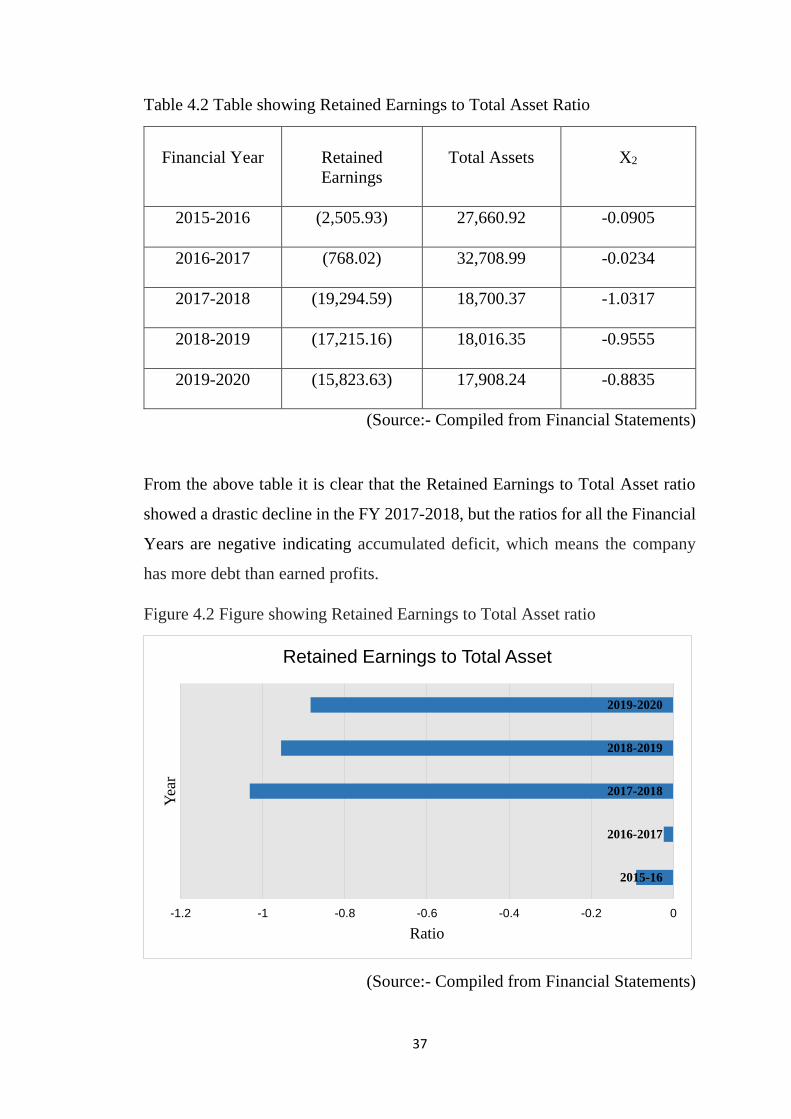
Table 4.2 Table showing Retained Earnings to Total Asset Ratio
Financial Year
Retained
Earnings
Total Assets
X2
2015-2016
(2,505.93)
27,660.92 -0.0905
2016-2017 (768.02)
32,708.99
-0.0234
2017-2018 (19,294.59)
18,700.37
-1.0317
2018-2019 (17,215.16)
18,016.35
-0.9555
2019-2020 (15,823.63)
17,908.24
-0.8835
(Source:- Compiled from Financial Statements)
From the above table it is clear that the Retained Earnings to Total Asset ratio
showed a drastic decline in the FY 2017-2018, but the ratios for all the Financial
Years are negative indicating accumulated deficit, which means the company
has more debt than earned profits.
Figure 4.2 Figure showing Retained Earnings to Total Asset ratio
(Source:- Compiled from Financial Statements)
-1.2 -1 -0.8 -0.6 -0.4 -0.2 0
2015-16
2016-2017
2017-2018
2018-2019
2019-2020
Ratio
Yea
r
Retained Earnings to Total Asset
38
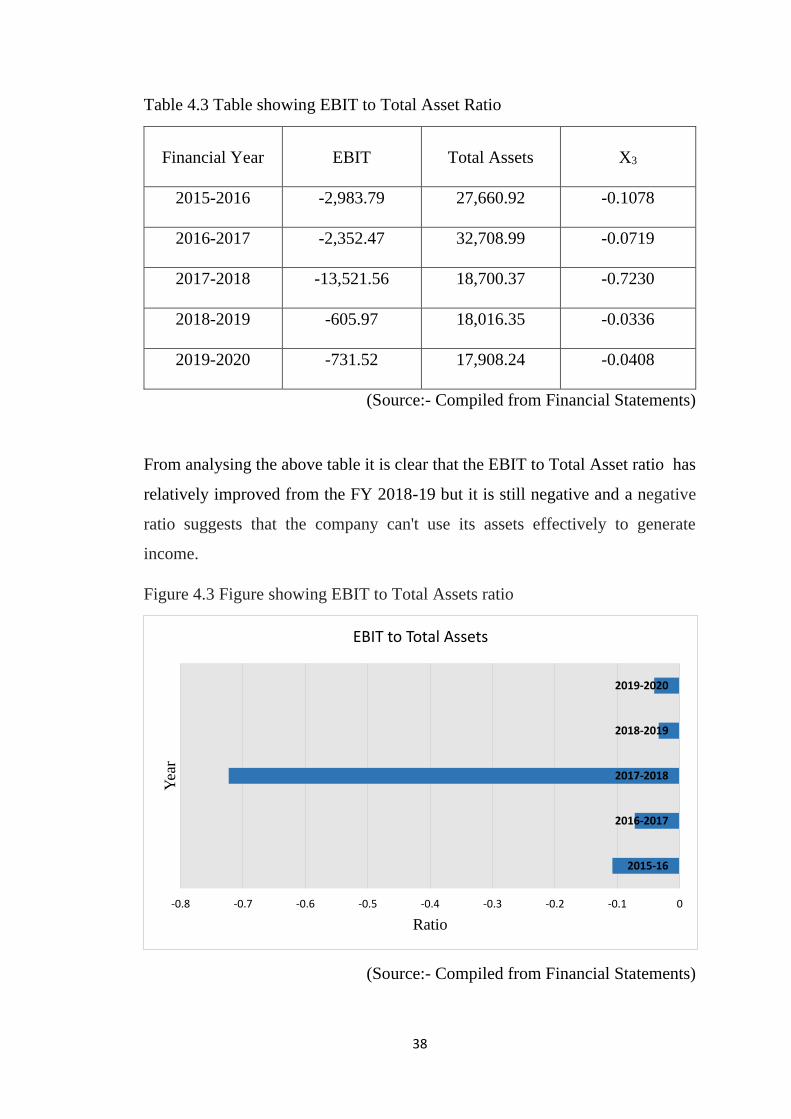
Table 4.3 Table showing EBIT to Total Asset Ratio
Financial Year
EBIT
Total Assets
X3
2015-2016
-2,983.79
27,660.92
-0.1078
2016-2017 -2,352.47
32,708.99
-0.0719
2017-2018 -13,521.56
18,700.37
-0.7230
2018-2019 -605.97
18,016.35
-0.0336
2019-2020 -731.52 17,908.24
-0.0408
(Source:- Compiled from Financial Statements)
From analysing the above table it is clear that the EBIT to Total Asset ratio has
relatively improved from the FY 2018-19 but it is still negative and a negative
ratio suggests that the company can't use its assets effectively to generate
income.
Figure 4.3 Figure showing EBIT to Total Assets ratio
(Source:- Compiled from Financial Statements)
-0.8 -0.7 -0.6 -0.5 -0.4 -0.3 -0.2 -0.1 0
2015-16
2016-2017
2017-2018
2018-2019
2019-2020
Ratio
Yea
r
EBIT to Total Assets
39
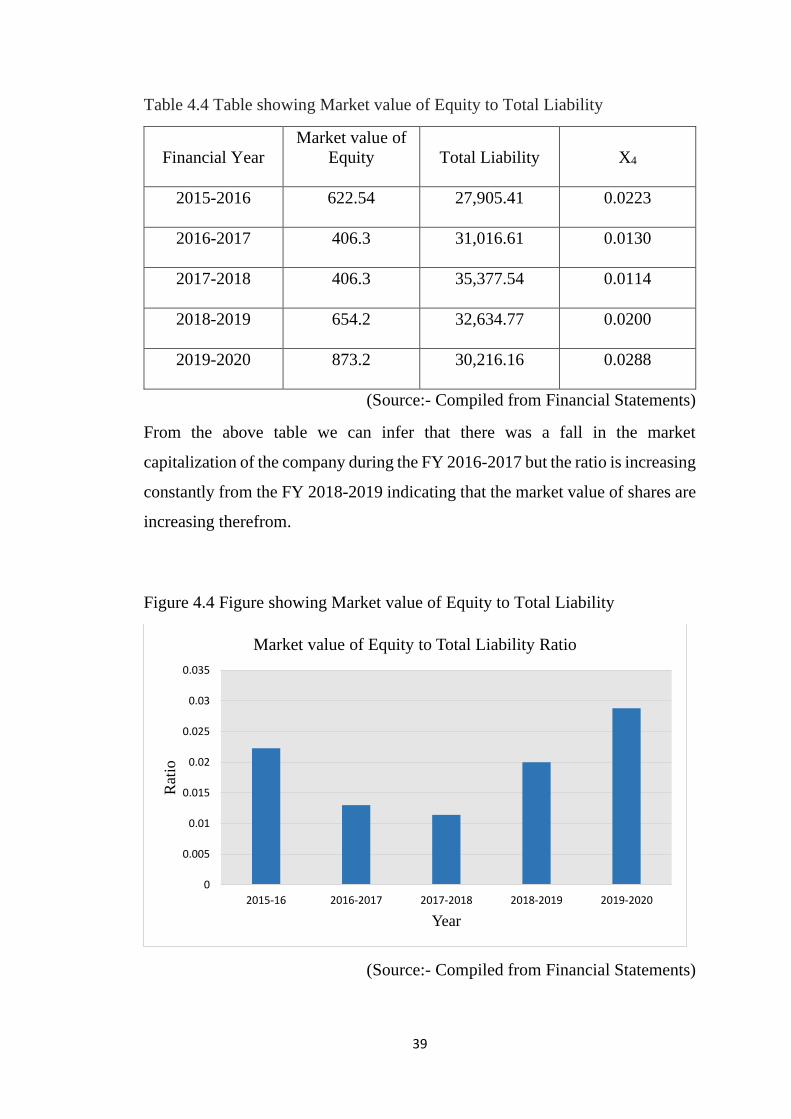
Table 4.4 Table showing Market value of Equity to Total Liability
Financial Year
Market value of
Equity
Total Liability
X4
2015-2016
622.54
27,905.41
0.0223
2016-2017 406.3
31,016.61
0.0130
2017-2018 406.3
35,377.54
0.0114
2018-2019 654.2
32,634.77
0.0200
2019-2020 873.2
30,216.16
0.0288
(Source:- Compiled from Financial Statements)
From the above table we can infer that there was a fall in the market
capitalization of the company during the FY 2016-2017 but the ratio is increasing
constantly from the FY 2018-2019 indicating that the market value of shares are
increasing therefrom.
Figure 4.4 Figure showing Market value of Equity to Total Liability
(Source:- Compiled from Financial Statements)
0
0.005
0.01
0.015
0.02
0.025
0.03
0.035
2015-16 2016-2017 2017-2018 2018-2019 2019-2020
Rat
io
Year
Market value of Equity to Total Liability Ratio
40
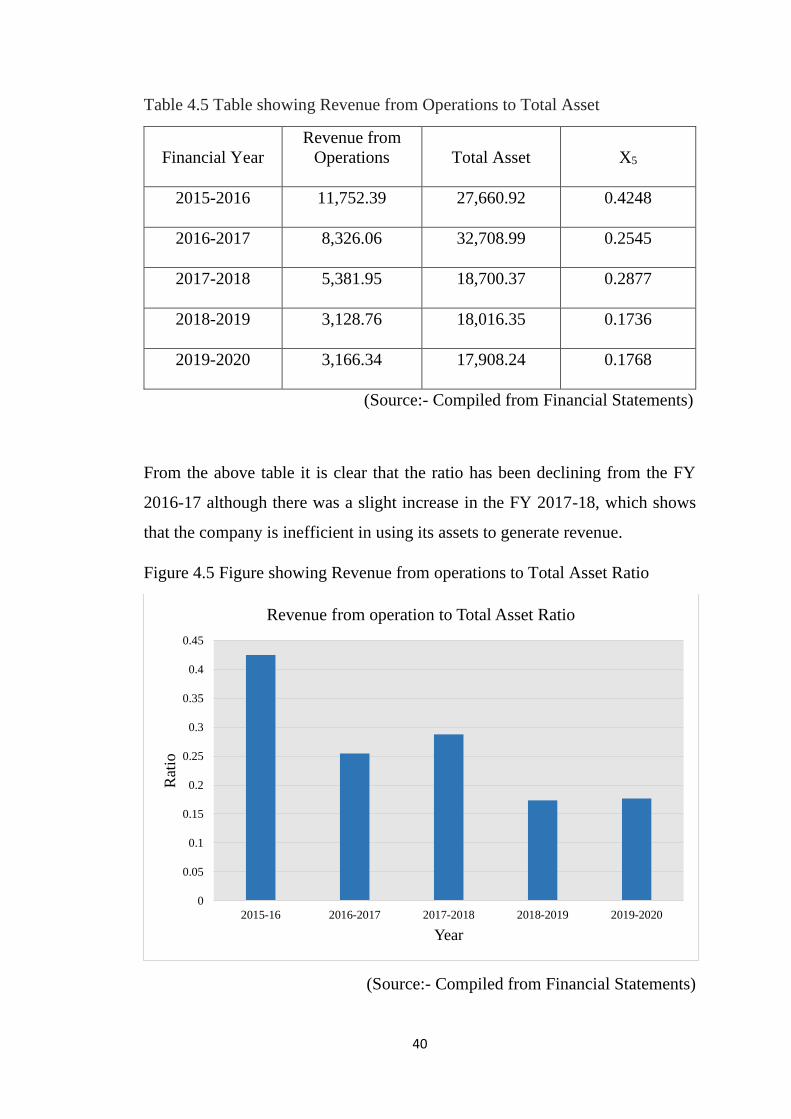
Table 4.5 Table showing Revenue from Operations to Total Asset
Financial Year
Revenue from
Operations
Total Asset
X5
2015-2016
11,752.39
27,660.92
0.4248
2016-2017 8,326.06
32,708.99
0.2545
2017-2018 5,381.95
18,700.37
0.2877
2018-2019 3,128.76
18,016.35
0.1736
2019-2020 3,166.34
17,908.24
0.1768
(Source:- Compiled from Financial Statements)
From the above table it is clear that the ratio has been declining from the FY
2016-17 although there was a slight increase in the FY 2017-18, which shows
that the company is inefficient in using its assets to generate revenue.
Figure 4.5 Figure showing Revenue from operations to Total Asset Ratio
(Source:- Compiled from Financial Statements)
0
0.05
0.1
0.15
0.2
0.25
0.3
0.35
0.4
0.45
2015-16 2016-2017 2017-2018 2018-2019 2019-2020
Rat
io
Year
Revenue from operation to Total Asset Ratio
41
Table 4.6 Table showing various scores used in Altman’s Z score
Year X1 X2 X3 X4 X5
2015-2016 0.025
-0.0905
-0.1078
0.0223
0.3520
2016-2017 -0.222
-0.0234
-0.0719
0.0130
0.2545
2017-2018 -1.432
-1.0317
-0.7230
0.0114
0.2877
2018-2019 -1.412
-0.9555
-0.0336
0.0200
0.1736
2019-2020 -0.024
-0.8835
-0.0408
0.0288
0.1768
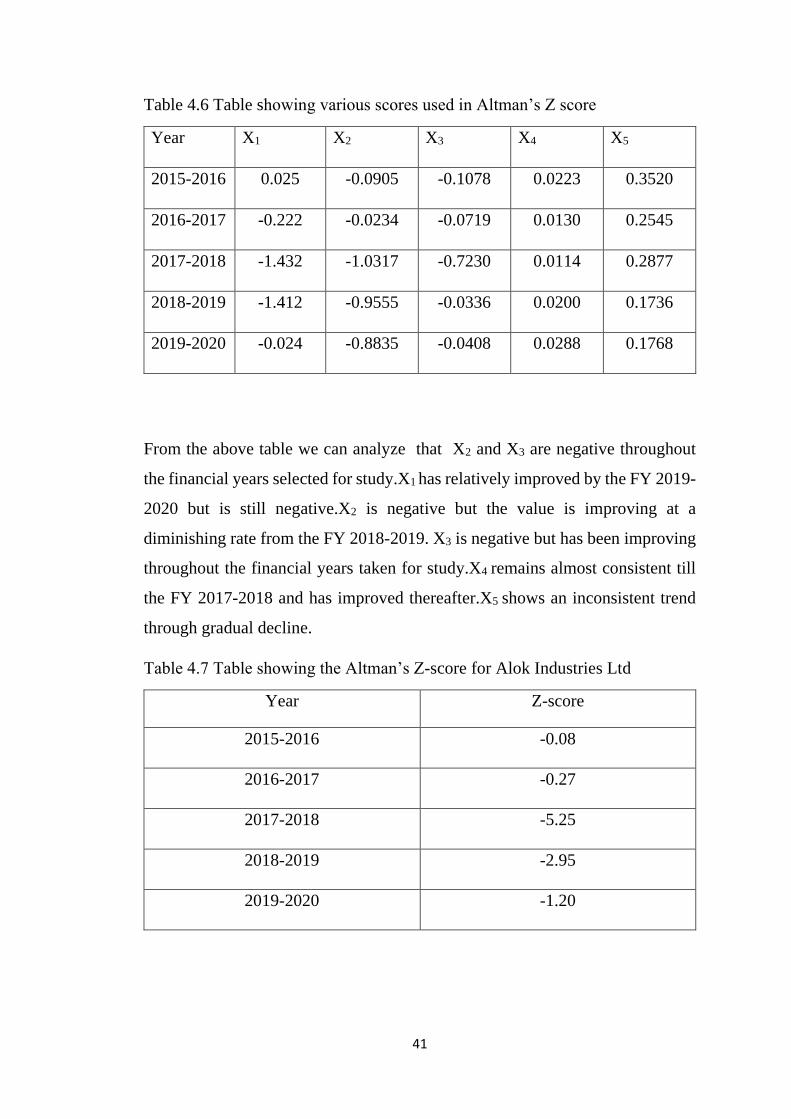
From the above table we can analyze that X2 and X3 are negative throughout
the financial years selected for study.X1 has relatively improved by the FY 2019-
2020 but is still negative.X2 is negative but the value is improving at a
diminishing rate from the FY 2018-2019. X3 is negative but has been improving
throughout the financial years taken for study.X4 remains almost consistent till
the FY 2017-2018 and has improved thereafter.X5 shows an inconsistent trend
through gradual decline.
Table 4.7 Table showing the Altman’s Z-score for Alok Industries Ltd
Year Z-score
2015-2016 -0.08
2016-2017 -0.27
2017-2018 -5.25
2018-2019 -2.95
2019-2020 -1.20
42
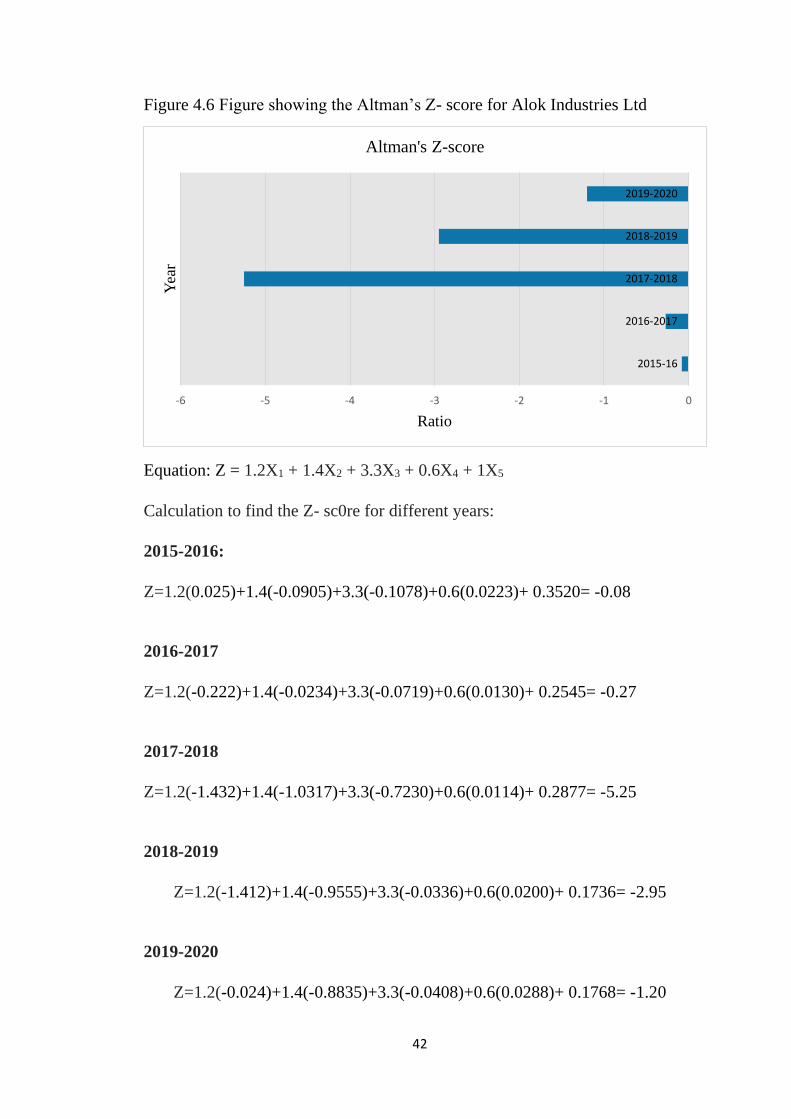
Figure 4.6 Figure showing the Altman’s Z- score for Alok Industries Ltd
Equation: Z = 1.2X1 + 1.4X2 + 3.3X3 + 0.6X4 + 1X5
Calculation to find the Z- sc0re for different years:
2015-2016:
Z=1.2(0.025)+1.4(-0.0905)+3.3(-0.1078)+0.6(0.0223)+ 0.3520= -0.08
2016-2017
Z=1.2(-0.222)+1.4(-0.0234)+3.3(-0.0719)+0.6(0.0130)+ 0.2545= -0.27
2017-2018
Z=1.2(-1.432)+1.4(-1.0317)+3.3(-0.7230)+0.6(0.0114)+ 0.2877= -5.25
2018-2019
Z=1.2(-1.412)+1.4(-0.9555)+3.3(-0.0336)+0.6(0.0200)+ 0.1736= -2.95
2019-2020
Z=1.2(-0.024)+1.4(-0.8835)+3.3(-0.0408)+0.6(0.0288)+ 0.1768= -1.20
-6 -5 -4 -3 -2 -1 0
2015-16
2016-2017
2017-2018
2018-2019
2019-2020
Ratio
Yea
r
Altman's Z-score
43
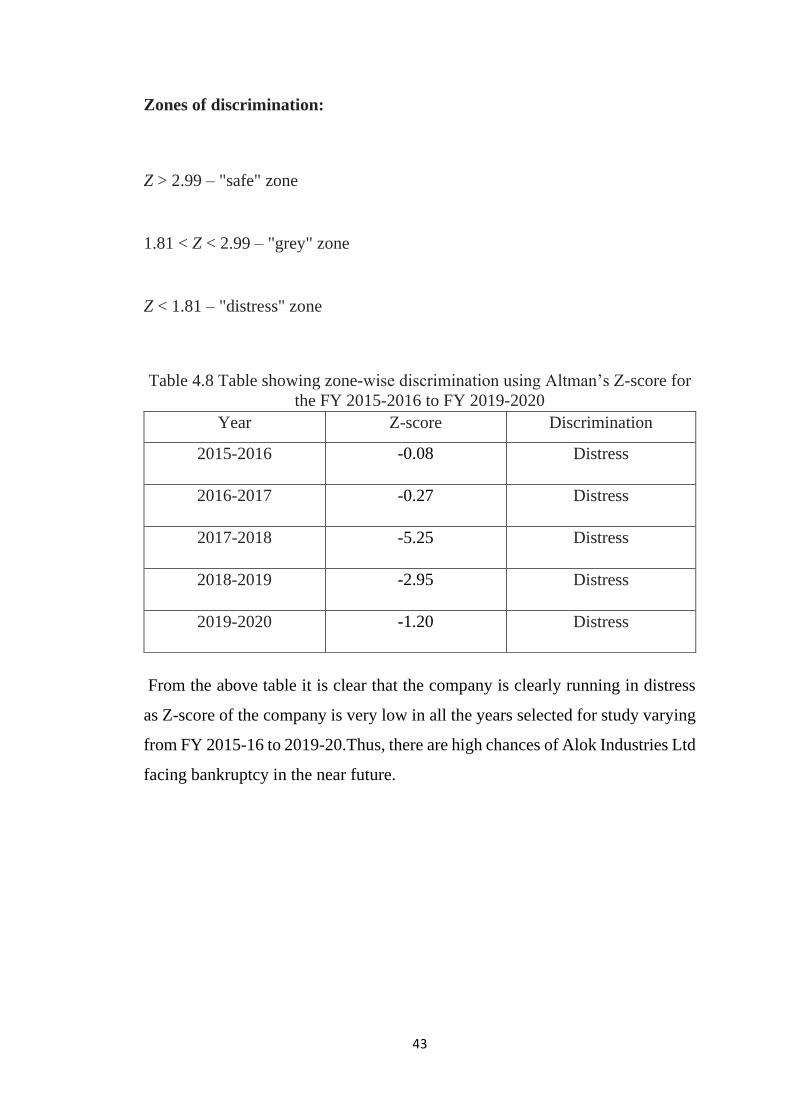
Zones of discrimination:
Z > 2.99 – "safe" zone
1.81 < Z < 2.99 – "grey" zone
Z < 1.81 – "distress" zone
Table 4.8 Table showing zone-wise discrimination using Altman’s Z-score for
the FY 2015-2016 to FY 2019-2020
Year Z-score Discrimination
2015-2016 -0.08
Distress
2016-2017 -0.27
Distress
2017-2018 -5.25
Distress
2018-2019 -2.95
Distress
2019-2020 -1.20
Distress
From the above table it is clear that the company is clearly running in distress
as Z-score of the company is very low in all the years selected for study varying
from FY 2015-16 to 2019-20.Thus, there are high chances of Alok Industries Ltd
facing bankruptcy in the near future.
CHAPTER Ⅴ
FINDINGS, SUGGESTIONS AND
CONCLUSION
44
5.1 Introduction
This chapter includes major findings of the study, conclusions and
suggestions to avoid a bankruptcy situation for Alok Industries Ltd.
5.2 Findings
• The first ratio, which shows the relation between working capital to
total asset is negative (figure 4.1).From further analysis, it is clear that
there is a gradual decrease in the working capital to total asset ratio
from Financial Year 2015-16 to 2018-2019, however by the end of the
FY 2019-2020 the ratio has relatively improved but it is still negative
indicating that the business is in financial distress and does not have
the necessary liquid assets to pay its current liabilities. So there are
problems with liquidity and hence a possibility to go bankrupt.
• The second ratio depicts the relation between the retained earnings of
the company and its total assets (figure 4.2). Retained Earnings to
Total Asset ratio showed a drastic decline from the FY 2017-2018, but
the ratios of all the Financial Years are negative indicating
accumulated deficit, which means the company has more debt than
earned profits. Thus, the company is facing difficulty in accumulating
earnings due to losses indicating the possibility of bankruptcy.
• The third ratio shows the relation between EBIT to total asset(figure
4.3). From analysis it was clear that the EBIT to Total Asset ratio is a
negative ratio and this suggests that the company can't use its assets
effectively to generate income. This also indicates poor operating
efficiency and financial leverage. Thus this ratio also supports the
notion of bankruptcy.
45
• The fourth ratio shows the relationship between market value of equity
to total liabilities(figure 4.4). From analysis we can infer that there
was a drastic fall in the market capitalization of the company during
the FY 2016-2017 but the ratio is increasing constantly from the FY
2018-2019 indicating that the market value of shares are increasing
therefrom. This ratio does not support bankruptcy as it is increasing
every year.
• The fifth ratio shows the relationship between revenue from
operations to total assets(figure 4.5). From analysis it is clear that the
ratio has been declining from the FY 2016-17 although there was a
slight increase in the FY 2017-18. This shows that the company is
inefficient in using its assets to generate revenue and thus, this ratio
supports the possibility of bankruptcy.
• The only ratio which gives positive sign to the company is the market
value of equity to total liabilities ratio, but this ratio alone cannot be
taken as an indicator of better position of the company.
• To accurately inspect the bankruptcy position of any company,
Altman’s Z-score must be calculated. From calculating and checking
the Z-score it is clear that the company is clearly running in distress
in all the years selected for study varying from FY 2015-16 to 2019-
20.As per the discriminations of Altman if the Z-score is less than 1.8,
the company is running in distress. It is difficult to overcome this
distress thus, we can presume that the company will face bankruotcy
in the upcoming years.
46
5.2 Suggestions
• It is advisable to attract the customers by giving offers, to attain more
profit in the upcoming years.
• Liquidity position of the company should be improved. It can be increased
by increasing the working capital of the company.
• It is recommended to improve the revenue from operation because it is
the backbone of the company.
• Market value of equity leads to increased credibility. Thus, it is advisable
to increase the market value of shares.
• Prioritize Debt Repayments.
47
5.3 Conclusion
The purpose of this study was to apply Altman’s Z-score model on Alok
Industries Ltd. Preliminary results show that the model correctly identified Alok
Industries Ltd. as a financially unstable company with Z-score below 1.81 in all
years of observation. After observing the discriminations we can conclude that
the company is clearly running in distress as Z-score of the company is very low
in all the years selected for study varying from FY 2015-16 to 2019-20. Thus,
there are high chances of Alok Industries Ltd facing bankruptcy in the near
future.

BIBLIOGRAPHY
Books
❖ Dr. K venugopalan, “Business Research Methods”, Calicut university Central co-
operative stories ltd. No.4347 Calicut University, 2016.
❖ A Vinod, “ Accounting for Management”, Calicut university Central co-operative
stories ltd. No.4347 Calicut University, 2017.
Journals
❖ John Stephen Grice, R. W. (2001). Tests of the generalizability of Altman's
bankruptcy prediction model. Journal of Business Research, 54(1), pp.53-61.
❖ Hayes, S., Hodge, K., & Hughes, L. (2010). Efficacy of Altman's Z to predict
Bankruptcy. Economic and Business Journal:Inquiries and Perspectives, 3(1),
pp.122-134.
❖ Gnyana Ranjan Bal. (2015). Prediction of financial distress using Altman Z-score:
a study of select FMCG companies. Indian Journal of Applied Research, 5(9),
pp.129-131.
❖ Lubawa, Galinoma & Louangrath, Paul. (2016). Using Altman Z-Score to Assess
the Financial Effects of Multiple Loans on SMEs. International Journal of Research
& Methodology in Social Science,2(1), pp.63-86.
❖ Senapati, M., & Ghosal, S. (2016). Modelling Corporate Sector Distress in India.
RBI Working Paper Series, (10), pp.1-22.
❖ Agarwal, S., & Singh, G. (2018). Altman Z score with reference to Public Sector
Banks in India. International Journal of Research and Analytical Reviews, 5(4),
pp.955-963.
❖ Ashok, P. (2019). Validity of Altman's Z score Model in Predicting Financial
Distress of Pharmaceutical Companies. Pp.65-73.
❖ D, A., & Curpod, S. (2019). Application of Altman Z score Model on selected Indian
companies to predict bankruptcy. International Journal of Business and
Management Invention (IJBMI), 8(1), pp.77-82.
❖ Stewart, B. (2019). Using the Altman Z score model to test bankruptcy in the Oil
Industry.
❖ Prof. Vandana Samba and Dr. Vani Harpanahalli. (2020). A Study on Bankruptcy
Using Altman Z-Score Prediction Model. International Journal of Advanced
Science and Technology, 29(11s), pp.1660 - 1663.
Websites
❖ www.wikipedia.org
❖ www.investopedia.com
❖ www.alokind.com
❖ www.moneycontrol.com

ANNEXURE
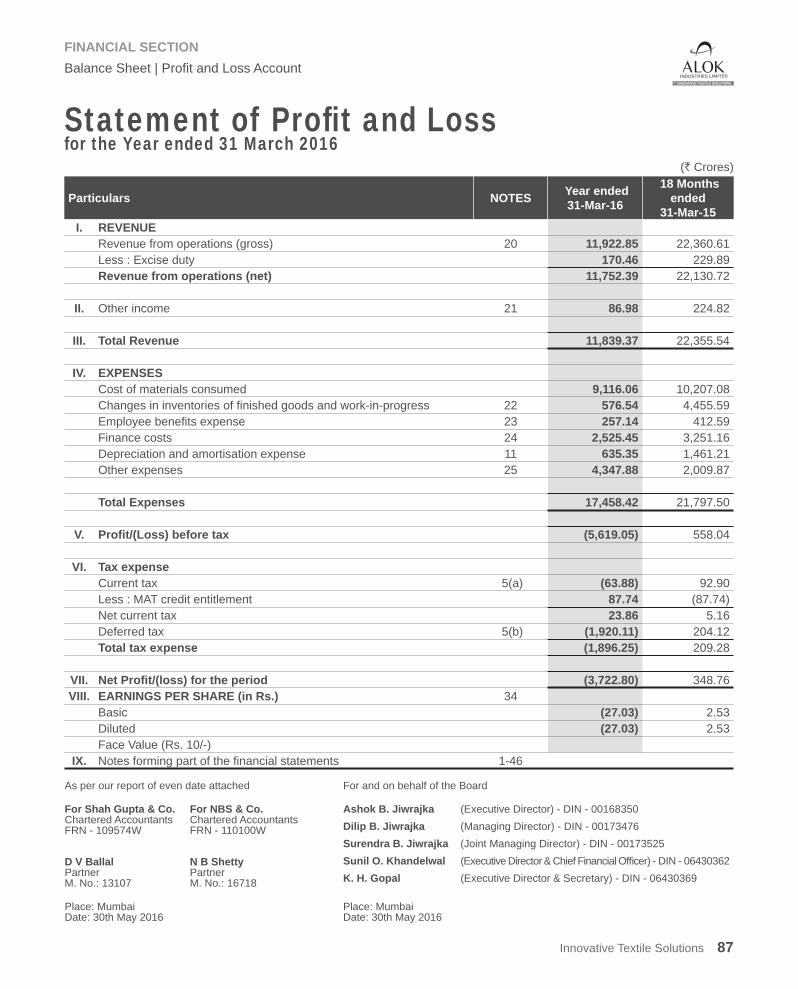
Innovative Textile Solutions 87
Statement of Profi t and Loss for the Year ended 31 March 2016
FINANCIAL SECTIONBalance Sheet | Profi t and Loss Account
As per our report of even date attached For and on behalf of the Board
For Shah Gupta & Co.Chartered AccountantsFRN - 109574W
For NBS & Co.Chartered AccountantsFRN - 110100W
Ashok B. JiwrajkaDilip B. JiwrajkaSurendra B. JiwrajkaSunil O. KhandelwalK. H. Gopal
(Executive Director) - DIN - 00168350(Managing Director) - DIN - 00173476(Joint Managing Director) - DIN - 00173525(Executive Director & Chief Financial Offi cer) - DIN - 06430362(Executive Director & Secretary) - DIN - 06430369
D V BallalPartnerM. No.: 13107
N B ShettyPartnerM. No.: 16718
Place: MumbaiDate: 30th May 2016
Place: MumbaiDate: 30th May 2016
(` Crores)
Particulars NOTES Year ended31-Mar-16
18 Months ended
31-Mar-15I. REVENUE
Revenue from operations (gross) 20 11,922.85 22,360.61Less : Excise duty 170.46 229.89Revenue from operations (net) 11,752.39 22,130.72
II. Other income 21 86.98 224.82
III. Total Revenue 11,839.37 22,355.54
IV. EXPENSESCost of materials consumed 9,116.06 10,207.08Changes in inventories of fi nished goods and work-in-progress 22 576.54 4,455.59Employee benefi ts expense 23 257.14 412.59Finance costs 24 2,525.45 3,251.16Depreciation and amortisation expense 11 635.35 1,461.21Other expenses 25 4,347.88 2,009.87
Total Expenses 17,458.42 21,797.50
V. Profi t/(Loss) before tax (5,619.05) 558.04
VI. Tax expenseCurrent tax 5(a) (63.88) 92.90Less : MAT credit entitlement 87.74 (87.74)Net current tax 23.86 5.16Deferred tax 5(b) (1,920.11) 204.12Total tax expense (1,896.25) 209.28
VII. Net Profi t/(loss) for the period (3,722.80) 348.76VIII. EARNINGS PER SHARE (in Rs.) 34
Basic (27.03) 2.53Diluted (27.03) 2.53Face Value (Rs. 10/-)
IX. Notes forming part of the fi nancial statements 1-46
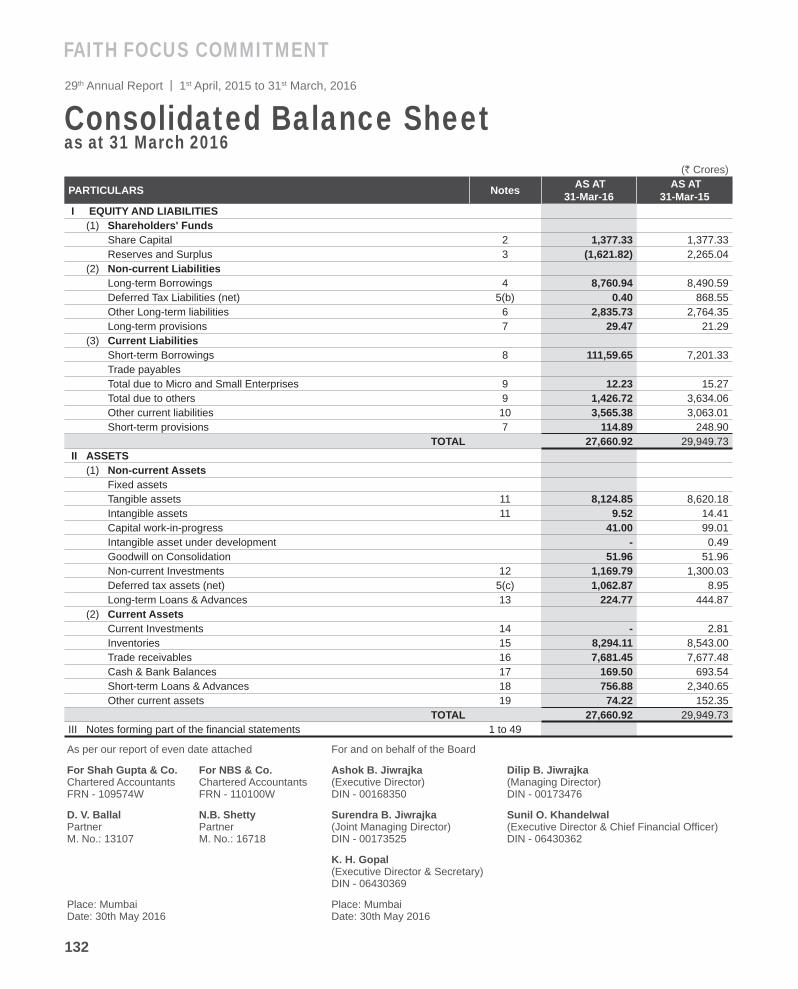
132
29th Annual Report | 1st April, 2015 to 31st March, 2016
FAITH FOCUS COMMITMENT
Consolidated Balance Sheet as at 31 March 2016
(` Crores)
PARTICULARS Notes AS AT 31-Mar-16
AS AT 31-Mar-15
I EQUITY AND LIABILITIES (1) Shareholders' Funds
Share Capital 2 1,377.33 1,377.33 Reserves and Surplus 3 (1,621.82) 2,265.04
(2) Non-current LiabilitiesLong-term Borrowings 4 8,760.94 8,490.59 Deferred Tax Liabilities (net) 5(b) 0.40 868.55 Other Long-term liabilities 6 2,835.73 2,764.35 Long-term provisions 7 29.47 21.29
(3) Current Liabilities Short-term Borrowings 8 111,59.65 7,201.33 Trade payables Total due to Micro and Small Enterprises 9 12.23 15.27Total due to others 9 1,426.72 3,634.06Other current liabilities 10 3,565.38 3,063.01Short-term provisions 7 114.89 248.90
TOTAL 27,660.92 29,949.73 II ASSETS
(1) Non-current Assets Fixed assetsTangible assets 11 8,124.85 8,620.18 Intangible assets 11 9.52 14.41 Capital work-in-progress 41.00 99.01Intangible asset under development - 0.49Goodwill on Consolidation 51.96 51.96 Non-current Investments 12 1,169.79 1,300.03 Deferred tax assets (net) 5(c) 1,062.87 8.95 Long-term Loans & Advances 13 224.77 444.87
(2) Current Assets Current Investments 14 - 2.81 Inventories 15 8,294.11 8,543.00 Trade receivables 16 7,681.45 7,677.48 Cash & Bank Balances 17 169.50 693.54 Short-term Loans & Advances 18 756.88 2,340.65 Other current assets 19 74.22 152.35
TOTAL 27,660.92 29,949.73 III Notes forming part of the fi nancial statements 1 to 49
As per our report of even date attached For and on behalf of the Board
For Shah Gupta & Co.Chartered Accountants FRN - 109574W
For NBS & Co.Chartered Accountants FRN - 110100W
Ashok B. Jiwrajka(Executive Director)DIN - 00168350
Dilip B. Jiwrajka(Managing Director)DIN - 00173476
D. V. BallalPartnerM. No.: 13107
N.B. ShettyPartnerM. No.: 16718
Surendra B. Jiwrajka(Joint Managing Director)DIN - 00173525
Sunil O. Khandelwal(Executive Director & Chief Financial Offi cer)DIN - 06430362
K. H. Gopal(Executive Director & Secretary)DIN - 06430369
Place: MumbaiDate: 30th May 2016
Place: MumbaiDate: 30th May 2016
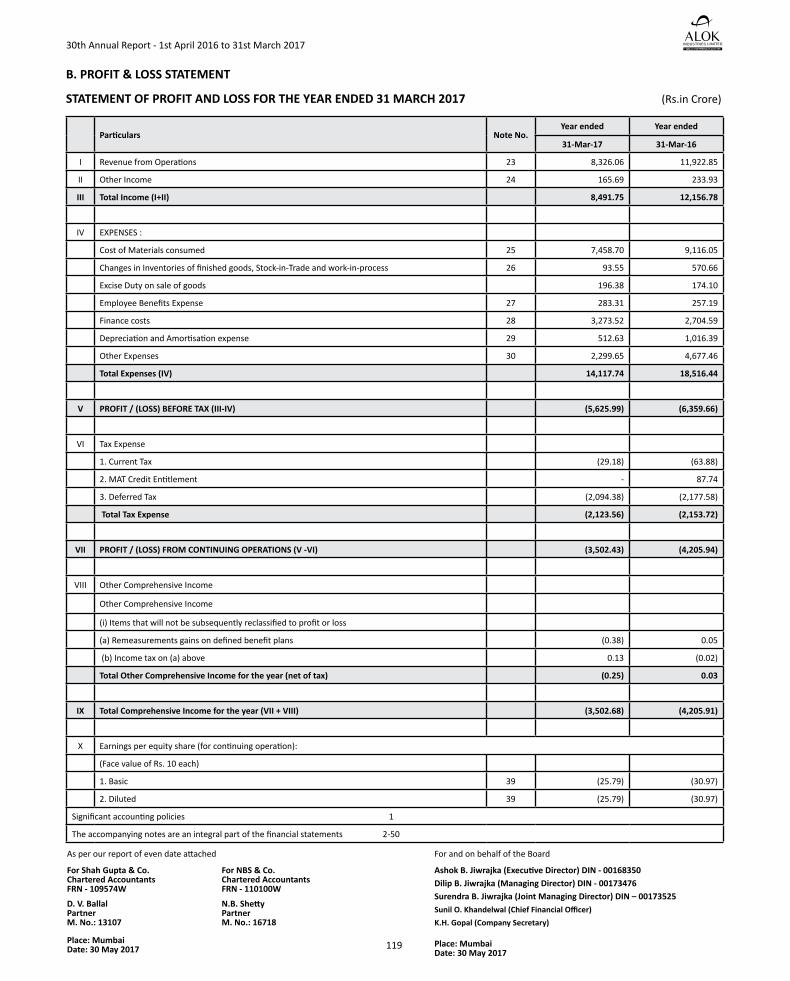
119
30th Annual Report - 1st April 2016 to 31st March 2017
B. PROFIT & LOSS STATEMENT
STATEMENT OF PROFIT AND LOSS FOR THE YEAR ENDED 31 MARCH 2017 (Rs.in Crore)
Particulars Note No.Year ended Year ended
31-Mar-17 31-Mar-16
I Revenue from Operations 23 8,326.06 11,922.85
II Other Income 24 165.69 233.93
III Total Income (I+II) 8,491.75 12,156.78
IV EXPENSES :
Cost of Materials consumed 25 7,458.70 9,116.05
Changes in Inventories of finished goods, Stock-in-Trade and work-in-process 26 93.55 570.66
Excise Duty on sale of goods 196.38 174.10
Employee Benefits Expense 27 283.31 257.19
Finance costs 28 3,273.52 2,704.59
Depreciation and Amortisation expense 29 512.63 1,016.39
Other Expenses 30 2,299.65 4,677.46
Total Expenses (IV) 14,117.74 18,516.44
V PROFIT / (LOSS) BEFORE TAX (III-IV) (5,625.99) (6,359.66)
VI Tax Expense
1. Current Tax (29.18) (63.88)
2. MAT Credit Entitlement - 87.74
3. Deferred Tax (2,094.38) (2,177.58)
Total Tax Expense (2,123.56) (2,153.72)
VII PROFIT / (LOSS) FROM CONTINUING OPERATIONS (V -VI) (3,502.43) (4,205.94)
VIII Other Comprehensive Income
Other Comprehensive Income
(i) Items that will not be subsequently reclassified to profit or loss
(a) Remeasurements gains on defined benefit plans (0.38) 0.05
(b) Income tax on (a) above 0.13 (0.02)
Total Other Comprehensive Income for the year (net of tax) (0.25) 0.03
IX Total Comprehensive Income for the year (VII + VIII) (3,502.68) (4,205.91)
X Earnings per equity share (for continuing operation):
(Face value of Rs. 10 each)
1. Basic 39 (25.79) (30.97)
2. Diluted 39 (25.79) (30.97)
Significant accounting policies 1
The accompanying notes are an integral part of the financial statements 2-50
As per our report of even date attached For and on behalf of the Board
For Shah Gupta & Co. Chartered Accountants FRN - 109574W
D. V. Ballal Partner M. No.: 13107
Place: Mumbai Date: 30 May 2017 Place: Mumbai
Date: 30 May 2017
For NBS & Co. Chartered Accountants FRN - 110100W
N.B. Shetty Partner M. No.: 16718
Ashok B. Jiwrajka (Executive Director) DIN - 00168350Dilip B. Jiwrajka (Managing Director) DIN - 00173476 Surendra B. Jiwrajka (Joint Managing Director) DIN – 00173525Sunil O. Khandelwal (Chief Financial Officer)K.H. Gopal (Company Secretary)
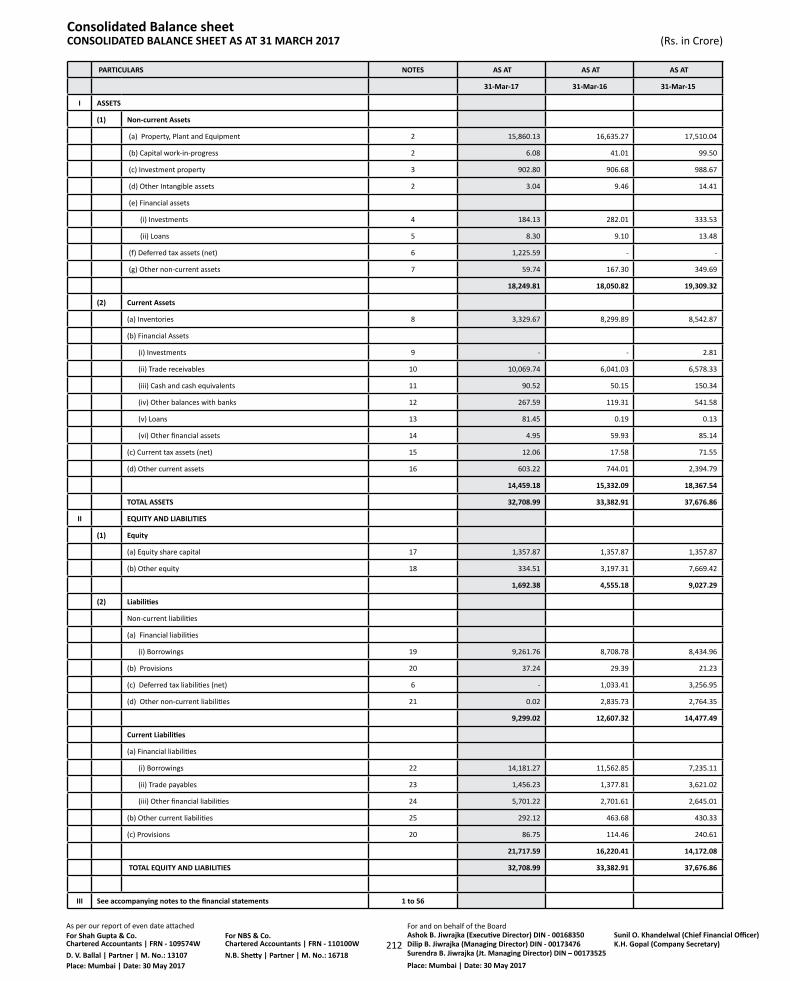
212
Consolidated Balance sheet CONSOLIDATED BALANCE SHEET AS AT 31 MARCH 2017 (Rs. in Crore)
PARTICULARS NOTES AS AT AS AT AS AT
31-Mar-17 31-Mar-16 31-Mar-15
I ASSETS
(1) Non-current Assets
(a) Property, Plant and Equipment 2 15,860.13 16,635.27 17,510.04
(b) Capital work-in-progress 2 6.08 41.01 99.50
(c) Investment property 3 902.80 906.68 988.67
(d) Other Intangible assets 2 3.04 9.46 14.41
(e) Financial assets
(i) Investments 4 184.13 282.01 333.53
(ii) Loans 5 8.30 9.10 13.48
(f) Deferred tax assets (net) 6 1,225.59 - -
(g) Other non-current assets 7 59.74 167.30 349.69
18,249.81 18,050.82 19,309.32
(2) Current Assets
(a) Inventories 8 3,329.67 8,299.89 8,542.87
(b) Financial Assets
(i) Investments 9 - - 2.81
(ii) Trade receivables 10 10,069.74 6,041.03 6,578.33
(iii) Cash and cash equivalents 11 90.52 50.15 150.34
(iv) Other balances with banks 12 267.59 119.31 541.58
(v) Loans 13 81.45 0.19 0.13
(vi) Other financial assets 14 4.95 59.93 85.14
(c) Current tax assets (net) 15 12.06 17.58 71.55
(d) Other current assets 16 603.22 744.01 2,394.79
14,459.18 15,332.09 18,367.54
TOTAL ASSETS 32,708.99 33,382.91 37,676.86
II EQUITY AND LIABILITIES
(1) Equity
(a) Equity share capital 17 1,357.87 1,357.87 1,357.87
(b) Other equity 18 334.51 3,197.31 7,669.42
1,692.38 4,555.18 9,027.29
(2) Liabilities
Non-current liabilities
(a) Financial liabilities
(i) Borrowings 19 9,261.76 8,708.78 8,434.96
(b) Provisions 20 37.24 29.39 21.23
(c) Deferred tax liabilities (net) 6 - 1,033.41 3,256.95
(d) Other non-current liabilities 21 0.02 2,835.73 2,764.35
9,299.02 12,607.32 14,477.49
Current Liabilities
(a) Financial liabilities
(i) Borrowings 22 14,181.27 11,562.85 7,235.11
(ii) Trade payables 23 1,456.23 1,377.81 3,621.02
(iii) Other financial liabilities 24 5,701.22 2,701.61 2,645.01
(b) Other current liabilities 25 292.12 463.68 430.33
(c) Provisions 20 86.75 114.46 240.61
21,717.59 16,220.41 14,172.08
TOTAL EQUITY AND LIABILITIES 32,708.99 33,382.91 37,676.86
III See accompanying notes to the financial statements 1 to 56
As per our report of even date attached For Shah Gupta & Co. Chartered Accountants | FRN - 109574WD. V. Ballal | Partner | M. No.: 13107
For NBS & Co. Chartered Accountants | FRN - 110100WN.B. Shetty | Partner | M. No.: 16718
For and on behalf of the Board
Place: Mumbai | Date: 30 May 2017Place: Mumbai | Date: 30 May 2017
Ashok B. Jiwrajka (Executive Director) DIN - 00168350Dilip B. Jiwrajka (Managing Director) DIN - 00173476 Surendra B. Jiwrajka (Jt. Managing Director) DIN – 00173525
Sunil O. Khandelwal (Chief Financial Officer)K.H. Gopal (Company Secretary)

97
As per our report of even date attached For and on behalf of the Board
For Shah Gupta & Co.Chartered Accountants FRN - 109574W
For NBS & Co.Chartered AccountantsFRN - 110100W
Sunil O. Khandelwal(Chief Financial Officer)K. H. Gopal(Company Secretary)
Taken on recordD. V. BallalPartnerM. No.: 013107
Devdas BhatPartnerM. No.: 048094
Ajay Joshi(Resolution Professional)
Place: Mumbai Date: 10 August 2018
Place: Mumbai Date: 10 August 2018
STATEMENT OF PROFIT AND LOSS FOR THE YEAR ENDED 31 MARCH 2018(Rs. in Crore)
Particulars Note No. Year ended 31 March 2018
Year ended 31 March 2017
I. Revenue from Operations 24 5,381.95 8,326.07 II. Other Income 25 236.31 165.69 III. Total Income (I+II) 5,618.26 8,491.76
IV. EXPENSES :Cost of Materials consumed 26 5,187.42 7,458.70 Changes in Inventories of finished goods, Stock-in-Trade and work-in-process 27 (26.22) 93.55 Excise Duty on sale of goods 41 48.33 196.38 Employee Benefits Expense 28 275.68 283.31 Finance costs 29 4,682.87 3,273.52 Depreciation and Amortisation expense 30 527.80 512.63 Other Expenses 31 13,126.80 2,299.65
Total Expenses (IV) 23,822.69 14,117.73
V PROFIT / (LOSS) BEFORE TAX (III-IV) (18,204.43) (5,625.98)VI Tax Expense
(1) Current Tax 7(a) 15.85 (29.18)(2) Deferred Tax (4.66) (2,094.38)Total Tax Expense 11.19 (2,123.56)
VII PROFIT / (LOSS) FROM CONTINUING OPERATIONS (V -VI) (18,215.62) (3,502.42)VIII Other Comprehensive Income
(i) Items that will not be subsequently reclassified to profit or loss(a) Remeasurements gains /(losses) on defined benefit plans 13.46 (0.38)(b) Income tax on (a) above (4.66) 0.13
Total Other Comprehensive Income for the year (net of tax) 8.80 (0.25)
IX Total Comprehensive Income for the year (VII + VIII) (18,206.82) (3,502.67)
X Earnings per equity share (for continuing operation):(Face value of Rs. 10 each)(1) Basic 45 (134.14) (25.79)(2) diluted 45 (134.14) (25.79)Significant accounting policies 1The accompanying notes are an integral part of the financial statements 2-58
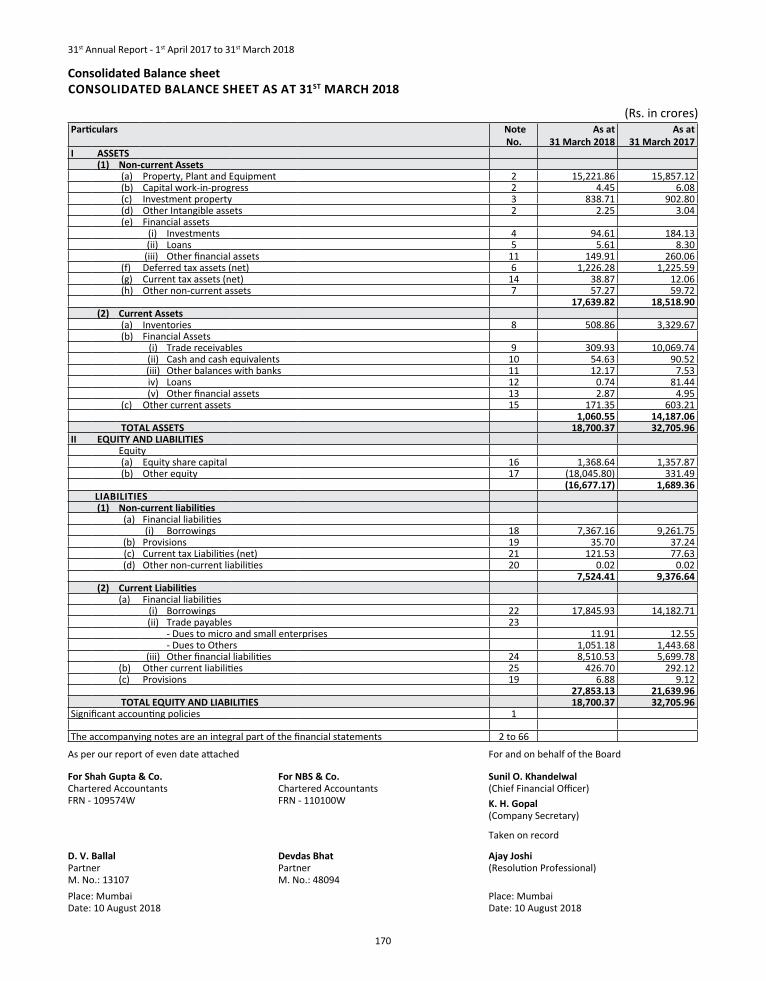
31st Annual Report - 1st April 2017 to 31st March 2018
170
Consolidated Balance sheetCONSOLIDATED BALANCE SHEET AS AT 31ST MARCH 2018
(Rs. in crores)Particulars Note
No. As at
31 March 2018 As at
31 March 2017I ASSETS
(1) Non-current Assets (a) Property, Plant and Equipment 2 15,221.86 15,857.12 (b) Capital work-in-progress 2 4.45 6.08 (c) Investment property 3 838.71 902.80 (d) Other Intangible assets 2 2.25 3.04 (e) Financial assets
(i) Investments 4 94.61 184.13 (ii) Loans 5 5.61 8.30(iii) Other financial assets 11 149.91 260.06
(f) Deferred tax assets (net) 6 1,226.28 1,225.59 (g) Current tax assets (net) 14 38.87 12.06 (h) Other non-current assets 7 57.27 59.72
17,639.82 18,518.90 (2) Current Assets
(a) Inventories 8 508.86 3,329.67 (b) Financial Assets
(i) Trade receivables 9 309.93 10,069.74 (ii) Cash and cash equivalents 10 54.63 90.52 (iii) Other balances with banks 11 12.17 7.53 iv) Loans 12 0.74 81.44 (v) Other financial assets 13 2.87 4.95
(c) Other current assets 15 171.35 603.21 1,060.55 14,187.06
TOTAL ASSETS 18,700.37 32,705.96II EQUITY AND LIABILITIES
Equity (a) Equity share capital 16 1,368.64 1,357.87 (b) Other equity 17 (18,045.80) 331.49
(16,677.17) 1,689.36LIABILITIES (1) Non-current liabilities
(a) Financial liabilities (i) Borrowings 18 7,367.16 9,261.75
(b) Provisions 19 35.70 37.24 (c) Current tax Liabilities (net) 21 121.53 77.63 (d) Other non-current liabilities 20 0.02 0.02
7,524.41 9,376.64 (2) Current Liabilities
(a) Financial liabilities (i) Borrowings 22 17,845.93 14,182.71 (ii) Trade payables 23
- Dues to micro and small enterprises 11.91 12.55- Dues to Others 1,051.18 1,443.68
(iii) Other financial liabilities 24 8,510.53 5,699.78(b) Other current liabilities 25 426.70 292.12(c) Provisions 19 6.88 9.12
27,853.13 21,639.96 TOTAL EQUITY AND LIABILITIES 18,700.37 32,705.96
Significant accounting policies 1
The accompanying notes are an integral part of the financial statements 2 to 66
As per our report of even date attached For and on behalf of the Board
For Shah Gupta & Co.Chartered Accountants FRN - 109574W
For NBS & Co.Chartered AccountantsFRN - 110100W
Sunil O. Khandelwal(Chief Financial Officer)K. H. Gopal(Company Secretary)
Taken on record
D. V. BallalPartnerM. No.: 13107
Devdas BhatPartnerM. No.: 48094
Ajay Joshi(Resolution Professional)
Place: Mumbai Date: 10 August 2018
Place: Mumbai Date: 10 August 2018
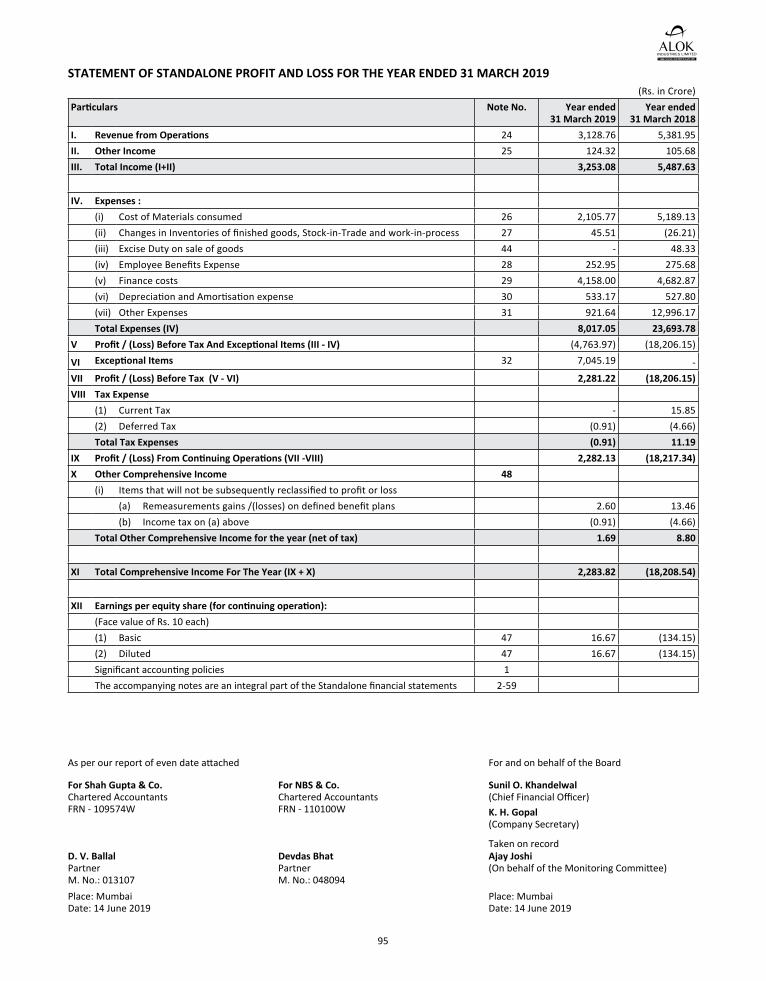
95
As per our report of even date attached For and on behalf of the Board
For Shah Gupta & Co.Chartered Accountants FRN - 109574W
For NBS & Co.Chartered AccountantsFRN - 110100W
Sunil O. Khandelwal(Chief Financial Officer)K. H. Gopal(Company Secretary)
Taken on recordD. V. BallalPartnerM. No.: 013107
Devdas BhatPartnerM. No.: 048094
Ajay Joshi(On behalf of the Monitoring Committee)
Place: Mumbai Date: 14 June 2019
Place: Mumbai Date: 14 June 2019
STATEMENT OF STANDALONE PROFIT AND LOSS FOR THE YEAR ENDED 31 MARCH 2019(Rs. in Crore)
Particulars Note No. Year ended 31 March 2019
Year ended 31 March 2018
I. Revenue from Operations 24 3,128.76 5,381.95 II. Other Income 25 124.32 105.68 III. Total Income (I+II) 3,253.08 5,487.63
IV. Expenses :(i) Cost of Materials consumed 26 2,105.77 5,189.13 (ii) Changes in Inventories of finished goods, Stock-in-Trade and work-in-process 27 45.51 (26.21)(iii) Excise Duty on sale of goods 44 - 48.33 (iv) Employee Benefits Expense 28 252.95 275.68 (v) Finance costs 29 4,158.00 4,682.87 (vi) Depreciation and Amortisation expense 30 533.17 527.80 (vii) Other Expenses 31 921.64 12,996.17 Total Expenses (IV) 8,017.05 23,693.78
V Profit / (Loss) Before Tax And Exceptional Items (III - IV) (4,763.97) (18,206.15)
VI Exceptional Items 32 7,045.19 - VII Profit / (Loss) Before Tax (V - VI) 2,281.22 (18,206.15)VIII Tax Expense
(1) Current Tax - 15.85 (2) Deferred Tax (0.91) (4.66)Total Tax Expenses (0.91) 11.19
IX Profit / (Loss) From Continuing Operations (VII -VIII) 2,282.13 (18,217.34)X Other Comprehensive Income 48
(i) Items that will not be subsequently reclassified to profit or loss(a) Remeasurements gains /(losses) on defined benefit plans 2.60 13.46 (b) Income tax on (a) above (0.91) (4.66)
Total Other Comprehensive Income for the year (net of tax) 1.69 8.80
XI Total Comprehensive Income For The Year (IX + X) 2,283.82 (18,208.54)
XII Earnings per equity share (for continuing operation):(Face value of Rs. 10 each)(1) Basic 47 16.67 (134.15)(2) Diluted 47 16.67 (134.15)Significant accounting policies 1The accompanying notes are an integral part of the Standalone financial statements 2-59
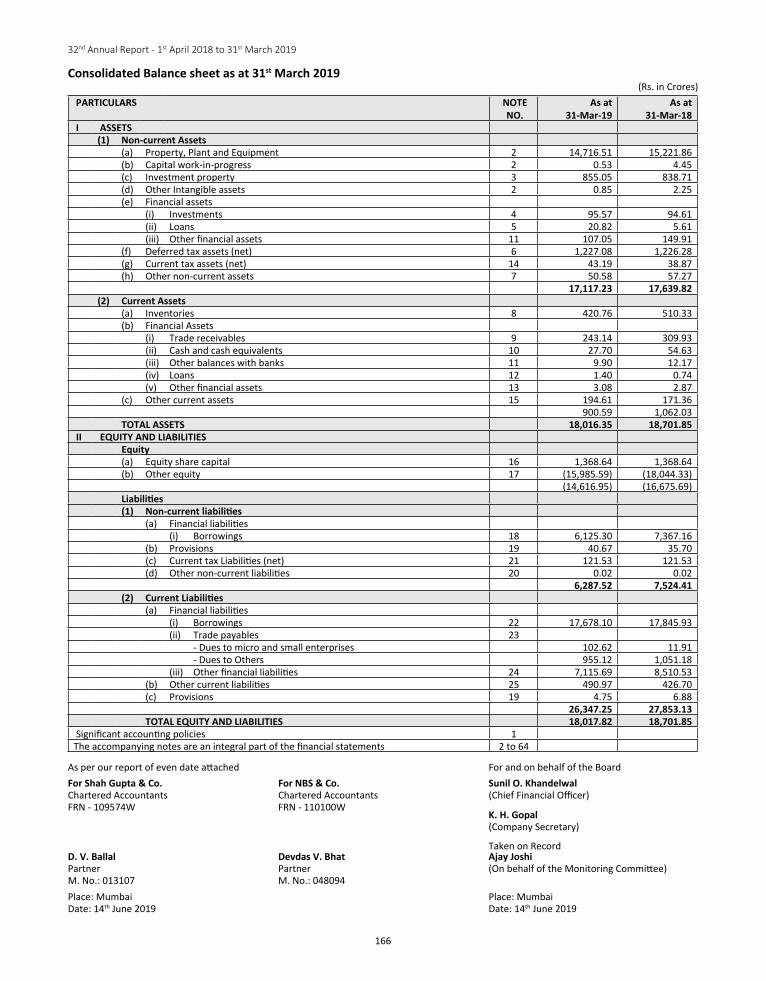
166
32nd Annual Report - 1st April 2018 to 31st March 2019
As per our report of even date attached For and on behalf of the BoardFor Shah Gupta & Co.Chartered Accountants FRn - 109574W
For NBS & Co.Chartered AccountantsFRn - 110100W
Sunil O. Khandelwal(Chief Financial Officer)
K. H. Gopal(Company Secretary)
taken on RecordD. V. BallalPartnerM. no.: 013107
Devdas V. BhatPartnerM. no.: 048094
Ajay Joshi(On behalf of the Monitoring Committee)
Place: Mumbaidate: 14th June 2019
Place: Mumbaidate: 14th June 2019
Consolidated Balance sheet as at 31st March 2019(Rs. in Crores)
PARTICULARS NOTE NO.
As at 31-Mar-19
As at31-Mar-18
I ASSETS(1) Non-current Assets
(a) Property, Plant and equipment 2 14,716.51 15,221.86(b) Capital work-in-progress 2 0.53 4.45(c) Investment property 3 855.05 838.71(d) Other Intangible assets 2 0.85 2.25(e) Financial assets
(i) Investments 4 95.57 94.61(ii) Loans 5 20.82 5.61(iii) Other financial assets 11 107.05 149.91
(f) deferred tax assets (net) 6 1,227.08 1,226.28(g) Current tax assets (net) 14 43.19 38.87(h) Other non-current assets 7 50.58 57.27
17,117.23 17,639.82(2) Current Assets
(a) Inventories 8 420.76 510.33(b) Financial Assets
(i) trade receivables 9 243.14 309.93(ii) Cash and cash equivalents 10 27.70 54.63(iii) Other balances with banks 11 9.90 12.17(iv) Loans 12 1.40 0.74(v) Other financial assets 13 3.08 2.87
(c) Other current assets 15 194.61 171.36900.59 1,062.03
TOTAL ASSETS 18,016.35 18,701.85 II EQUITY AND LIABILITIES
Equity(a) equity share capital 16 1,368.64 1,368.64(b) Other equity 17 (15,985.59) (18,044.33)
(14,616.95) (16,675.69)Liabilities(1) Non-current liabilities
(a) Financial liabilities(i) Borrowings 18 6,125.30 7,367.16
(b) Provisions 19 40.67 35.70(c) Current tax Liabilities (net) 21 121.53 121.53(d) Other non-current liabilities 20 0.02 0.02
6,287.52 7,524.41(2) Current Liabilities
(a) Financial liabilities(i) Borrowings 22 17,678.10 17,845.93(ii) trade payables 23 - Dues to micro and small enterprises 102.62 11.91 - dues to Others 955.12 1,051.18(iii) Other financial liabilities 24 7,115.69 8,510.53
(b) Other current liabilities 25 490.97 426.70(c) Provisions 19 4.75 6.88
26,347.25 27,853.13TOTAL EQUITY AND LIABILITIES 18,017.82 18,701.85
Significant accounting policies 1the accompanying notes are an integral part of the financial statements 2 to 64
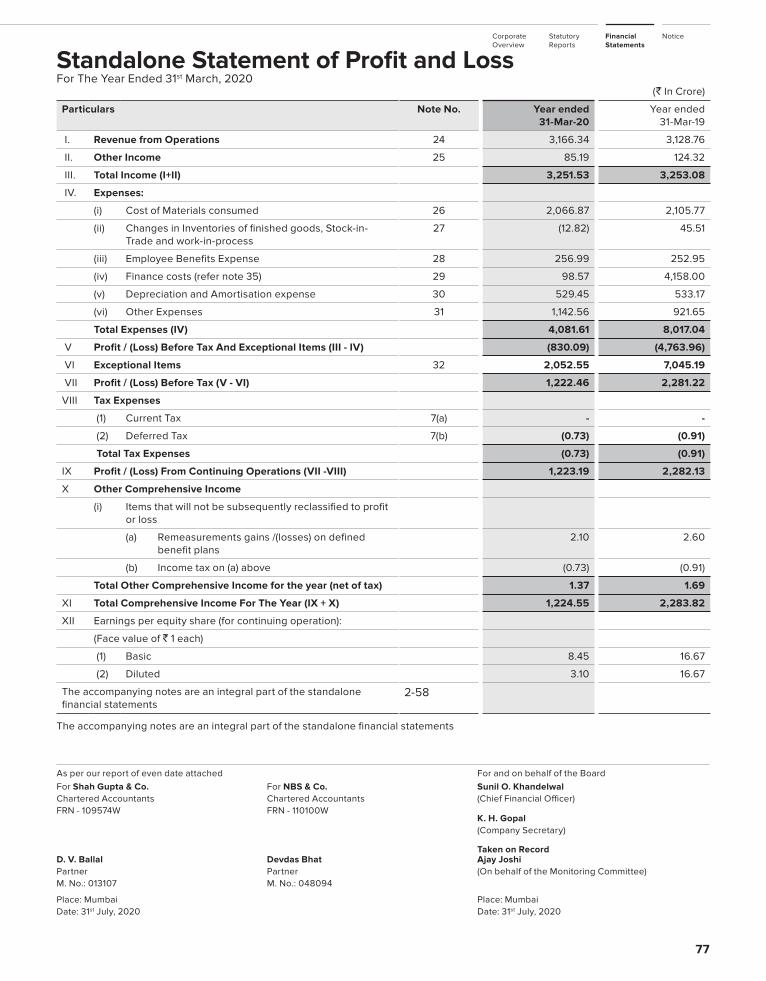
77
Corporate Overview
Statutory Reports
Financial Statements
Notice
(` In Crore)
Particulars Note No. Year ended 31-Mar-20
Year ended 31-Mar-19
I. Revenue from Operations 24 3,166.34 3,128.76
II. Other Income 25 85.19 124.32
III. Total Income (I+II) 3,251.53 3,253.08
IV. Expenses:
(i) Cost of Materials consumed 26 2,066.87 2,105.77
(ii) Changes in Inventories of finished goods, Stock-in-Trade and work-in-process
27 (12.82) 45.51
(iii) Employee Benefits Expense 28 256.99 252.95
(iv) Finance costs (refer note 35) 29 98.57 4,158.00
(v) Depreciation and Amortisation expense 30 529.45 533.17
(vi) Other Expenses 31 1,142.56 921.65
Total Expenses (IV) 4,081.61 8,017.04
V Profit / (Loss) Before Tax And Exceptional Items (III - IV) (830.09) (4,763.96)
VI Exceptional Items 32 2,052.55 7,045.19
VII Profit / (Loss) Before Tax (V - VI) 1,222.46 2,281.22
VIII Tax Expenses
(1) Current Tax 7(a) - -
(2) Deferred Tax 7(b) (0.73) (0.91)
Total Tax Expenses (0.73) (0.91)
IX Profit / (Loss) From Continuing Operations (VII -VIII) 1,223.19 2,282.13
X Other Comprehensive Income
(i) Items that will not be subsequently reclassified to profit or loss
(a) Remeasurements gains /(losses) on defined benefit plans
2.10 2.60
(b) Income tax on (a) above (0.73) (0.91)
Total Other Comprehensive Income for the year (net of tax) 1.37 1.69
XI Total Comprehensive Income For The Year (IX + X) 1,224.55 2,283.82
XII Earnings per equity share (for continuing operation):
(Face value of ` 1 each)
(1) Basic 8.45 16.67
(2) Diluted 3.10 16.67
The accompanying notes are an integral part of the standalone financial statements
2-58
The accompanying notes are an integral part of the standalone financial statements
Standalone Statement of Profit and Loss For The Year Ended 31st March, 2020
As per our report of even date attached For and on behalf of the BoardFor Shah Gupta & Co.Chartered Accountants FRN - 109574W
For NBS & Co.Chartered Accountants FRN - 110100W
Sunil O. Khandelwal(Chief Financial Officer)
K. H. Gopal(Company Secretary)
Taken on RecordD. V. BallalPartnerM. No.: 013107
Devdas BhatPartnerM. No.: 048094
Ajay Joshi(On behalf of the Monitoring Committee)
Place: MumbaiDate: 31st July, 2020
Place: MumbaiDate: 31st July, 2020
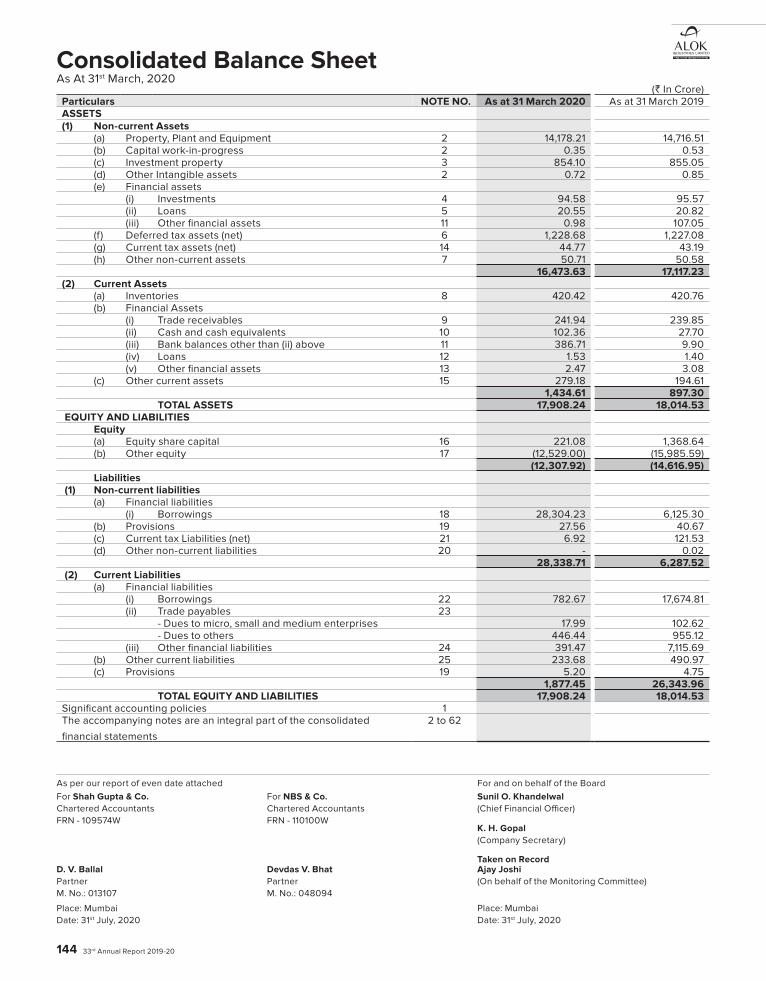
144 33rd Annual Report 2019-20
(` In Crore)Particulars NOTE NO. As at 31 March 2020 As at 31 March 2019ASSETS(1) Non-current Assets
(a) Property, Plant and Equipment 2 14,178.21 14,716.51 (b) Capital work-in-progress 2 0.35 0.53 (c) Investment property 3 854.10 855.05 (d) Other Intangible assets 2 0.72 0.85 (e) Financial assets
(i) Investments 4 94.58 95.57 (ii) Loans 5 20.55 20.82 (iii) Other financial assets 11 0.98 107.05
(f) Deferred tax assets (net) 6 1,228.68 1,227.08 (g) Current tax assets (net) 14 44.77 43.19 (h) Other non-current assets 7 50.71 50.58
16,473.63 17,117.23 (2) Current Assets
(a) Inventories 8 420.42 420.76 (b) Financial Assets
(i) Trade receivables 9 241.94 239.85 (ii) Cash and cash equivalents 10 102.36 27.70 (iii) Bank balances other than (ii) above 11 386.71 9.90 (iv) Loans 12 1.53 1.40 (v) Other financial assets 13 2.47 3.08
(c) Other current assets 15 279.18 194.61 1,434.61 897.30
TOTAL ASSETS 17,908.24 18,014.53 EQUITY AND LIABILITIES
Equity(a) Equity share capital 16 221.08 1,368.64 (b) Other equity 17 (12,529.00) (15,985.59)
(12,307.92) (14,616.95)Liabilities
(1) Non-current liabilities(a) Financial liabilities
(i) Borrowings 18 28,304.23 6,125.30 (b) Provisions 19 27.56 40.67 (c) Current tax Liabilities (net) 21 6.92 121.53 (d) Other non-current liabilities 20 - 0.02
28,338.71 6,287.52 (2) Current Liabilities
(a) Financial liabilities(i) Borrowings 22 782.67 17,674.81 (ii) Trade payables 23
- Dues to micro, small and medium enterprises 17.99 102.62 - Dues to others 446.44 955.12
(iii) Other financial liabilities 24 391.47 7,115.69 (b) Other current liabilities 25 233.68 490.97 (c) Provisions 19 5.20 4.75
1,877.45 26,343.96 TOTAL EQUITY AND LIABILITIES 17,908.24 18,014.53
Significant accounting policies 1The accompanying notes are an integral part of the consolidated
financial statements
2 to 62
Consolidated Balance Sheet As At 31st March, 2020
As per our report of even date attached For and on behalf of the BoardFor Shah Gupta & Co.Chartered Accountants FRN - 109574W
For NBS & Co.Chartered Accountants FRN - 110100W
Sunil O. Khandelwal(Chief Financial Officer)
K. H. Gopal(Company Secretary)
Taken on RecordD. V. BallalPartnerM. No.: 013107
Devdas V. BhatPartnerM. No.: 048094
Ajay Joshi(On behalf of the Monitoring Committee)
Place: MumbaiDate: 31st July, 2020
Place: MumbaiDate: 31st July, 2020
Related Documents