ORIGINAL RESEARCH Open Access A study conducted on the impact of effluent waste from machining process on the environment by water analysis Punnose P Kovoor 1* , Mohd Razif Idris 1 , Masjuki Haji Hassan 2 and Tengku Fazli Tengku Yahya 3 Abstract Ferrous block metals are used frequently in large quantities in various sectors of industry for making automotive, furniture, electrical and mechanical items, body parts for consumables, and so forth. During the manufacturing stage, the block metals are subjected to some form of material removal process either through turning, grinding, milling, or drilling operations to obtain the final product. Wastes are generated from the machining process in the form of effluent waste, solid waste, atmospheric emission, and energy emission. These wastes, if not recycled or treated properly before disposal, will have a detrimental impact on the environment through air, water, and soil pollution. The purpose of this paper is to determine the impact of the effluent waste from the machining process on the environment through water analysis. A twofold study is carried out to determine the impact of the effluent waste on the water stream. The preliminary study consists of a scenario analysis where five scenarios are drawn out using substances such as spent coolant, tramp oil, solvent, powdered chips, and sludge, which are commonly found in the effluent waste. The wastes are prepared according to the scenarios and are disposed through the Institute of Product Design and Manufacturing (IPROM) storm water drain. Samples of effluent waste are collected at specific locations according to the APHA method and are tested for parameters such as pH, ammoniacal nitrogen, dissolved oxygen, biochemical oxygen demand, chemical oxygen demand, and total suspended solids. A subsequent study is done by collecting 30 samples of the effluent waste from the machining operations from two small- and medium-scale enterprise locations and the IPROM workshop to test the quality of water. The results obtained from the tests showed high values of chemical oxygen demand, ammoniacal nitrogen, and total suspended solids when compared with the Standard B specification for inland water bodies as specified by the Department of Environment, Malaysia. Keywords: Effluent waste, Ammoniacal nitrogen, Biochemical oxygen demand, Chemical oxygen demand, Total suspended solids, Dissolved oxygen, pH Background The rapid deterioration of the world's environment in the name of development is a major cause of concern for every human being on this planet. Both individuals and businesses have a social and environmental respon- sibility to keep this planet clean. With the rapid develop- ment in today's industrialized world, the issue of preserving and managing our environment has become crucial. The need for a good environmental management system is evidenced by the amendments made to the En- vironmental Quality Act 1974 and other environmental regulations, which serve to ensure stricter compliance of environmental standards in Malaysia. Malaysia also adopted the National Environment Policy in 2002 as a means of addressing environmental issues in an inte- grated manner, while more and more companies are striving to attain the MS14001 EMS certification [1]. Small- and medium-scale enterprises (SMEs) are the backbone of industrialization in many developed and developing countries and play a crucial role in the growth of the country's economy. While most SMEs are in the service sector, approximately one quarter or so that are * Correspondence: [email protected] 1 Institute of Product Design & Manufacturing, IPROM, Universiti Kuala Lumpur, Kuala Lumpur 56100, Malaysia Full list of author information is available at the end of the article © 2012 Kovoor et al.; licensee Springer. This is an Open Access article distributed under the terms of the Creative Commons Attribution License (http://creativecommons.org/licenses/by/2.0), which permits unrestricted use, distribution, and reproduction in any medium, provided the original work is properly cited. Kovoor et al. International Journal of Energy and Environmental Engineering 2012, 3:21 http://www.journal-ijeee.com/content/3/1/21

Welcome message from author
This document is posted to help you gain knowledge. Please leave a comment to let me know what you think about it! Share it to your friends and learn new things together.
Transcript

Kovoor et al. International Journal of Energy and Environmental Engineering 2012, 3:21http://www.journal-ijeee.com/content/3/1/21
ORIGINAL RESEARCH Open Access
A study conducted on the impact of effluentwaste from machining process on theenvironment by water analysisPunnose P Kovoor1*, Mohd Razif Idris1, Masjuki Haji Hassan2 and Tengku Fazli Tengku Yahya3
Abstract
Ferrous block metals are used frequently in large quantities in various sectors of industry for making automotive,furniture, electrical and mechanical items, body parts for consumables, and so forth. During the manufacturingstage, the block metals are subjected to some form of material removal process either through turning, grinding,milling, or drilling operations to obtain the final product. Wastes are generated from the machining process in theform of effluent waste, solid waste, atmospheric emission, and energy emission. These wastes, if not recycled ortreated properly before disposal, will have a detrimental impact on the environment through air, water, and soilpollution. The purpose of this paper is to determine the impact of the effluent waste from the machining processon the environment through water analysis. A twofold study is carried out to determine the impact of the effluentwaste on the water stream. The preliminary study consists of a scenario analysis where five scenarios are drawn outusing substances such as spent coolant, tramp oil, solvent, powdered chips, and sludge, which are commonlyfound in the effluent waste. The wastes are prepared according to the scenarios and are disposed through theInstitute of Product Design and Manufacturing (IPROM) storm water drain. Samples of effluent waste are collectedat specific locations according to the APHA method and are tested for parameters such as pH, ammoniacalnitrogen, dissolved oxygen, biochemical oxygen demand, chemical oxygen demand, and total suspended solids. Asubsequent study is done by collecting 30 samples of the effluent waste from the machining operations from twosmall- and medium-scale enterprise locations and the IPROM workshop to test the quality of water. The resultsobtained from the tests showed high values of chemical oxygen demand, ammoniacal nitrogen, and totalsuspended solids when compared with the Standard B specification for inland water bodies as specified by theDepartment of Environment, Malaysia.
Keywords: Effluent waste, Ammoniacal nitrogen, Biochemical oxygen demand, Chemical oxygen demand, Totalsuspended solids, Dissolved oxygen, pH
BackgroundThe rapid deterioration of the world's environment inthe name of development is a major cause of concernfor every human being on this planet. Both individualsand businesses have a social and environmental respon-sibility to keep this planet clean. With the rapid develop-ment in today's industrialized world, the issue ofpreserving and managing our environment has becomecrucial. The need for a good environmental management
* Correspondence: [email protected] of Product Design & Manufacturing, IPROM, Universiti KualaLumpur, Kuala Lumpur 56100, MalaysiaFull list of author information is available at the end of the article
© 2012 Kovoor et al.; licensee Springer. This isAttribution License (http://creativecommons.orin any medium, provided the original work is p
system is evidenced by the amendments made to the En-vironmental Quality Act 1974 and other environmentalregulations, which serve to ensure stricter compliance ofenvironmental standards in Malaysia. Malaysia alsoadopted the National Environment Policy in 2002 as ameans of addressing environmental issues in an inte-grated manner, while more and more companies arestriving to attain the MS14001 EMS certification [1].Small- and medium-scale enterprises (SMEs) are the
backbone of industrialization in many developed anddeveloping countries and play a crucial role in the growthof the country's economy. While most SMEs are in theservice sector, approximately one quarter or so that are
an Open Access article distributed under the terms of the Creative Commonsg/licenses/by/2.0), which permits unrestricted use, distribution, and reproductionroperly cited.
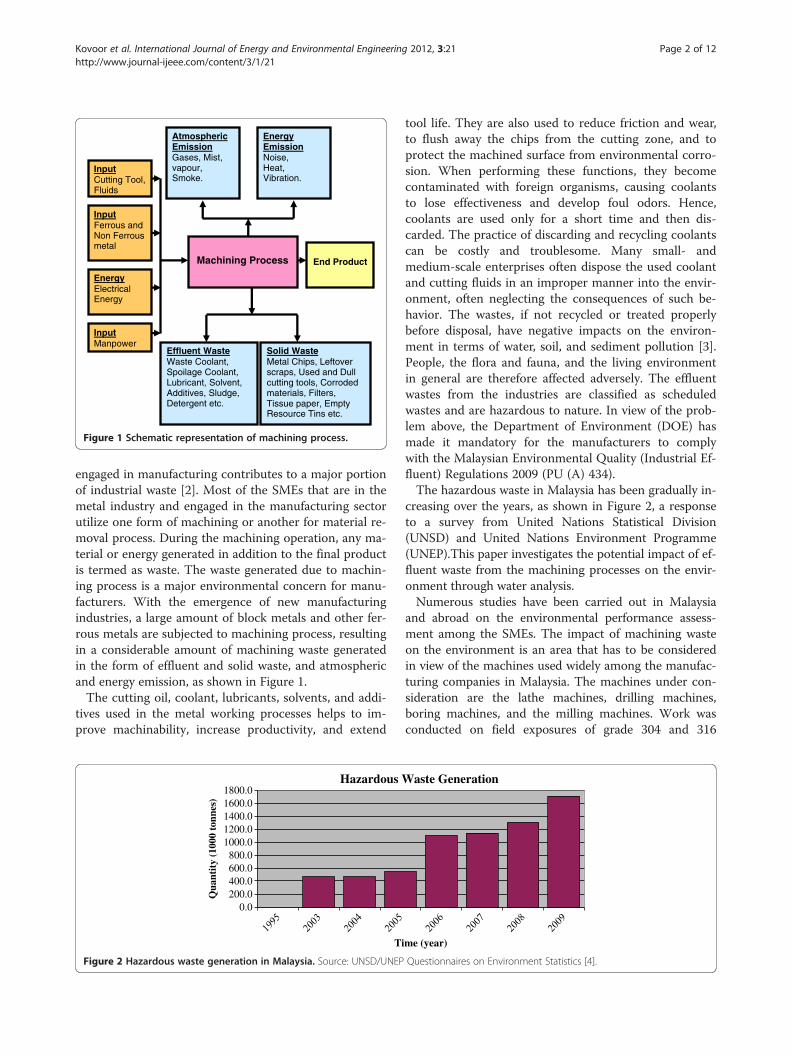
InputFerrous and Non Ferrous metal
EnergyElectrical Energy
AtmosphericEmissionGases, Mist, vapour,Smoke.
EnergyEmissionNoise,Heat,Vibration.
End ProductMachining Process
Effluent WasteWaste Coolant,Spoilage Coolant,Lubricant, Solvent, Additives, Sludge, Detergent etc.
Solid WasteMetal Chips, Leftover scraps, Used and Dull cutting tools, Corroded materials, Filters, Tissue paper, Empty Resource Tins etc.
InputCutting Tool, Fluids
InputManpower
Figure 1 Schematic representation of machining process.
Kovoor et al. International Journal of Energy and Environmental Engineering 2012, 3:21 Page 2 of 12http://www.journal-ijeee.com/content/3/1/21
engaged in manufacturing contributes to a major portionof industrial waste [2]. Most of the SMEs that are in themetal industry and engaged in the manufacturing sectorutilize one form of machining or another for material re-moval process. During the machining operation, any ma-terial or energy generated in addition to the final productis termed as waste. The waste generated due to machin-ing process is a major environmental concern for manu-facturers. With the emergence of new manufacturingindustries, a large amount of block metals and other fer-rous metals are subjected to machining process, resultingin a considerable amount of machining waste generatedin the form of effluent and solid waste, and atmosphericand energy emission, as shown in Figure 1.The cutting oil, coolant, lubricants, solvents, and addi-
tives used in the metal working processes helps to im-prove machinability, increase productivity, and extend
0.0200.0400.0600.0800.0
1000.01200.01400.01600.01800.0
Qua
ntit
y (1
000
tonn
es)
Ti
Hazardous W
Figure 2 Hazardous waste generation in Malaysia. Source: UNSD/UNEP
tool life. They are also used to reduce friction and wear,to flush away the chips from the cutting zone, and toprotect the machined surface from environmental corro-sion. When performing these functions, they becomecontaminated with foreign organisms, causing coolantsto lose effectiveness and develop foul odors. Hence,coolants are used only for a short time and then dis-carded. The practice of discarding and recycling coolantscan be costly and troublesome. Many small- andmedium-scale enterprises often dispose the used coolantand cutting fluids in an improper manner into the envir-onment, often neglecting the consequences of such be-havior. The wastes, if not recycled or treated properlybefore disposal, have negative impacts on the environ-ment in terms of water, soil, and sediment pollution [3].People, the flora and fauna, and the living environmentin general are therefore affected adversely. The effluentwastes from the industries are classified as scheduledwastes and are hazardous to nature. In view of the prob-lem above, the Department of Environment (DOE) hasmade it mandatory for the manufacturers to complywith the Malaysian Environmental Quality (Industrial Ef-fluent) Regulations 2009 (PU (A) 434).The hazardous waste in Malaysia has been gradually in-
creasing over the years, as shown in Figure 2, a responseto a survey from United Nations Statistical Division(UNSD) and United Nations Environment Programme(UNEP).This paper investigates the potential impact of ef-fluent waste from the machining processes on the envir-onment through water analysis.Numerous studies have been carried out in Malaysia
and abroad on the environmental performance assess-ment among the SMEs. The impact of machining wasteon the environment is an area that has to be consideredin view of the machines used widely among the manufac-turing companies in Malaysia. The machines under con-sideration are the lathe machines, drilling machines,boring machines, and the milling machines. Work wasconducted on field exposures of grade 304 and 316
me (year)
aste Generation
Questionnaires on Environment Statistics [4].
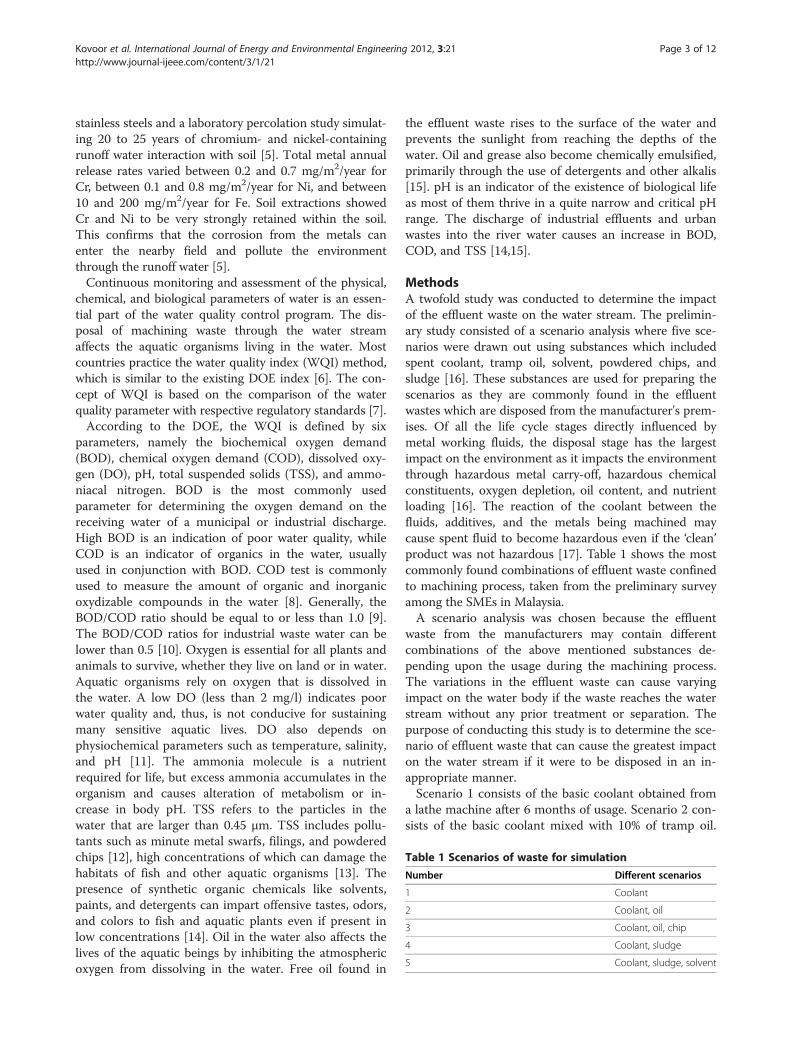
Table 1 Scenarios of waste for simulation
Number Different scenarios
1 Coolant
2 Coolant, oil
3 Coolant, oil, chip
4 Coolant, sludge
5 Coolant, sludge, solvent
Kovoor et al. International Journal of Energy and Environmental Engineering 2012, 3:21 Page 3 of 12http://www.journal-ijeee.com/content/3/1/21
stainless steels and a laboratory percolation study simulat-ing 20 to 25 years of chromium- and nickel-containingrunoff water interaction with soil [5]. Total metal annualrelease rates varied between 0.2 and 0.7 mg/m2/year forCr, between 0.1 and 0.8 mg/m2/year for Ni, and between10 and 200 mg/m2/year for Fe. Soil extractions showedCr and Ni to be very strongly retained within the soil.This confirms that the corrosion from the metals canenter the nearby field and pollute the environmentthrough the runoff water [5].Continuous monitoring and assessment of the physical,
chemical, and biological parameters of water is an essen-tial part of the water quality control program. The dis-posal of machining waste through the water streamaffects the aquatic organisms living in the water. Mostcountries practice the water quality index (WQI) method,which is similar to the existing DOE index [6]. The con-cept of WQI is based on the comparison of the waterquality parameter with respective regulatory standards [7].According to the DOE, the WQI is defined by six
parameters, namely the biochemical oxygen demand(BOD), chemical oxygen demand (COD), dissolved oxy-gen (DO), pH, total suspended solids (TSS), and ammo-niacal nitrogen. BOD is the most commonly usedparameter for determining the oxygen demand on thereceiving water of a municipal or industrial discharge.High BOD is an indication of poor water quality, whileCOD is an indicator of organics in the water, usuallyused in conjunction with BOD. COD test is commonlyused to measure the amount of organic and inorganicoxydizable compounds in the water [8]. Generally, theBOD/COD ratio should be equal to or less than 1.0 [9].The BOD/COD ratios for industrial waste water can belower than 0.5 [10]. Oxygen is essential for all plants andanimals to survive, whether they live on land or in water.Aquatic organisms rely on oxygen that is dissolved inthe water. A low DO (less than 2 mg/l) indicates poorwater quality and, thus, is not conducive for sustainingmany sensitive aquatic lives. DO also depends onphysiochemical parameters such as temperature, salinity,and pH [11]. The ammonia molecule is a nutrientrequired for life, but excess ammonia accumulates in theorganism and causes alteration of metabolism or in-crease in body pH. TSS refers to the particles in thewater that are larger than 0.45 μm. TSS includes pollu-tants such as minute metal swarfs, filings, and powderedchips [12], high concentrations of which can damage thehabitats of fish and other aquatic organisms [13]. Thepresence of synthetic organic chemicals like solvents,paints, and detergents can impart offensive tastes, odors,and colors to fish and aquatic plants even if present inlow concentrations [14]. Oil in the water also affects thelives of the aquatic beings by inhibiting the atmosphericoxygen from dissolving in the water. Free oil found in
the effluent waste rises to the surface of the water andprevents the sunlight from reaching the depths of thewater. Oil and grease also become chemically emulsified,primarily through the use of detergents and other alkalis[15]. pH is an indicator of the existence of biological lifeas most of them thrive in a quite narrow and critical pHrange. The discharge of industrial effluents and urbanwastes into the river water causes an increase in BOD,COD, and TSS [14,15].
MethodsA twofold study was conducted to determine the impactof the effluent waste on the water stream. The prelimin-ary study consisted of a scenario analysis where five sce-narios were drawn out using substances which includedspent coolant, tramp oil, solvent, powdered chips, andsludge [16]. These substances are used for preparing thescenarios as they are commonly found in the effluentwastes which are disposed from the manufacturer's prem-ises. Of all the life cycle stages directly influenced bymetal working fluids, the disposal stage has the largestimpact on the environment as it impacts the environmentthrough hazardous metal carry-off, hazardous chemicalconstituents, oxygen depletion, oil content, and nutrientloading [16]. The reaction of the coolant between thefluids, additives, and the metals being machined maycause spent fluid to become hazardous even if the ‘clean’product was not hazardous [17]. Table 1 shows the mostcommonly found combinations of effluent waste confinedto machining process, taken from the preliminary surveyamong the SMEs in Malaysia.A scenario analysis was chosen because the effluent
waste from the manufacturers may contain differentcombinations of the above mentioned substances de-pending upon the usage during the machining process.The variations in the effluent waste can cause varyingimpact on the water body if the waste reaches the waterstream without any prior treatment or separation. Thepurpose of conducting this study is to determine the sce-nario of effluent waste that can cause the greatest impacton the water stream if it were to be disposed in an in-appropriate manner.Scenario 1 consists of the basic coolant obtained from
a lathe machine after 6 months of usage. Scenario 2 con-sists of the basic coolant mixed with 10% of tramp oil.
Kovoor et al. International Journal of Energy and Environmental Engineering 2012, 3:21 Page 4 of 12http://www.journal-ijeee.com/content/3/1/21
The amount of tramp oil in the effluent waste was foundto be between 1% and 16% [18]. Tramp oil originates aslubrication oil seeping out from the slideways and wash-ing into the coolant mixture, as the protective film withwhich the steel supplier coats the bar stock to preventrusting, or as hydraulic oil leaks. In extreme cases, it canbe seen as a film or skin on the surface of the coolant oras floating specks of oil. A tramp oil level above 2%could cause health issues due to emulsification [18]. Sce-nario 3 consists of the basic coolant mixed with 10% oiland around 10 g of ferrous material chips in near-powdered form [19]. Generally the effluent waste from agrinding machine includes minute particles of iron andworn-out or burnt-out abrasives from the wheel, whichare difficult to segregate from the used coolant. Thecomplexity of the fluid is compounded by contaminationfrom a combination of substances from the manufactur-ing process, such as tramp oils, hydraulic fluids, and par-ticulate matter from the machining operations [19].Scenario 4 consists of 10% sludge mixed with the basiccoolant. Sludge is a heavy residue that lies at the bottomof the sump or in a drum where the used coolants arestored before disposal. Microorganisms such as bacteriatend to multiply and grow in the sludge that is presentin the effluent waste. Scenario 5 consists of the basiccoolant mixed with 10% sludge and 2% solvent. Solventsare used to clean and degrease the finished goods andeven certain machine parts after the machining oper-ation. The effluents, in combination with oil and grease,can form a toxic substance for the aquatic organisms [8].These wastes are then diluted with 20% of water from
the Institute of Product Design and Manufacturing(IPROM) workshop to simulate the type of effluentwaste which is disposed by manufacturers into the waterstream. These wastes are disposed into the storm waterdrain in the IPROM; from there, the effluent waste flows
0
2
4
6
8
10
12
14
16
18
Scenario 1 Scenario 2 Scenario 3
mg/
l
BOD present in differ
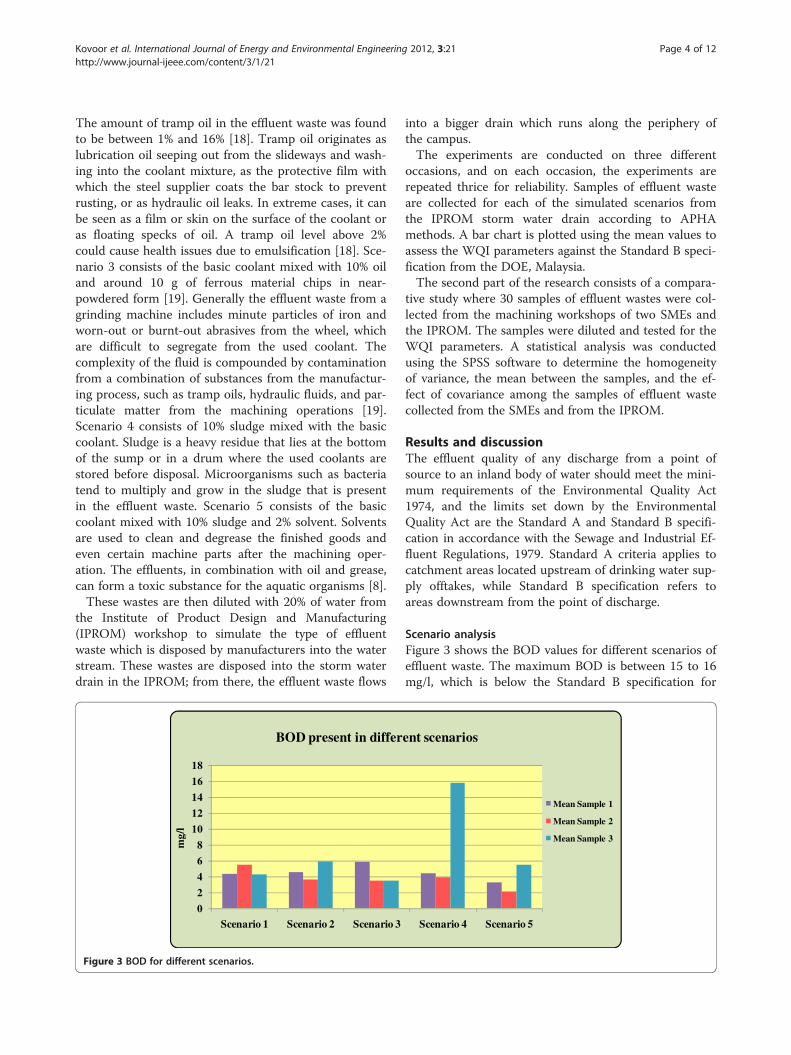
Figure 3 BOD for different scenarios.
into a bigger drain which runs along the periphery ofthe campus.The experiments are conducted on three different
occasions, and on each occasion, the experiments arerepeated thrice for reliability. Samples of effluent wasteare collected for each of the simulated scenarios fromthe IPROM storm water drain according to APHAmethods. A bar chart is plotted using the mean values toassess the WQI parameters against the Standard B speci-fication from the DOE, Malaysia.The second part of the research consists of a compara-
tive study where 30 samples of effluent wastes were col-lected from the machining workshops of two SMEs andthe IPROM. The samples were diluted and tested for theWQI parameters. A statistical analysis was conductedusing the SPSS software to determine the homogeneityof variance, the mean between the samples, and the ef-fect of covariance among the samples of effluent wastecollected from the SMEs and from the IPROM.
Results and discussionThe effluent quality of any discharge from a point ofsource to an inland body of water should meet the mini-mum requirements of the Environmental Quality Act1974, and the limits set down by the EnvironmentalQuality Act are the Standard A and Standard B specifi-cation in accordance with the Sewage and Industrial Ef-fluent Regulations, 1979. Standard A criteria applies tocatchment areas located upstream of drinking water sup-ply offtakes, while Standard B specification refers toareas downstream from the point of discharge.
Scenario analysisFigure 3 shows the BOD values for different scenarios ofeffluent waste. The maximum BOD is between 15 to 16mg/l, which is below the Standard B specification for
Scenario 4 Scenario 5
Mean Sample 1
Mean Sample 2
Mean Sample 3
ent scenarios
24
25
26
27
28
29
30
31
32
Scenario 1 Scenario 2 Scenario 3 Scenario 4 Scenario 5
Mean Sample 1
Mean Sample 2
Mean Sample 3mg/
l
COD present in different scenarios
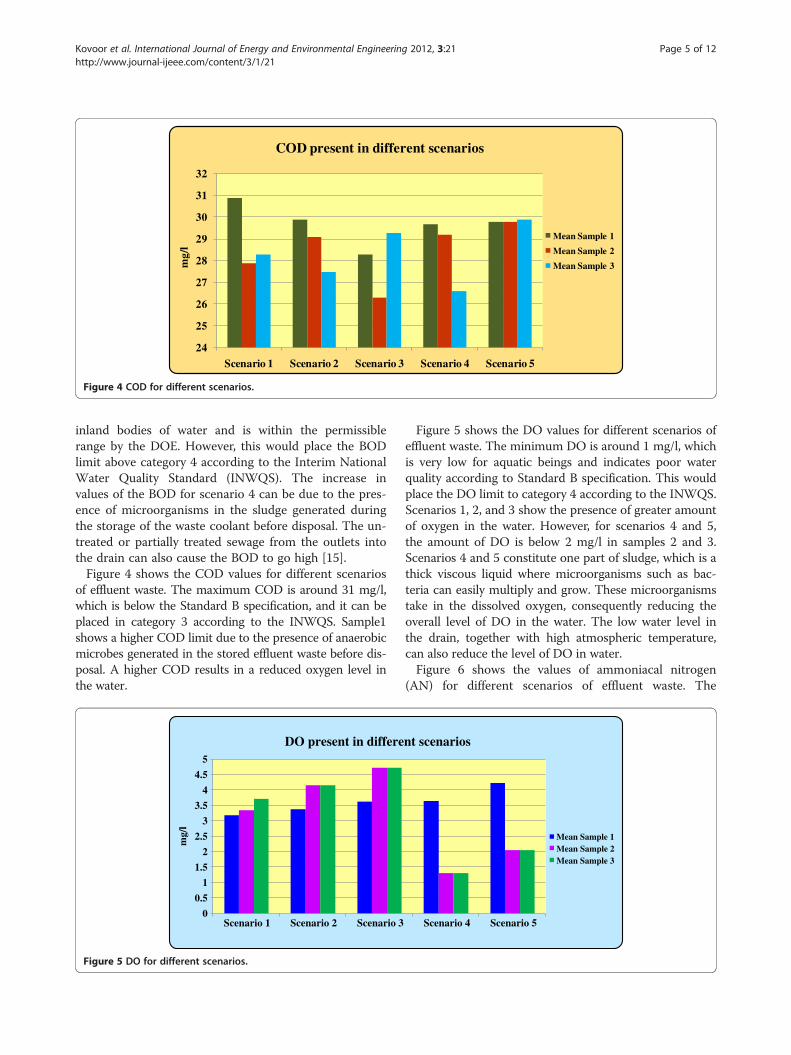
Figure 4 COD for different scenarios.
Kovoor et al. International Journal of Energy and Environmental Engineering 2012, 3:21 Page 5 of 12http://www.journal-ijeee.com/content/3/1/21
inland bodies of water and is within the permissiblerange by the DOE. However, this would place the BODlimit above category 4 according to the Interim NationalWater Quality Standard (INWQS). The increase invalues of the BOD for scenario 4 can be due to the pres-ence of microorganisms in the sludge generated duringthe storage of the waste coolant before disposal. The un-treated or partially treated sewage from the outlets intothe drain can also cause the BOD to go high [15].Figure 4 shows the COD values for different scenarios
of effluent waste. The maximum COD is around 31 mg/l,which is below the Standard B specification, and it can beplaced in category 3 according to the INWQS. Sample1shows a higher COD limit due to the presence of anaerobicmicrobes generated in the stored effluent waste before dis-posal. A higher COD results in a reduced oxygen level inthe water.
0
0.5
1
1.5
2
2.5
3
3.5
4
4.5
5
Scenario 1 Scenario 2 Scenario 3
DO present in differe
mg/
l
Figure 5 DO for different scenarios.
Figure 5 shows the DO values for different scenarios ofeffluent waste. The minimum DO is around 1 mg/l, whichis very low for aquatic beings and indicates poor waterquality according to Standard B specification. This wouldplace the DO limit to category 4 according to the INWQS.Scenarios 1, 2, and 3 show the presence of greater amountof oxygen in the water. However, for scenarios 4 and 5,the amount of DO is below 2 mg/l in samples 2 and 3.Scenarios 4 and 5 constitute one part of sludge, which is athick viscous liquid where microorganisms such as bac-teria can easily multiply and grow. These microorganismstake in the dissolved oxygen, consequently reducing theoverall level of DO in the water. The low water level inthe drain, together with high atmospheric temperature,can also reduce the level of DO in water.Figure 6 shows the values of ammoniacal nitrogen
(AN) for different scenarios of effluent waste. The
Scenario 4 Scenario 5
Mean Sample 1Mean Sample 2Mean Sample 3
nt scenarios

0
1
2
3
4
5
6
7
8
9
10
Scenario 1 Scenario 2 Scenario 3 Scenario 4 Scenario 5
Mean Sample 1
Mean Sample 2
Mean Sample 3mg/
l
AN present in different scenarios
Figure 6 Ammoniacal nitrogen for different scenarios.
Kovoor et al. International Journal of Energy and Environmental Engineering 2012, 3:21 Page 6 of 12http://www.journal-ijeee.com/content/3/1/21
maximum AN is between 8 and 9 mg/l, which is higherthan the Standard B specification limit and places theAN limit in category 5 according to the INWQS. Am-monia is produced from the decay of organic matter andanimal waste. The bacteria break down the organic mat-ter into nitrate. The sources of AN can also be from thedomestic sewage that is resident in the drain. Excess am-monia accumulates in the organism and causes alter-ation of metabolism or increase in body pH.Figure 7 shows the pH values for different scenarios of
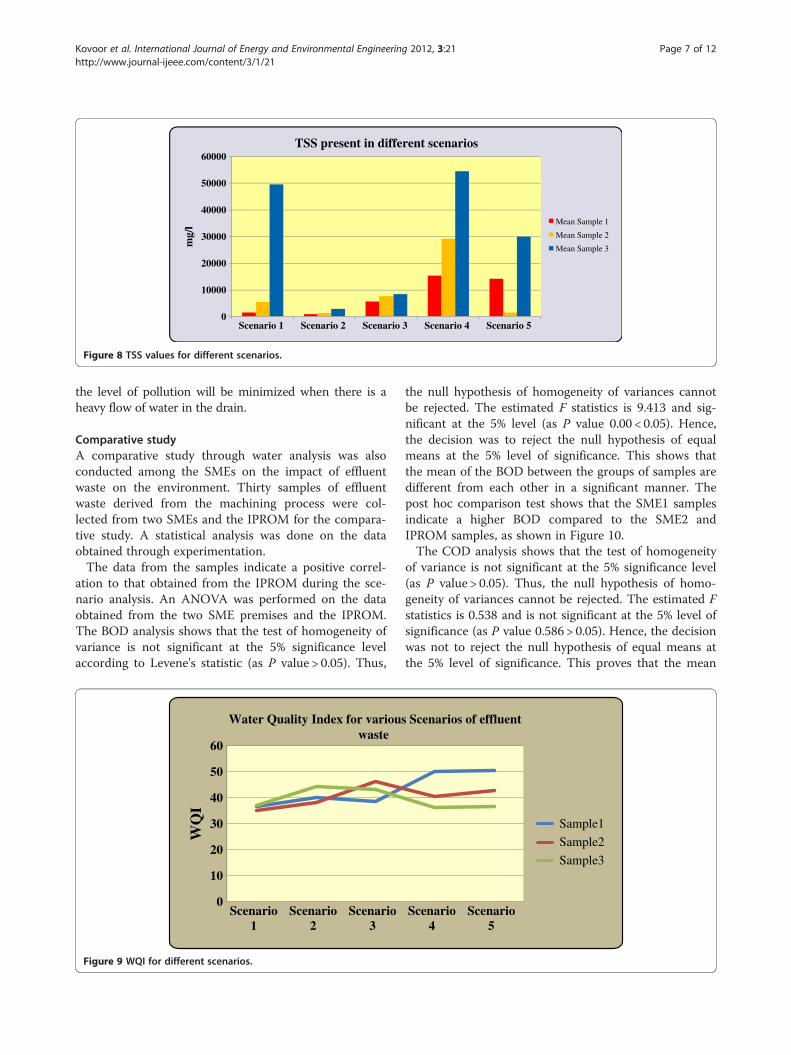
effluent waste. The samples containing the effluentwaste appear to be mildly alkaline as they exceed 7 onthe pH scale. The levels are within the range of StandardB specification and can be placed in category 2 accord-ing to the INWQS.Figure 8 shows the values for TSS for different sce-
narios of effluent waste. The maximum limit of TSS
0
1
2
3
4
5
6
7
8
9
10
Scenario 1 Scenario 2 Scenario 3
mg/
l
pH in different sc
Figure 7 pH values for different scenarios.
obtained from the samples is between 50,000 and60,000 mg/l.This is much higher than the Standard B specification
limit. It places the TSS limit to category 5 as specified bythe INWQS. The TSS limits are very high during thethird sampling conducted with scenario 4 of the effluentwaste. The effluent waste from the IPROM containingsludge and small particles of iron chips contributes tothis effect. High suspended solids also prevent the sun-light from penetrating into the water [8].The Water Quality Index for the five scenarios is shown
in Figure 9. According to the DOE standards, a rangefrom 0 to 59 indicates a high pollution level, while a rangefrom 60 to 80 indicates slight pollution, and any valuehigher than 81 indicates no pollution. The results of theexperiment show that when the effluent waste is disposedinto the water stream, the water can be polluted. However,
Scenario 4 Scenario 5
Mean Sample 1
Mean Sample 2
Mean Sample 3
enarios
0
10000
20000
30000
40000
50000
60000
Scenario 1 Scenario 2 Scenario 3 Scenario 4 Scenario 5
Mean Sample 1
Mean Sample 2
Mean Sample 3mg/
l
TSS present in different scenarios
Figure 8 TSS values for different scenarios.
Kovoor et al. International Journal of Energy and Environmental Engineering 2012, 3:21 Page 7 of 12http://www.journal-ijeee.com/content/3/1/21
the level of pollution will be minimized when there is aheavy flow of water in the drain.
Comparative studyA comparative study through water analysis was alsoconducted among the SMEs on the impact of effluentwaste on the environment. Thirty samples of effluentwaste derived from the machining process were col-lected from two SMEs and the IPROM for the compara-tive study. A statistical analysis was done on the dataobtained through experimentation.The data from the samples indicate a positive correl-
ation to that obtained from the IPROM during the sce-nario analysis. An ANOVA was performed on the dataobtained from the two SME premises and the IPROM.The BOD analysis shows that the test of homogeneity ofvariance is not significant at the 5% significance levelaccording to Levene's statistic (as P value > 0.05). Thus,
0
10
20
30
40
50
60
Scenario1
Scenario2
Scenario3
WQ
I
Water Quality Index for variouswaste
Figure 9 WQI for different scenarios.
the null hypothesis of homogeneity of variances cannotbe rejected. The estimated F statistics is 9.413 and sig-nificant at the 5% level (as P value 0.00 < 0.05). Hence,the decision was to reject the null hypothesis of equalmeans at the 5% level of significance. This shows thatthe mean of the BOD between the groups of samples aredifferent from each other in a significant manner. Thepost hoc comparison test shows that the SME1 samplesindicate a higher BOD compared to the SME2 andIPROM samples, as shown in Figure 10.The COD analysis shows that the test of homogeneity
of variance is not significant at the 5% significance level(as P value > 0.05). Thus, the null hypothesis of homo-geneity of variances cannot be rejected. The estimated Fstatistics is 0.538 and is not significant at the 5% level ofsignificance (as P value 0.586 > 0.05). Hence, the decisionwas not to reject the null hypothesis of equal means atthe 5% level of significance. This proves that the mean
Scenario4
Scenario5
Scenarios of effluent
Sample1
Sample2
Sample3

4.50
5.00
5.50
6.00
6.50
SME 1 SME 2 IPROM
BOD(mg/L)
Sources
Mean BOD
Figure 10 Mean value of BOD between samples.
Kovoor et al. International Journal of Energy and Environmental Engineering 2012, 3:21 Page 8 of 12http://www.journal-ijeee.com/content/3/1/21
COD between the groups of samples is not significantlydifferent from each other. The post hoc comparison testshows that the SME1 samples indicate a higher CODcompared to the SME2 and IPROM samples, as shownin Figure 11.The DO present among the three samples was also sub-
jected to an ANOVA test. The test of homogeneity ofvariance shows that Levene's statistic is not significant atthe 5% significance level (as P value > 0.05). Thus, the nullhypothesis of homogeneity of variances is not rejected.The estimated F statistics is 15.970 and significant at the5% level of significance (as P value 0.00 < 0.05). Hence,the decision was to reject the null hypothesis of equalmeans at the 5% level of significance. This proves thatthe mean of the DO between the groups of samples aredifferent from each other in a significant manner. The
27.7027.7527.8027.8527.9027.9528.0028.0528.1028.15
SME 1
COD(mg/L)
Figure 11 Mean value of COD between samples.
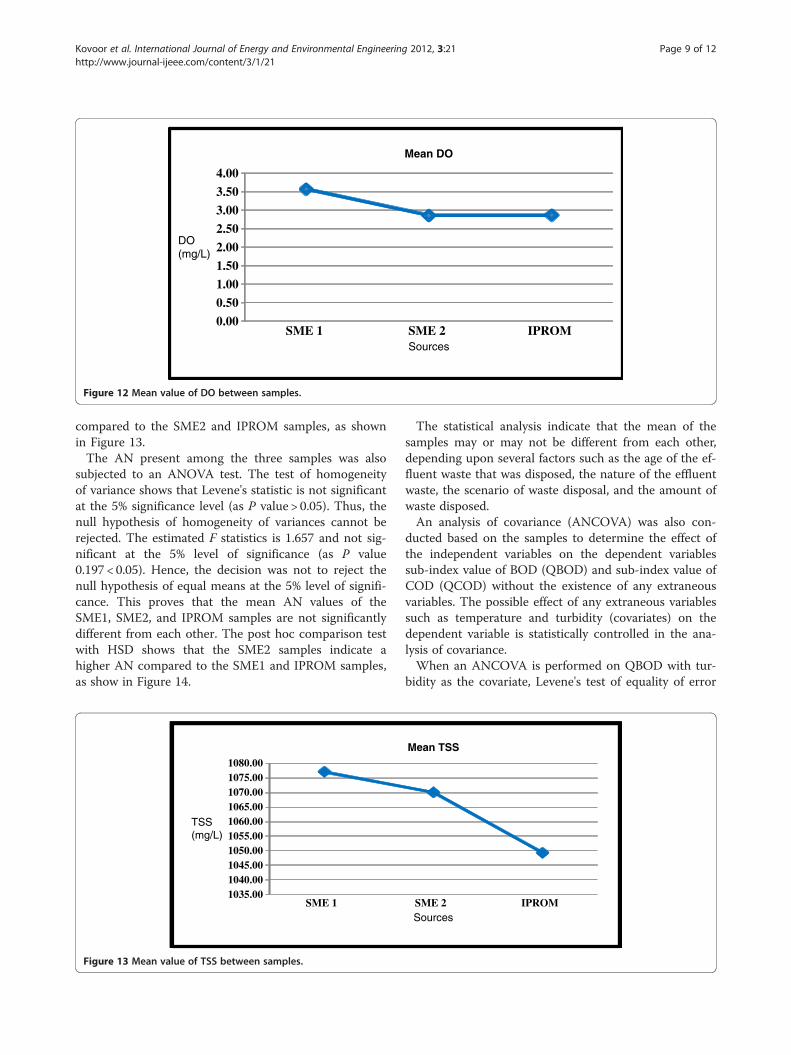
post hoc comparison test with honestly significant differ-ence (HSD) test shows that the SME1 samples indicate ahigher DO compared to the SME 2 and IPROM sam-ples, as shown in Figure 12.In the analysis for TSS, the test of homogeneity of
variance shows that Levene's statistic is not significantat the 5% significance level (as P value > 0.05). Thus, thenull hypothesis of homogeneity of variances cannot berejected. The estimated F statistics is 0.021 and is notsignificant at the 5% level of significance (as P value0.979 > 0.05). Hence, the decision was not to reject thenull hypothesis of equal means at the 5% level of sig-nificance. This proves that the mean TSS values ofSME1, SME2, and the IPROM are not significantly dif-ferent from each other. The post hoc comparison testshows that the SME1 samples indicate a higher TSS
SME 2 IPROMSources
Mean COD
0.00
0.50
1.00
1.50
2.00
2.50
3.00
3.50
4.00
SME 1 SME 2 IPROM
DO(mg/L)
Sources
Mean DO
Figure 12 Mean value of DO between samples.
Kovoor et al. International Journal of Energy and Environmental Engineering 2012, 3:21 Page 9 of 12http://www.journal-ijeee.com/content/3/1/21
compared to the SME2 and IPROM samples, as shownin Figure 13.The AN present among the three samples was also
subjected to an ANOVA test. The test of homogeneityof variance shows that Levene's statistic is not significantat the 5% significance level (as P value > 0.05). Thus, thenull hypothesis of homogeneity of variances cannot berejected. The estimated F statistics is 1.657 and not sig-nificant at the 5% level of significance (as P value0.197 < 0.05). Hence, the decision was not to reject thenull hypothesis of equal means at the 5% level of signifi-cance. This proves that the mean AN values of theSME1, SME2, and IPROM samples are not significantlydifferent from each other. The post hoc comparison testwith HSD shows that the SME2 samples indicate ahigher AN compared to the SME1 and IPROM samples,as show in Figure 14.
1035.001040.001045.001050.001055.001060.001065.001070.001075.001080.00
SME 1
TSS(mg/L)
Figure 13 Mean value of TSS between samples.
The statistical analysis indicate that the mean of thesamples may or may not be different from each other,depending upon several factors such as the age of the ef-fluent waste that was disposed, the nature of the effluentwaste, the scenario of waste disposal, and the amount ofwaste disposed.An analysis of covariance (ANCOVA) was also con-
ducted based on the samples to determine the effect ofthe independent variables on the dependent variablessub-index value of BOD (QBOD) and sub-index value ofCOD (QCOD) without the existence of any extraneousvariables. The possible effect of any extraneous variablessuch as temperature and turbidity (covariates) on thedependent variable is statistically controlled in the ana-lysis of covariance.When an ANCOVA is performed on QBOD with tur-
bidity as the covariate, Levene's test of equality of error
SME 2 IPROMSources
Mean TSS

0.00
0.50
1.00
1.50
2.00
2.50
3.00
3.50
SME 1 SME 2 IPROM
AN(mg/L)
Sources
Mean AN
Figure 14 Mean value of AN between samples.
Kovoor et al. International Journal of Energy and Environmental Engineering 2012, 3:21 Page 10 of 12http://www.journal-ijeee.com/content/3/1/21
variances shows that there is no significant differencebetween the variances of the QBOD values of the threesamples (as P value 0.174 > 0.05). As the probabilityvalue obtained from SPSS (0.662 for the sample com-prised of the IPROM, SME1, and SME2) is higher thanthe predetermined value (0.05), the null hypothesis wasnot rejected. Hence, there exists adequate evidence toshow that there is no significant difference in the meanscore of QBOD between the different samples when tur-bidity is statistically controlled. As the probability valueobtained from SPSS (0.730 for turbidity) is higher thanthe predetermined value (0.05), the null hypothesis wasnot rejected. There exists adequate evidence to showthat there is no significant difference in the mean scoreof QBOD due to turbidity. When the ANCOVA wasperformed on QBOD with temperature as the covariate,Levene's test of equality of error variances shows thatthere is no significant difference between the variancesof the QBOD values of the three samples (as P value0.153 > 0.05). As the probability value obtained fromSPSS (0.006 for the samples comprised of the IPROM,SME1, and SME2) is lower than the predetermined value(0.05), the null hypothesis is rejected. Hence, there existsadequate evidence to show that there is a significant dif-ference in the mean score of QBOD between the differ-ent samples when temperature is statistically controlled.The ANCOVA was also conducted on QCOD with tur-
bidity as the covariate. Levene's test of equality of errorvariances shows that there is no significant difference be-tween the variances of the QCOD values of the threesamples (as P value 0.365 > 0.05). As the probability valueobtained from SPSS (0.388 for the sample comprised ofthe IPROM, SME1, and SME2) is higher than the prede-termined value (0.05), the null hypothesis was notrejected. Hence, there exists adequate evidence to showthat there is no significant difference in the mean score of
QCOD between the different samples when turbidity isstatistically controlled. As the probability value obtainedfrom SPSS (0.294 for turbidity) is higher than the prede-termined value (0.05), the null hypothesis was notrejected. There exists adequate evidence to show thatthere is no significant difference in the mean score ofQCOD due to turbidity. When the ANCOVA was con-ducted with temperature as the covariance, Levene's testof equality of error variances shows that there is no sig-nificant difference between the variances of the QCODvalues of the three samples (as P value 0.311 > 0.05). Asthe probability value obtained from SPSS (0.576 for thesample comprised of the IPROM, SME1, and SME2) ishigher than the predetermined value (0.05), the null hy-pothesis was not rejected. Hence, there exists adequateevidence to show that there is no significant difference inthe mean score of QCOD between the different sampleswhen temperature is statistically controlled. As the prob-ability value obtained from SPSS (0.591 for Temperature)is higher than the predetermined value (0.05), the null hy-pothesis was not rejected. There exists adequate evidenceto show that there is no significant difference in the meanscore of QCOD due to temperature.The ANCOVA is used to minimize the possible errors
by individual differences in the samples. The results forthe ANCOVA show that the covariates considered inthis study, turbidity and temperature, do not have sig-nificant influence on the dependent variable, apart fromthe case when temperature causes a fluctuation in theQBOD. The temperature of the water causes the DO tofluctuate, and colder water can hold more oxygen com-pared to warmer waters [20].
ConclusionsNumerous studies through water analysis have been madeon the impact of effluent waste on the environment, a few
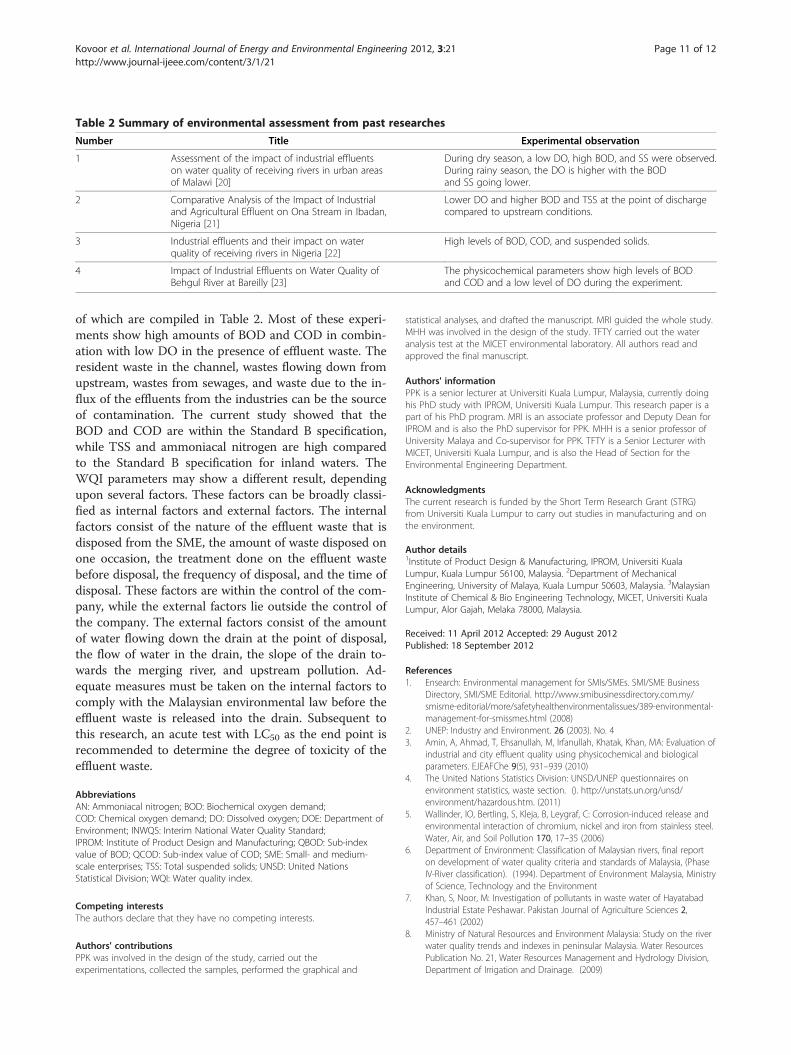
Table 2 Summary of environmental assessment from past researches
Number Title Experimental observation
1 Assessment of the impact of industrial effluentson water quality of receiving rivers in urban areasof Malawi [20]
During dry season, a low DO, high BOD, and SS were observed.During rainy season, the DO is higher with the BODand SS going lower.
2 Comparative Analysis of the Impact of Industrialand Agricultural Effluent on Ona Stream in Ibadan,Nigeria [21]
Lower DO and higher BOD and TSS at the point of dischargecompared to upstream conditions.
3 Industrial effluents and their impact on waterquality of receiving rivers in Nigeria [22]
High levels of BOD, COD, and suspended solids.
4 Impact of Industrial Effluents on Water Quality ofBehgul River at Bareilly [23]
The physicochemical parameters show high levels of BODand COD and a low level of DO during the experiment.
Kovoor et al. International Journal of Energy and Environmental Engineering 2012, 3:21 Page 11 of 12http://www.journal-ijeee.com/content/3/1/21
of which are compiled in Table 2. Most of these experi-ments show high amounts of BOD and COD in combin-ation with low DO in the presence of effluent waste. Theresident waste in the channel, wastes flowing down fromupstream, wastes from sewages, and waste due to the in-flux of the effluents from the industries can be the sourceof contamination. The current study showed that theBOD and COD are within the Standard B specification,while TSS and ammoniacal nitrogen are high comparedto the Standard B specification for inland waters. TheWQI parameters may show a different result, dependingupon several factors. These factors can be broadly classi-fied as internal factors and external factors. The internalfactors consist of the nature of the effluent waste that isdisposed from the SME, the amount of waste disposed onone occasion, the treatment done on the effluent wastebefore disposal, the frequency of disposal, and the time ofdisposal. These factors are within the control of the com-pany, while the external factors lie outside the control ofthe company. The external factors consist of the amountof water flowing down the drain at the point of disposal,the flow of water in the drain, the slope of the drain to-wards the merging river, and upstream pollution. Ad-equate measures must be taken on the internal factors tocomply with the Malaysian environmental law before theeffluent waste is released into the drain. Subsequent tothis research, an acute test with LC50 as the end point isrecommended to determine the degree of toxicity of theeffluent waste.
AbbreviationsAN: Ammoniacal nitrogen; BOD: Biochemical oxygen demand;COD: Chemical oxygen demand; DO: Dissolved oxygen; DOE: Department ofEnvironment; INWQS: Interim National Water Quality Standard;IPROM: Institute of Product Design and Manufacturing; QBOD: Sub-indexvalue of BOD; QCOD: Sub-index value of COD; SME: Small- and medium-scale enterprises; TSS: Total suspended solids; UNSD: United NationsStatistical Division; WQI: Water quality index.
Competing interestsThe authors declare that they have no competing interests.
Authors' contributionsPPK was involved in the design of the study, carried out theexperimentations, collected the samples, performed the graphical and
statistical analyses, and drafted the manuscript. MRI guided the whole study.MHH was involved in the design of the study. TFTY carried out the wateranalysis test at the MICET environmental laboratory. All authors read andapproved the final manuscript.
Authors' informationPPK is a senior lecturer at Universiti Kuala Lumpur, Malaysia, currently doinghis PhD study with IPROM, Universiti Kuala Lumpur. This research paper is apart of his PhD program. MRI is an associate professor and Deputy Dean forIPROM and is also the PhD supervisor for PPK. MHH is a senior professor ofUniversity Malaya and Co-supervisor for PPK. TFTY is a Senior Lecturer withMICET, Universiti Kuala Lumpur, and is also the Head of Section for theEnvironmental Engineering Department.
AcknowledgmentsThe current research is funded by the Short Term Research Grant (STRG)from Universiti Kuala Lumpur to carry out studies in manufacturing and onthe environment.
Author details1Institute of Product Design & Manufacturing, IPROM, Universiti KualaLumpur, Kuala Lumpur 56100, Malaysia. 2Department of MechanicalEngineering, University of Malaya, Kuala Lumpur 50603, Malaysia. 3MalaysianInstitute of Chemical & Bio Engineering Technology, MICET, Universiti KualaLumpur, Alor Gajah, Melaka 78000, Malaysia.
Received: 11 April 2012 Accepted: 29 August 2012Published: 18 September 2012
References1. Ensearch: Environmental management for SMIs/SMEs. SMI/SME Business
Directory, SMI/SME Editorial. http://www.smibusinessdirectory.com.my/smisme-editorial/more/safetyhealthenvironmentalissues/389-environmental-management-for-smissmes.html (2008)
2. UNEP: Industry and Environment. 26 (2003). No. 43. Amin, A, Ahmad, T, Ehsanullah, M, Irfanullah, Khatak, Khan, MA: Evaluation of
industrial and city effluent quality using physicochemical and biologicalparameters. EJEAFChe 9(5), 931–939 (2010)
4. The United Nations Statistics Division: UNSD/UNEP questionnaires onenvironment statistics, waste section. (). http://unstats.un.org/unsd/environment/hazardous.htm. (2011)
5. Wallinder, IO, Bertling, S, Kleja, B, Leygraf, C: Corrosion-induced release andenvironmental interaction of chromium, nickel and iron from stainless steel.Water, Air, and Soil Pollution 170, 17–35 (2006)
6. Department of Environment: Classification of Malaysian rivers, final reporton development of water quality criteria and standards of Malaysia, (PhaseIV-River classification). (1994). Department of Environment Malaysia, Ministryof Science, Technology and the Environment
7. Khan, S, Noor, M: Investigation of pollutants in waste water of HayatabadIndustrial Estate Peshawar. Pakistan Journal of Agriculture Sciences 2,457–461 (2002)
8. Ministry of Natural Resources and Environment Malaysia: Study on the riverwater quality trends and indexes in peninsular Malaysia. Water ResourcesPublication No. 21, Water Resources Management and Hydrology Division,Department of Irrigation and Drainage. (2009)

Kovoor et al. International Journal of Energy and Environmental Engineering 2012, 3:21 Page 12 of 12http://www.journal-ijeee.com/content/3/1/21
9. Samudro, G, Mangkoedihardjo, S: Review on BOD, COD and BOD/COD ratio:a triangle zone for toxic, biodegradable and stable levels. InternationalJournal of Academic Research. 2, 4 (2010)
10. Mangkoedihardjo, S: Biodegradability improvement of industrial wastewaterusing hyacinth. Journal of Applied Sciences. 6(6), 1409–1414 (2006)
11. Jack, PJ, Abdsalam, AT, Khalifa, NS: Assessment of dissolved oxygen incoastal waters of Benghazi. Libya. J. Black Sea/Mediterranean Environment15, 135–150 (2009)
12. Said, A, Stevens, DK, Sehlke, G: An innovative index for evaluating waterquality in streams. Environ Manage 34(3), 406–414 (2004)
13. Avvannavar, SM, Shrihari, S: Evaluation of water quality index for drinkingpurposes for river Netravathi. South India, Environmental Monitoring andAssessment, Mangalore (2007)
14. Sisodia, R, Chaturbhuj, M: Assessment of water quality index of wetlandKalakho Lake, Rajasthan. India. Journal of Environmental Hydrology. 14,23 (2006)
15. Tariq, M, Ali, M, Shah, Z: Characteristics of industrial effluents and theirpossible impacts on quality of underground water. Soil & Environ. 25(1),64–69 (2006)
16. Handbook of Environmentally Conscious Mechanical Design:Environmentally Conscious Manufacturing. Prevention of MetalworkingFluid Pollution: Environmentally Conscious Manufacturing at the MachineTool, 2nd edn. Wiley, New York (2000)
17. USEPA: Pollution prevention in machining and metal fabrication: a manualfor technical assistance providers. NEWMOA (2001). http://www.newmoa.org/prevention/topichub/23/newmoamanual.pdf
18. Gauthier, SL: Metalworking fluids: oil mist and beyond. Appl Occup EnvironHyg 18, 818–824 (2003)
19. National Institute for Occupational Safety and Health (NIOSH): MetalworkingFluids. Centers for Disease Control and Prevention. Atlanta. http://[email protected]. Accessed January 2012
20. Phiri, O: Assessment of the impact of industrial effluents on water quality ofreceiving rivers in urban areas of Malawi. Int. J. Environ. Sci. Tech. 2(3),237–244 (2005)
21. Ogedengbe, K, Akinbile, CO: Comparative analysis of the impact of industrialand agricultural effluent on Ona Stream in Ibadan. Nigeria. New YorkScience Journal. 3, 7 (2010)
22. Kanu, I, Jeoma, P, Achi, OK: Industrial effluents and their impact on waterquality of receiving rivers in Nigeria. Journal of Applied Technology inEnvironmental Sanitation 1(1), 75–86 (2011)
23. Kumara, P, Kumar, S, Agarwal, A: Impact of industrial effluents on waterquality of Behgul River at Bareilly. Advances in Bioresearch. 1(2), 127–130(2010)
doi:10.1186/2251-6832-3-21Cite this article as: Kovoor et al.: A study conducted on the impact ofeffluent waste from machining process on the environment by wateranalysis. International Journal of Energy and Environmental Engineering 20123:21.
Submit your manuscript to a journal and benefi t from:
7 Convenient online submission
7 Rigorous peer review
7 Immediate publication on acceptance
7 Open access: articles freely available online
7 High visibility within the fi eld
7 Retaining the copyright to your article
Submit your next manuscript at 7 springeropen.com
Related Documents