1 ( ) , , . . . 102410028 . & ( , ) 20102012

Welcome message from author
This document is posted to help you gain knowledge. Please leave a comment to let me know what you think about it! Share it to your friends and learn new things together.
Transcript
8102019 A Study A Study On Financial Performance Analysis With Reference To Kesoram Cementon Financial Performance hellip
httpslidepdfcomreaderfulla-study-a-study-on-financial-performance-analysis-with-reference-to-kesoram 181
1
991260983105 983123983124983125983108983129 983119983118 983110983113983118983105983118983107983113983105983116 983120983109983122983110983119983122983117983105983118983107983109 983105983118983105983118983116983129983123983113983123991261
(983127983113983124983112 983122983109983110983109983122983109983118983107983109 983124983119 983115983109983123983119983122983105983117 983107983109983117983109983118983124)
983105 983120983154983151983146983141983139983156 983154983141983152983151983154983156 983155983157983138983149983145983156983156983141983140 983156983151 983114983137983159983137983144983137983154983148983137983148 983118983141983144983154983157 983124983141983139983144983150983151983148983151983143983145983139983137983148 983125983150983145983158983141983154983155983145983156983161 983112983161983140983141983154983137983138983137983140 983142983151983154 983156983144983141
983137983159983137983154983140 983151983142 983140983141983143983154983141983141
983117983105983123983124983109983122 983119983110 983106983125983123983113983118983109983123983123 983105983108983117983113983118983113983123983124983122983105983124983113983119983118
983106983161
983117983126983113983115983122983105983117 983123983113983118983111983112
983122983141983143 983118983151 102419831090028
983125983150983140983141983154 983156983144983141 983111983157983145983140983137983150983139983141 983151983142
983120983154983151983142 983115983126983123 983122983105983114983125
983108983141983152983137983154983156983149983141983150983156 983151983142 983117983137983150983137983143983141983149983141983150983156 983123983156983157983140983145983141983155
983111983151983147983137983154983137983146983157 983122983137983150983143983137983154983137983146983157 983113983150983155983156983145983156983157983156983141 983151983142 983109983150983143983145983150983141983141983154983145983150983143 amp 983124983141983139983144983150983151983148983151983143983161
(983105983142983142983145983148983145983137983156983141983140 983156983151 983114983137983159983137983144983137983154983148983137983148 983124983141983139983144983150983151983148983151983143983145983139983137983148 983125983150983145983158983141983154983155983145983156983161 983112983161983140983141983154983137983138983137983140)
983112983161983140983141983154983137983138983137983140
20109830852012
8102019 A Study A Study On Financial Performance Analysis With Reference To Kesoram Cementon Financial Performance hellip
httpslidepdfcomreaderfulla-study-a-study-on-financial-performance-analysis-with-reference-to-kesoram 281
2
8102019 A Study A Study On Financial Performance Analysis With Reference To Kesoram Cementon Financial Performance hellip
httpslidepdfcomreaderfulla-study-a-study-on-financial-performance-analysis-with-reference-to-kesoram 381
3
8102019 A Study A Study On Financial Performance Analysis With Reference To Kesoram Cementon Financial Performance hellip
httpslidepdfcomreaderfulla-study-a-study-on-financial-performance-analysis-with-reference-to-kesoram 481
4
DECLARATION
I hereby declare that the project entitled ldquoA study on financial performance
analysis aatt KKeessoorraamm CCeemmeennttrdquo submitted in partial fulfillment of the requirements for
award of the degree of MBA at Gokaraju Rangaraju Institute of Engineering and
Technology affiliated to Jawaharlal Nehru Technological University Hyderabad is
an authentic work and has not been submitted to any other UniversityInstitute for
award of any degreediploma
MVIKRAM SINGH
(10241e0028)
MBA GRIET
HYDERABAD
8102019 A Study A Study On Financial Performance Analysis With Reference To Kesoram Cementon Financial Performance hellip
httpslidepdfcomreaderfulla-study-a-study-on-financial-performance-analysis-with-reference-to-kesoram 581
5
ACKNOWLEDGEMENT
Firstly I would like to express our immense gratitude towards our institution
Gokaraju Rangaraju Institute of Engineering amp Technology which created a great
platform to attain profound technical skills in the field of MBA thereby fulfilling our most
cherished goal
I would thank all the finance department of Kesoram specially Mr MURTHY ASST
Manager Finance for guiding me and helping me in successful completion of the project
I am very much thankful to our Prof KVS RAJU (Internal Guide) sir for extending
his cooperation in doing this project
I am also thankful to our project coordinator Prof S RAVINDRA CHARY for
extending his cooperation in completion of Project
I convey my thanks to my beloved parents and my faculty who helped me directly or
indirectly in bringing this project successfully
M VIKRAM SINGH
(102419831090028)
8102019 A Study A Study On Financial Performance Analysis With Reference To Kesoram Cementon Financial Performance hellip
httpslidepdfcomreaderfulla-study-a-study-on-financial-performance-analysis-with-reference-to-kesoram 681
6
INDEX
SNo Contents Page No
Chapter-1 1-8
Introduction
Need of the Study
Objectives of the Study
Methodology of the Study
Limitations of the Study
Chapter-2 9-28
Industry Profile
Company Profile
Chapter-3 29-38
Review of Literature
Chapter-4 39-68
Data Analysis And Interpretation
Chapter-5 69-71
Findings
Suggestions
Chapter-6 72-75
Annexure
Bibliography
8102019 A Study A Study On Financial Performance Analysis With Reference To Kesoram Cementon Financial Performance hellip
httpslidepdfcomreaderfulla-study-a-study-on-financial-performance-analysis-with-reference-to-kesoram 781
7
CHAPTER-I
INTRODUCTION
8102019 A Study A Study On Financial Performance Analysis With Reference To Kesoram Cementon Financial Performance hellip
httpslidepdfcomreaderfulla-study-a-study-on-financial-performance-analysis-with-reference-to-kesoram 881
8
Introduction-
The term lsquofinancial performance analysis also known as analysis and interpretation
of financial statementsrsquo refers to the process of determining financial strength and
weaknesses of the firm by establishing strategic relationship between the items of the
balance sheet profit and loss account and other operative data
ldquoFinancial performance analysis is a process of evaluating the relationship between
component parts of a financial statement to obtain a better understanding of a firmrsquos
position and performance
The purpose of financial analysis is to diagnose the information contained in
financial statements so as to judge the profitability and financial soundness of the firm Just
like a doctor examines his patient by recording his body temperature blood pressure etc
Before making his conclusion regarding the illness and before giving his treatment A
financial analyst analyses the financial statements with various tools of analysis before
commenting upon the financial health or weaknesses of an enterprise
The analysis and interpretation of financial statements is essential to bring out the
mystery behind the figures in financial statements Financial statements analysis is an
attempt to determine the significance and meaning of the financial statement data so that
forecast may be made of the future earnings ability to pay interest and debt maturities (both
current and long term) and profitability of a sound divided policy
Financial performance refers to the act of performing financial activity In broader sense
financial performance refers to the degree to which financial objectives being or has been
accomplished It is the process of measuring the results of a firms policies and operations in
monetary terms It is used to measure firms overall financial health over a given period oftime and can also be used to compare similar firms across the same industry or to compare
industries or sectors in aggregation
In short the firm itself as well as various interested groups such as managers
shareholders creditors tax authorities and others seeks answers to the
Following important questions
8102019 A Study A Study On Financial Performance Analysis With Reference To Kesoram Cementon Financial Performance hellip
httpslidepdfcomreaderfulla-study-a-study-on-financial-performance-analysis-with-reference-to-kesoram 981
9
1 What is the financial position of the firm at a given point of time
2 How is the financial performance of the firm over a given period
Of time
These questions can be answered with the help of financial analysis of a firm Financial
analysis involves the use of financial statements A financial statement is an organized
collection of data according to logical and conceptual framework 50 consistent accounting
procedures Its purpose is to convey an understanding of some financial aspects of a
business firm It may show a position at a moment of time as in the case of a balance sheet
or may reveal a series of activities over a given period of time as in the case of an income
statement
Thus the term lsquofinancial statementsrsquo generally refers to two basic statements
The balance sheet and the income statement
The balance sheet shows the financial position (condition) of the firm at a given point of
time It provides a snapshot and may be regarded as a static picture
ldquoBalance sheet is a summary of a firmrsquos financial position on a given date that
Shows total assets = total liabilities + ownerrsquos equityrdquo
The income statement (referred to in India as the profit and loss statement) reflects the
performance of the firm over a period of time
ldquoIncome statement is a summary of a firmrsquos revenues and expenses over a specified period
ending with net income or loss for the periodrdquo
However financial statements do not reveal all the information related to the financial
operations of a firm but they furnish some extremely useful information which highlights
two important factors profitability and financial soundness Thus analysis of financial
statements is an important aid to financial performance analysis Financial performance
analysis includes analysis and interpretation of financial statements in such a way that it
Undertakes full diagnosis of the profitability and financial soundness of the business
ldquoThe analysis of financial statements is a process of evaluating the relationship between
component parts of financial statements to obtain a better understanding of the firmrsquos
position and performancerdquo
8102019 A Study A Study On Financial Performance Analysis With Reference To Kesoram Cementon Financial Performance hellip
httpslidepdfcomreaderfulla-study-a-study-on-financial-performance-analysis-with-reference-to-kesoram 1081
10
Need for Study
Need Of Financial Management Study To Diagnose The Information Contain In
Financial Statement So as To Judge the Profitability and Financial Position of the
Firm
Financial Analyst Analyses The Financial Statements With Various Tools Of
Analysis Before Commanding Upon The Financial Health Of The Firm
Essential to Bring Out the History
Significance and Meaning of the Financial Statements
8102019 A Study A Study On Financial Performance Analysis With Reference To Kesoram Cementon Financial Performance hellip
httpslidepdfcomreaderfulla-study-a-study-on-financial-performance-analysis-with-reference-to-kesoram 1181
11
Objectives
1 To understand the financial statements of Kesoram cement
2 To study the change in assets and liabilities of the company
3 To study the liquidity position of the firm
4 To study the financial health of the company using ratio analysis
5 To study the profitability of the company
6 To offer suggestions to the company
8102019 A Study A Study On Financial Performance Analysis With Reference To Kesoram Cementon Financial Performance hellip
httpslidepdfcomreaderfulla-study-a-study-on-financial-performance-analysis-with-reference-to-kesoram 1281
12
Significance of Financial Performance Analysis
Interest of various related groups is affected by the financial performance of a firm
Therefore these groups analyze the financial performance of the firm The type of analysis
varies according to the specific interest of the party involved
Trade creditors interested in the liquidity of the firm (appraisal of firmrsquos liquidity)
Bond holders interested in the cash-flow ability of the firm (appraisal of firmrsquos capital
structure the major sources and uses of funds profitability over time and projection of
future profitability)
Investors interested in present and expected future earnings as well as stability of these
earnings (appraisal of firmrsquos profitability and financial condition)
Management interested in internal control better financial condition and betterperformance (appraisal of firmrsquos present financial condition evaluation of opportunities in
relation to this current position return on investment provided by various assets of the
company etc)
Research Methodology
Research Design
This is a systematic way to solve the research problem and it is important
component for the study without which researches may not be able to obtain the format A
research design is the arrangement of conditions for collection and analysis of data in a
manager that aims to combine for collection and analysis of data relevance to the research
purpose with economy in procedure
Meaning of Research Design
The formidable problem that follows the task of defining the research problem is the
preparation of design of the research project popularly known as the research design
decision regarding what where when how much by what means concerning an inquiry of
a research study constitute a research design A research design is the arrangement of
conditions for collection and analysis of data in a manager that aims to combine for
collection and analysis of data relevance to the research purpose with economy in
procedure
8102019 A Study A Study On Financial Performance Analysis With Reference To Kesoram Cementon Financial Performance hellip
httpslidepdfcomreaderfulla-study-a-study-on-financial-performance-analysis-with-reference-to-kesoram 1381
13
Sources of Data
Data we collected based on two sources
Primary Data
Secondary Data
Primary Data
The Primary Data Are Those Informationrsquos which are Collected afresh and for the
First Time And Thus Happen to Be Original in Character
Secondary Data
The secondary data are those which have already been collected by some other agency and
which have already been processed The sources of secondary data are annual reports
browsing internet through magazines
1 It includes data gathered from the annual reports of Kesoram
2 Articles are collected from official website of Kesoram
Methodology Used
Types Of Financial Statements Adopted
Following Two Types of Financial Statements Are Commonly Used in
Analyzing the Firmrsquos Financial Position
a Balance Sheet
b Income Statements
8102019 A Study A Study On Financial Performance Analysis With Reference To Kesoram Cementon Financial Performance hellip
httpslidepdfcomreaderfulla-study-a-study-on-financial-performance-analysis-with-reference-to-kesoram 1481
14
Limitations of Financial Statement
Each Project Gives Rise to Its Own Unique Risks And Hence Possess Its Own Unique
Challenges
1 Only Interim Reports
Only interim statements donrsquot give a final picture of the concern The data given in
these statements is only approximate The actual position can only be determined when the
business is sold or liquidated
2 Donrsquot Give Extra Position
The Financial Statements Are Expressed In Monetary Values So They Appear To
Give Final And Accurate Position The Values Of Fixed Assets In The Balance Sheet
Neither Represent The Value For Which Fixed Assets Can Be Sold Nor The Amount Which
Will Be Required To Replace These Assets
3 Historical Costs
The Financial Statements Are Prepared On The Basis Of Historical Costs Or
Original Costs The Value of Assets Decreases with the Passage of Time Current Price
Changes Are Not Taken Into Account The Statements Are Not Prepared Keeping In View
The Present Economic Conditions The Balance Sheet Loses The Significance Of Being An
Index Of Current Economic Realities
4 Act of non monitory factors Ignored
There are certain factors which have a bearing on the financial position and
operating results of the business but they donrsquot become a part of these statements because
they canrsquot be measured in monetary terms Such factors may include in the reputation of the
management
No Precision
The precision of financial statement data is not possible because the statements deal with
matters which canrsquot be precisely stated The data are recorded by conventional procedures
followed over the years Various conventions postulates personal judgments etc
8102019 A Study A Study On Financial Performance Analysis With Reference To Kesoram Cementon Financial Performance hellip
httpslidepdfcomreaderfulla-study-a-study-on-financial-performance-analysis-with-reference-to-kesoram 1581
15
CHAPTER-II
INDUSTRY PROFILE
amp
COMPANY PROFILE
8102019 A Study A Study On Financial Performance Analysis With Reference To Kesoram Cementon Financial Performance hellip
httpslidepdfcomreaderfulla-study-a-study-on-financial-performance-analysis-with-reference-to-kesoram 1681
16
Industry Profile
In the most general sense of the word cement is a binder a substance which
sets and hardens independently and can bind other materials together The word cement
traces to the Romans who used the term opus caementicium to describe masonry whichresembled concrete and was made from crushed rock with burnt lime as binder The
volcanic ash and pulverized brick additives which were added to the burnt lime to obtain a
hydraulic binder were later referred to as cementum and cement Cements used in
construction are characterized as hydraulic or non-hydraulic
The most important use of cement is the production of mortar and concretemdashthe bonding of
natural or artificial aggregates to form a strong building material which is durable in the
face of normal environmental effects
Concrete should not be confused with cement because the term cement refers only to the dry
powder substance used to bind the aggregate materials of concrete Upon the addition of
water andor additives the cement mixture is referred to as concrete especially if aggregates
have been added
It is uncertain where it was first discovered that a combination of hydrated non-hydraulic
lime and a pozzolan produces a hydraulic mixture (see also Pozzolanic reaction) but
concrete made from such mixtures was first used on a large scale by engineers They used
both natural pozzolans (trass or pumice) and artificial pozzolans (ground brick or pottery) in
these concretes Many excellent examples of structures made from these concretes are still
standing notably the huge monolithic dome of the Pantheon in Rome and the massive Baths
of Caracalla The vast system of Roman aqueducts also made extensive use of hydraulic
cement The use of structural concrete disappeared in medieval Europe although weak
pozzolanic concretes continued to be used as a core fill in stone walls and columns
Modern cement
Modern hydraulic cements began to be developed from the start of the Industrial Revolution
(around 1800) driven by three main needs
Hydraulic renders for finishing brick buildings in wet climates
Hydraulic mortars for masonry construction of harbor works etc in contact with sea water
Development of strong concretes
In Britain particularly good quality building stone became ever more expensive during a
period of rapid growth and it became a common practice to construct prestige buildings
8102019 A Study A Study On Financial Performance Analysis With Reference To Kesoram Cementon Financial Performance hellip
httpslidepdfcomreaderfulla-study-a-study-on-financial-performance-analysis-with-reference-to-kesoram 1781
17
from the new industrial bricks and to finish them with a stucco to imitate stone Hydraulic
limes were favored for this but the need for a fast set time encouraged the development of
new cements Most famous was Parkers Roman cement This was developed by James
Parker in the 1780s and finally patented in 1796 It was in fact nothing like any material
used by the Romans but was ldquoNatural cement made by burning septaria - nodules that are
found in certain clay deposits and that contain both clay minerals and calcium carbonate
The burnt nodules were ground to a fine powder This product made into a mortar with
sand set in 5ndash15 minutes The success of Roman Cement led other manufacturers to
develop rival products by burning artificial mixtures of clay and chalk
John Smeaton made an important contribution to the development of cements when he was
planning the construction of the third Eddystone Lighthouse (1755-9) in the English
Channel He needed a hydraulic mortar that would set and develop some strength in the
twelve hour period between successive high tides He performed an exhaustive market
research on the available hydraulic limes visiting their production sites and noted that the
hydraulicity of the lime was directly related to the clay content of the limestone from
which it was made Smeaton was a civil engineer by profession and took the idea no
further Apparently unaware of Smeatons work the same principle was identified by Louis
Vicat in the first decade of the nineteenth century Vicat went on to devise a method of
combining chalk and clay into an intimate mixture and burning this produced an artificial
cement in 1817 James Frost working in Britain produced what he called British cement
in a similar manner around the same time but did not obtain a patent until 1822 In 1824
Joseph Aspdin patented a similar material which he called Portland cement because the
render made from it was in color similar to the prestigious Portland stone
All the above products could not compete with limepozzolan concretes because of fast-
setting (giving insufficient time for placement) and low early strengths (requiring a delay of
many weeks before formwork could be removed) Hydraulic limes natural cements and
artificial cements all rely upon their belite content for strength development Belite
develops strength slowly Because they were burned at temperatures below 1250 degC they
contained no alite which is responsible for early strength in modern cements The first
cement to consistently contain alite was made by Joseph Aspdins son William in the early
1840s This was what we call today modern Portland cement Because of the air of
mystery with which William Aspdin surrounded his product others (eg Vicat and I C
Johnson) have claimed precedence in this invention but recent analysis of both his concrete
8102019 A Study A Study On Financial Performance Analysis With Reference To Kesoram Cementon Financial Performance hellip
httpslidepdfcomreaderfulla-study-a-study-on-financial-performance-analysis-with-reference-to-kesoram 1881
18
and raw cement have shown that William Aspdins product made at North fleet Kent was a
true alite-based cement However Aspdins methods were rule-of-thumb Vicat is
responsible for establishing the chemical basis of these cements and Johnson established
the importance of sintering the mix in the kiln
William Aspdins innovation was counter-intuitive for manufacturers of artificial cements
because they required more lime in the mix (a problem for his father) because they required
a much higher kiln temperature (and therefore more fuel) and because the resulting clinker
was very hard and rapidly wore down the millstones which were the only available grinding
technology of the time Manufacturing costs were therefore considerably higher but the
product set reasonably slowly and developed strength quickly thus opening up a market for
use in concrete The use of concrete in construction grew rapidly from 1850 onwards and
was soon the dominant use for cements Thus Portland cement began its predominant role
It is made from water and sand
Types of modern cement
Portland cement
Cement is made by heating limestone (calcium carbonate) with small quantities of other
materials (such as clay) to 1450degC in a kiln in a process known as calcination whereby a
molecule of carbon dioxide is liberated from the calcium carbonate to form calcium oxide
or lime which is then blended with the other materials that have been included in the mix
The resulting hard substance called clinker is then ground with a small amount of gypsum
into a powder to make Ordinary Portland Cement the most commonly used type of cement
(often referred to as OPC)
Portland cement is a basic ingredient of concrete mortar and most non-speciality grout The
most common use for Portland cement is in the production of concrete Concrete is a
composite material consisting of aggregate (gravel and sand) cement and water As a
construction material concrete can be cast in almost any shape desired and once hardened
can become a structural (load bearing) element Portland cement may be gray or whitePortland cement blends
These are often available as inter-ground mixtures from cement manufacturers but similar
formulations are often also mixed from the ground components at the concrete mixing plant
Portland blast furnace cement contains up to 70 ground granulated blast furnace slag
with the rest Portland clinker and a little gypsum All compositions produce high ultimate
8102019 A Study A Study On Financial Performance Analysis With Reference To Kesoram Cementon Financial Performance hellip
httpslidepdfcomreaderfulla-study-a-study-on-financial-performance-analysis-with-reference-to-kesoram 1981
19
strength but as slag content is increased early strength is reduced while sulfate resistance
increases and heat evolution diminishes Used as an economic alternative to Portland
sulfate-resisting and low-heat cements
Portland fly ash cement contains up to 30 fly ash The fly ash is pozzolanic so that
ultimate strength is maintained Because fly ash addition allows lower concrete water
content early strength can also be maintained Where good quality cheap fly ash is
available this can be an economic alternative to ordinary Portland cement
Portland pozzolan cement includes fly ash cement since fly ash is a pozzolan but also
includes cements made from other natural or artificial pozzolans In countries where
volcanic ashes are available (eg Italy Chile Mexico and the Philippines) these cements
are often the most common form in use
Portland silica fume cement Addition of silica fume can yield exceptionally high
strengths and cements containing 5-20 silica fume are occasionally produced However
silica fume is more usually added to Portland cement at the concrete mixer
Masonry cements are used for preparing bricklaying mortars and stuccos and must not be
used in concrete They are usually complex proprietary formulations containing Portland
clinker and a number of other ingredients that may include limestone hydrated lime air
entrainers retarders water proofers and coloring agents They are formulated to yield
workable mortars that allow rapid and consistent masonry work Subtle variations of
Masonry cement in the US are Plastic Cements and Stucco Cements These are designed to
produce controlled bond with masonry blocks
Expansive cements contain in addition to Portland clinker expansive clinkers (usually
sulfoaluminate clinkers) and are designed to offset the effects of drying shrinkage that is
normally encountered with hydraulic cements This allows large floor slabs (up to 60 m
square) to be prepared without contraction joints
White blended cements may be made using white clinker and white supplementary
materials such as high-purity metakaolin
Colored cements are used for decorative purposes In some standards the addition of
pigments to produce colored Portland cement is allowed In other standards (eg ASTM)
pigments are not allowed constituents of Portland cement and colored cements are sold as
blended hydraulic cements
Very finely ground cements are made from mixtures of cement with sand or with slag or
other pozzolan type minerals which are extremely finely ground together Such cements can
8102019 A Study A Study On Financial Performance Analysis With Reference To Kesoram Cementon Financial Performance hellip
httpslidepdfcomreaderfulla-study-a-study-on-financial-performance-analysis-with-reference-to-kesoram 2081
have the same physical characteristics as normal cement but with 50 less cement
particularly due to their increased surface area for the chemical reaction Even with
intensive grinding they can use up to 50 less energy to fabricate than ordinary Portland
cements
Non-Portland hydraulic cements
Pozzolan-lime cements Mixtures of ground Pozzolan and lime are the cements used by the
Romans and are to be found in Roman structures still standing (eg the Pantheon in Rome)
They develop strength slowly but their ultimate strength can be very high The hydration
products that produce strength are essentially the same as those produced by Portland
cement
Slag-lime cements Ground granulated blast furnace slag is not hydraulic on its own but is
activated by addition of alkalis most economically using lime They are similar to
pozzolan lime cements in their properties Only granulated slag (ie water-quenched glassy
slag) is effective as a cement component
Super sulfated cements These contain about 80 ground granulated blast furnace slag
15 gypsum or anhydrite and a little Portland clinker or lime as an activator They produce
strength by formation of ettringite with strength growth similar to a slow Portland cement
They exhibit good resistance to aggressive agents including sulfate
Calcium aluminate cements are hydraulic cements made primarily from limestone and
bauxite The active ingredients are monocalcium aluminate CaAl2O4 (CaO middot Al2O3 or CA in
Cement chemist notation CCN) and mayenite Ca12Al14O33 (12 CaO middot 7 Al2O3 or C12A7 in
CCN) Strength forms by hydration to calcium aluminate hydrates They are well-adapted
for use in refractory (high-temperature resistant) concretes eg for furnace linings
Calcium sulfoaluminate cements are made from clinkers that include yeelimite (Ca4
(AlO2)6SO4 or C4A3 in Cement chemists notation) as a primary phase They are used in
expansive cements in ultra-high early strength cements and in low-energy cements
Hydration produces ettringite and specialized physical properties (such as expansion or
rapid reaction) are obtained by adjustment of the availability of calcium and sulfate ionsTheir use as a low-energy alternative to Portland cement has been pioneered in China
where several million tonnes per year are produced Energy requirements are lower because
of the lower kiln temperatures required for reaction and the lower amount of limestone
(which must be endothermically decarbonated) in the mix In addition the lower limestone
8102019 A Study A Study On Financial Performance Analysis With Reference To Kesoram Cementon Financial Performance hellip
httpslidepdfcomreaderfulla-study-a-study-on-financial-performance-analysis-with-reference-to-kesoram 2181
21
content and lower fuel consumption leads to a CO2 emission around half that associated
with Portland clinker However SO2 emissions are usually significantly higher
Natural Cements correspond to certain cements of the pre-Portland era produced by
burning argillaceous limestones at moderate temperatures The level of clay components in
the limestone (around 30-35) is such that large amounts of belite (the low-early strength
high-late strength mineral in Portland cement) are formed without the formation of
excessive amounts of free lime As with any natural material such cements have highly
variable properties
Geopolymer cements are made from mixtures of water-soluble alkali metal silicates and
aluminosilicate mineral powders such as fly ash and metakaolin
8102019 A Study A Study On Financial Performance Analysis With Reference To Kesoram Cementon Financial Performance hellip
httpslidepdfcomreaderfulla-study-a-study-on-financial-performance-analysis-with-reference-to-kesoram 2281
22
COMPANY PROFILE
8102019 A Study A Study On Financial Performance Analysis With Reference To Kesoram Cementon Financial Performance hellip
httpslidepdfcomreaderfulla-study-a-study-on-financial-performance-analysis-with-reference-to-kesoram 2381
23
Kesoram Cement Industry is one of the leading manufacturers of cement in India It is a day
process cement Plant The plant capacity is 826 lakh tones per annum It is located at
Basanthnagar in Karimnagar district of Andhra Pradesh Basanthnagar is 8 km away from
the Ramagundam Railway station linking Madras to New Delhi The Chairman of the
Company is BKBirla
History
The first unit at Basanthnagar with a capacity of 21 lakh tones per annum
incorporating humble suspension preheated system was commissioner during the year 1969
The second unit was setup in year 1971 with a capacity of 21 lakh tones per annum went on
stream in the year 1978 The coal for this company is being supplied from Singgareni
Collieries and the power is obtained from APSEB The power demand for the factory is
about 21 MW Kesoram has got 2 DG sets of 4 MW each installed in the year 1987
Kesoram Cement has setup a 15 KW captor power plant to facilitate for
uninterrupted power supply for manufacturing of cement at 24th
august 1997 per hour 12
mw actual power is 15 mw
The Company was incorporated on 18th October 1919 under the Indian Companies Act
1913 in the name and style of Kesoram Cotton Mills Ltd It had a Textile Mill at 42
Garden Reach Road Calcutta 700 024 The name of the Company was changed to Kesoram
Industries amp Cotton Mills Ltd on 30th
August 1961 and the same was further changed to Kesoram Industries Limited on 9th July
1986 The said Textile Mill at Garden Reach Road was eventually demerged into a separate
company
The First Plant for manufacturing of rayon yarn was established at Tribeni District
Hooghly West Bengal and the same was commissioned in December 1959 and the second
plant was commissioned in the year 1962 enabling it to manufacture 4635 metric tons perannum (mtpa) of rayon yarn This Unit has 6500 metric tons per annum (mtpa) capacity as
on 3132009
The plant for manufacturing of transparent paper was also set up at the same location at
Tribeni District Hooghly West Bengal in June 1961 It has the annual capacity to
manufacture 3600 metric tons per annum (mtpa) of transparent Paper
8102019 A Study A Study On Financial Performance Analysis With Reference To Kesoram Cementon Financial Performance hellip
httpslidepdfcomreaderfulla-study-a-study-on-financial-performance-analysis-with-reference-to-kesoram 2481
24
The Company diversified into manufacturing of cast iron spun pipes and pipe fittings at
Bansberia District Hooghly West Bengal with a production capacity of 45000 metric tons
per annum (mtpa) of cast iron spun pipes and pipe fittings in December 1964
The Company subsequently diversified into the manufacturing of Cement and in 1969
established its first cement plant under the name Kesoram Cement at Basantnagar Dist
Karimnagar (Andhra Pradesh) and to take advantage of favorable market conditions in
1986 another cement plant known as Vasavadatta Cement was commissioned by it at
Sedam Dist
Gulbarga (Karnataka) The cement manufacturing capacities at both the plants were
augmented from time to time according to the market conditions and as on 3132009
Kesoram Cement and Vasavadatta Cement have annual cement manufacturing capacities of
15 million metric tons and 41 million metric tons respectively
The Company in March 1992 commissioned a plant at Balasore known as Birla Tyres in
Orissa for manufacturing of 10 lakh mtpa automotive tyres and tubes in the first phase in
collaboration with Pirelli Ltd UK a subsidiary company of the world famous Pirelli
Group of Italy - a pioneer in production and development of automotive tyres in the world
The capacity at the said plant was further augmented during the year by 19 MT per day
aggregating to 271 MT per day production facility The Greenfield Project of 257 MT per
day capacity in the State of Uttarakhand with a capex of about Rs760 crores commenced
the commercial production in phases during the financial year 2008-09The Company as on
3132009 had the manufacturing capacities of 371 million tyres 295 million tubes and
153 million flaps per annum in the Plants including at Uttarakhand Plant It has small
manufacturing capacities of various Chemicals at Kharda in the State of West Bengal also
It has the annual manufacturing capacities of 12410 mtpa of Caustic Soda Lye 5045 mtpa
of Liquid Chlorine 6205 mtpa of Sodium Hypochlorite 8200 mtpa of Hydrochloric Acid
3200 mtpa of Ferric Alum 18700 mtpa of Sulphuric Acid and 1620000 m3pa of purified
Hydrogen Gas
The Company is a well-diversified entity in the fields of Cement Tyre Rayon Yarn
Transparent Paper Spun Pipes and Heavy Chemicals with two core business segments ie
Cement and Tyres
8102019 A Study A Study On Financial Performance Analysis With Reference To Kesoram Cementon Financial Performance hellip
httpslidepdfcomreaderfulla-study-a-study-on-financial-performance-analysis-with-reference-to-kesoram 2581
25
In Spun Pipes amp Foundries a unit of the Company work suspended from 2nd May 2008
still commences till further notice
The Company as of now is listed on three major Stock Exchanges in India ie Bombay
Stock Exchange Ltd Mumbai Calcutta Stock Exchange Association Ltd Kolkata and
National Stock Exchange of India Ltd Mumbai and at the Societe de la Bourse de
Luxembourg Luxembourg
A further expansion upto 165 million tons of cement per annum in Vasavadatta Cement at
Sedam in Karnataka as unit IV at the same site is in progress with a 175 MW Captive
Power Plant involving a capital expenditure of about Rs 78350 crores (including the cost
of Captive Power Plant)
The commercial production of cement in the aforesaid unit IV has commenced in June
2009 The work for the further expansion in the Tyres Section at Uttarakhand for radial
tyres with 100 MT per day capacity and bias tyres with 125 MT per day capacity involving
an estimated aggregate capital outlay of about Rs 840 crores is under progress The Board
has further approved a Motor Cycle Tyre Project of 70 MT per day capacity at the same site
involving a capital outlay of Rs190 crore The civil construction of both the Projects is in
full swing The commercial production in both the Projects is likely to start by December
2009 January 2010
Birla Supreme in popular brand of Kesoram cement from its prestigious plant of
Basantnagar in AP which has outstanding track record In performance and productivity
serving the nation for the last two and half decades It has proved its distinction by bagging
several national awards It also has the distinction of achieving optimum capacity
utilization
Kesoram offers a choice of top quality portioned cement for light heavy
constructions and allied applications Quality is built every fact of the operations
The plant lay out is rational to begin with The limestone is rich in calcium
carbonate a key factor that influences the quality of final product The day process
technology uses in the latest computerized monitoring overseas the manufacturing process
Samples are sent regularly to the bureau of Indian standards National council of
construction and building material for certification of derived quality norms
8102019 A Study A Study On Financial Performance Analysis With Reference To Kesoram Cementon Financial Performance hellip
httpslidepdfcomreaderfulla-study-a-study-on-financial-performance-analysis-with-reference-to-kesoram 2681
26
The company has vigorously undertaking different promotional measures for
promoting their product through different media which includes the use of news papers
magazine hoarding etc
Kesoram cement industry distinguished itself among all the cement factories in
Indian by bagging the National Productivity Award consecutively for two years ie for the
year 1985-1987 The federation of Andhra Pradesh Chamber amp Commerce and Industries
(FAPCCI) also conferred on Kesoram Cement An award for the best industrial promotion
expansion efforts in the state for the year 1984 Kesoram also bagged FAPCCI awarded for
ldquoBest Family Planning Effort in the staterdquo for the year 1987-1988
One among the industrial giants in the country today serving the nation on the
industrial front Kesoram industry ltd has a checked and eventful history dating back to the
twenties when the Industrial House of Birlarsquos acquired it With only a textile mill under its
banner 1924 it grew from strength to strength and spread its activities to newer fields like
Rayon Transparent paper pipes Refractors tyres and other products
Looking to the wide gap between the demand and supply of vital commodity
cement which play in important role in National building activity the Government of India
had de-licensed the cement industry in the year 1966 with a review to attract private
entrepreneur to augment the cement production Kesoram rose to the occasions and divided
to set up a few cement plants in the country
Kesoram cement undertaking marketing activities extensively in the state of Andhra
Pradesh Karnataka Tamilnadu Kerala Maharashtra and Gujarat In AP sales Depts are
located in different areas like Karimnagar Warangal Nizamabad Vijayawada and Nellore
In other states it has opened around 10 depots
The market share of Kesoram Cement in AP is 705 The market share of the
company in various states is shown as under
STATES MARKET SHARE
Karnataka 409
Tamilnadu 094
Kerala 029
Maharashtra 281
8102019 A Study A Study On Financial Performance Analysis With Reference To Kesoram Cementon Financial Performance hellip
httpslidepdfcomreaderfulla-study-a-study-on-financial-performance-analysis-with-reference-to-kesoram 2781
27
Process and Quality Control
It has been the endeavor of Kesoram to incorporate the Worldrsquos latest technology in
the plant and today the plant has the most sophisticated
X-ray analysis
Fully computerized XRF and XRD X-RAY Analyzers keep a constant round the
clock vigil on quality
Supreme performance
One of the largest Cement Plants in Andhra Pradesh the plant incorporate the latest
technology in Cement - making
It is professionally managed and well established Cement Manufacturing Company
enjoying the confidence of the consumers Kesoram has outstanding track record in
performance and productivity with quite a few national and state awards to its credit
BIRLA SUPREME the 43 Grade Cement is a widely accepted and popular brand
in the market commanding a premium
However to meet the specific demands of the consumer Kesoram bought out the 53
grade BIRLA SUPREME ndash GOLD which has special qualities like higher fineness quick-
setting high compressive strength and durability
Supreme Strength
Kesoram Cement has huge captive Limestone Deposits which make it possible tofeed high- grade limestone consistently its natural Grey colour is anion- born ingredient
and gives good shade
Both the products offered by Kesoram ie BIRLA SUPREME-43 Grade and
BIRLA SUPREME-GOLD-53 Grade cement are outstanding with much higher
compressive strength and durability
The following characteristics show their distinctive qualities
Comprehensive
Strength
Opc 43
grls 8112
1989
Birla
Supreme 43
grade
Opc 43 gr
Is 1226987
Birla
Supreme
Gold 53 gr
3 days mpa Min 23 31 + Min 27 38+
7 days mpa Min 23 42+ Min 37 48+
28 days mpa Min 43 50+ Min 53 60+
8102019 A Study A Study On Financial Performance Analysis With Reference To Kesoram Cementon Financial Performance hellip
httpslidepdfcomreaderfulla-study-a-study-on-financial-performance-analysis-with-reference-to-kesoram 2881
28
DC SYSTEM
Clinker making process is a key step in the overall cement making process In the case of
BIRLA SUPREMEGOLD the clinker-making process is totally computer control The
Distributed Control System (DCS) constantly monitors the process and ensures operating
efficiency This eliminates variation and ensures consistency in the quality of Clinker
Physical Characteristics
Ope 43
Is 8 112-89
Birla
Supreme
43 grade
Ope 53 gr
Is 12269-87
Birla Supreme
Gold 53 gr
Setting time Min30 120-180 Min 30 130-170
a Initial (mats) Max 600 180-240 Max 600 170-220
b final (mats) Min 225 270-280 Min 225 300-320
Fincncssm 2Kg Max 10 10-20 Max 10 05-10
Soundness Max 08 004-008 Max 0080 004-02
a le-chart (mm)
b autoclave ()
Supreme Expertise
The Best Technical Team exclusive to Kesoram mans the Plant and monitors the process
to blend the cement in just the required proportions to make BIRLA SUPREMEGOLD OF
Rock Strength
18 Million Tones of Solid Foundation
Staying at the top for over a Quarter Century Quarter Century is no less an achievement
Infact Kesoram is synonymous with for over 28 years
Over the years Kesoram has dispatched 18 million tones of cement to the nook and cornersof the country and joined hands in strengthening the Nation No one else in Andhra Pradesh
has this distinction The prestigious World Bank aided Ramagundam Super Thermal Power
Project of NTPC and Mannair Dam of Pochampad project in AP arc a couple of projects for
which Kesoram Cement was exclusively uses to cite an example
8102019 A Study A Study On Financial Performance Analysis With Reference To Kesoram Cementon Financial Performance hellip
httpslidepdfcomreaderfulla-study-a-study-on-financial-performance-analysis-with-reference-to-kesoram 2981
29
Chemical Characteristics
Opc 43 gr
Is 81 132-989
Birla
Supreme
43 grade
Ope 53 gr
Is 12269-
87
Birla
Supreme
Gold 53 gr
Loss on inflection Max 5 lt16 Max 40 lt15
Insoluble residue Max 20 lt08 Max 20 lt 06
Magnesium oxide Max 60 lt 13 Max 60 lt 13
Lime saturation factor 066-102 08-09 08-102 088-09
Alumna iron ratio MinO66 15-17 MinO66 15-17
Sulfuric anhydride Max 253 16-20 Max 2 53 16-20
Alkalis Chlorides Max 005 Max 001 Max 005 Max 04
Kesoram Cement - advantages
Helps in designing sleeker and more elegant
Structures giving greater flexibility in design concept
Due to its fine quality super fine construction can be achieved Its gives maximum
strength at Minimum use of cement with water in the water cement ratio especially the 53
grade Birlas supreme-gold
Feathers in Kesorams cap
Kesoram has outstanding track record achieving over 100 capacity utilization I
productivity and energy conservation It has proved its distinction by bagging several
national and state awards noteworthy being
NATIONAL
1 National productivity award for 1985-86
2 National productivity award for 1986-87
3 National award for mines safety for 1985-86
4 National award for mines safety for 1986-875 National award for energy conservation 1989-90
8102019 A Study A Study On Financial Performance Analysis With Reference To Kesoram Cementon Financial Performance hellip
httpslidepdfcomreaderfulla-study-a-study-on-financial-performance-analysis-with-reference-to-kesoram 3081
30
STATE
1 AP State productivity award for 1988
2 State award for best industrial management 1988-89
3 Best industrial productivity award of FAPCCI (federation of AP chamber of
commerce and industry) 1991
4 Best management award of the state Govt 1993
5 FAPCCI award for the workers welfare 1995-96
ISO 9002
All quality systems of Kesoram have been certified under ISO 90021S 4002 which
proves the worldwide acceptance of the products
All quality systems in production and marketing of the product have been certified by BIS
under ISO 90021S 14002
The first unit was installed at basanthnagar with a capacity of 25 ndashlakhs TPA (tones per
annum) incorporating humble supervision preheated system during the year 1969
The second unit followed suit with added a capacity of 2 lakhs TPA in 1971
The plant was further expanded to 9 lakhs by adding 25 lakhs tones in august 1978 113
lakhs tones in January 1981 and 087 lakhs tones in September 1981
Power
Singareni collieries make the supply of coal for this industry and the power was
obtained from AP TRANSCO The power demand for the factory is about 21MW Kesoram
has got 2-diesel generator seats of 4 MW each installed in the year 1987
Kesoram cement now has a 15MWcaptive power plant to facilities for uninterrupted
power supply for manufacturing of cement
Performance
The performance of kersoram cement industry has been outstanding achieving over
cent percent capacity utilization all through despite many odds like power cuts and which
most 40 was wasted due to wagon shortage etc
The company being a continuous process industry works round the clock and has
excellent records of performance achieving over 1005 capacity utilization
Kesoram has always combined technical progress with industrial performance The
company had glorious track record for the last 27 years in the industry
Technology
8102019 A Study A Study On Financial Performance Analysis With Reference To Kesoram Cementon Financial Performance hellip
httpslidepdfcomreaderfulla-study-a-study-on-financial-performance-analysis-with-reference-to-kesoram 3181
31
Kesoram cement uses most modern technology and the computerized control in the
plant A team of dedicated and well- experienced experts manages the plant
The quality is maintained much above the bureau of Indian standards
The raw materials used for manufacturing cement are
Lime stone
Bauxite
Hematite
Gypsum
Environmental and Social Obligations
For environmental promotion and to keep ndashup the ecological balance this section
has planted over two lakhs trees on social obligation front this section has undertaken
various social welfare programs by adopting ten nearly villages organizing family welfare
campus surgical camps animal health camps blood donation camps children immunization
camps seeds training for farmers etc were arranged
Welfare and Recreation Facilities
For the purpose of recreation facilities 2 auditoriums were provided for playing
indoor games cultural function and activities like drama music and dance etc
The industry has provided libraries and reading rooms About 1000 books are available in
the library All kinds of newspaper magazines are made available
Canteen is provided to cater to the needs of the employees for supply of snacks tea
coffee and meals etc
One English medium and one Telugu medium school are provided to meet the
educational requirements
The company has provided a dispenser with a qualified medical office and
paramedical staff for the benefit of the employees The employees covered under ESI
scheme have to avail the medical facilities from the ESI hospital
Competitions in sports and games are conducted every year for august 15th
Independence Day and January 26th republic day among the employees
Electricity
The power consumption per ton of cement has come down to 108 units against 113
units last year due to implementation of various energy saving measures The performance
of captive power plant of this section continues to be satisfactory Total power generation
8102019 A Study A Study On Financial Performance Analysis With Reference To Kesoram Cementon Financial Performance hellip
httpslidepdfcomreaderfulla-study-a-study-on-financial-performance-analysis-with-reference-to-kesoram 3281
32
during the year was 84 million units last year This captive power plant is a major role in
keeping power costs with in economic levels
The management has introduced various HRD programs for training and
development and has taken various other measures for the betterment of employeersquos
efficiency
The section has installed adequate air pollution control system and equipment and is
ISO14001 such as Environment management system is under implementation
Awards
Kesoram cement bagged many prestigious awards including national awards for
productivity technology conservation and several state awards since 1984 The following
are the some of important awards
AWARDS OF KESORAM CEMENT
No Year Awards
National
State
1 1989-90 Management award community
Development
State
2 1991 Energy conservation may day award of the
Govt
State
3 1991 Pundit Jawaharlal Nehru rolling trophy for
best
State
4 1993 National productivity effort Indira Gandhi
national award
State
5 1994 Best management award State
6 1994-
1995
Best industrial rebellion award State
7 1995 Rural development by chief minister
Environment and mineral conservation
award
State
8 1995 Best industrial rebellion award State
8102019 A Study A Study On Financial Performance Analysis With Reference To Kesoram Cementon Financial Performance hellip
httpslidepdfcomreaderfulla-study-a-study-on-financial-performance-analysis-with-reference-to-kesoram 3381
33
9 1995-
1996
Best effort of an industrial unit to
development rural economy shriSRRungta
award for social
National
10 1996 Awareness for best rural development
efforts
State
11 1999 Best workers welfare best family welfare
award
State
12 2001 First prize for mine environment amppollution
control for the 3rd
year in succession
State
13 2002 Vana mithra award from AP Govt State
14 2003 Company has got OHSAS-18001 State
15 2005 Certification from DNV New Delhi State
16 2006 Award for pollution control and
environmental protection FAPCCI award
for best rural development in the state
State
8102019 A Study A Study On Financial Performance Analysis With Reference To Kesoram Cementon Financial Performance hellip
httpslidepdfcomreaderfulla-study-a-study-on-financial-performance-analysis-with-reference-to-kesoram 3481
34
Products of the organization
8102019 A Study A Study On Financial Performance Analysis With Reference To Kesoram Cementon Financial Performance hellip
httpslidepdfcomreaderfulla-study-a-study-on-financial-performance-analysis-with-reference-to-kesoram 3581
35
CHAPTER-III
LITERATURE REVIEW
8102019 A Study A Study On Financial Performance Analysis With Reference To Kesoram Cementon Financial Performance hellip
httpslidepdfcomreaderfulla-study-a-study-on-financial-performance-analysis-with-reference-to-kesoram 3681
36
Introduction
Financial Performance Analysis
The term lsquofinancial performance analysis also known as analysis and interpretation of
financial statementsrsquo refers to the process of determining financial strength and
weaknesses of the firm by establishing strategic relationship between the items of the
balance sheet profit and loss account and other operative data
ldquoAnalyzing financial statementsrdquo by Metcalf and Titard
ldquoFinancial analysis is a process of evaluating the relationship between component
parts of a financial statement to obtain a better understanding of a firms position and
performancerdquo by Myers
Financial Performance
The word lsquoPerformance is derived from the word lsquoparfourmenrsquo which means lsquoto dorsquo lsquoto
carry outrsquo or lsquoto renderrsquo It refers the act of performing execution accomplishment
fulfillment etc In border sense performance refers to the accomplishment of a given task
measured against preset standards of accuracy completeness cost and speed In other
words it refers to the degree to which an achievement is being or has been accomplished In
the Words of Frich Kohlar ldquoThe performance is a general term applied to a part or to all the
conducts of activities of an organization over a period of time often with reference to past or
projected cost efficiency management responsibility or accountability or the like Thus not
just the presentation but the quality of results achieved refers to the performance
Performance is used to indicate firmrsquos success conditions and compliance
Financial performance refers to the act of performing financial activity In broader
sense financial performance refers to the degree to which financial objectives being or has
been accomplished It is the process of measuring the results of a firms policies and
operations in monetary terms It is used to measure firms overall financial health over a
given period of time and can also be used to compare similar firms across the same industry
or to compare industries or sectors in aggregation
The purpose of financial analysis is to diagnose the information contained in financial
statements so as to Jude the profitability and financial soundness of the firm Just like a
doctor examines his patient by recording his body temperature blood pressure etc Before
8102019 A Study A Study On Financial Performance Analysis With Reference To Kesoram Cementon Financial Performance hellip
httpslidepdfcomreaderfulla-study-a-study-on-financial-performance-analysis-with-reference-to-kesoram 3781
37
making his conclusion regarding the illness and before giving his treatment a financial
analyst analysis the financial statements with various tools of analysis before commenting
upon the financial health or weaknesses of an enterprise
The analysis and interpretation of financial statements is essential to bring out the
mystery behind the figures in financial statements Financial statements analysis is an
attempt to determine the significance and meaning of the financial statement data so that
forecast may be made of the future earnings ability to pay interest and debt maturities (both
current and long term) and profitability of a sound divided policy
Types of financial analysis-
Financial analysis into different categories depending upon
(1) The material used and
(2) The method of operation followed in the analysis or the modus operandi of
analysis
Types of financial analysis
On the basis of material used on the basis of modus operandi
External Internal Horizontal Vertical
Analysis Analysis Analysis Analysis
1 On the basis of material used - According to material used financial analysis canbe of two types
External analysis
Internal analysis
External analysis-
This analysis is done by outsiders who do not have access to the detailed internal
outsiders include investors potential investors Creditors Potential Creditors Government
Agencies Credit Agencies and General Public For financial analysis these external parties
to the firm depend almost entirely on the published financial statements
Internal analysis-
This analysis is undertaken by the persons namely executives and employees of the
organization or by the officers appointed by government or court who have access to the
8102019 A Study A Study On Financial Performance Analysis With Reference To Kesoram Cementon Financial Performance hellip
httpslidepdfcomreaderfulla-study-a-study-on-financial-performance-analysis-with-reference-to-kesoram 3881
38
books of account ( internal accounting records) and other information related to the
business
2 983119983150 983156983144983141 983138983137983155983145983155 983151983142 983149983151983140983157983155 983151983152983141983154983137983150983140983145983085
According to the modus operandi financial analysis can also be of two types
a Horizontal analysis
bVertical analysis
Horizontal analysis-
Horizontal analysis refers to the comparison of financial data of a company for several
years The figures for this type of analysis are presented horizontally over a number of
columns The figures of the various years are compared with standard or base year a base
year is year chosen as beginning point This type of analysis is also called lsquodynamicanalysisrsquo as it is based on the data from year to year rather than on data of any one year The
horizontal analysis makes it possible to focus attention on items that have changed
significantly during the period under view
b Vertical analysis-
Vertical analysis refers to the study of relationship of the various items in the financial
statements of one accounting period In this types of analysis the figures from financial
statement of a year are compared with a base selected from the same yearrsquos statement
Methods of financial analysis-
The following methods of analysis are generally used-
1 Comparative Statements
2 Trend Analysis
3 Common-Size Statements
4 Funds flow Analysis
5 Cash Analysis
6 Ratio Analysis
7 Cost-volume-Profit Analysis
8102019 A Study A Study On Financial Performance Analysis With Reference To Kesoram Cementon Financial Performance hellip
httpslidepdfcomreaderfulla-study-a-study-on-financial-performance-analysis-with-reference-to-kesoram 3981
39
Comparative statements-
The comparative financial statements are statements of the financial position at
different periods of time the elements of financial position are show in a
Comparative Statement provides an idea of financial position at two or more
periods Generally two financial statements (balance sheet and income statement) are
prepared in comparative form for financial analysis
The Comparative Statement May Show-
1 Absolute figures (rupee amounts)
2 Changes in absolute figures ie increase or decrease in absolute figures
3 Absolute data in terms of percentages
4 Increase or decrease in terms of percentages
The Two Comparative Statements Are-
1 Comparative balance sheet and
2 Income statement
1 983107983151983149983152983137983154983137983156983145983158983141 983138983137983148983137983150983139983141 983155983144983141983141983156983085
The comparative balance sheet analysis is the study of the trend of the same items group of
items and computed items in two or more balance sheets of the same business enterprise on
different dates The change in periodic balance sheet items reflect the conduct of a business
the change can be observed by comparison of the balance sheet at the beginning and at the
end of a period and these changes can help in forming an opinion about the progress of an
enterprise
Guide Lines for Interpretation of Comparative Balance Sheet-
While interpreting comparative balance sheet the interpreter is expected to study the
following aspects-
1 Current financial position and liquidity position
2 Long-term financial position
3 Profitability of the concern
8102019 A Study A Study On Financial Performance Analysis With Reference To Kesoram Cementon Financial Performance hellip
httpslidepdfcomreaderfulla-study-a-study-on-financial-performance-analysis-with-reference-to-kesoram 4081
40
Common Size Statement-
The common-size statements balance sheet and income statement are show in
analytical percentages The figures are shown as percentages of total assets total liabilities
and total sales The total assets are taken as 100 and different assets are expressed as a
percentage of the total similarly various liabilities are taken as a part of total liabilities
Common Size Balance Sheet-
A statement in which balance sheet items are expressed as the ratio of each asset to
total assets and the ratio of each liability is expressed as a ratio of total liabilities is called
common size balance The common size balance sheet can be used to compare companies
of differing size The comparison of figures in different periods is not useful because total
figures may be affected by a number of factors It is not possible to establish standard norms
for various assets The trends of figures from year to year may not be studied and even they
may not give proper results
Trend Analysis of Balance Sheet-
Trend analysis is Very important tool of horizontal financial analysis
This analysis enables to known the change in the financial function and operating efficiency
in between the time period chosen
By studding the trend analysis of each item we can known the direction of changes and
based upon the direction of changes the options can be changed
Trend =Absolute Value of item in the statement understudy 100
Absolute Value of same item in the base statement
Ratio Analysis
Ratio analysis is used as a technique of analyzing the financial information contained in the
balance sheet and profit and loss accounts for a more meaningful understanding of the
financial position and performance of a firm
The relationship between two accounting figures expressed mathematically is known as a
financial ratio A ratio helps the analyst to make qualitative judgment about the firmrsquos
financial position and performance
Several ratios can be calculated from the accounting data contained in the financial
statements The parties which generally undertake financial analysis is short ndashterm
creditors long-term creditors owner and management In view of the requirements of the
various ratios ratios are classified into the following four important categories
8102019 A Study A Study On Financial Performance Analysis With Reference To Kesoram Cementon Financial Performance hellip
httpslidepdfcomreaderfulla-study-a-study-on-financial-performance-analysis-with-reference-to-kesoram 4181
41
Liquidity ratios
Leverage ratios
Activity ratios
Profitability ratios
Liquidity Ratios
It is extremely essential for a firm to be able to meet its obligations as they become due
Liquidity ratios measure the ability of the firm to meet its current obligations A firm should
ensure that it does not suffer from lack of liquidity and also that it does not have excess
liquidity The failure of a company to meet its obligations due to lack of sufficient liquidity
will result in a poor creditworthiness loss of creditorsrsquo confidence or even in legal tangles
resulting in the closure of the company A very high degree of liquidity is also bad idle
assets earn nothing The firmrsquos funds will be unnecessarily tied up in current assets
Therefore it is necessary to strike a proper balance high liquidity and lack of liquidity
The most common ratios which indicate the extent of liquidity or lack of it are
Current ratio
Quick ratio
Other ratios include Cash ratio Interval Measure and Net working capital ratio
Current Ratio
The current ratio is calculated by dividing current assets by current liabilities
Current assets
Current ratio = --------------------------
Current liabilities
Current ratio is a measure of the firmrsquos short term solvency It indicates the availability of
current assets in rupees for every one rupee of current liability A ratio of greater than one
means that the firm has more current assets than current claims against the Current ratio of
2 to 1 or more is considered satisfactory Current ratio represents a margin of safety for
creditors
Quick Ratio
Quick ratio also known as acid-test ratio establishes a relationship between quick assets and
the current liabilities Cash is the most liquid asset It is calculated by dividing quick assets
by current liabilities
Quick ratio = Quick Assets Current Liabilities
8102019 A Study A Study On Financial Performance Analysis With Reference To Kesoram Cementon Financial Performance hellip
httpslidepdfcomreaderfulla-study-a-study-on-financial-performance-analysis-with-reference-to-kesoram 4281
42
(Quick Assets = Current assets ndash Inventory)
One defect of the current ratio is that it fails to convey any information on the composition
of the current assets of the firm A rupee of cash is considered equivalent to a rupee of
inventory of receivables But it is not so A rupee of cash is more readily available to meet
current liabilities than a rupee of say inventory This implies the usefulness of the current
ratio
The Acid ndashtest ratio measures the firmrsquos ability to convert its current assets quickly into
cash in order to meet its current liabilities
A quick ratio of 1 to 1 is considered to represent a satisfactory current financial condition It
is an important index of the firmrsquos liquidity
Leverage Ratios
Leverage ratios identify the source of a firmrsquos capital ndashowners or outside creditors
Financial leverage refers to the use of debt in financing non-current assets If the return on
assets exceeds the cost of debt the leverage is successful ndash ie it improves return on equity
Debt ndashEquity Ratio
The Debt ndash Equity is determined to analyze the soundness of the long term financial
policies of the organization It is also known as ldquoInternal External Equity Ratiordquo
It is calculated as follows
Debt ndash Equity Ratio = Total long term debt Share holders funds
Equity Ratio
This ratio is also called as proprietary ratio establishes a relationship between share holderrsquos
funds to total assets of company Equity Ratio is calculated by dividing share holders fund
by total assets
Fixed Asset Ratio
This ratio indicates the extent to which the assets of the companyrsquos can be lost without
affecting the interest of the creditors of the company Higher the ratios better the long-term
position of the company
Activity Ratios
They are primarily used for studying a firmrsquos working capital situation A well managed
firm should have good activity ratios
8102019 A Study A Study On Financial Performance Analysis With Reference To Kesoram Cementon Financial Performance hellip
httpslidepdfcomreaderfulla-study-a-study-on-financial-performance-analysis-with-reference-to-kesoram 4381
43
Working Capital Turnover Ratio
The working capital turnover ratio indicates whether or not working capital has been
effectively used in making sales
Working capital turnover = Sales Net current assets
Inventory Turnover Ratio
This ratio also known as Stock Turnover Ratio establishes the relationship between costs of
goods sold or net sales during the given period and the average amt of stock held during the
period This ratio reveals the number of times finished stock in turnover during a given
accounting period
Higher the ratio the better is it because it shows the finished stock is rapidly turned
in to sales On the other hand a low stock turnover ratio is not desirable because it reveals
the accumulation of stock
Debtors Turnover Ratio
This ratio indicates the velocity of debt collection of a company In other words it shows
the number of times average turnover during a year
A Higher Debtor Turnover Ratio indicates a more efficient is the management towards
debtors and low ratio ratio implies inefficient management of debtors
Total Assets Turnover Ratio
The asset turnover ratio indicates how efficiently management is employing Assets
Total Assets Turnover Ratio = Sales Total Assets
Profitability Ratios
Profitability ratios are the ratios which measure a firmrsquos overall effectiveness as revealed by
the returns generated on sales and investment
General Profitability Ratios
1 Gross Profit Ratio
2 Net profit Ratio
3 Operating or Expenses Ratio
8102019 A Study A Study On Financial Performance Analysis With Reference To Kesoram Cementon Financial Performance hellip
httpslidepdfcomreaderfulla-study-a-study-on-financial-performance-analysis-with-reference-to-kesoram 4481
44
Gross Profit Ratio
Gross profit Ratio measures the relationships to net sales and is usually represented as a
percentage It is a good measure of profitability
The gross profit ratio indicates the extent to which selling price of goods per unit may
decline without resulting in losses on operation Higher the gross profit betters the result
Net Profit Ratio
Net Profit Ratio indicates net margin on sales It is given by the following equation
Net Profit Ratio = (Net Profit Sales) 100
Operating or Expenses Ratio
This ratio is complimentary of Net Profit Ratio The more the net profit the less the
Operating Ratio Operating costs include the cost of direct materials direct labors and otheroverheads viz are generally excluded from operating costs A comparison of the Operating
Ratio will indicate whether the cost efficiency is high or low in the figure of sales This less
the ratio it depicts the efficiency of the management
8102019 A Study A Study On Financial Performance Analysis With Reference To Kesoram Cementon Financial Performance hellip
httpslidepdfcomreaderfulla-study-a-study-on-financial-performance-analysis-with-reference-to-kesoram 4581
45
CHAPTER IV
DATA ANALYSIS amp INTERPRETATION
8102019 A Study A Study On Financial Performance Analysis With Reference To Kesoram Cementon Financial Performance hellip
httpslidepdfcomreaderfulla-study-a-study-on-financial-performance-analysis-with-reference-to-kesoram 4681
46
Comparative Balance Sheet of Kesoram in the Year between 2008-2009
(Rupee in crores)
Years Changes
Particulars 2008 2009 In Rupees In Percentage
Liabilities
Share Capital 4574 4574 000 000
Reserves amp Surplus 93085 128024 34939
Revaluation Reserves 533 412 -121 -2270
Loans
Secured Loans 97106 153627 56521 5821
Un Secured Loans 12129 43416 31287 25795
Deferred Tax Liabilities 000 000 000 000
Current Liabilities
Provisions 33039 34529 1490 451
Current Liabilities 57067 66587 9520 1668
Total 297533 431169 133636 4491
Assets
Net Block 108424 180435 72011 6642
Capital Wip 63459 86485 23026 3628
Investments 4783 6178 1395 2917
Current Assets
Inventories 44217 58906 14689 3322
Sundry Debtors 27307 38017 10710 3922
Cash amp Bank Balances 4036 5657 1621 4016
Total Current Assets 75560 102580 27020 3576
Loans amp Advances 45289 55462 10173 2246
Fixed Deposits 018 028 010 5556
Total 297533 431169 133636 4491
8102019 A Study A Study On Financial Performance Analysis With Reference To Kesoram Cementon Financial Performance hellip
httpslidepdfcomreaderfulla-study-a-study-on-financial-performance-analysis-with-reference-to-kesoram 4781
47
Interpretation of comparative balance sheet of 2008-2009
Reserves amp Surplus were increased to 3753 (percent) ie in Rupees 34939
crores
Revaluation Reserves decreased to 121 ie in Rupees 2270 crores
Secured Loans are increased to 5821 ie in Rupees 56521 crores And UN
secured loans highly Increased to 25795
Current liabilities and Provisions are increased to 1668 and 451 respectively ie in
Rupees 9520 amp 1490 crores
Fixed assets were highly increased to 6642 ie in Rupees 72011 crores
Investments were increased to 2917 ie in Rupees 1395 crores
Sundry debtors increased to 3922 ie in Rupees 10710 crores
Current assets increased 3576 ie in Rupees 27020 crores And Loans amp
Advances increased to 2246 respectively
The overall financial position was satisfactory
8102019 A Study A Study On Financial Performance Analysis With Reference To Kesoram Cementon Financial Performance hellip
httpslidepdfcomreaderfulla-study-a-study-on-financial-performance-analysis-with-reference-to-kesoram 4881
48
Comparative Balance Sheet of Kesoram in the Year between 2009-2010
(Rupees in crores)
Years Changes
Particulars 2009 2010 In Rupees In Percentage
Liabilities
Share Capital 4574 4574 000 000
Reserves amp Surplus 128024 149111 21087 1647
Revaluation Reserves 412 339 -073 -1772
Loans
Secured Loans 153627 186372 32745 2131
Un Secured Loans 43416 126250 82834 19079
Deferred Tax Liabilities 000 000 000
Current Liabilities
Provisions 34529 35734 1205 349
Current Liabilities 66587 107688 41101 6173
Total 431169 610068 178899 4149
Assets
Net Block 180435 343182 162747 9020
Capital WIP 86485 41283 -45202 -5227
Investments 6178 5143 -1035 -1675
Current Assets
Inventories 58906 91619 32713 5553
Sundry Debtors 38017 54289 16272 4280
Cash amp Bank Balances 5657 8014 2357 4167
Total Current Assets 102580 153922 51342 5005
Loans amp Advances 55462 66506 11044 1991
Fixed Deposits 028 031 003 1071
Total 431169 610068 178899 4149
8102019 A Study A Study On Financial Performance Analysis With Reference To Kesoram Cementon Financial Performance hellip
httpslidepdfcomreaderfulla-study-a-study-on-financial-performance-analysis-with-reference-to-kesoram 4981
49
Interpretation of comparative balance sheet of 2009-2010
Reserves amp surplus increased to 1647 ie in Rupees 21087 crores
Revaluation Reserves decreased to 1772 ie in Rupees 073 crores
Secured loans increased to 2131 ie in Rupees 32745 crores
Current Liabilities were increased to 6173 ie in Rupees 41101 crores and
Provisions 349 ie in Rupees 1205 crores
Fixed Assets were increased to 9020 ie in Rupees 162747 crores
Investments were decreased to 1675 ie in Rupees 1035 crores
Sundry debtors were increased to 4280 ie in Rupees 16272 crores
Current assets increased to 5005 ie in Rupees 51342 crores And loans and
Advances increased 1919 ie in Rupees 11044 crores
The overall financial position was satisfactory
8102019 A Study A Study On Financial Performance Analysis With Reference To Kesoram Cementon Financial Performance hellip
httpslidepdfcomreaderfulla-study-a-study-on-financial-performance-analysis-with-reference-to-kesoram 5081
50
Comparative Balance Sheet of Kesoram in the Year between 2010-2011
(Rupees in crores)
Years Changes
Particulars 2010 2011 In Rupees In Percentage
Liabilities
Share Capital 4574 4574 000 000
Reserves amp Surplus 149111 125162 -23949 -1606
Revaluation Reserves 339 289 -050 -1475
Loans
Secured Loans 186372 237183 50811 2726
Un Secured Loans 126250 162744 36494 2891
Deferred Tax Liabilities 000 000 000
Current Liabilities
Provisions 35734 1494 -34240 -9582
Current Liabilities 107688 113902 6214 577
Total 610068 645348 35280 578
Assets
Net Block 343182 369172 25990 757
Capital WIP 41283 43781 2498 605
Investments 5143 6582 1439 2798
Current Assets
Inventories 91619 111855 20236 2209
Sundry Debtors 54289 63134 8845 1629
Cash amp Bank Balances 8014 7188 -826 -1031
Total Current Assets 153922 182177 28255 1836
Loans amp Advances 66506 43460 -23046 -3465
Fixed Deposits 031 176 145 46774
Total 610068 645348 35280 578
8102019 A Study A Study On Financial Performance Analysis With Reference To Kesoram Cementon Financial Performance hellip
httpslidepdfcomreaderfulla-study-a-study-on-financial-performance-analysis-with-reference-to-kesoram 5181
51
Interpretation of comparative balance sheet of 2010-2011
Reserves amp surplus decreased to 1606 ie in Rupees 23949 crores
Revaluation Reserves decreased to 1475 ie in Rupees 050 crores
Secured loans increased to 2726 ie in Rupees 50811 crores
Current Liabilities were increased to 577 ie in Rupees 6214 crores
Provisions decreased to 9582 ie in Rupees 34240 crores
Fixed Assets were increased to 757 ie in Rupees 25990 crores
Investments were decreased to 2798 ie in Rupees 1439 crores
Sundry debtors were increased to 1629 ie in Rupees8845 crores
Current assets increased to 1836 ie in Rupees 28255 crores And loans and
Advances increased 3465 ie in Rupees 23046 crores
The overall financial position was UN satisfactory
8102019 A Study A Study On Financial Performance Analysis With Reference To Kesoram Cementon Financial Performance hellip
httpslidepdfcomreaderfulla-study-a-study-on-financial-performance-analysis-with-reference-to-kesoram 5281
52
Comparative Balance Sheet of Kesoram In The Year Between 2011-2012
(Rupees in crores)
Years Changes
Particulars 2011 2012 In Rupees In Percentage
Liabilities
Share Capital 4574 4574 000 000
Reserves amp Surplus 125162 86657 -38505 -3076
Revaluation Reserves 289 270 -019 -657
Loans
Secured Loans 237183 317792 80609 3399
Un Secured Loans 162744 92742 -70002 -4301
Deferred Tax Liabilities 000 000 000
Current Liabilities
Provisions 1494 40726 39232 262597
Current Liabilities 113902 180010 66108 5804
Total 645348 722771 77423 1200
Assets 000
Net Block 369172 358721 -10451 -283
Capital WIP 43781 68065 24284 5547
Investments 6582 6636 054 082
Current Assets
Inventories 111855 99516 -12339 -1103
Sundry Debtors 63134 67358 4224 669
Cash amp Bank Balances 7188 6959 -229 -319
Total Current Assets 182177 173833 -8344 -458
Loans amp Advances 43460 115409 71949 16555
Fixed Deposits 176 107 -069 -3920
Total 645348 722771 77423 1200
8102019 A Study A Study On Financial Performance Analysis With Reference To Kesoram Cementon Financial Performance hellip
httpslidepdfcomreaderfulla-study-a-study-on-financial-performance-analysis-with-reference-to-kesoram 5381
53
Interpretation of comparative balance sheet of 2011-2012
Reserves amp surplus decreased to 3076 ie in Rupee 38505 crores
Revaluation Reserves decreased to 657 ie in Rupees 019 crores
Secured loans increased to 3399 ie in Rupees 80699 crores
Current Liabilities were increased to 5804 ie in Rupees 66108 crores
Provisions increased to 262597 ie in Rupees 39232 crores
Fixed Assets were decreased to 283 ie in Rupee 10451 crores
Investments were increased to 082 ie in Rupees 054 crores
Sundry debtors were increased to 669 ie in Rupees 4224 crores
Current assets decreased to 458 ie in Rupees 8344 crores And loans and
Advances increased 16555 ie in Rupees 71949 crores
The overall financial position was UN satisfactory
8102019 A Study A Study On Financial Performance Analysis With Reference To Kesoram Cementon Financial Performance hellip
httpslidepdfcomreaderfulla-study-a-study-on-financial-performance-analysis-with-reference-to-kesoram 5481
54
Common Size Balance Sheet of Kesoram For The Year 2008-2009
(Rupees in crores)
Particulars 2008 Change Percentage 2009 Change Percentage
Liabilities
Share Capital 4574 154 4574 106
Reserves amp Surplus 93085 3129 128024 2969
Revaluation Reserves 533 018 412 010
Loans
Secured Loans 97106 3264 153627 3563
Un Secured Loans 12129 408 43416 1007
Deferred Tax Liabilities 000 000 000 000
Current Liabilities
Provisions 33039 1110 34529 801
Current Liabilities 57067 1918 66587 1544
Total 297533 10000 431169 10000
Assets
Net Block 108424 3644 180435 4185
Capital WIP 63459 2133 86485 2006
Investments 4783 161 6178 143
Current Assets
Inventories 44217 1486 58906 1366
Sundry Debtors 27307 918 38017 882
Cash amp Bank Balances 4036 136 5657 131
Loans amp Advances 45289 1522 55462 1286
Fixed Deposits 018 001 028 001
Total 297533 10000 431169 10000
8102019 A Study A Study On Financial Performance Analysis With Reference To Kesoram Cementon Financial Performance hellip
httpslidepdfcomreaderfulla-study-a-study-on-financial-performance-analysis-with-reference-to-kesoram 5581
55
Interpretation of Common Size Balance Sheet of 2008-2009
Share capital was recorded 154 percent in the total liabilities in the year 2008 it is
decreased to 106 in the year 2009
Reserves amp surplus contributed to 3129 in the total liabilities in the year 2008 it is
decreased to 2969 in the year 2009
Secured loans were 3264 in the total liabilities in the year 2008 it is increased to
3563 in the year 2009
Current Liabilities shown to 1918 in the total liabilities in the year 2008 it is
decreased to 1544 in the year 2009
Provisions 1110 in the total liabilities in the year 2008 it is decreased to 801 in the
year 2009
Fixed Assets were 3644 in the total liabilities in the year 2008 ie decreased to 4185
in the year 2009
Investments were 161 in the total liabilities in the year 2008 it is decreased to 143
in the year 2009
Sundry debtors were 918 in the total liabilities in the year 2008 it is decreased to 882
in the year 2009
8102019 A Study A Study On Financial Performance Analysis With Reference To Kesoram Cementon Financial Performance hellip
httpslidepdfcomreaderfulla-study-a-study-on-financial-performance-analysis-with-reference-to-kesoram 5681
56
Common Size Balance Sheet of Kesoram For The Year 2009-2010
(Rs in crores)
Particulars 2009 Change Percentage 2010Change
Percentage
Liabilities
Share Capital 4574 106 4574 075
Reserves amp Surplus 128024 2969 149111 2444
Revaluation Reserves 412 010 339 006
Loans
Secured Loans 153627 3563 186372 3055
Un Secured Loans 43416 1007 126250 2069
Deferred Tax Liabilities 000 000 000 000
Current Liabilities
Provisions 34529 801 35734 586
Current Liabilities 66587 1544 107688 1765
Total 431169 10000 610068 10000
Assets
Net Block 180435 4185 343182 5625
Capital WIP 86485 2006 41283 677
Investments 6178 143 5143 084
Current Assets
Inventories 58906 1366 91619 1502
Sundry Debtors 38017 882 54289 890
Cash amp Bank Balances 5657 131 8014 131
Loans amp Advances 55462 1286 66506 1090
Fixed Deposits 028 001 031 001
Total 431169 10000 610068 10000
8102019 A Study A Study On Financial Performance Analysis With Reference To Kesoram Cementon Financial Performance hellip
httpslidepdfcomreaderfulla-study-a-study-on-financial-performance-analysis-with-reference-to-kesoram 5781
57
Interpretation of common size balance sheet of 2009-2010
Share capital was recorded 106 percent in the total liabilities in the
year 2009 it is decreased to 075 in the year 2010
Reserves amp surplus contributed to 2969 in the total liabilities in the
year 2009 it is decreased to2444 in the year 2010
Secured loans were 3563 in the total liabilities in the year 2009 it is
increased to 3055 in the year 2010
Current Liabilities shown to 1544 in the total liabilities in the year
2009 it is decreased to 1765 in the year 2010
Provisions 801 in the total liabilities in the year 2009 it is decreased
to 586 in the year 2010
Fixed Assets were 4185 in the total liabilities in the year 2009 ie
increased to 5625 in the year 2010
Investments were 143 in the total liabilities in the year 2009 it is
decreased to 084 in the year 2010
Sundry debtors were 882 in the total liabilities in the year 2009 it is
increased to 890 in the year 2010
8102019 A Study A Study On Financial Performance Analysis With Reference To Kesoram Cementon Financial Performance hellip
httpslidepdfcomreaderfulla-study-a-study-on-financial-performance-analysis-with-reference-to-kesoram 5881
58
Common Size Balance sheet of Kesoram for the year 2010-2011
983080Rupees in crores)
Particulars 2010 Change Percentage 2011
Change
Percentage
Liabilities
Share Capital 4574 075 4574 071
Reserves amp Surplus 149111 2444 125162 1939
Revaluation Reserves 339 006 289 004
Loans
Secured Loans 186372 3055 237183 3675
Un Secured Loans 126250 2069 162744 2522
Deferred Tax Liabilities 000 000 000 000
Current Liabilities
Provisions 35734 586 1494 023
Current Liabilities 107688 1765 113902 1765
Total 610068 10000 645348 10000
Assets
Net Block 343182 5625 369172 5721
Capital WIP 41283 677 43781 678
Investments 5143 084 6582 102
Current Assets
Inventories 91619 1502 111855 1733
Sundry Debtors 54289 890 63134 978
Cash amp Bank Balances 8014 131 7188 111
Loans amp Advances 66506 1090 43460 673
Fixed Deposits 031 001 176 003
Total 610068 10000 645348 10000
8102019 A Study A Study On Financial Performance Analysis With Reference To Kesoram Cementon Financial Performance hellip
httpslidepdfcomreaderfulla-study-a-study-on-financial-performance-analysis-with-reference-to-kesoram 5981
59
Interpretation of Common Size Balance Sheet Of 2010-2011
Share capital was recorded 075 percent in the total liabilities in the year 2010 it is
decreased to 071 in the year 2011
Reserves amp surplus contributed to 2444 in the total liabilities in the year 2010 it is
decreased to1939 in the year 2011
Secured loans were 3055 in the total liabilities in the year 2010 it is increased to
3675 in the year 2011
Current Liabilities shown to 1765 in the total liabilities in the year 2010 it is
also1765 in the year 2011
Provisions 586 in the total liabilities in the year 2010 it is decreased to 023 in the
year 2011
Fixed Assets were 5625 in the total liabilities in the year 2010 ie increased to 5721
in the year 2011
Investments were 084 in the total liabilities in the year 2010 it increased to 102 in
the year 2011
Sundry debtors were 890 in the total liabilities in the year 2010 it is increased to 978
in the year 2011
8102019 A Study A Study On Financial Performance Analysis With Reference To Kesoram Cementon Financial Performance hellip
httpslidepdfcomreaderfulla-study-a-study-on-financial-performance-analysis-with-reference-to-kesoram 6081
60
Common Size Balance Sheet of Kesoram for the Year 2011-2012
983080Rupees in crores)
Particulars 2011 Change Percentage 2012
Change
Percentage
Liabilities
Share Capital 4574 071 4574 063
Reserves amp Surplus 125162 1939 86657 1199
Revaluation Reserves 289 004 270 004
Loans
Secured Loans 237183 3675 317792 4397
Un Secured Loans 162744 2522 92742 1283
Deferred Tax Liabilities 000 000 000 000
Current Liabilities
Provisions 1494 023 40726 563
Current Liabilities 113902 1765 180010 2491
Total 645348 10000 722771 10000
Assets
Net Block 369172 5721 358721 4963
Capital WIP 43781 678 68065 942
Investments 6582 102 6636 092
Current Assets
Inventories 111855 1733 99516 1377
Sundry Debtors 63134 978 67358 932
Cash amp Bank Balances 7188 111 6959 096
Loans amp Advances 43460 673 115409 1597
Fixed Deposits 176 003 107 001
Total 645348 10000 722771 10000
8102019 A Study A Study On Financial Performance Analysis With Reference To Kesoram Cementon Financial Performance hellip
httpslidepdfcomreaderfulla-study-a-study-on-financial-performance-analysis-with-reference-to-kesoram 6181
61
Interpretation of common size balance sheet of 2011-2012
Share capital was recorded 071 percent in the total liabilities in the year 2011 it is
decreased to 063 in the year 2012
Reserves amp surplus contributed to 1939 in the total liabilities in the year 2011 it
is decreased to 1199 in the year 2012
Secured loans were 3675 in the total liabilities in the year 2011 it is increased to
4397 in the year 2012
Current Liabilities shown to 1765 in the total liabilities in the year 2011 it is
increased to 2491 in the year 2012
Provisions 023 in the total liabilities in the year 2011 it is increased to 563 in the
year 2012
Fixed Assets were 5721 in the total liabilities in the year 2011 ie decreased to
4963 in the year 2012
Investments were 102 in the total liabilities in the year 2011 it increased to 092
in the year 2012
Sundry debtors were 978 in the total liabilities in the year 2011 it is decreased to
932 in the year 2012
8102019 A Study A Study On Financial Performance Analysis With Reference To Kesoram Cementon Financial Performance hellip
httpslidepdfcomreaderfulla-study-a-study-on-financial-performance-analysis-with-reference-to-kesoram 6281
Trend Analysis
Share Capital-
Year
Amount
(In Crores) Trend
IncreaseDecrease
Base Year Previous Year
2008 4574 10000 000 000
2009 4574 10000 000 000
2010 4574 10000 000 000
2011 4574 10000 000 000
2012 4574 10000 000 000
Trend Percentages in Share Capital
Share capital shown a constant trend in the period 2008 and 2012
Share capital is 4574 crores all the years from 2008-2012
8102019 A Study A Study On Financial Performance Analysis With Reference To Kesoram Cementon Financial Performance hellip
httpslidepdfcomreaderfulla-study-a-study-on-financial-performance-analysis-with-reference-to-kesoram 6381
Reserves amp Surplus-
Year
Amount
(In Crores) Trend
IncreaseDecrease
Base Year Previous Year
2008 93085 10000 000 000
2009 128024 13753 3753 3753
2010 149111 16019 6019 2266
2011 125162 13446 3446 -2573
2012 86657 9309 -691 -4137
Trend Percentages in Reserves amp Surplus
Reserves amp surplus shown an increasing trend in the period between 2008 and 2010
The average trend was 13277 till 2010
The Reserves amp surplus was showing decreasing trend in the period 2011-2012 (ie
from 16019 in 2010 to 9309 in 2012)
The decreasing trend in Reserves amp surplus indicates the decrease in profits of the
firm
8102019 A Study A Study On Financial Performance Analysis With Reference To Kesoram Cementon Financial Performance hellip
httpslidepdfcomreaderfulla-study-a-study-on-financial-performance-analysis-with-reference-to-kesoram 6481
Investments-
Year
Amount
(In Crores) Trend
IncreaseDecrease
Base Year Previous Year
2008 4783 10000 000 000
2009 6178 12917 2917 2917
2010 5143 10753 753 -2164
2011 6582 13761 3761 3009
2012 6636 13874 3874 113
Trend Percentages in Investments-
The investments are shown an increasing trend in the period between 2008 ndash 2009
and it is decreasing in the year 2010
The average trend was 11458 till 2009
The investments increased in the periods 2011-2012 (ie from 10753 in 2010 to
13874 in 2012)
The overall trend in investments shown is satisfactory
8102019 A Study A Study On Financial Performance Analysis With Reference To Kesoram Cementon Financial Performance hellip
httpslidepdfcomreaderfulla-study-a-study-on-financial-performance-analysis-with-reference-to-kesoram 6581
Net Current Assets-
Year
Amount
(In Crores) Trend
IncreaseDecrease
Base Year Previous Year
2008 30761 10000 000 000
2009 56954 18515 8515 8515
2010 77037 25044 15044 6529
2011 110417 35895 25895 10851
2012 68613 22305 12305 -13590
Trends in Net Current Assets-
The NCA shown positive (increasing) trend
The NCA are increased to 35895 (the year 2011) compared with base year and
decreased in the year 2012 to 22305
The NCA shown increased trend from year and crossed 100
The overall trend was good
8102019 A Study A Study On Financial Performance Analysis With Reference To Kesoram Cementon Financial Performance hellip
httpslidepdfcomreaderfulla-study-a-study-on-financial-performance-analysis-with-reference-to-kesoram 6681
66
Ratio Analysis-
Current Ratio-
Current Ratio = Current Assets Current Liabilities
Current assets are cash in hand Cash at bank Marketable Securities(short term) short term
Investment Bills receivables sundry debtors Inventories (stock) Work in progress prepaid
expenses Current Liabilities are outstanding expenses Bills payable sundry Creditors
short-term advances income tax payable and Dividend payable
Current Ratio of Kesoram-
(Rupees in crores)
Year Current Assets Current Liabilities Current Ratio
2007-08 75560 57067 132
2008-09 102580 66587 154
2009-10 153922 107688 143
2010-11 182177 113902 160
2011-12 173833 180010 097
Interpretation-
As per the standard rule of current ratio ie 21 where current assets double the current
liabilities is considered satisfactory
In the present analysis the current ratio of the Kesoram is not satisfactory
from the above table It was assessed that the current ratio for all the five year is lower (less)
than the standard rule ie 21 And it is 097 in the year 2011-2012 (current year) This is
highly UN satisfactory
8102019 A Study A Study On Financial Performance Analysis With Reference To Kesoram Cementon Financial Performance hellip
httpslidepdfcomreaderfulla-study-a-study-on-financial-performance-analysis-with-reference-to-kesoram 6781
Quick Ratio-
Quick ratio also known as acid-test ratio establishes a relationship between quick
assets and the current liabilities Cash is the most liquid asset It is calculated by dividing
quick assets by current liabilities
Quick ratio = Quick Assets Current Liabilities
(Quick Assets = Current assets ndash Inventory)
Quick Ratio of Kesoram-
Rupees in crores)
Year Total QuickAssets
Current Liabilities Quick Ratio
2007-08 33343 57067 058
2008-09 43674 66587 066
2009-10 62303 107688 058
2010-11 70322 113902 0622011-12 74333 180010 041
Interpretation-
Usually a high Quick ratio is an indication that the company is liquid and has the ability to
meet its current or liquid liabilities in time on the other hand a low Quick Ratio represents
8102019 A Study A Study On Financial Performance Analysis With Reference To Kesoram Cementon Financial Performance hellip
httpslidepdfcomreaderfulla-study-a-study-on-financial-performance-analysis-with-reference-to-kesoram 6881
that the companyrsquos liquidity position is not good The above table showing the quick ratios
of Kesoram are canrsquot be considered satisfactory
Leverage Ratios-
Debt-Equity Ratio-
Debt-Equity Ratio = Total Long Term Debt Equity Share Holders Fund
Total Long term Debt= Debenture Capital + Long term loans from banks and financial
institutions + Public deposits
Equity Share Holders fund = Equity + Reserves and Surplus
Debt Equity Ratio of Kesoram
(Rupees in crores)
Year Total Debt Share Holders Fund Debt Equity Ratio
2007-08 109235 98192 111
2008-09 197043 133010 148
2009-10 312622 154024 203
2010-11 399927 130025 308
2011-12 410534 91501 449
8102019 A Study A Study On Financial Performance Analysis With Reference To Kesoram Cementon Financial Performance hellip
httpslidepdfcomreaderfulla-study-a-study-on-financial-performance-analysis-with-reference-to-kesoram 6981
Interpretation-
The Debt-Equity Ratio accepted standard is 05 This ratio reflects the relative contribution
of creditors and owners of business in its financing From the above it is clear that the long
term debt is more than that of the share holdersrsquo fund So we can interpret that the firmrsquosassets are financed more by the external funds rather than by the internal funds
8102019 A Study A Study On Financial Performance Analysis With Reference To Kesoram Cementon Financial Performance hellip
httpslidepdfcomreaderfulla-study-a-study-on-financial-performance-analysis-with-reference-to-kesoram 7081
Fixed Asset Ratio-
Net Sales
Fixed Asset Ratio = helliphelliphelliphelliphelliphelliphelliphelliphelliphelliphellip
Net Assets
Fixed Asset Ratio of Kesoram-
(Rupees in crores)
Year Net Sales Net Assets Fixed Assets Ratio
2007-08 300271 358721 084
2008-09 389797 369172 106
2009-10 475062 343182 1382010-11 539788 180435 299
2011-12 59182 108424 546
Interpretation
This ratio indicates the extent to which the assets of the companyrsquos can be lost without
affecting the interest of the creditors of the company Higher the ratios better the long-term
position of the companyThe above table shows fixed assets ratio in increasing trend Which is good for the
company
8102019 A Study A Study On Financial Performance Analysis With Reference To Kesoram Cementon Financial Performance hellip
httpslidepdfcomreaderfulla-study-a-study-on-financial-performance-analysis-with-reference-to-kesoram 7181
Overall Profitability Ratios-
Net Profit Ratio
Net Profit Ratio indicates net margin on sales It is given by the following equation
Net Profit Ratio = (Net Profit Sales) 100
Net Profit Ratio of Kesoram
(Rupees in crores)
Year Net Profit Sales Net Profit Ratio
2007-08 37917 300271 1263
2008-09 41432 389797 1063
2009-10 20298 475062 427
2010-11 -28176 539788 -5222011-12 -38108 59182 -644
Interpretation
It establishes a relationship between net profits after tax and net sales and
indicates the efficiency of the management in manufacturing selling administrative and
other activities of the company
The higher the ratio the better is the profitability or performance of the business
The above table depicts the net profit Ratio of Kesoram has decreased every year from
2007-2008 to 2011-2012It further decreased to negative in the year 2010-11 to -522 and -
644 in the year 2011-2012 This shows constant decrease in the profits of the company
8102019 A Study A Study On Financial Performance Analysis With Reference To Kesoram Cementon Financial Performance hellip
httpslidepdfcomreaderfulla-study-a-study-on-financial-performance-analysis-with-reference-to-kesoram 7281
72
Return on Investment-
Net Profit
Return on Investment = helliphelliphelliphelliphelliphelliphelliphelliphelliphelliphelliphellip X 100
Share Holders Fund
Return on Investment Ratio of Kesoram-
(Rupees in crores)
Year Net Profit Share Holders Fund Return On Investment
2007-08 37917 98192 3862
2008-09 41432 133010 3115
2009-10 20298 154024 1318
2010-11 -28176 130025 -2167
2011-12 -38108 91501 -4165
Interpretation-
The above table reveals how well the resources of the firm are being used Higher
the ratio better the result The above ratio implies how well the firm is growing in
terms of profitability and efficiency From the above table we can concern that the return on
investment is in decreasing trend ROI is highest in the year 2007-2008 as 3862 But
there after itrsquos decreased every year
The ROI is negative in the years 2010-2011 amp 2011-2012 as -2167 amp -4165 respectively
Which is not a good sign for the firm
8102019 A Study A Study On Financial Performance Analysis With Reference To Kesoram Cementon Financial Performance hellip
httpslidepdfcomreaderfulla-study-a-study-on-financial-performance-analysis-with-reference-to-kesoram 7381
8102019 A Study A Study On Financial Performance Analysis With Reference To Kesoram Cementon Financial Performance hellip
httpslidepdfcomreaderfulla-study-a-study-on-financial-performance-analysis-with-reference-to-kesoram 7481
8102019 A Study A Study On Financial Performance Analysis With Reference To Kesoram Cementon Financial Performance hellip
httpslidepdfcomreaderfulla-study-a-study-on-financial-performance-analysis-with-reference-to-kesoram 7581
75
CHAPTER V
FINDINGS amp SUGGESTIONS
8102019 A Study A Study On Financial Performance Analysis With Reference To Kesoram Cementon Financial Performance hellip
httpslidepdfcomreaderfulla-study-a-study-on-financial-performance-analysis-with-reference-to-kesoram 7681
76
Findings
The Share capital remains constant Share capital is unchanged all the years from
2008-2012
Reserves amp surplus were recorded an increasing trend in the period between 2008
and 2010It is showing decreasing trend in the period 2011-2012 (ie from 16019
in 2010 to 9309 in 2012)
Current Liabilities were increased compared to base year ie 2008
Provisions increased to 262597 ie in Rupees 39232 crores in the current year
The current ratio for all the five year is lower (less) than the standard rule ie 21
And it is 097 in the year 2011-2012 (current year)
The Debt-Equity Ratio was shown under the standard ratio It is clear that the long
term debt is more than that of the share holdersrsquo fund It indicates that the firm
heavily relying on external funds rather than the internal funds
The operating and net profit of Kesoram is in decreasing trend due to heavy
increase of manufacturing amp administrative expenses
ROI is highest in the year 2007-2008 as 3862 The ROI is negative in the years
2010-2011 amp 2011-2012 as -2167 amp -4165 respectively
Return on Equity Capital Employed Ratio of Kesoram has decreased every year
from 2007-2008 to 2010-2011It further decreased to negative in the year 2011-12 to
-3280
EPS of Kesoram has decreased every year from 2008-12It is negative in the year
2011 amp 12
8102019 A Study A Study On Financial Performance Analysis With Reference To Kesoram Cementon Financial Performance hellip
httpslidepdfcomreaderfulla-study-a-study-on-financial-performance-analysis-with-reference-to-kesoram 7781
77
Suggestion
The organization should adopt an appropriate capital structure
The companyrsquos debt-equity ratio is recorded more or less as 111 in the year 2008
and it is increased to 449 in the year 2012 (current year)The company should
adopt a better debt equity mix in the future to control the fluctuations in returns
The company should control fluctuations in cash and bank balances as it impacts the
current ratio of the company
The provisions are showing increasing trend which indicates risk of debtors The
firm should implement an effective credit management policy It should utilize its
idle funds by decreasing provisions
The company should control heavy increase of manufacturing amp administration
expenses as it is impacting the operating and net profit of company
8102019 A Study A Study On Financial Performance Analysis With Reference To Kesoram Cementon Financial Performance hellip
httpslidepdfcomreaderfulla-study-a-study-on-financial-performance-analysis-with-reference-to-kesoram 7881
78
ANNEXURE
Profit And Loss Account of Kesoram Cement
Mar12 Mar11 Mar10 Mar09 Mar08
12 Months 12 Months 12 Months 12 Months 12 Months
INCOME
Sales Turnover 628260 575072 505151 431613 345700
Excise Duty 36440 35284 30089 41815 45429
NET SALES 591820 539788 475062 389797 300271
Other Income 000 000 000 000 000
TOTALINCOME
596129 548733 481019 393969 302020
EXPENDITURE
Manufacturing
Expenses81903 74803 13974 13153 44113
MaterialConsumed
370897 310150 295550 229359 118448
Personal
Expenses33468 27355 23294 18690 15344
Selling Expenses 81910 78253 58667 48846 45019
AdministrativeExpenses
28225 29308 17219 16179 9907
Expenses
Capitalized000 000 000 000 000
Provisions Made 000 000 000 000 000
TOTAL
EXPENDITURE 596403 519870 408704 326227 232832Operating Profit -4583 19918 66358 63570 67439
EBITDA -274 28864 72316 67742 69188
Depreciation 29740 27259 17280 11186 8927
Other Write-offs 000 000 000 000 000
EBIT -30014 1605 55035 56557 60261
Interest 41015 23983 10921 12087 5426
EBT -71029 -22377 44114 44470 54835
Taxes -32921 5798 23816 3037 16918
Profit and Loss
for the Year-38108 -28176 20298 41432 37917
Non RecurringItems
-1142 7063 3228 -4023 402
Other Non Cash
Adjustments1276 091 207 465 017
OtherAdjustments
000 000 000 000 000
REPORTED
PAT-37974 -21021 23734 37874 38335
8102019 A Study A Study On Financial Performance Analysis With Reference To Kesoram Cementon Financial Performance hellip
httpslidepdfcomreaderfulla-study-a-study-on-financial-performance-analysis-with-reference-to-kesoram 7981
79
Balance Sheet Of Kesoram
Years
Particulars 2008 2009 2010 2011 2012
Liabilities
Share Capital 4574 4574 4574 4574 4574Reserves amp Surplus 93085 128024 149111 125162 86657
Revaluation Reserves 533 412 339 289 27
Loans
Secured Loans 97106 153627 186372 237183 317792
Un Secured Loans 12129 43416 12625 162744 92742
Deferred Tax Liabilities 0 0 0 0 0
Current Liabilities
Provisions 33039 34529 35734 1494 40726
Current Liabilities 57067 66587 107688 113902 18001
Total 297533 431169 610068 645348 722771
Assets
Net Block 108424 180435 343182 369172 358721
Capital WIP 63459 86485 41283 43781 68065
Investments 4783 6178 5143 6582 6636
Current Assets
Inventories 44217 58906 91619 111855 99516
Sundry Debtors 27307 38017 54289 63134 67358
Cash amp Bank Balances 4036 5657 8014 7188 6959
Total Current Assets 7556 10258 153922 182177 173833Loans amp Advances 45289 55462 66506 4346 115409
Fixed Deposits 018 028 031 176 107
Total 297533 431169 610068 645348 722771
8102019 A Study A Study On Financial Performance Analysis With Reference To Kesoram Cementon Financial Performance hellip
httpslidepdfcomreaderfulla-study-a-study-on-financial-performance-analysis-with-reference-to-kesoram 8081
80
KEY ITEMS 2012 2011 2010 2009 2008
Preference
Dividend 0 0 0 0 0
Equity Dividend 457 2516 2516 2516 2516
Equity Dividend
() 999 55 55 55 55
Shares in Issue(Lakhs) 45743 45743 45743 45743 45743
EPS - Annualised
(Rs) -8302 -4595 5188 828 838
8102019 A Study A Study On Financial Performance Analysis With Reference To Kesoram Cementon Financial Performance hellip
httpslidepdfcomreaderfulla-study-a-study-on-financial-performance-analysis-with-reference-to-kesoram 8181
BIBLIOGRAPHY
Sl
No
Books Author Name
1 Financial Management Khan amp JAIN
2 Financial Management IMPandey
3 Management Accounting RPTrivedi
Websites amp Search Engines
1 wwwkesoramcom983086
2 wwwmoneycontrolcom
3 wwwgooglefinancecom983086
Annual reports of Kesoram cement limited 2008-2012
8102019 A Study A Study On Financial Performance Analysis With Reference To Kesoram Cementon Financial Performance hellip
httpslidepdfcomreaderfulla-study-a-study-on-financial-performance-analysis-with-reference-to-kesoram 281
2
8102019 A Study A Study On Financial Performance Analysis With Reference To Kesoram Cementon Financial Performance hellip
httpslidepdfcomreaderfulla-study-a-study-on-financial-performance-analysis-with-reference-to-kesoram 381
3
8102019 A Study A Study On Financial Performance Analysis With Reference To Kesoram Cementon Financial Performance hellip
httpslidepdfcomreaderfulla-study-a-study-on-financial-performance-analysis-with-reference-to-kesoram 481
4
DECLARATION
I hereby declare that the project entitled ldquoA study on financial performance
analysis aatt KKeessoorraamm CCeemmeennttrdquo submitted in partial fulfillment of the requirements for
award of the degree of MBA at Gokaraju Rangaraju Institute of Engineering and
Technology affiliated to Jawaharlal Nehru Technological University Hyderabad is
an authentic work and has not been submitted to any other UniversityInstitute for
award of any degreediploma
MVIKRAM SINGH
(10241e0028)
MBA GRIET
HYDERABAD
8102019 A Study A Study On Financial Performance Analysis With Reference To Kesoram Cementon Financial Performance hellip
httpslidepdfcomreaderfulla-study-a-study-on-financial-performance-analysis-with-reference-to-kesoram 581
5
ACKNOWLEDGEMENT
Firstly I would like to express our immense gratitude towards our institution
Gokaraju Rangaraju Institute of Engineering amp Technology which created a great
platform to attain profound technical skills in the field of MBA thereby fulfilling our most
cherished goal
I would thank all the finance department of Kesoram specially Mr MURTHY ASST
Manager Finance for guiding me and helping me in successful completion of the project
I am very much thankful to our Prof KVS RAJU (Internal Guide) sir for extending
his cooperation in doing this project
I am also thankful to our project coordinator Prof S RAVINDRA CHARY for
extending his cooperation in completion of Project
I convey my thanks to my beloved parents and my faculty who helped me directly or
indirectly in bringing this project successfully
M VIKRAM SINGH
(102419831090028)
8102019 A Study A Study On Financial Performance Analysis With Reference To Kesoram Cementon Financial Performance hellip
httpslidepdfcomreaderfulla-study-a-study-on-financial-performance-analysis-with-reference-to-kesoram 681
6
INDEX
SNo Contents Page No
Chapter-1 1-8
Introduction
Need of the Study
Objectives of the Study
Methodology of the Study
Limitations of the Study
Chapter-2 9-28
Industry Profile
Company Profile
Chapter-3 29-38
Review of Literature
Chapter-4 39-68
Data Analysis And Interpretation
Chapter-5 69-71
Findings
Suggestions
Chapter-6 72-75
Annexure
Bibliography
8102019 A Study A Study On Financial Performance Analysis With Reference To Kesoram Cementon Financial Performance hellip
httpslidepdfcomreaderfulla-study-a-study-on-financial-performance-analysis-with-reference-to-kesoram 781
7
CHAPTER-I
INTRODUCTION
8102019 A Study A Study On Financial Performance Analysis With Reference To Kesoram Cementon Financial Performance hellip
httpslidepdfcomreaderfulla-study-a-study-on-financial-performance-analysis-with-reference-to-kesoram 881
8
Introduction-
The term lsquofinancial performance analysis also known as analysis and interpretation
of financial statementsrsquo refers to the process of determining financial strength and
weaknesses of the firm by establishing strategic relationship between the items of the
balance sheet profit and loss account and other operative data
ldquoFinancial performance analysis is a process of evaluating the relationship between
component parts of a financial statement to obtain a better understanding of a firmrsquos
position and performance
The purpose of financial analysis is to diagnose the information contained in
financial statements so as to judge the profitability and financial soundness of the firm Just
like a doctor examines his patient by recording his body temperature blood pressure etc
Before making his conclusion regarding the illness and before giving his treatment A
financial analyst analyses the financial statements with various tools of analysis before
commenting upon the financial health or weaknesses of an enterprise
The analysis and interpretation of financial statements is essential to bring out the
mystery behind the figures in financial statements Financial statements analysis is an
attempt to determine the significance and meaning of the financial statement data so that
forecast may be made of the future earnings ability to pay interest and debt maturities (both
current and long term) and profitability of a sound divided policy
Financial performance refers to the act of performing financial activity In broader sense
financial performance refers to the degree to which financial objectives being or has been
accomplished It is the process of measuring the results of a firms policies and operations in
monetary terms It is used to measure firms overall financial health over a given period oftime and can also be used to compare similar firms across the same industry or to compare
industries or sectors in aggregation
In short the firm itself as well as various interested groups such as managers
shareholders creditors tax authorities and others seeks answers to the
Following important questions
8102019 A Study A Study On Financial Performance Analysis With Reference To Kesoram Cementon Financial Performance hellip
httpslidepdfcomreaderfulla-study-a-study-on-financial-performance-analysis-with-reference-to-kesoram 981
9
1 What is the financial position of the firm at a given point of time
2 How is the financial performance of the firm over a given period
Of time
These questions can be answered with the help of financial analysis of a firm Financial
analysis involves the use of financial statements A financial statement is an organized
collection of data according to logical and conceptual framework 50 consistent accounting
procedures Its purpose is to convey an understanding of some financial aspects of a
business firm It may show a position at a moment of time as in the case of a balance sheet
or may reveal a series of activities over a given period of time as in the case of an income
statement
Thus the term lsquofinancial statementsrsquo generally refers to two basic statements
The balance sheet and the income statement
The balance sheet shows the financial position (condition) of the firm at a given point of
time It provides a snapshot and may be regarded as a static picture
ldquoBalance sheet is a summary of a firmrsquos financial position on a given date that
Shows total assets = total liabilities + ownerrsquos equityrdquo
The income statement (referred to in India as the profit and loss statement) reflects the
performance of the firm over a period of time
ldquoIncome statement is a summary of a firmrsquos revenues and expenses over a specified period
ending with net income or loss for the periodrdquo
However financial statements do not reveal all the information related to the financial
operations of a firm but they furnish some extremely useful information which highlights
two important factors profitability and financial soundness Thus analysis of financial
statements is an important aid to financial performance analysis Financial performance
analysis includes analysis and interpretation of financial statements in such a way that it
Undertakes full diagnosis of the profitability and financial soundness of the business
ldquoThe analysis of financial statements is a process of evaluating the relationship between
component parts of financial statements to obtain a better understanding of the firmrsquos
position and performancerdquo
8102019 A Study A Study On Financial Performance Analysis With Reference To Kesoram Cementon Financial Performance hellip
httpslidepdfcomreaderfulla-study-a-study-on-financial-performance-analysis-with-reference-to-kesoram 1081
10
Need for Study
Need Of Financial Management Study To Diagnose The Information Contain In
Financial Statement So as To Judge the Profitability and Financial Position of the
Firm
Financial Analyst Analyses The Financial Statements With Various Tools Of
Analysis Before Commanding Upon The Financial Health Of The Firm
Essential to Bring Out the History
Significance and Meaning of the Financial Statements
8102019 A Study A Study On Financial Performance Analysis With Reference To Kesoram Cementon Financial Performance hellip
httpslidepdfcomreaderfulla-study-a-study-on-financial-performance-analysis-with-reference-to-kesoram 1181
11
Objectives
1 To understand the financial statements of Kesoram cement
2 To study the change in assets and liabilities of the company
3 To study the liquidity position of the firm
4 To study the financial health of the company using ratio analysis
5 To study the profitability of the company
6 To offer suggestions to the company
8102019 A Study A Study On Financial Performance Analysis With Reference To Kesoram Cementon Financial Performance hellip
httpslidepdfcomreaderfulla-study-a-study-on-financial-performance-analysis-with-reference-to-kesoram 1281
12
Significance of Financial Performance Analysis
Interest of various related groups is affected by the financial performance of a firm
Therefore these groups analyze the financial performance of the firm The type of analysis
varies according to the specific interest of the party involved
Trade creditors interested in the liquidity of the firm (appraisal of firmrsquos liquidity)
Bond holders interested in the cash-flow ability of the firm (appraisal of firmrsquos capital
structure the major sources and uses of funds profitability over time and projection of
future profitability)
Investors interested in present and expected future earnings as well as stability of these
earnings (appraisal of firmrsquos profitability and financial condition)
Management interested in internal control better financial condition and betterperformance (appraisal of firmrsquos present financial condition evaluation of opportunities in
relation to this current position return on investment provided by various assets of the
company etc)
Research Methodology
Research Design
This is a systematic way to solve the research problem and it is important
component for the study without which researches may not be able to obtain the format A
research design is the arrangement of conditions for collection and analysis of data in a
manager that aims to combine for collection and analysis of data relevance to the research
purpose with economy in procedure
Meaning of Research Design
The formidable problem that follows the task of defining the research problem is the
preparation of design of the research project popularly known as the research design
decision regarding what where when how much by what means concerning an inquiry of
a research study constitute a research design A research design is the arrangement of
conditions for collection and analysis of data in a manager that aims to combine for
collection and analysis of data relevance to the research purpose with economy in
procedure
8102019 A Study A Study On Financial Performance Analysis With Reference To Kesoram Cementon Financial Performance hellip
httpslidepdfcomreaderfulla-study-a-study-on-financial-performance-analysis-with-reference-to-kesoram 1381
13
Sources of Data
Data we collected based on two sources
Primary Data
Secondary Data
Primary Data
The Primary Data Are Those Informationrsquos which are Collected afresh and for the
First Time And Thus Happen to Be Original in Character
Secondary Data
The secondary data are those which have already been collected by some other agency and
which have already been processed The sources of secondary data are annual reports
browsing internet through magazines
1 It includes data gathered from the annual reports of Kesoram
2 Articles are collected from official website of Kesoram
Methodology Used
Types Of Financial Statements Adopted
Following Two Types of Financial Statements Are Commonly Used in
Analyzing the Firmrsquos Financial Position
a Balance Sheet
b Income Statements
8102019 A Study A Study On Financial Performance Analysis With Reference To Kesoram Cementon Financial Performance hellip
httpslidepdfcomreaderfulla-study-a-study-on-financial-performance-analysis-with-reference-to-kesoram 1481
14
Limitations of Financial Statement
Each Project Gives Rise to Its Own Unique Risks And Hence Possess Its Own Unique
Challenges
1 Only Interim Reports
Only interim statements donrsquot give a final picture of the concern The data given in
these statements is only approximate The actual position can only be determined when the
business is sold or liquidated
2 Donrsquot Give Extra Position
The Financial Statements Are Expressed In Monetary Values So They Appear To
Give Final And Accurate Position The Values Of Fixed Assets In The Balance Sheet
Neither Represent The Value For Which Fixed Assets Can Be Sold Nor The Amount Which
Will Be Required To Replace These Assets
3 Historical Costs
The Financial Statements Are Prepared On The Basis Of Historical Costs Or
Original Costs The Value of Assets Decreases with the Passage of Time Current Price
Changes Are Not Taken Into Account The Statements Are Not Prepared Keeping In View
The Present Economic Conditions The Balance Sheet Loses The Significance Of Being An
Index Of Current Economic Realities
4 Act of non monitory factors Ignored
There are certain factors which have a bearing on the financial position and
operating results of the business but they donrsquot become a part of these statements because
they canrsquot be measured in monetary terms Such factors may include in the reputation of the
management
No Precision
The precision of financial statement data is not possible because the statements deal with
matters which canrsquot be precisely stated The data are recorded by conventional procedures
followed over the years Various conventions postulates personal judgments etc
8102019 A Study A Study On Financial Performance Analysis With Reference To Kesoram Cementon Financial Performance hellip
httpslidepdfcomreaderfulla-study-a-study-on-financial-performance-analysis-with-reference-to-kesoram 1581
15
CHAPTER-II
INDUSTRY PROFILE
amp
COMPANY PROFILE
8102019 A Study A Study On Financial Performance Analysis With Reference To Kesoram Cementon Financial Performance hellip
httpslidepdfcomreaderfulla-study-a-study-on-financial-performance-analysis-with-reference-to-kesoram 1681
16
Industry Profile
In the most general sense of the word cement is a binder a substance which
sets and hardens independently and can bind other materials together The word cement
traces to the Romans who used the term opus caementicium to describe masonry whichresembled concrete and was made from crushed rock with burnt lime as binder The
volcanic ash and pulverized brick additives which were added to the burnt lime to obtain a
hydraulic binder were later referred to as cementum and cement Cements used in
construction are characterized as hydraulic or non-hydraulic
The most important use of cement is the production of mortar and concretemdashthe bonding of
natural or artificial aggregates to form a strong building material which is durable in the
face of normal environmental effects
Concrete should not be confused with cement because the term cement refers only to the dry
powder substance used to bind the aggregate materials of concrete Upon the addition of
water andor additives the cement mixture is referred to as concrete especially if aggregates
have been added
It is uncertain where it was first discovered that a combination of hydrated non-hydraulic
lime and a pozzolan produces a hydraulic mixture (see also Pozzolanic reaction) but
concrete made from such mixtures was first used on a large scale by engineers They used
both natural pozzolans (trass or pumice) and artificial pozzolans (ground brick or pottery) in
these concretes Many excellent examples of structures made from these concretes are still
standing notably the huge monolithic dome of the Pantheon in Rome and the massive Baths
of Caracalla The vast system of Roman aqueducts also made extensive use of hydraulic
cement The use of structural concrete disappeared in medieval Europe although weak
pozzolanic concretes continued to be used as a core fill in stone walls and columns
Modern cement
Modern hydraulic cements began to be developed from the start of the Industrial Revolution
(around 1800) driven by three main needs
Hydraulic renders for finishing brick buildings in wet climates
Hydraulic mortars for masonry construction of harbor works etc in contact with sea water
Development of strong concretes
In Britain particularly good quality building stone became ever more expensive during a
period of rapid growth and it became a common practice to construct prestige buildings
8102019 A Study A Study On Financial Performance Analysis With Reference To Kesoram Cementon Financial Performance hellip
httpslidepdfcomreaderfulla-study-a-study-on-financial-performance-analysis-with-reference-to-kesoram 1781
17
from the new industrial bricks and to finish them with a stucco to imitate stone Hydraulic
limes were favored for this but the need for a fast set time encouraged the development of
new cements Most famous was Parkers Roman cement This was developed by James
Parker in the 1780s and finally patented in 1796 It was in fact nothing like any material
used by the Romans but was ldquoNatural cement made by burning septaria - nodules that are
found in certain clay deposits and that contain both clay minerals and calcium carbonate
The burnt nodules were ground to a fine powder This product made into a mortar with
sand set in 5ndash15 minutes The success of Roman Cement led other manufacturers to
develop rival products by burning artificial mixtures of clay and chalk
John Smeaton made an important contribution to the development of cements when he was
planning the construction of the third Eddystone Lighthouse (1755-9) in the English
Channel He needed a hydraulic mortar that would set and develop some strength in the
twelve hour period between successive high tides He performed an exhaustive market
research on the available hydraulic limes visiting their production sites and noted that the
hydraulicity of the lime was directly related to the clay content of the limestone from
which it was made Smeaton was a civil engineer by profession and took the idea no
further Apparently unaware of Smeatons work the same principle was identified by Louis
Vicat in the first decade of the nineteenth century Vicat went on to devise a method of
combining chalk and clay into an intimate mixture and burning this produced an artificial
cement in 1817 James Frost working in Britain produced what he called British cement
in a similar manner around the same time but did not obtain a patent until 1822 In 1824
Joseph Aspdin patented a similar material which he called Portland cement because the
render made from it was in color similar to the prestigious Portland stone
All the above products could not compete with limepozzolan concretes because of fast-
setting (giving insufficient time for placement) and low early strengths (requiring a delay of
many weeks before formwork could be removed) Hydraulic limes natural cements and
artificial cements all rely upon their belite content for strength development Belite
develops strength slowly Because they were burned at temperatures below 1250 degC they
contained no alite which is responsible for early strength in modern cements The first
cement to consistently contain alite was made by Joseph Aspdins son William in the early
1840s This was what we call today modern Portland cement Because of the air of
mystery with which William Aspdin surrounded his product others (eg Vicat and I C
Johnson) have claimed precedence in this invention but recent analysis of both his concrete
8102019 A Study A Study On Financial Performance Analysis With Reference To Kesoram Cementon Financial Performance hellip
httpslidepdfcomreaderfulla-study-a-study-on-financial-performance-analysis-with-reference-to-kesoram 1881
18
and raw cement have shown that William Aspdins product made at North fleet Kent was a
true alite-based cement However Aspdins methods were rule-of-thumb Vicat is
responsible for establishing the chemical basis of these cements and Johnson established
the importance of sintering the mix in the kiln
William Aspdins innovation was counter-intuitive for manufacturers of artificial cements
because they required more lime in the mix (a problem for his father) because they required
a much higher kiln temperature (and therefore more fuel) and because the resulting clinker
was very hard and rapidly wore down the millstones which were the only available grinding
technology of the time Manufacturing costs were therefore considerably higher but the
product set reasonably slowly and developed strength quickly thus opening up a market for
use in concrete The use of concrete in construction grew rapidly from 1850 onwards and
was soon the dominant use for cements Thus Portland cement began its predominant role
It is made from water and sand
Types of modern cement
Portland cement
Cement is made by heating limestone (calcium carbonate) with small quantities of other
materials (such as clay) to 1450degC in a kiln in a process known as calcination whereby a
molecule of carbon dioxide is liberated from the calcium carbonate to form calcium oxide
or lime which is then blended with the other materials that have been included in the mix
The resulting hard substance called clinker is then ground with a small amount of gypsum
into a powder to make Ordinary Portland Cement the most commonly used type of cement
(often referred to as OPC)
Portland cement is a basic ingredient of concrete mortar and most non-speciality grout The
most common use for Portland cement is in the production of concrete Concrete is a
composite material consisting of aggregate (gravel and sand) cement and water As a
construction material concrete can be cast in almost any shape desired and once hardened
can become a structural (load bearing) element Portland cement may be gray or whitePortland cement blends
These are often available as inter-ground mixtures from cement manufacturers but similar
formulations are often also mixed from the ground components at the concrete mixing plant
Portland blast furnace cement contains up to 70 ground granulated blast furnace slag
with the rest Portland clinker and a little gypsum All compositions produce high ultimate
8102019 A Study A Study On Financial Performance Analysis With Reference To Kesoram Cementon Financial Performance hellip
httpslidepdfcomreaderfulla-study-a-study-on-financial-performance-analysis-with-reference-to-kesoram 1981
19
strength but as slag content is increased early strength is reduced while sulfate resistance
increases and heat evolution diminishes Used as an economic alternative to Portland
sulfate-resisting and low-heat cements
Portland fly ash cement contains up to 30 fly ash The fly ash is pozzolanic so that
ultimate strength is maintained Because fly ash addition allows lower concrete water
content early strength can also be maintained Where good quality cheap fly ash is
available this can be an economic alternative to ordinary Portland cement
Portland pozzolan cement includes fly ash cement since fly ash is a pozzolan but also
includes cements made from other natural or artificial pozzolans In countries where
volcanic ashes are available (eg Italy Chile Mexico and the Philippines) these cements
are often the most common form in use
Portland silica fume cement Addition of silica fume can yield exceptionally high
strengths and cements containing 5-20 silica fume are occasionally produced However
silica fume is more usually added to Portland cement at the concrete mixer
Masonry cements are used for preparing bricklaying mortars and stuccos and must not be
used in concrete They are usually complex proprietary formulations containing Portland
clinker and a number of other ingredients that may include limestone hydrated lime air
entrainers retarders water proofers and coloring agents They are formulated to yield
workable mortars that allow rapid and consistent masonry work Subtle variations of
Masonry cement in the US are Plastic Cements and Stucco Cements These are designed to
produce controlled bond with masonry blocks
Expansive cements contain in addition to Portland clinker expansive clinkers (usually
sulfoaluminate clinkers) and are designed to offset the effects of drying shrinkage that is
normally encountered with hydraulic cements This allows large floor slabs (up to 60 m
square) to be prepared without contraction joints
White blended cements may be made using white clinker and white supplementary
materials such as high-purity metakaolin
Colored cements are used for decorative purposes In some standards the addition of
pigments to produce colored Portland cement is allowed In other standards (eg ASTM)
pigments are not allowed constituents of Portland cement and colored cements are sold as
blended hydraulic cements
Very finely ground cements are made from mixtures of cement with sand or with slag or
other pozzolan type minerals which are extremely finely ground together Such cements can
8102019 A Study A Study On Financial Performance Analysis With Reference To Kesoram Cementon Financial Performance hellip
httpslidepdfcomreaderfulla-study-a-study-on-financial-performance-analysis-with-reference-to-kesoram 2081
have the same physical characteristics as normal cement but with 50 less cement
particularly due to their increased surface area for the chemical reaction Even with
intensive grinding they can use up to 50 less energy to fabricate than ordinary Portland
cements
Non-Portland hydraulic cements
Pozzolan-lime cements Mixtures of ground Pozzolan and lime are the cements used by the
Romans and are to be found in Roman structures still standing (eg the Pantheon in Rome)
They develop strength slowly but their ultimate strength can be very high The hydration
products that produce strength are essentially the same as those produced by Portland
cement
Slag-lime cements Ground granulated blast furnace slag is not hydraulic on its own but is
activated by addition of alkalis most economically using lime They are similar to
pozzolan lime cements in their properties Only granulated slag (ie water-quenched glassy
slag) is effective as a cement component
Super sulfated cements These contain about 80 ground granulated blast furnace slag
15 gypsum or anhydrite and a little Portland clinker or lime as an activator They produce
strength by formation of ettringite with strength growth similar to a slow Portland cement
They exhibit good resistance to aggressive agents including sulfate
Calcium aluminate cements are hydraulic cements made primarily from limestone and
bauxite The active ingredients are monocalcium aluminate CaAl2O4 (CaO middot Al2O3 or CA in
Cement chemist notation CCN) and mayenite Ca12Al14O33 (12 CaO middot 7 Al2O3 or C12A7 in
CCN) Strength forms by hydration to calcium aluminate hydrates They are well-adapted
for use in refractory (high-temperature resistant) concretes eg for furnace linings
Calcium sulfoaluminate cements are made from clinkers that include yeelimite (Ca4
(AlO2)6SO4 or C4A3 in Cement chemists notation) as a primary phase They are used in
expansive cements in ultra-high early strength cements and in low-energy cements
Hydration produces ettringite and specialized physical properties (such as expansion or
rapid reaction) are obtained by adjustment of the availability of calcium and sulfate ionsTheir use as a low-energy alternative to Portland cement has been pioneered in China
where several million tonnes per year are produced Energy requirements are lower because
of the lower kiln temperatures required for reaction and the lower amount of limestone
(which must be endothermically decarbonated) in the mix In addition the lower limestone
8102019 A Study A Study On Financial Performance Analysis With Reference To Kesoram Cementon Financial Performance hellip
httpslidepdfcomreaderfulla-study-a-study-on-financial-performance-analysis-with-reference-to-kesoram 2181
21
content and lower fuel consumption leads to a CO2 emission around half that associated
with Portland clinker However SO2 emissions are usually significantly higher
Natural Cements correspond to certain cements of the pre-Portland era produced by
burning argillaceous limestones at moderate temperatures The level of clay components in
the limestone (around 30-35) is such that large amounts of belite (the low-early strength
high-late strength mineral in Portland cement) are formed without the formation of
excessive amounts of free lime As with any natural material such cements have highly
variable properties
Geopolymer cements are made from mixtures of water-soluble alkali metal silicates and
aluminosilicate mineral powders such as fly ash and metakaolin
8102019 A Study A Study On Financial Performance Analysis With Reference To Kesoram Cementon Financial Performance hellip
httpslidepdfcomreaderfulla-study-a-study-on-financial-performance-analysis-with-reference-to-kesoram 2281
22
COMPANY PROFILE
8102019 A Study A Study On Financial Performance Analysis With Reference To Kesoram Cementon Financial Performance hellip
httpslidepdfcomreaderfulla-study-a-study-on-financial-performance-analysis-with-reference-to-kesoram 2381
23
Kesoram Cement Industry is one of the leading manufacturers of cement in India It is a day
process cement Plant The plant capacity is 826 lakh tones per annum It is located at
Basanthnagar in Karimnagar district of Andhra Pradesh Basanthnagar is 8 km away from
the Ramagundam Railway station linking Madras to New Delhi The Chairman of the
Company is BKBirla
History
The first unit at Basanthnagar with a capacity of 21 lakh tones per annum
incorporating humble suspension preheated system was commissioner during the year 1969
The second unit was setup in year 1971 with a capacity of 21 lakh tones per annum went on
stream in the year 1978 The coal for this company is being supplied from Singgareni
Collieries and the power is obtained from APSEB The power demand for the factory is
about 21 MW Kesoram has got 2 DG sets of 4 MW each installed in the year 1987
Kesoram Cement has setup a 15 KW captor power plant to facilitate for
uninterrupted power supply for manufacturing of cement at 24th
august 1997 per hour 12
mw actual power is 15 mw
The Company was incorporated on 18th October 1919 under the Indian Companies Act
1913 in the name and style of Kesoram Cotton Mills Ltd It had a Textile Mill at 42
Garden Reach Road Calcutta 700 024 The name of the Company was changed to Kesoram
Industries amp Cotton Mills Ltd on 30th
August 1961 and the same was further changed to Kesoram Industries Limited on 9th July
1986 The said Textile Mill at Garden Reach Road was eventually demerged into a separate
company
The First Plant for manufacturing of rayon yarn was established at Tribeni District
Hooghly West Bengal and the same was commissioned in December 1959 and the second
plant was commissioned in the year 1962 enabling it to manufacture 4635 metric tons perannum (mtpa) of rayon yarn This Unit has 6500 metric tons per annum (mtpa) capacity as
on 3132009
The plant for manufacturing of transparent paper was also set up at the same location at
Tribeni District Hooghly West Bengal in June 1961 It has the annual capacity to
manufacture 3600 metric tons per annum (mtpa) of transparent Paper
8102019 A Study A Study On Financial Performance Analysis With Reference To Kesoram Cementon Financial Performance hellip
httpslidepdfcomreaderfulla-study-a-study-on-financial-performance-analysis-with-reference-to-kesoram 2481
24
The Company diversified into manufacturing of cast iron spun pipes and pipe fittings at
Bansberia District Hooghly West Bengal with a production capacity of 45000 metric tons
per annum (mtpa) of cast iron spun pipes and pipe fittings in December 1964
The Company subsequently diversified into the manufacturing of Cement and in 1969
established its first cement plant under the name Kesoram Cement at Basantnagar Dist
Karimnagar (Andhra Pradesh) and to take advantage of favorable market conditions in
1986 another cement plant known as Vasavadatta Cement was commissioned by it at
Sedam Dist
Gulbarga (Karnataka) The cement manufacturing capacities at both the plants were
augmented from time to time according to the market conditions and as on 3132009
Kesoram Cement and Vasavadatta Cement have annual cement manufacturing capacities of
15 million metric tons and 41 million metric tons respectively
The Company in March 1992 commissioned a plant at Balasore known as Birla Tyres in
Orissa for manufacturing of 10 lakh mtpa automotive tyres and tubes in the first phase in
collaboration with Pirelli Ltd UK a subsidiary company of the world famous Pirelli
Group of Italy - a pioneer in production and development of automotive tyres in the world
The capacity at the said plant was further augmented during the year by 19 MT per day
aggregating to 271 MT per day production facility The Greenfield Project of 257 MT per
day capacity in the State of Uttarakhand with a capex of about Rs760 crores commenced
the commercial production in phases during the financial year 2008-09The Company as on
3132009 had the manufacturing capacities of 371 million tyres 295 million tubes and
153 million flaps per annum in the Plants including at Uttarakhand Plant It has small
manufacturing capacities of various Chemicals at Kharda in the State of West Bengal also
It has the annual manufacturing capacities of 12410 mtpa of Caustic Soda Lye 5045 mtpa
of Liquid Chlorine 6205 mtpa of Sodium Hypochlorite 8200 mtpa of Hydrochloric Acid
3200 mtpa of Ferric Alum 18700 mtpa of Sulphuric Acid and 1620000 m3pa of purified
Hydrogen Gas
The Company is a well-diversified entity in the fields of Cement Tyre Rayon Yarn
Transparent Paper Spun Pipes and Heavy Chemicals with two core business segments ie
Cement and Tyres
8102019 A Study A Study On Financial Performance Analysis With Reference To Kesoram Cementon Financial Performance hellip
httpslidepdfcomreaderfulla-study-a-study-on-financial-performance-analysis-with-reference-to-kesoram 2581
25
In Spun Pipes amp Foundries a unit of the Company work suspended from 2nd May 2008
still commences till further notice
The Company as of now is listed on three major Stock Exchanges in India ie Bombay
Stock Exchange Ltd Mumbai Calcutta Stock Exchange Association Ltd Kolkata and
National Stock Exchange of India Ltd Mumbai and at the Societe de la Bourse de
Luxembourg Luxembourg
A further expansion upto 165 million tons of cement per annum in Vasavadatta Cement at
Sedam in Karnataka as unit IV at the same site is in progress with a 175 MW Captive
Power Plant involving a capital expenditure of about Rs 78350 crores (including the cost
of Captive Power Plant)
The commercial production of cement in the aforesaid unit IV has commenced in June
2009 The work for the further expansion in the Tyres Section at Uttarakhand for radial
tyres with 100 MT per day capacity and bias tyres with 125 MT per day capacity involving
an estimated aggregate capital outlay of about Rs 840 crores is under progress The Board
has further approved a Motor Cycle Tyre Project of 70 MT per day capacity at the same site
involving a capital outlay of Rs190 crore The civil construction of both the Projects is in
full swing The commercial production in both the Projects is likely to start by December
2009 January 2010
Birla Supreme in popular brand of Kesoram cement from its prestigious plant of
Basantnagar in AP which has outstanding track record In performance and productivity
serving the nation for the last two and half decades It has proved its distinction by bagging
several national awards It also has the distinction of achieving optimum capacity
utilization
Kesoram offers a choice of top quality portioned cement for light heavy
constructions and allied applications Quality is built every fact of the operations
The plant lay out is rational to begin with The limestone is rich in calcium
carbonate a key factor that influences the quality of final product The day process
technology uses in the latest computerized monitoring overseas the manufacturing process
Samples are sent regularly to the bureau of Indian standards National council of
construction and building material for certification of derived quality norms
8102019 A Study A Study On Financial Performance Analysis With Reference To Kesoram Cementon Financial Performance hellip
httpslidepdfcomreaderfulla-study-a-study-on-financial-performance-analysis-with-reference-to-kesoram 2681
26
The company has vigorously undertaking different promotional measures for
promoting their product through different media which includes the use of news papers
magazine hoarding etc
Kesoram cement industry distinguished itself among all the cement factories in
Indian by bagging the National Productivity Award consecutively for two years ie for the
year 1985-1987 The federation of Andhra Pradesh Chamber amp Commerce and Industries
(FAPCCI) also conferred on Kesoram Cement An award for the best industrial promotion
expansion efforts in the state for the year 1984 Kesoram also bagged FAPCCI awarded for
ldquoBest Family Planning Effort in the staterdquo for the year 1987-1988
One among the industrial giants in the country today serving the nation on the
industrial front Kesoram industry ltd has a checked and eventful history dating back to the
twenties when the Industrial House of Birlarsquos acquired it With only a textile mill under its
banner 1924 it grew from strength to strength and spread its activities to newer fields like
Rayon Transparent paper pipes Refractors tyres and other products
Looking to the wide gap between the demand and supply of vital commodity
cement which play in important role in National building activity the Government of India
had de-licensed the cement industry in the year 1966 with a review to attract private
entrepreneur to augment the cement production Kesoram rose to the occasions and divided
to set up a few cement plants in the country
Kesoram cement undertaking marketing activities extensively in the state of Andhra
Pradesh Karnataka Tamilnadu Kerala Maharashtra and Gujarat In AP sales Depts are
located in different areas like Karimnagar Warangal Nizamabad Vijayawada and Nellore
In other states it has opened around 10 depots
The market share of Kesoram Cement in AP is 705 The market share of the
company in various states is shown as under
STATES MARKET SHARE
Karnataka 409
Tamilnadu 094
Kerala 029
Maharashtra 281
8102019 A Study A Study On Financial Performance Analysis With Reference To Kesoram Cementon Financial Performance hellip
httpslidepdfcomreaderfulla-study-a-study-on-financial-performance-analysis-with-reference-to-kesoram 2781
27
Process and Quality Control
It has been the endeavor of Kesoram to incorporate the Worldrsquos latest technology in
the plant and today the plant has the most sophisticated
X-ray analysis
Fully computerized XRF and XRD X-RAY Analyzers keep a constant round the
clock vigil on quality
Supreme performance
One of the largest Cement Plants in Andhra Pradesh the plant incorporate the latest
technology in Cement - making
It is professionally managed and well established Cement Manufacturing Company
enjoying the confidence of the consumers Kesoram has outstanding track record in
performance and productivity with quite a few national and state awards to its credit
BIRLA SUPREME the 43 Grade Cement is a widely accepted and popular brand
in the market commanding a premium
However to meet the specific demands of the consumer Kesoram bought out the 53
grade BIRLA SUPREME ndash GOLD which has special qualities like higher fineness quick-
setting high compressive strength and durability
Supreme Strength
Kesoram Cement has huge captive Limestone Deposits which make it possible tofeed high- grade limestone consistently its natural Grey colour is anion- born ingredient
and gives good shade
Both the products offered by Kesoram ie BIRLA SUPREME-43 Grade and
BIRLA SUPREME-GOLD-53 Grade cement are outstanding with much higher
compressive strength and durability
The following characteristics show their distinctive qualities
Comprehensive
Strength
Opc 43
grls 8112
1989
Birla
Supreme 43
grade
Opc 43 gr
Is 1226987
Birla
Supreme
Gold 53 gr
3 days mpa Min 23 31 + Min 27 38+
7 days mpa Min 23 42+ Min 37 48+
28 days mpa Min 43 50+ Min 53 60+
8102019 A Study A Study On Financial Performance Analysis With Reference To Kesoram Cementon Financial Performance hellip
httpslidepdfcomreaderfulla-study-a-study-on-financial-performance-analysis-with-reference-to-kesoram 2881
28
DC SYSTEM
Clinker making process is a key step in the overall cement making process In the case of
BIRLA SUPREMEGOLD the clinker-making process is totally computer control The
Distributed Control System (DCS) constantly monitors the process and ensures operating
efficiency This eliminates variation and ensures consistency in the quality of Clinker
Physical Characteristics
Ope 43
Is 8 112-89
Birla
Supreme
43 grade
Ope 53 gr
Is 12269-87
Birla Supreme
Gold 53 gr
Setting time Min30 120-180 Min 30 130-170
a Initial (mats) Max 600 180-240 Max 600 170-220
b final (mats) Min 225 270-280 Min 225 300-320
Fincncssm 2Kg Max 10 10-20 Max 10 05-10
Soundness Max 08 004-008 Max 0080 004-02
a le-chart (mm)
b autoclave ()
Supreme Expertise
The Best Technical Team exclusive to Kesoram mans the Plant and monitors the process
to blend the cement in just the required proportions to make BIRLA SUPREMEGOLD OF
Rock Strength
18 Million Tones of Solid Foundation
Staying at the top for over a Quarter Century Quarter Century is no less an achievement
Infact Kesoram is synonymous with for over 28 years
Over the years Kesoram has dispatched 18 million tones of cement to the nook and cornersof the country and joined hands in strengthening the Nation No one else in Andhra Pradesh
has this distinction The prestigious World Bank aided Ramagundam Super Thermal Power
Project of NTPC and Mannair Dam of Pochampad project in AP arc a couple of projects for
which Kesoram Cement was exclusively uses to cite an example
8102019 A Study A Study On Financial Performance Analysis With Reference To Kesoram Cementon Financial Performance hellip
httpslidepdfcomreaderfulla-study-a-study-on-financial-performance-analysis-with-reference-to-kesoram 2981
29
Chemical Characteristics
Opc 43 gr
Is 81 132-989
Birla
Supreme
43 grade
Ope 53 gr
Is 12269-
87
Birla
Supreme
Gold 53 gr
Loss on inflection Max 5 lt16 Max 40 lt15
Insoluble residue Max 20 lt08 Max 20 lt 06
Magnesium oxide Max 60 lt 13 Max 60 lt 13
Lime saturation factor 066-102 08-09 08-102 088-09
Alumna iron ratio MinO66 15-17 MinO66 15-17
Sulfuric anhydride Max 253 16-20 Max 2 53 16-20
Alkalis Chlorides Max 005 Max 001 Max 005 Max 04
Kesoram Cement - advantages
Helps in designing sleeker and more elegant
Structures giving greater flexibility in design concept
Due to its fine quality super fine construction can be achieved Its gives maximum
strength at Minimum use of cement with water in the water cement ratio especially the 53
grade Birlas supreme-gold
Feathers in Kesorams cap
Kesoram has outstanding track record achieving over 100 capacity utilization I
productivity and energy conservation It has proved its distinction by bagging several
national and state awards noteworthy being
NATIONAL
1 National productivity award for 1985-86
2 National productivity award for 1986-87
3 National award for mines safety for 1985-86
4 National award for mines safety for 1986-875 National award for energy conservation 1989-90
8102019 A Study A Study On Financial Performance Analysis With Reference To Kesoram Cementon Financial Performance hellip
httpslidepdfcomreaderfulla-study-a-study-on-financial-performance-analysis-with-reference-to-kesoram 3081
30
STATE
1 AP State productivity award for 1988
2 State award for best industrial management 1988-89
3 Best industrial productivity award of FAPCCI (federation of AP chamber of
commerce and industry) 1991
4 Best management award of the state Govt 1993
5 FAPCCI award for the workers welfare 1995-96
ISO 9002
All quality systems of Kesoram have been certified under ISO 90021S 4002 which
proves the worldwide acceptance of the products
All quality systems in production and marketing of the product have been certified by BIS
under ISO 90021S 14002
The first unit was installed at basanthnagar with a capacity of 25 ndashlakhs TPA (tones per
annum) incorporating humble supervision preheated system during the year 1969
The second unit followed suit with added a capacity of 2 lakhs TPA in 1971
The plant was further expanded to 9 lakhs by adding 25 lakhs tones in august 1978 113
lakhs tones in January 1981 and 087 lakhs tones in September 1981
Power
Singareni collieries make the supply of coal for this industry and the power was
obtained from AP TRANSCO The power demand for the factory is about 21MW Kesoram
has got 2-diesel generator seats of 4 MW each installed in the year 1987
Kesoram cement now has a 15MWcaptive power plant to facilities for uninterrupted
power supply for manufacturing of cement
Performance
The performance of kersoram cement industry has been outstanding achieving over
cent percent capacity utilization all through despite many odds like power cuts and which
most 40 was wasted due to wagon shortage etc
The company being a continuous process industry works round the clock and has
excellent records of performance achieving over 1005 capacity utilization
Kesoram has always combined technical progress with industrial performance The
company had glorious track record for the last 27 years in the industry
Technology
8102019 A Study A Study On Financial Performance Analysis With Reference To Kesoram Cementon Financial Performance hellip
httpslidepdfcomreaderfulla-study-a-study-on-financial-performance-analysis-with-reference-to-kesoram 3181
31
Kesoram cement uses most modern technology and the computerized control in the
plant A team of dedicated and well- experienced experts manages the plant
The quality is maintained much above the bureau of Indian standards
The raw materials used for manufacturing cement are
Lime stone
Bauxite
Hematite
Gypsum
Environmental and Social Obligations
For environmental promotion and to keep ndashup the ecological balance this section
has planted over two lakhs trees on social obligation front this section has undertaken
various social welfare programs by adopting ten nearly villages organizing family welfare
campus surgical camps animal health camps blood donation camps children immunization
camps seeds training for farmers etc were arranged
Welfare and Recreation Facilities
For the purpose of recreation facilities 2 auditoriums were provided for playing
indoor games cultural function and activities like drama music and dance etc
The industry has provided libraries and reading rooms About 1000 books are available in
the library All kinds of newspaper magazines are made available
Canteen is provided to cater to the needs of the employees for supply of snacks tea
coffee and meals etc
One English medium and one Telugu medium school are provided to meet the
educational requirements
The company has provided a dispenser with a qualified medical office and
paramedical staff for the benefit of the employees The employees covered under ESI
scheme have to avail the medical facilities from the ESI hospital
Competitions in sports and games are conducted every year for august 15th
Independence Day and January 26th republic day among the employees
Electricity
The power consumption per ton of cement has come down to 108 units against 113
units last year due to implementation of various energy saving measures The performance
of captive power plant of this section continues to be satisfactory Total power generation
8102019 A Study A Study On Financial Performance Analysis With Reference To Kesoram Cementon Financial Performance hellip
httpslidepdfcomreaderfulla-study-a-study-on-financial-performance-analysis-with-reference-to-kesoram 3281
32
during the year was 84 million units last year This captive power plant is a major role in
keeping power costs with in economic levels
The management has introduced various HRD programs for training and
development and has taken various other measures for the betterment of employeersquos
efficiency
The section has installed adequate air pollution control system and equipment and is
ISO14001 such as Environment management system is under implementation
Awards
Kesoram cement bagged many prestigious awards including national awards for
productivity technology conservation and several state awards since 1984 The following
are the some of important awards
AWARDS OF KESORAM CEMENT
No Year Awards
National
State
1 1989-90 Management award community
Development
State
2 1991 Energy conservation may day award of the
Govt
State
3 1991 Pundit Jawaharlal Nehru rolling trophy for
best
State
4 1993 National productivity effort Indira Gandhi
national award
State
5 1994 Best management award State
6 1994-
1995
Best industrial rebellion award State
7 1995 Rural development by chief minister
Environment and mineral conservation
award
State
8 1995 Best industrial rebellion award State
8102019 A Study A Study On Financial Performance Analysis With Reference To Kesoram Cementon Financial Performance hellip
httpslidepdfcomreaderfulla-study-a-study-on-financial-performance-analysis-with-reference-to-kesoram 3381
33
9 1995-
1996
Best effort of an industrial unit to
development rural economy shriSRRungta
award for social
National
10 1996 Awareness for best rural development
efforts
State
11 1999 Best workers welfare best family welfare
award
State
12 2001 First prize for mine environment amppollution
control for the 3rd
year in succession
State
13 2002 Vana mithra award from AP Govt State
14 2003 Company has got OHSAS-18001 State
15 2005 Certification from DNV New Delhi State
16 2006 Award for pollution control and
environmental protection FAPCCI award
for best rural development in the state
State
8102019 A Study A Study On Financial Performance Analysis With Reference To Kesoram Cementon Financial Performance hellip
httpslidepdfcomreaderfulla-study-a-study-on-financial-performance-analysis-with-reference-to-kesoram 3481
34
Products of the organization
8102019 A Study A Study On Financial Performance Analysis With Reference To Kesoram Cementon Financial Performance hellip
httpslidepdfcomreaderfulla-study-a-study-on-financial-performance-analysis-with-reference-to-kesoram 3581
35
CHAPTER-III
LITERATURE REVIEW
8102019 A Study A Study On Financial Performance Analysis With Reference To Kesoram Cementon Financial Performance hellip
httpslidepdfcomreaderfulla-study-a-study-on-financial-performance-analysis-with-reference-to-kesoram 3681
36
Introduction
Financial Performance Analysis
The term lsquofinancial performance analysis also known as analysis and interpretation of
financial statementsrsquo refers to the process of determining financial strength and
weaknesses of the firm by establishing strategic relationship between the items of the
balance sheet profit and loss account and other operative data
ldquoAnalyzing financial statementsrdquo by Metcalf and Titard
ldquoFinancial analysis is a process of evaluating the relationship between component
parts of a financial statement to obtain a better understanding of a firms position and
performancerdquo by Myers
Financial Performance
The word lsquoPerformance is derived from the word lsquoparfourmenrsquo which means lsquoto dorsquo lsquoto
carry outrsquo or lsquoto renderrsquo It refers the act of performing execution accomplishment
fulfillment etc In border sense performance refers to the accomplishment of a given task
measured against preset standards of accuracy completeness cost and speed In other
words it refers to the degree to which an achievement is being or has been accomplished In
the Words of Frich Kohlar ldquoThe performance is a general term applied to a part or to all the
conducts of activities of an organization over a period of time often with reference to past or
projected cost efficiency management responsibility or accountability or the like Thus not
just the presentation but the quality of results achieved refers to the performance
Performance is used to indicate firmrsquos success conditions and compliance
Financial performance refers to the act of performing financial activity In broader
sense financial performance refers to the degree to which financial objectives being or has
been accomplished It is the process of measuring the results of a firms policies and
operations in monetary terms It is used to measure firms overall financial health over a
given period of time and can also be used to compare similar firms across the same industry
or to compare industries or sectors in aggregation
The purpose of financial analysis is to diagnose the information contained in financial
statements so as to Jude the profitability and financial soundness of the firm Just like a
doctor examines his patient by recording his body temperature blood pressure etc Before
8102019 A Study A Study On Financial Performance Analysis With Reference To Kesoram Cementon Financial Performance hellip
httpslidepdfcomreaderfulla-study-a-study-on-financial-performance-analysis-with-reference-to-kesoram 3781
37
making his conclusion regarding the illness and before giving his treatment a financial
analyst analysis the financial statements with various tools of analysis before commenting
upon the financial health or weaknesses of an enterprise
The analysis and interpretation of financial statements is essential to bring out the
mystery behind the figures in financial statements Financial statements analysis is an
attempt to determine the significance and meaning of the financial statement data so that
forecast may be made of the future earnings ability to pay interest and debt maturities (both
current and long term) and profitability of a sound divided policy
Types of financial analysis-
Financial analysis into different categories depending upon
(1) The material used and
(2) The method of operation followed in the analysis or the modus operandi of
analysis
Types of financial analysis
On the basis of material used on the basis of modus operandi
External Internal Horizontal Vertical
Analysis Analysis Analysis Analysis
1 On the basis of material used - According to material used financial analysis canbe of two types
External analysis
Internal analysis
External analysis-
This analysis is done by outsiders who do not have access to the detailed internal
outsiders include investors potential investors Creditors Potential Creditors Government
Agencies Credit Agencies and General Public For financial analysis these external parties
to the firm depend almost entirely on the published financial statements
Internal analysis-
This analysis is undertaken by the persons namely executives and employees of the
organization or by the officers appointed by government or court who have access to the
8102019 A Study A Study On Financial Performance Analysis With Reference To Kesoram Cementon Financial Performance hellip
httpslidepdfcomreaderfulla-study-a-study-on-financial-performance-analysis-with-reference-to-kesoram 3881
38
books of account ( internal accounting records) and other information related to the
business
2 983119983150 983156983144983141 983138983137983155983145983155 983151983142 983149983151983140983157983155 983151983152983141983154983137983150983140983145983085
According to the modus operandi financial analysis can also be of two types
a Horizontal analysis
bVertical analysis
Horizontal analysis-
Horizontal analysis refers to the comparison of financial data of a company for several
years The figures for this type of analysis are presented horizontally over a number of
columns The figures of the various years are compared with standard or base year a base
year is year chosen as beginning point This type of analysis is also called lsquodynamicanalysisrsquo as it is based on the data from year to year rather than on data of any one year The
horizontal analysis makes it possible to focus attention on items that have changed
significantly during the period under view
b Vertical analysis-
Vertical analysis refers to the study of relationship of the various items in the financial
statements of one accounting period In this types of analysis the figures from financial
statement of a year are compared with a base selected from the same yearrsquos statement
Methods of financial analysis-
The following methods of analysis are generally used-
1 Comparative Statements
2 Trend Analysis
3 Common-Size Statements
4 Funds flow Analysis
5 Cash Analysis
6 Ratio Analysis
7 Cost-volume-Profit Analysis
8102019 A Study A Study On Financial Performance Analysis With Reference To Kesoram Cementon Financial Performance hellip
httpslidepdfcomreaderfulla-study-a-study-on-financial-performance-analysis-with-reference-to-kesoram 3981
39
Comparative statements-
The comparative financial statements are statements of the financial position at
different periods of time the elements of financial position are show in a
Comparative Statement provides an idea of financial position at two or more
periods Generally two financial statements (balance sheet and income statement) are
prepared in comparative form for financial analysis
The Comparative Statement May Show-
1 Absolute figures (rupee amounts)
2 Changes in absolute figures ie increase or decrease in absolute figures
3 Absolute data in terms of percentages
4 Increase or decrease in terms of percentages
The Two Comparative Statements Are-
1 Comparative balance sheet and
2 Income statement
1 983107983151983149983152983137983154983137983156983145983158983141 983138983137983148983137983150983139983141 983155983144983141983141983156983085
The comparative balance sheet analysis is the study of the trend of the same items group of
items and computed items in two or more balance sheets of the same business enterprise on
different dates The change in periodic balance sheet items reflect the conduct of a business
the change can be observed by comparison of the balance sheet at the beginning and at the
end of a period and these changes can help in forming an opinion about the progress of an
enterprise
Guide Lines for Interpretation of Comparative Balance Sheet-
While interpreting comparative balance sheet the interpreter is expected to study the
following aspects-
1 Current financial position and liquidity position
2 Long-term financial position
3 Profitability of the concern
8102019 A Study A Study On Financial Performance Analysis With Reference To Kesoram Cementon Financial Performance hellip
httpslidepdfcomreaderfulla-study-a-study-on-financial-performance-analysis-with-reference-to-kesoram 4081
40
Common Size Statement-
The common-size statements balance sheet and income statement are show in
analytical percentages The figures are shown as percentages of total assets total liabilities
and total sales The total assets are taken as 100 and different assets are expressed as a
percentage of the total similarly various liabilities are taken as a part of total liabilities
Common Size Balance Sheet-
A statement in which balance sheet items are expressed as the ratio of each asset to
total assets and the ratio of each liability is expressed as a ratio of total liabilities is called
common size balance The common size balance sheet can be used to compare companies
of differing size The comparison of figures in different periods is not useful because total
figures may be affected by a number of factors It is not possible to establish standard norms
for various assets The trends of figures from year to year may not be studied and even they
may not give proper results
Trend Analysis of Balance Sheet-
Trend analysis is Very important tool of horizontal financial analysis
This analysis enables to known the change in the financial function and operating efficiency
in between the time period chosen
By studding the trend analysis of each item we can known the direction of changes and
based upon the direction of changes the options can be changed
Trend =Absolute Value of item in the statement understudy 100
Absolute Value of same item in the base statement
Ratio Analysis
Ratio analysis is used as a technique of analyzing the financial information contained in the
balance sheet and profit and loss accounts for a more meaningful understanding of the
financial position and performance of a firm
The relationship between two accounting figures expressed mathematically is known as a
financial ratio A ratio helps the analyst to make qualitative judgment about the firmrsquos
financial position and performance
Several ratios can be calculated from the accounting data contained in the financial
statements The parties which generally undertake financial analysis is short ndashterm
creditors long-term creditors owner and management In view of the requirements of the
various ratios ratios are classified into the following four important categories
8102019 A Study A Study On Financial Performance Analysis With Reference To Kesoram Cementon Financial Performance hellip
httpslidepdfcomreaderfulla-study-a-study-on-financial-performance-analysis-with-reference-to-kesoram 4181
41
Liquidity ratios
Leverage ratios
Activity ratios
Profitability ratios
Liquidity Ratios
It is extremely essential for a firm to be able to meet its obligations as they become due
Liquidity ratios measure the ability of the firm to meet its current obligations A firm should
ensure that it does not suffer from lack of liquidity and also that it does not have excess
liquidity The failure of a company to meet its obligations due to lack of sufficient liquidity
will result in a poor creditworthiness loss of creditorsrsquo confidence or even in legal tangles
resulting in the closure of the company A very high degree of liquidity is also bad idle
assets earn nothing The firmrsquos funds will be unnecessarily tied up in current assets
Therefore it is necessary to strike a proper balance high liquidity and lack of liquidity
The most common ratios which indicate the extent of liquidity or lack of it are
Current ratio
Quick ratio
Other ratios include Cash ratio Interval Measure and Net working capital ratio
Current Ratio
The current ratio is calculated by dividing current assets by current liabilities
Current assets
Current ratio = --------------------------
Current liabilities
Current ratio is a measure of the firmrsquos short term solvency It indicates the availability of
current assets in rupees for every one rupee of current liability A ratio of greater than one
means that the firm has more current assets than current claims against the Current ratio of
2 to 1 or more is considered satisfactory Current ratio represents a margin of safety for
creditors
Quick Ratio
Quick ratio also known as acid-test ratio establishes a relationship between quick assets and
the current liabilities Cash is the most liquid asset It is calculated by dividing quick assets
by current liabilities
Quick ratio = Quick Assets Current Liabilities
8102019 A Study A Study On Financial Performance Analysis With Reference To Kesoram Cementon Financial Performance hellip
httpslidepdfcomreaderfulla-study-a-study-on-financial-performance-analysis-with-reference-to-kesoram 4281
42
(Quick Assets = Current assets ndash Inventory)
One defect of the current ratio is that it fails to convey any information on the composition
of the current assets of the firm A rupee of cash is considered equivalent to a rupee of
inventory of receivables But it is not so A rupee of cash is more readily available to meet
current liabilities than a rupee of say inventory This implies the usefulness of the current
ratio
The Acid ndashtest ratio measures the firmrsquos ability to convert its current assets quickly into
cash in order to meet its current liabilities
A quick ratio of 1 to 1 is considered to represent a satisfactory current financial condition It
is an important index of the firmrsquos liquidity
Leverage Ratios
Leverage ratios identify the source of a firmrsquos capital ndashowners or outside creditors
Financial leverage refers to the use of debt in financing non-current assets If the return on
assets exceeds the cost of debt the leverage is successful ndash ie it improves return on equity
Debt ndashEquity Ratio
The Debt ndash Equity is determined to analyze the soundness of the long term financial
policies of the organization It is also known as ldquoInternal External Equity Ratiordquo
It is calculated as follows
Debt ndash Equity Ratio = Total long term debt Share holders funds
Equity Ratio
This ratio is also called as proprietary ratio establishes a relationship between share holderrsquos
funds to total assets of company Equity Ratio is calculated by dividing share holders fund
by total assets
Fixed Asset Ratio
This ratio indicates the extent to which the assets of the companyrsquos can be lost without
affecting the interest of the creditors of the company Higher the ratios better the long-term
position of the company
Activity Ratios
They are primarily used for studying a firmrsquos working capital situation A well managed
firm should have good activity ratios
8102019 A Study A Study On Financial Performance Analysis With Reference To Kesoram Cementon Financial Performance hellip
httpslidepdfcomreaderfulla-study-a-study-on-financial-performance-analysis-with-reference-to-kesoram 4381
43
Working Capital Turnover Ratio
The working capital turnover ratio indicates whether or not working capital has been
effectively used in making sales
Working capital turnover = Sales Net current assets
Inventory Turnover Ratio
This ratio also known as Stock Turnover Ratio establishes the relationship between costs of
goods sold or net sales during the given period and the average amt of stock held during the
period This ratio reveals the number of times finished stock in turnover during a given
accounting period
Higher the ratio the better is it because it shows the finished stock is rapidly turned
in to sales On the other hand a low stock turnover ratio is not desirable because it reveals
the accumulation of stock
Debtors Turnover Ratio
This ratio indicates the velocity of debt collection of a company In other words it shows
the number of times average turnover during a year
A Higher Debtor Turnover Ratio indicates a more efficient is the management towards
debtors and low ratio ratio implies inefficient management of debtors
Total Assets Turnover Ratio
The asset turnover ratio indicates how efficiently management is employing Assets
Total Assets Turnover Ratio = Sales Total Assets
Profitability Ratios
Profitability ratios are the ratios which measure a firmrsquos overall effectiveness as revealed by
the returns generated on sales and investment
General Profitability Ratios
1 Gross Profit Ratio
2 Net profit Ratio
3 Operating or Expenses Ratio
8102019 A Study A Study On Financial Performance Analysis With Reference To Kesoram Cementon Financial Performance hellip
httpslidepdfcomreaderfulla-study-a-study-on-financial-performance-analysis-with-reference-to-kesoram 4481
44
Gross Profit Ratio
Gross profit Ratio measures the relationships to net sales and is usually represented as a
percentage It is a good measure of profitability
The gross profit ratio indicates the extent to which selling price of goods per unit may
decline without resulting in losses on operation Higher the gross profit betters the result
Net Profit Ratio
Net Profit Ratio indicates net margin on sales It is given by the following equation
Net Profit Ratio = (Net Profit Sales) 100
Operating or Expenses Ratio
This ratio is complimentary of Net Profit Ratio The more the net profit the less the
Operating Ratio Operating costs include the cost of direct materials direct labors and otheroverheads viz are generally excluded from operating costs A comparison of the Operating
Ratio will indicate whether the cost efficiency is high or low in the figure of sales This less
the ratio it depicts the efficiency of the management
8102019 A Study A Study On Financial Performance Analysis With Reference To Kesoram Cementon Financial Performance hellip
httpslidepdfcomreaderfulla-study-a-study-on-financial-performance-analysis-with-reference-to-kesoram 4581
45
CHAPTER IV
DATA ANALYSIS amp INTERPRETATION
8102019 A Study A Study On Financial Performance Analysis With Reference To Kesoram Cementon Financial Performance hellip
httpslidepdfcomreaderfulla-study-a-study-on-financial-performance-analysis-with-reference-to-kesoram 4681
46
Comparative Balance Sheet of Kesoram in the Year between 2008-2009
(Rupee in crores)
Years Changes
Particulars 2008 2009 In Rupees In Percentage
Liabilities
Share Capital 4574 4574 000 000
Reserves amp Surplus 93085 128024 34939
Revaluation Reserves 533 412 -121 -2270
Loans
Secured Loans 97106 153627 56521 5821
Un Secured Loans 12129 43416 31287 25795
Deferred Tax Liabilities 000 000 000 000
Current Liabilities
Provisions 33039 34529 1490 451
Current Liabilities 57067 66587 9520 1668
Total 297533 431169 133636 4491
Assets
Net Block 108424 180435 72011 6642
Capital Wip 63459 86485 23026 3628
Investments 4783 6178 1395 2917
Current Assets
Inventories 44217 58906 14689 3322
Sundry Debtors 27307 38017 10710 3922
Cash amp Bank Balances 4036 5657 1621 4016
Total Current Assets 75560 102580 27020 3576
Loans amp Advances 45289 55462 10173 2246
Fixed Deposits 018 028 010 5556
Total 297533 431169 133636 4491
8102019 A Study A Study On Financial Performance Analysis With Reference To Kesoram Cementon Financial Performance hellip
httpslidepdfcomreaderfulla-study-a-study-on-financial-performance-analysis-with-reference-to-kesoram 4781
47
Interpretation of comparative balance sheet of 2008-2009
Reserves amp Surplus were increased to 3753 (percent) ie in Rupees 34939
crores
Revaluation Reserves decreased to 121 ie in Rupees 2270 crores
Secured Loans are increased to 5821 ie in Rupees 56521 crores And UN
secured loans highly Increased to 25795
Current liabilities and Provisions are increased to 1668 and 451 respectively ie in
Rupees 9520 amp 1490 crores
Fixed assets were highly increased to 6642 ie in Rupees 72011 crores
Investments were increased to 2917 ie in Rupees 1395 crores
Sundry debtors increased to 3922 ie in Rupees 10710 crores
Current assets increased 3576 ie in Rupees 27020 crores And Loans amp
Advances increased to 2246 respectively
The overall financial position was satisfactory
8102019 A Study A Study On Financial Performance Analysis With Reference To Kesoram Cementon Financial Performance hellip
httpslidepdfcomreaderfulla-study-a-study-on-financial-performance-analysis-with-reference-to-kesoram 4881
48
Comparative Balance Sheet of Kesoram in the Year between 2009-2010
(Rupees in crores)
Years Changes
Particulars 2009 2010 In Rupees In Percentage
Liabilities
Share Capital 4574 4574 000 000
Reserves amp Surplus 128024 149111 21087 1647
Revaluation Reserves 412 339 -073 -1772
Loans
Secured Loans 153627 186372 32745 2131
Un Secured Loans 43416 126250 82834 19079
Deferred Tax Liabilities 000 000 000
Current Liabilities
Provisions 34529 35734 1205 349
Current Liabilities 66587 107688 41101 6173
Total 431169 610068 178899 4149
Assets
Net Block 180435 343182 162747 9020
Capital WIP 86485 41283 -45202 -5227
Investments 6178 5143 -1035 -1675
Current Assets
Inventories 58906 91619 32713 5553
Sundry Debtors 38017 54289 16272 4280
Cash amp Bank Balances 5657 8014 2357 4167
Total Current Assets 102580 153922 51342 5005
Loans amp Advances 55462 66506 11044 1991
Fixed Deposits 028 031 003 1071
Total 431169 610068 178899 4149
8102019 A Study A Study On Financial Performance Analysis With Reference To Kesoram Cementon Financial Performance hellip
httpslidepdfcomreaderfulla-study-a-study-on-financial-performance-analysis-with-reference-to-kesoram 4981
49
Interpretation of comparative balance sheet of 2009-2010
Reserves amp surplus increased to 1647 ie in Rupees 21087 crores
Revaluation Reserves decreased to 1772 ie in Rupees 073 crores
Secured loans increased to 2131 ie in Rupees 32745 crores
Current Liabilities were increased to 6173 ie in Rupees 41101 crores and
Provisions 349 ie in Rupees 1205 crores
Fixed Assets were increased to 9020 ie in Rupees 162747 crores
Investments were decreased to 1675 ie in Rupees 1035 crores
Sundry debtors were increased to 4280 ie in Rupees 16272 crores
Current assets increased to 5005 ie in Rupees 51342 crores And loans and
Advances increased 1919 ie in Rupees 11044 crores
The overall financial position was satisfactory
8102019 A Study A Study On Financial Performance Analysis With Reference To Kesoram Cementon Financial Performance hellip
httpslidepdfcomreaderfulla-study-a-study-on-financial-performance-analysis-with-reference-to-kesoram 5081
50
Comparative Balance Sheet of Kesoram in the Year between 2010-2011
(Rupees in crores)
Years Changes
Particulars 2010 2011 In Rupees In Percentage
Liabilities
Share Capital 4574 4574 000 000
Reserves amp Surplus 149111 125162 -23949 -1606
Revaluation Reserves 339 289 -050 -1475
Loans
Secured Loans 186372 237183 50811 2726
Un Secured Loans 126250 162744 36494 2891
Deferred Tax Liabilities 000 000 000
Current Liabilities
Provisions 35734 1494 -34240 -9582
Current Liabilities 107688 113902 6214 577
Total 610068 645348 35280 578
Assets
Net Block 343182 369172 25990 757
Capital WIP 41283 43781 2498 605
Investments 5143 6582 1439 2798
Current Assets
Inventories 91619 111855 20236 2209
Sundry Debtors 54289 63134 8845 1629
Cash amp Bank Balances 8014 7188 -826 -1031
Total Current Assets 153922 182177 28255 1836
Loans amp Advances 66506 43460 -23046 -3465
Fixed Deposits 031 176 145 46774
Total 610068 645348 35280 578
8102019 A Study A Study On Financial Performance Analysis With Reference To Kesoram Cementon Financial Performance hellip
httpslidepdfcomreaderfulla-study-a-study-on-financial-performance-analysis-with-reference-to-kesoram 5181
51
Interpretation of comparative balance sheet of 2010-2011
Reserves amp surplus decreased to 1606 ie in Rupees 23949 crores
Revaluation Reserves decreased to 1475 ie in Rupees 050 crores
Secured loans increased to 2726 ie in Rupees 50811 crores
Current Liabilities were increased to 577 ie in Rupees 6214 crores
Provisions decreased to 9582 ie in Rupees 34240 crores
Fixed Assets were increased to 757 ie in Rupees 25990 crores
Investments were decreased to 2798 ie in Rupees 1439 crores
Sundry debtors were increased to 1629 ie in Rupees8845 crores
Current assets increased to 1836 ie in Rupees 28255 crores And loans and
Advances increased 3465 ie in Rupees 23046 crores
The overall financial position was UN satisfactory
8102019 A Study A Study On Financial Performance Analysis With Reference To Kesoram Cementon Financial Performance hellip
httpslidepdfcomreaderfulla-study-a-study-on-financial-performance-analysis-with-reference-to-kesoram 5281
52
Comparative Balance Sheet of Kesoram In The Year Between 2011-2012
(Rupees in crores)
Years Changes
Particulars 2011 2012 In Rupees In Percentage
Liabilities
Share Capital 4574 4574 000 000
Reserves amp Surplus 125162 86657 -38505 -3076
Revaluation Reserves 289 270 -019 -657
Loans
Secured Loans 237183 317792 80609 3399
Un Secured Loans 162744 92742 -70002 -4301
Deferred Tax Liabilities 000 000 000
Current Liabilities
Provisions 1494 40726 39232 262597
Current Liabilities 113902 180010 66108 5804
Total 645348 722771 77423 1200
Assets 000
Net Block 369172 358721 -10451 -283
Capital WIP 43781 68065 24284 5547
Investments 6582 6636 054 082
Current Assets
Inventories 111855 99516 -12339 -1103
Sundry Debtors 63134 67358 4224 669
Cash amp Bank Balances 7188 6959 -229 -319
Total Current Assets 182177 173833 -8344 -458
Loans amp Advances 43460 115409 71949 16555
Fixed Deposits 176 107 -069 -3920
Total 645348 722771 77423 1200
8102019 A Study A Study On Financial Performance Analysis With Reference To Kesoram Cementon Financial Performance hellip
httpslidepdfcomreaderfulla-study-a-study-on-financial-performance-analysis-with-reference-to-kesoram 5381
53
Interpretation of comparative balance sheet of 2011-2012
Reserves amp surplus decreased to 3076 ie in Rupee 38505 crores
Revaluation Reserves decreased to 657 ie in Rupees 019 crores
Secured loans increased to 3399 ie in Rupees 80699 crores
Current Liabilities were increased to 5804 ie in Rupees 66108 crores
Provisions increased to 262597 ie in Rupees 39232 crores
Fixed Assets were decreased to 283 ie in Rupee 10451 crores
Investments were increased to 082 ie in Rupees 054 crores
Sundry debtors were increased to 669 ie in Rupees 4224 crores
Current assets decreased to 458 ie in Rupees 8344 crores And loans and
Advances increased 16555 ie in Rupees 71949 crores
The overall financial position was UN satisfactory
8102019 A Study A Study On Financial Performance Analysis With Reference To Kesoram Cementon Financial Performance hellip
httpslidepdfcomreaderfulla-study-a-study-on-financial-performance-analysis-with-reference-to-kesoram 5481
54
Common Size Balance Sheet of Kesoram For The Year 2008-2009
(Rupees in crores)
Particulars 2008 Change Percentage 2009 Change Percentage
Liabilities
Share Capital 4574 154 4574 106
Reserves amp Surplus 93085 3129 128024 2969
Revaluation Reserves 533 018 412 010
Loans
Secured Loans 97106 3264 153627 3563
Un Secured Loans 12129 408 43416 1007
Deferred Tax Liabilities 000 000 000 000
Current Liabilities
Provisions 33039 1110 34529 801
Current Liabilities 57067 1918 66587 1544
Total 297533 10000 431169 10000
Assets
Net Block 108424 3644 180435 4185
Capital WIP 63459 2133 86485 2006
Investments 4783 161 6178 143
Current Assets
Inventories 44217 1486 58906 1366
Sundry Debtors 27307 918 38017 882
Cash amp Bank Balances 4036 136 5657 131
Loans amp Advances 45289 1522 55462 1286
Fixed Deposits 018 001 028 001
Total 297533 10000 431169 10000
8102019 A Study A Study On Financial Performance Analysis With Reference To Kesoram Cementon Financial Performance hellip
httpslidepdfcomreaderfulla-study-a-study-on-financial-performance-analysis-with-reference-to-kesoram 5581
55
Interpretation of Common Size Balance Sheet of 2008-2009
Share capital was recorded 154 percent in the total liabilities in the year 2008 it is
decreased to 106 in the year 2009
Reserves amp surplus contributed to 3129 in the total liabilities in the year 2008 it is
decreased to 2969 in the year 2009
Secured loans were 3264 in the total liabilities in the year 2008 it is increased to
3563 in the year 2009
Current Liabilities shown to 1918 in the total liabilities in the year 2008 it is
decreased to 1544 in the year 2009
Provisions 1110 in the total liabilities in the year 2008 it is decreased to 801 in the
year 2009
Fixed Assets were 3644 in the total liabilities in the year 2008 ie decreased to 4185
in the year 2009
Investments were 161 in the total liabilities in the year 2008 it is decreased to 143
in the year 2009
Sundry debtors were 918 in the total liabilities in the year 2008 it is decreased to 882
in the year 2009
8102019 A Study A Study On Financial Performance Analysis With Reference To Kesoram Cementon Financial Performance hellip
httpslidepdfcomreaderfulla-study-a-study-on-financial-performance-analysis-with-reference-to-kesoram 5681
56
Common Size Balance Sheet of Kesoram For The Year 2009-2010
(Rs in crores)
Particulars 2009 Change Percentage 2010Change
Percentage
Liabilities
Share Capital 4574 106 4574 075
Reserves amp Surplus 128024 2969 149111 2444
Revaluation Reserves 412 010 339 006
Loans
Secured Loans 153627 3563 186372 3055
Un Secured Loans 43416 1007 126250 2069
Deferred Tax Liabilities 000 000 000 000
Current Liabilities
Provisions 34529 801 35734 586
Current Liabilities 66587 1544 107688 1765
Total 431169 10000 610068 10000
Assets
Net Block 180435 4185 343182 5625
Capital WIP 86485 2006 41283 677
Investments 6178 143 5143 084
Current Assets
Inventories 58906 1366 91619 1502
Sundry Debtors 38017 882 54289 890
Cash amp Bank Balances 5657 131 8014 131
Loans amp Advances 55462 1286 66506 1090
Fixed Deposits 028 001 031 001
Total 431169 10000 610068 10000
8102019 A Study A Study On Financial Performance Analysis With Reference To Kesoram Cementon Financial Performance hellip
httpslidepdfcomreaderfulla-study-a-study-on-financial-performance-analysis-with-reference-to-kesoram 5781
57
Interpretation of common size balance sheet of 2009-2010
Share capital was recorded 106 percent in the total liabilities in the
year 2009 it is decreased to 075 in the year 2010
Reserves amp surplus contributed to 2969 in the total liabilities in the
year 2009 it is decreased to2444 in the year 2010
Secured loans were 3563 in the total liabilities in the year 2009 it is
increased to 3055 in the year 2010
Current Liabilities shown to 1544 in the total liabilities in the year
2009 it is decreased to 1765 in the year 2010
Provisions 801 in the total liabilities in the year 2009 it is decreased
to 586 in the year 2010
Fixed Assets were 4185 in the total liabilities in the year 2009 ie
increased to 5625 in the year 2010
Investments were 143 in the total liabilities in the year 2009 it is
decreased to 084 in the year 2010
Sundry debtors were 882 in the total liabilities in the year 2009 it is
increased to 890 in the year 2010
8102019 A Study A Study On Financial Performance Analysis With Reference To Kesoram Cementon Financial Performance hellip
httpslidepdfcomreaderfulla-study-a-study-on-financial-performance-analysis-with-reference-to-kesoram 5881
58
Common Size Balance sheet of Kesoram for the year 2010-2011
983080Rupees in crores)
Particulars 2010 Change Percentage 2011
Change
Percentage
Liabilities
Share Capital 4574 075 4574 071
Reserves amp Surplus 149111 2444 125162 1939
Revaluation Reserves 339 006 289 004
Loans
Secured Loans 186372 3055 237183 3675
Un Secured Loans 126250 2069 162744 2522
Deferred Tax Liabilities 000 000 000 000
Current Liabilities
Provisions 35734 586 1494 023
Current Liabilities 107688 1765 113902 1765
Total 610068 10000 645348 10000
Assets
Net Block 343182 5625 369172 5721
Capital WIP 41283 677 43781 678
Investments 5143 084 6582 102
Current Assets
Inventories 91619 1502 111855 1733
Sundry Debtors 54289 890 63134 978
Cash amp Bank Balances 8014 131 7188 111
Loans amp Advances 66506 1090 43460 673
Fixed Deposits 031 001 176 003
Total 610068 10000 645348 10000
8102019 A Study A Study On Financial Performance Analysis With Reference To Kesoram Cementon Financial Performance hellip
httpslidepdfcomreaderfulla-study-a-study-on-financial-performance-analysis-with-reference-to-kesoram 5981
59
Interpretation of Common Size Balance Sheet Of 2010-2011
Share capital was recorded 075 percent in the total liabilities in the year 2010 it is
decreased to 071 in the year 2011
Reserves amp surplus contributed to 2444 in the total liabilities in the year 2010 it is
decreased to1939 in the year 2011
Secured loans were 3055 in the total liabilities in the year 2010 it is increased to
3675 in the year 2011
Current Liabilities shown to 1765 in the total liabilities in the year 2010 it is
also1765 in the year 2011
Provisions 586 in the total liabilities in the year 2010 it is decreased to 023 in the
year 2011
Fixed Assets were 5625 in the total liabilities in the year 2010 ie increased to 5721
in the year 2011
Investments were 084 in the total liabilities in the year 2010 it increased to 102 in
the year 2011
Sundry debtors were 890 in the total liabilities in the year 2010 it is increased to 978
in the year 2011
8102019 A Study A Study On Financial Performance Analysis With Reference To Kesoram Cementon Financial Performance hellip
httpslidepdfcomreaderfulla-study-a-study-on-financial-performance-analysis-with-reference-to-kesoram 6081
60
Common Size Balance Sheet of Kesoram for the Year 2011-2012
983080Rupees in crores)
Particulars 2011 Change Percentage 2012
Change
Percentage
Liabilities
Share Capital 4574 071 4574 063
Reserves amp Surplus 125162 1939 86657 1199
Revaluation Reserves 289 004 270 004
Loans
Secured Loans 237183 3675 317792 4397
Un Secured Loans 162744 2522 92742 1283
Deferred Tax Liabilities 000 000 000 000
Current Liabilities
Provisions 1494 023 40726 563
Current Liabilities 113902 1765 180010 2491
Total 645348 10000 722771 10000
Assets
Net Block 369172 5721 358721 4963
Capital WIP 43781 678 68065 942
Investments 6582 102 6636 092
Current Assets
Inventories 111855 1733 99516 1377
Sundry Debtors 63134 978 67358 932
Cash amp Bank Balances 7188 111 6959 096
Loans amp Advances 43460 673 115409 1597
Fixed Deposits 176 003 107 001
Total 645348 10000 722771 10000
8102019 A Study A Study On Financial Performance Analysis With Reference To Kesoram Cementon Financial Performance hellip
httpslidepdfcomreaderfulla-study-a-study-on-financial-performance-analysis-with-reference-to-kesoram 6181
61
Interpretation of common size balance sheet of 2011-2012
Share capital was recorded 071 percent in the total liabilities in the year 2011 it is
decreased to 063 in the year 2012
Reserves amp surplus contributed to 1939 in the total liabilities in the year 2011 it
is decreased to 1199 in the year 2012
Secured loans were 3675 in the total liabilities in the year 2011 it is increased to
4397 in the year 2012
Current Liabilities shown to 1765 in the total liabilities in the year 2011 it is
increased to 2491 in the year 2012
Provisions 023 in the total liabilities in the year 2011 it is increased to 563 in the
year 2012
Fixed Assets were 5721 in the total liabilities in the year 2011 ie decreased to
4963 in the year 2012
Investments were 102 in the total liabilities in the year 2011 it increased to 092
in the year 2012
Sundry debtors were 978 in the total liabilities in the year 2011 it is decreased to
932 in the year 2012
8102019 A Study A Study On Financial Performance Analysis With Reference To Kesoram Cementon Financial Performance hellip
httpslidepdfcomreaderfulla-study-a-study-on-financial-performance-analysis-with-reference-to-kesoram 6281
Trend Analysis
Share Capital-
Year
Amount
(In Crores) Trend
IncreaseDecrease
Base Year Previous Year
2008 4574 10000 000 000
2009 4574 10000 000 000
2010 4574 10000 000 000
2011 4574 10000 000 000
2012 4574 10000 000 000
Trend Percentages in Share Capital
Share capital shown a constant trend in the period 2008 and 2012
Share capital is 4574 crores all the years from 2008-2012
8102019 A Study A Study On Financial Performance Analysis With Reference To Kesoram Cementon Financial Performance hellip
httpslidepdfcomreaderfulla-study-a-study-on-financial-performance-analysis-with-reference-to-kesoram 6381
Reserves amp Surplus-
Year
Amount
(In Crores) Trend
IncreaseDecrease
Base Year Previous Year
2008 93085 10000 000 000
2009 128024 13753 3753 3753
2010 149111 16019 6019 2266
2011 125162 13446 3446 -2573
2012 86657 9309 -691 -4137
Trend Percentages in Reserves amp Surplus
Reserves amp surplus shown an increasing trend in the period between 2008 and 2010
The average trend was 13277 till 2010
The Reserves amp surplus was showing decreasing trend in the period 2011-2012 (ie
from 16019 in 2010 to 9309 in 2012)
The decreasing trend in Reserves amp surplus indicates the decrease in profits of the
firm
8102019 A Study A Study On Financial Performance Analysis With Reference To Kesoram Cementon Financial Performance hellip
httpslidepdfcomreaderfulla-study-a-study-on-financial-performance-analysis-with-reference-to-kesoram 6481
Investments-
Year
Amount
(In Crores) Trend
IncreaseDecrease
Base Year Previous Year
2008 4783 10000 000 000
2009 6178 12917 2917 2917
2010 5143 10753 753 -2164
2011 6582 13761 3761 3009
2012 6636 13874 3874 113
Trend Percentages in Investments-
The investments are shown an increasing trend in the period between 2008 ndash 2009
and it is decreasing in the year 2010
The average trend was 11458 till 2009
The investments increased in the periods 2011-2012 (ie from 10753 in 2010 to
13874 in 2012)
The overall trend in investments shown is satisfactory
8102019 A Study A Study On Financial Performance Analysis With Reference To Kesoram Cementon Financial Performance hellip
httpslidepdfcomreaderfulla-study-a-study-on-financial-performance-analysis-with-reference-to-kesoram 6581
Net Current Assets-
Year
Amount
(In Crores) Trend
IncreaseDecrease
Base Year Previous Year
2008 30761 10000 000 000
2009 56954 18515 8515 8515
2010 77037 25044 15044 6529
2011 110417 35895 25895 10851
2012 68613 22305 12305 -13590
Trends in Net Current Assets-
The NCA shown positive (increasing) trend
The NCA are increased to 35895 (the year 2011) compared with base year and
decreased in the year 2012 to 22305
The NCA shown increased trend from year and crossed 100
The overall trend was good
8102019 A Study A Study On Financial Performance Analysis With Reference To Kesoram Cementon Financial Performance hellip
httpslidepdfcomreaderfulla-study-a-study-on-financial-performance-analysis-with-reference-to-kesoram 6681
66
Ratio Analysis-
Current Ratio-
Current Ratio = Current Assets Current Liabilities
Current assets are cash in hand Cash at bank Marketable Securities(short term) short term
Investment Bills receivables sundry debtors Inventories (stock) Work in progress prepaid
expenses Current Liabilities are outstanding expenses Bills payable sundry Creditors
short-term advances income tax payable and Dividend payable
Current Ratio of Kesoram-
(Rupees in crores)
Year Current Assets Current Liabilities Current Ratio
2007-08 75560 57067 132
2008-09 102580 66587 154
2009-10 153922 107688 143
2010-11 182177 113902 160
2011-12 173833 180010 097
Interpretation-
As per the standard rule of current ratio ie 21 where current assets double the current
liabilities is considered satisfactory
In the present analysis the current ratio of the Kesoram is not satisfactory
from the above table It was assessed that the current ratio for all the five year is lower (less)
than the standard rule ie 21 And it is 097 in the year 2011-2012 (current year) This is
highly UN satisfactory
8102019 A Study A Study On Financial Performance Analysis With Reference To Kesoram Cementon Financial Performance hellip
httpslidepdfcomreaderfulla-study-a-study-on-financial-performance-analysis-with-reference-to-kesoram 6781
Quick Ratio-
Quick ratio also known as acid-test ratio establishes a relationship between quick
assets and the current liabilities Cash is the most liquid asset It is calculated by dividing
quick assets by current liabilities
Quick ratio = Quick Assets Current Liabilities
(Quick Assets = Current assets ndash Inventory)
Quick Ratio of Kesoram-
Rupees in crores)
Year Total QuickAssets
Current Liabilities Quick Ratio
2007-08 33343 57067 058
2008-09 43674 66587 066
2009-10 62303 107688 058
2010-11 70322 113902 0622011-12 74333 180010 041
Interpretation-
Usually a high Quick ratio is an indication that the company is liquid and has the ability to
meet its current or liquid liabilities in time on the other hand a low Quick Ratio represents
8102019 A Study A Study On Financial Performance Analysis With Reference To Kesoram Cementon Financial Performance hellip
httpslidepdfcomreaderfulla-study-a-study-on-financial-performance-analysis-with-reference-to-kesoram 6881
that the companyrsquos liquidity position is not good The above table showing the quick ratios
of Kesoram are canrsquot be considered satisfactory
Leverage Ratios-
Debt-Equity Ratio-
Debt-Equity Ratio = Total Long Term Debt Equity Share Holders Fund
Total Long term Debt= Debenture Capital + Long term loans from banks and financial
institutions + Public deposits
Equity Share Holders fund = Equity + Reserves and Surplus
Debt Equity Ratio of Kesoram
(Rupees in crores)
Year Total Debt Share Holders Fund Debt Equity Ratio
2007-08 109235 98192 111
2008-09 197043 133010 148
2009-10 312622 154024 203
2010-11 399927 130025 308
2011-12 410534 91501 449
8102019 A Study A Study On Financial Performance Analysis With Reference To Kesoram Cementon Financial Performance hellip
httpslidepdfcomreaderfulla-study-a-study-on-financial-performance-analysis-with-reference-to-kesoram 6981
Interpretation-
The Debt-Equity Ratio accepted standard is 05 This ratio reflects the relative contribution
of creditors and owners of business in its financing From the above it is clear that the long
term debt is more than that of the share holdersrsquo fund So we can interpret that the firmrsquosassets are financed more by the external funds rather than by the internal funds
8102019 A Study A Study On Financial Performance Analysis With Reference To Kesoram Cementon Financial Performance hellip
httpslidepdfcomreaderfulla-study-a-study-on-financial-performance-analysis-with-reference-to-kesoram 7081
Fixed Asset Ratio-
Net Sales
Fixed Asset Ratio = helliphelliphelliphelliphelliphelliphelliphelliphelliphelliphellip
Net Assets
Fixed Asset Ratio of Kesoram-
(Rupees in crores)
Year Net Sales Net Assets Fixed Assets Ratio
2007-08 300271 358721 084
2008-09 389797 369172 106
2009-10 475062 343182 1382010-11 539788 180435 299
2011-12 59182 108424 546
Interpretation
This ratio indicates the extent to which the assets of the companyrsquos can be lost without
affecting the interest of the creditors of the company Higher the ratios better the long-term
position of the companyThe above table shows fixed assets ratio in increasing trend Which is good for the
company
8102019 A Study A Study On Financial Performance Analysis With Reference To Kesoram Cementon Financial Performance hellip
httpslidepdfcomreaderfulla-study-a-study-on-financial-performance-analysis-with-reference-to-kesoram 7181
Overall Profitability Ratios-
Net Profit Ratio
Net Profit Ratio indicates net margin on sales It is given by the following equation
Net Profit Ratio = (Net Profit Sales) 100
Net Profit Ratio of Kesoram
(Rupees in crores)
Year Net Profit Sales Net Profit Ratio
2007-08 37917 300271 1263
2008-09 41432 389797 1063
2009-10 20298 475062 427
2010-11 -28176 539788 -5222011-12 -38108 59182 -644
Interpretation
It establishes a relationship between net profits after tax and net sales and
indicates the efficiency of the management in manufacturing selling administrative and
other activities of the company
The higher the ratio the better is the profitability or performance of the business
The above table depicts the net profit Ratio of Kesoram has decreased every year from
2007-2008 to 2011-2012It further decreased to negative in the year 2010-11 to -522 and -
644 in the year 2011-2012 This shows constant decrease in the profits of the company
8102019 A Study A Study On Financial Performance Analysis With Reference To Kesoram Cementon Financial Performance hellip
httpslidepdfcomreaderfulla-study-a-study-on-financial-performance-analysis-with-reference-to-kesoram 7281
72
Return on Investment-
Net Profit
Return on Investment = helliphelliphelliphelliphelliphelliphelliphelliphelliphelliphelliphellip X 100
Share Holders Fund
Return on Investment Ratio of Kesoram-
(Rupees in crores)
Year Net Profit Share Holders Fund Return On Investment
2007-08 37917 98192 3862
2008-09 41432 133010 3115
2009-10 20298 154024 1318
2010-11 -28176 130025 -2167
2011-12 -38108 91501 -4165
Interpretation-
The above table reveals how well the resources of the firm are being used Higher
the ratio better the result The above ratio implies how well the firm is growing in
terms of profitability and efficiency From the above table we can concern that the return on
investment is in decreasing trend ROI is highest in the year 2007-2008 as 3862 But
there after itrsquos decreased every year
The ROI is negative in the years 2010-2011 amp 2011-2012 as -2167 amp -4165 respectively
Which is not a good sign for the firm
8102019 A Study A Study On Financial Performance Analysis With Reference To Kesoram Cementon Financial Performance hellip
httpslidepdfcomreaderfulla-study-a-study-on-financial-performance-analysis-with-reference-to-kesoram 7381
8102019 A Study A Study On Financial Performance Analysis With Reference To Kesoram Cementon Financial Performance hellip
httpslidepdfcomreaderfulla-study-a-study-on-financial-performance-analysis-with-reference-to-kesoram 7481
8102019 A Study A Study On Financial Performance Analysis With Reference To Kesoram Cementon Financial Performance hellip
httpslidepdfcomreaderfulla-study-a-study-on-financial-performance-analysis-with-reference-to-kesoram 7581
75
CHAPTER V
FINDINGS amp SUGGESTIONS
8102019 A Study A Study On Financial Performance Analysis With Reference To Kesoram Cementon Financial Performance hellip
httpslidepdfcomreaderfulla-study-a-study-on-financial-performance-analysis-with-reference-to-kesoram 7681
76
Findings
The Share capital remains constant Share capital is unchanged all the years from
2008-2012
Reserves amp surplus were recorded an increasing trend in the period between 2008
and 2010It is showing decreasing trend in the period 2011-2012 (ie from 16019
in 2010 to 9309 in 2012)
Current Liabilities were increased compared to base year ie 2008
Provisions increased to 262597 ie in Rupees 39232 crores in the current year
The current ratio for all the five year is lower (less) than the standard rule ie 21
And it is 097 in the year 2011-2012 (current year)
The Debt-Equity Ratio was shown under the standard ratio It is clear that the long
term debt is more than that of the share holdersrsquo fund It indicates that the firm
heavily relying on external funds rather than the internal funds
The operating and net profit of Kesoram is in decreasing trend due to heavy
increase of manufacturing amp administrative expenses
ROI is highest in the year 2007-2008 as 3862 The ROI is negative in the years
2010-2011 amp 2011-2012 as -2167 amp -4165 respectively
Return on Equity Capital Employed Ratio of Kesoram has decreased every year
from 2007-2008 to 2010-2011It further decreased to negative in the year 2011-12 to
-3280
EPS of Kesoram has decreased every year from 2008-12It is negative in the year
2011 amp 12
8102019 A Study A Study On Financial Performance Analysis With Reference To Kesoram Cementon Financial Performance hellip
httpslidepdfcomreaderfulla-study-a-study-on-financial-performance-analysis-with-reference-to-kesoram 7781
77
Suggestion
The organization should adopt an appropriate capital structure
The companyrsquos debt-equity ratio is recorded more or less as 111 in the year 2008
and it is increased to 449 in the year 2012 (current year)The company should
adopt a better debt equity mix in the future to control the fluctuations in returns
The company should control fluctuations in cash and bank balances as it impacts the
current ratio of the company
The provisions are showing increasing trend which indicates risk of debtors The
firm should implement an effective credit management policy It should utilize its
idle funds by decreasing provisions
The company should control heavy increase of manufacturing amp administration
expenses as it is impacting the operating and net profit of company
8102019 A Study A Study On Financial Performance Analysis With Reference To Kesoram Cementon Financial Performance hellip
httpslidepdfcomreaderfulla-study-a-study-on-financial-performance-analysis-with-reference-to-kesoram 7881
78
ANNEXURE
Profit And Loss Account of Kesoram Cement
Mar12 Mar11 Mar10 Mar09 Mar08
12 Months 12 Months 12 Months 12 Months 12 Months
INCOME
Sales Turnover 628260 575072 505151 431613 345700
Excise Duty 36440 35284 30089 41815 45429
NET SALES 591820 539788 475062 389797 300271
Other Income 000 000 000 000 000
TOTALINCOME
596129 548733 481019 393969 302020
EXPENDITURE
Manufacturing
Expenses81903 74803 13974 13153 44113
MaterialConsumed
370897 310150 295550 229359 118448
Personal
Expenses33468 27355 23294 18690 15344
Selling Expenses 81910 78253 58667 48846 45019
AdministrativeExpenses
28225 29308 17219 16179 9907
Expenses
Capitalized000 000 000 000 000
Provisions Made 000 000 000 000 000
TOTAL
EXPENDITURE 596403 519870 408704 326227 232832Operating Profit -4583 19918 66358 63570 67439
EBITDA -274 28864 72316 67742 69188
Depreciation 29740 27259 17280 11186 8927
Other Write-offs 000 000 000 000 000
EBIT -30014 1605 55035 56557 60261
Interest 41015 23983 10921 12087 5426
EBT -71029 -22377 44114 44470 54835
Taxes -32921 5798 23816 3037 16918
Profit and Loss
for the Year-38108 -28176 20298 41432 37917
Non RecurringItems
-1142 7063 3228 -4023 402
Other Non Cash
Adjustments1276 091 207 465 017
OtherAdjustments
000 000 000 000 000
REPORTED
PAT-37974 -21021 23734 37874 38335
8102019 A Study A Study On Financial Performance Analysis With Reference To Kesoram Cementon Financial Performance hellip
httpslidepdfcomreaderfulla-study-a-study-on-financial-performance-analysis-with-reference-to-kesoram 7981
79
Balance Sheet Of Kesoram
Years
Particulars 2008 2009 2010 2011 2012
Liabilities
Share Capital 4574 4574 4574 4574 4574Reserves amp Surplus 93085 128024 149111 125162 86657
Revaluation Reserves 533 412 339 289 27
Loans
Secured Loans 97106 153627 186372 237183 317792
Un Secured Loans 12129 43416 12625 162744 92742
Deferred Tax Liabilities 0 0 0 0 0
Current Liabilities
Provisions 33039 34529 35734 1494 40726
Current Liabilities 57067 66587 107688 113902 18001
Total 297533 431169 610068 645348 722771
Assets
Net Block 108424 180435 343182 369172 358721
Capital WIP 63459 86485 41283 43781 68065
Investments 4783 6178 5143 6582 6636
Current Assets
Inventories 44217 58906 91619 111855 99516
Sundry Debtors 27307 38017 54289 63134 67358
Cash amp Bank Balances 4036 5657 8014 7188 6959
Total Current Assets 7556 10258 153922 182177 173833Loans amp Advances 45289 55462 66506 4346 115409
Fixed Deposits 018 028 031 176 107
Total 297533 431169 610068 645348 722771
8102019 A Study A Study On Financial Performance Analysis With Reference To Kesoram Cementon Financial Performance hellip
httpslidepdfcomreaderfulla-study-a-study-on-financial-performance-analysis-with-reference-to-kesoram 8081
80
KEY ITEMS 2012 2011 2010 2009 2008
Preference
Dividend 0 0 0 0 0
Equity Dividend 457 2516 2516 2516 2516
Equity Dividend
() 999 55 55 55 55
Shares in Issue(Lakhs) 45743 45743 45743 45743 45743
EPS - Annualised
(Rs) -8302 -4595 5188 828 838
8102019 A Study A Study On Financial Performance Analysis With Reference To Kesoram Cementon Financial Performance hellip
httpslidepdfcomreaderfulla-study-a-study-on-financial-performance-analysis-with-reference-to-kesoram 8181
BIBLIOGRAPHY
Sl
No
Books Author Name
1 Financial Management Khan amp JAIN
2 Financial Management IMPandey
3 Management Accounting RPTrivedi
Websites amp Search Engines
1 wwwkesoramcom983086
2 wwwmoneycontrolcom
3 wwwgooglefinancecom983086
Annual reports of Kesoram cement limited 2008-2012

8102019 A Study A Study On Financial Performance Analysis With Reference To Kesoram Cementon Financial Performance hellip
httpslidepdfcomreaderfulla-study-a-study-on-financial-performance-analysis-with-reference-to-kesoram 381
3
8102019 A Study A Study On Financial Performance Analysis With Reference To Kesoram Cementon Financial Performance hellip
httpslidepdfcomreaderfulla-study-a-study-on-financial-performance-analysis-with-reference-to-kesoram 481
4
DECLARATION
I hereby declare that the project entitled ldquoA study on financial performance
analysis aatt KKeessoorraamm CCeemmeennttrdquo submitted in partial fulfillment of the requirements for
award of the degree of MBA at Gokaraju Rangaraju Institute of Engineering and
Technology affiliated to Jawaharlal Nehru Technological University Hyderabad is
an authentic work and has not been submitted to any other UniversityInstitute for
award of any degreediploma
MVIKRAM SINGH
(10241e0028)
MBA GRIET
HYDERABAD
8102019 A Study A Study On Financial Performance Analysis With Reference To Kesoram Cementon Financial Performance hellip
httpslidepdfcomreaderfulla-study-a-study-on-financial-performance-analysis-with-reference-to-kesoram 581
5
ACKNOWLEDGEMENT
Firstly I would like to express our immense gratitude towards our institution
Gokaraju Rangaraju Institute of Engineering amp Technology which created a great
platform to attain profound technical skills in the field of MBA thereby fulfilling our most
cherished goal
I would thank all the finance department of Kesoram specially Mr MURTHY ASST
Manager Finance for guiding me and helping me in successful completion of the project
I am very much thankful to our Prof KVS RAJU (Internal Guide) sir for extending
his cooperation in doing this project
I am also thankful to our project coordinator Prof S RAVINDRA CHARY for
extending his cooperation in completion of Project
I convey my thanks to my beloved parents and my faculty who helped me directly or
indirectly in bringing this project successfully
M VIKRAM SINGH
(102419831090028)
8102019 A Study A Study On Financial Performance Analysis With Reference To Kesoram Cementon Financial Performance hellip
httpslidepdfcomreaderfulla-study-a-study-on-financial-performance-analysis-with-reference-to-kesoram 681
6
INDEX
SNo Contents Page No
Chapter-1 1-8
Introduction
Need of the Study
Objectives of the Study
Methodology of the Study
Limitations of the Study
Chapter-2 9-28
Industry Profile
Company Profile
Chapter-3 29-38
Review of Literature
Chapter-4 39-68
Data Analysis And Interpretation
Chapter-5 69-71
Findings
Suggestions
Chapter-6 72-75
Annexure
Bibliography
8102019 A Study A Study On Financial Performance Analysis With Reference To Kesoram Cementon Financial Performance hellip
httpslidepdfcomreaderfulla-study-a-study-on-financial-performance-analysis-with-reference-to-kesoram 781
7
CHAPTER-I
INTRODUCTION
8102019 A Study A Study On Financial Performance Analysis With Reference To Kesoram Cementon Financial Performance hellip
httpslidepdfcomreaderfulla-study-a-study-on-financial-performance-analysis-with-reference-to-kesoram 881
8
Introduction-
The term lsquofinancial performance analysis also known as analysis and interpretation
of financial statementsrsquo refers to the process of determining financial strength and
weaknesses of the firm by establishing strategic relationship between the items of the
balance sheet profit and loss account and other operative data
ldquoFinancial performance analysis is a process of evaluating the relationship between
component parts of a financial statement to obtain a better understanding of a firmrsquos
position and performance
The purpose of financial analysis is to diagnose the information contained in
financial statements so as to judge the profitability and financial soundness of the firm Just
like a doctor examines his patient by recording his body temperature blood pressure etc
Before making his conclusion regarding the illness and before giving his treatment A
financial analyst analyses the financial statements with various tools of analysis before
commenting upon the financial health or weaknesses of an enterprise
The analysis and interpretation of financial statements is essential to bring out the
mystery behind the figures in financial statements Financial statements analysis is an
attempt to determine the significance and meaning of the financial statement data so that
forecast may be made of the future earnings ability to pay interest and debt maturities (both
current and long term) and profitability of a sound divided policy
Financial performance refers to the act of performing financial activity In broader sense
financial performance refers to the degree to which financial objectives being or has been
accomplished It is the process of measuring the results of a firms policies and operations in
monetary terms It is used to measure firms overall financial health over a given period oftime and can also be used to compare similar firms across the same industry or to compare
industries or sectors in aggregation
In short the firm itself as well as various interested groups such as managers
shareholders creditors tax authorities and others seeks answers to the
Following important questions
8102019 A Study A Study On Financial Performance Analysis With Reference To Kesoram Cementon Financial Performance hellip
httpslidepdfcomreaderfulla-study-a-study-on-financial-performance-analysis-with-reference-to-kesoram 981
9
1 What is the financial position of the firm at a given point of time
2 How is the financial performance of the firm over a given period
Of time
These questions can be answered with the help of financial analysis of a firm Financial
analysis involves the use of financial statements A financial statement is an organized
collection of data according to logical and conceptual framework 50 consistent accounting
procedures Its purpose is to convey an understanding of some financial aspects of a
business firm It may show a position at a moment of time as in the case of a balance sheet
or may reveal a series of activities over a given period of time as in the case of an income
statement
Thus the term lsquofinancial statementsrsquo generally refers to two basic statements
The balance sheet and the income statement
The balance sheet shows the financial position (condition) of the firm at a given point of
time It provides a snapshot and may be regarded as a static picture
ldquoBalance sheet is a summary of a firmrsquos financial position on a given date that
Shows total assets = total liabilities + ownerrsquos equityrdquo
The income statement (referred to in India as the profit and loss statement) reflects the
performance of the firm over a period of time
ldquoIncome statement is a summary of a firmrsquos revenues and expenses over a specified period
ending with net income or loss for the periodrdquo
However financial statements do not reveal all the information related to the financial
operations of a firm but they furnish some extremely useful information which highlights
two important factors profitability and financial soundness Thus analysis of financial
statements is an important aid to financial performance analysis Financial performance
analysis includes analysis and interpretation of financial statements in such a way that it
Undertakes full diagnosis of the profitability and financial soundness of the business
ldquoThe analysis of financial statements is a process of evaluating the relationship between
component parts of financial statements to obtain a better understanding of the firmrsquos
position and performancerdquo
8102019 A Study A Study On Financial Performance Analysis With Reference To Kesoram Cementon Financial Performance hellip
httpslidepdfcomreaderfulla-study-a-study-on-financial-performance-analysis-with-reference-to-kesoram 1081
10
Need for Study
Need Of Financial Management Study To Diagnose The Information Contain In
Financial Statement So as To Judge the Profitability and Financial Position of the
Firm
Financial Analyst Analyses The Financial Statements With Various Tools Of
Analysis Before Commanding Upon The Financial Health Of The Firm
Essential to Bring Out the History
Significance and Meaning of the Financial Statements
8102019 A Study A Study On Financial Performance Analysis With Reference To Kesoram Cementon Financial Performance hellip
httpslidepdfcomreaderfulla-study-a-study-on-financial-performance-analysis-with-reference-to-kesoram 1181
11
Objectives
1 To understand the financial statements of Kesoram cement
2 To study the change in assets and liabilities of the company
3 To study the liquidity position of the firm
4 To study the financial health of the company using ratio analysis
5 To study the profitability of the company
6 To offer suggestions to the company
8102019 A Study A Study On Financial Performance Analysis With Reference To Kesoram Cementon Financial Performance hellip
httpslidepdfcomreaderfulla-study-a-study-on-financial-performance-analysis-with-reference-to-kesoram 1281
12
Significance of Financial Performance Analysis
Interest of various related groups is affected by the financial performance of a firm
Therefore these groups analyze the financial performance of the firm The type of analysis
varies according to the specific interest of the party involved
Trade creditors interested in the liquidity of the firm (appraisal of firmrsquos liquidity)
Bond holders interested in the cash-flow ability of the firm (appraisal of firmrsquos capital
structure the major sources and uses of funds profitability over time and projection of
future profitability)
Investors interested in present and expected future earnings as well as stability of these
earnings (appraisal of firmrsquos profitability and financial condition)
Management interested in internal control better financial condition and betterperformance (appraisal of firmrsquos present financial condition evaluation of opportunities in
relation to this current position return on investment provided by various assets of the
company etc)
Research Methodology
Research Design
This is a systematic way to solve the research problem and it is important
component for the study without which researches may not be able to obtain the format A
research design is the arrangement of conditions for collection and analysis of data in a
manager that aims to combine for collection and analysis of data relevance to the research
purpose with economy in procedure
Meaning of Research Design
The formidable problem that follows the task of defining the research problem is the
preparation of design of the research project popularly known as the research design
decision regarding what where when how much by what means concerning an inquiry of
a research study constitute a research design A research design is the arrangement of
conditions for collection and analysis of data in a manager that aims to combine for
collection and analysis of data relevance to the research purpose with economy in
procedure
8102019 A Study A Study On Financial Performance Analysis With Reference To Kesoram Cementon Financial Performance hellip
httpslidepdfcomreaderfulla-study-a-study-on-financial-performance-analysis-with-reference-to-kesoram 1381
13
Sources of Data
Data we collected based on two sources
Primary Data
Secondary Data
Primary Data
The Primary Data Are Those Informationrsquos which are Collected afresh and for the
First Time And Thus Happen to Be Original in Character
Secondary Data
The secondary data are those which have already been collected by some other agency and
which have already been processed The sources of secondary data are annual reports
browsing internet through magazines
1 It includes data gathered from the annual reports of Kesoram
2 Articles are collected from official website of Kesoram
Methodology Used
Types Of Financial Statements Adopted
Following Two Types of Financial Statements Are Commonly Used in
Analyzing the Firmrsquos Financial Position
a Balance Sheet
b Income Statements
8102019 A Study A Study On Financial Performance Analysis With Reference To Kesoram Cementon Financial Performance hellip
httpslidepdfcomreaderfulla-study-a-study-on-financial-performance-analysis-with-reference-to-kesoram 1481
14
Limitations of Financial Statement
Each Project Gives Rise to Its Own Unique Risks And Hence Possess Its Own Unique
Challenges
1 Only Interim Reports
Only interim statements donrsquot give a final picture of the concern The data given in
these statements is only approximate The actual position can only be determined when the
business is sold or liquidated
2 Donrsquot Give Extra Position
The Financial Statements Are Expressed In Monetary Values So They Appear To
Give Final And Accurate Position The Values Of Fixed Assets In The Balance Sheet
Neither Represent The Value For Which Fixed Assets Can Be Sold Nor The Amount Which
Will Be Required To Replace These Assets
3 Historical Costs
The Financial Statements Are Prepared On The Basis Of Historical Costs Or
Original Costs The Value of Assets Decreases with the Passage of Time Current Price
Changes Are Not Taken Into Account The Statements Are Not Prepared Keeping In View
The Present Economic Conditions The Balance Sheet Loses The Significance Of Being An
Index Of Current Economic Realities
4 Act of non monitory factors Ignored
There are certain factors which have a bearing on the financial position and
operating results of the business but they donrsquot become a part of these statements because
they canrsquot be measured in monetary terms Such factors may include in the reputation of the
management
No Precision
The precision of financial statement data is not possible because the statements deal with
matters which canrsquot be precisely stated The data are recorded by conventional procedures
followed over the years Various conventions postulates personal judgments etc
8102019 A Study A Study On Financial Performance Analysis With Reference To Kesoram Cementon Financial Performance hellip
httpslidepdfcomreaderfulla-study-a-study-on-financial-performance-analysis-with-reference-to-kesoram 1581
15
CHAPTER-II
INDUSTRY PROFILE
amp
COMPANY PROFILE
8102019 A Study A Study On Financial Performance Analysis With Reference To Kesoram Cementon Financial Performance hellip
httpslidepdfcomreaderfulla-study-a-study-on-financial-performance-analysis-with-reference-to-kesoram 1681
16
Industry Profile
In the most general sense of the word cement is a binder a substance which
sets and hardens independently and can bind other materials together The word cement
traces to the Romans who used the term opus caementicium to describe masonry whichresembled concrete and was made from crushed rock with burnt lime as binder The
volcanic ash and pulverized brick additives which were added to the burnt lime to obtain a
hydraulic binder were later referred to as cementum and cement Cements used in
construction are characterized as hydraulic or non-hydraulic
The most important use of cement is the production of mortar and concretemdashthe bonding of
natural or artificial aggregates to form a strong building material which is durable in the
face of normal environmental effects
Concrete should not be confused with cement because the term cement refers only to the dry
powder substance used to bind the aggregate materials of concrete Upon the addition of
water andor additives the cement mixture is referred to as concrete especially if aggregates
have been added
It is uncertain where it was first discovered that a combination of hydrated non-hydraulic
lime and a pozzolan produces a hydraulic mixture (see also Pozzolanic reaction) but
concrete made from such mixtures was first used on a large scale by engineers They used
both natural pozzolans (trass or pumice) and artificial pozzolans (ground brick or pottery) in
these concretes Many excellent examples of structures made from these concretes are still
standing notably the huge monolithic dome of the Pantheon in Rome and the massive Baths
of Caracalla The vast system of Roman aqueducts also made extensive use of hydraulic
cement The use of structural concrete disappeared in medieval Europe although weak
pozzolanic concretes continued to be used as a core fill in stone walls and columns
Modern cement
Modern hydraulic cements began to be developed from the start of the Industrial Revolution
(around 1800) driven by three main needs
Hydraulic renders for finishing brick buildings in wet climates
Hydraulic mortars for masonry construction of harbor works etc in contact with sea water
Development of strong concretes
In Britain particularly good quality building stone became ever more expensive during a
period of rapid growth and it became a common practice to construct prestige buildings
8102019 A Study A Study On Financial Performance Analysis With Reference To Kesoram Cementon Financial Performance hellip
httpslidepdfcomreaderfulla-study-a-study-on-financial-performance-analysis-with-reference-to-kesoram 1781
17
from the new industrial bricks and to finish them with a stucco to imitate stone Hydraulic
limes were favored for this but the need for a fast set time encouraged the development of
new cements Most famous was Parkers Roman cement This was developed by James
Parker in the 1780s and finally patented in 1796 It was in fact nothing like any material
used by the Romans but was ldquoNatural cement made by burning septaria - nodules that are
found in certain clay deposits and that contain both clay minerals and calcium carbonate
The burnt nodules were ground to a fine powder This product made into a mortar with
sand set in 5ndash15 minutes The success of Roman Cement led other manufacturers to
develop rival products by burning artificial mixtures of clay and chalk
John Smeaton made an important contribution to the development of cements when he was
planning the construction of the third Eddystone Lighthouse (1755-9) in the English
Channel He needed a hydraulic mortar that would set and develop some strength in the
twelve hour period between successive high tides He performed an exhaustive market
research on the available hydraulic limes visiting their production sites and noted that the
hydraulicity of the lime was directly related to the clay content of the limestone from
which it was made Smeaton was a civil engineer by profession and took the idea no
further Apparently unaware of Smeatons work the same principle was identified by Louis
Vicat in the first decade of the nineteenth century Vicat went on to devise a method of
combining chalk and clay into an intimate mixture and burning this produced an artificial
cement in 1817 James Frost working in Britain produced what he called British cement
in a similar manner around the same time but did not obtain a patent until 1822 In 1824
Joseph Aspdin patented a similar material which he called Portland cement because the
render made from it was in color similar to the prestigious Portland stone
All the above products could not compete with limepozzolan concretes because of fast-
setting (giving insufficient time for placement) and low early strengths (requiring a delay of
many weeks before formwork could be removed) Hydraulic limes natural cements and
artificial cements all rely upon their belite content for strength development Belite
develops strength slowly Because they were burned at temperatures below 1250 degC they
contained no alite which is responsible for early strength in modern cements The first
cement to consistently contain alite was made by Joseph Aspdins son William in the early
1840s This was what we call today modern Portland cement Because of the air of
mystery with which William Aspdin surrounded his product others (eg Vicat and I C
Johnson) have claimed precedence in this invention but recent analysis of both his concrete
8102019 A Study A Study On Financial Performance Analysis With Reference To Kesoram Cementon Financial Performance hellip
httpslidepdfcomreaderfulla-study-a-study-on-financial-performance-analysis-with-reference-to-kesoram 1881
18
and raw cement have shown that William Aspdins product made at North fleet Kent was a
true alite-based cement However Aspdins methods were rule-of-thumb Vicat is
responsible for establishing the chemical basis of these cements and Johnson established
the importance of sintering the mix in the kiln
William Aspdins innovation was counter-intuitive for manufacturers of artificial cements
because they required more lime in the mix (a problem for his father) because they required
a much higher kiln temperature (and therefore more fuel) and because the resulting clinker
was very hard and rapidly wore down the millstones which were the only available grinding
technology of the time Manufacturing costs were therefore considerably higher but the
product set reasonably slowly and developed strength quickly thus opening up a market for
use in concrete The use of concrete in construction grew rapidly from 1850 onwards and
was soon the dominant use for cements Thus Portland cement began its predominant role
It is made from water and sand
Types of modern cement
Portland cement
Cement is made by heating limestone (calcium carbonate) with small quantities of other
materials (such as clay) to 1450degC in a kiln in a process known as calcination whereby a
molecule of carbon dioxide is liberated from the calcium carbonate to form calcium oxide
or lime which is then blended with the other materials that have been included in the mix
The resulting hard substance called clinker is then ground with a small amount of gypsum
into a powder to make Ordinary Portland Cement the most commonly used type of cement
(often referred to as OPC)
Portland cement is a basic ingredient of concrete mortar and most non-speciality grout The
most common use for Portland cement is in the production of concrete Concrete is a
composite material consisting of aggregate (gravel and sand) cement and water As a
construction material concrete can be cast in almost any shape desired and once hardened
can become a structural (load bearing) element Portland cement may be gray or whitePortland cement blends
These are often available as inter-ground mixtures from cement manufacturers but similar
formulations are often also mixed from the ground components at the concrete mixing plant
Portland blast furnace cement contains up to 70 ground granulated blast furnace slag
with the rest Portland clinker and a little gypsum All compositions produce high ultimate
8102019 A Study A Study On Financial Performance Analysis With Reference To Kesoram Cementon Financial Performance hellip
httpslidepdfcomreaderfulla-study-a-study-on-financial-performance-analysis-with-reference-to-kesoram 1981
19
strength but as slag content is increased early strength is reduced while sulfate resistance
increases and heat evolution diminishes Used as an economic alternative to Portland
sulfate-resisting and low-heat cements
Portland fly ash cement contains up to 30 fly ash The fly ash is pozzolanic so that
ultimate strength is maintained Because fly ash addition allows lower concrete water
content early strength can also be maintained Where good quality cheap fly ash is
available this can be an economic alternative to ordinary Portland cement
Portland pozzolan cement includes fly ash cement since fly ash is a pozzolan but also
includes cements made from other natural or artificial pozzolans In countries where
volcanic ashes are available (eg Italy Chile Mexico and the Philippines) these cements
are often the most common form in use
Portland silica fume cement Addition of silica fume can yield exceptionally high
strengths and cements containing 5-20 silica fume are occasionally produced However
silica fume is more usually added to Portland cement at the concrete mixer
Masonry cements are used for preparing bricklaying mortars and stuccos and must not be
used in concrete They are usually complex proprietary formulations containing Portland
clinker and a number of other ingredients that may include limestone hydrated lime air
entrainers retarders water proofers and coloring agents They are formulated to yield
workable mortars that allow rapid and consistent masonry work Subtle variations of
Masonry cement in the US are Plastic Cements and Stucco Cements These are designed to
produce controlled bond with masonry blocks
Expansive cements contain in addition to Portland clinker expansive clinkers (usually
sulfoaluminate clinkers) and are designed to offset the effects of drying shrinkage that is
normally encountered with hydraulic cements This allows large floor slabs (up to 60 m
square) to be prepared without contraction joints
White blended cements may be made using white clinker and white supplementary
materials such as high-purity metakaolin
Colored cements are used for decorative purposes In some standards the addition of
pigments to produce colored Portland cement is allowed In other standards (eg ASTM)
pigments are not allowed constituents of Portland cement and colored cements are sold as
blended hydraulic cements
Very finely ground cements are made from mixtures of cement with sand or with slag or
other pozzolan type minerals which are extremely finely ground together Such cements can
8102019 A Study A Study On Financial Performance Analysis With Reference To Kesoram Cementon Financial Performance hellip
httpslidepdfcomreaderfulla-study-a-study-on-financial-performance-analysis-with-reference-to-kesoram 2081
have the same physical characteristics as normal cement but with 50 less cement
particularly due to their increased surface area for the chemical reaction Even with
intensive grinding they can use up to 50 less energy to fabricate than ordinary Portland
cements
Non-Portland hydraulic cements
Pozzolan-lime cements Mixtures of ground Pozzolan and lime are the cements used by the
Romans and are to be found in Roman structures still standing (eg the Pantheon in Rome)
They develop strength slowly but their ultimate strength can be very high The hydration
products that produce strength are essentially the same as those produced by Portland
cement
Slag-lime cements Ground granulated blast furnace slag is not hydraulic on its own but is
activated by addition of alkalis most economically using lime They are similar to
pozzolan lime cements in their properties Only granulated slag (ie water-quenched glassy
slag) is effective as a cement component
Super sulfated cements These contain about 80 ground granulated blast furnace slag
15 gypsum or anhydrite and a little Portland clinker or lime as an activator They produce
strength by formation of ettringite with strength growth similar to a slow Portland cement
They exhibit good resistance to aggressive agents including sulfate
Calcium aluminate cements are hydraulic cements made primarily from limestone and
bauxite The active ingredients are monocalcium aluminate CaAl2O4 (CaO middot Al2O3 or CA in
Cement chemist notation CCN) and mayenite Ca12Al14O33 (12 CaO middot 7 Al2O3 or C12A7 in
CCN) Strength forms by hydration to calcium aluminate hydrates They are well-adapted
for use in refractory (high-temperature resistant) concretes eg for furnace linings
Calcium sulfoaluminate cements are made from clinkers that include yeelimite (Ca4
(AlO2)6SO4 or C4A3 in Cement chemists notation) as a primary phase They are used in
expansive cements in ultra-high early strength cements and in low-energy cements
Hydration produces ettringite and specialized physical properties (such as expansion or
rapid reaction) are obtained by adjustment of the availability of calcium and sulfate ionsTheir use as a low-energy alternative to Portland cement has been pioneered in China
where several million tonnes per year are produced Energy requirements are lower because
of the lower kiln temperatures required for reaction and the lower amount of limestone
(which must be endothermically decarbonated) in the mix In addition the lower limestone
8102019 A Study A Study On Financial Performance Analysis With Reference To Kesoram Cementon Financial Performance hellip
httpslidepdfcomreaderfulla-study-a-study-on-financial-performance-analysis-with-reference-to-kesoram 2181
21
content and lower fuel consumption leads to a CO2 emission around half that associated
with Portland clinker However SO2 emissions are usually significantly higher
Natural Cements correspond to certain cements of the pre-Portland era produced by
burning argillaceous limestones at moderate temperatures The level of clay components in
the limestone (around 30-35) is such that large amounts of belite (the low-early strength
high-late strength mineral in Portland cement) are formed without the formation of
excessive amounts of free lime As with any natural material such cements have highly
variable properties
Geopolymer cements are made from mixtures of water-soluble alkali metal silicates and
aluminosilicate mineral powders such as fly ash and metakaolin
8102019 A Study A Study On Financial Performance Analysis With Reference To Kesoram Cementon Financial Performance hellip
httpslidepdfcomreaderfulla-study-a-study-on-financial-performance-analysis-with-reference-to-kesoram 2281
22
COMPANY PROFILE
8102019 A Study A Study On Financial Performance Analysis With Reference To Kesoram Cementon Financial Performance hellip
httpslidepdfcomreaderfulla-study-a-study-on-financial-performance-analysis-with-reference-to-kesoram 2381
23
Kesoram Cement Industry is one of the leading manufacturers of cement in India It is a day
process cement Plant The plant capacity is 826 lakh tones per annum It is located at
Basanthnagar in Karimnagar district of Andhra Pradesh Basanthnagar is 8 km away from
the Ramagundam Railway station linking Madras to New Delhi The Chairman of the
Company is BKBirla
History
The first unit at Basanthnagar with a capacity of 21 lakh tones per annum
incorporating humble suspension preheated system was commissioner during the year 1969
The second unit was setup in year 1971 with a capacity of 21 lakh tones per annum went on
stream in the year 1978 The coal for this company is being supplied from Singgareni
Collieries and the power is obtained from APSEB The power demand for the factory is
about 21 MW Kesoram has got 2 DG sets of 4 MW each installed in the year 1987
Kesoram Cement has setup a 15 KW captor power plant to facilitate for
uninterrupted power supply for manufacturing of cement at 24th
august 1997 per hour 12
mw actual power is 15 mw
The Company was incorporated on 18th October 1919 under the Indian Companies Act
1913 in the name and style of Kesoram Cotton Mills Ltd It had a Textile Mill at 42
Garden Reach Road Calcutta 700 024 The name of the Company was changed to Kesoram
Industries amp Cotton Mills Ltd on 30th
August 1961 and the same was further changed to Kesoram Industries Limited on 9th July
1986 The said Textile Mill at Garden Reach Road was eventually demerged into a separate
company
The First Plant for manufacturing of rayon yarn was established at Tribeni District
Hooghly West Bengal and the same was commissioned in December 1959 and the second
plant was commissioned in the year 1962 enabling it to manufacture 4635 metric tons perannum (mtpa) of rayon yarn This Unit has 6500 metric tons per annum (mtpa) capacity as
on 3132009
The plant for manufacturing of transparent paper was also set up at the same location at
Tribeni District Hooghly West Bengal in June 1961 It has the annual capacity to
manufacture 3600 metric tons per annum (mtpa) of transparent Paper
8102019 A Study A Study On Financial Performance Analysis With Reference To Kesoram Cementon Financial Performance hellip
httpslidepdfcomreaderfulla-study-a-study-on-financial-performance-analysis-with-reference-to-kesoram 2481
24
The Company diversified into manufacturing of cast iron spun pipes and pipe fittings at
Bansberia District Hooghly West Bengal with a production capacity of 45000 metric tons
per annum (mtpa) of cast iron spun pipes and pipe fittings in December 1964
The Company subsequently diversified into the manufacturing of Cement and in 1969
established its first cement plant under the name Kesoram Cement at Basantnagar Dist
Karimnagar (Andhra Pradesh) and to take advantage of favorable market conditions in
1986 another cement plant known as Vasavadatta Cement was commissioned by it at
Sedam Dist
Gulbarga (Karnataka) The cement manufacturing capacities at both the plants were
augmented from time to time according to the market conditions and as on 3132009
Kesoram Cement and Vasavadatta Cement have annual cement manufacturing capacities of
15 million metric tons and 41 million metric tons respectively
The Company in March 1992 commissioned a plant at Balasore known as Birla Tyres in
Orissa for manufacturing of 10 lakh mtpa automotive tyres and tubes in the first phase in
collaboration with Pirelli Ltd UK a subsidiary company of the world famous Pirelli
Group of Italy - a pioneer in production and development of automotive tyres in the world
The capacity at the said plant was further augmented during the year by 19 MT per day
aggregating to 271 MT per day production facility The Greenfield Project of 257 MT per
day capacity in the State of Uttarakhand with a capex of about Rs760 crores commenced
the commercial production in phases during the financial year 2008-09The Company as on
3132009 had the manufacturing capacities of 371 million tyres 295 million tubes and
153 million flaps per annum in the Plants including at Uttarakhand Plant It has small
manufacturing capacities of various Chemicals at Kharda in the State of West Bengal also
It has the annual manufacturing capacities of 12410 mtpa of Caustic Soda Lye 5045 mtpa
of Liquid Chlorine 6205 mtpa of Sodium Hypochlorite 8200 mtpa of Hydrochloric Acid
3200 mtpa of Ferric Alum 18700 mtpa of Sulphuric Acid and 1620000 m3pa of purified
Hydrogen Gas
The Company is a well-diversified entity in the fields of Cement Tyre Rayon Yarn
Transparent Paper Spun Pipes and Heavy Chemicals with two core business segments ie
Cement and Tyres
8102019 A Study A Study On Financial Performance Analysis With Reference To Kesoram Cementon Financial Performance hellip
httpslidepdfcomreaderfulla-study-a-study-on-financial-performance-analysis-with-reference-to-kesoram 2581
25
In Spun Pipes amp Foundries a unit of the Company work suspended from 2nd May 2008
still commences till further notice
The Company as of now is listed on three major Stock Exchanges in India ie Bombay
Stock Exchange Ltd Mumbai Calcutta Stock Exchange Association Ltd Kolkata and
National Stock Exchange of India Ltd Mumbai and at the Societe de la Bourse de
Luxembourg Luxembourg
A further expansion upto 165 million tons of cement per annum in Vasavadatta Cement at
Sedam in Karnataka as unit IV at the same site is in progress with a 175 MW Captive
Power Plant involving a capital expenditure of about Rs 78350 crores (including the cost
of Captive Power Plant)
The commercial production of cement in the aforesaid unit IV has commenced in June
2009 The work for the further expansion in the Tyres Section at Uttarakhand for radial
tyres with 100 MT per day capacity and bias tyres with 125 MT per day capacity involving
an estimated aggregate capital outlay of about Rs 840 crores is under progress The Board
has further approved a Motor Cycle Tyre Project of 70 MT per day capacity at the same site
involving a capital outlay of Rs190 crore The civil construction of both the Projects is in
full swing The commercial production in both the Projects is likely to start by December
2009 January 2010
Birla Supreme in popular brand of Kesoram cement from its prestigious plant of
Basantnagar in AP which has outstanding track record In performance and productivity
serving the nation for the last two and half decades It has proved its distinction by bagging
several national awards It also has the distinction of achieving optimum capacity
utilization
Kesoram offers a choice of top quality portioned cement for light heavy
constructions and allied applications Quality is built every fact of the operations
The plant lay out is rational to begin with The limestone is rich in calcium
carbonate a key factor that influences the quality of final product The day process
technology uses in the latest computerized monitoring overseas the manufacturing process
Samples are sent regularly to the bureau of Indian standards National council of
construction and building material for certification of derived quality norms
8102019 A Study A Study On Financial Performance Analysis With Reference To Kesoram Cementon Financial Performance hellip
httpslidepdfcomreaderfulla-study-a-study-on-financial-performance-analysis-with-reference-to-kesoram 2681
26
The company has vigorously undertaking different promotional measures for
promoting their product through different media which includes the use of news papers
magazine hoarding etc
Kesoram cement industry distinguished itself among all the cement factories in
Indian by bagging the National Productivity Award consecutively for two years ie for the
year 1985-1987 The federation of Andhra Pradesh Chamber amp Commerce and Industries
(FAPCCI) also conferred on Kesoram Cement An award for the best industrial promotion
expansion efforts in the state for the year 1984 Kesoram also bagged FAPCCI awarded for
ldquoBest Family Planning Effort in the staterdquo for the year 1987-1988
One among the industrial giants in the country today serving the nation on the
industrial front Kesoram industry ltd has a checked and eventful history dating back to the
twenties when the Industrial House of Birlarsquos acquired it With only a textile mill under its
banner 1924 it grew from strength to strength and spread its activities to newer fields like
Rayon Transparent paper pipes Refractors tyres and other products
Looking to the wide gap between the demand and supply of vital commodity
cement which play in important role in National building activity the Government of India
had de-licensed the cement industry in the year 1966 with a review to attract private
entrepreneur to augment the cement production Kesoram rose to the occasions and divided
to set up a few cement plants in the country
Kesoram cement undertaking marketing activities extensively in the state of Andhra
Pradesh Karnataka Tamilnadu Kerala Maharashtra and Gujarat In AP sales Depts are
located in different areas like Karimnagar Warangal Nizamabad Vijayawada and Nellore
In other states it has opened around 10 depots
The market share of Kesoram Cement in AP is 705 The market share of the
company in various states is shown as under
STATES MARKET SHARE
Karnataka 409
Tamilnadu 094
Kerala 029
Maharashtra 281
8102019 A Study A Study On Financial Performance Analysis With Reference To Kesoram Cementon Financial Performance hellip
httpslidepdfcomreaderfulla-study-a-study-on-financial-performance-analysis-with-reference-to-kesoram 2781
27
Process and Quality Control
It has been the endeavor of Kesoram to incorporate the Worldrsquos latest technology in
the plant and today the plant has the most sophisticated
X-ray analysis
Fully computerized XRF and XRD X-RAY Analyzers keep a constant round the
clock vigil on quality
Supreme performance
One of the largest Cement Plants in Andhra Pradesh the plant incorporate the latest
technology in Cement - making
It is professionally managed and well established Cement Manufacturing Company
enjoying the confidence of the consumers Kesoram has outstanding track record in
performance and productivity with quite a few national and state awards to its credit
BIRLA SUPREME the 43 Grade Cement is a widely accepted and popular brand
in the market commanding a premium
However to meet the specific demands of the consumer Kesoram bought out the 53
grade BIRLA SUPREME ndash GOLD which has special qualities like higher fineness quick-
setting high compressive strength and durability
Supreme Strength
Kesoram Cement has huge captive Limestone Deposits which make it possible tofeed high- grade limestone consistently its natural Grey colour is anion- born ingredient
and gives good shade
Both the products offered by Kesoram ie BIRLA SUPREME-43 Grade and
BIRLA SUPREME-GOLD-53 Grade cement are outstanding with much higher
compressive strength and durability
The following characteristics show their distinctive qualities
Comprehensive
Strength
Opc 43
grls 8112
1989
Birla
Supreme 43
grade
Opc 43 gr
Is 1226987
Birla
Supreme
Gold 53 gr
3 days mpa Min 23 31 + Min 27 38+
7 days mpa Min 23 42+ Min 37 48+
28 days mpa Min 43 50+ Min 53 60+
8102019 A Study A Study On Financial Performance Analysis With Reference To Kesoram Cementon Financial Performance hellip
httpslidepdfcomreaderfulla-study-a-study-on-financial-performance-analysis-with-reference-to-kesoram 2881
28
DC SYSTEM
Clinker making process is a key step in the overall cement making process In the case of
BIRLA SUPREMEGOLD the clinker-making process is totally computer control The
Distributed Control System (DCS) constantly monitors the process and ensures operating
efficiency This eliminates variation and ensures consistency in the quality of Clinker
Physical Characteristics
Ope 43
Is 8 112-89
Birla
Supreme
43 grade
Ope 53 gr
Is 12269-87
Birla Supreme
Gold 53 gr
Setting time Min30 120-180 Min 30 130-170
a Initial (mats) Max 600 180-240 Max 600 170-220
b final (mats) Min 225 270-280 Min 225 300-320
Fincncssm 2Kg Max 10 10-20 Max 10 05-10
Soundness Max 08 004-008 Max 0080 004-02
a le-chart (mm)
b autoclave ()
Supreme Expertise
The Best Technical Team exclusive to Kesoram mans the Plant and monitors the process
to blend the cement in just the required proportions to make BIRLA SUPREMEGOLD OF
Rock Strength
18 Million Tones of Solid Foundation
Staying at the top for over a Quarter Century Quarter Century is no less an achievement
Infact Kesoram is synonymous with for over 28 years
Over the years Kesoram has dispatched 18 million tones of cement to the nook and cornersof the country and joined hands in strengthening the Nation No one else in Andhra Pradesh
has this distinction The prestigious World Bank aided Ramagundam Super Thermal Power
Project of NTPC and Mannair Dam of Pochampad project in AP arc a couple of projects for
which Kesoram Cement was exclusively uses to cite an example
8102019 A Study A Study On Financial Performance Analysis With Reference To Kesoram Cementon Financial Performance hellip
httpslidepdfcomreaderfulla-study-a-study-on-financial-performance-analysis-with-reference-to-kesoram 2981
29
Chemical Characteristics
Opc 43 gr
Is 81 132-989
Birla
Supreme
43 grade
Ope 53 gr
Is 12269-
87
Birla
Supreme
Gold 53 gr
Loss on inflection Max 5 lt16 Max 40 lt15
Insoluble residue Max 20 lt08 Max 20 lt 06
Magnesium oxide Max 60 lt 13 Max 60 lt 13
Lime saturation factor 066-102 08-09 08-102 088-09
Alumna iron ratio MinO66 15-17 MinO66 15-17
Sulfuric anhydride Max 253 16-20 Max 2 53 16-20
Alkalis Chlorides Max 005 Max 001 Max 005 Max 04
Kesoram Cement - advantages
Helps in designing sleeker and more elegant
Structures giving greater flexibility in design concept
Due to its fine quality super fine construction can be achieved Its gives maximum
strength at Minimum use of cement with water in the water cement ratio especially the 53
grade Birlas supreme-gold
Feathers in Kesorams cap
Kesoram has outstanding track record achieving over 100 capacity utilization I
productivity and energy conservation It has proved its distinction by bagging several
national and state awards noteworthy being
NATIONAL
1 National productivity award for 1985-86
2 National productivity award for 1986-87
3 National award for mines safety for 1985-86
4 National award for mines safety for 1986-875 National award for energy conservation 1989-90
8102019 A Study A Study On Financial Performance Analysis With Reference To Kesoram Cementon Financial Performance hellip
httpslidepdfcomreaderfulla-study-a-study-on-financial-performance-analysis-with-reference-to-kesoram 3081
30
STATE
1 AP State productivity award for 1988
2 State award for best industrial management 1988-89
3 Best industrial productivity award of FAPCCI (federation of AP chamber of
commerce and industry) 1991
4 Best management award of the state Govt 1993
5 FAPCCI award for the workers welfare 1995-96
ISO 9002
All quality systems of Kesoram have been certified under ISO 90021S 4002 which
proves the worldwide acceptance of the products
All quality systems in production and marketing of the product have been certified by BIS
under ISO 90021S 14002
The first unit was installed at basanthnagar with a capacity of 25 ndashlakhs TPA (tones per
annum) incorporating humble supervision preheated system during the year 1969
The second unit followed suit with added a capacity of 2 lakhs TPA in 1971
The plant was further expanded to 9 lakhs by adding 25 lakhs tones in august 1978 113
lakhs tones in January 1981 and 087 lakhs tones in September 1981
Power
Singareni collieries make the supply of coal for this industry and the power was
obtained from AP TRANSCO The power demand for the factory is about 21MW Kesoram
has got 2-diesel generator seats of 4 MW each installed in the year 1987
Kesoram cement now has a 15MWcaptive power plant to facilities for uninterrupted
power supply for manufacturing of cement
Performance
The performance of kersoram cement industry has been outstanding achieving over
cent percent capacity utilization all through despite many odds like power cuts and which
most 40 was wasted due to wagon shortage etc
The company being a continuous process industry works round the clock and has
excellent records of performance achieving over 1005 capacity utilization
Kesoram has always combined technical progress with industrial performance The
company had glorious track record for the last 27 years in the industry
Technology
8102019 A Study A Study On Financial Performance Analysis With Reference To Kesoram Cementon Financial Performance hellip
httpslidepdfcomreaderfulla-study-a-study-on-financial-performance-analysis-with-reference-to-kesoram 3181
31
Kesoram cement uses most modern technology and the computerized control in the
plant A team of dedicated and well- experienced experts manages the plant
The quality is maintained much above the bureau of Indian standards
The raw materials used for manufacturing cement are
Lime stone
Bauxite
Hematite
Gypsum
Environmental and Social Obligations
For environmental promotion and to keep ndashup the ecological balance this section
has planted over two lakhs trees on social obligation front this section has undertaken
various social welfare programs by adopting ten nearly villages organizing family welfare
campus surgical camps animal health camps blood donation camps children immunization
camps seeds training for farmers etc were arranged
Welfare and Recreation Facilities
For the purpose of recreation facilities 2 auditoriums were provided for playing
indoor games cultural function and activities like drama music and dance etc
The industry has provided libraries and reading rooms About 1000 books are available in
the library All kinds of newspaper magazines are made available
Canteen is provided to cater to the needs of the employees for supply of snacks tea
coffee and meals etc
One English medium and one Telugu medium school are provided to meet the
educational requirements
The company has provided a dispenser with a qualified medical office and
paramedical staff for the benefit of the employees The employees covered under ESI
scheme have to avail the medical facilities from the ESI hospital
Competitions in sports and games are conducted every year for august 15th
Independence Day and January 26th republic day among the employees
Electricity
The power consumption per ton of cement has come down to 108 units against 113
units last year due to implementation of various energy saving measures The performance
of captive power plant of this section continues to be satisfactory Total power generation
8102019 A Study A Study On Financial Performance Analysis With Reference To Kesoram Cementon Financial Performance hellip
httpslidepdfcomreaderfulla-study-a-study-on-financial-performance-analysis-with-reference-to-kesoram 3281
32
during the year was 84 million units last year This captive power plant is a major role in
keeping power costs with in economic levels
The management has introduced various HRD programs for training and
development and has taken various other measures for the betterment of employeersquos
efficiency
The section has installed adequate air pollution control system and equipment and is
ISO14001 such as Environment management system is under implementation
Awards
Kesoram cement bagged many prestigious awards including national awards for
productivity technology conservation and several state awards since 1984 The following
are the some of important awards
AWARDS OF KESORAM CEMENT
No Year Awards
National
State
1 1989-90 Management award community
Development
State
2 1991 Energy conservation may day award of the
Govt
State
3 1991 Pundit Jawaharlal Nehru rolling trophy for
best
State
4 1993 National productivity effort Indira Gandhi
national award
State
5 1994 Best management award State
6 1994-
1995
Best industrial rebellion award State
7 1995 Rural development by chief minister
Environment and mineral conservation
award
State
8 1995 Best industrial rebellion award State
8102019 A Study A Study On Financial Performance Analysis With Reference To Kesoram Cementon Financial Performance hellip
httpslidepdfcomreaderfulla-study-a-study-on-financial-performance-analysis-with-reference-to-kesoram 3381
33
9 1995-
1996
Best effort of an industrial unit to
development rural economy shriSRRungta
award for social
National
10 1996 Awareness for best rural development
efforts
State
11 1999 Best workers welfare best family welfare
award
State
12 2001 First prize for mine environment amppollution
control for the 3rd
year in succession
State
13 2002 Vana mithra award from AP Govt State
14 2003 Company has got OHSAS-18001 State
15 2005 Certification from DNV New Delhi State
16 2006 Award for pollution control and
environmental protection FAPCCI award
for best rural development in the state
State
8102019 A Study A Study On Financial Performance Analysis With Reference To Kesoram Cementon Financial Performance hellip
httpslidepdfcomreaderfulla-study-a-study-on-financial-performance-analysis-with-reference-to-kesoram 3481
34
Products of the organization
8102019 A Study A Study On Financial Performance Analysis With Reference To Kesoram Cementon Financial Performance hellip
httpslidepdfcomreaderfulla-study-a-study-on-financial-performance-analysis-with-reference-to-kesoram 3581
35
CHAPTER-III
LITERATURE REVIEW
8102019 A Study A Study On Financial Performance Analysis With Reference To Kesoram Cementon Financial Performance hellip
httpslidepdfcomreaderfulla-study-a-study-on-financial-performance-analysis-with-reference-to-kesoram 3681
36
Introduction
Financial Performance Analysis
The term lsquofinancial performance analysis also known as analysis and interpretation of
financial statementsrsquo refers to the process of determining financial strength and
weaknesses of the firm by establishing strategic relationship between the items of the
balance sheet profit and loss account and other operative data
ldquoAnalyzing financial statementsrdquo by Metcalf and Titard
ldquoFinancial analysis is a process of evaluating the relationship between component
parts of a financial statement to obtain a better understanding of a firms position and
performancerdquo by Myers
Financial Performance
The word lsquoPerformance is derived from the word lsquoparfourmenrsquo which means lsquoto dorsquo lsquoto
carry outrsquo or lsquoto renderrsquo It refers the act of performing execution accomplishment
fulfillment etc In border sense performance refers to the accomplishment of a given task
measured against preset standards of accuracy completeness cost and speed In other
words it refers to the degree to which an achievement is being or has been accomplished In
the Words of Frich Kohlar ldquoThe performance is a general term applied to a part or to all the
conducts of activities of an organization over a period of time often with reference to past or
projected cost efficiency management responsibility or accountability or the like Thus not
just the presentation but the quality of results achieved refers to the performance
Performance is used to indicate firmrsquos success conditions and compliance
Financial performance refers to the act of performing financial activity In broader
sense financial performance refers to the degree to which financial objectives being or has
been accomplished It is the process of measuring the results of a firms policies and
operations in monetary terms It is used to measure firms overall financial health over a
given period of time and can also be used to compare similar firms across the same industry
or to compare industries or sectors in aggregation
The purpose of financial analysis is to diagnose the information contained in financial
statements so as to Jude the profitability and financial soundness of the firm Just like a
doctor examines his patient by recording his body temperature blood pressure etc Before
8102019 A Study A Study On Financial Performance Analysis With Reference To Kesoram Cementon Financial Performance hellip
httpslidepdfcomreaderfulla-study-a-study-on-financial-performance-analysis-with-reference-to-kesoram 3781
37
making his conclusion regarding the illness and before giving his treatment a financial
analyst analysis the financial statements with various tools of analysis before commenting
upon the financial health or weaknesses of an enterprise
The analysis and interpretation of financial statements is essential to bring out the
mystery behind the figures in financial statements Financial statements analysis is an
attempt to determine the significance and meaning of the financial statement data so that
forecast may be made of the future earnings ability to pay interest and debt maturities (both
current and long term) and profitability of a sound divided policy
Types of financial analysis-
Financial analysis into different categories depending upon
(1) The material used and
(2) The method of operation followed in the analysis or the modus operandi of
analysis
Types of financial analysis
On the basis of material used on the basis of modus operandi
External Internal Horizontal Vertical
Analysis Analysis Analysis Analysis
1 On the basis of material used - According to material used financial analysis canbe of two types
External analysis
Internal analysis
External analysis-
This analysis is done by outsiders who do not have access to the detailed internal
outsiders include investors potential investors Creditors Potential Creditors Government
Agencies Credit Agencies and General Public For financial analysis these external parties
to the firm depend almost entirely on the published financial statements
Internal analysis-
This analysis is undertaken by the persons namely executives and employees of the
organization or by the officers appointed by government or court who have access to the
8102019 A Study A Study On Financial Performance Analysis With Reference To Kesoram Cementon Financial Performance hellip
httpslidepdfcomreaderfulla-study-a-study-on-financial-performance-analysis-with-reference-to-kesoram 3881
38
books of account ( internal accounting records) and other information related to the
business
2 983119983150 983156983144983141 983138983137983155983145983155 983151983142 983149983151983140983157983155 983151983152983141983154983137983150983140983145983085
According to the modus operandi financial analysis can also be of two types
a Horizontal analysis
bVertical analysis
Horizontal analysis-
Horizontal analysis refers to the comparison of financial data of a company for several
years The figures for this type of analysis are presented horizontally over a number of
columns The figures of the various years are compared with standard or base year a base
year is year chosen as beginning point This type of analysis is also called lsquodynamicanalysisrsquo as it is based on the data from year to year rather than on data of any one year The
horizontal analysis makes it possible to focus attention on items that have changed
significantly during the period under view
b Vertical analysis-
Vertical analysis refers to the study of relationship of the various items in the financial
statements of one accounting period In this types of analysis the figures from financial
statement of a year are compared with a base selected from the same yearrsquos statement
Methods of financial analysis-
The following methods of analysis are generally used-
1 Comparative Statements
2 Trend Analysis
3 Common-Size Statements
4 Funds flow Analysis
5 Cash Analysis
6 Ratio Analysis
7 Cost-volume-Profit Analysis
8102019 A Study A Study On Financial Performance Analysis With Reference To Kesoram Cementon Financial Performance hellip
httpslidepdfcomreaderfulla-study-a-study-on-financial-performance-analysis-with-reference-to-kesoram 3981
39
Comparative statements-
The comparative financial statements are statements of the financial position at
different periods of time the elements of financial position are show in a
Comparative Statement provides an idea of financial position at two or more
periods Generally two financial statements (balance sheet and income statement) are
prepared in comparative form for financial analysis
The Comparative Statement May Show-
1 Absolute figures (rupee amounts)
2 Changes in absolute figures ie increase or decrease in absolute figures
3 Absolute data in terms of percentages
4 Increase or decrease in terms of percentages
The Two Comparative Statements Are-
1 Comparative balance sheet and
2 Income statement
1 983107983151983149983152983137983154983137983156983145983158983141 983138983137983148983137983150983139983141 983155983144983141983141983156983085
The comparative balance sheet analysis is the study of the trend of the same items group of
items and computed items in two or more balance sheets of the same business enterprise on
different dates The change in periodic balance sheet items reflect the conduct of a business
the change can be observed by comparison of the balance sheet at the beginning and at the
end of a period and these changes can help in forming an opinion about the progress of an
enterprise
Guide Lines for Interpretation of Comparative Balance Sheet-
While interpreting comparative balance sheet the interpreter is expected to study the
following aspects-
1 Current financial position and liquidity position
2 Long-term financial position
3 Profitability of the concern
8102019 A Study A Study On Financial Performance Analysis With Reference To Kesoram Cementon Financial Performance hellip
httpslidepdfcomreaderfulla-study-a-study-on-financial-performance-analysis-with-reference-to-kesoram 4081
40
Common Size Statement-
The common-size statements balance sheet and income statement are show in
analytical percentages The figures are shown as percentages of total assets total liabilities
and total sales The total assets are taken as 100 and different assets are expressed as a
percentage of the total similarly various liabilities are taken as a part of total liabilities
Common Size Balance Sheet-
A statement in which balance sheet items are expressed as the ratio of each asset to
total assets and the ratio of each liability is expressed as a ratio of total liabilities is called
common size balance The common size balance sheet can be used to compare companies
of differing size The comparison of figures in different periods is not useful because total
figures may be affected by a number of factors It is not possible to establish standard norms
for various assets The trends of figures from year to year may not be studied and even they
may not give proper results
Trend Analysis of Balance Sheet-
Trend analysis is Very important tool of horizontal financial analysis
This analysis enables to known the change in the financial function and operating efficiency
in between the time period chosen
By studding the trend analysis of each item we can known the direction of changes and
based upon the direction of changes the options can be changed
Trend =Absolute Value of item in the statement understudy 100
Absolute Value of same item in the base statement
Ratio Analysis
Ratio analysis is used as a technique of analyzing the financial information contained in the
balance sheet and profit and loss accounts for a more meaningful understanding of the
financial position and performance of a firm
The relationship between two accounting figures expressed mathematically is known as a
financial ratio A ratio helps the analyst to make qualitative judgment about the firmrsquos
financial position and performance
Several ratios can be calculated from the accounting data contained in the financial
statements The parties which generally undertake financial analysis is short ndashterm
creditors long-term creditors owner and management In view of the requirements of the
various ratios ratios are classified into the following four important categories
8102019 A Study A Study On Financial Performance Analysis With Reference To Kesoram Cementon Financial Performance hellip
httpslidepdfcomreaderfulla-study-a-study-on-financial-performance-analysis-with-reference-to-kesoram 4181
41
Liquidity ratios
Leverage ratios
Activity ratios
Profitability ratios
Liquidity Ratios
It is extremely essential for a firm to be able to meet its obligations as they become due
Liquidity ratios measure the ability of the firm to meet its current obligations A firm should
ensure that it does not suffer from lack of liquidity and also that it does not have excess
liquidity The failure of a company to meet its obligations due to lack of sufficient liquidity
will result in a poor creditworthiness loss of creditorsrsquo confidence or even in legal tangles
resulting in the closure of the company A very high degree of liquidity is also bad idle
assets earn nothing The firmrsquos funds will be unnecessarily tied up in current assets
Therefore it is necessary to strike a proper balance high liquidity and lack of liquidity
The most common ratios which indicate the extent of liquidity or lack of it are
Current ratio
Quick ratio
Other ratios include Cash ratio Interval Measure and Net working capital ratio
Current Ratio
The current ratio is calculated by dividing current assets by current liabilities
Current assets
Current ratio = --------------------------
Current liabilities
Current ratio is a measure of the firmrsquos short term solvency It indicates the availability of
current assets in rupees for every one rupee of current liability A ratio of greater than one
means that the firm has more current assets than current claims against the Current ratio of
2 to 1 or more is considered satisfactory Current ratio represents a margin of safety for
creditors
Quick Ratio
Quick ratio also known as acid-test ratio establishes a relationship between quick assets and
the current liabilities Cash is the most liquid asset It is calculated by dividing quick assets
by current liabilities
Quick ratio = Quick Assets Current Liabilities
8102019 A Study A Study On Financial Performance Analysis With Reference To Kesoram Cementon Financial Performance hellip
httpslidepdfcomreaderfulla-study-a-study-on-financial-performance-analysis-with-reference-to-kesoram 4281
42
(Quick Assets = Current assets ndash Inventory)
One defect of the current ratio is that it fails to convey any information on the composition
of the current assets of the firm A rupee of cash is considered equivalent to a rupee of
inventory of receivables But it is not so A rupee of cash is more readily available to meet
current liabilities than a rupee of say inventory This implies the usefulness of the current
ratio
The Acid ndashtest ratio measures the firmrsquos ability to convert its current assets quickly into
cash in order to meet its current liabilities
A quick ratio of 1 to 1 is considered to represent a satisfactory current financial condition It
is an important index of the firmrsquos liquidity
Leverage Ratios
Leverage ratios identify the source of a firmrsquos capital ndashowners or outside creditors
Financial leverage refers to the use of debt in financing non-current assets If the return on
assets exceeds the cost of debt the leverage is successful ndash ie it improves return on equity
Debt ndashEquity Ratio
The Debt ndash Equity is determined to analyze the soundness of the long term financial
policies of the organization It is also known as ldquoInternal External Equity Ratiordquo
It is calculated as follows
Debt ndash Equity Ratio = Total long term debt Share holders funds
Equity Ratio
This ratio is also called as proprietary ratio establishes a relationship between share holderrsquos
funds to total assets of company Equity Ratio is calculated by dividing share holders fund
by total assets
Fixed Asset Ratio
This ratio indicates the extent to which the assets of the companyrsquos can be lost without
affecting the interest of the creditors of the company Higher the ratios better the long-term
position of the company
Activity Ratios
They are primarily used for studying a firmrsquos working capital situation A well managed
firm should have good activity ratios
8102019 A Study A Study On Financial Performance Analysis With Reference To Kesoram Cementon Financial Performance hellip
httpslidepdfcomreaderfulla-study-a-study-on-financial-performance-analysis-with-reference-to-kesoram 4381
43
Working Capital Turnover Ratio
The working capital turnover ratio indicates whether or not working capital has been
effectively used in making sales
Working capital turnover = Sales Net current assets
Inventory Turnover Ratio
This ratio also known as Stock Turnover Ratio establishes the relationship between costs of
goods sold or net sales during the given period and the average amt of stock held during the
period This ratio reveals the number of times finished stock in turnover during a given
accounting period
Higher the ratio the better is it because it shows the finished stock is rapidly turned
in to sales On the other hand a low stock turnover ratio is not desirable because it reveals
the accumulation of stock
Debtors Turnover Ratio
This ratio indicates the velocity of debt collection of a company In other words it shows
the number of times average turnover during a year
A Higher Debtor Turnover Ratio indicates a more efficient is the management towards
debtors and low ratio ratio implies inefficient management of debtors
Total Assets Turnover Ratio
The asset turnover ratio indicates how efficiently management is employing Assets
Total Assets Turnover Ratio = Sales Total Assets
Profitability Ratios
Profitability ratios are the ratios which measure a firmrsquos overall effectiveness as revealed by
the returns generated on sales and investment
General Profitability Ratios
1 Gross Profit Ratio
2 Net profit Ratio
3 Operating or Expenses Ratio
8102019 A Study A Study On Financial Performance Analysis With Reference To Kesoram Cementon Financial Performance hellip
httpslidepdfcomreaderfulla-study-a-study-on-financial-performance-analysis-with-reference-to-kesoram 4481
44
Gross Profit Ratio
Gross profit Ratio measures the relationships to net sales and is usually represented as a
percentage It is a good measure of profitability
The gross profit ratio indicates the extent to which selling price of goods per unit may
decline without resulting in losses on operation Higher the gross profit betters the result
Net Profit Ratio
Net Profit Ratio indicates net margin on sales It is given by the following equation
Net Profit Ratio = (Net Profit Sales) 100
Operating or Expenses Ratio
This ratio is complimentary of Net Profit Ratio The more the net profit the less the
Operating Ratio Operating costs include the cost of direct materials direct labors and otheroverheads viz are generally excluded from operating costs A comparison of the Operating
Ratio will indicate whether the cost efficiency is high or low in the figure of sales This less
the ratio it depicts the efficiency of the management
8102019 A Study A Study On Financial Performance Analysis With Reference To Kesoram Cementon Financial Performance hellip
httpslidepdfcomreaderfulla-study-a-study-on-financial-performance-analysis-with-reference-to-kesoram 4581
45
CHAPTER IV
DATA ANALYSIS amp INTERPRETATION
8102019 A Study A Study On Financial Performance Analysis With Reference To Kesoram Cementon Financial Performance hellip
httpslidepdfcomreaderfulla-study-a-study-on-financial-performance-analysis-with-reference-to-kesoram 4681
46
Comparative Balance Sheet of Kesoram in the Year between 2008-2009
(Rupee in crores)
Years Changes
Particulars 2008 2009 In Rupees In Percentage
Liabilities
Share Capital 4574 4574 000 000
Reserves amp Surplus 93085 128024 34939
Revaluation Reserves 533 412 -121 -2270
Loans
Secured Loans 97106 153627 56521 5821
Un Secured Loans 12129 43416 31287 25795
Deferred Tax Liabilities 000 000 000 000
Current Liabilities
Provisions 33039 34529 1490 451
Current Liabilities 57067 66587 9520 1668
Total 297533 431169 133636 4491
Assets
Net Block 108424 180435 72011 6642
Capital Wip 63459 86485 23026 3628
Investments 4783 6178 1395 2917
Current Assets
Inventories 44217 58906 14689 3322
Sundry Debtors 27307 38017 10710 3922
Cash amp Bank Balances 4036 5657 1621 4016
Total Current Assets 75560 102580 27020 3576
Loans amp Advances 45289 55462 10173 2246
Fixed Deposits 018 028 010 5556
Total 297533 431169 133636 4491
8102019 A Study A Study On Financial Performance Analysis With Reference To Kesoram Cementon Financial Performance hellip
httpslidepdfcomreaderfulla-study-a-study-on-financial-performance-analysis-with-reference-to-kesoram 4781
47
Interpretation of comparative balance sheet of 2008-2009
Reserves amp Surplus were increased to 3753 (percent) ie in Rupees 34939
crores
Revaluation Reserves decreased to 121 ie in Rupees 2270 crores
Secured Loans are increased to 5821 ie in Rupees 56521 crores And UN
secured loans highly Increased to 25795
Current liabilities and Provisions are increased to 1668 and 451 respectively ie in
Rupees 9520 amp 1490 crores
Fixed assets were highly increased to 6642 ie in Rupees 72011 crores
Investments were increased to 2917 ie in Rupees 1395 crores
Sundry debtors increased to 3922 ie in Rupees 10710 crores
Current assets increased 3576 ie in Rupees 27020 crores And Loans amp
Advances increased to 2246 respectively
The overall financial position was satisfactory
8102019 A Study A Study On Financial Performance Analysis With Reference To Kesoram Cementon Financial Performance hellip
httpslidepdfcomreaderfulla-study-a-study-on-financial-performance-analysis-with-reference-to-kesoram 4881
48
Comparative Balance Sheet of Kesoram in the Year between 2009-2010
(Rupees in crores)
Years Changes
Particulars 2009 2010 In Rupees In Percentage
Liabilities
Share Capital 4574 4574 000 000
Reserves amp Surplus 128024 149111 21087 1647
Revaluation Reserves 412 339 -073 -1772
Loans
Secured Loans 153627 186372 32745 2131
Un Secured Loans 43416 126250 82834 19079
Deferred Tax Liabilities 000 000 000
Current Liabilities
Provisions 34529 35734 1205 349
Current Liabilities 66587 107688 41101 6173
Total 431169 610068 178899 4149
Assets
Net Block 180435 343182 162747 9020
Capital WIP 86485 41283 -45202 -5227
Investments 6178 5143 -1035 -1675
Current Assets
Inventories 58906 91619 32713 5553
Sundry Debtors 38017 54289 16272 4280
Cash amp Bank Balances 5657 8014 2357 4167
Total Current Assets 102580 153922 51342 5005
Loans amp Advances 55462 66506 11044 1991
Fixed Deposits 028 031 003 1071
Total 431169 610068 178899 4149
8102019 A Study A Study On Financial Performance Analysis With Reference To Kesoram Cementon Financial Performance hellip
httpslidepdfcomreaderfulla-study-a-study-on-financial-performance-analysis-with-reference-to-kesoram 4981
49
Interpretation of comparative balance sheet of 2009-2010
Reserves amp surplus increased to 1647 ie in Rupees 21087 crores
Revaluation Reserves decreased to 1772 ie in Rupees 073 crores
Secured loans increased to 2131 ie in Rupees 32745 crores
Current Liabilities were increased to 6173 ie in Rupees 41101 crores and
Provisions 349 ie in Rupees 1205 crores
Fixed Assets were increased to 9020 ie in Rupees 162747 crores
Investments were decreased to 1675 ie in Rupees 1035 crores
Sundry debtors were increased to 4280 ie in Rupees 16272 crores
Current assets increased to 5005 ie in Rupees 51342 crores And loans and
Advances increased 1919 ie in Rupees 11044 crores
The overall financial position was satisfactory
8102019 A Study A Study On Financial Performance Analysis With Reference To Kesoram Cementon Financial Performance hellip
httpslidepdfcomreaderfulla-study-a-study-on-financial-performance-analysis-with-reference-to-kesoram 5081
50
Comparative Balance Sheet of Kesoram in the Year between 2010-2011
(Rupees in crores)
Years Changes
Particulars 2010 2011 In Rupees In Percentage
Liabilities
Share Capital 4574 4574 000 000
Reserves amp Surplus 149111 125162 -23949 -1606
Revaluation Reserves 339 289 -050 -1475
Loans
Secured Loans 186372 237183 50811 2726
Un Secured Loans 126250 162744 36494 2891
Deferred Tax Liabilities 000 000 000
Current Liabilities
Provisions 35734 1494 -34240 -9582
Current Liabilities 107688 113902 6214 577
Total 610068 645348 35280 578
Assets
Net Block 343182 369172 25990 757
Capital WIP 41283 43781 2498 605
Investments 5143 6582 1439 2798
Current Assets
Inventories 91619 111855 20236 2209
Sundry Debtors 54289 63134 8845 1629
Cash amp Bank Balances 8014 7188 -826 -1031
Total Current Assets 153922 182177 28255 1836
Loans amp Advances 66506 43460 -23046 -3465
Fixed Deposits 031 176 145 46774
Total 610068 645348 35280 578
8102019 A Study A Study On Financial Performance Analysis With Reference To Kesoram Cementon Financial Performance hellip
httpslidepdfcomreaderfulla-study-a-study-on-financial-performance-analysis-with-reference-to-kesoram 5181
51
Interpretation of comparative balance sheet of 2010-2011
Reserves amp surplus decreased to 1606 ie in Rupees 23949 crores
Revaluation Reserves decreased to 1475 ie in Rupees 050 crores
Secured loans increased to 2726 ie in Rupees 50811 crores
Current Liabilities were increased to 577 ie in Rupees 6214 crores
Provisions decreased to 9582 ie in Rupees 34240 crores
Fixed Assets were increased to 757 ie in Rupees 25990 crores
Investments were decreased to 2798 ie in Rupees 1439 crores
Sundry debtors were increased to 1629 ie in Rupees8845 crores
Current assets increased to 1836 ie in Rupees 28255 crores And loans and
Advances increased 3465 ie in Rupees 23046 crores
The overall financial position was UN satisfactory
8102019 A Study A Study On Financial Performance Analysis With Reference To Kesoram Cementon Financial Performance hellip
httpslidepdfcomreaderfulla-study-a-study-on-financial-performance-analysis-with-reference-to-kesoram 5281
52
Comparative Balance Sheet of Kesoram In The Year Between 2011-2012
(Rupees in crores)
Years Changes
Particulars 2011 2012 In Rupees In Percentage
Liabilities
Share Capital 4574 4574 000 000
Reserves amp Surplus 125162 86657 -38505 -3076
Revaluation Reserves 289 270 -019 -657
Loans
Secured Loans 237183 317792 80609 3399
Un Secured Loans 162744 92742 -70002 -4301
Deferred Tax Liabilities 000 000 000
Current Liabilities
Provisions 1494 40726 39232 262597
Current Liabilities 113902 180010 66108 5804
Total 645348 722771 77423 1200
Assets 000
Net Block 369172 358721 -10451 -283
Capital WIP 43781 68065 24284 5547
Investments 6582 6636 054 082
Current Assets
Inventories 111855 99516 -12339 -1103
Sundry Debtors 63134 67358 4224 669
Cash amp Bank Balances 7188 6959 -229 -319
Total Current Assets 182177 173833 -8344 -458
Loans amp Advances 43460 115409 71949 16555
Fixed Deposits 176 107 -069 -3920
Total 645348 722771 77423 1200
8102019 A Study A Study On Financial Performance Analysis With Reference To Kesoram Cementon Financial Performance hellip
httpslidepdfcomreaderfulla-study-a-study-on-financial-performance-analysis-with-reference-to-kesoram 5381
53
Interpretation of comparative balance sheet of 2011-2012
Reserves amp surplus decreased to 3076 ie in Rupee 38505 crores
Revaluation Reserves decreased to 657 ie in Rupees 019 crores
Secured loans increased to 3399 ie in Rupees 80699 crores
Current Liabilities were increased to 5804 ie in Rupees 66108 crores
Provisions increased to 262597 ie in Rupees 39232 crores
Fixed Assets were decreased to 283 ie in Rupee 10451 crores
Investments were increased to 082 ie in Rupees 054 crores
Sundry debtors were increased to 669 ie in Rupees 4224 crores
Current assets decreased to 458 ie in Rupees 8344 crores And loans and
Advances increased 16555 ie in Rupees 71949 crores
The overall financial position was UN satisfactory
8102019 A Study A Study On Financial Performance Analysis With Reference To Kesoram Cementon Financial Performance hellip
httpslidepdfcomreaderfulla-study-a-study-on-financial-performance-analysis-with-reference-to-kesoram 5481
54
Common Size Balance Sheet of Kesoram For The Year 2008-2009
(Rupees in crores)
Particulars 2008 Change Percentage 2009 Change Percentage
Liabilities
Share Capital 4574 154 4574 106
Reserves amp Surplus 93085 3129 128024 2969
Revaluation Reserves 533 018 412 010
Loans
Secured Loans 97106 3264 153627 3563
Un Secured Loans 12129 408 43416 1007
Deferred Tax Liabilities 000 000 000 000
Current Liabilities
Provisions 33039 1110 34529 801
Current Liabilities 57067 1918 66587 1544
Total 297533 10000 431169 10000
Assets
Net Block 108424 3644 180435 4185
Capital WIP 63459 2133 86485 2006
Investments 4783 161 6178 143
Current Assets
Inventories 44217 1486 58906 1366
Sundry Debtors 27307 918 38017 882
Cash amp Bank Balances 4036 136 5657 131
Loans amp Advances 45289 1522 55462 1286
Fixed Deposits 018 001 028 001
Total 297533 10000 431169 10000
8102019 A Study A Study On Financial Performance Analysis With Reference To Kesoram Cementon Financial Performance hellip
httpslidepdfcomreaderfulla-study-a-study-on-financial-performance-analysis-with-reference-to-kesoram 5581
55
Interpretation of Common Size Balance Sheet of 2008-2009
Share capital was recorded 154 percent in the total liabilities in the year 2008 it is
decreased to 106 in the year 2009
Reserves amp surplus contributed to 3129 in the total liabilities in the year 2008 it is
decreased to 2969 in the year 2009
Secured loans were 3264 in the total liabilities in the year 2008 it is increased to
3563 in the year 2009
Current Liabilities shown to 1918 in the total liabilities in the year 2008 it is
decreased to 1544 in the year 2009
Provisions 1110 in the total liabilities in the year 2008 it is decreased to 801 in the
year 2009
Fixed Assets were 3644 in the total liabilities in the year 2008 ie decreased to 4185
in the year 2009
Investments were 161 in the total liabilities in the year 2008 it is decreased to 143
in the year 2009
Sundry debtors were 918 in the total liabilities in the year 2008 it is decreased to 882
in the year 2009
8102019 A Study A Study On Financial Performance Analysis With Reference To Kesoram Cementon Financial Performance hellip
httpslidepdfcomreaderfulla-study-a-study-on-financial-performance-analysis-with-reference-to-kesoram 5681
56
Common Size Balance Sheet of Kesoram For The Year 2009-2010
(Rs in crores)
Particulars 2009 Change Percentage 2010Change
Percentage
Liabilities
Share Capital 4574 106 4574 075
Reserves amp Surplus 128024 2969 149111 2444
Revaluation Reserves 412 010 339 006
Loans
Secured Loans 153627 3563 186372 3055
Un Secured Loans 43416 1007 126250 2069
Deferred Tax Liabilities 000 000 000 000
Current Liabilities
Provisions 34529 801 35734 586
Current Liabilities 66587 1544 107688 1765
Total 431169 10000 610068 10000
Assets
Net Block 180435 4185 343182 5625
Capital WIP 86485 2006 41283 677
Investments 6178 143 5143 084
Current Assets
Inventories 58906 1366 91619 1502
Sundry Debtors 38017 882 54289 890
Cash amp Bank Balances 5657 131 8014 131
Loans amp Advances 55462 1286 66506 1090
Fixed Deposits 028 001 031 001
Total 431169 10000 610068 10000
8102019 A Study A Study On Financial Performance Analysis With Reference To Kesoram Cementon Financial Performance hellip
httpslidepdfcomreaderfulla-study-a-study-on-financial-performance-analysis-with-reference-to-kesoram 5781
57
Interpretation of common size balance sheet of 2009-2010
Share capital was recorded 106 percent in the total liabilities in the
year 2009 it is decreased to 075 in the year 2010
Reserves amp surplus contributed to 2969 in the total liabilities in the
year 2009 it is decreased to2444 in the year 2010
Secured loans were 3563 in the total liabilities in the year 2009 it is
increased to 3055 in the year 2010
Current Liabilities shown to 1544 in the total liabilities in the year
2009 it is decreased to 1765 in the year 2010
Provisions 801 in the total liabilities in the year 2009 it is decreased
to 586 in the year 2010
Fixed Assets were 4185 in the total liabilities in the year 2009 ie
increased to 5625 in the year 2010
Investments were 143 in the total liabilities in the year 2009 it is
decreased to 084 in the year 2010
Sundry debtors were 882 in the total liabilities in the year 2009 it is
increased to 890 in the year 2010
8102019 A Study A Study On Financial Performance Analysis With Reference To Kesoram Cementon Financial Performance hellip
httpslidepdfcomreaderfulla-study-a-study-on-financial-performance-analysis-with-reference-to-kesoram 5881
58
Common Size Balance sheet of Kesoram for the year 2010-2011
983080Rupees in crores)
Particulars 2010 Change Percentage 2011
Change
Percentage
Liabilities
Share Capital 4574 075 4574 071
Reserves amp Surplus 149111 2444 125162 1939
Revaluation Reserves 339 006 289 004
Loans
Secured Loans 186372 3055 237183 3675
Un Secured Loans 126250 2069 162744 2522
Deferred Tax Liabilities 000 000 000 000
Current Liabilities
Provisions 35734 586 1494 023
Current Liabilities 107688 1765 113902 1765
Total 610068 10000 645348 10000
Assets
Net Block 343182 5625 369172 5721
Capital WIP 41283 677 43781 678
Investments 5143 084 6582 102
Current Assets
Inventories 91619 1502 111855 1733
Sundry Debtors 54289 890 63134 978
Cash amp Bank Balances 8014 131 7188 111
Loans amp Advances 66506 1090 43460 673
Fixed Deposits 031 001 176 003
Total 610068 10000 645348 10000
8102019 A Study A Study On Financial Performance Analysis With Reference To Kesoram Cementon Financial Performance hellip
httpslidepdfcomreaderfulla-study-a-study-on-financial-performance-analysis-with-reference-to-kesoram 5981
59
Interpretation of Common Size Balance Sheet Of 2010-2011
Share capital was recorded 075 percent in the total liabilities in the year 2010 it is
decreased to 071 in the year 2011
Reserves amp surplus contributed to 2444 in the total liabilities in the year 2010 it is
decreased to1939 in the year 2011
Secured loans were 3055 in the total liabilities in the year 2010 it is increased to
3675 in the year 2011
Current Liabilities shown to 1765 in the total liabilities in the year 2010 it is
also1765 in the year 2011
Provisions 586 in the total liabilities in the year 2010 it is decreased to 023 in the
year 2011
Fixed Assets were 5625 in the total liabilities in the year 2010 ie increased to 5721
in the year 2011
Investments were 084 in the total liabilities in the year 2010 it increased to 102 in
the year 2011
Sundry debtors were 890 in the total liabilities in the year 2010 it is increased to 978
in the year 2011
8102019 A Study A Study On Financial Performance Analysis With Reference To Kesoram Cementon Financial Performance hellip
httpslidepdfcomreaderfulla-study-a-study-on-financial-performance-analysis-with-reference-to-kesoram 6081
60
Common Size Balance Sheet of Kesoram for the Year 2011-2012
983080Rupees in crores)
Particulars 2011 Change Percentage 2012
Change
Percentage
Liabilities
Share Capital 4574 071 4574 063
Reserves amp Surplus 125162 1939 86657 1199
Revaluation Reserves 289 004 270 004
Loans
Secured Loans 237183 3675 317792 4397
Un Secured Loans 162744 2522 92742 1283
Deferred Tax Liabilities 000 000 000 000
Current Liabilities
Provisions 1494 023 40726 563
Current Liabilities 113902 1765 180010 2491
Total 645348 10000 722771 10000
Assets
Net Block 369172 5721 358721 4963
Capital WIP 43781 678 68065 942
Investments 6582 102 6636 092
Current Assets
Inventories 111855 1733 99516 1377
Sundry Debtors 63134 978 67358 932
Cash amp Bank Balances 7188 111 6959 096
Loans amp Advances 43460 673 115409 1597
Fixed Deposits 176 003 107 001
Total 645348 10000 722771 10000
8102019 A Study A Study On Financial Performance Analysis With Reference To Kesoram Cementon Financial Performance hellip
httpslidepdfcomreaderfulla-study-a-study-on-financial-performance-analysis-with-reference-to-kesoram 6181
61
Interpretation of common size balance sheet of 2011-2012
Share capital was recorded 071 percent in the total liabilities in the year 2011 it is
decreased to 063 in the year 2012
Reserves amp surplus contributed to 1939 in the total liabilities in the year 2011 it
is decreased to 1199 in the year 2012
Secured loans were 3675 in the total liabilities in the year 2011 it is increased to
4397 in the year 2012
Current Liabilities shown to 1765 in the total liabilities in the year 2011 it is
increased to 2491 in the year 2012
Provisions 023 in the total liabilities in the year 2011 it is increased to 563 in the
year 2012
Fixed Assets were 5721 in the total liabilities in the year 2011 ie decreased to
4963 in the year 2012
Investments were 102 in the total liabilities in the year 2011 it increased to 092
in the year 2012
Sundry debtors were 978 in the total liabilities in the year 2011 it is decreased to
932 in the year 2012
8102019 A Study A Study On Financial Performance Analysis With Reference To Kesoram Cementon Financial Performance hellip
httpslidepdfcomreaderfulla-study-a-study-on-financial-performance-analysis-with-reference-to-kesoram 6281
Trend Analysis
Share Capital-
Year
Amount
(In Crores) Trend
IncreaseDecrease
Base Year Previous Year
2008 4574 10000 000 000
2009 4574 10000 000 000
2010 4574 10000 000 000
2011 4574 10000 000 000
2012 4574 10000 000 000
Trend Percentages in Share Capital
Share capital shown a constant trend in the period 2008 and 2012
Share capital is 4574 crores all the years from 2008-2012
8102019 A Study A Study On Financial Performance Analysis With Reference To Kesoram Cementon Financial Performance hellip
httpslidepdfcomreaderfulla-study-a-study-on-financial-performance-analysis-with-reference-to-kesoram 6381
Reserves amp Surplus-
Year
Amount
(In Crores) Trend
IncreaseDecrease
Base Year Previous Year
2008 93085 10000 000 000
2009 128024 13753 3753 3753
2010 149111 16019 6019 2266
2011 125162 13446 3446 -2573
2012 86657 9309 -691 -4137
Trend Percentages in Reserves amp Surplus
Reserves amp surplus shown an increasing trend in the period between 2008 and 2010
The average trend was 13277 till 2010
The Reserves amp surplus was showing decreasing trend in the period 2011-2012 (ie
from 16019 in 2010 to 9309 in 2012)
The decreasing trend in Reserves amp surplus indicates the decrease in profits of the
firm
8102019 A Study A Study On Financial Performance Analysis With Reference To Kesoram Cementon Financial Performance hellip
httpslidepdfcomreaderfulla-study-a-study-on-financial-performance-analysis-with-reference-to-kesoram 6481
Investments-
Year
Amount
(In Crores) Trend
IncreaseDecrease
Base Year Previous Year
2008 4783 10000 000 000
2009 6178 12917 2917 2917
2010 5143 10753 753 -2164
2011 6582 13761 3761 3009
2012 6636 13874 3874 113
Trend Percentages in Investments-
The investments are shown an increasing trend in the period between 2008 ndash 2009
and it is decreasing in the year 2010
The average trend was 11458 till 2009
The investments increased in the periods 2011-2012 (ie from 10753 in 2010 to
13874 in 2012)
The overall trend in investments shown is satisfactory
8102019 A Study A Study On Financial Performance Analysis With Reference To Kesoram Cementon Financial Performance hellip
httpslidepdfcomreaderfulla-study-a-study-on-financial-performance-analysis-with-reference-to-kesoram 6581
Net Current Assets-
Year
Amount
(In Crores) Trend
IncreaseDecrease
Base Year Previous Year
2008 30761 10000 000 000
2009 56954 18515 8515 8515
2010 77037 25044 15044 6529
2011 110417 35895 25895 10851
2012 68613 22305 12305 -13590
Trends in Net Current Assets-
The NCA shown positive (increasing) trend
The NCA are increased to 35895 (the year 2011) compared with base year and
decreased in the year 2012 to 22305
The NCA shown increased trend from year and crossed 100
The overall trend was good
8102019 A Study A Study On Financial Performance Analysis With Reference To Kesoram Cementon Financial Performance hellip
httpslidepdfcomreaderfulla-study-a-study-on-financial-performance-analysis-with-reference-to-kesoram 6681
66
Ratio Analysis-
Current Ratio-
Current Ratio = Current Assets Current Liabilities
Current assets are cash in hand Cash at bank Marketable Securities(short term) short term
Investment Bills receivables sundry debtors Inventories (stock) Work in progress prepaid
expenses Current Liabilities are outstanding expenses Bills payable sundry Creditors
short-term advances income tax payable and Dividend payable
Current Ratio of Kesoram-
(Rupees in crores)
Year Current Assets Current Liabilities Current Ratio
2007-08 75560 57067 132
2008-09 102580 66587 154
2009-10 153922 107688 143
2010-11 182177 113902 160
2011-12 173833 180010 097
Interpretation-
As per the standard rule of current ratio ie 21 where current assets double the current
liabilities is considered satisfactory
In the present analysis the current ratio of the Kesoram is not satisfactory
from the above table It was assessed that the current ratio for all the five year is lower (less)
than the standard rule ie 21 And it is 097 in the year 2011-2012 (current year) This is
highly UN satisfactory
8102019 A Study A Study On Financial Performance Analysis With Reference To Kesoram Cementon Financial Performance hellip
httpslidepdfcomreaderfulla-study-a-study-on-financial-performance-analysis-with-reference-to-kesoram 6781
Quick Ratio-
Quick ratio also known as acid-test ratio establishes a relationship between quick
assets and the current liabilities Cash is the most liquid asset It is calculated by dividing
quick assets by current liabilities
Quick ratio = Quick Assets Current Liabilities
(Quick Assets = Current assets ndash Inventory)
Quick Ratio of Kesoram-
Rupees in crores)
Year Total QuickAssets
Current Liabilities Quick Ratio
2007-08 33343 57067 058
2008-09 43674 66587 066
2009-10 62303 107688 058
2010-11 70322 113902 0622011-12 74333 180010 041
Interpretation-
Usually a high Quick ratio is an indication that the company is liquid and has the ability to
meet its current or liquid liabilities in time on the other hand a low Quick Ratio represents
8102019 A Study A Study On Financial Performance Analysis With Reference To Kesoram Cementon Financial Performance hellip
httpslidepdfcomreaderfulla-study-a-study-on-financial-performance-analysis-with-reference-to-kesoram 6881
that the companyrsquos liquidity position is not good The above table showing the quick ratios
of Kesoram are canrsquot be considered satisfactory
Leverage Ratios-
Debt-Equity Ratio-
Debt-Equity Ratio = Total Long Term Debt Equity Share Holders Fund
Total Long term Debt= Debenture Capital + Long term loans from banks and financial
institutions + Public deposits
Equity Share Holders fund = Equity + Reserves and Surplus
Debt Equity Ratio of Kesoram
(Rupees in crores)
Year Total Debt Share Holders Fund Debt Equity Ratio
2007-08 109235 98192 111
2008-09 197043 133010 148
2009-10 312622 154024 203
2010-11 399927 130025 308
2011-12 410534 91501 449
8102019 A Study A Study On Financial Performance Analysis With Reference To Kesoram Cementon Financial Performance hellip
httpslidepdfcomreaderfulla-study-a-study-on-financial-performance-analysis-with-reference-to-kesoram 6981
Interpretation-
The Debt-Equity Ratio accepted standard is 05 This ratio reflects the relative contribution
of creditors and owners of business in its financing From the above it is clear that the long
term debt is more than that of the share holdersrsquo fund So we can interpret that the firmrsquosassets are financed more by the external funds rather than by the internal funds
8102019 A Study A Study On Financial Performance Analysis With Reference To Kesoram Cementon Financial Performance hellip
httpslidepdfcomreaderfulla-study-a-study-on-financial-performance-analysis-with-reference-to-kesoram 7081
Fixed Asset Ratio-
Net Sales
Fixed Asset Ratio = helliphelliphelliphelliphelliphelliphelliphelliphelliphelliphellip
Net Assets
Fixed Asset Ratio of Kesoram-
(Rupees in crores)
Year Net Sales Net Assets Fixed Assets Ratio
2007-08 300271 358721 084
2008-09 389797 369172 106
2009-10 475062 343182 1382010-11 539788 180435 299
2011-12 59182 108424 546
Interpretation
This ratio indicates the extent to which the assets of the companyrsquos can be lost without
affecting the interest of the creditors of the company Higher the ratios better the long-term
position of the companyThe above table shows fixed assets ratio in increasing trend Which is good for the
company
8102019 A Study A Study On Financial Performance Analysis With Reference To Kesoram Cementon Financial Performance hellip
httpslidepdfcomreaderfulla-study-a-study-on-financial-performance-analysis-with-reference-to-kesoram 7181
Overall Profitability Ratios-
Net Profit Ratio
Net Profit Ratio indicates net margin on sales It is given by the following equation
Net Profit Ratio = (Net Profit Sales) 100
Net Profit Ratio of Kesoram
(Rupees in crores)
Year Net Profit Sales Net Profit Ratio
2007-08 37917 300271 1263
2008-09 41432 389797 1063
2009-10 20298 475062 427
2010-11 -28176 539788 -5222011-12 -38108 59182 -644
Interpretation
It establishes a relationship between net profits after tax and net sales and
indicates the efficiency of the management in manufacturing selling administrative and
other activities of the company
The higher the ratio the better is the profitability or performance of the business
The above table depicts the net profit Ratio of Kesoram has decreased every year from
2007-2008 to 2011-2012It further decreased to negative in the year 2010-11 to -522 and -
644 in the year 2011-2012 This shows constant decrease in the profits of the company
8102019 A Study A Study On Financial Performance Analysis With Reference To Kesoram Cementon Financial Performance hellip
httpslidepdfcomreaderfulla-study-a-study-on-financial-performance-analysis-with-reference-to-kesoram 7281
72
Return on Investment-
Net Profit
Return on Investment = helliphelliphelliphelliphelliphelliphelliphelliphelliphelliphelliphellip X 100
Share Holders Fund
Return on Investment Ratio of Kesoram-
(Rupees in crores)
Year Net Profit Share Holders Fund Return On Investment
2007-08 37917 98192 3862
2008-09 41432 133010 3115
2009-10 20298 154024 1318
2010-11 -28176 130025 -2167
2011-12 -38108 91501 -4165
Interpretation-
The above table reveals how well the resources of the firm are being used Higher
the ratio better the result The above ratio implies how well the firm is growing in
terms of profitability and efficiency From the above table we can concern that the return on
investment is in decreasing trend ROI is highest in the year 2007-2008 as 3862 But
there after itrsquos decreased every year
The ROI is negative in the years 2010-2011 amp 2011-2012 as -2167 amp -4165 respectively
Which is not a good sign for the firm
8102019 A Study A Study On Financial Performance Analysis With Reference To Kesoram Cementon Financial Performance hellip
httpslidepdfcomreaderfulla-study-a-study-on-financial-performance-analysis-with-reference-to-kesoram 7381
8102019 A Study A Study On Financial Performance Analysis With Reference To Kesoram Cementon Financial Performance hellip
httpslidepdfcomreaderfulla-study-a-study-on-financial-performance-analysis-with-reference-to-kesoram 7481
8102019 A Study A Study On Financial Performance Analysis With Reference To Kesoram Cementon Financial Performance hellip
httpslidepdfcomreaderfulla-study-a-study-on-financial-performance-analysis-with-reference-to-kesoram 7581
75
CHAPTER V
FINDINGS amp SUGGESTIONS
8102019 A Study A Study On Financial Performance Analysis With Reference To Kesoram Cementon Financial Performance hellip
httpslidepdfcomreaderfulla-study-a-study-on-financial-performance-analysis-with-reference-to-kesoram 7681
76
Findings
The Share capital remains constant Share capital is unchanged all the years from
2008-2012
Reserves amp surplus were recorded an increasing trend in the period between 2008
and 2010It is showing decreasing trend in the period 2011-2012 (ie from 16019
in 2010 to 9309 in 2012)
Current Liabilities were increased compared to base year ie 2008
Provisions increased to 262597 ie in Rupees 39232 crores in the current year
The current ratio for all the five year is lower (less) than the standard rule ie 21
And it is 097 in the year 2011-2012 (current year)
The Debt-Equity Ratio was shown under the standard ratio It is clear that the long
term debt is more than that of the share holdersrsquo fund It indicates that the firm
heavily relying on external funds rather than the internal funds
The operating and net profit of Kesoram is in decreasing trend due to heavy
increase of manufacturing amp administrative expenses
ROI is highest in the year 2007-2008 as 3862 The ROI is negative in the years
2010-2011 amp 2011-2012 as -2167 amp -4165 respectively
Return on Equity Capital Employed Ratio of Kesoram has decreased every year
from 2007-2008 to 2010-2011It further decreased to negative in the year 2011-12 to
-3280
EPS of Kesoram has decreased every year from 2008-12It is negative in the year
2011 amp 12
8102019 A Study A Study On Financial Performance Analysis With Reference To Kesoram Cementon Financial Performance hellip
httpslidepdfcomreaderfulla-study-a-study-on-financial-performance-analysis-with-reference-to-kesoram 7781
77
Suggestion
The organization should adopt an appropriate capital structure
The companyrsquos debt-equity ratio is recorded more or less as 111 in the year 2008
and it is increased to 449 in the year 2012 (current year)The company should
adopt a better debt equity mix in the future to control the fluctuations in returns
The company should control fluctuations in cash and bank balances as it impacts the
current ratio of the company
The provisions are showing increasing trend which indicates risk of debtors The
firm should implement an effective credit management policy It should utilize its
idle funds by decreasing provisions
The company should control heavy increase of manufacturing amp administration
expenses as it is impacting the operating and net profit of company
8102019 A Study A Study On Financial Performance Analysis With Reference To Kesoram Cementon Financial Performance hellip
httpslidepdfcomreaderfulla-study-a-study-on-financial-performance-analysis-with-reference-to-kesoram 7881
78
ANNEXURE
Profit And Loss Account of Kesoram Cement
Mar12 Mar11 Mar10 Mar09 Mar08
12 Months 12 Months 12 Months 12 Months 12 Months
INCOME
Sales Turnover 628260 575072 505151 431613 345700
Excise Duty 36440 35284 30089 41815 45429
NET SALES 591820 539788 475062 389797 300271
Other Income 000 000 000 000 000
TOTALINCOME
596129 548733 481019 393969 302020
EXPENDITURE
Manufacturing
Expenses81903 74803 13974 13153 44113
MaterialConsumed
370897 310150 295550 229359 118448
Personal
Expenses33468 27355 23294 18690 15344
Selling Expenses 81910 78253 58667 48846 45019
AdministrativeExpenses
28225 29308 17219 16179 9907
Expenses
Capitalized000 000 000 000 000
Provisions Made 000 000 000 000 000
TOTAL
EXPENDITURE 596403 519870 408704 326227 232832Operating Profit -4583 19918 66358 63570 67439
EBITDA -274 28864 72316 67742 69188
Depreciation 29740 27259 17280 11186 8927
Other Write-offs 000 000 000 000 000
EBIT -30014 1605 55035 56557 60261
Interest 41015 23983 10921 12087 5426
EBT -71029 -22377 44114 44470 54835
Taxes -32921 5798 23816 3037 16918
Profit and Loss
for the Year-38108 -28176 20298 41432 37917
Non RecurringItems
-1142 7063 3228 -4023 402
Other Non Cash
Adjustments1276 091 207 465 017
OtherAdjustments
000 000 000 000 000
REPORTED
PAT-37974 -21021 23734 37874 38335
8102019 A Study A Study On Financial Performance Analysis With Reference To Kesoram Cementon Financial Performance hellip
httpslidepdfcomreaderfulla-study-a-study-on-financial-performance-analysis-with-reference-to-kesoram 7981
79
Balance Sheet Of Kesoram
Years
Particulars 2008 2009 2010 2011 2012
Liabilities
Share Capital 4574 4574 4574 4574 4574Reserves amp Surplus 93085 128024 149111 125162 86657
Revaluation Reserves 533 412 339 289 27
Loans
Secured Loans 97106 153627 186372 237183 317792
Un Secured Loans 12129 43416 12625 162744 92742
Deferred Tax Liabilities 0 0 0 0 0
Current Liabilities
Provisions 33039 34529 35734 1494 40726
Current Liabilities 57067 66587 107688 113902 18001
Total 297533 431169 610068 645348 722771
Assets
Net Block 108424 180435 343182 369172 358721
Capital WIP 63459 86485 41283 43781 68065
Investments 4783 6178 5143 6582 6636
Current Assets
Inventories 44217 58906 91619 111855 99516
Sundry Debtors 27307 38017 54289 63134 67358
Cash amp Bank Balances 4036 5657 8014 7188 6959
Total Current Assets 7556 10258 153922 182177 173833Loans amp Advances 45289 55462 66506 4346 115409
Fixed Deposits 018 028 031 176 107
Total 297533 431169 610068 645348 722771
8102019 A Study A Study On Financial Performance Analysis With Reference To Kesoram Cementon Financial Performance hellip
httpslidepdfcomreaderfulla-study-a-study-on-financial-performance-analysis-with-reference-to-kesoram 8081
80
KEY ITEMS 2012 2011 2010 2009 2008
Preference
Dividend 0 0 0 0 0
Equity Dividend 457 2516 2516 2516 2516
Equity Dividend
() 999 55 55 55 55
Shares in Issue(Lakhs) 45743 45743 45743 45743 45743
EPS - Annualised
(Rs) -8302 -4595 5188 828 838
8102019 A Study A Study On Financial Performance Analysis With Reference To Kesoram Cementon Financial Performance hellip
httpslidepdfcomreaderfulla-study-a-study-on-financial-performance-analysis-with-reference-to-kesoram 8181
BIBLIOGRAPHY
Sl
No
Books Author Name
1 Financial Management Khan amp JAIN
2 Financial Management IMPandey
3 Management Accounting RPTrivedi
Websites amp Search Engines
1 wwwkesoramcom983086
2 wwwmoneycontrolcom
3 wwwgooglefinancecom983086
Annual reports of Kesoram cement limited 2008-2012
8102019 A Study A Study On Financial Performance Analysis With Reference To Kesoram Cementon Financial Performance hellip
httpslidepdfcomreaderfulla-study-a-study-on-financial-performance-analysis-with-reference-to-kesoram 681
6
INDEX
SNo Contents Page No
Chapter-1 1-8
Introduction
Need of the Study
Objectives of the Study
Methodology of the Study
Limitations of the Study
Chapter-2 9-28
Industry Profile
Company Profile
Chapter-3 29-38
Review of Literature
Chapter-4 39-68
Data Analysis And Interpretation
Chapter-5 69-71
Findings
Suggestions
Chapter-6 72-75
Annexure
Bibliography
8102019 A Study A Study On Financial Performance Analysis With Reference To Kesoram Cementon Financial Performance hellip
httpslidepdfcomreaderfulla-study-a-study-on-financial-performance-analysis-with-reference-to-kesoram 781
7
CHAPTER-I
INTRODUCTION
8102019 A Study A Study On Financial Performance Analysis With Reference To Kesoram Cementon Financial Performance hellip
httpslidepdfcomreaderfulla-study-a-study-on-financial-performance-analysis-with-reference-to-kesoram 881
8
Introduction-
The term lsquofinancial performance analysis also known as analysis and interpretation
of financial statementsrsquo refers to the process of determining financial strength and
weaknesses of the firm by establishing strategic relationship between the items of the
balance sheet profit and loss account and other operative data
ldquoFinancial performance analysis is a process of evaluating the relationship between
component parts of a financial statement to obtain a better understanding of a firmrsquos
position and performance
The purpose of financial analysis is to diagnose the information contained in
financial statements so as to judge the profitability and financial soundness of the firm Just
like a doctor examines his patient by recording his body temperature blood pressure etc
Before making his conclusion regarding the illness and before giving his treatment A
financial analyst analyses the financial statements with various tools of analysis before
commenting upon the financial health or weaknesses of an enterprise
The analysis and interpretation of financial statements is essential to bring out the
mystery behind the figures in financial statements Financial statements analysis is an
attempt to determine the significance and meaning of the financial statement data so that
forecast may be made of the future earnings ability to pay interest and debt maturities (both
current and long term) and profitability of a sound divided policy
Financial performance refers to the act of performing financial activity In broader sense
financial performance refers to the degree to which financial objectives being or has been
accomplished It is the process of measuring the results of a firms policies and operations in
monetary terms It is used to measure firms overall financial health over a given period oftime and can also be used to compare similar firms across the same industry or to compare
industries or sectors in aggregation
In short the firm itself as well as various interested groups such as managers
shareholders creditors tax authorities and others seeks answers to the
Following important questions
8102019 A Study A Study On Financial Performance Analysis With Reference To Kesoram Cementon Financial Performance hellip
httpslidepdfcomreaderfulla-study-a-study-on-financial-performance-analysis-with-reference-to-kesoram 981
9
1 What is the financial position of the firm at a given point of time
2 How is the financial performance of the firm over a given period
Of time
These questions can be answered with the help of financial analysis of a firm Financial
analysis involves the use of financial statements A financial statement is an organized
collection of data according to logical and conceptual framework 50 consistent accounting
procedures Its purpose is to convey an understanding of some financial aspects of a
business firm It may show a position at a moment of time as in the case of a balance sheet
or may reveal a series of activities over a given period of time as in the case of an income
statement
Thus the term lsquofinancial statementsrsquo generally refers to two basic statements
The balance sheet and the income statement
The balance sheet shows the financial position (condition) of the firm at a given point of
time It provides a snapshot and may be regarded as a static picture
ldquoBalance sheet is a summary of a firmrsquos financial position on a given date that
Shows total assets = total liabilities + ownerrsquos equityrdquo
The income statement (referred to in India as the profit and loss statement) reflects the
performance of the firm over a period of time
ldquoIncome statement is a summary of a firmrsquos revenues and expenses over a specified period
ending with net income or loss for the periodrdquo
However financial statements do not reveal all the information related to the financial
operations of a firm but they furnish some extremely useful information which highlights
two important factors profitability and financial soundness Thus analysis of financial
statements is an important aid to financial performance analysis Financial performance
analysis includes analysis and interpretation of financial statements in such a way that it
Undertakes full diagnosis of the profitability and financial soundness of the business
ldquoThe analysis of financial statements is a process of evaluating the relationship between
component parts of financial statements to obtain a better understanding of the firmrsquos
position and performancerdquo
8102019 A Study A Study On Financial Performance Analysis With Reference To Kesoram Cementon Financial Performance hellip
httpslidepdfcomreaderfulla-study-a-study-on-financial-performance-analysis-with-reference-to-kesoram 1081
10
Need for Study
Need Of Financial Management Study To Diagnose The Information Contain In
Financial Statement So as To Judge the Profitability and Financial Position of the
Firm
Financial Analyst Analyses The Financial Statements With Various Tools Of
Analysis Before Commanding Upon The Financial Health Of The Firm
Essential to Bring Out the History
Significance and Meaning of the Financial Statements
8102019 A Study A Study On Financial Performance Analysis With Reference To Kesoram Cementon Financial Performance hellip
httpslidepdfcomreaderfulla-study-a-study-on-financial-performance-analysis-with-reference-to-kesoram 1181
11
Objectives
1 To understand the financial statements of Kesoram cement
2 To study the change in assets and liabilities of the company
3 To study the liquidity position of the firm
4 To study the financial health of the company using ratio analysis
5 To study the profitability of the company
6 To offer suggestions to the company
8102019 A Study A Study On Financial Performance Analysis With Reference To Kesoram Cementon Financial Performance hellip
httpslidepdfcomreaderfulla-study-a-study-on-financial-performance-analysis-with-reference-to-kesoram 1281
12
Significance of Financial Performance Analysis
Interest of various related groups is affected by the financial performance of a firm
Therefore these groups analyze the financial performance of the firm The type of analysis
varies according to the specific interest of the party involved
Trade creditors interested in the liquidity of the firm (appraisal of firmrsquos liquidity)
Bond holders interested in the cash-flow ability of the firm (appraisal of firmrsquos capital
structure the major sources and uses of funds profitability over time and projection of
future profitability)
Investors interested in present and expected future earnings as well as stability of these
earnings (appraisal of firmrsquos profitability and financial condition)
Management interested in internal control better financial condition and betterperformance (appraisal of firmrsquos present financial condition evaluation of opportunities in
relation to this current position return on investment provided by various assets of the
company etc)
Research Methodology
Research Design
This is a systematic way to solve the research problem and it is important
component for the study without which researches may not be able to obtain the format A
research design is the arrangement of conditions for collection and analysis of data in a
manager that aims to combine for collection and analysis of data relevance to the research
purpose with economy in procedure
Meaning of Research Design
The formidable problem that follows the task of defining the research problem is the
preparation of design of the research project popularly known as the research design
decision regarding what where when how much by what means concerning an inquiry of
a research study constitute a research design A research design is the arrangement of
conditions for collection and analysis of data in a manager that aims to combine for
collection and analysis of data relevance to the research purpose with economy in
procedure
8102019 A Study A Study On Financial Performance Analysis With Reference To Kesoram Cementon Financial Performance hellip
httpslidepdfcomreaderfulla-study-a-study-on-financial-performance-analysis-with-reference-to-kesoram 1381
13
Sources of Data
Data we collected based on two sources
Primary Data
Secondary Data
Primary Data
The Primary Data Are Those Informationrsquos which are Collected afresh and for the
First Time And Thus Happen to Be Original in Character
Secondary Data
The secondary data are those which have already been collected by some other agency and
which have already been processed The sources of secondary data are annual reports
browsing internet through magazines
1 It includes data gathered from the annual reports of Kesoram
2 Articles are collected from official website of Kesoram
Methodology Used
Types Of Financial Statements Adopted
Following Two Types of Financial Statements Are Commonly Used in
Analyzing the Firmrsquos Financial Position
a Balance Sheet
b Income Statements
8102019 A Study A Study On Financial Performance Analysis With Reference To Kesoram Cementon Financial Performance hellip
httpslidepdfcomreaderfulla-study-a-study-on-financial-performance-analysis-with-reference-to-kesoram 1481
14
Limitations of Financial Statement
Each Project Gives Rise to Its Own Unique Risks And Hence Possess Its Own Unique
Challenges
1 Only Interim Reports
Only interim statements donrsquot give a final picture of the concern The data given in
these statements is only approximate The actual position can only be determined when the
business is sold or liquidated
2 Donrsquot Give Extra Position
The Financial Statements Are Expressed In Monetary Values So They Appear To
Give Final And Accurate Position The Values Of Fixed Assets In The Balance Sheet
Neither Represent The Value For Which Fixed Assets Can Be Sold Nor The Amount Which
Will Be Required To Replace These Assets
3 Historical Costs
The Financial Statements Are Prepared On The Basis Of Historical Costs Or
Original Costs The Value of Assets Decreases with the Passage of Time Current Price
Changes Are Not Taken Into Account The Statements Are Not Prepared Keeping In View
The Present Economic Conditions The Balance Sheet Loses The Significance Of Being An
Index Of Current Economic Realities
4 Act of non monitory factors Ignored
There are certain factors which have a bearing on the financial position and
operating results of the business but they donrsquot become a part of these statements because
they canrsquot be measured in monetary terms Such factors may include in the reputation of the
management
No Precision
The precision of financial statement data is not possible because the statements deal with
matters which canrsquot be precisely stated The data are recorded by conventional procedures
followed over the years Various conventions postulates personal judgments etc
8102019 A Study A Study On Financial Performance Analysis With Reference To Kesoram Cementon Financial Performance hellip
httpslidepdfcomreaderfulla-study-a-study-on-financial-performance-analysis-with-reference-to-kesoram 1581
15
CHAPTER-II
INDUSTRY PROFILE
amp
COMPANY PROFILE
8102019 A Study A Study On Financial Performance Analysis With Reference To Kesoram Cementon Financial Performance hellip
httpslidepdfcomreaderfulla-study-a-study-on-financial-performance-analysis-with-reference-to-kesoram 1681
16
Industry Profile
In the most general sense of the word cement is a binder a substance which
sets and hardens independently and can bind other materials together The word cement
traces to the Romans who used the term opus caementicium to describe masonry whichresembled concrete and was made from crushed rock with burnt lime as binder The
volcanic ash and pulverized brick additives which were added to the burnt lime to obtain a
hydraulic binder were later referred to as cementum and cement Cements used in
construction are characterized as hydraulic or non-hydraulic
The most important use of cement is the production of mortar and concretemdashthe bonding of
natural or artificial aggregates to form a strong building material which is durable in the
face of normal environmental effects
Concrete should not be confused with cement because the term cement refers only to the dry
powder substance used to bind the aggregate materials of concrete Upon the addition of
water andor additives the cement mixture is referred to as concrete especially if aggregates
have been added
It is uncertain where it was first discovered that a combination of hydrated non-hydraulic
lime and a pozzolan produces a hydraulic mixture (see also Pozzolanic reaction) but
concrete made from such mixtures was first used on a large scale by engineers They used
both natural pozzolans (trass or pumice) and artificial pozzolans (ground brick or pottery) in
these concretes Many excellent examples of structures made from these concretes are still
standing notably the huge monolithic dome of the Pantheon in Rome and the massive Baths
of Caracalla The vast system of Roman aqueducts also made extensive use of hydraulic
cement The use of structural concrete disappeared in medieval Europe although weak
pozzolanic concretes continued to be used as a core fill in stone walls and columns
Modern cement
Modern hydraulic cements began to be developed from the start of the Industrial Revolution
(around 1800) driven by three main needs
Hydraulic renders for finishing brick buildings in wet climates
Hydraulic mortars for masonry construction of harbor works etc in contact with sea water
Development of strong concretes
In Britain particularly good quality building stone became ever more expensive during a
period of rapid growth and it became a common practice to construct prestige buildings
8102019 A Study A Study On Financial Performance Analysis With Reference To Kesoram Cementon Financial Performance hellip
httpslidepdfcomreaderfulla-study-a-study-on-financial-performance-analysis-with-reference-to-kesoram 1781
17
from the new industrial bricks and to finish them with a stucco to imitate stone Hydraulic
limes were favored for this but the need for a fast set time encouraged the development of
new cements Most famous was Parkers Roman cement This was developed by James
Parker in the 1780s and finally patented in 1796 It was in fact nothing like any material
used by the Romans but was ldquoNatural cement made by burning septaria - nodules that are
found in certain clay deposits and that contain both clay minerals and calcium carbonate
The burnt nodules were ground to a fine powder This product made into a mortar with
sand set in 5ndash15 minutes The success of Roman Cement led other manufacturers to
develop rival products by burning artificial mixtures of clay and chalk
John Smeaton made an important contribution to the development of cements when he was
planning the construction of the third Eddystone Lighthouse (1755-9) in the English
Channel He needed a hydraulic mortar that would set and develop some strength in the
twelve hour period between successive high tides He performed an exhaustive market
research on the available hydraulic limes visiting their production sites and noted that the
hydraulicity of the lime was directly related to the clay content of the limestone from
which it was made Smeaton was a civil engineer by profession and took the idea no
further Apparently unaware of Smeatons work the same principle was identified by Louis
Vicat in the first decade of the nineteenth century Vicat went on to devise a method of
combining chalk and clay into an intimate mixture and burning this produced an artificial
cement in 1817 James Frost working in Britain produced what he called British cement
in a similar manner around the same time but did not obtain a patent until 1822 In 1824
Joseph Aspdin patented a similar material which he called Portland cement because the
render made from it was in color similar to the prestigious Portland stone
All the above products could not compete with limepozzolan concretes because of fast-
setting (giving insufficient time for placement) and low early strengths (requiring a delay of
many weeks before formwork could be removed) Hydraulic limes natural cements and
artificial cements all rely upon their belite content for strength development Belite
develops strength slowly Because they were burned at temperatures below 1250 degC they
contained no alite which is responsible for early strength in modern cements The first
cement to consistently contain alite was made by Joseph Aspdins son William in the early
1840s This was what we call today modern Portland cement Because of the air of
mystery with which William Aspdin surrounded his product others (eg Vicat and I C
Johnson) have claimed precedence in this invention but recent analysis of both his concrete
8102019 A Study A Study On Financial Performance Analysis With Reference To Kesoram Cementon Financial Performance hellip
httpslidepdfcomreaderfulla-study-a-study-on-financial-performance-analysis-with-reference-to-kesoram 1881
18
and raw cement have shown that William Aspdins product made at North fleet Kent was a
true alite-based cement However Aspdins methods were rule-of-thumb Vicat is
responsible for establishing the chemical basis of these cements and Johnson established
the importance of sintering the mix in the kiln
William Aspdins innovation was counter-intuitive for manufacturers of artificial cements
because they required more lime in the mix (a problem for his father) because they required
a much higher kiln temperature (and therefore more fuel) and because the resulting clinker
was very hard and rapidly wore down the millstones which were the only available grinding
technology of the time Manufacturing costs were therefore considerably higher but the
product set reasonably slowly and developed strength quickly thus opening up a market for
use in concrete The use of concrete in construction grew rapidly from 1850 onwards and
was soon the dominant use for cements Thus Portland cement began its predominant role
It is made from water and sand
Types of modern cement
Portland cement
Cement is made by heating limestone (calcium carbonate) with small quantities of other
materials (such as clay) to 1450degC in a kiln in a process known as calcination whereby a
molecule of carbon dioxide is liberated from the calcium carbonate to form calcium oxide
or lime which is then blended with the other materials that have been included in the mix
The resulting hard substance called clinker is then ground with a small amount of gypsum
into a powder to make Ordinary Portland Cement the most commonly used type of cement
(often referred to as OPC)
Portland cement is a basic ingredient of concrete mortar and most non-speciality grout The
most common use for Portland cement is in the production of concrete Concrete is a
composite material consisting of aggregate (gravel and sand) cement and water As a
construction material concrete can be cast in almost any shape desired and once hardened
can become a structural (load bearing) element Portland cement may be gray or whitePortland cement blends
These are often available as inter-ground mixtures from cement manufacturers but similar
formulations are often also mixed from the ground components at the concrete mixing plant
Portland blast furnace cement contains up to 70 ground granulated blast furnace slag
with the rest Portland clinker and a little gypsum All compositions produce high ultimate
8102019 A Study A Study On Financial Performance Analysis With Reference To Kesoram Cementon Financial Performance hellip
httpslidepdfcomreaderfulla-study-a-study-on-financial-performance-analysis-with-reference-to-kesoram 1981
19
strength but as slag content is increased early strength is reduced while sulfate resistance
increases and heat evolution diminishes Used as an economic alternative to Portland
sulfate-resisting and low-heat cements
Portland fly ash cement contains up to 30 fly ash The fly ash is pozzolanic so that
ultimate strength is maintained Because fly ash addition allows lower concrete water
content early strength can also be maintained Where good quality cheap fly ash is
available this can be an economic alternative to ordinary Portland cement
Portland pozzolan cement includes fly ash cement since fly ash is a pozzolan but also
includes cements made from other natural or artificial pozzolans In countries where
volcanic ashes are available (eg Italy Chile Mexico and the Philippines) these cements
are often the most common form in use
Portland silica fume cement Addition of silica fume can yield exceptionally high
strengths and cements containing 5-20 silica fume are occasionally produced However
silica fume is more usually added to Portland cement at the concrete mixer
Masonry cements are used for preparing bricklaying mortars and stuccos and must not be
used in concrete They are usually complex proprietary formulations containing Portland
clinker and a number of other ingredients that may include limestone hydrated lime air
entrainers retarders water proofers and coloring agents They are formulated to yield
workable mortars that allow rapid and consistent masonry work Subtle variations of
Masonry cement in the US are Plastic Cements and Stucco Cements These are designed to
produce controlled bond with masonry blocks
Expansive cements contain in addition to Portland clinker expansive clinkers (usually
sulfoaluminate clinkers) and are designed to offset the effects of drying shrinkage that is
normally encountered with hydraulic cements This allows large floor slabs (up to 60 m
square) to be prepared without contraction joints
White blended cements may be made using white clinker and white supplementary
materials such as high-purity metakaolin
Colored cements are used for decorative purposes In some standards the addition of
pigments to produce colored Portland cement is allowed In other standards (eg ASTM)
pigments are not allowed constituents of Portland cement and colored cements are sold as
blended hydraulic cements
Very finely ground cements are made from mixtures of cement with sand or with slag or
other pozzolan type minerals which are extremely finely ground together Such cements can
8102019 A Study A Study On Financial Performance Analysis With Reference To Kesoram Cementon Financial Performance hellip
httpslidepdfcomreaderfulla-study-a-study-on-financial-performance-analysis-with-reference-to-kesoram 2081
have the same physical characteristics as normal cement but with 50 less cement
particularly due to their increased surface area for the chemical reaction Even with
intensive grinding they can use up to 50 less energy to fabricate than ordinary Portland
cements
Non-Portland hydraulic cements
Pozzolan-lime cements Mixtures of ground Pozzolan and lime are the cements used by the
Romans and are to be found in Roman structures still standing (eg the Pantheon in Rome)
They develop strength slowly but their ultimate strength can be very high The hydration
products that produce strength are essentially the same as those produced by Portland
cement
Slag-lime cements Ground granulated blast furnace slag is not hydraulic on its own but is
activated by addition of alkalis most economically using lime They are similar to
pozzolan lime cements in their properties Only granulated slag (ie water-quenched glassy
slag) is effective as a cement component
Super sulfated cements These contain about 80 ground granulated blast furnace slag
15 gypsum or anhydrite and a little Portland clinker or lime as an activator They produce
strength by formation of ettringite with strength growth similar to a slow Portland cement
They exhibit good resistance to aggressive agents including sulfate
Calcium aluminate cements are hydraulic cements made primarily from limestone and
bauxite The active ingredients are monocalcium aluminate CaAl2O4 (CaO middot Al2O3 or CA in
Cement chemist notation CCN) and mayenite Ca12Al14O33 (12 CaO middot 7 Al2O3 or C12A7 in
CCN) Strength forms by hydration to calcium aluminate hydrates They are well-adapted
for use in refractory (high-temperature resistant) concretes eg for furnace linings
Calcium sulfoaluminate cements are made from clinkers that include yeelimite (Ca4
(AlO2)6SO4 or C4A3 in Cement chemists notation) as a primary phase They are used in
expansive cements in ultra-high early strength cements and in low-energy cements
Hydration produces ettringite and specialized physical properties (such as expansion or
rapid reaction) are obtained by adjustment of the availability of calcium and sulfate ionsTheir use as a low-energy alternative to Portland cement has been pioneered in China
where several million tonnes per year are produced Energy requirements are lower because
of the lower kiln temperatures required for reaction and the lower amount of limestone
(which must be endothermically decarbonated) in the mix In addition the lower limestone
8102019 A Study A Study On Financial Performance Analysis With Reference To Kesoram Cementon Financial Performance hellip
httpslidepdfcomreaderfulla-study-a-study-on-financial-performance-analysis-with-reference-to-kesoram 2181
21
content and lower fuel consumption leads to a CO2 emission around half that associated
with Portland clinker However SO2 emissions are usually significantly higher
Natural Cements correspond to certain cements of the pre-Portland era produced by
burning argillaceous limestones at moderate temperatures The level of clay components in
the limestone (around 30-35) is such that large amounts of belite (the low-early strength
high-late strength mineral in Portland cement) are formed without the formation of
excessive amounts of free lime As with any natural material such cements have highly
variable properties
Geopolymer cements are made from mixtures of water-soluble alkali metal silicates and
aluminosilicate mineral powders such as fly ash and metakaolin
8102019 A Study A Study On Financial Performance Analysis With Reference To Kesoram Cementon Financial Performance hellip
httpslidepdfcomreaderfulla-study-a-study-on-financial-performance-analysis-with-reference-to-kesoram 2281
22
COMPANY PROFILE
8102019 A Study A Study On Financial Performance Analysis With Reference To Kesoram Cementon Financial Performance hellip
httpslidepdfcomreaderfulla-study-a-study-on-financial-performance-analysis-with-reference-to-kesoram 2381
23
Kesoram Cement Industry is one of the leading manufacturers of cement in India It is a day
process cement Plant The plant capacity is 826 lakh tones per annum It is located at
Basanthnagar in Karimnagar district of Andhra Pradesh Basanthnagar is 8 km away from
the Ramagundam Railway station linking Madras to New Delhi The Chairman of the
Company is BKBirla
History
The first unit at Basanthnagar with a capacity of 21 lakh tones per annum
incorporating humble suspension preheated system was commissioner during the year 1969
The second unit was setup in year 1971 with a capacity of 21 lakh tones per annum went on
stream in the year 1978 The coal for this company is being supplied from Singgareni
Collieries and the power is obtained from APSEB The power demand for the factory is
about 21 MW Kesoram has got 2 DG sets of 4 MW each installed in the year 1987
Kesoram Cement has setup a 15 KW captor power plant to facilitate for
uninterrupted power supply for manufacturing of cement at 24th
august 1997 per hour 12
mw actual power is 15 mw
The Company was incorporated on 18th October 1919 under the Indian Companies Act
1913 in the name and style of Kesoram Cotton Mills Ltd It had a Textile Mill at 42
Garden Reach Road Calcutta 700 024 The name of the Company was changed to Kesoram
Industries amp Cotton Mills Ltd on 30th
August 1961 and the same was further changed to Kesoram Industries Limited on 9th July
1986 The said Textile Mill at Garden Reach Road was eventually demerged into a separate
company
The First Plant for manufacturing of rayon yarn was established at Tribeni District
Hooghly West Bengal and the same was commissioned in December 1959 and the second
plant was commissioned in the year 1962 enabling it to manufacture 4635 metric tons perannum (mtpa) of rayon yarn This Unit has 6500 metric tons per annum (mtpa) capacity as
on 3132009
The plant for manufacturing of transparent paper was also set up at the same location at
Tribeni District Hooghly West Bengal in June 1961 It has the annual capacity to
manufacture 3600 metric tons per annum (mtpa) of transparent Paper
8102019 A Study A Study On Financial Performance Analysis With Reference To Kesoram Cementon Financial Performance hellip
httpslidepdfcomreaderfulla-study-a-study-on-financial-performance-analysis-with-reference-to-kesoram 2481
24
The Company diversified into manufacturing of cast iron spun pipes and pipe fittings at
Bansberia District Hooghly West Bengal with a production capacity of 45000 metric tons
per annum (mtpa) of cast iron spun pipes and pipe fittings in December 1964
The Company subsequently diversified into the manufacturing of Cement and in 1969
established its first cement plant under the name Kesoram Cement at Basantnagar Dist
Karimnagar (Andhra Pradesh) and to take advantage of favorable market conditions in
1986 another cement plant known as Vasavadatta Cement was commissioned by it at
Sedam Dist
Gulbarga (Karnataka) The cement manufacturing capacities at both the plants were
augmented from time to time according to the market conditions and as on 3132009
Kesoram Cement and Vasavadatta Cement have annual cement manufacturing capacities of
15 million metric tons and 41 million metric tons respectively
The Company in March 1992 commissioned a plant at Balasore known as Birla Tyres in
Orissa for manufacturing of 10 lakh mtpa automotive tyres and tubes in the first phase in
collaboration with Pirelli Ltd UK a subsidiary company of the world famous Pirelli
Group of Italy - a pioneer in production and development of automotive tyres in the world
The capacity at the said plant was further augmented during the year by 19 MT per day
aggregating to 271 MT per day production facility The Greenfield Project of 257 MT per
day capacity in the State of Uttarakhand with a capex of about Rs760 crores commenced
the commercial production in phases during the financial year 2008-09The Company as on
3132009 had the manufacturing capacities of 371 million tyres 295 million tubes and
153 million flaps per annum in the Plants including at Uttarakhand Plant It has small
manufacturing capacities of various Chemicals at Kharda in the State of West Bengal also
It has the annual manufacturing capacities of 12410 mtpa of Caustic Soda Lye 5045 mtpa
of Liquid Chlorine 6205 mtpa of Sodium Hypochlorite 8200 mtpa of Hydrochloric Acid
3200 mtpa of Ferric Alum 18700 mtpa of Sulphuric Acid and 1620000 m3pa of purified
Hydrogen Gas
The Company is a well-diversified entity in the fields of Cement Tyre Rayon Yarn
Transparent Paper Spun Pipes and Heavy Chemicals with two core business segments ie
Cement and Tyres
8102019 A Study A Study On Financial Performance Analysis With Reference To Kesoram Cementon Financial Performance hellip
httpslidepdfcomreaderfulla-study-a-study-on-financial-performance-analysis-with-reference-to-kesoram 2581
25
In Spun Pipes amp Foundries a unit of the Company work suspended from 2nd May 2008
still commences till further notice
The Company as of now is listed on three major Stock Exchanges in India ie Bombay
Stock Exchange Ltd Mumbai Calcutta Stock Exchange Association Ltd Kolkata and
National Stock Exchange of India Ltd Mumbai and at the Societe de la Bourse de
Luxembourg Luxembourg
A further expansion upto 165 million tons of cement per annum in Vasavadatta Cement at
Sedam in Karnataka as unit IV at the same site is in progress with a 175 MW Captive
Power Plant involving a capital expenditure of about Rs 78350 crores (including the cost
of Captive Power Plant)
The commercial production of cement in the aforesaid unit IV has commenced in June
2009 The work for the further expansion in the Tyres Section at Uttarakhand for radial
tyres with 100 MT per day capacity and bias tyres with 125 MT per day capacity involving
an estimated aggregate capital outlay of about Rs 840 crores is under progress The Board
has further approved a Motor Cycle Tyre Project of 70 MT per day capacity at the same site
involving a capital outlay of Rs190 crore The civil construction of both the Projects is in
full swing The commercial production in both the Projects is likely to start by December
2009 January 2010
Birla Supreme in popular brand of Kesoram cement from its prestigious plant of
Basantnagar in AP which has outstanding track record In performance and productivity
serving the nation for the last two and half decades It has proved its distinction by bagging
several national awards It also has the distinction of achieving optimum capacity
utilization
Kesoram offers a choice of top quality portioned cement for light heavy
constructions and allied applications Quality is built every fact of the operations
The plant lay out is rational to begin with The limestone is rich in calcium
carbonate a key factor that influences the quality of final product The day process
technology uses in the latest computerized monitoring overseas the manufacturing process
Samples are sent regularly to the bureau of Indian standards National council of
construction and building material for certification of derived quality norms
8102019 A Study A Study On Financial Performance Analysis With Reference To Kesoram Cementon Financial Performance hellip
httpslidepdfcomreaderfulla-study-a-study-on-financial-performance-analysis-with-reference-to-kesoram 2681
26
The company has vigorously undertaking different promotional measures for
promoting their product through different media which includes the use of news papers
magazine hoarding etc
Kesoram cement industry distinguished itself among all the cement factories in
Indian by bagging the National Productivity Award consecutively for two years ie for the
year 1985-1987 The federation of Andhra Pradesh Chamber amp Commerce and Industries
(FAPCCI) also conferred on Kesoram Cement An award for the best industrial promotion
expansion efforts in the state for the year 1984 Kesoram also bagged FAPCCI awarded for
ldquoBest Family Planning Effort in the staterdquo for the year 1987-1988
One among the industrial giants in the country today serving the nation on the
industrial front Kesoram industry ltd has a checked and eventful history dating back to the
twenties when the Industrial House of Birlarsquos acquired it With only a textile mill under its
banner 1924 it grew from strength to strength and spread its activities to newer fields like
Rayon Transparent paper pipes Refractors tyres and other products
Looking to the wide gap between the demand and supply of vital commodity
cement which play in important role in National building activity the Government of India
had de-licensed the cement industry in the year 1966 with a review to attract private
entrepreneur to augment the cement production Kesoram rose to the occasions and divided
to set up a few cement plants in the country
Kesoram cement undertaking marketing activities extensively in the state of Andhra
Pradesh Karnataka Tamilnadu Kerala Maharashtra and Gujarat In AP sales Depts are
located in different areas like Karimnagar Warangal Nizamabad Vijayawada and Nellore
In other states it has opened around 10 depots
The market share of Kesoram Cement in AP is 705 The market share of the
company in various states is shown as under
STATES MARKET SHARE
Karnataka 409
Tamilnadu 094
Kerala 029
Maharashtra 281
8102019 A Study A Study On Financial Performance Analysis With Reference To Kesoram Cementon Financial Performance hellip
httpslidepdfcomreaderfulla-study-a-study-on-financial-performance-analysis-with-reference-to-kesoram 2781
27
Process and Quality Control
It has been the endeavor of Kesoram to incorporate the Worldrsquos latest technology in
the plant and today the plant has the most sophisticated
X-ray analysis
Fully computerized XRF and XRD X-RAY Analyzers keep a constant round the
clock vigil on quality
Supreme performance
One of the largest Cement Plants in Andhra Pradesh the plant incorporate the latest
technology in Cement - making
It is professionally managed and well established Cement Manufacturing Company
enjoying the confidence of the consumers Kesoram has outstanding track record in
performance and productivity with quite a few national and state awards to its credit
BIRLA SUPREME the 43 Grade Cement is a widely accepted and popular brand
in the market commanding a premium
However to meet the specific demands of the consumer Kesoram bought out the 53
grade BIRLA SUPREME ndash GOLD which has special qualities like higher fineness quick-
setting high compressive strength and durability
Supreme Strength
Kesoram Cement has huge captive Limestone Deposits which make it possible tofeed high- grade limestone consistently its natural Grey colour is anion- born ingredient
and gives good shade
Both the products offered by Kesoram ie BIRLA SUPREME-43 Grade and
BIRLA SUPREME-GOLD-53 Grade cement are outstanding with much higher
compressive strength and durability
The following characteristics show their distinctive qualities
Comprehensive
Strength
Opc 43
grls 8112
1989
Birla
Supreme 43
grade
Opc 43 gr
Is 1226987
Birla
Supreme
Gold 53 gr
3 days mpa Min 23 31 + Min 27 38+
7 days mpa Min 23 42+ Min 37 48+
28 days mpa Min 43 50+ Min 53 60+
8102019 A Study A Study On Financial Performance Analysis With Reference To Kesoram Cementon Financial Performance hellip
httpslidepdfcomreaderfulla-study-a-study-on-financial-performance-analysis-with-reference-to-kesoram 2881
28
DC SYSTEM
Clinker making process is a key step in the overall cement making process In the case of
BIRLA SUPREMEGOLD the clinker-making process is totally computer control The
Distributed Control System (DCS) constantly monitors the process and ensures operating
efficiency This eliminates variation and ensures consistency in the quality of Clinker
Physical Characteristics
Ope 43
Is 8 112-89
Birla
Supreme
43 grade
Ope 53 gr
Is 12269-87
Birla Supreme
Gold 53 gr
Setting time Min30 120-180 Min 30 130-170
a Initial (mats) Max 600 180-240 Max 600 170-220
b final (mats) Min 225 270-280 Min 225 300-320
Fincncssm 2Kg Max 10 10-20 Max 10 05-10
Soundness Max 08 004-008 Max 0080 004-02
a le-chart (mm)
b autoclave ()
Supreme Expertise
The Best Technical Team exclusive to Kesoram mans the Plant and monitors the process
to blend the cement in just the required proportions to make BIRLA SUPREMEGOLD OF
Rock Strength
18 Million Tones of Solid Foundation
Staying at the top for over a Quarter Century Quarter Century is no less an achievement
Infact Kesoram is synonymous with for over 28 years
Over the years Kesoram has dispatched 18 million tones of cement to the nook and cornersof the country and joined hands in strengthening the Nation No one else in Andhra Pradesh
has this distinction The prestigious World Bank aided Ramagundam Super Thermal Power
Project of NTPC and Mannair Dam of Pochampad project in AP arc a couple of projects for
which Kesoram Cement was exclusively uses to cite an example
8102019 A Study A Study On Financial Performance Analysis With Reference To Kesoram Cementon Financial Performance hellip
httpslidepdfcomreaderfulla-study-a-study-on-financial-performance-analysis-with-reference-to-kesoram 2981
29
Chemical Characteristics
Opc 43 gr
Is 81 132-989
Birla
Supreme
43 grade
Ope 53 gr
Is 12269-
87
Birla
Supreme
Gold 53 gr
Loss on inflection Max 5 lt16 Max 40 lt15
Insoluble residue Max 20 lt08 Max 20 lt 06
Magnesium oxide Max 60 lt 13 Max 60 lt 13
Lime saturation factor 066-102 08-09 08-102 088-09
Alumna iron ratio MinO66 15-17 MinO66 15-17
Sulfuric anhydride Max 253 16-20 Max 2 53 16-20
Alkalis Chlorides Max 005 Max 001 Max 005 Max 04
Kesoram Cement - advantages
Helps in designing sleeker and more elegant
Structures giving greater flexibility in design concept
Due to its fine quality super fine construction can be achieved Its gives maximum
strength at Minimum use of cement with water in the water cement ratio especially the 53
grade Birlas supreme-gold
Feathers in Kesorams cap
Kesoram has outstanding track record achieving over 100 capacity utilization I
productivity and energy conservation It has proved its distinction by bagging several
national and state awards noteworthy being
NATIONAL
1 National productivity award for 1985-86
2 National productivity award for 1986-87
3 National award for mines safety for 1985-86
4 National award for mines safety for 1986-875 National award for energy conservation 1989-90
8102019 A Study A Study On Financial Performance Analysis With Reference To Kesoram Cementon Financial Performance hellip
httpslidepdfcomreaderfulla-study-a-study-on-financial-performance-analysis-with-reference-to-kesoram 3081
30
STATE
1 AP State productivity award for 1988
2 State award for best industrial management 1988-89
3 Best industrial productivity award of FAPCCI (federation of AP chamber of
commerce and industry) 1991
4 Best management award of the state Govt 1993
5 FAPCCI award for the workers welfare 1995-96
ISO 9002
All quality systems of Kesoram have been certified under ISO 90021S 4002 which
proves the worldwide acceptance of the products
All quality systems in production and marketing of the product have been certified by BIS
under ISO 90021S 14002
The first unit was installed at basanthnagar with a capacity of 25 ndashlakhs TPA (tones per
annum) incorporating humble supervision preheated system during the year 1969
The second unit followed suit with added a capacity of 2 lakhs TPA in 1971
The plant was further expanded to 9 lakhs by adding 25 lakhs tones in august 1978 113
lakhs tones in January 1981 and 087 lakhs tones in September 1981
Power
Singareni collieries make the supply of coal for this industry and the power was
obtained from AP TRANSCO The power demand for the factory is about 21MW Kesoram
has got 2-diesel generator seats of 4 MW each installed in the year 1987
Kesoram cement now has a 15MWcaptive power plant to facilities for uninterrupted
power supply for manufacturing of cement
Performance
The performance of kersoram cement industry has been outstanding achieving over
cent percent capacity utilization all through despite many odds like power cuts and which
most 40 was wasted due to wagon shortage etc
The company being a continuous process industry works round the clock and has
excellent records of performance achieving over 1005 capacity utilization
Kesoram has always combined technical progress with industrial performance The
company had glorious track record for the last 27 years in the industry
Technology
8102019 A Study A Study On Financial Performance Analysis With Reference To Kesoram Cementon Financial Performance hellip
httpslidepdfcomreaderfulla-study-a-study-on-financial-performance-analysis-with-reference-to-kesoram 3181
31
Kesoram cement uses most modern technology and the computerized control in the
plant A team of dedicated and well- experienced experts manages the plant
The quality is maintained much above the bureau of Indian standards
The raw materials used for manufacturing cement are
Lime stone
Bauxite
Hematite
Gypsum
Environmental and Social Obligations
For environmental promotion and to keep ndashup the ecological balance this section
has planted over two lakhs trees on social obligation front this section has undertaken
various social welfare programs by adopting ten nearly villages organizing family welfare
campus surgical camps animal health camps blood donation camps children immunization
camps seeds training for farmers etc were arranged
Welfare and Recreation Facilities
For the purpose of recreation facilities 2 auditoriums were provided for playing
indoor games cultural function and activities like drama music and dance etc
The industry has provided libraries and reading rooms About 1000 books are available in
the library All kinds of newspaper magazines are made available
Canteen is provided to cater to the needs of the employees for supply of snacks tea
coffee and meals etc
One English medium and one Telugu medium school are provided to meet the
educational requirements
The company has provided a dispenser with a qualified medical office and
paramedical staff for the benefit of the employees The employees covered under ESI
scheme have to avail the medical facilities from the ESI hospital
Competitions in sports and games are conducted every year for august 15th
Independence Day and January 26th republic day among the employees
Electricity
The power consumption per ton of cement has come down to 108 units against 113
units last year due to implementation of various energy saving measures The performance
of captive power plant of this section continues to be satisfactory Total power generation
8102019 A Study A Study On Financial Performance Analysis With Reference To Kesoram Cementon Financial Performance hellip
httpslidepdfcomreaderfulla-study-a-study-on-financial-performance-analysis-with-reference-to-kesoram 3281
32
during the year was 84 million units last year This captive power plant is a major role in
keeping power costs with in economic levels
The management has introduced various HRD programs for training and
development and has taken various other measures for the betterment of employeersquos
efficiency
The section has installed adequate air pollution control system and equipment and is
ISO14001 such as Environment management system is under implementation
Awards
Kesoram cement bagged many prestigious awards including national awards for
productivity technology conservation and several state awards since 1984 The following
are the some of important awards
AWARDS OF KESORAM CEMENT
No Year Awards
National
State
1 1989-90 Management award community
Development
State
2 1991 Energy conservation may day award of the
Govt
State
3 1991 Pundit Jawaharlal Nehru rolling trophy for
best
State
4 1993 National productivity effort Indira Gandhi
national award
State
5 1994 Best management award State
6 1994-
1995
Best industrial rebellion award State
7 1995 Rural development by chief minister
Environment and mineral conservation
award
State
8 1995 Best industrial rebellion award State
8102019 A Study A Study On Financial Performance Analysis With Reference To Kesoram Cementon Financial Performance hellip
httpslidepdfcomreaderfulla-study-a-study-on-financial-performance-analysis-with-reference-to-kesoram 3381
33
9 1995-
1996
Best effort of an industrial unit to
development rural economy shriSRRungta
award for social
National
10 1996 Awareness for best rural development
efforts
State
11 1999 Best workers welfare best family welfare
award
State
12 2001 First prize for mine environment amppollution
control for the 3rd
year in succession
State
13 2002 Vana mithra award from AP Govt State
14 2003 Company has got OHSAS-18001 State
15 2005 Certification from DNV New Delhi State
16 2006 Award for pollution control and
environmental protection FAPCCI award
for best rural development in the state
State
8102019 A Study A Study On Financial Performance Analysis With Reference To Kesoram Cementon Financial Performance hellip
httpslidepdfcomreaderfulla-study-a-study-on-financial-performance-analysis-with-reference-to-kesoram 3481
34
Products of the organization
8102019 A Study A Study On Financial Performance Analysis With Reference To Kesoram Cementon Financial Performance hellip
httpslidepdfcomreaderfulla-study-a-study-on-financial-performance-analysis-with-reference-to-kesoram 3581
35
CHAPTER-III
LITERATURE REVIEW
8102019 A Study A Study On Financial Performance Analysis With Reference To Kesoram Cementon Financial Performance hellip
httpslidepdfcomreaderfulla-study-a-study-on-financial-performance-analysis-with-reference-to-kesoram 3681
36
Introduction
Financial Performance Analysis
The term lsquofinancial performance analysis also known as analysis and interpretation of
financial statementsrsquo refers to the process of determining financial strength and
weaknesses of the firm by establishing strategic relationship between the items of the
balance sheet profit and loss account and other operative data
ldquoAnalyzing financial statementsrdquo by Metcalf and Titard
ldquoFinancial analysis is a process of evaluating the relationship between component
parts of a financial statement to obtain a better understanding of a firms position and
performancerdquo by Myers
Financial Performance
The word lsquoPerformance is derived from the word lsquoparfourmenrsquo which means lsquoto dorsquo lsquoto
carry outrsquo or lsquoto renderrsquo It refers the act of performing execution accomplishment
fulfillment etc In border sense performance refers to the accomplishment of a given task
measured against preset standards of accuracy completeness cost and speed In other
words it refers to the degree to which an achievement is being or has been accomplished In
the Words of Frich Kohlar ldquoThe performance is a general term applied to a part or to all the
conducts of activities of an organization over a period of time often with reference to past or
projected cost efficiency management responsibility or accountability or the like Thus not
just the presentation but the quality of results achieved refers to the performance
Performance is used to indicate firmrsquos success conditions and compliance
Financial performance refers to the act of performing financial activity In broader
sense financial performance refers to the degree to which financial objectives being or has
been accomplished It is the process of measuring the results of a firms policies and
operations in monetary terms It is used to measure firms overall financial health over a
given period of time and can also be used to compare similar firms across the same industry
or to compare industries or sectors in aggregation
The purpose of financial analysis is to diagnose the information contained in financial
statements so as to Jude the profitability and financial soundness of the firm Just like a
doctor examines his patient by recording his body temperature blood pressure etc Before
8102019 A Study A Study On Financial Performance Analysis With Reference To Kesoram Cementon Financial Performance hellip
httpslidepdfcomreaderfulla-study-a-study-on-financial-performance-analysis-with-reference-to-kesoram 3781
37
making his conclusion regarding the illness and before giving his treatment a financial
analyst analysis the financial statements with various tools of analysis before commenting
upon the financial health or weaknesses of an enterprise
The analysis and interpretation of financial statements is essential to bring out the
mystery behind the figures in financial statements Financial statements analysis is an
attempt to determine the significance and meaning of the financial statement data so that
forecast may be made of the future earnings ability to pay interest and debt maturities (both
current and long term) and profitability of a sound divided policy
Types of financial analysis-
Financial analysis into different categories depending upon
(1) The material used and
(2) The method of operation followed in the analysis or the modus operandi of
analysis
Types of financial analysis
On the basis of material used on the basis of modus operandi
External Internal Horizontal Vertical
Analysis Analysis Analysis Analysis
1 On the basis of material used - According to material used financial analysis canbe of two types
External analysis
Internal analysis
External analysis-
This analysis is done by outsiders who do not have access to the detailed internal
outsiders include investors potential investors Creditors Potential Creditors Government
Agencies Credit Agencies and General Public For financial analysis these external parties
to the firm depend almost entirely on the published financial statements
Internal analysis-
This analysis is undertaken by the persons namely executives and employees of the
organization or by the officers appointed by government or court who have access to the
8102019 A Study A Study On Financial Performance Analysis With Reference To Kesoram Cementon Financial Performance hellip
httpslidepdfcomreaderfulla-study-a-study-on-financial-performance-analysis-with-reference-to-kesoram 3881
38
books of account ( internal accounting records) and other information related to the
business
2 983119983150 983156983144983141 983138983137983155983145983155 983151983142 983149983151983140983157983155 983151983152983141983154983137983150983140983145983085
According to the modus operandi financial analysis can also be of two types
a Horizontal analysis
bVertical analysis
Horizontal analysis-
Horizontal analysis refers to the comparison of financial data of a company for several
years The figures for this type of analysis are presented horizontally over a number of
columns The figures of the various years are compared with standard or base year a base
year is year chosen as beginning point This type of analysis is also called lsquodynamicanalysisrsquo as it is based on the data from year to year rather than on data of any one year The
horizontal analysis makes it possible to focus attention on items that have changed
significantly during the period under view
b Vertical analysis-
Vertical analysis refers to the study of relationship of the various items in the financial
statements of one accounting period In this types of analysis the figures from financial
statement of a year are compared with a base selected from the same yearrsquos statement
Methods of financial analysis-
The following methods of analysis are generally used-
1 Comparative Statements
2 Trend Analysis
3 Common-Size Statements
4 Funds flow Analysis
5 Cash Analysis
6 Ratio Analysis
7 Cost-volume-Profit Analysis
8102019 A Study A Study On Financial Performance Analysis With Reference To Kesoram Cementon Financial Performance hellip
httpslidepdfcomreaderfulla-study-a-study-on-financial-performance-analysis-with-reference-to-kesoram 3981
39
Comparative statements-
The comparative financial statements are statements of the financial position at
different periods of time the elements of financial position are show in a
Comparative Statement provides an idea of financial position at two or more
periods Generally two financial statements (balance sheet and income statement) are
prepared in comparative form for financial analysis
The Comparative Statement May Show-
1 Absolute figures (rupee amounts)
2 Changes in absolute figures ie increase or decrease in absolute figures
3 Absolute data in terms of percentages
4 Increase or decrease in terms of percentages
The Two Comparative Statements Are-
1 Comparative balance sheet and
2 Income statement
1 983107983151983149983152983137983154983137983156983145983158983141 983138983137983148983137983150983139983141 983155983144983141983141983156983085
The comparative balance sheet analysis is the study of the trend of the same items group of
items and computed items in two or more balance sheets of the same business enterprise on
different dates The change in periodic balance sheet items reflect the conduct of a business
the change can be observed by comparison of the balance sheet at the beginning and at the
end of a period and these changes can help in forming an opinion about the progress of an
enterprise
Guide Lines for Interpretation of Comparative Balance Sheet-
While interpreting comparative balance sheet the interpreter is expected to study the
following aspects-
1 Current financial position and liquidity position
2 Long-term financial position
3 Profitability of the concern
8102019 A Study A Study On Financial Performance Analysis With Reference To Kesoram Cementon Financial Performance hellip
httpslidepdfcomreaderfulla-study-a-study-on-financial-performance-analysis-with-reference-to-kesoram 4081
40
Common Size Statement-
The common-size statements balance sheet and income statement are show in
analytical percentages The figures are shown as percentages of total assets total liabilities
and total sales The total assets are taken as 100 and different assets are expressed as a
percentage of the total similarly various liabilities are taken as a part of total liabilities
Common Size Balance Sheet-
A statement in which balance sheet items are expressed as the ratio of each asset to
total assets and the ratio of each liability is expressed as a ratio of total liabilities is called
common size balance The common size balance sheet can be used to compare companies
of differing size The comparison of figures in different periods is not useful because total
figures may be affected by a number of factors It is not possible to establish standard norms
for various assets The trends of figures from year to year may not be studied and even they
may not give proper results
Trend Analysis of Balance Sheet-
Trend analysis is Very important tool of horizontal financial analysis
This analysis enables to known the change in the financial function and operating efficiency
in between the time period chosen
By studding the trend analysis of each item we can known the direction of changes and
based upon the direction of changes the options can be changed
Trend =Absolute Value of item in the statement understudy 100
Absolute Value of same item in the base statement
Ratio Analysis
Ratio analysis is used as a technique of analyzing the financial information contained in the
balance sheet and profit and loss accounts for a more meaningful understanding of the
financial position and performance of a firm
The relationship between two accounting figures expressed mathematically is known as a
financial ratio A ratio helps the analyst to make qualitative judgment about the firmrsquos
financial position and performance
Several ratios can be calculated from the accounting data contained in the financial
statements The parties which generally undertake financial analysis is short ndashterm
creditors long-term creditors owner and management In view of the requirements of the
various ratios ratios are classified into the following four important categories
8102019 A Study A Study On Financial Performance Analysis With Reference To Kesoram Cementon Financial Performance hellip
httpslidepdfcomreaderfulla-study-a-study-on-financial-performance-analysis-with-reference-to-kesoram 4181
41
Liquidity ratios
Leverage ratios
Activity ratios
Profitability ratios
Liquidity Ratios
It is extremely essential for a firm to be able to meet its obligations as they become due
Liquidity ratios measure the ability of the firm to meet its current obligations A firm should
ensure that it does not suffer from lack of liquidity and also that it does not have excess
liquidity The failure of a company to meet its obligations due to lack of sufficient liquidity
will result in a poor creditworthiness loss of creditorsrsquo confidence or even in legal tangles
resulting in the closure of the company A very high degree of liquidity is also bad idle
assets earn nothing The firmrsquos funds will be unnecessarily tied up in current assets
Therefore it is necessary to strike a proper balance high liquidity and lack of liquidity
The most common ratios which indicate the extent of liquidity or lack of it are
Current ratio
Quick ratio
Other ratios include Cash ratio Interval Measure and Net working capital ratio
Current Ratio
The current ratio is calculated by dividing current assets by current liabilities
Current assets
Current ratio = --------------------------
Current liabilities
Current ratio is a measure of the firmrsquos short term solvency It indicates the availability of
current assets in rupees for every one rupee of current liability A ratio of greater than one
means that the firm has more current assets than current claims against the Current ratio of
2 to 1 or more is considered satisfactory Current ratio represents a margin of safety for
creditors
Quick Ratio
Quick ratio also known as acid-test ratio establishes a relationship between quick assets and
the current liabilities Cash is the most liquid asset It is calculated by dividing quick assets
by current liabilities
Quick ratio = Quick Assets Current Liabilities
8102019 A Study A Study On Financial Performance Analysis With Reference To Kesoram Cementon Financial Performance hellip
httpslidepdfcomreaderfulla-study-a-study-on-financial-performance-analysis-with-reference-to-kesoram 4281
42
(Quick Assets = Current assets ndash Inventory)
One defect of the current ratio is that it fails to convey any information on the composition
of the current assets of the firm A rupee of cash is considered equivalent to a rupee of
inventory of receivables But it is not so A rupee of cash is more readily available to meet
current liabilities than a rupee of say inventory This implies the usefulness of the current
ratio
The Acid ndashtest ratio measures the firmrsquos ability to convert its current assets quickly into
cash in order to meet its current liabilities
A quick ratio of 1 to 1 is considered to represent a satisfactory current financial condition It
is an important index of the firmrsquos liquidity
Leverage Ratios
Leverage ratios identify the source of a firmrsquos capital ndashowners or outside creditors
Financial leverage refers to the use of debt in financing non-current assets If the return on
assets exceeds the cost of debt the leverage is successful ndash ie it improves return on equity
Debt ndashEquity Ratio
The Debt ndash Equity is determined to analyze the soundness of the long term financial
policies of the organization It is also known as ldquoInternal External Equity Ratiordquo
It is calculated as follows
Debt ndash Equity Ratio = Total long term debt Share holders funds
Equity Ratio
This ratio is also called as proprietary ratio establishes a relationship between share holderrsquos
funds to total assets of company Equity Ratio is calculated by dividing share holders fund
by total assets
Fixed Asset Ratio
This ratio indicates the extent to which the assets of the companyrsquos can be lost without
affecting the interest of the creditors of the company Higher the ratios better the long-term
position of the company
Activity Ratios
They are primarily used for studying a firmrsquos working capital situation A well managed
firm should have good activity ratios
8102019 A Study A Study On Financial Performance Analysis With Reference To Kesoram Cementon Financial Performance hellip
httpslidepdfcomreaderfulla-study-a-study-on-financial-performance-analysis-with-reference-to-kesoram 4381
43
Working Capital Turnover Ratio
The working capital turnover ratio indicates whether or not working capital has been
effectively used in making sales
Working capital turnover = Sales Net current assets
Inventory Turnover Ratio
This ratio also known as Stock Turnover Ratio establishes the relationship between costs of
goods sold or net sales during the given period and the average amt of stock held during the
period This ratio reveals the number of times finished stock in turnover during a given
accounting period
Higher the ratio the better is it because it shows the finished stock is rapidly turned
in to sales On the other hand a low stock turnover ratio is not desirable because it reveals
the accumulation of stock
Debtors Turnover Ratio
This ratio indicates the velocity of debt collection of a company In other words it shows
the number of times average turnover during a year
A Higher Debtor Turnover Ratio indicates a more efficient is the management towards
debtors and low ratio ratio implies inefficient management of debtors
Total Assets Turnover Ratio
The asset turnover ratio indicates how efficiently management is employing Assets
Total Assets Turnover Ratio = Sales Total Assets
Profitability Ratios
Profitability ratios are the ratios which measure a firmrsquos overall effectiveness as revealed by
the returns generated on sales and investment
General Profitability Ratios
1 Gross Profit Ratio
2 Net profit Ratio
3 Operating or Expenses Ratio
8102019 A Study A Study On Financial Performance Analysis With Reference To Kesoram Cementon Financial Performance hellip
httpslidepdfcomreaderfulla-study-a-study-on-financial-performance-analysis-with-reference-to-kesoram 4481
44
Gross Profit Ratio
Gross profit Ratio measures the relationships to net sales and is usually represented as a
percentage It is a good measure of profitability
The gross profit ratio indicates the extent to which selling price of goods per unit may
decline without resulting in losses on operation Higher the gross profit betters the result
Net Profit Ratio
Net Profit Ratio indicates net margin on sales It is given by the following equation
Net Profit Ratio = (Net Profit Sales) 100
Operating or Expenses Ratio
This ratio is complimentary of Net Profit Ratio The more the net profit the less the
Operating Ratio Operating costs include the cost of direct materials direct labors and otheroverheads viz are generally excluded from operating costs A comparison of the Operating
Ratio will indicate whether the cost efficiency is high or low in the figure of sales This less
the ratio it depicts the efficiency of the management
8102019 A Study A Study On Financial Performance Analysis With Reference To Kesoram Cementon Financial Performance hellip
httpslidepdfcomreaderfulla-study-a-study-on-financial-performance-analysis-with-reference-to-kesoram 4581
45
CHAPTER IV
DATA ANALYSIS amp INTERPRETATION
8102019 A Study A Study On Financial Performance Analysis With Reference To Kesoram Cementon Financial Performance hellip
httpslidepdfcomreaderfulla-study-a-study-on-financial-performance-analysis-with-reference-to-kesoram 4681
46
Comparative Balance Sheet of Kesoram in the Year between 2008-2009
(Rupee in crores)
Years Changes
Particulars 2008 2009 In Rupees In Percentage
Liabilities
Share Capital 4574 4574 000 000
Reserves amp Surplus 93085 128024 34939
Revaluation Reserves 533 412 -121 -2270
Loans
Secured Loans 97106 153627 56521 5821
Un Secured Loans 12129 43416 31287 25795
Deferred Tax Liabilities 000 000 000 000
Current Liabilities
Provisions 33039 34529 1490 451
Current Liabilities 57067 66587 9520 1668
Total 297533 431169 133636 4491
Assets
Net Block 108424 180435 72011 6642
Capital Wip 63459 86485 23026 3628
Investments 4783 6178 1395 2917
Current Assets
Inventories 44217 58906 14689 3322
Sundry Debtors 27307 38017 10710 3922
Cash amp Bank Balances 4036 5657 1621 4016
Total Current Assets 75560 102580 27020 3576
Loans amp Advances 45289 55462 10173 2246
Fixed Deposits 018 028 010 5556
Total 297533 431169 133636 4491
8102019 A Study A Study On Financial Performance Analysis With Reference To Kesoram Cementon Financial Performance hellip
httpslidepdfcomreaderfulla-study-a-study-on-financial-performance-analysis-with-reference-to-kesoram 4781
47
Interpretation of comparative balance sheet of 2008-2009
Reserves amp Surplus were increased to 3753 (percent) ie in Rupees 34939
crores
Revaluation Reserves decreased to 121 ie in Rupees 2270 crores
Secured Loans are increased to 5821 ie in Rupees 56521 crores And UN
secured loans highly Increased to 25795
Current liabilities and Provisions are increased to 1668 and 451 respectively ie in
Rupees 9520 amp 1490 crores
Fixed assets were highly increased to 6642 ie in Rupees 72011 crores
Investments were increased to 2917 ie in Rupees 1395 crores
Sundry debtors increased to 3922 ie in Rupees 10710 crores
Current assets increased 3576 ie in Rupees 27020 crores And Loans amp
Advances increased to 2246 respectively
The overall financial position was satisfactory
8102019 A Study A Study On Financial Performance Analysis With Reference To Kesoram Cementon Financial Performance hellip
httpslidepdfcomreaderfulla-study-a-study-on-financial-performance-analysis-with-reference-to-kesoram 4881
48
Comparative Balance Sheet of Kesoram in the Year between 2009-2010
(Rupees in crores)
Years Changes
Particulars 2009 2010 In Rupees In Percentage
Liabilities
Share Capital 4574 4574 000 000
Reserves amp Surplus 128024 149111 21087 1647
Revaluation Reserves 412 339 -073 -1772
Loans
Secured Loans 153627 186372 32745 2131
Un Secured Loans 43416 126250 82834 19079
Deferred Tax Liabilities 000 000 000
Current Liabilities
Provisions 34529 35734 1205 349
Current Liabilities 66587 107688 41101 6173
Total 431169 610068 178899 4149
Assets
Net Block 180435 343182 162747 9020
Capital WIP 86485 41283 -45202 -5227
Investments 6178 5143 -1035 -1675
Current Assets
Inventories 58906 91619 32713 5553
Sundry Debtors 38017 54289 16272 4280
Cash amp Bank Balances 5657 8014 2357 4167
Total Current Assets 102580 153922 51342 5005
Loans amp Advances 55462 66506 11044 1991
Fixed Deposits 028 031 003 1071
Total 431169 610068 178899 4149
8102019 A Study A Study On Financial Performance Analysis With Reference To Kesoram Cementon Financial Performance hellip
httpslidepdfcomreaderfulla-study-a-study-on-financial-performance-analysis-with-reference-to-kesoram 4981
49
Interpretation of comparative balance sheet of 2009-2010
Reserves amp surplus increased to 1647 ie in Rupees 21087 crores
Revaluation Reserves decreased to 1772 ie in Rupees 073 crores
Secured loans increased to 2131 ie in Rupees 32745 crores
Current Liabilities were increased to 6173 ie in Rupees 41101 crores and
Provisions 349 ie in Rupees 1205 crores
Fixed Assets were increased to 9020 ie in Rupees 162747 crores
Investments were decreased to 1675 ie in Rupees 1035 crores
Sundry debtors were increased to 4280 ie in Rupees 16272 crores
Current assets increased to 5005 ie in Rupees 51342 crores And loans and
Advances increased 1919 ie in Rupees 11044 crores
The overall financial position was satisfactory
8102019 A Study A Study On Financial Performance Analysis With Reference To Kesoram Cementon Financial Performance hellip
httpslidepdfcomreaderfulla-study-a-study-on-financial-performance-analysis-with-reference-to-kesoram 5081
50
Comparative Balance Sheet of Kesoram in the Year between 2010-2011
(Rupees in crores)
Years Changes
Particulars 2010 2011 In Rupees In Percentage
Liabilities
Share Capital 4574 4574 000 000
Reserves amp Surplus 149111 125162 -23949 -1606
Revaluation Reserves 339 289 -050 -1475
Loans
Secured Loans 186372 237183 50811 2726
Un Secured Loans 126250 162744 36494 2891
Deferred Tax Liabilities 000 000 000
Current Liabilities
Provisions 35734 1494 -34240 -9582
Current Liabilities 107688 113902 6214 577
Total 610068 645348 35280 578
Assets
Net Block 343182 369172 25990 757
Capital WIP 41283 43781 2498 605
Investments 5143 6582 1439 2798
Current Assets
Inventories 91619 111855 20236 2209
Sundry Debtors 54289 63134 8845 1629
Cash amp Bank Balances 8014 7188 -826 -1031
Total Current Assets 153922 182177 28255 1836
Loans amp Advances 66506 43460 -23046 -3465
Fixed Deposits 031 176 145 46774
Total 610068 645348 35280 578
8102019 A Study A Study On Financial Performance Analysis With Reference To Kesoram Cementon Financial Performance hellip
httpslidepdfcomreaderfulla-study-a-study-on-financial-performance-analysis-with-reference-to-kesoram 5181
51
Interpretation of comparative balance sheet of 2010-2011
Reserves amp surplus decreased to 1606 ie in Rupees 23949 crores
Revaluation Reserves decreased to 1475 ie in Rupees 050 crores
Secured loans increased to 2726 ie in Rupees 50811 crores
Current Liabilities were increased to 577 ie in Rupees 6214 crores
Provisions decreased to 9582 ie in Rupees 34240 crores
Fixed Assets were increased to 757 ie in Rupees 25990 crores
Investments were decreased to 2798 ie in Rupees 1439 crores
Sundry debtors were increased to 1629 ie in Rupees8845 crores
Current assets increased to 1836 ie in Rupees 28255 crores And loans and
Advances increased 3465 ie in Rupees 23046 crores
The overall financial position was UN satisfactory
8102019 A Study A Study On Financial Performance Analysis With Reference To Kesoram Cementon Financial Performance hellip
httpslidepdfcomreaderfulla-study-a-study-on-financial-performance-analysis-with-reference-to-kesoram 5281
52
Comparative Balance Sheet of Kesoram In The Year Between 2011-2012
(Rupees in crores)
Years Changes
Particulars 2011 2012 In Rupees In Percentage
Liabilities
Share Capital 4574 4574 000 000
Reserves amp Surplus 125162 86657 -38505 -3076
Revaluation Reserves 289 270 -019 -657
Loans
Secured Loans 237183 317792 80609 3399
Un Secured Loans 162744 92742 -70002 -4301
Deferred Tax Liabilities 000 000 000
Current Liabilities
Provisions 1494 40726 39232 262597
Current Liabilities 113902 180010 66108 5804
Total 645348 722771 77423 1200
Assets 000
Net Block 369172 358721 -10451 -283
Capital WIP 43781 68065 24284 5547
Investments 6582 6636 054 082
Current Assets
Inventories 111855 99516 -12339 -1103
Sundry Debtors 63134 67358 4224 669
Cash amp Bank Balances 7188 6959 -229 -319
Total Current Assets 182177 173833 -8344 -458
Loans amp Advances 43460 115409 71949 16555
Fixed Deposits 176 107 -069 -3920
Total 645348 722771 77423 1200
8102019 A Study A Study On Financial Performance Analysis With Reference To Kesoram Cementon Financial Performance hellip
httpslidepdfcomreaderfulla-study-a-study-on-financial-performance-analysis-with-reference-to-kesoram 5381
53
Interpretation of comparative balance sheet of 2011-2012
Reserves amp surplus decreased to 3076 ie in Rupee 38505 crores
Revaluation Reserves decreased to 657 ie in Rupees 019 crores
Secured loans increased to 3399 ie in Rupees 80699 crores
Current Liabilities were increased to 5804 ie in Rupees 66108 crores
Provisions increased to 262597 ie in Rupees 39232 crores
Fixed Assets were decreased to 283 ie in Rupee 10451 crores
Investments were increased to 082 ie in Rupees 054 crores
Sundry debtors were increased to 669 ie in Rupees 4224 crores
Current assets decreased to 458 ie in Rupees 8344 crores And loans and
Advances increased 16555 ie in Rupees 71949 crores
The overall financial position was UN satisfactory
8102019 A Study A Study On Financial Performance Analysis With Reference To Kesoram Cementon Financial Performance hellip
httpslidepdfcomreaderfulla-study-a-study-on-financial-performance-analysis-with-reference-to-kesoram 5481
54
Common Size Balance Sheet of Kesoram For The Year 2008-2009
(Rupees in crores)
Particulars 2008 Change Percentage 2009 Change Percentage
Liabilities
Share Capital 4574 154 4574 106
Reserves amp Surplus 93085 3129 128024 2969
Revaluation Reserves 533 018 412 010
Loans
Secured Loans 97106 3264 153627 3563
Un Secured Loans 12129 408 43416 1007
Deferred Tax Liabilities 000 000 000 000
Current Liabilities
Provisions 33039 1110 34529 801
Current Liabilities 57067 1918 66587 1544
Total 297533 10000 431169 10000
Assets
Net Block 108424 3644 180435 4185
Capital WIP 63459 2133 86485 2006
Investments 4783 161 6178 143
Current Assets
Inventories 44217 1486 58906 1366
Sundry Debtors 27307 918 38017 882
Cash amp Bank Balances 4036 136 5657 131
Loans amp Advances 45289 1522 55462 1286
Fixed Deposits 018 001 028 001
Total 297533 10000 431169 10000
8102019 A Study A Study On Financial Performance Analysis With Reference To Kesoram Cementon Financial Performance hellip
httpslidepdfcomreaderfulla-study-a-study-on-financial-performance-analysis-with-reference-to-kesoram 5581
55
Interpretation of Common Size Balance Sheet of 2008-2009
Share capital was recorded 154 percent in the total liabilities in the year 2008 it is
decreased to 106 in the year 2009
Reserves amp surplus contributed to 3129 in the total liabilities in the year 2008 it is
decreased to 2969 in the year 2009
Secured loans were 3264 in the total liabilities in the year 2008 it is increased to
3563 in the year 2009
Current Liabilities shown to 1918 in the total liabilities in the year 2008 it is
decreased to 1544 in the year 2009
Provisions 1110 in the total liabilities in the year 2008 it is decreased to 801 in the
year 2009
Fixed Assets were 3644 in the total liabilities in the year 2008 ie decreased to 4185
in the year 2009
Investments were 161 in the total liabilities in the year 2008 it is decreased to 143
in the year 2009
Sundry debtors were 918 in the total liabilities in the year 2008 it is decreased to 882
in the year 2009
8102019 A Study A Study On Financial Performance Analysis With Reference To Kesoram Cementon Financial Performance hellip
httpslidepdfcomreaderfulla-study-a-study-on-financial-performance-analysis-with-reference-to-kesoram 5681
56
Common Size Balance Sheet of Kesoram For The Year 2009-2010
(Rs in crores)
Particulars 2009 Change Percentage 2010Change
Percentage
Liabilities
Share Capital 4574 106 4574 075
Reserves amp Surplus 128024 2969 149111 2444
Revaluation Reserves 412 010 339 006
Loans
Secured Loans 153627 3563 186372 3055
Un Secured Loans 43416 1007 126250 2069
Deferred Tax Liabilities 000 000 000 000
Current Liabilities
Provisions 34529 801 35734 586
Current Liabilities 66587 1544 107688 1765
Total 431169 10000 610068 10000
Assets
Net Block 180435 4185 343182 5625
Capital WIP 86485 2006 41283 677
Investments 6178 143 5143 084
Current Assets
Inventories 58906 1366 91619 1502
Sundry Debtors 38017 882 54289 890
Cash amp Bank Balances 5657 131 8014 131
Loans amp Advances 55462 1286 66506 1090
Fixed Deposits 028 001 031 001
Total 431169 10000 610068 10000
8102019 A Study A Study On Financial Performance Analysis With Reference To Kesoram Cementon Financial Performance hellip
httpslidepdfcomreaderfulla-study-a-study-on-financial-performance-analysis-with-reference-to-kesoram 5781
57
Interpretation of common size balance sheet of 2009-2010
Share capital was recorded 106 percent in the total liabilities in the
year 2009 it is decreased to 075 in the year 2010
Reserves amp surplus contributed to 2969 in the total liabilities in the
year 2009 it is decreased to2444 in the year 2010
Secured loans were 3563 in the total liabilities in the year 2009 it is
increased to 3055 in the year 2010
Current Liabilities shown to 1544 in the total liabilities in the year
2009 it is decreased to 1765 in the year 2010
Provisions 801 in the total liabilities in the year 2009 it is decreased
to 586 in the year 2010
Fixed Assets were 4185 in the total liabilities in the year 2009 ie
increased to 5625 in the year 2010
Investments were 143 in the total liabilities in the year 2009 it is
decreased to 084 in the year 2010
Sundry debtors were 882 in the total liabilities in the year 2009 it is
increased to 890 in the year 2010
8102019 A Study A Study On Financial Performance Analysis With Reference To Kesoram Cementon Financial Performance hellip
httpslidepdfcomreaderfulla-study-a-study-on-financial-performance-analysis-with-reference-to-kesoram 5881
58
Common Size Balance sheet of Kesoram for the year 2010-2011
983080Rupees in crores)
Particulars 2010 Change Percentage 2011
Change
Percentage
Liabilities
Share Capital 4574 075 4574 071
Reserves amp Surplus 149111 2444 125162 1939
Revaluation Reserves 339 006 289 004
Loans
Secured Loans 186372 3055 237183 3675
Un Secured Loans 126250 2069 162744 2522
Deferred Tax Liabilities 000 000 000 000
Current Liabilities
Provisions 35734 586 1494 023
Current Liabilities 107688 1765 113902 1765
Total 610068 10000 645348 10000
Assets
Net Block 343182 5625 369172 5721
Capital WIP 41283 677 43781 678
Investments 5143 084 6582 102
Current Assets
Inventories 91619 1502 111855 1733
Sundry Debtors 54289 890 63134 978
Cash amp Bank Balances 8014 131 7188 111
Loans amp Advances 66506 1090 43460 673
Fixed Deposits 031 001 176 003
Total 610068 10000 645348 10000
8102019 A Study A Study On Financial Performance Analysis With Reference To Kesoram Cementon Financial Performance hellip
httpslidepdfcomreaderfulla-study-a-study-on-financial-performance-analysis-with-reference-to-kesoram 5981
59
Interpretation of Common Size Balance Sheet Of 2010-2011
Share capital was recorded 075 percent in the total liabilities in the year 2010 it is
decreased to 071 in the year 2011
Reserves amp surplus contributed to 2444 in the total liabilities in the year 2010 it is
decreased to1939 in the year 2011
Secured loans were 3055 in the total liabilities in the year 2010 it is increased to
3675 in the year 2011
Current Liabilities shown to 1765 in the total liabilities in the year 2010 it is
also1765 in the year 2011
Provisions 586 in the total liabilities in the year 2010 it is decreased to 023 in the
year 2011
Fixed Assets were 5625 in the total liabilities in the year 2010 ie increased to 5721
in the year 2011
Investments were 084 in the total liabilities in the year 2010 it increased to 102 in
the year 2011
Sundry debtors were 890 in the total liabilities in the year 2010 it is increased to 978
in the year 2011
8102019 A Study A Study On Financial Performance Analysis With Reference To Kesoram Cementon Financial Performance hellip
httpslidepdfcomreaderfulla-study-a-study-on-financial-performance-analysis-with-reference-to-kesoram 6081
60
Common Size Balance Sheet of Kesoram for the Year 2011-2012
983080Rupees in crores)
Particulars 2011 Change Percentage 2012
Change
Percentage
Liabilities
Share Capital 4574 071 4574 063
Reserves amp Surplus 125162 1939 86657 1199
Revaluation Reserves 289 004 270 004
Loans
Secured Loans 237183 3675 317792 4397
Un Secured Loans 162744 2522 92742 1283
Deferred Tax Liabilities 000 000 000 000
Current Liabilities
Provisions 1494 023 40726 563
Current Liabilities 113902 1765 180010 2491
Total 645348 10000 722771 10000
Assets
Net Block 369172 5721 358721 4963
Capital WIP 43781 678 68065 942
Investments 6582 102 6636 092
Current Assets
Inventories 111855 1733 99516 1377
Sundry Debtors 63134 978 67358 932
Cash amp Bank Balances 7188 111 6959 096
Loans amp Advances 43460 673 115409 1597
Fixed Deposits 176 003 107 001
Total 645348 10000 722771 10000
8102019 A Study A Study On Financial Performance Analysis With Reference To Kesoram Cementon Financial Performance hellip
httpslidepdfcomreaderfulla-study-a-study-on-financial-performance-analysis-with-reference-to-kesoram 6181
61
Interpretation of common size balance sheet of 2011-2012
Share capital was recorded 071 percent in the total liabilities in the year 2011 it is
decreased to 063 in the year 2012
Reserves amp surplus contributed to 1939 in the total liabilities in the year 2011 it
is decreased to 1199 in the year 2012
Secured loans were 3675 in the total liabilities in the year 2011 it is increased to
4397 in the year 2012
Current Liabilities shown to 1765 in the total liabilities in the year 2011 it is
increased to 2491 in the year 2012
Provisions 023 in the total liabilities in the year 2011 it is increased to 563 in the
year 2012
Fixed Assets were 5721 in the total liabilities in the year 2011 ie decreased to
4963 in the year 2012
Investments were 102 in the total liabilities in the year 2011 it increased to 092
in the year 2012
Sundry debtors were 978 in the total liabilities in the year 2011 it is decreased to
932 in the year 2012
8102019 A Study A Study On Financial Performance Analysis With Reference To Kesoram Cementon Financial Performance hellip
httpslidepdfcomreaderfulla-study-a-study-on-financial-performance-analysis-with-reference-to-kesoram 6281
Trend Analysis
Share Capital-
Year
Amount
(In Crores) Trend
IncreaseDecrease
Base Year Previous Year
2008 4574 10000 000 000
2009 4574 10000 000 000
2010 4574 10000 000 000
2011 4574 10000 000 000
2012 4574 10000 000 000
Trend Percentages in Share Capital
Share capital shown a constant trend in the period 2008 and 2012
Share capital is 4574 crores all the years from 2008-2012
8102019 A Study A Study On Financial Performance Analysis With Reference To Kesoram Cementon Financial Performance hellip
httpslidepdfcomreaderfulla-study-a-study-on-financial-performance-analysis-with-reference-to-kesoram 6381
Reserves amp Surplus-
Year
Amount
(In Crores) Trend
IncreaseDecrease
Base Year Previous Year
2008 93085 10000 000 000
2009 128024 13753 3753 3753
2010 149111 16019 6019 2266
2011 125162 13446 3446 -2573
2012 86657 9309 -691 -4137
Trend Percentages in Reserves amp Surplus
Reserves amp surplus shown an increasing trend in the period between 2008 and 2010
The average trend was 13277 till 2010
The Reserves amp surplus was showing decreasing trend in the period 2011-2012 (ie
from 16019 in 2010 to 9309 in 2012)
The decreasing trend in Reserves amp surplus indicates the decrease in profits of the
firm
8102019 A Study A Study On Financial Performance Analysis With Reference To Kesoram Cementon Financial Performance hellip
httpslidepdfcomreaderfulla-study-a-study-on-financial-performance-analysis-with-reference-to-kesoram 6481
Investments-
Year
Amount
(In Crores) Trend
IncreaseDecrease
Base Year Previous Year
2008 4783 10000 000 000
2009 6178 12917 2917 2917
2010 5143 10753 753 -2164
2011 6582 13761 3761 3009
2012 6636 13874 3874 113
Trend Percentages in Investments-
The investments are shown an increasing trend in the period between 2008 ndash 2009
and it is decreasing in the year 2010
The average trend was 11458 till 2009
The investments increased in the periods 2011-2012 (ie from 10753 in 2010 to
13874 in 2012)
The overall trend in investments shown is satisfactory
8102019 A Study A Study On Financial Performance Analysis With Reference To Kesoram Cementon Financial Performance hellip
httpslidepdfcomreaderfulla-study-a-study-on-financial-performance-analysis-with-reference-to-kesoram 6581
Net Current Assets-
Year
Amount
(In Crores) Trend
IncreaseDecrease
Base Year Previous Year
2008 30761 10000 000 000
2009 56954 18515 8515 8515
2010 77037 25044 15044 6529
2011 110417 35895 25895 10851
2012 68613 22305 12305 -13590
Trends in Net Current Assets-
The NCA shown positive (increasing) trend
The NCA are increased to 35895 (the year 2011) compared with base year and
decreased in the year 2012 to 22305
The NCA shown increased trend from year and crossed 100
The overall trend was good
8102019 A Study A Study On Financial Performance Analysis With Reference To Kesoram Cementon Financial Performance hellip
httpslidepdfcomreaderfulla-study-a-study-on-financial-performance-analysis-with-reference-to-kesoram 6681
66
Ratio Analysis-
Current Ratio-
Current Ratio = Current Assets Current Liabilities
Current assets are cash in hand Cash at bank Marketable Securities(short term) short term
Investment Bills receivables sundry debtors Inventories (stock) Work in progress prepaid
expenses Current Liabilities are outstanding expenses Bills payable sundry Creditors
short-term advances income tax payable and Dividend payable
Current Ratio of Kesoram-
(Rupees in crores)
Year Current Assets Current Liabilities Current Ratio
2007-08 75560 57067 132
2008-09 102580 66587 154
2009-10 153922 107688 143
2010-11 182177 113902 160
2011-12 173833 180010 097
Interpretation-
As per the standard rule of current ratio ie 21 where current assets double the current
liabilities is considered satisfactory
In the present analysis the current ratio of the Kesoram is not satisfactory
from the above table It was assessed that the current ratio for all the five year is lower (less)
than the standard rule ie 21 And it is 097 in the year 2011-2012 (current year) This is
highly UN satisfactory
8102019 A Study A Study On Financial Performance Analysis With Reference To Kesoram Cementon Financial Performance hellip
httpslidepdfcomreaderfulla-study-a-study-on-financial-performance-analysis-with-reference-to-kesoram 6781
Quick Ratio-
Quick ratio also known as acid-test ratio establishes a relationship between quick
assets and the current liabilities Cash is the most liquid asset It is calculated by dividing
quick assets by current liabilities
Quick ratio = Quick Assets Current Liabilities
(Quick Assets = Current assets ndash Inventory)
Quick Ratio of Kesoram-
Rupees in crores)
Year Total QuickAssets
Current Liabilities Quick Ratio
2007-08 33343 57067 058
2008-09 43674 66587 066
2009-10 62303 107688 058
2010-11 70322 113902 0622011-12 74333 180010 041
Interpretation-
Usually a high Quick ratio is an indication that the company is liquid and has the ability to
meet its current or liquid liabilities in time on the other hand a low Quick Ratio represents
8102019 A Study A Study On Financial Performance Analysis With Reference To Kesoram Cementon Financial Performance hellip
httpslidepdfcomreaderfulla-study-a-study-on-financial-performance-analysis-with-reference-to-kesoram 6881
that the companyrsquos liquidity position is not good The above table showing the quick ratios
of Kesoram are canrsquot be considered satisfactory
Leverage Ratios-
Debt-Equity Ratio-
Debt-Equity Ratio = Total Long Term Debt Equity Share Holders Fund
Total Long term Debt= Debenture Capital + Long term loans from banks and financial
institutions + Public deposits
Equity Share Holders fund = Equity + Reserves and Surplus
Debt Equity Ratio of Kesoram
(Rupees in crores)
Year Total Debt Share Holders Fund Debt Equity Ratio
2007-08 109235 98192 111
2008-09 197043 133010 148
2009-10 312622 154024 203
2010-11 399927 130025 308
2011-12 410534 91501 449
8102019 A Study A Study On Financial Performance Analysis With Reference To Kesoram Cementon Financial Performance hellip
httpslidepdfcomreaderfulla-study-a-study-on-financial-performance-analysis-with-reference-to-kesoram 6981
Interpretation-
The Debt-Equity Ratio accepted standard is 05 This ratio reflects the relative contribution
of creditors and owners of business in its financing From the above it is clear that the long
term debt is more than that of the share holdersrsquo fund So we can interpret that the firmrsquosassets are financed more by the external funds rather than by the internal funds
8102019 A Study A Study On Financial Performance Analysis With Reference To Kesoram Cementon Financial Performance hellip
httpslidepdfcomreaderfulla-study-a-study-on-financial-performance-analysis-with-reference-to-kesoram 7081
Fixed Asset Ratio-
Net Sales
Fixed Asset Ratio = helliphelliphelliphelliphelliphelliphelliphelliphelliphelliphellip
Net Assets
Fixed Asset Ratio of Kesoram-
(Rupees in crores)
Year Net Sales Net Assets Fixed Assets Ratio
2007-08 300271 358721 084
2008-09 389797 369172 106
2009-10 475062 343182 1382010-11 539788 180435 299
2011-12 59182 108424 546
Interpretation
This ratio indicates the extent to which the assets of the companyrsquos can be lost without
affecting the interest of the creditors of the company Higher the ratios better the long-term
position of the companyThe above table shows fixed assets ratio in increasing trend Which is good for the
company
8102019 A Study A Study On Financial Performance Analysis With Reference To Kesoram Cementon Financial Performance hellip
httpslidepdfcomreaderfulla-study-a-study-on-financial-performance-analysis-with-reference-to-kesoram 7181
Overall Profitability Ratios-
Net Profit Ratio
Net Profit Ratio indicates net margin on sales It is given by the following equation
Net Profit Ratio = (Net Profit Sales) 100
Net Profit Ratio of Kesoram
(Rupees in crores)
Year Net Profit Sales Net Profit Ratio
2007-08 37917 300271 1263
2008-09 41432 389797 1063
2009-10 20298 475062 427
2010-11 -28176 539788 -5222011-12 -38108 59182 -644
Interpretation
It establishes a relationship between net profits after tax and net sales and
indicates the efficiency of the management in manufacturing selling administrative and
other activities of the company
The higher the ratio the better is the profitability or performance of the business
The above table depicts the net profit Ratio of Kesoram has decreased every year from
2007-2008 to 2011-2012It further decreased to negative in the year 2010-11 to -522 and -
644 in the year 2011-2012 This shows constant decrease in the profits of the company
8102019 A Study A Study On Financial Performance Analysis With Reference To Kesoram Cementon Financial Performance hellip
httpslidepdfcomreaderfulla-study-a-study-on-financial-performance-analysis-with-reference-to-kesoram 7281
72
Return on Investment-
Net Profit
Return on Investment = helliphelliphelliphelliphelliphelliphelliphelliphelliphelliphelliphellip X 100
Share Holders Fund
Return on Investment Ratio of Kesoram-
(Rupees in crores)
Year Net Profit Share Holders Fund Return On Investment
2007-08 37917 98192 3862
2008-09 41432 133010 3115
2009-10 20298 154024 1318
2010-11 -28176 130025 -2167
2011-12 -38108 91501 -4165
Interpretation-
The above table reveals how well the resources of the firm are being used Higher
the ratio better the result The above ratio implies how well the firm is growing in
terms of profitability and efficiency From the above table we can concern that the return on
investment is in decreasing trend ROI is highest in the year 2007-2008 as 3862 But
there after itrsquos decreased every year
The ROI is negative in the years 2010-2011 amp 2011-2012 as -2167 amp -4165 respectively
Which is not a good sign for the firm
8102019 A Study A Study On Financial Performance Analysis With Reference To Kesoram Cementon Financial Performance hellip
httpslidepdfcomreaderfulla-study-a-study-on-financial-performance-analysis-with-reference-to-kesoram 7381
8102019 A Study A Study On Financial Performance Analysis With Reference To Kesoram Cementon Financial Performance hellip
httpslidepdfcomreaderfulla-study-a-study-on-financial-performance-analysis-with-reference-to-kesoram 7481
8102019 A Study A Study On Financial Performance Analysis With Reference To Kesoram Cementon Financial Performance hellip
httpslidepdfcomreaderfulla-study-a-study-on-financial-performance-analysis-with-reference-to-kesoram 7581
75
CHAPTER V
FINDINGS amp SUGGESTIONS
8102019 A Study A Study On Financial Performance Analysis With Reference To Kesoram Cementon Financial Performance hellip
httpslidepdfcomreaderfulla-study-a-study-on-financial-performance-analysis-with-reference-to-kesoram 7681
76
Findings
The Share capital remains constant Share capital is unchanged all the years from
2008-2012
Reserves amp surplus were recorded an increasing trend in the period between 2008
and 2010It is showing decreasing trend in the period 2011-2012 (ie from 16019
in 2010 to 9309 in 2012)
Current Liabilities were increased compared to base year ie 2008
Provisions increased to 262597 ie in Rupees 39232 crores in the current year
The current ratio for all the five year is lower (less) than the standard rule ie 21
And it is 097 in the year 2011-2012 (current year)
The Debt-Equity Ratio was shown under the standard ratio It is clear that the long
term debt is more than that of the share holdersrsquo fund It indicates that the firm
heavily relying on external funds rather than the internal funds
The operating and net profit of Kesoram is in decreasing trend due to heavy
increase of manufacturing amp administrative expenses
ROI is highest in the year 2007-2008 as 3862 The ROI is negative in the years
2010-2011 amp 2011-2012 as -2167 amp -4165 respectively
Return on Equity Capital Employed Ratio of Kesoram has decreased every year
from 2007-2008 to 2010-2011It further decreased to negative in the year 2011-12 to
-3280
EPS of Kesoram has decreased every year from 2008-12It is negative in the year
2011 amp 12
8102019 A Study A Study On Financial Performance Analysis With Reference To Kesoram Cementon Financial Performance hellip
httpslidepdfcomreaderfulla-study-a-study-on-financial-performance-analysis-with-reference-to-kesoram 7781
77
Suggestion
The organization should adopt an appropriate capital structure
The companyrsquos debt-equity ratio is recorded more or less as 111 in the year 2008
and it is increased to 449 in the year 2012 (current year)The company should
adopt a better debt equity mix in the future to control the fluctuations in returns
The company should control fluctuations in cash and bank balances as it impacts the
current ratio of the company
The provisions are showing increasing trend which indicates risk of debtors The
firm should implement an effective credit management policy It should utilize its
idle funds by decreasing provisions
The company should control heavy increase of manufacturing amp administration
expenses as it is impacting the operating and net profit of company
8102019 A Study A Study On Financial Performance Analysis With Reference To Kesoram Cementon Financial Performance hellip
httpslidepdfcomreaderfulla-study-a-study-on-financial-performance-analysis-with-reference-to-kesoram 7881
78
ANNEXURE
Profit And Loss Account of Kesoram Cement
Mar12 Mar11 Mar10 Mar09 Mar08
12 Months 12 Months 12 Months 12 Months 12 Months
INCOME
Sales Turnover 628260 575072 505151 431613 345700
Excise Duty 36440 35284 30089 41815 45429
NET SALES 591820 539788 475062 389797 300271
Other Income 000 000 000 000 000
TOTALINCOME
596129 548733 481019 393969 302020
EXPENDITURE
Manufacturing
Expenses81903 74803 13974 13153 44113
MaterialConsumed
370897 310150 295550 229359 118448
Personal
Expenses33468 27355 23294 18690 15344
Selling Expenses 81910 78253 58667 48846 45019
AdministrativeExpenses
28225 29308 17219 16179 9907
Expenses
Capitalized000 000 000 000 000
Provisions Made 000 000 000 000 000
TOTAL
EXPENDITURE 596403 519870 408704 326227 232832Operating Profit -4583 19918 66358 63570 67439
EBITDA -274 28864 72316 67742 69188
Depreciation 29740 27259 17280 11186 8927
Other Write-offs 000 000 000 000 000
EBIT -30014 1605 55035 56557 60261
Interest 41015 23983 10921 12087 5426
EBT -71029 -22377 44114 44470 54835
Taxes -32921 5798 23816 3037 16918
Profit and Loss
for the Year-38108 -28176 20298 41432 37917
Non RecurringItems
-1142 7063 3228 -4023 402
Other Non Cash
Adjustments1276 091 207 465 017
OtherAdjustments
000 000 000 000 000
REPORTED
PAT-37974 -21021 23734 37874 38335
8102019 A Study A Study On Financial Performance Analysis With Reference To Kesoram Cementon Financial Performance hellip
httpslidepdfcomreaderfulla-study-a-study-on-financial-performance-analysis-with-reference-to-kesoram 7981
79
Balance Sheet Of Kesoram
Years
Particulars 2008 2009 2010 2011 2012
Liabilities
Share Capital 4574 4574 4574 4574 4574Reserves amp Surplus 93085 128024 149111 125162 86657
Revaluation Reserves 533 412 339 289 27
Loans
Secured Loans 97106 153627 186372 237183 317792
Un Secured Loans 12129 43416 12625 162744 92742
Deferred Tax Liabilities 0 0 0 0 0
Current Liabilities
Provisions 33039 34529 35734 1494 40726
Current Liabilities 57067 66587 107688 113902 18001
Total 297533 431169 610068 645348 722771
Assets
Net Block 108424 180435 343182 369172 358721
Capital WIP 63459 86485 41283 43781 68065
Investments 4783 6178 5143 6582 6636
Current Assets
Inventories 44217 58906 91619 111855 99516
Sundry Debtors 27307 38017 54289 63134 67358
Cash amp Bank Balances 4036 5657 8014 7188 6959
Total Current Assets 7556 10258 153922 182177 173833Loans amp Advances 45289 55462 66506 4346 115409
Fixed Deposits 018 028 031 176 107
Total 297533 431169 610068 645348 722771
8102019 A Study A Study On Financial Performance Analysis With Reference To Kesoram Cementon Financial Performance hellip
httpslidepdfcomreaderfulla-study-a-study-on-financial-performance-analysis-with-reference-to-kesoram 8081
80
KEY ITEMS 2012 2011 2010 2009 2008
Preference
Dividend 0 0 0 0 0
Equity Dividend 457 2516 2516 2516 2516
Equity Dividend
() 999 55 55 55 55
Shares in Issue(Lakhs) 45743 45743 45743 45743 45743
EPS - Annualised
(Rs) -8302 -4595 5188 828 838
8102019 A Study A Study On Financial Performance Analysis With Reference To Kesoram Cementon Financial Performance hellip
httpslidepdfcomreaderfulla-study-a-study-on-financial-performance-analysis-with-reference-to-kesoram 8181
BIBLIOGRAPHY
Sl
No
Books Author Name
1 Financial Management Khan amp JAIN
2 Financial Management IMPandey
3 Management Accounting RPTrivedi
Websites amp Search Engines
1 wwwkesoramcom983086
2 wwwmoneycontrolcom
3 wwwgooglefinancecom983086
Annual reports of Kesoram cement limited 2008-2012

8102019 A Study A Study On Financial Performance Analysis With Reference To Kesoram Cementon Financial Performance hellip
httpslidepdfcomreaderfulla-study-a-study-on-financial-performance-analysis-with-reference-to-kesoram 981
9
1 What is the financial position of the firm at a given point of time
2 How is the financial performance of the firm over a given period
Of time
These questions can be answered with the help of financial analysis of a firm Financial
analysis involves the use of financial statements A financial statement is an organized
collection of data according to logical and conceptual framework 50 consistent accounting
procedures Its purpose is to convey an understanding of some financial aspects of a
business firm It may show a position at a moment of time as in the case of a balance sheet
or may reveal a series of activities over a given period of time as in the case of an income
statement
Thus the term lsquofinancial statementsrsquo generally refers to two basic statements
The balance sheet and the income statement
The balance sheet shows the financial position (condition) of the firm at a given point of
time It provides a snapshot and may be regarded as a static picture
ldquoBalance sheet is a summary of a firmrsquos financial position on a given date that
Shows total assets = total liabilities + ownerrsquos equityrdquo
The income statement (referred to in India as the profit and loss statement) reflects the
performance of the firm over a period of time
ldquoIncome statement is a summary of a firmrsquos revenues and expenses over a specified period
ending with net income or loss for the periodrdquo
However financial statements do not reveal all the information related to the financial
operations of a firm but they furnish some extremely useful information which highlights
two important factors profitability and financial soundness Thus analysis of financial
statements is an important aid to financial performance analysis Financial performance
analysis includes analysis and interpretation of financial statements in such a way that it
Undertakes full diagnosis of the profitability and financial soundness of the business
ldquoThe analysis of financial statements is a process of evaluating the relationship between
component parts of financial statements to obtain a better understanding of the firmrsquos
position and performancerdquo
8102019 A Study A Study On Financial Performance Analysis With Reference To Kesoram Cementon Financial Performance hellip
httpslidepdfcomreaderfulla-study-a-study-on-financial-performance-analysis-with-reference-to-kesoram 1081
10
Need for Study
Need Of Financial Management Study To Diagnose The Information Contain In
Financial Statement So as To Judge the Profitability and Financial Position of the
Firm
Financial Analyst Analyses The Financial Statements With Various Tools Of
Analysis Before Commanding Upon The Financial Health Of The Firm
Essential to Bring Out the History
Significance and Meaning of the Financial Statements
8102019 A Study A Study On Financial Performance Analysis With Reference To Kesoram Cementon Financial Performance hellip
httpslidepdfcomreaderfulla-study-a-study-on-financial-performance-analysis-with-reference-to-kesoram 1181
11
Objectives
1 To understand the financial statements of Kesoram cement
2 To study the change in assets and liabilities of the company
3 To study the liquidity position of the firm
4 To study the financial health of the company using ratio analysis
5 To study the profitability of the company
6 To offer suggestions to the company
8102019 A Study A Study On Financial Performance Analysis With Reference To Kesoram Cementon Financial Performance hellip
httpslidepdfcomreaderfulla-study-a-study-on-financial-performance-analysis-with-reference-to-kesoram 1281
12
Significance of Financial Performance Analysis
Interest of various related groups is affected by the financial performance of a firm
Therefore these groups analyze the financial performance of the firm The type of analysis
varies according to the specific interest of the party involved
Trade creditors interested in the liquidity of the firm (appraisal of firmrsquos liquidity)
Bond holders interested in the cash-flow ability of the firm (appraisal of firmrsquos capital
structure the major sources and uses of funds profitability over time and projection of
future profitability)
Investors interested in present and expected future earnings as well as stability of these
earnings (appraisal of firmrsquos profitability and financial condition)
Management interested in internal control better financial condition and betterperformance (appraisal of firmrsquos present financial condition evaluation of opportunities in
relation to this current position return on investment provided by various assets of the
company etc)
Research Methodology
Research Design
This is a systematic way to solve the research problem and it is important
component for the study without which researches may not be able to obtain the format A
research design is the arrangement of conditions for collection and analysis of data in a
manager that aims to combine for collection and analysis of data relevance to the research
purpose with economy in procedure
Meaning of Research Design
The formidable problem that follows the task of defining the research problem is the
preparation of design of the research project popularly known as the research design
decision regarding what where when how much by what means concerning an inquiry of
a research study constitute a research design A research design is the arrangement of
conditions for collection and analysis of data in a manager that aims to combine for
collection and analysis of data relevance to the research purpose with economy in
procedure
8102019 A Study A Study On Financial Performance Analysis With Reference To Kesoram Cementon Financial Performance hellip
httpslidepdfcomreaderfulla-study-a-study-on-financial-performance-analysis-with-reference-to-kesoram 1381
13
Sources of Data
Data we collected based on two sources
Primary Data
Secondary Data
Primary Data
The Primary Data Are Those Informationrsquos which are Collected afresh and for the
First Time And Thus Happen to Be Original in Character
Secondary Data
The secondary data are those which have already been collected by some other agency and
which have already been processed The sources of secondary data are annual reports
browsing internet through magazines
1 It includes data gathered from the annual reports of Kesoram
2 Articles are collected from official website of Kesoram
Methodology Used
Types Of Financial Statements Adopted
Following Two Types of Financial Statements Are Commonly Used in
Analyzing the Firmrsquos Financial Position
a Balance Sheet
b Income Statements
8102019 A Study A Study On Financial Performance Analysis With Reference To Kesoram Cementon Financial Performance hellip
httpslidepdfcomreaderfulla-study-a-study-on-financial-performance-analysis-with-reference-to-kesoram 1481
14
Limitations of Financial Statement
Each Project Gives Rise to Its Own Unique Risks And Hence Possess Its Own Unique
Challenges
1 Only Interim Reports
Only interim statements donrsquot give a final picture of the concern The data given in
these statements is only approximate The actual position can only be determined when the
business is sold or liquidated
2 Donrsquot Give Extra Position
The Financial Statements Are Expressed In Monetary Values So They Appear To
Give Final And Accurate Position The Values Of Fixed Assets In The Balance Sheet
Neither Represent The Value For Which Fixed Assets Can Be Sold Nor The Amount Which
Will Be Required To Replace These Assets
3 Historical Costs
The Financial Statements Are Prepared On The Basis Of Historical Costs Or
Original Costs The Value of Assets Decreases with the Passage of Time Current Price
Changes Are Not Taken Into Account The Statements Are Not Prepared Keeping In View
The Present Economic Conditions The Balance Sheet Loses The Significance Of Being An
Index Of Current Economic Realities
4 Act of non monitory factors Ignored
There are certain factors which have a bearing on the financial position and
operating results of the business but they donrsquot become a part of these statements because
they canrsquot be measured in monetary terms Such factors may include in the reputation of the
management
No Precision
The precision of financial statement data is not possible because the statements deal with
matters which canrsquot be precisely stated The data are recorded by conventional procedures
followed over the years Various conventions postulates personal judgments etc
8102019 A Study A Study On Financial Performance Analysis With Reference To Kesoram Cementon Financial Performance hellip
httpslidepdfcomreaderfulla-study-a-study-on-financial-performance-analysis-with-reference-to-kesoram 1581
15
CHAPTER-II
INDUSTRY PROFILE
amp
COMPANY PROFILE
8102019 A Study A Study On Financial Performance Analysis With Reference To Kesoram Cementon Financial Performance hellip
httpslidepdfcomreaderfulla-study-a-study-on-financial-performance-analysis-with-reference-to-kesoram 1681
16
Industry Profile
In the most general sense of the word cement is a binder a substance which
sets and hardens independently and can bind other materials together The word cement
traces to the Romans who used the term opus caementicium to describe masonry whichresembled concrete and was made from crushed rock with burnt lime as binder The
volcanic ash and pulverized brick additives which were added to the burnt lime to obtain a
hydraulic binder were later referred to as cementum and cement Cements used in
construction are characterized as hydraulic or non-hydraulic
The most important use of cement is the production of mortar and concretemdashthe bonding of
natural or artificial aggregates to form a strong building material which is durable in the
face of normal environmental effects
Concrete should not be confused with cement because the term cement refers only to the dry
powder substance used to bind the aggregate materials of concrete Upon the addition of
water andor additives the cement mixture is referred to as concrete especially if aggregates
have been added
It is uncertain where it was first discovered that a combination of hydrated non-hydraulic
lime and a pozzolan produces a hydraulic mixture (see also Pozzolanic reaction) but
concrete made from such mixtures was first used on a large scale by engineers They used
both natural pozzolans (trass or pumice) and artificial pozzolans (ground brick or pottery) in
these concretes Many excellent examples of structures made from these concretes are still
standing notably the huge monolithic dome of the Pantheon in Rome and the massive Baths
of Caracalla The vast system of Roman aqueducts also made extensive use of hydraulic
cement The use of structural concrete disappeared in medieval Europe although weak
pozzolanic concretes continued to be used as a core fill in stone walls and columns
Modern cement
Modern hydraulic cements began to be developed from the start of the Industrial Revolution
(around 1800) driven by three main needs
Hydraulic renders for finishing brick buildings in wet climates
Hydraulic mortars for masonry construction of harbor works etc in contact with sea water
Development of strong concretes
In Britain particularly good quality building stone became ever more expensive during a
period of rapid growth and it became a common practice to construct prestige buildings
8102019 A Study A Study On Financial Performance Analysis With Reference To Kesoram Cementon Financial Performance hellip
httpslidepdfcomreaderfulla-study-a-study-on-financial-performance-analysis-with-reference-to-kesoram 1781
17
from the new industrial bricks and to finish them with a stucco to imitate stone Hydraulic
limes were favored for this but the need for a fast set time encouraged the development of
new cements Most famous was Parkers Roman cement This was developed by James
Parker in the 1780s and finally patented in 1796 It was in fact nothing like any material
used by the Romans but was ldquoNatural cement made by burning septaria - nodules that are
found in certain clay deposits and that contain both clay minerals and calcium carbonate
The burnt nodules were ground to a fine powder This product made into a mortar with
sand set in 5ndash15 minutes The success of Roman Cement led other manufacturers to
develop rival products by burning artificial mixtures of clay and chalk
John Smeaton made an important contribution to the development of cements when he was
planning the construction of the third Eddystone Lighthouse (1755-9) in the English
Channel He needed a hydraulic mortar that would set and develop some strength in the
twelve hour period between successive high tides He performed an exhaustive market
research on the available hydraulic limes visiting their production sites and noted that the
hydraulicity of the lime was directly related to the clay content of the limestone from
which it was made Smeaton was a civil engineer by profession and took the idea no
further Apparently unaware of Smeatons work the same principle was identified by Louis
Vicat in the first decade of the nineteenth century Vicat went on to devise a method of
combining chalk and clay into an intimate mixture and burning this produced an artificial
cement in 1817 James Frost working in Britain produced what he called British cement
in a similar manner around the same time but did not obtain a patent until 1822 In 1824
Joseph Aspdin patented a similar material which he called Portland cement because the
render made from it was in color similar to the prestigious Portland stone
All the above products could not compete with limepozzolan concretes because of fast-
setting (giving insufficient time for placement) and low early strengths (requiring a delay of
many weeks before formwork could be removed) Hydraulic limes natural cements and
artificial cements all rely upon their belite content for strength development Belite
develops strength slowly Because they were burned at temperatures below 1250 degC they
contained no alite which is responsible for early strength in modern cements The first
cement to consistently contain alite was made by Joseph Aspdins son William in the early
1840s This was what we call today modern Portland cement Because of the air of
mystery with which William Aspdin surrounded his product others (eg Vicat and I C
Johnson) have claimed precedence in this invention but recent analysis of both his concrete
8102019 A Study A Study On Financial Performance Analysis With Reference To Kesoram Cementon Financial Performance hellip
httpslidepdfcomreaderfulla-study-a-study-on-financial-performance-analysis-with-reference-to-kesoram 1881
18
and raw cement have shown that William Aspdins product made at North fleet Kent was a
true alite-based cement However Aspdins methods were rule-of-thumb Vicat is
responsible for establishing the chemical basis of these cements and Johnson established
the importance of sintering the mix in the kiln
William Aspdins innovation was counter-intuitive for manufacturers of artificial cements
because they required more lime in the mix (a problem for his father) because they required
a much higher kiln temperature (and therefore more fuel) and because the resulting clinker
was very hard and rapidly wore down the millstones which were the only available grinding
technology of the time Manufacturing costs were therefore considerably higher but the
product set reasonably slowly and developed strength quickly thus opening up a market for
use in concrete The use of concrete in construction grew rapidly from 1850 onwards and
was soon the dominant use for cements Thus Portland cement began its predominant role
It is made from water and sand
Types of modern cement
Portland cement
Cement is made by heating limestone (calcium carbonate) with small quantities of other
materials (such as clay) to 1450degC in a kiln in a process known as calcination whereby a
molecule of carbon dioxide is liberated from the calcium carbonate to form calcium oxide
or lime which is then blended with the other materials that have been included in the mix
The resulting hard substance called clinker is then ground with a small amount of gypsum
into a powder to make Ordinary Portland Cement the most commonly used type of cement
(often referred to as OPC)
Portland cement is a basic ingredient of concrete mortar and most non-speciality grout The
most common use for Portland cement is in the production of concrete Concrete is a
composite material consisting of aggregate (gravel and sand) cement and water As a
construction material concrete can be cast in almost any shape desired and once hardened
can become a structural (load bearing) element Portland cement may be gray or whitePortland cement blends
These are often available as inter-ground mixtures from cement manufacturers but similar
formulations are often also mixed from the ground components at the concrete mixing plant
Portland blast furnace cement contains up to 70 ground granulated blast furnace slag
with the rest Portland clinker and a little gypsum All compositions produce high ultimate
8102019 A Study A Study On Financial Performance Analysis With Reference To Kesoram Cementon Financial Performance hellip
httpslidepdfcomreaderfulla-study-a-study-on-financial-performance-analysis-with-reference-to-kesoram 1981
19
strength but as slag content is increased early strength is reduced while sulfate resistance
increases and heat evolution diminishes Used as an economic alternative to Portland
sulfate-resisting and low-heat cements
Portland fly ash cement contains up to 30 fly ash The fly ash is pozzolanic so that
ultimate strength is maintained Because fly ash addition allows lower concrete water
content early strength can also be maintained Where good quality cheap fly ash is
available this can be an economic alternative to ordinary Portland cement
Portland pozzolan cement includes fly ash cement since fly ash is a pozzolan but also
includes cements made from other natural or artificial pozzolans In countries where
volcanic ashes are available (eg Italy Chile Mexico and the Philippines) these cements
are often the most common form in use
Portland silica fume cement Addition of silica fume can yield exceptionally high
strengths and cements containing 5-20 silica fume are occasionally produced However
silica fume is more usually added to Portland cement at the concrete mixer
Masonry cements are used for preparing bricklaying mortars and stuccos and must not be
used in concrete They are usually complex proprietary formulations containing Portland
clinker and a number of other ingredients that may include limestone hydrated lime air
entrainers retarders water proofers and coloring agents They are formulated to yield
workable mortars that allow rapid and consistent masonry work Subtle variations of
Masonry cement in the US are Plastic Cements and Stucco Cements These are designed to
produce controlled bond with masonry blocks
Expansive cements contain in addition to Portland clinker expansive clinkers (usually
sulfoaluminate clinkers) and are designed to offset the effects of drying shrinkage that is
normally encountered with hydraulic cements This allows large floor slabs (up to 60 m
square) to be prepared without contraction joints
White blended cements may be made using white clinker and white supplementary
materials such as high-purity metakaolin
Colored cements are used for decorative purposes In some standards the addition of
pigments to produce colored Portland cement is allowed In other standards (eg ASTM)
pigments are not allowed constituents of Portland cement and colored cements are sold as
blended hydraulic cements
Very finely ground cements are made from mixtures of cement with sand or with slag or
other pozzolan type minerals which are extremely finely ground together Such cements can
8102019 A Study A Study On Financial Performance Analysis With Reference To Kesoram Cementon Financial Performance hellip
httpslidepdfcomreaderfulla-study-a-study-on-financial-performance-analysis-with-reference-to-kesoram 2081
have the same physical characteristics as normal cement but with 50 less cement
particularly due to their increased surface area for the chemical reaction Even with
intensive grinding they can use up to 50 less energy to fabricate than ordinary Portland
cements
Non-Portland hydraulic cements
Pozzolan-lime cements Mixtures of ground Pozzolan and lime are the cements used by the
Romans and are to be found in Roman structures still standing (eg the Pantheon in Rome)
They develop strength slowly but their ultimate strength can be very high The hydration
products that produce strength are essentially the same as those produced by Portland
cement
Slag-lime cements Ground granulated blast furnace slag is not hydraulic on its own but is
activated by addition of alkalis most economically using lime They are similar to
pozzolan lime cements in their properties Only granulated slag (ie water-quenched glassy
slag) is effective as a cement component
Super sulfated cements These contain about 80 ground granulated blast furnace slag
15 gypsum or anhydrite and a little Portland clinker or lime as an activator They produce
strength by formation of ettringite with strength growth similar to a slow Portland cement
They exhibit good resistance to aggressive agents including sulfate
Calcium aluminate cements are hydraulic cements made primarily from limestone and
bauxite The active ingredients are monocalcium aluminate CaAl2O4 (CaO middot Al2O3 or CA in
Cement chemist notation CCN) and mayenite Ca12Al14O33 (12 CaO middot 7 Al2O3 or C12A7 in
CCN) Strength forms by hydration to calcium aluminate hydrates They are well-adapted
for use in refractory (high-temperature resistant) concretes eg for furnace linings
Calcium sulfoaluminate cements are made from clinkers that include yeelimite (Ca4
(AlO2)6SO4 or C4A3 in Cement chemists notation) as a primary phase They are used in
expansive cements in ultra-high early strength cements and in low-energy cements
Hydration produces ettringite and specialized physical properties (such as expansion or
rapid reaction) are obtained by adjustment of the availability of calcium and sulfate ionsTheir use as a low-energy alternative to Portland cement has been pioneered in China
where several million tonnes per year are produced Energy requirements are lower because
of the lower kiln temperatures required for reaction and the lower amount of limestone
(which must be endothermically decarbonated) in the mix In addition the lower limestone
8102019 A Study A Study On Financial Performance Analysis With Reference To Kesoram Cementon Financial Performance hellip
httpslidepdfcomreaderfulla-study-a-study-on-financial-performance-analysis-with-reference-to-kesoram 2181
21
content and lower fuel consumption leads to a CO2 emission around half that associated
with Portland clinker However SO2 emissions are usually significantly higher
Natural Cements correspond to certain cements of the pre-Portland era produced by
burning argillaceous limestones at moderate temperatures The level of clay components in
the limestone (around 30-35) is such that large amounts of belite (the low-early strength
high-late strength mineral in Portland cement) are formed without the formation of
excessive amounts of free lime As with any natural material such cements have highly
variable properties
Geopolymer cements are made from mixtures of water-soluble alkali metal silicates and
aluminosilicate mineral powders such as fly ash and metakaolin
8102019 A Study A Study On Financial Performance Analysis With Reference To Kesoram Cementon Financial Performance hellip
httpslidepdfcomreaderfulla-study-a-study-on-financial-performance-analysis-with-reference-to-kesoram 2281
22
COMPANY PROFILE
8102019 A Study A Study On Financial Performance Analysis With Reference To Kesoram Cementon Financial Performance hellip
httpslidepdfcomreaderfulla-study-a-study-on-financial-performance-analysis-with-reference-to-kesoram 2381
23
Kesoram Cement Industry is one of the leading manufacturers of cement in India It is a day
process cement Plant The plant capacity is 826 lakh tones per annum It is located at
Basanthnagar in Karimnagar district of Andhra Pradesh Basanthnagar is 8 km away from
the Ramagundam Railway station linking Madras to New Delhi The Chairman of the
Company is BKBirla
History
The first unit at Basanthnagar with a capacity of 21 lakh tones per annum
incorporating humble suspension preheated system was commissioner during the year 1969
The second unit was setup in year 1971 with a capacity of 21 lakh tones per annum went on
stream in the year 1978 The coal for this company is being supplied from Singgareni
Collieries and the power is obtained from APSEB The power demand for the factory is
about 21 MW Kesoram has got 2 DG sets of 4 MW each installed in the year 1987
Kesoram Cement has setup a 15 KW captor power plant to facilitate for
uninterrupted power supply for manufacturing of cement at 24th
august 1997 per hour 12
mw actual power is 15 mw
The Company was incorporated on 18th October 1919 under the Indian Companies Act
1913 in the name and style of Kesoram Cotton Mills Ltd It had a Textile Mill at 42
Garden Reach Road Calcutta 700 024 The name of the Company was changed to Kesoram
Industries amp Cotton Mills Ltd on 30th
August 1961 and the same was further changed to Kesoram Industries Limited on 9th July
1986 The said Textile Mill at Garden Reach Road was eventually demerged into a separate
company
The First Plant for manufacturing of rayon yarn was established at Tribeni District
Hooghly West Bengal and the same was commissioned in December 1959 and the second
plant was commissioned in the year 1962 enabling it to manufacture 4635 metric tons perannum (mtpa) of rayon yarn This Unit has 6500 metric tons per annum (mtpa) capacity as
on 3132009
The plant for manufacturing of transparent paper was also set up at the same location at
Tribeni District Hooghly West Bengal in June 1961 It has the annual capacity to
manufacture 3600 metric tons per annum (mtpa) of transparent Paper
8102019 A Study A Study On Financial Performance Analysis With Reference To Kesoram Cementon Financial Performance hellip
httpslidepdfcomreaderfulla-study-a-study-on-financial-performance-analysis-with-reference-to-kesoram 2481
24
The Company diversified into manufacturing of cast iron spun pipes and pipe fittings at
Bansberia District Hooghly West Bengal with a production capacity of 45000 metric tons
per annum (mtpa) of cast iron spun pipes and pipe fittings in December 1964
The Company subsequently diversified into the manufacturing of Cement and in 1969
established its first cement plant under the name Kesoram Cement at Basantnagar Dist
Karimnagar (Andhra Pradesh) and to take advantage of favorable market conditions in
1986 another cement plant known as Vasavadatta Cement was commissioned by it at
Sedam Dist
Gulbarga (Karnataka) The cement manufacturing capacities at both the plants were
augmented from time to time according to the market conditions and as on 3132009
Kesoram Cement and Vasavadatta Cement have annual cement manufacturing capacities of
15 million metric tons and 41 million metric tons respectively
The Company in March 1992 commissioned a plant at Balasore known as Birla Tyres in
Orissa for manufacturing of 10 lakh mtpa automotive tyres and tubes in the first phase in
collaboration with Pirelli Ltd UK a subsidiary company of the world famous Pirelli
Group of Italy - a pioneer in production and development of automotive tyres in the world
The capacity at the said plant was further augmented during the year by 19 MT per day
aggregating to 271 MT per day production facility The Greenfield Project of 257 MT per
day capacity in the State of Uttarakhand with a capex of about Rs760 crores commenced
the commercial production in phases during the financial year 2008-09The Company as on
3132009 had the manufacturing capacities of 371 million tyres 295 million tubes and
153 million flaps per annum in the Plants including at Uttarakhand Plant It has small
manufacturing capacities of various Chemicals at Kharda in the State of West Bengal also
It has the annual manufacturing capacities of 12410 mtpa of Caustic Soda Lye 5045 mtpa
of Liquid Chlorine 6205 mtpa of Sodium Hypochlorite 8200 mtpa of Hydrochloric Acid
3200 mtpa of Ferric Alum 18700 mtpa of Sulphuric Acid and 1620000 m3pa of purified
Hydrogen Gas
The Company is a well-diversified entity in the fields of Cement Tyre Rayon Yarn
Transparent Paper Spun Pipes and Heavy Chemicals with two core business segments ie
Cement and Tyres
8102019 A Study A Study On Financial Performance Analysis With Reference To Kesoram Cementon Financial Performance hellip
httpslidepdfcomreaderfulla-study-a-study-on-financial-performance-analysis-with-reference-to-kesoram 2581
25
In Spun Pipes amp Foundries a unit of the Company work suspended from 2nd May 2008
still commences till further notice
The Company as of now is listed on three major Stock Exchanges in India ie Bombay
Stock Exchange Ltd Mumbai Calcutta Stock Exchange Association Ltd Kolkata and
National Stock Exchange of India Ltd Mumbai and at the Societe de la Bourse de
Luxembourg Luxembourg
A further expansion upto 165 million tons of cement per annum in Vasavadatta Cement at
Sedam in Karnataka as unit IV at the same site is in progress with a 175 MW Captive
Power Plant involving a capital expenditure of about Rs 78350 crores (including the cost
of Captive Power Plant)
The commercial production of cement in the aforesaid unit IV has commenced in June
2009 The work for the further expansion in the Tyres Section at Uttarakhand for radial
tyres with 100 MT per day capacity and bias tyres with 125 MT per day capacity involving
an estimated aggregate capital outlay of about Rs 840 crores is under progress The Board
has further approved a Motor Cycle Tyre Project of 70 MT per day capacity at the same site
involving a capital outlay of Rs190 crore The civil construction of both the Projects is in
full swing The commercial production in both the Projects is likely to start by December
2009 January 2010
Birla Supreme in popular brand of Kesoram cement from its prestigious plant of
Basantnagar in AP which has outstanding track record In performance and productivity
serving the nation for the last two and half decades It has proved its distinction by bagging
several national awards It also has the distinction of achieving optimum capacity
utilization
Kesoram offers a choice of top quality portioned cement for light heavy
constructions and allied applications Quality is built every fact of the operations
The plant lay out is rational to begin with The limestone is rich in calcium
carbonate a key factor that influences the quality of final product The day process
technology uses in the latest computerized monitoring overseas the manufacturing process
Samples are sent regularly to the bureau of Indian standards National council of
construction and building material for certification of derived quality norms
8102019 A Study A Study On Financial Performance Analysis With Reference To Kesoram Cementon Financial Performance hellip
httpslidepdfcomreaderfulla-study-a-study-on-financial-performance-analysis-with-reference-to-kesoram 2681
26
The company has vigorously undertaking different promotional measures for
promoting their product through different media which includes the use of news papers
magazine hoarding etc
Kesoram cement industry distinguished itself among all the cement factories in
Indian by bagging the National Productivity Award consecutively for two years ie for the
year 1985-1987 The federation of Andhra Pradesh Chamber amp Commerce and Industries
(FAPCCI) also conferred on Kesoram Cement An award for the best industrial promotion
expansion efforts in the state for the year 1984 Kesoram also bagged FAPCCI awarded for
ldquoBest Family Planning Effort in the staterdquo for the year 1987-1988
One among the industrial giants in the country today serving the nation on the
industrial front Kesoram industry ltd has a checked and eventful history dating back to the
twenties when the Industrial House of Birlarsquos acquired it With only a textile mill under its
banner 1924 it grew from strength to strength and spread its activities to newer fields like
Rayon Transparent paper pipes Refractors tyres and other products
Looking to the wide gap between the demand and supply of vital commodity
cement which play in important role in National building activity the Government of India
had de-licensed the cement industry in the year 1966 with a review to attract private
entrepreneur to augment the cement production Kesoram rose to the occasions and divided
to set up a few cement plants in the country
Kesoram cement undertaking marketing activities extensively in the state of Andhra
Pradesh Karnataka Tamilnadu Kerala Maharashtra and Gujarat In AP sales Depts are
located in different areas like Karimnagar Warangal Nizamabad Vijayawada and Nellore
In other states it has opened around 10 depots
The market share of Kesoram Cement in AP is 705 The market share of the
company in various states is shown as under
STATES MARKET SHARE
Karnataka 409
Tamilnadu 094
Kerala 029
Maharashtra 281
8102019 A Study A Study On Financial Performance Analysis With Reference To Kesoram Cementon Financial Performance hellip
httpslidepdfcomreaderfulla-study-a-study-on-financial-performance-analysis-with-reference-to-kesoram 2781
27
Process and Quality Control
It has been the endeavor of Kesoram to incorporate the Worldrsquos latest technology in
the plant and today the plant has the most sophisticated
X-ray analysis
Fully computerized XRF and XRD X-RAY Analyzers keep a constant round the
clock vigil on quality
Supreme performance
One of the largest Cement Plants in Andhra Pradesh the plant incorporate the latest
technology in Cement - making
It is professionally managed and well established Cement Manufacturing Company
enjoying the confidence of the consumers Kesoram has outstanding track record in
performance and productivity with quite a few national and state awards to its credit
BIRLA SUPREME the 43 Grade Cement is a widely accepted and popular brand
in the market commanding a premium
However to meet the specific demands of the consumer Kesoram bought out the 53
grade BIRLA SUPREME ndash GOLD which has special qualities like higher fineness quick-
setting high compressive strength and durability
Supreme Strength
Kesoram Cement has huge captive Limestone Deposits which make it possible tofeed high- grade limestone consistently its natural Grey colour is anion- born ingredient
and gives good shade
Both the products offered by Kesoram ie BIRLA SUPREME-43 Grade and
BIRLA SUPREME-GOLD-53 Grade cement are outstanding with much higher
compressive strength and durability
The following characteristics show their distinctive qualities
Comprehensive
Strength
Opc 43
grls 8112
1989
Birla
Supreme 43
grade
Opc 43 gr
Is 1226987
Birla
Supreme
Gold 53 gr
3 days mpa Min 23 31 + Min 27 38+
7 days mpa Min 23 42+ Min 37 48+
28 days mpa Min 43 50+ Min 53 60+
8102019 A Study A Study On Financial Performance Analysis With Reference To Kesoram Cementon Financial Performance hellip
httpslidepdfcomreaderfulla-study-a-study-on-financial-performance-analysis-with-reference-to-kesoram 2881
28
DC SYSTEM
Clinker making process is a key step in the overall cement making process In the case of
BIRLA SUPREMEGOLD the clinker-making process is totally computer control The
Distributed Control System (DCS) constantly monitors the process and ensures operating
efficiency This eliminates variation and ensures consistency in the quality of Clinker
Physical Characteristics
Ope 43
Is 8 112-89
Birla
Supreme
43 grade
Ope 53 gr
Is 12269-87
Birla Supreme
Gold 53 gr
Setting time Min30 120-180 Min 30 130-170
a Initial (mats) Max 600 180-240 Max 600 170-220
b final (mats) Min 225 270-280 Min 225 300-320
Fincncssm 2Kg Max 10 10-20 Max 10 05-10
Soundness Max 08 004-008 Max 0080 004-02
a le-chart (mm)
b autoclave ()
Supreme Expertise
The Best Technical Team exclusive to Kesoram mans the Plant and monitors the process
to blend the cement in just the required proportions to make BIRLA SUPREMEGOLD OF
Rock Strength
18 Million Tones of Solid Foundation
Staying at the top for over a Quarter Century Quarter Century is no less an achievement
Infact Kesoram is synonymous with for over 28 years
Over the years Kesoram has dispatched 18 million tones of cement to the nook and cornersof the country and joined hands in strengthening the Nation No one else in Andhra Pradesh
has this distinction The prestigious World Bank aided Ramagundam Super Thermal Power
Project of NTPC and Mannair Dam of Pochampad project in AP arc a couple of projects for
which Kesoram Cement was exclusively uses to cite an example
8102019 A Study A Study On Financial Performance Analysis With Reference To Kesoram Cementon Financial Performance hellip
httpslidepdfcomreaderfulla-study-a-study-on-financial-performance-analysis-with-reference-to-kesoram 2981
29
Chemical Characteristics
Opc 43 gr
Is 81 132-989
Birla
Supreme
43 grade
Ope 53 gr
Is 12269-
87
Birla
Supreme
Gold 53 gr
Loss on inflection Max 5 lt16 Max 40 lt15
Insoluble residue Max 20 lt08 Max 20 lt 06
Magnesium oxide Max 60 lt 13 Max 60 lt 13
Lime saturation factor 066-102 08-09 08-102 088-09
Alumna iron ratio MinO66 15-17 MinO66 15-17
Sulfuric anhydride Max 253 16-20 Max 2 53 16-20
Alkalis Chlorides Max 005 Max 001 Max 005 Max 04
Kesoram Cement - advantages
Helps in designing sleeker and more elegant
Structures giving greater flexibility in design concept
Due to its fine quality super fine construction can be achieved Its gives maximum
strength at Minimum use of cement with water in the water cement ratio especially the 53
grade Birlas supreme-gold
Feathers in Kesorams cap
Kesoram has outstanding track record achieving over 100 capacity utilization I
productivity and energy conservation It has proved its distinction by bagging several
national and state awards noteworthy being
NATIONAL
1 National productivity award for 1985-86
2 National productivity award for 1986-87
3 National award for mines safety for 1985-86
4 National award for mines safety for 1986-875 National award for energy conservation 1989-90
8102019 A Study A Study On Financial Performance Analysis With Reference To Kesoram Cementon Financial Performance hellip
httpslidepdfcomreaderfulla-study-a-study-on-financial-performance-analysis-with-reference-to-kesoram 3081
30
STATE
1 AP State productivity award for 1988
2 State award for best industrial management 1988-89
3 Best industrial productivity award of FAPCCI (federation of AP chamber of
commerce and industry) 1991
4 Best management award of the state Govt 1993
5 FAPCCI award for the workers welfare 1995-96
ISO 9002
All quality systems of Kesoram have been certified under ISO 90021S 4002 which
proves the worldwide acceptance of the products
All quality systems in production and marketing of the product have been certified by BIS
under ISO 90021S 14002
The first unit was installed at basanthnagar with a capacity of 25 ndashlakhs TPA (tones per
annum) incorporating humble supervision preheated system during the year 1969
The second unit followed suit with added a capacity of 2 lakhs TPA in 1971
The plant was further expanded to 9 lakhs by adding 25 lakhs tones in august 1978 113
lakhs tones in January 1981 and 087 lakhs tones in September 1981
Power
Singareni collieries make the supply of coal for this industry and the power was
obtained from AP TRANSCO The power demand for the factory is about 21MW Kesoram
has got 2-diesel generator seats of 4 MW each installed in the year 1987
Kesoram cement now has a 15MWcaptive power plant to facilities for uninterrupted
power supply for manufacturing of cement
Performance
The performance of kersoram cement industry has been outstanding achieving over
cent percent capacity utilization all through despite many odds like power cuts and which
most 40 was wasted due to wagon shortage etc
The company being a continuous process industry works round the clock and has
excellent records of performance achieving over 1005 capacity utilization
Kesoram has always combined technical progress with industrial performance The
company had glorious track record for the last 27 years in the industry
Technology
8102019 A Study A Study On Financial Performance Analysis With Reference To Kesoram Cementon Financial Performance hellip
httpslidepdfcomreaderfulla-study-a-study-on-financial-performance-analysis-with-reference-to-kesoram 3181
31
Kesoram cement uses most modern technology and the computerized control in the
plant A team of dedicated and well- experienced experts manages the plant
The quality is maintained much above the bureau of Indian standards
The raw materials used for manufacturing cement are
Lime stone
Bauxite
Hematite
Gypsum
Environmental and Social Obligations
For environmental promotion and to keep ndashup the ecological balance this section
has planted over two lakhs trees on social obligation front this section has undertaken
various social welfare programs by adopting ten nearly villages organizing family welfare
campus surgical camps animal health camps blood donation camps children immunization
camps seeds training for farmers etc were arranged
Welfare and Recreation Facilities
For the purpose of recreation facilities 2 auditoriums were provided for playing
indoor games cultural function and activities like drama music and dance etc
The industry has provided libraries and reading rooms About 1000 books are available in
the library All kinds of newspaper magazines are made available
Canteen is provided to cater to the needs of the employees for supply of snacks tea
coffee and meals etc
One English medium and one Telugu medium school are provided to meet the
educational requirements
The company has provided a dispenser with a qualified medical office and
paramedical staff for the benefit of the employees The employees covered under ESI
scheme have to avail the medical facilities from the ESI hospital
Competitions in sports and games are conducted every year for august 15th
Independence Day and January 26th republic day among the employees
Electricity
The power consumption per ton of cement has come down to 108 units against 113
units last year due to implementation of various energy saving measures The performance
of captive power plant of this section continues to be satisfactory Total power generation
8102019 A Study A Study On Financial Performance Analysis With Reference To Kesoram Cementon Financial Performance hellip
httpslidepdfcomreaderfulla-study-a-study-on-financial-performance-analysis-with-reference-to-kesoram 3281
32
during the year was 84 million units last year This captive power plant is a major role in
keeping power costs with in economic levels
The management has introduced various HRD programs for training and
development and has taken various other measures for the betterment of employeersquos
efficiency
The section has installed adequate air pollution control system and equipment and is
ISO14001 such as Environment management system is under implementation
Awards
Kesoram cement bagged many prestigious awards including national awards for
productivity technology conservation and several state awards since 1984 The following
are the some of important awards
AWARDS OF KESORAM CEMENT
No Year Awards
National
State
1 1989-90 Management award community
Development
State
2 1991 Energy conservation may day award of the
Govt
State
3 1991 Pundit Jawaharlal Nehru rolling trophy for
best
State
4 1993 National productivity effort Indira Gandhi
national award
State
5 1994 Best management award State
6 1994-
1995
Best industrial rebellion award State
7 1995 Rural development by chief minister
Environment and mineral conservation
award
State
8 1995 Best industrial rebellion award State
8102019 A Study A Study On Financial Performance Analysis With Reference To Kesoram Cementon Financial Performance hellip
httpslidepdfcomreaderfulla-study-a-study-on-financial-performance-analysis-with-reference-to-kesoram 3381
33
9 1995-
1996
Best effort of an industrial unit to
development rural economy shriSRRungta
award for social
National
10 1996 Awareness for best rural development
efforts
State
11 1999 Best workers welfare best family welfare
award
State
12 2001 First prize for mine environment amppollution
control for the 3rd
year in succession
State
13 2002 Vana mithra award from AP Govt State
14 2003 Company has got OHSAS-18001 State
15 2005 Certification from DNV New Delhi State
16 2006 Award for pollution control and
environmental protection FAPCCI award
for best rural development in the state
State
8102019 A Study A Study On Financial Performance Analysis With Reference To Kesoram Cementon Financial Performance hellip
httpslidepdfcomreaderfulla-study-a-study-on-financial-performance-analysis-with-reference-to-kesoram 3481
34
Products of the organization
8102019 A Study A Study On Financial Performance Analysis With Reference To Kesoram Cementon Financial Performance hellip
httpslidepdfcomreaderfulla-study-a-study-on-financial-performance-analysis-with-reference-to-kesoram 3581
35
CHAPTER-III
LITERATURE REVIEW
8102019 A Study A Study On Financial Performance Analysis With Reference To Kesoram Cementon Financial Performance hellip
httpslidepdfcomreaderfulla-study-a-study-on-financial-performance-analysis-with-reference-to-kesoram 3681
36
Introduction
Financial Performance Analysis
The term lsquofinancial performance analysis also known as analysis and interpretation of
financial statementsrsquo refers to the process of determining financial strength and
weaknesses of the firm by establishing strategic relationship between the items of the
balance sheet profit and loss account and other operative data
ldquoAnalyzing financial statementsrdquo by Metcalf and Titard
ldquoFinancial analysis is a process of evaluating the relationship between component
parts of a financial statement to obtain a better understanding of a firms position and
performancerdquo by Myers
Financial Performance
The word lsquoPerformance is derived from the word lsquoparfourmenrsquo which means lsquoto dorsquo lsquoto
carry outrsquo or lsquoto renderrsquo It refers the act of performing execution accomplishment
fulfillment etc In border sense performance refers to the accomplishment of a given task
measured against preset standards of accuracy completeness cost and speed In other
words it refers to the degree to which an achievement is being or has been accomplished In
the Words of Frich Kohlar ldquoThe performance is a general term applied to a part or to all the
conducts of activities of an organization over a period of time often with reference to past or
projected cost efficiency management responsibility or accountability or the like Thus not
just the presentation but the quality of results achieved refers to the performance
Performance is used to indicate firmrsquos success conditions and compliance
Financial performance refers to the act of performing financial activity In broader
sense financial performance refers to the degree to which financial objectives being or has
been accomplished It is the process of measuring the results of a firms policies and
operations in monetary terms It is used to measure firms overall financial health over a
given period of time and can also be used to compare similar firms across the same industry
or to compare industries or sectors in aggregation
The purpose of financial analysis is to diagnose the information contained in financial
statements so as to Jude the profitability and financial soundness of the firm Just like a
doctor examines his patient by recording his body temperature blood pressure etc Before
8102019 A Study A Study On Financial Performance Analysis With Reference To Kesoram Cementon Financial Performance hellip
httpslidepdfcomreaderfulla-study-a-study-on-financial-performance-analysis-with-reference-to-kesoram 3781
37
making his conclusion regarding the illness and before giving his treatment a financial
analyst analysis the financial statements with various tools of analysis before commenting
upon the financial health or weaknesses of an enterprise
The analysis and interpretation of financial statements is essential to bring out the
mystery behind the figures in financial statements Financial statements analysis is an
attempt to determine the significance and meaning of the financial statement data so that
forecast may be made of the future earnings ability to pay interest and debt maturities (both
current and long term) and profitability of a sound divided policy
Types of financial analysis-
Financial analysis into different categories depending upon
(1) The material used and
(2) The method of operation followed in the analysis or the modus operandi of
analysis
Types of financial analysis
On the basis of material used on the basis of modus operandi
External Internal Horizontal Vertical
Analysis Analysis Analysis Analysis
1 On the basis of material used - According to material used financial analysis canbe of two types
External analysis
Internal analysis
External analysis-
This analysis is done by outsiders who do not have access to the detailed internal
outsiders include investors potential investors Creditors Potential Creditors Government
Agencies Credit Agencies and General Public For financial analysis these external parties
to the firm depend almost entirely on the published financial statements
Internal analysis-
This analysis is undertaken by the persons namely executives and employees of the
organization or by the officers appointed by government or court who have access to the
8102019 A Study A Study On Financial Performance Analysis With Reference To Kesoram Cementon Financial Performance hellip
httpslidepdfcomreaderfulla-study-a-study-on-financial-performance-analysis-with-reference-to-kesoram 3881
38
books of account ( internal accounting records) and other information related to the
business
2 983119983150 983156983144983141 983138983137983155983145983155 983151983142 983149983151983140983157983155 983151983152983141983154983137983150983140983145983085
According to the modus operandi financial analysis can also be of two types
a Horizontal analysis
bVertical analysis
Horizontal analysis-
Horizontal analysis refers to the comparison of financial data of a company for several
years The figures for this type of analysis are presented horizontally over a number of
columns The figures of the various years are compared with standard or base year a base
year is year chosen as beginning point This type of analysis is also called lsquodynamicanalysisrsquo as it is based on the data from year to year rather than on data of any one year The
horizontal analysis makes it possible to focus attention on items that have changed
significantly during the period under view
b Vertical analysis-
Vertical analysis refers to the study of relationship of the various items in the financial
statements of one accounting period In this types of analysis the figures from financial
statement of a year are compared with a base selected from the same yearrsquos statement
Methods of financial analysis-
The following methods of analysis are generally used-
1 Comparative Statements
2 Trend Analysis
3 Common-Size Statements
4 Funds flow Analysis
5 Cash Analysis
6 Ratio Analysis
7 Cost-volume-Profit Analysis
8102019 A Study A Study On Financial Performance Analysis With Reference To Kesoram Cementon Financial Performance hellip
httpslidepdfcomreaderfulla-study-a-study-on-financial-performance-analysis-with-reference-to-kesoram 3981
39
Comparative statements-
The comparative financial statements are statements of the financial position at
different periods of time the elements of financial position are show in a
Comparative Statement provides an idea of financial position at two or more
periods Generally two financial statements (balance sheet and income statement) are
prepared in comparative form for financial analysis
The Comparative Statement May Show-
1 Absolute figures (rupee amounts)
2 Changes in absolute figures ie increase or decrease in absolute figures
3 Absolute data in terms of percentages
4 Increase or decrease in terms of percentages
The Two Comparative Statements Are-
1 Comparative balance sheet and
2 Income statement
1 983107983151983149983152983137983154983137983156983145983158983141 983138983137983148983137983150983139983141 983155983144983141983141983156983085
The comparative balance sheet analysis is the study of the trend of the same items group of
items and computed items in two or more balance sheets of the same business enterprise on
different dates The change in periodic balance sheet items reflect the conduct of a business
the change can be observed by comparison of the balance sheet at the beginning and at the
end of a period and these changes can help in forming an opinion about the progress of an
enterprise
Guide Lines for Interpretation of Comparative Balance Sheet-
While interpreting comparative balance sheet the interpreter is expected to study the
following aspects-
1 Current financial position and liquidity position
2 Long-term financial position
3 Profitability of the concern
8102019 A Study A Study On Financial Performance Analysis With Reference To Kesoram Cementon Financial Performance hellip
httpslidepdfcomreaderfulla-study-a-study-on-financial-performance-analysis-with-reference-to-kesoram 4081
40
Common Size Statement-
The common-size statements balance sheet and income statement are show in
analytical percentages The figures are shown as percentages of total assets total liabilities
and total sales The total assets are taken as 100 and different assets are expressed as a
percentage of the total similarly various liabilities are taken as a part of total liabilities
Common Size Balance Sheet-
A statement in which balance sheet items are expressed as the ratio of each asset to
total assets and the ratio of each liability is expressed as a ratio of total liabilities is called
common size balance The common size balance sheet can be used to compare companies
of differing size The comparison of figures in different periods is not useful because total
figures may be affected by a number of factors It is not possible to establish standard norms
for various assets The trends of figures from year to year may not be studied and even they
may not give proper results
Trend Analysis of Balance Sheet-
Trend analysis is Very important tool of horizontal financial analysis
This analysis enables to known the change in the financial function and operating efficiency
in between the time period chosen
By studding the trend analysis of each item we can known the direction of changes and
based upon the direction of changes the options can be changed
Trend =Absolute Value of item in the statement understudy 100
Absolute Value of same item in the base statement
Ratio Analysis
Ratio analysis is used as a technique of analyzing the financial information contained in the
balance sheet and profit and loss accounts for a more meaningful understanding of the
financial position and performance of a firm
The relationship between two accounting figures expressed mathematically is known as a
financial ratio A ratio helps the analyst to make qualitative judgment about the firmrsquos
financial position and performance
Several ratios can be calculated from the accounting data contained in the financial
statements The parties which generally undertake financial analysis is short ndashterm
creditors long-term creditors owner and management In view of the requirements of the
various ratios ratios are classified into the following four important categories
8102019 A Study A Study On Financial Performance Analysis With Reference To Kesoram Cementon Financial Performance hellip
httpslidepdfcomreaderfulla-study-a-study-on-financial-performance-analysis-with-reference-to-kesoram 4181
41
Liquidity ratios
Leverage ratios
Activity ratios
Profitability ratios
Liquidity Ratios
It is extremely essential for a firm to be able to meet its obligations as they become due
Liquidity ratios measure the ability of the firm to meet its current obligations A firm should
ensure that it does not suffer from lack of liquidity and also that it does not have excess
liquidity The failure of a company to meet its obligations due to lack of sufficient liquidity
will result in a poor creditworthiness loss of creditorsrsquo confidence or even in legal tangles
resulting in the closure of the company A very high degree of liquidity is also bad idle
assets earn nothing The firmrsquos funds will be unnecessarily tied up in current assets
Therefore it is necessary to strike a proper balance high liquidity and lack of liquidity
The most common ratios which indicate the extent of liquidity or lack of it are
Current ratio
Quick ratio
Other ratios include Cash ratio Interval Measure and Net working capital ratio
Current Ratio
The current ratio is calculated by dividing current assets by current liabilities
Current assets
Current ratio = --------------------------
Current liabilities
Current ratio is a measure of the firmrsquos short term solvency It indicates the availability of
current assets in rupees for every one rupee of current liability A ratio of greater than one
means that the firm has more current assets than current claims against the Current ratio of
2 to 1 or more is considered satisfactory Current ratio represents a margin of safety for
creditors
Quick Ratio
Quick ratio also known as acid-test ratio establishes a relationship between quick assets and
the current liabilities Cash is the most liquid asset It is calculated by dividing quick assets
by current liabilities
Quick ratio = Quick Assets Current Liabilities
8102019 A Study A Study On Financial Performance Analysis With Reference To Kesoram Cementon Financial Performance hellip
httpslidepdfcomreaderfulla-study-a-study-on-financial-performance-analysis-with-reference-to-kesoram 4281
42
(Quick Assets = Current assets ndash Inventory)
One defect of the current ratio is that it fails to convey any information on the composition
of the current assets of the firm A rupee of cash is considered equivalent to a rupee of
inventory of receivables But it is not so A rupee of cash is more readily available to meet
current liabilities than a rupee of say inventory This implies the usefulness of the current
ratio
The Acid ndashtest ratio measures the firmrsquos ability to convert its current assets quickly into
cash in order to meet its current liabilities
A quick ratio of 1 to 1 is considered to represent a satisfactory current financial condition It
is an important index of the firmrsquos liquidity
Leverage Ratios
Leverage ratios identify the source of a firmrsquos capital ndashowners or outside creditors
Financial leverage refers to the use of debt in financing non-current assets If the return on
assets exceeds the cost of debt the leverage is successful ndash ie it improves return on equity
Debt ndashEquity Ratio
The Debt ndash Equity is determined to analyze the soundness of the long term financial
policies of the organization It is also known as ldquoInternal External Equity Ratiordquo
It is calculated as follows
Debt ndash Equity Ratio = Total long term debt Share holders funds
Equity Ratio
This ratio is also called as proprietary ratio establishes a relationship between share holderrsquos
funds to total assets of company Equity Ratio is calculated by dividing share holders fund
by total assets
Fixed Asset Ratio
This ratio indicates the extent to which the assets of the companyrsquos can be lost without
affecting the interest of the creditors of the company Higher the ratios better the long-term
position of the company
Activity Ratios
They are primarily used for studying a firmrsquos working capital situation A well managed
firm should have good activity ratios
8102019 A Study A Study On Financial Performance Analysis With Reference To Kesoram Cementon Financial Performance hellip
httpslidepdfcomreaderfulla-study-a-study-on-financial-performance-analysis-with-reference-to-kesoram 4381
43
Working Capital Turnover Ratio
The working capital turnover ratio indicates whether or not working capital has been
effectively used in making sales
Working capital turnover = Sales Net current assets
Inventory Turnover Ratio
This ratio also known as Stock Turnover Ratio establishes the relationship between costs of
goods sold or net sales during the given period and the average amt of stock held during the
period This ratio reveals the number of times finished stock in turnover during a given
accounting period
Higher the ratio the better is it because it shows the finished stock is rapidly turned
in to sales On the other hand a low stock turnover ratio is not desirable because it reveals
the accumulation of stock
Debtors Turnover Ratio
This ratio indicates the velocity of debt collection of a company In other words it shows
the number of times average turnover during a year
A Higher Debtor Turnover Ratio indicates a more efficient is the management towards
debtors and low ratio ratio implies inefficient management of debtors
Total Assets Turnover Ratio
The asset turnover ratio indicates how efficiently management is employing Assets
Total Assets Turnover Ratio = Sales Total Assets
Profitability Ratios
Profitability ratios are the ratios which measure a firmrsquos overall effectiveness as revealed by
the returns generated on sales and investment
General Profitability Ratios
1 Gross Profit Ratio
2 Net profit Ratio
3 Operating or Expenses Ratio
8102019 A Study A Study On Financial Performance Analysis With Reference To Kesoram Cementon Financial Performance hellip
httpslidepdfcomreaderfulla-study-a-study-on-financial-performance-analysis-with-reference-to-kesoram 4481
44
Gross Profit Ratio
Gross profit Ratio measures the relationships to net sales and is usually represented as a
percentage It is a good measure of profitability
The gross profit ratio indicates the extent to which selling price of goods per unit may
decline without resulting in losses on operation Higher the gross profit betters the result
Net Profit Ratio
Net Profit Ratio indicates net margin on sales It is given by the following equation
Net Profit Ratio = (Net Profit Sales) 100
Operating or Expenses Ratio
This ratio is complimentary of Net Profit Ratio The more the net profit the less the
Operating Ratio Operating costs include the cost of direct materials direct labors and otheroverheads viz are generally excluded from operating costs A comparison of the Operating
Ratio will indicate whether the cost efficiency is high or low in the figure of sales This less
the ratio it depicts the efficiency of the management
8102019 A Study A Study On Financial Performance Analysis With Reference To Kesoram Cementon Financial Performance hellip
httpslidepdfcomreaderfulla-study-a-study-on-financial-performance-analysis-with-reference-to-kesoram 4581
45
CHAPTER IV
DATA ANALYSIS amp INTERPRETATION
8102019 A Study A Study On Financial Performance Analysis With Reference To Kesoram Cementon Financial Performance hellip
httpslidepdfcomreaderfulla-study-a-study-on-financial-performance-analysis-with-reference-to-kesoram 4681
46
Comparative Balance Sheet of Kesoram in the Year between 2008-2009
(Rupee in crores)
Years Changes
Particulars 2008 2009 In Rupees In Percentage
Liabilities
Share Capital 4574 4574 000 000
Reserves amp Surplus 93085 128024 34939
Revaluation Reserves 533 412 -121 -2270
Loans
Secured Loans 97106 153627 56521 5821
Un Secured Loans 12129 43416 31287 25795
Deferred Tax Liabilities 000 000 000 000
Current Liabilities
Provisions 33039 34529 1490 451
Current Liabilities 57067 66587 9520 1668
Total 297533 431169 133636 4491
Assets
Net Block 108424 180435 72011 6642
Capital Wip 63459 86485 23026 3628
Investments 4783 6178 1395 2917
Current Assets
Inventories 44217 58906 14689 3322
Sundry Debtors 27307 38017 10710 3922
Cash amp Bank Balances 4036 5657 1621 4016
Total Current Assets 75560 102580 27020 3576
Loans amp Advances 45289 55462 10173 2246
Fixed Deposits 018 028 010 5556
Total 297533 431169 133636 4491
8102019 A Study A Study On Financial Performance Analysis With Reference To Kesoram Cementon Financial Performance hellip
httpslidepdfcomreaderfulla-study-a-study-on-financial-performance-analysis-with-reference-to-kesoram 4781
47
Interpretation of comparative balance sheet of 2008-2009
Reserves amp Surplus were increased to 3753 (percent) ie in Rupees 34939
crores
Revaluation Reserves decreased to 121 ie in Rupees 2270 crores
Secured Loans are increased to 5821 ie in Rupees 56521 crores And UN
secured loans highly Increased to 25795
Current liabilities and Provisions are increased to 1668 and 451 respectively ie in
Rupees 9520 amp 1490 crores
Fixed assets were highly increased to 6642 ie in Rupees 72011 crores
Investments were increased to 2917 ie in Rupees 1395 crores
Sundry debtors increased to 3922 ie in Rupees 10710 crores
Current assets increased 3576 ie in Rupees 27020 crores And Loans amp
Advances increased to 2246 respectively
The overall financial position was satisfactory
8102019 A Study A Study On Financial Performance Analysis With Reference To Kesoram Cementon Financial Performance hellip
httpslidepdfcomreaderfulla-study-a-study-on-financial-performance-analysis-with-reference-to-kesoram 4881
48
Comparative Balance Sheet of Kesoram in the Year between 2009-2010
(Rupees in crores)
Years Changes
Particulars 2009 2010 In Rupees In Percentage
Liabilities
Share Capital 4574 4574 000 000
Reserves amp Surplus 128024 149111 21087 1647
Revaluation Reserves 412 339 -073 -1772
Loans
Secured Loans 153627 186372 32745 2131
Un Secured Loans 43416 126250 82834 19079
Deferred Tax Liabilities 000 000 000
Current Liabilities
Provisions 34529 35734 1205 349
Current Liabilities 66587 107688 41101 6173
Total 431169 610068 178899 4149
Assets
Net Block 180435 343182 162747 9020
Capital WIP 86485 41283 -45202 -5227
Investments 6178 5143 -1035 -1675
Current Assets
Inventories 58906 91619 32713 5553
Sundry Debtors 38017 54289 16272 4280
Cash amp Bank Balances 5657 8014 2357 4167
Total Current Assets 102580 153922 51342 5005
Loans amp Advances 55462 66506 11044 1991
Fixed Deposits 028 031 003 1071
Total 431169 610068 178899 4149
8102019 A Study A Study On Financial Performance Analysis With Reference To Kesoram Cementon Financial Performance hellip
httpslidepdfcomreaderfulla-study-a-study-on-financial-performance-analysis-with-reference-to-kesoram 4981
49
Interpretation of comparative balance sheet of 2009-2010
Reserves amp surplus increased to 1647 ie in Rupees 21087 crores
Revaluation Reserves decreased to 1772 ie in Rupees 073 crores
Secured loans increased to 2131 ie in Rupees 32745 crores
Current Liabilities were increased to 6173 ie in Rupees 41101 crores and
Provisions 349 ie in Rupees 1205 crores
Fixed Assets were increased to 9020 ie in Rupees 162747 crores
Investments were decreased to 1675 ie in Rupees 1035 crores
Sundry debtors were increased to 4280 ie in Rupees 16272 crores
Current assets increased to 5005 ie in Rupees 51342 crores And loans and
Advances increased 1919 ie in Rupees 11044 crores
The overall financial position was satisfactory
8102019 A Study A Study On Financial Performance Analysis With Reference To Kesoram Cementon Financial Performance hellip
httpslidepdfcomreaderfulla-study-a-study-on-financial-performance-analysis-with-reference-to-kesoram 5081
50
Comparative Balance Sheet of Kesoram in the Year between 2010-2011
(Rupees in crores)
Years Changes
Particulars 2010 2011 In Rupees In Percentage
Liabilities
Share Capital 4574 4574 000 000
Reserves amp Surplus 149111 125162 -23949 -1606
Revaluation Reserves 339 289 -050 -1475
Loans
Secured Loans 186372 237183 50811 2726
Un Secured Loans 126250 162744 36494 2891
Deferred Tax Liabilities 000 000 000
Current Liabilities
Provisions 35734 1494 -34240 -9582
Current Liabilities 107688 113902 6214 577
Total 610068 645348 35280 578
Assets
Net Block 343182 369172 25990 757
Capital WIP 41283 43781 2498 605
Investments 5143 6582 1439 2798
Current Assets
Inventories 91619 111855 20236 2209
Sundry Debtors 54289 63134 8845 1629
Cash amp Bank Balances 8014 7188 -826 -1031
Total Current Assets 153922 182177 28255 1836
Loans amp Advances 66506 43460 -23046 -3465
Fixed Deposits 031 176 145 46774
Total 610068 645348 35280 578
8102019 A Study A Study On Financial Performance Analysis With Reference To Kesoram Cementon Financial Performance hellip
httpslidepdfcomreaderfulla-study-a-study-on-financial-performance-analysis-with-reference-to-kesoram 5181
51
Interpretation of comparative balance sheet of 2010-2011
Reserves amp surplus decreased to 1606 ie in Rupees 23949 crores
Revaluation Reserves decreased to 1475 ie in Rupees 050 crores
Secured loans increased to 2726 ie in Rupees 50811 crores
Current Liabilities were increased to 577 ie in Rupees 6214 crores
Provisions decreased to 9582 ie in Rupees 34240 crores
Fixed Assets were increased to 757 ie in Rupees 25990 crores
Investments were decreased to 2798 ie in Rupees 1439 crores
Sundry debtors were increased to 1629 ie in Rupees8845 crores
Current assets increased to 1836 ie in Rupees 28255 crores And loans and
Advances increased 3465 ie in Rupees 23046 crores
The overall financial position was UN satisfactory
8102019 A Study A Study On Financial Performance Analysis With Reference To Kesoram Cementon Financial Performance hellip
httpslidepdfcomreaderfulla-study-a-study-on-financial-performance-analysis-with-reference-to-kesoram 5281
52
Comparative Balance Sheet of Kesoram In The Year Between 2011-2012
(Rupees in crores)
Years Changes
Particulars 2011 2012 In Rupees In Percentage
Liabilities
Share Capital 4574 4574 000 000
Reserves amp Surplus 125162 86657 -38505 -3076
Revaluation Reserves 289 270 -019 -657
Loans
Secured Loans 237183 317792 80609 3399
Un Secured Loans 162744 92742 -70002 -4301
Deferred Tax Liabilities 000 000 000
Current Liabilities
Provisions 1494 40726 39232 262597
Current Liabilities 113902 180010 66108 5804
Total 645348 722771 77423 1200
Assets 000
Net Block 369172 358721 -10451 -283
Capital WIP 43781 68065 24284 5547
Investments 6582 6636 054 082
Current Assets
Inventories 111855 99516 -12339 -1103
Sundry Debtors 63134 67358 4224 669
Cash amp Bank Balances 7188 6959 -229 -319
Total Current Assets 182177 173833 -8344 -458
Loans amp Advances 43460 115409 71949 16555
Fixed Deposits 176 107 -069 -3920
Total 645348 722771 77423 1200
8102019 A Study A Study On Financial Performance Analysis With Reference To Kesoram Cementon Financial Performance hellip
httpslidepdfcomreaderfulla-study-a-study-on-financial-performance-analysis-with-reference-to-kesoram 5381
53
Interpretation of comparative balance sheet of 2011-2012
Reserves amp surplus decreased to 3076 ie in Rupee 38505 crores
Revaluation Reserves decreased to 657 ie in Rupees 019 crores
Secured loans increased to 3399 ie in Rupees 80699 crores
Current Liabilities were increased to 5804 ie in Rupees 66108 crores
Provisions increased to 262597 ie in Rupees 39232 crores
Fixed Assets were decreased to 283 ie in Rupee 10451 crores
Investments were increased to 082 ie in Rupees 054 crores
Sundry debtors were increased to 669 ie in Rupees 4224 crores
Current assets decreased to 458 ie in Rupees 8344 crores And loans and
Advances increased 16555 ie in Rupees 71949 crores
The overall financial position was UN satisfactory
8102019 A Study A Study On Financial Performance Analysis With Reference To Kesoram Cementon Financial Performance hellip
httpslidepdfcomreaderfulla-study-a-study-on-financial-performance-analysis-with-reference-to-kesoram 5481
54
Common Size Balance Sheet of Kesoram For The Year 2008-2009
(Rupees in crores)
Particulars 2008 Change Percentage 2009 Change Percentage
Liabilities
Share Capital 4574 154 4574 106
Reserves amp Surplus 93085 3129 128024 2969
Revaluation Reserves 533 018 412 010
Loans
Secured Loans 97106 3264 153627 3563
Un Secured Loans 12129 408 43416 1007
Deferred Tax Liabilities 000 000 000 000
Current Liabilities
Provisions 33039 1110 34529 801
Current Liabilities 57067 1918 66587 1544
Total 297533 10000 431169 10000
Assets
Net Block 108424 3644 180435 4185
Capital WIP 63459 2133 86485 2006
Investments 4783 161 6178 143
Current Assets
Inventories 44217 1486 58906 1366
Sundry Debtors 27307 918 38017 882
Cash amp Bank Balances 4036 136 5657 131
Loans amp Advances 45289 1522 55462 1286
Fixed Deposits 018 001 028 001
Total 297533 10000 431169 10000
8102019 A Study A Study On Financial Performance Analysis With Reference To Kesoram Cementon Financial Performance hellip
httpslidepdfcomreaderfulla-study-a-study-on-financial-performance-analysis-with-reference-to-kesoram 5581
55
Interpretation of Common Size Balance Sheet of 2008-2009
Share capital was recorded 154 percent in the total liabilities in the year 2008 it is
decreased to 106 in the year 2009
Reserves amp surplus contributed to 3129 in the total liabilities in the year 2008 it is
decreased to 2969 in the year 2009
Secured loans were 3264 in the total liabilities in the year 2008 it is increased to
3563 in the year 2009
Current Liabilities shown to 1918 in the total liabilities in the year 2008 it is
decreased to 1544 in the year 2009
Provisions 1110 in the total liabilities in the year 2008 it is decreased to 801 in the
year 2009
Fixed Assets were 3644 in the total liabilities in the year 2008 ie decreased to 4185
in the year 2009
Investments were 161 in the total liabilities in the year 2008 it is decreased to 143
in the year 2009
Sundry debtors were 918 in the total liabilities in the year 2008 it is decreased to 882
in the year 2009
8102019 A Study A Study On Financial Performance Analysis With Reference To Kesoram Cementon Financial Performance hellip
httpslidepdfcomreaderfulla-study-a-study-on-financial-performance-analysis-with-reference-to-kesoram 5681
56
Common Size Balance Sheet of Kesoram For The Year 2009-2010
(Rs in crores)
Particulars 2009 Change Percentage 2010Change
Percentage
Liabilities
Share Capital 4574 106 4574 075
Reserves amp Surplus 128024 2969 149111 2444
Revaluation Reserves 412 010 339 006
Loans
Secured Loans 153627 3563 186372 3055
Un Secured Loans 43416 1007 126250 2069
Deferred Tax Liabilities 000 000 000 000
Current Liabilities
Provisions 34529 801 35734 586
Current Liabilities 66587 1544 107688 1765
Total 431169 10000 610068 10000
Assets
Net Block 180435 4185 343182 5625
Capital WIP 86485 2006 41283 677
Investments 6178 143 5143 084
Current Assets
Inventories 58906 1366 91619 1502
Sundry Debtors 38017 882 54289 890
Cash amp Bank Balances 5657 131 8014 131
Loans amp Advances 55462 1286 66506 1090
Fixed Deposits 028 001 031 001
Total 431169 10000 610068 10000
8102019 A Study A Study On Financial Performance Analysis With Reference To Kesoram Cementon Financial Performance hellip
httpslidepdfcomreaderfulla-study-a-study-on-financial-performance-analysis-with-reference-to-kesoram 5781
57
Interpretation of common size balance sheet of 2009-2010
Share capital was recorded 106 percent in the total liabilities in the
year 2009 it is decreased to 075 in the year 2010
Reserves amp surplus contributed to 2969 in the total liabilities in the
year 2009 it is decreased to2444 in the year 2010
Secured loans were 3563 in the total liabilities in the year 2009 it is
increased to 3055 in the year 2010
Current Liabilities shown to 1544 in the total liabilities in the year
2009 it is decreased to 1765 in the year 2010
Provisions 801 in the total liabilities in the year 2009 it is decreased
to 586 in the year 2010
Fixed Assets were 4185 in the total liabilities in the year 2009 ie
increased to 5625 in the year 2010
Investments were 143 in the total liabilities in the year 2009 it is
decreased to 084 in the year 2010
Sundry debtors were 882 in the total liabilities in the year 2009 it is
increased to 890 in the year 2010
8102019 A Study A Study On Financial Performance Analysis With Reference To Kesoram Cementon Financial Performance hellip
httpslidepdfcomreaderfulla-study-a-study-on-financial-performance-analysis-with-reference-to-kesoram 5881
58
Common Size Balance sheet of Kesoram for the year 2010-2011
983080Rupees in crores)
Particulars 2010 Change Percentage 2011
Change
Percentage
Liabilities
Share Capital 4574 075 4574 071
Reserves amp Surplus 149111 2444 125162 1939
Revaluation Reserves 339 006 289 004
Loans
Secured Loans 186372 3055 237183 3675
Un Secured Loans 126250 2069 162744 2522
Deferred Tax Liabilities 000 000 000 000
Current Liabilities
Provisions 35734 586 1494 023
Current Liabilities 107688 1765 113902 1765
Total 610068 10000 645348 10000
Assets
Net Block 343182 5625 369172 5721
Capital WIP 41283 677 43781 678
Investments 5143 084 6582 102
Current Assets
Inventories 91619 1502 111855 1733
Sundry Debtors 54289 890 63134 978
Cash amp Bank Balances 8014 131 7188 111
Loans amp Advances 66506 1090 43460 673
Fixed Deposits 031 001 176 003
Total 610068 10000 645348 10000
8102019 A Study A Study On Financial Performance Analysis With Reference To Kesoram Cementon Financial Performance hellip
httpslidepdfcomreaderfulla-study-a-study-on-financial-performance-analysis-with-reference-to-kesoram 5981
59
Interpretation of Common Size Balance Sheet Of 2010-2011
Share capital was recorded 075 percent in the total liabilities in the year 2010 it is
decreased to 071 in the year 2011
Reserves amp surplus contributed to 2444 in the total liabilities in the year 2010 it is
decreased to1939 in the year 2011
Secured loans were 3055 in the total liabilities in the year 2010 it is increased to
3675 in the year 2011
Current Liabilities shown to 1765 in the total liabilities in the year 2010 it is
also1765 in the year 2011
Provisions 586 in the total liabilities in the year 2010 it is decreased to 023 in the
year 2011
Fixed Assets were 5625 in the total liabilities in the year 2010 ie increased to 5721
in the year 2011
Investments were 084 in the total liabilities in the year 2010 it increased to 102 in
the year 2011
Sundry debtors were 890 in the total liabilities in the year 2010 it is increased to 978
in the year 2011
8102019 A Study A Study On Financial Performance Analysis With Reference To Kesoram Cementon Financial Performance hellip
httpslidepdfcomreaderfulla-study-a-study-on-financial-performance-analysis-with-reference-to-kesoram 6081
60
Common Size Balance Sheet of Kesoram for the Year 2011-2012
983080Rupees in crores)
Particulars 2011 Change Percentage 2012
Change
Percentage
Liabilities
Share Capital 4574 071 4574 063
Reserves amp Surplus 125162 1939 86657 1199
Revaluation Reserves 289 004 270 004
Loans
Secured Loans 237183 3675 317792 4397
Un Secured Loans 162744 2522 92742 1283
Deferred Tax Liabilities 000 000 000 000
Current Liabilities
Provisions 1494 023 40726 563
Current Liabilities 113902 1765 180010 2491
Total 645348 10000 722771 10000
Assets
Net Block 369172 5721 358721 4963
Capital WIP 43781 678 68065 942
Investments 6582 102 6636 092
Current Assets
Inventories 111855 1733 99516 1377
Sundry Debtors 63134 978 67358 932
Cash amp Bank Balances 7188 111 6959 096
Loans amp Advances 43460 673 115409 1597
Fixed Deposits 176 003 107 001
Total 645348 10000 722771 10000
8102019 A Study A Study On Financial Performance Analysis With Reference To Kesoram Cementon Financial Performance hellip
httpslidepdfcomreaderfulla-study-a-study-on-financial-performance-analysis-with-reference-to-kesoram 6181
61
Interpretation of common size balance sheet of 2011-2012
Share capital was recorded 071 percent in the total liabilities in the year 2011 it is
decreased to 063 in the year 2012
Reserves amp surplus contributed to 1939 in the total liabilities in the year 2011 it
is decreased to 1199 in the year 2012
Secured loans were 3675 in the total liabilities in the year 2011 it is increased to
4397 in the year 2012
Current Liabilities shown to 1765 in the total liabilities in the year 2011 it is
increased to 2491 in the year 2012
Provisions 023 in the total liabilities in the year 2011 it is increased to 563 in the
year 2012
Fixed Assets were 5721 in the total liabilities in the year 2011 ie decreased to
4963 in the year 2012
Investments were 102 in the total liabilities in the year 2011 it increased to 092
in the year 2012
Sundry debtors were 978 in the total liabilities in the year 2011 it is decreased to
932 in the year 2012
8102019 A Study A Study On Financial Performance Analysis With Reference To Kesoram Cementon Financial Performance hellip
httpslidepdfcomreaderfulla-study-a-study-on-financial-performance-analysis-with-reference-to-kesoram 6281
Trend Analysis
Share Capital-
Year
Amount
(In Crores) Trend
IncreaseDecrease
Base Year Previous Year
2008 4574 10000 000 000
2009 4574 10000 000 000
2010 4574 10000 000 000
2011 4574 10000 000 000
2012 4574 10000 000 000
Trend Percentages in Share Capital
Share capital shown a constant trend in the period 2008 and 2012
Share capital is 4574 crores all the years from 2008-2012
8102019 A Study A Study On Financial Performance Analysis With Reference To Kesoram Cementon Financial Performance hellip
httpslidepdfcomreaderfulla-study-a-study-on-financial-performance-analysis-with-reference-to-kesoram 6381
Reserves amp Surplus-
Year
Amount
(In Crores) Trend
IncreaseDecrease
Base Year Previous Year
2008 93085 10000 000 000
2009 128024 13753 3753 3753
2010 149111 16019 6019 2266
2011 125162 13446 3446 -2573
2012 86657 9309 -691 -4137
Trend Percentages in Reserves amp Surplus
Reserves amp surplus shown an increasing trend in the period between 2008 and 2010
The average trend was 13277 till 2010
The Reserves amp surplus was showing decreasing trend in the period 2011-2012 (ie
from 16019 in 2010 to 9309 in 2012)
The decreasing trend in Reserves amp surplus indicates the decrease in profits of the
firm
8102019 A Study A Study On Financial Performance Analysis With Reference To Kesoram Cementon Financial Performance hellip
httpslidepdfcomreaderfulla-study-a-study-on-financial-performance-analysis-with-reference-to-kesoram 6481
Investments-
Year
Amount
(In Crores) Trend
IncreaseDecrease
Base Year Previous Year
2008 4783 10000 000 000
2009 6178 12917 2917 2917
2010 5143 10753 753 -2164
2011 6582 13761 3761 3009
2012 6636 13874 3874 113
Trend Percentages in Investments-
The investments are shown an increasing trend in the period between 2008 ndash 2009
and it is decreasing in the year 2010
The average trend was 11458 till 2009
The investments increased in the periods 2011-2012 (ie from 10753 in 2010 to
13874 in 2012)
The overall trend in investments shown is satisfactory
8102019 A Study A Study On Financial Performance Analysis With Reference To Kesoram Cementon Financial Performance hellip
httpslidepdfcomreaderfulla-study-a-study-on-financial-performance-analysis-with-reference-to-kesoram 6581
Net Current Assets-
Year
Amount
(In Crores) Trend
IncreaseDecrease
Base Year Previous Year
2008 30761 10000 000 000
2009 56954 18515 8515 8515
2010 77037 25044 15044 6529
2011 110417 35895 25895 10851
2012 68613 22305 12305 -13590
Trends in Net Current Assets-
The NCA shown positive (increasing) trend
The NCA are increased to 35895 (the year 2011) compared with base year and
decreased in the year 2012 to 22305
The NCA shown increased trend from year and crossed 100
The overall trend was good
8102019 A Study A Study On Financial Performance Analysis With Reference To Kesoram Cementon Financial Performance hellip
httpslidepdfcomreaderfulla-study-a-study-on-financial-performance-analysis-with-reference-to-kesoram 6681
66
Ratio Analysis-
Current Ratio-
Current Ratio = Current Assets Current Liabilities
Current assets are cash in hand Cash at bank Marketable Securities(short term) short term
Investment Bills receivables sundry debtors Inventories (stock) Work in progress prepaid
expenses Current Liabilities are outstanding expenses Bills payable sundry Creditors
short-term advances income tax payable and Dividend payable
Current Ratio of Kesoram-
(Rupees in crores)
Year Current Assets Current Liabilities Current Ratio
2007-08 75560 57067 132
2008-09 102580 66587 154
2009-10 153922 107688 143
2010-11 182177 113902 160
2011-12 173833 180010 097
Interpretation-
As per the standard rule of current ratio ie 21 where current assets double the current
liabilities is considered satisfactory
In the present analysis the current ratio of the Kesoram is not satisfactory
from the above table It was assessed that the current ratio for all the five year is lower (less)
than the standard rule ie 21 And it is 097 in the year 2011-2012 (current year) This is
highly UN satisfactory
8102019 A Study A Study On Financial Performance Analysis With Reference To Kesoram Cementon Financial Performance hellip
httpslidepdfcomreaderfulla-study-a-study-on-financial-performance-analysis-with-reference-to-kesoram 6781
Quick Ratio-
Quick ratio also known as acid-test ratio establishes a relationship between quick
assets and the current liabilities Cash is the most liquid asset It is calculated by dividing
quick assets by current liabilities
Quick ratio = Quick Assets Current Liabilities
(Quick Assets = Current assets ndash Inventory)
Quick Ratio of Kesoram-
Rupees in crores)
Year Total QuickAssets
Current Liabilities Quick Ratio
2007-08 33343 57067 058
2008-09 43674 66587 066
2009-10 62303 107688 058
2010-11 70322 113902 0622011-12 74333 180010 041
Interpretation-
Usually a high Quick ratio is an indication that the company is liquid and has the ability to
meet its current or liquid liabilities in time on the other hand a low Quick Ratio represents
8102019 A Study A Study On Financial Performance Analysis With Reference To Kesoram Cementon Financial Performance hellip
httpslidepdfcomreaderfulla-study-a-study-on-financial-performance-analysis-with-reference-to-kesoram 6881
that the companyrsquos liquidity position is not good The above table showing the quick ratios
of Kesoram are canrsquot be considered satisfactory
Leverage Ratios-
Debt-Equity Ratio-
Debt-Equity Ratio = Total Long Term Debt Equity Share Holders Fund
Total Long term Debt= Debenture Capital + Long term loans from banks and financial
institutions + Public deposits
Equity Share Holders fund = Equity + Reserves and Surplus
Debt Equity Ratio of Kesoram
(Rupees in crores)
Year Total Debt Share Holders Fund Debt Equity Ratio
2007-08 109235 98192 111
2008-09 197043 133010 148
2009-10 312622 154024 203
2010-11 399927 130025 308
2011-12 410534 91501 449
8102019 A Study A Study On Financial Performance Analysis With Reference To Kesoram Cementon Financial Performance hellip
httpslidepdfcomreaderfulla-study-a-study-on-financial-performance-analysis-with-reference-to-kesoram 6981
Interpretation-
The Debt-Equity Ratio accepted standard is 05 This ratio reflects the relative contribution
of creditors and owners of business in its financing From the above it is clear that the long
term debt is more than that of the share holdersrsquo fund So we can interpret that the firmrsquosassets are financed more by the external funds rather than by the internal funds
8102019 A Study A Study On Financial Performance Analysis With Reference To Kesoram Cementon Financial Performance hellip
httpslidepdfcomreaderfulla-study-a-study-on-financial-performance-analysis-with-reference-to-kesoram 7081
Fixed Asset Ratio-
Net Sales
Fixed Asset Ratio = helliphelliphelliphelliphelliphelliphelliphelliphelliphelliphellip
Net Assets
Fixed Asset Ratio of Kesoram-
(Rupees in crores)
Year Net Sales Net Assets Fixed Assets Ratio
2007-08 300271 358721 084
2008-09 389797 369172 106
2009-10 475062 343182 1382010-11 539788 180435 299
2011-12 59182 108424 546
Interpretation
This ratio indicates the extent to which the assets of the companyrsquos can be lost without
affecting the interest of the creditors of the company Higher the ratios better the long-term
position of the companyThe above table shows fixed assets ratio in increasing trend Which is good for the
company
8102019 A Study A Study On Financial Performance Analysis With Reference To Kesoram Cementon Financial Performance hellip
httpslidepdfcomreaderfulla-study-a-study-on-financial-performance-analysis-with-reference-to-kesoram 7181
Overall Profitability Ratios-
Net Profit Ratio
Net Profit Ratio indicates net margin on sales It is given by the following equation
Net Profit Ratio = (Net Profit Sales) 100
Net Profit Ratio of Kesoram
(Rupees in crores)
Year Net Profit Sales Net Profit Ratio
2007-08 37917 300271 1263
2008-09 41432 389797 1063
2009-10 20298 475062 427
2010-11 -28176 539788 -5222011-12 -38108 59182 -644
Interpretation
It establishes a relationship between net profits after tax and net sales and
indicates the efficiency of the management in manufacturing selling administrative and
other activities of the company
The higher the ratio the better is the profitability or performance of the business
The above table depicts the net profit Ratio of Kesoram has decreased every year from
2007-2008 to 2011-2012It further decreased to negative in the year 2010-11 to -522 and -
644 in the year 2011-2012 This shows constant decrease in the profits of the company
8102019 A Study A Study On Financial Performance Analysis With Reference To Kesoram Cementon Financial Performance hellip
httpslidepdfcomreaderfulla-study-a-study-on-financial-performance-analysis-with-reference-to-kesoram 7281
72
Return on Investment-
Net Profit
Return on Investment = helliphelliphelliphelliphelliphelliphelliphelliphelliphelliphelliphellip X 100
Share Holders Fund
Return on Investment Ratio of Kesoram-
(Rupees in crores)
Year Net Profit Share Holders Fund Return On Investment
2007-08 37917 98192 3862
2008-09 41432 133010 3115
2009-10 20298 154024 1318
2010-11 -28176 130025 -2167
2011-12 -38108 91501 -4165
Interpretation-
The above table reveals how well the resources of the firm are being used Higher
the ratio better the result The above ratio implies how well the firm is growing in
terms of profitability and efficiency From the above table we can concern that the return on
investment is in decreasing trend ROI is highest in the year 2007-2008 as 3862 But
there after itrsquos decreased every year
The ROI is negative in the years 2010-2011 amp 2011-2012 as -2167 amp -4165 respectively
Which is not a good sign for the firm
8102019 A Study A Study On Financial Performance Analysis With Reference To Kesoram Cementon Financial Performance hellip
httpslidepdfcomreaderfulla-study-a-study-on-financial-performance-analysis-with-reference-to-kesoram 7381
8102019 A Study A Study On Financial Performance Analysis With Reference To Kesoram Cementon Financial Performance hellip
httpslidepdfcomreaderfulla-study-a-study-on-financial-performance-analysis-with-reference-to-kesoram 7481
8102019 A Study A Study On Financial Performance Analysis With Reference To Kesoram Cementon Financial Performance hellip
httpslidepdfcomreaderfulla-study-a-study-on-financial-performance-analysis-with-reference-to-kesoram 7581
75
CHAPTER V
FINDINGS amp SUGGESTIONS
8102019 A Study A Study On Financial Performance Analysis With Reference To Kesoram Cementon Financial Performance hellip
httpslidepdfcomreaderfulla-study-a-study-on-financial-performance-analysis-with-reference-to-kesoram 7681
76
Findings
The Share capital remains constant Share capital is unchanged all the years from
2008-2012
Reserves amp surplus were recorded an increasing trend in the period between 2008
and 2010It is showing decreasing trend in the period 2011-2012 (ie from 16019
in 2010 to 9309 in 2012)
Current Liabilities were increased compared to base year ie 2008
Provisions increased to 262597 ie in Rupees 39232 crores in the current year
The current ratio for all the five year is lower (less) than the standard rule ie 21
And it is 097 in the year 2011-2012 (current year)
The Debt-Equity Ratio was shown under the standard ratio It is clear that the long
term debt is more than that of the share holdersrsquo fund It indicates that the firm
heavily relying on external funds rather than the internal funds
The operating and net profit of Kesoram is in decreasing trend due to heavy
increase of manufacturing amp administrative expenses
ROI is highest in the year 2007-2008 as 3862 The ROI is negative in the years
2010-2011 amp 2011-2012 as -2167 amp -4165 respectively
Return on Equity Capital Employed Ratio of Kesoram has decreased every year
from 2007-2008 to 2010-2011It further decreased to negative in the year 2011-12 to
-3280
EPS of Kesoram has decreased every year from 2008-12It is negative in the year
2011 amp 12
8102019 A Study A Study On Financial Performance Analysis With Reference To Kesoram Cementon Financial Performance hellip
httpslidepdfcomreaderfulla-study-a-study-on-financial-performance-analysis-with-reference-to-kesoram 7781
77
Suggestion
The organization should adopt an appropriate capital structure
The companyrsquos debt-equity ratio is recorded more or less as 111 in the year 2008
and it is increased to 449 in the year 2012 (current year)The company should
adopt a better debt equity mix in the future to control the fluctuations in returns
The company should control fluctuations in cash and bank balances as it impacts the
current ratio of the company
The provisions are showing increasing trend which indicates risk of debtors The
firm should implement an effective credit management policy It should utilize its
idle funds by decreasing provisions
The company should control heavy increase of manufacturing amp administration
expenses as it is impacting the operating and net profit of company
8102019 A Study A Study On Financial Performance Analysis With Reference To Kesoram Cementon Financial Performance hellip
httpslidepdfcomreaderfulla-study-a-study-on-financial-performance-analysis-with-reference-to-kesoram 7881
78
ANNEXURE
Profit And Loss Account of Kesoram Cement
Mar12 Mar11 Mar10 Mar09 Mar08
12 Months 12 Months 12 Months 12 Months 12 Months
INCOME
Sales Turnover 628260 575072 505151 431613 345700
Excise Duty 36440 35284 30089 41815 45429
NET SALES 591820 539788 475062 389797 300271
Other Income 000 000 000 000 000
TOTALINCOME
596129 548733 481019 393969 302020
EXPENDITURE
Manufacturing
Expenses81903 74803 13974 13153 44113
MaterialConsumed
370897 310150 295550 229359 118448
Personal
Expenses33468 27355 23294 18690 15344
Selling Expenses 81910 78253 58667 48846 45019
AdministrativeExpenses
28225 29308 17219 16179 9907
Expenses
Capitalized000 000 000 000 000
Provisions Made 000 000 000 000 000
TOTAL
EXPENDITURE 596403 519870 408704 326227 232832Operating Profit -4583 19918 66358 63570 67439
EBITDA -274 28864 72316 67742 69188
Depreciation 29740 27259 17280 11186 8927
Other Write-offs 000 000 000 000 000
EBIT -30014 1605 55035 56557 60261
Interest 41015 23983 10921 12087 5426
EBT -71029 -22377 44114 44470 54835
Taxes -32921 5798 23816 3037 16918
Profit and Loss
for the Year-38108 -28176 20298 41432 37917
Non RecurringItems
-1142 7063 3228 -4023 402
Other Non Cash
Adjustments1276 091 207 465 017
OtherAdjustments
000 000 000 000 000
REPORTED
PAT-37974 -21021 23734 37874 38335
8102019 A Study A Study On Financial Performance Analysis With Reference To Kesoram Cementon Financial Performance hellip
httpslidepdfcomreaderfulla-study-a-study-on-financial-performance-analysis-with-reference-to-kesoram 7981
79
Balance Sheet Of Kesoram
Years
Particulars 2008 2009 2010 2011 2012
Liabilities
Share Capital 4574 4574 4574 4574 4574Reserves amp Surplus 93085 128024 149111 125162 86657
Revaluation Reserves 533 412 339 289 27
Loans
Secured Loans 97106 153627 186372 237183 317792
Un Secured Loans 12129 43416 12625 162744 92742
Deferred Tax Liabilities 0 0 0 0 0
Current Liabilities
Provisions 33039 34529 35734 1494 40726
Current Liabilities 57067 66587 107688 113902 18001
Total 297533 431169 610068 645348 722771
Assets
Net Block 108424 180435 343182 369172 358721
Capital WIP 63459 86485 41283 43781 68065
Investments 4783 6178 5143 6582 6636
Current Assets
Inventories 44217 58906 91619 111855 99516
Sundry Debtors 27307 38017 54289 63134 67358
Cash amp Bank Balances 4036 5657 8014 7188 6959
Total Current Assets 7556 10258 153922 182177 173833Loans amp Advances 45289 55462 66506 4346 115409
Fixed Deposits 018 028 031 176 107
Total 297533 431169 610068 645348 722771
8102019 A Study A Study On Financial Performance Analysis With Reference To Kesoram Cementon Financial Performance hellip
httpslidepdfcomreaderfulla-study-a-study-on-financial-performance-analysis-with-reference-to-kesoram 8081
80
KEY ITEMS 2012 2011 2010 2009 2008
Preference
Dividend 0 0 0 0 0
Equity Dividend 457 2516 2516 2516 2516
Equity Dividend
() 999 55 55 55 55
Shares in Issue(Lakhs) 45743 45743 45743 45743 45743
EPS - Annualised
(Rs) -8302 -4595 5188 828 838
8102019 A Study A Study On Financial Performance Analysis With Reference To Kesoram Cementon Financial Performance hellip
httpslidepdfcomreaderfulla-study-a-study-on-financial-performance-analysis-with-reference-to-kesoram 8181
BIBLIOGRAPHY
Sl
No
Books Author Name
1 Financial Management Khan amp JAIN
2 Financial Management IMPandey
3 Management Accounting RPTrivedi
Websites amp Search Engines
1 wwwkesoramcom983086
2 wwwmoneycontrolcom
3 wwwgooglefinancecom983086
Annual reports of Kesoram cement limited 2008-2012
8102019 A Study A Study On Financial Performance Analysis With Reference To Kesoram Cementon Financial Performance hellip
httpslidepdfcomreaderfulla-study-a-study-on-financial-performance-analysis-with-reference-to-kesoram 1081
10
Need for Study
Need Of Financial Management Study To Diagnose The Information Contain In
Financial Statement So as To Judge the Profitability and Financial Position of the
Firm
Financial Analyst Analyses The Financial Statements With Various Tools Of
Analysis Before Commanding Upon The Financial Health Of The Firm
Essential to Bring Out the History
Significance and Meaning of the Financial Statements
8102019 A Study A Study On Financial Performance Analysis With Reference To Kesoram Cementon Financial Performance hellip
httpslidepdfcomreaderfulla-study-a-study-on-financial-performance-analysis-with-reference-to-kesoram 1181
11
Objectives
1 To understand the financial statements of Kesoram cement
2 To study the change in assets and liabilities of the company
3 To study the liquidity position of the firm
4 To study the financial health of the company using ratio analysis
5 To study the profitability of the company
6 To offer suggestions to the company
8102019 A Study A Study On Financial Performance Analysis With Reference To Kesoram Cementon Financial Performance hellip
httpslidepdfcomreaderfulla-study-a-study-on-financial-performance-analysis-with-reference-to-kesoram 1281
12
Significance of Financial Performance Analysis
Interest of various related groups is affected by the financial performance of a firm
Therefore these groups analyze the financial performance of the firm The type of analysis
varies according to the specific interest of the party involved
Trade creditors interested in the liquidity of the firm (appraisal of firmrsquos liquidity)
Bond holders interested in the cash-flow ability of the firm (appraisal of firmrsquos capital
structure the major sources and uses of funds profitability over time and projection of
future profitability)
Investors interested in present and expected future earnings as well as stability of these
earnings (appraisal of firmrsquos profitability and financial condition)
Management interested in internal control better financial condition and betterperformance (appraisal of firmrsquos present financial condition evaluation of opportunities in
relation to this current position return on investment provided by various assets of the
company etc)
Research Methodology
Research Design
This is a systematic way to solve the research problem and it is important
component for the study without which researches may not be able to obtain the format A
research design is the arrangement of conditions for collection and analysis of data in a
manager that aims to combine for collection and analysis of data relevance to the research
purpose with economy in procedure
Meaning of Research Design
The formidable problem that follows the task of defining the research problem is the
preparation of design of the research project popularly known as the research design
decision regarding what where when how much by what means concerning an inquiry of
a research study constitute a research design A research design is the arrangement of
conditions for collection and analysis of data in a manager that aims to combine for
collection and analysis of data relevance to the research purpose with economy in
procedure
8102019 A Study A Study On Financial Performance Analysis With Reference To Kesoram Cementon Financial Performance hellip
httpslidepdfcomreaderfulla-study-a-study-on-financial-performance-analysis-with-reference-to-kesoram 1381
13
Sources of Data
Data we collected based on two sources
Primary Data
Secondary Data
Primary Data
The Primary Data Are Those Informationrsquos which are Collected afresh and for the
First Time And Thus Happen to Be Original in Character
Secondary Data
The secondary data are those which have already been collected by some other agency and
which have already been processed The sources of secondary data are annual reports
browsing internet through magazines
1 It includes data gathered from the annual reports of Kesoram
2 Articles are collected from official website of Kesoram
Methodology Used
Types Of Financial Statements Adopted
Following Two Types of Financial Statements Are Commonly Used in
Analyzing the Firmrsquos Financial Position
a Balance Sheet
b Income Statements
8102019 A Study A Study On Financial Performance Analysis With Reference To Kesoram Cementon Financial Performance hellip
httpslidepdfcomreaderfulla-study-a-study-on-financial-performance-analysis-with-reference-to-kesoram 1481
14
Limitations of Financial Statement
Each Project Gives Rise to Its Own Unique Risks And Hence Possess Its Own Unique
Challenges
1 Only Interim Reports
Only interim statements donrsquot give a final picture of the concern The data given in
these statements is only approximate The actual position can only be determined when the
business is sold or liquidated
2 Donrsquot Give Extra Position
The Financial Statements Are Expressed In Monetary Values So They Appear To
Give Final And Accurate Position The Values Of Fixed Assets In The Balance Sheet
Neither Represent The Value For Which Fixed Assets Can Be Sold Nor The Amount Which
Will Be Required To Replace These Assets
3 Historical Costs
The Financial Statements Are Prepared On The Basis Of Historical Costs Or
Original Costs The Value of Assets Decreases with the Passage of Time Current Price
Changes Are Not Taken Into Account The Statements Are Not Prepared Keeping In View
The Present Economic Conditions The Balance Sheet Loses The Significance Of Being An
Index Of Current Economic Realities
4 Act of non monitory factors Ignored
There are certain factors which have a bearing on the financial position and
operating results of the business but they donrsquot become a part of these statements because
they canrsquot be measured in monetary terms Such factors may include in the reputation of the
management
No Precision
The precision of financial statement data is not possible because the statements deal with
matters which canrsquot be precisely stated The data are recorded by conventional procedures
followed over the years Various conventions postulates personal judgments etc
8102019 A Study A Study On Financial Performance Analysis With Reference To Kesoram Cementon Financial Performance hellip
httpslidepdfcomreaderfulla-study-a-study-on-financial-performance-analysis-with-reference-to-kesoram 1581
15
CHAPTER-II
INDUSTRY PROFILE
amp
COMPANY PROFILE
8102019 A Study A Study On Financial Performance Analysis With Reference To Kesoram Cementon Financial Performance hellip
httpslidepdfcomreaderfulla-study-a-study-on-financial-performance-analysis-with-reference-to-kesoram 1681
16
Industry Profile
In the most general sense of the word cement is a binder a substance which
sets and hardens independently and can bind other materials together The word cement
traces to the Romans who used the term opus caementicium to describe masonry whichresembled concrete and was made from crushed rock with burnt lime as binder The
volcanic ash and pulverized brick additives which were added to the burnt lime to obtain a
hydraulic binder were later referred to as cementum and cement Cements used in
construction are characterized as hydraulic or non-hydraulic
The most important use of cement is the production of mortar and concretemdashthe bonding of
natural or artificial aggregates to form a strong building material which is durable in the
face of normal environmental effects
Concrete should not be confused with cement because the term cement refers only to the dry
powder substance used to bind the aggregate materials of concrete Upon the addition of
water andor additives the cement mixture is referred to as concrete especially if aggregates
have been added
It is uncertain where it was first discovered that a combination of hydrated non-hydraulic
lime and a pozzolan produces a hydraulic mixture (see also Pozzolanic reaction) but
concrete made from such mixtures was first used on a large scale by engineers They used
both natural pozzolans (trass or pumice) and artificial pozzolans (ground brick or pottery) in
these concretes Many excellent examples of structures made from these concretes are still
standing notably the huge monolithic dome of the Pantheon in Rome and the massive Baths
of Caracalla The vast system of Roman aqueducts also made extensive use of hydraulic
cement The use of structural concrete disappeared in medieval Europe although weak
pozzolanic concretes continued to be used as a core fill in stone walls and columns
Modern cement
Modern hydraulic cements began to be developed from the start of the Industrial Revolution
(around 1800) driven by three main needs
Hydraulic renders for finishing brick buildings in wet climates
Hydraulic mortars for masonry construction of harbor works etc in contact with sea water
Development of strong concretes
In Britain particularly good quality building stone became ever more expensive during a
period of rapid growth and it became a common practice to construct prestige buildings
8102019 A Study A Study On Financial Performance Analysis With Reference To Kesoram Cementon Financial Performance hellip
httpslidepdfcomreaderfulla-study-a-study-on-financial-performance-analysis-with-reference-to-kesoram 1781
17
from the new industrial bricks and to finish them with a stucco to imitate stone Hydraulic
limes were favored for this but the need for a fast set time encouraged the development of
new cements Most famous was Parkers Roman cement This was developed by James
Parker in the 1780s and finally patented in 1796 It was in fact nothing like any material
used by the Romans but was ldquoNatural cement made by burning septaria - nodules that are
found in certain clay deposits and that contain both clay minerals and calcium carbonate
The burnt nodules were ground to a fine powder This product made into a mortar with
sand set in 5ndash15 minutes The success of Roman Cement led other manufacturers to
develop rival products by burning artificial mixtures of clay and chalk
John Smeaton made an important contribution to the development of cements when he was
planning the construction of the third Eddystone Lighthouse (1755-9) in the English
Channel He needed a hydraulic mortar that would set and develop some strength in the
twelve hour period between successive high tides He performed an exhaustive market
research on the available hydraulic limes visiting their production sites and noted that the
hydraulicity of the lime was directly related to the clay content of the limestone from
which it was made Smeaton was a civil engineer by profession and took the idea no
further Apparently unaware of Smeatons work the same principle was identified by Louis
Vicat in the first decade of the nineteenth century Vicat went on to devise a method of
combining chalk and clay into an intimate mixture and burning this produced an artificial
cement in 1817 James Frost working in Britain produced what he called British cement
in a similar manner around the same time but did not obtain a patent until 1822 In 1824
Joseph Aspdin patented a similar material which he called Portland cement because the
render made from it was in color similar to the prestigious Portland stone
All the above products could not compete with limepozzolan concretes because of fast-
setting (giving insufficient time for placement) and low early strengths (requiring a delay of
many weeks before formwork could be removed) Hydraulic limes natural cements and
artificial cements all rely upon their belite content for strength development Belite
develops strength slowly Because they were burned at temperatures below 1250 degC they
contained no alite which is responsible for early strength in modern cements The first
cement to consistently contain alite was made by Joseph Aspdins son William in the early
1840s This was what we call today modern Portland cement Because of the air of
mystery with which William Aspdin surrounded his product others (eg Vicat and I C
Johnson) have claimed precedence in this invention but recent analysis of both his concrete
8102019 A Study A Study On Financial Performance Analysis With Reference To Kesoram Cementon Financial Performance hellip
httpslidepdfcomreaderfulla-study-a-study-on-financial-performance-analysis-with-reference-to-kesoram 1881
18
and raw cement have shown that William Aspdins product made at North fleet Kent was a
true alite-based cement However Aspdins methods were rule-of-thumb Vicat is
responsible for establishing the chemical basis of these cements and Johnson established
the importance of sintering the mix in the kiln
William Aspdins innovation was counter-intuitive for manufacturers of artificial cements
because they required more lime in the mix (a problem for his father) because they required
a much higher kiln temperature (and therefore more fuel) and because the resulting clinker
was very hard and rapidly wore down the millstones which were the only available grinding
technology of the time Manufacturing costs were therefore considerably higher but the
product set reasonably slowly and developed strength quickly thus opening up a market for
use in concrete The use of concrete in construction grew rapidly from 1850 onwards and
was soon the dominant use for cements Thus Portland cement began its predominant role
It is made from water and sand
Types of modern cement
Portland cement
Cement is made by heating limestone (calcium carbonate) with small quantities of other
materials (such as clay) to 1450degC in a kiln in a process known as calcination whereby a
molecule of carbon dioxide is liberated from the calcium carbonate to form calcium oxide
or lime which is then blended with the other materials that have been included in the mix
The resulting hard substance called clinker is then ground with a small amount of gypsum
into a powder to make Ordinary Portland Cement the most commonly used type of cement
(often referred to as OPC)
Portland cement is a basic ingredient of concrete mortar and most non-speciality grout The
most common use for Portland cement is in the production of concrete Concrete is a
composite material consisting of aggregate (gravel and sand) cement and water As a
construction material concrete can be cast in almost any shape desired and once hardened
can become a structural (load bearing) element Portland cement may be gray or whitePortland cement blends
These are often available as inter-ground mixtures from cement manufacturers but similar
formulations are often also mixed from the ground components at the concrete mixing plant
Portland blast furnace cement contains up to 70 ground granulated blast furnace slag
with the rest Portland clinker and a little gypsum All compositions produce high ultimate
8102019 A Study A Study On Financial Performance Analysis With Reference To Kesoram Cementon Financial Performance hellip
httpslidepdfcomreaderfulla-study-a-study-on-financial-performance-analysis-with-reference-to-kesoram 1981
19
strength but as slag content is increased early strength is reduced while sulfate resistance
increases and heat evolution diminishes Used as an economic alternative to Portland
sulfate-resisting and low-heat cements
Portland fly ash cement contains up to 30 fly ash The fly ash is pozzolanic so that
ultimate strength is maintained Because fly ash addition allows lower concrete water
content early strength can also be maintained Where good quality cheap fly ash is
available this can be an economic alternative to ordinary Portland cement
Portland pozzolan cement includes fly ash cement since fly ash is a pozzolan but also
includes cements made from other natural or artificial pozzolans In countries where
volcanic ashes are available (eg Italy Chile Mexico and the Philippines) these cements
are often the most common form in use
Portland silica fume cement Addition of silica fume can yield exceptionally high
strengths and cements containing 5-20 silica fume are occasionally produced However
silica fume is more usually added to Portland cement at the concrete mixer
Masonry cements are used for preparing bricklaying mortars and stuccos and must not be
used in concrete They are usually complex proprietary formulations containing Portland
clinker and a number of other ingredients that may include limestone hydrated lime air
entrainers retarders water proofers and coloring agents They are formulated to yield
workable mortars that allow rapid and consistent masonry work Subtle variations of
Masonry cement in the US are Plastic Cements and Stucco Cements These are designed to
produce controlled bond with masonry blocks
Expansive cements contain in addition to Portland clinker expansive clinkers (usually
sulfoaluminate clinkers) and are designed to offset the effects of drying shrinkage that is
normally encountered with hydraulic cements This allows large floor slabs (up to 60 m
square) to be prepared without contraction joints
White blended cements may be made using white clinker and white supplementary
materials such as high-purity metakaolin
Colored cements are used for decorative purposes In some standards the addition of
pigments to produce colored Portland cement is allowed In other standards (eg ASTM)
pigments are not allowed constituents of Portland cement and colored cements are sold as
blended hydraulic cements
Very finely ground cements are made from mixtures of cement with sand or with slag or
other pozzolan type minerals which are extremely finely ground together Such cements can
8102019 A Study A Study On Financial Performance Analysis With Reference To Kesoram Cementon Financial Performance hellip
httpslidepdfcomreaderfulla-study-a-study-on-financial-performance-analysis-with-reference-to-kesoram 2081
have the same physical characteristics as normal cement but with 50 less cement
particularly due to their increased surface area for the chemical reaction Even with
intensive grinding they can use up to 50 less energy to fabricate than ordinary Portland
cements
Non-Portland hydraulic cements
Pozzolan-lime cements Mixtures of ground Pozzolan and lime are the cements used by the
Romans and are to be found in Roman structures still standing (eg the Pantheon in Rome)
They develop strength slowly but their ultimate strength can be very high The hydration
products that produce strength are essentially the same as those produced by Portland
cement
Slag-lime cements Ground granulated blast furnace slag is not hydraulic on its own but is
activated by addition of alkalis most economically using lime They are similar to
pozzolan lime cements in their properties Only granulated slag (ie water-quenched glassy
slag) is effective as a cement component
Super sulfated cements These contain about 80 ground granulated blast furnace slag
15 gypsum or anhydrite and a little Portland clinker or lime as an activator They produce
strength by formation of ettringite with strength growth similar to a slow Portland cement
They exhibit good resistance to aggressive agents including sulfate
Calcium aluminate cements are hydraulic cements made primarily from limestone and
bauxite The active ingredients are monocalcium aluminate CaAl2O4 (CaO middot Al2O3 or CA in
Cement chemist notation CCN) and mayenite Ca12Al14O33 (12 CaO middot 7 Al2O3 or C12A7 in
CCN) Strength forms by hydration to calcium aluminate hydrates They are well-adapted
for use in refractory (high-temperature resistant) concretes eg for furnace linings
Calcium sulfoaluminate cements are made from clinkers that include yeelimite (Ca4
(AlO2)6SO4 or C4A3 in Cement chemists notation) as a primary phase They are used in
expansive cements in ultra-high early strength cements and in low-energy cements
Hydration produces ettringite and specialized physical properties (such as expansion or
rapid reaction) are obtained by adjustment of the availability of calcium and sulfate ionsTheir use as a low-energy alternative to Portland cement has been pioneered in China
where several million tonnes per year are produced Energy requirements are lower because
of the lower kiln temperatures required for reaction and the lower amount of limestone
(which must be endothermically decarbonated) in the mix In addition the lower limestone
8102019 A Study A Study On Financial Performance Analysis With Reference To Kesoram Cementon Financial Performance hellip
httpslidepdfcomreaderfulla-study-a-study-on-financial-performance-analysis-with-reference-to-kesoram 2181
21
content and lower fuel consumption leads to a CO2 emission around half that associated
with Portland clinker However SO2 emissions are usually significantly higher
Natural Cements correspond to certain cements of the pre-Portland era produced by
burning argillaceous limestones at moderate temperatures The level of clay components in
the limestone (around 30-35) is such that large amounts of belite (the low-early strength
high-late strength mineral in Portland cement) are formed without the formation of
excessive amounts of free lime As with any natural material such cements have highly
variable properties
Geopolymer cements are made from mixtures of water-soluble alkali metal silicates and
aluminosilicate mineral powders such as fly ash and metakaolin
8102019 A Study A Study On Financial Performance Analysis With Reference To Kesoram Cementon Financial Performance hellip
httpslidepdfcomreaderfulla-study-a-study-on-financial-performance-analysis-with-reference-to-kesoram 2281
22
COMPANY PROFILE
8102019 A Study A Study On Financial Performance Analysis With Reference To Kesoram Cementon Financial Performance hellip
httpslidepdfcomreaderfulla-study-a-study-on-financial-performance-analysis-with-reference-to-kesoram 2381
23
Kesoram Cement Industry is one of the leading manufacturers of cement in India It is a day
process cement Plant The plant capacity is 826 lakh tones per annum It is located at
Basanthnagar in Karimnagar district of Andhra Pradesh Basanthnagar is 8 km away from
the Ramagundam Railway station linking Madras to New Delhi The Chairman of the
Company is BKBirla
History
The first unit at Basanthnagar with a capacity of 21 lakh tones per annum
incorporating humble suspension preheated system was commissioner during the year 1969
The second unit was setup in year 1971 with a capacity of 21 lakh tones per annum went on
stream in the year 1978 The coal for this company is being supplied from Singgareni
Collieries and the power is obtained from APSEB The power demand for the factory is
about 21 MW Kesoram has got 2 DG sets of 4 MW each installed in the year 1987
Kesoram Cement has setup a 15 KW captor power plant to facilitate for
uninterrupted power supply for manufacturing of cement at 24th
august 1997 per hour 12
mw actual power is 15 mw
The Company was incorporated on 18th October 1919 under the Indian Companies Act
1913 in the name and style of Kesoram Cotton Mills Ltd It had a Textile Mill at 42
Garden Reach Road Calcutta 700 024 The name of the Company was changed to Kesoram
Industries amp Cotton Mills Ltd on 30th
August 1961 and the same was further changed to Kesoram Industries Limited on 9th July
1986 The said Textile Mill at Garden Reach Road was eventually demerged into a separate
company
The First Plant for manufacturing of rayon yarn was established at Tribeni District
Hooghly West Bengal and the same was commissioned in December 1959 and the second
plant was commissioned in the year 1962 enabling it to manufacture 4635 metric tons perannum (mtpa) of rayon yarn This Unit has 6500 metric tons per annum (mtpa) capacity as
on 3132009
The plant for manufacturing of transparent paper was also set up at the same location at
Tribeni District Hooghly West Bengal in June 1961 It has the annual capacity to
manufacture 3600 metric tons per annum (mtpa) of transparent Paper
8102019 A Study A Study On Financial Performance Analysis With Reference To Kesoram Cementon Financial Performance hellip
httpslidepdfcomreaderfulla-study-a-study-on-financial-performance-analysis-with-reference-to-kesoram 2481
24
The Company diversified into manufacturing of cast iron spun pipes and pipe fittings at
Bansberia District Hooghly West Bengal with a production capacity of 45000 metric tons
per annum (mtpa) of cast iron spun pipes and pipe fittings in December 1964
The Company subsequently diversified into the manufacturing of Cement and in 1969
established its first cement plant under the name Kesoram Cement at Basantnagar Dist
Karimnagar (Andhra Pradesh) and to take advantage of favorable market conditions in
1986 another cement plant known as Vasavadatta Cement was commissioned by it at
Sedam Dist
Gulbarga (Karnataka) The cement manufacturing capacities at both the plants were
augmented from time to time according to the market conditions and as on 3132009
Kesoram Cement and Vasavadatta Cement have annual cement manufacturing capacities of
15 million metric tons and 41 million metric tons respectively
The Company in March 1992 commissioned a plant at Balasore known as Birla Tyres in
Orissa for manufacturing of 10 lakh mtpa automotive tyres and tubes in the first phase in
collaboration with Pirelli Ltd UK a subsidiary company of the world famous Pirelli
Group of Italy - a pioneer in production and development of automotive tyres in the world
The capacity at the said plant was further augmented during the year by 19 MT per day
aggregating to 271 MT per day production facility The Greenfield Project of 257 MT per
day capacity in the State of Uttarakhand with a capex of about Rs760 crores commenced
the commercial production in phases during the financial year 2008-09The Company as on
3132009 had the manufacturing capacities of 371 million tyres 295 million tubes and
153 million flaps per annum in the Plants including at Uttarakhand Plant It has small
manufacturing capacities of various Chemicals at Kharda in the State of West Bengal also
It has the annual manufacturing capacities of 12410 mtpa of Caustic Soda Lye 5045 mtpa
of Liquid Chlorine 6205 mtpa of Sodium Hypochlorite 8200 mtpa of Hydrochloric Acid
3200 mtpa of Ferric Alum 18700 mtpa of Sulphuric Acid and 1620000 m3pa of purified
Hydrogen Gas
The Company is a well-diversified entity in the fields of Cement Tyre Rayon Yarn
Transparent Paper Spun Pipes and Heavy Chemicals with two core business segments ie
Cement and Tyres
8102019 A Study A Study On Financial Performance Analysis With Reference To Kesoram Cementon Financial Performance hellip
httpslidepdfcomreaderfulla-study-a-study-on-financial-performance-analysis-with-reference-to-kesoram 2581
25
In Spun Pipes amp Foundries a unit of the Company work suspended from 2nd May 2008
still commences till further notice
The Company as of now is listed on three major Stock Exchanges in India ie Bombay
Stock Exchange Ltd Mumbai Calcutta Stock Exchange Association Ltd Kolkata and
National Stock Exchange of India Ltd Mumbai and at the Societe de la Bourse de
Luxembourg Luxembourg
A further expansion upto 165 million tons of cement per annum in Vasavadatta Cement at
Sedam in Karnataka as unit IV at the same site is in progress with a 175 MW Captive
Power Plant involving a capital expenditure of about Rs 78350 crores (including the cost
of Captive Power Plant)
The commercial production of cement in the aforesaid unit IV has commenced in June
2009 The work for the further expansion in the Tyres Section at Uttarakhand for radial
tyres with 100 MT per day capacity and bias tyres with 125 MT per day capacity involving
an estimated aggregate capital outlay of about Rs 840 crores is under progress The Board
has further approved a Motor Cycle Tyre Project of 70 MT per day capacity at the same site
involving a capital outlay of Rs190 crore The civil construction of both the Projects is in
full swing The commercial production in both the Projects is likely to start by December
2009 January 2010
Birla Supreme in popular brand of Kesoram cement from its prestigious plant of
Basantnagar in AP which has outstanding track record In performance and productivity
serving the nation for the last two and half decades It has proved its distinction by bagging
several national awards It also has the distinction of achieving optimum capacity
utilization
Kesoram offers a choice of top quality portioned cement for light heavy
constructions and allied applications Quality is built every fact of the operations
The plant lay out is rational to begin with The limestone is rich in calcium
carbonate a key factor that influences the quality of final product The day process
technology uses in the latest computerized monitoring overseas the manufacturing process
Samples are sent regularly to the bureau of Indian standards National council of
construction and building material for certification of derived quality norms
8102019 A Study A Study On Financial Performance Analysis With Reference To Kesoram Cementon Financial Performance hellip
httpslidepdfcomreaderfulla-study-a-study-on-financial-performance-analysis-with-reference-to-kesoram 2681
26
The company has vigorously undertaking different promotional measures for
promoting their product through different media which includes the use of news papers
magazine hoarding etc
Kesoram cement industry distinguished itself among all the cement factories in
Indian by bagging the National Productivity Award consecutively for two years ie for the
year 1985-1987 The federation of Andhra Pradesh Chamber amp Commerce and Industries
(FAPCCI) also conferred on Kesoram Cement An award for the best industrial promotion
expansion efforts in the state for the year 1984 Kesoram also bagged FAPCCI awarded for
ldquoBest Family Planning Effort in the staterdquo for the year 1987-1988
One among the industrial giants in the country today serving the nation on the
industrial front Kesoram industry ltd has a checked and eventful history dating back to the
twenties when the Industrial House of Birlarsquos acquired it With only a textile mill under its
banner 1924 it grew from strength to strength and spread its activities to newer fields like
Rayon Transparent paper pipes Refractors tyres and other products
Looking to the wide gap between the demand and supply of vital commodity
cement which play in important role in National building activity the Government of India
had de-licensed the cement industry in the year 1966 with a review to attract private
entrepreneur to augment the cement production Kesoram rose to the occasions and divided
to set up a few cement plants in the country
Kesoram cement undertaking marketing activities extensively in the state of Andhra
Pradesh Karnataka Tamilnadu Kerala Maharashtra and Gujarat In AP sales Depts are
located in different areas like Karimnagar Warangal Nizamabad Vijayawada and Nellore
In other states it has opened around 10 depots
The market share of Kesoram Cement in AP is 705 The market share of the
company in various states is shown as under
STATES MARKET SHARE
Karnataka 409
Tamilnadu 094
Kerala 029
Maharashtra 281
8102019 A Study A Study On Financial Performance Analysis With Reference To Kesoram Cementon Financial Performance hellip
httpslidepdfcomreaderfulla-study-a-study-on-financial-performance-analysis-with-reference-to-kesoram 2781
27
Process and Quality Control
It has been the endeavor of Kesoram to incorporate the Worldrsquos latest technology in
the plant and today the plant has the most sophisticated
X-ray analysis
Fully computerized XRF and XRD X-RAY Analyzers keep a constant round the
clock vigil on quality
Supreme performance
One of the largest Cement Plants in Andhra Pradesh the plant incorporate the latest
technology in Cement - making
It is professionally managed and well established Cement Manufacturing Company
enjoying the confidence of the consumers Kesoram has outstanding track record in
performance and productivity with quite a few national and state awards to its credit
BIRLA SUPREME the 43 Grade Cement is a widely accepted and popular brand
in the market commanding a premium
However to meet the specific demands of the consumer Kesoram bought out the 53
grade BIRLA SUPREME ndash GOLD which has special qualities like higher fineness quick-
setting high compressive strength and durability
Supreme Strength
Kesoram Cement has huge captive Limestone Deposits which make it possible tofeed high- grade limestone consistently its natural Grey colour is anion- born ingredient
and gives good shade
Both the products offered by Kesoram ie BIRLA SUPREME-43 Grade and
BIRLA SUPREME-GOLD-53 Grade cement are outstanding with much higher
compressive strength and durability
The following characteristics show their distinctive qualities
Comprehensive
Strength
Opc 43
grls 8112
1989
Birla
Supreme 43
grade
Opc 43 gr
Is 1226987
Birla
Supreme
Gold 53 gr
3 days mpa Min 23 31 + Min 27 38+
7 days mpa Min 23 42+ Min 37 48+
28 days mpa Min 43 50+ Min 53 60+
8102019 A Study A Study On Financial Performance Analysis With Reference To Kesoram Cementon Financial Performance hellip
httpslidepdfcomreaderfulla-study-a-study-on-financial-performance-analysis-with-reference-to-kesoram 2881
28
DC SYSTEM
Clinker making process is a key step in the overall cement making process In the case of
BIRLA SUPREMEGOLD the clinker-making process is totally computer control The
Distributed Control System (DCS) constantly monitors the process and ensures operating
efficiency This eliminates variation and ensures consistency in the quality of Clinker
Physical Characteristics
Ope 43
Is 8 112-89
Birla
Supreme
43 grade
Ope 53 gr
Is 12269-87
Birla Supreme
Gold 53 gr
Setting time Min30 120-180 Min 30 130-170
a Initial (mats) Max 600 180-240 Max 600 170-220
b final (mats) Min 225 270-280 Min 225 300-320
Fincncssm 2Kg Max 10 10-20 Max 10 05-10
Soundness Max 08 004-008 Max 0080 004-02
a le-chart (mm)
b autoclave ()
Supreme Expertise
The Best Technical Team exclusive to Kesoram mans the Plant and monitors the process
to blend the cement in just the required proportions to make BIRLA SUPREMEGOLD OF
Rock Strength
18 Million Tones of Solid Foundation
Staying at the top for over a Quarter Century Quarter Century is no less an achievement
Infact Kesoram is synonymous with for over 28 years
Over the years Kesoram has dispatched 18 million tones of cement to the nook and cornersof the country and joined hands in strengthening the Nation No one else in Andhra Pradesh
has this distinction The prestigious World Bank aided Ramagundam Super Thermal Power
Project of NTPC and Mannair Dam of Pochampad project in AP arc a couple of projects for
which Kesoram Cement was exclusively uses to cite an example
8102019 A Study A Study On Financial Performance Analysis With Reference To Kesoram Cementon Financial Performance hellip
httpslidepdfcomreaderfulla-study-a-study-on-financial-performance-analysis-with-reference-to-kesoram 2981
29
Chemical Characteristics
Opc 43 gr
Is 81 132-989
Birla
Supreme
43 grade
Ope 53 gr
Is 12269-
87
Birla
Supreme
Gold 53 gr
Loss on inflection Max 5 lt16 Max 40 lt15
Insoluble residue Max 20 lt08 Max 20 lt 06
Magnesium oxide Max 60 lt 13 Max 60 lt 13
Lime saturation factor 066-102 08-09 08-102 088-09
Alumna iron ratio MinO66 15-17 MinO66 15-17
Sulfuric anhydride Max 253 16-20 Max 2 53 16-20
Alkalis Chlorides Max 005 Max 001 Max 005 Max 04
Kesoram Cement - advantages
Helps in designing sleeker and more elegant
Structures giving greater flexibility in design concept
Due to its fine quality super fine construction can be achieved Its gives maximum
strength at Minimum use of cement with water in the water cement ratio especially the 53
grade Birlas supreme-gold
Feathers in Kesorams cap
Kesoram has outstanding track record achieving over 100 capacity utilization I
productivity and energy conservation It has proved its distinction by bagging several
national and state awards noteworthy being
NATIONAL
1 National productivity award for 1985-86
2 National productivity award for 1986-87
3 National award for mines safety for 1985-86
4 National award for mines safety for 1986-875 National award for energy conservation 1989-90
8102019 A Study A Study On Financial Performance Analysis With Reference To Kesoram Cementon Financial Performance hellip
httpslidepdfcomreaderfulla-study-a-study-on-financial-performance-analysis-with-reference-to-kesoram 3081
30
STATE
1 AP State productivity award for 1988
2 State award for best industrial management 1988-89
3 Best industrial productivity award of FAPCCI (federation of AP chamber of
commerce and industry) 1991
4 Best management award of the state Govt 1993
5 FAPCCI award for the workers welfare 1995-96
ISO 9002
All quality systems of Kesoram have been certified under ISO 90021S 4002 which
proves the worldwide acceptance of the products
All quality systems in production and marketing of the product have been certified by BIS
under ISO 90021S 14002
The first unit was installed at basanthnagar with a capacity of 25 ndashlakhs TPA (tones per
annum) incorporating humble supervision preheated system during the year 1969
The second unit followed suit with added a capacity of 2 lakhs TPA in 1971
The plant was further expanded to 9 lakhs by adding 25 lakhs tones in august 1978 113
lakhs tones in January 1981 and 087 lakhs tones in September 1981
Power
Singareni collieries make the supply of coal for this industry and the power was
obtained from AP TRANSCO The power demand for the factory is about 21MW Kesoram
has got 2-diesel generator seats of 4 MW each installed in the year 1987
Kesoram cement now has a 15MWcaptive power plant to facilities for uninterrupted
power supply for manufacturing of cement
Performance
The performance of kersoram cement industry has been outstanding achieving over
cent percent capacity utilization all through despite many odds like power cuts and which
most 40 was wasted due to wagon shortage etc
The company being a continuous process industry works round the clock and has
excellent records of performance achieving over 1005 capacity utilization
Kesoram has always combined technical progress with industrial performance The
company had glorious track record for the last 27 years in the industry
Technology
8102019 A Study A Study On Financial Performance Analysis With Reference To Kesoram Cementon Financial Performance hellip
httpslidepdfcomreaderfulla-study-a-study-on-financial-performance-analysis-with-reference-to-kesoram 3181
31
Kesoram cement uses most modern technology and the computerized control in the
plant A team of dedicated and well- experienced experts manages the plant
The quality is maintained much above the bureau of Indian standards
The raw materials used for manufacturing cement are
Lime stone
Bauxite
Hematite
Gypsum
Environmental and Social Obligations
For environmental promotion and to keep ndashup the ecological balance this section
has planted over two lakhs trees on social obligation front this section has undertaken
various social welfare programs by adopting ten nearly villages organizing family welfare
campus surgical camps animal health camps blood donation camps children immunization
camps seeds training for farmers etc were arranged
Welfare and Recreation Facilities
For the purpose of recreation facilities 2 auditoriums were provided for playing
indoor games cultural function and activities like drama music and dance etc
The industry has provided libraries and reading rooms About 1000 books are available in
the library All kinds of newspaper magazines are made available
Canteen is provided to cater to the needs of the employees for supply of snacks tea
coffee and meals etc
One English medium and one Telugu medium school are provided to meet the
educational requirements
The company has provided a dispenser with a qualified medical office and
paramedical staff for the benefit of the employees The employees covered under ESI
scheme have to avail the medical facilities from the ESI hospital
Competitions in sports and games are conducted every year for august 15th
Independence Day and January 26th republic day among the employees
Electricity
The power consumption per ton of cement has come down to 108 units against 113
units last year due to implementation of various energy saving measures The performance
of captive power plant of this section continues to be satisfactory Total power generation
8102019 A Study A Study On Financial Performance Analysis With Reference To Kesoram Cementon Financial Performance hellip
httpslidepdfcomreaderfulla-study-a-study-on-financial-performance-analysis-with-reference-to-kesoram 3281
32
during the year was 84 million units last year This captive power plant is a major role in
keeping power costs with in economic levels
The management has introduced various HRD programs for training and
development and has taken various other measures for the betterment of employeersquos
efficiency
The section has installed adequate air pollution control system and equipment and is
ISO14001 such as Environment management system is under implementation
Awards
Kesoram cement bagged many prestigious awards including national awards for
productivity technology conservation and several state awards since 1984 The following
are the some of important awards
AWARDS OF KESORAM CEMENT
No Year Awards
National
State
1 1989-90 Management award community
Development
State
2 1991 Energy conservation may day award of the
Govt
State
3 1991 Pundit Jawaharlal Nehru rolling trophy for
best
State
4 1993 National productivity effort Indira Gandhi
national award
State
5 1994 Best management award State
6 1994-
1995
Best industrial rebellion award State
7 1995 Rural development by chief minister
Environment and mineral conservation
award
State
8 1995 Best industrial rebellion award State
8102019 A Study A Study On Financial Performance Analysis With Reference To Kesoram Cementon Financial Performance hellip
httpslidepdfcomreaderfulla-study-a-study-on-financial-performance-analysis-with-reference-to-kesoram 3381
33
9 1995-
1996
Best effort of an industrial unit to
development rural economy shriSRRungta
award for social
National
10 1996 Awareness for best rural development
efforts
State
11 1999 Best workers welfare best family welfare
award
State
12 2001 First prize for mine environment amppollution
control for the 3rd
year in succession
State
13 2002 Vana mithra award from AP Govt State
14 2003 Company has got OHSAS-18001 State
15 2005 Certification from DNV New Delhi State
16 2006 Award for pollution control and
environmental protection FAPCCI award
for best rural development in the state
State
8102019 A Study A Study On Financial Performance Analysis With Reference To Kesoram Cementon Financial Performance hellip
httpslidepdfcomreaderfulla-study-a-study-on-financial-performance-analysis-with-reference-to-kesoram 3481
34
Products of the organization
8102019 A Study A Study On Financial Performance Analysis With Reference To Kesoram Cementon Financial Performance hellip
httpslidepdfcomreaderfulla-study-a-study-on-financial-performance-analysis-with-reference-to-kesoram 3581
35
CHAPTER-III
LITERATURE REVIEW
8102019 A Study A Study On Financial Performance Analysis With Reference To Kesoram Cementon Financial Performance hellip
httpslidepdfcomreaderfulla-study-a-study-on-financial-performance-analysis-with-reference-to-kesoram 3681
36
Introduction
Financial Performance Analysis
The term lsquofinancial performance analysis also known as analysis and interpretation of
financial statementsrsquo refers to the process of determining financial strength and
weaknesses of the firm by establishing strategic relationship between the items of the
balance sheet profit and loss account and other operative data
ldquoAnalyzing financial statementsrdquo by Metcalf and Titard
ldquoFinancial analysis is a process of evaluating the relationship between component
parts of a financial statement to obtain a better understanding of a firms position and
performancerdquo by Myers
Financial Performance
The word lsquoPerformance is derived from the word lsquoparfourmenrsquo which means lsquoto dorsquo lsquoto
carry outrsquo or lsquoto renderrsquo It refers the act of performing execution accomplishment
fulfillment etc In border sense performance refers to the accomplishment of a given task
measured against preset standards of accuracy completeness cost and speed In other
words it refers to the degree to which an achievement is being or has been accomplished In
the Words of Frich Kohlar ldquoThe performance is a general term applied to a part or to all the
conducts of activities of an organization over a period of time often with reference to past or
projected cost efficiency management responsibility or accountability or the like Thus not
just the presentation but the quality of results achieved refers to the performance
Performance is used to indicate firmrsquos success conditions and compliance
Financial performance refers to the act of performing financial activity In broader
sense financial performance refers to the degree to which financial objectives being or has
been accomplished It is the process of measuring the results of a firms policies and
operations in monetary terms It is used to measure firms overall financial health over a
given period of time and can also be used to compare similar firms across the same industry
or to compare industries or sectors in aggregation
The purpose of financial analysis is to diagnose the information contained in financial
statements so as to Jude the profitability and financial soundness of the firm Just like a
doctor examines his patient by recording his body temperature blood pressure etc Before
8102019 A Study A Study On Financial Performance Analysis With Reference To Kesoram Cementon Financial Performance hellip
httpslidepdfcomreaderfulla-study-a-study-on-financial-performance-analysis-with-reference-to-kesoram 3781
37
making his conclusion regarding the illness and before giving his treatment a financial
analyst analysis the financial statements with various tools of analysis before commenting
upon the financial health or weaknesses of an enterprise
The analysis and interpretation of financial statements is essential to bring out the
mystery behind the figures in financial statements Financial statements analysis is an
attempt to determine the significance and meaning of the financial statement data so that
forecast may be made of the future earnings ability to pay interest and debt maturities (both
current and long term) and profitability of a sound divided policy
Types of financial analysis-
Financial analysis into different categories depending upon
(1) The material used and
(2) The method of operation followed in the analysis or the modus operandi of
analysis
Types of financial analysis
On the basis of material used on the basis of modus operandi
External Internal Horizontal Vertical
Analysis Analysis Analysis Analysis
1 On the basis of material used - According to material used financial analysis canbe of two types
External analysis
Internal analysis
External analysis-
This analysis is done by outsiders who do not have access to the detailed internal
outsiders include investors potential investors Creditors Potential Creditors Government
Agencies Credit Agencies and General Public For financial analysis these external parties
to the firm depend almost entirely on the published financial statements
Internal analysis-
This analysis is undertaken by the persons namely executives and employees of the
organization or by the officers appointed by government or court who have access to the
8102019 A Study A Study On Financial Performance Analysis With Reference To Kesoram Cementon Financial Performance hellip
httpslidepdfcomreaderfulla-study-a-study-on-financial-performance-analysis-with-reference-to-kesoram 3881
38
books of account ( internal accounting records) and other information related to the
business
2 983119983150 983156983144983141 983138983137983155983145983155 983151983142 983149983151983140983157983155 983151983152983141983154983137983150983140983145983085
According to the modus operandi financial analysis can also be of two types
a Horizontal analysis
bVertical analysis
Horizontal analysis-
Horizontal analysis refers to the comparison of financial data of a company for several
years The figures for this type of analysis are presented horizontally over a number of
columns The figures of the various years are compared with standard or base year a base
year is year chosen as beginning point This type of analysis is also called lsquodynamicanalysisrsquo as it is based on the data from year to year rather than on data of any one year The
horizontal analysis makes it possible to focus attention on items that have changed
significantly during the period under view
b Vertical analysis-
Vertical analysis refers to the study of relationship of the various items in the financial
statements of one accounting period In this types of analysis the figures from financial
statement of a year are compared with a base selected from the same yearrsquos statement
Methods of financial analysis-
The following methods of analysis are generally used-
1 Comparative Statements
2 Trend Analysis
3 Common-Size Statements
4 Funds flow Analysis
5 Cash Analysis
6 Ratio Analysis
7 Cost-volume-Profit Analysis
8102019 A Study A Study On Financial Performance Analysis With Reference To Kesoram Cementon Financial Performance hellip
httpslidepdfcomreaderfulla-study-a-study-on-financial-performance-analysis-with-reference-to-kesoram 3981
39
Comparative statements-
The comparative financial statements are statements of the financial position at
different periods of time the elements of financial position are show in a
Comparative Statement provides an idea of financial position at two or more
periods Generally two financial statements (balance sheet and income statement) are
prepared in comparative form for financial analysis
The Comparative Statement May Show-
1 Absolute figures (rupee amounts)
2 Changes in absolute figures ie increase or decrease in absolute figures
3 Absolute data in terms of percentages
4 Increase or decrease in terms of percentages
The Two Comparative Statements Are-
1 Comparative balance sheet and
2 Income statement
1 983107983151983149983152983137983154983137983156983145983158983141 983138983137983148983137983150983139983141 983155983144983141983141983156983085
The comparative balance sheet analysis is the study of the trend of the same items group of
items and computed items in two or more balance sheets of the same business enterprise on
different dates The change in periodic balance sheet items reflect the conduct of a business
the change can be observed by comparison of the balance sheet at the beginning and at the
end of a period and these changes can help in forming an opinion about the progress of an
enterprise
Guide Lines for Interpretation of Comparative Balance Sheet-
While interpreting comparative balance sheet the interpreter is expected to study the
following aspects-
1 Current financial position and liquidity position
2 Long-term financial position
3 Profitability of the concern
8102019 A Study A Study On Financial Performance Analysis With Reference To Kesoram Cementon Financial Performance hellip
httpslidepdfcomreaderfulla-study-a-study-on-financial-performance-analysis-with-reference-to-kesoram 4081
40
Common Size Statement-
The common-size statements balance sheet and income statement are show in
analytical percentages The figures are shown as percentages of total assets total liabilities
and total sales The total assets are taken as 100 and different assets are expressed as a
percentage of the total similarly various liabilities are taken as a part of total liabilities
Common Size Balance Sheet-
A statement in which balance sheet items are expressed as the ratio of each asset to
total assets and the ratio of each liability is expressed as a ratio of total liabilities is called
common size balance The common size balance sheet can be used to compare companies
of differing size The comparison of figures in different periods is not useful because total
figures may be affected by a number of factors It is not possible to establish standard norms
for various assets The trends of figures from year to year may not be studied and even they
may not give proper results
Trend Analysis of Balance Sheet-
Trend analysis is Very important tool of horizontal financial analysis
This analysis enables to known the change in the financial function and operating efficiency
in between the time period chosen
By studding the trend analysis of each item we can known the direction of changes and
based upon the direction of changes the options can be changed
Trend =Absolute Value of item in the statement understudy 100
Absolute Value of same item in the base statement
Ratio Analysis
Ratio analysis is used as a technique of analyzing the financial information contained in the
balance sheet and profit and loss accounts for a more meaningful understanding of the
financial position and performance of a firm
The relationship between two accounting figures expressed mathematically is known as a
financial ratio A ratio helps the analyst to make qualitative judgment about the firmrsquos
financial position and performance
Several ratios can be calculated from the accounting data contained in the financial
statements The parties which generally undertake financial analysis is short ndashterm
creditors long-term creditors owner and management In view of the requirements of the
various ratios ratios are classified into the following four important categories
8102019 A Study A Study On Financial Performance Analysis With Reference To Kesoram Cementon Financial Performance hellip
httpslidepdfcomreaderfulla-study-a-study-on-financial-performance-analysis-with-reference-to-kesoram 4181
41
Liquidity ratios
Leverage ratios
Activity ratios
Profitability ratios
Liquidity Ratios
It is extremely essential for a firm to be able to meet its obligations as they become due
Liquidity ratios measure the ability of the firm to meet its current obligations A firm should
ensure that it does not suffer from lack of liquidity and also that it does not have excess
liquidity The failure of a company to meet its obligations due to lack of sufficient liquidity
will result in a poor creditworthiness loss of creditorsrsquo confidence or even in legal tangles
resulting in the closure of the company A very high degree of liquidity is also bad idle
assets earn nothing The firmrsquos funds will be unnecessarily tied up in current assets
Therefore it is necessary to strike a proper balance high liquidity and lack of liquidity
The most common ratios which indicate the extent of liquidity or lack of it are
Current ratio
Quick ratio
Other ratios include Cash ratio Interval Measure and Net working capital ratio
Current Ratio
The current ratio is calculated by dividing current assets by current liabilities
Current assets
Current ratio = --------------------------
Current liabilities
Current ratio is a measure of the firmrsquos short term solvency It indicates the availability of
current assets in rupees for every one rupee of current liability A ratio of greater than one
means that the firm has more current assets than current claims against the Current ratio of
2 to 1 or more is considered satisfactory Current ratio represents a margin of safety for
creditors
Quick Ratio
Quick ratio also known as acid-test ratio establishes a relationship between quick assets and
the current liabilities Cash is the most liquid asset It is calculated by dividing quick assets
by current liabilities
Quick ratio = Quick Assets Current Liabilities
8102019 A Study A Study On Financial Performance Analysis With Reference To Kesoram Cementon Financial Performance hellip
httpslidepdfcomreaderfulla-study-a-study-on-financial-performance-analysis-with-reference-to-kesoram 4281
42
(Quick Assets = Current assets ndash Inventory)
One defect of the current ratio is that it fails to convey any information on the composition
of the current assets of the firm A rupee of cash is considered equivalent to a rupee of
inventory of receivables But it is not so A rupee of cash is more readily available to meet
current liabilities than a rupee of say inventory This implies the usefulness of the current
ratio
The Acid ndashtest ratio measures the firmrsquos ability to convert its current assets quickly into
cash in order to meet its current liabilities
A quick ratio of 1 to 1 is considered to represent a satisfactory current financial condition It
is an important index of the firmrsquos liquidity
Leverage Ratios
Leverage ratios identify the source of a firmrsquos capital ndashowners or outside creditors
Financial leverage refers to the use of debt in financing non-current assets If the return on
assets exceeds the cost of debt the leverage is successful ndash ie it improves return on equity
Debt ndashEquity Ratio
The Debt ndash Equity is determined to analyze the soundness of the long term financial
policies of the organization It is also known as ldquoInternal External Equity Ratiordquo
It is calculated as follows
Debt ndash Equity Ratio = Total long term debt Share holders funds
Equity Ratio
This ratio is also called as proprietary ratio establishes a relationship between share holderrsquos
funds to total assets of company Equity Ratio is calculated by dividing share holders fund
by total assets
Fixed Asset Ratio
This ratio indicates the extent to which the assets of the companyrsquos can be lost without
affecting the interest of the creditors of the company Higher the ratios better the long-term
position of the company
Activity Ratios
They are primarily used for studying a firmrsquos working capital situation A well managed
firm should have good activity ratios
8102019 A Study A Study On Financial Performance Analysis With Reference To Kesoram Cementon Financial Performance hellip
httpslidepdfcomreaderfulla-study-a-study-on-financial-performance-analysis-with-reference-to-kesoram 4381
43
Working Capital Turnover Ratio
The working capital turnover ratio indicates whether or not working capital has been
effectively used in making sales
Working capital turnover = Sales Net current assets
Inventory Turnover Ratio
This ratio also known as Stock Turnover Ratio establishes the relationship between costs of
goods sold or net sales during the given period and the average amt of stock held during the
period This ratio reveals the number of times finished stock in turnover during a given
accounting period
Higher the ratio the better is it because it shows the finished stock is rapidly turned
in to sales On the other hand a low stock turnover ratio is not desirable because it reveals
the accumulation of stock
Debtors Turnover Ratio
This ratio indicates the velocity of debt collection of a company In other words it shows
the number of times average turnover during a year
A Higher Debtor Turnover Ratio indicates a more efficient is the management towards
debtors and low ratio ratio implies inefficient management of debtors
Total Assets Turnover Ratio
The asset turnover ratio indicates how efficiently management is employing Assets
Total Assets Turnover Ratio = Sales Total Assets
Profitability Ratios
Profitability ratios are the ratios which measure a firmrsquos overall effectiveness as revealed by
the returns generated on sales and investment
General Profitability Ratios
1 Gross Profit Ratio
2 Net profit Ratio
3 Operating or Expenses Ratio
8102019 A Study A Study On Financial Performance Analysis With Reference To Kesoram Cementon Financial Performance hellip
httpslidepdfcomreaderfulla-study-a-study-on-financial-performance-analysis-with-reference-to-kesoram 4481
44
Gross Profit Ratio
Gross profit Ratio measures the relationships to net sales and is usually represented as a
percentage It is a good measure of profitability
The gross profit ratio indicates the extent to which selling price of goods per unit may
decline without resulting in losses on operation Higher the gross profit betters the result
Net Profit Ratio
Net Profit Ratio indicates net margin on sales It is given by the following equation
Net Profit Ratio = (Net Profit Sales) 100
Operating or Expenses Ratio
This ratio is complimentary of Net Profit Ratio The more the net profit the less the
Operating Ratio Operating costs include the cost of direct materials direct labors and otheroverheads viz are generally excluded from operating costs A comparison of the Operating
Ratio will indicate whether the cost efficiency is high or low in the figure of sales This less
the ratio it depicts the efficiency of the management
8102019 A Study A Study On Financial Performance Analysis With Reference To Kesoram Cementon Financial Performance hellip
httpslidepdfcomreaderfulla-study-a-study-on-financial-performance-analysis-with-reference-to-kesoram 4581
45
CHAPTER IV
DATA ANALYSIS amp INTERPRETATION
8102019 A Study A Study On Financial Performance Analysis With Reference To Kesoram Cementon Financial Performance hellip
httpslidepdfcomreaderfulla-study-a-study-on-financial-performance-analysis-with-reference-to-kesoram 4681
46
Comparative Balance Sheet of Kesoram in the Year between 2008-2009
(Rupee in crores)
Years Changes
Particulars 2008 2009 In Rupees In Percentage
Liabilities
Share Capital 4574 4574 000 000
Reserves amp Surplus 93085 128024 34939
Revaluation Reserves 533 412 -121 -2270
Loans
Secured Loans 97106 153627 56521 5821
Un Secured Loans 12129 43416 31287 25795
Deferred Tax Liabilities 000 000 000 000
Current Liabilities
Provisions 33039 34529 1490 451
Current Liabilities 57067 66587 9520 1668
Total 297533 431169 133636 4491
Assets
Net Block 108424 180435 72011 6642
Capital Wip 63459 86485 23026 3628
Investments 4783 6178 1395 2917
Current Assets
Inventories 44217 58906 14689 3322
Sundry Debtors 27307 38017 10710 3922
Cash amp Bank Balances 4036 5657 1621 4016
Total Current Assets 75560 102580 27020 3576
Loans amp Advances 45289 55462 10173 2246
Fixed Deposits 018 028 010 5556
Total 297533 431169 133636 4491
8102019 A Study A Study On Financial Performance Analysis With Reference To Kesoram Cementon Financial Performance hellip
httpslidepdfcomreaderfulla-study-a-study-on-financial-performance-analysis-with-reference-to-kesoram 4781
47
Interpretation of comparative balance sheet of 2008-2009
Reserves amp Surplus were increased to 3753 (percent) ie in Rupees 34939
crores
Revaluation Reserves decreased to 121 ie in Rupees 2270 crores
Secured Loans are increased to 5821 ie in Rupees 56521 crores And UN
secured loans highly Increased to 25795
Current liabilities and Provisions are increased to 1668 and 451 respectively ie in
Rupees 9520 amp 1490 crores
Fixed assets were highly increased to 6642 ie in Rupees 72011 crores
Investments were increased to 2917 ie in Rupees 1395 crores
Sundry debtors increased to 3922 ie in Rupees 10710 crores
Current assets increased 3576 ie in Rupees 27020 crores And Loans amp
Advances increased to 2246 respectively
The overall financial position was satisfactory
8102019 A Study A Study On Financial Performance Analysis With Reference To Kesoram Cementon Financial Performance hellip
httpslidepdfcomreaderfulla-study-a-study-on-financial-performance-analysis-with-reference-to-kesoram 4881
48
Comparative Balance Sheet of Kesoram in the Year between 2009-2010
(Rupees in crores)
Years Changes
Particulars 2009 2010 In Rupees In Percentage
Liabilities
Share Capital 4574 4574 000 000
Reserves amp Surplus 128024 149111 21087 1647
Revaluation Reserves 412 339 -073 -1772
Loans
Secured Loans 153627 186372 32745 2131
Un Secured Loans 43416 126250 82834 19079
Deferred Tax Liabilities 000 000 000
Current Liabilities
Provisions 34529 35734 1205 349
Current Liabilities 66587 107688 41101 6173
Total 431169 610068 178899 4149
Assets
Net Block 180435 343182 162747 9020
Capital WIP 86485 41283 -45202 -5227
Investments 6178 5143 -1035 -1675
Current Assets
Inventories 58906 91619 32713 5553
Sundry Debtors 38017 54289 16272 4280
Cash amp Bank Balances 5657 8014 2357 4167
Total Current Assets 102580 153922 51342 5005
Loans amp Advances 55462 66506 11044 1991
Fixed Deposits 028 031 003 1071
Total 431169 610068 178899 4149
8102019 A Study A Study On Financial Performance Analysis With Reference To Kesoram Cementon Financial Performance hellip
httpslidepdfcomreaderfulla-study-a-study-on-financial-performance-analysis-with-reference-to-kesoram 4981
49
Interpretation of comparative balance sheet of 2009-2010
Reserves amp surplus increased to 1647 ie in Rupees 21087 crores
Revaluation Reserves decreased to 1772 ie in Rupees 073 crores
Secured loans increased to 2131 ie in Rupees 32745 crores
Current Liabilities were increased to 6173 ie in Rupees 41101 crores and
Provisions 349 ie in Rupees 1205 crores
Fixed Assets were increased to 9020 ie in Rupees 162747 crores
Investments were decreased to 1675 ie in Rupees 1035 crores
Sundry debtors were increased to 4280 ie in Rupees 16272 crores
Current assets increased to 5005 ie in Rupees 51342 crores And loans and
Advances increased 1919 ie in Rupees 11044 crores
The overall financial position was satisfactory
8102019 A Study A Study On Financial Performance Analysis With Reference To Kesoram Cementon Financial Performance hellip
httpslidepdfcomreaderfulla-study-a-study-on-financial-performance-analysis-with-reference-to-kesoram 5081
50
Comparative Balance Sheet of Kesoram in the Year between 2010-2011
(Rupees in crores)
Years Changes
Particulars 2010 2011 In Rupees In Percentage
Liabilities
Share Capital 4574 4574 000 000
Reserves amp Surplus 149111 125162 -23949 -1606
Revaluation Reserves 339 289 -050 -1475
Loans
Secured Loans 186372 237183 50811 2726
Un Secured Loans 126250 162744 36494 2891
Deferred Tax Liabilities 000 000 000
Current Liabilities
Provisions 35734 1494 -34240 -9582
Current Liabilities 107688 113902 6214 577
Total 610068 645348 35280 578
Assets
Net Block 343182 369172 25990 757
Capital WIP 41283 43781 2498 605
Investments 5143 6582 1439 2798
Current Assets
Inventories 91619 111855 20236 2209
Sundry Debtors 54289 63134 8845 1629
Cash amp Bank Balances 8014 7188 -826 -1031
Total Current Assets 153922 182177 28255 1836
Loans amp Advances 66506 43460 -23046 -3465
Fixed Deposits 031 176 145 46774
Total 610068 645348 35280 578
8102019 A Study A Study On Financial Performance Analysis With Reference To Kesoram Cementon Financial Performance hellip
httpslidepdfcomreaderfulla-study-a-study-on-financial-performance-analysis-with-reference-to-kesoram 5181
51
Interpretation of comparative balance sheet of 2010-2011
Reserves amp surplus decreased to 1606 ie in Rupees 23949 crores
Revaluation Reserves decreased to 1475 ie in Rupees 050 crores
Secured loans increased to 2726 ie in Rupees 50811 crores
Current Liabilities were increased to 577 ie in Rupees 6214 crores
Provisions decreased to 9582 ie in Rupees 34240 crores
Fixed Assets were increased to 757 ie in Rupees 25990 crores
Investments were decreased to 2798 ie in Rupees 1439 crores
Sundry debtors were increased to 1629 ie in Rupees8845 crores
Current assets increased to 1836 ie in Rupees 28255 crores And loans and
Advances increased 3465 ie in Rupees 23046 crores
The overall financial position was UN satisfactory
8102019 A Study A Study On Financial Performance Analysis With Reference To Kesoram Cementon Financial Performance hellip
httpslidepdfcomreaderfulla-study-a-study-on-financial-performance-analysis-with-reference-to-kesoram 5281
52
Comparative Balance Sheet of Kesoram In The Year Between 2011-2012
(Rupees in crores)
Years Changes
Particulars 2011 2012 In Rupees In Percentage
Liabilities
Share Capital 4574 4574 000 000
Reserves amp Surplus 125162 86657 -38505 -3076
Revaluation Reserves 289 270 -019 -657
Loans
Secured Loans 237183 317792 80609 3399
Un Secured Loans 162744 92742 -70002 -4301
Deferred Tax Liabilities 000 000 000
Current Liabilities
Provisions 1494 40726 39232 262597
Current Liabilities 113902 180010 66108 5804
Total 645348 722771 77423 1200
Assets 000
Net Block 369172 358721 -10451 -283
Capital WIP 43781 68065 24284 5547
Investments 6582 6636 054 082
Current Assets
Inventories 111855 99516 -12339 -1103
Sundry Debtors 63134 67358 4224 669
Cash amp Bank Balances 7188 6959 -229 -319
Total Current Assets 182177 173833 -8344 -458
Loans amp Advances 43460 115409 71949 16555
Fixed Deposits 176 107 -069 -3920
Total 645348 722771 77423 1200
8102019 A Study A Study On Financial Performance Analysis With Reference To Kesoram Cementon Financial Performance hellip
httpslidepdfcomreaderfulla-study-a-study-on-financial-performance-analysis-with-reference-to-kesoram 5381
53
Interpretation of comparative balance sheet of 2011-2012
Reserves amp surplus decreased to 3076 ie in Rupee 38505 crores
Revaluation Reserves decreased to 657 ie in Rupees 019 crores
Secured loans increased to 3399 ie in Rupees 80699 crores
Current Liabilities were increased to 5804 ie in Rupees 66108 crores
Provisions increased to 262597 ie in Rupees 39232 crores
Fixed Assets were decreased to 283 ie in Rupee 10451 crores
Investments were increased to 082 ie in Rupees 054 crores
Sundry debtors were increased to 669 ie in Rupees 4224 crores
Current assets decreased to 458 ie in Rupees 8344 crores And loans and
Advances increased 16555 ie in Rupees 71949 crores
The overall financial position was UN satisfactory
8102019 A Study A Study On Financial Performance Analysis With Reference To Kesoram Cementon Financial Performance hellip
httpslidepdfcomreaderfulla-study-a-study-on-financial-performance-analysis-with-reference-to-kesoram 5481
54
Common Size Balance Sheet of Kesoram For The Year 2008-2009
(Rupees in crores)
Particulars 2008 Change Percentage 2009 Change Percentage
Liabilities
Share Capital 4574 154 4574 106
Reserves amp Surplus 93085 3129 128024 2969
Revaluation Reserves 533 018 412 010
Loans
Secured Loans 97106 3264 153627 3563
Un Secured Loans 12129 408 43416 1007
Deferred Tax Liabilities 000 000 000 000
Current Liabilities
Provisions 33039 1110 34529 801
Current Liabilities 57067 1918 66587 1544
Total 297533 10000 431169 10000
Assets
Net Block 108424 3644 180435 4185
Capital WIP 63459 2133 86485 2006
Investments 4783 161 6178 143
Current Assets
Inventories 44217 1486 58906 1366
Sundry Debtors 27307 918 38017 882
Cash amp Bank Balances 4036 136 5657 131
Loans amp Advances 45289 1522 55462 1286
Fixed Deposits 018 001 028 001
Total 297533 10000 431169 10000
8102019 A Study A Study On Financial Performance Analysis With Reference To Kesoram Cementon Financial Performance hellip
httpslidepdfcomreaderfulla-study-a-study-on-financial-performance-analysis-with-reference-to-kesoram 5581
55
Interpretation of Common Size Balance Sheet of 2008-2009
Share capital was recorded 154 percent in the total liabilities in the year 2008 it is
decreased to 106 in the year 2009
Reserves amp surplus contributed to 3129 in the total liabilities in the year 2008 it is
decreased to 2969 in the year 2009
Secured loans were 3264 in the total liabilities in the year 2008 it is increased to
3563 in the year 2009
Current Liabilities shown to 1918 in the total liabilities in the year 2008 it is
decreased to 1544 in the year 2009
Provisions 1110 in the total liabilities in the year 2008 it is decreased to 801 in the
year 2009
Fixed Assets were 3644 in the total liabilities in the year 2008 ie decreased to 4185
in the year 2009
Investments were 161 in the total liabilities in the year 2008 it is decreased to 143
in the year 2009
Sundry debtors were 918 in the total liabilities in the year 2008 it is decreased to 882
in the year 2009
8102019 A Study A Study On Financial Performance Analysis With Reference To Kesoram Cementon Financial Performance hellip
httpslidepdfcomreaderfulla-study-a-study-on-financial-performance-analysis-with-reference-to-kesoram 5681
56
Common Size Balance Sheet of Kesoram For The Year 2009-2010
(Rs in crores)
Particulars 2009 Change Percentage 2010Change
Percentage
Liabilities
Share Capital 4574 106 4574 075
Reserves amp Surplus 128024 2969 149111 2444
Revaluation Reserves 412 010 339 006
Loans
Secured Loans 153627 3563 186372 3055
Un Secured Loans 43416 1007 126250 2069
Deferred Tax Liabilities 000 000 000 000
Current Liabilities
Provisions 34529 801 35734 586
Current Liabilities 66587 1544 107688 1765
Total 431169 10000 610068 10000
Assets
Net Block 180435 4185 343182 5625
Capital WIP 86485 2006 41283 677
Investments 6178 143 5143 084
Current Assets
Inventories 58906 1366 91619 1502
Sundry Debtors 38017 882 54289 890
Cash amp Bank Balances 5657 131 8014 131
Loans amp Advances 55462 1286 66506 1090
Fixed Deposits 028 001 031 001
Total 431169 10000 610068 10000
8102019 A Study A Study On Financial Performance Analysis With Reference To Kesoram Cementon Financial Performance hellip
httpslidepdfcomreaderfulla-study-a-study-on-financial-performance-analysis-with-reference-to-kesoram 5781
57
Interpretation of common size balance sheet of 2009-2010
Share capital was recorded 106 percent in the total liabilities in the
year 2009 it is decreased to 075 in the year 2010
Reserves amp surplus contributed to 2969 in the total liabilities in the
year 2009 it is decreased to2444 in the year 2010
Secured loans were 3563 in the total liabilities in the year 2009 it is
increased to 3055 in the year 2010
Current Liabilities shown to 1544 in the total liabilities in the year
2009 it is decreased to 1765 in the year 2010
Provisions 801 in the total liabilities in the year 2009 it is decreased
to 586 in the year 2010
Fixed Assets were 4185 in the total liabilities in the year 2009 ie
increased to 5625 in the year 2010
Investments were 143 in the total liabilities in the year 2009 it is
decreased to 084 in the year 2010
Sundry debtors were 882 in the total liabilities in the year 2009 it is
increased to 890 in the year 2010
8102019 A Study A Study On Financial Performance Analysis With Reference To Kesoram Cementon Financial Performance hellip
httpslidepdfcomreaderfulla-study-a-study-on-financial-performance-analysis-with-reference-to-kesoram 5881
58
Common Size Balance sheet of Kesoram for the year 2010-2011
983080Rupees in crores)
Particulars 2010 Change Percentage 2011
Change
Percentage
Liabilities
Share Capital 4574 075 4574 071
Reserves amp Surplus 149111 2444 125162 1939
Revaluation Reserves 339 006 289 004
Loans
Secured Loans 186372 3055 237183 3675
Un Secured Loans 126250 2069 162744 2522
Deferred Tax Liabilities 000 000 000 000
Current Liabilities
Provisions 35734 586 1494 023
Current Liabilities 107688 1765 113902 1765
Total 610068 10000 645348 10000
Assets
Net Block 343182 5625 369172 5721
Capital WIP 41283 677 43781 678
Investments 5143 084 6582 102
Current Assets
Inventories 91619 1502 111855 1733
Sundry Debtors 54289 890 63134 978
Cash amp Bank Balances 8014 131 7188 111
Loans amp Advances 66506 1090 43460 673
Fixed Deposits 031 001 176 003
Total 610068 10000 645348 10000
8102019 A Study A Study On Financial Performance Analysis With Reference To Kesoram Cementon Financial Performance hellip
httpslidepdfcomreaderfulla-study-a-study-on-financial-performance-analysis-with-reference-to-kesoram 5981
59
Interpretation of Common Size Balance Sheet Of 2010-2011
Share capital was recorded 075 percent in the total liabilities in the year 2010 it is
decreased to 071 in the year 2011
Reserves amp surplus contributed to 2444 in the total liabilities in the year 2010 it is
decreased to1939 in the year 2011
Secured loans were 3055 in the total liabilities in the year 2010 it is increased to
3675 in the year 2011
Current Liabilities shown to 1765 in the total liabilities in the year 2010 it is
also1765 in the year 2011
Provisions 586 in the total liabilities in the year 2010 it is decreased to 023 in the
year 2011
Fixed Assets were 5625 in the total liabilities in the year 2010 ie increased to 5721
in the year 2011
Investments were 084 in the total liabilities in the year 2010 it increased to 102 in
the year 2011
Sundry debtors were 890 in the total liabilities in the year 2010 it is increased to 978
in the year 2011
8102019 A Study A Study On Financial Performance Analysis With Reference To Kesoram Cementon Financial Performance hellip
httpslidepdfcomreaderfulla-study-a-study-on-financial-performance-analysis-with-reference-to-kesoram 6081
60
Common Size Balance Sheet of Kesoram for the Year 2011-2012
983080Rupees in crores)
Particulars 2011 Change Percentage 2012
Change
Percentage
Liabilities
Share Capital 4574 071 4574 063
Reserves amp Surplus 125162 1939 86657 1199
Revaluation Reserves 289 004 270 004
Loans
Secured Loans 237183 3675 317792 4397
Un Secured Loans 162744 2522 92742 1283
Deferred Tax Liabilities 000 000 000 000
Current Liabilities
Provisions 1494 023 40726 563
Current Liabilities 113902 1765 180010 2491
Total 645348 10000 722771 10000
Assets
Net Block 369172 5721 358721 4963
Capital WIP 43781 678 68065 942
Investments 6582 102 6636 092
Current Assets
Inventories 111855 1733 99516 1377
Sundry Debtors 63134 978 67358 932
Cash amp Bank Balances 7188 111 6959 096
Loans amp Advances 43460 673 115409 1597
Fixed Deposits 176 003 107 001
Total 645348 10000 722771 10000
8102019 A Study A Study On Financial Performance Analysis With Reference To Kesoram Cementon Financial Performance hellip
httpslidepdfcomreaderfulla-study-a-study-on-financial-performance-analysis-with-reference-to-kesoram 6181
61
Interpretation of common size balance sheet of 2011-2012
Share capital was recorded 071 percent in the total liabilities in the year 2011 it is
decreased to 063 in the year 2012
Reserves amp surplus contributed to 1939 in the total liabilities in the year 2011 it
is decreased to 1199 in the year 2012
Secured loans were 3675 in the total liabilities in the year 2011 it is increased to
4397 in the year 2012
Current Liabilities shown to 1765 in the total liabilities in the year 2011 it is
increased to 2491 in the year 2012
Provisions 023 in the total liabilities in the year 2011 it is increased to 563 in the
year 2012
Fixed Assets were 5721 in the total liabilities in the year 2011 ie decreased to
4963 in the year 2012
Investments were 102 in the total liabilities in the year 2011 it increased to 092
in the year 2012
Sundry debtors were 978 in the total liabilities in the year 2011 it is decreased to
932 in the year 2012
8102019 A Study A Study On Financial Performance Analysis With Reference To Kesoram Cementon Financial Performance hellip
httpslidepdfcomreaderfulla-study-a-study-on-financial-performance-analysis-with-reference-to-kesoram 6281
Trend Analysis
Share Capital-
Year
Amount
(In Crores) Trend
IncreaseDecrease
Base Year Previous Year
2008 4574 10000 000 000
2009 4574 10000 000 000
2010 4574 10000 000 000
2011 4574 10000 000 000
2012 4574 10000 000 000
Trend Percentages in Share Capital
Share capital shown a constant trend in the period 2008 and 2012
Share capital is 4574 crores all the years from 2008-2012
8102019 A Study A Study On Financial Performance Analysis With Reference To Kesoram Cementon Financial Performance hellip
httpslidepdfcomreaderfulla-study-a-study-on-financial-performance-analysis-with-reference-to-kesoram 6381
Reserves amp Surplus-
Year
Amount
(In Crores) Trend
IncreaseDecrease
Base Year Previous Year
2008 93085 10000 000 000
2009 128024 13753 3753 3753
2010 149111 16019 6019 2266
2011 125162 13446 3446 -2573
2012 86657 9309 -691 -4137
Trend Percentages in Reserves amp Surplus
Reserves amp surplus shown an increasing trend in the period between 2008 and 2010
The average trend was 13277 till 2010
The Reserves amp surplus was showing decreasing trend in the period 2011-2012 (ie
from 16019 in 2010 to 9309 in 2012)
The decreasing trend in Reserves amp surplus indicates the decrease in profits of the
firm
8102019 A Study A Study On Financial Performance Analysis With Reference To Kesoram Cementon Financial Performance hellip
httpslidepdfcomreaderfulla-study-a-study-on-financial-performance-analysis-with-reference-to-kesoram 6481
Investments-
Year
Amount
(In Crores) Trend
IncreaseDecrease
Base Year Previous Year
2008 4783 10000 000 000
2009 6178 12917 2917 2917
2010 5143 10753 753 -2164
2011 6582 13761 3761 3009
2012 6636 13874 3874 113
Trend Percentages in Investments-
The investments are shown an increasing trend in the period between 2008 ndash 2009
and it is decreasing in the year 2010
The average trend was 11458 till 2009
The investments increased in the periods 2011-2012 (ie from 10753 in 2010 to
13874 in 2012)
The overall trend in investments shown is satisfactory
8102019 A Study A Study On Financial Performance Analysis With Reference To Kesoram Cementon Financial Performance hellip
httpslidepdfcomreaderfulla-study-a-study-on-financial-performance-analysis-with-reference-to-kesoram 6581
Net Current Assets-
Year
Amount
(In Crores) Trend
IncreaseDecrease
Base Year Previous Year
2008 30761 10000 000 000
2009 56954 18515 8515 8515
2010 77037 25044 15044 6529
2011 110417 35895 25895 10851
2012 68613 22305 12305 -13590
Trends in Net Current Assets-
The NCA shown positive (increasing) trend
The NCA are increased to 35895 (the year 2011) compared with base year and
decreased in the year 2012 to 22305
The NCA shown increased trend from year and crossed 100
The overall trend was good
8102019 A Study A Study On Financial Performance Analysis With Reference To Kesoram Cementon Financial Performance hellip
httpslidepdfcomreaderfulla-study-a-study-on-financial-performance-analysis-with-reference-to-kesoram 6681
66
Ratio Analysis-
Current Ratio-
Current Ratio = Current Assets Current Liabilities
Current assets are cash in hand Cash at bank Marketable Securities(short term) short term
Investment Bills receivables sundry debtors Inventories (stock) Work in progress prepaid
expenses Current Liabilities are outstanding expenses Bills payable sundry Creditors
short-term advances income tax payable and Dividend payable
Current Ratio of Kesoram-
(Rupees in crores)
Year Current Assets Current Liabilities Current Ratio
2007-08 75560 57067 132
2008-09 102580 66587 154
2009-10 153922 107688 143
2010-11 182177 113902 160
2011-12 173833 180010 097
Interpretation-
As per the standard rule of current ratio ie 21 where current assets double the current
liabilities is considered satisfactory
In the present analysis the current ratio of the Kesoram is not satisfactory
from the above table It was assessed that the current ratio for all the five year is lower (less)
than the standard rule ie 21 And it is 097 in the year 2011-2012 (current year) This is
highly UN satisfactory
8102019 A Study A Study On Financial Performance Analysis With Reference To Kesoram Cementon Financial Performance hellip
httpslidepdfcomreaderfulla-study-a-study-on-financial-performance-analysis-with-reference-to-kesoram 6781
Quick Ratio-
Quick ratio also known as acid-test ratio establishes a relationship between quick
assets and the current liabilities Cash is the most liquid asset It is calculated by dividing
quick assets by current liabilities
Quick ratio = Quick Assets Current Liabilities
(Quick Assets = Current assets ndash Inventory)
Quick Ratio of Kesoram-
Rupees in crores)
Year Total QuickAssets
Current Liabilities Quick Ratio
2007-08 33343 57067 058
2008-09 43674 66587 066
2009-10 62303 107688 058
2010-11 70322 113902 0622011-12 74333 180010 041
Interpretation-
Usually a high Quick ratio is an indication that the company is liquid and has the ability to
meet its current or liquid liabilities in time on the other hand a low Quick Ratio represents
8102019 A Study A Study On Financial Performance Analysis With Reference To Kesoram Cementon Financial Performance hellip
httpslidepdfcomreaderfulla-study-a-study-on-financial-performance-analysis-with-reference-to-kesoram 6881
that the companyrsquos liquidity position is not good The above table showing the quick ratios
of Kesoram are canrsquot be considered satisfactory
Leverage Ratios-
Debt-Equity Ratio-
Debt-Equity Ratio = Total Long Term Debt Equity Share Holders Fund
Total Long term Debt= Debenture Capital + Long term loans from banks and financial
institutions + Public deposits
Equity Share Holders fund = Equity + Reserves and Surplus
Debt Equity Ratio of Kesoram
(Rupees in crores)
Year Total Debt Share Holders Fund Debt Equity Ratio
2007-08 109235 98192 111
2008-09 197043 133010 148
2009-10 312622 154024 203
2010-11 399927 130025 308
2011-12 410534 91501 449
8102019 A Study A Study On Financial Performance Analysis With Reference To Kesoram Cementon Financial Performance hellip
httpslidepdfcomreaderfulla-study-a-study-on-financial-performance-analysis-with-reference-to-kesoram 6981
Interpretation-
The Debt-Equity Ratio accepted standard is 05 This ratio reflects the relative contribution
of creditors and owners of business in its financing From the above it is clear that the long
term debt is more than that of the share holdersrsquo fund So we can interpret that the firmrsquosassets are financed more by the external funds rather than by the internal funds
8102019 A Study A Study On Financial Performance Analysis With Reference To Kesoram Cementon Financial Performance hellip
httpslidepdfcomreaderfulla-study-a-study-on-financial-performance-analysis-with-reference-to-kesoram 7081
Fixed Asset Ratio-
Net Sales
Fixed Asset Ratio = helliphelliphelliphelliphelliphelliphelliphelliphelliphelliphellip
Net Assets
Fixed Asset Ratio of Kesoram-
(Rupees in crores)
Year Net Sales Net Assets Fixed Assets Ratio
2007-08 300271 358721 084
2008-09 389797 369172 106
2009-10 475062 343182 1382010-11 539788 180435 299
2011-12 59182 108424 546
Interpretation
This ratio indicates the extent to which the assets of the companyrsquos can be lost without
affecting the interest of the creditors of the company Higher the ratios better the long-term
position of the companyThe above table shows fixed assets ratio in increasing trend Which is good for the
company
8102019 A Study A Study On Financial Performance Analysis With Reference To Kesoram Cementon Financial Performance hellip
httpslidepdfcomreaderfulla-study-a-study-on-financial-performance-analysis-with-reference-to-kesoram 7181
Overall Profitability Ratios-
Net Profit Ratio
Net Profit Ratio indicates net margin on sales It is given by the following equation
Net Profit Ratio = (Net Profit Sales) 100
Net Profit Ratio of Kesoram
(Rupees in crores)
Year Net Profit Sales Net Profit Ratio
2007-08 37917 300271 1263
2008-09 41432 389797 1063
2009-10 20298 475062 427
2010-11 -28176 539788 -5222011-12 -38108 59182 -644
Interpretation
It establishes a relationship between net profits after tax and net sales and
indicates the efficiency of the management in manufacturing selling administrative and
other activities of the company
The higher the ratio the better is the profitability or performance of the business
The above table depicts the net profit Ratio of Kesoram has decreased every year from
2007-2008 to 2011-2012It further decreased to negative in the year 2010-11 to -522 and -
644 in the year 2011-2012 This shows constant decrease in the profits of the company
8102019 A Study A Study On Financial Performance Analysis With Reference To Kesoram Cementon Financial Performance hellip
httpslidepdfcomreaderfulla-study-a-study-on-financial-performance-analysis-with-reference-to-kesoram 7281
72
Return on Investment-
Net Profit
Return on Investment = helliphelliphelliphelliphelliphelliphelliphelliphelliphelliphelliphellip X 100
Share Holders Fund
Return on Investment Ratio of Kesoram-
(Rupees in crores)
Year Net Profit Share Holders Fund Return On Investment
2007-08 37917 98192 3862
2008-09 41432 133010 3115
2009-10 20298 154024 1318
2010-11 -28176 130025 -2167
2011-12 -38108 91501 -4165
Interpretation-
The above table reveals how well the resources of the firm are being used Higher
the ratio better the result The above ratio implies how well the firm is growing in
terms of profitability and efficiency From the above table we can concern that the return on
investment is in decreasing trend ROI is highest in the year 2007-2008 as 3862 But
there after itrsquos decreased every year
The ROI is negative in the years 2010-2011 amp 2011-2012 as -2167 amp -4165 respectively
Which is not a good sign for the firm
8102019 A Study A Study On Financial Performance Analysis With Reference To Kesoram Cementon Financial Performance hellip
httpslidepdfcomreaderfulla-study-a-study-on-financial-performance-analysis-with-reference-to-kesoram 7381
8102019 A Study A Study On Financial Performance Analysis With Reference To Kesoram Cementon Financial Performance hellip
httpslidepdfcomreaderfulla-study-a-study-on-financial-performance-analysis-with-reference-to-kesoram 7481
8102019 A Study A Study On Financial Performance Analysis With Reference To Kesoram Cementon Financial Performance hellip
httpslidepdfcomreaderfulla-study-a-study-on-financial-performance-analysis-with-reference-to-kesoram 7581
75
CHAPTER V
FINDINGS amp SUGGESTIONS
8102019 A Study A Study On Financial Performance Analysis With Reference To Kesoram Cementon Financial Performance hellip
httpslidepdfcomreaderfulla-study-a-study-on-financial-performance-analysis-with-reference-to-kesoram 7681
76
Findings
The Share capital remains constant Share capital is unchanged all the years from
2008-2012
Reserves amp surplus were recorded an increasing trend in the period between 2008
and 2010It is showing decreasing trend in the period 2011-2012 (ie from 16019
in 2010 to 9309 in 2012)
Current Liabilities were increased compared to base year ie 2008
Provisions increased to 262597 ie in Rupees 39232 crores in the current year
The current ratio for all the five year is lower (less) than the standard rule ie 21
And it is 097 in the year 2011-2012 (current year)
The Debt-Equity Ratio was shown under the standard ratio It is clear that the long
term debt is more than that of the share holdersrsquo fund It indicates that the firm
heavily relying on external funds rather than the internal funds
The operating and net profit of Kesoram is in decreasing trend due to heavy
increase of manufacturing amp administrative expenses
ROI is highest in the year 2007-2008 as 3862 The ROI is negative in the years
2010-2011 amp 2011-2012 as -2167 amp -4165 respectively
Return on Equity Capital Employed Ratio of Kesoram has decreased every year
from 2007-2008 to 2010-2011It further decreased to negative in the year 2011-12 to
-3280
EPS of Kesoram has decreased every year from 2008-12It is negative in the year
2011 amp 12
8102019 A Study A Study On Financial Performance Analysis With Reference To Kesoram Cementon Financial Performance hellip
httpslidepdfcomreaderfulla-study-a-study-on-financial-performance-analysis-with-reference-to-kesoram 7781
77
Suggestion
The organization should adopt an appropriate capital structure
The companyrsquos debt-equity ratio is recorded more or less as 111 in the year 2008
and it is increased to 449 in the year 2012 (current year)The company should
adopt a better debt equity mix in the future to control the fluctuations in returns
The company should control fluctuations in cash and bank balances as it impacts the
current ratio of the company
The provisions are showing increasing trend which indicates risk of debtors The
firm should implement an effective credit management policy It should utilize its
idle funds by decreasing provisions
The company should control heavy increase of manufacturing amp administration
expenses as it is impacting the operating and net profit of company
8102019 A Study A Study On Financial Performance Analysis With Reference To Kesoram Cementon Financial Performance hellip
httpslidepdfcomreaderfulla-study-a-study-on-financial-performance-analysis-with-reference-to-kesoram 7881
78
ANNEXURE
Profit And Loss Account of Kesoram Cement
Mar12 Mar11 Mar10 Mar09 Mar08
12 Months 12 Months 12 Months 12 Months 12 Months
INCOME
Sales Turnover 628260 575072 505151 431613 345700
Excise Duty 36440 35284 30089 41815 45429
NET SALES 591820 539788 475062 389797 300271
Other Income 000 000 000 000 000
TOTALINCOME
596129 548733 481019 393969 302020
EXPENDITURE
Manufacturing
Expenses81903 74803 13974 13153 44113
MaterialConsumed
370897 310150 295550 229359 118448
Personal
Expenses33468 27355 23294 18690 15344
Selling Expenses 81910 78253 58667 48846 45019
AdministrativeExpenses
28225 29308 17219 16179 9907
Expenses
Capitalized000 000 000 000 000
Provisions Made 000 000 000 000 000
TOTAL
EXPENDITURE 596403 519870 408704 326227 232832Operating Profit -4583 19918 66358 63570 67439
EBITDA -274 28864 72316 67742 69188
Depreciation 29740 27259 17280 11186 8927
Other Write-offs 000 000 000 000 000
EBIT -30014 1605 55035 56557 60261
Interest 41015 23983 10921 12087 5426
EBT -71029 -22377 44114 44470 54835
Taxes -32921 5798 23816 3037 16918
Profit and Loss
for the Year-38108 -28176 20298 41432 37917
Non RecurringItems
-1142 7063 3228 -4023 402
Other Non Cash
Adjustments1276 091 207 465 017
OtherAdjustments
000 000 000 000 000
REPORTED
PAT-37974 -21021 23734 37874 38335
8102019 A Study A Study On Financial Performance Analysis With Reference To Kesoram Cementon Financial Performance hellip
httpslidepdfcomreaderfulla-study-a-study-on-financial-performance-analysis-with-reference-to-kesoram 7981
79
Balance Sheet Of Kesoram
Years
Particulars 2008 2009 2010 2011 2012
Liabilities
Share Capital 4574 4574 4574 4574 4574Reserves amp Surplus 93085 128024 149111 125162 86657
Revaluation Reserves 533 412 339 289 27
Loans
Secured Loans 97106 153627 186372 237183 317792
Un Secured Loans 12129 43416 12625 162744 92742
Deferred Tax Liabilities 0 0 0 0 0
Current Liabilities
Provisions 33039 34529 35734 1494 40726
Current Liabilities 57067 66587 107688 113902 18001
Total 297533 431169 610068 645348 722771
Assets
Net Block 108424 180435 343182 369172 358721
Capital WIP 63459 86485 41283 43781 68065
Investments 4783 6178 5143 6582 6636
Current Assets
Inventories 44217 58906 91619 111855 99516
Sundry Debtors 27307 38017 54289 63134 67358
Cash amp Bank Balances 4036 5657 8014 7188 6959
Total Current Assets 7556 10258 153922 182177 173833Loans amp Advances 45289 55462 66506 4346 115409
Fixed Deposits 018 028 031 176 107
Total 297533 431169 610068 645348 722771
8102019 A Study A Study On Financial Performance Analysis With Reference To Kesoram Cementon Financial Performance hellip
httpslidepdfcomreaderfulla-study-a-study-on-financial-performance-analysis-with-reference-to-kesoram 8081
80
KEY ITEMS 2012 2011 2010 2009 2008
Preference
Dividend 0 0 0 0 0
Equity Dividend 457 2516 2516 2516 2516
Equity Dividend
() 999 55 55 55 55
Shares in Issue(Lakhs) 45743 45743 45743 45743 45743
EPS - Annualised
(Rs) -8302 -4595 5188 828 838
8102019 A Study A Study On Financial Performance Analysis With Reference To Kesoram Cementon Financial Performance hellip
httpslidepdfcomreaderfulla-study-a-study-on-financial-performance-analysis-with-reference-to-kesoram 8181
BIBLIOGRAPHY
Sl
No
Books Author Name
1 Financial Management Khan amp JAIN
2 Financial Management IMPandey
3 Management Accounting RPTrivedi
Websites amp Search Engines
1 wwwkesoramcom983086
2 wwwmoneycontrolcom
3 wwwgooglefinancecom983086
Annual reports of Kesoram cement limited 2008-2012

8102019 A Study A Study On Financial Performance Analysis With Reference To Kesoram Cementon Financial Performance hellip
httpslidepdfcomreaderfulla-study-a-study-on-financial-performance-analysis-with-reference-to-kesoram 1181
11
Objectives
1 To understand the financial statements of Kesoram cement
2 To study the change in assets and liabilities of the company
3 To study the liquidity position of the firm
4 To study the financial health of the company using ratio analysis
5 To study the profitability of the company
6 To offer suggestions to the company
8102019 A Study A Study On Financial Performance Analysis With Reference To Kesoram Cementon Financial Performance hellip
httpslidepdfcomreaderfulla-study-a-study-on-financial-performance-analysis-with-reference-to-kesoram 1281
12
Significance of Financial Performance Analysis
Interest of various related groups is affected by the financial performance of a firm
Therefore these groups analyze the financial performance of the firm The type of analysis
varies according to the specific interest of the party involved
Trade creditors interested in the liquidity of the firm (appraisal of firmrsquos liquidity)
Bond holders interested in the cash-flow ability of the firm (appraisal of firmrsquos capital
structure the major sources and uses of funds profitability over time and projection of
future profitability)
Investors interested in present and expected future earnings as well as stability of these
earnings (appraisal of firmrsquos profitability and financial condition)
Management interested in internal control better financial condition and betterperformance (appraisal of firmrsquos present financial condition evaluation of opportunities in
relation to this current position return on investment provided by various assets of the
company etc)
Research Methodology
Research Design
This is a systematic way to solve the research problem and it is important
component for the study without which researches may not be able to obtain the format A
research design is the arrangement of conditions for collection and analysis of data in a
manager that aims to combine for collection and analysis of data relevance to the research
purpose with economy in procedure
Meaning of Research Design
The formidable problem that follows the task of defining the research problem is the
preparation of design of the research project popularly known as the research design
decision regarding what where when how much by what means concerning an inquiry of
a research study constitute a research design A research design is the arrangement of
conditions for collection and analysis of data in a manager that aims to combine for
collection and analysis of data relevance to the research purpose with economy in
procedure
8102019 A Study A Study On Financial Performance Analysis With Reference To Kesoram Cementon Financial Performance hellip
httpslidepdfcomreaderfulla-study-a-study-on-financial-performance-analysis-with-reference-to-kesoram 1381
13
Sources of Data
Data we collected based on two sources
Primary Data
Secondary Data
Primary Data
The Primary Data Are Those Informationrsquos which are Collected afresh and for the
First Time And Thus Happen to Be Original in Character
Secondary Data
The secondary data are those which have already been collected by some other agency and
which have already been processed The sources of secondary data are annual reports
browsing internet through magazines
1 It includes data gathered from the annual reports of Kesoram
2 Articles are collected from official website of Kesoram
Methodology Used
Types Of Financial Statements Adopted
Following Two Types of Financial Statements Are Commonly Used in
Analyzing the Firmrsquos Financial Position
a Balance Sheet
b Income Statements
8102019 A Study A Study On Financial Performance Analysis With Reference To Kesoram Cementon Financial Performance hellip
httpslidepdfcomreaderfulla-study-a-study-on-financial-performance-analysis-with-reference-to-kesoram 1481
14
Limitations of Financial Statement
Each Project Gives Rise to Its Own Unique Risks And Hence Possess Its Own Unique
Challenges
1 Only Interim Reports
Only interim statements donrsquot give a final picture of the concern The data given in
these statements is only approximate The actual position can only be determined when the
business is sold or liquidated
2 Donrsquot Give Extra Position
The Financial Statements Are Expressed In Monetary Values So They Appear To
Give Final And Accurate Position The Values Of Fixed Assets In The Balance Sheet
Neither Represent The Value For Which Fixed Assets Can Be Sold Nor The Amount Which
Will Be Required To Replace These Assets
3 Historical Costs
The Financial Statements Are Prepared On The Basis Of Historical Costs Or
Original Costs The Value of Assets Decreases with the Passage of Time Current Price
Changes Are Not Taken Into Account The Statements Are Not Prepared Keeping In View
The Present Economic Conditions The Balance Sheet Loses The Significance Of Being An
Index Of Current Economic Realities
4 Act of non monitory factors Ignored
There are certain factors which have a bearing on the financial position and
operating results of the business but they donrsquot become a part of these statements because
they canrsquot be measured in monetary terms Such factors may include in the reputation of the
management
No Precision
The precision of financial statement data is not possible because the statements deal with
matters which canrsquot be precisely stated The data are recorded by conventional procedures
followed over the years Various conventions postulates personal judgments etc
8102019 A Study A Study On Financial Performance Analysis With Reference To Kesoram Cementon Financial Performance hellip
httpslidepdfcomreaderfulla-study-a-study-on-financial-performance-analysis-with-reference-to-kesoram 1581
15
CHAPTER-II
INDUSTRY PROFILE
amp
COMPANY PROFILE
8102019 A Study A Study On Financial Performance Analysis With Reference To Kesoram Cementon Financial Performance hellip
httpslidepdfcomreaderfulla-study-a-study-on-financial-performance-analysis-with-reference-to-kesoram 1681
16
Industry Profile
In the most general sense of the word cement is a binder a substance which
sets and hardens independently and can bind other materials together The word cement
traces to the Romans who used the term opus caementicium to describe masonry whichresembled concrete and was made from crushed rock with burnt lime as binder The
volcanic ash and pulverized brick additives which were added to the burnt lime to obtain a
hydraulic binder were later referred to as cementum and cement Cements used in
construction are characterized as hydraulic or non-hydraulic
The most important use of cement is the production of mortar and concretemdashthe bonding of
natural or artificial aggregates to form a strong building material which is durable in the
face of normal environmental effects
Concrete should not be confused with cement because the term cement refers only to the dry
powder substance used to bind the aggregate materials of concrete Upon the addition of
water andor additives the cement mixture is referred to as concrete especially if aggregates
have been added
It is uncertain where it was first discovered that a combination of hydrated non-hydraulic
lime and a pozzolan produces a hydraulic mixture (see also Pozzolanic reaction) but
concrete made from such mixtures was first used on a large scale by engineers They used
both natural pozzolans (trass or pumice) and artificial pozzolans (ground brick or pottery) in
these concretes Many excellent examples of structures made from these concretes are still
standing notably the huge monolithic dome of the Pantheon in Rome and the massive Baths
of Caracalla The vast system of Roman aqueducts also made extensive use of hydraulic
cement The use of structural concrete disappeared in medieval Europe although weak
pozzolanic concretes continued to be used as a core fill in stone walls and columns
Modern cement
Modern hydraulic cements began to be developed from the start of the Industrial Revolution
(around 1800) driven by three main needs
Hydraulic renders for finishing brick buildings in wet climates
Hydraulic mortars for masonry construction of harbor works etc in contact with sea water
Development of strong concretes
In Britain particularly good quality building stone became ever more expensive during a
period of rapid growth and it became a common practice to construct prestige buildings
8102019 A Study A Study On Financial Performance Analysis With Reference To Kesoram Cementon Financial Performance hellip
httpslidepdfcomreaderfulla-study-a-study-on-financial-performance-analysis-with-reference-to-kesoram 1781
17
from the new industrial bricks and to finish them with a stucco to imitate stone Hydraulic
limes were favored for this but the need for a fast set time encouraged the development of
new cements Most famous was Parkers Roman cement This was developed by James
Parker in the 1780s and finally patented in 1796 It was in fact nothing like any material
used by the Romans but was ldquoNatural cement made by burning septaria - nodules that are
found in certain clay deposits and that contain both clay minerals and calcium carbonate
The burnt nodules were ground to a fine powder This product made into a mortar with
sand set in 5ndash15 minutes The success of Roman Cement led other manufacturers to
develop rival products by burning artificial mixtures of clay and chalk
John Smeaton made an important contribution to the development of cements when he was
planning the construction of the third Eddystone Lighthouse (1755-9) in the English
Channel He needed a hydraulic mortar that would set and develop some strength in the
twelve hour period between successive high tides He performed an exhaustive market
research on the available hydraulic limes visiting their production sites and noted that the
hydraulicity of the lime was directly related to the clay content of the limestone from
which it was made Smeaton was a civil engineer by profession and took the idea no
further Apparently unaware of Smeatons work the same principle was identified by Louis
Vicat in the first decade of the nineteenth century Vicat went on to devise a method of
combining chalk and clay into an intimate mixture and burning this produced an artificial
cement in 1817 James Frost working in Britain produced what he called British cement
in a similar manner around the same time but did not obtain a patent until 1822 In 1824
Joseph Aspdin patented a similar material which he called Portland cement because the
render made from it was in color similar to the prestigious Portland stone
All the above products could not compete with limepozzolan concretes because of fast-
setting (giving insufficient time for placement) and low early strengths (requiring a delay of
many weeks before formwork could be removed) Hydraulic limes natural cements and
artificial cements all rely upon their belite content for strength development Belite
develops strength slowly Because they were burned at temperatures below 1250 degC they
contained no alite which is responsible for early strength in modern cements The first
cement to consistently contain alite was made by Joseph Aspdins son William in the early
1840s This was what we call today modern Portland cement Because of the air of
mystery with which William Aspdin surrounded his product others (eg Vicat and I C
Johnson) have claimed precedence in this invention but recent analysis of both his concrete
8102019 A Study A Study On Financial Performance Analysis With Reference To Kesoram Cementon Financial Performance hellip
httpslidepdfcomreaderfulla-study-a-study-on-financial-performance-analysis-with-reference-to-kesoram 1881
18
and raw cement have shown that William Aspdins product made at North fleet Kent was a
true alite-based cement However Aspdins methods were rule-of-thumb Vicat is
responsible for establishing the chemical basis of these cements and Johnson established
the importance of sintering the mix in the kiln
William Aspdins innovation was counter-intuitive for manufacturers of artificial cements
because they required more lime in the mix (a problem for his father) because they required
a much higher kiln temperature (and therefore more fuel) and because the resulting clinker
was very hard and rapidly wore down the millstones which were the only available grinding
technology of the time Manufacturing costs were therefore considerably higher but the
product set reasonably slowly and developed strength quickly thus opening up a market for
use in concrete The use of concrete in construction grew rapidly from 1850 onwards and
was soon the dominant use for cements Thus Portland cement began its predominant role
It is made from water and sand
Types of modern cement
Portland cement
Cement is made by heating limestone (calcium carbonate) with small quantities of other
materials (such as clay) to 1450degC in a kiln in a process known as calcination whereby a
molecule of carbon dioxide is liberated from the calcium carbonate to form calcium oxide
or lime which is then blended with the other materials that have been included in the mix
The resulting hard substance called clinker is then ground with a small amount of gypsum
into a powder to make Ordinary Portland Cement the most commonly used type of cement
(often referred to as OPC)
Portland cement is a basic ingredient of concrete mortar and most non-speciality grout The
most common use for Portland cement is in the production of concrete Concrete is a
composite material consisting of aggregate (gravel and sand) cement and water As a
construction material concrete can be cast in almost any shape desired and once hardened
can become a structural (load bearing) element Portland cement may be gray or whitePortland cement blends
These are often available as inter-ground mixtures from cement manufacturers but similar
formulations are often also mixed from the ground components at the concrete mixing plant
Portland blast furnace cement contains up to 70 ground granulated blast furnace slag
with the rest Portland clinker and a little gypsum All compositions produce high ultimate
8102019 A Study A Study On Financial Performance Analysis With Reference To Kesoram Cementon Financial Performance hellip
httpslidepdfcomreaderfulla-study-a-study-on-financial-performance-analysis-with-reference-to-kesoram 1981
19
strength but as slag content is increased early strength is reduced while sulfate resistance
increases and heat evolution diminishes Used as an economic alternative to Portland
sulfate-resisting and low-heat cements
Portland fly ash cement contains up to 30 fly ash The fly ash is pozzolanic so that
ultimate strength is maintained Because fly ash addition allows lower concrete water
content early strength can also be maintained Where good quality cheap fly ash is
available this can be an economic alternative to ordinary Portland cement
Portland pozzolan cement includes fly ash cement since fly ash is a pozzolan but also
includes cements made from other natural or artificial pozzolans In countries where
volcanic ashes are available (eg Italy Chile Mexico and the Philippines) these cements
are often the most common form in use
Portland silica fume cement Addition of silica fume can yield exceptionally high
strengths and cements containing 5-20 silica fume are occasionally produced However
silica fume is more usually added to Portland cement at the concrete mixer
Masonry cements are used for preparing bricklaying mortars and stuccos and must not be
used in concrete They are usually complex proprietary formulations containing Portland
clinker and a number of other ingredients that may include limestone hydrated lime air
entrainers retarders water proofers and coloring agents They are formulated to yield
workable mortars that allow rapid and consistent masonry work Subtle variations of
Masonry cement in the US are Plastic Cements and Stucco Cements These are designed to
produce controlled bond with masonry blocks
Expansive cements contain in addition to Portland clinker expansive clinkers (usually
sulfoaluminate clinkers) and are designed to offset the effects of drying shrinkage that is
normally encountered with hydraulic cements This allows large floor slabs (up to 60 m
square) to be prepared without contraction joints
White blended cements may be made using white clinker and white supplementary
materials such as high-purity metakaolin
Colored cements are used for decorative purposes In some standards the addition of
pigments to produce colored Portland cement is allowed In other standards (eg ASTM)
pigments are not allowed constituents of Portland cement and colored cements are sold as
blended hydraulic cements
Very finely ground cements are made from mixtures of cement with sand or with slag or
other pozzolan type minerals which are extremely finely ground together Such cements can
8102019 A Study A Study On Financial Performance Analysis With Reference To Kesoram Cementon Financial Performance hellip
httpslidepdfcomreaderfulla-study-a-study-on-financial-performance-analysis-with-reference-to-kesoram 2081
have the same physical characteristics as normal cement but with 50 less cement
particularly due to their increased surface area for the chemical reaction Even with
intensive grinding they can use up to 50 less energy to fabricate than ordinary Portland
cements
Non-Portland hydraulic cements
Pozzolan-lime cements Mixtures of ground Pozzolan and lime are the cements used by the
Romans and are to be found in Roman structures still standing (eg the Pantheon in Rome)
They develop strength slowly but their ultimate strength can be very high The hydration
products that produce strength are essentially the same as those produced by Portland
cement
Slag-lime cements Ground granulated blast furnace slag is not hydraulic on its own but is
activated by addition of alkalis most economically using lime They are similar to
pozzolan lime cements in their properties Only granulated slag (ie water-quenched glassy
slag) is effective as a cement component
Super sulfated cements These contain about 80 ground granulated blast furnace slag
15 gypsum or anhydrite and a little Portland clinker or lime as an activator They produce
strength by formation of ettringite with strength growth similar to a slow Portland cement
They exhibit good resistance to aggressive agents including sulfate
Calcium aluminate cements are hydraulic cements made primarily from limestone and
bauxite The active ingredients are monocalcium aluminate CaAl2O4 (CaO middot Al2O3 or CA in
Cement chemist notation CCN) and mayenite Ca12Al14O33 (12 CaO middot 7 Al2O3 or C12A7 in
CCN) Strength forms by hydration to calcium aluminate hydrates They are well-adapted
for use in refractory (high-temperature resistant) concretes eg for furnace linings
Calcium sulfoaluminate cements are made from clinkers that include yeelimite (Ca4
(AlO2)6SO4 or C4A3 in Cement chemists notation) as a primary phase They are used in
expansive cements in ultra-high early strength cements and in low-energy cements
Hydration produces ettringite and specialized physical properties (such as expansion or
rapid reaction) are obtained by adjustment of the availability of calcium and sulfate ionsTheir use as a low-energy alternative to Portland cement has been pioneered in China
where several million tonnes per year are produced Energy requirements are lower because
of the lower kiln temperatures required for reaction and the lower amount of limestone
(which must be endothermically decarbonated) in the mix In addition the lower limestone
8102019 A Study A Study On Financial Performance Analysis With Reference To Kesoram Cementon Financial Performance hellip
httpslidepdfcomreaderfulla-study-a-study-on-financial-performance-analysis-with-reference-to-kesoram 2181
21
content and lower fuel consumption leads to a CO2 emission around half that associated
with Portland clinker However SO2 emissions are usually significantly higher
Natural Cements correspond to certain cements of the pre-Portland era produced by
burning argillaceous limestones at moderate temperatures The level of clay components in
the limestone (around 30-35) is such that large amounts of belite (the low-early strength
high-late strength mineral in Portland cement) are formed without the formation of
excessive amounts of free lime As with any natural material such cements have highly
variable properties
Geopolymer cements are made from mixtures of water-soluble alkali metal silicates and
aluminosilicate mineral powders such as fly ash and metakaolin
8102019 A Study A Study On Financial Performance Analysis With Reference To Kesoram Cementon Financial Performance hellip
httpslidepdfcomreaderfulla-study-a-study-on-financial-performance-analysis-with-reference-to-kesoram 2281
22
COMPANY PROFILE
8102019 A Study A Study On Financial Performance Analysis With Reference To Kesoram Cementon Financial Performance hellip
httpslidepdfcomreaderfulla-study-a-study-on-financial-performance-analysis-with-reference-to-kesoram 2381
23
Kesoram Cement Industry is one of the leading manufacturers of cement in India It is a day
process cement Plant The plant capacity is 826 lakh tones per annum It is located at
Basanthnagar in Karimnagar district of Andhra Pradesh Basanthnagar is 8 km away from
the Ramagundam Railway station linking Madras to New Delhi The Chairman of the
Company is BKBirla
History
The first unit at Basanthnagar with a capacity of 21 lakh tones per annum
incorporating humble suspension preheated system was commissioner during the year 1969
The second unit was setup in year 1971 with a capacity of 21 lakh tones per annum went on
stream in the year 1978 The coal for this company is being supplied from Singgareni
Collieries and the power is obtained from APSEB The power demand for the factory is
about 21 MW Kesoram has got 2 DG sets of 4 MW each installed in the year 1987
Kesoram Cement has setup a 15 KW captor power plant to facilitate for
uninterrupted power supply for manufacturing of cement at 24th
august 1997 per hour 12
mw actual power is 15 mw
The Company was incorporated on 18th October 1919 under the Indian Companies Act
1913 in the name and style of Kesoram Cotton Mills Ltd It had a Textile Mill at 42
Garden Reach Road Calcutta 700 024 The name of the Company was changed to Kesoram
Industries amp Cotton Mills Ltd on 30th
August 1961 and the same was further changed to Kesoram Industries Limited on 9th July
1986 The said Textile Mill at Garden Reach Road was eventually demerged into a separate
company
The First Plant for manufacturing of rayon yarn was established at Tribeni District
Hooghly West Bengal and the same was commissioned in December 1959 and the second
plant was commissioned in the year 1962 enabling it to manufacture 4635 metric tons perannum (mtpa) of rayon yarn This Unit has 6500 metric tons per annum (mtpa) capacity as
on 3132009
The plant for manufacturing of transparent paper was also set up at the same location at
Tribeni District Hooghly West Bengal in June 1961 It has the annual capacity to
manufacture 3600 metric tons per annum (mtpa) of transparent Paper
8102019 A Study A Study On Financial Performance Analysis With Reference To Kesoram Cementon Financial Performance hellip
httpslidepdfcomreaderfulla-study-a-study-on-financial-performance-analysis-with-reference-to-kesoram 2481
24
The Company diversified into manufacturing of cast iron spun pipes and pipe fittings at
Bansberia District Hooghly West Bengal with a production capacity of 45000 metric tons
per annum (mtpa) of cast iron spun pipes and pipe fittings in December 1964
The Company subsequently diversified into the manufacturing of Cement and in 1969
established its first cement plant under the name Kesoram Cement at Basantnagar Dist
Karimnagar (Andhra Pradesh) and to take advantage of favorable market conditions in
1986 another cement plant known as Vasavadatta Cement was commissioned by it at
Sedam Dist
Gulbarga (Karnataka) The cement manufacturing capacities at both the plants were
augmented from time to time according to the market conditions and as on 3132009
Kesoram Cement and Vasavadatta Cement have annual cement manufacturing capacities of
15 million metric tons and 41 million metric tons respectively
The Company in March 1992 commissioned a plant at Balasore known as Birla Tyres in
Orissa for manufacturing of 10 lakh mtpa automotive tyres and tubes in the first phase in
collaboration with Pirelli Ltd UK a subsidiary company of the world famous Pirelli
Group of Italy - a pioneer in production and development of automotive tyres in the world
The capacity at the said plant was further augmented during the year by 19 MT per day
aggregating to 271 MT per day production facility The Greenfield Project of 257 MT per
day capacity in the State of Uttarakhand with a capex of about Rs760 crores commenced
the commercial production in phases during the financial year 2008-09The Company as on
3132009 had the manufacturing capacities of 371 million tyres 295 million tubes and
153 million flaps per annum in the Plants including at Uttarakhand Plant It has small
manufacturing capacities of various Chemicals at Kharda in the State of West Bengal also
It has the annual manufacturing capacities of 12410 mtpa of Caustic Soda Lye 5045 mtpa
of Liquid Chlorine 6205 mtpa of Sodium Hypochlorite 8200 mtpa of Hydrochloric Acid
3200 mtpa of Ferric Alum 18700 mtpa of Sulphuric Acid and 1620000 m3pa of purified
Hydrogen Gas
The Company is a well-diversified entity in the fields of Cement Tyre Rayon Yarn
Transparent Paper Spun Pipes and Heavy Chemicals with two core business segments ie
Cement and Tyres
8102019 A Study A Study On Financial Performance Analysis With Reference To Kesoram Cementon Financial Performance hellip
httpslidepdfcomreaderfulla-study-a-study-on-financial-performance-analysis-with-reference-to-kesoram 2581
25
In Spun Pipes amp Foundries a unit of the Company work suspended from 2nd May 2008
still commences till further notice
The Company as of now is listed on three major Stock Exchanges in India ie Bombay
Stock Exchange Ltd Mumbai Calcutta Stock Exchange Association Ltd Kolkata and
National Stock Exchange of India Ltd Mumbai and at the Societe de la Bourse de
Luxembourg Luxembourg
A further expansion upto 165 million tons of cement per annum in Vasavadatta Cement at
Sedam in Karnataka as unit IV at the same site is in progress with a 175 MW Captive
Power Plant involving a capital expenditure of about Rs 78350 crores (including the cost
of Captive Power Plant)
The commercial production of cement in the aforesaid unit IV has commenced in June
2009 The work for the further expansion in the Tyres Section at Uttarakhand for radial
tyres with 100 MT per day capacity and bias tyres with 125 MT per day capacity involving
an estimated aggregate capital outlay of about Rs 840 crores is under progress The Board
has further approved a Motor Cycle Tyre Project of 70 MT per day capacity at the same site
involving a capital outlay of Rs190 crore The civil construction of both the Projects is in
full swing The commercial production in both the Projects is likely to start by December
2009 January 2010
Birla Supreme in popular brand of Kesoram cement from its prestigious plant of
Basantnagar in AP which has outstanding track record In performance and productivity
serving the nation for the last two and half decades It has proved its distinction by bagging
several national awards It also has the distinction of achieving optimum capacity
utilization
Kesoram offers a choice of top quality portioned cement for light heavy
constructions and allied applications Quality is built every fact of the operations
The plant lay out is rational to begin with The limestone is rich in calcium
carbonate a key factor that influences the quality of final product The day process
technology uses in the latest computerized monitoring overseas the manufacturing process
Samples are sent regularly to the bureau of Indian standards National council of
construction and building material for certification of derived quality norms
8102019 A Study A Study On Financial Performance Analysis With Reference To Kesoram Cementon Financial Performance hellip
httpslidepdfcomreaderfulla-study-a-study-on-financial-performance-analysis-with-reference-to-kesoram 2681
26
The company has vigorously undertaking different promotional measures for
promoting their product through different media which includes the use of news papers
magazine hoarding etc
Kesoram cement industry distinguished itself among all the cement factories in
Indian by bagging the National Productivity Award consecutively for two years ie for the
year 1985-1987 The federation of Andhra Pradesh Chamber amp Commerce and Industries
(FAPCCI) also conferred on Kesoram Cement An award for the best industrial promotion
expansion efforts in the state for the year 1984 Kesoram also bagged FAPCCI awarded for
ldquoBest Family Planning Effort in the staterdquo for the year 1987-1988
One among the industrial giants in the country today serving the nation on the
industrial front Kesoram industry ltd has a checked and eventful history dating back to the
twenties when the Industrial House of Birlarsquos acquired it With only a textile mill under its
banner 1924 it grew from strength to strength and spread its activities to newer fields like
Rayon Transparent paper pipes Refractors tyres and other products
Looking to the wide gap between the demand and supply of vital commodity
cement which play in important role in National building activity the Government of India
had de-licensed the cement industry in the year 1966 with a review to attract private
entrepreneur to augment the cement production Kesoram rose to the occasions and divided
to set up a few cement plants in the country
Kesoram cement undertaking marketing activities extensively in the state of Andhra
Pradesh Karnataka Tamilnadu Kerala Maharashtra and Gujarat In AP sales Depts are
located in different areas like Karimnagar Warangal Nizamabad Vijayawada and Nellore
In other states it has opened around 10 depots
The market share of Kesoram Cement in AP is 705 The market share of the
company in various states is shown as under
STATES MARKET SHARE
Karnataka 409
Tamilnadu 094
Kerala 029
Maharashtra 281
8102019 A Study A Study On Financial Performance Analysis With Reference To Kesoram Cementon Financial Performance hellip
httpslidepdfcomreaderfulla-study-a-study-on-financial-performance-analysis-with-reference-to-kesoram 2781
27
Process and Quality Control
It has been the endeavor of Kesoram to incorporate the Worldrsquos latest technology in
the plant and today the plant has the most sophisticated
X-ray analysis
Fully computerized XRF and XRD X-RAY Analyzers keep a constant round the
clock vigil on quality
Supreme performance
One of the largest Cement Plants in Andhra Pradesh the plant incorporate the latest
technology in Cement - making
It is professionally managed and well established Cement Manufacturing Company
enjoying the confidence of the consumers Kesoram has outstanding track record in
performance and productivity with quite a few national and state awards to its credit
BIRLA SUPREME the 43 Grade Cement is a widely accepted and popular brand
in the market commanding a premium
However to meet the specific demands of the consumer Kesoram bought out the 53
grade BIRLA SUPREME ndash GOLD which has special qualities like higher fineness quick-
setting high compressive strength and durability
Supreme Strength
Kesoram Cement has huge captive Limestone Deposits which make it possible tofeed high- grade limestone consistently its natural Grey colour is anion- born ingredient
and gives good shade
Both the products offered by Kesoram ie BIRLA SUPREME-43 Grade and
BIRLA SUPREME-GOLD-53 Grade cement are outstanding with much higher
compressive strength and durability
The following characteristics show their distinctive qualities
Comprehensive
Strength
Opc 43
grls 8112
1989
Birla
Supreme 43
grade
Opc 43 gr
Is 1226987
Birla
Supreme
Gold 53 gr
3 days mpa Min 23 31 + Min 27 38+
7 days mpa Min 23 42+ Min 37 48+
28 days mpa Min 43 50+ Min 53 60+
8102019 A Study A Study On Financial Performance Analysis With Reference To Kesoram Cementon Financial Performance hellip
httpslidepdfcomreaderfulla-study-a-study-on-financial-performance-analysis-with-reference-to-kesoram 2881
28
DC SYSTEM
Clinker making process is a key step in the overall cement making process In the case of
BIRLA SUPREMEGOLD the clinker-making process is totally computer control The
Distributed Control System (DCS) constantly monitors the process and ensures operating
efficiency This eliminates variation and ensures consistency in the quality of Clinker
Physical Characteristics
Ope 43
Is 8 112-89
Birla
Supreme
43 grade
Ope 53 gr
Is 12269-87
Birla Supreme
Gold 53 gr
Setting time Min30 120-180 Min 30 130-170
a Initial (mats) Max 600 180-240 Max 600 170-220
b final (mats) Min 225 270-280 Min 225 300-320
Fincncssm 2Kg Max 10 10-20 Max 10 05-10
Soundness Max 08 004-008 Max 0080 004-02
a le-chart (mm)
b autoclave ()
Supreme Expertise
The Best Technical Team exclusive to Kesoram mans the Plant and monitors the process
to blend the cement in just the required proportions to make BIRLA SUPREMEGOLD OF
Rock Strength
18 Million Tones of Solid Foundation
Staying at the top for over a Quarter Century Quarter Century is no less an achievement
Infact Kesoram is synonymous with for over 28 years
Over the years Kesoram has dispatched 18 million tones of cement to the nook and cornersof the country and joined hands in strengthening the Nation No one else in Andhra Pradesh
has this distinction The prestigious World Bank aided Ramagundam Super Thermal Power
Project of NTPC and Mannair Dam of Pochampad project in AP arc a couple of projects for
which Kesoram Cement was exclusively uses to cite an example
8102019 A Study A Study On Financial Performance Analysis With Reference To Kesoram Cementon Financial Performance hellip
httpslidepdfcomreaderfulla-study-a-study-on-financial-performance-analysis-with-reference-to-kesoram 2981
29
Chemical Characteristics
Opc 43 gr
Is 81 132-989
Birla
Supreme
43 grade
Ope 53 gr
Is 12269-
87
Birla
Supreme
Gold 53 gr
Loss on inflection Max 5 lt16 Max 40 lt15
Insoluble residue Max 20 lt08 Max 20 lt 06
Magnesium oxide Max 60 lt 13 Max 60 lt 13
Lime saturation factor 066-102 08-09 08-102 088-09
Alumna iron ratio MinO66 15-17 MinO66 15-17
Sulfuric anhydride Max 253 16-20 Max 2 53 16-20
Alkalis Chlorides Max 005 Max 001 Max 005 Max 04
Kesoram Cement - advantages
Helps in designing sleeker and more elegant
Structures giving greater flexibility in design concept
Due to its fine quality super fine construction can be achieved Its gives maximum
strength at Minimum use of cement with water in the water cement ratio especially the 53
grade Birlas supreme-gold
Feathers in Kesorams cap
Kesoram has outstanding track record achieving over 100 capacity utilization I
productivity and energy conservation It has proved its distinction by bagging several
national and state awards noteworthy being
NATIONAL
1 National productivity award for 1985-86
2 National productivity award for 1986-87
3 National award for mines safety for 1985-86
4 National award for mines safety for 1986-875 National award for energy conservation 1989-90
8102019 A Study A Study On Financial Performance Analysis With Reference To Kesoram Cementon Financial Performance hellip
httpslidepdfcomreaderfulla-study-a-study-on-financial-performance-analysis-with-reference-to-kesoram 3081
30
STATE
1 AP State productivity award for 1988
2 State award for best industrial management 1988-89
3 Best industrial productivity award of FAPCCI (federation of AP chamber of
commerce and industry) 1991
4 Best management award of the state Govt 1993
5 FAPCCI award for the workers welfare 1995-96
ISO 9002
All quality systems of Kesoram have been certified under ISO 90021S 4002 which
proves the worldwide acceptance of the products
All quality systems in production and marketing of the product have been certified by BIS
under ISO 90021S 14002
The first unit was installed at basanthnagar with a capacity of 25 ndashlakhs TPA (tones per
annum) incorporating humble supervision preheated system during the year 1969
The second unit followed suit with added a capacity of 2 lakhs TPA in 1971
The plant was further expanded to 9 lakhs by adding 25 lakhs tones in august 1978 113
lakhs tones in January 1981 and 087 lakhs tones in September 1981
Power
Singareni collieries make the supply of coal for this industry and the power was
obtained from AP TRANSCO The power demand for the factory is about 21MW Kesoram
has got 2-diesel generator seats of 4 MW each installed in the year 1987
Kesoram cement now has a 15MWcaptive power plant to facilities for uninterrupted
power supply for manufacturing of cement
Performance
The performance of kersoram cement industry has been outstanding achieving over
cent percent capacity utilization all through despite many odds like power cuts and which
most 40 was wasted due to wagon shortage etc
The company being a continuous process industry works round the clock and has
excellent records of performance achieving over 1005 capacity utilization
Kesoram has always combined technical progress with industrial performance The
company had glorious track record for the last 27 years in the industry
Technology
8102019 A Study A Study On Financial Performance Analysis With Reference To Kesoram Cementon Financial Performance hellip
httpslidepdfcomreaderfulla-study-a-study-on-financial-performance-analysis-with-reference-to-kesoram 3181
31
Kesoram cement uses most modern technology and the computerized control in the
plant A team of dedicated and well- experienced experts manages the plant
The quality is maintained much above the bureau of Indian standards
The raw materials used for manufacturing cement are
Lime stone
Bauxite
Hematite
Gypsum
Environmental and Social Obligations
For environmental promotion and to keep ndashup the ecological balance this section
has planted over two lakhs trees on social obligation front this section has undertaken
various social welfare programs by adopting ten nearly villages organizing family welfare
campus surgical camps animal health camps blood donation camps children immunization
camps seeds training for farmers etc were arranged
Welfare and Recreation Facilities
For the purpose of recreation facilities 2 auditoriums were provided for playing
indoor games cultural function and activities like drama music and dance etc
The industry has provided libraries and reading rooms About 1000 books are available in
the library All kinds of newspaper magazines are made available
Canteen is provided to cater to the needs of the employees for supply of snacks tea
coffee and meals etc
One English medium and one Telugu medium school are provided to meet the
educational requirements
The company has provided a dispenser with a qualified medical office and
paramedical staff for the benefit of the employees The employees covered under ESI
scheme have to avail the medical facilities from the ESI hospital
Competitions in sports and games are conducted every year for august 15th
Independence Day and January 26th republic day among the employees
Electricity
The power consumption per ton of cement has come down to 108 units against 113
units last year due to implementation of various energy saving measures The performance
of captive power plant of this section continues to be satisfactory Total power generation
8102019 A Study A Study On Financial Performance Analysis With Reference To Kesoram Cementon Financial Performance hellip
httpslidepdfcomreaderfulla-study-a-study-on-financial-performance-analysis-with-reference-to-kesoram 3281
32
during the year was 84 million units last year This captive power plant is a major role in
keeping power costs with in economic levels
The management has introduced various HRD programs for training and
development and has taken various other measures for the betterment of employeersquos
efficiency
The section has installed adequate air pollution control system and equipment and is
ISO14001 such as Environment management system is under implementation
Awards
Kesoram cement bagged many prestigious awards including national awards for
productivity technology conservation and several state awards since 1984 The following
are the some of important awards
AWARDS OF KESORAM CEMENT
No Year Awards
National
State
1 1989-90 Management award community
Development
State
2 1991 Energy conservation may day award of the
Govt
State
3 1991 Pundit Jawaharlal Nehru rolling trophy for
best
State
4 1993 National productivity effort Indira Gandhi
national award
State
5 1994 Best management award State
6 1994-
1995
Best industrial rebellion award State
7 1995 Rural development by chief minister
Environment and mineral conservation
award
State
8 1995 Best industrial rebellion award State
8102019 A Study A Study On Financial Performance Analysis With Reference To Kesoram Cementon Financial Performance hellip
httpslidepdfcomreaderfulla-study-a-study-on-financial-performance-analysis-with-reference-to-kesoram 3381
33
9 1995-
1996
Best effort of an industrial unit to
development rural economy shriSRRungta
award for social
National
10 1996 Awareness for best rural development
efforts
State
11 1999 Best workers welfare best family welfare
award
State
12 2001 First prize for mine environment amppollution
control for the 3rd
year in succession
State
13 2002 Vana mithra award from AP Govt State
14 2003 Company has got OHSAS-18001 State
15 2005 Certification from DNV New Delhi State
16 2006 Award for pollution control and
environmental protection FAPCCI award
for best rural development in the state
State
8102019 A Study A Study On Financial Performance Analysis With Reference To Kesoram Cementon Financial Performance hellip
httpslidepdfcomreaderfulla-study-a-study-on-financial-performance-analysis-with-reference-to-kesoram 3481
34
Products of the organization
8102019 A Study A Study On Financial Performance Analysis With Reference To Kesoram Cementon Financial Performance hellip
httpslidepdfcomreaderfulla-study-a-study-on-financial-performance-analysis-with-reference-to-kesoram 3581
35
CHAPTER-III
LITERATURE REVIEW
8102019 A Study A Study On Financial Performance Analysis With Reference To Kesoram Cementon Financial Performance hellip
httpslidepdfcomreaderfulla-study-a-study-on-financial-performance-analysis-with-reference-to-kesoram 3681
36
Introduction
Financial Performance Analysis
The term lsquofinancial performance analysis also known as analysis and interpretation of
financial statementsrsquo refers to the process of determining financial strength and
weaknesses of the firm by establishing strategic relationship between the items of the
balance sheet profit and loss account and other operative data
ldquoAnalyzing financial statementsrdquo by Metcalf and Titard
ldquoFinancial analysis is a process of evaluating the relationship between component
parts of a financial statement to obtain a better understanding of a firms position and
performancerdquo by Myers
Financial Performance
The word lsquoPerformance is derived from the word lsquoparfourmenrsquo which means lsquoto dorsquo lsquoto
carry outrsquo or lsquoto renderrsquo It refers the act of performing execution accomplishment
fulfillment etc In border sense performance refers to the accomplishment of a given task
measured against preset standards of accuracy completeness cost and speed In other
words it refers to the degree to which an achievement is being or has been accomplished In
the Words of Frich Kohlar ldquoThe performance is a general term applied to a part or to all the
conducts of activities of an organization over a period of time often with reference to past or
projected cost efficiency management responsibility or accountability or the like Thus not
just the presentation but the quality of results achieved refers to the performance
Performance is used to indicate firmrsquos success conditions and compliance
Financial performance refers to the act of performing financial activity In broader
sense financial performance refers to the degree to which financial objectives being or has
been accomplished It is the process of measuring the results of a firms policies and
operations in monetary terms It is used to measure firms overall financial health over a
given period of time and can also be used to compare similar firms across the same industry
or to compare industries or sectors in aggregation
The purpose of financial analysis is to diagnose the information contained in financial
statements so as to Jude the profitability and financial soundness of the firm Just like a
doctor examines his patient by recording his body temperature blood pressure etc Before
8102019 A Study A Study On Financial Performance Analysis With Reference To Kesoram Cementon Financial Performance hellip
httpslidepdfcomreaderfulla-study-a-study-on-financial-performance-analysis-with-reference-to-kesoram 3781
37
making his conclusion regarding the illness and before giving his treatment a financial
analyst analysis the financial statements with various tools of analysis before commenting
upon the financial health or weaknesses of an enterprise
The analysis and interpretation of financial statements is essential to bring out the
mystery behind the figures in financial statements Financial statements analysis is an
attempt to determine the significance and meaning of the financial statement data so that
forecast may be made of the future earnings ability to pay interest and debt maturities (both
current and long term) and profitability of a sound divided policy
Types of financial analysis-
Financial analysis into different categories depending upon
(1) The material used and
(2) The method of operation followed in the analysis or the modus operandi of
analysis
Types of financial analysis
On the basis of material used on the basis of modus operandi
External Internal Horizontal Vertical
Analysis Analysis Analysis Analysis
1 On the basis of material used - According to material used financial analysis canbe of two types
External analysis
Internal analysis
External analysis-
This analysis is done by outsiders who do not have access to the detailed internal
outsiders include investors potential investors Creditors Potential Creditors Government
Agencies Credit Agencies and General Public For financial analysis these external parties
to the firm depend almost entirely on the published financial statements
Internal analysis-
This analysis is undertaken by the persons namely executives and employees of the
organization or by the officers appointed by government or court who have access to the
8102019 A Study A Study On Financial Performance Analysis With Reference To Kesoram Cementon Financial Performance hellip
httpslidepdfcomreaderfulla-study-a-study-on-financial-performance-analysis-with-reference-to-kesoram 3881
38
books of account ( internal accounting records) and other information related to the
business
2 983119983150 983156983144983141 983138983137983155983145983155 983151983142 983149983151983140983157983155 983151983152983141983154983137983150983140983145983085
According to the modus operandi financial analysis can also be of two types
a Horizontal analysis
bVertical analysis
Horizontal analysis-
Horizontal analysis refers to the comparison of financial data of a company for several
years The figures for this type of analysis are presented horizontally over a number of
columns The figures of the various years are compared with standard or base year a base
year is year chosen as beginning point This type of analysis is also called lsquodynamicanalysisrsquo as it is based on the data from year to year rather than on data of any one year The
horizontal analysis makes it possible to focus attention on items that have changed
significantly during the period under view
b Vertical analysis-
Vertical analysis refers to the study of relationship of the various items in the financial
statements of one accounting period In this types of analysis the figures from financial
statement of a year are compared with a base selected from the same yearrsquos statement
Methods of financial analysis-
The following methods of analysis are generally used-
1 Comparative Statements
2 Trend Analysis
3 Common-Size Statements
4 Funds flow Analysis
5 Cash Analysis
6 Ratio Analysis
7 Cost-volume-Profit Analysis
8102019 A Study A Study On Financial Performance Analysis With Reference To Kesoram Cementon Financial Performance hellip
httpslidepdfcomreaderfulla-study-a-study-on-financial-performance-analysis-with-reference-to-kesoram 3981
39
Comparative statements-
The comparative financial statements are statements of the financial position at
different periods of time the elements of financial position are show in a
Comparative Statement provides an idea of financial position at two or more
periods Generally two financial statements (balance sheet and income statement) are
prepared in comparative form for financial analysis
The Comparative Statement May Show-
1 Absolute figures (rupee amounts)
2 Changes in absolute figures ie increase or decrease in absolute figures
3 Absolute data in terms of percentages
4 Increase or decrease in terms of percentages
The Two Comparative Statements Are-
1 Comparative balance sheet and
2 Income statement
1 983107983151983149983152983137983154983137983156983145983158983141 983138983137983148983137983150983139983141 983155983144983141983141983156983085
The comparative balance sheet analysis is the study of the trend of the same items group of
items and computed items in two or more balance sheets of the same business enterprise on
different dates The change in periodic balance sheet items reflect the conduct of a business
the change can be observed by comparison of the balance sheet at the beginning and at the
end of a period and these changes can help in forming an opinion about the progress of an
enterprise
Guide Lines for Interpretation of Comparative Balance Sheet-
While interpreting comparative balance sheet the interpreter is expected to study the
following aspects-
1 Current financial position and liquidity position
2 Long-term financial position
3 Profitability of the concern
8102019 A Study A Study On Financial Performance Analysis With Reference To Kesoram Cementon Financial Performance hellip
httpslidepdfcomreaderfulla-study-a-study-on-financial-performance-analysis-with-reference-to-kesoram 4081
40
Common Size Statement-
The common-size statements balance sheet and income statement are show in
analytical percentages The figures are shown as percentages of total assets total liabilities
and total sales The total assets are taken as 100 and different assets are expressed as a
percentage of the total similarly various liabilities are taken as a part of total liabilities
Common Size Balance Sheet-
A statement in which balance sheet items are expressed as the ratio of each asset to
total assets and the ratio of each liability is expressed as a ratio of total liabilities is called
common size balance The common size balance sheet can be used to compare companies
of differing size The comparison of figures in different periods is not useful because total
figures may be affected by a number of factors It is not possible to establish standard norms
for various assets The trends of figures from year to year may not be studied and even they
may not give proper results
Trend Analysis of Balance Sheet-
Trend analysis is Very important tool of horizontal financial analysis
This analysis enables to known the change in the financial function and operating efficiency
in between the time period chosen
By studding the trend analysis of each item we can known the direction of changes and
based upon the direction of changes the options can be changed
Trend =Absolute Value of item in the statement understudy 100
Absolute Value of same item in the base statement
Ratio Analysis
Ratio analysis is used as a technique of analyzing the financial information contained in the
balance sheet and profit and loss accounts for a more meaningful understanding of the
financial position and performance of a firm
The relationship between two accounting figures expressed mathematically is known as a
financial ratio A ratio helps the analyst to make qualitative judgment about the firmrsquos
financial position and performance
Several ratios can be calculated from the accounting data contained in the financial
statements The parties which generally undertake financial analysis is short ndashterm
creditors long-term creditors owner and management In view of the requirements of the
various ratios ratios are classified into the following four important categories
8102019 A Study A Study On Financial Performance Analysis With Reference To Kesoram Cementon Financial Performance hellip
httpslidepdfcomreaderfulla-study-a-study-on-financial-performance-analysis-with-reference-to-kesoram 4181
41
Liquidity ratios
Leverage ratios
Activity ratios
Profitability ratios
Liquidity Ratios
It is extremely essential for a firm to be able to meet its obligations as they become due
Liquidity ratios measure the ability of the firm to meet its current obligations A firm should
ensure that it does not suffer from lack of liquidity and also that it does not have excess
liquidity The failure of a company to meet its obligations due to lack of sufficient liquidity
will result in a poor creditworthiness loss of creditorsrsquo confidence or even in legal tangles
resulting in the closure of the company A very high degree of liquidity is also bad idle
assets earn nothing The firmrsquos funds will be unnecessarily tied up in current assets
Therefore it is necessary to strike a proper balance high liquidity and lack of liquidity
The most common ratios which indicate the extent of liquidity or lack of it are
Current ratio
Quick ratio
Other ratios include Cash ratio Interval Measure and Net working capital ratio
Current Ratio
The current ratio is calculated by dividing current assets by current liabilities
Current assets
Current ratio = --------------------------
Current liabilities
Current ratio is a measure of the firmrsquos short term solvency It indicates the availability of
current assets in rupees for every one rupee of current liability A ratio of greater than one
means that the firm has more current assets than current claims against the Current ratio of
2 to 1 or more is considered satisfactory Current ratio represents a margin of safety for
creditors
Quick Ratio
Quick ratio also known as acid-test ratio establishes a relationship between quick assets and
the current liabilities Cash is the most liquid asset It is calculated by dividing quick assets
by current liabilities
Quick ratio = Quick Assets Current Liabilities
8102019 A Study A Study On Financial Performance Analysis With Reference To Kesoram Cementon Financial Performance hellip
httpslidepdfcomreaderfulla-study-a-study-on-financial-performance-analysis-with-reference-to-kesoram 4281
42
(Quick Assets = Current assets ndash Inventory)
One defect of the current ratio is that it fails to convey any information on the composition
of the current assets of the firm A rupee of cash is considered equivalent to a rupee of
inventory of receivables But it is not so A rupee of cash is more readily available to meet
current liabilities than a rupee of say inventory This implies the usefulness of the current
ratio
The Acid ndashtest ratio measures the firmrsquos ability to convert its current assets quickly into
cash in order to meet its current liabilities
A quick ratio of 1 to 1 is considered to represent a satisfactory current financial condition It
is an important index of the firmrsquos liquidity
Leverage Ratios
Leverage ratios identify the source of a firmrsquos capital ndashowners or outside creditors
Financial leverage refers to the use of debt in financing non-current assets If the return on
assets exceeds the cost of debt the leverage is successful ndash ie it improves return on equity
Debt ndashEquity Ratio
The Debt ndash Equity is determined to analyze the soundness of the long term financial
policies of the organization It is also known as ldquoInternal External Equity Ratiordquo
It is calculated as follows
Debt ndash Equity Ratio = Total long term debt Share holders funds
Equity Ratio
This ratio is also called as proprietary ratio establishes a relationship between share holderrsquos
funds to total assets of company Equity Ratio is calculated by dividing share holders fund
by total assets
Fixed Asset Ratio
This ratio indicates the extent to which the assets of the companyrsquos can be lost without
affecting the interest of the creditors of the company Higher the ratios better the long-term
position of the company
Activity Ratios
They are primarily used for studying a firmrsquos working capital situation A well managed
firm should have good activity ratios
8102019 A Study A Study On Financial Performance Analysis With Reference To Kesoram Cementon Financial Performance hellip
httpslidepdfcomreaderfulla-study-a-study-on-financial-performance-analysis-with-reference-to-kesoram 4381
43
Working Capital Turnover Ratio
The working capital turnover ratio indicates whether or not working capital has been
effectively used in making sales
Working capital turnover = Sales Net current assets
Inventory Turnover Ratio
This ratio also known as Stock Turnover Ratio establishes the relationship between costs of
goods sold or net sales during the given period and the average amt of stock held during the
period This ratio reveals the number of times finished stock in turnover during a given
accounting period
Higher the ratio the better is it because it shows the finished stock is rapidly turned
in to sales On the other hand a low stock turnover ratio is not desirable because it reveals
the accumulation of stock
Debtors Turnover Ratio
This ratio indicates the velocity of debt collection of a company In other words it shows
the number of times average turnover during a year
A Higher Debtor Turnover Ratio indicates a more efficient is the management towards
debtors and low ratio ratio implies inefficient management of debtors
Total Assets Turnover Ratio
The asset turnover ratio indicates how efficiently management is employing Assets
Total Assets Turnover Ratio = Sales Total Assets
Profitability Ratios
Profitability ratios are the ratios which measure a firmrsquos overall effectiveness as revealed by
the returns generated on sales and investment
General Profitability Ratios
1 Gross Profit Ratio
2 Net profit Ratio
3 Operating or Expenses Ratio
8102019 A Study A Study On Financial Performance Analysis With Reference To Kesoram Cementon Financial Performance hellip
httpslidepdfcomreaderfulla-study-a-study-on-financial-performance-analysis-with-reference-to-kesoram 4481
44
Gross Profit Ratio
Gross profit Ratio measures the relationships to net sales and is usually represented as a
percentage It is a good measure of profitability
The gross profit ratio indicates the extent to which selling price of goods per unit may
decline without resulting in losses on operation Higher the gross profit betters the result
Net Profit Ratio
Net Profit Ratio indicates net margin on sales It is given by the following equation
Net Profit Ratio = (Net Profit Sales) 100
Operating or Expenses Ratio
This ratio is complimentary of Net Profit Ratio The more the net profit the less the
Operating Ratio Operating costs include the cost of direct materials direct labors and otheroverheads viz are generally excluded from operating costs A comparison of the Operating
Ratio will indicate whether the cost efficiency is high or low in the figure of sales This less
the ratio it depicts the efficiency of the management
8102019 A Study A Study On Financial Performance Analysis With Reference To Kesoram Cementon Financial Performance hellip
httpslidepdfcomreaderfulla-study-a-study-on-financial-performance-analysis-with-reference-to-kesoram 4581
45
CHAPTER IV
DATA ANALYSIS amp INTERPRETATION
8102019 A Study A Study On Financial Performance Analysis With Reference To Kesoram Cementon Financial Performance hellip
httpslidepdfcomreaderfulla-study-a-study-on-financial-performance-analysis-with-reference-to-kesoram 4681
46
Comparative Balance Sheet of Kesoram in the Year between 2008-2009
(Rupee in crores)
Years Changes
Particulars 2008 2009 In Rupees In Percentage
Liabilities
Share Capital 4574 4574 000 000
Reserves amp Surplus 93085 128024 34939
Revaluation Reserves 533 412 -121 -2270
Loans
Secured Loans 97106 153627 56521 5821
Un Secured Loans 12129 43416 31287 25795
Deferred Tax Liabilities 000 000 000 000
Current Liabilities
Provisions 33039 34529 1490 451
Current Liabilities 57067 66587 9520 1668
Total 297533 431169 133636 4491
Assets
Net Block 108424 180435 72011 6642
Capital Wip 63459 86485 23026 3628
Investments 4783 6178 1395 2917
Current Assets
Inventories 44217 58906 14689 3322
Sundry Debtors 27307 38017 10710 3922
Cash amp Bank Balances 4036 5657 1621 4016
Total Current Assets 75560 102580 27020 3576
Loans amp Advances 45289 55462 10173 2246
Fixed Deposits 018 028 010 5556
Total 297533 431169 133636 4491
8102019 A Study A Study On Financial Performance Analysis With Reference To Kesoram Cementon Financial Performance hellip
httpslidepdfcomreaderfulla-study-a-study-on-financial-performance-analysis-with-reference-to-kesoram 4781
47
Interpretation of comparative balance sheet of 2008-2009
Reserves amp Surplus were increased to 3753 (percent) ie in Rupees 34939
crores
Revaluation Reserves decreased to 121 ie in Rupees 2270 crores
Secured Loans are increased to 5821 ie in Rupees 56521 crores And UN
secured loans highly Increased to 25795
Current liabilities and Provisions are increased to 1668 and 451 respectively ie in
Rupees 9520 amp 1490 crores
Fixed assets were highly increased to 6642 ie in Rupees 72011 crores
Investments were increased to 2917 ie in Rupees 1395 crores
Sundry debtors increased to 3922 ie in Rupees 10710 crores
Current assets increased 3576 ie in Rupees 27020 crores And Loans amp
Advances increased to 2246 respectively
The overall financial position was satisfactory
8102019 A Study A Study On Financial Performance Analysis With Reference To Kesoram Cementon Financial Performance hellip
httpslidepdfcomreaderfulla-study-a-study-on-financial-performance-analysis-with-reference-to-kesoram 4881
48
Comparative Balance Sheet of Kesoram in the Year between 2009-2010
(Rupees in crores)
Years Changes
Particulars 2009 2010 In Rupees In Percentage
Liabilities
Share Capital 4574 4574 000 000
Reserves amp Surplus 128024 149111 21087 1647
Revaluation Reserves 412 339 -073 -1772
Loans
Secured Loans 153627 186372 32745 2131
Un Secured Loans 43416 126250 82834 19079
Deferred Tax Liabilities 000 000 000
Current Liabilities
Provisions 34529 35734 1205 349
Current Liabilities 66587 107688 41101 6173
Total 431169 610068 178899 4149
Assets
Net Block 180435 343182 162747 9020
Capital WIP 86485 41283 -45202 -5227
Investments 6178 5143 -1035 -1675
Current Assets
Inventories 58906 91619 32713 5553
Sundry Debtors 38017 54289 16272 4280
Cash amp Bank Balances 5657 8014 2357 4167
Total Current Assets 102580 153922 51342 5005
Loans amp Advances 55462 66506 11044 1991
Fixed Deposits 028 031 003 1071
Total 431169 610068 178899 4149
8102019 A Study A Study On Financial Performance Analysis With Reference To Kesoram Cementon Financial Performance hellip
httpslidepdfcomreaderfulla-study-a-study-on-financial-performance-analysis-with-reference-to-kesoram 4981
49
Interpretation of comparative balance sheet of 2009-2010
Reserves amp surplus increased to 1647 ie in Rupees 21087 crores
Revaluation Reserves decreased to 1772 ie in Rupees 073 crores
Secured loans increased to 2131 ie in Rupees 32745 crores
Current Liabilities were increased to 6173 ie in Rupees 41101 crores and
Provisions 349 ie in Rupees 1205 crores
Fixed Assets were increased to 9020 ie in Rupees 162747 crores
Investments were decreased to 1675 ie in Rupees 1035 crores
Sundry debtors were increased to 4280 ie in Rupees 16272 crores
Current assets increased to 5005 ie in Rupees 51342 crores And loans and
Advances increased 1919 ie in Rupees 11044 crores
The overall financial position was satisfactory
8102019 A Study A Study On Financial Performance Analysis With Reference To Kesoram Cementon Financial Performance hellip
httpslidepdfcomreaderfulla-study-a-study-on-financial-performance-analysis-with-reference-to-kesoram 5081
50
Comparative Balance Sheet of Kesoram in the Year between 2010-2011
(Rupees in crores)
Years Changes
Particulars 2010 2011 In Rupees In Percentage
Liabilities
Share Capital 4574 4574 000 000
Reserves amp Surplus 149111 125162 -23949 -1606
Revaluation Reserves 339 289 -050 -1475
Loans
Secured Loans 186372 237183 50811 2726
Un Secured Loans 126250 162744 36494 2891
Deferred Tax Liabilities 000 000 000
Current Liabilities
Provisions 35734 1494 -34240 -9582
Current Liabilities 107688 113902 6214 577
Total 610068 645348 35280 578
Assets
Net Block 343182 369172 25990 757
Capital WIP 41283 43781 2498 605
Investments 5143 6582 1439 2798
Current Assets
Inventories 91619 111855 20236 2209
Sundry Debtors 54289 63134 8845 1629
Cash amp Bank Balances 8014 7188 -826 -1031
Total Current Assets 153922 182177 28255 1836
Loans amp Advances 66506 43460 -23046 -3465
Fixed Deposits 031 176 145 46774
Total 610068 645348 35280 578
8102019 A Study A Study On Financial Performance Analysis With Reference To Kesoram Cementon Financial Performance hellip
httpslidepdfcomreaderfulla-study-a-study-on-financial-performance-analysis-with-reference-to-kesoram 5181
51
Interpretation of comparative balance sheet of 2010-2011
Reserves amp surplus decreased to 1606 ie in Rupees 23949 crores
Revaluation Reserves decreased to 1475 ie in Rupees 050 crores
Secured loans increased to 2726 ie in Rupees 50811 crores
Current Liabilities were increased to 577 ie in Rupees 6214 crores
Provisions decreased to 9582 ie in Rupees 34240 crores
Fixed Assets were increased to 757 ie in Rupees 25990 crores
Investments were decreased to 2798 ie in Rupees 1439 crores
Sundry debtors were increased to 1629 ie in Rupees8845 crores
Current assets increased to 1836 ie in Rupees 28255 crores And loans and
Advances increased 3465 ie in Rupees 23046 crores
The overall financial position was UN satisfactory
8102019 A Study A Study On Financial Performance Analysis With Reference To Kesoram Cementon Financial Performance hellip
httpslidepdfcomreaderfulla-study-a-study-on-financial-performance-analysis-with-reference-to-kesoram 5281
52
Comparative Balance Sheet of Kesoram In The Year Between 2011-2012
(Rupees in crores)
Years Changes
Particulars 2011 2012 In Rupees In Percentage
Liabilities
Share Capital 4574 4574 000 000
Reserves amp Surplus 125162 86657 -38505 -3076
Revaluation Reserves 289 270 -019 -657
Loans
Secured Loans 237183 317792 80609 3399
Un Secured Loans 162744 92742 -70002 -4301
Deferred Tax Liabilities 000 000 000
Current Liabilities
Provisions 1494 40726 39232 262597
Current Liabilities 113902 180010 66108 5804
Total 645348 722771 77423 1200
Assets 000
Net Block 369172 358721 -10451 -283
Capital WIP 43781 68065 24284 5547
Investments 6582 6636 054 082
Current Assets
Inventories 111855 99516 -12339 -1103
Sundry Debtors 63134 67358 4224 669
Cash amp Bank Balances 7188 6959 -229 -319
Total Current Assets 182177 173833 -8344 -458
Loans amp Advances 43460 115409 71949 16555
Fixed Deposits 176 107 -069 -3920
Total 645348 722771 77423 1200
8102019 A Study A Study On Financial Performance Analysis With Reference To Kesoram Cementon Financial Performance hellip
httpslidepdfcomreaderfulla-study-a-study-on-financial-performance-analysis-with-reference-to-kesoram 5381
53
Interpretation of comparative balance sheet of 2011-2012
Reserves amp surplus decreased to 3076 ie in Rupee 38505 crores
Revaluation Reserves decreased to 657 ie in Rupees 019 crores
Secured loans increased to 3399 ie in Rupees 80699 crores
Current Liabilities were increased to 5804 ie in Rupees 66108 crores
Provisions increased to 262597 ie in Rupees 39232 crores
Fixed Assets were decreased to 283 ie in Rupee 10451 crores
Investments were increased to 082 ie in Rupees 054 crores
Sundry debtors were increased to 669 ie in Rupees 4224 crores
Current assets decreased to 458 ie in Rupees 8344 crores And loans and
Advances increased 16555 ie in Rupees 71949 crores
The overall financial position was UN satisfactory
8102019 A Study A Study On Financial Performance Analysis With Reference To Kesoram Cementon Financial Performance hellip
httpslidepdfcomreaderfulla-study-a-study-on-financial-performance-analysis-with-reference-to-kesoram 5481
54
Common Size Balance Sheet of Kesoram For The Year 2008-2009
(Rupees in crores)
Particulars 2008 Change Percentage 2009 Change Percentage
Liabilities
Share Capital 4574 154 4574 106
Reserves amp Surplus 93085 3129 128024 2969
Revaluation Reserves 533 018 412 010
Loans
Secured Loans 97106 3264 153627 3563
Un Secured Loans 12129 408 43416 1007
Deferred Tax Liabilities 000 000 000 000
Current Liabilities
Provisions 33039 1110 34529 801
Current Liabilities 57067 1918 66587 1544
Total 297533 10000 431169 10000
Assets
Net Block 108424 3644 180435 4185
Capital WIP 63459 2133 86485 2006
Investments 4783 161 6178 143
Current Assets
Inventories 44217 1486 58906 1366
Sundry Debtors 27307 918 38017 882
Cash amp Bank Balances 4036 136 5657 131
Loans amp Advances 45289 1522 55462 1286
Fixed Deposits 018 001 028 001
Total 297533 10000 431169 10000
8102019 A Study A Study On Financial Performance Analysis With Reference To Kesoram Cementon Financial Performance hellip
httpslidepdfcomreaderfulla-study-a-study-on-financial-performance-analysis-with-reference-to-kesoram 5581
55
Interpretation of Common Size Balance Sheet of 2008-2009
Share capital was recorded 154 percent in the total liabilities in the year 2008 it is
decreased to 106 in the year 2009
Reserves amp surplus contributed to 3129 in the total liabilities in the year 2008 it is
decreased to 2969 in the year 2009
Secured loans were 3264 in the total liabilities in the year 2008 it is increased to
3563 in the year 2009
Current Liabilities shown to 1918 in the total liabilities in the year 2008 it is
decreased to 1544 in the year 2009
Provisions 1110 in the total liabilities in the year 2008 it is decreased to 801 in the
year 2009
Fixed Assets were 3644 in the total liabilities in the year 2008 ie decreased to 4185
in the year 2009
Investments were 161 in the total liabilities in the year 2008 it is decreased to 143
in the year 2009
Sundry debtors were 918 in the total liabilities in the year 2008 it is decreased to 882
in the year 2009
8102019 A Study A Study On Financial Performance Analysis With Reference To Kesoram Cementon Financial Performance hellip
httpslidepdfcomreaderfulla-study-a-study-on-financial-performance-analysis-with-reference-to-kesoram 5681
56
Common Size Balance Sheet of Kesoram For The Year 2009-2010
(Rs in crores)
Particulars 2009 Change Percentage 2010Change
Percentage
Liabilities
Share Capital 4574 106 4574 075
Reserves amp Surplus 128024 2969 149111 2444
Revaluation Reserves 412 010 339 006
Loans
Secured Loans 153627 3563 186372 3055
Un Secured Loans 43416 1007 126250 2069
Deferred Tax Liabilities 000 000 000 000
Current Liabilities
Provisions 34529 801 35734 586
Current Liabilities 66587 1544 107688 1765
Total 431169 10000 610068 10000
Assets
Net Block 180435 4185 343182 5625
Capital WIP 86485 2006 41283 677
Investments 6178 143 5143 084
Current Assets
Inventories 58906 1366 91619 1502
Sundry Debtors 38017 882 54289 890
Cash amp Bank Balances 5657 131 8014 131
Loans amp Advances 55462 1286 66506 1090
Fixed Deposits 028 001 031 001
Total 431169 10000 610068 10000
8102019 A Study A Study On Financial Performance Analysis With Reference To Kesoram Cementon Financial Performance hellip
httpslidepdfcomreaderfulla-study-a-study-on-financial-performance-analysis-with-reference-to-kesoram 5781
57
Interpretation of common size balance sheet of 2009-2010
Share capital was recorded 106 percent in the total liabilities in the
year 2009 it is decreased to 075 in the year 2010
Reserves amp surplus contributed to 2969 in the total liabilities in the
year 2009 it is decreased to2444 in the year 2010
Secured loans were 3563 in the total liabilities in the year 2009 it is
increased to 3055 in the year 2010
Current Liabilities shown to 1544 in the total liabilities in the year
2009 it is decreased to 1765 in the year 2010
Provisions 801 in the total liabilities in the year 2009 it is decreased
to 586 in the year 2010
Fixed Assets were 4185 in the total liabilities in the year 2009 ie
increased to 5625 in the year 2010
Investments were 143 in the total liabilities in the year 2009 it is
decreased to 084 in the year 2010
Sundry debtors were 882 in the total liabilities in the year 2009 it is
increased to 890 in the year 2010
8102019 A Study A Study On Financial Performance Analysis With Reference To Kesoram Cementon Financial Performance hellip
httpslidepdfcomreaderfulla-study-a-study-on-financial-performance-analysis-with-reference-to-kesoram 5881
58
Common Size Balance sheet of Kesoram for the year 2010-2011
983080Rupees in crores)
Particulars 2010 Change Percentage 2011
Change
Percentage
Liabilities
Share Capital 4574 075 4574 071
Reserves amp Surplus 149111 2444 125162 1939
Revaluation Reserves 339 006 289 004
Loans
Secured Loans 186372 3055 237183 3675
Un Secured Loans 126250 2069 162744 2522
Deferred Tax Liabilities 000 000 000 000
Current Liabilities
Provisions 35734 586 1494 023
Current Liabilities 107688 1765 113902 1765
Total 610068 10000 645348 10000
Assets
Net Block 343182 5625 369172 5721
Capital WIP 41283 677 43781 678
Investments 5143 084 6582 102
Current Assets
Inventories 91619 1502 111855 1733
Sundry Debtors 54289 890 63134 978
Cash amp Bank Balances 8014 131 7188 111
Loans amp Advances 66506 1090 43460 673
Fixed Deposits 031 001 176 003
Total 610068 10000 645348 10000
8102019 A Study A Study On Financial Performance Analysis With Reference To Kesoram Cementon Financial Performance hellip
httpslidepdfcomreaderfulla-study-a-study-on-financial-performance-analysis-with-reference-to-kesoram 5981
59
Interpretation of Common Size Balance Sheet Of 2010-2011
Share capital was recorded 075 percent in the total liabilities in the year 2010 it is
decreased to 071 in the year 2011
Reserves amp surplus contributed to 2444 in the total liabilities in the year 2010 it is
decreased to1939 in the year 2011
Secured loans were 3055 in the total liabilities in the year 2010 it is increased to
3675 in the year 2011
Current Liabilities shown to 1765 in the total liabilities in the year 2010 it is
also1765 in the year 2011
Provisions 586 in the total liabilities in the year 2010 it is decreased to 023 in the
year 2011
Fixed Assets were 5625 in the total liabilities in the year 2010 ie increased to 5721
in the year 2011
Investments were 084 in the total liabilities in the year 2010 it increased to 102 in
the year 2011
Sundry debtors were 890 in the total liabilities in the year 2010 it is increased to 978
in the year 2011
8102019 A Study A Study On Financial Performance Analysis With Reference To Kesoram Cementon Financial Performance hellip
httpslidepdfcomreaderfulla-study-a-study-on-financial-performance-analysis-with-reference-to-kesoram 6081
60
Common Size Balance Sheet of Kesoram for the Year 2011-2012
983080Rupees in crores)
Particulars 2011 Change Percentage 2012
Change
Percentage
Liabilities
Share Capital 4574 071 4574 063
Reserves amp Surplus 125162 1939 86657 1199
Revaluation Reserves 289 004 270 004
Loans
Secured Loans 237183 3675 317792 4397
Un Secured Loans 162744 2522 92742 1283
Deferred Tax Liabilities 000 000 000 000
Current Liabilities
Provisions 1494 023 40726 563
Current Liabilities 113902 1765 180010 2491
Total 645348 10000 722771 10000
Assets
Net Block 369172 5721 358721 4963
Capital WIP 43781 678 68065 942
Investments 6582 102 6636 092
Current Assets
Inventories 111855 1733 99516 1377
Sundry Debtors 63134 978 67358 932
Cash amp Bank Balances 7188 111 6959 096
Loans amp Advances 43460 673 115409 1597
Fixed Deposits 176 003 107 001
Total 645348 10000 722771 10000
8102019 A Study A Study On Financial Performance Analysis With Reference To Kesoram Cementon Financial Performance hellip
httpslidepdfcomreaderfulla-study-a-study-on-financial-performance-analysis-with-reference-to-kesoram 6181
61
Interpretation of common size balance sheet of 2011-2012
Share capital was recorded 071 percent in the total liabilities in the year 2011 it is
decreased to 063 in the year 2012
Reserves amp surplus contributed to 1939 in the total liabilities in the year 2011 it
is decreased to 1199 in the year 2012
Secured loans were 3675 in the total liabilities in the year 2011 it is increased to
4397 in the year 2012
Current Liabilities shown to 1765 in the total liabilities in the year 2011 it is
increased to 2491 in the year 2012
Provisions 023 in the total liabilities in the year 2011 it is increased to 563 in the
year 2012
Fixed Assets were 5721 in the total liabilities in the year 2011 ie decreased to
4963 in the year 2012
Investments were 102 in the total liabilities in the year 2011 it increased to 092
in the year 2012
Sundry debtors were 978 in the total liabilities in the year 2011 it is decreased to
932 in the year 2012
8102019 A Study A Study On Financial Performance Analysis With Reference To Kesoram Cementon Financial Performance hellip
httpslidepdfcomreaderfulla-study-a-study-on-financial-performance-analysis-with-reference-to-kesoram 6281
Trend Analysis
Share Capital-
Year
Amount
(In Crores) Trend
IncreaseDecrease
Base Year Previous Year
2008 4574 10000 000 000
2009 4574 10000 000 000
2010 4574 10000 000 000
2011 4574 10000 000 000
2012 4574 10000 000 000
Trend Percentages in Share Capital
Share capital shown a constant trend in the period 2008 and 2012
Share capital is 4574 crores all the years from 2008-2012
8102019 A Study A Study On Financial Performance Analysis With Reference To Kesoram Cementon Financial Performance hellip
httpslidepdfcomreaderfulla-study-a-study-on-financial-performance-analysis-with-reference-to-kesoram 6381
Reserves amp Surplus-
Year
Amount
(In Crores) Trend
IncreaseDecrease
Base Year Previous Year
2008 93085 10000 000 000
2009 128024 13753 3753 3753
2010 149111 16019 6019 2266
2011 125162 13446 3446 -2573
2012 86657 9309 -691 -4137
Trend Percentages in Reserves amp Surplus
Reserves amp surplus shown an increasing trend in the period between 2008 and 2010
The average trend was 13277 till 2010
The Reserves amp surplus was showing decreasing trend in the period 2011-2012 (ie
from 16019 in 2010 to 9309 in 2012)
The decreasing trend in Reserves amp surplus indicates the decrease in profits of the
firm
8102019 A Study A Study On Financial Performance Analysis With Reference To Kesoram Cementon Financial Performance hellip
httpslidepdfcomreaderfulla-study-a-study-on-financial-performance-analysis-with-reference-to-kesoram 6481
Investments-
Year
Amount
(In Crores) Trend
IncreaseDecrease
Base Year Previous Year
2008 4783 10000 000 000
2009 6178 12917 2917 2917
2010 5143 10753 753 -2164
2011 6582 13761 3761 3009
2012 6636 13874 3874 113
Trend Percentages in Investments-
The investments are shown an increasing trend in the period between 2008 ndash 2009
and it is decreasing in the year 2010
The average trend was 11458 till 2009
The investments increased in the periods 2011-2012 (ie from 10753 in 2010 to
13874 in 2012)
The overall trend in investments shown is satisfactory
8102019 A Study A Study On Financial Performance Analysis With Reference To Kesoram Cementon Financial Performance hellip
httpslidepdfcomreaderfulla-study-a-study-on-financial-performance-analysis-with-reference-to-kesoram 6581
Net Current Assets-
Year
Amount
(In Crores) Trend
IncreaseDecrease
Base Year Previous Year
2008 30761 10000 000 000
2009 56954 18515 8515 8515
2010 77037 25044 15044 6529
2011 110417 35895 25895 10851
2012 68613 22305 12305 -13590
Trends in Net Current Assets-
The NCA shown positive (increasing) trend
The NCA are increased to 35895 (the year 2011) compared with base year and
decreased in the year 2012 to 22305
The NCA shown increased trend from year and crossed 100
The overall trend was good
8102019 A Study A Study On Financial Performance Analysis With Reference To Kesoram Cementon Financial Performance hellip
httpslidepdfcomreaderfulla-study-a-study-on-financial-performance-analysis-with-reference-to-kesoram 6681
66
Ratio Analysis-
Current Ratio-
Current Ratio = Current Assets Current Liabilities
Current assets are cash in hand Cash at bank Marketable Securities(short term) short term
Investment Bills receivables sundry debtors Inventories (stock) Work in progress prepaid
expenses Current Liabilities are outstanding expenses Bills payable sundry Creditors
short-term advances income tax payable and Dividend payable
Current Ratio of Kesoram-
(Rupees in crores)
Year Current Assets Current Liabilities Current Ratio
2007-08 75560 57067 132
2008-09 102580 66587 154
2009-10 153922 107688 143
2010-11 182177 113902 160
2011-12 173833 180010 097
Interpretation-
As per the standard rule of current ratio ie 21 where current assets double the current
liabilities is considered satisfactory
In the present analysis the current ratio of the Kesoram is not satisfactory
from the above table It was assessed that the current ratio for all the five year is lower (less)
than the standard rule ie 21 And it is 097 in the year 2011-2012 (current year) This is
highly UN satisfactory
8102019 A Study A Study On Financial Performance Analysis With Reference To Kesoram Cementon Financial Performance hellip
httpslidepdfcomreaderfulla-study-a-study-on-financial-performance-analysis-with-reference-to-kesoram 6781
Quick Ratio-
Quick ratio also known as acid-test ratio establishes a relationship between quick
assets and the current liabilities Cash is the most liquid asset It is calculated by dividing
quick assets by current liabilities
Quick ratio = Quick Assets Current Liabilities
(Quick Assets = Current assets ndash Inventory)
Quick Ratio of Kesoram-
Rupees in crores)
Year Total QuickAssets
Current Liabilities Quick Ratio
2007-08 33343 57067 058
2008-09 43674 66587 066
2009-10 62303 107688 058
2010-11 70322 113902 0622011-12 74333 180010 041
Interpretation-
Usually a high Quick ratio is an indication that the company is liquid and has the ability to
meet its current or liquid liabilities in time on the other hand a low Quick Ratio represents
8102019 A Study A Study On Financial Performance Analysis With Reference To Kesoram Cementon Financial Performance hellip
httpslidepdfcomreaderfulla-study-a-study-on-financial-performance-analysis-with-reference-to-kesoram 6881
that the companyrsquos liquidity position is not good The above table showing the quick ratios
of Kesoram are canrsquot be considered satisfactory
Leverage Ratios-
Debt-Equity Ratio-
Debt-Equity Ratio = Total Long Term Debt Equity Share Holders Fund
Total Long term Debt= Debenture Capital + Long term loans from banks and financial
institutions + Public deposits
Equity Share Holders fund = Equity + Reserves and Surplus
Debt Equity Ratio of Kesoram
(Rupees in crores)
Year Total Debt Share Holders Fund Debt Equity Ratio
2007-08 109235 98192 111
2008-09 197043 133010 148
2009-10 312622 154024 203
2010-11 399927 130025 308
2011-12 410534 91501 449
8102019 A Study A Study On Financial Performance Analysis With Reference To Kesoram Cementon Financial Performance hellip
httpslidepdfcomreaderfulla-study-a-study-on-financial-performance-analysis-with-reference-to-kesoram 6981
Interpretation-
The Debt-Equity Ratio accepted standard is 05 This ratio reflects the relative contribution
of creditors and owners of business in its financing From the above it is clear that the long
term debt is more than that of the share holdersrsquo fund So we can interpret that the firmrsquosassets are financed more by the external funds rather than by the internal funds
8102019 A Study A Study On Financial Performance Analysis With Reference To Kesoram Cementon Financial Performance hellip
httpslidepdfcomreaderfulla-study-a-study-on-financial-performance-analysis-with-reference-to-kesoram 7081
Fixed Asset Ratio-
Net Sales
Fixed Asset Ratio = helliphelliphelliphelliphelliphelliphelliphelliphelliphelliphellip
Net Assets
Fixed Asset Ratio of Kesoram-
(Rupees in crores)
Year Net Sales Net Assets Fixed Assets Ratio
2007-08 300271 358721 084
2008-09 389797 369172 106
2009-10 475062 343182 1382010-11 539788 180435 299
2011-12 59182 108424 546
Interpretation
This ratio indicates the extent to which the assets of the companyrsquos can be lost without
affecting the interest of the creditors of the company Higher the ratios better the long-term
position of the companyThe above table shows fixed assets ratio in increasing trend Which is good for the
company
8102019 A Study A Study On Financial Performance Analysis With Reference To Kesoram Cementon Financial Performance hellip
httpslidepdfcomreaderfulla-study-a-study-on-financial-performance-analysis-with-reference-to-kesoram 7181
Overall Profitability Ratios-
Net Profit Ratio
Net Profit Ratio indicates net margin on sales It is given by the following equation
Net Profit Ratio = (Net Profit Sales) 100
Net Profit Ratio of Kesoram
(Rupees in crores)
Year Net Profit Sales Net Profit Ratio
2007-08 37917 300271 1263
2008-09 41432 389797 1063
2009-10 20298 475062 427
2010-11 -28176 539788 -5222011-12 -38108 59182 -644
Interpretation
It establishes a relationship between net profits after tax and net sales and
indicates the efficiency of the management in manufacturing selling administrative and
other activities of the company
The higher the ratio the better is the profitability or performance of the business
The above table depicts the net profit Ratio of Kesoram has decreased every year from
2007-2008 to 2011-2012It further decreased to negative in the year 2010-11 to -522 and -
644 in the year 2011-2012 This shows constant decrease in the profits of the company
8102019 A Study A Study On Financial Performance Analysis With Reference To Kesoram Cementon Financial Performance hellip
httpslidepdfcomreaderfulla-study-a-study-on-financial-performance-analysis-with-reference-to-kesoram 7281
72
Return on Investment-
Net Profit
Return on Investment = helliphelliphelliphelliphelliphelliphelliphelliphelliphelliphelliphellip X 100
Share Holders Fund
Return on Investment Ratio of Kesoram-
(Rupees in crores)
Year Net Profit Share Holders Fund Return On Investment
2007-08 37917 98192 3862
2008-09 41432 133010 3115
2009-10 20298 154024 1318
2010-11 -28176 130025 -2167
2011-12 -38108 91501 -4165
Interpretation-
The above table reveals how well the resources of the firm are being used Higher
the ratio better the result The above ratio implies how well the firm is growing in
terms of profitability and efficiency From the above table we can concern that the return on
investment is in decreasing trend ROI is highest in the year 2007-2008 as 3862 But
there after itrsquos decreased every year
The ROI is negative in the years 2010-2011 amp 2011-2012 as -2167 amp -4165 respectively
Which is not a good sign for the firm
8102019 A Study A Study On Financial Performance Analysis With Reference To Kesoram Cementon Financial Performance hellip
httpslidepdfcomreaderfulla-study-a-study-on-financial-performance-analysis-with-reference-to-kesoram 7381
8102019 A Study A Study On Financial Performance Analysis With Reference To Kesoram Cementon Financial Performance hellip
httpslidepdfcomreaderfulla-study-a-study-on-financial-performance-analysis-with-reference-to-kesoram 7481
8102019 A Study A Study On Financial Performance Analysis With Reference To Kesoram Cementon Financial Performance hellip
httpslidepdfcomreaderfulla-study-a-study-on-financial-performance-analysis-with-reference-to-kesoram 7581
75
CHAPTER V
FINDINGS amp SUGGESTIONS
8102019 A Study A Study On Financial Performance Analysis With Reference To Kesoram Cementon Financial Performance hellip
httpslidepdfcomreaderfulla-study-a-study-on-financial-performance-analysis-with-reference-to-kesoram 7681
76
Findings
The Share capital remains constant Share capital is unchanged all the years from
2008-2012
Reserves amp surplus were recorded an increasing trend in the period between 2008
and 2010It is showing decreasing trend in the period 2011-2012 (ie from 16019
in 2010 to 9309 in 2012)
Current Liabilities were increased compared to base year ie 2008
Provisions increased to 262597 ie in Rupees 39232 crores in the current year
The current ratio for all the five year is lower (less) than the standard rule ie 21
And it is 097 in the year 2011-2012 (current year)
The Debt-Equity Ratio was shown under the standard ratio It is clear that the long
term debt is more than that of the share holdersrsquo fund It indicates that the firm
heavily relying on external funds rather than the internal funds
The operating and net profit of Kesoram is in decreasing trend due to heavy
increase of manufacturing amp administrative expenses
ROI is highest in the year 2007-2008 as 3862 The ROI is negative in the years
2010-2011 amp 2011-2012 as -2167 amp -4165 respectively
Return on Equity Capital Employed Ratio of Kesoram has decreased every year
from 2007-2008 to 2010-2011It further decreased to negative in the year 2011-12 to
-3280
EPS of Kesoram has decreased every year from 2008-12It is negative in the year
2011 amp 12
8102019 A Study A Study On Financial Performance Analysis With Reference To Kesoram Cementon Financial Performance hellip
httpslidepdfcomreaderfulla-study-a-study-on-financial-performance-analysis-with-reference-to-kesoram 7781
77
Suggestion
The organization should adopt an appropriate capital structure
The companyrsquos debt-equity ratio is recorded more or less as 111 in the year 2008
and it is increased to 449 in the year 2012 (current year)The company should
adopt a better debt equity mix in the future to control the fluctuations in returns
The company should control fluctuations in cash and bank balances as it impacts the
current ratio of the company
The provisions are showing increasing trend which indicates risk of debtors The
firm should implement an effective credit management policy It should utilize its
idle funds by decreasing provisions
The company should control heavy increase of manufacturing amp administration
expenses as it is impacting the operating and net profit of company
8102019 A Study A Study On Financial Performance Analysis With Reference To Kesoram Cementon Financial Performance hellip
httpslidepdfcomreaderfulla-study-a-study-on-financial-performance-analysis-with-reference-to-kesoram 7881
78
ANNEXURE
Profit And Loss Account of Kesoram Cement
Mar12 Mar11 Mar10 Mar09 Mar08
12 Months 12 Months 12 Months 12 Months 12 Months
INCOME
Sales Turnover 628260 575072 505151 431613 345700
Excise Duty 36440 35284 30089 41815 45429
NET SALES 591820 539788 475062 389797 300271
Other Income 000 000 000 000 000
TOTALINCOME
596129 548733 481019 393969 302020
EXPENDITURE
Manufacturing
Expenses81903 74803 13974 13153 44113
MaterialConsumed
370897 310150 295550 229359 118448
Personal
Expenses33468 27355 23294 18690 15344
Selling Expenses 81910 78253 58667 48846 45019
AdministrativeExpenses
28225 29308 17219 16179 9907
Expenses
Capitalized000 000 000 000 000
Provisions Made 000 000 000 000 000
TOTAL
EXPENDITURE 596403 519870 408704 326227 232832Operating Profit -4583 19918 66358 63570 67439
EBITDA -274 28864 72316 67742 69188
Depreciation 29740 27259 17280 11186 8927
Other Write-offs 000 000 000 000 000
EBIT -30014 1605 55035 56557 60261
Interest 41015 23983 10921 12087 5426
EBT -71029 -22377 44114 44470 54835
Taxes -32921 5798 23816 3037 16918
Profit and Loss
for the Year-38108 -28176 20298 41432 37917
Non RecurringItems
-1142 7063 3228 -4023 402
Other Non Cash
Adjustments1276 091 207 465 017
OtherAdjustments
000 000 000 000 000
REPORTED
PAT-37974 -21021 23734 37874 38335
8102019 A Study A Study On Financial Performance Analysis With Reference To Kesoram Cementon Financial Performance hellip
httpslidepdfcomreaderfulla-study-a-study-on-financial-performance-analysis-with-reference-to-kesoram 7981
79
Balance Sheet Of Kesoram
Years
Particulars 2008 2009 2010 2011 2012
Liabilities
Share Capital 4574 4574 4574 4574 4574Reserves amp Surplus 93085 128024 149111 125162 86657
Revaluation Reserves 533 412 339 289 27
Loans
Secured Loans 97106 153627 186372 237183 317792
Un Secured Loans 12129 43416 12625 162744 92742
Deferred Tax Liabilities 0 0 0 0 0
Current Liabilities
Provisions 33039 34529 35734 1494 40726
Current Liabilities 57067 66587 107688 113902 18001
Total 297533 431169 610068 645348 722771
Assets
Net Block 108424 180435 343182 369172 358721
Capital WIP 63459 86485 41283 43781 68065
Investments 4783 6178 5143 6582 6636
Current Assets
Inventories 44217 58906 91619 111855 99516
Sundry Debtors 27307 38017 54289 63134 67358
Cash amp Bank Balances 4036 5657 8014 7188 6959
Total Current Assets 7556 10258 153922 182177 173833Loans amp Advances 45289 55462 66506 4346 115409
Fixed Deposits 018 028 031 176 107
Total 297533 431169 610068 645348 722771
8102019 A Study A Study On Financial Performance Analysis With Reference To Kesoram Cementon Financial Performance hellip
httpslidepdfcomreaderfulla-study-a-study-on-financial-performance-analysis-with-reference-to-kesoram 8081
80
KEY ITEMS 2012 2011 2010 2009 2008
Preference
Dividend 0 0 0 0 0
Equity Dividend 457 2516 2516 2516 2516
Equity Dividend
() 999 55 55 55 55
Shares in Issue(Lakhs) 45743 45743 45743 45743 45743
EPS - Annualised
(Rs) -8302 -4595 5188 828 838
8102019 A Study A Study On Financial Performance Analysis With Reference To Kesoram Cementon Financial Performance hellip
httpslidepdfcomreaderfulla-study-a-study-on-financial-performance-analysis-with-reference-to-kesoram 8181
BIBLIOGRAPHY
Sl
No
Books Author Name
1 Financial Management Khan amp JAIN
2 Financial Management IMPandey
3 Management Accounting RPTrivedi
Websites amp Search Engines
1 wwwkesoramcom983086
2 wwwmoneycontrolcom
3 wwwgooglefinancecom983086
Annual reports of Kesoram cement limited 2008-2012
8102019 A Study A Study On Financial Performance Analysis With Reference To Kesoram Cementon Financial Performance hellip
httpslidepdfcomreaderfulla-study-a-study-on-financial-performance-analysis-with-reference-to-kesoram 1281
12
Significance of Financial Performance Analysis
Interest of various related groups is affected by the financial performance of a firm
Therefore these groups analyze the financial performance of the firm The type of analysis
varies according to the specific interest of the party involved
Trade creditors interested in the liquidity of the firm (appraisal of firmrsquos liquidity)
Bond holders interested in the cash-flow ability of the firm (appraisal of firmrsquos capital
structure the major sources and uses of funds profitability over time and projection of
future profitability)
Investors interested in present and expected future earnings as well as stability of these
earnings (appraisal of firmrsquos profitability and financial condition)
Management interested in internal control better financial condition and betterperformance (appraisal of firmrsquos present financial condition evaluation of opportunities in
relation to this current position return on investment provided by various assets of the
company etc)
Research Methodology
Research Design
This is a systematic way to solve the research problem and it is important
component for the study without which researches may not be able to obtain the format A
research design is the arrangement of conditions for collection and analysis of data in a
manager that aims to combine for collection and analysis of data relevance to the research
purpose with economy in procedure
Meaning of Research Design
The formidable problem that follows the task of defining the research problem is the
preparation of design of the research project popularly known as the research design
decision regarding what where when how much by what means concerning an inquiry of
a research study constitute a research design A research design is the arrangement of
conditions for collection and analysis of data in a manager that aims to combine for
collection and analysis of data relevance to the research purpose with economy in
procedure
8102019 A Study A Study On Financial Performance Analysis With Reference To Kesoram Cementon Financial Performance hellip
httpslidepdfcomreaderfulla-study-a-study-on-financial-performance-analysis-with-reference-to-kesoram 1381
13
Sources of Data
Data we collected based on two sources
Primary Data
Secondary Data
Primary Data
The Primary Data Are Those Informationrsquos which are Collected afresh and for the
First Time And Thus Happen to Be Original in Character
Secondary Data
The secondary data are those which have already been collected by some other agency and
which have already been processed The sources of secondary data are annual reports
browsing internet through magazines
1 It includes data gathered from the annual reports of Kesoram
2 Articles are collected from official website of Kesoram
Methodology Used
Types Of Financial Statements Adopted
Following Two Types of Financial Statements Are Commonly Used in
Analyzing the Firmrsquos Financial Position
a Balance Sheet
b Income Statements
8102019 A Study A Study On Financial Performance Analysis With Reference To Kesoram Cementon Financial Performance hellip
httpslidepdfcomreaderfulla-study-a-study-on-financial-performance-analysis-with-reference-to-kesoram 1481
14
Limitations of Financial Statement
Each Project Gives Rise to Its Own Unique Risks And Hence Possess Its Own Unique
Challenges
1 Only Interim Reports
Only interim statements donrsquot give a final picture of the concern The data given in
these statements is only approximate The actual position can only be determined when the
business is sold or liquidated
2 Donrsquot Give Extra Position
The Financial Statements Are Expressed In Monetary Values So They Appear To
Give Final And Accurate Position The Values Of Fixed Assets In The Balance Sheet
Neither Represent The Value For Which Fixed Assets Can Be Sold Nor The Amount Which
Will Be Required To Replace These Assets
3 Historical Costs
The Financial Statements Are Prepared On The Basis Of Historical Costs Or
Original Costs The Value of Assets Decreases with the Passage of Time Current Price
Changes Are Not Taken Into Account The Statements Are Not Prepared Keeping In View
The Present Economic Conditions The Balance Sheet Loses The Significance Of Being An
Index Of Current Economic Realities
4 Act of non monitory factors Ignored
There are certain factors which have a bearing on the financial position and
operating results of the business but they donrsquot become a part of these statements because
they canrsquot be measured in monetary terms Such factors may include in the reputation of the
management
No Precision
The precision of financial statement data is not possible because the statements deal with
matters which canrsquot be precisely stated The data are recorded by conventional procedures
followed over the years Various conventions postulates personal judgments etc
8102019 A Study A Study On Financial Performance Analysis With Reference To Kesoram Cementon Financial Performance hellip
httpslidepdfcomreaderfulla-study-a-study-on-financial-performance-analysis-with-reference-to-kesoram 1581
15
CHAPTER-II
INDUSTRY PROFILE
amp
COMPANY PROFILE
8102019 A Study A Study On Financial Performance Analysis With Reference To Kesoram Cementon Financial Performance hellip
httpslidepdfcomreaderfulla-study-a-study-on-financial-performance-analysis-with-reference-to-kesoram 1681
16
Industry Profile
In the most general sense of the word cement is a binder a substance which
sets and hardens independently and can bind other materials together The word cement
traces to the Romans who used the term opus caementicium to describe masonry whichresembled concrete and was made from crushed rock with burnt lime as binder The
volcanic ash and pulverized brick additives which were added to the burnt lime to obtain a
hydraulic binder were later referred to as cementum and cement Cements used in
construction are characterized as hydraulic or non-hydraulic
The most important use of cement is the production of mortar and concretemdashthe bonding of
natural or artificial aggregates to form a strong building material which is durable in the
face of normal environmental effects
Concrete should not be confused with cement because the term cement refers only to the dry
powder substance used to bind the aggregate materials of concrete Upon the addition of
water andor additives the cement mixture is referred to as concrete especially if aggregates
have been added
It is uncertain where it was first discovered that a combination of hydrated non-hydraulic
lime and a pozzolan produces a hydraulic mixture (see also Pozzolanic reaction) but
concrete made from such mixtures was first used on a large scale by engineers They used
both natural pozzolans (trass or pumice) and artificial pozzolans (ground brick or pottery) in
these concretes Many excellent examples of structures made from these concretes are still
standing notably the huge monolithic dome of the Pantheon in Rome and the massive Baths
of Caracalla The vast system of Roman aqueducts also made extensive use of hydraulic
cement The use of structural concrete disappeared in medieval Europe although weak
pozzolanic concretes continued to be used as a core fill in stone walls and columns
Modern cement
Modern hydraulic cements began to be developed from the start of the Industrial Revolution
(around 1800) driven by three main needs
Hydraulic renders for finishing brick buildings in wet climates
Hydraulic mortars for masonry construction of harbor works etc in contact with sea water
Development of strong concretes
In Britain particularly good quality building stone became ever more expensive during a
period of rapid growth and it became a common practice to construct prestige buildings
8102019 A Study A Study On Financial Performance Analysis With Reference To Kesoram Cementon Financial Performance hellip
httpslidepdfcomreaderfulla-study-a-study-on-financial-performance-analysis-with-reference-to-kesoram 1781
17
from the new industrial bricks and to finish them with a stucco to imitate stone Hydraulic
limes were favored for this but the need for a fast set time encouraged the development of
new cements Most famous was Parkers Roman cement This was developed by James
Parker in the 1780s and finally patented in 1796 It was in fact nothing like any material
used by the Romans but was ldquoNatural cement made by burning septaria - nodules that are
found in certain clay deposits and that contain both clay minerals and calcium carbonate
The burnt nodules were ground to a fine powder This product made into a mortar with
sand set in 5ndash15 minutes The success of Roman Cement led other manufacturers to
develop rival products by burning artificial mixtures of clay and chalk
John Smeaton made an important contribution to the development of cements when he was
planning the construction of the third Eddystone Lighthouse (1755-9) in the English
Channel He needed a hydraulic mortar that would set and develop some strength in the
twelve hour period between successive high tides He performed an exhaustive market
research on the available hydraulic limes visiting their production sites and noted that the
hydraulicity of the lime was directly related to the clay content of the limestone from
which it was made Smeaton was a civil engineer by profession and took the idea no
further Apparently unaware of Smeatons work the same principle was identified by Louis
Vicat in the first decade of the nineteenth century Vicat went on to devise a method of
combining chalk and clay into an intimate mixture and burning this produced an artificial
cement in 1817 James Frost working in Britain produced what he called British cement
in a similar manner around the same time but did not obtain a patent until 1822 In 1824
Joseph Aspdin patented a similar material which he called Portland cement because the
render made from it was in color similar to the prestigious Portland stone
All the above products could not compete with limepozzolan concretes because of fast-
setting (giving insufficient time for placement) and low early strengths (requiring a delay of
many weeks before formwork could be removed) Hydraulic limes natural cements and
artificial cements all rely upon their belite content for strength development Belite
develops strength slowly Because they were burned at temperatures below 1250 degC they
contained no alite which is responsible for early strength in modern cements The first
cement to consistently contain alite was made by Joseph Aspdins son William in the early
1840s This was what we call today modern Portland cement Because of the air of
mystery with which William Aspdin surrounded his product others (eg Vicat and I C
Johnson) have claimed precedence in this invention but recent analysis of both his concrete
8102019 A Study A Study On Financial Performance Analysis With Reference To Kesoram Cementon Financial Performance hellip
httpslidepdfcomreaderfulla-study-a-study-on-financial-performance-analysis-with-reference-to-kesoram 1881
18
and raw cement have shown that William Aspdins product made at North fleet Kent was a
true alite-based cement However Aspdins methods were rule-of-thumb Vicat is
responsible for establishing the chemical basis of these cements and Johnson established
the importance of sintering the mix in the kiln
William Aspdins innovation was counter-intuitive for manufacturers of artificial cements
because they required more lime in the mix (a problem for his father) because they required
a much higher kiln temperature (and therefore more fuel) and because the resulting clinker
was very hard and rapidly wore down the millstones which were the only available grinding
technology of the time Manufacturing costs were therefore considerably higher but the
product set reasonably slowly and developed strength quickly thus opening up a market for
use in concrete The use of concrete in construction grew rapidly from 1850 onwards and
was soon the dominant use for cements Thus Portland cement began its predominant role
It is made from water and sand
Types of modern cement
Portland cement
Cement is made by heating limestone (calcium carbonate) with small quantities of other
materials (such as clay) to 1450degC in a kiln in a process known as calcination whereby a
molecule of carbon dioxide is liberated from the calcium carbonate to form calcium oxide
or lime which is then blended with the other materials that have been included in the mix
The resulting hard substance called clinker is then ground with a small amount of gypsum
into a powder to make Ordinary Portland Cement the most commonly used type of cement
(often referred to as OPC)
Portland cement is a basic ingredient of concrete mortar and most non-speciality grout The
most common use for Portland cement is in the production of concrete Concrete is a
composite material consisting of aggregate (gravel and sand) cement and water As a
construction material concrete can be cast in almost any shape desired and once hardened
can become a structural (load bearing) element Portland cement may be gray or whitePortland cement blends
These are often available as inter-ground mixtures from cement manufacturers but similar
formulations are often also mixed from the ground components at the concrete mixing plant
Portland blast furnace cement contains up to 70 ground granulated blast furnace slag
with the rest Portland clinker and a little gypsum All compositions produce high ultimate
8102019 A Study A Study On Financial Performance Analysis With Reference To Kesoram Cementon Financial Performance hellip
httpslidepdfcomreaderfulla-study-a-study-on-financial-performance-analysis-with-reference-to-kesoram 1981
19
strength but as slag content is increased early strength is reduced while sulfate resistance
increases and heat evolution diminishes Used as an economic alternative to Portland
sulfate-resisting and low-heat cements
Portland fly ash cement contains up to 30 fly ash The fly ash is pozzolanic so that
ultimate strength is maintained Because fly ash addition allows lower concrete water
content early strength can also be maintained Where good quality cheap fly ash is
available this can be an economic alternative to ordinary Portland cement
Portland pozzolan cement includes fly ash cement since fly ash is a pozzolan but also
includes cements made from other natural or artificial pozzolans In countries where
volcanic ashes are available (eg Italy Chile Mexico and the Philippines) these cements
are often the most common form in use
Portland silica fume cement Addition of silica fume can yield exceptionally high
strengths and cements containing 5-20 silica fume are occasionally produced However
silica fume is more usually added to Portland cement at the concrete mixer
Masonry cements are used for preparing bricklaying mortars and stuccos and must not be
used in concrete They are usually complex proprietary formulations containing Portland
clinker and a number of other ingredients that may include limestone hydrated lime air
entrainers retarders water proofers and coloring agents They are formulated to yield
workable mortars that allow rapid and consistent masonry work Subtle variations of
Masonry cement in the US are Plastic Cements and Stucco Cements These are designed to
produce controlled bond with masonry blocks
Expansive cements contain in addition to Portland clinker expansive clinkers (usually
sulfoaluminate clinkers) and are designed to offset the effects of drying shrinkage that is
normally encountered with hydraulic cements This allows large floor slabs (up to 60 m
square) to be prepared without contraction joints
White blended cements may be made using white clinker and white supplementary
materials such as high-purity metakaolin
Colored cements are used for decorative purposes In some standards the addition of
pigments to produce colored Portland cement is allowed In other standards (eg ASTM)
pigments are not allowed constituents of Portland cement and colored cements are sold as
blended hydraulic cements
Very finely ground cements are made from mixtures of cement with sand or with slag or
other pozzolan type minerals which are extremely finely ground together Such cements can
8102019 A Study A Study On Financial Performance Analysis With Reference To Kesoram Cementon Financial Performance hellip
httpslidepdfcomreaderfulla-study-a-study-on-financial-performance-analysis-with-reference-to-kesoram 2081
have the same physical characteristics as normal cement but with 50 less cement
particularly due to their increased surface area for the chemical reaction Even with
intensive grinding they can use up to 50 less energy to fabricate than ordinary Portland
cements
Non-Portland hydraulic cements
Pozzolan-lime cements Mixtures of ground Pozzolan and lime are the cements used by the
Romans and are to be found in Roman structures still standing (eg the Pantheon in Rome)
They develop strength slowly but their ultimate strength can be very high The hydration
products that produce strength are essentially the same as those produced by Portland
cement
Slag-lime cements Ground granulated blast furnace slag is not hydraulic on its own but is
activated by addition of alkalis most economically using lime They are similar to
pozzolan lime cements in their properties Only granulated slag (ie water-quenched glassy
slag) is effective as a cement component
Super sulfated cements These contain about 80 ground granulated blast furnace slag
15 gypsum or anhydrite and a little Portland clinker or lime as an activator They produce
strength by formation of ettringite with strength growth similar to a slow Portland cement
They exhibit good resistance to aggressive agents including sulfate
Calcium aluminate cements are hydraulic cements made primarily from limestone and
bauxite The active ingredients are monocalcium aluminate CaAl2O4 (CaO middot Al2O3 or CA in
Cement chemist notation CCN) and mayenite Ca12Al14O33 (12 CaO middot 7 Al2O3 or C12A7 in
CCN) Strength forms by hydration to calcium aluminate hydrates They are well-adapted
for use in refractory (high-temperature resistant) concretes eg for furnace linings
Calcium sulfoaluminate cements are made from clinkers that include yeelimite (Ca4
(AlO2)6SO4 or C4A3 in Cement chemists notation) as a primary phase They are used in
expansive cements in ultra-high early strength cements and in low-energy cements
Hydration produces ettringite and specialized physical properties (such as expansion or
rapid reaction) are obtained by adjustment of the availability of calcium and sulfate ionsTheir use as a low-energy alternative to Portland cement has been pioneered in China
where several million tonnes per year are produced Energy requirements are lower because
of the lower kiln temperatures required for reaction and the lower amount of limestone
(which must be endothermically decarbonated) in the mix In addition the lower limestone
8102019 A Study A Study On Financial Performance Analysis With Reference To Kesoram Cementon Financial Performance hellip
httpslidepdfcomreaderfulla-study-a-study-on-financial-performance-analysis-with-reference-to-kesoram 2181
21
content and lower fuel consumption leads to a CO2 emission around half that associated
with Portland clinker However SO2 emissions are usually significantly higher
Natural Cements correspond to certain cements of the pre-Portland era produced by
burning argillaceous limestones at moderate temperatures The level of clay components in
the limestone (around 30-35) is such that large amounts of belite (the low-early strength
high-late strength mineral in Portland cement) are formed without the formation of
excessive amounts of free lime As with any natural material such cements have highly
variable properties
Geopolymer cements are made from mixtures of water-soluble alkali metal silicates and
aluminosilicate mineral powders such as fly ash and metakaolin
8102019 A Study A Study On Financial Performance Analysis With Reference To Kesoram Cementon Financial Performance hellip
httpslidepdfcomreaderfulla-study-a-study-on-financial-performance-analysis-with-reference-to-kesoram 2281
22
COMPANY PROFILE
8102019 A Study A Study On Financial Performance Analysis With Reference To Kesoram Cementon Financial Performance hellip
httpslidepdfcomreaderfulla-study-a-study-on-financial-performance-analysis-with-reference-to-kesoram 2381
23
Kesoram Cement Industry is one of the leading manufacturers of cement in India It is a day
process cement Plant The plant capacity is 826 lakh tones per annum It is located at
Basanthnagar in Karimnagar district of Andhra Pradesh Basanthnagar is 8 km away from
the Ramagundam Railway station linking Madras to New Delhi The Chairman of the
Company is BKBirla
History
The first unit at Basanthnagar with a capacity of 21 lakh tones per annum
incorporating humble suspension preheated system was commissioner during the year 1969
The second unit was setup in year 1971 with a capacity of 21 lakh tones per annum went on
stream in the year 1978 The coal for this company is being supplied from Singgareni
Collieries and the power is obtained from APSEB The power demand for the factory is
about 21 MW Kesoram has got 2 DG sets of 4 MW each installed in the year 1987
Kesoram Cement has setup a 15 KW captor power plant to facilitate for
uninterrupted power supply for manufacturing of cement at 24th
august 1997 per hour 12
mw actual power is 15 mw
The Company was incorporated on 18th October 1919 under the Indian Companies Act
1913 in the name and style of Kesoram Cotton Mills Ltd It had a Textile Mill at 42
Garden Reach Road Calcutta 700 024 The name of the Company was changed to Kesoram
Industries amp Cotton Mills Ltd on 30th
August 1961 and the same was further changed to Kesoram Industries Limited on 9th July
1986 The said Textile Mill at Garden Reach Road was eventually demerged into a separate
company
The First Plant for manufacturing of rayon yarn was established at Tribeni District
Hooghly West Bengal and the same was commissioned in December 1959 and the second
plant was commissioned in the year 1962 enabling it to manufacture 4635 metric tons perannum (mtpa) of rayon yarn This Unit has 6500 metric tons per annum (mtpa) capacity as
on 3132009
The plant for manufacturing of transparent paper was also set up at the same location at
Tribeni District Hooghly West Bengal in June 1961 It has the annual capacity to
manufacture 3600 metric tons per annum (mtpa) of transparent Paper
8102019 A Study A Study On Financial Performance Analysis With Reference To Kesoram Cementon Financial Performance hellip
httpslidepdfcomreaderfulla-study-a-study-on-financial-performance-analysis-with-reference-to-kesoram 2481
24
The Company diversified into manufacturing of cast iron spun pipes and pipe fittings at
Bansberia District Hooghly West Bengal with a production capacity of 45000 metric tons
per annum (mtpa) of cast iron spun pipes and pipe fittings in December 1964
The Company subsequently diversified into the manufacturing of Cement and in 1969
established its first cement plant under the name Kesoram Cement at Basantnagar Dist
Karimnagar (Andhra Pradesh) and to take advantage of favorable market conditions in
1986 another cement plant known as Vasavadatta Cement was commissioned by it at
Sedam Dist
Gulbarga (Karnataka) The cement manufacturing capacities at both the plants were
augmented from time to time according to the market conditions and as on 3132009
Kesoram Cement and Vasavadatta Cement have annual cement manufacturing capacities of
15 million metric tons and 41 million metric tons respectively
The Company in March 1992 commissioned a plant at Balasore known as Birla Tyres in
Orissa for manufacturing of 10 lakh mtpa automotive tyres and tubes in the first phase in
collaboration with Pirelli Ltd UK a subsidiary company of the world famous Pirelli
Group of Italy - a pioneer in production and development of automotive tyres in the world
The capacity at the said plant was further augmented during the year by 19 MT per day
aggregating to 271 MT per day production facility The Greenfield Project of 257 MT per
day capacity in the State of Uttarakhand with a capex of about Rs760 crores commenced
the commercial production in phases during the financial year 2008-09The Company as on
3132009 had the manufacturing capacities of 371 million tyres 295 million tubes and
153 million flaps per annum in the Plants including at Uttarakhand Plant It has small
manufacturing capacities of various Chemicals at Kharda in the State of West Bengal also
It has the annual manufacturing capacities of 12410 mtpa of Caustic Soda Lye 5045 mtpa
of Liquid Chlorine 6205 mtpa of Sodium Hypochlorite 8200 mtpa of Hydrochloric Acid
3200 mtpa of Ferric Alum 18700 mtpa of Sulphuric Acid and 1620000 m3pa of purified
Hydrogen Gas
The Company is a well-diversified entity in the fields of Cement Tyre Rayon Yarn
Transparent Paper Spun Pipes and Heavy Chemicals with two core business segments ie
Cement and Tyres
8102019 A Study A Study On Financial Performance Analysis With Reference To Kesoram Cementon Financial Performance hellip
httpslidepdfcomreaderfulla-study-a-study-on-financial-performance-analysis-with-reference-to-kesoram 2581
25
In Spun Pipes amp Foundries a unit of the Company work suspended from 2nd May 2008
still commences till further notice
The Company as of now is listed on three major Stock Exchanges in India ie Bombay
Stock Exchange Ltd Mumbai Calcutta Stock Exchange Association Ltd Kolkata and
National Stock Exchange of India Ltd Mumbai and at the Societe de la Bourse de
Luxembourg Luxembourg
A further expansion upto 165 million tons of cement per annum in Vasavadatta Cement at
Sedam in Karnataka as unit IV at the same site is in progress with a 175 MW Captive
Power Plant involving a capital expenditure of about Rs 78350 crores (including the cost
of Captive Power Plant)
The commercial production of cement in the aforesaid unit IV has commenced in June
2009 The work for the further expansion in the Tyres Section at Uttarakhand for radial
tyres with 100 MT per day capacity and bias tyres with 125 MT per day capacity involving
an estimated aggregate capital outlay of about Rs 840 crores is under progress The Board
has further approved a Motor Cycle Tyre Project of 70 MT per day capacity at the same site
involving a capital outlay of Rs190 crore The civil construction of both the Projects is in
full swing The commercial production in both the Projects is likely to start by December
2009 January 2010
Birla Supreme in popular brand of Kesoram cement from its prestigious plant of
Basantnagar in AP which has outstanding track record In performance and productivity
serving the nation for the last two and half decades It has proved its distinction by bagging
several national awards It also has the distinction of achieving optimum capacity
utilization
Kesoram offers a choice of top quality portioned cement for light heavy
constructions and allied applications Quality is built every fact of the operations
The plant lay out is rational to begin with The limestone is rich in calcium
carbonate a key factor that influences the quality of final product The day process
technology uses in the latest computerized monitoring overseas the manufacturing process
Samples are sent regularly to the bureau of Indian standards National council of
construction and building material for certification of derived quality norms
8102019 A Study A Study On Financial Performance Analysis With Reference To Kesoram Cementon Financial Performance hellip
httpslidepdfcomreaderfulla-study-a-study-on-financial-performance-analysis-with-reference-to-kesoram 2681
26
The company has vigorously undertaking different promotional measures for
promoting their product through different media which includes the use of news papers
magazine hoarding etc
Kesoram cement industry distinguished itself among all the cement factories in
Indian by bagging the National Productivity Award consecutively for two years ie for the
year 1985-1987 The federation of Andhra Pradesh Chamber amp Commerce and Industries
(FAPCCI) also conferred on Kesoram Cement An award for the best industrial promotion
expansion efforts in the state for the year 1984 Kesoram also bagged FAPCCI awarded for
ldquoBest Family Planning Effort in the staterdquo for the year 1987-1988
One among the industrial giants in the country today serving the nation on the
industrial front Kesoram industry ltd has a checked and eventful history dating back to the
twenties when the Industrial House of Birlarsquos acquired it With only a textile mill under its
banner 1924 it grew from strength to strength and spread its activities to newer fields like
Rayon Transparent paper pipes Refractors tyres and other products
Looking to the wide gap between the demand and supply of vital commodity
cement which play in important role in National building activity the Government of India
had de-licensed the cement industry in the year 1966 with a review to attract private
entrepreneur to augment the cement production Kesoram rose to the occasions and divided
to set up a few cement plants in the country
Kesoram cement undertaking marketing activities extensively in the state of Andhra
Pradesh Karnataka Tamilnadu Kerala Maharashtra and Gujarat In AP sales Depts are
located in different areas like Karimnagar Warangal Nizamabad Vijayawada and Nellore
In other states it has opened around 10 depots
The market share of Kesoram Cement in AP is 705 The market share of the
company in various states is shown as under
STATES MARKET SHARE
Karnataka 409
Tamilnadu 094
Kerala 029
Maharashtra 281
8102019 A Study A Study On Financial Performance Analysis With Reference To Kesoram Cementon Financial Performance hellip
httpslidepdfcomreaderfulla-study-a-study-on-financial-performance-analysis-with-reference-to-kesoram 2781
27
Process and Quality Control
It has been the endeavor of Kesoram to incorporate the Worldrsquos latest technology in
the plant and today the plant has the most sophisticated
X-ray analysis
Fully computerized XRF and XRD X-RAY Analyzers keep a constant round the
clock vigil on quality
Supreme performance
One of the largest Cement Plants in Andhra Pradesh the plant incorporate the latest
technology in Cement - making
It is professionally managed and well established Cement Manufacturing Company
enjoying the confidence of the consumers Kesoram has outstanding track record in
performance and productivity with quite a few national and state awards to its credit
BIRLA SUPREME the 43 Grade Cement is a widely accepted and popular brand
in the market commanding a premium
However to meet the specific demands of the consumer Kesoram bought out the 53
grade BIRLA SUPREME ndash GOLD which has special qualities like higher fineness quick-
setting high compressive strength and durability
Supreme Strength
Kesoram Cement has huge captive Limestone Deposits which make it possible tofeed high- grade limestone consistently its natural Grey colour is anion- born ingredient
and gives good shade
Both the products offered by Kesoram ie BIRLA SUPREME-43 Grade and
BIRLA SUPREME-GOLD-53 Grade cement are outstanding with much higher
compressive strength and durability
The following characteristics show their distinctive qualities
Comprehensive
Strength
Opc 43
grls 8112
1989
Birla
Supreme 43
grade
Opc 43 gr
Is 1226987
Birla
Supreme
Gold 53 gr
3 days mpa Min 23 31 + Min 27 38+
7 days mpa Min 23 42+ Min 37 48+
28 days mpa Min 43 50+ Min 53 60+
8102019 A Study A Study On Financial Performance Analysis With Reference To Kesoram Cementon Financial Performance hellip
httpslidepdfcomreaderfulla-study-a-study-on-financial-performance-analysis-with-reference-to-kesoram 2881
28
DC SYSTEM
Clinker making process is a key step in the overall cement making process In the case of
BIRLA SUPREMEGOLD the clinker-making process is totally computer control The
Distributed Control System (DCS) constantly monitors the process and ensures operating
efficiency This eliminates variation and ensures consistency in the quality of Clinker
Physical Characteristics
Ope 43
Is 8 112-89
Birla
Supreme
43 grade
Ope 53 gr
Is 12269-87
Birla Supreme
Gold 53 gr
Setting time Min30 120-180 Min 30 130-170
a Initial (mats) Max 600 180-240 Max 600 170-220
b final (mats) Min 225 270-280 Min 225 300-320
Fincncssm 2Kg Max 10 10-20 Max 10 05-10
Soundness Max 08 004-008 Max 0080 004-02
a le-chart (mm)
b autoclave ()
Supreme Expertise
The Best Technical Team exclusive to Kesoram mans the Plant and monitors the process
to blend the cement in just the required proportions to make BIRLA SUPREMEGOLD OF
Rock Strength
18 Million Tones of Solid Foundation
Staying at the top for over a Quarter Century Quarter Century is no less an achievement
Infact Kesoram is synonymous with for over 28 years
Over the years Kesoram has dispatched 18 million tones of cement to the nook and cornersof the country and joined hands in strengthening the Nation No one else in Andhra Pradesh
has this distinction The prestigious World Bank aided Ramagundam Super Thermal Power
Project of NTPC and Mannair Dam of Pochampad project in AP arc a couple of projects for
which Kesoram Cement was exclusively uses to cite an example
8102019 A Study A Study On Financial Performance Analysis With Reference To Kesoram Cementon Financial Performance hellip
httpslidepdfcomreaderfulla-study-a-study-on-financial-performance-analysis-with-reference-to-kesoram 2981
29
Chemical Characteristics
Opc 43 gr
Is 81 132-989
Birla
Supreme
43 grade
Ope 53 gr
Is 12269-
87
Birla
Supreme
Gold 53 gr
Loss on inflection Max 5 lt16 Max 40 lt15
Insoluble residue Max 20 lt08 Max 20 lt 06
Magnesium oxide Max 60 lt 13 Max 60 lt 13
Lime saturation factor 066-102 08-09 08-102 088-09
Alumna iron ratio MinO66 15-17 MinO66 15-17
Sulfuric anhydride Max 253 16-20 Max 2 53 16-20
Alkalis Chlorides Max 005 Max 001 Max 005 Max 04
Kesoram Cement - advantages
Helps in designing sleeker and more elegant
Structures giving greater flexibility in design concept
Due to its fine quality super fine construction can be achieved Its gives maximum
strength at Minimum use of cement with water in the water cement ratio especially the 53
grade Birlas supreme-gold
Feathers in Kesorams cap
Kesoram has outstanding track record achieving over 100 capacity utilization I
productivity and energy conservation It has proved its distinction by bagging several
national and state awards noteworthy being
NATIONAL
1 National productivity award for 1985-86
2 National productivity award for 1986-87
3 National award for mines safety for 1985-86
4 National award for mines safety for 1986-875 National award for energy conservation 1989-90
8102019 A Study A Study On Financial Performance Analysis With Reference To Kesoram Cementon Financial Performance hellip
httpslidepdfcomreaderfulla-study-a-study-on-financial-performance-analysis-with-reference-to-kesoram 3081
30
STATE
1 AP State productivity award for 1988
2 State award for best industrial management 1988-89
3 Best industrial productivity award of FAPCCI (federation of AP chamber of
commerce and industry) 1991
4 Best management award of the state Govt 1993
5 FAPCCI award for the workers welfare 1995-96
ISO 9002
All quality systems of Kesoram have been certified under ISO 90021S 4002 which
proves the worldwide acceptance of the products
All quality systems in production and marketing of the product have been certified by BIS
under ISO 90021S 14002
The first unit was installed at basanthnagar with a capacity of 25 ndashlakhs TPA (tones per
annum) incorporating humble supervision preheated system during the year 1969
The second unit followed suit with added a capacity of 2 lakhs TPA in 1971
The plant was further expanded to 9 lakhs by adding 25 lakhs tones in august 1978 113
lakhs tones in January 1981 and 087 lakhs tones in September 1981
Power
Singareni collieries make the supply of coal for this industry and the power was
obtained from AP TRANSCO The power demand for the factory is about 21MW Kesoram
has got 2-diesel generator seats of 4 MW each installed in the year 1987
Kesoram cement now has a 15MWcaptive power plant to facilities for uninterrupted
power supply for manufacturing of cement
Performance
The performance of kersoram cement industry has been outstanding achieving over
cent percent capacity utilization all through despite many odds like power cuts and which
most 40 was wasted due to wagon shortage etc
The company being a continuous process industry works round the clock and has
excellent records of performance achieving over 1005 capacity utilization
Kesoram has always combined technical progress with industrial performance The
company had glorious track record for the last 27 years in the industry
Technology
8102019 A Study A Study On Financial Performance Analysis With Reference To Kesoram Cementon Financial Performance hellip
httpslidepdfcomreaderfulla-study-a-study-on-financial-performance-analysis-with-reference-to-kesoram 3181
31
Kesoram cement uses most modern technology and the computerized control in the
plant A team of dedicated and well- experienced experts manages the plant
The quality is maintained much above the bureau of Indian standards
The raw materials used for manufacturing cement are
Lime stone
Bauxite
Hematite
Gypsum
Environmental and Social Obligations
For environmental promotion and to keep ndashup the ecological balance this section
has planted over two lakhs trees on social obligation front this section has undertaken
various social welfare programs by adopting ten nearly villages organizing family welfare
campus surgical camps animal health camps blood donation camps children immunization
camps seeds training for farmers etc were arranged
Welfare and Recreation Facilities
For the purpose of recreation facilities 2 auditoriums were provided for playing
indoor games cultural function and activities like drama music and dance etc
The industry has provided libraries and reading rooms About 1000 books are available in
the library All kinds of newspaper magazines are made available
Canteen is provided to cater to the needs of the employees for supply of snacks tea
coffee and meals etc
One English medium and one Telugu medium school are provided to meet the
educational requirements
The company has provided a dispenser with a qualified medical office and
paramedical staff for the benefit of the employees The employees covered under ESI
scheme have to avail the medical facilities from the ESI hospital
Competitions in sports and games are conducted every year for august 15th
Independence Day and January 26th republic day among the employees
Electricity
The power consumption per ton of cement has come down to 108 units against 113
units last year due to implementation of various energy saving measures The performance
of captive power plant of this section continues to be satisfactory Total power generation
8102019 A Study A Study On Financial Performance Analysis With Reference To Kesoram Cementon Financial Performance hellip
httpslidepdfcomreaderfulla-study-a-study-on-financial-performance-analysis-with-reference-to-kesoram 3281
32
during the year was 84 million units last year This captive power plant is a major role in
keeping power costs with in economic levels
The management has introduced various HRD programs for training and
development and has taken various other measures for the betterment of employeersquos
efficiency
The section has installed adequate air pollution control system and equipment and is
ISO14001 such as Environment management system is under implementation
Awards
Kesoram cement bagged many prestigious awards including national awards for
productivity technology conservation and several state awards since 1984 The following
are the some of important awards
AWARDS OF KESORAM CEMENT
No Year Awards
National
State
1 1989-90 Management award community
Development
State
2 1991 Energy conservation may day award of the
Govt
State
3 1991 Pundit Jawaharlal Nehru rolling trophy for
best
State
4 1993 National productivity effort Indira Gandhi
national award
State
5 1994 Best management award State
6 1994-
1995
Best industrial rebellion award State
7 1995 Rural development by chief minister
Environment and mineral conservation
award
State
8 1995 Best industrial rebellion award State
8102019 A Study A Study On Financial Performance Analysis With Reference To Kesoram Cementon Financial Performance hellip
httpslidepdfcomreaderfulla-study-a-study-on-financial-performance-analysis-with-reference-to-kesoram 3381
33
9 1995-
1996
Best effort of an industrial unit to
development rural economy shriSRRungta
award for social
National
10 1996 Awareness for best rural development
efforts
State
11 1999 Best workers welfare best family welfare
award
State
12 2001 First prize for mine environment amppollution
control for the 3rd
year in succession
State
13 2002 Vana mithra award from AP Govt State
14 2003 Company has got OHSAS-18001 State
15 2005 Certification from DNV New Delhi State
16 2006 Award for pollution control and
environmental protection FAPCCI award
for best rural development in the state
State
8102019 A Study A Study On Financial Performance Analysis With Reference To Kesoram Cementon Financial Performance hellip
httpslidepdfcomreaderfulla-study-a-study-on-financial-performance-analysis-with-reference-to-kesoram 3481
34
Products of the organization
8102019 A Study A Study On Financial Performance Analysis With Reference To Kesoram Cementon Financial Performance hellip
httpslidepdfcomreaderfulla-study-a-study-on-financial-performance-analysis-with-reference-to-kesoram 3581
35
CHAPTER-III
LITERATURE REVIEW
8102019 A Study A Study On Financial Performance Analysis With Reference To Kesoram Cementon Financial Performance hellip
httpslidepdfcomreaderfulla-study-a-study-on-financial-performance-analysis-with-reference-to-kesoram 3681
36
Introduction
Financial Performance Analysis
The term lsquofinancial performance analysis also known as analysis and interpretation of
financial statementsrsquo refers to the process of determining financial strength and
weaknesses of the firm by establishing strategic relationship between the items of the
balance sheet profit and loss account and other operative data
ldquoAnalyzing financial statementsrdquo by Metcalf and Titard
ldquoFinancial analysis is a process of evaluating the relationship between component
parts of a financial statement to obtain a better understanding of a firms position and
performancerdquo by Myers
Financial Performance
The word lsquoPerformance is derived from the word lsquoparfourmenrsquo which means lsquoto dorsquo lsquoto
carry outrsquo or lsquoto renderrsquo It refers the act of performing execution accomplishment
fulfillment etc In border sense performance refers to the accomplishment of a given task
measured against preset standards of accuracy completeness cost and speed In other
words it refers to the degree to which an achievement is being or has been accomplished In
the Words of Frich Kohlar ldquoThe performance is a general term applied to a part or to all the
conducts of activities of an organization over a period of time often with reference to past or
projected cost efficiency management responsibility or accountability or the like Thus not
just the presentation but the quality of results achieved refers to the performance
Performance is used to indicate firmrsquos success conditions and compliance
Financial performance refers to the act of performing financial activity In broader
sense financial performance refers to the degree to which financial objectives being or has
been accomplished It is the process of measuring the results of a firms policies and
operations in monetary terms It is used to measure firms overall financial health over a
given period of time and can also be used to compare similar firms across the same industry
or to compare industries or sectors in aggregation
The purpose of financial analysis is to diagnose the information contained in financial
statements so as to Jude the profitability and financial soundness of the firm Just like a
doctor examines his patient by recording his body temperature blood pressure etc Before
8102019 A Study A Study On Financial Performance Analysis With Reference To Kesoram Cementon Financial Performance hellip
httpslidepdfcomreaderfulla-study-a-study-on-financial-performance-analysis-with-reference-to-kesoram 3781
37
making his conclusion regarding the illness and before giving his treatment a financial
analyst analysis the financial statements with various tools of analysis before commenting
upon the financial health or weaknesses of an enterprise
The analysis and interpretation of financial statements is essential to bring out the
mystery behind the figures in financial statements Financial statements analysis is an
attempt to determine the significance and meaning of the financial statement data so that
forecast may be made of the future earnings ability to pay interest and debt maturities (both
current and long term) and profitability of a sound divided policy
Types of financial analysis-
Financial analysis into different categories depending upon
(1) The material used and
(2) The method of operation followed in the analysis or the modus operandi of
analysis
Types of financial analysis
On the basis of material used on the basis of modus operandi
External Internal Horizontal Vertical
Analysis Analysis Analysis Analysis
1 On the basis of material used - According to material used financial analysis canbe of two types
External analysis
Internal analysis
External analysis-
This analysis is done by outsiders who do not have access to the detailed internal
outsiders include investors potential investors Creditors Potential Creditors Government
Agencies Credit Agencies and General Public For financial analysis these external parties
to the firm depend almost entirely on the published financial statements
Internal analysis-
This analysis is undertaken by the persons namely executives and employees of the
organization or by the officers appointed by government or court who have access to the
8102019 A Study A Study On Financial Performance Analysis With Reference To Kesoram Cementon Financial Performance hellip
httpslidepdfcomreaderfulla-study-a-study-on-financial-performance-analysis-with-reference-to-kesoram 3881
38
books of account ( internal accounting records) and other information related to the
business
2 983119983150 983156983144983141 983138983137983155983145983155 983151983142 983149983151983140983157983155 983151983152983141983154983137983150983140983145983085
According to the modus operandi financial analysis can also be of two types
a Horizontal analysis
bVertical analysis
Horizontal analysis-
Horizontal analysis refers to the comparison of financial data of a company for several
years The figures for this type of analysis are presented horizontally over a number of
columns The figures of the various years are compared with standard or base year a base
year is year chosen as beginning point This type of analysis is also called lsquodynamicanalysisrsquo as it is based on the data from year to year rather than on data of any one year The
horizontal analysis makes it possible to focus attention on items that have changed
significantly during the period under view
b Vertical analysis-
Vertical analysis refers to the study of relationship of the various items in the financial
statements of one accounting period In this types of analysis the figures from financial
statement of a year are compared with a base selected from the same yearrsquos statement
Methods of financial analysis-
The following methods of analysis are generally used-
1 Comparative Statements
2 Trend Analysis
3 Common-Size Statements
4 Funds flow Analysis
5 Cash Analysis
6 Ratio Analysis
7 Cost-volume-Profit Analysis
8102019 A Study A Study On Financial Performance Analysis With Reference To Kesoram Cementon Financial Performance hellip
httpslidepdfcomreaderfulla-study-a-study-on-financial-performance-analysis-with-reference-to-kesoram 3981
39
Comparative statements-
The comparative financial statements are statements of the financial position at
different periods of time the elements of financial position are show in a
Comparative Statement provides an idea of financial position at two or more
periods Generally two financial statements (balance sheet and income statement) are
prepared in comparative form for financial analysis
The Comparative Statement May Show-
1 Absolute figures (rupee amounts)
2 Changes in absolute figures ie increase or decrease in absolute figures
3 Absolute data in terms of percentages
4 Increase or decrease in terms of percentages
The Two Comparative Statements Are-
1 Comparative balance sheet and
2 Income statement
1 983107983151983149983152983137983154983137983156983145983158983141 983138983137983148983137983150983139983141 983155983144983141983141983156983085
The comparative balance sheet analysis is the study of the trend of the same items group of
items and computed items in two or more balance sheets of the same business enterprise on
different dates The change in periodic balance sheet items reflect the conduct of a business
the change can be observed by comparison of the balance sheet at the beginning and at the
end of a period and these changes can help in forming an opinion about the progress of an
enterprise
Guide Lines for Interpretation of Comparative Balance Sheet-
While interpreting comparative balance sheet the interpreter is expected to study the
following aspects-
1 Current financial position and liquidity position
2 Long-term financial position
3 Profitability of the concern
8102019 A Study A Study On Financial Performance Analysis With Reference To Kesoram Cementon Financial Performance hellip
httpslidepdfcomreaderfulla-study-a-study-on-financial-performance-analysis-with-reference-to-kesoram 4081
40
Common Size Statement-
The common-size statements balance sheet and income statement are show in
analytical percentages The figures are shown as percentages of total assets total liabilities
and total sales The total assets are taken as 100 and different assets are expressed as a
percentage of the total similarly various liabilities are taken as a part of total liabilities
Common Size Balance Sheet-
A statement in which balance sheet items are expressed as the ratio of each asset to
total assets and the ratio of each liability is expressed as a ratio of total liabilities is called
common size balance The common size balance sheet can be used to compare companies
of differing size The comparison of figures in different periods is not useful because total
figures may be affected by a number of factors It is not possible to establish standard norms
for various assets The trends of figures from year to year may not be studied and even they
may not give proper results
Trend Analysis of Balance Sheet-
Trend analysis is Very important tool of horizontal financial analysis
This analysis enables to known the change in the financial function and operating efficiency
in between the time period chosen
By studding the trend analysis of each item we can known the direction of changes and
based upon the direction of changes the options can be changed
Trend =Absolute Value of item in the statement understudy 100
Absolute Value of same item in the base statement
Ratio Analysis
Ratio analysis is used as a technique of analyzing the financial information contained in the
balance sheet and profit and loss accounts for a more meaningful understanding of the
financial position and performance of a firm
The relationship between two accounting figures expressed mathematically is known as a
financial ratio A ratio helps the analyst to make qualitative judgment about the firmrsquos
financial position and performance
Several ratios can be calculated from the accounting data contained in the financial
statements The parties which generally undertake financial analysis is short ndashterm
creditors long-term creditors owner and management In view of the requirements of the
various ratios ratios are classified into the following four important categories
8102019 A Study A Study On Financial Performance Analysis With Reference To Kesoram Cementon Financial Performance hellip
httpslidepdfcomreaderfulla-study-a-study-on-financial-performance-analysis-with-reference-to-kesoram 4181
41
Liquidity ratios
Leverage ratios
Activity ratios
Profitability ratios
Liquidity Ratios
It is extremely essential for a firm to be able to meet its obligations as they become due
Liquidity ratios measure the ability of the firm to meet its current obligations A firm should
ensure that it does not suffer from lack of liquidity and also that it does not have excess
liquidity The failure of a company to meet its obligations due to lack of sufficient liquidity
will result in a poor creditworthiness loss of creditorsrsquo confidence or even in legal tangles
resulting in the closure of the company A very high degree of liquidity is also bad idle
assets earn nothing The firmrsquos funds will be unnecessarily tied up in current assets
Therefore it is necessary to strike a proper balance high liquidity and lack of liquidity
The most common ratios which indicate the extent of liquidity or lack of it are
Current ratio
Quick ratio
Other ratios include Cash ratio Interval Measure and Net working capital ratio
Current Ratio
The current ratio is calculated by dividing current assets by current liabilities
Current assets
Current ratio = --------------------------
Current liabilities
Current ratio is a measure of the firmrsquos short term solvency It indicates the availability of
current assets in rupees for every one rupee of current liability A ratio of greater than one
means that the firm has more current assets than current claims against the Current ratio of
2 to 1 or more is considered satisfactory Current ratio represents a margin of safety for
creditors
Quick Ratio
Quick ratio also known as acid-test ratio establishes a relationship between quick assets and
the current liabilities Cash is the most liquid asset It is calculated by dividing quick assets
by current liabilities
Quick ratio = Quick Assets Current Liabilities
8102019 A Study A Study On Financial Performance Analysis With Reference To Kesoram Cementon Financial Performance hellip
httpslidepdfcomreaderfulla-study-a-study-on-financial-performance-analysis-with-reference-to-kesoram 4281
42
(Quick Assets = Current assets ndash Inventory)
One defect of the current ratio is that it fails to convey any information on the composition
of the current assets of the firm A rupee of cash is considered equivalent to a rupee of
inventory of receivables But it is not so A rupee of cash is more readily available to meet
current liabilities than a rupee of say inventory This implies the usefulness of the current
ratio
The Acid ndashtest ratio measures the firmrsquos ability to convert its current assets quickly into
cash in order to meet its current liabilities
A quick ratio of 1 to 1 is considered to represent a satisfactory current financial condition It
is an important index of the firmrsquos liquidity
Leverage Ratios
Leverage ratios identify the source of a firmrsquos capital ndashowners or outside creditors
Financial leverage refers to the use of debt in financing non-current assets If the return on
assets exceeds the cost of debt the leverage is successful ndash ie it improves return on equity
Debt ndashEquity Ratio
The Debt ndash Equity is determined to analyze the soundness of the long term financial
policies of the organization It is also known as ldquoInternal External Equity Ratiordquo
It is calculated as follows
Debt ndash Equity Ratio = Total long term debt Share holders funds
Equity Ratio
This ratio is also called as proprietary ratio establishes a relationship between share holderrsquos
funds to total assets of company Equity Ratio is calculated by dividing share holders fund
by total assets
Fixed Asset Ratio
This ratio indicates the extent to which the assets of the companyrsquos can be lost without
affecting the interest of the creditors of the company Higher the ratios better the long-term
position of the company
Activity Ratios
They are primarily used for studying a firmrsquos working capital situation A well managed
firm should have good activity ratios
8102019 A Study A Study On Financial Performance Analysis With Reference To Kesoram Cementon Financial Performance hellip
httpslidepdfcomreaderfulla-study-a-study-on-financial-performance-analysis-with-reference-to-kesoram 4381
43
Working Capital Turnover Ratio
The working capital turnover ratio indicates whether or not working capital has been
effectively used in making sales
Working capital turnover = Sales Net current assets
Inventory Turnover Ratio
This ratio also known as Stock Turnover Ratio establishes the relationship between costs of
goods sold or net sales during the given period and the average amt of stock held during the
period This ratio reveals the number of times finished stock in turnover during a given
accounting period
Higher the ratio the better is it because it shows the finished stock is rapidly turned
in to sales On the other hand a low stock turnover ratio is not desirable because it reveals
the accumulation of stock
Debtors Turnover Ratio
This ratio indicates the velocity of debt collection of a company In other words it shows
the number of times average turnover during a year
A Higher Debtor Turnover Ratio indicates a more efficient is the management towards
debtors and low ratio ratio implies inefficient management of debtors
Total Assets Turnover Ratio
The asset turnover ratio indicates how efficiently management is employing Assets
Total Assets Turnover Ratio = Sales Total Assets
Profitability Ratios
Profitability ratios are the ratios which measure a firmrsquos overall effectiveness as revealed by
the returns generated on sales and investment
General Profitability Ratios
1 Gross Profit Ratio
2 Net profit Ratio
3 Operating or Expenses Ratio
8102019 A Study A Study On Financial Performance Analysis With Reference To Kesoram Cementon Financial Performance hellip
httpslidepdfcomreaderfulla-study-a-study-on-financial-performance-analysis-with-reference-to-kesoram 4481
44
Gross Profit Ratio
Gross profit Ratio measures the relationships to net sales and is usually represented as a
percentage It is a good measure of profitability
The gross profit ratio indicates the extent to which selling price of goods per unit may
decline without resulting in losses on operation Higher the gross profit betters the result
Net Profit Ratio
Net Profit Ratio indicates net margin on sales It is given by the following equation
Net Profit Ratio = (Net Profit Sales) 100
Operating or Expenses Ratio
This ratio is complimentary of Net Profit Ratio The more the net profit the less the
Operating Ratio Operating costs include the cost of direct materials direct labors and otheroverheads viz are generally excluded from operating costs A comparison of the Operating
Ratio will indicate whether the cost efficiency is high or low in the figure of sales This less
the ratio it depicts the efficiency of the management
8102019 A Study A Study On Financial Performance Analysis With Reference To Kesoram Cementon Financial Performance hellip
httpslidepdfcomreaderfulla-study-a-study-on-financial-performance-analysis-with-reference-to-kesoram 4581
45
CHAPTER IV
DATA ANALYSIS amp INTERPRETATION
8102019 A Study A Study On Financial Performance Analysis With Reference To Kesoram Cementon Financial Performance hellip
httpslidepdfcomreaderfulla-study-a-study-on-financial-performance-analysis-with-reference-to-kesoram 4681
46
Comparative Balance Sheet of Kesoram in the Year between 2008-2009
(Rupee in crores)
Years Changes
Particulars 2008 2009 In Rupees In Percentage
Liabilities
Share Capital 4574 4574 000 000
Reserves amp Surplus 93085 128024 34939
Revaluation Reserves 533 412 -121 -2270
Loans
Secured Loans 97106 153627 56521 5821
Un Secured Loans 12129 43416 31287 25795
Deferred Tax Liabilities 000 000 000 000
Current Liabilities
Provisions 33039 34529 1490 451
Current Liabilities 57067 66587 9520 1668
Total 297533 431169 133636 4491
Assets
Net Block 108424 180435 72011 6642
Capital Wip 63459 86485 23026 3628
Investments 4783 6178 1395 2917
Current Assets
Inventories 44217 58906 14689 3322
Sundry Debtors 27307 38017 10710 3922
Cash amp Bank Balances 4036 5657 1621 4016
Total Current Assets 75560 102580 27020 3576
Loans amp Advances 45289 55462 10173 2246
Fixed Deposits 018 028 010 5556
Total 297533 431169 133636 4491
8102019 A Study A Study On Financial Performance Analysis With Reference To Kesoram Cementon Financial Performance hellip
httpslidepdfcomreaderfulla-study-a-study-on-financial-performance-analysis-with-reference-to-kesoram 4781
47
Interpretation of comparative balance sheet of 2008-2009
Reserves amp Surplus were increased to 3753 (percent) ie in Rupees 34939
crores
Revaluation Reserves decreased to 121 ie in Rupees 2270 crores
Secured Loans are increased to 5821 ie in Rupees 56521 crores And UN
secured loans highly Increased to 25795
Current liabilities and Provisions are increased to 1668 and 451 respectively ie in
Rupees 9520 amp 1490 crores
Fixed assets were highly increased to 6642 ie in Rupees 72011 crores
Investments were increased to 2917 ie in Rupees 1395 crores
Sundry debtors increased to 3922 ie in Rupees 10710 crores
Current assets increased 3576 ie in Rupees 27020 crores And Loans amp
Advances increased to 2246 respectively
The overall financial position was satisfactory
8102019 A Study A Study On Financial Performance Analysis With Reference To Kesoram Cementon Financial Performance hellip
httpslidepdfcomreaderfulla-study-a-study-on-financial-performance-analysis-with-reference-to-kesoram 4881
48
Comparative Balance Sheet of Kesoram in the Year between 2009-2010
(Rupees in crores)
Years Changes
Particulars 2009 2010 In Rupees In Percentage
Liabilities
Share Capital 4574 4574 000 000
Reserves amp Surplus 128024 149111 21087 1647
Revaluation Reserves 412 339 -073 -1772
Loans
Secured Loans 153627 186372 32745 2131
Un Secured Loans 43416 126250 82834 19079
Deferred Tax Liabilities 000 000 000
Current Liabilities
Provisions 34529 35734 1205 349
Current Liabilities 66587 107688 41101 6173
Total 431169 610068 178899 4149
Assets
Net Block 180435 343182 162747 9020
Capital WIP 86485 41283 -45202 -5227
Investments 6178 5143 -1035 -1675
Current Assets
Inventories 58906 91619 32713 5553
Sundry Debtors 38017 54289 16272 4280
Cash amp Bank Balances 5657 8014 2357 4167
Total Current Assets 102580 153922 51342 5005
Loans amp Advances 55462 66506 11044 1991
Fixed Deposits 028 031 003 1071
Total 431169 610068 178899 4149
8102019 A Study A Study On Financial Performance Analysis With Reference To Kesoram Cementon Financial Performance hellip
httpslidepdfcomreaderfulla-study-a-study-on-financial-performance-analysis-with-reference-to-kesoram 4981
49
Interpretation of comparative balance sheet of 2009-2010
Reserves amp surplus increased to 1647 ie in Rupees 21087 crores
Revaluation Reserves decreased to 1772 ie in Rupees 073 crores
Secured loans increased to 2131 ie in Rupees 32745 crores
Current Liabilities were increased to 6173 ie in Rupees 41101 crores and
Provisions 349 ie in Rupees 1205 crores
Fixed Assets were increased to 9020 ie in Rupees 162747 crores
Investments were decreased to 1675 ie in Rupees 1035 crores
Sundry debtors were increased to 4280 ie in Rupees 16272 crores
Current assets increased to 5005 ie in Rupees 51342 crores And loans and
Advances increased 1919 ie in Rupees 11044 crores
The overall financial position was satisfactory
8102019 A Study A Study On Financial Performance Analysis With Reference To Kesoram Cementon Financial Performance hellip
httpslidepdfcomreaderfulla-study-a-study-on-financial-performance-analysis-with-reference-to-kesoram 5081
50
Comparative Balance Sheet of Kesoram in the Year between 2010-2011
(Rupees in crores)
Years Changes
Particulars 2010 2011 In Rupees In Percentage
Liabilities
Share Capital 4574 4574 000 000
Reserves amp Surplus 149111 125162 -23949 -1606
Revaluation Reserves 339 289 -050 -1475
Loans
Secured Loans 186372 237183 50811 2726
Un Secured Loans 126250 162744 36494 2891
Deferred Tax Liabilities 000 000 000
Current Liabilities
Provisions 35734 1494 -34240 -9582
Current Liabilities 107688 113902 6214 577
Total 610068 645348 35280 578
Assets
Net Block 343182 369172 25990 757
Capital WIP 41283 43781 2498 605
Investments 5143 6582 1439 2798
Current Assets
Inventories 91619 111855 20236 2209
Sundry Debtors 54289 63134 8845 1629
Cash amp Bank Balances 8014 7188 -826 -1031
Total Current Assets 153922 182177 28255 1836
Loans amp Advances 66506 43460 -23046 -3465
Fixed Deposits 031 176 145 46774
Total 610068 645348 35280 578
8102019 A Study A Study On Financial Performance Analysis With Reference To Kesoram Cementon Financial Performance hellip
httpslidepdfcomreaderfulla-study-a-study-on-financial-performance-analysis-with-reference-to-kesoram 5181
51
Interpretation of comparative balance sheet of 2010-2011
Reserves amp surplus decreased to 1606 ie in Rupees 23949 crores
Revaluation Reserves decreased to 1475 ie in Rupees 050 crores
Secured loans increased to 2726 ie in Rupees 50811 crores
Current Liabilities were increased to 577 ie in Rupees 6214 crores
Provisions decreased to 9582 ie in Rupees 34240 crores
Fixed Assets were increased to 757 ie in Rupees 25990 crores
Investments were decreased to 2798 ie in Rupees 1439 crores
Sundry debtors were increased to 1629 ie in Rupees8845 crores
Current assets increased to 1836 ie in Rupees 28255 crores And loans and
Advances increased 3465 ie in Rupees 23046 crores
The overall financial position was UN satisfactory
8102019 A Study A Study On Financial Performance Analysis With Reference To Kesoram Cementon Financial Performance hellip
httpslidepdfcomreaderfulla-study-a-study-on-financial-performance-analysis-with-reference-to-kesoram 5281
52
Comparative Balance Sheet of Kesoram In The Year Between 2011-2012
(Rupees in crores)
Years Changes
Particulars 2011 2012 In Rupees In Percentage
Liabilities
Share Capital 4574 4574 000 000
Reserves amp Surplus 125162 86657 -38505 -3076
Revaluation Reserves 289 270 -019 -657
Loans
Secured Loans 237183 317792 80609 3399
Un Secured Loans 162744 92742 -70002 -4301
Deferred Tax Liabilities 000 000 000
Current Liabilities
Provisions 1494 40726 39232 262597
Current Liabilities 113902 180010 66108 5804
Total 645348 722771 77423 1200
Assets 000
Net Block 369172 358721 -10451 -283
Capital WIP 43781 68065 24284 5547
Investments 6582 6636 054 082
Current Assets
Inventories 111855 99516 -12339 -1103
Sundry Debtors 63134 67358 4224 669
Cash amp Bank Balances 7188 6959 -229 -319
Total Current Assets 182177 173833 -8344 -458
Loans amp Advances 43460 115409 71949 16555
Fixed Deposits 176 107 -069 -3920
Total 645348 722771 77423 1200
8102019 A Study A Study On Financial Performance Analysis With Reference To Kesoram Cementon Financial Performance hellip
httpslidepdfcomreaderfulla-study-a-study-on-financial-performance-analysis-with-reference-to-kesoram 5381
53
Interpretation of comparative balance sheet of 2011-2012
Reserves amp surplus decreased to 3076 ie in Rupee 38505 crores
Revaluation Reserves decreased to 657 ie in Rupees 019 crores
Secured loans increased to 3399 ie in Rupees 80699 crores
Current Liabilities were increased to 5804 ie in Rupees 66108 crores
Provisions increased to 262597 ie in Rupees 39232 crores
Fixed Assets were decreased to 283 ie in Rupee 10451 crores
Investments were increased to 082 ie in Rupees 054 crores
Sundry debtors were increased to 669 ie in Rupees 4224 crores
Current assets decreased to 458 ie in Rupees 8344 crores And loans and
Advances increased 16555 ie in Rupees 71949 crores
The overall financial position was UN satisfactory
8102019 A Study A Study On Financial Performance Analysis With Reference To Kesoram Cementon Financial Performance hellip
httpslidepdfcomreaderfulla-study-a-study-on-financial-performance-analysis-with-reference-to-kesoram 5481
54
Common Size Balance Sheet of Kesoram For The Year 2008-2009
(Rupees in crores)
Particulars 2008 Change Percentage 2009 Change Percentage
Liabilities
Share Capital 4574 154 4574 106
Reserves amp Surplus 93085 3129 128024 2969
Revaluation Reserves 533 018 412 010
Loans
Secured Loans 97106 3264 153627 3563
Un Secured Loans 12129 408 43416 1007
Deferred Tax Liabilities 000 000 000 000
Current Liabilities
Provisions 33039 1110 34529 801
Current Liabilities 57067 1918 66587 1544
Total 297533 10000 431169 10000
Assets
Net Block 108424 3644 180435 4185
Capital WIP 63459 2133 86485 2006
Investments 4783 161 6178 143
Current Assets
Inventories 44217 1486 58906 1366
Sundry Debtors 27307 918 38017 882
Cash amp Bank Balances 4036 136 5657 131
Loans amp Advances 45289 1522 55462 1286
Fixed Deposits 018 001 028 001
Total 297533 10000 431169 10000
8102019 A Study A Study On Financial Performance Analysis With Reference To Kesoram Cementon Financial Performance hellip
httpslidepdfcomreaderfulla-study-a-study-on-financial-performance-analysis-with-reference-to-kesoram 5581
55
Interpretation of Common Size Balance Sheet of 2008-2009
Share capital was recorded 154 percent in the total liabilities in the year 2008 it is
decreased to 106 in the year 2009
Reserves amp surplus contributed to 3129 in the total liabilities in the year 2008 it is
decreased to 2969 in the year 2009
Secured loans were 3264 in the total liabilities in the year 2008 it is increased to
3563 in the year 2009
Current Liabilities shown to 1918 in the total liabilities in the year 2008 it is
decreased to 1544 in the year 2009
Provisions 1110 in the total liabilities in the year 2008 it is decreased to 801 in the
year 2009
Fixed Assets were 3644 in the total liabilities in the year 2008 ie decreased to 4185
in the year 2009
Investments were 161 in the total liabilities in the year 2008 it is decreased to 143
in the year 2009
Sundry debtors were 918 in the total liabilities in the year 2008 it is decreased to 882
in the year 2009
8102019 A Study A Study On Financial Performance Analysis With Reference To Kesoram Cementon Financial Performance hellip
httpslidepdfcomreaderfulla-study-a-study-on-financial-performance-analysis-with-reference-to-kesoram 5681
56
Common Size Balance Sheet of Kesoram For The Year 2009-2010
(Rs in crores)
Particulars 2009 Change Percentage 2010Change
Percentage
Liabilities
Share Capital 4574 106 4574 075
Reserves amp Surplus 128024 2969 149111 2444
Revaluation Reserves 412 010 339 006
Loans
Secured Loans 153627 3563 186372 3055
Un Secured Loans 43416 1007 126250 2069
Deferred Tax Liabilities 000 000 000 000
Current Liabilities
Provisions 34529 801 35734 586
Current Liabilities 66587 1544 107688 1765
Total 431169 10000 610068 10000
Assets
Net Block 180435 4185 343182 5625
Capital WIP 86485 2006 41283 677
Investments 6178 143 5143 084
Current Assets
Inventories 58906 1366 91619 1502
Sundry Debtors 38017 882 54289 890
Cash amp Bank Balances 5657 131 8014 131
Loans amp Advances 55462 1286 66506 1090
Fixed Deposits 028 001 031 001
Total 431169 10000 610068 10000
8102019 A Study A Study On Financial Performance Analysis With Reference To Kesoram Cementon Financial Performance hellip
httpslidepdfcomreaderfulla-study-a-study-on-financial-performance-analysis-with-reference-to-kesoram 5781
57
Interpretation of common size balance sheet of 2009-2010
Share capital was recorded 106 percent in the total liabilities in the
year 2009 it is decreased to 075 in the year 2010
Reserves amp surplus contributed to 2969 in the total liabilities in the
year 2009 it is decreased to2444 in the year 2010
Secured loans were 3563 in the total liabilities in the year 2009 it is
increased to 3055 in the year 2010
Current Liabilities shown to 1544 in the total liabilities in the year
2009 it is decreased to 1765 in the year 2010
Provisions 801 in the total liabilities in the year 2009 it is decreased
to 586 in the year 2010
Fixed Assets were 4185 in the total liabilities in the year 2009 ie
increased to 5625 in the year 2010
Investments were 143 in the total liabilities in the year 2009 it is
decreased to 084 in the year 2010
Sundry debtors were 882 in the total liabilities in the year 2009 it is
increased to 890 in the year 2010
8102019 A Study A Study On Financial Performance Analysis With Reference To Kesoram Cementon Financial Performance hellip
httpslidepdfcomreaderfulla-study-a-study-on-financial-performance-analysis-with-reference-to-kesoram 5881
58
Common Size Balance sheet of Kesoram for the year 2010-2011
983080Rupees in crores)
Particulars 2010 Change Percentage 2011
Change
Percentage
Liabilities
Share Capital 4574 075 4574 071
Reserves amp Surplus 149111 2444 125162 1939
Revaluation Reserves 339 006 289 004
Loans
Secured Loans 186372 3055 237183 3675
Un Secured Loans 126250 2069 162744 2522
Deferred Tax Liabilities 000 000 000 000
Current Liabilities
Provisions 35734 586 1494 023
Current Liabilities 107688 1765 113902 1765
Total 610068 10000 645348 10000
Assets
Net Block 343182 5625 369172 5721
Capital WIP 41283 677 43781 678
Investments 5143 084 6582 102
Current Assets
Inventories 91619 1502 111855 1733
Sundry Debtors 54289 890 63134 978
Cash amp Bank Balances 8014 131 7188 111
Loans amp Advances 66506 1090 43460 673
Fixed Deposits 031 001 176 003
Total 610068 10000 645348 10000
8102019 A Study A Study On Financial Performance Analysis With Reference To Kesoram Cementon Financial Performance hellip
httpslidepdfcomreaderfulla-study-a-study-on-financial-performance-analysis-with-reference-to-kesoram 5981
59
Interpretation of Common Size Balance Sheet Of 2010-2011
Share capital was recorded 075 percent in the total liabilities in the year 2010 it is
decreased to 071 in the year 2011
Reserves amp surplus contributed to 2444 in the total liabilities in the year 2010 it is
decreased to1939 in the year 2011
Secured loans were 3055 in the total liabilities in the year 2010 it is increased to
3675 in the year 2011
Current Liabilities shown to 1765 in the total liabilities in the year 2010 it is
also1765 in the year 2011
Provisions 586 in the total liabilities in the year 2010 it is decreased to 023 in the
year 2011
Fixed Assets were 5625 in the total liabilities in the year 2010 ie increased to 5721
in the year 2011
Investments were 084 in the total liabilities in the year 2010 it increased to 102 in
the year 2011
Sundry debtors were 890 in the total liabilities in the year 2010 it is increased to 978
in the year 2011
8102019 A Study A Study On Financial Performance Analysis With Reference To Kesoram Cementon Financial Performance hellip
httpslidepdfcomreaderfulla-study-a-study-on-financial-performance-analysis-with-reference-to-kesoram 6081
60
Common Size Balance Sheet of Kesoram for the Year 2011-2012
983080Rupees in crores)
Particulars 2011 Change Percentage 2012
Change
Percentage
Liabilities
Share Capital 4574 071 4574 063
Reserves amp Surplus 125162 1939 86657 1199
Revaluation Reserves 289 004 270 004
Loans
Secured Loans 237183 3675 317792 4397
Un Secured Loans 162744 2522 92742 1283
Deferred Tax Liabilities 000 000 000 000
Current Liabilities
Provisions 1494 023 40726 563
Current Liabilities 113902 1765 180010 2491
Total 645348 10000 722771 10000
Assets
Net Block 369172 5721 358721 4963
Capital WIP 43781 678 68065 942
Investments 6582 102 6636 092
Current Assets
Inventories 111855 1733 99516 1377
Sundry Debtors 63134 978 67358 932
Cash amp Bank Balances 7188 111 6959 096
Loans amp Advances 43460 673 115409 1597
Fixed Deposits 176 003 107 001
Total 645348 10000 722771 10000
8102019 A Study A Study On Financial Performance Analysis With Reference To Kesoram Cementon Financial Performance hellip
httpslidepdfcomreaderfulla-study-a-study-on-financial-performance-analysis-with-reference-to-kesoram 6181
61
Interpretation of common size balance sheet of 2011-2012
Share capital was recorded 071 percent in the total liabilities in the year 2011 it is
decreased to 063 in the year 2012
Reserves amp surplus contributed to 1939 in the total liabilities in the year 2011 it
is decreased to 1199 in the year 2012
Secured loans were 3675 in the total liabilities in the year 2011 it is increased to
4397 in the year 2012
Current Liabilities shown to 1765 in the total liabilities in the year 2011 it is
increased to 2491 in the year 2012
Provisions 023 in the total liabilities in the year 2011 it is increased to 563 in the
year 2012
Fixed Assets were 5721 in the total liabilities in the year 2011 ie decreased to
4963 in the year 2012
Investments were 102 in the total liabilities in the year 2011 it increased to 092
in the year 2012
Sundry debtors were 978 in the total liabilities in the year 2011 it is decreased to
932 in the year 2012
8102019 A Study A Study On Financial Performance Analysis With Reference To Kesoram Cementon Financial Performance hellip
httpslidepdfcomreaderfulla-study-a-study-on-financial-performance-analysis-with-reference-to-kesoram 6281
Trend Analysis
Share Capital-
Year
Amount
(In Crores) Trend
IncreaseDecrease
Base Year Previous Year
2008 4574 10000 000 000
2009 4574 10000 000 000
2010 4574 10000 000 000
2011 4574 10000 000 000
2012 4574 10000 000 000
Trend Percentages in Share Capital
Share capital shown a constant trend in the period 2008 and 2012
Share capital is 4574 crores all the years from 2008-2012
8102019 A Study A Study On Financial Performance Analysis With Reference To Kesoram Cementon Financial Performance hellip
httpslidepdfcomreaderfulla-study-a-study-on-financial-performance-analysis-with-reference-to-kesoram 6381
Reserves amp Surplus-
Year
Amount
(In Crores) Trend
IncreaseDecrease
Base Year Previous Year
2008 93085 10000 000 000
2009 128024 13753 3753 3753
2010 149111 16019 6019 2266
2011 125162 13446 3446 -2573
2012 86657 9309 -691 -4137
Trend Percentages in Reserves amp Surplus
Reserves amp surplus shown an increasing trend in the period between 2008 and 2010
The average trend was 13277 till 2010
The Reserves amp surplus was showing decreasing trend in the period 2011-2012 (ie
from 16019 in 2010 to 9309 in 2012)
The decreasing trend in Reserves amp surplus indicates the decrease in profits of the
firm
8102019 A Study A Study On Financial Performance Analysis With Reference To Kesoram Cementon Financial Performance hellip
httpslidepdfcomreaderfulla-study-a-study-on-financial-performance-analysis-with-reference-to-kesoram 6481
Investments-
Year
Amount
(In Crores) Trend
IncreaseDecrease
Base Year Previous Year
2008 4783 10000 000 000
2009 6178 12917 2917 2917
2010 5143 10753 753 -2164
2011 6582 13761 3761 3009
2012 6636 13874 3874 113
Trend Percentages in Investments-
The investments are shown an increasing trend in the period between 2008 ndash 2009
and it is decreasing in the year 2010
The average trend was 11458 till 2009
The investments increased in the periods 2011-2012 (ie from 10753 in 2010 to
13874 in 2012)
The overall trend in investments shown is satisfactory
8102019 A Study A Study On Financial Performance Analysis With Reference To Kesoram Cementon Financial Performance hellip
httpslidepdfcomreaderfulla-study-a-study-on-financial-performance-analysis-with-reference-to-kesoram 6581
Net Current Assets-
Year
Amount
(In Crores) Trend
IncreaseDecrease
Base Year Previous Year
2008 30761 10000 000 000
2009 56954 18515 8515 8515
2010 77037 25044 15044 6529
2011 110417 35895 25895 10851
2012 68613 22305 12305 -13590
Trends in Net Current Assets-
The NCA shown positive (increasing) trend
The NCA are increased to 35895 (the year 2011) compared with base year and
decreased in the year 2012 to 22305
The NCA shown increased trend from year and crossed 100
The overall trend was good
8102019 A Study A Study On Financial Performance Analysis With Reference To Kesoram Cementon Financial Performance hellip
httpslidepdfcomreaderfulla-study-a-study-on-financial-performance-analysis-with-reference-to-kesoram 6681
66
Ratio Analysis-
Current Ratio-
Current Ratio = Current Assets Current Liabilities
Current assets are cash in hand Cash at bank Marketable Securities(short term) short term
Investment Bills receivables sundry debtors Inventories (stock) Work in progress prepaid
expenses Current Liabilities are outstanding expenses Bills payable sundry Creditors
short-term advances income tax payable and Dividend payable
Current Ratio of Kesoram-
(Rupees in crores)
Year Current Assets Current Liabilities Current Ratio
2007-08 75560 57067 132
2008-09 102580 66587 154
2009-10 153922 107688 143
2010-11 182177 113902 160
2011-12 173833 180010 097
Interpretation-
As per the standard rule of current ratio ie 21 where current assets double the current
liabilities is considered satisfactory
In the present analysis the current ratio of the Kesoram is not satisfactory
from the above table It was assessed that the current ratio for all the five year is lower (less)
than the standard rule ie 21 And it is 097 in the year 2011-2012 (current year) This is
highly UN satisfactory
8102019 A Study A Study On Financial Performance Analysis With Reference To Kesoram Cementon Financial Performance hellip
httpslidepdfcomreaderfulla-study-a-study-on-financial-performance-analysis-with-reference-to-kesoram 6781
Quick Ratio-
Quick ratio also known as acid-test ratio establishes a relationship between quick
assets and the current liabilities Cash is the most liquid asset It is calculated by dividing
quick assets by current liabilities
Quick ratio = Quick Assets Current Liabilities
(Quick Assets = Current assets ndash Inventory)
Quick Ratio of Kesoram-
Rupees in crores)
Year Total QuickAssets
Current Liabilities Quick Ratio
2007-08 33343 57067 058
2008-09 43674 66587 066
2009-10 62303 107688 058
2010-11 70322 113902 0622011-12 74333 180010 041
Interpretation-
Usually a high Quick ratio is an indication that the company is liquid and has the ability to
meet its current or liquid liabilities in time on the other hand a low Quick Ratio represents
8102019 A Study A Study On Financial Performance Analysis With Reference To Kesoram Cementon Financial Performance hellip
httpslidepdfcomreaderfulla-study-a-study-on-financial-performance-analysis-with-reference-to-kesoram 6881
that the companyrsquos liquidity position is not good The above table showing the quick ratios
of Kesoram are canrsquot be considered satisfactory
Leverage Ratios-
Debt-Equity Ratio-
Debt-Equity Ratio = Total Long Term Debt Equity Share Holders Fund
Total Long term Debt= Debenture Capital + Long term loans from banks and financial
institutions + Public deposits
Equity Share Holders fund = Equity + Reserves and Surplus
Debt Equity Ratio of Kesoram
(Rupees in crores)
Year Total Debt Share Holders Fund Debt Equity Ratio
2007-08 109235 98192 111
2008-09 197043 133010 148
2009-10 312622 154024 203
2010-11 399927 130025 308
2011-12 410534 91501 449
8102019 A Study A Study On Financial Performance Analysis With Reference To Kesoram Cementon Financial Performance hellip
httpslidepdfcomreaderfulla-study-a-study-on-financial-performance-analysis-with-reference-to-kesoram 6981
Interpretation-
The Debt-Equity Ratio accepted standard is 05 This ratio reflects the relative contribution
of creditors and owners of business in its financing From the above it is clear that the long
term debt is more than that of the share holdersrsquo fund So we can interpret that the firmrsquosassets are financed more by the external funds rather than by the internal funds
8102019 A Study A Study On Financial Performance Analysis With Reference To Kesoram Cementon Financial Performance hellip
httpslidepdfcomreaderfulla-study-a-study-on-financial-performance-analysis-with-reference-to-kesoram 7081
Fixed Asset Ratio-
Net Sales
Fixed Asset Ratio = helliphelliphelliphelliphelliphelliphelliphelliphelliphelliphellip
Net Assets
Fixed Asset Ratio of Kesoram-
(Rupees in crores)
Year Net Sales Net Assets Fixed Assets Ratio
2007-08 300271 358721 084
2008-09 389797 369172 106
2009-10 475062 343182 1382010-11 539788 180435 299
2011-12 59182 108424 546
Interpretation
This ratio indicates the extent to which the assets of the companyrsquos can be lost without
affecting the interest of the creditors of the company Higher the ratios better the long-term
position of the companyThe above table shows fixed assets ratio in increasing trend Which is good for the
company
8102019 A Study A Study On Financial Performance Analysis With Reference To Kesoram Cementon Financial Performance hellip
httpslidepdfcomreaderfulla-study-a-study-on-financial-performance-analysis-with-reference-to-kesoram 7181
Overall Profitability Ratios-
Net Profit Ratio
Net Profit Ratio indicates net margin on sales It is given by the following equation
Net Profit Ratio = (Net Profit Sales) 100
Net Profit Ratio of Kesoram
(Rupees in crores)
Year Net Profit Sales Net Profit Ratio
2007-08 37917 300271 1263
2008-09 41432 389797 1063
2009-10 20298 475062 427
2010-11 -28176 539788 -5222011-12 -38108 59182 -644
Interpretation
It establishes a relationship between net profits after tax and net sales and
indicates the efficiency of the management in manufacturing selling administrative and
other activities of the company
The higher the ratio the better is the profitability or performance of the business
The above table depicts the net profit Ratio of Kesoram has decreased every year from
2007-2008 to 2011-2012It further decreased to negative in the year 2010-11 to -522 and -
644 in the year 2011-2012 This shows constant decrease in the profits of the company
8102019 A Study A Study On Financial Performance Analysis With Reference To Kesoram Cementon Financial Performance hellip
httpslidepdfcomreaderfulla-study-a-study-on-financial-performance-analysis-with-reference-to-kesoram 7281
72
Return on Investment-
Net Profit
Return on Investment = helliphelliphelliphelliphelliphelliphelliphelliphelliphelliphelliphellip X 100
Share Holders Fund
Return on Investment Ratio of Kesoram-
(Rupees in crores)
Year Net Profit Share Holders Fund Return On Investment
2007-08 37917 98192 3862
2008-09 41432 133010 3115
2009-10 20298 154024 1318
2010-11 -28176 130025 -2167
2011-12 -38108 91501 -4165
Interpretation-
The above table reveals how well the resources of the firm are being used Higher
the ratio better the result The above ratio implies how well the firm is growing in
terms of profitability and efficiency From the above table we can concern that the return on
investment is in decreasing trend ROI is highest in the year 2007-2008 as 3862 But
there after itrsquos decreased every year
The ROI is negative in the years 2010-2011 amp 2011-2012 as -2167 amp -4165 respectively
Which is not a good sign for the firm
8102019 A Study A Study On Financial Performance Analysis With Reference To Kesoram Cementon Financial Performance hellip
httpslidepdfcomreaderfulla-study-a-study-on-financial-performance-analysis-with-reference-to-kesoram 7381
8102019 A Study A Study On Financial Performance Analysis With Reference To Kesoram Cementon Financial Performance hellip
httpslidepdfcomreaderfulla-study-a-study-on-financial-performance-analysis-with-reference-to-kesoram 7481
8102019 A Study A Study On Financial Performance Analysis With Reference To Kesoram Cementon Financial Performance hellip
httpslidepdfcomreaderfulla-study-a-study-on-financial-performance-analysis-with-reference-to-kesoram 7581
75
CHAPTER V
FINDINGS amp SUGGESTIONS
8102019 A Study A Study On Financial Performance Analysis With Reference To Kesoram Cementon Financial Performance hellip
httpslidepdfcomreaderfulla-study-a-study-on-financial-performance-analysis-with-reference-to-kesoram 7681
76
Findings
The Share capital remains constant Share capital is unchanged all the years from
2008-2012
Reserves amp surplus were recorded an increasing trend in the period between 2008
and 2010It is showing decreasing trend in the period 2011-2012 (ie from 16019
in 2010 to 9309 in 2012)
Current Liabilities were increased compared to base year ie 2008
Provisions increased to 262597 ie in Rupees 39232 crores in the current year
The current ratio for all the five year is lower (less) than the standard rule ie 21
And it is 097 in the year 2011-2012 (current year)
The Debt-Equity Ratio was shown under the standard ratio It is clear that the long
term debt is more than that of the share holdersrsquo fund It indicates that the firm
heavily relying on external funds rather than the internal funds
The operating and net profit of Kesoram is in decreasing trend due to heavy
increase of manufacturing amp administrative expenses
ROI is highest in the year 2007-2008 as 3862 The ROI is negative in the years
2010-2011 amp 2011-2012 as -2167 amp -4165 respectively
Return on Equity Capital Employed Ratio of Kesoram has decreased every year
from 2007-2008 to 2010-2011It further decreased to negative in the year 2011-12 to
-3280
EPS of Kesoram has decreased every year from 2008-12It is negative in the year
2011 amp 12
8102019 A Study A Study On Financial Performance Analysis With Reference To Kesoram Cementon Financial Performance hellip
httpslidepdfcomreaderfulla-study-a-study-on-financial-performance-analysis-with-reference-to-kesoram 7781
77
Suggestion
The organization should adopt an appropriate capital structure
The companyrsquos debt-equity ratio is recorded more or less as 111 in the year 2008
and it is increased to 449 in the year 2012 (current year)The company should
adopt a better debt equity mix in the future to control the fluctuations in returns
The company should control fluctuations in cash and bank balances as it impacts the
current ratio of the company
The provisions are showing increasing trend which indicates risk of debtors The
firm should implement an effective credit management policy It should utilize its
idle funds by decreasing provisions
The company should control heavy increase of manufacturing amp administration
expenses as it is impacting the operating and net profit of company
8102019 A Study A Study On Financial Performance Analysis With Reference To Kesoram Cementon Financial Performance hellip
httpslidepdfcomreaderfulla-study-a-study-on-financial-performance-analysis-with-reference-to-kesoram 7881
78
ANNEXURE
Profit And Loss Account of Kesoram Cement
Mar12 Mar11 Mar10 Mar09 Mar08
12 Months 12 Months 12 Months 12 Months 12 Months
INCOME
Sales Turnover 628260 575072 505151 431613 345700
Excise Duty 36440 35284 30089 41815 45429
NET SALES 591820 539788 475062 389797 300271
Other Income 000 000 000 000 000
TOTALINCOME
596129 548733 481019 393969 302020
EXPENDITURE
Manufacturing
Expenses81903 74803 13974 13153 44113
MaterialConsumed
370897 310150 295550 229359 118448
Personal
Expenses33468 27355 23294 18690 15344
Selling Expenses 81910 78253 58667 48846 45019
AdministrativeExpenses
28225 29308 17219 16179 9907
Expenses
Capitalized000 000 000 000 000
Provisions Made 000 000 000 000 000
TOTAL
EXPENDITURE 596403 519870 408704 326227 232832Operating Profit -4583 19918 66358 63570 67439
EBITDA -274 28864 72316 67742 69188
Depreciation 29740 27259 17280 11186 8927
Other Write-offs 000 000 000 000 000
EBIT -30014 1605 55035 56557 60261
Interest 41015 23983 10921 12087 5426
EBT -71029 -22377 44114 44470 54835
Taxes -32921 5798 23816 3037 16918
Profit and Loss
for the Year-38108 -28176 20298 41432 37917
Non RecurringItems
-1142 7063 3228 -4023 402
Other Non Cash
Adjustments1276 091 207 465 017
OtherAdjustments
000 000 000 000 000
REPORTED
PAT-37974 -21021 23734 37874 38335
8102019 A Study A Study On Financial Performance Analysis With Reference To Kesoram Cementon Financial Performance hellip
httpslidepdfcomreaderfulla-study-a-study-on-financial-performance-analysis-with-reference-to-kesoram 7981
79
Balance Sheet Of Kesoram
Years
Particulars 2008 2009 2010 2011 2012
Liabilities
Share Capital 4574 4574 4574 4574 4574Reserves amp Surplus 93085 128024 149111 125162 86657
Revaluation Reserves 533 412 339 289 27
Loans
Secured Loans 97106 153627 186372 237183 317792
Un Secured Loans 12129 43416 12625 162744 92742
Deferred Tax Liabilities 0 0 0 0 0
Current Liabilities
Provisions 33039 34529 35734 1494 40726
Current Liabilities 57067 66587 107688 113902 18001
Total 297533 431169 610068 645348 722771
Assets
Net Block 108424 180435 343182 369172 358721
Capital WIP 63459 86485 41283 43781 68065
Investments 4783 6178 5143 6582 6636
Current Assets
Inventories 44217 58906 91619 111855 99516
Sundry Debtors 27307 38017 54289 63134 67358
Cash amp Bank Balances 4036 5657 8014 7188 6959
Total Current Assets 7556 10258 153922 182177 173833Loans amp Advances 45289 55462 66506 4346 115409
Fixed Deposits 018 028 031 176 107
Total 297533 431169 610068 645348 722771
8102019 A Study A Study On Financial Performance Analysis With Reference To Kesoram Cementon Financial Performance hellip
httpslidepdfcomreaderfulla-study-a-study-on-financial-performance-analysis-with-reference-to-kesoram 8081
80
KEY ITEMS 2012 2011 2010 2009 2008
Preference
Dividend 0 0 0 0 0
Equity Dividend 457 2516 2516 2516 2516
Equity Dividend
() 999 55 55 55 55
Shares in Issue(Lakhs) 45743 45743 45743 45743 45743
EPS - Annualised
(Rs) -8302 -4595 5188 828 838
8102019 A Study A Study On Financial Performance Analysis With Reference To Kesoram Cementon Financial Performance hellip
httpslidepdfcomreaderfulla-study-a-study-on-financial-performance-analysis-with-reference-to-kesoram 8181
BIBLIOGRAPHY
Sl
No
Books Author Name
1 Financial Management Khan amp JAIN
2 Financial Management IMPandey
3 Management Accounting RPTrivedi
Websites amp Search Engines
1 wwwkesoramcom983086
2 wwwmoneycontrolcom
3 wwwgooglefinancecom983086
Annual reports of Kesoram cement limited 2008-2012

8102019 A Study A Study On Financial Performance Analysis With Reference To Kesoram Cementon Financial Performance hellip
httpslidepdfcomreaderfulla-study-a-study-on-financial-performance-analysis-with-reference-to-kesoram 1681
16
Industry Profile
In the most general sense of the word cement is a binder a substance which
sets and hardens independently and can bind other materials together The word cement
traces to the Romans who used the term opus caementicium to describe masonry whichresembled concrete and was made from crushed rock with burnt lime as binder The
volcanic ash and pulverized brick additives which were added to the burnt lime to obtain a
hydraulic binder were later referred to as cementum and cement Cements used in
construction are characterized as hydraulic or non-hydraulic
The most important use of cement is the production of mortar and concretemdashthe bonding of
natural or artificial aggregates to form a strong building material which is durable in the
face of normal environmental effects
Concrete should not be confused with cement because the term cement refers only to the dry
powder substance used to bind the aggregate materials of concrete Upon the addition of
water andor additives the cement mixture is referred to as concrete especially if aggregates
have been added
It is uncertain where it was first discovered that a combination of hydrated non-hydraulic
lime and a pozzolan produces a hydraulic mixture (see also Pozzolanic reaction) but
concrete made from such mixtures was first used on a large scale by engineers They used
both natural pozzolans (trass or pumice) and artificial pozzolans (ground brick or pottery) in
these concretes Many excellent examples of structures made from these concretes are still
standing notably the huge monolithic dome of the Pantheon in Rome and the massive Baths
of Caracalla The vast system of Roman aqueducts also made extensive use of hydraulic
cement The use of structural concrete disappeared in medieval Europe although weak
pozzolanic concretes continued to be used as a core fill in stone walls and columns
Modern cement
Modern hydraulic cements began to be developed from the start of the Industrial Revolution
(around 1800) driven by three main needs
Hydraulic renders for finishing brick buildings in wet climates
Hydraulic mortars for masonry construction of harbor works etc in contact with sea water
Development of strong concretes
In Britain particularly good quality building stone became ever more expensive during a
period of rapid growth and it became a common practice to construct prestige buildings
8102019 A Study A Study On Financial Performance Analysis With Reference To Kesoram Cementon Financial Performance hellip
httpslidepdfcomreaderfulla-study-a-study-on-financial-performance-analysis-with-reference-to-kesoram 1781
17
from the new industrial bricks and to finish them with a stucco to imitate stone Hydraulic
limes were favored for this but the need for a fast set time encouraged the development of
new cements Most famous was Parkers Roman cement This was developed by James
Parker in the 1780s and finally patented in 1796 It was in fact nothing like any material
used by the Romans but was ldquoNatural cement made by burning septaria - nodules that are
found in certain clay deposits and that contain both clay minerals and calcium carbonate
The burnt nodules were ground to a fine powder This product made into a mortar with
sand set in 5ndash15 minutes The success of Roman Cement led other manufacturers to
develop rival products by burning artificial mixtures of clay and chalk
John Smeaton made an important contribution to the development of cements when he was
planning the construction of the third Eddystone Lighthouse (1755-9) in the English
Channel He needed a hydraulic mortar that would set and develop some strength in the
twelve hour period between successive high tides He performed an exhaustive market
research on the available hydraulic limes visiting their production sites and noted that the
hydraulicity of the lime was directly related to the clay content of the limestone from
which it was made Smeaton was a civil engineer by profession and took the idea no
further Apparently unaware of Smeatons work the same principle was identified by Louis
Vicat in the first decade of the nineteenth century Vicat went on to devise a method of
combining chalk and clay into an intimate mixture and burning this produced an artificial
cement in 1817 James Frost working in Britain produced what he called British cement
in a similar manner around the same time but did not obtain a patent until 1822 In 1824
Joseph Aspdin patented a similar material which he called Portland cement because the
render made from it was in color similar to the prestigious Portland stone
All the above products could not compete with limepozzolan concretes because of fast-
setting (giving insufficient time for placement) and low early strengths (requiring a delay of
many weeks before formwork could be removed) Hydraulic limes natural cements and
artificial cements all rely upon their belite content for strength development Belite
develops strength slowly Because they were burned at temperatures below 1250 degC they
contained no alite which is responsible for early strength in modern cements The first
cement to consistently contain alite was made by Joseph Aspdins son William in the early
1840s This was what we call today modern Portland cement Because of the air of
mystery with which William Aspdin surrounded his product others (eg Vicat and I C
Johnson) have claimed precedence in this invention but recent analysis of both his concrete
8102019 A Study A Study On Financial Performance Analysis With Reference To Kesoram Cementon Financial Performance hellip
httpslidepdfcomreaderfulla-study-a-study-on-financial-performance-analysis-with-reference-to-kesoram 1881
18
and raw cement have shown that William Aspdins product made at North fleet Kent was a
true alite-based cement However Aspdins methods were rule-of-thumb Vicat is
responsible for establishing the chemical basis of these cements and Johnson established
the importance of sintering the mix in the kiln
William Aspdins innovation was counter-intuitive for manufacturers of artificial cements
because they required more lime in the mix (a problem for his father) because they required
a much higher kiln temperature (and therefore more fuel) and because the resulting clinker
was very hard and rapidly wore down the millstones which were the only available grinding
technology of the time Manufacturing costs were therefore considerably higher but the
product set reasonably slowly and developed strength quickly thus opening up a market for
use in concrete The use of concrete in construction grew rapidly from 1850 onwards and
was soon the dominant use for cements Thus Portland cement began its predominant role
It is made from water and sand
Types of modern cement
Portland cement
Cement is made by heating limestone (calcium carbonate) with small quantities of other
materials (such as clay) to 1450degC in a kiln in a process known as calcination whereby a
molecule of carbon dioxide is liberated from the calcium carbonate to form calcium oxide
or lime which is then blended with the other materials that have been included in the mix
The resulting hard substance called clinker is then ground with a small amount of gypsum
into a powder to make Ordinary Portland Cement the most commonly used type of cement
(often referred to as OPC)
Portland cement is a basic ingredient of concrete mortar and most non-speciality grout The
most common use for Portland cement is in the production of concrete Concrete is a
composite material consisting of aggregate (gravel and sand) cement and water As a
construction material concrete can be cast in almost any shape desired and once hardened
can become a structural (load bearing) element Portland cement may be gray or whitePortland cement blends
These are often available as inter-ground mixtures from cement manufacturers but similar
formulations are often also mixed from the ground components at the concrete mixing plant
Portland blast furnace cement contains up to 70 ground granulated blast furnace slag
with the rest Portland clinker and a little gypsum All compositions produce high ultimate
8102019 A Study A Study On Financial Performance Analysis With Reference To Kesoram Cementon Financial Performance hellip
httpslidepdfcomreaderfulla-study-a-study-on-financial-performance-analysis-with-reference-to-kesoram 1981
19
strength but as slag content is increased early strength is reduced while sulfate resistance
increases and heat evolution diminishes Used as an economic alternative to Portland
sulfate-resisting and low-heat cements
Portland fly ash cement contains up to 30 fly ash The fly ash is pozzolanic so that
ultimate strength is maintained Because fly ash addition allows lower concrete water
content early strength can also be maintained Where good quality cheap fly ash is
available this can be an economic alternative to ordinary Portland cement
Portland pozzolan cement includes fly ash cement since fly ash is a pozzolan but also
includes cements made from other natural or artificial pozzolans In countries where
volcanic ashes are available (eg Italy Chile Mexico and the Philippines) these cements
are often the most common form in use
Portland silica fume cement Addition of silica fume can yield exceptionally high
strengths and cements containing 5-20 silica fume are occasionally produced However
silica fume is more usually added to Portland cement at the concrete mixer
Masonry cements are used for preparing bricklaying mortars and stuccos and must not be
used in concrete They are usually complex proprietary formulations containing Portland
clinker and a number of other ingredients that may include limestone hydrated lime air
entrainers retarders water proofers and coloring agents They are formulated to yield
workable mortars that allow rapid and consistent masonry work Subtle variations of
Masonry cement in the US are Plastic Cements and Stucco Cements These are designed to
produce controlled bond with masonry blocks
Expansive cements contain in addition to Portland clinker expansive clinkers (usually
sulfoaluminate clinkers) and are designed to offset the effects of drying shrinkage that is
normally encountered with hydraulic cements This allows large floor slabs (up to 60 m
square) to be prepared without contraction joints
White blended cements may be made using white clinker and white supplementary
materials such as high-purity metakaolin
Colored cements are used for decorative purposes In some standards the addition of
pigments to produce colored Portland cement is allowed In other standards (eg ASTM)
pigments are not allowed constituents of Portland cement and colored cements are sold as
blended hydraulic cements
Very finely ground cements are made from mixtures of cement with sand or with slag or
other pozzolan type minerals which are extremely finely ground together Such cements can
8102019 A Study A Study On Financial Performance Analysis With Reference To Kesoram Cementon Financial Performance hellip
httpslidepdfcomreaderfulla-study-a-study-on-financial-performance-analysis-with-reference-to-kesoram 2081
have the same physical characteristics as normal cement but with 50 less cement
particularly due to their increased surface area for the chemical reaction Even with
intensive grinding they can use up to 50 less energy to fabricate than ordinary Portland
cements
Non-Portland hydraulic cements
Pozzolan-lime cements Mixtures of ground Pozzolan and lime are the cements used by the
Romans and are to be found in Roman structures still standing (eg the Pantheon in Rome)
They develop strength slowly but their ultimate strength can be very high The hydration
products that produce strength are essentially the same as those produced by Portland
cement
Slag-lime cements Ground granulated blast furnace slag is not hydraulic on its own but is
activated by addition of alkalis most economically using lime They are similar to
pozzolan lime cements in their properties Only granulated slag (ie water-quenched glassy
slag) is effective as a cement component
Super sulfated cements These contain about 80 ground granulated blast furnace slag
15 gypsum or anhydrite and a little Portland clinker or lime as an activator They produce
strength by formation of ettringite with strength growth similar to a slow Portland cement
They exhibit good resistance to aggressive agents including sulfate
Calcium aluminate cements are hydraulic cements made primarily from limestone and
bauxite The active ingredients are monocalcium aluminate CaAl2O4 (CaO middot Al2O3 or CA in
Cement chemist notation CCN) and mayenite Ca12Al14O33 (12 CaO middot 7 Al2O3 or C12A7 in
CCN) Strength forms by hydration to calcium aluminate hydrates They are well-adapted
for use in refractory (high-temperature resistant) concretes eg for furnace linings
Calcium sulfoaluminate cements are made from clinkers that include yeelimite (Ca4
(AlO2)6SO4 or C4A3 in Cement chemists notation) as a primary phase They are used in
expansive cements in ultra-high early strength cements and in low-energy cements
Hydration produces ettringite and specialized physical properties (such as expansion or
rapid reaction) are obtained by adjustment of the availability of calcium and sulfate ionsTheir use as a low-energy alternative to Portland cement has been pioneered in China
where several million tonnes per year are produced Energy requirements are lower because
of the lower kiln temperatures required for reaction and the lower amount of limestone
(which must be endothermically decarbonated) in the mix In addition the lower limestone
8102019 A Study A Study On Financial Performance Analysis With Reference To Kesoram Cementon Financial Performance hellip
httpslidepdfcomreaderfulla-study-a-study-on-financial-performance-analysis-with-reference-to-kesoram 2181
21
content and lower fuel consumption leads to a CO2 emission around half that associated
with Portland clinker However SO2 emissions are usually significantly higher
Natural Cements correspond to certain cements of the pre-Portland era produced by
burning argillaceous limestones at moderate temperatures The level of clay components in
the limestone (around 30-35) is such that large amounts of belite (the low-early strength
high-late strength mineral in Portland cement) are formed without the formation of
excessive amounts of free lime As with any natural material such cements have highly
variable properties
Geopolymer cements are made from mixtures of water-soluble alkali metal silicates and
aluminosilicate mineral powders such as fly ash and metakaolin
8102019 A Study A Study On Financial Performance Analysis With Reference To Kesoram Cementon Financial Performance hellip
httpslidepdfcomreaderfulla-study-a-study-on-financial-performance-analysis-with-reference-to-kesoram 2281
22
COMPANY PROFILE
8102019 A Study A Study On Financial Performance Analysis With Reference To Kesoram Cementon Financial Performance hellip
httpslidepdfcomreaderfulla-study-a-study-on-financial-performance-analysis-with-reference-to-kesoram 2381
23
Kesoram Cement Industry is one of the leading manufacturers of cement in India It is a day
process cement Plant The plant capacity is 826 lakh tones per annum It is located at
Basanthnagar in Karimnagar district of Andhra Pradesh Basanthnagar is 8 km away from
the Ramagundam Railway station linking Madras to New Delhi The Chairman of the
Company is BKBirla
History
The first unit at Basanthnagar with a capacity of 21 lakh tones per annum
incorporating humble suspension preheated system was commissioner during the year 1969
The second unit was setup in year 1971 with a capacity of 21 lakh tones per annum went on
stream in the year 1978 The coal for this company is being supplied from Singgareni
Collieries and the power is obtained from APSEB The power demand for the factory is
about 21 MW Kesoram has got 2 DG sets of 4 MW each installed in the year 1987
Kesoram Cement has setup a 15 KW captor power plant to facilitate for
uninterrupted power supply for manufacturing of cement at 24th
august 1997 per hour 12
mw actual power is 15 mw
The Company was incorporated on 18th October 1919 under the Indian Companies Act
1913 in the name and style of Kesoram Cotton Mills Ltd It had a Textile Mill at 42
Garden Reach Road Calcutta 700 024 The name of the Company was changed to Kesoram
Industries amp Cotton Mills Ltd on 30th
August 1961 and the same was further changed to Kesoram Industries Limited on 9th July
1986 The said Textile Mill at Garden Reach Road was eventually demerged into a separate
company
The First Plant for manufacturing of rayon yarn was established at Tribeni District
Hooghly West Bengal and the same was commissioned in December 1959 and the second
plant was commissioned in the year 1962 enabling it to manufacture 4635 metric tons perannum (mtpa) of rayon yarn This Unit has 6500 metric tons per annum (mtpa) capacity as
on 3132009
The plant for manufacturing of transparent paper was also set up at the same location at
Tribeni District Hooghly West Bengal in June 1961 It has the annual capacity to
manufacture 3600 metric tons per annum (mtpa) of transparent Paper
8102019 A Study A Study On Financial Performance Analysis With Reference To Kesoram Cementon Financial Performance hellip
httpslidepdfcomreaderfulla-study-a-study-on-financial-performance-analysis-with-reference-to-kesoram 2481
24
The Company diversified into manufacturing of cast iron spun pipes and pipe fittings at
Bansberia District Hooghly West Bengal with a production capacity of 45000 metric tons
per annum (mtpa) of cast iron spun pipes and pipe fittings in December 1964
The Company subsequently diversified into the manufacturing of Cement and in 1969
established its first cement plant under the name Kesoram Cement at Basantnagar Dist
Karimnagar (Andhra Pradesh) and to take advantage of favorable market conditions in
1986 another cement plant known as Vasavadatta Cement was commissioned by it at
Sedam Dist
Gulbarga (Karnataka) The cement manufacturing capacities at both the plants were
augmented from time to time according to the market conditions and as on 3132009
Kesoram Cement and Vasavadatta Cement have annual cement manufacturing capacities of
15 million metric tons and 41 million metric tons respectively
The Company in March 1992 commissioned a plant at Balasore known as Birla Tyres in
Orissa for manufacturing of 10 lakh mtpa automotive tyres and tubes in the first phase in
collaboration with Pirelli Ltd UK a subsidiary company of the world famous Pirelli
Group of Italy - a pioneer in production and development of automotive tyres in the world
The capacity at the said plant was further augmented during the year by 19 MT per day
aggregating to 271 MT per day production facility The Greenfield Project of 257 MT per
day capacity in the State of Uttarakhand with a capex of about Rs760 crores commenced
the commercial production in phases during the financial year 2008-09The Company as on
3132009 had the manufacturing capacities of 371 million tyres 295 million tubes and
153 million flaps per annum in the Plants including at Uttarakhand Plant It has small
manufacturing capacities of various Chemicals at Kharda in the State of West Bengal also
It has the annual manufacturing capacities of 12410 mtpa of Caustic Soda Lye 5045 mtpa
of Liquid Chlorine 6205 mtpa of Sodium Hypochlorite 8200 mtpa of Hydrochloric Acid
3200 mtpa of Ferric Alum 18700 mtpa of Sulphuric Acid and 1620000 m3pa of purified
Hydrogen Gas
The Company is a well-diversified entity in the fields of Cement Tyre Rayon Yarn
Transparent Paper Spun Pipes and Heavy Chemicals with two core business segments ie
Cement and Tyres
8102019 A Study A Study On Financial Performance Analysis With Reference To Kesoram Cementon Financial Performance hellip
httpslidepdfcomreaderfulla-study-a-study-on-financial-performance-analysis-with-reference-to-kesoram 2581
25
In Spun Pipes amp Foundries a unit of the Company work suspended from 2nd May 2008
still commences till further notice
The Company as of now is listed on three major Stock Exchanges in India ie Bombay
Stock Exchange Ltd Mumbai Calcutta Stock Exchange Association Ltd Kolkata and
National Stock Exchange of India Ltd Mumbai and at the Societe de la Bourse de
Luxembourg Luxembourg
A further expansion upto 165 million tons of cement per annum in Vasavadatta Cement at
Sedam in Karnataka as unit IV at the same site is in progress with a 175 MW Captive
Power Plant involving a capital expenditure of about Rs 78350 crores (including the cost
of Captive Power Plant)
The commercial production of cement in the aforesaid unit IV has commenced in June
2009 The work for the further expansion in the Tyres Section at Uttarakhand for radial
tyres with 100 MT per day capacity and bias tyres with 125 MT per day capacity involving
an estimated aggregate capital outlay of about Rs 840 crores is under progress The Board
has further approved a Motor Cycle Tyre Project of 70 MT per day capacity at the same site
involving a capital outlay of Rs190 crore The civil construction of both the Projects is in
full swing The commercial production in both the Projects is likely to start by December
2009 January 2010
Birla Supreme in popular brand of Kesoram cement from its prestigious plant of
Basantnagar in AP which has outstanding track record In performance and productivity
serving the nation for the last two and half decades It has proved its distinction by bagging
several national awards It also has the distinction of achieving optimum capacity
utilization
Kesoram offers a choice of top quality portioned cement for light heavy
constructions and allied applications Quality is built every fact of the operations
The plant lay out is rational to begin with The limestone is rich in calcium
carbonate a key factor that influences the quality of final product The day process
technology uses in the latest computerized monitoring overseas the manufacturing process
Samples are sent regularly to the bureau of Indian standards National council of
construction and building material for certification of derived quality norms
8102019 A Study A Study On Financial Performance Analysis With Reference To Kesoram Cementon Financial Performance hellip
httpslidepdfcomreaderfulla-study-a-study-on-financial-performance-analysis-with-reference-to-kesoram 2681
26
The company has vigorously undertaking different promotional measures for
promoting their product through different media which includes the use of news papers
magazine hoarding etc
Kesoram cement industry distinguished itself among all the cement factories in
Indian by bagging the National Productivity Award consecutively for two years ie for the
year 1985-1987 The federation of Andhra Pradesh Chamber amp Commerce and Industries
(FAPCCI) also conferred on Kesoram Cement An award for the best industrial promotion
expansion efforts in the state for the year 1984 Kesoram also bagged FAPCCI awarded for
ldquoBest Family Planning Effort in the staterdquo for the year 1987-1988
One among the industrial giants in the country today serving the nation on the
industrial front Kesoram industry ltd has a checked and eventful history dating back to the
twenties when the Industrial House of Birlarsquos acquired it With only a textile mill under its
banner 1924 it grew from strength to strength and spread its activities to newer fields like
Rayon Transparent paper pipes Refractors tyres and other products
Looking to the wide gap between the demand and supply of vital commodity
cement which play in important role in National building activity the Government of India
had de-licensed the cement industry in the year 1966 with a review to attract private
entrepreneur to augment the cement production Kesoram rose to the occasions and divided
to set up a few cement plants in the country
Kesoram cement undertaking marketing activities extensively in the state of Andhra
Pradesh Karnataka Tamilnadu Kerala Maharashtra and Gujarat In AP sales Depts are
located in different areas like Karimnagar Warangal Nizamabad Vijayawada and Nellore
In other states it has opened around 10 depots
The market share of Kesoram Cement in AP is 705 The market share of the
company in various states is shown as under
STATES MARKET SHARE
Karnataka 409
Tamilnadu 094
Kerala 029
Maharashtra 281
8102019 A Study A Study On Financial Performance Analysis With Reference To Kesoram Cementon Financial Performance hellip
httpslidepdfcomreaderfulla-study-a-study-on-financial-performance-analysis-with-reference-to-kesoram 2781
27
Process and Quality Control
It has been the endeavor of Kesoram to incorporate the Worldrsquos latest technology in
the plant and today the plant has the most sophisticated
X-ray analysis
Fully computerized XRF and XRD X-RAY Analyzers keep a constant round the
clock vigil on quality
Supreme performance
One of the largest Cement Plants in Andhra Pradesh the plant incorporate the latest
technology in Cement - making
It is professionally managed and well established Cement Manufacturing Company
enjoying the confidence of the consumers Kesoram has outstanding track record in
performance and productivity with quite a few national and state awards to its credit
BIRLA SUPREME the 43 Grade Cement is a widely accepted and popular brand
in the market commanding a premium
However to meet the specific demands of the consumer Kesoram bought out the 53
grade BIRLA SUPREME ndash GOLD which has special qualities like higher fineness quick-
setting high compressive strength and durability
Supreme Strength
Kesoram Cement has huge captive Limestone Deposits which make it possible tofeed high- grade limestone consistently its natural Grey colour is anion- born ingredient
and gives good shade
Both the products offered by Kesoram ie BIRLA SUPREME-43 Grade and
BIRLA SUPREME-GOLD-53 Grade cement are outstanding with much higher
compressive strength and durability
The following characteristics show their distinctive qualities
Comprehensive
Strength
Opc 43
grls 8112
1989
Birla
Supreme 43
grade
Opc 43 gr
Is 1226987
Birla
Supreme
Gold 53 gr
3 days mpa Min 23 31 + Min 27 38+
7 days mpa Min 23 42+ Min 37 48+
28 days mpa Min 43 50+ Min 53 60+
8102019 A Study A Study On Financial Performance Analysis With Reference To Kesoram Cementon Financial Performance hellip
httpslidepdfcomreaderfulla-study-a-study-on-financial-performance-analysis-with-reference-to-kesoram 2881
28
DC SYSTEM
Clinker making process is a key step in the overall cement making process In the case of
BIRLA SUPREMEGOLD the clinker-making process is totally computer control The
Distributed Control System (DCS) constantly monitors the process and ensures operating
efficiency This eliminates variation and ensures consistency in the quality of Clinker
Physical Characteristics
Ope 43
Is 8 112-89
Birla
Supreme
43 grade
Ope 53 gr
Is 12269-87
Birla Supreme
Gold 53 gr
Setting time Min30 120-180 Min 30 130-170
a Initial (mats) Max 600 180-240 Max 600 170-220
b final (mats) Min 225 270-280 Min 225 300-320
Fincncssm 2Kg Max 10 10-20 Max 10 05-10
Soundness Max 08 004-008 Max 0080 004-02
a le-chart (mm)
b autoclave ()
Supreme Expertise
The Best Technical Team exclusive to Kesoram mans the Plant and monitors the process
to blend the cement in just the required proportions to make BIRLA SUPREMEGOLD OF
Rock Strength
18 Million Tones of Solid Foundation
Staying at the top for over a Quarter Century Quarter Century is no less an achievement
Infact Kesoram is synonymous with for over 28 years
Over the years Kesoram has dispatched 18 million tones of cement to the nook and cornersof the country and joined hands in strengthening the Nation No one else in Andhra Pradesh
has this distinction The prestigious World Bank aided Ramagundam Super Thermal Power
Project of NTPC and Mannair Dam of Pochampad project in AP arc a couple of projects for
which Kesoram Cement was exclusively uses to cite an example
8102019 A Study A Study On Financial Performance Analysis With Reference To Kesoram Cementon Financial Performance hellip
httpslidepdfcomreaderfulla-study-a-study-on-financial-performance-analysis-with-reference-to-kesoram 2981
29
Chemical Characteristics
Opc 43 gr
Is 81 132-989
Birla
Supreme
43 grade
Ope 53 gr
Is 12269-
87
Birla
Supreme
Gold 53 gr
Loss on inflection Max 5 lt16 Max 40 lt15
Insoluble residue Max 20 lt08 Max 20 lt 06
Magnesium oxide Max 60 lt 13 Max 60 lt 13
Lime saturation factor 066-102 08-09 08-102 088-09
Alumna iron ratio MinO66 15-17 MinO66 15-17
Sulfuric anhydride Max 253 16-20 Max 2 53 16-20
Alkalis Chlorides Max 005 Max 001 Max 005 Max 04
Kesoram Cement - advantages
Helps in designing sleeker and more elegant
Structures giving greater flexibility in design concept
Due to its fine quality super fine construction can be achieved Its gives maximum
strength at Minimum use of cement with water in the water cement ratio especially the 53
grade Birlas supreme-gold
Feathers in Kesorams cap
Kesoram has outstanding track record achieving over 100 capacity utilization I
productivity and energy conservation It has proved its distinction by bagging several
national and state awards noteworthy being
NATIONAL
1 National productivity award for 1985-86
2 National productivity award for 1986-87
3 National award for mines safety for 1985-86
4 National award for mines safety for 1986-875 National award for energy conservation 1989-90
8102019 A Study A Study On Financial Performance Analysis With Reference To Kesoram Cementon Financial Performance hellip
httpslidepdfcomreaderfulla-study-a-study-on-financial-performance-analysis-with-reference-to-kesoram 3081
30
STATE
1 AP State productivity award for 1988
2 State award for best industrial management 1988-89
3 Best industrial productivity award of FAPCCI (federation of AP chamber of
commerce and industry) 1991
4 Best management award of the state Govt 1993
5 FAPCCI award for the workers welfare 1995-96
ISO 9002
All quality systems of Kesoram have been certified under ISO 90021S 4002 which
proves the worldwide acceptance of the products
All quality systems in production and marketing of the product have been certified by BIS
under ISO 90021S 14002
The first unit was installed at basanthnagar with a capacity of 25 ndashlakhs TPA (tones per
annum) incorporating humble supervision preheated system during the year 1969
The second unit followed suit with added a capacity of 2 lakhs TPA in 1971
The plant was further expanded to 9 lakhs by adding 25 lakhs tones in august 1978 113
lakhs tones in January 1981 and 087 lakhs tones in September 1981
Power
Singareni collieries make the supply of coal for this industry and the power was
obtained from AP TRANSCO The power demand for the factory is about 21MW Kesoram
has got 2-diesel generator seats of 4 MW each installed in the year 1987
Kesoram cement now has a 15MWcaptive power plant to facilities for uninterrupted
power supply for manufacturing of cement
Performance
The performance of kersoram cement industry has been outstanding achieving over
cent percent capacity utilization all through despite many odds like power cuts and which
most 40 was wasted due to wagon shortage etc
The company being a continuous process industry works round the clock and has
excellent records of performance achieving over 1005 capacity utilization
Kesoram has always combined technical progress with industrial performance The
company had glorious track record for the last 27 years in the industry
Technology
8102019 A Study A Study On Financial Performance Analysis With Reference To Kesoram Cementon Financial Performance hellip
httpslidepdfcomreaderfulla-study-a-study-on-financial-performance-analysis-with-reference-to-kesoram 3181
31
Kesoram cement uses most modern technology and the computerized control in the
plant A team of dedicated and well- experienced experts manages the plant
The quality is maintained much above the bureau of Indian standards
The raw materials used for manufacturing cement are
Lime stone
Bauxite
Hematite
Gypsum
Environmental and Social Obligations
For environmental promotion and to keep ndashup the ecological balance this section
has planted over two lakhs trees on social obligation front this section has undertaken
various social welfare programs by adopting ten nearly villages organizing family welfare
campus surgical camps animal health camps blood donation camps children immunization
camps seeds training for farmers etc were arranged
Welfare and Recreation Facilities
For the purpose of recreation facilities 2 auditoriums were provided for playing
indoor games cultural function and activities like drama music and dance etc
The industry has provided libraries and reading rooms About 1000 books are available in
the library All kinds of newspaper magazines are made available
Canteen is provided to cater to the needs of the employees for supply of snacks tea
coffee and meals etc
One English medium and one Telugu medium school are provided to meet the
educational requirements
The company has provided a dispenser with a qualified medical office and
paramedical staff for the benefit of the employees The employees covered under ESI
scheme have to avail the medical facilities from the ESI hospital
Competitions in sports and games are conducted every year for august 15th
Independence Day and January 26th republic day among the employees
Electricity
The power consumption per ton of cement has come down to 108 units against 113
units last year due to implementation of various energy saving measures The performance
of captive power plant of this section continues to be satisfactory Total power generation
8102019 A Study A Study On Financial Performance Analysis With Reference To Kesoram Cementon Financial Performance hellip
httpslidepdfcomreaderfulla-study-a-study-on-financial-performance-analysis-with-reference-to-kesoram 3281
32
during the year was 84 million units last year This captive power plant is a major role in
keeping power costs with in economic levels
The management has introduced various HRD programs for training and
development and has taken various other measures for the betterment of employeersquos
efficiency
The section has installed adequate air pollution control system and equipment and is
ISO14001 such as Environment management system is under implementation
Awards
Kesoram cement bagged many prestigious awards including national awards for
productivity technology conservation and several state awards since 1984 The following
are the some of important awards
AWARDS OF KESORAM CEMENT
No Year Awards
National
State
1 1989-90 Management award community
Development
State
2 1991 Energy conservation may day award of the
Govt
State
3 1991 Pundit Jawaharlal Nehru rolling trophy for
best
State
4 1993 National productivity effort Indira Gandhi
national award
State
5 1994 Best management award State
6 1994-
1995
Best industrial rebellion award State
7 1995 Rural development by chief minister
Environment and mineral conservation
award
State
8 1995 Best industrial rebellion award State
8102019 A Study A Study On Financial Performance Analysis With Reference To Kesoram Cementon Financial Performance hellip
httpslidepdfcomreaderfulla-study-a-study-on-financial-performance-analysis-with-reference-to-kesoram 3381
33
9 1995-
1996
Best effort of an industrial unit to
development rural economy shriSRRungta
award for social
National
10 1996 Awareness for best rural development
efforts
State
11 1999 Best workers welfare best family welfare
award
State
12 2001 First prize for mine environment amppollution
control for the 3rd
year in succession
State
13 2002 Vana mithra award from AP Govt State
14 2003 Company has got OHSAS-18001 State
15 2005 Certification from DNV New Delhi State
16 2006 Award for pollution control and
environmental protection FAPCCI award
for best rural development in the state
State
8102019 A Study A Study On Financial Performance Analysis With Reference To Kesoram Cementon Financial Performance hellip
httpslidepdfcomreaderfulla-study-a-study-on-financial-performance-analysis-with-reference-to-kesoram 3481
34
Products of the organization
8102019 A Study A Study On Financial Performance Analysis With Reference To Kesoram Cementon Financial Performance hellip
httpslidepdfcomreaderfulla-study-a-study-on-financial-performance-analysis-with-reference-to-kesoram 3581
35
CHAPTER-III
LITERATURE REVIEW
8102019 A Study A Study On Financial Performance Analysis With Reference To Kesoram Cementon Financial Performance hellip
httpslidepdfcomreaderfulla-study-a-study-on-financial-performance-analysis-with-reference-to-kesoram 3681
36
Introduction
Financial Performance Analysis
The term lsquofinancial performance analysis also known as analysis and interpretation of
financial statementsrsquo refers to the process of determining financial strength and
weaknesses of the firm by establishing strategic relationship between the items of the
balance sheet profit and loss account and other operative data
ldquoAnalyzing financial statementsrdquo by Metcalf and Titard
ldquoFinancial analysis is a process of evaluating the relationship between component
parts of a financial statement to obtain a better understanding of a firms position and
performancerdquo by Myers
Financial Performance
The word lsquoPerformance is derived from the word lsquoparfourmenrsquo which means lsquoto dorsquo lsquoto
carry outrsquo or lsquoto renderrsquo It refers the act of performing execution accomplishment
fulfillment etc In border sense performance refers to the accomplishment of a given task
measured against preset standards of accuracy completeness cost and speed In other
words it refers to the degree to which an achievement is being or has been accomplished In
the Words of Frich Kohlar ldquoThe performance is a general term applied to a part or to all the
conducts of activities of an organization over a period of time often with reference to past or
projected cost efficiency management responsibility or accountability or the like Thus not
just the presentation but the quality of results achieved refers to the performance
Performance is used to indicate firmrsquos success conditions and compliance
Financial performance refers to the act of performing financial activity In broader
sense financial performance refers to the degree to which financial objectives being or has
been accomplished It is the process of measuring the results of a firms policies and
operations in monetary terms It is used to measure firms overall financial health over a
given period of time and can also be used to compare similar firms across the same industry
or to compare industries or sectors in aggregation
The purpose of financial analysis is to diagnose the information contained in financial
statements so as to Jude the profitability and financial soundness of the firm Just like a
doctor examines his patient by recording his body temperature blood pressure etc Before
8102019 A Study A Study On Financial Performance Analysis With Reference To Kesoram Cementon Financial Performance hellip
httpslidepdfcomreaderfulla-study-a-study-on-financial-performance-analysis-with-reference-to-kesoram 3781
37
making his conclusion regarding the illness and before giving his treatment a financial
analyst analysis the financial statements with various tools of analysis before commenting
upon the financial health or weaknesses of an enterprise
The analysis and interpretation of financial statements is essential to bring out the
mystery behind the figures in financial statements Financial statements analysis is an
attempt to determine the significance and meaning of the financial statement data so that
forecast may be made of the future earnings ability to pay interest and debt maturities (both
current and long term) and profitability of a sound divided policy
Types of financial analysis-
Financial analysis into different categories depending upon
(1) The material used and
(2) The method of operation followed in the analysis or the modus operandi of
analysis
Types of financial analysis
On the basis of material used on the basis of modus operandi
External Internal Horizontal Vertical
Analysis Analysis Analysis Analysis
1 On the basis of material used - According to material used financial analysis canbe of two types
External analysis
Internal analysis
External analysis-
This analysis is done by outsiders who do not have access to the detailed internal
outsiders include investors potential investors Creditors Potential Creditors Government
Agencies Credit Agencies and General Public For financial analysis these external parties
to the firm depend almost entirely on the published financial statements
Internal analysis-
This analysis is undertaken by the persons namely executives and employees of the
organization or by the officers appointed by government or court who have access to the
8102019 A Study A Study On Financial Performance Analysis With Reference To Kesoram Cementon Financial Performance hellip
httpslidepdfcomreaderfulla-study-a-study-on-financial-performance-analysis-with-reference-to-kesoram 3881
38
books of account ( internal accounting records) and other information related to the
business
2 983119983150 983156983144983141 983138983137983155983145983155 983151983142 983149983151983140983157983155 983151983152983141983154983137983150983140983145983085
According to the modus operandi financial analysis can also be of two types
a Horizontal analysis
bVertical analysis
Horizontal analysis-
Horizontal analysis refers to the comparison of financial data of a company for several
years The figures for this type of analysis are presented horizontally over a number of
columns The figures of the various years are compared with standard or base year a base
year is year chosen as beginning point This type of analysis is also called lsquodynamicanalysisrsquo as it is based on the data from year to year rather than on data of any one year The
horizontal analysis makes it possible to focus attention on items that have changed
significantly during the period under view
b Vertical analysis-
Vertical analysis refers to the study of relationship of the various items in the financial
statements of one accounting period In this types of analysis the figures from financial
statement of a year are compared with a base selected from the same yearrsquos statement
Methods of financial analysis-
The following methods of analysis are generally used-
1 Comparative Statements
2 Trend Analysis
3 Common-Size Statements
4 Funds flow Analysis
5 Cash Analysis
6 Ratio Analysis
7 Cost-volume-Profit Analysis
8102019 A Study A Study On Financial Performance Analysis With Reference To Kesoram Cementon Financial Performance hellip
httpslidepdfcomreaderfulla-study-a-study-on-financial-performance-analysis-with-reference-to-kesoram 3981
39
Comparative statements-
The comparative financial statements are statements of the financial position at
different periods of time the elements of financial position are show in a
Comparative Statement provides an idea of financial position at two or more
periods Generally two financial statements (balance sheet and income statement) are
prepared in comparative form for financial analysis
The Comparative Statement May Show-
1 Absolute figures (rupee amounts)
2 Changes in absolute figures ie increase or decrease in absolute figures
3 Absolute data in terms of percentages
4 Increase or decrease in terms of percentages
The Two Comparative Statements Are-
1 Comparative balance sheet and
2 Income statement
1 983107983151983149983152983137983154983137983156983145983158983141 983138983137983148983137983150983139983141 983155983144983141983141983156983085
The comparative balance sheet analysis is the study of the trend of the same items group of
items and computed items in two or more balance sheets of the same business enterprise on
different dates The change in periodic balance sheet items reflect the conduct of a business
the change can be observed by comparison of the balance sheet at the beginning and at the
end of a period and these changes can help in forming an opinion about the progress of an
enterprise
Guide Lines for Interpretation of Comparative Balance Sheet-
While interpreting comparative balance sheet the interpreter is expected to study the
following aspects-
1 Current financial position and liquidity position
2 Long-term financial position
3 Profitability of the concern
8102019 A Study A Study On Financial Performance Analysis With Reference To Kesoram Cementon Financial Performance hellip
httpslidepdfcomreaderfulla-study-a-study-on-financial-performance-analysis-with-reference-to-kesoram 4081
40
Common Size Statement-
The common-size statements balance sheet and income statement are show in
analytical percentages The figures are shown as percentages of total assets total liabilities
and total sales The total assets are taken as 100 and different assets are expressed as a
percentage of the total similarly various liabilities are taken as a part of total liabilities
Common Size Balance Sheet-
A statement in which balance sheet items are expressed as the ratio of each asset to
total assets and the ratio of each liability is expressed as a ratio of total liabilities is called
common size balance The common size balance sheet can be used to compare companies
of differing size The comparison of figures in different periods is not useful because total
figures may be affected by a number of factors It is not possible to establish standard norms
for various assets The trends of figures from year to year may not be studied and even they
may not give proper results
Trend Analysis of Balance Sheet-
Trend analysis is Very important tool of horizontal financial analysis
This analysis enables to known the change in the financial function and operating efficiency
in between the time period chosen
By studding the trend analysis of each item we can known the direction of changes and
based upon the direction of changes the options can be changed
Trend =Absolute Value of item in the statement understudy 100
Absolute Value of same item in the base statement
Ratio Analysis
Ratio analysis is used as a technique of analyzing the financial information contained in the
balance sheet and profit and loss accounts for a more meaningful understanding of the
financial position and performance of a firm
The relationship between two accounting figures expressed mathematically is known as a
financial ratio A ratio helps the analyst to make qualitative judgment about the firmrsquos
financial position and performance
Several ratios can be calculated from the accounting data contained in the financial
statements The parties which generally undertake financial analysis is short ndashterm
creditors long-term creditors owner and management In view of the requirements of the
various ratios ratios are classified into the following four important categories
8102019 A Study A Study On Financial Performance Analysis With Reference To Kesoram Cementon Financial Performance hellip
httpslidepdfcomreaderfulla-study-a-study-on-financial-performance-analysis-with-reference-to-kesoram 4181
41
Liquidity ratios
Leverage ratios
Activity ratios
Profitability ratios
Liquidity Ratios
It is extremely essential for a firm to be able to meet its obligations as they become due
Liquidity ratios measure the ability of the firm to meet its current obligations A firm should
ensure that it does not suffer from lack of liquidity and also that it does not have excess
liquidity The failure of a company to meet its obligations due to lack of sufficient liquidity
will result in a poor creditworthiness loss of creditorsrsquo confidence or even in legal tangles
resulting in the closure of the company A very high degree of liquidity is also bad idle
assets earn nothing The firmrsquos funds will be unnecessarily tied up in current assets
Therefore it is necessary to strike a proper balance high liquidity and lack of liquidity
The most common ratios which indicate the extent of liquidity or lack of it are
Current ratio
Quick ratio
Other ratios include Cash ratio Interval Measure and Net working capital ratio
Current Ratio
The current ratio is calculated by dividing current assets by current liabilities
Current assets
Current ratio = --------------------------
Current liabilities
Current ratio is a measure of the firmrsquos short term solvency It indicates the availability of
current assets in rupees for every one rupee of current liability A ratio of greater than one
means that the firm has more current assets than current claims against the Current ratio of
2 to 1 or more is considered satisfactory Current ratio represents a margin of safety for
creditors
Quick Ratio
Quick ratio also known as acid-test ratio establishes a relationship between quick assets and
the current liabilities Cash is the most liquid asset It is calculated by dividing quick assets
by current liabilities
Quick ratio = Quick Assets Current Liabilities
8102019 A Study A Study On Financial Performance Analysis With Reference To Kesoram Cementon Financial Performance hellip
httpslidepdfcomreaderfulla-study-a-study-on-financial-performance-analysis-with-reference-to-kesoram 4281
42
(Quick Assets = Current assets ndash Inventory)
One defect of the current ratio is that it fails to convey any information on the composition
of the current assets of the firm A rupee of cash is considered equivalent to a rupee of
inventory of receivables But it is not so A rupee of cash is more readily available to meet
current liabilities than a rupee of say inventory This implies the usefulness of the current
ratio
The Acid ndashtest ratio measures the firmrsquos ability to convert its current assets quickly into
cash in order to meet its current liabilities
A quick ratio of 1 to 1 is considered to represent a satisfactory current financial condition It
is an important index of the firmrsquos liquidity
Leverage Ratios
Leverage ratios identify the source of a firmrsquos capital ndashowners or outside creditors
Financial leverage refers to the use of debt in financing non-current assets If the return on
assets exceeds the cost of debt the leverage is successful ndash ie it improves return on equity
Debt ndashEquity Ratio
The Debt ndash Equity is determined to analyze the soundness of the long term financial
policies of the organization It is also known as ldquoInternal External Equity Ratiordquo
It is calculated as follows
Debt ndash Equity Ratio = Total long term debt Share holders funds
Equity Ratio
This ratio is also called as proprietary ratio establishes a relationship between share holderrsquos
funds to total assets of company Equity Ratio is calculated by dividing share holders fund
by total assets
Fixed Asset Ratio
This ratio indicates the extent to which the assets of the companyrsquos can be lost without
affecting the interest of the creditors of the company Higher the ratios better the long-term
position of the company
Activity Ratios
They are primarily used for studying a firmrsquos working capital situation A well managed
firm should have good activity ratios
8102019 A Study A Study On Financial Performance Analysis With Reference To Kesoram Cementon Financial Performance hellip
httpslidepdfcomreaderfulla-study-a-study-on-financial-performance-analysis-with-reference-to-kesoram 4381
43
Working Capital Turnover Ratio
The working capital turnover ratio indicates whether or not working capital has been
effectively used in making sales
Working capital turnover = Sales Net current assets
Inventory Turnover Ratio
This ratio also known as Stock Turnover Ratio establishes the relationship between costs of
goods sold or net sales during the given period and the average amt of stock held during the
period This ratio reveals the number of times finished stock in turnover during a given
accounting period
Higher the ratio the better is it because it shows the finished stock is rapidly turned
in to sales On the other hand a low stock turnover ratio is not desirable because it reveals
the accumulation of stock
Debtors Turnover Ratio
This ratio indicates the velocity of debt collection of a company In other words it shows
the number of times average turnover during a year
A Higher Debtor Turnover Ratio indicates a more efficient is the management towards
debtors and low ratio ratio implies inefficient management of debtors
Total Assets Turnover Ratio
The asset turnover ratio indicates how efficiently management is employing Assets
Total Assets Turnover Ratio = Sales Total Assets
Profitability Ratios
Profitability ratios are the ratios which measure a firmrsquos overall effectiveness as revealed by
the returns generated on sales and investment
General Profitability Ratios
1 Gross Profit Ratio
2 Net profit Ratio
3 Operating or Expenses Ratio
8102019 A Study A Study On Financial Performance Analysis With Reference To Kesoram Cementon Financial Performance hellip
httpslidepdfcomreaderfulla-study-a-study-on-financial-performance-analysis-with-reference-to-kesoram 4481
44
Gross Profit Ratio
Gross profit Ratio measures the relationships to net sales and is usually represented as a
percentage It is a good measure of profitability
The gross profit ratio indicates the extent to which selling price of goods per unit may
decline without resulting in losses on operation Higher the gross profit betters the result
Net Profit Ratio
Net Profit Ratio indicates net margin on sales It is given by the following equation
Net Profit Ratio = (Net Profit Sales) 100
Operating or Expenses Ratio
This ratio is complimentary of Net Profit Ratio The more the net profit the less the
Operating Ratio Operating costs include the cost of direct materials direct labors and otheroverheads viz are generally excluded from operating costs A comparison of the Operating
Ratio will indicate whether the cost efficiency is high or low in the figure of sales This less
the ratio it depicts the efficiency of the management
8102019 A Study A Study On Financial Performance Analysis With Reference To Kesoram Cementon Financial Performance hellip
httpslidepdfcomreaderfulla-study-a-study-on-financial-performance-analysis-with-reference-to-kesoram 4581
45
CHAPTER IV
DATA ANALYSIS amp INTERPRETATION
8102019 A Study A Study On Financial Performance Analysis With Reference To Kesoram Cementon Financial Performance hellip
httpslidepdfcomreaderfulla-study-a-study-on-financial-performance-analysis-with-reference-to-kesoram 4681
46
Comparative Balance Sheet of Kesoram in the Year between 2008-2009
(Rupee in crores)
Years Changes
Particulars 2008 2009 In Rupees In Percentage
Liabilities
Share Capital 4574 4574 000 000
Reserves amp Surplus 93085 128024 34939
Revaluation Reserves 533 412 -121 -2270
Loans
Secured Loans 97106 153627 56521 5821
Un Secured Loans 12129 43416 31287 25795
Deferred Tax Liabilities 000 000 000 000
Current Liabilities
Provisions 33039 34529 1490 451
Current Liabilities 57067 66587 9520 1668
Total 297533 431169 133636 4491
Assets
Net Block 108424 180435 72011 6642
Capital Wip 63459 86485 23026 3628
Investments 4783 6178 1395 2917
Current Assets
Inventories 44217 58906 14689 3322
Sundry Debtors 27307 38017 10710 3922
Cash amp Bank Balances 4036 5657 1621 4016
Total Current Assets 75560 102580 27020 3576
Loans amp Advances 45289 55462 10173 2246
Fixed Deposits 018 028 010 5556
Total 297533 431169 133636 4491
8102019 A Study A Study On Financial Performance Analysis With Reference To Kesoram Cementon Financial Performance hellip
httpslidepdfcomreaderfulla-study-a-study-on-financial-performance-analysis-with-reference-to-kesoram 4781
47
Interpretation of comparative balance sheet of 2008-2009
Reserves amp Surplus were increased to 3753 (percent) ie in Rupees 34939
crores
Revaluation Reserves decreased to 121 ie in Rupees 2270 crores
Secured Loans are increased to 5821 ie in Rupees 56521 crores And UN
secured loans highly Increased to 25795
Current liabilities and Provisions are increased to 1668 and 451 respectively ie in
Rupees 9520 amp 1490 crores
Fixed assets were highly increased to 6642 ie in Rupees 72011 crores
Investments were increased to 2917 ie in Rupees 1395 crores
Sundry debtors increased to 3922 ie in Rupees 10710 crores
Current assets increased 3576 ie in Rupees 27020 crores And Loans amp
Advances increased to 2246 respectively
The overall financial position was satisfactory
8102019 A Study A Study On Financial Performance Analysis With Reference To Kesoram Cementon Financial Performance hellip
httpslidepdfcomreaderfulla-study-a-study-on-financial-performance-analysis-with-reference-to-kesoram 4881
48
Comparative Balance Sheet of Kesoram in the Year between 2009-2010
(Rupees in crores)
Years Changes
Particulars 2009 2010 In Rupees In Percentage
Liabilities
Share Capital 4574 4574 000 000
Reserves amp Surplus 128024 149111 21087 1647
Revaluation Reserves 412 339 -073 -1772
Loans
Secured Loans 153627 186372 32745 2131
Un Secured Loans 43416 126250 82834 19079
Deferred Tax Liabilities 000 000 000
Current Liabilities
Provisions 34529 35734 1205 349
Current Liabilities 66587 107688 41101 6173
Total 431169 610068 178899 4149
Assets
Net Block 180435 343182 162747 9020
Capital WIP 86485 41283 -45202 -5227
Investments 6178 5143 -1035 -1675
Current Assets
Inventories 58906 91619 32713 5553
Sundry Debtors 38017 54289 16272 4280
Cash amp Bank Balances 5657 8014 2357 4167
Total Current Assets 102580 153922 51342 5005
Loans amp Advances 55462 66506 11044 1991
Fixed Deposits 028 031 003 1071
Total 431169 610068 178899 4149
8102019 A Study A Study On Financial Performance Analysis With Reference To Kesoram Cementon Financial Performance hellip
httpslidepdfcomreaderfulla-study-a-study-on-financial-performance-analysis-with-reference-to-kesoram 4981
49
Interpretation of comparative balance sheet of 2009-2010
Reserves amp surplus increased to 1647 ie in Rupees 21087 crores
Revaluation Reserves decreased to 1772 ie in Rupees 073 crores
Secured loans increased to 2131 ie in Rupees 32745 crores
Current Liabilities were increased to 6173 ie in Rupees 41101 crores and
Provisions 349 ie in Rupees 1205 crores
Fixed Assets were increased to 9020 ie in Rupees 162747 crores
Investments were decreased to 1675 ie in Rupees 1035 crores
Sundry debtors were increased to 4280 ie in Rupees 16272 crores
Current assets increased to 5005 ie in Rupees 51342 crores And loans and
Advances increased 1919 ie in Rupees 11044 crores
The overall financial position was satisfactory
8102019 A Study A Study On Financial Performance Analysis With Reference To Kesoram Cementon Financial Performance hellip
httpslidepdfcomreaderfulla-study-a-study-on-financial-performance-analysis-with-reference-to-kesoram 5081
50
Comparative Balance Sheet of Kesoram in the Year between 2010-2011
(Rupees in crores)
Years Changes
Particulars 2010 2011 In Rupees In Percentage
Liabilities
Share Capital 4574 4574 000 000
Reserves amp Surplus 149111 125162 -23949 -1606
Revaluation Reserves 339 289 -050 -1475
Loans
Secured Loans 186372 237183 50811 2726
Un Secured Loans 126250 162744 36494 2891
Deferred Tax Liabilities 000 000 000
Current Liabilities
Provisions 35734 1494 -34240 -9582
Current Liabilities 107688 113902 6214 577
Total 610068 645348 35280 578
Assets
Net Block 343182 369172 25990 757
Capital WIP 41283 43781 2498 605
Investments 5143 6582 1439 2798
Current Assets
Inventories 91619 111855 20236 2209
Sundry Debtors 54289 63134 8845 1629
Cash amp Bank Balances 8014 7188 -826 -1031
Total Current Assets 153922 182177 28255 1836
Loans amp Advances 66506 43460 -23046 -3465
Fixed Deposits 031 176 145 46774
Total 610068 645348 35280 578
8102019 A Study A Study On Financial Performance Analysis With Reference To Kesoram Cementon Financial Performance hellip
httpslidepdfcomreaderfulla-study-a-study-on-financial-performance-analysis-with-reference-to-kesoram 5181
51
Interpretation of comparative balance sheet of 2010-2011
Reserves amp surplus decreased to 1606 ie in Rupees 23949 crores
Revaluation Reserves decreased to 1475 ie in Rupees 050 crores
Secured loans increased to 2726 ie in Rupees 50811 crores
Current Liabilities were increased to 577 ie in Rupees 6214 crores
Provisions decreased to 9582 ie in Rupees 34240 crores
Fixed Assets were increased to 757 ie in Rupees 25990 crores
Investments were decreased to 2798 ie in Rupees 1439 crores
Sundry debtors were increased to 1629 ie in Rupees8845 crores
Current assets increased to 1836 ie in Rupees 28255 crores And loans and
Advances increased 3465 ie in Rupees 23046 crores
The overall financial position was UN satisfactory
8102019 A Study A Study On Financial Performance Analysis With Reference To Kesoram Cementon Financial Performance hellip
httpslidepdfcomreaderfulla-study-a-study-on-financial-performance-analysis-with-reference-to-kesoram 5281
52
Comparative Balance Sheet of Kesoram In The Year Between 2011-2012
(Rupees in crores)
Years Changes
Particulars 2011 2012 In Rupees In Percentage
Liabilities
Share Capital 4574 4574 000 000
Reserves amp Surplus 125162 86657 -38505 -3076
Revaluation Reserves 289 270 -019 -657
Loans
Secured Loans 237183 317792 80609 3399
Un Secured Loans 162744 92742 -70002 -4301
Deferred Tax Liabilities 000 000 000
Current Liabilities
Provisions 1494 40726 39232 262597
Current Liabilities 113902 180010 66108 5804
Total 645348 722771 77423 1200
Assets 000
Net Block 369172 358721 -10451 -283
Capital WIP 43781 68065 24284 5547
Investments 6582 6636 054 082
Current Assets
Inventories 111855 99516 -12339 -1103
Sundry Debtors 63134 67358 4224 669
Cash amp Bank Balances 7188 6959 -229 -319
Total Current Assets 182177 173833 -8344 -458
Loans amp Advances 43460 115409 71949 16555
Fixed Deposits 176 107 -069 -3920
Total 645348 722771 77423 1200
8102019 A Study A Study On Financial Performance Analysis With Reference To Kesoram Cementon Financial Performance hellip
httpslidepdfcomreaderfulla-study-a-study-on-financial-performance-analysis-with-reference-to-kesoram 5381
53
Interpretation of comparative balance sheet of 2011-2012
Reserves amp surplus decreased to 3076 ie in Rupee 38505 crores
Revaluation Reserves decreased to 657 ie in Rupees 019 crores
Secured loans increased to 3399 ie in Rupees 80699 crores
Current Liabilities were increased to 5804 ie in Rupees 66108 crores
Provisions increased to 262597 ie in Rupees 39232 crores
Fixed Assets were decreased to 283 ie in Rupee 10451 crores
Investments were increased to 082 ie in Rupees 054 crores
Sundry debtors were increased to 669 ie in Rupees 4224 crores
Current assets decreased to 458 ie in Rupees 8344 crores And loans and
Advances increased 16555 ie in Rupees 71949 crores
The overall financial position was UN satisfactory
8102019 A Study A Study On Financial Performance Analysis With Reference To Kesoram Cementon Financial Performance hellip
httpslidepdfcomreaderfulla-study-a-study-on-financial-performance-analysis-with-reference-to-kesoram 5481
54
Common Size Balance Sheet of Kesoram For The Year 2008-2009
(Rupees in crores)
Particulars 2008 Change Percentage 2009 Change Percentage
Liabilities
Share Capital 4574 154 4574 106
Reserves amp Surplus 93085 3129 128024 2969
Revaluation Reserves 533 018 412 010
Loans
Secured Loans 97106 3264 153627 3563
Un Secured Loans 12129 408 43416 1007
Deferred Tax Liabilities 000 000 000 000
Current Liabilities
Provisions 33039 1110 34529 801
Current Liabilities 57067 1918 66587 1544
Total 297533 10000 431169 10000
Assets
Net Block 108424 3644 180435 4185
Capital WIP 63459 2133 86485 2006
Investments 4783 161 6178 143
Current Assets
Inventories 44217 1486 58906 1366
Sundry Debtors 27307 918 38017 882
Cash amp Bank Balances 4036 136 5657 131
Loans amp Advances 45289 1522 55462 1286
Fixed Deposits 018 001 028 001
Total 297533 10000 431169 10000
8102019 A Study A Study On Financial Performance Analysis With Reference To Kesoram Cementon Financial Performance hellip
httpslidepdfcomreaderfulla-study-a-study-on-financial-performance-analysis-with-reference-to-kesoram 5581
55
Interpretation of Common Size Balance Sheet of 2008-2009
Share capital was recorded 154 percent in the total liabilities in the year 2008 it is
decreased to 106 in the year 2009
Reserves amp surplus contributed to 3129 in the total liabilities in the year 2008 it is
decreased to 2969 in the year 2009
Secured loans were 3264 in the total liabilities in the year 2008 it is increased to
3563 in the year 2009
Current Liabilities shown to 1918 in the total liabilities in the year 2008 it is
decreased to 1544 in the year 2009
Provisions 1110 in the total liabilities in the year 2008 it is decreased to 801 in the
year 2009
Fixed Assets were 3644 in the total liabilities in the year 2008 ie decreased to 4185
in the year 2009
Investments were 161 in the total liabilities in the year 2008 it is decreased to 143
in the year 2009
Sundry debtors were 918 in the total liabilities in the year 2008 it is decreased to 882
in the year 2009
8102019 A Study A Study On Financial Performance Analysis With Reference To Kesoram Cementon Financial Performance hellip
httpslidepdfcomreaderfulla-study-a-study-on-financial-performance-analysis-with-reference-to-kesoram 5681
56
Common Size Balance Sheet of Kesoram For The Year 2009-2010
(Rs in crores)
Particulars 2009 Change Percentage 2010Change
Percentage
Liabilities
Share Capital 4574 106 4574 075
Reserves amp Surplus 128024 2969 149111 2444
Revaluation Reserves 412 010 339 006
Loans
Secured Loans 153627 3563 186372 3055
Un Secured Loans 43416 1007 126250 2069
Deferred Tax Liabilities 000 000 000 000
Current Liabilities
Provisions 34529 801 35734 586
Current Liabilities 66587 1544 107688 1765
Total 431169 10000 610068 10000
Assets
Net Block 180435 4185 343182 5625
Capital WIP 86485 2006 41283 677
Investments 6178 143 5143 084
Current Assets
Inventories 58906 1366 91619 1502
Sundry Debtors 38017 882 54289 890
Cash amp Bank Balances 5657 131 8014 131
Loans amp Advances 55462 1286 66506 1090
Fixed Deposits 028 001 031 001
Total 431169 10000 610068 10000
8102019 A Study A Study On Financial Performance Analysis With Reference To Kesoram Cementon Financial Performance hellip
httpslidepdfcomreaderfulla-study-a-study-on-financial-performance-analysis-with-reference-to-kesoram 5781
57
Interpretation of common size balance sheet of 2009-2010
Share capital was recorded 106 percent in the total liabilities in the
year 2009 it is decreased to 075 in the year 2010
Reserves amp surplus contributed to 2969 in the total liabilities in the
year 2009 it is decreased to2444 in the year 2010
Secured loans were 3563 in the total liabilities in the year 2009 it is
increased to 3055 in the year 2010
Current Liabilities shown to 1544 in the total liabilities in the year
2009 it is decreased to 1765 in the year 2010
Provisions 801 in the total liabilities in the year 2009 it is decreased
to 586 in the year 2010
Fixed Assets were 4185 in the total liabilities in the year 2009 ie
increased to 5625 in the year 2010
Investments were 143 in the total liabilities in the year 2009 it is
decreased to 084 in the year 2010
Sundry debtors were 882 in the total liabilities in the year 2009 it is
increased to 890 in the year 2010
8102019 A Study A Study On Financial Performance Analysis With Reference To Kesoram Cementon Financial Performance hellip
httpslidepdfcomreaderfulla-study-a-study-on-financial-performance-analysis-with-reference-to-kesoram 5881
58
Common Size Balance sheet of Kesoram for the year 2010-2011
983080Rupees in crores)
Particulars 2010 Change Percentage 2011
Change
Percentage
Liabilities
Share Capital 4574 075 4574 071
Reserves amp Surplus 149111 2444 125162 1939
Revaluation Reserves 339 006 289 004
Loans
Secured Loans 186372 3055 237183 3675
Un Secured Loans 126250 2069 162744 2522
Deferred Tax Liabilities 000 000 000 000
Current Liabilities
Provisions 35734 586 1494 023
Current Liabilities 107688 1765 113902 1765
Total 610068 10000 645348 10000
Assets
Net Block 343182 5625 369172 5721
Capital WIP 41283 677 43781 678
Investments 5143 084 6582 102
Current Assets
Inventories 91619 1502 111855 1733
Sundry Debtors 54289 890 63134 978
Cash amp Bank Balances 8014 131 7188 111
Loans amp Advances 66506 1090 43460 673
Fixed Deposits 031 001 176 003
Total 610068 10000 645348 10000
8102019 A Study A Study On Financial Performance Analysis With Reference To Kesoram Cementon Financial Performance hellip
httpslidepdfcomreaderfulla-study-a-study-on-financial-performance-analysis-with-reference-to-kesoram 5981
59
Interpretation of Common Size Balance Sheet Of 2010-2011
Share capital was recorded 075 percent in the total liabilities in the year 2010 it is
decreased to 071 in the year 2011
Reserves amp surplus contributed to 2444 in the total liabilities in the year 2010 it is
decreased to1939 in the year 2011
Secured loans were 3055 in the total liabilities in the year 2010 it is increased to
3675 in the year 2011
Current Liabilities shown to 1765 in the total liabilities in the year 2010 it is
also1765 in the year 2011
Provisions 586 in the total liabilities in the year 2010 it is decreased to 023 in the
year 2011
Fixed Assets were 5625 in the total liabilities in the year 2010 ie increased to 5721
in the year 2011
Investments were 084 in the total liabilities in the year 2010 it increased to 102 in
the year 2011
Sundry debtors were 890 in the total liabilities in the year 2010 it is increased to 978
in the year 2011
8102019 A Study A Study On Financial Performance Analysis With Reference To Kesoram Cementon Financial Performance hellip
httpslidepdfcomreaderfulla-study-a-study-on-financial-performance-analysis-with-reference-to-kesoram 6081
60
Common Size Balance Sheet of Kesoram for the Year 2011-2012
983080Rupees in crores)
Particulars 2011 Change Percentage 2012
Change
Percentage
Liabilities
Share Capital 4574 071 4574 063
Reserves amp Surplus 125162 1939 86657 1199
Revaluation Reserves 289 004 270 004
Loans
Secured Loans 237183 3675 317792 4397
Un Secured Loans 162744 2522 92742 1283
Deferred Tax Liabilities 000 000 000 000
Current Liabilities
Provisions 1494 023 40726 563
Current Liabilities 113902 1765 180010 2491
Total 645348 10000 722771 10000
Assets
Net Block 369172 5721 358721 4963
Capital WIP 43781 678 68065 942
Investments 6582 102 6636 092
Current Assets
Inventories 111855 1733 99516 1377
Sundry Debtors 63134 978 67358 932
Cash amp Bank Balances 7188 111 6959 096
Loans amp Advances 43460 673 115409 1597
Fixed Deposits 176 003 107 001
Total 645348 10000 722771 10000
8102019 A Study A Study On Financial Performance Analysis With Reference To Kesoram Cementon Financial Performance hellip
httpslidepdfcomreaderfulla-study-a-study-on-financial-performance-analysis-with-reference-to-kesoram 6181
61
Interpretation of common size balance sheet of 2011-2012
Share capital was recorded 071 percent in the total liabilities in the year 2011 it is
decreased to 063 in the year 2012
Reserves amp surplus contributed to 1939 in the total liabilities in the year 2011 it
is decreased to 1199 in the year 2012
Secured loans were 3675 in the total liabilities in the year 2011 it is increased to
4397 in the year 2012
Current Liabilities shown to 1765 in the total liabilities in the year 2011 it is
increased to 2491 in the year 2012
Provisions 023 in the total liabilities in the year 2011 it is increased to 563 in the
year 2012
Fixed Assets were 5721 in the total liabilities in the year 2011 ie decreased to
4963 in the year 2012
Investments were 102 in the total liabilities in the year 2011 it increased to 092
in the year 2012
Sundry debtors were 978 in the total liabilities in the year 2011 it is decreased to
932 in the year 2012
8102019 A Study A Study On Financial Performance Analysis With Reference To Kesoram Cementon Financial Performance hellip
httpslidepdfcomreaderfulla-study-a-study-on-financial-performance-analysis-with-reference-to-kesoram 6281
Trend Analysis
Share Capital-
Year
Amount
(In Crores) Trend
IncreaseDecrease
Base Year Previous Year
2008 4574 10000 000 000
2009 4574 10000 000 000
2010 4574 10000 000 000
2011 4574 10000 000 000
2012 4574 10000 000 000
Trend Percentages in Share Capital
Share capital shown a constant trend in the period 2008 and 2012
Share capital is 4574 crores all the years from 2008-2012
8102019 A Study A Study On Financial Performance Analysis With Reference To Kesoram Cementon Financial Performance hellip
httpslidepdfcomreaderfulla-study-a-study-on-financial-performance-analysis-with-reference-to-kesoram 6381
Reserves amp Surplus-
Year
Amount
(In Crores) Trend
IncreaseDecrease
Base Year Previous Year
2008 93085 10000 000 000
2009 128024 13753 3753 3753
2010 149111 16019 6019 2266
2011 125162 13446 3446 -2573
2012 86657 9309 -691 -4137
Trend Percentages in Reserves amp Surplus
Reserves amp surplus shown an increasing trend in the period between 2008 and 2010
The average trend was 13277 till 2010
The Reserves amp surplus was showing decreasing trend in the period 2011-2012 (ie
from 16019 in 2010 to 9309 in 2012)
The decreasing trend in Reserves amp surplus indicates the decrease in profits of the
firm
8102019 A Study A Study On Financial Performance Analysis With Reference To Kesoram Cementon Financial Performance hellip
httpslidepdfcomreaderfulla-study-a-study-on-financial-performance-analysis-with-reference-to-kesoram 6481
Investments-
Year
Amount
(In Crores) Trend
IncreaseDecrease
Base Year Previous Year
2008 4783 10000 000 000
2009 6178 12917 2917 2917
2010 5143 10753 753 -2164
2011 6582 13761 3761 3009
2012 6636 13874 3874 113
Trend Percentages in Investments-
The investments are shown an increasing trend in the period between 2008 ndash 2009
and it is decreasing in the year 2010
The average trend was 11458 till 2009
The investments increased in the periods 2011-2012 (ie from 10753 in 2010 to
13874 in 2012)
The overall trend in investments shown is satisfactory
8102019 A Study A Study On Financial Performance Analysis With Reference To Kesoram Cementon Financial Performance hellip
httpslidepdfcomreaderfulla-study-a-study-on-financial-performance-analysis-with-reference-to-kesoram 6581
Net Current Assets-
Year
Amount
(In Crores) Trend
IncreaseDecrease
Base Year Previous Year
2008 30761 10000 000 000
2009 56954 18515 8515 8515
2010 77037 25044 15044 6529
2011 110417 35895 25895 10851
2012 68613 22305 12305 -13590
Trends in Net Current Assets-
The NCA shown positive (increasing) trend
The NCA are increased to 35895 (the year 2011) compared with base year and
decreased in the year 2012 to 22305
The NCA shown increased trend from year and crossed 100
The overall trend was good
8102019 A Study A Study On Financial Performance Analysis With Reference To Kesoram Cementon Financial Performance hellip
httpslidepdfcomreaderfulla-study-a-study-on-financial-performance-analysis-with-reference-to-kesoram 6681
66
Ratio Analysis-
Current Ratio-
Current Ratio = Current Assets Current Liabilities
Current assets are cash in hand Cash at bank Marketable Securities(short term) short term
Investment Bills receivables sundry debtors Inventories (stock) Work in progress prepaid
expenses Current Liabilities are outstanding expenses Bills payable sundry Creditors
short-term advances income tax payable and Dividend payable
Current Ratio of Kesoram-
(Rupees in crores)
Year Current Assets Current Liabilities Current Ratio
2007-08 75560 57067 132
2008-09 102580 66587 154
2009-10 153922 107688 143
2010-11 182177 113902 160
2011-12 173833 180010 097
Interpretation-
As per the standard rule of current ratio ie 21 where current assets double the current
liabilities is considered satisfactory
In the present analysis the current ratio of the Kesoram is not satisfactory
from the above table It was assessed that the current ratio for all the five year is lower (less)
than the standard rule ie 21 And it is 097 in the year 2011-2012 (current year) This is
highly UN satisfactory
8102019 A Study A Study On Financial Performance Analysis With Reference To Kesoram Cementon Financial Performance hellip
httpslidepdfcomreaderfulla-study-a-study-on-financial-performance-analysis-with-reference-to-kesoram 6781
Quick Ratio-
Quick ratio also known as acid-test ratio establishes a relationship between quick
assets and the current liabilities Cash is the most liquid asset It is calculated by dividing
quick assets by current liabilities
Quick ratio = Quick Assets Current Liabilities
(Quick Assets = Current assets ndash Inventory)
Quick Ratio of Kesoram-
Rupees in crores)
Year Total QuickAssets
Current Liabilities Quick Ratio
2007-08 33343 57067 058
2008-09 43674 66587 066
2009-10 62303 107688 058
2010-11 70322 113902 0622011-12 74333 180010 041
Interpretation-
Usually a high Quick ratio is an indication that the company is liquid and has the ability to
meet its current or liquid liabilities in time on the other hand a low Quick Ratio represents
8102019 A Study A Study On Financial Performance Analysis With Reference To Kesoram Cementon Financial Performance hellip
httpslidepdfcomreaderfulla-study-a-study-on-financial-performance-analysis-with-reference-to-kesoram 6881
that the companyrsquos liquidity position is not good The above table showing the quick ratios
of Kesoram are canrsquot be considered satisfactory
Leverage Ratios-
Debt-Equity Ratio-
Debt-Equity Ratio = Total Long Term Debt Equity Share Holders Fund
Total Long term Debt= Debenture Capital + Long term loans from banks and financial
institutions + Public deposits
Equity Share Holders fund = Equity + Reserves and Surplus
Debt Equity Ratio of Kesoram
(Rupees in crores)
Year Total Debt Share Holders Fund Debt Equity Ratio
2007-08 109235 98192 111
2008-09 197043 133010 148
2009-10 312622 154024 203
2010-11 399927 130025 308
2011-12 410534 91501 449
8102019 A Study A Study On Financial Performance Analysis With Reference To Kesoram Cementon Financial Performance hellip
httpslidepdfcomreaderfulla-study-a-study-on-financial-performance-analysis-with-reference-to-kesoram 6981
Interpretation-
The Debt-Equity Ratio accepted standard is 05 This ratio reflects the relative contribution
of creditors and owners of business in its financing From the above it is clear that the long
term debt is more than that of the share holdersrsquo fund So we can interpret that the firmrsquosassets are financed more by the external funds rather than by the internal funds
8102019 A Study A Study On Financial Performance Analysis With Reference To Kesoram Cementon Financial Performance hellip
httpslidepdfcomreaderfulla-study-a-study-on-financial-performance-analysis-with-reference-to-kesoram 7081
Fixed Asset Ratio-
Net Sales
Fixed Asset Ratio = helliphelliphelliphelliphelliphelliphelliphelliphelliphelliphellip
Net Assets
Fixed Asset Ratio of Kesoram-
(Rupees in crores)
Year Net Sales Net Assets Fixed Assets Ratio
2007-08 300271 358721 084
2008-09 389797 369172 106
2009-10 475062 343182 1382010-11 539788 180435 299
2011-12 59182 108424 546
Interpretation
This ratio indicates the extent to which the assets of the companyrsquos can be lost without
affecting the interest of the creditors of the company Higher the ratios better the long-term
position of the companyThe above table shows fixed assets ratio in increasing trend Which is good for the
company
8102019 A Study A Study On Financial Performance Analysis With Reference To Kesoram Cementon Financial Performance hellip
httpslidepdfcomreaderfulla-study-a-study-on-financial-performance-analysis-with-reference-to-kesoram 7181
Overall Profitability Ratios-
Net Profit Ratio
Net Profit Ratio indicates net margin on sales It is given by the following equation
Net Profit Ratio = (Net Profit Sales) 100
Net Profit Ratio of Kesoram
(Rupees in crores)
Year Net Profit Sales Net Profit Ratio
2007-08 37917 300271 1263
2008-09 41432 389797 1063
2009-10 20298 475062 427
2010-11 -28176 539788 -5222011-12 -38108 59182 -644
Interpretation
It establishes a relationship between net profits after tax and net sales and
indicates the efficiency of the management in manufacturing selling administrative and
other activities of the company
The higher the ratio the better is the profitability or performance of the business
The above table depicts the net profit Ratio of Kesoram has decreased every year from
2007-2008 to 2011-2012It further decreased to negative in the year 2010-11 to -522 and -
644 in the year 2011-2012 This shows constant decrease in the profits of the company
8102019 A Study A Study On Financial Performance Analysis With Reference To Kesoram Cementon Financial Performance hellip
httpslidepdfcomreaderfulla-study-a-study-on-financial-performance-analysis-with-reference-to-kesoram 7281
72
Return on Investment-
Net Profit
Return on Investment = helliphelliphelliphelliphelliphelliphelliphelliphelliphelliphelliphellip X 100
Share Holders Fund
Return on Investment Ratio of Kesoram-
(Rupees in crores)
Year Net Profit Share Holders Fund Return On Investment
2007-08 37917 98192 3862
2008-09 41432 133010 3115
2009-10 20298 154024 1318
2010-11 -28176 130025 -2167
2011-12 -38108 91501 -4165
Interpretation-
The above table reveals how well the resources of the firm are being used Higher
the ratio better the result The above ratio implies how well the firm is growing in
terms of profitability and efficiency From the above table we can concern that the return on
investment is in decreasing trend ROI is highest in the year 2007-2008 as 3862 But
there after itrsquos decreased every year
The ROI is negative in the years 2010-2011 amp 2011-2012 as -2167 amp -4165 respectively
Which is not a good sign for the firm
8102019 A Study A Study On Financial Performance Analysis With Reference To Kesoram Cementon Financial Performance hellip
httpslidepdfcomreaderfulla-study-a-study-on-financial-performance-analysis-with-reference-to-kesoram 7381
8102019 A Study A Study On Financial Performance Analysis With Reference To Kesoram Cementon Financial Performance hellip
httpslidepdfcomreaderfulla-study-a-study-on-financial-performance-analysis-with-reference-to-kesoram 7481
8102019 A Study A Study On Financial Performance Analysis With Reference To Kesoram Cementon Financial Performance hellip
httpslidepdfcomreaderfulla-study-a-study-on-financial-performance-analysis-with-reference-to-kesoram 7581
75
CHAPTER V
FINDINGS amp SUGGESTIONS
8102019 A Study A Study On Financial Performance Analysis With Reference To Kesoram Cementon Financial Performance hellip
httpslidepdfcomreaderfulla-study-a-study-on-financial-performance-analysis-with-reference-to-kesoram 7681
76
Findings
The Share capital remains constant Share capital is unchanged all the years from
2008-2012
Reserves amp surplus were recorded an increasing trend in the period between 2008
and 2010It is showing decreasing trend in the period 2011-2012 (ie from 16019
in 2010 to 9309 in 2012)
Current Liabilities were increased compared to base year ie 2008
Provisions increased to 262597 ie in Rupees 39232 crores in the current year
The current ratio for all the five year is lower (less) than the standard rule ie 21
And it is 097 in the year 2011-2012 (current year)
The Debt-Equity Ratio was shown under the standard ratio It is clear that the long
term debt is more than that of the share holdersrsquo fund It indicates that the firm
heavily relying on external funds rather than the internal funds
The operating and net profit of Kesoram is in decreasing trend due to heavy
increase of manufacturing amp administrative expenses
ROI is highest in the year 2007-2008 as 3862 The ROI is negative in the years
2010-2011 amp 2011-2012 as -2167 amp -4165 respectively
Return on Equity Capital Employed Ratio of Kesoram has decreased every year
from 2007-2008 to 2010-2011It further decreased to negative in the year 2011-12 to
-3280
EPS of Kesoram has decreased every year from 2008-12It is negative in the year
2011 amp 12
8102019 A Study A Study On Financial Performance Analysis With Reference To Kesoram Cementon Financial Performance hellip
httpslidepdfcomreaderfulla-study-a-study-on-financial-performance-analysis-with-reference-to-kesoram 7781
77
Suggestion
The organization should adopt an appropriate capital structure
The companyrsquos debt-equity ratio is recorded more or less as 111 in the year 2008
and it is increased to 449 in the year 2012 (current year)The company should
adopt a better debt equity mix in the future to control the fluctuations in returns
The company should control fluctuations in cash and bank balances as it impacts the
current ratio of the company
The provisions are showing increasing trend which indicates risk of debtors The
firm should implement an effective credit management policy It should utilize its
idle funds by decreasing provisions
The company should control heavy increase of manufacturing amp administration
expenses as it is impacting the operating and net profit of company
8102019 A Study A Study On Financial Performance Analysis With Reference To Kesoram Cementon Financial Performance hellip
httpslidepdfcomreaderfulla-study-a-study-on-financial-performance-analysis-with-reference-to-kesoram 7881
78
ANNEXURE
Profit And Loss Account of Kesoram Cement
Mar12 Mar11 Mar10 Mar09 Mar08
12 Months 12 Months 12 Months 12 Months 12 Months
INCOME
Sales Turnover 628260 575072 505151 431613 345700
Excise Duty 36440 35284 30089 41815 45429
NET SALES 591820 539788 475062 389797 300271
Other Income 000 000 000 000 000
TOTALINCOME
596129 548733 481019 393969 302020
EXPENDITURE
Manufacturing
Expenses81903 74803 13974 13153 44113
MaterialConsumed
370897 310150 295550 229359 118448
Personal
Expenses33468 27355 23294 18690 15344
Selling Expenses 81910 78253 58667 48846 45019
AdministrativeExpenses
28225 29308 17219 16179 9907
Expenses
Capitalized000 000 000 000 000
Provisions Made 000 000 000 000 000
TOTAL
EXPENDITURE 596403 519870 408704 326227 232832Operating Profit -4583 19918 66358 63570 67439
EBITDA -274 28864 72316 67742 69188
Depreciation 29740 27259 17280 11186 8927
Other Write-offs 000 000 000 000 000
EBIT -30014 1605 55035 56557 60261
Interest 41015 23983 10921 12087 5426
EBT -71029 -22377 44114 44470 54835
Taxes -32921 5798 23816 3037 16918
Profit and Loss
for the Year-38108 -28176 20298 41432 37917
Non RecurringItems
-1142 7063 3228 -4023 402
Other Non Cash
Adjustments1276 091 207 465 017
OtherAdjustments
000 000 000 000 000
REPORTED
PAT-37974 -21021 23734 37874 38335
8102019 A Study A Study On Financial Performance Analysis With Reference To Kesoram Cementon Financial Performance hellip
httpslidepdfcomreaderfulla-study-a-study-on-financial-performance-analysis-with-reference-to-kesoram 7981
79
Balance Sheet Of Kesoram
Years
Particulars 2008 2009 2010 2011 2012
Liabilities
Share Capital 4574 4574 4574 4574 4574Reserves amp Surplus 93085 128024 149111 125162 86657
Revaluation Reserves 533 412 339 289 27
Loans
Secured Loans 97106 153627 186372 237183 317792
Un Secured Loans 12129 43416 12625 162744 92742
Deferred Tax Liabilities 0 0 0 0 0
Current Liabilities
Provisions 33039 34529 35734 1494 40726
Current Liabilities 57067 66587 107688 113902 18001
Total 297533 431169 610068 645348 722771
Assets
Net Block 108424 180435 343182 369172 358721
Capital WIP 63459 86485 41283 43781 68065
Investments 4783 6178 5143 6582 6636
Current Assets
Inventories 44217 58906 91619 111855 99516
Sundry Debtors 27307 38017 54289 63134 67358
Cash amp Bank Balances 4036 5657 8014 7188 6959
Total Current Assets 7556 10258 153922 182177 173833Loans amp Advances 45289 55462 66506 4346 115409
Fixed Deposits 018 028 031 176 107
Total 297533 431169 610068 645348 722771
8102019 A Study A Study On Financial Performance Analysis With Reference To Kesoram Cementon Financial Performance hellip
httpslidepdfcomreaderfulla-study-a-study-on-financial-performance-analysis-with-reference-to-kesoram 8081
80
KEY ITEMS 2012 2011 2010 2009 2008
Preference
Dividend 0 0 0 0 0
Equity Dividend 457 2516 2516 2516 2516
Equity Dividend
() 999 55 55 55 55
Shares in Issue(Lakhs) 45743 45743 45743 45743 45743
EPS - Annualised
(Rs) -8302 -4595 5188 828 838
8102019 A Study A Study On Financial Performance Analysis With Reference To Kesoram Cementon Financial Performance hellip
httpslidepdfcomreaderfulla-study-a-study-on-financial-performance-analysis-with-reference-to-kesoram 8181
BIBLIOGRAPHY
Sl
No
Books Author Name
1 Financial Management Khan amp JAIN
2 Financial Management IMPandey
3 Management Accounting RPTrivedi
Websites amp Search Engines
1 wwwkesoramcom983086
2 wwwmoneycontrolcom
3 wwwgooglefinancecom983086
Annual reports of Kesoram cement limited 2008-2012
8102019 A Study A Study On Financial Performance Analysis With Reference To Kesoram Cementon Financial Performance hellip
httpslidepdfcomreaderfulla-study-a-study-on-financial-performance-analysis-with-reference-to-kesoram 1881
18
and raw cement have shown that William Aspdins product made at North fleet Kent was a
true alite-based cement However Aspdins methods were rule-of-thumb Vicat is
responsible for establishing the chemical basis of these cements and Johnson established
the importance of sintering the mix in the kiln
William Aspdins innovation was counter-intuitive for manufacturers of artificial cements
because they required more lime in the mix (a problem for his father) because they required
a much higher kiln temperature (and therefore more fuel) and because the resulting clinker
was very hard and rapidly wore down the millstones which were the only available grinding
technology of the time Manufacturing costs were therefore considerably higher but the
product set reasonably slowly and developed strength quickly thus opening up a market for
use in concrete The use of concrete in construction grew rapidly from 1850 onwards and
was soon the dominant use for cements Thus Portland cement began its predominant role
It is made from water and sand
Types of modern cement
Portland cement
Cement is made by heating limestone (calcium carbonate) with small quantities of other
materials (such as clay) to 1450degC in a kiln in a process known as calcination whereby a
molecule of carbon dioxide is liberated from the calcium carbonate to form calcium oxide
or lime which is then blended with the other materials that have been included in the mix
The resulting hard substance called clinker is then ground with a small amount of gypsum
into a powder to make Ordinary Portland Cement the most commonly used type of cement
(often referred to as OPC)
Portland cement is a basic ingredient of concrete mortar and most non-speciality grout The
most common use for Portland cement is in the production of concrete Concrete is a
composite material consisting of aggregate (gravel and sand) cement and water As a
construction material concrete can be cast in almost any shape desired and once hardened
can become a structural (load bearing) element Portland cement may be gray or whitePortland cement blends
These are often available as inter-ground mixtures from cement manufacturers but similar
formulations are often also mixed from the ground components at the concrete mixing plant
Portland blast furnace cement contains up to 70 ground granulated blast furnace slag
with the rest Portland clinker and a little gypsum All compositions produce high ultimate
8102019 A Study A Study On Financial Performance Analysis With Reference To Kesoram Cementon Financial Performance hellip
httpslidepdfcomreaderfulla-study-a-study-on-financial-performance-analysis-with-reference-to-kesoram 1981
19
strength but as slag content is increased early strength is reduced while sulfate resistance
increases and heat evolution diminishes Used as an economic alternative to Portland
sulfate-resisting and low-heat cements
Portland fly ash cement contains up to 30 fly ash The fly ash is pozzolanic so that
ultimate strength is maintained Because fly ash addition allows lower concrete water
content early strength can also be maintained Where good quality cheap fly ash is
available this can be an economic alternative to ordinary Portland cement
Portland pozzolan cement includes fly ash cement since fly ash is a pozzolan but also
includes cements made from other natural or artificial pozzolans In countries where
volcanic ashes are available (eg Italy Chile Mexico and the Philippines) these cements
are often the most common form in use
Portland silica fume cement Addition of silica fume can yield exceptionally high
strengths and cements containing 5-20 silica fume are occasionally produced However
silica fume is more usually added to Portland cement at the concrete mixer
Masonry cements are used for preparing bricklaying mortars and stuccos and must not be
used in concrete They are usually complex proprietary formulations containing Portland
clinker and a number of other ingredients that may include limestone hydrated lime air
entrainers retarders water proofers and coloring agents They are formulated to yield
workable mortars that allow rapid and consistent masonry work Subtle variations of
Masonry cement in the US are Plastic Cements and Stucco Cements These are designed to
produce controlled bond with masonry blocks
Expansive cements contain in addition to Portland clinker expansive clinkers (usually
sulfoaluminate clinkers) and are designed to offset the effects of drying shrinkage that is
normally encountered with hydraulic cements This allows large floor slabs (up to 60 m
square) to be prepared without contraction joints
White blended cements may be made using white clinker and white supplementary
materials such as high-purity metakaolin
Colored cements are used for decorative purposes In some standards the addition of
pigments to produce colored Portland cement is allowed In other standards (eg ASTM)
pigments are not allowed constituents of Portland cement and colored cements are sold as
blended hydraulic cements
Very finely ground cements are made from mixtures of cement with sand or with slag or
other pozzolan type minerals which are extremely finely ground together Such cements can
8102019 A Study A Study On Financial Performance Analysis With Reference To Kesoram Cementon Financial Performance hellip
httpslidepdfcomreaderfulla-study-a-study-on-financial-performance-analysis-with-reference-to-kesoram 2081
have the same physical characteristics as normal cement but with 50 less cement
particularly due to their increased surface area for the chemical reaction Even with
intensive grinding they can use up to 50 less energy to fabricate than ordinary Portland
cements
Non-Portland hydraulic cements
Pozzolan-lime cements Mixtures of ground Pozzolan and lime are the cements used by the
Romans and are to be found in Roman structures still standing (eg the Pantheon in Rome)
They develop strength slowly but their ultimate strength can be very high The hydration
products that produce strength are essentially the same as those produced by Portland
cement
Slag-lime cements Ground granulated blast furnace slag is not hydraulic on its own but is
activated by addition of alkalis most economically using lime They are similar to
pozzolan lime cements in their properties Only granulated slag (ie water-quenched glassy
slag) is effective as a cement component
Super sulfated cements These contain about 80 ground granulated blast furnace slag
15 gypsum or anhydrite and a little Portland clinker or lime as an activator They produce
strength by formation of ettringite with strength growth similar to a slow Portland cement
They exhibit good resistance to aggressive agents including sulfate
Calcium aluminate cements are hydraulic cements made primarily from limestone and
bauxite The active ingredients are monocalcium aluminate CaAl2O4 (CaO middot Al2O3 or CA in
Cement chemist notation CCN) and mayenite Ca12Al14O33 (12 CaO middot 7 Al2O3 or C12A7 in
CCN) Strength forms by hydration to calcium aluminate hydrates They are well-adapted
for use in refractory (high-temperature resistant) concretes eg for furnace linings
Calcium sulfoaluminate cements are made from clinkers that include yeelimite (Ca4
(AlO2)6SO4 or C4A3 in Cement chemists notation) as a primary phase They are used in
expansive cements in ultra-high early strength cements and in low-energy cements
Hydration produces ettringite and specialized physical properties (such as expansion or
rapid reaction) are obtained by adjustment of the availability of calcium and sulfate ionsTheir use as a low-energy alternative to Portland cement has been pioneered in China
where several million tonnes per year are produced Energy requirements are lower because
of the lower kiln temperatures required for reaction and the lower amount of limestone
(which must be endothermically decarbonated) in the mix In addition the lower limestone
8102019 A Study A Study On Financial Performance Analysis With Reference To Kesoram Cementon Financial Performance hellip
httpslidepdfcomreaderfulla-study-a-study-on-financial-performance-analysis-with-reference-to-kesoram 2181
21
content and lower fuel consumption leads to a CO2 emission around half that associated
with Portland clinker However SO2 emissions are usually significantly higher
Natural Cements correspond to certain cements of the pre-Portland era produced by
burning argillaceous limestones at moderate temperatures The level of clay components in
the limestone (around 30-35) is such that large amounts of belite (the low-early strength
high-late strength mineral in Portland cement) are formed without the formation of
excessive amounts of free lime As with any natural material such cements have highly
variable properties
Geopolymer cements are made from mixtures of water-soluble alkali metal silicates and
aluminosilicate mineral powders such as fly ash and metakaolin
8102019 A Study A Study On Financial Performance Analysis With Reference To Kesoram Cementon Financial Performance hellip
httpslidepdfcomreaderfulla-study-a-study-on-financial-performance-analysis-with-reference-to-kesoram 2281
22
COMPANY PROFILE
8102019 A Study A Study On Financial Performance Analysis With Reference To Kesoram Cementon Financial Performance hellip
httpslidepdfcomreaderfulla-study-a-study-on-financial-performance-analysis-with-reference-to-kesoram 2381
23
Kesoram Cement Industry is one of the leading manufacturers of cement in India It is a day
process cement Plant The plant capacity is 826 lakh tones per annum It is located at
Basanthnagar in Karimnagar district of Andhra Pradesh Basanthnagar is 8 km away from
the Ramagundam Railway station linking Madras to New Delhi The Chairman of the
Company is BKBirla
History
The first unit at Basanthnagar with a capacity of 21 lakh tones per annum
incorporating humble suspension preheated system was commissioner during the year 1969
The second unit was setup in year 1971 with a capacity of 21 lakh tones per annum went on
stream in the year 1978 The coal for this company is being supplied from Singgareni
Collieries and the power is obtained from APSEB The power demand for the factory is
about 21 MW Kesoram has got 2 DG sets of 4 MW each installed in the year 1987
Kesoram Cement has setup a 15 KW captor power plant to facilitate for
uninterrupted power supply for manufacturing of cement at 24th
august 1997 per hour 12
mw actual power is 15 mw
The Company was incorporated on 18th October 1919 under the Indian Companies Act
1913 in the name and style of Kesoram Cotton Mills Ltd It had a Textile Mill at 42
Garden Reach Road Calcutta 700 024 The name of the Company was changed to Kesoram
Industries amp Cotton Mills Ltd on 30th
August 1961 and the same was further changed to Kesoram Industries Limited on 9th July
1986 The said Textile Mill at Garden Reach Road was eventually demerged into a separate
company
The First Plant for manufacturing of rayon yarn was established at Tribeni District
Hooghly West Bengal and the same was commissioned in December 1959 and the second
plant was commissioned in the year 1962 enabling it to manufacture 4635 metric tons perannum (mtpa) of rayon yarn This Unit has 6500 metric tons per annum (mtpa) capacity as
on 3132009
The plant for manufacturing of transparent paper was also set up at the same location at
Tribeni District Hooghly West Bengal in June 1961 It has the annual capacity to
manufacture 3600 metric tons per annum (mtpa) of transparent Paper
8102019 A Study A Study On Financial Performance Analysis With Reference To Kesoram Cementon Financial Performance hellip
httpslidepdfcomreaderfulla-study-a-study-on-financial-performance-analysis-with-reference-to-kesoram 2481
24
The Company diversified into manufacturing of cast iron spun pipes and pipe fittings at
Bansberia District Hooghly West Bengal with a production capacity of 45000 metric tons
per annum (mtpa) of cast iron spun pipes and pipe fittings in December 1964
The Company subsequently diversified into the manufacturing of Cement and in 1969
established its first cement plant under the name Kesoram Cement at Basantnagar Dist
Karimnagar (Andhra Pradesh) and to take advantage of favorable market conditions in
1986 another cement plant known as Vasavadatta Cement was commissioned by it at
Sedam Dist
Gulbarga (Karnataka) The cement manufacturing capacities at both the plants were
augmented from time to time according to the market conditions and as on 3132009
Kesoram Cement and Vasavadatta Cement have annual cement manufacturing capacities of
15 million metric tons and 41 million metric tons respectively
The Company in March 1992 commissioned a plant at Balasore known as Birla Tyres in
Orissa for manufacturing of 10 lakh mtpa automotive tyres and tubes in the first phase in
collaboration with Pirelli Ltd UK a subsidiary company of the world famous Pirelli
Group of Italy - a pioneer in production and development of automotive tyres in the world
The capacity at the said plant was further augmented during the year by 19 MT per day
aggregating to 271 MT per day production facility The Greenfield Project of 257 MT per
day capacity in the State of Uttarakhand with a capex of about Rs760 crores commenced
the commercial production in phases during the financial year 2008-09The Company as on
3132009 had the manufacturing capacities of 371 million tyres 295 million tubes and
153 million flaps per annum in the Plants including at Uttarakhand Plant It has small
manufacturing capacities of various Chemicals at Kharda in the State of West Bengal also
It has the annual manufacturing capacities of 12410 mtpa of Caustic Soda Lye 5045 mtpa
of Liquid Chlorine 6205 mtpa of Sodium Hypochlorite 8200 mtpa of Hydrochloric Acid
3200 mtpa of Ferric Alum 18700 mtpa of Sulphuric Acid and 1620000 m3pa of purified
Hydrogen Gas
The Company is a well-diversified entity in the fields of Cement Tyre Rayon Yarn
Transparent Paper Spun Pipes and Heavy Chemicals with two core business segments ie
Cement and Tyres
8102019 A Study A Study On Financial Performance Analysis With Reference To Kesoram Cementon Financial Performance hellip
httpslidepdfcomreaderfulla-study-a-study-on-financial-performance-analysis-with-reference-to-kesoram 2581
25
In Spun Pipes amp Foundries a unit of the Company work suspended from 2nd May 2008
still commences till further notice
The Company as of now is listed on three major Stock Exchanges in India ie Bombay
Stock Exchange Ltd Mumbai Calcutta Stock Exchange Association Ltd Kolkata and
National Stock Exchange of India Ltd Mumbai and at the Societe de la Bourse de
Luxembourg Luxembourg
A further expansion upto 165 million tons of cement per annum in Vasavadatta Cement at
Sedam in Karnataka as unit IV at the same site is in progress with a 175 MW Captive
Power Plant involving a capital expenditure of about Rs 78350 crores (including the cost
of Captive Power Plant)
The commercial production of cement in the aforesaid unit IV has commenced in June
2009 The work for the further expansion in the Tyres Section at Uttarakhand for radial
tyres with 100 MT per day capacity and bias tyres with 125 MT per day capacity involving
an estimated aggregate capital outlay of about Rs 840 crores is under progress The Board
has further approved a Motor Cycle Tyre Project of 70 MT per day capacity at the same site
involving a capital outlay of Rs190 crore The civil construction of both the Projects is in
full swing The commercial production in both the Projects is likely to start by December
2009 January 2010
Birla Supreme in popular brand of Kesoram cement from its prestigious plant of
Basantnagar in AP which has outstanding track record In performance and productivity
serving the nation for the last two and half decades It has proved its distinction by bagging
several national awards It also has the distinction of achieving optimum capacity
utilization
Kesoram offers a choice of top quality portioned cement for light heavy
constructions and allied applications Quality is built every fact of the operations
The plant lay out is rational to begin with The limestone is rich in calcium
carbonate a key factor that influences the quality of final product The day process
technology uses in the latest computerized monitoring overseas the manufacturing process
Samples are sent regularly to the bureau of Indian standards National council of
construction and building material for certification of derived quality norms
8102019 A Study A Study On Financial Performance Analysis With Reference To Kesoram Cementon Financial Performance hellip
httpslidepdfcomreaderfulla-study-a-study-on-financial-performance-analysis-with-reference-to-kesoram 2681
26
The company has vigorously undertaking different promotional measures for
promoting their product through different media which includes the use of news papers
magazine hoarding etc
Kesoram cement industry distinguished itself among all the cement factories in
Indian by bagging the National Productivity Award consecutively for two years ie for the
year 1985-1987 The federation of Andhra Pradesh Chamber amp Commerce and Industries
(FAPCCI) also conferred on Kesoram Cement An award for the best industrial promotion
expansion efforts in the state for the year 1984 Kesoram also bagged FAPCCI awarded for
ldquoBest Family Planning Effort in the staterdquo for the year 1987-1988
One among the industrial giants in the country today serving the nation on the
industrial front Kesoram industry ltd has a checked and eventful history dating back to the
twenties when the Industrial House of Birlarsquos acquired it With only a textile mill under its
banner 1924 it grew from strength to strength and spread its activities to newer fields like
Rayon Transparent paper pipes Refractors tyres and other products
Looking to the wide gap between the demand and supply of vital commodity
cement which play in important role in National building activity the Government of India
had de-licensed the cement industry in the year 1966 with a review to attract private
entrepreneur to augment the cement production Kesoram rose to the occasions and divided
to set up a few cement plants in the country
Kesoram cement undertaking marketing activities extensively in the state of Andhra
Pradesh Karnataka Tamilnadu Kerala Maharashtra and Gujarat In AP sales Depts are
located in different areas like Karimnagar Warangal Nizamabad Vijayawada and Nellore
In other states it has opened around 10 depots
The market share of Kesoram Cement in AP is 705 The market share of the
company in various states is shown as under
STATES MARKET SHARE
Karnataka 409
Tamilnadu 094
Kerala 029
Maharashtra 281
8102019 A Study A Study On Financial Performance Analysis With Reference To Kesoram Cementon Financial Performance hellip
httpslidepdfcomreaderfulla-study-a-study-on-financial-performance-analysis-with-reference-to-kesoram 2781
27
Process and Quality Control
It has been the endeavor of Kesoram to incorporate the Worldrsquos latest technology in
the plant and today the plant has the most sophisticated
X-ray analysis
Fully computerized XRF and XRD X-RAY Analyzers keep a constant round the
clock vigil on quality
Supreme performance
One of the largest Cement Plants in Andhra Pradesh the plant incorporate the latest
technology in Cement - making
It is professionally managed and well established Cement Manufacturing Company
enjoying the confidence of the consumers Kesoram has outstanding track record in
performance and productivity with quite a few national and state awards to its credit
BIRLA SUPREME the 43 Grade Cement is a widely accepted and popular brand
in the market commanding a premium
However to meet the specific demands of the consumer Kesoram bought out the 53
grade BIRLA SUPREME ndash GOLD which has special qualities like higher fineness quick-
setting high compressive strength and durability
Supreme Strength
Kesoram Cement has huge captive Limestone Deposits which make it possible tofeed high- grade limestone consistently its natural Grey colour is anion- born ingredient
and gives good shade
Both the products offered by Kesoram ie BIRLA SUPREME-43 Grade and
BIRLA SUPREME-GOLD-53 Grade cement are outstanding with much higher
compressive strength and durability
The following characteristics show their distinctive qualities
Comprehensive
Strength
Opc 43
grls 8112
1989
Birla
Supreme 43
grade
Opc 43 gr
Is 1226987
Birla
Supreme
Gold 53 gr
3 days mpa Min 23 31 + Min 27 38+
7 days mpa Min 23 42+ Min 37 48+
28 days mpa Min 43 50+ Min 53 60+
8102019 A Study A Study On Financial Performance Analysis With Reference To Kesoram Cementon Financial Performance hellip
httpslidepdfcomreaderfulla-study-a-study-on-financial-performance-analysis-with-reference-to-kesoram 2881
28
DC SYSTEM
Clinker making process is a key step in the overall cement making process In the case of
BIRLA SUPREMEGOLD the clinker-making process is totally computer control The
Distributed Control System (DCS) constantly monitors the process and ensures operating
efficiency This eliminates variation and ensures consistency in the quality of Clinker
Physical Characteristics
Ope 43
Is 8 112-89
Birla
Supreme
43 grade
Ope 53 gr
Is 12269-87
Birla Supreme
Gold 53 gr
Setting time Min30 120-180 Min 30 130-170
a Initial (mats) Max 600 180-240 Max 600 170-220
b final (mats) Min 225 270-280 Min 225 300-320
Fincncssm 2Kg Max 10 10-20 Max 10 05-10
Soundness Max 08 004-008 Max 0080 004-02
a le-chart (mm)
b autoclave ()
Supreme Expertise
The Best Technical Team exclusive to Kesoram mans the Plant and monitors the process
to blend the cement in just the required proportions to make BIRLA SUPREMEGOLD OF
Rock Strength
18 Million Tones of Solid Foundation
Staying at the top for over a Quarter Century Quarter Century is no less an achievement
Infact Kesoram is synonymous with for over 28 years
Over the years Kesoram has dispatched 18 million tones of cement to the nook and cornersof the country and joined hands in strengthening the Nation No one else in Andhra Pradesh
has this distinction The prestigious World Bank aided Ramagundam Super Thermal Power
Project of NTPC and Mannair Dam of Pochampad project in AP arc a couple of projects for
which Kesoram Cement was exclusively uses to cite an example
8102019 A Study A Study On Financial Performance Analysis With Reference To Kesoram Cementon Financial Performance hellip
httpslidepdfcomreaderfulla-study-a-study-on-financial-performance-analysis-with-reference-to-kesoram 2981
29
Chemical Characteristics
Opc 43 gr
Is 81 132-989
Birla
Supreme
43 grade
Ope 53 gr
Is 12269-
87
Birla
Supreme
Gold 53 gr
Loss on inflection Max 5 lt16 Max 40 lt15
Insoluble residue Max 20 lt08 Max 20 lt 06
Magnesium oxide Max 60 lt 13 Max 60 lt 13
Lime saturation factor 066-102 08-09 08-102 088-09
Alumna iron ratio MinO66 15-17 MinO66 15-17
Sulfuric anhydride Max 253 16-20 Max 2 53 16-20
Alkalis Chlorides Max 005 Max 001 Max 005 Max 04
Kesoram Cement - advantages
Helps in designing sleeker and more elegant
Structures giving greater flexibility in design concept
Due to its fine quality super fine construction can be achieved Its gives maximum
strength at Minimum use of cement with water in the water cement ratio especially the 53
grade Birlas supreme-gold
Feathers in Kesorams cap
Kesoram has outstanding track record achieving over 100 capacity utilization I
productivity and energy conservation It has proved its distinction by bagging several
national and state awards noteworthy being
NATIONAL
1 National productivity award for 1985-86
2 National productivity award for 1986-87
3 National award for mines safety for 1985-86
4 National award for mines safety for 1986-875 National award for energy conservation 1989-90
8102019 A Study A Study On Financial Performance Analysis With Reference To Kesoram Cementon Financial Performance hellip
httpslidepdfcomreaderfulla-study-a-study-on-financial-performance-analysis-with-reference-to-kesoram 3081
30
STATE
1 AP State productivity award for 1988
2 State award for best industrial management 1988-89
3 Best industrial productivity award of FAPCCI (federation of AP chamber of
commerce and industry) 1991
4 Best management award of the state Govt 1993
5 FAPCCI award for the workers welfare 1995-96
ISO 9002
All quality systems of Kesoram have been certified under ISO 90021S 4002 which
proves the worldwide acceptance of the products
All quality systems in production and marketing of the product have been certified by BIS
under ISO 90021S 14002
The first unit was installed at basanthnagar with a capacity of 25 ndashlakhs TPA (tones per
annum) incorporating humble supervision preheated system during the year 1969
The second unit followed suit with added a capacity of 2 lakhs TPA in 1971
The plant was further expanded to 9 lakhs by adding 25 lakhs tones in august 1978 113
lakhs tones in January 1981 and 087 lakhs tones in September 1981
Power
Singareni collieries make the supply of coal for this industry and the power was
obtained from AP TRANSCO The power demand for the factory is about 21MW Kesoram
has got 2-diesel generator seats of 4 MW each installed in the year 1987
Kesoram cement now has a 15MWcaptive power plant to facilities for uninterrupted
power supply for manufacturing of cement
Performance
The performance of kersoram cement industry has been outstanding achieving over
cent percent capacity utilization all through despite many odds like power cuts and which
most 40 was wasted due to wagon shortage etc
The company being a continuous process industry works round the clock and has
excellent records of performance achieving over 1005 capacity utilization
Kesoram has always combined technical progress with industrial performance The
company had glorious track record for the last 27 years in the industry
Technology
8102019 A Study A Study On Financial Performance Analysis With Reference To Kesoram Cementon Financial Performance hellip
httpslidepdfcomreaderfulla-study-a-study-on-financial-performance-analysis-with-reference-to-kesoram 3181
31
Kesoram cement uses most modern technology and the computerized control in the
plant A team of dedicated and well- experienced experts manages the plant
The quality is maintained much above the bureau of Indian standards
The raw materials used for manufacturing cement are
Lime stone
Bauxite
Hematite
Gypsum
Environmental and Social Obligations
For environmental promotion and to keep ndashup the ecological balance this section
has planted over two lakhs trees on social obligation front this section has undertaken
various social welfare programs by adopting ten nearly villages organizing family welfare
campus surgical camps animal health camps blood donation camps children immunization
camps seeds training for farmers etc were arranged
Welfare and Recreation Facilities
For the purpose of recreation facilities 2 auditoriums were provided for playing
indoor games cultural function and activities like drama music and dance etc
The industry has provided libraries and reading rooms About 1000 books are available in
the library All kinds of newspaper magazines are made available
Canteen is provided to cater to the needs of the employees for supply of snacks tea
coffee and meals etc
One English medium and one Telugu medium school are provided to meet the
educational requirements
The company has provided a dispenser with a qualified medical office and
paramedical staff for the benefit of the employees The employees covered under ESI
scheme have to avail the medical facilities from the ESI hospital
Competitions in sports and games are conducted every year for august 15th
Independence Day and January 26th republic day among the employees
Electricity
The power consumption per ton of cement has come down to 108 units against 113
units last year due to implementation of various energy saving measures The performance
of captive power plant of this section continues to be satisfactory Total power generation
8102019 A Study A Study On Financial Performance Analysis With Reference To Kesoram Cementon Financial Performance hellip
httpslidepdfcomreaderfulla-study-a-study-on-financial-performance-analysis-with-reference-to-kesoram 3281
32
during the year was 84 million units last year This captive power plant is a major role in
keeping power costs with in economic levels
The management has introduced various HRD programs for training and
development and has taken various other measures for the betterment of employeersquos
efficiency
The section has installed adequate air pollution control system and equipment and is
ISO14001 such as Environment management system is under implementation
Awards
Kesoram cement bagged many prestigious awards including national awards for
productivity technology conservation and several state awards since 1984 The following
are the some of important awards
AWARDS OF KESORAM CEMENT
No Year Awards
National
State
1 1989-90 Management award community
Development
State
2 1991 Energy conservation may day award of the
Govt
State
3 1991 Pundit Jawaharlal Nehru rolling trophy for
best
State
4 1993 National productivity effort Indira Gandhi
national award
State
5 1994 Best management award State
6 1994-
1995
Best industrial rebellion award State
7 1995 Rural development by chief minister
Environment and mineral conservation
award
State
8 1995 Best industrial rebellion award State
8102019 A Study A Study On Financial Performance Analysis With Reference To Kesoram Cementon Financial Performance hellip
httpslidepdfcomreaderfulla-study-a-study-on-financial-performance-analysis-with-reference-to-kesoram 3381
33
9 1995-
1996
Best effort of an industrial unit to
development rural economy shriSRRungta
award for social
National
10 1996 Awareness for best rural development
efforts
State
11 1999 Best workers welfare best family welfare
award
State
12 2001 First prize for mine environment amppollution
control for the 3rd
year in succession
State
13 2002 Vana mithra award from AP Govt State
14 2003 Company has got OHSAS-18001 State
15 2005 Certification from DNV New Delhi State
16 2006 Award for pollution control and
environmental protection FAPCCI award
for best rural development in the state
State
8102019 A Study A Study On Financial Performance Analysis With Reference To Kesoram Cementon Financial Performance hellip
httpslidepdfcomreaderfulla-study-a-study-on-financial-performance-analysis-with-reference-to-kesoram 3481
34
Products of the organization
8102019 A Study A Study On Financial Performance Analysis With Reference To Kesoram Cementon Financial Performance hellip
httpslidepdfcomreaderfulla-study-a-study-on-financial-performance-analysis-with-reference-to-kesoram 3581
35
CHAPTER-III
LITERATURE REVIEW
8102019 A Study A Study On Financial Performance Analysis With Reference To Kesoram Cementon Financial Performance hellip
httpslidepdfcomreaderfulla-study-a-study-on-financial-performance-analysis-with-reference-to-kesoram 3681
36
Introduction
Financial Performance Analysis
The term lsquofinancial performance analysis also known as analysis and interpretation of
financial statementsrsquo refers to the process of determining financial strength and
weaknesses of the firm by establishing strategic relationship between the items of the
balance sheet profit and loss account and other operative data
ldquoAnalyzing financial statementsrdquo by Metcalf and Titard
ldquoFinancial analysis is a process of evaluating the relationship between component
parts of a financial statement to obtain a better understanding of a firms position and
performancerdquo by Myers
Financial Performance
The word lsquoPerformance is derived from the word lsquoparfourmenrsquo which means lsquoto dorsquo lsquoto
carry outrsquo or lsquoto renderrsquo It refers the act of performing execution accomplishment
fulfillment etc In border sense performance refers to the accomplishment of a given task
measured against preset standards of accuracy completeness cost and speed In other
words it refers to the degree to which an achievement is being or has been accomplished In
the Words of Frich Kohlar ldquoThe performance is a general term applied to a part or to all the
conducts of activities of an organization over a period of time often with reference to past or
projected cost efficiency management responsibility or accountability or the like Thus not
just the presentation but the quality of results achieved refers to the performance
Performance is used to indicate firmrsquos success conditions and compliance
Financial performance refers to the act of performing financial activity In broader
sense financial performance refers to the degree to which financial objectives being or has
been accomplished It is the process of measuring the results of a firms policies and
operations in monetary terms It is used to measure firms overall financial health over a
given period of time and can also be used to compare similar firms across the same industry
or to compare industries or sectors in aggregation
The purpose of financial analysis is to diagnose the information contained in financial
statements so as to Jude the profitability and financial soundness of the firm Just like a
doctor examines his patient by recording his body temperature blood pressure etc Before
8102019 A Study A Study On Financial Performance Analysis With Reference To Kesoram Cementon Financial Performance hellip
httpslidepdfcomreaderfulla-study-a-study-on-financial-performance-analysis-with-reference-to-kesoram 3781
37
making his conclusion regarding the illness and before giving his treatment a financial
analyst analysis the financial statements with various tools of analysis before commenting
upon the financial health or weaknesses of an enterprise
The analysis and interpretation of financial statements is essential to bring out the
mystery behind the figures in financial statements Financial statements analysis is an
attempt to determine the significance and meaning of the financial statement data so that
forecast may be made of the future earnings ability to pay interest and debt maturities (both
current and long term) and profitability of a sound divided policy
Types of financial analysis-
Financial analysis into different categories depending upon
(1) The material used and
(2) The method of operation followed in the analysis or the modus operandi of
analysis
Types of financial analysis
On the basis of material used on the basis of modus operandi
External Internal Horizontal Vertical
Analysis Analysis Analysis Analysis
1 On the basis of material used - According to material used financial analysis canbe of two types
External analysis
Internal analysis
External analysis-
This analysis is done by outsiders who do not have access to the detailed internal
outsiders include investors potential investors Creditors Potential Creditors Government
Agencies Credit Agencies and General Public For financial analysis these external parties
to the firm depend almost entirely on the published financial statements
Internal analysis-
This analysis is undertaken by the persons namely executives and employees of the
organization or by the officers appointed by government or court who have access to the
8102019 A Study A Study On Financial Performance Analysis With Reference To Kesoram Cementon Financial Performance hellip
httpslidepdfcomreaderfulla-study-a-study-on-financial-performance-analysis-with-reference-to-kesoram 3881
38
books of account ( internal accounting records) and other information related to the
business
2 983119983150 983156983144983141 983138983137983155983145983155 983151983142 983149983151983140983157983155 983151983152983141983154983137983150983140983145983085
According to the modus operandi financial analysis can also be of two types
a Horizontal analysis
bVertical analysis
Horizontal analysis-
Horizontal analysis refers to the comparison of financial data of a company for several
years The figures for this type of analysis are presented horizontally over a number of
columns The figures of the various years are compared with standard or base year a base
year is year chosen as beginning point This type of analysis is also called lsquodynamicanalysisrsquo as it is based on the data from year to year rather than on data of any one year The
horizontal analysis makes it possible to focus attention on items that have changed
significantly during the period under view
b Vertical analysis-
Vertical analysis refers to the study of relationship of the various items in the financial
statements of one accounting period In this types of analysis the figures from financial
statement of a year are compared with a base selected from the same yearrsquos statement
Methods of financial analysis-
The following methods of analysis are generally used-
1 Comparative Statements
2 Trend Analysis
3 Common-Size Statements
4 Funds flow Analysis
5 Cash Analysis
6 Ratio Analysis
7 Cost-volume-Profit Analysis
8102019 A Study A Study On Financial Performance Analysis With Reference To Kesoram Cementon Financial Performance hellip
httpslidepdfcomreaderfulla-study-a-study-on-financial-performance-analysis-with-reference-to-kesoram 3981
39
Comparative statements-
The comparative financial statements are statements of the financial position at
different periods of time the elements of financial position are show in a
Comparative Statement provides an idea of financial position at two or more
periods Generally two financial statements (balance sheet and income statement) are
prepared in comparative form for financial analysis
The Comparative Statement May Show-
1 Absolute figures (rupee amounts)
2 Changes in absolute figures ie increase or decrease in absolute figures
3 Absolute data in terms of percentages
4 Increase or decrease in terms of percentages
The Two Comparative Statements Are-
1 Comparative balance sheet and
2 Income statement
1 983107983151983149983152983137983154983137983156983145983158983141 983138983137983148983137983150983139983141 983155983144983141983141983156983085
The comparative balance sheet analysis is the study of the trend of the same items group of
items and computed items in two or more balance sheets of the same business enterprise on
different dates The change in periodic balance sheet items reflect the conduct of a business
the change can be observed by comparison of the balance sheet at the beginning and at the
end of a period and these changes can help in forming an opinion about the progress of an
enterprise
Guide Lines for Interpretation of Comparative Balance Sheet-
While interpreting comparative balance sheet the interpreter is expected to study the
following aspects-
1 Current financial position and liquidity position
2 Long-term financial position
3 Profitability of the concern
8102019 A Study A Study On Financial Performance Analysis With Reference To Kesoram Cementon Financial Performance hellip
httpslidepdfcomreaderfulla-study-a-study-on-financial-performance-analysis-with-reference-to-kesoram 4081
40
Common Size Statement-
The common-size statements balance sheet and income statement are show in
analytical percentages The figures are shown as percentages of total assets total liabilities
and total sales The total assets are taken as 100 and different assets are expressed as a
percentage of the total similarly various liabilities are taken as a part of total liabilities
Common Size Balance Sheet-
A statement in which balance sheet items are expressed as the ratio of each asset to
total assets and the ratio of each liability is expressed as a ratio of total liabilities is called
common size balance The common size balance sheet can be used to compare companies
of differing size The comparison of figures in different periods is not useful because total
figures may be affected by a number of factors It is not possible to establish standard norms
for various assets The trends of figures from year to year may not be studied and even they
may not give proper results
Trend Analysis of Balance Sheet-
Trend analysis is Very important tool of horizontal financial analysis
This analysis enables to known the change in the financial function and operating efficiency
in between the time period chosen
By studding the trend analysis of each item we can known the direction of changes and
based upon the direction of changes the options can be changed
Trend =Absolute Value of item in the statement understudy 100
Absolute Value of same item in the base statement
Ratio Analysis
Ratio analysis is used as a technique of analyzing the financial information contained in the
balance sheet and profit and loss accounts for a more meaningful understanding of the
financial position and performance of a firm
The relationship between two accounting figures expressed mathematically is known as a
financial ratio A ratio helps the analyst to make qualitative judgment about the firmrsquos
financial position and performance
Several ratios can be calculated from the accounting data contained in the financial
statements The parties which generally undertake financial analysis is short ndashterm
creditors long-term creditors owner and management In view of the requirements of the
various ratios ratios are classified into the following four important categories
8102019 A Study A Study On Financial Performance Analysis With Reference To Kesoram Cementon Financial Performance hellip
httpslidepdfcomreaderfulla-study-a-study-on-financial-performance-analysis-with-reference-to-kesoram 4181
41
Liquidity ratios
Leverage ratios
Activity ratios
Profitability ratios
Liquidity Ratios
It is extremely essential for a firm to be able to meet its obligations as they become due
Liquidity ratios measure the ability of the firm to meet its current obligations A firm should
ensure that it does not suffer from lack of liquidity and also that it does not have excess
liquidity The failure of a company to meet its obligations due to lack of sufficient liquidity
will result in a poor creditworthiness loss of creditorsrsquo confidence or even in legal tangles
resulting in the closure of the company A very high degree of liquidity is also bad idle
assets earn nothing The firmrsquos funds will be unnecessarily tied up in current assets
Therefore it is necessary to strike a proper balance high liquidity and lack of liquidity
The most common ratios which indicate the extent of liquidity or lack of it are
Current ratio
Quick ratio
Other ratios include Cash ratio Interval Measure and Net working capital ratio
Current Ratio
The current ratio is calculated by dividing current assets by current liabilities
Current assets
Current ratio = --------------------------
Current liabilities
Current ratio is a measure of the firmrsquos short term solvency It indicates the availability of
current assets in rupees for every one rupee of current liability A ratio of greater than one
means that the firm has more current assets than current claims against the Current ratio of
2 to 1 or more is considered satisfactory Current ratio represents a margin of safety for
creditors
Quick Ratio
Quick ratio also known as acid-test ratio establishes a relationship between quick assets and
the current liabilities Cash is the most liquid asset It is calculated by dividing quick assets
by current liabilities
Quick ratio = Quick Assets Current Liabilities
8102019 A Study A Study On Financial Performance Analysis With Reference To Kesoram Cementon Financial Performance hellip
httpslidepdfcomreaderfulla-study-a-study-on-financial-performance-analysis-with-reference-to-kesoram 4281
42
(Quick Assets = Current assets ndash Inventory)
One defect of the current ratio is that it fails to convey any information on the composition
of the current assets of the firm A rupee of cash is considered equivalent to a rupee of
inventory of receivables But it is not so A rupee of cash is more readily available to meet
current liabilities than a rupee of say inventory This implies the usefulness of the current
ratio
The Acid ndashtest ratio measures the firmrsquos ability to convert its current assets quickly into
cash in order to meet its current liabilities
A quick ratio of 1 to 1 is considered to represent a satisfactory current financial condition It
is an important index of the firmrsquos liquidity
Leverage Ratios
Leverage ratios identify the source of a firmrsquos capital ndashowners or outside creditors
Financial leverage refers to the use of debt in financing non-current assets If the return on
assets exceeds the cost of debt the leverage is successful ndash ie it improves return on equity
Debt ndashEquity Ratio
The Debt ndash Equity is determined to analyze the soundness of the long term financial
policies of the organization It is also known as ldquoInternal External Equity Ratiordquo
It is calculated as follows
Debt ndash Equity Ratio = Total long term debt Share holders funds
Equity Ratio
This ratio is also called as proprietary ratio establishes a relationship between share holderrsquos
funds to total assets of company Equity Ratio is calculated by dividing share holders fund
by total assets
Fixed Asset Ratio
This ratio indicates the extent to which the assets of the companyrsquos can be lost without
affecting the interest of the creditors of the company Higher the ratios better the long-term
position of the company
Activity Ratios
They are primarily used for studying a firmrsquos working capital situation A well managed
firm should have good activity ratios
8102019 A Study A Study On Financial Performance Analysis With Reference To Kesoram Cementon Financial Performance hellip
httpslidepdfcomreaderfulla-study-a-study-on-financial-performance-analysis-with-reference-to-kesoram 4381
43
Working Capital Turnover Ratio
The working capital turnover ratio indicates whether or not working capital has been
effectively used in making sales
Working capital turnover = Sales Net current assets
Inventory Turnover Ratio
This ratio also known as Stock Turnover Ratio establishes the relationship between costs of
goods sold or net sales during the given period and the average amt of stock held during the
period This ratio reveals the number of times finished stock in turnover during a given
accounting period
Higher the ratio the better is it because it shows the finished stock is rapidly turned
in to sales On the other hand a low stock turnover ratio is not desirable because it reveals
the accumulation of stock
Debtors Turnover Ratio
This ratio indicates the velocity of debt collection of a company In other words it shows
the number of times average turnover during a year
A Higher Debtor Turnover Ratio indicates a more efficient is the management towards
debtors and low ratio ratio implies inefficient management of debtors
Total Assets Turnover Ratio
The asset turnover ratio indicates how efficiently management is employing Assets
Total Assets Turnover Ratio = Sales Total Assets
Profitability Ratios
Profitability ratios are the ratios which measure a firmrsquos overall effectiveness as revealed by
the returns generated on sales and investment
General Profitability Ratios
1 Gross Profit Ratio
2 Net profit Ratio
3 Operating or Expenses Ratio
8102019 A Study A Study On Financial Performance Analysis With Reference To Kesoram Cementon Financial Performance hellip
httpslidepdfcomreaderfulla-study-a-study-on-financial-performance-analysis-with-reference-to-kesoram 4481
44
Gross Profit Ratio
Gross profit Ratio measures the relationships to net sales and is usually represented as a
percentage It is a good measure of profitability
The gross profit ratio indicates the extent to which selling price of goods per unit may
decline without resulting in losses on operation Higher the gross profit betters the result
Net Profit Ratio
Net Profit Ratio indicates net margin on sales It is given by the following equation
Net Profit Ratio = (Net Profit Sales) 100
Operating or Expenses Ratio
This ratio is complimentary of Net Profit Ratio The more the net profit the less the
Operating Ratio Operating costs include the cost of direct materials direct labors and otheroverheads viz are generally excluded from operating costs A comparison of the Operating
Ratio will indicate whether the cost efficiency is high or low in the figure of sales This less
the ratio it depicts the efficiency of the management
8102019 A Study A Study On Financial Performance Analysis With Reference To Kesoram Cementon Financial Performance hellip
httpslidepdfcomreaderfulla-study-a-study-on-financial-performance-analysis-with-reference-to-kesoram 4581
45
CHAPTER IV
DATA ANALYSIS amp INTERPRETATION
8102019 A Study A Study On Financial Performance Analysis With Reference To Kesoram Cementon Financial Performance hellip
httpslidepdfcomreaderfulla-study-a-study-on-financial-performance-analysis-with-reference-to-kesoram 4681
46
Comparative Balance Sheet of Kesoram in the Year between 2008-2009
(Rupee in crores)
Years Changes
Particulars 2008 2009 In Rupees In Percentage
Liabilities
Share Capital 4574 4574 000 000
Reserves amp Surplus 93085 128024 34939
Revaluation Reserves 533 412 -121 -2270
Loans
Secured Loans 97106 153627 56521 5821
Un Secured Loans 12129 43416 31287 25795
Deferred Tax Liabilities 000 000 000 000
Current Liabilities
Provisions 33039 34529 1490 451
Current Liabilities 57067 66587 9520 1668
Total 297533 431169 133636 4491
Assets
Net Block 108424 180435 72011 6642
Capital Wip 63459 86485 23026 3628
Investments 4783 6178 1395 2917
Current Assets
Inventories 44217 58906 14689 3322
Sundry Debtors 27307 38017 10710 3922
Cash amp Bank Balances 4036 5657 1621 4016
Total Current Assets 75560 102580 27020 3576
Loans amp Advances 45289 55462 10173 2246
Fixed Deposits 018 028 010 5556
Total 297533 431169 133636 4491
8102019 A Study A Study On Financial Performance Analysis With Reference To Kesoram Cementon Financial Performance hellip
httpslidepdfcomreaderfulla-study-a-study-on-financial-performance-analysis-with-reference-to-kesoram 4781
47
Interpretation of comparative balance sheet of 2008-2009
Reserves amp Surplus were increased to 3753 (percent) ie in Rupees 34939
crores
Revaluation Reserves decreased to 121 ie in Rupees 2270 crores
Secured Loans are increased to 5821 ie in Rupees 56521 crores And UN
secured loans highly Increased to 25795
Current liabilities and Provisions are increased to 1668 and 451 respectively ie in
Rupees 9520 amp 1490 crores
Fixed assets were highly increased to 6642 ie in Rupees 72011 crores
Investments were increased to 2917 ie in Rupees 1395 crores
Sundry debtors increased to 3922 ie in Rupees 10710 crores
Current assets increased 3576 ie in Rupees 27020 crores And Loans amp
Advances increased to 2246 respectively
The overall financial position was satisfactory
8102019 A Study A Study On Financial Performance Analysis With Reference To Kesoram Cementon Financial Performance hellip
httpslidepdfcomreaderfulla-study-a-study-on-financial-performance-analysis-with-reference-to-kesoram 4881
48
Comparative Balance Sheet of Kesoram in the Year between 2009-2010
(Rupees in crores)
Years Changes
Particulars 2009 2010 In Rupees In Percentage
Liabilities
Share Capital 4574 4574 000 000
Reserves amp Surplus 128024 149111 21087 1647
Revaluation Reserves 412 339 -073 -1772
Loans
Secured Loans 153627 186372 32745 2131
Un Secured Loans 43416 126250 82834 19079
Deferred Tax Liabilities 000 000 000
Current Liabilities
Provisions 34529 35734 1205 349
Current Liabilities 66587 107688 41101 6173
Total 431169 610068 178899 4149
Assets
Net Block 180435 343182 162747 9020
Capital WIP 86485 41283 -45202 -5227
Investments 6178 5143 -1035 -1675
Current Assets
Inventories 58906 91619 32713 5553
Sundry Debtors 38017 54289 16272 4280
Cash amp Bank Balances 5657 8014 2357 4167
Total Current Assets 102580 153922 51342 5005
Loans amp Advances 55462 66506 11044 1991
Fixed Deposits 028 031 003 1071
Total 431169 610068 178899 4149
8102019 A Study A Study On Financial Performance Analysis With Reference To Kesoram Cementon Financial Performance hellip
httpslidepdfcomreaderfulla-study-a-study-on-financial-performance-analysis-with-reference-to-kesoram 4981
49
Interpretation of comparative balance sheet of 2009-2010
Reserves amp surplus increased to 1647 ie in Rupees 21087 crores
Revaluation Reserves decreased to 1772 ie in Rupees 073 crores
Secured loans increased to 2131 ie in Rupees 32745 crores
Current Liabilities were increased to 6173 ie in Rupees 41101 crores and
Provisions 349 ie in Rupees 1205 crores
Fixed Assets were increased to 9020 ie in Rupees 162747 crores
Investments were decreased to 1675 ie in Rupees 1035 crores
Sundry debtors were increased to 4280 ie in Rupees 16272 crores
Current assets increased to 5005 ie in Rupees 51342 crores And loans and
Advances increased 1919 ie in Rupees 11044 crores
The overall financial position was satisfactory
8102019 A Study A Study On Financial Performance Analysis With Reference To Kesoram Cementon Financial Performance hellip
httpslidepdfcomreaderfulla-study-a-study-on-financial-performance-analysis-with-reference-to-kesoram 5081
50
Comparative Balance Sheet of Kesoram in the Year between 2010-2011
(Rupees in crores)
Years Changes
Particulars 2010 2011 In Rupees In Percentage
Liabilities
Share Capital 4574 4574 000 000
Reserves amp Surplus 149111 125162 -23949 -1606
Revaluation Reserves 339 289 -050 -1475
Loans
Secured Loans 186372 237183 50811 2726
Un Secured Loans 126250 162744 36494 2891
Deferred Tax Liabilities 000 000 000
Current Liabilities
Provisions 35734 1494 -34240 -9582
Current Liabilities 107688 113902 6214 577
Total 610068 645348 35280 578
Assets
Net Block 343182 369172 25990 757
Capital WIP 41283 43781 2498 605
Investments 5143 6582 1439 2798
Current Assets
Inventories 91619 111855 20236 2209
Sundry Debtors 54289 63134 8845 1629
Cash amp Bank Balances 8014 7188 -826 -1031
Total Current Assets 153922 182177 28255 1836
Loans amp Advances 66506 43460 -23046 -3465
Fixed Deposits 031 176 145 46774
Total 610068 645348 35280 578
8102019 A Study A Study On Financial Performance Analysis With Reference To Kesoram Cementon Financial Performance hellip
httpslidepdfcomreaderfulla-study-a-study-on-financial-performance-analysis-with-reference-to-kesoram 5181
51
Interpretation of comparative balance sheet of 2010-2011
Reserves amp surplus decreased to 1606 ie in Rupees 23949 crores
Revaluation Reserves decreased to 1475 ie in Rupees 050 crores
Secured loans increased to 2726 ie in Rupees 50811 crores
Current Liabilities were increased to 577 ie in Rupees 6214 crores
Provisions decreased to 9582 ie in Rupees 34240 crores
Fixed Assets were increased to 757 ie in Rupees 25990 crores
Investments were decreased to 2798 ie in Rupees 1439 crores
Sundry debtors were increased to 1629 ie in Rupees8845 crores
Current assets increased to 1836 ie in Rupees 28255 crores And loans and
Advances increased 3465 ie in Rupees 23046 crores
The overall financial position was UN satisfactory
8102019 A Study A Study On Financial Performance Analysis With Reference To Kesoram Cementon Financial Performance hellip
httpslidepdfcomreaderfulla-study-a-study-on-financial-performance-analysis-with-reference-to-kesoram 5281
52
Comparative Balance Sheet of Kesoram In The Year Between 2011-2012
(Rupees in crores)
Years Changes
Particulars 2011 2012 In Rupees In Percentage
Liabilities
Share Capital 4574 4574 000 000
Reserves amp Surplus 125162 86657 -38505 -3076
Revaluation Reserves 289 270 -019 -657
Loans
Secured Loans 237183 317792 80609 3399
Un Secured Loans 162744 92742 -70002 -4301
Deferred Tax Liabilities 000 000 000
Current Liabilities
Provisions 1494 40726 39232 262597
Current Liabilities 113902 180010 66108 5804
Total 645348 722771 77423 1200
Assets 000
Net Block 369172 358721 -10451 -283
Capital WIP 43781 68065 24284 5547
Investments 6582 6636 054 082
Current Assets
Inventories 111855 99516 -12339 -1103
Sundry Debtors 63134 67358 4224 669
Cash amp Bank Balances 7188 6959 -229 -319
Total Current Assets 182177 173833 -8344 -458
Loans amp Advances 43460 115409 71949 16555
Fixed Deposits 176 107 -069 -3920
Total 645348 722771 77423 1200
8102019 A Study A Study On Financial Performance Analysis With Reference To Kesoram Cementon Financial Performance hellip
httpslidepdfcomreaderfulla-study-a-study-on-financial-performance-analysis-with-reference-to-kesoram 5381
53
Interpretation of comparative balance sheet of 2011-2012
Reserves amp surplus decreased to 3076 ie in Rupee 38505 crores
Revaluation Reserves decreased to 657 ie in Rupees 019 crores
Secured loans increased to 3399 ie in Rupees 80699 crores
Current Liabilities were increased to 5804 ie in Rupees 66108 crores
Provisions increased to 262597 ie in Rupees 39232 crores
Fixed Assets were decreased to 283 ie in Rupee 10451 crores
Investments were increased to 082 ie in Rupees 054 crores
Sundry debtors were increased to 669 ie in Rupees 4224 crores
Current assets decreased to 458 ie in Rupees 8344 crores And loans and
Advances increased 16555 ie in Rupees 71949 crores
The overall financial position was UN satisfactory
8102019 A Study A Study On Financial Performance Analysis With Reference To Kesoram Cementon Financial Performance hellip
httpslidepdfcomreaderfulla-study-a-study-on-financial-performance-analysis-with-reference-to-kesoram 5481
54
Common Size Balance Sheet of Kesoram For The Year 2008-2009
(Rupees in crores)
Particulars 2008 Change Percentage 2009 Change Percentage
Liabilities
Share Capital 4574 154 4574 106
Reserves amp Surplus 93085 3129 128024 2969
Revaluation Reserves 533 018 412 010
Loans
Secured Loans 97106 3264 153627 3563
Un Secured Loans 12129 408 43416 1007
Deferred Tax Liabilities 000 000 000 000
Current Liabilities
Provisions 33039 1110 34529 801
Current Liabilities 57067 1918 66587 1544
Total 297533 10000 431169 10000
Assets
Net Block 108424 3644 180435 4185
Capital WIP 63459 2133 86485 2006
Investments 4783 161 6178 143
Current Assets
Inventories 44217 1486 58906 1366
Sundry Debtors 27307 918 38017 882
Cash amp Bank Balances 4036 136 5657 131
Loans amp Advances 45289 1522 55462 1286
Fixed Deposits 018 001 028 001
Total 297533 10000 431169 10000
8102019 A Study A Study On Financial Performance Analysis With Reference To Kesoram Cementon Financial Performance hellip
httpslidepdfcomreaderfulla-study-a-study-on-financial-performance-analysis-with-reference-to-kesoram 5581
55
Interpretation of Common Size Balance Sheet of 2008-2009
Share capital was recorded 154 percent in the total liabilities in the year 2008 it is
decreased to 106 in the year 2009
Reserves amp surplus contributed to 3129 in the total liabilities in the year 2008 it is
decreased to 2969 in the year 2009
Secured loans were 3264 in the total liabilities in the year 2008 it is increased to
3563 in the year 2009
Current Liabilities shown to 1918 in the total liabilities in the year 2008 it is
decreased to 1544 in the year 2009
Provisions 1110 in the total liabilities in the year 2008 it is decreased to 801 in the
year 2009
Fixed Assets were 3644 in the total liabilities in the year 2008 ie decreased to 4185
in the year 2009
Investments were 161 in the total liabilities in the year 2008 it is decreased to 143
in the year 2009
Sundry debtors were 918 in the total liabilities in the year 2008 it is decreased to 882
in the year 2009
8102019 A Study A Study On Financial Performance Analysis With Reference To Kesoram Cementon Financial Performance hellip
httpslidepdfcomreaderfulla-study-a-study-on-financial-performance-analysis-with-reference-to-kesoram 5681
56
Common Size Balance Sheet of Kesoram For The Year 2009-2010
(Rs in crores)
Particulars 2009 Change Percentage 2010Change
Percentage
Liabilities
Share Capital 4574 106 4574 075
Reserves amp Surplus 128024 2969 149111 2444
Revaluation Reserves 412 010 339 006
Loans
Secured Loans 153627 3563 186372 3055
Un Secured Loans 43416 1007 126250 2069
Deferred Tax Liabilities 000 000 000 000
Current Liabilities
Provisions 34529 801 35734 586
Current Liabilities 66587 1544 107688 1765
Total 431169 10000 610068 10000
Assets
Net Block 180435 4185 343182 5625
Capital WIP 86485 2006 41283 677
Investments 6178 143 5143 084
Current Assets
Inventories 58906 1366 91619 1502
Sundry Debtors 38017 882 54289 890
Cash amp Bank Balances 5657 131 8014 131
Loans amp Advances 55462 1286 66506 1090
Fixed Deposits 028 001 031 001
Total 431169 10000 610068 10000
8102019 A Study A Study On Financial Performance Analysis With Reference To Kesoram Cementon Financial Performance hellip
httpslidepdfcomreaderfulla-study-a-study-on-financial-performance-analysis-with-reference-to-kesoram 5781
57
Interpretation of common size balance sheet of 2009-2010
Share capital was recorded 106 percent in the total liabilities in the
year 2009 it is decreased to 075 in the year 2010
Reserves amp surplus contributed to 2969 in the total liabilities in the
year 2009 it is decreased to2444 in the year 2010
Secured loans were 3563 in the total liabilities in the year 2009 it is
increased to 3055 in the year 2010
Current Liabilities shown to 1544 in the total liabilities in the year
2009 it is decreased to 1765 in the year 2010
Provisions 801 in the total liabilities in the year 2009 it is decreased
to 586 in the year 2010
Fixed Assets were 4185 in the total liabilities in the year 2009 ie
increased to 5625 in the year 2010
Investments were 143 in the total liabilities in the year 2009 it is
decreased to 084 in the year 2010
Sundry debtors were 882 in the total liabilities in the year 2009 it is
increased to 890 in the year 2010
8102019 A Study A Study On Financial Performance Analysis With Reference To Kesoram Cementon Financial Performance hellip
httpslidepdfcomreaderfulla-study-a-study-on-financial-performance-analysis-with-reference-to-kesoram 5881
58
Common Size Balance sheet of Kesoram for the year 2010-2011
983080Rupees in crores)
Particulars 2010 Change Percentage 2011
Change
Percentage
Liabilities
Share Capital 4574 075 4574 071
Reserves amp Surplus 149111 2444 125162 1939
Revaluation Reserves 339 006 289 004
Loans
Secured Loans 186372 3055 237183 3675
Un Secured Loans 126250 2069 162744 2522
Deferred Tax Liabilities 000 000 000 000
Current Liabilities
Provisions 35734 586 1494 023
Current Liabilities 107688 1765 113902 1765
Total 610068 10000 645348 10000
Assets
Net Block 343182 5625 369172 5721
Capital WIP 41283 677 43781 678
Investments 5143 084 6582 102
Current Assets
Inventories 91619 1502 111855 1733
Sundry Debtors 54289 890 63134 978
Cash amp Bank Balances 8014 131 7188 111
Loans amp Advances 66506 1090 43460 673
Fixed Deposits 031 001 176 003
Total 610068 10000 645348 10000
8102019 A Study A Study On Financial Performance Analysis With Reference To Kesoram Cementon Financial Performance hellip
httpslidepdfcomreaderfulla-study-a-study-on-financial-performance-analysis-with-reference-to-kesoram 5981
59
Interpretation of Common Size Balance Sheet Of 2010-2011
Share capital was recorded 075 percent in the total liabilities in the year 2010 it is
decreased to 071 in the year 2011
Reserves amp surplus contributed to 2444 in the total liabilities in the year 2010 it is
decreased to1939 in the year 2011
Secured loans were 3055 in the total liabilities in the year 2010 it is increased to
3675 in the year 2011
Current Liabilities shown to 1765 in the total liabilities in the year 2010 it is
also1765 in the year 2011
Provisions 586 in the total liabilities in the year 2010 it is decreased to 023 in the
year 2011
Fixed Assets were 5625 in the total liabilities in the year 2010 ie increased to 5721
in the year 2011
Investments were 084 in the total liabilities in the year 2010 it increased to 102 in
the year 2011
Sundry debtors were 890 in the total liabilities in the year 2010 it is increased to 978
in the year 2011
8102019 A Study A Study On Financial Performance Analysis With Reference To Kesoram Cementon Financial Performance hellip
httpslidepdfcomreaderfulla-study-a-study-on-financial-performance-analysis-with-reference-to-kesoram 6081
60
Common Size Balance Sheet of Kesoram for the Year 2011-2012
983080Rupees in crores)
Particulars 2011 Change Percentage 2012
Change
Percentage
Liabilities
Share Capital 4574 071 4574 063
Reserves amp Surplus 125162 1939 86657 1199
Revaluation Reserves 289 004 270 004
Loans
Secured Loans 237183 3675 317792 4397
Un Secured Loans 162744 2522 92742 1283
Deferred Tax Liabilities 000 000 000 000
Current Liabilities
Provisions 1494 023 40726 563
Current Liabilities 113902 1765 180010 2491
Total 645348 10000 722771 10000
Assets
Net Block 369172 5721 358721 4963
Capital WIP 43781 678 68065 942
Investments 6582 102 6636 092
Current Assets
Inventories 111855 1733 99516 1377
Sundry Debtors 63134 978 67358 932
Cash amp Bank Balances 7188 111 6959 096
Loans amp Advances 43460 673 115409 1597
Fixed Deposits 176 003 107 001
Total 645348 10000 722771 10000
8102019 A Study A Study On Financial Performance Analysis With Reference To Kesoram Cementon Financial Performance hellip
httpslidepdfcomreaderfulla-study-a-study-on-financial-performance-analysis-with-reference-to-kesoram 6181
61
Interpretation of common size balance sheet of 2011-2012
Share capital was recorded 071 percent in the total liabilities in the year 2011 it is
decreased to 063 in the year 2012
Reserves amp surplus contributed to 1939 in the total liabilities in the year 2011 it
is decreased to 1199 in the year 2012
Secured loans were 3675 in the total liabilities in the year 2011 it is increased to
4397 in the year 2012
Current Liabilities shown to 1765 in the total liabilities in the year 2011 it is
increased to 2491 in the year 2012
Provisions 023 in the total liabilities in the year 2011 it is increased to 563 in the
year 2012
Fixed Assets were 5721 in the total liabilities in the year 2011 ie decreased to
4963 in the year 2012
Investments were 102 in the total liabilities in the year 2011 it increased to 092
in the year 2012
Sundry debtors were 978 in the total liabilities in the year 2011 it is decreased to
932 in the year 2012
8102019 A Study A Study On Financial Performance Analysis With Reference To Kesoram Cementon Financial Performance hellip
httpslidepdfcomreaderfulla-study-a-study-on-financial-performance-analysis-with-reference-to-kesoram 6281
Trend Analysis
Share Capital-
Year
Amount
(In Crores) Trend
IncreaseDecrease
Base Year Previous Year
2008 4574 10000 000 000
2009 4574 10000 000 000
2010 4574 10000 000 000
2011 4574 10000 000 000
2012 4574 10000 000 000
Trend Percentages in Share Capital
Share capital shown a constant trend in the period 2008 and 2012
Share capital is 4574 crores all the years from 2008-2012
8102019 A Study A Study On Financial Performance Analysis With Reference To Kesoram Cementon Financial Performance hellip
httpslidepdfcomreaderfulla-study-a-study-on-financial-performance-analysis-with-reference-to-kesoram 6381
Reserves amp Surplus-
Year
Amount
(In Crores) Trend
IncreaseDecrease
Base Year Previous Year
2008 93085 10000 000 000
2009 128024 13753 3753 3753
2010 149111 16019 6019 2266
2011 125162 13446 3446 -2573
2012 86657 9309 -691 -4137
Trend Percentages in Reserves amp Surplus
Reserves amp surplus shown an increasing trend in the period between 2008 and 2010
The average trend was 13277 till 2010
The Reserves amp surplus was showing decreasing trend in the period 2011-2012 (ie
from 16019 in 2010 to 9309 in 2012)
The decreasing trend in Reserves amp surplus indicates the decrease in profits of the
firm
8102019 A Study A Study On Financial Performance Analysis With Reference To Kesoram Cementon Financial Performance hellip
httpslidepdfcomreaderfulla-study-a-study-on-financial-performance-analysis-with-reference-to-kesoram 6481
Investments-
Year
Amount
(In Crores) Trend
IncreaseDecrease
Base Year Previous Year
2008 4783 10000 000 000
2009 6178 12917 2917 2917
2010 5143 10753 753 -2164
2011 6582 13761 3761 3009
2012 6636 13874 3874 113
Trend Percentages in Investments-
The investments are shown an increasing trend in the period between 2008 ndash 2009
and it is decreasing in the year 2010
The average trend was 11458 till 2009
The investments increased in the periods 2011-2012 (ie from 10753 in 2010 to
13874 in 2012)
The overall trend in investments shown is satisfactory
8102019 A Study A Study On Financial Performance Analysis With Reference To Kesoram Cementon Financial Performance hellip
httpslidepdfcomreaderfulla-study-a-study-on-financial-performance-analysis-with-reference-to-kesoram 6581
Net Current Assets-
Year
Amount
(In Crores) Trend
IncreaseDecrease
Base Year Previous Year
2008 30761 10000 000 000
2009 56954 18515 8515 8515
2010 77037 25044 15044 6529
2011 110417 35895 25895 10851
2012 68613 22305 12305 -13590
Trends in Net Current Assets-
The NCA shown positive (increasing) trend
The NCA are increased to 35895 (the year 2011) compared with base year and
decreased in the year 2012 to 22305
The NCA shown increased trend from year and crossed 100
The overall trend was good
8102019 A Study A Study On Financial Performance Analysis With Reference To Kesoram Cementon Financial Performance hellip
httpslidepdfcomreaderfulla-study-a-study-on-financial-performance-analysis-with-reference-to-kesoram 6681
66
Ratio Analysis-
Current Ratio-
Current Ratio = Current Assets Current Liabilities
Current assets are cash in hand Cash at bank Marketable Securities(short term) short term
Investment Bills receivables sundry debtors Inventories (stock) Work in progress prepaid
expenses Current Liabilities are outstanding expenses Bills payable sundry Creditors
short-term advances income tax payable and Dividend payable
Current Ratio of Kesoram-
(Rupees in crores)
Year Current Assets Current Liabilities Current Ratio
2007-08 75560 57067 132
2008-09 102580 66587 154
2009-10 153922 107688 143
2010-11 182177 113902 160
2011-12 173833 180010 097
Interpretation-
As per the standard rule of current ratio ie 21 where current assets double the current
liabilities is considered satisfactory
In the present analysis the current ratio of the Kesoram is not satisfactory
from the above table It was assessed that the current ratio for all the five year is lower (less)
than the standard rule ie 21 And it is 097 in the year 2011-2012 (current year) This is
highly UN satisfactory
8102019 A Study A Study On Financial Performance Analysis With Reference To Kesoram Cementon Financial Performance hellip
httpslidepdfcomreaderfulla-study-a-study-on-financial-performance-analysis-with-reference-to-kesoram 6781
Quick Ratio-
Quick ratio also known as acid-test ratio establishes a relationship between quick
assets and the current liabilities Cash is the most liquid asset It is calculated by dividing
quick assets by current liabilities
Quick ratio = Quick Assets Current Liabilities
(Quick Assets = Current assets ndash Inventory)
Quick Ratio of Kesoram-
Rupees in crores)
Year Total QuickAssets
Current Liabilities Quick Ratio
2007-08 33343 57067 058
2008-09 43674 66587 066
2009-10 62303 107688 058
2010-11 70322 113902 0622011-12 74333 180010 041
Interpretation-
Usually a high Quick ratio is an indication that the company is liquid and has the ability to
meet its current or liquid liabilities in time on the other hand a low Quick Ratio represents
8102019 A Study A Study On Financial Performance Analysis With Reference To Kesoram Cementon Financial Performance hellip
httpslidepdfcomreaderfulla-study-a-study-on-financial-performance-analysis-with-reference-to-kesoram 6881
that the companyrsquos liquidity position is not good The above table showing the quick ratios
of Kesoram are canrsquot be considered satisfactory
Leverage Ratios-
Debt-Equity Ratio-
Debt-Equity Ratio = Total Long Term Debt Equity Share Holders Fund
Total Long term Debt= Debenture Capital + Long term loans from banks and financial
institutions + Public deposits
Equity Share Holders fund = Equity + Reserves and Surplus
Debt Equity Ratio of Kesoram
(Rupees in crores)
Year Total Debt Share Holders Fund Debt Equity Ratio
2007-08 109235 98192 111
2008-09 197043 133010 148
2009-10 312622 154024 203
2010-11 399927 130025 308
2011-12 410534 91501 449
8102019 A Study A Study On Financial Performance Analysis With Reference To Kesoram Cementon Financial Performance hellip
httpslidepdfcomreaderfulla-study-a-study-on-financial-performance-analysis-with-reference-to-kesoram 6981
Interpretation-
The Debt-Equity Ratio accepted standard is 05 This ratio reflects the relative contribution
of creditors and owners of business in its financing From the above it is clear that the long
term debt is more than that of the share holdersrsquo fund So we can interpret that the firmrsquosassets are financed more by the external funds rather than by the internal funds
8102019 A Study A Study On Financial Performance Analysis With Reference To Kesoram Cementon Financial Performance hellip
httpslidepdfcomreaderfulla-study-a-study-on-financial-performance-analysis-with-reference-to-kesoram 7081
Fixed Asset Ratio-
Net Sales
Fixed Asset Ratio = helliphelliphelliphelliphelliphelliphelliphelliphelliphelliphellip
Net Assets
Fixed Asset Ratio of Kesoram-
(Rupees in crores)
Year Net Sales Net Assets Fixed Assets Ratio
2007-08 300271 358721 084
2008-09 389797 369172 106
2009-10 475062 343182 1382010-11 539788 180435 299
2011-12 59182 108424 546
Interpretation
This ratio indicates the extent to which the assets of the companyrsquos can be lost without
affecting the interest of the creditors of the company Higher the ratios better the long-term
position of the companyThe above table shows fixed assets ratio in increasing trend Which is good for the
company
8102019 A Study A Study On Financial Performance Analysis With Reference To Kesoram Cementon Financial Performance hellip
httpslidepdfcomreaderfulla-study-a-study-on-financial-performance-analysis-with-reference-to-kesoram 7181
Overall Profitability Ratios-
Net Profit Ratio
Net Profit Ratio indicates net margin on sales It is given by the following equation
Net Profit Ratio = (Net Profit Sales) 100
Net Profit Ratio of Kesoram
(Rupees in crores)
Year Net Profit Sales Net Profit Ratio
2007-08 37917 300271 1263
2008-09 41432 389797 1063
2009-10 20298 475062 427
2010-11 -28176 539788 -5222011-12 -38108 59182 -644
Interpretation
It establishes a relationship between net profits after tax and net sales and
indicates the efficiency of the management in manufacturing selling administrative and
other activities of the company
The higher the ratio the better is the profitability or performance of the business
The above table depicts the net profit Ratio of Kesoram has decreased every year from
2007-2008 to 2011-2012It further decreased to negative in the year 2010-11 to -522 and -
644 in the year 2011-2012 This shows constant decrease in the profits of the company
8102019 A Study A Study On Financial Performance Analysis With Reference To Kesoram Cementon Financial Performance hellip
httpslidepdfcomreaderfulla-study-a-study-on-financial-performance-analysis-with-reference-to-kesoram 7281
72
Return on Investment-
Net Profit
Return on Investment = helliphelliphelliphelliphelliphelliphelliphelliphelliphelliphelliphellip X 100
Share Holders Fund
Return on Investment Ratio of Kesoram-
(Rupees in crores)
Year Net Profit Share Holders Fund Return On Investment
2007-08 37917 98192 3862
2008-09 41432 133010 3115
2009-10 20298 154024 1318
2010-11 -28176 130025 -2167
2011-12 -38108 91501 -4165
Interpretation-
The above table reveals how well the resources of the firm are being used Higher
the ratio better the result The above ratio implies how well the firm is growing in
terms of profitability and efficiency From the above table we can concern that the return on
investment is in decreasing trend ROI is highest in the year 2007-2008 as 3862 But
there after itrsquos decreased every year
The ROI is negative in the years 2010-2011 amp 2011-2012 as -2167 amp -4165 respectively
Which is not a good sign for the firm
8102019 A Study A Study On Financial Performance Analysis With Reference To Kesoram Cementon Financial Performance hellip
httpslidepdfcomreaderfulla-study-a-study-on-financial-performance-analysis-with-reference-to-kesoram 7381
8102019 A Study A Study On Financial Performance Analysis With Reference To Kesoram Cementon Financial Performance hellip
httpslidepdfcomreaderfulla-study-a-study-on-financial-performance-analysis-with-reference-to-kesoram 7481
8102019 A Study A Study On Financial Performance Analysis With Reference To Kesoram Cementon Financial Performance hellip
httpslidepdfcomreaderfulla-study-a-study-on-financial-performance-analysis-with-reference-to-kesoram 7581
75
CHAPTER V
FINDINGS amp SUGGESTIONS
8102019 A Study A Study On Financial Performance Analysis With Reference To Kesoram Cementon Financial Performance hellip
httpslidepdfcomreaderfulla-study-a-study-on-financial-performance-analysis-with-reference-to-kesoram 7681
76
Findings
The Share capital remains constant Share capital is unchanged all the years from
2008-2012
Reserves amp surplus were recorded an increasing trend in the period between 2008
and 2010It is showing decreasing trend in the period 2011-2012 (ie from 16019
in 2010 to 9309 in 2012)
Current Liabilities were increased compared to base year ie 2008
Provisions increased to 262597 ie in Rupees 39232 crores in the current year
The current ratio for all the five year is lower (less) than the standard rule ie 21
And it is 097 in the year 2011-2012 (current year)
The Debt-Equity Ratio was shown under the standard ratio It is clear that the long
term debt is more than that of the share holdersrsquo fund It indicates that the firm
heavily relying on external funds rather than the internal funds
The operating and net profit of Kesoram is in decreasing trend due to heavy
increase of manufacturing amp administrative expenses
ROI is highest in the year 2007-2008 as 3862 The ROI is negative in the years
2010-2011 amp 2011-2012 as -2167 amp -4165 respectively
Return on Equity Capital Employed Ratio of Kesoram has decreased every year
from 2007-2008 to 2010-2011It further decreased to negative in the year 2011-12 to
-3280
EPS of Kesoram has decreased every year from 2008-12It is negative in the year
2011 amp 12
8102019 A Study A Study On Financial Performance Analysis With Reference To Kesoram Cementon Financial Performance hellip
httpslidepdfcomreaderfulla-study-a-study-on-financial-performance-analysis-with-reference-to-kesoram 7781
77
Suggestion
The organization should adopt an appropriate capital structure
The companyrsquos debt-equity ratio is recorded more or less as 111 in the year 2008
and it is increased to 449 in the year 2012 (current year)The company should
adopt a better debt equity mix in the future to control the fluctuations in returns
The company should control fluctuations in cash and bank balances as it impacts the
current ratio of the company
The provisions are showing increasing trend which indicates risk of debtors The
firm should implement an effective credit management policy It should utilize its
idle funds by decreasing provisions
The company should control heavy increase of manufacturing amp administration
expenses as it is impacting the operating and net profit of company
8102019 A Study A Study On Financial Performance Analysis With Reference To Kesoram Cementon Financial Performance hellip
httpslidepdfcomreaderfulla-study-a-study-on-financial-performance-analysis-with-reference-to-kesoram 7881
78
ANNEXURE
Profit And Loss Account of Kesoram Cement
Mar12 Mar11 Mar10 Mar09 Mar08
12 Months 12 Months 12 Months 12 Months 12 Months
INCOME
Sales Turnover 628260 575072 505151 431613 345700
Excise Duty 36440 35284 30089 41815 45429
NET SALES 591820 539788 475062 389797 300271
Other Income 000 000 000 000 000
TOTALINCOME
596129 548733 481019 393969 302020
EXPENDITURE
Manufacturing
Expenses81903 74803 13974 13153 44113
MaterialConsumed
370897 310150 295550 229359 118448
Personal
Expenses33468 27355 23294 18690 15344
Selling Expenses 81910 78253 58667 48846 45019
AdministrativeExpenses
28225 29308 17219 16179 9907
Expenses
Capitalized000 000 000 000 000
Provisions Made 000 000 000 000 000
TOTAL
EXPENDITURE 596403 519870 408704 326227 232832Operating Profit -4583 19918 66358 63570 67439
EBITDA -274 28864 72316 67742 69188
Depreciation 29740 27259 17280 11186 8927
Other Write-offs 000 000 000 000 000
EBIT -30014 1605 55035 56557 60261
Interest 41015 23983 10921 12087 5426
EBT -71029 -22377 44114 44470 54835
Taxes -32921 5798 23816 3037 16918
Profit and Loss
for the Year-38108 -28176 20298 41432 37917
Non RecurringItems
-1142 7063 3228 -4023 402
Other Non Cash
Adjustments1276 091 207 465 017
OtherAdjustments
000 000 000 000 000
REPORTED
PAT-37974 -21021 23734 37874 38335
8102019 A Study A Study On Financial Performance Analysis With Reference To Kesoram Cementon Financial Performance hellip
httpslidepdfcomreaderfulla-study-a-study-on-financial-performance-analysis-with-reference-to-kesoram 7981
79
Balance Sheet Of Kesoram
Years
Particulars 2008 2009 2010 2011 2012
Liabilities
Share Capital 4574 4574 4574 4574 4574Reserves amp Surplus 93085 128024 149111 125162 86657
Revaluation Reserves 533 412 339 289 27
Loans
Secured Loans 97106 153627 186372 237183 317792
Un Secured Loans 12129 43416 12625 162744 92742
Deferred Tax Liabilities 0 0 0 0 0
Current Liabilities
Provisions 33039 34529 35734 1494 40726
Current Liabilities 57067 66587 107688 113902 18001
Total 297533 431169 610068 645348 722771
Assets
Net Block 108424 180435 343182 369172 358721
Capital WIP 63459 86485 41283 43781 68065
Investments 4783 6178 5143 6582 6636
Current Assets
Inventories 44217 58906 91619 111855 99516
Sundry Debtors 27307 38017 54289 63134 67358
Cash amp Bank Balances 4036 5657 8014 7188 6959
Total Current Assets 7556 10258 153922 182177 173833Loans amp Advances 45289 55462 66506 4346 115409
Fixed Deposits 018 028 031 176 107
Total 297533 431169 610068 645348 722771
8102019 A Study A Study On Financial Performance Analysis With Reference To Kesoram Cementon Financial Performance hellip
httpslidepdfcomreaderfulla-study-a-study-on-financial-performance-analysis-with-reference-to-kesoram 8081
80
KEY ITEMS 2012 2011 2010 2009 2008
Preference
Dividend 0 0 0 0 0
Equity Dividend 457 2516 2516 2516 2516
Equity Dividend
() 999 55 55 55 55
Shares in Issue(Lakhs) 45743 45743 45743 45743 45743
EPS - Annualised
(Rs) -8302 -4595 5188 828 838
8102019 A Study A Study On Financial Performance Analysis With Reference To Kesoram Cementon Financial Performance hellip
httpslidepdfcomreaderfulla-study-a-study-on-financial-performance-analysis-with-reference-to-kesoram 8181
BIBLIOGRAPHY
Sl
No
Books Author Name
1 Financial Management Khan amp JAIN
2 Financial Management IMPandey
3 Management Accounting RPTrivedi
Websites amp Search Engines
1 wwwkesoramcom983086
2 wwwmoneycontrolcom
3 wwwgooglefinancecom983086
Annual reports of Kesoram cement limited 2008-2012

8102019 A Study A Study On Financial Performance Analysis With Reference To Kesoram Cementon Financial Performance hellip
httpslidepdfcomreaderfulla-study-a-study-on-financial-performance-analysis-with-reference-to-kesoram 1981
19
strength but as slag content is increased early strength is reduced while sulfate resistance
increases and heat evolution diminishes Used as an economic alternative to Portland
sulfate-resisting and low-heat cements
Portland fly ash cement contains up to 30 fly ash The fly ash is pozzolanic so that
ultimate strength is maintained Because fly ash addition allows lower concrete water
content early strength can also be maintained Where good quality cheap fly ash is
available this can be an economic alternative to ordinary Portland cement
Portland pozzolan cement includes fly ash cement since fly ash is a pozzolan but also
includes cements made from other natural or artificial pozzolans In countries where
volcanic ashes are available (eg Italy Chile Mexico and the Philippines) these cements
are often the most common form in use
Portland silica fume cement Addition of silica fume can yield exceptionally high
strengths and cements containing 5-20 silica fume are occasionally produced However
silica fume is more usually added to Portland cement at the concrete mixer
Masonry cements are used for preparing bricklaying mortars and stuccos and must not be
used in concrete They are usually complex proprietary formulations containing Portland
clinker and a number of other ingredients that may include limestone hydrated lime air
entrainers retarders water proofers and coloring agents They are formulated to yield
workable mortars that allow rapid and consistent masonry work Subtle variations of
Masonry cement in the US are Plastic Cements and Stucco Cements These are designed to
produce controlled bond with masonry blocks
Expansive cements contain in addition to Portland clinker expansive clinkers (usually
sulfoaluminate clinkers) and are designed to offset the effects of drying shrinkage that is
normally encountered with hydraulic cements This allows large floor slabs (up to 60 m
square) to be prepared without contraction joints
White blended cements may be made using white clinker and white supplementary
materials such as high-purity metakaolin
Colored cements are used for decorative purposes In some standards the addition of
pigments to produce colored Portland cement is allowed In other standards (eg ASTM)
pigments are not allowed constituents of Portland cement and colored cements are sold as
blended hydraulic cements
Very finely ground cements are made from mixtures of cement with sand or with slag or
other pozzolan type minerals which are extremely finely ground together Such cements can
8102019 A Study A Study On Financial Performance Analysis With Reference To Kesoram Cementon Financial Performance hellip
httpslidepdfcomreaderfulla-study-a-study-on-financial-performance-analysis-with-reference-to-kesoram 2081
have the same physical characteristics as normal cement but with 50 less cement
particularly due to their increased surface area for the chemical reaction Even with
intensive grinding they can use up to 50 less energy to fabricate than ordinary Portland
cements
Non-Portland hydraulic cements
Pozzolan-lime cements Mixtures of ground Pozzolan and lime are the cements used by the
Romans and are to be found in Roman structures still standing (eg the Pantheon in Rome)
They develop strength slowly but their ultimate strength can be very high The hydration
products that produce strength are essentially the same as those produced by Portland
cement
Slag-lime cements Ground granulated blast furnace slag is not hydraulic on its own but is
activated by addition of alkalis most economically using lime They are similar to
pozzolan lime cements in their properties Only granulated slag (ie water-quenched glassy
slag) is effective as a cement component
Super sulfated cements These contain about 80 ground granulated blast furnace slag
15 gypsum or anhydrite and a little Portland clinker or lime as an activator They produce
strength by formation of ettringite with strength growth similar to a slow Portland cement
They exhibit good resistance to aggressive agents including sulfate
Calcium aluminate cements are hydraulic cements made primarily from limestone and
bauxite The active ingredients are monocalcium aluminate CaAl2O4 (CaO middot Al2O3 or CA in
Cement chemist notation CCN) and mayenite Ca12Al14O33 (12 CaO middot 7 Al2O3 or C12A7 in
CCN) Strength forms by hydration to calcium aluminate hydrates They are well-adapted
for use in refractory (high-temperature resistant) concretes eg for furnace linings
Calcium sulfoaluminate cements are made from clinkers that include yeelimite (Ca4
(AlO2)6SO4 or C4A3 in Cement chemists notation) as a primary phase They are used in
expansive cements in ultra-high early strength cements and in low-energy cements
Hydration produces ettringite and specialized physical properties (such as expansion or
rapid reaction) are obtained by adjustment of the availability of calcium and sulfate ionsTheir use as a low-energy alternative to Portland cement has been pioneered in China
where several million tonnes per year are produced Energy requirements are lower because
of the lower kiln temperatures required for reaction and the lower amount of limestone
(which must be endothermically decarbonated) in the mix In addition the lower limestone
8102019 A Study A Study On Financial Performance Analysis With Reference To Kesoram Cementon Financial Performance hellip
httpslidepdfcomreaderfulla-study-a-study-on-financial-performance-analysis-with-reference-to-kesoram 2181
21
content and lower fuel consumption leads to a CO2 emission around half that associated
with Portland clinker However SO2 emissions are usually significantly higher
Natural Cements correspond to certain cements of the pre-Portland era produced by
burning argillaceous limestones at moderate temperatures The level of clay components in
the limestone (around 30-35) is such that large amounts of belite (the low-early strength
high-late strength mineral in Portland cement) are formed without the formation of
excessive amounts of free lime As with any natural material such cements have highly
variable properties
Geopolymer cements are made from mixtures of water-soluble alkali metal silicates and
aluminosilicate mineral powders such as fly ash and metakaolin
8102019 A Study A Study On Financial Performance Analysis With Reference To Kesoram Cementon Financial Performance hellip
httpslidepdfcomreaderfulla-study-a-study-on-financial-performance-analysis-with-reference-to-kesoram 2281
22
COMPANY PROFILE
8102019 A Study A Study On Financial Performance Analysis With Reference To Kesoram Cementon Financial Performance hellip
httpslidepdfcomreaderfulla-study-a-study-on-financial-performance-analysis-with-reference-to-kesoram 2381
23
Kesoram Cement Industry is one of the leading manufacturers of cement in India It is a day
process cement Plant The plant capacity is 826 lakh tones per annum It is located at
Basanthnagar in Karimnagar district of Andhra Pradesh Basanthnagar is 8 km away from
the Ramagundam Railway station linking Madras to New Delhi The Chairman of the
Company is BKBirla
History
The first unit at Basanthnagar with a capacity of 21 lakh tones per annum
incorporating humble suspension preheated system was commissioner during the year 1969
The second unit was setup in year 1971 with a capacity of 21 lakh tones per annum went on
stream in the year 1978 The coal for this company is being supplied from Singgareni
Collieries and the power is obtained from APSEB The power demand for the factory is
about 21 MW Kesoram has got 2 DG sets of 4 MW each installed in the year 1987
Kesoram Cement has setup a 15 KW captor power plant to facilitate for
uninterrupted power supply for manufacturing of cement at 24th
august 1997 per hour 12
mw actual power is 15 mw
The Company was incorporated on 18th October 1919 under the Indian Companies Act
1913 in the name and style of Kesoram Cotton Mills Ltd It had a Textile Mill at 42
Garden Reach Road Calcutta 700 024 The name of the Company was changed to Kesoram
Industries amp Cotton Mills Ltd on 30th
August 1961 and the same was further changed to Kesoram Industries Limited on 9th July
1986 The said Textile Mill at Garden Reach Road was eventually demerged into a separate
company
The First Plant for manufacturing of rayon yarn was established at Tribeni District
Hooghly West Bengal and the same was commissioned in December 1959 and the second
plant was commissioned in the year 1962 enabling it to manufacture 4635 metric tons perannum (mtpa) of rayon yarn This Unit has 6500 metric tons per annum (mtpa) capacity as
on 3132009
The plant for manufacturing of transparent paper was also set up at the same location at
Tribeni District Hooghly West Bengal in June 1961 It has the annual capacity to
manufacture 3600 metric tons per annum (mtpa) of transparent Paper
8102019 A Study A Study On Financial Performance Analysis With Reference To Kesoram Cementon Financial Performance hellip
httpslidepdfcomreaderfulla-study-a-study-on-financial-performance-analysis-with-reference-to-kesoram 2481
24
The Company diversified into manufacturing of cast iron spun pipes and pipe fittings at
Bansberia District Hooghly West Bengal with a production capacity of 45000 metric tons
per annum (mtpa) of cast iron spun pipes and pipe fittings in December 1964
The Company subsequently diversified into the manufacturing of Cement and in 1969
established its first cement plant under the name Kesoram Cement at Basantnagar Dist
Karimnagar (Andhra Pradesh) and to take advantage of favorable market conditions in
1986 another cement plant known as Vasavadatta Cement was commissioned by it at
Sedam Dist
Gulbarga (Karnataka) The cement manufacturing capacities at both the plants were
augmented from time to time according to the market conditions and as on 3132009
Kesoram Cement and Vasavadatta Cement have annual cement manufacturing capacities of
15 million metric tons and 41 million metric tons respectively
The Company in March 1992 commissioned a plant at Balasore known as Birla Tyres in
Orissa for manufacturing of 10 lakh mtpa automotive tyres and tubes in the first phase in
collaboration with Pirelli Ltd UK a subsidiary company of the world famous Pirelli
Group of Italy - a pioneer in production and development of automotive tyres in the world
The capacity at the said plant was further augmented during the year by 19 MT per day
aggregating to 271 MT per day production facility The Greenfield Project of 257 MT per
day capacity in the State of Uttarakhand with a capex of about Rs760 crores commenced
the commercial production in phases during the financial year 2008-09The Company as on
3132009 had the manufacturing capacities of 371 million tyres 295 million tubes and
153 million flaps per annum in the Plants including at Uttarakhand Plant It has small
manufacturing capacities of various Chemicals at Kharda in the State of West Bengal also
It has the annual manufacturing capacities of 12410 mtpa of Caustic Soda Lye 5045 mtpa
of Liquid Chlorine 6205 mtpa of Sodium Hypochlorite 8200 mtpa of Hydrochloric Acid
3200 mtpa of Ferric Alum 18700 mtpa of Sulphuric Acid and 1620000 m3pa of purified
Hydrogen Gas
The Company is a well-diversified entity in the fields of Cement Tyre Rayon Yarn
Transparent Paper Spun Pipes and Heavy Chemicals with two core business segments ie
Cement and Tyres
8102019 A Study A Study On Financial Performance Analysis With Reference To Kesoram Cementon Financial Performance hellip
httpslidepdfcomreaderfulla-study-a-study-on-financial-performance-analysis-with-reference-to-kesoram 2581
25
In Spun Pipes amp Foundries a unit of the Company work suspended from 2nd May 2008
still commences till further notice
The Company as of now is listed on three major Stock Exchanges in India ie Bombay
Stock Exchange Ltd Mumbai Calcutta Stock Exchange Association Ltd Kolkata and
National Stock Exchange of India Ltd Mumbai and at the Societe de la Bourse de
Luxembourg Luxembourg
A further expansion upto 165 million tons of cement per annum in Vasavadatta Cement at
Sedam in Karnataka as unit IV at the same site is in progress with a 175 MW Captive
Power Plant involving a capital expenditure of about Rs 78350 crores (including the cost
of Captive Power Plant)
The commercial production of cement in the aforesaid unit IV has commenced in June
2009 The work for the further expansion in the Tyres Section at Uttarakhand for radial
tyres with 100 MT per day capacity and bias tyres with 125 MT per day capacity involving
an estimated aggregate capital outlay of about Rs 840 crores is under progress The Board
has further approved a Motor Cycle Tyre Project of 70 MT per day capacity at the same site
involving a capital outlay of Rs190 crore The civil construction of both the Projects is in
full swing The commercial production in both the Projects is likely to start by December
2009 January 2010
Birla Supreme in popular brand of Kesoram cement from its prestigious plant of
Basantnagar in AP which has outstanding track record In performance and productivity
serving the nation for the last two and half decades It has proved its distinction by bagging
several national awards It also has the distinction of achieving optimum capacity
utilization
Kesoram offers a choice of top quality portioned cement for light heavy
constructions and allied applications Quality is built every fact of the operations
The plant lay out is rational to begin with The limestone is rich in calcium
carbonate a key factor that influences the quality of final product The day process
technology uses in the latest computerized monitoring overseas the manufacturing process
Samples are sent regularly to the bureau of Indian standards National council of
construction and building material for certification of derived quality norms
8102019 A Study A Study On Financial Performance Analysis With Reference To Kesoram Cementon Financial Performance hellip
httpslidepdfcomreaderfulla-study-a-study-on-financial-performance-analysis-with-reference-to-kesoram 2681
26
The company has vigorously undertaking different promotional measures for
promoting their product through different media which includes the use of news papers
magazine hoarding etc
Kesoram cement industry distinguished itself among all the cement factories in
Indian by bagging the National Productivity Award consecutively for two years ie for the
year 1985-1987 The federation of Andhra Pradesh Chamber amp Commerce and Industries
(FAPCCI) also conferred on Kesoram Cement An award for the best industrial promotion
expansion efforts in the state for the year 1984 Kesoram also bagged FAPCCI awarded for
ldquoBest Family Planning Effort in the staterdquo for the year 1987-1988
One among the industrial giants in the country today serving the nation on the
industrial front Kesoram industry ltd has a checked and eventful history dating back to the
twenties when the Industrial House of Birlarsquos acquired it With only a textile mill under its
banner 1924 it grew from strength to strength and spread its activities to newer fields like
Rayon Transparent paper pipes Refractors tyres and other products
Looking to the wide gap between the demand and supply of vital commodity
cement which play in important role in National building activity the Government of India
had de-licensed the cement industry in the year 1966 with a review to attract private
entrepreneur to augment the cement production Kesoram rose to the occasions and divided
to set up a few cement plants in the country
Kesoram cement undertaking marketing activities extensively in the state of Andhra
Pradesh Karnataka Tamilnadu Kerala Maharashtra and Gujarat In AP sales Depts are
located in different areas like Karimnagar Warangal Nizamabad Vijayawada and Nellore
In other states it has opened around 10 depots
The market share of Kesoram Cement in AP is 705 The market share of the
company in various states is shown as under
STATES MARKET SHARE
Karnataka 409
Tamilnadu 094
Kerala 029
Maharashtra 281
8102019 A Study A Study On Financial Performance Analysis With Reference To Kesoram Cementon Financial Performance hellip
httpslidepdfcomreaderfulla-study-a-study-on-financial-performance-analysis-with-reference-to-kesoram 2781
27
Process and Quality Control
It has been the endeavor of Kesoram to incorporate the Worldrsquos latest technology in
the plant and today the plant has the most sophisticated
X-ray analysis
Fully computerized XRF and XRD X-RAY Analyzers keep a constant round the
clock vigil on quality
Supreme performance
One of the largest Cement Plants in Andhra Pradesh the plant incorporate the latest
technology in Cement - making
It is professionally managed and well established Cement Manufacturing Company
enjoying the confidence of the consumers Kesoram has outstanding track record in
performance and productivity with quite a few national and state awards to its credit
BIRLA SUPREME the 43 Grade Cement is a widely accepted and popular brand
in the market commanding a premium
However to meet the specific demands of the consumer Kesoram bought out the 53
grade BIRLA SUPREME ndash GOLD which has special qualities like higher fineness quick-
setting high compressive strength and durability
Supreme Strength
Kesoram Cement has huge captive Limestone Deposits which make it possible tofeed high- grade limestone consistently its natural Grey colour is anion- born ingredient
and gives good shade
Both the products offered by Kesoram ie BIRLA SUPREME-43 Grade and
BIRLA SUPREME-GOLD-53 Grade cement are outstanding with much higher
compressive strength and durability
The following characteristics show their distinctive qualities
Comprehensive
Strength
Opc 43
grls 8112
1989
Birla
Supreme 43
grade
Opc 43 gr
Is 1226987
Birla
Supreme
Gold 53 gr
3 days mpa Min 23 31 + Min 27 38+
7 days mpa Min 23 42+ Min 37 48+
28 days mpa Min 43 50+ Min 53 60+
8102019 A Study A Study On Financial Performance Analysis With Reference To Kesoram Cementon Financial Performance hellip
httpslidepdfcomreaderfulla-study-a-study-on-financial-performance-analysis-with-reference-to-kesoram 2881
28
DC SYSTEM
Clinker making process is a key step in the overall cement making process In the case of
BIRLA SUPREMEGOLD the clinker-making process is totally computer control The
Distributed Control System (DCS) constantly monitors the process and ensures operating
efficiency This eliminates variation and ensures consistency in the quality of Clinker
Physical Characteristics
Ope 43
Is 8 112-89
Birla
Supreme
43 grade
Ope 53 gr
Is 12269-87
Birla Supreme
Gold 53 gr
Setting time Min30 120-180 Min 30 130-170
a Initial (mats) Max 600 180-240 Max 600 170-220
b final (mats) Min 225 270-280 Min 225 300-320
Fincncssm 2Kg Max 10 10-20 Max 10 05-10
Soundness Max 08 004-008 Max 0080 004-02
a le-chart (mm)
b autoclave ()
Supreme Expertise
The Best Technical Team exclusive to Kesoram mans the Plant and monitors the process
to blend the cement in just the required proportions to make BIRLA SUPREMEGOLD OF
Rock Strength
18 Million Tones of Solid Foundation
Staying at the top for over a Quarter Century Quarter Century is no less an achievement
Infact Kesoram is synonymous with for over 28 years
Over the years Kesoram has dispatched 18 million tones of cement to the nook and cornersof the country and joined hands in strengthening the Nation No one else in Andhra Pradesh
has this distinction The prestigious World Bank aided Ramagundam Super Thermal Power
Project of NTPC and Mannair Dam of Pochampad project in AP arc a couple of projects for
which Kesoram Cement was exclusively uses to cite an example
8102019 A Study A Study On Financial Performance Analysis With Reference To Kesoram Cementon Financial Performance hellip
httpslidepdfcomreaderfulla-study-a-study-on-financial-performance-analysis-with-reference-to-kesoram 2981
29
Chemical Characteristics
Opc 43 gr
Is 81 132-989
Birla
Supreme
43 grade
Ope 53 gr
Is 12269-
87
Birla
Supreme
Gold 53 gr
Loss on inflection Max 5 lt16 Max 40 lt15
Insoluble residue Max 20 lt08 Max 20 lt 06
Magnesium oxide Max 60 lt 13 Max 60 lt 13
Lime saturation factor 066-102 08-09 08-102 088-09
Alumna iron ratio MinO66 15-17 MinO66 15-17
Sulfuric anhydride Max 253 16-20 Max 2 53 16-20
Alkalis Chlorides Max 005 Max 001 Max 005 Max 04
Kesoram Cement - advantages
Helps in designing sleeker and more elegant
Structures giving greater flexibility in design concept
Due to its fine quality super fine construction can be achieved Its gives maximum
strength at Minimum use of cement with water in the water cement ratio especially the 53
grade Birlas supreme-gold
Feathers in Kesorams cap
Kesoram has outstanding track record achieving over 100 capacity utilization I
productivity and energy conservation It has proved its distinction by bagging several
national and state awards noteworthy being
NATIONAL
1 National productivity award for 1985-86
2 National productivity award for 1986-87
3 National award for mines safety for 1985-86
4 National award for mines safety for 1986-875 National award for energy conservation 1989-90
8102019 A Study A Study On Financial Performance Analysis With Reference To Kesoram Cementon Financial Performance hellip
httpslidepdfcomreaderfulla-study-a-study-on-financial-performance-analysis-with-reference-to-kesoram 3081
30
STATE
1 AP State productivity award for 1988
2 State award for best industrial management 1988-89
3 Best industrial productivity award of FAPCCI (federation of AP chamber of
commerce and industry) 1991
4 Best management award of the state Govt 1993
5 FAPCCI award for the workers welfare 1995-96
ISO 9002
All quality systems of Kesoram have been certified under ISO 90021S 4002 which
proves the worldwide acceptance of the products
All quality systems in production and marketing of the product have been certified by BIS
under ISO 90021S 14002
The first unit was installed at basanthnagar with a capacity of 25 ndashlakhs TPA (tones per
annum) incorporating humble supervision preheated system during the year 1969
The second unit followed suit with added a capacity of 2 lakhs TPA in 1971
The plant was further expanded to 9 lakhs by adding 25 lakhs tones in august 1978 113
lakhs tones in January 1981 and 087 lakhs tones in September 1981
Power
Singareni collieries make the supply of coal for this industry and the power was
obtained from AP TRANSCO The power demand for the factory is about 21MW Kesoram
has got 2-diesel generator seats of 4 MW each installed in the year 1987
Kesoram cement now has a 15MWcaptive power plant to facilities for uninterrupted
power supply for manufacturing of cement
Performance
The performance of kersoram cement industry has been outstanding achieving over
cent percent capacity utilization all through despite many odds like power cuts and which
most 40 was wasted due to wagon shortage etc
The company being a continuous process industry works round the clock and has
excellent records of performance achieving over 1005 capacity utilization
Kesoram has always combined technical progress with industrial performance The
company had glorious track record for the last 27 years in the industry
Technology
8102019 A Study A Study On Financial Performance Analysis With Reference To Kesoram Cementon Financial Performance hellip
httpslidepdfcomreaderfulla-study-a-study-on-financial-performance-analysis-with-reference-to-kesoram 3181
31
Kesoram cement uses most modern technology and the computerized control in the
plant A team of dedicated and well- experienced experts manages the plant
The quality is maintained much above the bureau of Indian standards
The raw materials used for manufacturing cement are
Lime stone
Bauxite
Hematite
Gypsum
Environmental and Social Obligations
For environmental promotion and to keep ndashup the ecological balance this section
has planted over two lakhs trees on social obligation front this section has undertaken
various social welfare programs by adopting ten nearly villages organizing family welfare
campus surgical camps animal health camps blood donation camps children immunization
camps seeds training for farmers etc were arranged
Welfare and Recreation Facilities
For the purpose of recreation facilities 2 auditoriums were provided for playing
indoor games cultural function and activities like drama music and dance etc
The industry has provided libraries and reading rooms About 1000 books are available in
the library All kinds of newspaper magazines are made available
Canteen is provided to cater to the needs of the employees for supply of snacks tea
coffee and meals etc
One English medium and one Telugu medium school are provided to meet the
educational requirements
The company has provided a dispenser with a qualified medical office and
paramedical staff for the benefit of the employees The employees covered under ESI
scheme have to avail the medical facilities from the ESI hospital
Competitions in sports and games are conducted every year for august 15th
Independence Day and January 26th republic day among the employees
Electricity
The power consumption per ton of cement has come down to 108 units against 113
units last year due to implementation of various energy saving measures The performance
of captive power plant of this section continues to be satisfactory Total power generation
8102019 A Study A Study On Financial Performance Analysis With Reference To Kesoram Cementon Financial Performance hellip
httpslidepdfcomreaderfulla-study-a-study-on-financial-performance-analysis-with-reference-to-kesoram 3281
32
during the year was 84 million units last year This captive power plant is a major role in
keeping power costs with in economic levels
The management has introduced various HRD programs for training and
development and has taken various other measures for the betterment of employeersquos
efficiency
The section has installed adequate air pollution control system and equipment and is
ISO14001 such as Environment management system is under implementation
Awards
Kesoram cement bagged many prestigious awards including national awards for
productivity technology conservation and several state awards since 1984 The following
are the some of important awards
AWARDS OF KESORAM CEMENT
No Year Awards
National
State
1 1989-90 Management award community
Development
State
2 1991 Energy conservation may day award of the
Govt
State
3 1991 Pundit Jawaharlal Nehru rolling trophy for
best
State
4 1993 National productivity effort Indira Gandhi
national award
State
5 1994 Best management award State
6 1994-
1995
Best industrial rebellion award State
7 1995 Rural development by chief minister
Environment and mineral conservation
award
State
8 1995 Best industrial rebellion award State
8102019 A Study A Study On Financial Performance Analysis With Reference To Kesoram Cementon Financial Performance hellip
httpslidepdfcomreaderfulla-study-a-study-on-financial-performance-analysis-with-reference-to-kesoram 3381
33
9 1995-
1996
Best effort of an industrial unit to
development rural economy shriSRRungta
award for social
National
10 1996 Awareness for best rural development
efforts
State
11 1999 Best workers welfare best family welfare
award
State
12 2001 First prize for mine environment amppollution
control for the 3rd
year in succession
State
13 2002 Vana mithra award from AP Govt State
14 2003 Company has got OHSAS-18001 State
15 2005 Certification from DNV New Delhi State
16 2006 Award for pollution control and
environmental protection FAPCCI award
for best rural development in the state
State
8102019 A Study A Study On Financial Performance Analysis With Reference To Kesoram Cementon Financial Performance hellip
httpslidepdfcomreaderfulla-study-a-study-on-financial-performance-analysis-with-reference-to-kesoram 3481
34
Products of the organization
8102019 A Study A Study On Financial Performance Analysis With Reference To Kesoram Cementon Financial Performance hellip
httpslidepdfcomreaderfulla-study-a-study-on-financial-performance-analysis-with-reference-to-kesoram 3581
35
CHAPTER-III
LITERATURE REVIEW
8102019 A Study A Study On Financial Performance Analysis With Reference To Kesoram Cementon Financial Performance hellip
httpslidepdfcomreaderfulla-study-a-study-on-financial-performance-analysis-with-reference-to-kesoram 3681
36
Introduction
Financial Performance Analysis
The term lsquofinancial performance analysis also known as analysis and interpretation of
financial statementsrsquo refers to the process of determining financial strength and
weaknesses of the firm by establishing strategic relationship between the items of the
balance sheet profit and loss account and other operative data
ldquoAnalyzing financial statementsrdquo by Metcalf and Titard
ldquoFinancial analysis is a process of evaluating the relationship between component
parts of a financial statement to obtain a better understanding of a firms position and
performancerdquo by Myers
Financial Performance
The word lsquoPerformance is derived from the word lsquoparfourmenrsquo which means lsquoto dorsquo lsquoto
carry outrsquo or lsquoto renderrsquo It refers the act of performing execution accomplishment
fulfillment etc In border sense performance refers to the accomplishment of a given task
measured against preset standards of accuracy completeness cost and speed In other
words it refers to the degree to which an achievement is being or has been accomplished In
the Words of Frich Kohlar ldquoThe performance is a general term applied to a part or to all the
conducts of activities of an organization over a period of time often with reference to past or
projected cost efficiency management responsibility or accountability or the like Thus not
just the presentation but the quality of results achieved refers to the performance
Performance is used to indicate firmrsquos success conditions and compliance
Financial performance refers to the act of performing financial activity In broader
sense financial performance refers to the degree to which financial objectives being or has
been accomplished It is the process of measuring the results of a firms policies and
operations in monetary terms It is used to measure firms overall financial health over a
given period of time and can also be used to compare similar firms across the same industry
or to compare industries or sectors in aggregation
The purpose of financial analysis is to diagnose the information contained in financial
statements so as to Jude the profitability and financial soundness of the firm Just like a
doctor examines his patient by recording his body temperature blood pressure etc Before
8102019 A Study A Study On Financial Performance Analysis With Reference To Kesoram Cementon Financial Performance hellip
httpslidepdfcomreaderfulla-study-a-study-on-financial-performance-analysis-with-reference-to-kesoram 3781
37
making his conclusion regarding the illness and before giving his treatment a financial
analyst analysis the financial statements with various tools of analysis before commenting
upon the financial health or weaknesses of an enterprise
The analysis and interpretation of financial statements is essential to bring out the
mystery behind the figures in financial statements Financial statements analysis is an
attempt to determine the significance and meaning of the financial statement data so that
forecast may be made of the future earnings ability to pay interest and debt maturities (both
current and long term) and profitability of a sound divided policy
Types of financial analysis-
Financial analysis into different categories depending upon
(1) The material used and
(2) The method of operation followed in the analysis or the modus operandi of
analysis
Types of financial analysis
On the basis of material used on the basis of modus operandi
External Internal Horizontal Vertical
Analysis Analysis Analysis Analysis
1 On the basis of material used - According to material used financial analysis canbe of two types
External analysis
Internal analysis
External analysis-
This analysis is done by outsiders who do not have access to the detailed internal
outsiders include investors potential investors Creditors Potential Creditors Government
Agencies Credit Agencies and General Public For financial analysis these external parties
to the firm depend almost entirely on the published financial statements
Internal analysis-
This analysis is undertaken by the persons namely executives and employees of the
organization or by the officers appointed by government or court who have access to the
8102019 A Study A Study On Financial Performance Analysis With Reference To Kesoram Cementon Financial Performance hellip
httpslidepdfcomreaderfulla-study-a-study-on-financial-performance-analysis-with-reference-to-kesoram 3881
38
books of account ( internal accounting records) and other information related to the
business
2 983119983150 983156983144983141 983138983137983155983145983155 983151983142 983149983151983140983157983155 983151983152983141983154983137983150983140983145983085
According to the modus operandi financial analysis can also be of two types
a Horizontal analysis
bVertical analysis
Horizontal analysis-
Horizontal analysis refers to the comparison of financial data of a company for several
years The figures for this type of analysis are presented horizontally over a number of
columns The figures of the various years are compared with standard or base year a base
year is year chosen as beginning point This type of analysis is also called lsquodynamicanalysisrsquo as it is based on the data from year to year rather than on data of any one year The
horizontal analysis makes it possible to focus attention on items that have changed
significantly during the period under view
b Vertical analysis-
Vertical analysis refers to the study of relationship of the various items in the financial
statements of one accounting period In this types of analysis the figures from financial
statement of a year are compared with a base selected from the same yearrsquos statement
Methods of financial analysis-
The following methods of analysis are generally used-
1 Comparative Statements
2 Trend Analysis
3 Common-Size Statements
4 Funds flow Analysis
5 Cash Analysis
6 Ratio Analysis
7 Cost-volume-Profit Analysis
8102019 A Study A Study On Financial Performance Analysis With Reference To Kesoram Cementon Financial Performance hellip
httpslidepdfcomreaderfulla-study-a-study-on-financial-performance-analysis-with-reference-to-kesoram 3981
39
Comparative statements-
The comparative financial statements are statements of the financial position at
different periods of time the elements of financial position are show in a
Comparative Statement provides an idea of financial position at two or more
periods Generally two financial statements (balance sheet and income statement) are
prepared in comparative form for financial analysis
The Comparative Statement May Show-
1 Absolute figures (rupee amounts)
2 Changes in absolute figures ie increase or decrease in absolute figures
3 Absolute data in terms of percentages
4 Increase or decrease in terms of percentages
The Two Comparative Statements Are-
1 Comparative balance sheet and
2 Income statement
1 983107983151983149983152983137983154983137983156983145983158983141 983138983137983148983137983150983139983141 983155983144983141983141983156983085
The comparative balance sheet analysis is the study of the trend of the same items group of
items and computed items in two or more balance sheets of the same business enterprise on
different dates The change in periodic balance sheet items reflect the conduct of a business
the change can be observed by comparison of the balance sheet at the beginning and at the
end of a period and these changes can help in forming an opinion about the progress of an
enterprise
Guide Lines for Interpretation of Comparative Balance Sheet-
While interpreting comparative balance sheet the interpreter is expected to study the
following aspects-
1 Current financial position and liquidity position
2 Long-term financial position
3 Profitability of the concern
8102019 A Study A Study On Financial Performance Analysis With Reference To Kesoram Cementon Financial Performance hellip
httpslidepdfcomreaderfulla-study-a-study-on-financial-performance-analysis-with-reference-to-kesoram 4081
40
Common Size Statement-
The common-size statements balance sheet and income statement are show in
analytical percentages The figures are shown as percentages of total assets total liabilities
and total sales The total assets are taken as 100 and different assets are expressed as a
percentage of the total similarly various liabilities are taken as a part of total liabilities
Common Size Balance Sheet-
A statement in which balance sheet items are expressed as the ratio of each asset to
total assets and the ratio of each liability is expressed as a ratio of total liabilities is called
common size balance The common size balance sheet can be used to compare companies
of differing size The comparison of figures in different periods is not useful because total
figures may be affected by a number of factors It is not possible to establish standard norms
for various assets The trends of figures from year to year may not be studied and even they
may not give proper results
Trend Analysis of Balance Sheet-
Trend analysis is Very important tool of horizontal financial analysis
This analysis enables to known the change in the financial function and operating efficiency
in between the time period chosen
By studding the trend analysis of each item we can known the direction of changes and
based upon the direction of changes the options can be changed
Trend =Absolute Value of item in the statement understudy 100
Absolute Value of same item in the base statement
Ratio Analysis
Ratio analysis is used as a technique of analyzing the financial information contained in the
balance sheet and profit and loss accounts for a more meaningful understanding of the
financial position and performance of a firm
The relationship between two accounting figures expressed mathematically is known as a
financial ratio A ratio helps the analyst to make qualitative judgment about the firmrsquos
financial position and performance
Several ratios can be calculated from the accounting data contained in the financial
statements The parties which generally undertake financial analysis is short ndashterm
creditors long-term creditors owner and management In view of the requirements of the
various ratios ratios are classified into the following four important categories
8102019 A Study A Study On Financial Performance Analysis With Reference To Kesoram Cementon Financial Performance hellip
httpslidepdfcomreaderfulla-study-a-study-on-financial-performance-analysis-with-reference-to-kesoram 4181
41
Liquidity ratios
Leverage ratios
Activity ratios
Profitability ratios
Liquidity Ratios
It is extremely essential for a firm to be able to meet its obligations as they become due
Liquidity ratios measure the ability of the firm to meet its current obligations A firm should
ensure that it does not suffer from lack of liquidity and also that it does not have excess
liquidity The failure of a company to meet its obligations due to lack of sufficient liquidity
will result in a poor creditworthiness loss of creditorsrsquo confidence or even in legal tangles
resulting in the closure of the company A very high degree of liquidity is also bad idle
assets earn nothing The firmrsquos funds will be unnecessarily tied up in current assets
Therefore it is necessary to strike a proper balance high liquidity and lack of liquidity
The most common ratios which indicate the extent of liquidity or lack of it are
Current ratio
Quick ratio
Other ratios include Cash ratio Interval Measure and Net working capital ratio
Current Ratio
The current ratio is calculated by dividing current assets by current liabilities
Current assets
Current ratio = --------------------------
Current liabilities
Current ratio is a measure of the firmrsquos short term solvency It indicates the availability of
current assets in rupees for every one rupee of current liability A ratio of greater than one
means that the firm has more current assets than current claims against the Current ratio of
2 to 1 or more is considered satisfactory Current ratio represents a margin of safety for
creditors
Quick Ratio
Quick ratio also known as acid-test ratio establishes a relationship between quick assets and
the current liabilities Cash is the most liquid asset It is calculated by dividing quick assets
by current liabilities
Quick ratio = Quick Assets Current Liabilities
8102019 A Study A Study On Financial Performance Analysis With Reference To Kesoram Cementon Financial Performance hellip
httpslidepdfcomreaderfulla-study-a-study-on-financial-performance-analysis-with-reference-to-kesoram 4281
42
(Quick Assets = Current assets ndash Inventory)
One defect of the current ratio is that it fails to convey any information on the composition
of the current assets of the firm A rupee of cash is considered equivalent to a rupee of
inventory of receivables But it is not so A rupee of cash is more readily available to meet
current liabilities than a rupee of say inventory This implies the usefulness of the current
ratio
The Acid ndashtest ratio measures the firmrsquos ability to convert its current assets quickly into
cash in order to meet its current liabilities
A quick ratio of 1 to 1 is considered to represent a satisfactory current financial condition It
is an important index of the firmrsquos liquidity
Leverage Ratios
Leverage ratios identify the source of a firmrsquos capital ndashowners or outside creditors
Financial leverage refers to the use of debt in financing non-current assets If the return on
assets exceeds the cost of debt the leverage is successful ndash ie it improves return on equity
Debt ndashEquity Ratio
The Debt ndash Equity is determined to analyze the soundness of the long term financial
policies of the organization It is also known as ldquoInternal External Equity Ratiordquo
It is calculated as follows
Debt ndash Equity Ratio = Total long term debt Share holders funds
Equity Ratio
This ratio is also called as proprietary ratio establishes a relationship between share holderrsquos
funds to total assets of company Equity Ratio is calculated by dividing share holders fund
by total assets
Fixed Asset Ratio
This ratio indicates the extent to which the assets of the companyrsquos can be lost without
affecting the interest of the creditors of the company Higher the ratios better the long-term
position of the company
Activity Ratios
They are primarily used for studying a firmrsquos working capital situation A well managed
firm should have good activity ratios
8102019 A Study A Study On Financial Performance Analysis With Reference To Kesoram Cementon Financial Performance hellip
httpslidepdfcomreaderfulla-study-a-study-on-financial-performance-analysis-with-reference-to-kesoram 4381
43
Working Capital Turnover Ratio
The working capital turnover ratio indicates whether or not working capital has been
effectively used in making sales
Working capital turnover = Sales Net current assets
Inventory Turnover Ratio
This ratio also known as Stock Turnover Ratio establishes the relationship between costs of
goods sold or net sales during the given period and the average amt of stock held during the
period This ratio reveals the number of times finished stock in turnover during a given
accounting period
Higher the ratio the better is it because it shows the finished stock is rapidly turned
in to sales On the other hand a low stock turnover ratio is not desirable because it reveals
the accumulation of stock
Debtors Turnover Ratio
This ratio indicates the velocity of debt collection of a company In other words it shows
the number of times average turnover during a year
A Higher Debtor Turnover Ratio indicates a more efficient is the management towards
debtors and low ratio ratio implies inefficient management of debtors
Total Assets Turnover Ratio
The asset turnover ratio indicates how efficiently management is employing Assets
Total Assets Turnover Ratio = Sales Total Assets
Profitability Ratios
Profitability ratios are the ratios which measure a firmrsquos overall effectiveness as revealed by
the returns generated on sales and investment
General Profitability Ratios
1 Gross Profit Ratio
2 Net profit Ratio
3 Operating or Expenses Ratio
8102019 A Study A Study On Financial Performance Analysis With Reference To Kesoram Cementon Financial Performance hellip
httpslidepdfcomreaderfulla-study-a-study-on-financial-performance-analysis-with-reference-to-kesoram 4481
44
Gross Profit Ratio
Gross profit Ratio measures the relationships to net sales and is usually represented as a
percentage It is a good measure of profitability
The gross profit ratio indicates the extent to which selling price of goods per unit may
decline without resulting in losses on operation Higher the gross profit betters the result
Net Profit Ratio
Net Profit Ratio indicates net margin on sales It is given by the following equation
Net Profit Ratio = (Net Profit Sales) 100
Operating or Expenses Ratio
This ratio is complimentary of Net Profit Ratio The more the net profit the less the
Operating Ratio Operating costs include the cost of direct materials direct labors and otheroverheads viz are generally excluded from operating costs A comparison of the Operating
Ratio will indicate whether the cost efficiency is high or low in the figure of sales This less
the ratio it depicts the efficiency of the management
8102019 A Study A Study On Financial Performance Analysis With Reference To Kesoram Cementon Financial Performance hellip
httpslidepdfcomreaderfulla-study-a-study-on-financial-performance-analysis-with-reference-to-kesoram 4581
45
CHAPTER IV
DATA ANALYSIS amp INTERPRETATION
8102019 A Study A Study On Financial Performance Analysis With Reference To Kesoram Cementon Financial Performance hellip
httpslidepdfcomreaderfulla-study-a-study-on-financial-performance-analysis-with-reference-to-kesoram 4681
46
Comparative Balance Sheet of Kesoram in the Year between 2008-2009
(Rupee in crores)
Years Changes
Particulars 2008 2009 In Rupees In Percentage
Liabilities
Share Capital 4574 4574 000 000
Reserves amp Surplus 93085 128024 34939
Revaluation Reserves 533 412 -121 -2270
Loans
Secured Loans 97106 153627 56521 5821
Un Secured Loans 12129 43416 31287 25795
Deferred Tax Liabilities 000 000 000 000
Current Liabilities
Provisions 33039 34529 1490 451
Current Liabilities 57067 66587 9520 1668
Total 297533 431169 133636 4491
Assets
Net Block 108424 180435 72011 6642
Capital Wip 63459 86485 23026 3628
Investments 4783 6178 1395 2917
Current Assets
Inventories 44217 58906 14689 3322
Sundry Debtors 27307 38017 10710 3922
Cash amp Bank Balances 4036 5657 1621 4016
Total Current Assets 75560 102580 27020 3576
Loans amp Advances 45289 55462 10173 2246
Fixed Deposits 018 028 010 5556
Total 297533 431169 133636 4491
8102019 A Study A Study On Financial Performance Analysis With Reference To Kesoram Cementon Financial Performance hellip
httpslidepdfcomreaderfulla-study-a-study-on-financial-performance-analysis-with-reference-to-kesoram 4781
47
Interpretation of comparative balance sheet of 2008-2009
Reserves amp Surplus were increased to 3753 (percent) ie in Rupees 34939
crores
Revaluation Reserves decreased to 121 ie in Rupees 2270 crores
Secured Loans are increased to 5821 ie in Rupees 56521 crores And UN
secured loans highly Increased to 25795
Current liabilities and Provisions are increased to 1668 and 451 respectively ie in
Rupees 9520 amp 1490 crores
Fixed assets were highly increased to 6642 ie in Rupees 72011 crores
Investments were increased to 2917 ie in Rupees 1395 crores
Sundry debtors increased to 3922 ie in Rupees 10710 crores
Current assets increased 3576 ie in Rupees 27020 crores And Loans amp
Advances increased to 2246 respectively
The overall financial position was satisfactory
8102019 A Study A Study On Financial Performance Analysis With Reference To Kesoram Cementon Financial Performance hellip
httpslidepdfcomreaderfulla-study-a-study-on-financial-performance-analysis-with-reference-to-kesoram 4881
48
Comparative Balance Sheet of Kesoram in the Year between 2009-2010
(Rupees in crores)
Years Changes
Particulars 2009 2010 In Rupees In Percentage
Liabilities
Share Capital 4574 4574 000 000
Reserves amp Surplus 128024 149111 21087 1647
Revaluation Reserves 412 339 -073 -1772
Loans
Secured Loans 153627 186372 32745 2131
Un Secured Loans 43416 126250 82834 19079
Deferred Tax Liabilities 000 000 000
Current Liabilities
Provisions 34529 35734 1205 349
Current Liabilities 66587 107688 41101 6173
Total 431169 610068 178899 4149
Assets
Net Block 180435 343182 162747 9020
Capital WIP 86485 41283 -45202 -5227
Investments 6178 5143 -1035 -1675
Current Assets
Inventories 58906 91619 32713 5553
Sundry Debtors 38017 54289 16272 4280
Cash amp Bank Balances 5657 8014 2357 4167
Total Current Assets 102580 153922 51342 5005
Loans amp Advances 55462 66506 11044 1991
Fixed Deposits 028 031 003 1071
Total 431169 610068 178899 4149
8102019 A Study A Study On Financial Performance Analysis With Reference To Kesoram Cementon Financial Performance hellip
httpslidepdfcomreaderfulla-study-a-study-on-financial-performance-analysis-with-reference-to-kesoram 4981
49
Interpretation of comparative balance sheet of 2009-2010
Reserves amp surplus increased to 1647 ie in Rupees 21087 crores
Revaluation Reserves decreased to 1772 ie in Rupees 073 crores
Secured loans increased to 2131 ie in Rupees 32745 crores
Current Liabilities were increased to 6173 ie in Rupees 41101 crores and
Provisions 349 ie in Rupees 1205 crores
Fixed Assets were increased to 9020 ie in Rupees 162747 crores
Investments were decreased to 1675 ie in Rupees 1035 crores
Sundry debtors were increased to 4280 ie in Rupees 16272 crores
Current assets increased to 5005 ie in Rupees 51342 crores And loans and
Advances increased 1919 ie in Rupees 11044 crores
The overall financial position was satisfactory
8102019 A Study A Study On Financial Performance Analysis With Reference To Kesoram Cementon Financial Performance hellip
httpslidepdfcomreaderfulla-study-a-study-on-financial-performance-analysis-with-reference-to-kesoram 5081
50
Comparative Balance Sheet of Kesoram in the Year between 2010-2011
(Rupees in crores)
Years Changes
Particulars 2010 2011 In Rupees In Percentage
Liabilities
Share Capital 4574 4574 000 000
Reserves amp Surplus 149111 125162 -23949 -1606
Revaluation Reserves 339 289 -050 -1475
Loans
Secured Loans 186372 237183 50811 2726
Un Secured Loans 126250 162744 36494 2891
Deferred Tax Liabilities 000 000 000
Current Liabilities
Provisions 35734 1494 -34240 -9582
Current Liabilities 107688 113902 6214 577
Total 610068 645348 35280 578
Assets
Net Block 343182 369172 25990 757
Capital WIP 41283 43781 2498 605
Investments 5143 6582 1439 2798
Current Assets
Inventories 91619 111855 20236 2209
Sundry Debtors 54289 63134 8845 1629
Cash amp Bank Balances 8014 7188 -826 -1031
Total Current Assets 153922 182177 28255 1836
Loans amp Advances 66506 43460 -23046 -3465
Fixed Deposits 031 176 145 46774
Total 610068 645348 35280 578
8102019 A Study A Study On Financial Performance Analysis With Reference To Kesoram Cementon Financial Performance hellip
httpslidepdfcomreaderfulla-study-a-study-on-financial-performance-analysis-with-reference-to-kesoram 5181
51
Interpretation of comparative balance sheet of 2010-2011
Reserves amp surplus decreased to 1606 ie in Rupees 23949 crores
Revaluation Reserves decreased to 1475 ie in Rupees 050 crores
Secured loans increased to 2726 ie in Rupees 50811 crores
Current Liabilities were increased to 577 ie in Rupees 6214 crores
Provisions decreased to 9582 ie in Rupees 34240 crores
Fixed Assets were increased to 757 ie in Rupees 25990 crores
Investments were decreased to 2798 ie in Rupees 1439 crores
Sundry debtors were increased to 1629 ie in Rupees8845 crores
Current assets increased to 1836 ie in Rupees 28255 crores And loans and
Advances increased 3465 ie in Rupees 23046 crores
The overall financial position was UN satisfactory
8102019 A Study A Study On Financial Performance Analysis With Reference To Kesoram Cementon Financial Performance hellip
httpslidepdfcomreaderfulla-study-a-study-on-financial-performance-analysis-with-reference-to-kesoram 5281
52
Comparative Balance Sheet of Kesoram In The Year Between 2011-2012
(Rupees in crores)
Years Changes
Particulars 2011 2012 In Rupees In Percentage
Liabilities
Share Capital 4574 4574 000 000
Reserves amp Surplus 125162 86657 -38505 -3076
Revaluation Reserves 289 270 -019 -657
Loans
Secured Loans 237183 317792 80609 3399
Un Secured Loans 162744 92742 -70002 -4301
Deferred Tax Liabilities 000 000 000
Current Liabilities
Provisions 1494 40726 39232 262597
Current Liabilities 113902 180010 66108 5804
Total 645348 722771 77423 1200
Assets 000
Net Block 369172 358721 -10451 -283
Capital WIP 43781 68065 24284 5547
Investments 6582 6636 054 082
Current Assets
Inventories 111855 99516 -12339 -1103
Sundry Debtors 63134 67358 4224 669
Cash amp Bank Balances 7188 6959 -229 -319
Total Current Assets 182177 173833 -8344 -458
Loans amp Advances 43460 115409 71949 16555
Fixed Deposits 176 107 -069 -3920
Total 645348 722771 77423 1200
8102019 A Study A Study On Financial Performance Analysis With Reference To Kesoram Cementon Financial Performance hellip
httpslidepdfcomreaderfulla-study-a-study-on-financial-performance-analysis-with-reference-to-kesoram 5381
53
Interpretation of comparative balance sheet of 2011-2012
Reserves amp surplus decreased to 3076 ie in Rupee 38505 crores
Revaluation Reserves decreased to 657 ie in Rupees 019 crores
Secured loans increased to 3399 ie in Rupees 80699 crores
Current Liabilities were increased to 5804 ie in Rupees 66108 crores
Provisions increased to 262597 ie in Rupees 39232 crores
Fixed Assets were decreased to 283 ie in Rupee 10451 crores
Investments were increased to 082 ie in Rupees 054 crores
Sundry debtors were increased to 669 ie in Rupees 4224 crores
Current assets decreased to 458 ie in Rupees 8344 crores And loans and
Advances increased 16555 ie in Rupees 71949 crores
The overall financial position was UN satisfactory
8102019 A Study A Study On Financial Performance Analysis With Reference To Kesoram Cementon Financial Performance hellip
httpslidepdfcomreaderfulla-study-a-study-on-financial-performance-analysis-with-reference-to-kesoram 5481
54
Common Size Balance Sheet of Kesoram For The Year 2008-2009
(Rupees in crores)
Particulars 2008 Change Percentage 2009 Change Percentage
Liabilities
Share Capital 4574 154 4574 106
Reserves amp Surplus 93085 3129 128024 2969
Revaluation Reserves 533 018 412 010
Loans
Secured Loans 97106 3264 153627 3563
Un Secured Loans 12129 408 43416 1007
Deferred Tax Liabilities 000 000 000 000
Current Liabilities
Provisions 33039 1110 34529 801
Current Liabilities 57067 1918 66587 1544
Total 297533 10000 431169 10000
Assets
Net Block 108424 3644 180435 4185
Capital WIP 63459 2133 86485 2006
Investments 4783 161 6178 143
Current Assets
Inventories 44217 1486 58906 1366
Sundry Debtors 27307 918 38017 882
Cash amp Bank Balances 4036 136 5657 131
Loans amp Advances 45289 1522 55462 1286
Fixed Deposits 018 001 028 001
Total 297533 10000 431169 10000
8102019 A Study A Study On Financial Performance Analysis With Reference To Kesoram Cementon Financial Performance hellip
httpslidepdfcomreaderfulla-study-a-study-on-financial-performance-analysis-with-reference-to-kesoram 5581
55
Interpretation of Common Size Balance Sheet of 2008-2009
Share capital was recorded 154 percent in the total liabilities in the year 2008 it is
decreased to 106 in the year 2009
Reserves amp surplus contributed to 3129 in the total liabilities in the year 2008 it is
decreased to 2969 in the year 2009
Secured loans were 3264 in the total liabilities in the year 2008 it is increased to
3563 in the year 2009
Current Liabilities shown to 1918 in the total liabilities in the year 2008 it is
decreased to 1544 in the year 2009
Provisions 1110 in the total liabilities in the year 2008 it is decreased to 801 in the
year 2009
Fixed Assets were 3644 in the total liabilities in the year 2008 ie decreased to 4185
in the year 2009
Investments were 161 in the total liabilities in the year 2008 it is decreased to 143
in the year 2009
Sundry debtors were 918 in the total liabilities in the year 2008 it is decreased to 882
in the year 2009
8102019 A Study A Study On Financial Performance Analysis With Reference To Kesoram Cementon Financial Performance hellip
httpslidepdfcomreaderfulla-study-a-study-on-financial-performance-analysis-with-reference-to-kesoram 5681
56
Common Size Balance Sheet of Kesoram For The Year 2009-2010
(Rs in crores)
Particulars 2009 Change Percentage 2010Change
Percentage
Liabilities
Share Capital 4574 106 4574 075
Reserves amp Surplus 128024 2969 149111 2444
Revaluation Reserves 412 010 339 006
Loans
Secured Loans 153627 3563 186372 3055
Un Secured Loans 43416 1007 126250 2069
Deferred Tax Liabilities 000 000 000 000
Current Liabilities
Provisions 34529 801 35734 586
Current Liabilities 66587 1544 107688 1765
Total 431169 10000 610068 10000
Assets
Net Block 180435 4185 343182 5625
Capital WIP 86485 2006 41283 677
Investments 6178 143 5143 084
Current Assets
Inventories 58906 1366 91619 1502
Sundry Debtors 38017 882 54289 890
Cash amp Bank Balances 5657 131 8014 131
Loans amp Advances 55462 1286 66506 1090
Fixed Deposits 028 001 031 001
Total 431169 10000 610068 10000
8102019 A Study A Study On Financial Performance Analysis With Reference To Kesoram Cementon Financial Performance hellip
httpslidepdfcomreaderfulla-study-a-study-on-financial-performance-analysis-with-reference-to-kesoram 5781
57
Interpretation of common size balance sheet of 2009-2010
Share capital was recorded 106 percent in the total liabilities in the
year 2009 it is decreased to 075 in the year 2010
Reserves amp surplus contributed to 2969 in the total liabilities in the
year 2009 it is decreased to2444 in the year 2010
Secured loans were 3563 in the total liabilities in the year 2009 it is
increased to 3055 in the year 2010
Current Liabilities shown to 1544 in the total liabilities in the year
2009 it is decreased to 1765 in the year 2010
Provisions 801 in the total liabilities in the year 2009 it is decreased
to 586 in the year 2010
Fixed Assets were 4185 in the total liabilities in the year 2009 ie
increased to 5625 in the year 2010
Investments were 143 in the total liabilities in the year 2009 it is
decreased to 084 in the year 2010
Sundry debtors were 882 in the total liabilities in the year 2009 it is
increased to 890 in the year 2010
8102019 A Study A Study On Financial Performance Analysis With Reference To Kesoram Cementon Financial Performance hellip
httpslidepdfcomreaderfulla-study-a-study-on-financial-performance-analysis-with-reference-to-kesoram 5881
58
Common Size Balance sheet of Kesoram for the year 2010-2011
983080Rupees in crores)
Particulars 2010 Change Percentage 2011
Change
Percentage
Liabilities
Share Capital 4574 075 4574 071
Reserves amp Surplus 149111 2444 125162 1939
Revaluation Reserves 339 006 289 004
Loans
Secured Loans 186372 3055 237183 3675
Un Secured Loans 126250 2069 162744 2522
Deferred Tax Liabilities 000 000 000 000
Current Liabilities
Provisions 35734 586 1494 023
Current Liabilities 107688 1765 113902 1765
Total 610068 10000 645348 10000
Assets
Net Block 343182 5625 369172 5721
Capital WIP 41283 677 43781 678
Investments 5143 084 6582 102
Current Assets
Inventories 91619 1502 111855 1733
Sundry Debtors 54289 890 63134 978
Cash amp Bank Balances 8014 131 7188 111
Loans amp Advances 66506 1090 43460 673
Fixed Deposits 031 001 176 003
Total 610068 10000 645348 10000
8102019 A Study A Study On Financial Performance Analysis With Reference To Kesoram Cementon Financial Performance hellip
httpslidepdfcomreaderfulla-study-a-study-on-financial-performance-analysis-with-reference-to-kesoram 5981
59
Interpretation of Common Size Balance Sheet Of 2010-2011
Share capital was recorded 075 percent in the total liabilities in the year 2010 it is
decreased to 071 in the year 2011
Reserves amp surplus contributed to 2444 in the total liabilities in the year 2010 it is
decreased to1939 in the year 2011
Secured loans were 3055 in the total liabilities in the year 2010 it is increased to
3675 in the year 2011
Current Liabilities shown to 1765 in the total liabilities in the year 2010 it is
also1765 in the year 2011
Provisions 586 in the total liabilities in the year 2010 it is decreased to 023 in the
year 2011
Fixed Assets were 5625 in the total liabilities in the year 2010 ie increased to 5721
in the year 2011
Investments were 084 in the total liabilities in the year 2010 it increased to 102 in
the year 2011
Sundry debtors were 890 in the total liabilities in the year 2010 it is increased to 978
in the year 2011
8102019 A Study A Study On Financial Performance Analysis With Reference To Kesoram Cementon Financial Performance hellip
httpslidepdfcomreaderfulla-study-a-study-on-financial-performance-analysis-with-reference-to-kesoram 6081
60
Common Size Balance Sheet of Kesoram for the Year 2011-2012
983080Rupees in crores)
Particulars 2011 Change Percentage 2012
Change
Percentage
Liabilities
Share Capital 4574 071 4574 063
Reserves amp Surplus 125162 1939 86657 1199
Revaluation Reserves 289 004 270 004
Loans
Secured Loans 237183 3675 317792 4397
Un Secured Loans 162744 2522 92742 1283
Deferred Tax Liabilities 000 000 000 000
Current Liabilities
Provisions 1494 023 40726 563
Current Liabilities 113902 1765 180010 2491
Total 645348 10000 722771 10000
Assets
Net Block 369172 5721 358721 4963
Capital WIP 43781 678 68065 942
Investments 6582 102 6636 092
Current Assets
Inventories 111855 1733 99516 1377
Sundry Debtors 63134 978 67358 932
Cash amp Bank Balances 7188 111 6959 096
Loans amp Advances 43460 673 115409 1597
Fixed Deposits 176 003 107 001
Total 645348 10000 722771 10000
8102019 A Study A Study On Financial Performance Analysis With Reference To Kesoram Cementon Financial Performance hellip
httpslidepdfcomreaderfulla-study-a-study-on-financial-performance-analysis-with-reference-to-kesoram 6181
61
Interpretation of common size balance sheet of 2011-2012
Share capital was recorded 071 percent in the total liabilities in the year 2011 it is
decreased to 063 in the year 2012
Reserves amp surplus contributed to 1939 in the total liabilities in the year 2011 it
is decreased to 1199 in the year 2012
Secured loans were 3675 in the total liabilities in the year 2011 it is increased to
4397 in the year 2012
Current Liabilities shown to 1765 in the total liabilities in the year 2011 it is
increased to 2491 in the year 2012
Provisions 023 in the total liabilities in the year 2011 it is increased to 563 in the
year 2012
Fixed Assets were 5721 in the total liabilities in the year 2011 ie decreased to
4963 in the year 2012
Investments were 102 in the total liabilities in the year 2011 it increased to 092
in the year 2012
Sundry debtors were 978 in the total liabilities in the year 2011 it is decreased to
932 in the year 2012
8102019 A Study A Study On Financial Performance Analysis With Reference To Kesoram Cementon Financial Performance hellip
httpslidepdfcomreaderfulla-study-a-study-on-financial-performance-analysis-with-reference-to-kesoram 6281
Trend Analysis
Share Capital-
Year
Amount
(In Crores) Trend
IncreaseDecrease
Base Year Previous Year
2008 4574 10000 000 000
2009 4574 10000 000 000
2010 4574 10000 000 000
2011 4574 10000 000 000
2012 4574 10000 000 000
Trend Percentages in Share Capital
Share capital shown a constant trend in the period 2008 and 2012
Share capital is 4574 crores all the years from 2008-2012
8102019 A Study A Study On Financial Performance Analysis With Reference To Kesoram Cementon Financial Performance hellip
httpslidepdfcomreaderfulla-study-a-study-on-financial-performance-analysis-with-reference-to-kesoram 6381
Reserves amp Surplus-
Year
Amount
(In Crores) Trend
IncreaseDecrease
Base Year Previous Year
2008 93085 10000 000 000
2009 128024 13753 3753 3753
2010 149111 16019 6019 2266
2011 125162 13446 3446 -2573
2012 86657 9309 -691 -4137
Trend Percentages in Reserves amp Surplus
Reserves amp surplus shown an increasing trend in the period between 2008 and 2010
The average trend was 13277 till 2010
The Reserves amp surplus was showing decreasing trend in the period 2011-2012 (ie
from 16019 in 2010 to 9309 in 2012)
The decreasing trend in Reserves amp surplus indicates the decrease in profits of the
firm
8102019 A Study A Study On Financial Performance Analysis With Reference To Kesoram Cementon Financial Performance hellip
httpslidepdfcomreaderfulla-study-a-study-on-financial-performance-analysis-with-reference-to-kesoram 6481
Investments-
Year
Amount
(In Crores) Trend
IncreaseDecrease
Base Year Previous Year
2008 4783 10000 000 000
2009 6178 12917 2917 2917
2010 5143 10753 753 -2164
2011 6582 13761 3761 3009
2012 6636 13874 3874 113
Trend Percentages in Investments-
The investments are shown an increasing trend in the period between 2008 ndash 2009
and it is decreasing in the year 2010
The average trend was 11458 till 2009
The investments increased in the periods 2011-2012 (ie from 10753 in 2010 to
13874 in 2012)
The overall trend in investments shown is satisfactory
8102019 A Study A Study On Financial Performance Analysis With Reference To Kesoram Cementon Financial Performance hellip
httpslidepdfcomreaderfulla-study-a-study-on-financial-performance-analysis-with-reference-to-kesoram 6581
Net Current Assets-
Year
Amount
(In Crores) Trend
IncreaseDecrease
Base Year Previous Year
2008 30761 10000 000 000
2009 56954 18515 8515 8515
2010 77037 25044 15044 6529
2011 110417 35895 25895 10851
2012 68613 22305 12305 -13590
Trends in Net Current Assets-
The NCA shown positive (increasing) trend
The NCA are increased to 35895 (the year 2011) compared with base year and
decreased in the year 2012 to 22305
The NCA shown increased trend from year and crossed 100
The overall trend was good
8102019 A Study A Study On Financial Performance Analysis With Reference To Kesoram Cementon Financial Performance hellip
httpslidepdfcomreaderfulla-study-a-study-on-financial-performance-analysis-with-reference-to-kesoram 6681
66
Ratio Analysis-
Current Ratio-
Current Ratio = Current Assets Current Liabilities
Current assets are cash in hand Cash at bank Marketable Securities(short term) short term
Investment Bills receivables sundry debtors Inventories (stock) Work in progress prepaid
expenses Current Liabilities are outstanding expenses Bills payable sundry Creditors
short-term advances income tax payable and Dividend payable
Current Ratio of Kesoram-
(Rupees in crores)
Year Current Assets Current Liabilities Current Ratio
2007-08 75560 57067 132
2008-09 102580 66587 154
2009-10 153922 107688 143
2010-11 182177 113902 160
2011-12 173833 180010 097
Interpretation-
As per the standard rule of current ratio ie 21 where current assets double the current
liabilities is considered satisfactory
In the present analysis the current ratio of the Kesoram is not satisfactory
from the above table It was assessed that the current ratio for all the five year is lower (less)
than the standard rule ie 21 And it is 097 in the year 2011-2012 (current year) This is
highly UN satisfactory
8102019 A Study A Study On Financial Performance Analysis With Reference To Kesoram Cementon Financial Performance hellip
httpslidepdfcomreaderfulla-study-a-study-on-financial-performance-analysis-with-reference-to-kesoram 6781
Quick Ratio-
Quick ratio also known as acid-test ratio establishes a relationship between quick
assets and the current liabilities Cash is the most liquid asset It is calculated by dividing
quick assets by current liabilities
Quick ratio = Quick Assets Current Liabilities
(Quick Assets = Current assets ndash Inventory)
Quick Ratio of Kesoram-
Rupees in crores)
Year Total QuickAssets
Current Liabilities Quick Ratio
2007-08 33343 57067 058
2008-09 43674 66587 066
2009-10 62303 107688 058
2010-11 70322 113902 0622011-12 74333 180010 041
Interpretation-
Usually a high Quick ratio is an indication that the company is liquid and has the ability to
meet its current or liquid liabilities in time on the other hand a low Quick Ratio represents
8102019 A Study A Study On Financial Performance Analysis With Reference To Kesoram Cementon Financial Performance hellip
httpslidepdfcomreaderfulla-study-a-study-on-financial-performance-analysis-with-reference-to-kesoram 6881
that the companyrsquos liquidity position is not good The above table showing the quick ratios
of Kesoram are canrsquot be considered satisfactory
Leverage Ratios-
Debt-Equity Ratio-
Debt-Equity Ratio = Total Long Term Debt Equity Share Holders Fund
Total Long term Debt= Debenture Capital + Long term loans from banks and financial
institutions + Public deposits
Equity Share Holders fund = Equity + Reserves and Surplus
Debt Equity Ratio of Kesoram
(Rupees in crores)
Year Total Debt Share Holders Fund Debt Equity Ratio
2007-08 109235 98192 111
2008-09 197043 133010 148
2009-10 312622 154024 203
2010-11 399927 130025 308
2011-12 410534 91501 449
8102019 A Study A Study On Financial Performance Analysis With Reference To Kesoram Cementon Financial Performance hellip
httpslidepdfcomreaderfulla-study-a-study-on-financial-performance-analysis-with-reference-to-kesoram 6981
Interpretation-
The Debt-Equity Ratio accepted standard is 05 This ratio reflects the relative contribution
of creditors and owners of business in its financing From the above it is clear that the long
term debt is more than that of the share holdersrsquo fund So we can interpret that the firmrsquosassets are financed more by the external funds rather than by the internal funds
8102019 A Study A Study On Financial Performance Analysis With Reference To Kesoram Cementon Financial Performance hellip
httpslidepdfcomreaderfulla-study-a-study-on-financial-performance-analysis-with-reference-to-kesoram 7081
Fixed Asset Ratio-
Net Sales
Fixed Asset Ratio = helliphelliphelliphelliphelliphelliphelliphelliphelliphelliphellip
Net Assets
Fixed Asset Ratio of Kesoram-
(Rupees in crores)
Year Net Sales Net Assets Fixed Assets Ratio
2007-08 300271 358721 084
2008-09 389797 369172 106
2009-10 475062 343182 1382010-11 539788 180435 299
2011-12 59182 108424 546
Interpretation
This ratio indicates the extent to which the assets of the companyrsquos can be lost without
affecting the interest of the creditors of the company Higher the ratios better the long-term
position of the companyThe above table shows fixed assets ratio in increasing trend Which is good for the
company
8102019 A Study A Study On Financial Performance Analysis With Reference To Kesoram Cementon Financial Performance hellip
httpslidepdfcomreaderfulla-study-a-study-on-financial-performance-analysis-with-reference-to-kesoram 7181
Overall Profitability Ratios-
Net Profit Ratio
Net Profit Ratio indicates net margin on sales It is given by the following equation
Net Profit Ratio = (Net Profit Sales) 100
Net Profit Ratio of Kesoram
(Rupees in crores)
Year Net Profit Sales Net Profit Ratio
2007-08 37917 300271 1263
2008-09 41432 389797 1063
2009-10 20298 475062 427
2010-11 -28176 539788 -5222011-12 -38108 59182 -644
Interpretation
It establishes a relationship between net profits after tax and net sales and
indicates the efficiency of the management in manufacturing selling administrative and
other activities of the company
The higher the ratio the better is the profitability or performance of the business
The above table depicts the net profit Ratio of Kesoram has decreased every year from
2007-2008 to 2011-2012It further decreased to negative in the year 2010-11 to -522 and -
644 in the year 2011-2012 This shows constant decrease in the profits of the company
8102019 A Study A Study On Financial Performance Analysis With Reference To Kesoram Cementon Financial Performance hellip
httpslidepdfcomreaderfulla-study-a-study-on-financial-performance-analysis-with-reference-to-kesoram 7281
72
Return on Investment-
Net Profit
Return on Investment = helliphelliphelliphelliphelliphelliphelliphelliphelliphelliphelliphellip X 100
Share Holders Fund
Return on Investment Ratio of Kesoram-
(Rupees in crores)
Year Net Profit Share Holders Fund Return On Investment
2007-08 37917 98192 3862
2008-09 41432 133010 3115
2009-10 20298 154024 1318
2010-11 -28176 130025 -2167
2011-12 -38108 91501 -4165
Interpretation-
The above table reveals how well the resources of the firm are being used Higher
the ratio better the result The above ratio implies how well the firm is growing in
terms of profitability and efficiency From the above table we can concern that the return on
investment is in decreasing trend ROI is highest in the year 2007-2008 as 3862 But
there after itrsquos decreased every year
The ROI is negative in the years 2010-2011 amp 2011-2012 as -2167 amp -4165 respectively
Which is not a good sign for the firm
8102019 A Study A Study On Financial Performance Analysis With Reference To Kesoram Cementon Financial Performance hellip
httpslidepdfcomreaderfulla-study-a-study-on-financial-performance-analysis-with-reference-to-kesoram 7381
8102019 A Study A Study On Financial Performance Analysis With Reference To Kesoram Cementon Financial Performance hellip
httpslidepdfcomreaderfulla-study-a-study-on-financial-performance-analysis-with-reference-to-kesoram 7481
8102019 A Study A Study On Financial Performance Analysis With Reference To Kesoram Cementon Financial Performance hellip
httpslidepdfcomreaderfulla-study-a-study-on-financial-performance-analysis-with-reference-to-kesoram 7581
75
CHAPTER V
FINDINGS amp SUGGESTIONS
8102019 A Study A Study On Financial Performance Analysis With Reference To Kesoram Cementon Financial Performance hellip
httpslidepdfcomreaderfulla-study-a-study-on-financial-performance-analysis-with-reference-to-kesoram 7681
76
Findings
The Share capital remains constant Share capital is unchanged all the years from
2008-2012
Reserves amp surplus were recorded an increasing trend in the period between 2008
and 2010It is showing decreasing trend in the period 2011-2012 (ie from 16019
in 2010 to 9309 in 2012)
Current Liabilities were increased compared to base year ie 2008
Provisions increased to 262597 ie in Rupees 39232 crores in the current year
The current ratio for all the five year is lower (less) than the standard rule ie 21
And it is 097 in the year 2011-2012 (current year)
The Debt-Equity Ratio was shown under the standard ratio It is clear that the long
term debt is more than that of the share holdersrsquo fund It indicates that the firm
heavily relying on external funds rather than the internal funds
The operating and net profit of Kesoram is in decreasing trend due to heavy
increase of manufacturing amp administrative expenses
ROI is highest in the year 2007-2008 as 3862 The ROI is negative in the years
2010-2011 amp 2011-2012 as -2167 amp -4165 respectively
Return on Equity Capital Employed Ratio of Kesoram has decreased every year
from 2007-2008 to 2010-2011It further decreased to negative in the year 2011-12 to
-3280
EPS of Kesoram has decreased every year from 2008-12It is negative in the year
2011 amp 12
8102019 A Study A Study On Financial Performance Analysis With Reference To Kesoram Cementon Financial Performance hellip
httpslidepdfcomreaderfulla-study-a-study-on-financial-performance-analysis-with-reference-to-kesoram 7781
77
Suggestion
The organization should adopt an appropriate capital structure
The companyrsquos debt-equity ratio is recorded more or less as 111 in the year 2008
and it is increased to 449 in the year 2012 (current year)The company should
adopt a better debt equity mix in the future to control the fluctuations in returns
The company should control fluctuations in cash and bank balances as it impacts the
current ratio of the company
The provisions are showing increasing trend which indicates risk of debtors The
firm should implement an effective credit management policy It should utilize its
idle funds by decreasing provisions
The company should control heavy increase of manufacturing amp administration
expenses as it is impacting the operating and net profit of company
8102019 A Study A Study On Financial Performance Analysis With Reference To Kesoram Cementon Financial Performance hellip
httpslidepdfcomreaderfulla-study-a-study-on-financial-performance-analysis-with-reference-to-kesoram 7881
78
ANNEXURE
Profit And Loss Account of Kesoram Cement
Mar12 Mar11 Mar10 Mar09 Mar08
12 Months 12 Months 12 Months 12 Months 12 Months
INCOME
Sales Turnover 628260 575072 505151 431613 345700
Excise Duty 36440 35284 30089 41815 45429
NET SALES 591820 539788 475062 389797 300271
Other Income 000 000 000 000 000
TOTALINCOME
596129 548733 481019 393969 302020
EXPENDITURE
Manufacturing
Expenses81903 74803 13974 13153 44113
MaterialConsumed
370897 310150 295550 229359 118448
Personal
Expenses33468 27355 23294 18690 15344
Selling Expenses 81910 78253 58667 48846 45019
AdministrativeExpenses
28225 29308 17219 16179 9907
Expenses
Capitalized000 000 000 000 000
Provisions Made 000 000 000 000 000
TOTAL
EXPENDITURE 596403 519870 408704 326227 232832Operating Profit -4583 19918 66358 63570 67439
EBITDA -274 28864 72316 67742 69188
Depreciation 29740 27259 17280 11186 8927
Other Write-offs 000 000 000 000 000
EBIT -30014 1605 55035 56557 60261
Interest 41015 23983 10921 12087 5426
EBT -71029 -22377 44114 44470 54835
Taxes -32921 5798 23816 3037 16918
Profit and Loss
for the Year-38108 -28176 20298 41432 37917
Non RecurringItems
-1142 7063 3228 -4023 402
Other Non Cash
Adjustments1276 091 207 465 017
OtherAdjustments
000 000 000 000 000
REPORTED
PAT-37974 -21021 23734 37874 38335
8102019 A Study A Study On Financial Performance Analysis With Reference To Kesoram Cementon Financial Performance hellip
httpslidepdfcomreaderfulla-study-a-study-on-financial-performance-analysis-with-reference-to-kesoram 7981
79
Balance Sheet Of Kesoram
Years
Particulars 2008 2009 2010 2011 2012
Liabilities
Share Capital 4574 4574 4574 4574 4574Reserves amp Surplus 93085 128024 149111 125162 86657
Revaluation Reserves 533 412 339 289 27
Loans
Secured Loans 97106 153627 186372 237183 317792
Un Secured Loans 12129 43416 12625 162744 92742
Deferred Tax Liabilities 0 0 0 0 0
Current Liabilities
Provisions 33039 34529 35734 1494 40726
Current Liabilities 57067 66587 107688 113902 18001
Total 297533 431169 610068 645348 722771
Assets
Net Block 108424 180435 343182 369172 358721
Capital WIP 63459 86485 41283 43781 68065
Investments 4783 6178 5143 6582 6636
Current Assets
Inventories 44217 58906 91619 111855 99516
Sundry Debtors 27307 38017 54289 63134 67358
Cash amp Bank Balances 4036 5657 8014 7188 6959
Total Current Assets 7556 10258 153922 182177 173833Loans amp Advances 45289 55462 66506 4346 115409
Fixed Deposits 018 028 031 176 107
Total 297533 431169 610068 645348 722771
8102019 A Study A Study On Financial Performance Analysis With Reference To Kesoram Cementon Financial Performance hellip
httpslidepdfcomreaderfulla-study-a-study-on-financial-performance-analysis-with-reference-to-kesoram 8081
80
KEY ITEMS 2012 2011 2010 2009 2008
Preference
Dividend 0 0 0 0 0
Equity Dividend 457 2516 2516 2516 2516
Equity Dividend
() 999 55 55 55 55
Shares in Issue(Lakhs) 45743 45743 45743 45743 45743
EPS - Annualised
(Rs) -8302 -4595 5188 828 838
8102019 A Study A Study On Financial Performance Analysis With Reference To Kesoram Cementon Financial Performance hellip
httpslidepdfcomreaderfulla-study-a-study-on-financial-performance-analysis-with-reference-to-kesoram 8181
BIBLIOGRAPHY
Sl
No
Books Author Name
1 Financial Management Khan amp JAIN
2 Financial Management IMPandey
3 Management Accounting RPTrivedi
Websites amp Search Engines
1 wwwkesoramcom983086
2 wwwmoneycontrolcom
3 wwwgooglefinancecom983086
Annual reports of Kesoram cement limited 2008-2012
8102019 A Study A Study On Financial Performance Analysis With Reference To Kesoram Cementon Financial Performance hellip
httpslidepdfcomreaderfulla-study-a-study-on-financial-performance-analysis-with-reference-to-kesoram 2181
21
content and lower fuel consumption leads to a CO2 emission around half that associated
with Portland clinker However SO2 emissions are usually significantly higher
Natural Cements correspond to certain cements of the pre-Portland era produced by
burning argillaceous limestones at moderate temperatures The level of clay components in
the limestone (around 30-35) is such that large amounts of belite (the low-early strength
high-late strength mineral in Portland cement) are formed without the formation of
excessive amounts of free lime As with any natural material such cements have highly
variable properties
Geopolymer cements are made from mixtures of water-soluble alkali metal silicates and
aluminosilicate mineral powders such as fly ash and metakaolin
8102019 A Study A Study On Financial Performance Analysis With Reference To Kesoram Cementon Financial Performance hellip
httpslidepdfcomreaderfulla-study-a-study-on-financial-performance-analysis-with-reference-to-kesoram 2281
22
COMPANY PROFILE
8102019 A Study A Study On Financial Performance Analysis With Reference To Kesoram Cementon Financial Performance hellip
httpslidepdfcomreaderfulla-study-a-study-on-financial-performance-analysis-with-reference-to-kesoram 2381
23
Kesoram Cement Industry is one of the leading manufacturers of cement in India It is a day
process cement Plant The plant capacity is 826 lakh tones per annum It is located at
Basanthnagar in Karimnagar district of Andhra Pradesh Basanthnagar is 8 km away from
the Ramagundam Railway station linking Madras to New Delhi The Chairman of the
Company is BKBirla
History
The first unit at Basanthnagar with a capacity of 21 lakh tones per annum
incorporating humble suspension preheated system was commissioner during the year 1969
The second unit was setup in year 1971 with a capacity of 21 lakh tones per annum went on
stream in the year 1978 The coal for this company is being supplied from Singgareni
Collieries and the power is obtained from APSEB The power demand for the factory is
about 21 MW Kesoram has got 2 DG sets of 4 MW each installed in the year 1987
Kesoram Cement has setup a 15 KW captor power plant to facilitate for
uninterrupted power supply for manufacturing of cement at 24th
august 1997 per hour 12
mw actual power is 15 mw
The Company was incorporated on 18th October 1919 under the Indian Companies Act
1913 in the name and style of Kesoram Cotton Mills Ltd It had a Textile Mill at 42
Garden Reach Road Calcutta 700 024 The name of the Company was changed to Kesoram
Industries amp Cotton Mills Ltd on 30th
August 1961 and the same was further changed to Kesoram Industries Limited on 9th July
1986 The said Textile Mill at Garden Reach Road was eventually demerged into a separate
company
The First Plant for manufacturing of rayon yarn was established at Tribeni District
Hooghly West Bengal and the same was commissioned in December 1959 and the second
plant was commissioned in the year 1962 enabling it to manufacture 4635 metric tons perannum (mtpa) of rayon yarn This Unit has 6500 metric tons per annum (mtpa) capacity as
on 3132009
The plant for manufacturing of transparent paper was also set up at the same location at
Tribeni District Hooghly West Bengal in June 1961 It has the annual capacity to
manufacture 3600 metric tons per annum (mtpa) of transparent Paper
8102019 A Study A Study On Financial Performance Analysis With Reference To Kesoram Cementon Financial Performance hellip
httpslidepdfcomreaderfulla-study-a-study-on-financial-performance-analysis-with-reference-to-kesoram 2481
24
The Company diversified into manufacturing of cast iron spun pipes and pipe fittings at
Bansberia District Hooghly West Bengal with a production capacity of 45000 metric tons
per annum (mtpa) of cast iron spun pipes and pipe fittings in December 1964
The Company subsequently diversified into the manufacturing of Cement and in 1969
established its first cement plant under the name Kesoram Cement at Basantnagar Dist
Karimnagar (Andhra Pradesh) and to take advantage of favorable market conditions in
1986 another cement plant known as Vasavadatta Cement was commissioned by it at
Sedam Dist
Gulbarga (Karnataka) The cement manufacturing capacities at both the plants were
augmented from time to time according to the market conditions and as on 3132009
Kesoram Cement and Vasavadatta Cement have annual cement manufacturing capacities of
15 million metric tons and 41 million metric tons respectively
The Company in March 1992 commissioned a plant at Balasore known as Birla Tyres in
Orissa for manufacturing of 10 lakh mtpa automotive tyres and tubes in the first phase in
collaboration with Pirelli Ltd UK a subsidiary company of the world famous Pirelli
Group of Italy - a pioneer in production and development of automotive tyres in the world
The capacity at the said plant was further augmented during the year by 19 MT per day
aggregating to 271 MT per day production facility The Greenfield Project of 257 MT per
day capacity in the State of Uttarakhand with a capex of about Rs760 crores commenced
the commercial production in phases during the financial year 2008-09The Company as on
3132009 had the manufacturing capacities of 371 million tyres 295 million tubes and
153 million flaps per annum in the Plants including at Uttarakhand Plant It has small
manufacturing capacities of various Chemicals at Kharda in the State of West Bengal also
It has the annual manufacturing capacities of 12410 mtpa of Caustic Soda Lye 5045 mtpa
of Liquid Chlorine 6205 mtpa of Sodium Hypochlorite 8200 mtpa of Hydrochloric Acid
3200 mtpa of Ferric Alum 18700 mtpa of Sulphuric Acid and 1620000 m3pa of purified
Hydrogen Gas
The Company is a well-diversified entity in the fields of Cement Tyre Rayon Yarn
Transparent Paper Spun Pipes and Heavy Chemicals with two core business segments ie
Cement and Tyres
8102019 A Study A Study On Financial Performance Analysis With Reference To Kesoram Cementon Financial Performance hellip
httpslidepdfcomreaderfulla-study-a-study-on-financial-performance-analysis-with-reference-to-kesoram 2581
25
In Spun Pipes amp Foundries a unit of the Company work suspended from 2nd May 2008
still commences till further notice
The Company as of now is listed on three major Stock Exchanges in India ie Bombay
Stock Exchange Ltd Mumbai Calcutta Stock Exchange Association Ltd Kolkata and
National Stock Exchange of India Ltd Mumbai and at the Societe de la Bourse de
Luxembourg Luxembourg
A further expansion upto 165 million tons of cement per annum in Vasavadatta Cement at
Sedam in Karnataka as unit IV at the same site is in progress with a 175 MW Captive
Power Plant involving a capital expenditure of about Rs 78350 crores (including the cost
of Captive Power Plant)
The commercial production of cement in the aforesaid unit IV has commenced in June
2009 The work for the further expansion in the Tyres Section at Uttarakhand for radial
tyres with 100 MT per day capacity and bias tyres with 125 MT per day capacity involving
an estimated aggregate capital outlay of about Rs 840 crores is under progress The Board
has further approved a Motor Cycle Tyre Project of 70 MT per day capacity at the same site
involving a capital outlay of Rs190 crore The civil construction of both the Projects is in
full swing The commercial production in both the Projects is likely to start by December
2009 January 2010
Birla Supreme in popular brand of Kesoram cement from its prestigious plant of
Basantnagar in AP which has outstanding track record In performance and productivity
serving the nation for the last two and half decades It has proved its distinction by bagging
several national awards It also has the distinction of achieving optimum capacity
utilization
Kesoram offers a choice of top quality portioned cement for light heavy
constructions and allied applications Quality is built every fact of the operations
The plant lay out is rational to begin with The limestone is rich in calcium
carbonate a key factor that influences the quality of final product The day process
technology uses in the latest computerized monitoring overseas the manufacturing process
Samples are sent regularly to the bureau of Indian standards National council of
construction and building material for certification of derived quality norms
8102019 A Study A Study On Financial Performance Analysis With Reference To Kesoram Cementon Financial Performance hellip
httpslidepdfcomreaderfulla-study-a-study-on-financial-performance-analysis-with-reference-to-kesoram 2681
26
The company has vigorously undertaking different promotional measures for
promoting their product through different media which includes the use of news papers
magazine hoarding etc
Kesoram cement industry distinguished itself among all the cement factories in
Indian by bagging the National Productivity Award consecutively for two years ie for the
year 1985-1987 The federation of Andhra Pradesh Chamber amp Commerce and Industries
(FAPCCI) also conferred on Kesoram Cement An award for the best industrial promotion
expansion efforts in the state for the year 1984 Kesoram also bagged FAPCCI awarded for
ldquoBest Family Planning Effort in the staterdquo for the year 1987-1988
One among the industrial giants in the country today serving the nation on the
industrial front Kesoram industry ltd has a checked and eventful history dating back to the
twenties when the Industrial House of Birlarsquos acquired it With only a textile mill under its
banner 1924 it grew from strength to strength and spread its activities to newer fields like
Rayon Transparent paper pipes Refractors tyres and other products
Looking to the wide gap between the demand and supply of vital commodity
cement which play in important role in National building activity the Government of India
had de-licensed the cement industry in the year 1966 with a review to attract private
entrepreneur to augment the cement production Kesoram rose to the occasions and divided
to set up a few cement plants in the country
Kesoram cement undertaking marketing activities extensively in the state of Andhra
Pradesh Karnataka Tamilnadu Kerala Maharashtra and Gujarat In AP sales Depts are
located in different areas like Karimnagar Warangal Nizamabad Vijayawada and Nellore
In other states it has opened around 10 depots
The market share of Kesoram Cement in AP is 705 The market share of the
company in various states is shown as under
STATES MARKET SHARE
Karnataka 409
Tamilnadu 094
Kerala 029
Maharashtra 281
8102019 A Study A Study On Financial Performance Analysis With Reference To Kesoram Cementon Financial Performance hellip
httpslidepdfcomreaderfulla-study-a-study-on-financial-performance-analysis-with-reference-to-kesoram 2781
27
Process and Quality Control
It has been the endeavor of Kesoram to incorporate the Worldrsquos latest technology in
the plant and today the plant has the most sophisticated
X-ray analysis
Fully computerized XRF and XRD X-RAY Analyzers keep a constant round the
clock vigil on quality
Supreme performance
One of the largest Cement Plants in Andhra Pradesh the plant incorporate the latest
technology in Cement - making
It is professionally managed and well established Cement Manufacturing Company
enjoying the confidence of the consumers Kesoram has outstanding track record in
performance and productivity with quite a few national and state awards to its credit
BIRLA SUPREME the 43 Grade Cement is a widely accepted and popular brand
in the market commanding a premium
However to meet the specific demands of the consumer Kesoram bought out the 53
grade BIRLA SUPREME ndash GOLD which has special qualities like higher fineness quick-
setting high compressive strength and durability
Supreme Strength
Kesoram Cement has huge captive Limestone Deposits which make it possible tofeed high- grade limestone consistently its natural Grey colour is anion- born ingredient
and gives good shade
Both the products offered by Kesoram ie BIRLA SUPREME-43 Grade and
BIRLA SUPREME-GOLD-53 Grade cement are outstanding with much higher
compressive strength and durability
The following characteristics show their distinctive qualities
Comprehensive
Strength
Opc 43
grls 8112
1989
Birla
Supreme 43
grade
Opc 43 gr
Is 1226987
Birla
Supreme
Gold 53 gr
3 days mpa Min 23 31 + Min 27 38+
7 days mpa Min 23 42+ Min 37 48+
28 days mpa Min 43 50+ Min 53 60+
8102019 A Study A Study On Financial Performance Analysis With Reference To Kesoram Cementon Financial Performance hellip
httpslidepdfcomreaderfulla-study-a-study-on-financial-performance-analysis-with-reference-to-kesoram 2881
28
DC SYSTEM
Clinker making process is a key step in the overall cement making process In the case of
BIRLA SUPREMEGOLD the clinker-making process is totally computer control The
Distributed Control System (DCS) constantly monitors the process and ensures operating
efficiency This eliminates variation and ensures consistency in the quality of Clinker
Physical Characteristics
Ope 43
Is 8 112-89
Birla
Supreme
43 grade
Ope 53 gr
Is 12269-87
Birla Supreme
Gold 53 gr
Setting time Min30 120-180 Min 30 130-170
a Initial (mats) Max 600 180-240 Max 600 170-220
b final (mats) Min 225 270-280 Min 225 300-320
Fincncssm 2Kg Max 10 10-20 Max 10 05-10
Soundness Max 08 004-008 Max 0080 004-02
a le-chart (mm)
b autoclave ()
Supreme Expertise
The Best Technical Team exclusive to Kesoram mans the Plant and monitors the process
to blend the cement in just the required proportions to make BIRLA SUPREMEGOLD OF
Rock Strength
18 Million Tones of Solid Foundation
Staying at the top for over a Quarter Century Quarter Century is no less an achievement
Infact Kesoram is synonymous with for over 28 years
Over the years Kesoram has dispatched 18 million tones of cement to the nook and cornersof the country and joined hands in strengthening the Nation No one else in Andhra Pradesh
has this distinction The prestigious World Bank aided Ramagundam Super Thermal Power
Project of NTPC and Mannair Dam of Pochampad project in AP arc a couple of projects for
which Kesoram Cement was exclusively uses to cite an example
8102019 A Study A Study On Financial Performance Analysis With Reference To Kesoram Cementon Financial Performance hellip
httpslidepdfcomreaderfulla-study-a-study-on-financial-performance-analysis-with-reference-to-kesoram 2981
29
Chemical Characteristics
Opc 43 gr
Is 81 132-989
Birla
Supreme
43 grade
Ope 53 gr
Is 12269-
87
Birla
Supreme
Gold 53 gr
Loss on inflection Max 5 lt16 Max 40 lt15
Insoluble residue Max 20 lt08 Max 20 lt 06
Magnesium oxide Max 60 lt 13 Max 60 lt 13
Lime saturation factor 066-102 08-09 08-102 088-09
Alumna iron ratio MinO66 15-17 MinO66 15-17
Sulfuric anhydride Max 253 16-20 Max 2 53 16-20
Alkalis Chlorides Max 005 Max 001 Max 005 Max 04
Kesoram Cement - advantages
Helps in designing sleeker and more elegant
Structures giving greater flexibility in design concept
Due to its fine quality super fine construction can be achieved Its gives maximum
strength at Minimum use of cement with water in the water cement ratio especially the 53
grade Birlas supreme-gold
Feathers in Kesorams cap
Kesoram has outstanding track record achieving over 100 capacity utilization I
productivity and energy conservation It has proved its distinction by bagging several
national and state awards noteworthy being
NATIONAL
1 National productivity award for 1985-86
2 National productivity award for 1986-87
3 National award for mines safety for 1985-86
4 National award for mines safety for 1986-875 National award for energy conservation 1989-90
8102019 A Study A Study On Financial Performance Analysis With Reference To Kesoram Cementon Financial Performance hellip
httpslidepdfcomreaderfulla-study-a-study-on-financial-performance-analysis-with-reference-to-kesoram 3081
30
STATE
1 AP State productivity award for 1988
2 State award for best industrial management 1988-89
3 Best industrial productivity award of FAPCCI (federation of AP chamber of
commerce and industry) 1991
4 Best management award of the state Govt 1993
5 FAPCCI award for the workers welfare 1995-96
ISO 9002
All quality systems of Kesoram have been certified under ISO 90021S 4002 which
proves the worldwide acceptance of the products
All quality systems in production and marketing of the product have been certified by BIS
under ISO 90021S 14002
The first unit was installed at basanthnagar with a capacity of 25 ndashlakhs TPA (tones per
annum) incorporating humble supervision preheated system during the year 1969
The second unit followed suit with added a capacity of 2 lakhs TPA in 1971
The plant was further expanded to 9 lakhs by adding 25 lakhs tones in august 1978 113
lakhs tones in January 1981 and 087 lakhs tones in September 1981
Power
Singareni collieries make the supply of coal for this industry and the power was
obtained from AP TRANSCO The power demand for the factory is about 21MW Kesoram
has got 2-diesel generator seats of 4 MW each installed in the year 1987
Kesoram cement now has a 15MWcaptive power plant to facilities for uninterrupted
power supply for manufacturing of cement
Performance
The performance of kersoram cement industry has been outstanding achieving over
cent percent capacity utilization all through despite many odds like power cuts and which
most 40 was wasted due to wagon shortage etc
The company being a continuous process industry works round the clock and has
excellent records of performance achieving over 1005 capacity utilization
Kesoram has always combined technical progress with industrial performance The
company had glorious track record for the last 27 years in the industry
Technology
8102019 A Study A Study On Financial Performance Analysis With Reference To Kesoram Cementon Financial Performance hellip
httpslidepdfcomreaderfulla-study-a-study-on-financial-performance-analysis-with-reference-to-kesoram 3181
31
Kesoram cement uses most modern technology and the computerized control in the
plant A team of dedicated and well- experienced experts manages the plant
The quality is maintained much above the bureau of Indian standards
The raw materials used for manufacturing cement are
Lime stone
Bauxite
Hematite
Gypsum
Environmental and Social Obligations
For environmental promotion and to keep ndashup the ecological balance this section
has planted over two lakhs trees on social obligation front this section has undertaken
various social welfare programs by adopting ten nearly villages organizing family welfare
campus surgical camps animal health camps blood donation camps children immunization
camps seeds training for farmers etc were arranged
Welfare and Recreation Facilities
For the purpose of recreation facilities 2 auditoriums were provided for playing
indoor games cultural function and activities like drama music and dance etc
The industry has provided libraries and reading rooms About 1000 books are available in
the library All kinds of newspaper magazines are made available
Canteen is provided to cater to the needs of the employees for supply of snacks tea
coffee and meals etc
One English medium and one Telugu medium school are provided to meet the
educational requirements
The company has provided a dispenser with a qualified medical office and
paramedical staff for the benefit of the employees The employees covered under ESI
scheme have to avail the medical facilities from the ESI hospital
Competitions in sports and games are conducted every year for august 15th
Independence Day and January 26th republic day among the employees
Electricity
The power consumption per ton of cement has come down to 108 units against 113
units last year due to implementation of various energy saving measures The performance
of captive power plant of this section continues to be satisfactory Total power generation
8102019 A Study A Study On Financial Performance Analysis With Reference To Kesoram Cementon Financial Performance hellip
httpslidepdfcomreaderfulla-study-a-study-on-financial-performance-analysis-with-reference-to-kesoram 3281
32
during the year was 84 million units last year This captive power plant is a major role in
keeping power costs with in economic levels
The management has introduced various HRD programs for training and
development and has taken various other measures for the betterment of employeersquos
efficiency
The section has installed adequate air pollution control system and equipment and is
ISO14001 such as Environment management system is under implementation
Awards
Kesoram cement bagged many prestigious awards including national awards for
productivity technology conservation and several state awards since 1984 The following
are the some of important awards
AWARDS OF KESORAM CEMENT
No Year Awards
National
State
1 1989-90 Management award community
Development
State
2 1991 Energy conservation may day award of the
Govt
State
3 1991 Pundit Jawaharlal Nehru rolling trophy for
best
State
4 1993 National productivity effort Indira Gandhi
national award
State
5 1994 Best management award State
6 1994-
1995
Best industrial rebellion award State
7 1995 Rural development by chief minister
Environment and mineral conservation
award
State
8 1995 Best industrial rebellion award State
8102019 A Study A Study On Financial Performance Analysis With Reference To Kesoram Cementon Financial Performance hellip
httpslidepdfcomreaderfulla-study-a-study-on-financial-performance-analysis-with-reference-to-kesoram 3381
33
9 1995-
1996
Best effort of an industrial unit to
development rural economy shriSRRungta
award for social
National
10 1996 Awareness for best rural development
efforts
State
11 1999 Best workers welfare best family welfare
award
State
12 2001 First prize for mine environment amppollution
control for the 3rd
year in succession
State
13 2002 Vana mithra award from AP Govt State
14 2003 Company has got OHSAS-18001 State
15 2005 Certification from DNV New Delhi State
16 2006 Award for pollution control and
environmental protection FAPCCI award
for best rural development in the state
State
8102019 A Study A Study On Financial Performance Analysis With Reference To Kesoram Cementon Financial Performance hellip
httpslidepdfcomreaderfulla-study-a-study-on-financial-performance-analysis-with-reference-to-kesoram 3481
34
Products of the organization
8102019 A Study A Study On Financial Performance Analysis With Reference To Kesoram Cementon Financial Performance hellip
httpslidepdfcomreaderfulla-study-a-study-on-financial-performance-analysis-with-reference-to-kesoram 3581
35
CHAPTER-III
LITERATURE REVIEW
8102019 A Study A Study On Financial Performance Analysis With Reference To Kesoram Cementon Financial Performance hellip
httpslidepdfcomreaderfulla-study-a-study-on-financial-performance-analysis-with-reference-to-kesoram 3681
36
Introduction
Financial Performance Analysis
The term lsquofinancial performance analysis also known as analysis and interpretation of
financial statementsrsquo refers to the process of determining financial strength and
weaknesses of the firm by establishing strategic relationship between the items of the
balance sheet profit and loss account and other operative data
ldquoAnalyzing financial statementsrdquo by Metcalf and Titard
ldquoFinancial analysis is a process of evaluating the relationship between component
parts of a financial statement to obtain a better understanding of a firms position and
performancerdquo by Myers
Financial Performance
The word lsquoPerformance is derived from the word lsquoparfourmenrsquo which means lsquoto dorsquo lsquoto
carry outrsquo or lsquoto renderrsquo It refers the act of performing execution accomplishment
fulfillment etc In border sense performance refers to the accomplishment of a given task
measured against preset standards of accuracy completeness cost and speed In other
words it refers to the degree to which an achievement is being or has been accomplished In
the Words of Frich Kohlar ldquoThe performance is a general term applied to a part or to all the
conducts of activities of an organization over a period of time often with reference to past or
projected cost efficiency management responsibility or accountability or the like Thus not
just the presentation but the quality of results achieved refers to the performance
Performance is used to indicate firmrsquos success conditions and compliance
Financial performance refers to the act of performing financial activity In broader
sense financial performance refers to the degree to which financial objectives being or has
been accomplished It is the process of measuring the results of a firms policies and
operations in monetary terms It is used to measure firms overall financial health over a
given period of time and can also be used to compare similar firms across the same industry
or to compare industries or sectors in aggregation
The purpose of financial analysis is to diagnose the information contained in financial
statements so as to Jude the profitability and financial soundness of the firm Just like a
doctor examines his patient by recording his body temperature blood pressure etc Before
8102019 A Study A Study On Financial Performance Analysis With Reference To Kesoram Cementon Financial Performance hellip
httpslidepdfcomreaderfulla-study-a-study-on-financial-performance-analysis-with-reference-to-kesoram 3781
37
making his conclusion regarding the illness and before giving his treatment a financial
analyst analysis the financial statements with various tools of analysis before commenting
upon the financial health or weaknesses of an enterprise
The analysis and interpretation of financial statements is essential to bring out the
mystery behind the figures in financial statements Financial statements analysis is an
attempt to determine the significance and meaning of the financial statement data so that
forecast may be made of the future earnings ability to pay interest and debt maturities (both
current and long term) and profitability of a sound divided policy
Types of financial analysis-
Financial analysis into different categories depending upon
(1) The material used and
(2) The method of operation followed in the analysis or the modus operandi of
analysis
Types of financial analysis
On the basis of material used on the basis of modus operandi
External Internal Horizontal Vertical
Analysis Analysis Analysis Analysis
1 On the basis of material used - According to material used financial analysis canbe of two types
External analysis
Internal analysis
External analysis-
This analysis is done by outsiders who do not have access to the detailed internal
outsiders include investors potential investors Creditors Potential Creditors Government
Agencies Credit Agencies and General Public For financial analysis these external parties
to the firm depend almost entirely on the published financial statements
Internal analysis-
This analysis is undertaken by the persons namely executives and employees of the
organization or by the officers appointed by government or court who have access to the
8102019 A Study A Study On Financial Performance Analysis With Reference To Kesoram Cementon Financial Performance hellip
httpslidepdfcomreaderfulla-study-a-study-on-financial-performance-analysis-with-reference-to-kesoram 3881
38
books of account ( internal accounting records) and other information related to the
business
2 983119983150 983156983144983141 983138983137983155983145983155 983151983142 983149983151983140983157983155 983151983152983141983154983137983150983140983145983085
According to the modus operandi financial analysis can also be of two types
a Horizontal analysis
bVertical analysis
Horizontal analysis-
Horizontal analysis refers to the comparison of financial data of a company for several
years The figures for this type of analysis are presented horizontally over a number of
columns The figures of the various years are compared with standard or base year a base
year is year chosen as beginning point This type of analysis is also called lsquodynamicanalysisrsquo as it is based on the data from year to year rather than on data of any one year The
horizontal analysis makes it possible to focus attention on items that have changed
significantly during the period under view
b Vertical analysis-
Vertical analysis refers to the study of relationship of the various items in the financial
statements of one accounting period In this types of analysis the figures from financial
statement of a year are compared with a base selected from the same yearrsquos statement
Methods of financial analysis-
The following methods of analysis are generally used-
1 Comparative Statements
2 Trend Analysis
3 Common-Size Statements
4 Funds flow Analysis
5 Cash Analysis
6 Ratio Analysis
7 Cost-volume-Profit Analysis
8102019 A Study A Study On Financial Performance Analysis With Reference To Kesoram Cementon Financial Performance hellip
httpslidepdfcomreaderfulla-study-a-study-on-financial-performance-analysis-with-reference-to-kesoram 3981
39
Comparative statements-
The comparative financial statements are statements of the financial position at
different periods of time the elements of financial position are show in a
Comparative Statement provides an idea of financial position at two or more
periods Generally two financial statements (balance sheet and income statement) are
prepared in comparative form for financial analysis
The Comparative Statement May Show-
1 Absolute figures (rupee amounts)
2 Changes in absolute figures ie increase or decrease in absolute figures
3 Absolute data in terms of percentages
4 Increase or decrease in terms of percentages
The Two Comparative Statements Are-
1 Comparative balance sheet and
2 Income statement
1 983107983151983149983152983137983154983137983156983145983158983141 983138983137983148983137983150983139983141 983155983144983141983141983156983085
The comparative balance sheet analysis is the study of the trend of the same items group of
items and computed items in two or more balance sheets of the same business enterprise on
different dates The change in periodic balance sheet items reflect the conduct of a business
the change can be observed by comparison of the balance sheet at the beginning and at the
end of a period and these changes can help in forming an opinion about the progress of an
enterprise
Guide Lines for Interpretation of Comparative Balance Sheet-
While interpreting comparative balance sheet the interpreter is expected to study the
following aspects-
1 Current financial position and liquidity position
2 Long-term financial position
3 Profitability of the concern
8102019 A Study A Study On Financial Performance Analysis With Reference To Kesoram Cementon Financial Performance hellip
httpslidepdfcomreaderfulla-study-a-study-on-financial-performance-analysis-with-reference-to-kesoram 4081
40
Common Size Statement-
The common-size statements balance sheet and income statement are show in
analytical percentages The figures are shown as percentages of total assets total liabilities
and total sales The total assets are taken as 100 and different assets are expressed as a
percentage of the total similarly various liabilities are taken as a part of total liabilities
Common Size Balance Sheet-
A statement in which balance sheet items are expressed as the ratio of each asset to
total assets and the ratio of each liability is expressed as a ratio of total liabilities is called
common size balance The common size balance sheet can be used to compare companies
of differing size The comparison of figures in different periods is not useful because total
figures may be affected by a number of factors It is not possible to establish standard norms
for various assets The trends of figures from year to year may not be studied and even they
may not give proper results
Trend Analysis of Balance Sheet-
Trend analysis is Very important tool of horizontal financial analysis
This analysis enables to known the change in the financial function and operating efficiency
in between the time period chosen
By studding the trend analysis of each item we can known the direction of changes and
based upon the direction of changes the options can be changed
Trend =Absolute Value of item in the statement understudy 100
Absolute Value of same item in the base statement
Ratio Analysis
Ratio analysis is used as a technique of analyzing the financial information contained in the
balance sheet and profit and loss accounts for a more meaningful understanding of the
financial position and performance of a firm
The relationship between two accounting figures expressed mathematically is known as a
financial ratio A ratio helps the analyst to make qualitative judgment about the firmrsquos
financial position and performance
Several ratios can be calculated from the accounting data contained in the financial
statements The parties which generally undertake financial analysis is short ndashterm
creditors long-term creditors owner and management In view of the requirements of the
various ratios ratios are classified into the following four important categories
8102019 A Study A Study On Financial Performance Analysis With Reference To Kesoram Cementon Financial Performance hellip
httpslidepdfcomreaderfulla-study-a-study-on-financial-performance-analysis-with-reference-to-kesoram 4181
41
Liquidity ratios
Leverage ratios
Activity ratios
Profitability ratios
Liquidity Ratios
It is extremely essential for a firm to be able to meet its obligations as they become due
Liquidity ratios measure the ability of the firm to meet its current obligations A firm should
ensure that it does not suffer from lack of liquidity and also that it does not have excess
liquidity The failure of a company to meet its obligations due to lack of sufficient liquidity
will result in a poor creditworthiness loss of creditorsrsquo confidence or even in legal tangles
resulting in the closure of the company A very high degree of liquidity is also bad idle
assets earn nothing The firmrsquos funds will be unnecessarily tied up in current assets
Therefore it is necessary to strike a proper balance high liquidity and lack of liquidity
The most common ratios which indicate the extent of liquidity or lack of it are
Current ratio
Quick ratio
Other ratios include Cash ratio Interval Measure and Net working capital ratio
Current Ratio
The current ratio is calculated by dividing current assets by current liabilities
Current assets
Current ratio = --------------------------
Current liabilities
Current ratio is a measure of the firmrsquos short term solvency It indicates the availability of
current assets in rupees for every one rupee of current liability A ratio of greater than one
means that the firm has more current assets than current claims against the Current ratio of
2 to 1 or more is considered satisfactory Current ratio represents a margin of safety for
creditors
Quick Ratio
Quick ratio also known as acid-test ratio establishes a relationship between quick assets and
the current liabilities Cash is the most liquid asset It is calculated by dividing quick assets
by current liabilities
Quick ratio = Quick Assets Current Liabilities
8102019 A Study A Study On Financial Performance Analysis With Reference To Kesoram Cementon Financial Performance hellip
httpslidepdfcomreaderfulla-study-a-study-on-financial-performance-analysis-with-reference-to-kesoram 4281
42
(Quick Assets = Current assets ndash Inventory)
One defect of the current ratio is that it fails to convey any information on the composition
of the current assets of the firm A rupee of cash is considered equivalent to a rupee of
inventory of receivables But it is not so A rupee of cash is more readily available to meet
current liabilities than a rupee of say inventory This implies the usefulness of the current
ratio
The Acid ndashtest ratio measures the firmrsquos ability to convert its current assets quickly into
cash in order to meet its current liabilities
A quick ratio of 1 to 1 is considered to represent a satisfactory current financial condition It
is an important index of the firmrsquos liquidity
Leverage Ratios
Leverage ratios identify the source of a firmrsquos capital ndashowners or outside creditors
Financial leverage refers to the use of debt in financing non-current assets If the return on
assets exceeds the cost of debt the leverage is successful ndash ie it improves return on equity
Debt ndashEquity Ratio
The Debt ndash Equity is determined to analyze the soundness of the long term financial
policies of the organization It is also known as ldquoInternal External Equity Ratiordquo
It is calculated as follows
Debt ndash Equity Ratio = Total long term debt Share holders funds
Equity Ratio
This ratio is also called as proprietary ratio establishes a relationship between share holderrsquos
funds to total assets of company Equity Ratio is calculated by dividing share holders fund
by total assets
Fixed Asset Ratio
This ratio indicates the extent to which the assets of the companyrsquos can be lost without
affecting the interest of the creditors of the company Higher the ratios better the long-term
position of the company
Activity Ratios
They are primarily used for studying a firmrsquos working capital situation A well managed
firm should have good activity ratios
8102019 A Study A Study On Financial Performance Analysis With Reference To Kesoram Cementon Financial Performance hellip
httpslidepdfcomreaderfulla-study-a-study-on-financial-performance-analysis-with-reference-to-kesoram 4381
43
Working Capital Turnover Ratio
The working capital turnover ratio indicates whether or not working capital has been
effectively used in making sales
Working capital turnover = Sales Net current assets
Inventory Turnover Ratio
This ratio also known as Stock Turnover Ratio establishes the relationship between costs of
goods sold or net sales during the given period and the average amt of stock held during the
period This ratio reveals the number of times finished stock in turnover during a given
accounting period
Higher the ratio the better is it because it shows the finished stock is rapidly turned
in to sales On the other hand a low stock turnover ratio is not desirable because it reveals
the accumulation of stock
Debtors Turnover Ratio
This ratio indicates the velocity of debt collection of a company In other words it shows
the number of times average turnover during a year
A Higher Debtor Turnover Ratio indicates a more efficient is the management towards
debtors and low ratio ratio implies inefficient management of debtors
Total Assets Turnover Ratio
The asset turnover ratio indicates how efficiently management is employing Assets
Total Assets Turnover Ratio = Sales Total Assets
Profitability Ratios
Profitability ratios are the ratios which measure a firmrsquos overall effectiveness as revealed by
the returns generated on sales and investment
General Profitability Ratios
1 Gross Profit Ratio
2 Net profit Ratio
3 Operating or Expenses Ratio
8102019 A Study A Study On Financial Performance Analysis With Reference To Kesoram Cementon Financial Performance hellip
httpslidepdfcomreaderfulla-study-a-study-on-financial-performance-analysis-with-reference-to-kesoram 4481
44
Gross Profit Ratio
Gross profit Ratio measures the relationships to net sales and is usually represented as a
percentage It is a good measure of profitability
The gross profit ratio indicates the extent to which selling price of goods per unit may
decline without resulting in losses on operation Higher the gross profit betters the result
Net Profit Ratio
Net Profit Ratio indicates net margin on sales It is given by the following equation
Net Profit Ratio = (Net Profit Sales) 100
Operating or Expenses Ratio
This ratio is complimentary of Net Profit Ratio The more the net profit the less the
Operating Ratio Operating costs include the cost of direct materials direct labors and otheroverheads viz are generally excluded from operating costs A comparison of the Operating
Ratio will indicate whether the cost efficiency is high or low in the figure of sales This less
the ratio it depicts the efficiency of the management
8102019 A Study A Study On Financial Performance Analysis With Reference To Kesoram Cementon Financial Performance hellip
httpslidepdfcomreaderfulla-study-a-study-on-financial-performance-analysis-with-reference-to-kesoram 4581
45
CHAPTER IV
DATA ANALYSIS amp INTERPRETATION
8102019 A Study A Study On Financial Performance Analysis With Reference To Kesoram Cementon Financial Performance hellip
httpslidepdfcomreaderfulla-study-a-study-on-financial-performance-analysis-with-reference-to-kesoram 4681
46
Comparative Balance Sheet of Kesoram in the Year between 2008-2009
(Rupee in crores)
Years Changes
Particulars 2008 2009 In Rupees In Percentage
Liabilities
Share Capital 4574 4574 000 000
Reserves amp Surplus 93085 128024 34939
Revaluation Reserves 533 412 -121 -2270
Loans
Secured Loans 97106 153627 56521 5821
Un Secured Loans 12129 43416 31287 25795
Deferred Tax Liabilities 000 000 000 000
Current Liabilities
Provisions 33039 34529 1490 451
Current Liabilities 57067 66587 9520 1668
Total 297533 431169 133636 4491
Assets
Net Block 108424 180435 72011 6642
Capital Wip 63459 86485 23026 3628
Investments 4783 6178 1395 2917
Current Assets
Inventories 44217 58906 14689 3322
Sundry Debtors 27307 38017 10710 3922
Cash amp Bank Balances 4036 5657 1621 4016
Total Current Assets 75560 102580 27020 3576
Loans amp Advances 45289 55462 10173 2246
Fixed Deposits 018 028 010 5556
Total 297533 431169 133636 4491
8102019 A Study A Study On Financial Performance Analysis With Reference To Kesoram Cementon Financial Performance hellip
httpslidepdfcomreaderfulla-study-a-study-on-financial-performance-analysis-with-reference-to-kesoram 4781
47
Interpretation of comparative balance sheet of 2008-2009
Reserves amp Surplus were increased to 3753 (percent) ie in Rupees 34939
crores
Revaluation Reserves decreased to 121 ie in Rupees 2270 crores
Secured Loans are increased to 5821 ie in Rupees 56521 crores And UN
secured loans highly Increased to 25795
Current liabilities and Provisions are increased to 1668 and 451 respectively ie in
Rupees 9520 amp 1490 crores
Fixed assets were highly increased to 6642 ie in Rupees 72011 crores
Investments were increased to 2917 ie in Rupees 1395 crores
Sundry debtors increased to 3922 ie in Rupees 10710 crores
Current assets increased 3576 ie in Rupees 27020 crores And Loans amp
Advances increased to 2246 respectively
The overall financial position was satisfactory
8102019 A Study A Study On Financial Performance Analysis With Reference To Kesoram Cementon Financial Performance hellip
httpslidepdfcomreaderfulla-study-a-study-on-financial-performance-analysis-with-reference-to-kesoram 4881
48
Comparative Balance Sheet of Kesoram in the Year between 2009-2010
(Rupees in crores)
Years Changes
Particulars 2009 2010 In Rupees In Percentage
Liabilities
Share Capital 4574 4574 000 000
Reserves amp Surplus 128024 149111 21087 1647
Revaluation Reserves 412 339 -073 -1772
Loans
Secured Loans 153627 186372 32745 2131
Un Secured Loans 43416 126250 82834 19079
Deferred Tax Liabilities 000 000 000
Current Liabilities
Provisions 34529 35734 1205 349
Current Liabilities 66587 107688 41101 6173
Total 431169 610068 178899 4149
Assets
Net Block 180435 343182 162747 9020
Capital WIP 86485 41283 -45202 -5227
Investments 6178 5143 -1035 -1675
Current Assets
Inventories 58906 91619 32713 5553
Sundry Debtors 38017 54289 16272 4280
Cash amp Bank Balances 5657 8014 2357 4167
Total Current Assets 102580 153922 51342 5005
Loans amp Advances 55462 66506 11044 1991
Fixed Deposits 028 031 003 1071
Total 431169 610068 178899 4149
8102019 A Study A Study On Financial Performance Analysis With Reference To Kesoram Cementon Financial Performance hellip
httpslidepdfcomreaderfulla-study-a-study-on-financial-performance-analysis-with-reference-to-kesoram 4981
49
Interpretation of comparative balance sheet of 2009-2010
Reserves amp surplus increased to 1647 ie in Rupees 21087 crores
Revaluation Reserves decreased to 1772 ie in Rupees 073 crores
Secured loans increased to 2131 ie in Rupees 32745 crores
Current Liabilities were increased to 6173 ie in Rupees 41101 crores and
Provisions 349 ie in Rupees 1205 crores
Fixed Assets were increased to 9020 ie in Rupees 162747 crores
Investments were decreased to 1675 ie in Rupees 1035 crores
Sundry debtors were increased to 4280 ie in Rupees 16272 crores
Current assets increased to 5005 ie in Rupees 51342 crores And loans and
Advances increased 1919 ie in Rupees 11044 crores
The overall financial position was satisfactory
8102019 A Study A Study On Financial Performance Analysis With Reference To Kesoram Cementon Financial Performance hellip
httpslidepdfcomreaderfulla-study-a-study-on-financial-performance-analysis-with-reference-to-kesoram 5081
50
Comparative Balance Sheet of Kesoram in the Year between 2010-2011
(Rupees in crores)
Years Changes
Particulars 2010 2011 In Rupees In Percentage
Liabilities
Share Capital 4574 4574 000 000
Reserves amp Surplus 149111 125162 -23949 -1606
Revaluation Reserves 339 289 -050 -1475
Loans
Secured Loans 186372 237183 50811 2726
Un Secured Loans 126250 162744 36494 2891
Deferred Tax Liabilities 000 000 000
Current Liabilities
Provisions 35734 1494 -34240 -9582
Current Liabilities 107688 113902 6214 577
Total 610068 645348 35280 578
Assets
Net Block 343182 369172 25990 757
Capital WIP 41283 43781 2498 605
Investments 5143 6582 1439 2798
Current Assets
Inventories 91619 111855 20236 2209
Sundry Debtors 54289 63134 8845 1629
Cash amp Bank Balances 8014 7188 -826 -1031
Total Current Assets 153922 182177 28255 1836
Loans amp Advances 66506 43460 -23046 -3465
Fixed Deposits 031 176 145 46774
Total 610068 645348 35280 578
8102019 A Study A Study On Financial Performance Analysis With Reference To Kesoram Cementon Financial Performance hellip
httpslidepdfcomreaderfulla-study-a-study-on-financial-performance-analysis-with-reference-to-kesoram 5181
51
Interpretation of comparative balance sheet of 2010-2011
Reserves amp surplus decreased to 1606 ie in Rupees 23949 crores
Revaluation Reserves decreased to 1475 ie in Rupees 050 crores
Secured loans increased to 2726 ie in Rupees 50811 crores
Current Liabilities were increased to 577 ie in Rupees 6214 crores
Provisions decreased to 9582 ie in Rupees 34240 crores
Fixed Assets were increased to 757 ie in Rupees 25990 crores
Investments were decreased to 2798 ie in Rupees 1439 crores
Sundry debtors were increased to 1629 ie in Rupees8845 crores
Current assets increased to 1836 ie in Rupees 28255 crores And loans and
Advances increased 3465 ie in Rupees 23046 crores
The overall financial position was UN satisfactory
8102019 A Study A Study On Financial Performance Analysis With Reference To Kesoram Cementon Financial Performance hellip
httpslidepdfcomreaderfulla-study-a-study-on-financial-performance-analysis-with-reference-to-kesoram 5281
52
Comparative Balance Sheet of Kesoram In The Year Between 2011-2012
(Rupees in crores)
Years Changes
Particulars 2011 2012 In Rupees In Percentage
Liabilities
Share Capital 4574 4574 000 000
Reserves amp Surplus 125162 86657 -38505 -3076
Revaluation Reserves 289 270 -019 -657
Loans
Secured Loans 237183 317792 80609 3399
Un Secured Loans 162744 92742 -70002 -4301
Deferred Tax Liabilities 000 000 000
Current Liabilities
Provisions 1494 40726 39232 262597
Current Liabilities 113902 180010 66108 5804
Total 645348 722771 77423 1200
Assets 000
Net Block 369172 358721 -10451 -283
Capital WIP 43781 68065 24284 5547
Investments 6582 6636 054 082
Current Assets
Inventories 111855 99516 -12339 -1103
Sundry Debtors 63134 67358 4224 669
Cash amp Bank Balances 7188 6959 -229 -319
Total Current Assets 182177 173833 -8344 -458
Loans amp Advances 43460 115409 71949 16555
Fixed Deposits 176 107 -069 -3920
Total 645348 722771 77423 1200
8102019 A Study A Study On Financial Performance Analysis With Reference To Kesoram Cementon Financial Performance hellip
httpslidepdfcomreaderfulla-study-a-study-on-financial-performance-analysis-with-reference-to-kesoram 5381
53
Interpretation of comparative balance sheet of 2011-2012
Reserves amp surplus decreased to 3076 ie in Rupee 38505 crores
Revaluation Reserves decreased to 657 ie in Rupees 019 crores
Secured loans increased to 3399 ie in Rupees 80699 crores
Current Liabilities were increased to 5804 ie in Rupees 66108 crores
Provisions increased to 262597 ie in Rupees 39232 crores
Fixed Assets were decreased to 283 ie in Rupee 10451 crores
Investments were increased to 082 ie in Rupees 054 crores
Sundry debtors were increased to 669 ie in Rupees 4224 crores
Current assets decreased to 458 ie in Rupees 8344 crores And loans and
Advances increased 16555 ie in Rupees 71949 crores
The overall financial position was UN satisfactory
8102019 A Study A Study On Financial Performance Analysis With Reference To Kesoram Cementon Financial Performance hellip
httpslidepdfcomreaderfulla-study-a-study-on-financial-performance-analysis-with-reference-to-kesoram 5481
54
Common Size Balance Sheet of Kesoram For The Year 2008-2009
(Rupees in crores)
Particulars 2008 Change Percentage 2009 Change Percentage
Liabilities
Share Capital 4574 154 4574 106
Reserves amp Surplus 93085 3129 128024 2969
Revaluation Reserves 533 018 412 010
Loans
Secured Loans 97106 3264 153627 3563
Un Secured Loans 12129 408 43416 1007
Deferred Tax Liabilities 000 000 000 000
Current Liabilities
Provisions 33039 1110 34529 801
Current Liabilities 57067 1918 66587 1544
Total 297533 10000 431169 10000
Assets
Net Block 108424 3644 180435 4185
Capital WIP 63459 2133 86485 2006
Investments 4783 161 6178 143
Current Assets
Inventories 44217 1486 58906 1366
Sundry Debtors 27307 918 38017 882
Cash amp Bank Balances 4036 136 5657 131
Loans amp Advances 45289 1522 55462 1286
Fixed Deposits 018 001 028 001
Total 297533 10000 431169 10000
8102019 A Study A Study On Financial Performance Analysis With Reference To Kesoram Cementon Financial Performance hellip
httpslidepdfcomreaderfulla-study-a-study-on-financial-performance-analysis-with-reference-to-kesoram 5581
55
Interpretation of Common Size Balance Sheet of 2008-2009
Share capital was recorded 154 percent in the total liabilities in the year 2008 it is
decreased to 106 in the year 2009
Reserves amp surplus contributed to 3129 in the total liabilities in the year 2008 it is
decreased to 2969 in the year 2009
Secured loans were 3264 in the total liabilities in the year 2008 it is increased to
3563 in the year 2009
Current Liabilities shown to 1918 in the total liabilities in the year 2008 it is
decreased to 1544 in the year 2009
Provisions 1110 in the total liabilities in the year 2008 it is decreased to 801 in the
year 2009
Fixed Assets were 3644 in the total liabilities in the year 2008 ie decreased to 4185
in the year 2009
Investments were 161 in the total liabilities in the year 2008 it is decreased to 143
in the year 2009
Sundry debtors were 918 in the total liabilities in the year 2008 it is decreased to 882
in the year 2009
8102019 A Study A Study On Financial Performance Analysis With Reference To Kesoram Cementon Financial Performance hellip
httpslidepdfcomreaderfulla-study-a-study-on-financial-performance-analysis-with-reference-to-kesoram 5681
56
Common Size Balance Sheet of Kesoram For The Year 2009-2010
(Rs in crores)
Particulars 2009 Change Percentage 2010Change
Percentage
Liabilities
Share Capital 4574 106 4574 075
Reserves amp Surplus 128024 2969 149111 2444
Revaluation Reserves 412 010 339 006
Loans
Secured Loans 153627 3563 186372 3055
Un Secured Loans 43416 1007 126250 2069
Deferred Tax Liabilities 000 000 000 000
Current Liabilities
Provisions 34529 801 35734 586
Current Liabilities 66587 1544 107688 1765
Total 431169 10000 610068 10000
Assets
Net Block 180435 4185 343182 5625
Capital WIP 86485 2006 41283 677
Investments 6178 143 5143 084
Current Assets
Inventories 58906 1366 91619 1502
Sundry Debtors 38017 882 54289 890
Cash amp Bank Balances 5657 131 8014 131
Loans amp Advances 55462 1286 66506 1090
Fixed Deposits 028 001 031 001
Total 431169 10000 610068 10000
8102019 A Study A Study On Financial Performance Analysis With Reference To Kesoram Cementon Financial Performance hellip
httpslidepdfcomreaderfulla-study-a-study-on-financial-performance-analysis-with-reference-to-kesoram 5781
57
Interpretation of common size balance sheet of 2009-2010
Share capital was recorded 106 percent in the total liabilities in the
year 2009 it is decreased to 075 in the year 2010
Reserves amp surplus contributed to 2969 in the total liabilities in the
year 2009 it is decreased to2444 in the year 2010
Secured loans were 3563 in the total liabilities in the year 2009 it is
increased to 3055 in the year 2010
Current Liabilities shown to 1544 in the total liabilities in the year
2009 it is decreased to 1765 in the year 2010
Provisions 801 in the total liabilities in the year 2009 it is decreased
to 586 in the year 2010
Fixed Assets were 4185 in the total liabilities in the year 2009 ie
increased to 5625 in the year 2010
Investments were 143 in the total liabilities in the year 2009 it is
decreased to 084 in the year 2010
Sundry debtors were 882 in the total liabilities in the year 2009 it is
increased to 890 in the year 2010
8102019 A Study A Study On Financial Performance Analysis With Reference To Kesoram Cementon Financial Performance hellip
httpslidepdfcomreaderfulla-study-a-study-on-financial-performance-analysis-with-reference-to-kesoram 5881
58
Common Size Balance sheet of Kesoram for the year 2010-2011
983080Rupees in crores)
Particulars 2010 Change Percentage 2011
Change
Percentage
Liabilities
Share Capital 4574 075 4574 071
Reserves amp Surplus 149111 2444 125162 1939
Revaluation Reserves 339 006 289 004
Loans
Secured Loans 186372 3055 237183 3675
Un Secured Loans 126250 2069 162744 2522
Deferred Tax Liabilities 000 000 000 000
Current Liabilities
Provisions 35734 586 1494 023
Current Liabilities 107688 1765 113902 1765
Total 610068 10000 645348 10000
Assets
Net Block 343182 5625 369172 5721
Capital WIP 41283 677 43781 678
Investments 5143 084 6582 102
Current Assets
Inventories 91619 1502 111855 1733
Sundry Debtors 54289 890 63134 978
Cash amp Bank Balances 8014 131 7188 111
Loans amp Advances 66506 1090 43460 673
Fixed Deposits 031 001 176 003
Total 610068 10000 645348 10000
8102019 A Study A Study On Financial Performance Analysis With Reference To Kesoram Cementon Financial Performance hellip
httpslidepdfcomreaderfulla-study-a-study-on-financial-performance-analysis-with-reference-to-kesoram 5981
59
Interpretation of Common Size Balance Sheet Of 2010-2011
Share capital was recorded 075 percent in the total liabilities in the year 2010 it is
decreased to 071 in the year 2011
Reserves amp surplus contributed to 2444 in the total liabilities in the year 2010 it is
decreased to1939 in the year 2011
Secured loans were 3055 in the total liabilities in the year 2010 it is increased to
3675 in the year 2011
Current Liabilities shown to 1765 in the total liabilities in the year 2010 it is
also1765 in the year 2011
Provisions 586 in the total liabilities in the year 2010 it is decreased to 023 in the
year 2011
Fixed Assets were 5625 in the total liabilities in the year 2010 ie increased to 5721
in the year 2011
Investments were 084 in the total liabilities in the year 2010 it increased to 102 in
the year 2011
Sundry debtors were 890 in the total liabilities in the year 2010 it is increased to 978
in the year 2011
8102019 A Study A Study On Financial Performance Analysis With Reference To Kesoram Cementon Financial Performance hellip
httpslidepdfcomreaderfulla-study-a-study-on-financial-performance-analysis-with-reference-to-kesoram 6081
60
Common Size Balance Sheet of Kesoram for the Year 2011-2012
983080Rupees in crores)
Particulars 2011 Change Percentage 2012
Change
Percentage
Liabilities
Share Capital 4574 071 4574 063
Reserves amp Surplus 125162 1939 86657 1199
Revaluation Reserves 289 004 270 004
Loans
Secured Loans 237183 3675 317792 4397
Un Secured Loans 162744 2522 92742 1283
Deferred Tax Liabilities 000 000 000 000
Current Liabilities
Provisions 1494 023 40726 563
Current Liabilities 113902 1765 180010 2491
Total 645348 10000 722771 10000
Assets
Net Block 369172 5721 358721 4963
Capital WIP 43781 678 68065 942
Investments 6582 102 6636 092
Current Assets
Inventories 111855 1733 99516 1377
Sundry Debtors 63134 978 67358 932
Cash amp Bank Balances 7188 111 6959 096
Loans amp Advances 43460 673 115409 1597
Fixed Deposits 176 003 107 001
Total 645348 10000 722771 10000
8102019 A Study A Study On Financial Performance Analysis With Reference To Kesoram Cementon Financial Performance hellip
httpslidepdfcomreaderfulla-study-a-study-on-financial-performance-analysis-with-reference-to-kesoram 6181
61
Interpretation of common size balance sheet of 2011-2012
Share capital was recorded 071 percent in the total liabilities in the year 2011 it is
decreased to 063 in the year 2012
Reserves amp surplus contributed to 1939 in the total liabilities in the year 2011 it
is decreased to 1199 in the year 2012
Secured loans were 3675 in the total liabilities in the year 2011 it is increased to
4397 in the year 2012
Current Liabilities shown to 1765 in the total liabilities in the year 2011 it is
increased to 2491 in the year 2012
Provisions 023 in the total liabilities in the year 2011 it is increased to 563 in the
year 2012
Fixed Assets were 5721 in the total liabilities in the year 2011 ie decreased to
4963 in the year 2012
Investments were 102 in the total liabilities in the year 2011 it increased to 092
in the year 2012
Sundry debtors were 978 in the total liabilities in the year 2011 it is decreased to
932 in the year 2012
8102019 A Study A Study On Financial Performance Analysis With Reference To Kesoram Cementon Financial Performance hellip
httpslidepdfcomreaderfulla-study-a-study-on-financial-performance-analysis-with-reference-to-kesoram 6281
Trend Analysis
Share Capital-
Year
Amount
(In Crores) Trend
IncreaseDecrease
Base Year Previous Year
2008 4574 10000 000 000
2009 4574 10000 000 000
2010 4574 10000 000 000
2011 4574 10000 000 000
2012 4574 10000 000 000
Trend Percentages in Share Capital
Share capital shown a constant trend in the period 2008 and 2012
Share capital is 4574 crores all the years from 2008-2012
8102019 A Study A Study On Financial Performance Analysis With Reference To Kesoram Cementon Financial Performance hellip
httpslidepdfcomreaderfulla-study-a-study-on-financial-performance-analysis-with-reference-to-kesoram 6381
Reserves amp Surplus-
Year
Amount
(In Crores) Trend
IncreaseDecrease
Base Year Previous Year
2008 93085 10000 000 000
2009 128024 13753 3753 3753
2010 149111 16019 6019 2266
2011 125162 13446 3446 -2573
2012 86657 9309 -691 -4137
Trend Percentages in Reserves amp Surplus
Reserves amp surplus shown an increasing trend in the period between 2008 and 2010
The average trend was 13277 till 2010
The Reserves amp surplus was showing decreasing trend in the period 2011-2012 (ie
from 16019 in 2010 to 9309 in 2012)
The decreasing trend in Reserves amp surplus indicates the decrease in profits of the
firm
8102019 A Study A Study On Financial Performance Analysis With Reference To Kesoram Cementon Financial Performance hellip
httpslidepdfcomreaderfulla-study-a-study-on-financial-performance-analysis-with-reference-to-kesoram 6481
Investments-
Year
Amount
(In Crores) Trend
IncreaseDecrease
Base Year Previous Year
2008 4783 10000 000 000
2009 6178 12917 2917 2917
2010 5143 10753 753 -2164
2011 6582 13761 3761 3009
2012 6636 13874 3874 113
Trend Percentages in Investments-
The investments are shown an increasing trend in the period between 2008 ndash 2009
and it is decreasing in the year 2010
The average trend was 11458 till 2009
The investments increased in the periods 2011-2012 (ie from 10753 in 2010 to
13874 in 2012)
The overall trend in investments shown is satisfactory
8102019 A Study A Study On Financial Performance Analysis With Reference To Kesoram Cementon Financial Performance hellip
httpslidepdfcomreaderfulla-study-a-study-on-financial-performance-analysis-with-reference-to-kesoram 6581
Net Current Assets-
Year
Amount
(In Crores) Trend
IncreaseDecrease
Base Year Previous Year
2008 30761 10000 000 000
2009 56954 18515 8515 8515
2010 77037 25044 15044 6529
2011 110417 35895 25895 10851
2012 68613 22305 12305 -13590
Trends in Net Current Assets-
The NCA shown positive (increasing) trend
The NCA are increased to 35895 (the year 2011) compared with base year and
decreased in the year 2012 to 22305
The NCA shown increased trend from year and crossed 100
The overall trend was good
8102019 A Study A Study On Financial Performance Analysis With Reference To Kesoram Cementon Financial Performance hellip
httpslidepdfcomreaderfulla-study-a-study-on-financial-performance-analysis-with-reference-to-kesoram 6681
66
Ratio Analysis-
Current Ratio-
Current Ratio = Current Assets Current Liabilities
Current assets are cash in hand Cash at bank Marketable Securities(short term) short term
Investment Bills receivables sundry debtors Inventories (stock) Work in progress prepaid
expenses Current Liabilities are outstanding expenses Bills payable sundry Creditors
short-term advances income tax payable and Dividend payable
Current Ratio of Kesoram-
(Rupees in crores)
Year Current Assets Current Liabilities Current Ratio
2007-08 75560 57067 132
2008-09 102580 66587 154
2009-10 153922 107688 143
2010-11 182177 113902 160
2011-12 173833 180010 097
Interpretation-
As per the standard rule of current ratio ie 21 where current assets double the current
liabilities is considered satisfactory
In the present analysis the current ratio of the Kesoram is not satisfactory
from the above table It was assessed that the current ratio for all the five year is lower (less)
than the standard rule ie 21 And it is 097 in the year 2011-2012 (current year) This is
highly UN satisfactory
8102019 A Study A Study On Financial Performance Analysis With Reference To Kesoram Cementon Financial Performance hellip
httpslidepdfcomreaderfulla-study-a-study-on-financial-performance-analysis-with-reference-to-kesoram 6781
Quick Ratio-
Quick ratio also known as acid-test ratio establishes a relationship between quick
assets and the current liabilities Cash is the most liquid asset It is calculated by dividing
quick assets by current liabilities
Quick ratio = Quick Assets Current Liabilities
(Quick Assets = Current assets ndash Inventory)
Quick Ratio of Kesoram-
Rupees in crores)
Year Total QuickAssets
Current Liabilities Quick Ratio
2007-08 33343 57067 058
2008-09 43674 66587 066
2009-10 62303 107688 058
2010-11 70322 113902 0622011-12 74333 180010 041
Interpretation-
Usually a high Quick ratio is an indication that the company is liquid and has the ability to
meet its current or liquid liabilities in time on the other hand a low Quick Ratio represents
8102019 A Study A Study On Financial Performance Analysis With Reference To Kesoram Cementon Financial Performance hellip
httpslidepdfcomreaderfulla-study-a-study-on-financial-performance-analysis-with-reference-to-kesoram 6881
that the companyrsquos liquidity position is not good The above table showing the quick ratios
of Kesoram are canrsquot be considered satisfactory
Leverage Ratios-
Debt-Equity Ratio-
Debt-Equity Ratio = Total Long Term Debt Equity Share Holders Fund
Total Long term Debt= Debenture Capital + Long term loans from banks and financial
institutions + Public deposits
Equity Share Holders fund = Equity + Reserves and Surplus
Debt Equity Ratio of Kesoram
(Rupees in crores)
Year Total Debt Share Holders Fund Debt Equity Ratio
2007-08 109235 98192 111
2008-09 197043 133010 148
2009-10 312622 154024 203
2010-11 399927 130025 308
2011-12 410534 91501 449
8102019 A Study A Study On Financial Performance Analysis With Reference To Kesoram Cementon Financial Performance hellip
httpslidepdfcomreaderfulla-study-a-study-on-financial-performance-analysis-with-reference-to-kesoram 6981
Interpretation-
The Debt-Equity Ratio accepted standard is 05 This ratio reflects the relative contribution
of creditors and owners of business in its financing From the above it is clear that the long
term debt is more than that of the share holdersrsquo fund So we can interpret that the firmrsquosassets are financed more by the external funds rather than by the internal funds
8102019 A Study A Study On Financial Performance Analysis With Reference To Kesoram Cementon Financial Performance hellip
httpslidepdfcomreaderfulla-study-a-study-on-financial-performance-analysis-with-reference-to-kesoram 7081
Fixed Asset Ratio-
Net Sales
Fixed Asset Ratio = helliphelliphelliphelliphelliphelliphelliphelliphelliphelliphellip
Net Assets
Fixed Asset Ratio of Kesoram-
(Rupees in crores)
Year Net Sales Net Assets Fixed Assets Ratio
2007-08 300271 358721 084
2008-09 389797 369172 106
2009-10 475062 343182 1382010-11 539788 180435 299
2011-12 59182 108424 546
Interpretation
This ratio indicates the extent to which the assets of the companyrsquos can be lost without
affecting the interest of the creditors of the company Higher the ratios better the long-term
position of the companyThe above table shows fixed assets ratio in increasing trend Which is good for the
company
8102019 A Study A Study On Financial Performance Analysis With Reference To Kesoram Cementon Financial Performance hellip
httpslidepdfcomreaderfulla-study-a-study-on-financial-performance-analysis-with-reference-to-kesoram 7181
Overall Profitability Ratios-
Net Profit Ratio
Net Profit Ratio indicates net margin on sales It is given by the following equation
Net Profit Ratio = (Net Profit Sales) 100
Net Profit Ratio of Kesoram
(Rupees in crores)
Year Net Profit Sales Net Profit Ratio
2007-08 37917 300271 1263
2008-09 41432 389797 1063
2009-10 20298 475062 427
2010-11 -28176 539788 -5222011-12 -38108 59182 -644
Interpretation
It establishes a relationship between net profits after tax and net sales and
indicates the efficiency of the management in manufacturing selling administrative and
other activities of the company
The higher the ratio the better is the profitability or performance of the business
The above table depicts the net profit Ratio of Kesoram has decreased every year from
2007-2008 to 2011-2012It further decreased to negative in the year 2010-11 to -522 and -
644 in the year 2011-2012 This shows constant decrease in the profits of the company
8102019 A Study A Study On Financial Performance Analysis With Reference To Kesoram Cementon Financial Performance hellip
httpslidepdfcomreaderfulla-study-a-study-on-financial-performance-analysis-with-reference-to-kesoram 7281
72
Return on Investment-
Net Profit
Return on Investment = helliphelliphelliphelliphelliphelliphelliphelliphelliphelliphelliphellip X 100
Share Holders Fund
Return on Investment Ratio of Kesoram-
(Rupees in crores)
Year Net Profit Share Holders Fund Return On Investment
2007-08 37917 98192 3862
2008-09 41432 133010 3115
2009-10 20298 154024 1318
2010-11 -28176 130025 -2167
2011-12 -38108 91501 -4165
Interpretation-
The above table reveals how well the resources of the firm are being used Higher
the ratio better the result The above ratio implies how well the firm is growing in
terms of profitability and efficiency From the above table we can concern that the return on
investment is in decreasing trend ROI is highest in the year 2007-2008 as 3862 But
there after itrsquos decreased every year
The ROI is negative in the years 2010-2011 amp 2011-2012 as -2167 amp -4165 respectively
Which is not a good sign for the firm
8102019 A Study A Study On Financial Performance Analysis With Reference To Kesoram Cementon Financial Performance hellip
httpslidepdfcomreaderfulla-study-a-study-on-financial-performance-analysis-with-reference-to-kesoram 7381
8102019 A Study A Study On Financial Performance Analysis With Reference To Kesoram Cementon Financial Performance hellip
httpslidepdfcomreaderfulla-study-a-study-on-financial-performance-analysis-with-reference-to-kesoram 7481
8102019 A Study A Study On Financial Performance Analysis With Reference To Kesoram Cementon Financial Performance hellip
httpslidepdfcomreaderfulla-study-a-study-on-financial-performance-analysis-with-reference-to-kesoram 7581
75
CHAPTER V
FINDINGS amp SUGGESTIONS
8102019 A Study A Study On Financial Performance Analysis With Reference To Kesoram Cementon Financial Performance hellip
httpslidepdfcomreaderfulla-study-a-study-on-financial-performance-analysis-with-reference-to-kesoram 7681
76
Findings
The Share capital remains constant Share capital is unchanged all the years from
2008-2012
Reserves amp surplus were recorded an increasing trend in the period between 2008
and 2010It is showing decreasing trend in the period 2011-2012 (ie from 16019
in 2010 to 9309 in 2012)
Current Liabilities were increased compared to base year ie 2008
Provisions increased to 262597 ie in Rupees 39232 crores in the current year
The current ratio for all the five year is lower (less) than the standard rule ie 21
And it is 097 in the year 2011-2012 (current year)
The Debt-Equity Ratio was shown under the standard ratio It is clear that the long
term debt is more than that of the share holdersrsquo fund It indicates that the firm
heavily relying on external funds rather than the internal funds
The operating and net profit of Kesoram is in decreasing trend due to heavy
increase of manufacturing amp administrative expenses
ROI is highest in the year 2007-2008 as 3862 The ROI is negative in the years
2010-2011 amp 2011-2012 as -2167 amp -4165 respectively
Return on Equity Capital Employed Ratio of Kesoram has decreased every year
from 2007-2008 to 2010-2011It further decreased to negative in the year 2011-12 to
-3280
EPS of Kesoram has decreased every year from 2008-12It is negative in the year
2011 amp 12
8102019 A Study A Study On Financial Performance Analysis With Reference To Kesoram Cementon Financial Performance hellip
httpslidepdfcomreaderfulla-study-a-study-on-financial-performance-analysis-with-reference-to-kesoram 7781
77
Suggestion
The organization should adopt an appropriate capital structure
The companyrsquos debt-equity ratio is recorded more or less as 111 in the year 2008
and it is increased to 449 in the year 2012 (current year)The company should
adopt a better debt equity mix in the future to control the fluctuations in returns
The company should control fluctuations in cash and bank balances as it impacts the
current ratio of the company
The provisions are showing increasing trend which indicates risk of debtors The
firm should implement an effective credit management policy It should utilize its
idle funds by decreasing provisions
The company should control heavy increase of manufacturing amp administration
expenses as it is impacting the operating and net profit of company
8102019 A Study A Study On Financial Performance Analysis With Reference To Kesoram Cementon Financial Performance hellip
httpslidepdfcomreaderfulla-study-a-study-on-financial-performance-analysis-with-reference-to-kesoram 7881
78
ANNEXURE
Profit And Loss Account of Kesoram Cement
Mar12 Mar11 Mar10 Mar09 Mar08
12 Months 12 Months 12 Months 12 Months 12 Months
INCOME
Sales Turnover 628260 575072 505151 431613 345700
Excise Duty 36440 35284 30089 41815 45429
NET SALES 591820 539788 475062 389797 300271
Other Income 000 000 000 000 000
TOTALINCOME
596129 548733 481019 393969 302020
EXPENDITURE
Manufacturing
Expenses81903 74803 13974 13153 44113
MaterialConsumed
370897 310150 295550 229359 118448
Personal
Expenses33468 27355 23294 18690 15344
Selling Expenses 81910 78253 58667 48846 45019
AdministrativeExpenses
28225 29308 17219 16179 9907
Expenses
Capitalized000 000 000 000 000
Provisions Made 000 000 000 000 000
TOTAL
EXPENDITURE 596403 519870 408704 326227 232832Operating Profit -4583 19918 66358 63570 67439
EBITDA -274 28864 72316 67742 69188
Depreciation 29740 27259 17280 11186 8927
Other Write-offs 000 000 000 000 000
EBIT -30014 1605 55035 56557 60261
Interest 41015 23983 10921 12087 5426
EBT -71029 -22377 44114 44470 54835
Taxes -32921 5798 23816 3037 16918
Profit and Loss
for the Year-38108 -28176 20298 41432 37917
Non RecurringItems
-1142 7063 3228 -4023 402
Other Non Cash
Adjustments1276 091 207 465 017
OtherAdjustments
000 000 000 000 000
REPORTED
PAT-37974 -21021 23734 37874 38335
8102019 A Study A Study On Financial Performance Analysis With Reference To Kesoram Cementon Financial Performance hellip
httpslidepdfcomreaderfulla-study-a-study-on-financial-performance-analysis-with-reference-to-kesoram 7981
79
Balance Sheet Of Kesoram
Years
Particulars 2008 2009 2010 2011 2012
Liabilities
Share Capital 4574 4574 4574 4574 4574Reserves amp Surplus 93085 128024 149111 125162 86657
Revaluation Reserves 533 412 339 289 27
Loans
Secured Loans 97106 153627 186372 237183 317792
Un Secured Loans 12129 43416 12625 162744 92742
Deferred Tax Liabilities 0 0 0 0 0
Current Liabilities
Provisions 33039 34529 35734 1494 40726
Current Liabilities 57067 66587 107688 113902 18001
Total 297533 431169 610068 645348 722771
Assets
Net Block 108424 180435 343182 369172 358721
Capital WIP 63459 86485 41283 43781 68065
Investments 4783 6178 5143 6582 6636
Current Assets
Inventories 44217 58906 91619 111855 99516
Sundry Debtors 27307 38017 54289 63134 67358
Cash amp Bank Balances 4036 5657 8014 7188 6959
Total Current Assets 7556 10258 153922 182177 173833Loans amp Advances 45289 55462 66506 4346 115409
Fixed Deposits 018 028 031 176 107
Total 297533 431169 610068 645348 722771
8102019 A Study A Study On Financial Performance Analysis With Reference To Kesoram Cementon Financial Performance hellip
httpslidepdfcomreaderfulla-study-a-study-on-financial-performance-analysis-with-reference-to-kesoram 8081
80
KEY ITEMS 2012 2011 2010 2009 2008
Preference
Dividend 0 0 0 0 0
Equity Dividend 457 2516 2516 2516 2516
Equity Dividend
() 999 55 55 55 55
Shares in Issue(Lakhs) 45743 45743 45743 45743 45743
EPS - Annualised
(Rs) -8302 -4595 5188 828 838
8102019 A Study A Study On Financial Performance Analysis With Reference To Kesoram Cementon Financial Performance hellip
httpslidepdfcomreaderfulla-study-a-study-on-financial-performance-analysis-with-reference-to-kesoram 8181
BIBLIOGRAPHY
Sl
No
Books Author Name
1 Financial Management Khan amp JAIN
2 Financial Management IMPandey
3 Management Accounting RPTrivedi
Websites amp Search Engines
1 wwwkesoramcom983086
2 wwwmoneycontrolcom
3 wwwgooglefinancecom983086
Annual reports of Kesoram cement limited 2008-2012

8102019 A Study A Study On Financial Performance Analysis With Reference To Kesoram Cementon Financial Performance hellip
httpslidepdfcomreaderfulla-study-a-study-on-financial-performance-analysis-with-reference-to-kesoram 2281
22
COMPANY PROFILE
8102019 A Study A Study On Financial Performance Analysis With Reference To Kesoram Cementon Financial Performance hellip
httpslidepdfcomreaderfulla-study-a-study-on-financial-performance-analysis-with-reference-to-kesoram 2381
23
Kesoram Cement Industry is one of the leading manufacturers of cement in India It is a day
process cement Plant The plant capacity is 826 lakh tones per annum It is located at
Basanthnagar in Karimnagar district of Andhra Pradesh Basanthnagar is 8 km away from
the Ramagundam Railway station linking Madras to New Delhi The Chairman of the
Company is BKBirla
History
The first unit at Basanthnagar with a capacity of 21 lakh tones per annum
incorporating humble suspension preheated system was commissioner during the year 1969
The second unit was setup in year 1971 with a capacity of 21 lakh tones per annum went on
stream in the year 1978 The coal for this company is being supplied from Singgareni
Collieries and the power is obtained from APSEB The power demand for the factory is
about 21 MW Kesoram has got 2 DG sets of 4 MW each installed in the year 1987
Kesoram Cement has setup a 15 KW captor power plant to facilitate for
uninterrupted power supply for manufacturing of cement at 24th
august 1997 per hour 12
mw actual power is 15 mw
The Company was incorporated on 18th October 1919 under the Indian Companies Act
1913 in the name and style of Kesoram Cotton Mills Ltd It had a Textile Mill at 42
Garden Reach Road Calcutta 700 024 The name of the Company was changed to Kesoram
Industries amp Cotton Mills Ltd on 30th
August 1961 and the same was further changed to Kesoram Industries Limited on 9th July
1986 The said Textile Mill at Garden Reach Road was eventually demerged into a separate
company
The First Plant for manufacturing of rayon yarn was established at Tribeni District
Hooghly West Bengal and the same was commissioned in December 1959 and the second
plant was commissioned in the year 1962 enabling it to manufacture 4635 metric tons perannum (mtpa) of rayon yarn This Unit has 6500 metric tons per annum (mtpa) capacity as
on 3132009
The plant for manufacturing of transparent paper was also set up at the same location at
Tribeni District Hooghly West Bengal in June 1961 It has the annual capacity to
manufacture 3600 metric tons per annum (mtpa) of transparent Paper
8102019 A Study A Study On Financial Performance Analysis With Reference To Kesoram Cementon Financial Performance hellip
httpslidepdfcomreaderfulla-study-a-study-on-financial-performance-analysis-with-reference-to-kesoram 2481
24
The Company diversified into manufacturing of cast iron spun pipes and pipe fittings at
Bansberia District Hooghly West Bengal with a production capacity of 45000 metric tons
per annum (mtpa) of cast iron spun pipes and pipe fittings in December 1964
The Company subsequently diversified into the manufacturing of Cement and in 1969
established its first cement plant under the name Kesoram Cement at Basantnagar Dist
Karimnagar (Andhra Pradesh) and to take advantage of favorable market conditions in
1986 another cement plant known as Vasavadatta Cement was commissioned by it at
Sedam Dist
Gulbarga (Karnataka) The cement manufacturing capacities at both the plants were
augmented from time to time according to the market conditions and as on 3132009
Kesoram Cement and Vasavadatta Cement have annual cement manufacturing capacities of
15 million metric tons and 41 million metric tons respectively
The Company in March 1992 commissioned a plant at Balasore known as Birla Tyres in
Orissa for manufacturing of 10 lakh mtpa automotive tyres and tubes in the first phase in
collaboration with Pirelli Ltd UK a subsidiary company of the world famous Pirelli
Group of Italy - a pioneer in production and development of automotive tyres in the world
The capacity at the said plant was further augmented during the year by 19 MT per day
aggregating to 271 MT per day production facility The Greenfield Project of 257 MT per
day capacity in the State of Uttarakhand with a capex of about Rs760 crores commenced
the commercial production in phases during the financial year 2008-09The Company as on
3132009 had the manufacturing capacities of 371 million tyres 295 million tubes and
153 million flaps per annum in the Plants including at Uttarakhand Plant It has small
manufacturing capacities of various Chemicals at Kharda in the State of West Bengal also
It has the annual manufacturing capacities of 12410 mtpa of Caustic Soda Lye 5045 mtpa
of Liquid Chlorine 6205 mtpa of Sodium Hypochlorite 8200 mtpa of Hydrochloric Acid
3200 mtpa of Ferric Alum 18700 mtpa of Sulphuric Acid and 1620000 m3pa of purified
Hydrogen Gas
The Company is a well-diversified entity in the fields of Cement Tyre Rayon Yarn
Transparent Paper Spun Pipes and Heavy Chemicals with two core business segments ie
Cement and Tyres
8102019 A Study A Study On Financial Performance Analysis With Reference To Kesoram Cementon Financial Performance hellip
httpslidepdfcomreaderfulla-study-a-study-on-financial-performance-analysis-with-reference-to-kesoram 2581
25
In Spun Pipes amp Foundries a unit of the Company work suspended from 2nd May 2008
still commences till further notice
The Company as of now is listed on three major Stock Exchanges in India ie Bombay
Stock Exchange Ltd Mumbai Calcutta Stock Exchange Association Ltd Kolkata and
National Stock Exchange of India Ltd Mumbai and at the Societe de la Bourse de
Luxembourg Luxembourg
A further expansion upto 165 million tons of cement per annum in Vasavadatta Cement at
Sedam in Karnataka as unit IV at the same site is in progress with a 175 MW Captive
Power Plant involving a capital expenditure of about Rs 78350 crores (including the cost
of Captive Power Plant)
The commercial production of cement in the aforesaid unit IV has commenced in June
2009 The work for the further expansion in the Tyres Section at Uttarakhand for radial
tyres with 100 MT per day capacity and bias tyres with 125 MT per day capacity involving
an estimated aggregate capital outlay of about Rs 840 crores is under progress The Board
has further approved a Motor Cycle Tyre Project of 70 MT per day capacity at the same site
involving a capital outlay of Rs190 crore The civil construction of both the Projects is in
full swing The commercial production in both the Projects is likely to start by December
2009 January 2010
Birla Supreme in popular brand of Kesoram cement from its prestigious plant of
Basantnagar in AP which has outstanding track record In performance and productivity
serving the nation for the last two and half decades It has proved its distinction by bagging
several national awards It also has the distinction of achieving optimum capacity
utilization
Kesoram offers a choice of top quality portioned cement for light heavy
constructions and allied applications Quality is built every fact of the operations
The plant lay out is rational to begin with The limestone is rich in calcium
carbonate a key factor that influences the quality of final product The day process
technology uses in the latest computerized monitoring overseas the manufacturing process
Samples are sent regularly to the bureau of Indian standards National council of
construction and building material for certification of derived quality norms
8102019 A Study A Study On Financial Performance Analysis With Reference To Kesoram Cementon Financial Performance hellip
httpslidepdfcomreaderfulla-study-a-study-on-financial-performance-analysis-with-reference-to-kesoram 2681
26
The company has vigorously undertaking different promotional measures for
promoting their product through different media which includes the use of news papers
magazine hoarding etc
Kesoram cement industry distinguished itself among all the cement factories in
Indian by bagging the National Productivity Award consecutively for two years ie for the
year 1985-1987 The federation of Andhra Pradesh Chamber amp Commerce and Industries
(FAPCCI) also conferred on Kesoram Cement An award for the best industrial promotion
expansion efforts in the state for the year 1984 Kesoram also bagged FAPCCI awarded for
ldquoBest Family Planning Effort in the staterdquo for the year 1987-1988
One among the industrial giants in the country today serving the nation on the
industrial front Kesoram industry ltd has a checked and eventful history dating back to the
twenties when the Industrial House of Birlarsquos acquired it With only a textile mill under its
banner 1924 it grew from strength to strength and spread its activities to newer fields like
Rayon Transparent paper pipes Refractors tyres and other products
Looking to the wide gap between the demand and supply of vital commodity
cement which play in important role in National building activity the Government of India
had de-licensed the cement industry in the year 1966 with a review to attract private
entrepreneur to augment the cement production Kesoram rose to the occasions and divided
to set up a few cement plants in the country
Kesoram cement undertaking marketing activities extensively in the state of Andhra
Pradesh Karnataka Tamilnadu Kerala Maharashtra and Gujarat In AP sales Depts are
located in different areas like Karimnagar Warangal Nizamabad Vijayawada and Nellore
In other states it has opened around 10 depots
The market share of Kesoram Cement in AP is 705 The market share of the
company in various states is shown as under
STATES MARKET SHARE
Karnataka 409
Tamilnadu 094
Kerala 029
Maharashtra 281
8102019 A Study A Study On Financial Performance Analysis With Reference To Kesoram Cementon Financial Performance hellip
httpslidepdfcomreaderfulla-study-a-study-on-financial-performance-analysis-with-reference-to-kesoram 2781
27
Process and Quality Control
It has been the endeavor of Kesoram to incorporate the Worldrsquos latest technology in
the plant and today the plant has the most sophisticated
X-ray analysis
Fully computerized XRF and XRD X-RAY Analyzers keep a constant round the
clock vigil on quality
Supreme performance
One of the largest Cement Plants in Andhra Pradesh the plant incorporate the latest
technology in Cement - making
It is professionally managed and well established Cement Manufacturing Company
enjoying the confidence of the consumers Kesoram has outstanding track record in
performance and productivity with quite a few national and state awards to its credit
BIRLA SUPREME the 43 Grade Cement is a widely accepted and popular brand
in the market commanding a premium
However to meet the specific demands of the consumer Kesoram bought out the 53
grade BIRLA SUPREME ndash GOLD which has special qualities like higher fineness quick-
setting high compressive strength and durability
Supreme Strength
Kesoram Cement has huge captive Limestone Deposits which make it possible tofeed high- grade limestone consistently its natural Grey colour is anion- born ingredient
and gives good shade
Both the products offered by Kesoram ie BIRLA SUPREME-43 Grade and
BIRLA SUPREME-GOLD-53 Grade cement are outstanding with much higher
compressive strength and durability
The following characteristics show their distinctive qualities
Comprehensive
Strength
Opc 43
grls 8112
1989
Birla
Supreme 43
grade
Opc 43 gr
Is 1226987
Birla
Supreme
Gold 53 gr
3 days mpa Min 23 31 + Min 27 38+
7 days mpa Min 23 42+ Min 37 48+
28 days mpa Min 43 50+ Min 53 60+
8102019 A Study A Study On Financial Performance Analysis With Reference To Kesoram Cementon Financial Performance hellip
httpslidepdfcomreaderfulla-study-a-study-on-financial-performance-analysis-with-reference-to-kesoram 2881
28
DC SYSTEM
Clinker making process is a key step in the overall cement making process In the case of
BIRLA SUPREMEGOLD the clinker-making process is totally computer control The
Distributed Control System (DCS) constantly monitors the process and ensures operating
efficiency This eliminates variation and ensures consistency in the quality of Clinker
Physical Characteristics
Ope 43
Is 8 112-89
Birla
Supreme
43 grade
Ope 53 gr
Is 12269-87
Birla Supreme
Gold 53 gr
Setting time Min30 120-180 Min 30 130-170
a Initial (mats) Max 600 180-240 Max 600 170-220
b final (mats) Min 225 270-280 Min 225 300-320
Fincncssm 2Kg Max 10 10-20 Max 10 05-10
Soundness Max 08 004-008 Max 0080 004-02
a le-chart (mm)
b autoclave ()
Supreme Expertise
The Best Technical Team exclusive to Kesoram mans the Plant and monitors the process
to blend the cement in just the required proportions to make BIRLA SUPREMEGOLD OF
Rock Strength
18 Million Tones of Solid Foundation
Staying at the top for over a Quarter Century Quarter Century is no less an achievement
Infact Kesoram is synonymous with for over 28 years
Over the years Kesoram has dispatched 18 million tones of cement to the nook and cornersof the country and joined hands in strengthening the Nation No one else in Andhra Pradesh
has this distinction The prestigious World Bank aided Ramagundam Super Thermal Power
Project of NTPC and Mannair Dam of Pochampad project in AP arc a couple of projects for
which Kesoram Cement was exclusively uses to cite an example
8102019 A Study A Study On Financial Performance Analysis With Reference To Kesoram Cementon Financial Performance hellip
httpslidepdfcomreaderfulla-study-a-study-on-financial-performance-analysis-with-reference-to-kesoram 2981
29
Chemical Characteristics
Opc 43 gr
Is 81 132-989
Birla
Supreme
43 grade
Ope 53 gr
Is 12269-
87
Birla
Supreme
Gold 53 gr
Loss on inflection Max 5 lt16 Max 40 lt15
Insoluble residue Max 20 lt08 Max 20 lt 06
Magnesium oxide Max 60 lt 13 Max 60 lt 13
Lime saturation factor 066-102 08-09 08-102 088-09
Alumna iron ratio MinO66 15-17 MinO66 15-17
Sulfuric anhydride Max 253 16-20 Max 2 53 16-20
Alkalis Chlorides Max 005 Max 001 Max 005 Max 04
Kesoram Cement - advantages
Helps in designing sleeker and more elegant
Structures giving greater flexibility in design concept
Due to its fine quality super fine construction can be achieved Its gives maximum
strength at Minimum use of cement with water in the water cement ratio especially the 53
grade Birlas supreme-gold
Feathers in Kesorams cap
Kesoram has outstanding track record achieving over 100 capacity utilization I
productivity and energy conservation It has proved its distinction by bagging several
national and state awards noteworthy being
NATIONAL
1 National productivity award for 1985-86
2 National productivity award for 1986-87
3 National award for mines safety for 1985-86
4 National award for mines safety for 1986-875 National award for energy conservation 1989-90
8102019 A Study A Study On Financial Performance Analysis With Reference To Kesoram Cementon Financial Performance hellip
httpslidepdfcomreaderfulla-study-a-study-on-financial-performance-analysis-with-reference-to-kesoram 3081
30
STATE
1 AP State productivity award for 1988
2 State award for best industrial management 1988-89
3 Best industrial productivity award of FAPCCI (federation of AP chamber of
commerce and industry) 1991
4 Best management award of the state Govt 1993
5 FAPCCI award for the workers welfare 1995-96
ISO 9002
All quality systems of Kesoram have been certified under ISO 90021S 4002 which
proves the worldwide acceptance of the products
All quality systems in production and marketing of the product have been certified by BIS
under ISO 90021S 14002
The first unit was installed at basanthnagar with a capacity of 25 ndashlakhs TPA (tones per
annum) incorporating humble supervision preheated system during the year 1969
The second unit followed suit with added a capacity of 2 lakhs TPA in 1971
The plant was further expanded to 9 lakhs by adding 25 lakhs tones in august 1978 113
lakhs tones in January 1981 and 087 lakhs tones in September 1981
Power
Singareni collieries make the supply of coal for this industry and the power was
obtained from AP TRANSCO The power demand for the factory is about 21MW Kesoram
has got 2-diesel generator seats of 4 MW each installed in the year 1987
Kesoram cement now has a 15MWcaptive power plant to facilities for uninterrupted
power supply for manufacturing of cement
Performance
The performance of kersoram cement industry has been outstanding achieving over
cent percent capacity utilization all through despite many odds like power cuts and which
most 40 was wasted due to wagon shortage etc
The company being a continuous process industry works round the clock and has
excellent records of performance achieving over 1005 capacity utilization
Kesoram has always combined technical progress with industrial performance The
company had glorious track record for the last 27 years in the industry
Technology
8102019 A Study A Study On Financial Performance Analysis With Reference To Kesoram Cementon Financial Performance hellip
httpslidepdfcomreaderfulla-study-a-study-on-financial-performance-analysis-with-reference-to-kesoram 3181
31
Kesoram cement uses most modern technology and the computerized control in the
plant A team of dedicated and well- experienced experts manages the plant
The quality is maintained much above the bureau of Indian standards
The raw materials used for manufacturing cement are
Lime stone
Bauxite
Hematite
Gypsum
Environmental and Social Obligations
For environmental promotion and to keep ndashup the ecological balance this section
has planted over two lakhs trees on social obligation front this section has undertaken
various social welfare programs by adopting ten nearly villages organizing family welfare
campus surgical camps animal health camps blood donation camps children immunization
camps seeds training for farmers etc were arranged
Welfare and Recreation Facilities
For the purpose of recreation facilities 2 auditoriums were provided for playing
indoor games cultural function and activities like drama music and dance etc
The industry has provided libraries and reading rooms About 1000 books are available in
the library All kinds of newspaper magazines are made available
Canteen is provided to cater to the needs of the employees for supply of snacks tea
coffee and meals etc
One English medium and one Telugu medium school are provided to meet the
educational requirements
The company has provided a dispenser with a qualified medical office and
paramedical staff for the benefit of the employees The employees covered under ESI
scheme have to avail the medical facilities from the ESI hospital
Competitions in sports and games are conducted every year for august 15th
Independence Day and January 26th republic day among the employees
Electricity
The power consumption per ton of cement has come down to 108 units against 113
units last year due to implementation of various energy saving measures The performance
of captive power plant of this section continues to be satisfactory Total power generation
8102019 A Study A Study On Financial Performance Analysis With Reference To Kesoram Cementon Financial Performance hellip
httpslidepdfcomreaderfulla-study-a-study-on-financial-performance-analysis-with-reference-to-kesoram 3281
32
during the year was 84 million units last year This captive power plant is a major role in
keeping power costs with in economic levels
The management has introduced various HRD programs for training and
development and has taken various other measures for the betterment of employeersquos
efficiency
The section has installed adequate air pollution control system and equipment and is
ISO14001 such as Environment management system is under implementation
Awards
Kesoram cement bagged many prestigious awards including national awards for
productivity technology conservation and several state awards since 1984 The following
are the some of important awards
AWARDS OF KESORAM CEMENT
No Year Awards
National
State
1 1989-90 Management award community
Development
State
2 1991 Energy conservation may day award of the
Govt
State
3 1991 Pundit Jawaharlal Nehru rolling trophy for
best
State
4 1993 National productivity effort Indira Gandhi
national award
State
5 1994 Best management award State
6 1994-
1995
Best industrial rebellion award State
7 1995 Rural development by chief minister
Environment and mineral conservation
award
State
8 1995 Best industrial rebellion award State
8102019 A Study A Study On Financial Performance Analysis With Reference To Kesoram Cementon Financial Performance hellip
httpslidepdfcomreaderfulla-study-a-study-on-financial-performance-analysis-with-reference-to-kesoram 3381
33
9 1995-
1996
Best effort of an industrial unit to
development rural economy shriSRRungta
award for social
National
10 1996 Awareness for best rural development
efforts
State
11 1999 Best workers welfare best family welfare
award
State
12 2001 First prize for mine environment amppollution
control for the 3rd
year in succession
State
13 2002 Vana mithra award from AP Govt State
14 2003 Company has got OHSAS-18001 State
15 2005 Certification from DNV New Delhi State
16 2006 Award for pollution control and
environmental protection FAPCCI award
for best rural development in the state
State
8102019 A Study A Study On Financial Performance Analysis With Reference To Kesoram Cementon Financial Performance hellip
httpslidepdfcomreaderfulla-study-a-study-on-financial-performance-analysis-with-reference-to-kesoram 3481
34
Products of the organization
8102019 A Study A Study On Financial Performance Analysis With Reference To Kesoram Cementon Financial Performance hellip
httpslidepdfcomreaderfulla-study-a-study-on-financial-performance-analysis-with-reference-to-kesoram 3581
35
CHAPTER-III
LITERATURE REVIEW
8102019 A Study A Study On Financial Performance Analysis With Reference To Kesoram Cementon Financial Performance hellip
httpslidepdfcomreaderfulla-study-a-study-on-financial-performance-analysis-with-reference-to-kesoram 3681
36
Introduction
Financial Performance Analysis
The term lsquofinancial performance analysis also known as analysis and interpretation of
financial statementsrsquo refers to the process of determining financial strength and
weaknesses of the firm by establishing strategic relationship between the items of the
balance sheet profit and loss account and other operative data
ldquoAnalyzing financial statementsrdquo by Metcalf and Titard
ldquoFinancial analysis is a process of evaluating the relationship between component
parts of a financial statement to obtain a better understanding of a firms position and
performancerdquo by Myers
Financial Performance
The word lsquoPerformance is derived from the word lsquoparfourmenrsquo which means lsquoto dorsquo lsquoto
carry outrsquo or lsquoto renderrsquo It refers the act of performing execution accomplishment
fulfillment etc In border sense performance refers to the accomplishment of a given task
measured against preset standards of accuracy completeness cost and speed In other
words it refers to the degree to which an achievement is being or has been accomplished In
the Words of Frich Kohlar ldquoThe performance is a general term applied to a part or to all the
conducts of activities of an organization over a period of time often with reference to past or
projected cost efficiency management responsibility or accountability or the like Thus not
just the presentation but the quality of results achieved refers to the performance
Performance is used to indicate firmrsquos success conditions and compliance
Financial performance refers to the act of performing financial activity In broader
sense financial performance refers to the degree to which financial objectives being or has
been accomplished It is the process of measuring the results of a firms policies and
operations in monetary terms It is used to measure firms overall financial health over a
given period of time and can also be used to compare similar firms across the same industry
or to compare industries or sectors in aggregation
The purpose of financial analysis is to diagnose the information contained in financial
statements so as to Jude the profitability and financial soundness of the firm Just like a
doctor examines his patient by recording his body temperature blood pressure etc Before
8102019 A Study A Study On Financial Performance Analysis With Reference To Kesoram Cementon Financial Performance hellip
httpslidepdfcomreaderfulla-study-a-study-on-financial-performance-analysis-with-reference-to-kesoram 3781
37
making his conclusion regarding the illness and before giving his treatment a financial
analyst analysis the financial statements with various tools of analysis before commenting
upon the financial health or weaknesses of an enterprise
The analysis and interpretation of financial statements is essential to bring out the
mystery behind the figures in financial statements Financial statements analysis is an
attempt to determine the significance and meaning of the financial statement data so that
forecast may be made of the future earnings ability to pay interest and debt maturities (both
current and long term) and profitability of a sound divided policy
Types of financial analysis-
Financial analysis into different categories depending upon
(1) The material used and
(2) The method of operation followed in the analysis or the modus operandi of
analysis
Types of financial analysis
On the basis of material used on the basis of modus operandi
External Internal Horizontal Vertical
Analysis Analysis Analysis Analysis
1 On the basis of material used - According to material used financial analysis canbe of two types
External analysis
Internal analysis
External analysis-
This analysis is done by outsiders who do not have access to the detailed internal
outsiders include investors potential investors Creditors Potential Creditors Government
Agencies Credit Agencies and General Public For financial analysis these external parties
to the firm depend almost entirely on the published financial statements
Internal analysis-
This analysis is undertaken by the persons namely executives and employees of the
organization or by the officers appointed by government or court who have access to the
8102019 A Study A Study On Financial Performance Analysis With Reference To Kesoram Cementon Financial Performance hellip
httpslidepdfcomreaderfulla-study-a-study-on-financial-performance-analysis-with-reference-to-kesoram 3881
38
books of account ( internal accounting records) and other information related to the
business
2 983119983150 983156983144983141 983138983137983155983145983155 983151983142 983149983151983140983157983155 983151983152983141983154983137983150983140983145983085
According to the modus operandi financial analysis can also be of two types
a Horizontal analysis
bVertical analysis
Horizontal analysis-
Horizontal analysis refers to the comparison of financial data of a company for several
years The figures for this type of analysis are presented horizontally over a number of
columns The figures of the various years are compared with standard or base year a base
year is year chosen as beginning point This type of analysis is also called lsquodynamicanalysisrsquo as it is based on the data from year to year rather than on data of any one year The
horizontal analysis makes it possible to focus attention on items that have changed
significantly during the period under view
b Vertical analysis-
Vertical analysis refers to the study of relationship of the various items in the financial
statements of one accounting period In this types of analysis the figures from financial
statement of a year are compared with a base selected from the same yearrsquos statement
Methods of financial analysis-
The following methods of analysis are generally used-
1 Comparative Statements
2 Trend Analysis
3 Common-Size Statements
4 Funds flow Analysis
5 Cash Analysis
6 Ratio Analysis
7 Cost-volume-Profit Analysis
8102019 A Study A Study On Financial Performance Analysis With Reference To Kesoram Cementon Financial Performance hellip
httpslidepdfcomreaderfulla-study-a-study-on-financial-performance-analysis-with-reference-to-kesoram 3981
39
Comparative statements-
The comparative financial statements are statements of the financial position at
different periods of time the elements of financial position are show in a
Comparative Statement provides an idea of financial position at two or more
periods Generally two financial statements (balance sheet and income statement) are
prepared in comparative form for financial analysis
The Comparative Statement May Show-
1 Absolute figures (rupee amounts)
2 Changes in absolute figures ie increase or decrease in absolute figures
3 Absolute data in terms of percentages
4 Increase or decrease in terms of percentages
The Two Comparative Statements Are-
1 Comparative balance sheet and
2 Income statement
1 983107983151983149983152983137983154983137983156983145983158983141 983138983137983148983137983150983139983141 983155983144983141983141983156983085
The comparative balance sheet analysis is the study of the trend of the same items group of
items and computed items in two or more balance sheets of the same business enterprise on
different dates The change in periodic balance sheet items reflect the conduct of a business
the change can be observed by comparison of the balance sheet at the beginning and at the
end of a period and these changes can help in forming an opinion about the progress of an
enterprise
Guide Lines for Interpretation of Comparative Balance Sheet-
While interpreting comparative balance sheet the interpreter is expected to study the
following aspects-
1 Current financial position and liquidity position
2 Long-term financial position
3 Profitability of the concern
8102019 A Study A Study On Financial Performance Analysis With Reference To Kesoram Cementon Financial Performance hellip
httpslidepdfcomreaderfulla-study-a-study-on-financial-performance-analysis-with-reference-to-kesoram 4081
40
Common Size Statement-
The common-size statements balance sheet and income statement are show in
analytical percentages The figures are shown as percentages of total assets total liabilities
and total sales The total assets are taken as 100 and different assets are expressed as a
percentage of the total similarly various liabilities are taken as a part of total liabilities
Common Size Balance Sheet-
A statement in which balance sheet items are expressed as the ratio of each asset to
total assets and the ratio of each liability is expressed as a ratio of total liabilities is called
common size balance The common size balance sheet can be used to compare companies
of differing size The comparison of figures in different periods is not useful because total
figures may be affected by a number of factors It is not possible to establish standard norms
for various assets The trends of figures from year to year may not be studied and even they
may not give proper results
Trend Analysis of Balance Sheet-
Trend analysis is Very important tool of horizontal financial analysis
This analysis enables to known the change in the financial function and operating efficiency
in between the time period chosen
By studding the trend analysis of each item we can known the direction of changes and
based upon the direction of changes the options can be changed
Trend =Absolute Value of item in the statement understudy 100
Absolute Value of same item in the base statement
Ratio Analysis
Ratio analysis is used as a technique of analyzing the financial information contained in the
balance sheet and profit and loss accounts for a more meaningful understanding of the
financial position and performance of a firm
The relationship between two accounting figures expressed mathematically is known as a
financial ratio A ratio helps the analyst to make qualitative judgment about the firmrsquos
financial position and performance
Several ratios can be calculated from the accounting data contained in the financial
statements The parties which generally undertake financial analysis is short ndashterm
creditors long-term creditors owner and management In view of the requirements of the
various ratios ratios are classified into the following four important categories
8102019 A Study A Study On Financial Performance Analysis With Reference To Kesoram Cementon Financial Performance hellip
httpslidepdfcomreaderfulla-study-a-study-on-financial-performance-analysis-with-reference-to-kesoram 4181
41
Liquidity ratios
Leverage ratios
Activity ratios
Profitability ratios
Liquidity Ratios
It is extremely essential for a firm to be able to meet its obligations as they become due
Liquidity ratios measure the ability of the firm to meet its current obligations A firm should
ensure that it does not suffer from lack of liquidity and also that it does not have excess
liquidity The failure of a company to meet its obligations due to lack of sufficient liquidity
will result in a poor creditworthiness loss of creditorsrsquo confidence or even in legal tangles
resulting in the closure of the company A very high degree of liquidity is also bad idle
assets earn nothing The firmrsquos funds will be unnecessarily tied up in current assets
Therefore it is necessary to strike a proper balance high liquidity and lack of liquidity
The most common ratios which indicate the extent of liquidity or lack of it are
Current ratio
Quick ratio
Other ratios include Cash ratio Interval Measure and Net working capital ratio
Current Ratio
The current ratio is calculated by dividing current assets by current liabilities
Current assets
Current ratio = --------------------------
Current liabilities
Current ratio is a measure of the firmrsquos short term solvency It indicates the availability of
current assets in rupees for every one rupee of current liability A ratio of greater than one
means that the firm has more current assets than current claims against the Current ratio of
2 to 1 or more is considered satisfactory Current ratio represents a margin of safety for
creditors
Quick Ratio
Quick ratio also known as acid-test ratio establishes a relationship between quick assets and
the current liabilities Cash is the most liquid asset It is calculated by dividing quick assets
by current liabilities
Quick ratio = Quick Assets Current Liabilities
8102019 A Study A Study On Financial Performance Analysis With Reference To Kesoram Cementon Financial Performance hellip
httpslidepdfcomreaderfulla-study-a-study-on-financial-performance-analysis-with-reference-to-kesoram 4281
42
(Quick Assets = Current assets ndash Inventory)
One defect of the current ratio is that it fails to convey any information on the composition
of the current assets of the firm A rupee of cash is considered equivalent to a rupee of
inventory of receivables But it is not so A rupee of cash is more readily available to meet
current liabilities than a rupee of say inventory This implies the usefulness of the current
ratio
The Acid ndashtest ratio measures the firmrsquos ability to convert its current assets quickly into
cash in order to meet its current liabilities
A quick ratio of 1 to 1 is considered to represent a satisfactory current financial condition It
is an important index of the firmrsquos liquidity
Leverage Ratios
Leverage ratios identify the source of a firmrsquos capital ndashowners or outside creditors
Financial leverage refers to the use of debt in financing non-current assets If the return on
assets exceeds the cost of debt the leverage is successful ndash ie it improves return on equity
Debt ndashEquity Ratio
The Debt ndash Equity is determined to analyze the soundness of the long term financial
policies of the organization It is also known as ldquoInternal External Equity Ratiordquo
It is calculated as follows
Debt ndash Equity Ratio = Total long term debt Share holders funds
Equity Ratio
This ratio is also called as proprietary ratio establishes a relationship between share holderrsquos
funds to total assets of company Equity Ratio is calculated by dividing share holders fund
by total assets
Fixed Asset Ratio
This ratio indicates the extent to which the assets of the companyrsquos can be lost without
affecting the interest of the creditors of the company Higher the ratios better the long-term
position of the company
Activity Ratios
They are primarily used for studying a firmrsquos working capital situation A well managed
firm should have good activity ratios
8102019 A Study A Study On Financial Performance Analysis With Reference To Kesoram Cementon Financial Performance hellip
httpslidepdfcomreaderfulla-study-a-study-on-financial-performance-analysis-with-reference-to-kesoram 4381
43
Working Capital Turnover Ratio
The working capital turnover ratio indicates whether or not working capital has been
effectively used in making sales
Working capital turnover = Sales Net current assets
Inventory Turnover Ratio
This ratio also known as Stock Turnover Ratio establishes the relationship between costs of
goods sold or net sales during the given period and the average amt of stock held during the
period This ratio reveals the number of times finished stock in turnover during a given
accounting period
Higher the ratio the better is it because it shows the finished stock is rapidly turned
in to sales On the other hand a low stock turnover ratio is not desirable because it reveals
the accumulation of stock
Debtors Turnover Ratio
This ratio indicates the velocity of debt collection of a company In other words it shows
the number of times average turnover during a year
A Higher Debtor Turnover Ratio indicates a more efficient is the management towards
debtors and low ratio ratio implies inefficient management of debtors
Total Assets Turnover Ratio
The asset turnover ratio indicates how efficiently management is employing Assets
Total Assets Turnover Ratio = Sales Total Assets
Profitability Ratios
Profitability ratios are the ratios which measure a firmrsquos overall effectiveness as revealed by
the returns generated on sales and investment
General Profitability Ratios
1 Gross Profit Ratio
2 Net profit Ratio
3 Operating or Expenses Ratio
8102019 A Study A Study On Financial Performance Analysis With Reference To Kesoram Cementon Financial Performance hellip
httpslidepdfcomreaderfulla-study-a-study-on-financial-performance-analysis-with-reference-to-kesoram 4481
44
Gross Profit Ratio
Gross profit Ratio measures the relationships to net sales and is usually represented as a
percentage It is a good measure of profitability
The gross profit ratio indicates the extent to which selling price of goods per unit may
decline without resulting in losses on operation Higher the gross profit betters the result
Net Profit Ratio
Net Profit Ratio indicates net margin on sales It is given by the following equation
Net Profit Ratio = (Net Profit Sales) 100
Operating or Expenses Ratio
This ratio is complimentary of Net Profit Ratio The more the net profit the less the
Operating Ratio Operating costs include the cost of direct materials direct labors and otheroverheads viz are generally excluded from operating costs A comparison of the Operating
Ratio will indicate whether the cost efficiency is high or low in the figure of sales This less
the ratio it depicts the efficiency of the management
8102019 A Study A Study On Financial Performance Analysis With Reference To Kesoram Cementon Financial Performance hellip
httpslidepdfcomreaderfulla-study-a-study-on-financial-performance-analysis-with-reference-to-kesoram 4581
45
CHAPTER IV
DATA ANALYSIS amp INTERPRETATION
8102019 A Study A Study On Financial Performance Analysis With Reference To Kesoram Cementon Financial Performance hellip
httpslidepdfcomreaderfulla-study-a-study-on-financial-performance-analysis-with-reference-to-kesoram 4681
46
Comparative Balance Sheet of Kesoram in the Year between 2008-2009
(Rupee in crores)
Years Changes
Particulars 2008 2009 In Rupees In Percentage
Liabilities
Share Capital 4574 4574 000 000
Reserves amp Surplus 93085 128024 34939
Revaluation Reserves 533 412 -121 -2270
Loans
Secured Loans 97106 153627 56521 5821
Un Secured Loans 12129 43416 31287 25795
Deferred Tax Liabilities 000 000 000 000
Current Liabilities
Provisions 33039 34529 1490 451
Current Liabilities 57067 66587 9520 1668
Total 297533 431169 133636 4491
Assets
Net Block 108424 180435 72011 6642
Capital Wip 63459 86485 23026 3628
Investments 4783 6178 1395 2917
Current Assets
Inventories 44217 58906 14689 3322
Sundry Debtors 27307 38017 10710 3922
Cash amp Bank Balances 4036 5657 1621 4016
Total Current Assets 75560 102580 27020 3576
Loans amp Advances 45289 55462 10173 2246
Fixed Deposits 018 028 010 5556
Total 297533 431169 133636 4491
8102019 A Study A Study On Financial Performance Analysis With Reference To Kesoram Cementon Financial Performance hellip
httpslidepdfcomreaderfulla-study-a-study-on-financial-performance-analysis-with-reference-to-kesoram 4781
47
Interpretation of comparative balance sheet of 2008-2009
Reserves amp Surplus were increased to 3753 (percent) ie in Rupees 34939
crores
Revaluation Reserves decreased to 121 ie in Rupees 2270 crores
Secured Loans are increased to 5821 ie in Rupees 56521 crores And UN
secured loans highly Increased to 25795
Current liabilities and Provisions are increased to 1668 and 451 respectively ie in
Rupees 9520 amp 1490 crores
Fixed assets were highly increased to 6642 ie in Rupees 72011 crores
Investments were increased to 2917 ie in Rupees 1395 crores
Sundry debtors increased to 3922 ie in Rupees 10710 crores
Current assets increased 3576 ie in Rupees 27020 crores And Loans amp
Advances increased to 2246 respectively
The overall financial position was satisfactory
8102019 A Study A Study On Financial Performance Analysis With Reference To Kesoram Cementon Financial Performance hellip
httpslidepdfcomreaderfulla-study-a-study-on-financial-performance-analysis-with-reference-to-kesoram 4881
48
Comparative Balance Sheet of Kesoram in the Year between 2009-2010
(Rupees in crores)
Years Changes
Particulars 2009 2010 In Rupees In Percentage
Liabilities
Share Capital 4574 4574 000 000
Reserves amp Surplus 128024 149111 21087 1647
Revaluation Reserves 412 339 -073 -1772
Loans
Secured Loans 153627 186372 32745 2131
Un Secured Loans 43416 126250 82834 19079
Deferred Tax Liabilities 000 000 000
Current Liabilities
Provisions 34529 35734 1205 349
Current Liabilities 66587 107688 41101 6173
Total 431169 610068 178899 4149
Assets
Net Block 180435 343182 162747 9020
Capital WIP 86485 41283 -45202 -5227
Investments 6178 5143 -1035 -1675
Current Assets
Inventories 58906 91619 32713 5553
Sundry Debtors 38017 54289 16272 4280
Cash amp Bank Balances 5657 8014 2357 4167
Total Current Assets 102580 153922 51342 5005
Loans amp Advances 55462 66506 11044 1991
Fixed Deposits 028 031 003 1071
Total 431169 610068 178899 4149
8102019 A Study A Study On Financial Performance Analysis With Reference To Kesoram Cementon Financial Performance hellip
httpslidepdfcomreaderfulla-study-a-study-on-financial-performance-analysis-with-reference-to-kesoram 4981
49
Interpretation of comparative balance sheet of 2009-2010
Reserves amp surplus increased to 1647 ie in Rupees 21087 crores
Revaluation Reserves decreased to 1772 ie in Rupees 073 crores
Secured loans increased to 2131 ie in Rupees 32745 crores
Current Liabilities were increased to 6173 ie in Rupees 41101 crores and
Provisions 349 ie in Rupees 1205 crores
Fixed Assets were increased to 9020 ie in Rupees 162747 crores
Investments were decreased to 1675 ie in Rupees 1035 crores
Sundry debtors were increased to 4280 ie in Rupees 16272 crores
Current assets increased to 5005 ie in Rupees 51342 crores And loans and
Advances increased 1919 ie in Rupees 11044 crores
The overall financial position was satisfactory
8102019 A Study A Study On Financial Performance Analysis With Reference To Kesoram Cementon Financial Performance hellip
httpslidepdfcomreaderfulla-study-a-study-on-financial-performance-analysis-with-reference-to-kesoram 5081
50
Comparative Balance Sheet of Kesoram in the Year between 2010-2011
(Rupees in crores)
Years Changes
Particulars 2010 2011 In Rupees In Percentage
Liabilities
Share Capital 4574 4574 000 000
Reserves amp Surplus 149111 125162 -23949 -1606
Revaluation Reserves 339 289 -050 -1475
Loans
Secured Loans 186372 237183 50811 2726
Un Secured Loans 126250 162744 36494 2891
Deferred Tax Liabilities 000 000 000
Current Liabilities
Provisions 35734 1494 -34240 -9582
Current Liabilities 107688 113902 6214 577
Total 610068 645348 35280 578
Assets
Net Block 343182 369172 25990 757
Capital WIP 41283 43781 2498 605
Investments 5143 6582 1439 2798
Current Assets
Inventories 91619 111855 20236 2209
Sundry Debtors 54289 63134 8845 1629
Cash amp Bank Balances 8014 7188 -826 -1031
Total Current Assets 153922 182177 28255 1836
Loans amp Advances 66506 43460 -23046 -3465
Fixed Deposits 031 176 145 46774
Total 610068 645348 35280 578
8102019 A Study A Study On Financial Performance Analysis With Reference To Kesoram Cementon Financial Performance hellip
httpslidepdfcomreaderfulla-study-a-study-on-financial-performance-analysis-with-reference-to-kesoram 5181
51
Interpretation of comparative balance sheet of 2010-2011
Reserves amp surplus decreased to 1606 ie in Rupees 23949 crores
Revaluation Reserves decreased to 1475 ie in Rupees 050 crores
Secured loans increased to 2726 ie in Rupees 50811 crores
Current Liabilities were increased to 577 ie in Rupees 6214 crores
Provisions decreased to 9582 ie in Rupees 34240 crores
Fixed Assets were increased to 757 ie in Rupees 25990 crores
Investments were decreased to 2798 ie in Rupees 1439 crores
Sundry debtors were increased to 1629 ie in Rupees8845 crores
Current assets increased to 1836 ie in Rupees 28255 crores And loans and
Advances increased 3465 ie in Rupees 23046 crores
The overall financial position was UN satisfactory
8102019 A Study A Study On Financial Performance Analysis With Reference To Kesoram Cementon Financial Performance hellip
httpslidepdfcomreaderfulla-study-a-study-on-financial-performance-analysis-with-reference-to-kesoram 5281
52
Comparative Balance Sheet of Kesoram In The Year Between 2011-2012
(Rupees in crores)
Years Changes
Particulars 2011 2012 In Rupees In Percentage
Liabilities
Share Capital 4574 4574 000 000
Reserves amp Surplus 125162 86657 -38505 -3076
Revaluation Reserves 289 270 -019 -657
Loans
Secured Loans 237183 317792 80609 3399
Un Secured Loans 162744 92742 -70002 -4301
Deferred Tax Liabilities 000 000 000
Current Liabilities
Provisions 1494 40726 39232 262597
Current Liabilities 113902 180010 66108 5804
Total 645348 722771 77423 1200
Assets 000
Net Block 369172 358721 -10451 -283
Capital WIP 43781 68065 24284 5547
Investments 6582 6636 054 082
Current Assets
Inventories 111855 99516 -12339 -1103
Sundry Debtors 63134 67358 4224 669
Cash amp Bank Balances 7188 6959 -229 -319
Total Current Assets 182177 173833 -8344 -458
Loans amp Advances 43460 115409 71949 16555
Fixed Deposits 176 107 -069 -3920
Total 645348 722771 77423 1200
8102019 A Study A Study On Financial Performance Analysis With Reference To Kesoram Cementon Financial Performance hellip
httpslidepdfcomreaderfulla-study-a-study-on-financial-performance-analysis-with-reference-to-kesoram 5381
53
Interpretation of comparative balance sheet of 2011-2012
Reserves amp surplus decreased to 3076 ie in Rupee 38505 crores
Revaluation Reserves decreased to 657 ie in Rupees 019 crores
Secured loans increased to 3399 ie in Rupees 80699 crores
Current Liabilities were increased to 5804 ie in Rupees 66108 crores
Provisions increased to 262597 ie in Rupees 39232 crores
Fixed Assets were decreased to 283 ie in Rupee 10451 crores
Investments were increased to 082 ie in Rupees 054 crores
Sundry debtors were increased to 669 ie in Rupees 4224 crores
Current assets decreased to 458 ie in Rupees 8344 crores And loans and
Advances increased 16555 ie in Rupees 71949 crores
The overall financial position was UN satisfactory
8102019 A Study A Study On Financial Performance Analysis With Reference To Kesoram Cementon Financial Performance hellip
httpslidepdfcomreaderfulla-study-a-study-on-financial-performance-analysis-with-reference-to-kesoram 5481
54
Common Size Balance Sheet of Kesoram For The Year 2008-2009
(Rupees in crores)
Particulars 2008 Change Percentage 2009 Change Percentage
Liabilities
Share Capital 4574 154 4574 106
Reserves amp Surplus 93085 3129 128024 2969
Revaluation Reserves 533 018 412 010
Loans
Secured Loans 97106 3264 153627 3563
Un Secured Loans 12129 408 43416 1007
Deferred Tax Liabilities 000 000 000 000
Current Liabilities
Provisions 33039 1110 34529 801
Current Liabilities 57067 1918 66587 1544
Total 297533 10000 431169 10000
Assets
Net Block 108424 3644 180435 4185
Capital WIP 63459 2133 86485 2006
Investments 4783 161 6178 143
Current Assets
Inventories 44217 1486 58906 1366
Sundry Debtors 27307 918 38017 882
Cash amp Bank Balances 4036 136 5657 131
Loans amp Advances 45289 1522 55462 1286
Fixed Deposits 018 001 028 001
Total 297533 10000 431169 10000
8102019 A Study A Study On Financial Performance Analysis With Reference To Kesoram Cementon Financial Performance hellip
httpslidepdfcomreaderfulla-study-a-study-on-financial-performance-analysis-with-reference-to-kesoram 5581
55
Interpretation of Common Size Balance Sheet of 2008-2009
Share capital was recorded 154 percent in the total liabilities in the year 2008 it is
decreased to 106 in the year 2009
Reserves amp surplus contributed to 3129 in the total liabilities in the year 2008 it is
decreased to 2969 in the year 2009
Secured loans were 3264 in the total liabilities in the year 2008 it is increased to
3563 in the year 2009
Current Liabilities shown to 1918 in the total liabilities in the year 2008 it is
decreased to 1544 in the year 2009
Provisions 1110 in the total liabilities in the year 2008 it is decreased to 801 in the
year 2009
Fixed Assets were 3644 in the total liabilities in the year 2008 ie decreased to 4185
in the year 2009
Investments were 161 in the total liabilities in the year 2008 it is decreased to 143
in the year 2009
Sundry debtors were 918 in the total liabilities in the year 2008 it is decreased to 882
in the year 2009
8102019 A Study A Study On Financial Performance Analysis With Reference To Kesoram Cementon Financial Performance hellip
httpslidepdfcomreaderfulla-study-a-study-on-financial-performance-analysis-with-reference-to-kesoram 5681
56
Common Size Balance Sheet of Kesoram For The Year 2009-2010
(Rs in crores)
Particulars 2009 Change Percentage 2010Change
Percentage
Liabilities
Share Capital 4574 106 4574 075
Reserves amp Surplus 128024 2969 149111 2444
Revaluation Reserves 412 010 339 006
Loans
Secured Loans 153627 3563 186372 3055
Un Secured Loans 43416 1007 126250 2069
Deferred Tax Liabilities 000 000 000 000
Current Liabilities
Provisions 34529 801 35734 586
Current Liabilities 66587 1544 107688 1765
Total 431169 10000 610068 10000
Assets
Net Block 180435 4185 343182 5625
Capital WIP 86485 2006 41283 677
Investments 6178 143 5143 084
Current Assets
Inventories 58906 1366 91619 1502
Sundry Debtors 38017 882 54289 890
Cash amp Bank Balances 5657 131 8014 131
Loans amp Advances 55462 1286 66506 1090
Fixed Deposits 028 001 031 001
Total 431169 10000 610068 10000
8102019 A Study A Study On Financial Performance Analysis With Reference To Kesoram Cementon Financial Performance hellip
httpslidepdfcomreaderfulla-study-a-study-on-financial-performance-analysis-with-reference-to-kesoram 5781
57
Interpretation of common size balance sheet of 2009-2010
Share capital was recorded 106 percent in the total liabilities in the
year 2009 it is decreased to 075 in the year 2010
Reserves amp surplus contributed to 2969 in the total liabilities in the
year 2009 it is decreased to2444 in the year 2010
Secured loans were 3563 in the total liabilities in the year 2009 it is
increased to 3055 in the year 2010
Current Liabilities shown to 1544 in the total liabilities in the year
2009 it is decreased to 1765 in the year 2010
Provisions 801 in the total liabilities in the year 2009 it is decreased
to 586 in the year 2010
Fixed Assets were 4185 in the total liabilities in the year 2009 ie
increased to 5625 in the year 2010
Investments were 143 in the total liabilities in the year 2009 it is
decreased to 084 in the year 2010
Sundry debtors were 882 in the total liabilities in the year 2009 it is
increased to 890 in the year 2010
8102019 A Study A Study On Financial Performance Analysis With Reference To Kesoram Cementon Financial Performance hellip
httpslidepdfcomreaderfulla-study-a-study-on-financial-performance-analysis-with-reference-to-kesoram 5881
58
Common Size Balance sheet of Kesoram for the year 2010-2011
983080Rupees in crores)
Particulars 2010 Change Percentage 2011
Change
Percentage
Liabilities
Share Capital 4574 075 4574 071
Reserves amp Surplus 149111 2444 125162 1939
Revaluation Reserves 339 006 289 004
Loans
Secured Loans 186372 3055 237183 3675
Un Secured Loans 126250 2069 162744 2522
Deferred Tax Liabilities 000 000 000 000
Current Liabilities
Provisions 35734 586 1494 023
Current Liabilities 107688 1765 113902 1765
Total 610068 10000 645348 10000
Assets
Net Block 343182 5625 369172 5721
Capital WIP 41283 677 43781 678
Investments 5143 084 6582 102
Current Assets
Inventories 91619 1502 111855 1733
Sundry Debtors 54289 890 63134 978
Cash amp Bank Balances 8014 131 7188 111
Loans amp Advances 66506 1090 43460 673
Fixed Deposits 031 001 176 003
Total 610068 10000 645348 10000
8102019 A Study A Study On Financial Performance Analysis With Reference To Kesoram Cementon Financial Performance hellip
httpslidepdfcomreaderfulla-study-a-study-on-financial-performance-analysis-with-reference-to-kesoram 5981
59
Interpretation of Common Size Balance Sheet Of 2010-2011
Share capital was recorded 075 percent in the total liabilities in the year 2010 it is
decreased to 071 in the year 2011
Reserves amp surplus contributed to 2444 in the total liabilities in the year 2010 it is
decreased to1939 in the year 2011
Secured loans were 3055 in the total liabilities in the year 2010 it is increased to
3675 in the year 2011
Current Liabilities shown to 1765 in the total liabilities in the year 2010 it is
also1765 in the year 2011
Provisions 586 in the total liabilities in the year 2010 it is decreased to 023 in the
year 2011
Fixed Assets were 5625 in the total liabilities in the year 2010 ie increased to 5721
in the year 2011
Investments were 084 in the total liabilities in the year 2010 it increased to 102 in
the year 2011
Sundry debtors were 890 in the total liabilities in the year 2010 it is increased to 978
in the year 2011
8102019 A Study A Study On Financial Performance Analysis With Reference To Kesoram Cementon Financial Performance hellip
httpslidepdfcomreaderfulla-study-a-study-on-financial-performance-analysis-with-reference-to-kesoram 6081
60
Common Size Balance Sheet of Kesoram for the Year 2011-2012
983080Rupees in crores)
Particulars 2011 Change Percentage 2012
Change
Percentage
Liabilities
Share Capital 4574 071 4574 063
Reserves amp Surplus 125162 1939 86657 1199
Revaluation Reserves 289 004 270 004
Loans
Secured Loans 237183 3675 317792 4397
Un Secured Loans 162744 2522 92742 1283
Deferred Tax Liabilities 000 000 000 000
Current Liabilities
Provisions 1494 023 40726 563
Current Liabilities 113902 1765 180010 2491
Total 645348 10000 722771 10000
Assets
Net Block 369172 5721 358721 4963
Capital WIP 43781 678 68065 942
Investments 6582 102 6636 092
Current Assets
Inventories 111855 1733 99516 1377
Sundry Debtors 63134 978 67358 932
Cash amp Bank Balances 7188 111 6959 096
Loans amp Advances 43460 673 115409 1597
Fixed Deposits 176 003 107 001
Total 645348 10000 722771 10000
8102019 A Study A Study On Financial Performance Analysis With Reference To Kesoram Cementon Financial Performance hellip
httpslidepdfcomreaderfulla-study-a-study-on-financial-performance-analysis-with-reference-to-kesoram 6181
61
Interpretation of common size balance sheet of 2011-2012
Share capital was recorded 071 percent in the total liabilities in the year 2011 it is
decreased to 063 in the year 2012
Reserves amp surplus contributed to 1939 in the total liabilities in the year 2011 it
is decreased to 1199 in the year 2012
Secured loans were 3675 in the total liabilities in the year 2011 it is increased to
4397 in the year 2012
Current Liabilities shown to 1765 in the total liabilities in the year 2011 it is
increased to 2491 in the year 2012
Provisions 023 in the total liabilities in the year 2011 it is increased to 563 in the
year 2012
Fixed Assets were 5721 in the total liabilities in the year 2011 ie decreased to
4963 in the year 2012
Investments were 102 in the total liabilities in the year 2011 it increased to 092
in the year 2012
Sundry debtors were 978 in the total liabilities in the year 2011 it is decreased to
932 in the year 2012
8102019 A Study A Study On Financial Performance Analysis With Reference To Kesoram Cementon Financial Performance hellip
httpslidepdfcomreaderfulla-study-a-study-on-financial-performance-analysis-with-reference-to-kesoram 6281
Trend Analysis
Share Capital-
Year
Amount
(In Crores) Trend
IncreaseDecrease
Base Year Previous Year
2008 4574 10000 000 000
2009 4574 10000 000 000
2010 4574 10000 000 000
2011 4574 10000 000 000
2012 4574 10000 000 000
Trend Percentages in Share Capital
Share capital shown a constant trend in the period 2008 and 2012
Share capital is 4574 crores all the years from 2008-2012
8102019 A Study A Study On Financial Performance Analysis With Reference To Kesoram Cementon Financial Performance hellip
httpslidepdfcomreaderfulla-study-a-study-on-financial-performance-analysis-with-reference-to-kesoram 6381
Reserves amp Surplus-
Year
Amount
(In Crores) Trend
IncreaseDecrease
Base Year Previous Year
2008 93085 10000 000 000
2009 128024 13753 3753 3753
2010 149111 16019 6019 2266
2011 125162 13446 3446 -2573
2012 86657 9309 -691 -4137
Trend Percentages in Reserves amp Surplus
Reserves amp surplus shown an increasing trend in the period between 2008 and 2010
The average trend was 13277 till 2010
The Reserves amp surplus was showing decreasing trend in the period 2011-2012 (ie
from 16019 in 2010 to 9309 in 2012)
The decreasing trend in Reserves amp surplus indicates the decrease in profits of the
firm
8102019 A Study A Study On Financial Performance Analysis With Reference To Kesoram Cementon Financial Performance hellip
httpslidepdfcomreaderfulla-study-a-study-on-financial-performance-analysis-with-reference-to-kesoram 6481
Investments-
Year
Amount
(In Crores) Trend
IncreaseDecrease
Base Year Previous Year
2008 4783 10000 000 000
2009 6178 12917 2917 2917
2010 5143 10753 753 -2164
2011 6582 13761 3761 3009
2012 6636 13874 3874 113
Trend Percentages in Investments-
The investments are shown an increasing trend in the period between 2008 ndash 2009
and it is decreasing in the year 2010
The average trend was 11458 till 2009
The investments increased in the periods 2011-2012 (ie from 10753 in 2010 to
13874 in 2012)
The overall trend in investments shown is satisfactory
8102019 A Study A Study On Financial Performance Analysis With Reference To Kesoram Cementon Financial Performance hellip
httpslidepdfcomreaderfulla-study-a-study-on-financial-performance-analysis-with-reference-to-kesoram 6581
Net Current Assets-
Year
Amount
(In Crores) Trend
IncreaseDecrease
Base Year Previous Year
2008 30761 10000 000 000
2009 56954 18515 8515 8515
2010 77037 25044 15044 6529
2011 110417 35895 25895 10851
2012 68613 22305 12305 -13590
Trends in Net Current Assets-
The NCA shown positive (increasing) trend
The NCA are increased to 35895 (the year 2011) compared with base year and
decreased in the year 2012 to 22305
The NCA shown increased trend from year and crossed 100
The overall trend was good
8102019 A Study A Study On Financial Performance Analysis With Reference To Kesoram Cementon Financial Performance hellip
httpslidepdfcomreaderfulla-study-a-study-on-financial-performance-analysis-with-reference-to-kesoram 6681
66
Ratio Analysis-
Current Ratio-
Current Ratio = Current Assets Current Liabilities
Current assets are cash in hand Cash at bank Marketable Securities(short term) short term
Investment Bills receivables sundry debtors Inventories (stock) Work in progress prepaid
expenses Current Liabilities are outstanding expenses Bills payable sundry Creditors
short-term advances income tax payable and Dividend payable
Current Ratio of Kesoram-
(Rupees in crores)
Year Current Assets Current Liabilities Current Ratio
2007-08 75560 57067 132
2008-09 102580 66587 154
2009-10 153922 107688 143
2010-11 182177 113902 160
2011-12 173833 180010 097
Interpretation-
As per the standard rule of current ratio ie 21 where current assets double the current
liabilities is considered satisfactory
In the present analysis the current ratio of the Kesoram is not satisfactory
from the above table It was assessed that the current ratio for all the five year is lower (less)
than the standard rule ie 21 And it is 097 in the year 2011-2012 (current year) This is
highly UN satisfactory
8102019 A Study A Study On Financial Performance Analysis With Reference To Kesoram Cementon Financial Performance hellip
httpslidepdfcomreaderfulla-study-a-study-on-financial-performance-analysis-with-reference-to-kesoram 6781
Quick Ratio-
Quick ratio also known as acid-test ratio establishes a relationship between quick
assets and the current liabilities Cash is the most liquid asset It is calculated by dividing
quick assets by current liabilities
Quick ratio = Quick Assets Current Liabilities
(Quick Assets = Current assets ndash Inventory)
Quick Ratio of Kesoram-
Rupees in crores)
Year Total QuickAssets
Current Liabilities Quick Ratio
2007-08 33343 57067 058
2008-09 43674 66587 066
2009-10 62303 107688 058
2010-11 70322 113902 0622011-12 74333 180010 041
Interpretation-
Usually a high Quick ratio is an indication that the company is liquid and has the ability to
meet its current or liquid liabilities in time on the other hand a low Quick Ratio represents
8102019 A Study A Study On Financial Performance Analysis With Reference To Kesoram Cementon Financial Performance hellip
httpslidepdfcomreaderfulla-study-a-study-on-financial-performance-analysis-with-reference-to-kesoram 6881
that the companyrsquos liquidity position is not good The above table showing the quick ratios
of Kesoram are canrsquot be considered satisfactory
Leverage Ratios-
Debt-Equity Ratio-
Debt-Equity Ratio = Total Long Term Debt Equity Share Holders Fund
Total Long term Debt= Debenture Capital + Long term loans from banks and financial
institutions + Public deposits
Equity Share Holders fund = Equity + Reserves and Surplus
Debt Equity Ratio of Kesoram
(Rupees in crores)
Year Total Debt Share Holders Fund Debt Equity Ratio
2007-08 109235 98192 111
2008-09 197043 133010 148
2009-10 312622 154024 203
2010-11 399927 130025 308
2011-12 410534 91501 449
8102019 A Study A Study On Financial Performance Analysis With Reference To Kesoram Cementon Financial Performance hellip
httpslidepdfcomreaderfulla-study-a-study-on-financial-performance-analysis-with-reference-to-kesoram 6981
Interpretation-
The Debt-Equity Ratio accepted standard is 05 This ratio reflects the relative contribution
of creditors and owners of business in its financing From the above it is clear that the long
term debt is more than that of the share holdersrsquo fund So we can interpret that the firmrsquosassets are financed more by the external funds rather than by the internal funds
8102019 A Study A Study On Financial Performance Analysis With Reference To Kesoram Cementon Financial Performance hellip
httpslidepdfcomreaderfulla-study-a-study-on-financial-performance-analysis-with-reference-to-kesoram 7081
Fixed Asset Ratio-
Net Sales
Fixed Asset Ratio = helliphelliphelliphelliphelliphelliphelliphelliphelliphelliphellip
Net Assets
Fixed Asset Ratio of Kesoram-
(Rupees in crores)
Year Net Sales Net Assets Fixed Assets Ratio
2007-08 300271 358721 084
2008-09 389797 369172 106
2009-10 475062 343182 1382010-11 539788 180435 299
2011-12 59182 108424 546
Interpretation
This ratio indicates the extent to which the assets of the companyrsquos can be lost without
affecting the interest of the creditors of the company Higher the ratios better the long-term
position of the companyThe above table shows fixed assets ratio in increasing trend Which is good for the
company
8102019 A Study A Study On Financial Performance Analysis With Reference To Kesoram Cementon Financial Performance hellip
httpslidepdfcomreaderfulla-study-a-study-on-financial-performance-analysis-with-reference-to-kesoram 7181
Overall Profitability Ratios-
Net Profit Ratio
Net Profit Ratio indicates net margin on sales It is given by the following equation
Net Profit Ratio = (Net Profit Sales) 100
Net Profit Ratio of Kesoram
(Rupees in crores)
Year Net Profit Sales Net Profit Ratio
2007-08 37917 300271 1263
2008-09 41432 389797 1063
2009-10 20298 475062 427
2010-11 -28176 539788 -5222011-12 -38108 59182 -644
Interpretation
It establishes a relationship between net profits after tax and net sales and
indicates the efficiency of the management in manufacturing selling administrative and
other activities of the company
The higher the ratio the better is the profitability or performance of the business
The above table depicts the net profit Ratio of Kesoram has decreased every year from
2007-2008 to 2011-2012It further decreased to negative in the year 2010-11 to -522 and -
644 in the year 2011-2012 This shows constant decrease in the profits of the company
8102019 A Study A Study On Financial Performance Analysis With Reference To Kesoram Cementon Financial Performance hellip
httpslidepdfcomreaderfulla-study-a-study-on-financial-performance-analysis-with-reference-to-kesoram 7281
72
Return on Investment-
Net Profit
Return on Investment = helliphelliphelliphelliphelliphelliphelliphelliphelliphelliphelliphellip X 100
Share Holders Fund
Return on Investment Ratio of Kesoram-
(Rupees in crores)
Year Net Profit Share Holders Fund Return On Investment
2007-08 37917 98192 3862
2008-09 41432 133010 3115
2009-10 20298 154024 1318
2010-11 -28176 130025 -2167
2011-12 -38108 91501 -4165
Interpretation-
The above table reveals how well the resources of the firm are being used Higher
the ratio better the result The above ratio implies how well the firm is growing in
terms of profitability and efficiency From the above table we can concern that the return on
investment is in decreasing trend ROI is highest in the year 2007-2008 as 3862 But
there after itrsquos decreased every year
The ROI is negative in the years 2010-2011 amp 2011-2012 as -2167 amp -4165 respectively
Which is not a good sign for the firm
8102019 A Study A Study On Financial Performance Analysis With Reference To Kesoram Cementon Financial Performance hellip
httpslidepdfcomreaderfulla-study-a-study-on-financial-performance-analysis-with-reference-to-kesoram 7381
8102019 A Study A Study On Financial Performance Analysis With Reference To Kesoram Cementon Financial Performance hellip
httpslidepdfcomreaderfulla-study-a-study-on-financial-performance-analysis-with-reference-to-kesoram 7481
8102019 A Study A Study On Financial Performance Analysis With Reference To Kesoram Cementon Financial Performance hellip
httpslidepdfcomreaderfulla-study-a-study-on-financial-performance-analysis-with-reference-to-kesoram 7581
75
CHAPTER V
FINDINGS amp SUGGESTIONS
8102019 A Study A Study On Financial Performance Analysis With Reference To Kesoram Cementon Financial Performance hellip
httpslidepdfcomreaderfulla-study-a-study-on-financial-performance-analysis-with-reference-to-kesoram 7681
76
Findings
The Share capital remains constant Share capital is unchanged all the years from
2008-2012
Reserves amp surplus were recorded an increasing trend in the period between 2008
and 2010It is showing decreasing trend in the period 2011-2012 (ie from 16019
in 2010 to 9309 in 2012)
Current Liabilities were increased compared to base year ie 2008
Provisions increased to 262597 ie in Rupees 39232 crores in the current year
The current ratio for all the five year is lower (less) than the standard rule ie 21
And it is 097 in the year 2011-2012 (current year)
The Debt-Equity Ratio was shown under the standard ratio It is clear that the long
term debt is more than that of the share holdersrsquo fund It indicates that the firm
heavily relying on external funds rather than the internal funds
The operating and net profit of Kesoram is in decreasing trend due to heavy
increase of manufacturing amp administrative expenses
ROI is highest in the year 2007-2008 as 3862 The ROI is negative in the years
2010-2011 amp 2011-2012 as -2167 amp -4165 respectively
Return on Equity Capital Employed Ratio of Kesoram has decreased every year
from 2007-2008 to 2010-2011It further decreased to negative in the year 2011-12 to
-3280
EPS of Kesoram has decreased every year from 2008-12It is negative in the year
2011 amp 12
8102019 A Study A Study On Financial Performance Analysis With Reference To Kesoram Cementon Financial Performance hellip
httpslidepdfcomreaderfulla-study-a-study-on-financial-performance-analysis-with-reference-to-kesoram 7781
77
Suggestion
The organization should adopt an appropriate capital structure
The companyrsquos debt-equity ratio is recorded more or less as 111 in the year 2008
and it is increased to 449 in the year 2012 (current year)The company should
adopt a better debt equity mix in the future to control the fluctuations in returns
The company should control fluctuations in cash and bank balances as it impacts the
current ratio of the company
The provisions are showing increasing trend which indicates risk of debtors The
firm should implement an effective credit management policy It should utilize its
idle funds by decreasing provisions
The company should control heavy increase of manufacturing amp administration
expenses as it is impacting the operating and net profit of company
8102019 A Study A Study On Financial Performance Analysis With Reference To Kesoram Cementon Financial Performance hellip
httpslidepdfcomreaderfulla-study-a-study-on-financial-performance-analysis-with-reference-to-kesoram 7881
78
ANNEXURE
Profit And Loss Account of Kesoram Cement
Mar12 Mar11 Mar10 Mar09 Mar08
12 Months 12 Months 12 Months 12 Months 12 Months
INCOME
Sales Turnover 628260 575072 505151 431613 345700
Excise Duty 36440 35284 30089 41815 45429
NET SALES 591820 539788 475062 389797 300271
Other Income 000 000 000 000 000
TOTALINCOME
596129 548733 481019 393969 302020
EXPENDITURE
Manufacturing
Expenses81903 74803 13974 13153 44113
MaterialConsumed
370897 310150 295550 229359 118448
Personal
Expenses33468 27355 23294 18690 15344
Selling Expenses 81910 78253 58667 48846 45019
AdministrativeExpenses
28225 29308 17219 16179 9907
Expenses
Capitalized000 000 000 000 000
Provisions Made 000 000 000 000 000
TOTAL
EXPENDITURE 596403 519870 408704 326227 232832Operating Profit -4583 19918 66358 63570 67439
EBITDA -274 28864 72316 67742 69188
Depreciation 29740 27259 17280 11186 8927
Other Write-offs 000 000 000 000 000
EBIT -30014 1605 55035 56557 60261
Interest 41015 23983 10921 12087 5426
EBT -71029 -22377 44114 44470 54835
Taxes -32921 5798 23816 3037 16918
Profit and Loss
for the Year-38108 -28176 20298 41432 37917
Non RecurringItems
-1142 7063 3228 -4023 402
Other Non Cash
Adjustments1276 091 207 465 017
OtherAdjustments
000 000 000 000 000
REPORTED
PAT-37974 -21021 23734 37874 38335
8102019 A Study A Study On Financial Performance Analysis With Reference To Kesoram Cementon Financial Performance hellip
httpslidepdfcomreaderfulla-study-a-study-on-financial-performance-analysis-with-reference-to-kesoram 7981
79
Balance Sheet Of Kesoram
Years
Particulars 2008 2009 2010 2011 2012
Liabilities
Share Capital 4574 4574 4574 4574 4574Reserves amp Surplus 93085 128024 149111 125162 86657
Revaluation Reserves 533 412 339 289 27
Loans
Secured Loans 97106 153627 186372 237183 317792
Un Secured Loans 12129 43416 12625 162744 92742
Deferred Tax Liabilities 0 0 0 0 0
Current Liabilities
Provisions 33039 34529 35734 1494 40726
Current Liabilities 57067 66587 107688 113902 18001
Total 297533 431169 610068 645348 722771
Assets
Net Block 108424 180435 343182 369172 358721
Capital WIP 63459 86485 41283 43781 68065
Investments 4783 6178 5143 6582 6636
Current Assets
Inventories 44217 58906 91619 111855 99516
Sundry Debtors 27307 38017 54289 63134 67358
Cash amp Bank Balances 4036 5657 8014 7188 6959
Total Current Assets 7556 10258 153922 182177 173833Loans amp Advances 45289 55462 66506 4346 115409
Fixed Deposits 018 028 031 176 107
Total 297533 431169 610068 645348 722771
8102019 A Study A Study On Financial Performance Analysis With Reference To Kesoram Cementon Financial Performance hellip
httpslidepdfcomreaderfulla-study-a-study-on-financial-performance-analysis-with-reference-to-kesoram 8081
80
KEY ITEMS 2012 2011 2010 2009 2008
Preference
Dividend 0 0 0 0 0
Equity Dividend 457 2516 2516 2516 2516
Equity Dividend
() 999 55 55 55 55
Shares in Issue(Lakhs) 45743 45743 45743 45743 45743
EPS - Annualised
(Rs) -8302 -4595 5188 828 838
8102019 A Study A Study On Financial Performance Analysis With Reference To Kesoram Cementon Financial Performance hellip
httpslidepdfcomreaderfulla-study-a-study-on-financial-performance-analysis-with-reference-to-kesoram 8181
BIBLIOGRAPHY
Sl
No
Books Author Name
1 Financial Management Khan amp JAIN
2 Financial Management IMPandey
3 Management Accounting RPTrivedi
Websites amp Search Engines
1 wwwkesoramcom983086
2 wwwmoneycontrolcom
3 wwwgooglefinancecom983086
Annual reports of Kesoram cement limited 2008-2012
8102019 A Study A Study On Financial Performance Analysis With Reference To Kesoram Cementon Financial Performance hellip
httpslidepdfcomreaderfulla-study-a-study-on-financial-performance-analysis-with-reference-to-kesoram 2381
23
Kesoram Cement Industry is one of the leading manufacturers of cement in India It is a day
process cement Plant The plant capacity is 826 lakh tones per annum It is located at
Basanthnagar in Karimnagar district of Andhra Pradesh Basanthnagar is 8 km away from
the Ramagundam Railway station linking Madras to New Delhi The Chairman of the
Company is BKBirla
History
The first unit at Basanthnagar with a capacity of 21 lakh tones per annum
incorporating humble suspension preheated system was commissioner during the year 1969
The second unit was setup in year 1971 with a capacity of 21 lakh tones per annum went on
stream in the year 1978 The coal for this company is being supplied from Singgareni
Collieries and the power is obtained from APSEB The power demand for the factory is
about 21 MW Kesoram has got 2 DG sets of 4 MW each installed in the year 1987
Kesoram Cement has setup a 15 KW captor power plant to facilitate for
uninterrupted power supply for manufacturing of cement at 24th
august 1997 per hour 12
mw actual power is 15 mw
The Company was incorporated on 18th October 1919 under the Indian Companies Act
1913 in the name and style of Kesoram Cotton Mills Ltd It had a Textile Mill at 42
Garden Reach Road Calcutta 700 024 The name of the Company was changed to Kesoram
Industries amp Cotton Mills Ltd on 30th
August 1961 and the same was further changed to Kesoram Industries Limited on 9th July
1986 The said Textile Mill at Garden Reach Road was eventually demerged into a separate
company
The First Plant for manufacturing of rayon yarn was established at Tribeni District
Hooghly West Bengal and the same was commissioned in December 1959 and the second
plant was commissioned in the year 1962 enabling it to manufacture 4635 metric tons perannum (mtpa) of rayon yarn This Unit has 6500 metric tons per annum (mtpa) capacity as
on 3132009
The plant for manufacturing of transparent paper was also set up at the same location at
Tribeni District Hooghly West Bengal in June 1961 It has the annual capacity to
manufacture 3600 metric tons per annum (mtpa) of transparent Paper
8102019 A Study A Study On Financial Performance Analysis With Reference To Kesoram Cementon Financial Performance hellip
httpslidepdfcomreaderfulla-study-a-study-on-financial-performance-analysis-with-reference-to-kesoram 2481
24
The Company diversified into manufacturing of cast iron spun pipes and pipe fittings at
Bansberia District Hooghly West Bengal with a production capacity of 45000 metric tons
per annum (mtpa) of cast iron spun pipes and pipe fittings in December 1964
The Company subsequently diversified into the manufacturing of Cement and in 1969
established its first cement plant under the name Kesoram Cement at Basantnagar Dist
Karimnagar (Andhra Pradesh) and to take advantage of favorable market conditions in
1986 another cement plant known as Vasavadatta Cement was commissioned by it at
Sedam Dist
Gulbarga (Karnataka) The cement manufacturing capacities at both the plants were
augmented from time to time according to the market conditions and as on 3132009
Kesoram Cement and Vasavadatta Cement have annual cement manufacturing capacities of
15 million metric tons and 41 million metric tons respectively
The Company in March 1992 commissioned a plant at Balasore known as Birla Tyres in
Orissa for manufacturing of 10 lakh mtpa automotive tyres and tubes in the first phase in
collaboration with Pirelli Ltd UK a subsidiary company of the world famous Pirelli
Group of Italy - a pioneer in production and development of automotive tyres in the world
The capacity at the said plant was further augmented during the year by 19 MT per day
aggregating to 271 MT per day production facility The Greenfield Project of 257 MT per
day capacity in the State of Uttarakhand with a capex of about Rs760 crores commenced
the commercial production in phases during the financial year 2008-09The Company as on
3132009 had the manufacturing capacities of 371 million tyres 295 million tubes and
153 million flaps per annum in the Plants including at Uttarakhand Plant It has small
manufacturing capacities of various Chemicals at Kharda in the State of West Bengal also
It has the annual manufacturing capacities of 12410 mtpa of Caustic Soda Lye 5045 mtpa
of Liquid Chlorine 6205 mtpa of Sodium Hypochlorite 8200 mtpa of Hydrochloric Acid
3200 mtpa of Ferric Alum 18700 mtpa of Sulphuric Acid and 1620000 m3pa of purified
Hydrogen Gas
The Company is a well-diversified entity in the fields of Cement Tyre Rayon Yarn
Transparent Paper Spun Pipes and Heavy Chemicals with two core business segments ie
Cement and Tyres
8102019 A Study A Study On Financial Performance Analysis With Reference To Kesoram Cementon Financial Performance hellip
httpslidepdfcomreaderfulla-study-a-study-on-financial-performance-analysis-with-reference-to-kesoram 2581
25
In Spun Pipes amp Foundries a unit of the Company work suspended from 2nd May 2008
still commences till further notice
The Company as of now is listed on three major Stock Exchanges in India ie Bombay
Stock Exchange Ltd Mumbai Calcutta Stock Exchange Association Ltd Kolkata and
National Stock Exchange of India Ltd Mumbai and at the Societe de la Bourse de
Luxembourg Luxembourg
A further expansion upto 165 million tons of cement per annum in Vasavadatta Cement at
Sedam in Karnataka as unit IV at the same site is in progress with a 175 MW Captive
Power Plant involving a capital expenditure of about Rs 78350 crores (including the cost
of Captive Power Plant)
The commercial production of cement in the aforesaid unit IV has commenced in June
2009 The work for the further expansion in the Tyres Section at Uttarakhand for radial
tyres with 100 MT per day capacity and bias tyres with 125 MT per day capacity involving
an estimated aggregate capital outlay of about Rs 840 crores is under progress The Board
has further approved a Motor Cycle Tyre Project of 70 MT per day capacity at the same site
involving a capital outlay of Rs190 crore The civil construction of both the Projects is in
full swing The commercial production in both the Projects is likely to start by December
2009 January 2010
Birla Supreme in popular brand of Kesoram cement from its prestigious plant of
Basantnagar in AP which has outstanding track record In performance and productivity
serving the nation for the last two and half decades It has proved its distinction by bagging
several national awards It also has the distinction of achieving optimum capacity
utilization
Kesoram offers a choice of top quality portioned cement for light heavy
constructions and allied applications Quality is built every fact of the operations
The plant lay out is rational to begin with The limestone is rich in calcium
carbonate a key factor that influences the quality of final product The day process
technology uses in the latest computerized monitoring overseas the manufacturing process
Samples are sent regularly to the bureau of Indian standards National council of
construction and building material for certification of derived quality norms
8102019 A Study A Study On Financial Performance Analysis With Reference To Kesoram Cementon Financial Performance hellip
httpslidepdfcomreaderfulla-study-a-study-on-financial-performance-analysis-with-reference-to-kesoram 2681
26
The company has vigorously undertaking different promotional measures for
promoting their product through different media which includes the use of news papers
magazine hoarding etc
Kesoram cement industry distinguished itself among all the cement factories in
Indian by bagging the National Productivity Award consecutively for two years ie for the
year 1985-1987 The federation of Andhra Pradesh Chamber amp Commerce and Industries
(FAPCCI) also conferred on Kesoram Cement An award for the best industrial promotion
expansion efforts in the state for the year 1984 Kesoram also bagged FAPCCI awarded for
ldquoBest Family Planning Effort in the staterdquo for the year 1987-1988
One among the industrial giants in the country today serving the nation on the
industrial front Kesoram industry ltd has a checked and eventful history dating back to the
twenties when the Industrial House of Birlarsquos acquired it With only a textile mill under its
banner 1924 it grew from strength to strength and spread its activities to newer fields like
Rayon Transparent paper pipes Refractors tyres and other products
Looking to the wide gap between the demand and supply of vital commodity
cement which play in important role in National building activity the Government of India
had de-licensed the cement industry in the year 1966 with a review to attract private
entrepreneur to augment the cement production Kesoram rose to the occasions and divided
to set up a few cement plants in the country
Kesoram cement undertaking marketing activities extensively in the state of Andhra
Pradesh Karnataka Tamilnadu Kerala Maharashtra and Gujarat In AP sales Depts are
located in different areas like Karimnagar Warangal Nizamabad Vijayawada and Nellore
In other states it has opened around 10 depots
The market share of Kesoram Cement in AP is 705 The market share of the
company in various states is shown as under
STATES MARKET SHARE
Karnataka 409
Tamilnadu 094
Kerala 029
Maharashtra 281
8102019 A Study A Study On Financial Performance Analysis With Reference To Kesoram Cementon Financial Performance hellip
httpslidepdfcomreaderfulla-study-a-study-on-financial-performance-analysis-with-reference-to-kesoram 2781
27
Process and Quality Control
It has been the endeavor of Kesoram to incorporate the Worldrsquos latest technology in
the plant and today the plant has the most sophisticated
X-ray analysis
Fully computerized XRF and XRD X-RAY Analyzers keep a constant round the
clock vigil on quality
Supreme performance
One of the largest Cement Plants in Andhra Pradesh the plant incorporate the latest
technology in Cement - making
It is professionally managed and well established Cement Manufacturing Company
enjoying the confidence of the consumers Kesoram has outstanding track record in
performance and productivity with quite a few national and state awards to its credit
BIRLA SUPREME the 43 Grade Cement is a widely accepted and popular brand
in the market commanding a premium
However to meet the specific demands of the consumer Kesoram bought out the 53
grade BIRLA SUPREME ndash GOLD which has special qualities like higher fineness quick-
setting high compressive strength and durability
Supreme Strength
Kesoram Cement has huge captive Limestone Deposits which make it possible tofeed high- grade limestone consistently its natural Grey colour is anion- born ingredient
and gives good shade
Both the products offered by Kesoram ie BIRLA SUPREME-43 Grade and
BIRLA SUPREME-GOLD-53 Grade cement are outstanding with much higher
compressive strength and durability
The following characteristics show their distinctive qualities
Comprehensive
Strength
Opc 43
grls 8112
1989
Birla
Supreme 43
grade
Opc 43 gr
Is 1226987
Birla
Supreme
Gold 53 gr
3 days mpa Min 23 31 + Min 27 38+
7 days mpa Min 23 42+ Min 37 48+
28 days mpa Min 43 50+ Min 53 60+
8102019 A Study A Study On Financial Performance Analysis With Reference To Kesoram Cementon Financial Performance hellip
httpslidepdfcomreaderfulla-study-a-study-on-financial-performance-analysis-with-reference-to-kesoram 2881
28
DC SYSTEM
Clinker making process is a key step in the overall cement making process In the case of
BIRLA SUPREMEGOLD the clinker-making process is totally computer control The
Distributed Control System (DCS) constantly monitors the process and ensures operating
efficiency This eliminates variation and ensures consistency in the quality of Clinker
Physical Characteristics
Ope 43
Is 8 112-89
Birla
Supreme
43 grade
Ope 53 gr
Is 12269-87
Birla Supreme
Gold 53 gr
Setting time Min30 120-180 Min 30 130-170
a Initial (mats) Max 600 180-240 Max 600 170-220
b final (mats) Min 225 270-280 Min 225 300-320
Fincncssm 2Kg Max 10 10-20 Max 10 05-10
Soundness Max 08 004-008 Max 0080 004-02
a le-chart (mm)
b autoclave ()
Supreme Expertise
The Best Technical Team exclusive to Kesoram mans the Plant and monitors the process
to blend the cement in just the required proportions to make BIRLA SUPREMEGOLD OF
Rock Strength
18 Million Tones of Solid Foundation
Staying at the top for over a Quarter Century Quarter Century is no less an achievement
Infact Kesoram is synonymous with for over 28 years
Over the years Kesoram has dispatched 18 million tones of cement to the nook and cornersof the country and joined hands in strengthening the Nation No one else in Andhra Pradesh
has this distinction The prestigious World Bank aided Ramagundam Super Thermal Power
Project of NTPC and Mannair Dam of Pochampad project in AP arc a couple of projects for
which Kesoram Cement was exclusively uses to cite an example
8102019 A Study A Study On Financial Performance Analysis With Reference To Kesoram Cementon Financial Performance hellip
httpslidepdfcomreaderfulla-study-a-study-on-financial-performance-analysis-with-reference-to-kesoram 2981
29
Chemical Characteristics
Opc 43 gr
Is 81 132-989
Birla
Supreme
43 grade
Ope 53 gr
Is 12269-
87
Birla
Supreme
Gold 53 gr
Loss on inflection Max 5 lt16 Max 40 lt15
Insoluble residue Max 20 lt08 Max 20 lt 06
Magnesium oxide Max 60 lt 13 Max 60 lt 13
Lime saturation factor 066-102 08-09 08-102 088-09
Alumna iron ratio MinO66 15-17 MinO66 15-17
Sulfuric anhydride Max 253 16-20 Max 2 53 16-20
Alkalis Chlorides Max 005 Max 001 Max 005 Max 04
Kesoram Cement - advantages
Helps in designing sleeker and more elegant
Structures giving greater flexibility in design concept
Due to its fine quality super fine construction can be achieved Its gives maximum
strength at Minimum use of cement with water in the water cement ratio especially the 53
grade Birlas supreme-gold
Feathers in Kesorams cap
Kesoram has outstanding track record achieving over 100 capacity utilization I
productivity and energy conservation It has proved its distinction by bagging several
national and state awards noteworthy being
NATIONAL
1 National productivity award for 1985-86
2 National productivity award for 1986-87
3 National award for mines safety for 1985-86
4 National award for mines safety for 1986-875 National award for energy conservation 1989-90
8102019 A Study A Study On Financial Performance Analysis With Reference To Kesoram Cementon Financial Performance hellip
httpslidepdfcomreaderfulla-study-a-study-on-financial-performance-analysis-with-reference-to-kesoram 3081
30
STATE
1 AP State productivity award for 1988
2 State award for best industrial management 1988-89
3 Best industrial productivity award of FAPCCI (federation of AP chamber of
commerce and industry) 1991
4 Best management award of the state Govt 1993
5 FAPCCI award for the workers welfare 1995-96
ISO 9002
All quality systems of Kesoram have been certified under ISO 90021S 4002 which
proves the worldwide acceptance of the products
All quality systems in production and marketing of the product have been certified by BIS
under ISO 90021S 14002
The first unit was installed at basanthnagar with a capacity of 25 ndashlakhs TPA (tones per
annum) incorporating humble supervision preheated system during the year 1969
The second unit followed suit with added a capacity of 2 lakhs TPA in 1971
The plant was further expanded to 9 lakhs by adding 25 lakhs tones in august 1978 113
lakhs tones in January 1981 and 087 lakhs tones in September 1981
Power
Singareni collieries make the supply of coal for this industry and the power was
obtained from AP TRANSCO The power demand for the factory is about 21MW Kesoram
has got 2-diesel generator seats of 4 MW each installed in the year 1987
Kesoram cement now has a 15MWcaptive power plant to facilities for uninterrupted
power supply for manufacturing of cement
Performance
The performance of kersoram cement industry has been outstanding achieving over
cent percent capacity utilization all through despite many odds like power cuts and which
most 40 was wasted due to wagon shortage etc
The company being a continuous process industry works round the clock and has
excellent records of performance achieving over 1005 capacity utilization
Kesoram has always combined technical progress with industrial performance The
company had glorious track record for the last 27 years in the industry
Technology
8102019 A Study A Study On Financial Performance Analysis With Reference To Kesoram Cementon Financial Performance hellip
httpslidepdfcomreaderfulla-study-a-study-on-financial-performance-analysis-with-reference-to-kesoram 3181
31
Kesoram cement uses most modern technology and the computerized control in the
plant A team of dedicated and well- experienced experts manages the plant
The quality is maintained much above the bureau of Indian standards
The raw materials used for manufacturing cement are
Lime stone
Bauxite
Hematite
Gypsum
Environmental and Social Obligations
For environmental promotion and to keep ndashup the ecological balance this section
has planted over two lakhs trees on social obligation front this section has undertaken
various social welfare programs by adopting ten nearly villages organizing family welfare
campus surgical camps animal health camps blood donation camps children immunization
camps seeds training for farmers etc were arranged
Welfare and Recreation Facilities
For the purpose of recreation facilities 2 auditoriums were provided for playing
indoor games cultural function and activities like drama music and dance etc
The industry has provided libraries and reading rooms About 1000 books are available in
the library All kinds of newspaper magazines are made available
Canteen is provided to cater to the needs of the employees for supply of snacks tea
coffee and meals etc
One English medium and one Telugu medium school are provided to meet the
educational requirements
The company has provided a dispenser with a qualified medical office and
paramedical staff for the benefit of the employees The employees covered under ESI
scheme have to avail the medical facilities from the ESI hospital
Competitions in sports and games are conducted every year for august 15th
Independence Day and January 26th republic day among the employees
Electricity
The power consumption per ton of cement has come down to 108 units against 113
units last year due to implementation of various energy saving measures The performance
of captive power plant of this section continues to be satisfactory Total power generation
8102019 A Study A Study On Financial Performance Analysis With Reference To Kesoram Cementon Financial Performance hellip
httpslidepdfcomreaderfulla-study-a-study-on-financial-performance-analysis-with-reference-to-kesoram 3281
32
during the year was 84 million units last year This captive power plant is a major role in
keeping power costs with in economic levels
The management has introduced various HRD programs for training and
development and has taken various other measures for the betterment of employeersquos
efficiency
The section has installed adequate air pollution control system and equipment and is
ISO14001 such as Environment management system is under implementation
Awards
Kesoram cement bagged many prestigious awards including national awards for
productivity technology conservation and several state awards since 1984 The following
are the some of important awards
AWARDS OF KESORAM CEMENT
No Year Awards
National
State
1 1989-90 Management award community
Development
State
2 1991 Energy conservation may day award of the
Govt
State
3 1991 Pundit Jawaharlal Nehru rolling trophy for
best
State
4 1993 National productivity effort Indira Gandhi
national award
State
5 1994 Best management award State
6 1994-
1995
Best industrial rebellion award State
7 1995 Rural development by chief minister
Environment and mineral conservation
award
State
8 1995 Best industrial rebellion award State
8102019 A Study A Study On Financial Performance Analysis With Reference To Kesoram Cementon Financial Performance hellip
httpslidepdfcomreaderfulla-study-a-study-on-financial-performance-analysis-with-reference-to-kesoram 3381
33
9 1995-
1996
Best effort of an industrial unit to
development rural economy shriSRRungta
award for social
National
10 1996 Awareness for best rural development
efforts
State
11 1999 Best workers welfare best family welfare
award
State
12 2001 First prize for mine environment amppollution
control for the 3rd
year in succession
State
13 2002 Vana mithra award from AP Govt State
14 2003 Company has got OHSAS-18001 State
15 2005 Certification from DNV New Delhi State
16 2006 Award for pollution control and
environmental protection FAPCCI award
for best rural development in the state
State
8102019 A Study A Study On Financial Performance Analysis With Reference To Kesoram Cementon Financial Performance hellip
httpslidepdfcomreaderfulla-study-a-study-on-financial-performance-analysis-with-reference-to-kesoram 3481
34
Products of the organization
8102019 A Study A Study On Financial Performance Analysis With Reference To Kesoram Cementon Financial Performance hellip
httpslidepdfcomreaderfulla-study-a-study-on-financial-performance-analysis-with-reference-to-kesoram 3581
35
CHAPTER-III
LITERATURE REVIEW
8102019 A Study A Study On Financial Performance Analysis With Reference To Kesoram Cementon Financial Performance hellip
httpslidepdfcomreaderfulla-study-a-study-on-financial-performance-analysis-with-reference-to-kesoram 3681
36
Introduction
Financial Performance Analysis
The term lsquofinancial performance analysis also known as analysis and interpretation of
financial statementsrsquo refers to the process of determining financial strength and
weaknesses of the firm by establishing strategic relationship between the items of the
balance sheet profit and loss account and other operative data
ldquoAnalyzing financial statementsrdquo by Metcalf and Titard
ldquoFinancial analysis is a process of evaluating the relationship between component
parts of a financial statement to obtain a better understanding of a firms position and
performancerdquo by Myers
Financial Performance
The word lsquoPerformance is derived from the word lsquoparfourmenrsquo which means lsquoto dorsquo lsquoto
carry outrsquo or lsquoto renderrsquo It refers the act of performing execution accomplishment
fulfillment etc In border sense performance refers to the accomplishment of a given task
measured against preset standards of accuracy completeness cost and speed In other
words it refers to the degree to which an achievement is being or has been accomplished In
the Words of Frich Kohlar ldquoThe performance is a general term applied to a part or to all the
conducts of activities of an organization over a period of time often with reference to past or
projected cost efficiency management responsibility or accountability or the like Thus not
just the presentation but the quality of results achieved refers to the performance
Performance is used to indicate firmrsquos success conditions and compliance
Financial performance refers to the act of performing financial activity In broader
sense financial performance refers to the degree to which financial objectives being or has
been accomplished It is the process of measuring the results of a firms policies and
operations in monetary terms It is used to measure firms overall financial health over a
given period of time and can also be used to compare similar firms across the same industry
or to compare industries or sectors in aggregation
The purpose of financial analysis is to diagnose the information contained in financial
statements so as to Jude the profitability and financial soundness of the firm Just like a
doctor examines his patient by recording his body temperature blood pressure etc Before
8102019 A Study A Study On Financial Performance Analysis With Reference To Kesoram Cementon Financial Performance hellip
httpslidepdfcomreaderfulla-study-a-study-on-financial-performance-analysis-with-reference-to-kesoram 3781
37
making his conclusion regarding the illness and before giving his treatment a financial
analyst analysis the financial statements with various tools of analysis before commenting
upon the financial health or weaknesses of an enterprise
The analysis and interpretation of financial statements is essential to bring out the
mystery behind the figures in financial statements Financial statements analysis is an
attempt to determine the significance and meaning of the financial statement data so that
forecast may be made of the future earnings ability to pay interest and debt maturities (both
current and long term) and profitability of a sound divided policy
Types of financial analysis-
Financial analysis into different categories depending upon
(1) The material used and
(2) The method of operation followed in the analysis or the modus operandi of
analysis
Types of financial analysis
On the basis of material used on the basis of modus operandi
External Internal Horizontal Vertical
Analysis Analysis Analysis Analysis
1 On the basis of material used - According to material used financial analysis canbe of two types
External analysis
Internal analysis
External analysis-
This analysis is done by outsiders who do not have access to the detailed internal
outsiders include investors potential investors Creditors Potential Creditors Government
Agencies Credit Agencies and General Public For financial analysis these external parties
to the firm depend almost entirely on the published financial statements
Internal analysis-
This analysis is undertaken by the persons namely executives and employees of the
organization or by the officers appointed by government or court who have access to the
8102019 A Study A Study On Financial Performance Analysis With Reference To Kesoram Cementon Financial Performance hellip
httpslidepdfcomreaderfulla-study-a-study-on-financial-performance-analysis-with-reference-to-kesoram 3881
38
books of account ( internal accounting records) and other information related to the
business
2 983119983150 983156983144983141 983138983137983155983145983155 983151983142 983149983151983140983157983155 983151983152983141983154983137983150983140983145983085
According to the modus operandi financial analysis can also be of two types
a Horizontal analysis
bVertical analysis
Horizontal analysis-
Horizontal analysis refers to the comparison of financial data of a company for several
years The figures for this type of analysis are presented horizontally over a number of
columns The figures of the various years are compared with standard or base year a base
year is year chosen as beginning point This type of analysis is also called lsquodynamicanalysisrsquo as it is based on the data from year to year rather than on data of any one year The
horizontal analysis makes it possible to focus attention on items that have changed
significantly during the period under view
b Vertical analysis-
Vertical analysis refers to the study of relationship of the various items in the financial
statements of one accounting period In this types of analysis the figures from financial
statement of a year are compared with a base selected from the same yearrsquos statement
Methods of financial analysis-
The following methods of analysis are generally used-
1 Comparative Statements
2 Trend Analysis
3 Common-Size Statements
4 Funds flow Analysis
5 Cash Analysis
6 Ratio Analysis
7 Cost-volume-Profit Analysis
8102019 A Study A Study On Financial Performance Analysis With Reference To Kesoram Cementon Financial Performance hellip
httpslidepdfcomreaderfulla-study-a-study-on-financial-performance-analysis-with-reference-to-kesoram 3981
39
Comparative statements-
The comparative financial statements are statements of the financial position at
different periods of time the elements of financial position are show in a
Comparative Statement provides an idea of financial position at two or more
periods Generally two financial statements (balance sheet and income statement) are
prepared in comparative form for financial analysis
The Comparative Statement May Show-
1 Absolute figures (rupee amounts)
2 Changes in absolute figures ie increase or decrease in absolute figures
3 Absolute data in terms of percentages
4 Increase or decrease in terms of percentages
The Two Comparative Statements Are-
1 Comparative balance sheet and
2 Income statement
1 983107983151983149983152983137983154983137983156983145983158983141 983138983137983148983137983150983139983141 983155983144983141983141983156983085
The comparative balance sheet analysis is the study of the trend of the same items group of
items and computed items in two or more balance sheets of the same business enterprise on
different dates The change in periodic balance sheet items reflect the conduct of a business
the change can be observed by comparison of the balance sheet at the beginning and at the
end of a period and these changes can help in forming an opinion about the progress of an
enterprise
Guide Lines for Interpretation of Comparative Balance Sheet-
While interpreting comparative balance sheet the interpreter is expected to study the
following aspects-
1 Current financial position and liquidity position
2 Long-term financial position
3 Profitability of the concern
8102019 A Study A Study On Financial Performance Analysis With Reference To Kesoram Cementon Financial Performance hellip
httpslidepdfcomreaderfulla-study-a-study-on-financial-performance-analysis-with-reference-to-kesoram 4081
40
Common Size Statement-
The common-size statements balance sheet and income statement are show in
analytical percentages The figures are shown as percentages of total assets total liabilities
and total sales The total assets are taken as 100 and different assets are expressed as a
percentage of the total similarly various liabilities are taken as a part of total liabilities
Common Size Balance Sheet-
A statement in which balance sheet items are expressed as the ratio of each asset to
total assets and the ratio of each liability is expressed as a ratio of total liabilities is called
common size balance The common size balance sheet can be used to compare companies
of differing size The comparison of figures in different periods is not useful because total
figures may be affected by a number of factors It is not possible to establish standard norms
for various assets The trends of figures from year to year may not be studied and even they
may not give proper results
Trend Analysis of Balance Sheet-
Trend analysis is Very important tool of horizontal financial analysis
This analysis enables to known the change in the financial function and operating efficiency
in between the time period chosen
By studding the trend analysis of each item we can known the direction of changes and
based upon the direction of changes the options can be changed
Trend =Absolute Value of item in the statement understudy 100
Absolute Value of same item in the base statement
Ratio Analysis
Ratio analysis is used as a technique of analyzing the financial information contained in the
balance sheet and profit and loss accounts for a more meaningful understanding of the
financial position and performance of a firm
The relationship between two accounting figures expressed mathematically is known as a
financial ratio A ratio helps the analyst to make qualitative judgment about the firmrsquos
financial position and performance
Several ratios can be calculated from the accounting data contained in the financial
statements The parties which generally undertake financial analysis is short ndashterm
creditors long-term creditors owner and management In view of the requirements of the
various ratios ratios are classified into the following four important categories
8102019 A Study A Study On Financial Performance Analysis With Reference To Kesoram Cementon Financial Performance hellip
httpslidepdfcomreaderfulla-study-a-study-on-financial-performance-analysis-with-reference-to-kesoram 4181
41
Liquidity ratios
Leverage ratios
Activity ratios
Profitability ratios
Liquidity Ratios
It is extremely essential for a firm to be able to meet its obligations as they become due
Liquidity ratios measure the ability of the firm to meet its current obligations A firm should
ensure that it does not suffer from lack of liquidity and also that it does not have excess
liquidity The failure of a company to meet its obligations due to lack of sufficient liquidity
will result in a poor creditworthiness loss of creditorsrsquo confidence or even in legal tangles
resulting in the closure of the company A very high degree of liquidity is also bad idle
assets earn nothing The firmrsquos funds will be unnecessarily tied up in current assets
Therefore it is necessary to strike a proper balance high liquidity and lack of liquidity
The most common ratios which indicate the extent of liquidity or lack of it are
Current ratio
Quick ratio
Other ratios include Cash ratio Interval Measure and Net working capital ratio
Current Ratio
The current ratio is calculated by dividing current assets by current liabilities
Current assets
Current ratio = --------------------------
Current liabilities
Current ratio is a measure of the firmrsquos short term solvency It indicates the availability of
current assets in rupees for every one rupee of current liability A ratio of greater than one
means that the firm has more current assets than current claims against the Current ratio of
2 to 1 or more is considered satisfactory Current ratio represents a margin of safety for
creditors
Quick Ratio
Quick ratio also known as acid-test ratio establishes a relationship between quick assets and
the current liabilities Cash is the most liquid asset It is calculated by dividing quick assets
by current liabilities
Quick ratio = Quick Assets Current Liabilities
8102019 A Study A Study On Financial Performance Analysis With Reference To Kesoram Cementon Financial Performance hellip
httpslidepdfcomreaderfulla-study-a-study-on-financial-performance-analysis-with-reference-to-kesoram 4281
42
(Quick Assets = Current assets ndash Inventory)
One defect of the current ratio is that it fails to convey any information on the composition
of the current assets of the firm A rupee of cash is considered equivalent to a rupee of
inventory of receivables But it is not so A rupee of cash is more readily available to meet
current liabilities than a rupee of say inventory This implies the usefulness of the current
ratio
The Acid ndashtest ratio measures the firmrsquos ability to convert its current assets quickly into
cash in order to meet its current liabilities
A quick ratio of 1 to 1 is considered to represent a satisfactory current financial condition It
is an important index of the firmrsquos liquidity
Leverage Ratios
Leverage ratios identify the source of a firmrsquos capital ndashowners or outside creditors
Financial leverage refers to the use of debt in financing non-current assets If the return on
assets exceeds the cost of debt the leverage is successful ndash ie it improves return on equity
Debt ndashEquity Ratio
The Debt ndash Equity is determined to analyze the soundness of the long term financial
policies of the organization It is also known as ldquoInternal External Equity Ratiordquo
It is calculated as follows
Debt ndash Equity Ratio = Total long term debt Share holders funds
Equity Ratio
This ratio is also called as proprietary ratio establishes a relationship between share holderrsquos
funds to total assets of company Equity Ratio is calculated by dividing share holders fund
by total assets
Fixed Asset Ratio
This ratio indicates the extent to which the assets of the companyrsquos can be lost without
affecting the interest of the creditors of the company Higher the ratios better the long-term
position of the company
Activity Ratios
They are primarily used for studying a firmrsquos working capital situation A well managed
firm should have good activity ratios
8102019 A Study A Study On Financial Performance Analysis With Reference To Kesoram Cementon Financial Performance hellip
httpslidepdfcomreaderfulla-study-a-study-on-financial-performance-analysis-with-reference-to-kesoram 4381
43
Working Capital Turnover Ratio
The working capital turnover ratio indicates whether or not working capital has been
effectively used in making sales
Working capital turnover = Sales Net current assets
Inventory Turnover Ratio
This ratio also known as Stock Turnover Ratio establishes the relationship between costs of
goods sold or net sales during the given period and the average amt of stock held during the
period This ratio reveals the number of times finished stock in turnover during a given
accounting period
Higher the ratio the better is it because it shows the finished stock is rapidly turned
in to sales On the other hand a low stock turnover ratio is not desirable because it reveals
the accumulation of stock
Debtors Turnover Ratio
This ratio indicates the velocity of debt collection of a company In other words it shows
the number of times average turnover during a year
A Higher Debtor Turnover Ratio indicates a more efficient is the management towards
debtors and low ratio ratio implies inefficient management of debtors
Total Assets Turnover Ratio
The asset turnover ratio indicates how efficiently management is employing Assets
Total Assets Turnover Ratio = Sales Total Assets
Profitability Ratios
Profitability ratios are the ratios which measure a firmrsquos overall effectiveness as revealed by
the returns generated on sales and investment
General Profitability Ratios
1 Gross Profit Ratio
2 Net profit Ratio
3 Operating or Expenses Ratio
8102019 A Study A Study On Financial Performance Analysis With Reference To Kesoram Cementon Financial Performance hellip
httpslidepdfcomreaderfulla-study-a-study-on-financial-performance-analysis-with-reference-to-kesoram 4481
44
Gross Profit Ratio
Gross profit Ratio measures the relationships to net sales and is usually represented as a
percentage It is a good measure of profitability
The gross profit ratio indicates the extent to which selling price of goods per unit may
decline without resulting in losses on operation Higher the gross profit betters the result
Net Profit Ratio
Net Profit Ratio indicates net margin on sales It is given by the following equation
Net Profit Ratio = (Net Profit Sales) 100
Operating or Expenses Ratio
This ratio is complimentary of Net Profit Ratio The more the net profit the less the
Operating Ratio Operating costs include the cost of direct materials direct labors and otheroverheads viz are generally excluded from operating costs A comparison of the Operating
Ratio will indicate whether the cost efficiency is high or low in the figure of sales This less
the ratio it depicts the efficiency of the management
8102019 A Study A Study On Financial Performance Analysis With Reference To Kesoram Cementon Financial Performance hellip
httpslidepdfcomreaderfulla-study-a-study-on-financial-performance-analysis-with-reference-to-kesoram 4581
45
CHAPTER IV
DATA ANALYSIS amp INTERPRETATION
8102019 A Study A Study On Financial Performance Analysis With Reference To Kesoram Cementon Financial Performance hellip
httpslidepdfcomreaderfulla-study-a-study-on-financial-performance-analysis-with-reference-to-kesoram 4681
46
Comparative Balance Sheet of Kesoram in the Year between 2008-2009
(Rupee in crores)
Years Changes
Particulars 2008 2009 In Rupees In Percentage
Liabilities
Share Capital 4574 4574 000 000
Reserves amp Surplus 93085 128024 34939
Revaluation Reserves 533 412 -121 -2270
Loans
Secured Loans 97106 153627 56521 5821
Un Secured Loans 12129 43416 31287 25795
Deferred Tax Liabilities 000 000 000 000
Current Liabilities
Provisions 33039 34529 1490 451
Current Liabilities 57067 66587 9520 1668
Total 297533 431169 133636 4491
Assets
Net Block 108424 180435 72011 6642
Capital Wip 63459 86485 23026 3628
Investments 4783 6178 1395 2917
Current Assets
Inventories 44217 58906 14689 3322
Sundry Debtors 27307 38017 10710 3922
Cash amp Bank Balances 4036 5657 1621 4016
Total Current Assets 75560 102580 27020 3576
Loans amp Advances 45289 55462 10173 2246
Fixed Deposits 018 028 010 5556
Total 297533 431169 133636 4491
8102019 A Study A Study On Financial Performance Analysis With Reference To Kesoram Cementon Financial Performance hellip
httpslidepdfcomreaderfulla-study-a-study-on-financial-performance-analysis-with-reference-to-kesoram 4781
47
Interpretation of comparative balance sheet of 2008-2009
Reserves amp Surplus were increased to 3753 (percent) ie in Rupees 34939
crores
Revaluation Reserves decreased to 121 ie in Rupees 2270 crores
Secured Loans are increased to 5821 ie in Rupees 56521 crores And UN
secured loans highly Increased to 25795
Current liabilities and Provisions are increased to 1668 and 451 respectively ie in
Rupees 9520 amp 1490 crores
Fixed assets were highly increased to 6642 ie in Rupees 72011 crores
Investments were increased to 2917 ie in Rupees 1395 crores
Sundry debtors increased to 3922 ie in Rupees 10710 crores
Current assets increased 3576 ie in Rupees 27020 crores And Loans amp
Advances increased to 2246 respectively
The overall financial position was satisfactory
8102019 A Study A Study On Financial Performance Analysis With Reference To Kesoram Cementon Financial Performance hellip
httpslidepdfcomreaderfulla-study-a-study-on-financial-performance-analysis-with-reference-to-kesoram 4881
48
Comparative Balance Sheet of Kesoram in the Year between 2009-2010
(Rupees in crores)
Years Changes
Particulars 2009 2010 In Rupees In Percentage
Liabilities
Share Capital 4574 4574 000 000
Reserves amp Surplus 128024 149111 21087 1647
Revaluation Reserves 412 339 -073 -1772
Loans
Secured Loans 153627 186372 32745 2131
Un Secured Loans 43416 126250 82834 19079
Deferred Tax Liabilities 000 000 000
Current Liabilities
Provisions 34529 35734 1205 349
Current Liabilities 66587 107688 41101 6173
Total 431169 610068 178899 4149
Assets
Net Block 180435 343182 162747 9020
Capital WIP 86485 41283 -45202 -5227
Investments 6178 5143 -1035 -1675
Current Assets
Inventories 58906 91619 32713 5553
Sundry Debtors 38017 54289 16272 4280
Cash amp Bank Balances 5657 8014 2357 4167
Total Current Assets 102580 153922 51342 5005
Loans amp Advances 55462 66506 11044 1991
Fixed Deposits 028 031 003 1071
Total 431169 610068 178899 4149
8102019 A Study A Study On Financial Performance Analysis With Reference To Kesoram Cementon Financial Performance hellip
httpslidepdfcomreaderfulla-study-a-study-on-financial-performance-analysis-with-reference-to-kesoram 4981
49
Interpretation of comparative balance sheet of 2009-2010
Reserves amp surplus increased to 1647 ie in Rupees 21087 crores
Revaluation Reserves decreased to 1772 ie in Rupees 073 crores
Secured loans increased to 2131 ie in Rupees 32745 crores
Current Liabilities were increased to 6173 ie in Rupees 41101 crores and
Provisions 349 ie in Rupees 1205 crores
Fixed Assets were increased to 9020 ie in Rupees 162747 crores
Investments were decreased to 1675 ie in Rupees 1035 crores
Sundry debtors were increased to 4280 ie in Rupees 16272 crores
Current assets increased to 5005 ie in Rupees 51342 crores And loans and
Advances increased 1919 ie in Rupees 11044 crores
The overall financial position was satisfactory
8102019 A Study A Study On Financial Performance Analysis With Reference To Kesoram Cementon Financial Performance hellip
httpslidepdfcomreaderfulla-study-a-study-on-financial-performance-analysis-with-reference-to-kesoram 5081
50
Comparative Balance Sheet of Kesoram in the Year between 2010-2011
(Rupees in crores)
Years Changes
Particulars 2010 2011 In Rupees In Percentage
Liabilities
Share Capital 4574 4574 000 000
Reserves amp Surplus 149111 125162 -23949 -1606
Revaluation Reserves 339 289 -050 -1475
Loans
Secured Loans 186372 237183 50811 2726
Un Secured Loans 126250 162744 36494 2891
Deferred Tax Liabilities 000 000 000
Current Liabilities
Provisions 35734 1494 -34240 -9582
Current Liabilities 107688 113902 6214 577
Total 610068 645348 35280 578
Assets
Net Block 343182 369172 25990 757
Capital WIP 41283 43781 2498 605
Investments 5143 6582 1439 2798
Current Assets
Inventories 91619 111855 20236 2209
Sundry Debtors 54289 63134 8845 1629
Cash amp Bank Balances 8014 7188 -826 -1031
Total Current Assets 153922 182177 28255 1836
Loans amp Advances 66506 43460 -23046 -3465
Fixed Deposits 031 176 145 46774
Total 610068 645348 35280 578
8102019 A Study A Study On Financial Performance Analysis With Reference To Kesoram Cementon Financial Performance hellip
httpslidepdfcomreaderfulla-study-a-study-on-financial-performance-analysis-with-reference-to-kesoram 5181
51
Interpretation of comparative balance sheet of 2010-2011
Reserves amp surplus decreased to 1606 ie in Rupees 23949 crores
Revaluation Reserves decreased to 1475 ie in Rupees 050 crores
Secured loans increased to 2726 ie in Rupees 50811 crores
Current Liabilities were increased to 577 ie in Rupees 6214 crores
Provisions decreased to 9582 ie in Rupees 34240 crores
Fixed Assets were increased to 757 ie in Rupees 25990 crores
Investments were decreased to 2798 ie in Rupees 1439 crores
Sundry debtors were increased to 1629 ie in Rupees8845 crores
Current assets increased to 1836 ie in Rupees 28255 crores And loans and
Advances increased 3465 ie in Rupees 23046 crores
The overall financial position was UN satisfactory
8102019 A Study A Study On Financial Performance Analysis With Reference To Kesoram Cementon Financial Performance hellip
httpslidepdfcomreaderfulla-study-a-study-on-financial-performance-analysis-with-reference-to-kesoram 5281
52
Comparative Balance Sheet of Kesoram In The Year Between 2011-2012
(Rupees in crores)
Years Changes
Particulars 2011 2012 In Rupees In Percentage
Liabilities
Share Capital 4574 4574 000 000
Reserves amp Surplus 125162 86657 -38505 -3076
Revaluation Reserves 289 270 -019 -657
Loans
Secured Loans 237183 317792 80609 3399
Un Secured Loans 162744 92742 -70002 -4301
Deferred Tax Liabilities 000 000 000
Current Liabilities
Provisions 1494 40726 39232 262597
Current Liabilities 113902 180010 66108 5804
Total 645348 722771 77423 1200
Assets 000
Net Block 369172 358721 -10451 -283
Capital WIP 43781 68065 24284 5547
Investments 6582 6636 054 082
Current Assets
Inventories 111855 99516 -12339 -1103
Sundry Debtors 63134 67358 4224 669
Cash amp Bank Balances 7188 6959 -229 -319
Total Current Assets 182177 173833 -8344 -458
Loans amp Advances 43460 115409 71949 16555
Fixed Deposits 176 107 -069 -3920
Total 645348 722771 77423 1200
8102019 A Study A Study On Financial Performance Analysis With Reference To Kesoram Cementon Financial Performance hellip
httpslidepdfcomreaderfulla-study-a-study-on-financial-performance-analysis-with-reference-to-kesoram 5381
53
Interpretation of comparative balance sheet of 2011-2012
Reserves amp surplus decreased to 3076 ie in Rupee 38505 crores
Revaluation Reserves decreased to 657 ie in Rupees 019 crores
Secured loans increased to 3399 ie in Rupees 80699 crores
Current Liabilities were increased to 5804 ie in Rupees 66108 crores
Provisions increased to 262597 ie in Rupees 39232 crores
Fixed Assets were decreased to 283 ie in Rupee 10451 crores
Investments were increased to 082 ie in Rupees 054 crores
Sundry debtors were increased to 669 ie in Rupees 4224 crores
Current assets decreased to 458 ie in Rupees 8344 crores And loans and
Advances increased 16555 ie in Rupees 71949 crores
The overall financial position was UN satisfactory
8102019 A Study A Study On Financial Performance Analysis With Reference To Kesoram Cementon Financial Performance hellip
httpslidepdfcomreaderfulla-study-a-study-on-financial-performance-analysis-with-reference-to-kesoram 5481
54
Common Size Balance Sheet of Kesoram For The Year 2008-2009
(Rupees in crores)
Particulars 2008 Change Percentage 2009 Change Percentage
Liabilities
Share Capital 4574 154 4574 106
Reserves amp Surplus 93085 3129 128024 2969
Revaluation Reserves 533 018 412 010
Loans
Secured Loans 97106 3264 153627 3563
Un Secured Loans 12129 408 43416 1007
Deferred Tax Liabilities 000 000 000 000
Current Liabilities
Provisions 33039 1110 34529 801
Current Liabilities 57067 1918 66587 1544
Total 297533 10000 431169 10000
Assets
Net Block 108424 3644 180435 4185
Capital WIP 63459 2133 86485 2006
Investments 4783 161 6178 143
Current Assets
Inventories 44217 1486 58906 1366
Sundry Debtors 27307 918 38017 882
Cash amp Bank Balances 4036 136 5657 131
Loans amp Advances 45289 1522 55462 1286
Fixed Deposits 018 001 028 001
Total 297533 10000 431169 10000
8102019 A Study A Study On Financial Performance Analysis With Reference To Kesoram Cementon Financial Performance hellip
httpslidepdfcomreaderfulla-study-a-study-on-financial-performance-analysis-with-reference-to-kesoram 5581
55
Interpretation of Common Size Balance Sheet of 2008-2009
Share capital was recorded 154 percent in the total liabilities in the year 2008 it is
decreased to 106 in the year 2009
Reserves amp surplus contributed to 3129 in the total liabilities in the year 2008 it is
decreased to 2969 in the year 2009
Secured loans were 3264 in the total liabilities in the year 2008 it is increased to
3563 in the year 2009
Current Liabilities shown to 1918 in the total liabilities in the year 2008 it is
decreased to 1544 in the year 2009
Provisions 1110 in the total liabilities in the year 2008 it is decreased to 801 in the
year 2009
Fixed Assets were 3644 in the total liabilities in the year 2008 ie decreased to 4185
in the year 2009
Investments were 161 in the total liabilities in the year 2008 it is decreased to 143
in the year 2009
Sundry debtors were 918 in the total liabilities in the year 2008 it is decreased to 882
in the year 2009
8102019 A Study A Study On Financial Performance Analysis With Reference To Kesoram Cementon Financial Performance hellip
httpslidepdfcomreaderfulla-study-a-study-on-financial-performance-analysis-with-reference-to-kesoram 5681
56
Common Size Balance Sheet of Kesoram For The Year 2009-2010
(Rs in crores)
Particulars 2009 Change Percentage 2010Change
Percentage
Liabilities
Share Capital 4574 106 4574 075
Reserves amp Surplus 128024 2969 149111 2444
Revaluation Reserves 412 010 339 006
Loans
Secured Loans 153627 3563 186372 3055
Un Secured Loans 43416 1007 126250 2069
Deferred Tax Liabilities 000 000 000 000
Current Liabilities
Provisions 34529 801 35734 586
Current Liabilities 66587 1544 107688 1765
Total 431169 10000 610068 10000
Assets
Net Block 180435 4185 343182 5625
Capital WIP 86485 2006 41283 677
Investments 6178 143 5143 084
Current Assets
Inventories 58906 1366 91619 1502
Sundry Debtors 38017 882 54289 890
Cash amp Bank Balances 5657 131 8014 131
Loans amp Advances 55462 1286 66506 1090
Fixed Deposits 028 001 031 001
Total 431169 10000 610068 10000
8102019 A Study A Study On Financial Performance Analysis With Reference To Kesoram Cementon Financial Performance hellip
httpslidepdfcomreaderfulla-study-a-study-on-financial-performance-analysis-with-reference-to-kesoram 5781
57
Interpretation of common size balance sheet of 2009-2010
Share capital was recorded 106 percent in the total liabilities in the
year 2009 it is decreased to 075 in the year 2010
Reserves amp surplus contributed to 2969 in the total liabilities in the
year 2009 it is decreased to2444 in the year 2010
Secured loans were 3563 in the total liabilities in the year 2009 it is
increased to 3055 in the year 2010
Current Liabilities shown to 1544 in the total liabilities in the year
2009 it is decreased to 1765 in the year 2010
Provisions 801 in the total liabilities in the year 2009 it is decreased
to 586 in the year 2010
Fixed Assets were 4185 in the total liabilities in the year 2009 ie
increased to 5625 in the year 2010
Investments were 143 in the total liabilities in the year 2009 it is
decreased to 084 in the year 2010
Sundry debtors were 882 in the total liabilities in the year 2009 it is
increased to 890 in the year 2010
8102019 A Study A Study On Financial Performance Analysis With Reference To Kesoram Cementon Financial Performance hellip
httpslidepdfcomreaderfulla-study-a-study-on-financial-performance-analysis-with-reference-to-kesoram 5881
58
Common Size Balance sheet of Kesoram for the year 2010-2011
983080Rupees in crores)
Particulars 2010 Change Percentage 2011
Change
Percentage
Liabilities
Share Capital 4574 075 4574 071
Reserves amp Surplus 149111 2444 125162 1939
Revaluation Reserves 339 006 289 004
Loans
Secured Loans 186372 3055 237183 3675
Un Secured Loans 126250 2069 162744 2522
Deferred Tax Liabilities 000 000 000 000
Current Liabilities
Provisions 35734 586 1494 023
Current Liabilities 107688 1765 113902 1765
Total 610068 10000 645348 10000
Assets
Net Block 343182 5625 369172 5721
Capital WIP 41283 677 43781 678
Investments 5143 084 6582 102
Current Assets
Inventories 91619 1502 111855 1733
Sundry Debtors 54289 890 63134 978
Cash amp Bank Balances 8014 131 7188 111
Loans amp Advances 66506 1090 43460 673
Fixed Deposits 031 001 176 003
Total 610068 10000 645348 10000
8102019 A Study A Study On Financial Performance Analysis With Reference To Kesoram Cementon Financial Performance hellip
httpslidepdfcomreaderfulla-study-a-study-on-financial-performance-analysis-with-reference-to-kesoram 5981
59
Interpretation of Common Size Balance Sheet Of 2010-2011
Share capital was recorded 075 percent in the total liabilities in the year 2010 it is
decreased to 071 in the year 2011
Reserves amp surplus contributed to 2444 in the total liabilities in the year 2010 it is
decreased to1939 in the year 2011
Secured loans were 3055 in the total liabilities in the year 2010 it is increased to
3675 in the year 2011
Current Liabilities shown to 1765 in the total liabilities in the year 2010 it is
also1765 in the year 2011
Provisions 586 in the total liabilities in the year 2010 it is decreased to 023 in the
year 2011
Fixed Assets were 5625 in the total liabilities in the year 2010 ie increased to 5721
in the year 2011
Investments were 084 in the total liabilities in the year 2010 it increased to 102 in
the year 2011
Sundry debtors were 890 in the total liabilities in the year 2010 it is increased to 978
in the year 2011
8102019 A Study A Study On Financial Performance Analysis With Reference To Kesoram Cementon Financial Performance hellip
httpslidepdfcomreaderfulla-study-a-study-on-financial-performance-analysis-with-reference-to-kesoram 6081
60
Common Size Balance Sheet of Kesoram for the Year 2011-2012
983080Rupees in crores)
Particulars 2011 Change Percentage 2012
Change
Percentage
Liabilities
Share Capital 4574 071 4574 063
Reserves amp Surplus 125162 1939 86657 1199
Revaluation Reserves 289 004 270 004
Loans
Secured Loans 237183 3675 317792 4397
Un Secured Loans 162744 2522 92742 1283
Deferred Tax Liabilities 000 000 000 000
Current Liabilities
Provisions 1494 023 40726 563
Current Liabilities 113902 1765 180010 2491
Total 645348 10000 722771 10000
Assets
Net Block 369172 5721 358721 4963
Capital WIP 43781 678 68065 942
Investments 6582 102 6636 092
Current Assets
Inventories 111855 1733 99516 1377
Sundry Debtors 63134 978 67358 932
Cash amp Bank Balances 7188 111 6959 096
Loans amp Advances 43460 673 115409 1597
Fixed Deposits 176 003 107 001
Total 645348 10000 722771 10000
8102019 A Study A Study On Financial Performance Analysis With Reference To Kesoram Cementon Financial Performance hellip
httpslidepdfcomreaderfulla-study-a-study-on-financial-performance-analysis-with-reference-to-kesoram 6181
61
Interpretation of common size balance sheet of 2011-2012
Share capital was recorded 071 percent in the total liabilities in the year 2011 it is
decreased to 063 in the year 2012
Reserves amp surplus contributed to 1939 in the total liabilities in the year 2011 it
is decreased to 1199 in the year 2012
Secured loans were 3675 in the total liabilities in the year 2011 it is increased to
4397 in the year 2012
Current Liabilities shown to 1765 in the total liabilities in the year 2011 it is
increased to 2491 in the year 2012
Provisions 023 in the total liabilities in the year 2011 it is increased to 563 in the
year 2012
Fixed Assets were 5721 in the total liabilities in the year 2011 ie decreased to
4963 in the year 2012
Investments were 102 in the total liabilities in the year 2011 it increased to 092
in the year 2012
Sundry debtors were 978 in the total liabilities in the year 2011 it is decreased to
932 in the year 2012
8102019 A Study A Study On Financial Performance Analysis With Reference To Kesoram Cementon Financial Performance hellip
httpslidepdfcomreaderfulla-study-a-study-on-financial-performance-analysis-with-reference-to-kesoram 6281
Trend Analysis
Share Capital-
Year
Amount
(In Crores) Trend
IncreaseDecrease
Base Year Previous Year
2008 4574 10000 000 000
2009 4574 10000 000 000
2010 4574 10000 000 000
2011 4574 10000 000 000
2012 4574 10000 000 000
Trend Percentages in Share Capital
Share capital shown a constant trend in the period 2008 and 2012
Share capital is 4574 crores all the years from 2008-2012
8102019 A Study A Study On Financial Performance Analysis With Reference To Kesoram Cementon Financial Performance hellip
httpslidepdfcomreaderfulla-study-a-study-on-financial-performance-analysis-with-reference-to-kesoram 6381
Reserves amp Surplus-
Year
Amount
(In Crores) Trend
IncreaseDecrease
Base Year Previous Year
2008 93085 10000 000 000
2009 128024 13753 3753 3753
2010 149111 16019 6019 2266
2011 125162 13446 3446 -2573
2012 86657 9309 -691 -4137
Trend Percentages in Reserves amp Surplus
Reserves amp surplus shown an increasing trend in the period between 2008 and 2010
The average trend was 13277 till 2010
The Reserves amp surplus was showing decreasing trend in the period 2011-2012 (ie
from 16019 in 2010 to 9309 in 2012)
The decreasing trend in Reserves amp surplus indicates the decrease in profits of the
firm
8102019 A Study A Study On Financial Performance Analysis With Reference To Kesoram Cementon Financial Performance hellip
httpslidepdfcomreaderfulla-study-a-study-on-financial-performance-analysis-with-reference-to-kesoram 6481
Investments-
Year
Amount
(In Crores) Trend
IncreaseDecrease
Base Year Previous Year
2008 4783 10000 000 000
2009 6178 12917 2917 2917
2010 5143 10753 753 -2164
2011 6582 13761 3761 3009
2012 6636 13874 3874 113
Trend Percentages in Investments-
The investments are shown an increasing trend in the period between 2008 ndash 2009
and it is decreasing in the year 2010
The average trend was 11458 till 2009
The investments increased in the periods 2011-2012 (ie from 10753 in 2010 to
13874 in 2012)
The overall trend in investments shown is satisfactory
8102019 A Study A Study On Financial Performance Analysis With Reference To Kesoram Cementon Financial Performance hellip
httpslidepdfcomreaderfulla-study-a-study-on-financial-performance-analysis-with-reference-to-kesoram 6581
Net Current Assets-
Year
Amount
(In Crores) Trend
IncreaseDecrease
Base Year Previous Year
2008 30761 10000 000 000
2009 56954 18515 8515 8515
2010 77037 25044 15044 6529
2011 110417 35895 25895 10851
2012 68613 22305 12305 -13590
Trends in Net Current Assets-
The NCA shown positive (increasing) trend
The NCA are increased to 35895 (the year 2011) compared with base year and
decreased in the year 2012 to 22305
The NCA shown increased trend from year and crossed 100
The overall trend was good
8102019 A Study A Study On Financial Performance Analysis With Reference To Kesoram Cementon Financial Performance hellip
httpslidepdfcomreaderfulla-study-a-study-on-financial-performance-analysis-with-reference-to-kesoram 6681
66
Ratio Analysis-
Current Ratio-
Current Ratio = Current Assets Current Liabilities
Current assets are cash in hand Cash at bank Marketable Securities(short term) short term
Investment Bills receivables sundry debtors Inventories (stock) Work in progress prepaid
expenses Current Liabilities are outstanding expenses Bills payable sundry Creditors
short-term advances income tax payable and Dividend payable
Current Ratio of Kesoram-
(Rupees in crores)
Year Current Assets Current Liabilities Current Ratio
2007-08 75560 57067 132
2008-09 102580 66587 154
2009-10 153922 107688 143
2010-11 182177 113902 160
2011-12 173833 180010 097
Interpretation-
As per the standard rule of current ratio ie 21 where current assets double the current
liabilities is considered satisfactory
In the present analysis the current ratio of the Kesoram is not satisfactory
from the above table It was assessed that the current ratio for all the five year is lower (less)
than the standard rule ie 21 And it is 097 in the year 2011-2012 (current year) This is
highly UN satisfactory
8102019 A Study A Study On Financial Performance Analysis With Reference To Kesoram Cementon Financial Performance hellip
httpslidepdfcomreaderfulla-study-a-study-on-financial-performance-analysis-with-reference-to-kesoram 6781
Quick Ratio-
Quick ratio also known as acid-test ratio establishes a relationship between quick
assets and the current liabilities Cash is the most liquid asset It is calculated by dividing
quick assets by current liabilities
Quick ratio = Quick Assets Current Liabilities
(Quick Assets = Current assets ndash Inventory)
Quick Ratio of Kesoram-
Rupees in crores)
Year Total QuickAssets
Current Liabilities Quick Ratio
2007-08 33343 57067 058
2008-09 43674 66587 066
2009-10 62303 107688 058
2010-11 70322 113902 0622011-12 74333 180010 041
Interpretation-
Usually a high Quick ratio is an indication that the company is liquid and has the ability to
meet its current or liquid liabilities in time on the other hand a low Quick Ratio represents
8102019 A Study A Study On Financial Performance Analysis With Reference To Kesoram Cementon Financial Performance hellip
httpslidepdfcomreaderfulla-study-a-study-on-financial-performance-analysis-with-reference-to-kesoram 6881
that the companyrsquos liquidity position is not good The above table showing the quick ratios
of Kesoram are canrsquot be considered satisfactory
Leverage Ratios-
Debt-Equity Ratio-
Debt-Equity Ratio = Total Long Term Debt Equity Share Holders Fund
Total Long term Debt= Debenture Capital + Long term loans from banks and financial
institutions + Public deposits
Equity Share Holders fund = Equity + Reserves and Surplus
Debt Equity Ratio of Kesoram
(Rupees in crores)
Year Total Debt Share Holders Fund Debt Equity Ratio
2007-08 109235 98192 111
2008-09 197043 133010 148
2009-10 312622 154024 203
2010-11 399927 130025 308
2011-12 410534 91501 449
8102019 A Study A Study On Financial Performance Analysis With Reference To Kesoram Cementon Financial Performance hellip
httpslidepdfcomreaderfulla-study-a-study-on-financial-performance-analysis-with-reference-to-kesoram 6981
Interpretation-
The Debt-Equity Ratio accepted standard is 05 This ratio reflects the relative contribution
of creditors and owners of business in its financing From the above it is clear that the long
term debt is more than that of the share holdersrsquo fund So we can interpret that the firmrsquosassets are financed more by the external funds rather than by the internal funds
8102019 A Study A Study On Financial Performance Analysis With Reference To Kesoram Cementon Financial Performance hellip
httpslidepdfcomreaderfulla-study-a-study-on-financial-performance-analysis-with-reference-to-kesoram 7081
Fixed Asset Ratio-
Net Sales
Fixed Asset Ratio = helliphelliphelliphelliphelliphelliphelliphelliphelliphelliphellip
Net Assets
Fixed Asset Ratio of Kesoram-
(Rupees in crores)
Year Net Sales Net Assets Fixed Assets Ratio
2007-08 300271 358721 084
2008-09 389797 369172 106
2009-10 475062 343182 1382010-11 539788 180435 299
2011-12 59182 108424 546
Interpretation
This ratio indicates the extent to which the assets of the companyrsquos can be lost without
affecting the interest of the creditors of the company Higher the ratios better the long-term
position of the companyThe above table shows fixed assets ratio in increasing trend Which is good for the
company
8102019 A Study A Study On Financial Performance Analysis With Reference To Kesoram Cementon Financial Performance hellip
httpslidepdfcomreaderfulla-study-a-study-on-financial-performance-analysis-with-reference-to-kesoram 7181
Overall Profitability Ratios-
Net Profit Ratio
Net Profit Ratio indicates net margin on sales It is given by the following equation
Net Profit Ratio = (Net Profit Sales) 100
Net Profit Ratio of Kesoram
(Rupees in crores)
Year Net Profit Sales Net Profit Ratio
2007-08 37917 300271 1263
2008-09 41432 389797 1063
2009-10 20298 475062 427
2010-11 -28176 539788 -5222011-12 -38108 59182 -644
Interpretation
It establishes a relationship between net profits after tax and net sales and
indicates the efficiency of the management in manufacturing selling administrative and
other activities of the company
The higher the ratio the better is the profitability or performance of the business
The above table depicts the net profit Ratio of Kesoram has decreased every year from
2007-2008 to 2011-2012It further decreased to negative in the year 2010-11 to -522 and -
644 in the year 2011-2012 This shows constant decrease in the profits of the company
8102019 A Study A Study On Financial Performance Analysis With Reference To Kesoram Cementon Financial Performance hellip
httpslidepdfcomreaderfulla-study-a-study-on-financial-performance-analysis-with-reference-to-kesoram 7281
72
Return on Investment-
Net Profit
Return on Investment = helliphelliphelliphelliphelliphelliphelliphelliphelliphelliphelliphellip X 100
Share Holders Fund
Return on Investment Ratio of Kesoram-
(Rupees in crores)
Year Net Profit Share Holders Fund Return On Investment
2007-08 37917 98192 3862
2008-09 41432 133010 3115
2009-10 20298 154024 1318
2010-11 -28176 130025 -2167
2011-12 -38108 91501 -4165
Interpretation-
The above table reveals how well the resources of the firm are being used Higher
the ratio better the result The above ratio implies how well the firm is growing in
terms of profitability and efficiency From the above table we can concern that the return on
investment is in decreasing trend ROI is highest in the year 2007-2008 as 3862 But
there after itrsquos decreased every year
The ROI is negative in the years 2010-2011 amp 2011-2012 as -2167 amp -4165 respectively
Which is not a good sign for the firm
8102019 A Study A Study On Financial Performance Analysis With Reference To Kesoram Cementon Financial Performance hellip
httpslidepdfcomreaderfulla-study-a-study-on-financial-performance-analysis-with-reference-to-kesoram 7381
8102019 A Study A Study On Financial Performance Analysis With Reference To Kesoram Cementon Financial Performance hellip
httpslidepdfcomreaderfulla-study-a-study-on-financial-performance-analysis-with-reference-to-kesoram 7481
8102019 A Study A Study On Financial Performance Analysis With Reference To Kesoram Cementon Financial Performance hellip
httpslidepdfcomreaderfulla-study-a-study-on-financial-performance-analysis-with-reference-to-kesoram 7581
75
CHAPTER V
FINDINGS amp SUGGESTIONS
8102019 A Study A Study On Financial Performance Analysis With Reference To Kesoram Cementon Financial Performance hellip
httpslidepdfcomreaderfulla-study-a-study-on-financial-performance-analysis-with-reference-to-kesoram 7681
76
Findings
The Share capital remains constant Share capital is unchanged all the years from
2008-2012
Reserves amp surplus were recorded an increasing trend in the period between 2008
and 2010It is showing decreasing trend in the period 2011-2012 (ie from 16019
in 2010 to 9309 in 2012)
Current Liabilities were increased compared to base year ie 2008
Provisions increased to 262597 ie in Rupees 39232 crores in the current year
The current ratio for all the five year is lower (less) than the standard rule ie 21
And it is 097 in the year 2011-2012 (current year)
The Debt-Equity Ratio was shown under the standard ratio It is clear that the long
term debt is more than that of the share holdersrsquo fund It indicates that the firm
heavily relying on external funds rather than the internal funds
The operating and net profit of Kesoram is in decreasing trend due to heavy
increase of manufacturing amp administrative expenses
ROI is highest in the year 2007-2008 as 3862 The ROI is negative in the years
2010-2011 amp 2011-2012 as -2167 amp -4165 respectively
Return on Equity Capital Employed Ratio of Kesoram has decreased every year
from 2007-2008 to 2010-2011It further decreased to negative in the year 2011-12 to
-3280
EPS of Kesoram has decreased every year from 2008-12It is negative in the year
2011 amp 12
8102019 A Study A Study On Financial Performance Analysis With Reference To Kesoram Cementon Financial Performance hellip
httpslidepdfcomreaderfulla-study-a-study-on-financial-performance-analysis-with-reference-to-kesoram 7781
77
Suggestion
The organization should adopt an appropriate capital structure
The companyrsquos debt-equity ratio is recorded more or less as 111 in the year 2008
and it is increased to 449 in the year 2012 (current year)The company should
adopt a better debt equity mix in the future to control the fluctuations in returns
The company should control fluctuations in cash and bank balances as it impacts the
current ratio of the company
The provisions are showing increasing trend which indicates risk of debtors The
firm should implement an effective credit management policy It should utilize its
idle funds by decreasing provisions
The company should control heavy increase of manufacturing amp administration
expenses as it is impacting the operating and net profit of company
8102019 A Study A Study On Financial Performance Analysis With Reference To Kesoram Cementon Financial Performance hellip
httpslidepdfcomreaderfulla-study-a-study-on-financial-performance-analysis-with-reference-to-kesoram 7881
78
ANNEXURE
Profit And Loss Account of Kesoram Cement
Mar12 Mar11 Mar10 Mar09 Mar08
12 Months 12 Months 12 Months 12 Months 12 Months
INCOME
Sales Turnover 628260 575072 505151 431613 345700
Excise Duty 36440 35284 30089 41815 45429
NET SALES 591820 539788 475062 389797 300271
Other Income 000 000 000 000 000
TOTALINCOME
596129 548733 481019 393969 302020
EXPENDITURE
Manufacturing
Expenses81903 74803 13974 13153 44113
MaterialConsumed
370897 310150 295550 229359 118448
Personal
Expenses33468 27355 23294 18690 15344
Selling Expenses 81910 78253 58667 48846 45019
AdministrativeExpenses
28225 29308 17219 16179 9907
Expenses
Capitalized000 000 000 000 000
Provisions Made 000 000 000 000 000
TOTAL
EXPENDITURE 596403 519870 408704 326227 232832Operating Profit -4583 19918 66358 63570 67439
EBITDA -274 28864 72316 67742 69188
Depreciation 29740 27259 17280 11186 8927
Other Write-offs 000 000 000 000 000
EBIT -30014 1605 55035 56557 60261
Interest 41015 23983 10921 12087 5426
EBT -71029 -22377 44114 44470 54835
Taxes -32921 5798 23816 3037 16918
Profit and Loss
for the Year-38108 -28176 20298 41432 37917
Non RecurringItems
-1142 7063 3228 -4023 402
Other Non Cash
Adjustments1276 091 207 465 017
OtherAdjustments
000 000 000 000 000
REPORTED
PAT-37974 -21021 23734 37874 38335
8102019 A Study A Study On Financial Performance Analysis With Reference To Kesoram Cementon Financial Performance hellip
httpslidepdfcomreaderfulla-study-a-study-on-financial-performance-analysis-with-reference-to-kesoram 7981
79
Balance Sheet Of Kesoram
Years
Particulars 2008 2009 2010 2011 2012
Liabilities
Share Capital 4574 4574 4574 4574 4574Reserves amp Surplus 93085 128024 149111 125162 86657
Revaluation Reserves 533 412 339 289 27
Loans
Secured Loans 97106 153627 186372 237183 317792
Un Secured Loans 12129 43416 12625 162744 92742
Deferred Tax Liabilities 0 0 0 0 0
Current Liabilities
Provisions 33039 34529 35734 1494 40726
Current Liabilities 57067 66587 107688 113902 18001
Total 297533 431169 610068 645348 722771
Assets
Net Block 108424 180435 343182 369172 358721
Capital WIP 63459 86485 41283 43781 68065
Investments 4783 6178 5143 6582 6636
Current Assets
Inventories 44217 58906 91619 111855 99516
Sundry Debtors 27307 38017 54289 63134 67358
Cash amp Bank Balances 4036 5657 8014 7188 6959
Total Current Assets 7556 10258 153922 182177 173833Loans amp Advances 45289 55462 66506 4346 115409
Fixed Deposits 018 028 031 176 107
Total 297533 431169 610068 645348 722771
8102019 A Study A Study On Financial Performance Analysis With Reference To Kesoram Cementon Financial Performance hellip
httpslidepdfcomreaderfulla-study-a-study-on-financial-performance-analysis-with-reference-to-kesoram 8081
80
KEY ITEMS 2012 2011 2010 2009 2008
Preference
Dividend 0 0 0 0 0
Equity Dividend 457 2516 2516 2516 2516
Equity Dividend
() 999 55 55 55 55
Shares in Issue(Lakhs) 45743 45743 45743 45743 45743
EPS - Annualised
(Rs) -8302 -4595 5188 828 838
8102019 A Study A Study On Financial Performance Analysis With Reference To Kesoram Cementon Financial Performance hellip
httpslidepdfcomreaderfulla-study-a-study-on-financial-performance-analysis-with-reference-to-kesoram 8181
BIBLIOGRAPHY
Sl
No
Books Author Name
1 Financial Management Khan amp JAIN
2 Financial Management IMPandey
3 Management Accounting RPTrivedi
Websites amp Search Engines
1 wwwkesoramcom983086
2 wwwmoneycontrolcom
3 wwwgooglefinancecom983086
Annual reports of Kesoram cement limited 2008-2012

8102019 A Study A Study On Financial Performance Analysis With Reference To Kesoram Cementon Financial Performance hellip
httpslidepdfcomreaderfulla-study-a-study-on-financial-performance-analysis-with-reference-to-kesoram 2481
24
The Company diversified into manufacturing of cast iron spun pipes and pipe fittings at
Bansberia District Hooghly West Bengal with a production capacity of 45000 metric tons
per annum (mtpa) of cast iron spun pipes and pipe fittings in December 1964
The Company subsequently diversified into the manufacturing of Cement and in 1969
established its first cement plant under the name Kesoram Cement at Basantnagar Dist
Karimnagar (Andhra Pradesh) and to take advantage of favorable market conditions in
1986 another cement plant known as Vasavadatta Cement was commissioned by it at
Sedam Dist
Gulbarga (Karnataka) The cement manufacturing capacities at both the plants were
augmented from time to time according to the market conditions and as on 3132009
Kesoram Cement and Vasavadatta Cement have annual cement manufacturing capacities of
15 million metric tons and 41 million metric tons respectively
The Company in March 1992 commissioned a plant at Balasore known as Birla Tyres in
Orissa for manufacturing of 10 lakh mtpa automotive tyres and tubes in the first phase in
collaboration with Pirelli Ltd UK a subsidiary company of the world famous Pirelli
Group of Italy - a pioneer in production and development of automotive tyres in the world
The capacity at the said plant was further augmented during the year by 19 MT per day
aggregating to 271 MT per day production facility The Greenfield Project of 257 MT per
day capacity in the State of Uttarakhand with a capex of about Rs760 crores commenced
the commercial production in phases during the financial year 2008-09The Company as on
3132009 had the manufacturing capacities of 371 million tyres 295 million tubes and
153 million flaps per annum in the Plants including at Uttarakhand Plant It has small
manufacturing capacities of various Chemicals at Kharda in the State of West Bengal also
It has the annual manufacturing capacities of 12410 mtpa of Caustic Soda Lye 5045 mtpa
of Liquid Chlorine 6205 mtpa of Sodium Hypochlorite 8200 mtpa of Hydrochloric Acid
3200 mtpa of Ferric Alum 18700 mtpa of Sulphuric Acid and 1620000 m3pa of purified
Hydrogen Gas
The Company is a well-diversified entity in the fields of Cement Tyre Rayon Yarn
Transparent Paper Spun Pipes and Heavy Chemicals with two core business segments ie
Cement and Tyres
8102019 A Study A Study On Financial Performance Analysis With Reference To Kesoram Cementon Financial Performance hellip
httpslidepdfcomreaderfulla-study-a-study-on-financial-performance-analysis-with-reference-to-kesoram 2581
25
In Spun Pipes amp Foundries a unit of the Company work suspended from 2nd May 2008
still commences till further notice
The Company as of now is listed on three major Stock Exchanges in India ie Bombay
Stock Exchange Ltd Mumbai Calcutta Stock Exchange Association Ltd Kolkata and
National Stock Exchange of India Ltd Mumbai and at the Societe de la Bourse de
Luxembourg Luxembourg
A further expansion upto 165 million tons of cement per annum in Vasavadatta Cement at
Sedam in Karnataka as unit IV at the same site is in progress with a 175 MW Captive
Power Plant involving a capital expenditure of about Rs 78350 crores (including the cost
of Captive Power Plant)
The commercial production of cement in the aforesaid unit IV has commenced in June
2009 The work for the further expansion in the Tyres Section at Uttarakhand for radial
tyres with 100 MT per day capacity and bias tyres with 125 MT per day capacity involving
an estimated aggregate capital outlay of about Rs 840 crores is under progress The Board
has further approved a Motor Cycle Tyre Project of 70 MT per day capacity at the same site
involving a capital outlay of Rs190 crore The civil construction of both the Projects is in
full swing The commercial production in both the Projects is likely to start by December
2009 January 2010
Birla Supreme in popular brand of Kesoram cement from its prestigious plant of
Basantnagar in AP which has outstanding track record In performance and productivity
serving the nation for the last two and half decades It has proved its distinction by bagging
several national awards It also has the distinction of achieving optimum capacity
utilization
Kesoram offers a choice of top quality portioned cement for light heavy
constructions and allied applications Quality is built every fact of the operations
The plant lay out is rational to begin with The limestone is rich in calcium
carbonate a key factor that influences the quality of final product The day process
technology uses in the latest computerized monitoring overseas the manufacturing process
Samples are sent regularly to the bureau of Indian standards National council of
construction and building material for certification of derived quality norms
8102019 A Study A Study On Financial Performance Analysis With Reference To Kesoram Cementon Financial Performance hellip
httpslidepdfcomreaderfulla-study-a-study-on-financial-performance-analysis-with-reference-to-kesoram 2681
26
The company has vigorously undertaking different promotional measures for
promoting their product through different media which includes the use of news papers
magazine hoarding etc
Kesoram cement industry distinguished itself among all the cement factories in
Indian by bagging the National Productivity Award consecutively for two years ie for the
year 1985-1987 The federation of Andhra Pradesh Chamber amp Commerce and Industries
(FAPCCI) also conferred on Kesoram Cement An award for the best industrial promotion
expansion efforts in the state for the year 1984 Kesoram also bagged FAPCCI awarded for
ldquoBest Family Planning Effort in the staterdquo for the year 1987-1988
One among the industrial giants in the country today serving the nation on the
industrial front Kesoram industry ltd has a checked and eventful history dating back to the
twenties when the Industrial House of Birlarsquos acquired it With only a textile mill under its
banner 1924 it grew from strength to strength and spread its activities to newer fields like
Rayon Transparent paper pipes Refractors tyres and other products
Looking to the wide gap between the demand and supply of vital commodity
cement which play in important role in National building activity the Government of India
had de-licensed the cement industry in the year 1966 with a review to attract private
entrepreneur to augment the cement production Kesoram rose to the occasions and divided
to set up a few cement plants in the country
Kesoram cement undertaking marketing activities extensively in the state of Andhra
Pradesh Karnataka Tamilnadu Kerala Maharashtra and Gujarat In AP sales Depts are
located in different areas like Karimnagar Warangal Nizamabad Vijayawada and Nellore
In other states it has opened around 10 depots
The market share of Kesoram Cement in AP is 705 The market share of the
company in various states is shown as under
STATES MARKET SHARE
Karnataka 409
Tamilnadu 094
Kerala 029
Maharashtra 281
8102019 A Study A Study On Financial Performance Analysis With Reference To Kesoram Cementon Financial Performance hellip
httpslidepdfcomreaderfulla-study-a-study-on-financial-performance-analysis-with-reference-to-kesoram 2781
27
Process and Quality Control
It has been the endeavor of Kesoram to incorporate the Worldrsquos latest technology in
the plant and today the plant has the most sophisticated
X-ray analysis
Fully computerized XRF and XRD X-RAY Analyzers keep a constant round the
clock vigil on quality
Supreme performance
One of the largest Cement Plants in Andhra Pradesh the plant incorporate the latest
technology in Cement - making
It is professionally managed and well established Cement Manufacturing Company
enjoying the confidence of the consumers Kesoram has outstanding track record in
performance and productivity with quite a few national and state awards to its credit
BIRLA SUPREME the 43 Grade Cement is a widely accepted and popular brand
in the market commanding a premium
However to meet the specific demands of the consumer Kesoram bought out the 53
grade BIRLA SUPREME ndash GOLD which has special qualities like higher fineness quick-
setting high compressive strength and durability
Supreme Strength
Kesoram Cement has huge captive Limestone Deposits which make it possible tofeed high- grade limestone consistently its natural Grey colour is anion- born ingredient
and gives good shade
Both the products offered by Kesoram ie BIRLA SUPREME-43 Grade and
BIRLA SUPREME-GOLD-53 Grade cement are outstanding with much higher
compressive strength and durability
The following characteristics show their distinctive qualities
Comprehensive
Strength
Opc 43
grls 8112
1989
Birla
Supreme 43
grade
Opc 43 gr
Is 1226987
Birla
Supreme
Gold 53 gr
3 days mpa Min 23 31 + Min 27 38+
7 days mpa Min 23 42+ Min 37 48+
28 days mpa Min 43 50+ Min 53 60+
8102019 A Study A Study On Financial Performance Analysis With Reference To Kesoram Cementon Financial Performance hellip
httpslidepdfcomreaderfulla-study-a-study-on-financial-performance-analysis-with-reference-to-kesoram 2881
28
DC SYSTEM
Clinker making process is a key step in the overall cement making process In the case of
BIRLA SUPREMEGOLD the clinker-making process is totally computer control The
Distributed Control System (DCS) constantly monitors the process and ensures operating
efficiency This eliminates variation and ensures consistency in the quality of Clinker
Physical Characteristics
Ope 43
Is 8 112-89
Birla
Supreme
43 grade
Ope 53 gr
Is 12269-87
Birla Supreme
Gold 53 gr
Setting time Min30 120-180 Min 30 130-170
a Initial (mats) Max 600 180-240 Max 600 170-220
b final (mats) Min 225 270-280 Min 225 300-320
Fincncssm 2Kg Max 10 10-20 Max 10 05-10
Soundness Max 08 004-008 Max 0080 004-02
a le-chart (mm)
b autoclave ()
Supreme Expertise
The Best Technical Team exclusive to Kesoram mans the Plant and monitors the process
to blend the cement in just the required proportions to make BIRLA SUPREMEGOLD OF
Rock Strength
18 Million Tones of Solid Foundation
Staying at the top for over a Quarter Century Quarter Century is no less an achievement
Infact Kesoram is synonymous with for over 28 years
Over the years Kesoram has dispatched 18 million tones of cement to the nook and cornersof the country and joined hands in strengthening the Nation No one else in Andhra Pradesh
has this distinction The prestigious World Bank aided Ramagundam Super Thermal Power
Project of NTPC and Mannair Dam of Pochampad project in AP arc a couple of projects for
which Kesoram Cement was exclusively uses to cite an example
8102019 A Study A Study On Financial Performance Analysis With Reference To Kesoram Cementon Financial Performance hellip
httpslidepdfcomreaderfulla-study-a-study-on-financial-performance-analysis-with-reference-to-kesoram 2981
29
Chemical Characteristics
Opc 43 gr
Is 81 132-989
Birla
Supreme
43 grade
Ope 53 gr
Is 12269-
87
Birla
Supreme
Gold 53 gr
Loss on inflection Max 5 lt16 Max 40 lt15
Insoluble residue Max 20 lt08 Max 20 lt 06
Magnesium oxide Max 60 lt 13 Max 60 lt 13
Lime saturation factor 066-102 08-09 08-102 088-09
Alumna iron ratio MinO66 15-17 MinO66 15-17
Sulfuric anhydride Max 253 16-20 Max 2 53 16-20
Alkalis Chlorides Max 005 Max 001 Max 005 Max 04
Kesoram Cement - advantages
Helps in designing sleeker and more elegant
Structures giving greater flexibility in design concept
Due to its fine quality super fine construction can be achieved Its gives maximum
strength at Minimum use of cement with water in the water cement ratio especially the 53
grade Birlas supreme-gold
Feathers in Kesorams cap
Kesoram has outstanding track record achieving over 100 capacity utilization I
productivity and energy conservation It has proved its distinction by bagging several
national and state awards noteworthy being
NATIONAL
1 National productivity award for 1985-86
2 National productivity award for 1986-87
3 National award for mines safety for 1985-86
4 National award for mines safety for 1986-875 National award for energy conservation 1989-90
8102019 A Study A Study On Financial Performance Analysis With Reference To Kesoram Cementon Financial Performance hellip
httpslidepdfcomreaderfulla-study-a-study-on-financial-performance-analysis-with-reference-to-kesoram 3081
30
STATE
1 AP State productivity award for 1988
2 State award for best industrial management 1988-89
3 Best industrial productivity award of FAPCCI (federation of AP chamber of
commerce and industry) 1991
4 Best management award of the state Govt 1993
5 FAPCCI award for the workers welfare 1995-96
ISO 9002
All quality systems of Kesoram have been certified under ISO 90021S 4002 which
proves the worldwide acceptance of the products
All quality systems in production and marketing of the product have been certified by BIS
under ISO 90021S 14002
The first unit was installed at basanthnagar with a capacity of 25 ndashlakhs TPA (tones per
annum) incorporating humble supervision preheated system during the year 1969
The second unit followed suit with added a capacity of 2 lakhs TPA in 1971
The plant was further expanded to 9 lakhs by adding 25 lakhs tones in august 1978 113
lakhs tones in January 1981 and 087 lakhs tones in September 1981
Power
Singareni collieries make the supply of coal for this industry and the power was
obtained from AP TRANSCO The power demand for the factory is about 21MW Kesoram
has got 2-diesel generator seats of 4 MW each installed in the year 1987
Kesoram cement now has a 15MWcaptive power plant to facilities for uninterrupted
power supply for manufacturing of cement
Performance
The performance of kersoram cement industry has been outstanding achieving over
cent percent capacity utilization all through despite many odds like power cuts and which
most 40 was wasted due to wagon shortage etc
The company being a continuous process industry works round the clock and has
excellent records of performance achieving over 1005 capacity utilization
Kesoram has always combined technical progress with industrial performance The
company had glorious track record for the last 27 years in the industry
Technology
8102019 A Study A Study On Financial Performance Analysis With Reference To Kesoram Cementon Financial Performance hellip
httpslidepdfcomreaderfulla-study-a-study-on-financial-performance-analysis-with-reference-to-kesoram 3181
31
Kesoram cement uses most modern technology and the computerized control in the
plant A team of dedicated and well- experienced experts manages the plant
The quality is maintained much above the bureau of Indian standards
The raw materials used for manufacturing cement are
Lime stone
Bauxite
Hematite
Gypsum
Environmental and Social Obligations
For environmental promotion and to keep ndashup the ecological balance this section
has planted over two lakhs trees on social obligation front this section has undertaken
various social welfare programs by adopting ten nearly villages organizing family welfare
campus surgical camps animal health camps blood donation camps children immunization
camps seeds training for farmers etc were arranged
Welfare and Recreation Facilities
For the purpose of recreation facilities 2 auditoriums were provided for playing
indoor games cultural function and activities like drama music and dance etc
The industry has provided libraries and reading rooms About 1000 books are available in
the library All kinds of newspaper magazines are made available
Canteen is provided to cater to the needs of the employees for supply of snacks tea
coffee and meals etc
One English medium and one Telugu medium school are provided to meet the
educational requirements
The company has provided a dispenser with a qualified medical office and
paramedical staff for the benefit of the employees The employees covered under ESI
scheme have to avail the medical facilities from the ESI hospital
Competitions in sports and games are conducted every year for august 15th
Independence Day and January 26th republic day among the employees
Electricity
The power consumption per ton of cement has come down to 108 units against 113
units last year due to implementation of various energy saving measures The performance
of captive power plant of this section continues to be satisfactory Total power generation
8102019 A Study A Study On Financial Performance Analysis With Reference To Kesoram Cementon Financial Performance hellip
httpslidepdfcomreaderfulla-study-a-study-on-financial-performance-analysis-with-reference-to-kesoram 3281
32
during the year was 84 million units last year This captive power plant is a major role in
keeping power costs with in economic levels
The management has introduced various HRD programs for training and
development and has taken various other measures for the betterment of employeersquos
efficiency
The section has installed adequate air pollution control system and equipment and is
ISO14001 such as Environment management system is under implementation
Awards
Kesoram cement bagged many prestigious awards including national awards for
productivity technology conservation and several state awards since 1984 The following
are the some of important awards
AWARDS OF KESORAM CEMENT
No Year Awards
National
State
1 1989-90 Management award community
Development
State
2 1991 Energy conservation may day award of the
Govt
State
3 1991 Pundit Jawaharlal Nehru rolling trophy for
best
State
4 1993 National productivity effort Indira Gandhi
national award
State
5 1994 Best management award State
6 1994-
1995
Best industrial rebellion award State
7 1995 Rural development by chief minister
Environment and mineral conservation
award
State
8 1995 Best industrial rebellion award State
8102019 A Study A Study On Financial Performance Analysis With Reference To Kesoram Cementon Financial Performance hellip
httpslidepdfcomreaderfulla-study-a-study-on-financial-performance-analysis-with-reference-to-kesoram 3381
33
9 1995-
1996
Best effort of an industrial unit to
development rural economy shriSRRungta
award for social
National
10 1996 Awareness for best rural development
efforts
State
11 1999 Best workers welfare best family welfare
award
State
12 2001 First prize for mine environment amppollution
control for the 3rd
year in succession
State
13 2002 Vana mithra award from AP Govt State
14 2003 Company has got OHSAS-18001 State
15 2005 Certification from DNV New Delhi State
16 2006 Award for pollution control and
environmental protection FAPCCI award
for best rural development in the state
State
8102019 A Study A Study On Financial Performance Analysis With Reference To Kesoram Cementon Financial Performance hellip
httpslidepdfcomreaderfulla-study-a-study-on-financial-performance-analysis-with-reference-to-kesoram 3481
34
Products of the organization
8102019 A Study A Study On Financial Performance Analysis With Reference To Kesoram Cementon Financial Performance hellip
httpslidepdfcomreaderfulla-study-a-study-on-financial-performance-analysis-with-reference-to-kesoram 3581
35
CHAPTER-III
LITERATURE REVIEW
8102019 A Study A Study On Financial Performance Analysis With Reference To Kesoram Cementon Financial Performance hellip
httpslidepdfcomreaderfulla-study-a-study-on-financial-performance-analysis-with-reference-to-kesoram 3681
36
Introduction
Financial Performance Analysis
The term lsquofinancial performance analysis also known as analysis and interpretation of
financial statementsrsquo refers to the process of determining financial strength and
weaknesses of the firm by establishing strategic relationship between the items of the
balance sheet profit and loss account and other operative data
ldquoAnalyzing financial statementsrdquo by Metcalf and Titard
ldquoFinancial analysis is a process of evaluating the relationship between component
parts of a financial statement to obtain a better understanding of a firms position and
performancerdquo by Myers
Financial Performance
The word lsquoPerformance is derived from the word lsquoparfourmenrsquo which means lsquoto dorsquo lsquoto
carry outrsquo or lsquoto renderrsquo It refers the act of performing execution accomplishment
fulfillment etc In border sense performance refers to the accomplishment of a given task
measured against preset standards of accuracy completeness cost and speed In other
words it refers to the degree to which an achievement is being or has been accomplished In
the Words of Frich Kohlar ldquoThe performance is a general term applied to a part or to all the
conducts of activities of an organization over a period of time often with reference to past or
projected cost efficiency management responsibility or accountability or the like Thus not
just the presentation but the quality of results achieved refers to the performance
Performance is used to indicate firmrsquos success conditions and compliance
Financial performance refers to the act of performing financial activity In broader
sense financial performance refers to the degree to which financial objectives being or has
been accomplished It is the process of measuring the results of a firms policies and
operations in monetary terms It is used to measure firms overall financial health over a
given period of time and can also be used to compare similar firms across the same industry
or to compare industries or sectors in aggregation
The purpose of financial analysis is to diagnose the information contained in financial
statements so as to Jude the profitability and financial soundness of the firm Just like a
doctor examines his patient by recording his body temperature blood pressure etc Before
8102019 A Study A Study On Financial Performance Analysis With Reference To Kesoram Cementon Financial Performance hellip
httpslidepdfcomreaderfulla-study-a-study-on-financial-performance-analysis-with-reference-to-kesoram 3781
37
making his conclusion regarding the illness and before giving his treatment a financial
analyst analysis the financial statements with various tools of analysis before commenting
upon the financial health or weaknesses of an enterprise
The analysis and interpretation of financial statements is essential to bring out the
mystery behind the figures in financial statements Financial statements analysis is an
attempt to determine the significance and meaning of the financial statement data so that
forecast may be made of the future earnings ability to pay interest and debt maturities (both
current and long term) and profitability of a sound divided policy
Types of financial analysis-
Financial analysis into different categories depending upon
(1) The material used and
(2) The method of operation followed in the analysis or the modus operandi of
analysis
Types of financial analysis
On the basis of material used on the basis of modus operandi
External Internal Horizontal Vertical
Analysis Analysis Analysis Analysis
1 On the basis of material used - According to material used financial analysis canbe of two types
External analysis
Internal analysis
External analysis-
This analysis is done by outsiders who do not have access to the detailed internal
outsiders include investors potential investors Creditors Potential Creditors Government
Agencies Credit Agencies and General Public For financial analysis these external parties
to the firm depend almost entirely on the published financial statements
Internal analysis-
This analysis is undertaken by the persons namely executives and employees of the
organization or by the officers appointed by government or court who have access to the
8102019 A Study A Study On Financial Performance Analysis With Reference To Kesoram Cementon Financial Performance hellip
httpslidepdfcomreaderfulla-study-a-study-on-financial-performance-analysis-with-reference-to-kesoram 3881
38
books of account ( internal accounting records) and other information related to the
business
2 983119983150 983156983144983141 983138983137983155983145983155 983151983142 983149983151983140983157983155 983151983152983141983154983137983150983140983145983085
According to the modus operandi financial analysis can also be of two types
a Horizontal analysis
bVertical analysis
Horizontal analysis-
Horizontal analysis refers to the comparison of financial data of a company for several
years The figures for this type of analysis are presented horizontally over a number of
columns The figures of the various years are compared with standard or base year a base
year is year chosen as beginning point This type of analysis is also called lsquodynamicanalysisrsquo as it is based on the data from year to year rather than on data of any one year The
horizontal analysis makes it possible to focus attention on items that have changed
significantly during the period under view
b Vertical analysis-
Vertical analysis refers to the study of relationship of the various items in the financial
statements of one accounting period In this types of analysis the figures from financial
statement of a year are compared with a base selected from the same yearrsquos statement
Methods of financial analysis-
The following methods of analysis are generally used-
1 Comparative Statements
2 Trend Analysis
3 Common-Size Statements
4 Funds flow Analysis
5 Cash Analysis
6 Ratio Analysis
7 Cost-volume-Profit Analysis
8102019 A Study A Study On Financial Performance Analysis With Reference To Kesoram Cementon Financial Performance hellip
httpslidepdfcomreaderfulla-study-a-study-on-financial-performance-analysis-with-reference-to-kesoram 3981
39
Comparative statements-
The comparative financial statements are statements of the financial position at
different periods of time the elements of financial position are show in a
Comparative Statement provides an idea of financial position at two or more
periods Generally two financial statements (balance sheet and income statement) are
prepared in comparative form for financial analysis
The Comparative Statement May Show-
1 Absolute figures (rupee amounts)
2 Changes in absolute figures ie increase or decrease in absolute figures
3 Absolute data in terms of percentages
4 Increase or decrease in terms of percentages
The Two Comparative Statements Are-
1 Comparative balance sheet and
2 Income statement
1 983107983151983149983152983137983154983137983156983145983158983141 983138983137983148983137983150983139983141 983155983144983141983141983156983085
The comparative balance sheet analysis is the study of the trend of the same items group of
items and computed items in two or more balance sheets of the same business enterprise on
different dates The change in periodic balance sheet items reflect the conduct of a business
the change can be observed by comparison of the balance sheet at the beginning and at the
end of a period and these changes can help in forming an opinion about the progress of an
enterprise
Guide Lines for Interpretation of Comparative Balance Sheet-
While interpreting comparative balance sheet the interpreter is expected to study the
following aspects-
1 Current financial position and liquidity position
2 Long-term financial position
3 Profitability of the concern
8102019 A Study A Study On Financial Performance Analysis With Reference To Kesoram Cementon Financial Performance hellip
httpslidepdfcomreaderfulla-study-a-study-on-financial-performance-analysis-with-reference-to-kesoram 4081
40
Common Size Statement-
The common-size statements balance sheet and income statement are show in
analytical percentages The figures are shown as percentages of total assets total liabilities
and total sales The total assets are taken as 100 and different assets are expressed as a
percentage of the total similarly various liabilities are taken as a part of total liabilities
Common Size Balance Sheet-
A statement in which balance sheet items are expressed as the ratio of each asset to
total assets and the ratio of each liability is expressed as a ratio of total liabilities is called
common size balance The common size balance sheet can be used to compare companies
of differing size The comparison of figures in different periods is not useful because total
figures may be affected by a number of factors It is not possible to establish standard norms
for various assets The trends of figures from year to year may not be studied and even they
may not give proper results
Trend Analysis of Balance Sheet-
Trend analysis is Very important tool of horizontal financial analysis
This analysis enables to known the change in the financial function and operating efficiency
in between the time period chosen
By studding the trend analysis of each item we can known the direction of changes and
based upon the direction of changes the options can be changed
Trend =Absolute Value of item in the statement understudy 100
Absolute Value of same item in the base statement
Ratio Analysis
Ratio analysis is used as a technique of analyzing the financial information contained in the
balance sheet and profit and loss accounts for a more meaningful understanding of the
financial position and performance of a firm
The relationship between two accounting figures expressed mathematically is known as a
financial ratio A ratio helps the analyst to make qualitative judgment about the firmrsquos
financial position and performance
Several ratios can be calculated from the accounting data contained in the financial
statements The parties which generally undertake financial analysis is short ndashterm
creditors long-term creditors owner and management In view of the requirements of the
various ratios ratios are classified into the following four important categories
8102019 A Study A Study On Financial Performance Analysis With Reference To Kesoram Cementon Financial Performance hellip
httpslidepdfcomreaderfulla-study-a-study-on-financial-performance-analysis-with-reference-to-kesoram 4181
41
Liquidity ratios
Leverage ratios
Activity ratios
Profitability ratios
Liquidity Ratios
It is extremely essential for a firm to be able to meet its obligations as they become due
Liquidity ratios measure the ability of the firm to meet its current obligations A firm should
ensure that it does not suffer from lack of liquidity and also that it does not have excess
liquidity The failure of a company to meet its obligations due to lack of sufficient liquidity
will result in a poor creditworthiness loss of creditorsrsquo confidence or even in legal tangles
resulting in the closure of the company A very high degree of liquidity is also bad idle
assets earn nothing The firmrsquos funds will be unnecessarily tied up in current assets
Therefore it is necessary to strike a proper balance high liquidity and lack of liquidity
The most common ratios which indicate the extent of liquidity or lack of it are
Current ratio
Quick ratio
Other ratios include Cash ratio Interval Measure and Net working capital ratio
Current Ratio
The current ratio is calculated by dividing current assets by current liabilities
Current assets
Current ratio = --------------------------
Current liabilities
Current ratio is a measure of the firmrsquos short term solvency It indicates the availability of
current assets in rupees for every one rupee of current liability A ratio of greater than one
means that the firm has more current assets than current claims against the Current ratio of
2 to 1 or more is considered satisfactory Current ratio represents a margin of safety for
creditors
Quick Ratio
Quick ratio also known as acid-test ratio establishes a relationship between quick assets and
the current liabilities Cash is the most liquid asset It is calculated by dividing quick assets
by current liabilities
Quick ratio = Quick Assets Current Liabilities
8102019 A Study A Study On Financial Performance Analysis With Reference To Kesoram Cementon Financial Performance hellip
httpslidepdfcomreaderfulla-study-a-study-on-financial-performance-analysis-with-reference-to-kesoram 4281
42
(Quick Assets = Current assets ndash Inventory)
One defect of the current ratio is that it fails to convey any information on the composition
of the current assets of the firm A rupee of cash is considered equivalent to a rupee of
inventory of receivables But it is not so A rupee of cash is more readily available to meet
current liabilities than a rupee of say inventory This implies the usefulness of the current
ratio
The Acid ndashtest ratio measures the firmrsquos ability to convert its current assets quickly into
cash in order to meet its current liabilities
A quick ratio of 1 to 1 is considered to represent a satisfactory current financial condition It
is an important index of the firmrsquos liquidity
Leverage Ratios
Leverage ratios identify the source of a firmrsquos capital ndashowners or outside creditors
Financial leverage refers to the use of debt in financing non-current assets If the return on
assets exceeds the cost of debt the leverage is successful ndash ie it improves return on equity
Debt ndashEquity Ratio
The Debt ndash Equity is determined to analyze the soundness of the long term financial
policies of the organization It is also known as ldquoInternal External Equity Ratiordquo
It is calculated as follows
Debt ndash Equity Ratio = Total long term debt Share holders funds
Equity Ratio
This ratio is also called as proprietary ratio establishes a relationship between share holderrsquos
funds to total assets of company Equity Ratio is calculated by dividing share holders fund
by total assets
Fixed Asset Ratio
This ratio indicates the extent to which the assets of the companyrsquos can be lost without
affecting the interest of the creditors of the company Higher the ratios better the long-term
position of the company
Activity Ratios
They are primarily used for studying a firmrsquos working capital situation A well managed
firm should have good activity ratios
8102019 A Study A Study On Financial Performance Analysis With Reference To Kesoram Cementon Financial Performance hellip
httpslidepdfcomreaderfulla-study-a-study-on-financial-performance-analysis-with-reference-to-kesoram 4381
43
Working Capital Turnover Ratio
The working capital turnover ratio indicates whether or not working capital has been
effectively used in making sales
Working capital turnover = Sales Net current assets
Inventory Turnover Ratio
This ratio also known as Stock Turnover Ratio establishes the relationship between costs of
goods sold or net sales during the given period and the average amt of stock held during the
period This ratio reveals the number of times finished stock in turnover during a given
accounting period
Higher the ratio the better is it because it shows the finished stock is rapidly turned
in to sales On the other hand a low stock turnover ratio is not desirable because it reveals
the accumulation of stock
Debtors Turnover Ratio
This ratio indicates the velocity of debt collection of a company In other words it shows
the number of times average turnover during a year
A Higher Debtor Turnover Ratio indicates a more efficient is the management towards
debtors and low ratio ratio implies inefficient management of debtors
Total Assets Turnover Ratio
The asset turnover ratio indicates how efficiently management is employing Assets
Total Assets Turnover Ratio = Sales Total Assets
Profitability Ratios
Profitability ratios are the ratios which measure a firmrsquos overall effectiveness as revealed by
the returns generated on sales and investment
General Profitability Ratios
1 Gross Profit Ratio
2 Net profit Ratio
3 Operating or Expenses Ratio
8102019 A Study A Study On Financial Performance Analysis With Reference To Kesoram Cementon Financial Performance hellip
httpslidepdfcomreaderfulla-study-a-study-on-financial-performance-analysis-with-reference-to-kesoram 4481
44
Gross Profit Ratio
Gross profit Ratio measures the relationships to net sales and is usually represented as a
percentage It is a good measure of profitability
The gross profit ratio indicates the extent to which selling price of goods per unit may
decline without resulting in losses on operation Higher the gross profit betters the result
Net Profit Ratio
Net Profit Ratio indicates net margin on sales It is given by the following equation
Net Profit Ratio = (Net Profit Sales) 100
Operating or Expenses Ratio
This ratio is complimentary of Net Profit Ratio The more the net profit the less the
Operating Ratio Operating costs include the cost of direct materials direct labors and otheroverheads viz are generally excluded from operating costs A comparison of the Operating
Ratio will indicate whether the cost efficiency is high or low in the figure of sales This less
the ratio it depicts the efficiency of the management
8102019 A Study A Study On Financial Performance Analysis With Reference To Kesoram Cementon Financial Performance hellip
httpslidepdfcomreaderfulla-study-a-study-on-financial-performance-analysis-with-reference-to-kesoram 4581
45
CHAPTER IV
DATA ANALYSIS amp INTERPRETATION
8102019 A Study A Study On Financial Performance Analysis With Reference To Kesoram Cementon Financial Performance hellip
httpslidepdfcomreaderfulla-study-a-study-on-financial-performance-analysis-with-reference-to-kesoram 4681
46
Comparative Balance Sheet of Kesoram in the Year between 2008-2009
(Rupee in crores)
Years Changes
Particulars 2008 2009 In Rupees In Percentage
Liabilities
Share Capital 4574 4574 000 000
Reserves amp Surplus 93085 128024 34939
Revaluation Reserves 533 412 -121 -2270
Loans
Secured Loans 97106 153627 56521 5821
Un Secured Loans 12129 43416 31287 25795
Deferred Tax Liabilities 000 000 000 000
Current Liabilities
Provisions 33039 34529 1490 451
Current Liabilities 57067 66587 9520 1668
Total 297533 431169 133636 4491
Assets
Net Block 108424 180435 72011 6642
Capital Wip 63459 86485 23026 3628
Investments 4783 6178 1395 2917
Current Assets
Inventories 44217 58906 14689 3322
Sundry Debtors 27307 38017 10710 3922
Cash amp Bank Balances 4036 5657 1621 4016
Total Current Assets 75560 102580 27020 3576
Loans amp Advances 45289 55462 10173 2246
Fixed Deposits 018 028 010 5556
Total 297533 431169 133636 4491
8102019 A Study A Study On Financial Performance Analysis With Reference To Kesoram Cementon Financial Performance hellip
httpslidepdfcomreaderfulla-study-a-study-on-financial-performance-analysis-with-reference-to-kesoram 4781
47
Interpretation of comparative balance sheet of 2008-2009
Reserves amp Surplus were increased to 3753 (percent) ie in Rupees 34939
crores
Revaluation Reserves decreased to 121 ie in Rupees 2270 crores
Secured Loans are increased to 5821 ie in Rupees 56521 crores And UN
secured loans highly Increased to 25795
Current liabilities and Provisions are increased to 1668 and 451 respectively ie in
Rupees 9520 amp 1490 crores
Fixed assets were highly increased to 6642 ie in Rupees 72011 crores
Investments were increased to 2917 ie in Rupees 1395 crores
Sundry debtors increased to 3922 ie in Rupees 10710 crores
Current assets increased 3576 ie in Rupees 27020 crores And Loans amp
Advances increased to 2246 respectively
The overall financial position was satisfactory
8102019 A Study A Study On Financial Performance Analysis With Reference To Kesoram Cementon Financial Performance hellip
httpslidepdfcomreaderfulla-study-a-study-on-financial-performance-analysis-with-reference-to-kesoram 4881
48
Comparative Balance Sheet of Kesoram in the Year between 2009-2010
(Rupees in crores)
Years Changes
Particulars 2009 2010 In Rupees In Percentage
Liabilities
Share Capital 4574 4574 000 000
Reserves amp Surplus 128024 149111 21087 1647
Revaluation Reserves 412 339 -073 -1772
Loans
Secured Loans 153627 186372 32745 2131
Un Secured Loans 43416 126250 82834 19079
Deferred Tax Liabilities 000 000 000
Current Liabilities
Provisions 34529 35734 1205 349
Current Liabilities 66587 107688 41101 6173
Total 431169 610068 178899 4149
Assets
Net Block 180435 343182 162747 9020
Capital WIP 86485 41283 -45202 -5227
Investments 6178 5143 -1035 -1675
Current Assets
Inventories 58906 91619 32713 5553
Sundry Debtors 38017 54289 16272 4280
Cash amp Bank Balances 5657 8014 2357 4167
Total Current Assets 102580 153922 51342 5005
Loans amp Advances 55462 66506 11044 1991
Fixed Deposits 028 031 003 1071
Total 431169 610068 178899 4149
8102019 A Study A Study On Financial Performance Analysis With Reference To Kesoram Cementon Financial Performance hellip
httpslidepdfcomreaderfulla-study-a-study-on-financial-performance-analysis-with-reference-to-kesoram 4981
49
Interpretation of comparative balance sheet of 2009-2010
Reserves amp surplus increased to 1647 ie in Rupees 21087 crores
Revaluation Reserves decreased to 1772 ie in Rupees 073 crores
Secured loans increased to 2131 ie in Rupees 32745 crores
Current Liabilities were increased to 6173 ie in Rupees 41101 crores and
Provisions 349 ie in Rupees 1205 crores
Fixed Assets were increased to 9020 ie in Rupees 162747 crores
Investments were decreased to 1675 ie in Rupees 1035 crores
Sundry debtors were increased to 4280 ie in Rupees 16272 crores
Current assets increased to 5005 ie in Rupees 51342 crores And loans and
Advances increased 1919 ie in Rupees 11044 crores
The overall financial position was satisfactory
8102019 A Study A Study On Financial Performance Analysis With Reference To Kesoram Cementon Financial Performance hellip
httpslidepdfcomreaderfulla-study-a-study-on-financial-performance-analysis-with-reference-to-kesoram 5081
50
Comparative Balance Sheet of Kesoram in the Year between 2010-2011
(Rupees in crores)
Years Changes
Particulars 2010 2011 In Rupees In Percentage
Liabilities
Share Capital 4574 4574 000 000
Reserves amp Surplus 149111 125162 -23949 -1606
Revaluation Reserves 339 289 -050 -1475
Loans
Secured Loans 186372 237183 50811 2726
Un Secured Loans 126250 162744 36494 2891
Deferred Tax Liabilities 000 000 000
Current Liabilities
Provisions 35734 1494 -34240 -9582
Current Liabilities 107688 113902 6214 577
Total 610068 645348 35280 578
Assets
Net Block 343182 369172 25990 757
Capital WIP 41283 43781 2498 605
Investments 5143 6582 1439 2798
Current Assets
Inventories 91619 111855 20236 2209
Sundry Debtors 54289 63134 8845 1629
Cash amp Bank Balances 8014 7188 -826 -1031
Total Current Assets 153922 182177 28255 1836
Loans amp Advances 66506 43460 -23046 -3465
Fixed Deposits 031 176 145 46774
Total 610068 645348 35280 578
8102019 A Study A Study On Financial Performance Analysis With Reference To Kesoram Cementon Financial Performance hellip
httpslidepdfcomreaderfulla-study-a-study-on-financial-performance-analysis-with-reference-to-kesoram 5181
51
Interpretation of comparative balance sheet of 2010-2011
Reserves amp surplus decreased to 1606 ie in Rupees 23949 crores
Revaluation Reserves decreased to 1475 ie in Rupees 050 crores
Secured loans increased to 2726 ie in Rupees 50811 crores
Current Liabilities were increased to 577 ie in Rupees 6214 crores
Provisions decreased to 9582 ie in Rupees 34240 crores
Fixed Assets were increased to 757 ie in Rupees 25990 crores
Investments were decreased to 2798 ie in Rupees 1439 crores
Sundry debtors were increased to 1629 ie in Rupees8845 crores
Current assets increased to 1836 ie in Rupees 28255 crores And loans and
Advances increased 3465 ie in Rupees 23046 crores
The overall financial position was UN satisfactory
8102019 A Study A Study On Financial Performance Analysis With Reference To Kesoram Cementon Financial Performance hellip
httpslidepdfcomreaderfulla-study-a-study-on-financial-performance-analysis-with-reference-to-kesoram 5281
52
Comparative Balance Sheet of Kesoram In The Year Between 2011-2012
(Rupees in crores)
Years Changes
Particulars 2011 2012 In Rupees In Percentage
Liabilities
Share Capital 4574 4574 000 000
Reserves amp Surplus 125162 86657 -38505 -3076
Revaluation Reserves 289 270 -019 -657
Loans
Secured Loans 237183 317792 80609 3399
Un Secured Loans 162744 92742 -70002 -4301
Deferred Tax Liabilities 000 000 000
Current Liabilities
Provisions 1494 40726 39232 262597
Current Liabilities 113902 180010 66108 5804
Total 645348 722771 77423 1200
Assets 000
Net Block 369172 358721 -10451 -283
Capital WIP 43781 68065 24284 5547
Investments 6582 6636 054 082
Current Assets
Inventories 111855 99516 -12339 -1103
Sundry Debtors 63134 67358 4224 669
Cash amp Bank Balances 7188 6959 -229 -319
Total Current Assets 182177 173833 -8344 -458
Loans amp Advances 43460 115409 71949 16555
Fixed Deposits 176 107 -069 -3920
Total 645348 722771 77423 1200
8102019 A Study A Study On Financial Performance Analysis With Reference To Kesoram Cementon Financial Performance hellip
httpslidepdfcomreaderfulla-study-a-study-on-financial-performance-analysis-with-reference-to-kesoram 5381
53
Interpretation of comparative balance sheet of 2011-2012
Reserves amp surplus decreased to 3076 ie in Rupee 38505 crores
Revaluation Reserves decreased to 657 ie in Rupees 019 crores
Secured loans increased to 3399 ie in Rupees 80699 crores
Current Liabilities were increased to 5804 ie in Rupees 66108 crores
Provisions increased to 262597 ie in Rupees 39232 crores
Fixed Assets were decreased to 283 ie in Rupee 10451 crores
Investments were increased to 082 ie in Rupees 054 crores
Sundry debtors were increased to 669 ie in Rupees 4224 crores
Current assets decreased to 458 ie in Rupees 8344 crores And loans and
Advances increased 16555 ie in Rupees 71949 crores
The overall financial position was UN satisfactory
8102019 A Study A Study On Financial Performance Analysis With Reference To Kesoram Cementon Financial Performance hellip
httpslidepdfcomreaderfulla-study-a-study-on-financial-performance-analysis-with-reference-to-kesoram 5481
54
Common Size Balance Sheet of Kesoram For The Year 2008-2009
(Rupees in crores)
Particulars 2008 Change Percentage 2009 Change Percentage
Liabilities
Share Capital 4574 154 4574 106
Reserves amp Surplus 93085 3129 128024 2969
Revaluation Reserves 533 018 412 010
Loans
Secured Loans 97106 3264 153627 3563
Un Secured Loans 12129 408 43416 1007
Deferred Tax Liabilities 000 000 000 000
Current Liabilities
Provisions 33039 1110 34529 801
Current Liabilities 57067 1918 66587 1544
Total 297533 10000 431169 10000
Assets
Net Block 108424 3644 180435 4185
Capital WIP 63459 2133 86485 2006
Investments 4783 161 6178 143
Current Assets
Inventories 44217 1486 58906 1366
Sundry Debtors 27307 918 38017 882
Cash amp Bank Balances 4036 136 5657 131
Loans amp Advances 45289 1522 55462 1286
Fixed Deposits 018 001 028 001
Total 297533 10000 431169 10000
8102019 A Study A Study On Financial Performance Analysis With Reference To Kesoram Cementon Financial Performance hellip
httpslidepdfcomreaderfulla-study-a-study-on-financial-performance-analysis-with-reference-to-kesoram 5581
55
Interpretation of Common Size Balance Sheet of 2008-2009
Share capital was recorded 154 percent in the total liabilities in the year 2008 it is
decreased to 106 in the year 2009
Reserves amp surplus contributed to 3129 in the total liabilities in the year 2008 it is
decreased to 2969 in the year 2009
Secured loans were 3264 in the total liabilities in the year 2008 it is increased to
3563 in the year 2009
Current Liabilities shown to 1918 in the total liabilities in the year 2008 it is
decreased to 1544 in the year 2009
Provisions 1110 in the total liabilities in the year 2008 it is decreased to 801 in the
year 2009
Fixed Assets were 3644 in the total liabilities in the year 2008 ie decreased to 4185
in the year 2009
Investments were 161 in the total liabilities in the year 2008 it is decreased to 143
in the year 2009
Sundry debtors were 918 in the total liabilities in the year 2008 it is decreased to 882
in the year 2009
8102019 A Study A Study On Financial Performance Analysis With Reference To Kesoram Cementon Financial Performance hellip
httpslidepdfcomreaderfulla-study-a-study-on-financial-performance-analysis-with-reference-to-kesoram 5681
56
Common Size Balance Sheet of Kesoram For The Year 2009-2010
(Rs in crores)
Particulars 2009 Change Percentage 2010Change
Percentage
Liabilities
Share Capital 4574 106 4574 075
Reserves amp Surplus 128024 2969 149111 2444
Revaluation Reserves 412 010 339 006
Loans
Secured Loans 153627 3563 186372 3055
Un Secured Loans 43416 1007 126250 2069
Deferred Tax Liabilities 000 000 000 000
Current Liabilities
Provisions 34529 801 35734 586
Current Liabilities 66587 1544 107688 1765
Total 431169 10000 610068 10000
Assets
Net Block 180435 4185 343182 5625
Capital WIP 86485 2006 41283 677
Investments 6178 143 5143 084
Current Assets
Inventories 58906 1366 91619 1502
Sundry Debtors 38017 882 54289 890
Cash amp Bank Balances 5657 131 8014 131
Loans amp Advances 55462 1286 66506 1090
Fixed Deposits 028 001 031 001
Total 431169 10000 610068 10000
8102019 A Study A Study On Financial Performance Analysis With Reference To Kesoram Cementon Financial Performance hellip
httpslidepdfcomreaderfulla-study-a-study-on-financial-performance-analysis-with-reference-to-kesoram 5781
57
Interpretation of common size balance sheet of 2009-2010
Share capital was recorded 106 percent in the total liabilities in the
year 2009 it is decreased to 075 in the year 2010
Reserves amp surplus contributed to 2969 in the total liabilities in the
year 2009 it is decreased to2444 in the year 2010
Secured loans were 3563 in the total liabilities in the year 2009 it is
increased to 3055 in the year 2010
Current Liabilities shown to 1544 in the total liabilities in the year
2009 it is decreased to 1765 in the year 2010
Provisions 801 in the total liabilities in the year 2009 it is decreased
to 586 in the year 2010
Fixed Assets were 4185 in the total liabilities in the year 2009 ie
increased to 5625 in the year 2010
Investments were 143 in the total liabilities in the year 2009 it is
decreased to 084 in the year 2010
Sundry debtors were 882 in the total liabilities in the year 2009 it is
increased to 890 in the year 2010
8102019 A Study A Study On Financial Performance Analysis With Reference To Kesoram Cementon Financial Performance hellip
httpslidepdfcomreaderfulla-study-a-study-on-financial-performance-analysis-with-reference-to-kesoram 5881
58
Common Size Balance sheet of Kesoram for the year 2010-2011
983080Rupees in crores)
Particulars 2010 Change Percentage 2011
Change
Percentage
Liabilities
Share Capital 4574 075 4574 071
Reserves amp Surplus 149111 2444 125162 1939
Revaluation Reserves 339 006 289 004
Loans
Secured Loans 186372 3055 237183 3675
Un Secured Loans 126250 2069 162744 2522
Deferred Tax Liabilities 000 000 000 000
Current Liabilities
Provisions 35734 586 1494 023
Current Liabilities 107688 1765 113902 1765
Total 610068 10000 645348 10000
Assets
Net Block 343182 5625 369172 5721
Capital WIP 41283 677 43781 678
Investments 5143 084 6582 102
Current Assets
Inventories 91619 1502 111855 1733
Sundry Debtors 54289 890 63134 978
Cash amp Bank Balances 8014 131 7188 111
Loans amp Advances 66506 1090 43460 673
Fixed Deposits 031 001 176 003
Total 610068 10000 645348 10000
8102019 A Study A Study On Financial Performance Analysis With Reference To Kesoram Cementon Financial Performance hellip
httpslidepdfcomreaderfulla-study-a-study-on-financial-performance-analysis-with-reference-to-kesoram 5981
59
Interpretation of Common Size Balance Sheet Of 2010-2011
Share capital was recorded 075 percent in the total liabilities in the year 2010 it is
decreased to 071 in the year 2011
Reserves amp surplus contributed to 2444 in the total liabilities in the year 2010 it is
decreased to1939 in the year 2011
Secured loans were 3055 in the total liabilities in the year 2010 it is increased to
3675 in the year 2011
Current Liabilities shown to 1765 in the total liabilities in the year 2010 it is
also1765 in the year 2011
Provisions 586 in the total liabilities in the year 2010 it is decreased to 023 in the
year 2011
Fixed Assets were 5625 in the total liabilities in the year 2010 ie increased to 5721
in the year 2011
Investments were 084 in the total liabilities in the year 2010 it increased to 102 in
the year 2011
Sundry debtors were 890 in the total liabilities in the year 2010 it is increased to 978
in the year 2011
8102019 A Study A Study On Financial Performance Analysis With Reference To Kesoram Cementon Financial Performance hellip
httpslidepdfcomreaderfulla-study-a-study-on-financial-performance-analysis-with-reference-to-kesoram 6081
60
Common Size Balance Sheet of Kesoram for the Year 2011-2012
983080Rupees in crores)
Particulars 2011 Change Percentage 2012
Change
Percentage
Liabilities
Share Capital 4574 071 4574 063
Reserves amp Surplus 125162 1939 86657 1199
Revaluation Reserves 289 004 270 004
Loans
Secured Loans 237183 3675 317792 4397
Un Secured Loans 162744 2522 92742 1283
Deferred Tax Liabilities 000 000 000 000
Current Liabilities
Provisions 1494 023 40726 563
Current Liabilities 113902 1765 180010 2491
Total 645348 10000 722771 10000
Assets
Net Block 369172 5721 358721 4963
Capital WIP 43781 678 68065 942
Investments 6582 102 6636 092
Current Assets
Inventories 111855 1733 99516 1377
Sundry Debtors 63134 978 67358 932
Cash amp Bank Balances 7188 111 6959 096
Loans amp Advances 43460 673 115409 1597
Fixed Deposits 176 003 107 001
Total 645348 10000 722771 10000
8102019 A Study A Study On Financial Performance Analysis With Reference To Kesoram Cementon Financial Performance hellip
httpslidepdfcomreaderfulla-study-a-study-on-financial-performance-analysis-with-reference-to-kesoram 6181
61
Interpretation of common size balance sheet of 2011-2012
Share capital was recorded 071 percent in the total liabilities in the year 2011 it is
decreased to 063 in the year 2012
Reserves amp surplus contributed to 1939 in the total liabilities in the year 2011 it
is decreased to 1199 in the year 2012
Secured loans were 3675 in the total liabilities in the year 2011 it is increased to
4397 in the year 2012
Current Liabilities shown to 1765 in the total liabilities in the year 2011 it is
increased to 2491 in the year 2012
Provisions 023 in the total liabilities in the year 2011 it is increased to 563 in the
year 2012
Fixed Assets were 5721 in the total liabilities in the year 2011 ie decreased to
4963 in the year 2012
Investments were 102 in the total liabilities in the year 2011 it increased to 092
in the year 2012
Sundry debtors were 978 in the total liabilities in the year 2011 it is decreased to
932 in the year 2012
8102019 A Study A Study On Financial Performance Analysis With Reference To Kesoram Cementon Financial Performance hellip
httpslidepdfcomreaderfulla-study-a-study-on-financial-performance-analysis-with-reference-to-kesoram 6281
Trend Analysis
Share Capital-
Year
Amount
(In Crores) Trend
IncreaseDecrease
Base Year Previous Year
2008 4574 10000 000 000
2009 4574 10000 000 000
2010 4574 10000 000 000
2011 4574 10000 000 000
2012 4574 10000 000 000
Trend Percentages in Share Capital
Share capital shown a constant trend in the period 2008 and 2012
Share capital is 4574 crores all the years from 2008-2012
8102019 A Study A Study On Financial Performance Analysis With Reference To Kesoram Cementon Financial Performance hellip
httpslidepdfcomreaderfulla-study-a-study-on-financial-performance-analysis-with-reference-to-kesoram 6381
Reserves amp Surplus-
Year
Amount
(In Crores) Trend
IncreaseDecrease
Base Year Previous Year
2008 93085 10000 000 000
2009 128024 13753 3753 3753
2010 149111 16019 6019 2266
2011 125162 13446 3446 -2573
2012 86657 9309 -691 -4137
Trend Percentages in Reserves amp Surplus
Reserves amp surplus shown an increasing trend in the period between 2008 and 2010
The average trend was 13277 till 2010
The Reserves amp surplus was showing decreasing trend in the period 2011-2012 (ie
from 16019 in 2010 to 9309 in 2012)
The decreasing trend in Reserves amp surplus indicates the decrease in profits of the
firm
8102019 A Study A Study On Financial Performance Analysis With Reference To Kesoram Cementon Financial Performance hellip
httpslidepdfcomreaderfulla-study-a-study-on-financial-performance-analysis-with-reference-to-kesoram 6481
Investments-
Year
Amount
(In Crores) Trend
IncreaseDecrease
Base Year Previous Year
2008 4783 10000 000 000
2009 6178 12917 2917 2917
2010 5143 10753 753 -2164
2011 6582 13761 3761 3009
2012 6636 13874 3874 113
Trend Percentages in Investments-
The investments are shown an increasing trend in the period between 2008 ndash 2009
and it is decreasing in the year 2010
The average trend was 11458 till 2009
The investments increased in the periods 2011-2012 (ie from 10753 in 2010 to
13874 in 2012)
The overall trend in investments shown is satisfactory
8102019 A Study A Study On Financial Performance Analysis With Reference To Kesoram Cementon Financial Performance hellip
httpslidepdfcomreaderfulla-study-a-study-on-financial-performance-analysis-with-reference-to-kesoram 6581
Net Current Assets-
Year
Amount
(In Crores) Trend
IncreaseDecrease
Base Year Previous Year
2008 30761 10000 000 000
2009 56954 18515 8515 8515
2010 77037 25044 15044 6529
2011 110417 35895 25895 10851
2012 68613 22305 12305 -13590
Trends in Net Current Assets-
The NCA shown positive (increasing) trend
The NCA are increased to 35895 (the year 2011) compared with base year and
decreased in the year 2012 to 22305
The NCA shown increased trend from year and crossed 100
The overall trend was good
8102019 A Study A Study On Financial Performance Analysis With Reference To Kesoram Cementon Financial Performance hellip
httpslidepdfcomreaderfulla-study-a-study-on-financial-performance-analysis-with-reference-to-kesoram 6681
66
Ratio Analysis-
Current Ratio-
Current Ratio = Current Assets Current Liabilities
Current assets are cash in hand Cash at bank Marketable Securities(short term) short term
Investment Bills receivables sundry debtors Inventories (stock) Work in progress prepaid
expenses Current Liabilities are outstanding expenses Bills payable sundry Creditors
short-term advances income tax payable and Dividend payable
Current Ratio of Kesoram-
(Rupees in crores)
Year Current Assets Current Liabilities Current Ratio
2007-08 75560 57067 132
2008-09 102580 66587 154
2009-10 153922 107688 143
2010-11 182177 113902 160
2011-12 173833 180010 097
Interpretation-
As per the standard rule of current ratio ie 21 where current assets double the current
liabilities is considered satisfactory
In the present analysis the current ratio of the Kesoram is not satisfactory
from the above table It was assessed that the current ratio for all the five year is lower (less)
than the standard rule ie 21 And it is 097 in the year 2011-2012 (current year) This is
highly UN satisfactory
8102019 A Study A Study On Financial Performance Analysis With Reference To Kesoram Cementon Financial Performance hellip
httpslidepdfcomreaderfulla-study-a-study-on-financial-performance-analysis-with-reference-to-kesoram 6781
Quick Ratio-
Quick ratio also known as acid-test ratio establishes a relationship between quick
assets and the current liabilities Cash is the most liquid asset It is calculated by dividing
quick assets by current liabilities
Quick ratio = Quick Assets Current Liabilities
(Quick Assets = Current assets ndash Inventory)
Quick Ratio of Kesoram-
Rupees in crores)
Year Total QuickAssets
Current Liabilities Quick Ratio
2007-08 33343 57067 058
2008-09 43674 66587 066
2009-10 62303 107688 058
2010-11 70322 113902 0622011-12 74333 180010 041
Interpretation-
Usually a high Quick ratio is an indication that the company is liquid and has the ability to
meet its current or liquid liabilities in time on the other hand a low Quick Ratio represents
8102019 A Study A Study On Financial Performance Analysis With Reference To Kesoram Cementon Financial Performance hellip
httpslidepdfcomreaderfulla-study-a-study-on-financial-performance-analysis-with-reference-to-kesoram 6881
that the companyrsquos liquidity position is not good The above table showing the quick ratios
of Kesoram are canrsquot be considered satisfactory
Leverage Ratios-
Debt-Equity Ratio-
Debt-Equity Ratio = Total Long Term Debt Equity Share Holders Fund
Total Long term Debt= Debenture Capital + Long term loans from banks and financial
institutions + Public deposits
Equity Share Holders fund = Equity + Reserves and Surplus
Debt Equity Ratio of Kesoram
(Rupees in crores)
Year Total Debt Share Holders Fund Debt Equity Ratio
2007-08 109235 98192 111
2008-09 197043 133010 148
2009-10 312622 154024 203
2010-11 399927 130025 308
2011-12 410534 91501 449
8102019 A Study A Study On Financial Performance Analysis With Reference To Kesoram Cementon Financial Performance hellip
httpslidepdfcomreaderfulla-study-a-study-on-financial-performance-analysis-with-reference-to-kesoram 6981
Interpretation-
The Debt-Equity Ratio accepted standard is 05 This ratio reflects the relative contribution
of creditors and owners of business in its financing From the above it is clear that the long
term debt is more than that of the share holdersrsquo fund So we can interpret that the firmrsquosassets are financed more by the external funds rather than by the internal funds
8102019 A Study A Study On Financial Performance Analysis With Reference To Kesoram Cementon Financial Performance hellip
httpslidepdfcomreaderfulla-study-a-study-on-financial-performance-analysis-with-reference-to-kesoram 7081
Fixed Asset Ratio-
Net Sales
Fixed Asset Ratio = helliphelliphelliphelliphelliphelliphelliphelliphelliphelliphellip
Net Assets
Fixed Asset Ratio of Kesoram-
(Rupees in crores)
Year Net Sales Net Assets Fixed Assets Ratio
2007-08 300271 358721 084
2008-09 389797 369172 106
2009-10 475062 343182 1382010-11 539788 180435 299
2011-12 59182 108424 546
Interpretation
This ratio indicates the extent to which the assets of the companyrsquos can be lost without
affecting the interest of the creditors of the company Higher the ratios better the long-term
position of the companyThe above table shows fixed assets ratio in increasing trend Which is good for the
company
8102019 A Study A Study On Financial Performance Analysis With Reference To Kesoram Cementon Financial Performance hellip
httpslidepdfcomreaderfulla-study-a-study-on-financial-performance-analysis-with-reference-to-kesoram 7181
Overall Profitability Ratios-
Net Profit Ratio
Net Profit Ratio indicates net margin on sales It is given by the following equation
Net Profit Ratio = (Net Profit Sales) 100
Net Profit Ratio of Kesoram
(Rupees in crores)
Year Net Profit Sales Net Profit Ratio
2007-08 37917 300271 1263
2008-09 41432 389797 1063
2009-10 20298 475062 427
2010-11 -28176 539788 -5222011-12 -38108 59182 -644
Interpretation
It establishes a relationship between net profits after tax and net sales and
indicates the efficiency of the management in manufacturing selling administrative and
other activities of the company
The higher the ratio the better is the profitability or performance of the business
The above table depicts the net profit Ratio of Kesoram has decreased every year from
2007-2008 to 2011-2012It further decreased to negative in the year 2010-11 to -522 and -
644 in the year 2011-2012 This shows constant decrease in the profits of the company
8102019 A Study A Study On Financial Performance Analysis With Reference To Kesoram Cementon Financial Performance hellip
httpslidepdfcomreaderfulla-study-a-study-on-financial-performance-analysis-with-reference-to-kesoram 7281
72
Return on Investment-
Net Profit
Return on Investment = helliphelliphelliphelliphelliphelliphelliphelliphelliphelliphelliphellip X 100
Share Holders Fund
Return on Investment Ratio of Kesoram-
(Rupees in crores)
Year Net Profit Share Holders Fund Return On Investment
2007-08 37917 98192 3862
2008-09 41432 133010 3115
2009-10 20298 154024 1318
2010-11 -28176 130025 -2167
2011-12 -38108 91501 -4165
Interpretation-
The above table reveals how well the resources of the firm are being used Higher
the ratio better the result The above ratio implies how well the firm is growing in
terms of profitability and efficiency From the above table we can concern that the return on
investment is in decreasing trend ROI is highest in the year 2007-2008 as 3862 But
there after itrsquos decreased every year
The ROI is negative in the years 2010-2011 amp 2011-2012 as -2167 amp -4165 respectively
Which is not a good sign for the firm
8102019 A Study A Study On Financial Performance Analysis With Reference To Kesoram Cementon Financial Performance hellip
httpslidepdfcomreaderfulla-study-a-study-on-financial-performance-analysis-with-reference-to-kesoram 7381
8102019 A Study A Study On Financial Performance Analysis With Reference To Kesoram Cementon Financial Performance hellip
httpslidepdfcomreaderfulla-study-a-study-on-financial-performance-analysis-with-reference-to-kesoram 7481
8102019 A Study A Study On Financial Performance Analysis With Reference To Kesoram Cementon Financial Performance hellip
httpslidepdfcomreaderfulla-study-a-study-on-financial-performance-analysis-with-reference-to-kesoram 7581
75
CHAPTER V
FINDINGS amp SUGGESTIONS
8102019 A Study A Study On Financial Performance Analysis With Reference To Kesoram Cementon Financial Performance hellip
httpslidepdfcomreaderfulla-study-a-study-on-financial-performance-analysis-with-reference-to-kesoram 7681
76
Findings
The Share capital remains constant Share capital is unchanged all the years from
2008-2012
Reserves amp surplus were recorded an increasing trend in the period between 2008
and 2010It is showing decreasing trend in the period 2011-2012 (ie from 16019
in 2010 to 9309 in 2012)
Current Liabilities were increased compared to base year ie 2008
Provisions increased to 262597 ie in Rupees 39232 crores in the current year
The current ratio for all the five year is lower (less) than the standard rule ie 21
And it is 097 in the year 2011-2012 (current year)
The Debt-Equity Ratio was shown under the standard ratio It is clear that the long
term debt is more than that of the share holdersrsquo fund It indicates that the firm
heavily relying on external funds rather than the internal funds
The operating and net profit of Kesoram is in decreasing trend due to heavy
increase of manufacturing amp administrative expenses
ROI is highest in the year 2007-2008 as 3862 The ROI is negative in the years
2010-2011 amp 2011-2012 as -2167 amp -4165 respectively
Return on Equity Capital Employed Ratio of Kesoram has decreased every year
from 2007-2008 to 2010-2011It further decreased to negative in the year 2011-12 to
-3280
EPS of Kesoram has decreased every year from 2008-12It is negative in the year
2011 amp 12
8102019 A Study A Study On Financial Performance Analysis With Reference To Kesoram Cementon Financial Performance hellip
httpslidepdfcomreaderfulla-study-a-study-on-financial-performance-analysis-with-reference-to-kesoram 7781
77
Suggestion
The organization should adopt an appropriate capital structure
The companyrsquos debt-equity ratio is recorded more or less as 111 in the year 2008
and it is increased to 449 in the year 2012 (current year)The company should
adopt a better debt equity mix in the future to control the fluctuations in returns
The company should control fluctuations in cash and bank balances as it impacts the
current ratio of the company
The provisions are showing increasing trend which indicates risk of debtors The
firm should implement an effective credit management policy It should utilize its
idle funds by decreasing provisions
The company should control heavy increase of manufacturing amp administration
expenses as it is impacting the operating and net profit of company
8102019 A Study A Study On Financial Performance Analysis With Reference To Kesoram Cementon Financial Performance hellip
httpslidepdfcomreaderfulla-study-a-study-on-financial-performance-analysis-with-reference-to-kesoram 7881
78
ANNEXURE
Profit And Loss Account of Kesoram Cement
Mar12 Mar11 Mar10 Mar09 Mar08
12 Months 12 Months 12 Months 12 Months 12 Months
INCOME
Sales Turnover 628260 575072 505151 431613 345700
Excise Duty 36440 35284 30089 41815 45429
NET SALES 591820 539788 475062 389797 300271
Other Income 000 000 000 000 000
TOTALINCOME
596129 548733 481019 393969 302020
EXPENDITURE
Manufacturing
Expenses81903 74803 13974 13153 44113
MaterialConsumed
370897 310150 295550 229359 118448
Personal
Expenses33468 27355 23294 18690 15344
Selling Expenses 81910 78253 58667 48846 45019
AdministrativeExpenses
28225 29308 17219 16179 9907
Expenses
Capitalized000 000 000 000 000
Provisions Made 000 000 000 000 000
TOTAL
EXPENDITURE 596403 519870 408704 326227 232832Operating Profit -4583 19918 66358 63570 67439
EBITDA -274 28864 72316 67742 69188
Depreciation 29740 27259 17280 11186 8927
Other Write-offs 000 000 000 000 000
EBIT -30014 1605 55035 56557 60261
Interest 41015 23983 10921 12087 5426
EBT -71029 -22377 44114 44470 54835
Taxes -32921 5798 23816 3037 16918
Profit and Loss
for the Year-38108 -28176 20298 41432 37917
Non RecurringItems
-1142 7063 3228 -4023 402
Other Non Cash
Adjustments1276 091 207 465 017
OtherAdjustments
000 000 000 000 000
REPORTED
PAT-37974 -21021 23734 37874 38335
8102019 A Study A Study On Financial Performance Analysis With Reference To Kesoram Cementon Financial Performance hellip
httpslidepdfcomreaderfulla-study-a-study-on-financial-performance-analysis-with-reference-to-kesoram 7981
79
Balance Sheet Of Kesoram
Years
Particulars 2008 2009 2010 2011 2012
Liabilities
Share Capital 4574 4574 4574 4574 4574Reserves amp Surplus 93085 128024 149111 125162 86657
Revaluation Reserves 533 412 339 289 27
Loans
Secured Loans 97106 153627 186372 237183 317792
Un Secured Loans 12129 43416 12625 162744 92742
Deferred Tax Liabilities 0 0 0 0 0
Current Liabilities
Provisions 33039 34529 35734 1494 40726
Current Liabilities 57067 66587 107688 113902 18001
Total 297533 431169 610068 645348 722771
Assets
Net Block 108424 180435 343182 369172 358721
Capital WIP 63459 86485 41283 43781 68065
Investments 4783 6178 5143 6582 6636
Current Assets
Inventories 44217 58906 91619 111855 99516
Sundry Debtors 27307 38017 54289 63134 67358
Cash amp Bank Balances 4036 5657 8014 7188 6959
Total Current Assets 7556 10258 153922 182177 173833Loans amp Advances 45289 55462 66506 4346 115409
Fixed Deposits 018 028 031 176 107
Total 297533 431169 610068 645348 722771
8102019 A Study A Study On Financial Performance Analysis With Reference To Kesoram Cementon Financial Performance hellip
httpslidepdfcomreaderfulla-study-a-study-on-financial-performance-analysis-with-reference-to-kesoram 8081
80
KEY ITEMS 2012 2011 2010 2009 2008
Preference
Dividend 0 0 0 0 0
Equity Dividend 457 2516 2516 2516 2516
Equity Dividend
() 999 55 55 55 55
Shares in Issue(Lakhs) 45743 45743 45743 45743 45743
EPS - Annualised
(Rs) -8302 -4595 5188 828 838
8102019 A Study A Study On Financial Performance Analysis With Reference To Kesoram Cementon Financial Performance hellip
httpslidepdfcomreaderfulla-study-a-study-on-financial-performance-analysis-with-reference-to-kesoram 8181
BIBLIOGRAPHY
Sl
No
Books Author Name
1 Financial Management Khan amp JAIN
2 Financial Management IMPandey
3 Management Accounting RPTrivedi
Websites amp Search Engines
1 wwwkesoramcom983086
2 wwwmoneycontrolcom
3 wwwgooglefinancecom983086
Annual reports of Kesoram cement limited 2008-2012
8102019 A Study A Study On Financial Performance Analysis With Reference To Kesoram Cementon Financial Performance hellip
httpslidepdfcomreaderfulla-study-a-study-on-financial-performance-analysis-with-reference-to-kesoram 2581
25
In Spun Pipes amp Foundries a unit of the Company work suspended from 2nd May 2008
still commences till further notice
The Company as of now is listed on three major Stock Exchanges in India ie Bombay
Stock Exchange Ltd Mumbai Calcutta Stock Exchange Association Ltd Kolkata and
National Stock Exchange of India Ltd Mumbai and at the Societe de la Bourse de
Luxembourg Luxembourg
A further expansion upto 165 million tons of cement per annum in Vasavadatta Cement at
Sedam in Karnataka as unit IV at the same site is in progress with a 175 MW Captive
Power Plant involving a capital expenditure of about Rs 78350 crores (including the cost
of Captive Power Plant)
The commercial production of cement in the aforesaid unit IV has commenced in June
2009 The work for the further expansion in the Tyres Section at Uttarakhand for radial
tyres with 100 MT per day capacity and bias tyres with 125 MT per day capacity involving
an estimated aggregate capital outlay of about Rs 840 crores is under progress The Board
has further approved a Motor Cycle Tyre Project of 70 MT per day capacity at the same site
involving a capital outlay of Rs190 crore The civil construction of both the Projects is in
full swing The commercial production in both the Projects is likely to start by December
2009 January 2010
Birla Supreme in popular brand of Kesoram cement from its prestigious plant of
Basantnagar in AP which has outstanding track record In performance and productivity
serving the nation for the last two and half decades It has proved its distinction by bagging
several national awards It also has the distinction of achieving optimum capacity
utilization
Kesoram offers a choice of top quality portioned cement for light heavy
constructions and allied applications Quality is built every fact of the operations
The plant lay out is rational to begin with The limestone is rich in calcium
carbonate a key factor that influences the quality of final product The day process
technology uses in the latest computerized monitoring overseas the manufacturing process
Samples are sent regularly to the bureau of Indian standards National council of
construction and building material for certification of derived quality norms
8102019 A Study A Study On Financial Performance Analysis With Reference To Kesoram Cementon Financial Performance hellip
httpslidepdfcomreaderfulla-study-a-study-on-financial-performance-analysis-with-reference-to-kesoram 2681
26
The company has vigorously undertaking different promotional measures for
promoting their product through different media which includes the use of news papers
magazine hoarding etc
Kesoram cement industry distinguished itself among all the cement factories in
Indian by bagging the National Productivity Award consecutively for two years ie for the
year 1985-1987 The federation of Andhra Pradesh Chamber amp Commerce and Industries
(FAPCCI) also conferred on Kesoram Cement An award for the best industrial promotion
expansion efforts in the state for the year 1984 Kesoram also bagged FAPCCI awarded for
ldquoBest Family Planning Effort in the staterdquo for the year 1987-1988
One among the industrial giants in the country today serving the nation on the
industrial front Kesoram industry ltd has a checked and eventful history dating back to the
twenties when the Industrial House of Birlarsquos acquired it With only a textile mill under its
banner 1924 it grew from strength to strength and spread its activities to newer fields like
Rayon Transparent paper pipes Refractors tyres and other products
Looking to the wide gap between the demand and supply of vital commodity
cement which play in important role in National building activity the Government of India
had de-licensed the cement industry in the year 1966 with a review to attract private
entrepreneur to augment the cement production Kesoram rose to the occasions and divided
to set up a few cement plants in the country
Kesoram cement undertaking marketing activities extensively in the state of Andhra
Pradesh Karnataka Tamilnadu Kerala Maharashtra and Gujarat In AP sales Depts are
located in different areas like Karimnagar Warangal Nizamabad Vijayawada and Nellore
In other states it has opened around 10 depots
The market share of Kesoram Cement in AP is 705 The market share of the
company in various states is shown as under
STATES MARKET SHARE
Karnataka 409
Tamilnadu 094
Kerala 029
Maharashtra 281
8102019 A Study A Study On Financial Performance Analysis With Reference To Kesoram Cementon Financial Performance hellip
httpslidepdfcomreaderfulla-study-a-study-on-financial-performance-analysis-with-reference-to-kesoram 2781
27
Process and Quality Control
It has been the endeavor of Kesoram to incorporate the Worldrsquos latest technology in
the plant and today the plant has the most sophisticated
X-ray analysis
Fully computerized XRF and XRD X-RAY Analyzers keep a constant round the
clock vigil on quality
Supreme performance
One of the largest Cement Plants in Andhra Pradesh the plant incorporate the latest
technology in Cement - making
It is professionally managed and well established Cement Manufacturing Company
enjoying the confidence of the consumers Kesoram has outstanding track record in
performance and productivity with quite a few national and state awards to its credit
BIRLA SUPREME the 43 Grade Cement is a widely accepted and popular brand
in the market commanding a premium
However to meet the specific demands of the consumer Kesoram bought out the 53
grade BIRLA SUPREME ndash GOLD which has special qualities like higher fineness quick-
setting high compressive strength and durability
Supreme Strength
Kesoram Cement has huge captive Limestone Deposits which make it possible tofeed high- grade limestone consistently its natural Grey colour is anion- born ingredient
and gives good shade
Both the products offered by Kesoram ie BIRLA SUPREME-43 Grade and
BIRLA SUPREME-GOLD-53 Grade cement are outstanding with much higher
compressive strength and durability
The following characteristics show their distinctive qualities
Comprehensive
Strength
Opc 43
grls 8112
1989
Birla
Supreme 43
grade
Opc 43 gr
Is 1226987
Birla
Supreme
Gold 53 gr
3 days mpa Min 23 31 + Min 27 38+
7 days mpa Min 23 42+ Min 37 48+
28 days mpa Min 43 50+ Min 53 60+
8102019 A Study A Study On Financial Performance Analysis With Reference To Kesoram Cementon Financial Performance hellip
httpslidepdfcomreaderfulla-study-a-study-on-financial-performance-analysis-with-reference-to-kesoram 2881
28
DC SYSTEM
Clinker making process is a key step in the overall cement making process In the case of
BIRLA SUPREMEGOLD the clinker-making process is totally computer control The
Distributed Control System (DCS) constantly monitors the process and ensures operating
efficiency This eliminates variation and ensures consistency in the quality of Clinker
Physical Characteristics
Ope 43
Is 8 112-89
Birla
Supreme
43 grade
Ope 53 gr
Is 12269-87
Birla Supreme
Gold 53 gr
Setting time Min30 120-180 Min 30 130-170
a Initial (mats) Max 600 180-240 Max 600 170-220
b final (mats) Min 225 270-280 Min 225 300-320
Fincncssm 2Kg Max 10 10-20 Max 10 05-10
Soundness Max 08 004-008 Max 0080 004-02
a le-chart (mm)
b autoclave ()
Supreme Expertise
The Best Technical Team exclusive to Kesoram mans the Plant and monitors the process
to blend the cement in just the required proportions to make BIRLA SUPREMEGOLD OF
Rock Strength
18 Million Tones of Solid Foundation
Staying at the top for over a Quarter Century Quarter Century is no less an achievement
Infact Kesoram is synonymous with for over 28 years
Over the years Kesoram has dispatched 18 million tones of cement to the nook and cornersof the country and joined hands in strengthening the Nation No one else in Andhra Pradesh
has this distinction The prestigious World Bank aided Ramagundam Super Thermal Power
Project of NTPC and Mannair Dam of Pochampad project in AP arc a couple of projects for
which Kesoram Cement was exclusively uses to cite an example
8102019 A Study A Study On Financial Performance Analysis With Reference To Kesoram Cementon Financial Performance hellip
httpslidepdfcomreaderfulla-study-a-study-on-financial-performance-analysis-with-reference-to-kesoram 2981
29
Chemical Characteristics
Opc 43 gr
Is 81 132-989
Birla
Supreme
43 grade
Ope 53 gr
Is 12269-
87
Birla
Supreme
Gold 53 gr
Loss on inflection Max 5 lt16 Max 40 lt15
Insoluble residue Max 20 lt08 Max 20 lt 06
Magnesium oxide Max 60 lt 13 Max 60 lt 13
Lime saturation factor 066-102 08-09 08-102 088-09
Alumna iron ratio MinO66 15-17 MinO66 15-17
Sulfuric anhydride Max 253 16-20 Max 2 53 16-20
Alkalis Chlorides Max 005 Max 001 Max 005 Max 04
Kesoram Cement - advantages
Helps in designing sleeker and more elegant
Structures giving greater flexibility in design concept
Due to its fine quality super fine construction can be achieved Its gives maximum
strength at Minimum use of cement with water in the water cement ratio especially the 53
grade Birlas supreme-gold
Feathers in Kesorams cap
Kesoram has outstanding track record achieving over 100 capacity utilization I
productivity and energy conservation It has proved its distinction by bagging several
national and state awards noteworthy being
NATIONAL
1 National productivity award for 1985-86
2 National productivity award for 1986-87
3 National award for mines safety for 1985-86
4 National award for mines safety for 1986-875 National award for energy conservation 1989-90
8102019 A Study A Study On Financial Performance Analysis With Reference To Kesoram Cementon Financial Performance hellip
httpslidepdfcomreaderfulla-study-a-study-on-financial-performance-analysis-with-reference-to-kesoram 3081
30
STATE
1 AP State productivity award for 1988
2 State award for best industrial management 1988-89
3 Best industrial productivity award of FAPCCI (federation of AP chamber of
commerce and industry) 1991
4 Best management award of the state Govt 1993
5 FAPCCI award for the workers welfare 1995-96
ISO 9002
All quality systems of Kesoram have been certified under ISO 90021S 4002 which
proves the worldwide acceptance of the products
All quality systems in production and marketing of the product have been certified by BIS
under ISO 90021S 14002
The first unit was installed at basanthnagar with a capacity of 25 ndashlakhs TPA (tones per
annum) incorporating humble supervision preheated system during the year 1969
The second unit followed suit with added a capacity of 2 lakhs TPA in 1971
The plant was further expanded to 9 lakhs by adding 25 lakhs tones in august 1978 113
lakhs tones in January 1981 and 087 lakhs tones in September 1981
Power
Singareni collieries make the supply of coal for this industry and the power was
obtained from AP TRANSCO The power demand for the factory is about 21MW Kesoram
has got 2-diesel generator seats of 4 MW each installed in the year 1987
Kesoram cement now has a 15MWcaptive power plant to facilities for uninterrupted
power supply for manufacturing of cement
Performance
The performance of kersoram cement industry has been outstanding achieving over
cent percent capacity utilization all through despite many odds like power cuts and which
most 40 was wasted due to wagon shortage etc
The company being a continuous process industry works round the clock and has
excellent records of performance achieving over 1005 capacity utilization
Kesoram has always combined technical progress with industrial performance The
company had glorious track record for the last 27 years in the industry
Technology
8102019 A Study A Study On Financial Performance Analysis With Reference To Kesoram Cementon Financial Performance hellip
httpslidepdfcomreaderfulla-study-a-study-on-financial-performance-analysis-with-reference-to-kesoram 3181
31
Kesoram cement uses most modern technology and the computerized control in the
plant A team of dedicated and well- experienced experts manages the plant
The quality is maintained much above the bureau of Indian standards
The raw materials used for manufacturing cement are
Lime stone
Bauxite
Hematite
Gypsum
Environmental and Social Obligations
For environmental promotion and to keep ndashup the ecological balance this section
has planted over two lakhs trees on social obligation front this section has undertaken
various social welfare programs by adopting ten nearly villages organizing family welfare
campus surgical camps animal health camps blood donation camps children immunization
camps seeds training for farmers etc were arranged
Welfare and Recreation Facilities
For the purpose of recreation facilities 2 auditoriums were provided for playing
indoor games cultural function and activities like drama music and dance etc
The industry has provided libraries and reading rooms About 1000 books are available in
the library All kinds of newspaper magazines are made available
Canteen is provided to cater to the needs of the employees for supply of snacks tea
coffee and meals etc
One English medium and one Telugu medium school are provided to meet the
educational requirements
The company has provided a dispenser with a qualified medical office and
paramedical staff for the benefit of the employees The employees covered under ESI
scheme have to avail the medical facilities from the ESI hospital
Competitions in sports and games are conducted every year for august 15th
Independence Day and January 26th republic day among the employees
Electricity
The power consumption per ton of cement has come down to 108 units against 113
units last year due to implementation of various energy saving measures The performance
of captive power plant of this section continues to be satisfactory Total power generation
8102019 A Study A Study On Financial Performance Analysis With Reference To Kesoram Cementon Financial Performance hellip
httpslidepdfcomreaderfulla-study-a-study-on-financial-performance-analysis-with-reference-to-kesoram 3281
32
during the year was 84 million units last year This captive power plant is a major role in
keeping power costs with in economic levels
The management has introduced various HRD programs for training and
development and has taken various other measures for the betterment of employeersquos
efficiency
The section has installed adequate air pollution control system and equipment and is
ISO14001 such as Environment management system is under implementation
Awards
Kesoram cement bagged many prestigious awards including national awards for
productivity technology conservation and several state awards since 1984 The following
are the some of important awards
AWARDS OF KESORAM CEMENT
No Year Awards
National
State
1 1989-90 Management award community
Development
State
2 1991 Energy conservation may day award of the
Govt
State
3 1991 Pundit Jawaharlal Nehru rolling trophy for
best
State
4 1993 National productivity effort Indira Gandhi
national award
State
5 1994 Best management award State
6 1994-
1995
Best industrial rebellion award State
7 1995 Rural development by chief minister
Environment and mineral conservation
award
State
8 1995 Best industrial rebellion award State
8102019 A Study A Study On Financial Performance Analysis With Reference To Kesoram Cementon Financial Performance hellip
httpslidepdfcomreaderfulla-study-a-study-on-financial-performance-analysis-with-reference-to-kesoram 3381
33
9 1995-
1996
Best effort of an industrial unit to
development rural economy shriSRRungta
award for social
National
10 1996 Awareness for best rural development
efforts
State
11 1999 Best workers welfare best family welfare
award
State
12 2001 First prize for mine environment amppollution
control for the 3rd
year in succession
State
13 2002 Vana mithra award from AP Govt State
14 2003 Company has got OHSAS-18001 State
15 2005 Certification from DNV New Delhi State
16 2006 Award for pollution control and
environmental protection FAPCCI award
for best rural development in the state
State
8102019 A Study A Study On Financial Performance Analysis With Reference To Kesoram Cementon Financial Performance hellip
httpslidepdfcomreaderfulla-study-a-study-on-financial-performance-analysis-with-reference-to-kesoram 3481
34
Products of the organization
8102019 A Study A Study On Financial Performance Analysis With Reference To Kesoram Cementon Financial Performance hellip
httpslidepdfcomreaderfulla-study-a-study-on-financial-performance-analysis-with-reference-to-kesoram 3581
35
CHAPTER-III
LITERATURE REVIEW
8102019 A Study A Study On Financial Performance Analysis With Reference To Kesoram Cementon Financial Performance hellip
httpslidepdfcomreaderfulla-study-a-study-on-financial-performance-analysis-with-reference-to-kesoram 3681
36
Introduction
Financial Performance Analysis
The term lsquofinancial performance analysis also known as analysis and interpretation of
financial statementsrsquo refers to the process of determining financial strength and
weaknesses of the firm by establishing strategic relationship between the items of the
balance sheet profit and loss account and other operative data
ldquoAnalyzing financial statementsrdquo by Metcalf and Titard
ldquoFinancial analysis is a process of evaluating the relationship between component
parts of a financial statement to obtain a better understanding of a firms position and
performancerdquo by Myers
Financial Performance
The word lsquoPerformance is derived from the word lsquoparfourmenrsquo which means lsquoto dorsquo lsquoto
carry outrsquo or lsquoto renderrsquo It refers the act of performing execution accomplishment
fulfillment etc In border sense performance refers to the accomplishment of a given task
measured against preset standards of accuracy completeness cost and speed In other
words it refers to the degree to which an achievement is being or has been accomplished In
the Words of Frich Kohlar ldquoThe performance is a general term applied to a part or to all the
conducts of activities of an organization over a period of time often with reference to past or
projected cost efficiency management responsibility or accountability or the like Thus not
just the presentation but the quality of results achieved refers to the performance
Performance is used to indicate firmrsquos success conditions and compliance
Financial performance refers to the act of performing financial activity In broader
sense financial performance refers to the degree to which financial objectives being or has
been accomplished It is the process of measuring the results of a firms policies and
operations in monetary terms It is used to measure firms overall financial health over a
given period of time and can also be used to compare similar firms across the same industry
or to compare industries or sectors in aggregation
The purpose of financial analysis is to diagnose the information contained in financial
statements so as to Jude the profitability and financial soundness of the firm Just like a
doctor examines his patient by recording his body temperature blood pressure etc Before
8102019 A Study A Study On Financial Performance Analysis With Reference To Kesoram Cementon Financial Performance hellip
httpslidepdfcomreaderfulla-study-a-study-on-financial-performance-analysis-with-reference-to-kesoram 3781
37
making his conclusion regarding the illness and before giving his treatment a financial
analyst analysis the financial statements with various tools of analysis before commenting
upon the financial health or weaknesses of an enterprise
The analysis and interpretation of financial statements is essential to bring out the
mystery behind the figures in financial statements Financial statements analysis is an
attempt to determine the significance and meaning of the financial statement data so that
forecast may be made of the future earnings ability to pay interest and debt maturities (both
current and long term) and profitability of a sound divided policy
Types of financial analysis-
Financial analysis into different categories depending upon
(1) The material used and
(2) The method of operation followed in the analysis or the modus operandi of
analysis
Types of financial analysis
On the basis of material used on the basis of modus operandi
External Internal Horizontal Vertical
Analysis Analysis Analysis Analysis
1 On the basis of material used - According to material used financial analysis canbe of two types
External analysis
Internal analysis
External analysis-
This analysis is done by outsiders who do not have access to the detailed internal
outsiders include investors potential investors Creditors Potential Creditors Government
Agencies Credit Agencies and General Public For financial analysis these external parties
to the firm depend almost entirely on the published financial statements
Internal analysis-
This analysis is undertaken by the persons namely executives and employees of the
organization or by the officers appointed by government or court who have access to the
8102019 A Study A Study On Financial Performance Analysis With Reference To Kesoram Cementon Financial Performance hellip
httpslidepdfcomreaderfulla-study-a-study-on-financial-performance-analysis-with-reference-to-kesoram 3881
38
books of account ( internal accounting records) and other information related to the
business
2 983119983150 983156983144983141 983138983137983155983145983155 983151983142 983149983151983140983157983155 983151983152983141983154983137983150983140983145983085
According to the modus operandi financial analysis can also be of two types
a Horizontal analysis
bVertical analysis
Horizontal analysis-
Horizontal analysis refers to the comparison of financial data of a company for several
years The figures for this type of analysis are presented horizontally over a number of
columns The figures of the various years are compared with standard or base year a base
year is year chosen as beginning point This type of analysis is also called lsquodynamicanalysisrsquo as it is based on the data from year to year rather than on data of any one year The
horizontal analysis makes it possible to focus attention on items that have changed
significantly during the period under view
b Vertical analysis-
Vertical analysis refers to the study of relationship of the various items in the financial
statements of one accounting period In this types of analysis the figures from financial
statement of a year are compared with a base selected from the same yearrsquos statement
Methods of financial analysis-
The following methods of analysis are generally used-
1 Comparative Statements
2 Trend Analysis
3 Common-Size Statements
4 Funds flow Analysis
5 Cash Analysis
6 Ratio Analysis
7 Cost-volume-Profit Analysis
8102019 A Study A Study On Financial Performance Analysis With Reference To Kesoram Cementon Financial Performance hellip
httpslidepdfcomreaderfulla-study-a-study-on-financial-performance-analysis-with-reference-to-kesoram 3981
39
Comparative statements-
The comparative financial statements are statements of the financial position at
different periods of time the elements of financial position are show in a
Comparative Statement provides an idea of financial position at two or more
periods Generally two financial statements (balance sheet and income statement) are
prepared in comparative form for financial analysis
The Comparative Statement May Show-
1 Absolute figures (rupee amounts)
2 Changes in absolute figures ie increase or decrease in absolute figures
3 Absolute data in terms of percentages
4 Increase or decrease in terms of percentages
The Two Comparative Statements Are-
1 Comparative balance sheet and
2 Income statement
1 983107983151983149983152983137983154983137983156983145983158983141 983138983137983148983137983150983139983141 983155983144983141983141983156983085
The comparative balance sheet analysis is the study of the trend of the same items group of
items and computed items in two or more balance sheets of the same business enterprise on
different dates The change in periodic balance sheet items reflect the conduct of a business
the change can be observed by comparison of the balance sheet at the beginning and at the
end of a period and these changes can help in forming an opinion about the progress of an
enterprise
Guide Lines for Interpretation of Comparative Balance Sheet-
While interpreting comparative balance sheet the interpreter is expected to study the
following aspects-
1 Current financial position and liquidity position
2 Long-term financial position
3 Profitability of the concern
8102019 A Study A Study On Financial Performance Analysis With Reference To Kesoram Cementon Financial Performance hellip
httpslidepdfcomreaderfulla-study-a-study-on-financial-performance-analysis-with-reference-to-kesoram 4081
40
Common Size Statement-
The common-size statements balance sheet and income statement are show in
analytical percentages The figures are shown as percentages of total assets total liabilities
and total sales The total assets are taken as 100 and different assets are expressed as a
percentage of the total similarly various liabilities are taken as a part of total liabilities
Common Size Balance Sheet-
A statement in which balance sheet items are expressed as the ratio of each asset to
total assets and the ratio of each liability is expressed as a ratio of total liabilities is called
common size balance The common size balance sheet can be used to compare companies
of differing size The comparison of figures in different periods is not useful because total
figures may be affected by a number of factors It is not possible to establish standard norms
for various assets The trends of figures from year to year may not be studied and even they
may not give proper results
Trend Analysis of Balance Sheet-
Trend analysis is Very important tool of horizontal financial analysis
This analysis enables to known the change in the financial function and operating efficiency
in between the time period chosen
By studding the trend analysis of each item we can known the direction of changes and
based upon the direction of changes the options can be changed
Trend =Absolute Value of item in the statement understudy 100
Absolute Value of same item in the base statement
Ratio Analysis
Ratio analysis is used as a technique of analyzing the financial information contained in the
balance sheet and profit and loss accounts for a more meaningful understanding of the
financial position and performance of a firm
The relationship between two accounting figures expressed mathematically is known as a
financial ratio A ratio helps the analyst to make qualitative judgment about the firmrsquos
financial position and performance
Several ratios can be calculated from the accounting data contained in the financial
statements The parties which generally undertake financial analysis is short ndashterm
creditors long-term creditors owner and management In view of the requirements of the
various ratios ratios are classified into the following four important categories
8102019 A Study A Study On Financial Performance Analysis With Reference To Kesoram Cementon Financial Performance hellip
httpslidepdfcomreaderfulla-study-a-study-on-financial-performance-analysis-with-reference-to-kesoram 4181
41
Liquidity ratios
Leverage ratios
Activity ratios
Profitability ratios
Liquidity Ratios
It is extremely essential for a firm to be able to meet its obligations as they become due
Liquidity ratios measure the ability of the firm to meet its current obligations A firm should
ensure that it does not suffer from lack of liquidity and also that it does not have excess
liquidity The failure of a company to meet its obligations due to lack of sufficient liquidity
will result in a poor creditworthiness loss of creditorsrsquo confidence or even in legal tangles
resulting in the closure of the company A very high degree of liquidity is also bad idle
assets earn nothing The firmrsquos funds will be unnecessarily tied up in current assets
Therefore it is necessary to strike a proper balance high liquidity and lack of liquidity
The most common ratios which indicate the extent of liquidity or lack of it are
Current ratio
Quick ratio
Other ratios include Cash ratio Interval Measure and Net working capital ratio
Current Ratio
The current ratio is calculated by dividing current assets by current liabilities
Current assets
Current ratio = --------------------------
Current liabilities
Current ratio is a measure of the firmrsquos short term solvency It indicates the availability of
current assets in rupees for every one rupee of current liability A ratio of greater than one
means that the firm has more current assets than current claims against the Current ratio of
2 to 1 or more is considered satisfactory Current ratio represents a margin of safety for
creditors
Quick Ratio
Quick ratio also known as acid-test ratio establishes a relationship between quick assets and
the current liabilities Cash is the most liquid asset It is calculated by dividing quick assets
by current liabilities
Quick ratio = Quick Assets Current Liabilities
8102019 A Study A Study On Financial Performance Analysis With Reference To Kesoram Cementon Financial Performance hellip
httpslidepdfcomreaderfulla-study-a-study-on-financial-performance-analysis-with-reference-to-kesoram 4281
42
(Quick Assets = Current assets ndash Inventory)
One defect of the current ratio is that it fails to convey any information on the composition
of the current assets of the firm A rupee of cash is considered equivalent to a rupee of
inventory of receivables But it is not so A rupee of cash is more readily available to meet
current liabilities than a rupee of say inventory This implies the usefulness of the current
ratio
The Acid ndashtest ratio measures the firmrsquos ability to convert its current assets quickly into
cash in order to meet its current liabilities
A quick ratio of 1 to 1 is considered to represent a satisfactory current financial condition It
is an important index of the firmrsquos liquidity
Leverage Ratios
Leverage ratios identify the source of a firmrsquos capital ndashowners or outside creditors
Financial leverage refers to the use of debt in financing non-current assets If the return on
assets exceeds the cost of debt the leverage is successful ndash ie it improves return on equity
Debt ndashEquity Ratio
The Debt ndash Equity is determined to analyze the soundness of the long term financial
policies of the organization It is also known as ldquoInternal External Equity Ratiordquo
It is calculated as follows
Debt ndash Equity Ratio = Total long term debt Share holders funds
Equity Ratio
This ratio is also called as proprietary ratio establishes a relationship between share holderrsquos
funds to total assets of company Equity Ratio is calculated by dividing share holders fund
by total assets
Fixed Asset Ratio
This ratio indicates the extent to which the assets of the companyrsquos can be lost without
affecting the interest of the creditors of the company Higher the ratios better the long-term
position of the company
Activity Ratios
They are primarily used for studying a firmrsquos working capital situation A well managed
firm should have good activity ratios
8102019 A Study A Study On Financial Performance Analysis With Reference To Kesoram Cementon Financial Performance hellip
httpslidepdfcomreaderfulla-study-a-study-on-financial-performance-analysis-with-reference-to-kesoram 4381
43
Working Capital Turnover Ratio
The working capital turnover ratio indicates whether or not working capital has been
effectively used in making sales
Working capital turnover = Sales Net current assets
Inventory Turnover Ratio
This ratio also known as Stock Turnover Ratio establishes the relationship between costs of
goods sold or net sales during the given period and the average amt of stock held during the
period This ratio reveals the number of times finished stock in turnover during a given
accounting period
Higher the ratio the better is it because it shows the finished stock is rapidly turned
in to sales On the other hand a low stock turnover ratio is not desirable because it reveals
the accumulation of stock
Debtors Turnover Ratio
This ratio indicates the velocity of debt collection of a company In other words it shows
the number of times average turnover during a year
A Higher Debtor Turnover Ratio indicates a more efficient is the management towards
debtors and low ratio ratio implies inefficient management of debtors
Total Assets Turnover Ratio
The asset turnover ratio indicates how efficiently management is employing Assets
Total Assets Turnover Ratio = Sales Total Assets
Profitability Ratios
Profitability ratios are the ratios which measure a firmrsquos overall effectiveness as revealed by
the returns generated on sales and investment
General Profitability Ratios
1 Gross Profit Ratio
2 Net profit Ratio
3 Operating or Expenses Ratio
8102019 A Study A Study On Financial Performance Analysis With Reference To Kesoram Cementon Financial Performance hellip
httpslidepdfcomreaderfulla-study-a-study-on-financial-performance-analysis-with-reference-to-kesoram 4481
44
Gross Profit Ratio
Gross profit Ratio measures the relationships to net sales and is usually represented as a
percentage It is a good measure of profitability
The gross profit ratio indicates the extent to which selling price of goods per unit may
decline without resulting in losses on operation Higher the gross profit betters the result
Net Profit Ratio
Net Profit Ratio indicates net margin on sales It is given by the following equation
Net Profit Ratio = (Net Profit Sales) 100
Operating or Expenses Ratio
This ratio is complimentary of Net Profit Ratio The more the net profit the less the
Operating Ratio Operating costs include the cost of direct materials direct labors and otheroverheads viz are generally excluded from operating costs A comparison of the Operating
Ratio will indicate whether the cost efficiency is high or low in the figure of sales This less
the ratio it depicts the efficiency of the management
8102019 A Study A Study On Financial Performance Analysis With Reference To Kesoram Cementon Financial Performance hellip
httpslidepdfcomreaderfulla-study-a-study-on-financial-performance-analysis-with-reference-to-kesoram 4581
45
CHAPTER IV
DATA ANALYSIS amp INTERPRETATION
8102019 A Study A Study On Financial Performance Analysis With Reference To Kesoram Cementon Financial Performance hellip
httpslidepdfcomreaderfulla-study-a-study-on-financial-performance-analysis-with-reference-to-kesoram 4681
46
Comparative Balance Sheet of Kesoram in the Year between 2008-2009
(Rupee in crores)
Years Changes
Particulars 2008 2009 In Rupees In Percentage
Liabilities
Share Capital 4574 4574 000 000
Reserves amp Surplus 93085 128024 34939
Revaluation Reserves 533 412 -121 -2270
Loans
Secured Loans 97106 153627 56521 5821
Un Secured Loans 12129 43416 31287 25795
Deferred Tax Liabilities 000 000 000 000
Current Liabilities
Provisions 33039 34529 1490 451
Current Liabilities 57067 66587 9520 1668
Total 297533 431169 133636 4491
Assets
Net Block 108424 180435 72011 6642
Capital Wip 63459 86485 23026 3628
Investments 4783 6178 1395 2917
Current Assets
Inventories 44217 58906 14689 3322
Sundry Debtors 27307 38017 10710 3922
Cash amp Bank Balances 4036 5657 1621 4016
Total Current Assets 75560 102580 27020 3576
Loans amp Advances 45289 55462 10173 2246
Fixed Deposits 018 028 010 5556
Total 297533 431169 133636 4491
8102019 A Study A Study On Financial Performance Analysis With Reference To Kesoram Cementon Financial Performance hellip
httpslidepdfcomreaderfulla-study-a-study-on-financial-performance-analysis-with-reference-to-kesoram 4781
47
Interpretation of comparative balance sheet of 2008-2009
Reserves amp Surplus were increased to 3753 (percent) ie in Rupees 34939
crores
Revaluation Reserves decreased to 121 ie in Rupees 2270 crores
Secured Loans are increased to 5821 ie in Rupees 56521 crores And UN
secured loans highly Increased to 25795
Current liabilities and Provisions are increased to 1668 and 451 respectively ie in
Rupees 9520 amp 1490 crores
Fixed assets were highly increased to 6642 ie in Rupees 72011 crores
Investments were increased to 2917 ie in Rupees 1395 crores
Sundry debtors increased to 3922 ie in Rupees 10710 crores
Current assets increased 3576 ie in Rupees 27020 crores And Loans amp
Advances increased to 2246 respectively
The overall financial position was satisfactory
8102019 A Study A Study On Financial Performance Analysis With Reference To Kesoram Cementon Financial Performance hellip
httpslidepdfcomreaderfulla-study-a-study-on-financial-performance-analysis-with-reference-to-kesoram 4881
48
Comparative Balance Sheet of Kesoram in the Year between 2009-2010
(Rupees in crores)
Years Changes
Particulars 2009 2010 In Rupees In Percentage
Liabilities
Share Capital 4574 4574 000 000
Reserves amp Surplus 128024 149111 21087 1647
Revaluation Reserves 412 339 -073 -1772
Loans
Secured Loans 153627 186372 32745 2131
Un Secured Loans 43416 126250 82834 19079
Deferred Tax Liabilities 000 000 000
Current Liabilities
Provisions 34529 35734 1205 349
Current Liabilities 66587 107688 41101 6173
Total 431169 610068 178899 4149
Assets
Net Block 180435 343182 162747 9020
Capital WIP 86485 41283 -45202 -5227
Investments 6178 5143 -1035 -1675
Current Assets
Inventories 58906 91619 32713 5553
Sundry Debtors 38017 54289 16272 4280
Cash amp Bank Balances 5657 8014 2357 4167
Total Current Assets 102580 153922 51342 5005
Loans amp Advances 55462 66506 11044 1991
Fixed Deposits 028 031 003 1071
Total 431169 610068 178899 4149
8102019 A Study A Study On Financial Performance Analysis With Reference To Kesoram Cementon Financial Performance hellip
httpslidepdfcomreaderfulla-study-a-study-on-financial-performance-analysis-with-reference-to-kesoram 4981
49
Interpretation of comparative balance sheet of 2009-2010
Reserves amp surplus increased to 1647 ie in Rupees 21087 crores
Revaluation Reserves decreased to 1772 ie in Rupees 073 crores
Secured loans increased to 2131 ie in Rupees 32745 crores
Current Liabilities were increased to 6173 ie in Rupees 41101 crores and
Provisions 349 ie in Rupees 1205 crores
Fixed Assets were increased to 9020 ie in Rupees 162747 crores
Investments were decreased to 1675 ie in Rupees 1035 crores
Sundry debtors were increased to 4280 ie in Rupees 16272 crores
Current assets increased to 5005 ie in Rupees 51342 crores And loans and
Advances increased 1919 ie in Rupees 11044 crores
The overall financial position was satisfactory
8102019 A Study A Study On Financial Performance Analysis With Reference To Kesoram Cementon Financial Performance hellip
httpslidepdfcomreaderfulla-study-a-study-on-financial-performance-analysis-with-reference-to-kesoram 5081
50
Comparative Balance Sheet of Kesoram in the Year between 2010-2011
(Rupees in crores)
Years Changes
Particulars 2010 2011 In Rupees In Percentage
Liabilities
Share Capital 4574 4574 000 000
Reserves amp Surplus 149111 125162 -23949 -1606
Revaluation Reserves 339 289 -050 -1475
Loans
Secured Loans 186372 237183 50811 2726
Un Secured Loans 126250 162744 36494 2891
Deferred Tax Liabilities 000 000 000
Current Liabilities
Provisions 35734 1494 -34240 -9582
Current Liabilities 107688 113902 6214 577
Total 610068 645348 35280 578
Assets
Net Block 343182 369172 25990 757
Capital WIP 41283 43781 2498 605
Investments 5143 6582 1439 2798
Current Assets
Inventories 91619 111855 20236 2209
Sundry Debtors 54289 63134 8845 1629
Cash amp Bank Balances 8014 7188 -826 -1031
Total Current Assets 153922 182177 28255 1836
Loans amp Advances 66506 43460 -23046 -3465
Fixed Deposits 031 176 145 46774
Total 610068 645348 35280 578
8102019 A Study A Study On Financial Performance Analysis With Reference To Kesoram Cementon Financial Performance hellip
httpslidepdfcomreaderfulla-study-a-study-on-financial-performance-analysis-with-reference-to-kesoram 5181
51
Interpretation of comparative balance sheet of 2010-2011
Reserves amp surplus decreased to 1606 ie in Rupees 23949 crores
Revaluation Reserves decreased to 1475 ie in Rupees 050 crores
Secured loans increased to 2726 ie in Rupees 50811 crores
Current Liabilities were increased to 577 ie in Rupees 6214 crores
Provisions decreased to 9582 ie in Rupees 34240 crores
Fixed Assets were increased to 757 ie in Rupees 25990 crores
Investments were decreased to 2798 ie in Rupees 1439 crores
Sundry debtors were increased to 1629 ie in Rupees8845 crores
Current assets increased to 1836 ie in Rupees 28255 crores And loans and
Advances increased 3465 ie in Rupees 23046 crores
The overall financial position was UN satisfactory
8102019 A Study A Study On Financial Performance Analysis With Reference To Kesoram Cementon Financial Performance hellip
httpslidepdfcomreaderfulla-study-a-study-on-financial-performance-analysis-with-reference-to-kesoram 5281
52
Comparative Balance Sheet of Kesoram In The Year Between 2011-2012
(Rupees in crores)
Years Changes
Particulars 2011 2012 In Rupees In Percentage
Liabilities
Share Capital 4574 4574 000 000
Reserves amp Surplus 125162 86657 -38505 -3076
Revaluation Reserves 289 270 -019 -657
Loans
Secured Loans 237183 317792 80609 3399
Un Secured Loans 162744 92742 -70002 -4301
Deferred Tax Liabilities 000 000 000
Current Liabilities
Provisions 1494 40726 39232 262597
Current Liabilities 113902 180010 66108 5804
Total 645348 722771 77423 1200
Assets 000
Net Block 369172 358721 -10451 -283
Capital WIP 43781 68065 24284 5547
Investments 6582 6636 054 082
Current Assets
Inventories 111855 99516 -12339 -1103
Sundry Debtors 63134 67358 4224 669
Cash amp Bank Balances 7188 6959 -229 -319
Total Current Assets 182177 173833 -8344 -458
Loans amp Advances 43460 115409 71949 16555
Fixed Deposits 176 107 -069 -3920
Total 645348 722771 77423 1200
8102019 A Study A Study On Financial Performance Analysis With Reference To Kesoram Cementon Financial Performance hellip
httpslidepdfcomreaderfulla-study-a-study-on-financial-performance-analysis-with-reference-to-kesoram 5381
53
Interpretation of comparative balance sheet of 2011-2012
Reserves amp surplus decreased to 3076 ie in Rupee 38505 crores
Revaluation Reserves decreased to 657 ie in Rupees 019 crores
Secured loans increased to 3399 ie in Rupees 80699 crores
Current Liabilities were increased to 5804 ie in Rupees 66108 crores
Provisions increased to 262597 ie in Rupees 39232 crores
Fixed Assets were decreased to 283 ie in Rupee 10451 crores
Investments were increased to 082 ie in Rupees 054 crores
Sundry debtors were increased to 669 ie in Rupees 4224 crores
Current assets decreased to 458 ie in Rupees 8344 crores And loans and
Advances increased 16555 ie in Rupees 71949 crores
The overall financial position was UN satisfactory
8102019 A Study A Study On Financial Performance Analysis With Reference To Kesoram Cementon Financial Performance hellip
httpslidepdfcomreaderfulla-study-a-study-on-financial-performance-analysis-with-reference-to-kesoram 5481
54
Common Size Balance Sheet of Kesoram For The Year 2008-2009
(Rupees in crores)
Particulars 2008 Change Percentage 2009 Change Percentage
Liabilities
Share Capital 4574 154 4574 106
Reserves amp Surplus 93085 3129 128024 2969
Revaluation Reserves 533 018 412 010
Loans
Secured Loans 97106 3264 153627 3563
Un Secured Loans 12129 408 43416 1007
Deferred Tax Liabilities 000 000 000 000
Current Liabilities
Provisions 33039 1110 34529 801
Current Liabilities 57067 1918 66587 1544
Total 297533 10000 431169 10000
Assets
Net Block 108424 3644 180435 4185
Capital WIP 63459 2133 86485 2006
Investments 4783 161 6178 143
Current Assets
Inventories 44217 1486 58906 1366
Sundry Debtors 27307 918 38017 882
Cash amp Bank Balances 4036 136 5657 131
Loans amp Advances 45289 1522 55462 1286
Fixed Deposits 018 001 028 001
Total 297533 10000 431169 10000
8102019 A Study A Study On Financial Performance Analysis With Reference To Kesoram Cementon Financial Performance hellip
httpslidepdfcomreaderfulla-study-a-study-on-financial-performance-analysis-with-reference-to-kesoram 5581
55
Interpretation of Common Size Balance Sheet of 2008-2009
Share capital was recorded 154 percent in the total liabilities in the year 2008 it is
decreased to 106 in the year 2009
Reserves amp surplus contributed to 3129 in the total liabilities in the year 2008 it is
decreased to 2969 in the year 2009
Secured loans were 3264 in the total liabilities in the year 2008 it is increased to
3563 in the year 2009
Current Liabilities shown to 1918 in the total liabilities in the year 2008 it is
decreased to 1544 in the year 2009
Provisions 1110 in the total liabilities in the year 2008 it is decreased to 801 in the
year 2009
Fixed Assets were 3644 in the total liabilities in the year 2008 ie decreased to 4185
in the year 2009
Investments were 161 in the total liabilities in the year 2008 it is decreased to 143
in the year 2009
Sundry debtors were 918 in the total liabilities in the year 2008 it is decreased to 882
in the year 2009
8102019 A Study A Study On Financial Performance Analysis With Reference To Kesoram Cementon Financial Performance hellip
httpslidepdfcomreaderfulla-study-a-study-on-financial-performance-analysis-with-reference-to-kesoram 5681
56
Common Size Balance Sheet of Kesoram For The Year 2009-2010
(Rs in crores)
Particulars 2009 Change Percentage 2010Change
Percentage
Liabilities
Share Capital 4574 106 4574 075
Reserves amp Surplus 128024 2969 149111 2444
Revaluation Reserves 412 010 339 006
Loans
Secured Loans 153627 3563 186372 3055
Un Secured Loans 43416 1007 126250 2069
Deferred Tax Liabilities 000 000 000 000
Current Liabilities
Provisions 34529 801 35734 586
Current Liabilities 66587 1544 107688 1765
Total 431169 10000 610068 10000
Assets
Net Block 180435 4185 343182 5625
Capital WIP 86485 2006 41283 677
Investments 6178 143 5143 084
Current Assets
Inventories 58906 1366 91619 1502
Sundry Debtors 38017 882 54289 890
Cash amp Bank Balances 5657 131 8014 131
Loans amp Advances 55462 1286 66506 1090
Fixed Deposits 028 001 031 001
Total 431169 10000 610068 10000
8102019 A Study A Study On Financial Performance Analysis With Reference To Kesoram Cementon Financial Performance hellip
httpslidepdfcomreaderfulla-study-a-study-on-financial-performance-analysis-with-reference-to-kesoram 5781
57
Interpretation of common size balance sheet of 2009-2010
Share capital was recorded 106 percent in the total liabilities in the
year 2009 it is decreased to 075 in the year 2010
Reserves amp surplus contributed to 2969 in the total liabilities in the
year 2009 it is decreased to2444 in the year 2010
Secured loans were 3563 in the total liabilities in the year 2009 it is
increased to 3055 in the year 2010
Current Liabilities shown to 1544 in the total liabilities in the year
2009 it is decreased to 1765 in the year 2010
Provisions 801 in the total liabilities in the year 2009 it is decreased
to 586 in the year 2010
Fixed Assets were 4185 in the total liabilities in the year 2009 ie
increased to 5625 in the year 2010
Investments were 143 in the total liabilities in the year 2009 it is
decreased to 084 in the year 2010
Sundry debtors were 882 in the total liabilities in the year 2009 it is
increased to 890 in the year 2010
8102019 A Study A Study On Financial Performance Analysis With Reference To Kesoram Cementon Financial Performance hellip
httpslidepdfcomreaderfulla-study-a-study-on-financial-performance-analysis-with-reference-to-kesoram 5881
58
Common Size Balance sheet of Kesoram for the year 2010-2011
983080Rupees in crores)
Particulars 2010 Change Percentage 2011
Change
Percentage
Liabilities
Share Capital 4574 075 4574 071
Reserves amp Surplus 149111 2444 125162 1939
Revaluation Reserves 339 006 289 004
Loans
Secured Loans 186372 3055 237183 3675
Un Secured Loans 126250 2069 162744 2522
Deferred Tax Liabilities 000 000 000 000
Current Liabilities
Provisions 35734 586 1494 023
Current Liabilities 107688 1765 113902 1765
Total 610068 10000 645348 10000
Assets
Net Block 343182 5625 369172 5721
Capital WIP 41283 677 43781 678
Investments 5143 084 6582 102
Current Assets
Inventories 91619 1502 111855 1733
Sundry Debtors 54289 890 63134 978
Cash amp Bank Balances 8014 131 7188 111
Loans amp Advances 66506 1090 43460 673
Fixed Deposits 031 001 176 003
Total 610068 10000 645348 10000
8102019 A Study A Study On Financial Performance Analysis With Reference To Kesoram Cementon Financial Performance hellip
httpslidepdfcomreaderfulla-study-a-study-on-financial-performance-analysis-with-reference-to-kesoram 5981
59
Interpretation of Common Size Balance Sheet Of 2010-2011
Share capital was recorded 075 percent in the total liabilities in the year 2010 it is
decreased to 071 in the year 2011
Reserves amp surplus contributed to 2444 in the total liabilities in the year 2010 it is
decreased to1939 in the year 2011
Secured loans were 3055 in the total liabilities in the year 2010 it is increased to
3675 in the year 2011
Current Liabilities shown to 1765 in the total liabilities in the year 2010 it is
also1765 in the year 2011
Provisions 586 in the total liabilities in the year 2010 it is decreased to 023 in the
year 2011
Fixed Assets were 5625 in the total liabilities in the year 2010 ie increased to 5721
in the year 2011
Investments were 084 in the total liabilities in the year 2010 it increased to 102 in
the year 2011
Sundry debtors were 890 in the total liabilities in the year 2010 it is increased to 978
in the year 2011
8102019 A Study A Study On Financial Performance Analysis With Reference To Kesoram Cementon Financial Performance hellip
httpslidepdfcomreaderfulla-study-a-study-on-financial-performance-analysis-with-reference-to-kesoram 6081
60
Common Size Balance Sheet of Kesoram for the Year 2011-2012
983080Rupees in crores)
Particulars 2011 Change Percentage 2012
Change
Percentage
Liabilities
Share Capital 4574 071 4574 063
Reserves amp Surplus 125162 1939 86657 1199
Revaluation Reserves 289 004 270 004
Loans
Secured Loans 237183 3675 317792 4397
Un Secured Loans 162744 2522 92742 1283
Deferred Tax Liabilities 000 000 000 000
Current Liabilities
Provisions 1494 023 40726 563
Current Liabilities 113902 1765 180010 2491
Total 645348 10000 722771 10000
Assets
Net Block 369172 5721 358721 4963
Capital WIP 43781 678 68065 942
Investments 6582 102 6636 092
Current Assets
Inventories 111855 1733 99516 1377
Sundry Debtors 63134 978 67358 932
Cash amp Bank Balances 7188 111 6959 096
Loans amp Advances 43460 673 115409 1597
Fixed Deposits 176 003 107 001
Total 645348 10000 722771 10000
8102019 A Study A Study On Financial Performance Analysis With Reference To Kesoram Cementon Financial Performance hellip
httpslidepdfcomreaderfulla-study-a-study-on-financial-performance-analysis-with-reference-to-kesoram 6181
61
Interpretation of common size balance sheet of 2011-2012
Share capital was recorded 071 percent in the total liabilities in the year 2011 it is
decreased to 063 in the year 2012
Reserves amp surplus contributed to 1939 in the total liabilities in the year 2011 it
is decreased to 1199 in the year 2012
Secured loans were 3675 in the total liabilities in the year 2011 it is increased to
4397 in the year 2012
Current Liabilities shown to 1765 in the total liabilities in the year 2011 it is
increased to 2491 in the year 2012
Provisions 023 in the total liabilities in the year 2011 it is increased to 563 in the
year 2012
Fixed Assets were 5721 in the total liabilities in the year 2011 ie decreased to
4963 in the year 2012
Investments were 102 in the total liabilities in the year 2011 it increased to 092
in the year 2012
Sundry debtors were 978 in the total liabilities in the year 2011 it is decreased to
932 in the year 2012
8102019 A Study A Study On Financial Performance Analysis With Reference To Kesoram Cementon Financial Performance hellip
httpslidepdfcomreaderfulla-study-a-study-on-financial-performance-analysis-with-reference-to-kesoram 6281
Trend Analysis
Share Capital-
Year
Amount
(In Crores) Trend
IncreaseDecrease
Base Year Previous Year
2008 4574 10000 000 000
2009 4574 10000 000 000
2010 4574 10000 000 000
2011 4574 10000 000 000
2012 4574 10000 000 000
Trend Percentages in Share Capital
Share capital shown a constant trend in the period 2008 and 2012
Share capital is 4574 crores all the years from 2008-2012
8102019 A Study A Study On Financial Performance Analysis With Reference To Kesoram Cementon Financial Performance hellip
httpslidepdfcomreaderfulla-study-a-study-on-financial-performance-analysis-with-reference-to-kesoram 6381
Reserves amp Surplus-
Year
Amount
(In Crores) Trend
IncreaseDecrease
Base Year Previous Year
2008 93085 10000 000 000
2009 128024 13753 3753 3753
2010 149111 16019 6019 2266
2011 125162 13446 3446 -2573
2012 86657 9309 -691 -4137
Trend Percentages in Reserves amp Surplus
Reserves amp surplus shown an increasing trend in the period between 2008 and 2010
The average trend was 13277 till 2010
The Reserves amp surplus was showing decreasing trend in the period 2011-2012 (ie
from 16019 in 2010 to 9309 in 2012)
The decreasing trend in Reserves amp surplus indicates the decrease in profits of the
firm
8102019 A Study A Study On Financial Performance Analysis With Reference To Kesoram Cementon Financial Performance hellip
httpslidepdfcomreaderfulla-study-a-study-on-financial-performance-analysis-with-reference-to-kesoram 6481
Investments-
Year
Amount
(In Crores) Trend
IncreaseDecrease
Base Year Previous Year
2008 4783 10000 000 000
2009 6178 12917 2917 2917
2010 5143 10753 753 -2164
2011 6582 13761 3761 3009
2012 6636 13874 3874 113
Trend Percentages in Investments-
The investments are shown an increasing trend in the period between 2008 ndash 2009
and it is decreasing in the year 2010
The average trend was 11458 till 2009
The investments increased in the periods 2011-2012 (ie from 10753 in 2010 to
13874 in 2012)
The overall trend in investments shown is satisfactory
8102019 A Study A Study On Financial Performance Analysis With Reference To Kesoram Cementon Financial Performance hellip
httpslidepdfcomreaderfulla-study-a-study-on-financial-performance-analysis-with-reference-to-kesoram 6581
Net Current Assets-
Year
Amount
(In Crores) Trend
IncreaseDecrease
Base Year Previous Year
2008 30761 10000 000 000
2009 56954 18515 8515 8515
2010 77037 25044 15044 6529
2011 110417 35895 25895 10851
2012 68613 22305 12305 -13590
Trends in Net Current Assets-
The NCA shown positive (increasing) trend
The NCA are increased to 35895 (the year 2011) compared with base year and
decreased in the year 2012 to 22305
The NCA shown increased trend from year and crossed 100
The overall trend was good
8102019 A Study A Study On Financial Performance Analysis With Reference To Kesoram Cementon Financial Performance hellip
httpslidepdfcomreaderfulla-study-a-study-on-financial-performance-analysis-with-reference-to-kesoram 6681
66
Ratio Analysis-
Current Ratio-
Current Ratio = Current Assets Current Liabilities
Current assets are cash in hand Cash at bank Marketable Securities(short term) short term
Investment Bills receivables sundry debtors Inventories (stock) Work in progress prepaid
expenses Current Liabilities are outstanding expenses Bills payable sundry Creditors
short-term advances income tax payable and Dividend payable
Current Ratio of Kesoram-
(Rupees in crores)
Year Current Assets Current Liabilities Current Ratio
2007-08 75560 57067 132
2008-09 102580 66587 154
2009-10 153922 107688 143
2010-11 182177 113902 160
2011-12 173833 180010 097
Interpretation-
As per the standard rule of current ratio ie 21 where current assets double the current
liabilities is considered satisfactory
In the present analysis the current ratio of the Kesoram is not satisfactory
from the above table It was assessed that the current ratio for all the five year is lower (less)
than the standard rule ie 21 And it is 097 in the year 2011-2012 (current year) This is
highly UN satisfactory
8102019 A Study A Study On Financial Performance Analysis With Reference To Kesoram Cementon Financial Performance hellip
httpslidepdfcomreaderfulla-study-a-study-on-financial-performance-analysis-with-reference-to-kesoram 6781
Quick Ratio-
Quick ratio also known as acid-test ratio establishes a relationship between quick
assets and the current liabilities Cash is the most liquid asset It is calculated by dividing
quick assets by current liabilities
Quick ratio = Quick Assets Current Liabilities
(Quick Assets = Current assets ndash Inventory)
Quick Ratio of Kesoram-
Rupees in crores)
Year Total QuickAssets
Current Liabilities Quick Ratio
2007-08 33343 57067 058
2008-09 43674 66587 066
2009-10 62303 107688 058
2010-11 70322 113902 0622011-12 74333 180010 041
Interpretation-
Usually a high Quick ratio is an indication that the company is liquid and has the ability to
meet its current or liquid liabilities in time on the other hand a low Quick Ratio represents
8102019 A Study A Study On Financial Performance Analysis With Reference To Kesoram Cementon Financial Performance hellip
httpslidepdfcomreaderfulla-study-a-study-on-financial-performance-analysis-with-reference-to-kesoram 6881
that the companyrsquos liquidity position is not good The above table showing the quick ratios
of Kesoram are canrsquot be considered satisfactory
Leverage Ratios-
Debt-Equity Ratio-
Debt-Equity Ratio = Total Long Term Debt Equity Share Holders Fund
Total Long term Debt= Debenture Capital + Long term loans from banks and financial
institutions + Public deposits
Equity Share Holders fund = Equity + Reserves and Surplus
Debt Equity Ratio of Kesoram
(Rupees in crores)
Year Total Debt Share Holders Fund Debt Equity Ratio
2007-08 109235 98192 111
2008-09 197043 133010 148
2009-10 312622 154024 203
2010-11 399927 130025 308
2011-12 410534 91501 449
8102019 A Study A Study On Financial Performance Analysis With Reference To Kesoram Cementon Financial Performance hellip
httpslidepdfcomreaderfulla-study-a-study-on-financial-performance-analysis-with-reference-to-kesoram 6981
Interpretation-
The Debt-Equity Ratio accepted standard is 05 This ratio reflects the relative contribution
of creditors and owners of business in its financing From the above it is clear that the long
term debt is more than that of the share holdersrsquo fund So we can interpret that the firmrsquosassets are financed more by the external funds rather than by the internal funds
8102019 A Study A Study On Financial Performance Analysis With Reference To Kesoram Cementon Financial Performance hellip
httpslidepdfcomreaderfulla-study-a-study-on-financial-performance-analysis-with-reference-to-kesoram 7081
Fixed Asset Ratio-
Net Sales
Fixed Asset Ratio = helliphelliphelliphelliphelliphelliphelliphelliphelliphelliphellip
Net Assets
Fixed Asset Ratio of Kesoram-
(Rupees in crores)
Year Net Sales Net Assets Fixed Assets Ratio
2007-08 300271 358721 084
2008-09 389797 369172 106
2009-10 475062 343182 1382010-11 539788 180435 299
2011-12 59182 108424 546
Interpretation
This ratio indicates the extent to which the assets of the companyrsquos can be lost without
affecting the interest of the creditors of the company Higher the ratios better the long-term
position of the companyThe above table shows fixed assets ratio in increasing trend Which is good for the
company
8102019 A Study A Study On Financial Performance Analysis With Reference To Kesoram Cementon Financial Performance hellip
httpslidepdfcomreaderfulla-study-a-study-on-financial-performance-analysis-with-reference-to-kesoram 7181
Overall Profitability Ratios-
Net Profit Ratio
Net Profit Ratio indicates net margin on sales It is given by the following equation
Net Profit Ratio = (Net Profit Sales) 100
Net Profit Ratio of Kesoram
(Rupees in crores)
Year Net Profit Sales Net Profit Ratio
2007-08 37917 300271 1263
2008-09 41432 389797 1063
2009-10 20298 475062 427
2010-11 -28176 539788 -5222011-12 -38108 59182 -644
Interpretation
It establishes a relationship between net profits after tax and net sales and
indicates the efficiency of the management in manufacturing selling administrative and
other activities of the company
The higher the ratio the better is the profitability or performance of the business
The above table depicts the net profit Ratio of Kesoram has decreased every year from
2007-2008 to 2011-2012It further decreased to negative in the year 2010-11 to -522 and -
644 in the year 2011-2012 This shows constant decrease in the profits of the company
8102019 A Study A Study On Financial Performance Analysis With Reference To Kesoram Cementon Financial Performance hellip
httpslidepdfcomreaderfulla-study-a-study-on-financial-performance-analysis-with-reference-to-kesoram 7281
72
Return on Investment-
Net Profit
Return on Investment = helliphelliphelliphelliphelliphelliphelliphelliphelliphelliphelliphellip X 100
Share Holders Fund
Return on Investment Ratio of Kesoram-
(Rupees in crores)
Year Net Profit Share Holders Fund Return On Investment
2007-08 37917 98192 3862
2008-09 41432 133010 3115
2009-10 20298 154024 1318
2010-11 -28176 130025 -2167
2011-12 -38108 91501 -4165
Interpretation-
The above table reveals how well the resources of the firm are being used Higher
the ratio better the result The above ratio implies how well the firm is growing in
terms of profitability and efficiency From the above table we can concern that the return on
investment is in decreasing trend ROI is highest in the year 2007-2008 as 3862 But
there after itrsquos decreased every year
The ROI is negative in the years 2010-2011 amp 2011-2012 as -2167 amp -4165 respectively
Which is not a good sign for the firm
8102019 A Study A Study On Financial Performance Analysis With Reference To Kesoram Cementon Financial Performance hellip
httpslidepdfcomreaderfulla-study-a-study-on-financial-performance-analysis-with-reference-to-kesoram 7381
8102019 A Study A Study On Financial Performance Analysis With Reference To Kesoram Cementon Financial Performance hellip
httpslidepdfcomreaderfulla-study-a-study-on-financial-performance-analysis-with-reference-to-kesoram 7481
8102019 A Study A Study On Financial Performance Analysis With Reference To Kesoram Cementon Financial Performance hellip
httpslidepdfcomreaderfulla-study-a-study-on-financial-performance-analysis-with-reference-to-kesoram 7581
75
CHAPTER V
FINDINGS amp SUGGESTIONS
8102019 A Study A Study On Financial Performance Analysis With Reference To Kesoram Cementon Financial Performance hellip
httpslidepdfcomreaderfulla-study-a-study-on-financial-performance-analysis-with-reference-to-kesoram 7681
76
Findings
The Share capital remains constant Share capital is unchanged all the years from
2008-2012
Reserves amp surplus were recorded an increasing trend in the period between 2008
and 2010It is showing decreasing trend in the period 2011-2012 (ie from 16019
in 2010 to 9309 in 2012)
Current Liabilities were increased compared to base year ie 2008
Provisions increased to 262597 ie in Rupees 39232 crores in the current year
The current ratio for all the five year is lower (less) than the standard rule ie 21
And it is 097 in the year 2011-2012 (current year)
The Debt-Equity Ratio was shown under the standard ratio It is clear that the long
term debt is more than that of the share holdersrsquo fund It indicates that the firm
heavily relying on external funds rather than the internal funds
The operating and net profit of Kesoram is in decreasing trend due to heavy
increase of manufacturing amp administrative expenses
ROI is highest in the year 2007-2008 as 3862 The ROI is negative in the years
2010-2011 amp 2011-2012 as -2167 amp -4165 respectively
Return on Equity Capital Employed Ratio of Kesoram has decreased every year
from 2007-2008 to 2010-2011It further decreased to negative in the year 2011-12 to
-3280
EPS of Kesoram has decreased every year from 2008-12It is negative in the year
2011 amp 12
8102019 A Study A Study On Financial Performance Analysis With Reference To Kesoram Cementon Financial Performance hellip
httpslidepdfcomreaderfulla-study-a-study-on-financial-performance-analysis-with-reference-to-kesoram 7781
77
Suggestion
The organization should adopt an appropriate capital structure
The companyrsquos debt-equity ratio is recorded more or less as 111 in the year 2008
and it is increased to 449 in the year 2012 (current year)The company should
adopt a better debt equity mix in the future to control the fluctuations in returns
The company should control fluctuations in cash and bank balances as it impacts the
current ratio of the company
The provisions are showing increasing trend which indicates risk of debtors The
firm should implement an effective credit management policy It should utilize its
idle funds by decreasing provisions
The company should control heavy increase of manufacturing amp administration
expenses as it is impacting the operating and net profit of company
8102019 A Study A Study On Financial Performance Analysis With Reference To Kesoram Cementon Financial Performance hellip
httpslidepdfcomreaderfulla-study-a-study-on-financial-performance-analysis-with-reference-to-kesoram 7881
78
ANNEXURE
Profit And Loss Account of Kesoram Cement
Mar12 Mar11 Mar10 Mar09 Mar08
12 Months 12 Months 12 Months 12 Months 12 Months
INCOME
Sales Turnover 628260 575072 505151 431613 345700
Excise Duty 36440 35284 30089 41815 45429
NET SALES 591820 539788 475062 389797 300271
Other Income 000 000 000 000 000
TOTALINCOME
596129 548733 481019 393969 302020
EXPENDITURE
Manufacturing
Expenses81903 74803 13974 13153 44113
MaterialConsumed
370897 310150 295550 229359 118448
Personal
Expenses33468 27355 23294 18690 15344
Selling Expenses 81910 78253 58667 48846 45019
AdministrativeExpenses
28225 29308 17219 16179 9907
Expenses
Capitalized000 000 000 000 000
Provisions Made 000 000 000 000 000
TOTAL
EXPENDITURE 596403 519870 408704 326227 232832Operating Profit -4583 19918 66358 63570 67439
EBITDA -274 28864 72316 67742 69188
Depreciation 29740 27259 17280 11186 8927
Other Write-offs 000 000 000 000 000
EBIT -30014 1605 55035 56557 60261
Interest 41015 23983 10921 12087 5426
EBT -71029 -22377 44114 44470 54835
Taxes -32921 5798 23816 3037 16918
Profit and Loss
for the Year-38108 -28176 20298 41432 37917
Non RecurringItems
-1142 7063 3228 -4023 402
Other Non Cash
Adjustments1276 091 207 465 017
OtherAdjustments
000 000 000 000 000
REPORTED
PAT-37974 -21021 23734 37874 38335
8102019 A Study A Study On Financial Performance Analysis With Reference To Kesoram Cementon Financial Performance hellip
httpslidepdfcomreaderfulla-study-a-study-on-financial-performance-analysis-with-reference-to-kesoram 7981
79
Balance Sheet Of Kesoram
Years
Particulars 2008 2009 2010 2011 2012
Liabilities
Share Capital 4574 4574 4574 4574 4574Reserves amp Surplus 93085 128024 149111 125162 86657
Revaluation Reserves 533 412 339 289 27
Loans
Secured Loans 97106 153627 186372 237183 317792
Un Secured Loans 12129 43416 12625 162744 92742
Deferred Tax Liabilities 0 0 0 0 0
Current Liabilities
Provisions 33039 34529 35734 1494 40726
Current Liabilities 57067 66587 107688 113902 18001
Total 297533 431169 610068 645348 722771
Assets
Net Block 108424 180435 343182 369172 358721
Capital WIP 63459 86485 41283 43781 68065
Investments 4783 6178 5143 6582 6636
Current Assets
Inventories 44217 58906 91619 111855 99516
Sundry Debtors 27307 38017 54289 63134 67358
Cash amp Bank Balances 4036 5657 8014 7188 6959
Total Current Assets 7556 10258 153922 182177 173833Loans amp Advances 45289 55462 66506 4346 115409
Fixed Deposits 018 028 031 176 107
Total 297533 431169 610068 645348 722771
8102019 A Study A Study On Financial Performance Analysis With Reference To Kesoram Cementon Financial Performance hellip
httpslidepdfcomreaderfulla-study-a-study-on-financial-performance-analysis-with-reference-to-kesoram 8081
80
KEY ITEMS 2012 2011 2010 2009 2008
Preference
Dividend 0 0 0 0 0
Equity Dividend 457 2516 2516 2516 2516
Equity Dividend
() 999 55 55 55 55
Shares in Issue(Lakhs) 45743 45743 45743 45743 45743
EPS - Annualised
(Rs) -8302 -4595 5188 828 838
8102019 A Study A Study On Financial Performance Analysis With Reference To Kesoram Cementon Financial Performance hellip
httpslidepdfcomreaderfulla-study-a-study-on-financial-performance-analysis-with-reference-to-kesoram 8181
BIBLIOGRAPHY
Sl
No
Books Author Name
1 Financial Management Khan amp JAIN
2 Financial Management IMPandey
3 Management Accounting RPTrivedi
Websites amp Search Engines
1 wwwkesoramcom983086
2 wwwmoneycontrolcom
3 wwwgooglefinancecom983086
Annual reports of Kesoram cement limited 2008-2012
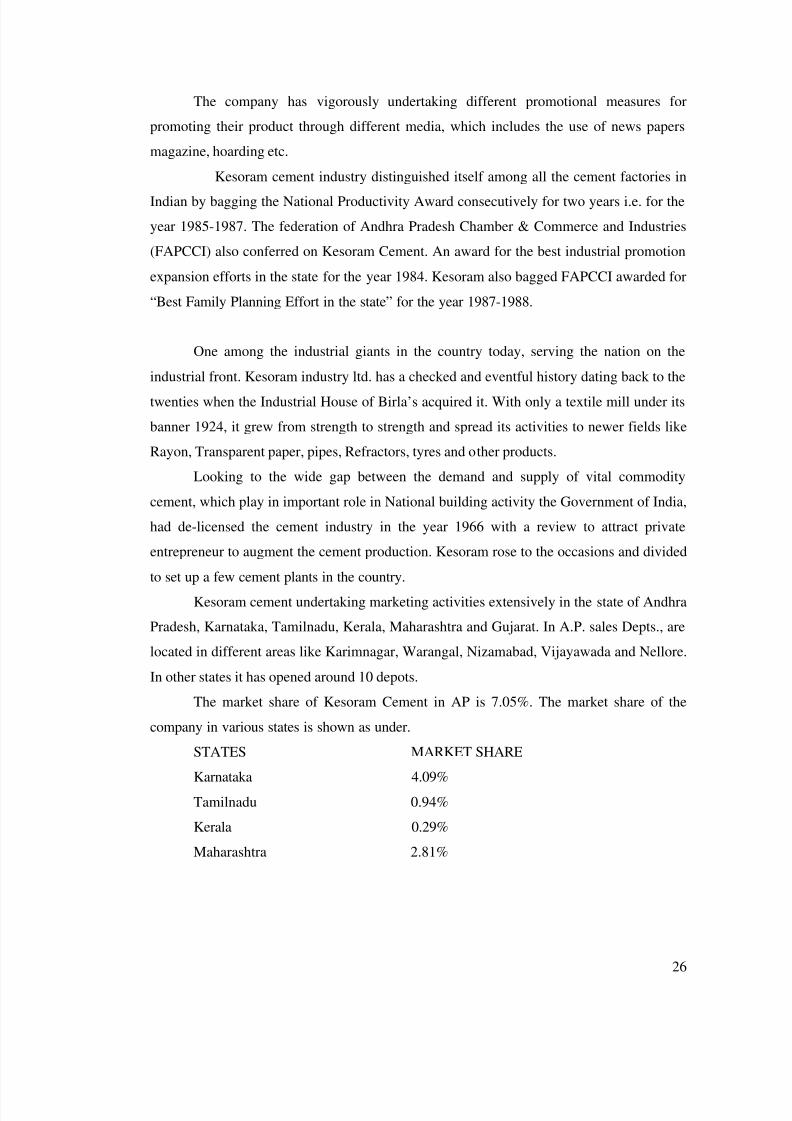
8102019 A Study A Study On Financial Performance Analysis With Reference To Kesoram Cementon Financial Performance hellip
httpslidepdfcomreaderfulla-study-a-study-on-financial-performance-analysis-with-reference-to-kesoram 2781
27
Process and Quality Control
It has been the endeavor of Kesoram to incorporate the Worldrsquos latest technology in
the plant and today the plant has the most sophisticated
X-ray analysis
Fully computerized XRF and XRD X-RAY Analyzers keep a constant round the
clock vigil on quality
Supreme performance
One of the largest Cement Plants in Andhra Pradesh the plant incorporate the latest
technology in Cement - making
It is professionally managed and well established Cement Manufacturing Company
enjoying the confidence of the consumers Kesoram has outstanding track record in
performance and productivity with quite a few national and state awards to its credit
BIRLA SUPREME the 43 Grade Cement is a widely accepted and popular brand
in the market commanding a premium
However to meet the specific demands of the consumer Kesoram bought out the 53
grade BIRLA SUPREME ndash GOLD which has special qualities like higher fineness quick-
setting high compressive strength and durability
Supreme Strength
Kesoram Cement has huge captive Limestone Deposits which make it possible tofeed high- grade limestone consistently its natural Grey colour is anion- born ingredient
and gives good shade
Both the products offered by Kesoram ie BIRLA SUPREME-43 Grade and
BIRLA SUPREME-GOLD-53 Grade cement are outstanding with much higher
compressive strength and durability
The following characteristics show their distinctive qualities
Comprehensive
Strength
Opc 43
grls 8112
1989
Birla
Supreme 43
grade
Opc 43 gr
Is 1226987
Birla
Supreme
Gold 53 gr
3 days mpa Min 23 31 + Min 27 38+
7 days mpa Min 23 42+ Min 37 48+
28 days mpa Min 43 50+ Min 53 60+
8102019 A Study A Study On Financial Performance Analysis With Reference To Kesoram Cementon Financial Performance hellip
httpslidepdfcomreaderfulla-study-a-study-on-financial-performance-analysis-with-reference-to-kesoram 2881
28
DC SYSTEM
Clinker making process is a key step in the overall cement making process In the case of
BIRLA SUPREMEGOLD the clinker-making process is totally computer control The
Distributed Control System (DCS) constantly monitors the process and ensures operating
efficiency This eliminates variation and ensures consistency in the quality of Clinker
Physical Characteristics
Ope 43
Is 8 112-89
Birla
Supreme
43 grade
Ope 53 gr
Is 12269-87
Birla Supreme
Gold 53 gr
Setting time Min30 120-180 Min 30 130-170
a Initial (mats) Max 600 180-240 Max 600 170-220
b final (mats) Min 225 270-280 Min 225 300-320
Fincncssm 2Kg Max 10 10-20 Max 10 05-10
Soundness Max 08 004-008 Max 0080 004-02
a le-chart (mm)
b autoclave ()
Supreme Expertise
The Best Technical Team exclusive to Kesoram mans the Plant and monitors the process
to blend the cement in just the required proportions to make BIRLA SUPREMEGOLD OF
Rock Strength
18 Million Tones of Solid Foundation
Staying at the top for over a Quarter Century Quarter Century is no less an achievement
Infact Kesoram is synonymous with for over 28 years
Over the years Kesoram has dispatched 18 million tones of cement to the nook and cornersof the country and joined hands in strengthening the Nation No one else in Andhra Pradesh
has this distinction The prestigious World Bank aided Ramagundam Super Thermal Power
Project of NTPC and Mannair Dam of Pochampad project in AP arc a couple of projects for
which Kesoram Cement was exclusively uses to cite an example
8102019 A Study A Study On Financial Performance Analysis With Reference To Kesoram Cementon Financial Performance hellip
httpslidepdfcomreaderfulla-study-a-study-on-financial-performance-analysis-with-reference-to-kesoram 2981
29
Chemical Characteristics
Opc 43 gr
Is 81 132-989
Birla
Supreme
43 grade
Ope 53 gr
Is 12269-
87
Birla
Supreme
Gold 53 gr
Loss on inflection Max 5 lt16 Max 40 lt15
Insoluble residue Max 20 lt08 Max 20 lt 06
Magnesium oxide Max 60 lt 13 Max 60 lt 13
Lime saturation factor 066-102 08-09 08-102 088-09
Alumna iron ratio MinO66 15-17 MinO66 15-17
Sulfuric anhydride Max 253 16-20 Max 2 53 16-20
Alkalis Chlorides Max 005 Max 001 Max 005 Max 04
Kesoram Cement - advantages
Helps in designing sleeker and more elegant
Structures giving greater flexibility in design concept
Due to its fine quality super fine construction can be achieved Its gives maximum
strength at Minimum use of cement with water in the water cement ratio especially the 53
grade Birlas supreme-gold
Feathers in Kesorams cap
Kesoram has outstanding track record achieving over 100 capacity utilization I
productivity and energy conservation It has proved its distinction by bagging several
national and state awards noteworthy being
NATIONAL
1 National productivity award for 1985-86
2 National productivity award for 1986-87
3 National award for mines safety for 1985-86
4 National award for mines safety for 1986-875 National award for energy conservation 1989-90
8102019 A Study A Study On Financial Performance Analysis With Reference To Kesoram Cementon Financial Performance hellip
httpslidepdfcomreaderfulla-study-a-study-on-financial-performance-analysis-with-reference-to-kesoram 3081
30
STATE
1 AP State productivity award for 1988
2 State award for best industrial management 1988-89
3 Best industrial productivity award of FAPCCI (federation of AP chamber of
commerce and industry) 1991
4 Best management award of the state Govt 1993
5 FAPCCI award for the workers welfare 1995-96
ISO 9002
All quality systems of Kesoram have been certified under ISO 90021S 4002 which
proves the worldwide acceptance of the products
All quality systems in production and marketing of the product have been certified by BIS
under ISO 90021S 14002
The first unit was installed at basanthnagar with a capacity of 25 ndashlakhs TPA (tones per
annum) incorporating humble supervision preheated system during the year 1969
The second unit followed suit with added a capacity of 2 lakhs TPA in 1971
The plant was further expanded to 9 lakhs by adding 25 lakhs tones in august 1978 113
lakhs tones in January 1981 and 087 lakhs tones in September 1981
Power
Singareni collieries make the supply of coal for this industry and the power was
obtained from AP TRANSCO The power demand for the factory is about 21MW Kesoram
has got 2-diesel generator seats of 4 MW each installed in the year 1987
Kesoram cement now has a 15MWcaptive power plant to facilities for uninterrupted
power supply for manufacturing of cement
Performance
The performance of kersoram cement industry has been outstanding achieving over
cent percent capacity utilization all through despite many odds like power cuts and which
most 40 was wasted due to wagon shortage etc
The company being a continuous process industry works round the clock and has
excellent records of performance achieving over 1005 capacity utilization
Kesoram has always combined technical progress with industrial performance The
company had glorious track record for the last 27 years in the industry
Technology
8102019 A Study A Study On Financial Performance Analysis With Reference To Kesoram Cementon Financial Performance hellip
httpslidepdfcomreaderfulla-study-a-study-on-financial-performance-analysis-with-reference-to-kesoram 3181
31
Kesoram cement uses most modern technology and the computerized control in the
plant A team of dedicated and well- experienced experts manages the plant
The quality is maintained much above the bureau of Indian standards
The raw materials used for manufacturing cement are
Lime stone
Bauxite
Hematite
Gypsum
Environmental and Social Obligations
For environmental promotion and to keep ndashup the ecological balance this section
has planted over two lakhs trees on social obligation front this section has undertaken
various social welfare programs by adopting ten nearly villages organizing family welfare
campus surgical camps animal health camps blood donation camps children immunization
camps seeds training for farmers etc were arranged
Welfare and Recreation Facilities
For the purpose of recreation facilities 2 auditoriums were provided for playing
indoor games cultural function and activities like drama music and dance etc
The industry has provided libraries and reading rooms About 1000 books are available in
the library All kinds of newspaper magazines are made available
Canteen is provided to cater to the needs of the employees for supply of snacks tea
coffee and meals etc
One English medium and one Telugu medium school are provided to meet the
educational requirements
The company has provided a dispenser with a qualified medical office and
paramedical staff for the benefit of the employees The employees covered under ESI
scheme have to avail the medical facilities from the ESI hospital
Competitions in sports and games are conducted every year for august 15th
Independence Day and January 26th republic day among the employees
Electricity
The power consumption per ton of cement has come down to 108 units against 113
units last year due to implementation of various energy saving measures The performance
of captive power plant of this section continues to be satisfactory Total power generation
8102019 A Study A Study On Financial Performance Analysis With Reference To Kesoram Cementon Financial Performance hellip
httpslidepdfcomreaderfulla-study-a-study-on-financial-performance-analysis-with-reference-to-kesoram 3281
32
during the year was 84 million units last year This captive power plant is a major role in
keeping power costs with in economic levels
The management has introduced various HRD programs for training and
development and has taken various other measures for the betterment of employeersquos
efficiency
The section has installed adequate air pollution control system and equipment and is
ISO14001 such as Environment management system is under implementation
Awards
Kesoram cement bagged many prestigious awards including national awards for
productivity technology conservation and several state awards since 1984 The following
are the some of important awards
AWARDS OF KESORAM CEMENT
No Year Awards
National
State
1 1989-90 Management award community
Development
State
2 1991 Energy conservation may day award of the
Govt
State
3 1991 Pundit Jawaharlal Nehru rolling trophy for
best
State
4 1993 National productivity effort Indira Gandhi
national award
State
5 1994 Best management award State
6 1994-
1995
Best industrial rebellion award State
7 1995 Rural development by chief minister
Environment and mineral conservation
award
State
8 1995 Best industrial rebellion award State
8102019 A Study A Study On Financial Performance Analysis With Reference To Kesoram Cementon Financial Performance hellip
httpslidepdfcomreaderfulla-study-a-study-on-financial-performance-analysis-with-reference-to-kesoram 3381
33
9 1995-
1996
Best effort of an industrial unit to
development rural economy shriSRRungta
award for social
National
10 1996 Awareness for best rural development
efforts
State
11 1999 Best workers welfare best family welfare
award
State
12 2001 First prize for mine environment amppollution
control for the 3rd
year in succession
State
13 2002 Vana mithra award from AP Govt State
14 2003 Company has got OHSAS-18001 State
15 2005 Certification from DNV New Delhi State
16 2006 Award for pollution control and
environmental protection FAPCCI award
for best rural development in the state
State
8102019 A Study A Study On Financial Performance Analysis With Reference To Kesoram Cementon Financial Performance hellip
httpslidepdfcomreaderfulla-study-a-study-on-financial-performance-analysis-with-reference-to-kesoram 3481
34
Products of the organization
8102019 A Study A Study On Financial Performance Analysis With Reference To Kesoram Cementon Financial Performance hellip
httpslidepdfcomreaderfulla-study-a-study-on-financial-performance-analysis-with-reference-to-kesoram 3581
35
CHAPTER-III
LITERATURE REVIEW
8102019 A Study A Study On Financial Performance Analysis With Reference To Kesoram Cementon Financial Performance hellip
httpslidepdfcomreaderfulla-study-a-study-on-financial-performance-analysis-with-reference-to-kesoram 3681
36
Introduction
Financial Performance Analysis
The term lsquofinancial performance analysis also known as analysis and interpretation of
financial statementsrsquo refers to the process of determining financial strength and
weaknesses of the firm by establishing strategic relationship between the items of the
balance sheet profit and loss account and other operative data
ldquoAnalyzing financial statementsrdquo by Metcalf and Titard
ldquoFinancial analysis is a process of evaluating the relationship between component
parts of a financial statement to obtain a better understanding of a firms position and
performancerdquo by Myers
Financial Performance
The word lsquoPerformance is derived from the word lsquoparfourmenrsquo which means lsquoto dorsquo lsquoto
carry outrsquo or lsquoto renderrsquo It refers the act of performing execution accomplishment
fulfillment etc In border sense performance refers to the accomplishment of a given task
measured against preset standards of accuracy completeness cost and speed In other
words it refers to the degree to which an achievement is being or has been accomplished In
the Words of Frich Kohlar ldquoThe performance is a general term applied to a part or to all the
conducts of activities of an organization over a period of time often with reference to past or
projected cost efficiency management responsibility or accountability or the like Thus not
just the presentation but the quality of results achieved refers to the performance
Performance is used to indicate firmrsquos success conditions and compliance
Financial performance refers to the act of performing financial activity In broader
sense financial performance refers to the degree to which financial objectives being or has
been accomplished It is the process of measuring the results of a firms policies and
operations in monetary terms It is used to measure firms overall financial health over a
given period of time and can also be used to compare similar firms across the same industry
or to compare industries or sectors in aggregation
The purpose of financial analysis is to diagnose the information contained in financial
statements so as to Jude the profitability and financial soundness of the firm Just like a
doctor examines his patient by recording his body temperature blood pressure etc Before
8102019 A Study A Study On Financial Performance Analysis With Reference To Kesoram Cementon Financial Performance hellip
httpslidepdfcomreaderfulla-study-a-study-on-financial-performance-analysis-with-reference-to-kesoram 3781
37
making his conclusion regarding the illness and before giving his treatment a financial
analyst analysis the financial statements with various tools of analysis before commenting
upon the financial health or weaknesses of an enterprise
The analysis and interpretation of financial statements is essential to bring out the
mystery behind the figures in financial statements Financial statements analysis is an
attempt to determine the significance and meaning of the financial statement data so that
forecast may be made of the future earnings ability to pay interest and debt maturities (both
current and long term) and profitability of a sound divided policy
Types of financial analysis-
Financial analysis into different categories depending upon
(1) The material used and
(2) The method of operation followed in the analysis or the modus operandi of
analysis
Types of financial analysis
On the basis of material used on the basis of modus operandi
External Internal Horizontal Vertical
Analysis Analysis Analysis Analysis
1 On the basis of material used - According to material used financial analysis canbe of two types
External analysis
Internal analysis
External analysis-
This analysis is done by outsiders who do not have access to the detailed internal
outsiders include investors potential investors Creditors Potential Creditors Government
Agencies Credit Agencies and General Public For financial analysis these external parties
to the firm depend almost entirely on the published financial statements
Internal analysis-
This analysis is undertaken by the persons namely executives and employees of the
organization or by the officers appointed by government or court who have access to the
8102019 A Study A Study On Financial Performance Analysis With Reference To Kesoram Cementon Financial Performance hellip
httpslidepdfcomreaderfulla-study-a-study-on-financial-performance-analysis-with-reference-to-kesoram 3881
38
books of account ( internal accounting records) and other information related to the
business
2 983119983150 983156983144983141 983138983137983155983145983155 983151983142 983149983151983140983157983155 983151983152983141983154983137983150983140983145983085
According to the modus operandi financial analysis can also be of two types
a Horizontal analysis
bVertical analysis
Horizontal analysis-
Horizontal analysis refers to the comparison of financial data of a company for several
years The figures for this type of analysis are presented horizontally over a number of
columns The figures of the various years are compared with standard or base year a base
year is year chosen as beginning point This type of analysis is also called lsquodynamicanalysisrsquo as it is based on the data from year to year rather than on data of any one year The
horizontal analysis makes it possible to focus attention on items that have changed
significantly during the period under view
b Vertical analysis-
Vertical analysis refers to the study of relationship of the various items in the financial
statements of one accounting period In this types of analysis the figures from financial
statement of a year are compared with a base selected from the same yearrsquos statement
Methods of financial analysis-
The following methods of analysis are generally used-
1 Comparative Statements
2 Trend Analysis
3 Common-Size Statements
4 Funds flow Analysis
5 Cash Analysis
6 Ratio Analysis
7 Cost-volume-Profit Analysis
8102019 A Study A Study On Financial Performance Analysis With Reference To Kesoram Cementon Financial Performance hellip
httpslidepdfcomreaderfulla-study-a-study-on-financial-performance-analysis-with-reference-to-kesoram 3981
39
Comparative statements-
The comparative financial statements are statements of the financial position at
different periods of time the elements of financial position are show in a
Comparative Statement provides an idea of financial position at two or more
periods Generally two financial statements (balance sheet and income statement) are
prepared in comparative form for financial analysis
The Comparative Statement May Show-
1 Absolute figures (rupee amounts)
2 Changes in absolute figures ie increase or decrease in absolute figures
3 Absolute data in terms of percentages
4 Increase or decrease in terms of percentages
The Two Comparative Statements Are-
1 Comparative balance sheet and
2 Income statement
1 983107983151983149983152983137983154983137983156983145983158983141 983138983137983148983137983150983139983141 983155983144983141983141983156983085
The comparative balance sheet analysis is the study of the trend of the same items group of
items and computed items in two or more balance sheets of the same business enterprise on
different dates The change in periodic balance sheet items reflect the conduct of a business
the change can be observed by comparison of the balance sheet at the beginning and at the
end of a period and these changes can help in forming an opinion about the progress of an
enterprise
Guide Lines for Interpretation of Comparative Balance Sheet-
While interpreting comparative balance sheet the interpreter is expected to study the
following aspects-
1 Current financial position and liquidity position
2 Long-term financial position
3 Profitability of the concern
8102019 A Study A Study On Financial Performance Analysis With Reference To Kesoram Cementon Financial Performance hellip
httpslidepdfcomreaderfulla-study-a-study-on-financial-performance-analysis-with-reference-to-kesoram 4081
40
Common Size Statement-
The common-size statements balance sheet and income statement are show in
analytical percentages The figures are shown as percentages of total assets total liabilities
and total sales The total assets are taken as 100 and different assets are expressed as a
percentage of the total similarly various liabilities are taken as a part of total liabilities
Common Size Balance Sheet-
A statement in which balance sheet items are expressed as the ratio of each asset to
total assets and the ratio of each liability is expressed as a ratio of total liabilities is called
common size balance The common size balance sheet can be used to compare companies
of differing size The comparison of figures in different periods is not useful because total
figures may be affected by a number of factors It is not possible to establish standard norms
for various assets The trends of figures from year to year may not be studied and even they
may not give proper results
Trend Analysis of Balance Sheet-
Trend analysis is Very important tool of horizontal financial analysis
This analysis enables to known the change in the financial function and operating efficiency
in between the time period chosen
By studding the trend analysis of each item we can known the direction of changes and
based upon the direction of changes the options can be changed
Trend =Absolute Value of item in the statement understudy 100
Absolute Value of same item in the base statement
Ratio Analysis
Ratio analysis is used as a technique of analyzing the financial information contained in the
balance sheet and profit and loss accounts for a more meaningful understanding of the
financial position and performance of a firm
The relationship between two accounting figures expressed mathematically is known as a
financial ratio A ratio helps the analyst to make qualitative judgment about the firmrsquos
financial position and performance
Several ratios can be calculated from the accounting data contained in the financial
statements The parties which generally undertake financial analysis is short ndashterm
creditors long-term creditors owner and management In view of the requirements of the
various ratios ratios are classified into the following four important categories
8102019 A Study A Study On Financial Performance Analysis With Reference To Kesoram Cementon Financial Performance hellip
httpslidepdfcomreaderfulla-study-a-study-on-financial-performance-analysis-with-reference-to-kesoram 4181
41
Liquidity ratios
Leverage ratios
Activity ratios
Profitability ratios
Liquidity Ratios
It is extremely essential for a firm to be able to meet its obligations as they become due
Liquidity ratios measure the ability of the firm to meet its current obligations A firm should
ensure that it does not suffer from lack of liquidity and also that it does not have excess
liquidity The failure of a company to meet its obligations due to lack of sufficient liquidity
will result in a poor creditworthiness loss of creditorsrsquo confidence or even in legal tangles
resulting in the closure of the company A very high degree of liquidity is also bad idle
assets earn nothing The firmrsquos funds will be unnecessarily tied up in current assets
Therefore it is necessary to strike a proper balance high liquidity and lack of liquidity
The most common ratios which indicate the extent of liquidity or lack of it are
Current ratio
Quick ratio
Other ratios include Cash ratio Interval Measure and Net working capital ratio
Current Ratio
The current ratio is calculated by dividing current assets by current liabilities
Current assets
Current ratio = --------------------------
Current liabilities
Current ratio is a measure of the firmrsquos short term solvency It indicates the availability of
current assets in rupees for every one rupee of current liability A ratio of greater than one
means that the firm has more current assets than current claims against the Current ratio of
2 to 1 or more is considered satisfactory Current ratio represents a margin of safety for
creditors
Quick Ratio
Quick ratio also known as acid-test ratio establishes a relationship between quick assets and
the current liabilities Cash is the most liquid asset It is calculated by dividing quick assets
by current liabilities
Quick ratio = Quick Assets Current Liabilities
8102019 A Study A Study On Financial Performance Analysis With Reference To Kesoram Cementon Financial Performance hellip
httpslidepdfcomreaderfulla-study-a-study-on-financial-performance-analysis-with-reference-to-kesoram 4281
42
(Quick Assets = Current assets ndash Inventory)
One defect of the current ratio is that it fails to convey any information on the composition
of the current assets of the firm A rupee of cash is considered equivalent to a rupee of
inventory of receivables But it is not so A rupee of cash is more readily available to meet
current liabilities than a rupee of say inventory This implies the usefulness of the current
ratio
The Acid ndashtest ratio measures the firmrsquos ability to convert its current assets quickly into
cash in order to meet its current liabilities
A quick ratio of 1 to 1 is considered to represent a satisfactory current financial condition It
is an important index of the firmrsquos liquidity
Leverage Ratios
Leverage ratios identify the source of a firmrsquos capital ndashowners or outside creditors
Financial leverage refers to the use of debt in financing non-current assets If the return on
assets exceeds the cost of debt the leverage is successful ndash ie it improves return on equity
Debt ndashEquity Ratio
The Debt ndash Equity is determined to analyze the soundness of the long term financial
policies of the organization It is also known as ldquoInternal External Equity Ratiordquo
It is calculated as follows
Debt ndash Equity Ratio = Total long term debt Share holders funds
Equity Ratio
This ratio is also called as proprietary ratio establishes a relationship between share holderrsquos
funds to total assets of company Equity Ratio is calculated by dividing share holders fund
by total assets
Fixed Asset Ratio
This ratio indicates the extent to which the assets of the companyrsquos can be lost without
affecting the interest of the creditors of the company Higher the ratios better the long-term
position of the company
Activity Ratios
They are primarily used for studying a firmrsquos working capital situation A well managed
firm should have good activity ratios
8102019 A Study A Study On Financial Performance Analysis With Reference To Kesoram Cementon Financial Performance hellip
httpslidepdfcomreaderfulla-study-a-study-on-financial-performance-analysis-with-reference-to-kesoram 4381
43
Working Capital Turnover Ratio
The working capital turnover ratio indicates whether or not working capital has been
effectively used in making sales
Working capital turnover = Sales Net current assets
Inventory Turnover Ratio
This ratio also known as Stock Turnover Ratio establishes the relationship between costs of
goods sold or net sales during the given period and the average amt of stock held during the
period This ratio reveals the number of times finished stock in turnover during a given
accounting period
Higher the ratio the better is it because it shows the finished stock is rapidly turned
in to sales On the other hand a low stock turnover ratio is not desirable because it reveals
the accumulation of stock
Debtors Turnover Ratio
This ratio indicates the velocity of debt collection of a company In other words it shows
the number of times average turnover during a year
A Higher Debtor Turnover Ratio indicates a more efficient is the management towards
debtors and low ratio ratio implies inefficient management of debtors
Total Assets Turnover Ratio
The asset turnover ratio indicates how efficiently management is employing Assets
Total Assets Turnover Ratio = Sales Total Assets
Profitability Ratios
Profitability ratios are the ratios which measure a firmrsquos overall effectiveness as revealed by
the returns generated on sales and investment
General Profitability Ratios
1 Gross Profit Ratio
2 Net profit Ratio
3 Operating or Expenses Ratio
8102019 A Study A Study On Financial Performance Analysis With Reference To Kesoram Cementon Financial Performance hellip
httpslidepdfcomreaderfulla-study-a-study-on-financial-performance-analysis-with-reference-to-kesoram 4481
44
Gross Profit Ratio
Gross profit Ratio measures the relationships to net sales and is usually represented as a
percentage It is a good measure of profitability
The gross profit ratio indicates the extent to which selling price of goods per unit may
decline without resulting in losses on operation Higher the gross profit betters the result
Net Profit Ratio
Net Profit Ratio indicates net margin on sales It is given by the following equation
Net Profit Ratio = (Net Profit Sales) 100
Operating or Expenses Ratio
This ratio is complimentary of Net Profit Ratio The more the net profit the less the
Operating Ratio Operating costs include the cost of direct materials direct labors and otheroverheads viz are generally excluded from operating costs A comparison of the Operating
Ratio will indicate whether the cost efficiency is high or low in the figure of sales This less
the ratio it depicts the efficiency of the management
8102019 A Study A Study On Financial Performance Analysis With Reference To Kesoram Cementon Financial Performance hellip
httpslidepdfcomreaderfulla-study-a-study-on-financial-performance-analysis-with-reference-to-kesoram 4581
45
CHAPTER IV
DATA ANALYSIS amp INTERPRETATION
8102019 A Study A Study On Financial Performance Analysis With Reference To Kesoram Cementon Financial Performance hellip
httpslidepdfcomreaderfulla-study-a-study-on-financial-performance-analysis-with-reference-to-kesoram 4681
46
Comparative Balance Sheet of Kesoram in the Year between 2008-2009
(Rupee in crores)
Years Changes
Particulars 2008 2009 In Rupees In Percentage
Liabilities
Share Capital 4574 4574 000 000
Reserves amp Surplus 93085 128024 34939
Revaluation Reserves 533 412 -121 -2270
Loans
Secured Loans 97106 153627 56521 5821
Un Secured Loans 12129 43416 31287 25795
Deferred Tax Liabilities 000 000 000 000
Current Liabilities
Provisions 33039 34529 1490 451
Current Liabilities 57067 66587 9520 1668
Total 297533 431169 133636 4491
Assets
Net Block 108424 180435 72011 6642
Capital Wip 63459 86485 23026 3628
Investments 4783 6178 1395 2917
Current Assets
Inventories 44217 58906 14689 3322
Sundry Debtors 27307 38017 10710 3922
Cash amp Bank Balances 4036 5657 1621 4016
Total Current Assets 75560 102580 27020 3576
Loans amp Advances 45289 55462 10173 2246
Fixed Deposits 018 028 010 5556
Total 297533 431169 133636 4491
8102019 A Study A Study On Financial Performance Analysis With Reference To Kesoram Cementon Financial Performance hellip
httpslidepdfcomreaderfulla-study-a-study-on-financial-performance-analysis-with-reference-to-kesoram 4781
47
Interpretation of comparative balance sheet of 2008-2009
Reserves amp Surplus were increased to 3753 (percent) ie in Rupees 34939
crores
Revaluation Reserves decreased to 121 ie in Rupees 2270 crores
Secured Loans are increased to 5821 ie in Rupees 56521 crores And UN
secured loans highly Increased to 25795
Current liabilities and Provisions are increased to 1668 and 451 respectively ie in
Rupees 9520 amp 1490 crores
Fixed assets were highly increased to 6642 ie in Rupees 72011 crores
Investments were increased to 2917 ie in Rupees 1395 crores
Sundry debtors increased to 3922 ie in Rupees 10710 crores
Current assets increased 3576 ie in Rupees 27020 crores And Loans amp
Advances increased to 2246 respectively
The overall financial position was satisfactory
8102019 A Study A Study On Financial Performance Analysis With Reference To Kesoram Cementon Financial Performance hellip
httpslidepdfcomreaderfulla-study-a-study-on-financial-performance-analysis-with-reference-to-kesoram 4881
48
Comparative Balance Sheet of Kesoram in the Year between 2009-2010
(Rupees in crores)
Years Changes
Particulars 2009 2010 In Rupees In Percentage
Liabilities
Share Capital 4574 4574 000 000
Reserves amp Surplus 128024 149111 21087 1647
Revaluation Reserves 412 339 -073 -1772
Loans
Secured Loans 153627 186372 32745 2131
Un Secured Loans 43416 126250 82834 19079
Deferred Tax Liabilities 000 000 000
Current Liabilities
Provisions 34529 35734 1205 349
Current Liabilities 66587 107688 41101 6173
Total 431169 610068 178899 4149
Assets
Net Block 180435 343182 162747 9020
Capital WIP 86485 41283 -45202 -5227
Investments 6178 5143 -1035 -1675
Current Assets
Inventories 58906 91619 32713 5553
Sundry Debtors 38017 54289 16272 4280
Cash amp Bank Balances 5657 8014 2357 4167
Total Current Assets 102580 153922 51342 5005
Loans amp Advances 55462 66506 11044 1991
Fixed Deposits 028 031 003 1071
Total 431169 610068 178899 4149
8102019 A Study A Study On Financial Performance Analysis With Reference To Kesoram Cementon Financial Performance hellip
httpslidepdfcomreaderfulla-study-a-study-on-financial-performance-analysis-with-reference-to-kesoram 4981
49
Interpretation of comparative balance sheet of 2009-2010
Reserves amp surplus increased to 1647 ie in Rupees 21087 crores
Revaluation Reserves decreased to 1772 ie in Rupees 073 crores
Secured loans increased to 2131 ie in Rupees 32745 crores
Current Liabilities were increased to 6173 ie in Rupees 41101 crores and
Provisions 349 ie in Rupees 1205 crores
Fixed Assets were increased to 9020 ie in Rupees 162747 crores
Investments were decreased to 1675 ie in Rupees 1035 crores
Sundry debtors were increased to 4280 ie in Rupees 16272 crores
Current assets increased to 5005 ie in Rupees 51342 crores And loans and
Advances increased 1919 ie in Rupees 11044 crores
The overall financial position was satisfactory
8102019 A Study A Study On Financial Performance Analysis With Reference To Kesoram Cementon Financial Performance hellip
httpslidepdfcomreaderfulla-study-a-study-on-financial-performance-analysis-with-reference-to-kesoram 5081
50
Comparative Balance Sheet of Kesoram in the Year between 2010-2011
(Rupees in crores)
Years Changes
Particulars 2010 2011 In Rupees In Percentage
Liabilities
Share Capital 4574 4574 000 000
Reserves amp Surplus 149111 125162 -23949 -1606
Revaluation Reserves 339 289 -050 -1475
Loans
Secured Loans 186372 237183 50811 2726
Un Secured Loans 126250 162744 36494 2891
Deferred Tax Liabilities 000 000 000
Current Liabilities
Provisions 35734 1494 -34240 -9582
Current Liabilities 107688 113902 6214 577
Total 610068 645348 35280 578
Assets
Net Block 343182 369172 25990 757
Capital WIP 41283 43781 2498 605
Investments 5143 6582 1439 2798
Current Assets
Inventories 91619 111855 20236 2209
Sundry Debtors 54289 63134 8845 1629
Cash amp Bank Balances 8014 7188 -826 -1031
Total Current Assets 153922 182177 28255 1836
Loans amp Advances 66506 43460 -23046 -3465
Fixed Deposits 031 176 145 46774
Total 610068 645348 35280 578
8102019 A Study A Study On Financial Performance Analysis With Reference To Kesoram Cementon Financial Performance hellip
httpslidepdfcomreaderfulla-study-a-study-on-financial-performance-analysis-with-reference-to-kesoram 5181
51
Interpretation of comparative balance sheet of 2010-2011
Reserves amp surplus decreased to 1606 ie in Rupees 23949 crores
Revaluation Reserves decreased to 1475 ie in Rupees 050 crores
Secured loans increased to 2726 ie in Rupees 50811 crores
Current Liabilities were increased to 577 ie in Rupees 6214 crores
Provisions decreased to 9582 ie in Rupees 34240 crores
Fixed Assets were increased to 757 ie in Rupees 25990 crores
Investments were decreased to 2798 ie in Rupees 1439 crores
Sundry debtors were increased to 1629 ie in Rupees8845 crores
Current assets increased to 1836 ie in Rupees 28255 crores And loans and
Advances increased 3465 ie in Rupees 23046 crores
The overall financial position was UN satisfactory
8102019 A Study A Study On Financial Performance Analysis With Reference To Kesoram Cementon Financial Performance hellip
httpslidepdfcomreaderfulla-study-a-study-on-financial-performance-analysis-with-reference-to-kesoram 5281
52
Comparative Balance Sheet of Kesoram In The Year Between 2011-2012
(Rupees in crores)
Years Changes
Particulars 2011 2012 In Rupees In Percentage
Liabilities
Share Capital 4574 4574 000 000
Reserves amp Surplus 125162 86657 -38505 -3076
Revaluation Reserves 289 270 -019 -657
Loans
Secured Loans 237183 317792 80609 3399
Un Secured Loans 162744 92742 -70002 -4301
Deferred Tax Liabilities 000 000 000
Current Liabilities
Provisions 1494 40726 39232 262597
Current Liabilities 113902 180010 66108 5804
Total 645348 722771 77423 1200
Assets 000
Net Block 369172 358721 -10451 -283
Capital WIP 43781 68065 24284 5547
Investments 6582 6636 054 082
Current Assets
Inventories 111855 99516 -12339 -1103
Sundry Debtors 63134 67358 4224 669
Cash amp Bank Balances 7188 6959 -229 -319
Total Current Assets 182177 173833 -8344 -458
Loans amp Advances 43460 115409 71949 16555
Fixed Deposits 176 107 -069 -3920
Total 645348 722771 77423 1200
8102019 A Study A Study On Financial Performance Analysis With Reference To Kesoram Cementon Financial Performance hellip
httpslidepdfcomreaderfulla-study-a-study-on-financial-performance-analysis-with-reference-to-kesoram 5381
53
Interpretation of comparative balance sheet of 2011-2012
Reserves amp surplus decreased to 3076 ie in Rupee 38505 crores
Revaluation Reserves decreased to 657 ie in Rupees 019 crores
Secured loans increased to 3399 ie in Rupees 80699 crores
Current Liabilities were increased to 5804 ie in Rupees 66108 crores
Provisions increased to 262597 ie in Rupees 39232 crores
Fixed Assets were decreased to 283 ie in Rupee 10451 crores
Investments were increased to 082 ie in Rupees 054 crores
Sundry debtors were increased to 669 ie in Rupees 4224 crores
Current assets decreased to 458 ie in Rupees 8344 crores And loans and
Advances increased 16555 ie in Rupees 71949 crores
The overall financial position was UN satisfactory
8102019 A Study A Study On Financial Performance Analysis With Reference To Kesoram Cementon Financial Performance hellip
httpslidepdfcomreaderfulla-study-a-study-on-financial-performance-analysis-with-reference-to-kesoram 5481
54
Common Size Balance Sheet of Kesoram For The Year 2008-2009
(Rupees in crores)
Particulars 2008 Change Percentage 2009 Change Percentage
Liabilities
Share Capital 4574 154 4574 106
Reserves amp Surplus 93085 3129 128024 2969
Revaluation Reserves 533 018 412 010
Loans
Secured Loans 97106 3264 153627 3563
Un Secured Loans 12129 408 43416 1007
Deferred Tax Liabilities 000 000 000 000
Current Liabilities
Provisions 33039 1110 34529 801
Current Liabilities 57067 1918 66587 1544
Total 297533 10000 431169 10000
Assets
Net Block 108424 3644 180435 4185
Capital WIP 63459 2133 86485 2006
Investments 4783 161 6178 143
Current Assets
Inventories 44217 1486 58906 1366
Sundry Debtors 27307 918 38017 882
Cash amp Bank Balances 4036 136 5657 131
Loans amp Advances 45289 1522 55462 1286
Fixed Deposits 018 001 028 001
Total 297533 10000 431169 10000
8102019 A Study A Study On Financial Performance Analysis With Reference To Kesoram Cementon Financial Performance hellip
httpslidepdfcomreaderfulla-study-a-study-on-financial-performance-analysis-with-reference-to-kesoram 5581
55
Interpretation of Common Size Balance Sheet of 2008-2009
Share capital was recorded 154 percent in the total liabilities in the year 2008 it is
decreased to 106 in the year 2009
Reserves amp surplus contributed to 3129 in the total liabilities in the year 2008 it is
decreased to 2969 in the year 2009
Secured loans were 3264 in the total liabilities in the year 2008 it is increased to
3563 in the year 2009
Current Liabilities shown to 1918 in the total liabilities in the year 2008 it is
decreased to 1544 in the year 2009
Provisions 1110 in the total liabilities in the year 2008 it is decreased to 801 in the
year 2009
Fixed Assets were 3644 in the total liabilities in the year 2008 ie decreased to 4185
in the year 2009
Investments were 161 in the total liabilities in the year 2008 it is decreased to 143
in the year 2009
Sundry debtors were 918 in the total liabilities in the year 2008 it is decreased to 882
in the year 2009
8102019 A Study A Study On Financial Performance Analysis With Reference To Kesoram Cementon Financial Performance hellip
httpslidepdfcomreaderfulla-study-a-study-on-financial-performance-analysis-with-reference-to-kesoram 5681
56
Common Size Balance Sheet of Kesoram For The Year 2009-2010
(Rs in crores)
Particulars 2009 Change Percentage 2010Change
Percentage
Liabilities
Share Capital 4574 106 4574 075
Reserves amp Surplus 128024 2969 149111 2444
Revaluation Reserves 412 010 339 006
Loans
Secured Loans 153627 3563 186372 3055
Un Secured Loans 43416 1007 126250 2069
Deferred Tax Liabilities 000 000 000 000
Current Liabilities
Provisions 34529 801 35734 586
Current Liabilities 66587 1544 107688 1765
Total 431169 10000 610068 10000
Assets
Net Block 180435 4185 343182 5625
Capital WIP 86485 2006 41283 677
Investments 6178 143 5143 084
Current Assets
Inventories 58906 1366 91619 1502
Sundry Debtors 38017 882 54289 890
Cash amp Bank Balances 5657 131 8014 131
Loans amp Advances 55462 1286 66506 1090
Fixed Deposits 028 001 031 001
Total 431169 10000 610068 10000
8102019 A Study A Study On Financial Performance Analysis With Reference To Kesoram Cementon Financial Performance hellip
httpslidepdfcomreaderfulla-study-a-study-on-financial-performance-analysis-with-reference-to-kesoram 5781
57
Interpretation of common size balance sheet of 2009-2010
Share capital was recorded 106 percent in the total liabilities in the
year 2009 it is decreased to 075 in the year 2010
Reserves amp surplus contributed to 2969 in the total liabilities in the
year 2009 it is decreased to2444 in the year 2010
Secured loans were 3563 in the total liabilities in the year 2009 it is
increased to 3055 in the year 2010
Current Liabilities shown to 1544 in the total liabilities in the year
2009 it is decreased to 1765 in the year 2010
Provisions 801 in the total liabilities in the year 2009 it is decreased
to 586 in the year 2010
Fixed Assets were 4185 in the total liabilities in the year 2009 ie
increased to 5625 in the year 2010
Investments were 143 in the total liabilities in the year 2009 it is
decreased to 084 in the year 2010
Sundry debtors were 882 in the total liabilities in the year 2009 it is
increased to 890 in the year 2010
8102019 A Study A Study On Financial Performance Analysis With Reference To Kesoram Cementon Financial Performance hellip
httpslidepdfcomreaderfulla-study-a-study-on-financial-performance-analysis-with-reference-to-kesoram 5881
58
Common Size Balance sheet of Kesoram for the year 2010-2011
983080Rupees in crores)
Particulars 2010 Change Percentage 2011
Change
Percentage
Liabilities
Share Capital 4574 075 4574 071
Reserves amp Surplus 149111 2444 125162 1939
Revaluation Reserves 339 006 289 004
Loans
Secured Loans 186372 3055 237183 3675
Un Secured Loans 126250 2069 162744 2522
Deferred Tax Liabilities 000 000 000 000
Current Liabilities
Provisions 35734 586 1494 023
Current Liabilities 107688 1765 113902 1765
Total 610068 10000 645348 10000
Assets
Net Block 343182 5625 369172 5721
Capital WIP 41283 677 43781 678
Investments 5143 084 6582 102
Current Assets
Inventories 91619 1502 111855 1733
Sundry Debtors 54289 890 63134 978
Cash amp Bank Balances 8014 131 7188 111
Loans amp Advances 66506 1090 43460 673
Fixed Deposits 031 001 176 003
Total 610068 10000 645348 10000
8102019 A Study A Study On Financial Performance Analysis With Reference To Kesoram Cementon Financial Performance hellip
httpslidepdfcomreaderfulla-study-a-study-on-financial-performance-analysis-with-reference-to-kesoram 5981
59
Interpretation of Common Size Balance Sheet Of 2010-2011
Share capital was recorded 075 percent in the total liabilities in the year 2010 it is
decreased to 071 in the year 2011
Reserves amp surplus contributed to 2444 in the total liabilities in the year 2010 it is
decreased to1939 in the year 2011
Secured loans were 3055 in the total liabilities in the year 2010 it is increased to
3675 in the year 2011
Current Liabilities shown to 1765 in the total liabilities in the year 2010 it is
also1765 in the year 2011
Provisions 586 in the total liabilities in the year 2010 it is decreased to 023 in the
year 2011
Fixed Assets were 5625 in the total liabilities in the year 2010 ie increased to 5721
in the year 2011
Investments were 084 in the total liabilities in the year 2010 it increased to 102 in
the year 2011
Sundry debtors were 890 in the total liabilities in the year 2010 it is increased to 978
in the year 2011
8102019 A Study A Study On Financial Performance Analysis With Reference To Kesoram Cementon Financial Performance hellip
httpslidepdfcomreaderfulla-study-a-study-on-financial-performance-analysis-with-reference-to-kesoram 6081
60
Common Size Balance Sheet of Kesoram for the Year 2011-2012
983080Rupees in crores)
Particulars 2011 Change Percentage 2012
Change
Percentage
Liabilities
Share Capital 4574 071 4574 063
Reserves amp Surplus 125162 1939 86657 1199
Revaluation Reserves 289 004 270 004
Loans
Secured Loans 237183 3675 317792 4397
Un Secured Loans 162744 2522 92742 1283
Deferred Tax Liabilities 000 000 000 000
Current Liabilities
Provisions 1494 023 40726 563
Current Liabilities 113902 1765 180010 2491
Total 645348 10000 722771 10000
Assets
Net Block 369172 5721 358721 4963
Capital WIP 43781 678 68065 942
Investments 6582 102 6636 092
Current Assets
Inventories 111855 1733 99516 1377
Sundry Debtors 63134 978 67358 932
Cash amp Bank Balances 7188 111 6959 096
Loans amp Advances 43460 673 115409 1597
Fixed Deposits 176 003 107 001
Total 645348 10000 722771 10000
8102019 A Study A Study On Financial Performance Analysis With Reference To Kesoram Cementon Financial Performance hellip
httpslidepdfcomreaderfulla-study-a-study-on-financial-performance-analysis-with-reference-to-kesoram 6181
61
Interpretation of common size balance sheet of 2011-2012
Share capital was recorded 071 percent in the total liabilities in the year 2011 it is
decreased to 063 in the year 2012
Reserves amp surplus contributed to 1939 in the total liabilities in the year 2011 it
is decreased to 1199 in the year 2012
Secured loans were 3675 in the total liabilities in the year 2011 it is increased to
4397 in the year 2012
Current Liabilities shown to 1765 in the total liabilities in the year 2011 it is
increased to 2491 in the year 2012
Provisions 023 in the total liabilities in the year 2011 it is increased to 563 in the
year 2012
Fixed Assets were 5721 in the total liabilities in the year 2011 ie decreased to
4963 in the year 2012
Investments were 102 in the total liabilities in the year 2011 it increased to 092
in the year 2012
Sundry debtors were 978 in the total liabilities in the year 2011 it is decreased to
932 in the year 2012
8102019 A Study A Study On Financial Performance Analysis With Reference To Kesoram Cementon Financial Performance hellip
httpslidepdfcomreaderfulla-study-a-study-on-financial-performance-analysis-with-reference-to-kesoram 6281
Trend Analysis
Share Capital-
Year
Amount
(In Crores) Trend
IncreaseDecrease
Base Year Previous Year
2008 4574 10000 000 000
2009 4574 10000 000 000
2010 4574 10000 000 000
2011 4574 10000 000 000
2012 4574 10000 000 000
Trend Percentages in Share Capital
Share capital shown a constant trend in the period 2008 and 2012
Share capital is 4574 crores all the years from 2008-2012
8102019 A Study A Study On Financial Performance Analysis With Reference To Kesoram Cementon Financial Performance hellip
httpslidepdfcomreaderfulla-study-a-study-on-financial-performance-analysis-with-reference-to-kesoram 6381
Reserves amp Surplus-
Year
Amount
(In Crores) Trend
IncreaseDecrease
Base Year Previous Year
2008 93085 10000 000 000
2009 128024 13753 3753 3753
2010 149111 16019 6019 2266
2011 125162 13446 3446 -2573
2012 86657 9309 -691 -4137
Trend Percentages in Reserves amp Surplus
Reserves amp surplus shown an increasing trend in the period between 2008 and 2010
The average trend was 13277 till 2010
The Reserves amp surplus was showing decreasing trend in the period 2011-2012 (ie
from 16019 in 2010 to 9309 in 2012)
The decreasing trend in Reserves amp surplus indicates the decrease in profits of the
firm
8102019 A Study A Study On Financial Performance Analysis With Reference To Kesoram Cementon Financial Performance hellip
httpslidepdfcomreaderfulla-study-a-study-on-financial-performance-analysis-with-reference-to-kesoram 6481
Investments-
Year
Amount
(In Crores) Trend
IncreaseDecrease
Base Year Previous Year
2008 4783 10000 000 000
2009 6178 12917 2917 2917
2010 5143 10753 753 -2164
2011 6582 13761 3761 3009
2012 6636 13874 3874 113
Trend Percentages in Investments-
The investments are shown an increasing trend in the period between 2008 ndash 2009
and it is decreasing in the year 2010
The average trend was 11458 till 2009
The investments increased in the periods 2011-2012 (ie from 10753 in 2010 to
13874 in 2012)
The overall trend in investments shown is satisfactory
8102019 A Study A Study On Financial Performance Analysis With Reference To Kesoram Cementon Financial Performance hellip
httpslidepdfcomreaderfulla-study-a-study-on-financial-performance-analysis-with-reference-to-kesoram 6581
Net Current Assets-
Year
Amount
(In Crores) Trend
IncreaseDecrease
Base Year Previous Year
2008 30761 10000 000 000
2009 56954 18515 8515 8515
2010 77037 25044 15044 6529
2011 110417 35895 25895 10851
2012 68613 22305 12305 -13590
Trends in Net Current Assets-
The NCA shown positive (increasing) trend
The NCA are increased to 35895 (the year 2011) compared with base year and
decreased in the year 2012 to 22305
The NCA shown increased trend from year and crossed 100
The overall trend was good
8102019 A Study A Study On Financial Performance Analysis With Reference To Kesoram Cementon Financial Performance hellip
httpslidepdfcomreaderfulla-study-a-study-on-financial-performance-analysis-with-reference-to-kesoram 6681
66
Ratio Analysis-
Current Ratio-
Current Ratio = Current Assets Current Liabilities
Current assets are cash in hand Cash at bank Marketable Securities(short term) short term
Investment Bills receivables sundry debtors Inventories (stock) Work in progress prepaid
expenses Current Liabilities are outstanding expenses Bills payable sundry Creditors
short-term advances income tax payable and Dividend payable
Current Ratio of Kesoram-
(Rupees in crores)
Year Current Assets Current Liabilities Current Ratio
2007-08 75560 57067 132
2008-09 102580 66587 154
2009-10 153922 107688 143
2010-11 182177 113902 160
2011-12 173833 180010 097
Interpretation-
As per the standard rule of current ratio ie 21 where current assets double the current
liabilities is considered satisfactory
In the present analysis the current ratio of the Kesoram is not satisfactory
from the above table It was assessed that the current ratio for all the five year is lower (less)
than the standard rule ie 21 And it is 097 in the year 2011-2012 (current year) This is
highly UN satisfactory
8102019 A Study A Study On Financial Performance Analysis With Reference To Kesoram Cementon Financial Performance hellip
httpslidepdfcomreaderfulla-study-a-study-on-financial-performance-analysis-with-reference-to-kesoram 6781
Quick Ratio-
Quick ratio also known as acid-test ratio establishes a relationship between quick
assets and the current liabilities Cash is the most liquid asset It is calculated by dividing
quick assets by current liabilities
Quick ratio = Quick Assets Current Liabilities
(Quick Assets = Current assets ndash Inventory)
Quick Ratio of Kesoram-
Rupees in crores)
Year Total QuickAssets
Current Liabilities Quick Ratio
2007-08 33343 57067 058
2008-09 43674 66587 066
2009-10 62303 107688 058
2010-11 70322 113902 0622011-12 74333 180010 041
Interpretation-
Usually a high Quick ratio is an indication that the company is liquid and has the ability to
meet its current or liquid liabilities in time on the other hand a low Quick Ratio represents
8102019 A Study A Study On Financial Performance Analysis With Reference To Kesoram Cementon Financial Performance hellip
httpslidepdfcomreaderfulla-study-a-study-on-financial-performance-analysis-with-reference-to-kesoram 6881
that the companyrsquos liquidity position is not good The above table showing the quick ratios
of Kesoram are canrsquot be considered satisfactory
Leverage Ratios-
Debt-Equity Ratio-
Debt-Equity Ratio = Total Long Term Debt Equity Share Holders Fund
Total Long term Debt= Debenture Capital + Long term loans from banks and financial
institutions + Public deposits
Equity Share Holders fund = Equity + Reserves and Surplus
Debt Equity Ratio of Kesoram
(Rupees in crores)
Year Total Debt Share Holders Fund Debt Equity Ratio
2007-08 109235 98192 111
2008-09 197043 133010 148
2009-10 312622 154024 203
2010-11 399927 130025 308
2011-12 410534 91501 449
8102019 A Study A Study On Financial Performance Analysis With Reference To Kesoram Cementon Financial Performance hellip
httpslidepdfcomreaderfulla-study-a-study-on-financial-performance-analysis-with-reference-to-kesoram 6981
Interpretation-
The Debt-Equity Ratio accepted standard is 05 This ratio reflects the relative contribution
of creditors and owners of business in its financing From the above it is clear that the long
term debt is more than that of the share holdersrsquo fund So we can interpret that the firmrsquosassets are financed more by the external funds rather than by the internal funds
8102019 A Study A Study On Financial Performance Analysis With Reference To Kesoram Cementon Financial Performance hellip
httpslidepdfcomreaderfulla-study-a-study-on-financial-performance-analysis-with-reference-to-kesoram 7081
Fixed Asset Ratio-
Net Sales
Fixed Asset Ratio = helliphelliphelliphelliphelliphelliphelliphelliphelliphelliphellip
Net Assets
Fixed Asset Ratio of Kesoram-
(Rupees in crores)
Year Net Sales Net Assets Fixed Assets Ratio
2007-08 300271 358721 084
2008-09 389797 369172 106
2009-10 475062 343182 1382010-11 539788 180435 299
2011-12 59182 108424 546
Interpretation
This ratio indicates the extent to which the assets of the companyrsquos can be lost without
affecting the interest of the creditors of the company Higher the ratios better the long-term
position of the companyThe above table shows fixed assets ratio in increasing trend Which is good for the
company
8102019 A Study A Study On Financial Performance Analysis With Reference To Kesoram Cementon Financial Performance hellip
httpslidepdfcomreaderfulla-study-a-study-on-financial-performance-analysis-with-reference-to-kesoram 7181
Overall Profitability Ratios-
Net Profit Ratio
Net Profit Ratio indicates net margin on sales It is given by the following equation
Net Profit Ratio = (Net Profit Sales) 100
Net Profit Ratio of Kesoram
(Rupees in crores)
Year Net Profit Sales Net Profit Ratio
2007-08 37917 300271 1263
2008-09 41432 389797 1063
2009-10 20298 475062 427
2010-11 -28176 539788 -5222011-12 -38108 59182 -644
Interpretation
It establishes a relationship between net profits after tax and net sales and
indicates the efficiency of the management in manufacturing selling administrative and
other activities of the company
The higher the ratio the better is the profitability or performance of the business
The above table depicts the net profit Ratio of Kesoram has decreased every year from
2007-2008 to 2011-2012It further decreased to negative in the year 2010-11 to -522 and -
644 in the year 2011-2012 This shows constant decrease in the profits of the company
8102019 A Study A Study On Financial Performance Analysis With Reference To Kesoram Cementon Financial Performance hellip
httpslidepdfcomreaderfulla-study-a-study-on-financial-performance-analysis-with-reference-to-kesoram 7281
72
Return on Investment-
Net Profit
Return on Investment = helliphelliphelliphelliphelliphelliphelliphelliphelliphelliphelliphellip X 100
Share Holders Fund
Return on Investment Ratio of Kesoram-
(Rupees in crores)
Year Net Profit Share Holders Fund Return On Investment
2007-08 37917 98192 3862
2008-09 41432 133010 3115
2009-10 20298 154024 1318
2010-11 -28176 130025 -2167
2011-12 -38108 91501 -4165
Interpretation-
The above table reveals how well the resources of the firm are being used Higher
the ratio better the result The above ratio implies how well the firm is growing in
terms of profitability and efficiency From the above table we can concern that the return on
investment is in decreasing trend ROI is highest in the year 2007-2008 as 3862 But
there after itrsquos decreased every year
The ROI is negative in the years 2010-2011 amp 2011-2012 as -2167 amp -4165 respectively
Which is not a good sign for the firm
8102019 A Study A Study On Financial Performance Analysis With Reference To Kesoram Cementon Financial Performance hellip
httpslidepdfcomreaderfulla-study-a-study-on-financial-performance-analysis-with-reference-to-kesoram 7381
8102019 A Study A Study On Financial Performance Analysis With Reference To Kesoram Cementon Financial Performance hellip
httpslidepdfcomreaderfulla-study-a-study-on-financial-performance-analysis-with-reference-to-kesoram 7481
8102019 A Study A Study On Financial Performance Analysis With Reference To Kesoram Cementon Financial Performance hellip
httpslidepdfcomreaderfulla-study-a-study-on-financial-performance-analysis-with-reference-to-kesoram 7581
75
CHAPTER V
FINDINGS amp SUGGESTIONS
8102019 A Study A Study On Financial Performance Analysis With Reference To Kesoram Cementon Financial Performance hellip
httpslidepdfcomreaderfulla-study-a-study-on-financial-performance-analysis-with-reference-to-kesoram 7681
76
Findings
The Share capital remains constant Share capital is unchanged all the years from
2008-2012
Reserves amp surplus were recorded an increasing trend in the period between 2008
and 2010It is showing decreasing trend in the period 2011-2012 (ie from 16019
in 2010 to 9309 in 2012)
Current Liabilities were increased compared to base year ie 2008
Provisions increased to 262597 ie in Rupees 39232 crores in the current year
The current ratio for all the five year is lower (less) than the standard rule ie 21
And it is 097 in the year 2011-2012 (current year)
The Debt-Equity Ratio was shown under the standard ratio It is clear that the long
term debt is more than that of the share holdersrsquo fund It indicates that the firm
heavily relying on external funds rather than the internal funds
The operating and net profit of Kesoram is in decreasing trend due to heavy
increase of manufacturing amp administrative expenses
ROI is highest in the year 2007-2008 as 3862 The ROI is negative in the years
2010-2011 amp 2011-2012 as -2167 amp -4165 respectively
Return on Equity Capital Employed Ratio of Kesoram has decreased every year
from 2007-2008 to 2010-2011It further decreased to negative in the year 2011-12 to
-3280
EPS of Kesoram has decreased every year from 2008-12It is negative in the year
2011 amp 12
8102019 A Study A Study On Financial Performance Analysis With Reference To Kesoram Cementon Financial Performance hellip
httpslidepdfcomreaderfulla-study-a-study-on-financial-performance-analysis-with-reference-to-kesoram 7781
77
Suggestion
The organization should adopt an appropriate capital structure
The companyrsquos debt-equity ratio is recorded more or less as 111 in the year 2008
and it is increased to 449 in the year 2012 (current year)The company should
adopt a better debt equity mix in the future to control the fluctuations in returns
The company should control fluctuations in cash and bank balances as it impacts the
current ratio of the company
The provisions are showing increasing trend which indicates risk of debtors The
firm should implement an effective credit management policy It should utilize its
idle funds by decreasing provisions
The company should control heavy increase of manufacturing amp administration
expenses as it is impacting the operating and net profit of company
8102019 A Study A Study On Financial Performance Analysis With Reference To Kesoram Cementon Financial Performance hellip
httpslidepdfcomreaderfulla-study-a-study-on-financial-performance-analysis-with-reference-to-kesoram 7881
78
ANNEXURE
Profit And Loss Account of Kesoram Cement
Mar12 Mar11 Mar10 Mar09 Mar08
12 Months 12 Months 12 Months 12 Months 12 Months
INCOME
Sales Turnover 628260 575072 505151 431613 345700
Excise Duty 36440 35284 30089 41815 45429
NET SALES 591820 539788 475062 389797 300271
Other Income 000 000 000 000 000
TOTALINCOME
596129 548733 481019 393969 302020
EXPENDITURE
Manufacturing
Expenses81903 74803 13974 13153 44113
MaterialConsumed
370897 310150 295550 229359 118448
Personal
Expenses33468 27355 23294 18690 15344
Selling Expenses 81910 78253 58667 48846 45019
AdministrativeExpenses
28225 29308 17219 16179 9907
Expenses
Capitalized000 000 000 000 000
Provisions Made 000 000 000 000 000
TOTAL
EXPENDITURE 596403 519870 408704 326227 232832Operating Profit -4583 19918 66358 63570 67439
EBITDA -274 28864 72316 67742 69188
Depreciation 29740 27259 17280 11186 8927
Other Write-offs 000 000 000 000 000
EBIT -30014 1605 55035 56557 60261
Interest 41015 23983 10921 12087 5426
EBT -71029 -22377 44114 44470 54835
Taxes -32921 5798 23816 3037 16918
Profit and Loss
for the Year-38108 -28176 20298 41432 37917
Non RecurringItems
-1142 7063 3228 -4023 402
Other Non Cash
Adjustments1276 091 207 465 017
OtherAdjustments
000 000 000 000 000
REPORTED
PAT-37974 -21021 23734 37874 38335
8102019 A Study A Study On Financial Performance Analysis With Reference To Kesoram Cementon Financial Performance hellip
httpslidepdfcomreaderfulla-study-a-study-on-financial-performance-analysis-with-reference-to-kesoram 7981
79
Balance Sheet Of Kesoram
Years
Particulars 2008 2009 2010 2011 2012
Liabilities
Share Capital 4574 4574 4574 4574 4574Reserves amp Surplus 93085 128024 149111 125162 86657
Revaluation Reserves 533 412 339 289 27
Loans
Secured Loans 97106 153627 186372 237183 317792
Un Secured Loans 12129 43416 12625 162744 92742
Deferred Tax Liabilities 0 0 0 0 0
Current Liabilities
Provisions 33039 34529 35734 1494 40726
Current Liabilities 57067 66587 107688 113902 18001
Total 297533 431169 610068 645348 722771
Assets
Net Block 108424 180435 343182 369172 358721
Capital WIP 63459 86485 41283 43781 68065
Investments 4783 6178 5143 6582 6636
Current Assets
Inventories 44217 58906 91619 111855 99516
Sundry Debtors 27307 38017 54289 63134 67358
Cash amp Bank Balances 4036 5657 8014 7188 6959
Total Current Assets 7556 10258 153922 182177 173833Loans amp Advances 45289 55462 66506 4346 115409
Fixed Deposits 018 028 031 176 107
Total 297533 431169 610068 645348 722771
8102019 A Study A Study On Financial Performance Analysis With Reference To Kesoram Cementon Financial Performance hellip
httpslidepdfcomreaderfulla-study-a-study-on-financial-performance-analysis-with-reference-to-kesoram 8081
80
KEY ITEMS 2012 2011 2010 2009 2008
Preference
Dividend 0 0 0 0 0
Equity Dividend 457 2516 2516 2516 2516
Equity Dividend
() 999 55 55 55 55
Shares in Issue(Lakhs) 45743 45743 45743 45743 45743
EPS - Annualised
(Rs) -8302 -4595 5188 828 838
8102019 A Study A Study On Financial Performance Analysis With Reference To Kesoram Cementon Financial Performance hellip
httpslidepdfcomreaderfulla-study-a-study-on-financial-performance-analysis-with-reference-to-kesoram 8181
BIBLIOGRAPHY
Sl
No
Books Author Name
1 Financial Management Khan amp JAIN
2 Financial Management IMPandey
3 Management Accounting RPTrivedi
Websites amp Search Engines
1 wwwkesoramcom983086
2 wwwmoneycontrolcom
3 wwwgooglefinancecom983086
Annual reports of Kesoram cement limited 2008-2012
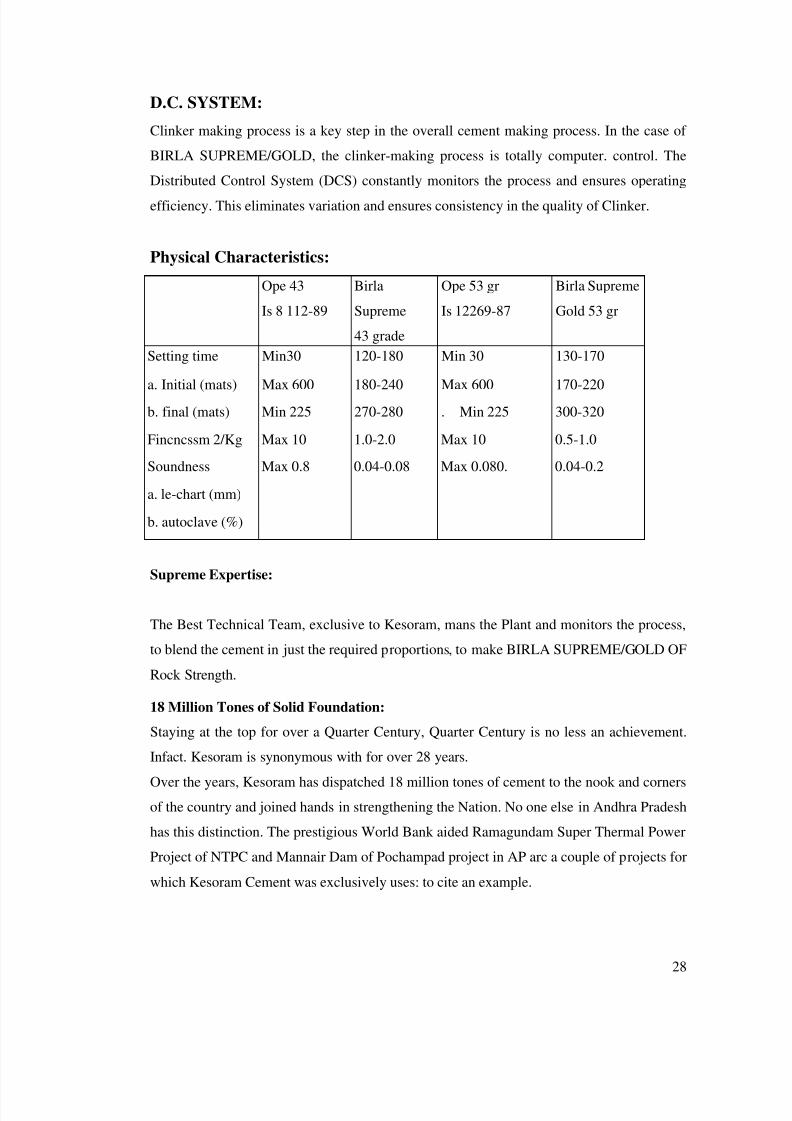
8102019 A Study A Study On Financial Performance Analysis With Reference To Kesoram Cementon Financial Performance hellip
httpslidepdfcomreaderfulla-study-a-study-on-financial-performance-analysis-with-reference-to-kesoram 2981
29
Chemical Characteristics
Opc 43 gr
Is 81 132-989
Birla
Supreme
43 grade
Ope 53 gr
Is 12269-
87
Birla
Supreme
Gold 53 gr
Loss on inflection Max 5 lt16 Max 40 lt15
Insoluble residue Max 20 lt08 Max 20 lt 06
Magnesium oxide Max 60 lt 13 Max 60 lt 13
Lime saturation factor 066-102 08-09 08-102 088-09
Alumna iron ratio MinO66 15-17 MinO66 15-17
Sulfuric anhydride Max 253 16-20 Max 2 53 16-20
Alkalis Chlorides Max 005 Max 001 Max 005 Max 04
Kesoram Cement - advantages
Helps in designing sleeker and more elegant
Structures giving greater flexibility in design concept
Due to its fine quality super fine construction can be achieved Its gives maximum
strength at Minimum use of cement with water in the water cement ratio especially the 53
grade Birlas supreme-gold
Feathers in Kesorams cap
Kesoram has outstanding track record achieving over 100 capacity utilization I
productivity and energy conservation It has proved its distinction by bagging several
national and state awards noteworthy being
NATIONAL
1 National productivity award for 1985-86
2 National productivity award for 1986-87
3 National award for mines safety for 1985-86
4 National award for mines safety for 1986-875 National award for energy conservation 1989-90
8102019 A Study A Study On Financial Performance Analysis With Reference To Kesoram Cementon Financial Performance hellip
httpslidepdfcomreaderfulla-study-a-study-on-financial-performance-analysis-with-reference-to-kesoram 3081
30
STATE
1 AP State productivity award for 1988
2 State award for best industrial management 1988-89
3 Best industrial productivity award of FAPCCI (federation of AP chamber of
commerce and industry) 1991
4 Best management award of the state Govt 1993
5 FAPCCI award for the workers welfare 1995-96
ISO 9002
All quality systems of Kesoram have been certified under ISO 90021S 4002 which
proves the worldwide acceptance of the products
All quality systems in production and marketing of the product have been certified by BIS
under ISO 90021S 14002
The first unit was installed at basanthnagar with a capacity of 25 ndashlakhs TPA (tones per
annum) incorporating humble supervision preheated system during the year 1969
The second unit followed suit with added a capacity of 2 lakhs TPA in 1971
The plant was further expanded to 9 lakhs by adding 25 lakhs tones in august 1978 113
lakhs tones in January 1981 and 087 lakhs tones in September 1981
Power
Singareni collieries make the supply of coal for this industry and the power was
obtained from AP TRANSCO The power demand for the factory is about 21MW Kesoram
has got 2-diesel generator seats of 4 MW each installed in the year 1987
Kesoram cement now has a 15MWcaptive power plant to facilities for uninterrupted
power supply for manufacturing of cement
Performance
The performance of kersoram cement industry has been outstanding achieving over
cent percent capacity utilization all through despite many odds like power cuts and which
most 40 was wasted due to wagon shortage etc
The company being a continuous process industry works round the clock and has
excellent records of performance achieving over 1005 capacity utilization
Kesoram has always combined technical progress with industrial performance The
company had glorious track record for the last 27 years in the industry
Technology
8102019 A Study A Study On Financial Performance Analysis With Reference To Kesoram Cementon Financial Performance hellip
httpslidepdfcomreaderfulla-study-a-study-on-financial-performance-analysis-with-reference-to-kesoram 3181
31
Kesoram cement uses most modern technology and the computerized control in the
plant A team of dedicated and well- experienced experts manages the plant
The quality is maintained much above the bureau of Indian standards
The raw materials used for manufacturing cement are
Lime stone
Bauxite
Hematite
Gypsum
Environmental and Social Obligations
For environmental promotion and to keep ndashup the ecological balance this section
has planted over two lakhs trees on social obligation front this section has undertaken
various social welfare programs by adopting ten nearly villages organizing family welfare
campus surgical camps animal health camps blood donation camps children immunization
camps seeds training for farmers etc were arranged
Welfare and Recreation Facilities
For the purpose of recreation facilities 2 auditoriums were provided for playing
indoor games cultural function and activities like drama music and dance etc
The industry has provided libraries and reading rooms About 1000 books are available in
the library All kinds of newspaper magazines are made available
Canteen is provided to cater to the needs of the employees for supply of snacks tea
coffee and meals etc
One English medium and one Telugu medium school are provided to meet the
educational requirements
The company has provided a dispenser with a qualified medical office and
paramedical staff for the benefit of the employees The employees covered under ESI
scheme have to avail the medical facilities from the ESI hospital
Competitions in sports and games are conducted every year for august 15th
Independence Day and January 26th republic day among the employees
Electricity
The power consumption per ton of cement has come down to 108 units against 113
units last year due to implementation of various energy saving measures The performance
of captive power plant of this section continues to be satisfactory Total power generation
8102019 A Study A Study On Financial Performance Analysis With Reference To Kesoram Cementon Financial Performance hellip
httpslidepdfcomreaderfulla-study-a-study-on-financial-performance-analysis-with-reference-to-kesoram 3281
32
during the year was 84 million units last year This captive power plant is a major role in
keeping power costs with in economic levels
The management has introduced various HRD programs for training and
development and has taken various other measures for the betterment of employeersquos
efficiency
The section has installed adequate air pollution control system and equipment and is
ISO14001 such as Environment management system is under implementation
Awards
Kesoram cement bagged many prestigious awards including national awards for
productivity technology conservation and several state awards since 1984 The following
are the some of important awards
AWARDS OF KESORAM CEMENT
No Year Awards
National
State
1 1989-90 Management award community
Development
State
2 1991 Energy conservation may day award of the
Govt
State
3 1991 Pundit Jawaharlal Nehru rolling trophy for
best
State
4 1993 National productivity effort Indira Gandhi
national award
State
5 1994 Best management award State
6 1994-
1995
Best industrial rebellion award State
7 1995 Rural development by chief minister
Environment and mineral conservation
award
State
8 1995 Best industrial rebellion award State
8102019 A Study A Study On Financial Performance Analysis With Reference To Kesoram Cementon Financial Performance hellip
httpslidepdfcomreaderfulla-study-a-study-on-financial-performance-analysis-with-reference-to-kesoram 3381
33
9 1995-
1996
Best effort of an industrial unit to
development rural economy shriSRRungta
award for social
National
10 1996 Awareness for best rural development
efforts
State
11 1999 Best workers welfare best family welfare
award
State
12 2001 First prize for mine environment amppollution
control for the 3rd
year in succession
State
13 2002 Vana mithra award from AP Govt State
14 2003 Company has got OHSAS-18001 State
15 2005 Certification from DNV New Delhi State
16 2006 Award for pollution control and
environmental protection FAPCCI award
for best rural development in the state
State
8102019 A Study A Study On Financial Performance Analysis With Reference To Kesoram Cementon Financial Performance hellip
httpslidepdfcomreaderfulla-study-a-study-on-financial-performance-analysis-with-reference-to-kesoram 3481
34
Products of the organization
8102019 A Study A Study On Financial Performance Analysis With Reference To Kesoram Cementon Financial Performance hellip
httpslidepdfcomreaderfulla-study-a-study-on-financial-performance-analysis-with-reference-to-kesoram 3581
35
CHAPTER-III
LITERATURE REVIEW
8102019 A Study A Study On Financial Performance Analysis With Reference To Kesoram Cementon Financial Performance hellip
httpslidepdfcomreaderfulla-study-a-study-on-financial-performance-analysis-with-reference-to-kesoram 3681
36
Introduction
Financial Performance Analysis
The term lsquofinancial performance analysis also known as analysis and interpretation of
financial statementsrsquo refers to the process of determining financial strength and
weaknesses of the firm by establishing strategic relationship between the items of the
balance sheet profit and loss account and other operative data
ldquoAnalyzing financial statementsrdquo by Metcalf and Titard
ldquoFinancial analysis is a process of evaluating the relationship between component
parts of a financial statement to obtain a better understanding of a firms position and
performancerdquo by Myers
Financial Performance
The word lsquoPerformance is derived from the word lsquoparfourmenrsquo which means lsquoto dorsquo lsquoto
carry outrsquo or lsquoto renderrsquo It refers the act of performing execution accomplishment
fulfillment etc In border sense performance refers to the accomplishment of a given task
measured against preset standards of accuracy completeness cost and speed In other
words it refers to the degree to which an achievement is being or has been accomplished In
the Words of Frich Kohlar ldquoThe performance is a general term applied to a part or to all the
conducts of activities of an organization over a period of time often with reference to past or
projected cost efficiency management responsibility or accountability or the like Thus not
just the presentation but the quality of results achieved refers to the performance
Performance is used to indicate firmrsquos success conditions and compliance
Financial performance refers to the act of performing financial activity In broader
sense financial performance refers to the degree to which financial objectives being or has
been accomplished It is the process of measuring the results of a firms policies and
operations in monetary terms It is used to measure firms overall financial health over a
given period of time and can also be used to compare similar firms across the same industry
or to compare industries or sectors in aggregation
The purpose of financial analysis is to diagnose the information contained in financial
statements so as to Jude the profitability and financial soundness of the firm Just like a
doctor examines his patient by recording his body temperature blood pressure etc Before
8102019 A Study A Study On Financial Performance Analysis With Reference To Kesoram Cementon Financial Performance hellip
httpslidepdfcomreaderfulla-study-a-study-on-financial-performance-analysis-with-reference-to-kesoram 3781
37
making his conclusion regarding the illness and before giving his treatment a financial
analyst analysis the financial statements with various tools of analysis before commenting
upon the financial health or weaknesses of an enterprise
The analysis and interpretation of financial statements is essential to bring out the
mystery behind the figures in financial statements Financial statements analysis is an
attempt to determine the significance and meaning of the financial statement data so that
forecast may be made of the future earnings ability to pay interest and debt maturities (both
current and long term) and profitability of a sound divided policy
Types of financial analysis-
Financial analysis into different categories depending upon
(1) The material used and
(2) The method of operation followed in the analysis or the modus operandi of
analysis
Types of financial analysis
On the basis of material used on the basis of modus operandi
External Internal Horizontal Vertical
Analysis Analysis Analysis Analysis
1 On the basis of material used - According to material used financial analysis canbe of two types
External analysis
Internal analysis
External analysis-
This analysis is done by outsiders who do not have access to the detailed internal
outsiders include investors potential investors Creditors Potential Creditors Government
Agencies Credit Agencies and General Public For financial analysis these external parties
to the firm depend almost entirely on the published financial statements
Internal analysis-
This analysis is undertaken by the persons namely executives and employees of the
organization or by the officers appointed by government or court who have access to the
8102019 A Study A Study On Financial Performance Analysis With Reference To Kesoram Cementon Financial Performance hellip
httpslidepdfcomreaderfulla-study-a-study-on-financial-performance-analysis-with-reference-to-kesoram 3881
38
books of account ( internal accounting records) and other information related to the
business
2 983119983150 983156983144983141 983138983137983155983145983155 983151983142 983149983151983140983157983155 983151983152983141983154983137983150983140983145983085
According to the modus operandi financial analysis can also be of two types
a Horizontal analysis
bVertical analysis
Horizontal analysis-
Horizontal analysis refers to the comparison of financial data of a company for several
years The figures for this type of analysis are presented horizontally over a number of
columns The figures of the various years are compared with standard or base year a base
year is year chosen as beginning point This type of analysis is also called lsquodynamicanalysisrsquo as it is based on the data from year to year rather than on data of any one year The
horizontal analysis makes it possible to focus attention on items that have changed
significantly during the period under view
b Vertical analysis-
Vertical analysis refers to the study of relationship of the various items in the financial
statements of one accounting period In this types of analysis the figures from financial
statement of a year are compared with a base selected from the same yearrsquos statement
Methods of financial analysis-
The following methods of analysis are generally used-
1 Comparative Statements
2 Trend Analysis
3 Common-Size Statements
4 Funds flow Analysis
5 Cash Analysis
6 Ratio Analysis
7 Cost-volume-Profit Analysis
8102019 A Study A Study On Financial Performance Analysis With Reference To Kesoram Cementon Financial Performance hellip
httpslidepdfcomreaderfulla-study-a-study-on-financial-performance-analysis-with-reference-to-kesoram 3981
39
Comparative statements-
The comparative financial statements are statements of the financial position at
different periods of time the elements of financial position are show in a
Comparative Statement provides an idea of financial position at two or more
periods Generally two financial statements (balance sheet and income statement) are
prepared in comparative form for financial analysis
The Comparative Statement May Show-
1 Absolute figures (rupee amounts)
2 Changes in absolute figures ie increase or decrease in absolute figures
3 Absolute data in terms of percentages
4 Increase or decrease in terms of percentages
The Two Comparative Statements Are-
1 Comparative balance sheet and
2 Income statement
1 983107983151983149983152983137983154983137983156983145983158983141 983138983137983148983137983150983139983141 983155983144983141983141983156983085
The comparative balance sheet analysis is the study of the trend of the same items group of
items and computed items in two or more balance sheets of the same business enterprise on
different dates The change in periodic balance sheet items reflect the conduct of a business
the change can be observed by comparison of the balance sheet at the beginning and at the
end of a period and these changes can help in forming an opinion about the progress of an
enterprise
Guide Lines for Interpretation of Comparative Balance Sheet-
While interpreting comparative balance sheet the interpreter is expected to study the
following aspects-
1 Current financial position and liquidity position
2 Long-term financial position
3 Profitability of the concern
8102019 A Study A Study On Financial Performance Analysis With Reference To Kesoram Cementon Financial Performance hellip
httpslidepdfcomreaderfulla-study-a-study-on-financial-performance-analysis-with-reference-to-kesoram 4081
40
Common Size Statement-
The common-size statements balance sheet and income statement are show in
analytical percentages The figures are shown as percentages of total assets total liabilities
and total sales The total assets are taken as 100 and different assets are expressed as a
percentage of the total similarly various liabilities are taken as a part of total liabilities
Common Size Balance Sheet-
A statement in which balance sheet items are expressed as the ratio of each asset to
total assets and the ratio of each liability is expressed as a ratio of total liabilities is called
common size balance The common size balance sheet can be used to compare companies
of differing size The comparison of figures in different periods is not useful because total
figures may be affected by a number of factors It is not possible to establish standard norms
for various assets The trends of figures from year to year may not be studied and even they
may not give proper results
Trend Analysis of Balance Sheet-
Trend analysis is Very important tool of horizontal financial analysis
This analysis enables to known the change in the financial function and operating efficiency
in between the time period chosen
By studding the trend analysis of each item we can known the direction of changes and
based upon the direction of changes the options can be changed
Trend =Absolute Value of item in the statement understudy 100
Absolute Value of same item in the base statement
Ratio Analysis
Ratio analysis is used as a technique of analyzing the financial information contained in the
balance sheet and profit and loss accounts for a more meaningful understanding of the
financial position and performance of a firm
The relationship between two accounting figures expressed mathematically is known as a
financial ratio A ratio helps the analyst to make qualitative judgment about the firmrsquos
financial position and performance
Several ratios can be calculated from the accounting data contained in the financial
statements The parties which generally undertake financial analysis is short ndashterm
creditors long-term creditors owner and management In view of the requirements of the
various ratios ratios are classified into the following four important categories
8102019 A Study A Study On Financial Performance Analysis With Reference To Kesoram Cementon Financial Performance hellip
httpslidepdfcomreaderfulla-study-a-study-on-financial-performance-analysis-with-reference-to-kesoram 4181
41
Liquidity ratios
Leverage ratios
Activity ratios
Profitability ratios
Liquidity Ratios
It is extremely essential for a firm to be able to meet its obligations as they become due
Liquidity ratios measure the ability of the firm to meet its current obligations A firm should
ensure that it does not suffer from lack of liquidity and also that it does not have excess
liquidity The failure of a company to meet its obligations due to lack of sufficient liquidity
will result in a poor creditworthiness loss of creditorsrsquo confidence or even in legal tangles
resulting in the closure of the company A very high degree of liquidity is also bad idle
assets earn nothing The firmrsquos funds will be unnecessarily tied up in current assets
Therefore it is necessary to strike a proper balance high liquidity and lack of liquidity
The most common ratios which indicate the extent of liquidity or lack of it are
Current ratio
Quick ratio
Other ratios include Cash ratio Interval Measure and Net working capital ratio
Current Ratio
The current ratio is calculated by dividing current assets by current liabilities
Current assets
Current ratio = --------------------------
Current liabilities
Current ratio is a measure of the firmrsquos short term solvency It indicates the availability of
current assets in rupees for every one rupee of current liability A ratio of greater than one
means that the firm has more current assets than current claims against the Current ratio of
2 to 1 or more is considered satisfactory Current ratio represents a margin of safety for
creditors
Quick Ratio
Quick ratio also known as acid-test ratio establishes a relationship between quick assets and
the current liabilities Cash is the most liquid asset It is calculated by dividing quick assets
by current liabilities
Quick ratio = Quick Assets Current Liabilities
8102019 A Study A Study On Financial Performance Analysis With Reference To Kesoram Cementon Financial Performance hellip
httpslidepdfcomreaderfulla-study-a-study-on-financial-performance-analysis-with-reference-to-kesoram 4281
42
(Quick Assets = Current assets ndash Inventory)
One defect of the current ratio is that it fails to convey any information on the composition
of the current assets of the firm A rupee of cash is considered equivalent to a rupee of
inventory of receivables But it is not so A rupee of cash is more readily available to meet
current liabilities than a rupee of say inventory This implies the usefulness of the current
ratio
The Acid ndashtest ratio measures the firmrsquos ability to convert its current assets quickly into
cash in order to meet its current liabilities
A quick ratio of 1 to 1 is considered to represent a satisfactory current financial condition It
is an important index of the firmrsquos liquidity
Leverage Ratios
Leverage ratios identify the source of a firmrsquos capital ndashowners or outside creditors
Financial leverage refers to the use of debt in financing non-current assets If the return on
assets exceeds the cost of debt the leverage is successful ndash ie it improves return on equity
Debt ndashEquity Ratio
The Debt ndash Equity is determined to analyze the soundness of the long term financial
policies of the organization It is also known as ldquoInternal External Equity Ratiordquo
It is calculated as follows
Debt ndash Equity Ratio = Total long term debt Share holders funds
Equity Ratio
This ratio is also called as proprietary ratio establishes a relationship between share holderrsquos
funds to total assets of company Equity Ratio is calculated by dividing share holders fund
by total assets
Fixed Asset Ratio
This ratio indicates the extent to which the assets of the companyrsquos can be lost without
affecting the interest of the creditors of the company Higher the ratios better the long-term
position of the company
Activity Ratios
They are primarily used for studying a firmrsquos working capital situation A well managed
firm should have good activity ratios
8102019 A Study A Study On Financial Performance Analysis With Reference To Kesoram Cementon Financial Performance hellip
httpslidepdfcomreaderfulla-study-a-study-on-financial-performance-analysis-with-reference-to-kesoram 4381
43
Working Capital Turnover Ratio
The working capital turnover ratio indicates whether or not working capital has been
effectively used in making sales
Working capital turnover = Sales Net current assets
Inventory Turnover Ratio
This ratio also known as Stock Turnover Ratio establishes the relationship between costs of
goods sold or net sales during the given period and the average amt of stock held during the
period This ratio reveals the number of times finished stock in turnover during a given
accounting period
Higher the ratio the better is it because it shows the finished stock is rapidly turned
in to sales On the other hand a low stock turnover ratio is not desirable because it reveals
the accumulation of stock
Debtors Turnover Ratio
This ratio indicates the velocity of debt collection of a company In other words it shows
the number of times average turnover during a year
A Higher Debtor Turnover Ratio indicates a more efficient is the management towards
debtors and low ratio ratio implies inefficient management of debtors
Total Assets Turnover Ratio
The asset turnover ratio indicates how efficiently management is employing Assets
Total Assets Turnover Ratio = Sales Total Assets
Profitability Ratios
Profitability ratios are the ratios which measure a firmrsquos overall effectiveness as revealed by
the returns generated on sales and investment
General Profitability Ratios
1 Gross Profit Ratio
2 Net profit Ratio
3 Operating or Expenses Ratio
8102019 A Study A Study On Financial Performance Analysis With Reference To Kesoram Cementon Financial Performance hellip
httpslidepdfcomreaderfulla-study-a-study-on-financial-performance-analysis-with-reference-to-kesoram 4481
44
Gross Profit Ratio
Gross profit Ratio measures the relationships to net sales and is usually represented as a
percentage It is a good measure of profitability
The gross profit ratio indicates the extent to which selling price of goods per unit may
decline without resulting in losses on operation Higher the gross profit betters the result
Net Profit Ratio
Net Profit Ratio indicates net margin on sales It is given by the following equation
Net Profit Ratio = (Net Profit Sales) 100
Operating or Expenses Ratio
This ratio is complimentary of Net Profit Ratio The more the net profit the less the
Operating Ratio Operating costs include the cost of direct materials direct labors and otheroverheads viz are generally excluded from operating costs A comparison of the Operating
Ratio will indicate whether the cost efficiency is high or low in the figure of sales This less
the ratio it depicts the efficiency of the management
8102019 A Study A Study On Financial Performance Analysis With Reference To Kesoram Cementon Financial Performance hellip
httpslidepdfcomreaderfulla-study-a-study-on-financial-performance-analysis-with-reference-to-kesoram 4581
45
CHAPTER IV
DATA ANALYSIS amp INTERPRETATION
8102019 A Study A Study On Financial Performance Analysis With Reference To Kesoram Cementon Financial Performance hellip
httpslidepdfcomreaderfulla-study-a-study-on-financial-performance-analysis-with-reference-to-kesoram 4681
46
Comparative Balance Sheet of Kesoram in the Year between 2008-2009
(Rupee in crores)
Years Changes
Particulars 2008 2009 In Rupees In Percentage
Liabilities
Share Capital 4574 4574 000 000
Reserves amp Surplus 93085 128024 34939
Revaluation Reserves 533 412 -121 -2270
Loans
Secured Loans 97106 153627 56521 5821
Un Secured Loans 12129 43416 31287 25795
Deferred Tax Liabilities 000 000 000 000
Current Liabilities
Provisions 33039 34529 1490 451
Current Liabilities 57067 66587 9520 1668
Total 297533 431169 133636 4491
Assets
Net Block 108424 180435 72011 6642
Capital Wip 63459 86485 23026 3628
Investments 4783 6178 1395 2917
Current Assets
Inventories 44217 58906 14689 3322
Sundry Debtors 27307 38017 10710 3922
Cash amp Bank Balances 4036 5657 1621 4016
Total Current Assets 75560 102580 27020 3576
Loans amp Advances 45289 55462 10173 2246
Fixed Deposits 018 028 010 5556
Total 297533 431169 133636 4491
8102019 A Study A Study On Financial Performance Analysis With Reference To Kesoram Cementon Financial Performance hellip
httpslidepdfcomreaderfulla-study-a-study-on-financial-performance-analysis-with-reference-to-kesoram 4781
47
Interpretation of comparative balance sheet of 2008-2009
Reserves amp Surplus were increased to 3753 (percent) ie in Rupees 34939
crores
Revaluation Reserves decreased to 121 ie in Rupees 2270 crores
Secured Loans are increased to 5821 ie in Rupees 56521 crores And UN
secured loans highly Increased to 25795
Current liabilities and Provisions are increased to 1668 and 451 respectively ie in
Rupees 9520 amp 1490 crores
Fixed assets were highly increased to 6642 ie in Rupees 72011 crores
Investments were increased to 2917 ie in Rupees 1395 crores
Sundry debtors increased to 3922 ie in Rupees 10710 crores
Current assets increased 3576 ie in Rupees 27020 crores And Loans amp
Advances increased to 2246 respectively
The overall financial position was satisfactory
8102019 A Study A Study On Financial Performance Analysis With Reference To Kesoram Cementon Financial Performance hellip
httpslidepdfcomreaderfulla-study-a-study-on-financial-performance-analysis-with-reference-to-kesoram 4881
48
Comparative Balance Sheet of Kesoram in the Year between 2009-2010
(Rupees in crores)
Years Changes
Particulars 2009 2010 In Rupees In Percentage
Liabilities
Share Capital 4574 4574 000 000
Reserves amp Surplus 128024 149111 21087 1647
Revaluation Reserves 412 339 -073 -1772
Loans
Secured Loans 153627 186372 32745 2131
Un Secured Loans 43416 126250 82834 19079
Deferred Tax Liabilities 000 000 000
Current Liabilities
Provisions 34529 35734 1205 349
Current Liabilities 66587 107688 41101 6173
Total 431169 610068 178899 4149
Assets
Net Block 180435 343182 162747 9020
Capital WIP 86485 41283 -45202 -5227
Investments 6178 5143 -1035 -1675
Current Assets
Inventories 58906 91619 32713 5553
Sundry Debtors 38017 54289 16272 4280
Cash amp Bank Balances 5657 8014 2357 4167
Total Current Assets 102580 153922 51342 5005
Loans amp Advances 55462 66506 11044 1991
Fixed Deposits 028 031 003 1071
Total 431169 610068 178899 4149
8102019 A Study A Study On Financial Performance Analysis With Reference To Kesoram Cementon Financial Performance hellip
httpslidepdfcomreaderfulla-study-a-study-on-financial-performance-analysis-with-reference-to-kesoram 4981
49
Interpretation of comparative balance sheet of 2009-2010
Reserves amp surplus increased to 1647 ie in Rupees 21087 crores
Revaluation Reserves decreased to 1772 ie in Rupees 073 crores
Secured loans increased to 2131 ie in Rupees 32745 crores
Current Liabilities were increased to 6173 ie in Rupees 41101 crores and
Provisions 349 ie in Rupees 1205 crores
Fixed Assets were increased to 9020 ie in Rupees 162747 crores
Investments were decreased to 1675 ie in Rupees 1035 crores
Sundry debtors were increased to 4280 ie in Rupees 16272 crores
Current assets increased to 5005 ie in Rupees 51342 crores And loans and
Advances increased 1919 ie in Rupees 11044 crores
The overall financial position was satisfactory
8102019 A Study A Study On Financial Performance Analysis With Reference To Kesoram Cementon Financial Performance hellip
httpslidepdfcomreaderfulla-study-a-study-on-financial-performance-analysis-with-reference-to-kesoram 5081
50
Comparative Balance Sheet of Kesoram in the Year between 2010-2011
(Rupees in crores)
Years Changes
Particulars 2010 2011 In Rupees In Percentage
Liabilities
Share Capital 4574 4574 000 000
Reserves amp Surplus 149111 125162 -23949 -1606
Revaluation Reserves 339 289 -050 -1475
Loans
Secured Loans 186372 237183 50811 2726
Un Secured Loans 126250 162744 36494 2891
Deferred Tax Liabilities 000 000 000
Current Liabilities
Provisions 35734 1494 -34240 -9582
Current Liabilities 107688 113902 6214 577
Total 610068 645348 35280 578
Assets
Net Block 343182 369172 25990 757
Capital WIP 41283 43781 2498 605
Investments 5143 6582 1439 2798
Current Assets
Inventories 91619 111855 20236 2209
Sundry Debtors 54289 63134 8845 1629
Cash amp Bank Balances 8014 7188 -826 -1031
Total Current Assets 153922 182177 28255 1836
Loans amp Advances 66506 43460 -23046 -3465
Fixed Deposits 031 176 145 46774
Total 610068 645348 35280 578
8102019 A Study A Study On Financial Performance Analysis With Reference To Kesoram Cementon Financial Performance hellip
httpslidepdfcomreaderfulla-study-a-study-on-financial-performance-analysis-with-reference-to-kesoram 5181
51
Interpretation of comparative balance sheet of 2010-2011
Reserves amp surplus decreased to 1606 ie in Rupees 23949 crores
Revaluation Reserves decreased to 1475 ie in Rupees 050 crores
Secured loans increased to 2726 ie in Rupees 50811 crores
Current Liabilities were increased to 577 ie in Rupees 6214 crores
Provisions decreased to 9582 ie in Rupees 34240 crores
Fixed Assets were increased to 757 ie in Rupees 25990 crores
Investments were decreased to 2798 ie in Rupees 1439 crores
Sundry debtors were increased to 1629 ie in Rupees8845 crores
Current assets increased to 1836 ie in Rupees 28255 crores And loans and
Advances increased 3465 ie in Rupees 23046 crores
The overall financial position was UN satisfactory
8102019 A Study A Study On Financial Performance Analysis With Reference To Kesoram Cementon Financial Performance hellip
httpslidepdfcomreaderfulla-study-a-study-on-financial-performance-analysis-with-reference-to-kesoram 5281
52
Comparative Balance Sheet of Kesoram In The Year Between 2011-2012
(Rupees in crores)
Years Changes
Particulars 2011 2012 In Rupees In Percentage
Liabilities
Share Capital 4574 4574 000 000
Reserves amp Surplus 125162 86657 -38505 -3076
Revaluation Reserves 289 270 -019 -657
Loans
Secured Loans 237183 317792 80609 3399
Un Secured Loans 162744 92742 -70002 -4301
Deferred Tax Liabilities 000 000 000
Current Liabilities
Provisions 1494 40726 39232 262597
Current Liabilities 113902 180010 66108 5804
Total 645348 722771 77423 1200
Assets 000
Net Block 369172 358721 -10451 -283
Capital WIP 43781 68065 24284 5547
Investments 6582 6636 054 082
Current Assets
Inventories 111855 99516 -12339 -1103
Sundry Debtors 63134 67358 4224 669
Cash amp Bank Balances 7188 6959 -229 -319
Total Current Assets 182177 173833 -8344 -458
Loans amp Advances 43460 115409 71949 16555
Fixed Deposits 176 107 -069 -3920
Total 645348 722771 77423 1200
8102019 A Study A Study On Financial Performance Analysis With Reference To Kesoram Cementon Financial Performance hellip
httpslidepdfcomreaderfulla-study-a-study-on-financial-performance-analysis-with-reference-to-kesoram 5381
53
Interpretation of comparative balance sheet of 2011-2012
Reserves amp surplus decreased to 3076 ie in Rupee 38505 crores
Revaluation Reserves decreased to 657 ie in Rupees 019 crores
Secured loans increased to 3399 ie in Rupees 80699 crores
Current Liabilities were increased to 5804 ie in Rupees 66108 crores
Provisions increased to 262597 ie in Rupees 39232 crores
Fixed Assets were decreased to 283 ie in Rupee 10451 crores
Investments were increased to 082 ie in Rupees 054 crores
Sundry debtors were increased to 669 ie in Rupees 4224 crores
Current assets decreased to 458 ie in Rupees 8344 crores And loans and
Advances increased 16555 ie in Rupees 71949 crores
The overall financial position was UN satisfactory
8102019 A Study A Study On Financial Performance Analysis With Reference To Kesoram Cementon Financial Performance hellip
httpslidepdfcomreaderfulla-study-a-study-on-financial-performance-analysis-with-reference-to-kesoram 5481
54
Common Size Balance Sheet of Kesoram For The Year 2008-2009
(Rupees in crores)
Particulars 2008 Change Percentage 2009 Change Percentage
Liabilities
Share Capital 4574 154 4574 106
Reserves amp Surplus 93085 3129 128024 2969
Revaluation Reserves 533 018 412 010
Loans
Secured Loans 97106 3264 153627 3563
Un Secured Loans 12129 408 43416 1007
Deferred Tax Liabilities 000 000 000 000
Current Liabilities
Provisions 33039 1110 34529 801
Current Liabilities 57067 1918 66587 1544
Total 297533 10000 431169 10000
Assets
Net Block 108424 3644 180435 4185
Capital WIP 63459 2133 86485 2006
Investments 4783 161 6178 143
Current Assets
Inventories 44217 1486 58906 1366
Sundry Debtors 27307 918 38017 882
Cash amp Bank Balances 4036 136 5657 131
Loans amp Advances 45289 1522 55462 1286
Fixed Deposits 018 001 028 001
Total 297533 10000 431169 10000
8102019 A Study A Study On Financial Performance Analysis With Reference To Kesoram Cementon Financial Performance hellip
httpslidepdfcomreaderfulla-study-a-study-on-financial-performance-analysis-with-reference-to-kesoram 5581
55
Interpretation of Common Size Balance Sheet of 2008-2009
Share capital was recorded 154 percent in the total liabilities in the year 2008 it is
decreased to 106 in the year 2009
Reserves amp surplus contributed to 3129 in the total liabilities in the year 2008 it is
decreased to 2969 in the year 2009
Secured loans were 3264 in the total liabilities in the year 2008 it is increased to
3563 in the year 2009
Current Liabilities shown to 1918 in the total liabilities in the year 2008 it is
decreased to 1544 in the year 2009
Provisions 1110 in the total liabilities in the year 2008 it is decreased to 801 in the
year 2009
Fixed Assets were 3644 in the total liabilities in the year 2008 ie decreased to 4185
in the year 2009
Investments were 161 in the total liabilities in the year 2008 it is decreased to 143
in the year 2009
Sundry debtors were 918 in the total liabilities in the year 2008 it is decreased to 882
in the year 2009
8102019 A Study A Study On Financial Performance Analysis With Reference To Kesoram Cementon Financial Performance hellip
httpslidepdfcomreaderfulla-study-a-study-on-financial-performance-analysis-with-reference-to-kesoram 5681
56
Common Size Balance Sheet of Kesoram For The Year 2009-2010
(Rs in crores)
Particulars 2009 Change Percentage 2010Change
Percentage
Liabilities
Share Capital 4574 106 4574 075
Reserves amp Surplus 128024 2969 149111 2444
Revaluation Reserves 412 010 339 006
Loans
Secured Loans 153627 3563 186372 3055
Un Secured Loans 43416 1007 126250 2069
Deferred Tax Liabilities 000 000 000 000
Current Liabilities
Provisions 34529 801 35734 586
Current Liabilities 66587 1544 107688 1765
Total 431169 10000 610068 10000
Assets
Net Block 180435 4185 343182 5625
Capital WIP 86485 2006 41283 677
Investments 6178 143 5143 084
Current Assets
Inventories 58906 1366 91619 1502
Sundry Debtors 38017 882 54289 890
Cash amp Bank Balances 5657 131 8014 131
Loans amp Advances 55462 1286 66506 1090
Fixed Deposits 028 001 031 001
Total 431169 10000 610068 10000
8102019 A Study A Study On Financial Performance Analysis With Reference To Kesoram Cementon Financial Performance hellip
httpslidepdfcomreaderfulla-study-a-study-on-financial-performance-analysis-with-reference-to-kesoram 5781
57
Interpretation of common size balance sheet of 2009-2010
Share capital was recorded 106 percent in the total liabilities in the
year 2009 it is decreased to 075 in the year 2010
Reserves amp surplus contributed to 2969 in the total liabilities in the
year 2009 it is decreased to2444 in the year 2010
Secured loans were 3563 in the total liabilities in the year 2009 it is
increased to 3055 in the year 2010
Current Liabilities shown to 1544 in the total liabilities in the year
2009 it is decreased to 1765 in the year 2010
Provisions 801 in the total liabilities in the year 2009 it is decreased
to 586 in the year 2010
Fixed Assets were 4185 in the total liabilities in the year 2009 ie
increased to 5625 in the year 2010
Investments were 143 in the total liabilities in the year 2009 it is
decreased to 084 in the year 2010
Sundry debtors were 882 in the total liabilities in the year 2009 it is
increased to 890 in the year 2010
8102019 A Study A Study On Financial Performance Analysis With Reference To Kesoram Cementon Financial Performance hellip
httpslidepdfcomreaderfulla-study-a-study-on-financial-performance-analysis-with-reference-to-kesoram 5881
58
Common Size Balance sheet of Kesoram for the year 2010-2011
983080Rupees in crores)
Particulars 2010 Change Percentage 2011
Change
Percentage
Liabilities
Share Capital 4574 075 4574 071
Reserves amp Surplus 149111 2444 125162 1939
Revaluation Reserves 339 006 289 004
Loans
Secured Loans 186372 3055 237183 3675
Un Secured Loans 126250 2069 162744 2522
Deferred Tax Liabilities 000 000 000 000
Current Liabilities
Provisions 35734 586 1494 023
Current Liabilities 107688 1765 113902 1765
Total 610068 10000 645348 10000
Assets
Net Block 343182 5625 369172 5721
Capital WIP 41283 677 43781 678
Investments 5143 084 6582 102
Current Assets
Inventories 91619 1502 111855 1733
Sundry Debtors 54289 890 63134 978
Cash amp Bank Balances 8014 131 7188 111
Loans amp Advances 66506 1090 43460 673
Fixed Deposits 031 001 176 003
Total 610068 10000 645348 10000
8102019 A Study A Study On Financial Performance Analysis With Reference To Kesoram Cementon Financial Performance hellip
httpslidepdfcomreaderfulla-study-a-study-on-financial-performance-analysis-with-reference-to-kesoram 5981
59
Interpretation of Common Size Balance Sheet Of 2010-2011
Share capital was recorded 075 percent in the total liabilities in the year 2010 it is
decreased to 071 in the year 2011
Reserves amp surplus contributed to 2444 in the total liabilities in the year 2010 it is
decreased to1939 in the year 2011
Secured loans were 3055 in the total liabilities in the year 2010 it is increased to
3675 in the year 2011
Current Liabilities shown to 1765 in the total liabilities in the year 2010 it is
also1765 in the year 2011
Provisions 586 in the total liabilities in the year 2010 it is decreased to 023 in the
year 2011
Fixed Assets were 5625 in the total liabilities in the year 2010 ie increased to 5721
in the year 2011
Investments were 084 in the total liabilities in the year 2010 it increased to 102 in
the year 2011
Sundry debtors were 890 in the total liabilities in the year 2010 it is increased to 978
in the year 2011
8102019 A Study A Study On Financial Performance Analysis With Reference To Kesoram Cementon Financial Performance hellip
httpslidepdfcomreaderfulla-study-a-study-on-financial-performance-analysis-with-reference-to-kesoram 6081
60
Common Size Balance Sheet of Kesoram for the Year 2011-2012
983080Rupees in crores)
Particulars 2011 Change Percentage 2012
Change
Percentage
Liabilities
Share Capital 4574 071 4574 063
Reserves amp Surplus 125162 1939 86657 1199
Revaluation Reserves 289 004 270 004
Loans
Secured Loans 237183 3675 317792 4397
Un Secured Loans 162744 2522 92742 1283
Deferred Tax Liabilities 000 000 000 000
Current Liabilities
Provisions 1494 023 40726 563
Current Liabilities 113902 1765 180010 2491
Total 645348 10000 722771 10000
Assets
Net Block 369172 5721 358721 4963
Capital WIP 43781 678 68065 942
Investments 6582 102 6636 092
Current Assets
Inventories 111855 1733 99516 1377
Sundry Debtors 63134 978 67358 932
Cash amp Bank Balances 7188 111 6959 096
Loans amp Advances 43460 673 115409 1597
Fixed Deposits 176 003 107 001
Total 645348 10000 722771 10000
8102019 A Study A Study On Financial Performance Analysis With Reference To Kesoram Cementon Financial Performance hellip
httpslidepdfcomreaderfulla-study-a-study-on-financial-performance-analysis-with-reference-to-kesoram 6181
61
Interpretation of common size balance sheet of 2011-2012
Share capital was recorded 071 percent in the total liabilities in the year 2011 it is
decreased to 063 in the year 2012
Reserves amp surplus contributed to 1939 in the total liabilities in the year 2011 it
is decreased to 1199 in the year 2012
Secured loans were 3675 in the total liabilities in the year 2011 it is increased to
4397 in the year 2012
Current Liabilities shown to 1765 in the total liabilities in the year 2011 it is
increased to 2491 in the year 2012
Provisions 023 in the total liabilities in the year 2011 it is increased to 563 in the
year 2012
Fixed Assets were 5721 in the total liabilities in the year 2011 ie decreased to
4963 in the year 2012
Investments were 102 in the total liabilities in the year 2011 it increased to 092
in the year 2012
Sundry debtors were 978 in the total liabilities in the year 2011 it is decreased to
932 in the year 2012
8102019 A Study A Study On Financial Performance Analysis With Reference To Kesoram Cementon Financial Performance hellip
httpslidepdfcomreaderfulla-study-a-study-on-financial-performance-analysis-with-reference-to-kesoram 6281
Trend Analysis
Share Capital-
Year
Amount
(In Crores) Trend
IncreaseDecrease
Base Year Previous Year
2008 4574 10000 000 000
2009 4574 10000 000 000
2010 4574 10000 000 000
2011 4574 10000 000 000
2012 4574 10000 000 000
Trend Percentages in Share Capital
Share capital shown a constant trend in the period 2008 and 2012
Share capital is 4574 crores all the years from 2008-2012
8102019 A Study A Study On Financial Performance Analysis With Reference To Kesoram Cementon Financial Performance hellip
httpslidepdfcomreaderfulla-study-a-study-on-financial-performance-analysis-with-reference-to-kesoram 6381
Reserves amp Surplus-
Year
Amount
(In Crores) Trend
IncreaseDecrease
Base Year Previous Year
2008 93085 10000 000 000
2009 128024 13753 3753 3753
2010 149111 16019 6019 2266
2011 125162 13446 3446 -2573
2012 86657 9309 -691 -4137
Trend Percentages in Reserves amp Surplus
Reserves amp surplus shown an increasing trend in the period between 2008 and 2010
The average trend was 13277 till 2010
The Reserves amp surplus was showing decreasing trend in the period 2011-2012 (ie
from 16019 in 2010 to 9309 in 2012)
The decreasing trend in Reserves amp surplus indicates the decrease in profits of the
firm
8102019 A Study A Study On Financial Performance Analysis With Reference To Kesoram Cementon Financial Performance hellip
httpslidepdfcomreaderfulla-study-a-study-on-financial-performance-analysis-with-reference-to-kesoram 6481
Investments-
Year
Amount
(In Crores) Trend
IncreaseDecrease
Base Year Previous Year
2008 4783 10000 000 000
2009 6178 12917 2917 2917
2010 5143 10753 753 -2164
2011 6582 13761 3761 3009
2012 6636 13874 3874 113
Trend Percentages in Investments-
The investments are shown an increasing trend in the period between 2008 ndash 2009
and it is decreasing in the year 2010
The average trend was 11458 till 2009
The investments increased in the periods 2011-2012 (ie from 10753 in 2010 to
13874 in 2012)
The overall trend in investments shown is satisfactory
8102019 A Study A Study On Financial Performance Analysis With Reference To Kesoram Cementon Financial Performance hellip
httpslidepdfcomreaderfulla-study-a-study-on-financial-performance-analysis-with-reference-to-kesoram 6581
Net Current Assets-
Year
Amount
(In Crores) Trend
IncreaseDecrease
Base Year Previous Year
2008 30761 10000 000 000
2009 56954 18515 8515 8515
2010 77037 25044 15044 6529
2011 110417 35895 25895 10851
2012 68613 22305 12305 -13590
Trends in Net Current Assets-
The NCA shown positive (increasing) trend
The NCA are increased to 35895 (the year 2011) compared with base year and
decreased in the year 2012 to 22305
The NCA shown increased trend from year and crossed 100
The overall trend was good
8102019 A Study A Study On Financial Performance Analysis With Reference To Kesoram Cementon Financial Performance hellip
httpslidepdfcomreaderfulla-study-a-study-on-financial-performance-analysis-with-reference-to-kesoram 6681
66
Ratio Analysis-
Current Ratio-
Current Ratio = Current Assets Current Liabilities
Current assets are cash in hand Cash at bank Marketable Securities(short term) short term
Investment Bills receivables sundry debtors Inventories (stock) Work in progress prepaid
expenses Current Liabilities are outstanding expenses Bills payable sundry Creditors
short-term advances income tax payable and Dividend payable
Current Ratio of Kesoram-
(Rupees in crores)
Year Current Assets Current Liabilities Current Ratio
2007-08 75560 57067 132
2008-09 102580 66587 154
2009-10 153922 107688 143
2010-11 182177 113902 160
2011-12 173833 180010 097
Interpretation-
As per the standard rule of current ratio ie 21 where current assets double the current
liabilities is considered satisfactory
In the present analysis the current ratio of the Kesoram is not satisfactory
from the above table It was assessed that the current ratio for all the five year is lower (less)
than the standard rule ie 21 And it is 097 in the year 2011-2012 (current year) This is
highly UN satisfactory
8102019 A Study A Study On Financial Performance Analysis With Reference To Kesoram Cementon Financial Performance hellip
httpslidepdfcomreaderfulla-study-a-study-on-financial-performance-analysis-with-reference-to-kesoram 6781
Quick Ratio-
Quick ratio also known as acid-test ratio establishes a relationship between quick
assets and the current liabilities Cash is the most liquid asset It is calculated by dividing
quick assets by current liabilities
Quick ratio = Quick Assets Current Liabilities
(Quick Assets = Current assets ndash Inventory)
Quick Ratio of Kesoram-
Rupees in crores)
Year Total QuickAssets
Current Liabilities Quick Ratio
2007-08 33343 57067 058
2008-09 43674 66587 066
2009-10 62303 107688 058
2010-11 70322 113902 0622011-12 74333 180010 041
Interpretation-
Usually a high Quick ratio is an indication that the company is liquid and has the ability to
meet its current or liquid liabilities in time on the other hand a low Quick Ratio represents
8102019 A Study A Study On Financial Performance Analysis With Reference To Kesoram Cementon Financial Performance hellip
httpslidepdfcomreaderfulla-study-a-study-on-financial-performance-analysis-with-reference-to-kesoram 6881
that the companyrsquos liquidity position is not good The above table showing the quick ratios
of Kesoram are canrsquot be considered satisfactory
Leverage Ratios-
Debt-Equity Ratio-
Debt-Equity Ratio = Total Long Term Debt Equity Share Holders Fund
Total Long term Debt= Debenture Capital + Long term loans from banks and financial
institutions + Public deposits
Equity Share Holders fund = Equity + Reserves and Surplus
Debt Equity Ratio of Kesoram
(Rupees in crores)
Year Total Debt Share Holders Fund Debt Equity Ratio
2007-08 109235 98192 111
2008-09 197043 133010 148
2009-10 312622 154024 203
2010-11 399927 130025 308
2011-12 410534 91501 449
8102019 A Study A Study On Financial Performance Analysis With Reference To Kesoram Cementon Financial Performance hellip
httpslidepdfcomreaderfulla-study-a-study-on-financial-performance-analysis-with-reference-to-kesoram 6981
Interpretation-
The Debt-Equity Ratio accepted standard is 05 This ratio reflects the relative contribution
of creditors and owners of business in its financing From the above it is clear that the long
term debt is more than that of the share holdersrsquo fund So we can interpret that the firmrsquosassets are financed more by the external funds rather than by the internal funds
8102019 A Study A Study On Financial Performance Analysis With Reference To Kesoram Cementon Financial Performance hellip
httpslidepdfcomreaderfulla-study-a-study-on-financial-performance-analysis-with-reference-to-kesoram 7081
Fixed Asset Ratio-
Net Sales
Fixed Asset Ratio = helliphelliphelliphelliphelliphelliphelliphelliphelliphelliphellip
Net Assets
Fixed Asset Ratio of Kesoram-
(Rupees in crores)
Year Net Sales Net Assets Fixed Assets Ratio
2007-08 300271 358721 084
2008-09 389797 369172 106
2009-10 475062 343182 1382010-11 539788 180435 299
2011-12 59182 108424 546
Interpretation
This ratio indicates the extent to which the assets of the companyrsquos can be lost without
affecting the interest of the creditors of the company Higher the ratios better the long-term
position of the companyThe above table shows fixed assets ratio in increasing trend Which is good for the
company
8102019 A Study A Study On Financial Performance Analysis With Reference To Kesoram Cementon Financial Performance hellip
httpslidepdfcomreaderfulla-study-a-study-on-financial-performance-analysis-with-reference-to-kesoram 7181
Overall Profitability Ratios-
Net Profit Ratio
Net Profit Ratio indicates net margin on sales It is given by the following equation
Net Profit Ratio = (Net Profit Sales) 100
Net Profit Ratio of Kesoram
(Rupees in crores)
Year Net Profit Sales Net Profit Ratio
2007-08 37917 300271 1263
2008-09 41432 389797 1063
2009-10 20298 475062 427
2010-11 -28176 539788 -5222011-12 -38108 59182 -644
Interpretation
It establishes a relationship between net profits after tax and net sales and
indicates the efficiency of the management in manufacturing selling administrative and
other activities of the company
The higher the ratio the better is the profitability or performance of the business
The above table depicts the net profit Ratio of Kesoram has decreased every year from
2007-2008 to 2011-2012It further decreased to negative in the year 2010-11 to -522 and -
644 in the year 2011-2012 This shows constant decrease in the profits of the company
8102019 A Study A Study On Financial Performance Analysis With Reference To Kesoram Cementon Financial Performance hellip
httpslidepdfcomreaderfulla-study-a-study-on-financial-performance-analysis-with-reference-to-kesoram 7281
72
Return on Investment-
Net Profit
Return on Investment = helliphelliphelliphelliphelliphelliphelliphelliphelliphelliphelliphellip X 100
Share Holders Fund
Return on Investment Ratio of Kesoram-
(Rupees in crores)
Year Net Profit Share Holders Fund Return On Investment
2007-08 37917 98192 3862
2008-09 41432 133010 3115
2009-10 20298 154024 1318
2010-11 -28176 130025 -2167
2011-12 -38108 91501 -4165
Interpretation-
The above table reveals how well the resources of the firm are being used Higher
the ratio better the result The above ratio implies how well the firm is growing in
terms of profitability and efficiency From the above table we can concern that the return on
investment is in decreasing trend ROI is highest in the year 2007-2008 as 3862 But
there after itrsquos decreased every year
The ROI is negative in the years 2010-2011 amp 2011-2012 as -2167 amp -4165 respectively
Which is not a good sign for the firm
8102019 A Study A Study On Financial Performance Analysis With Reference To Kesoram Cementon Financial Performance hellip
httpslidepdfcomreaderfulla-study-a-study-on-financial-performance-analysis-with-reference-to-kesoram 7381
8102019 A Study A Study On Financial Performance Analysis With Reference To Kesoram Cementon Financial Performance hellip
httpslidepdfcomreaderfulla-study-a-study-on-financial-performance-analysis-with-reference-to-kesoram 7481
8102019 A Study A Study On Financial Performance Analysis With Reference To Kesoram Cementon Financial Performance hellip
httpslidepdfcomreaderfulla-study-a-study-on-financial-performance-analysis-with-reference-to-kesoram 7581
75
CHAPTER V
FINDINGS amp SUGGESTIONS
8102019 A Study A Study On Financial Performance Analysis With Reference To Kesoram Cementon Financial Performance hellip
httpslidepdfcomreaderfulla-study-a-study-on-financial-performance-analysis-with-reference-to-kesoram 7681
76
Findings
The Share capital remains constant Share capital is unchanged all the years from
2008-2012
Reserves amp surplus were recorded an increasing trend in the period between 2008
and 2010It is showing decreasing trend in the period 2011-2012 (ie from 16019
in 2010 to 9309 in 2012)
Current Liabilities were increased compared to base year ie 2008
Provisions increased to 262597 ie in Rupees 39232 crores in the current year
The current ratio for all the five year is lower (less) than the standard rule ie 21
And it is 097 in the year 2011-2012 (current year)
The Debt-Equity Ratio was shown under the standard ratio It is clear that the long
term debt is more than that of the share holdersrsquo fund It indicates that the firm
heavily relying on external funds rather than the internal funds
The operating and net profit of Kesoram is in decreasing trend due to heavy
increase of manufacturing amp administrative expenses
ROI is highest in the year 2007-2008 as 3862 The ROI is negative in the years
2010-2011 amp 2011-2012 as -2167 amp -4165 respectively
Return on Equity Capital Employed Ratio of Kesoram has decreased every year
from 2007-2008 to 2010-2011It further decreased to negative in the year 2011-12 to
-3280
EPS of Kesoram has decreased every year from 2008-12It is negative in the year
2011 amp 12
8102019 A Study A Study On Financial Performance Analysis With Reference To Kesoram Cementon Financial Performance hellip
httpslidepdfcomreaderfulla-study-a-study-on-financial-performance-analysis-with-reference-to-kesoram 7781
77
Suggestion
The organization should adopt an appropriate capital structure
The companyrsquos debt-equity ratio is recorded more or less as 111 in the year 2008
and it is increased to 449 in the year 2012 (current year)The company should
adopt a better debt equity mix in the future to control the fluctuations in returns
The company should control fluctuations in cash and bank balances as it impacts the
current ratio of the company
The provisions are showing increasing trend which indicates risk of debtors The
firm should implement an effective credit management policy It should utilize its
idle funds by decreasing provisions
The company should control heavy increase of manufacturing amp administration
expenses as it is impacting the operating and net profit of company
8102019 A Study A Study On Financial Performance Analysis With Reference To Kesoram Cementon Financial Performance hellip
httpslidepdfcomreaderfulla-study-a-study-on-financial-performance-analysis-with-reference-to-kesoram 7881
78
ANNEXURE
Profit And Loss Account of Kesoram Cement
Mar12 Mar11 Mar10 Mar09 Mar08
12 Months 12 Months 12 Months 12 Months 12 Months
INCOME
Sales Turnover 628260 575072 505151 431613 345700
Excise Duty 36440 35284 30089 41815 45429
NET SALES 591820 539788 475062 389797 300271
Other Income 000 000 000 000 000
TOTALINCOME
596129 548733 481019 393969 302020
EXPENDITURE
Manufacturing
Expenses81903 74803 13974 13153 44113
MaterialConsumed
370897 310150 295550 229359 118448
Personal
Expenses33468 27355 23294 18690 15344
Selling Expenses 81910 78253 58667 48846 45019
AdministrativeExpenses
28225 29308 17219 16179 9907
Expenses
Capitalized000 000 000 000 000
Provisions Made 000 000 000 000 000
TOTAL
EXPENDITURE 596403 519870 408704 326227 232832Operating Profit -4583 19918 66358 63570 67439
EBITDA -274 28864 72316 67742 69188
Depreciation 29740 27259 17280 11186 8927
Other Write-offs 000 000 000 000 000
EBIT -30014 1605 55035 56557 60261
Interest 41015 23983 10921 12087 5426
EBT -71029 -22377 44114 44470 54835
Taxes -32921 5798 23816 3037 16918
Profit and Loss
for the Year-38108 -28176 20298 41432 37917
Non RecurringItems
-1142 7063 3228 -4023 402
Other Non Cash
Adjustments1276 091 207 465 017
OtherAdjustments
000 000 000 000 000
REPORTED
PAT-37974 -21021 23734 37874 38335
8102019 A Study A Study On Financial Performance Analysis With Reference To Kesoram Cementon Financial Performance hellip
httpslidepdfcomreaderfulla-study-a-study-on-financial-performance-analysis-with-reference-to-kesoram 7981
79
Balance Sheet Of Kesoram
Years
Particulars 2008 2009 2010 2011 2012
Liabilities
Share Capital 4574 4574 4574 4574 4574Reserves amp Surplus 93085 128024 149111 125162 86657
Revaluation Reserves 533 412 339 289 27
Loans
Secured Loans 97106 153627 186372 237183 317792
Un Secured Loans 12129 43416 12625 162744 92742
Deferred Tax Liabilities 0 0 0 0 0
Current Liabilities
Provisions 33039 34529 35734 1494 40726
Current Liabilities 57067 66587 107688 113902 18001
Total 297533 431169 610068 645348 722771
Assets
Net Block 108424 180435 343182 369172 358721
Capital WIP 63459 86485 41283 43781 68065
Investments 4783 6178 5143 6582 6636
Current Assets
Inventories 44217 58906 91619 111855 99516
Sundry Debtors 27307 38017 54289 63134 67358
Cash amp Bank Balances 4036 5657 8014 7188 6959
Total Current Assets 7556 10258 153922 182177 173833Loans amp Advances 45289 55462 66506 4346 115409
Fixed Deposits 018 028 031 176 107
Total 297533 431169 610068 645348 722771
8102019 A Study A Study On Financial Performance Analysis With Reference To Kesoram Cementon Financial Performance hellip
httpslidepdfcomreaderfulla-study-a-study-on-financial-performance-analysis-with-reference-to-kesoram 8081
80
KEY ITEMS 2012 2011 2010 2009 2008
Preference
Dividend 0 0 0 0 0
Equity Dividend 457 2516 2516 2516 2516
Equity Dividend
() 999 55 55 55 55
Shares in Issue(Lakhs) 45743 45743 45743 45743 45743
EPS - Annualised
(Rs) -8302 -4595 5188 828 838
8102019 A Study A Study On Financial Performance Analysis With Reference To Kesoram Cementon Financial Performance hellip
httpslidepdfcomreaderfulla-study-a-study-on-financial-performance-analysis-with-reference-to-kesoram 8181
BIBLIOGRAPHY
Sl
No
Books Author Name
1 Financial Management Khan amp JAIN
2 Financial Management IMPandey
3 Management Accounting RPTrivedi
Websites amp Search Engines
1 wwwkesoramcom983086
2 wwwmoneycontrolcom
3 wwwgooglefinancecom983086
Annual reports of Kesoram cement limited 2008-2012
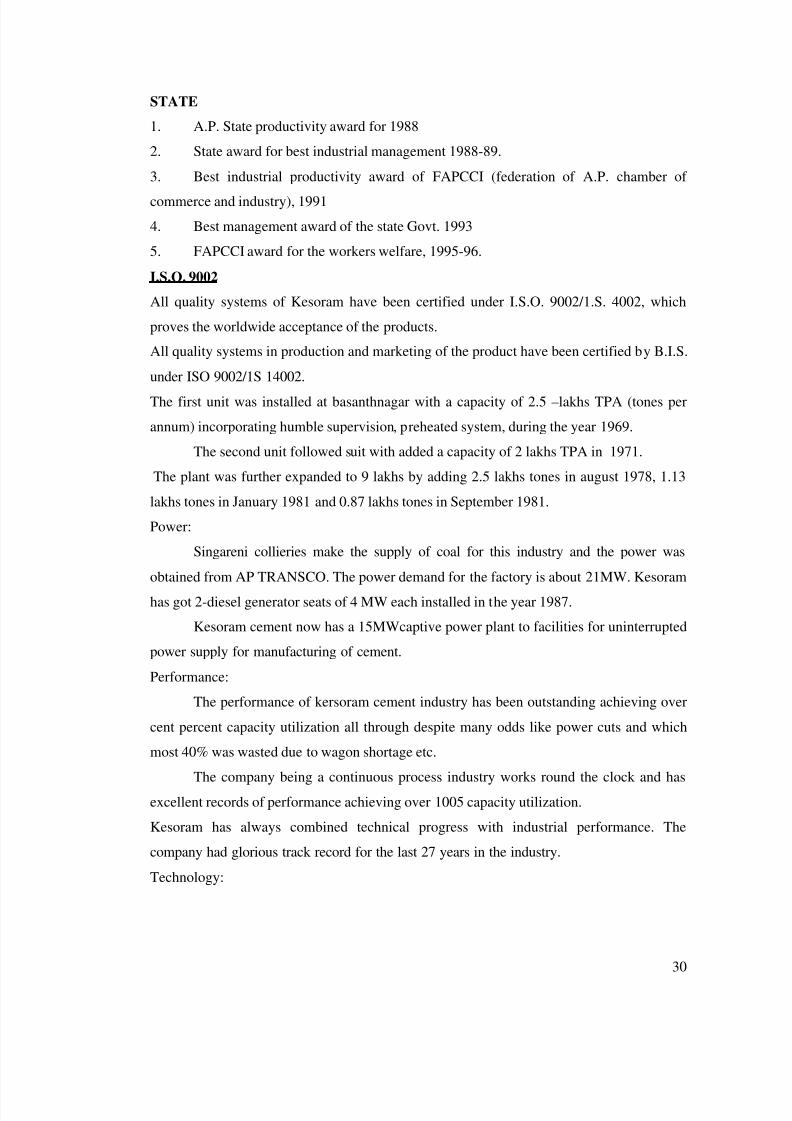
8102019 A Study A Study On Financial Performance Analysis With Reference To Kesoram Cementon Financial Performance hellip
httpslidepdfcomreaderfulla-study-a-study-on-financial-performance-analysis-with-reference-to-kesoram 3581
35
CHAPTER-III
LITERATURE REVIEW
8102019 A Study A Study On Financial Performance Analysis With Reference To Kesoram Cementon Financial Performance hellip
httpslidepdfcomreaderfulla-study-a-study-on-financial-performance-analysis-with-reference-to-kesoram 3681
36
Introduction
Financial Performance Analysis
The term lsquofinancial performance analysis also known as analysis and interpretation of
financial statementsrsquo refers to the process of determining financial strength and
weaknesses of the firm by establishing strategic relationship between the items of the
balance sheet profit and loss account and other operative data
ldquoAnalyzing financial statementsrdquo by Metcalf and Titard
ldquoFinancial analysis is a process of evaluating the relationship between component
parts of a financial statement to obtain a better understanding of a firms position and
performancerdquo by Myers
Financial Performance
The word lsquoPerformance is derived from the word lsquoparfourmenrsquo which means lsquoto dorsquo lsquoto
carry outrsquo or lsquoto renderrsquo It refers the act of performing execution accomplishment
fulfillment etc In border sense performance refers to the accomplishment of a given task
measured against preset standards of accuracy completeness cost and speed In other
words it refers to the degree to which an achievement is being or has been accomplished In
the Words of Frich Kohlar ldquoThe performance is a general term applied to a part or to all the
conducts of activities of an organization over a period of time often with reference to past or
projected cost efficiency management responsibility or accountability or the like Thus not
just the presentation but the quality of results achieved refers to the performance
Performance is used to indicate firmrsquos success conditions and compliance
Financial performance refers to the act of performing financial activity In broader
sense financial performance refers to the degree to which financial objectives being or has
been accomplished It is the process of measuring the results of a firms policies and
operations in monetary terms It is used to measure firms overall financial health over a
given period of time and can also be used to compare similar firms across the same industry
or to compare industries or sectors in aggregation
The purpose of financial analysis is to diagnose the information contained in financial
statements so as to Jude the profitability and financial soundness of the firm Just like a
doctor examines his patient by recording his body temperature blood pressure etc Before
8102019 A Study A Study On Financial Performance Analysis With Reference To Kesoram Cementon Financial Performance hellip
httpslidepdfcomreaderfulla-study-a-study-on-financial-performance-analysis-with-reference-to-kesoram 3781
37
making his conclusion regarding the illness and before giving his treatment a financial
analyst analysis the financial statements with various tools of analysis before commenting
upon the financial health or weaknesses of an enterprise
The analysis and interpretation of financial statements is essential to bring out the
mystery behind the figures in financial statements Financial statements analysis is an
attempt to determine the significance and meaning of the financial statement data so that
forecast may be made of the future earnings ability to pay interest and debt maturities (both
current and long term) and profitability of a sound divided policy
Types of financial analysis-
Financial analysis into different categories depending upon
(1) The material used and
(2) The method of operation followed in the analysis or the modus operandi of
analysis
Types of financial analysis
On the basis of material used on the basis of modus operandi
External Internal Horizontal Vertical
Analysis Analysis Analysis Analysis
1 On the basis of material used - According to material used financial analysis canbe of two types
External analysis
Internal analysis
External analysis-
This analysis is done by outsiders who do not have access to the detailed internal
outsiders include investors potential investors Creditors Potential Creditors Government
Agencies Credit Agencies and General Public For financial analysis these external parties
to the firm depend almost entirely on the published financial statements
Internal analysis-
This analysis is undertaken by the persons namely executives and employees of the
organization or by the officers appointed by government or court who have access to the
8102019 A Study A Study On Financial Performance Analysis With Reference To Kesoram Cementon Financial Performance hellip
httpslidepdfcomreaderfulla-study-a-study-on-financial-performance-analysis-with-reference-to-kesoram 3881
38
books of account ( internal accounting records) and other information related to the
business
2 983119983150 983156983144983141 983138983137983155983145983155 983151983142 983149983151983140983157983155 983151983152983141983154983137983150983140983145983085
According to the modus operandi financial analysis can also be of two types
a Horizontal analysis
bVertical analysis
Horizontal analysis-
Horizontal analysis refers to the comparison of financial data of a company for several
years The figures for this type of analysis are presented horizontally over a number of
columns The figures of the various years are compared with standard or base year a base
year is year chosen as beginning point This type of analysis is also called lsquodynamicanalysisrsquo as it is based on the data from year to year rather than on data of any one year The
horizontal analysis makes it possible to focus attention on items that have changed
significantly during the period under view
b Vertical analysis-
Vertical analysis refers to the study of relationship of the various items in the financial
statements of one accounting period In this types of analysis the figures from financial
statement of a year are compared with a base selected from the same yearrsquos statement
Methods of financial analysis-
The following methods of analysis are generally used-
1 Comparative Statements
2 Trend Analysis
3 Common-Size Statements
4 Funds flow Analysis
5 Cash Analysis
6 Ratio Analysis
7 Cost-volume-Profit Analysis
8102019 A Study A Study On Financial Performance Analysis With Reference To Kesoram Cementon Financial Performance hellip
httpslidepdfcomreaderfulla-study-a-study-on-financial-performance-analysis-with-reference-to-kesoram 3981
39
Comparative statements-
The comparative financial statements are statements of the financial position at
different periods of time the elements of financial position are show in a
Comparative Statement provides an idea of financial position at two or more
periods Generally two financial statements (balance sheet and income statement) are
prepared in comparative form for financial analysis
The Comparative Statement May Show-
1 Absolute figures (rupee amounts)
2 Changes in absolute figures ie increase or decrease in absolute figures
3 Absolute data in terms of percentages
4 Increase or decrease in terms of percentages
The Two Comparative Statements Are-
1 Comparative balance sheet and
2 Income statement
1 983107983151983149983152983137983154983137983156983145983158983141 983138983137983148983137983150983139983141 983155983144983141983141983156983085
The comparative balance sheet analysis is the study of the trend of the same items group of
items and computed items in two or more balance sheets of the same business enterprise on
different dates The change in periodic balance sheet items reflect the conduct of a business
the change can be observed by comparison of the balance sheet at the beginning and at the
end of a period and these changes can help in forming an opinion about the progress of an
enterprise
Guide Lines for Interpretation of Comparative Balance Sheet-
While interpreting comparative balance sheet the interpreter is expected to study the
following aspects-
1 Current financial position and liquidity position
2 Long-term financial position
3 Profitability of the concern
8102019 A Study A Study On Financial Performance Analysis With Reference To Kesoram Cementon Financial Performance hellip
httpslidepdfcomreaderfulla-study-a-study-on-financial-performance-analysis-with-reference-to-kesoram 4081
40
Common Size Statement-
The common-size statements balance sheet and income statement are show in
analytical percentages The figures are shown as percentages of total assets total liabilities
and total sales The total assets are taken as 100 and different assets are expressed as a
percentage of the total similarly various liabilities are taken as a part of total liabilities
Common Size Balance Sheet-
A statement in which balance sheet items are expressed as the ratio of each asset to
total assets and the ratio of each liability is expressed as a ratio of total liabilities is called
common size balance The common size balance sheet can be used to compare companies
of differing size The comparison of figures in different periods is not useful because total
figures may be affected by a number of factors It is not possible to establish standard norms
for various assets The trends of figures from year to year may not be studied and even they
may not give proper results
Trend Analysis of Balance Sheet-
Trend analysis is Very important tool of horizontal financial analysis
This analysis enables to known the change in the financial function and operating efficiency
in between the time period chosen
By studding the trend analysis of each item we can known the direction of changes and
based upon the direction of changes the options can be changed
Trend =Absolute Value of item in the statement understudy 100
Absolute Value of same item in the base statement
Ratio Analysis
Ratio analysis is used as a technique of analyzing the financial information contained in the
balance sheet and profit and loss accounts for a more meaningful understanding of the
financial position and performance of a firm
The relationship between two accounting figures expressed mathematically is known as a
financial ratio A ratio helps the analyst to make qualitative judgment about the firmrsquos
financial position and performance
Several ratios can be calculated from the accounting data contained in the financial
statements The parties which generally undertake financial analysis is short ndashterm
creditors long-term creditors owner and management In view of the requirements of the
various ratios ratios are classified into the following four important categories
8102019 A Study A Study On Financial Performance Analysis With Reference To Kesoram Cementon Financial Performance hellip
httpslidepdfcomreaderfulla-study-a-study-on-financial-performance-analysis-with-reference-to-kesoram 4181
41
Liquidity ratios
Leverage ratios
Activity ratios
Profitability ratios
Liquidity Ratios
It is extremely essential for a firm to be able to meet its obligations as they become due
Liquidity ratios measure the ability of the firm to meet its current obligations A firm should
ensure that it does not suffer from lack of liquidity and also that it does not have excess
liquidity The failure of a company to meet its obligations due to lack of sufficient liquidity
will result in a poor creditworthiness loss of creditorsrsquo confidence or even in legal tangles
resulting in the closure of the company A very high degree of liquidity is also bad idle
assets earn nothing The firmrsquos funds will be unnecessarily tied up in current assets
Therefore it is necessary to strike a proper balance high liquidity and lack of liquidity
The most common ratios which indicate the extent of liquidity or lack of it are
Current ratio
Quick ratio
Other ratios include Cash ratio Interval Measure and Net working capital ratio
Current Ratio
The current ratio is calculated by dividing current assets by current liabilities
Current assets
Current ratio = --------------------------
Current liabilities
Current ratio is a measure of the firmrsquos short term solvency It indicates the availability of
current assets in rupees for every one rupee of current liability A ratio of greater than one
means that the firm has more current assets than current claims against the Current ratio of
2 to 1 or more is considered satisfactory Current ratio represents a margin of safety for
creditors
Quick Ratio
Quick ratio also known as acid-test ratio establishes a relationship between quick assets and
the current liabilities Cash is the most liquid asset It is calculated by dividing quick assets
by current liabilities
Quick ratio = Quick Assets Current Liabilities
8102019 A Study A Study On Financial Performance Analysis With Reference To Kesoram Cementon Financial Performance hellip
httpslidepdfcomreaderfulla-study-a-study-on-financial-performance-analysis-with-reference-to-kesoram 4281
42
(Quick Assets = Current assets ndash Inventory)
One defect of the current ratio is that it fails to convey any information on the composition
of the current assets of the firm A rupee of cash is considered equivalent to a rupee of
inventory of receivables But it is not so A rupee of cash is more readily available to meet
current liabilities than a rupee of say inventory This implies the usefulness of the current
ratio
The Acid ndashtest ratio measures the firmrsquos ability to convert its current assets quickly into
cash in order to meet its current liabilities
A quick ratio of 1 to 1 is considered to represent a satisfactory current financial condition It
is an important index of the firmrsquos liquidity
Leverage Ratios
Leverage ratios identify the source of a firmrsquos capital ndashowners or outside creditors
Financial leverage refers to the use of debt in financing non-current assets If the return on
assets exceeds the cost of debt the leverage is successful ndash ie it improves return on equity
Debt ndashEquity Ratio
The Debt ndash Equity is determined to analyze the soundness of the long term financial
policies of the organization It is also known as ldquoInternal External Equity Ratiordquo
It is calculated as follows
Debt ndash Equity Ratio = Total long term debt Share holders funds
Equity Ratio
This ratio is also called as proprietary ratio establishes a relationship between share holderrsquos
funds to total assets of company Equity Ratio is calculated by dividing share holders fund
by total assets
Fixed Asset Ratio
This ratio indicates the extent to which the assets of the companyrsquos can be lost without
affecting the interest of the creditors of the company Higher the ratios better the long-term
position of the company
Activity Ratios
They are primarily used for studying a firmrsquos working capital situation A well managed
firm should have good activity ratios
8102019 A Study A Study On Financial Performance Analysis With Reference To Kesoram Cementon Financial Performance hellip
httpslidepdfcomreaderfulla-study-a-study-on-financial-performance-analysis-with-reference-to-kesoram 4381
43
Working Capital Turnover Ratio
The working capital turnover ratio indicates whether or not working capital has been
effectively used in making sales
Working capital turnover = Sales Net current assets
Inventory Turnover Ratio
This ratio also known as Stock Turnover Ratio establishes the relationship between costs of
goods sold or net sales during the given period and the average amt of stock held during the
period This ratio reveals the number of times finished stock in turnover during a given
accounting period
Higher the ratio the better is it because it shows the finished stock is rapidly turned
in to sales On the other hand a low stock turnover ratio is not desirable because it reveals
the accumulation of stock
Debtors Turnover Ratio
This ratio indicates the velocity of debt collection of a company In other words it shows
the number of times average turnover during a year
A Higher Debtor Turnover Ratio indicates a more efficient is the management towards
debtors and low ratio ratio implies inefficient management of debtors
Total Assets Turnover Ratio
The asset turnover ratio indicates how efficiently management is employing Assets
Total Assets Turnover Ratio = Sales Total Assets
Profitability Ratios
Profitability ratios are the ratios which measure a firmrsquos overall effectiveness as revealed by
the returns generated on sales and investment
General Profitability Ratios
1 Gross Profit Ratio
2 Net profit Ratio
3 Operating or Expenses Ratio
8102019 A Study A Study On Financial Performance Analysis With Reference To Kesoram Cementon Financial Performance hellip
httpslidepdfcomreaderfulla-study-a-study-on-financial-performance-analysis-with-reference-to-kesoram 4481
44
Gross Profit Ratio
Gross profit Ratio measures the relationships to net sales and is usually represented as a
percentage It is a good measure of profitability
The gross profit ratio indicates the extent to which selling price of goods per unit may
decline without resulting in losses on operation Higher the gross profit betters the result
Net Profit Ratio
Net Profit Ratio indicates net margin on sales It is given by the following equation
Net Profit Ratio = (Net Profit Sales) 100
Operating or Expenses Ratio
This ratio is complimentary of Net Profit Ratio The more the net profit the less the
Operating Ratio Operating costs include the cost of direct materials direct labors and otheroverheads viz are generally excluded from operating costs A comparison of the Operating
Ratio will indicate whether the cost efficiency is high or low in the figure of sales This less
the ratio it depicts the efficiency of the management
8102019 A Study A Study On Financial Performance Analysis With Reference To Kesoram Cementon Financial Performance hellip
httpslidepdfcomreaderfulla-study-a-study-on-financial-performance-analysis-with-reference-to-kesoram 4581
45
CHAPTER IV
DATA ANALYSIS amp INTERPRETATION
8102019 A Study A Study On Financial Performance Analysis With Reference To Kesoram Cementon Financial Performance hellip
httpslidepdfcomreaderfulla-study-a-study-on-financial-performance-analysis-with-reference-to-kesoram 4681
46
Comparative Balance Sheet of Kesoram in the Year between 2008-2009
(Rupee in crores)
Years Changes
Particulars 2008 2009 In Rupees In Percentage
Liabilities
Share Capital 4574 4574 000 000
Reserves amp Surplus 93085 128024 34939
Revaluation Reserves 533 412 -121 -2270
Loans
Secured Loans 97106 153627 56521 5821
Un Secured Loans 12129 43416 31287 25795
Deferred Tax Liabilities 000 000 000 000
Current Liabilities
Provisions 33039 34529 1490 451
Current Liabilities 57067 66587 9520 1668
Total 297533 431169 133636 4491
Assets
Net Block 108424 180435 72011 6642
Capital Wip 63459 86485 23026 3628
Investments 4783 6178 1395 2917
Current Assets
Inventories 44217 58906 14689 3322
Sundry Debtors 27307 38017 10710 3922
Cash amp Bank Balances 4036 5657 1621 4016
Total Current Assets 75560 102580 27020 3576
Loans amp Advances 45289 55462 10173 2246
Fixed Deposits 018 028 010 5556
Total 297533 431169 133636 4491
8102019 A Study A Study On Financial Performance Analysis With Reference To Kesoram Cementon Financial Performance hellip
httpslidepdfcomreaderfulla-study-a-study-on-financial-performance-analysis-with-reference-to-kesoram 4781
47
Interpretation of comparative balance sheet of 2008-2009
Reserves amp Surplus were increased to 3753 (percent) ie in Rupees 34939
crores
Revaluation Reserves decreased to 121 ie in Rupees 2270 crores
Secured Loans are increased to 5821 ie in Rupees 56521 crores And UN
secured loans highly Increased to 25795
Current liabilities and Provisions are increased to 1668 and 451 respectively ie in
Rupees 9520 amp 1490 crores
Fixed assets were highly increased to 6642 ie in Rupees 72011 crores
Investments were increased to 2917 ie in Rupees 1395 crores
Sundry debtors increased to 3922 ie in Rupees 10710 crores
Current assets increased 3576 ie in Rupees 27020 crores And Loans amp
Advances increased to 2246 respectively
The overall financial position was satisfactory
8102019 A Study A Study On Financial Performance Analysis With Reference To Kesoram Cementon Financial Performance hellip
httpslidepdfcomreaderfulla-study-a-study-on-financial-performance-analysis-with-reference-to-kesoram 4881
48
Comparative Balance Sheet of Kesoram in the Year between 2009-2010
(Rupees in crores)
Years Changes
Particulars 2009 2010 In Rupees In Percentage
Liabilities
Share Capital 4574 4574 000 000
Reserves amp Surplus 128024 149111 21087 1647
Revaluation Reserves 412 339 -073 -1772
Loans
Secured Loans 153627 186372 32745 2131
Un Secured Loans 43416 126250 82834 19079
Deferred Tax Liabilities 000 000 000
Current Liabilities
Provisions 34529 35734 1205 349
Current Liabilities 66587 107688 41101 6173
Total 431169 610068 178899 4149
Assets
Net Block 180435 343182 162747 9020
Capital WIP 86485 41283 -45202 -5227
Investments 6178 5143 -1035 -1675
Current Assets
Inventories 58906 91619 32713 5553
Sundry Debtors 38017 54289 16272 4280
Cash amp Bank Balances 5657 8014 2357 4167
Total Current Assets 102580 153922 51342 5005
Loans amp Advances 55462 66506 11044 1991
Fixed Deposits 028 031 003 1071
Total 431169 610068 178899 4149
8102019 A Study A Study On Financial Performance Analysis With Reference To Kesoram Cementon Financial Performance hellip
httpslidepdfcomreaderfulla-study-a-study-on-financial-performance-analysis-with-reference-to-kesoram 4981
49
Interpretation of comparative balance sheet of 2009-2010
Reserves amp surplus increased to 1647 ie in Rupees 21087 crores
Revaluation Reserves decreased to 1772 ie in Rupees 073 crores
Secured loans increased to 2131 ie in Rupees 32745 crores
Current Liabilities were increased to 6173 ie in Rupees 41101 crores and
Provisions 349 ie in Rupees 1205 crores
Fixed Assets were increased to 9020 ie in Rupees 162747 crores
Investments were decreased to 1675 ie in Rupees 1035 crores
Sundry debtors were increased to 4280 ie in Rupees 16272 crores
Current assets increased to 5005 ie in Rupees 51342 crores And loans and
Advances increased 1919 ie in Rupees 11044 crores
The overall financial position was satisfactory
8102019 A Study A Study On Financial Performance Analysis With Reference To Kesoram Cementon Financial Performance hellip
httpslidepdfcomreaderfulla-study-a-study-on-financial-performance-analysis-with-reference-to-kesoram 5081
50
Comparative Balance Sheet of Kesoram in the Year between 2010-2011
(Rupees in crores)
Years Changes
Particulars 2010 2011 In Rupees In Percentage
Liabilities
Share Capital 4574 4574 000 000
Reserves amp Surplus 149111 125162 -23949 -1606
Revaluation Reserves 339 289 -050 -1475
Loans
Secured Loans 186372 237183 50811 2726
Un Secured Loans 126250 162744 36494 2891
Deferred Tax Liabilities 000 000 000
Current Liabilities
Provisions 35734 1494 -34240 -9582
Current Liabilities 107688 113902 6214 577
Total 610068 645348 35280 578
Assets
Net Block 343182 369172 25990 757
Capital WIP 41283 43781 2498 605
Investments 5143 6582 1439 2798
Current Assets
Inventories 91619 111855 20236 2209
Sundry Debtors 54289 63134 8845 1629
Cash amp Bank Balances 8014 7188 -826 -1031
Total Current Assets 153922 182177 28255 1836
Loans amp Advances 66506 43460 -23046 -3465
Fixed Deposits 031 176 145 46774
Total 610068 645348 35280 578
8102019 A Study A Study On Financial Performance Analysis With Reference To Kesoram Cementon Financial Performance hellip
httpslidepdfcomreaderfulla-study-a-study-on-financial-performance-analysis-with-reference-to-kesoram 5181
51
Interpretation of comparative balance sheet of 2010-2011
Reserves amp surplus decreased to 1606 ie in Rupees 23949 crores
Revaluation Reserves decreased to 1475 ie in Rupees 050 crores
Secured loans increased to 2726 ie in Rupees 50811 crores
Current Liabilities were increased to 577 ie in Rupees 6214 crores
Provisions decreased to 9582 ie in Rupees 34240 crores
Fixed Assets were increased to 757 ie in Rupees 25990 crores
Investments were decreased to 2798 ie in Rupees 1439 crores
Sundry debtors were increased to 1629 ie in Rupees8845 crores
Current assets increased to 1836 ie in Rupees 28255 crores And loans and
Advances increased 3465 ie in Rupees 23046 crores
The overall financial position was UN satisfactory
8102019 A Study A Study On Financial Performance Analysis With Reference To Kesoram Cementon Financial Performance hellip
httpslidepdfcomreaderfulla-study-a-study-on-financial-performance-analysis-with-reference-to-kesoram 5281
52
Comparative Balance Sheet of Kesoram In The Year Between 2011-2012
(Rupees in crores)
Years Changes
Particulars 2011 2012 In Rupees In Percentage
Liabilities
Share Capital 4574 4574 000 000
Reserves amp Surplus 125162 86657 -38505 -3076
Revaluation Reserves 289 270 -019 -657
Loans
Secured Loans 237183 317792 80609 3399
Un Secured Loans 162744 92742 -70002 -4301
Deferred Tax Liabilities 000 000 000
Current Liabilities
Provisions 1494 40726 39232 262597
Current Liabilities 113902 180010 66108 5804
Total 645348 722771 77423 1200
Assets 000
Net Block 369172 358721 -10451 -283
Capital WIP 43781 68065 24284 5547
Investments 6582 6636 054 082
Current Assets
Inventories 111855 99516 -12339 -1103
Sundry Debtors 63134 67358 4224 669
Cash amp Bank Balances 7188 6959 -229 -319
Total Current Assets 182177 173833 -8344 -458
Loans amp Advances 43460 115409 71949 16555
Fixed Deposits 176 107 -069 -3920
Total 645348 722771 77423 1200
8102019 A Study A Study On Financial Performance Analysis With Reference To Kesoram Cementon Financial Performance hellip
httpslidepdfcomreaderfulla-study-a-study-on-financial-performance-analysis-with-reference-to-kesoram 5381
53
Interpretation of comparative balance sheet of 2011-2012
Reserves amp surplus decreased to 3076 ie in Rupee 38505 crores
Revaluation Reserves decreased to 657 ie in Rupees 019 crores
Secured loans increased to 3399 ie in Rupees 80699 crores
Current Liabilities were increased to 5804 ie in Rupees 66108 crores
Provisions increased to 262597 ie in Rupees 39232 crores
Fixed Assets were decreased to 283 ie in Rupee 10451 crores
Investments were increased to 082 ie in Rupees 054 crores
Sundry debtors were increased to 669 ie in Rupees 4224 crores
Current assets decreased to 458 ie in Rupees 8344 crores And loans and
Advances increased 16555 ie in Rupees 71949 crores
The overall financial position was UN satisfactory
8102019 A Study A Study On Financial Performance Analysis With Reference To Kesoram Cementon Financial Performance hellip
httpslidepdfcomreaderfulla-study-a-study-on-financial-performance-analysis-with-reference-to-kesoram 5481
54
Common Size Balance Sheet of Kesoram For The Year 2008-2009
(Rupees in crores)
Particulars 2008 Change Percentage 2009 Change Percentage
Liabilities
Share Capital 4574 154 4574 106
Reserves amp Surplus 93085 3129 128024 2969
Revaluation Reserves 533 018 412 010
Loans
Secured Loans 97106 3264 153627 3563
Un Secured Loans 12129 408 43416 1007
Deferred Tax Liabilities 000 000 000 000
Current Liabilities
Provisions 33039 1110 34529 801
Current Liabilities 57067 1918 66587 1544
Total 297533 10000 431169 10000
Assets
Net Block 108424 3644 180435 4185
Capital WIP 63459 2133 86485 2006
Investments 4783 161 6178 143
Current Assets
Inventories 44217 1486 58906 1366
Sundry Debtors 27307 918 38017 882
Cash amp Bank Balances 4036 136 5657 131
Loans amp Advances 45289 1522 55462 1286
Fixed Deposits 018 001 028 001
Total 297533 10000 431169 10000
8102019 A Study A Study On Financial Performance Analysis With Reference To Kesoram Cementon Financial Performance hellip
httpslidepdfcomreaderfulla-study-a-study-on-financial-performance-analysis-with-reference-to-kesoram 5581
55
Interpretation of Common Size Balance Sheet of 2008-2009
Share capital was recorded 154 percent in the total liabilities in the year 2008 it is
decreased to 106 in the year 2009
Reserves amp surplus contributed to 3129 in the total liabilities in the year 2008 it is
decreased to 2969 in the year 2009
Secured loans were 3264 in the total liabilities in the year 2008 it is increased to
3563 in the year 2009
Current Liabilities shown to 1918 in the total liabilities in the year 2008 it is
decreased to 1544 in the year 2009
Provisions 1110 in the total liabilities in the year 2008 it is decreased to 801 in the
year 2009
Fixed Assets were 3644 in the total liabilities in the year 2008 ie decreased to 4185
in the year 2009
Investments were 161 in the total liabilities in the year 2008 it is decreased to 143
in the year 2009
Sundry debtors were 918 in the total liabilities in the year 2008 it is decreased to 882
in the year 2009
8102019 A Study A Study On Financial Performance Analysis With Reference To Kesoram Cementon Financial Performance hellip
httpslidepdfcomreaderfulla-study-a-study-on-financial-performance-analysis-with-reference-to-kesoram 5681
56
Common Size Balance Sheet of Kesoram For The Year 2009-2010
(Rs in crores)
Particulars 2009 Change Percentage 2010Change
Percentage
Liabilities
Share Capital 4574 106 4574 075
Reserves amp Surplus 128024 2969 149111 2444
Revaluation Reserves 412 010 339 006
Loans
Secured Loans 153627 3563 186372 3055
Un Secured Loans 43416 1007 126250 2069
Deferred Tax Liabilities 000 000 000 000
Current Liabilities
Provisions 34529 801 35734 586
Current Liabilities 66587 1544 107688 1765
Total 431169 10000 610068 10000
Assets
Net Block 180435 4185 343182 5625
Capital WIP 86485 2006 41283 677
Investments 6178 143 5143 084
Current Assets
Inventories 58906 1366 91619 1502
Sundry Debtors 38017 882 54289 890
Cash amp Bank Balances 5657 131 8014 131
Loans amp Advances 55462 1286 66506 1090
Fixed Deposits 028 001 031 001
Total 431169 10000 610068 10000
8102019 A Study A Study On Financial Performance Analysis With Reference To Kesoram Cementon Financial Performance hellip
httpslidepdfcomreaderfulla-study-a-study-on-financial-performance-analysis-with-reference-to-kesoram 5781
57
Interpretation of common size balance sheet of 2009-2010
Share capital was recorded 106 percent in the total liabilities in the
year 2009 it is decreased to 075 in the year 2010
Reserves amp surplus contributed to 2969 in the total liabilities in the
year 2009 it is decreased to2444 in the year 2010
Secured loans were 3563 in the total liabilities in the year 2009 it is
increased to 3055 in the year 2010
Current Liabilities shown to 1544 in the total liabilities in the year
2009 it is decreased to 1765 in the year 2010
Provisions 801 in the total liabilities in the year 2009 it is decreased
to 586 in the year 2010
Fixed Assets were 4185 in the total liabilities in the year 2009 ie
increased to 5625 in the year 2010
Investments were 143 in the total liabilities in the year 2009 it is
decreased to 084 in the year 2010
Sundry debtors were 882 in the total liabilities in the year 2009 it is
increased to 890 in the year 2010
8102019 A Study A Study On Financial Performance Analysis With Reference To Kesoram Cementon Financial Performance hellip
httpslidepdfcomreaderfulla-study-a-study-on-financial-performance-analysis-with-reference-to-kesoram 5881
58
Common Size Balance sheet of Kesoram for the year 2010-2011
983080Rupees in crores)
Particulars 2010 Change Percentage 2011
Change
Percentage
Liabilities
Share Capital 4574 075 4574 071
Reserves amp Surplus 149111 2444 125162 1939
Revaluation Reserves 339 006 289 004
Loans
Secured Loans 186372 3055 237183 3675
Un Secured Loans 126250 2069 162744 2522
Deferred Tax Liabilities 000 000 000 000
Current Liabilities
Provisions 35734 586 1494 023
Current Liabilities 107688 1765 113902 1765
Total 610068 10000 645348 10000
Assets
Net Block 343182 5625 369172 5721
Capital WIP 41283 677 43781 678
Investments 5143 084 6582 102
Current Assets
Inventories 91619 1502 111855 1733
Sundry Debtors 54289 890 63134 978
Cash amp Bank Balances 8014 131 7188 111
Loans amp Advances 66506 1090 43460 673
Fixed Deposits 031 001 176 003
Total 610068 10000 645348 10000
8102019 A Study A Study On Financial Performance Analysis With Reference To Kesoram Cementon Financial Performance hellip
httpslidepdfcomreaderfulla-study-a-study-on-financial-performance-analysis-with-reference-to-kesoram 5981
59
Interpretation of Common Size Balance Sheet Of 2010-2011
Share capital was recorded 075 percent in the total liabilities in the year 2010 it is
decreased to 071 in the year 2011
Reserves amp surplus contributed to 2444 in the total liabilities in the year 2010 it is
decreased to1939 in the year 2011
Secured loans were 3055 in the total liabilities in the year 2010 it is increased to
3675 in the year 2011
Current Liabilities shown to 1765 in the total liabilities in the year 2010 it is
also1765 in the year 2011
Provisions 586 in the total liabilities in the year 2010 it is decreased to 023 in the
year 2011
Fixed Assets were 5625 in the total liabilities in the year 2010 ie increased to 5721
in the year 2011
Investments were 084 in the total liabilities in the year 2010 it increased to 102 in
the year 2011
Sundry debtors were 890 in the total liabilities in the year 2010 it is increased to 978
in the year 2011
8102019 A Study A Study On Financial Performance Analysis With Reference To Kesoram Cementon Financial Performance hellip
httpslidepdfcomreaderfulla-study-a-study-on-financial-performance-analysis-with-reference-to-kesoram 6081
60
Common Size Balance Sheet of Kesoram for the Year 2011-2012
983080Rupees in crores)
Particulars 2011 Change Percentage 2012
Change
Percentage
Liabilities
Share Capital 4574 071 4574 063
Reserves amp Surplus 125162 1939 86657 1199
Revaluation Reserves 289 004 270 004
Loans
Secured Loans 237183 3675 317792 4397
Un Secured Loans 162744 2522 92742 1283
Deferred Tax Liabilities 000 000 000 000
Current Liabilities
Provisions 1494 023 40726 563
Current Liabilities 113902 1765 180010 2491
Total 645348 10000 722771 10000
Assets
Net Block 369172 5721 358721 4963
Capital WIP 43781 678 68065 942
Investments 6582 102 6636 092
Current Assets
Inventories 111855 1733 99516 1377
Sundry Debtors 63134 978 67358 932
Cash amp Bank Balances 7188 111 6959 096
Loans amp Advances 43460 673 115409 1597
Fixed Deposits 176 003 107 001
Total 645348 10000 722771 10000
8102019 A Study A Study On Financial Performance Analysis With Reference To Kesoram Cementon Financial Performance hellip
httpslidepdfcomreaderfulla-study-a-study-on-financial-performance-analysis-with-reference-to-kesoram 6181
61
Interpretation of common size balance sheet of 2011-2012
Share capital was recorded 071 percent in the total liabilities in the year 2011 it is
decreased to 063 in the year 2012
Reserves amp surplus contributed to 1939 in the total liabilities in the year 2011 it
is decreased to 1199 in the year 2012
Secured loans were 3675 in the total liabilities in the year 2011 it is increased to
4397 in the year 2012
Current Liabilities shown to 1765 in the total liabilities in the year 2011 it is
increased to 2491 in the year 2012
Provisions 023 in the total liabilities in the year 2011 it is increased to 563 in the
year 2012
Fixed Assets were 5721 in the total liabilities in the year 2011 ie decreased to
4963 in the year 2012
Investments were 102 in the total liabilities in the year 2011 it increased to 092
in the year 2012
Sundry debtors were 978 in the total liabilities in the year 2011 it is decreased to
932 in the year 2012
8102019 A Study A Study On Financial Performance Analysis With Reference To Kesoram Cementon Financial Performance hellip
httpslidepdfcomreaderfulla-study-a-study-on-financial-performance-analysis-with-reference-to-kesoram 6281
Trend Analysis
Share Capital-
Year
Amount
(In Crores) Trend
IncreaseDecrease
Base Year Previous Year
2008 4574 10000 000 000
2009 4574 10000 000 000
2010 4574 10000 000 000
2011 4574 10000 000 000
2012 4574 10000 000 000
Trend Percentages in Share Capital
Share capital shown a constant trend in the period 2008 and 2012
Share capital is 4574 crores all the years from 2008-2012
8102019 A Study A Study On Financial Performance Analysis With Reference To Kesoram Cementon Financial Performance hellip
httpslidepdfcomreaderfulla-study-a-study-on-financial-performance-analysis-with-reference-to-kesoram 6381
Reserves amp Surplus-
Year
Amount
(In Crores) Trend
IncreaseDecrease
Base Year Previous Year
2008 93085 10000 000 000
2009 128024 13753 3753 3753
2010 149111 16019 6019 2266
2011 125162 13446 3446 -2573
2012 86657 9309 -691 -4137
Trend Percentages in Reserves amp Surplus
Reserves amp surplus shown an increasing trend in the period between 2008 and 2010
The average trend was 13277 till 2010
The Reserves amp surplus was showing decreasing trend in the period 2011-2012 (ie
from 16019 in 2010 to 9309 in 2012)
The decreasing trend in Reserves amp surplus indicates the decrease in profits of the
firm
8102019 A Study A Study On Financial Performance Analysis With Reference To Kesoram Cementon Financial Performance hellip
httpslidepdfcomreaderfulla-study-a-study-on-financial-performance-analysis-with-reference-to-kesoram 6481
Investments-
Year
Amount
(In Crores) Trend
IncreaseDecrease
Base Year Previous Year
2008 4783 10000 000 000
2009 6178 12917 2917 2917
2010 5143 10753 753 -2164
2011 6582 13761 3761 3009
2012 6636 13874 3874 113
Trend Percentages in Investments-
The investments are shown an increasing trend in the period between 2008 ndash 2009
and it is decreasing in the year 2010
The average trend was 11458 till 2009
The investments increased in the periods 2011-2012 (ie from 10753 in 2010 to
13874 in 2012)
The overall trend in investments shown is satisfactory
8102019 A Study A Study On Financial Performance Analysis With Reference To Kesoram Cementon Financial Performance hellip
httpslidepdfcomreaderfulla-study-a-study-on-financial-performance-analysis-with-reference-to-kesoram 6581
Net Current Assets-
Year
Amount
(In Crores) Trend
IncreaseDecrease
Base Year Previous Year
2008 30761 10000 000 000
2009 56954 18515 8515 8515
2010 77037 25044 15044 6529
2011 110417 35895 25895 10851
2012 68613 22305 12305 -13590
Trends in Net Current Assets-
The NCA shown positive (increasing) trend
The NCA are increased to 35895 (the year 2011) compared with base year and
decreased in the year 2012 to 22305
The NCA shown increased trend from year and crossed 100
The overall trend was good
8102019 A Study A Study On Financial Performance Analysis With Reference To Kesoram Cementon Financial Performance hellip
httpslidepdfcomreaderfulla-study-a-study-on-financial-performance-analysis-with-reference-to-kesoram 6681
66
Ratio Analysis-
Current Ratio-
Current Ratio = Current Assets Current Liabilities
Current assets are cash in hand Cash at bank Marketable Securities(short term) short term
Investment Bills receivables sundry debtors Inventories (stock) Work in progress prepaid
expenses Current Liabilities are outstanding expenses Bills payable sundry Creditors
short-term advances income tax payable and Dividend payable
Current Ratio of Kesoram-
(Rupees in crores)
Year Current Assets Current Liabilities Current Ratio
2007-08 75560 57067 132
2008-09 102580 66587 154
2009-10 153922 107688 143
2010-11 182177 113902 160
2011-12 173833 180010 097
Interpretation-
As per the standard rule of current ratio ie 21 where current assets double the current
liabilities is considered satisfactory
In the present analysis the current ratio of the Kesoram is not satisfactory
from the above table It was assessed that the current ratio for all the five year is lower (less)
than the standard rule ie 21 And it is 097 in the year 2011-2012 (current year) This is
highly UN satisfactory
8102019 A Study A Study On Financial Performance Analysis With Reference To Kesoram Cementon Financial Performance hellip
httpslidepdfcomreaderfulla-study-a-study-on-financial-performance-analysis-with-reference-to-kesoram 6781
Quick Ratio-
Quick ratio also known as acid-test ratio establishes a relationship between quick
assets and the current liabilities Cash is the most liquid asset It is calculated by dividing
quick assets by current liabilities
Quick ratio = Quick Assets Current Liabilities
(Quick Assets = Current assets ndash Inventory)
Quick Ratio of Kesoram-
Rupees in crores)
Year Total QuickAssets
Current Liabilities Quick Ratio
2007-08 33343 57067 058
2008-09 43674 66587 066
2009-10 62303 107688 058
2010-11 70322 113902 0622011-12 74333 180010 041
Interpretation-
Usually a high Quick ratio is an indication that the company is liquid and has the ability to
meet its current or liquid liabilities in time on the other hand a low Quick Ratio represents
8102019 A Study A Study On Financial Performance Analysis With Reference To Kesoram Cementon Financial Performance hellip
httpslidepdfcomreaderfulla-study-a-study-on-financial-performance-analysis-with-reference-to-kesoram 6881
that the companyrsquos liquidity position is not good The above table showing the quick ratios
of Kesoram are canrsquot be considered satisfactory
Leverage Ratios-
Debt-Equity Ratio-
Debt-Equity Ratio = Total Long Term Debt Equity Share Holders Fund
Total Long term Debt= Debenture Capital + Long term loans from banks and financial
institutions + Public deposits
Equity Share Holders fund = Equity + Reserves and Surplus
Debt Equity Ratio of Kesoram
(Rupees in crores)
Year Total Debt Share Holders Fund Debt Equity Ratio
2007-08 109235 98192 111
2008-09 197043 133010 148
2009-10 312622 154024 203
2010-11 399927 130025 308
2011-12 410534 91501 449
8102019 A Study A Study On Financial Performance Analysis With Reference To Kesoram Cementon Financial Performance hellip
httpslidepdfcomreaderfulla-study-a-study-on-financial-performance-analysis-with-reference-to-kesoram 6981
Interpretation-
The Debt-Equity Ratio accepted standard is 05 This ratio reflects the relative contribution
of creditors and owners of business in its financing From the above it is clear that the long
term debt is more than that of the share holdersrsquo fund So we can interpret that the firmrsquosassets are financed more by the external funds rather than by the internal funds
8102019 A Study A Study On Financial Performance Analysis With Reference To Kesoram Cementon Financial Performance hellip
httpslidepdfcomreaderfulla-study-a-study-on-financial-performance-analysis-with-reference-to-kesoram 7081
Fixed Asset Ratio-
Net Sales
Fixed Asset Ratio = helliphelliphelliphelliphelliphelliphelliphelliphelliphelliphellip
Net Assets
Fixed Asset Ratio of Kesoram-
(Rupees in crores)
Year Net Sales Net Assets Fixed Assets Ratio
2007-08 300271 358721 084
2008-09 389797 369172 106
2009-10 475062 343182 1382010-11 539788 180435 299
2011-12 59182 108424 546
Interpretation
This ratio indicates the extent to which the assets of the companyrsquos can be lost without
affecting the interest of the creditors of the company Higher the ratios better the long-term
position of the companyThe above table shows fixed assets ratio in increasing trend Which is good for the
company
8102019 A Study A Study On Financial Performance Analysis With Reference To Kesoram Cementon Financial Performance hellip
httpslidepdfcomreaderfulla-study-a-study-on-financial-performance-analysis-with-reference-to-kesoram 7181
Overall Profitability Ratios-
Net Profit Ratio
Net Profit Ratio indicates net margin on sales It is given by the following equation
Net Profit Ratio = (Net Profit Sales) 100
Net Profit Ratio of Kesoram
(Rupees in crores)
Year Net Profit Sales Net Profit Ratio
2007-08 37917 300271 1263
2008-09 41432 389797 1063
2009-10 20298 475062 427
2010-11 -28176 539788 -5222011-12 -38108 59182 -644
Interpretation
It establishes a relationship between net profits after tax and net sales and
indicates the efficiency of the management in manufacturing selling administrative and
other activities of the company
The higher the ratio the better is the profitability or performance of the business
The above table depicts the net profit Ratio of Kesoram has decreased every year from
2007-2008 to 2011-2012It further decreased to negative in the year 2010-11 to -522 and -
644 in the year 2011-2012 This shows constant decrease in the profits of the company
8102019 A Study A Study On Financial Performance Analysis With Reference To Kesoram Cementon Financial Performance hellip
httpslidepdfcomreaderfulla-study-a-study-on-financial-performance-analysis-with-reference-to-kesoram 7281
72
Return on Investment-
Net Profit
Return on Investment = helliphelliphelliphelliphelliphelliphelliphelliphelliphelliphelliphellip X 100
Share Holders Fund
Return on Investment Ratio of Kesoram-
(Rupees in crores)
Year Net Profit Share Holders Fund Return On Investment
2007-08 37917 98192 3862
2008-09 41432 133010 3115
2009-10 20298 154024 1318
2010-11 -28176 130025 -2167
2011-12 -38108 91501 -4165
Interpretation-
The above table reveals how well the resources of the firm are being used Higher
the ratio better the result The above ratio implies how well the firm is growing in
terms of profitability and efficiency From the above table we can concern that the return on
investment is in decreasing trend ROI is highest in the year 2007-2008 as 3862 But
there after itrsquos decreased every year
The ROI is negative in the years 2010-2011 amp 2011-2012 as -2167 amp -4165 respectively
Which is not a good sign for the firm
8102019 A Study A Study On Financial Performance Analysis With Reference To Kesoram Cementon Financial Performance hellip
httpslidepdfcomreaderfulla-study-a-study-on-financial-performance-analysis-with-reference-to-kesoram 7381
8102019 A Study A Study On Financial Performance Analysis With Reference To Kesoram Cementon Financial Performance hellip
httpslidepdfcomreaderfulla-study-a-study-on-financial-performance-analysis-with-reference-to-kesoram 7481
8102019 A Study A Study On Financial Performance Analysis With Reference To Kesoram Cementon Financial Performance hellip
httpslidepdfcomreaderfulla-study-a-study-on-financial-performance-analysis-with-reference-to-kesoram 7581
75
CHAPTER V
FINDINGS amp SUGGESTIONS
8102019 A Study A Study On Financial Performance Analysis With Reference To Kesoram Cementon Financial Performance hellip
httpslidepdfcomreaderfulla-study-a-study-on-financial-performance-analysis-with-reference-to-kesoram 7681
76
Findings
The Share capital remains constant Share capital is unchanged all the years from
2008-2012
Reserves amp surplus were recorded an increasing trend in the period between 2008
and 2010It is showing decreasing trend in the period 2011-2012 (ie from 16019
in 2010 to 9309 in 2012)
Current Liabilities were increased compared to base year ie 2008
Provisions increased to 262597 ie in Rupees 39232 crores in the current year
The current ratio for all the five year is lower (less) than the standard rule ie 21
And it is 097 in the year 2011-2012 (current year)
The Debt-Equity Ratio was shown under the standard ratio It is clear that the long
term debt is more than that of the share holdersrsquo fund It indicates that the firm
heavily relying on external funds rather than the internal funds
The operating and net profit of Kesoram is in decreasing trend due to heavy
increase of manufacturing amp administrative expenses
ROI is highest in the year 2007-2008 as 3862 The ROI is negative in the years
2010-2011 amp 2011-2012 as -2167 amp -4165 respectively
Return on Equity Capital Employed Ratio of Kesoram has decreased every year
from 2007-2008 to 2010-2011It further decreased to negative in the year 2011-12 to
-3280
EPS of Kesoram has decreased every year from 2008-12It is negative in the year
2011 amp 12
8102019 A Study A Study On Financial Performance Analysis With Reference To Kesoram Cementon Financial Performance hellip
httpslidepdfcomreaderfulla-study-a-study-on-financial-performance-analysis-with-reference-to-kesoram 7781
77
Suggestion
The organization should adopt an appropriate capital structure
The companyrsquos debt-equity ratio is recorded more or less as 111 in the year 2008
and it is increased to 449 in the year 2012 (current year)The company should
adopt a better debt equity mix in the future to control the fluctuations in returns
The company should control fluctuations in cash and bank balances as it impacts the
current ratio of the company
The provisions are showing increasing trend which indicates risk of debtors The
firm should implement an effective credit management policy It should utilize its
idle funds by decreasing provisions
The company should control heavy increase of manufacturing amp administration
expenses as it is impacting the operating and net profit of company
8102019 A Study A Study On Financial Performance Analysis With Reference To Kesoram Cementon Financial Performance hellip
httpslidepdfcomreaderfulla-study-a-study-on-financial-performance-analysis-with-reference-to-kesoram 7881
78
ANNEXURE
Profit And Loss Account of Kesoram Cement
Mar12 Mar11 Mar10 Mar09 Mar08
12 Months 12 Months 12 Months 12 Months 12 Months
INCOME
Sales Turnover 628260 575072 505151 431613 345700
Excise Duty 36440 35284 30089 41815 45429
NET SALES 591820 539788 475062 389797 300271
Other Income 000 000 000 000 000
TOTALINCOME
596129 548733 481019 393969 302020
EXPENDITURE
Manufacturing
Expenses81903 74803 13974 13153 44113
MaterialConsumed
370897 310150 295550 229359 118448
Personal
Expenses33468 27355 23294 18690 15344
Selling Expenses 81910 78253 58667 48846 45019
AdministrativeExpenses
28225 29308 17219 16179 9907
Expenses
Capitalized000 000 000 000 000
Provisions Made 000 000 000 000 000
TOTAL
EXPENDITURE 596403 519870 408704 326227 232832Operating Profit -4583 19918 66358 63570 67439
EBITDA -274 28864 72316 67742 69188
Depreciation 29740 27259 17280 11186 8927
Other Write-offs 000 000 000 000 000
EBIT -30014 1605 55035 56557 60261
Interest 41015 23983 10921 12087 5426
EBT -71029 -22377 44114 44470 54835
Taxes -32921 5798 23816 3037 16918
Profit and Loss
for the Year-38108 -28176 20298 41432 37917
Non RecurringItems
-1142 7063 3228 -4023 402
Other Non Cash
Adjustments1276 091 207 465 017
OtherAdjustments
000 000 000 000 000
REPORTED
PAT-37974 -21021 23734 37874 38335
8102019 A Study A Study On Financial Performance Analysis With Reference To Kesoram Cementon Financial Performance hellip
httpslidepdfcomreaderfulla-study-a-study-on-financial-performance-analysis-with-reference-to-kesoram 7981
79
Balance Sheet Of Kesoram
Years
Particulars 2008 2009 2010 2011 2012
Liabilities
Share Capital 4574 4574 4574 4574 4574Reserves amp Surplus 93085 128024 149111 125162 86657
Revaluation Reserves 533 412 339 289 27
Loans
Secured Loans 97106 153627 186372 237183 317792
Un Secured Loans 12129 43416 12625 162744 92742
Deferred Tax Liabilities 0 0 0 0 0
Current Liabilities
Provisions 33039 34529 35734 1494 40726
Current Liabilities 57067 66587 107688 113902 18001
Total 297533 431169 610068 645348 722771
Assets
Net Block 108424 180435 343182 369172 358721
Capital WIP 63459 86485 41283 43781 68065
Investments 4783 6178 5143 6582 6636
Current Assets
Inventories 44217 58906 91619 111855 99516
Sundry Debtors 27307 38017 54289 63134 67358
Cash amp Bank Balances 4036 5657 8014 7188 6959
Total Current Assets 7556 10258 153922 182177 173833Loans amp Advances 45289 55462 66506 4346 115409
Fixed Deposits 018 028 031 176 107
Total 297533 431169 610068 645348 722771
8102019 A Study A Study On Financial Performance Analysis With Reference To Kesoram Cementon Financial Performance hellip
httpslidepdfcomreaderfulla-study-a-study-on-financial-performance-analysis-with-reference-to-kesoram 8081
80
KEY ITEMS 2012 2011 2010 2009 2008
Preference
Dividend 0 0 0 0 0
Equity Dividend 457 2516 2516 2516 2516
Equity Dividend
() 999 55 55 55 55
Shares in Issue(Lakhs) 45743 45743 45743 45743 45743
EPS - Annualised
(Rs) -8302 -4595 5188 828 838
8102019 A Study A Study On Financial Performance Analysis With Reference To Kesoram Cementon Financial Performance hellip
httpslidepdfcomreaderfulla-study-a-study-on-financial-performance-analysis-with-reference-to-kesoram 8181
BIBLIOGRAPHY
Sl
No
Books Author Name
1 Financial Management Khan amp JAIN
2 Financial Management IMPandey
3 Management Accounting RPTrivedi
Websites amp Search Engines
1 wwwkesoramcom983086
2 wwwmoneycontrolcom
3 wwwgooglefinancecom983086
Annual reports of Kesoram cement limited 2008-2012
8102019 A Study A Study On Financial Performance Analysis With Reference To Kesoram Cementon Financial Performance hellip
httpslidepdfcomreaderfulla-study-a-study-on-financial-performance-analysis-with-reference-to-kesoram 3681
36
Introduction
Financial Performance Analysis
The term lsquofinancial performance analysis also known as analysis and interpretation of
financial statementsrsquo refers to the process of determining financial strength and
weaknesses of the firm by establishing strategic relationship between the items of the
balance sheet profit and loss account and other operative data
ldquoAnalyzing financial statementsrdquo by Metcalf and Titard
ldquoFinancial analysis is a process of evaluating the relationship between component
parts of a financial statement to obtain a better understanding of a firms position and
performancerdquo by Myers
Financial Performance
The word lsquoPerformance is derived from the word lsquoparfourmenrsquo which means lsquoto dorsquo lsquoto
carry outrsquo or lsquoto renderrsquo It refers the act of performing execution accomplishment
fulfillment etc In border sense performance refers to the accomplishment of a given task
measured against preset standards of accuracy completeness cost and speed In other
words it refers to the degree to which an achievement is being or has been accomplished In
the Words of Frich Kohlar ldquoThe performance is a general term applied to a part or to all the
conducts of activities of an organization over a period of time often with reference to past or
projected cost efficiency management responsibility or accountability or the like Thus not
just the presentation but the quality of results achieved refers to the performance
Performance is used to indicate firmrsquos success conditions and compliance
Financial performance refers to the act of performing financial activity In broader
sense financial performance refers to the degree to which financial objectives being or has
been accomplished It is the process of measuring the results of a firms policies and
operations in monetary terms It is used to measure firms overall financial health over a
given period of time and can also be used to compare similar firms across the same industry
or to compare industries or sectors in aggregation
The purpose of financial analysis is to diagnose the information contained in financial
statements so as to Jude the profitability and financial soundness of the firm Just like a
doctor examines his patient by recording his body temperature blood pressure etc Before
8102019 A Study A Study On Financial Performance Analysis With Reference To Kesoram Cementon Financial Performance hellip
httpslidepdfcomreaderfulla-study-a-study-on-financial-performance-analysis-with-reference-to-kesoram 3781
37
making his conclusion regarding the illness and before giving his treatment a financial
analyst analysis the financial statements with various tools of analysis before commenting
upon the financial health or weaknesses of an enterprise
The analysis and interpretation of financial statements is essential to bring out the
mystery behind the figures in financial statements Financial statements analysis is an
attempt to determine the significance and meaning of the financial statement data so that
forecast may be made of the future earnings ability to pay interest and debt maturities (both
current and long term) and profitability of a sound divided policy
Types of financial analysis-
Financial analysis into different categories depending upon
(1) The material used and
(2) The method of operation followed in the analysis or the modus operandi of
analysis
Types of financial analysis
On the basis of material used on the basis of modus operandi
External Internal Horizontal Vertical
Analysis Analysis Analysis Analysis
1 On the basis of material used - According to material used financial analysis canbe of two types
External analysis
Internal analysis
External analysis-
This analysis is done by outsiders who do not have access to the detailed internal
outsiders include investors potential investors Creditors Potential Creditors Government
Agencies Credit Agencies and General Public For financial analysis these external parties
to the firm depend almost entirely on the published financial statements
Internal analysis-
This analysis is undertaken by the persons namely executives and employees of the
organization or by the officers appointed by government or court who have access to the
8102019 A Study A Study On Financial Performance Analysis With Reference To Kesoram Cementon Financial Performance hellip
httpslidepdfcomreaderfulla-study-a-study-on-financial-performance-analysis-with-reference-to-kesoram 3881
38
books of account ( internal accounting records) and other information related to the
business
2 983119983150 983156983144983141 983138983137983155983145983155 983151983142 983149983151983140983157983155 983151983152983141983154983137983150983140983145983085
According to the modus operandi financial analysis can also be of two types
a Horizontal analysis
bVertical analysis
Horizontal analysis-
Horizontal analysis refers to the comparison of financial data of a company for several
years The figures for this type of analysis are presented horizontally over a number of
columns The figures of the various years are compared with standard or base year a base
year is year chosen as beginning point This type of analysis is also called lsquodynamicanalysisrsquo as it is based on the data from year to year rather than on data of any one year The
horizontal analysis makes it possible to focus attention on items that have changed
significantly during the period under view
b Vertical analysis-
Vertical analysis refers to the study of relationship of the various items in the financial
statements of one accounting period In this types of analysis the figures from financial
statement of a year are compared with a base selected from the same yearrsquos statement
Methods of financial analysis-
The following methods of analysis are generally used-
1 Comparative Statements
2 Trend Analysis
3 Common-Size Statements
4 Funds flow Analysis
5 Cash Analysis
6 Ratio Analysis
7 Cost-volume-Profit Analysis
8102019 A Study A Study On Financial Performance Analysis With Reference To Kesoram Cementon Financial Performance hellip
httpslidepdfcomreaderfulla-study-a-study-on-financial-performance-analysis-with-reference-to-kesoram 3981
39
Comparative statements-
The comparative financial statements are statements of the financial position at
different periods of time the elements of financial position are show in a
Comparative Statement provides an idea of financial position at two or more
periods Generally two financial statements (balance sheet and income statement) are
prepared in comparative form for financial analysis
The Comparative Statement May Show-
1 Absolute figures (rupee amounts)
2 Changes in absolute figures ie increase or decrease in absolute figures
3 Absolute data in terms of percentages
4 Increase or decrease in terms of percentages
The Two Comparative Statements Are-
1 Comparative balance sheet and
2 Income statement
1 983107983151983149983152983137983154983137983156983145983158983141 983138983137983148983137983150983139983141 983155983144983141983141983156983085
The comparative balance sheet analysis is the study of the trend of the same items group of
items and computed items in two or more balance sheets of the same business enterprise on
different dates The change in periodic balance sheet items reflect the conduct of a business
the change can be observed by comparison of the balance sheet at the beginning and at the
end of a period and these changes can help in forming an opinion about the progress of an
enterprise
Guide Lines for Interpretation of Comparative Balance Sheet-
While interpreting comparative balance sheet the interpreter is expected to study the
following aspects-
1 Current financial position and liquidity position
2 Long-term financial position
3 Profitability of the concern
8102019 A Study A Study On Financial Performance Analysis With Reference To Kesoram Cementon Financial Performance hellip
httpslidepdfcomreaderfulla-study-a-study-on-financial-performance-analysis-with-reference-to-kesoram 4081
40
Common Size Statement-
The common-size statements balance sheet and income statement are show in
analytical percentages The figures are shown as percentages of total assets total liabilities
and total sales The total assets are taken as 100 and different assets are expressed as a
percentage of the total similarly various liabilities are taken as a part of total liabilities
Common Size Balance Sheet-
A statement in which balance sheet items are expressed as the ratio of each asset to
total assets and the ratio of each liability is expressed as a ratio of total liabilities is called
common size balance The common size balance sheet can be used to compare companies
of differing size The comparison of figures in different periods is not useful because total
figures may be affected by a number of factors It is not possible to establish standard norms
for various assets The trends of figures from year to year may not be studied and even they
may not give proper results
Trend Analysis of Balance Sheet-
Trend analysis is Very important tool of horizontal financial analysis
This analysis enables to known the change in the financial function and operating efficiency
in between the time period chosen
By studding the trend analysis of each item we can known the direction of changes and
based upon the direction of changes the options can be changed
Trend =Absolute Value of item in the statement understudy 100
Absolute Value of same item in the base statement
Ratio Analysis
Ratio analysis is used as a technique of analyzing the financial information contained in the
balance sheet and profit and loss accounts for a more meaningful understanding of the
financial position and performance of a firm
The relationship between two accounting figures expressed mathematically is known as a
financial ratio A ratio helps the analyst to make qualitative judgment about the firmrsquos
financial position and performance
Several ratios can be calculated from the accounting data contained in the financial
statements The parties which generally undertake financial analysis is short ndashterm
creditors long-term creditors owner and management In view of the requirements of the
various ratios ratios are classified into the following four important categories
8102019 A Study A Study On Financial Performance Analysis With Reference To Kesoram Cementon Financial Performance hellip
httpslidepdfcomreaderfulla-study-a-study-on-financial-performance-analysis-with-reference-to-kesoram 4181
41
Liquidity ratios
Leverage ratios
Activity ratios
Profitability ratios
Liquidity Ratios
It is extremely essential for a firm to be able to meet its obligations as they become due
Liquidity ratios measure the ability of the firm to meet its current obligations A firm should
ensure that it does not suffer from lack of liquidity and also that it does not have excess
liquidity The failure of a company to meet its obligations due to lack of sufficient liquidity
will result in a poor creditworthiness loss of creditorsrsquo confidence or even in legal tangles
resulting in the closure of the company A very high degree of liquidity is also bad idle
assets earn nothing The firmrsquos funds will be unnecessarily tied up in current assets
Therefore it is necessary to strike a proper balance high liquidity and lack of liquidity
The most common ratios which indicate the extent of liquidity or lack of it are
Current ratio
Quick ratio
Other ratios include Cash ratio Interval Measure and Net working capital ratio
Current Ratio
The current ratio is calculated by dividing current assets by current liabilities
Current assets
Current ratio = --------------------------
Current liabilities
Current ratio is a measure of the firmrsquos short term solvency It indicates the availability of
current assets in rupees for every one rupee of current liability A ratio of greater than one
means that the firm has more current assets than current claims against the Current ratio of
2 to 1 or more is considered satisfactory Current ratio represents a margin of safety for
creditors
Quick Ratio
Quick ratio also known as acid-test ratio establishes a relationship between quick assets and
the current liabilities Cash is the most liquid asset It is calculated by dividing quick assets
by current liabilities
Quick ratio = Quick Assets Current Liabilities
8102019 A Study A Study On Financial Performance Analysis With Reference To Kesoram Cementon Financial Performance hellip
httpslidepdfcomreaderfulla-study-a-study-on-financial-performance-analysis-with-reference-to-kesoram 4281
42
(Quick Assets = Current assets ndash Inventory)
One defect of the current ratio is that it fails to convey any information on the composition
of the current assets of the firm A rupee of cash is considered equivalent to a rupee of
inventory of receivables But it is not so A rupee of cash is more readily available to meet
current liabilities than a rupee of say inventory This implies the usefulness of the current
ratio
The Acid ndashtest ratio measures the firmrsquos ability to convert its current assets quickly into
cash in order to meet its current liabilities
A quick ratio of 1 to 1 is considered to represent a satisfactory current financial condition It
is an important index of the firmrsquos liquidity
Leverage Ratios
Leverage ratios identify the source of a firmrsquos capital ndashowners or outside creditors
Financial leverage refers to the use of debt in financing non-current assets If the return on
assets exceeds the cost of debt the leverage is successful ndash ie it improves return on equity
Debt ndashEquity Ratio
The Debt ndash Equity is determined to analyze the soundness of the long term financial
policies of the organization It is also known as ldquoInternal External Equity Ratiordquo
It is calculated as follows
Debt ndash Equity Ratio = Total long term debt Share holders funds
Equity Ratio
This ratio is also called as proprietary ratio establishes a relationship between share holderrsquos
funds to total assets of company Equity Ratio is calculated by dividing share holders fund
by total assets
Fixed Asset Ratio
This ratio indicates the extent to which the assets of the companyrsquos can be lost without
affecting the interest of the creditors of the company Higher the ratios better the long-term
position of the company
Activity Ratios
They are primarily used for studying a firmrsquos working capital situation A well managed
firm should have good activity ratios
8102019 A Study A Study On Financial Performance Analysis With Reference To Kesoram Cementon Financial Performance hellip
httpslidepdfcomreaderfulla-study-a-study-on-financial-performance-analysis-with-reference-to-kesoram 4381
43
Working Capital Turnover Ratio
The working capital turnover ratio indicates whether or not working capital has been
effectively used in making sales
Working capital turnover = Sales Net current assets
Inventory Turnover Ratio
This ratio also known as Stock Turnover Ratio establishes the relationship between costs of
goods sold or net sales during the given period and the average amt of stock held during the
period This ratio reveals the number of times finished stock in turnover during a given
accounting period
Higher the ratio the better is it because it shows the finished stock is rapidly turned
in to sales On the other hand a low stock turnover ratio is not desirable because it reveals
the accumulation of stock
Debtors Turnover Ratio
This ratio indicates the velocity of debt collection of a company In other words it shows
the number of times average turnover during a year
A Higher Debtor Turnover Ratio indicates a more efficient is the management towards
debtors and low ratio ratio implies inefficient management of debtors
Total Assets Turnover Ratio
The asset turnover ratio indicates how efficiently management is employing Assets
Total Assets Turnover Ratio = Sales Total Assets
Profitability Ratios
Profitability ratios are the ratios which measure a firmrsquos overall effectiveness as revealed by
the returns generated on sales and investment
General Profitability Ratios
1 Gross Profit Ratio
2 Net profit Ratio
3 Operating or Expenses Ratio
8102019 A Study A Study On Financial Performance Analysis With Reference To Kesoram Cementon Financial Performance hellip
httpslidepdfcomreaderfulla-study-a-study-on-financial-performance-analysis-with-reference-to-kesoram 4481
44
Gross Profit Ratio
Gross profit Ratio measures the relationships to net sales and is usually represented as a
percentage It is a good measure of profitability
The gross profit ratio indicates the extent to which selling price of goods per unit may
decline without resulting in losses on operation Higher the gross profit betters the result
Net Profit Ratio
Net Profit Ratio indicates net margin on sales It is given by the following equation
Net Profit Ratio = (Net Profit Sales) 100
Operating or Expenses Ratio
This ratio is complimentary of Net Profit Ratio The more the net profit the less the
Operating Ratio Operating costs include the cost of direct materials direct labors and otheroverheads viz are generally excluded from operating costs A comparison of the Operating
Ratio will indicate whether the cost efficiency is high or low in the figure of sales This less
the ratio it depicts the efficiency of the management
8102019 A Study A Study On Financial Performance Analysis With Reference To Kesoram Cementon Financial Performance hellip
httpslidepdfcomreaderfulla-study-a-study-on-financial-performance-analysis-with-reference-to-kesoram 4581
45
CHAPTER IV
DATA ANALYSIS amp INTERPRETATION
8102019 A Study A Study On Financial Performance Analysis With Reference To Kesoram Cementon Financial Performance hellip
httpslidepdfcomreaderfulla-study-a-study-on-financial-performance-analysis-with-reference-to-kesoram 4681
46
Comparative Balance Sheet of Kesoram in the Year between 2008-2009
(Rupee in crores)
Years Changes
Particulars 2008 2009 In Rupees In Percentage
Liabilities
Share Capital 4574 4574 000 000
Reserves amp Surplus 93085 128024 34939
Revaluation Reserves 533 412 -121 -2270
Loans
Secured Loans 97106 153627 56521 5821
Un Secured Loans 12129 43416 31287 25795
Deferred Tax Liabilities 000 000 000 000
Current Liabilities
Provisions 33039 34529 1490 451
Current Liabilities 57067 66587 9520 1668
Total 297533 431169 133636 4491
Assets
Net Block 108424 180435 72011 6642
Capital Wip 63459 86485 23026 3628
Investments 4783 6178 1395 2917
Current Assets
Inventories 44217 58906 14689 3322
Sundry Debtors 27307 38017 10710 3922
Cash amp Bank Balances 4036 5657 1621 4016
Total Current Assets 75560 102580 27020 3576
Loans amp Advances 45289 55462 10173 2246
Fixed Deposits 018 028 010 5556
Total 297533 431169 133636 4491
8102019 A Study A Study On Financial Performance Analysis With Reference To Kesoram Cementon Financial Performance hellip
httpslidepdfcomreaderfulla-study-a-study-on-financial-performance-analysis-with-reference-to-kesoram 4781
47
Interpretation of comparative balance sheet of 2008-2009
Reserves amp Surplus were increased to 3753 (percent) ie in Rupees 34939
crores
Revaluation Reserves decreased to 121 ie in Rupees 2270 crores
Secured Loans are increased to 5821 ie in Rupees 56521 crores And UN
secured loans highly Increased to 25795
Current liabilities and Provisions are increased to 1668 and 451 respectively ie in
Rupees 9520 amp 1490 crores
Fixed assets were highly increased to 6642 ie in Rupees 72011 crores
Investments were increased to 2917 ie in Rupees 1395 crores
Sundry debtors increased to 3922 ie in Rupees 10710 crores
Current assets increased 3576 ie in Rupees 27020 crores And Loans amp
Advances increased to 2246 respectively
The overall financial position was satisfactory
8102019 A Study A Study On Financial Performance Analysis With Reference To Kesoram Cementon Financial Performance hellip
httpslidepdfcomreaderfulla-study-a-study-on-financial-performance-analysis-with-reference-to-kesoram 4881
48
Comparative Balance Sheet of Kesoram in the Year between 2009-2010
(Rupees in crores)
Years Changes
Particulars 2009 2010 In Rupees In Percentage
Liabilities
Share Capital 4574 4574 000 000
Reserves amp Surplus 128024 149111 21087 1647
Revaluation Reserves 412 339 -073 -1772
Loans
Secured Loans 153627 186372 32745 2131
Un Secured Loans 43416 126250 82834 19079
Deferred Tax Liabilities 000 000 000
Current Liabilities
Provisions 34529 35734 1205 349
Current Liabilities 66587 107688 41101 6173
Total 431169 610068 178899 4149
Assets
Net Block 180435 343182 162747 9020
Capital WIP 86485 41283 -45202 -5227
Investments 6178 5143 -1035 -1675
Current Assets
Inventories 58906 91619 32713 5553
Sundry Debtors 38017 54289 16272 4280
Cash amp Bank Balances 5657 8014 2357 4167
Total Current Assets 102580 153922 51342 5005
Loans amp Advances 55462 66506 11044 1991
Fixed Deposits 028 031 003 1071
Total 431169 610068 178899 4149
8102019 A Study A Study On Financial Performance Analysis With Reference To Kesoram Cementon Financial Performance hellip
httpslidepdfcomreaderfulla-study-a-study-on-financial-performance-analysis-with-reference-to-kesoram 4981
49
Interpretation of comparative balance sheet of 2009-2010
Reserves amp surplus increased to 1647 ie in Rupees 21087 crores
Revaluation Reserves decreased to 1772 ie in Rupees 073 crores
Secured loans increased to 2131 ie in Rupees 32745 crores
Current Liabilities were increased to 6173 ie in Rupees 41101 crores and
Provisions 349 ie in Rupees 1205 crores
Fixed Assets were increased to 9020 ie in Rupees 162747 crores
Investments were decreased to 1675 ie in Rupees 1035 crores
Sundry debtors were increased to 4280 ie in Rupees 16272 crores
Current assets increased to 5005 ie in Rupees 51342 crores And loans and
Advances increased 1919 ie in Rupees 11044 crores
The overall financial position was satisfactory
8102019 A Study A Study On Financial Performance Analysis With Reference To Kesoram Cementon Financial Performance hellip
httpslidepdfcomreaderfulla-study-a-study-on-financial-performance-analysis-with-reference-to-kesoram 5081
50
Comparative Balance Sheet of Kesoram in the Year between 2010-2011
(Rupees in crores)
Years Changes
Particulars 2010 2011 In Rupees In Percentage
Liabilities
Share Capital 4574 4574 000 000
Reserves amp Surplus 149111 125162 -23949 -1606
Revaluation Reserves 339 289 -050 -1475
Loans
Secured Loans 186372 237183 50811 2726
Un Secured Loans 126250 162744 36494 2891
Deferred Tax Liabilities 000 000 000
Current Liabilities
Provisions 35734 1494 -34240 -9582
Current Liabilities 107688 113902 6214 577
Total 610068 645348 35280 578
Assets
Net Block 343182 369172 25990 757
Capital WIP 41283 43781 2498 605
Investments 5143 6582 1439 2798
Current Assets
Inventories 91619 111855 20236 2209
Sundry Debtors 54289 63134 8845 1629
Cash amp Bank Balances 8014 7188 -826 -1031
Total Current Assets 153922 182177 28255 1836
Loans amp Advances 66506 43460 -23046 -3465
Fixed Deposits 031 176 145 46774
Total 610068 645348 35280 578
8102019 A Study A Study On Financial Performance Analysis With Reference To Kesoram Cementon Financial Performance hellip
httpslidepdfcomreaderfulla-study-a-study-on-financial-performance-analysis-with-reference-to-kesoram 5181
51
Interpretation of comparative balance sheet of 2010-2011
Reserves amp surplus decreased to 1606 ie in Rupees 23949 crores
Revaluation Reserves decreased to 1475 ie in Rupees 050 crores
Secured loans increased to 2726 ie in Rupees 50811 crores
Current Liabilities were increased to 577 ie in Rupees 6214 crores
Provisions decreased to 9582 ie in Rupees 34240 crores
Fixed Assets were increased to 757 ie in Rupees 25990 crores
Investments were decreased to 2798 ie in Rupees 1439 crores
Sundry debtors were increased to 1629 ie in Rupees8845 crores
Current assets increased to 1836 ie in Rupees 28255 crores And loans and
Advances increased 3465 ie in Rupees 23046 crores
The overall financial position was UN satisfactory
8102019 A Study A Study On Financial Performance Analysis With Reference To Kesoram Cementon Financial Performance hellip
httpslidepdfcomreaderfulla-study-a-study-on-financial-performance-analysis-with-reference-to-kesoram 5281
52
Comparative Balance Sheet of Kesoram In The Year Between 2011-2012
(Rupees in crores)
Years Changes
Particulars 2011 2012 In Rupees In Percentage
Liabilities
Share Capital 4574 4574 000 000
Reserves amp Surplus 125162 86657 -38505 -3076
Revaluation Reserves 289 270 -019 -657
Loans
Secured Loans 237183 317792 80609 3399
Un Secured Loans 162744 92742 -70002 -4301
Deferred Tax Liabilities 000 000 000
Current Liabilities
Provisions 1494 40726 39232 262597
Current Liabilities 113902 180010 66108 5804
Total 645348 722771 77423 1200
Assets 000
Net Block 369172 358721 -10451 -283
Capital WIP 43781 68065 24284 5547
Investments 6582 6636 054 082
Current Assets
Inventories 111855 99516 -12339 -1103
Sundry Debtors 63134 67358 4224 669
Cash amp Bank Balances 7188 6959 -229 -319
Total Current Assets 182177 173833 -8344 -458
Loans amp Advances 43460 115409 71949 16555
Fixed Deposits 176 107 -069 -3920
Total 645348 722771 77423 1200
8102019 A Study A Study On Financial Performance Analysis With Reference To Kesoram Cementon Financial Performance hellip
httpslidepdfcomreaderfulla-study-a-study-on-financial-performance-analysis-with-reference-to-kesoram 5381
53
Interpretation of comparative balance sheet of 2011-2012
Reserves amp surplus decreased to 3076 ie in Rupee 38505 crores
Revaluation Reserves decreased to 657 ie in Rupees 019 crores
Secured loans increased to 3399 ie in Rupees 80699 crores
Current Liabilities were increased to 5804 ie in Rupees 66108 crores
Provisions increased to 262597 ie in Rupees 39232 crores
Fixed Assets were decreased to 283 ie in Rupee 10451 crores
Investments were increased to 082 ie in Rupees 054 crores
Sundry debtors were increased to 669 ie in Rupees 4224 crores
Current assets decreased to 458 ie in Rupees 8344 crores And loans and
Advances increased 16555 ie in Rupees 71949 crores
The overall financial position was UN satisfactory
8102019 A Study A Study On Financial Performance Analysis With Reference To Kesoram Cementon Financial Performance hellip
httpslidepdfcomreaderfulla-study-a-study-on-financial-performance-analysis-with-reference-to-kesoram 5481
54
Common Size Balance Sheet of Kesoram For The Year 2008-2009
(Rupees in crores)
Particulars 2008 Change Percentage 2009 Change Percentage
Liabilities
Share Capital 4574 154 4574 106
Reserves amp Surplus 93085 3129 128024 2969
Revaluation Reserves 533 018 412 010
Loans
Secured Loans 97106 3264 153627 3563
Un Secured Loans 12129 408 43416 1007
Deferred Tax Liabilities 000 000 000 000
Current Liabilities
Provisions 33039 1110 34529 801
Current Liabilities 57067 1918 66587 1544
Total 297533 10000 431169 10000
Assets
Net Block 108424 3644 180435 4185
Capital WIP 63459 2133 86485 2006
Investments 4783 161 6178 143
Current Assets
Inventories 44217 1486 58906 1366
Sundry Debtors 27307 918 38017 882
Cash amp Bank Balances 4036 136 5657 131
Loans amp Advances 45289 1522 55462 1286
Fixed Deposits 018 001 028 001
Total 297533 10000 431169 10000
8102019 A Study A Study On Financial Performance Analysis With Reference To Kesoram Cementon Financial Performance hellip
httpslidepdfcomreaderfulla-study-a-study-on-financial-performance-analysis-with-reference-to-kesoram 5581
55
Interpretation of Common Size Balance Sheet of 2008-2009
Share capital was recorded 154 percent in the total liabilities in the year 2008 it is
decreased to 106 in the year 2009
Reserves amp surplus contributed to 3129 in the total liabilities in the year 2008 it is
decreased to 2969 in the year 2009
Secured loans were 3264 in the total liabilities in the year 2008 it is increased to
3563 in the year 2009
Current Liabilities shown to 1918 in the total liabilities in the year 2008 it is
decreased to 1544 in the year 2009
Provisions 1110 in the total liabilities in the year 2008 it is decreased to 801 in the
year 2009
Fixed Assets were 3644 in the total liabilities in the year 2008 ie decreased to 4185
in the year 2009
Investments were 161 in the total liabilities in the year 2008 it is decreased to 143
in the year 2009
Sundry debtors were 918 in the total liabilities in the year 2008 it is decreased to 882
in the year 2009
8102019 A Study A Study On Financial Performance Analysis With Reference To Kesoram Cementon Financial Performance hellip
httpslidepdfcomreaderfulla-study-a-study-on-financial-performance-analysis-with-reference-to-kesoram 5681
56
Common Size Balance Sheet of Kesoram For The Year 2009-2010
(Rs in crores)
Particulars 2009 Change Percentage 2010Change
Percentage
Liabilities
Share Capital 4574 106 4574 075
Reserves amp Surplus 128024 2969 149111 2444
Revaluation Reserves 412 010 339 006
Loans
Secured Loans 153627 3563 186372 3055
Un Secured Loans 43416 1007 126250 2069
Deferred Tax Liabilities 000 000 000 000
Current Liabilities
Provisions 34529 801 35734 586
Current Liabilities 66587 1544 107688 1765
Total 431169 10000 610068 10000
Assets
Net Block 180435 4185 343182 5625
Capital WIP 86485 2006 41283 677
Investments 6178 143 5143 084
Current Assets
Inventories 58906 1366 91619 1502
Sundry Debtors 38017 882 54289 890
Cash amp Bank Balances 5657 131 8014 131
Loans amp Advances 55462 1286 66506 1090
Fixed Deposits 028 001 031 001
Total 431169 10000 610068 10000
8102019 A Study A Study On Financial Performance Analysis With Reference To Kesoram Cementon Financial Performance hellip
httpslidepdfcomreaderfulla-study-a-study-on-financial-performance-analysis-with-reference-to-kesoram 5781
57
Interpretation of common size balance sheet of 2009-2010
Share capital was recorded 106 percent in the total liabilities in the
year 2009 it is decreased to 075 in the year 2010
Reserves amp surplus contributed to 2969 in the total liabilities in the
year 2009 it is decreased to2444 in the year 2010
Secured loans were 3563 in the total liabilities in the year 2009 it is
increased to 3055 in the year 2010
Current Liabilities shown to 1544 in the total liabilities in the year
2009 it is decreased to 1765 in the year 2010
Provisions 801 in the total liabilities in the year 2009 it is decreased
to 586 in the year 2010
Fixed Assets were 4185 in the total liabilities in the year 2009 ie
increased to 5625 in the year 2010
Investments were 143 in the total liabilities in the year 2009 it is
decreased to 084 in the year 2010
Sundry debtors were 882 in the total liabilities in the year 2009 it is
increased to 890 in the year 2010
8102019 A Study A Study On Financial Performance Analysis With Reference To Kesoram Cementon Financial Performance hellip
httpslidepdfcomreaderfulla-study-a-study-on-financial-performance-analysis-with-reference-to-kesoram 5881
58
Common Size Balance sheet of Kesoram for the year 2010-2011
983080Rupees in crores)
Particulars 2010 Change Percentage 2011
Change
Percentage
Liabilities
Share Capital 4574 075 4574 071
Reserves amp Surplus 149111 2444 125162 1939
Revaluation Reserves 339 006 289 004
Loans
Secured Loans 186372 3055 237183 3675
Un Secured Loans 126250 2069 162744 2522
Deferred Tax Liabilities 000 000 000 000
Current Liabilities
Provisions 35734 586 1494 023
Current Liabilities 107688 1765 113902 1765
Total 610068 10000 645348 10000
Assets
Net Block 343182 5625 369172 5721
Capital WIP 41283 677 43781 678
Investments 5143 084 6582 102
Current Assets
Inventories 91619 1502 111855 1733
Sundry Debtors 54289 890 63134 978
Cash amp Bank Balances 8014 131 7188 111
Loans amp Advances 66506 1090 43460 673
Fixed Deposits 031 001 176 003
Total 610068 10000 645348 10000
8102019 A Study A Study On Financial Performance Analysis With Reference To Kesoram Cementon Financial Performance hellip
httpslidepdfcomreaderfulla-study-a-study-on-financial-performance-analysis-with-reference-to-kesoram 5981
59
Interpretation of Common Size Balance Sheet Of 2010-2011
Share capital was recorded 075 percent in the total liabilities in the year 2010 it is
decreased to 071 in the year 2011
Reserves amp surplus contributed to 2444 in the total liabilities in the year 2010 it is
decreased to1939 in the year 2011
Secured loans were 3055 in the total liabilities in the year 2010 it is increased to
3675 in the year 2011
Current Liabilities shown to 1765 in the total liabilities in the year 2010 it is
also1765 in the year 2011
Provisions 586 in the total liabilities in the year 2010 it is decreased to 023 in the
year 2011
Fixed Assets were 5625 in the total liabilities in the year 2010 ie increased to 5721
in the year 2011
Investments were 084 in the total liabilities in the year 2010 it increased to 102 in
the year 2011
Sundry debtors were 890 in the total liabilities in the year 2010 it is increased to 978
in the year 2011
8102019 A Study A Study On Financial Performance Analysis With Reference To Kesoram Cementon Financial Performance hellip
httpslidepdfcomreaderfulla-study-a-study-on-financial-performance-analysis-with-reference-to-kesoram 6081
60
Common Size Balance Sheet of Kesoram for the Year 2011-2012
983080Rupees in crores)
Particulars 2011 Change Percentage 2012
Change
Percentage
Liabilities
Share Capital 4574 071 4574 063
Reserves amp Surplus 125162 1939 86657 1199
Revaluation Reserves 289 004 270 004
Loans
Secured Loans 237183 3675 317792 4397
Un Secured Loans 162744 2522 92742 1283
Deferred Tax Liabilities 000 000 000 000
Current Liabilities
Provisions 1494 023 40726 563
Current Liabilities 113902 1765 180010 2491
Total 645348 10000 722771 10000
Assets
Net Block 369172 5721 358721 4963
Capital WIP 43781 678 68065 942
Investments 6582 102 6636 092
Current Assets
Inventories 111855 1733 99516 1377
Sundry Debtors 63134 978 67358 932
Cash amp Bank Balances 7188 111 6959 096
Loans amp Advances 43460 673 115409 1597
Fixed Deposits 176 003 107 001
Total 645348 10000 722771 10000
8102019 A Study A Study On Financial Performance Analysis With Reference To Kesoram Cementon Financial Performance hellip
httpslidepdfcomreaderfulla-study-a-study-on-financial-performance-analysis-with-reference-to-kesoram 6181
61
Interpretation of common size balance sheet of 2011-2012
Share capital was recorded 071 percent in the total liabilities in the year 2011 it is
decreased to 063 in the year 2012
Reserves amp surplus contributed to 1939 in the total liabilities in the year 2011 it
is decreased to 1199 in the year 2012
Secured loans were 3675 in the total liabilities in the year 2011 it is increased to
4397 in the year 2012
Current Liabilities shown to 1765 in the total liabilities in the year 2011 it is
increased to 2491 in the year 2012
Provisions 023 in the total liabilities in the year 2011 it is increased to 563 in the
year 2012
Fixed Assets were 5721 in the total liabilities in the year 2011 ie decreased to
4963 in the year 2012
Investments were 102 in the total liabilities in the year 2011 it increased to 092
in the year 2012
Sundry debtors were 978 in the total liabilities in the year 2011 it is decreased to
932 in the year 2012
8102019 A Study A Study On Financial Performance Analysis With Reference To Kesoram Cementon Financial Performance hellip
httpslidepdfcomreaderfulla-study-a-study-on-financial-performance-analysis-with-reference-to-kesoram 6281
Trend Analysis
Share Capital-
Year
Amount
(In Crores) Trend
IncreaseDecrease
Base Year Previous Year
2008 4574 10000 000 000
2009 4574 10000 000 000
2010 4574 10000 000 000
2011 4574 10000 000 000
2012 4574 10000 000 000
Trend Percentages in Share Capital
Share capital shown a constant trend in the period 2008 and 2012
Share capital is 4574 crores all the years from 2008-2012
8102019 A Study A Study On Financial Performance Analysis With Reference To Kesoram Cementon Financial Performance hellip
httpslidepdfcomreaderfulla-study-a-study-on-financial-performance-analysis-with-reference-to-kesoram 6381
Reserves amp Surplus-
Year
Amount
(In Crores) Trend
IncreaseDecrease
Base Year Previous Year
2008 93085 10000 000 000
2009 128024 13753 3753 3753
2010 149111 16019 6019 2266
2011 125162 13446 3446 -2573
2012 86657 9309 -691 -4137
Trend Percentages in Reserves amp Surplus
Reserves amp surplus shown an increasing trend in the period between 2008 and 2010
The average trend was 13277 till 2010
The Reserves amp surplus was showing decreasing trend in the period 2011-2012 (ie
from 16019 in 2010 to 9309 in 2012)
The decreasing trend in Reserves amp surplus indicates the decrease in profits of the
firm
8102019 A Study A Study On Financial Performance Analysis With Reference To Kesoram Cementon Financial Performance hellip
httpslidepdfcomreaderfulla-study-a-study-on-financial-performance-analysis-with-reference-to-kesoram 6481
Investments-
Year
Amount
(In Crores) Trend
IncreaseDecrease
Base Year Previous Year
2008 4783 10000 000 000
2009 6178 12917 2917 2917
2010 5143 10753 753 -2164
2011 6582 13761 3761 3009
2012 6636 13874 3874 113
Trend Percentages in Investments-
The investments are shown an increasing trend in the period between 2008 ndash 2009
and it is decreasing in the year 2010
The average trend was 11458 till 2009
The investments increased in the periods 2011-2012 (ie from 10753 in 2010 to
13874 in 2012)
The overall trend in investments shown is satisfactory
8102019 A Study A Study On Financial Performance Analysis With Reference To Kesoram Cementon Financial Performance hellip
httpslidepdfcomreaderfulla-study-a-study-on-financial-performance-analysis-with-reference-to-kesoram 6581
Net Current Assets-
Year
Amount
(In Crores) Trend
IncreaseDecrease
Base Year Previous Year
2008 30761 10000 000 000
2009 56954 18515 8515 8515
2010 77037 25044 15044 6529
2011 110417 35895 25895 10851
2012 68613 22305 12305 -13590
Trends in Net Current Assets-
The NCA shown positive (increasing) trend
The NCA are increased to 35895 (the year 2011) compared with base year and
decreased in the year 2012 to 22305
The NCA shown increased trend from year and crossed 100
The overall trend was good
8102019 A Study A Study On Financial Performance Analysis With Reference To Kesoram Cementon Financial Performance hellip
httpslidepdfcomreaderfulla-study-a-study-on-financial-performance-analysis-with-reference-to-kesoram 6681
66
Ratio Analysis-
Current Ratio-
Current Ratio = Current Assets Current Liabilities
Current assets are cash in hand Cash at bank Marketable Securities(short term) short term
Investment Bills receivables sundry debtors Inventories (stock) Work in progress prepaid
expenses Current Liabilities are outstanding expenses Bills payable sundry Creditors
short-term advances income tax payable and Dividend payable
Current Ratio of Kesoram-
(Rupees in crores)
Year Current Assets Current Liabilities Current Ratio
2007-08 75560 57067 132
2008-09 102580 66587 154
2009-10 153922 107688 143
2010-11 182177 113902 160
2011-12 173833 180010 097
Interpretation-
As per the standard rule of current ratio ie 21 where current assets double the current
liabilities is considered satisfactory
In the present analysis the current ratio of the Kesoram is not satisfactory
from the above table It was assessed that the current ratio for all the five year is lower (less)
than the standard rule ie 21 And it is 097 in the year 2011-2012 (current year) This is
highly UN satisfactory
8102019 A Study A Study On Financial Performance Analysis With Reference To Kesoram Cementon Financial Performance hellip
httpslidepdfcomreaderfulla-study-a-study-on-financial-performance-analysis-with-reference-to-kesoram 6781
Quick Ratio-
Quick ratio also known as acid-test ratio establishes a relationship between quick
assets and the current liabilities Cash is the most liquid asset It is calculated by dividing
quick assets by current liabilities
Quick ratio = Quick Assets Current Liabilities
(Quick Assets = Current assets ndash Inventory)
Quick Ratio of Kesoram-
Rupees in crores)
Year Total QuickAssets
Current Liabilities Quick Ratio
2007-08 33343 57067 058
2008-09 43674 66587 066
2009-10 62303 107688 058
2010-11 70322 113902 0622011-12 74333 180010 041
Interpretation-
Usually a high Quick ratio is an indication that the company is liquid and has the ability to
meet its current or liquid liabilities in time on the other hand a low Quick Ratio represents
8102019 A Study A Study On Financial Performance Analysis With Reference To Kesoram Cementon Financial Performance hellip
httpslidepdfcomreaderfulla-study-a-study-on-financial-performance-analysis-with-reference-to-kesoram 6881
that the companyrsquos liquidity position is not good The above table showing the quick ratios
of Kesoram are canrsquot be considered satisfactory
Leverage Ratios-
Debt-Equity Ratio-
Debt-Equity Ratio = Total Long Term Debt Equity Share Holders Fund
Total Long term Debt= Debenture Capital + Long term loans from banks and financial
institutions + Public deposits
Equity Share Holders fund = Equity + Reserves and Surplus
Debt Equity Ratio of Kesoram
(Rupees in crores)
Year Total Debt Share Holders Fund Debt Equity Ratio
2007-08 109235 98192 111
2008-09 197043 133010 148
2009-10 312622 154024 203
2010-11 399927 130025 308
2011-12 410534 91501 449
8102019 A Study A Study On Financial Performance Analysis With Reference To Kesoram Cementon Financial Performance hellip
httpslidepdfcomreaderfulla-study-a-study-on-financial-performance-analysis-with-reference-to-kesoram 6981
Interpretation-
The Debt-Equity Ratio accepted standard is 05 This ratio reflects the relative contribution
of creditors and owners of business in its financing From the above it is clear that the long
term debt is more than that of the share holdersrsquo fund So we can interpret that the firmrsquosassets are financed more by the external funds rather than by the internal funds
8102019 A Study A Study On Financial Performance Analysis With Reference To Kesoram Cementon Financial Performance hellip
httpslidepdfcomreaderfulla-study-a-study-on-financial-performance-analysis-with-reference-to-kesoram 7081
Fixed Asset Ratio-
Net Sales
Fixed Asset Ratio = helliphelliphelliphelliphelliphelliphelliphelliphelliphelliphellip
Net Assets
Fixed Asset Ratio of Kesoram-
(Rupees in crores)
Year Net Sales Net Assets Fixed Assets Ratio
2007-08 300271 358721 084
2008-09 389797 369172 106
2009-10 475062 343182 1382010-11 539788 180435 299
2011-12 59182 108424 546
Interpretation
This ratio indicates the extent to which the assets of the companyrsquos can be lost without
affecting the interest of the creditors of the company Higher the ratios better the long-term
position of the companyThe above table shows fixed assets ratio in increasing trend Which is good for the
company
8102019 A Study A Study On Financial Performance Analysis With Reference To Kesoram Cementon Financial Performance hellip
httpslidepdfcomreaderfulla-study-a-study-on-financial-performance-analysis-with-reference-to-kesoram 7181
Overall Profitability Ratios-
Net Profit Ratio
Net Profit Ratio indicates net margin on sales It is given by the following equation
Net Profit Ratio = (Net Profit Sales) 100
Net Profit Ratio of Kesoram
(Rupees in crores)
Year Net Profit Sales Net Profit Ratio
2007-08 37917 300271 1263
2008-09 41432 389797 1063
2009-10 20298 475062 427
2010-11 -28176 539788 -5222011-12 -38108 59182 -644
Interpretation
It establishes a relationship between net profits after tax and net sales and
indicates the efficiency of the management in manufacturing selling administrative and
other activities of the company
The higher the ratio the better is the profitability or performance of the business
The above table depicts the net profit Ratio of Kesoram has decreased every year from
2007-2008 to 2011-2012It further decreased to negative in the year 2010-11 to -522 and -
644 in the year 2011-2012 This shows constant decrease in the profits of the company
8102019 A Study A Study On Financial Performance Analysis With Reference To Kesoram Cementon Financial Performance hellip
httpslidepdfcomreaderfulla-study-a-study-on-financial-performance-analysis-with-reference-to-kesoram 7281
72
Return on Investment-
Net Profit
Return on Investment = helliphelliphelliphelliphelliphelliphelliphelliphelliphelliphelliphellip X 100
Share Holders Fund
Return on Investment Ratio of Kesoram-
(Rupees in crores)
Year Net Profit Share Holders Fund Return On Investment
2007-08 37917 98192 3862
2008-09 41432 133010 3115
2009-10 20298 154024 1318
2010-11 -28176 130025 -2167
2011-12 -38108 91501 -4165
Interpretation-
The above table reveals how well the resources of the firm are being used Higher
the ratio better the result The above ratio implies how well the firm is growing in
terms of profitability and efficiency From the above table we can concern that the return on
investment is in decreasing trend ROI is highest in the year 2007-2008 as 3862 But
there after itrsquos decreased every year
The ROI is negative in the years 2010-2011 amp 2011-2012 as -2167 amp -4165 respectively
Which is not a good sign for the firm
8102019 A Study A Study On Financial Performance Analysis With Reference To Kesoram Cementon Financial Performance hellip
httpslidepdfcomreaderfulla-study-a-study-on-financial-performance-analysis-with-reference-to-kesoram 7381
8102019 A Study A Study On Financial Performance Analysis With Reference To Kesoram Cementon Financial Performance hellip
httpslidepdfcomreaderfulla-study-a-study-on-financial-performance-analysis-with-reference-to-kesoram 7481
8102019 A Study A Study On Financial Performance Analysis With Reference To Kesoram Cementon Financial Performance hellip
httpslidepdfcomreaderfulla-study-a-study-on-financial-performance-analysis-with-reference-to-kesoram 7581
75
CHAPTER V
FINDINGS amp SUGGESTIONS
8102019 A Study A Study On Financial Performance Analysis With Reference To Kesoram Cementon Financial Performance hellip
httpslidepdfcomreaderfulla-study-a-study-on-financial-performance-analysis-with-reference-to-kesoram 7681
76
Findings
The Share capital remains constant Share capital is unchanged all the years from
2008-2012
Reserves amp surplus were recorded an increasing trend in the period between 2008
and 2010It is showing decreasing trend in the period 2011-2012 (ie from 16019
in 2010 to 9309 in 2012)
Current Liabilities were increased compared to base year ie 2008
Provisions increased to 262597 ie in Rupees 39232 crores in the current year
The current ratio for all the five year is lower (less) than the standard rule ie 21
And it is 097 in the year 2011-2012 (current year)
The Debt-Equity Ratio was shown under the standard ratio It is clear that the long
term debt is more than that of the share holdersrsquo fund It indicates that the firm
heavily relying on external funds rather than the internal funds
The operating and net profit of Kesoram is in decreasing trend due to heavy
increase of manufacturing amp administrative expenses
ROI is highest in the year 2007-2008 as 3862 The ROI is negative in the years
2010-2011 amp 2011-2012 as -2167 amp -4165 respectively
Return on Equity Capital Employed Ratio of Kesoram has decreased every year
from 2007-2008 to 2010-2011It further decreased to negative in the year 2011-12 to
-3280
EPS of Kesoram has decreased every year from 2008-12It is negative in the year
2011 amp 12
8102019 A Study A Study On Financial Performance Analysis With Reference To Kesoram Cementon Financial Performance hellip
httpslidepdfcomreaderfulla-study-a-study-on-financial-performance-analysis-with-reference-to-kesoram 7781
77
Suggestion
The organization should adopt an appropriate capital structure
The companyrsquos debt-equity ratio is recorded more or less as 111 in the year 2008
and it is increased to 449 in the year 2012 (current year)The company should
adopt a better debt equity mix in the future to control the fluctuations in returns
The company should control fluctuations in cash and bank balances as it impacts the
current ratio of the company
The provisions are showing increasing trend which indicates risk of debtors The
firm should implement an effective credit management policy It should utilize its
idle funds by decreasing provisions
The company should control heavy increase of manufacturing amp administration
expenses as it is impacting the operating and net profit of company
8102019 A Study A Study On Financial Performance Analysis With Reference To Kesoram Cementon Financial Performance hellip
httpslidepdfcomreaderfulla-study-a-study-on-financial-performance-analysis-with-reference-to-kesoram 7881
78
ANNEXURE
Profit And Loss Account of Kesoram Cement
Mar12 Mar11 Mar10 Mar09 Mar08
12 Months 12 Months 12 Months 12 Months 12 Months
INCOME
Sales Turnover 628260 575072 505151 431613 345700
Excise Duty 36440 35284 30089 41815 45429
NET SALES 591820 539788 475062 389797 300271
Other Income 000 000 000 000 000
TOTALINCOME
596129 548733 481019 393969 302020
EXPENDITURE
Manufacturing
Expenses81903 74803 13974 13153 44113
MaterialConsumed
370897 310150 295550 229359 118448
Personal
Expenses33468 27355 23294 18690 15344
Selling Expenses 81910 78253 58667 48846 45019
AdministrativeExpenses
28225 29308 17219 16179 9907
Expenses
Capitalized000 000 000 000 000
Provisions Made 000 000 000 000 000
TOTAL
EXPENDITURE 596403 519870 408704 326227 232832Operating Profit -4583 19918 66358 63570 67439
EBITDA -274 28864 72316 67742 69188
Depreciation 29740 27259 17280 11186 8927
Other Write-offs 000 000 000 000 000
EBIT -30014 1605 55035 56557 60261
Interest 41015 23983 10921 12087 5426
EBT -71029 -22377 44114 44470 54835
Taxes -32921 5798 23816 3037 16918
Profit and Loss
for the Year-38108 -28176 20298 41432 37917
Non RecurringItems
-1142 7063 3228 -4023 402
Other Non Cash
Adjustments1276 091 207 465 017
OtherAdjustments
000 000 000 000 000
REPORTED
PAT-37974 -21021 23734 37874 38335
8102019 A Study A Study On Financial Performance Analysis With Reference To Kesoram Cementon Financial Performance hellip
httpslidepdfcomreaderfulla-study-a-study-on-financial-performance-analysis-with-reference-to-kesoram 7981
79
Balance Sheet Of Kesoram
Years
Particulars 2008 2009 2010 2011 2012
Liabilities
Share Capital 4574 4574 4574 4574 4574Reserves amp Surplus 93085 128024 149111 125162 86657
Revaluation Reserves 533 412 339 289 27
Loans
Secured Loans 97106 153627 186372 237183 317792
Un Secured Loans 12129 43416 12625 162744 92742
Deferred Tax Liabilities 0 0 0 0 0
Current Liabilities
Provisions 33039 34529 35734 1494 40726
Current Liabilities 57067 66587 107688 113902 18001
Total 297533 431169 610068 645348 722771
Assets
Net Block 108424 180435 343182 369172 358721
Capital WIP 63459 86485 41283 43781 68065
Investments 4783 6178 5143 6582 6636
Current Assets
Inventories 44217 58906 91619 111855 99516
Sundry Debtors 27307 38017 54289 63134 67358
Cash amp Bank Balances 4036 5657 8014 7188 6959
Total Current Assets 7556 10258 153922 182177 173833Loans amp Advances 45289 55462 66506 4346 115409
Fixed Deposits 018 028 031 176 107
Total 297533 431169 610068 645348 722771
8102019 A Study A Study On Financial Performance Analysis With Reference To Kesoram Cementon Financial Performance hellip
httpslidepdfcomreaderfulla-study-a-study-on-financial-performance-analysis-with-reference-to-kesoram 8081
80
KEY ITEMS 2012 2011 2010 2009 2008
Preference
Dividend 0 0 0 0 0
Equity Dividend 457 2516 2516 2516 2516
Equity Dividend
() 999 55 55 55 55
Shares in Issue(Lakhs) 45743 45743 45743 45743 45743
EPS - Annualised
(Rs) -8302 -4595 5188 828 838
8102019 A Study A Study On Financial Performance Analysis With Reference To Kesoram Cementon Financial Performance hellip
httpslidepdfcomreaderfulla-study-a-study-on-financial-performance-analysis-with-reference-to-kesoram 8181
BIBLIOGRAPHY
Sl
No
Books Author Name
1 Financial Management Khan amp JAIN
2 Financial Management IMPandey
3 Management Accounting RPTrivedi
Websites amp Search Engines
1 wwwkesoramcom983086
2 wwwmoneycontrolcom
3 wwwgooglefinancecom983086
Annual reports of Kesoram cement limited 2008-2012

8102019 A Study A Study On Financial Performance Analysis With Reference To Kesoram Cementon Financial Performance hellip
httpslidepdfcomreaderfulla-study-a-study-on-financial-performance-analysis-with-reference-to-kesoram 3781
37
making his conclusion regarding the illness and before giving his treatment a financial
analyst analysis the financial statements with various tools of analysis before commenting
upon the financial health or weaknesses of an enterprise
The analysis and interpretation of financial statements is essential to bring out the
mystery behind the figures in financial statements Financial statements analysis is an
attempt to determine the significance and meaning of the financial statement data so that
forecast may be made of the future earnings ability to pay interest and debt maturities (both
current and long term) and profitability of a sound divided policy
Types of financial analysis-
Financial analysis into different categories depending upon
(1) The material used and
(2) The method of operation followed in the analysis or the modus operandi of
analysis
Types of financial analysis
On the basis of material used on the basis of modus operandi
External Internal Horizontal Vertical
Analysis Analysis Analysis Analysis
1 On the basis of material used - According to material used financial analysis canbe of two types
External analysis
Internal analysis
External analysis-
This analysis is done by outsiders who do not have access to the detailed internal
outsiders include investors potential investors Creditors Potential Creditors Government
Agencies Credit Agencies and General Public For financial analysis these external parties
to the firm depend almost entirely on the published financial statements
Internal analysis-
This analysis is undertaken by the persons namely executives and employees of the
organization or by the officers appointed by government or court who have access to the
8102019 A Study A Study On Financial Performance Analysis With Reference To Kesoram Cementon Financial Performance hellip
httpslidepdfcomreaderfulla-study-a-study-on-financial-performance-analysis-with-reference-to-kesoram 3881
38
books of account ( internal accounting records) and other information related to the
business
2 983119983150 983156983144983141 983138983137983155983145983155 983151983142 983149983151983140983157983155 983151983152983141983154983137983150983140983145983085
According to the modus operandi financial analysis can also be of two types
a Horizontal analysis
bVertical analysis
Horizontal analysis-
Horizontal analysis refers to the comparison of financial data of a company for several
years The figures for this type of analysis are presented horizontally over a number of
columns The figures of the various years are compared with standard or base year a base
year is year chosen as beginning point This type of analysis is also called lsquodynamicanalysisrsquo as it is based on the data from year to year rather than on data of any one year The
horizontal analysis makes it possible to focus attention on items that have changed
significantly during the period under view
b Vertical analysis-
Vertical analysis refers to the study of relationship of the various items in the financial
statements of one accounting period In this types of analysis the figures from financial
statement of a year are compared with a base selected from the same yearrsquos statement
Methods of financial analysis-
The following methods of analysis are generally used-
1 Comparative Statements
2 Trend Analysis
3 Common-Size Statements
4 Funds flow Analysis
5 Cash Analysis
6 Ratio Analysis
7 Cost-volume-Profit Analysis
8102019 A Study A Study On Financial Performance Analysis With Reference To Kesoram Cementon Financial Performance hellip
httpslidepdfcomreaderfulla-study-a-study-on-financial-performance-analysis-with-reference-to-kesoram 3981
39
Comparative statements-
The comparative financial statements are statements of the financial position at
different periods of time the elements of financial position are show in a
Comparative Statement provides an idea of financial position at two or more
periods Generally two financial statements (balance sheet and income statement) are
prepared in comparative form for financial analysis
The Comparative Statement May Show-
1 Absolute figures (rupee amounts)
2 Changes in absolute figures ie increase or decrease in absolute figures
3 Absolute data in terms of percentages
4 Increase or decrease in terms of percentages
The Two Comparative Statements Are-
1 Comparative balance sheet and
2 Income statement
1 983107983151983149983152983137983154983137983156983145983158983141 983138983137983148983137983150983139983141 983155983144983141983141983156983085
The comparative balance sheet analysis is the study of the trend of the same items group of
items and computed items in two or more balance sheets of the same business enterprise on
different dates The change in periodic balance sheet items reflect the conduct of a business
the change can be observed by comparison of the balance sheet at the beginning and at the
end of a period and these changes can help in forming an opinion about the progress of an
enterprise
Guide Lines for Interpretation of Comparative Balance Sheet-
While interpreting comparative balance sheet the interpreter is expected to study the
following aspects-
1 Current financial position and liquidity position
2 Long-term financial position
3 Profitability of the concern
8102019 A Study A Study On Financial Performance Analysis With Reference To Kesoram Cementon Financial Performance hellip
httpslidepdfcomreaderfulla-study-a-study-on-financial-performance-analysis-with-reference-to-kesoram 4081
40
Common Size Statement-
The common-size statements balance sheet and income statement are show in
analytical percentages The figures are shown as percentages of total assets total liabilities
and total sales The total assets are taken as 100 and different assets are expressed as a
percentage of the total similarly various liabilities are taken as a part of total liabilities
Common Size Balance Sheet-
A statement in which balance sheet items are expressed as the ratio of each asset to
total assets and the ratio of each liability is expressed as a ratio of total liabilities is called
common size balance The common size balance sheet can be used to compare companies
of differing size The comparison of figures in different periods is not useful because total
figures may be affected by a number of factors It is not possible to establish standard norms
for various assets The trends of figures from year to year may not be studied and even they
may not give proper results
Trend Analysis of Balance Sheet-
Trend analysis is Very important tool of horizontal financial analysis
This analysis enables to known the change in the financial function and operating efficiency
in between the time period chosen
By studding the trend analysis of each item we can known the direction of changes and
based upon the direction of changes the options can be changed
Trend =Absolute Value of item in the statement understudy 100
Absolute Value of same item in the base statement
Ratio Analysis
Ratio analysis is used as a technique of analyzing the financial information contained in the
balance sheet and profit and loss accounts for a more meaningful understanding of the
financial position and performance of a firm
The relationship between two accounting figures expressed mathematically is known as a
financial ratio A ratio helps the analyst to make qualitative judgment about the firmrsquos
financial position and performance
Several ratios can be calculated from the accounting data contained in the financial
statements The parties which generally undertake financial analysis is short ndashterm
creditors long-term creditors owner and management In view of the requirements of the
various ratios ratios are classified into the following four important categories
8102019 A Study A Study On Financial Performance Analysis With Reference To Kesoram Cementon Financial Performance hellip
httpslidepdfcomreaderfulla-study-a-study-on-financial-performance-analysis-with-reference-to-kesoram 4181
41
Liquidity ratios
Leverage ratios
Activity ratios
Profitability ratios
Liquidity Ratios
It is extremely essential for a firm to be able to meet its obligations as they become due
Liquidity ratios measure the ability of the firm to meet its current obligations A firm should
ensure that it does not suffer from lack of liquidity and also that it does not have excess
liquidity The failure of a company to meet its obligations due to lack of sufficient liquidity
will result in a poor creditworthiness loss of creditorsrsquo confidence or even in legal tangles
resulting in the closure of the company A very high degree of liquidity is also bad idle
assets earn nothing The firmrsquos funds will be unnecessarily tied up in current assets
Therefore it is necessary to strike a proper balance high liquidity and lack of liquidity
The most common ratios which indicate the extent of liquidity or lack of it are
Current ratio
Quick ratio
Other ratios include Cash ratio Interval Measure and Net working capital ratio
Current Ratio
The current ratio is calculated by dividing current assets by current liabilities
Current assets
Current ratio = --------------------------
Current liabilities
Current ratio is a measure of the firmrsquos short term solvency It indicates the availability of
current assets in rupees for every one rupee of current liability A ratio of greater than one
means that the firm has more current assets than current claims against the Current ratio of
2 to 1 or more is considered satisfactory Current ratio represents a margin of safety for
creditors
Quick Ratio
Quick ratio also known as acid-test ratio establishes a relationship between quick assets and
the current liabilities Cash is the most liquid asset It is calculated by dividing quick assets
by current liabilities
Quick ratio = Quick Assets Current Liabilities
8102019 A Study A Study On Financial Performance Analysis With Reference To Kesoram Cementon Financial Performance hellip
httpslidepdfcomreaderfulla-study-a-study-on-financial-performance-analysis-with-reference-to-kesoram 4281
42
(Quick Assets = Current assets ndash Inventory)
One defect of the current ratio is that it fails to convey any information on the composition
of the current assets of the firm A rupee of cash is considered equivalent to a rupee of
inventory of receivables But it is not so A rupee of cash is more readily available to meet
current liabilities than a rupee of say inventory This implies the usefulness of the current
ratio
The Acid ndashtest ratio measures the firmrsquos ability to convert its current assets quickly into
cash in order to meet its current liabilities
A quick ratio of 1 to 1 is considered to represent a satisfactory current financial condition It
is an important index of the firmrsquos liquidity
Leverage Ratios
Leverage ratios identify the source of a firmrsquos capital ndashowners or outside creditors
Financial leverage refers to the use of debt in financing non-current assets If the return on
assets exceeds the cost of debt the leverage is successful ndash ie it improves return on equity
Debt ndashEquity Ratio
The Debt ndash Equity is determined to analyze the soundness of the long term financial
policies of the organization It is also known as ldquoInternal External Equity Ratiordquo
It is calculated as follows
Debt ndash Equity Ratio = Total long term debt Share holders funds
Equity Ratio
This ratio is also called as proprietary ratio establishes a relationship between share holderrsquos
funds to total assets of company Equity Ratio is calculated by dividing share holders fund
by total assets
Fixed Asset Ratio
This ratio indicates the extent to which the assets of the companyrsquos can be lost without
affecting the interest of the creditors of the company Higher the ratios better the long-term
position of the company
Activity Ratios
They are primarily used for studying a firmrsquos working capital situation A well managed
firm should have good activity ratios
8102019 A Study A Study On Financial Performance Analysis With Reference To Kesoram Cementon Financial Performance hellip
httpslidepdfcomreaderfulla-study-a-study-on-financial-performance-analysis-with-reference-to-kesoram 4381
43
Working Capital Turnover Ratio
The working capital turnover ratio indicates whether or not working capital has been
effectively used in making sales
Working capital turnover = Sales Net current assets
Inventory Turnover Ratio
This ratio also known as Stock Turnover Ratio establishes the relationship between costs of
goods sold or net sales during the given period and the average amt of stock held during the
period This ratio reveals the number of times finished stock in turnover during a given
accounting period
Higher the ratio the better is it because it shows the finished stock is rapidly turned
in to sales On the other hand a low stock turnover ratio is not desirable because it reveals
the accumulation of stock
Debtors Turnover Ratio
This ratio indicates the velocity of debt collection of a company In other words it shows
the number of times average turnover during a year
A Higher Debtor Turnover Ratio indicates a more efficient is the management towards
debtors and low ratio ratio implies inefficient management of debtors
Total Assets Turnover Ratio
The asset turnover ratio indicates how efficiently management is employing Assets
Total Assets Turnover Ratio = Sales Total Assets
Profitability Ratios
Profitability ratios are the ratios which measure a firmrsquos overall effectiveness as revealed by
the returns generated on sales and investment
General Profitability Ratios
1 Gross Profit Ratio
2 Net profit Ratio
3 Operating or Expenses Ratio
8102019 A Study A Study On Financial Performance Analysis With Reference To Kesoram Cementon Financial Performance hellip
httpslidepdfcomreaderfulla-study-a-study-on-financial-performance-analysis-with-reference-to-kesoram 4481
44
Gross Profit Ratio
Gross profit Ratio measures the relationships to net sales and is usually represented as a
percentage It is a good measure of profitability
The gross profit ratio indicates the extent to which selling price of goods per unit may
decline without resulting in losses on operation Higher the gross profit betters the result
Net Profit Ratio
Net Profit Ratio indicates net margin on sales It is given by the following equation
Net Profit Ratio = (Net Profit Sales) 100
Operating or Expenses Ratio
This ratio is complimentary of Net Profit Ratio The more the net profit the less the
Operating Ratio Operating costs include the cost of direct materials direct labors and otheroverheads viz are generally excluded from operating costs A comparison of the Operating
Ratio will indicate whether the cost efficiency is high or low in the figure of sales This less
the ratio it depicts the efficiency of the management
8102019 A Study A Study On Financial Performance Analysis With Reference To Kesoram Cementon Financial Performance hellip
httpslidepdfcomreaderfulla-study-a-study-on-financial-performance-analysis-with-reference-to-kesoram 4581
45
CHAPTER IV
DATA ANALYSIS amp INTERPRETATION
8102019 A Study A Study On Financial Performance Analysis With Reference To Kesoram Cementon Financial Performance hellip
httpslidepdfcomreaderfulla-study-a-study-on-financial-performance-analysis-with-reference-to-kesoram 4681
46
Comparative Balance Sheet of Kesoram in the Year between 2008-2009
(Rupee in crores)
Years Changes
Particulars 2008 2009 In Rupees In Percentage
Liabilities
Share Capital 4574 4574 000 000
Reserves amp Surplus 93085 128024 34939
Revaluation Reserves 533 412 -121 -2270
Loans
Secured Loans 97106 153627 56521 5821
Un Secured Loans 12129 43416 31287 25795
Deferred Tax Liabilities 000 000 000 000
Current Liabilities
Provisions 33039 34529 1490 451
Current Liabilities 57067 66587 9520 1668
Total 297533 431169 133636 4491
Assets
Net Block 108424 180435 72011 6642
Capital Wip 63459 86485 23026 3628
Investments 4783 6178 1395 2917
Current Assets
Inventories 44217 58906 14689 3322
Sundry Debtors 27307 38017 10710 3922
Cash amp Bank Balances 4036 5657 1621 4016
Total Current Assets 75560 102580 27020 3576
Loans amp Advances 45289 55462 10173 2246
Fixed Deposits 018 028 010 5556
Total 297533 431169 133636 4491
8102019 A Study A Study On Financial Performance Analysis With Reference To Kesoram Cementon Financial Performance hellip
httpslidepdfcomreaderfulla-study-a-study-on-financial-performance-analysis-with-reference-to-kesoram 4781
47
Interpretation of comparative balance sheet of 2008-2009
Reserves amp Surplus were increased to 3753 (percent) ie in Rupees 34939
crores
Revaluation Reserves decreased to 121 ie in Rupees 2270 crores
Secured Loans are increased to 5821 ie in Rupees 56521 crores And UN
secured loans highly Increased to 25795
Current liabilities and Provisions are increased to 1668 and 451 respectively ie in
Rupees 9520 amp 1490 crores
Fixed assets were highly increased to 6642 ie in Rupees 72011 crores
Investments were increased to 2917 ie in Rupees 1395 crores
Sundry debtors increased to 3922 ie in Rupees 10710 crores
Current assets increased 3576 ie in Rupees 27020 crores And Loans amp
Advances increased to 2246 respectively
The overall financial position was satisfactory
8102019 A Study A Study On Financial Performance Analysis With Reference To Kesoram Cementon Financial Performance hellip
httpslidepdfcomreaderfulla-study-a-study-on-financial-performance-analysis-with-reference-to-kesoram 4881
48
Comparative Balance Sheet of Kesoram in the Year between 2009-2010
(Rupees in crores)
Years Changes
Particulars 2009 2010 In Rupees In Percentage
Liabilities
Share Capital 4574 4574 000 000
Reserves amp Surplus 128024 149111 21087 1647
Revaluation Reserves 412 339 -073 -1772
Loans
Secured Loans 153627 186372 32745 2131
Un Secured Loans 43416 126250 82834 19079
Deferred Tax Liabilities 000 000 000
Current Liabilities
Provisions 34529 35734 1205 349
Current Liabilities 66587 107688 41101 6173
Total 431169 610068 178899 4149
Assets
Net Block 180435 343182 162747 9020
Capital WIP 86485 41283 -45202 -5227
Investments 6178 5143 -1035 -1675
Current Assets
Inventories 58906 91619 32713 5553
Sundry Debtors 38017 54289 16272 4280
Cash amp Bank Balances 5657 8014 2357 4167
Total Current Assets 102580 153922 51342 5005
Loans amp Advances 55462 66506 11044 1991
Fixed Deposits 028 031 003 1071
Total 431169 610068 178899 4149
8102019 A Study A Study On Financial Performance Analysis With Reference To Kesoram Cementon Financial Performance hellip
httpslidepdfcomreaderfulla-study-a-study-on-financial-performance-analysis-with-reference-to-kesoram 4981
49
Interpretation of comparative balance sheet of 2009-2010
Reserves amp surplus increased to 1647 ie in Rupees 21087 crores
Revaluation Reserves decreased to 1772 ie in Rupees 073 crores
Secured loans increased to 2131 ie in Rupees 32745 crores
Current Liabilities were increased to 6173 ie in Rupees 41101 crores and
Provisions 349 ie in Rupees 1205 crores
Fixed Assets were increased to 9020 ie in Rupees 162747 crores
Investments were decreased to 1675 ie in Rupees 1035 crores
Sundry debtors were increased to 4280 ie in Rupees 16272 crores
Current assets increased to 5005 ie in Rupees 51342 crores And loans and
Advances increased 1919 ie in Rupees 11044 crores
The overall financial position was satisfactory
8102019 A Study A Study On Financial Performance Analysis With Reference To Kesoram Cementon Financial Performance hellip
httpslidepdfcomreaderfulla-study-a-study-on-financial-performance-analysis-with-reference-to-kesoram 5081
50
Comparative Balance Sheet of Kesoram in the Year between 2010-2011
(Rupees in crores)
Years Changes
Particulars 2010 2011 In Rupees In Percentage
Liabilities
Share Capital 4574 4574 000 000
Reserves amp Surplus 149111 125162 -23949 -1606
Revaluation Reserves 339 289 -050 -1475
Loans
Secured Loans 186372 237183 50811 2726
Un Secured Loans 126250 162744 36494 2891
Deferred Tax Liabilities 000 000 000
Current Liabilities
Provisions 35734 1494 -34240 -9582
Current Liabilities 107688 113902 6214 577
Total 610068 645348 35280 578
Assets
Net Block 343182 369172 25990 757
Capital WIP 41283 43781 2498 605
Investments 5143 6582 1439 2798
Current Assets
Inventories 91619 111855 20236 2209
Sundry Debtors 54289 63134 8845 1629
Cash amp Bank Balances 8014 7188 -826 -1031
Total Current Assets 153922 182177 28255 1836
Loans amp Advances 66506 43460 -23046 -3465
Fixed Deposits 031 176 145 46774
Total 610068 645348 35280 578
8102019 A Study A Study On Financial Performance Analysis With Reference To Kesoram Cementon Financial Performance hellip
httpslidepdfcomreaderfulla-study-a-study-on-financial-performance-analysis-with-reference-to-kesoram 5181
51
Interpretation of comparative balance sheet of 2010-2011
Reserves amp surplus decreased to 1606 ie in Rupees 23949 crores
Revaluation Reserves decreased to 1475 ie in Rupees 050 crores
Secured loans increased to 2726 ie in Rupees 50811 crores
Current Liabilities were increased to 577 ie in Rupees 6214 crores
Provisions decreased to 9582 ie in Rupees 34240 crores
Fixed Assets were increased to 757 ie in Rupees 25990 crores
Investments were decreased to 2798 ie in Rupees 1439 crores
Sundry debtors were increased to 1629 ie in Rupees8845 crores
Current assets increased to 1836 ie in Rupees 28255 crores And loans and
Advances increased 3465 ie in Rupees 23046 crores
The overall financial position was UN satisfactory
8102019 A Study A Study On Financial Performance Analysis With Reference To Kesoram Cementon Financial Performance hellip
httpslidepdfcomreaderfulla-study-a-study-on-financial-performance-analysis-with-reference-to-kesoram 5281
52
Comparative Balance Sheet of Kesoram In The Year Between 2011-2012
(Rupees in crores)
Years Changes
Particulars 2011 2012 In Rupees In Percentage
Liabilities
Share Capital 4574 4574 000 000
Reserves amp Surplus 125162 86657 -38505 -3076
Revaluation Reserves 289 270 -019 -657
Loans
Secured Loans 237183 317792 80609 3399
Un Secured Loans 162744 92742 -70002 -4301
Deferred Tax Liabilities 000 000 000
Current Liabilities
Provisions 1494 40726 39232 262597
Current Liabilities 113902 180010 66108 5804
Total 645348 722771 77423 1200
Assets 000
Net Block 369172 358721 -10451 -283
Capital WIP 43781 68065 24284 5547
Investments 6582 6636 054 082
Current Assets
Inventories 111855 99516 -12339 -1103
Sundry Debtors 63134 67358 4224 669
Cash amp Bank Balances 7188 6959 -229 -319
Total Current Assets 182177 173833 -8344 -458
Loans amp Advances 43460 115409 71949 16555
Fixed Deposits 176 107 -069 -3920
Total 645348 722771 77423 1200
8102019 A Study A Study On Financial Performance Analysis With Reference To Kesoram Cementon Financial Performance hellip
httpslidepdfcomreaderfulla-study-a-study-on-financial-performance-analysis-with-reference-to-kesoram 5381
53
Interpretation of comparative balance sheet of 2011-2012
Reserves amp surplus decreased to 3076 ie in Rupee 38505 crores
Revaluation Reserves decreased to 657 ie in Rupees 019 crores
Secured loans increased to 3399 ie in Rupees 80699 crores
Current Liabilities were increased to 5804 ie in Rupees 66108 crores
Provisions increased to 262597 ie in Rupees 39232 crores
Fixed Assets were decreased to 283 ie in Rupee 10451 crores
Investments were increased to 082 ie in Rupees 054 crores
Sundry debtors were increased to 669 ie in Rupees 4224 crores
Current assets decreased to 458 ie in Rupees 8344 crores And loans and
Advances increased 16555 ie in Rupees 71949 crores
The overall financial position was UN satisfactory
8102019 A Study A Study On Financial Performance Analysis With Reference To Kesoram Cementon Financial Performance hellip
httpslidepdfcomreaderfulla-study-a-study-on-financial-performance-analysis-with-reference-to-kesoram 5481
54
Common Size Balance Sheet of Kesoram For The Year 2008-2009
(Rupees in crores)
Particulars 2008 Change Percentage 2009 Change Percentage
Liabilities
Share Capital 4574 154 4574 106
Reserves amp Surplus 93085 3129 128024 2969
Revaluation Reserves 533 018 412 010
Loans
Secured Loans 97106 3264 153627 3563
Un Secured Loans 12129 408 43416 1007
Deferred Tax Liabilities 000 000 000 000
Current Liabilities
Provisions 33039 1110 34529 801
Current Liabilities 57067 1918 66587 1544
Total 297533 10000 431169 10000
Assets
Net Block 108424 3644 180435 4185
Capital WIP 63459 2133 86485 2006
Investments 4783 161 6178 143
Current Assets
Inventories 44217 1486 58906 1366
Sundry Debtors 27307 918 38017 882
Cash amp Bank Balances 4036 136 5657 131
Loans amp Advances 45289 1522 55462 1286
Fixed Deposits 018 001 028 001
Total 297533 10000 431169 10000
8102019 A Study A Study On Financial Performance Analysis With Reference To Kesoram Cementon Financial Performance hellip
httpslidepdfcomreaderfulla-study-a-study-on-financial-performance-analysis-with-reference-to-kesoram 5581
55
Interpretation of Common Size Balance Sheet of 2008-2009
Share capital was recorded 154 percent in the total liabilities in the year 2008 it is
decreased to 106 in the year 2009
Reserves amp surplus contributed to 3129 in the total liabilities in the year 2008 it is
decreased to 2969 in the year 2009
Secured loans were 3264 in the total liabilities in the year 2008 it is increased to
3563 in the year 2009
Current Liabilities shown to 1918 in the total liabilities in the year 2008 it is
decreased to 1544 in the year 2009
Provisions 1110 in the total liabilities in the year 2008 it is decreased to 801 in the
year 2009
Fixed Assets were 3644 in the total liabilities in the year 2008 ie decreased to 4185
in the year 2009
Investments were 161 in the total liabilities in the year 2008 it is decreased to 143
in the year 2009
Sundry debtors were 918 in the total liabilities in the year 2008 it is decreased to 882
in the year 2009
8102019 A Study A Study On Financial Performance Analysis With Reference To Kesoram Cementon Financial Performance hellip
httpslidepdfcomreaderfulla-study-a-study-on-financial-performance-analysis-with-reference-to-kesoram 5681
56
Common Size Balance Sheet of Kesoram For The Year 2009-2010
(Rs in crores)
Particulars 2009 Change Percentage 2010Change
Percentage
Liabilities
Share Capital 4574 106 4574 075
Reserves amp Surplus 128024 2969 149111 2444
Revaluation Reserves 412 010 339 006
Loans
Secured Loans 153627 3563 186372 3055
Un Secured Loans 43416 1007 126250 2069
Deferred Tax Liabilities 000 000 000 000
Current Liabilities
Provisions 34529 801 35734 586
Current Liabilities 66587 1544 107688 1765
Total 431169 10000 610068 10000
Assets
Net Block 180435 4185 343182 5625
Capital WIP 86485 2006 41283 677
Investments 6178 143 5143 084
Current Assets
Inventories 58906 1366 91619 1502
Sundry Debtors 38017 882 54289 890
Cash amp Bank Balances 5657 131 8014 131
Loans amp Advances 55462 1286 66506 1090
Fixed Deposits 028 001 031 001
Total 431169 10000 610068 10000
8102019 A Study A Study On Financial Performance Analysis With Reference To Kesoram Cementon Financial Performance hellip
httpslidepdfcomreaderfulla-study-a-study-on-financial-performance-analysis-with-reference-to-kesoram 5781
57
Interpretation of common size balance sheet of 2009-2010
Share capital was recorded 106 percent in the total liabilities in the
year 2009 it is decreased to 075 in the year 2010
Reserves amp surplus contributed to 2969 in the total liabilities in the
year 2009 it is decreased to2444 in the year 2010
Secured loans were 3563 in the total liabilities in the year 2009 it is
increased to 3055 in the year 2010
Current Liabilities shown to 1544 in the total liabilities in the year
2009 it is decreased to 1765 in the year 2010
Provisions 801 in the total liabilities in the year 2009 it is decreased
to 586 in the year 2010
Fixed Assets were 4185 in the total liabilities in the year 2009 ie
increased to 5625 in the year 2010
Investments were 143 in the total liabilities in the year 2009 it is
decreased to 084 in the year 2010
Sundry debtors were 882 in the total liabilities in the year 2009 it is
increased to 890 in the year 2010
8102019 A Study A Study On Financial Performance Analysis With Reference To Kesoram Cementon Financial Performance hellip
httpslidepdfcomreaderfulla-study-a-study-on-financial-performance-analysis-with-reference-to-kesoram 5881
58
Common Size Balance sheet of Kesoram for the year 2010-2011
983080Rupees in crores)
Particulars 2010 Change Percentage 2011
Change
Percentage
Liabilities
Share Capital 4574 075 4574 071
Reserves amp Surplus 149111 2444 125162 1939
Revaluation Reserves 339 006 289 004
Loans
Secured Loans 186372 3055 237183 3675
Un Secured Loans 126250 2069 162744 2522
Deferred Tax Liabilities 000 000 000 000
Current Liabilities
Provisions 35734 586 1494 023
Current Liabilities 107688 1765 113902 1765
Total 610068 10000 645348 10000
Assets
Net Block 343182 5625 369172 5721
Capital WIP 41283 677 43781 678
Investments 5143 084 6582 102
Current Assets
Inventories 91619 1502 111855 1733
Sundry Debtors 54289 890 63134 978
Cash amp Bank Balances 8014 131 7188 111
Loans amp Advances 66506 1090 43460 673
Fixed Deposits 031 001 176 003
Total 610068 10000 645348 10000
8102019 A Study A Study On Financial Performance Analysis With Reference To Kesoram Cementon Financial Performance hellip
httpslidepdfcomreaderfulla-study-a-study-on-financial-performance-analysis-with-reference-to-kesoram 5981
59
Interpretation of Common Size Balance Sheet Of 2010-2011
Share capital was recorded 075 percent in the total liabilities in the year 2010 it is
decreased to 071 in the year 2011
Reserves amp surplus contributed to 2444 in the total liabilities in the year 2010 it is
decreased to1939 in the year 2011
Secured loans were 3055 in the total liabilities in the year 2010 it is increased to
3675 in the year 2011
Current Liabilities shown to 1765 in the total liabilities in the year 2010 it is
also1765 in the year 2011
Provisions 586 in the total liabilities in the year 2010 it is decreased to 023 in the
year 2011
Fixed Assets were 5625 in the total liabilities in the year 2010 ie increased to 5721
in the year 2011
Investments were 084 in the total liabilities in the year 2010 it increased to 102 in
the year 2011
Sundry debtors were 890 in the total liabilities in the year 2010 it is increased to 978
in the year 2011
8102019 A Study A Study On Financial Performance Analysis With Reference To Kesoram Cementon Financial Performance hellip
httpslidepdfcomreaderfulla-study-a-study-on-financial-performance-analysis-with-reference-to-kesoram 6081
60
Common Size Balance Sheet of Kesoram for the Year 2011-2012
983080Rupees in crores)
Particulars 2011 Change Percentage 2012
Change
Percentage
Liabilities
Share Capital 4574 071 4574 063
Reserves amp Surplus 125162 1939 86657 1199
Revaluation Reserves 289 004 270 004
Loans
Secured Loans 237183 3675 317792 4397
Un Secured Loans 162744 2522 92742 1283
Deferred Tax Liabilities 000 000 000 000
Current Liabilities
Provisions 1494 023 40726 563
Current Liabilities 113902 1765 180010 2491
Total 645348 10000 722771 10000
Assets
Net Block 369172 5721 358721 4963
Capital WIP 43781 678 68065 942
Investments 6582 102 6636 092
Current Assets
Inventories 111855 1733 99516 1377
Sundry Debtors 63134 978 67358 932
Cash amp Bank Balances 7188 111 6959 096
Loans amp Advances 43460 673 115409 1597
Fixed Deposits 176 003 107 001
Total 645348 10000 722771 10000
8102019 A Study A Study On Financial Performance Analysis With Reference To Kesoram Cementon Financial Performance hellip
httpslidepdfcomreaderfulla-study-a-study-on-financial-performance-analysis-with-reference-to-kesoram 6181
61
Interpretation of common size balance sheet of 2011-2012
Share capital was recorded 071 percent in the total liabilities in the year 2011 it is
decreased to 063 in the year 2012
Reserves amp surplus contributed to 1939 in the total liabilities in the year 2011 it
is decreased to 1199 in the year 2012
Secured loans were 3675 in the total liabilities in the year 2011 it is increased to
4397 in the year 2012
Current Liabilities shown to 1765 in the total liabilities in the year 2011 it is
increased to 2491 in the year 2012
Provisions 023 in the total liabilities in the year 2011 it is increased to 563 in the
year 2012
Fixed Assets were 5721 in the total liabilities in the year 2011 ie decreased to
4963 in the year 2012
Investments were 102 in the total liabilities in the year 2011 it increased to 092
in the year 2012
Sundry debtors were 978 in the total liabilities in the year 2011 it is decreased to
932 in the year 2012
8102019 A Study A Study On Financial Performance Analysis With Reference To Kesoram Cementon Financial Performance hellip
httpslidepdfcomreaderfulla-study-a-study-on-financial-performance-analysis-with-reference-to-kesoram 6281
Trend Analysis
Share Capital-
Year
Amount
(In Crores) Trend
IncreaseDecrease
Base Year Previous Year
2008 4574 10000 000 000
2009 4574 10000 000 000
2010 4574 10000 000 000
2011 4574 10000 000 000
2012 4574 10000 000 000
Trend Percentages in Share Capital
Share capital shown a constant trend in the period 2008 and 2012
Share capital is 4574 crores all the years from 2008-2012
8102019 A Study A Study On Financial Performance Analysis With Reference To Kesoram Cementon Financial Performance hellip
httpslidepdfcomreaderfulla-study-a-study-on-financial-performance-analysis-with-reference-to-kesoram 6381
Reserves amp Surplus-
Year
Amount
(In Crores) Trend
IncreaseDecrease
Base Year Previous Year
2008 93085 10000 000 000
2009 128024 13753 3753 3753
2010 149111 16019 6019 2266
2011 125162 13446 3446 -2573
2012 86657 9309 -691 -4137
Trend Percentages in Reserves amp Surplus
Reserves amp surplus shown an increasing trend in the period between 2008 and 2010
The average trend was 13277 till 2010
The Reserves amp surplus was showing decreasing trend in the period 2011-2012 (ie
from 16019 in 2010 to 9309 in 2012)
The decreasing trend in Reserves amp surplus indicates the decrease in profits of the
firm
8102019 A Study A Study On Financial Performance Analysis With Reference To Kesoram Cementon Financial Performance hellip
httpslidepdfcomreaderfulla-study-a-study-on-financial-performance-analysis-with-reference-to-kesoram 6481
Investments-
Year
Amount
(In Crores) Trend
IncreaseDecrease
Base Year Previous Year
2008 4783 10000 000 000
2009 6178 12917 2917 2917
2010 5143 10753 753 -2164
2011 6582 13761 3761 3009
2012 6636 13874 3874 113
Trend Percentages in Investments-
The investments are shown an increasing trend in the period between 2008 ndash 2009
and it is decreasing in the year 2010
The average trend was 11458 till 2009
The investments increased in the periods 2011-2012 (ie from 10753 in 2010 to
13874 in 2012)
The overall trend in investments shown is satisfactory
8102019 A Study A Study On Financial Performance Analysis With Reference To Kesoram Cementon Financial Performance hellip
httpslidepdfcomreaderfulla-study-a-study-on-financial-performance-analysis-with-reference-to-kesoram 6581
Net Current Assets-
Year
Amount
(In Crores) Trend
IncreaseDecrease
Base Year Previous Year
2008 30761 10000 000 000
2009 56954 18515 8515 8515
2010 77037 25044 15044 6529
2011 110417 35895 25895 10851
2012 68613 22305 12305 -13590
Trends in Net Current Assets-
The NCA shown positive (increasing) trend
The NCA are increased to 35895 (the year 2011) compared with base year and
decreased in the year 2012 to 22305
The NCA shown increased trend from year and crossed 100
The overall trend was good
8102019 A Study A Study On Financial Performance Analysis With Reference To Kesoram Cementon Financial Performance hellip
httpslidepdfcomreaderfulla-study-a-study-on-financial-performance-analysis-with-reference-to-kesoram 6681
66
Ratio Analysis-
Current Ratio-
Current Ratio = Current Assets Current Liabilities
Current assets are cash in hand Cash at bank Marketable Securities(short term) short term
Investment Bills receivables sundry debtors Inventories (stock) Work in progress prepaid
expenses Current Liabilities are outstanding expenses Bills payable sundry Creditors
short-term advances income tax payable and Dividend payable
Current Ratio of Kesoram-
(Rupees in crores)
Year Current Assets Current Liabilities Current Ratio
2007-08 75560 57067 132
2008-09 102580 66587 154
2009-10 153922 107688 143
2010-11 182177 113902 160
2011-12 173833 180010 097
Interpretation-
As per the standard rule of current ratio ie 21 where current assets double the current
liabilities is considered satisfactory
In the present analysis the current ratio of the Kesoram is not satisfactory
from the above table It was assessed that the current ratio for all the five year is lower (less)
than the standard rule ie 21 And it is 097 in the year 2011-2012 (current year) This is
highly UN satisfactory
8102019 A Study A Study On Financial Performance Analysis With Reference To Kesoram Cementon Financial Performance hellip
httpslidepdfcomreaderfulla-study-a-study-on-financial-performance-analysis-with-reference-to-kesoram 6781
Quick Ratio-
Quick ratio also known as acid-test ratio establishes a relationship between quick
assets and the current liabilities Cash is the most liquid asset It is calculated by dividing
quick assets by current liabilities
Quick ratio = Quick Assets Current Liabilities
(Quick Assets = Current assets ndash Inventory)
Quick Ratio of Kesoram-
Rupees in crores)
Year Total QuickAssets
Current Liabilities Quick Ratio
2007-08 33343 57067 058
2008-09 43674 66587 066
2009-10 62303 107688 058
2010-11 70322 113902 0622011-12 74333 180010 041
Interpretation-
Usually a high Quick ratio is an indication that the company is liquid and has the ability to
meet its current or liquid liabilities in time on the other hand a low Quick Ratio represents
8102019 A Study A Study On Financial Performance Analysis With Reference To Kesoram Cementon Financial Performance hellip
httpslidepdfcomreaderfulla-study-a-study-on-financial-performance-analysis-with-reference-to-kesoram 6881
that the companyrsquos liquidity position is not good The above table showing the quick ratios
of Kesoram are canrsquot be considered satisfactory
Leverage Ratios-
Debt-Equity Ratio-
Debt-Equity Ratio = Total Long Term Debt Equity Share Holders Fund
Total Long term Debt= Debenture Capital + Long term loans from banks and financial
institutions + Public deposits
Equity Share Holders fund = Equity + Reserves and Surplus
Debt Equity Ratio of Kesoram
(Rupees in crores)
Year Total Debt Share Holders Fund Debt Equity Ratio
2007-08 109235 98192 111
2008-09 197043 133010 148
2009-10 312622 154024 203
2010-11 399927 130025 308
2011-12 410534 91501 449
8102019 A Study A Study On Financial Performance Analysis With Reference To Kesoram Cementon Financial Performance hellip
httpslidepdfcomreaderfulla-study-a-study-on-financial-performance-analysis-with-reference-to-kesoram 6981
Interpretation-
The Debt-Equity Ratio accepted standard is 05 This ratio reflects the relative contribution
of creditors and owners of business in its financing From the above it is clear that the long
term debt is more than that of the share holdersrsquo fund So we can interpret that the firmrsquosassets are financed more by the external funds rather than by the internal funds
8102019 A Study A Study On Financial Performance Analysis With Reference To Kesoram Cementon Financial Performance hellip
httpslidepdfcomreaderfulla-study-a-study-on-financial-performance-analysis-with-reference-to-kesoram 7081
Fixed Asset Ratio-
Net Sales
Fixed Asset Ratio = helliphelliphelliphelliphelliphelliphelliphelliphelliphelliphellip
Net Assets
Fixed Asset Ratio of Kesoram-
(Rupees in crores)
Year Net Sales Net Assets Fixed Assets Ratio
2007-08 300271 358721 084
2008-09 389797 369172 106
2009-10 475062 343182 1382010-11 539788 180435 299
2011-12 59182 108424 546
Interpretation
This ratio indicates the extent to which the assets of the companyrsquos can be lost without
affecting the interest of the creditors of the company Higher the ratios better the long-term
position of the companyThe above table shows fixed assets ratio in increasing trend Which is good for the
company
8102019 A Study A Study On Financial Performance Analysis With Reference To Kesoram Cementon Financial Performance hellip
httpslidepdfcomreaderfulla-study-a-study-on-financial-performance-analysis-with-reference-to-kesoram 7181
Overall Profitability Ratios-
Net Profit Ratio
Net Profit Ratio indicates net margin on sales It is given by the following equation
Net Profit Ratio = (Net Profit Sales) 100
Net Profit Ratio of Kesoram
(Rupees in crores)
Year Net Profit Sales Net Profit Ratio
2007-08 37917 300271 1263
2008-09 41432 389797 1063
2009-10 20298 475062 427
2010-11 -28176 539788 -5222011-12 -38108 59182 -644
Interpretation
It establishes a relationship between net profits after tax and net sales and
indicates the efficiency of the management in manufacturing selling administrative and
other activities of the company
The higher the ratio the better is the profitability or performance of the business
The above table depicts the net profit Ratio of Kesoram has decreased every year from
2007-2008 to 2011-2012It further decreased to negative in the year 2010-11 to -522 and -
644 in the year 2011-2012 This shows constant decrease in the profits of the company
8102019 A Study A Study On Financial Performance Analysis With Reference To Kesoram Cementon Financial Performance hellip
httpslidepdfcomreaderfulla-study-a-study-on-financial-performance-analysis-with-reference-to-kesoram 7281
72
Return on Investment-
Net Profit
Return on Investment = helliphelliphelliphelliphelliphelliphelliphelliphelliphelliphelliphellip X 100
Share Holders Fund
Return on Investment Ratio of Kesoram-
(Rupees in crores)
Year Net Profit Share Holders Fund Return On Investment
2007-08 37917 98192 3862
2008-09 41432 133010 3115
2009-10 20298 154024 1318
2010-11 -28176 130025 -2167
2011-12 -38108 91501 -4165
Interpretation-
The above table reveals how well the resources of the firm are being used Higher
the ratio better the result The above ratio implies how well the firm is growing in
terms of profitability and efficiency From the above table we can concern that the return on
investment is in decreasing trend ROI is highest in the year 2007-2008 as 3862 But
there after itrsquos decreased every year
The ROI is negative in the years 2010-2011 amp 2011-2012 as -2167 amp -4165 respectively
Which is not a good sign for the firm
8102019 A Study A Study On Financial Performance Analysis With Reference To Kesoram Cementon Financial Performance hellip
httpslidepdfcomreaderfulla-study-a-study-on-financial-performance-analysis-with-reference-to-kesoram 7381
8102019 A Study A Study On Financial Performance Analysis With Reference To Kesoram Cementon Financial Performance hellip
httpslidepdfcomreaderfulla-study-a-study-on-financial-performance-analysis-with-reference-to-kesoram 7481
8102019 A Study A Study On Financial Performance Analysis With Reference To Kesoram Cementon Financial Performance hellip
httpslidepdfcomreaderfulla-study-a-study-on-financial-performance-analysis-with-reference-to-kesoram 7581
75
CHAPTER V
FINDINGS amp SUGGESTIONS
8102019 A Study A Study On Financial Performance Analysis With Reference To Kesoram Cementon Financial Performance hellip
httpslidepdfcomreaderfulla-study-a-study-on-financial-performance-analysis-with-reference-to-kesoram 7681
76
Findings
The Share capital remains constant Share capital is unchanged all the years from
2008-2012
Reserves amp surplus were recorded an increasing trend in the period between 2008
and 2010It is showing decreasing trend in the period 2011-2012 (ie from 16019
in 2010 to 9309 in 2012)
Current Liabilities were increased compared to base year ie 2008
Provisions increased to 262597 ie in Rupees 39232 crores in the current year
The current ratio for all the five year is lower (less) than the standard rule ie 21
And it is 097 in the year 2011-2012 (current year)
The Debt-Equity Ratio was shown under the standard ratio It is clear that the long
term debt is more than that of the share holdersrsquo fund It indicates that the firm
heavily relying on external funds rather than the internal funds
The operating and net profit of Kesoram is in decreasing trend due to heavy
increase of manufacturing amp administrative expenses
ROI is highest in the year 2007-2008 as 3862 The ROI is negative in the years
2010-2011 amp 2011-2012 as -2167 amp -4165 respectively
Return on Equity Capital Employed Ratio of Kesoram has decreased every year
from 2007-2008 to 2010-2011It further decreased to negative in the year 2011-12 to
-3280
EPS of Kesoram has decreased every year from 2008-12It is negative in the year
2011 amp 12
8102019 A Study A Study On Financial Performance Analysis With Reference To Kesoram Cementon Financial Performance hellip
httpslidepdfcomreaderfulla-study-a-study-on-financial-performance-analysis-with-reference-to-kesoram 7781
77
Suggestion
The organization should adopt an appropriate capital structure
The companyrsquos debt-equity ratio is recorded more or less as 111 in the year 2008
and it is increased to 449 in the year 2012 (current year)The company should
adopt a better debt equity mix in the future to control the fluctuations in returns
The company should control fluctuations in cash and bank balances as it impacts the
current ratio of the company
The provisions are showing increasing trend which indicates risk of debtors The
firm should implement an effective credit management policy It should utilize its
idle funds by decreasing provisions
The company should control heavy increase of manufacturing amp administration
expenses as it is impacting the operating and net profit of company
8102019 A Study A Study On Financial Performance Analysis With Reference To Kesoram Cementon Financial Performance hellip
httpslidepdfcomreaderfulla-study-a-study-on-financial-performance-analysis-with-reference-to-kesoram 7881
78
ANNEXURE
Profit And Loss Account of Kesoram Cement
Mar12 Mar11 Mar10 Mar09 Mar08
12 Months 12 Months 12 Months 12 Months 12 Months
INCOME
Sales Turnover 628260 575072 505151 431613 345700
Excise Duty 36440 35284 30089 41815 45429
NET SALES 591820 539788 475062 389797 300271
Other Income 000 000 000 000 000
TOTALINCOME
596129 548733 481019 393969 302020
EXPENDITURE
Manufacturing
Expenses81903 74803 13974 13153 44113
MaterialConsumed
370897 310150 295550 229359 118448
Personal
Expenses33468 27355 23294 18690 15344
Selling Expenses 81910 78253 58667 48846 45019
AdministrativeExpenses
28225 29308 17219 16179 9907
Expenses
Capitalized000 000 000 000 000
Provisions Made 000 000 000 000 000
TOTAL
EXPENDITURE 596403 519870 408704 326227 232832Operating Profit -4583 19918 66358 63570 67439
EBITDA -274 28864 72316 67742 69188
Depreciation 29740 27259 17280 11186 8927
Other Write-offs 000 000 000 000 000
EBIT -30014 1605 55035 56557 60261
Interest 41015 23983 10921 12087 5426
EBT -71029 -22377 44114 44470 54835
Taxes -32921 5798 23816 3037 16918
Profit and Loss
for the Year-38108 -28176 20298 41432 37917
Non RecurringItems
-1142 7063 3228 -4023 402
Other Non Cash
Adjustments1276 091 207 465 017
OtherAdjustments
000 000 000 000 000
REPORTED
PAT-37974 -21021 23734 37874 38335
8102019 A Study A Study On Financial Performance Analysis With Reference To Kesoram Cementon Financial Performance hellip
httpslidepdfcomreaderfulla-study-a-study-on-financial-performance-analysis-with-reference-to-kesoram 7981
79
Balance Sheet Of Kesoram
Years
Particulars 2008 2009 2010 2011 2012
Liabilities
Share Capital 4574 4574 4574 4574 4574Reserves amp Surplus 93085 128024 149111 125162 86657
Revaluation Reserves 533 412 339 289 27
Loans
Secured Loans 97106 153627 186372 237183 317792
Un Secured Loans 12129 43416 12625 162744 92742
Deferred Tax Liabilities 0 0 0 0 0
Current Liabilities
Provisions 33039 34529 35734 1494 40726
Current Liabilities 57067 66587 107688 113902 18001
Total 297533 431169 610068 645348 722771
Assets
Net Block 108424 180435 343182 369172 358721
Capital WIP 63459 86485 41283 43781 68065
Investments 4783 6178 5143 6582 6636
Current Assets
Inventories 44217 58906 91619 111855 99516
Sundry Debtors 27307 38017 54289 63134 67358
Cash amp Bank Balances 4036 5657 8014 7188 6959
Total Current Assets 7556 10258 153922 182177 173833Loans amp Advances 45289 55462 66506 4346 115409
Fixed Deposits 018 028 031 176 107
Total 297533 431169 610068 645348 722771
8102019 A Study A Study On Financial Performance Analysis With Reference To Kesoram Cementon Financial Performance hellip
httpslidepdfcomreaderfulla-study-a-study-on-financial-performance-analysis-with-reference-to-kesoram 8081
80
KEY ITEMS 2012 2011 2010 2009 2008
Preference
Dividend 0 0 0 0 0
Equity Dividend 457 2516 2516 2516 2516
Equity Dividend
() 999 55 55 55 55
Shares in Issue(Lakhs) 45743 45743 45743 45743 45743
EPS - Annualised
(Rs) -8302 -4595 5188 828 838
8102019 A Study A Study On Financial Performance Analysis With Reference To Kesoram Cementon Financial Performance hellip
httpslidepdfcomreaderfulla-study-a-study-on-financial-performance-analysis-with-reference-to-kesoram 8181
BIBLIOGRAPHY
Sl
No
Books Author Name
1 Financial Management Khan amp JAIN
2 Financial Management IMPandey
3 Management Accounting RPTrivedi
Websites amp Search Engines
1 wwwkesoramcom983086
2 wwwmoneycontrolcom
3 wwwgooglefinancecom983086
Annual reports of Kesoram cement limited 2008-2012
8102019 A Study A Study On Financial Performance Analysis With Reference To Kesoram Cementon Financial Performance hellip
httpslidepdfcomreaderfulla-study-a-study-on-financial-performance-analysis-with-reference-to-kesoram 3981
39
Comparative statements-
The comparative financial statements are statements of the financial position at
different periods of time the elements of financial position are show in a
Comparative Statement provides an idea of financial position at two or more
periods Generally two financial statements (balance sheet and income statement) are
prepared in comparative form for financial analysis
The Comparative Statement May Show-
1 Absolute figures (rupee amounts)
2 Changes in absolute figures ie increase or decrease in absolute figures
3 Absolute data in terms of percentages
4 Increase or decrease in terms of percentages
The Two Comparative Statements Are-
1 Comparative balance sheet and
2 Income statement
1 983107983151983149983152983137983154983137983156983145983158983141 983138983137983148983137983150983139983141 983155983144983141983141983156983085
The comparative balance sheet analysis is the study of the trend of the same items group of
items and computed items in two or more balance sheets of the same business enterprise on
different dates The change in periodic balance sheet items reflect the conduct of a business
the change can be observed by comparison of the balance sheet at the beginning and at the
end of a period and these changes can help in forming an opinion about the progress of an
enterprise
Guide Lines for Interpretation of Comparative Balance Sheet-
While interpreting comparative balance sheet the interpreter is expected to study the
following aspects-
1 Current financial position and liquidity position
2 Long-term financial position
3 Profitability of the concern
8102019 A Study A Study On Financial Performance Analysis With Reference To Kesoram Cementon Financial Performance hellip
httpslidepdfcomreaderfulla-study-a-study-on-financial-performance-analysis-with-reference-to-kesoram 4081
40
Common Size Statement-
The common-size statements balance sheet and income statement are show in
analytical percentages The figures are shown as percentages of total assets total liabilities
and total sales The total assets are taken as 100 and different assets are expressed as a
percentage of the total similarly various liabilities are taken as a part of total liabilities
Common Size Balance Sheet-
A statement in which balance sheet items are expressed as the ratio of each asset to
total assets and the ratio of each liability is expressed as a ratio of total liabilities is called
common size balance The common size balance sheet can be used to compare companies
of differing size The comparison of figures in different periods is not useful because total
figures may be affected by a number of factors It is not possible to establish standard norms
for various assets The trends of figures from year to year may not be studied and even they
may not give proper results
Trend Analysis of Balance Sheet-
Trend analysis is Very important tool of horizontal financial analysis
This analysis enables to known the change in the financial function and operating efficiency
in between the time period chosen
By studding the trend analysis of each item we can known the direction of changes and
based upon the direction of changes the options can be changed
Trend =Absolute Value of item in the statement understudy 100
Absolute Value of same item in the base statement
Ratio Analysis
Ratio analysis is used as a technique of analyzing the financial information contained in the
balance sheet and profit and loss accounts for a more meaningful understanding of the
financial position and performance of a firm
The relationship between two accounting figures expressed mathematically is known as a
financial ratio A ratio helps the analyst to make qualitative judgment about the firmrsquos
financial position and performance
Several ratios can be calculated from the accounting data contained in the financial
statements The parties which generally undertake financial analysis is short ndashterm
creditors long-term creditors owner and management In view of the requirements of the
various ratios ratios are classified into the following four important categories
8102019 A Study A Study On Financial Performance Analysis With Reference To Kesoram Cementon Financial Performance hellip
httpslidepdfcomreaderfulla-study-a-study-on-financial-performance-analysis-with-reference-to-kesoram 4181
41
Liquidity ratios
Leverage ratios
Activity ratios
Profitability ratios
Liquidity Ratios
It is extremely essential for a firm to be able to meet its obligations as they become due
Liquidity ratios measure the ability of the firm to meet its current obligations A firm should
ensure that it does not suffer from lack of liquidity and also that it does not have excess
liquidity The failure of a company to meet its obligations due to lack of sufficient liquidity
will result in a poor creditworthiness loss of creditorsrsquo confidence or even in legal tangles
resulting in the closure of the company A very high degree of liquidity is also bad idle
assets earn nothing The firmrsquos funds will be unnecessarily tied up in current assets
Therefore it is necessary to strike a proper balance high liquidity and lack of liquidity
The most common ratios which indicate the extent of liquidity or lack of it are
Current ratio
Quick ratio
Other ratios include Cash ratio Interval Measure and Net working capital ratio
Current Ratio
The current ratio is calculated by dividing current assets by current liabilities
Current assets
Current ratio = --------------------------
Current liabilities
Current ratio is a measure of the firmrsquos short term solvency It indicates the availability of
current assets in rupees for every one rupee of current liability A ratio of greater than one
means that the firm has more current assets than current claims against the Current ratio of
2 to 1 or more is considered satisfactory Current ratio represents a margin of safety for
creditors
Quick Ratio
Quick ratio also known as acid-test ratio establishes a relationship between quick assets and
the current liabilities Cash is the most liquid asset It is calculated by dividing quick assets
by current liabilities
Quick ratio = Quick Assets Current Liabilities
8102019 A Study A Study On Financial Performance Analysis With Reference To Kesoram Cementon Financial Performance hellip
httpslidepdfcomreaderfulla-study-a-study-on-financial-performance-analysis-with-reference-to-kesoram 4281
42
(Quick Assets = Current assets ndash Inventory)
One defect of the current ratio is that it fails to convey any information on the composition
of the current assets of the firm A rupee of cash is considered equivalent to a rupee of
inventory of receivables But it is not so A rupee of cash is more readily available to meet
current liabilities than a rupee of say inventory This implies the usefulness of the current
ratio
The Acid ndashtest ratio measures the firmrsquos ability to convert its current assets quickly into
cash in order to meet its current liabilities
A quick ratio of 1 to 1 is considered to represent a satisfactory current financial condition It
is an important index of the firmrsquos liquidity
Leverage Ratios
Leverage ratios identify the source of a firmrsquos capital ndashowners or outside creditors
Financial leverage refers to the use of debt in financing non-current assets If the return on
assets exceeds the cost of debt the leverage is successful ndash ie it improves return on equity
Debt ndashEquity Ratio
The Debt ndash Equity is determined to analyze the soundness of the long term financial
policies of the organization It is also known as ldquoInternal External Equity Ratiordquo
It is calculated as follows
Debt ndash Equity Ratio = Total long term debt Share holders funds
Equity Ratio
This ratio is also called as proprietary ratio establishes a relationship between share holderrsquos
funds to total assets of company Equity Ratio is calculated by dividing share holders fund
by total assets
Fixed Asset Ratio
This ratio indicates the extent to which the assets of the companyrsquos can be lost without
affecting the interest of the creditors of the company Higher the ratios better the long-term
position of the company
Activity Ratios
They are primarily used for studying a firmrsquos working capital situation A well managed
firm should have good activity ratios
8102019 A Study A Study On Financial Performance Analysis With Reference To Kesoram Cementon Financial Performance hellip
httpslidepdfcomreaderfulla-study-a-study-on-financial-performance-analysis-with-reference-to-kesoram 4381
43
Working Capital Turnover Ratio
The working capital turnover ratio indicates whether or not working capital has been
effectively used in making sales
Working capital turnover = Sales Net current assets
Inventory Turnover Ratio
This ratio also known as Stock Turnover Ratio establishes the relationship between costs of
goods sold or net sales during the given period and the average amt of stock held during the
period This ratio reveals the number of times finished stock in turnover during a given
accounting period
Higher the ratio the better is it because it shows the finished stock is rapidly turned
in to sales On the other hand a low stock turnover ratio is not desirable because it reveals
the accumulation of stock
Debtors Turnover Ratio
This ratio indicates the velocity of debt collection of a company In other words it shows
the number of times average turnover during a year
A Higher Debtor Turnover Ratio indicates a more efficient is the management towards
debtors and low ratio ratio implies inefficient management of debtors
Total Assets Turnover Ratio
The asset turnover ratio indicates how efficiently management is employing Assets
Total Assets Turnover Ratio = Sales Total Assets
Profitability Ratios
Profitability ratios are the ratios which measure a firmrsquos overall effectiveness as revealed by
the returns generated on sales and investment
General Profitability Ratios
1 Gross Profit Ratio
2 Net profit Ratio
3 Operating or Expenses Ratio
8102019 A Study A Study On Financial Performance Analysis With Reference To Kesoram Cementon Financial Performance hellip
httpslidepdfcomreaderfulla-study-a-study-on-financial-performance-analysis-with-reference-to-kesoram 4481
44
Gross Profit Ratio
Gross profit Ratio measures the relationships to net sales and is usually represented as a
percentage It is a good measure of profitability
The gross profit ratio indicates the extent to which selling price of goods per unit may
decline without resulting in losses on operation Higher the gross profit betters the result
Net Profit Ratio
Net Profit Ratio indicates net margin on sales It is given by the following equation
Net Profit Ratio = (Net Profit Sales) 100
Operating or Expenses Ratio
This ratio is complimentary of Net Profit Ratio The more the net profit the less the
Operating Ratio Operating costs include the cost of direct materials direct labors and otheroverheads viz are generally excluded from operating costs A comparison of the Operating
Ratio will indicate whether the cost efficiency is high or low in the figure of sales This less
the ratio it depicts the efficiency of the management
8102019 A Study A Study On Financial Performance Analysis With Reference To Kesoram Cementon Financial Performance hellip
httpslidepdfcomreaderfulla-study-a-study-on-financial-performance-analysis-with-reference-to-kesoram 4581
45
CHAPTER IV
DATA ANALYSIS amp INTERPRETATION
8102019 A Study A Study On Financial Performance Analysis With Reference To Kesoram Cementon Financial Performance hellip
httpslidepdfcomreaderfulla-study-a-study-on-financial-performance-analysis-with-reference-to-kesoram 4681
46
Comparative Balance Sheet of Kesoram in the Year between 2008-2009
(Rupee in crores)
Years Changes
Particulars 2008 2009 In Rupees In Percentage
Liabilities
Share Capital 4574 4574 000 000
Reserves amp Surplus 93085 128024 34939
Revaluation Reserves 533 412 -121 -2270
Loans
Secured Loans 97106 153627 56521 5821
Un Secured Loans 12129 43416 31287 25795
Deferred Tax Liabilities 000 000 000 000
Current Liabilities
Provisions 33039 34529 1490 451
Current Liabilities 57067 66587 9520 1668
Total 297533 431169 133636 4491
Assets
Net Block 108424 180435 72011 6642
Capital Wip 63459 86485 23026 3628
Investments 4783 6178 1395 2917
Current Assets
Inventories 44217 58906 14689 3322
Sundry Debtors 27307 38017 10710 3922
Cash amp Bank Balances 4036 5657 1621 4016
Total Current Assets 75560 102580 27020 3576
Loans amp Advances 45289 55462 10173 2246
Fixed Deposits 018 028 010 5556
Total 297533 431169 133636 4491
8102019 A Study A Study On Financial Performance Analysis With Reference To Kesoram Cementon Financial Performance hellip
httpslidepdfcomreaderfulla-study-a-study-on-financial-performance-analysis-with-reference-to-kesoram 4781
47
Interpretation of comparative balance sheet of 2008-2009
Reserves amp Surplus were increased to 3753 (percent) ie in Rupees 34939
crores
Revaluation Reserves decreased to 121 ie in Rupees 2270 crores
Secured Loans are increased to 5821 ie in Rupees 56521 crores And UN
secured loans highly Increased to 25795
Current liabilities and Provisions are increased to 1668 and 451 respectively ie in
Rupees 9520 amp 1490 crores
Fixed assets were highly increased to 6642 ie in Rupees 72011 crores
Investments were increased to 2917 ie in Rupees 1395 crores
Sundry debtors increased to 3922 ie in Rupees 10710 crores
Current assets increased 3576 ie in Rupees 27020 crores And Loans amp
Advances increased to 2246 respectively
The overall financial position was satisfactory
8102019 A Study A Study On Financial Performance Analysis With Reference To Kesoram Cementon Financial Performance hellip
httpslidepdfcomreaderfulla-study-a-study-on-financial-performance-analysis-with-reference-to-kesoram 4881
48
Comparative Balance Sheet of Kesoram in the Year between 2009-2010
(Rupees in crores)
Years Changes
Particulars 2009 2010 In Rupees In Percentage
Liabilities
Share Capital 4574 4574 000 000
Reserves amp Surplus 128024 149111 21087 1647
Revaluation Reserves 412 339 -073 -1772
Loans
Secured Loans 153627 186372 32745 2131
Un Secured Loans 43416 126250 82834 19079
Deferred Tax Liabilities 000 000 000
Current Liabilities
Provisions 34529 35734 1205 349
Current Liabilities 66587 107688 41101 6173
Total 431169 610068 178899 4149
Assets
Net Block 180435 343182 162747 9020
Capital WIP 86485 41283 -45202 -5227
Investments 6178 5143 -1035 -1675
Current Assets
Inventories 58906 91619 32713 5553
Sundry Debtors 38017 54289 16272 4280
Cash amp Bank Balances 5657 8014 2357 4167
Total Current Assets 102580 153922 51342 5005
Loans amp Advances 55462 66506 11044 1991
Fixed Deposits 028 031 003 1071
Total 431169 610068 178899 4149
8102019 A Study A Study On Financial Performance Analysis With Reference To Kesoram Cementon Financial Performance hellip
httpslidepdfcomreaderfulla-study-a-study-on-financial-performance-analysis-with-reference-to-kesoram 4981
49
Interpretation of comparative balance sheet of 2009-2010
Reserves amp surplus increased to 1647 ie in Rupees 21087 crores
Revaluation Reserves decreased to 1772 ie in Rupees 073 crores
Secured loans increased to 2131 ie in Rupees 32745 crores
Current Liabilities were increased to 6173 ie in Rupees 41101 crores and
Provisions 349 ie in Rupees 1205 crores
Fixed Assets were increased to 9020 ie in Rupees 162747 crores
Investments were decreased to 1675 ie in Rupees 1035 crores
Sundry debtors were increased to 4280 ie in Rupees 16272 crores
Current assets increased to 5005 ie in Rupees 51342 crores And loans and
Advances increased 1919 ie in Rupees 11044 crores
The overall financial position was satisfactory
8102019 A Study A Study On Financial Performance Analysis With Reference To Kesoram Cementon Financial Performance hellip
httpslidepdfcomreaderfulla-study-a-study-on-financial-performance-analysis-with-reference-to-kesoram 5081
50
Comparative Balance Sheet of Kesoram in the Year between 2010-2011
(Rupees in crores)
Years Changes
Particulars 2010 2011 In Rupees In Percentage
Liabilities
Share Capital 4574 4574 000 000
Reserves amp Surplus 149111 125162 -23949 -1606
Revaluation Reserves 339 289 -050 -1475
Loans
Secured Loans 186372 237183 50811 2726
Un Secured Loans 126250 162744 36494 2891
Deferred Tax Liabilities 000 000 000
Current Liabilities
Provisions 35734 1494 -34240 -9582
Current Liabilities 107688 113902 6214 577
Total 610068 645348 35280 578
Assets
Net Block 343182 369172 25990 757
Capital WIP 41283 43781 2498 605
Investments 5143 6582 1439 2798
Current Assets
Inventories 91619 111855 20236 2209
Sundry Debtors 54289 63134 8845 1629
Cash amp Bank Balances 8014 7188 -826 -1031
Total Current Assets 153922 182177 28255 1836
Loans amp Advances 66506 43460 -23046 -3465
Fixed Deposits 031 176 145 46774
Total 610068 645348 35280 578
8102019 A Study A Study On Financial Performance Analysis With Reference To Kesoram Cementon Financial Performance hellip
httpslidepdfcomreaderfulla-study-a-study-on-financial-performance-analysis-with-reference-to-kesoram 5181
51
Interpretation of comparative balance sheet of 2010-2011
Reserves amp surplus decreased to 1606 ie in Rupees 23949 crores
Revaluation Reserves decreased to 1475 ie in Rupees 050 crores
Secured loans increased to 2726 ie in Rupees 50811 crores
Current Liabilities were increased to 577 ie in Rupees 6214 crores
Provisions decreased to 9582 ie in Rupees 34240 crores
Fixed Assets were increased to 757 ie in Rupees 25990 crores
Investments were decreased to 2798 ie in Rupees 1439 crores
Sundry debtors were increased to 1629 ie in Rupees8845 crores
Current assets increased to 1836 ie in Rupees 28255 crores And loans and
Advances increased 3465 ie in Rupees 23046 crores
The overall financial position was UN satisfactory
8102019 A Study A Study On Financial Performance Analysis With Reference To Kesoram Cementon Financial Performance hellip
httpslidepdfcomreaderfulla-study-a-study-on-financial-performance-analysis-with-reference-to-kesoram 5281
52
Comparative Balance Sheet of Kesoram In The Year Between 2011-2012
(Rupees in crores)
Years Changes
Particulars 2011 2012 In Rupees In Percentage
Liabilities
Share Capital 4574 4574 000 000
Reserves amp Surplus 125162 86657 -38505 -3076
Revaluation Reserves 289 270 -019 -657
Loans
Secured Loans 237183 317792 80609 3399
Un Secured Loans 162744 92742 -70002 -4301
Deferred Tax Liabilities 000 000 000
Current Liabilities
Provisions 1494 40726 39232 262597
Current Liabilities 113902 180010 66108 5804
Total 645348 722771 77423 1200
Assets 000
Net Block 369172 358721 -10451 -283
Capital WIP 43781 68065 24284 5547
Investments 6582 6636 054 082
Current Assets
Inventories 111855 99516 -12339 -1103
Sundry Debtors 63134 67358 4224 669
Cash amp Bank Balances 7188 6959 -229 -319
Total Current Assets 182177 173833 -8344 -458
Loans amp Advances 43460 115409 71949 16555
Fixed Deposits 176 107 -069 -3920
Total 645348 722771 77423 1200
8102019 A Study A Study On Financial Performance Analysis With Reference To Kesoram Cementon Financial Performance hellip
httpslidepdfcomreaderfulla-study-a-study-on-financial-performance-analysis-with-reference-to-kesoram 5381
53
Interpretation of comparative balance sheet of 2011-2012
Reserves amp surplus decreased to 3076 ie in Rupee 38505 crores
Revaluation Reserves decreased to 657 ie in Rupees 019 crores
Secured loans increased to 3399 ie in Rupees 80699 crores
Current Liabilities were increased to 5804 ie in Rupees 66108 crores
Provisions increased to 262597 ie in Rupees 39232 crores
Fixed Assets were decreased to 283 ie in Rupee 10451 crores
Investments were increased to 082 ie in Rupees 054 crores
Sundry debtors were increased to 669 ie in Rupees 4224 crores
Current assets decreased to 458 ie in Rupees 8344 crores And loans and
Advances increased 16555 ie in Rupees 71949 crores
The overall financial position was UN satisfactory
8102019 A Study A Study On Financial Performance Analysis With Reference To Kesoram Cementon Financial Performance hellip
httpslidepdfcomreaderfulla-study-a-study-on-financial-performance-analysis-with-reference-to-kesoram 5481
54
Common Size Balance Sheet of Kesoram For The Year 2008-2009
(Rupees in crores)
Particulars 2008 Change Percentage 2009 Change Percentage
Liabilities
Share Capital 4574 154 4574 106
Reserves amp Surplus 93085 3129 128024 2969
Revaluation Reserves 533 018 412 010
Loans
Secured Loans 97106 3264 153627 3563
Un Secured Loans 12129 408 43416 1007
Deferred Tax Liabilities 000 000 000 000
Current Liabilities
Provisions 33039 1110 34529 801
Current Liabilities 57067 1918 66587 1544
Total 297533 10000 431169 10000
Assets
Net Block 108424 3644 180435 4185
Capital WIP 63459 2133 86485 2006
Investments 4783 161 6178 143
Current Assets
Inventories 44217 1486 58906 1366
Sundry Debtors 27307 918 38017 882
Cash amp Bank Balances 4036 136 5657 131
Loans amp Advances 45289 1522 55462 1286
Fixed Deposits 018 001 028 001
Total 297533 10000 431169 10000
8102019 A Study A Study On Financial Performance Analysis With Reference To Kesoram Cementon Financial Performance hellip
httpslidepdfcomreaderfulla-study-a-study-on-financial-performance-analysis-with-reference-to-kesoram 5581
55
Interpretation of Common Size Balance Sheet of 2008-2009
Share capital was recorded 154 percent in the total liabilities in the year 2008 it is
decreased to 106 in the year 2009
Reserves amp surplus contributed to 3129 in the total liabilities in the year 2008 it is
decreased to 2969 in the year 2009
Secured loans were 3264 in the total liabilities in the year 2008 it is increased to
3563 in the year 2009
Current Liabilities shown to 1918 in the total liabilities in the year 2008 it is
decreased to 1544 in the year 2009
Provisions 1110 in the total liabilities in the year 2008 it is decreased to 801 in the
year 2009
Fixed Assets were 3644 in the total liabilities in the year 2008 ie decreased to 4185
in the year 2009
Investments were 161 in the total liabilities in the year 2008 it is decreased to 143
in the year 2009
Sundry debtors were 918 in the total liabilities in the year 2008 it is decreased to 882
in the year 2009
8102019 A Study A Study On Financial Performance Analysis With Reference To Kesoram Cementon Financial Performance hellip
httpslidepdfcomreaderfulla-study-a-study-on-financial-performance-analysis-with-reference-to-kesoram 5681
56
Common Size Balance Sheet of Kesoram For The Year 2009-2010
(Rs in crores)
Particulars 2009 Change Percentage 2010Change
Percentage
Liabilities
Share Capital 4574 106 4574 075
Reserves amp Surplus 128024 2969 149111 2444
Revaluation Reserves 412 010 339 006
Loans
Secured Loans 153627 3563 186372 3055
Un Secured Loans 43416 1007 126250 2069
Deferred Tax Liabilities 000 000 000 000
Current Liabilities
Provisions 34529 801 35734 586
Current Liabilities 66587 1544 107688 1765
Total 431169 10000 610068 10000
Assets
Net Block 180435 4185 343182 5625
Capital WIP 86485 2006 41283 677
Investments 6178 143 5143 084
Current Assets
Inventories 58906 1366 91619 1502
Sundry Debtors 38017 882 54289 890
Cash amp Bank Balances 5657 131 8014 131
Loans amp Advances 55462 1286 66506 1090
Fixed Deposits 028 001 031 001
Total 431169 10000 610068 10000
8102019 A Study A Study On Financial Performance Analysis With Reference To Kesoram Cementon Financial Performance hellip
httpslidepdfcomreaderfulla-study-a-study-on-financial-performance-analysis-with-reference-to-kesoram 5781
57
Interpretation of common size balance sheet of 2009-2010
Share capital was recorded 106 percent in the total liabilities in the
year 2009 it is decreased to 075 in the year 2010
Reserves amp surplus contributed to 2969 in the total liabilities in the
year 2009 it is decreased to2444 in the year 2010
Secured loans were 3563 in the total liabilities in the year 2009 it is
increased to 3055 in the year 2010
Current Liabilities shown to 1544 in the total liabilities in the year
2009 it is decreased to 1765 in the year 2010
Provisions 801 in the total liabilities in the year 2009 it is decreased
to 586 in the year 2010
Fixed Assets were 4185 in the total liabilities in the year 2009 ie
increased to 5625 in the year 2010
Investments were 143 in the total liabilities in the year 2009 it is
decreased to 084 in the year 2010
Sundry debtors were 882 in the total liabilities in the year 2009 it is
increased to 890 in the year 2010
8102019 A Study A Study On Financial Performance Analysis With Reference To Kesoram Cementon Financial Performance hellip
httpslidepdfcomreaderfulla-study-a-study-on-financial-performance-analysis-with-reference-to-kesoram 5881
58
Common Size Balance sheet of Kesoram for the year 2010-2011
983080Rupees in crores)
Particulars 2010 Change Percentage 2011
Change
Percentage
Liabilities
Share Capital 4574 075 4574 071
Reserves amp Surplus 149111 2444 125162 1939
Revaluation Reserves 339 006 289 004
Loans
Secured Loans 186372 3055 237183 3675
Un Secured Loans 126250 2069 162744 2522
Deferred Tax Liabilities 000 000 000 000
Current Liabilities
Provisions 35734 586 1494 023
Current Liabilities 107688 1765 113902 1765
Total 610068 10000 645348 10000
Assets
Net Block 343182 5625 369172 5721
Capital WIP 41283 677 43781 678
Investments 5143 084 6582 102
Current Assets
Inventories 91619 1502 111855 1733
Sundry Debtors 54289 890 63134 978
Cash amp Bank Balances 8014 131 7188 111
Loans amp Advances 66506 1090 43460 673
Fixed Deposits 031 001 176 003
Total 610068 10000 645348 10000
8102019 A Study A Study On Financial Performance Analysis With Reference To Kesoram Cementon Financial Performance hellip
httpslidepdfcomreaderfulla-study-a-study-on-financial-performance-analysis-with-reference-to-kesoram 5981
59
Interpretation of Common Size Balance Sheet Of 2010-2011
Share capital was recorded 075 percent in the total liabilities in the year 2010 it is
decreased to 071 in the year 2011
Reserves amp surplus contributed to 2444 in the total liabilities in the year 2010 it is
decreased to1939 in the year 2011
Secured loans were 3055 in the total liabilities in the year 2010 it is increased to
3675 in the year 2011
Current Liabilities shown to 1765 in the total liabilities in the year 2010 it is
also1765 in the year 2011
Provisions 586 in the total liabilities in the year 2010 it is decreased to 023 in the
year 2011
Fixed Assets were 5625 in the total liabilities in the year 2010 ie increased to 5721
in the year 2011
Investments were 084 in the total liabilities in the year 2010 it increased to 102 in
the year 2011
Sundry debtors were 890 in the total liabilities in the year 2010 it is increased to 978
in the year 2011
8102019 A Study A Study On Financial Performance Analysis With Reference To Kesoram Cementon Financial Performance hellip
httpslidepdfcomreaderfulla-study-a-study-on-financial-performance-analysis-with-reference-to-kesoram 6081
60
Common Size Balance Sheet of Kesoram for the Year 2011-2012
983080Rupees in crores)
Particulars 2011 Change Percentage 2012
Change
Percentage
Liabilities
Share Capital 4574 071 4574 063
Reserves amp Surplus 125162 1939 86657 1199
Revaluation Reserves 289 004 270 004
Loans
Secured Loans 237183 3675 317792 4397
Un Secured Loans 162744 2522 92742 1283
Deferred Tax Liabilities 000 000 000 000
Current Liabilities
Provisions 1494 023 40726 563
Current Liabilities 113902 1765 180010 2491
Total 645348 10000 722771 10000
Assets
Net Block 369172 5721 358721 4963
Capital WIP 43781 678 68065 942
Investments 6582 102 6636 092
Current Assets
Inventories 111855 1733 99516 1377
Sundry Debtors 63134 978 67358 932
Cash amp Bank Balances 7188 111 6959 096
Loans amp Advances 43460 673 115409 1597
Fixed Deposits 176 003 107 001
Total 645348 10000 722771 10000
8102019 A Study A Study On Financial Performance Analysis With Reference To Kesoram Cementon Financial Performance hellip
httpslidepdfcomreaderfulla-study-a-study-on-financial-performance-analysis-with-reference-to-kesoram 6181
61
Interpretation of common size balance sheet of 2011-2012
Share capital was recorded 071 percent in the total liabilities in the year 2011 it is
decreased to 063 in the year 2012
Reserves amp surplus contributed to 1939 in the total liabilities in the year 2011 it
is decreased to 1199 in the year 2012
Secured loans were 3675 in the total liabilities in the year 2011 it is increased to
4397 in the year 2012
Current Liabilities shown to 1765 in the total liabilities in the year 2011 it is
increased to 2491 in the year 2012
Provisions 023 in the total liabilities in the year 2011 it is increased to 563 in the
year 2012
Fixed Assets were 5721 in the total liabilities in the year 2011 ie decreased to
4963 in the year 2012
Investments were 102 in the total liabilities in the year 2011 it increased to 092
in the year 2012
Sundry debtors were 978 in the total liabilities in the year 2011 it is decreased to
932 in the year 2012
8102019 A Study A Study On Financial Performance Analysis With Reference To Kesoram Cementon Financial Performance hellip
httpslidepdfcomreaderfulla-study-a-study-on-financial-performance-analysis-with-reference-to-kesoram 6281
Trend Analysis
Share Capital-
Year
Amount
(In Crores) Trend
IncreaseDecrease
Base Year Previous Year
2008 4574 10000 000 000
2009 4574 10000 000 000
2010 4574 10000 000 000
2011 4574 10000 000 000
2012 4574 10000 000 000
Trend Percentages in Share Capital
Share capital shown a constant trend in the period 2008 and 2012
Share capital is 4574 crores all the years from 2008-2012
8102019 A Study A Study On Financial Performance Analysis With Reference To Kesoram Cementon Financial Performance hellip
httpslidepdfcomreaderfulla-study-a-study-on-financial-performance-analysis-with-reference-to-kesoram 6381
Reserves amp Surplus-
Year
Amount
(In Crores) Trend
IncreaseDecrease
Base Year Previous Year
2008 93085 10000 000 000
2009 128024 13753 3753 3753
2010 149111 16019 6019 2266
2011 125162 13446 3446 -2573
2012 86657 9309 -691 -4137
Trend Percentages in Reserves amp Surplus
Reserves amp surplus shown an increasing trend in the period between 2008 and 2010
The average trend was 13277 till 2010
The Reserves amp surplus was showing decreasing trend in the period 2011-2012 (ie
from 16019 in 2010 to 9309 in 2012)
The decreasing trend in Reserves amp surplus indicates the decrease in profits of the
firm
8102019 A Study A Study On Financial Performance Analysis With Reference To Kesoram Cementon Financial Performance hellip
httpslidepdfcomreaderfulla-study-a-study-on-financial-performance-analysis-with-reference-to-kesoram 6481
Investments-
Year
Amount
(In Crores) Trend
IncreaseDecrease
Base Year Previous Year
2008 4783 10000 000 000
2009 6178 12917 2917 2917
2010 5143 10753 753 -2164
2011 6582 13761 3761 3009
2012 6636 13874 3874 113
Trend Percentages in Investments-
The investments are shown an increasing trend in the period between 2008 ndash 2009
and it is decreasing in the year 2010
The average trend was 11458 till 2009
The investments increased in the periods 2011-2012 (ie from 10753 in 2010 to
13874 in 2012)
The overall trend in investments shown is satisfactory
8102019 A Study A Study On Financial Performance Analysis With Reference To Kesoram Cementon Financial Performance hellip
httpslidepdfcomreaderfulla-study-a-study-on-financial-performance-analysis-with-reference-to-kesoram 6581
Net Current Assets-
Year
Amount
(In Crores) Trend
IncreaseDecrease
Base Year Previous Year
2008 30761 10000 000 000
2009 56954 18515 8515 8515
2010 77037 25044 15044 6529
2011 110417 35895 25895 10851
2012 68613 22305 12305 -13590
Trends in Net Current Assets-
The NCA shown positive (increasing) trend
The NCA are increased to 35895 (the year 2011) compared with base year and
decreased in the year 2012 to 22305
The NCA shown increased trend from year and crossed 100
The overall trend was good
8102019 A Study A Study On Financial Performance Analysis With Reference To Kesoram Cementon Financial Performance hellip
httpslidepdfcomreaderfulla-study-a-study-on-financial-performance-analysis-with-reference-to-kesoram 6681
66
Ratio Analysis-
Current Ratio-
Current Ratio = Current Assets Current Liabilities
Current assets are cash in hand Cash at bank Marketable Securities(short term) short term
Investment Bills receivables sundry debtors Inventories (stock) Work in progress prepaid
expenses Current Liabilities are outstanding expenses Bills payable sundry Creditors
short-term advances income tax payable and Dividend payable
Current Ratio of Kesoram-
(Rupees in crores)
Year Current Assets Current Liabilities Current Ratio
2007-08 75560 57067 132
2008-09 102580 66587 154
2009-10 153922 107688 143
2010-11 182177 113902 160
2011-12 173833 180010 097
Interpretation-
As per the standard rule of current ratio ie 21 where current assets double the current
liabilities is considered satisfactory
In the present analysis the current ratio of the Kesoram is not satisfactory
from the above table It was assessed that the current ratio for all the five year is lower (less)
than the standard rule ie 21 And it is 097 in the year 2011-2012 (current year) This is
highly UN satisfactory
8102019 A Study A Study On Financial Performance Analysis With Reference To Kesoram Cementon Financial Performance hellip
httpslidepdfcomreaderfulla-study-a-study-on-financial-performance-analysis-with-reference-to-kesoram 6781
Quick Ratio-
Quick ratio also known as acid-test ratio establishes a relationship between quick
assets and the current liabilities Cash is the most liquid asset It is calculated by dividing
quick assets by current liabilities
Quick ratio = Quick Assets Current Liabilities
(Quick Assets = Current assets ndash Inventory)
Quick Ratio of Kesoram-
Rupees in crores)
Year Total QuickAssets
Current Liabilities Quick Ratio
2007-08 33343 57067 058
2008-09 43674 66587 066
2009-10 62303 107688 058
2010-11 70322 113902 0622011-12 74333 180010 041
Interpretation-
Usually a high Quick ratio is an indication that the company is liquid and has the ability to
meet its current or liquid liabilities in time on the other hand a low Quick Ratio represents
8102019 A Study A Study On Financial Performance Analysis With Reference To Kesoram Cementon Financial Performance hellip
httpslidepdfcomreaderfulla-study-a-study-on-financial-performance-analysis-with-reference-to-kesoram 6881
that the companyrsquos liquidity position is not good The above table showing the quick ratios
of Kesoram are canrsquot be considered satisfactory
Leverage Ratios-
Debt-Equity Ratio-
Debt-Equity Ratio = Total Long Term Debt Equity Share Holders Fund
Total Long term Debt= Debenture Capital + Long term loans from banks and financial
institutions + Public deposits
Equity Share Holders fund = Equity + Reserves and Surplus
Debt Equity Ratio of Kesoram
(Rupees in crores)
Year Total Debt Share Holders Fund Debt Equity Ratio
2007-08 109235 98192 111
2008-09 197043 133010 148
2009-10 312622 154024 203
2010-11 399927 130025 308
2011-12 410534 91501 449
8102019 A Study A Study On Financial Performance Analysis With Reference To Kesoram Cementon Financial Performance hellip
httpslidepdfcomreaderfulla-study-a-study-on-financial-performance-analysis-with-reference-to-kesoram 6981
Interpretation-
The Debt-Equity Ratio accepted standard is 05 This ratio reflects the relative contribution
of creditors and owners of business in its financing From the above it is clear that the long
term debt is more than that of the share holdersrsquo fund So we can interpret that the firmrsquosassets are financed more by the external funds rather than by the internal funds
8102019 A Study A Study On Financial Performance Analysis With Reference To Kesoram Cementon Financial Performance hellip
httpslidepdfcomreaderfulla-study-a-study-on-financial-performance-analysis-with-reference-to-kesoram 7081
Fixed Asset Ratio-
Net Sales
Fixed Asset Ratio = helliphelliphelliphelliphelliphelliphelliphelliphelliphelliphellip
Net Assets
Fixed Asset Ratio of Kesoram-
(Rupees in crores)
Year Net Sales Net Assets Fixed Assets Ratio
2007-08 300271 358721 084
2008-09 389797 369172 106
2009-10 475062 343182 1382010-11 539788 180435 299
2011-12 59182 108424 546
Interpretation
This ratio indicates the extent to which the assets of the companyrsquos can be lost without
affecting the interest of the creditors of the company Higher the ratios better the long-term
position of the companyThe above table shows fixed assets ratio in increasing trend Which is good for the
company
8102019 A Study A Study On Financial Performance Analysis With Reference To Kesoram Cementon Financial Performance hellip
httpslidepdfcomreaderfulla-study-a-study-on-financial-performance-analysis-with-reference-to-kesoram 7181
Overall Profitability Ratios-
Net Profit Ratio
Net Profit Ratio indicates net margin on sales It is given by the following equation
Net Profit Ratio = (Net Profit Sales) 100
Net Profit Ratio of Kesoram
(Rupees in crores)
Year Net Profit Sales Net Profit Ratio
2007-08 37917 300271 1263
2008-09 41432 389797 1063
2009-10 20298 475062 427
2010-11 -28176 539788 -5222011-12 -38108 59182 -644
Interpretation
It establishes a relationship between net profits after tax and net sales and
indicates the efficiency of the management in manufacturing selling administrative and
other activities of the company
The higher the ratio the better is the profitability or performance of the business
The above table depicts the net profit Ratio of Kesoram has decreased every year from
2007-2008 to 2011-2012It further decreased to negative in the year 2010-11 to -522 and -
644 in the year 2011-2012 This shows constant decrease in the profits of the company
8102019 A Study A Study On Financial Performance Analysis With Reference To Kesoram Cementon Financial Performance hellip
httpslidepdfcomreaderfulla-study-a-study-on-financial-performance-analysis-with-reference-to-kesoram 7281
72
Return on Investment-
Net Profit
Return on Investment = helliphelliphelliphelliphelliphelliphelliphelliphelliphelliphelliphellip X 100
Share Holders Fund
Return on Investment Ratio of Kesoram-
(Rupees in crores)
Year Net Profit Share Holders Fund Return On Investment
2007-08 37917 98192 3862
2008-09 41432 133010 3115
2009-10 20298 154024 1318
2010-11 -28176 130025 -2167
2011-12 -38108 91501 -4165
Interpretation-
The above table reveals how well the resources of the firm are being used Higher
the ratio better the result The above ratio implies how well the firm is growing in
terms of profitability and efficiency From the above table we can concern that the return on
investment is in decreasing trend ROI is highest in the year 2007-2008 as 3862 But
there after itrsquos decreased every year
The ROI is negative in the years 2010-2011 amp 2011-2012 as -2167 amp -4165 respectively
Which is not a good sign for the firm
8102019 A Study A Study On Financial Performance Analysis With Reference To Kesoram Cementon Financial Performance hellip
httpslidepdfcomreaderfulla-study-a-study-on-financial-performance-analysis-with-reference-to-kesoram 7381
8102019 A Study A Study On Financial Performance Analysis With Reference To Kesoram Cementon Financial Performance hellip
httpslidepdfcomreaderfulla-study-a-study-on-financial-performance-analysis-with-reference-to-kesoram 7481
8102019 A Study A Study On Financial Performance Analysis With Reference To Kesoram Cementon Financial Performance hellip
httpslidepdfcomreaderfulla-study-a-study-on-financial-performance-analysis-with-reference-to-kesoram 7581
75
CHAPTER V
FINDINGS amp SUGGESTIONS
8102019 A Study A Study On Financial Performance Analysis With Reference To Kesoram Cementon Financial Performance hellip
httpslidepdfcomreaderfulla-study-a-study-on-financial-performance-analysis-with-reference-to-kesoram 7681
76
Findings
The Share capital remains constant Share capital is unchanged all the years from
2008-2012
Reserves amp surplus were recorded an increasing trend in the period between 2008
and 2010It is showing decreasing trend in the period 2011-2012 (ie from 16019
in 2010 to 9309 in 2012)
Current Liabilities were increased compared to base year ie 2008
Provisions increased to 262597 ie in Rupees 39232 crores in the current year
The current ratio for all the five year is lower (less) than the standard rule ie 21
And it is 097 in the year 2011-2012 (current year)
The Debt-Equity Ratio was shown under the standard ratio It is clear that the long
term debt is more than that of the share holdersrsquo fund It indicates that the firm
heavily relying on external funds rather than the internal funds
The operating and net profit of Kesoram is in decreasing trend due to heavy
increase of manufacturing amp administrative expenses
ROI is highest in the year 2007-2008 as 3862 The ROI is negative in the years
2010-2011 amp 2011-2012 as -2167 amp -4165 respectively
Return on Equity Capital Employed Ratio of Kesoram has decreased every year
from 2007-2008 to 2010-2011It further decreased to negative in the year 2011-12 to
-3280
EPS of Kesoram has decreased every year from 2008-12It is negative in the year
2011 amp 12
8102019 A Study A Study On Financial Performance Analysis With Reference To Kesoram Cementon Financial Performance hellip
httpslidepdfcomreaderfulla-study-a-study-on-financial-performance-analysis-with-reference-to-kesoram 7781
77
Suggestion
The organization should adopt an appropriate capital structure
The companyrsquos debt-equity ratio is recorded more or less as 111 in the year 2008
and it is increased to 449 in the year 2012 (current year)The company should
adopt a better debt equity mix in the future to control the fluctuations in returns
The company should control fluctuations in cash and bank balances as it impacts the
current ratio of the company
The provisions are showing increasing trend which indicates risk of debtors The
firm should implement an effective credit management policy It should utilize its
idle funds by decreasing provisions
The company should control heavy increase of manufacturing amp administration
expenses as it is impacting the operating and net profit of company
8102019 A Study A Study On Financial Performance Analysis With Reference To Kesoram Cementon Financial Performance hellip
httpslidepdfcomreaderfulla-study-a-study-on-financial-performance-analysis-with-reference-to-kesoram 7881
78
ANNEXURE
Profit And Loss Account of Kesoram Cement
Mar12 Mar11 Mar10 Mar09 Mar08
12 Months 12 Months 12 Months 12 Months 12 Months
INCOME
Sales Turnover 628260 575072 505151 431613 345700
Excise Duty 36440 35284 30089 41815 45429
NET SALES 591820 539788 475062 389797 300271
Other Income 000 000 000 000 000
TOTALINCOME
596129 548733 481019 393969 302020
EXPENDITURE
Manufacturing
Expenses81903 74803 13974 13153 44113
MaterialConsumed
370897 310150 295550 229359 118448
Personal
Expenses33468 27355 23294 18690 15344
Selling Expenses 81910 78253 58667 48846 45019
AdministrativeExpenses
28225 29308 17219 16179 9907
Expenses
Capitalized000 000 000 000 000
Provisions Made 000 000 000 000 000
TOTAL
EXPENDITURE 596403 519870 408704 326227 232832Operating Profit -4583 19918 66358 63570 67439
EBITDA -274 28864 72316 67742 69188
Depreciation 29740 27259 17280 11186 8927
Other Write-offs 000 000 000 000 000
EBIT -30014 1605 55035 56557 60261
Interest 41015 23983 10921 12087 5426
EBT -71029 -22377 44114 44470 54835
Taxes -32921 5798 23816 3037 16918
Profit and Loss
for the Year-38108 -28176 20298 41432 37917
Non RecurringItems
-1142 7063 3228 -4023 402
Other Non Cash
Adjustments1276 091 207 465 017
OtherAdjustments
000 000 000 000 000
REPORTED
PAT-37974 -21021 23734 37874 38335
8102019 A Study A Study On Financial Performance Analysis With Reference To Kesoram Cementon Financial Performance hellip
httpslidepdfcomreaderfulla-study-a-study-on-financial-performance-analysis-with-reference-to-kesoram 7981
79
Balance Sheet Of Kesoram
Years
Particulars 2008 2009 2010 2011 2012
Liabilities
Share Capital 4574 4574 4574 4574 4574Reserves amp Surplus 93085 128024 149111 125162 86657
Revaluation Reserves 533 412 339 289 27
Loans
Secured Loans 97106 153627 186372 237183 317792
Un Secured Loans 12129 43416 12625 162744 92742
Deferred Tax Liabilities 0 0 0 0 0
Current Liabilities
Provisions 33039 34529 35734 1494 40726
Current Liabilities 57067 66587 107688 113902 18001
Total 297533 431169 610068 645348 722771
Assets
Net Block 108424 180435 343182 369172 358721
Capital WIP 63459 86485 41283 43781 68065
Investments 4783 6178 5143 6582 6636
Current Assets
Inventories 44217 58906 91619 111855 99516
Sundry Debtors 27307 38017 54289 63134 67358
Cash amp Bank Balances 4036 5657 8014 7188 6959
Total Current Assets 7556 10258 153922 182177 173833Loans amp Advances 45289 55462 66506 4346 115409
Fixed Deposits 018 028 031 176 107
Total 297533 431169 610068 645348 722771
8102019 A Study A Study On Financial Performance Analysis With Reference To Kesoram Cementon Financial Performance hellip
httpslidepdfcomreaderfulla-study-a-study-on-financial-performance-analysis-with-reference-to-kesoram 8081
80
KEY ITEMS 2012 2011 2010 2009 2008
Preference
Dividend 0 0 0 0 0
Equity Dividend 457 2516 2516 2516 2516
Equity Dividend
() 999 55 55 55 55
Shares in Issue(Lakhs) 45743 45743 45743 45743 45743
EPS - Annualised
(Rs) -8302 -4595 5188 828 838
8102019 A Study A Study On Financial Performance Analysis With Reference To Kesoram Cementon Financial Performance hellip
httpslidepdfcomreaderfulla-study-a-study-on-financial-performance-analysis-with-reference-to-kesoram 8181
BIBLIOGRAPHY
Sl
No
Books Author Name
1 Financial Management Khan amp JAIN
2 Financial Management IMPandey
3 Management Accounting RPTrivedi
Websites amp Search Engines
1 wwwkesoramcom983086
2 wwwmoneycontrolcom
3 wwwgooglefinancecom983086
Annual reports of Kesoram cement limited 2008-2012

8102019 A Study A Study On Financial Performance Analysis With Reference To Kesoram Cementon Financial Performance hellip
httpslidepdfcomreaderfulla-study-a-study-on-financial-performance-analysis-with-reference-to-kesoram 4281
42
(Quick Assets = Current assets ndash Inventory)
One defect of the current ratio is that it fails to convey any information on the composition
of the current assets of the firm A rupee of cash is considered equivalent to a rupee of
inventory of receivables But it is not so A rupee of cash is more readily available to meet
current liabilities than a rupee of say inventory This implies the usefulness of the current
ratio
The Acid ndashtest ratio measures the firmrsquos ability to convert its current assets quickly into
cash in order to meet its current liabilities
A quick ratio of 1 to 1 is considered to represent a satisfactory current financial condition It
is an important index of the firmrsquos liquidity
Leverage Ratios
Leverage ratios identify the source of a firmrsquos capital ndashowners or outside creditors
Financial leverage refers to the use of debt in financing non-current assets If the return on
assets exceeds the cost of debt the leverage is successful ndash ie it improves return on equity
Debt ndashEquity Ratio
The Debt ndash Equity is determined to analyze the soundness of the long term financial
policies of the organization It is also known as ldquoInternal External Equity Ratiordquo
It is calculated as follows
Debt ndash Equity Ratio = Total long term debt Share holders funds
Equity Ratio
This ratio is also called as proprietary ratio establishes a relationship between share holderrsquos
funds to total assets of company Equity Ratio is calculated by dividing share holders fund
by total assets
Fixed Asset Ratio
This ratio indicates the extent to which the assets of the companyrsquos can be lost without
affecting the interest of the creditors of the company Higher the ratios better the long-term
position of the company
Activity Ratios
They are primarily used for studying a firmrsquos working capital situation A well managed
firm should have good activity ratios
8102019 A Study A Study On Financial Performance Analysis With Reference To Kesoram Cementon Financial Performance hellip
httpslidepdfcomreaderfulla-study-a-study-on-financial-performance-analysis-with-reference-to-kesoram 4381
43
Working Capital Turnover Ratio
The working capital turnover ratio indicates whether or not working capital has been
effectively used in making sales
Working capital turnover = Sales Net current assets
Inventory Turnover Ratio
This ratio also known as Stock Turnover Ratio establishes the relationship between costs of
goods sold or net sales during the given period and the average amt of stock held during the
period This ratio reveals the number of times finished stock in turnover during a given
accounting period
Higher the ratio the better is it because it shows the finished stock is rapidly turned
in to sales On the other hand a low stock turnover ratio is not desirable because it reveals
the accumulation of stock
Debtors Turnover Ratio
This ratio indicates the velocity of debt collection of a company In other words it shows
the number of times average turnover during a year
A Higher Debtor Turnover Ratio indicates a more efficient is the management towards
debtors and low ratio ratio implies inefficient management of debtors
Total Assets Turnover Ratio
The asset turnover ratio indicates how efficiently management is employing Assets
Total Assets Turnover Ratio = Sales Total Assets
Profitability Ratios
Profitability ratios are the ratios which measure a firmrsquos overall effectiveness as revealed by
the returns generated on sales and investment
General Profitability Ratios
1 Gross Profit Ratio
2 Net profit Ratio
3 Operating or Expenses Ratio
8102019 A Study A Study On Financial Performance Analysis With Reference To Kesoram Cementon Financial Performance hellip
httpslidepdfcomreaderfulla-study-a-study-on-financial-performance-analysis-with-reference-to-kesoram 4481
44
Gross Profit Ratio
Gross profit Ratio measures the relationships to net sales and is usually represented as a
percentage It is a good measure of profitability
The gross profit ratio indicates the extent to which selling price of goods per unit may
decline without resulting in losses on operation Higher the gross profit betters the result
Net Profit Ratio
Net Profit Ratio indicates net margin on sales It is given by the following equation
Net Profit Ratio = (Net Profit Sales) 100
Operating or Expenses Ratio
This ratio is complimentary of Net Profit Ratio The more the net profit the less the
Operating Ratio Operating costs include the cost of direct materials direct labors and otheroverheads viz are generally excluded from operating costs A comparison of the Operating
Ratio will indicate whether the cost efficiency is high or low in the figure of sales This less
the ratio it depicts the efficiency of the management
8102019 A Study A Study On Financial Performance Analysis With Reference To Kesoram Cementon Financial Performance hellip
httpslidepdfcomreaderfulla-study-a-study-on-financial-performance-analysis-with-reference-to-kesoram 4581
45
CHAPTER IV
DATA ANALYSIS amp INTERPRETATION
8102019 A Study A Study On Financial Performance Analysis With Reference To Kesoram Cementon Financial Performance hellip
httpslidepdfcomreaderfulla-study-a-study-on-financial-performance-analysis-with-reference-to-kesoram 4681
46
Comparative Balance Sheet of Kesoram in the Year between 2008-2009
(Rupee in crores)
Years Changes
Particulars 2008 2009 In Rupees In Percentage
Liabilities
Share Capital 4574 4574 000 000
Reserves amp Surplus 93085 128024 34939
Revaluation Reserves 533 412 -121 -2270
Loans
Secured Loans 97106 153627 56521 5821
Un Secured Loans 12129 43416 31287 25795
Deferred Tax Liabilities 000 000 000 000
Current Liabilities
Provisions 33039 34529 1490 451
Current Liabilities 57067 66587 9520 1668
Total 297533 431169 133636 4491
Assets
Net Block 108424 180435 72011 6642
Capital Wip 63459 86485 23026 3628
Investments 4783 6178 1395 2917
Current Assets
Inventories 44217 58906 14689 3322
Sundry Debtors 27307 38017 10710 3922
Cash amp Bank Balances 4036 5657 1621 4016
Total Current Assets 75560 102580 27020 3576
Loans amp Advances 45289 55462 10173 2246
Fixed Deposits 018 028 010 5556
Total 297533 431169 133636 4491
8102019 A Study A Study On Financial Performance Analysis With Reference To Kesoram Cementon Financial Performance hellip
httpslidepdfcomreaderfulla-study-a-study-on-financial-performance-analysis-with-reference-to-kesoram 4781
47
Interpretation of comparative balance sheet of 2008-2009
Reserves amp Surplus were increased to 3753 (percent) ie in Rupees 34939
crores
Revaluation Reserves decreased to 121 ie in Rupees 2270 crores
Secured Loans are increased to 5821 ie in Rupees 56521 crores And UN
secured loans highly Increased to 25795
Current liabilities and Provisions are increased to 1668 and 451 respectively ie in
Rupees 9520 amp 1490 crores
Fixed assets were highly increased to 6642 ie in Rupees 72011 crores
Investments were increased to 2917 ie in Rupees 1395 crores
Sundry debtors increased to 3922 ie in Rupees 10710 crores
Current assets increased 3576 ie in Rupees 27020 crores And Loans amp
Advances increased to 2246 respectively
The overall financial position was satisfactory
8102019 A Study A Study On Financial Performance Analysis With Reference To Kesoram Cementon Financial Performance hellip
httpslidepdfcomreaderfulla-study-a-study-on-financial-performance-analysis-with-reference-to-kesoram 4881
48
Comparative Balance Sheet of Kesoram in the Year between 2009-2010
(Rupees in crores)
Years Changes
Particulars 2009 2010 In Rupees In Percentage
Liabilities
Share Capital 4574 4574 000 000
Reserves amp Surplus 128024 149111 21087 1647
Revaluation Reserves 412 339 -073 -1772
Loans
Secured Loans 153627 186372 32745 2131
Un Secured Loans 43416 126250 82834 19079
Deferred Tax Liabilities 000 000 000
Current Liabilities
Provisions 34529 35734 1205 349
Current Liabilities 66587 107688 41101 6173
Total 431169 610068 178899 4149
Assets
Net Block 180435 343182 162747 9020
Capital WIP 86485 41283 -45202 -5227
Investments 6178 5143 -1035 -1675
Current Assets
Inventories 58906 91619 32713 5553
Sundry Debtors 38017 54289 16272 4280
Cash amp Bank Balances 5657 8014 2357 4167
Total Current Assets 102580 153922 51342 5005
Loans amp Advances 55462 66506 11044 1991
Fixed Deposits 028 031 003 1071
Total 431169 610068 178899 4149
8102019 A Study A Study On Financial Performance Analysis With Reference To Kesoram Cementon Financial Performance hellip
httpslidepdfcomreaderfulla-study-a-study-on-financial-performance-analysis-with-reference-to-kesoram 4981
49
Interpretation of comparative balance sheet of 2009-2010
Reserves amp surplus increased to 1647 ie in Rupees 21087 crores
Revaluation Reserves decreased to 1772 ie in Rupees 073 crores
Secured loans increased to 2131 ie in Rupees 32745 crores
Current Liabilities were increased to 6173 ie in Rupees 41101 crores and
Provisions 349 ie in Rupees 1205 crores
Fixed Assets were increased to 9020 ie in Rupees 162747 crores
Investments were decreased to 1675 ie in Rupees 1035 crores
Sundry debtors were increased to 4280 ie in Rupees 16272 crores
Current assets increased to 5005 ie in Rupees 51342 crores And loans and
Advances increased 1919 ie in Rupees 11044 crores
The overall financial position was satisfactory
8102019 A Study A Study On Financial Performance Analysis With Reference To Kesoram Cementon Financial Performance hellip
httpslidepdfcomreaderfulla-study-a-study-on-financial-performance-analysis-with-reference-to-kesoram 5081
50
Comparative Balance Sheet of Kesoram in the Year between 2010-2011
(Rupees in crores)
Years Changes
Particulars 2010 2011 In Rupees In Percentage
Liabilities
Share Capital 4574 4574 000 000
Reserves amp Surplus 149111 125162 -23949 -1606
Revaluation Reserves 339 289 -050 -1475
Loans
Secured Loans 186372 237183 50811 2726
Un Secured Loans 126250 162744 36494 2891
Deferred Tax Liabilities 000 000 000
Current Liabilities
Provisions 35734 1494 -34240 -9582
Current Liabilities 107688 113902 6214 577
Total 610068 645348 35280 578
Assets
Net Block 343182 369172 25990 757
Capital WIP 41283 43781 2498 605
Investments 5143 6582 1439 2798
Current Assets
Inventories 91619 111855 20236 2209
Sundry Debtors 54289 63134 8845 1629
Cash amp Bank Balances 8014 7188 -826 -1031
Total Current Assets 153922 182177 28255 1836
Loans amp Advances 66506 43460 -23046 -3465
Fixed Deposits 031 176 145 46774
Total 610068 645348 35280 578
8102019 A Study A Study On Financial Performance Analysis With Reference To Kesoram Cementon Financial Performance hellip
httpslidepdfcomreaderfulla-study-a-study-on-financial-performance-analysis-with-reference-to-kesoram 5181
51
Interpretation of comparative balance sheet of 2010-2011
Reserves amp surplus decreased to 1606 ie in Rupees 23949 crores
Revaluation Reserves decreased to 1475 ie in Rupees 050 crores
Secured loans increased to 2726 ie in Rupees 50811 crores
Current Liabilities were increased to 577 ie in Rupees 6214 crores
Provisions decreased to 9582 ie in Rupees 34240 crores
Fixed Assets were increased to 757 ie in Rupees 25990 crores
Investments were decreased to 2798 ie in Rupees 1439 crores
Sundry debtors were increased to 1629 ie in Rupees8845 crores
Current assets increased to 1836 ie in Rupees 28255 crores And loans and
Advances increased 3465 ie in Rupees 23046 crores
The overall financial position was UN satisfactory
8102019 A Study A Study On Financial Performance Analysis With Reference To Kesoram Cementon Financial Performance hellip
httpslidepdfcomreaderfulla-study-a-study-on-financial-performance-analysis-with-reference-to-kesoram 5281
52
Comparative Balance Sheet of Kesoram In The Year Between 2011-2012
(Rupees in crores)
Years Changes
Particulars 2011 2012 In Rupees In Percentage
Liabilities
Share Capital 4574 4574 000 000
Reserves amp Surplus 125162 86657 -38505 -3076
Revaluation Reserves 289 270 -019 -657
Loans
Secured Loans 237183 317792 80609 3399
Un Secured Loans 162744 92742 -70002 -4301
Deferred Tax Liabilities 000 000 000
Current Liabilities
Provisions 1494 40726 39232 262597
Current Liabilities 113902 180010 66108 5804
Total 645348 722771 77423 1200
Assets 000
Net Block 369172 358721 -10451 -283
Capital WIP 43781 68065 24284 5547
Investments 6582 6636 054 082
Current Assets
Inventories 111855 99516 -12339 -1103
Sundry Debtors 63134 67358 4224 669
Cash amp Bank Balances 7188 6959 -229 -319
Total Current Assets 182177 173833 -8344 -458
Loans amp Advances 43460 115409 71949 16555
Fixed Deposits 176 107 -069 -3920
Total 645348 722771 77423 1200
8102019 A Study A Study On Financial Performance Analysis With Reference To Kesoram Cementon Financial Performance hellip
httpslidepdfcomreaderfulla-study-a-study-on-financial-performance-analysis-with-reference-to-kesoram 5381
53
Interpretation of comparative balance sheet of 2011-2012
Reserves amp surplus decreased to 3076 ie in Rupee 38505 crores
Revaluation Reserves decreased to 657 ie in Rupees 019 crores
Secured loans increased to 3399 ie in Rupees 80699 crores
Current Liabilities were increased to 5804 ie in Rupees 66108 crores
Provisions increased to 262597 ie in Rupees 39232 crores
Fixed Assets were decreased to 283 ie in Rupee 10451 crores
Investments were increased to 082 ie in Rupees 054 crores
Sundry debtors were increased to 669 ie in Rupees 4224 crores
Current assets decreased to 458 ie in Rupees 8344 crores And loans and
Advances increased 16555 ie in Rupees 71949 crores
The overall financial position was UN satisfactory
8102019 A Study A Study On Financial Performance Analysis With Reference To Kesoram Cementon Financial Performance hellip
httpslidepdfcomreaderfulla-study-a-study-on-financial-performance-analysis-with-reference-to-kesoram 5481
54
Common Size Balance Sheet of Kesoram For The Year 2008-2009
(Rupees in crores)
Particulars 2008 Change Percentage 2009 Change Percentage
Liabilities
Share Capital 4574 154 4574 106
Reserves amp Surplus 93085 3129 128024 2969
Revaluation Reserves 533 018 412 010
Loans
Secured Loans 97106 3264 153627 3563
Un Secured Loans 12129 408 43416 1007
Deferred Tax Liabilities 000 000 000 000
Current Liabilities
Provisions 33039 1110 34529 801
Current Liabilities 57067 1918 66587 1544
Total 297533 10000 431169 10000
Assets
Net Block 108424 3644 180435 4185
Capital WIP 63459 2133 86485 2006
Investments 4783 161 6178 143
Current Assets
Inventories 44217 1486 58906 1366
Sundry Debtors 27307 918 38017 882
Cash amp Bank Balances 4036 136 5657 131
Loans amp Advances 45289 1522 55462 1286
Fixed Deposits 018 001 028 001
Total 297533 10000 431169 10000
8102019 A Study A Study On Financial Performance Analysis With Reference To Kesoram Cementon Financial Performance hellip
httpslidepdfcomreaderfulla-study-a-study-on-financial-performance-analysis-with-reference-to-kesoram 5581
55
Interpretation of Common Size Balance Sheet of 2008-2009
Share capital was recorded 154 percent in the total liabilities in the year 2008 it is
decreased to 106 in the year 2009
Reserves amp surplus contributed to 3129 in the total liabilities in the year 2008 it is
decreased to 2969 in the year 2009
Secured loans were 3264 in the total liabilities in the year 2008 it is increased to
3563 in the year 2009
Current Liabilities shown to 1918 in the total liabilities in the year 2008 it is
decreased to 1544 in the year 2009
Provisions 1110 in the total liabilities in the year 2008 it is decreased to 801 in the
year 2009
Fixed Assets were 3644 in the total liabilities in the year 2008 ie decreased to 4185
in the year 2009
Investments were 161 in the total liabilities in the year 2008 it is decreased to 143
in the year 2009
Sundry debtors were 918 in the total liabilities in the year 2008 it is decreased to 882
in the year 2009
8102019 A Study A Study On Financial Performance Analysis With Reference To Kesoram Cementon Financial Performance hellip
httpslidepdfcomreaderfulla-study-a-study-on-financial-performance-analysis-with-reference-to-kesoram 5681
56
Common Size Balance Sheet of Kesoram For The Year 2009-2010
(Rs in crores)
Particulars 2009 Change Percentage 2010Change
Percentage
Liabilities
Share Capital 4574 106 4574 075
Reserves amp Surplus 128024 2969 149111 2444
Revaluation Reserves 412 010 339 006
Loans
Secured Loans 153627 3563 186372 3055
Un Secured Loans 43416 1007 126250 2069
Deferred Tax Liabilities 000 000 000 000
Current Liabilities
Provisions 34529 801 35734 586
Current Liabilities 66587 1544 107688 1765
Total 431169 10000 610068 10000
Assets
Net Block 180435 4185 343182 5625
Capital WIP 86485 2006 41283 677
Investments 6178 143 5143 084
Current Assets
Inventories 58906 1366 91619 1502
Sundry Debtors 38017 882 54289 890
Cash amp Bank Balances 5657 131 8014 131
Loans amp Advances 55462 1286 66506 1090
Fixed Deposits 028 001 031 001
Total 431169 10000 610068 10000
8102019 A Study A Study On Financial Performance Analysis With Reference To Kesoram Cementon Financial Performance hellip
httpslidepdfcomreaderfulla-study-a-study-on-financial-performance-analysis-with-reference-to-kesoram 5781
57
Interpretation of common size balance sheet of 2009-2010
Share capital was recorded 106 percent in the total liabilities in the
year 2009 it is decreased to 075 in the year 2010
Reserves amp surplus contributed to 2969 in the total liabilities in the
year 2009 it is decreased to2444 in the year 2010
Secured loans were 3563 in the total liabilities in the year 2009 it is
increased to 3055 in the year 2010
Current Liabilities shown to 1544 in the total liabilities in the year
2009 it is decreased to 1765 in the year 2010
Provisions 801 in the total liabilities in the year 2009 it is decreased
to 586 in the year 2010
Fixed Assets were 4185 in the total liabilities in the year 2009 ie
increased to 5625 in the year 2010
Investments were 143 in the total liabilities in the year 2009 it is
decreased to 084 in the year 2010
Sundry debtors were 882 in the total liabilities in the year 2009 it is
increased to 890 in the year 2010
8102019 A Study A Study On Financial Performance Analysis With Reference To Kesoram Cementon Financial Performance hellip
httpslidepdfcomreaderfulla-study-a-study-on-financial-performance-analysis-with-reference-to-kesoram 5881
58
Common Size Balance sheet of Kesoram for the year 2010-2011
983080Rupees in crores)
Particulars 2010 Change Percentage 2011
Change
Percentage
Liabilities
Share Capital 4574 075 4574 071
Reserves amp Surplus 149111 2444 125162 1939
Revaluation Reserves 339 006 289 004
Loans
Secured Loans 186372 3055 237183 3675
Un Secured Loans 126250 2069 162744 2522
Deferred Tax Liabilities 000 000 000 000
Current Liabilities
Provisions 35734 586 1494 023
Current Liabilities 107688 1765 113902 1765
Total 610068 10000 645348 10000
Assets
Net Block 343182 5625 369172 5721
Capital WIP 41283 677 43781 678
Investments 5143 084 6582 102
Current Assets
Inventories 91619 1502 111855 1733
Sundry Debtors 54289 890 63134 978
Cash amp Bank Balances 8014 131 7188 111
Loans amp Advances 66506 1090 43460 673
Fixed Deposits 031 001 176 003
Total 610068 10000 645348 10000
8102019 A Study A Study On Financial Performance Analysis With Reference To Kesoram Cementon Financial Performance hellip
httpslidepdfcomreaderfulla-study-a-study-on-financial-performance-analysis-with-reference-to-kesoram 5981
59
Interpretation of Common Size Balance Sheet Of 2010-2011
Share capital was recorded 075 percent in the total liabilities in the year 2010 it is
decreased to 071 in the year 2011
Reserves amp surplus contributed to 2444 in the total liabilities in the year 2010 it is
decreased to1939 in the year 2011
Secured loans were 3055 in the total liabilities in the year 2010 it is increased to
3675 in the year 2011
Current Liabilities shown to 1765 in the total liabilities in the year 2010 it is
also1765 in the year 2011
Provisions 586 in the total liabilities in the year 2010 it is decreased to 023 in the
year 2011
Fixed Assets were 5625 in the total liabilities in the year 2010 ie increased to 5721
in the year 2011
Investments were 084 in the total liabilities in the year 2010 it increased to 102 in
the year 2011
Sundry debtors were 890 in the total liabilities in the year 2010 it is increased to 978
in the year 2011
8102019 A Study A Study On Financial Performance Analysis With Reference To Kesoram Cementon Financial Performance hellip
httpslidepdfcomreaderfulla-study-a-study-on-financial-performance-analysis-with-reference-to-kesoram 6081
60
Common Size Balance Sheet of Kesoram for the Year 2011-2012
983080Rupees in crores)
Particulars 2011 Change Percentage 2012
Change
Percentage
Liabilities
Share Capital 4574 071 4574 063
Reserves amp Surplus 125162 1939 86657 1199
Revaluation Reserves 289 004 270 004
Loans
Secured Loans 237183 3675 317792 4397
Un Secured Loans 162744 2522 92742 1283
Deferred Tax Liabilities 000 000 000 000
Current Liabilities
Provisions 1494 023 40726 563
Current Liabilities 113902 1765 180010 2491
Total 645348 10000 722771 10000
Assets
Net Block 369172 5721 358721 4963
Capital WIP 43781 678 68065 942
Investments 6582 102 6636 092
Current Assets
Inventories 111855 1733 99516 1377
Sundry Debtors 63134 978 67358 932
Cash amp Bank Balances 7188 111 6959 096
Loans amp Advances 43460 673 115409 1597
Fixed Deposits 176 003 107 001
Total 645348 10000 722771 10000
8102019 A Study A Study On Financial Performance Analysis With Reference To Kesoram Cementon Financial Performance hellip
httpslidepdfcomreaderfulla-study-a-study-on-financial-performance-analysis-with-reference-to-kesoram 6181
61
Interpretation of common size balance sheet of 2011-2012
Share capital was recorded 071 percent in the total liabilities in the year 2011 it is
decreased to 063 in the year 2012
Reserves amp surplus contributed to 1939 in the total liabilities in the year 2011 it
is decreased to 1199 in the year 2012
Secured loans were 3675 in the total liabilities in the year 2011 it is increased to
4397 in the year 2012
Current Liabilities shown to 1765 in the total liabilities in the year 2011 it is
increased to 2491 in the year 2012
Provisions 023 in the total liabilities in the year 2011 it is increased to 563 in the
year 2012
Fixed Assets were 5721 in the total liabilities in the year 2011 ie decreased to
4963 in the year 2012
Investments were 102 in the total liabilities in the year 2011 it increased to 092
in the year 2012
Sundry debtors were 978 in the total liabilities in the year 2011 it is decreased to
932 in the year 2012
8102019 A Study A Study On Financial Performance Analysis With Reference To Kesoram Cementon Financial Performance hellip
httpslidepdfcomreaderfulla-study-a-study-on-financial-performance-analysis-with-reference-to-kesoram 6281
Trend Analysis
Share Capital-
Year
Amount
(In Crores) Trend
IncreaseDecrease
Base Year Previous Year
2008 4574 10000 000 000
2009 4574 10000 000 000
2010 4574 10000 000 000
2011 4574 10000 000 000
2012 4574 10000 000 000
Trend Percentages in Share Capital
Share capital shown a constant trend in the period 2008 and 2012
Share capital is 4574 crores all the years from 2008-2012
8102019 A Study A Study On Financial Performance Analysis With Reference To Kesoram Cementon Financial Performance hellip
httpslidepdfcomreaderfulla-study-a-study-on-financial-performance-analysis-with-reference-to-kesoram 6381
Reserves amp Surplus-
Year
Amount
(In Crores) Trend
IncreaseDecrease
Base Year Previous Year
2008 93085 10000 000 000
2009 128024 13753 3753 3753
2010 149111 16019 6019 2266
2011 125162 13446 3446 -2573
2012 86657 9309 -691 -4137
Trend Percentages in Reserves amp Surplus
Reserves amp surplus shown an increasing trend in the period between 2008 and 2010
The average trend was 13277 till 2010
The Reserves amp surplus was showing decreasing trend in the period 2011-2012 (ie
from 16019 in 2010 to 9309 in 2012)
The decreasing trend in Reserves amp surplus indicates the decrease in profits of the
firm
8102019 A Study A Study On Financial Performance Analysis With Reference To Kesoram Cementon Financial Performance hellip
httpslidepdfcomreaderfulla-study-a-study-on-financial-performance-analysis-with-reference-to-kesoram 6481
Investments-
Year
Amount
(In Crores) Trend
IncreaseDecrease
Base Year Previous Year
2008 4783 10000 000 000
2009 6178 12917 2917 2917
2010 5143 10753 753 -2164
2011 6582 13761 3761 3009
2012 6636 13874 3874 113
Trend Percentages in Investments-
The investments are shown an increasing trend in the period between 2008 ndash 2009
and it is decreasing in the year 2010
The average trend was 11458 till 2009
The investments increased in the periods 2011-2012 (ie from 10753 in 2010 to
13874 in 2012)
The overall trend in investments shown is satisfactory
8102019 A Study A Study On Financial Performance Analysis With Reference To Kesoram Cementon Financial Performance hellip
httpslidepdfcomreaderfulla-study-a-study-on-financial-performance-analysis-with-reference-to-kesoram 6581
Net Current Assets-
Year
Amount
(In Crores) Trend
IncreaseDecrease
Base Year Previous Year
2008 30761 10000 000 000
2009 56954 18515 8515 8515
2010 77037 25044 15044 6529
2011 110417 35895 25895 10851
2012 68613 22305 12305 -13590
Trends in Net Current Assets-
The NCA shown positive (increasing) trend
The NCA are increased to 35895 (the year 2011) compared with base year and
decreased in the year 2012 to 22305
The NCA shown increased trend from year and crossed 100
The overall trend was good
8102019 A Study A Study On Financial Performance Analysis With Reference To Kesoram Cementon Financial Performance hellip
httpslidepdfcomreaderfulla-study-a-study-on-financial-performance-analysis-with-reference-to-kesoram 6681
66
Ratio Analysis-
Current Ratio-
Current Ratio = Current Assets Current Liabilities
Current assets are cash in hand Cash at bank Marketable Securities(short term) short term
Investment Bills receivables sundry debtors Inventories (stock) Work in progress prepaid
expenses Current Liabilities are outstanding expenses Bills payable sundry Creditors
short-term advances income tax payable and Dividend payable
Current Ratio of Kesoram-
(Rupees in crores)
Year Current Assets Current Liabilities Current Ratio
2007-08 75560 57067 132
2008-09 102580 66587 154
2009-10 153922 107688 143
2010-11 182177 113902 160
2011-12 173833 180010 097
Interpretation-
As per the standard rule of current ratio ie 21 where current assets double the current
liabilities is considered satisfactory
In the present analysis the current ratio of the Kesoram is not satisfactory
from the above table It was assessed that the current ratio for all the five year is lower (less)
than the standard rule ie 21 And it is 097 in the year 2011-2012 (current year) This is
highly UN satisfactory
8102019 A Study A Study On Financial Performance Analysis With Reference To Kesoram Cementon Financial Performance hellip
httpslidepdfcomreaderfulla-study-a-study-on-financial-performance-analysis-with-reference-to-kesoram 6781
Quick Ratio-
Quick ratio also known as acid-test ratio establishes a relationship between quick
assets and the current liabilities Cash is the most liquid asset It is calculated by dividing
quick assets by current liabilities
Quick ratio = Quick Assets Current Liabilities
(Quick Assets = Current assets ndash Inventory)
Quick Ratio of Kesoram-
Rupees in crores)
Year Total QuickAssets
Current Liabilities Quick Ratio
2007-08 33343 57067 058
2008-09 43674 66587 066
2009-10 62303 107688 058
2010-11 70322 113902 0622011-12 74333 180010 041
Interpretation-
Usually a high Quick ratio is an indication that the company is liquid and has the ability to
meet its current or liquid liabilities in time on the other hand a low Quick Ratio represents
8102019 A Study A Study On Financial Performance Analysis With Reference To Kesoram Cementon Financial Performance hellip
httpslidepdfcomreaderfulla-study-a-study-on-financial-performance-analysis-with-reference-to-kesoram 6881
that the companyrsquos liquidity position is not good The above table showing the quick ratios
of Kesoram are canrsquot be considered satisfactory
Leverage Ratios-
Debt-Equity Ratio-
Debt-Equity Ratio = Total Long Term Debt Equity Share Holders Fund
Total Long term Debt= Debenture Capital + Long term loans from banks and financial
institutions + Public deposits
Equity Share Holders fund = Equity + Reserves and Surplus
Debt Equity Ratio of Kesoram
(Rupees in crores)
Year Total Debt Share Holders Fund Debt Equity Ratio
2007-08 109235 98192 111
2008-09 197043 133010 148
2009-10 312622 154024 203
2010-11 399927 130025 308
2011-12 410534 91501 449
8102019 A Study A Study On Financial Performance Analysis With Reference To Kesoram Cementon Financial Performance hellip
httpslidepdfcomreaderfulla-study-a-study-on-financial-performance-analysis-with-reference-to-kesoram 6981
Interpretation-
The Debt-Equity Ratio accepted standard is 05 This ratio reflects the relative contribution
of creditors and owners of business in its financing From the above it is clear that the long
term debt is more than that of the share holdersrsquo fund So we can interpret that the firmrsquosassets are financed more by the external funds rather than by the internal funds
8102019 A Study A Study On Financial Performance Analysis With Reference To Kesoram Cementon Financial Performance hellip
httpslidepdfcomreaderfulla-study-a-study-on-financial-performance-analysis-with-reference-to-kesoram 7081
Fixed Asset Ratio-
Net Sales
Fixed Asset Ratio = helliphelliphelliphelliphelliphelliphelliphelliphelliphelliphellip
Net Assets
Fixed Asset Ratio of Kesoram-
(Rupees in crores)
Year Net Sales Net Assets Fixed Assets Ratio
2007-08 300271 358721 084
2008-09 389797 369172 106
2009-10 475062 343182 1382010-11 539788 180435 299
2011-12 59182 108424 546
Interpretation
This ratio indicates the extent to which the assets of the companyrsquos can be lost without
affecting the interest of the creditors of the company Higher the ratios better the long-term
position of the companyThe above table shows fixed assets ratio in increasing trend Which is good for the
company
8102019 A Study A Study On Financial Performance Analysis With Reference To Kesoram Cementon Financial Performance hellip
httpslidepdfcomreaderfulla-study-a-study-on-financial-performance-analysis-with-reference-to-kesoram 7181
Overall Profitability Ratios-
Net Profit Ratio
Net Profit Ratio indicates net margin on sales It is given by the following equation
Net Profit Ratio = (Net Profit Sales) 100
Net Profit Ratio of Kesoram
(Rupees in crores)
Year Net Profit Sales Net Profit Ratio
2007-08 37917 300271 1263
2008-09 41432 389797 1063
2009-10 20298 475062 427
2010-11 -28176 539788 -5222011-12 -38108 59182 -644
Interpretation
It establishes a relationship between net profits after tax and net sales and
indicates the efficiency of the management in manufacturing selling administrative and
other activities of the company
The higher the ratio the better is the profitability or performance of the business
The above table depicts the net profit Ratio of Kesoram has decreased every year from
2007-2008 to 2011-2012It further decreased to negative in the year 2010-11 to -522 and -
644 in the year 2011-2012 This shows constant decrease in the profits of the company
8102019 A Study A Study On Financial Performance Analysis With Reference To Kesoram Cementon Financial Performance hellip
httpslidepdfcomreaderfulla-study-a-study-on-financial-performance-analysis-with-reference-to-kesoram 7281
72
Return on Investment-
Net Profit
Return on Investment = helliphelliphelliphelliphelliphelliphelliphelliphelliphelliphelliphellip X 100
Share Holders Fund
Return on Investment Ratio of Kesoram-
(Rupees in crores)
Year Net Profit Share Holders Fund Return On Investment
2007-08 37917 98192 3862
2008-09 41432 133010 3115
2009-10 20298 154024 1318
2010-11 -28176 130025 -2167
2011-12 -38108 91501 -4165
Interpretation-
The above table reveals how well the resources of the firm are being used Higher
the ratio better the result The above ratio implies how well the firm is growing in
terms of profitability and efficiency From the above table we can concern that the return on
investment is in decreasing trend ROI is highest in the year 2007-2008 as 3862 But
there after itrsquos decreased every year
The ROI is negative in the years 2010-2011 amp 2011-2012 as -2167 amp -4165 respectively
Which is not a good sign for the firm
8102019 A Study A Study On Financial Performance Analysis With Reference To Kesoram Cementon Financial Performance hellip
httpslidepdfcomreaderfulla-study-a-study-on-financial-performance-analysis-with-reference-to-kesoram 7381
8102019 A Study A Study On Financial Performance Analysis With Reference To Kesoram Cementon Financial Performance hellip
httpslidepdfcomreaderfulla-study-a-study-on-financial-performance-analysis-with-reference-to-kesoram 7481
8102019 A Study A Study On Financial Performance Analysis With Reference To Kesoram Cementon Financial Performance hellip
httpslidepdfcomreaderfulla-study-a-study-on-financial-performance-analysis-with-reference-to-kesoram 7581
75
CHAPTER V
FINDINGS amp SUGGESTIONS
8102019 A Study A Study On Financial Performance Analysis With Reference To Kesoram Cementon Financial Performance hellip
httpslidepdfcomreaderfulla-study-a-study-on-financial-performance-analysis-with-reference-to-kesoram 7681
76
Findings
The Share capital remains constant Share capital is unchanged all the years from
2008-2012
Reserves amp surplus were recorded an increasing trend in the period between 2008
and 2010It is showing decreasing trend in the period 2011-2012 (ie from 16019
in 2010 to 9309 in 2012)
Current Liabilities were increased compared to base year ie 2008
Provisions increased to 262597 ie in Rupees 39232 crores in the current year
The current ratio for all the five year is lower (less) than the standard rule ie 21
And it is 097 in the year 2011-2012 (current year)
The Debt-Equity Ratio was shown under the standard ratio It is clear that the long
term debt is more than that of the share holdersrsquo fund It indicates that the firm
heavily relying on external funds rather than the internal funds
The operating and net profit of Kesoram is in decreasing trend due to heavy
increase of manufacturing amp administrative expenses
ROI is highest in the year 2007-2008 as 3862 The ROI is negative in the years
2010-2011 amp 2011-2012 as -2167 amp -4165 respectively
Return on Equity Capital Employed Ratio of Kesoram has decreased every year
from 2007-2008 to 2010-2011It further decreased to negative in the year 2011-12 to
-3280
EPS of Kesoram has decreased every year from 2008-12It is negative in the year
2011 amp 12
8102019 A Study A Study On Financial Performance Analysis With Reference To Kesoram Cementon Financial Performance hellip
httpslidepdfcomreaderfulla-study-a-study-on-financial-performance-analysis-with-reference-to-kesoram 7781
77
Suggestion
The organization should adopt an appropriate capital structure
The companyrsquos debt-equity ratio is recorded more or less as 111 in the year 2008
and it is increased to 449 in the year 2012 (current year)The company should
adopt a better debt equity mix in the future to control the fluctuations in returns
The company should control fluctuations in cash and bank balances as it impacts the
current ratio of the company
The provisions are showing increasing trend which indicates risk of debtors The
firm should implement an effective credit management policy It should utilize its
idle funds by decreasing provisions
The company should control heavy increase of manufacturing amp administration
expenses as it is impacting the operating and net profit of company
8102019 A Study A Study On Financial Performance Analysis With Reference To Kesoram Cementon Financial Performance hellip
httpslidepdfcomreaderfulla-study-a-study-on-financial-performance-analysis-with-reference-to-kesoram 7881
78
ANNEXURE
Profit And Loss Account of Kesoram Cement
Mar12 Mar11 Mar10 Mar09 Mar08
12 Months 12 Months 12 Months 12 Months 12 Months
INCOME
Sales Turnover 628260 575072 505151 431613 345700
Excise Duty 36440 35284 30089 41815 45429
NET SALES 591820 539788 475062 389797 300271
Other Income 000 000 000 000 000
TOTALINCOME
596129 548733 481019 393969 302020
EXPENDITURE
Manufacturing
Expenses81903 74803 13974 13153 44113
MaterialConsumed
370897 310150 295550 229359 118448
Personal
Expenses33468 27355 23294 18690 15344
Selling Expenses 81910 78253 58667 48846 45019
AdministrativeExpenses
28225 29308 17219 16179 9907
Expenses
Capitalized000 000 000 000 000
Provisions Made 000 000 000 000 000
TOTAL
EXPENDITURE 596403 519870 408704 326227 232832Operating Profit -4583 19918 66358 63570 67439
EBITDA -274 28864 72316 67742 69188
Depreciation 29740 27259 17280 11186 8927
Other Write-offs 000 000 000 000 000
EBIT -30014 1605 55035 56557 60261
Interest 41015 23983 10921 12087 5426
EBT -71029 -22377 44114 44470 54835
Taxes -32921 5798 23816 3037 16918
Profit and Loss
for the Year-38108 -28176 20298 41432 37917
Non RecurringItems
-1142 7063 3228 -4023 402
Other Non Cash
Adjustments1276 091 207 465 017
OtherAdjustments
000 000 000 000 000
REPORTED
PAT-37974 -21021 23734 37874 38335
8102019 A Study A Study On Financial Performance Analysis With Reference To Kesoram Cementon Financial Performance hellip
httpslidepdfcomreaderfulla-study-a-study-on-financial-performance-analysis-with-reference-to-kesoram 7981
79
Balance Sheet Of Kesoram
Years
Particulars 2008 2009 2010 2011 2012
Liabilities
Share Capital 4574 4574 4574 4574 4574Reserves amp Surplus 93085 128024 149111 125162 86657
Revaluation Reserves 533 412 339 289 27
Loans
Secured Loans 97106 153627 186372 237183 317792
Un Secured Loans 12129 43416 12625 162744 92742
Deferred Tax Liabilities 0 0 0 0 0
Current Liabilities
Provisions 33039 34529 35734 1494 40726
Current Liabilities 57067 66587 107688 113902 18001
Total 297533 431169 610068 645348 722771
Assets
Net Block 108424 180435 343182 369172 358721
Capital WIP 63459 86485 41283 43781 68065
Investments 4783 6178 5143 6582 6636
Current Assets
Inventories 44217 58906 91619 111855 99516
Sundry Debtors 27307 38017 54289 63134 67358
Cash amp Bank Balances 4036 5657 8014 7188 6959
Total Current Assets 7556 10258 153922 182177 173833Loans amp Advances 45289 55462 66506 4346 115409
Fixed Deposits 018 028 031 176 107
Total 297533 431169 610068 645348 722771
8102019 A Study A Study On Financial Performance Analysis With Reference To Kesoram Cementon Financial Performance hellip
httpslidepdfcomreaderfulla-study-a-study-on-financial-performance-analysis-with-reference-to-kesoram 8081
80
KEY ITEMS 2012 2011 2010 2009 2008
Preference
Dividend 0 0 0 0 0
Equity Dividend 457 2516 2516 2516 2516
Equity Dividend
() 999 55 55 55 55
Shares in Issue(Lakhs) 45743 45743 45743 45743 45743
EPS - Annualised
(Rs) -8302 -4595 5188 828 838
8102019 A Study A Study On Financial Performance Analysis With Reference To Kesoram Cementon Financial Performance hellip
httpslidepdfcomreaderfulla-study-a-study-on-financial-performance-analysis-with-reference-to-kesoram 8181
BIBLIOGRAPHY
Sl
No
Books Author Name
1 Financial Management Khan amp JAIN
2 Financial Management IMPandey
3 Management Accounting RPTrivedi
Websites amp Search Engines
1 wwwkesoramcom983086
2 wwwmoneycontrolcom
3 wwwgooglefinancecom983086
Annual reports of Kesoram cement limited 2008-2012
8102019 A Study A Study On Financial Performance Analysis With Reference To Kesoram Cementon Financial Performance hellip
httpslidepdfcomreaderfulla-study-a-study-on-financial-performance-analysis-with-reference-to-kesoram 4481
44
Gross Profit Ratio
Gross profit Ratio measures the relationships to net sales and is usually represented as a
percentage It is a good measure of profitability
The gross profit ratio indicates the extent to which selling price of goods per unit may
decline without resulting in losses on operation Higher the gross profit betters the result
Net Profit Ratio
Net Profit Ratio indicates net margin on sales It is given by the following equation
Net Profit Ratio = (Net Profit Sales) 100
Operating or Expenses Ratio
This ratio is complimentary of Net Profit Ratio The more the net profit the less the
Operating Ratio Operating costs include the cost of direct materials direct labors and otheroverheads viz are generally excluded from operating costs A comparison of the Operating
Ratio will indicate whether the cost efficiency is high or low in the figure of sales This less
the ratio it depicts the efficiency of the management
8102019 A Study A Study On Financial Performance Analysis With Reference To Kesoram Cementon Financial Performance hellip
httpslidepdfcomreaderfulla-study-a-study-on-financial-performance-analysis-with-reference-to-kesoram 4581
45
CHAPTER IV
DATA ANALYSIS amp INTERPRETATION
8102019 A Study A Study On Financial Performance Analysis With Reference To Kesoram Cementon Financial Performance hellip
httpslidepdfcomreaderfulla-study-a-study-on-financial-performance-analysis-with-reference-to-kesoram 4681
46
Comparative Balance Sheet of Kesoram in the Year between 2008-2009
(Rupee in crores)
Years Changes
Particulars 2008 2009 In Rupees In Percentage
Liabilities
Share Capital 4574 4574 000 000
Reserves amp Surplus 93085 128024 34939
Revaluation Reserves 533 412 -121 -2270
Loans
Secured Loans 97106 153627 56521 5821
Un Secured Loans 12129 43416 31287 25795
Deferred Tax Liabilities 000 000 000 000
Current Liabilities
Provisions 33039 34529 1490 451
Current Liabilities 57067 66587 9520 1668
Total 297533 431169 133636 4491
Assets
Net Block 108424 180435 72011 6642
Capital Wip 63459 86485 23026 3628
Investments 4783 6178 1395 2917
Current Assets
Inventories 44217 58906 14689 3322
Sundry Debtors 27307 38017 10710 3922
Cash amp Bank Balances 4036 5657 1621 4016
Total Current Assets 75560 102580 27020 3576
Loans amp Advances 45289 55462 10173 2246
Fixed Deposits 018 028 010 5556
Total 297533 431169 133636 4491
8102019 A Study A Study On Financial Performance Analysis With Reference To Kesoram Cementon Financial Performance hellip
httpslidepdfcomreaderfulla-study-a-study-on-financial-performance-analysis-with-reference-to-kesoram 4781
47
Interpretation of comparative balance sheet of 2008-2009
Reserves amp Surplus were increased to 3753 (percent) ie in Rupees 34939
crores
Revaluation Reserves decreased to 121 ie in Rupees 2270 crores
Secured Loans are increased to 5821 ie in Rupees 56521 crores And UN
secured loans highly Increased to 25795
Current liabilities and Provisions are increased to 1668 and 451 respectively ie in
Rupees 9520 amp 1490 crores
Fixed assets were highly increased to 6642 ie in Rupees 72011 crores
Investments were increased to 2917 ie in Rupees 1395 crores
Sundry debtors increased to 3922 ie in Rupees 10710 crores
Current assets increased 3576 ie in Rupees 27020 crores And Loans amp
Advances increased to 2246 respectively
The overall financial position was satisfactory
8102019 A Study A Study On Financial Performance Analysis With Reference To Kesoram Cementon Financial Performance hellip
httpslidepdfcomreaderfulla-study-a-study-on-financial-performance-analysis-with-reference-to-kesoram 4881
48
Comparative Balance Sheet of Kesoram in the Year between 2009-2010
(Rupees in crores)
Years Changes
Particulars 2009 2010 In Rupees In Percentage
Liabilities
Share Capital 4574 4574 000 000
Reserves amp Surplus 128024 149111 21087 1647
Revaluation Reserves 412 339 -073 -1772
Loans
Secured Loans 153627 186372 32745 2131
Un Secured Loans 43416 126250 82834 19079
Deferred Tax Liabilities 000 000 000
Current Liabilities
Provisions 34529 35734 1205 349
Current Liabilities 66587 107688 41101 6173
Total 431169 610068 178899 4149
Assets
Net Block 180435 343182 162747 9020
Capital WIP 86485 41283 -45202 -5227
Investments 6178 5143 -1035 -1675
Current Assets
Inventories 58906 91619 32713 5553
Sundry Debtors 38017 54289 16272 4280
Cash amp Bank Balances 5657 8014 2357 4167
Total Current Assets 102580 153922 51342 5005
Loans amp Advances 55462 66506 11044 1991
Fixed Deposits 028 031 003 1071
Total 431169 610068 178899 4149
8102019 A Study A Study On Financial Performance Analysis With Reference To Kesoram Cementon Financial Performance hellip
httpslidepdfcomreaderfulla-study-a-study-on-financial-performance-analysis-with-reference-to-kesoram 4981
49
Interpretation of comparative balance sheet of 2009-2010
Reserves amp surplus increased to 1647 ie in Rupees 21087 crores
Revaluation Reserves decreased to 1772 ie in Rupees 073 crores
Secured loans increased to 2131 ie in Rupees 32745 crores
Current Liabilities were increased to 6173 ie in Rupees 41101 crores and
Provisions 349 ie in Rupees 1205 crores
Fixed Assets were increased to 9020 ie in Rupees 162747 crores
Investments were decreased to 1675 ie in Rupees 1035 crores
Sundry debtors were increased to 4280 ie in Rupees 16272 crores
Current assets increased to 5005 ie in Rupees 51342 crores And loans and
Advances increased 1919 ie in Rupees 11044 crores
The overall financial position was satisfactory
8102019 A Study A Study On Financial Performance Analysis With Reference To Kesoram Cementon Financial Performance hellip
httpslidepdfcomreaderfulla-study-a-study-on-financial-performance-analysis-with-reference-to-kesoram 5081
50
Comparative Balance Sheet of Kesoram in the Year between 2010-2011
(Rupees in crores)
Years Changes
Particulars 2010 2011 In Rupees In Percentage
Liabilities
Share Capital 4574 4574 000 000
Reserves amp Surplus 149111 125162 -23949 -1606
Revaluation Reserves 339 289 -050 -1475
Loans
Secured Loans 186372 237183 50811 2726
Un Secured Loans 126250 162744 36494 2891
Deferred Tax Liabilities 000 000 000
Current Liabilities
Provisions 35734 1494 -34240 -9582
Current Liabilities 107688 113902 6214 577
Total 610068 645348 35280 578
Assets
Net Block 343182 369172 25990 757
Capital WIP 41283 43781 2498 605
Investments 5143 6582 1439 2798
Current Assets
Inventories 91619 111855 20236 2209
Sundry Debtors 54289 63134 8845 1629
Cash amp Bank Balances 8014 7188 -826 -1031
Total Current Assets 153922 182177 28255 1836
Loans amp Advances 66506 43460 -23046 -3465
Fixed Deposits 031 176 145 46774
Total 610068 645348 35280 578
8102019 A Study A Study On Financial Performance Analysis With Reference To Kesoram Cementon Financial Performance hellip
httpslidepdfcomreaderfulla-study-a-study-on-financial-performance-analysis-with-reference-to-kesoram 5181
51
Interpretation of comparative balance sheet of 2010-2011
Reserves amp surplus decreased to 1606 ie in Rupees 23949 crores
Revaluation Reserves decreased to 1475 ie in Rupees 050 crores
Secured loans increased to 2726 ie in Rupees 50811 crores
Current Liabilities were increased to 577 ie in Rupees 6214 crores
Provisions decreased to 9582 ie in Rupees 34240 crores
Fixed Assets were increased to 757 ie in Rupees 25990 crores
Investments were decreased to 2798 ie in Rupees 1439 crores
Sundry debtors were increased to 1629 ie in Rupees8845 crores
Current assets increased to 1836 ie in Rupees 28255 crores And loans and
Advances increased 3465 ie in Rupees 23046 crores
The overall financial position was UN satisfactory
8102019 A Study A Study On Financial Performance Analysis With Reference To Kesoram Cementon Financial Performance hellip
httpslidepdfcomreaderfulla-study-a-study-on-financial-performance-analysis-with-reference-to-kesoram 5281
52
Comparative Balance Sheet of Kesoram In The Year Between 2011-2012
(Rupees in crores)
Years Changes
Particulars 2011 2012 In Rupees In Percentage
Liabilities
Share Capital 4574 4574 000 000
Reserves amp Surplus 125162 86657 -38505 -3076
Revaluation Reserves 289 270 -019 -657
Loans
Secured Loans 237183 317792 80609 3399
Un Secured Loans 162744 92742 -70002 -4301
Deferred Tax Liabilities 000 000 000
Current Liabilities
Provisions 1494 40726 39232 262597
Current Liabilities 113902 180010 66108 5804
Total 645348 722771 77423 1200
Assets 000
Net Block 369172 358721 -10451 -283
Capital WIP 43781 68065 24284 5547
Investments 6582 6636 054 082
Current Assets
Inventories 111855 99516 -12339 -1103
Sundry Debtors 63134 67358 4224 669
Cash amp Bank Balances 7188 6959 -229 -319
Total Current Assets 182177 173833 -8344 -458
Loans amp Advances 43460 115409 71949 16555
Fixed Deposits 176 107 -069 -3920
Total 645348 722771 77423 1200
8102019 A Study A Study On Financial Performance Analysis With Reference To Kesoram Cementon Financial Performance hellip
httpslidepdfcomreaderfulla-study-a-study-on-financial-performance-analysis-with-reference-to-kesoram 5381
53
Interpretation of comparative balance sheet of 2011-2012
Reserves amp surplus decreased to 3076 ie in Rupee 38505 crores
Revaluation Reserves decreased to 657 ie in Rupees 019 crores
Secured loans increased to 3399 ie in Rupees 80699 crores
Current Liabilities were increased to 5804 ie in Rupees 66108 crores
Provisions increased to 262597 ie in Rupees 39232 crores
Fixed Assets were decreased to 283 ie in Rupee 10451 crores
Investments were increased to 082 ie in Rupees 054 crores
Sundry debtors were increased to 669 ie in Rupees 4224 crores
Current assets decreased to 458 ie in Rupees 8344 crores And loans and
Advances increased 16555 ie in Rupees 71949 crores
The overall financial position was UN satisfactory
8102019 A Study A Study On Financial Performance Analysis With Reference To Kesoram Cementon Financial Performance hellip
httpslidepdfcomreaderfulla-study-a-study-on-financial-performance-analysis-with-reference-to-kesoram 5481
54
Common Size Balance Sheet of Kesoram For The Year 2008-2009
(Rupees in crores)
Particulars 2008 Change Percentage 2009 Change Percentage
Liabilities
Share Capital 4574 154 4574 106
Reserves amp Surplus 93085 3129 128024 2969
Revaluation Reserves 533 018 412 010
Loans
Secured Loans 97106 3264 153627 3563
Un Secured Loans 12129 408 43416 1007
Deferred Tax Liabilities 000 000 000 000
Current Liabilities
Provisions 33039 1110 34529 801
Current Liabilities 57067 1918 66587 1544
Total 297533 10000 431169 10000
Assets
Net Block 108424 3644 180435 4185
Capital WIP 63459 2133 86485 2006
Investments 4783 161 6178 143
Current Assets
Inventories 44217 1486 58906 1366
Sundry Debtors 27307 918 38017 882
Cash amp Bank Balances 4036 136 5657 131
Loans amp Advances 45289 1522 55462 1286
Fixed Deposits 018 001 028 001
Total 297533 10000 431169 10000
8102019 A Study A Study On Financial Performance Analysis With Reference To Kesoram Cementon Financial Performance hellip
httpslidepdfcomreaderfulla-study-a-study-on-financial-performance-analysis-with-reference-to-kesoram 5581
55
Interpretation of Common Size Balance Sheet of 2008-2009
Share capital was recorded 154 percent in the total liabilities in the year 2008 it is
decreased to 106 in the year 2009
Reserves amp surplus contributed to 3129 in the total liabilities in the year 2008 it is
decreased to 2969 in the year 2009
Secured loans were 3264 in the total liabilities in the year 2008 it is increased to
3563 in the year 2009
Current Liabilities shown to 1918 in the total liabilities in the year 2008 it is
decreased to 1544 in the year 2009
Provisions 1110 in the total liabilities in the year 2008 it is decreased to 801 in the
year 2009
Fixed Assets were 3644 in the total liabilities in the year 2008 ie decreased to 4185
in the year 2009
Investments were 161 in the total liabilities in the year 2008 it is decreased to 143
in the year 2009
Sundry debtors were 918 in the total liabilities in the year 2008 it is decreased to 882
in the year 2009
8102019 A Study A Study On Financial Performance Analysis With Reference To Kesoram Cementon Financial Performance hellip
httpslidepdfcomreaderfulla-study-a-study-on-financial-performance-analysis-with-reference-to-kesoram 5681
56
Common Size Balance Sheet of Kesoram For The Year 2009-2010
(Rs in crores)
Particulars 2009 Change Percentage 2010Change
Percentage
Liabilities
Share Capital 4574 106 4574 075
Reserves amp Surplus 128024 2969 149111 2444
Revaluation Reserves 412 010 339 006
Loans
Secured Loans 153627 3563 186372 3055
Un Secured Loans 43416 1007 126250 2069
Deferred Tax Liabilities 000 000 000 000
Current Liabilities
Provisions 34529 801 35734 586
Current Liabilities 66587 1544 107688 1765
Total 431169 10000 610068 10000
Assets
Net Block 180435 4185 343182 5625
Capital WIP 86485 2006 41283 677
Investments 6178 143 5143 084
Current Assets
Inventories 58906 1366 91619 1502
Sundry Debtors 38017 882 54289 890
Cash amp Bank Balances 5657 131 8014 131
Loans amp Advances 55462 1286 66506 1090
Fixed Deposits 028 001 031 001
Total 431169 10000 610068 10000
8102019 A Study A Study On Financial Performance Analysis With Reference To Kesoram Cementon Financial Performance hellip
httpslidepdfcomreaderfulla-study-a-study-on-financial-performance-analysis-with-reference-to-kesoram 5781
57
Interpretation of common size balance sheet of 2009-2010
Share capital was recorded 106 percent in the total liabilities in the
year 2009 it is decreased to 075 in the year 2010
Reserves amp surplus contributed to 2969 in the total liabilities in the
year 2009 it is decreased to2444 in the year 2010
Secured loans were 3563 in the total liabilities in the year 2009 it is
increased to 3055 in the year 2010
Current Liabilities shown to 1544 in the total liabilities in the year
2009 it is decreased to 1765 in the year 2010
Provisions 801 in the total liabilities in the year 2009 it is decreased
to 586 in the year 2010
Fixed Assets were 4185 in the total liabilities in the year 2009 ie
increased to 5625 in the year 2010
Investments were 143 in the total liabilities in the year 2009 it is
decreased to 084 in the year 2010
Sundry debtors were 882 in the total liabilities in the year 2009 it is
increased to 890 in the year 2010
8102019 A Study A Study On Financial Performance Analysis With Reference To Kesoram Cementon Financial Performance hellip
httpslidepdfcomreaderfulla-study-a-study-on-financial-performance-analysis-with-reference-to-kesoram 5881
58
Common Size Balance sheet of Kesoram for the year 2010-2011
983080Rupees in crores)
Particulars 2010 Change Percentage 2011
Change
Percentage
Liabilities
Share Capital 4574 075 4574 071
Reserves amp Surplus 149111 2444 125162 1939
Revaluation Reserves 339 006 289 004
Loans
Secured Loans 186372 3055 237183 3675
Un Secured Loans 126250 2069 162744 2522
Deferred Tax Liabilities 000 000 000 000
Current Liabilities
Provisions 35734 586 1494 023
Current Liabilities 107688 1765 113902 1765
Total 610068 10000 645348 10000
Assets
Net Block 343182 5625 369172 5721
Capital WIP 41283 677 43781 678
Investments 5143 084 6582 102
Current Assets
Inventories 91619 1502 111855 1733
Sundry Debtors 54289 890 63134 978
Cash amp Bank Balances 8014 131 7188 111
Loans amp Advances 66506 1090 43460 673
Fixed Deposits 031 001 176 003
Total 610068 10000 645348 10000
8102019 A Study A Study On Financial Performance Analysis With Reference To Kesoram Cementon Financial Performance hellip
httpslidepdfcomreaderfulla-study-a-study-on-financial-performance-analysis-with-reference-to-kesoram 5981
59
Interpretation of Common Size Balance Sheet Of 2010-2011
Share capital was recorded 075 percent in the total liabilities in the year 2010 it is
decreased to 071 in the year 2011
Reserves amp surplus contributed to 2444 in the total liabilities in the year 2010 it is
decreased to1939 in the year 2011
Secured loans were 3055 in the total liabilities in the year 2010 it is increased to
3675 in the year 2011
Current Liabilities shown to 1765 in the total liabilities in the year 2010 it is
also1765 in the year 2011
Provisions 586 in the total liabilities in the year 2010 it is decreased to 023 in the
year 2011
Fixed Assets were 5625 in the total liabilities in the year 2010 ie increased to 5721
in the year 2011
Investments were 084 in the total liabilities in the year 2010 it increased to 102 in
the year 2011
Sundry debtors were 890 in the total liabilities in the year 2010 it is increased to 978
in the year 2011
8102019 A Study A Study On Financial Performance Analysis With Reference To Kesoram Cementon Financial Performance hellip
httpslidepdfcomreaderfulla-study-a-study-on-financial-performance-analysis-with-reference-to-kesoram 6081
60
Common Size Balance Sheet of Kesoram for the Year 2011-2012
983080Rupees in crores)
Particulars 2011 Change Percentage 2012
Change
Percentage
Liabilities
Share Capital 4574 071 4574 063
Reserves amp Surplus 125162 1939 86657 1199
Revaluation Reserves 289 004 270 004
Loans
Secured Loans 237183 3675 317792 4397
Un Secured Loans 162744 2522 92742 1283
Deferred Tax Liabilities 000 000 000 000
Current Liabilities
Provisions 1494 023 40726 563
Current Liabilities 113902 1765 180010 2491
Total 645348 10000 722771 10000
Assets
Net Block 369172 5721 358721 4963
Capital WIP 43781 678 68065 942
Investments 6582 102 6636 092
Current Assets
Inventories 111855 1733 99516 1377
Sundry Debtors 63134 978 67358 932
Cash amp Bank Balances 7188 111 6959 096
Loans amp Advances 43460 673 115409 1597
Fixed Deposits 176 003 107 001
Total 645348 10000 722771 10000
8102019 A Study A Study On Financial Performance Analysis With Reference To Kesoram Cementon Financial Performance hellip
httpslidepdfcomreaderfulla-study-a-study-on-financial-performance-analysis-with-reference-to-kesoram 6181
61
Interpretation of common size balance sheet of 2011-2012
Share capital was recorded 071 percent in the total liabilities in the year 2011 it is
decreased to 063 in the year 2012
Reserves amp surplus contributed to 1939 in the total liabilities in the year 2011 it
is decreased to 1199 in the year 2012
Secured loans were 3675 in the total liabilities in the year 2011 it is increased to
4397 in the year 2012
Current Liabilities shown to 1765 in the total liabilities in the year 2011 it is
increased to 2491 in the year 2012
Provisions 023 in the total liabilities in the year 2011 it is increased to 563 in the
year 2012
Fixed Assets were 5721 in the total liabilities in the year 2011 ie decreased to
4963 in the year 2012
Investments were 102 in the total liabilities in the year 2011 it increased to 092
in the year 2012
Sundry debtors were 978 in the total liabilities in the year 2011 it is decreased to
932 in the year 2012
8102019 A Study A Study On Financial Performance Analysis With Reference To Kesoram Cementon Financial Performance hellip
httpslidepdfcomreaderfulla-study-a-study-on-financial-performance-analysis-with-reference-to-kesoram 6281
Trend Analysis
Share Capital-
Year
Amount
(In Crores) Trend
IncreaseDecrease
Base Year Previous Year
2008 4574 10000 000 000
2009 4574 10000 000 000
2010 4574 10000 000 000
2011 4574 10000 000 000
2012 4574 10000 000 000
Trend Percentages in Share Capital
Share capital shown a constant trend in the period 2008 and 2012
Share capital is 4574 crores all the years from 2008-2012
8102019 A Study A Study On Financial Performance Analysis With Reference To Kesoram Cementon Financial Performance hellip
httpslidepdfcomreaderfulla-study-a-study-on-financial-performance-analysis-with-reference-to-kesoram 6381
Reserves amp Surplus-
Year
Amount
(In Crores) Trend
IncreaseDecrease
Base Year Previous Year
2008 93085 10000 000 000
2009 128024 13753 3753 3753
2010 149111 16019 6019 2266
2011 125162 13446 3446 -2573
2012 86657 9309 -691 -4137
Trend Percentages in Reserves amp Surplus
Reserves amp surplus shown an increasing trend in the period between 2008 and 2010
The average trend was 13277 till 2010
The Reserves amp surplus was showing decreasing trend in the period 2011-2012 (ie
from 16019 in 2010 to 9309 in 2012)
The decreasing trend in Reserves amp surplus indicates the decrease in profits of the
firm
8102019 A Study A Study On Financial Performance Analysis With Reference To Kesoram Cementon Financial Performance hellip
httpslidepdfcomreaderfulla-study-a-study-on-financial-performance-analysis-with-reference-to-kesoram 6481
Investments-
Year
Amount
(In Crores) Trend
IncreaseDecrease
Base Year Previous Year
2008 4783 10000 000 000
2009 6178 12917 2917 2917
2010 5143 10753 753 -2164
2011 6582 13761 3761 3009
2012 6636 13874 3874 113
Trend Percentages in Investments-
The investments are shown an increasing trend in the period between 2008 ndash 2009
and it is decreasing in the year 2010
The average trend was 11458 till 2009
The investments increased in the periods 2011-2012 (ie from 10753 in 2010 to
13874 in 2012)
The overall trend in investments shown is satisfactory
8102019 A Study A Study On Financial Performance Analysis With Reference To Kesoram Cementon Financial Performance hellip
httpslidepdfcomreaderfulla-study-a-study-on-financial-performance-analysis-with-reference-to-kesoram 6581
Net Current Assets-
Year
Amount
(In Crores) Trend
IncreaseDecrease
Base Year Previous Year
2008 30761 10000 000 000
2009 56954 18515 8515 8515
2010 77037 25044 15044 6529
2011 110417 35895 25895 10851
2012 68613 22305 12305 -13590
Trends in Net Current Assets-
The NCA shown positive (increasing) trend
The NCA are increased to 35895 (the year 2011) compared with base year and
decreased in the year 2012 to 22305
The NCA shown increased trend from year and crossed 100
The overall trend was good
8102019 A Study A Study On Financial Performance Analysis With Reference To Kesoram Cementon Financial Performance hellip
httpslidepdfcomreaderfulla-study-a-study-on-financial-performance-analysis-with-reference-to-kesoram 6681
66
Ratio Analysis-
Current Ratio-
Current Ratio = Current Assets Current Liabilities
Current assets are cash in hand Cash at bank Marketable Securities(short term) short term
Investment Bills receivables sundry debtors Inventories (stock) Work in progress prepaid
expenses Current Liabilities are outstanding expenses Bills payable sundry Creditors
short-term advances income tax payable and Dividend payable
Current Ratio of Kesoram-
(Rupees in crores)
Year Current Assets Current Liabilities Current Ratio
2007-08 75560 57067 132
2008-09 102580 66587 154
2009-10 153922 107688 143
2010-11 182177 113902 160
2011-12 173833 180010 097
Interpretation-
As per the standard rule of current ratio ie 21 where current assets double the current
liabilities is considered satisfactory
In the present analysis the current ratio of the Kesoram is not satisfactory
from the above table It was assessed that the current ratio for all the five year is lower (less)
than the standard rule ie 21 And it is 097 in the year 2011-2012 (current year) This is
highly UN satisfactory
8102019 A Study A Study On Financial Performance Analysis With Reference To Kesoram Cementon Financial Performance hellip
httpslidepdfcomreaderfulla-study-a-study-on-financial-performance-analysis-with-reference-to-kesoram 6781
Quick Ratio-
Quick ratio also known as acid-test ratio establishes a relationship between quick
assets and the current liabilities Cash is the most liquid asset It is calculated by dividing
quick assets by current liabilities
Quick ratio = Quick Assets Current Liabilities
(Quick Assets = Current assets ndash Inventory)
Quick Ratio of Kesoram-
Rupees in crores)
Year Total QuickAssets
Current Liabilities Quick Ratio
2007-08 33343 57067 058
2008-09 43674 66587 066
2009-10 62303 107688 058
2010-11 70322 113902 0622011-12 74333 180010 041
Interpretation-
Usually a high Quick ratio is an indication that the company is liquid and has the ability to
meet its current or liquid liabilities in time on the other hand a low Quick Ratio represents
8102019 A Study A Study On Financial Performance Analysis With Reference To Kesoram Cementon Financial Performance hellip
httpslidepdfcomreaderfulla-study-a-study-on-financial-performance-analysis-with-reference-to-kesoram 6881
that the companyrsquos liquidity position is not good The above table showing the quick ratios
of Kesoram are canrsquot be considered satisfactory
Leverage Ratios-
Debt-Equity Ratio-
Debt-Equity Ratio = Total Long Term Debt Equity Share Holders Fund
Total Long term Debt= Debenture Capital + Long term loans from banks and financial
institutions + Public deposits
Equity Share Holders fund = Equity + Reserves and Surplus
Debt Equity Ratio of Kesoram
(Rupees in crores)
Year Total Debt Share Holders Fund Debt Equity Ratio
2007-08 109235 98192 111
2008-09 197043 133010 148
2009-10 312622 154024 203
2010-11 399927 130025 308
2011-12 410534 91501 449
8102019 A Study A Study On Financial Performance Analysis With Reference To Kesoram Cementon Financial Performance hellip
httpslidepdfcomreaderfulla-study-a-study-on-financial-performance-analysis-with-reference-to-kesoram 6981
Interpretation-
The Debt-Equity Ratio accepted standard is 05 This ratio reflects the relative contribution
of creditors and owners of business in its financing From the above it is clear that the long
term debt is more than that of the share holdersrsquo fund So we can interpret that the firmrsquosassets are financed more by the external funds rather than by the internal funds
8102019 A Study A Study On Financial Performance Analysis With Reference To Kesoram Cementon Financial Performance hellip
httpslidepdfcomreaderfulla-study-a-study-on-financial-performance-analysis-with-reference-to-kesoram 7081
Fixed Asset Ratio-
Net Sales
Fixed Asset Ratio = helliphelliphelliphelliphelliphelliphelliphelliphelliphelliphellip
Net Assets
Fixed Asset Ratio of Kesoram-
(Rupees in crores)
Year Net Sales Net Assets Fixed Assets Ratio
2007-08 300271 358721 084
2008-09 389797 369172 106
2009-10 475062 343182 1382010-11 539788 180435 299
2011-12 59182 108424 546
Interpretation
This ratio indicates the extent to which the assets of the companyrsquos can be lost without
affecting the interest of the creditors of the company Higher the ratios better the long-term
position of the companyThe above table shows fixed assets ratio in increasing trend Which is good for the
company
8102019 A Study A Study On Financial Performance Analysis With Reference To Kesoram Cementon Financial Performance hellip
httpslidepdfcomreaderfulla-study-a-study-on-financial-performance-analysis-with-reference-to-kesoram 7181
Overall Profitability Ratios-
Net Profit Ratio
Net Profit Ratio indicates net margin on sales It is given by the following equation
Net Profit Ratio = (Net Profit Sales) 100
Net Profit Ratio of Kesoram
(Rupees in crores)
Year Net Profit Sales Net Profit Ratio
2007-08 37917 300271 1263
2008-09 41432 389797 1063
2009-10 20298 475062 427
2010-11 -28176 539788 -5222011-12 -38108 59182 -644
Interpretation
It establishes a relationship between net profits after tax and net sales and
indicates the efficiency of the management in manufacturing selling administrative and
other activities of the company
The higher the ratio the better is the profitability or performance of the business
The above table depicts the net profit Ratio of Kesoram has decreased every year from
2007-2008 to 2011-2012It further decreased to negative in the year 2010-11 to -522 and -
644 in the year 2011-2012 This shows constant decrease in the profits of the company
8102019 A Study A Study On Financial Performance Analysis With Reference To Kesoram Cementon Financial Performance hellip
httpslidepdfcomreaderfulla-study-a-study-on-financial-performance-analysis-with-reference-to-kesoram 7281
72
Return on Investment-
Net Profit
Return on Investment = helliphelliphelliphelliphelliphelliphelliphelliphelliphelliphelliphellip X 100
Share Holders Fund
Return on Investment Ratio of Kesoram-
(Rupees in crores)
Year Net Profit Share Holders Fund Return On Investment
2007-08 37917 98192 3862
2008-09 41432 133010 3115
2009-10 20298 154024 1318
2010-11 -28176 130025 -2167
2011-12 -38108 91501 -4165
Interpretation-
The above table reveals how well the resources of the firm are being used Higher
the ratio better the result The above ratio implies how well the firm is growing in
terms of profitability and efficiency From the above table we can concern that the return on
investment is in decreasing trend ROI is highest in the year 2007-2008 as 3862 But
there after itrsquos decreased every year
The ROI is negative in the years 2010-2011 amp 2011-2012 as -2167 amp -4165 respectively
Which is not a good sign for the firm
8102019 A Study A Study On Financial Performance Analysis With Reference To Kesoram Cementon Financial Performance hellip
httpslidepdfcomreaderfulla-study-a-study-on-financial-performance-analysis-with-reference-to-kesoram 7381
8102019 A Study A Study On Financial Performance Analysis With Reference To Kesoram Cementon Financial Performance hellip
httpslidepdfcomreaderfulla-study-a-study-on-financial-performance-analysis-with-reference-to-kesoram 7481
8102019 A Study A Study On Financial Performance Analysis With Reference To Kesoram Cementon Financial Performance hellip
httpslidepdfcomreaderfulla-study-a-study-on-financial-performance-analysis-with-reference-to-kesoram 7581
75
CHAPTER V
FINDINGS amp SUGGESTIONS
8102019 A Study A Study On Financial Performance Analysis With Reference To Kesoram Cementon Financial Performance hellip
httpslidepdfcomreaderfulla-study-a-study-on-financial-performance-analysis-with-reference-to-kesoram 7681
76
Findings
The Share capital remains constant Share capital is unchanged all the years from
2008-2012
Reserves amp surplus were recorded an increasing trend in the period between 2008
and 2010It is showing decreasing trend in the period 2011-2012 (ie from 16019
in 2010 to 9309 in 2012)
Current Liabilities were increased compared to base year ie 2008
Provisions increased to 262597 ie in Rupees 39232 crores in the current year
The current ratio for all the five year is lower (less) than the standard rule ie 21
And it is 097 in the year 2011-2012 (current year)
The Debt-Equity Ratio was shown under the standard ratio It is clear that the long
term debt is more than that of the share holdersrsquo fund It indicates that the firm
heavily relying on external funds rather than the internal funds
The operating and net profit of Kesoram is in decreasing trend due to heavy
increase of manufacturing amp administrative expenses
ROI is highest in the year 2007-2008 as 3862 The ROI is negative in the years
2010-2011 amp 2011-2012 as -2167 amp -4165 respectively
Return on Equity Capital Employed Ratio of Kesoram has decreased every year
from 2007-2008 to 2010-2011It further decreased to negative in the year 2011-12 to
-3280
EPS of Kesoram has decreased every year from 2008-12It is negative in the year
2011 amp 12
8102019 A Study A Study On Financial Performance Analysis With Reference To Kesoram Cementon Financial Performance hellip
httpslidepdfcomreaderfulla-study-a-study-on-financial-performance-analysis-with-reference-to-kesoram 7781
77
Suggestion
The organization should adopt an appropriate capital structure
The companyrsquos debt-equity ratio is recorded more or less as 111 in the year 2008
and it is increased to 449 in the year 2012 (current year)The company should
adopt a better debt equity mix in the future to control the fluctuations in returns
The company should control fluctuations in cash and bank balances as it impacts the
current ratio of the company
The provisions are showing increasing trend which indicates risk of debtors The
firm should implement an effective credit management policy It should utilize its
idle funds by decreasing provisions
The company should control heavy increase of manufacturing amp administration
expenses as it is impacting the operating and net profit of company
8102019 A Study A Study On Financial Performance Analysis With Reference To Kesoram Cementon Financial Performance hellip
httpslidepdfcomreaderfulla-study-a-study-on-financial-performance-analysis-with-reference-to-kesoram 7881
78
ANNEXURE
Profit And Loss Account of Kesoram Cement
Mar12 Mar11 Mar10 Mar09 Mar08
12 Months 12 Months 12 Months 12 Months 12 Months
INCOME
Sales Turnover 628260 575072 505151 431613 345700
Excise Duty 36440 35284 30089 41815 45429
NET SALES 591820 539788 475062 389797 300271
Other Income 000 000 000 000 000
TOTALINCOME
596129 548733 481019 393969 302020
EXPENDITURE
Manufacturing
Expenses81903 74803 13974 13153 44113
MaterialConsumed
370897 310150 295550 229359 118448
Personal
Expenses33468 27355 23294 18690 15344
Selling Expenses 81910 78253 58667 48846 45019
AdministrativeExpenses
28225 29308 17219 16179 9907
Expenses
Capitalized000 000 000 000 000
Provisions Made 000 000 000 000 000
TOTAL
EXPENDITURE 596403 519870 408704 326227 232832Operating Profit -4583 19918 66358 63570 67439
EBITDA -274 28864 72316 67742 69188
Depreciation 29740 27259 17280 11186 8927
Other Write-offs 000 000 000 000 000
EBIT -30014 1605 55035 56557 60261
Interest 41015 23983 10921 12087 5426
EBT -71029 -22377 44114 44470 54835
Taxes -32921 5798 23816 3037 16918
Profit and Loss
for the Year-38108 -28176 20298 41432 37917
Non RecurringItems
-1142 7063 3228 -4023 402
Other Non Cash
Adjustments1276 091 207 465 017
OtherAdjustments
000 000 000 000 000
REPORTED
PAT-37974 -21021 23734 37874 38335
8102019 A Study A Study On Financial Performance Analysis With Reference To Kesoram Cementon Financial Performance hellip
httpslidepdfcomreaderfulla-study-a-study-on-financial-performance-analysis-with-reference-to-kesoram 7981
79
Balance Sheet Of Kesoram
Years
Particulars 2008 2009 2010 2011 2012
Liabilities
Share Capital 4574 4574 4574 4574 4574Reserves amp Surplus 93085 128024 149111 125162 86657
Revaluation Reserves 533 412 339 289 27
Loans
Secured Loans 97106 153627 186372 237183 317792
Un Secured Loans 12129 43416 12625 162744 92742
Deferred Tax Liabilities 0 0 0 0 0
Current Liabilities
Provisions 33039 34529 35734 1494 40726
Current Liabilities 57067 66587 107688 113902 18001
Total 297533 431169 610068 645348 722771
Assets
Net Block 108424 180435 343182 369172 358721
Capital WIP 63459 86485 41283 43781 68065
Investments 4783 6178 5143 6582 6636
Current Assets
Inventories 44217 58906 91619 111855 99516
Sundry Debtors 27307 38017 54289 63134 67358
Cash amp Bank Balances 4036 5657 8014 7188 6959
Total Current Assets 7556 10258 153922 182177 173833Loans amp Advances 45289 55462 66506 4346 115409
Fixed Deposits 018 028 031 176 107
Total 297533 431169 610068 645348 722771
8102019 A Study A Study On Financial Performance Analysis With Reference To Kesoram Cementon Financial Performance hellip
httpslidepdfcomreaderfulla-study-a-study-on-financial-performance-analysis-with-reference-to-kesoram 8081
80
KEY ITEMS 2012 2011 2010 2009 2008
Preference
Dividend 0 0 0 0 0
Equity Dividend 457 2516 2516 2516 2516
Equity Dividend
() 999 55 55 55 55
Shares in Issue(Lakhs) 45743 45743 45743 45743 45743
EPS - Annualised
(Rs) -8302 -4595 5188 828 838
8102019 A Study A Study On Financial Performance Analysis With Reference To Kesoram Cementon Financial Performance hellip
httpslidepdfcomreaderfulla-study-a-study-on-financial-performance-analysis-with-reference-to-kesoram 8181
BIBLIOGRAPHY
Sl
No
Books Author Name
1 Financial Management Khan amp JAIN
2 Financial Management IMPandey
3 Management Accounting RPTrivedi
Websites amp Search Engines
1 wwwkesoramcom983086
2 wwwmoneycontrolcom
3 wwwgooglefinancecom983086
Annual reports of Kesoram cement limited 2008-2012

8102019 A Study A Study On Financial Performance Analysis With Reference To Kesoram Cementon Financial Performance hellip
httpslidepdfcomreaderfulla-study-a-study-on-financial-performance-analysis-with-reference-to-kesoram 4781
47
Interpretation of comparative balance sheet of 2008-2009
Reserves amp Surplus were increased to 3753 (percent) ie in Rupees 34939
crores
Revaluation Reserves decreased to 121 ie in Rupees 2270 crores
Secured Loans are increased to 5821 ie in Rupees 56521 crores And UN
secured loans highly Increased to 25795
Current liabilities and Provisions are increased to 1668 and 451 respectively ie in
Rupees 9520 amp 1490 crores
Fixed assets were highly increased to 6642 ie in Rupees 72011 crores
Investments were increased to 2917 ie in Rupees 1395 crores
Sundry debtors increased to 3922 ie in Rupees 10710 crores
Current assets increased 3576 ie in Rupees 27020 crores And Loans amp
Advances increased to 2246 respectively
The overall financial position was satisfactory
8102019 A Study A Study On Financial Performance Analysis With Reference To Kesoram Cementon Financial Performance hellip
httpslidepdfcomreaderfulla-study-a-study-on-financial-performance-analysis-with-reference-to-kesoram 4881
48
Comparative Balance Sheet of Kesoram in the Year between 2009-2010
(Rupees in crores)
Years Changes
Particulars 2009 2010 In Rupees In Percentage
Liabilities
Share Capital 4574 4574 000 000
Reserves amp Surplus 128024 149111 21087 1647
Revaluation Reserves 412 339 -073 -1772
Loans
Secured Loans 153627 186372 32745 2131
Un Secured Loans 43416 126250 82834 19079
Deferred Tax Liabilities 000 000 000
Current Liabilities
Provisions 34529 35734 1205 349
Current Liabilities 66587 107688 41101 6173
Total 431169 610068 178899 4149
Assets
Net Block 180435 343182 162747 9020
Capital WIP 86485 41283 -45202 -5227
Investments 6178 5143 -1035 -1675
Current Assets
Inventories 58906 91619 32713 5553
Sundry Debtors 38017 54289 16272 4280
Cash amp Bank Balances 5657 8014 2357 4167
Total Current Assets 102580 153922 51342 5005
Loans amp Advances 55462 66506 11044 1991
Fixed Deposits 028 031 003 1071
Total 431169 610068 178899 4149
8102019 A Study A Study On Financial Performance Analysis With Reference To Kesoram Cementon Financial Performance hellip
httpslidepdfcomreaderfulla-study-a-study-on-financial-performance-analysis-with-reference-to-kesoram 4981
49
Interpretation of comparative balance sheet of 2009-2010
Reserves amp surplus increased to 1647 ie in Rupees 21087 crores
Revaluation Reserves decreased to 1772 ie in Rupees 073 crores
Secured loans increased to 2131 ie in Rupees 32745 crores
Current Liabilities were increased to 6173 ie in Rupees 41101 crores and
Provisions 349 ie in Rupees 1205 crores
Fixed Assets were increased to 9020 ie in Rupees 162747 crores
Investments were decreased to 1675 ie in Rupees 1035 crores
Sundry debtors were increased to 4280 ie in Rupees 16272 crores
Current assets increased to 5005 ie in Rupees 51342 crores And loans and
Advances increased 1919 ie in Rupees 11044 crores
The overall financial position was satisfactory
8102019 A Study A Study On Financial Performance Analysis With Reference To Kesoram Cementon Financial Performance hellip
httpslidepdfcomreaderfulla-study-a-study-on-financial-performance-analysis-with-reference-to-kesoram 5081
50
Comparative Balance Sheet of Kesoram in the Year between 2010-2011
(Rupees in crores)
Years Changes
Particulars 2010 2011 In Rupees In Percentage
Liabilities
Share Capital 4574 4574 000 000
Reserves amp Surplus 149111 125162 -23949 -1606
Revaluation Reserves 339 289 -050 -1475
Loans
Secured Loans 186372 237183 50811 2726
Un Secured Loans 126250 162744 36494 2891
Deferred Tax Liabilities 000 000 000
Current Liabilities
Provisions 35734 1494 -34240 -9582
Current Liabilities 107688 113902 6214 577
Total 610068 645348 35280 578
Assets
Net Block 343182 369172 25990 757
Capital WIP 41283 43781 2498 605
Investments 5143 6582 1439 2798
Current Assets
Inventories 91619 111855 20236 2209
Sundry Debtors 54289 63134 8845 1629
Cash amp Bank Balances 8014 7188 -826 -1031
Total Current Assets 153922 182177 28255 1836
Loans amp Advances 66506 43460 -23046 -3465
Fixed Deposits 031 176 145 46774
Total 610068 645348 35280 578
8102019 A Study A Study On Financial Performance Analysis With Reference To Kesoram Cementon Financial Performance hellip
httpslidepdfcomreaderfulla-study-a-study-on-financial-performance-analysis-with-reference-to-kesoram 5181
51
Interpretation of comparative balance sheet of 2010-2011
Reserves amp surplus decreased to 1606 ie in Rupees 23949 crores
Revaluation Reserves decreased to 1475 ie in Rupees 050 crores
Secured loans increased to 2726 ie in Rupees 50811 crores
Current Liabilities were increased to 577 ie in Rupees 6214 crores
Provisions decreased to 9582 ie in Rupees 34240 crores
Fixed Assets were increased to 757 ie in Rupees 25990 crores
Investments were decreased to 2798 ie in Rupees 1439 crores
Sundry debtors were increased to 1629 ie in Rupees8845 crores
Current assets increased to 1836 ie in Rupees 28255 crores And loans and
Advances increased 3465 ie in Rupees 23046 crores
The overall financial position was UN satisfactory
8102019 A Study A Study On Financial Performance Analysis With Reference To Kesoram Cementon Financial Performance hellip
httpslidepdfcomreaderfulla-study-a-study-on-financial-performance-analysis-with-reference-to-kesoram 5281
52
Comparative Balance Sheet of Kesoram In The Year Between 2011-2012
(Rupees in crores)
Years Changes
Particulars 2011 2012 In Rupees In Percentage
Liabilities
Share Capital 4574 4574 000 000
Reserves amp Surplus 125162 86657 -38505 -3076
Revaluation Reserves 289 270 -019 -657
Loans
Secured Loans 237183 317792 80609 3399
Un Secured Loans 162744 92742 -70002 -4301
Deferred Tax Liabilities 000 000 000
Current Liabilities
Provisions 1494 40726 39232 262597
Current Liabilities 113902 180010 66108 5804
Total 645348 722771 77423 1200
Assets 000
Net Block 369172 358721 -10451 -283
Capital WIP 43781 68065 24284 5547
Investments 6582 6636 054 082
Current Assets
Inventories 111855 99516 -12339 -1103
Sundry Debtors 63134 67358 4224 669
Cash amp Bank Balances 7188 6959 -229 -319
Total Current Assets 182177 173833 -8344 -458
Loans amp Advances 43460 115409 71949 16555
Fixed Deposits 176 107 -069 -3920
Total 645348 722771 77423 1200
8102019 A Study A Study On Financial Performance Analysis With Reference To Kesoram Cementon Financial Performance hellip
httpslidepdfcomreaderfulla-study-a-study-on-financial-performance-analysis-with-reference-to-kesoram 5381
53
Interpretation of comparative balance sheet of 2011-2012
Reserves amp surplus decreased to 3076 ie in Rupee 38505 crores
Revaluation Reserves decreased to 657 ie in Rupees 019 crores
Secured loans increased to 3399 ie in Rupees 80699 crores
Current Liabilities were increased to 5804 ie in Rupees 66108 crores
Provisions increased to 262597 ie in Rupees 39232 crores
Fixed Assets were decreased to 283 ie in Rupee 10451 crores
Investments were increased to 082 ie in Rupees 054 crores
Sundry debtors were increased to 669 ie in Rupees 4224 crores
Current assets decreased to 458 ie in Rupees 8344 crores And loans and
Advances increased 16555 ie in Rupees 71949 crores
The overall financial position was UN satisfactory
8102019 A Study A Study On Financial Performance Analysis With Reference To Kesoram Cementon Financial Performance hellip
httpslidepdfcomreaderfulla-study-a-study-on-financial-performance-analysis-with-reference-to-kesoram 5481
54
Common Size Balance Sheet of Kesoram For The Year 2008-2009
(Rupees in crores)
Particulars 2008 Change Percentage 2009 Change Percentage
Liabilities
Share Capital 4574 154 4574 106
Reserves amp Surplus 93085 3129 128024 2969
Revaluation Reserves 533 018 412 010
Loans
Secured Loans 97106 3264 153627 3563
Un Secured Loans 12129 408 43416 1007
Deferred Tax Liabilities 000 000 000 000
Current Liabilities
Provisions 33039 1110 34529 801
Current Liabilities 57067 1918 66587 1544
Total 297533 10000 431169 10000
Assets
Net Block 108424 3644 180435 4185
Capital WIP 63459 2133 86485 2006
Investments 4783 161 6178 143
Current Assets
Inventories 44217 1486 58906 1366
Sundry Debtors 27307 918 38017 882
Cash amp Bank Balances 4036 136 5657 131
Loans amp Advances 45289 1522 55462 1286
Fixed Deposits 018 001 028 001
Total 297533 10000 431169 10000
8102019 A Study A Study On Financial Performance Analysis With Reference To Kesoram Cementon Financial Performance hellip
httpslidepdfcomreaderfulla-study-a-study-on-financial-performance-analysis-with-reference-to-kesoram 5581
55
Interpretation of Common Size Balance Sheet of 2008-2009
Share capital was recorded 154 percent in the total liabilities in the year 2008 it is
decreased to 106 in the year 2009
Reserves amp surplus contributed to 3129 in the total liabilities in the year 2008 it is
decreased to 2969 in the year 2009
Secured loans were 3264 in the total liabilities in the year 2008 it is increased to
3563 in the year 2009
Current Liabilities shown to 1918 in the total liabilities in the year 2008 it is
decreased to 1544 in the year 2009
Provisions 1110 in the total liabilities in the year 2008 it is decreased to 801 in the
year 2009
Fixed Assets were 3644 in the total liabilities in the year 2008 ie decreased to 4185
in the year 2009
Investments were 161 in the total liabilities in the year 2008 it is decreased to 143
in the year 2009
Sundry debtors were 918 in the total liabilities in the year 2008 it is decreased to 882
in the year 2009
8102019 A Study A Study On Financial Performance Analysis With Reference To Kesoram Cementon Financial Performance hellip
httpslidepdfcomreaderfulla-study-a-study-on-financial-performance-analysis-with-reference-to-kesoram 5681
56
Common Size Balance Sheet of Kesoram For The Year 2009-2010
(Rs in crores)
Particulars 2009 Change Percentage 2010Change
Percentage
Liabilities
Share Capital 4574 106 4574 075
Reserves amp Surplus 128024 2969 149111 2444
Revaluation Reserves 412 010 339 006
Loans
Secured Loans 153627 3563 186372 3055
Un Secured Loans 43416 1007 126250 2069
Deferred Tax Liabilities 000 000 000 000
Current Liabilities
Provisions 34529 801 35734 586
Current Liabilities 66587 1544 107688 1765
Total 431169 10000 610068 10000
Assets
Net Block 180435 4185 343182 5625
Capital WIP 86485 2006 41283 677
Investments 6178 143 5143 084
Current Assets
Inventories 58906 1366 91619 1502
Sundry Debtors 38017 882 54289 890
Cash amp Bank Balances 5657 131 8014 131
Loans amp Advances 55462 1286 66506 1090
Fixed Deposits 028 001 031 001
Total 431169 10000 610068 10000
8102019 A Study A Study On Financial Performance Analysis With Reference To Kesoram Cementon Financial Performance hellip
httpslidepdfcomreaderfulla-study-a-study-on-financial-performance-analysis-with-reference-to-kesoram 5781
57
Interpretation of common size balance sheet of 2009-2010
Share capital was recorded 106 percent in the total liabilities in the
year 2009 it is decreased to 075 in the year 2010
Reserves amp surplus contributed to 2969 in the total liabilities in the
year 2009 it is decreased to2444 in the year 2010
Secured loans were 3563 in the total liabilities in the year 2009 it is
increased to 3055 in the year 2010
Current Liabilities shown to 1544 in the total liabilities in the year
2009 it is decreased to 1765 in the year 2010
Provisions 801 in the total liabilities in the year 2009 it is decreased
to 586 in the year 2010
Fixed Assets were 4185 in the total liabilities in the year 2009 ie
increased to 5625 in the year 2010
Investments were 143 in the total liabilities in the year 2009 it is
decreased to 084 in the year 2010
Sundry debtors were 882 in the total liabilities in the year 2009 it is
increased to 890 in the year 2010
8102019 A Study A Study On Financial Performance Analysis With Reference To Kesoram Cementon Financial Performance hellip
httpslidepdfcomreaderfulla-study-a-study-on-financial-performance-analysis-with-reference-to-kesoram 5881
58
Common Size Balance sheet of Kesoram for the year 2010-2011
983080Rupees in crores)
Particulars 2010 Change Percentage 2011
Change
Percentage
Liabilities
Share Capital 4574 075 4574 071
Reserves amp Surplus 149111 2444 125162 1939
Revaluation Reserves 339 006 289 004
Loans
Secured Loans 186372 3055 237183 3675
Un Secured Loans 126250 2069 162744 2522
Deferred Tax Liabilities 000 000 000 000
Current Liabilities
Provisions 35734 586 1494 023
Current Liabilities 107688 1765 113902 1765
Total 610068 10000 645348 10000
Assets
Net Block 343182 5625 369172 5721
Capital WIP 41283 677 43781 678
Investments 5143 084 6582 102
Current Assets
Inventories 91619 1502 111855 1733
Sundry Debtors 54289 890 63134 978
Cash amp Bank Balances 8014 131 7188 111
Loans amp Advances 66506 1090 43460 673
Fixed Deposits 031 001 176 003
Total 610068 10000 645348 10000
8102019 A Study A Study On Financial Performance Analysis With Reference To Kesoram Cementon Financial Performance hellip
httpslidepdfcomreaderfulla-study-a-study-on-financial-performance-analysis-with-reference-to-kesoram 5981
59
Interpretation of Common Size Balance Sheet Of 2010-2011
Share capital was recorded 075 percent in the total liabilities in the year 2010 it is
decreased to 071 in the year 2011
Reserves amp surplus contributed to 2444 in the total liabilities in the year 2010 it is
decreased to1939 in the year 2011
Secured loans were 3055 in the total liabilities in the year 2010 it is increased to
3675 in the year 2011
Current Liabilities shown to 1765 in the total liabilities in the year 2010 it is
also1765 in the year 2011
Provisions 586 in the total liabilities in the year 2010 it is decreased to 023 in the
year 2011
Fixed Assets were 5625 in the total liabilities in the year 2010 ie increased to 5721
in the year 2011
Investments were 084 in the total liabilities in the year 2010 it increased to 102 in
the year 2011
Sundry debtors were 890 in the total liabilities in the year 2010 it is increased to 978
in the year 2011
8102019 A Study A Study On Financial Performance Analysis With Reference To Kesoram Cementon Financial Performance hellip
httpslidepdfcomreaderfulla-study-a-study-on-financial-performance-analysis-with-reference-to-kesoram 6081
60
Common Size Balance Sheet of Kesoram for the Year 2011-2012
983080Rupees in crores)
Particulars 2011 Change Percentage 2012
Change
Percentage
Liabilities
Share Capital 4574 071 4574 063
Reserves amp Surplus 125162 1939 86657 1199
Revaluation Reserves 289 004 270 004
Loans
Secured Loans 237183 3675 317792 4397
Un Secured Loans 162744 2522 92742 1283
Deferred Tax Liabilities 000 000 000 000
Current Liabilities
Provisions 1494 023 40726 563
Current Liabilities 113902 1765 180010 2491
Total 645348 10000 722771 10000
Assets
Net Block 369172 5721 358721 4963
Capital WIP 43781 678 68065 942
Investments 6582 102 6636 092
Current Assets
Inventories 111855 1733 99516 1377
Sundry Debtors 63134 978 67358 932
Cash amp Bank Balances 7188 111 6959 096
Loans amp Advances 43460 673 115409 1597
Fixed Deposits 176 003 107 001
Total 645348 10000 722771 10000
8102019 A Study A Study On Financial Performance Analysis With Reference To Kesoram Cementon Financial Performance hellip
httpslidepdfcomreaderfulla-study-a-study-on-financial-performance-analysis-with-reference-to-kesoram 6181
61
Interpretation of common size balance sheet of 2011-2012
Share capital was recorded 071 percent in the total liabilities in the year 2011 it is
decreased to 063 in the year 2012
Reserves amp surplus contributed to 1939 in the total liabilities in the year 2011 it
is decreased to 1199 in the year 2012
Secured loans were 3675 in the total liabilities in the year 2011 it is increased to
4397 in the year 2012
Current Liabilities shown to 1765 in the total liabilities in the year 2011 it is
increased to 2491 in the year 2012
Provisions 023 in the total liabilities in the year 2011 it is increased to 563 in the
year 2012
Fixed Assets were 5721 in the total liabilities in the year 2011 ie decreased to
4963 in the year 2012
Investments were 102 in the total liabilities in the year 2011 it increased to 092
in the year 2012
Sundry debtors were 978 in the total liabilities in the year 2011 it is decreased to
932 in the year 2012
8102019 A Study A Study On Financial Performance Analysis With Reference To Kesoram Cementon Financial Performance hellip
httpslidepdfcomreaderfulla-study-a-study-on-financial-performance-analysis-with-reference-to-kesoram 6281
Trend Analysis
Share Capital-
Year
Amount
(In Crores) Trend
IncreaseDecrease
Base Year Previous Year
2008 4574 10000 000 000
2009 4574 10000 000 000
2010 4574 10000 000 000
2011 4574 10000 000 000
2012 4574 10000 000 000
Trend Percentages in Share Capital
Share capital shown a constant trend in the period 2008 and 2012
Share capital is 4574 crores all the years from 2008-2012
8102019 A Study A Study On Financial Performance Analysis With Reference To Kesoram Cementon Financial Performance hellip
httpslidepdfcomreaderfulla-study-a-study-on-financial-performance-analysis-with-reference-to-kesoram 6381
Reserves amp Surplus-
Year
Amount
(In Crores) Trend
IncreaseDecrease
Base Year Previous Year
2008 93085 10000 000 000
2009 128024 13753 3753 3753
2010 149111 16019 6019 2266
2011 125162 13446 3446 -2573
2012 86657 9309 -691 -4137
Trend Percentages in Reserves amp Surplus
Reserves amp surplus shown an increasing trend in the period between 2008 and 2010
The average trend was 13277 till 2010
The Reserves amp surplus was showing decreasing trend in the period 2011-2012 (ie
from 16019 in 2010 to 9309 in 2012)
The decreasing trend in Reserves amp surplus indicates the decrease in profits of the
firm
8102019 A Study A Study On Financial Performance Analysis With Reference To Kesoram Cementon Financial Performance hellip
httpslidepdfcomreaderfulla-study-a-study-on-financial-performance-analysis-with-reference-to-kesoram 6481
Investments-
Year
Amount
(In Crores) Trend
IncreaseDecrease
Base Year Previous Year
2008 4783 10000 000 000
2009 6178 12917 2917 2917
2010 5143 10753 753 -2164
2011 6582 13761 3761 3009
2012 6636 13874 3874 113
Trend Percentages in Investments-
The investments are shown an increasing trend in the period between 2008 ndash 2009
and it is decreasing in the year 2010
The average trend was 11458 till 2009
The investments increased in the periods 2011-2012 (ie from 10753 in 2010 to
13874 in 2012)
The overall trend in investments shown is satisfactory
8102019 A Study A Study On Financial Performance Analysis With Reference To Kesoram Cementon Financial Performance hellip
httpslidepdfcomreaderfulla-study-a-study-on-financial-performance-analysis-with-reference-to-kesoram 6581
Net Current Assets-
Year
Amount
(In Crores) Trend
IncreaseDecrease
Base Year Previous Year
2008 30761 10000 000 000
2009 56954 18515 8515 8515
2010 77037 25044 15044 6529
2011 110417 35895 25895 10851
2012 68613 22305 12305 -13590
Trends in Net Current Assets-
The NCA shown positive (increasing) trend
The NCA are increased to 35895 (the year 2011) compared with base year and
decreased in the year 2012 to 22305
The NCA shown increased trend from year and crossed 100
The overall trend was good
8102019 A Study A Study On Financial Performance Analysis With Reference To Kesoram Cementon Financial Performance hellip
httpslidepdfcomreaderfulla-study-a-study-on-financial-performance-analysis-with-reference-to-kesoram 6681
66
Ratio Analysis-
Current Ratio-
Current Ratio = Current Assets Current Liabilities
Current assets are cash in hand Cash at bank Marketable Securities(short term) short term
Investment Bills receivables sundry debtors Inventories (stock) Work in progress prepaid
expenses Current Liabilities are outstanding expenses Bills payable sundry Creditors
short-term advances income tax payable and Dividend payable
Current Ratio of Kesoram-
(Rupees in crores)
Year Current Assets Current Liabilities Current Ratio
2007-08 75560 57067 132
2008-09 102580 66587 154
2009-10 153922 107688 143
2010-11 182177 113902 160
2011-12 173833 180010 097
Interpretation-
As per the standard rule of current ratio ie 21 where current assets double the current
liabilities is considered satisfactory
In the present analysis the current ratio of the Kesoram is not satisfactory
from the above table It was assessed that the current ratio for all the five year is lower (less)
than the standard rule ie 21 And it is 097 in the year 2011-2012 (current year) This is
highly UN satisfactory
8102019 A Study A Study On Financial Performance Analysis With Reference To Kesoram Cementon Financial Performance hellip
httpslidepdfcomreaderfulla-study-a-study-on-financial-performance-analysis-with-reference-to-kesoram 6781
Quick Ratio-
Quick ratio also known as acid-test ratio establishes a relationship between quick
assets and the current liabilities Cash is the most liquid asset It is calculated by dividing
quick assets by current liabilities
Quick ratio = Quick Assets Current Liabilities
(Quick Assets = Current assets ndash Inventory)
Quick Ratio of Kesoram-
Rupees in crores)
Year Total QuickAssets
Current Liabilities Quick Ratio
2007-08 33343 57067 058
2008-09 43674 66587 066
2009-10 62303 107688 058
2010-11 70322 113902 0622011-12 74333 180010 041
Interpretation-
Usually a high Quick ratio is an indication that the company is liquid and has the ability to
meet its current or liquid liabilities in time on the other hand a low Quick Ratio represents
8102019 A Study A Study On Financial Performance Analysis With Reference To Kesoram Cementon Financial Performance hellip
httpslidepdfcomreaderfulla-study-a-study-on-financial-performance-analysis-with-reference-to-kesoram 6881
that the companyrsquos liquidity position is not good The above table showing the quick ratios
of Kesoram are canrsquot be considered satisfactory
Leverage Ratios-
Debt-Equity Ratio-
Debt-Equity Ratio = Total Long Term Debt Equity Share Holders Fund
Total Long term Debt= Debenture Capital + Long term loans from banks and financial
institutions + Public deposits
Equity Share Holders fund = Equity + Reserves and Surplus
Debt Equity Ratio of Kesoram
(Rupees in crores)
Year Total Debt Share Holders Fund Debt Equity Ratio
2007-08 109235 98192 111
2008-09 197043 133010 148
2009-10 312622 154024 203
2010-11 399927 130025 308
2011-12 410534 91501 449
8102019 A Study A Study On Financial Performance Analysis With Reference To Kesoram Cementon Financial Performance hellip
httpslidepdfcomreaderfulla-study-a-study-on-financial-performance-analysis-with-reference-to-kesoram 6981
Interpretation-
The Debt-Equity Ratio accepted standard is 05 This ratio reflects the relative contribution
of creditors and owners of business in its financing From the above it is clear that the long
term debt is more than that of the share holdersrsquo fund So we can interpret that the firmrsquosassets are financed more by the external funds rather than by the internal funds
8102019 A Study A Study On Financial Performance Analysis With Reference To Kesoram Cementon Financial Performance hellip
httpslidepdfcomreaderfulla-study-a-study-on-financial-performance-analysis-with-reference-to-kesoram 7081
Fixed Asset Ratio-
Net Sales
Fixed Asset Ratio = helliphelliphelliphelliphelliphelliphelliphelliphelliphelliphellip
Net Assets
Fixed Asset Ratio of Kesoram-
(Rupees in crores)
Year Net Sales Net Assets Fixed Assets Ratio
2007-08 300271 358721 084
2008-09 389797 369172 106
2009-10 475062 343182 1382010-11 539788 180435 299
2011-12 59182 108424 546
Interpretation
This ratio indicates the extent to which the assets of the companyrsquos can be lost without
affecting the interest of the creditors of the company Higher the ratios better the long-term
position of the companyThe above table shows fixed assets ratio in increasing trend Which is good for the
company
8102019 A Study A Study On Financial Performance Analysis With Reference To Kesoram Cementon Financial Performance hellip
httpslidepdfcomreaderfulla-study-a-study-on-financial-performance-analysis-with-reference-to-kesoram 7181
Overall Profitability Ratios-
Net Profit Ratio
Net Profit Ratio indicates net margin on sales It is given by the following equation
Net Profit Ratio = (Net Profit Sales) 100
Net Profit Ratio of Kesoram
(Rupees in crores)
Year Net Profit Sales Net Profit Ratio
2007-08 37917 300271 1263
2008-09 41432 389797 1063
2009-10 20298 475062 427
2010-11 -28176 539788 -5222011-12 -38108 59182 -644
Interpretation
It establishes a relationship between net profits after tax and net sales and
indicates the efficiency of the management in manufacturing selling administrative and
other activities of the company
The higher the ratio the better is the profitability or performance of the business
The above table depicts the net profit Ratio of Kesoram has decreased every year from
2007-2008 to 2011-2012It further decreased to negative in the year 2010-11 to -522 and -
644 in the year 2011-2012 This shows constant decrease in the profits of the company
8102019 A Study A Study On Financial Performance Analysis With Reference To Kesoram Cementon Financial Performance hellip
httpslidepdfcomreaderfulla-study-a-study-on-financial-performance-analysis-with-reference-to-kesoram 7281
72
Return on Investment-
Net Profit
Return on Investment = helliphelliphelliphelliphelliphelliphelliphelliphelliphelliphelliphellip X 100
Share Holders Fund
Return on Investment Ratio of Kesoram-
(Rupees in crores)
Year Net Profit Share Holders Fund Return On Investment
2007-08 37917 98192 3862
2008-09 41432 133010 3115
2009-10 20298 154024 1318
2010-11 -28176 130025 -2167
2011-12 -38108 91501 -4165
Interpretation-
The above table reveals how well the resources of the firm are being used Higher
the ratio better the result The above ratio implies how well the firm is growing in
terms of profitability and efficiency From the above table we can concern that the return on
investment is in decreasing trend ROI is highest in the year 2007-2008 as 3862 But
there after itrsquos decreased every year
The ROI is negative in the years 2010-2011 amp 2011-2012 as -2167 amp -4165 respectively
Which is not a good sign for the firm
8102019 A Study A Study On Financial Performance Analysis With Reference To Kesoram Cementon Financial Performance hellip
httpslidepdfcomreaderfulla-study-a-study-on-financial-performance-analysis-with-reference-to-kesoram 7381
8102019 A Study A Study On Financial Performance Analysis With Reference To Kesoram Cementon Financial Performance hellip
httpslidepdfcomreaderfulla-study-a-study-on-financial-performance-analysis-with-reference-to-kesoram 7481
8102019 A Study A Study On Financial Performance Analysis With Reference To Kesoram Cementon Financial Performance hellip
httpslidepdfcomreaderfulla-study-a-study-on-financial-performance-analysis-with-reference-to-kesoram 7581
75
CHAPTER V
FINDINGS amp SUGGESTIONS
8102019 A Study A Study On Financial Performance Analysis With Reference To Kesoram Cementon Financial Performance hellip
httpslidepdfcomreaderfulla-study-a-study-on-financial-performance-analysis-with-reference-to-kesoram 7681
76
Findings
The Share capital remains constant Share capital is unchanged all the years from
2008-2012
Reserves amp surplus were recorded an increasing trend in the period between 2008
and 2010It is showing decreasing trend in the period 2011-2012 (ie from 16019
in 2010 to 9309 in 2012)
Current Liabilities were increased compared to base year ie 2008
Provisions increased to 262597 ie in Rupees 39232 crores in the current year
The current ratio for all the five year is lower (less) than the standard rule ie 21
And it is 097 in the year 2011-2012 (current year)
The Debt-Equity Ratio was shown under the standard ratio It is clear that the long
term debt is more than that of the share holdersrsquo fund It indicates that the firm
heavily relying on external funds rather than the internal funds
The operating and net profit of Kesoram is in decreasing trend due to heavy
increase of manufacturing amp administrative expenses
ROI is highest in the year 2007-2008 as 3862 The ROI is negative in the years
2010-2011 amp 2011-2012 as -2167 amp -4165 respectively
Return on Equity Capital Employed Ratio of Kesoram has decreased every year
from 2007-2008 to 2010-2011It further decreased to negative in the year 2011-12 to
-3280
EPS of Kesoram has decreased every year from 2008-12It is negative in the year
2011 amp 12
8102019 A Study A Study On Financial Performance Analysis With Reference To Kesoram Cementon Financial Performance hellip
httpslidepdfcomreaderfulla-study-a-study-on-financial-performance-analysis-with-reference-to-kesoram 7781
77
Suggestion
The organization should adopt an appropriate capital structure
The companyrsquos debt-equity ratio is recorded more or less as 111 in the year 2008
and it is increased to 449 in the year 2012 (current year)The company should
adopt a better debt equity mix in the future to control the fluctuations in returns
The company should control fluctuations in cash and bank balances as it impacts the
current ratio of the company
The provisions are showing increasing trend which indicates risk of debtors The
firm should implement an effective credit management policy It should utilize its
idle funds by decreasing provisions
The company should control heavy increase of manufacturing amp administration
expenses as it is impacting the operating and net profit of company
8102019 A Study A Study On Financial Performance Analysis With Reference To Kesoram Cementon Financial Performance hellip
httpslidepdfcomreaderfulla-study-a-study-on-financial-performance-analysis-with-reference-to-kesoram 7881
78
ANNEXURE
Profit And Loss Account of Kesoram Cement
Mar12 Mar11 Mar10 Mar09 Mar08
12 Months 12 Months 12 Months 12 Months 12 Months
INCOME
Sales Turnover 628260 575072 505151 431613 345700
Excise Duty 36440 35284 30089 41815 45429
NET SALES 591820 539788 475062 389797 300271
Other Income 000 000 000 000 000
TOTALINCOME
596129 548733 481019 393969 302020
EXPENDITURE
Manufacturing
Expenses81903 74803 13974 13153 44113
MaterialConsumed
370897 310150 295550 229359 118448
Personal
Expenses33468 27355 23294 18690 15344
Selling Expenses 81910 78253 58667 48846 45019
AdministrativeExpenses
28225 29308 17219 16179 9907
Expenses
Capitalized000 000 000 000 000
Provisions Made 000 000 000 000 000
TOTAL
EXPENDITURE 596403 519870 408704 326227 232832Operating Profit -4583 19918 66358 63570 67439
EBITDA -274 28864 72316 67742 69188
Depreciation 29740 27259 17280 11186 8927
Other Write-offs 000 000 000 000 000
EBIT -30014 1605 55035 56557 60261
Interest 41015 23983 10921 12087 5426
EBT -71029 -22377 44114 44470 54835
Taxes -32921 5798 23816 3037 16918
Profit and Loss
for the Year-38108 -28176 20298 41432 37917
Non RecurringItems
-1142 7063 3228 -4023 402
Other Non Cash
Adjustments1276 091 207 465 017
OtherAdjustments
000 000 000 000 000
REPORTED
PAT-37974 -21021 23734 37874 38335
8102019 A Study A Study On Financial Performance Analysis With Reference To Kesoram Cementon Financial Performance hellip
httpslidepdfcomreaderfulla-study-a-study-on-financial-performance-analysis-with-reference-to-kesoram 7981
79
Balance Sheet Of Kesoram
Years
Particulars 2008 2009 2010 2011 2012
Liabilities
Share Capital 4574 4574 4574 4574 4574Reserves amp Surplus 93085 128024 149111 125162 86657
Revaluation Reserves 533 412 339 289 27
Loans
Secured Loans 97106 153627 186372 237183 317792
Un Secured Loans 12129 43416 12625 162744 92742
Deferred Tax Liabilities 0 0 0 0 0
Current Liabilities
Provisions 33039 34529 35734 1494 40726
Current Liabilities 57067 66587 107688 113902 18001
Total 297533 431169 610068 645348 722771
Assets
Net Block 108424 180435 343182 369172 358721
Capital WIP 63459 86485 41283 43781 68065
Investments 4783 6178 5143 6582 6636
Current Assets
Inventories 44217 58906 91619 111855 99516
Sundry Debtors 27307 38017 54289 63134 67358
Cash amp Bank Balances 4036 5657 8014 7188 6959
Total Current Assets 7556 10258 153922 182177 173833Loans amp Advances 45289 55462 66506 4346 115409
Fixed Deposits 018 028 031 176 107
Total 297533 431169 610068 645348 722771
8102019 A Study A Study On Financial Performance Analysis With Reference To Kesoram Cementon Financial Performance hellip
httpslidepdfcomreaderfulla-study-a-study-on-financial-performance-analysis-with-reference-to-kesoram 8081
80
KEY ITEMS 2012 2011 2010 2009 2008
Preference
Dividend 0 0 0 0 0
Equity Dividend 457 2516 2516 2516 2516
Equity Dividend
() 999 55 55 55 55
Shares in Issue(Lakhs) 45743 45743 45743 45743 45743
EPS - Annualised
(Rs) -8302 -4595 5188 828 838
8102019 A Study A Study On Financial Performance Analysis With Reference To Kesoram Cementon Financial Performance hellip
httpslidepdfcomreaderfulla-study-a-study-on-financial-performance-analysis-with-reference-to-kesoram 8181
BIBLIOGRAPHY
Sl
No
Books Author Name
1 Financial Management Khan amp JAIN
2 Financial Management IMPandey
3 Management Accounting RPTrivedi
Websites amp Search Engines
1 wwwkesoramcom983086
2 wwwmoneycontrolcom
3 wwwgooglefinancecom983086
Annual reports of Kesoram cement limited 2008-2012
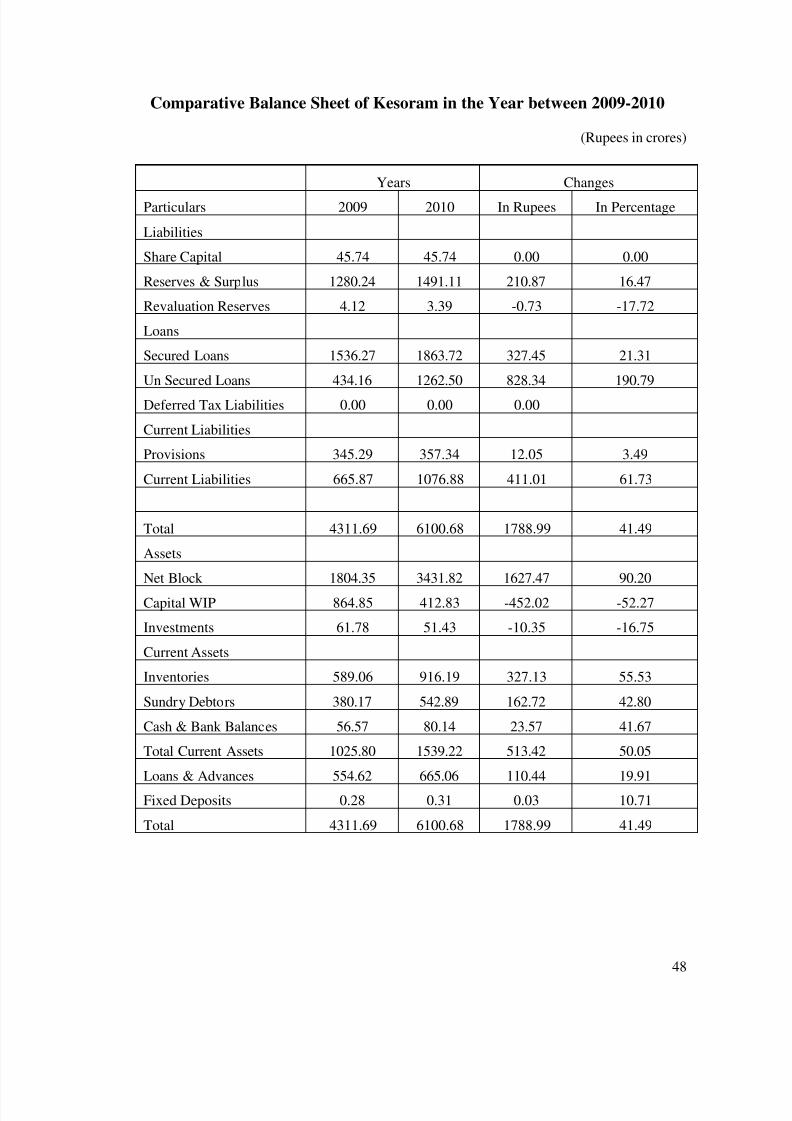
8102019 A Study A Study On Financial Performance Analysis With Reference To Kesoram Cementon Financial Performance hellip
httpslidepdfcomreaderfulla-study-a-study-on-financial-performance-analysis-with-reference-to-kesoram 4981
49
Interpretation of comparative balance sheet of 2009-2010
Reserves amp surplus increased to 1647 ie in Rupees 21087 crores
Revaluation Reserves decreased to 1772 ie in Rupees 073 crores
Secured loans increased to 2131 ie in Rupees 32745 crores
Current Liabilities were increased to 6173 ie in Rupees 41101 crores and
Provisions 349 ie in Rupees 1205 crores
Fixed Assets were increased to 9020 ie in Rupees 162747 crores
Investments were decreased to 1675 ie in Rupees 1035 crores
Sundry debtors were increased to 4280 ie in Rupees 16272 crores
Current assets increased to 5005 ie in Rupees 51342 crores And loans and
Advances increased 1919 ie in Rupees 11044 crores
The overall financial position was satisfactory
8102019 A Study A Study On Financial Performance Analysis With Reference To Kesoram Cementon Financial Performance hellip
httpslidepdfcomreaderfulla-study-a-study-on-financial-performance-analysis-with-reference-to-kesoram 5081
50
Comparative Balance Sheet of Kesoram in the Year between 2010-2011
(Rupees in crores)
Years Changes
Particulars 2010 2011 In Rupees In Percentage
Liabilities
Share Capital 4574 4574 000 000
Reserves amp Surplus 149111 125162 -23949 -1606
Revaluation Reserves 339 289 -050 -1475
Loans
Secured Loans 186372 237183 50811 2726
Un Secured Loans 126250 162744 36494 2891
Deferred Tax Liabilities 000 000 000
Current Liabilities
Provisions 35734 1494 -34240 -9582
Current Liabilities 107688 113902 6214 577
Total 610068 645348 35280 578
Assets
Net Block 343182 369172 25990 757
Capital WIP 41283 43781 2498 605
Investments 5143 6582 1439 2798
Current Assets
Inventories 91619 111855 20236 2209
Sundry Debtors 54289 63134 8845 1629
Cash amp Bank Balances 8014 7188 -826 -1031
Total Current Assets 153922 182177 28255 1836
Loans amp Advances 66506 43460 -23046 -3465
Fixed Deposits 031 176 145 46774
Total 610068 645348 35280 578
8102019 A Study A Study On Financial Performance Analysis With Reference To Kesoram Cementon Financial Performance hellip
httpslidepdfcomreaderfulla-study-a-study-on-financial-performance-analysis-with-reference-to-kesoram 5181
51
Interpretation of comparative balance sheet of 2010-2011
Reserves amp surplus decreased to 1606 ie in Rupees 23949 crores
Revaluation Reserves decreased to 1475 ie in Rupees 050 crores
Secured loans increased to 2726 ie in Rupees 50811 crores
Current Liabilities were increased to 577 ie in Rupees 6214 crores
Provisions decreased to 9582 ie in Rupees 34240 crores
Fixed Assets were increased to 757 ie in Rupees 25990 crores
Investments were decreased to 2798 ie in Rupees 1439 crores
Sundry debtors were increased to 1629 ie in Rupees8845 crores
Current assets increased to 1836 ie in Rupees 28255 crores And loans and
Advances increased 3465 ie in Rupees 23046 crores
The overall financial position was UN satisfactory
8102019 A Study A Study On Financial Performance Analysis With Reference To Kesoram Cementon Financial Performance hellip
httpslidepdfcomreaderfulla-study-a-study-on-financial-performance-analysis-with-reference-to-kesoram 5281
52
Comparative Balance Sheet of Kesoram In The Year Between 2011-2012
(Rupees in crores)
Years Changes
Particulars 2011 2012 In Rupees In Percentage
Liabilities
Share Capital 4574 4574 000 000
Reserves amp Surplus 125162 86657 -38505 -3076
Revaluation Reserves 289 270 -019 -657
Loans
Secured Loans 237183 317792 80609 3399
Un Secured Loans 162744 92742 -70002 -4301
Deferred Tax Liabilities 000 000 000
Current Liabilities
Provisions 1494 40726 39232 262597
Current Liabilities 113902 180010 66108 5804
Total 645348 722771 77423 1200
Assets 000
Net Block 369172 358721 -10451 -283
Capital WIP 43781 68065 24284 5547
Investments 6582 6636 054 082
Current Assets
Inventories 111855 99516 -12339 -1103
Sundry Debtors 63134 67358 4224 669
Cash amp Bank Balances 7188 6959 -229 -319
Total Current Assets 182177 173833 -8344 -458
Loans amp Advances 43460 115409 71949 16555
Fixed Deposits 176 107 -069 -3920
Total 645348 722771 77423 1200
8102019 A Study A Study On Financial Performance Analysis With Reference To Kesoram Cementon Financial Performance hellip
httpslidepdfcomreaderfulla-study-a-study-on-financial-performance-analysis-with-reference-to-kesoram 5381
53
Interpretation of comparative balance sheet of 2011-2012
Reserves amp surplus decreased to 3076 ie in Rupee 38505 crores
Revaluation Reserves decreased to 657 ie in Rupees 019 crores
Secured loans increased to 3399 ie in Rupees 80699 crores
Current Liabilities were increased to 5804 ie in Rupees 66108 crores
Provisions increased to 262597 ie in Rupees 39232 crores
Fixed Assets were decreased to 283 ie in Rupee 10451 crores
Investments were increased to 082 ie in Rupees 054 crores
Sundry debtors were increased to 669 ie in Rupees 4224 crores
Current assets decreased to 458 ie in Rupees 8344 crores And loans and
Advances increased 16555 ie in Rupees 71949 crores
The overall financial position was UN satisfactory
8102019 A Study A Study On Financial Performance Analysis With Reference To Kesoram Cementon Financial Performance hellip
httpslidepdfcomreaderfulla-study-a-study-on-financial-performance-analysis-with-reference-to-kesoram 5481
54
Common Size Balance Sheet of Kesoram For The Year 2008-2009
(Rupees in crores)
Particulars 2008 Change Percentage 2009 Change Percentage
Liabilities
Share Capital 4574 154 4574 106
Reserves amp Surplus 93085 3129 128024 2969
Revaluation Reserves 533 018 412 010
Loans
Secured Loans 97106 3264 153627 3563
Un Secured Loans 12129 408 43416 1007
Deferred Tax Liabilities 000 000 000 000
Current Liabilities
Provisions 33039 1110 34529 801
Current Liabilities 57067 1918 66587 1544
Total 297533 10000 431169 10000
Assets
Net Block 108424 3644 180435 4185
Capital WIP 63459 2133 86485 2006
Investments 4783 161 6178 143
Current Assets
Inventories 44217 1486 58906 1366
Sundry Debtors 27307 918 38017 882
Cash amp Bank Balances 4036 136 5657 131
Loans amp Advances 45289 1522 55462 1286
Fixed Deposits 018 001 028 001
Total 297533 10000 431169 10000
8102019 A Study A Study On Financial Performance Analysis With Reference To Kesoram Cementon Financial Performance hellip
httpslidepdfcomreaderfulla-study-a-study-on-financial-performance-analysis-with-reference-to-kesoram 5581
55
Interpretation of Common Size Balance Sheet of 2008-2009
Share capital was recorded 154 percent in the total liabilities in the year 2008 it is
decreased to 106 in the year 2009
Reserves amp surplus contributed to 3129 in the total liabilities in the year 2008 it is
decreased to 2969 in the year 2009
Secured loans were 3264 in the total liabilities in the year 2008 it is increased to
3563 in the year 2009
Current Liabilities shown to 1918 in the total liabilities in the year 2008 it is
decreased to 1544 in the year 2009
Provisions 1110 in the total liabilities in the year 2008 it is decreased to 801 in the
year 2009
Fixed Assets were 3644 in the total liabilities in the year 2008 ie decreased to 4185
in the year 2009
Investments were 161 in the total liabilities in the year 2008 it is decreased to 143
in the year 2009
Sundry debtors were 918 in the total liabilities in the year 2008 it is decreased to 882
in the year 2009
8102019 A Study A Study On Financial Performance Analysis With Reference To Kesoram Cementon Financial Performance hellip
httpslidepdfcomreaderfulla-study-a-study-on-financial-performance-analysis-with-reference-to-kesoram 5681
56
Common Size Balance Sheet of Kesoram For The Year 2009-2010
(Rs in crores)
Particulars 2009 Change Percentage 2010Change
Percentage
Liabilities
Share Capital 4574 106 4574 075
Reserves amp Surplus 128024 2969 149111 2444
Revaluation Reserves 412 010 339 006
Loans
Secured Loans 153627 3563 186372 3055
Un Secured Loans 43416 1007 126250 2069
Deferred Tax Liabilities 000 000 000 000
Current Liabilities
Provisions 34529 801 35734 586
Current Liabilities 66587 1544 107688 1765
Total 431169 10000 610068 10000
Assets
Net Block 180435 4185 343182 5625
Capital WIP 86485 2006 41283 677
Investments 6178 143 5143 084
Current Assets
Inventories 58906 1366 91619 1502
Sundry Debtors 38017 882 54289 890
Cash amp Bank Balances 5657 131 8014 131
Loans amp Advances 55462 1286 66506 1090
Fixed Deposits 028 001 031 001
Total 431169 10000 610068 10000
8102019 A Study A Study On Financial Performance Analysis With Reference To Kesoram Cementon Financial Performance hellip
httpslidepdfcomreaderfulla-study-a-study-on-financial-performance-analysis-with-reference-to-kesoram 5781
57
Interpretation of common size balance sheet of 2009-2010
Share capital was recorded 106 percent in the total liabilities in the
year 2009 it is decreased to 075 in the year 2010
Reserves amp surplus contributed to 2969 in the total liabilities in the
year 2009 it is decreased to2444 in the year 2010
Secured loans were 3563 in the total liabilities in the year 2009 it is
increased to 3055 in the year 2010
Current Liabilities shown to 1544 in the total liabilities in the year
2009 it is decreased to 1765 in the year 2010
Provisions 801 in the total liabilities in the year 2009 it is decreased
to 586 in the year 2010
Fixed Assets were 4185 in the total liabilities in the year 2009 ie
increased to 5625 in the year 2010
Investments were 143 in the total liabilities in the year 2009 it is
decreased to 084 in the year 2010
Sundry debtors were 882 in the total liabilities in the year 2009 it is
increased to 890 in the year 2010
8102019 A Study A Study On Financial Performance Analysis With Reference To Kesoram Cementon Financial Performance hellip
httpslidepdfcomreaderfulla-study-a-study-on-financial-performance-analysis-with-reference-to-kesoram 5881
58
Common Size Balance sheet of Kesoram for the year 2010-2011
983080Rupees in crores)
Particulars 2010 Change Percentage 2011
Change
Percentage
Liabilities
Share Capital 4574 075 4574 071
Reserves amp Surplus 149111 2444 125162 1939
Revaluation Reserves 339 006 289 004
Loans
Secured Loans 186372 3055 237183 3675
Un Secured Loans 126250 2069 162744 2522
Deferred Tax Liabilities 000 000 000 000
Current Liabilities
Provisions 35734 586 1494 023
Current Liabilities 107688 1765 113902 1765
Total 610068 10000 645348 10000
Assets
Net Block 343182 5625 369172 5721
Capital WIP 41283 677 43781 678
Investments 5143 084 6582 102
Current Assets
Inventories 91619 1502 111855 1733
Sundry Debtors 54289 890 63134 978
Cash amp Bank Balances 8014 131 7188 111
Loans amp Advances 66506 1090 43460 673
Fixed Deposits 031 001 176 003
Total 610068 10000 645348 10000
8102019 A Study A Study On Financial Performance Analysis With Reference To Kesoram Cementon Financial Performance hellip
httpslidepdfcomreaderfulla-study-a-study-on-financial-performance-analysis-with-reference-to-kesoram 5981
59
Interpretation of Common Size Balance Sheet Of 2010-2011
Share capital was recorded 075 percent in the total liabilities in the year 2010 it is
decreased to 071 in the year 2011
Reserves amp surplus contributed to 2444 in the total liabilities in the year 2010 it is
decreased to1939 in the year 2011
Secured loans were 3055 in the total liabilities in the year 2010 it is increased to
3675 in the year 2011
Current Liabilities shown to 1765 in the total liabilities in the year 2010 it is
also1765 in the year 2011
Provisions 586 in the total liabilities in the year 2010 it is decreased to 023 in the
year 2011
Fixed Assets were 5625 in the total liabilities in the year 2010 ie increased to 5721
in the year 2011
Investments were 084 in the total liabilities in the year 2010 it increased to 102 in
the year 2011
Sundry debtors were 890 in the total liabilities in the year 2010 it is increased to 978
in the year 2011
8102019 A Study A Study On Financial Performance Analysis With Reference To Kesoram Cementon Financial Performance hellip
httpslidepdfcomreaderfulla-study-a-study-on-financial-performance-analysis-with-reference-to-kesoram 6081
60
Common Size Balance Sheet of Kesoram for the Year 2011-2012
983080Rupees in crores)
Particulars 2011 Change Percentage 2012
Change
Percentage
Liabilities
Share Capital 4574 071 4574 063
Reserves amp Surplus 125162 1939 86657 1199
Revaluation Reserves 289 004 270 004
Loans
Secured Loans 237183 3675 317792 4397
Un Secured Loans 162744 2522 92742 1283
Deferred Tax Liabilities 000 000 000 000
Current Liabilities
Provisions 1494 023 40726 563
Current Liabilities 113902 1765 180010 2491
Total 645348 10000 722771 10000
Assets
Net Block 369172 5721 358721 4963
Capital WIP 43781 678 68065 942
Investments 6582 102 6636 092
Current Assets
Inventories 111855 1733 99516 1377
Sundry Debtors 63134 978 67358 932
Cash amp Bank Balances 7188 111 6959 096
Loans amp Advances 43460 673 115409 1597
Fixed Deposits 176 003 107 001
Total 645348 10000 722771 10000
8102019 A Study A Study On Financial Performance Analysis With Reference To Kesoram Cementon Financial Performance hellip
httpslidepdfcomreaderfulla-study-a-study-on-financial-performance-analysis-with-reference-to-kesoram 6181
61
Interpretation of common size balance sheet of 2011-2012
Share capital was recorded 071 percent in the total liabilities in the year 2011 it is
decreased to 063 in the year 2012
Reserves amp surplus contributed to 1939 in the total liabilities in the year 2011 it
is decreased to 1199 in the year 2012
Secured loans were 3675 in the total liabilities in the year 2011 it is increased to
4397 in the year 2012
Current Liabilities shown to 1765 in the total liabilities in the year 2011 it is
increased to 2491 in the year 2012
Provisions 023 in the total liabilities in the year 2011 it is increased to 563 in the
year 2012
Fixed Assets were 5721 in the total liabilities in the year 2011 ie decreased to
4963 in the year 2012
Investments were 102 in the total liabilities in the year 2011 it increased to 092
in the year 2012
Sundry debtors were 978 in the total liabilities in the year 2011 it is decreased to
932 in the year 2012
8102019 A Study A Study On Financial Performance Analysis With Reference To Kesoram Cementon Financial Performance hellip
httpslidepdfcomreaderfulla-study-a-study-on-financial-performance-analysis-with-reference-to-kesoram 6281
Trend Analysis
Share Capital-
Year
Amount
(In Crores) Trend
IncreaseDecrease
Base Year Previous Year
2008 4574 10000 000 000
2009 4574 10000 000 000
2010 4574 10000 000 000
2011 4574 10000 000 000
2012 4574 10000 000 000
Trend Percentages in Share Capital
Share capital shown a constant trend in the period 2008 and 2012
Share capital is 4574 crores all the years from 2008-2012
8102019 A Study A Study On Financial Performance Analysis With Reference To Kesoram Cementon Financial Performance hellip
httpslidepdfcomreaderfulla-study-a-study-on-financial-performance-analysis-with-reference-to-kesoram 6381
Reserves amp Surplus-
Year
Amount
(In Crores) Trend
IncreaseDecrease
Base Year Previous Year
2008 93085 10000 000 000
2009 128024 13753 3753 3753
2010 149111 16019 6019 2266
2011 125162 13446 3446 -2573
2012 86657 9309 -691 -4137
Trend Percentages in Reserves amp Surplus
Reserves amp surplus shown an increasing trend in the period between 2008 and 2010
The average trend was 13277 till 2010
The Reserves amp surplus was showing decreasing trend in the period 2011-2012 (ie
from 16019 in 2010 to 9309 in 2012)
The decreasing trend in Reserves amp surplus indicates the decrease in profits of the
firm
8102019 A Study A Study On Financial Performance Analysis With Reference To Kesoram Cementon Financial Performance hellip
httpslidepdfcomreaderfulla-study-a-study-on-financial-performance-analysis-with-reference-to-kesoram 6481
Investments-
Year
Amount
(In Crores) Trend
IncreaseDecrease
Base Year Previous Year
2008 4783 10000 000 000
2009 6178 12917 2917 2917
2010 5143 10753 753 -2164
2011 6582 13761 3761 3009
2012 6636 13874 3874 113
Trend Percentages in Investments-
The investments are shown an increasing trend in the period between 2008 ndash 2009
and it is decreasing in the year 2010
The average trend was 11458 till 2009
The investments increased in the periods 2011-2012 (ie from 10753 in 2010 to
13874 in 2012)
The overall trend in investments shown is satisfactory
8102019 A Study A Study On Financial Performance Analysis With Reference To Kesoram Cementon Financial Performance hellip
httpslidepdfcomreaderfulla-study-a-study-on-financial-performance-analysis-with-reference-to-kesoram 6581
Net Current Assets-
Year
Amount
(In Crores) Trend
IncreaseDecrease
Base Year Previous Year
2008 30761 10000 000 000
2009 56954 18515 8515 8515
2010 77037 25044 15044 6529
2011 110417 35895 25895 10851
2012 68613 22305 12305 -13590
Trends in Net Current Assets-
The NCA shown positive (increasing) trend
The NCA are increased to 35895 (the year 2011) compared with base year and
decreased in the year 2012 to 22305
The NCA shown increased trend from year and crossed 100
The overall trend was good
8102019 A Study A Study On Financial Performance Analysis With Reference To Kesoram Cementon Financial Performance hellip
httpslidepdfcomreaderfulla-study-a-study-on-financial-performance-analysis-with-reference-to-kesoram 6681
66
Ratio Analysis-
Current Ratio-
Current Ratio = Current Assets Current Liabilities
Current assets are cash in hand Cash at bank Marketable Securities(short term) short term
Investment Bills receivables sundry debtors Inventories (stock) Work in progress prepaid
expenses Current Liabilities are outstanding expenses Bills payable sundry Creditors
short-term advances income tax payable and Dividend payable
Current Ratio of Kesoram-
(Rupees in crores)
Year Current Assets Current Liabilities Current Ratio
2007-08 75560 57067 132
2008-09 102580 66587 154
2009-10 153922 107688 143
2010-11 182177 113902 160
2011-12 173833 180010 097
Interpretation-
As per the standard rule of current ratio ie 21 where current assets double the current
liabilities is considered satisfactory
In the present analysis the current ratio of the Kesoram is not satisfactory
from the above table It was assessed that the current ratio for all the five year is lower (less)
than the standard rule ie 21 And it is 097 in the year 2011-2012 (current year) This is
highly UN satisfactory
8102019 A Study A Study On Financial Performance Analysis With Reference To Kesoram Cementon Financial Performance hellip
httpslidepdfcomreaderfulla-study-a-study-on-financial-performance-analysis-with-reference-to-kesoram 6781
Quick Ratio-
Quick ratio also known as acid-test ratio establishes a relationship between quick
assets and the current liabilities Cash is the most liquid asset It is calculated by dividing
quick assets by current liabilities
Quick ratio = Quick Assets Current Liabilities
(Quick Assets = Current assets ndash Inventory)
Quick Ratio of Kesoram-
Rupees in crores)
Year Total QuickAssets
Current Liabilities Quick Ratio
2007-08 33343 57067 058
2008-09 43674 66587 066
2009-10 62303 107688 058
2010-11 70322 113902 0622011-12 74333 180010 041
Interpretation-
Usually a high Quick ratio is an indication that the company is liquid and has the ability to
meet its current or liquid liabilities in time on the other hand a low Quick Ratio represents
8102019 A Study A Study On Financial Performance Analysis With Reference To Kesoram Cementon Financial Performance hellip
httpslidepdfcomreaderfulla-study-a-study-on-financial-performance-analysis-with-reference-to-kesoram 6881
that the companyrsquos liquidity position is not good The above table showing the quick ratios
of Kesoram are canrsquot be considered satisfactory
Leverage Ratios-
Debt-Equity Ratio-
Debt-Equity Ratio = Total Long Term Debt Equity Share Holders Fund
Total Long term Debt= Debenture Capital + Long term loans from banks and financial
institutions + Public deposits
Equity Share Holders fund = Equity + Reserves and Surplus
Debt Equity Ratio of Kesoram
(Rupees in crores)
Year Total Debt Share Holders Fund Debt Equity Ratio
2007-08 109235 98192 111
2008-09 197043 133010 148
2009-10 312622 154024 203
2010-11 399927 130025 308
2011-12 410534 91501 449
8102019 A Study A Study On Financial Performance Analysis With Reference To Kesoram Cementon Financial Performance hellip
httpslidepdfcomreaderfulla-study-a-study-on-financial-performance-analysis-with-reference-to-kesoram 6981
Interpretation-
The Debt-Equity Ratio accepted standard is 05 This ratio reflects the relative contribution
of creditors and owners of business in its financing From the above it is clear that the long
term debt is more than that of the share holdersrsquo fund So we can interpret that the firmrsquosassets are financed more by the external funds rather than by the internal funds
8102019 A Study A Study On Financial Performance Analysis With Reference To Kesoram Cementon Financial Performance hellip
httpslidepdfcomreaderfulla-study-a-study-on-financial-performance-analysis-with-reference-to-kesoram 7081
Fixed Asset Ratio-
Net Sales
Fixed Asset Ratio = helliphelliphelliphelliphelliphelliphelliphelliphelliphelliphellip
Net Assets
Fixed Asset Ratio of Kesoram-
(Rupees in crores)
Year Net Sales Net Assets Fixed Assets Ratio
2007-08 300271 358721 084
2008-09 389797 369172 106
2009-10 475062 343182 1382010-11 539788 180435 299
2011-12 59182 108424 546
Interpretation
This ratio indicates the extent to which the assets of the companyrsquos can be lost without
affecting the interest of the creditors of the company Higher the ratios better the long-term
position of the companyThe above table shows fixed assets ratio in increasing trend Which is good for the
company
8102019 A Study A Study On Financial Performance Analysis With Reference To Kesoram Cementon Financial Performance hellip
httpslidepdfcomreaderfulla-study-a-study-on-financial-performance-analysis-with-reference-to-kesoram 7181
Overall Profitability Ratios-
Net Profit Ratio
Net Profit Ratio indicates net margin on sales It is given by the following equation
Net Profit Ratio = (Net Profit Sales) 100
Net Profit Ratio of Kesoram
(Rupees in crores)
Year Net Profit Sales Net Profit Ratio
2007-08 37917 300271 1263
2008-09 41432 389797 1063
2009-10 20298 475062 427
2010-11 -28176 539788 -5222011-12 -38108 59182 -644
Interpretation
It establishes a relationship between net profits after tax and net sales and
indicates the efficiency of the management in manufacturing selling administrative and
other activities of the company
The higher the ratio the better is the profitability or performance of the business
The above table depicts the net profit Ratio of Kesoram has decreased every year from
2007-2008 to 2011-2012It further decreased to negative in the year 2010-11 to -522 and -
644 in the year 2011-2012 This shows constant decrease in the profits of the company
8102019 A Study A Study On Financial Performance Analysis With Reference To Kesoram Cementon Financial Performance hellip
httpslidepdfcomreaderfulla-study-a-study-on-financial-performance-analysis-with-reference-to-kesoram 7281
72
Return on Investment-
Net Profit
Return on Investment = helliphelliphelliphelliphelliphelliphelliphelliphelliphelliphelliphellip X 100
Share Holders Fund
Return on Investment Ratio of Kesoram-
(Rupees in crores)
Year Net Profit Share Holders Fund Return On Investment
2007-08 37917 98192 3862
2008-09 41432 133010 3115
2009-10 20298 154024 1318
2010-11 -28176 130025 -2167
2011-12 -38108 91501 -4165
Interpretation-
The above table reveals how well the resources of the firm are being used Higher
the ratio better the result The above ratio implies how well the firm is growing in
terms of profitability and efficiency From the above table we can concern that the return on
investment is in decreasing trend ROI is highest in the year 2007-2008 as 3862 But
there after itrsquos decreased every year
The ROI is negative in the years 2010-2011 amp 2011-2012 as -2167 amp -4165 respectively
Which is not a good sign for the firm
8102019 A Study A Study On Financial Performance Analysis With Reference To Kesoram Cementon Financial Performance hellip
httpslidepdfcomreaderfulla-study-a-study-on-financial-performance-analysis-with-reference-to-kesoram 7381
8102019 A Study A Study On Financial Performance Analysis With Reference To Kesoram Cementon Financial Performance hellip
httpslidepdfcomreaderfulla-study-a-study-on-financial-performance-analysis-with-reference-to-kesoram 7481
8102019 A Study A Study On Financial Performance Analysis With Reference To Kesoram Cementon Financial Performance hellip
httpslidepdfcomreaderfulla-study-a-study-on-financial-performance-analysis-with-reference-to-kesoram 7581
75
CHAPTER V
FINDINGS amp SUGGESTIONS
8102019 A Study A Study On Financial Performance Analysis With Reference To Kesoram Cementon Financial Performance hellip
httpslidepdfcomreaderfulla-study-a-study-on-financial-performance-analysis-with-reference-to-kesoram 7681
76
Findings
The Share capital remains constant Share capital is unchanged all the years from
2008-2012
Reserves amp surplus were recorded an increasing trend in the period between 2008
and 2010It is showing decreasing trend in the period 2011-2012 (ie from 16019
in 2010 to 9309 in 2012)
Current Liabilities were increased compared to base year ie 2008
Provisions increased to 262597 ie in Rupees 39232 crores in the current year
The current ratio for all the five year is lower (less) than the standard rule ie 21
And it is 097 in the year 2011-2012 (current year)
The Debt-Equity Ratio was shown under the standard ratio It is clear that the long
term debt is more than that of the share holdersrsquo fund It indicates that the firm
heavily relying on external funds rather than the internal funds
The operating and net profit of Kesoram is in decreasing trend due to heavy
increase of manufacturing amp administrative expenses
ROI is highest in the year 2007-2008 as 3862 The ROI is negative in the years
2010-2011 amp 2011-2012 as -2167 amp -4165 respectively
Return on Equity Capital Employed Ratio of Kesoram has decreased every year
from 2007-2008 to 2010-2011It further decreased to negative in the year 2011-12 to
-3280
EPS of Kesoram has decreased every year from 2008-12It is negative in the year
2011 amp 12
8102019 A Study A Study On Financial Performance Analysis With Reference To Kesoram Cementon Financial Performance hellip
httpslidepdfcomreaderfulla-study-a-study-on-financial-performance-analysis-with-reference-to-kesoram 7781
77
Suggestion
The organization should adopt an appropriate capital structure
The companyrsquos debt-equity ratio is recorded more or less as 111 in the year 2008
and it is increased to 449 in the year 2012 (current year)The company should
adopt a better debt equity mix in the future to control the fluctuations in returns
The company should control fluctuations in cash and bank balances as it impacts the
current ratio of the company
The provisions are showing increasing trend which indicates risk of debtors The
firm should implement an effective credit management policy It should utilize its
idle funds by decreasing provisions
The company should control heavy increase of manufacturing amp administration
expenses as it is impacting the operating and net profit of company
8102019 A Study A Study On Financial Performance Analysis With Reference To Kesoram Cementon Financial Performance hellip
httpslidepdfcomreaderfulla-study-a-study-on-financial-performance-analysis-with-reference-to-kesoram 7881
78
ANNEXURE
Profit And Loss Account of Kesoram Cement
Mar12 Mar11 Mar10 Mar09 Mar08
12 Months 12 Months 12 Months 12 Months 12 Months
INCOME
Sales Turnover 628260 575072 505151 431613 345700
Excise Duty 36440 35284 30089 41815 45429
NET SALES 591820 539788 475062 389797 300271
Other Income 000 000 000 000 000
TOTALINCOME
596129 548733 481019 393969 302020
EXPENDITURE
Manufacturing
Expenses81903 74803 13974 13153 44113
MaterialConsumed
370897 310150 295550 229359 118448
Personal
Expenses33468 27355 23294 18690 15344
Selling Expenses 81910 78253 58667 48846 45019
AdministrativeExpenses
28225 29308 17219 16179 9907
Expenses
Capitalized000 000 000 000 000
Provisions Made 000 000 000 000 000
TOTAL
EXPENDITURE 596403 519870 408704 326227 232832Operating Profit -4583 19918 66358 63570 67439
EBITDA -274 28864 72316 67742 69188
Depreciation 29740 27259 17280 11186 8927
Other Write-offs 000 000 000 000 000
EBIT -30014 1605 55035 56557 60261
Interest 41015 23983 10921 12087 5426
EBT -71029 -22377 44114 44470 54835
Taxes -32921 5798 23816 3037 16918
Profit and Loss
for the Year-38108 -28176 20298 41432 37917
Non RecurringItems
-1142 7063 3228 -4023 402
Other Non Cash
Adjustments1276 091 207 465 017
OtherAdjustments
000 000 000 000 000
REPORTED
PAT-37974 -21021 23734 37874 38335
8102019 A Study A Study On Financial Performance Analysis With Reference To Kesoram Cementon Financial Performance hellip
httpslidepdfcomreaderfulla-study-a-study-on-financial-performance-analysis-with-reference-to-kesoram 7981
79
Balance Sheet Of Kesoram
Years
Particulars 2008 2009 2010 2011 2012
Liabilities
Share Capital 4574 4574 4574 4574 4574Reserves amp Surplus 93085 128024 149111 125162 86657
Revaluation Reserves 533 412 339 289 27
Loans
Secured Loans 97106 153627 186372 237183 317792
Un Secured Loans 12129 43416 12625 162744 92742
Deferred Tax Liabilities 0 0 0 0 0
Current Liabilities
Provisions 33039 34529 35734 1494 40726
Current Liabilities 57067 66587 107688 113902 18001
Total 297533 431169 610068 645348 722771
Assets
Net Block 108424 180435 343182 369172 358721
Capital WIP 63459 86485 41283 43781 68065
Investments 4783 6178 5143 6582 6636
Current Assets
Inventories 44217 58906 91619 111855 99516
Sundry Debtors 27307 38017 54289 63134 67358
Cash amp Bank Balances 4036 5657 8014 7188 6959
Total Current Assets 7556 10258 153922 182177 173833Loans amp Advances 45289 55462 66506 4346 115409
Fixed Deposits 018 028 031 176 107
Total 297533 431169 610068 645348 722771
8102019 A Study A Study On Financial Performance Analysis With Reference To Kesoram Cementon Financial Performance hellip
httpslidepdfcomreaderfulla-study-a-study-on-financial-performance-analysis-with-reference-to-kesoram 8081
80
KEY ITEMS 2012 2011 2010 2009 2008
Preference
Dividend 0 0 0 0 0
Equity Dividend 457 2516 2516 2516 2516
Equity Dividend
() 999 55 55 55 55
Shares in Issue(Lakhs) 45743 45743 45743 45743 45743
EPS - Annualised
(Rs) -8302 -4595 5188 828 838
8102019 A Study A Study On Financial Performance Analysis With Reference To Kesoram Cementon Financial Performance hellip
httpslidepdfcomreaderfulla-study-a-study-on-financial-performance-analysis-with-reference-to-kesoram 8181
BIBLIOGRAPHY
Sl
No
Books Author Name
1 Financial Management Khan amp JAIN
2 Financial Management IMPandey
3 Management Accounting RPTrivedi
Websites amp Search Engines
1 wwwkesoramcom983086
2 wwwmoneycontrolcom
3 wwwgooglefinancecom983086
Annual reports of Kesoram cement limited 2008-2012
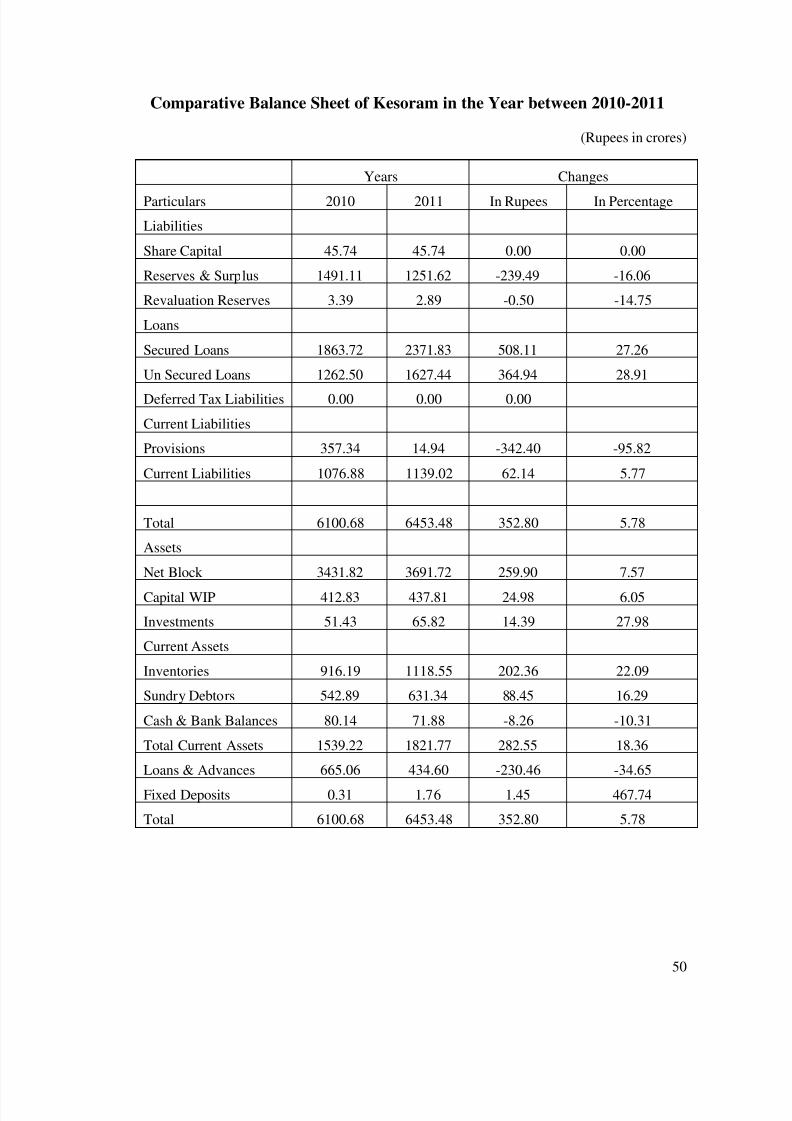
8102019 A Study A Study On Financial Performance Analysis With Reference To Kesoram Cementon Financial Performance hellip
httpslidepdfcomreaderfulla-study-a-study-on-financial-performance-analysis-with-reference-to-kesoram 5081
50
Comparative Balance Sheet of Kesoram in the Year between 2010-2011
(Rupees in crores)
Years Changes
Particulars 2010 2011 In Rupees In Percentage
Liabilities
Share Capital 4574 4574 000 000
Reserves amp Surplus 149111 125162 -23949 -1606
Revaluation Reserves 339 289 -050 -1475
Loans
Secured Loans 186372 237183 50811 2726
Un Secured Loans 126250 162744 36494 2891
Deferred Tax Liabilities 000 000 000
Current Liabilities
Provisions 35734 1494 -34240 -9582
Current Liabilities 107688 113902 6214 577
Total 610068 645348 35280 578
Assets
Net Block 343182 369172 25990 757
Capital WIP 41283 43781 2498 605
Investments 5143 6582 1439 2798
Current Assets
Inventories 91619 111855 20236 2209
Sundry Debtors 54289 63134 8845 1629
Cash amp Bank Balances 8014 7188 -826 -1031
Total Current Assets 153922 182177 28255 1836
Loans amp Advances 66506 43460 -23046 -3465
Fixed Deposits 031 176 145 46774
Total 610068 645348 35280 578
8102019 A Study A Study On Financial Performance Analysis With Reference To Kesoram Cementon Financial Performance hellip
httpslidepdfcomreaderfulla-study-a-study-on-financial-performance-analysis-with-reference-to-kesoram 5181
51
Interpretation of comparative balance sheet of 2010-2011
Reserves amp surplus decreased to 1606 ie in Rupees 23949 crores
Revaluation Reserves decreased to 1475 ie in Rupees 050 crores
Secured loans increased to 2726 ie in Rupees 50811 crores
Current Liabilities were increased to 577 ie in Rupees 6214 crores
Provisions decreased to 9582 ie in Rupees 34240 crores
Fixed Assets were increased to 757 ie in Rupees 25990 crores
Investments were decreased to 2798 ie in Rupees 1439 crores
Sundry debtors were increased to 1629 ie in Rupees8845 crores
Current assets increased to 1836 ie in Rupees 28255 crores And loans and
Advances increased 3465 ie in Rupees 23046 crores
The overall financial position was UN satisfactory
8102019 A Study A Study On Financial Performance Analysis With Reference To Kesoram Cementon Financial Performance hellip
httpslidepdfcomreaderfulla-study-a-study-on-financial-performance-analysis-with-reference-to-kesoram 5281
52
Comparative Balance Sheet of Kesoram In The Year Between 2011-2012
(Rupees in crores)
Years Changes
Particulars 2011 2012 In Rupees In Percentage
Liabilities
Share Capital 4574 4574 000 000
Reserves amp Surplus 125162 86657 -38505 -3076
Revaluation Reserves 289 270 -019 -657
Loans
Secured Loans 237183 317792 80609 3399
Un Secured Loans 162744 92742 -70002 -4301
Deferred Tax Liabilities 000 000 000
Current Liabilities
Provisions 1494 40726 39232 262597
Current Liabilities 113902 180010 66108 5804
Total 645348 722771 77423 1200
Assets 000
Net Block 369172 358721 -10451 -283
Capital WIP 43781 68065 24284 5547
Investments 6582 6636 054 082
Current Assets
Inventories 111855 99516 -12339 -1103
Sundry Debtors 63134 67358 4224 669
Cash amp Bank Balances 7188 6959 -229 -319
Total Current Assets 182177 173833 -8344 -458
Loans amp Advances 43460 115409 71949 16555
Fixed Deposits 176 107 -069 -3920
Total 645348 722771 77423 1200
8102019 A Study A Study On Financial Performance Analysis With Reference To Kesoram Cementon Financial Performance hellip
httpslidepdfcomreaderfulla-study-a-study-on-financial-performance-analysis-with-reference-to-kesoram 5381
53
Interpretation of comparative balance sheet of 2011-2012
Reserves amp surplus decreased to 3076 ie in Rupee 38505 crores
Revaluation Reserves decreased to 657 ie in Rupees 019 crores
Secured loans increased to 3399 ie in Rupees 80699 crores
Current Liabilities were increased to 5804 ie in Rupees 66108 crores
Provisions increased to 262597 ie in Rupees 39232 crores
Fixed Assets were decreased to 283 ie in Rupee 10451 crores
Investments were increased to 082 ie in Rupees 054 crores
Sundry debtors were increased to 669 ie in Rupees 4224 crores
Current assets decreased to 458 ie in Rupees 8344 crores And loans and
Advances increased 16555 ie in Rupees 71949 crores
The overall financial position was UN satisfactory
8102019 A Study A Study On Financial Performance Analysis With Reference To Kesoram Cementon Financial Performance hellip
httpslidepdfcomreaderfulla-study-a-study-on-financial-performance-analysis-with-reference-to-kesoram 5481
54
Common Size Balance Sheet of Kesoram For The Year 2008-2009
(Rupees in crores)
Particulars 2008 Change Percentage 2009 Change Percentage
Liabilities
Share Capital 4574 154 4574 106
Reserves amp Surplus 93085 3129 128024 2969
Revaluation Reserves 533 018 412 010
Loans
Secured Loans 97106 3264 153627 3563
Un Secured Loans 12129 408 43416 1007
Deferred Tax Liabilities 000 000 000 000
Current Liabilities
Provisions 33039 1110 34529 801
Current Liabilities 57067 1918 66587 1544
Total 297533 10000 431169 10000
Assets
Net Block 108424 3644 180435 4185
Capital WIP 63459 2133 86485 2006
Investments 4783 161 6178 143
Current Assets
Inventories 44217 1486 58906 1366
Sundry Debtors 27307 918 38017 882
Cash amp Bank Balances 4036 136 5657 131
Loans amp Advances 45289 1522 55462 1286
Fixed Deposits 018 001 028 001
Total 297533 10000 431169 10000
8102019 A Study A Study On Financial Performance Analysis With Reference To Kesoram Cementon Financial Performance hellip
httpslidepdfcomreaderfulla-study-a-study-on-financial-performance-analysis-with-reference-to-kesoram 5581
55
Interpretation of Common Size Balance Sheet of 2008-2009
Share capital was recorded 154 percent in the total liabilities in the year 2008 it is
decreased to 106 in the year 2009
Reserves amp surplus contributed to 3129 in the total liabilities in the year 2008 it is
decreased to 2969 in the year 2009
Secured loans were 3264 in the total liabilities in the year 2008 it is increased to
3563 in the year 2009
Current Liabilities shown to 1918 in the total liabilities in the year 2008 it is
decreased to 1544 in the year 2009
Provisions 1110 in the total liabilities in the year 2008 it is decreased to 801 in the
year 2009
Fixed Assets were 3644 in the total liabilities in the year 2008 ie decreased to 4185
in the year 2009
Investments were 161 in the total liabilities in the year 2008 it is decreased to 143
in the year 2009
Sundry debtors were 918 in the total liabilities in the year 2008 it is decreased to 882
in the year 2009
8102019 A Study A Study On Financial Performance Analysis With Reference To Kesoram Cementon Financial Performance hellip
httpslidepdfcomreaderfulla-study-a-study-on-financial-performance-analysis-with-reference-to-kesoram 5681
56
Common Size Balance Sheet of Kesoram For The Year 2009-2010
(Rs in crores)
Particulars 2009 Change Percentage 2010Change
Percentage
Liabilities
Share Capital 4574 106 4574 075
Reserves amp Surplus 128024 2969 149111 2444
Revaluation Reserves 412 010 339 006
Loans
Secured Loans 153627 3563 186372 3055
Un Secured Loans 43416 1007 126250 2069
Deferred Tax Liabilities 000 000 000 000
Current Liabilities
Provisions 34529 801 35734 586
Current Liabilities 66587 1544 107688 1765
Total 431169 10000 610068 10000
Assets
Net Block 180435 4185 343182 5625
Capital WIP 86485 2006 41283 677
Investments 6178 143 5143 084
Current Assets
Inventories 58906 1366 91619 1502
Sundry Debtors 38017 882 54289 890
Cash amp Bank Balances 5657 131 8014 131
Loans amp Advances 55462 1286 66506 1090
Fixed Deposits 028 001 031 001
Total 431169 10000 610068 10000
8102019 A Study A Study On Financial Performance Analysis With Reference To Kesoram Cementon Financial Performance hellip
httpslidepdfcomreaderfulla-study-a-study-on-financial-performance-analysis-with-reference-to-kesoram 5781
57
Interpretation of common size balance sheet of 2009-2010
Share capital was recorded 106 percent in the total liabilities in the
year 2009 it is decreased to 075 in the year 2010
Reserves amp surplus contributed to 2969 in the total liabilities in the
year 2009 it is decreased to2444 in the year 2010
Secured loans were 3563 in the total liabilities in the year 2009 it is
increased to 3055 in the year 2010
Current Liabilities shown to 1544 in the total liabilities in the year
2009 it is decreased to 1765 in the year 2010
Provisions 801 in the total liabilities in the year 2009 it is decreased
to 586 in the year 2010
Fixed Assets were 4185 in the total liabilities in the year 2009 ie
increased to 5625 in the year 2010
Investments were 143 in the total liabilities in the year 2009 it is
decreased to 084 in the year 2010
Sundry debtors were 882 in the total liabilities in the year 2009 it is
increased to 890 in the year 2010
8102019 A Study A Study On Financial Performance Analysis With Reference To Kesoram Cementon Financial Performance hellip
httpslidepdfcomreaderfulla-study-a-study-on-financial-performance-analysis-with-reference-to-kesoram 5881
58
Common Size Balance sheet of Kesoram for the year 2010-2011
983080Rupees in crores)
Particulars 2010 Change Percentage 2011
Change
Percentage
Liabilities
Share Capital 4574 075 4574 071
Reserves amp Surplus 149111 2444 125162 1939
Revaluation Reserves 339 006 289 004
Loans
Secured Loans 186372 3055 237183 3675
Un Secured Loans 126250 2069 162744 2522
Deferred Tax Liabilities 000 000 000 000
Current Liabilities
Provisions 35734 586 1494 023
Current Liabilities 107688 1765 113902 1765
Total 610068 10000 645348 10000
Assets
Net Block 343182 5625 369172 5721
Capital WIP 41283 677 43781 678
Investments 5143 084 6582 102
Current Assets
Inventories 91619 1502 111855 1733
Sundry Debtors 54289 890 63134 978
Cash amp Bank Balances 8014 131 7188 111
Loans amp Advances 66506 1090 43460 673
Fixed Deposits 031 001 176 003
Total 610068 10000 645348 10000
8102019 A Study A Study On Financial Performance Analysis With Reference To Kesoram Cementon Financial Performance hellip
httpslidepdfcomreaderfulla-study-a-study-on-financial-performance-analysis-with-reference-to-kesoram 5981
59
Interpretation of Common Size Balance Sheet Of 2010-2011
Share capital was recorded 075 percent in the total liabilities in the year 2010 it is
decreased to 071 in the year 2011
Reserves amp surplus contributed to 2444 in the total liabilities in the year 2010 it is
decreased to1939 in the year 2011
Secured loans were 3055 in the total liabilities in the year 2010 it is increased to
3675 in the year 2011
Current Liabilities shown to 1765 in the total liabilities in the year 2010 it is
also1765 in the year 2011
Provisions 586 in the total liabilities in the year 2010 it is decreased to 023 in the
year 2011
Fixed Assets were 5625 in the total liabilities in the year 2010 ie increased to 5721
in the year 2011
Investments were 084 in the total liabilities in the year 2010 it increased to 102 in
the year 2011
Sundry debtors were 890 in the total liabilities in the year 2010 it is increased to 978
in the year 2011
8102019 A Study A Study On Financial Performance Analysis With Reference To Kesoram Cementon Financial Performance hellip
httpslidepdfcomreaderfulla-study-a-study-on-financial-performance-analysis-with-reference-to-kesoram 6081
60
Common Size Balance Sheet of Kesoram for the Year 2011-2012
983080Rupees in crores)
Particulars 2011 Change Percentage 2012
Change
Percentage
Liabilities
Share Capital 4574 071 4574 063
Reserves amp Surplus 125162 1939 86657 1199
Revaluation Reserves 289 004 270 004
Loans
Secured Loans 237183 3675 317792 4397
Un Secured Loans 162744 2522 92742 1283
Deferred Tax Liabilities 000 000 000 000
Current Liabilities
Provisions 1494 023 40726 563
Current Liabilities 113902 1765 180010 2491
Total 645348 10000 722771 10000
Assets
Net Block 369172 5721 358721 4963
Capital WIP 43781 678 68065 942
Investments 6582 102 6636 092
Current Assets
Inventories 111855 1733 99516 1377
Sundry Debtors 63134 978 67358 932
Cash amp Bank Balances 7188 111 6959 096
Loans amp Advances 43460 673 115409 1597
Fixed Deposits 176 003 107 001
Total 645348 10000 722771 10000
8102019 A Study A Study On Financial Performance Analysis With Reference To Kesoram Cementon Financial Performance hellip
httpslidepdfcomreaderfulla-study-a-study-on-financial-performance-analysis-with-reference-to-kesoram 6181
61
Interpretation of common size balance sheet of 2011-2012
Share capital was recorded 071 percent in the total liabilities in the year 2011 it is
decreased to 063 in the year 2012
Reserves amp surplus contributed to 1939 in the total liabilities in the year 2011 it
is decreased to 1199 in the year 2012
Secured loans were 3675 in the total liabilities in the year 2011 it is increased to
4397 in the year 2012
Current Liabilities shown to 1765 in the total liabilities in the year 2011 it is
increased to 2491 in the year 2012
Provisions 023 in the total liabilities in the year 2011 it is increased to 563 in the
year 2012
Fixed Assets were 5721 in the total liabilities in the year 2011 ie decreased to
4963 in the year 2012
Investments were 102 in the total liabilities in the year 2011 it increased to 092
in the year 2012
Sundry debtors were 978 in the total liabilities in the year 2011 it is decreased to
932 in the year 2012
8102019 A Study A Study On Financial Performance Analysis With Reference To Kesoram Cementon Financial Performance hellip
httpslidepdfcomreaderfulla-study-a-study-on-financial-performance-analysis-with-reference-to-kesoram 6281
Trend Analysis
Share Capital-
Year
Amount
(In Crores) Trend
IncreaseDecrease
Base Year Previous Year
2008 4574 10000 000 000
2009 4574 10000 000 000
2010 4574 10000 000 000
2011 4574 10000 000 000
2012 4574 10000 000 000
Trend Percentages in Share Capital
Share capital shown a constant trend in the period 2008 and 2012
Share capital is 4574 crores all the years from 2008-2012
8102019 A Study A Study On Financial Performance Analysis With Reference To Kesoram Cementon Financial Performance hellip
httpslidepdfcomreaderfulla-study-a-study-on-financial-performance-analysis-with-reference-to-kesoram 6381
Reserves amp Surplus-
Year
Amount
(In Crores) Trend
IncreaseDecrease
Base Year Previous Year
2008 93085 10000 000 000
2009 128024 13753 3753 3753
2010 149111 16019 6019 2266
2011 125162 13446 3446 -2573
2012 86657 9309 -691 -4137
Trend Percentages in Reserves amp Surplus
Reserves amp surplus shown an increasing trend in the period between 2008 and 2010
The average trend was 13277 till 2010
The Reserves amp surplus was showing decreasing trend in the period 2011-2012 (ie
from 16019 in 2010 to 9309 in 2012)
The decreasing trend in Reserves amp surplus indicates the decrease in profits of the
firm
8102019 A Study A Study On Financial Performance Analysis With Reference To Kesoram Cementon Financial Performance hellip
httpslidepdfcomreaderfulla-study-a-study-on-financial-performance-analysis-with-reference-to-kesoram 6481
Investments-
Year
Amount
(In Crores) Trend
IncreaseDecrease
Base Year Previous Year
2008 4783 10000 000 000
2009 6178 12917 2917 2917
2010 5143 10753 753 -2164
2011 6582 13761 3761 3009
2012 6636 13874 3874 113
Trend Percentages in Investments-
The investments are shown an increasing trend in the period between 2008 ndash 2009
and it is decreasing in the year 2010
The average trend was 11458 till 2009
The investments increased in the periods 2011-2012 (ie from 10753 in 2010 to
13874 in 2012)
The overall trend in investments shown is satisfactory
8102019 A Study A Study On Financial Performance Analysis With Reference To Kesoram Cementon Financial Performance hellip
httpslidepdfcomreaderfulla-study-a-study-on-financial-performance-analysis-with-reference-to-kesoram 6581
Net Current Assets-
Year
Amount
(In Crores) Trend
IncreaseDecrease
Base Year Previous Year
2008 30761 10000 000 000
2009 56954 18515 8515 8515
2010 77037 25044 15044 6529
2011 110417 35895 25895 10851
2012 68613 22305 12305 -13590
Trends in Net Current Assets-
The NCA shown positive (increasing) trend
The NCA are increased to 35895 (the year 2011) compared with base year and
decreased in the year 2012 to 22305
The NCA shown increased trend from year and crossed 100
The overall trend was good
8102019 A Study A Study On Financial Performance Analysis With Reference To Kesoram Cementon Financial Performance hellip
httpslidepdfcomreaderfulla-study-a-study-on-financial-performance-analysis-with-reference-to-kesoram 6681
66
Ratio Analysis-
Current Ratio-
Current Ratio = Current Assets Current Liabilities
Current assets are cash in hand Cash at bank Marketable Securities(short term) short term
Investment Bills receivables sundry debtors Inventories (stock) Work in progress prepaid
expenses Current Liabilities are outstanding expenses Bills payable sundry Creditors
short-term advances income tax payable and Dividend payable
Current Ratio of Kesoram-
(Rupees in crores)
Year Current Assets Current Liabilities Current Ratio
2007-08 75560 57067 132
2008-09 102580 66587 154
2009-10 153922 107688 143
2010-11 182177 113902 160
2011-12 173833 180010 097
Interpretation-
As per the standard rule of current ratio ie 21 where current assets double the current
liabilities is considered satisfactory
In the present analysis the current ratio of the Kesoram is not satisfactory
from the above table It was assessed that the current ratio for all the five year is lower (less)
than the standard rule ie 21 And it is 097 in the year 2011-2012 (current year) This is
highly UN satisfactory
8102019 A Study A Study On Financial Performance Analysis With Reference To Kesoram Cementon Financial Performance hellip
httpslidepdfcomreaderfulla-study-a-study-on-financial-performance-analysis-with-reference-to-kesoram 6781
Quick Ratio-
Quick ratio also known as acid-test ratio establishes a relationship between quick
assets and the current liabilities Cash is the most liquid asset It is calculated by dividing
quick assets by current liabilities
Quick ratio = Quick Assets Current Liabilities
(Quick Assets = Current assets ndash Inventory)
Quick Ratio of Kesoram-
Rupees in crores)
Year Total QuickAssets
Current Liabilities Quick Ratio
2007-08 33343 57067 058
2008-09 43674 66587 066
2009-10 62303 107688 058
2010-11 70322 113902 0622011-12 74333 180010 041
Interpretation-
Usually a high Quick ratio is an indication that the company is liquid and has the ability to
meet its current or liquid liabilities in time on the other hand a low Quick Ratio represents
8102019 A Study A Study On Financial Performance Analysis With Reference To Kesoram Cementon Financial Performance hellip
httpslidepdfcomreaderfulla-study-a-study-on-financial-performance-analysis-with-reference-to-kesoram 6881
that the companyrsquos liquidity position is not good The above table showing the quick ratios
of Kesoram are canrsquot be considered satisfactory
Leverage Ratios-
Debt-Equity Ratio-
Debt-Equity Ratio = Total Long Term Debt Equity Share Holders Fund
Total Long term Debt= Debenture Capital + Long term loans from banks and financial
institutions + Public deposits
Equity Share Holders fund = Equity + Reserves and Surplus
Debt Equity Ratio of Kesoram
(Rupees in crores)
Year Total Debt Share Holders Fund Debt Equity Ratio
2007-08 109235 98192 111
2008-09 197043 133010 148
2009-10 312622 154024 203
2010-11 399927 130025 308
2011-12 410534 91501 449
8102019 A Study A Study On Financial Performance Analysis With Reference To Kesoram Cementon Financial Performance hellip
httpslidepdfcomreaderfulla-study-a-study-on-financial-performance-analysis-with-reference-to-kesoram 6981
Interpretation-
The Debt-Equity Ratio accepted standard is 05 This ratio reflects the relative contribution
of creditors and owners of business in its financing From the above it is clear that the long
term debt is more than that of the share holdersrsquo fund So we can interpret that the firmrsquosassets are financed more by the external funds rather than by the internal funds
8102019 A Study A Study On Financial Performance Analysis With Reference To Kesoram Cementon Financial Performance hellip
httpslidepdfcomreaderfulla-study-a-study-on-financial-performance-analysis-with-reference-to-kesoram 7081
Fixed Asset Ratio-
Net Sales
Fixed Asset Ratio = helliphelliphelliphelliphelliphelliphelliphelliphelliphelliphellip
Net Assets
Fixed Asset Ratio of Kesoram-
(Rupees in crores)
Year Net Sales Net Assets Fixed Assets Ratio
2007-08 300271 358721 084
2008-09 389797 369172 106
2009-10 475062 343182 1382010-11 539788 180435 299
2011-12 59182 108424 546
Interpretation
This ratio indicates the extent to which the assets of the companyrsquos can be lost without
affecting the interest of the creditors of the company Higher the ratios better the long-term
position of the companyThe above table shows fixed assets ratio in increasing trend Which is good for the
company
8102019 A Study A Study On Financial Performance Analysis With Reference To Kesoram Cementon Financial Performance hellip
httpslidepdfcomreaderfulla-study-a-study-on-financial-performance-analysis-with-reference-to-kesoram 7181
Overall Profitability Ratios-
Net Profit Ratio
Net Profit Ratio indicates net margin on sales It is given by the following equation
Net Profit Ratio = (Net Profit Sales) 100
Net Profit Ratio of Kesoram
(Rupees in crores)
Year Net Profit Sales Net Profit Ratio
2007-08 37917 300271 1263
2008-09 41432 389797 1063
2009-10 20298 475062 427
2010-11 -28176 539788 -5222011-12 -38108 59182 -644
Interpretation
It establishes a relationship between net profits after tax and net sales and
indicates the efficiency of the management in manufacturing selling administrative and
other activities of the company
The higher the ratio the better is the profitability or performance of the business
The above table depicts the net profit Ratio of Kesoram has decreased every year from
2007-2008 to 2011-2012It further decreased to negative in the year 2010-11 to -522 and -
644 in the year 2011-2012 This shows constant decrease in the profits of the company
8102019 A Study A Study On Financial Performance Analysis With Reference To Kesoram Cementon Financial Performance hellip
httpslidepdfcomreaderfulla-study-a-study-on-financial-performance-analysis-with-reference-to-kesoram 7281
72
Return on Investment-
Net Profit
Return on Investment = helliphelliphelliphelliphelliphelliphelliphelliphelliphelliphelliphellip X 100
Share Holders Fund
Return on Investment Ratio of Kesoram-
(Rupees in crores)
Year Net Profit Share Holders Fund Return On Investment
2007-08 37917 98192 3862
2008-09 41432 133010 3115
2009-10 20298 154024 1318
2010-11 -28176 130025 -2167
2011-12 -38108 91501 -4165
Interpretation-
The above table reveals how well the resources of the firm are being used Higher
the ratio better the result The above ratio implies how well the firm is growing in
terms of profitability and efficiency From the above table we can concern that the return on
investment is in decreasing trend ROI is highest in the year 2007-2008 as 3862 But
there after itrsquos decreased every year
The ROI is negative in the years 2010-2011 amp 2011-2012 as -2167 amp -4165 respectively
Which is not a good sign for the firm
8102019 A Study A Study On Financial Performance Analysis With Reference To Kesoram Cementon Financial Performance hellip
httpslidepdfcomreaderfulla-study-a-study-on-financial-performance-analysis-with-reference-to-kesoram 7381
8102019 A Study A Study On Financial Performance Analysis With Reference To Kesoram Cementon Financial Performance hellip
httpslidepdfcomreaderfulla-study-a-study-on-financial-performance-analysis-with-reference-to-kesoram 7481
8102019 A Study A Study On Financial Performance Analysis With Reference To Kesoram Cementon Financial Performance hellip
httpslidepdfcomreaderfulla-study-a-study-on-financial-performance-analysis-with-reference-to-kesoram 7581
75
CHAPTER V
FINDINGS amp SUGGESTIONS
8102019 A Study A Study On Financial Performance Analysis With Reference To Kesoram Cementon Financial Performance hellip
httpslidepdfcomreaderfulla-study-a-study-on-financial-performance-analysis-with-reference-to-kesoram 7681
76
Findings
The Share capital remains constant Share capital is unchanged all the years from
2008-2012
Reserves amp surplus were recorded an increasing trend in the period between 2008
and 2010It is showing decreasing trend in the period 2011-2012 (ie from 16019
in 2010 to 9309 in 2012)
Current Liabilities were increased compared to base year ie 2008
Provisions increased to 262597 ie in Rupees 39232 crores in the current year
The current ratio for all the five year is lower (less) than the standard rule ie 21
And it is 097 in the year 2011-2012 (current year)
The Debt-Equity Ratio was shown under the standard ratio It is clear that the long
term debt is more than that of the share holdersrsquo fund It indicates that the firm
heavily relying on external funds rather than the internal funds
The operating and net profit of Kesoram is in decreasing trend due to heavy
increase of manufacturing amp administrative expenses
ROI is highest in the year 2007-2008 as 3862 The ROI is negative in the years
2010-2011 amp 2011-2012 as -2167 amp -4165 respectively
Return on Equity Capital Employed Ratio of Kesoram has decreased every year
from 2007-2008 to 2010-2011It further decreased to negative in the year 2011-12 to
-3280
EPS of Kesoram has decreased every year from 2008-12It is negative in the year
2011 amp 12
8102019 A Study A Study On Financial Performance Analysis With Reference To Kesoram Cementon Financial Performance hellip
httpslidepdfcomreaderfulla-study-a-study-on-financial-performance-analysis-with-reference-to-kesoram 7781
77
Suggestion
The organization should adopt an appropriate capital structure
The companyrsquos debt-equity ratio is recorded more or less as 111 in the year 2008
and it is increased to 449 in the year 2012 (current year)The company should
adopt a better debt equity mix in the future to control the fluctuations in returns
The company should control fluctuations in cash and bank balances as it impacts the
current ratio of the company
The provisions are showing increasing trend which indicates risk of debtors The
firm should implement an effective credit management policy It should utilize its
idle funds by decreasing provisions
The company should control heavy increase of manufacturing amp administration
expenses as it is impacting the operating and net profit of company
8102019 A Study A Study On Financial Performance Analysis With Reference To Kesoram Cementon Financial Performance hellip
httpslidepdfcomreaderfulla-study-a-study-on-financial-performance-analysis-with-reference-to-kesoram 7881
78
ANNEXURE
Profit And Loss Account of Kesoram Cement
Mar12 Mar11 Mar10 Mar09 Mar08
12 Months 12 Months 12 Months 12 Months 12 Months
INCOME
Sales Turnover 628260 575072 505151 431613 345700
Excise Duty 36440 35284 30089 41815 45429
NET SALES 591820 539788 475062 389797 300271
Other Income 000 000 000 000 000
TOTALINCOME
596129 548733 481019 393969 302020
EXPENDITURE
Manufacturing
Expenses81903 74803 13974 13153 44113
MaterialConsumed
370897 310150 295550 229359 118448
Personal
Expenses33468 27355 23294 18690 15344
Selling Expenses 81910 78253 58667 48846 45019
AdministrativeExpenses
28225 29308 17219 16179 9907
Expenses
Capitalized000 000 000 000 000
Provisions Made 000 000 000 000 000
TOTAL
EXPENDITURE 596403 519870 408704 326227 232832Operating Profit -4583 19918 66358 63570 67439
EBITDA -274 28864 72316 67742 69188
Depreciation 29740 27259 17280 11186 8927
Other Write-offs 000 000 000 000 000
EBIT -30014 1605 55035 56557 60261
Interest 41015 23983 10921 12087 5426
EBT -71029 -22377 44114 44470 54835
Taxes -32921 5798 23816 3037 16918
Profit and Loss
for the Year-38108 -28176 20298 41432 37917
Non RecurringItems
-1142 7063 3228 -4023 402
Other Non Cash
Adjustments1276 091 207 465 017
OtherAdjustments
000 000 000 000 000
REPORTED
PAT-37974 -21021 23734 37874 38335
8102019 A Study A Study On Financial Performance Analysis With Reference To Kesoram Cementon Financial Performance hellip
httpslidepdfcomreaderfulla-study-a-study-on-financial-performance-analysis-with-reference-to-kesoram 7981
79
Balance Sheet Of Kesoram
Years
Particulars 2008 2009 2010 2011 2012
Liabilities
Share Capital 4574 4574 4574 4574 4574Reserves amp Surplus 93085 128024 149111 125162 86657
Revaluation Reserves 533 412 339 289 27
Loans
Secured Loans 97106 153627 186372 237183 317792
Un Secured Loans 12129 43416 12625 162744 92742
Deferred Tax Liabilities 0 0 0 0 0
Current Liabilities
Provisions 33039 34529 35734 1494 40726
Current Liabilities 57067 66587 107688 113902 18001
Total 297533 431169 610068 645348 722771
Assets
Net Block 108424 180435 343182 369172 358721
Capital WIP 63459 86485 41283 43781 68065
Investments 4783 6178 5143 6582 6636
Current Assets
Inventories 44217 58906 91619 111855 99516
Sundry Debtors 27307 38017 54289 63134 67358
Cash amp Bank Balances 4036 5657 8014 7188 6959
Total Current Assets 7556 10258 153922 182177 173833Loans amp Advances 45289 55462 66506 4346 115409
Fixed Deposits 018 028 031 176 107
Total 297533 431169 610068 645348 722771
8102019 A Study A Study On Financial Performance Analysis With Reference To Kesoram Cementon Financial Performance hellip
httpslidepdfcomreaderfulla-study-a-study-on-financial-performance-analysis-with-reference-to-kesoram 8081
80
KEY ITEMS 2012 2011 2010 2009 2008
Preference
Dividend 0 0 0 0 0
Equity Dividend 457 2516 2516 2516 2516
Equity Dividend
() 999 55 55 55 55
Shares in Issue(Lakhs) 45743 45743 45743 45743 45743
EPS - Annualised
(Rs) -8302 -4595 5188 828 838
8102019 A Study A Study On Financial Performance Analysis With Reference To Kesoram Cementon Financial Performance hellip
httpslidepdfcomreaderfulla-study-a-study-on-financial-performance-analysis-with-reference-to-kesoram 8181
BIBLIOGRAPHY
Sl
No
Books Author Name
1 Financial Management Khan amp JAIN
2 Financial Management IMPandey
3 Management Accounting RPTrivedi
Websites amp Search Engines
1 wwwkesoramcom983086
2 wwwmoneycontrolcom
3 wwwgooglefinancecom983086
Annual reports of Kesoram cement limited 2008-2012
8102019 A Study A Study On Financial Performance Analysis With Reference To Kesoram Cementon Financial Performance hellip
httpslidepdfcomreaderfulla-study-a-study-on-financial-performance-analysis-with-reference-to-kesoram 5181
51
Interpretation of comparative balance sheet of 2010-2011
Reserves amp surplus decreased to 1606 ie in Rupees 23949 crores
Revaluation Reserves decreased to 1475 ie in Rupees 050 crores
Secured loans increased to 2726 ie in Rupees 50811 crores
Current Liabilities were increased to 577 ie in Rupees 6214 crores
Provisions decreased to 9582 ie in Rupees 34240 crores
Fixed Assets were increased to 757 ie in Rupees 25990 crores
Investments were decreased to 2798 ie in Rupees 1439 crores
Sundry debtors were increased to 1629 ie in Rupees8845 crores
Current assets increased to 1836 ie in Rupees 28255 crores And loans and
Advances increased 3465 ie in Rupees 23046 crores
The overall financial position was UN satisfactory
8102019 A Study A Study On Financial Performance Analysis With Reference To Kesoram Cementon Financial Performance hellip
httpslidepdfcomreaderfulla-study-a-study-on-financial-performance-analysis-with-reference-to-kesoram 5281
52
Comparative Balance Sheet of Kesoram In The Year Between 2011-2012
(Rupees in crores)
Years Changes
Particulars 2011 2012 In Rupees In Percentage
Liabilities
Share Capital 4574 4574 000 000
Reserves amp Surplus 125162 86657 -38505 -3076
Revaluation Reserves 289 270 -019 -657
Loans
Secured Loans 237183 317792 80609 3399
Un Secured Loans 162744 92742 -70002 -4301
Deferred Tax Liabilities 000 000 000
Current Liabilities
Provisions 1494 40726 39232 262597
Current Liabilities 113902 180010 66108 5804
Total 645348 722771 77423 1200
Assets 000
Net Block 369172 358721 -10451 -283
Capital WIP 43781 68065 24284 5547
Investments 6582 6636 054 082
Current Assets
Inventories 111855 99516 -12339 -1103
Sundry Debtors 63134 67358 4224 669
Cash amp Bank Balances 7188 6959 -229 -319
Total Current Assets 182177 173833 -8344 -458
Loans amp Advances 43460 115409 71949 16555
Fixed Deposits 176 107 -069 -3920
Total 645348 722771 77423 1200
8102019 A Study A Study On Financial Performance Analysis With Reference To Kesoram Cementon Financial Performance hellip
httpslidepdfcomreaderfulla-study-a-study-on-financial-performance-analysis-with-reference-to-kesoram 5381
53
Interpretation of comparative balance sheet of 2011-2012
Reserves amp surplus decreased to 3076 ie in Rupee 38505 crores
Revaluation Reserves decreased to 657 ie in Rupees 019 crores
Secured loans increased to 3399 ie in Rupees 80699 crores
Current Liabilities were increased to 5804 ie in Rupees 66108 crores
Provisions increased to 262597 ie in Rupees 39232 crores
Fixed Assets were decreased to 283 ie in Rupee 10451 crores
Investments were increased to 082 ie in Rupees 054 crores
Sundry debtors were increased to 669 ie in Rupees 4224 crores
Current assets decreased to 458 ie in Rupees 8344 crores And loans and
Advances increased 16555 ie in Rupees 71949 crores
The overall financial position was UN satisfactory
8102019 A Study A Study On Financial Performance Analysis With Reference To Kesoram Cementon Financial Performance hellip
httpslidepdfcomreaderfulla-study-a-study-on-financial-performance-analysis-with-reference-to-kesoram 5481
54
Common Size Balance Sheet of Kesoram For The Year 2008-2009
(Rupees in crores)
Particulars 2008 Change Percentage 2009 Change Percentage
Liabilities
Share Capital 4574 154 4574 106
Reserves amp Surplus 93085 3129 128024 2969
Revaluation Reserves 533 018 412 010
Loans
Secured Loans 97106 3264 153627 3563
Un Secured Loans 12129 408 43416 1007
Deferred Tax Liabilities 000 000 000 000
Current Liabilities
Provisions 33039 1110 34529 801
Current Liabilities 57067 1918 66587 1544
Total 297533 10000 431169 10000
Assets
Net Block 108424 3644 180435 4185
Capital WIP 63459 2133 86485 2006
Investments 4783 161 6178 143
Current Assets
Inventories 44217 1486 58906 1366
Sundry Debtors 27307 918 38017 882
Cash amp Bank Balances 4036 136 5657 131
Loans amp Advances 45289 1522 55462 1286
Fixed Deposits 018 001 028 001
Total 297533 10000 431169 10000
8102019 A Study A Study On Financial Performance Analysis With Reference To Kesoram Cementon Financial Performance hellip
httpslidepdfcomreaderfulla-study-a-study-on-financial-performance-analysis-with-reference-to-kesoram 5581
55
Interpretation of Common Size Balance Sheet of 2008-2009
Share capital was recorded 154 percent in the total liabilities in the year 2008 it is
decreased to 106 in the year 2009
Reserves amp surplus contributed to 3129 in the total liabilities in the year 2008 it is
decreased to 2969 in the year 2009
Secured loans were 3264 in the total liabilities in the year 2008 it is increased to
3563 in the year 2009
Current Liabilities shown to 1918 in the total liabilities in the year 2008 it is
decreased to 1544 in the year 2009
Provisions 1110 in the total liabilities in the year 2008 it is decreased to 801 in the
year 2009
Fixed Assets were 3644 in the total liabilities in the year 2008 ie decreased to 4185
in the year 2009
Investments were 161 in the total liabilities in the year 2008 it is decreased to 143
in the year 2009
Sundry debtors were 918 in the total liabilities in the year 2008 it is decreased to 882
in the year 2009
8102019 A Study A Study On Financial Performance Analysis With Reference To Kesoram Cementon Financial Performance hellip
httpslidepdfcomreaderfulla-study-a-study-on-financial-performance-analysis-with-reference-to-kesoram 5681
56
Common Size Balance Sheet of Kesoram For The Year 2009-2010
(Rs in crores)
Particulars 2009 Change Percentage 2010Change
Percentage
Liabilities
Share Capital 4574 106 4574 075
Reserves amp Surplus 128024 2969 149111 2444
Revaluation Reserves 412 010 339 006
Loans
Secured Loans 153627 3563 186372 3055
Un Secured Loans 43416 1007 126250 2069
Deferred Tax Liabilities 000 000 000 000
Current Liabilities
Provisions 34529 801 35734 586
Current Liabilities 66587 1544 107688 1765
Total 431169 10000 610068 10000
Assets
Net Block 180435 4185 343182 5625
Capital WIP 86485 2006 41283 677
Investments 6178 143 5143 084
Current Assets
Inventories 58906 1366 91619 1502
Sundry Debtors 38017 882 54289 890
Cash amp Bank Balances 5657 131 8014 131
Loans amp Advances 55462 1286 66506 1090
Fixed Deposits 028 001 031 001
Total 431169 10000 610068 10000
8102019 A Study A Study On Financial Performance Analysis With Reference To Kesoram Cementon Financial Performance hellip
httpslidepdfcomreaderfulla-study-a-study-on-financial-performance-analysis-with-reference-to-kesoram 5781
57
Interpretation of common size balance sheet of 2009-2010
Share capital was recorded 106 percent in the total liabilities in the
year 2009 it is decreased to 075 in the year 2010
Reserves amp surplus contributed to 2969 in the total liabilities in the
year 2009 it is decreased to2444 in the year 2010
Secured loans were 3563 in the total liabilities in the year 2009 it is
increased to 3055 in the year 2010
Current Liabilities shown to 1544 in the total liabilities in the year
2009 it is decreased to 1765 in the year 2010
Provisions 801 in the total liabilities in the year 2009 it is decreased
to 586 in the year 2010
Fixed Assets were 4185 in the total liabilities in the year 2009 ie
increased to 5625 in the year 2010
Investments were 143 in the total liabilities in the year 2009 it is
decreased to 084 in the year 2010
Sundry debtors were 882 in the total liabilities in the year 2009 it is
increased to 890 in the year 2010
8102019 A Study A Study On Financial Performance Analysis With Reference To Kesoram Cementon Financial Performance hellip
httpslidepdfcomreaderfulla-study-a-study-on-financial-performance-analysis-with-reference-to-kesoram 5881
58
Common Size Balance sheet of Kesoram for the year 2010-2011
983080Rupees in crores)
Particulars 2010 Change Percentage 2011
Change
Percentage
Liabilities
Share Capital 4574 075 4574 071
Reserves amp Surplus 149111 2444 125162 1939
Revaluation Reserves 339 006 289 004
Loans
Secured Loans 186372 3055 237183 3675
Un Secured Loans 126250 2069 162744 2522
Deferred Tax Liabilities 000 000 000 000
Current Liabilities
Provisions 35734 586 1494 023
Current Liabilities 107688 1765 113902 1765
Total 610068 10000 645348 10000
Assets
Net Block 343182 5625 369172 5721
Capital WIP 41283 677 43781 678
Investments 5143 084 6582 102
Current Assets
Inventories 91619 1502 111855 1733
Sundry Debtors 54289 890 63134 978
Cash amp Bank Balances 8014 131 7188 111
Loans amp Advances 66506 1090 43460 673
Fixed Deposits 031 001 176 003
Total 610068 10000 645348 10000
8102019 A Study A Study On Financial Performance Analysis With Reference To Kesoram Cementon Financial Performance hellip
httpslidepdfcomreaderfulla-study-a-study-on-financial-performance-analysis-with-reference-to-kesoram 5981
59
Interpretation of Common Size Balance Sheet Of 2010-2011
Share capital was recorded 075 percent in the total liabilities in the year 2010 it is
decreased to 071 in the year 2011
Reserves amp surplus contributed to 2444 in the total liabilities in the year 2010 it is
decreased to1939 in the year 2011
Secured loans were 3055 in the total liabilities in the year 2010 it is increased to
3675 in the year 2011
Current Liabilities shown to 1765 in the total liabilities in the year 2010 it is
also1765 in the year 2011
Provisions 586 in the total liabilities in the year 2010 it is decreased to 023 in the
year 2011
Fixed Assets were 5625 in the total liabilities in the year 2010 ie increased to 5721
in the year 2011
Investments were 084 in the total liabilities in the year 2010 it increased to 102 in
the year 2011
Sundry debtors were 890 in the total liabilities in the year 2010 it is increased to 978
in the year 2011
8102019 A Study A Study On Financial Performance Analysis With Reference To Kesoram Cementon Financial Performance hellip
httpslidepdfcomreaderfulla-study-a-study-on-financial-performance-analysis-with-reference-to-kesoram 6081
60
Common Size Balance Sheet of Kesoram for the Year 2011-2012
983080Rupees in crores)
Particulars 2011 Change Percentage 2012
Change
Percentage
Liabilities
Share Capital 4574 071 4574 063
Reserves amp Surplus 125162 1939 86657 1199
Revaluation Reserves 289 004 270 004
Loans
Secured Loans 237183 3675 317792 4397
Un Secured Loans 162744 2522 92742 1283
Deferred Tax Liabilities 000 000 000 000
Current Liabilities
Provisions 1494 023 40726 563
Current Liabilities 113902 1765 180010 2491
Total 645348 10000 722771 10000
Assets
Net Block 369172 5721 358721 4963
Capital WIP 43781 678 68065 942
Investments 6582 102 6636 092
Current Assets
Inventories 111855 1733 99516 1377
Sundry Debtors 63134 978 67358 932
Cash amp Bank Balances 7188 111 6959 096
Loans amp Advances 43460 673 115409 1597
Fixed Deposits 176 003 107 001
Total 645348 10000 722771 10000
8102019 A Study A Study On Financial Performance Analysis With Reference To Kesoram Cementon Financial Performance hellip
httpslidepdfcomreaderfulla-study-a-study-on-financial-performance-analysis-with-reference-to-kesoram 6181
61
Interpretation of common size balance sheet of 2011-2012
Share capital was recorded 071 percent in the total liabilities in the year 2011 it is
decreased to 063 in the year 2012
Reserves amp surplus contributed to 1939 in the total liabilities in the year 2011 it
is decreased to 1199 in the year 2012
Secured loans were 3675 in the total liabilities in the year 2011 it is increased to
4397 in the year 2012
Current Liabilities shown to 1765 in the total liabilities in the year 2011 it is
increased to 2491 in the year 2012
Provisions 023 in the total liabilities in the year 2011 it is increased to 563 in the
year 2012
Fixed Assets were 5721 in the total liabilities in the year 2011 ie decreased to
4963 in the year 2012
Investments were 102 in the total liabilities in the year 2011 it increased to 092
in the year 2012
Sundry debtors were 978 in the total liabilities in the year 2011 it is decreased to
932 in the year 2012
8102019 A Study A Study On Financial Performance Analysis With Reference To Kesoram Cementon Financial Performance hellip
httpslidepdfcomreaderfulla-study-a-study-on-financial-performance-analysis-with-reference-to-kesoram 6281
Trend Analysis
Share Capital-
Year
Amount
(In Crores) Trend
IncreaseDecrease
Base Year Previous Year
2008 4574 10000 000 000
2009 4574 10000 000 000
2010 4574 10000 000 000
2011 4574 10000 000 000
2012 4574 10000 000 000
Trend Percentages in Share Capital
Share capital shown a constant trend in the period 2008 and 2012
Share capital is 4574 crores all the years from 2008-2012
8102019 A Study A Study On Financial Performance Analysis With Reference To Kesoram Cementon Financial Performance hellip
httpslidepdfcomreaderfulla-study-a-study-on-financial-performance-analysis-with-reference-to-kesoram 6381
Reserves amp Surplus-
Year
Amount
(In Crores) Trend
IncreaseDecrease
Base Year Previous Year
2008 93085 10000 000 000
2009 128024 13753 3753 3753
2010 149111 16019 6019 2266
2011 125162 13446 3446 -2573
2012 86657 9309 -691 -4137
Trend Percentages in Reserves amp Surplus
Reserves amp surplus shown an increasing trend in the period between 2008 and 2010
The average trend was 13277 till 2010
The Reserves amp surplus was showing decreasing trend in the period 2011-2012 (ie
from 16019 in 2010 to 9309 in 2012)
The decreasing trend in Reserves amp surplus indicates the decrease in profits of the
firm
8102019 A Study A Study On Financial Performance Analysis With Reference To Kesoram Cementon Financial Performance hellip
httpslidepdfcomreaderfulla-study-a-study-on-financial-performance-analysis-with-reference-to-kesoram 6481
Investments-
Year
Amount
(In Crores) Trend
IncreaseDecrease
Base Year Previous Year
2008 4783 10000 000 000
2009 6178 12917 2917 2917
2010 5143 10753 753 -2164
2011 6582 13761 3761 3009
2012 6636 13874 3874 113
Trend Percentages in Investments-
The investments are shown an increasing trend in the period between 2008 ndash 2009
and it is decreasing in the year 2010
The average trend was 11458 till 2009
The investments increased in the periods 2011-2012 (ie from 10753 in 2010 to
13874 in 2012)
The overall trend in investments shown is satisfactory
8102019 A Study A Study On Financial Performance Analysis With Reference To Kesoram Cementon Financial Performance hellip
httpslidepdfcomreaderfulla-study-a-study-on-financial-performance-analysis-with-reference-to-kesoram 6581
Net Current Assets-
Year
Amount
(In Crores) Trend
IncreaseDecrease
Base Year Previous Year
2008 30761 10000 000 000
2009 56954 18515 8515 8515
2010 77037 25044 15044 6529
2011 110417 35895 25895 10851
2012 68613 22305 12305 -13590
Trends in Net Current Assets-
The NCA shown positive (increasing) trend
The NCA are increased to 35895 (the year 2011) compared with base year and
decreased in the year 2012 to 22305
The NCA shown increased trend from year and crossed 100
The overall trend was good
8102019 A Study A Study On Financial Performance Analysis With Reference To Kesoram Cementon Financial Performance hellip
httpslidepdfcomreaderfulla-study-a-study-on-financial-performance-analysis-with-reference-to-kesoram 6681
66
Ratio Analysis-
Current Ratio-
Current Ratio = Current Assets Current Liabilities
Current assets are cash in hand Cash at bank Marketable Securities(short term) short term
Investment Bills receivables sundry debtors Inventories (stock) Work in progress prepaid
expenses Current Liabilities are outstanding expenses Bills payable sundry Creditors
short-term advances income tax payable and Dividend payable
Current Ratio of Kesoram-
(Rupees in crores)
Year Current Assets Current Liabilities Current Ratio
2007-08 75560 57067 132
2008-09 102580 66587 154
2009-10 153922 107688 143
2010-11 182177 113902 160
2011-12 173833 180010 097
Interpretation-
As per the standard rule of current ratio ie 21 where current assets double the current
liabilities is considered satisfactory
In the present analysis the current ratio of the Kesoram is not satisfactory
from the above table It was assessed that the current ratio for all the five year is lower (less)
than the standard rule ie 21 And it is 097 in the year 2011-2012 (current year) This is
highly UN satisfactory
8102019 A Study A Study On Financial Performance Analysis With Reference To Kesoram Cementon Financial Performance hellip
httpslidepdfcomreaderfulla-study-a-study-on-financial-performance-analysis-with-reference-to-kesoram 6781
Quick Ratio-
Quick ratio also known as acid-test ratio establishes a relationship between quick
assets and the current liabilities Cash is the most liquid asset It is calculated by dividing
quick assets by current liabilities
Quick ratio = Quick Assets Current Liabilities
(Quick Assets = Current assets ndash Inventory)
Quick Ratio of Kesoram-
Rupees in crores)
Year Total QuickAssets
Current Liabilities Quick Ratio
2007-08 33343 57067 058
2008-09 43674 66587 066
2009-10 62303 107688 058
2010-11 70322 113902 0622011-12 74333 180010 041
Interpretation-
Usually a high Quick ratio is an indication that the company is liquid and has the ability to
meet its current or liquid liabilities in time on the other hand a low Quick Ratio represents
8102019 A Study A Study On Financial Performance Analysis With Reference To Kesoram Cementon Financial Performance hellip
httpslidepdfcomreaderfulla-study-a-study-on-financial-performance-analysis-with-reference-to-kesoram 6881
that the companyrsquos liquidity position is not good The above table showing the quick ratios
of Kesoram are canrsquot be considered satisfactory
Leverage Ratios-
Debt-Equity Ratio-
Debt-Equity Ratio = Total Long Term Debt Equity Share Holders Fund
Total Long term Debt= Debenture Capital + Long term loans from banks and financial
institutions + Public deposits
Equity Share Holders fund = Equity + Reserves and Surplus
Debt Equity Ratio of Kesoram
(Rupees in crores)
Year Total Debt Share Holders Fund Debt Equity Ratio
2007-08 109235 98192 111
2008-09 197043 133010 148
2009-10 312622 154024 203
2010-11 399927 130025 308
2011-12 410534 91501 449
8102019 A Study A Study On Financial Performance Analysis With Reference To Kesoram Cementon Financial Performance hellip
httpslidepdfcomreaderfulla-study-a-study-on-financial-performance-analysis-with-reference-to-kesoram 6981
Interpretation-
The Debt-Equity Ratio accepted standard is 05 This ratio reflects the relative contribution
of creditors and owners of business in its financing From the above it is clear that the long
term debt is more than that of the share holdersrsquo fund So we can interpret that the firmrsquosassets are financed more by the external funds rather than by the internal funds
8102019 A Study A Study On Financial Performance Analysis With Reference To Kesoram Cementon Financial Performance hellip
httpslidepdfcomreaderfulla-study-a-study-on-financial-performance-analysis-with-reference-to-kesoram 7081
Fixed Asset Ratio-
Net Sales
Fixed Asset Ratio = helliphelliphelliphelliphelliphelliphelliphelliphelliphelliphellip
Net Assets
Fixed Asset Ratio of Kesoram-
(Rupees in crores)
Year Net Sales Net Assets Fixed Assets Ratio
2007-08 300271 358721 084
2008-09 389797 369172 106
2009-10 475062 343182 1382010-11 539788 180435 299
2011-12 59182 108424 546
Interpretation
This ratio indicates the extent to which the assets of the companyrsquos can be lost without
affecting the interest of the creditors of the company Higher the ratios better the long-term
position of the companyThe above table shows fixed assets ratio in increasing trend Which is good for the
company
8102019 A Study A Study On Financial Performance Analysis With Reference To Kesoram Cementon Financial Performance hellip
httpslidepdfcomreaderfulla-study-a-study-on-financial-performance-analysis-with-reference-to-kesoram 7181
Overall Profitability Ratios-
Net Profit Ratio
Net Profit Ratio indicates net margin on sales It is given by the following equation
Net Profit Ratio = (Net Profit Sales) 100
Net Profit Ratio of Kesoram
(Rupees in crores)
Year Net Profit Sales Net Profit Ratio
2007-08 37917 300271 1263
2008-09 41432 389797 1063
2009-10 20298 475062 427
2010-11 -28176 539788 -5222011-12 -38108 59182 -644
Interpretation
It establishes a relationship between net profits after tax and net sales and
indicates the efficiency of the management in manufacturing selling administrative and
other activities of the company
The higher the ratio the better is the profitability or performance of the business
The above table depicts the net profit Ratio of Kesoram has decreased every year from
2007-2008 to 2011-2012It further decreased to negative in the year 2010-11 to -522 and -
644 in the year 2011-2012 This shows constant decrease in the profits of the company
8102019 A Study A Study On Financial Performance Analysis With Reference To Kesoram Cementon Financial Performance hellip
httpslidepdfcomreaderfulla-study-a-study-on-financial-performance-analysis-with-reference-to-kesoram 7281
72
Return on Investment-
Net Profit
Return on Investment = helliphelliphelliphelliphelliphelliphelliphelliphelliphelliphelliphellip X 100
Share Holders Fund
Return on Investment Ratio of Kesoram-
(Rupees in crores)
Year Net Profit Share Holders Fund Return On Investment
2007-08 37917 98192 3862
2008-09 41432 133010 3115
2009-10 20298 154024 1318
2010-11 -28176 130025 -2167
2011-12 -38108 91501 -4165
Interpretation-
The above table reveals how well the resources of the firm are being used Higher
the ratio better the result The above ratio implies how well the firm is growing in
terms of profitability and efficiency From the above table we can concern that the return on
investment is in decreasing trend ROI is highest in the year 2007-2008 as 3862 But
there after itrsquos decreased every year
The ROI is negative in the years 2010-2011 amp 2011-2012 as -2167 amp -4165 respectively
Which is not a good sign for the firm
8102019 A Study A Study On Financial Performance Analysis With Reference To Kesoram Cementon Financial Performance hellip
httpslidepdfcomreaderfulla-study-a-study-on-financial-performance-analysis-with-reference-to-kesoram 7381
8102019 A Study A Study On Financial Performance Analysis With Reference To Kesoram Cementon Financial Performance hellip
httpslidepdfcomreaderfulla-study-a-study-on-financial-performance-analysis-with-reference-to-kesoram 7481
8102019 A Study A Study On Financial Performance Analysis With Reference To Kesoram Cementon Financial Performance hellip
httpslidepdfcomreaderfulla-study-a-study-on-financial-performance-analysis-with-reference-to-kesoram 7581
75
CHAPTER V
FINDINGS amp SUGGESTIONS
8102019 A Study A Study On Financial Performance Analysis With Reference To Kesoram Cementon Financial Performance hellip
httpslidepdfcomreaderfulla-study-a-study-on-financial-performance-analysis-with-reference-to-kesoram 7681
76
Findings
The Share capital remains constant Share capital is unchanged all the years from
2008-2012
Reserves amp surplus were recorded an increasing trend in the period between 2008
and 2010It is showing decreasing trend in the period 2011-2012 (ie from 16019
in 2010 to 9309 in 2012)
Current Liabilities were increased compared to base year ie 2008
Provisions increased to 262597 ie in Rupees 39232 crores in the current year
The current ratio for all the five year is lower (less) than the standard rule ie 21
And it is 097 in the year 2011-2012 (current year)
The Debt-Equity Ratio was shown under the standard ratio It is clear that the long
term debt is more than that of the share holdersrsquo fund It indicates that the firm
heavily relying on external funds rather than the internal funds
The operating and net profit of Kesoram is in decreasing trend due to heavy
increase of manufacturing amp administrative expenses
ROI is highest in the year 2007-2008 as 3862 The ROI is negative in the years
2010-2011 amp 2011-2012 as -2167 amp -4165 respectively
Return on Equity Capital Employed Ratio of Kesoram has decreased every year
from 2007-2008 to 2010-2011It further decreased to negative in the year 2011-12 to
-3280
EPS of Kesoram has decreased every year from 2008-12It is negative in the year
2011 amp 12
8102019 A Study A Study On Financial Performance Analysis With Reference To Kesoram Cementon Financial Performance hellip
httpslidepdfcomreaderfulla-study-a-study-on-financial-performance-analysis-with-reference-to-kesoram 7781
77
Suggestion
The organization should adopt an appropriate capital structure
The companyrsquos debt-equity ratio is recorded more or less as 111 in the year 2008
and it is increased to 449 in the year 2012 (current year)The company should
adopt a better debt equity mix in the future to control the fluctuations in returns
The company should control fluctuations in cash and bank balances as it impacts the
current ratio of the company
The provisions are showing increasing trend which indicates risk of debtors The
firm should implement an effective credit management policy It should utilize its
idle funds by decreasing provisions
The company should control heavy increase of manufacturing amp administration
expenses as it is impacting the operating and net profit of company
8102019 A Study A Study On Financial Performance Analysis With Reference To Kesoram Cementon Financial Performance hellip
httpslidepdfcomreaderfulla-study-a-study-on-financial-performance-analysis-with-reference-to-kesoram 7881
78
ANNEXURE
Profit And Loss Account of Kesoram Cement
Mar12 Mar11 Mar10 Mar09 Mar08
12 Months 12 Months 12 Months 12 Months 12 Months
INCOME
Sales Turnover 628260 575072 505151 431613 345700
Excise Duty 36440 35284 30089 41815 45429
NET SALES 591820 539788 475062 389797 300271
Other Income 000 000 000 000 000
TOTALINCOME
596129 548733 481019 393969 302020
EXPENDITURE
Manufacturing
Expenses81903 74803 13974 13153 44113
MaterialConsumed
370897 310150 295550 229359 118448
Personal
Expenses33468 27355 23294 18690 15344
Selling Expenses 81910 78253 58667 48846 45019
AdministrativeExpenses
28225 29308 17219 16179 9907
Expenses
Capitalized000 000 000 000 000
Provisions Made 000 000 000 000 000
TOTAL
EXPENDITURE 596403 519870 408704 326227 232832Operating Profit -4583 19918 66358 63570 67439
EBITDA -274 28864 72316 67742 69188
Depreciation 29740 27259 17280 11186 8927
Other Write-offs 000 000 000 000 000
EBIT -30014 1605 55035 56557 60261
Interest 41015 23983 10921 12087 5426
EBT -71029 -22377 44114 44470 54835
Taxes -32921 5798 23816 3037 16918
Profit and Loss
for the Year-38108 -28176 20298 41432 37917
Non RecurringItems
-1142 7063 3228 -4023 402
Other Non Cash
Adjustments1276 091 207 465 017
OtherAdjustments
000 000 000 000 000
REPORTED
PAT-37974 -21021 23734 37874 38335
8102019 A Study A Study On Financial Performance Analysis With Reference To Kesoram Cementon Financial Performance hellip
httpslidepdfcomreaderfulla-study-a-study-on-financial-performance-analysis-with-reference-to-kesoram 7981
79
Balance Sheet Of Kesoram
Years
Particulars 2008 2009 2010 2011 2012
Liabilities
Share Capital 4574 4574 4574 4574 4574Reserves amp Surplus 93085 128024 149111 125162 86657
Revaluation Reserves 533 412 339 289 27
Loans
Secured Loans 97106 153627 186372 237183 317792
Un Secured Loans 12129 43416 12625 162744 92742
Deferred Tax Liabilities 0 0 0 0 0
Current Liabilities
Provisions 33039 34529 35734 1494 40726
Current Liabilities 57067 66587 107688 113902 18001
Total 297533 431169 610068 645348 722771
Assets
Net Block 108424 180435 343182 369172 358721
Capital WIP 63459 86485 41283 43781 68065
Investments 4783 6178 5143 6582 6636
Current Assets
Inventories 44217 58906 91619 111855 99516
Sundry Debtors 27307 38017 54289 63134 67358
Cash amp Bank Balances 4036 5657 8014 7188 6959
Total Current Assets 7556 10258 153922 182177 173833Loans amp Advances 45289 55462 66506 4346 115409
Fixed Deposits 018 028 031 176 107
Total 297533 431169 610068 645348 722771
8102019 A Study A Study On Financial Performance Analysis With Reference To Kesoram Cementon Financial Performance hellip
httpslidepdfcomreaderfulla-study-a-study-on-financial-performance-analysis-with-reference-to-kesoram 8081
80
KEY ITEMS 2012 2011 2010 2009 2008
Preference
Dividend 0 0 0 0 0
Equity Dividend 457 2516 2516 2516 2516
Equity Dividend
() 999 55 55 55 55
Shares in Issue(Lakhs) 45743 45743 45743 45743 45743
EPS - Annualised
(Rs) -8302 -4595 5188 828 838
8102019 A Study A Study On Financial Performance Analysis With Reference To Kesoram Cementon Financial Performance hellip
httpslidepdfcomreaderfulla-study-a-study-on-financial-performance-analysis-with-reference-to-kesoram 8181
BIBLIOGRAPHY
Sl
No
Books Author Name
1 Financial Management Khan amp JAIN
2 Financial Management IMPandey
3 Management Accounting RPTrivedi
Websites amp Search Engines
1 wwwkesoramcom983086
2 wwwmoneycontrolcom
3 wwwgooglefinancecom983086
Annual reports of Kesoram cement limited 2008-2012
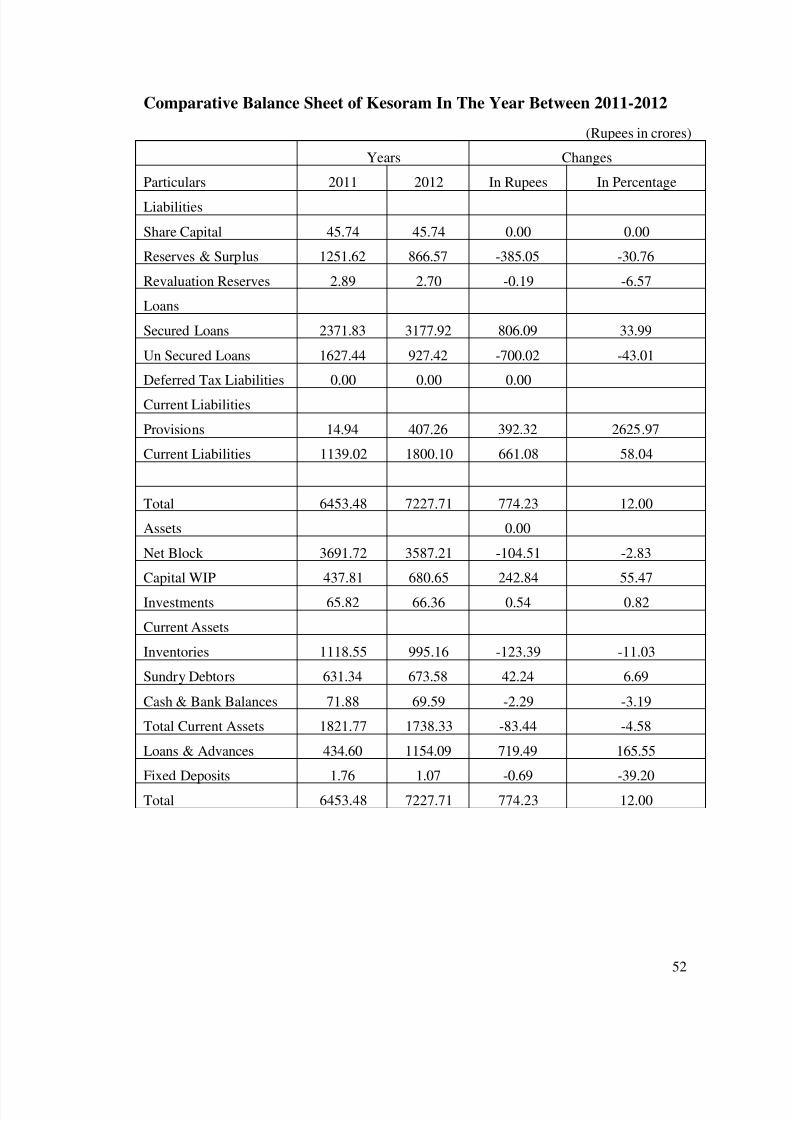
8102019 A Study A Study On Financial Performance Analysis With Reference To Kesoram Cementon Financial Performance hellip
httpslidepdfcomreaderfulla-study-a-study-on-financial-performance-analysis-with-reference-to-kesoram 5381
53
Interpretation of comparative balance sheet of 2011-2012
Reserves amp surplus decreased to 3076 ie in Rupee 38505 crores
Revaluation Reserves decreased to 657 ie in Rupees 019 crores
Secured loans increased to 3399 ie in Rupees 80699 crores
Current Liabilities were increased to 5804 ie in Rupees 66108 crores
Provisions increased to 262597 ie in Rupees 39232 crores
Fixed Assets were decreased to 283 ie in Rupee 10451 crores
Investments were increased to 082 ie in Rupees 054 crores
Sundry debtors were increased to 669 ie in Rupees 4224 crores
Current assets decreased to 458 ie in Rupees 8344 crores And loans and
Advances increased 16555 ie in Rupees 71949 crores
The overall financial position was UN satisfactory
8102019 A Study A Study On Financial Performance Analysis With Reference To Kesoram Cementon Financial Performance hellip
httpslidepdfcomreaderfulla-study-a-study-on-financial-performance-analysis-with-reference-to-kesoram 5481
54
Common Size Balance Sheet of Kesoram For The Year 2008-2009
(Rupees in crores)
Particulars 2008 Change Percentage 2009 Change Percentage
Liabilities
Share Capital 4574 154 4574 106
Reserves amp Surplus 93085 3129 128024 2969
Revaluation Reserves 533 018 412 010
Loans
Secured Loans 97106 3264 153627 3563
Un Secured Loans 12129 408 43416 1007
Deferred Tax Liabilities 000 000 000 000
Current Liabilities
Provisions 33039 1110 34529 801
Current Liabilities 57067 1918 66587 1544
Total 297533 10000 431169 10000
Assets
Net Block 108424 3644 180435 4185
Capital WIP 63459 2133 86485 2006
Investments 4783 161 6178 143
Current Assets
Inventories 44217 1486 58906 1366
Sundry Debtors 27307 918 38017 882
Cash amp Bank Balances 4036 136 5657 131
Loans amp Advances 45289 1522 55462 1286
Fixed Deposits 018 001 028 001
Total 297533 10000 431169 10000
8102019 A Study A Study On Financial Performance Analysis With Reference To Kesoram Cementon Financial Performance hellip
httpslidepdfcomreaderfulla-study-a-study-on-financial-performance-analysis-with-reference-to-kesoram 5581
55
Interpretation of Common Size Balance Sheet of 2008-2009
Share capital was recorded 154 percent in the total liabilities in the year 2008 it is
decreased to 106 in the year 2009
Reserves amp surplus contributed to 3129 in the total liabilities in the year 2008 it is
decreased to 2969 in the year 2009
Secured loans were 3264 in the total liabilities in the year 2008 it is increased to
3563 in the year 2009
Current Liabilities shown to 1918 in the total liabilities in the year 2008 it is
decreased to 1544 in the year 2009
Provisions 1110 in the total liabilities in the year 2008 it is decreased to 801 in the
year 2009
Fixed Assets were 3644 in the total liabilities in the year 2008 ie decreased to 4185
in the year 2009
Investments were 161 in the total liabilities in the year 2008 it is decreased to 143
in the year 2009
Sundry debtors were 918 in the total liabilities in the year 2008 it is decreased to 882
in the year 2009
8102019 A Study A Study On Financial Performance Analysis With Reference To Kesoram Cementon Financial Performance hellip
httpslidepdfcomreaderfulla-study-a-study-on-financial-performance-analysis-with-reference-to-kesoram 5681
56
Common Size Balance Sheet of Kesoram For The Year 2009-2010
(Rs in crores)
Particulars 2009 Change Percentage 2010Change
Percentage
Liabilities
Share Capital 4574 106 4574 075
Reserves amp Surplus 128024 2969 149111 2444
Revaluation Reserves 412 010 339 006
Loans
Secured Loans 153627 3563 186372 3055
Un Secured Loans 43416 1007 126250 2069
Deferred Tax Liabilities 000 000 000 000
Current Liabilities
Provisions 34529 801 35734 586
Current Liabilities 66587 1544 107688 1765
Total 431169 10000 610068 10000
Assets
Net Block 180435 4185 343182 5625
Capital WIP 86485 2006 41283 677
Investments 6178 143 5143 084
Current Assets
Inventories 58906 1366 91619 1502
Sundry Debtors 38017 882 54289 890
Cash amp Bank Balances 5657 131 8014 131
Loans amp Advances 55462 1286 66506 1090
Fixed Deposits 028 001 031 001
Total 431169 10000 610068 10000
8102019 A Study A Study On Financial Performance Analysis With Reference To Kesoram Cementon Financial Performance hellip
httpslidepdfcomreaderfulla-study-a-study-on-financial-performance-analysis-with-reference-to-kesoram 5781
57
Interpretation of common size balance sheet of 2009-2010
Share capital was recorded 106 percent in the total liabilities in the
year 2009 it is decreased to 075 in the year 2010
Reserves amp surplus contributed to 2969 in the total liabilities in the
year 2009 it is decreased to2444 in the year 2010
Secured loans were 3563 in the total liabilities in the year 2009 it is
increased to 3055 in the year 2010
Current Liabilities shown to 1544 in the total liabilities in the year
2009 it is decreased to 1765 in the year 2010
Provisions 801 in the total liabilities in the year 2009 it is decreased
to 586 in the year 2010
Fixed Assets were 4185 in the total liabilities in the year 2009 ie
increased to 5625 in the year 2010
Investments were 143 in the total liabilities in the year 2009 it is
decreased to 084 in the year 2010
Sundry debtors were 882 in the total liabilities in the year 2009 it is
increased to 890 in the year 2010
8102019 A Study A Study On Financial Performance Analysis With Reference To Kesoram Cementon Financial Performance hellip
httpslidepdfcomreaderfulla-study-a-study-on-financial-performance-analysis-with-reference-to-kesoram 5881
58
Common Size Balance sheet of Kesoram for the year 2010-2011
983080Rupees in crores)
Particulars 2010 Change Percentage 2011
Change
Percentage
Liabilities
Share Capital 4574 075 4574 071
Reserves amp Surplus 149111 2444 125162 1939
Revaluation Reserves 339 006 289 004
Loans
Secured Loans 186372 3055 237183 3675
Un Secured Loans 126250 2069 162744 2522
Deferred Tax Liabilities 000 000 000 000
Current Liabilities
Provisions 35734 586 1494 023
Current Liabilities 107688 1765 113902 1765
Total 610068 10000 645348 10000
Assets
Net Block 343182 5625 369172 5721
Capital WIP 41283 677 43781 678
Investments 5143 084 6582 102
Current Assets
Inventories 91619 1502 111855 1733
Sundry Debtors 54289 890 63134 978
Cash amp Bank Balances 8014 131 7188 111
Loans amp Advances 66506 1090 43460 673
Fixed Deposits 031 001 176 003
Total 610068 10000 645348 10000
8102019 A Study A Study On Financial Performance Analysis With Reference To Kesoram Cementon Financial Performance hellip
httpslidepdfcomreaderfulla-study-a-study-on-financial-performance-analysis-with-reference-to-kesoram 5981
59
Interpretation of Common Size Balance Sheet Of 2010-2011
Share capital was recorded 075 percent in the total liabilities in the year 2010 it is
decreased to 071 in the year 2011
Reserves amp surplus contributed to 2444 in the total liabilities in the year 2010 it is
decreased to1939 in the year 2011
Secured loans were 3055 in the total liabilities in the year 2010 it is increased to
3675 in the year 2011
Current Liabilities shown to 1765 in the total liabilities in the year 2010 it is
also1765 in the year 2011
Provisions 586 in the total liabilities in the year 2010 it is decreased to 023 in the
year 2011
Fixed Assets were 5625 in the total liabilities in the year 2010 ie increased to 5721
in the year 2011
Investments were 084 in the total liabilities in the year 2010 it increased to 102 in
the year 2011
Sundry debtors were 890 in the total liabilities in the year 2010 it is increased to 978
in the year 2011
8102019 A Study A Study On Financial Performance Analysis With Reference To Kesoram Cementon Financial Performance hellip
httpslidepdfcomreaderfulla-study-a-study-on-financial-performance-analysis-with-reference-to-kesoram 6081
60
Common Size Balance Sheet of Kesoram for the Year 2011-2012
983080Rupees in crores)
Particulars 2011 Change Percentage 2012
Change
Percentage
Liabilities
Share Capital 4574 071 4574 063
Reserves amp Surplus 125162 1939 86657 1199
Revaluation Reserves 289 004 270 004
Loans
Secured Loans 237183 3675 317792 4397
Un Secured Loans 162744 2522 92742 1283
Deferred Tax Liabilities 000 000 000 000
Current Liabilities
Provisions 1494 023 40726 563
Current Liabilities 113902 1765 180010 2491
Total 645348 10000 722771 10000
Assets
Net Block 369172 5721 358721 4963
Capital WIP 43781 678 68065 942
Investments 6582 102 6636 092
Current Assets
Inventories 111855 1733 99516 1377
Sundry Debtors 63134 978 67358 932
Cash amp Bank Balances 7188 111 6959 096
Loans amp Advances 43460 673 115409 1597
Fixed Deposits 176 003 107 001
Total 645348 10000 722771 10000
8102019 A Study A Study On Financial Performance Analysis With Reference To Kesoram Cementon Financial Performance hellip
httpslidepdfcomreaderfulla-study-a-study-on-financial-performance-analysis-with-reference-to-kesoram 6181
61
Interpretation of common size balance sheet of 2011-2012
Share capital was recorded 071 percent in the total liabilities in the year 2011 it is
decreased to 063 in the year 2012
Reserves amp surplus contributed to 1939 in the total liabilities in the year 2011 it
is decreased to 1199 in the year 2012
Secured loans were 3675 in the total liabilities in the year 2011 it is increased to
4397 in the year 2012
Current Liabilities shown to 1765 in the total liabilities in the year 2011 it is
increased to 2491 in the year 2012
Provisions 023 in the total liabilities in the year 2011 it is increased to 563 in the
year 2012
Fixed Assets were 5721 in the total liabilities in the year 2011 ie decreased to
4963 in the year 2012
Investments were 102 in the total liabilities in the year 2011 it increased to 092
in the year 2012
Sundry debtors were 978 in the total liabilities in the year 2011 it is decreased to
932 in the year 2012
8102019 A Study A Study On Financial Performance Analysis With Reference To Kesoram Cementon Financial Performance hellip
httpslidepdfcomreaderfulla-study-a-study-on-financial-performance-analysis-with-reference-to-kesoram 6281
Trend Analysis
Share Capital-
Year
Amount
(In Crores) Trend
IncreaseDecrease
Base Year Previous Year
2008 4574 10000 000 000
2009 4574 10000 000 000
2010 4574 10000 000 000
2011 4574 10000 000 000
2012 4574 10000 000 000
Trend Percentages in Share Capital
Share capital shown a constant trend in the period 2008 and 2012
Share capital is 4574 crores all the years from 2008-2012
8102019 A Study A Study On Financial Performance Analysis With Reference To Kesoram Cementon Financial Performance hellip
httpslidepdfcomreaderfulla-study-a-study-on-financial-performance-analysis-with-reference-to-kesoram 6381
Reserves amp Surplus-
Year
Amount
(In Crores) Trend
IncreaseDecrease
Base Year Previous Year
2008 93085 10000 000 000
2009 128024 13753 3753 3753
2010 149111 16019 6019 2266
2011 125162 13446 3446 -2573
2012 86657 9309 -691 -4137
Trend Percentages in Reserves amp Surplus
Reserves amp surplus shown an increasing trend in the period between 2008 and 2010
The average trend was 13277 till 2010
The Reserves amp surplus was showing decreasing trend in the period 2011-2012 (ie
from 16019 in 2010 to 9309 in 2012)
The decreasing trend in Reserves amp surplus indicates the decrease in profits of the
firm
8102019 A Study A Study On Financial Performance Analysis With Reference To Kesoram Cementon Financial Performance hellip
httpslidepdfcomreaderfulla-study-a-study-on-financial-performance-analysis-with-reference-to-kesoram 6481
Investments-
Year
Amount
(In Crores) Trend
IncreaseDecrease
Base Year Previous Year
2008 4783 10000 000 000
2009 6178 12917 2917 2917
2010 5143 10753 753 -2164
2011 6582 13761 3761 3009
2012 6636 13874 3874 113
Trend Percentages in Investments-
The investments are shown an increasing trend in the period between 2008 ndash 2009
and it is decreasing in the year 2010
The average trend was 11458 till 2009
The investments increased in the periods 2011-2012 (ie from 10753 in 2010 to
13874 in 2012)
The overall trend in investments shown is satisfactory
8102019 A Study A Study On Financial Performance Analysis With Reference To Kesoram Cementon Financial Performance hellip
httpslidepdfcomreaderfulla-study-a-study-on-financial-performance-analysis-with-reference-to-kesoram 6581
Net Current Assets-
Year
Amount
(In Crores) Trend
IncreaseDecrease
Base Year Previous Year
2008 30761 10000 000 000
2009 56954 18515 8515 8515
2010 77037 25044 15044 6529
2011 110417 35895 25895 10851
2012 68613 22305 12305 -13590
Trends in Net Current Assets-
The NCA shown positive (increasing) trend
The NCA are increased to 35895 (the year 2011) compared with base year and
decreased in the year 2012 to 22305
The NCA shown increased trend from year and crossed 100
The overall trend was good
8102019 A Study A Study On Financial Performance Analysis With Reference To Kesoram Cementon Financial Performance hellip
httpslidepdfcomreaderfulla-study-a-study-on-financial-performance-analysis-with-reference-to-kesoram 6681
66
Ratio Analysis-
Current Ratio-
Current Ratio = Current Assets Current Liabilities
Current assets are cash in hand Cash at bank Marketable Securities(short term) short term
Investment Bills receivables sundry debtors Inventories (stock) Work in progress prepaid
expenses Current Liabilities are outstanding expenses Bills payable sundry Creditors
short-term advances income tax payable and Dividend payable
Current Ratio of Kesoram-
(Rupees in crores)
Year Current Assets Current Liabilities Current Ratio
2007-08 75560 57067 132
2008-09 102580 66587 154
2009-10 153922 107688 143
2010-11 182177 113902 160
2011-12 173833 180010 097
Interpretation-
As per the standard rule of current ratio ie 21 where current assets double the current
liabilities is considered satisfactory
In the present analysis the current ratio of the Kesoram is not satisfactory
from the above table It was assessed that the current ratio for all the five year is lower (less)
than the standard rule ie 21 And it is 097 in the year 2011-2012 (current year) This is
highly UN satisfactory
8102019 A Study A Study On Financial Performance Analysis With Reference To Kesoram Cementon Financial Performance hellip
httpslidepdfcomreaderfulla-study-a-study-on-financial-performance-analysis-with-reference-to-kesoram 6781
Quick Ratio-
Quick ratio also known as acid-test ratio establishes a relationship between quick
assets and the current liabilities Cash is the most liquid asset It is calculated by dividing
quick assets by current liabilities
Quick ratio = Quick Assets Current Liabilities
(Quick Assets = Current assets ndash Inventory)
Quick Ratio of Kesoram-
Rupees in crores)
Year Total QuickAssets
Current Liabilities Quick Ratio
2007-08 33343 57067 058
2008-09 43674 66587 066
2009-10 62303 107688 058
2010-11 70322 113902 0622011-12 74333 180010 041
Interpretation-
Usually a high Quick ratio is an indication that the company is liquid and has the ability to
meet its current or liquid liabilities in time on the other hand a low Quick Ratio represents
8102019 A Study A Study On Financial Performance Analysis With Reference To Kesoram Cementon Financial Performance hellip
httpslidepdfcomreaderfulla-study-a-study-on-financial-performance-analysis-with-reference-to-kesoram 6881
that the companyrsquos liquidity position is not good The above table showing the quick ratios
of Kesoram are canrsquot be considered satisfactory
Leverage Ratios-
Debt-Equity Ratio-
Debt-Equity Ratio = Total Long Term Debt Equity Share Holders Fund
Total Long term Debt= Debenture Capital + Long term loans from banks and financial
institutions + Public deposits
Equity Share Holders fund = Equity + Reserves and Surplus
Debt Equity Ratio of Kesoram
(Rupees in crores)
Year Total Debt Share Holders Fund Debt Equity Ratio
2007-08 109235 98192 111
2008-09 197043 133010 148
2009-10 312622 154024 203
2010-11 399927 130025 308
2011-12 410534 91501 449
8102019 A Study A Study On Financial Performance Analysis With Reference To Kesoram Cementon Financial Performance hellip
httpslidepdfcomreaderfulla-study-a-study-on-financial-performance-analysis-with-reference-to-kesoram 6981
Interpretation-
The Debt-Equity Ratio accepted standard is 05 This ratio reflects the relative contribution
of creditors and owners of business in its financing From the above it is clear that the long
term debt is more than that of the share holdersrsquo fund So we can interpret that the firmrsquosassets are financed more by the external funds rather than by the internal funds
8102019 A Study A Study On Financial Performance Analysis With Reference To Kesoram Cementon Financial Performance hellip
httpslidepdfcomreaderfulla-study-a-study-on-financial-performance-analysis-with-reference-to-kesoram 7081
Fixed Asset Ratio-
Net Sales
Fixed Asset Ratio = helliphelliphelliphelliphelliphelliphelliphelliphelliphelliphellip
Net Assets
Fixed Asset Ratio of Kesoram-
(Rupees in crores)
Year Net Sales Net Assets Fixed Assets Ratio
2007-08 300271 358721 084
2008-09 389797 369172 106
2009-10 475062 343182 1382010-11 539788 180435 299
2011-12 59182 108424 546
Interpretation
This ratio indicates the extent to which the assets of the companyrsquos can be lost without
affecting the interest of the creditors of the company Higher the ratios better the long-term
position of the companyThe above table shows fixed assets ratio in increasing trend Which is good for the
company
8102019 A Study A Study On Financial Performance Analysis With Reference To Kesoram Cementon Financial Performance hellip
httpslidepdfcomreaderfulla-study-a-study-on-financial-performance-analysis-with-reference-to-kesoram 7181
Overall Profitability Ratios-
Net Profit Ratio
Net Profit Ratio indicates net margin on sales It is given by the following equation
Net Profit Ratio = (Net Profit Sales) 100
Net Profit Ratio of Kesoram
(Rupees in crores)
Year Net Profit Sales Net Profit Ratio
2007-08 37917 300271 1263
2008-09 41432 389797 1063
2009-10 20298 475062 427
2010-11 -28176 539788 -5222011-12 -38108 59182 -644
Interpretation
It establishes a relationship between net profits after tax and net sales and
indicates the efficiency of the management in manufacturing selling administrative and
other activities of the company
The higher the ratio the better is the profitability or performance of the business
The above table depicts the net profit Ratio of Kesoram has decreased every year from
2007-2008 to 2011-2012It further decreased to negative in the year 2010-11 to -522 and -
644 in the year 2011-2012 This shows constant decrease in the profits of the company
8102019 A Study A Study On Financial Performance Analysis With Reference To Kesoram Cementon Financial Performance hellip
httpslidepdfcomreaderfulla-study-a-study-on-financial-performance-analysis-with-reference-to-kesoram 7281
72
Return on Investment-
Net Profit
Return on Investment = helliphelliphelliphelliphelliphelliphelliphelliphelliphelliphelliphellip X 100
Share Holders Fund
Return on Investment Ratio of Kesoram-
(Rupees in crores)
Year Net Profit Share Holders Fund Return On Investment
2007-08 37917 98192 3862
2008-09 41432 133010 3115
2009-10 20298 154024 1318
2010-11 -28176 130025 -2167
2011-12 -38108 91501 -4165
Interpretation-
The above table reveals how well the resources of the firm are being used Higher
the ratio better the result The above ratio implies how well the firm is growing in
terms of profitability and efficiency From the above table we can concern that the return on
investment is in decreasing trend ROI is highest in the year 2007-2008 as 3862 But
there after itrsquos decreased every year
The ROI is negative in the years 2010-2011 amp 2011-2012 as -2167 amp -4165 respectively
Which is not a good sign for the firm
8102019 A Study A Study On Financial Performance Analysis With Reference To Kesoram Cementon Financial Performance hellip
httpslidepdfcomreaderfulla-study-a-study-on-financial-performance-analysis-with-reference-to-kesoram 7381
8102019 A Study A Study On Financial Performance Analysis With Reference To Kesoram Cementon Financial Performance hellip
httpslidepdfcomreaderfulla-study-a-study-on-financial-performance-analysis-with-reference-to-kesoram 7481
8102019 A Study A Study On Financial Performance Analysis With Reference To Kesoram Cementon Financial Performance hellip
httpslidepdfcomreaderfulla-study-a-study-on-financial-performance-analysis-with-reference-to-kesoram 7581
75
CHAPTER V
FINDINGS amp SUGGESTIONS
8102019 A Study A Study On Financial Performance Analysis With Reference To Kesoram Cementon Financial Performance hellip
httpslidepdfcomreaderfulla-study-a-study-on-financial-performance-analysis-with-reference-to-kesoram 7681
76
Findings
The Share capital remains constant Share capital is unchanged all the years from
2008-2012
Reserves amp surplus were recorded an increasing trend in the period between 2008
and 2010It is showing decreasing trend in the period 2011-2012 (ie from 16019
in 2010 to 9309 in 2012)
Current Liabilities were increased compared to base year ie 2008
Provisions increased to 262597 ie in Rupees 39232 crores in the current year
The current ratio for all the five year is lower (less) than the standard rule ie 21
And it is 097 in the year 2011-2012 (current year)
The Debt-Equity Ratio was shown under the standard ratio It is clear that the long
term debt is more than that of the share holdersrsquo fund It indicates that the firm
heavily relying on external funds rather than the internal funds
The operating and net profit of Kesoram is in decreasing trend due to heavy
increase of manufacturing amp administrative expenses
ROI is highest in the year 2007-2008 as 3862 The ROI is negative in the years
2010-2011 amp 2011-2012 as -2167 amp -4165 respectively
Return on Equity Capital Employed Ratio of Kesoram has decreased every year
from 2007-2008 to 2010-2011It further decreased to negative in the year 2011-12 to
-3280
EPS of Kesoram has decreased every year from 2008-12It is negative in the year
2011 amp 12
8102019 A Study A Study On Financial Performance Analysis With Reference To Kesoram Cementon Financial Performance hellip
httpslidepdfcomreaderfulla-study-a-study-on-financial-performance-analysis-with-reference-to-kesoram 7781
77
Suggestion
The organization should adopt an appropriate capital structure
The companyrsquos debt-equity ratio is recorded more or less as 111 in the year 2008
and it is increased to 449 in the year 2012 (current year)The company should
adopt a better debt equity mix in the future to control the fluctuations in returns
The company should control fluctuations in cash and bank balances as it impacts the
current ratio of the company
The provisions are showing increasing trend which indicates risk of debtors The
firm should implement an effective credit management policy It should utilize its
idle funds by decreasing provisions
The company should control heavy increase of manufacturing amp administration
expenses as it is impacting the operating and net profit of company
8102019 A Study A Study On Financial Performance Analysis With Reference To Kesoram Cementon Financial Performance hellip
httpslidepdfcomreaderfulla-study-a-study-on-financial-performance-analysis-with-reference-to-kesoram 7881
78
ANNEXURE
Profit And Loss Account of Kesoram Cement
Mar12 Mar11 Mar10 Mar09 Mar08
12 Months 12 Months 12 Months 12 Months 12 Months
INCOME
Sales Turnover 628260 575072 505151 431613 345700
Excise Duty 36440 35284 30089 41815 45429
NET SALES 591820 539788 475062 389797 300271
Other Income 000 000 000 000 000
TOTALINCOME
596129 548733 481019 393969 302020
EXPENDITURE
Manufacturing
Expenses81903 74803 13974 13153 44113
MaterialConsumed
370897 310150 295550 229359 118448
Personal
Expenses33468 27355 23294 18690 15344
Selling Expenses 81910 78253 58667 48846 45019
AdministrativeExpenses
28225 29308 17219 16179 9907
Expenses
Capitalized000 000 000 000 000
Provisions Made 000 000 000 000 000
TOTAL
EXPENDITURE 596403 519870 408704 326227 232832Operating Profit -4583 19918 66358 63570 67439
EBITDA -274 28864 72316 67742 69188
Depreciation 29740 27259 17280 11186 8927
Other Write-offs 000 000 000 000 000
EBIT -30014 1605 55035 56557 60261
Interest 41015 23983 10921 12087 5426
EBT -71029 -22377 44114 44470 54835
Taxes -32921 5798 23816 3037 16918
Profit and Loss
for the Year-38108 -28176 20298 41432 37917
Non RecurringItems
-1142 7063 3228 -4023 402
Other Non Cash
Adjustments1276 091 207 465 017
OtherAdjustments
000 000 000 000 000
REPORTED
PAT-37974 -21021 23734 37874 38335
8102019 A Study A Study On Financial Performance Analysis With Reference To Kesoram Cementon Financial Performance hellip
httpslidepdfcomreaderfulla-study-a-study-on-financial-performance-analysis-with-reference-to-kesoram 7981
79
Balance Sheet Of Kesoram
Years
Particulars 2008 2009 2010 2011 2012
Liabilities
Share Capital 4574 4574 4574 4574 4574Reserves amp Surplus 93085 128024 149111 125162 86657
Revaluation Reserves 533 412 339 289 27
Loans
Secured Loans 97106 153627 186372 237183 317792
Un Secured Loans 12129 43416 12625 162744 92742
Deferred Tax Liabilities 0 0 0 0 0
Current Liabilities
Provisions 33039 34529 35734 1494 40726
Current Liabilities 57067 66587 107688 113902 18001
Total 297533 431169 610068 645348 722771
Assets
Net Block 108424 180435 343182 369172 358721
Capital WIP 63459 86485 41283 43781 68065
Investments 4783 6178 5143 6582 6636
Current Assets
Inventories 44217 58906 91619 111855 99516
Sundry Debtors 27307 38017 54289 63134 67358
Cash amp Bank Balances 4036 5657 8014 7188 6959
Total Current Assets 7556 10258 153922 182177 173833Loans amp Advances 45289 55462 66506 4346 115409
Fixed Deposits 018 028 031 176 107
Total 297533 431169 610068 645348 722771
8102019 A Study A Study On Financial Performance Analysis With Reference To Kesoram Cementon Financial Performance hellip
httpslidepdfcomreaderfulla-study-a-study-on-financial-performance-analysis-with-reference-to-kesoram 8081
80
KEY ITEMS 2012 2011 2010 2009 2008
Preference
Dividend 0 0 0 0 0
Equity Dividend 457 2516 2516 2516 2516
Equity Dividend
() 999 55 55 55 55
Shares in Issue(Lakhs) 45743 45743 45743 45743 45743
EPS - Annualised
(Rs) -8302 -4595 5188 828 838
8102019 A Study A Study On Financial Performance Analysis With Reference To Kesoram Cementon Financial Performance hellip
httpslidepdfcomreaderfulla-study-a-study-on-financial-performance-analysis-with-reference-to-kesoram 8181
BIBLIOGRAPHY
Sl
No
Books Author Name
1 Financial Management Khan amp JAIN
2 Financial Management IMPandey
3 Management Accounting RPTrivedi
Websites amp Search Engines
1 wwwkesoramcom983086
2 wwwmoneycontrolcom
3 wwwgooglefinancecom983086
Annual reports of Kesoram cement limited 2008-2012
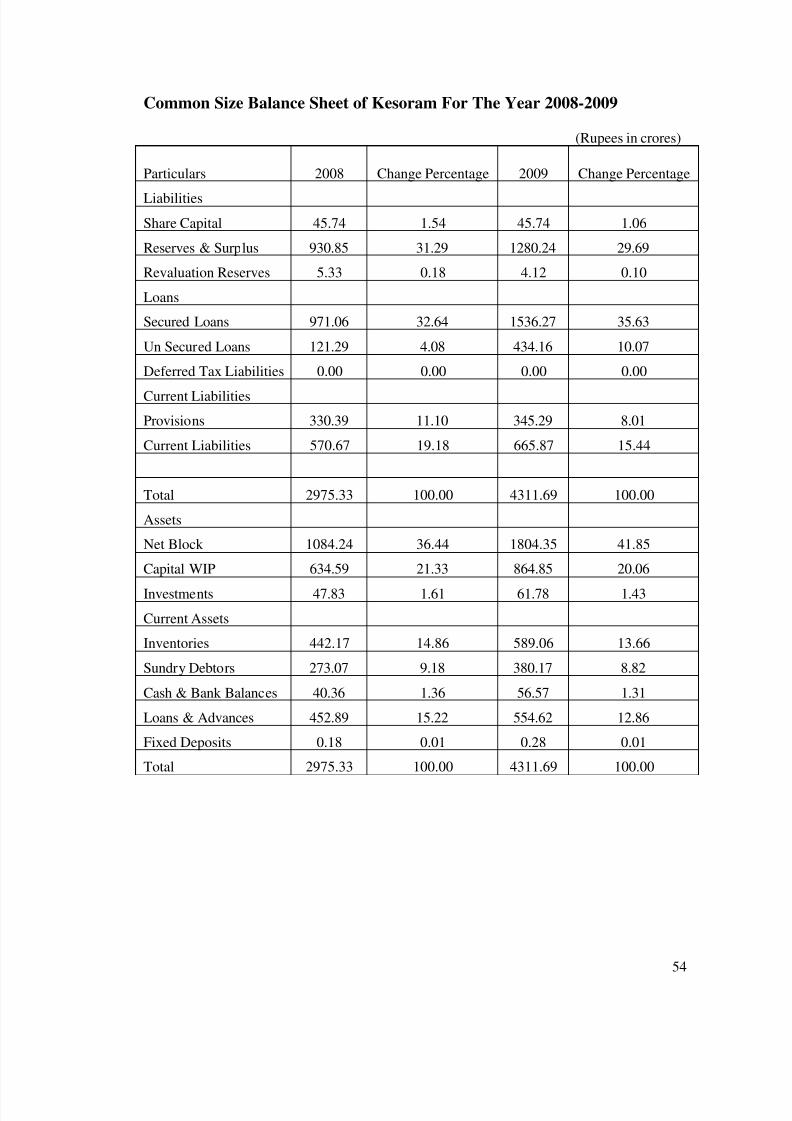
8102019 A Study A Study On Financial Performance Analysis With Reference To Kesoram Cementon Financial Performance hellip
httpslidepdfcomreaderfulla-study-a-study-on-financial-performance-analysis-with-reference-to-kesoram 5481
54
Common Size Balance Sheet of Kesoram For The Year 2008-2009
(Rupees in crores)
Particulars 2008 Change Percentage 2009 Change Percentage
Liabilities
Share Capital 4574 154 4574 106
Reserves amp Surplus 93085 3129 128024 2969
Revaluation Reserves 533 018 412 010
Loans
Secured Loans 97106 3264 153627 3563
Un Secured Loans 12129 408 43416 1007
Deferred Tax Liabilities 000 000 000 000
Current Liabilities
Provisions 33039 1110 34529 801
Current Liabilities 57067 1918 66587 1544
Total 297533 10000 431169 10000
Assets
Net Block 108424 3644 180435 4185
Capital WIP 63459 2133 86485 2006
Investments 4783 161 6178 143
Current Assets
Inventories 44217 1486 58906 1366
Sundry Debtors 27307 918 38017 882
Cash amp Bank Balances 4036 136 5657 131
Loans amp Advances 45289 1522 55462 1286
Fixed Deposits 018 001 028 001
Total 297533 10000 431169 10000
8102019 A Study A Study On Financial Performance Analysis With Reference To Kesoram Cementon Financial Performance hellip
httpslidepdfcomreaderfulla-study-a-study-on-financial-performance-analysis-with-reference-to-kesoram 5581
55
Interpretation of Common Size Balance Sheet of 2008-2009
Share capital was recorded 154 percent in the total liabilities in the year 2008 it is
decreased to 106 in the year 2009
Reserves amp surplus contributed to 3129 in the total liabilities in the year 2008 it is
decreased to 2969 in the year 2009
Secured loans were 3264 in the total liabilities in the year 2008 it is increased to
3563 in the year 2009
Current Liabilities shown to 1918 in the total liabilities in the year 2008 it is
decreased to 1544 in the year 2009
Provisions 1110 in the total liabilities in the year 2008 it is decreased to 801 in the
year 2009
Fixed Assets were 3644 in the total liabilities in the year 2008 ie decreased to 4185
in the year 2009
Investments were 161 in the total liabilities in the year 2008 it is decreased to 143
in the year 2009
Sundry debtors were 918 in the total liabilities in the year 2008 it is decreased to 882
in the year 2009
8102019 A Study A Study On Financial Performance Analysis With Reference To Kesoram Cementon Financial Performance hellip
httpslidepdfcomreaderfulla-study-a-study-on-financial-performance-analysis-with-reference-to-kesoram 5681
56
Common Size Balance Sheet of Kesoram For The Year 2009-2010
(Rs in crores)
Particulars 2009 Change Percentage 2010Change
Percentage
Liabilities
Share Capital 4574 106 4574 075
Reserves amp Surplus 128024 2969 149111 2444
Revaluation Reserves 412 010 339 006
Loans
Secured Loans 153627 3563 186372 3055
Un Secured Loans 43416 1007 126250 2069
Deferred Tax Liabilities 000 000 000 000
Current Liabilities
Provisions 34529 801 35734 586
Current Liabilities 66587 1544 107688 1765
Total 431169 10000 610068 10000
Assets
Net Block 180435 4185 343182 5625
Capital WIP 86485 2006 41283 677
Investments 6178 143 5143 084
Current Assets
Inventories 58906 1366 91619 1502
Sundry Debtors 38017 882 54289 890
Cash amp Bank Balances 5657 131 8014 131
Loans amp Advances 55462 1286 66506 1090
Fixed Deposits 028 001 031 001
Total 431169 10000 610068 10000
8102019 A Study A Study On Financial Performance Analysis With Reference To Kesoram Cementon Financial Performance hellip
httpslidepdfcomreaderfulla-study-a-study-on-financial-performance-analysis-with-reference-to-kesoram 5781
57
Interpretation of common size balance sheet of 2009-2010
Share capital was recorded 106 percent in the total liabilities in the
year 2009 it is decreased to 075 in the year 2010
Reserves amp surplus contributed to 2969 in the total liabilities in the
year 2009 it is decreased to2444 in the year 2010
Secured loans were 3563 in the total liabilities in the year 2009 it is
increased to 3055 in the year 2010
Current Liabilities shown to 1544 in the total liabilities in the year
2009 it is decreased to 1765 in the year 2010
Provisions 801 in the total liabilities in the year 2009 it is decreased
to 586 in the year 2010
Fixed Assets were 4185 in the total liabilities in the year 2009 ie
increased to 5625 in the year 2010
Investments were 143 in the total liabilities in the year 2009 it is
decreased to 084 in the year 2010
Sundry debtors were 882 in the total liabilities in the year 2009 it is
increased to 890 in the year 2010
8102019 A Study A Study On Financial Performance Analysis With Reference To Kesoram Cementon Financial Performance hellip
httpslidepdfcomreaderfulla-study-a-study-on-financial-performance-analysis-with-reference-to-kesoram 5881
58
Common Size Balance sheet of Kesoram for the year 2010-2011
983080Rupees in crores)
Particulars 2010 Change Percentage 2011
Change
Percentage
Liabilities
Share Capital 4574 075 4574 071
Reserves amp Surplus 149111 2444 125162 1939
Revaluation Reserves 339 006 289 004
Loans
Secured Loans 186372 3055 237183 3675
Un Secured Loans 126250 2069 162744 2522
Deferred Tax Liabilities 000 000 000 000
Current Liabilities
Provisions 35734 586 1494 023
Current Liabilities 107688 1765 113902 1765
Total 610068 10000 645348 10000
Assets
Net Block 343182 5625 369172 5721
Capital WIP 41283 677 43781 678
Investments 5143 084 6582 102
Current Assets
Inventories 91619 1502 111855 1733
Sundry Debtors 54289 890 63134 978
Cash amp Bank Balances 8014 131 7188 111
Loans amp Advances 66506 1090 43460 673
Fixed Deposits 031 001 176 003
Total 610068 10000 645348 10000
8102019 A Study A Study On Financial Performance Analysis With Reference To Kesoram Cementon Financial Performance hellip
httpslidepdfcomreaderfulla-study-a-study-on-financial-performance-analysis-with-reference-to-kesoram 5981
59
Interpretation of Common Size Balance Sheet Of 2010-2011
Share capital was recorded 075 percent in the total liabilities in the year 2010 it is
decreased to 071 in the year 2011
Reserves amp surplus contributed to 2444 in the total liabilities in the year 2010 it is
decreased to1939 in the year 2011
Secured loans were 3055 in the total liabilities in the year 2010 it is increased to
3675 in the year 2011
Current Liabilities shown to 1765 in the total liabilities in the year 2010 it is
also1765 in the year 2011
Provisions 586 in the total liabilities in the year 2010 it is decreased to 023 in the
year 2011
Fixed Assets were 5625 in the total liabilities in the year 2010 ie increased to 5721
in the year 2011
Investments were 084 in the total liabilities in the year 2010 it increased to 102 in
the year 2011
Sundry debtors were 890 in the total liabilities in the year 2010 it is increased to 978
in the year 2011
8102019 A Study A Study On Financial Performance Analysis With Reference To Kesoram Cementon Financial Performance hellip
httpslidepdfcomreaderfulla-study-a-study-on-financial-performance-analysis-with-reference-to-kesoram 6081
60
Common Size Balance Sheet of Kesoram for the Year 2011-2012
983080Rupees in crores)
Particulars 2011 Change Percentage 2012
Change
Percentage
Liabilities
Share Capital 4574 071 4574 063
Reserves amp Surplus 125162 1939 86657 1199
Revaluation Reserves 289 004 270 004
Loans
Secured Loans 237183 3675 317792 4397
Un Secured Loans 162744 2522 92742 1283
Deferred Tax Liabilities 000 000 000 000
Current Liabilities
Provisions 1494 023 40726 563
Current Liabilities 113902 1765 180010 2491
Total 645348 10000 722771 10000
Assets
Net Block 369172 5721 358721 4963
Capital WIP 43781 678 68065 942
Investments 6582 102 6636 092
Current Assets
Inventories 111855 1733 99516 1377
Sundry Debtors 63134 978 67358 932
Cash amp Bank Balances 7188 111 6959 096
Loans amp Advances 43460 673 115409 1597
Fixed Deposits 176 003 107 001
Total 645348 10000 722771 10000
8102019 A Study A Study On Financial Performance Analysis With Reference To Kesoram Cementon Financial Performance hellip
httpslidepdfcomreaderfulla-study-a-study-on-financial-performance-analysis-with-reference-to-kesoram 6181
61
Interpretation of common size balance sheet of 2011-2012
Share capital was recorded 071 percent in the total liabilities in the year 2011 it is
decreased to 063 in the year 2012
Reserves amp surplus contributed to 1939 in the total liabilities in the year 2011 it
is decreased to 1199 in the year 2012
Secured loans were 3675 in the total liabilities in the year 2011 it is increased to
4397 in the year 2012
Current Liabilities shown to 1765 in the total liabilities in the year 2011 it is
increased to 2491 in the year 2012
Provisions 023 in the total liabilities in the year 2011 it is increased to 563 in the
year 2012
Fixed Assets were 5721 in the total liabilities in the year 2011 ie decreased to
4963 in the year 2012
Investments were 102 in the total liabilities in the year 2011 it increased to 092
in the year 2012
Sundry debtors were 978 in the total liabilities in the year 2011 it is decreased to
932 in the year 2012
8102019 A Study A Study On Financial Performance Analysis With Reference To Kesoram Cementon Financial Performance hellip
httpslidepdfcomreaderfulla-study-a-study-on-financial-performance-analysis-with-reference-to-kesoram 6281
Trend Analysis
Share Capital-
Year
Amount
(In Crores) Trend
IncreaseDecrease
Base Year Previous Year
2008 4574 10000 000 000
2009 4574 10000 000 000
2010 4574 10000 000 000
2011 4574 10000 000 000
2012 4574 10000 000 000
Trend Percentages in Share Capital
Share capital shown a constant trend in the period 2008 and 2012
Share capital is 4574 crores all the years from 2008-2012
8102019 A Study A Study On Financial Performance Analysis With Reference To Kesoram Cementon Financial Performance hellip
httpslidepdfcomreaderfulla-study-a-study-on-financial-performance-analysis-with-reference-to-kesoram 6381
Reserves amp Surplus-
Year
Amount
(In Crores) Trend
IncreaseDecrease
Base Year Previous Year
2008 93085 10000 000 000
2009 128024 13753 3753 3753
2010 149111 16019 6019 2266
2011 125162 13446 3446 -2573
2012 86657 9309 -691 -4137
Trend Percentages in Reserves amp Surplus
Reserves amp surplus shown an increasing trend in the period between 2008 and 2010
The average trend was 13277 till 2010
The Reserves amp surplus was showing decreasing trend in the period 2011-2012 (ie
from 16019 in 2010 to 9309 in 2012)
The decreasing trend in Reserves amp surplus indicates the decrease in profits of the
firm
8102019 A Study A Study On Financial Performance Analysis With Reference To Kesoram Cementon Financial Performance hellip
httpslidepdfcomreaderfulla-study-a-study-on-financial-performance-analysis-with-reference-to-kesoram 6481
Investments-
Year
Amount
(In Crores) Trend
IncreaseDecrease
Base Year Previous Year
2008 4783 10000 000 000
2009 6178 12917 2917 2917
2010 5143 10753 753 -2164
2011 6582 13761 3761 3009
2012 6636 13874 3874 113
Trend Percentages in Investments-
The investments are shown an increasing trend in the period between 2008 ndash 2009
and it is decreasing in the year 2010
The average trend was 11458 till 2009
The investments increased in the periods 2011-2012 (ie from 10753 in 2010 to
13874 in 2012)
The overall trend in investments shown is satisfactory
8102019 A Study A Study On Financial Performance Analysis With Reference To Kesoram Cementon Financial Performance hellip
httpslidepdfcomreaderfulla-study-a-study-on-financial-performance-analysis-with-reference-to-kesoram 6581
Net Current Assets-
Year
Amount
(In Crores) Trend
IncreaseDecrease
Base Year Previous Year
2008 30761 10000 000 000
2009 56954 18515 8515 8515
2010 77037 25044 15044 6529
2011 110417 35895 25895 10851
2012 68613 22305 12305 -13590
Trends in Net Current Assets-
The NCA shown positive (increasing) trend
The NCA are increased to 35895 (the year 2011) compared with base year and
decreased in the year 2012 to 22305
The NCA shown increased trend from year and crossed 100
The overall trend was good
8102019 A Study A Study On Financial Performance Analysis With Reference To Kesoram Cementon Financial Performance hellip
httpslidepdfcomreaderfulla-study-a-study-on-financial-performance-analysis-with-reference-to-kesoram 6681
66
Ratio Analysis-
Current Ratio-
Current Ratio = Current Assets Current Liabilities
Current assets are cash in hand Cash at bank Marketable Securities(short term) short term
Investment Bills receivables sundry debtors Inventories (stock) Work in progress prepaid
expenses Current Liabilities are outstanding expenses Bills payable sundry Creditors
short-term advances income tax payable and Dividend payable
Current Ratio of Kesoram-
(Rupees in crores)
Year Current Assets Current Liabilities Current Ratio
2007-08 75560 57067 132
2008-09 102580 66587 154
2009-10 153922 107688 143
2010-11 182177 113902 160
2011-12 173833 180010 097
Interpretation-
As per the standard rule of current ratio ie 21 where current assets double the current
liabilities is considered satisfactory
In the present analysis the current ratio of the Kesoram is not satisfactory
from the above table It was assessed that the current ratio for all the five year is lower (less)
than the standard rule ie 21 And it is 097 in the year 2011-2012 (current year) This is
highly UN satisfactory
8102019 A Study A Study On Financial Performance Analysis With Reference To Kesoram Cementon Financial Performance hellip
httpslidepdfcomreaderfulla-study-a-study-on-financial-performance-analysis-with-reference-to-kesoram 6781
Quick Ratio-
Quick ratio also known as acid-test ratio establishes a relationship between quick
assets and the current liabilities Cash is the most liquid asset It is calculated by dividing
quick assets by current liabilities
Quick ratio = Quick Assets Current Liabilities
(Quick Assets = Current assets ndash Inventory)
Quick Ratio of Kesoram-
Rupees in crores)
Year Total QuickAssets
Current Liabilities Quick Ratio
2007-08 33343 57067 058
2008-09 43674 66587 066
2009-10 62303 107688 058
2010-11 70322 113902 0622011-12 74333 180010 041
Interpretation-
Usually a high Quick ratio is an indication that the company is liquid and has the ability to
meet its current or liquid liabilities in time on the other hand a low Quick Ratio represents
8102019 A Study A Study On Financial Performance Analysis With Reference To Kesoram Cementon Financial Performance hellip
httpslidepdfcomreaderfulla-study-a-study-on-financial-performance-analysis-with-reference-to-kesoram 6881
that the companyrsquos liquidity position is not good The above table showing the quick ratios
of Kesoram are canrsquot be considered satisfactory
Leverage Ratios-
Debt-Equity Ratio-
Debt-Equity Ratio = Total Long Term Debt Equity Share Holders Fund
Total Long term Debt= Debenture Capital + Long term loans from banks and financial
institutions + Public deposits
Equity Share Holders fund = Equity + Reserves and Surplus
Debt Equity Ratio of Kesoram
(Rupees in crores)
Year Total Debt Share Holders Fund Debt Equity Ratio
2007-08 109235 98192 111
2008-09 197043 133010 148
2009-10 312622 154024 203
2010-11 399927 130025 308
2011-12 410534 91501 449
8102019 A Study A Study On Financial Performance Analysis With Reference To Kesoram Cementon Financial Performance hellip
httpslidepdfcomreaderfulla-study-a-study-on-financial-performance-analysis-with-reference-to-kesoram 6981
Interpretation-
The Debt-Equity Ratio accepted standard is 05 This ratio reflects the relative contribution
of creditors and owners of business in its financing From the above it is clear that the long
term debt is more than that of the share holdersrsquo fund So we can interpret that the firmrsquosassets are financed more by the external funds rather than by the internal funds
8102019 A Study A Study On Financial Performance Analysis With Reference To Kesoram Cementon Financial Performance hellip
httpslidepdfcomreaderfulla-study-a-study-on-financial-performance-analysis-with-reference-to-kesoram 7081
Fixed Asset Ratio-
Net Sales
Fixed Asset Ratio = helliphelliphelliphelliphelliphelliphelliphelliphelliphelliphellip
Net Assets
Fixed Asset Ratio of Kesoram-
(Rupees in crores)
Year Net Sales Net Assets Fixed Assets Ratio
2007-08 300271 358721 084
2008-09 389797 369172 106
2009-10 475062 343182 1382010-11 539788 180435 299
2011-12 59182 108424 546
Interpretation
This ratio indicates the extent to which the assets of the companyrsquos can be lost without
affecting the interest of the creditors of the company Higher the ratios better the long-term
position of the companyThe above table shows fixed assets ratio in increasing trend Which is good for the
company
8102019 A Study A Study On Financial Performance Analysis With Reference To Kesoram Cementon Financial Performance hellip
httpslidepdfcomreaderfulla-study-a-study-on-financial-performance-analysis-with-reference-to-kesoram 7181
Overall Profitability Ratios-
Net Profit Ratio
Net Profit Ratio indicates net margin on sales It is given by the following equation
Net Profit Ratio = (Net Profit Sales) 100
Net Profit Ratio of Kesoram
(Rupees in crores)
Year Net Profit Sales Net Profit Ratio
2007-08 37917 300271 1263
2008-09 41432 389797 1063
2009-10 20298 475062 427
2010-11 -28176 539788 -5222011-12 -38108 59182 -644
Interpretation
It establishes a relationship between net profits after tax and net sales and
indicates the efficiency of the management in manufacturing selling administrative and
other activities of the company
The higher the ratio the better is the profitability or performance of the business
The above table depicts the net profit Ratio of Kesoram has decreased every year from
2007-2008 to 2011-2012It further decreased to negative in the year 2010-11 to -522 and -
644 in the year 2011-2012 This shows constant decrease in the profits of the company
8102019 A Study A Study On Financial Performance Analysis With Reference To Kesoram Cementon Financial Performance hellip
httpslidepdfcomreaderfulla-study-a-study-on-financial-performance-analysis-with-reference-to-kesoram 7281
72
Return on Investment-
Net Profit
Return on Investment = helliphelliphelliphelliphelliphelliphelliphelliphelliphelliphelliphellip X 100
Share Holders Fund
Return on Investment Ratio of Kesoram-
(Rupees in crores)
Year Net Profit Share Holders Fund Return On Investment
2007-08 37917 98192 3862
2008-09 41432 133010 3115
2009-10 20298 154024 1318
2010-11 -28176 130025 -2167
2011-12 -38108 91501 -4165
Interpretation-
The above table reveals how well the resources of the firm are being used Higher
the ratio better the result The above ratio implies how well the firm is growing in
terms of profitability and efficiency From the above table we can concern that the return on
investment is in decreasing trend ROI is highest in the year 2007-2008 as 3862 But
there after itrsquos decreased every year
The ROI is negative in the years 2010-2011 amp 2011-2012 as -2167 amp -4165 respectively
Which is not a good sign for the firm
8102019 A Study A Study On Financial Performance Analysis With Reference To Kesoram Cementon Financial Performance hellip
httpslidepdfcomreaderfulla-study-a-study-on-financial-performance-analysis-with-reference-to-kesoram 7381
8102019 A Study A Study On Financial Performance Analysis With Reference To Kesoram Cementon Financial Performance hellip
httpslidepdfcomreaderfulla-study-a-study-on-financial-performance-analysis-with-reference-to-kesoram 7481
8102019 A Study A Study On Financial Performance Analysis With Reference To Kesoram Cementon Financial Performance hellip
httpslidepdfcomreaderfulla-study-a-study-on-financial-performance-analysis-with-reference-to-kesoram 7581
75
CHAPTER V
FINDINGS amp SUGGESTIONS
8102019 A Study A Study On Financial Performance Analysis With Reference To Kesoram Cementon Financial Performance hellip
httpslidepdfcomreaderfulla-study-a-study-on-financial-performance-analysis-with-reference-to-kesoram 7681
76
Findings
The Share capital remains constant Share capital is unchanged all the years from
2008-2012
Reserves amp surplus were recorded an increasing trend in the period between 2008
and 2010It is showing decreasing trend in the period 2011-2012 (ie from 16019
in 2010 to 9309 in 2012)
Current Liabilities were increased compared to base year ie 2008
Provisions increased to 262597 ie in Rupees 39232 crores in the current year
The current ratio for all the five year is lower (less) than the standard rule ie 21
And it is 097 in the year 2011-2012 (current year)
The Debt-Equity Ratio was shown under the standard ratio It is clear that the long
term debt is more than that of the share holdersrsquo fund It indicates that the firm
heavily relying on external funds rather than the internal funds
The operating and net profit of Kesoram is in decreasing trend due to heavy
increase of manufacturing amp administrative expenses
ROI is highest in the year 2007-2008 as 3862 The ROI is negative in the years
2010-2011 amp 2011-2012 as -2167 amp -4165 respectively
Return on Equity Capital Employed Ratio of Kesoram has decreased every year
from 2007-2008 to 2010-2011It further decreased to negative in the year 2011-12 to
-3280
EPS of Kesoram has decreased every year from 2008-12It is negative in the year
2011 amp 12
8102019 A Study A Study On Financial Performance Analysis With Reference To Kesoram Cementon Financial Performance hellip
httpslidepdfcomreaderfulla-study-a-study-on-financial-performance-analysis-with-reference-to-kesoram 7781
77
Suggestion
The organization should adopt an appropriate capital structure
The companyrsquos debt-equity ratio is recorded more or less as 111 in the year 2008
and it is increased to 449 in the year 2012 (current year)The company should
adopt a better debt equity mix in the future to control the fluctuations in returns
The company should control fluctuations in cash and bank balances as it impacts the
current ratio of the company
The provisions are showing increasing trend which indicates risk of debtors The
firm should implement an effective credit management policy It should utilize its
idle funds by decreasing provisions
The company should control heavy increase of manufacturing amp administration
expenses as it is impacting the operating and net profit of company
8102019 A Study A Study On Financial Performance Analysis With Reference To Kesoram Cementon Financial Performance hellip
httpslidepdfcomreaderfulla-study-a-study-on-financial-performance-analysis-with-reference-to-kesoram 7881
78
ANNEXURE
Profit And Loss Account of Kesoram Cement
Mar12 Mar11 Mar10 Mar09 Mar08
12 Months 12 Months 12 Months 12 Months 12 Months
INCOME
Sales Turnover 628260 575072 505151 431613 345700
Excise Duty 36440 35284 30089 41815 45429
NET SALES 591820 539788 475062 389797 300271
Other Income 000 000 000 000 000
TOTALINCOME
596129 548733 481019 393969 302020
EXPENDITURE
Manufacturing
Expenses81903 74803 13974 13153 44113
MaterialConsumed
370897 310150 295550 229359 118448
Personal
Expenses33468 27355 23294 18690 15344
Selling Expenses 81910 78253 58667 48846 45019
AdministrativeExpenses
28225 29308 17219 16179 9907
Expenses
Capitalized000 000 000 000 000
Provisions Made 000 000 000 000 000
TOTAL
EXPENDITURE 596403 519870 408704 326227 232832Operating Profit -4583 19918 66358 63570 67439
EBITDA -274 28864 72316 67742 69188
Depreciation 29740 27259 17280 11186 8927
Other Write-offs 000 000 000 000 000
EBIT -30014 1605 55035 56557 60261
Interest 41015 23983 10921 12087 5426
EBT -71029 -22377 44114 44470 54835
Taxes -32921 5798 23816 3037 16918
Profit and Loss
for the Year-38108 -28176 20298 41432 37917
Non RecurringItems
-1142 7063 3228 -4023 402
Other Non Cash
Adjustments1276 091 207 465 017
OtherAdjustments
000 000 000 000 000
REPORTED
PAT-37974 -21021 23734 37874 38335
8102019 A Study A Study On Financial Performance Analysis With Reference To Kesoram Cementon Financial Performance hellip
httpslidepdfcomreaderfulla-study-a-study-on-financial-performance-analysis-with-reference-to-kesoram 7981
79
Balance Sheet Of Kesoram
Years
Particulars 2008 2009 2010 2011 2012
Liabilities
Share Capital 4574 4574 4574 4574 4574Reserves amp Surplus 93085 128024 149111 125162 86657
Revaluation Reserves 533 412 339 289 27
Loans
Secured Loans 97106 153627 186372 237183 317792
Un Secured Loans 12129 43416 12625 162744 92742
Deferred Tax Liabilities 0 0 0 0 0
Current Liabilities
Provisions 33039 34529 35734 1494 40726
Current Liabilities 57067 66587 107688 113902 18001
Total 297533 431169 610068 645348 722771
Assets
Net Block 108424 180435 343182 369172 358721
Capital WIP 63459 86485 41283 43781 68065
Investments 4783 6178 5143 6582 6636
Current Assets
Inventories 44217 58906 91619 111855 99516
Sundry Debtors 27307 38017 54289 63134 67358
Cash amp Bank Balances 4036 5657 8014 7188 6959
Total Current Assets 7556 10258 153922 182177 173833Loans amp Advances 45289 55462 66506 4346 115409
Fixed Deposits 018 028 031 176 107
Total 297533 431169 610068 645348 722771
8102019 A Study A Study On Financial Performance Analysis With Reference To Kesoram Cementon Financial Performance hellip
httpslidepdfcomreaderfulla-study-a-study-on-financial-performance-analysis-with-reference-to-kesoram 8081
80
KEY ITEMS 2012 2011 2010 2009 2008
Preference
Dividend 0 0 0 0 0
Equity Dividend 457 2516 2516 2516 2516
Equity Dividend
() 999 55 55 55 55
Shares in Issue(Lakhs) 45743 45743 45743 45743 45743
EPS - Annualised
(Rs) -8302 -4595 5188 828 838
8102019 A Study A Study On Financial Performance Analysis With Reference To Kesoram Cementon Financial Performance hellip
httpslidepdfcomreaderfulla-study-a-study-on-financial-performance-analysis-with-reference-to-kesoram 8181
BIBLIOGRAPHY
Sl
No
Books Author Name
1 Financial Management Khan amp JAIN
2 Financial Management IMPandey
3 Management Accounting RPTrivedi
Websites amp Search Engines
1 wwwkesoramcom983086
2 wwwmoneycontrolcom
3 wwwgooglefinancecom983086
Annual reports of Kesoram cement limited 2008-2012
8102019 A Study A Study On Financial Performance Analysis With Reference To Kesoram Cementon Financial Performance hellip
httpslidepdfcomreaderfulla-study-a-study-on-financial-performance-analysis-with-reference-to-kesoram 5581
55
Interpretation of Common Size Balance Sheet of 2008-2009
Share capital was recorded 154 percent in the total liabilities in the year 2008 it is
decreased to 106 in the year 2009
Reserves amp surplus contributed to 3129 in the total liabilities in the year 2008 it is
decreased to 2969 in the year 2009
Secured loans were 3264 in the total liabilities in the year 2008 it is increased to
3563 in the year 2009
Current Liabilities shown to 1918 in the total liabilities in the year 2008 it is
decreased to 1544 in the year 2009
Provisions 1110 in the total liabilities in the year 2008 it is decreased to 801 in the
year 2009
Fixed Assets were 3644 in the total liabilities in the year 2008 ie decreased to 4185
in the year 2009
Investments were 161 in the total liabilities in the year 2008 it is decreased to 143
in the year 2009
Sundry debtors were 918 in the total liabilities in the year 2008 it is decreased to 882
in the year 2009
8102019 A Study A Study On Financial Performance Analysis With Reference To Kesoram Cementon Financial Performance hellip
httpslidepdfcomreaderfulla-study-a-study-on-financial-performance-analysis-with-reference-to-kesoram 5681
56
Common Size Balance Sheet of Kesoram For The Year 2009-2010
(Rs in crores)
Particulars 2009 Change Percentage 2010Change
Percentage
Liabilities
Share Capital 4574 106 4574 075
Reserves amp Surplus 128024 2969 149111 2444
Revaluation Reserves 412 010 339 006
Loans
Secured Loans 153627 3563 186372 3055
Un Secured Loans 43416 1007 126250 2069
Deferred Tax Liabilities 000 000 000 000
Current Liabilities
Provisions 34529 801 35734 586
Current Liabilities 66587 1544 107688 1765
Total 431169 10000 610068 10000
Assets
Net Block 180435 4185 343182 5625
Capital WIP 86485 2006 41283 677
Investments 6178 143 5143 084
Current Assets
Inventories 58906 1366 91619 1502
Sundry Debtors 38017 882 54289 890
Cash amp Bank Balances 5657 131 8014 131
Loans amp Advances 55462 1286 66506 1090
Fixed Deposits 028 001 031 001
Total 431169 10000 610068 10000
8102019 A Study A Study On Financial Performance Analysis With Reference To Kesoram Cementon Financial Performance hellip
httpslidepdfcomreaderfulla-study-a-study-on-financial-performance-analysis-with-reference-to-kesoram 5781
57
Interpretation of common size balance sheet of 2009-2010
Share capital was recorded 106 percent in the total liabilities in the
year 2009 it is decreased to 075 in the year 2010
Reserves amp surplus contributed to 2969 in the total liabilities in the
year 2009 it is decreased to2444 in the year 2010
Secured loans were 3563 in the total liabilities in the year 2009 it is
increased to 3055 in the year 2010
Current Liabilities shown to 1544 in the total liabilities in the year
2009 it is decreased to 1765 in the year 2010
Provisions 801 in the total liabilities in the year 2009 it is decreased
to 586 in the year 2010
Fixed Assets were 4185 in the total liabilities in the year 2009 ie
increased to 5625 in the year 2010
Investments were 143 in the total liabilities in the year 2009 it is
decreased to 084 in the year 2010
Sundry debtors were 882 in the total liabilities in the year 2009 it is
increased to 890 in the year 2010
8102019 A Study A Study On Financial Performance Analysis With Reference To Kesoram Cementon Financial Performance hellip
httpslidepdfcomreaderfulla-study-a-study-on-financial-performance-analysis-with-reference-to-kesoram 5881
58
Common Size Balance sheet of Kesoram for the year 2010-2011
983080Rupees in crores)
Particulars 2010 Change Percentage 2011
Change
Percentage
Liabilities
Share Capital 4574 075 4574 071
Reserves amp Surplus 149111 2444 125162 1939
Revaluation Reserves 339 006 289 004
Loans
Secured Loans 186372 3055 237183 3675
Un Secured Loans 126250 2069 162744 2522
Deferred Tax Liabilities 000 000 000 000
Current Liabilities
Provisions 35734 586 1494 023
Current Liabilities 107688 1765 113902 1765
Total 610068 10000 645348 10000
Assets
Net Block 343182 5625 369172 5721
Capital WIP 41283 677 43781 678
Investments 5143 084 6582 102
Current Assets
Inventories 91619 1502 111855 1733
Sundry Debtors 54289 890 63134 978
Cash amp Bank Balances 8014 131 7188 111
Loans amp Advances 66506 1090 43460 673
Fixed Deposits 031 001 176 003
Total 610068 10000 645348 10000
8102019 A Study A Study On Financial Performance Analysis With Reference To Kesoram Cementon Financial Performance hellip
httpslidepdfcomreaderfulla-study-a-study-on-financial-performance-analysis-with-reference-to-kesoram 5981
59
Interpretation of Common Size Balance Sheet Of 2010-2011
Share capital was recorded 075 percent in the total liabilities in the year 2010 it is
decreased to 071 in the year 2011
Reserves amp surplus contributed to 2444 in the total liabilities in the year 2010 it is
decreased to1939 in the year 2011
Secured loans were 3055 in the total liabilities in the year 2010 it is increased to
3675 in the year 2011
Current Liabilities shown to 1765 in the total liabilities in the year 2010 it is
also1765 in the year 2011
Provisions 586 in the total liabilities in the year 2010 it is decreased to 023 in the
year 2011
Fixed Assets were 5625 in the total liabilities in the year 2010 ie increased to 5721
in the year 2011
Investments were 084 in the total liabilities in the year 2010 it increased to 102 in
the year 2011
Sundry debtors were 890 in the total liabilities in the year 2010 it is increased to 978
in the year 2011
8102019 A Study A Study On Financial Performance Analysis With Reference To Kesoram Cementon Financial Performance hellip
httpslidepdfcomreaderfulla-study-a-study-on-financial-performance-analysis-with-reference-to-kesoram 6081
60
Common Size Balance Sheet of Kesoram for the Year 2011-2012
983080Rupees in crores)
Particulars 2011 Change Percentage 2012
Change
Percentage
Liabilities
Share Capital 4574 071 4574 063
Reserves amp Surplus 125162 1939 86657 1199
Revaluation Reserves 289 004 270 004
Loans
Secured Loans 237183 3675 317792 4397
Un Secured Loans 162744 2522 92742 1283
Deferred Tax Liabilities 000 000 000 000
Current Liabilities
Provisions 1494 023 40726 563
Current Liabilities 113902 1765 180010 2491
Total 645348 10000 722771 10000
Assets
Net Block 369172 5721 358721 4963
Capital WIP 43781 678 68065 942
Investments 6582 102 6636 092
Current Assets
Inventories 111855 1733 99516 1377
Sundry Debtors 63134 978 67358 932
Cash amp Bank Balances 7188 111 6959 096
Loans amp Advances 43460 673 115409 1597
Fixed Deposits 176 003 107 001
Total 645348 10000 722771 10000
8102019 A Study A Study On Financial Performance Analysis With Reference To Kesoram Cementon Financial Performance hellip
httpslidepdfcomreaderfulla-study-a-study-on-financial-performance-analysis-with-reference-to-kesoram 6181
61
Interpretation of common size balance sheet of 2011-2012
Share capital was recorded 071 percent in the total liabilities in the year 2011 it is
decreased to 063 in the year 2012
Reserves amp surplus contributed to 1939 in the total liabilities in the year 2011 it
is decreased to 1199 in the year 2012
Secured loans were 3675 in the total liabilities in the year 2011 it is increased to
4397 in the year 2012
Current Liabilities shown to 1765 in the total liabilities in the year 2011 it is
increased to 2491 in the year 2012
Provisions 023 in the total liabilities in the year 2011 it is increased to 563 in the
year 2012
Fixed Assets were 5721 in the total liabilities in the year 2011 ie decreased to
4963 in the year 2012
Investments were 102 in the total liabilities in the year 2011 it increased to 092
in the year 2012
Sundry debtors were 978 in the total liabilities in the year 2011 it is decreased to
932 in the year 2012
8102019 A Study A Study On Financial Performance Analysis With Reference To Kesoram Cementon Financial Performance hellip
httpslidepdfcomreaderfulla-study-a-study-on-financial-performance-analysis-with-reference-to-kesoram 6281
Trend Analysis
Share Capital-
Year
Amount
(In Crores) Trend
IncreaseDecrease
Base Year Previous Year
2008 4574 10000 000 000
2009 4574 10000 000 000
2010 4574 10000 000 000
2011 4574 10000 000 000
2012 4574 10000 000 000
Trend Percentages in Share Capital
Share capital shown a constant trend in the period 2008 and 2012
Share capital is 4574 crores all the years from 2008-2012
8102019 A Study A Study On Financial Performance Analysis With Reference To Kesoram Cementon Financial Performance hellip
httpslidepdfcomreaderfulla-study-a-study-on-financial-performance-analysis-with-reference-to-kesoram 6381
Reserves amp Surplus-
Year
Amount
(In Crores) Trend
IncreaseDecrease
Base Year Previous Year
2008 93085 10000 000 000
2009 128024 13753 3753 3753
2010 149111 16019 6019 2266
2011 125162 13446 3446 -2573
2012 86657 9309 -691 -4137
Trend Percentages in Reserves amp Surplus
Reserves amp surplus shown an increasing trend in the period between 2008 and 2010
The average trend was 13277 till 2010
The Reserves amp surplus was showing decreasing trend in the period 2011-2012 (ie
from 16019 in 2010 to 9309 in 2012)
The decreasing trend in Reserves amp surplus indicates the decrease in profits of the
firm
8102019 A Study A Study On Financial Performance Analysis With Reference To Kesoram Cementon Financial Performance hellip
httpslidepdfcomreaderfulla-study-a-study-on-financial-performance-analysis-with-reference-to-kesoram 6481
Investments-
Year
Amount
(In Crores) Trend
IncreaseDecrease
Base Year Previous Year
2008 4783 10000 000 000
2009 6178 12917 2917 2917
2010 5143 10753 753 -2164
2011 6582 13761 3761 3009
2012 6636 13874 3874 113
Trend Percentages in Investments-
The investments are shown an increasing trend in the period between 2008 ndash 2009
and it is decreasing in the year 2010
The average trend was 11458 till 2009
The investments increased in the periods 2011-2012 (ie from 10753 in 2010 to
13874 in 2012)
The overall trend in investments shown is satisfactory
8102019 A Study A Study On Financial Performance Analysis With Reference To Kesoram Cementon Financial Performance hellip
httpslidepdfcomreaderfulla-study-a-study-on-financial-performance-analysis-with-reference-to-kesoram 6581
Net Current Assets-
Year
Amount
(In Crores) Trend
IncreaseDecrease
Base Year Previous Year
2008 30761 10000 000 000
2009 56954 18515 8515 8515
2010 77037 25044 15044 6529
2011 110417 35895 25895 10851
2012 68613 22305 12305 -13590
Trends in Net Current Assets-
The NCA shown positive (increasing) trend
The NCA are increased to 35895 (the year 2011) compared with base year and
decreased in the year 2012 to 22305
The NCA shown increased trend from year and crossed 100
The overall trend was good
8102019 A Study A Study On Financial Performance Analysis With Reference To Kesoram Cementon Financial Performance hellip
httpslidepdfcomreaderfulla-study-a-study-on-financial-performance-analysis-with-reference-to-kesoram 6681
66
Ratio Analysis-
Current Ratio-
Current Ratio = Current Assets Current Liabilities
Current assets are cash in hand Cash at bank Marketable Securities(short term) short term
Investment Bills receivables sundry debtors Inventories (stock) Work in progress prepaid
expenses Current Liabilities are outstanding expenses Bills payable sundry Creditors
short-term advances income tax payable and Dividend payable
Current Ratio of Kesoram-
(Rupees in crores)
Year Current Assets Current Liabilities Current Ratio
2007-08 75560 57067 132
2008-09 102580 66587 154
2009-10 153922 107688 143
2010-11 182177 113902 160
2011-12 173833 180010 097
Interpretation-
As per the standard rule of current ratio ie 21 where current assets double the current
liabilities is considered satisfactory
In the present analysis the current ratio of the Kesoram is not satisfactory
from the above table It was assessed that the current ratio for all the five year is lower (less)
than the standard rule ie 21 And it is 097 in the year 2011-2012 (current year) This is
highly UN satisfactory
8102019 A Study A Study On Financial Performance Analysis With Reference To Kesoram Cementon Financial Performance hellip
httpslidepdfcomreaderfulla-study-a-study-on-financial-performance-analysis-with-reference-to-kesoram 6781
Quick Ratio-
Quick ratio also known as acid-test ratio establishes a relationship between quick
assets and the current liabilities Cash is the most liquid asset It is calculated by dividing
quick assets by current liabilities
Quick ratio = Quick Assets Current Liabilities
(Quick Assets = Current assets ndash Inventory)
Quick Ratio of Kesoram-
Rupees in crores)
Year Total QuickAssets
Current Liabilities Quick Ratio
2007-08 33343 57067 058
2008-09 43674 66587 066
2009-10 62303 107688 058
2010-11 70322 113902 0622011-12 74333 180010 041
Interpretation-
Usually a high Quick ratio is an indication that the company is liquid and has the ability to
meet its current or liquid liabilities in time on the other hand a low Quick Ratio represents
8102019 A Study A Study On Financial Performance Analysis With Reference To Kesoram Cementon Financial Performance hellip
httpslidepdfcomreaderfulla-study-a-study-on-financial-performance-analysis-with-reference-to-kesoram 6881
that the companyrsquos liquidity position is not good The above table showing the quick ratios
of Kesoram are canrsquot be considered satisfactory
Leverage Ratios-
Debt-Equity Ratio-
Debt-Equity Ratio = Total Long Term Debt Equity Share Holders Fund
Total Long term Debt= Debenture Capital + Long term loans from banks and financial
institutions + Public deposits
Equity Share Holders fund = Equity + Reserves and Surplus
Debt Equity Ratio of Kesoram
(Rupees in crores)
Year Total Debt Share Holders Fund Debt Equity Ratio
2007-08 109235 98192 111
2008-09 197043 133010 148
2009-10 312622 154024 203
2010-11 399927 130025 308
2011-12 410534 91501 449
8102019 A Study A Study On Financial Performance Analysis With Reference To Kesoram Cementon Financial Performance hellip
httpslidepdfcomreaderfulla-study-a-study-on-financial-performance-analysis-with-reference-to-kesoram 6981
Interpretation-
The Debt-Equity Ratio accepted standard is 05 This ratio reflects the relative contribution
of creditors and owners of business in its financing From the above it is clear that the long
term debt is more than that of the share holdersrsquo fund So we can interpret that the firmrsquosassets are financed more by the external funds rather than by the internal funds
8102019 A Study A Study On Financial Performance Analysis With Reference To Kesoram Cementon Financial Performance hellip
httpslidepdfcomreaderfulla-study-a-study-on-financial-performance-analysis-with-reference-to-kesoram 7081
Fixed Asset Ratio-
Net Sales
Fixed Asset Ratio = helliphelliphelliphelliphelliphelliphelliphelliphelliphelliphellip
Net Assets
Fixed Asset Ratio of Kesoram-
(Rupees in crores)
Year Net Sales Net Assets Fixed Assets Ratio
2007-08 300271 358721 084
2008-09 389797 369172 106
2009-10 475062 343182 1382010-11 539788 180435 299
2011-12 59182 108424 546
Interpretation
This ratio indicates the extent to which the assets of the companyrsquos can be lost without
affecting the interest of the creditors of the company Higher the ratios better the long-term
position of the companyThe above table shows fixed assets ratio in increasing trend Which is good for the
company
8102019 A Study A Study On Financial Performance Analysis With Reference To Kesoram Cementon Financial Performance hellip
httpslidepdfcomreaderfulla-study-a-study-on-financial-performance-analysis-with-reference-to-kesoram 7181
Overall Profitability Ratios-
Net Profit Ratio
Net Profit Ratio indicates net margin on sales It is given by the following equation
Net Profit Ratio = (Net Profit Sales) 100
Net Profit Ratio of Kesoram
(Rupees in crores)
Year Net Profit Sales Net Profit Ratio
2007-08 37917 300271 1263
2008-09 41432 389797 1063
2009-10 20298 475062 427
2010-11 -28176 539788 -5222011-12 -38108 59182 -644
Interpretation
It establishes a relationship between net profits after tax and net sales and
indicates the efficiency of the management in manufacturing selling administrative and
other activities of the company
The higher the ratio the better is the profitability or performance of the business
The above table depicts the net profit Ratio of Kesoram has decreased every year from
2007-2008 to 2011-2012It further decreased to negative in the year 2010-11 to -522 and -
644 in the year 2011-2012 This shows constant decrease in the profits of the company
8102019 A Study A Study On Financial Performance Analysis With Reference To Kesoram Cementon Financial Performance hellip
httpslidepdfcomreaderfulla-study-a-study-on-financial-performance-analysis-with-reference-to-kesoram 7281
72
Return on Investment-
Net Profit
Return on Investment = helliphelliphelliphelliphelliphelliphelliphelliphelliphelliphelliphellip X 100
Share Holders Fund
Return on Investment Ratio of Kesoram-
(Rupees in crores)
Year Net Profit Share Holders Fund Return On Investment
2007-08 37917 98192 3862
2008-09 41432 133010 3115
2009-10 20298 154024 1318
2010-11 -28176 130025 -2167
2011-12 -38108 91501 -4165
Interpretation-
The above table reveals how well the resources of the firm are being used Higher
the ratio better the result The above ratio implies how well the firm is growing in
terms of profitability and efficiency From the above table we can concern that the return on
investment is in decreasing trend ROI is highest in the year 2007-2008 as 3862 But
there after itrsquos decreased every year
The ROI is negative in the years 2010-2011 amp 2011-2012 as -2167 amp -4165 respectively
Which is not a good sign for the firm
8102019 A Study A Study On Financial Performance Analysis With Reference To Kesoram Cementon Financial Performance hellip
httpslidepdfcomreaderfulla-study-a-study-on-financial-performance-analysis-with-reference-to-kesoram 7381
8102019 A Study A Study On Financial Performance Analysis With Reference To Kesoram Cementon Financial Performance hellip
httpslidepdfcomreaderfulla-study-a-study-on-financial-performance-analysis-with-reference-to-kesoram 7481
8102019 A Study A Study On Financial Performance Analysis With Reference To Kesoram Cementon Financial Performance hellip
httpslidepdfcomreaderfulla-study-a-study-on-financial-performance-analysis-with-reference-to-kesoram 7581
75
CHAPTER V
FINDINGS amp SUGGESTIONS
8102019 A Study A Study On Financial Performance Analysis With Reference To Kesoram Cementon Financial Performance hellip
httpslidepdfcomreaderfulla-study-a-study-on-financial-performance-analysis-with-reference-to-kesoram 7681
76
Findings
The Share capital remains constant Share capital is unchanged all the years from
2008-2012
Reserves amp surplus were recorded an increasing trend in the period between 2008
and 2010It is showing decreasing trend in the period 2011-2012 (ie from 16019
in 2010 to 9309 in 2012)
Current Liabilities were increased compared to base year ie 2008
Provisions increased to 262597 ie in Rupees 39232 crores in the current year
The current ratio for all the five year is lower (less) than the standard rule ie 21
And it is 097 in the year 2011-2012 (current year)
The Debt-Equity Ratio was shown under the standard ratio It is clear that the long
term debt is more than that of the share holdersrsquo fund It indicates that the firm
heavily relying on external funds rather than the internal funds
The operating and net profit of Kesoram is in decreasing trend due to heavy
increase of manufacturing amp administrative expenses
ROI is highest in the year 2007-2008 as 3862 The ROI is negative in the years
2010-2011 amp 2011-2012 as -2167 amp -4165 respectively
Return on Equity Capital Employed Ratio of Kesoram has decreased every year
from 2007-2008 to 2010-2011It further decreased to negative in the year 2011-12 to
-3280
EPS of Kesoram has decreased every year from 2008-12It is negative in the year
2011 amp 12
8102019 A Study A Study On Financial Performance Analysis With Reference To Kesoram Cementon Financial Performance hellip
httpslidepdfcomreaderfulla-study-a-study-on-financial-performance-analysis-with-reference-to-kesoram 7781
77
Suggestion
The organization should adopt an appropriate capital structure
The companyrsquos debt-equity ratio is recorded more or less as 111 in the year 2008
and it is increased to 449 in the year 2012 (current year)The company should
adopt a better debt equity mix in the future to control the fluctuations in returns
The company should control fluctuations in cash and bank balances as it impacts the
current ratio of the company
The provisions are showing increasing trend which indicates risk of debtors The
firm should implement an effective credit management policy It should utilize its
idle funds by decreasing provisions
The company should control heavy increase of manufacturing amp administration
expenses as it is impacting the operating and net profit of company
8102019 A Study A Study On Financial Performance Analysis With Reference To Kesoram Cementon Financial Performance hellip
httpslidepdfcomreaderfulla-study-a-study-on-financial-performance-analysis-with-reference-to-kesoram 7881
78
ANNEXURE
Profit And Loss Account of Kesoram Cement
Mar12 Mar11 Mar10 Mar09 Mar08
12 Months 12 Months 12 Months 12 Months 12 Months
INCOME
Sales Turnover 628260 575072 505151 431613 345700
Excise Duty 36440 35284 30089 41815 45429
NET SALES 591820 539788 475062 389797 300271
Other Income 000 000 000 000 000
TOTALINCOME
596129 548733 481019 393969 302020
EXPENDITURE
Manufacturing
Expenses81903 74803 13974 13153 44113
MaterialConsumed
370897 310150 295550 229359 118448
Personal
Expenses33468 27355 23294 18690 15344
Selling Expenses 81910 78253 58667 48846 45019
AdministrativeExpenses
28225 29308 17219 16179 9907
Expenses
Capitalized000 000 000 000 000
Provisions Made 000 000 000 000 000
TOTAL
EXPENDITURE 596403 519870 408704 326227 232832Operating Profit -4583 19918 66358 63570 67439
EBITDA -274 28864 72316 67742 69188
Depreciation 29740 27259 17280 11186 8927
Other Write-offs 000 000 000 000 000
EBIT -30014 1605 55035 56557 60261
Interest 41015 23983 10921 12087 5426
EBT -71029 -22377 44114 44470 54835
Taxes -32921 5798 23816 3037 16918
Profit and Loss
for the Year-38108 -28176 20298 41432 37917
Non RecurringItems
-1142 7063 3228 -4023 402
Other Non Cash
Adjustments1276 091 207 465 017
OtherAdjustments
000 000 000 000 000
REPORTED
PAT-37974 -21021 23734 37874 38335
8102019 A Study A Study On Financial Performance Analysis With Reference To Kesoram Cementon Financial Performance hellip
httpslidepdfcomreaderfulla-study-a-study-on-financial-performance-analysis-with-reference-to-kesoram 7981
79
Balance Sheet Of Kesoram
Years
Particulars 2008 2009 2010 2011 2012
Liabilities
Share Capital 4574 4574 4574 4574 4574Reserves amp Surplus 93085 128024 149111 125162 86657
Revaluation Reserves 533 412 339 289 27
Loans
Secured Loans 97106 153627 186372 237183 317792
Un Secured Loans 12129 43416 12625 162744 92742
Deferred Tax Liabilities 0 0 0 0 0
Current Liabilities
Provisions 33039 34529 35734 1494 40726
Current Liabilities 57067 66587 107688 113902 18001
Total 297533 431169 610068 645348 722771
Assets
Net Block 108424 180435 343182 369172 358721
Capital WIP 63459 86485 41283 43781 68065
Investments 4783 6178 5143 6582 6636
Current Assets
Inventories 44217 58906 91619 111855 99516
Sundry Debtors 27307 38017 54289 63134 67358
Cash amp Bank Balances 4036 5657 8014 7188 6959
Total Current Assets 7556 10258 153922 182177 173833Loans amp Advances 45289 55462 66506 4346 115409
Fixed Deposits 018 028 031 176 107
Total 297533 431169 610068 645348 722771
8102019 A Study A Study On Financial Performance Analysis With Reference To Kesoram Cementon Financial Performance hellip
httpslidepdfcomreaderfulla-study-a-study-on-financial-performance-analysis-with-reference-to-kesoram 8081
80
KEY ITEMS 2012 2011 2010 2009 2008
Preference
Dividend 0 0 0 0 0
Equity Dividend 457 2516 2516 2516 2516
Equity Dividend
() 999 55 55 55 55
Shares in Issue(Lakhs) 45743 45743 45743 45743 45743
EPS - Annualised
(Rs) -8302 -4595 5188 828 838
8102019 A Study A Study On Financial Performance Analysis With Reference To Kesoram Cementon Financial Performance hellip
httpslidepdfcomreaderfulla-study-a-study-on-financial-performance-analysis-with-reference-to-kesoram 8181
BIBLIOGRAPHY
Sl
No
Books Author Name
1 Financial Management Khan amp JAIN
2 Financial Management IMPandey
3 Management Accounting RPTrivedi
Websites amp Search Engines
1 wwwkesoramcom983086
2 wwwmoneycontrolcom
3 wwwgooglefinancecom983086
Annual reports of Kesoram cement limited 2008-2012
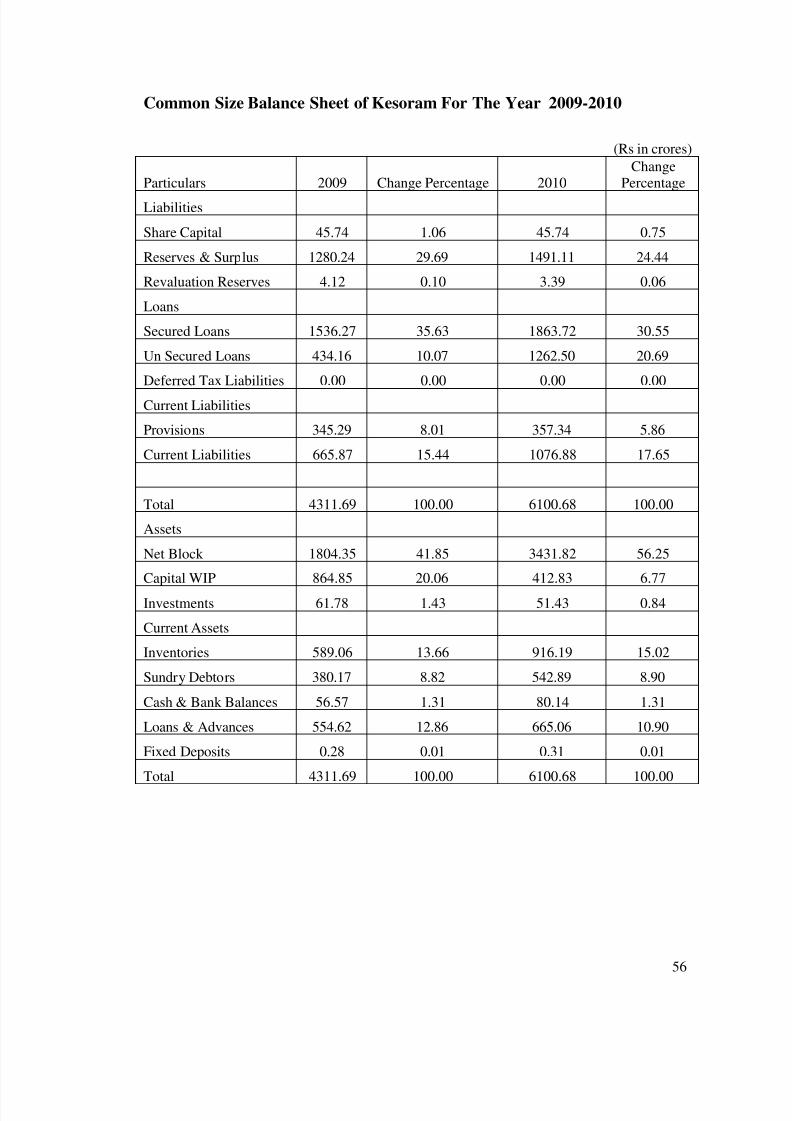
8102019 A Study A Study On Financial Performance Analysis With Reference To Kesoram Cementon Financial Performance hellip
httpslidepdfcomreaderfulla-study-a-study-on-financial-performance-analysis-with-reference-to-kesoram 5781
57
Interpretation of common size balance sheet of 2009-2010
Share capital was recorded 106 percent in the total liabilities in the
year 2009 it is decreased to 075 in the year 2010
Reserves amp surplus contributed to 2969 in the total liabilities in the
year 2009 it is decreased to2444 in the year 2010
Secured loans were 3563 in the total liabilities in the year 2009 it is
increased to 3055 in the year 2010
Current Liabilities shown to 1544 in the total liabilities in the year
2009 it is decreased to 1765 in the year 2010
Provisions 801 in the total liabilities in the year 2009 it is decreased
to 586 in the year 2010
Fixed Assets were 4185 in the total liabilities in the year 2009 ie
increased to 5625 in the year 2010
Investments were 143 in the total liabilities in the year 2009 it is
decreased to 084 in the year 2010
Sundry debtors were 882 in the total liabilities in the year 2009 it is
increased to 890 in the year 2010
8102019 A Study A Study On Financial Performance Analysis With Reference To Kesoram Cementon Financial Performance hellip
httpslidepdfcomreaderfulla-study-a-study-on-financial-performance-analysis-with-reference-to-kesoram 5881
58
Common Size Balance sheet of Kesoram for the year 2010-2011
983080Rupees in crores)
Particulars 2010 Change Percentage 2011
Change
Percentage
Liabilities
Share Capital 4574 075 4574 071
Reserves amp Surplus 149111 2444 125162 1939
Revaluation Reserves 339 006 289 004
Loans
Secured Loans 186372 3055 237183 3675
Un Secured Loans 126250 2069 162744 2522
Deferred Tax Liabilities 000 000 000 000
Current Liabilities
Provisions 35734 586 1494 023
Current Liabilities 107688 1765 113902 1765
Total 610068 10000 645348 10000
Assets
Net Block 343182 5625 369172 5721
Capital WIP 41283 677 43781 678
Investments 5143 084 6582 102
Current Assets
Inventories 91619 1502 111855 1733
Sundry Debtors 54289 890 63134 978
Cash amp Bank Balances 8014 131 7188 111
Loans amp Advances 66506 1090 43460 673
Fixed Deposits 031 001 176 003
Total 610068 10000 645348 10000
8102019 A Study A Study On Financial Performance Analysis With Reference To Kesoram Cementon Financial Performance hellip
httpslidepdfcomreaderfulla-study-a-study-on-financial-performance-analysis-with-reference-to-kesoram 5981
59
Interpretation of Common Size Balance Sheet Of 2010-2011
Share capital was recorded 075 percent in the total liabilities in the year 2010 it is
decreased to 071 in the year 2011
Reserves amp surplus contributed to 2444 in the total liabilities in the year 2010 it is
decreased to1939 in the year 2011
Secured loans were 3055 in the total liabilities in the year 2010 it is increased to
3675 in the year 2011
Current Liabilities shown to 1765 in the total liabilities in the year 2010 it is
also1765 in the year 2011
Provisions 586 in the total liabilities in the year 2010 it is decreased to 023 in the
year 2011
Fixed Assets were 5625 in the total liabilities in the year 2010 ie increased to 5721
in the year 2011
Investments were 084 in the total liabilities in the year 2010 it increased to 102 in
the year 2011
Sundry debtors were 890 in the total liabilities in the year 2010 it is increased to 978
in the year 2011
8102019 A Study A Study On Financial Performance Analysis With Reference To Kesoram Cementon Financial Performance hellip
httpslidepdfcomreaderfulla-study-a-study-on-financial-performance-analysis-with-reference-to-kesoram 6081
60
Common Size Balance Sheet of Kesoram for the Year 2011-2012
983080Rupees in crores)
Particulars 2011 Change Percentage 2012
Change
Percentage
Liabilities
Share Capital 4574 071 4574 063
Reserves amp Surplus 125162 1939 86657 1199
Revaluation Reserves 289 004 270 004
Loans
Secured Loans 237183 3675 317792 4397
Un Secured Loans 162744 2522 92742 1283
Deferred Tax Liabilities 000 000 000 000
Current Liabilities
Provisions 1494 023 40726 563
Current Liabilities 113902 1765 180010 2491
Total 645348 10000 722771 10000
Assets
Net Block 369172 5721 358721 4963
Capital WIP 43781 678 68065 942
Investments 6582 102 6636 092
Current Assets
Inventories 111855 1733 99516 1377
Sundry Debtors 63134 978 67358 932
Cash amp Bank Balances 7188 111 6959 096
Loans amp Advances 43460 673 115409 1597
Fixed Deposits 176 003 107 001
Total 645348 10000 722771 10000
8102019 A Study A Study On Financial Performance Analysis With Reference To Kesoram Cementon Financial Performance hellip
httpslidepdfcomreaderfulla-study-a-study-on-financial-performance-analysis-with-reference-to-kesoram 6181
61
Interpretation of common size balance sheet of 2011-2012
Share capital was recorded 071 percent in the total liabilities in the year 2011 it is
decreased to 063 in the year 2012
Reserves amp surplus contributed to 1939 in the total liabilities in the year 2011 it
is decreased to 1199 in the year 2012
Secured loans were 3675 in the total liabilities in the year 2011 it is increased to
4397 in the year 2012
Current Liabilities shown to 1765 in the total liabilities in the year 2011 it is
increased to 2491 in the year 2012
Provisions 023 in the total liabilities in the year 2011 it is increased to 563 in the
year 2012
Fixed Assets were 5721 in the total liabilities in the year 2011 ie decreased to
4963 in the year 2012
Investments were 102 in the total liabilities in the year 2011 it increased to 092
in the year 2012
Sundry debtors were 978 in the total liabilities in the year 2011 it is decreased to
932 in the year 2012
8102019 A Study A Study On Financial Performance Analysis With Reference To Kesoram Cementon Financial Performance hellip
httpslidepdfcomreaderfulla-study-a-study-on-financial-performance-analysis-with-reference-to-kesoram 6281
Trend Analysis
Share Capital-
Year
Amount
(In Crores) Trend
IncreaseDecrease
Base Year Previous Year
2008 4574 10000 000 000
2009 4574 10000 000 000
2010 4574 10000 000 000
2011 4574 10000 000 000
2012 4574 10000 000 000
Trend Percentages in Share Capital
Share capital shown a constant trend in the period 2008 and 2012
Share capital is 4574 crores all the years from 2008-2012
8102019 A Study A Study On Financial Performance Analysis With Reference To Kesoram Cementon Financial Performance hellip
httpslidepdfcomreaderfulla-study-a-study-on-financial-performance-analysis-with-reference-to-kesoram 6381
Reserves amp Surplus-
Year
Amount
(In Crores) Trend
IncreaseDecrease
Base Year Previous Year
2008 93085 10000 000 000
2009 128024 13753 3753 3753
2010 149111 16019 6019 2266
2011 125162 13446 3446 -2573
2012 86657 9309 -691 -4137
Trend Percentages in Reserves amp Surplus
Reserves amp surplus shown an increasing trend in the period between 2008 and 2010
The average trend was 13277 till 2010
The Reserves amp surplus was showing decreasing trend in the period 2011-2012 (ie
from 16019 in 2010 to 9309 in 2012)
The decreasing trend in Reserves amp surplus indicates the decrease in profits of the
firm
8102019 A Study A Study On Financial Performance Analysis With Reference To Kesoram Cementon Financial Performance hellip
httpslidepdfcomreaderfulla-study-a-study-on-financial-performance-analysis-with-reference-to-kesoram 6481
Investments-
Year
Amount
(In Crores) Trend
IncreaseDecrease
Base Year Previous Year
2008 4783 10000 000 000
2009 6178 12917 2917 2917
2010 5143 10753 753 -2164
2011 6582 13761 3761 3009
2012 6636 13874 3874 113
Trend Percentages in Investments-
The investments are shown an increasing trend in the period between 2008 ndash 2009
and it is decreasing in the year 2010
The average trend was 11458 till 2009
The investments increased in the periods 2011-2012 (ie from 10753 in 2010 to
13874 in 2012)
The overall trend in investments shown is satisfactory
8102019 A Study A Study On Financial Performance Analysis With Reference To Kesoram Cementon Financial Performance hellip
httpslidepdfcomreaderfulla-study-a-study-on-financial-performance-analysis-with-reference-to-kesoram 6581
Net Current Assets-
Year
Amount
(In Crores) Trend
IncreaseDecrease
Base Year Previous Year
2008 30761 10000 000 000
2009 56954 18515 8515 8515
2010 77037 25044 15044 6529
2011 110417 35895 25895 10851
2012 68613 22305 12305 -13590
Trends in Net Current Assets-
The NCA shown positive (increasing) trend
The NCA are increased to 35895 (the year 2011) compared with base year and
decreased in the year 2012 to 22305
The NCA shown increased trend from year and crossed 100
The overall trend was good
8102019 A Study A Study On Financial Performance Analysis With Reference To Kesoram Cementon Financial Performance hellip
httpslidepdfcomreaderfulla-study-a-study-on-financial-performance-analysis-with-reference-to-kesoram 6681
66
Ratio Analysis-
Current Ratio-
Current Ratio = Current Assets Current Liabilities
Current assets are cash in hand Cash at bank Marketable Securities(short term) short term
Investment Bills receivables sundry debtors Inventories (stock) Work in progress prepaid
expenses Current Liabilities are outstanding expenses Bills payable sundry Creditors
short-term advances income tax payable and Dividend payable
Current Ratio of Kesoram-
(Rupees in crores)
Year Current Assets Current Liabilities Current Ratio
2007-08 75560 57067 132
2008-09 102580 66587 154
2009-10 153922 107688 143
2010-11 182177 113902 160
2011-12 173833 180010 097
Interpretation-
As per the standard rule of current ratio ie 21 where current assets double the current
liabilities is considered satisfactory
In the present analysis the current ratio of the Kesoram is not satisfactory
from the above table It was assessed that the current ratio for all the five year is lower (less)
than the standard rule ie 21 And it is 097 in the year 2011-2012 (current year) This is
highly UN satisfactory
8102019 A Study A Study On Financial Performance Analysis With Reference To Kesoram Cementon Financial Performance hellip
httpslidepdfcomreaderfulla-study-a-study-on-financial-performance-analysis-with-reference-to-kesoram 6781
Quick Ratio-
Quick ratio also known as acid-test ratio establishes a relationship between quick
assets and the current liabilities Cash is the most liquid asset It is calculated by dividing
quick assets by current liabilities
Quick ratio = Quick Assets Current Liabilities
(Quick Assets = Current assets ndash Inventory)
Quick Ratio of Kesoram-
Rupees in crores)
Year Total QuickAssets
Current Liabilities Quick Ratio
2007-08 33343 57067 058
2008-09 43674 66587 066
2009-10 62303 107688 058
2010-11 70322 113902 0622011-12 74333 180010 041
Interpretation-
Usually a high Quick ratio is an indication that the company is liquid and has the ability to
meet its current or liquid liabilities in time on the other hand a low Quick Ratio represents
8102019 A Study A Study On Financial Performance Analysis With Reference To Kesoram Cementon Financial Performance hellip
httpslidepdfcomreaderfulla-study-a-study-on-financial-performance-analysis-with-reference-to-kesoram 6881
that the companyrsquos liquidity position is not good The above table showing the quick ratios
of Kesoram are canrsquot be considered satisfactory
Leverage Ratios-
Debt-Equity Ratio-
Debt-Equity Ratio = Total Long Term Debt Equity Share Holders Fund
Total Long term Debt= Debenture Capital + Long term loans from banks and financial
institutions + Public deposits
Equity Share Holders fund = Equity + Reserves and Surplus
Debt Equity Ratio of Kesoram
(Rupees in crores)
Year Total Debt Share Holders Fund Debt Equity Ratio
2007-08 109235 98192 111
2008-09 197043 133010 148
2009-10 312622 154024 203
2010-11 399927 130025 308
2011-12 410534 91501 449
8102019 A Study A Study On Financial Performance Analysis With Reference To Kesoram Cementon Financial Performance hellip
httpslidepdfcomreaderfulla-study-a-study-on-financial-performance-analysis-with-reference-to-kesoram 6981
Interpretation-
The Debt-Equity Ratio accepted standard is 05 This ratio reflects the relative contribution
of creditors and owners of business in its financing From the above it is clear that the long
term debt is more than that of the share holdersrsquo fund So we can interpret that the firmrsquosassets are financed more by the external funds rather than by the internal funds
8102019 A Study A Study On Financial Performance Analysis With Reference To Kesoram Cementon Financial Performance hellip
httpslidepdfcomreaderfulla-study-a-study-on-financial-performance-analysis-with-reference-to-kesoram 7081
Fixed Asset Ratio-
Net Sales
Fixed Asset Ratio = helliphelliphelliphelliphelliphelliphelliphelliphelliphelliphellip
Net Assets
Fixed Asset Ratio of Kesoram-
(Rupees in crores)
Year Net Sales Net Assets Fixed Assets Ratio
2007-08 300271 358721 084
2008-09 389797 369172 106
2009-10 475062 343182 1382010-11 539788 180435 299
2011-12 59182 108424 546
Interpretation
This ratio indicates the extent to which the assets of the companyrsquos can be lost without
affecting the interest of the creditors of the company Higher the ratios better the long-term
position of the companyThe above table shows fixed assets ratio in increasing trend Which is good for the
company
8102019 A Study A Study On Financial Performance Analysis With Reference To Kesoram Cementon Financial Performance hellip
httpslidepdfcomreaderfulla-study-a-study-on-financial-performance-analysis-with-reference-to-kesoram 7181
Overall Profitability Ratios-
Net Profit Ratio
Net Profit Ratio indicates net margin on sales It is given by the following equation
Net Profit Ratio = (Net Profit Sales) 100
Net Profit Ratio of Kesoram
(Rupees in crores)
Year Net Profit Sales Net Profit Ratio
2007-08 37917 300271 1263
2008-09 41432 389797 1063
2009-10 20298 475062 427
2010-11 -28176 539788 -5222011-12 -38108 59182 -644
Interpretation
It establishes a relationship between net profits after tax and net sales and
indicates the efficiency of the management in manufacturing selling administrative and
other activities of the company
The higher the ratio the better is the profitability or performance of the business
The above table depicts the net profit Ratio of Kesoram has decreased every year from
2007-2008 to 2011-2012It further decreased to negative in the year 2010-11 to -522 and -
644 in the year 2011-2012 This shows constant decrease in the profits of the company
8102019 A Study A Study On Financial Performance Analysis With Reference To Kesoram Cementon Financial Performance hellip
httpslidepdfcomreaderfulla-study-a-study-on-financial-performance-analysis-with-reference-to-kesoram 7281
72
Return on Investment-
Net Profit
Return on Investment = helliphelliphelliphelliphelliphelliphelliphelliphelliphelliphelliphellip X 100
Share Holders Fund
Return on Investment Ratio of Kesoram-
(Rupees in crores)
Year Net Profit Share Holders Fund Return On Investment
2007-08 37917 98192 3862
2008-09 41432 133010 3115
2009-10 20298 154024 1318
2010-11 -28176 130025 -2167
2011-12 -38108 91501 -4165
Interpretation-
The above table reveals how well the resources of the firm are being used Higher
the ratio better the result The above ratio implies how well the firm is growing in
terms of profitability and efficiency From the above table we can concern that the return on
investment is in decreasing trend ROI is highest in the year 2007-2008 as 3862 But
there after itrsquos decreased every year
The ROI is negative in the years 2010-2011 amp 2011-2012 as -2167 amp -4165 respectively
Which is not a good sign for the firm
8102019 A Study A Study On Financial Performance Analysis With Reference To Kesoram Cementon Financial Performance hellip
httpslidepdfcomreaderfulla-study-a-study-on-financial-performance-analysis-with-reference-to-kesoram 7381
8102019 A Study A Study On Financial Performance Analysis With Reference To Kesoram Cementon Financial Performance hellip
httpslidepdfcomreaderfulla-study-a-study-on-financial-performance-analysis-with-reference-to-kesoram 7481
8102019 A Study A Study On Financial Performance Analysis With Reference To Kesoram Cementon Financial Performance hellip
httpslidepdfcomreaderfulla-study-a-study-on-financial-performance-analysis-with-reference-to-kesoram 7581
75
CHAPTER V
FINDINGS amp SUGGESTIONS
8102019 A Study A Study On Financial Performance Analysis With Reference To Kesoram Cementon Financial Performance hellip
httpslidepdfcomreaderfulla-study-a-study-on-financial-performance-analysis-with-reference-to-kesoram 7681
76
Findings
The Share capital remains constant Share capital is unchanged all the years from
2008-2012
Reserves amp surplus were recorded an increasing trend in the period between 2008
and 2010It is showing decreasing trend in the period 2011-2012 (ie from 16019
in 2010 to 9309 in 2012)
Current Liabilities were increased compared to base year ie 2008
Provisions increased to 262597 ie in Rupees 39232 crores in the current year
The current ratio for all the five year is lower (less) than the standard rule ie 21
And it is 097 in the year 2011-2012 (current year)
The Debt-Equity Ratio was shown under the standard ratio It is clear that the long
term debt is more than that of the share holdersrsquo fund It indicates that the firm
heavily relying on external funds rather than the internal funds
The operating and net profit of Kesoram is in decreasing trend due to heavy
increase of manufacturing amp administrative expenses
ROI is highest in the year 2007-2008 as 3862 The ROI is negative in the years
2010-2011 amp 2011-2012 as -2167 amp -4165 respectively
Return on Equity Capital Employed Ratio of Kesoram has decreased every year
from 2007-2008 to 2010-2011It further decreased to negative in the year 2011-12 to
-3280
EPS of Kesoram has decreased every year from 2008-12It is negative in the year
2011 amp 12
8102019 A Study A Study On Financial Performance Analysis With Reference To Kesoram Cementon Financial Performance hellip
httpslidepdfcomreaderfulla-study-a-study-on-financial-performance-analysis-with-reference-to-kesoram 7781
77
Suggestion
The organization should adopt an appropriate capital structure
The companyrsquos debt-equity ratio is recorded more or less as 111 in the year 2008
and it is increased to 449 in the year 2012 (current year)The company should
adopt a better debt equity mix in the future to control the fluctuations in returns
The company should control fluctuations in cash and bank balances as it impacts the
current ratio of the company
The provisions are showing increasing trend which indicates risk of debtors The
firm should implement an effective credit management policy It should utilize its
idle funds by decreasing provisions
The company should control heavy increase of manufacturing amp administration
expenses as it is impacting the operating and net profit of company
8102019 A Study A Study On Financial Performance Analysis With Reference To Kesoram Cementon Financial Performance hellip
httpslidepdfcomreaderfulla-study-a-study-on-financial-performance-analysis-with-reference-to-kesoram 7881
78
ANNEXURE
Profit And Loss Account of Kesoram Cement
Mar12 Mar11 Mar10 Mar09 Mar08
12 Months 12 Months 12 Months 12 Months 12 Months
INCOME
Sales Turnover 628260 575072 505151 431613 345700
Excise Duty 36440 35284 30089 41815 45429
NET SALES 591820 539788 475062 389797 300271
Other Income 000 000 000 000 000
TOTALINCOME
596129 548733 481019 393969 302020
EXPENDITURE
Manufacturing
Expenses81903 74803 13974 13153 44113
MaterialConsumed
370897 310150 295550 229359 118448
Personal
Expenses33468 27355 23294 18690 15344
Selling Expenses 81910 78253 58667 48846 45019
AdministrativeExpenses
28225 29308 17219 16179 9907
Expenses
Capitalized000 000 000 000 000
Provisions Made 000 000 000 000 000
TOTAL
EXPENDITURE 596403 519870 408704 326227 232832Operating Profit -4583 19918 66358 63570 67439
EBITDA -274 28864 72316 67742 69188
Depreciation 29740 27259 17280 11186 8927
Other Write-offs 000 000 000 000 000
EBIT -30014 1605 55035 56557 60261
Interest 41015 23983 10921 12087 5426
EBT -71029 -22377 44114 44470 54835
Taxes -32921 5798 23816 3037 16918
Profit and Loss
for the Year-38108 -28176 20298 41432 37917
Non RecurringItems
-1142 7063 3228 -4023 402
Other Non Cash
Adjustments1276 091 207 465 017
OtherAdjustments
000 000 000 000 000
REPORTED
PAT-37974 -21021 23734 37874 38335
8102019 A Study A Study On Financial Performance Analysis With Reference To Kesoram Cementon Financial Performance hellip
httpslidepdfcomreaderfulla-study-a-study-on-financial-performance-analysis-with-reference-to-kesoram 7981
79
Balance Sheet Of Kesoram
Years
Particulars 2008 2009 2010 2011 2012
Liabilities
Share Capital 4574 4574 4574 4574 4574Reserves amp Surplus 93085 128024 149111 125162 86657
Revaluation Reserves 533 412 339 289 27
Loans
Secured Loans 97106 153627 186372 237183 317792
Un Secured Loans 12129 43416 12625 162744 92742
Deferred Tax Liabilities 0 0 0 0 0
Current Liabilities
Provisions 33039 34529 35734 1494 40726
Current Liabilities 57067 66587 107688 113902 18001
Total 297533 431169 610068 645348 722771
Assets
Net Block 108424 180435 343182 369172 358721
Capital WIP 63459 86485 41283 43781 68065
Investments 4783 6178 5143 6582 6636
Current Assets
Inventories 44217 58906 91619 111855 99516
Sundry Debtors 27307 38017 54289 63134 67358
Cash amp Bank Balances 4036 5657 8014 7188 6959
Total Current Assets 7556 10258 153922 182177 173833Loans amp Advances 45289 55462 66506 4346 115409
Fixed Deposits 018 028 031 176 107
Total 297533 431169 610068 645348 722771
8102019 A Study A Study On Financial Performance Analysis With Reference To Kesoram Cementon Financial Performance hellip
httpslidepdfcomreaderfulla-study-a-study-on-financial-performance-analysis-with-reference-to-kesoram 8081
80
KEY ITEMS 2012 2011 2010 2009 2008
Preference
Dividend 0 0 0 0 0
Equity Dividend 457 2516 2516 2516 2516
Equity Dividend
() 999 55 55 55 55
Shares in Issue(Lakhs) 45743 45743 45743 45743 45743
EPS - Annualised
(Rs) -8302 -4595 5188 828 838
8102019 A Study A Study On Financial Performance Analysis With Reference To Kesoram Cementon Financial Performance hellip
httpslidepdfcomreaderfulla-study-a-study-on-financial-performance-analysis-with-reference-to-kesoram 8181
BIBLIOGRAPHY
Sl
No
Books Author Name
1 Financial Management Khan amp JAIN
2 Financial Management IMPandey
3 Management Accounting RPTrivedi
Websites amp Search Engines
1 wwwkesoramcom983086
2 wwwmoneycontrolcom
3 wwwgooglefinancecom983086
Annual reports of Kesoram cement limited 2008-2012
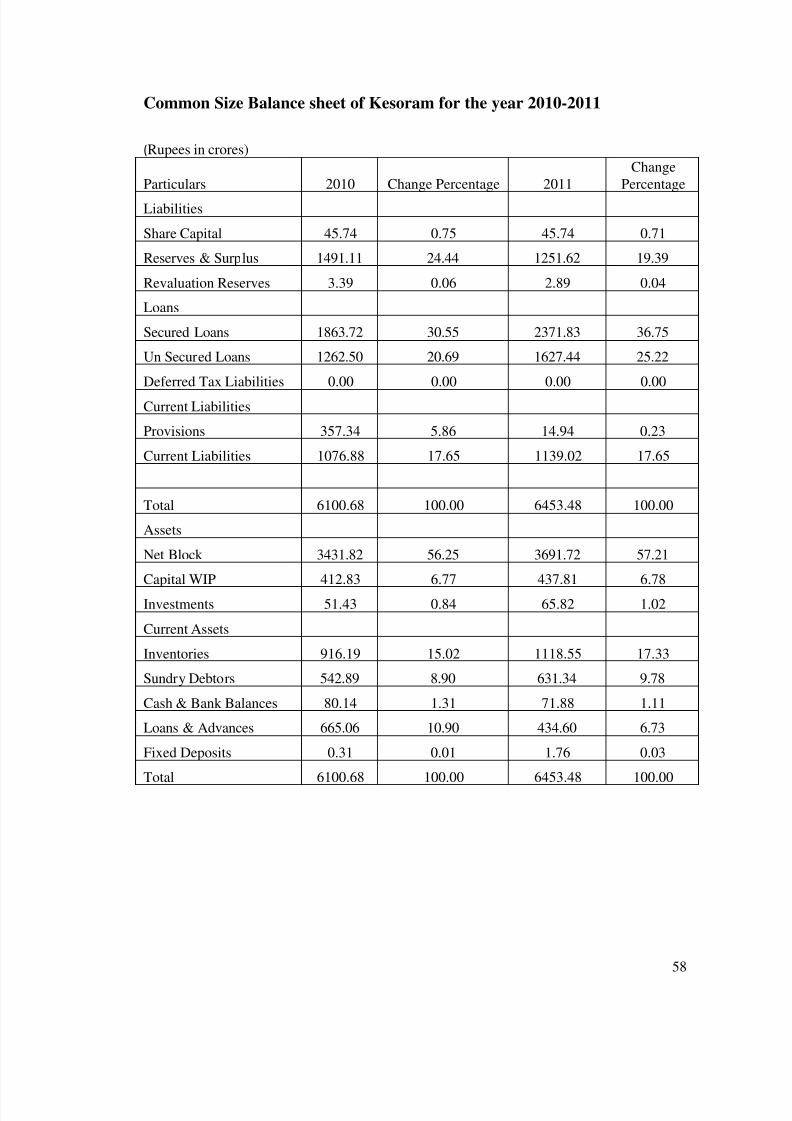
8102019 A Study A Study On Financial Performance Analysis With Reference To Kesoram Cementon Financial Performance hellip
httpslidepdfcomreaderfulla-study-a-study-on-financial-performance-analysis-with-reference-to-kesoram 5881
58
Common Size Balance sheet of Kesoram for the year 2010-2011
983080Rupees in crores)
Particulars 2010 Change Percentage 2011
Change
Percentage
Liabilities
Share Capital 4574 075 4574 071
Reserves amp Surplus 149111 2444 125162 1939
Revaluation Reserves 339 006 289 004
Loans
Secured Loans 186372 3055 237183 3675
Un Secured Loans 126250 2069 162744 2522
Deferred Tax Liabilities 000 000 000 000
Current Liabilities
Provisions 35734 586 1494 023
Current Liabilities 107688 1765 113902 1765
Total 610068 10000 645348 10000
Assets
Net Block 343182 5625 369172 5721
Capital WIP 41283 677 43781 678
Investments 5143 084 6582 102
Current Assets
Inventories 91619 1502 111855 1733
Sundry Debtors 54289 890 63134 978
Cash amp Bank Balances 8014 131 7188 111
Loans amp Advances 66506 1090 43460 673
Fixed Deposits 031 001 176 003
Total 610068 10000 645348 10000
8102019 A Study A Study On Financial Performance Analysis With Reference To Kesoram Cementon Financial Performance hellip
httpslidepdfcomreaderfulla-study-a-study-on-financial-performance-analysis-with-reference-to-kesoram 5981
59
Interpretation of Common Size Balance Sheet Of 2010-2011
Share capital was recorded 075 percent in the total liabilities in the year 2010 it is
decreased to 071 in the year 2011
Reserves amp surplus contributed to 2444 in the total liabilities in the year 2010 it is
decreased to1939 in the year 2011
Secured loans were 3055 in the total liabilities in the year 2010 it is increased to
3675 in the year 2011
Current Liabilities shown to 1765 in the total liabilities in the year 2010 it is
also1765 in the year 2011
Provisions 586 in the total liabilities in the year 2010 it is decreased to 023 in the
year 2011
Fixed Assets were 5625 in the total liabilities in the year 2010 ie increased to 5721
in the year 2011
Investments were 084 in the total liabilities in the year 2010 it increased to 102 in
the year 2011
Sundry debtors were 890 in the total liabilities in the year 2010 it is increased to 978
in the year 2011
8102019 A Study A Study On Financial Performance Analysis With Reference To Kesoram Cementon Financial Performance hellip
httpslidepdfcomreaderfulla-study-a-study-on-financial-performance-analysis-with-reference-to-kesoram 6081
60
Common Size Balance Sheet of Kesoram for the Year 2011-2012
983080Rupees in crores)
Particulars 2011 Change Percentage 2012
Change
Percentage
Liabilities
Share Capital 4574 071 4574 063
Reserves amp Surplus 125162 1939 86657 1199
Revaluation Reserves 289 004 270 004
Loans
Secured Loans 237183 3675 317792 4397
Un Secured Loans 162744 2522 92742 1283
Deferred Tax Liabilities 000 000 000 000
Current Liabilities
Provisions 1494 023 40726 563
Current Liabilities 113902 1765 180010 2491
Total 645348 10000 722771 10000
Assets
Net Block 369172 5721 358721 4963
Capital WIP 43781 678 68065 942
Investments 6582 102 6636 092
Current Assets
Inventories 111855 1733 99516 1377
Sundry Debtors 63134 978 67358 932
Cash amp Bank Balances 7188 111 6959 096
Loans amp Advances 43460 673 115409 1597
Fixed Deposits 176 003 107 001
Total 645348 10000 722771 10000
8102019 A Study A Study On Financial Performance Analysis With Reference To Kesoram Cementon Financial Performance hellip
httpslidepdfcomreaderfulla-study-a-study-on-financial-performance-analysis-with-reference-to-kesoram 6181
61
Interpretation of common size balance sheet of 2011-2012
Share capital was recorded 071 percent in the total liabilities in the year 2011 it is
decreased to 063 in the year 2012
Reserves amp surplus contributed to 1939 in the total liabilities in the year 2011 it
is decreased to 1199 in the year 2012
Secured loans were 3675 in the total liabilities in the year 2011 it is increased to
4397 in the year 2012
Current Liabilities shown to 1765 in the total liabilities in the year 2011 it is
increased to 2491 in the year 2012
Provisions 023 in the total liabilities in the year 2011 it is increased to 563 in the
year 2012
Fixed Assets were 5721 in the total liabilities in the year 2011 ie decreased to
4963 in the year 2012
Investments were 102 in the total liabilities in the year 2011 it increased to 092
in the year 2012
Sundry debtors were 978 in the total liabilities in the year 2011 it is decreased to
932 in the year 2012
8102019 A Study A Study On Financial Performance Analysis With Reference To Kesoram Cementon Financial Performance hellip
httpslidepdfcomreaderfulla-study-a-study-on-financial-performance-analysis-with-reference-to-kesoram 6281
Trend Analysis
Share Capital-
Year
Amount
(In Crores) Trend
IncreaseDecrease
Base Year Previous Year
2008 4574 10000 000 000
2009 4574 10000 000 000
2010 4574 10000 000 000
2011 4574 10000 000 000
2012 4574 10000 000 000
Trend Percentages in Share Capital
Share capital shown a constant trend in the period 2008 and 2012
Share capital is 4574 crores all the years from 2008-2012
8102019 A Study A Study On Financial Performance Analysis With Reference To Kesoram Cementon Financial Performance hellip
httpslidepdfcomreaderfulla-study-a-study-on-financial-performance-analysis-with-reference-to-kesoram 6381
Reserves amp Surplus-
Year
Amount
(In Crores) Trend
IncreaseDecrease
Base Year Previous Year
2008 93085 10000 000 000
2009 128024 13753 3753 3753
2010 149111 16019 6019 2266
2011 125162 13446 3446 -2573
2012 86657 9309 -691 -4137
Trend Percentages in Reserves amp Surplus
Reserves amp surplus shown an increasing trend in the period between 2008 and 2010
The average trend was 13277 till 2010
The Reserves amp surplus was showing decreasing trend in the period 2011-2012 (ie
from 16019 in 2010 to 9309 in 2012)
The decreasing trend in Reserves amp surplus indicates the decrease in profits of the
firm
8102019 A Study A Study On Financial Performance Analysis With Reference To Kesoram Cementon Financial Performance hellip
httpslidepdfcomreaderfulla-study-a-study-on-financial-performance-analysis-with-reference-to-kesoram 6481
Investments-
Year
Amount
(In Crores) Trend
IncreaseDecrease
Base Year Previous Year
2008 4783 10000 000 000
2009 6178 12917 2917 2917
2010 5143 10753 753 -2164
2011 6582 13761 3761 3009
2012 6636 13874 3874 113
Trend Percentages in Investments-
The investments are shown an increasing trend in the period between 2008 ndash 2009
and it is decreasing in the year 2010
The average trend was 11458 till 2009
The investments increased in the periods 2011-2012 (ie from 10753 in 2010 to
13874 in 2012)
The overall trend in investments shown is satisfactory
8102019 A Study A Study On Financial Performance Analysis With Reference To Kesoram Cementon Financial Performance hellip
httpslidepdfcomreaderfulla-study-a-study-on-financial-performance-analysis-with-reference-to-kesoram 6581
Net Current Assets-
Year
Amount
(In Crores) Trend
IncreaseDecrease
Base Year Previous Year
2008 30761 10000 000 000
2009 56954 18515 8515 8515
2010 77037 25044 15044 6529
2011 110417 35895 25895 10851
2012 68613 22305 12305 -13590
Trends in Net Current Assets-
The NCA shown positive (increasing) trend
The NCA are increased to 35895 (the year 2011) compared with base year and
decreased in the year 2012 to 22305
The NCA shown increased trend from year and crossed 100
The overall trend was good
8102019 A Study A Study On Financial Performance Analysis With Reference To Kesoram Cementon Financial Performance hellip
httpslidepdfcomreaderfulla-study-a-study-on-financial-performance-analysis-with-reference-to-kesoram 6681
66
Ratio Analysis-
Current Ratio-
Current Ratio = Current Assets Current Liabilities
Current assets are cash in hand Cash at bank Marketable Securities(short term) short term
Investment Bills receivables sundry debtors Inventories (stock) Work in progress prepaid
expenses Current Liabilities are outstanding expenses Bills payable sundry Creditors
short-term advances income tax payable and Dividend payable
Current Ratio of Kesoram-
(Rupees in crores)
Year Current Assets Current Liabilities Current Ratio
2007-08 75560 57067 132
2008-09 102580 66587 154
2009-10 153922 107688 143
2010-11 182177 113902 160
2011-12 173833 180010 097
Interpretation-
As per the standard rule of current ratio ie 21 where current assets double the current
liabilities is considered satisfactory
In the present analysis the current ratio of the Kesoram is not satisfactory
from the above table It was assessed that the current ratio for all the five year is lower (less)
than the standard rule ie 21 And it is 097 in the year 2011-2012 (current year) This is
highly UN satisfactory
8102019 A Study A Study On Financial Performance Analysis With Reference To Kesoram Cementon Financial Performance hellip
httpslidepdfcomreaderfulla-study-a-study-on-financial-performance-analysis-with-reference-to-kesoram 6781
Quick Ratio-
Quick ratio also known as acid-test ratio establishes a relationship between quick
assets and the current liabilities Cash is the most liquid asset It is calculated by dividing
quick assets by current liabilities
Quick ratio = Quick Assets Current Liabilities
(Quick Assets = Current assets ndash Inventory)
Quick Ratio of Kesoram-
Rupees in crores)
Year Total QuickAssets
Current Liabilities Quick Ratio
2007-08 33343 57067 058
2008-09 43674 66587 066
2009-10 62303 107688 058
2010-11 70322 113902 0622011-12 74333 180010 041
Interpretation-
Usually a high Quick ratio is an indication that the company is liquid and has the ability to
meet its current or liquid liabilities in time on the other hand a low Quick Ratio represents
8102019 A Study A Study On Financial Performance Analysis With Reference To Kesoram Cementon Financial Performance hellip
httpslidepdfcomreaderfulla-study-a-study-on-financial-performance-analysis-with-reference-to-kesoram 6881
that the companyrsquos liquidity position is not good The above table showing the quick ratios
of Kesoram are canrsquot be considered satisfactory
Leverage Ratios-
Debt-Equity Ratio-
Debt-Equity Ratio = Total Long Term Debt Equity Share Holders Fund
Total Long term Debt= Debenture Capital + Long term loans from banks and financial
institutions + Public deposits
Equity Share Holders fund = Equity + Reserves and Surplus
Debt Equity Ratio of Kesoram
(Rupees in crores)
Year Total Debt Share Holders Fund Debt Equity Ratio
2007-08 109235 98192 111
2008-09 197043 133010 148
2009-10 312622 154024 203
2010-11 399927 130025 308
2011-12 410534 91501 449
8102019 A Study A Study On Financial Performance Analysis With Reference To Kesoram Cementon Financial Performance hellip
httpslidepdfcomreaderfulla-study-a-study-on-financial-performance-analysis-with-reference-to-kesoram 6981
Interpretation-
The Debt-Equity Ratio accepted standard is 05 This ratio reflects the relative contribution
of creditors and owners of business in its financing From the above it is clear that the long
term debt is more than that of the share holdersrsquo fund So we can interpret that the firmrsquosassets are financed more by the external funds rather than by the internal funds
8102019 A Study A Study On Financial Performance Analysis With Reference To Kesoram Cementon Financial Performance hellip
httpslidepdfcomreaderfulla-study-a-study-on-financial-performance-analysis-with-reference-to-kesoram 7081
Fixed Asset Ratio-
Net Sales
Fixed Asset Ratio = helliphelliphelliphelliphelliphelliphelliphelliphelliphelliphellip
Net Assets
Fixed Asset Ratio of Kesoram-
(Rupees in crores)
Year Net Sales Net Assets Fixed Assets Ratio
2007-08 300271 358721 084
2008-09 389797 369172 106
2009-10 475062 343182 1382010-11 539788 180435 299
2011-12 59182 108424 546
Interpretation
This ratio indicates the extent to which the assets of the companyrsquos can be lost without
affecting the interest of the creditors of the company Higher the ratios better the long-term
position of the companyThe above table shows fixed assets ratio in increasing trend Which is good for the
company
8102019 A Study A Study On Financial Performance Analysis With Reference To Kesoram Cementon Financial Performance hellip
httpslidepdfcomreaderfulla-study-a-study-on-financial-performance-analysis-with-reference-to-kesoram 7181
Overall Profitability Ratios-
Net Profit Ratio
Net Profit Ratio indicates net margin on sales It is given by the following equation
Net Profit Ratio = (Net Profit Sales) 100
Net Profit Ratio of Kesoram
(Rupees in crores)
Year Net Profit Sales Net Profit Ratio
2007-08 37917 300271 1263
2008-09 41432 389797 1063
2009-10 20298 475062 427
2010-11 -28176 539788 -5222011-12 -38108 59182 -644
Interpretation
It establishes a relationship between net profits after tax and net sales and
indicates the efficiency of the management in manufacturing selling administrative and
other activities of the company
The higher the ratio the better is the profitability or performance of the business
The above table depicts the net profit Ratio of Kesoram has decreased every year from
2007-2008 to 2011-2012It further decreased to negative in the year 2010-11 to -522 and -
644 in the year 2011-2012 This shows constant decrease in the profits of the company
8102019 A Study A Study On Financial Performance Analysis With Reference To Kesoram Cementon Financial Performance hellip
httpslidepdfcomreaderfulla-study-a-study-on-financial-performance-analysis-with-reference-to-kesoram 7281
72
Return on Investment-
Net Profit
Return on Investment = helliphelliphelliphelliphelliphelliphelliphelliphelliphelliphelliphellip X 100
Share Holders Fund
Return on Investment Ratio of Kesoram-
(Rupees in crores)
Year Net Profit Share Holders Fund Return On Investment
2007-08 37917 98192 3862
2008-09 41432 133010 3115
2009-10 20298 154024 1318
2010-11 -28176 130025 -2167
2011-12 -38108 91501 -4165
Interpretation-
The above table reveals how well the resources of the firm are being used Higher
the ratio better the result The above ratio implies how well the firm is growing in
terms of profitability and efficiency From the above table we can concern that the return on
investment is in decreasing trend ROI is highest in the year 2007-2008 as 3862 But
there after itrsquos decreased every year
The ROI is negative in the years 2010-2011 amp 2011-2012 as -2167 amp -4165 respectively
Which is not a good sign for the firm
8102019 A Study A Study On Financial Performance Analysis With Reference To Kesoram Cementon Financial Performance hellip
httpslidepdfcomreaderfulla-study-a-study-on-financial-performance-analysis-with-reference-to-kesoram 7381
8102019 A Study A Study On Financial Performance Analysis With Reference To Kesoram Cementon Financial Performance hellip
httpslidepdfcomreaderfulla-study-a-study-on-financial-performance-analysis-with-reference-to-kesoram 7481
8102019 A Study A Study On Financial Performance Analysis With Reference To Kesoram Cementon Financial Performance hellip
httpslidepdfcomreaderfulla-study-a-study-on-financial-performance-analysis-with-reference-to-kesoram 7581
75
CHAPTER V
FINDINGS amp SUGGESTIONS
8102019 A Study A Study On Financial Performance Analysis With Reference To Kesoram Cementon Financial Performance hellip
httpslidepdfcomreaderfulla-study-a-study-on-financial-performance-analysis-with-reference-to-kesoram 7681
76
Findings
The Share capital remains constant Share capital is unchanged all the years from
2008-2012
Reserves amp surplus were recorded an increasing trend in the period between 2008
and 2010It is showing decreasing trend in the period 2011-2012 (ie from 16019
in 2010 to 9309 in 2012)
Current Liabilities were increased compared to base year ie 2008
Provisions increased to 262597 ie in Rupees 39232 crores in the current year
The current ratio for all the five year is lower (less) than the standard rule ie 21
And it is 097 in the year 2011-2012 (current year)
The Debt-Equity Ratio was shown under the standard ratio It is clear that the long
term debt is more than that of the share holdersrsquo fund It indicates that the firm
heavily relying on external funds rather than the internal funds
The operating and net profit of Kesoram is in decreasing trend due to heavy
increase of manufacturing amp administrative expenses
ROI is highest in the year 2007-2008 as 3862 The ROI is negative in the years
2010-2011 amp 2011-2012 as -2167 amp -4165 respectively
Return on Equity Capital Employed Ratio of Kesoram has decreased every year
from 2007-2008 to 2010-2011It further decreased to negative in the year 2011-12 to
-3280
EPS of Kesoram has decreased every year from 2008-12It is negative in the year
2011 amp 12
8102019 A Study A Study On Financial Performance Analysis With Reference To Kesoram Cementon Financial Performance hellip
httpslidepdfcomreaderfulla-study-a-study-on-financial-performance-analysis-with-reference-to-kesoram 7781
77
Suggestion
The organization should adopt an appropriate capital structure
The companyrsquos debt-equity ratio is recorded more or less as 111 in the year 2008
and it is increased to 449 in the year 2012 (current year)The company should
adopt a better debt equity mix in the future to control the fluctuations in returns
The company should control fluctuations in cash and bank balances as it impacts the
current ratio of the company
The provisions are showing increasing trend which indicates risk of debtors The
firm should implement an effective credit management policy It should utilize its
idle funds by decreasing provisions
The company should control heavy increase of manufacturing amp administration
expenses as it is impacting the operating and net profit of company
8102019 A Study A Study On Financial Performance Analysis With Reference To Kesoram Cementon Financial Performance hellip
httpslidepdfcomreaderfulla-study-a-study-on-financial-performance-analysis-with-reference-to-kesoram 7881
78
ANNEXURE
Profit And Loss Account of Kesoram Cement
Mar12 Mar11 Mar10 Mar09 Mar08
12 Months 12 Months 12 Months 12 Months 12 Months
INCOME
Sales Turnover 628260 575072 505151 431613 345700
Excise Duty 36440 35284 30089 41815 45429
NET SALES 591820 539788 475062 389797 300271
Other Income 000 000 000 000 000
TOTALINCOME
596129 548733 481019 393969 302020
EXPENDITURE
Manufacturing
Expenses81903 74803 13974 13153 44113
MaterialConsumed
370897 310150 295550 229359 118448
Personal
Expenses33468 27355 23294 18690 15344
Selling Expenses 81910 78253 58667 48846 45019
AdministrativeExpenses
28225 29308 17219 16179 9907
Expenses
Capitalized000 000 000 000 000
Provisions Made 000 000 000 000 000
TOTAL
EXPENDITURE 596403 519870 408704 326227 232832Operating Profit -4583 19918 66358 63570 67439
EBITDA -274 28864 72316 67742 69188
Depreciation 29740 27259 17280 11186 8927
Other Write-offs 000 000 000 000 000
EBIT -30014 1605 55035 56557 60261
Interest 41015 23983 10921 12087 5426
EBT -71029 -22377 44114 44470 54835
Taxes -32921 5798 23816 3037 16918
Profit and Loss
for the Year-38108 -28176 20298 41432 37917
Non RecurringItems
-1142 7063 3228 -4023 402
Other Non Cash
Adjustments1276 091 207 465 017
OtherAdjustments
000 000 000 000 000
REPORTED
PAT-37974 -21021 23734 37874 38335
8102019 A Study A Study On Financial Performance Analysis With Reference To Kesoram Cementon Financial Performance hellip
httpslidepdfcomreaderfulla-study-a-study-on-financial-performance-analysis-with-reference-to-kesoram 7981
79
Balance Sheet Of Kesoram
Years
Particulars 2008 2009 2010 2011 2012
Liabilities
Share Capital 4574 4574 4574 4574 4574Reserves amp Surplus 93085 128024 149111 125162 86657
Revaluation Reserves 533 412 339 289 27
Loans
Secured Loans 97106 153627 186372 237183 317792
Un Secured Loans 12129 43416 12625 162744 92742
Deferred Tax Liabilities 0 0 0 0 0
Current Liabilities
Provisions 33039 34529 35734 1494 40726
Current Liabilities 57067 66587 107688 113902 18001
Total 297533 431169 610068 645348 722771
Assets
Net Block 108424 180435 343182 369172 358721
Capital WIP 63459 86485 41283 43781 68065
Investments 4783 6178 5143 6582 6636
Current Assets
Inventories 44217 58906 91619 111855 99516
Sundry Debtors 27307 38017 54289 63134 67358
Cash amp Bank Balances 4036 5657 8014 7188 6959
Total Current Assets 7556 10258 153922 182177 173833Loans amp Advances 45289 55462 66506 4346 115409
Fixed Deposits 018 028 031 176 107
Total 297533 431169 610068 645348 722771
8102019 A Study A Study On Financial Performance Analysis With Reference To Kesoram Cementon Financial Performance hellip
httpslidepdfcomreaderfulla-study-a-study-on-financial-performance-analysis-with-reference-to-kesoram 8081
80
KEY ITEMS 2012 2011 2010 2009 2008
Preference
Dividend 0 0 0 0 0
Equity Dividend 457 2516 2516 2516 2516
Equity Dividend
() 999 55 55 55 55
Shares in Issue(Lakhs) 45743 45743 45743 45743 45743
EPS - Annualised
(Rs) -8302 -4595 5188 828 838
8102019 A Study A Study On Financial Performance Analysis With Reference To Kesoram Cementon Financial Performance hellip
httpslidepdfcomreaderfulla-study-a-study-on-financial-performance-analysis-with-reference-to-kesoram 8181
BIBLIOGRAPHY
Sl
No
Books Author Name
1 Financial Management Khan amp JAIN
2 Financial Management IMPandey
3 Management Accounting RPTrivedi
Websites amp Search Engines
1 wwwkesoramcom983086
2 wwwmoneycontrolcom
3 wwwgooglefinancecom983086
Annual reports of Kesoram cement limited 2008-2012
8102019 A Study A Study On Financial Performance Analysis With Reference To Kesoram Cementon Financial Performance hellip
httpslidepdfcomreaderfulla-study-a-study-on-financial-performance-analysis-with-reference-to-kesoram 5981
59
Interpretation of Common Size Balance Sheet Of 2010-2011
Share capital was recorded 075 percent in the total liabilities in the year 2010 it is
decreased to 071 in the year 2011
Reserves amp surplus contributed to 2444 in the total liabilities in the year 2010 it is
decreased to1939 in the year 2011
Secured loans were 3055 in the total liabilities in the year 2010 it is increased to
3675 in the year 2011
Current Liabilities shown to 1765 in the total liabilities in the year 2010 it is
also1765 in the year 2011
Provisions 586 in the total liabilities in the year 2010 it is decreased to 023 in the
year 2011
Fixed Assets were 5625 in the total liabilities in the year 2010 ie increased to 5721
in the year 2011
Investments were 084 in the total liabilities in the year 2010 it increased to 102 in
the year 2011
Sundry debtors were 890 in the total liabilities in the year 2010 it is increased to 978
in the year 2011
8102019 A Study A Study On Financial Performance Analysis With Reference To Kesoram Cementon Financial Performance hellip
httpslidepdfcomreaderfulla-study-a-study-on-financial-performance-analysis-with-reference-to-kesoram 6081
60
Common Size Balance Sheet of Kesoram for the Year 2011-2012
983080Rupees in crores)
Particulars 2011 Change Percentage 2012
Change
Percentage
Liabilities
Share Capital 4574 071 4574 063
Reserves amp Surplus 125162 1939 86657 1199
Revaluation Reserves 289 004 270 004
Loans
Secured Loans 237183 3675 317792 4397
Un Secured Loans 162744 2522 92742 1283
Deferred Tax Liabilities 000 000 000 000
Current Liabilities
Provisions 1494 023 40726 563
Current Liabilities 113902 1765 180010 2491
Total 645348 10000 722771 10000
Assets
Net Block 369172 5721 358721 4963
Capital WIP 43781 678 68065 942
Investments 6582 102 6636 092
Current Assets
Inventories 111855 1733 99516 1377
Sundry Debtors 63134 978 67358 932
Cash amp Bank Balances 7188 111 6959 096
Loans amp Advances 43460 673 115409 1597
Fixed Deposits 176 003 107 001
Total 645348 10000 722771 10000
8102019 A Study A Study On Financial Performance Analysis With Reference To Kesoram Cementon Financial Performance hellip
httpslidepdfcomreaderfulla-study-a-study-on-financial-performance-analysis-with-reference-to-kesoram 6181
61
Interpretation of common size balance sheet of 2011-2012
Share capital was recorded 071 percent in the total liabilities in the year 2011 it is
decreased to 063 in the year 2012
Reserves amp surplus contributed to 1939 in the total liabilities in the year 2011 it
is decreased to 1199 in the year 2012
Secured loans were 3675 in the total liabilities in the year 2011 it is increased to
4397 in the year 2012
Current Liabilities shown to 1765 in the total liabilities in the year 2011 it is
increased to 2491 in the year 2012
Provisions 023 in the total liabilities in the year 2011 it is increased to 563 in the
year 2012
Fixed Assets were 5721 in the total liabilities in the year 2011 ie decreased to
4963 in the year 2012
Investments were 102 in the total liabilities in the year 2011 it increased to 092
in the year 2012
Sundry debtors were 978 in the total liabilities in the year 2011 it is decreased to
932 in the year 2012
8102019 A Study A Study On Financial Performance Analysis With Reference To Kesoram Cementon Financial Performance hellip
httpslidepdfcomreaderfulla-study-a-study-on-financial-performance-analysis-with-reference-to-kesoram 6281
Trend Analysis
Share Capital-
Year
Amount
(In Crores) Trend
IncreaseDecrease
Base Year Previous Year
2008 4574 10000 000 000
2009 4574 10000 000 000
2010 4574 10000 000 000
2011 4574 10000 000 000
2012 4574 10000 000 000
Trend Percentages in Share Capital
Share capital shown a constant trend in the period 2008 and 2012
Share capital is 4574 crores all the years from 2008-2012
8102019 A Study A Study On Financial Performance Analysis With Reference To Kesoram Cementon Financial Performance hellip
httpslidepdfcomreaderfulla-study-a-study-on-financial-performance-analysis-with-reference-to-kesoram 6381
Reserves amp Surplus-
Year
Amount
(In Crores) Trend
IncreaseDecrease
Base Year Previous Year
2008 93085 10000 000 000
2009 128024 13753 3753 3753
2010 149111 16019 6019 2266
2011 125162 13446 3446 -2573
2012 86657 9309 -691 -4137
Trend Percentages in Reserves amp Surplus
Reserves amp surplus shown an increasing trend in the period between 2008 and 2010
The average trend was 13277 till 2010
The Reserves amp surplus was showing decreasing trend in the period 2011-2012 (ie
from 16019 in 2010 to 9309 in 2012)
The decreasing trend in Reserves amp surplus indicates the decrease in profits of the
firm
8102019 A Study A Study On Financial Performance Analysis With Reference To Kesoram Cementon Financial Performance hellip
httpslidepdfcomreaderfulla-study-a-study-on-financial-performance-analysis-with-reference-to-kesoram 6481
Investments-
Year
Amount
(In Crores) Trend
IncreaseDecrease
Base Year Previous Year
2008 4783 10000 000 000
2009 6178 12917 2917 2917
2010 5143 10753 753 -2164
2011 6582 13761 3761 3009
2012 6636 13874 3874 113
Trend Percentages in Investments-
The investments are shown an increasing trend in the period between 2008 ndash 2009
and it is decreasing in the year 2010
The average trend was 11458 till 2009
The investments increased in the periods 2011-2012 (ie from 10753 in 2010 to
13874 in 2012)
The overall trend in investments shown is satisfactory
8102019 A Study A Study On Financial Performance Analysis With Reference To Kesoram Cementon Financial Performance hellip
httpslidepdfcomreaderfulla-study-a-study-on-financial-performance-analysis-with-reference-to-kesoram 6581
Net Current Assets-
Year
Amount
(In Crores) Trend
IncreaseDecrease
Base Year Previous Year
2008 30761 10000 000 000
2009 56954 18515 8515 8515
2010 77037 25044 15044 6529
2011 110417 35895 25895 10851
2012 68613 22305 12305 -13590
Trends in Net Current Assets-
The NCA shown positive (increasing) trend
The NCA are increased to 35895 (the year 2011) compared with base year and
decreased in the year 2012 to 22305
The NCA shown increased trend from year and crossed 100
The overall trend was good
8102019 A Study A Study On Financial Performance Analysis With Reference To Kesoram Cementon Financial Performance hellip
httpslidepdfcomreaderfulla-study-a-study-on-financial-performance-analysis-with-reference-to-kesoram 6681
66
Ratio Analysis-
Current Ratio-
Current Ratio = Current Assets Current Liabilities
Current assets are cash in hand Cash at bank Marketable Securities(short term) short term
Investment Bills receivables sundry debtors Inventories (stock) Work in progress prepaid
expenses Current Liabilities are outstanding expenses Bills payable sundry Creditors
short-term advances income tax payable and Dividend payable
Current Ratio of Kesoram-
(Rupees in crores)
Year Current Assets Current Liabilities Current Ratio
2007-08 75560 57067 132
2008-09 102580 66587 154
2009-10 153922 107688 143
2010-11 182177 113902 160
2011-12 173833 180010 097
Interpretation-
As per the standard rule of current ratio ie 21 where current assets double the current
liabilities is considered satisfactory
In the present analysis the current ratio of the Kesoram is not satisfactory
from the above table It was assessed that the current ratio for all the five year is lower (less)
than the standard rule ie 21 And it is 097 in the year 2011-2012 (current year) This is
highly UN satisfactory
8102019 A Study A Study On Financial Performance Analysis With Reference To Kesoram Cementon Financial Performance hellip
httpslidepdfcomreaderfulla-study-a-study-on-financial-performance-analysis-with-reference-to-kesoram 6781
Quick Ratio-
Quick ratio also known as acid-test ratio establishes a relationship between quick
assets and the current liabilities Cash is the most liquid asset It is calculated by dividing
quick assets by current liabilities
Quick ratio = Quick Assets Current Liabilities
(Quick Assets = Current assets ndash Inventory)
Quick Ratio of Kesoram-
Rupees in crores)
Year Total QuickAssets
Current Liabilities Quick Ratio
2007-08 33343 57067 058
2008-09 43674 66587 066
2009-10 62303 107688 058
2010-11 70322 113902 0622011-12 74333 180010 041
Interpretation-
Usually a high Quick ratio is an indication that the company is liquid and has the ability to
meet its current or liquid liabilities in time on the other hand a low Quick Ratio represents
8102019 A Study A Study On Financial Performance Analysis With Reference To Kesoram Cementon Financial Performance hellip
httpslidepdfcomreaderfulla-study-a-study-on-financial-performance-analysis-with-reference-to-kesoram 6881
that the companyrsquos liquidity position is not good The above table showing the quick ratios
of Kesoram are canrsquot be considered satisfactory
Leverage Ratios-
Debt-Equity Ratio-
Debt-Equity Ratio = Total Long Term Debt Equity Share Holders Fund
Total Long term Debt= Debenture Capital + Long term loans from banks and financial
institutions + Public deposits
Equity Share Holders fund = Equity + Reserves and Surplus
Debt Equity Ratio of Kesoram
(Rupees in crores)
Year Total Debt Share Holders Fund Debt Equity Ratio
2007-08 109235 98192 111
2008-09 197043 133010 148
2009-10 312622 154024 203
2010-11 399927 130025 308
2011-12 410534 91501 449
8102019 A Study A Study On Financial Performance Analysis With Reference To Kesoram Cementon Financial Performance hellip
httpslidepdfcomreaderfulla-study-a-study-on-financial-performance-analysis-with-reference-to-kesoram 6981
Interpretation-
The Debt-Equity Ratio accepted standard is 05 This ratio reflects the relative contribution
of creditors and owners of business in its financing From the above it is clear that the long
term debt is more than that of the share holdersrsquo fund So we can interpret that the firmrsquosassets are financed more by the external funds rather than by the internal funds
8102019 A Study A Study On Financial Performance Analysis With Reference To Kesoram Cementon Financial Performance hellip
httpslidepdfcomreaderfulla-study-a-study-on-financial-performance-analysis-with-reference-to-kesoram 7081
Fixed Asset Ratio-
Net Sales
Fixed Asset Ratio = helliphelliphelliphelliphelliphelliphelliphelliphelliphelliphellip
Net Assets
Fixed Asset Ratio of Kesoram-
(Rupees in crores)
Year Net Sales Net Assets Fixed Assets Ratio
2007-08 300271 358721 084
2008-09 389797 369172 106
2009-10 475062 343182 1382010-11 539788 180435 299
2011-12 59182 108424 546
Interpretation
This ratio indicates the extent to which the assets of the companyrsquos can be lost without
affecting the interest of the creditors of the company Higher the ratios better the long-term
position of the companyThe above table shows fixed assets ratio in increasing trend Which is good for the
company
8102019 A Study A Study On Financial Performance Analysis With Reference To Kesoram Cementon Financial Performance hellip
httpslidepdfcomreaderfulla-study-a-study-on-financial-performance-analysis-with-reference-to-kesoram 7181
Overall Profitability Ratios-
Net Profit Ratio
Net Profit Ratio indicates net margin on sales It is given by the following equation
Net Profit Ratio = (Net Profit Sales) 100
Net Profit Ratio of Kesoram
(Rupees in crores)
Year Net Profit Sales Net Profit Ratio
2007-08 37917 300271 1263
2008-09 41432 389797 1063
2009-10 20298 475062 427
2010-11 -28176 539788 -5222011-12 -38108 59182 -644
Interpretation
It establishes a relationship between net profits after tax and net sales and
indicates the efficiency of the management in manufacturing selling administrative and
other activities of the company
The higher the ratio the better is the profitability or performance of the business
The above table depicts the net profit Ratio of Kesoram has decreased every year from
2007-2008 to 2011-2012It further decreased to negative in the year 2010-11 to -522 and -
644 in the year 2011-2012 This shows constant decrease in the profits of the company
8102019 A Study A Study On Financial Performance Analysis With Reference To Kesoram Cementon Financial Performance hellip
httpslidepdfcomreaderfulla-study-a-study-on-financial-performance-analysis-with-reference-to-kesoram 7281
72
Return on Investment-
Net Profit
Return on Investment = helliphelliphelliphelliphelliphelliphelliphelliphelliphelliphelliphellip X 100
Share Holders Fund
Return on Investment Ratio of Kesoram-
(Rupees in crores)
Year Net Profit Share Holders Fund Return On Investment
2007-08 37917 98192 3862
2008-09 41432 133010 3115
2009-10 20298 154024 1318
2010-11 -28176 130025 -2167
2011-12 -38108 91501 -4165
Interpretation-
The above table reveals how well the resources of the firm are being used Higher
the ratio better the result The above ratio implies how well the firm is growing in
terms of profitability and efficiency From the above table we can concern that the return on
investment is in decreasing trend ROI is highest in the year 2007-2008 as 3862 But
there after itrsquos decreased every year
The ROI is negative in the years 2010-2011 amp 2011-2012 as -2167 amp -4165 respectively
Which is not a good sign for the firm
8102019 A Study A Study On Financial Performance Analysis With Reference To Kesoram Cementon Financial Performance hellip
httpslidepdfcomreaderfulla-study-a-study-on-financial-performance-analysis-with-reference-to-kesoram 7381
8102019 A Study A Study On Financial Performance Analysis With Reference To Kesoram Cementon Financial Performance hellip
httpslidepdfcomreaderfulla-study-a-study-on-financial-performance-analysis-with-reference-to-kesoram 7481
8102019 A Study A Study On Financial Performance Analysis With Reference To Kesoram Cementon Financial Performance hellip
httpslidepdfcomreaderfulla-study-a-study-on-financial-performance-analysis-with-reference-to-kesoram 7581
75
CHAPTER V
FINDINGS amp SUGGESTIONS
8102019 A Study A Study On Financial Performance Analysis With Reference To Kesoram Cementon Financial Performance hellip
httpslidepdfcomreaderfulla-study-a-study-on-financial-performance-analysis-with-reference-to-kesoram 7681
76
Findings
The Share capital remains constant Share capital is unchanged all the years from
2008-2012
Reserves amp surplus were recorded an increasing trend in the period between 2008
and 2010It is showing decreasing trend in the period 2011-2012 (ie from 16019
in 2010 to 9309 in 2012)
Current Liabilities were increased compared to base year ie 2008
Provisions increased to 262597 ie in Rupees 39232 crores in the current year
The current ratio for all the five year is lower (less) than the standard rule ie 21
And it is 097 in the year 2011-2012 (current year)
The Debt-Equity Ratio was shown under the standard ratio It is clear that the long
term debt is more than that of the share holdersrsquo fund It indicates that the firm
heavily relying on external funds rather than the internal funds
The operating and net profit of Kesoram is in decreasing trend due to heavy
increase of manufacturing amp administrative expenses
ROI is highest in the year 2007-2008 as 3862 The ROI is negative in the years
2010-2011 amp 2011-2012 as -2167 amp -4165 respectively
Return on Equity Capital Employed Ratio of Kesoram has decreased every year
from 2007-2008 to 2010-2011It further decreased to negative in the year 2011-12 to
-3280
EPS of Kesoram has decreased every year from 2008-12It is negative in the year
2011 amp 12
8102019 A Study A Study On Financial Performance Analysis With Reference To Kesoram Cementon Financial Performance hellip
httpslidepdfcomreaderfulla-study-a-study-on-financial-performance-analysis-with-reference-to-kesoram 7781
77
Suggestion
The organization should adopt an appropriate capital structure
The companyrsquos debt-equity ratio is recorded more or less as 111 in the year 2008
and it is increased to 449 in the year 2012 (current year)The company should
adopt a better debt equity mix in the future to control the fluctuations in returns
The company should control fluctuations in cash and bank balances as it impacts the
current ratio of the company
The provisions are showing increasing trend which indicates risk of debtors The
firm should implement an effective credit management policy It should utilize its
idle funds by decreasing provisions
The company should control heavy increase of manufacturing amp administration
expenses as it is impacting the operating and net profit of company
8102019 A Study A Study On Financial Performance Analysis With Reference To Kesoram Cementon Financial Performance hellip
httpslidepdfcomreaderfulla-study-a-study-on-financial-performance-analysis-with-reference-to-kesoram 7881
78
ANNEXURE
Profit And Loss Account of Kesoram Cement
Mar12 Mar11 Mar10 Mar09 Mar08
12 Months 12 Months 12 Months 12 Months 12 Months
INCOME
Sales Turnover 628260 575072 505151 431613 345700
Excise Duty 36440 35284 30089 41815 45429
NET SALES 591820 539788 475062 389797 300271
Other Income 000 000 000 000 000
TOTALINCOME
596129 548733 481019 393969 302020
EXPENDITURE
Manufacturing
Expenses81903 74803 13974 13153 44113
MaterialConsumed
370897 310150 295550 229359 118448
Personal
Expenses33468 27355 23294 18690 15344
Selling Expenses 81910 78253 58667 48846 45019
AdministrativeExpenses
28225 29308 17219 16179 9907
Expenses
Capitalized000 000 000 000 000
Provisions Made 000 000 000 000 000
TOTAL
EXPENDITURE 596403 519870 408704 326227 232832Operating Profit -4583 19918 66358 63570 67439
EBITDA -274 28864 72316 67742 69188
Depreciation 29740 27259 17280 11186 8927
Other Write-offs 000 000 000 000 000
EBIT -30014 1605 55035 56557 60261
Interest 41015 23983 10921 12087 5426
EBT -71029 -22377 44114 44470 54835
Taxes -32921 5798 23816 3037 16918
Profit and Loss
for the Year-38108 -28176 20298 41432 37917
Non RecurringItems
-1142 7063 3228 -4023 402
Other Non Cash
Adjustments1276 091 207 465 017
OtherAdjustments
000 000 000 000 000
REPORTED
PAT-37974 -21021 23734 37874 38335
8102019 A Study A Study On Financial Performance Analysis With Reference To Kesoram Cementon Financial Performance hellip
httpslidepdfcomreaderfulla-study-a-study-on-financial-performance-analysis-with-reference-to-kesoram 7981
79
Balance Sheet Of Kesoram
Years
Particulars 2008 2009 2010 2011 2012
Liabilities
Share Capital 4574 4574 4574 4574 4574Reserves amp Surplus 93085 128024 149111 125162 86657
Revaluation Reserves 533 412 339 289 27
Loans
Secured Loans 97106 153627 186372 237183 317792
Un Secured Loans 12129 43416 12625 162744 92742
Deferred Tax Liabilities 0 0 0 0 0
Current Liabilities
Provisions 33039 34529 35734 1494 40726
Current Liabilities 57067 66587 107688 113902 18001
Total 297533 431169 610068 645348 722771
Assets
Net Block 108424 180435 343182 369172 358721
Capital WIP 63459 86485 41283 43781 68065
Investments 4783 6178 5143 6582 6636
Current Assets
Inventories 44217 58906 91619 111855 99516
Sundry Debtors 27307 38017 54289 63134 67358
Cash amp Bank Balances 4036 5657 8014 7188 6959
Total Current Assets 7556 10258 153922 182177 173833Loans amp Advances 45289 55462 66506 4346 115409
Fixed Deposits 018 028 031 176 107
Total 297533 431169 610068 645348 722771
8102019 A Study A Study On Financial Performance Analysis With Reference To Kesoram Cementon Financial Performance hellip
httpslidepdfcomreaderfulla-study-a-study-on-financial-performance-analysis-with-reference-to-kesoram 8081
80
KEY ITEMS 2012 2011 2010 2009 2008
Preference
Dividend 0 0 0 0 0
Equity Dividend 457 2516 2516 2516 2516
Equity Dividend
() 999 55 55 55 55
Shares in Issue(Lakhs) 45743 45743 45743 45743 45743
EPS - Annualised
(Rs) -8302 -4595 5188 828 838
8102019 A Study A Study On Financial Performance Analysis With Reference To Kesoram Cementon Financial Performance hellip
httpslidepdfcomreaderfulla-study-a-study-on-financial-performance-analysis-with-reference-to-kesoram 8181
BIBLIOGRAPHY
Sl
No
Books Author Name
1 Financial Management Khan amp JAIN
2 Financial Management IMPandey
3 Management Accounting RPTrivedi
Websites amp Search Engines
1 wwwkesoramcom983086
2 wwwmoneycontrolcom
3 wwwgooglefinancecom983086
Annual reports of Kesoram cement limited 2008-2012
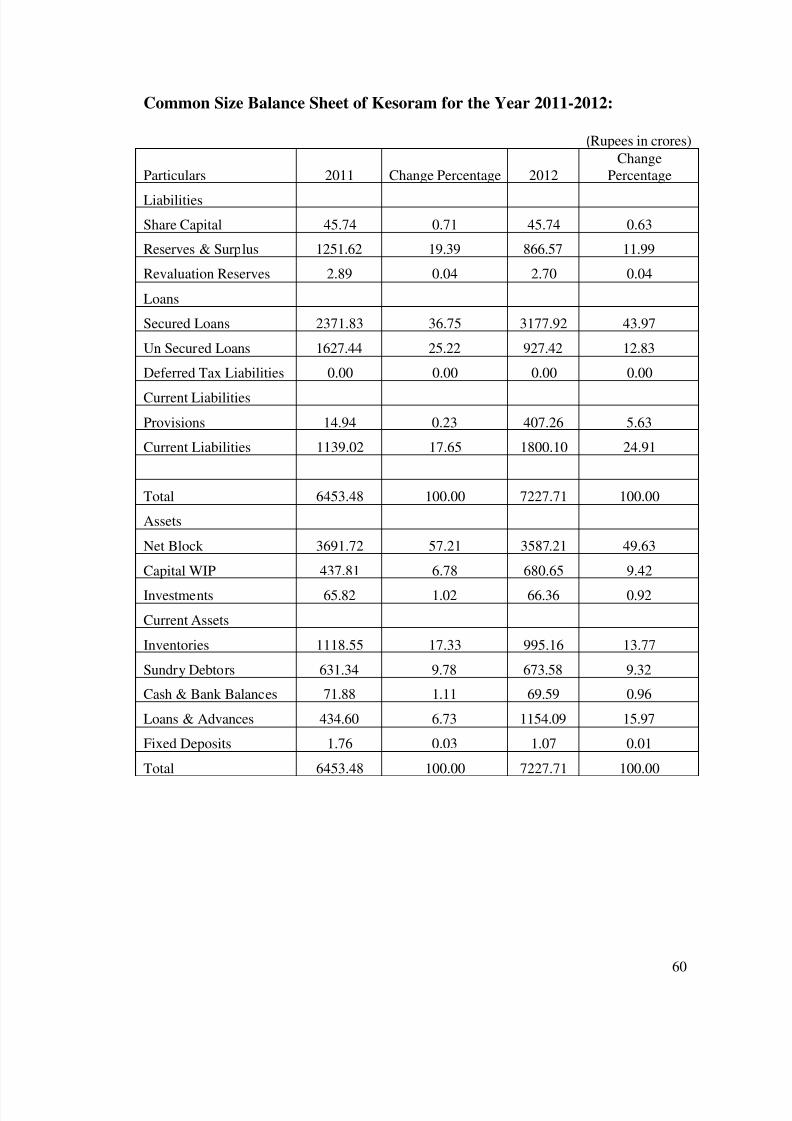
8102019 A Study A Study On Financial Performance Analysis With Reference To Kesoram Cementon Financial Performance hellip
httpslidepdfcomreaderfulla-study-a-study-on-financial-performance-analysis-with-reference-to-kesoram 6081
60
Common Size Balance Sheet of Kesoram for the Year 2011-2012
983080Rupees in crores)
Particulars 2011 Change Percentage 2012
Change
Percentage
Liabilities
Share Capital 4574 071 4574 063
Reserves amp Surplus 125162 1939 86657 1199
Revaluation Reserves 289 004 270 004
Loans
Secured Loans 237183 3675 317792 4397
Un Secured Loans 162744 2522 92742 1283
Deferred Tax Liabilities 000 000 000 000
Current Liabilities
Provisions 1494 023 40726 563
Current Liabilities 113902 1765 180010 2491
Total 645348 10000 722771 10000
Assets
Net Block 369172 5721 358721 4963
Capital WIP 43781 678 68065 942
Investments 6582 102 6636 092
Current Assets
Inventories 111855 1733 99516 1377
Sundry Debtors 63134 978 67358 932
Cash amp Bank Balances 7188 111 6959 096
Loans amp Advances 43460 673 115409 1597
Fixed Deposits 176 003 107 001
Total 645348 10000 722771 10000
8102019 A Study A Study On Financial Performance Analysis With Reference To Kesoram Cementon Financial Performance hellip
httpslidepdfcomreaderfulla-study-a-study-on-financial-performance-analysis-with-reference-to-kesoram 6181
61
Interpretation of common size balance sheet of 2011-2012
Share capital was recorded 071 percent in the total liabilities in the year 2011 it is
decreased to 063 in the year 2012
Reserves amp surplus contributed to 1939 in the total liabilities in the year 2011 it
is decreased to 1199 in the year 2012
Secured loans were 3675 in the total liabilities in the year 2011 it is increased to
4397 in the year 2012
Current Liabilities shown to 1765 in the total liabilities in the year 2011 it is
increased to 2491 in the year 2012
Provisions 023 in the total liabilities in the year 2011 it is increased to 563 in the
year 2012
Fixed Assets were 5721 in the total liabilities in the year 2011 ie decreased to
4963 in the year 2012
Investments were 102 in the total liabilities in the year 2011 it increased to 092
in the year 2012
Sundry debtors were 978 in the total liabilities in the year 2011 it is decreased to
932 in the year 2012
8102019 A Study A Study On Financial Performance Analysis With Reference To Kesoram Cementon Financial Performance hellip
httpslidepdfcomreaderfulla-study-a-study-on-financial-performance-analysis-with-reference-to-kesoram 6281
Trend Analysis
Share Capital-
Year
Amount
(In Crores) Trend
IncreaseDecrease
Base Year Previous Year
2008 4574 10000 000 000
2009 4574 10000 000 000
2010 4574 10000 000 000
2011 4574 10000 000 000
2012 4574 10000 000 000
Trend Percentages in Share Capital
Share capital shown a constant trend in the period 2008 and 2012
Share capital is 4574 crores all the years from 2008-2012
8102019 A Study A Study On Financial Performance Analysis With Reference To Kesoram Cementon Financial Performance hellip
httpslidepdfcomreaderfulla-study-a-study-on-financial-performance-analysis-with-reference-to-kesoram 6381
Reserves amp Surplus-
Year
Amount
(In Crores) Trend
IncreaseDecrease
Base Year Previous Year
2008 93085 10000 000 000
2009 128024 13753 3753 3753
2010 149111 16019 6019 2266
2011 125162 13446 3446 -2573
2012 86657 9309 -691 -4137
Trend Percentages in Reserves amp Surplus
Reserves amp surplus shown an increasing trend in the period between 2008 and 2010
The average trend was 13277 till 2010
The Reserves amp surplus was showing decreasing trend in the period 2011-2012 (ie
from 16019 in 2010 to 9309 in 2012)
The decreasing trend in Reserves amp surplus indicates the decrease in profits of the
firm
8102019 A Study A Study On Financial Performance Analysis With Reference To Kesoram Cementon Financial Performance hellip
httpslidepdfcomreaderfulla-study-a-study-on-financial-performance-analysis-with-reference-to-kesoram 6481
Investments-
Year
Amount
(In Crores) Trend
IncreaseDecrease
Base Year Previous Year
2008 4783 10000 000 000
2009 6178 12917 2917 2917
2010 5143 10753 753 -2164
2011 6582 13761 3761 3009
2012 6636 13874 3874 113
Trend Percentages in Investments-
The investments are shown an increasing trend in the period between 2008 ndash 2009
and it is decreasing in the year 2010
The average trend was 11458 till 2009
The investments increased in the periods 2011-2012 (ie from 10753 in 2010 to
13874 in 2012)
The overall trend in investments shown is satisfactory
8102019 A Study A Study On Financial Performance Analysis With Reference To Kesoram Cementon Financial Performance hellip
httpslidepdfcomreaderfulla-study-a-study-on-financial-performance-analysis-with-reference-to-kesoram 6581
Net Current Assets-
Year
Amount
(In Crores) Trend
IncreaseDecrease
Base Year Previous Year
2008 30761 10000 000 000
2009 56954 18515 8515 8515
2010 77037 25044 15044 6529
2011 110417 35895 25895 10851
2012 68613 22305 12305 -13590
Trends in Net Current Assets-
The NCA shown positive (increasing) trend
The NCA are increased to 35895 (the year 2011) compared with base year and
decreased in the year 2012 to 22305
The NCA shown increased trend from year and crossed 100
The overall trend was good
8102019 A Study A Study On Financial Performance Analysis With Reference To Kesoram Cementon Financial Performance hellip
httpslidepdfcomreaderfulla-study-a-study-on-financial-performance-analysis-with-reference-to-kesoram 6681
66
Ratio Analysis-
Current Ratio-
Current Ratio = Current Assets Current Liabilities
Current assets are cash in hand Cash at bank Marketable Securities(short term) short term
Investment Bills receivables sundry debtors Inventories (stock) Work in progress prepaid
expenses Current Liabilities are outstanding expenses Bills payable sundry Creditors
short-term advances income tax payable and Dividend payable
Current Ratio of Kesoram-
(Rupees in crores)
Year Current Assets Current Liabilities Current Ratio
2007-08 75560 57067 132
2008-09 102580 66587 154
2009-10 153922 107688 143
2010-11 182177 113902 160
2011-12 173833 180010 097
Interpretation-
As per the standard rule of current ratio ie 21 where current assets double the current
liabilities is considered satisfactory
In the present analysis the current ratio of the Kesoram is not satisfactory
from the above table It was assessed that the current ratio for all the five year is lower (less)
than the standard rule ie 21 And it is 097 in the year 2011-2012 (current year) This is
highly UN satisfactory
8102019 A Study A Study On Financial Performance Analysis With Reference To Kesoram Cementon Financial Performance hellip
httpslidepdfcomreaderfulla-study-a-study-on-financial-performance-analysis-with-reference-to-kesoram 6781
Quick Ratio-
Quick ratio also known as acid-test ratio establishes a relationship between quick
assets and the current liabilities Cash is the most liquid asset It is calculated by dividing
quick assets by current liabilities
Quick ratio = Quick Assets Current Liabilities
(Quick Assets = Current assets ndash Inventory)
Quick Ratio of Kesoram-
Rupees in crores)
Year Total QuickAssets
Current Liabilities Quick Ratio
2007-08 33343 57067 058
2008-09 43674 66587 066
2009-10 62303 107688 058
2010-11 70322 113902 0622011-12 74333 180010 041
Interpretation-
Usually a high Quick ratio is an indication that the company is liquid and has the ability to
meet its current or liquid liabilities in time on the other hand a low Quick Ratio represents
8102019 A Study A Study On Financial Performance Analysis With Reference To Kesoram Cementon Financial Performance hellip
httpslidepdfcomreaderfulla-study-a-study-on-financial-performance-analysis-with-reference-to-kesoram 6881
that the companyrsquos liquidity position is not good The above table showing the quick ratios
of Kesoram are canrsquot be considered satisfactory
Leverage Ratios-
Debt-Equity Ratio-
Debt-Equity Ratio = Total Long Term Debt Equity Share Holders Fund
Total Long term Debt= Debenture Capital + Long term loans from banks and financial
institutions + Public deposits
Equity Share Holders fund = Equity + Reserves and Surplus
Debt Equity Ratio of Kesoram
(Rupees in crores)
Year Total Debt Share Holders Fund Debt Equity Ratio
2007-08 109235 98192 111
2008-09 197043 133010 148
2009-10 312622 154024 203
2010-11 399927 130025 308
2011-12 410534 91501 449
8102019 A Study A Study On Financial Performance Analysis With Reference To Kesoram Cementon Financial Performance hellip
httpslidepdfcomreaderfulla-study-a-study-on-financial-performance-analysis-with-reference-to-kesoram 6981
Interpretation-
The Debt-Equity Ratio accepted standard is 05 This ratio reflects the relative contribution
of creditors and owners of business in its financing From the above it is clear that the long
term debt is more than that of the share holdersrsquo fund So we can interpret that the firmrsquosassets are financed more by the external funds rather than by the internal funds
8102019 A Study A Study On Financial Performance Analysis With Reference To Kesoram Cementon Financial Performance hellip
httpslidepdfcomreaderfulla-study-a-study-on-financial-performance-analysis-with-reference-to-kesoram 7081
Fixed Asset Ratio-
Net Sales
Fixed Asset Ratio = helliphelliphelliphelliphelliphelliphelliphelliphelliphelliphellip
Net Assets
Fixed Asset Ratio of Kesoram-
(Rupees in crores)
Year Net Sales Net Assets Fixed Assets Ratio
2007-08 300271 358721 084
2008-09 389797 369172 106
2009-10 475062 343182 1382010-11 539788 180435 299
2011-12 59182 108424 546
Interpretation
This ratio indicates the extent to which the assets of the companyrsquos can be lost without
affecting the interest of the creditors of the company Higher the ratios better the long-term
position of the companyThe above table shows fixed assets ratio in increasing trend Which is good for the
company
8102019 A Study A Study On Financial Performance Analysis With Reference To Kesoram Cementon Financial Performance hellip
httpslidepdfcomreaderfulla-study-a-study-on-financial-performance-analysis-with-reference-to-kesoram 7181
Overall Profitability Ratios-
Net Profit Ratio
Net Profit Ratio indicates net margin on sales It is given by the following equation
Net Profit Ratio = (Net Profit Sales) 100
Net Profit Ratio of Kesoram
(Rupees in crores)
Year Net Profit Sales Net Profit Ratio
2007-08 37917 300271 1263
2008-09 41432 389797 1063
2009-10 20298 475062 427
2010-11 -28176 539788 -5222011-12 -38108 59182 -644
Interpretation
It establishes a relationship between net profits after tax and net sales and
indicates the efficiency of the management in manufacturing selling administrative and
other activities of the company
The higher the ratio the better is the profitability or performance of the business
The above table depicts the net profit Ratio of Kesoram has decreased every year from
2007-2008 to 2011-2012It further decreased to negative in the year 2010-11 to -522 and -
644 in the year 2011-2012 This shows constant decrease in the profits of the company
8102019 A Study A Study On Financial Performance Analysis With Reference To Kesoram Cementon Financial Performance hellip
httpslidepdfcomreaderfulla-study-a-study-on-financial-performance-analysis-with-reference-to-kesoram 7281
72
Return on Investment-
Net Profit
Return on Investment = helliphelliphelliphelliphelliphelliphelliphelliphelliphelliphelliphellip X 100
Share Holders Fund
Return on Investment Ratio of Kesoram-
(Rupees in crores)
Year Net Profit Share Holders Fund Return On Investment
2007-08 37917 98192 3862
2008-09 41432 133010 3115
2009-10 20298 154024 1318
2010-11 -28176 130025 -2167
2011-12 -38108 91501 -4165
Interpretation-
The above table reveals how well the resources of the firm are being used Higher
the ratio better the result The above ratio implies how well the firm is growing in
terms of profitability and efficiency From the above table we can concern that the return on
investment is in decreasing trend ROI is highest in the year 2007-2008 as 3862 But
there after itrsquos decreased every year
The ROI is negative in the years 2010-2011 amp 2011-2012 as -2167 amp -4165 respectively
Which is not a good sign for the firm
8102019 A Study A Study On Financial Performance Analysis With Reference To Kesoram Cementon Financial Performance hellip
httpslidepdfcomreaderfulla-study-a-study-on-financial-performance-analysis-with-reference-to-kesoram 7381
8102019 A Study A Study On Financial Performance Analysis With Reference To Kesoram Cementon Financial Performance hellip
httpslidepdfcomreaderfulla-study-a-study-on-financial-performance-analysis-with-reference-to-kesoram 7481
8102019 A Study A Study On Financial Performance Analysis With Reference To Kesoram Cementon Financial Performance hellip
httpslidepdfcomreaderfulla-study-a-study-on-financial-performance-analysis-with-reference-to-kesoram 7581
75
CHAPTER V
FINDINGS amp SUGGESTIONS
8102019 A Study A Study On Financial Performance Analysis With Reference To Kesoram Cementon Financial Performance hellip
httpslidepdfcomreaderfulla-study-a-study-on-financial-performance-analysis-with-reference-to-kesoram 7681
76
Findings
The Share capital remains constant Share capital is unchanged all the years from
2008-2012
Reserves amp surplus were recorded an increasing trend in the period between 2008
and 2010It is showing decreasing trend in the period 2011-2012 (ie from 16019
in 2010 to 9309 in 2012)
Current Liabilities were increased compared to base year ie 2008
Provisions increased to 262597 ie in Rupees 39232 crores in the current year
The current ratio for all the five year is lower (less) than the standard rule ie 21
And it is 097 in the year 2011-2012 (current year)
The Debt-Equity Ratio was shown under the standard ratio It is clear that the long
term debt is more than that of the share holdersrsquo fund It indicates that the firm
heavily relying on external funds rather than the internal funds
The operating and net profit of Kesoram is in decreasing trend due to heavy
increase of manufacturing amp administrative expenses
ROI is highest in the year 2007-2008 as 3862 The ROI is negative in the years
2010-2011 amp 2011-2012 as -2167 amp -4165 respectively
Return on Equity Capital Employed Ratio of Kesoram has decreased every year
from 2007-2008 to 2010-2011It further decreased to negative in the year 2011-12 to
-3280
EPS of Kesoram has decreased every year from 2008-12It is negative in the year
2011 amp 12
8102019 A Study A Study On Financial Performance Analysis With Reference To Kesoram Cementon Financial Performance hellip
httpslidepdfcomreaderfulla-study-a-study-on-financial-performance-analysis-with-reference-to-kesoram 7781
77
Suggestion
The organization should adopt an appropriate capital structure
The companyrsquos debt-equity ratio is recorded more or less as 111 in the year 2008
and it is increased to 449 in the year 2012 (current year)The company should
adopt a better debt equity mix in the future to control the fluctuations in returns
The company should control fluctuations in cash and bank balances as it impacts the
current ratio of the company
The provisions are showing increasing trend which indicates risk of debtors The
firm should implement an effective credit management policy It should utilize its
idle funds by decreasing provisions
The company should control heavy increase of manufacturing amp administration
expenses as it is impacting the operating and net profit of company
8102019 A Study A Study On Financial Performance Analysis With Reference To Kesoram Cementon Financial Performance hellip
httpslidepdfcomreaderfulla-study-a-study-on-financial-performance-analysis-with-reference-to-kesoram 7881
78
ANNEXURE
Profit And Loss Account of Kesoram Cement
Mar12 Mar11 Mar10 Mar09 Mar08
12 Months 12 Months 12 Months 12 Months 12 Months
INCOME
Sales Turnover 628260 575072 505151 431613 345700
Excise Duty 36440 35284 30089 41815 45429
NET SALES 591820 539788 475062 389797 300271
Other Income 000 000 000 000 000
TOTALINCOME
596129 548733 481019 393969 302020
EXPENDITURE
Manufacturing
Expenses81903 74803 13974 13153 44113
MaterialConsumed
370897 310150 295550 229359 118448
Personal
Expenses33468 27355 23294 18690 15344
Selling Expenses 81910 78253 58667 48846 45019
AdministrativeExpenses
28225 29308 17219 16179 9907
Expenses
Capitalized000 000 000 000 000
Provisions Made 000 000 000 000 000
TOTAL
EXPENDITURE 596403 519870 408704 326227 232832Operating Profit -4583 19918 66358 63570 67439
EBITDA -274 28864 72316 67742 69188
Depreciation 29740 27259 17280 11186 8927
Other Write-offs 000 000 000 000 000
EBIT -30014 1605 55035 56557 60261
Interest 41015 23983 10921 12087 5426
EBT -71029 -22377 44114 44470 54835
Taxes -32921 5798 23816 3037 16918
Profit and Loss
for the Year-38108 -28176 20298 41432 37917
Non RecurringItems
-1142 7063 3228 -4023 402
Other Non Cash
Adjustments1276 091 207 465 017
OtherAdjustments
000 000 000 000 000
REPORTED
PAT-37974 -21021 23734 37874 38335
8102019 A Study A Study On Financial Performance Analysis With Reference To Kesoram Cementon Financial Performance hellip
httpslidepdfcomreaderfulla-study-a-study-on-financial-performance-analysis-with-reference-to-kesoram 7981
79
Balance Sheet Of Kesoram
Years
Particulars 2008 2009 2010 2011 2012
Liabilities
Share Capital 4574 4574 4574 4574 4574Reserves amp Surplus 93085 128024 149111 125162 86657
Revaluation Reserves 533 412 339 289 27
Loans
Secured Loans 97106 153627 186372 237183 317792
Un Secured Loans 12129 43416 12625 162744 92742
Deferred Tax Liabilities 0 0 0 0 0
Current Liabilities
Provisions 33039 34529 35734 1494 40726
Current Liabilities 57067 66587 107688 113902 18001
Total 297533 431169 610068 645348 722771
Assets
Net Block 108424 180435 343182 369172 358721
Capital WIP 63459 86485 41283 43781 68065
Investments 4783 6178 5143 6582 6636
Current Assets
Inventories 44217 58906 91619 111855 99516
Sundry Debtors 27307 38017 54289 63134 67358
Cash amp Bank Balances 4036 5657 8014 7188 6959
Total Current Assets 7556 10258 153922 182177 173833Loans amp Advances 45289 55462 66506 4346 115409
Fixed Deposits 018 028 031 176 107
Total 297533 431169 610068 645348 722771
8102019 A Study A Study On Financial Performance Analysis With Reference To Kesoram Cementon Financial Performance hellip
httpslidepdfcomreaderfulla-study-a-study-on-financial-performance-analysis-with-reference-to-kesoram 8081
80
KEY ITEMS 2012 2011 2010 2009 2008
Preference
Dividend 0 0 0 0 0
Equity Dividend 457 2516 2516 2516 2516
Equity Dividend
() 999 55 55 55 55
Shares in Issue(Lakhs) 45743 45743 45743 45743 45743
EPS - Annualised
(Rs) -8302 -4595 5188 828 838
8102019 A Study A Study On Financial Performance Analysis With Reference To Kesoram Cementon Financial Performance hellip
httpslidepdfcomreaderfulla-study-a-study-on-financial-performance-analysis-with-reference-to-kesoram 8181
BIBLIOGRAPHY
Sl
No
Books Author Name
1 Financial Management Khan amp JAIN
2 Financial Management IMPandey
3 Management Accounting RPTrivedi
Websites amp Search Engines
1 wwwkesoramcom983086
2 wwwmoneycontrolcom
3 wwwgooglefinancecom983086
Annual reports of Kesoram cement limited 2008-2012
8102019 A Study A Study On Financial Performance Analysis With Reference To Kesoram Cementon Financial Performance hellip
httpslidepdfcomreaderfulla-study-a-study-on-financial-performance-analysis-with-reference-to-kesoram 6181
61
Interpretation of common size balance sheet of 2011-2012
Share capital was recorded 071 percent in the total liabilities in the year 2011 it is
decreased to 063 in the year 2012
Reserves amp surplus contributed to 1939 in the total liabilities in the year 2011 it
is decreased to 1199 in the year 2012
Secured loans were 3675 in the total liabilities in the year 2011 it is increased to
4397 in the year 2012
Current Liabilities shown to 1765 in the total liabilities in the year 2011 it is
increased to 2491 in the year 2012
Provisions 023 in the total liabilities in the year 2011 it is increased to 563 in the
year 2012
Fixed Assets were 5721 in the total liabilities in the year 2011 ie decreased to
4963 in the year 2012
Investments were 102 in the total liabilities in the year 2011 it increased to 092
in the year 2012
Sundry debtors were 978 in the total liabilities in the year 2011 it is decreased to
932 in the year 2012
8102019 A Study A Study On Financial Performance Analysis With Reference To Kesoram Cementon Financial Performance hellip
httpslidepdfcomreaderfulla-study-a-study-on-financial-performance-analysis-with-reference-to-kesoram 6281
Trend Analysis
Share Capital-
Year
Amount
(In Crores) Trend
IncreaseDecrease
Base Year Previous Year
2008 4574 10000 000 000
2009 4574 10000 000 000
2010 4574 10000 000 000
2011 4574 10000 000 000
2012 4574 10000 000 000
Trend Percentages in Share Capital
Share capital shown a constant trend in the period 2008 and 2012
Share capital is 4574 crores all the years from 2008-2012
8102019 A Study A Study On Financial Performance Analysis With Reference To Kesoram Cementon Financial Performance hellip
httpslidepdfcomreaderfulla-study-a-study-on-financial-performance-analysis-with-reference-to-kesoram 6381
Reserves amp Surplus-
Year
Amount
(In Crores) Trend
IncreaseDecrease
Base Year Previous Year
2008 93085 10000 000 000
2009 128024 13753 3753 3753
2010 149111 16019 6019 2266
2011 125162 13446 3446 -2573
2012 86657 9309 -691 -4137
Trend Percentages in Reserves amp Surplus
Reserves amp surplus shown an increasing trend in the period between 2008 and 2010
The average trend was 13277 till 2010
The Reserves amp surplus was showing decreasing trend in the period 2011-2012 (ie
from 16019 in 2010 to 9309 in 2012)
The decreasing trend in Reserves amp surplus indicates the decrease in profits of the
firm
8102019 A Study A Study On Financial Performance Analysis With Reference To Kesoram Cementon Financial Performance hellip
httpslidepdfcomreaderfulla-study-a-study-on-financial-performance-analysis-with-reference-to-kesoram 6481
Investments-
Year
Amount
(In Crores) Trend
IncreaseDecrease
Base Year Previous Year
2008 4783 10000 000 000
2009 6178 12917 2917 2917
2010 5143 10753 753 -2164
2011 6582 13761 3761 3009
2012 6636 13874 3874 113
Trend Percentages in Investments-
The investments are shown an increasing trend in the period between 2008 ndash 2009
and it is decreasing in the year 2010
The average trend was 11458 till 2009
The investments increased in the periods 2011-2012 (ie from 10753 in 2010 to
13874 in 2012)
The overall trend in investments shown is satisfactory
8102019 A Study A Study On Financial Performance Analysis With Reference To Kesoram Cementon Financial Performance hellip
httpslidepdfcomreaderfulla-study-a-study-on-financial-performance-analysis-with-reference-to-kesoram 6581
Net Current Assets-
Year
Amount
(In Crores) Trend
IncreaseDecrease
Base Year Previous Year
2008 30761 10000 000 000
2009 56954 18515 8515 8515
2010 77037 25044 15044 6529
2011 110417 35895 25895 10851
2012 68613 22305 12305 -13590
Trends in Net Current Assets-
The NCA shown positive (increasing) trend
The NCA are increased to 35895 (the year 2011) compared with base year and
decreased in the year 2012 to 22305
The NCA shown increased trend from year and crossed 100
The overall trend was good
8102019 A Study A Study On Financial Performance Analysis With Reference To Kesoram Cementon Financial Performance hellip
httpslidepdfcomreaderfulla-study-a-study-on-financial-performance-analysis-with-reference-to-kesoram 6681
66
Ratio Analysis-
Current Ratio-
Current Ratio = Current Assets Current Liabilities
Current assets are cash in hand Cash at bank Marketable Securities(short term) short term
Investment Bills receivables sundry debtors Inventories (stock) Work in progress prepaid
expenses Current Liabilities are outstanding expenses Bills payable sundry Creditors
short-term advances income tax payable and Dividend payable
Current Ratio of Kesoram-
(Rupees in crores)
Year Current Assets Current Liabilities Current Ratio
2007-08 75560 57067 132
2008-09 102580 66587 154
2009-10 153922 107688 143
2010-11 182177 113902 160
2011-12 173833 180010 097
Interpretation-
As per the standard rule of current ratio ie 21 where current assets double the current
liabilities is considered satisfactory
In the present analysis the current ratio of the Kesoram is not satisfactory
from the above table It was assessed that the current ratio for all the five year is lower (less)
than the standard rule ie 21 And it is 097 in the year 2011-2012 (current year) This is
highly UN satisfactory
8102019 A Study A Study On Financial Performance Analysis With Reference To Kesoram Cementon Financial Performance hellip
httpslidepdfcomreaderfulla-study-a-study-on-financial-performance-analysis-with-reference-to-kesoram 6781
Quick Ratio-
Quick ratio also known as acid-test ratio establishes a relationship between quick
assets and the current liabilities Cash is the most liquid asset It is calculated by dividing
quick assets by current liabilities
Quick ratio = Quick Assets Current Liabilities
(Quick Assets = Current assets ndash Inventory)
Quick Ratio of Kesoram-
Rupees in crores)
Year Total QuickAssets
Current Liabilities Quick Ratio
2007-08 33343 57067 058
2008-09 43674 66587 066
2009-10 62303 107688 058
2010-11 70322 113902 0622011-12 74333 180010 041
Interpretation-
Usually a high Quick ratio is an indication that the company is liquid and has the ability to
meet its current or liquid liabilities in time on the other hand a low Quick Ratio represents
8102019 A Study A Study On Financial Performance Analysis With Reference To Kesoram Cementon Financial Performance hellip
httpslidepdfcomreaderfulla-study-a-study-on-financial-performance-analysis-with-reference-to-kesoram 6881
that the companyrsquos liquidity position is not good The above table showing the quick ratios
of Kesoram are canrsquot be considered satisfactory
Leverage Ratios-
Debt-Equity Ratio-
Debt-Equity Ratio = Total Long Term Debt Equity Share Holders Fund
Total Long term Debt= Debenture Capital + Long term loans from banks and financial
institutions + Public deposits
Equity Share Holders fund = Equity + Reserves and Surplus
Debt Equity Ratio of Kesoram
(Rupees in crores)
Year Total Debt Share Holders Fund Debt Equity Ratio
2007-08 109235 98192 111
2008-09 197043 133010 148
2009-10 312622 154024 203
2010-11 399927 130025 308
2011-12 410534 91501 449
8102019 A Study A Study On Financial Performance Analysis With Reference To Kesoram Cementon Financial Performance hellip
httpslidepdfcomreaderfulla-study-a-study-on-financial-performance-analysis-with-reference-to-kesoram 6981
Interpretation-
The Debt-Equity Ratio accepted standard is 05 This ratio reflects the relative contribution
of creditors and owners of business in its financing From the above it is clear that the long
term debt is more than that of the share holdersrsquo fund So we can interpret that the firmrsquosassets are financed more by the external funds rather than by the internal funds
8102019 A Study A Study On Financial Performance Analysis With Reference To Kesoram Cementon Financial Performance hellip
httpslidepdfcomreaderfulla-study-a-study-on-financial-performance-analysis-with-reference-to-kesoram 7081
Fixed Asset Ratio-
Net Sales
Fixed Asset Ratio = helliphelliphelliphelliphelliphelliphelliphelliphelliphelliphellip
Net Assets
Fixed Asset Ratio of Kesoram-
(Rupees in crores)
Year Net Sales Net Assets Fixed Assets Ratio
2007-08 300271 358721 084
2008-09 389797 369172 106
2009-10 475062 343182 1382010-11 539788 180435 299
2011-12 59182 108424 546
Interpretation
This ratio indicates the extent to which the assets of the companyrsquos can be lost without
affecting the interest of the creditors of the company Higher the ratios better the long-term
position of the companyThe above table shows fixed assets ratio in increasing trend Which is good for the
company
8102019 A Study A Study On Financial Performance Analysis With Reference To Kesoram Cementon Financial Performance hellip
httpslidepdfcomreaderfulla-study-a-study-on-financial-performance-analysis-with-reference-to-kesoram 7181
Overall Profitability Ratios-
Net Profit Ratio
Net Profit Ratio indicates net margin on sales It is given by the following equation
Net Profit Ratio = (Net Profit Sales) 100
Net Profit Ratio of Kesoram
(Rupees in crores)
Year Net Profit Sales Net Profit Ratio
2007-08 37917 300271 1263
2008-09 41432 389797 1063
2009-10 20298 475062 427
2010-11 -28176 539788 -5222011-12 -38108 59182 -644
Interpretation
It establishes a relationship between net profits after tax and net sales and
indicates the efficiency of the management in manufacturing selling administrative and
other activities of the company
The higher the ratio the better is the profitability or performance of the business
The above table depicts the net profit Ratio of Kesoram has decreased every year from
2007-2008 to 2011-2012It further decreased to negative in the year 2010-11 to -522 and -
644 in the year 2011-2012 This shows constant decrease in the profits of the company
8102019 A Study A Study On Financial Performance Analysis With Reference To Kesoram Cementon Financial Performance hellip
httpslidepdfcomreaderfulla-study-a-study-on-financial-performance-analysis-with-reference-to-kesoram 7281
72
Return on Investment-
Net Profit
Return on Investment = helliphelliphelliphelliphelliphelliphelliphelliphelliphelliphelliphellip X 100
Share Holders Fund
Return on Investment Ratio of Kesoram-
(Rupees in crores)
Year Net Profit Share Holders Fund Return On Investment
2007-08 37917 98192 3862
2008-09 41432 133010 3115
2009-10 20298 154024 1318
2010-11 -28176 130025 -2167
2011-12 -38108 91501 -4165
Interpretation-
The above table reveals how well the resources of the firm are being used Higher
the ratio better the result The above ratio implies how well the firm is growing in
terms of profitability and efficiency From the above table we can concern that the return on
investment is in decreasing trend ROI is highest in the year 2007-2008 as 3862 But
there after itrsquos decreased every year
The ROI is negative in the years 2010-2011 amp 2011-2012 as -2167 amp -4165 respectively
Which is not a good sign for the firm
8102019 A Study A Study On Financial Performance Analysis With Reference To Kesoram Cementon Financial Performance hellip
httpslidepdfcomreaderfulla-study-a-study-on-financial-performance-analysis-with-reference-to-kesoram 7381
8102019 A Study A Study On Financial Performance Analysis With Reference To Kesoram Cementon Financial Performance hellip
httpslidepdfcomreaderfulla-study-a-study-on-financial-performance-analysis-with-reference-to-kesoram 7481
8102019 A Study A Study On Financial Performance Analysis With Reference To Kesoram Cementon Financial Performance hellip
httpslidepdfcomreaderfulla-study-a-study-on-financial-performance-analysis-with-reference-to-kesoram 7581
75
CHAPTER V
FINDINGS amp SUGGESTIONS
8102019 A Study A Study On Financial Performance Analysis With Reference To Kesoram Cementon Financial Performance hellip
httpslidepdfcomreaderfulla-study-a-study-on-financial-performance-analysis-with-reference-to-kesoram 7681
76
Findings
The Share capital remains constant Share capital is unchanged all the years from
2008-2012
Reserves amp surplus were recorded an increasing trend in the period between 2008
and 2010It is showing decreasing trend in the period 2011-2012 (ie from 16019
in 2010 to 9309 in 2012)
Current Liabilities were increased compared to base year ie 2008
Provisions increased to 262597 ie in Rupees 39232 crores in the current year
The current ratio for all the five year is lower (less) than the standard rule ie 21
And it is 097 in the year 2011-2012 (current year)
The Debt-Equity Ratio was shown under the standard ratio It is clear that the long
term debt is more than that of the share holdersrsquo fund It indicates that the firm
heavily relying on external funds rather than the internal funds
The operating and net profit of Kesoram is in decreasing trend due to heavy
increase of manufacturing amp administrative expenses
ROI is highest in the year 2007-2008 as 3862 The ROI is negative in the years
2010-2011 amp 2011-2012 as -2167 amp -4165 respectively
Return on Equity Capital Employed Ratio of Kesoram has decreased every year
from 2007-2008 to 2010-2011It further decreased to negative in the year 2011-12 to
-3280
EPS of Kesoram has decreased every year from 2008-12It is negative in the year
2011 amp 12
8102019 A Study A Study On Financial Performance Analysis With Reference To Kesoram Cementon Financial Performance hellip
httpslidepdfcomreaderfulla-study-a-study-on-financial-performance-analysis-with-reference-to-kesoram 7781
77
Suggestion
The organization should adopt an appropriate capital structure
The companyrsquos debt-equity ratio is recorded more or less as 111 in the year 2008
and it is increased to 449 in the year 2012 (current year)The company should
adopt a better debt equity mix in the future to control the fluctuations in returns
The company should control fluctuations in cash and bank balances as it impacts the
current ratio of the company
The provisions are showing increasing trend which indicates risk of debtors The
firm should implement an effective credit management policy It should utilize its
idle funds by decreasing provisions
The company should control heavy increase of manufacturing amp administration
expenses as it is impacting the operating and net profit of company
8102019 A Study A Study On Financial Performance Analysis With Reference To Kesoram Cementon Financial Performance hellip
httpslidepdfcomreaderfulla-study-a-study-on-financial-performance-analysis-with-reference-to-kesoram 7881
78
ANNEXURE
Profit And Loss Account of Kesoram Cement
Mar12 Mar11 Mar10 Mar09 Mar08
12 Months 12 Months 12 Months 12 Months 12 Months
INCOME
Sales Turnover 628260 575072 505151 431613 345700
Excise Duty 36440 35284 30089 41815 45429
NET SALES 591820 539788 475062 389797 300271
Other Income 000 000 000 000 000
TOTALINCOME
596129 548733 481019 393969 302020
EXPENDITURE
Manufacturing
Expenses81903 74803 13974 13153 44113
MaterialConsumed
370897 310150 295550 229359 118448
Personal
Expenses33468 27355 23294 18690 15344
Selling Expenses 81910 78253 58667 48846 45019
AdministrativeExpenses
28225 29308 17219 16179 9907
Expenses
Capitalized000 000 000 000 000
Provisions Made 000 000 000 000 000
TOTAL
EXPENDITURE 596403 519870 408704 326227 232832Operating Profit -4583 19918 66358 63570 67439
EBITDA -274 28864 72316 67742 69188
Depreciation 29740 27259 17280 11186 8927
Other Write-offs 000 000 000 000 000
EBIT -30014 1605 55035 56557 60261
Interest 41015 23983 10921 12087 5426
EBT -71029 -22377 44114 44470 54835
Taxes -32921 5798 23816 3037 16918
Profit and Loss
for the Year-38108 -28176 20298 41432 37917
Non RecurringItems
-1142 7063 3228 -4023 402
Other Non Cash
Adjustments1276 091 207 465 017
OtherAdjustments
000 000 000 000 000
REPORTED
PAT-37974 -21021 23734 37874 38335
8102019 A Study A Study On Financial Performance Analysis With Reference To Kesoram Cementon Financial Performance hellip
httpslidepdfcomreaderfulla-study-a-study-on-financial-performance-analysis-with-reference-to-kesoram 7981
79
Balance Sheet Of Kesoram
Years
Particulars 2008 2009 2010 2011 2012
Liabilities
Share Capital 4574 4574 4574 4574 4574Reserves amp Surplus 93085 128024 149111 125162 86657
Revaluation Reserves 533 412 339 289 27
Loans
Secured Loans 97106 153627 186372 237183 317792
Un Secured Loans 12129 43416 12625 162744 92742
Deferred Tax Liabilities 0 0 0 0 0
Current Liabilities
Provisions 33039 34529 35734 1494 40726
Current Liabilities 57067 66587 107688 113902 18001
Total 297533 431169 610068 645348 722771
Assets
Net Block 108424 180435 343182 369172 358721
Capital WIP 63459 86485 41283 43781 68065
Investments 4783 6178 5143 6582 6636
Current Assets
Inventories 44217 58906 91619 111855 99516
Sundry Debtors 27307 38017 54289 63134 67358
Cash amp Bank Balances 4036 5657 8014 7188 6959
Total Current Assets 7556 10258 153922 182177 173833Loans amp Advances 45289 55462 66506 4346 115409
Fixed Deposits 018 028 031 176 107
Total 297533 431169 610068 645348 722771
8102019 A Study A Study On Financial Performance Analysis With Reference To Kesoram Cementon Financial Performance hellip
httpslidepdfcomreaderfulla-study-a-study-on-financial-performance-analysis-with-reference-to-kesoram 8081
80
KEY ITEMS 2012 2011 2010 2009 2008
Preference
Dividend 0 0 0 0 0
Equity Dividend 457 2516 2516 2516 2516
Equity Dividend
() 999 55 55 55 55
Shares in Issue(Lakhs) 45743 45743 45743 45743 45743
EPS - Annualised
(Rs) -8302 -4595 5188 828 838
8102019 A Study A Study On Financial Performance Analysis With Reference To Kesoram Cementon Financial Performance hellip
httpslidepdfcomreaderfulla-study-a-study-on-financial-performance-analysis-with-reference-to-kesoram 8181
BIBLIOGRAPHY
Sl
No
Books Author Name
1 Financial Management Khan amp JAIN
2 Financial Management IMPandey
3 Management Accounting RPTrivedi
Websites amp Search Engines
1 wwwkesoramcom983086
2 wwwmoneycontrolcom
3 wwwgooglefinancecom983086
Annual reports of Kesoram cement limited 2008-2012

8102019 A Study A Study On Financial Performance Analysis With Reference To Kesoram Cementon Financial Performance hellip
httpslidepdfcomreaderfulla-study-a-study-on-financial-performance-analysis-with-reference-to-kesoram 6481
Investments-
Year
Amount
(In Crores) Trend
IncreaseDecrease
Base Year Previous Year
2008 4783 10000 000 000
2009 6178 12917 2917 2917
2010 5143 10753 753 -2164
2011 6582 13761 3761 3009
2012 6636 13874 3874 113
Trend Percentages in Investments-
The investments are shown an increasing trend in the period between 2008 ndash 2009
and it is decreasing in the year 2010
The average trend was 11458 till 2009
The investments increased in the periods 2011-2012 (ie from 10753 in 2010 to
13874 in 2012)
The overall trend in investments shown is satisfactory
8102019 A Study A Study On Financial Performance Analysis With Reference To Kesoram Cementon Financial Performance hellip
httpslidepdfcomreaderfulla-study-a-study-on-financial-performance-analysis-with-reference-to-kesoram 6581
Net Current Assets-
Year
Amount
(In Crores) Trend
IncreaseDecrease
Base Year Previous Year
2008 30761 10000 000 000
2009 56954 18515 8515 8515
2010 77037 25044 15044 6529
2011 110417 35895 25895 10851
2012 68613 22305 12305 -13590
Trends in Net Current Assets-
The NCA shown positive (increasing) trend
The NCA are increased to 35895 (the year 2011) compared with base year and
decreased in the year 2012 to 22305
The NCA shown increased trend from year and crossed 100
The overall trend was good
8102019 A Study A Study On Financial Performance Analysis With Reference To Kesoram Cementon Financial Performance hellip
httpslidepdfcomreaderfulla-study-a-study-on-financial-performance-analysis-with-reference-to-kesoram 6681
66
Ratio Analysis-
Current Ratio-
Current Ratio = Current Assets Current Liabilities
Current assets are cash in hand Cash at bank Marketable Securities(short term) short term
Investment Bills receivables sundry debtors Inventories (stock) Work in progress prepaid
expenses Current Liabilities are outstanding expenses Bills payable sundry Creditors
short-term advances income tax payable and Dividend payable
Current Ratio of Kesoram-
(Rupees in crores)
Year Current Assets Current Liabilities Current Ratio
2007-08 75560 57067 132
2008-09 102580 66587 154
2009-10 153922 107688 143
2010-11 182177 113902 160
2011-12 173833 180010 097
Interpretation-
As per the standard rule of current ratio ie 21 where current assets double the current
liabilities is considered satisfactory
In the present analysis the current ratio of the Kesoram is not satisfactory
from the above table It was assessed that the current ratio for all the five year is lower (less)
than the standard rule ie 21 And it is 097 in the year 2011-2012 (current year) This is
highly UN satisfactory
8102019 A Study A Study On Financial Performance Analysis With Reference To Kesoram Cementon Financial Performance hellip
httpslidepdfcomreaderfulla-study-a-study-on-financial-performance-analysis-with-reference-to-kesoram 6781
Quick Ratio-
Quick ratio also known as acid-test ratio establishes a relationship between quick
assets and the current liabilities Cash is the most liquid asset It is calculated by dividing
quick assets by current liabilities
Quick ratio = Quick Assets Current Liabilities
(Quick Assets = Current assets ndash Inventory)
Quick Ratio of Kesoram-
Rupees in crores)
Year Total QuickAssets
Current Liabilities Quick Ratio
2007-08 33343 57067 058
2008-09 43674 66587 066
2009-10 62303 107688 058
2010-11 70322 113902 0622011-12 74333 180010 041
Interpretation-
Usually a high Quick ratio is an indication that the company is liquid and has the ability to
meet its current or liquid liabilities in time on the other hand a low Quick Ratio represents
8102019 A Study A Study On Financial Performance Analysis With Reference To Kesoram Cementon Financial Performance hellip
httpslidepdfcomreaderfulla-study-a-study-on-financial-performance-analysis-with-reference-to-kesoram 6881
that the companyrsquos liquidity position is not good The above table showing the quick ratios
of Kesoram are canrsquot be considered satisfactory
Leverage Ratios-
Debt-Equity Ratio-
Debt-Equity Ratio = Total Long Term Debt Equity Share Holders Fund
Total Long term Debt= Debenture Capital + Long term loans from banks and financial
institutions + Public deposits
Equity Share Holders fund = Equity + Reserves and Surplus
Debt Equity Ratio of Kesoram
(Rupees in crores)
Year Total Debt Share Holders Fund Debt Equity Ratio
2007-08 109235 98192 111
2008-09 197043 133010 148
2009-10 312622 154024 203
2010-11 399927 130025 308
2011-12 410534 91501 449
8102019 A Study A Study On Financial Performance Analysis With Reference To Kesoram Cementon Financial Performance hellip
httpslidepdfcomreaderfulla-study-a-study-on-financial-performance-analysis-with-reference-to-kesoram 6981
Interpretation-
The Debt-Equity Ratio accepted standard is 05 This ratio reflects the relative contribution
of creditors and owners of business in its financing From the above it is clear that the long
term debt is more than that of the share holdersrsquo fund So we can interpret that the firmrsquosassets are financed more by the external funds rather than by the internal funds
8102019 A Study A Study On Financial Performance Analysis With Reference To Kesoram Cementon Financial Performance hellip
httpslidepdfcomreaderfulla-study-a-study-on-financial-performance-analysis-with-reference-to-kesoram 7081
Fixed Asset Ratio-
Net Sales
Fixed Asset Ratio = helliphelliphelliphelliphelliphelliphelliphelliphelliphelliphellip
Net Assets
Fixed Asset Ratio of Kesoram-
(Rupees in crores)
Year Net Sales Net Assets Fixed Assets Ratio
2007-08 300271 358721 084
2008-09 389797 369172 106
2009-10 475062 343182 1382010-11 539788 180435 299
2011-12 59182 108424 546
Interpretation
This ratio indicates the extent to which the assets of the companyrsquos can be lost without
affecting the interest of the creditors of the company Higher the ratios better the long-term
position of the companyThe above table shows fixed assets ratio in increasing trend Which is good for the
company
8102019 A Study A Study On Financial Performance Analysis With Reference To Kesoram Cementon Financial Performance hellip
httpslidepdfcomreaderfulla-study-a-study-on-financial-performance-analysis-with-reference-to-kesoram 7181
Overall Profitability Ratios-
Net Profit Ratio
Net Profit Ratio indicates net margin on sales It is given by the following equation
Net Profit Ratio = (Net Profit Sales) 100
Net Profit Ratio of Kesoram
(Rupees in crores)
Year Net Profit Sales Net Profit Ratio
2007-08 37917 300271 1263
2008-09 41432 389797 1063
2009-10 20298 475062 427
2010-11 -28176 539788 -5222011-12 -38108 59182 -644
Interpretation
It establishes a relationship between net profits after tax and net sales and
indicates the efficiency of the management in manufacturing selling administrative and
other activities of the company
The higher the ratio the better is the profitability or performance of the business
The above table depicts the net profit Ratio of Kesoram has decreased every year from
2007-2008 to 2011-2012It further decreased to negative in the year 2010-11 to -522 and -
644 in the year 2011-2012 This shows constant decrease in the profits of the company
8102019 A Study A Study On Financial Performance Analysis With Reference To Kesoram Cementon Financial Performance hellip
httpslidepdfcomreaderfulla-study-a-study-on-financial-performance-analysis-with-reference-to-kesoram 7281
72
Return on Investment-
Net Profit
Return on Investment = helliphelliphelliphelliphelliphelliphelliphelliphelliphelliphelliphellip X 100
Share Holders Fund
Return on Investment Ratio of Kesoram-
(Rupees in crores)
Year Net Profit Share Holders Fund Return On Investment
2007-08 37917 98192 3862
2008-09 41432 133010 3115
2009-10 20298 154024 1318
2010-11 -28176 130025 -2167
2011-12 -38108 91501 -4165
Interpretation-
The above table reveals how well the resources of the firm are being used Higher
the ratio better the result The above ratio implies how well the firm is growing in
terms of profitability and efficiency From the above table we can concern that the return on
investment is in decreasing trend ROI is highest in the year 2007-2008 as 3862 But
there after itrsquos decreased every year
The ROI is negative in the years 2010-2011 amp 2011-2012 as -2167 amp -4165 respectively
Which is not a good sign for the firm
8102019 A Study A Study On Financial Performance Analysis With Reference To Kesoram Cementon Financial Performance hellip
httpslidepdfcomreaderfulla-study-a-study-on-financial-performance-analysis-with-reference-to-kesoram 7381
8102019 A Study A Study On Financial Performance Analysis With Reference To Kesoram Cementon Financial Performance hellip
httpslidepdfcomreaderfulla-study-a-study-on-financial-performance-analysis-with-reference-to-kesoram 7481
8102019 A Study A Study On Financial Performance Analysis With Reference To Kesoram Cementon Financial Performance hellip
httpslidepdfcomreaderfulla-study-a-study-on-financial-performance-analysis-with-reference-to-kesoram 7581
75
CHAPTER V
FINDINGS amp SUGGESTIONS
8102019 A Study A Study On Financial Performance Analysis With Reference To Kesoram Cementon Financial Performance hellip
httpslidepdfcomreaderfulla-study-a-study-on-financial-performance-analysis-with-reference-to-kesoram 7681
76
Findings
The Share capital remains constant Share capital is unchanged all the years from
2008-2012
Reserves amp surplus were recorded an increasing trend in the period between 2008
and 2010It is showing decreasing trend in the period 2011-2012 (ie from 16019
in 2010 to 9309 in 2012)
Current Liabilities were increased compared to base year ie 2008
Provisions increased to 262597 ie in Rupees 39232 crores in the current year
The current ratio for all the five year is lower (less) than the standard rule ie 21
And it is 097 in the year 2011-2012 (current year)
The Debt-Equity Ratio was shown under the standard ratio It is clear that the long
term debt is more than that of the share holdersrsquo fund It indicates that the firm
heavily relying on external funds rather than the internal funds
The operating and net profit of Kesoram is in decreasing trend due to heavy
increase of manufacturing amp administrative expenses
ROI is highest in the year 2007-2008 as 3862 The ROI is negative in the years
2010-2011 amp 2011-2012 as -2167 amp -4165 respectively
Return on Equity Capital Employed Ratio of Kesoram has decreased every year
from 2007-2008 to 2010-2011It further decreased to negative in the year 2011-12 to
-3280
EPS of Kesoram has decreased every year from 2008-12It is negative in the year
2011 amp 12
8102019 A Study A Study On Financial Performance Analysis With Reference To Kesoram Cementon Financial Performance hellip
httpslidepdfcomreaderfulla-study-a-study-on-financial-performance-analysis-with-reference-to-kesoram 7781
77
Suggestion
The organization should adopt an appropriate capital structure
The companyrsquos debt-equity ratio is recorded more or less as 111 in the year 2008
and it is increased to 449 in the year 2012 (current year)The company should
adopt a better debt equity mix in the future to control the fluctuations in returns
The company should control fluctuations in cash and bank balances as it impacts the
current ratio of the company
The provisions are showing increasing trend which indicates risk of debtors The
firm should implement an effective credit management policy It should utilize its
idle funds by decreasing provisions
The company should control heavy increase of manufacturing amp administration
expenses as it is impacting the operating and net profit of company
8102019 A Study A Study On Financial Performance Analysis With Reference To Kesoram Cementon Financial Performance hellip
httpslidepdfcomreaderfulla-study-a-study-on-financial-performance-analysis-with-reference-to-kesoram 7881
78
ANNEXURE
Profit And Loss Account of Kesoram Cement
Mar12 Mar11 Mar10 Mar09 Mar08
12 Months 12 Months 12 Months 12 Months 12 Months
INCOME
Sales Turnover 628260 575072 505151 431613 345700
Excise Duty 36440 35284 30089 41815 45429
NET SALES 591820 539788 475062 389797 300271
Other Income 000 000 000 000 000
TOTALINCOME
596129 548733 481019 393969 302020
EXPENDITURE
Manufacturing
Expenses81903 74803 13974 13153 44113
MaterialConsumed
370897 310150 295550 229359 118448
Personal
Expenses33468 27355 23294 18690 15344
Selling Expenses 81910 78253 58667 48846 45019
AdministrativeExpenses
28225 29308 17219 16179 9907
Expenses
Capitalized000 000 000 000 000
Provisions Made 000 000 000 000 000
TOTAL
EXPENDITURE 596403 519870 408704 326227 232832Operating Profit -4583 19918 66358 63570 67439
EBITDA -274 28864 72316 67742 69188
Depreciation 29740 27259 17280 11186 8927
Other Write-offs 000 000 000 000 000
EBIT -30014 1605 55035 56557 60261
Interest 41015 23983 10921 12087 5426
EBT -71029 -22377 44114 44470 54835
Taxes -32921 5798 23816 3037 16918
Profit and Loss
for the Year-38108 -28176 20298 41432 37917
Non RecurringItems
-1142 7063 3228 -4023 402
Other Non Cash
Adjustments1276 091 207 465 017
OtherAdjustments
000 000 000 000 000
REPORTED
PAT-37974 -21021 23734 37874 38335
8102019 A Study A Study On Financial Performance Analysis With Reference To Kesoram Cementon Financial Performance hellip
httpslidepdfcomreaderfulla-study-a-study-on-financial-performance-analysis-with-reference-to-kesoram 7981
79
Balance Sheet Of Kesoram
Years
Particulars 2008 2009 2010 2011 2012
Liabilities
Share Capital 4574 4574 4574 4574 4574Reserves amp Surplus 93085 128024 149111 125162 86657
Revaluation Reserves 533 412 339 289 27
Loans
Secured Loans 97106 153627 186372 237183 317792
Un Secured Loans 12129 43416 12625 162744 92742
Deferred Tax Liabilities 0 0 0 0 0
Current Liabilities
Provisions 33039 34529 35734 1494 40726
Current Liabilities 57067 66587 107688 113902 18001
Total 297533 431169 610068 645348 722771
Assets
Net Block 108424 180435 343182 369172 358721
Capital WIP 63459 86485 41283 43781 68065
Investments 4783 6178 5143 6582 6636
Current Assets
Inventories 44217 58906 91619 111855 99516
Sundry Debtors 27307 38017 54289 63134 67358
Cash amp Bank Balances 4036 5657 8014 7188 6959
Total Current Assets 7556 10258 153922 182177 173833Loans amp Advances 45289 55462 66506 4346 115409
Fixed Deposits 018 028 031 176 107
Total 297533 431169 610068 645348 722771
8102019 A Study A Study On Financial Performance Analysis With Reference To Kesoram Cementon Financial Performance hellip
httpslidepdfcomreaderfulla-study-a-study-on-financial-performance-analysis-with-reference-to-kesoram 8081
80
KEY ITEMS 2012 2011 2010 2009 2008
Preference
Dividend 0 0 0 0 0
Equity Dividend 457 2516 2516 2516 2516
Equity Dividend
() 999 55 55 55 55
Shares in Issue(Lakhs) 45743 45743 45743 45743 45743
EPS - Annualised
(Rs) -8302 -4595 5188 828 838
8102019 A Study A Study On Financial Performance Analysis With Reference To Kesoram Cementon Financial Performance hellip
httpslidepdfcomreaderfulla-study-a-study-on-financial-performance-analysis-with-reference-to-kesoram 8181
BIBLIOGRAPHY
Sl
No
Books Author Name
1 Financial Management Khan amp JAIN
2 Financial Management IMPandey
3 Management Accounting RPTrivedi
Websites amp Search Engines
1 wwwkesoramcom983086
2 wwwmoneycontrolcom
3 wwwgooglefinancecom983086
Annual reports of Kesoram cement limited 2008-2012
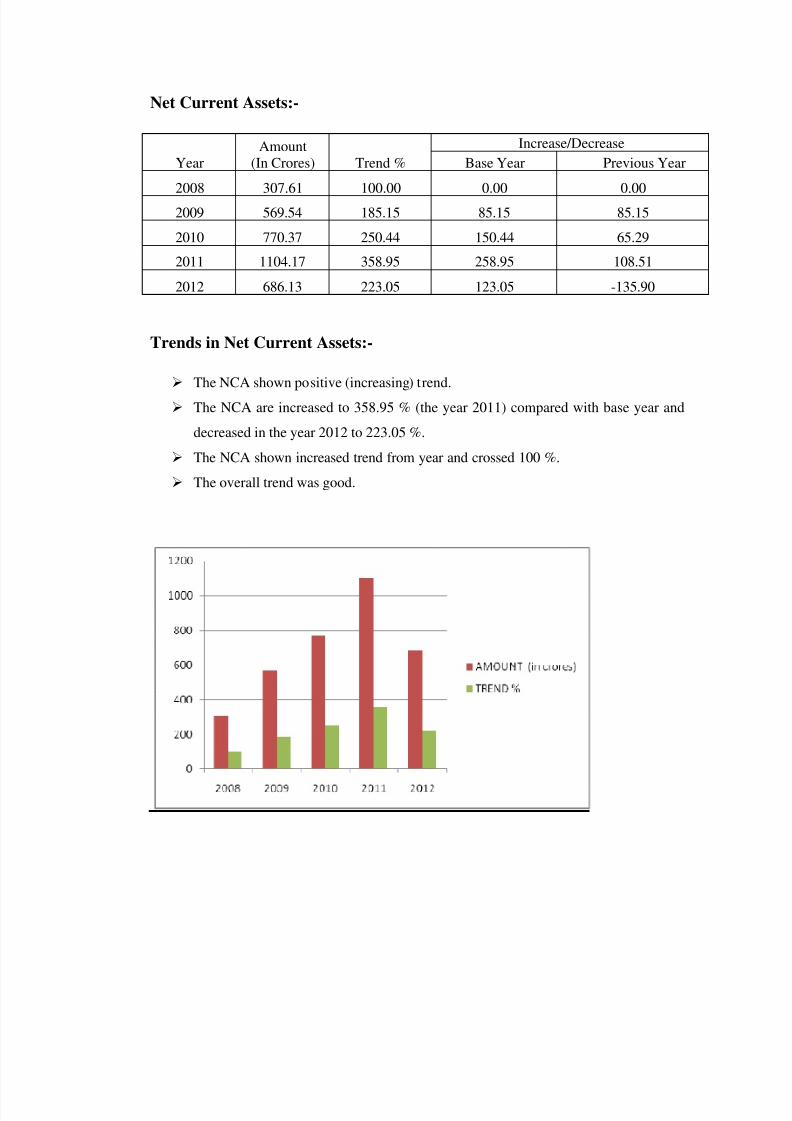
8102019 A Study A Study On Financial Performance Analysis With Reference To Kesoram Cementon Financial Performance hellip
httpslidepdfcomreaderfulla-study-a-study-on-financial-performance-analysis-with-reference-to-kesoram 6581
Net Current Assets-
Year
Amount
(In Crores) Trend
IncreaseDecrease
Base Year Previous Year
2008 30761 10000 000 000
2009 56954 18515 8515 8515
2010 77037 25044 15044 6529
2011 110417 35895 25895 10851
2012 68613 22305 12305 -13590
Trends in Net Current Assets-
The NCA shown positive (increasing) trend
The NCA are increased to 35895 (the year 2011) compared with base year and
decreased in the year 2012 to 22305
The NCA shown increased trend from year and crossed 100
The overall trend was good
8102019 A Study A Study On Financial Performance Analysis With Reference To Kesoram Cementon Financial Performance hellip
httpslidepdfcomreaderfulla-study-a-study-on-financial-performance-analysis-with-reference-to-kesoram 6681
66
Ratio Analysis-
Current Ratio-
Current Ratio = Current Assets Current Liabilities
Current assets are cash in hand Cash at bank Marketable Securities(short term) short term
Investment Bills receivables sundry debtors Inventories (stock) Work in progress prepaid
expenses Current Liabilities are outstanding expenses Bills payable sundry Creditors
short-term advances income tax payable and Dividend payable
Current Ratio of Kesoram-
(Rupees in crores)
Year Current Assets Current Liabilities Current Ratio
2007-08 75560 57067 132
2008-09 102580 66587 154
2009-10 153922 107688 143
2010-11 182177 113902 160
2011-12 173833 180010 097
Interpretation-
As per the standard rule of current ratio ie 21 where current assets double the current
liabilities is considered satisfactory
In the present analysis the current ratio of the Kesoram is not satisfactory
from the above table It was assessed that the current ratio for all the five year is lower (less)
than the standard rule ie 21 And it is 097 in the year 2011-2012 (current year) This is
highly UN satisfactory
8102019 A Study A Study On Financial Performance Analysis With Reference To Kesoram Cementon Financial Performance hellip
httpslidepdfcomreaderfulla-study-a-study-on-financial-performance-analysis-with-reference-to-kesoram 6781
Quick Ratio-
Quick ratio also known as acid-test ratio establishes a relationship between quick
assets and the current liabilities Cash is the most liquid asset It is calculated by dividing
quick assets by current liabilities
Quick ratio = Quick Assets Current Liabilities
(Quick Assets = Current assets ndash Inventory)
Quick Ratio of Kesoram-
Rupees in crores)
Year Total QuickAssets
Current Liabilities Quick Ratio
2007-08 33343 57067 058
2008-09 43674 66587 066
2009-10 62303 107688 058
2010-11 70322 113902 0622011-12 74333 180010 041
Interpretation-
Usually a high Quick ratio is an indication that the company is liquid and has the ability to
meet its current or liquid liabilities in time on the other hand a low Quick Ratio represents
8102019 A Study A Study On Financial Performance Analysis With Reference To Kesoram Cementon Financial Performance hellip
httpslidepdfcomreaderfulla-study-a-study-on-financial-performance-analysis-with-reference-to-kesoram 6881
that the companyrsquos liquidity position is not good The above table showing the quick ratios
of Kesoram are canrsquot be considered satisfactory
Leverage Ratios-
Debt-Equity Ratio-
Debt-Equity Ratio = Total Long Term Debt Equity Share Holders Fund
Total Long term Debt= Debenture Capital + Long term loans from banks and financial
institutions + Public deposits
Equity Share Holders fund = Equity + Reserves and Surplus
Debt Equity Ratio of Kesoram
(Rupees in crores)
Year Total Debt Share Holders Fund Debt Equity Ratio
2007-08 109235 98192 111
2008-09 197043 133010 148
2009-10 312622 154024 203
2010-11 399927 130025 308
2011-12 410534 91501 449
8102019 A Study A Study On Financial Performance Analysis With Reference To Kesoram Cementon Financial Performance hellip
httpslidepdfcomreaderfulla-study-a-study-on-financial-performance-analysis-with-reference-to-kesoram 6981
Interpretation-
The Debt-Equity Ratio accepted standard is 05 This ratio reflects the relative contribution
of creditors and owners of business in its financing From the above it is clear that the long
term debt is more than that of the share holdersrsquo fund So we can interpret that the firmrsquosassets are financed more by the external funds rather than by the internal funds
8102019 A Study A Study On Financial Performance Analysis With Reference To Kesoram Cementon Financial Performance hellip
httpslidepdfcomreaderfulla-study-a-study-on-financial-performance-analysis-with-reference-to-kesoram 7081
Fixed Asset Ratio-
Net Sales
Fixed Asset Ratio = helliphelliphelliphelliphelliphelliphelliphelliphelliphelliphellip
Net Assets
Fixed Asset Ratio of Kesoram-
(Rupees in crores)
Year Net Sales Net Assets Fixed Assets Ratio
2007-08 300271 358721 084
2008-09 389797 369172 106
2009-10 475062 343182 1382010-11 539788 180435 299
2011-12 59182 108424 546
Interpretation
This ratio indicates the extent to which the assets of the companyrsquos can be lost without
affecting the interest of the creditors of the company Higher the ratios better the long-term
position of the companyThe above table shows fixed assets ratio in increasing trend Which is good for the
company
8102019 A Study A Study On Financial Performance Analysis With Reference To Kesoram Cementon Financial Performance hellip
httpslidepdfcomreaderfulla-study-a-study-on-financial-performance-analysis-with-reference-to-kesoram 7181
Overall Profitability Ratios-
Net Profit Ratio
Net Profit Ratio indicates net margin on sales It is given by the following equation
Net Profit Ratio = (Net Profit Sales) 100
Net Profit Ratio of Kesoram
(Rupees in crores)
Year Net Profit Sales Net Profit Ratio
2007-08 37917 300271 1263
2008-09 41432 389797 1063
2009-10 20298 475062 427
2010-11 -28176 539788 -5222011-12 -38108 59182 -644
Interpretation
It establishes a relationship between net profits after tax and net sales and
indicates the efficiency of the management in manufacturing selling administrative and
other activities of the company
The higher the ratio the better is the profitability or performance of the business
The above table depicts the net profit Ratio of Kesoram has decreased every year from
2007-2008 to 2011-2012It further decreased to negative in the year 2010-11 to -522 and -
644 in the year 2011-2012 This shows constant decrease in the profits of the company
8102019 A Study A Study On Financial Performance Analysis With Reference To Kesoram Cementon Financial Performance hellip
httpslidepdfcomreaderfulla-study-a-study-on-financial-performance-analysis-with-reference-to-kesoram 7281
72
Return on Investment-
Net Profit
Return on Investment = helliphelliphelliphelliphelliphelliphelliphelliphelliphelliphelliphellip X 100
Share Holders Fund
Return on Investment Ratio of Kesoram-
(Rupees in crores)
Year Net Profit Share Holders Fund Return On Investment
2007-08 37917 98192 3862
2008-09 41432 133010 3115
2009-10 20298 154024 1318
2010-11 -28176 130025 -2167
2011-12 -38108 91501 -4165
Interpretation-
The above table reveals how well the resources of the firm are being used Higher
the ratio better the result The above ratio implies how well the firm is growing in
terms of profitability and efficiency From the above table we can concern that the return on
investment is in decreasing trend ROI is highest in the year 2007-2008 as 3862 But
there after itrsquos decreased every year
The ROI is negative in the years 2010-2011 amp 2011-2012 as -2167 amp -4165 respectively
Which is not a good sign for the firm
8102019 A Study A Study On Financial Performance Analysis With Reference To Kesoram Cementon Financial Performance hellip
httpslidepdfcomreaderfulla-study-a-study-on-financial-performance-analysis-with-reference-to-kesoram 7381
8102019 A Study A Study On Financial Performance Analysis With Reference To Kesoram Cementon Financial Performance hellip
httpslidepdfcomreaderfulla-study-a-study-on-financial-performance-analysis-with-reference-to-kesoram 7481
8102019 A Study A Study On Financial Performance Analysis With Reference To Kesoram Cementon Financial Performance hellip
httpslidepdfcomreaderfulla-study-a-study-on-financial-performance-analysis-with-reference-to-kesoram 7581
75
CHAPTER V
FINDINGS amp SUGGESTIONS
8102019 A Study A Study On Financial Performance Analysis With Reference To Kesoram Cementon Financial Performance hellip
httpslidepdfcomreaderfulla-study-a-study-on-financial-performance-analysis-with-reference-to-kesoram 7681
76
Findings
The Share capital remains constant Share capital is unchanged all the years from
2008-2012
Reserves amp surplus were recorded an increasing trend in the period between 2008
and 2010It is showing decreasing trend in the period 2011-2012 (ie from 16019
in 2010 to 9309 in 2012)
Current Liabilities were increased compared to base year ie 2008
Provisions increased to 262597 ie in Rupees 39232 crores in the current year
The current ratio for all the five year is lower (less) than the standard rule ie 21
And it is 097 in the year 2011-2012 (current year)
The Debt-Equity Ratio was shown under the standard ratio It is clear that the long
term debt is more than that of the share holdersrsquo fund It indicates that the firm
heavily relying on external funds rather than the internal funds
The operating and net profit of Kesoram is in decreasing trend due to heavy
increase of manufacturing amp administrative expenses
ROI is highest in the year 2007-2008 as 3862 The ROI is negative in the years
2010-2011 amp 2011-2012 as -2167 amp -4165 respectively
Return on Equity Capital Employed Ratio of Kesoram has decreased every year
from 2007-2008 to 2010-2011It further decreased to negative in the year 2011-12 to
-3280
EPS of Kesoram has decreased every year from 2008-12It is negative in the year
2011 amp 12
8102019 A Study A Study On Financial Performance Analysis With Reference To Kesoram Cementon Financial Performance hellip
httpslidepdfcomreaderfulla-study-a-study-on-financial-performance-analysis-with-reference-to-kesoram 7781
77
Suggestion
The organization should adopt an appropriate capital structure
The companyrsquos debt-equity ratio is recorded more or less as 111 in the year 2008
and it is increased to 449 in the year 2012 (current year)The company should
adopt a better debt equity mix in the future to control the fluctuations in returns
The company should control fluctuations in cash and bank balances as it impacts the
current ratio of the company
The provisions are showing increasing trend which indicates risk of debtors The
firm should implement an effective credit management policy It should utilize its
idle funds by decreasing provisions
The company should control heavy increase of manufacturing amp administration
expenses as it is impacting the operating and net profit of company
8102019 A Study A Study On Financial Performance Analysis With Reference To Kesoram Cementon Financial Performance hellip
httpslidepdfcomreaderfulla-study-a-study-on-financial-performance-analysis-with-reference-to-kesoram 7881
78
ANNEXURE
Profit And Loss Account of Kesoram Cement
Mar12 Mar11 Mar10 Mar09 Mar08
12 Months 12 Months 12 Months 12 Months 12 Months
INCOME
Sales Turnover 628260 575072 505151 431613 345700
Excise Duty 36440 35284 30089 41815 45429
NET SALES 591820 539788 475062 389797 300271
Other Income 000 000 000 000 000
TOTALINCOME
596129 548733 481019 393969 302020
EXPENDITURE
Manufacturing
Expenses81903 74803 13974 13153 44113
MaterialConsumed
370897 310150 295550 229359 118448
Personal
Expenses33468 27355 23294 18690 15344
Selling Expenses 81910 78253 58667 48846 45019
AdministrativeExpenses
28225 29308 17219 16179 9907
Expenses
Capitalized000 000 000 000 000
Provisions Made 000 000 000 000 000
TOTAL
EXPENDITURE 596403 519870 408704 326227 232832Operating Profit -4583 19918 66358 63570 67439
EBITDA -274 28864 72316 67742 69188
Depreciation 29740 27259 17280 11186 8927
Other Write-offs 000 000 000 000 000
EBIT -30014 1605 55035 56557 60261
Interest 41015 23983 10921 12087 5426
EBT -71029 -22377 44114 44470 54835
Taxes -32921 5798 23816 3037 16918
Profit and Loss
for the Year-38108 -28176 20298 41432 37917
Non RecurringItems
-1142 7063 3228 -4023 402
Other Non Cash
Adjustments1276 091 207 465 017
OtherAdjustments
000 000 000 000 000
REPORTED
PAT-37974 -21021 23734 37874 38335
8102019 A Study A Study On Financial Performance Analysis With Reference To Kesoram Cementon Financial Performance hellip
httpslidepdfcomreaderfulla-study-a-study-on-financial-performance-analysis-with-reference-to-kesoram 7981
79
Balance Sheet Of Kesoram
Years
Particulars 2008 2009 2010 2011 2012
Liabilities
Share Capital 4574 4574 4574 4574 4574Reserves amp Surplus 93085 128024 149111 125162 86657
Revaluation Reserves 533 412 339 289 27
Loans
Secured Loans 97106 153627 186372 237183 317792
Un Secured Loans 12129 43416 12625 162744 92742
Deferred Tax Liabilities 0 0 0 0 0
Current Liabilities
Provisions 33039 34529 35734 1494 40726
Current Liabilities 57067 66587 107688 113902 18001
Total 297533 431169 610068 645348 722771
Assets
Net Block 108424 180435 343182 369172 358721
Capital WIP 63459 86485 41283 43781 68065
Investments 4783 6178 5143 6582 6636
Current Assets
Inventories 44217 58906 91619 111855 99516
Sundry Debtors 27307 38017 54289 63134 67358
Cash amp Bank Balances 4036 5657 8014 7188 6959
Total Current Assets 7556 10258 153922 182177 173833Loans amp Advances 45289 55462 66506 4346 115409
Fixed Deposits 018 028 031 176 107
Total 297533 431169 610068 645348 722771
8102019 A Study A Study On Financial Performance Analysis With Reference To Kesoram Cementon Financial Performance hellip
httpslidepdfcomreaderfulla-study-a-study-on-financial-performance-analysis-with-reference-to-kesoram 8081
80
KEY ITEMS 2012 2011 2010 2009 2008
Preference
Dividend 0 0 0 0 0
Equity Dividend 457 2516 2516 2516 2516
Equity Dividend
() 999 55 55 55 55
Shares in Issue(Lakhs) 45743 45743 45743 45743 45743
EPS - Annualised
(Rs) -8302 -4595 5188 828 838
8102019 A Study A Study On Financial Performance Analysis With Reference To Kesoram Cementon Financial Performance hellip
httpslidepdfcomreaderfulla-study-a-study-on-financial-performance-analysis-with-reference-to-kesoram 8181
BIBLIOGRAPHY
Sl
No
Books Author Name
1 Financial Management Khan amp JAIN
2 Financial Management IMPandey
3 Management Accounting RPTrivedi
Websites amp Search Engines
1 wwwkesoramcom983086
2 wwwmoneycontrolcom
3 wwwgooglefinancecom983086
Annual reports of Kesoram cement limited 2008-2012
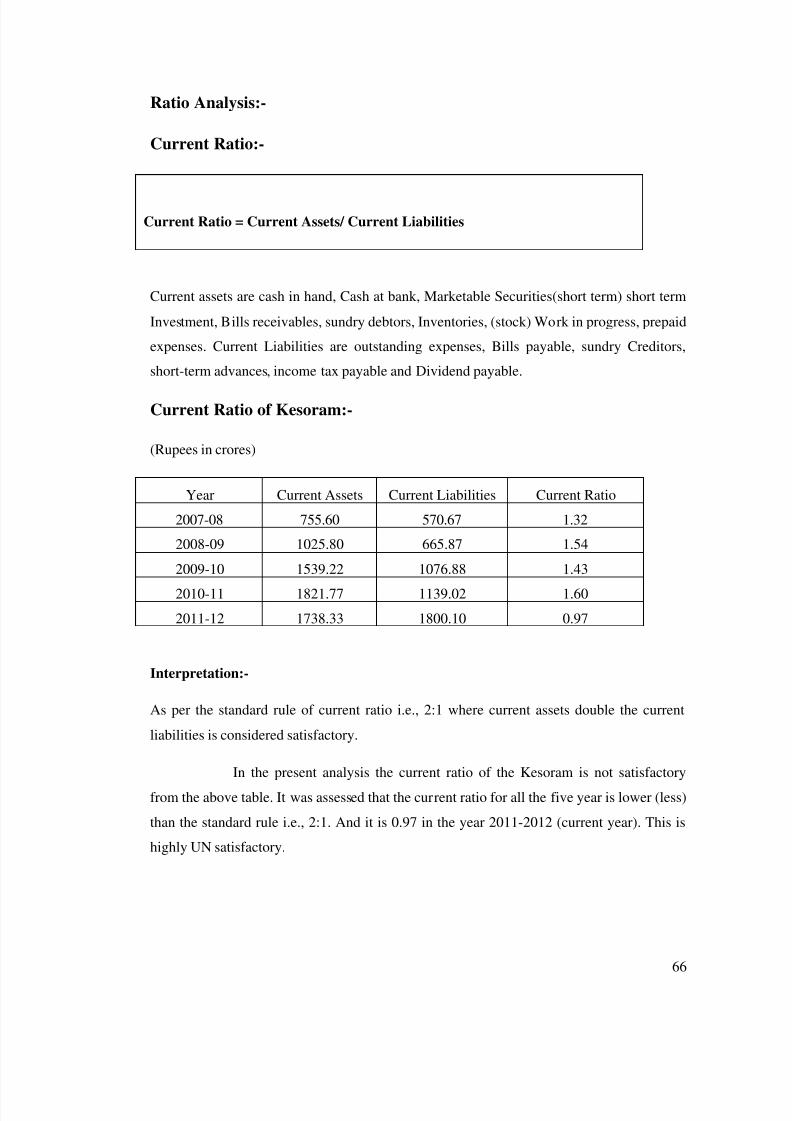
8102019 A Study A Study On Financial Performance Analysis With Reference To Kesoram Cementon Financial Performance hellip
httpslidepdfcomreaderfulla-study-a-study-on-financial-performance-analysis-with-reference-to-kesoram 6681
66
Ratio Analysis-
Current Ratio-
Current Ratio = Current Assets Current Liabilities
Current assets are cash in hand Cash at bank Marketable Securities(short term) short term
Investment Bills receivables sundry debtors Inventories (stock) Work in progress prepaid
expenses Current Liabilities are outstanding expenses Bills payable sundry Creditors
short-term advances income tax payable and Dividend payable
Current Ratio of Kesoram-
(Rupees in crores)
Year Current Assets Current Liabilities Current Ratio
2007-08 75560 57067 132
2008-09 102580 66587 154
2009-10 153922 107688 143
2010-11 182177 113902 160
2011-12 173833 180010 097
Interpretation-
As per the standard rule of current ratio ie 21 where current assets double the current
liabilities is considered satisfactory
In the present analysis the current ratio of the Kesoram is not satisfactory
from the above table It was assessed that the current ratio for all the five year is lower (less)
than the standard rule ie 21 And it is 097 in the year 2011-2012 (current year) This is
highly UN satisfactory
8102019 A Study A Study On Financial Performance Analysis With Reference To Kesoram Cementon Financial Performance hellip
httpslidepdfcomreaderfulla-study-a-study-on-financial-performance-analysis-with-reference-to-kesoram 6781
Quick Ratio-
Quick ratio also known as acid-test ratio establishes a relationship between quick
assets and the current liabilities Cash is the most liquid asset It is calculated by dividing
quick assets by current liabilities
Quick ratio = Quick Assets Current Liabilities
(Quick Assets = Current assets ndash Inventory)
Quick Ratio of Kesoram-
Rupees in crores)
Year Total QuickAssets
Current Liabilities Quick Ratio
2007-08 33343 57067 058
2008-09 43674 66587 066
2009-10 62303 107688 058
2010-11 70322 113902 0622011-12 74333 180010 041
Interpretation-
Usually a high Quick ratio is an indication that the company is liquid and has the ability to
meet its current or liquid liabilities in time on the other hand a low Quick Ratio represents
8102019 A Study A Study On Financial Performance Analysis With Reference To Kesoram Cementon Financial Performance hellip
httpslidepdfcomreaderfulla-study-a-study-on-financial-performance-analysis-with-reference-to-kesoram 6881
that the companyrsquos liquidity position is not good The above table showing the quick ratios
of Kesoram are canrsquot be considered satisfactory
Leverage Ratios-
Debt-Equity Ratio-
Debt-Equity Ratio = Total Long Term Debt Equity Share Holders Fund
Total Long term Debt= Debenture Capital + Long term loans from banks and financial
institutions + Public deposits
Equity Share Holders fund = Equity + Reserves and Surplus
Debt Equity Ratio of Kesoram
(Rupees in crores)
Year Total Debt Share Holders Fund Debt Equity Ratio
2007-08 109235 98192 111
2008-09 197043 133010 148
2009-10 312622 154024 203
2010-11 399927 130025 308
2011-12 410534 91501 449
8102019 A Study A Study On Financial Performance Analysis With Reference To Kesoram Cementon Financial Performance hellip
httpslidepdfcomreaderfulla-study-a-study-on-financial-performance-analysis-with-reference-to-kesoram 6981
Interpretation-
The Debt-Equity Ratio accepted standard is 05 This ratio reflects the relative contribution
of creditors and owners of business in its financing From the above it is clear that the long
term debt is more than that of the share holdersrsquo fund So we can interpret that the firmrsquosassets are financed more by the external funds rather than by the internal funds
8102019 A Study A Study On Financial Performance Analysis With Reference To Kesoram Cementon Financial Performance hellip
httpslidepdfcomreaderfulla-study-a-study-on-financial-performance-analysis-with-reference-to-kesoram 7081
Fixed Asset Ratio-
Net Sales
Fixed Asset Ratio = helliphelliphelliphelliphelliphelliphelliphelliphelliphelliphellip
Net Assets
Fixed Asset Ratio of Kesoram-
(Rupees in crores)
Year Net Sales Net Assets Fixed Assets Ratio
2007-08 300271 358721 084
2008-09 389797 369172 106
2009-10 475062 343182 1382010-11 539788 180435 299
2011-12 59182 108424 546
Interpretation
This ratio indicates the extent to which the assets of the companyrsquos can be lost without
affecting the interest of the creditors of the company Higher the ratios better the long-term
position of the companyThe above table shows fixed assets ratio in increasing trend Which is good for the
company
8102019 A Study A Study On Financial Performance Analysis With Reference To Kesoram Cementon Financial Performance hellip
httpslidepdfcomreaderfulla-study-a-study-on-financial-performance-analysis-with-reference-to-kesoram 7181
Overall Profitability Ratios-
Net Profit Ratio
Net Profit Ratio indicates net margin on sales It is given by the following equation
Net Profit Ratio = (Net Profit Sales) 100
Net Profit Ratio of Kesoram
(Rupees in crores)
Year Net Profit Sales Net Profit Ratio
2007-08 37917 300271 1263
2008-09 41432 389797 1063
2009-10 20298 475062 427
2010-11 -28176 539788 -5222011-12 -38108 59182 -644
Interpretation
It establishes a relationship between net profits after tax and net sales and
indicates the efficiency of the management in manufacturing selling administrative and
other activities of the company
The higher the ratio the better is the profitability or performance of the business
The above table depicts the net profit Ratio of Kesoram has decreased every year from
2007-2008 to 2011-2012It further decreased to negative in the year 2010-11 to -522 and -
644 in the year 2011-2012 This shows constant decrease in the profits of the company
8102019 A Study A Study On Financial Performance Analysis With Reference To Kesoram Cementon Financial Performance hellip
httpslidepdfcomreaderfulla-study-a-study-on-financial-performance-analysis-with-reference-to-kesoram 7281
72
Return on Investment-
Net Profit
Return on Investment = helliphelliphelliphelliphelliphelliphelliphelliphelliphelliphelliphellip X 100
Share Holders Fund
Return on Investment Ratio of Kesoram-
(Rupees in crores)
Year Net Profit Share Holders Fund Return On Investment
2007-08 37917 98192 3862
2008-09 41432 133010 3115
2009-10 20298 154024 1318
2010-11 -28176 130025 -2167
2011-12 -38108 91501 -4165
Interpretation-
The above table reveals how well the resources of the firm are being used Higher
the ratio better the result The above ratio implies how well the firm is growing in
terms of profitability and efficiency From the above table we can concern that the return on
investment is in decreasing trend ROI is highest in the year 2007-2008 as 3862 But
there after itrsquos decreased every year
The ROI is negative in the years 2010-2011 amp 2011-2012 as -2167 amp -4165 respectively
Which is not a good sign for the firm
8102019 A Study A Study On Financial Performance Analysis With Reference To Kesoram Cementon Financial Performance hellip
httpslidepdfcomreaderfulla-study-a-study-on-financial-performance-analysis-with-reference-to-kesoram 7381
8102019 A Study A Study On Financial Performance Analysis With Reference To Kesoram Cementon Financial Performance hellip
httpslidepdfcomreaderfulla-study-a-study-on-financial-performance-analysis-with-reference-to-kesoram 7481
8102019 A Study A Study On Financial Performance Analysis With Reference To Kesoram Cementon Financial Performance hellip
httpslidepdfcomreaderfulla-study-a-study-on-financial-performance-analysis-with-reference-to-kesoram 7581
75
CHAPTER V
FINDINGS amp SUGGESTIONS
8102019 A Study A Study On Financial Performance Analysis With Reference To Kesoram Cementon Financial Performance hellip
httpslidepdfcomreaderfulla-study-a-study-on-financial-performance-analysis-with-reference-to-kesoram 7681
76
Findings
The Share capital remains constant Share capital is unchanged all the years from
2008-2012
Reserves amp surplus were recorded an increasing trend in the period between 2008
and 2010It is showing decreasing trend in the period 2011-2012 (ie from 16019
in 2010 to 9309 in 2012)
Current Liabilities were increased compared to base year ie 2008
Provisions increased to 262597 ie in Rupees 39232 crores in the current year
The current ratio for all the five year is lower (less) than the standard rule ie 21
And it is 097 in the year 2011-2012 (current year)
The Debt-Equity Ratio was shown under the standard ratio It is clear that the long
term debt is more than that of the share holdersrsquo fund It indicates that the firm
heavily relying on external funds rather than the internal funds
The operating and net profit of Kesoram is in decreasing trend due to heavy
increase of manufacturing amp administrative expenses
ROI is highest in the year 2007-2008 as 3862 The ROI is negative in the years
2010-2011 amp 2011-2012 as -2167 amp -4165 respectively
Return on Equity Capital Employed Ratio of Kesoram has decreased every year
from 2007-2008 to 2010-2011It further decreased to negative in the year 2011-12 to
-3280
EPS of Kesoram has decreased every year from 2008-12It is negative in the year
2011 amp 12
8102019 A Study A Study On Financial Performance Analysis With Reference To Kesoram Cementon Financial Performance hellip
httpslidepdfcomreaderfulla-study-a-study-on-financial-performance-analysis-with-reference-to-kesoram 7781
77
Suggestion
The organization should adopt an appropriate capital structure
The companyrsquos debt-equity ratio is recorded more or less as 111 in the year 2008
and it is increased to 449 in the year 2012 (current year)The company should
adopt a better debt equity mix in the future to control the fluctuations in returns
The company should control fluctuations in cash and bank balances as it impacts the
current ratio of the company
The provisions are showing increasing trend which indicates risk of debtors The
firm should implement an effective credit management policy It should utilize its
idle funds by decreasing provisions
The company should control heavy increase of manufacturing amp administration
expenses as it is impacting the operating and net profit of company
8102019 A Study A Study On Financial Performance Analysis With Reference To Kesoram Cementon Financial Performance hellip
httpslidepdfcomreaderfulla-study-a-study-on-financial-performance-analysis-with-reference-to-kesoram 7881
78
ANNEXURE
Profit And Loss Account of Kesoram Cement
Mar12 Mar11 Mar10 Mar09 Mar08
12 Months 12 Months 12 Months 12 Months 12 Months
INCOME
Sales Turnover 628260 575072 505151 431613 345700
Excise Duty 36440 35284 30089 41815 45429
NET SALES 591820 539788 475062 389797 300271
Other Income 000 000 000 000 000
TOTALINCOME
596129 548733 481019 393969 302020
EXPENDITURE
Manufacturing
Expenses81903 74803 13974 13153 44113
MaterialConsumed
370897 310150 295550 229359 118448
Personal
Expenses33468 27355 23294 18690 15344
Selling Expenses 81910 78253 58667 48846 45019
AdministrativeExpenses
28225 29308 17219 16179 9907
Expenses
Capitalized000 000 000 000 000
Provisions Made 000 000 000 000 000
TOTAL
EXPENDITURE 596403 519870 408704 326227 232832Operating Profit -4583 19918 66358 63570 67439
EBITDA -274 28864 72316 67742 69188
Depreciation 29740 27259 17280 11186 8927
Other Write-offs 000 000 000 000 000
EBIT -30014 1605 55035 56557 60261
Interest 41015 23983 10921 12087 5426
EBT -71029 -22377 44114 44470 54835
Taxes -32921 5798 23816 3037 16918
Profit and Loss
for the Year-38108 -28176 20298 41432 37917
Non RecurringItems
-1142 7063 3228 -4023 402
Other Non Cash
Adjustments1276 091 207 465 017
OtherAdjustments
000 000 000 000 000
REPORTED
PAT-37974 -21021 23734 37874 38335
8102019 A Study A Study On Financial Performance Analysis With Reference To Kesoram Cementon Financial Performance hellip
httpslidepdfcomreaderfulla-study-a-study-on-financial-performance-analysis-with-reference-to-kesoram 7981
79
Balance Sheet Of Kesoram
Years
Particulars 2008 2009 2010 2011 2012
Liabilities
Share Capital 4574 4574 4574 4574 4574Reserves amp Surplus 93085 128024 149111 125162 86657
Revaluation Reserves 533 412 339 289 27
Loans
Secured Loans 97106 153627 186372 237183 317792
Un Secured Loans 12129 43416 12625 162744 92742
Deferred Tax Liabilities 0 0 0 0 0
Current Liabilities
Provisions 33039 34529 35734 1494 40726
Current Liabilities 57067 66587 107688 113902 18001
Total 297533 431169 610068 645348 722771
Assets
Net Block 108424 180435 343182 369172 358721
Capital WIP 63459 86485 41283 43781 68065
Investments 4783 6178 5143 6582 6636
Current Assets
Inventories 44217 58906 91619 111855 99516
Sundry Debtors 27307 38017 54289 63134 67358
Cash amp Bank Balances 4036 5657 8014 7188 6959
Total Current Assets 7556 10258 153922 182177 173833Loans amp Advances 45289 55462 66506 4346 115409
Fixed Deposits 018 028 031 176 107
Total 297533 431169 610068 645348 722771
8102019 A Study A Study On Financial Performance Analysis With Reference To Kesoram Cementon Financial Performance hellip
httpslidepdfcomreaderfulla-study-a-study-on-financial-performance-analysis-with-reference-to-kesoram 8081
80
KEY ITEMS 2012 2011 2010 2009 2008
Preference
Dividend 0 0 0 0 0
Equity Dividend 457 2516 2516 2516 2516
Equity Dividend
() 999 55 55 55 55
Shares in Issue(Lakhs) 45743 45743 45743 45743 45743
EPS - Annualised
(Rs) -8302 -4595 5188 828 838
8102019 A Study A Study On Financial Performance Analysis With Reference To Kesoram Cementon Financial Performance hellip
httpslidepdfcomreaderfulla-study-a-study-on-financial-performance-analysis-with-reference-to-kesoram 8181
BIBLIOGRAPHY
Sl
No
Books Author Name
1 Financial Management Khan amp JAIN
2 Financial Management IMPandey
3 Management Accounting RPTrivedi
Websites amp Search Engines
1 wwwkesoramcom983086
2 wwwmoneycontrolcom
3 wwwgooglefinancecom983086
Annual reports of Kesoram cement limited 2008-2012
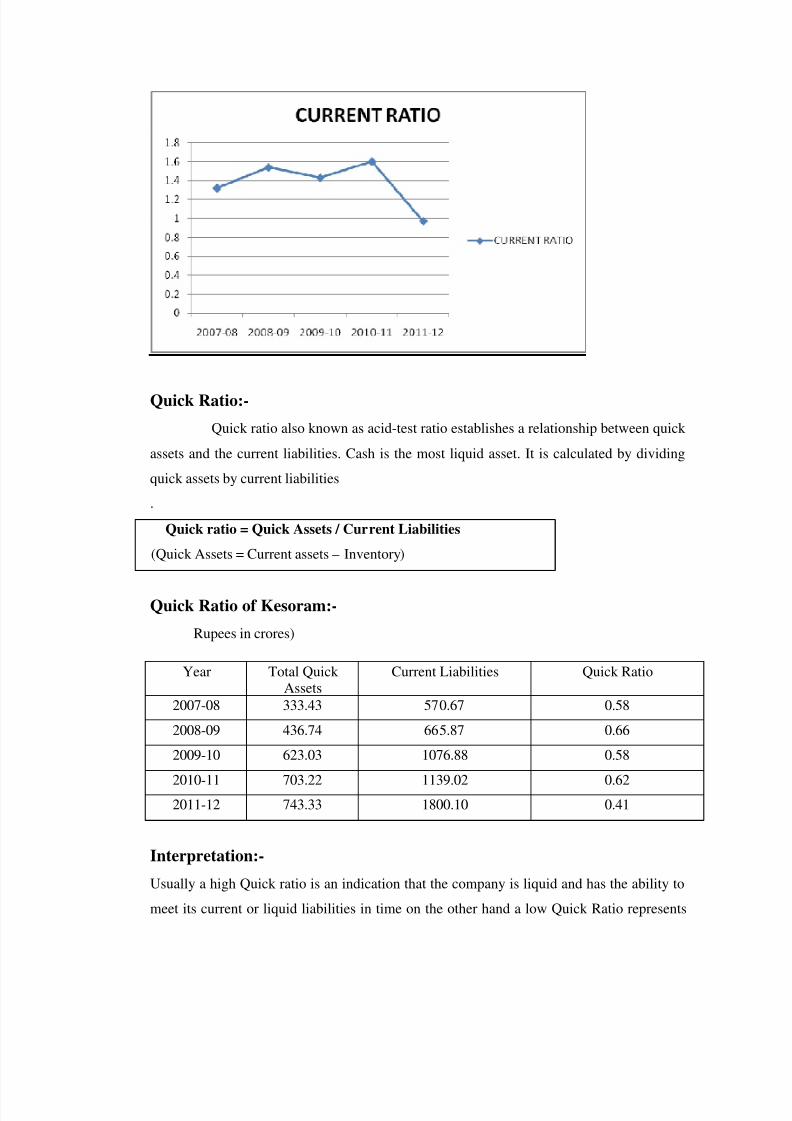
8102019 A Study A Study On Financial Performance Analysis With Reference To Kesoram Cementon Financial Performance hellip
httpslidepdfcomreaderfulla-study-a-study-on-financial-performance-analysis-with-reference-to-kesoram 6881
that the companyrsquos liquidity position is not good The above table showing the quick ratios
of Kesoram are canrsquot be considered satisfactory
Leverage Ratios-
Debt-Equity Ratio-
Debt-Equity Ratio = Total Long Term Debt Equity Share Holders Fund
Total Long term Debt= Debenture Capital + Long term loans from banks and financial
institutions + Public deposits
Equity Share Holders fund = Equity + Reserves and Surplus
Debt Equity Ratio of Kesoram
(Rupees in crores)
Year Total Debt Share Holders Fund Debt Equity Ratio
2007-08 109235 98192 111
2008-09 197043 133010 148
2009-10 312622 154024 203
2010-11 399927 130025 308
2011-12 410534 91501 449
8102019 A Study A Study On Financial Performance Analysis With Reference To Kesoram Cementon Financial Performance hellip
httpslidepdfcomreaderfulla-study-a-study-on-financial-performance-analysis-with-reference-to-kesoram 6981
Interpretation-
The Debt-Equity Ratio accepted standard is 05 This ratio reflects the relative contribution
of creditors and owners of business in its financing From the above it is clear that the long
term debt is more than that of the share holdersrsquo fund So we can interpret that the firmrsquosassets are financed more by the external funds rather than by the internal funds
8102019 A Study A Study On Financial Performance Analysis With Reference To Kesoram Cementon Financial Performance hellip
httpslidepdfcomreaderfulla-study-a-study-on-financial-performance-analysis-with-reference-to-kesoram 7081
Fixed Asset Ratio-
Net Sales
Fixed Asset Ratio = helliphelliphelliphelliphelliphelliphelliphelliphelliphelliphellip
Net Assets
Fixed Asset Ratio of Kesoram-
(Rupees in crores)
Year Net Sales Net Assets Fixed Assets Ratio
2007-08 300271 358721 084
2008-09 389797 369172 106
2009-10 475062 343182 1382010-11 539788 180435 299
2011-12 59182 108424 546
Interpretation
This ratio indicates the extent to which the assets of the companyrsquos can be lost without
affecting the interest of the creditors of the company Higher the ratios better the long-term
position of the companyThe above table shows fixed assets ratio in increasing trend Which is good for the
company
8102019 A Study A Study On Financial Performance Analysis With Reference To Kesoram Cementon Financial Performance hellip
httpslidepdfcomreaderfulla-study-a-study-on-financial-performance-analysis-with-reference-to-kesoram 7181
Overall Profitability Ratios-
Net Profit Ratio
Net Profit Ratio indicates net margin on sales It is given by the following equation
Net Profit Ratio = (Net Profit Sales) 100
Net Profit Ratio of Kesoram
(Rupees in crores)
Year Net Profit Sales Net Profit Ratio
2007-08 37917 300271 1263
2008-09 41432 389797 1063
2009-10 20298 475062 427
2010-11 -28176 539788 -5222011-12 -38108 59182 -644
Interpretation
It establishes a relationship between net profits after tax and net sales and
indicates the efficiency of the management in manufacturing selling administrative and
other activities of the company
The higher the ratio the better is the profitability or performance of the business
The above table depicts the net profit Ratio of Kesoram has decreased every year from
2007-2008 to 2011-2012It further decreased to negative in the year 2010-11 to -522 and -
644 in the year 2011-2012 This shows constant decrease in the profits of the company
8102019 A Study A Study On Financial Performance Analysis With Reference To Kesoram Cementon Financial Performance hellip
httpslidepdfcomreaderfulla-study-a-study-on-financial-performance-analysis-with-reference-to-kesoram 7281
72
Return on Investment-
Net Profit
Return on Investment = helliphelliphelliphelliphelliphelliphelliphelliphelliphelliphelliphellip X 100
Share Holders Fund
Return on Investment Ratio of Kesoram-
(Rupees in crores)
Year Net Profit Share Holders Fund Return On Investment
2007-08 37917 98192 3862
2008-09 41432 133010 3115
2009-10 20298 154024 1318
2010-11 -28176 130025 -2167
2011-12 -38108 91501 -4165
Interpretation-
The above table reveals how well the resources of the firm are being used Higher
the ratio better the result The above ratio implies how well the firm is growing in
terms of profitability and efficiency From the above table we can concern that the return on
investment is in decreasing trend ROI is highest in the year 2007-2008 as 3862 But
there after itrsquos decreased every year
The ROI is negative in the years 2010-2011 amp 2011-2012 as -2167 amp -4165 respectively
Which is not a good sign for the firm
8102019 A Study A Study On Financial Performance Analysis With Reference To Kesoram Cementon Financial Performance hellip
httpslidepdfcomreaderfulla-study-a-study-on-financial-performance-analysis-with-reference-to-kesoram 7381
8102019 A Study A Study On Financial Performance Analysis With Reference To Kesoram Cementon Financial Performance hellip
httpslidepdfcomreaderfulla-study-a-study-on-financial-performance-analysis-with-reference-to-kesoram 7481
8102019 A Study A Study On Financial Performance Analysis With Reference To Kesoram Cementon Financial Performance hellip
httpslidepdfcomreaderfulla-study-a-study-on-financial-performance-analysis-with-reference-to-kesoram 7581
75
CHAPTER V
FINDINGS amp SUGGESTIONS
8102019 A Study A Study On Financial Performance Analysis With Reference To Kesoram Cementon Financial Performance hellip
httpslidepdfcomreaderfulla-study-a-study-on-financial-performance-analysis-with-reference-to-kesoram 7681
76
Findings
The Share capital remains constant Share capital is unchanged all the years from
2008-2012
Reserves amp surplus were recorded an increasing trend in the period between 2008
and 2010It is showing decreasing trend in the period 2011-2012 (ie from 16019
in 2010 to 9309 in 2012)
Current Liabilities were increased compared to base year ie 2008
Provisions increased to 262597 ie in Rupees 39232 crores in the current year
The current ratio for all the five year is lower (less) than the standard rule ie 21
And it is 097 in the year 2011-2012 (current year)
The Debt-Equity Ratio was shown under the standard ratio It is clear that the long
term debt is more than that of the share holdersrsquo fund It indicates that the firm
heavily relying on external funds rather than the internal funds
The operating and net profit of Kesoram is in decreasing trend due to heavy
increase of manufacturing amp administrative expenses
ROI is highest in the year 2007-2008 as 3862 The ROI is negative in the years
2010-2011 amp 2011-2012 as -2167 amp -4165 respectively
Return on Equity Capital Employed Ratio of Kesoram has decreased every year
from 2007-2008 to 2010-2011It further decreased to negative in the year 2011-12 to
-3280
EPS of Kesoram has decreased every year from 2008-12It is negative in the year
2011 amp 12
8102019 A Study A Study On Financial Performance Analysis With Reference To Kesoram Cementon Financial Performance hellip
httpslidepdfcomreaderfulla-study-a-study-on-financial-performance-analysis-with-reference-to-kesoram 7781
77
Suggestion
The organization should adopt an appropriate capital structure
The companyrsquos debt-equity ratio is recorded more or less as 111 in the year 2008
and it is increased to 449 in the year 2012 (current year)The company should
adopt a better debt equity mix in the future to control the fluctuations in returns
The company should control fluctuations in cash and bank balances as it impacts the
current ratio of the company
The provisions are showing increasing trend which indicates risk of debtors The
firm should implement an effective credit management policy It should utilize its
idle funds by decreasing provisions
The company should control heavy increase of manufacturing amp administration
expenses as it is impacting the operating and net profit of company
8102019 A Study A Study On Financial Performance Analysis With Reference To Kesoram Cementon Financial Performance hellip
httpslidepdfcomreaderfulla-study-a-study-on-financial-performance-analysis-with-reference-to-kesoram 7881
78
ANNEXURE
Profit And Loss Account of Kesoram Cement
Mar12 Mar11 Mar10 Mar09 Mar08
12 Months 12 Months 12 Months 12 Months 12 Months
INCOME
Sales Turnover 628260 575072 505151 431613 345700
Excise Duty 36440 35284 30089 41815 45429
NET SALES 591820 539788 475062 389797 300271
Other Income 000 000 000 000 000
TOTALINCOME
596129 548733 481019 393969 302020
EXPENDITURE
Manufacturing
Expenses81903 74803 13974 13153 44113
MaterialConsumed
370897 310150 295550 229359 118448
Personal
Expenses33468 27355 23294 18690 15344
Selling Expenses 81910 78253 58667 48846 45019
AdministrativeExpenses
28225 29308 17219 16179 9907
Expenses
Capitalized000 000 000 000 000
Provisions Made 000 000 000 000 000
TOTAL
EXPENDITURE 596403 519870 408704 326227 232832Operating Profit -4583 19918 66358 63570 67439
EBITDA -274 28864 72316 67742 69188
Depreciation 29740 27259 17280 11186 8927
Other Write-offs 000 000 000 000 000
EBIT -30014 1605 55035 56557 60261
Interest 41015 23983 10921 12087 5426
EBT -71029 -22377 44114 44470 54835
Taxes -32921 5798 23816 3037 16918
Profit and Loss
for the Year-38108 -28176 20298 41432 37917
Non RecurringItems
-1142 7063 3228 -4023 402
Other Non Cash
Adjustments1276 091 207 465 017
OtherAdjustments
000 000 000 000 000
REPORTED
PAT-37974 -21021 23734 37874 38335
8102019 A Study A Study On Financial Performance Analysis With Reference To Kesoram Cementon Financial Performance hellip
httpslidepdfcomreaderfulla-study-a-study-on-financial-performance-analysis-with-reference-to-kesoram 7981
79
Balance Sheet Of Kesoram
Years
Particulars 2008 2009 2010 2011 2012
Liabilities
Share Capital 4574 4574 4574 4574 4574Reserves amp Surplus 93085 128024 149111 125162 86657
Revaluation Reserves 533 412 339 289 27
Loans
Secured Loans 97106 153627 186372 237183 317792
Un Secured Loans 12129 43416 12625 162744 92742
Deferred Tax Liabilities 0 0 0 0 0
Current Liabilities
Provisions 33039 34529 35734 1494 40726
Current Liabilities 57067 66587 107688 113902 18001
Total 297533 431169 610068 645348 722771
Assets
Net Block 108424 180435 343182 369172 358721
Capital WIP 63459 86485 41283 43781 68065
Investments 4783 6178 5143 6582 6636
Current Assets
Inventories 44217 58906 91619 111855 99516
Sundry Debtors 27307 38017 54289 63134 67358
Cash amp Bank Balances 4036 5657 8014 7188 6959
Total Current Assets 7556 10258 153922 182177 173833Loans amp Advances 45289 55462 66506 4346 115409
Fixed Deposits 018 028 031 176 107
Total 297533 431169 610068 645348 722771
8102019 A Study A Study On Financial Performance Analysis With Reference To Kesoram Cementon Financial Performance hellip
httpslidepdfcomreaderfulla-study-a-study-on-financial-performance-analysis-with-reference-to-kesoram 8081
80
KEY ITEMS 2012 2011 2010 2009 2008
Preference
Dividend 0 0 0 0 0
Equity Dividend 457 2516 2516 2516 2516
Equity Dividend
() 999 55 55 55 55
Shares in Issue(Lakhs) 45743 45743 45743 45743 45743
EPS - Annualised
(Rs) -8302 -4595 5188 828 838
8102019 A Study A Study On Financial Performance Analysis With Reference To Kesoram Cementon Financial Performance hellip
httpslidepdfcomreaderfulla-study-a-study-on-financial-performance-analysis-with-reference-to-kesoram 8181
BIBLIOGRAPHY
Sl
No
Books Author Name
1 Financial Management Khan amp JAIN
2 Financial Management IMPandey
3 Management Accounting RPTrivedi
Websites amp Search Engines
1 wwwkesoramcom983086
2 wwwmoneycontrolcom
3 wwwgooglefinancecom983086
Annual reports of Kesoram cement limited 2008-2012
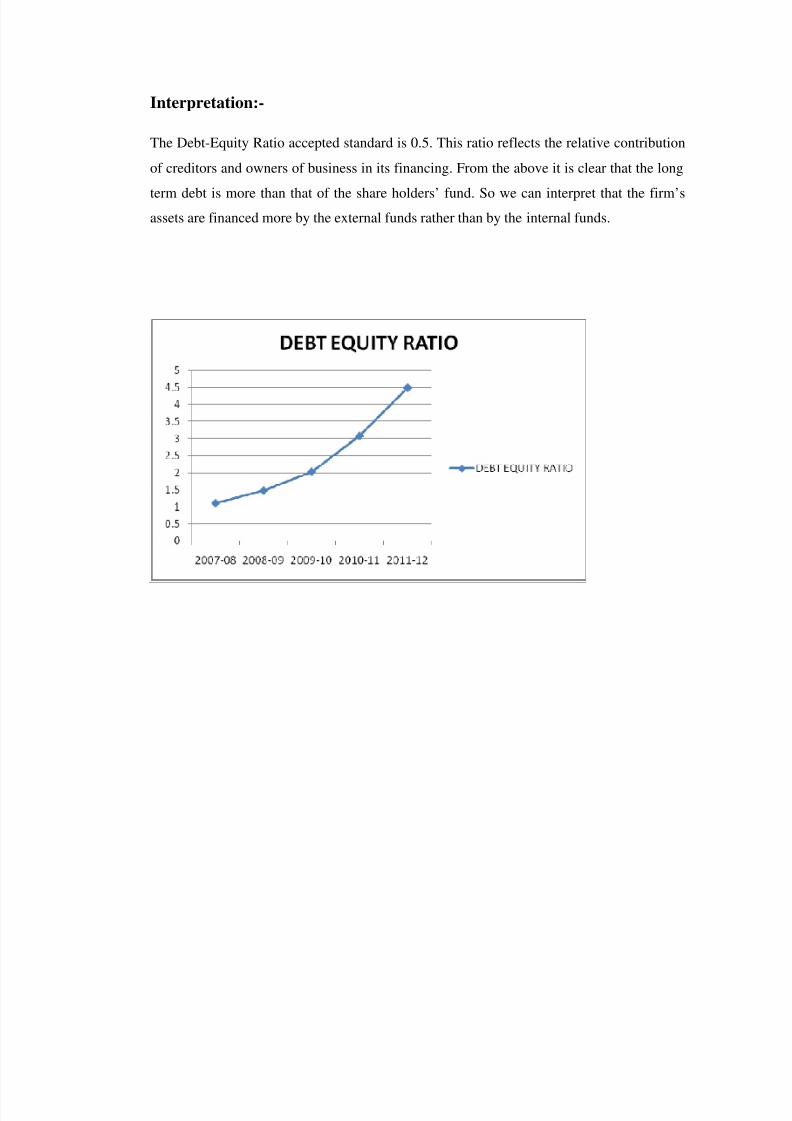
8102019 A Study A Study On Financial Performance Analysis With Reference To Kesoram Cementon Financial Performance hellip
httpslidepdfcomreaderfulla-study-a-study-on-financial-performance-analysis-with-reference-to-kesoram 6981
Interpretation-
The Debt-Equity Ratio accepted standard is 05 This ratio reflects the relative contribution
of creditors and owners of business in its financing From the above it is clear that the long
term debt is more than that of the share holdersrsquo fund So we can interpret that the firmrsquosassets are financed more by the external funds rather than by the internal funds
8102019 A Study A Study On Financial Performance Analysis With Reference To Kesoram Cementon Financial Performance hellip
httpslidepdfcomreaderfulla-study-a-study-on-financial-performance-analysis-with-reference-to-kesoram 7081
Fixed Asset Ratio-
Net Sales
Fixed Asset Ratio = helliphelliphelliphelliphelliphelliphelliphelliphelliphelliphellip
Net Assets
Fixed Asset Ratio of Kesoram-
(Rupees in crores)
Year Net Sales Net Assets Fixed Assets Ratio
2007-08 300271 358721 084
2008-09 389797 369172 106
2009-10 475062 343182 1382010-11 539788 180435 299
2011-12 59182 108424 546
Interpretation
This ratio indicates the extent to which the assets of the companyrsquos can be lost without
affecting the interest of the creditors of the company Higher the ratios better the long-term
position of the companyThe above table shows fixed assets ratio in increasing trend Which is good for the
company
8102019 A Study A Study On Financial Performance Analysis With Reference To Kesoram Cementon Financial Performance hellip
httpslidepdfcomreaderfulla-study-a-study-on-financial-performance-analysis-with-reference-to-kesoram 7181
Overall Profitability Ratios-
Net Profit Ratio
Net Profit Ratio indicates net margin on sales It is given by the following equation
Net Profit Ratio = (Net Profit Sales) 100
Net Profit Ratio of Kesoram
(Rupees in crores)
Year Net Profit Sales Net Profit Ratio
2007-08 37917 300271 1263
2008-09 41432 389797 1063
2009-10 20298 475062 427
2010-11 -28176 539788 -5222011-12 -38108 59182 -644
Interpretation
It establishes a relationship between net profits after tax and net sales and
indicates the efficiency of the management in manufacturing selling administrative and
other activities of the company
The higher the ratio the better is the profitability or performance of the business
The above table depicts the net profit Ratio of Kesoram has decreased every year from
2007-2008 to 2011-2012It further decreased to negative in the year 2010-11 to -522 and -
644 in the year 2011-2012 This shows constant decrease in the profits of the company
8102019 A Study A Study On Financial Performance Analysis With Reference To Kesoram Cementon Financial Performance hellip
httpslidepdfcomreaderfulla-study-a-study-on-financial-performance-analysis-with-reference-to-kesoram 7281
72
Return on Investment-
Net Profit
Return on Investment = helliphelliphelliphelliphelliphelliphelliphelliphelliphelliphelliphellip X 100
Share Holders Fund
Return on Investment Ratio of Kesoram-
(Rupees in crores)
Year Net Profit Share Holders Fund Return On Investment
2007-08 37917 98192 3862
2008-09 41432 133010 3115
2009-10 20298 154024 1318
2010-11 -28176 130025 -2167
2011-12 -38108 91501 -4165
Interpretation-
The above table reveals how well the resources of the firm are being used Higher
the ratio better the result The above ratio implies how well the firm is growing in
terms of profitability and efficiency From the above table we can concern that the return on
investment is in decreasing trend ROI is highest in the year 2007-2008 as 3862 But
there after itrsquos decreased every year
The ROI is negative in the years 2010-2011 amp 2011-2012 as -2167 amp -4165 respectively
Which is not a good sign for the firm
8102019 A Study A Study On Financial Performance Analysis With Reference To Kesoram Cementon Financial Performance hellip
httpslidepdfcomreaderfulla-study-a-study-on-financial-performance-analysis-with-reference-to-kesoram 7381
8102019 A Study A Study On Financial Performance Analysis With Reference To Kesoram Cementon Financial Performance hellip
httpslidepdfcomreaderfulla-study-a-study-on-financial-performance-analysis-with-reference-to-kesoram 7481
8102019 A Study A Study On Financial Performance Analysis With Reference To Kesoram Cementon Financial Performance hellip
httpslidepdfcomreaderfulla-study-a-study-on-financial-performance-analysis-with-reference-to-kesoram 7581
75
CHAPTER V
FINDINGS amp SUGGESTIONS
8102019 A Study A Study On Financial Performance Analysis With Reference To Kesoram Cementon Financial Performance hellip
httpslidepdfcomreaderfulla-study-a-study-on-financial-performance-analysis-with-reference-to-kesoram 7681
76
Findings
The Share capital remains constant Share capital is unchanged all the years from
2008-2012
Reserves amp surplus were recorded an increasing trend in the period between 2008
and 2010It is showing decreasing trend in the period 2011-2012 (ie from 16019
in 2010 to 9309 in 2012)
Current Liabilities were increased compared to base year ie 2008
Provisions increased to 262597 ie in Rupees 39232 crores in the current year
The current ratio for all the five year is lower (less) than the standard rule ie 21
And it is 097 in the year 2011-2012 (current year)
The Debt-Equity Ratio was shown under the standard ratio It is clear that the long
term debt is more than that of the share holdersrsquo fund It indicates that the firm
heavily relying on external funds rather than the internal funds
The operating and net profit of Kesoram is in decreasing trend due to heavy
increase of manufacturing amp administrative expenses
ROI is highest in the year 2007-2008 as 3862 The ROI is negative in the years
2010-2011 amp 2011-2012 as -2167 amp -4165 respectively
Return on Equity Capital Employed Ratio of Kesoram has decreased every year
from 2007-2008 to 2010-2011It further decreased to negative in the year 2011-12 to
-3280
EPS of Kesoram has decreased every year from 2008-12It is negative in the year
2011 amp 12
8102019 A Study A Study On Financial Performance Analysis With Reference To Kesoram Cementon Financial Performance hellip
httpslidepdfcomreaderfulla-study-a-study-on-financial-performance-analysis-with-reference-to-kesoram 7781
77
Suggestion
The organization should adopt an appropriate capital structure
The companyrsquos debt-equity ratio is recorded more or less as 111 in the year 2008
and it is increased to 449 in the year 2012 (current year)The company should
adopt a better debt equity mix in the future to control the fluctuations in returns
The company should control fluctuations in cash and bank balances as it impacts the
current ratio of the company
The provisions are showing increasing trend which indicates risk of debtors The
firm should implement an effective credit management policy It should utilize its
idle funds by decreasing provisions
The company should control heavy increase of manufacturing amp administration
expenses as it is impacting the operating and net profit of company
8102019 A Study A Study On Financial Performance Analysis With Reference To Kesoram Cementon Financial Performance hellip
httpslidepdfcomreaderfulla-study-a-study-on-financial-performance-analysis-with-reference-to-kesoram 7881
78
ANNEXURE
Profit And Loss Account of Kesoram Cement
Mar12 Mar11 Mar10 Mar09 Mar08
12 Months 12 Months 12 Months 12 Months 12 Months
INCOME
Sales Turnover 628260 575072 505151 431613 345700
Excise Duty 36440 35284 30089 41815 45429
NET SALES 591820 539788 475062 389797 300271
Other Income 000 000 000 000 000
TOTALINCOME
596129 548733 481019 393969 302020
EXPENDITURE
Manufacturing
Expenses81903 74803 13974 13153 44113
MaterialConsumed
370897 310150 295550 229359 118448
Personal
Expenses33468 27355 23294 18690 15344
Selling Expenses 81910 78253 58667 48846 45019
AdministrativeExpenses
28225 29308 17219 16179 9907
Expenses
Capitalized000 000 000 000 000
Provisions Made 000 000 000 000 000
TOTAL
EXPENDITURE 596403 519870 408704 326227 232832Operating Profit -4583 19918 66358 63570 67439
EBITDA -274 28864 72316 67742 69188
Depreciation 29740 27259 17280 11186 8927
Other Write-offs 000 000 000 000 000
EBIT -30014 1605 55035 56557 60261
Interest 41015 23983 10921 12087 5426
EBT -71029 -22377 44114 44470 54835
Taxes -32921 5798 23816 3037 16918
Profit and Loss
for the Year-38108 -28176 20298 41432 37917
Non RecurringItems
-1142 7063 3228 -4023 402
Other Non Cash
Adjustments1276 091 207 465 017
OtherAdjustments
000 000 000 000 000
REPORTED
PAT-37974 -21021 23734 37874 38335
8102019 A Study A Study On Financial Performance Analysis With Reference To Kesoram Cementon Financial Performance hellip
httpslidepdfcomreaderfulla-study-a-study-on-financial-performance-analysis-with-reference-to-kesoram 7981
79
Balance Sheet Of Kesoram
Years
Particulars 2008 2009 2010 2011 2012
Liabilities
Share Capital 4574 4574 4574 4574 4574Reserves amp Surplus 93085 128024 149111 125162 86657
Revaluation Reserves 533 412 339 289 27
Loans
Secured Loans 97106 153627 186372 237183 317792
Un Secured Loans 12129 43416 12625 162744 92742
Deferred Tax Liabilities 0 0 0 0 0
Current Liabilities
Provisions 33039 34529 35734 1494 40726
Current Liabilities 57067 66587 107688 113902 18001
Total 297533 431169 610068 645348 722771
Assets
Net Block 108424 180435 343182 369172 358721
Capital WIP 63459 86485 41283 43781 68065
Investments 4783 6178 5143 6582 6636
Current Assets
Inventories 44217 58906 91619 111855 99516
Sundry Debtors 27307 38017 54289 63134 67358
Cash amp Bank Balances 4036 5657 8014 7188 6959
Total Current Assets 7556 10258 153922 182177 173833Loans amp Advances 45289 55462 66506 4346 115409
Fixed Deposits 018 028 031 176 107
Total 297533 431169 610068 645348 722771
8102019 A Study A Study On Financial Performance Analysis With Reference To Kesoram Cementon Financial Performance hellip
httpslidepdfcomreaderfulla-study-a-study-on-financial-performance-analysis-with-reference-to-kesoram 8081
80
KEY ITEMS 2012 2011 2010 2009 2008
Preference
Dividend 0 0 0 0 0
Equity Dividend 457 2516 2516 2516 2516
Equity Dividend
() 999 55 55 55 55
Shares in Issue(Lakhs) 45743 45743 45743 45743 45743
EPS - Annualised
(Rs) -8302 -4595 5188 828 838
8102019 A Study A Study On Financial Performance Analysis With Reference To Kesoram Cementon Financial Performance hellip
httpslidepdfcomreaderfulla-study-a-study-on-financial-performance-analysis-with-reference-to-kesoram 8181
BIBLIOGRAPHY
Sl
No
Books Author Name
1 Financial Management Khan amp JAIN
2 Financial Management IMPandey
3 Management Accounting RPTrivedi
Websites amp Search Engines
1 wwwkesoramcom983086
2 wwwmoneycontrolcom
3 wwwgooglefinancecom983086
Annual reports of Kesoram cement limited 2008-2012
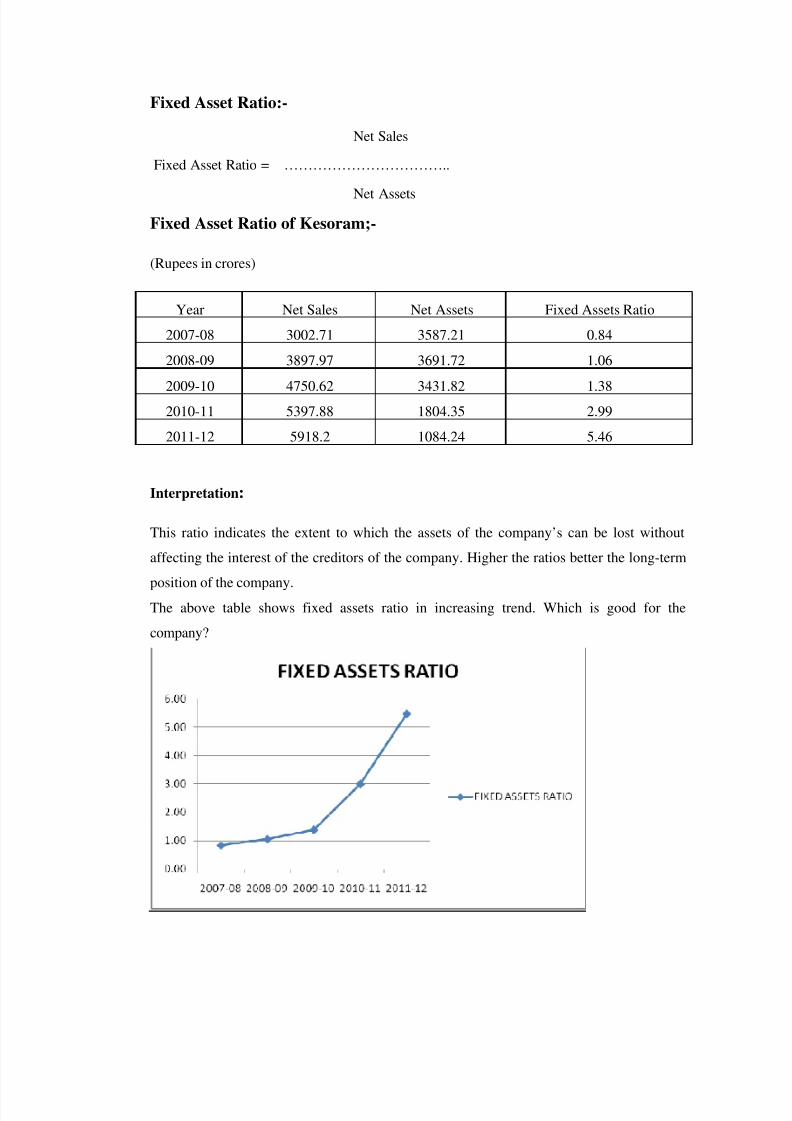
8102019 A Study A Study On Financial Performance Analysis With Reference To Kesoram Cementon Financial Performance hellip
httpslidepdfcomreaderfulla-study-a-study-on-financial-performance-analysis-with-reference-to-kesoram 7081
Fixed Asset Ratio-
Net Sales
Fixed Asset Ratio = helliphelliphelliphelliphelliphelliphelliphelliphelliphelliphellip
Net Assets
Fixed Asset Ratio of Kesoram-
(Rupees in crores)
Year Net Sales Net Assets Fixed Assets Ratio
2007-08 300271 358721 084
2008-09 389797 369172 106
2009-10 475062 343182 1382010-11 539788 180435 299
2011-12 59182 108424 546
Interpretation
This ratio indicates the extent to which the assets of the companyrsquos can be lost without
affecting the interest of the creditors of the company Higher the ratios better the long-term
position of the companyThe above table shows fixed assets ratio in increasing trend Which is good for the
company
8102019 A Study A Study On Financial Performance Analysis With Reference To Kesoram Cementon Financial Performance hellip
httpslidepdfcomreaderfulla-study-a-study-on-financial-performance-analysis-with-reference-to-kesoram 7181
Overall Profitability Ratios-
Net Profit Ratio
Net Profit Ratio indicates net margin on sales It is given by the following equation
Net Profit Ratio = (Net Profit Sales) 100
Net Profit Ratio of Kesoram
(Rupees in crores)
Year Net Profit Sales Net Profit Ratio
2007-08 37917 300271 1263
2008-09 41432 389797 1063
2009-10 20298 475062 427
2010-11 -28176 539788 -5222011-12 -38108 59182 -644
Interpretation
It establishes a relationship between net profits after tax and net sales and
indicates the efficiency of the management in manufacturing selling administrative and
other activities of the company
The higher the ratio the better is the profitability or performance of the business
The above table depicts the net profit Ratio of Kesoram has decreased every year from
2007-2008 to 2011-2012It further decreased to negative in the year 2010-11 to -522 and -
644 in the year 2011-2012 This shows constant decrease in the profits of the company
8102019 A Study A Study On Financial Performance Analysis With Reference To Kesoram Cementon Financial Performance hellip
httpslidepdfcomreaderfulla-study-a-study-on-financial-performance-analysis-with-reference-to-kesoram 7281
72
Return on Investment-
Net Profit
Return on Investment = helliphelliphelliphelliphelliphelliphelliphelliphelliphelliphelliphellip X 100
Share Holders Fund
Return on Investment Ratio of Kesoram-
(Rupees in crores)
Year Net Profit Share Holders Fund Return On Investment
2007-08 37917 98192 3862
2008-09 41432 133010 3115
2009-10 20298 154024 1318
2010-11 -28176 130025 -2167
2011-12 -38108 91501 -4165
Interpretation-
The above table reveals how well the resources of the firm are being used Higher
the ratio better the result The above ratio implies how well the firm is growing in
terms of profitability and efficiency From the above table we can concern that the return on
investment is in decreasing trend ROI is highest in the year 2007-2008 as 3862 But
there after itrsquos decreased every year
The ROI is negative in the years 2010-2011 amp 2011-2012 as -2167 amp -4165 respectively
Which is not a good sign for the firm
8102019 A Study A Study On Financial Performance Analysis With Reference To Kesoram Cementon Financial Performance hellip
httpslidepdfcomreaderfulla-study-a-study-on-financial-performance-analysis-with-reference-to-kesoram 7381
8102019 A Study A Study On Financial Performance Analysis With Reference To Kesoram Cementon Financial Performance hellip
httpslidepdfcomreaderfulla-study-a-study-on-financial-performance-analysis-with-reference-to-kesoram 7481
8102019 A Study A Study On Financial Performance Analysis With Reference To Kesoram Cementon Financial Performance hellip
httpslidepdfcomreaderfulla-study-a-study-on-financial-performance-analysis-with-reference-to-kesoram 7581
75
CHAPTER V
FINDINGS amp SUGGESTIONS
8102019 A Study A Study On Financial Performance Analysis With Reference To Kesoram Cementon Financial Performance hellip
httpslidepdfcomreaderfulla-study-a-study-on-financial-performance-analysis-with-reference-to-kesoram 7681
76
Findings
The Share capital remains constant Share capital is unchanged all the years from
2008-2012
Reserves amp surplus were recorded an increasing trend in the period between 2008
and 2010It is showing decreasing trend in the period 2011-2012 (ie from 16019
in 2010 to 9309 in 2012)
Current Liabilities were increased compared to base year ie 2008
Provisions increased to 262597 ie in Rupees 39232 crores in the current year
The current ratio for all the five year is lower (less) than the standard rule ie 21
And it is 097 in the year 2011-2012 (current year)
The Debt-Equity Ratio was shown under the standard ratio It is clear that the long
term debt is more than that of the share holdersrsquo fund It indicates that the firm
heavily relying on external funds rather than the internal funds
The operating and net profit of Kesoram is in decreasing trend due to heavy
increase of manufacturing amp administrative expenses
ROI is highest in the year 2007-2008 as 3862 The ROI is negative in the years
2010-2011 amp 2011-2012 as -2167 amp -4165 respectively
Return on Equity Capital Employed Ratio of Kesoram has decreased every year
from 2007-2008 to 2010-2011It further decreased to negative in the year 2011-12 to
-3280
EPS of Kesoram has decreased every year from 2008-12It is negative in the year
2011 amp 12
8102019 A Study A Study On Financial Performance Analysis With Reference To Kesoram Cementon Financial Performance hellip
httpslidepdfcomreaderfulla-study-a-study-on-financial-performance-analysis-with-reference-to-kesoram 7781
77
Suggestion
The organization should adopt an appropriate capital structure
The companyrsquos debt-equity ratio is recorded more or less as 111 in the year 2008
and it is increased to 449 in the year 2012 (current year)The company should
adopt a better debt equity mix in the future to control the fluctuations in returns
The company should control fluctuations in cash and bank balances as it impacts the
current ratio of the company
The provisions are showing increasing trend which indicates risk of debtors The
firm should implement an effective credit management policy It should utilize its
idle funds by decreasing provisions
The company should control heavy increase of manufacturing amp administration
expenses as it is impacting the operating and net profit of company
8102019 A Study A Study On Financial Performance Analysis With Reference To Kesoram Cementon Financial Performance hellip
httpslidepdfcomreaderfulla-study-a-study-on-financial-performance-analysis-with-reference-to-kesoram 7881
78
ANNEXURE
Profit And Loss Account of Kesoram Cement
Mar12 Mar11 Mar10 Mar09 Mar08
12 Months 12 Months 12 Months 12 Months 12 Months
INCOME
Sales Turnover 628260 575072 505151 431613 345700
Excise Duty 36440 35284 30089 41815 45429
NET SALES 591820 539788 475062 389797 300271
Other Income 000 000 000 000 000
TOTALINCOME
596129 548733 481019 393969 302020
EXPENDITURE
Manufacturing
Expenses81903 74803 13974 13153 44113
MaterialConsumed
370897 310150 295550 229359 118448
Personal
Expenses33468 27355 23294 18690 15344
Selling Expenses 81910 78253 58667 48846 45019
AdministrativeExpenses
28225 29308 17219 16179 9907
Expenses
Capitalized000 000 000 000 000
Provisions Made 000 000 000 000 000
TOTAL
EXPENDITURE 596403 519870 408704 326227 232832Operating Profit -4583 19918 66358 63570 67439
EBITDA -274 28864 72316 67742 69188
Depreciation 29740 27259 17280 11186 8927
Other Write-offs 000 000 000 000 000
EBIT -30014 1605 55035 56557 60261
Interest 41015 23983 10921 12087 5426
EBT -71029 -22377 44114 44470 54835
Taxes -32921 5798 23816 3037 16918
Profit and Loss
for the Year-38108 -28176 20298 41432 37917
Non RecurringItems
-1142 7063 3228 -4023 402
Other Non Cash
Adjustments1276 091 207 465 017
OtherAdjustments
000 000 000 000 000
REPORTED
PAT-37974 -21021 23734 37874 38335
8102019 A Study A Study On Financial Performance Analysis With Reference To Kesoram Cementon Financial Performance hellip
httpslidepdfcomreaderfulla-study-a-study-on-financial-performance-analysis-with-reference-to-kesoram 7981
79
Balance Sheet Of Kesoram
Years
Particulars 2008 2009 2010 2011 2012
Liabilities
Share Capital 4574 4574 4574 4574 4574Reserves amp Surplus 93085 128024 149111 125162 86657
Revaluation Reserves 533 412 339 289 27
Loans
Secured Loans 97106 153627 186372 237183 317792
Un Secured Loans 12129 43416 12625 162744 92742
Deferred Tax Liabilities 0 0 0 0 0
Current Liabilities
Provisions 33039 34529 35734 1494 40726
Current Liabilities 57067 66587 107688 113902 18001
Total 297533 431169 610068 645348 722771
Assets
Net Block 108424 180435 343182 369172 358721
Capital WIP 63459 86485 41283 43781 68065
Investments 4783 6178 5143 6582 6636
Current Assets
Inventories 44217 58906 91619 111855 99516
Sundry Debtors 27307 38017 54289 63134 67358
Cash amp Bank Balances 4036 5657 8014 7188 6959
Total Current Assets 7556 10258 153922 182177 173833Loans amp Advances 45289 55462 66506 4346 115409
Fixed Deposits 018 028 031 176 107
Total 297533 431169 610068 645348 722771
8102019 A Study A Study On Financial Performance Analysis With Reference To Kesoram Cementon Financial Performance hellip
httpslidepdfcomreaderfulla-study-a-study-on-financial-performance-analysis-with-reference-to-kesoram 8081
80
KEY ITEMS 2012 2011 2010 2009 2008
Preference
Dividend 0 0 0 0 0
Equity Dividend 457 2516 2516 2516 2516
Equity Dividend
() 999 55 55 55 55
Shares in Issue(Lakhs) 45743 45743 45743 45743 45743
EPS - Annualised
(Rs) -8302 -4595 5188 828 838
8102019 A Study A Study On Financial Performance Analysis With Reference To Kesoram Cementon Financial Performance hellip
httpslidepdfcomreaderfulla-study-a-study-on-financial-performance-analysis-with-reference-to-kesoram 8181
BIBLIOGRAPHY
Sl
No
Books Author Name
1 Financial Management Khan amp JAIN
2 Financial Management IMPandey
3 Management Accounting RPTrivedi
Websites amp Search Engines
1 wwwkesoramcom983086
2 wwwmoneycontrolcom
3 wwwgooglefinancecom983086
Annual reports of Kesoram cement limited 2008-2012
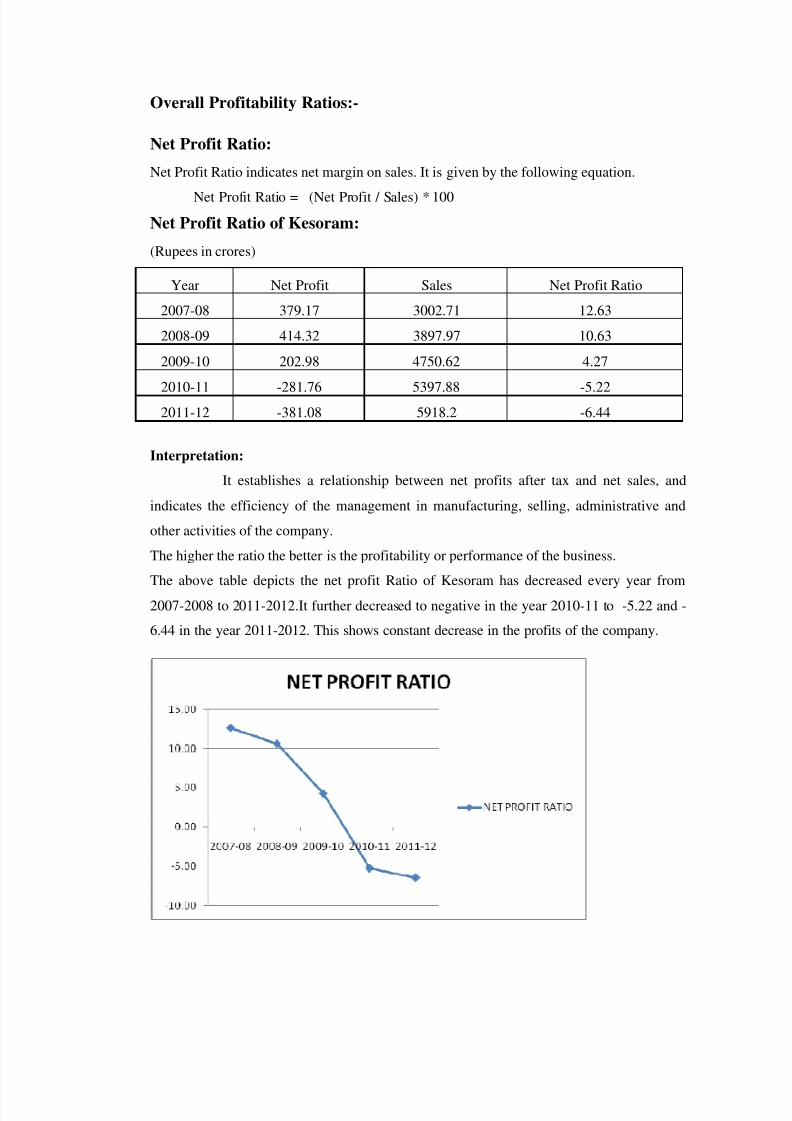
8102019 A Study A Study On Financial Performance Analysis With Reference To Kesoram Cementon Financial Performance hellip
httpslidepdfcomreaderfulla-study-a-study-on-financial-performance-analysis-with-reference-to-kesoram 7381
8102019 A Study A Study On Financial Performance Analysis With Reference To Kesoram Cementon Financial Performance hellip
httpslidepdfcomreaderfulla-study-a-study-on-financial-performance-analysis-with-reference-to-kesoram 7481
8102019 A Study A Study On Financial Performance Analysis With Reference To Kesoram Cementon Financial Performance hellip
httpslidepdfcomreaderfulla-study-a-study-on-financial-performance-analysis-with-reference-to-kesoram 7581
75
CHAPTER V
FINDINGS amp SUGGESTIONS
8102019 A Study A Study On Financial Performance Analysis With Reference To Kesoram Cementon Financial Performance hellip
httpslidepdfcomreaderfulla-study-a-study-on-financial-performance-analysis-with-reference-to-kesoram 7681
76
Findings
The Share capital remains constant Share capital is unchanged all the years from
2008-2012
Reserves amp surplus were recorded an increasing trend in the period between 2008
and 2010It is showing decreasing trend in the period 2011-2012 (ie from 16019
in 2010 to 9309 in 2012)
Current Liabilities were increased compared to base year ie 2008
Provisions increased to 262597 ie in Rupees 39232 crores in the current year
The current ratio for all the five year is lower (less) than the standard rule ie 21
And it is 097 in the year 2011-2012 (current year)
The Debt-Equity Ratio was shown under the standard ratio It is clear that the long
term debt is more than that of the share holdersrsquo fund It indicates that the firm
heavily relying on external funds rather than the internal funds
The operating and net profit of Kesoram is in decreasing trend due to heavy
increase of manufacturing amp administrative expenses
ROI is highest in the year 2007-2008 as 3862 The ROI is negative in the years
2010-2011 amp 2011-2012 as -2167 amp -4165 respectively
Return on Equity Capital Employed Ratio of Kesoram has decreased every year
from 2007-2008 to 2010-2011It further decreased to negative in the year 2011-12 to
-3280
EPS of Kesoram has decreased every year from 2008-12It is negative in the year
2011 amp 12
8102019 A Study A Study On Financial Performance Analysis With Reference To Kesoram Cementon Financial Performance hellip
httpslidepdfcomreaderfulla-study-a-study-on-financial-performance-analysis-with-reference-to-kesoram 7781
77
Suggestion
The organization should adopt an appropriate capital structure
The companyrsquos debt-equity ratio is recorded more or less as 111 in the year 2008
and it is increased to 449 in the year 2012 (current year)The company should
adopt a better debt equity mix in the future to control the fluctuations in returns
The company should control fluctuations in cash and bank balances as it impacts the
current ratio of the company
The provisions are showing increasing trend which indicates risk of debtors The
firm should implement an effective credit management policy It should utilize its
idle funds by decreasing provisions
The company should control heavy increase of manufacturing amp administration
expenses as it is impacting the operating and net profit of company
8102019 A Study A Study On Financial Performance Analysis With Reference To Kesoram Cementon Financial Performance hellip
httpslidepdfcomreaderfulla-study-a-study-on-financial-performance-analysis-with-reference-to-kesoram 7881
78
ANNEXURE
Profit And Loss Account of Kesoram Cement
Mar12 Mar11 Mar10 Mar09 Mar08
12 Months 12 Months 12 Months 12 Months 12 Months
INCOME
Sales Turnover 628260 575072 505151 431613 345700
Excise Duty 36440 35284 30089 41815 45429
NET SALES 591820 539788 475062 389797 300271
Other Income 000 000 000 000 000
TOTALINCOME
596129 548733 481019 393969 302020
EXPENDITURE
Manufacturing
Expenses81903 74803 13974 13153 44113
MaterialConsumed
370897 310150 295550 229359 118448
Personal
Expenses33468 27355 23294 18690 15344
Selling Expenses 81910 78253 58667 48846 45019
AdministrativeExpenses
28225 29308 17219 16179 9907
Expenses
Capitalized000 000 000 000 000
Provisions Made 000 000 000 000 000
TOTAL
EXPENDITURE 596403 519870 408704 326227 232832Operating Profit -4583 19918 66358 63570 67439
EBITDA -274 28864 72316 67742 69188
Depreciation 29740 27259 17280 11186 8927
Other Write-offs 000 000 000 000 000
EBIT -30014 1605 55035 56557 60261
Interest 41015 23983 10921 12087 5426
EBT -71029 -22377 44114 44470 54835
Taxes -32921 5798 23816 3037 16918
Profit and Loss
for the Year-38108 -28176 20298 41432 37917
Non RecurringItems
-1142 7063 3228 -4023 402
Other Non Cash
Adjustments1276 091 207 465 017
OtherAdjustments
000 000 000 000 000
REPORTED
PAT-37974 -21021 23734 37874 38335
8102019 A Study A Study On Financial Performance Analysis With Reference To Kesoram Cementon Financial Performance hellip
httpslidepdfcomreaderfulla-study-a-study-on-financial-performance-analysis-with-reference-to-kesoram 7981
79
Balance Sheet Of Kesoram
Years
Particulars 2008 2009 2010 2011 2012
Liabilities
Share Capital 4574 4574 4574 4574 4574Reserves amp Surplus 93085 128024 149111 125162 86657
Revaluation Reserves 533 412 339 289 27
Loans
Secured Loans 97106 153627 186372 237183 317792
Un Secured Loans 12129 43416 12625 162744 92742
Deferred Tax Liabilities 0 0 0 0 0
Current Liabilities
Provisions 33039 34529 35734 1494 40726
Current Liabilities 57067 66587 107688 113902 18001
Total 297533 431169 610068 645348 722771
Assets
Net Block 108424 180435 343182 369172 358721
Capital WIP 63459 86485 41283 43781 68065
Investments 4783 6178 5143 6582 6636
Current Assets
Inventories 44217 58906 91619 111855 99516
Sundry Debtors 27307 38017 54289 63134 67358
Cash amp Bank Balances 4036 5657 8014 7188 6959
Total Current Assets 7556 10258 153922 182177 173833Loans amp Advances 45289 55462 66506 4346 115409
Fixed Deposits 018 028 031 176 107
Total 297533 431169 610068 645348 722771
8102019 A Study A Study On Financial Performance Analysis With Reference To Kesoram Cementon Financial Performance hellip
httpslidepdfcomreaderfulla-study-a-study-on-financial-performance-analysis-with-reference-to-kesoram 8081
80
KEY ITEMS 2012 2011 2010 2009 2008
Preference
Dividend 0 0 0 0 0
Equity Dividend 457 2516 2516 2516 2516
Equity Dividend
() 999 55 55 55 55
Shares in Issue(Lakhs) 45743 45743 45743 45743 45743
EPS - Annualised
(Rs) -8302 -4595 5188 828 838
8102019 A Study A Study On Financial Performance Analysis With Reference To Kesoram Cementon Financial Performance hellip
httpslidepdfcomreaderfulla-study-a-study-on-financial-performance-analysis-with-reference-to-kesoram 8181
BIBLIOGRAPHY
Sl
No
Books Author Name
1 Financial Management Khan amp JAIN
2 Financial Management IMPandey
3 Management Accounting RPTrivedi
Websites amp Search Engines
1 wwwkesoramcom983086
2 wwwmoneycontrolcom
3 wwwgooglefinancecom983086
Annual reports of Kesoram cement limited 2008-2012
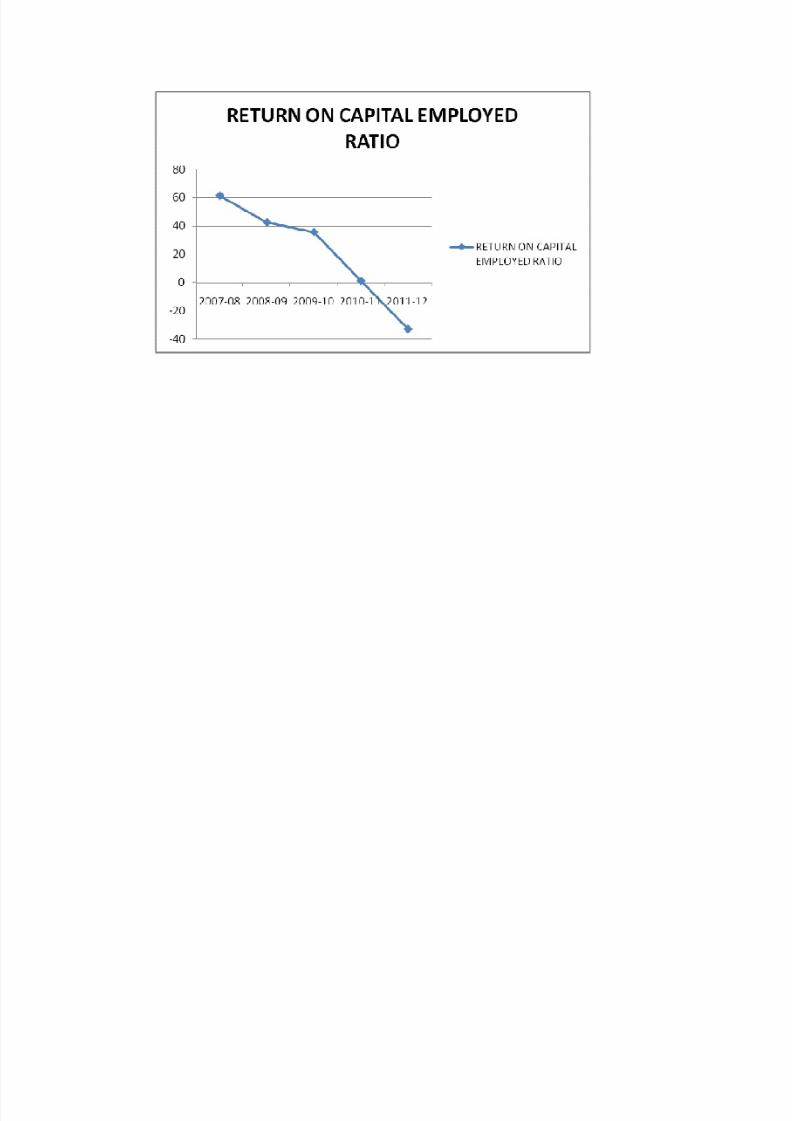
8102019 A Study A Study On Financial Performance Analysis With Reference To Kesoram Cementon Financial Performance hellip
httpslidepdfcomreaderfulla-study-a-study-on-financial-performance-analysis-with-reference-to-kesoram 7481
8102019 A Study A Study On Financial Performance Analysis With Reference To Kesoram Cementon Financial Performance hellip
httpslidepdfcomreaderfulla-study-a-study-on-financial-performance-analysis-with-reference-to-kesoram 7581
75
CHAPTER V
FINDINGS amp SUGGESTIONS
8102019 A Study A Study On Financial Performance Analysis With Reference To Kesoram Cementon Financial Performance hellip
httpslidepdfcomreaderfulla-study-a-study-on-financial-performance-analysis-with-reference-to-kesoram 7681
76
Findings
The Share capital remains constant Share capital is unchanged all the years from
2008-2012
Reserves amp surplus were recorded an increasing trend in the period between 2008
and 2010It is showing decreasing trend in the period 2011-2012 (ie from 16019
in 2010 to 9309 in 2012)
Current Liabilities were increased compared to base year ie 2008
Provisions increased to 262597 ie in Rupees 39232 crores in the current year
The current ratio for all the five year is lower (less) than the standard rule ie 21
And it is 097 in the year 2011-2012 (current year)
The Debt-Equity Ratio was shown under the standard ratio It is clear that the long
term debt is more than that of the share holdersrsquo fund It indicates that the firm
heavily relying on external funds rather than the internal funds
The operating and net profit of Kesoram is in decreasing trend due to heavy
increase of manufacturing amp administrative expenses
ROI is highest in the year 2007-2008 as 3862 The ROI is negative in the years
2010-2011 amp 2011-2012 as -2167 amp -4165 respectively
Return on Equity Capital Employed Ratio of Kesoram has decreased every year
from 2007-2008 to 2010-2011It further decreased to negative in the year 2011-12 to
-3280
EPS of Kesoram has decreased every year from 2008-12It is negative in the year
2011 amp 12
8102019 A Study A Study On Financial Performance Analysis With Reference To Kesoram Cementon Financial Performance hellip
httpslidepdfcomreaderfulla-study-a-study-on-financial-performance-analysis-with-reference-to-kesoram 7781
77
Suggestion
The organization should adopt an appropriate capital structure
The companyrsquos debt-equity ratio is recorded more or less as 111 in the year 2008
and it is increased to 449 in the year 2012 (current year)The company should
adopt a better debt equity mix in the future to control the fluctuations in returns
The company should control fluctuations in cash and bank balances as it impacts the
current ratio of the company
The provisions are showing increasing trend which indicates risk of debtors The
firm should implement an effective credit management policy It should utilize its
idle funds by decreasing provisions
The company should control heavy increase of manufacturing amp administration
expenses as it is impacting the operating and net profit of company
8102019 A Study A Study On Financial Performance Analysis With Reference To Kesoram Cementon Financial Performance hellip
httpslidepdfcomreaderfulla-study-a-study-on-financial-performance-analysis-with-reference-to-kesoram 7881
78
ANNEXURE
Profit And Loss Account of Kesoram Cement
Mar12 Mar11 Mar10 Mar09 Mar08
12 Months 12 Months 12 Months 12 Months 12 Months
INCOME
Sales Turnover 628260 575072 505151 431613 345700
Excise Duty 36440 35284 30089 41815 45429
NET SALES 591820 539788 475062 389797 300271
Other Income 000 000 000 000 000
TOTALINCOME
596129 548733 481019 393969 302020
EXPENDITURE
Manufacturing
Expenses81903 74803 13974 13153 44113
MaterialConsumed
370897 310150 295550 229359 118448
Personal
Expenses33468 27355 23294 18690 15344
Selling Expenses 81910 78253 58667 48846 45019
AdministrativeExpenses
28225 29308 17219 16179 9907
Expenses
Capitalized000 000 000 000 000
Provisions Made 000 000 000 000 000
TOTAL
EXPENDITURE 596403 519870 408704 326227 232832Operating Profit -4583 19918 66358 63570 67439
EBITDA -274 28864 72316 67742 69188
Depreciation 29740 27259 17280 11186 8927
Other Write-offs 000 000 000 000 000
EBIT -30014 1605 55035 56557 60261
Interest 41015 23983 10921 12087 5426
EBT -71029 -22377 44114 44470 54835
Taxes -32921 5798 23816 3037 16918
Profit and Loss
for the Year-38108 -28176 20298 41432 37917
Non RecurringItems
-1142 7063 3228 -4023 402
Other Non Cash
Adjustments1276 091 207 465 017
OtherAdjustments
000 000 000 000 000
REPORTED
PAT-37974 -21021 23734 37874 38335
8102019 A Study A Study On Financial Performance Analysis With Reference To Kesoram Cementon Financial Performance hellip
httpslidepdfcomreaderfulla-study-a-study-on-financial-performance-analysis-with-reference-to-kesoram 7981
79
Balance Sheet Of Kesoram
Years
Particulars 2008 2009 2010 2011 2012
Liabilities
Share Capital 4574 4574 4574 4574 4574Reserves amp Surplus 93085 128024 149111 125162 86657
Revaluation Reserves 533 412 339 289 27
Loans
Secured Loans 97106 153627 186372 237183 317792
Un Secured Loans 12129 43416 12625 162744 92742
Deferred Tax Liabilities 0 0 0 0 0
Current Liabilities
Provisions 33039 34529 35734 1494 40726
Current Liabilities 57067 66587 107688 113902 18001
Total 297533 431169 610068 645348 722771
Assets
Net Block 108424 180435 343182 369172 358721
Capital WIP 63459 86485 41283 43781 68065
Investments 4783 6178 5143 6582 6636
Current Assets
Inventories 44217 58906 91619 111855 99516
Sundry Debtors 27307 38017 54289 63134 67358
Cash amp Bank Balances 4036 5657 8014 7188 6959
Total Current Assets 7556 10258 153922 182177 173833Loans amp Advances 45289 55462 66506 4346 115409
Fixed Deposits 018 028 031 176 107
Total 297533 431169 610068 645348 722771
8102019 A Study A Study On Financial Performance Analysis With Reference To Kesoram Cementon Financial Performance hellip
httpslidepdfcomreaderfulla-study-a-study-on-financial-performance-analysis-with-reference-to-kesoram 8081
80
KEY ITEMS 2012 2011 2010 2009 2008
Preference
Dividend 0 0 0 0 0
Equity Dividend 457 2516 2516 2516 2516
Equity Dividend
() 999 55 55 55 55
Shares in Issue(Lakhs) 45743 45743 45743 45743 45743
EPS - Annualised
(Rs) -8302 -4595 5188 828 838
8102019 A Study A Study On Financial Performance Analysis With Reference To Kesoram Cementon Financial Performance hellip
httpslidepdfcomreaderfulla-study-a-study-on-financial-performance-analysis-with-reference-to-kesoram 8181
BIBLIOGRAPHY
Sl
No
Books Author Name
1 Financial Management Khan amp JAIN
2 Financial Management IMPandey
3 Management Accounting RPTrivedi
Websites amp Search Engines
1 wwwkesoramcom983086
2 wwwmoneycontrolcom
3 wwwgooglefinancecom983086
Annual reports of Kesoram cement limited 2008-2012
8102019 A Study A Study On Financial Performance Analysis With Reference To Kesoram Cementon Financial Performance hellip
httpslidepdfcomreaderfulla-study-a-study-on-financial-performance-analysis-with-reference-to-kesoram 7581
75
CHAPTER V
FINDINGS amp SUGGESTIONS
8102019 A Study A Study On Financial Performance Analysis With Reference To Kesoram Cementon Financial Performance hellip
httpslidepdfcomreaderfulla-study-a-study-on-financial-performance-analysis-with-reference-to-kesoram 7681
76
Findings
The Share capital remains constant Share capital is unchanged all the years from
2008-2012
Reserves amp surplus were recorded an increasing trend in the period between 2008
and 2010It is showing decreasing trend in the period 2011-2012 (ie from 16019
in 2010 to 9309 in 2012)
Current Liabilities were increased compared to base year ie 2008
Provisions increased to 262597 ie in Rupees 39232 crores in the current year
The current ratio for all the five year is lower (less) than the standard rule ie 21
And it is 097 in the year 2011-2012 (current year)
The Debt-Equity Ratio was shown under the standard ratio It is clear that the long
term debt is more than that of the share holdersrsquo fund It indicates that the firm
heavily relying on external funds rather than the internal funds
The operating and net profit of Kesoram is in decreasing trend due to heavy
increase of manufacturing amp administrative expenses
ROI is highest in the year 2007-2008 as 3862 The ROI is negative in the years
2010-2011 amp 2011-2012 as -2167 amp -4165 respectively
Return on Equity Capital Employed Ratio of Kesoram has decreased every year
from 2007-2008 to 2010-2011It further decreased to negative in the year 2011-12 to
-3280
EPS of Kesoram has decreased every year from 2008-12It is negative in the year
2011 amp 12
8102019 A Study A Study On Financial Performance Analysis With Reference To Kesoram Cementon Financial Performance hellip
httpslidepdfcomreaderfulla-study-a-study-on-financial-performance-analysis-with-reference-to-kesoram 7781
77
Suggestion
The organization should adopt an appropriate capital structure
The companyrsquos debt-equity ratio is recorded more or less as 111 in the year 2008
and it is increased to 449 in the year 2012 (current year)The company should
adopt a better debt equity mix in the future to control the fluctuations in returns
The company should control fluctuations in cash and bank balances as it impacts the
current ratio of the company
The provisions are showing increasing trend which indicates risk of debtors The
firm should implement an effective credit management policy It should utilize its
idle funds by decreasing provisions
The company should control heavy increase of manufacturing amp administration
expenses as it is impacting the operating and net profit of company
8102019 A Study A Study On Financial Performance Analysis With Reference To Kesoram Cementon Financial Performance hellip
httpslidepdfcomreaderfulla-study-a-study-on-financial-performance-analysis-with-reference-to-kesoram 7881
78
ANNEXURE
Profit And Loss Account of Kesoram Cement
Mar12 Mar11 Mar10 Mar09 Mar08
12 Months 12 Months 12 Months 12 Months 12 Months
INCOME
Sales Turnover 628260 575072 505151 431613 345700
Excise Duty 36440 35284 30089 41815 45429
NET SALES 591820 539788 475062 389797 300271
Other Income 000 000 000 000 000
TOTALINCOME
596129 548733 481019 393969 302020
EXPENDITURE
Manufacturing
Expenses81903 74803 13974 13153 44113
MaterialConsumed
370897 310150 295550 229359 118448
Personal
Expenses33468 27355 23294 18690 15344
Selling Expenses 81910 78253 58667 48846 45019
AdministrativeExpenses
28225 29308 17219 16179 9907
Expenses
Capitalized000 000 000 000 000
Provisions Made 000 000 000 000 000
TOTAL
EXPENDITURE 596403 519870 408704 326227 232832Operating Profit -4583 19918 66358 63570 67439
EBITDA -274 28864 72316 67742 69188
Depreciation 29740 27259 17280 11186 8927
Other Write-offs 000 000 000 000 000
EBIT -30014 1605 55035 56557 60261
Interest 41015 23983 10921 12087 5426
EBT -71029 -22377 44114 44470 54835
Taxes -32921 5798 23816 3037 16918
Profit and Loss
for the Year-38108 -28176 20298 41432 37917
Non RecurringItems
-1142 7063 3228 -4023 402
Other Non Cash
Adjustments1276 091 207 465 017
OtherAdjustments
000 000 000 000 000
REPORTED
PAT-37974 -21021 23734 37874 38335
8102019 A Study A Study On Financial Performance Analysis With Reference To Kesoram Cementon Financial Performance hellip
httpslidepdfcomreaderfulla-study-a-study-on-financial-performance-analysis-with-reference-to-kesoram 7981
79
Balance Sheet Of Kesoram
Years
Particulars 2008 2009 2010 2011 2012
Liabilities
Share Capital 4574 4574 4574 4574 4574Reserves amp Surplus 93085 128024 149111 125162 86657
Revaluation Reserves 533 412 339 289 27
Loans
Secured Loans 97106 153627 186372 237183 317792
Un Secured Loans 12129 43416 12625 162744 92742
Deferred Tax Liabilities 0 0 0 0 0
Current Liabilities
Provisions 33039 34529 35734 1494 40726
Current Liabilities 57067 66587 107688 113902 18001
Total 297533 431169 610068 645348 722771
Assets
Net Block 108424 180435 343182 369172 358721
Capital WIP 63459 86485 41283 43781 68065
Investments 4783 6178 5143 6582 6636
Current Assets
Inventories 44217 58906 91619 111855 99516
Sundry Debtors 27307 38017 54289 63134 67358
Cash amp Bank Balances 4036 5657 8014 7188 6959
Total Current Assets 7556 10258 153922 182177 173833Loans amp Advances 45289 55462 66506 4346 115409
Fixed Deposits 018 028 031 176 107
Total 297533 431169 610068 645348 722771
8102019 A Study A Study On Financial Performance Analysis With Reference To Kesoram Cementon Financial Performance hellip
httpslidepdfcomreaderfulla-study-a-study-on-financial-performance-analysis-with-reference-to-kesoram 8081
80
KEY ITEMS 2012 2011 2010 2009 2008
Preference
Dividend 0 0 0 0 0
Equity Dividend 457 2516 2516 2516 2516
Equity Dividend
() 999 55 55 55 55
Shares in Issue(Lakhs) 45743 45743 45743 45743 45743
EPS - Annualised
(Rs) -8302 -4595 5188 828 838
8102019 A Study A Study On Financial Performance Analysis With Reference To Kesoram Cementon Financial Performance hellip
httpslidepdfcomreaderfulla-study-a-study-on-financial-performance-analysis-with-reference-to-kesoram 8181
BIBLIOGRAPHY
Sl
No
Books Author Name
1 Financial Management Khan amp JAIN
2 Financial Management IMPandey
3 Management Accounting RPTrivedi
Websites amp Search Engines
1 wwwkesoramcom983086
2 wwwmoneycontrolcom
3 wwwgooglefinancecom983086
Annual reports of Kesoram cement limited 2008-2012

8102019 A Study A Study On Financial Performance Analysis With Reference To Kesoram Cementon Financial Performance hellip
httpslidepdfcomreaderfulla-study-a-study-on-financial-performance-analysis-with-reference-to-kesoram 7681
76
Findings
The Share capital remains constant Share capital is unchanged all the years from
2008-2012
Reserves amp surplus were recorded an increasing trend in the period between 2008
and 2010It is showing decreasing trend in the period 2011-2012 (ie from 16019
in 2010 to 9309 in 2012)
Current Liabilities were increased compared to base year ie 2008
Provisions increased to 262597 ie in Rupees 39232 crores in the current year
The current ratio for all the five year is lower (less) than the standard rule ie 21
And it is 097 in the year 2011-2012 (current year)
The Debt-Equity Ratio was shown under the standard ratio It is clear that the long
term debt is more than that of the share holdersrsquo fund It indicates that the firm
heavily relying on external funds rather than the internal funds
The operating and net profit of Kesoram is in decreasing trend due to heavy
increase of manufacturing amp administrative expenses
ROI is highest in the year 2007-2008 as 3862 The ROI is negative in the years
2010-2011 amp 2011-2012 as -2167 amp -4165 respectively
Return on Equity Capital Employed Ratio of Kesoram has decreased every year
from 2007-2008 to 2010-2011It further decreased to negative in the year 2011-12 to
-3280
EPS of Kesoram has decreased every year from 2008-12It is negative in the year
2011 amp 12
8102019 A Study A Study On Financial Performance Analysis With Reference To Kesoram Cementon Financial Performance hellip
httpslidepdfcomreaderfulla-study-a-study-on-financial-performance-analysis-with-reference-to-kesoram 7781
77
Suggestion
The organization should adopt an appropriate capital structure
The companyrsquos debt-equity ratio is recorded more or less as 111 in the year 2008
and it is increased to 449 in the year 2012 (current year)The company should
adopt a better debt equity mix in the future to control the fluctuations in returns
The company should control fluctuations in cash and bank balances as it impacts the
current ratio of the company
The provisions are showing increasing trend which indicates risk of debtors The
firm should implement an effective credit management policy It should utilize its
idle funds by decreasing provisions
The company should control heavy increase of manufacturing amp administration
expenses as it is impacting the operating and net profit of company
8102019 A Study A Study On Financial Performance Analysis With Reference To Kesoram Cementon Financial Performance hellip
httpslidepdfcomreaderfulla-study-a-study-on-financial-performance-analysis-with-reference-to-kesoram 7881
78
ANNEXURE
Profit And Loss Account of Kesoram Cement
Mar12 Mar11 Mar10 Mar09 Mar08
12 Months 12 Months 12 Months 12 Months 12 Months
INCOME
Sales Turnover 628260 575072 505151 431613 345700
Excise Duty 36440 35284 30089 41815 45429
NET SALES 591820 539788 475062 389797 300271
Other Income 000 000 000 000 000
TOTALINCOME
596129 548733 481019 393969 302020
EXPENDITURE
Manufacturing
Expenses81903 74803 13974 13153 44113
MaterialConsumed
370897 310150 295550 229359 118448
Personal
Expenses33468 27355 23294 18690 15344
Selling Expenses 81910 78253 58667 48846 45019
AdministrativeExpenses
28225 29308 17219 16179 9907
Expenses
Capitalized000 000 000 000 000
Provisions Made 000 000 000 000 000
TOTAL
EXPENDITURE 596403 519870 408704 326227 232832Operating Profit -4583 19918 66358 63570 67439
EBITDA -274 28864 72316 67742 69188
Depreciation 29740 27259 17280 11186 8927
Other Write-offs 000 000 000 000 000
EBIT -30014 1605 55035 56557 60261
Interest 41015 23983 10921 12087 5426
EBT -71029 -22377 44114 44470 54835
Taxes -32921 5798 23816 3037 16918
Profit and Loss
for the Year-38108 -28176 20298 41432 37917
Non RecurringItems
-1142 7063 3228 -4023 402
Other Non Cash
Adjustments1276 091 207 465 017
OtherAdjustments
000 000 000 000 000
REPORTED
PAT-37974 -21021 23734 37874 38335
8102019 A Study A Study On Financial Performance Analysis With Reference To Kesoram Cementon Financial Performance hellip
httpslidepdfcomreaderfulla-study-a-study-on-financial-performance-analysis-with-reference-to-kesoram 7981
79
Balance Sheet Of Kesoram
Years
Particulars 2008 2009 2010 2011 2012
Liabilities
Share Capital 4574 4574 4574 4574 4574Reserves amp Surplus 93085 128024 149111 125162 86657
Revaluation Reserves 533 412 339 289 27
Loans
Secured Loans 97106 153627 186372 237183 317792
Un Secured Loans 12129 43416 12625 162744 92742
Deferred Tax Liabilities 0 0 0 0 0
Current Liabilities
Provisions 33039 34529 35734 1494 40726
Current Liabilities 57067 66587 107688 113902 18001
Total 297533 431169 610068 645348 722771
Assets
Net Block 108424 180435 343182 369172 358721
Capital WIP 63459 86485 41283 43781 68065
Investments 4783 6178 5143 6582 6636
Current Assets
Inventories 44217 58906 91619 111855 99516
Sundry Debtors 27307 38017 54289 63134 67358
Cash amp Bank Balances 4036 5657 8014 7188 6959
Total Current Assets 7556 10258 153922 182177 173833Loans amp Advances 45289 55462 66506 4346 115409
Fixed Deposits 018 028 031 176 107
Total 297533 431169 610068 645348 722771
8102019 A Study A Study On Financial Performance Analysis With Reference To Kesoram Cementon Financial Performance hellip
httpslidepdfcomreaderfulla-study-a-study-on-financial-performance-analysis-with-reference-to-kesoram 8081
80
KEY ITEMS 2012 2011 2010 2009 2008
Preference
Dividend 0 0 0 0 0
Equity Dividend 457 2516 2516 2516 2516
Equity Dividend
() 999 55 55 55 55
Shares in Issue(Lakhs) 45743 45743 45743 45743 45743
EPS - Annualised
(Rs) -8302 -4595 5188 828 838
8102019 A Study A Study On Financial Performance Analysis With Reference To Kesoram Cementon Financial Performance hellip
httpslidepdfcomreaderfulla-study-a-study-on-financial-performance-analysis-with-reference-to-kesoram 8181
BIBLIOGRAPHY
Sl
No
Books Author Name
1 Financial Management Khan amp JAIN
2 Financial Management IMPandey
3 Management Accounting RPTrivedi
Websites amp Search Engines
1 wwwkesoramcom983086
2 wwwmoneycontrolcom
3 wwwgooglefinancecom983086
Annual reports of Kesoram cement limited 2008-2012
8102019 A Study A Study On Financial Performance Analysis With Reference To Kesoram Cementon Financial Performance hellip
httpslidepdfcomreaderfulla-study-a-study-on-financial-performance-analysis-with-reference-to-kesoram 7781
77
Suggestion
The organization should adopt an appropriate capital structure
The companyrsquos debt-equity ratio is recorded more or less as 111 in the year 2008
and it is increased to 449 in the year 2012 (current year)The company should
adopt a better debt equity mix in the future to control the fluctuations in returns
The company should control fluctuations in cash and bank balances as it impacts the
current ratio of the company
The provisions are showing increasing trend which indicates risk of debtors The
firm should implement an effective credit management policy It should utilize its
idle funds by decreasing provisions
The company should control heavy increase of manufacturing amp administration
expenses as it is impacting the operating and net profit of company
8102019 A Study A Study On Financial Performance Analysis With Reference To Kesoram Cementon Financial Performance hellip
httpslidepdfcomreaderfulla-study-a-study-on-financial-performance-analysis-with-reference-to-kesoram 7881
78
ANNEXURE
Profit And Loss Account of Kesoram Cement
Mar12 Mar11 Mar10 Mar09 Mar08
12 Months 12 Months 12 Months 12 Months 12 Months
INCOME
Sales Turnover 628260 575072 505151 431613 345700
Excise Duty 36440 35284 30089 41815 45429
NET SALES 591820 539788 475062 389797 300271
Other Income 000 000 000 000 000
TOTALINCOME
596129 548733 481019 393969 302020
EXPENDITURE
Manufacturing
Expenses81903 74803 13974 13153 44113
MaterialConsumed
370897 310150 295550 229359 118448
Personal
Expenses33468 27355 23294 18690 15344
Selling Expenses 81910 78253 58667 48846 45019
AdministrativeExpenses
28225 29308 17219 16179 9907
Expenses
Capitalized000 000 000 000 000
Provisions Made 000 000 000 000 000
TOTAL
EXPENDITURE 596403 519870 408704 326227 232832Operating Profit -4583 19918 66358 63570 67439
EBITDA -274 28864 72316 67742 69188
Depreciation 29740 27259 17280 11186 8927
Other Write-offs 000 000 000 000 000
EBIT -30014 1605 55035 56557 60261
Interest 41015 23983 10921 12087 5426
EBT -71029 -22377 44114 44470 54835
Taxes -32921 5798 23816 3037 16918
Profit and Loss
for the Year-38108 -28176 20298 41432 37917
Non RecurringItems
-1142 7063 3228 -4023 402
Other Non Cash
Adjustments1276 091 207 465 017
OtherAdjustments
000 000 000 000 000
REPORTED
PAT-37974 -21021 23734 37874 38335
8102019 A Study A Study On Financial Performance Analysis With Reference To Kesoram Cementon Financial Performance hellip
httpslidepdfcomreaderfulla-study-a-study-on-financial-performance-analysis-with-reference-to-kesoram 7981
79
Balance Sheet Of Kesoram
Years
Particulars 2008 2009 2010 2011 2012
Liabilities
Share Capital 4574 4574 4574 4574 4574Reserves amp Surplus 93085 128024 149111 125162 86657
Revaluation Reserves 533 412 339 289 27
Loans
Secured Loans 97106 153627 186372 237183 317792
Un Secured Loans 12129 43416 12625 162744 92742
Deferred Tax Liabilities 0 0 0 0 0
Current Liabilities
Provisions 33039 34529 35734 1494 40726
Current Liabilities 57067 66587 107688 113902 18001
Total 297533 431169 610068 645348 722771
Assets
Net Block 108424 180435 343182 369172 358721
Capital WIP 63459 86485 41283 43781 68065
Investments 4783 6178 5143 6582 6636
Current Assets
Inventories 44217 58906 91619 111855 99516
Sundry Debtors 27307 38017 54289 63134 67358
Cash amp Bank Balances 4036 5657 8014 7188 6959
Total Current Assets 7556 10258 153922 182177 173833Loans amp Advances 45289 55462 66506 4346 115409
Fixed Deposits 018 028 031 176 107
Total 297533 431169 610068 645348 722771
8102019 A Study A Study On Financial Performance Analysis With Reference To Kesoram Cementon Financial Performance hellip
httpslidepdfcomreaderfulla-study-a-study-on-financial-performance-analysis-with-reference-to-kesoram 8081
80
KEY ITEMS 2012 2011 2010 2009 2008
Preference
Dividend 0 0 0 0 0
Equity Dividend 457 2516 2516 2516 2516
Equity Dividend
() 999 55 55 55 55
Shares in Issue(Lakhs) 45743 45743 45743 45743 45743
EPS - Annualised
(Rs) -8302 -4595 5188 828 838
8102019 A Study A Study On Financial Performance Analysis With Reference To Kesoram Cementon Financial Performance hellip
httpslidepdfcomreaderfulla-study-a-study-on-financial-performance-analysis-with-reference-to-kesoram 8181
BIBLIOGRAPHY
Sl
No
Books Author Name
1 Financial Management Khan amp JAIN
2 Financial Management IMPandey
3 Management Accounting RPTrivedi
Websites amp Search Engines
1 wwwkesoramcom983086
2 wwwmoneycontrolcom
3 wwwgooglefinancecom983086
Annual reports of Kesoram cement limited 2008-2012

8102019 A Study A Study On Financial Performance Analysis With Reference To Kesoram Cementon Financial Performance hellip
httpslidepdfcomreaderfulla-study-a-study-on-financial-performance-analysis-with-reference-to-kesoram 7881
78
ANNEXURE
Profit And Loss Account of Kesoram Cement
Mar12 Mar11 Mar10 Mar09 Mar08
12 Months 12 Months 12 Months 12 Months 12 Months
INCOME
Sales Turnover 628260 575072 505151 431613 345700
Excise Duty 36440 35284 30089 41815 45429
NET SALES 591820 539788 475062 389797 300271
Other Income 000 000 000 000 000
TOTALINCOME
596129 548733 481019 393969 302020
EXPENDITURE
Manufacturing
Expenses81903 74803 13974 13153 44113
MaterialConsumed
370897 310150 295550 229359 118448
Personal
Expenses33468 27355 23294 18690 15344
Selling Expenses 81910 78253 58667 48846 45019
AdministrativeExpenses
28225 29308 17219 16179 9907
Expenses
Capitalized000 000 000 000 000
Provisions Made 000 000 000 000 000
TOTAL
EXPENDITURE 596403 519870 408704 326227 232832Operating Profit -4583 19918 66358 63570 67439
EBITDA -274 28864 72316 67742 69188
Depreciation 29740 27259 17280 11186 8927
Other Write-offs 000 000 000 000 000
EBIT -30014 1605 55035 56557 60261
Interest 41015 23983 10921 12087 5426
EBT -71029 -22377 44114 44470 54835
Taxes -32921 5798 23816 3037 16918
Profit and Loss
for the Year-38108 -28176 20298 41432 37917
Non RecurringItems
-1142 7063 3228 -4023 402
Other Non Cash
Adjustments1276 091 207 465 017
OtherAdjustments
000 000 000 000 000
REPORTED
PAT-37974 -21021 23734 37874 38335
8102019 A Study A Study On Financial Performance Analysis With Reference To Kesoram Cementon Financial Performance hellip
httpslidepdfcomreaderfulla-study-a-study-on-financial-performance-analysis-with-reference-to-kesoram 7981
79
Balance Sheet Of Kesoram
Years
Particulars 2008 2009 2010 2011 2012
Liabilities
Share Capital 4574 4574 4574 4574 4574Reserves amp Surplus 93085 128024 149111 125162 86657
Revaluation Reserves 533 412 339 289 27
Loans
Secured Loans 97106 153627 186372 237183 317792
Un Secured Loans 12129 43416 12625 162744 92742
Deferred Tax Liabilities 0 0 0 0 0
Current Liabilities
Provisions 33039 34529 35734 1494 40726
Current Liabilities 57067 66587 107688 113902 18001
Total 297533 431169 610068 645348 722771
Assets
Net Block 108424 180435 343182 369172 358721
Capital WIP 63459 86485 41283 43781 68065
Investments 4783 6178 5143 6582 6636
Current Assets
Inventories 44217 58906 91619 111855 99516
Sundry Debtors 27307 38017 54289 63134 67358
Cash amp Bank Balances 4036 5657 8014 7188 6959
Total Current Assets 7556 10258 153922 182177 173833Loans amp Advances 45289 55462 66506 4346 115409
Fixed Deposits 018 028 031 176 107
Total 297533 431169 610068 645348 722771
8102019 A Study A Study On Financial Performance Analysis With Reference To Kesoram Cementon Financial Performance hellip
httpslidepdfcomreaderfulla-study-a-study-on-financial-performance-analysis-with-reference-to-kesoram 8081
80
KEY ITEMS 2012 2011 2010 2009 2008
Preference
Dividend 0 0 0 0 0
Equity Dividend 457 2516 2516 2516 2516
Equity Dividend
() 999 55 55 55 55
Shares in Issue(Lakhs) 45743 45743 45743 45743 45743
EPS - Annualised
(Rs) -8302 -4595 5188 828 838
8102019 A Study A Study On Financial Performance Analysis With Reference To Kesoram Cementon Financial Performance hellip
httpslidepdfcomreaderfulla-study-a-study-on-financial-performance-analysis-with-reference-to-kesoram 8181
BIBLIOGRAPHY
Sl
No
Books Author Name
1 Financial Management Khan amp JAIN
2 Financial Management IMPandey
3 Management Accounting RPTrivedi
Websites amp Search Engines
1 wwwkesoramcom983086
2 wwwmoneycontrolcom
3 wwwgooglefinancecom983086
Annual reports of Kesoram cement limited 2008-2012
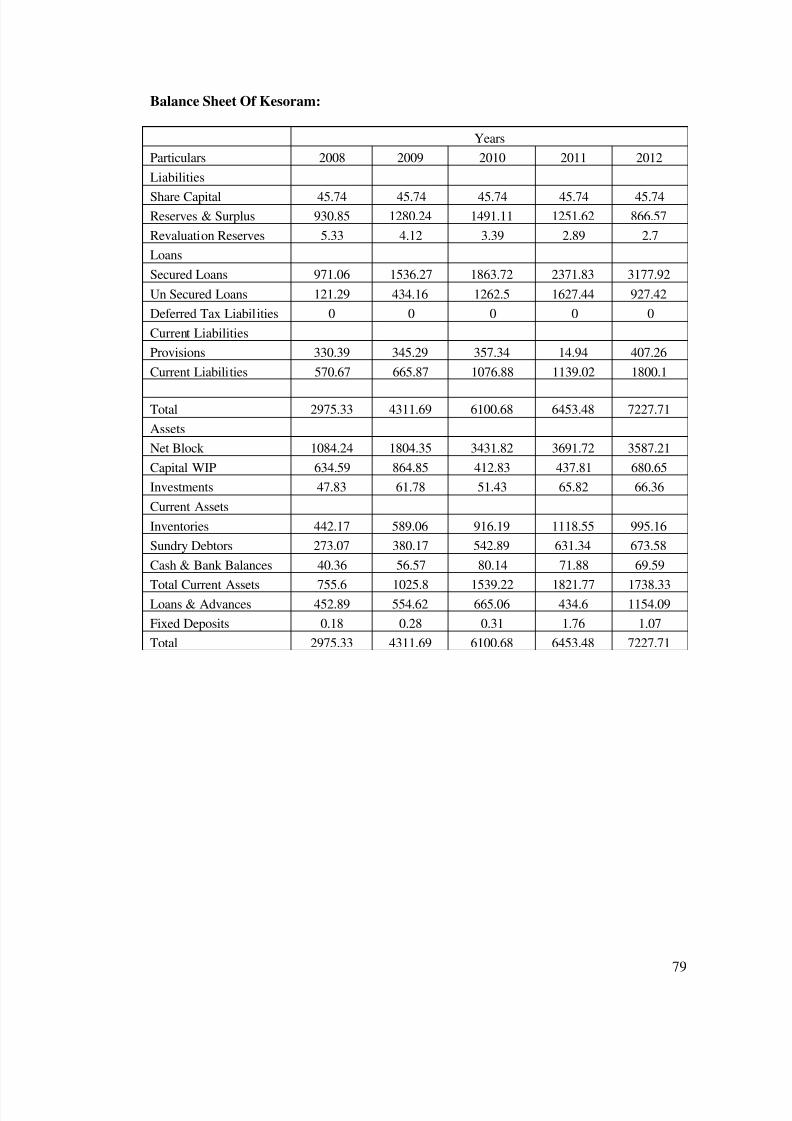
8102019 A Study A Study On Financial Performance Analysis With Reference To Kesoram Cementon Financial Performance hellip
httpslidepdfcomreaderfulla-study-a-study-on-financial-performance-analysis-with-reference-to-kesoram 7981
79
Balance Sheet Of Kesoram
Years
Particulars 2008 2009 2010 2011 2012
Liabilities
Share Capital 4574 4574 4574 4574 4574Reserves amp Surplus 93085 128024 149111 125162 86657
Revaluation Reserves 533 412 339 289 27
Loans
Secured Loans 97106 153627 186372 237183 317792
Un Secured Loans 12129 43416 12625 162744 92742
Deferred Tax Liabilities 0 0 0 0 0
Current Liabilities
Provisions 33039 34529 35734 1494 40726
Current Liabilities 57067 66587 107688 113902 18001
Total 297533 431169 610068 645348 722771
Assets
Net Block 108424 180435 343182 369172 358721
Capital WIP 63459 86485 41283 43781 68065
Investments 4783 6178 5143 6582 6636
Current Assets
Inventories 44217 58906 91619 111855 99516
Sundry Debtors 27307 38017 54289 63134 67358
Cash amp Bank Balances 4036 5657 8014 7188 6959
Total Current Assets 7556 10258 153922 182177 173833Loans amp Advances 45289 55462 66506 4346 115409
Fixed Deposits 018 028 031 176 107
Total 297533 431169 610068 645348 722771
8102019 A Study A Study On Financial Performance Analysis With Reference To Kesoram Cementon Financial Performance hellip
httpslidepdfcomreaderfulla-study-a-study-on-financial-performance-analysis-with-reference-to-kesoram 8081
80
KEY ITEMS 2012 2011 2010 2009 2008
Preference
Dividend 0 0 0 0 0
Equity Dividend 457 2516 2516 2516 2516
Equity Dividend
() 999 55 55 55 55
Shares in Issue(Lakhs) 45743 45743 45743 45743 45743
EPS - Annualised
(Rs) -8302 -4595 5188 828 838
8102019 A Study A Study On Financial Performance Analysis With Reference To Kesoram Cementon Financial Performance hellip
httpslidepdfcomreaderfulla-study-a-study-on-financial-performance-analysis-with-reference-to-kesoram 8181
BIBLIOGRAPHY
Sl
No
Books Author Name
1 Financial Management Khan amp JAIN
2 Financial Management IMPandey
3 Management Accounting RPTrivedi
Websites amp Search Engines
1 wwwkesoramcom983086
2 wwwmoneycontrolcom
3 wwwgooglefinancecom983086
Annual reports of Kesoram cement limited 2008-2012
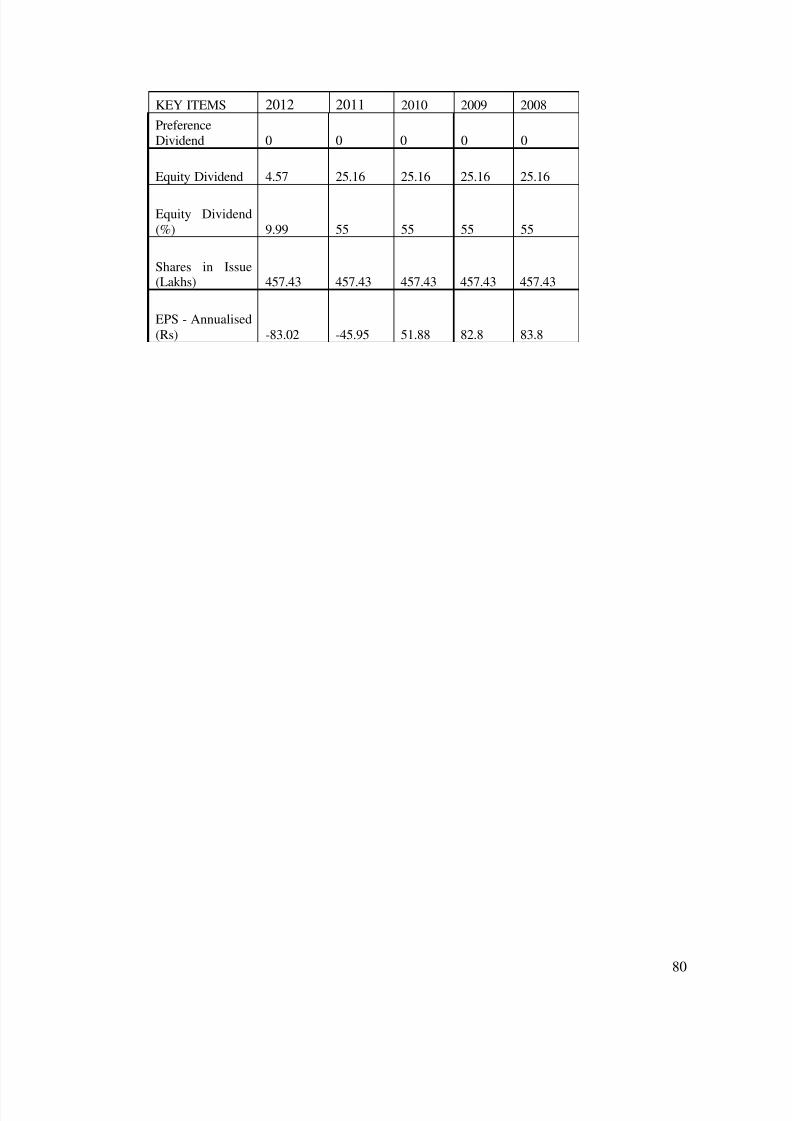
8102019 A Study A Study On Financial Performance Analysis With Reference To Kesoram Cementon Financial Performance hellip
httpslidepdfcomreaderfulla-study-a-study-on-financial-performance-analysis-with-reference-to-kesoram 8181
BIBLIOGRAPHY
Sl
No
Books Author Name
1 Financial Management Khan amp JAIN
2 Financial Management IMPandey
3 Management Accounting RPTrivedi
Websites amp Search Engines
1 wwwkesoramcom983086
2 wwwmoneycontrolcom
3 wwwgooglefinancecom983086
Annual reports of Kesoram cement limited 2008-2012
Related Documents