INGENIER ´ IA E INVESTIGACI ´ ON VOL. 42 NO. 1, APRIL - 2022 (e86819) Research Article / Civil and Sanitary Engineering https://doi.org/10.15446/ing.investig.v42n1.86819 A Structural Design Comparison Between Two Reinforced Concrete Regular 6-Level Buildings using Soil-Structure Interaction in Linear Range Comparación de diseño estructural entre dos edificaciones de concreto armado de seis niveles utilizando interacción suelo-estructura en el rango lineal Nelson A. López M. 1 , Gabriela E. Pérez M. 2 , Christian F. Castro P. 3 , Juan C. Vielma P. 4 , Leonardo J. López M. 5 , José D. Alviar M. 6 , Carlos A. Romero R. 7 , David P. Guerrero C. 8 , and Vanessa V. Montesinos M. 9 ABSTRACT Structural engineers commonly design superstructures as fixed at the base and transmit the reactions to the infrastructure in order to design the foundation system and estimate the displacement of the soil while disregarding the change in seismic response that this induces. In this article, the foundation system was transformed into equivalent springs, and the seismic response in the linear range was compared and quantified, obtaining results such as increased periods, increased amounts of steel reinforcement in beams (between 7% and 25%) and columns (between 29% and 39%), an increase in the number of stirrups per linear meter (between 3% and 11% in columns and between 5% and 45% in beams) and drifts (between 1% and 14%), and a decrease in basal shear (up to 20%), which directly affects the design of the structure. This study concludes that the inclusion of the soil-structure interaction is necessary for structural design in the linear range. Keywords: seismic response, foundation system, soil-structure interaction, linear range RESUMEN Comúnmente, los ingenieros estructurales diseñan superestructuras como empotradas en la base y transmiten las reacciones a la infraestructura para diseñar el sistema de cimientos y estimar los desplazamientos del suelo, obviando el cambio en la respuesta sísmica que esto induce. En este artículo se transformó el sistema de cimientos en resortes equivalentes y se comparó y cuantificó la respuesta sísmica en el rango lineal, obteniendo resultados como aumento de los períodos, aumento de las cuantías de acero de refuerzo en vigas (entre 7 % y 25 %) y columnas (entre 29 % y 39 %) un aumento de la cantidad de estribos por metro lineal (entre 3 % y 11 % en columnas y entre 5 % y 45 % en vigas) y las derivas (entre 1 % y 14 %), y una disminución de cortantes basales (hasta 20 %), lo que afecta de forma directa el diseño de la estructura. Este estudio concluye que es necesaria la inclusión de la interacción suelo estructura en el diseño estructural en el rango lineal. Palabras clave: respuesta sísmica, sistema de cimientos, interacción suelo-estructura, rango lineal Received: April 30th, 2020 Accepted: May 25th, 2021 1 Civil engineer, Universidad Centroccidental Lisandro Alvarado, Venezuela. MSc. in Mechanics Applied to Construction, Universidad Centroccidental Lisandro Al- varado, Venezuela. Affiliation: PhD. Candidate, Pontificia Universidad Católica de Chile, Chile. E-mail: [email protected] 2 Civil engineer, Universidad Politécnica Salesiana, Ecuador. E-mail: [email protected] 3 Civil engineer, Universidad Politécnica Salesiana, Ecuador. E-mail: [email protected] 4 Civil engineer, Universidad Centroccidental Lisandro Alvarado, Venezuela. PhD. from Universidad Politécnica de Cataluña. Affiliation: University professor, Pontifi- cia Universidad Católica de Valparaíso. E-mail: [email protected] 5 Civil engineer, Universidad Centroccidental Lisandro Alvarado, Venezuela. MSc. in Mechanics Applied to Construction, Universidad Centroccidental Lisandro Al- varado, Venezuela. Affiliation: PhD. Candidate, Pontificia Universidad Católica de Chile, Chile. E-mail: [email protected] 6 Civil engineer, Universidad Central de Venezuela, Venezuela. PhD. in Structures and Geotechnics, Universidad Central de Venezuela, Venezuela. Affiliation: Uni- versity professor, Universidad politécnica Salesiana, Ecuador. E-mail: [email protected] 7 Civil engineer, Universidad del Zulia. Venezuela. MSc. in Structures, Universidad del Zulia. Venezuela. Affiliation: Professor, Universidad Politécnica Salesiana, Ecuador. E-mail: [email protected] 8 Civil engineer, Universdiad Central del Ecuador, Ecuador. MSc. in Structures, Es- cuela Politécnica Nacional, Ecuador. Affiliation: University professor, Universidad Politécnica Salesiana, Ecuador. E-mail: [email protected] 9 Civil engineer, Universidad Centroccidental Lisandro Alvarado, Venezuela. Spe- cialist in Structures, Universidad Católica Andres Bello, Venezuela. E-mail: [email protected] How to cite: López, N., Pérez, G., Castro, C., Vielma, J., López, N., Romero, C., Alviar, J., Guerrero, D., and Montesinos, V. (2021). A Structural Design Comparison Between Two Reinforced Concrete Regular 6-Level Buildings using Soil-Structure Interaction in Linear Range. Ingeniería e Investigación, 42(1), e86819. https://doi.org/10.15446/ing.investig.v42n1.86819 Attribution 4.0 International (CC BY 4.0) Share - Adapt 1 of 10

Welcome message from author
This document is posted to help you gain knowledge. Please leave a comment to let me know what you think about it! Share it to your friends and learn new things together.
Transcript

INGENIERIA E INVESTIGACION VOL. 42 NO. 1, APRIL - 2022 (e86819)
Research Article / Civil and Sanitary Engineering https://doi.org/10.15446/ing.investig.v42n1.86819
A Structural Design Comparison Between Two ReinforcedConcrete Regular 6-Level Buildings using Soil-Structure
Interaction in Linear RangeComparación de diseño estructural entre dos edificaciones de concreto
armado de seis niveles utilizando interacción suelo-estructura en elrango lineal
Nelson A. López M. 1, Gabriela E. Pérez M. 2, Christian F. Castro P. 3, Juan C. Vielma P. 4, LeonardoJ. López M. 5, José D. Alviar M. 6, Carlos A. Romero R. 7, David P. Guerrero C. 8, and Vanessa V.
Montesinos M. 9
ABSTRACTStructural engineers commonly design superstructures as fixed at the base and transmit the reactions to the infrastructure in orderto design the foundation system and estimate the displacement of the soil while disregarding the change in seismic response thatthis induces. In this article, the foundation system was transformed into equivalent springs, and the seismic response in the linearrange was compared and quantified, obtaining results such as increased periods, increased amounts of steel reinforcement in beams(between 7% and 25%) and columns (between 29% and 39%), an increase in the number of stirrups per linear meter (between 3%and 11% in columns and between 5% and 45% in beams) and drifts (between 1% and 14%), and a decrease in basal shear (up to20%), which directly affects the design of the structure. This study concludes that the inclusion of the soil-structure interaction isnecessary for structural design in the linear range.
Keywords: seismic response, foundation system, soil-structure interaction, linear range
RESUMENComúnmente, los ingenieros estructurales diseñan superestructuras como empotradas en la base y transmiten las reacciones a lainfraestructura para diseñar el sistema de cimientos y estimar los desplazamientos del suelo, obviando el cambio en la respuestasísmica que esto induce. En este artículo se transformó el sistema de cimientos en resortes equivalentes y se comparó y cuantificó larespuesta sísmica en el rango lineal, obteniendo resultados como aumento de los períodos, aumento de las cuantías de acero derefuerzo en vigas (entre 7 % y 25 %) y columnas (entre 29 % y 39 %) un aumento de la cantidad de estribos por metro lineal (entre 3 %y 11 % en columnas y entre 5 % y 45 % en vigas) y las derivas (entre 1 % y 14 %), y una disminución de cortantes basales (hasta 20 %),lo que afecta de forma directa el diseño de la estructura. Este estudio concluye que es necesaria la inclusión de la interacción sueloestructura en el diseño estructural en el rango lineal.
Palabras clave: respuesta sísmica, sistema de cimientos, interacción suelo-estructura, rango lineal
Received: April 30th, 2020Accepted: May 25th, 2021
1Civil engineer, Universidad Centroccidental Lisandro Alvarado, Venezuela. MSc.in Mechanics Applied to Construction, Universidad Centroccidental Lisandro Al-varado, Venezuela. Affiliation: PhD. Candidate, Pontificia Universidad Católica deChile, Chile. E-mail: [email protected] engineer, Universidad Politécnica Salesiana, Ecuador.E-mail: [email protected] engineer, Universidad Politécnica Salesiana, Ecuador.E-mail: [email protected] engineer, Universidad Centroccidental Lisandro Alvarado, Venezuela. PhD.from Universidad Politécnica de Cataluña. Affiliation: University professor, Pontifi-cia Universidad Católica de Valparaíso. E-mail: [email protected] engineer, Universidad Centroccidental Lisandro Alvarado, Venezuela. MSc.in Mechanics Applied to Construction, Universidad Centroccidental Lisandro Al-varado, Venezuela. Affiliation: PhD. Candidate, Pontificia Universidad Católica deChile, Chile. E-mail: [email protected] engineer, Universidad Central de Venezuela, Venezuela. PhD. in Structuresand Geotechnics, Universidad Central de Venezuela, Venezuela. Affiliation: Uni-versity professor, Universidad politécnica Salesiana, Ecuador.E-mail: [email protected] engineer, Universidad del Zulia. Venezuela. MSc. in Structures, Universidaddel Zulia. Venezuela. Affiliation: Professor, Universidad Politécnica Salesiana,
Ecuador. E-mail: [email protected] engineer, Universdiad Central del Ecuador, Ecuador. MSc. in Structures, Es-cuela Politécnica Nacional, Ecuador. Affiliation: University professor, UniversidadPolitécnica Salesiana, Ecuador. E-mail: [email protected] engineer, Universidad Centroccidental Lisandro Alvarado, Venezuela. Spe-cialist in Structures, Universidad Católica Andres Bello, Venezuela.E-mail: [email protected]
How to cite: López, N., Pérez, G., Castro, C., Vielma, J., López, N., Romero,C., Alviar, J., Guerrero, D., and Montesinos, V. (2021). A Structural DesignComparison Between Two Reinforced Concrete Regular 6-Level Buildings usingSoil-Structure Interaction in Linear Range. Ingeniería e Investigación, 42(1),e86819. https://doi.org/10.15446/ing.investig.v42n1.86819
Attribution 4.0 International (CC BY 4.0) Share - Adapt
1 of 10

A Structural Design Comparison Between Two Reinforced Concrete Regular 6-Level Buildings using Soil-Structure Interaction in Linear...
IntroductionStructural engineering always aims for the best way to rep-resent a real structure in a mathematical model in order toobtain the best approach to the reality. Soil-structure interac-tion is one of many ways to get closer to the behavior of a realstructure. There are many ways to represent this relationship:it could be static or dynamic, linear or non-linear, and thepossible combinations among them (Zeevaert, 1980; Mejía-Bermejo, 2017; Hernández-Velasco, 2013; Galicia and León,2007; Villareal, G. 2009). To represent soil and substructuredisplacements, it is necessary to calculate the foundationsystem, in order to substitute it with equivalent springs usingthe concepts of rotational and translational stiffness (Uribe-Escamilla, 2000; Weaver and Gere, 1990; López et al., 2019),which express that a structural element can be representedthrough its rotational and translational stiffness coefficients,as shown in Equations (1) and (2).
F = KTd (1)
F = KRθ (2)
where F is the force applied on a structural element; KTis the element’s translational stiffness constant; d is thedisplacement in the force’s direction; M is the torsional orbending moment applied on the structural element; KR is theelement’s rotational stiffness constant; and θ is the rotationin the moment’s direction. To make soil-structure interactionpossible, it is necessary to obtain the values of F, d, M, andθ. Thus, the values of KT and KR, can be calculated for eachdirection, representing the equivalent spring constants for thefoundation system, as shown in Figure 1. It is worth notingthat that KT and F = KR remain linear, with a single value foreach direction (Wu and Pantelides, 2019).
Figure 1. Equivalent springs for foundation system.Source: (Castro-Pilco and Pérez-Martínez, 2020)
After calculating the equivalent springs, the initial structuralmodel fixed at the base is submitted to a new structuralanalysis using springs (Figure 2), thus allowing changes inglobal stiffness and, hence, a variation in the results.
MethodologyThis research was based on basic structural concepts for soil-structure interaction in linear range. The structure used forthis research was residential and consisted of six levels, oneelevator, one stair module, with 3 types of foundation soil and
Figure 2. Structural model with fixed supports (left) and equivalentsprings (rigth) at the base.Source: (Authors)
spectral parameters typical from Quito, Ecuador. The mainobjective of this research was to quantify the differences inseismic response and structural members design of the sameregular reinforced concrete structure using soil-structure in-teraction in linear range. Basic structural dynamics applied tobuilding analysis and design explains how to obtain the mainstructural criteria in order to accept or reject the structuralmember cross section, with the vibrational modes, periods,and drifts being the most important, including the force di-agrams for structural member design. Based on the basicconcepts of structural dynamics, the modal matrix and thestructure’s frequencies can be calculated from Equations (3),(4), and (5).
[M] {x} + [C] {x} + [Ke] {x} = 0 (3)
ϕ = eigenvectors {[Ke],[M]} (4)
w2 = eigenvalues {[Ke],[M]} (5)
where [Ke] is the structure’s equivalent stiffness matrix, whichdepends on the cross section, inertia, length, supports, andmaterial of each structural member for 2D planar analysis;[M] is the mass matrix of the structure; [C] is the matrixof damping factor, which is considered to be constant inthis research; x is the structure acceleration vector; x is thestructure velocity vector; x is the structure displacementvector; ϕ is the modal matrix; and w is the angular velocityfor each vibrational mode.
In this research, three different inelastic spectra were consid-ered, and the general solution was obtained by performingmodal-spectral analysis, with modal truncation for three vi-bration modes per floor, and then obtaining the response ofeach degree of freedom (DOF) by applying Equations (6) and(7).
Dn + 2ζnwnDn + w2nDn = ug (6)
un =ϕT
n MιmnϕnDn (7)
where ζn is the damping value per mode; wn is the angularvelocity per mode; Dn is the modal displacement value per
2 of 10 INGENIERIA E INVESTIGACION VOL. 42 NO. 1, APRIL - 2022
LOPEZ M., PEREZ M., CASTRO P., VIELMA P., LOPEZ M., ALVIAR M., ROMERO R., GUERRERO C., AND MONTESINOS M.
mode; ug is the spectral acceleration; ι is the directional vectorfor the spectral acceleration (x, y, z); un is the displacementfor each DOF and each vibrational mode; m is the modalmass; and n is the number of each vibrational mode. Thetotal response is estimated through the CQC method. Thesecalculations were made with Autodesk Robot Structural 2020,academic version (547L1, 900-95470127).
The [Ke] factor is the key for the structural changes in resultsusing soil-structure interaction due to the change in stiffnessin the first level, which directly affects global stiffness. If astructure is assumed to be fixed at the base or uses equiv-alent springs, stiffness changes according to the case. Thefixed element has translational and rotational restrictions atthe base, whereas the non-fixed element has no restrictions,thus allowing displacements and rotations at the base andincreasing displacements. According to the literature (Fal-coní, 2008; Chopra, 1980); Reyes, 1998; Paz, 1992), stiffnessdecreases are in accordance with equivalent stiffness the-ory, which expresses an equivalence with the configurationthrough Equation (8), for springs in parallel arrangement, andEquation (9), for springs in continuous arrangement.
Ke =n∑1
K (8)
1Ke=
n∑1
1Kn
(9)
The stiffness modification at the base directly affects the [Ke]structure matrix, modifying the periods, frequency, modal re-sponse, and modal displacements. Some studies express thatdamping is another important factor (Lutes and Sarkani, 1995;Cruz, and Miranda, 2017). However, this value has remainedconstant, imposing a 5,00% damping value corresponding tostructures provided with reinforced concrete.
Analysis and discussionInelastic design spectrumThis research was based on three typical soil types from thecity of Quito, Ecuador, with an acceleration value on rockaccording to a seismic hazard of 0,40 g. The three soil typeswere A, C, and E, based on the scale from A to E, with Abeing the best soil type, with a shear wave velocity greaterthan 1500,00 m/s; C, an intermediate soil, with shear wavevelocities between 360 m/s and 760 m/s; and E, the worstsoil type, with a shear wave velocity of less than 180 m/s.The inelastic spectrum by soil type used for the analysisare shown in Figure 3, as a fraction of gravity accordingto the Ecuadorian building regulations for seismic hazard(NEC, 2014).
Fixed superstructure analysis and designThe first step in the analysis is the correct design of thestructure, in accordance with the regulations (ACI, 20142019; NEC, 2015; ASCE/FEMA, 2000), aiming to guarantee a
Figure 3. Inelastic seismic design spectrum for each soil type.Source: Authors
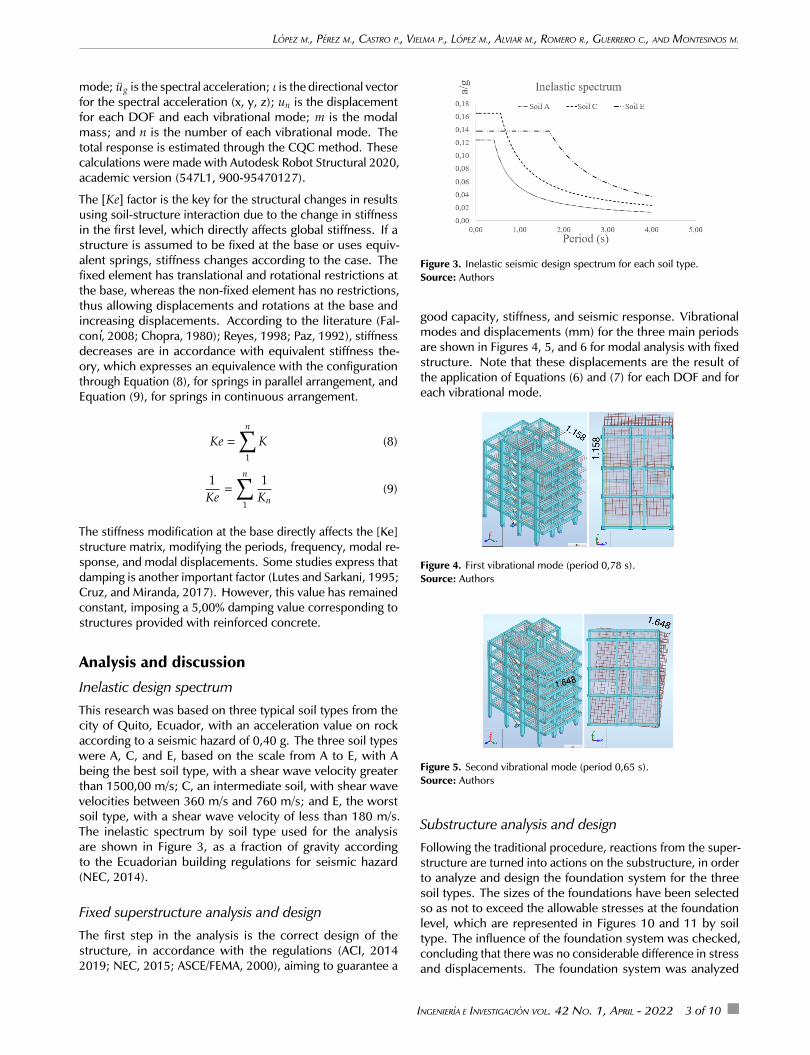
good capacity, stiffness, and seismic response. Vibrationalmodes and displacements (mm) for the three main periodsare shown in Figures 4, 5, and 6 for modal analysis with fixedstructure. Note that these displacements are the result ofthe application of Equations (6) and (7) for each DOF and foreach vibrational mode.
Figure 4. First vibrational mode (period 0,78 s).Source: Authors
Figure 5. Second vibrational mode (period 0,65 s).Source: Authors
Substructure analysis and designFollowing the traditional procedure, reactions from the super-structure are turned into actions on the substructure, in orderto analyze and design the foundation system for the threesoil types. The sizes of the foundations have been selectedso as not to exceed the allowable stresses at the foundationlevel, which are represented in Figures 10 and 11 by soiltype. The influence of the foundation system was checked,concluding that there was no considerable difference in stressand displacements. The foundation system was analyzed
INGENIERIA E INVESTIGACION VOL. 42 NO. 1, APRIL - 2022 3 of 10

A Structural Design Comparison Between Two Reinforced Concrete Regular 6-Level Buildings using Soil-Structure Interaction in Linear...
using equivalent springs for vertical displacements at thebase to simulate soil elasticity (Figure 7), based on Ballastcoefficient (Meli Piralla, 1986). The equivalent soil stiffnessis shown in Table 1, using a finite element node spacing of25 cm (de Macedo Wahrhaftig, 2020) (Figures 8 and 9).
Figure 6. Third vibrational mode (period 0,58 s).Source: Authors
Figure 7. Isolines for displacements.Source: Authors
Figure 8. Foundation system using equivalent springs at the isolatedfoundation base (kN, kN.m).Source: Authors
Table 1. Ballast coefficient for each soil type
Soil typeBallast Coefficient
(N/cm3)Equivalent stiffness
(N/cm)A 470,88 294 300,00B 196,20 122 625,00C 78,48 49 050,00
Source: Authors
The definitive dimensions for each foundation system and foreach soil type are shown in Figures 10 and 11, according to(Pérez-Valcárcel, J., 2013; Garza-Vásquez, 2000; Paz, 1992).
Figure 9. Foundation system using equivalent springs at the combinedfoundation base (kN, kN.m).Source: Authors
Figure 10. Foundation system for soils A and C (m).Source: Authors
Figure 11. Foundation system for soil E (m).Source: Authors
According to Equations (1) and (2), stiffness constants foreach soil type are shown in Tables 2 to 7. After calculatingthe equivalent spring constants, the fixed supports werereplaced, thus changing structure stiffness. Please note that,on average, stiffness decreases for soils A to E, with soil Abeing the best, and E the worst in terms of behavior.
4 of 10 INGENIERIA E INVESTIGACION VOL. 42 NO. 1, APRIL - 2022

LOPEZ M., PEREZ M., CASTRO P., VIELMA P., LOPEZ M., ALVIAR M., ROMERO R., GUERRERO C., AND MONTESINOS M.
Table 2. Equivalent translational springs constant for soil A
Translational stiffness (MN/m)Axis 4 3 2 1
A kx 164,41 127,78 126,47 56,81A ky 50,99 21,72 59,45 63,80A kz 1 030,00 1442,00 1 442,00 765,19B kx 242,20 122,52 131,38 49,58B ky 56,22 30,46 59,48 62,03B kz 1 177,00 1 177,00 1 177,00 1 000,00C kx 158,67 124,10 126,78 62,73C ky 55,48 58,61 52,50 63,09C kz 1 177,00 1 177,00 1 177,00 1 000,00D kx 202,59 134,92 125,81 50,78D ky 54,24 72,36 41,95 84,62D kz 1 030,00 1 442,00 1 442,00 765,15
Source: Authors
Table 3. Equivalent rotational springs constant for soil A
Rotational stiffness (MN.m/rad)Axis 4 3 2 1
A kx 393,65 243,77 247,05 94,97A ky 233,22 267,74 169,1 77,18A kz 5,40E−4 6,40E−4 8,30E−5 1,50E−4
B kx 196,61 254,29 247,51 113,36B ky 220,77 250,66 169,24 81,66B kz 9,50E-05 2,70E−4 2,40E−5 7,80E−5
C kx 400,97 260,23 245,77 76,69C ky 220,48 173,36 189,31 77,78C kz 2,80E-04 5,60E−4 1,60E−4 3,80E−5
D kx 287,98 224,1 248,88 111,68D ky 224,77 134,98 216,23 18,68D kz 2,20E−4 1,80E−3 8,80E−4 5,00E−4
Source: Authors
Table 4. Equivalent rotational springs constant for soil C
Rotational stiffness (MN.m/rad)Axis 4 3 2 1
A kx 462,38 243,77 247,05 94,97A ky 247,21 267,74 169,1 77,18A kz 4,90E−4 6,40E−4 8,30E−5 1,50E−4
B kx 196,61 254,29 247,51 113,36B ky 220,77 250,66 169,24 81,66B kz 9,50E−5 2,70E−4 2,40E−5 7,80E−5
C kx 400,97 260,23 245,77 76,69C ky 220,48 173,36 189,31 77,78C kz 2,80E−4 5,60E−4 1,60E−4 3,80E−4
D kx 341,03 224,1 248,88 111,68D ky 237,49 134,98 216,23 18,68D kz 1,90E−4 1,80E−3 8,80E−4 5,00E−4
Source: Authors
Analysis and design of the superstructure using equiv-alent springsAs shown in Figure 2, the fixed supports were replaced, anda new modal analysis including the new global stiffness wasmade. The first main comparison takes place on displace-ments and periods, as shown in Figures 12 to 14. Periodsand displacements remained closer with the use of equiva-lent springs, and they were located at different points of the
Table 5. Equivalent translational springs constant for soil C
Translational stiffness (MN/m)Axis 4 3 2 1
A kx 193,12 127,78 126,47 56,81A ky 54,05 21,72 59,45 63,8A kz 772,52 1.079,13 1.078 527,32B kx 242,2 122,52 131,38 49,58B ky 56,22 30,46 59,48 62,03B kz 876,72 876,77 876,81 472,11C kx 158,67 124,1 126,78 62,73C ky 55,48 58,61 52,5 63,09C kz 876,72 876,77 876,81 472,11D kx 239,91 134,92 125,81 50,78D ky 57,31 72,36 41,95 84,62D kz 772,54 1 079,10 1 079,00 527,34
Source: Authors
Table 6. Equivalent translational springs constant for soil E
Translational stiffness (MN/m)Axis 4 3 2 1
A kx 164,41 127,78 126,47 56,81A ky 50,99 21,72 59,45 63,8A kz 1 030,00 1 442,00 1 442,00 765,19B kx 242,2 122,52 131,38 49,58B ky 56,22 30,46 59,48 62,03B kz 1 177,00 1 177,00 1 177,00 1 000,00C kx 158,67 124,1 126,78 62,73C ky 55,48 58,61 52,5 63,09C kz 1 177,00 1 177,00 1 177,00 1 000,00D kx 202,59 134,92 125,81 50,78D ky 54,24 72,36 41,95 84,62D kz 1 030,00 1 442,00 1 442,00 765,15
Source: Authors
Table 7. Equivalent rotational springs constant for soil E
Rotational stiffness (MN.m/rad)Axis 4 3 2 1
A kx 393,65 243,77 247,05 94,97A ky 233,22 267,74 169,1 77,18A kz 5,40E−4 6,40E−4 8,30E−5 1,50E−4
B kx 196,61 254,29 247,51 113,36B ky 220,77 250,66 169,24 81,66B kz 9,50E−5 2,70E−4 2,40E−5 7,80E−5
C kx 400,97 260,23 245,77 76,69C ky 220,48 173,36 189,31 77,78C kz 2,80E−4 5,60E−4 1,60E−4 3,80E−5
D kx 287,98 224,1 248,88 111,68D ky 224,77 134,98 216,23 18,68D kz 2,20E−4 1,80E−3 8,80E−4 5,00E−4
Source: Authors
structure, in comparison with Figures 4 to 6, which meansthat foundation equivalent system reflects a similar response.On the other hand, results for frequencies and periods areshown in Tables 8 and 9, and the maximum displacementsare shown in table 10 for each soil type and the first three vi-brational modes. The frequencies decrease while the periodsincrease, as well as the maximum displacements. Addition-ally, the global stiffness estimate is shown in Table 11, which
INGENIERIA E INVESTIGACION VOL. 42 NO. 1, APRIL - 2022 5 of 10

A Structural Design Comparison Between Two Reinforced Concrete Regular 6-Level Buildings using Soil-Structure Interaction in Linear...
decreases from soil E to soil A, meaning that the stiffness isnot related only to the size of the foundation system, but alsoto the Ballast coefficient and the type of foundation (isolatedor combined).
Figure 12. Maximum displacements for soil A (cm): 1st mode on theleft, 2nd mode in the middle, and 3rd mode on the right.Source: Authors
Figure 13. Maximum displacements for soil C (cm): the 1st mode onthe left, the 2nd mode in the middle, and the 3rd mode on the right.Source: Authors
Figure 14. Maximum displacements for soil E (cm): 1st mode on theleft, the 2nd mode in the middle, and the 3rd mode on the right.Source: Authors
Table 8. Frequencies
Frequencies w (rad/s)Mode Fixed Springs (A) Springs (C) Springs (E)
1 1,27 1,19 1,18 1,172 1,54 1,44 1,42 1,413 1,73 1,60 1,59 1,58
Source: Authors
Comparisson between fixed models and with springsmodelsTo compare the structural response among the fixed and non-fixed models, a complete design for each soil type was made.The final dimensions for the fixed structure remained the samefor the non-fixed structure, in order to compare them against
Table 9. Periods
Periods T (s)Mode Fixed Springs (A) Springs (C) Springs (E)
1 0,78 0,84 0,85 0,852 0,65 0,70 0,70 0,713 0,58 0,62 0,63 0,63
Source: Authors
Table 10. Maximum displacements
Maximum displacements (cm)Fixed Springs (A) Springs (C) Springs (E)1,158 1,131 1,134 1,1371,648 1,565 1,531 1,5102,051 2,002 2,003 2,002
Source: Authors
Table 11. Global stiffness
Kx (kN/mm) Ky (kN/mm) K average (kN/mm)Fixed 166,69 126,38 146,53
A 129,06 123,17 126.12C 137,56 100,11 118.83E 133,79 98,65 116,22
Source: Authors
the reinforcement steel areas and drifts. Reinforcement steelareas for beams and columns for each model are shownin Tables 12 to 16. It can be observed that, for soil A, therequired reinforcement increase is related to the stiffness,which is the highest among the three soil types, approachingto fixed model (Wahrhaftig and Brasil, 2017).
Table 12. Average required reinforcement
Average requiredreinforcement (cm2)
Average requiredreinforcement (%)
FixedEquivalent
springsDifference
Soil type As- As+ As- As+ As- As+A 3,98 2,61 4,37 3,24 9,89 24,04C 4,74 2,90 4,97 3,18 4,75 9,97E 4,78 2,87 5,12 3,15 7,05 9,79
Source: Authors
Table 13. Total required reinforcement for beams (entire structure)
Total required reinforcement for beams (cm2)
FixedEquivalent
springsSoil type As- As+ As- As+
A 3 128,23 2 050,05 3 437,65 2 542,90C 3 725,82 2 275,83 3 902,86 2 502,73E 3 759,05 2 256,32 4 024,00 2 477,18
Source: Authors
The increase in positive and negative reinforcement areasimplies an increase in the maximum deflection of beams,as shown in Table 17. Please note that these increaseswere negligible, but, if a structural design is susceptible
6 of 10 INGENIERIA E INVESTIGACION VOL. 42 NO. 1, APRIL - 2022

LOPEZ M., PEREZ M., CASTRO P., VIELMA P., LOPEZ M., ALVIAR M., ROMERO R., GUERRERO C., AND MONTESINOS M.
Table 14. Differences on total required reinforcement for beams (entirestructure)
Difference (cm2) Difference (%)Soil type As- As+ As- As+
A 309,42 492,85 9,89 24,04C 177,04 226,90 4,75 9,97E 264,95 220,86 7,05 9,79
Source: Authors
Table 15. Total reinforcement required for columns (entire structure)
Average requiredreinforcement
(cm2)
Total required reinforcementfor columns
(cm2)
Soil type FixedEquivalent
springsFixed
Equivalentsprings
A 16,92 23,54 1 760,00 2 448,51C 18,12 23,54 1 884,86 2 448,50E 17,30 23,54 1 799,25 2 448,37
Source: Authors
Table 16. Differences on total reinforcement required for columns(entire structure)
Soil type Difference (cm2) Difference (%)A 688,51 39,12C 563,64 29,90E 649,12 36,08
Source: Authors
to deflections, the amplification must be considered, eventhough the increases for positive bending moments are beingcountered by the increase in negative bending moments,thus compensating the deflection increase. For columns, thequantities of reinforcement areas remain almost equal foreach soil type, but, for all cases, there was a considerableincrease associated with the new bending moments of thebeams.
Table 17. Average maximum deflection for beams
Average deflection (mm)Level Fixed A C E
1 -4,12 -4,20 -4,16 -4,212 -4,08 -4,05 -4,06 -4,123 -4,10 -4,08 -4,10 -4,134 -4,11 -4,10 -4,11 -4,145 -4,19 -4,16 -4,16 -4,196 -3,37 -3,37 -3,37 -3,46
Source: Authors
The direct relationship between bending moment and shearforce implies an increase in shear effects; hence, a measure-ment of quantities of stirrups per length was established, asshown in Tables 19 and 20. Please note that stirrups quanti-ties increase in average for beams and columns, and this isrelated to the increase bending moments due to gravitationaleffects and the reduction of the stiffness. Tables 21 and 22show the base shear, and, for soil E, there is an amplification
Table 18. Average ratios for maximum deflection for beams
Average ratios (spring/fixed)Level A C E
1 1,0196 1,0103 1,02182 0,9919 0,9940 1,00873 0,9946 0,9998 1,00624 0,9991 1,0004 1,00665 0,9936 0,9943 1,00096 1,0002 1,0009 1,0272
Average 0,9998 0,9999 1,0119
Source: Authors
consistent with these results, whereas, for soils A and C, areduction is observed while gravitational forces still increase.
Table 19. Stirrups per length in columns (16 mm)
Soil type FixedEquivalent
springsDifference
(%)A 4,51 4,67 3,55C 4,71 5,01 6,45E 4,55 5,03 10,56
Source: Authors
Table 20. Stirrups per length in beams (10 mm)
Soil type FixedEquivalent
springsDifference
(%)A 7,50 7,86 4,8C 8,88 9,44 6,31E 7,55 11,00 45,7
Source: Authors
As an example, the calculation of drifts for soil E are shownin Tables 21 and 22, while the total drifts and ratios for eachsoil type are shown in Table 23. Ratios were calculated usingEquation (10). Elastic drifts were calculated according to(NEC, 2014), which specifies that, if ratio > 1, then driftsusing equivalent springs are greater than drifts using fixedsupports, and vice-versa.
ratio =Equivalent springs drits
Fixed dri f ts(10)
The procedure shown in Tables 21 and 22 was applied to allframes in both directions to obtain a global average for eachstructure (Table 23).
The results for drifts were as expected, which means that theywere greater in models based on equivalent springs than inthe fixed models. Although drifts for models with equivalentsprings are greater, all models still remained within admissiblevalues, which did not exceed the value of 0,02. Ratiosincreased from soil A to soil E, which is related to the globalstiffness, modified due to the change from fixed supports tospring supports. Torsional irregularity was checked accordingto regulations and standards (FEMA, 2006, 2018; NEC, 2014),by applying Equation (8). If r ≥ 1,4, then the torsionalirregularity is extreme. If 1,2 ≤ r ≤ 1,4, then the torsional
INGENIERIA E INVESTIGACION VOL. 42 NO. 1, APRIL - 2022 7 of 10

A Structural Design Comparison Between Two Reinforced Concrete Regular 6-Level Buildings using Soil-Structure Interaction in Linear...
Table 21. Example for calculation of inelastic drifts for spectral Ydisplacements (soil E, one frame)
Spectral (Y)
Level Fixed (mm) DriftsEquivalent
springs(mm)
Drifts Ratio
6 29,195 0,004 34,847 0,005 1,155 26,665 0,006 31,946 0,007 1,104 22,613 0,009 27,499 0,009 1,083 17,146 0,010 21,593 0,011 1,072 10,671 0,010 14,639 0,011 1,091 4,052 0,006 7,432 0,008 1,280 0,000 0,000 2,251 0,004 -
Average ratio Y 1,13
Source: Authors
Table 22. Example for calculation of inelastic drifts for spectral Xdisplacements (soil E, one frame)
Spectral (X)
Level Fixed (mm) DriftsEquivalent
springs(mm)
Drifts Ratio
6 15,662 0,002 17,594 0,003 1,195 14,177 0,004 15,825 0,004 1,094 11,923 0,005 13,369 0,005 1,043 9,006 0,005 10,324 0,005 1,022 5,617 0,005 6,855 0,005 1,011 2,170 0,003 3,365 0,003 1,020 0,000 0,000 1,159 0,002 -
Average ratio X 1,06
Source: Authors
Table 23. Average ratios for each soil type (all frames)
Average ratiosSoil type Spectral X Spectral Y Average
A 1,04 0,98 1,01C 1,04 1,01 1,02E 1,16 1,12 1,14
Source: Authors
irregularity must be considered in the structural analysis anddesign by reinforcing columns or changing their configurationor orientation. If r ≤ 1,2, then the torsional irregularity canbe dismissed from the analysis. The results for torsionalirregularity are shown in Tables 24 to 26.
Table 24. Average ratios for soil A (all frames)
Condition FixedEquivalent
springsDirection X Y X Y
Displacements (mm) 14,17 13,25 14,58 14,969,65 15,31 10,62 12,81
Average (mm) 11,91 14,28 12,60 13,88r(mm/mm) 1,19 1,07 1,16 1,08
Source: Authors
Tables 24 to 26, show that torsional irregularity values remainadmissible, and that the difference between fixed and equiva-
Table 25. Average ratios for soil C (all frames)
Condition FixedEquivalent
springsDirection X Y X Y
Displacements (mm) 21,71 21,07 26,89 23,7517,94 24,96 18,81 27,70
Average (mm) 22,83 23,01 22,85 25,73r (mm/mm) 1,21 1,08 1,18 1,08
Source: Authors
Table 26. Average ratios for soil E (all frames)
Condition FixedEquivalent
springsDirection X Y X Y
Displacements (mm) 22,58 24,93 28,51 34,8714,22 28,92 18,13 29,88
Average (mm) 18,40 26,92 23,32 32,37r(mm/mm) 1,23 1,07 1,22 1,08
Source: Authors
lent springs models remain closer. Despite using equivalentsprings, the structure still has admissible values. Additionally,the ratios for torsional moments were evaluated. Therefore,if ratio ≥ 1, then the torsional moment increases using equiv-alent springs and vice versa. The same equation was usedto calculate ratio for base shear forces; Figure 15 showsthe results for base shear forces and torsional moments forsoil C.
Tables 27 to 29 show a decrease in shear forces in directionsX and Y for soil A and C, although, for soil E, an increment isvisible in the direction of the applied spectral forces. Theseresults reflect that the displacements and rotations at thebase using equivalent springs not only imply that the behaviorof the structure changes for bad (in the form of drifts, rein-forcement, or increasing torsional moments), but the spectralforces can also be reduced for each spectral load state. Table30 shows similar results for torsional moments, decreasingfor soils A and C, and increasing for soil E. These results canbe attributed to the stiffness, given the fact that it decreasedfrom soil A to E.
Figure 15. Base shear for soil C (kN, kN.m).Source: Authors
8 of 10 INGENIERIA E INVESTIGACION VOL. 42 NO. 1, APRIL - 2022

LOPEZ M., PEREZ M., CASTRO P., VIELMA P., LOPEZ M., ALVIAR M., ROMERO R., GUERRERO C., AND MONTESINOS M.
Table 27. Soil A (spectral)
X YLevel Base shear ratio
Fx Fy Fx Fy6 0,91 0,88 0,87 0,965 0,89 0,88 0,88 0,864 0,88 0,88 0,88 0,853 0,88 0,88 0,89 0,852 0,89 0,89 0,90 0,861 0,91 0,91 0,91 0,88
Average. 0,89 0,89 0,89 0,88
Source: Authors
Table 28. Soil C (spectral)
X YLevel Base shear ratio
Fx Fy Fx Fy6 0,96 0,92 0,93 0,945 0,95 0,91 0,93 0,944 0,95 0,92 0,93 0,943 0,95 0,92 0,93 0,942 0,96 0,93 0,94 0,951 0,98 0,95 0,95 0,98
Average. 0,96 0,92 0,93 0,95
Source: Authors
Table 29. Soil E (spectral)
X YLevel Base shear ratio
Fx Fy Fx Fy6 1,05 1,00 1,01 1,005 1,05 0,99 1,01 1,014 1,05 1,00 1,01 1,013 1,05 1,00 1,02 1,022 1,06 1,02 1,02 1,031 1,07 1,03 1,03 1,05
Average. 1,05 1,01 1,02 1,02
Source: Authors
Table 30. Ratios for torsional moments for each soil type
Level Soil A Soil C Soil EX Y X Y X Y
Torsional Moment ratio (Mz)6 0,81 0,96 0,82 1,02 0,87 1,085 0,81 0,95 0,82 1,02 0,88 1,094 0,80 0,95 0,82 1,02 0,88 1,093 0,80 0,95 0,83 1,03 0,88 1,102 0,81 0,85 0,83 1,04 0,89 1,111 0,83 0,98 0,85 1,06 0,91 1,13
Av. 0,81 0,94 0,83 1,03 0,88 1,10
Source: Authors
ConclusionsAccording to the results, for this regular structure, soil-structure interaction in linear range has an impact on theanalysis and design. The former is related with reinforcementareas for structural elements which increased for positive and
negative bending moments in all the structural models, whilealso increasing the quantities of stirrups per length.
Drift values showed an expected increase, being greater forsoil E (14%), which was the most critical in terms of stiffnessand soil resistance, as well as subjected to gravitational andseismic influences, thus allowing more displacements androtations at the base. However, it could be enhanced bygiving more stiffness to its foundation system by mechanicallyaltering the soil properties to preserve the superstructure’scross section.
A similar response was obtained for torsional irregularity,but, in this case, it remained almost equal in terms of dis-placement, which is related with stiffness reduction andincreasing displacements. Despite this, the torsional risk isthe same, and it does not imply a significant change in thesuperstructure’s design, so it could be enhanced by changingthe substructure’s stiffness.
A structure generally functions as a filter for seismic move-ment, that is, depending on the structure and its transferfunction, it can be susceptible to the frequencies a certainearthquake. The transfer function, in turn, depends directlyon the stiffness of the structure; when the structure is fixedat the base, it has more stiffness than it would with springson it, but even so, this does not mean that the structure withsprings at the base will have greater lateral displacementsthan the fixed structure, given that, when placing translationaland rotational springs, vertical and lateral displacements androtations will occur at the base, which can even reduce lateraldisplacement.
The shear forces and torsional moments increased and de-creased, and so did the drifts, but the stiffness of the structurewith springs decreased, which produced a reduction of shearforces in soils A and C, but increased with soil E, which is notthe case for torsional moments, (it only increased for soilsC and E). The explanation for this lies in the linear stiffnessof the structure (translational and rotational). In the caseof springs, the stiffness decreased, but the displacementsincreased, so there is a compensation comparable to the fixedmodel.
It is highly recommended to apply this study for other soiltypes and the same structure by optimizing the superstructureand substructure. Additonally, it is recommended to avoiddisplacements with higher variations at the base, which allowsto control additional stresses on the superstructure.
ReferencesAmerican Concrete Institute, Committee 318 (ACI) (2014). Build-
ing Code Requirements or Structural Concrete (ACI 318-14)and Commentary (ACI 318R-14). ACI.
American Concrete Institute, Committee 318 (ACI) (2019). Build-ing Code Requirements or Structural Concrete (ACI 318-19)and Commentary (ACI 318R-19). ACI.
ASCE/FEMA (2000). Prestandard and Commentary for the SeismicRehabilitation of Buildings (FEMA 356). Federal EmergencyManagement Agency.
INGENIERIA E INVESTIGACION VOL. 42 NO. 1, APRIL - 2022 9 of 10

A Structural Design Comparison Between Two Reinforced Concrete Regular 6-Level Buildings using Soil-Structure Interaction in Linear...
Castro-Pilco, C. F. and Pérez-Martínez, G. E. (2020). Análisis dela interacción suelo-estructura estática para una edificaciónregular de hormigón armado y 3 tipos de suelos [Bachelor’sthesis].
Chopra, A. K. (1980). Dynamics of structures. Earthquake Engi-neering Research Institute.
Cruz, C. and Miranda, E. (2017). Evaluation of soil-structure inter-action effects on the damping ratios of buildings subjectedto earthquakes. Soil Dynamics and Earthquake Engineering,100, 183-195. 10.1016/j.soildyn.2017.05.034
DAS, B. M. (2011). Principles of Foundation Engineering (7th ed.).Braja Das.
Díaz-Guzmán, F. D., Espinoza-Barreras, F., Sánchez-Vergara,R., and Huerta-López, C. I. (2012). Respuesta dinámicade un edificio considerando el efecto de interacción suelo-estructura. Centro Internacional de Métodos Numéricos enIngeniería. https://core.ac.uk/download/41779960.pdf
Falconí, R. A. (2008). Análisis sísmico de edificios. Centro deInvestigaciones Cientificas, Escuela Politécnica del Ejército.
FEMA (2006).NEHRP recommended provisions: Design examples(FEMA 451). Federal Emergency Management Agency.
FEMA, P. (2018). Assessing Seismic Performance of Buildings withConfiguration Irregularities. Calibrating Current Standardsand Practices.
Galicia, W. and León, J. (2007). Interacción sísmica suelo-estructura en edificaciones de albañilería confinada conplateas de cimentación. Universidad Privada AntenorOrrego.
Garza-Vásquez, L. (2000). Diseño y construcción de cimenta-ciones. Escuela de Ingeniería Civil.
Hernández-Velasco, E. (2013). Análisis de la interacción dinámicasuelo - estructura de un edificio desplantado en la zonade Lago de la Ciudad de México. Universidad NacionalAutónoma de México.
López, N., Vielma, J., López, L., and Montesinos, V. (2019).Using Microsoft Excel Macros to Analyze Planar Structures.Revista internacional de ingeniería de estructuras, 24(1),123-139. 10.24133/riie.v24i1.1169
Lutes, L. D. and Sarkani, S. (1995). Structural damping for soil-structure interaction studies. Structural Engineering andMechanics, 3(2), 107-120. 10.12989/sem.1995.3.2.107
Mejía-Bermejo, L. A. (2017). Interacción dinámica suelo-estructura [Bachelor’s Thesis, Universidad NacionalAutónoma de México, México]. https://repositorio.unam.mx/contenidos/215732
Meli Piralla, R. (1986). Diseño estructural. LIMUSA.
Norma Ecuatoriana de la Construcción (NEC) (2015). Estruc-turas de hormigón armado. Cámara de la Industria y laConstrucción.
Paz, M. (1992). Structural Dynamics, theory and computations.Van Nostrand Reinhold Company Inc.
Pérez-Valcárcel, J. (2013). Métodos de cálculo de cimentacionessuperficiales. https://www.udc.es/dep/dtcon/estructuras/ETSAC/Publicaciones/pub-val/Suelos/Zapatas%20EHE.pdf
Reyes, L. E. G. (1998). Dinámica estructural aplicada al diseñosísmico. Universidad de los Andes, Facultad de Ingeniería,Departamento de Ingeniería Civil.
Norma Ecuatoriana de la Construcción (NEC) (2014). PeligroSísmica. Cámara de la Industria y la Construcción.
Uribe-Escamilla, J. (2000). Análisis de estructuras. ECOE.
Villareal, G. (2009). Interacción sísmica suelo-estructura en ed-ificaciones con zapatas aisladas. Asamblea Nacional deRectores. http://blog.pucp.edu.pe/blog/wp-content/uploads/sites/109/2009/07/Interaccion-suelo-zapata.pdf
Wahrhaftig, A. de M. and Brasil, R. M. (2017). Initial undampedresonant frequency of slender structures considering non-linear geometric effects: the case of a 60.8 m-high mobilephone mast. Journal of the Brazilian Society of MechanicalSciences and Engineering, 39(3), 725-735. 10.1007/s40430-016-0547-1
Wahrhaftig, A. de M. (2020). Time-dependent analysis of slender,tapered reinforced concrete columns. Steel and CompositeStructures, 36(2), 229-247. 10.12989/scs.2020.36.2.229
Weaver, W. and Gere, J. M. (1990). Finite-Element Method forFramed Structures.In Matrix Analysis of Framed Structures(pp. 447-467). Springer. 10.1007/978-1-4684-7487-9_7
Wu, R. Y. and Pantelides, C. P. (2019). Seismic evaluation ofrepaired multi-column bridge bent using static and dynamicanalysis. Construction and Building Materials, 208, 792-807.10.1016/j.conbuildmat.2019.03.027
Zeevaert, L. (1980) Interacción suelo-estructura, estática y sís-mica de cimentaciones monolíticas superficiales [Confer-ence presentation]. VI Seminario de Mecánica de SuelosInteracción Suelo-Estructura, Caracas, Venezuela. https://docplayer.es/14218639-Interaccion-suelo-estructura-estatica-y-sismica-de-cimentaciones-monoliticas-superficiales-1-por-dr-leonardo-zeevaert.html
10 of 10 INGENIERIA E INVESTIGACION VOL. 42 NO. 1, APRIL - 2022
Related Documents